Embed Size (px)
Citation preview
International Journal of Plasticity 43 (2013) 128–152
Contents lists available at SciVerse ScienceDirect
International Journal of Plasticity
journal homepage: www.elsevier .com/locate / i jp las
Quantification of the effect of transformation-induced geometricallynecessary dislocations on the flow-curve modelling of dual-phase steels
A. Ramazani a,⇑, K. Mukherjee a, A. Schwedt b, P. Goravanchi c, U. Prahl a, W. Bleck a
a Department of Ferrous Metallurgy, RWTH Aachen University, Intzestr. 1, D-52072 Aachen, Germanyb Central Facility for Electron Microscopy, RWTH Aachen University, Ahornstr. 55, D-52074 Aachen, Germanyc Integrated Analog Circuits, RWTH Aachen University, Sommerfeldstr. 24, D-52074 Aachen, Germany
a r t i c l e i n f o
Article history:Received 19 June 2012Received in final revised form 2 November2012Available online 28 November 2012
Keywords:Dual-phase (DP) steelTransformation-induced geometricallynecessary dislocations (GNDs)Electron backscatter diffraction (EBSD)Representative volume element (RVE)Dislocation-based model
0749-6419/$ - see front matter � 2012 Elsevier Ltdhttp://dx.doi.org/10.1016/j.ijplas.2012.11.003
⇑ Corresponding author.E-mail address: [email protected]
a b s t r a c t
The current work aims to predict the work-hardening behaviour of dual-phase (DP) steel,focusing on the effect of transformation-induced geometrically necessary dislocations(GNDs). Equiaxed and banded microstructures were produced through suitable heat treat-ment cycles in a laboratory. Electron backscatter diffraction measurements wereperformed to characterise GNDs. The flow behaviour was modelled within the microscalefinite element method, considering the effect of the microstructures using the representa-tive volume element (RVE) approach. 2-D RVEs were created based on real microstructures.The flow behaviour of single phases was modelled using the dislocation-based work-hard-ening approach. The volume change during the austenite-to-martensite transformationwas also modelled, and the resulting prestrained areas in ferrite were considered to bethe storage place of GNDs. The thickness of the GND layer around martensite islandswas quantified experimentally and numerically. Subsequently, three criteria were devel-oped to describe the strength, thickness, and amount of prestrain in the GND zone as afunction of microstructural features in DP steel. Then, numerical uniaxial loading in therolling direction was applied on the RVEs to study the effect of GNDs on the stress andstrain distribution in the microstructures, flow curve, and hardening behaviour of DP steel.A computational first-order homogenisation strategy was employed to obtain the truestress–true strain curves from the RVE calculations. The flow curves of simulations thattook the GNDs into account were in better agreement with the experimental flow curves,compared with those of simulations that did not consider the GNDs.
� 2012 Elsevier Ltd. All rights reserved.
1. Introduction
Dual-phase (DP) steel is characterised by a microstructure consisting of hard martensite particles dispersed in a soft andductile ferrite matrix. Such a structure leads to several unique properties, such as high strength, a continuous yielding behav-iour (no sharp yield-point phenomenon), a high work-hardening rate, and good ductility. Moreover, due to the elimination ofthe yield-point elongation, DP steel possesses high crash resistance, good formability, and excellent surface finish (Zuidemaet al., 2011; Rigsbee and Van der Arend, 1979; Speich and Miller, 1979; Rashid, 1981; Speich, 1981; Balliger and Gladman,1981). This steel is also becoming more important in the automotive industry, where high strength and ductility permitweight reduction without sacrificing formability. DP steel is also low-carbon and low-alloy and therefore costs less(WorldAutosteel, 2002; Pfestorf, 2005; Matlock et al., 1984; Qu, 2011; ULSAB-AVC-PES Engineering Report, 2001).
. All rights reserved.
e (A. Ramazani).
A. Ramazani et al. / International Journal of Plasticity 43 (2013) 128–152 129
The general belief is that mobile dislocations, introduced into the ferrite matrix as a result of the austenite-to-martensitetransformation, are primarily responsible for the continuous yielding behaviour and the high work-hardening rate of DPsteel. The movement of these dislocations results in the elimination of yield-point elongation and in the observed low yieldstrength. The interaction of dislocations with each other and with the finely dispersed martensite grains results in a highstrain-hardening exponent. Hahn’s model (Hahn, 1962) for discontinuous yielding predicts that mobile dislocation densitiesof 107–109 m�2 lead to discontinuous yielding, while mobile dislocation densities of 1011–1013 m�2 result in continuousyielding behaviour (Hahn, 1962; Hansen and Pradhan, 1981). Tsipouridis (2006) stated that the total average ferritedislocation density in DP steel is dependent on the martensite fraction and ranges from 1 � 1011 to 1.5 � 1011 m�2, hencesatisfying Hahn’s criterion. According to his measurements, the total average ferrite dislocation density is a linearly increas-ing function of martensite, with values in the order of 1011 m�2.
Several researchers have worked on electron backscatter diffraction (EBSD) studies of DP steel. Mukherjee et al. (2009)used objects with mean band contrast to separate ferrite from martensite. Kang et al. (2011a,b) used the same parametersto differentiate between ferrite and martensite in their DP steel. Kang et al. (2011b) studied in situ microtexture develop-ment during the equi-biaxial tensile deformation of DP steel. They showed the formation of a strain gradient in the ferriteregion near the ferrite–martensite (FM) interfaces, which was confirmed by the observed loss of pattern quality in ferrite inthose regions. They concluded that the strain gradient resulted in the formation of mobile dislocations in those regions. Thereason for the existence of mobile dislocations is that the austenite-to-martensite transformation during quenching intro-duced a dilatation effect on the microscale, and at least part of the neighbouring ferrite grains must deform plastically toaccommodate the transformation strain.
According to Speich and Miller (1979), the rapid increase in the work hardening of DP steel at low strains is the outcomeof three interaction parameters. First, residual stresses are generated by small amounts of plastic deformation upon coolingduring the austenite-to-martensite transformation. Second, the dislocation density in ferrite is increased by the generation ofboth statistically stored dislocations (SSDs) and geometrically necessary dislocations (GNDs) (Ashby, 1970). The SSDs resultfrom simple work hardening of ferrite, while the GNDs are created by the need to maintain contact between the two phasesduring plastic deformation (compatibility). Third, because the plastic incompatibility of the two phases cannot be accommo-dated completely by plastic deformation, stresses are created within the martensite phase that are compensated for by backstresses in the ferrite. The back stresses impede dislocation movement in the ferrite.
The complicated interplay among these three factors makes exact treatment of the initial work-hardening behaviour ofthese steels very difficult. The martensite island size affects the work-hardening behaviour. According to Balliger and Glad-man (1981) and Pickering (1992), in DP steel, the work-hardening rate increases with the decrease in the martensite islandsize. However, experimental studies on the effect of martensite shape on the work-hardening behaviour of DP steel are lim-ited. Based on the study of Sarosiek and Owen (1984), DP steel with a banded martensite morphology (mostly continuous)has almost the same work-hardening behaviour as the homogenised DP steel with smaller (noncontinuous) martensiteislands. Jiang et al. (1995) used Sarosiek and Owen’s methodology to quantify the effects of microstructural variables onthe deformation behaviour of DP steel.
The concept of GNDs has been extensively discussed in the literature (Ashby, 1970; Van der Giessen and Needleman,2003; Nye, 1953; Kroner, 1967; Cottrell, 1964; Arsenlis and Parks, 1999). Nye (1953) and Ashby (1970) introduced GNDsto interpret modes of plastic deformation, such as bending of a beam, where an internal accumulation of a density of dislo-cations is required to accommodate the gradients of plastic strain induced by the deformation. For the bent beam, the gra-dient of deformation is associated with the macroscopically imposed strain field. But even if the imposed strain field ismacroscopically uniform, as in simple tension, dislocation structures develop that lead locally to non-uniform deformationfields. These dislocation structures, which are also referred to as GNDs although the geometric necessity is lacking, can giverise to size effects as well and appear to play a significant role near boundaries and interfaces. Proposed descriptions of GND-induced, size-dependent plastic flow include theories that the measure of the density of GNDs enters the hardening, thestrength, or the free energy. Each of these gives rise to a different set of governing equations, different boundary conditions,and a different notion of what material property is needed to characterise size dependence (Ashby, 1970; Van der Giessenand Needleman, 2003; Needleman and Gil Sevillano, 2003; Gao and Huang, 2003; Zaiser and Aifantis, 2003).
Gao and Huang (2003) have shown that the GNDs represent an additional storage of dislocations required to accommo-date the lattice curvature that arises whenever there is a non-uniform plastic deformation. Based on their statement, GNDsdo not contribute to plastic strain, but they act as obstacles to the motion of other SSDs and hence contribute to the workhardening of the material. GNDs do not necessarily have different structures from SSDs. They can be ordinary dislocations,and it would be impossible to identify an individual dislocation as a geometrically necessary one or otherwise (Gao andHuang, 2003; Liu and Ngan, 2001; Horstmeyer et al., 2001; Kubin and Mortensen, 2003). In pure FCC crystals, the resolvedflow stress s is then given by the well-known relationship:
s ¼ a� l� b� ðqs þ qgÞ1=2 ð1Þ
where a is a constant coefficient with the value of 0.3 ± 0.1, qs is the density of SSDs, and qg the density of GNDs (Ashby,1970; Kubin and Mortensen, 2003; Nix and Gao, 1998; Kouzeli and Mortensen, 2002). The critical point in this equationis distinguishing between GNDs and SSDs. In this regard, Hansen and Huang (1998) studied the deformation of bulk alumin-ium polycrystals. Their research successfully measured density of GNDs from TEM measurements. The dislocation
130 A. Ramazani et al. / International Journal of Plasticity 43 (2013) 128–152
microstructures are built up from subgrains or walls, which accommodate the mis-orientations between dislocation-poorareas. From direct measurements of the local mis-orientations, the density of dislocations within cell walls was inferredand the coefficient a was estimated from the knowledge of a Taylor-averaged flow stress. Increasing the deformation from5% to 34% increases the dislocation density, which causes the value of a to decrease from 0.28 to 0.2. This finding is in linewith theoretical expectations, experimental (Basinski and Basinski, 1979) and simulation (Madec, 2001) results. Further-more, the majority of the dislocations are in the walls and hence are GNDs accommodating naturally occurring spatial strainvariations. The hardening behaviour behaves in the same manner as statistically stored dislocations, to which it is implicitlyassimilated in strain gradient plasticity. In fact, the origin of most of the flow stress of the material at large strains (qg� qs)is GNDs, while qg should be negligible regarding qs at small strains, since local mis-orientations are very small. However, thedependency of strain on GNDs and SSDs densities is little known when they are considered individually (Kubin and Morten-sen, 2003; Hansen and Huang, 1998).
There is on-going debate about the nature, definition, and characterisation of GNDs (Van der Giessen and Needleman,2003; Needleman and Gil Sevillano, 2003; Zaiser and Aifantis, 2003), as it is critical to separate the dependency of strainon the GNDs and SSDs densities separately (Gao and Huang, 2003; Zaiser and Aifantis, 2003; Kubin and Mortensen, 2003)or to identify an individual dislocation as a GND or SSD (Gao and Huang, 2003). Thus for simplification, we decided to defineGNDs to be those dislocations ‘‘that exist only because the geometry of the sample was changed by means of plastic defor-mation’’. For the rest, we must distinguish between immobile and mobile dislocations. In that sense, those dislocations beingintroduced into the ferrite matrix as a gradient from martensite–ferrite interface to ferrite grain centre due to the transfor-mation dilatation effect will be counted as GNDs, and they consist of dislocations due to compatibility reasons at theinterface and statistically stored dislocations due to hardening in ferrite.
Besides EBSD, other strategies have also been developed to measure lattice orientation gradient in a highly heterogeneousdeformation state and estimate GND densities. In fact, the lattice orientation gradient can be accepted to be a lower boundfor GND density. One strategy is to use X-ray microbeam diffraction methods. Lattice rotation and lattice strain at the surfaceof very small volumes of material can be measured. (Larson et al., 2004; Feng et al., 2008; Ohashi et al., 2009). The secondstrategy is to use Orientation Imaging Microscopy (OIM) or Transmission Electron Microscopy (TEM) to measure lattice rota-tion in a highly heterogeneous deformation state along with serial Focused Ion Beam (FIB) sectioning to map out the 3-Dstructure of the lattice rotation fields (Zaafarani et al., 2006, 2008; Rester et al., 2007, 2008; McLaughlin and Clegg, 2008;Kiener et al., 2006; Demir et al., 2009; Man et al., 2010). Barabash et al. (2009) applied a spatially resolved X-ray diffractionmethod with a submicron 3-D resolution together with SEM and OIM analysis to quantify GNDs in Al and Cu single crystalsshocked to incipient spallation fracture. They carried out streak analyses, which determined the low-limit number of GNDsand their density tensor within each probed region (Barabash et al., 2009; Barabash and Ice, 2005). The third approach is tointroduce a 2-D deformation state so that all out-of-plane deformation gradients are zero, to within the tolerance of exper-imental error. This technique has been pursued in the framework of wedge indentation and voids in single crystals andcracks in bicrystals (Kysar and Briant, 2002; Kysar et al., 2005, 2007, 2010; Gan et al., 2005).
Calcagnotto et al. (2010) calculated the transformation-induced GND density from kernel average mis-orientation (KAM)values, which vary from about 2.5 � 1014 m�2 close to the martensite particles to about 2.5 � 1013 m�2 in the grain interior.The GND densities presented by Calcagnotto et al. agree with the dislocation densities in DP steel calculated by Cai et al.(1985) and Sarosiek and Owen (1984) based on TEM measurements. However, the TEM studies (Larson et al., 2004; Caiet al., 1985) yield dislocation densities that are somewhat higher than those developed using the KAM values (Calcagnottoet al., 2010). Here, Calcagnotto et al. reported that KAM values give a lower bound only for dislocation density in a measuredzone with the argument that SSDs are additionally counted when evaluating TEM images. Rigsbee and Van der Arend (1979)and Marder (1982) used TEM measurements to show GNDs in ferrite regions adjacent to the martensite islands. Davies(1979) reported that for DP steel of industrial relevance (with 15–25% martensite), yielding is accounted for by the GNDs.The seminal work by Ashby introduced a methodology to take into account the effect of GNDs in the calculation of the flowcurves of metal matrix composite materials (Ashby, 1970, 1971). Gardner et al. (2010) performed high-resolution EBSD withan emphasis on particular experimental challenges encountered, such as precision placement of the pattern centre to char-acterise the elastic stress fields, lattice curvature fields, and surface dislocation densities in polycrystals. Based on their inves-tigation, high-resolution data acquired near a single grain boundary in well-annealed, low-content steel can be used tomeasure the intrinsic elastic properties of grain boundaries.
The mechanical properties of multiphase steel are modelled using two different approaches: First, there are empiricalflow-curve models that describe the material as homogeneous and neglect its two-phase nature; then, there is a microstruc-ture-based flow law formulated as a function of independent constitutive laws for ferrite and martensite. An example of thefirst approach was presented by Khan et al. (2012). They successfully modelled the quasi-static and dynamic responses of DPsteel using the modified Khan–Huang–Liang (KHL) model, which predicts flow stress as a function of plastic strain (Khanet al., 2012, 2004, 2007; Khan and Liang 1999). Sung et al. (2010) proposed an empirical plasticity constitutive form to quan-tify the flow stress of DP steel as a function of strain, strain rate, and temperature. However, the second, microstructure-based approach considers individual flow curves of single phases and takes into account the multiphase microstructure. Thisapproach is termed micromechanical modelling.
In the current research, the formability and failure behaviour of DP steel are predicted based on 2-D or 3-D RVE modelling.The hole-expansion formability of DP steel is modelled through the RVE-based finite element method (FEM) approach, using
A. Ramazani et al. / International Journal of Plasticity 43 (2013) 128–152 131
the Ludwik equation for individual ferrite and martensite flow curves (Kim et al., 2010). Sun et al. (2009) generated 2-D RVEfrom real DP steel microstructures to predict the failure modes and ductility of DP steel by plastic strain localisation.
As reported by Liedl et al. (2002), the behaviour of DP steel is not fully explained through composite flow properties.According to Fischmeister and Karlsson (1977), the yield stress of the matrix controls the start of the plastic flow of compos-ite materials, with hard inclusions embedded in a continuous soft matrix. As ferrite and martensite have comparable elasticmoduli, the yield stress of ferrite should be independent of the martensite content (Khan et al., 2012). However, Liedl et al.(2002) found that the yield stress of DP steel does depend on the martensite content. To explain this, they initiated a micro-mechanical study of the flow behaviour of DP steel, taking into consideration the expansion of volume in the second phase,during the austenite-to-martensite transformation in the production of DP steel.
Recently, there has been great interest in micromechanical models that couple the effects of SSDs and GNDs to bridgebetween macro- and micromechanical plasticity. Abu Al-Rub and Voyiadjis (2004) proposed a length-scale parameter con-sidering SSDs, GNDs, grain size, precipitation distribution, Schmidt’s orientation factor, etc. Micromechanical modellingwithin the framework of crystal plasticity can be used to simulate the mechanical response of materials (Anand and Kalid-indi, 1994; Bieler et al., 2009; Prakash et al., 2009; Ma et al., 2006a,b; Yassar et al., 2007; Engels et al., 2012). In this approach,every grain is associated with different crystallographic orientations; therefore, the development of deformation texture andpossible flow localisation can be predicted. Kim et al. (2012) performed a crystal-plasticity-based multiscale micromechan-ical modelling to predict the Bauschinger effect in DP steel. Several investigations studied the evolution of the heterogeneousstrain field throughout a plastically deforming microstructure (K-Kanjarla et al., 2010; Diard et al., 2005; Osipov et al., 2008).Engels et al. (2012) performed two-dimensional plane-strain simulations of nano-indentation in a single crystal with a cir-cular-shaped tip. For this purpose, they implemented a lower-order, non-local and physically based crystal plasticity modelin a finite difference code for small deformations. Using the developed model, they studied the macro- and micromechanicalbehaviour simultaneously and, by virtue of the continuum approach, dislocation density fields in rather large areas aroundthe indentation. Also, some investigations used the crystal plasticity finite element method (CPFEM), and results were com-pared with experimental observations (Zaafarani et al., 2006; Ma et al., 2006a,b). Because classical plasticity theories, havingno intrinsic material lengths in the constitutive models, cannot explain the size-dependent material behaviour, strain gra-dient crystal plasticity must be used to consider GNDs in the simulations (Ma et al., 2006a; Gurtin, 2008, 2010; Shi et al.,2004; Fleck et al., 1994; Aoyagi and Shizawa, 2007; Roters et al., 2010; Gurtin et al., 2011; Lee and Chen, 2010; Mayamaet al., 2009).
Busso and Cheong (2001) introduced the concept of describing a dislocation density tensor as the curl of plastic distortionrelating the GND density to a discontinuity of strains in a crystal. However, this value becomes zero, theoretically, in the caseof the usual continuum model. Therefore, it is desirable for a dislocation-crystal plasticity simulation to relate the dislocationdensity to a slip gradient in a crystal. Clayton and McDowell (2003) and Clayton et al. (2006) have discussed GNDs as rota-tional lattice defects based on the principles of multiscale volume averaging. GND density can be used to quantify the crystaldefects, such as shape of dislocation loops from geometrical images; to distinguish between edge and screw components;and to predict a size effect due to the slip gradient. However, dislocation dynamics and dislocation pairs cannot be describedby GND density. A dislocation pair is uncountable by using GND, since it vanishes in a Burgers circuit surrounding the GND.Fleck et al. (1994) adopted not only SSD density but also GND density as arguments of a hardening law. Ohashi (2004, 2005)introduced only SSD density into a hardening law and GND density into a dislocation mean free path model in order to studythe size effect of grains. Methods that consider both the SSD and the GND densities simultaneously are useful because eachmakes up for faults of the other. However, in this case, two kinds of dislocation densities belonging to different categories,i.e., geometry and statistics, are mixed in a total dislocation density. Danas et al. (2010) used discrete dislocation (DD) andstrain-gradient plasticity (SGP) formulations to carry out a plane-strain analysis of a sandwiched, sheared single crystalwhose upper and lower surfaces were bonded to rigid blocks via interfaces of finite height. They showed that the strain-gra-dient crystal plasticity results were in very good agreement with the discrete dislocation simulations in all investigatedcases.
There are many studies on multiscale computation based on dislocation information without crystal plasticity. Delaireet al. (2000) carried out a simulation using an evolution equation of SSD density and an expression of dynamic recoveryfor a copper polycrystal. A constitutive model based on the difference between accumulated immobile dislocation densityand recovered one has been proposed by Estrin et al. (1996). Gurtin (2000) presents a constitutive equation of microstressusing a dislocation density tensor, which is similar to the couple stress in the conventional Cosserat-type theories (Forest andSedlac�ek, 2003). Although Gurtin’s theory has the advantage that a user can select an arbitrary proper length scale as withthe Cosserat theory, it has the disadvantage that a length scale cannot concretely be specified on the basis of intrinsic lengthsuch as the size of dislocation substructure.
A large amount of work has been done to model the flow curve of individual phases based on the evolution of dislocationdensity (Mukherjee et al., 2010; Rodriguez and Gutierrez, 2003; Uthaisangsuk, 2009; Uthaisangsuk et al., 2011; Thomseret al., 2009; Ramazani et al., 2012a). In all research studies, the dislocation generation rate, recovery rate, and recrystallisa-tion rate have been used to correlate flow stress to dislocation density. This approach has also been used in the study of fer-rite and martensite. However, for ferrite and martensite, the effect of recrystallisation is neglected. The recovery rates offerrite and martensite are related to grain size and lath width, respectively.
Ramazani et al. (2012b) studied the effect of ferrite grain size on the yield stress and initial work-hardening behaviour ofDP steel using microscale FEM. GNDs caused by volume change due to the austenite-to-martensite transformation during
132 A. Ramazani et al. / International Journal of Plasticity 43 (2013) 128–152
cooling were taken into account, following the general idea of Liedl et al. (2002). According to their results, the flow curves ofsimulations that took GNDs into account were in better agreement with experimental flow curves, compared to the flowcurves of simulations that did not consider GNDs. The experimental results (Calcagnotto et al., 2011) obeyed the Hall–Petchrelationship between yield stress and flow stress, and the simulations that considered GNDs were able to precisely predictthis relationship (Ramazani et al., 2012b).
The objective of this study is to develop a modelling approach for predicting the flow curve of DP steel using microme-chanical modelling and to show that this approach can capture the effect of GNDs on the yield stress and the initial work-hardening behaviour of the material. A dislocation-based work-hardening approach was used to model the flow curves in theferrite and martensite phases (Rodriguez and Gutierrez, 2003; Uthaisangsuk, 2009; Uthaisangsuk et al., 2011; Thomser et al.,2009; Ramazani et al., 2012a). These curves were introduced in the 2-D RVE calculation domains to model the flow behav-iour of DP steel. The experimental microstructures were considered in this framework. The effect of GNDs was incorporatedinto the FEM framework by including the volume change of the remaining austenite-to-martensite transformation duringcooling (Ramazani et al., 2012b). Finally, the effect of martensite morphology on the yield stress and initial work-hardeningbehaviour of DP steel was studied.
2. Experiment
2.1. Materials
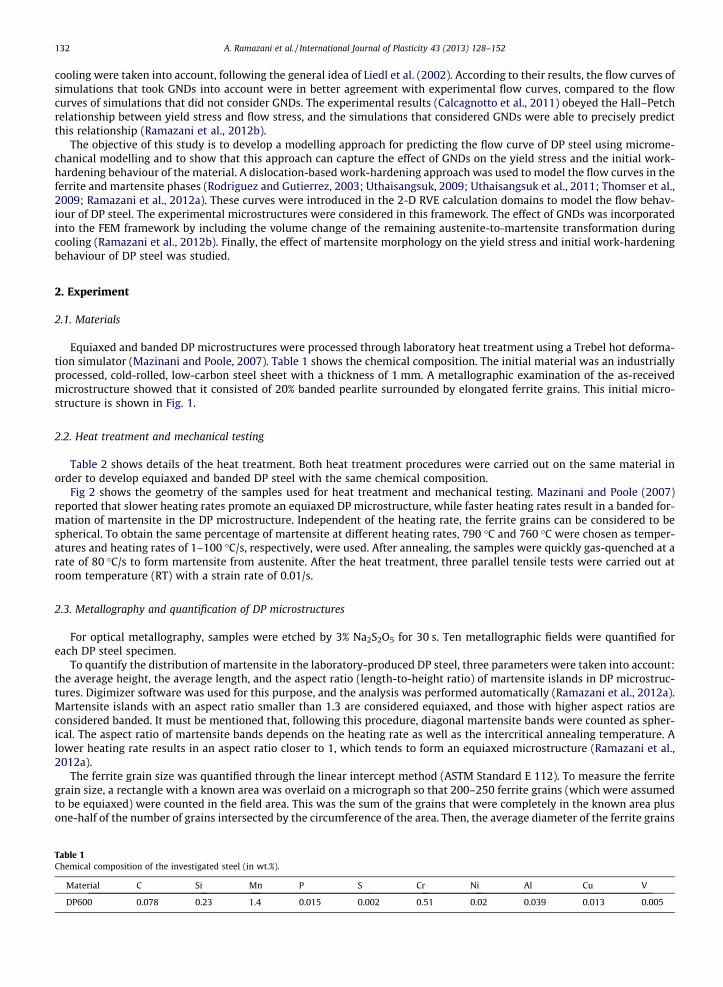
Equiaxed and banded DP microstructures were processed through laboratory heat treatment using a Trebel hot deforma-tion simulator (Mazinani and Poole, 2007). Table 1 shows the chemical composition. The initial material was an industriallyprocessed, cold-rolled, low-carbon steel sheet with a thickness of 1 mm. A metallographic examination of the as-receivedmicrostructure showed that it consisted of 20% banded pearlite surrounded by elongated ferrite grains. This initial micro-structure is shown in Fig. 1.
2.2. Heat treatment and mechanical testing
Table 2 shows details of the heat treatment. Both heat treatment procedures were carried out on the same material inorder to develop equiaxed and banded DP steel with the same chemical composition.
Fig 2 shows the geometry of the samples used for heat treatment and mechanical testing. Mazinani and Poole (2007)reported that slower heating rates promote an equiaxed DP microstructure, while faster heating rates result in a banded for-mation of martensite in the DP microstructure. Independent of the heating rate, the ferrite grains can be considered to bespherical. To obtain the same percentage of martensite at different heating rates, 790 �C and 760 �C were chosen as temper-atures and heating rates of 1–100 �C/s, respectively, were used. After annealing, the samples were quickly gas-quenched at arate of 80 �C/s to form martensite from austenite. After the heat treatment, three parallel tensile tests were carried out atroom temperature (RT) with a strain rate of 0.01/s.
2.3. Metallography and quantification of DP microstructures
For optical metallography, samples were etched by 3% Na2S2O5 for 30 s. Ten metallographic fields were quantified foreach DP steel specimen.
To quantify the distribution of martensite in the laboratory-produced DP steel, three parameters were taken into account:the average height, the average length, and the aspect ratio (length-to-height ratio) of martensite islands in DP microstruc-tures. Digimizer software was used for this purpose, and the analysis was performed automatically (Ramazani et al., 2012a).Martensite islands with an aspect ratio smaller than 1.3 are considered equiaxed, and those with higher aspect ratios areconsidered banded. It must be mentioned that, following this procedure, diagonal martensite bands were counted as spher-ical. The aspect ratio of martensite bands depends on the heating rate as well as the intercritical annealing temperature. Alower heating rate results in an aspect ratio closer to 1, which tends to form an equiaxed microstructure (Ramazani et al.,2012a).
The ferrite grain size was quantified through the linear intercept method (ASTM Standard E 112). To measure the ferritegrain size, a rectangle with a known area was overlaid on a micrograph so that 200–250 ferrite grains (which were assumedto be equiaxed) were counted in the field area. This was the sum of the grains that were completely in the known area plusone-half of the number of grains intersected by the circumference of the area. Then, the average diameter of the ferrite grains
Table 1Chemical composition of the investigated steel (in wt.%).
Material C Si Mn P S Cr Ni Al Cu V
DP600 0.078 0.23 1.4 0.015 0.002 0.51 0.02 0.039 0.013 0.005
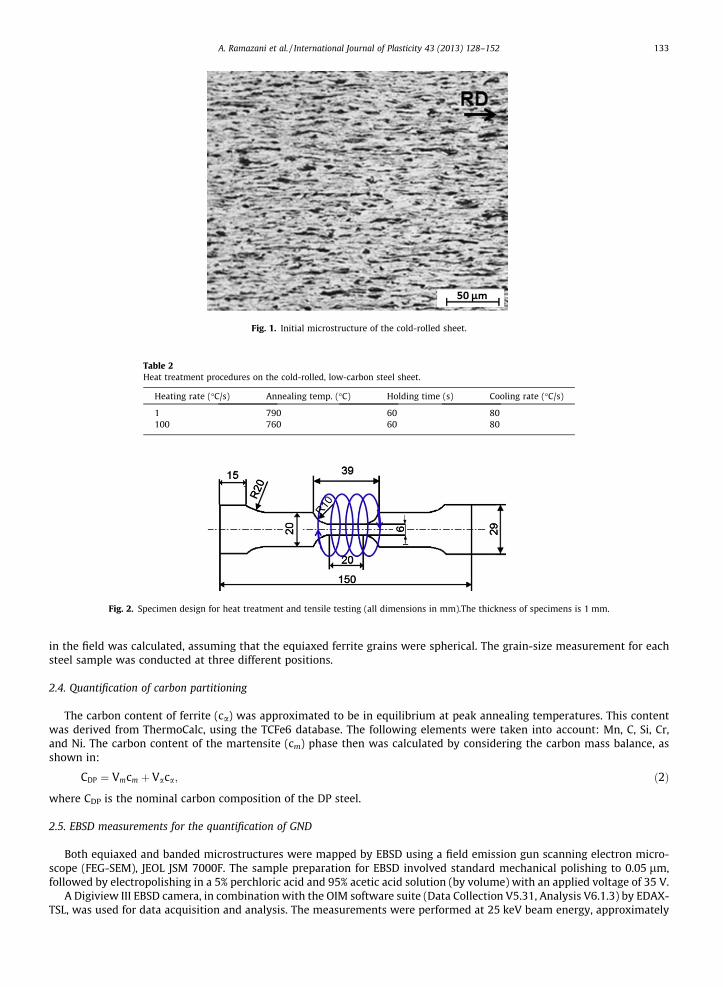
Fig. 1. Initial microstructure of the cold-rolled sheet.
Table 2Heat treatment procedures on the cold-rolled, low-carbon steel sheet.
Heating rate (�C/s) Annealing temp. (�C) Holding time (s) Cooling rate (�C/s)
1 790 60 80100 760 60 80
Fig. 2. Specimen design for heat treatment and tensile testing (all dimensions in mm).The thickness of specimens is 1 mm.
A. Ramazani et al. / International Journal of Plasticity 43 (2013) 128–152 133
in the field was calculated, assuming that the equiaxed ferrite grains were spherical. The grain-size measurement for eachsteel sample was conducted at three different positions.
2.4. Quantification of carbon partitioning
The carbon content of ferrite (ca) was approximated to be in equilibrium at peak annealing temperatures. This contentwas derived from ThermoCalc, using the TCFe6 database. The following elements were taken into account: Mn, C, Si, Cr,and Ni. The carbon content of the martensite (cm) phase then was calculated by considering the carbon mass balance, asshown in:
CDP ¼ Vmcm þ Vaca; ð2Þ
where CDP is the nominal carbon composition of the DP steel.
2.5. EBSD measurements for the quantification of GND
Both equiaxed and banded microstructures were mapped by EBSD using a field emission gun scanning electron micro-scope (FEG-SEM), JEOL JSM 7000F. The sample preparation for EBSD involved standard mechanical polishing to 0.05 lm,followed by electropolishing in a 5% perchloric acid and 95% acetic acid solution (by volume) with an applied voltage of 35 V.
A Digiview III EBSD camera, in combination with the OIM software suite (Data Collection V5.31, Analysis V6.1.3) by EDAX-TSL, was used for data acquisition and analysis. The measurements were performed at 25 keV beam energy, approximately
134 A. Ramazani et al. / International Journal of Plasticity 43 (2013) 128–152
15 nA probe current, and 100 nm step size. In the resulting data sets, the image quality (IQ) parameter was used to separatethe ferritic and martensitic phases. The KAM parameter, calculating the average angular deviation between a point and itsneighbours in a 200 nm distance as long as their mis-orientation does not exceed 2�, was used to determine the GND layer inthe grain-boundary region of ferrite grains adjacent to martensite islands. To estimate the thickness of the GND zone, mis-orientation angle profiles from the ferrite–martensite interface to the ferrite grain were used.
3. Micromechanical flow-curve modelling technique
In studying the flow behaviour of DP steel, micromechanical modelling is a suitable procedure that provides a gooddescription of the deformation at the microlevel. Numerical calculation within the framework of continuum mechanicswas performed using FEM. The DP microstructure was embodied in FEM through RVE. 2-D plane-strain conditions were usedfor the numerical tensile tests. All phases were assumed to be homogeneous, and flow behaviour was modelled through anisotropic material model. The effective macroscopic flow curves of multiphase composites were computed from the numer-ical tensile test results through a first-order homogenisation strategy, as shown by Kouznetsova (2002). The followingsubsections discuss the premises and simulation methods that were used in modelling.
3.1. Description of RVEs for DP steel
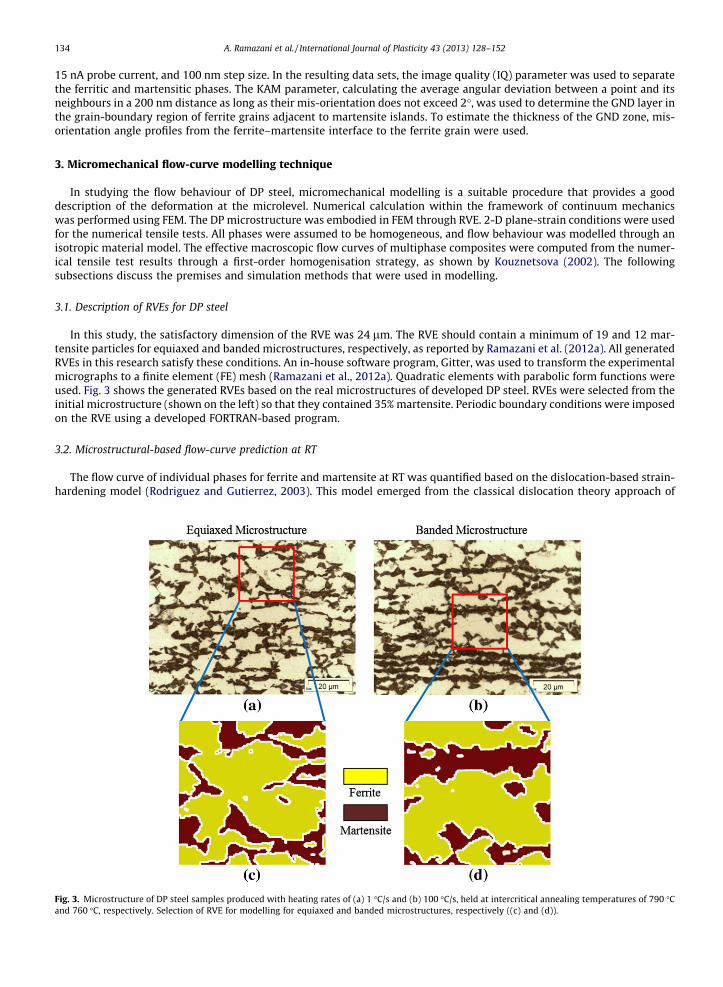
In this study, the satisfactory dimension of the RVE was 24 lm. The RVE should contain a minimum of 19 and 12 mar-tensite particles for equiaxed and banded microstructures, respectively, as reported by Ramazani et al. (2012a). All generatedRVEs in this research satisfy these conditions. An in-house software program, Gitter, was used to transform the experimentalmicrographs to a finite element (FE) mesh (Ramazani et al., 2012a). Quadratic elements with parabolic form functions wereused. Fig. 3 shows the generated RVEs based on the real microstructures of developed DP steel. RVEs were selected from theinitial microstructure (shown on the left) so that they contained 35% martensite. Periodic boundary conditions were imposedon the RVE using a developed FORTRAN-based program.
3.2. Microstructural-based flow-curve prediction at RT
The flow curve of individual phases for ferrite and martensite at RT was quantified based on the dislocation-based strain-hardening model (Rodriguez and Gutierrez, 2003). This model emerged from the classical dislocation theory approach of
Fig. 3. Microstructure of DP steel samples produced with heating rates of (a) 1 �C/s and (b) 100 �C/s, held at intercritical annealing temperatures of 790 �Cand 760 �C, respectively. Selection of RVE for modelling for equiaxed and banded microstructures, respectively ((c) and (d)).
A. Ramazani et al. / International Journal of Plasticity 43 (2013) 128–152 135
Bergström (1969) and from Estrin and Mecking (1984). The model constants were quantified by Refs. Rodriguez and Gut-ierrez (2003) and Thomser et al. (2009) and are reported in Eqs. (3) and (4):
r ¼ r0 þ Drþ a�MT � l�ffiffiffibp�
ffiffiffiffiffiffiffiffiffiffiffiffiffiffiffiffiffiffiffiffiffiffiffiffiffiffiffiffiffiffiffiffiffiffiffiffiffiffiffiffiffiffiffiffiffiffiffiffiffi1� expð�MT � kr � eÞ
kr � L
s: ð3Þ
The first term in Eq. (3) signifies the contribution of the lattice friction and takes the elements in solid solution intoaccount. This contribution can be calculated by the application of:
r0 ðin MPaÞ ¼ 77þ 750� ð%PÞ þ 60� ð%SiÞ þ 80� ð%CuÞ þ 45� ð%NiÞ þ 60� ð%CrÞ þ 80� ð%MnÞ þ 11
� ð%MoÞ þ 5000� ð%NssÞ: ð4Þ
The second term in Eq. (3) (Dr) indicates strengthening by precipitation and carbon in solution. For ferrite, it is5000� ð%Cf
ssÞ; for martensite, it is 3065� ð%CmssÞ � 161, where Cf
ss is the solution of carbon in ferrite and Cmss is the martensite
carbon content, as reported by Thomser et al. (2009).The last term in Eq. (3) is the strain-dependent portion. It was deduced from the literature (Uthaisangsuk et al., 2011;
Bouaziz and Buessler, 2002), where MT is the Taylor factor (MT = 3), l is the shear modulus (l = 80,000 MPa), b is the Burger’svector (b = 2.5 � 10�10 m), a is a constant (a = 0.33), L is the dislocation mean free path (for ferrite, it is the average graindiameter (da), which was determined experimentally; for martensite, it is 3.8 � 10�8 m), kr is the recovery rate (for ferrite,it is 10�5/da; for martensite, it is 41), and r0 is the Peierls stress and the effects of elements in solid solution.
3.3. Flow curves at higher temperatures
For the later introduction of transformation-induced geometrical dislocations for each phase, high-temperature (HT) flowcurves are needed at each martensite start (Ms) and martensite finishing (Mf) temperature that depends on local averagecarbon content of austenite after carbon partitioning. Ms and Mf were calculated using the commercial phase-transformationsoftware JMatPro
�.
For ferrite, an interstitial-free (IF) steel with 0.04% C, similar to the investigated DP steel, was tensile tested at 234 �C and173 �C (Mf of equiaxed and banded DP microstructures), at 374 �C and 320 �C (Ms of equiaxed and banded DP microstruc-tures), and at RT to determine the ferritic flow curve and to find the ratio of the flow curves. This ratio was used to evaluatethe ferritic flow curve in the range of the HT-RT flow curves of the ferrite.
To calculate the flow curve of austenite at HT, first, the flow curve of austenite at RT should be calculated based on Lud-wik’s equation, as was done in Reisner’s thesis (Reisner, 2000):
r ðin MPaÞ ¼ 650þ ð1200 � e0:4Þ: ð5Þ
The relationships between the flow curves of austenitic stainless steel (AISI 304, AISI 316, and AISI 321) at 200 �C, 400 �C,750 �C, and RT were used, as published in Refs. (Albertini and Montagnani, 1980) and (Piatti and Schiller, 1986). These rela-tionships were used to describe the flow curve of austenite at HT as a function of flow curve at RT.
Because the HT flow curve of martensite was unavailable for carbon content of 0.214–0.216 wt.%, which are the carboncontents of martensite in this study, we simplified so that the ratio of the flow curve of martensite at RT and at elevatedtemperatures was independent of carbon content. Hence, steel chemistry with 0.17 wt.% carbon was selected to determinethe ratio of the flow curve of martensite at RT and at Mf temperatures. These ratios were used to obtain the flow curve ofmartensite with carbon content of 0.214–0.216 wt.% at Mf of DP steel with equiaxed and banded microstructures, respec-tively. The RT flow curve of martensite was determined from the dislocation-based models, as discussed in Section 3.2.
To calculate the martensite flow curve at Mf temperatures, steel with carbon content of 0.17 wt.% was heat-treated in aTrebel hot deformation simulator. The geometry of the samples used for heat treatment and mechanical testing was dis-cussed in Section 2.2. The heating rate was 1 �C/s, and the annealing temperature was 860 �C, which was applied to obtainfully austenitic steel. After annealing, the samples were immediately gas-quenched at a rate of 80 K/s to form full martensitefrom austenite. After the heat treatment, tensile testing was carried out on the generated martensitic steel at RT and Mf tem-peratures (234 �C and 173 �C) of equiaxed and banded microstructures, respectively, and with a strain rate of 0.01 mm/s inthe Trebel hot deformation simulator. The ratio between RT and HT for this martensitic steel was applied for the flow curveof martensitic phases in the DP microstructures under investigation.
3.4. Simulation of formation of GNDs
To simulate the creation of the GNDs during cooling, the martensite dilatation effect affecting the hardening of ferrite wascalculated using the FE method by imposing a quasi-temperature dependent volume expansion on the austenite, triggeringthis expansion by a linear temperature regime, and following the elastoplastic response in all phases with a temperature-dependent flow curve. Therefore, it was assumed that the austenite-to-martensite transformation exerts a volumetric expan-sion force and by this, a plastic hardening on the neighbouring ferritic regions. In this study, we postulated that GND occursdue to volume expansion, while the shear component of the austenite-to-martensite transformation was neglected as the
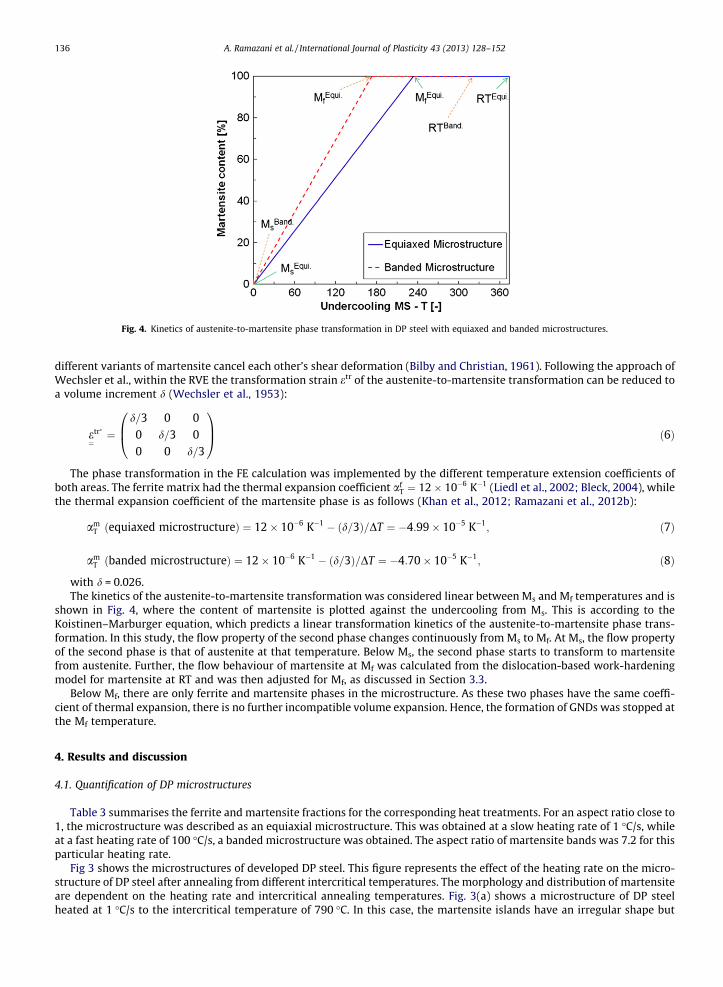
Fig. 4. Kinetics of austenite-to-martensite phase transformation in DP steel with equiaxed and banded microstructures.
136 A. Ramazani et al. / International Journal of Plasticity 43 (2013) 128–152
different variants of martensite cancel each other’s shear deformation (Bilby and Christian, 1961). Following the approach ofWechsler et al., within the RVE the transformation strain etr of the austenite-to-martensite transformation can be reduced toa volume increment d (Wechsler et al., 1953):
e¼
tr� ¼d=3 0 0
0 d=3 00 0 d=3
0B@
1CA ð6Þ
The phase transformation in the FE calculation was implemented by the different temperature extension coefficients ofboth areas. The ferrite matrix had the thermal expansion coefficient af
T ¼ 12� 10�6 K�1 (Liedl et al., 2002; Bleck, 2004), whilethe thermal expansion coefficient of the martensite phase is as follows (Khan et al., 2012; Ramazani et al., 2012b):
amT ðequiaxed microstructureÞ ¼ 12� 10�6 K�1 � ðd=3Þ=DT ¼ �4:99� 10�5 K�1; ð7Þ
amT ðbanded microstructureÞ ¼ 12� 10�6 K�1 � ðd=3Þ=DT ¼ �4:70� 10�5 K�1; ð8Þ
with d = 0.026.The kinetics of the austenite-to-martensite transformation was considered linear between Ms and Mf temperatures and is
shown in Fig. 4, where the content of martensite is plotted against the undercooling from Ms. This is according to theKoistinen–Marburger equation, which predicts a linear transformation kinetics of the austenite-to-martensite phase trans-formation. In this study, the flow property of the second phase changes continuously from Ms to Mf. At Ms, the flow propertyof the second phase is that of austenite at that temperature. Below Ms, the second phase starts to transform to martensitefrom austenite. Further, the flow behaviour of martensite at Mf was calculated from the dislocation-based work-hardeningmodel for martensite at RT and was then adjusted for Mf, as discussed in Section 3.3.
Below Mf, there are only ferrite and martensite phases in the microstructure. As these two phases have the same coeffi-cient of thermal expansion, there is no further incompatible volume expansion. Hence, the formation of GNDs was stopped atthe Mf temperature.
4. Results and discussion
4.1. Quantification of DP microstructures
Table 3 summarises the ferrite and martensite fractions for the corresponding heat treatments. For an aspect ratio close to1, the microstructure was described as an equiaxial microstructure. This was obtained at a slow heating rate of 1 �C/s, whileat a fast heating rate of 100 �C/s, a banded microstructure was obtained. The aspect ratio of martensite bands was 7.2 for thisparticular heating rate.
Fig 3 shows the microstructures of developed DP steel. This figure represents the effect of the heating rate on the micro-structure of DP steel after annealing from different intercritical temperatures. The morphology and distribution of martensiteare dependent on the heating rate and intercritical annealing temperatures. Fig. 3(a) shows a microstructure of DP steelheated at 1 �C/s to the intercritical temperature of 790 �C. In this case, the martensite islands have an irregular shape but
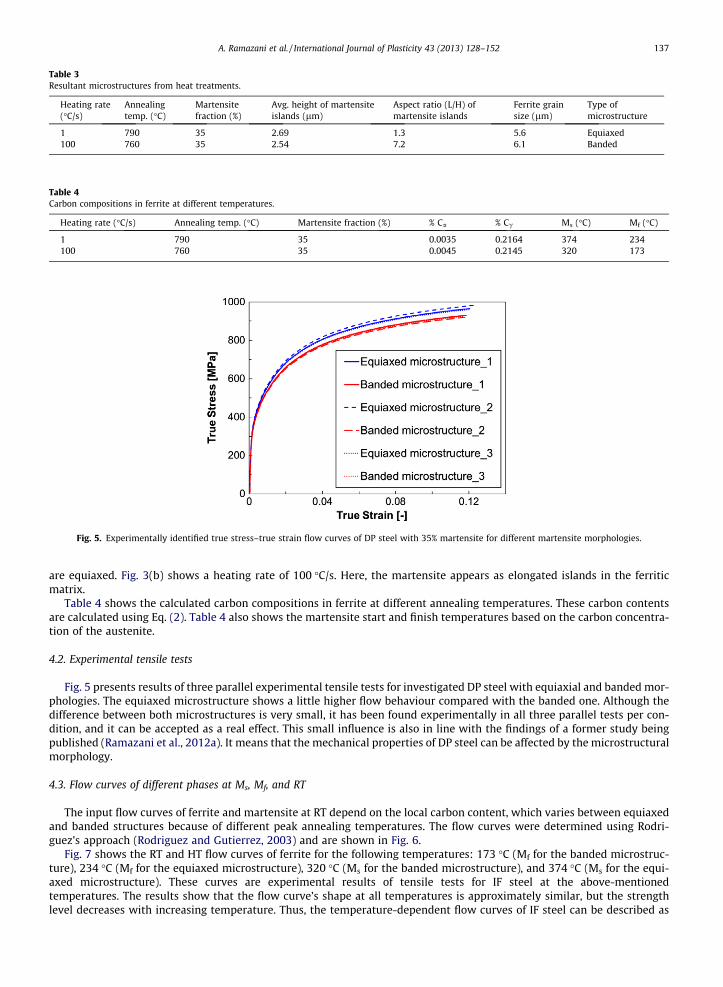
Table 3Resultant microstructures from heat treatments.
Heating rate(�C/s)
Annealingtemp. (�C)
Martensitefraction (%)
Avg. height of martensiteislands (lm)
Aspect ratio (L/H) ofmartensite islands
Ferrite grainsize (lm)
Type ofmicrostructure
1 790 35 2.69 1.3 5.6 Equiaxed100 760 35 2.54 7.2 6.1 Banded
Table 4Carbon compositions in ferrite at different temperatures.
Heating rate (�C/s) Annealing temp. (�C) Martensite fraction (%) % Ca % Cc Ms (�C) Mf (�C)
1 790 35 0.0035 0.2164 374 234100 760 35 0.0045 0.2145 320 173
Fig. 5. Experimentally identified true stress–true strain flow curves of DP steel with 35% martensite for different martensite morphologies.
A. Ramazani et al. / International Journal of Plasticity 43 (2013) 128–152 137
are equiaxed. Fig. 3(b) shows a heating rate of 100 �C/s. Here, the martensite appears as elongated islands in the ferriticmatrix.
Table 4 shows the calculated carbon compositions in ferrite at different annealing temperatures. These carbon contentsare calculated using Eq. (2). Table 4 also shows the martensite start and finish temperatures based on the carbon concentra-tion of the austenite.
4.2. Experimental tensile tests
Fig. 5 presents results of three parallel experimental tensile tests for investigated DP steel with equiaxial and banded mor-phologies. The equiaxed microstructure shows a little higher flow behaviour compared with the banded one. Although thedifference between both microstructures is very small, it has been found experimentally in all three parallel tests per con-dition, and it can be accepted as a real effect. This small influence is also in line with the findings of a former study beingpublished (Ramazani et al., 2012a). It means that the mechanical properties of DP steel can be affected by the microstructuralmorphology.
4.3. Flow curves of different phases at Ms, Mf, and RT
The input flow curves of ferrite and martensite at RT depend on the local carbon content, which varies between equiaxedand banded structures because of different peak annealing temperatures. The flow curves were determined using Rodri-guez’s approach (Rodriguez and Gutierrez, 2003) and are shown in Fig. 6.
Fig. 7 shows the RT and HT flow curves of ferrite for the following temperatures: 173 �C (Mf for the banded microstruc-ture), 234 �C (Mf for the equiaxed microstructure), 320 �C (Ms for the banded microstructure), and 374 �C (Ms for the equi-axed microstructure). These curves are experimental results of tensile tests for IF steel at the above-mentionedtemperatures. The results show that the flow curve’s shape at all temperatures is approximately similar, but the strengthlevel decreases with increasing temperature. Thus, the temperature-dependent flow curves of IF steel can be described as
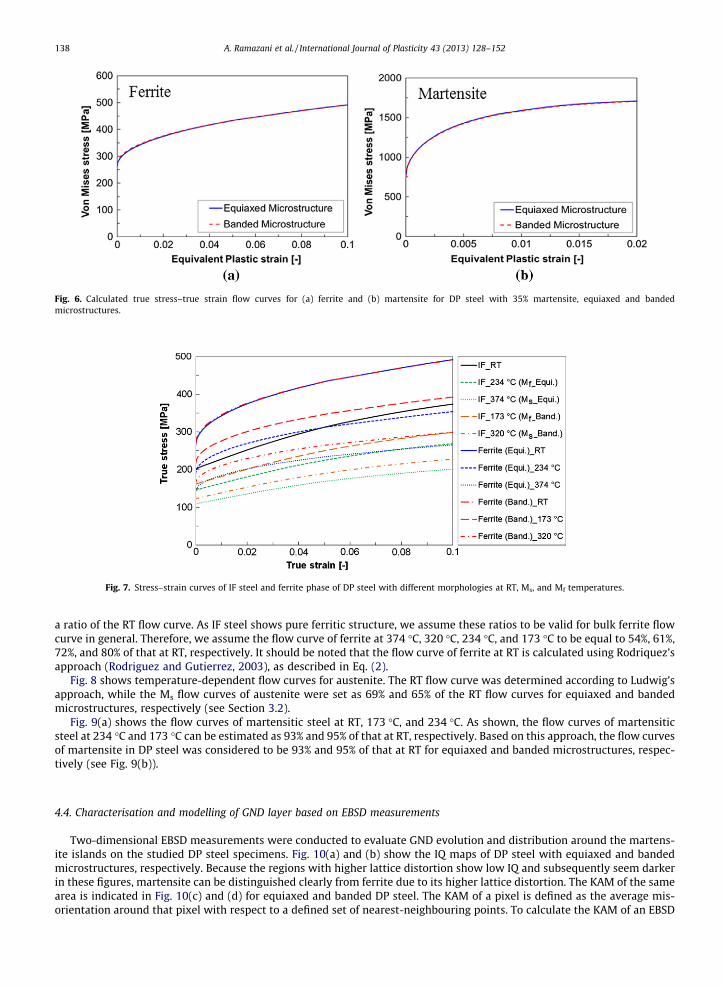
Fig. 6. Calculated true stress–true strain flow curves for (a) ferrite and (b) martensite for DP steel with 35% martensite, equiaxed and bandedmicrostructures.
Fig. 7. Stress–strain curves of IF steel and ferrite phase of DP steel with different morphologies at RT, Ms, and Mf temperatures.
138 A. Ramazani et al. / International Journal of Plasticity 43 (2013) 128–152
a ratio of the RT flow curve. As IF steel shows pure ferritic structure, we assume these ratios to be valid for bulk ferrite flowcurve in general. Therefore, we assume the flow curve of ferrite at 374 �C, 320 �C, 234 �C, and 173 �C to be equal to 54%, 61%,72%, and 80% of that at RT, respectively. It should be noted that the flow curve of ferrite at RT is calculated using Rodriquez’sapproach (Rodriguez and Gutierrez, 2003), as described in Eq. (2).
Fig. 8 shows temperature-dependent flow curves for austenite. The RT flow curve was determined according to Ludwig’sapproach, while the Ms flow curves of austenite were set as 69% and 65% of the RT flow curves for equiaxed and bandedmicrostructures, respectively (see Section 3.2).
Fig. 9(a) shows the flow curves of martensitic steel at RT, 173 �C, and 234 �C. As shown, the flow curves of martensiticsteel at 234 �C and 173 �C can be estimated as 93% and 95% of that at RT, respectively. Based on this approach, the flow curvesof martensite in DP steel was considered to be 93% and 95% of that at RT for equiaxed and banded microstructures, respec-tively (see Fig. 9(b)).
4.4. Characterisation and modelling of GND layer based on EBSD measurements
Two-dimensional EBSD measurements were conducted to evaluate GND evolution and distribution around the martens-ite islands on the studied DP steel specimens. Fig. 10(a) and (b) show the IQ maps of DP steel with equiaxed and bandedmicrostructures, respectively. Because the regions with higher lattice distortion show low IQ and subsequently seem darkerin these figures, martensite can be distinguished clearly from ferrite due to its higher lattice distortion. The KAM of the samearea is indicated in Fig. 10(c) and (d) for equiaxed and banded DP steel. The KAM of a pixel is defined as the average mis-orientation around that pixel with respect to a defined set of nearest-neighbouring points. To calculate the KAM of an EBSD
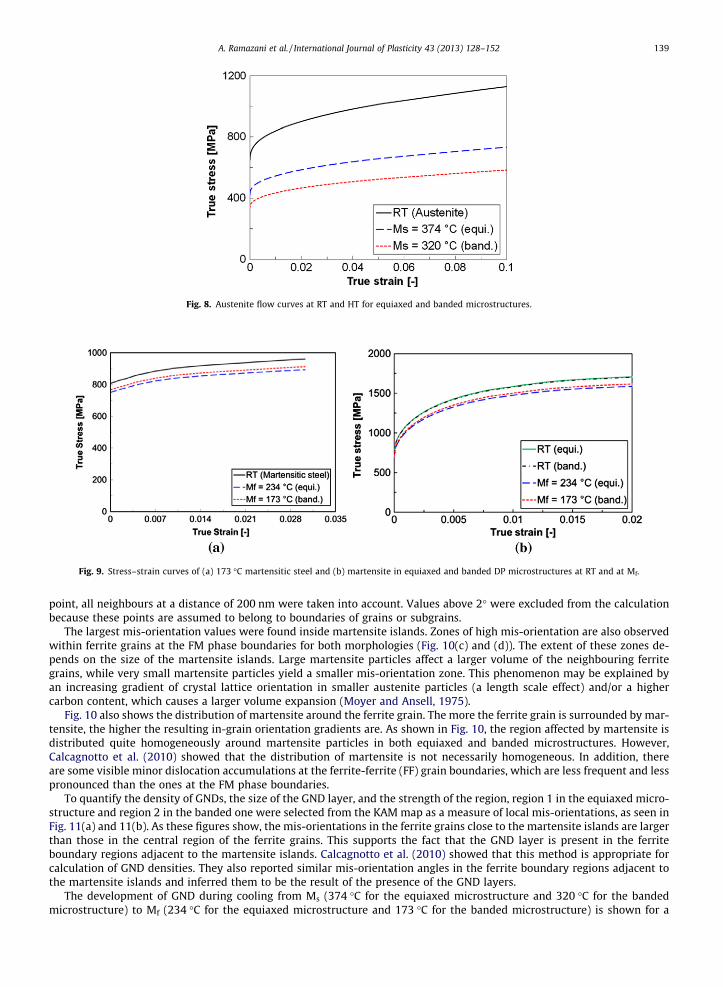
Fig. 9. Stress–strain curves of (a) 173 �C martensitic steel and (b) martensite in equiaxed and banded DP microstructures at RT and at Mf.
Fig. 8. Austenite flow curves at RT and HT for equiaxed and banded microstructures.
A. Ramazani et al. / International Journal of Plasticity 43 (2013) 128–152 139
point, all neighbours at a distance of 200 nm were taken into account. Values above 2� were excluded from the calculationbecause these points are assumed to belong to boundaries of grains or subgrains.
The largest mis-orientation values were found inside martensite islands. Zones of high mis-orientation are also observedwithin ferrite grains at the FM phase boundaries for both morphologies (Fig. 10(c) and (d)). The extent of these zones de-pends on the size of the martensite islands. Large martensite particles affect a larger volume of the neighbouring ferritegrains, while very small martensite particles yield a smaller mis-orientation zone. This phenomenon may be explained byan increasing gradient of crystal lattice orientation in smaller austenite particles (a length scale effect) and/or a highercarbon content, which causes a larger volume expansion (Moyer and Ansell, 1975).
Fig. 10 also shows the distribution of martensite around the ferrite grain. The more the ferrite grain is surrounded by mar-tensite, the higher the resulting in-grain orientation gradients are. As shown in Fig. 10, the region affected by martensite isdistributed quite homogeneously around martensite particles in both equiaxed and banded microstructures. However,Calcagnotto et al. (2010) showed that the distribution of martensite is not necessarily homogeneous. In addition, thereare some visible minor dislocation accumulations at the ferrite-ferrite (FF) grain boundaries, which are less frequent and lesspronounced than the ones at the FM phase boundaries.
To quantify the density of GNDs, the size of the GND layer, and the strength of the region, region 1 in the equiaxed micro-structure and region 2 in the banded one were selected from the KAM map as a measure of local mis-orientations, as seen inFig. 11(a) and 11(b). As these figures show, the mis-orientations in the ferrite grains close to the martensite islands are largerthan those in the central region of the ferrite grains. This supports the fact that the GND layer is present in the ferriteboundary regions adjacent to the martensite islands. Calcagnotto et al. (2010) showed that this method is appropriate forcalculation of GND densities. They also reported similar mis-orientation angles in the ferrite boundary regions adjacent tothe martensite islands and inferred them to be the result of the presence of the GND layers.
The development of GND during cooling from Ms (374 �C for the equiaxed microstructure and 320 �C for the bandedmicrostructure) to Mf (234 �C for the equiaxed microstructure and 173 �C for the banded microstructure) is shown for a
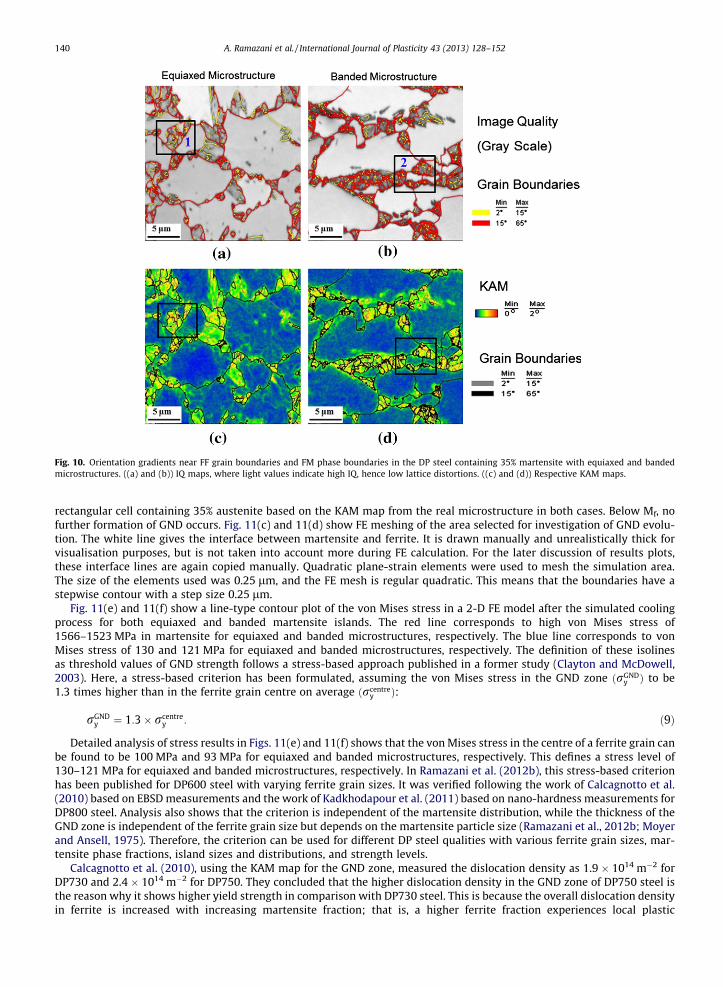
Fig. 10. Orientation gradients near FF grain boundaries and FM phase boundaries in the DP steel containing 35% martensite with equiaxed and bandedmicrostructures. ((a) and (b)) IQ maps, where light values indicate high IQ, hence low lattice distortions. ((c) and (d)) Respective KAM maps.
140 A. Ramazani et al. / International Journal of Plasticity 43 (2013) 128–152
rectangular cell containing 35% austenite based on the KAM map from the real microstructure in both cases. Below Mf, nofurther formation of GND occurs. Fig. 11(c) and 11(d) show FE meshing of the area selected for investigation of GND evolu-tion. The white line gives the interface between martensite and ferrite. It is drawn manually and unrealistically thick forvisualisation purposes, but is not taken into account more during FE calculation. For the later discussion of results plots,these interface lines are again copied manually. Quadratic plane-strain elements were used to mesh the simulation area.The size of the elements used was 0.25 lm, and the FE mesh is regular quadratic. This means that the boundaries have astepwise contour with a step size 0.25 lm.
Fig. 11(e) and 11(f) show a line-type contour plot of the von Mises stress in a 2-D FE model after the simulated coolingprocess for both equiaxed and banded martensite islands. The red line corresponds to high von Mises stress of1566–1523 MPa in martensite for equiaxed and banded microstructures, respectively. The blue line corresponds to vonMises stress of 130 and 121 MPa for equiaxed and banded microstructures, respectively. The definition of these isolinesas threshold values of GND strength follows a stress-based approach published in a former study (Clayton and McDowell,2003). Here, a stress-based criterion has been formulated, assuming the von Mises stress in the GND zone ðrGND
y Þ to be1.3 times higher than in the ferrite grain centre on average ðrcentre
y Þ:
rGNDy ¼ 1:3� rcentre
y : ð9Þ
Detailed analysis of stress results in Figs. 11(e) and 11(f) shows that the von Mises stress in the centre of a ferrite grain canbe found to be 100 MPa and 93 MPa for equiaxed and banded microstructures, respectively. This defines a stress level of130–121 MPa for equiaxed and banded microstructures, respectively. In Ramazani et al. (2012b), this stress-based criterionhas been published for DP600 steel with varying ferrite grain sizes. It was verified following the work of Calcagnotto et al.(2010) based on EBSD measurements and the work of Kadkhodapour et al. (2011) based on nano-hardness measurements forDP800 steel. Analysis also shows that the criterion is independent of the martensite distribution, while the thickness of theGND zone is independent of the ferrite grain size but depends on the martensite particle size (Ramazani et al., 2012b; Moyerand Ansell, 1975). Therefore, the criterion can be used for different DP steel qualities with various ferrite grain sizes, mar-tensite phase fractions, island sizes and distributions, and strength levels.
Calcagnotto et al. (2010), using the KAM map for the GND zone, measured the dislocation density as 1.9 � 1014 m�2 forDP730 and 2.4 � 1014 m�2 for DP750. They concluded that the higher dislocation density in the GND zone of DP750 steel isthe reason why it shows higher yield strength in comparison with DP730 steel. This is because the overall dislocation densityin ferrite is increased with increasing martensite fraction; that is, a higher ferrite fraction experiences local plastic
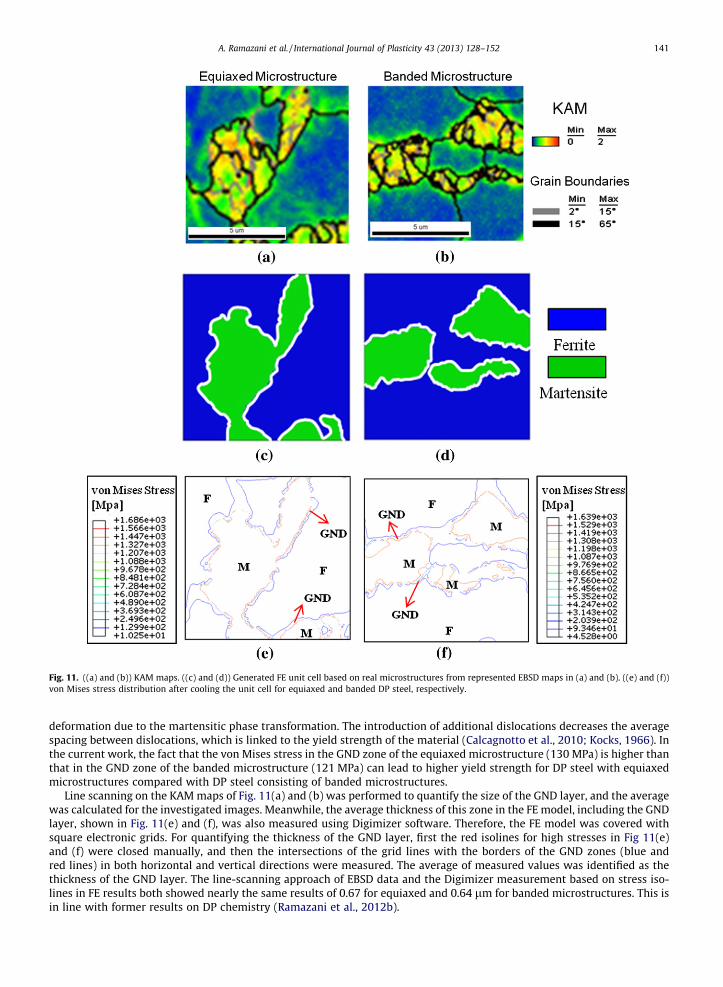
Fig. 11. ((a) and (b)) KAM maps. ((c) and (d)) Generated FE unit cell based on real microstructures from represented EBSD maps in (a) and (b). ((e) and (f))von Mises stress distribution after cooling the unit cell for equiaxed and banded DP steel, respectively.
A. Ramazani et al. / International Journal of Plasticity 43 (2013) 128–152 141
deformation due to the martensitic phase transformation. The introduction of additional dislocations decreases the averagespacing between dislocations, which is linked to the yield strength of the material (Calcagnotto et al., 2010; Kocks, 1966). Inthe current work, the fact that the von Mises stress in the GND zone of the equiaxed microstructure (130 MPa) is higher thanthat in the GND zone of the banded microstructure (121 MPa) can lead to higher yield strength for DP steel with equiaxedmicrostructures compared with DP steel consisting of banded microstructures.
Line scanning on the KAM maps of Fig. 11(a) and (b) was performed to quantify the size of the GND layer, and the averagewas calculated for the investigated images. Meanwhile, the average thickness of this zone in the FE model, including the GNDlayer, shown in Fig. 11(e) and (f), was also measured using Digimizer software. Therefore, the FE model was covered withsquare electronic grids. For quantifying the thickness of the GND layer, first the red isolines for high stresses in Fig 11(e)and (f) were closed manually, and then the intersections of the grid lines with the borders of the GND zones (blue andred lines) in both horizontal and vertical directions were measured. The average of measured values was identified as thethickness of the GND layer. The line-scanning approach of EBSD data and the Digimizer measurement based on stress iso-lines in FE results both showed nearly the same results of 0.67 for equiaxed and 0.64 lm for banded microstructures. This isin line with former results on DP chemistry (Ramazani et al., 2012b).
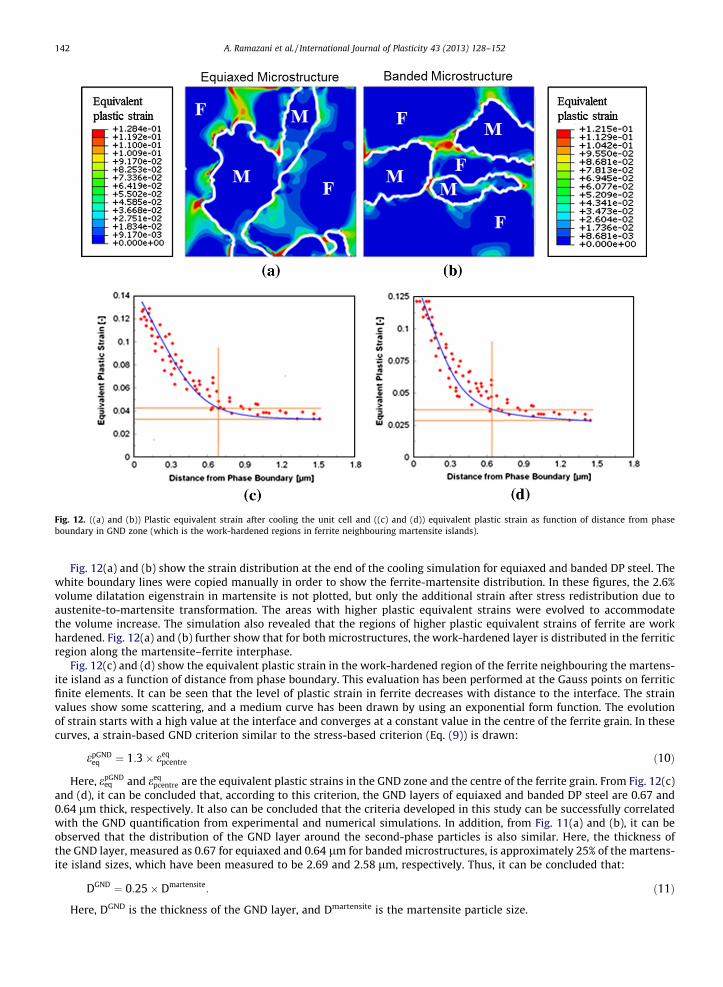
Fig. 12. ((a) and (b)) Plastic equivalent strain after cooling the unit cell and ((c) and (d)) equivalent plastic strain as function of distance from phaseboundary in GND zone (which is the work-hardened regions in ferrite neighbouring martensite islands).
142 A. Ramazani et al. / International Journal of Plasticity 43 (2013) 128–152
Fig. 12(a) and (b) show the strain distribution at the end of the cooling simulation for equiaxed and banded DP steel. Thewhite boundary lines were copied manually in order to show the ferrite-martensite distribution. In these figures, the 2.6%volume dilatation eigenstrain in martensite is not plotted, but only the additional strain after stress redistribution due toaustenite-to-martensite transformation. The areas with higher plastic equivalent strains were evolved to accommodatethe volume increase. The simulation also revealed that the regions of higher plastic equivalent strains of ferrite are workhardened. Fig. 12(a) and (b) further show that for both microstructures, the work-hardened layer is distributed in the ferriticregion along the martensite–ferrite interphase.
Fig. 12(c) and (d) show the equivalent plastic strain in the work-hardened region of the ferrite neighbouring the martens-ite island as a function of distance from phase boundary. This evaluation has been performed at the Gauss points on ferriticfinite elements. It can be seen that the level of plastic strain in ferrite decreases with distance to the interface. The strainvalues show some scattering, and a medium curve has been drawn by using an exponential form function. The evolutionof strain starts with a high value at the interface and converges at a constant value in the centre of the ferrite grain. In thesecurves, a strain-based GND criterion similar to the stress-based criterion (Eq. (9)) is drawn:
epGNDeq ¼ 1:3� eeq
pcentre ð10Þ
Here, epGNDeq and eeq
pcentre are the equivalent plastic strains in the GND zone and the centre of the ferrite grain. From Fig. 12(c)and (d), it can be concluded that, according to this criterion, the GND layers of equiaxed and banded DP steel are 0.67 and0.64 lm thick, respectively. It also can be concluded that the criteria developed in this study can be successfully correlatedwith the GND quantification from experimental and numerical simulations. In addition, from Fig. 11(a) and (b), it can beobserved that the distribution of the GND layer around the second-phase particles is also similar. Here, the thickness ofthe GND layer, measured as 0.67 for equiaxed and 0.64 lm for banded microstructures, is approximately 25% of the martens-ite island sizes, which have been measured to be 2.69 and 2.58 lm, respectively. Thus, it can be concluded that:
DGND ¼ 0:25� Dmartensite: ð11Þ
Here, DGND is the thickness of the GND layer, and Dmartensite is the martensite particle size.
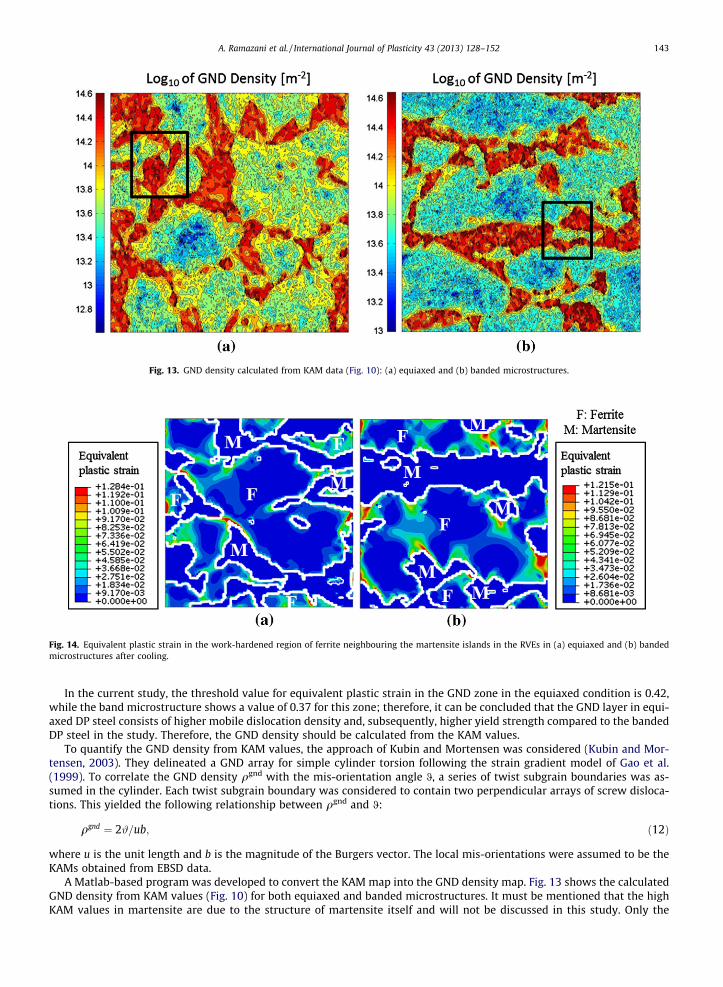
Fig. 13. GND density calculated from KAM data (Fig. 10): (a) equiaxed and (b) banded microstructures.
Fig. 14. Equivalent plastic strain in the work-hardened region of ferrite neighbouring the martensite islands in the RVEs in (a) equiaxed and (b) bandedmicrostructures after cooling.
A. Ramazani et al. / International Journal of Plasticity 43 (2013) 128–152 143
In the current study, the threshold value for equivalent plastic strain in the GND zone in the equiaxed condition is 0.42,while the band microstructure shows a value of 0.37 for this zone; therefore, it can be concluded that the GND layer in equi-axed DP steel consists of higher mobile dislocation density and, subsequently, higher yield strength compared to the bandedDP steel in the study. Therefore, the GND density should be calculated from the KAM values.
To quantify the GND density from KAM values, the approach of Kubin and Mortensen was considered (Kubin and Mor-tensen, 2003). They delineated a GND array for simple cylinder torsion following the strain gradient model of Gao et al.(1999). To correlate the GND density qgnd with the mis-orientation angle 0, a series of twist subgrain boundaries was as-sumed in the cylinder. Each twist subgrain boundary was considered to contain two perpendicular arrays of screw disloca-tions. This yielded the following relationship between qgnd and 0:
qgnd ¼ 2#=ub; ð12Þ
where u is the unit length and b is the magnitude of the Burgers vector. The local mis-orientations were assumed to be theKAMs obtained from EBSD data.
A Matlab-based program was developed to convert the KAM map into the GND density map. Fig. 13 shows the calculatedGND density from KAM values (Fig. 10) for both equiaxed and banded microstructures. It must be mentioned that the highKAM values in martensite are due to the structure of martensite itself and will not be discussed in this study. Only the
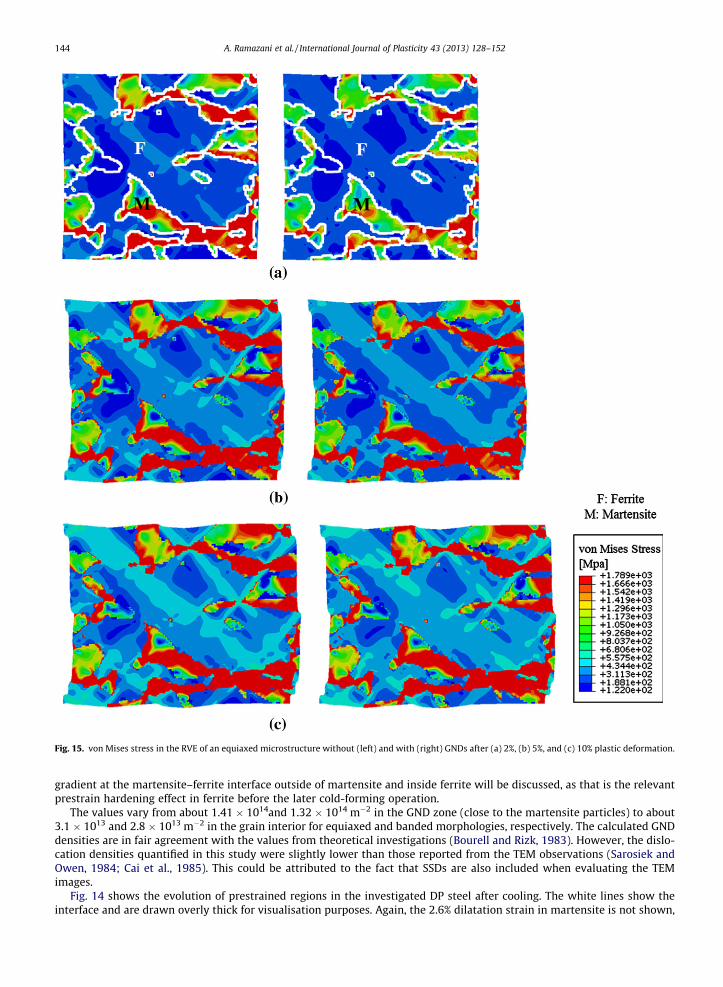
Fig. 15. von Mises stress in the RVE of an equiaxed microstructure without (left) and with (right) GNDs after (a) 2%, (b) 5%, and (c) 10% plastic deformation.
144 A. Ramazani et al. / International Journal of Plasticity 43 (2013) 128–152
gradient at the martensite–ferrite interface outside of martensite and inside ferrite will be discussed, as that is the relevantprestrain hardening effect in ferrite before the later cold-forming operation.
The values vary from about 1.41 � 1014and 1.32 � 1014 m�2 in the GND zone (close to the martensite particles) to about3.1 � 1013 and 2.8 � 1013 m�2 in the grain interior for equiaxed and banded morphologies, respectively. The calculated GNDdensities are in fair agreement with the values from theoretical investigations (Bourell and Rizk, 1983). However, the dislo-cation densities quantified in this study were slightly lower than those reported from the TEM observations (Sarosiek andOwen, 1984; Cai et al., 1985). This could be attributed to the fact that SSDs are also included when evaluating the TEMimages.
Fig. 14 shows the evolution of prestrained regions in the investigated DP steel after cooling. The white lines show theinterface and are drawn overly thick for visualisation purposes. Again, the 2.6% dilatation strain in martensite is not shown,
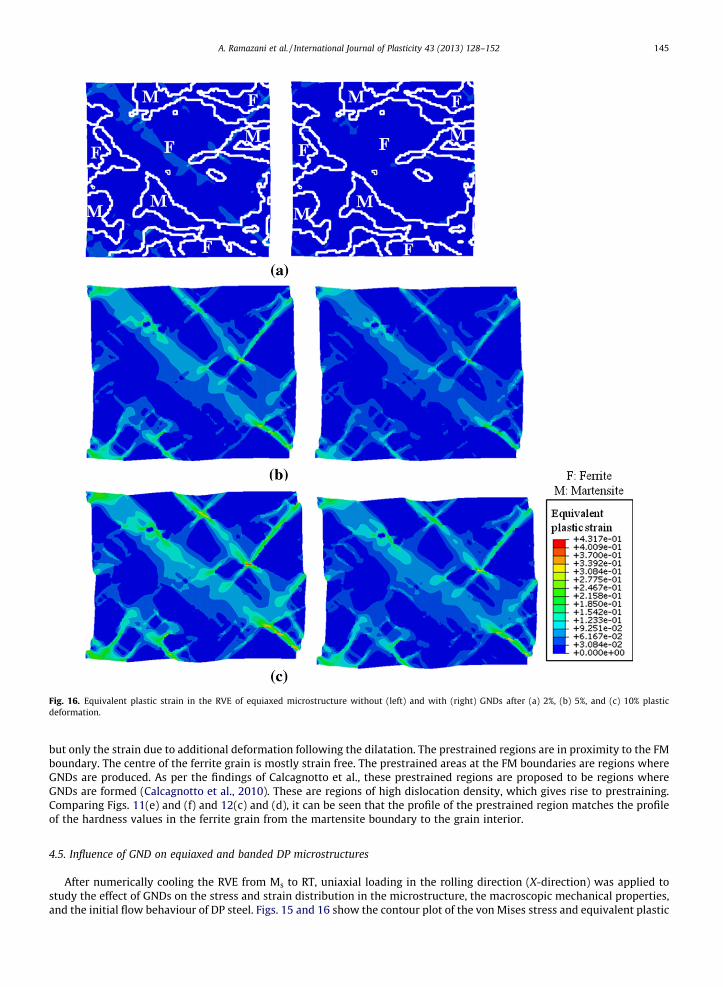
Fig. 16. Equivalent plastic strain in the RVE of equiaxed microstructure without (left) and with (right) GNDs after (a) 2%, (b) 5%, and (c) 10% plasticdeformation.
A. Ramazani et al. / International Journal of Plasticity 43 (2013) 128–152 145
but only the strain due to additional deformation following the dilatation. The prestrained regions are in proximity to the FMboundary. The centre of the ferrite grain is mostly strain free. The prestrained areas at the FM boundaries are regions whereGNDs are produced. As per the findings of Calcagnotto et al., these prestrained regions are proposed to be regions whereGNDs are formed (Calcagnotto et al., 2010). These are regions of high dislocation density, which gives rise to prestraining.Comparing Figs. 11(e) and (f) and 12(c) and (d), it can be seen that the profile of the prestrained region matches the profileof the hardness values in the ferrite grain from the martensite boundary to the grain interior.
4.5. Influence of GND on equiaxed and banded DP microstructures
After numerically cooling the RVE from Ms to RT, uniaxial loading in the rolling direction (X-direction) was applied tostudy the effect of GNDs on the stress and strain distribution in the microstructure, the macroscopic mechanical properties,and the initial flow behaviour of DP steel. Figs. 15 and 16 show the contour plot of the von Mises stress and equivalent plastic
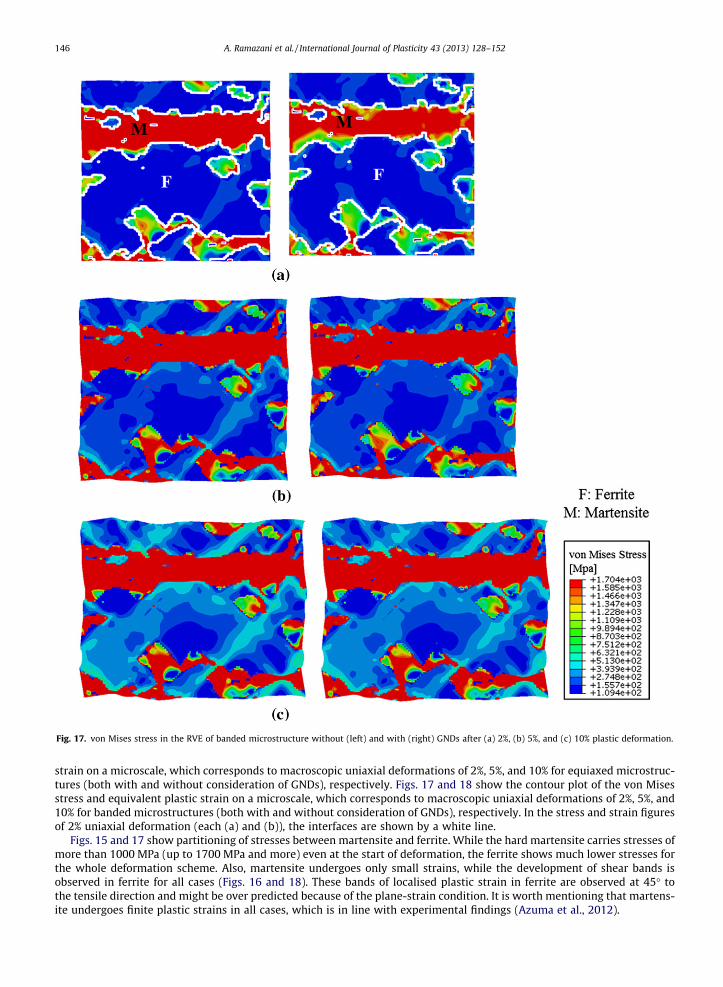
Fig. 17. von Mises stress in the RVE of banded microstructure without (left) and with (right) GNDs after (a) 2%, (b) 5%, and (c) 10% plastic deformation.
146 A. Ramazani et al. / International Journal of Plasticity 43 (2013) 128–152
strain on a microscale, which corresponds to macroscopic uniaxial deformations of 2%, 5%, and 10% for equiaxed microstruc-tures (both with and without consideration of GNDs), respectively. Figs. 17 and 18 show the contour plot of the von Misesstress and equivalent plastic strain on a microscale, which corresponds to macroscopic uniaxial deformations of 2%, 5%, and10% for banded microstructures (both with and without consideration of GNDs), respectively. In the stress and strain figuresof 2% uniaxial deformation (each (a) and (b)), the interfaces are shown by a white line.
Figs. 15 and 17 show partitioning of stresses between martensite and ferrite. While the hard martensite carries stresses ofmore than 1000 MPa (up to 1700 MPa and more) even at the start of deformation, the ferrite shows much lower stresses forthe whole deformation scheme. Also, martensite undergoes only small strains, while the development of shear bands isobserved in ferrite for all cases (Figs. 16 and 18). These bands of localised plastic strain in ferrite are observed at 45� tothe tensile direction and might be over predicted because of the plane-strain condition. It is worth mentioning that martens-ite undergoes finite plastic strains in all cases, which is in line with experimental findings (Azuma et al., 2012).
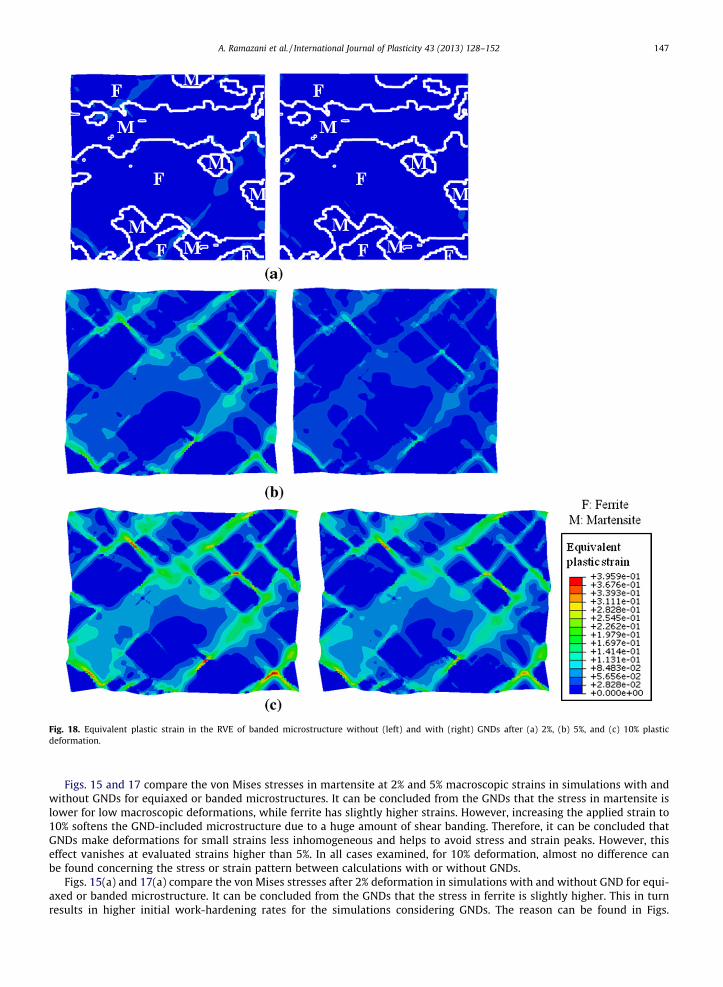
Fig. 18. Equivalent plastic strain in the RVE of banded microstructure without (left) and with (right) GNDs after (a) 2%, (b) 5%, and (c) 10% plasticdeformation.
A. Ramazani et al. / International Journal of Plasticity 43 (2013) 128–152 147
Figs. 15 and 17 compare the von Mises stresses in martensite at 2% and 5% macroscopic strains in simulations with andwithout GNDs for equiaxed or banded microstructures. It can be concluded from the GNDs that the stress in martensite islower for low macroscopic deformations, while ferrite has slightly higher strains. However, increasing the applied strain to10% softens the GND-included microstructure due to a huge amount of shear banding. Therefore, it can be concluded thatGNDs make deformations for small strains less inhomogeneous and helps to avoid stress and strain peaks. However, thiseffect vanishes at evaluated strains higher than 5%. In all cases examined, for 10% deformation, almost no difference canbe found concerning the stress or strain pattern between calculations with or without GNDs.
Figs. 15(a) and 17(a) compare the von Mises stresses after 2% deformation in simulations with and without GND for equi-axed or banded microstructure. It can be concluded from the GNDs that the stress in ferrite is slightly higher. This in turnresults in higher initial work-hardening rates for the simulations considering GNDs. The reason can be found in Figs.
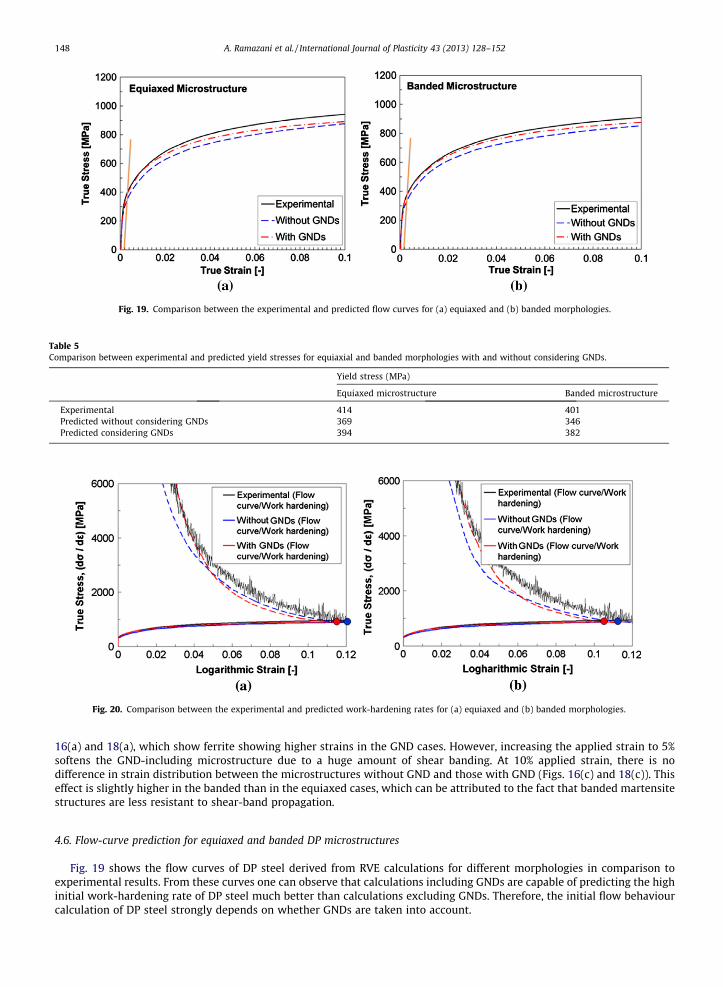
Fig. 19. Comparison between the experimental and predicted flow curves for (a) equiaxed and (b) banded morphologies.
Table 5Comparison between experimental and predicted yield stresses for equiaxial and banded morphologies with and without considering GNDs.
Yield stress (MPa)
Equiaxed microstructure Banded microstructure
Experimental 414 401Predicted without considering GNDs 369 346Predicted considering GNDs 394 382
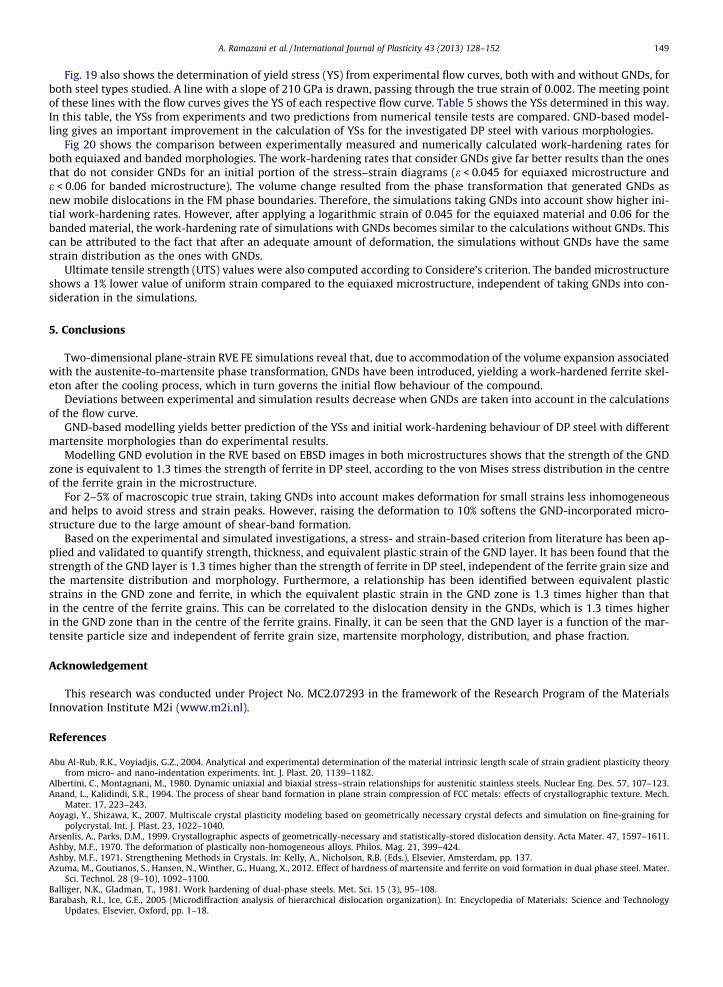
Fig. 20. Comparison between the experimental and predicted work-hardening rates for (a) equiaxed and (b) banded morphologies.
148 A. Ramazani et al. / International Journal of Plasticity 43 (2013) 128–152
16(a) and 18(a), which show ferrite showing higher strains in the GND cases. However, increasing the applied strain to 5%softens the GND-including microstructure due to a huge amount of shear banding. At 10% applied strain, there is nodifference in strain distribution between the microstructures without GND and those with GND (Figs. 16(c) and 18(c)). Thiseffect is slightly higher in the banded than in the equiaxed cases, which can be attributed to the fact that banded martensitestructures are less resistant to shear-band propagation.
4.6. Flow-curve prediction for equiaxed and banded DP microstructures
Fig. 19 shows the flow curves of DP steel derived from RVE calculations for different morphologies in comparison toexperimental results. From these curves one can observe that calculations including GNDs are capable of predicting the highinitial work-hardening rate of DP steel much better than calculations excluding GNDs. Therefore, the initial flow behaviourcalculation of DP steel strongly depends on whether GNDs are taken into account.
A. Ramazani et al. / International Journal of Plasticity 43 (2013) 128–152 149
Fig. 19 also shows the determination of yield stress (YS) from experimental flow curves, both with and without GNDs, forboth steel types studied. A line with a slope of 210 GPa is drawn, passing through the true strain of 0.002. The meeting pointof these lines with the flow curves gives the YS of each respective flow curve. Table 5 shows the YSs determined in this way.In this table, the YSs from experiments and two predictions from numerical tensile tests are compared. GND-based model-ling gives an important improvement in the calculation of YSs for the investigated DP steel with various morphologies.
Fig 20 shows the comparison between experimentally measured and numerically calculated work-hardening rates forboth equiaxed and banded morphologies. The work-hardening rates that consider GNDs give far better results than the onesthat do not consider GNDs for an initial portion of the stress–strain diagrams (e < 0.045 for equiaxed microstructure ande < 0.06 for banded microstructure). The volume change resulted from the phase transformation that generated GNDs asnew mobile dislocations in the FM phase boundaries. Therefore, the simulations taking GNDs into account show higher ini-tial work-hardening rates. However, after applying a logarithmic strain of 0.045 for the equiaxed material and 0.06 for thebanded material, the work-hardening rate of simulations with GNDs becomes similar to the calculations without GNDs. Thiscan be attributed to the fact that after an adequate amount of deformation, the simulations without GNDs have the samestrain distribution as the ones with GNDs.
Ultimate tensile strength (UTS) values were also computed according to Considere’s criterion. The banded microstructureshows a 1% lower value of uniform strain compared to the equiaxed microstructure, independent of taking GNDs into con-sideration in the simulations.
5. Conclusions
Two-dimensional plane-strain RVE FE simulations reveal that, due to accommodation of the volume expansion associatedwith the austenite-to-martensite phase transformation, GNDs have been introduced, yielding a work-hardened ferrite skel-eton after the cooling process, which in turn governs the initial flow behaviour of the compound.
Deviations between experimental and simulation results decrease when GNDs are taken into account in the calculationsof the flow curve.
GND-based modelling yields better prediction of the YSs and initial work-hardening behaviour of DP steel with differentmartensite morphologies than do experimental results.
Modelling GND evolution in the RVE based on EBSD images in both microstructures shows that the strength of the GNDzone is equivalent to 1.3 times the strength of ferrite in DP steel, according to the von Mises stress distribution in the centreof the ferrite grain in the microstructure.
For 2–5% of macroscopic true strain, taking GNDs into account makes deformation for small strains less inhomogeneousand helps to avoid stress and strain peaks. However, raising the deformation to 10% softens the GND-incorporated micro-structure due to the large amount of shear-band formation.
Based on the experimental and simulated investigations, a stress- and strain-based criterion from literature has been ap-plied and validated to quantify strength, thickness, and equivalent plastic strain of the GND layer. It has been found that thestrength of the GND layer is 1.3 times higher than the strength of ferrite in DP steel, independent of the ferrite grain size andthe martensite distribution and morphology. Furthermore, a relationship has been identified between equivalent plasticstrains in the GND zone and ferrite, in which the equivalent plastic strain in the GND zone is 1.3 times higher than thatin the centre of the ferrite grains. This can be correlated to the dislocation density in the GNDs, which is 1.3 times higherin the GND zone than in the centre of the ferrite grains. Finally, it can be seen that the GND layer is a function of the mar-tensite particle size and independent of ferrite grain size, martensite morphology, distribution, and phase fraction.
Acknowledgement
This research was conducted under Project No. MC2.07293 in the framework of the Research Program of the MaterialsInnovation Institute M2i (www.m2i.nl).
References
Abu Al-Rub, R.K., Voyiadjis, G.Z., 2004. Analytical and experimental determination of the material intrinsic length scale of strain gradient plasticity theoryfrom micro- and nano-indentation experiments. Int. J. Plast. 20, 1139–1182.
Albertini, C., Montagnani, M., 1980. Dynamic uniaxial and biaxial stress–strain relationships for austenitic stainless steels. Nuclear Eng. Des. 57, 107–123.Anand, L., Kalidindi, S.R., 1994. The process of shear band formation in plane strain compression of FCC metals: effects of crystallographic texture. Mech.
Mater. 17, 223–243.Aoyagi, Y., Shizawa, K., 2007. Multiscale crystal plasticity modeling based on geometrically necessary crystal defects and simulation on fine-graining for
polycrystal. Int. J. Plast. 23, 1022–1040.Arsenlis, A., Parks, D.M., 1999. Crystallographic aspects of geometrically-necessary and statistically-stored dislocation density. Acta Mater. 47, 1597–1611.Ashby, M.F., 1970. The deformation of plastically non-homogeneous alloys. Philos. Mag. 21, 399–424.Ashby, M.F., 1971. Strengthening Methods in Crystals. In: Kelly, A., Nicholson, R.B. (Eds.), Elsevier, Amsterdam, pp. 137.Azuma, M., Goutianos, S., Hansen, N., Winther, G., Huang, X., 2012. Effect of hardness of martensite and ferrite on void formation in dual phase steel. Mater.
Sci. Technol. 28 (9–10), 1092–1100.Balliger, N.K., Gladman, T., 1981. Work hardening of dual-phase steels. Met. Sci. 15 (3), 95–108.Barabash, R.I., Ice, G.E., 2005 (Microdiffraction analysis of hierarchical dislocation organization). In: Encyclopedia of Materials: Science and Technology
Updates. Elsevier, Oxford, pp. 1–18.
150 A. Ramazani et al. / International Journal of Plasticity 43 (2013) 128–152
Barabash, R.I., Ice, G.E., Kumar, M., Ilavsky, J., Belak, J., 2009. Polychromatic microdiffraction analysis of defect self-organization in shock deformed singlecrystals. Int. J. Plast. 25, 2081–2093.
Basinski, S.J., Basinski, Z.J., 1979. Plastic deformation and work hardening. In: Nabarro, F.R.N. (Ed.), Dislocations in Solids, vol. 4. North Holland, Amsterdam,p. 261.
Bergström, Y., 1969. Dislocation model for the stress–strain behavior of polycrystalline a-Fe with special emphasis on the variation of the densities of mobileand immobile dislocations. Mater. Sci. Eng. 5, 193–200.
Bieler, T.R., Eisenlohr, P., Roters, F., Kumar, D., Mason, D.E., Crimp, M.A., Raabe, D., 2009. The role of heterogeneous deformation on damage nucleation atgrain boundaries in single phase metals. Int. J. Plast. 25, 1655–1683.
Bilby, B.A., Christian, J.W., 1961. Crystallography of martensitic transformations. JISI 197, 122–131.Bleck, W., 2004 (Materials Science of Steel). RWTH-Aachen (text book, pp. 133–156).Bouaziz, O., Buessler, P., 2002. Mechanical behaviour of multiphase materials: An intermediate mixture law without fitting parameter. La Revue de
Metallurgie – CIT 99, 71–77.Bourell, D.L., Rizk, A., 1983. Influence of martensite transformation strain on the ductility of dual-phase steels. Acta Metall. 31, 609–617.Busso, E.P., Cheong, K.S., 2001. Length scale effects on the macroscopic behaviour of single and polycrystalline FCC crystals. J. Phys. IV France 11, Pr5-161–
Pr5-170.Cai, X.L., Feng, J., Owen, W.S., 1985. The dependence of some tensile and fatigue properties of a dual-phase steel on its microstructure. Metall. Trans. A 16,
1405–1415.Calcagnotto, M., Ponge, D., Demir, E., Raabe, D., 2010. Orientation gradients and geometrically necessary dislocations in ultrafine grained dual-phase steels
studied by 2D and 3D EBSD. Mater. Sci. Eng. A 527, 2738–2746.Calcagnotto, M., Adachi, Y., Ponge, D., Raabe, D., 2011. Deformation and fracture mechanisms in fine- and ultrafine-grained ferrite/martensite dual-phase
steels and the effect of aging. Acta Mater. 59, 658–670.Clayton, J.D., McDowell, D.L., 2003. A multiscale multiplicative decomposition for elastoplasticity of polycrystals. Int. J. Plast. 19 (9), 1401–1444.Clayton, J.D., McDowell, D.L., Bammann, D.J., 2006. Modeling dislocations and disclinations with finite micropolar elastoplasticity. Int. J. Plast. 22 (2), 210–
256.Cottrell, A.H., 1964. The Mechanical Properties of Matter. Wiley, New York.Danas, K., Deshpande, V.S., Fleck, N.A., 2010. Compliant interfaces: a mechanism for relaxation of dislocation pile-ups in a sheared single crystal. Int. J. Plast.
26, 1792–1805.Davies, R.G., 1979. Early stages of yielding and strain-aging of a vanadium-containing dual-phase steel. Metall. Trans. A 10, 1549–1555.Delaire, F., Raphanel, J.L., Rey, C., 2000. Plastic heterogeneities of a copper multicrystal deformed in uniaxial tension: experimental study and finite element
simulations. Acta Mater. 48, 1075–1087.Demir, E., Raabe, D., Zaafarani, N., Zaefferer, S., 2009. Investigation of the indentation size effect through the measurement of the geometrically necessary
dislocations beneath small indents of different depths using EBSD tomography. Acta Mater. 57 (2), 559–569.Diard, O., Leclercq, S., Rousselier, G., Cailletaud, G., 2005. Evaluation of finite element based analysis of 3D multicrystalline aggregates plasticity: application
to crystal plasticity model identification and the study of stress and strain fields near grain boundaries. Int. J. Plast. 21, 691–722.Engels, P., Ma, A., Hartmaier, A., 2012. Continuum simulation of the evolution of dislocation densities during nanoindentation. Int. J. Plast. 38, 159–169.Estrin, Y., Mecking, H., 1984. A unified phenomenological description of work hardening and creep based on one-parameter models. Acta Metall. 32, 57–70.Estrin, Y., Braasch, H., Brechet, Y., 1996. A dislocation density based constitutive model for cyclic deformation. Trans. ASME J. Eng. Mater. Technol. 118 (4),
441–447.Feng, G., Budiman, A.S., Nix, W.D., Tamura, N., Patel, J.R., 2008. Indentation size effects in single crystal copper as revealed by synchrotron X-ray
microdiffraction. J. Appl. Phys. 104 (4), 043501. http://dx.doi.org/10.1063/1.2966297.Fischmeister, H., Karlsson, B., 1977. Plasticity of two-phase materials with a coarse microstructure. Z. Metallkd. 68, 311–327.Fleck, N.A., Muller, G.M., Ashby, M.F., Hutchinson, J.W., 1994. Strain gradient plasticity: theory and experiment. Acta Metall. Mater. 42, 475–487.Forest, S., Sedlac�ek, R., 2003. Plastic slip distribution in two-phase laminate microstructures: dislocation-based versus generalized-continuum approaches.
Philos. Mag. 83 (2), 245–276.Gan, Y.X., Kysar, J.W., Morse, T.L., 2005. Cylindrical void in a rigid-ideally plastic single crystal II: experiments and simulations. Int. J. Plast. 22 (1), 39–72.Gao, H., Huang, Y., 2003. Geometrically necessary dislocation and size-dependent plasticity. Scripta Mater. 48, 113–118.Gao, H., Huang, Y., Nix, W.D., Hutchinson, J.W., Mech, J., 1999. Mechanism-based strain gradient plasticity – I. – Theory. Mech. Phys. Solids 47, 1239–1263.Gardner, C.J., Adams, B.L., Basinger, J., Fullwood, D.T., 2010. EBSD-based continuum dislocation microscopy. Int. J. Plast. 26, 1234–1247.Gurtin, M.E., 2000. On the plasticity of single crystals: free energy, microforces, plastic-strain gradients. J. Mech. Phys. Solids 48, 989–1036.Gurtin, M.E., 2008. A finite-deformation, gradient theory of single-crystal plasticity with free energy dependent on densities of geometrically necessary
dislocations. Int. J. Plast. 24, 702–725.Gurtin, M.E., 2010. A finite-deformation, gradient theory of single-crystal plasticity with free energy dependent on the accumulation of geometrically
necessary dislocations. Int. J. Plast. 26, 1073–1096.Gurtin, M:E., Ohno, N., 2011. A gradient theory of small-deformation, single-crystal plasticity that accounts for GND-induced interactions between slip
systems. J. Mech. Phys. Solids 59, 320–343.Hahn, G.T., 1962. A model for yielding with special reference to the yield-point phenomena of iron and related BCC metals. Acta Met. 10 (8), 727–738.Hansen, N., Huang, X., 1998. Microstructure and flow stress of polycrystals and single crystals. Acta Mater. 46, 1827–1836.Hansen, S.S., Pradhan, R.R., 1981. Fundamentals of dual-phase steels. In: Kot, R.A., Bramfitt, B.L. (Eds.), TMS-AIME. Warrendale, PA, pp. 113–144.Horstmeyer, M.F., Baskes, M.I., Plimpton, S.J., 2001. Length scale and time scale effects on the plastic flow of FCC metals. Acta Mater. 49, 4363–4374.Jiang, Z., Guan, Z., Lian, J., 1995. Effects of microstructural variables on the deformation behaviour of dual-phase steel. Mater. Sci. Eng. A 190, 55–64.Kadkhodapour, J., Schmauder, S., Raabe, D., Ziaei-Rad, S., Weber, U., Calcagnotto, M., 2011. Experimental and numerical study on geometrically necessary
dislocations and non-homogeneous mechanical properties of the ferrite phase in dual phase steels. Acta Mater. 59, 4387–4394.Kang, J.-Y., Kim, D.H., Baek, S.-I., Ahn, T.-H., Kim, Y.-W., Han, H.N., Oh, K.H., Lee, H.-C., Han, S.H., 2011a. Phase analysis of steels by grain averaged EBSD
functions. ISIJ Int. 51, 130–136.Kang, J.Y., Lee, H.C., Han, S.H., 2011b. Effect of Al and Mo on the textures and microstructures of dual phase steels. Mater. Sci. Eng. A 530, 183–190.Khan, A.S., Liang, R., 1999. Behaviors of three BCC metals over a wide range of strain rates and temperatures: experiments and modelling. Int. J. Plast. 15,
1089–1109.Khan, A.S., Suh, Y.S., Kazmi, R., 2004. Quasi-static and dynamic loading responses and constitutive modeling of titanium alloys. Int. J. Plast. 20, 2233–2248.Khan, A.S., Kazmi, R., Farrokh, B., 2007. Multiaxial and non-proportional loading responses, anisotropy and modeling of Ti–6Al–4V titanium alloy over wide
ranges of strain rates and temperatures. Int. J. Plast. 23, 931–950.Khan, A.S., Baig, M., Choi, S.H., Yang, H.S., Sun, X., 2012. Quasi-static and dynamic responses of advanced high strength steels: experiments and modeling.
Int. J. Plast. 30–31, 1–17.Kiener, D., Pippan, R., Motz, C., Kreuzer, H., 2006. Microstructural evolution of the deformed volume beneath microindents in tungsten and copper. Acta
Mater. 54 (10), 2801–2811.Kim, J.H., Lee, M.G., Kim, D., Matlock, D.K., Wagoner, R.H., 2010. Hole-expansion formability of dual-phase steels using representative volume element
approach with boundary-smoothing technique. Mater. Sci. Eng. A 527, 7353–7363.Kim, J.H., Kim, D., Barlat, F., Lee, M.G., 2012. Crystal plasticity approach for predicting the Bauschinger effect in dual-phase steels. Mater. Sci. Eng. A 539,
259–270.
A. Ramazani et al. / International Journal of Plasticity 43 (2013) 128–152 151
K-Kanjarla, A., Van Houtte, P., Delannay, L., 2010. Assessment of plastic heterogeneity in grain interaction models using crystal plasticity finite elementmethod. Int. J. Plast. 26, 1220–1233.
Kocks, U.F., 1966. A statistical theory of flow stress and work-hardening. Philos. Mag. 13, 541–566.Kouzeli, M., Mortensen, A., 2002. Size dependent strengthening in particle reinforced aluminium. Acta Mater. 50, 39–51.Kouznetsova, V.G., 2002. Computational homogenization for the multi-scale analysis of multi-phase materials. Ph.D. Thesis, Technical University Eindhoven,
The Netherlands.Kroner, E., 1967. Elasticity theory of materials with long range cohesive forces. Int. J. Solids Struct. 24, 581–597.Kubin, L.P., Mortensen, A., 2003. Geometrically necessary dislocations and strain-gradient plasticity: a few critical issues. Scripta Mater. 48, 119–125.Kysar, J.W., Briant, C.L., 2002. Crack tip deformation fields in ductile single crystals. Acta Mater. 50 (9), 2367–2380.Kysar, J.W., Gan, Y.X., Mendez-Arzuza, G., 2005. Cylindrical void in a rigid-ideally plastic single crystal I: anisotropic slip line theory solution for facecentered
cubic crystals. Int. J. Plast. 21 (8), 1481–1520.Kysar, J.W., Gan, Y.X., Morse, T.L., Chen, X., Jones, M.E., 2007. High strain gradient plasticity associated with wedge indentation into face-centered cubic
single crystals: geometrically necessary dislocation densities. J. Mech. Phys. Solids 55 (7), 1554–1573.Kysar, J.W., Saito, Y., Oztop, M.S., Lee, D., Huh, W.T., 2010. Experimental lower bounds on geometrically necessary dislocation density. Int. J. Plast. 26, 1097–
1123.Larson, B.C., Yang, W., Tischler, J.Z., Ice, G.E., Budai, J.D., Liu, W., Weiland, H., 2004. Micron-resolution 3-D measurement of local orientations near a grain
boundary in plane-strained aluminum using X-ray microbeams. Int. J. Plast. 20 (3), 543–560.Lee, W.B., Chen, Y.P., 2010. Simulation of micro-indentation hardness of FCC single crystals by mechanism-based strain gradient crystal plasticity. Int. J.
Plast. 26, 1527–1540.Liedl, U., Traint, S., Werner, E.A., 2002. An unexpected feature of the stress–strain diagram of dual-phase steel. Comput. Mater. Sci. 25, 122–128.Liu, Y., Ngan, A.H.W., 2001. Depth dependence of hardness in copper single crystals measured by nanoindentation. Scripta Mater. 44, 237–241.Ma, A., Roters, F., Raabe, D., 2006a. On the consideration of interactions between dislocations and grain boundaries in crystal plasticity finite element
modeling – theory, experiments, and simulations. Acta Mater. 54, 2181–2194.Ma, A., Roters, F., Raabe, D., 2006b. A dislocation density based constitutive model for crystal plasticity FEM including geometrically necessary dislocations.
Acta Mater. 54, 2169–2179.Madec, R., 2001. Doctoral dissertation. University Paris XI. Des interactions entre dislocations à la plasticité du monocristal CFC, Une étude par dynamique
des dislocations.Man, C., Gao, X., Godefroy, S., Kenik, E.A., 2010. Estimating geometric dislocation densities in polycrystalline materials from orientation imaging microscopy.
Int. J. Plast. 26, 423–440.Marder, A.R., 1982. Deformation characteristics of dual-phase steels. Metall. Trans. A 13, 85–92.Matlock, D.K., Krauss, G., Zia-Ebrahimi, F., 1984. Strain hardening of dual-phase steels: an evaluation of the importance of processing history. In: Krauss, G.
(Ed.), Deformation, Processing and Structure. ASM, Metals Park, Ohio, pp. 47–87.Mayama, T., Ohashi, T., Kondou, R., 2009. Geometrically necessary dislocation structure organization in FCC bicrystal subjected to cyclic plasticity. Int. J.
Plast. 25, 2122–2140.Mazinani, M., Poole, W.J., 2007. Effect of martensite plasticity on the deformation behavior of a low-carbon dual-phase steel. Metall. Mater. Trans. A. 38A,
328–339.McLaughlin, K.K., Clegg, W.J., 2008. Deformation underneath low-load indentations in copper. J. Phys. D 41 (7), 074007. http://dx.doi.org/10.1088/0022-
3727/41/7/074007.Moyer, J.M., Ansell, G.S., 1975. The volume expansion accompanying the martensite transformation in iron–carbon alloys. Metall. Trans. A 6, 1785–1791.Mukherjee, K., Hazra, S., Militzer, M., 2009. Grain refinement in dual-phase steels. Metall. Mater. Trans. 40, 2145–2159.Mukherjee, M., Prahl, U., Bleck, W., 2010. Modelling of microstructure and flow stress evolution during hot forging. Steel Res. Int. 81 (12), 1102–1116.Needleman, A., Gil Sevillano, J., 2003. Preface to the viewpoint set on geometrically necessary dislocation and size dependent plasticity. Scripta Mater. 48,
109–111.Nix, W.D., Gao, H., 1998. Indentation size effects in crystalline materials: a law for strain gradient plasticity. Mech. Phys. Solids 46, 411–425.Nye, J.F., 1953. Some geometrical relations in dislocated crystals. Acta Metall. 1, 153–162.Ohashi, T., 2004. Three dimensional structures of the geometrically necessary dislocations in matrix-inclusion systems under uniaxial tensile loading. Int. J.
Plast. 20, 1093–1109.Ohashi, T., 2005. Crystal plasticity analysis of dislocation emission from micro voids. Int. J. Plast. 21 (11), 2071–2088.Ohashi, T., Barabash, R.I., Pang, J.W.L., Ice, G.E., Barabash, O.M., 2009. X-ray micro-diffraction and strain gradient crystal plasticity studies of geometrically
necessary dislocations near a Ni bicrystal grain boundary. Int. J. Plast. 25 (5), 920–941.Osipov, N., Gourgues-Lorenzon, A.-F., Marini, B., Mounoury, V., Nguyen, F., Cailletau, G., 2008. FE modelling of bainitic steels using crystal plasticity. Philos.
Mag. 88, 3757–3777.Pfestorf, M., 2005. The application of multiphase steel in the Body-in-White. Great Designs in Steel seminar, BMW Group.Piatti, G., Schiller, P., 1986. Thermal and mechanical properties of the Cr-Mn-(Ni-free) austenitic steels for fusion reactor applications. J. Nuclear Mater. 141–
143, 417–426.Pickering, F.B., 1992. Constitution and properties of steels, in: Chan, R.W., Pickering, F.B. (Eds.), VCH Verlasgesellschaft GmbH, Weinheim, pp. 41–94.Prakash, A., Weygand, S.M., Riedel, H., 2009. Modeling the evolution of texture and grain shape in Mg alloy AZ31 using the crystal plasticity finite element
method. Comput. Mater. Sci. 45, 744–750.Qu, H., 2011. Advanced high strength steel through paraequilibrium carbon partitioning and austenite stabilization, Master’s Thesis, Case Western Reserve
University, USA.Ramazani, A., Mukherjee, K., Prahl, U., Bleck, W., 2012a. Modelling the effect of microstructural banding on the flow curve behaviour of dual-phase (DP)
steels. Comput. Mater. Sci. 52, 46–54.Ramazani, A., Mukherjee, K., Prahl, U., Bleck, W., 2012b. Transformation-Induced, geometrically necessary, dislocation-based flow curve modeling of dual-
phase steels: effect of grain size. Metall. Mater. Trans. A. http://dx.doi.org/10.1007/s11661-012-1196-3.Rashid, M.S., 1981. Dual-phase steels. Annu. Rev. Mater. Sci. 11, 245–266.Reisner, G., 2000. Micromechanical modelling of strain induced martensitic transformation in Cu–Fe-alloys and in low alloyed TRIP-steels. VDI Fortschritt-
Berichte, Reihe 18: Mechanik/Bruchmechanik, No. 214.Rester, M., Motz, C., Pippan, R., 2007. Microstructural investigation of the volume beneath nanoindentations in copper. Acta Mater. 55 (19), 6427–6435.Rester, M., Motz, C., Pippan, R., 2008. The deformation-induced zone below large and shallow nanoindentations: a comparative study using EBSD and TEM.
Philos. Mag. Lett. 88 (12), 879–887.Rigsbee, J.M., Van der Arend, P.J., 1979. Formable HSLA and dual-phase steels. In: Kot, R.A., Morris, J.W. (Eds.), TMS-AIME. Warrendale, PA, pp. 56–86.Rodriguez, R.M., Gutierrez, I., 2003. A unified formulation to predict the tensile curves of steels with different microstructures. Mater. Sci. Forum 426–432,
4525–4530.Roters, F., Eisenlohr, P., Hantcherli, L., Tjahjanto, D.D., Bieler, T.R., Raabe, D., 2010. Overview of constitutive laws, kinematics, homogenization and multiscale
methods in crystal plasticity finite-element modeling: theory, experiments, applications. Acta Mater. 58, 1152–1211.Sarosiek, A.M., Owen, W.S., 1984. The work hardening of dual-phase steels at small plastic strains. Mater. Sci. Eng. 66 (1), 13–34.Shi, M.X., Huang, Y., Gao, H., 2004. The J-integral and geometrically necessary dislocations in nonuniform plastic deformation. Int. J. Plast. 20, 1739–1762.Speich, G.R., 1981. Fundamentals of Dual-Phase Steels. TMS-AIME, Warrendale, PA, pp. 3–45.Speich, G.R., Miller, R.L., 1979. Structure and properties of dual-phase steels. In: Kot, R.A., Morris, J.W. (Eds.), TMS-AIME. Warrendale, PA, pp. 145–182.
152 A. Ramazani et al. / International Journal of Plasticity 43 (2013) 128–152
Sun, X., Choi, K.S., Liu, W.N., Khaleel, M.A., 2009. Predicting failure modes and ductility of dual phase steels using plastic strain localization. Int. J. Plast. 25,1888–1909.
Sung, J.H., Kim, J.H., Wagoner, R.H., 2010. A plastic constitutive equation incorporating strain, strain-rate, and temperature. Int. J. Plast. 26, 1746–1771.Thomser, C., Uthaisangsuk, V., Bleck, W., 2009. Influence of martensite distribution on the mechanical properties of dual phase steels: experiments and
simulation. Steel Res. Int. 80, 582–587.Tsipouridis, P., 2006. Mechanical properties of dual-phase steels. Ph.D. Thesis, Technical University, Muenchen, Germany.ULSAB-AVC-PES Engineering Report, October 2001.Uthaisangsuk, V., 2009. Microstructure based formability modeling of multiphase steels. Ph.D. Thesis, RWTH Aachen University, Germany.Uthaisangsuk, V., Muenstermann, S., Prahl, U., Bleck, W., Schmitz, H.-P., Pretorius, T., 2011. A study of microcrack formation in multiphase steel using
representative volume element and damage mechanics. Comput. Mater. Sci. 50, 1225–1232.Van der Giessen, E., Needleman, A., 2003. GNDs in nonlocal plasticity theories: lessons from discrete dislocation simulations. Scripta Mater. 48, 127–132.Wechsler, M.S., Lieberman, D.S., Read, T.A., 1953. On the theory of the forma of martensite. Trans. AIME J. Met. 197, 1503–1515.WorldAutosteel, 2002. Ultra-light steel auto body-advanced vehicle technology (ULSABAVC) Programme, Overview Report, www.elsab.org.Yassar, R.S., Mesarovic, S.D., Field, D.P., 2007. Micromechanics of hardening of elastic–plastic crystals with elastic inclusions: I – Dilute concentration. Int. J.
Plast. 23, 1901–1917.Zaafarani, N., Raabe, D., Singh, R.N., Roters, F., Zaefferer, S., 2006. Three-dimensional investigation of the texture and microstructure below a nanoindent in a
Cu single crystal using 3D EBSD and crystal plasticity finite element simulations. Acta Mater. 54, 1863–1876.Zaafarani, N., Raabe, D., Roters, F., Zaefferer, S., 2008. On the origin of deformation induced rotation patterns below nanoindents. Acta Mater. 56 (1), 31–42.Zaiser, M., Aifantis, E.C., 2003. Geometrically necessary dislocations and strain gradient plasticity – a dislocation dynamics point of view. Scripta Mater. 48,
133–139.Zuidema, B.K., Denner, S.G., Engl, B., Sperle, J., 2011. New high strength steels applied to the body structure of ULSAB–AVC. Soc. Automot. Eng., 984–992.


