Embed Size (px)
Citation preview

Ecological Applications, 20(6), 2010, pp. 1633–1647� 2010 by the Ecological Society of America
Quantifying fire severity, carbon, and nitrogen emissionsin Alaska’s boreal forest
LESLIE A. BOBY,1,2 EDWARD A. G. SCHUUR,2,5 MICHELLE C. MACK,2 DAVID VERBYLA,3 AND JILL F. JOHNSTONE3,4
1School of Natural Resources, University of Florida, Gainesville, Florida 32611 USA2Department of Biology, University of Florida, Gainesville, Florida 32611 USA
3Institute of Arctic Biology, University of Alaska, Fairbanks, Alaska 99775 USA4Department of Biology, University of Saskatchewan, Saskatoon, Saskatchewan S7N5E2 Canada
Abstract. The boreal region stores a large proportion of the world’s terrestrial carbon (C)and is subject to high-intensity, stand-replacing wildfires that release C and nitrogen (N)stored in biomass and soils through combustion. While severity and extent of fires drivesoverall emissions, methods for accurately estimating fire severity are poorly tested in thisunique region where organic soil combustion is responsible for a large proportion of totalemissions. We tested a method using adventitious roots on black spruce trees (Picea mariana)in combination with canopy allometry to reconstruct prefire organic soil layers and canopybiomass in boreal black spruce forests of Alaska (USA), thus providing a basis for moreaccurately quantifying fire severity levels. We calibrated this adventitious-root-height methodin unburned spruce stands and then tested it by comparing our biomass and soils estimatesreconstructed in burned stands with actual prefire stand measurements. We applied thisapproach to 38 black spruce stands burned in 2004 in Alaska, where we measured organic soiland stand characteristics and estimated the amount of soil and canopy biomass, as well as Cand N pools, consumed by fire. These high-intensity quantitative estimates of severity weresignificantly correlated to a semiquantitative visual rapid assessment tool, the composite burnindex (CBI). This index has proved useful for assessing fire severity in forests in the westernUnited States but has not yet been widely tested in the boreal forest. From our study, weconclude that using postfire measurements of adventitious roots on black spruce trees incombination with soils and tree data can be used to reconstruct prefire organic soil depths andbiomass pools, providing accurate estimates of fire severity and emissions. Furthermore, usingour quantitative reconstruction we show that CBI is a reasonably good predictor of biomassand soil C loss at these sites, and it shows promise for rapidly estimating fire severity across awide range of boreal black spruce forest types, especially where the use of high-intensitymeasurements may be limited by cost and time.
Key words: adventitious roots; Alaska, USA; allometric equations; black spruce; carbon emissions;forest fire; nitrogen; organic layer depth; Picea mariana; soil carbon; surface fuel consumption.
INTRODUCTION
Boreal forests typically accumulate large pools of
carbon (C) in surface organic soil layers as a result of
poorly decomposable plant litter, cold temperatures,
and waterlogged soil that together contribute to slow
decomposition rates (Hobbie et al. 2000). As a result,
soil C pools in the boreal region are estimated to
represent a large fraction of the total global terrestrial
soil C pool (Gorham 1991, Dixon et al. 1994, Jobbagy
and Jackson 2000). While heterotrophic respiration of
soil organic matter is a continuous process that largely
controls annual to decadal rates of soil C accumulation,
periodic wildfire, the dominant disturbance in the boreal
forest, can combust soil organic layers and thus is a
major episodic factor controlling the decadal to century
scale distribution of C in the boreal biome (Harden et al.
2000). Fire return intervals are estimated to be ;80–150
years for the boreal forest of western North America
(Johnson 1992, Payette 1992). However, climate change
is expected to increase the frequency and the intensity of
wildfires as well as the duration of the fire season
(Flannigan et al. 2000), thus increasing ecosystem C loss
and potentially acting as a positive feedback to climate
change (Kasischke et al. 1995, Chapin et al. 2008).
Thick horizons of organic material overlaying the
mineral soil surface make boreal forests quite different
from temperate forests in terms of C sequestration, fire
emissions, and the ecological impacts of fire. Fire affects
ecosystem C balance immediately via direct C emissions
as surface organic layers are consumed during wildfire,
and also over time by affecting the composition and
growth rate of postfire successional forests (Kasischke et
al. 2000, Lecomte et al. 2006). Boreal tree seedling
recruitment generally increases with exposure of the
Manuscript received 12 December 2008; revised 20 October2009; accepted 26 October 2009. Corresponding Editor: A. D.McGuire.
5 Corresponding author. E-mail: [email protected]
1633

mineral soil below the organic soil layers, with small-
seeded, deciduous species being most sensitive to this
effect (Charron and Greene 2002, Johnstone and Chapin
2006, Greene et al. 2007). Early postfire recruitment is a
good predictor of future stand patterns (Johnstone et al.
2004, Peters et al. 2005) and thus has direct impacts on
the density, composition, and C sequestration potential
of future forests (Johnstone and Chapin 2006, Lecomte
et al. 2006, Greene et al. 2007).
Boreal wildfires vary considerably in intensity (the
amount of energy) and severity (the proportional change
in forest structure) as they burn across the landscape,
creating heterogeneity in both direct C emissions and the
ecological controls over future forest recruitment. Fire
behavior and severity patterns in the boreal forest differ
greatly from many other forests due to the high fire
intensity and flame length that characterizes boreal fires
(Johnson 1992). In a severe fire, the canopy often burns
in a fast-paced, high-intensity crown fire, which results
in near total canopy death (Johnson 1992), while the
thick organic soil horizons may burn in active flames or
in smoldering consumption later in time (Miyanishi and
Johnson 2002). Boreal forest fires interact with physical
conditions such as site aspect, elevation, soil moisture,
and weather conditions as well as with biological
properties such as vegetation fuel type and forest
structure to influence overall fire severity patterns on
the landscape (Johnson 1992, Hely et al. 2001, Duffy et
al. 2007). In turn, patterns of fire severity influence the
amount of direct C emissions (Kasischke et al. 1995,
Amiro et al. 2001), the postfire vegetation recovery
(Greene et al. 2004, Johnstone and Chapin 2006), and
subsequent ecosystem C balance (Lecomte et al. 2006).
Fire severity is a general term that refers to the
proportion of consumption of organic material or
vegetation mortality that occurs as the direct conse-
quence of a fire (Rowe 1983, Lentile et al. 2006). As
such, measurements of fire severity are key to estimating
C emissions and remaining nitrogen (N) pools that will
be available for future forest growth. In boreal forests, a
substantial portion of the fuel consumption occurs in the
surface soil organic layers, so characterization of fire
severity requires consideration of both canopy and soil
components. Currently, there is no standardized method
of quantifying fire consumption of organic soil layers in
boreal forests. As a result, semiquantitative assessments
of severity used by land managers have been largely
untested against measurements of C and N emissions
and remaining pools in boreal forests. The composite
burn index (CBI), which was developed in the western
United States, includes visual assessment of both canopy
and organic soil consumption (Key and Benson 2005),
yet few studies have compared this rapid index against
quantitative measurements of C and N consumption or
residual pools. An accurate, quantitative method of
measuring fire severity would provide the basis for these
comparisons, enhancing C accounting, and significantly
contributing to assessments of how changes in fire
regime may affect atmospheric CO2 and future climate
(de Groot et al. 2007).
Many studies of fire in boreal forests have categorized
levels of fire severity based on measurements of the
amount of organic soil remaining after fire (Turner et al.
1997, Arseneault 2001, Wang 2002, Bergner et al. 2004,
de Groot and Wein 2004, Greene et al. 2004, Johnstone
and Kasischke 2005, Johnstone and Chapin 2006).
However, this approach assumes that the amount of
postfire residual organic soil was proportional to the
amount of organic soil consumption. While postfire soil
organic depth is likely to be affected by consumption, it
is also strongly influenced by the thickness of the organic
soil layers that were present before the fire. Thus,
estimates of fire severity based solely on measurements
of residual organic matter are likely to be confounded by
prefire differences in biomass and soil (Miyanishi and
Johnson 2002). Techniques used to avoid this bias
include the use of prefire data, which are rarely available
for remote boreal wildfires, paired-sample studies where
residual biomass in burned sites is compared to
unburned sites assuming no significant between-site
heterogeneity (Kasischke and Johnstone 2005), and last,
detailed analyses of surface ash concentrations to
estimate organic soil consumption that must be carried
out immediately after fire (Turetsky and Wieder 2001).
Recently, a new approach to estimating fire severity in
boreal forests has been developed that uses adventitious
roots of black spruce (Picea mariana) to reconstruct
prefire organic layer depths after a stand has burned
(Kasischke and Johnstone 2005). Adventitious roots
grow above the initial root collar of black spruce trees
into the organic soil/moss layer that surrounds the tree
(Lebarron 1945), and the distribution of these roots is
clearly visible on burned trees for many years after fire.
In our study, we tested whether height measurements of
small (,2 mm) adventitious roots on black spruce boles
above the remaining soil organic material can be used
to: (1) reconstruct prefire organic soil depth, both near
and away from tree bases, (2) quantify pre- and postfire
C and N pools, and (3) constrain wildfire organic soil
combustion estimates. We also applied an approach for
estimating canopy severity that combined allometry-
based estimates of fine fuel biomass with visual
consumption estimates to measure total biomass loss
from the canopy. We used these field-based approaches
to develop quantitative estimates of organic matter
consumption and N and C emissions for 38 black spruce
stands distributed across a range of site moisture
conditions in interior Alaska that burned in 2004, the
largest fire season on record (Todd and Jewkes 2006).
Finally, these quantitative measurements were com-
pared to semiquantitative, but rapid, consumption
assessments obtained from the same sites using the
CBI to determine if this quicker and cheaper metric
developed in other forests might be applicable to boreal
systems.
LESLIE A. BOBY ET AL.1634 Ecological ApplicationsVol. 20, No. 6

METHODS
Study area
The Alaskan boreal forest covers ;17 million ha and
stores about 4.7 3 108 Mg C, or 27.6 Mg C/ha (Yarie
and Billings 2002). Our study sites in interior Alaska
were located in three large fire complexes that burned in
2004 along the Dalton, Steese, and Taylor Highways
(Fig. 1). The ;250 000-km2 study area encompassing
these sites is bounded by the Brooks Range to the North
(;678 N), the Alaska Range to the South (;638 N), the
Alaska–Canada border to the East (;1428 W), and the
Dalton Highway to the West (;1508 W). The area
includes small mountain ranges, flat to sloping uplands,
and broad lowland floodplains adjacent to braided
rivers (Hollingsworth et al. 2006). Temperatures across
this region are highly continental and range from�708C
to 358C with mean annual precipitation at ;285 mm,
including ;35% of that from snow (Hinzman et al.
2005). The dominant vegetation type in the study area is
open- to closed-canopy black spruce (Picea mariana),
occurring in mostly even-aged stands (Hollingsworth et
al. 2006). Black spruce forest includes three distinct
community types: acidic black spruce/lichen forest,
nonacidic black spruce/rose/horsetail forest, and tree-
line black spruce woodland (Hollingsworth et al. 2006).
In addition, white spruce (Picea glauca) and deciduous
species such as aspen (Populus tremuloides) and birch
(Betula neoalaskan) are also locally abundant. Soils of
interior Alaska are undeveloped and primarily (;90%)
consist of Inceptisols, Gelisols, Histosols, and Entisols
(Ahrens et al. 2004), and our sites are underlain by
permafrost or seasonal ice. Black spruce trees are
generally rooted in thick (5 to .50 cm) layers of organic
material overlying the mineral soil (Johnson 1992).
These surface organic horizons are largely derived from
live and dead mosses or lichens and inputs from vascular
plant litter and root turnover (Miyanishi and Johnson
2002). Using the Canadian system of soil classification,
these organic soil horizons can be categorized as litter
(recently deposited and largely unaltered plant remains,
including moss), fibric (slightly decomposed, but still
identifiable plant material), and humic (more decom-
posed and not identifiable), with mineral soil below
(Canada Soil Survey Committee 1978).
FIG. 1. Map of interior Alaska, USA, delineating the areas burned by wildfire in 2004 and the location of the 38 burned and 28unburned study sites. Note that the burn perimeter outline is the maximum extent of burn and includes some unburned area within,and that some site symbols overlap.
September 2010 1635FIRE SEVERITY IN BOREAL FOREST

For this study, we selected 38 sites in burned black
spruce forest from a larger pool of 90 road-accessible
burned sites distributed across the study region
(Johnstone et al. 2009). The 38 sites were not a random
selection of all burned areas, but instead were roughly
equally distributed across the full range of fire severity
(low to high) and drainage class (poor to good) as
determined by the larger pool of 90 sites. For 13 of these
sites, we also had prefire soil and vegetation data
(Hollingsworth et al. 2006). Six sites were located in
burned tree-line black spruce woodland communities,
and the remaining in burned acidic and nonacidic black
spruce forests. We also selected 28 additional sites from
nearby, unburned areas that had previously been
sampled by Hollingsworth et al. (2006). The unburned
stands were selected to cover a similar range of black
spruce stand types with respect to tree density and
drainage class.
Experimental design
The study sites were established in June 2005, one year
after fire. Each site was represented by a 30 3 30 m
square plot, within which soil and stand measurements
were made along a 2 3 30 m belt transect located near
the center of each plot. Soil measurements in the plots
included postfire organic soil depth, and C and N pools
in the organic layer and near-surface mineral soil. Boreal
fires leave behind unburned or lightly charred tree stems
that can usually be easily identified to species (Johnson
1992). We used these stems to estimate prefire tree
density, basal area (BA), and tree canopy consumption.
As part of a broader study, postfire vascular plant
species cover and composition, and tree seedling
recruitment were also measured in these plots.
Identical belt transects were established in adjacent
unburned forest stands in the summer of 2006 in order
to obtain the empirical relationships between ecosystem
structure and element pools necessary in order to
reconstruct prefire soil C and N pools. These sites are
referred to as ‘‘burned’’ and ‘‘unburned,’’ respectively.
Soil measurements
Across all burned sites, combustion ranged from low,
wherein a large proportion of the fibric or upper litter
layer had not burned, to high, where the fibric layer was
completely combusted and the humic layer was partially
or fully combusted (Rowe 1983). To quantitatively
reconstruct C emissions, we used a series of linked
measurements that included: (1) an estimate of the
organic matter remaining after the fire, (2) an estimate of
the organic matter present before the fire, and (3) a test
of whether organic matter measurements made near or
away from tree bases were different, because our organic
matter reconstruction using adventitious roots could
only be made at tree bases. These measurements were
made at both burned and unburned stands to test the
methods, and are described in more detail in the
subsequent paragraphs (Supplement).
Within each burned site, the depth of remaining soil
organic layers (SOL) was measured at 11 randomly
selected points on the transect in order to characterize
site average postfire SOL. At each sampling point, we
used a serrated knife to view the horizons, and measured
the depth of each of the following horizons: brown moss
(BM, undecomposed or slightly decomposed brown
moss of any taxa, equivalent to the litter layer), fibric (F,
moderately decomposed organic matter with more roots
than moss), and humic (H, highly humified or decom-
posed organic matter including the interface between the
humic horizon and the A horizon) down to the mineral
soil horizon.
In addition to our randomly located sampling points,
we also measured SOL depth near the base of trees. Tree
sampling points were chosen at the tree nearest to each
random sampling point and SOL depth was sampled as
close to the bole as possible while avoiding large roots.
At tree sampling points, we measured the height from
the top of the remaining SOL to the middle of the
highest adventitious root on the bole of the tree,
henceforth referred to as the adventitious root height
(ARH). Because prefire SOL depth could only be
reconstructed at tree sampling points with the ARH
method, we compared SOL depths at tree bases and at
random sampling points in both burned and unburned
sites to determine if sampling only at trees would bias
our measurements of soil combustion. To test if our
reconstructed prefire SOL depths were accurate, we
compared our values to actual prefire SOL measure-
ments at 13 sites where we had both prefire and postfire
data (Hollingsworth et al. 2008).
To convert plot-scale SOL depth measurements to
mass, we sampled soils at four points that were
representative of the range of within-site variation in
fire severity. Organic soil horizons were sampled
volumetrically with a serrated knife and separated into
horizons. Mineral soil was sampled via volumetric
coring at 0–5 cm and 5–10 cm depths. Soil samples
were stored in coolers with ice packs in the field and
frozen prior to laboratory analyses.
To test the ARH method of estimating the prefire soil
pools, we also measured these same soil characteristics
in the 28 unburned sites using an identical plot and
transect design. The SOL was divided into similar
horizons as the burn plots but we added a fourth
horizon, green moss (GM). We volumetrically sampled
soils with a serrated knife and a soil corer and measured
horizons at eight points (four tree bases and four
randomly located points), and measured the height of
adventitious roots in relation to the green moss surface.
Stand measurements
In burned sites, we measured the diameter of trees at
breast height (dbh; 1.4 m) for all trees �1.4 m tall and
the basal diameter of trees ,1.4 m tall that were
originally rooted within six 2 3 5 m subplots along the
30-m transects. Fallen trees killed by the fire were
LESLIE A. BOBY ET AL.1636 Ecological ApplicationsVol. 20, No. 6
included in this census if they had been rooted in the
subplot before they fell. We used stem diameter and
allometric equations to calculate tree density (number
per hectare), basal area (square meter per hectare), and
aboveground biomass (grams dry mass per hectare) of
branches, leaves, and cones. For each stem, we visually
estimated percentage fire consumption using five classes
(0, 25%, 50%, 75%, or 100%) for four separate
components of the remaining tree canopy: cones,
needles, fine branches, and coarse branches, basing this
on previous direct observation of similar sized unburned
trees. To calculate prefire biomass of canopy compo-
nents (excluding the tree bole), we grouped trees into
three diameter and height classes and applied different
allometric equations that predicted standing dry bio-
mass from dbh of individual trees. Classes consisted of
(1) dbh . 2.7 cm and height . 1.4 m, (2) dbh , 2.7 cm
and height . 1.4 m, and (3) height , 1.4 m, using basal
diameter (Mack et al. 2008; Appendix).
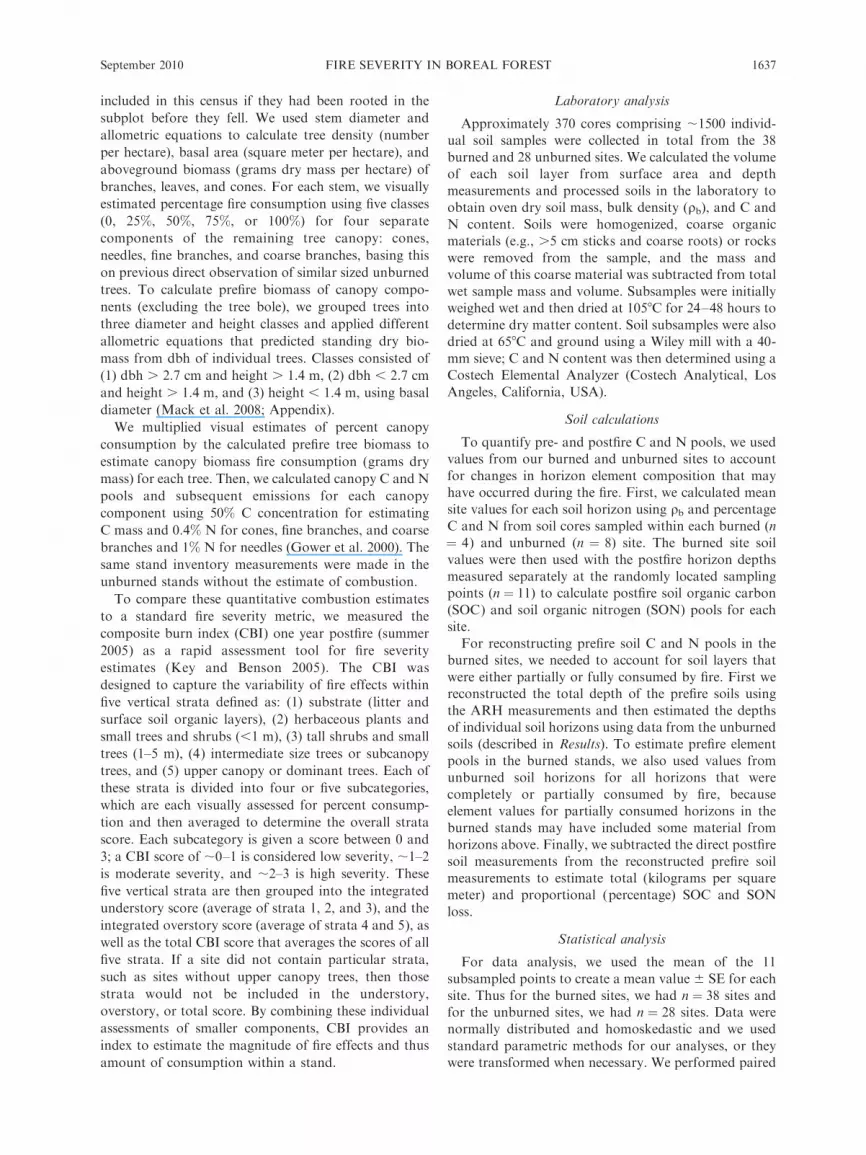
We multiplied visual estimates of percent canopy
consumption by the calculated prefire tree biomass to
estimate canopy biomass fire consumption (grams dry
mass) for each tree. Then, we calculated canopy C and N
pools and subsequent emissions for each canopy
component using 50% C concentration for estimating
C mass and 0.4% N for cones, fine branches, and coarse
branches and 1% N for needles (Gower et al. 2000). The
same stand inventory measurements were made in the
unburned stands without the estimate of combustion.
To compare these quantitative combustion estimates
to a standard fire severity metric, we measured the
composite burn index (CBI) one year postfire (summer
2005) as a rapid assessment tool for fire severity
estimates (Key and Benson 2005). The CBI was
designed to capture the variability of fire effects within
five vertical strata defined as: (1) substrate (litter and
surface soil organic layers), (2) herbaceous plants and
small trees and shrubs (,1 m), (3) tall shrubs and small
trees (1–5 m), (4) intermediate size trees or subcanopy
trees, and (5) upper canopy or dominant trees. Each of
these strata is divided into four or five subcategories,
which are each visually assessed for percent consump-
tion and then averaged to determine the overall strata
score. Each subcategory is given a score between 0 and
3; a CBI score of ;0–1 is considered low severity, ;1–2
is moderate severity, and ;2–3 is high severity. These
five vertical strata are then grouped into the integrated
understory score (average of strata 1, 2, and 3), and the
integrated overstory score (average of strata 4 and 5), as
well as the total CBI score that averages the scores of all
five strata. If a site did not contain particular strata,
such as sites without upper canopy trees, then those
strata would not be included in the understory,
overstory, or total score. By combining these individual
assessments of smaller components, CBI provides an
index to estimate the magnitude of fire effects and thus
amount of consumption within a stand.
Laboratory analysis
Approximately 370 cores comprising ;1500 individ-ual soil samples were collected in total from the 38
burned and 28 unburned sites. We calculated the volumeof each soil layer from surface area and depth
measurements and processed soils in the laboratory toobtain oven dry soil mass, bulk density (qb), and C and
N content. Soils were homogenized, coarse organicmaterials (e.g., .5 cm sticks and coarse roots) or rocks
were removed from the sample, and the mass andvolume of this coarse material was subtracted from total
wet sample mass and volume. Subsamples were initiallyweighed wet and then dried at 1058C for 24–48 hours to
determine dry matter content. Soil subsamples were alsodried at 658C and ground using a Wiley mill with a 40-
mm sieve; C and N content was then determined using aCostech Elemental Analyzer (Costech Analytical, Los
Angeles, California, USA).
Soil calculations
To quantify pre- and postfire C and N pools, we usedvalues from our burned and unburned sites to account
for changes in horizon element composition that mayhave occurred during the fire. First, we calculated mean
site values for each soil horizon using qb and percentageC and N from soil cores sampled within each burned (n
¼ 4) and unburned (n ¼ 8) site. The burned site soilvalues were then used with the postfire horizon depths
measured separately at the randomly located samplingpoints (n ¼ 11) to calculate postfire soil organic carbon
(SOC) and soil organic nitrogen (SON) pools for eachsite.
For reconstructing prefire soil C and N pools in theburned sites, we needed to account for soil layers that
were either partially or fully consumed by fire. First wereconstructed the total depth of the prefire soils using
the ARH measurements and then estimated the depthsof individual soil horizons using data from the unburned
soils (described in Results). To estimate prefire elementpools in the burned stands, we also used values fromunburned soil horizons for all horizons that were
completely or partially consumed by fire, becauseelement values for partially consumed horizons in the
burned stands may have included some material fromhorizons above. Finally, we subtracted the direct postfire
soil measurements from the reconstructed prefire soilmeasurements to estimate total (kilograms per square
meter) and proportional (percentage) SOC and SONloss.
Statistical analysis
For data analysis, we used the mean of the 11subsampled points to create a mean value 6 SE for each
site. Thus for the burned sites, we had n ¼ 38 sites andfor the unburned sites, we had n ¼ 28 sites. Data werenormally distributed and homoskedastic and we used
standard parametric methods for our analyses, or theywere transformed when necessary. We performed paired
September 2010 1637FIRE SEVERITY IN BOREAL FOREST

t tests to compare randomly selected points vs. tree base
sampling points across sites. Additionally, we usedcorrelation analysis and linear regression to explore
relationships between different ecosystem attributes.
RESULTS
Black spruce stand characteristics
Postfire SOL depth, tree basal area and density, as
well as postfire soil C and N pools, varied considerably
across the 38 burned sites. Postfire SOL depth ranged
from 0 to 21 cm with 16 sites having 5 cm or less of soil
organic matter remaining, 15 sites having 7–15 cm, and 7
sites having 15–20 cm organic matter remaining (Fig.
2A). Across all sites, soil organic layers that remained
after fire ranged from a shallow ash–humic layer to
nearly the full soil profile with all three layers (Fig. 2B).
Postfire soil C pools followed similar trends and ranged
from 0.43 kg C/m2 to as much as 14 kg C/m2, with an
average of 3.46 6 0.46 kg C/m2 (mean 6 SE) across all
sites (Fig. 2C). Postfire SON pools averaged 0.126 6
0.016 kg N/m2 with the pattern mirroring SOC pools
because of the tight coupling between soil C and N.
Mean tree densities in our burned sites ranged from
2000 trees/ha to .8000 trees/ha, with a mean density of
6210 6 751 trees/ha (Fig. 3A). Basal area ranged from
0.05 to 28.00 m2/ha, with mean basal area of 9.4 6 1.2
m2/ha. The majority of our study sites had relatively low
basal area reflecting small trees and/or sparse stands,
both which are typical for black spruce forests (Fig. 3B).
Stand age determined by ring counts of five trees per
stand ranged from 30 to 176 years across all sites with a
mean age of 91.3 6 4.7 years (Johnstone et al. 2010).
Age was not related to basal area or stand density (data
not shown).
Reconstructing prefire soil organic layers
Because adventitious root development is stimulated
by moss and humus cover (Lebarron 1945, Krause and
Morin 2005), we explored the applicability of using the
adventitious root remains (hereafter called ‘‘scars’’) on
burned trees to estimate prefire organic soil depth.
Kasischke and Johnstone (2005) hypothesized that
ARH in burned stands indicated the minimum height
of the prefire soil surface, or more specifically, the top of
the green moss layer. To test this hypothesis, we
measured ARH in our 28 unburned sites to determine
if there was any systematic offset between the ARH and
the top of the green moss; this difference is hereafter
referred to as the adventitious-root-height offset
(ARHo). The ARHo was normally distributed around
a mean value of 3.2 6 0.43 cm below the surface. Site
mean ARHo was not related to moss type, soil pH, soil
moisture, total SOL depth, or basal area (data not
shown). ARHo was, however, positively related to tree
dbh (ARHo¼�5.07þ0.313dbh, R2¼0.23, F1,26¼7.59,
P¼ 0.01). Because this predictor explained only a small
proportion of the total variation in the ARHo, we added
a mean offset of 3.2 cm to correct our calculations of
prefire SOL depth in order to keep this method as simple
as possible.
Next, we determined whether measuring postfire SOL
depth only at tree bases might bias our estimates of
remaining soil organic material for the site, which could
occur if either soil organic matter accumulation or
combustion was different under trees. Across all burned
sites, average organic soil depth was 8.2 6 1.0 cm at
randomly located sampling points and was comprised of
FIG. 2. Soil characteristics of 38 burned black spruce (Piceamariana) sites grouped by the depth of the soil organic layerthat remained following fire: (A) the actual number of studysites in each soil depth class, (B) the thickness (depth) of thehorizons in the remaining soil organic layer, and (C) the Cpools contained in the remaining soil organic layer, by horizontype. Error bars showþSE for the total pool.
LESLIE A. BOBY ET AL.1638 Ecological ApplicationsVol. 20, No. 6

three horizons with the following mean depths: 1.1 6 0.3
cm (BM), 3.7 6 0.5 cm (F), and 3.3 6 0.4 cm (H) (Table1). Across all sites, mean SOL depths at tree bases and
randomly located organic soil depths were highly
correlated (R2 ¼ 0.91, P , 0.001). But, total postfire
SOL depth in the burned plots was significantly
shallower at tree bases by 6.4% compared to the random
points (paired t1,37 ¼ 2.40, P ¼ 0.02). The difference in
postfire SOL depth was primarily due to a thinner BM
horizon near trees (paired t1,37 ¼ 3.30, P ¼ 0.02), which
offset a somewhat thicker H horizon (paired t1,37 ¼�2.20, P ¼ 0.03).
This pattern of shallower residual SOL depths under
trees vs. randomly located points in burned plots
(hereafter called tree bias) may have been due to: (1)
greater organic consumption under trees (Miyanishi and
Johnson 2002, Greene et al. 2007), and (2) less prefire
organic matter accumulation under trees, or a combi-
nation of both factors. As a test of (2), we found that in
unburned forest, total SOL depth under trees was not
significantly different from SOL depth at randomly
located points (paired t1,27 ¼ 0.37, P ¼ 0.71). This then
suggests that (1), greater combustion under trees, is the
cause of shallower residual SOL depths under trees in
the burned sites. Across the unburned sites, mean total
SOL depth at random points was 25.3 6 1.3 cm (Table
1). Layer depth, bulk density, soil moisture, and C and
N concentrations were not different at tree bases as
compared to random points for all organic soil horizons
but did differ among horizons. While GM and BM
horizons accounted for 24% of the total SOL depth in
the unburned forest, they only accounted for 10.4% of
total mass of soil organic matter, 11.9% of the total SOC
pool, and 8.8% of the total SON pool because of the
lower bulk density in those upper horizons.
In order to account for increased combustion at tree
bases in our reconstruction of prefire and postfire SOL,
we calculated a correction factor for each horizon in
order to extrapolate measurements at tree bases to the
whole stand. Corrections were empirically determined
from measurements in the unburned stands near and
away from trees (BMcorr ¼ 1.10 3 BMtree þ 0.67, R2 ¼0.91, P , 0.001; Fcorr¼ 0.91 3 Ftreeþ 0.73, R2¼ 0.91, P
, 0.001; Hcorr ¼ 0.71 3 Htree þ 0.62, R2 ¼ 0.91, P ,
0.001). The sum of these corrected horizon values
yielded the total unbiased postfire SOL depth (referred
to as SOLc,post-F). We used these depth corrections along
with our prefire depth estimates to calculate organic soil
consumption for each site.
FIG. 3. Stand characteristics of 38 burned black spruce sitesgrouped by basal area class: (A) tree density (mean þ SE) and(B) the frequency of study sites in each basal area class. Theactual number of sites is shown above each bar in panel (B).
TABLE 1. Organic soil characteristics by horizon for 38 black spruce (Picea mariana) forest sitesthat burned in 2004 and for 28 unburned black spruce sites, in interior Alaska, USA.
HorizonHorizon
thickness (cm)Bulk density
(g/cm3)Carbon
concentration (%)Nitrogen
concentration (%)
Burned
Brown moss (BM) 1.12 6 0.3 0.04 6 0.004 40.2 6 1.4 0.97 6 0.1Fibric (F) 3.69 6 0.5 0.10 6 0.01 41.4 6 0.8 1.28 6 0.04Humic (H) 3.30 6 0.4 0.21 6 0.01 30.0 6 1.0 1.25 6 0.04
Unburned
Green moss (GM) 2.49 6 0.14 0.03 6 0.01 42.5 6 0.54 1.07 6 0.04Brown moss (BM) 3.79 6 0.69 0.03 6 0.003 41.4 6 0.61 1.03 6 0.04Fibric (F) 11.41 6 0.79 0.05 6 0.004 41.4 6 0.74 1.16 6 0.06Humic (H) 7.56 6 0.39 0.14 6 0.01 32.9 6 1.44 1.30 6 0.07
Note: Values are mean 6 SE.
September 2010 1639FIRE SEVERITY IN BOREAL FOREST

Organic soil fire severity
We combined our measurements from burned and
unburned stands to calculate organic soil combustion as
a percentage of total original SOL depth and then used
those same depths with bulk density, %C, and %N to
estimate SOL mass, and SOC and SON combustion. We
first used the following equation to estimate prefire soil
depth (SOLpre-F) for our burned sites:
SOLpre-F ¼ SOLpost-F þ ARHþ ARHo:
Next, because we calculated the SOLpre-F at tree bases
and because combustion was higher under trees, we used
our random/tree bias corrected residual SOL depth to
estimate total SOL combustion:
SOL combustion ¼ SOLpre-F � SOLc;post-F:
Note that the SOLpre-F does not need to be corrected for
increased burning at tree bases because we use SOLpost-F
measurements from the tree base as well as ARH from
the same point, and measurements in unburned stands
show no bias in SOL depth under trees. Percentage SOL
combustion across all sites was generally high with a
mean value of 66.8% 6 3.7%, with loss ranging from
34% to 96% of the organic soil depth. In the original
experimental design, our aim was to select burn sites
along a continuum from low to high fire severity. While
we achieved that aim as shown by the range of estimated
combustion across sites, the mean value overall demon-
strates that more sites had high combustion losses.
Because the ARH method is based on accurately
reconstructing prefire depth, we compared our prefire
estimates with independent data collected prior to the
wildfire (Hollingsworth et al. 2006) for 13 of our burned
sites where we had data. Our reconstructed SOL depth
of 26.6 6 1.66 cm for these sites was not significantly
different from measured prefire depths (paired t1,12 ¼1.65, P ¼ 0.13).
Reconstructing depth of organic soil horizons
After reconstructing total prefire SOL depth with the
ARH method, we divided the total SOL depth into
individual horizons to quantify C and N pools because
each layer differed in bulk density and element
concentration. To estimate the depth of individual
horizons, we examined correlations between total SOL
depth and each individual horizon from the 28 unburned
sites and found that green moss (GM) was a constant
depth for all points, while brown moss (BM), fibric (F),
and humic (H) horizons were generally constant
proportions (Fig. 4). This model is not necessarily the
best fit line, but instead has a biological mechanism with
the depth of green moss a function of light attenuation
in the soil, with the remaining horizons varying as a
constant proportion of overall organic matter thickness.
Green moss depth averaged 2.4 6 0.14 cm and ranged
between 0.82 and 3.9 cm. The BM, F, and H horizons
were estimated as 18%, 50%, and 32%, respectively, of
the remaining soil (total mean SOL depth minus the
green moss average: 2.4 cm). Using other measured
stand variables in multiple regression models did not
improve the prediction of individual horizon thickness
as compared to using the total SOL depth alone. Thus,
these proportions and the GM constant value were then
applied to the reconstructed prefire organic soil depth to
estimate the depth of individual soil horizons that had
been partially or wholly consumed in the burned stands.
Soil organic layer C and N pools and combustion
In the burned sites, soil core sampling points were
taken randomly across the plots. In contrast, the eight
unburned soil sample cores were stratified at tree bases
FIG. 4. Total depth of the soil organic layer compared to individual soil horizon thickness (green moss, GM; brown moss, BM;fibric, F; and humic, H) for 28 unburned black spruce sites. Linear relationships are shown for all horizons except for GM, wherethickness of this horizon was not significantly related to overall soil organic layer depth. For all slopes, P , 0.001.
LESLIE A. BOBY ET AL.1640 Ecological ApplicationsVol. 20, No. 6

and randomly located points away from trees (four
each). Because there were no significant differences
between qb, and C and N concentrations between these
two groups, these soil data were pooled within each
unburned site (Table 1). In terms of other measured soil
parameters, the F horizon alone had significantly
different gravimetric moisture content (paired t1,27 ¼�2.24, P ¼ 0.03; random mean ¼ 251.1% 6 41.1% and
tree mean ¼ 213.4% 6 32.7% moisture) close to and
away from trees, which could relate to the increased
burn depth observed at tree bases.
Our estimates of postfire SOC pools ranged from 0.33
kg/m2 to 10.63 kg/m2 with a mean of 2.99 6 0.40 kg/m2,
while SON pools ranged from 0.01 kg/m2 to 0.30 kg/m2
with a mean of 0.11 6 0.02 kg/m2. Reconstructed
postfire element pools using unburned stand element
values were 17.0% 6 3.9% (SOC) and 19.3% 6 3.8%(SON) less than direct pool measurements in burned
stands (SOC paired t1,37 ¼ 3.31, P ¼ 0.002 and SON
paired t1,37¼ 3.45, P¼ 0.001), suggesting that there was
some accumulation of C and N in the remaining SOL
that came from combusted soil horizons and biomass
above. Comparing prefire SOL pools to what remained
after fire, we calculated that the proportion of SOC and
SON lost ranged from as low as 0% to as high as 94%,
with mean losses of 52.9% 6 4.8% and 49.8% 6 5.04%,
respectively, across the 38 sites (Fig. 5A). Overall, SOC
emissions were 41.6 6 5.6 times greater than SON
emissions (Fig. 5B).
Tree biomass, C and N pools, and combustion
We used allometric biomass equations to calculate
prefire canopy biomass (not including boles) and
combined these with visual combustion estimates to
calculate canopy biomass consumed by fire. Mean
prefire total canopy biomass throughout all burned sites
was 8686 6 1080 kg/ha. Of this amount, canopy
biomass losses were 6618 6 960 kg/ha, with a mean
proportional consumption across all sites of 64% 6 4%.
We did not include the tree bole in our measurements
because it was almost always charred or black from ash
or soot, regardless of the severity of the fire, and
therefore difficult to visually estimate consumption. This
likely results in an underestimate of canopy consump-
tion, but tree boles remain largely unburned even in
severe fires so this underestimate should be relatively
small (Gutsell and Johnson 1996).
Prefire C and N biomass of the tree canopy (excluding
bole) averaged 0.43 6 0.05 kg/m2 and 0.0054 6 0.001
kg/m2, about an order of magnitude less than that
contained in the organic soil. These estimates assume a
general canopy C concentration of 50% and N
concentrations of 1% for needles and 0.4% for cones,
fine, and coarse branches (see Methods). In our burned
stands, C and N losses from combustion were 0.37 6
0.05 kg/m2 and 0.005 6 0.0006 kg/m2, respectively, and
are equivalent to mean losses of 80.2% 6 2.5% of
canopy C and 80.6% 6 2.7% of canopy N (Fig. 5A, B).
CBI and combustion losses
We compared our organic soil and canopy combus-
tion estimates with CBI scores from each site in order to
relate our intensive quantitative estimate to a severity
metric that can be assessed more rapidly. We evaluated
the following CBI scores in relation to our measure-
ments: total (a total site value), overstory (upper plus
mid-canopy trees and tall shrubs), understory (substrate,
herbaceous plants, and small shrubs), and substrate (soil
FIG. 5. (A) Carbon emission, (B) nitrogen emission, and(C) percentage of the total C and N pools lost during fire from38 burned black spruce sites, grouped by the depth of the soilorganic layer that remained following fire. The canopy estimatedoes not include tree boles, which typically burn very little.Error bars showþSE for the total combustion estimate.
September 2010 1641FIRE SEVERITY IN BOREAL FOREST

organic layers and litter). The CBI range varies from 0
(low severity) to 3 (high severity) and the mean total
CBI score in our stands was 2.3 6 0.07. In general,
substrate and understory scores were lower than
overstory scores; mean CBI scores for substrate,
understory, and overstory were 1.9 6 0.14, 2.2 6 0.09,
and 2.5 6 0.06, respectively.
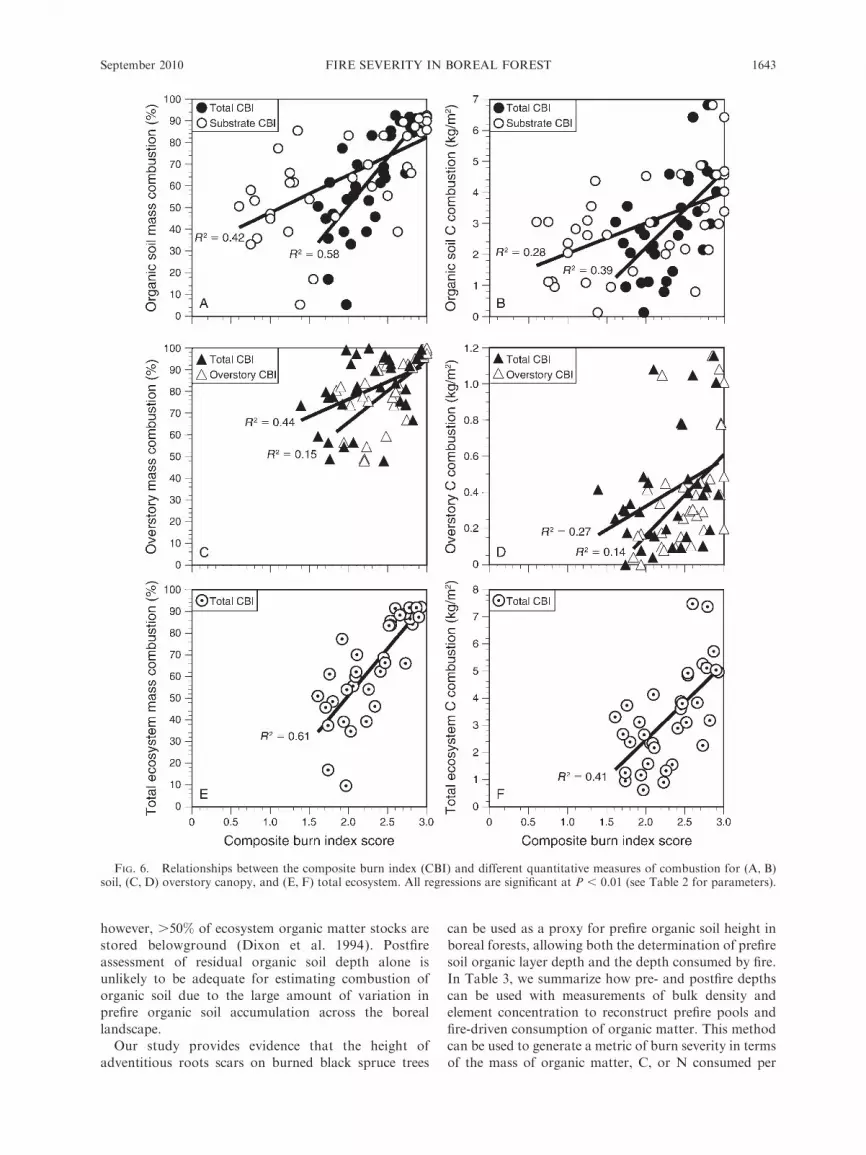
Total CBI scores were positively related to propor-
tional and absolute metrics of ecosystem mass loss and C
emissions, and explained 41–61% of the variation in
combustion overall (Table 2, Fig. 6). Overall, CBI scores
were better for predicting the relative mass loss (percent-
age) across all ecosystem components as compared to
predicting absolute C emissions (kilograms per square
meter) due to variation in biomass and SOL among
stands (Table 2). However, CBI was better for estimating
SOL or forest floor C emissions than canopy C emissions.
Total, understory, and substrate CBI scores were
significantly related to all SOL combustion measure-
ments and between 28% and 59% of the variation were
explained. Surprisingly the total CBI score was the best
predictor for soil combustion overall, even better than
the understory or substrate CBI scores alone. The
overstory CBI score was positively related to percent of
canopy biomass and C combusted and explained 44% of
the variation of this proportional metric, but only 27% of
the variation in the absolute amount of C emitted. Total
CBI score only explained ;15% of the variation in tree
canopy combustion (Table 2). Because CBI is a visual
estimate of consumption that does not really account for
initial stand biomass and forest floor, it is reasonable that
overall CBI was a better predictor of proportional
combustion than actual mass combusted.
DISCUSSION
The most commonly used methods for estimating fire
severity in forests rely on quantification of postfire
conditions (Robichaud 2000, Keeley et al. 2005).
Postfire assessment may adequately index the amount
of aboveground biomass consumed because of the
predictive relationship between remaining boles and
prefire biomass in many forest types. In boreal forests,
TABLE 2. Relationships between the composite burn index (CBI) and quantitative measures ofcombustion.
Y, ecosystem components,and X (CBI score) Slope Intercept R2 P n
Organic soil combustionTotal depth (%)Total 39.01 �21.05 0.50 ,0.0001 36Understory 29.63 3.03 0.50 ,0.0001 36Substrate 15.85 37.79 0.38 ,0.0001 36
Total mass (%)Total 43.93 �36.97 0.58 ,0.0001 36Understory 33.50 �10.15 0.59 ,0.0001 36Substrate 17.30 30.37 0.42 ,0.0001 36
Total C mass (%)Total 51.42 �63.49 0.50 ,0.0001 36Understory 39.97 �33.77 0.52 ,0.0001 36Substrate 17.30 30.37 0.42 ,0.0001 36
Total C mass (kg/m2)Total 2.47 �2.72 0.39 ,0.0001 36Understory 1.87 �1.19 0.39 ,0.0001 36Substrate 0.98 1.06 0.28 ,0.0001 36
Tree canopy combustionTotal mass (%)Total 14.15 48.63 0.15 0.02 36Overstory 28.72 8.38 0.44 ,0.0001 33
Total C mass (%)Total 14.15 48.63 0.15 0.02 36Overstory 28.72 8.38 0.44 ,0.0001 33
Total C mass (kg/m2)Total 0.28 �0.25 0.14 0.02 36Overstory 0.45 �0.74 0.27 0.002 33
Total ecosystem combustionTotal mass (%) 43.20 �35.23 0.61 ,0.0001 35Total C mass (%) 49.83 �59.10 0.52 ,0.0001 35Total C mass (kg/m2) 2.80 �3.14 0.41 ,0.0001 35
Notes: The total CBI score comprises individual understory, soil substrate, and overstory CBIscores. Regression equations relate the predictive value of these unitless CBI scores to quantitativemeasures of combustion of different ecosystem components for Alaskan black spruce forests thatburned in 2004.
LESLIE A. BOBY ET AL.1642 Ecological ApplicationsVol. 20, No. 6
however, .50% of ecosystem organic matter stocks arestored belowground (Dixon et al. 1994). Postfire
assessment of residual organic soil depth alone isunlikely to be adequate for estimating combustion of
organic soil due to the large amount of variation inprefire organic soil accumulation across the boreal
landscape.Our study provides evidence that the height of
adventitious roots scars on burned black spruce trees
can be used as a proxy for prefire organic soil height inboreal forests, allowing both the determination of prefire
soil organic layer depth and the depth consumed by fire.In Table 3, we summarize how pre- and postfire depths
can be used with measurements of bulk density andelement concentration to reconstruct prefire pools and
fire-driven consumption of organic matter. This methodcan be used to generate a metric of burn severity in terms
of the mass of organic matter, C, or N consumed per
FIG. 6. Relationships between the composite burn index (CBI) and different quantitative measures of combustion for (A, B)soil, (C, D) overstory canopy, and (E, F) total ecosystem. All regressions are significant at P , 0.01 (see Table 2 for parameters).
September 2010 1643FIRE SEVERITY IN BOREAL FOREST

unit area. It also enables assessment of within- and
among-stand heterogeneity in fire severity, a key driver
of ecological processes in the boreal forest. The metric
provides a quantitative baseline for assessing the
efficiency of widely used semiquantitative methods, such
as the CBI that we explored in our study. Finally, the
units of this metric are globally comparable and should
facilitate direct comparison of burn severity and
emissions between boreal forests and the structurally
diverse ecosystems around the world that are impacted
by fire.
While the ARH method has previously been used to
estimate the depth of burning (Kasischke and Johnstone
2005, Kasischke et al. 2008), key assumptions of the
method were based on relatively few data (Kasischke et
al. 2008). We verified these assumptions by making
extensive measurements in burned and unburned black
spruce stands in interior Alaska. Across 28 independent
unburned stands, we found that the average height of
the highest adventitious roots on the stem corresponded
to the surface of the moss layer; roots were, on average,
3.2 6 0.43 cm below the surface of the green moss. This
pattern was consistent across a range of understory moss
communities, including feather mosses, Sphagnum spp.,
and other moss species (Hollingsworth et al. 2008). The
diverse array of woody plant species where adventitious
root formation has been observed (Paolillo and Zobel
2002) makes it likely that the relationship between
adventitious roots and soil organic matter could be used
to determine prefire organic layer depth in other
systems, following the general process outlined in
Table 3.
In our burned stands, measurements at tree bases
alone underestimated the site mean depth of postfire
organic soil by 6.4%. In unburned stands, by contrast,
we found that soil organic layer thickness was not
different between the bases of trees and randomly
sampled points, and did not vary systematically with
distance to tree bases. Taken together, these observa-
tions suggest that organic soils burned more severely at
the bases of trees than on average across the stand.
Although this bias was relatively small across our
stands, the pattern has been observed in many other
coniferous forest types (Miyanishi and Johnson 2002,
Greene et al. 2007, Rein et al. 2008) and should be
considered prior to the application of this method in
other systems. Deeper burning under tree canopies has
been ascribed to drier fuel beneath tree canopies due to
interception of precipitation (Miyanishi and Johnson
2002) or to a reduced latent heat sink during propaga-
TABLE 3. Steps for application of the adventitious root method to estimate wildfire consumption of organic matter and emissionsof C and N in interior Alaska or in other regions.
Step Measurement
Task
Application to interior Alaska Application to other regions
1 Adventitious root height(cm)
Measure from highest AR to burned soilsurface. Add 3.2 cm to correct for mosssurface offset.
Calibrate regional surface offset.
2 Postfire total SOL depth(cm)
Measure from burned surface to mineralsoil surface. Note soil layer exposed(green moss, brown moss, fibric, orhumic). Correct for tree bias bymultiplying by 1.06.
Measure depth of individual soil horizonsand correct tree bias by horizon withregional calibration.
3 Prefire total SOL depth (cm) Sum depths in steps 1 and 2.4 Prefire SOL depth by
horizon (cm)Starting with the total prefire soil depth,
subtract 2.4 cm for green moss. Thenmultiply the remainder by the followingconstant proportions: brown moss ¼0.18, fibric ¼ 0.50, and humic ¼ 0.32 toget thickness of individual horizons.
5 Prefire OM, C, and N pools(g/m2)
Multiply horizon depths from step 4 bybulk density, [C], and [N] in Table 1 andsum horizons.
Calibrate regional bulk density, [C], and[N] values.
6 Postfire SOL depth byhorizon (cm)
If the depth in step 2 is greater than thedepth increment of the deepest horizonin 4, then that horizon is intact and itspostfire depth is equal to its depth instep 4. Move up soil profile, comparingeach horizon, until an incompletehorizon is reached; this is the depth ofburning. Check the horizon identityagainst field notes to confirm.
7 Postfire OM, C, and Npools (kg/m2)
Multiply horizon depths from step 6 bybulk density, [C], and [N] in Table 1 andsum horizons.
Measure bulk density, [C], and [N] valuesat profiles in step 2, or calibrate regionalvalues.
8 Combustion loss of OM, C,and N (kg/m2)
Subtract pool sizes in step 7 from step 5for each pool.
Note: Key to abbreviations: ARH, adventitious root height; SOL, soil organic layer; OM, organic matter.
LESLIE A. BOBY ET AL.1644 Ecological ApplicationsVol. 20, No. 6
tion of the combustion front associated with tree roots
and stems (Greene et al. 2007).
While we found no significant difference between soil
organic matter pools calculated with this reconstruction
method and prefire measurements reported by
Hollingsworth et al. (2008) for the same sites, this
method may be ineffective for estimating pools in
intense fires that leave trees uprooted, or in sites where
trees were rooted within a layer of organic soil that was
completely combusted, leaving no evidence of the
rooting position of the prefire trees. In such situations,
the ARH method can only provide a minimum estimate
of prefire SOL depth. Despite the high intensity of the
2004 fire season, we encountered only two sites in our
survey that fell into these categories, suggesting that the
adventitious root method should be generally useful to
provide unbiased estimates of SOL consumption in
boreal Alaska and perhaps in boreal forests elsewhere.
C and N pools and emissions
Our estimates of carbon emission rates from the 2004
fires averaged 3.3 kg C/m2 and ranged from 1.5 to 4.6 kg
C/m2. Mean emissions calculated with our method were
similar to values reported for comparable boreal
ecotypes in North America, including interior Alaska
(2.5–3.0 kg C/m2; Kasischke et al. 1995), Boreal and
Taiga Cordillera ecozones (3.23 and 3.06 kg C/m2,
respectively; Amiro et al. 2001), and diverse boreal
peatlands in Canada (3.2 kg C/m2; Turetsky et al. 2002).
Our mean emission value is substantially larger than
other values reported from Canada, including a direct
measurement of emissions from a bog (2.1 kg C/m2;
Benscoter and Wieder 2003), an estimate of average C
emissions over multiple fire cycles (,1.0 kg C/m2;
Harden et al. 2000), and estimates of emissions from
the taiga and boreal shield ecozones (1.9 to 2.5 kg C/m2;
Amiro et al. 2001).
Nitrogen emission rates for the 2004 fires averaged
0.09 kg N/m2 and ranged from 0.03 to 0.14 kg N/m2.
There are few published values to compare to our
estimate, but the magnitude alone indicates that fire is
an important pathway of N loss from these ecosystems.
Nitrogen deposition rates in boreal Alaska are low
(0.00003 kg N�m�2�yr�1; Jones et al. 2005) and inputs
from biological fixation are estimated to be slightly
higher (Billington and Alexander 1983, DeLuca et al.
2002). If we assume linear inputs of an average of 0.0002
kg N�m�2�yr�1, then the 2004 fires emitted, on average,
450 years of N accumulation. Although this is clearly an
oversimplification of nitrogen mass balance, the sheer
magnitude of the loss makes it likely that fire plays a role
in maintaining nitrogen limitation in these forests.
Assessing CBI for black spruce forests
Comparisons of visual estimates of fire severity with
quantitative estimates of canopy and surface fuel
consumption indicate that CBI is a viable method for
assessing overall patterns of fire severity in black spruce
forests in Alaska. The total CBI score, a composite score
including visual estimation of above- and belowground
consumption, showed the strongest correlations with
SOL consumption expressed as percentage soil organic
mass combusted (Table 3, Fig. 6). Interestingly,
correlations of CBI with SOL combustion were stronger
when using the total or understory (ground-layer
mosses, dwarf shrubs, and herbs) CBI scores, and were
comparatively weak when using substrate (i.e., organic
soil layer) CBI scores. This suggests that observers may
have a poor ability to visually estimate the categories of
percentage substrate consumption used in CBI, perhaps
because only the surface of the soil can be seen.
Nevertheless, our quantitative estimates of surface fuel
consumption were strongly correlated with total and
understory CBI, suggesting that consideration of all
strata in the CBI provides an improved ability to
estimate consumption in poorly observed layers.
Canopy CBI scores significantly predicted percentage
biomass consumption of canopy fine fuels, although
these relationships were weaker than for organic soil
consumption. Differences in predictive power are
unlikely to be related to differences in the observed
ranges of canopy vs. soil consumption, as the range of
canopy fuel combustion (29–98%) was similar to that of
organic soil consumption (34–96%). However, the
percentage tree mortality of most of our sampled stands
was very high (only two stands had ,90% stem
mortality). Canopy CBI scores are derived from
estimates of percentage stem mortality, char height,
and proportions of green, scorched, and charred canopy
(Key and Benson 2005). Consequently, this visual index
is likely to be relatively insensitive to variations in
canopy fuel consumption once much of the tree canopy
has been charred.
Rapid, repeatable, and quantitative methods of
estimating severity and emissions are crucial for
understanding the impacts of fire on the structure and
function of the boreal landscape. Because of the large
scale of our sampling effort, our calibration of the ARH
method should be directly applicable to estimating burn
severity and emissions in interior Alaska and possibly to
other ecosystems where trees initiate adventitious roots
into organic soils. Managers in Alaska could use their
own field measurements of adventitious roots with our
depth calibrations and estimates of bulk density and
element concentration to calculate burn severity and
emissions (Table 3). Alternatively, these data can also be
used to calibrate CBI measurements to actual combus-
tion, depending on the needs of the assessment.
ACKNOWLEDGMENTS
We thank Teresa Nettleton Hollingsworth, Terry Chapin,Laura Gutierrez, Emily Tissier, and Adrian Frisbee forassistance with fieldwork, and Grace Crummer for assistancewith laboratory work. Funding for this project was provided bythe Joint Fire Science Program grant 05-1-2-06 to J. F.Johnstone, NSF grant 0445458 to M. C. Mack, and theBonanza Creek LTER (DEB-0423442). L. A. Boby was
September 2010 1645FIRE SEVERITY IN BOREAL FOREST

supported by a fellowship from the School for NaturalResources and the Environment at the University of Florida.
LITERATURE CITED
Ahrens, R. J., J. G. Bockheim, and C. Ping. 2004. The Gelisolorder in soil taxonomy. Pages 2–10 in J. Kimble, editor.Cryosols: permafrost-affected soils. Springer-Verlag, NewYork, New York, USA.
Amiro, B. D., B. J. Stocks, M. E. Alexander, M. D. Flannigan,and B. M. Wotton. 2001. Fire, climate change, carbon andfuel management in the Canadian boreal forest. InternationalJournal of Wildland Fire 10:405–413.
Arseneault, D. 2001. Impact of fire behavior on postfire forestdevelopment in a homogeneous boreal landscape. CanadianJournal of Forest Research 31:1367–1374.
Benscoter, B. W., and R. K. Wieder. 2003. Variability inorganic matter lost by combustion in a boreal bog during the2001 Chisholm fire. Canadian Journal of Forest Research 33:2509–2513.
Bergner, B., J. Johnstone, and K. K. Treseder. 2004.Experimental warming and burn severity alter soil CO2 fluxand soil functional groups in a recently burned boreal forest.Global Change Biology 10:1996–2004.
Billington, M. M., and V. Alexander. 1983. Site-to-sitevariations in nitrogenase activity in a subarctic black spruceforest. Canadian Journal of Forest Research 13:782–788.
Canada Soil Survey Committee. 1978. The Canadian system ofsoil classification. Subcommittee on Soil Classification.Canada Department of Agriculture Publication 1646. Supplyand Services Canada, Ottawa, Ontario, Canada.
Chapin, F. S., et al. 2008. Increasing wildfire in Alaska’s borealforest: pathways to potential solutions of a wicked problem.BioScience 58:531–540.
Charron, I., and D. F. Greene. 2002. Post-wildfire seedbeds andtree establishment in the southern mixedwood boreal forest.Canadian Journal of Forest Research 32:1607–1615.
de Groot, W. J., R. Landry, W. A. Kurz, K. R. Anderson, P.Englefield, R. H. Fraser, R. J. Hall, E. Banfield, D. A.Raymond, V. Decker, T. J. Lynham, and J. M. Pritchard.2007. Estimating direct carbon emissions from Canadianwildland fires. International Journal of Wildland Fire 16:593–606.
de Groot, W. J., and R. Wein. 2004. Effects of fire severity andseason of burn on Betula glandulosa growth dynamics.International Journal of Wildland Fire 13:287–295.
DeLuca, T. H., O. Zackrisson, M. C. Nilsson, and A. Sellstedt.2002. Quantifying nitrogen-fixation in feather moss carpetsof boreal forests. Nature 419:917–920.
Dixon, R. K., S. Brown, R. A. Houghton, A. M. Solomon,M. C. Trexler, and J. Wisniewski. 1994. Carbon pools andflux of global forest ecosystems. Science 263:185–190.
Duffy, P. A., J. Epting, J. M. Graham, T. S. Rupp, and A. D.McGuire. 2007. Analysis of Alaskan burn severity patternsusing remotely sensed data. International Journal of Wild-land Fire 16:277–284.
Flannigan, M. D., B. J. Stocks, and B. M. Wotton. 2000.Climate change and forest fires. Science of the TotalEnvironment 262:221–229.
Gorham, E. 1991. Northern peatlands: role in the carbon cycleand probable responses to climatic warming. EcologicalApplications 1:182–195.
Gower, S. T., A. Hunter, J. Campbell, J. Vogel, H. Veldhuis, J.Harden, S. Trumbore, J. M. Norman, and C. J. Kucharik.2000. Nutrient dynamics of the southern and northernBOREAS boreal forests. Ecoscience 7:481–490.
Greene, D. F., S. E. Macdonald, S. Haeussler, S. Domenicano,J. Noel, K. Jayen, I. Charron, S. Gauthier, S. Hunt, E. T.Gielau, Y. Bergeron, and L. Swift. 2007. The reduction oforganic-layer depth by wildfire in the North American borealforest and its effect on tree recruitment by seed. CanadianJournal of Forest Research 37:1012–1023.
Greene, D. F., J. Noel, Y. Bergeron, M. Rousseau, and S.Gauthier. 2004. Recruitment of Picea mariana, Pinus bank-siana, and Populus tremuloides across a burn severity gradientfollowing wildfire in the southern boreal forest of Quebec.Canadian Journal of Forest Research 34:1845–1857.
Gutsell, S. L., and E. A. Johnson. 1996. How fire scars areformed: coupling a disturbance process to its ecologicaleffect. Canadian Journal of Forest Research 26:166–174.
Harden, J. W., S. E. Trumbore, B. J. Stocks, A. Hirsch, S. T.Gower, K. P. O’Neill, and E. S. Kasischke. 2000. The role offire in the boreal carbon budget. Global Change Biology 6:174–184.
Hely, C., M. Flannigan, Y. Bergeron, and D. McRae. 2001.Role of vegetation and weather on fire behavior in theCanadian mixedwood boreal forest using two fire behaviorprediction systems. Canadian Journal of Forest Research 31:430–441.
Hinzman, L., L. A. Viereck, P. Adams, V. E. Romanovsky, andK. Yoshikawa. 2005. Climatic and permafrost dynamics inthe Alaskan boreal forest. Pages 39–61 in M. Oswood andF. S. Chapin, III, editors. Alaska’s changing boreal forest.Oxford University Press, New York, New York, USA.
Hobbie, S. E., J. P. Schimel, S. E. Trumbore, and J. R.Randerson. 2000. Controls over carbon storage and turnoverin high-latitude soils. Global Change Biology 6:196–210.
Hollingsworth, T. N., E. A. G. Schuur, F. S. Chapin, and M. D.Walker. 2008. Plant community composition as a predictorof regional soil carbon storage in Alaskan boreal blackspruce ecosystems. Ecosystems 11:629–642.
Hollingsworth, T. N., M. D. Walker, F. S. Chapin, and A. L.Parsons. 2006. Scale-dependent environmental controls overspecies composition in Alaskan black spruce communities.Canadian Journal of Forest Research 36:1781–1796.
Jobbagy, E. G., and R. B. Jackson. 2000. The verticaldistribution of soil organic carbon and its relation to climateand vegetation. Ecological Applications 10:423–436.
Johnson, E. A. 1992. Fire and vegetation dynamics: studiesfrom the North American boreal forest. Cambridge Univer-sity Press, Cambridge, UK.
Johnstone, J., and F. Chapin. 2006. Effects of soil burn severityon post-fire tree recruitment in boreal forest. Ecosystems 9:14–31.
Johnstone, J. F., F. S. Chapin, J. Foote, S. Kemmett, K. Price,and L. Viereck. 2004. Decadal observations of tree regener-ation following fire in boreal forests. Canadian Journal ofForest Research 34:267–273.
Johnstone, J. F., T. N. Hollingsworth, F. S. Chapin, III, andM. C. Mack. 2010. Changes in fire regime break the legacylock on successional trajectories in Alaskan boreal forest.Global Change Biology 16:1281–1295.
Johnstone, J. F., and E. S. Kasischke. 2005. Stand-level effectsof soil burn severity on postfire regeneration in a recentlyburned black spruce forest. Canadian Journal of ForestResearch 35:2151–2163.
Jones, J. B., K. C. Petrone, J. C. Finlay, L. D. Hinzman, andW. R. Bolton. 2005. Nitrogen loss from watersheds ofinterior Alaska underlain with discontinuous permafrost.Geophysical Research Letters 32:L02401.
Kasischke, E. S., N. L. Christensen, and B. J. Stocks. 1995.Fire, global warming, and the carbon balance of borealforests. Ecological Applications 5:437–451.
Kasischke, E. S., N. H. F. French, K. P. O’Neill, D. D. Richter,L. L. Bourgeau-Chavez, and P. A. Harrell. 2000. Influence offire on long-term patterns of forest succession in Alaskanboreal forests. Pages 214–238 in E. S. Kasischke and B. J.Stocks, editors. Fire, climate change and carbon cycling inthe boreal forest. Springer-Verlag, New York, New York,USA.
Kasischke, E. S., and J. F. Johnstone. 2005. Variation inpostfire organic layer thickness in a black spruce forestcomplex in interior Alaska and its effects on soil temperature
LESLIE A. BOBY ET AL.1646 Ecological ApplicationsVol. 20, No. 6

and moisture. Canadian Journal of Forest Research 35:2164–2177.
Kasischke, E. S., M. R. Turetsky, R. D. Ottmar, N. H. F.French, E. E. Hoy, and E. S. Kane. 2008. Evaluation of thecomposite burn index for assessing fire severity in Alaskanblack spruce forests. International Journal of Wildland Fire17:515–526.
Keeley, J. E., C. J. Fotheringham, and M. Baer-Keeley. 2005.Determinants of postfire recovery and succession in mediter-ranean-climate shrublands of California. Ecological Appli-cations 15:1515–1534.
Key, C. H., and N. C. Benson. 2005. Landscape assessment:ground measure of severity, the composite burn index; andremote sensing of severity, the normalized burn ratio. Pages25–36 in D. C. Lutes, R. E. Keane, J. F. Caratti, C. H. Key,N. C. Benson, S. Sutherland, and L. J. Gangi, editors.FIREMON: fire effects monitoring and inventory system.USDA Forest Service, Rocky Mountain Monitoring andInventory System, Ogden, Utah, USA.
Krause, C., and H. Morin. 2005. Adventive-root developmentin mature black spruce and balsam fir in the boreal forests ofQuebec, Canada. Canadian Journal of Forest Research 35:2642–2654.
Lebarron, R. K. 1945. Adjustment of black spruce root systemsto increasing depth of peat. Ecology 26:309–311.
Lecomte, N., M. Simard, and Y. Bergeron. 2006. Effects of fireseverity and initial tree composition on stand structuraldevelopment in the coniferous boreal forest of northwesternQuebec, Canada. Ecoscience 13:152–163.
Lentile, L. B., Z. A. Holden, A. M. S. Smith, M. J. Falkowski,A. T. Hudak, P. Morgan, S. A. Lewis, P. E. Gessler, andN. C. Benson. 2006. Remote sensing techniques to assessactive fire characteristics and post-fire effects. InternationalJournal of Wildland Fire 15:319–345.
Mack, M. C., K. K. Treseder, K. L. Manies, J. W. Harden,E. A. G. Schuur, J. G. Vogel, J. T. Randerson, and F. S.Chapin. 2008. Recovery of aboveground plant biomass andproductivity after fire in mesic and dry black spruce forests ofinterior Alaska. Ecosystems 11:209–225.
Miyanishi, K., and E. A. Johnson. 2002. Process and patternsof duff consumption in the mixedwood boreal forest.Canadian Journal of Forest Research 32:1285–1295.
Paolillo, D. J., and R. W. Zobel. 2002. The formation ofadventitious roots on root axes is a widespread occurrence infield-grown dicotyledonous plants. American Journal ofBotany 89:1361–1372.
Payette, S. 1992. Fire as a controlling process in the NorthAmerican boreal forest. Pages 144–165 in H. H. Shugart, R.Leemans, and G. B. Bonan, editors. A systems analysis of theglobal boreal forest. Cambridge University Press, Cam-bridge, UK.
Peters, V. S., S. E. Macdonald, and M. R. T. Dale. 2005. Theinteraction between masting and fire is key to white spruceregeneration. Ecology 86:1744–1750.
Rein, G., N. Cleaver, C. Ashton, P. Pironi, and J. L. Torero.2008. The severity of smouldering peat fires and damage tothe forest soil. Catena 74:304–309.
Robichaud, P. R. 2000. Fire effects on infiltration rates afterprescribed fire in Northern Rocky Mountain forests, USA.Journal of Hydrology 231:220–229.
Rowe, J. S. 1983. Concepts of fire effects on plant individualsand species. Pages 135–154 in R. W. Wein and D. A.MacLean, editors. The role of fire in northern circumpolarecosystems. Wiley, Chichester, UK.
Todd, S., and H. Jewkes. 2006. Fire in Alaska: a history oforganized fire suppression and management in the lastfrontier. University of Alaska, Fairbanks, Alaska, USA.
Turetsky, M. R., and R. K. Wieder. 2001. A direct approach toquantifying organic matter lost as a result of peatlandwildfire. Canadian Journal of Forest Research 31:363–366.
Turetsky, M. R., R. K. Wieder, and D. H. Vitt. 2002. Borealpeatland C fluxes under varying permafrost regimes. SoilBiology and Biochemistry 34:907–912.
Turner, M. G., W. H. Romme, R. H. Gardner, and W. W.Hargrove. 1997. Effects of fire size and pattern on earlysuccession in Yellowstone National Park. Ecological Mono-graphs 67:411–433.
Wang, G. G. 2002. Fire severity in relation to canopycomposition within burned boreal mixedwood stands. ForestEcology and Management 163:85–92.
Yarie, J., and S. Billings. 2002. Carbon balance of the taigaforest within Alaska: present and future. Canadian Journalof Forest Research 32:757–767.
APPENDIX
Allometric equations for predicting canopy biomass from the diameter of interior Alaska Picea mariana trees in three size classes(Ecological Archives A020-060-A1).
SUPPLEMENT
Ecosystem characteristics of 38 Picea mariana stands in interior Alaska that burned in 2004 (Ecological Archives A020-060-S1).
September 2010 1647FIRE SEVERITY IN BOREAL FOREST