Embed Size (px)
Citation preview

Quantifying Archaeological ResearchAuthor(s): G. A. ClarkSource: Advances in Archaeological Method and Theory, Vol. 5 (1982), pp. 217-273Published by: SpringerStable URL: http://www.jstor.org/stable/20210057 .Accessed: 17/06/2011 18:03
Your use of the JSTOR archive indicates your acceptance of JSTOR's Terms and Conditions of Use, available at .http://www.jstor.org/page/info/about/policies/terms.jsp. JSTOR's Terms and Conditions of Use provides, in part, that unlessyou have obtained prior permission, you may not download an entire issue of a journal or multiple copies of articles, and youmay use content in the JSTOR archive only for your personal, non-commercial use.
Please contact the publisher regarding any further use of this work. Publisher contact information may be obtained at .http://www.jstor.org/action/showPublisher?publisherCode=springer. .
Each copy of any part of a JSTOR transmission must contain the same copyright notice that appears on the screen or printedpage of such transmission.
JSTOR is a not-for-profit service that helps scholars, researchers, and students discover, use, and build upon a wide range ofcontent in a trusted digital archive. We use information technology and tools to increase productivity and facilitate new formsof scholarship. For more information about JSTOR, please contact [email protected].
Springer is collaborating with JSTOR to digitize, preserve and extend access to Advances in ArchaeologicalMethod and Theory.
http://www.jstor.org
Quantifying Archaeological Research
G. A. CLARK
INTRODUCTION
This chapter concerns quantification in archaeological research; it consists of four parts. First, quantitative methods are examined from a historical perspective to outline the roles that statistics have played in past research and
to shed some light on the nature of the relationship between theories,
methods, and archaeological research designs. It seems to me that, for any given period of time, there are recurrent features that allow for a description
of the research process in the discipline. These features often have a historical
derivation and are influenced by developments in fields tangential to archae
ology. They do not seem to be very different in archaeological research from
procedures characteristic of research in other, more traditionally "scientific" fields.
Next, the major features of a proposed general design for confirmatory
data analysis (CDA) in archaeological research are outlined. I think that such
a research design should be founded on the principles of inferential statistics,
and should specify
1. how propositions of broad anthropological interest are transformed into hypotheses that are meaningful in behavioral terms;
2. how behavioral hypotheses are converted into propositions that have empirical referents and that are amenable to statistical analysis using
actual data sets;
217
ADVANCES IN ARCHAEOLOGICAL METHOD AND THEORY, VOL. 5 Copyright ? 1982 by Academic Press, Inc.
All rights of reproduction in any form reserved. ISBN 0-12-003105-1
218 G. A. CLARK
3. how those data sets are to be acquired and manipulated in a standard
confirmatory mode; 4. what criteria are to be employed in making decisions about statistical
hypotheses; and 5. how behavioral implications are to be extracted from decisions based on
statistical conclusions.
The emphasis on hypothesis testing in the archaeology of the 1970s has overshadowed the development of alternative approaches to quantification in
social science research, including that of exploratory data analysis (EDA) (Hartwig and Dearing 1979; Leinhardt and Wasserman 1979; McNeil 1977;
Tukey 1977). The tenets of EDA are outlined in the section on alternatives to
hypothesis testing. The utility of the approach is contrasted with the confir
matory model that underlies the classic Neyman-Pearson statistics discussed in the section on statistical hypotheses. The basis of the EDA perspective is formalized pattern searching using a variety of different techniques to assess the same body of data. Although testing is not a formal part of the approach,
EDA techniques are not incompatible with a confirmatory mode of analysis. Instead, EDA techniques are regarded as useful procedures that are simple to
do, that amplify understanding of data patterns, and that can be incor
porated, under some conditions, in generalized procedures for the evaluation of research propositions.
In the final section, a concern with quantification in general and with the
adoption of statistical modes of analysis is documented through the inspec tion of survey data (Schiffer 1977, 1978). Some suggestions are offered about how university curricula might be restructured at both the undergraduate and graduate levels in order to bring archaeological research designs more in line with those of other social sciences that have enjoyed a more long-standing commitment to quantified research.
QUANTIFICATION IN ANTHROPOLOGICAL RESEARCH
Some archaeologists have suggested recently that what separates contem
porary archaeology from its predecessors is not the paradigm shift so often proclaimed in the literature, but rather an enormous proliferation of new methodology (Meltzer 1979; Zubrow 1972). If this is true, archaeologists might have more in common with respect to methodological concerns than with respect to any overarching archaeological theory of human behavior. In fact, there do appear to be broad commonalities about the proper conduct of archaeological research, and substantial agreement about methodological issues even in the absence of a clearly defined, unifying body of archaeological theory. This section examines the proposition that this methodological
QUANTIFYING ARCHAEOLOGICAL RESEARCH 219
change has been primarily quantitative in nature. It outlines and discusses historical antecedents to quantified approaches in both anthropology and ar chaeology, and attempts to characterize the present status of quantification in archaeology.
The reader might wonder about the justification for quantification, for taking a statistical approach to the analysis of anthropological data, espe
cially in view of the fact that some of the natural sciences have developed for
centuries without employing statistical procedures to any significant degree. Blalock (1972:6) has noted that, in contrast with physics and chemistry, the social sciences are generally observational rather than experimental disciplines, and that the carefully controlled laboratory conditions characteristic of the natural sciences are usually absent in social science research. He regards "statistics [as] a poor man's substitute for contrived laboratory experiments in which all important relevant variables have been controlled" (Blalock 1972:6). But the need for generalization in all scientific research, whether observational or experimental is apparent, so that in fact a
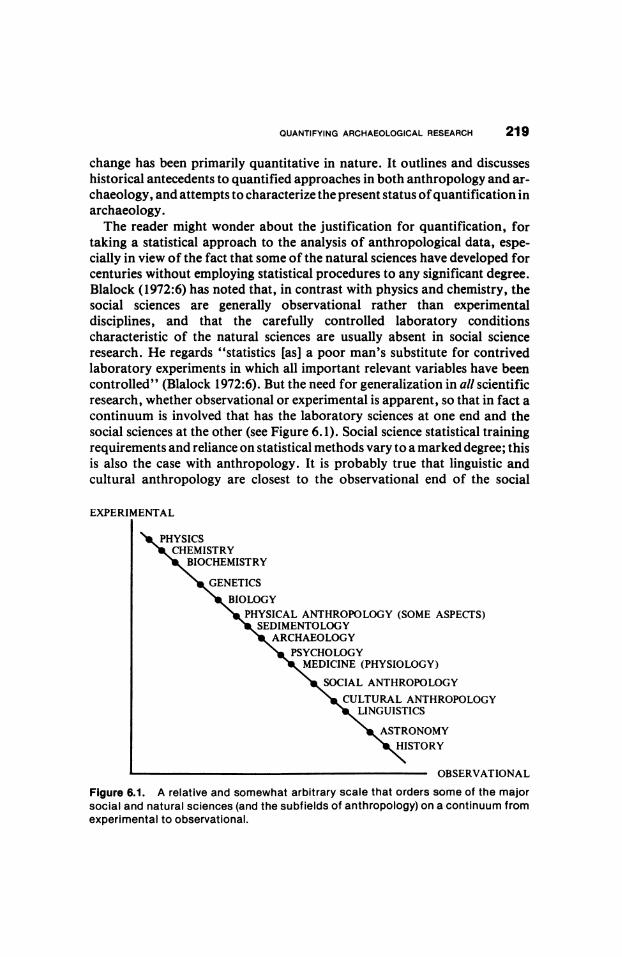
continuum is involved that has the laboratory sciences at one end and the
social sciences at the other (see Figure 6. 1). Social science statistical training
requirements and reliance on statistical methods vary to a marked degree; this is also the case with anthropology. It is probably true that linguistic and
cultural anthropology are closest to the observational end of the social
EXPERIMENTAL
PHYSICS CHEMISTRY
BIOCHEMISTRY
GENETICS
BIOLOGY PHYSICAL ANTHROPOLOGY (SOME ASPECTS)
SEDIMENTOLOGY ARCHAEOLOGY
PSYCHOLOGY MEDICINE (PHYSIOLOGY)
SOCIAL ANTHROPOLOGY
CULTURAL ANTHROPOLOGY LINGUISTICS
ASTRONOMY HISTORY
OBSERVATIONAL
Figure 6.1. A relative and somewhat arbitrary scale that orders some of the major
social and natural sciences (and the subfields of anthropology) on a continuum from experimental to observational.
220 G. A. CLARK
sciences part of the spectrum, but that physical anthropology (perhaps, in
some aspects, the most experimental of the anthropological subfields) is closer to the other extreme. Archaeology falls somewhere in between (Figure 6.1). These observations are borne out to a considerable extent by the
literature searches discussed in the following.
FUNCTIONS OF STATISTICS
Statistics has two general functions. The first is simple description-the
summarizing or reduction of information in such a way that certain facts that
data patterns suggest become readily apparent. Descriptive statistics may
consist of nothing more complex than percentage graphs, frequency polygons, or histograms. More commonly, however, researchers desire to compress information further through the use of measures of central ten
dency (mean, median, mode), dispersion (standard deviation, variance) and association (correlation coefficients). Even the computation of these well known summaries entails consideration of the problem of loss of informa
tion, and the scaling constraints that limit the appropriateness of all of them
(Siegel 1956). Descriptive statistics are especially useful in situations where the effects of multiple variables are considered simultaneously, as is shown by the development of complex forms of multivariate analysis. It should be kept in mind that many multivariate procedures are little more than sophisticated pattern-search techniques most frequently used to suggest relationships among suites of variables. In a confirmatory mode of analysis, such relation
ships are typically subjected to the more rigorous kinds of evaluation implied by hypothesis testing.
The second function of statistics is induction-inferring properties of a population on the basis of known sample results or formulating general laws on the basis of repeated observations (Blalock 1972:4, 5). Inductive or in
ferential statistics is based on probability theory-the mathematical aspect of
the discipline concerned with predicting outcomes of data generated from a given mathematical model. Inferential statistics is the branch of the discipline
most crucial to those multifaceted aspects of archaeological research con cerned with sampling strategies and designs, although some degree of generalization on the basis of limited sample information is required of most modern archaeological research, whatever form it might take. Practical reasons for making generalizations about populations from samples include time-cost factors (i.e., it may not be practical, given available resources, to
describe some aspect(s) of a population), the inherent inaccessibility of a target population, or situations when the target population is theoretically infinite.
The extent to which statistical methods are employed in the social sciences is
QUANTIFYING ARCHAEOLOGICAL RESEARCH 221
variable. Most psychology, sociology, and economics courses cannot be undertaken without at least some statistical preparation. This has not been the case with archaeology in the past, although it is becoming increasingly true to day. Most people (including archaeologists) are somewhat leery of statistics, and resort to two rather extreme positions in attempting to cope with them. The first reaction is one of uncritical acceptance. To some, statistics possess a magical quality; data subjected to statistical analysis become "sacred," in Durkheim's sense of being beyond question. The other extreme is unilateral suspicion of statistical reasoning and statistical "facts." There are good reasons for this skeptical attitude, and there is little question that govern
ments and other large corporate bodies have done much to foster it. Both ex tremes are unsatisfactory from the standpoint of the practicing professional, however, and there are really only two alternatives to them.
One is to rely exclusively on authority to resolve statistical questions (i.e., hire a consultant to develop the statistical aspects of the research design). However, qualified statisticians are not always available and are usually ex pensive, especially if hired on a short-term basis at an hourly rate. A far more serious drawback is that a properly executed statistical analysis can rarely if ever compensate for a piece of research that is poorly conceived initially. It is unrealistic to expect statisticians, however competent, to be more than the technicians they claim to be. The responsibility for the overall research design
must rest with the social scientist. From this perspective, statistics is simply a tool but, as will be shown, an extremely useful one.
The second alternative, and one that is finding increased favor among ar
chaeologists, is to try to learn enough about statistical reasoning and pro cedural frameworks to be able to use and to evaluate uses of statistics in one's area of interest. Most contemporary archaeological research projects are con cerned with quantification because of the need for generalization and because of the rigorous descriptive capabilities of quantified analysis. Perhaps more than anything else, these departures from traditional methodological formats for data analysis constitute an advance over what has been done previously.
Moreover, adoption of a statistical perspective carries with it a capacity to
alter and expand our perceptions of the complexity of archaeological data.
Thus, statistics becomes a much more flexible instrument for exploratory analysis than is commonly appreciated.
STATISTICS IN ANTHROPOLOGY AND ARCHAEOLOGY: A HISTORICAL PERSPECTIVE
Statistics has had a long-standing, although very partial, usage in anthro
pological research. Simple descriptive quantification goes back very nearly to
the inception of the discipline and is evident in virtually all of its subfields.
222 G. A. CLARK
However long overdue quantification might have been in archaeology, it is significant that, according to a recent survey, it has now become an important
element of many, perhaps even most, archaeological research designs (Schif fer 1977, 1978). The general acceptance of a quantitative perspective is a
phenomenon of the past 5 years, however, and one that remains to be in
tegrated with any new paradigm for archaeological research that might
emerge in the future. A brief historical consideration of statistical applica
tions in anthropology is warranted here to provide a clearer idea of the kinds
of quantification that have been used in the traditionally defined anthropo logical subfields (for a more extensive evaluation, see Clark 1981).
Anthropology
The most comprehensive survey of the general anthropological literature was accomplished by Thomas (1976:2-5), who examined the four major American anthropological journals for data relevant to the proportion of ar
ticles in the total run of each journal that was concerned with statistical in
ference. His survey covered the period from 1900 to 1970, and used American Anthropologist to monitor statistical inference in social and cultural anthro pology, and in the field as a whole; American Journal ofPhysicalAnthropol
ogy (AJPA) to assess inference in physical anthropology; American An tiquity for prehistoric archaeology; and Language for anthropological linguistics. His findings indicate a clear trend toward increasing quantifica tion in all subfields except anthropological linguistics, with physical anthro pologists clearly the vanguard users of inferential techniques (Thomas 1976:3). The post-World War II era is marked by a rather dramatic departure
from the first half of the century in that the use of statistical inference begins
in earnest in social-cultural anthropology and in prehistoric archaeology. This is part of a general proliferation of quantified research that can be di
rectly attributed to the stimulus provided by World War II. In anthropology, it reflects the realization that anthropological questions and data are not in
trinsically different from other behavioral science data. While it might seem unnecessary to make a point of the fundamental similarity of all observa
tional (as opposed to purely experimental) science data, there are scholars (ar
chaeologists among them) who seem reluctant to accept this basic congruity. Archaeological data differ from other social science data only insofar as con
clusions that are meaningful in behavioral terms must be teased from the
broken and discarded residual products of human activity rather than arrived
at more directly through the observation and interrogation of living infor mants.
Thomas also assesses the relative importance of different degrees of an thropological quantification by examining a single volume (1972) in each of
QUANTIFYING ARCHAEOLOGICAL RESEARCH 223
the four major subfield journals (1976:3, 4). For each, he determined the pro portion of papers that were strictly qualitative, those that contained simple quantification (graphs, tables, etc.), those that relied on or used basic statistics (measures of central tendency, dispersion, basic probability theory, and the common probability distributions for discrete and continuous variables), and those which included advanced statistical methods (multivari ate analysis). Again quantification was shown to be most advanced in physical anthropology; 86% of the papers published in AJPA were quantified at least to the extent that basic descriptive statistics were used. Archaeology in 1972 was still dominated by qualitative papers (58%), but a trend toward quantification was clearly evident from the results of Thomas' longitudinal study. What is perhaps somewhat surprising is the relatively low incidence (31 070) of quantitative papers in the 1972 run of American Anthropologist,
which Thomas regarded as a bellwether for the discipline as a whole. Given the increasing importance of demographic and simulation studies in social an thropology, one would have expected a larger proportion of quantitative papers-especially in view of the early and quite sophisticated pleas for quan tification from Kroeber (1940, 1942) and more recent arguments for statistical approaches to the analysis of ethnographic data (White 1973). Anthropologi cal linguistics continues to be an essentially qualitative discipline.
Archaeology
In order to monitor archaeological quantification, a survey was conducted by the author in which practically the entire run of American Antiquity was examined. The content of all "Articles," "Facts and Comments," and "Reports" was analyzed for the period 1935-1980. The objective was to try to assess with greater precision the kinds of quantification in which American archaeologists have engaged over the past 45 years. (American Antiquity was first published in 1935, the initial survey year.) To be included in the survey data, papers had to be characterized by at least simple quantification; purely qualitative essays, which account for about 81 0No of the total run, were ex cluded. To make the survey roughly comparable to Thomas' study, papers were scored according to whether they contained simple quantification, basic statistics, or advanced techniques (or any combination thereof), defined as in the preceding except for the last, which was expanded to include correlation coefficients (and techniques based on analysis of correlation coefficient
matrices). Papers in which the only quantification consisted of lists of radiocarbon dates were scored as qualitative after 1955 (see the following).
Memoirs dedicated to special topics were excluded. Although American Antiquity is only a single data source, it is nevertheless
a major one, and one that presumably would reflect "mainstream"

224 G. A. CLARK
developments in the field. I acknowledge that quantified approaches are also
evident to various degrees in certain aspects of the archaeology of some Euro
pean nations (e.g., France and Belgium). However, only in England and to
some extent the Netherlands have quantified approaches become well integrated features of many archaeological research designs. It is unfor
tunately the case that the work of continental scholars has had relatively little
impact on American archaeology, and to provide a more exhaustive catalogue
of quantitative applications would only make a lengthy paper even longer.
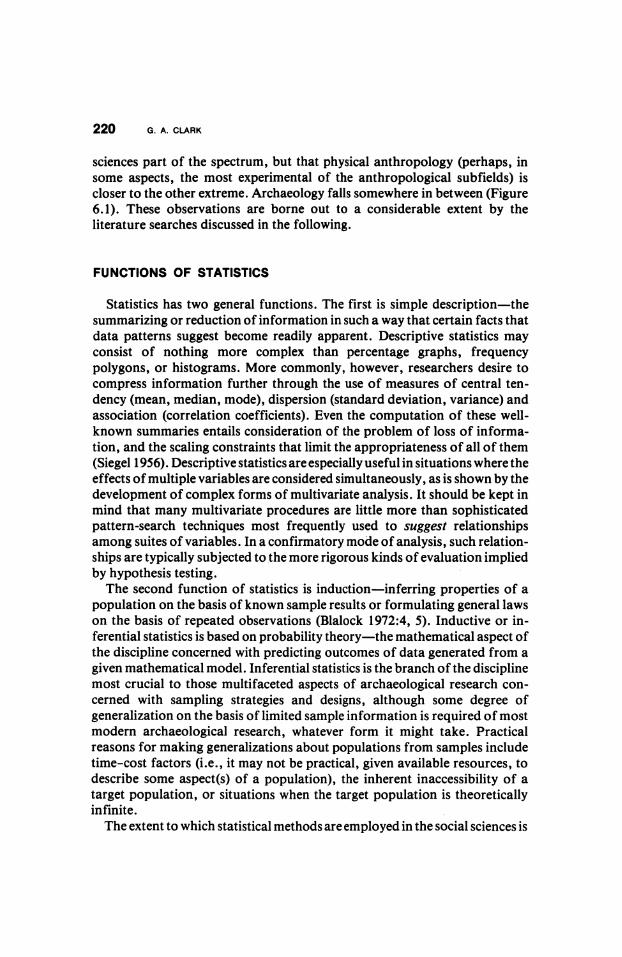
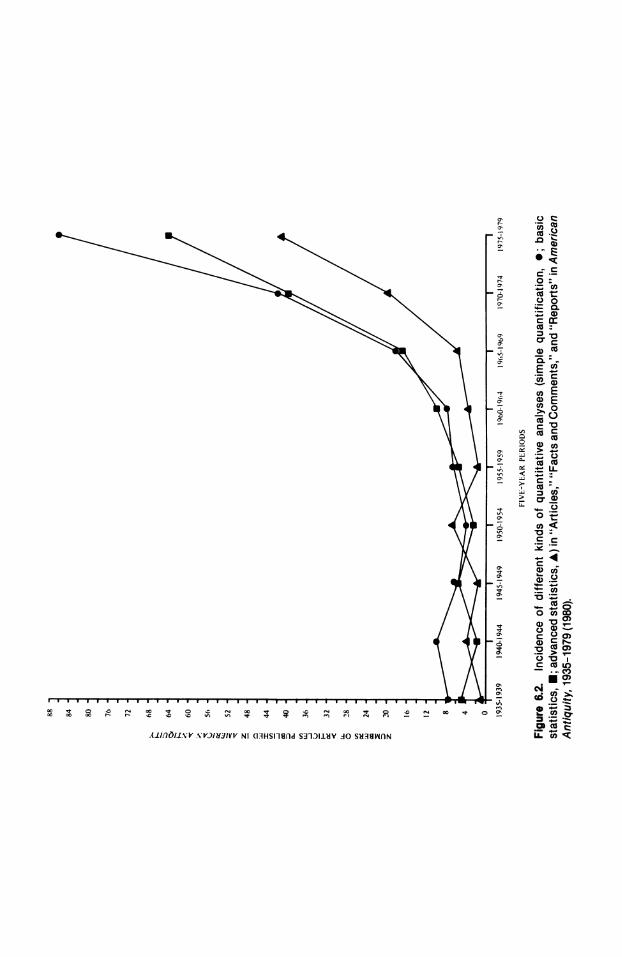
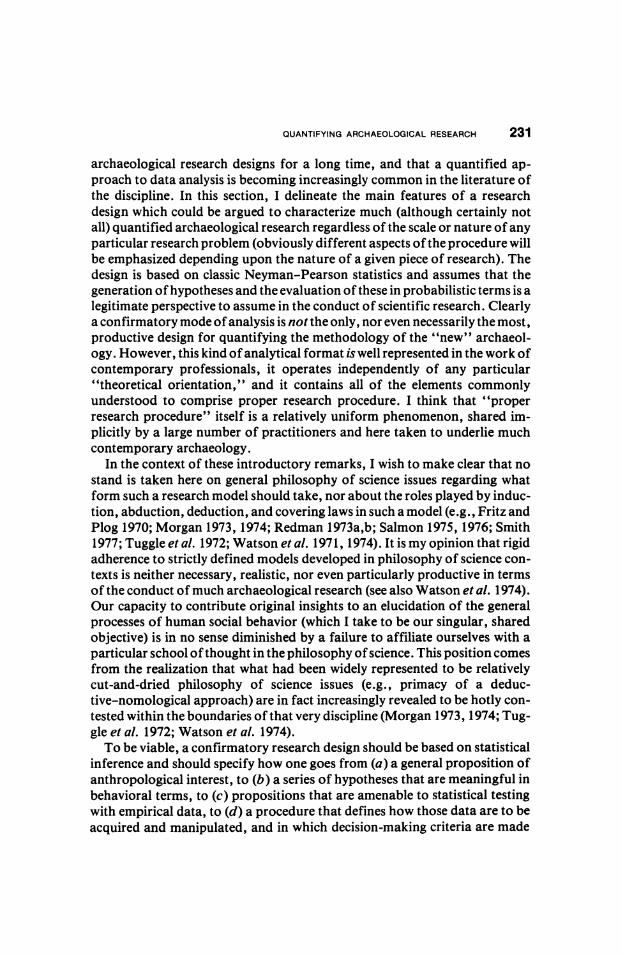
The results of the American Antiquity survey are presented in Figure 6.2.
Several features of the exercise deserve special emphasis. First, it is apparent that simple quantification (counting and measuring things, arranging counts
in lists or tables) goes back to the journal's inception, although enumeration
of this sort was very differentially exercised by American archaeologists in the 1930s and early 1940s, and then only by a small minority of practicing (or
publishing) professionals. Second and not apparent from an inspection of
Figure 6.2 is the existence from 1940 to 1950 of a series of cumbersome,
wholly qualitative papers outlining monothetic systems for describing ar tifacts using discrete (e.g., presence-absence) data categories. Third, many of the papers using basic statistics (means, standard deviations) in the 1950-1952 era do so in the context of discussions of radiocarbon dating. In fact, there
was a special issue of American Antiquity dedicated exclusively to these then novel methodological advances (Johnson 1951). Fourth, discussion generated by the well-known Ford-Spaulding debate on the nature of artifact
types (Ford 1952, 1954a,b,c; Spaulding 1953a,b, 1954a,b) combined with the initial publications by Brainerd (1951) and Robinson (1951) (Lehmer 1951;
Robinson and Brainerd 1952) describing the use of a similarity coefficient for chronological ordering, together account for most of the spate of papers deal
ing with comparatively advanced statistical topics in the 1950-1955 period. Interest in these methods appears to dwindle somewhat after 1955, at least as
measured by pertinent American Antiquity citations. Fifth, the trend toward quantification shows a sharp upswing in American archaeology after 1970. Although the number of papers published in American Antiquity has in creased gradually over the years, the figure has remained fairly stable for the
past decade at an average of 17 per issue, or about 68 per year. However, the
proportion of papers that are dedicated to quantitative topics or make use of
at least elementary quantitative methods has risen from about 12% in 1965 to
about 30% in 1975. For the past 5-year period (1975-1980), quantified papers
account for about 54% of the total run. The survey disclosed the existence of a
few comparatively sophisticated statistical papers, which appeared quite early (e.g., Kroeber 1940, 1942) but which seem to have had little discernible
impact on the field. Noteworthy are essays by Merrill (1946:35-72) on Maya
astronomy and Kroeber (1940:29-44) on statistical classification. The latter paper makes use of correlation coefficients, x2 and the probability distribu
88 84 80 76 72 68 ~64
m 60 : 56 s 52 Z 48 = 44 40
wU 36 -j U
32
U~.
o 28
AJ 24
1 0 1 2 8 4 0
1935-1939 1940-1944 1945-1949 1950-1954
1955-1959
1960-19(4 1965-1969 1970-1974 1975-1979 FIVE-YEAR PE RIODS Figure 6.2. Incidence of different kinds of quantitative analyses (simple quantification, 0; basic
statistics, *; advanced statistics, A) in "Articles," "Facts and Comments," and "Reports" in American
Antiquity, 1935-1979(1980).
226 G. A. CLARK
tion of the standard normal variable to analyze a series of contingency tables
cross-classifying artifactual trait data. Correlation is also discussed in subse quent papers by Fairbanks (1942:223-231) and Kroeber (1942:403-405).
1935-1950
In summary, most archaeological consumption of quantitative methods prior to 1950 consisted of simple enumeration of trait and artifact frequencies for the purposes of classification and/or description of assemblages. The ob jective of much of this research was chronological ordering and "cross
cultural" comparison, but although regional sequences were established in
many areas, relationships among culture-historical units remained vague and ill defined. This lack of definition was due partly to fuzzy and conflicting no tions of culture itself, and partly to a failure to recognize that culture could not be studied as a monolithic entity. Assumptions about culture, aspects of culture such as stability and change, the mechanisms of change, and, ulti
mately, the relationships that might exist between objects uncovered during excavations and concepts borrowed from anthropology were seldom scru
tinized, yet were perpetuated in the literature as if they were commonly understood by everyone (Binford 1962). Implicit in the work of this period was the idea that all or most of the data could be collected to answer all or most
of the questions regarded as "relevant" by the workers of the time. The
earliest criticisms of a lack of independent conceptual development in ar
chaeology were made during this period (e.g., Kluckhohn 1940; Steward and Setzler 1938).
Even by the end of this era, the massive quantification of science, which was an outgrowth of World War II, had not yet made much of an impact on archaeology. Although variety-minimizing, "normative" conceptions of culture were commonplace, they were most frequently expressed by nonquan tified summations of shared material culture traits-modal suites of at tributes that supposedly characterized a particular archaeological entity. A classic example is Anasazi, defined since the Pecos Conference (1927) by a
specific geographical location and time range, an agriculture-based sub sistence system, a distinctive burial configuration, certain ceramic and archi tectural types, etc. These criteria for delineating an "Anasazi Culture" are oc casionally used today (e.g., Gumerman et al. 1972), although it has recently been suggested that they result in analytical units that limit, rather than ex pand, our capacity to understand prehistoric human behavior (Cordell and Plog 1979).
1950-1955
After 1950 and up until about 1955, there was increased interest in quan tification, due to the development of radiocarbon dating techniques, and the
publication of a number of controversial papers advocating the use of
QUANTIFYING ARCHAEOLOGICAL RESEARCH 227
statistical procedures for type-discovery purposes and for seriating artifact frequencies for chronological ends. No significant increase in the use of basic statistical techniques was evident, but the first papers to make use of statistical inference were published during this period.
Willey and Sabloff (1974) characterize this period as one of increasing dissatisfaction with the limitations of the atheoretical "time-space systematics" of the preceding three decades, and point to an increased con cern with context (the associational aspects of archaeological phenomena) and function (the ways in which artifacts were made and used). Archaeologi cal remains came to be understood by an increasingly large segment of the discipline as the material remains of past human behavior, rather than as categories of objects to be studied in isolation. Settlement-pattern studies developed as a logical extension of a concern with function elevated to the level of sites (e.g., Willey 1953); primitive cultural ecological studies made their debut in the context of the first large-scale multidisciplinary research projects (e.g., Braidwood 1952, 1958; Braidwood and Howe 1960; Clark 1954).
1955-1965
The decade from 1955 to 1965 marked the first explicit recognition that complete data recovery is impossible and that particular kinds of data are re
quired to resolve particular kinds of problems. A nascent concern with sam pling was inevitable in this context, but explicit sampling designs are really a product of the 1970s. Archaeological usage of basic descriptive statistics in creased at a slow and steady rate, although they were more often than not ap plied to traditional archaeological concerns, rather than to the processual ob jectives that were being articulated in the early 1960s (e.g., Binford 1962, 1965). The goal of all archaeological research was proposed to be the "discovery of regularities that are . .. spaceless and timeless" (Willey and Phillips 1958:2). This was a significant departure from previous research orientations because it lent to archaeology the notion of a quest for lawlike generalizations, motivated by a desire to bring archaeology back into the fold of general anthropology. In the absence of a strong concern with the relation ship between methodology and objectives, however, there were problems regarding how one was to arrive at these "spaceless and timeless" regularities (Plog 1974:2). The much discussed "normative" orientation of the day had by now become a major liability. There was little appreciation of the existence of the enormous variability characteristic of the archaeological record, and still less understanding of how it might be monitored or controlled. Patterns
were assumed to be intrinsic features of data, and it was widely held that data, suitably exposed, would somehow yield up their secrets to anyone prepared to
observe them (Schwartz 1967). Thompson perhaps articulated the consensus view when, toward the beginning of this decade (1955-1965), he argued that
228 G. A. CLARK
the confidence placed in any particular archaeological reconstruction must ultimately rest on an assessment of the professional credentials of the ar
chaeologist involved (1956:331). Despite the quest for cross-culturally valid generalizations, and the edict
that "archaeology is anthropology or it is nothing" (Willey and Phillips 1958:2), archaeology was in fact drifting away from the mainstream of an
thropological thought. Research was based on analytical units which were by now so divorced from their anthropological counterparts that archaeological research no longer had any relevance for anthropologists. Willey and Phillips (1958) recognized that this was a problem, and sought to resolve it by propos ing units of study that were supposedly comparable to those of the parent
discipline. The result was a descriptive stage model (Lithic, Archaic, For mative, etc.), which expressed a chronological and developmental order, but which neither constituted an advance on the explanatory level nor was suc
cessful at reintegrating archaeological research into the broader context of an
thropology. By the early 1960s, there was apparently some agreement about what constituted archaeological goals (i.e., the generation and testing of generalizations), but increasing discord about the conceptions of culture that framed archaeological goals, the appropriateness of different analytical units for the study of variability, and the methodology to be employed in research
designs (Willey and Sabloff 1974).
1965-1970
This confused state of affairs was rectified somewhat in the 1965-1970 era
by the recognition that goals and the procedures advocated for attaining them
must be made compatible and explicit. The self-imposed constraints that had
reduced archaeology to a sterile kind of time-space systematics were lifted by Binford's 1962 contention that the entire cultural system was preserved (at least in theory) in the archaeological record. It followed from this that any
limitations to an understanding of the past were not inherent in the nature of
archaeological data (as had often been claimed), but were instead to be at
tributed to flawed research designs and methodological naivete (Binford 1968:23). The optimism generated by Binford's expansion of the realm of ar
chaeological enquiry led to a number of explicit formulations of the ground rules that supposedly underlie "correct" research procedures (e.g., Watson et al. 1971). Pursuit of a "scientific" methodology led to the viewpoints whim
sically characterized as the "law and order" (deductive-nomological) and
"serutan" (systems theory) approaches (Flannery 1973). Although these and
other models of scientific enquiry differed in many important respects, they all shared the notion that the past is empirically knowable, and that the for
mulation of lawlike generalizations is the goal of all science. Much had
changed in the decade that had elapsed since Thompson's subjective appraisal of the quality of archaeological research. By 1967i Binford could argue that
the formulation of hypotheses, the generation of test implications and their
QUANTIFYING ARCHAEOLOGICAL RESEARCH 229
subsequent evaluation in probabilistic terms were the ways that archaeologi cal research should proceed if the subjective element was to be minimized, and if independently replicable results were to be obtained (1967:10). Those replications would, presumably, constitute the basis for any generalizations that might ultimately achieve lawlike status.
Post-1970
As indicated in Figure 2, most of these changes in the archaeological metaphysic took place in the absence of a significant increase in quantitative methodology. After 1970, however, there is evidence of a proliferation of statistical methods in virtually all aspects of archaeological research. This is due (a) to the post-World War II quantification of research in general, which apparently only began to have an effect on archaeology after about 1965; and (b) the widespread availability of third-generation electronic computers in the late 1960s, which stimulated quantified approaches to data analysis in all areas and levels, and which made sophisticated multivariate procedures a viable option to many researchers for the first time.
In archaeology, consumption of inferential techniques received con siderable impetus from the explicit concern with the development of regional sampling designs that dominated much of the literature in the early-middle 1970s (Chenhall 1975; Cowgill 1964, 1970, 1975; Judge et al. 1975; Matson and Lipe 1975; Mueller 1972, 1974, 1975; Plog 1980; Read 1975). The shift to a regional perspective has also been accompanied by the adaptation of
geographical and economic models for describing and explaining distribu tions of sites and resources in space. These usually entail statistical com
parison of observed patterns with idealizations constructed on the basis of
minimization, maximization, or optimization principles applied to sets of economic variables monitored by quantified measures of interaction among human aggregates of various kinds (Bailey 1978; Blanton 1976; Cassels 1972; Clark and Lerner 1980; Clarke 1977; Crumley 1976, 1979; Euler and Gumer man 1978; Flannery 1976a, 1976b; Francis and Clark 1980; Hodder 1972a, 1972b, 1974, 1979; Hodder and Hassall 1971; Hodder and Orton 1976; Johnson 1972, 1973, 1975; Meiklejohn 1978; Mellars and Reinhardt 1978; Price 1978; Renfrew 1977; Roper 1979; Rossman 1976; Stark and Young 1981; Zarky 1976). Statistical approaches emphasizing nonparametric tech niques are also being used to identify and compare artifact distributions at the intrasite level (Clark 1979; Clark et al. 1977; Dacey 1973; Hanson and
Goodyear 1975; Hietala and Stevens 1977; Newell and Dekin 1978; Whallon 1973a,b; 1974, 1978). Use of these pattern search and comparison procedures has been facilitated by development of sophisticated software packages capable of manipulating large data matrices. The creation of computerized regional data banks (Chenhall 1971a,b, 1972; Cowgill 1967; Gaines 1978, 1981; Plog et al. 1978) should ultimately allow for increased application of
these powerful methods to a wide range of problems. As Christenson (1979)
230 G. A. CLARK
and Thomas (1978) have observed, however, they also increase the incidence of inappropriately applied methods given the trendy nature of the discipline and a relatively low level of statistical expertise among archaeologists in general.
A parallel but unrelated trend is the focus on the quantification of artifact
and attribute classification with the objective of refining and objectifying diverse sorts of classificatory schemes using the methods of numerical tax onomy (Sneath and Sokal 1973; Sokal and Rohlf 1969; Sokal and Sneath
1963). Renewed interest in the logic of classification was sparked by Dunnell (1971), who observed that all classifications are imposed constructs that func
tion to order data so that the explanation of patterns of interest becomes
possible. From this perspective, the justification for a particular classificatory scheme lies not in its ability to replicate some "native" or
"natural" scheme (the existence of which is irrelevant), but rather in its
capacity to address certain kinds of questions or to delineate certain sorts of
problems of interest to the investigator. Statistical procedures brought to bear on classification problems range from comparatively straightforward contingency-table approaches analyzed with nonparametric techniques (e.g.,
Whallon 1974), to the use of different kinds of clustering algorithms (e.g., Hodson 1970, 1971; Hodson et al. 1966; Sibson 1971), factor and principal
components analyses (e.g., Binford 1972; Binford and Binford 1966; Cowgill 1968), canonical variates (e.g., Graham 1970), regression (e.g., Binford 1962), and other powerful multivariate procedures. The rationale behind classification of different kinds of data has also been discussed at some length
(e.g., Christenson and Read 1977; Clark 1976; Read 1974a,b).
As mentioned before, the incidence of misapplication of these methods (particularly multivariate analysis) is increasing proportionately to the overall use of them in the field. Archaeologists are not statisticians, nor is it
reasonable to expect them to become statisticians. It does seem reasonable to expect them to be methodologically sophisticated enough to be able to under
stand and contribute to the corpus of ideas and substantive knowledge that
make up the discipline. If there is at present an overuse of statistical pro
cedures, it can only be hoped that a more reasonable perspective will be
established in the future as the novelty of automated archaeological analysis wears off.
TOWARD A DESIGN FOR QUANTIFYING
ARCHAEOLOGICAL RESEARCH
It would seem evident from the historical discussion just presented that what might be loosely termed "statistical reasoning"-thinking about prob lems in quantitative and/or statistical terms-has been part of at least some
QUANTIFYING ARCHAEOLOGICAL RESEARCH 231
archaeological research designs for a long time, and that a quantified ap
proach to data analysis is becoming increasingly common in the literature of
the discipline. In this section, I delineate the main features of a research
design which could be argued to characterize much (although certainly not all) quantified archaeological research regardless of the scale or nature of any
particular research problem (obviously different aspects of the procedure will be emphasized depending upon the nature of a given piece of research). The design is based on classic Neyman-Pearson statistics and assumes that the generation of hypotheses and the evaluation of these in probabilistic terms is a legitimate perspective to assume in the conduct of scientific research. Clearly a confirmatory mode of analysis is not the only, nor even necessarily the most,
productive design for quantifying the methodology of the "new" archaeol ogy. However, this kind of analytical format is well represented in the work of
contemporary professionals, it operates independently of any particular "theoretical orientation," and it contains all of the elements commonly understood to comprise proper research procedure. I think that "proper research procedure" itself is a relatively uniform phenomenon, shared im plicitly by a large number of practitioners and here taken to underlie much
contemporary archaeology. In the context of these introductory remarks, I wish to make clear that no
stand is taken here on general philosophy of science issues regarding what
form such a research model should take, nor about the roles played by induc
tion, abduction, deduction, and covering laws in such a model (e.g., Fritz and
Plog 1970; Morgan 1973, 1974; Redman 1973a,b; Salmon 1975, 1976; Smith
1977; Tuggle et al. 1972; Watson et al. 1971, 1974). It is my opinion that rigid
adherence to strictly defined models developed in philosophy of science con texts is neither necessary, realistic, nor even particularly productive in terms
of the conduct of much archaeological research (see also Watson et al. 1974).
Our capacity to contribute original insights to an elucidation of the general processes of human social behavior (which I take to be our singular, shared
objective) is in no sense diminished by a failure to affiliate ourselves with a
particular school of thought in the philosophy of science. This position comes
from the realization that what had been widely represented to be relatively
cut-and-dried philosophy of science issues (e.g., primacy of a deduc
tive-nomological approach) are in fact increasingly revealed to be hotly con
tested within the boundaries of that very discipline (Morgan 1973, 1974; Tug
gle et al. 1972; Watson et al. 1974).
To be viable, a confirmatory research design should be based on statistical
inference and should specify how one goes from (a) a general proposition of
anthropological interest, to (b) a series of hypotheses that are meaningful in
behavioral terms, to (c) propositions that are amenable to statistical testing
with empirical data, to (d) a procedure that defines how those data are to be
acquired and manipulated, and in which decision-making criteria are made
232 G. A. CLARK
explicit, and finally back to (e) a reassessment of the behavioral implications of decisions based on statistical conclusions.
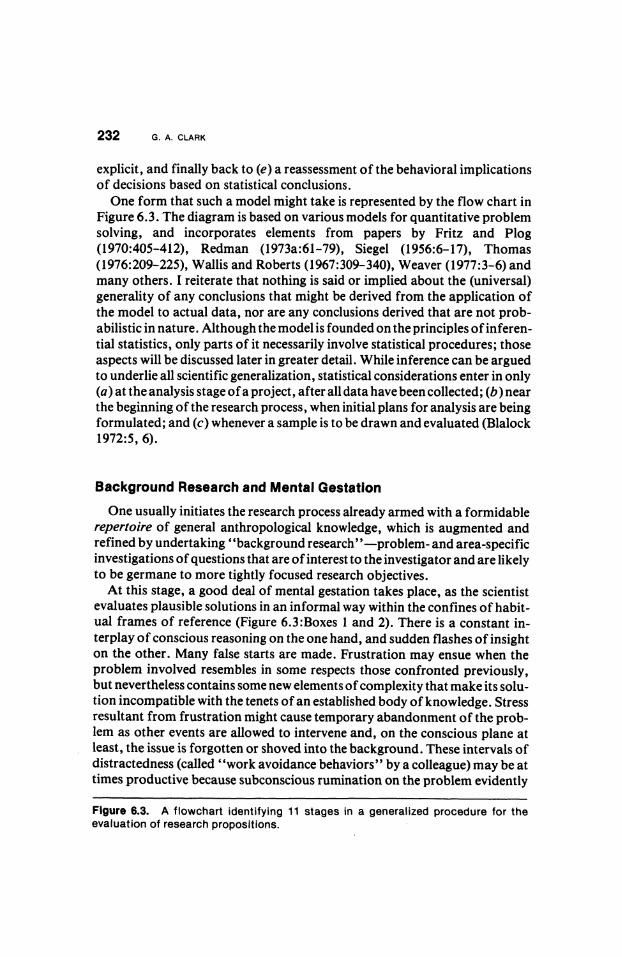
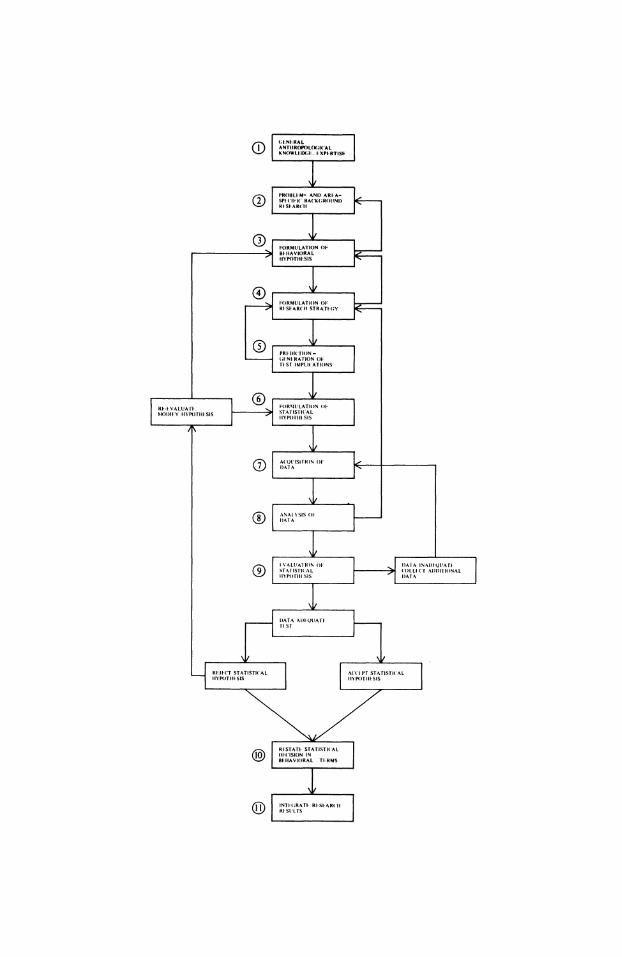
One form that such a model might take is represented by the flow chart in Figure 6.3. The diagram is based on various models for quantitative problem solving, and incorporates elements from papers by Fritz and Plog (1970:405-412), Redman (1973a:61-79), Siegel (1956:6-17), Thomas (1976:209-225), Wallis and Roberts (1967:309-340), Weaver (1977:3-6) and
many others. I reiterate that nothing is said or implied about the (universal) generality of any conclusions that might be derived from the application of the model to actual data, nor are any conclusions derived that are not prob abilistic in nature. Although the model is founded on the principles of inferen tial statistics, only parts of it necessarily involve statistical procedures; those aspects will be discussed later in greater detail. While inference can be argued to underlie all scientific generalization, statistical considerations enter in only (a) at the analysis stage of a project, after all data have been collected; (b) near the beginning of the research process, when initial plans for analysis are being formulated; and (c) whenever a sample is to be drawn and evaluated (Blalock 1972:5, 6).
Background Research and Mental Gestation
One usually initiates the research process already armed with a formidable repertoire of general anthropological knowledge, which is augmented and refined by undertaking "background research"-problem- and area-specific investigations of questions that are of interest to the investigator and are likely to be germane to more tightly focused research objectives.
At this stage, a good deal of mental gestation takes place, as the scientist evaluates plausible solutions in an informal way within the confines of habit ual frames of reference (Figure 6.3:Boxes 1 and 2). There is a constant in terplay of conscious reasoning on the one hand, and sudden flashes of insight
on the other. Many false starts are made. Frustration may ensue when the problem involved resembles in some respects those confronted previously, but nevertheless contains some new elements of complexity that make its solu tion incompatible with the tenets of an established body of knowledge. Stress resultant from frustration might cause temporary abandonment of the prob lem as other events are allowed to intervene and, on the conscious plane at least, the issue is forgotten or shoved into the background. These intervals of distractedness (called "work avoidance behaviors" by a colleague) may be at times productive because subconscious rumination on the problem evidently
Figure 6.3. A flowchart identifying 11 stages in a generalized procedure for the evaluation of research propositions.
|GEt^NERALI () ANTIIROPOLM(IC'AL _z KNOWLIX:IXiF. E-XPE RTISE
PR()HLI-M- A NI) ARI A ) SPUCI'F'I(' BAC'KG;ROUtND
Rl SlAR('ll
(g FORMtI LATIO N OF' 3 BHtAVIO)RAL L.
HYPOTIWFSIS _
|F'ORMLILATIO)N OF' > RlFSFARCHl STRATFC(Y
PR DTIO l)(ll) (;I NI RA'TlON ()F' T | S'T IMP LICTIOtNS
RF-I-.VALUA,rt.. ~ (S F'(RIt(ILATIO)N (01
A Q 'II Ol(N O}F' DJIATA_
|ANAI N'SIS ()W
I'ALUlATM 01- DAIA INADIQAr s SrA rls'ri( AL COLC ADDIIONA IlY'P()III SIS D)ATA
. DIATA A l)lQU1ATI nl sr
Rl Jl (Tr STATISTI('AL ACC('l-r STrATISTIC'AL IIYPOT}III SIS IlY'PO)TIIUSIS
Rl'STATI- STATISTI(-AL DFC )l(ISI()N IN
>_ BHIlAVIO)RAL TIERMS
IN) TI(GRrATl- RU SUAR(CII
234 G. A. CLARK
continues. During these episodes, allegiance to established paradigms may partially weaken, or in some dramatic cases, disappear altogether. A period
of more or less random trial and error ensues, which at times can result in the
discovery of hidden analogies between distinct conceptual categories. The discovery of these hidden analogies is what is commonly understood as
creativity. Although the origins of meaningful insights are obscure, they ap pear to involve the capacity to shift habitual referential formats from one
body (or "matrix") of knowledge to another in a creative way so that new and
original relationships become apparent (Koestler 1964). It is in the variable
capacity of people to shift formats of reference and to extricate themselves
from habitual patterns of thought that differences in creativity lie, with the human tendency for automatized modes of thinking being perhaps the single most significant limiting factor.
The Behavioral Hypothesis
These complicated mental gymnastics sometimes culminate in the develop ment of what I refer to as a behavioral hypothesis (Figure 6.3:Box 3). A
behavioral hypothesis can be defined as a trial formulation derived from the
complex factors just noted (i.e., background research, insight, intuition), which the investigator believes is likely to express a significant relationship between two or more variables. Such hypotheses might at this stage be vague and poorly defined, but should minimally contain as elements variables that refer to human behavior. The variables incorporated in a behavioral hypothesis must have phenomenological referents (i.e., they must be referable to or monitored by phenomena observable in the archaeological context). If they do not, there is no mechanism through which the plausibility of the hypothesis can ultimately be assessed. Behavioral hypotheses are
generated from the theoretical conceptions that characterize a discipline. Some of these have observable implications; others do not (or at least it is not immediately apparent what those implications might be). While it is acknowledged that the observability of a given phenomenon is time depen dent, in practical terms hypotheses that have no observable implications must be disallowed for the time being as untestable (although they might become testable in the future).
It is often remarked that much social science research appears to be founded on highly tentative theoretical propositions ("weak" theories) that are not directly amenable to evaluation. Consider, for example, the (anthro
pological) propositions that "patrilocal societies tend to practice female in fanticide more than [do] matrilocal societies" (Thomas 1976:206); and "stylistic microtraditions in ceramic surface decoration tend to be inherited
QUANTIFYING ARCHAEOLOGICAL RESEARCH 235
matrilineally, and thus should co-occur spatially with matrilocal post-marital resident units" (Longacre 1970). In neither case do these statements specify variables to be monitored in the event of a test (either in past or present con texts), nor do they identify sequences of analytical stages to be followed in any attempt to evaluate them. In short, they are imprecise statements that are understandable at a common sense level but that, in their present form, can not be more rigorously assessed.
Formulation of the Research Strategy
With respect to creativity, the combination of reasoning and subconscious rumination are the most crucial aspects of the research process. Novelty lies in the restructuring of familiar elements, which, taken out of familiar contexts, can sometimes be transformed into a new synthesis. However, it is theformal evaluation of the tenability of an idea, and not its conceptualization, that is embodied in common conceptions of research design. The processes involved in getting from theoretical propositions of interest to statistical hypotheses, and from statistical hypotheses to the probability statements used in making inferences are by no means obvious or direct, and may in fact be exceedingly complex (Blalock 1972:1 1). This complexity is evident from the arrows con necting Boxes 3-5 in Figure 6.3. Whereas the fuzzy concepts and notions that are the currency of daily intercourse suffice in most ordinary situations, they
must be considerably refined if they are to function in the context of a research methodology.
Theoretical and Operational Definitions
Following Bridgman (1938) and Northrop (1947), Blalock (1972:12-15) makes a distinction between theoretical definitions (Northrop's "concepts by postulation") and operational definitions (Northrop's "concepts by intui tion"), which, he suggests, are both features of any scientific evaluation. In a theoretical definition, "a concept is defined in terms of other concepts, which supposedly are already understood" (Blalock 1972:12). In anthropology, for example, the concepts "culture" and "society" are often treated as theoretical definitions in the context of a given problem even though they are
subject to debate in general terms. Theoretical definitions are arbitrary, although what constitutes the "given" terms in a problem (i.e., those con cepts that are assumed to be understood) will vary (perhaps considerably) from one investigator to the next. In the first example cited (Thomas 1976:206), the concepts "patrilocal," "matrilocal," and "society" are theoretical definitions. Within the context of a single linguistic system (and across many linguistic systems), most ordinary definitions are theoretical
236 G. A. CLARK
rather than operational; yet despite their vagueness, they function with suffi cient facility and precision to make possible everyday communication in a nearly infinite variety of experiential contexts.
Operational definitions, on the other hand, specify criteria for measure ment. Since all measurement must entail classification of some kind, "an
operational definition can be considered ... a detailed set of instructions
enabling one to classify... unambiguously" (Blalock 1972:12). An opera tional definition of "length" would specify exactly how the length of a partic ular class of objects is to be measured. An operational definition of the be
havioral concept "microtradition" would indicate how a microtradition would be detected and monitored in the archaeological context. In a given classification, operational definitions should be sufficiently precise that any investigator acting independently would achieve essentially similar results by employing them (see also Thomas 1970:32-35).
Test Implications and Prediction
Ideally, for simplicity's sake, operational and theoretical definitions should be characterized by a close correspondence (Bridgman 1938:23-27). This is seldom realistic in any discipline, however, because of conceptual am
biguity and because there is typically an absence of full consensus about what
constitutes an adequate operational definition of a given concept. It is a more
common practice to generate a number of more or less acceptable operational
definitions for a particular theoretical concept of interest; these are then
argued to monitor, measure, or index-poorly or well-that theoretically
defined concept or variable (Northrop 1947; Selltiz et al. 1959). The reader
should recognize that operational definitions are the basis for the ar
chaeologist's test implications, the imperfect reflections of theoretical vari ables that are themselves not directly measurable. The relationship between
test implications and the theoretical variables they monitor cannot be reduced
to an algorithm or formula. The adequacy of operational definitions must be
grounded in air-tight "linking" or "bridging" arguments, which clearly establish that a particular operational definition does in fact provide a
satisfactory measure of a particular theoretical concept.
Because multiple test implications can usually be generated for any
theoretical concept, results can vary according to the particular test implica
tions that are selected. It is important to keep in mind that actual tests are
made by evaluating the concepts as operationally defined. While results
should be reasonably consistent so long as the testing procedure is held con
stant and the test implications chosen are appropriate, discrepancies can in
dicate that the test implications are not measuring the same theoretical quan
tity or that the theoretical concept itself is ambiguous or even completely
wrong (see, for example, Kepler's well-known attempts to compute a circular
QUANTIFYING ARCHAEOLOGICAL RESEARCH 237
Martian orbit). In this sense, the theoretical foundations of a discipline can be
shaken or altered as a consequence of the testing procedure, subject, of course, to a consensus about what constitutes the theoretical foundation in
the first place (Kuhn 1962, 1970a,b). A research strategy, which has the function of operationalizing a test of the
behavioral hypothesis, is formulated at this juncture (Figure 6.3:Box 4). Up to this point, relationships among anthropological variables may only have been conceptualized in rather vague terms, and test implications may or may
not have been made explicit. Statistical procedures need not necessarily figure in the research process described thus far, although they may do so. Notice
that in the flowchart (Figure 6.3), prediction (Box 5) is associated with the
generation of test implications. I suggest that, in terms of the mental gym nastics that are characteristic of this phase of the research procedure, predic tion is more of a process than an event. It can, for example, occur as part of the
flash of insight that at times accompanies the crystallization of a behavioral
hypothesis. If so, it might constitute no more than a vague expectation about
what kinds of patterns would be observed in data yet to be gathered. Alter
natively, prediction might be the outcome of conscious, deliberative cerebra tion. Regardless of their form, however, and the point at which they occur in
the reasoning process, predictions are made concrete by the generation of test implications-expected patterns of variation in actual data sets-and
hypotheses are considered confirmed to the extent that predictions derived from them are borne out by later events (Wallis and Roberts 1967:7).
The Statistical Hypothesis
With the formulation of the research strategy, statistical considerations become important in the generation and evaluation of the statistical
hypothesis and in the development of the sampling design. Adoption of a
statistical perspective requires the investigator to define and measure variables in precise and explicit ways, and, in a confirmatory mode of
analysis, to specify expected relationships among them. As Read (1974a) has
observed, attempts to employ statistical models in research can assist in the
process of understanding and explaining phenomena because the investigator is compelled to scrutinize data in ways not demanded of nonquantitative ap
proaches. Behavioral hypotheses cannot be evaluated directly, so it is necessary to transform them into statistical hypotheses. Put another way, "substantive research propositions must be translated into unequivocal statements of relationship between or among variables" (Thomas 1976:209).
Whereas the term hypothesis has, in social science research, a variety of dif
ferent meanings, the notion of a statistical hypothesis can be circumscribed
more rigorously. Blalock (1972:111) defines a hypothesis as "a statement
238 G. A. CLARK
about a future event, or an event the outcome of which is unknown at the time
of prediction, set forth in such a way that it can be rejected." Ideally,
hypotheses should be conditional statements of the form: if x, then y, given (conditions) z. However, it is immediately apparent that for very many research propositions, rigidly defined conditional statements implying deter
ministic relationships are so unrealistic as to be completely inappropriate. Rather than to hold that if xis true, theny must follow, it is more reasonable to
restate the hypothesis in probabilistic terms: if x is true, then y will follow (with a probability of z). The implication of certainty is thus avoided, and we
can admit to the possibility that, some of the time, y might be false even if x is
true. The general form of a statistical hypothesis can be described as follows
(Kruger 1976):
Of all things that are M, m/n of these have property P.
a is an M.
Therefore, there is an m/n probability that a is also a P.
Here m/n is the a priori expectation based on "background research" (i.e., previous empirical work, theoretical suppositions, general knowledge of a problem domain) that a is (or has) P (Blair 1975).
A test of such a hypothesis would entail (a) prior agreement about the
operational definitions of any theoretical variables or concepts that it might contain; (b) consideration of all possible outcomes of the test in advance of
the test itself; and (c) agreement beforehand as to which outcomes would
result in acceptance and which in rejection of the hypothesis (with rejection a possible result). The first criterion of a valid test is a particularly important one insofar as an absence of consensus about operational definitions would nullify any test because it could be argued that the operational definitions actually evaluated are not really effective or accurate monitors of some
theoretical concept or variable of interest. Because sampling of some kind is explicitly or implicitly involved in archae
ological research, statistical hypotheses are generally statements about population parameters, which will be evaluated by comparing sample statistics with each other or with an estimate of some theoretical value. It is
thus assumed that some degree of statistical generalization is characteristic of all research endeavors, and this is held to be true regardless of the nature of a
particular problem and regardless of the discipline (or subdiscipline) in volved. By statistical generalization, I mean the ability to arrive at conclusions about aspects of a population on the basis of facts known about a sample drawn from that population.
Whatever form the behavioral hypotheses might take, they should be amenable to transformation into pairs of statistical hypotheses, which should be mutually exclusive, maximally contrastive and exhaustive sets (i.e., the null and alternative hypotheses). Statistical hypotheses are either directional (if a relationship is postulated in which a parameter or statistic is greater than or
less than some other parameter, statistic) or nondirectional (if a relationship
QUANTIFYING ARCHAEOLOGICAL RESEARCH 239
of equivalence does or does not hold) (Siegel 1956). Multiple alternative hypotheses may represent the only realistic approximation of the complexity of a series of postulated relationships; and, if that is the case, tests for
"goodness of fit" and criteria for choosing among competing "successful" hypotheses should be devised at this stage (Clark 1974, 1976).
The Statistical Model
It is at this juncture (Box 6) that consideration should be given to the selec
tion of an appropriate statistical model. In a standard confirmatory mode of
analysis, the statistical model comprises the set of assumptions about the data that are not likely to be the subject of much disagreement. The relationship between the common probability distributions and the level of scaling characteristic of measurement should be taken into account in the choice of a statistical model, because these factors will ultimately influence the choice of a test statistic. If, after due consideration, it is decided that a multivariate
technique is required, the (often numerous) constraints and assumptions that are entailed in its proper application should be reviewed. Many multivariate
methods are based on a multivariate normal distribution and make at least
that assumption (i.e., that the data are intrinsically continuous and are
multivariate normally distributed). Testing this assumption can be difficult, however, as variables may be marginally normal and yet are not necessarily
multivariate normal in their joint distributions (Andrews et al. 1973). It has
been claimed that when a method such as principal-components analysis is
used only in a descriptive mode, such assumptions need not hold (Benfer
1979), although there would seem to be few instances when inferences from a
sample to a population are not being made in archaeological research con
texts. Similarly, assumptions, such as the equality of covariance matrices in
discriminant analysis, generally have not been tested, and more appropriate potential alternatives, such as quadratic discriminant analysis, generally are
not available. Disregard for statistical assumptions is not restricted to multivariate
methods. Misapplications of bivariate significance tests also occur with some regularity. Violations of assumptions are more problematic here than in
multivariate applications because no appeal can be made to their use in a
purely descriptive mode. Bivariate significance tests are clearly inferential in nature, and the validity of conclusions based on them are directly dependent on the appropriateness of the underlying model. Even these techniques pro
duce conclusions that contain qualifiers of the form: "If the assumptions regarding the shape of the underlying population are valid, then we may con
clude that.... "
Given recent indictments of the tendency for archaeological misuse of com
plex multivariate procedures (Flannery 1973; Thomas 1978, 1980) and the fact that large numbers of inferential techniques exist that do not make as
numerous or stringent assumptions about parameters (i.e., about the charac
240 G. A. CLARK
teristics of the underlying populations from which the samples compared are being drawn), a strong case could be made for increased archaeological usage of nonparametric methods (Conover 1971; Hollander and Wolfe 1973; Siegel 1956). To overstate the case somewhat for comparative purposes, non parametric tests produce conclusions of the form: "Almost regardless of the shape of the underlying population, we may conclude that...." Although testing is emphasized here, it should be noted that nonparametric statistics are also useful and appropriate in point estimation, confidence interval, and
multiple comparison contexts (Hollander and Wolfe 1973). Nonparametric tests are often of the type referred to as "rank order" tests,
referring to the level of scaling necessary for valid use of many of them. This highlights another important distinction between parametric and non parametric tests-it is permissible to use the parametric techniques only on
data that are truly numerical (i.e., where at least interval scaling is present). Nonparametric techniques do not have this constraint, and some may of course be used when only nominal or classificatory scaling is present. That
many archaeological applications do utilize enumerated data (i.e., counts on
categories of attributes, artifacts, sites, etc.) is a strong argument for the
adoption of such methods. However, scaling is often not an intrinsic feature of measurement, but rather is imposed on it by the ways in which measure
ment is conceptualized. Many variables usually regarded as nominal or or
dinal are capable of being intervally scaled. For example, it is a common prac
tice to dichotomize Southwestern vegetation types into "pinyon-juniper" and "grasslands. " Yet the variable "vegetation" can in fact be scaled along a
continuum ranging from low grass density (i.e., pinyon-juniper) to high grass
density (i.e., grasslands). Variables are typically conceived as nominal or or
dinal for convenience, and a methodological trade-off is usually involved. To
conceptualize measurement as nominal or ordinal allows for use of a wider
range of statistical procedures, but sometimes at the expense of more power ful parametric alternatives. That expense might not be very great, however, since theoretical investigations indicate that many nonparametric procedures are only slightly less efficient than their normal theory counterparts given reasonably adequate data (Hollander and Wolfe 1973). Few readers would
disagree that nonparametric statistics are typically underutilized in archaeol
ogy. They remain a vast, largely untapped methodological reservoir, which is likely to prove useful in many future research applications. The fact that they are comparatively straightforward and easily understood makes them
preferable to complex multivariate parametric designs where substitution is legitimately possible. Quite useful sequences of nonparametric procedures can sometimes be constructed to evaluate hypotheses and, in a descriptive
mode, to detect the existence and measure the strength of association among
pairs of variables (e.g., Clark 1979; Clark etal. 1977; Francis and Clark 1980; Hanson and Goodyear 1975; Whallon 1974).
QUANTIFYING ARCHAEOLOGICAL RESEARCH 241
The foregoing has generally emphasized simplicity in data analysis, a plea
made by a number of other authors (e.g., Christenson 1979; Thomas 1978). It
should be stressed, however, that an extreme position should not be taken with respect to this issue, because there are relationships or data dependencies that cannot be detected in the univariate or bivariate case (Matson 1980). In
significant results, for example, may be obtained in a series of t-tests on a
given array of variables, yet significant results could be obtained on these same data using Hotelling's 72, a multivariate equivalent. Jolicoeur (1975) provides an example in which multivariate and bivariate analyses failed to discriminate between three groups, whereas a projection of the same groups into two-dimensional discriminant space allowed the distinction to be made.
Even when a multivariate statistic is used to reduce the dimensionality of a
data matrix, significant relationships may exist at higher dimensions (e.g., Gnanadesikan 1977). Andrews' (1972) reevaluation of a discriminant analysis of fossil data using high-dimensional plotting techniques is a case in point.
Mechanical Aspects
Having selected an appropriate statistical model after due consideration of the nature of the data to be collected, the mechanical aspects of making a deci
sion about the statistical hypothesis should be considered next. These are
widely known, since they are common to all statistical tests, and are published
in virtually every elementary statistics textbook (e.g., Henkel 1976; Ott 1977:70-83; Siegel 1956:6-34; Thomas 1976:205-226). They entail (a) selec tion of a level of (statistical) significance, which will define the critical region
for acceptance-rejection of the null hypothesis (Ho) in the probability distribution of the test statistic involved (Figure 6.3:Box 6); (b) acquisition of the data (Box 7); (c) analysis of the data (computation of the test statistic
Box 8); and (d) evaluation of the statistical hypothesis (Box 9). It should be
kept in mind that the decisions involved in step a should be made prior to the
actual collection of any data. In essence, they provide the researcher with an
unambiguous criterion for identifying those possible values of the test statistic
that will allow for rejection and those that permit acceptance of Ho. In stan
dard Neyman-Pearson statistics, research always proceeds by the successive
elimination of false hypotheses (rather than by the confirmation of true ones),
so that Ho is in actuality established only to be subjected to the possibility of
rejection. It is at this point that the importance of the "mutually exclusive and
maximally contrastive" pairs of hypotheses mentioned earlier becomes evi
dent, for rejection of H0 should, ideally, entail acceptance of H1 (the alter
native or research hypothesis) as the only other reasonable possibility.
However, what constitutes a "reasonable possibility" is in fact conditioned beforehand by the likelihood that the research hypothesis is true in the first
place (Salmon 1973:112-115). It is worth remarking that hypotheses typically
242 G. A. CLARK
are not deduced in any formal sense from some proposition of interest, but rather are arrived at and evaluated inductively. The ability to rank (or, ideally, to assign probabilities to) research hypotheses is strictly a function of a priori expectations about the nature of structure in the data, which is in turn depen dent on the statistical model chosen and the level of development of a par ticular discipline (see, for example, the following). In some highly developed experimental fields (e.g., in chemistry, physics), it is possible to derive deduc tively (i.e., assign probabilities to) a suite of research hypotheses. As far as ar
chaeology is concerned, however, we are as yet rather far from that state of grace and can at best provide a crude ordering of research hypotheses in terms
of their relative plausibility. Smith (1977:607) has observed that "such plausibility considerations in archaeological inference invariably take the form of argument by analogy (Binford 1967)," which is probably true as long as "analogy" is used in the generic sense and not in the narrower context of
analogy with ethnographic situations. Wilcox and Sullivan (1979) make the
point that such a restriction would unnecessarily preclude the eventual development of an independent body of archaeological theory.
The decision to "accept" or reject Ho is usually based on an inference made from a sample, and because samples are always variable, there is some proba bility that an error will be made in the decision to accept or reject Ho. Because the characteristics of the population sampled are typically unknown, we are never really in a position to know with certainty whether a particular decision based on a sample statistic is the correct one or not. There are two possibilities for making an incorrect decision called, respectively, Type I and Type II er rors. A Type I error occurs when Ho is true but is mistakenly rejected; a Type II error occurs when H0 is false but is erroneously accepted. The probability of Type I error is conventionally symbolized by alpha (ca); the probability of Type II error is symbolized by beta (13). Given the unpalatable prospect of making an error of some kind a certain percentage of the time in the evalua tion of any sample statistic, we have recourse to probability theory to allow for an assessment of the different error risks, which in turn allows these risks to be taken into account in establishing criteria for rejection of Ho.
Power Functions
In a relatively simple case, consideration of the power of a significance test will provide an objective means of assessing the relative importance of dif ferent sources of error in making the statistical decision (Cohen 1969; Siegel 1956). This aspect of the decision process has been increasingly recognized by archaeologists as an important part of any quantified research design (Cowgill 1977; Stafford and Stafford 1979). The power of a test is based on the fact that an inverse relationship exists between the probabilities of Type I and Type II error: a decrease in a will result in an increase in 13 for any given sample size. If we wish to reduce simultaneously the probabilities of both
QUANTIFYING ARCHAEOLOGICAL RESEARCH 243
types of error, it can only be done by increasing the sample size. Ideally, one seeks to reduce the error probabilities to tolerable levels without increasing sample size to the extent that it becomes unwieldy. In normal practice though, the investigator commonly fixes a and disregards the fact that by doing so, 13
may be maximized-a procedure that might be quite justifiable in the context of a given problem.
The various statistical tests offer the possibility of different balances of er ror risks, which are measured in terms of the power function of the test. The power of a test is defined as the probability of rejecting Ho when in fact it is false, which is a correct decision, and which is measured by 1 - ,. The power of a test increases as sample size increases for the fixed a level. Since the error probabilities are based ultimately on the probability distribution of the test statistic involved and are fixed only as long as sample size is fixed, about the only criterion that can be employed in balancing risk is an evaluation of the practical consequences of each type of error in the particular case involved. Error probabilities can be neatly summarized in simple statistical tests by use of an operating characteristic (OC) curve (Wallis and Roberts 1967:388-396). The probability of Type I error specifies the level of significance attached to the decision to reject H. It permits definition of the region of rejection of Ho in the probability distribution of the text statistic involved, and it indicates how willing the investigator is to tolerate a risk of Type I error due solely to chance variation in a computed test statistic.
Sampling
If the foregoing has been undertaken in a careful and systematic way, it
becomes a comparatively straightforward matter to acquire and analyze the data (Figure 6.3:Boxes 7 and 8). Considerations of sampling design are of course relevant here because inference is directly influenced by sampling
methods. Are conclusions to be restricted to the sample evaluated, or are they to have wider implications (as is presumed to be the case here)? If the conclu sions are to have implications beyond those restricted to the cases observed, one must determine how to choose the sample, bearing in mind that the pat tern of sampling variability for any population is known if, but only if, the
sampling technique results in a probability sample. A probability sample can
be defined as a sample drawn in such a way that it is possible to assign a prob ability to every individual that might possibly be included in it. Probability samples are the very foundation of statistical inference, whereas nonprob ability samples are of the very limited statistical interest. Probability sampling allows for estimates of the risk of error-the basis for all statistical inference;
nonprobability sampling does not allow those estimates to be made; therefore, statistical inference is really not appropriate if based on non
probability samples. Nonprobability sampling, however, can be employed to advantage in certain phases of an archaeological research design in which, for
244 G. A. CLARK
example, maximally representative (though biased) samples might be re quired, where preservational differences are marked, and to increase effi ciency in the collection of rare but significant data (Asch 1975:170-191).
Sampling has recently occupied the attention of a number of archaeologists (e.g., Cowgill 1975; Judge et al. 1975; Mueller 1974, 1975, 1978; Plog et al. 1978; Plog 1976; Read 1975), so I will confine my remarks to a few general
observations pertinent to statistical conceptions of sampling. These provide the basis for most archaeological discussions of the topic.
Probability sampling is commonly equated with simple random sampling, but there are actually four basic kinds of probability sampling, of which ran dom sampling is only one (the others are systematic sampling, stratified sampling, and cluster sampling) (Blalock 1972:509-530). Systematic sam pling is sometimes regarded by archaeologists as a form of nonprobability sampling, but if the selection process is initially random, then a probability sample can theoretically be attained (Blalock 1972:514, 515). The danger in systematic sampling lies in the introduction of bias in the sample selection process due to undetected trends or periodicity in the enumeration of elements in the population to be sampled. In practical terms, it usually does not matter very much as long as there is reason to believe that the ordering of elements is essentially random (this can often be checked by simple graphic means, etc.). If it is, a systematic sample will be the equivalent of a simple random sample.
If it is not (i.e., if nonrandom patterns can be detected), then a systematic
sample is best regarded as a form of stratified sample, and should be treated
accordingly. In most research situations, stratified sampling is to be preferred over simple random sampling because it incorporates useful a priori knowl edge about structure in data sets into the process of their evaluation. This in turn will improve both the sophistication (always) and the efficiency (often) of the sampling design. Blalock (1972:524) suggests that efficiency be
measured by the relative size of the standard error of the estimate (the smaller
the standard error, the higher the efficiency of the design). Cluster sampling, often unavoidable in archaeological contexts, can also improve efficiency over simple random samples as long as sample sizes are comparable and the
clusters themselves are relatively homogeneous. Because cluster samples are often more easily obtained than other kinds of samples, cost factors might make cluster sampling preferable in some instances. Blalock (1972:526) observes that whenever costs that depend on the number of clusters selected are large in relation to costs that vary directly with the number of cases, cluster sampling will prove more economical than simple random sampling. In general, a balance between cost considerations and the efficiency of the design must be maintained. The design with the smallest standard error for a given cost should be selected.
Although it is possible to make use of statistical inference with each of these
types of probability samples, it is also unfortunately true that the number of
QUANTIFYING ARCHAEOLOGICAL RESEARCH 245
different kinds of tests that are appropriate for use with experimental designs utilizing nonrandom probability samples is somewhat restricted. While stratified and cluster sampling can often improve the sophistication and effi ciency of a sampling design, and stratification in particular is conceptually simple and has obvious archaeological advantages, both can also be analytically complicated-especially with respect to computation of the prob abilities to be assigned to individuals in strata or clusters. These probabilities are directly conditioned by decisions about how the strata and/or clusters are to be formed, what sampling fraction is regarded as "optimal" vis a vis the ac tual or theoretical population, whether stratified sampling is proportional or disproportional, and the like. Regardless of the nature of a probability sam ple, however, as long as it is a probability sample, accuracy, precision, bias, and representativeness should be taken into account (Cowgill 1975:263-266).
Restating the Statistical Decision
The statistical decision (to accept or reject Hd) follows from routine com putational procedures, and all that remains is to restate the consequences of the statistical decision in behavioral terms (Figure 6.3 :Box 10). Here, the ma jor difficulty may lie in a failure to consider adequately the nature of the rela tionship between the samples actually evaluated, the population from which they were derived (sampled population), and the population about which con clusions are to be drawn (target population). It is particularly important that "archaeological context" variables be selected, and that test implications be
generated from them, which monitor as accurately as possible variables of in terest in the "systemic context" (the nonobservable behavioral system of
which these remains were once a part and about which we are ultimately in terested in drawing conclusions) (Schiffer 1972, 1973). Intervening "cultural and natural formation processes," which might influence the preservation and recovery and/or distort the relational aspects of archaeological remains should also be carefully controlled (Wilcox 1975). Failure to take deposi tional, postdepositional, and recovery factors into account would certainly diminish, and might vitiate altogether, the impact of any substantive results that might be forthcoming from a quantified research design, no matter how careful the design might have been as far as the statistical methodology is con cerned.
ALTERNATIVES TO HYPOTHESIS TESTING
In the inferential model described in Figure 6.3 and the subsequent discus
sion of it, it has been assumed that the formal specification and evaluation of sets of paired hypotheses is or should be part of all quantified research
designs. While many archaeologists appear to share this conception of the
246 G. A. CLARK
research process, it is important to note that it is not the only, nor even
necessarily the most productive scenario for quantifying archaeology. Within statistics, hypothesis testing is recognized as an area of limited applicability, and some statisticians have argued that other statistical methodologies are both more powerful and more generally appropriate to a wider range of prob
lems in data analysis than is the classic Neyman-Pearson inferential model for
confirmation (e.g., Tukey 1977). Within archaeology, there is some diversity of opinion about the relative importance of significance testing, and the claim
has been made that significance tests are unnecessarily limiting and prone to
misinterpretation (Cowgill 1977). In this section, I give an assessment of significance testing and contrast it with the use of interval estimates. I then
outline some of the major elements of a recently developed statistical perspec
tive called exploratory data analysis, and offer some suggestions about where EDA methods and techniques might most appropriately be integrated with a
design for evaluating research propositions.
Significance Tests and Interval Estimates: Some Pros and Cons
The litany of sins associated with significance testing is unfortunately a
long one. Moreover, it is not confined to the interpretational difficulties cataloged by various authors (e.g., ex post facto manipulation of a, con
founding with measures of association [see, e.g., Bettinger 1979; Cowgill 1977; Munday and Lincoln 1979; Stafford and Stafford 1979; Thomas 1976, 1978]). Despite these drawbacks, however, there are compelling reasons for
the continued incorporation of significance testing in archaeological research designs. On the positive side, formulation of hypotheses amenable to statistical evaluation forces the investigator to devote attention to the selec
tion of theoretically meaningful variables. At the same time, he is required to
insure that those variables are monitored in some justifiable way by the ar
chaeological variables examined through the generation of test implications. These concerns are not as apparent or even important in other branches of
social science research where the hiatus between the "behaviorally mean
ingful" and the "directly observable" can be more readily narrowed.
The precision inherent in hypothesis-testing is often absent in the ad hoc
pattern-search techniques commonly used in archaeology, and it could be
argued that we have gone on long enough appealing to our lack of knowledge
of archaeological phenomena to continue to justify the use of these methods
in a purely inductive mode. As Read (1974b) has observed, a large number of
dependency structures exist in any set of archaeological material. Whereas
these are often implicit, a researcher benefits enormously from making them
QUANTIFYING ARCHAEOLOGICAL RESEARCH 247
explicit by specifying a priori expectations about the nature of structure in the data. The results obtained from any statistical analysis reflect not only the structure that may exist in the data but the structure imposed on the data by
the selection of a particular statistical model (for example, see Everitt [1974] regarding imposed structures in cluster analysis).
Interpretability of results is often the sole justification for accepting the results of the multivariate techniques often used in pattern searching (e.g., cluster analysis, factor and principal components analysis). Interpretability, however, is a necessary, but not a sufficient, condition for acceptance of a set
of conclusions based on a statistical analysis. This is because the human mind
is sufficiently flexible and inventive to make something of almost any set of results. The increased use of significance tests and confidence intervals in
multivariate analysis is at least a partial solution to this dilemma (Christenson 1979), but when analysis takes place completely outside of a deductive framework, any procedure is likely to be problematic. As a first step in the
analytical process, it is necessary to recognize the formal structures such pro
cedures are designed to reveal in a data matrix (Degerman 1972).
Perhaps the most general argument in support of tests of significance, however, is one so obvious that it is seldom made explicit: correctly used, significance tests provide a mechanism for guarding against according
substantive importance to results that can be explained easily by chance
(Henkel 1976:87). On the negative side, most problematic aspects of significance testing turn
on its contribution, relative to other procedures, to the ultimate objective of
scientific research in general: the development and validation of theories that
allow for the explanation of empirical phenomena (Henkel 1976:83). It has
been argued-by archaeologists (e.g., Cowgill 1977) as well as by statisticians
and philosophers of science-that that contribution is likely to be rather
meager. For one thing, because we cannot "prove" a hypothesis to be true,
but can only falsify it, the substantive results of a test of significance can at
best provide negative information insofar as they result in a decision to reject or to fail to reject some theoretical proposition.
Moreover, only exceptionally do tests of significance allow for generaliza tions to the hypothetical population of interest. This is because the property
of generalizability is restricted to the sampled population, and cannot usually be extended to the target population (which is apt to be an abstract,
theoretically infinite population). Only in the (unusual) situation in which sampled and target populations are identical would it be legitimate to make a
direct statistical inference about the target population. If the target popula
tion is theoretically infinite, statistical inferences are not legitimately possible since, strictly speaking, there is no way to obtain a probability sample from it.
(However, statisticians have few qualms about applying probability theory to
248 G. A. CLARK
finite but large populations. Certainly most archaeological populations are large but finite populations.)
Finally, null hypotheses typically evaluated in social science research are often limited, inefficient, and somewhat unrealistic insofar as parameters are usually posited as equal to zero or to some other specified value (i.e., two or a
series of parameters or statistics, or a parameter and a statistic are compared,
and then they are tested for differences between or among them). Since it is
rather unlikely that the difference between the parameters of interest would be precisely zero (a point estimate), it has been observed that the ability to re
ject such null hypotheses does not really mean very much (Meehl 1967). In this
context, Blalock (1972:209-212) advocates the use of confidence intervals (in terval estimates). Placement of a confidence interval around an estimate in
dicates not only the degree of accuracy of that estimate but also and
simultaneously constitutes an implicit and informal test of a whole range of
hypotheses (Figure 6.4). Increased use of interval estimates has also recently
been supported by Cowgill (1977), who argues that they are better suited to
many kinds of archaeological problems than are testing approaches (see also
Gross 1976). It should be kept in mind that although hypothesis testing and interval
estimates are closely related to one another, they are in fact conceptually
distinct procedures. Although the same constraints and assumptions apply to the appropriate use of each (e.g., probability sampling), it is unnecessary in
the latter case to hypothesize a specific value for a parameter to be estimated.
In a single-sample problem in particular, placing confidence intervals about a
parameter is often more reasonable than testing a hypothesis. However, con
fidence intervals are seldom used as alternatives to two- or k-sample tests in
social science, mainly because in these situations, one is usually interested in
simply establishing the existence of a relationship between two or among
several variables; there is less concern with estimating the actual magnitude of
that relationship. It has been suggested that this reflects the immaturity of the
social sciences more than any other factor, and the prevalence of exploratory
studies (Blalock 1972; Henkel 1976).
Exploratory Data Analysis
We have seen that the typical research project is characterized by a sequence
of operations that progressively narrow the research focus. One defines the
subject of study, generates hypotheses, collects appropriate data and analyzes
them, and finally comes to some kind of substantive conclusion as a result of
the analysis. In the standard confirmatory mode, data are defined in terms of
hypotheses, and do not exist in any formal sense apart from them (i.e., what
constitutes data is determined by the hypotheses evaluated; those hypotheses are formally defined). Some criticisms of the rigid analytical format of confir
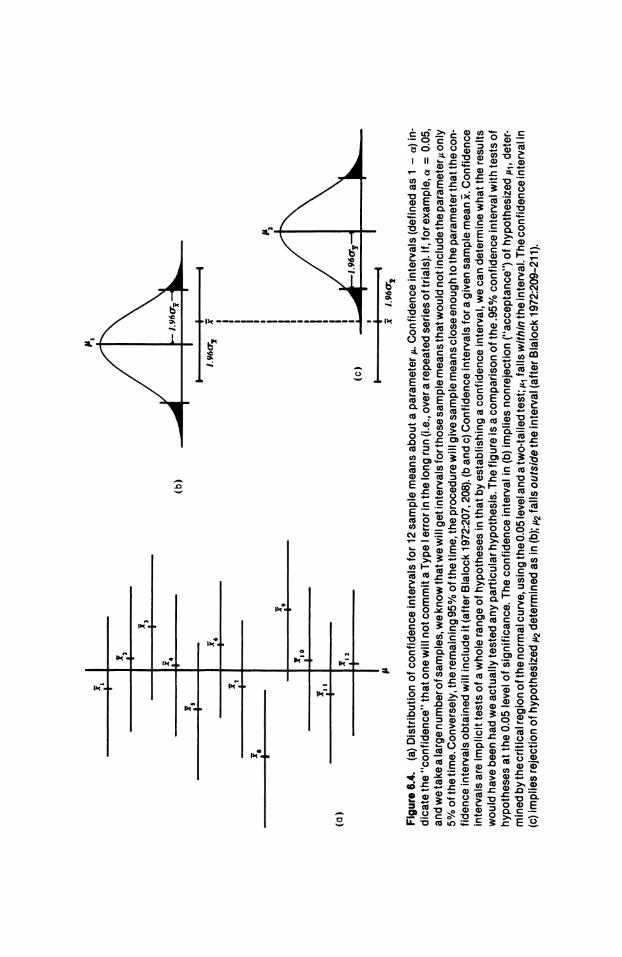
| ~~~ ~ ~ ~ ~~~(b) (/ 9 e
X7i
12~~~~~~~~~~~~~~~~~~~~~~~~~~P
|~~ ~ ~~ i.O x
I ' I
(a)<
x. 6096C
Figure 6.4. (a) Distribution of confidence intervals for 12 sample means about a parameter i. Confidence intervals (defined as 1 - )in
dicate the "conf idence" that one will not commit a Type I error in the long run (i.e., over a repeated series of trials). If, for example, a =0.05, and we take a large number of samples, we know that we will get intervals for those sample means that would not include the parameter;t only 5% of the time. Conversely, the remaining 95% of the time, the procedure will give sample means close enough to the parameter that the con
f idence intervals obtained will include it (after Blalock 1972:207, 208). (b and c) Conf idence intervals f or a given sample mean x. Conf idence
intervals are implicit tests of a whole range of hypotheses in that by establishing a confidence interval, we can determine what the resulIts would have been had we actually tested any particular hypothesis. The f igure is a comparison of the .95% conf idence interval with tests of
hypotheses at the 0.05 level of significance. The confidence interval in (b) implies nonrejection ("acceptance") of hypothesized 1&, deter mined by the critical region of the normal curve, using the 0.05 level and a two-tailed test; it f alls within the interval. The conf idence interval in
(c) implies rejection of hypothesized A2 determined as in (b); 2 fails outside the interval (after Blalock 1972:209-2_1).
250 G. A. CLARK
matory data analysis have been voiced already. In statistics, these and other
concerns have led to the development of an alternative mode of data analysis
that emphasizes systematic pattern-search techniques. This perspective is called exploratory data analysis (Hartwig and Dearing 1979; Leinhardt and
Wasserman 1979; Mosteller and Tukey 1977; Tukey 1977). Exploratory data analysis is an empirical approach founded on the notion
that as much as possible should be learned about structure in data before they
are used to evaluate hypothesized relationships. Thus, EDA complements, rather than replaces, hypothesis testing. It employs visual methods and (visually represented) nonparametric measures of central tendency and dispersion. The techniques advocated are relatively simple and straightfor
ward, and thus less likely to be abused than more complex procedures.
Moreover, they can be used with qualitative (nominal, ordinal) as well as
metric (interval, ratio) data. In an informal way, some EDA concepts and
procedures have been used by data analysts for years in standard hypothesis
testing contexts. EDA developed because of dissatisfaction with the numerical summaries
that are so marked a feature of the confirmatory mode of analysis (e.g.,
means, standard deviations, regression lines, etc.). The use of these measures
is typically based on the assumption of a "normal" (Gaussian or quasi
Gaussian) distribution. Although it was recognized that such numerical sum
maries express certain important aspects of data patterning, it was also
thought that they mask or conceal other (perhaps equally important) aspects
(i.e., those that cannot be described by the standard statistical summaries)
(Hartwig and Dearing 1979:9-12). An overemphasis on confirmatory
analysis typically restricts explanation to only a few alternatives (i.e., those
expressed in the null and alternative hypotheses). Explanation of other pat
terns that might exist is thus precluded (or at least discouraged).
The most fundamental conception of the exploratory approach is that all
data are regarded as comprised of two components: the smooth and the
rough.
data = smooth + rough
The smooth is the underlying simplified structure of a set of observations the general shape of a distribution or relationship usually summarized by the standard measures of central tendency, regression lines, and the like. The
rough constitutes the residuals-what is left behind after the smooth has been extracted (Hartwig and Dearing 1979:10, 11). Tukey (1977:205-235) has argued that traditional social science research typically ignores the rough, and
that data that do not "fit" a preconceived model (e.g., a "normal" distribu
tion) are as important in their own right as data that do. This is because the
rough can suggest alternative explanations of patterns and reveal important
QUANTIFYING ARCHAEOLOGICAL RESEARCH 251
structural characteristics of a data set that are likely to be minimized or ig nored by an overemphasis on the smooth. From this point of view, all data analysis consists of the partitioning of data sets into smooth and rough com ponents. What distinguishes EDA from CDA is a willingness to explore alter native models of relationship by the successive extraction of the smooth until nothing but unpatterned residuals remain.
The quest for structure is facilitated by "reexpression"-expressing the same information by some kind of transformation (e.g., logs, roots) (Tukey 1977:57-93). Measurement scales are regarded as arbitrary conceptions of the investigator imposed on data sets, and the use of a scale of measurement other than that in which a variable was originally recorded allows for the discovery of unanticipated patterns. Any transformation is considered acceptable as long as it can ultimately be related back to the original data. Tukey advocates as much reexpression as possible (although care should be taken that reexpres sion does not mislead the analyst later in the analysis). Usually, the more data are reexpressed (i.e., subjected to different transformations), the more smooth can be extracted.
Given the EDA emphasis on nonparametric methods, it is important that measures be "resistant" and "robust." A summary is considered resistant if changing a small portion of the data-no matter what part or how substan
tially-fails to change the value of the summary. Two qualities of robustness are (a) robustness of validity and (b) robustness of efficiency. Generally, robust measures lack susceptibility to the effects of nonnormality. The first type of robustness involves tolerance of nonnormal tails (e.g., confidence in tervals for ,u that have a 95% chance of including At regardless of the popula
tion sampled). Robustness of efficiency involves high effectiveness in the event of nonnormal tails. An example would be confidence intervals for y that
tend to be almost as narrow for any roughly normal distribution as the best
that could be achieved if the true distribution shape were known to a close ap
proximation (Mosteller and Tukey 1977). The question of how well these "robust" and "resistant" measures perform is presently being addressed, often in a very sophisticated manner (cf. Gross 1976; Hampel 1978; Lax
1975). Studies of these kinds should ultimately lead to a more comprehensive understanding of these statistics and their roles in both EDA and CDA.
In a complete EDA scenario, analysis proceeds from the examination of
single variables, to examination of relationships between two or more
variables, to multivariate analysis. The rationale behind this incremental ap proach is to allow for as complete an understanding as possible of the struc
ture of each variable as an entity, to understand pairs of variables as relation
ships, and ultimately, to understand groups of variables as models. Each
stage in the process is characterized by a set of basic concepts and techniques.
Most of these are familiar (or at least recognizable) to anyone with a basic
252 G. A. CLARK
statistical background; but they are modified to emphasize visual relation ships, and they are described in terms of an unfamiliar vocabulary, which is likely to be a considerable obstacle to the novice reader (Tukey [1977] and
Hartwig and Dearing [1979] provide glossaries).
The Univariate Case: Shape, Location, and Spread
As might be expected, analysis at the univariate level basically constitutes examination of the locational, spread, and shape characteristics of a distribu tion. Location refers to the point at which the distribution is anchored on a continuum from the lowest to the highest possible value of the range.
Measures of location should identify the value most characteristic of a
distribution, the single value that best describes the data set. In EDA, the loca tion of a distribution refers to the dispersion of the observations, which is described in CDA by the standard deviation. Shape indicates the type of distribution (i.e., whether it is normal, symmetrical, unimodal, skewed to right or left, multimodal; whether it has outliers; etc.). Departures from nor
mality are attributed to discreteness, gross shape differences, minor dif ferences in "central shape, " and patterning in a distribution's tails-the most difficult anomaly to detect (Mosteller and Tukey 1977:23). For each parametric concept, data displays are developed that are the visual equivalents of the standard statistical summaries. The objective is to simultaneously compress information and display more structure than is usually contained in a statistical summary.
Examples of such displays are Tukey's "stem-and-leaf" and "box-and whisker" plots, shown in Figure 6.5. In EDA, a preliminary procedure for data analysis consists of "scratching down a batch" (organizing, condensing, and summarizing data prior to construction of a model). The stem-and-leaf display (Figure 6.5a) is the basic organizational device for doing this. A stem and-leaf display is composed of a column of digits called starting parts (or stem values) that is separated by a vertical line from rows of digits. Each row is a stem; the individual digits on it are leaves. The batch displayed in the exam ple is decomposed by tens. However, many other decompositions of a given batch are possible; other values can be used for starting parts (which themselves can be variously decomposed). A stem-and-leaf plot is superior to conventional data displays (e.g., histograms) because it focuses attention on shape-each leaf occupies a given amount of space, hence, the length of a line is proportional to the number of data entries for that particular stem. Besides general impressions regarding shape, spread, and location, the display clearly indicates where clustering occurs. It is also possible to use the stem-and-leaf display to make transformations of the data and to obtain the distribution of the transformed batch of numbers-by hand, and without a great deal of ef fort (Leinhardt and Wasserman 1979:317-319; McNeil 1977:3-6).
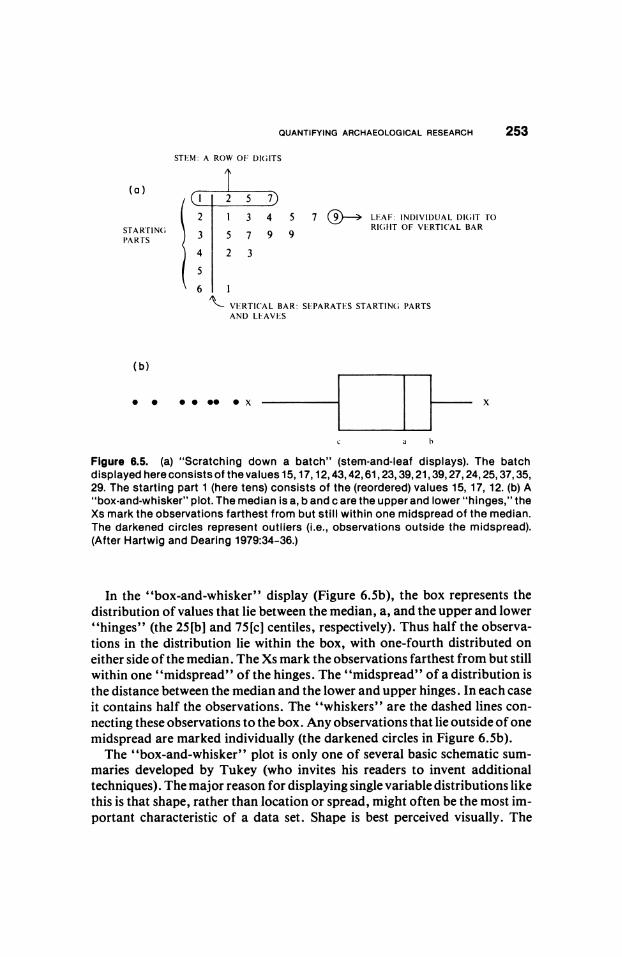
QUANTIFYING ARCHAEOLOGICAL RESEARCH 253
STEM: A ROW OF DIGITS
(a) 2 2 5 7
2 1 3 4 5 7 LEAF: INI)IVIDUAL DI(GIT TO
sTARTING RI(;IHT OF VERTICAL BAR l'ART 3 rs 799
4 2 3
, VERTICAL BAR: SEPARATES STARTING PARTS AND LEAVES
(b)
* * *e *e * x x
c a b
Figure 6.5. (a) "Scratching down a batch" (stem-and-leaf displays). The batch displayed hereconsistsof thevalues 15,17,12,43,42,61,23,39,21,39,27,24,25,37,35, 29. The starting part 1 (here tens) consists of the (reordered) values 15, 17, 12. (b) A "box-and-whisker" plot. The median is a, b and c are the upper and lower "hinges," the
Xs mark the observations farthest from but still within one midspread of the median. The darkened circles represent outliers (i.e., observations outside the midspread). (After Hartwig and Dearing 1979:34-36.)
In the "box-and-whisker" display (Figure 6.5b), the box represents the
distribution of values that lie between the median, a, and the upper and lower
"hinges" (the 25[b] and 751c] centiles, respectively). Thus half the observa
tions in the distribution lie within the box, with one-fourth distributed on
either side of the median. The Xs mark the observations farthest from but still
within one "midspread" of the hinges. The "midspread" of a distribution is
the distance between the median and the lower and upper hinges. In each case
it contains half the observations. The "whiskers" are the dashed lines con
necting these observations to the box. Any observations that lie outside of one
midspread are marked individually (the darkened circles in Figure 6.5b).
The "box-and-whisker" plot is only one of several basic schematic sum
maries developed by Tukey (who invites his readers to invent additional
techniques). The major reason for displaying single variable distributions like this is that shape, rather than location or spread, might often be the most im
portant characteristic of a data set. Shape is best perceived visually. The
254 G. A. CLARK
"stem-and-leaf" and "box-and-whisker" displays not only preserve the smooth-they also highlight the rough-detail at the ends of the distribution.
The Bivariate Case: Shape, Strength, and Direction
In the bivariate case, it is necessary to examine not only single distributions, but the relationship between two variables. From an EDA perspective, rela tionships between variables also have three important characteristics, one of
which is shape (here the shape of the line formed by the smooth). The other two are strength and direction (Hartwig and Dearing 1979:31, 32). The strength of a relationship refers to the extent to which observed values on one variable can be predicted by observed values on the other. Strength assesses the relative importance of the smooth as compared to the rough. The closer the data points are to the smooth, the stronger the relationship (i.e., the smaller the residuals [the rough] after the smooth is extracted, the better values on one variable predict values on the other). Direction refers to whether or not a relationship is positive or negative (or both-a U-shaped distribution, for example, changes from a negative to a positive direction).
Bivariate relationships are displayed by scatter plots and summarized by modified forms of curve fitting. Scatter plots allow for the detection of pat terns because they provide a complete picture of the relationship between the two variables (i.e., all three characteristics of relationships can be observed) (Tukey 1977:125-157). However useful scatter plots may be in an intuitive sense, though, only in exceptional cases do they allow for the partitioning of the data into its component parts (i.e., the rough and the smooth). More systematic techniques which are less sensitive to differences in individual perception are desirable if the subjective element in analysis is to be mini mized. In CDA, those "more systematic techniques" typically involve fitting lines (usually straight ones) to the relationship and then making some kind of an assessment of how good the "fit" is (i.e., how well or poorly the line describes the relationship). Least-squares linear regression is probably the
most common method for doing this (Blalock 1972:362-376). Least-squares regression lines are not satisfactory "smoothers" from an EDA standpoint, however, because they lack the property of "resistance" (i.e., they are sen sitive to the effects of outliers). This is because means are used and residual values are squared and summed; the farther a case is from a regression line, the greater the effect it has on the location of that line. McNeil (1977) suggests that standard regression lines tend to "track" these outliers because they must come reasonably close to them to satisfy the least-squares criterion. Thus the position of the line in a scatter of points is influenced disproportionately by a few atypical cases. A nonparametric method that is a more resistant smoother
would have obvious advantages. An example of an EDA alternative to the least-squares regression line is the
"Tukey line" (McNeil 1977). A Tukey line is contrasted with a least-squares
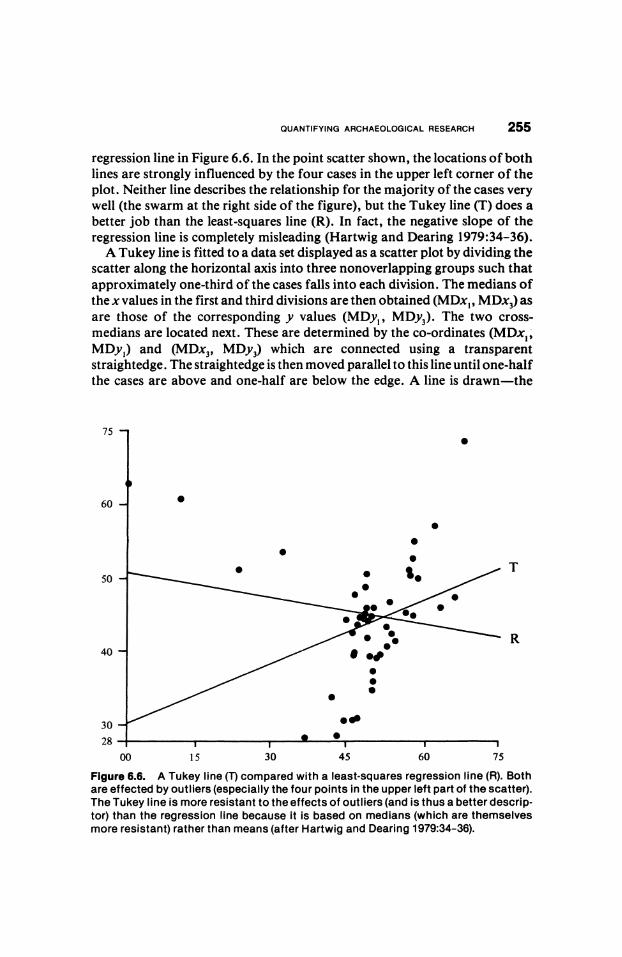
QUANTIFYING ARCHAEOLOGICAL RESEARCH 255
regression line in Figure 6.6. In the point scatter shown, the locations of both
lines are strongly influenced by the four cases in the upper left corner of the
plot. Neither line describes the relationship for the majority of the cases very well (the swarm at the right side of the figure), but the Tukey line (T) does a
better job than the least-squares line (R). In fact, the negative slope of the
regression line is completely misleading (Hartwig and Dearing 1979:34-36). A Tukey line is fitted to a data set displayed as a scatter plot by dividing the
scatter along the horizontal axis into three nonoverlapping groups such that
approximately one-third of the cases falls into each division. The medians of
the x values in the first and third divisions are then obtained (MDx1, MDx3) as
are those of the corresponding y values (MDy,, MDy3). The two cross
medians are located next. These are determined by the co-ordinates (MDx, MDy1) and (MDx3, MDy3) which are connected using a transparent
straightedge. The straightedge is then moved parallel to this line until one-half the cases are above and one-half are below the edge. A line is drawn-the
75
60
50- /
R 40
30 -
28 - 0
00 1 5 30 45 60 75
Figure 6.6. A Tukey line (T) compared with a least-squares regression line (R). Both are effected by outliers (especially the four points in the upper left part of the scatter). The Tukey line is more resistant to the effects of outliers (and is thus a better descrip tor) than the regression line because it is based on medians (which are themselves
more resistant) rather than means (after Hartwig and Dearing 1979:34-36).
256 G. A. CLARK
Tukey line. The arithmetic equivalent is given by determining the slope b and the intercept a coefficients for the formula for a straight line:
y; = a + bxi.
The slope is given by (MDy3- MDy,)/(MDx3 - MDx,). The intercept is the
median of the values Di = y; - bx;. The Tukey line can then be drawn in the
scatter plot by a line between any two xy, points (McNeil 1977).
The property of resistance in a line used as a smoother is desirable because it
is less likely than a nonresistant line to obscure the distinction between the
smooth and the rough. The reason the Tukey line is more resistant than a
regression line is that its location is based on medians. Medians are not as sub
ject to the influence of outliers as are the means used in least-squares linear
regression (Hartwig and Dearing 1979:35, 36). In examining the relationships between pairs of variables, the Tukey line is
used in conjunction with other smoothing sequences (e.g., running medians, "hanning'," median and hinge traces, reexpressing nonlinear relationships) to develop a more thorough understanding of the network of relationships that are characteristic of a particular data set. In the bivariate case, outliers, asym
metries and nonlinear relationships of various kinds deserve special scrutiny because of the effect they can have on linear regression. As noted, exploratory
data analysts are skeptical of least-squares linear regression without visual
representation and reexpression because they believe that the method often results in misleading statistical summaries (cf. Figure 6.6). If asymmetrical distributions and nonlinear relationships are detected, the data should first be reexpressed in as many ways as possible to detect the possible presence of
underlying linearity in the transformed variables. If successive smoothing still fails to produce linearity, outliers and other residuals should be isolated from
the rest of the data (which can then usually be adequately summarized by the
shape, strength, and direction of the relationship that characterizes them).
Separate analysis of outliers is an entirely reasonable thing to do from an EDA
standpoint since they are, by definition, not part of the same relationship as
the other observations. EDA advocates do not reject standard numerical summaries like regres
sion, however, but instead use them in two ways: (a) to provide "first approx
imations" (initial smooths) of data, which are then subjected to further manipulation, and (b) to reanalyze reexpressed data. Reexpression facilitates
further analysis by symmetrizing distributions of individual variables and by offering possible models for nonlinear relationships. In both cases, however, there are a number of possible reexpressions and no formal procedures for
choosing among them. Tukey suggests that nonnormally distributed
variables and nonlinear monotonic relationships (those in which the rate, but
not the direction of the relationship changes) are most adequately trans
QUANTIFYING ARCHAEOLOGICAL RESEARCH 257
formed by reexpressions that adjust relative distances between variables while preserving their rank order (1977:309-329). The common nonlinear
monotonic reexpressions include concave and convex transformations, and "hybrids" like the sine root function, odd-numbered roots and powers, and folded roots and logs (froots, flogs). Choice among these functions should be dictated by the particulars of the data set involved and by substantive con
siderations (i.e., some make more "sense" in given contexts than others). The
transformed distribution should provide a better basis for further analysis (in cluding analysis with standard statistical methods) than the untransformed data.
Multivariate Analysis
In the incremental approach advocated by Tukey, development of a multivariate model of the data is based on and derives directly from preceding univariate and bivariate analyses. The process is an iterative one, in which
more and more structure (smooth) is extracted from successive sets of
residuals by the creation through reexpression and analysis of new variables. When additional smooth can no longer be extracted from some final set of
residuals (an "ultimate" rough), the multivariate model is considered to be complete. The rationale is that by pursuing the step-by-step interactive ap proach outlined above, a thorough understanding of the structure of variables is attained. Multivariate relationships are thus constructed from bivariate ones by adding additional explanatory variables that smooth (ex
tract structure from) successive roughs (sets of residuals). "Instant" multivariate methods like factor analysis and multiple linear
regression are rejected in the early stages of analysis because they place too
much emphasis on complex (and nonresistant) numerical summaries. These summaries might be based on erroneous assumptions of normal distribu tions, linear relationships, and the like, which-presumably-would be un covered in the course of a complete EDA scenario. Tukey and his colleagues
believe that an understanding of structure through interaction with the data at
all levels is sometimes precluded in CDA by premature use of multivariate
statistics (Tukey 1977). Multivariate methods can, however, be employed to
advantage in the final stages of an EDA analysis to examine an ultimate rough
for patterned residuals expected under a particular multivariate model (e.g.,
to compare residuals against the values predicted by the multiple linear regres
sion equation (Hartwig and Dearing 1979:70-72). Although it is recognized
that this conception of multivariate causality is somewhat at odds with that of
standard CDA, EDA advocates suggest that relatively more is gained in terms
of understanding by thorough structure searching than is lost from
(premature and oversimplified) recourse to a "most comprehensive" multivariate statistical summary.
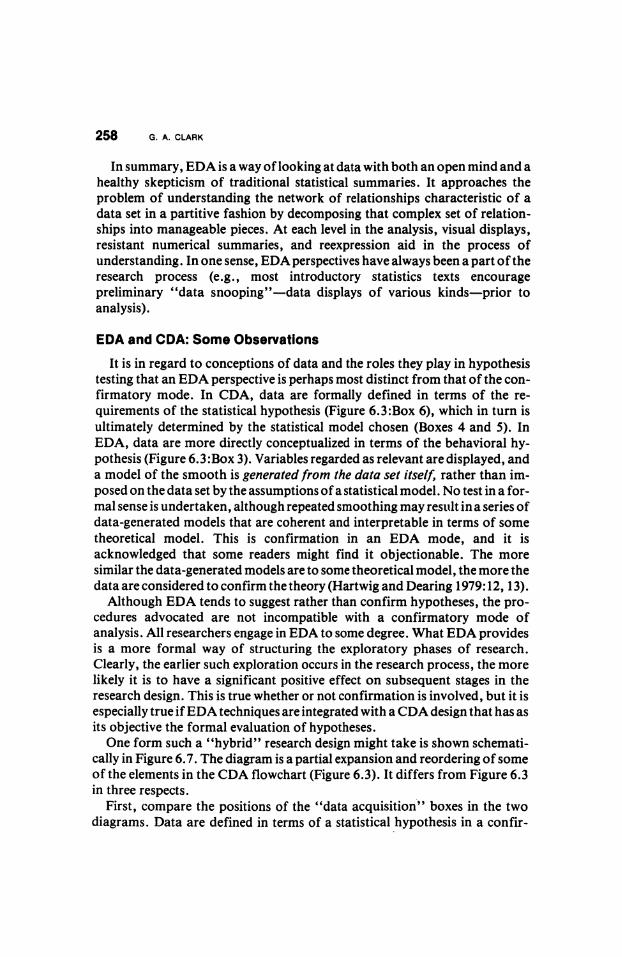
258 G. A. CLARK
In summary, EDA is a way of looking at data with both an open mind and a
healthy skepticism of traditional statistical summaries. It approaches the problem of understanding the network of relationships characteristic of a data set in a partitive fashion by decomposing that complex set of relation
ships into manageable pieces. At each level in the analysis, visual displays, resistant numerical summaries, and reexpression aid in the process of understanding. In one sense, EDA perspectives have always been a part of the research process (e.g., most introductory statistics texts encourage preliminary "data snooping"-data displays of various kinds-prior to analysis).
EDA and CDA: Some Observations
It is in regard to conceptions of data and the roles they play in hypothesis testing that an EDA perspective is perhaps most distinct from that of the con
firmatory mode. In CDA, data are formally defined in terms of the re
quirements of the statistical hypothesis (Figure 6.3:Box 6), which in turn is
ultimately determined by the statistical model chosen (Boxes 4 and 5). In
EDA, data are more directly conceptualized in terms of the behavioral hy pothesis (Figure 6.3:Box 3). Variables regarded as relevant are displayed, and a model of the smooth is generated from the data set itself, rather than im
posed on the data set by the assumptions of a statistical model. No test in a for mal sense is undertaken, although repeated smoothing may resutlt in a series of
data-generated models that are coherent and interpretable in terms of some
theoretical model. This is confirmation in an EDA mode, and it is
acknowledged that some readers might find it objectionable. The more
similar the data-generated models are to some theoretical model, the more the data are considered to confirm the theory (Hartwig and Dearing 1979:12, 13).
Although EDA tends to suggest rather than confirm hypotheses, the pro cedures advocated are not incompatible with a confirmatory mode of
analysis. All researchers engage in EDA to some degree. What EDA provides is a more formal way of structuring the exploratory phases of research.
Clearly, the earlier such exploration occurs in the research process, the more likely it is to have a significant positive effect on subsequent stages in the research design. This is true whether or not confirmation is involved, but it is especially true if EDA techniques are integrated with a CDA design that has as its objective the formal evaluation of hypotheses.
One form such a "hybrid" research design might take is shown schemati
cally in Figure 6.7. The diagram is a partial expansion and reordering of some of the elements in the CDA flowchart (Figure 6.3). It differs from Figure 6.3 in three respects.
First, compare the positions of the "data acquisition" boxes in the two
diagrams. Data are defined in terms of a statistical hypothesis in a confir
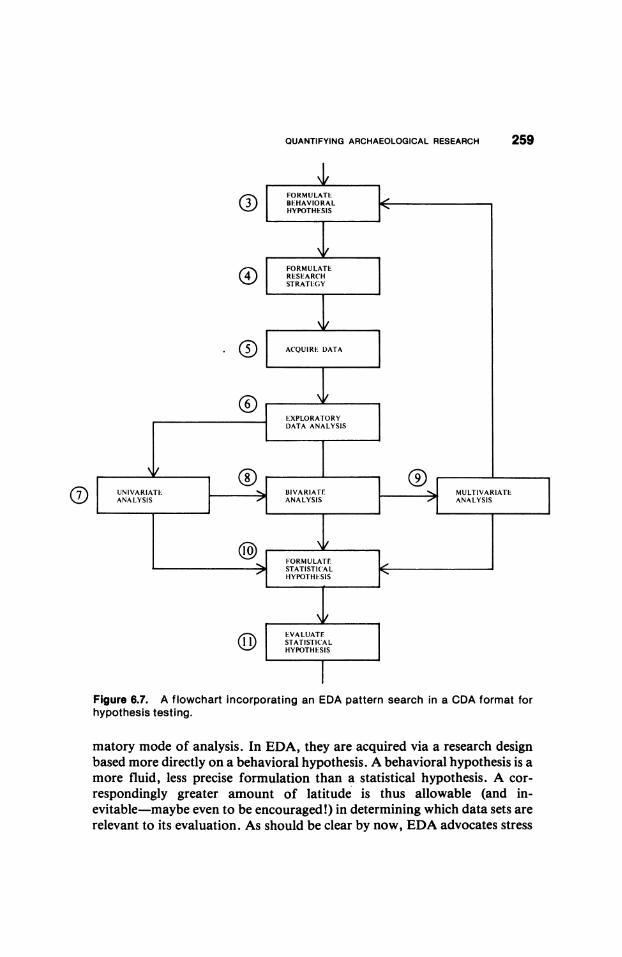
QUANTIFYING ARCHAEOLOGICAL RESEARCH 259
FORMULATE BEHAVIORAL d HYPOTHESIS
FORMULATE RESEARCH STRATEGY
ACQUIRE DATA
EXPLORATORY DATA ANALYSIS
O2) | UNIVARIATE BMVARIAT MULTIVARIATE | ANALYSIS ANALYSIS | l ANALYSIS
()| FORMULATE: , > ~~~~~~STATISTI('AL
HYPOTHES IS
EVA LUATEX () STATISTIC'AL
HYPOTHE.SIS
Figure 6.7. A flowchart incorporating an EDA pattern search in a CDA format for hypothesis testing.
matory mode of analysis. In EDA, they are acquired via a research design based more directly on a behavioral hypothesis. A behavioral hypothesis is a
more fluid, less precise formulation than a statistical hypothesis. A cor
respondingly greater amount of latitude is thus allowable (and in evitable-maybe even to be encouraged!) in determining which data sets are
relevant to its evaluation. As should be clear by now, EDA advocates stress
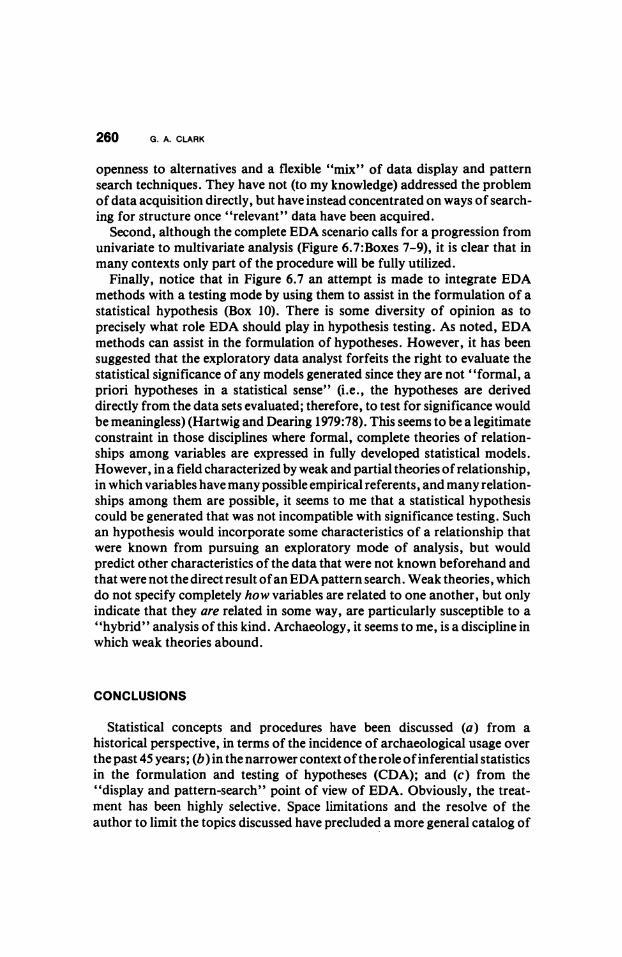
260 G. A. CLARK
openness to alternatives and a flexible "mix" of data display and pattern search techniques. They have not (to my knowledge) addressed the problem of data acquisition directly, but have instead concentrated on ways of search ing for structure once "relevant" data have been acquired.
Second, although the complete EDA scenario calls for a progression from univariate to multivariate analysis (Figure 6.7:Boxes 7-9), it is clear that in
many contexts only part of the procedure will be fully utilized. Finally, notice that in Figure 6.7 an attempt is made to integrate EDA
methods with a testing mode by using them to assist in the formulation of a
statistical hypothesis (Box 10). There is some diversity of opinion as to precisely what role EDA should play in hypothesis testing. As noted, EDA methods can assist in the formulation of hypotheses. However, it has been suggested that the exploratory data analyst forfeits the right to evaluate the statistical significance of any models generated since they are not "formal, a priori hypotheses in a statistical sense" (i.e., the hypotheses are derived directly from the data sets evaluated; therefore, to test for significance would be meaningless) (Hartwig and Dearing 1979:78). This seems to be a legitimate constraint in those disciplines where formal, complete theories of relation ships among variables are expressed in fully developed statistical models.
However, in a field characterized by weak and partial theories of relationship, in which variables have many possible empirical referents, and many relation ships among them are possible, it seems to me that a statistical hypothesis
could be generated that was not incompatible with significance testing. Such an hypothesis would incorporate some characteristics of a relationship that were known from pursuing an exploratory mode of analysis, but would predict other characteristics of the data that were not known beforehand and that were not the direct result of an EDA pattern search. Weak theories, which
do not specify completely how variables are related to one another, but only indicate that they are related in some way, are particularly susceptible to a "hybrid" analysis of this kind. Archaeology, it seems to me, is a discipline in
which weak theories abound.
CONCLUSIONS
Statistical concepts and procedures have been discussed (a) from a historical perspective, in terms of the incidence of archaeological usage over the past 45 years; (b) in the narrower context of the role of inferential statistics in the formulation and testing of hypotheses (CDA); and (c) from the "display and pattern-search" point of view of EDA. Obviously, the treat
ment has been highly selective. Space limitations and the resolve of the author to limit the topics discussed have precluded a more general catalog of
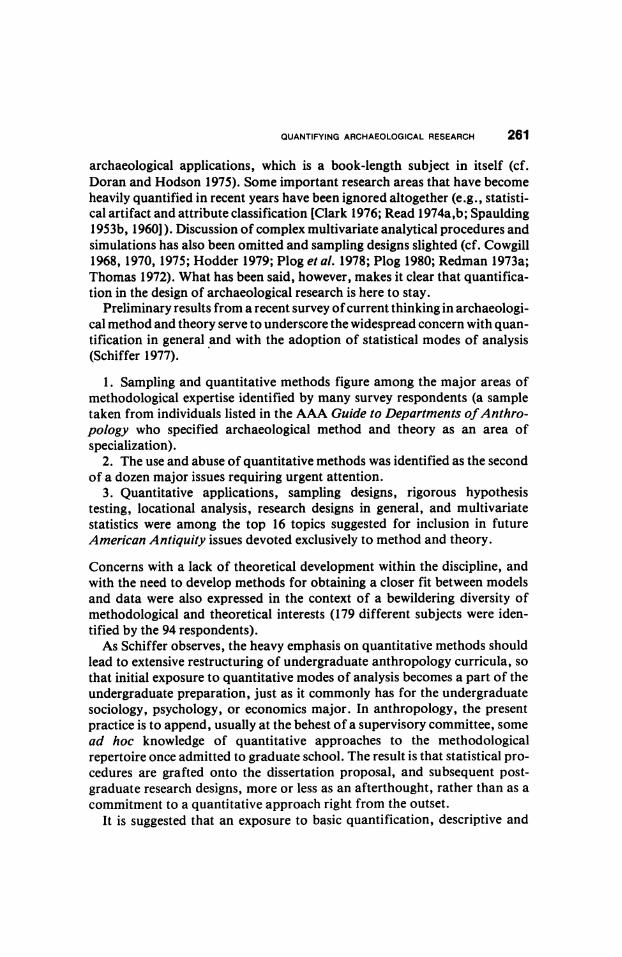
QUANTIFYING ARCHAEOLOGICAL RESEARCH 261
archaeological applications, which is a book-length subject in itself (cf. Doran and Hodson 1975). Some important research areas that have become
heavily quantified in recent years have been ignored altogether (e.g., statisti cal artifact and attribute classification [Clark 1976; Read 1974a,b; Spaulding 1953b, 1960]). Discussion of complex multivariate analytical procedures and simulations has also been omitted and sampling designs slighted (cf. Cowgill 1968, 1970, 1975; Hodder 1979; Plog et al. 1978; Plog 1980; Redman 1973a;
Thomas 1972). What has been said, however, makes it clear that quantifica
tion in the design of archaeological research is here to stay.
Preliminary results from a recent survey of current thinking in archaeologi cal method and theory serve to underscore the widespread concern with quan tification in general and with the adoption of statistical modes of analysis
(Schiffer 1977).
1. Sampling and quantitative methods figure among the major areas of
methodological expertise identified by many survey respondents (a sample taken from individuals listed in the AAA Guide to Departments of Anthro
pology who specified archaeological method and theory as an area of
specialization). 2. The use and abuse of quantitative methods was identified as the second
of a dozen major issues requiring urgent attention.
3. Quantitative applications, sampling designs, rigorous hypothesis testing, locational analysis, research designs in general, and multivariate
statistics were among the top 16 topics suggested for inclusion in future
American Antiquity issues devoted exclusively to method and theory.
Concerns with a lack of theoretical development within the discipline, and
with the need to develop methods for obtaining a closer fit between models
and data were also expressed in the context of a bewildering diversity of
methodological and theoretical interests (179 different subjects were iden tified by the 94 respondents).
As Schiffer observes, the heavy emphasis on quantitative methods should
lead to extensive restructuring of undergraduate anthropology curricula, so that initial exposure to quantitative modes of analysis becomes a part of the
undergraduate preparation, just as it commonly has for the undergraduate
sociology, psychology, or economics major. In anthropology, the present practice is to append, usually at the behest of a supervisory committee, some
ad hoc knowledge of quantitative approaches to the methodological
repertoire once admitted to graduate school. The result is that statistical pro
cedures are grafted onto the dissertation proposal, and subsequent post
graduate research designs, more or less as an afterthought, rather than as a
commitment to a quantitative approach right from the outset.
It is suggested that an exposure to basic quantification, descriptive and
262 G. A. CLARK
inferential techniques (i.e., univariate descriptive methods, basic probability theory, inductive statistics, the common probability distributions, and the common bivariate methods) would not be inappropraite by the end of the
sophomore year and could be accommodated by the inclusion of a single in
troductory course in the undergraduate curriculum. With this basic founda tion, at least three more courses would be helpful. One would consist of a
survey of nonparametric approaches (e.g., Hollander and Wolfe 1973), which are of considerable utility to researchers because of wider applicability to archaeological data, fewer constraints (than multivariate techniques) on appropriate application, greater ease in comprehension, and a probable lower
incidence of abuse. The second course would consist of an intensive exposure to one or more
advanced techniques (e.g., correlation, analysis of variance, simple linear regression), perhaps followed by an introduction to multiple linear regression and the more complicated ANOVA models (cf. Cooley and Lohnes 1971; Tat
suoka 1971). Such special topic courses can be found among the undergrad
uate "service" offerings of any average-sized mathematics or statistics
department. Exposure to the more complex aspects of social statistics (e.g., factor and principal components analysis, multivariate ANOVA, etc.) should probably be deferred until graduate school, or be confined to optional courses available to the upper division undergraduate major.
The third course should provide an introduction to the EDA perspective. Although EDA is a recent development in statistics itself (the "definitive" texts [Mosteller and Tukey 1977; McNeil 1977; Tukey 1977] have appeared
only in the past 4 years ), universities with comprehensive, service-oriented
mathematics and/or statistics departments have apparently been offering such courses since about 1979 (Young, personal communication 1981). At
Arizona State University, which is perhaps typical of the large state
supported institutions in which most anthropology programs are found, EDA courses are offered by the Department of Mathematics and are assigned
numbers that allow for both upper division undergraduate and graduate credit. Thus far, archaeologists have made only partial and eclectic use of
EDA techniques, and they have not been formally incorporated into most ar chaeological research designs. This lack of penetration is due to the com
parative "newness" of the approach, and to the bias in favor of CDA, which
has been so evident in the literature of the past 15 years.
It is believed that curriculum restructuring of the kind suggested would bring anthropology more in line with other undergraduate social science cur ricula. At a minimum, the total student credit-hour investment would be on the order of three courses-not too great a price to pay for a more integrated
conception of statistical reasoning and a better appreciation of the range of
QUANTIFYING ARCHAEOLOGICAL RESEARCH 263
statistical methods, both of which are likely to pay dividends later on in graduate school and in subsequent professional life.
The regional orientation of many projects (e.g., SARG) and the related development of large, computerized archaeological data banks combine to create a situation in which broad sets of interrelated problems can be studied simultaneously and under the umbrella of a comprehensive research design. Because of the central role of sampling and the impact that descriptive and in
ferential statistics have had on the technical level of archaeological research in these regional contexts, the potential now exists for the acquisition of bodies of data useful for the evaluation of many different kinds of hypotheses. Statistical methods, appropriately applied, greatly expand the possibilities for manipulating these kinds of data in precise, sophisticated, and replicable
ways, both to answer more limited questions of archaeological interest, and ultimately to produce conclusions that have some credibility within the broader field of anthropology as a whole.
ACKNOWLEDGMENTS
I want to thank N. Ackerly, F. Plog, C. R. Stafford, J. Hepworth, and D. Young (Arizona
State University); D. H. Thomas (American Museum of Natural History); M. Schiffer (Univer sity of Arizona); and A. C. Spaulding (University of California at Santa Barbara) for taking the time to evaluate various drafts of this chapter. Thomas, Schiffer, and Ackerly were especially helpful and, quite apart from substantive matters, their encouragement and support did much to keep my morale up while struggling with the revision of the manuscript. The comments of these
individuals, and those of five anonymous reviewers, have been incorporated wherever possible, and they have substantially improved the paper. P. Whitten (Eastern New Mexico University)
helped me collect the American Antiquity data, for which I am most grateful. Barbara Bellamy
typed the lengthy manuscript in short order, cheerfully, and with a minimum of errors. If, after
all of this, any factual shortcomings or misconceptions remain, they are of course my respon
sibility.
REFERENCES
Andrews, D. 1972 Plots of high-dimensional data. Biometrics 28:125-136.
Andrews, D., R. Gnanadesikan, and J. Warner 1973 Methods for assessing multivariate normality. In Multivariate analysis (Vol. III),
edited by P. Krishnaiah. New York: Academic Press. Pp. 95-116. Asch, D.
1975 On sample size problems and the uses of nonprobabilistic sampling. In Sampling in archaeology, edited by J. Mueller. Tucson: University of Arizona Press. Pp. 170 191.
264 G. A. CLARK
Bailey, G. 1978 Shell middens as indicators of postglacial economies: a territorial perspective. In
The early postglacial settlement of Northern Europe, edited by P. Mellars. Lon don: Duckworth. Pp. 37-63.
Benfer, R. 1979 Sample size in multivariate analysis: some corrections of Davis' review of Sam
pling in Archaeology. Plains Anthropologist 24:71-73. Bettinger, R.
1979 Curation, statistics and settlement studies: a reply to Munday and Lincoln. American Antiquity 44:352-359.
Binford, L. 1962 Archaeology as anthropology. American Antiquity 28(2):217-225. 1965 Archaeological systematics and the study of culture process. American Antiquity
31(2):203-210. 1967 Smudge pits and hide smoking: the use of analogy in archaeological reasoning.
American Antiquity 32(l):1-12. 1968 Archaeological perspectives. InNewperspectivesin archaeology, edited by S. Bin
ford and L. Binford. Chicago: Aldine. Pp. 5-32. 1972 Model building-paradigms, and the current state of paleolithic research. In An
archaeologicalperspective. New York: Seminar Press. Pp. 244-294. Binford, L., and S. Binford
1966 A preliminary analysis of functional variability in the Mousterian of Levallois facies. American Anthropologist 68(2):238-295.
Blair, D. 1975 On purely probabilistic theories of scientific inference. Philosophy of Science
42(3):242-249. Blalock, H.
1972 Social statistics (second ed.). New York: McGraw-Hill. Blanton, R.
1976 The role of symbiosis in adaptation and sociocultural change in the Valley of Mex ico. In The valley of Mexico: studies in prehispanic ecology and society, edited by
E. Wolf. Albuquerque: University of New Mexico Press. Pp. 181-201. Braidwood, R.
1952 The Near East and thefoundations of civilization. Condon Lectures, Oregon State System for Higher Education, Eugene.
1958 Near Eastern prehistory. Science 127(3312):1419-1430. Braidwood, R., and B. Howe
1960 Prehistoric investigations in Iraqi Kurdistan. Studies in Ancient Oriental Civiliza tion No. 31. Oriental Institute, University of Chicago.
Brainerd, G. 1951 The place of chronological ordering in archaeological analysis. American An
tiquity 16(4):301-313. Bridgman, P.
1938 The logic of modern physics. New York: Macmillan. Cassels, R.
1972 Locational analysis of prehistoric settlement in New Zealand. Mankind 8:212 222.
Chenhall, R. 1971a The archaeological data bank, a progress report. Computers and the Humanities
5(3):159-169.
QUANTIFYING ARCHAEOLOGICAL RESEARCH 265
1971b Computers in anthropology and archaeology. IBM Data Processing Application Manual GE 20-0384-0.
1972 Computerized data banks for archaeologists. Archaologie, 3, Berlin: B. Heslig. 1975 A rationale for archaeological sampling. In Sampling in archaeology, edited by
J. Mueller. Tucson: University of Arizona Press. Pp. 3-25. Christenson, A.
1979 On the virtues of simplicity: some comments on statistical analysis in anthropol ogy. Plains Anthropologist 24:35-38.
Christenson, A., and D. Read 1977 Numerical taxonomy, R-mode factor analysis and archaeological classification.
American Antiquity 42(2):163-179. Clark, G.
1974 On the analysis of multidimensional contingency table data using log linear models. In Computer applications in archaeology, edited by J. Wilcock and S. Laflin. Birmingham: Computer Centre. Pp. 47-58. University of Birmingham.
1976 More on contingency table analysis, decision-making criteria and the use of log linear models. American Antiquity 41(3):259-273.
1979 Spatial association at Liencres, an Early Holocene open site on the Santander coast, north-central Spain. In Computer graphics in archaeology, edited by S. Upham. Anthropological Research Paper No. 15. Tempe: Arizona State University. Pp. 121-144.
1981 Aspects of statistics in archaeological research designs. In The design of archaeo logical research, edited by L. Raab and T. Klinger. Chicago: Aldine.
Clark, G., R. Effland, J. Johnstone 1977 Quantitative spatial analysis. In Computer applications in archaeology, edited by
S. Laflin. Birmingham: Computer Centre, University of Birmingham. Pp. 27-44. Clark, G., and S. Lerner
1980 Prehistoric resource utilization in early Holocene Cantabrian Spain. In Catchment analysis: essays in prehistoric resource space, edited by F. Findlow and J. Ericson. Los Angeles: University of California. Pp. 53-96.
Clark, J. G. D.
1954 Excavations at Star Carr. Cambridge: Cambridge University Press. Clarke, D.
1973 Archaeology: the loss of innocence. Antiquity 47(l):6-18. 1977 Spatial information in archaeology. In Spatial archaeology, edited by D. Clarke.
New York: Academic Press. Pp. 1-32. Cohen, J.
1969 Statisticalpower analysisfor the behavioral sciences. New York: Academic Press. Conover, W.
1971 Practical nonparametric statistics. New York: Wiley. Cooley, W. W., and T. R. Lohnes
1971 Multivariate data analysis. New York: Wiley. Cordell, L., and F. Plog
1979 Escaping the confines of normative thought: a re-evaluation of Puebloan
prehistory. American Antiquity 44(3):405-429. Cowgill, G.
1964 The selection of samples from large sherd collections. American Antiquity 29(4):467-473.
1967 Computers and prehistoric archaeology. In Computers in humanistic research,
edited by C. Bowles. Englewood Cliffs (N.J.): Prentice-Hall. Pp. 47-56.
266 G. A. CLARK
1968 Archaeological applications of factor, cluster and proximity analysis. American Antiquity 33(3):367-375.
1970 Some sampling and reliability problems in archaeology. In Archeologie et calculateurs: problemes semiologiques et mathematiques. Paris: Editions du Cen tre National de la Recherche Scientifique. Pp. 161-172.
1975 A selection of samplers: comments on archaeostatistics. In Sampling in archaeol ogy, edited by J. Mueller. Tucson: University of Arizona Press. Pp. 258-276.
1977 The trouble with significance tests and what we can do about it. American An tiquity 42:350-368.
Crumley, C. 1976 Toward a locational definition of state systems of settlement. American Anthro
pologist 78(1):59-73. 1979 Three locational models: an epistemological assessment for anthropology and ar
chaeology. In Advances in archaeological method and theory (Vol. 2), edited by M. B. Schiffer. New York: Academic Press. Pp. 143-174.
Dacey, M. 1973 Statistical tests of spatial association in the locations of tool types. American An
tiquity 38(3):320-328. Degerman, R.
1972 The geometric representation of some structures. In Multi-dimensional scaling: theory and applications in the behavioral sciences (Vol. 1), edited by R. Shepard,
K. Romney, and S. Nerlove, New York: Seminar Press. Doran, J., and F. Hodson
1975 Mathematics and computers in archaeology. Cambridge, Massachusetts: Harvard University Press.
Dunnell, R. 1971 Systematics in prehistory. New York: Free Press.
Euler, R., and G. Gumerman (Editors) 1978 Investigations of the southwestern anthropological research group. Flagstaff:
Museum of Northern Arizona. Everitt, B.
1974 Cluster analysis. London: Heinemann Educational Books. Fairbanks, C.
1942 The taxonomic position of Stalling's Island, Georgia. American Antiquity 7(3):223-231.
Flannery, K. 1973 Archaeology with a capital "S." In Research and theory in current archaeology,
edited by C. Redman. New York: Wiley Interscience. Pp. 47-53. 1976a Empirical determinants of site catchments in Oaxaca and TehuacAn. In The early
mesoamerican village, edited by K. Flannery. New York: Academic Press. Pp. 103-116.
1976b Evolution of complex settlement systems. In The early mesoamerican village, edited by K. Flannery. New York: Academic Press. Pp. 162-172.
Ford, J. 1952 Measurements of some prehistoric design developments in the Southeastern states.
Anthropological Papers of the American Museum of Natural History 44(3). 1954a Spaulding's review of Ford. American Anthropologist. 56(1):109-111. 1954b Comment on A. C. Spaulding's "Statistical techniques for the discovery of arti
fact types." American Antiquity 19(4):390-391. 1954c On the concept of types: the type concept revisited. American Anthropologist
56(1):42-54.
QUANTIFYING ARCHAEOLOGICAL RESEARCH 267
Francis, J., and G. Clark 1980 Bronze and Iron Age economies on the Meseta del Norte, north-central Spain. In
Catchment analysis: essays in prehistoric resource space, edited by F. Findlow and J. Ericson. Los Angeles: University of California. Pp. 97-136.
Fritz, J., and F. Plog 1970 The nature of archaeological explanation. American Antiquity 35(4):405-412.
Gaines, S. 1978 Computer application of the SARG data: an evaluation. In Investigations of the
southwestern anthropological research group, edited by R. Euler and G. Gumer man. Flagstaff: Museum of Northern Arizona. Pp. 119-138.
1981 Data bankapplications in archaeology, edited by S. Gaines. Tucson: University of Arizona Press.
Gnanadesikan, R. 1977 Methods for statistical data analysis of multivariate observations. New York:
Wiley. Graham, J.
1970 Discrimination of British Lower and Middle Paleolithic handaxe groups using canonical variates. World Archaeology 1(3):321-327.
Gross, A. 1976 Confidence interval robustness with long-tailed symmetrical distributions. Jour
nal of the American Statistical Association 71:409-416. Gumerman, G., D. Westfall, and C. Weed
1972 Archaeological investigations on Black Mesa: the 1969-1970 seasons. Prescott College, Studies in Anthropology No. 4.
Hampel, F. 1978 Contributions to the theory of robust estimation. Unpublished Ph.D dissertation,
Department of Statistics, University of California, Berkeley. Hanson, G., and A. Goodyear
1975 The shared tool method of spatial analysis: applications at the Brand Site. Un published manuscript, Department of Anthropology, Arizona State University, Tempe.
Hartwig, F., and B. Dearing
1979 Exploratory data analysis. Sage Quantitative Applications in the Social Sciences No. 16. Beverly Hills, California: Sage.
Henkel, R. 1976 Tests of significance. Sage University Paper on Quantitative Applications in the
Social Sciences, No. 4, edited by E. Uslaner. Beverly Hills, California: Sage.
Hietala, H., and D. Stevens
1977 Spatial analysis: multiple procedures in pattern recognition studies. American An tiquity 42(4):539-559.
Hodder, I. 1972a Interpretation of spatial patterns in archaeology: two examples. Area 4:223-229. 1972b Locational models and the study of Romano-British settlement. In Models in ar
chaeology, edited by D. Clarke. London: Methuen. Pp. 887-909. 1974 A regression analysis of some trade and marketing patterns. World Archaeology
6(2):172-189. 1979 Trends and surfaces in archaeology. In Computer graphics in archaeology, edited
by S. Upham. Anthropological Research Paper No. 15. Tempe: Arizona State
University. Pp. 149-154. Hodder, I., and M. Hassall
1971 The non-random spacing of Romano-British walled towns. Man 6(2):391-407.
268 G. A. CLARK
Hodder, I., and C. Orton 1976 Spatial analysis in archaeology. London: Cambridge University Press.
Hodson, F. 1970 Cluster analysis and archaeology: some new developments and applications.
World Archaeology 1(3):299-320. 1971 Numerical typology and prehistoric archaeology. In Mathematics in the archaeo
logical and historical sciences, edited by F. Hodson, D. Kendall, and P. Tautu. Edinburgh: Edinburgh University Press. Pp. 30-45.
Hodson, F., P. Sneath, J. Doran 1966 Some experiments in the numerical analysis of archaeological data. Biometrika
53(2):31 1-324. Hollander, M., and D. Wolfe
1973 Nonparametric statistical methods. New York: Wiley. Huber, D.
1975 Robust statistics: a review. Annals of Mathematical Statistics 43:1041-1067. Johnson, F.
1951 Radiocarbon dating. American Antiquity 17(1):1-65. Johnson, G.
1972 A test of the utility of central place theory in archaeology. In Man, settlement and urbanism, edited by J. Ucko, R. Tringham, and G. Dimbleby. London: Duck worth. Pp. 769-785.
1973 Local exchange and early state development in southwestern Iran. Anthropologi cal papers, Museum of Anthropology, University of Michigan, No. 51.
1975 Locational analysis and the investigation of Uruk local exchange systems. In An cient civilization and trade, edited by J. Sabloff and C. Lamberg-Karlovsky. Albu querque: University of New Mexico Press. Pp. 285-339.
Jolicoeur, P. 1975 Multivariate geographical variation in wolf Canis lupus L. In Multivariate
statistical methods: among groups covariation, edited by W. Atchley and E. Dowder. Stroudsburg (PA): Hutchinson and Ross. Pp. 200-216.
Judge, J., J. Ebert, and R. Hitchcock 1975 Sampling in regional archaeological survey. In Sampling in archaeology, edited by
J. Mueller. Tucson: University of Arizona Press. Pp. 82-123. Kluckhohn, C.
1940 The conceptual structure in Middle American studies. In The Maya and their neighbors, edited by C. Hay et al. New York: Appleton. Pp. 41-51.
Koestler, A. 1964 The act of creation. New York: Dell.
Kroeber, A. 1940 Statistical classification. American Antiquity 6(1):29-44. 1942 Tapajo pottery. American Antiquity 7(4):403-405.
Kruger, L. 1976 Are statistical explanations possible? Philosophy of Science 43(1):129-146.
Kuhn, T. 1962 The structure of scientific revolutions. Chicago: University of Chicago Press. 1970a Logic of discovery or psychology of research? In Criticism and the growth of
knowledge, edited by I. Lakatos and A. Musgrave. Cambridge: Cambridge University Press. Pp. 1-23.
1970b Reflections on my critics. In Criticism and the growth of knowledge, edited by I. Lakatos and A. Musgrave. Cambridge: Cambridge University Press. Pp. 231 278.
QUANTIFYING ARCHAEOLOGICAL RESEARCH 269
Lax, D. 1975 An interim report of a Monte Carlo study of robust estimators of width. Technical
Report 93 (Series 2), Department of Statistics, Princeton University, Princeton. Lehmer, D.
1951 Robinson's coefficient of agreement-a critique. American Antiquity 17(2):151. Leinhardt, S., and S. Wasserman
1979 Exploratory data analysis: an introduction to selected methods. In Sociological methodology 1979, edited by K. Schuessler. San Francisco: Jossey-Bass. Pp. 31 1 372.
Longacre, W. 1970 Archaeology as anthropology: a case study. Anthropological papers of the
University of Arizona, No. 17. Tucson: University of Arizona Press. Matson, R.
1980 The proper place of multivariate techniques in archaeology. American Antiquity 45(2):340-344.
Matson, R., and W. Lipe 1975 Regional sampling: a case study of Cedar Mesa, Utah. In Sampling in archaeol
ogy, edited by J. Mueller. Tucson: University of Arizona Press. Pp. 124-146. McNeil, D.
1977 Interactive data analysis: a practical primer. New York: Wiley. Meehl, P.
1967 Theory testing in psychology and physics: a methodological paradox. Philosophy of Science 34(2):103-115.
Meiklejohn, C. 1978 Ecological aspects of population size and growth in late-glacial and early post
glacial northwestern Europe. In The early postglacial settlement of Northern Europe, edited by P. Mellars. London: Duckworth. Pp. 243-294.
Mellars, P., and S. Reinhardt 1978 Patterns of Mesolithic land-use in southern England: a geological perspective. In
The early postglacial settlement of Northern Europe, edited by P. Mellars. Lon
don: Duckworth. Pp. 243-294. Meltzer, D.
1979 Paradigms and the nature of change in American archaeology. American Antiq uity 44(4):644-657.
Merrill, R. 1946 A graphical approach to some problems in Maya astronomy. American Antiquity
12(1):35-72. Morgan, C.
1973 Archaeology and explanation. World Archaeology 4(3):259-276. 1974 Explanation and scientific archaeology. World Archaeology 6(2):133-137.
Mosteller, F., and J. Tukey 1977 Data analysis and regression: a second course in statistics. Reading, Massachu
setts: Addison-Wesley. Mueller, J.
1972 The use of sampling in archaeological survey. Unpublished Ph.D. dissertation, Department of Anthropology, University of Arizona, Tucson.
1974 The use of sampling in archaeological survey. Memoirs, Society for American Ar chaeology, No. 28.
1975 Sampling in archaeology, edited by J. Mueller. Tucson: University of Arizona Press.
1978 A reply to Plog and Thomas. American Antiquity 43(2):286, 287.
270 G. A. CLARK
Munday, F., and T. Lincoln 1979 A comment on Bettinger: problems in archaeological interpretation. American
Antiquity 44:345-351. Newell, R., and A. Dekin
1978 An integrative strategy for the definition of behaviourally meaningful archaeolog ical units. Palaeohistoria 20:7-38.
Northrop, F. 1947 The logic of the sciences and the humanities. New York: Macmillan.
Ott, L. 1977 An introduction to statistical methods and data analysis. North Scituate, Massa
chusetts: Duxbury Press. Plog, F.
1974 The study ofprehistoric change. New York: Academic Press. Plog, F., R. Effland, and D. Green
1978 Inferences using the SARG data bank. In Investigations of the southwestern an thropological research group, edited by R. Euler and G. Gumerman. Flagstaff:
Museum of Northern Arizona. Pp. 139-148. Plog, S.
1976 Relative efficiencies of sampling techniques for archaeological surveys. In The early mesoamerican village, edited by K. Flannery. New York: Academic Press. Pp. 136-158.
1980 Stylistic variation in prehistoric ceramics. Cambridge: Cambridge University Press.
Plog, S., F. Plog, and W. Wait
1978 Decision making in modern surveys. In Advances in archaeological method and theory (Vol. 1), edited by M. Schiffer. New York: Academic Press. Pp. 384-422.
Price, T. D. 1978 Mesolithic settlement systems in the Nederlands. In The early postglacial settle
ment ofNorthern Europe, edited by P. Mellars. London: Duckworth. Pp.81-114. Read, D.
1974a Some comments on the use of mathematical models in anthropology. American Antiquity 39(1):3-15.
1974b Some comments on typologies in archaeology and an outline of a methodology. American Antiquity 39(2):216-242.
1975 Regional sampling. In Sampling in archaeology, edited by J. Mueller. Tucson: University of Arizona Press. Pp. 45-60.
Redman, C. 1973a Multistage field work and analytical techniques. AmericanAntiquity 38(1):61-79. 1973b Research and theory in current archaeology: an introduction. In Research and
theory in current archaeology, edited by C. Redman. New York: Wiley Inter science. Pp. 5-20.
Renfrew, C. 1977 Models for exchange and spatial distribution. In Exchange systems in prehistory,
edited by T. Earle and J. Ericson. New York: Academic Press. Pp. 71-90.
Robinson, W. 1951 A method for chronologically ordering archaeological deposits. American Antiq
uity 16(4):293-301. Robinson, W., and G. Brainerd
1952 Robinson's coefficient of agreement-a rejoinder. American Antiquity 18(1):60, 61.
QUANTIFYING ARCHAEOLOGICAL RESEARCH 271
Roper, D. 1979 The method and theory of site catchment analysis: a review. In Advances in ar
chaeological method and theory (Vol. 2), edited by M. B. Schiffer. New York: Academic Press. Pp. 120-142.
Rossman, D. 1976 A site catchment analysis of San Lorenzo, Veracruz. In The early mesoamerican
village, edited by K. Flannery. New York: Academic Press. Pp. 95-102. Salmon, Merrilee H.
1975 Confirmation and explanation in archaeology. American Antiquity 40:459-470. 1976 "Deductive" versus "inductive" archaeology. American Antiquity 41:376-380.
Salmon, Wesley C. 1973 Logic (second ed.). Englewood Cliffs, New Jersey: Prentice-Hall.
Schiffer, M. 1972 Archaeological context and systemic context. American Antiquity 37(2): 156-165. 1973 Cultural formation processes of the archaeological record: applications at the
Joint Site. Unpublished Ph.D. dissertation, Department of Anthropology, University of Arizona, Tucson.
1977 Current directions in archaeological method and theory. American Anthropolo gist 79(3):647-649.
1978 Taking the pulse of method and theory in American archaeology. American An tiquity 43:153-158.
Schwartz, B. 1967 A logical sequence of archaeological objectives. American Antiquity 32(4):487
497. Selltiz, C., M. Jahoda, M. Deutsch, and S. Cook
1959 Research methods in social relations. New York: Holt. Sibson, R.
1971 Computational methods in cluster analysis. In Mathematics in the archaeological and historical sciences, edited by F. Hodson, D. Kendall, and P. Tautu. Edin
burgh: Edinburgh University Press. Pp. 59-61. Siegel, S.
1956 Nonparametric statistics for the behavioral sciences. New York: McGraw-Hill. Smith, B.
1977 Archaeological inference and inductive confirmation. American Anthropologist 79(3):598-617.
Sneath, P., and R. Sokal
1973 Numerical taxonomy. San Francisco: Freeman. Sokal, R., and F. Rohlf
1969 Biometry. San Francisco: Freeman. Sokal, R., and P. Sneath
1963 Principles of numerical taxonomy. San Francisco: Freeman. Spaulding, A.
1953a Review: measurements of some prehistoric design developments in the south eastern states (Ford). American Anthropologist 55(4):588-591.
1953b Statistical techniques for the discovery of artifact types. American Antiquity 18(3):305-313.
1954a Reply to Ford. American Antiquity 19(4):391-393. 1954b Reply to Ford. American Anthropologist 56(1):112-114. 1960 Statistical description and comparison of artifact assemblages. Viking Fund
Publications in Anthropology 28:60-83.
272 G. A. CLARK
1971 Some elements of quantitative archaeology. In Mathematics in the archaeological and historical sciences, edited by F. Hodson, D. Kendall, and P. Tautu. Edin burgh: Edinburgh University Press. Pp. 3-16.
Stafford, C., and B. Stafford
1979 Some comments on the design of lithic experiments. Lithic Technology 8(2). Stark, B., and D. Young
1981 Linear nearest neighbor analysis. American Antiquity 46(2):284-300. Steward, J., and F. Setzler
1938 Function and configuration in archaeology. American Antiquity 4(1):4-l0. Sterud, E.
1978 Changing aims of Americanist archaeology: a citations analysis of American Antiquity-1946-1975. American Antiquity 43(2):294-302.
Tatsuoka, M. 1971 Multivariate analysis. New York: Wiley.
Thomas, D. 1970 Archaeology's operational imperative: Great Basin projectile points as a test case.
In Annual report, archaeological survey. Los Angeles: University of California. Pp. 29-60.
1972 The use and abuse of numerical taxonomy in archaeology. Archaeology and Physical Anthropology in Oceania 7(1):31-49.
1976 Figuring anthropology: first principles of probability and statistics. New York: Holt, Rinehart and Winston.
1978 The awful truth about statistics in archaeology. American Antiquity 43(2). 1980 The gruesome truth about statistics in archaeology. American Antiquity
45(2):344, 345. Thompson, R.
1956 The subjective element in archaeological inference. Southwestern Journal of An thropology 12(2):327-332.
Tuggle, D., A. Townsend, and T. Riley 1972 Laws, systems and research designs: a discussion of explanation in archaeology.
American Antiquity 37(1):3-12. Tukey, J.
1977 Exploratory data analysis. Reading, Massachusetts: Addison-Wesley. Wallis, W., and H. Roberts
1967 Statistics: a new approach. New York: Free Press. Watson, P., S. LeBlanc, and C. Redman
1971 Explanation in archaeology: an explicitly scientific approach. New York: Colum bia University Press.
1974 The covering law model in archaeology: practical uses and formal interpretations.
World Archaeology 6(2):125-132. Weaver, D.
1977 Prehistoric population dynamics and environmental exploitation in the Manuelito Canyon district, northwestern New Mexico. Unpublished Ph.D. dissertation, Department of Anthropology, Arizona State University.
Whallon, R. 1973a Spatial analysis of occupation floors: the application of dimensional analysis of
variance. In The explanation of culture change: models in prehistory, edited by C. Renfrew. London: Duckworth. Pp. 115-130.
1973b Spatial analysis of occupation floors I: application of dimensional analysis
variance. American Antiquity 38(3):266-278.
QUANTIFYING ARCHAEOLOGICAL RESEARCH 273
1974 Spatial analysis of occupation floors II: application of nearest neighbor analysis. American Antiquity 39(1):16-34.
1978 The spatial analysis of Mesolithic occupation floors: a reappraisal. In The early postglacial settlement of Northern Europe, edited by P. Mellars. London: Duckworth. Pp. 27-36.
White, D. 1973 Mathematical anthropology. In Handbook of social and cultural anthropology,
edited by J. Honigman. Chicago: Rand McNally. Pp. 369-446.
Wilcox, D. 1975 A strategy for perceiving social groups in puebloan sites. Fieldiana: Anthropology
65: 120-159. Wilcox, D., and A. Sullivan
1979 Toward independent archaeological theory. Ms. available from authors, Depart ment of Anthropology, Arizona State University, Tempe.
Willey, G. 1953 Prehistoric settlement patterns in the Viru Valley, Peru. Bureau of American
Ethnology Bulletin No. 155. Washington, D.C. Willey, G., and P. Phillips
1958 Method and theory in American archaeology. Chicago: Phoenix Books, Univer sity of Chicago Press.
Willey, G., and J. Sabloff
1974 A history of American archaeology. San Francisco: Freeman.
Zarky, A. 1976 Statistical analysis of site catchments at Oc6s, Guatemala. In The early meso
american village, edited by K. Flannery. New York: Academic Press. Pp. 117-127.
Zubrow, E. 1972 Environment, subsistence and society: the changing archaeological perspective. In
Annual review of anthropology (Vol. 1), Palo Alto, California: Annual Reviews.
Pp. 179-206.


