Embed Size (px)
Citation preview

Quantitative Nonlinear Optical Assessment of AtherosclerosisProgression in RabbitsLeila B. Mostaco-Guidolin,†,‡ Elicia K. Kohlenberg,† Michael Smith,† Mark Hewko,† Arkady Major,‡
Michael G. Sowa,† and Alex C.-T. Ko*,†,‡
†National Research Council Canada, Medical Devices Portfolio, 435 Ellice Avenue, Winnipeg, MB, Canada R3B 1Y6‡Department of Electrical and Computer Engineering, University of Manitoba, 75A Chancellor’s Circle, Winnipeg, MB, Canada R3T5V6
ABSTRACT: Quantification of atherosclerosis has been a challeng-ing task owing to its complex pathology. In this study, we validated aquantitative approach for assessing atherosclerosis progression in arabbit model using a numerical matrix, optical index for plaqueburden, derived directly from the nonlinear optical microscopicimages captured on the atherosclerosis-affected blood vessel. Apositive correlation between this optical index and the severity ofatherosclerotic lesions, represented by the age of the rabbits, wasestablished based on data collected from 21 myocardial infarction-prone Watanabe heritable hyperlipidemic rabbits with age rangingbetween new-born and 27 months old. The same optical index also accurately identified high-risk locations for atheroscleroticplaque formation along the entire aorta, which was validated by immunohistochemical fluorescence imaging.
Atherosclerosis is a progressive disease. It begins as a fattystreak on the endothelial surface, and gradually develops
into a focally thickened intima. Although the etiology ofatherosclerosis is not completely understood, historically,atherosclerosis has been regarded as a disease of vascularlipid accumulation with endothelial alterations mainly left outof the picture until recently.The response-to-injury hypothesis1,2 postulates that noxious
agents, such as shear stress and oxidizing molecules, damage theendothelium, resulting in increased permeability and enhancedexpression of cell adhesion molecules. The ensuing infiltrationof inflammatory cells starts a complex process of persistentinflammation and vascular remodeling, which stretches overdecades and leads to the development and progression ofatheromatous plaques, aneurysms, and arterial thrombosis.Infiltrating leukocytes scavenge lipids and are subsequently
transformed to foam cells, making up the bulk of early lesions.3
The ensuing inflammation attracts more leukocytes andstimulates vascular smooth muscle cells to proliferate andmigrate toward the intima.4 The accumulation of smoothmuscle cells is the predominant source of extracellular matrix(ECM) proteins, such as collagen and elastin, which contributeto progressive plaque growth and arterial remodeling.5,6 Inadvanced lesions, circumferential stress from high arterial bloodpressure has direct impact on the structural integrity of theprotective fibrous cap. The fibrous cap of advanced atheromasgradually becomes thinner (and weaker) at the plaqueshoulders and ultimately ruptures. As a consequence, thethrombotic content of the necrotic core is exposed to theblood,7−9 thus leading to thrombus formation which occludesthe artery. Resulting blockage of blood flow often causes acute
ischemia in downstream organs, which may result in loss offunction and, ultimately, in death. Therefore, having thecapability to differentiate high-risk from stable atheromabecomes important in clinical evaluation. Developing newmethodologies to identify morphological features of variousstages of atherosclerosis development would enable stand-ardization of clinical interpretation of atherosclerotic pro-gression and aid in studying the relationship between plaquemorphology, composition, pathophysiology, and clinicalrepercussions.Conventional clinical imaging techniques such as X-ray
fluorescence angiography,10 intravascular ultrasound(IVUS),11−13 and magnetic resonance imaging (MRI)14 arewidely used for detecting and localizing stenotic lesions inpatients;9,11−13 however, they are not sensitive tools fordetecting nonstenotic lesions due to low spatial resolutionand lack of in vivo chemical specificity. In vivo differentiation ofplaque type and assessment of plaque burden still largely relyon the use of IVUS. Although IVUS allows visualization of thegeometry of the artery and atherosclerotic lesions,11−13
according to histopathological studies, it lacks the requiredspecificity and sensitivity in detecting early lesions and lipid-richlesions.Recently, optical coherence tomography (OCT) demon-
strated strong clinical potential in anatomical imaging foratherosclerosis.15−18 Despite its high-resolution visualization ofvessel wall structures, OCT does not provide chemical
Received: February 10, 2014Accepted: June 3, 2014
Article
pubs.acs.org/ac
© XXXX American Chemical Society A dx.doi.org/10.1021/ac5005635 | Anal. Chem. XXXX, XXX, XXX−XXX

identification of plaques. Exogenous labeling or a secondarymodality with higher biochemical specificity is required forconfirmation. For example, in a very recent study, Liang et al.19
reported an intravascular optical imaging system with integratedfluorescence and OCT functionalities, demonstrated throughexcised arterial tissue of normal rabbit injected with modelplaque material of highly saturated grease. The plaque materialcould only be confirmed as high-lipid material by fluorescenceimaging after labeling with Annexin V-conjugated Cy 5.5.Another emerging optical technique, nonlinear optical
imaging microscopy (NLOM), has also demonstrated its utilityin imaging vascular structures, including atherosclerotic lesions.Multimodal NLOM imaging is capable of rapidly surveyingbulk arterial tissue and providing information related to the keybiochemical components and structures that portend advancedatherosclerosis. One of the best attributes of NLOM for tissueimaging is that it can be operated without labeling. These label-free NLOM contrasts can be attributed to its intrinsicsensitivity toward specific structural proteins and lipid-richstructures.20−24 Extensive studies have confirmed that majorextracellular components such as elastin and collagen gave riseto strong two-photon excited fluorescence (TPEF) and second-harmonic generation (SHG) signals, respectively.25−27
Although extracellular collagen also exhibits TPEF, it is muchless bright, therefore collagen fibril distribution has been mainlyinvestigated with SHG imaging.The third NLOM modality, coherent anti-Stokes Raman
scattering (CARS), was demonstrated highly useful for high-resolution visualization of biological structures with dense,long-chain C−H groups, such as extracellular lipid droplets andintracellular lipids.28−30 Using two colinear wavelengths, thepump and the Stokes beams, CARS is capable of selectiveimaging of lipids and lipid-rich extracellular structures when theenergy difference between the pump and the Stokes is tuned tomatch the signature CH2 stretching vibrations at ∼2845 cm−1.In arterial imaging, each of these NLOM methods has been
used to capture the biochemical morphology of majorbiomolecules accumulated on the arterial wall, for exampleTPEF for extracellular elastin structures, SHG for type-1collagen fibrils, while CARS for depositions of lipid-ladenextracellular structures. While elastin and collagen are majorstructural proteins implicated in the remodeling of the arterialwall during plaque development, lipid accumulation is ahallmark feature of atherosclerosis. Atherosclerosis imaginghas been reported using various forms of NLOM,31−38 and anumber of studies have compared histoimmunochemicalsections of atherosclerotic tissues with corresponding NLOMimages of adjacent sections for confirmation.35,39−41 Thesestudies clearly indicated strong correlation between NLOMsignatures and the extracellular changes in tunica media andinternal elastic lamina (IEL) during atherosclerosis progression.In order for NLOM to translate into a clinical imaging tool,
not only does it need to provide reliable chemical data but alsoneeds to be compatible with catheterization. Angioscopy is acommon imaging tool in clinical assessment of atherosclerosis.As a conventional imaging-based endoscopic technique, itprovides almost no biochemical contrast. Adding biochemicalspecificity through integration of a secondary imaging modalitywithin a medical catheter is an attractive approach to improvethe sensitivity and specificity of conventional endoscopicimaging. The concept of NLO endoscope has been aroundfor many years, yet it faces several technical challenges.
Recently, several studies have started to demonstratesignificant progress toward overcoming these technical barriers,which have earlier prevented realization of a clinical NLOendoscope.42−44 These challenges include, but are not limitedto, inefficient transmission of ultrafast laser pulses in fiber opticsand miniaturization of optical scanning mechanism at the fibertip. Prototypes and patent applications have been publishedrecently, demonstrating the feasibility and clinical potential of aNLO endoscope in the near future.While the technology has evolved from a benchtop tool to a
potential clinical device, very few studies have in factinvestigated the potential of quantitative NLOM imaging incorrelating with atherosclerosis progression, which we believe isa very important step to bridge the gap between technologicaldevelopment and actual clinical acceptance.Previously, we have reported a preliminary study of a
quantitative NLOM method for tracking atherosclerosis plaqueburden using NLOM data collected from four rabbits of variousages.38 The current study expanded on this basis and included amuch larger and more complete sample size in order toevaluate the true correlation between these newly proposedquantitative NLOM data metrics and the expected temporalpattern of plaque accumulation within the aorta of theserabbits.45
Moreover, in this study we also explored the possibility ofusing the proposed NLOM image metrics to identify high-risklocations of atherosclerosis development along the aorta. It wasfound that atherosclerotic lesions show a remarkably consistentdistribution pattern throughout the arterial lumen, being mostlyconfined to branch points of large- and middle-sized arteries.46
Typical sites of atherosclerotic burden include the carotidbifurcation, aortic arch, coronary arteries, the aorta near branchpoints of intercostal, renal, and mesenteric arteries, as well asthe iliac bifurcation. These sites correspond to devianthemodynamic blood flow conditions compared to the laminarflow pattern that is found in the greater part of thevasculature.47 Complementary immunohistochemistry testsbased on the expression of intercellular adhesion molecules(ICAM) were also performed to confirm these critical locationsalong the aorta.48 ICAM fluorescence imaging results werecompared with data processed using the proposed quantitativeNLOM image metrics. The results of this work demonstratethat the developed quantitative analysis of NLOM images canbe used to greatly enhance the quality and reliability of clinicalinterpretation of atherosclerosis progression.
■ EXPERIMENTAL SECTIONAll animal experiments conformed to the guidelines set out bythe Canadian Council on Animal Care regarding the care anduse of experimental animals and were approved by the localAnimal Care Committee of the National Research Council ofCanada.
Animal Model and Tissue Preparation. A rabbit modeldeveloped for studying atherosclerosis was used for this study.The myocardial infarction prone Watanabe heritable hyper-lipidemic (WHHL-MI) rabbits spontaneously develop athero-sclerotic plaques without modified diet due to a hereditarydefect in low-density lipoprotein (LDL) processing.49,50
Arterial tissues were harvested from a total of 21 WHHL-MIrabbits that were sacrificed at ages ranging from new born to 27months. This sampling represents stages of atheroscleroticdisease progression, with the 27 month-old rabbit considered tobe at the end of its natural life cycle based on the observation
Analytical Chemistry Article
dx.doi.org/10.1021/ac5005635 | Anal. Chem. XXXX, XXX, XXX−XXXB

that both the 24- and the 27-month-old rabbits died of naturalcauses. A schematic illustration of the adopted procedure isshown in Figure 1.
The excised aorta was dissected from the ascending aorta tothe external iliac artery and then rinsed in heparinized saline.The exterior surfaces of the harvested aorta tissue weredelicately cleaned of connective tissue prior to subdividing theaorta into four tissue segments. Each of these segmentsrepresents a specific location along the artery, as illustrated inFigure 2: the aortic arch (AA), thoracic artery (TA), abdominalartery (AbA), and external iliac artery (EIA).These bulk artery samples were placed on a moist surface in
Petri dishes with the luminal surface facing up. Hydration wasmaintained throughout the measurements by periodicapplication of PBS solution on the luminal surface. Digitalphotographs of the luminal surface were acquired and regionsof interest were identified prior to imaging. More proceduraldetails can be found elsewhere.35,38 After imaging, a portion of
each piece of bulk tissue was set aside for histology andimmunohistochemistry.
Histology. The artery was cross-sectioned on a cryotomeinto 8 μm thin sections while embedded in optical cuttingtemperature medium. The tissue sections were immersion-fixedin either 95% ethanol or 10% buffered formalin based onindividual staining protocols. Three different types of stainingwere carried out. Hematoxylin and eosin (H&E) stainingrevealed general tissue morphology, picro-sirius red highlightedcollagen/elastin fibers under circularly polarized condition, andoil red O staining accented high-lipid structures. Unlabeledartery sections imaged under the NLOM microscope were thencompared to adjacent stained sections for validation. Histo-logical images were obtained using a 10× air objective lens on aZeiss Axio Observer Z1 system equipped with AxioCam ICc3CCD camera (Carl Zeiss Canada, Toronto, ON, Canada).
Immunohistochemistry and Fluorescence Imaging.Bulk tissue immunohistochemistry tests based on near-IRfluorescence imaging of intercellular adhesion molecule 1(ICAM-1) was carried out in order to confirm and quantify theplaque severity at various locations along the aorta. Binding andrecruitment of circulating leukocytes to the vascular endothe-lium and further migration into the subendothelial spaces aremajor processes in the development of atherosclerosis and aremediated through a diverse family of cellular adhesionmolecules that are expressed on the surface of vascularendothelial cells.51 Among all identified adhesion molecules,the expression and biological properties of intercellularadhesion molecule 1 (ICAM-1) are well-characterized.52−54
ICAM-1 concentration is elevated during inflammatoryconditions in which detailed pathology studies have docu-mented increased expression of cellular adhesion molecules onendothelial cells and other tissue types.55−57 Frozen arterialtissue samples from 6 rabbits representing different age groupswere cut into smaller segments and then fixed for 10 min atroom temperature in methanol (MeOH). Samples were thenwashed three times with phosphate-buffered saline (PBS)followed by incubation in a 10% normal goat serum solution(in PBS with 0.03% Triton) at room temperature for 1 h andthen washed once with PBS. Samples were then incubatedovernight with 1:250 solution of Cy5.5-labeled mdAb-ICAM.Samples were washed once with PBS and kept in PBS untilimaging. After imaging, samples were stored in the −80 °C
Figure 1. Overview/schematic of sample cutting adopted in this study.The aorta was divided into four segments; each segment was furtherdivided into smaller pieces to be used for NLOM imaging, histology,and immunohistochemistry validation experiments.
Figure 2. Points along the aorta which were used as a reference for NLOM measurements. These points represent locations of interest to be studiedwith respect to plaque burden along the blood vessels.
Analytical Chemistry Article
dx.doi.org/10.1021/ac5005635 | Anal. Chem. XXXX, XXX, XXX−XXXC

freezer. The Cy5.5 dye present in mdAb-ICAM was stimulatedwith an array of light-emitting diodes emitting at 675 nm. Thefluorescence was obtained at 700 nm, and the images wereacquired using a Photometrics CCD camera at a 1 s acquisitiontime, defined after testing the signal-to-noise ratio for eachsample. The CCD camera was equipped with a 700 nm cut-offfilter. All of the fluorescence data collected were analyzed usingMatlab. The region containing the sample in each image wassegmented, in order to consider only the pixels which werecarrying information regarding the sample itself; in other words,the background area where no sample was present was notcounted. The mean fluorescent intensity for each image wascomputed by averaging over all pixels carrying the sample’sfluorescence information.CARS-Based Multimodal Nonlinear Optical Micros-
copy. A custom-built multimodal nonlinear optical (NLO)laser scanning microscope was used for two-photon-excitedfluorescence (TPEF), second harmonic generation (SHG), andcoherent anti-Stokes Raman scattering (CARS) imaging ofarterial tissue. For bulk tissue samples, all signals were collectedin the epi-direction. Technical details of the NLO microscopewere previously reported.35 In summary, this is a NLOmicroscope powered by a femtosecond Ti:sapphire oscillator(Tsunami, Spectra-Physics). The Ti:sapphire oscillator waspumped by 8 W of green laser light at 532 nm (Mellellium Pro,Spectra-Physics) and produced 100 fs pulses centered at 800nm. The pulse train was divided into two beams; one beam wasused to generate tissue TPEF and SHG signals, and the otherbeam was coupled into a photonic crystal fiber (PCF) togenerate a supercontinuum (SC). In this arrangement, theCARS signal was generated by spatially and temporallyoverlapping the pump beam (fs pulses at 800 nm) and theStokes beam (the near-IR portion of the SC emission from thePCF, which was selected by using a bandpass filter). Thefrequency difference between the pump and the Stokes beamswas tuned to match the vibrational frequency of the C−Hstretching mode for fast lipid imaging. This system wasequipped with three nondescanned PMT detectors forcapturing colocalized TPEF, SHG, and CARS signalssimultaneously through an array of optical filters and dichroicmirrors. A 20×, 0.75 NA air objective lens (Olympus) was used
for both laser focusing and epi-imaging in order to maintain areasonably sized field of view and good spatial resolution.During imaging, typical laser powers measured at the samplewere 25 mW for the pump beam and 8 mW for the Stokesbeam. Scanimage software (version 3.5) was used forcontrolling hardware and acquiring images.58 Corrections forillumination variations, dark current, and signal intensitynormalization were performed according to the proceduresoutlined previously.59
■ RESULTS AND DISCUSSION
Indexing Atherosclerosis Progression with NLOMImage Parameters. In Figure 3, representative biomorpho-logical features of atherosclerotic arterial lumen (Figure 3a) andhealthy artery wall (Figure 3e) were visualized utilizingmultimodal NLOM imaging. Covered with complex extrac-ellular components, the surface of an atherosclerotic plaque(shown in Figure 3a) revealed abundant lipid-laden structuresand the formation of thick collagen fibrils. No significantcontribution from elastin proteins was observed. The brightgreen particles shown in the TPEF image are likely to beoxidized low-density lipo-proteins (ox-LDL). In contrast, ahealthy arterial wall showed intact internal elastic lamina(mainly elastin) with no lipids. A small amount of collagen wasalso observed as part of the intrinsic tunica intima structure.60
Premerged TPEF, SHG, and CARS images for Figure 3(panels a and e) are illustrated in Figure 3 (panels b−d and f−h), respectively.Certain types of biomorphological changes can be tracked by
each of the nonlinear signals (e.g., collagen by SHG and lipidsby CARS).None of these signals by itself, however, was able to provide a
reliable correlation between NLOM image features andatherosclerosis progression.32 In order to improve the level ofcorrelation, we previously proposed a new multidimensionalapproach to tracking atherosclerosis progression with NLOMimage characteristics. This approach not only took into accountcontributions from each individual channel (TPEF, SHG, andCARS) but also included interchannel signal correlations. Ournew discriminatory parameter, optical index for plaque burden
Figure 3. Representative epi-NLOM images of a WHHL-MI rabbit’s artery wall, acquired from (a) plaque surface and (e) healthy artery wall. Images(b−d) and (f−h) are premerged TPEF, SHG, and CARS images for (a) and (e), respectively.
Analytical Chemistry Article
dx.doi.org/10.1021/ac5005635 | Anal. Chem. XXXX, XXX, XXX−XXXD

or OIPB (eq 1), was tested and found to be useful indifferentiating the atherosclerotic plaque burden.38
The OIPB index is a linear expression of several imagestatistics extracted from NLO images obtained from the arteriallumen of rabbit aortas. These values are derived primarily fromsignal intensity and the interchannel intensity correlationbetween three intrinsic NLO signals (TPEF, SHG, andCARS). Preliminary results obtained from 4 WHHLMI rabbitssuggested a semilinear correlation between OIPB index andatherosclerosis progression.38 The OIPB index can be ex-pressed as
= + +
+ +
OIPB SS SS d(SS , SS )
d(SS , SS ) d(SS , SS )SHG CARS SHG TPEF
CARS TPEF CARS SHG (1)
Equation 1 contains 5 parameters that are extracted fromNLOM images. Each SSx term is the ratio of signal to density
(S/D), where S (signal) is the average signal value for the imageand D (density) the density of pixels with significant signaldivided by the total number of pixels in each image (512 × 512,in our case).Significant signal corresponds to the number of pixels
showing signal intensity above a pre-established thresholddivided by the total number of pixels (512 × 512) of theacquired image. The threshold is established by computing theaverage signal level measured from multiple backgroundlocations, in the absence of any targeted molecular structures(e.g., collagen fibrils).The NLO signals are designated by subscript (SHG, CARS,
or TPEF).38,59 The term d(SSX, SSY) is the numericaldifference between two SS scores, for example, d(SSCARS,SSTPEF) = SSCARS − SSTPEF. Note that the SSTPEF score was notincluded on its own in the calculation of OIPB because itprovided no additional contrast for discrimination between
Figure 4. (a−e) Representative epi-NLOM images obtained from the (f−j) luminal surface of healthy rabbit aorta obtained from the luminal surfaceof atherosclerotic plaques. Each image is labeled with the age of the rabbit when it was sacrificed and its corresponding OIPB index calculated usingeq 1. Images were collected using a 20× air objective lens.
Figure 5. (a) Mean OIPB values for images acquired from plaque (large squares) and healthy (large circles) regions of each rabbit, plotted againstrabbit’s age. Each small point represents data acquired from a single rabbit with indicated age on the chart. The big symbols represent the mean valueof each region. As the rabbit’s age increases, regions dominated by plaque show higher OIPB values, suggesting that the lesions are advancing withage. The solid line is the mean value, considering all animals, and the two colored regions are the standard deviation around the mean. (b) MeanOIPB values for all rabbits, considering both plaque and healthy regions. Each small point represents data acquired from a single rabbit withindicated age on the chart. The Greek numbers on top of each graph are associated with age groups presenting similar histopathological patterns.(Buja et al.36). The solid black circles represent the overall mean OIPB value for each age group.
Analytical Chemistry Article
dx.doi.org/10.1021/ac5005635 | Anal. Chem. XXXX, XXX, XXX−XXXE
atherosclerosis lesions from the healthy vessel wall based onpreliminary data. Detailed discussion of the selection andinterpretation of each term in eq 1 can be found elsewhere.38
The OIPB index is a tool developed to quantifyatherosclerotic plaque development as a function of thevariations of four main extracellular components representedin multimodal NLO images: collagen, lipid deposition, elastinfibers, and other fluorescent macromolecules. Examples ofOIPB indices and images are illustrated in Figure 4. Each imagein Figure 4 is shown with its corresponding OPIB index(highlighted in yellow). Figure 4 (panels a−e) show relativelyhealthy lumen with low OIPB indices, while Figure 4 (panelsf−j) show representative images of atherosclerotic lumencaptured at increasing ages with correspondingly higher OIPBindices. Figure 4f shows an image of a plaque from a 4-month-old rabbit artery which has an OIPB of 17.3, whereas Figure 4j,shows an image of a 24-month-old rabbit artery, which has anOIPB value of 69.3.The average OIPB indices obtained from images of healthy
lumen surfaces (OIPBhealthy) and atherosclerotic (OIPBathero)locations are plotted against rabbit’s age in Figure 5a. Eachpoint shown in this plot corresponds to the mean OIPB valueobtained from regions either dominated by plaque or free ofplaques. The horizontal coordinate represents the age of eachrabbit when it was sacrificed. In the majority of these 21 rabbits,the values of OIPBathero are significantly higher than those of
OIPBhealthy. The OIPBhealthy values are distributed between −73and 5, while most OIPBathero values range from 15 to 70. Thehigh level of OIPBathero values are attributed to the higher levelof collagen remodeling and higher-density of lipid deposition inplaques, thus translating into the higher SSSHG and SSCARSterms.Other information, such as unique patterns of lesion
development are also noticed. In Figure 5a, it shows thatOIPBhealthy index increases steadily over the first 14−15 monthsperiod (shaded in green) before leveling off, whereas theOIPBathero index is relatively stable before the 14−15 monthsperiod and then jumps up very quickly reaching a new high.This observation suggests that in this rabbit model, there seemsto be a critical time window when atherosclerotic plaquesundergo the most prominent lipid and collagen deposition,which can be associated with the disease progression. In ourcase, this time window is between 15 and 20 months of therabbits’ life cycle. Although no direct histological evidence hasbeen reported to date for such a pattern of atherosclerosisprogression, this observation has the potential to greatly impacttherapeutic strategies if it can be proved to be true histologicallyin the future.In Figure 5b, the mean OIPB values from all rabbits are
presented as a function of age. In this plot, each rabbit wasrepresented by a mean OIPB value, obtained by averaging datacollected from all imaged healthy lumen and atherosclerotic
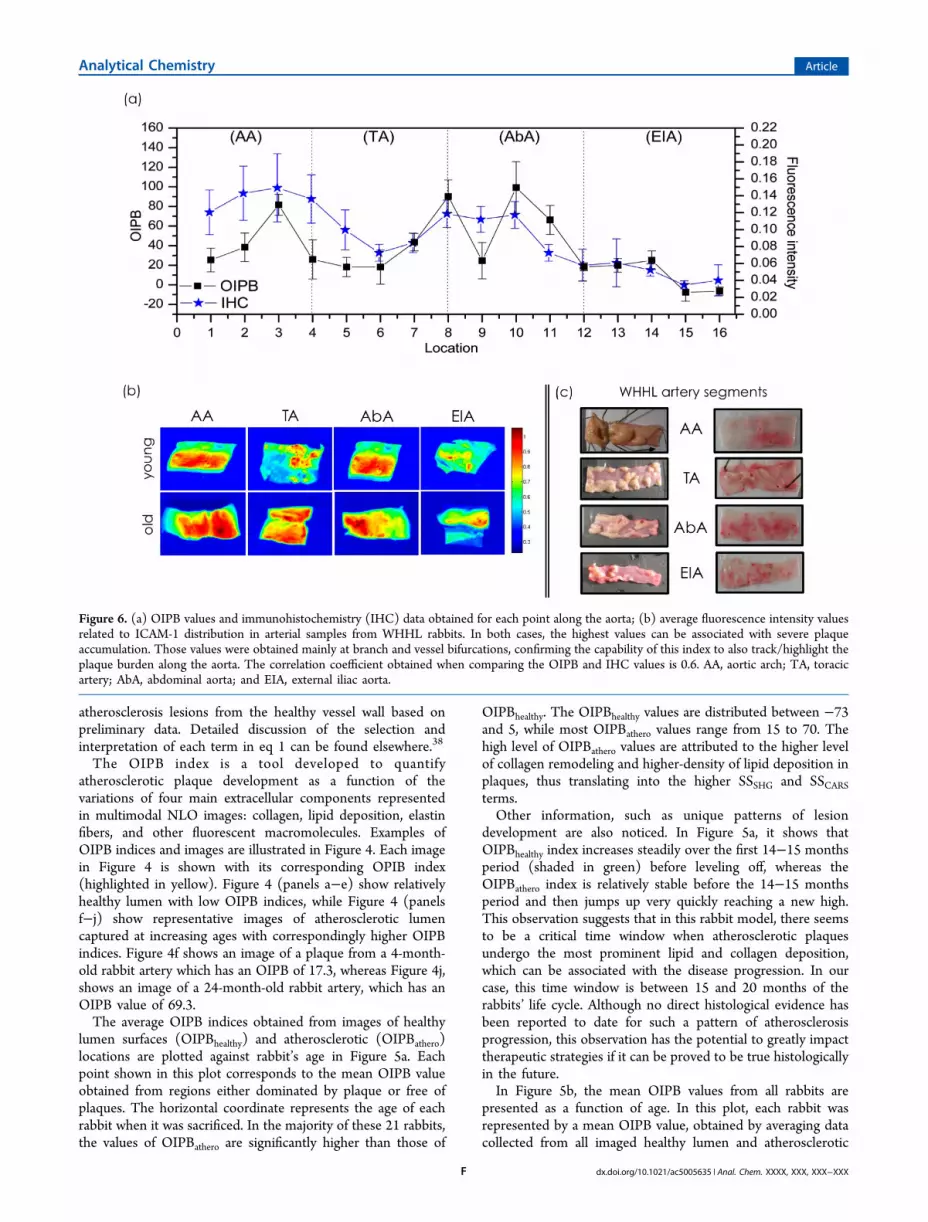
Figure 6. (a) OIPB values and immunohistochemistry (IHC) data obtained for each point along the aorta; (b) average fluorescence intensity valuesrelated to ICAM-1 distribution in arterial samples from WHHL rabbits. In both cases, the highest values can be associated with severe plaqueaccumulation. Those values were obtained mainly at branch and vessel bifurcations, confirming the capability of this index to also track/highlight theplaque burden along the aorta. The correlation coefficient obtained when comparing the OIPB and IHC values is 0.6. AA, aortic arch; TA, toracicartery; AbA, abdominal aorta; and EIA, external iliac aorta.
Analytical Chemistry Article
dx.doi.org/10.1021/ac5005635 | Anal. Chem. XXXX, XXX, XXX−XXXF

locations. The index shows a clear correlation with age. Sinceplaque burden increases with the age of the rabbit in thismodel,45 this result implies that the OIPB value is quantitativelyindicative of the severity of the atherosclerotic lesions or plaqueburden. The groups (I), (II), (III), and (IV) indicated in Figure5 (panels a and b) represent age groups which present similarhistopathological patterns in the arterial wall, according to aprevious study reported by Buja et al.45 Group (I) contains datafrom rabbits aged from 0 to 5 months; group (II) presents datacollected from 5.5 to 14 months old animals; and group (III)and (IV) show data acquired from the rabbits within the 14.5 to20 months and 20.5 to 27 months aged groups, respectively.Previously, Kolodgie et al.60 published an extensive report
tracking the progression and the varying levels of athero-sclerotic plaques in WHHL rabbits, using histology and SEMimaging. Kolodgie’s study indicated that the degree ofatherosclerotic progression correlated closely with rabbit’s ageand animals older than 12−14 month-old showed signs ofsevere atherosclerosis. These conclusions are consistent withobservations revealed by the OIPB data. Another point to bemade for Figure 5b is that, statistically speaking, the differencebetween the OIPB values of age groups (II) and (III) issignificant. In contrast, the OIPB values of age groups (III) and(IV) are not statistically different, suggesting that after a criticalage (e.g., 18−20 month-old), the disease has already reached itsmost severe stage. As the OIPB is very sensitive tracking theaccumulation of lipid-rich cells and collagen, we can build thehypothesis that this index has a great potential tracking thedisease progression.Indexing Plaque Burden at Critical Locations along
the Aorta. During the course of atherosclerosis progression,certain locations along the aorta are more prone to plaquedevelopment than others.36,61−62 These locations includetransition zones such as bends, arches, and bifurcations. Atthese locations, the rate and pattern of blood flow are alteredthus affecting local hemodymanics.63−65
Attempts have been made to assess the role of hemodynamicfactors in atherosclerosis by correlating the distribution ofintimal lesions, usually in excised collapsed arteries, withpresumed changes in blood flow conditions or with flowpatterns visualized in idealized glass or plastic models.Elevations or variations in flow velocity and shear stress,66,67
flow separation,68 and turbulence69−71 have each beenproposed as hemodynamic potentiator of lesion formation.The relation between vessel wall shear stress and the
development and progression of atherosclerosis has been well-established.70−72 Low and oscillating wall shear stress seems tofavor the development of atherosclerosis as determined by theinverse relation between the wall shear stress and arterial wallthickness.73−75 Wall shear stress also seems to depend on age,blood pressure, and body mass index. The value of wall shearstress is subject-specific and vessel-specific. Wall shear stressvaries along the same vessel and around the vessel’scircumference.In this context, since we have demonstrated that OIPB index
was a good indicator for assessing plaque burden in alongitudinal study, it would be interesting to test if OIPBindex is also capable of accurately detecting higher plaqueburden at critical locations along the aorta. NLOM imagesacquired at four predefined points per segment (i.e., arterialarch, thoracic artery, abdominal artery, and external iliac artery)were thus analyzed and then compared with immunohisto-
logical data based upon ICAM-1 fluorescence imaging. Theapproximate location of each point is shown in Figure 2.The average OIPB value for each point shown in Figure 2,
calculated by considering both healthy and plaque regions, ispresented in Figure 6a (black trace, with squared points). Notethat locations 3, 8, and 10 are characterized by the highestOIPB values, hence the highest plaque burden along the entireaorta tree. When compared with the OIPB data, data fromimmunohistochemistry (IHC, blue trace) based on ICAM-1fluorescence intensity showed marked similarity with acalculated correlation coefficient (ρ) of 0.6. In addition, Figure6 (panels b and c) illustrate representative ICAM-1fluorescence images and white-light video images of the fourpredefined arterial segments.Matching results in Figure 6a with location maps in Figure 2,
it becomes clear that the 3 locations with the highest OIPBvalues and ICAM-1 fluorescence intensities correspond to theaortic arch and regions close to the two kidneys’ arterybranches, respectively.In the aortic arch, the pattern of blood flow is more complex
than in the other regions along the descending abdominal aorta,with constant helical and extensive reversal flow resulting fromthe curvature of the arch and the strong pulsatility of flow.70,71
As a result, this turbulence of blood flow and change in arterialwall shear stress leads to an elevated probability of plaquedevelopment within the aortic arch.76 Similarly, regions whichare close to artery branches to the kidney also experiencenonlaminar blood flow due to arterial bifurcation. This too,significantly enhances the early development of atherosclerosislesions.77
Although similar patterns were observed, the ICAM-1 datadoes look slightly different from the OIPB data. From Figure6a, one can see that the drop and rise in OIPB values aroundthese critical locations are much steeper than those presented inthe ICAM-1 fluorescence data. This can be explained by thedifferent sampling size of these two very different opticaltechniques. While each NLOM imaged area is 200 × 200 μm2
in size (with a 20× objective lens), ICAM-1 fluorescence istypically evaluated over an area of ∼1 × 1 cm2. The smallersampling size in NLOM gives a more localized snapshot,whereas the ICAM-1 data presents a picture with informationaveraged over a larger area. This characteristic of NLOM makesit a more sensitive tool in detecting local changes thusgenerating a sharper contrast between different locations.Nonetheless, regions with a greater tendency to be affected byatherosclerotic lesions were successfully tracked by the OIPB.Another interesting observation is that as the rabbit’s age
increases, all four studied aorta regions (AA, TA, AbA, andEIA) show increasing OIPB values. The accumulation of lipid-rich cells and collagen, as previously presented78 and discussedin this work, suggest that the lesions are advancing with age. Onthe basis of this evidence, we believe that the OIPB can be auseful tool to optically track the lesions progression.
■ CONCLUSIONSIn this study, we presented an intensity-based NLOM imageparameter, the optical index for plaque burden (OIPB), andapplied it to assessing atherosclerotic plaque burden. On thebasis of data collected from 21 WHHL-MI rabbits, we havedemonstrated a strong correlation between the OIPB and theseverity of atherosclerotic lesions, which increase with therabbits’ age. The OIPB index was also used to accuratelyidentify high-risk locations for plaque formation along the
Analytical Chemistry Article
dx.doi.org/10.1021/ac5005635 | Anal. Chem. XXXX, XXX, XXX−XXXG

entire aorta. Identified locations were later validated byimmunohistochemical fluorescence imaging. While the OIPBindex seems to be an adequate objective indicator ofatherosclerosis plaque burden, other relevant NLOM quanti-tative matrices might be added to improve the quality of clinicalinterpretation. For instance, including quantitative analysis ofcollagen fibril orientation from the SHG images66 and theshape and size of lipid-rich structures from the CARS imagesmight greatly enhance the reliability of this model for objectivequantification of plaque burden. Ultimately, this would allowclassification of lesions according to the guidelines provided bythe American Heart Association using only the NLOM imagingdata.
■ AUTHOR INFORMATIONCorresponding Author*E-mail: [email protected] ContributionsL.B.M-G. conceived the method, performed imaging measure-ments, and data analyses. A.C-T.K. designed the experiments,performed imaging measurements, and supervised the project.M.H. established the rabbit colony, also coordinated animalservice and imaging works. M.S.D.S. provided expertise onsetting up and maintaining the NLO imaging microscope. A.M.cosupervised the project and also provided assistance inimaging protocols. M.G.S. provided guidance on the imageanalysis. L.B.M-G. and A.C-T K. cowrote the manuscript withinputs from all other authors.NotesThe authors declare no competing financial interest.
■ ACKNOWLEDGMENTSThis work is partially supported by the National ResearchCouncil Canada, Genomics and Health initiative and NaturalScience and Engineering Research Council (NSERC) Discov-ery Grant in the form of student financial support. We thankDr. Elda Hegmann (Kent State University, Kent, OH) for allsupport provided related to the IHC experiments. L.B.M-G.also acknowledges financial support from Edward R. ToporeckGraduate Fellowship, Berdie Irvin Cohen Fellowship, ElizabethAnne Hogan Memorial Scholarship, and International GraduateStudent Scholarship at University of Manitoba.
■ REFERENCES(1) Virchow, R. Thrombosis and Emboli; Science History Publications:Sagamore Beach, MA, 1998.(2) Ross, R.; Glomset, J.; Harker, L. Am. J. Pathol. 1977, 86, 675.(3) Stary, H.; Chandler, A.; Glagov, S.; Guyton, J.; Insull, W., Jr;Rosenfeld, M.; Schecer, S.; Schwartz, C.; Wagner, W.; Wissler, R.Arterioscler., Thromb.,Vasc. Biol. 1994, 14, 840.(4) Raines, E.; Ross, R. Br. Heart J. 1993, 69, 30.(5) Andreeva, E.; Pugach, I.; Orekhov, A. Atherosclerosis 1997, 130,133−142.(6) MacLeod, D.; Strauss, B.; de Jong, M.; Escaned, J.; Umans, V.;van Suylen, R.; Verkerk, A.; de Feyter, P.; Serruys, P. J. Am. Coll.Cardiol. 1994, 23, 59−65.(7) Stary, H.; Chandler, A.; Dinsmore, R.; Fuster, V.; Glagov, S.;Insull, W., Jr; Rosenfeld, M.; Schwartz, C.; Wagner, W.; Wissler, R.Circulation 1995, 92, 1355.(8) Kolodgie, F.; Burke, A.; Farb, A.; Gold, H.; Yuan, J.; Narula, J.;Finn, A.; Virmani, R. Curr. Opin. Cardiol. 2001, 16, 285.(9) Libby, P. J. Int. Med. 2000, 247, 349−358.(10) Courtney, B. K.; Munce, N. R.; Anderson, K. J.; Thind, A. S.;Leung, G.; Radau, P. E.; Foster, F. S.; Vitkin, I. A.; Schwartz, R. S.;
Dick, A. J.; Wright, G. A.; Strauss, B. H. Eur. Heart J. 2008, 29, 583−593.(11) Sun, J.; Zhang, Z.; Lu, B.; Yu, W.; Yang, Y.; Zhou, Y.; Wang, Y.;Fan, Z. Am. J. Roentgenol. 2008, 190, 748−754.(12) Yock, P. G.; Fitzgerald, P. J. Am. J. Cardiol. 1998, 81, 27E−32E.(13) Hodgson, J. M.; Reddy, K. G.; Suneja, R. J. Am. Coll. Cardiol.1993, 21, 35−44.(14) Honda, Y.; Fitzgerald, P. J. Circulation 2008, 117, 2024−2037.(15) Barlis, P.; Schmitt, J. M. EuroIntervention 2009, 4, 529−534.(16) Barlis, P.; Serruys, P. W.; Devries, A.; Regar, E. Eur. Heart J.2008, 29, 2023.(17) Barlis, P.; Ferrante, G.; Del Furia, F.; Di Mario, C. Med. J. Aust.2008, 188, 728.(18) Jang, I. K.; Tearney, G. J.; MacNeil, B.; Takano, M.; Moselewski,F.; Iftima, N.; Shishkov, M.; Houser, S.; Aretz, H. T.; Halpern, E. F.Circulation 2005, 111, 1551−1555.(19) Liang, S.; Saidi, A.; Jing, J.; Liu, G.; Li, J.; Zhang, J.; Sun, C.;Narula, J.; Chen, Z. J. Biomed. Opt. 2012, 17, 070501.(20) Mertz, J. Curr. Opin. Neurobiol. 2004, 14, 610−616.(21) Yue, S.; Slipchenko, M.; Cheng, J. Laser Photonics Rev. 2011.(22) Williams, R.; Zipfel, W.; Webb, W. Curr. Opin. Chem. Biol. 2001,5, 603−608.(23) Zipfel, W.; Williams, R.; Webb, W. Nat. Biotechnol. 2003, 21,1369−1377.(24) Evans, C.; Xie, X. Annu. Rev. Anal. Chem. 2008, 1, 883−909.(25) Helmchen, F.; Denk, W. c. Nat. Methods 2005, 2, 932−940.(26) Zoumi, A.; et al. Biophys. J. 2004, 87.4, 2778−2786.(27) Zipfel, W. R.; et al. Proc. Natl. Acad. Sci. U.S.A. 2003, 100, 7075−7080.(28) Cheng, J.-X.; Xie, X. S. J. Phys. Chem. B 2004, 108, 827−840.(29) Evans, C. L.; et al. Proc. Natl. Acad. Sci. U.S.A. 2005, 102,16807−16812.(30) Evans, C. L.; Xie, X. S. Annu. Rev. Anal. Chem. 2008, 1, 883−909.(31) Le, T.; Langohr, I.; Locker, M.; Sturek, M.; Cheng, J. J. Biomed.Opt. 2007, 12, 054007.(32) Zoumi, A.; Lu, X.; Kassab, G.; Tromberg, B. Biophys. J. 2004, 87,2778−2786.(33) Wang, H.; Langohr, I.; Sturek, M.; Cheng, J. Arterioscler.,Thromb.,Vasc. Biol. 2009, 29, 1342.(34) Wang, H.; Le, T.; Cheng, J. Opt. Commun. 2008, 281, 1813−1822.(35) Ko, A.; Ridsdale, A.; Smith, M.; Mostaco-Guidolin, L.; Hewko,M.; Pegoraro, A.; Kohlenberg, E.; Schattka, B.; Shiomi, M.; Stolow, A.;et al. J. Biomed. Opt. 2010, 15, 020501.(36) Megens, R.; oude Egbrink, M.; Merkx, M.; Slaaf, D.; vanZandvoort, M. Vital Imaging of Large Arteries using Two-Photon LaserScanning Microscopy: Focus on the Arterial Wall; Maastricht UniversityPress, 2008; 87.(37) Doras, C.; Taupier, G.; Barsella, A.; Mager, L.; Boeglin, A.;Bulou, H.; Bousquet, P.; Dorkenoo, K. Opt. Exp. 2011, 19, 15062−15068.(38) Mostaco-Guidolin, L.; Sowa, M.; Ridsdale, A.; Pegoraro, A.;Smith, M.; Hewko, M.; Kohlenberg, E.; Schattka, B.; Shiomi, M.;Stolow, A.; et al. Biom. Opt. Exp. 2010, 1, 59−73.(39) Wang, H.-W.; Thuc, T. L.; Cheng, X. Opt. Commun. 2008, 281,1813−1822.(40) Wang, H.-W.; et al. Arterioscler., Thromb., Vasc. Biol. 2009, 29,1342−1348.(41) Le, T. T.; et al. J. Biomed. Opt. 2007, 12, 054007−054007.(42) Tu, H.; Boppart, S. J. Biophotonics 2014, 9−22.(43) Legare, F.; Evans, C. L.; Ganikhanov, F.; Xie, S. Opt. Exp. 2006,4427−4432.(44) Smith, B.; Naji, M.; Murugkar, S.; Alarcon, E.; Brideau, C.; Stys,P.; Anis, H. Opt. Exp. 2013, 17161−17171.(45) Buja, L.; Kita, T.; Goldstein, J.; Watanabe, Y.; Brown, M.Arterioscler., Thromb., Vasc. Biol. 1983, 3, 87.(46) Caro, C., Fitz-Gerald, J., Schroter, R. Arterial Wall Shear andDistribution of Early Atheroma in Man; Wiley: New York, 1969.
Analytical Chemistry Article
dx.doi.org/10.1021/ac5005635 | Anal. Chem. XXXX, XXX, XXX−XXXH

(47) Ku, D.; Giddens, D.; Zarins, C.; Glagov, S. Arterioscler., Thromb.,Vasc. Biol. 1985, 5 (3), 293−302.(48) Walpola, P.; Gotlieb, A.; Cybulsky, M.; Langille, B. Arterioscler.,Thromb., Vasc. Biol. 1995, 15, 2.(49) Shiomi, M.; Ito, T.; Yamada, S.; Kawashima, S.; Fan, J.Arterioscler., Thromb., Vasc. Biol. 2003, 23, 1239−1244.(50) Shiomi, M.; Ito, T.; Yamada, S.; Kawashima, S.; Fan, J. J.Atheroscler. Thromb. 2004, 11, 184−189.(51) Hwang, S. J.; Ballantyne, C. M.; Sharrett, A. R.; Smith, L. C.;Davis, C. E.; Gotto, A. M.; Boerwinkle, E. Circulation 1997, 96, 4219−4225.(52) Davies, M. J.; Gordon, J. L.; Gearing, A. J. H.; Pigott, R.; Woolf,N.; Katz, D.; Kyriakopoulos, A. J. Pathol. 1993, 171, 223−229.(53) Blann, A. D.; Seigneur, M.; Steiner, M.; Miller, J. P.; McCollum,C. N. Thromb. Haemostasis 1998, 79, 1080−1085.(54) Poston, R. N.; Haskard, D. O.; Coucher, J. R.; Gall, N. P.;Johnson-Tidey, R. R. Am. J. Pathol. 1992, 140, 665.(55) Katz, A. M.; Rosenthal, D.; Sauder, D. N. Int. J. Dermatol. 1991,30, 153−160.(56) Telek, G.; Ducroc, R.; Scoazec, J. Y.; Pasquier, C.; Feldmann,G.; Roze, C. J. Surg. Res. 2001, 96, 56−67.(57) Albelda, S. M. Lab. Invest.; a journal of tech. meth. and path. 1993,68, 4−17.(58) Pologruto, T. A.; Sabatini, B. L.; Svoboda, K. BiomedicalEngineering Online 2003, 2, 13.(59) Strupler, S.; Pena, A.-M.; Hernest, M. Opt. Express 2007, 15,4054−4065.(60) Kolodgie, F. D.; Virmani, R.; Rice, H. E.; Mergner, W. J. Circ.Res. 1990, 66, 1112−1126.(61) Di Tullio, M.; Russo, C.; Jin, Z.; Sacco, R.; Mohr, J.; Homma, S.Circulation 2009, 119, 2376−2382.(62) Ku, D. Annu. Rev. Fluid Mech. 1997, 29, 399−434.(63) Shahcheraghi, N.; Dwyer, H.; Cheer, A.; Barakat, A.; Rutaganira,T. J. Biomech. Eng. 2002, 124, 378.(64) Frangos, S.; Gahtan, V.; Sumpio, B. Arch. Surg. 1999, 134, 1142.(65) Tarbell, J. Annu. Rev. of Biomed. Eng. 2003, 5, 79−118.(66) Fry, D. Hemodynamic Forces in Atherogenesis. In Cerebrovas-cular Diseases; Scheinberg, P., Ed.; Raven Press: New York, 1976, pp77−95.(67) Aoki, T.; Wood, H. A.; Old, L. J.; Boyse, E. A. Nature 1969, 223,159.(68) Scharfstein, H.; Gutstein, W.; Lewis, L. Circ. Res. 1963, 13, 580−584.(69) Ferguson, G.; Roach, M. Cardiovascular Fluid Dynamics 1972, 2,141−157.(70) Gutstein, W.; Schneck, D.; Marks, J. J. Atheroscler. Res. 1968, 8,381−388.(71) Stehbens, W. Exp. Physiol. 1959, 44, 110.(72) Frangos, S.; Gahtan, V.; Sumpio, B. Arch. Surg. 1999, 130, 1142.(73) Tarbell, J. M. Annu. Rev. of Biom. Eng. 2003, 5, 79−118.(74) Gibson, C. Michael; et al. Arterioscler., Thromb.,Vasc. Biol. 1993,13, 310−315.(75) Malek, A. M.; Alper, Seth L.; Izumo, S. JAMA, J. Am. Med. Assoc.1999, 282, 2035−2042.(76) Cheng, C.; et al. Circulation 2003, 113, 2744−2753.(77) Cecchi, E.; et al. Atherosclerosis 2011, 214, 249−256.(78) Mostaco-Guidolin, L. B.; Ko, A. C. T.; Wang, F.; Xiang, B.;Hewko, M.; Tian, G.; Sowa, M. G. Sci. Rep. 2013, 3, 10.1038/srep02190.
Analytical Chemistry Article
dx.doi.org/10.1021/ac5005635 | Anal. Chem. XXXX, XXX, XXX−XXXI


