Embed Size (px)
Citation preview

Quantum and thermal spin relaxation in diluted spin ice: Dy2-xMxTi2O7 (M = Lu, Y) J. Snyder1, B. G. Ueland1, Ari Mizel1, J. S. Slusky2, H. Karunadasa2, R. J. Cava2, and
P. Schiffer1*
1Department of Physics and Materials Research Institute, Pennsylvania State University,
University Park PA 16802
2Department of Chemistry and Princeton Materials Institute, Princeton University,
Princeton, NJ 08540
Abstract
We have studied the low temperature a.c. magnetic susceptibility of the diluted
spin ice compound Dy2-xMxTi2O7, where the magnetic Dy ions on the frustrated
pyrochlore lattice have been replaced with non-magnetic ions, M = Y or Lu. We
examine a broad range of dilutions, 0 ≤ x ≤ 1.98, and we find that the T ~ 16 K freezing is
suppressed for low levels of dilution but re-emerges for x > 0.4 and persists to x = 1.98.
This behavior can be understood as a non-monotonic dependence of the quantum spin
relaxation time with dilution. The results suggest that the observed spin freezing is
fundamentally a single spin process which is affected by the local environment, rather
than the development of spin-spin correlations as earlier data suggested.
1
I. Introduction
Geometrically frustrated magnetic materials, in which the lattice geometry leads
to frustration of the spin-spin interactions, display a variety of novel magnetic behavior
[1]. Of particular recent interest are the rare earth pyrochlores spin ice materials such as
Dy2Ti2O7, Ho2Ti2O7, and Ho2Sn2O7 [2,3,4,5,6,7,8,9,10,11,12,13,14,15,16]. In these
materials the lattice geometry and spin symmetry lead to frustration of ferromagnetic and
dipolar interactions [17,18,19,20] and an unusual disordered ground state that has been
demonstrated experimentally through neutron scattering studies [3,10,14] and also
through measurements of the magnetic specific heat [4,12] and the a.c. magnetic
susceptibility [16]. While the spin entropy only freezes out below Tice ~ 4 K in Dy2Ti2O7,
a.c. magnetic susceptibility studies show a strongly frequency dependent spin-freezing at
Tf ~ 16 K [5,7], below which the high frequency susceptibility (f > 100 Hz) is suppressed.
Because of the high degree of structural and chemical order in this material, the Dy spins
respond to external fields with a very narrow distribution of spin relaxation times around
a single characteristic relaxation time, τ. While τ (T) is thermally activated for T > Tcross
(where Tcross ~ 13 K), below Tcross, τ(T) exhibits relatively weak temperature dependence
due to a crossover from thermal to quantum spin relaxation [6,15,16]. Neutron spin-echo
studies suggest that all of the spin dynamics for T > Tice are associated with single spin
processes [6], while dilution studies over a limited range of dilution [5] suggest that spin-
spin correlations are important even at these high temperatures (which are well above the
energy scale of the spin-spin interactions).
2

To further study the spin dynamics of the spin ice system, we have diluted the
magnetic sublattice by replacing magnetic Dy3+ ions with non-magnetic Y3+ and Lu3+
ions. In doing so, we extended previous studies of diluted spin ice [5] to a much broader
range of dilutions, examining Dy2-xRxTi2O7 for 0 ≤ x ≤ 1.98 (i.e. between a complete
magnetic lattice to 1% filling of the lattice with magnetic Dy3+ ions). Dilution studies of
other geometrically frustrated magnets have lent considerable insight into the nature of
the low temperature behavior [21,22,23,24]. For example, SrCr8-xGa4+xO19 (SCGO), a
frustrated antiferromagnet with a layered kagomé structure [25,26] has been studied
extensively as a function of the concentration of the Cr ions relative to non-magnetic Ga.
While not possessing the level of disorder traditionally associated with spin glasses,
SCGO displays a spin glass transition at low temperatures (Tf ~ 5 K << ΘWeiss ~ 500 K),
which is associated with the geometrical frustration inherent to the kagomé lattice.
Dilution is expected to have a significant impact on such a strongly frustrated system, and
indeed Tf in SCGO is strongly reduced by dilution [27,28], decreasing by ~ 32% for x = 2
(~25% dilution).
In the present study, we use a.c. magnetic susceptibility to probe the nature of the
Dy spin relaxation as a function of dilution in both the thermal and the quantum spin
relaxation regimes. We find that the Tf ~ 16 K spin-freezing is suppressed for low levels
of dilution but re-emerges for x > 0.4 and persists to x = 1.98. This behavior is reflected
in the spin relaxation time, which appears to increase monotonically with dilution in the
thermally activated regime while it has distinctly non-monotonic behavior in the quantum
relaxation regime.
3
II. Experimental Results
Polycrystalline powder samples of Dy2-xMxTi2O7 samples were prepared using
standard solid-state synthesis techniques described previously [5,29]. We used non-
magnetic ions, M = Y and Lu, which have nearly the same ionic radius as Dy. X-ray
diffraction demonstrated the samples to be single-phase with the pyrochlore structure.
We studied the magnetization (M) as well as the real and imaginary parts (χ' and χ'') of
the a.c. susceptibility (χac) using a Quantum Design MPMS SQUID magnetometer and
the ACMS option of the Quantum Design PPMS cryostat respectively.
Curie-Weiss fits to the high temperature d.c. magnetization yielded the effective
moment per ion for all samples studied to be consistent with J = 15/2 Dy3+ ions. To
confirm that dilution did not alter the single-ion anisotropy which is essential to the spin
ice ground state, we measured the saturation magnetization. In the pure sample, the
crystal field induced anisotropy reduces the saturation moment to be half the free ion
value [10], which would presumably be changed systematically with dilution if the
anisotropy were altered by the dilution. As can be seen in Figure 1, the saturation
moment is essentially unchanged with dilution, demonstrating that dilution does not
measurably alter the anisotropy of the system [10].
Figures 2-4 show the measured temperature dependent a.c. susceptibility of
samples across our range of dilution with both Y and Lu at a characteristic frequency of 1
kHz. The undiluted sample shows the previously observed freezing transition, as
indicated by a drop in χ' (T) and a corresponding rise in χ''(T) at Tf ~ 16 K [5,7] (Tf
depends on the frequency of measurement, as discussed below). The drop in χ'(T)
indicates that the spins’ dynamic response is slowed such that they cannot respond to the
4

time-varying magnetic field for T < Tf. This implies that the system is out of equilibrium
on the time scale of the measurement, i.e. that the spin relaxation time is longer than the
inverse of the frequency of the a.c. measurement. The appearance of this freezing
temperature is sharply suppressed with dilution of the Dy up to x = 0.4 as we have
reported previously [5], suggesting that the freezing is a cooperative effect. Our new
data, which go to higher levels of dilution, surprisingly show that the freezing transition
is reentrant in dilution, i.e. rather than being further suppressed with increasing dilution
for x > 0.4, it becomes strikingly more pronounced as the dilution is increased.
Furthermore, the freezing temperature increases with higher dilution -- up to Tf ~ 21 K
for x = 1.98 at this frequency. This reentrance of the freezing transition is seen for both
Lu and Y dilution as shown in figures 2 and 3, although there are differences between
samples diluted with the two different ions, as shown in figure 4.
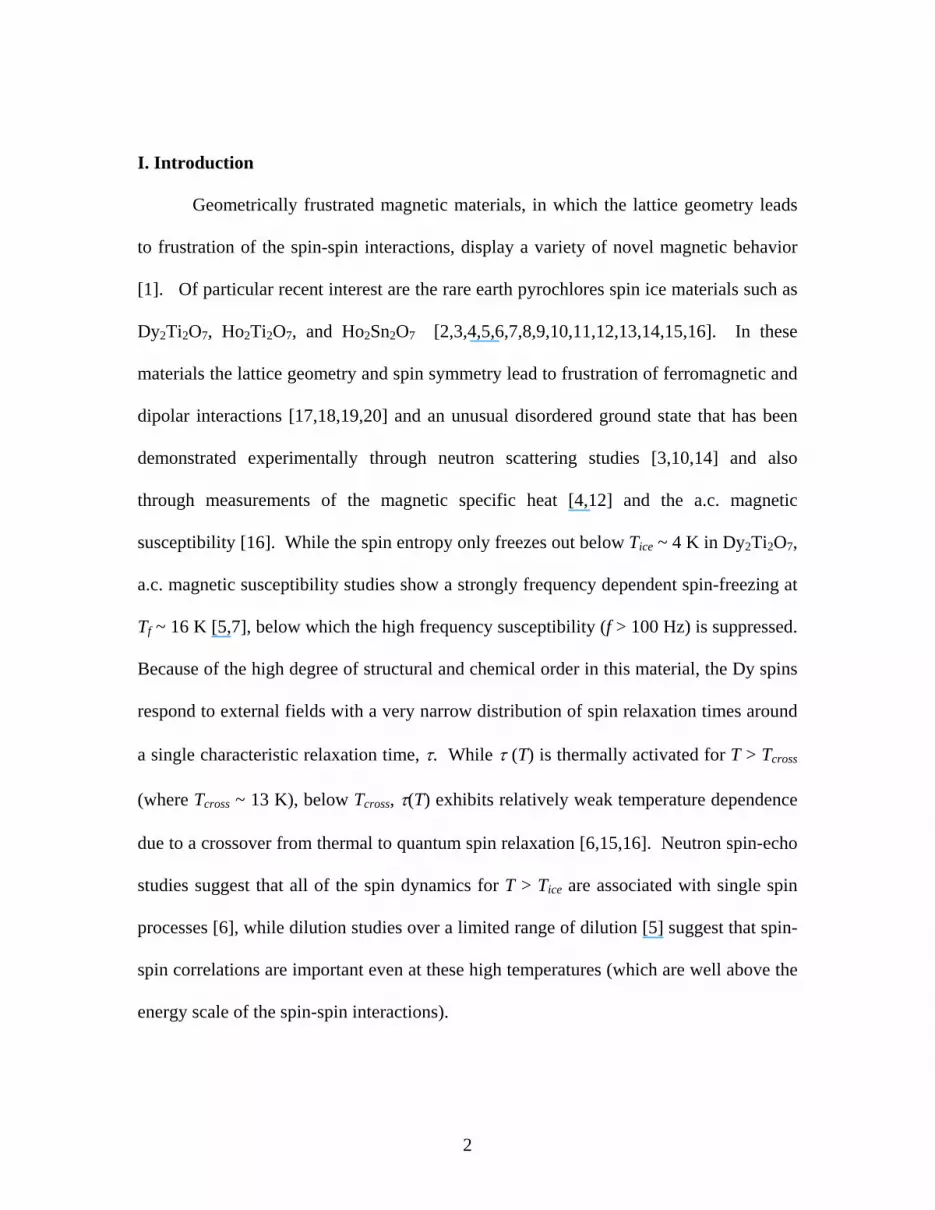
We can also characterize the effects of dilution by fitting the frequency
dependence of the freezing temperature to an Arrhenius law, where E/0
A B fE k Tf f e−= A is
an activation energy for spin fluctuations and fo is a measure of the microscopic limiting
frequency in the system. We plot such data in figure 5, and we find that EA is of order the
single ion anisotropy energy and fo is of order GHz, both physically reasonable numbers
for individual spin flips. The fitted values of EA and fo are given in the inset to figure 5,
and it is notable that EA increases substantially with increasing x, especially at larger
values of x. Given the correspondence of EA to the single ion anisotropy, the dependence
of EA on dilution suggests that the slight change in the lattice constants associated with
substitution on the Dy site result in a change in the crystal field level spacing which
effectively changes the magnitude of the single-ion anisotropy (although not its
5

qualitative character). Indeed, x-ray diffraction studies of the Y diluted series indicates
that the lattice parameter decreases monotonically with dilution which is consistent with
the rise in EA.
Another method of parameterizing the spin response to the time-dependent a.c.
magnetic field is through the Casimir-du Pré relation [30] which predicts, for a single
relaxation time τ, that 2 2"( )1
T Sf ff
χ χχ ττ
⎛ ⎞−= ⎜ ⎟+⎝ ⎠
where χT is the isothermal susceptibility in
the limit of low frequency and χS is the adiabatic susceptibility in the limit of high
frequency. Data of this sort are shown in figure 6 for different levels of dilution in
magnetic fields of 0, 5, and 10 kOe. We have previously demonstrated that
measurements of the undiluted sample fit the above form at T = 16 K fairly well with
only a slight broadening at lower temperatures [5,15,16]. Note that this behavior is in
sharp contrast to that in other dense magnetic systems exhibiting glass-like behavior, in
which the peak typically spans several decades [31,32,33]. Since the χ″(f) data display
clear maxima, we can use these data to obtain a characteristic spin relaxation time, τ,
where 1/τ is the frequency of the maximum in χ″(f) at a given temperature. The changing
peak position with temperature allows us to characterize the evolution of τ(T), and these
data have previously been analyzed to demonstrate the crossover from thermal to
quantum spin relaxation below Tcross ~ 13 K in the undiluted sample [15,16].
The χ″(f) data show a single clear peak in zero field (figure 6a), but application
of a field of 5 kOe results in a double-peak structure to χ″(f) near Tcross (figures 6b and
7a) [15]. This double-peak apparently corresponds to the two relaxation mechanisms – a
phenomenon which is enhanced by dilution, as can be seen in figure 7b. The double
6

peaks are quite surprising since we expect only a single peak corresponding to whichever
relaxation mechanism is faster (quantum or thermal). The application of a 5 kOe field
apparently suppresses the quantum tunneling of some of the spins (depending on
orientation) due to the increased splitting of the spin states in the field. These spins relax
thermally instead, and the two relaxation mechanisms produce the double-peak structure
in χ″(f). When the field is increased much higher as seen in figure 6c, the quantum
relaxation is more strongly suppressed for most of the spins, since the final and initial
states are farther separated in energy [15].
The evolution of the double-peak structure with decreasing temperature is shown
in figure 7. While the two peaks are only slightly separated for the undiluted sample data
(figure 7a), the x = 0.4 sample data show two distinct peaks over a broad range of
temperature (figure 7b). The temperature dependence of the peak positions for this
diluted sample provide evidence that the two maxima in the data should be associated
with quantum and thermal relaxation processes. The higher frequency peaks for the x =
0.4 sample are at approximately the same frequency at each temperature in the figure, as
expected for quantum spin relaxation. By contrast, the lower frequency peaks (indicated
by the vertical arrows) clearly show a decrease in the peak frequency with decreasing
temperature as expected for thermally induced spin relaxation. The difference between
the diluted samples and the undiluted sample in the structure of χ″(f) is difficult to
explain without a detailed analysis of the microscopic physics, since spin relaxation
depends sensitively on the energy states of the Dy ions. Curiously, as seen in figure 7c, a
quite similar enhancement of the double-peak structure is observed in powder samples of
the undiluted compound which were potted in non-magnetic Stycast 1266 epoxy (the
7

potted sample shows little difference from the loose powder sample in zero field data
[16]). Since the epoxy is expected to have a considerably larger thermal contraction
coefficient than the pyrochlore compounds, the epoxy potted material will be subjected to
pressure at low temperature. The resultant changes in the data from the epoxy-potted
material further suggest that some of the differences between the diluted and the pure
samples are due to chemical pressure associated with dilution of the lattice with the non-
magnetic ions. As in the case of the applied pressure from the epoxy’s thermal
contraction, this chemical pressure can affect both the phonon spectrum and the
crystalline field which determines the tunneling barrier between spin states.
As mentioned above, we can use the maxima in χ″(f) to obtain a characteristic
spin relaxation time, τ, where 1/τ is the frequency of the maximum in χ″(f) at a given
temperature. In figure 8, we plot τ(T) for samples with a range of dilutions in magnetic
fields of 0, 5, and 10 kOe. In cases where χ″(f) displayed two maxima, both are plotted
in the figure, and points are not shown for temperatures where χ″(f) did not show a
maximum in our frequency range. There are three clear temperature regimes to the data.
At high temperatures, the relaxation time appears to be activated, as expected for a
thermally driven process. Below T ~ Tcross, the temperature dependence becomes much
weaker, as the primary relaxation mechanism becomes quantum mechanical. A strong
temperature dependence re-emerges at the lowest temperatures, an effect which has been
associated with the development of correlations among the spins [15,16]. One unusual
feature in the undiluted sample data is the sharp decrease of τ(T) on cooling near Tcross at
5 kOe, since one ordinarily would not expect the relaxation time to shorten as the
temperature is lowered. This apparent decrease is an artifact of the way we obtain the
8

values of τ. Since we take τ from local maxima in χ″(f), at temperatures and fields where
there is a crossover from thermal to quantum spin relaxation, there can be an apparent
jump in τ(T) when the maximum switches between the thermal and quantum relaxation
frequencies. The data from the diluted samples where both relaxation mechanisms yield
maxima for some range of fields and temperatures confirm that the sharp decrease in τ(T)
can be attributed to this crossover effect.
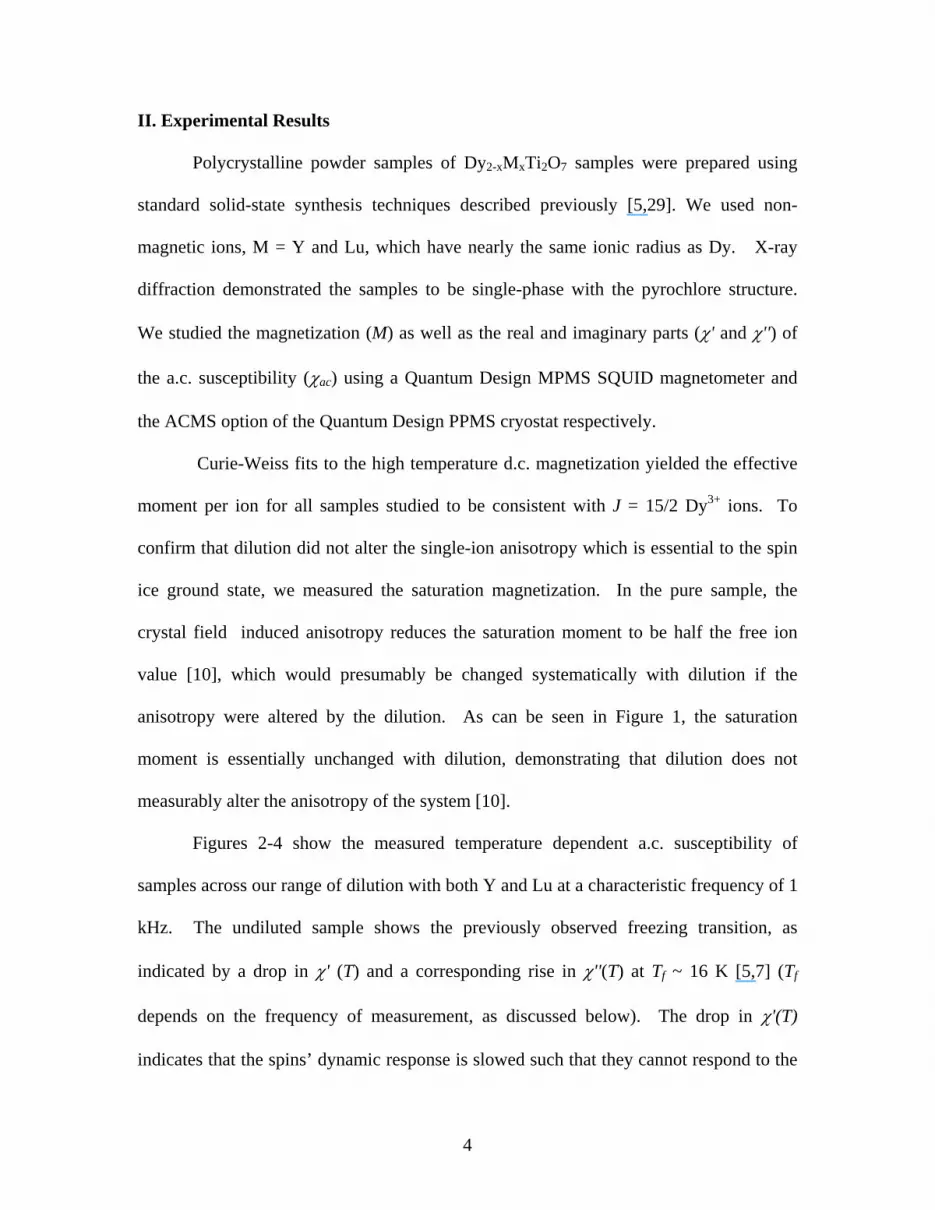
The data in figure 8 demonstrate that there is a non-trivial dependence of the
relaxation time on dilution in this system, as could have been deduced from the non-
monotonic dilution dependence of the spin freezing transition. This dependence is shown
explicitly in figure 9, in which we plot τ(x) at temperatures of T = 5, 11, and 16 K in
zero magnetic field and in different fields at T = 16 K. These data show that τ(x) rises
almost monotonically with increasing non-magnetic dilution for T = 16 K, which is above
Tcross, and the rise is strictly monotonic for the non-zero magnetic fields. By contrast, for
the two lower temperatures, which are below Tcross, τ(x) decreases initially with dilution
of the full magnetic lattice, has a minimum near x = 0.5 (we note for reference that at x =
0.5 each tetrahedron has on average one corner replaced with a non-magnetic ion), and
subsequently increases with increasing dilution up to the largest values of x where τ
remained within the frequency range of our measurement apparatus.
III. Analysis and Discussion
The data presented above provide an improved understanding of the spin
relaxation and the dynamic spin-freezing in Dy2-xMxTi2O7. Previously published data
obtained by our group (for x ≤ 0.4) showed the freezing transition disappearing with
9

dilution and thus suggested that the transition was associated with spin-spin correlations
[5]. The present data, showing the re-emergence of the freezing transition with
increasing dilution and its presence up to 99% dilution (i.e. x = 1.98), imply instead that
the freezing is fundamentally a single-ion phenomenon [6], akin to a superparamagnetic
blocking transition (albeit a phenomenon affected by the spin-spin interactions as
described below).
The explanation for this highly unusual re-entrance of the spin-freezing transition
can be found in the data of figure 9, which shows the spin relaxation time initially
decreasing with dilution (which would naturally suppress the spin freezing) and
subsequently increasing (which would cause spin freezing to re-emerge). The non-
monotonic nature of τ(x) can be understood as the combination of two competing effects.
The energy barrier for spin flips increases with dilution, as is evidenced by both the
increasing value of EA(x) we obtain from the Arrhenius law data of figure 5 and from the
increasing value of τ(x) we observe at T = 16 K in the presence of a magnetic field. In
both of these cases, the data are dominated by thermal processes, and thus the physical
interpretation of a barrier increasing with dilution is unambiguous. This increasing
barrier is presumably due to changes in the crystal field splitting associated with changes
in the lattice constant resulting from the dilution. In fact, at lower temperatures where
spin relaxation occurs through quantum tunneling, the large barrier of the very highly
diluted samples makes τ(x) unobservably long (Figure 8). The increasing barrier with
dilution explains the increase in τ(x) for larger x, even at lower temperatures where the
spin relaxation is through quantum tunneling.
10

The increasing energy barrier for spin flips with dilution does not, however,
explain the decrease at smaller values of x. As can be seen in the inset to figure 8, the
quantum spin relaxation is sensitive to magnetic field. This is presumably due to the
effects of aligning and separating the energy levels of different spins states through the
Zeeman term in the spin Hamiltonian. As the magnetic lattice is diluted, the local fields
felt by each Dy spin will presumably be reduced, thus increasing the degeneracy of the
different spin states and consequently reducing the spin relaxation time. The existence of
the minimum in τ(x) at x ~ 0.4 does not have an obvious physical significance other than
corresponding to the point where there exists a crossover between the two competing
effects on τ(x).
IV. Conclusions
In summary, studies of the nearly full range of non-magnetic dilution of Dy2Ti2O7
provide new evidence that the spin relaxation near the classical to quantum crossover
temperature is dominated by single-ion effects. As the reentrance of the spin-freezing
transition with dilution indicates, quantum spin relaxation processes can lead to other
novel behavior in frustrated rare-earth magnets. The results imply that even such large
spin systems, where the spins are typically treated classically, ought to be considered
with the effects of quantum dynamics in mind. The results further point to the
importance of dilution as a tool with which to probe these systems, since the dilution
dependence clearly elucidates the complex nature of the spin relaxation processes in this
important model system.
11

ACKNOWLEDGEMENTS
We gratefully acknowledge helpful discussions with D. A. Huse, A. Kent, M. Gingras
and support from the Army Research Office PECASE grant DAAD19-01-1-0021 and
NSF grant DMR-0101318. A.M. gratefully acknowledges the support of the Packard
Foundation.
12

Figure captions
Figure 1. Magnetization as a function of applied field for Dy2-xYxTi2O7 with values of x
from 0 to 1.98 at a temperature T = 1.8 K. All samples show saturation at a value of
approximately 5 µ /Dy indicating that the crystalline field effects are not changed by
dilution.
B
Figure 2. The real and imaginary parts of the a.c. susceptibility of Dy2-xYxTi2O7 as a
function of temperature at a frequency of 1 kHz. The freezing transition is initially
suppressed and then enhanced with increasing dilution of the Dy sites with Y.
Figure 3. The real part of the a.c. susceptibility of Dy2-xLuxTi2O7 as a function of
temperature at a frequency of 1 kHz. The freezing transition is initially suppressed and
then enhanced with increasing dilution of the Dy sites with Lu.
Figure 4. Comparison of the freezing transitions between Lu and Y doped samples at 1
kHz. While there are differences between the two, the trend with dilution is similar.
Figure 5. Arrhenius law fits of the freezing temperature dependence on frequency for a
range of diluted samples of Dy Y Ti O and Dy Lu Ti O . The values of the freezing
temperature are obtained from the minimum in the slope of χ
2-x x 2 7 2-x x 2 7
″ which corresponds to the
maximum in χ'. The inset shows the resulting fit parameters as a function of x, indicating
that the energy barrier for thermal relaxation increases substantially with dilution.
13

Squares show EA and circles show fo with open symbols for Y-diluted samples and filled
symbols for Lu-diluted.
Figure 6. Frequency dependence of χ″ for Dy2-xYxTi2O7 in applied fields of 0, 5, and 10
kOe at 12 K. Note the double-peak nature of the data at 5 kOe which demonstrates the
combination of thermal and quantum spin relaxation processes which are active at this
temperature.
Figure 7. Frequency dependence of χ″ in an applied field of 5 kOe, showing the
evolution of the peak shape with decreasing temperature below Tcross. a. The undiluted
sample shows a broadened peak for T = 11 and 12 K indicating the presence of two
underlying relaxation mechanisms. b. The sample with x = 0.4 shows a clear double peak
structure corresponding to the two relaxation mechanisms. c. An undiluted sample potted
in epoxy shows much the same behavior as the diluted sample with two clear peaks.
Figure 8. The temperature dependence of the characteristic spin relaxation time, τ, for
Dy2-xYxTi2O7 for a range of dilutions, x, in magnetic fields of 0, 5, and 10 kOe. The
inset shows the magnetic field dependence of the relaxation time, τ(H), for the undiluted
Dy2Ti2O7 sample at T = 6 K (reprinted from [15]).
Figure 9. The characteristic spin relaxation time as a function of dilution for
Dy2-xYxTi2O7 at T = 5, 11, and 16 K in zero field, and at H = 0, 5, and 10 kOe at T = 16
K. A minimum is evident near x = 0.4 for low temperatures and small fields.
14

Figure 1 Snyder et al.
0 1 2 3 4 5 6 70
1
2
3
4
5
6
Mag
netiz
atio
n [ µ B
/Dy
]
Field [ T ]
x = 0.0 x = 0.2 x = 0.4 x = 0.6 x = 0.8 x = 1.0 x = 1.2 x = 1.4 x = 1.98
Dy2-xYxTi2O7
15

Figure 2 Snyder et al.
0
0.3
0.6
0.9
1.2
1.5
0 5 10 15 20 250
0.2
0.4
0.6
0.8
1.0
f = 1 kHz H = 0
χ' [
em
u/O
e m
olD
y ]
x = 0.0 x = 0.2 x = 0.4 x = 0.6 x = 0.8 x = 1.4 x = 1.75 x = 1.98
Dy2-xYxTi2O7
χ'' [
em
u/O
e m
olD
y ]
Temperature [ K ]
16

Figure 3 Snyder et al.
0 5 10 15 20 250
0.5
1.0
1.5
2.0
2.5
Dy2-xLuxTi2O7
f = 1 kHzH = 0 Oe
χ'
[ e
mu/
Oe
mol
Dy ]
Temperature [ K ]
x = 0.0 x = 0.2 x = 1.0 x = 1.75 x = 1.9
17

Figure 4 Snyder et al.
0
1
2
3
00.51.01.5
00.20.40.60.8
0 5 10 15 20 250
0.2
0.4
f = 1 kHz
x = 0.2
Dy2-xMxTi2O7
x = 1.0
x = 1.75
x = 1.9
χ' [
em
u/O
e m
olD
y ]
Temperature [ K ]
M = Lu Y
18
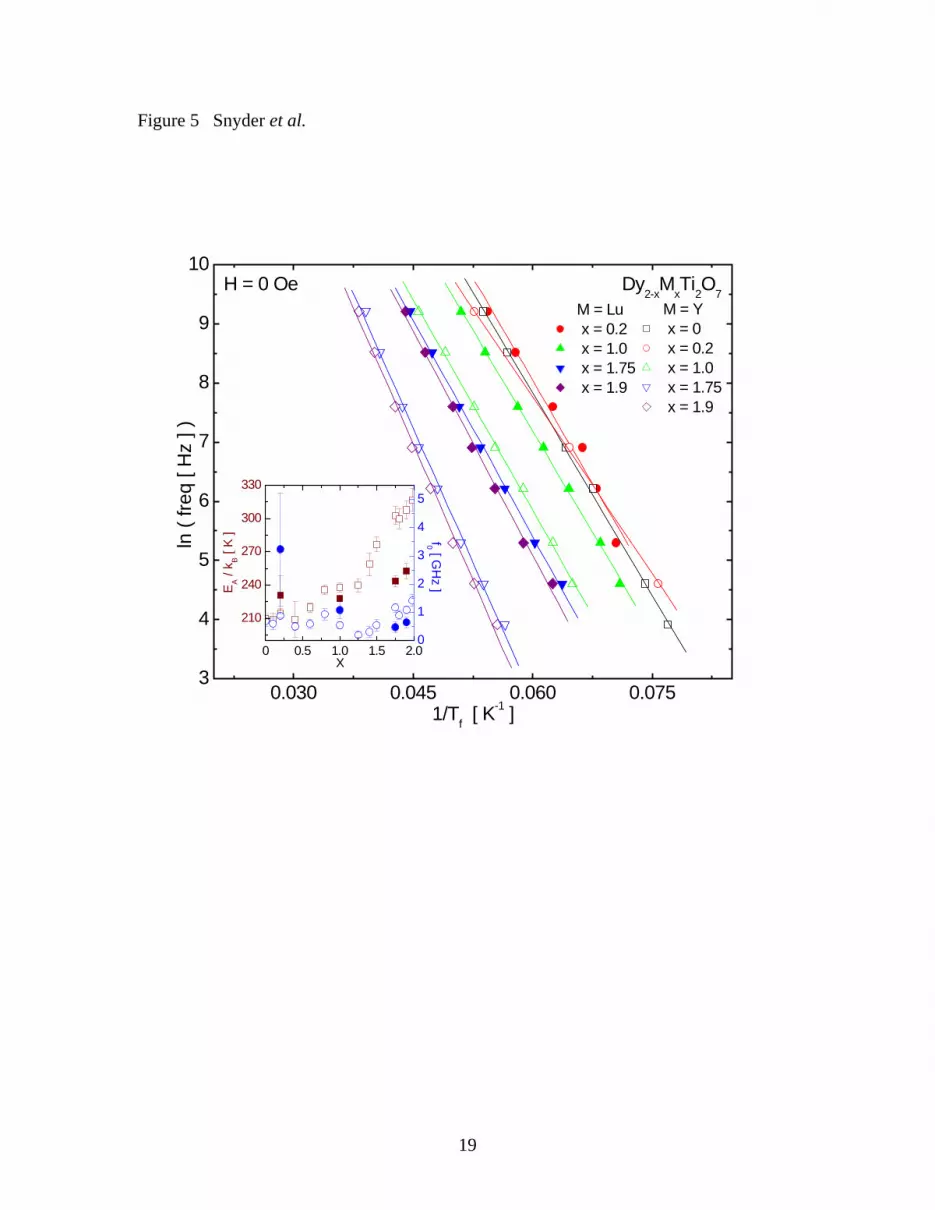
Figure 5 Snyder et al.
0.030 0.045 0.060 0.0753
4
5
6
7
8
9
10
ln (
freq
[ Hz
] )
M = Lu x = 0.2 x = 1.0 x = 1.75 x = 1.9
Dy2-xMxTi2O7H = 0 Oe
1/Tf [ K-1 ]
M = Y x = 0 x = 0.2 x = 1.0 x = 1.75 x = 1.9
0 0.5 1.0 1.5 2.0
210
240
270
300
330
X
0
1
2
3
4
5f0 [ G
Hz ]E
A / k
B [ K
]
19

Figure 6 Snyder et al.
0
0.1
0.2
0.3
10 100 1k 10k0
0.05
0.10
0.15
0.20
0.05
0.10
0.15
0.20
χ''
[em
u/O
e m
olD
y]
x = 0.0 x = 0.1 x = 0.2 x = 0.4 x = 0.6 x = 0.8 x = 1.0
H = 0
Dy2-xYxTi2O7
T = 12 Ka
b
c
H = 10 kOe
χ''
[em
u/O
e m
olD
y]
Frequency [Hz]
H = 5 kOe
χ''
[em
u/O
e m
olD
y]
20

Figure 7 Snyder et al.
0.04
0.08
0.12
0.16
10 100 1k 10k0
0.05
0.10
0.15
0.20
0
0.05
0.10
0.15
0.20
χ''
[em
u/O
e m
olD
y ]
Dy2Ti2O7In Epoxy
H = 5 kOe
χ''
[em
u/O
e m
olD
y ]
9 K 10 K 11 K 12 K 13 K
Dy1.6Y0.4Ti2O7Loose Powder
9 K 10 K 11 K 12 K 13 K
χ''
[em
u/O
e m
olD
y ]
Frequency [ Hz ]
a
b
c
Dy2Ti
2O
7Loose Powder
9 K 10 K 11 K 12 K 13 K
21

Figure 8 Snyder et al.
0 4 8 12 16 20 2410-4
10-3
10-2
10-1
0 4 8 12 16 20 2410-4
10-3
10-2
10-1
0 4 8 12 1610-4
10-3
10-2
10-1
τ [s
]H = 0 Oe
τ [s
]
Temperature [K]
x = 0.0 x = 1.0 x = 0.1 x = 1.2 x = 0.2 x = 1.4 x = 0.4 x = 1.75 x = 0.6 x = 1.9 x = 0.8 x = 1.98
H = 5 kOe
Temperature [K]τ
[s]
H = 10 kOe
Temperature [K]
0 2 4 6 8 100
5
10
15
τ [m
s]
H [kOe]
22
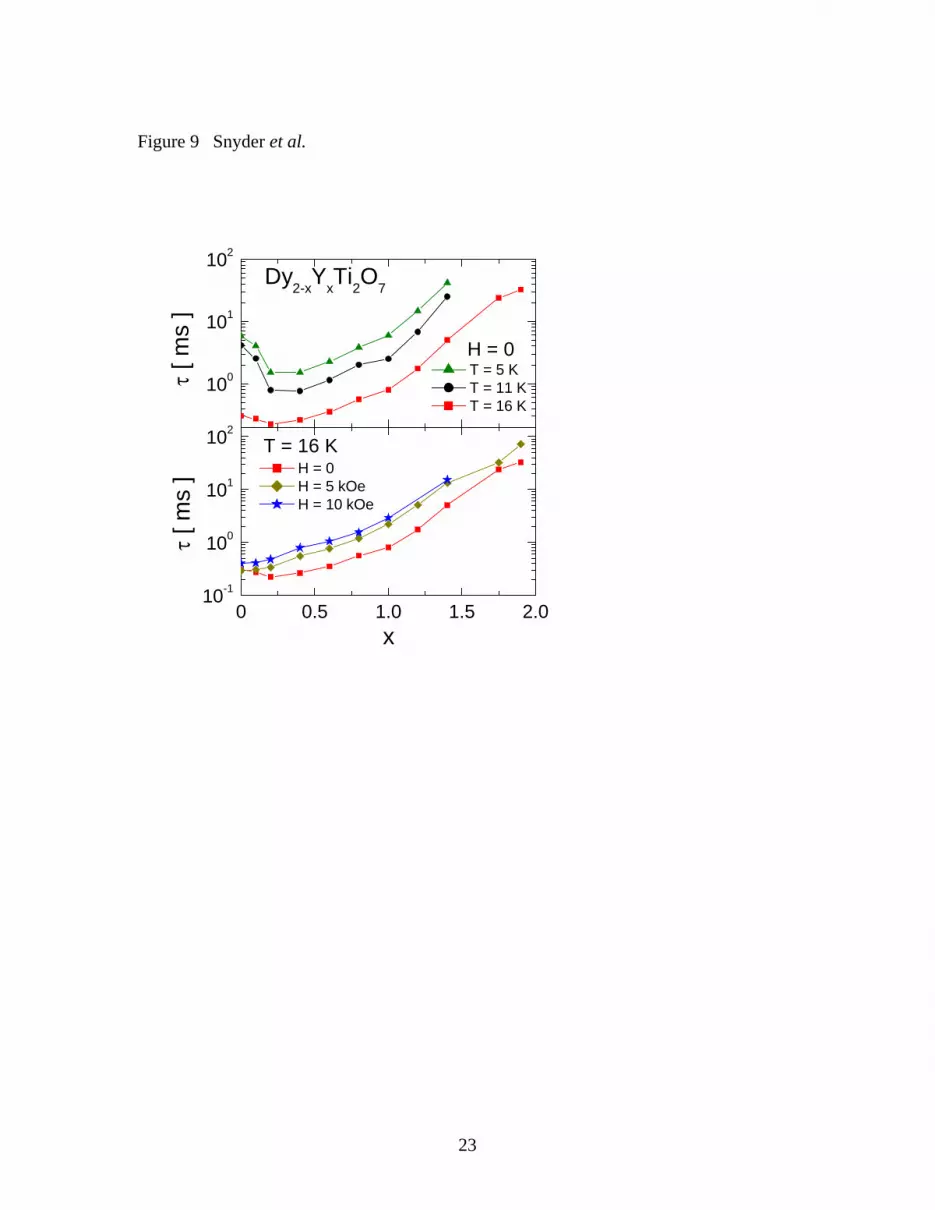
Figure 9 Snyder et al.
100
101
102
0 0.5 1.0 1.5 2.010-1
100
101
102
H = 0
τ [ m
s ]
T = 5 K T = 11 K T = 16 K
Dy2-xYxTi2O7
x
H = 0 H = 5 kOe H = 10 kOe
τ [ m
s ]
T = 16 K
23
1. A. P. Ramirez, in Handbook of Magnetic Materials, edited by K. J. H. Buschow
(Elsevier, Amsterdam, 2001), Vol. 13; P. Schiffer and A.P. Ramirez, Comments Cond.
Mat. Phys. 18, 21 (1996).
2. S. T. Bramwell and M. J. P Gingras, Science 294, 1495 (2001).
3. M.J. Harris, S.T. Bramwell, D.F. McMorrow, T. Zeiske, and K.W. Godfrey, Phys.
Rev. Lett. 79, 2554 (1997); M.J. Harris, S.T. Bramwell, P.C.W. Holdsworth, and J.D.M.
Champion, Phys. Rev. Lett. 81, 4496 (1998); S.T. Bramwell and M.J. Harris, J. Phys.
Condens. Matt.. 10, L215 (1998).
4. A.P. Ramirez, A. Hayashi, R.J. Cava, R. Siddharthan, and B.S. Shastry, Nature 399,
333 (1999).
5. J. Snyder, J.S. Slusky, R.J. Cava, and P. Schiffer, Nature 413, 48 (2001) and Phys.
Rev. B 66, 064432 (2002).
6. G. Ehlers, A. L. Cornelius, M. Orendác, M. Kajnaková, T. Fennell, S. T. Bramwell and
J. S. Gardner, J. Phys. Condensed Matter 15, L9 (2003).
7. K. Matsuhira, Y. Hinatsu, and T. Sakakibara, J. Phys Condens. Matter 13, L737
(2001).
8. K. Matsuhira, Y. Hinatsu, K. Tenya, and T. Sakakibara, J. Phys Condens. Matter 12,
L649 (2000).
9. A. L. Cornelius and J. S. Gardner, Phys. Rev. B 64 060406 (2001).
24

10. H. Fukazawa, R. G. Melko, R. Higashinaka, Y. Maeno, and M. J. P. Gingras, Phys.
Rev. B 65, 054410 (2002).
11. K. Matsuhira, Z. Hiroi, T. Tayama,S. Takagi, T. Sakakibara, J. Phys. Cond. Mat.
14, L559 (2002) and T. Sakakibara, T. Tayama, Z. Hiroi, Matsuhira K, and S. Takagi
Phys. Rev. Lett. 90, 207205 (2003).
12. S. T. Bramwell et al., Phys. Rev. Lett. 87, 047205 (2001).
13. H. Kadowaki, Y. Ishii, K. Matsuhira, andY. Hinatsu, Phys. Rev. B 65, 144421
(2002).
14. S.T. Bramwell, M.J. Harris, B.C. den Hertog, M.J.P. Gingras, J.S. Gardner, D.F.
McMorrow, A.R. Wildes, A.L. Cornelius, J.D.M. Champion, R.G. Melko, and T.
Fennell, Phys. Rev. Lett. 87, 047205 (2001).
15. J. Snyder, B.G. Ueland, J.S. Slusky, H. Karunadasa, R.J. Cava, Ari Mizel, and P.
Schiffer, Phys. Rev. Lett. 91, 107201 (2003).
16. J. Snyder, B.G. Ueland, J.S. Slusky, H. Karunadasa, R.J. Cava, and P. Schiffer, Phys.
Rev. B 69, 064414 (2004) .
17. R. Siddharthan, B. S. Shastry, A. P. Ramirez, A. Hayashi, R. J. Cava, and S.
Rosenkranz, Phys. Rev. Lett. 83, 854 (1999).
18. B.C. den Hertog and M.J.P. Gingras, Phys. Rev. Lett. 84, 3430 (2000).
19. R.G. Melko, B.C. den Hertog, and M.J.P. Gingras, Phys. Rev. Lett. 87, 067203
(2001).
20. R. Siddharthan, B. S. Shastry, and A. P. Ramirez, Phys. Rev. B 63, 184412 (2001).
25

21. P. Schiffer and I. Daruka, Phys Rev B 56, 13712 (1997).
22. R. Moessner and A.J. Berlinsky, Phys. Rev. Lett. 83, 3293 (1999).
23. A.J. Garcia-Adeva, D.L. Huber, Phys. Rev. B 64, 014418 (2001).
24. A. Keren,J. S. Gardner, G. Ehlers, A. Fukaya, E. Segal, and Y. J. Uemura Phys. Rev.
Lett. 92, 107204 (2004).
25. A.P. Ramirez, G.P. Espinosa, and A.S. Cooper, Phys Rev Lett. 64, 2070 (1990).
26. X. Obradors, A. Labarta, A. Isalgue, J. Tejada, J. Rodriguez, and M. Pernet, Solid
State Commun. 65, 189 (1988).
27. B. Martinez, F. Sandiumenge, and A. Rouco, Phys. Rev. B 46, 10786 (1992).
28. P. Mendels, A. Keren, L. Limot, Phys. Rev. Lett. 85, 3496 (2000), L. Limot et al.,
Phys. Rev.B 65, 144447 (2002).
29. J. Snyder, Ph.D thesis, Pennsylvania State University (2003).
30. H.B.G. Casimir and F.K. du Pré, Physica 5, 507 (1938).
31. A.J. Dirkmaat, D. Huser, G.J. Nieuwenhuys, J.A. Mydosh, P. Kettler, and M. Steiner,
Phys. Rev. B 36, 352 (1987).
32. D. Huser, L.E. Wenger, A.J. van Duyneveldt, and J.A. Mydosh, Phys. Rev. B 27,
3100 (1983).
33. C. Dekker, A.F.M. Arts, H.W. de Wijn, A.J. van Duyneveldt, and J.A. Mydosh, Phys.
Rev. B 40, 243 (1989).
26


