Embed Size (px)
Citation preview
Available online at www.sciencedirect.com Construction
www.elsevier.com/locate/conbuildmat
Construction and Building Materials 23 (2009) 171–182
and Building
MATERIALS
Quasi-static mechanical behaviour of a double-shear single dowelwood connection
Cristovao L. Santos a,*, Abılio M.P. De Jesus a, Jose J.L. Morais b, Jose L.P.C. Lousada c
a Departamento de Engenharias, Universidade de Tras-os-Montes e Alto Douro, Quinta de Prados, 5001-801 Vila Real, Portugalb CITAB/Departamento de Engenharias, Universidade de Tras-os-Montes e Alto Douro, Quinta de Prados, 5001-801 Vila Real, Portugal
c CITAB/Departamento de Florestal, Universidade de Tras-os-Montes e Alto Douro, Quinta de Prados, 5001-801 Vila Real, Portugal
Received 2 August 2007; received in revised form 11 January 2008; accepted 11 January 2008Available online 7 March 2008
Abstract
Results of a double-shear single dowel wood connection tested under monotonic quasi-static loading, according to the EN26891 stan-dard, are discussed in this paper. The Pinus pinaster species, which is one of the most important Portuguese woods, was used in thisstudy. The initial joint slip modulus, the ultimate strength and the ductility are evaluated and compared with values given by the Euro-code 5. Embedding tests are also carried out according to the EN383 standard. The resulting data is used to predict the joint slip mod-ulus, through a proposed analytical model supported by statistical regression analysis data. Finally, a three dimensional finite elementmodel of the wood connection was built and calibrated using available experimental data. This model can be applied to evaluate accuratevalues for the joint initial slip modulus.� 2008 Elsevier Ltd. All rights reserved.
Keywords: Pine wood; Dowel-type connection; Double-shear; Tensile testing; Finite element analysis
1. Introduction
The connections are frequently the critical locations oftimber structures, being responsible for the reduction ofthe continuity and the global structural strength, requiringoversized structural elements. About 80% of failuresobserved in timber structures are due to connections [1].Dowel-type timber connections are the most common con-nections applied in timber structures. The singularity of thistype of timber connections is associated to the combinationof very distinct materials – wood and steel – and to the highanisotropy of wood. The knowledge of the mechanicalbehaviour of these dowel-type connections (e.g. load–sliprelation, stress distribution, ultimate strength and failuremodes) is of primordial importance for their rational appli-cation. This complex behaviour is governed by several geo-metric, material and load parameters (e.g. wood species,
0950-0618/$ - see front matter � 2008 Elsevier Ltd. All rights reserved.
doi:10.1016/j.conbuildmat.2008.01.005
* Corresponding author. Tel.: +351 259 350 320; fax: +351 259 350 356.E-mail address: [email protected] (C.L. Santos).
dowel diameter, end and edge distances, space between con-nectors, number of connecters, clearance, friction and loadconfiguration).
According to design codes of current practice [2,3], thedesign of dowel-type timber connections has been basedon the European Yield Model proposed by Johansen [4].This model has an empirical basis and assumes an elastic-perfect plastic behaviour, for both wood and dowel. It alsoconsiders that embedding strength is a material property,when in fact it is a combination of several geometric andmaterial parameters. Generally, in order to verify the influ-ence of those parameters, a number of tests are required forassessing the embedding strength. These embedding testsare standardized such as in the EN383 standard [5].
The Johansen model only predicts ductile failure modes[6]. Fragile failures observed in single or multiple dowelconnections are not envisaged by the Johansen model.Alternative 2D models have been proposed such as nonlin-ear beam on foundation [6,7] and finite element (FE) mod-els [6,8–10]. However, it has been recognized that these
172 C.L. Santos et al. / Construction and Building Materials 23 (2009) 171–182
models only give reasonable predictions for very specificextreme situations such as very thin or very thick timbermembers. Typically, dowel-type connections are threedimensional problems (non-uniform stress distributionsacross the thickness of members) that must be accountedfor a convenient modelling. Few 3D FE models can befound in literature to predict the mechanical behaviour ofsingle-fastener joints [11,12]. However, no comprehensiveFE models for multi-fastener joints are available in litera-ture. Many modelling issues are controversial in the FEmodels, such as the choice of the appropriate constitutivemodels for wood and the adequate failure criteria. Also,deterministic approaches are the common procedure,which represents an important limitation since the problemis governed by several important parameters with stochas-tic nature (e.g. wood properties, dimensions).
This paper presents results from monotonic quasi-statictensile tests of a double-shear single dowel wood connec-tion made of pine wood, namely the Pinus pinaster species,which is one of the species with large implantation in Por-tugal. Despite the abundance of this raw material, its usefor structural applications has been disregarded due to sev-eral reasons, such as the cultural and lack of data about thebehaviour of this material. The connection wood membersare loaded in the parallel-to-grain direction according tothe recommendations of the EN26891 standard [13]. Thewhole load–slip behaviour of the joint is illustrated untilfailure. In particular, the initial joint slip modulus, the ulti-mate strength and the ductility are evaluated and comparedwith corresponding values given by the Eurocode 5 (EC5).Also, embedding tests are carried out in parallel-to-grain
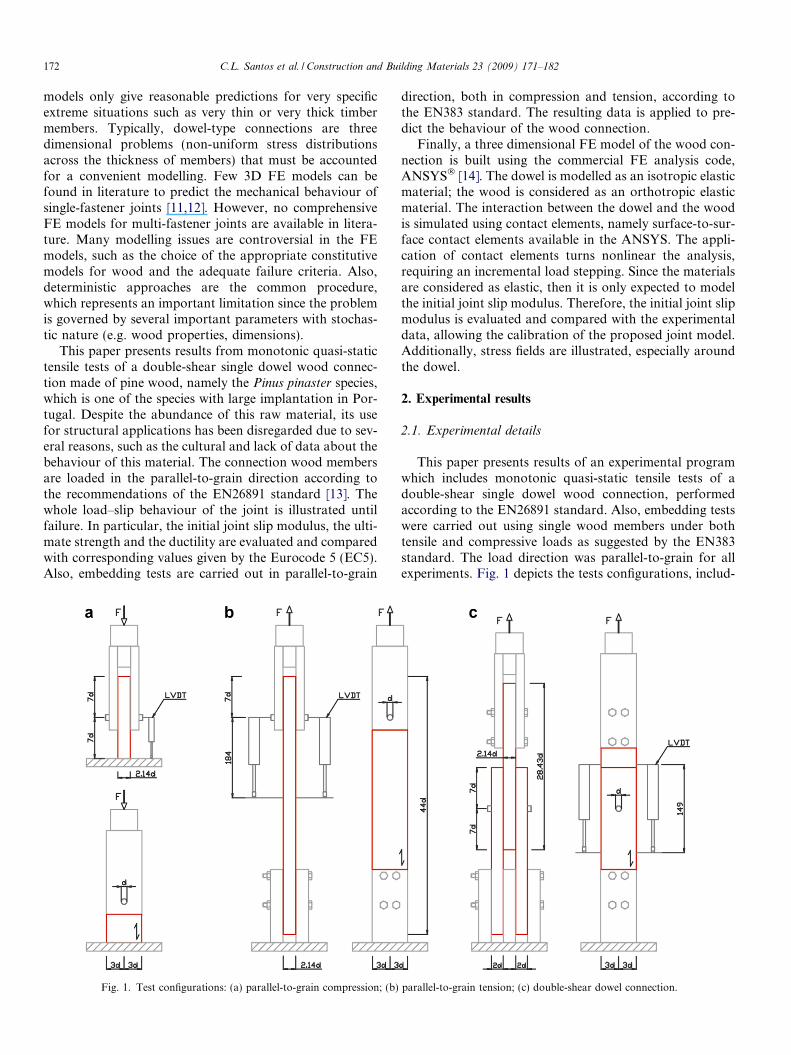
Fig. 1. Test configurations: (a) parallel-to-grain compression; (b)
direction, both in compression and tension, according tothe EN383 standard. The resulting data is applied to pre-dict the behaviour of the wood connection.
Finally, a three dimensional FE model of the wood con-nection is built using the commercial FE analysis code,ANSYS� [14]. The dowel is modelled as an isotropic elasticmaterial; the wood is considered as an orthotropic elasticmaterial. The interaction between the dowel and the woodis simulated using contact elements, namely surface-to-sur-face contact elements available in the ANSYS. The appli-cation of contact elements turns nonlinear the analysis,requiring an incremental load stepping. Since the materialsare considered as elastic, then it is only expected to modelthe initial joint slip modulus. Therefore, the initial joint slipmodulus is evaluated and compared with the experimentaldata, allowing the calibration of the proposed joint model.Additionally, stress fields are illustrated, especially aroundthe dowel.
2. Experimental results
2.1. Experimental details
This paper presents results of an experimental programwhich includes monotonic quasi-static tensile tests of adouble-shear single dowel wood connection, performedaccording to the EN26891 standard. Also, embedding testswere carried out using single wood members under bothtensile and compressive loads as suggested by the EN383standard. The load direction was parallel-to-grain for allexperiments. Fig. 1 depicts the tests configurations, includ-
parallel-to-grain tension; (c) double-shear dowel connection.
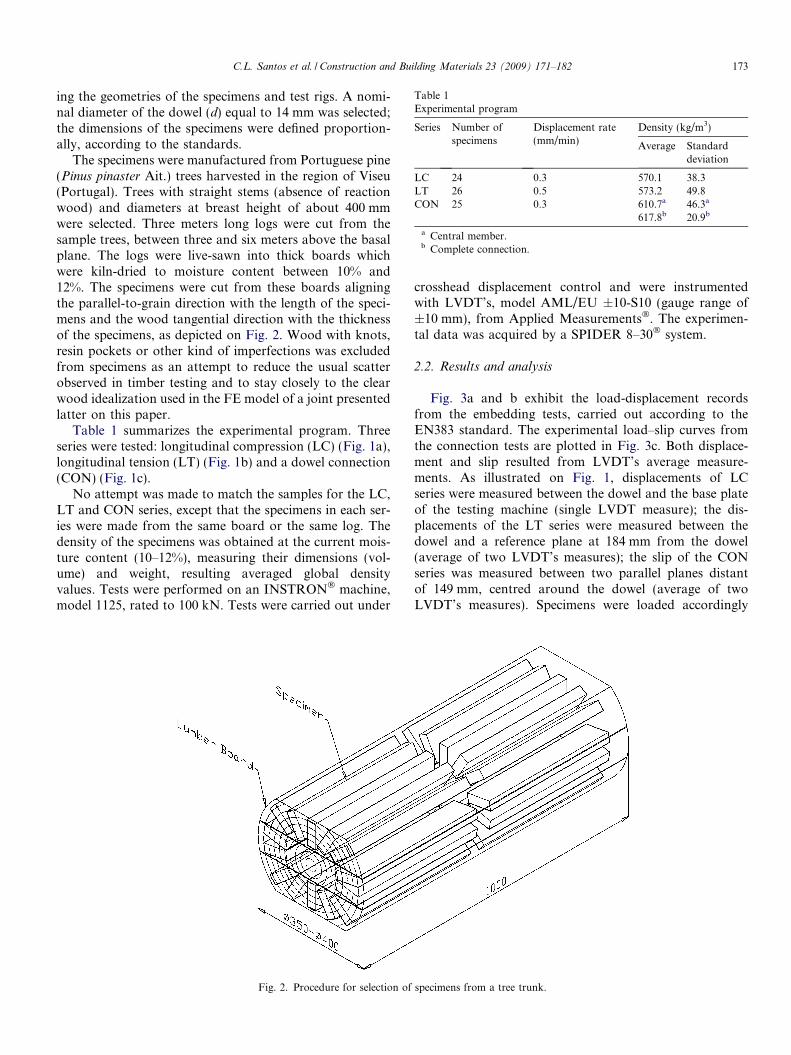
Table 1Experimental program
Series Number ofspecimens
Displacement rate(mm/min)
Density (kg/m3)
Average Standarddeviation
LC 24 0.3 570.1 38.3LT 26 0.5 573.2 49.8CON 25 0.3 610.7a 46.3a
617.8b 20.9b
a Central member.b Complete connection.
C.L. Santos et al. / Construction and Building Materials 23 (2009) 171–182 173
ing the geometries of the specimens and test rigs. A nomi-nal diameter of the dowel (d) equal to 14 mm was selected;the dimensions of the specimens were defined proportion-ally, according to the standards.
The specimens were manufactured from Portuguese pine(Pinus pinaster Ait.) trees harvested in the region of Viseu(Portugal). Trees with straight stems (absence of reactionwood) and diameters at breast height of about 400 mmwere selected. Three meters long logs were cut from thesample trees, between three and six meters above the basalplane. The logs were live-sawn into thick boards whichwere kiln-dried to moisture content between 10% and12%. The specimens were cut from these boards aligningthe parallel-to-grain direction with the length of the speci-mens and the wood tangential direction with the thicknessof the specimens, as depicted on Fig. 2. Wood with knots,resin pockets or other kind of imperfections was excludedfrom specimens as an attempt to reduce the usual scatterobserved in timber testing and to stay closely to the clearwood idealization used in the FE model of a joint presentedlatter on this paper.
Table 1 summarizes the experimental program. Threeseries were tested: longitudinal compression (LC) (Fig. 1a),longitudinal tension (LT) (Fig. 1b) and a dowel connection(CON) (Fig. 1c).
No attempt was made to match the samples for the LC,LT and CON series, except that the specimens in each ser-ies were made from the same board or the same log. Thedensity of the specimens was obtained at the current mois-ture content (10–12%), measuring their dimensions (vol-ume) and weight, resulting averaged global densityvalues. Tests were performed on an INSTRON� machine,model 1125, rated to 100 kN. Tests were carried out under
Fig. 2. Procedure for selection of
crosshead displacement control and were instrumentedwith LVDT’s, model AML/EU ±10-S10 (gauge range of±10 mm), from Applied Measurements�. The experimen-tal data was acquired by a SPIDER 8–30� system.
2.2. Results and analysis
Fig. 3a and b exhibit the load-displacement recordsfrom the embedding tests, carried out according to theEN383 standard. The experimental load–slip curves fromthe connection tests are plotted in Fig. 3c. Both displace-ment and slip resulted from LVDT’s average measure-ments. As illustrated on Fig. 1, displacements of LCseries were measured between the dowel and the base plateof the testing machine (single LVDT measure); the dis-placements of the LT series were measured between thedowel and a reference plane at 184 mm from the dowel(average of two LVDT’s measures); the slip of the CONseries was measured between two parallel planes distantof 149 mm, centred around the dowel (average of twoLVDT’s measures). Specimens were loaded accordingly
specimens from a tree trunk.
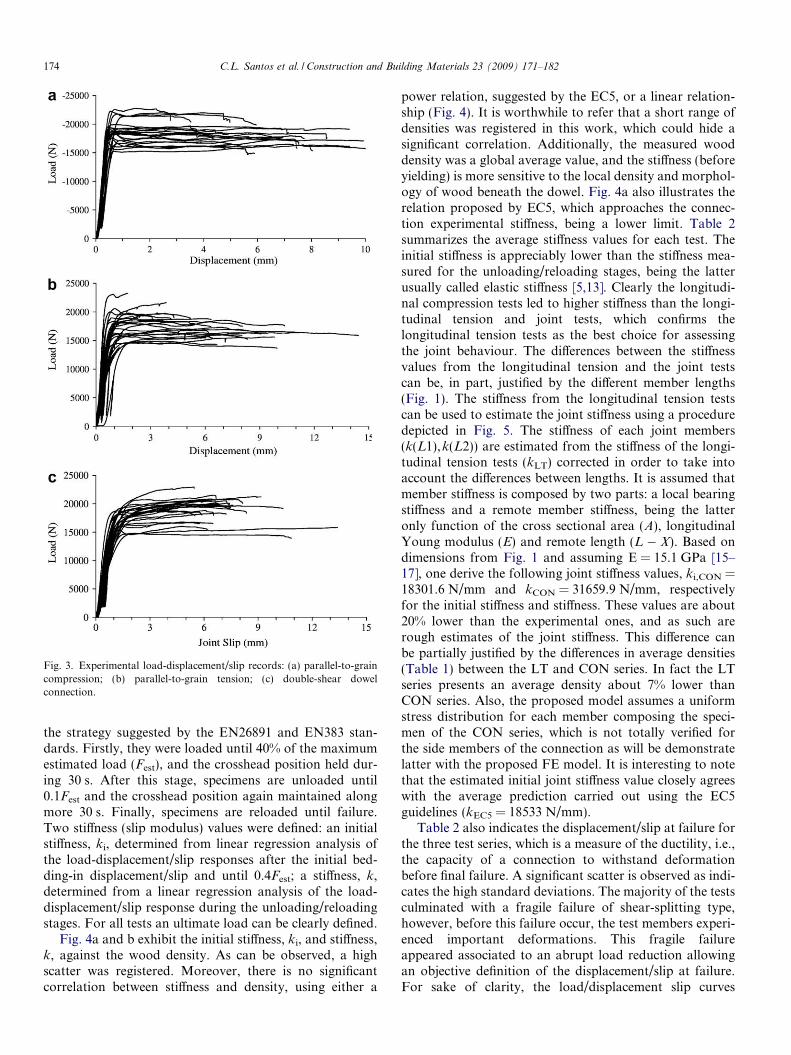
Fig. 3. Experimental load-displacement/slip records: (a) parallel-to-graincompression; (b) parallel-to-grain tension; (c) double-shear dowelconnection.
174 C.L. Santos et al. / Construction and Building Materials 23 (2009) 171–182
the strategy suggested by the EN26891 and EN383 stan-dards. Firstly, they were loaded until 40% of the maximumestimated load (Fest), and the crosshead position held dur-ing 30 s. After this stage, specimens are unloaded until0.1Fest and the crosshead position again maintained alongmore 30 s. Finally, specimens are reloaded until failure.Two stiffness (slip modulus) values were defined: an initialstiffness, ki, determined from linear regression analysis ofthe load-displacement/slip responses after the initial bed-ding-in displacement/slip and until 0.4Fest; a stiffness, k,determined from a linear regression analysis of the load-displacement/slip response during the unloading/reloadingstages. For all tests an ultimate load can be clearly defined.
Fig. 4a and b exhibit the initial stiffness, ki, and stiffness,k, against the wood density. As can be observed, a highscatter was registered. Moreover, there is no significantcorrelation between stiffness and density, using either a
power relation, suggested by the EC5, or a linear relation-ship (Fig. 4). It is worthwhile to refer that a short range ofdensities was registered in this work, which could hide asignificant correlation. Additionally, the measured wooddensity was a global average value, and the stiffness (beforeyielding) is more sensitive to the local density and morphol-ogy of wood beneath the dowel. Fig. 4a also illustrates therelation proposed by EC5, which approaches the connec-tion experimental stiffness, being a lower limit. Table 2summarizes the average stiffness values for each test. Theinitial stiffness is appreciably lower than the stiffness mea-sured for the unloading/reloading stages, being the latterusually called elastic stiffness [5,13]. Clearly the longitudi-nal compression tests led to higher stiffness than the longi-tudinal tension and joint tests, which confirms thelongitudinal tension tests as the best choice for assessingthe joint behaviour. The differences between the stiffnessvalues from the longitudinal tension and the joint testscan be, in part, justified by the different member lengths(Fig. 1). The stiffness from the longitudinal tension testscan be used to estimate the joint stiffness using a proceduredepicted in Fig. 5. The stiffness of each joint members(k(L1),k(L2)) are estimated from the stiffness of the longi-tudinal tension tests (kLT) corrected in order to take intoaccount the differences between lengths. It is assumed thatmember stiffness is composed by two parts: a local bearingstiffness and a remote member stiffness, being the latteronly function of the cross sectional area (A), longitudinalYoung modulus (E) and remote length (L � X). Based ondimensions from Fig. 1 and assuming E = 15.1 GPa [15–17], one derive the following joint stiffness values, ki,CON =18301.6 N/mm and kCON = 31659.9 N/mm, respectivelyfor the initial stiffness and stiffness. These values are about20% lower than the experimental ones, and as such arerough estimates of the joint stiffness. This difference canbe partially justified by the differences in average densities(Table 1) between the LT and CON series. In fact the LTseries presents an average density about 7% lower thanCON series. Also, the proposed model assumes a uniformstress distribution for each member composing the speci-men of the CON series, which is not totally verified forthe side members of the connection as will be demonstratelatter with the proposed FE model. It is interesting to notethat the estimated initial joint stiffness value closely agreeswith the average prediction carried out using the EC5guidelines (kEC5 = 18533 N/mm).
Table 2 also indicates the displacement/slip at failure forthe three test series, which is a measure of the ductility, i.e.,the capacity of a connection to withstand deformationbefore final failure. A significant scatter is observed as indi-cates the high standard deviations. The majority of the testsculminated with a fragile failure of shear-splitting type,however, before this failure occur, the test members experi-enced important deformations. This fragile failureappeared associated to an abrupt load reduction allowingan objective definition of the displacement/slip at failure.For sake of clarity, the load/displacement slip curves
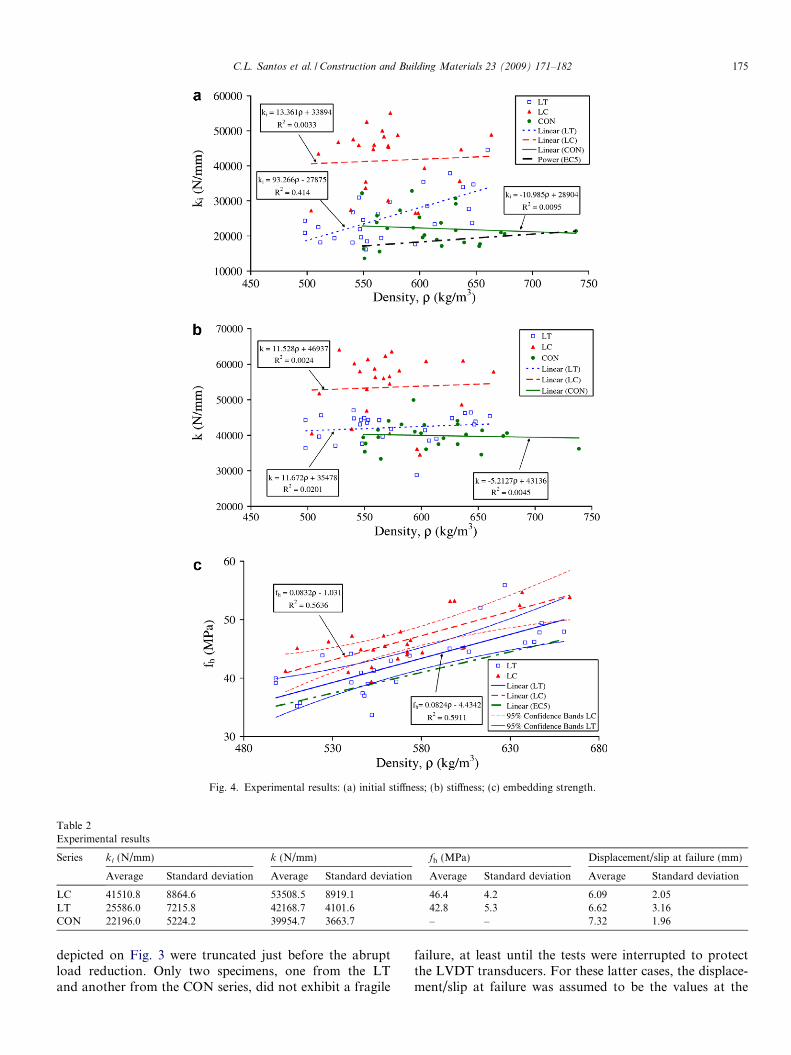
Fig. 4. Experimental results: (a) initial stiffness; (b) stiffness; (c) embedding strength.
Table 2Experimental results
Series ki (N/mm) k (N/mm) fh (MPa) Displacement/slip at failure (mm)
Average Standard deviation Average Standard deviation Average Standard deviation Average Standard deviation
LC 41510.8 8864.6 53508.5 8919.1 46.4 4.2 6.09 2.05LT 25586.0 7215.8 42168.7 4101.6 42.8 5.3 6.62 3.16CON 22196.0 5224.2 39954.7 3663.7 – – 7.32 1.96
C.L. Santos et al. / Construction and Building Materials 23 (2009) 171–182 175
depicted on Fig. 3 were truncated just before the abruptload reduction. Only two specimens, one from the LTand another from the CON series, did not exhibit a fragile
failure, at least until the tests were interrupted to protectthe LVDT transducers. For these latter cases, the displace-ment/slip at failure was assumed to be the values at the
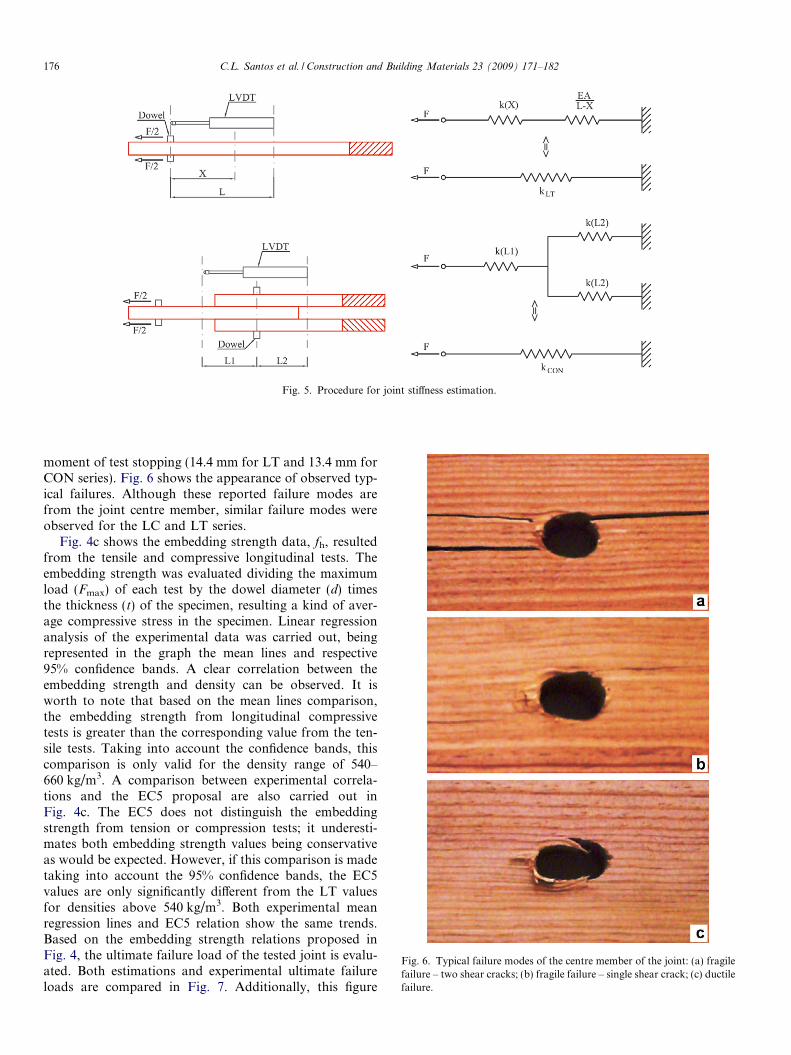
Fig. 5. Procedure for joint stiffness estimation.
Fig. 6. Typical failure modes of the centre member of the joint: (a) fragilefailure – two shear cracks; (b) fragile failure – single shear crack; (c) ductilefailure.
176 C.L. Santos et al. / Construction and Building Materials 23 (2009) 171–182
moment of test stopping (14.4 mm for LT and 13.4 mm forCON series). Fig. 6 shows the appearance of observed typ-ical failures. Although these reported failure modes arefrom the joint centre member, similar failure modes wereobserved for the LC and LT series.
Fig. 4c shows the embedding strength data, fh, resultedfrom the tensile and compressive longitudinal tests. Theembedding strength was evaluated dividing the maximumload (Fmax) of each test by the dowel diameter (d) timesthe thickness (t) of the specimen, resulting a kind of aver-age compressive stress in the specimen. Linear regressionanalysis of the experimental data was carried out, beingrepresented in the graph the mean lines and respective95% confidence bands. A clear correlation between theembedding strength and density can be observed. It isworth to note that based on the mean lines comparison,the embedding strength from longitudinal compressivetests is greater than the corresponding value from the ten-sile tests. Taking into account the confidence bands, thiscomparison is only valid for the density range of 540–660 kg/m3. A comparison between experimental correla-tions and the EC5 proposal are also carried out inFig. 4c. The EC5 does not distinguish the embeddingstrength from tension or compression tests; it underesti-mates both embedding strength values being conservativeas would be expected. However, if this comparison is madetaking into account the 95% confidence bands, the EC5values are only significantly different from the LT valuesfor densities above 540 kg/m3. Both experimental meanregression lines and EC5 relation show the same trends.Based on the embedding strength relations proposed inFig. 4, the ultimate failure load of the tested joint is evalu-ated. Both estimations and experimental ultimate failureloads are compared in Fig. 7. Additionally, this figure
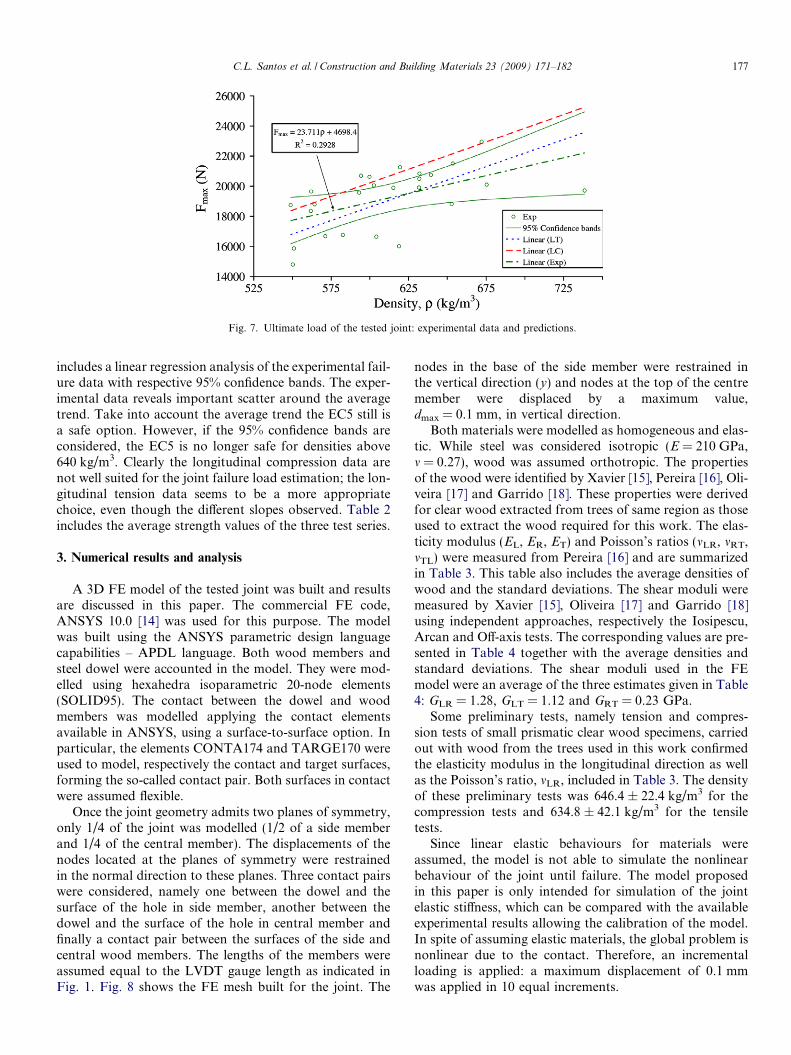
Fig. 7. Ultimate load of the tested joint: experimental data and predictions.
C.L. Santos et al. / Construction and Building Materials 23 (2009) 171–182 177
includes a linear regression analysis of the experimental fail-ure data with respective 95% confidence bands. The exper-imental data reveals important scatter around the averagetrend. Take into account the average trend the EC5 still isa safe option. However, if the 95% confidence bands areconsidered, the EC5 is no longer safe for densities above640 kg/m3. Clearly the longitudinal compression data arenot well suited for the joint failure load estimation; the lon-gitudinal tension data seems to be a more appropriatechoice, even though the different slopes observed. Table 2includes the average strength values of the three test series.
3. Numerical results and analysis
A 3D FE model of the tested joint was built and resultsare discussed in this paper. The commercial FE code,ANSYS 10.0 [14] was used for this purpose. The modelwas built using the ANSYS parametric design languagecapabilities – APDL language. Both wood members andsteel dowel were accounted in the model. They were mod-elled using hexahedra isoparametric 20-node elements(SOLID95). The contact between the dowel and woodmembers was modelled applying the contact elementsavailable in ANSYS, using a surface-to-surface option. Inparticular, the elements CONTA174 and TARGE170 wereused to model, respectively the contact and target surfaces,forming the so-called contact pair. Both surfaces in contactwere assumed flexible.
Once the joint geometry admits two planes of symmetry,only 1/4 of the joint was modelled (1/2 of a side memberand 1/4 of the central member). The displacements of thenodes located at the planes of symmetry were restrainedin the normal direction to these planes. Three contact pairswere considered, namely one between the dowel and thesurface of the hole in side member, another between thedowel and the surface of the hole in central member andfinally a contact pair between the surfaces of the side andcentral wood members. The lengths of the members wereassumed equal to the LVDT gauge length as indicated inFig. 1. Fig. 8 shows the FE mesh built for the joint. The
nodes in the base of the side member were restrained inthe vertical direction (y) and nodes at the top of the centremember were displaced by a maximum value,dmax = 0.1 mm, in vertical direction.
Both materials were modelled as homogeneous and elas-tic. While steel was considered isotropic (E = 210 GPa,m = 0.27), wood was assumed orthotropic. The propertiesof the wood were identified by Xavier [15], Pereira [16], Oli-veira [17] and Garrido [18]. These properties were derivedfor clear wood extracted from trees of same region as thoseused to extract the wood required for this work. The elas-ticity modulus (EL, ER, ET) and Poisson’s ratios (mLR, mRT,mTL) were measured from Pereira [16] and are summarizedin Table 3. This table also includes the average densities ofwood and the standard deviations. The shear moduli weremeasured by Xavier [15], Oliveira [17] and Garrido [18]using independent approaches, respectively the Iosipescu,Arcan and Off-axis tests. The corresponding values are pre-sented in Table 4 together with the average densities andstandard deviations. The shear moduli used in the FEmodel were an average of the three estimates given in Table4: GLR = 1.28, GLT = 1.12 and GRT = 0.23 GPa.
Some preliminary tests, namely tension and compres-sion tests of small prismatic clear wood specimens, carriedout with wood from the trees used in this work confirmedthe elasticity modulus in the longitudinal direction as wellas the Poisson’s ratio, mLR, included in Table 3. The densityof these preliminary tests was 646.4 ± 22.4 kg/m3 for thecompression tests and 634.8 ± 42.1 kg/m3 for the tensiletests.
Since linear elastic behaviours for materials wereassumed, the model is not able to simulate the nonlinearbehaviour of the joint until failure. The model proposedin this paper is only intended for simulation of the jointelastic stiffness, which can be compared with the availableexperimental results allowing the calibration of the model.In spite of assuming elastic materials, the global problem isnonlinear due to the contact. Therefore, an incrementalloading is applied: a maximum displacement of 0.1 mmwas applied in 10 equal increments.
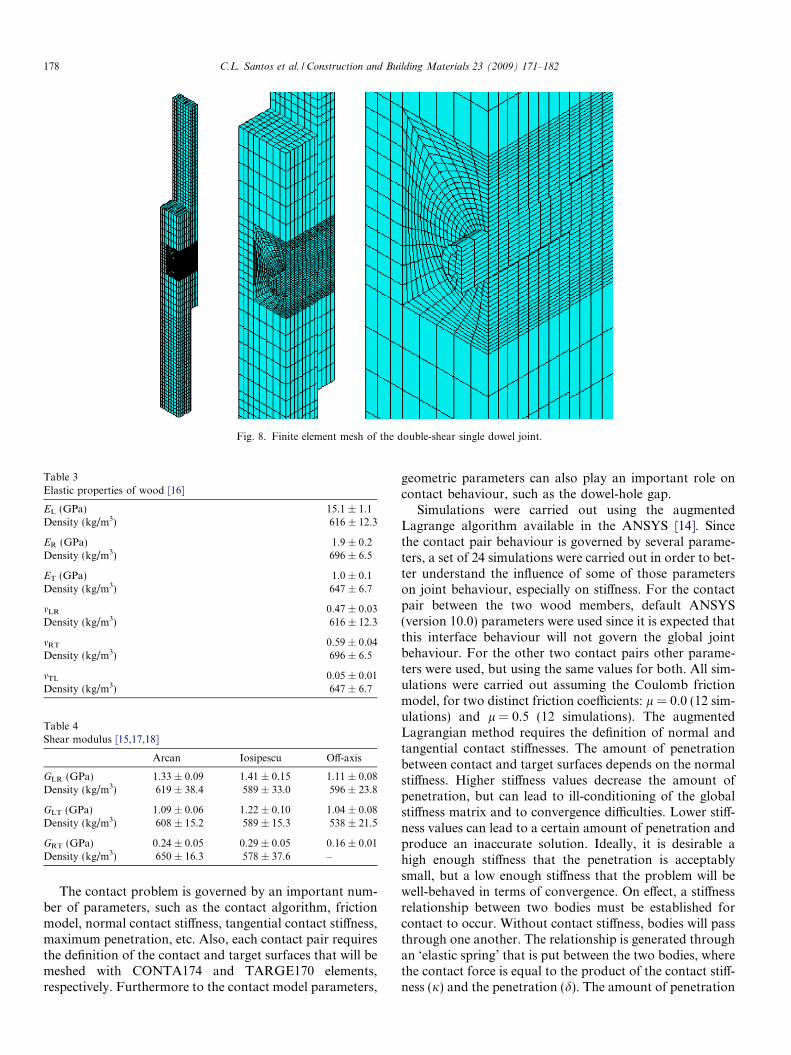
Table 3Elastic properties of wood [16]
EL (GPa) 15.1 ± 1.1Density (kg/m3) 616 ± 12.3
ER (GPa) 1.9 ± 0.2Density (kg/m3) 696 ± 6.5
ET (GPa) 1.0 ± 0.1Density (kg/m3) 647 ± 6.7
mLR 0.47 ± 0.03Density (kg/m3) 616 ± 12.3
mRT 0.59 ± 0.04Density (kg/m3) 696 ± 6.5
mTL 0.05 ± 0.01Density (kg/m3) 647 ± 6.7
Table 4Shear modulus [15,17,18]
Arcan Iosipescu Off-axis
GLR (GPa) 1.33 ± 0.09 1.41 ± 0.15 1.11 ± 0.08Density (kg/m3) 619 ± 38.4 589 ± 33.0 596 ± 23.8
GLT (GPa) 1.09 ± 0.06 1.22 ± 0.10 1.04 ± 0.08Density (kg/m3) 608 ± 15.2 589 ± 15.3 538 ± 21.5
GRT (GPa) 0.24 ± 0.05 0.29 ± 0.05 0.16 ± 0.01Density (kg/m3) 650 ± 16.3 578 ± 37.6 –
Fig. 8. Finite element mesh of the double-shear single dowel joint.
178 C.L. Santos et al. / Construction and Building Materials 23 (2009) 171–182
The contact problem is governed by an important num-ber of parameters, such as the contact algorithm, frictionmodel, normal contact stiffness, tangential contact stiffness,maximum penetration, etc. Also, each contact pair requiresthe definition of the contact and target surfaces that will bemeshed with CONTA174 and TARGE170 elements,respectively. Furthermore to the contact model parameters,
geometric parameters can also play an important role oncontact behaviour, such as the dowel-hole gap.
Simulations were carried out using the augmentedLagrange algorithm available in the ANSYS [14]. Sincethe contact pair behaviour is governed by several parame-ters, a set of 24 simulations were carried out in order to bet-ter understand the influence of some of those parameterson joint behaviour, especially on stiffness. For the contactpair between the two wood members, default ANSYS(version 10.0) parameters were used since it is expected thatthis interface behaviour will not govern the global jointbehaviour. For the other two contact pairs other parame-ters were used, but using the same values for both. All sim-ulations were carried out assuming the Coulomb frictionmodel, for two distinct friction coefficients: l = 0.0 (12 sim-ulations) and l = 0.5 (12 simulations). The augmentedLagrangian method requires the definition of normal andtangential contact stiffnesses. The amount of penetrationbetween contact and target surfaces depends on the normalstiffness. Higher stiffness values decrease the amount ofpenetration, but can lead to ill-conditioning of the globalstiffness matrix and to convergence difficulties. Lower stiff-ness values can lead to a certain amount of penetration andproduce an inaccurate solution. Ideally, it is desirable ahigh enough stiffness that the penetration is acceptablysmall, but a low enough stiffness that the problem will bewell-behaved in terms of convergence. On effect, a stiffnessrelationship between two bodies must be established forcontact to occur. Without contact stiffness, bodies will passthrough one another. The relationship is generated throughan ‘elastic spring’ that is put between the two bodies, wherethe contact force is equal to the product of the contact stiff-ness (j) and the penetration (d). The amount of penetration
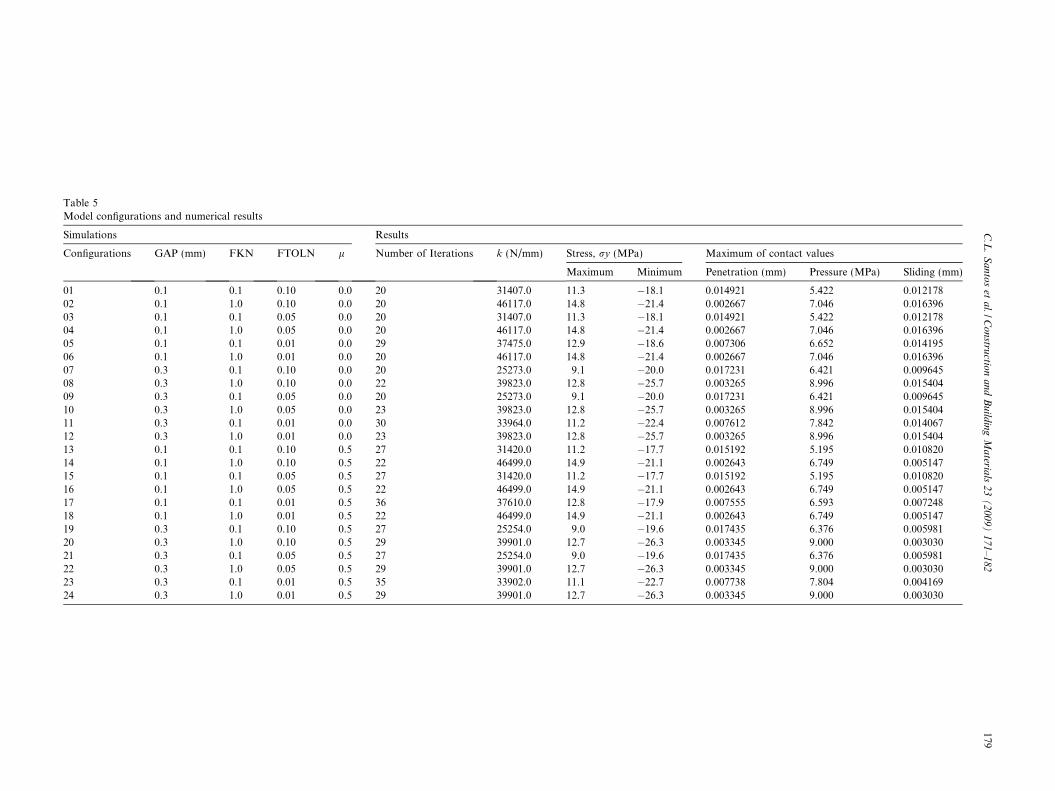
Table 5Model configurations and numerical results
Simulations Results
Configurations GAP (mm) FKN FTOLN l Number of Iterations k (N/mm) Stress, ry (MPa) Maximum of contact values
Maximum Minimum Penetration (mm) Pressure (MPa) Sliding (mm)
01 0.1 0.1 0.10 0.0 20 31407.0 11.3 �18.1 0.014921 5.422 0.01217802 0.1 1.0 0.10 0.0 20 46117.0 14.8 �21.4 0.002667 7.046 0.01639603 0.1 0.1 0.05 0.0 20 31407.0 11.3 �18.1 0.014921 5.422 0.01217804 0.1 1.0 0.05 0.0 20 46117.0 14.8 �21.4 0.002667 7.046 0.01639605 0.1 0.1 0.01 0.0 29 37475.0 12.9 �18.6 0.007306 6.652 0.01419506 0.1 1.0 0.01 0.0 20 46117.0 14.8 �21.4 0.002667 7.046 0.01639607 0.3 0.1 0.10 0.0 20 25273.0 9.1 �20.0 0.017231 6.421 0.00964508 0.3 1.0 0.10 0.0 22 39823.0 12.8 �25.7 0.003265 8.996 0.01540409 0.3 0.1 0.05 0.0 20 25273.0 9.1 �20.0 0.017231 6.421 0.00964510 0.3 1.0 0.05 0.0 23 39823.0 12.8 �25.7 0.003265 8.996 0.01540411 0.3 0.1 0.01 0.0 30 33964.0 11.2 �22.4 0.007612 7.842 0.01406712 0.3 1.0 0.01 0.0 23 39823.0 12.8 �25.7 0.003265 8.996 0.01540413 0.1 0.1 0.10 0.5 27 31420.0 11.2 �17.7 0.015192 5.195 0.01082014 0.1 1.0 0.10 0.5 22 46499.0 14.9 �21.1 0.002643 6.749 0.00514715 0.1 0.1 0.05 0.5 27 31420.0 11.2 �17.7 0.015192 5.195 0.01082016 0.1 1.0 0.05 0.5 22 46499.0 14.9 �21.1 0.002643 6.749 0.00514717 0.1 0.1 0.01 0.5 36 37610.0 12.8 �17.9 0.007555 6.593 0.00724818 0.1 1.0 0.01 0.5 22 46499.0 14.9 �21.1 0.002643 6.749 0.00514719 0.3 0.1 0.10 0.5 27 25254.0 9.0 �19.6 0.017435 6.376 0.00598120 0.3 1.0 0.10 0.5 29 39901.0 12.7 �26.3 0.003345 9.000 0.00303021 0.3 0.1 0.05 0.5 27 25254.0 9.0 �19.6 0.017435 6.376 0.00598122 0.3 1.0 0.05 0.5 29 39901.0 12.7 �26.3 0.003345 9.000 0.00303023 0.3 0.1 0.01 0.5 35 33902.0 11.1 �22.7 0.007738 7.804 0.00416924 0.3 1.0 0.01 0.5 29 39901.0 12.7 �26.3 0.003345 9.000 0.003030
C.L
.S
an
tos
eta
l./Co
nstru
ction
an
dB
uild
ing
Ma
terials
23
(2
00
9)
17
1–
18
2179
180 C.L. Santos et al. / Construction and Building Materials 23 (2009) 171–182
(d), or incompatibility, between the two bodies is thereforedependent of the stiffness (j). Ideally, there should be nopenetration, but this implies that j =1, which will leadto numerical instabilities. The value of j that is computedby ANSYS depends on the relative stiffness of the bodies incontact (bulk modulus, K, of contacted element) existingthe possibility of scaling j through the FKN factor alsocalled normal penalty stiffness factor. The usual factorrange is from 0.01 to 1.0, with a default of 1.0. The defaultvalue is appropriate for bulk deformation. Present simula-tions covered FKN values equal to 0.1 and 1.0. Anotherrelevant contact parameter to be used in conjunction withthe augmented Lagrangian method is FTOLN. FTOLNis a tolerance factor to be applied in the direction of thesurface normal. The range for this factor is less than 1.0(usually less than 0.2), with a default of 0.1, and is basedon the depth of the underlying solid element. This factoris used to determine if penetration compatibility is satisfied.Contact compatibility is satisfied if penetration is within anallowable tolerance (FTOLN times the depth of underlyingelements). The depth is defined by the average depth ofeach individual contact element in the pair. If ANSYSdetects any penetration larger than this tolerance, the glo-bal solution is still considered unconverged, even thoughthe residual forces and displacement increments have metconvergence criteria. FTOLN values equal to 0.01, 0.05and 0.1 were simulated. For all other contact parametersnot mentioned here default values were adopted [14].
The contact performance is strongly influenced by thegap between dowel and hole. This geometric parameter isnot easy to estimate due to the difficulty on dimensional con-trol of manufactured holes. Also, bedding-in phenomenonis observed between the dowel and the hole, which elimi-nates any irregular surface roughness and misalignments,contributing, in practice, to increase this gap. Based ondirect measurements and on the unloading branch of theload–slip curves, we concluded that gaps in the range of0.1–0.3 mm are realistic. Thus, simulations were carried
Fig. 9. ry stresses in MPa obta
out considering the two extreme gap values of the referredrange.
Table 5 summarizes the configurations of the simulationsand respective numerical results. Results include the jointstiffness (slip modulus), the maximum and minimum stres-ses on the surface of the holes and some relevant contactresults, such as the maximum penetration, pressure andsliding distance. Also, the number of iterations is includedin the table, since it serves as a measure of the computa-tional cost, which is important for nonlinear simulations.
The joint stiffness is the only numerical result that can beassessed using the available experimental data, namely thejoint stiffness obtained at the unloading–reloading stages(Table 2). The experimental average stiffness falls withinthe range of numerical results. The gap has a determinanteffect on stiffness values; its increase results in a systematicstiffness reduction. For frictionless contact and usingdefault values of FKN and FTOLN with GAP = 0.3 (con-figuration 08), simulations yield about the same value ofthe average experimental stiffness. Considering frictioncoefficient of 0.5 (configuration 20) this stiffness slightlyincreases getting even better. Consideration of a non-nullfriction coefficient yields a slightly results change, with anincrease in computational cost, since the stiffness matrixof the structure become unsymmetric.
The FKN factor also plays an important role on contactsimulation as demonstrated by the numerical results ofTable 5. In fact, the reduction of this factor produces a sig-nificant reduction on the joint stiffness. Apparently theFTOLN parameter has a minor influence on results; onlyfor small values of this parameter, changes in results arevisible since more iterations are needed to accommodatea smaller penetration. In all simulations the numerical pen-etration was kept very small as certified the maximum pen-etration value of Table 5 (17 lm).
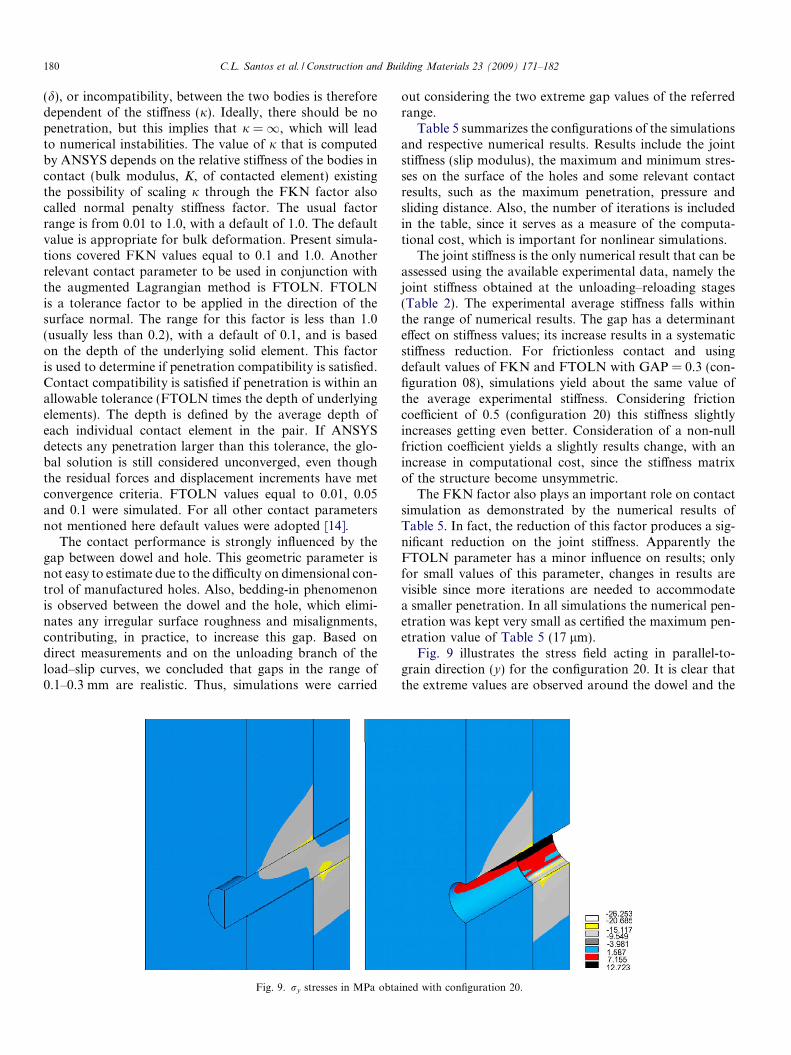
Fig. 9 illustrates the stress field acting in parallel-to-grain direction (y) for the configuration 20. It is clear thatthe extreme values are observed around the dowel and the
ined with configuration 20.
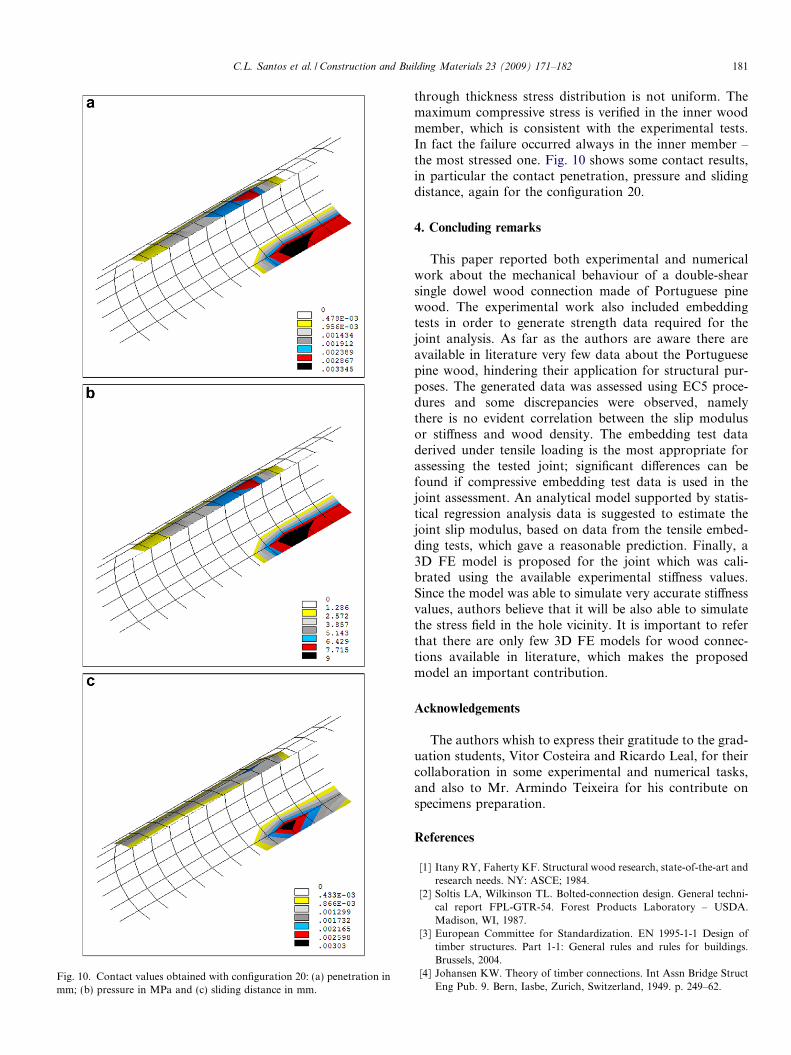
Fig. 10. Contact values obtained with configuration 20: (a) penetration inmm; (b) pressure in MPa and (c) sliding distance in mm.
C.L. Santos et al. / Construction and Building Materials 23 (2009) 171–182 181
through thickness stress distribution is not uniform. Themaximum compressive stress is verified in the inner woodmember, which is consistent with the experimental tests.In fact the failure occurred always in the inner member –the most stressed one. Fig. 10 shows some contact results,in particular the contact penetration, pressure and slidingdistance, again for the configuration 20.
4. Concluding remarks
This paper reported both experimental and numericalwork about the mechanical behaviour of a double-shearsingle dowel wood connection made of Portuguese pinewood. The experimental work also included embeddingtests in order to generate strength data required for thejoint analysis. As far as the authors are aware there areavailable in literature very few data about the Portuguesepine wood, hindering their application for structural pur-poses. The generated data was assessed using EC5 proce-dures and some discrepancies were observed, namelythere is no evident correlation between the slip modulusor stiffness and wood density. The embedding test dataderived under tensile loading is the most appropriate forassessing the tested joint; significant differences can befound if compressive embedding test data is used in thejoint assessment. An analytical model supported by statis-tical regression analysis data is suggested to estimate thejoint slip modulus, based on data from the tensile embed-ding tests, which gave a reasonable prediction. Finally, a3D FE model is proposed for the joint which was cali-brated using the available experimental stiffness values.Since the model was able to simulate very accurate stiffnessvalues, authors believe that it will be also able to simulatethe stress field in the hole vicinity. It is important to referthat there are only few 3D FE models for wood connec-tions available in literature, which makes the proposedmodel an important contribution.
Acknowledgements
The authors whish to express their gratitude to the grad-uation students, Vitor Costeira and Ricardo Leal, for theircollaboration in some experimental and numerical tasks,and also to Mr. Armindo Teixeira for his contribute onspecimens preparation.
References
[1] Itany RY, Faherty KF. Structural wood research, state-of-the-art andresearch needs. NY: ASCE; 1984.
[2] Soltis LA, Wilkinson TL. Bolted-connection design. General techni-cal report FPL-GTR-54. Forest Products Laboratory – USDA.Madison, WI, 1987.
[3] European Committee for Standardization. EN 1995-1-1 Design oftimber structures. Part 1-1: General rules and rules for buildings.Brussels, 2004.
[4] Johansen KW. Theory of timber connections. Int Assn Bridge StructEng Pub. 9. Bern, Iasbe, Zurich, Switzerland, 1949. p. 249–62.
182 C.L. Santos et al. / Construction and Building Materials 23 (2009) 171–182
[5] European Committee for Standardization. EN383: Timber struc-tures. Test methods. Determination of embedding strength andfoundation values for dowel-type fasteners. European Standard,1993.
[6] Patton-Mallory M, Pellicane PJ, Smith FW. Modelling boltedconnections in wood: review. J Struct Eng 1997;123:1054–62.
[7] Sawata K, Yasamura M. Estimation of yield and ultimate strengthsof bolted timber joints by nonlinear analysis and yield theory. J WoodSci 2003;49:383–91.
[8] Chen CJ, Lee TL, Jeng DS. Finite element modelling for themechanical behaviour of dowel-type timber joints. Comput Struct2003;81:2731–8.
[9] Racher P, Bocquet JF. Non-linear analysis of dowelled timberconnections: a new approach for embedding modelling. Electron JStruct Eng 2005;5:1–9.
[10] Kharouf N, McClure G, Smith I. Elasto-plastic modelling of woodbolted connections. Comput Struct 2003;81:747–54.
[11] Patton-Mallory M, Cramer SM, Smith FW, Pellicane PJ. Nonlinearmaterial models for analysis of bolted wood connections. J Struct Eng1997;123:1063–70.
[12] Moses DM, Prion HGL. A three-dimensional model for boltedconnections in wood. Can J Civil Eng 2003;30:555–67.
[13] European Committee for Standardization. EN26891: Timber struc-tures. Test methods. Determination of embedding strength andfoundation values for dowel type fasteners. European Standard, 1993.
[14] Swanson Analysis Systems Inc. ANSYS. Version 10.0. Houston,2005.
[15] Xavier JC. Caracterizac�ao do comportamento ao corte da madeirausando o ensaio de Iosipescu. MSc Thesis, University of Tras-os-Montes and Alto Douro, Vila Real, Portugal, 2003.
[16] Pereira J. Comportamento mecanico da madeira em tracc�ao nasdirecc�oes de simetria material. MSc Thesis, University of Tras-os-Montes and Alto Douro, Vila Real, Portugal, 2003.
[17] Oliveira M. Caracterizac�ao do comportamento ao corte da madeirausando o ensaio de Arcan. MSc Thesis, Universidade of Tras-os-Montes and Alto Douro, Vila Real, Portugal, 2003.
[18] Garrido N, Identificac�ao do comportamento ao corte da madeira,atraves do ensaio de tracc�ao fora dos eixos de simetria material. MScThesis, Universidade of Tras-os-Montes and Alto Douro, Vila Real,Portugal, 2004.