Embed Size (px)
Citation preview
Rural and Regional Affairs and Transport Legislation Committee
ANSWERS TO QUESTIONS ON NOTICE
Supplementary Budget Estimates October 2016
Agriculture and Water Resources
Question: 178
Division/Agency: Rural Industries Research and Development Corporation
Topic: Redundancy
Proof Hansard page: 15
Senator McCARTHY asked:
Senator McCARTHY: So only one staff member refused to go and took the redundancy, or are you saying that only one staff member—
Mr Harvey: At the moment, we have paid one redundancy, but we have expectations that there may be more redundancies. Our expectation is that there will be up to four more redundancies. Clearly, this move has been on the cards for quite a while, and a number of staff have voluntarily found other employment.
Senator McCARTHY: How many of those staff?
Mr Harvey: Approximately five. If you want that exactly, I will need to take it on notice.
Answer:
Since the announcement to relocate was made on 24 February 2016, there has been 6 staff that have left voluntarily to take up other employment opportunities.
Rural and Regional Affairs and Transport Legislation Committee
ANSWERS TO QUESTIONS ON NOTICE
Supplementary Budget Estimates October 2016
Agriculture and Water Resources
Question: 179
Division/Agency: Rural Industries Research and Development Corporation
Topic: Annual Report Stats
Proof Hansard page: 16
Senator RICE asked:
Senator RICE: There was an article in The Weekly Times in August that said, according to the RIRDC's annual report last year, the organisation had 18 full-time equivalent staff.
Mr Harvey: Numbers do fluctuate from time to time, depending on what we have on our agenda. The numbers I based my figures on are the 16.
Senator RICE: Could you take on notice the difference between the 18 that was in your annual report and the 16?
Mr Harvey: Sure, absolutely.
Answer:
At 30 June 2015 the Corporation had 11 staff employed on a full time basis (including the Managing Director) and seven part-time staff members, 18 in total. We also had one staff member on maternity leave.
As at 30 September 2016 the Corporation has 16 staff.
A steady staff turn-over since the decision has seen several positions not replaced (or replaced via secondments and short term contracts) as the corporation moves towards a smaller structure.
Rural and Regional Affairs and Transport Legislation Committee
ANSWERS TO QUESTIONS ON NOTICE
Supplementary Budget Estimates October 2016
Agriculture and Water Resources
Question: 180
Division/Agency: Rural Industries Research and Development Corporation
Topic: Measure of Success going forward
Proof Hansard page: 17
Senator RICE asked:
Senator RICE: Can you take on notice whether it is the KPIs and the board or the criteria that you are using to judge the success and how you are going to measure that success as you go forward?
Mrs Hull: Absolutely. The board will undertake these discussions in further detail in December and we already have undertaken discussions. We will finalise those discussions in December, so I am happy to take that on notice and provide you with the outcomes.
Answer:
We are going to measure Rural Industries Research and Development Corporation’s success going forward based on the KPIs of the board, which the board intends to finalise at its December meeting and can be subsequently made available to the committee.
Rural and Regional Affairs and Transport Legislation Committee
ANSWERS TO QUESTIONS ON NOTICE
Supplementary Budget Estimates October 2016
Agriculture and Water Resources
Question: 181
Division/Agency: Rural Industries Research and Development Corporation
Topic: Cost-Benefit Analysis
Proof Hansard page: 17
Senator RICE asked:
Senator RICE: Was there a cost-benefit analysis done of the relocation prior to it being undertaken?
Mr Harvey: My understanding is that a costing was done.
Senator RICE: But was there any articulation of the benefits?
Mr Harvey: I would need to take that on notice. That was before I joined the organisation.
Senator RICE: Could you please answer that and, if that cost-benefit analysis was done, whether it is a public document?
Answer:
An independent cost benefit analysis was carried out early in the period leading up to the decision to relocate the Corporation to Wagga. This analysis wasn’t released publically but utilised during deliberations by the Board on the best option for the future of the Corporation.
Rural and Regional Affairs and Transport Legislation Committee
ANSWERS TO QUESTIONS ON NOTICE
Supplementary Budget Estimates October 2016
Agriculture and Water Resources
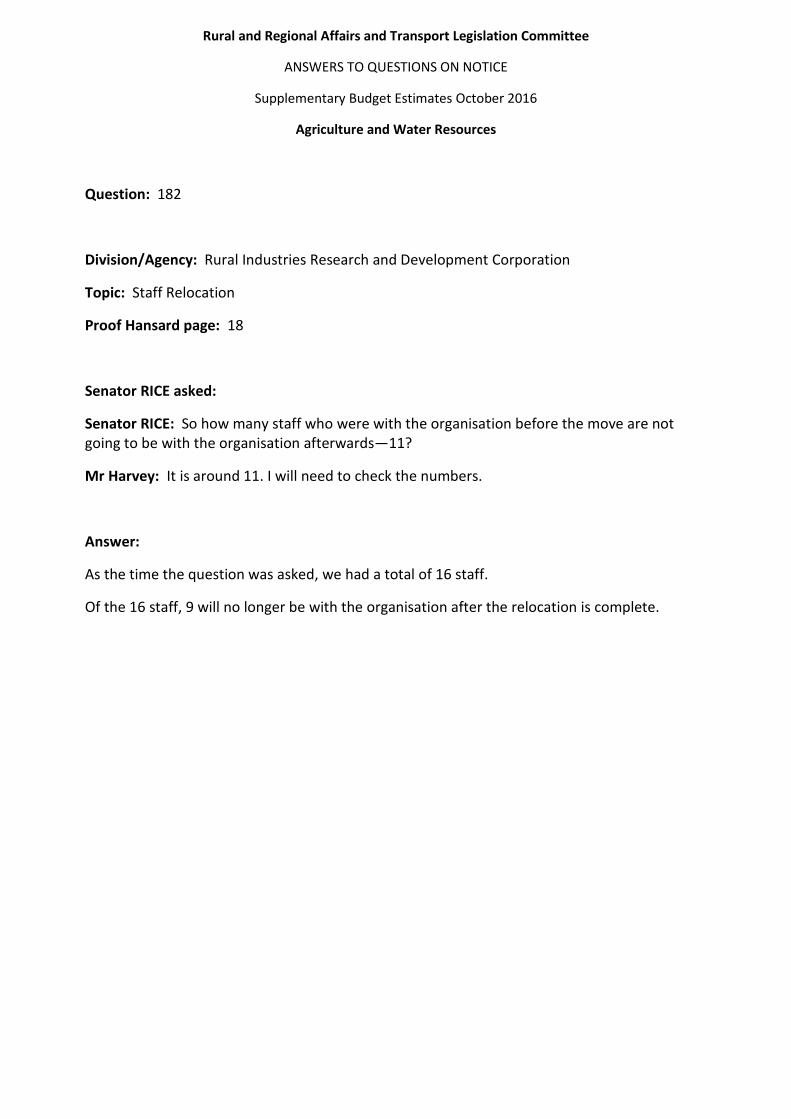
Question: 182
Division/Agency: Rural Industries Research and Development Corporation
Topic: Staff Relocation
Proof Hansard page: 18
Senator RICE asked:
Senator RICE: So how many staff who were with the organisation before the move are not going to be with the organisation afterwards—11?
Mr Harvey: It is around 11. I will need to check the numbers.
Answer:
As the time the question was asked, we had a total of 16 staff.
Of the 16 staff, 9 will no longer be with the organisation after the relocation is complete.
Rural and Regional Affairs and Transport Legislation Committee
ANSWERS TO QUESTIONS ON NOTICE
Supplementary Budget Estimates October 2016
Agriculture and Water Resources
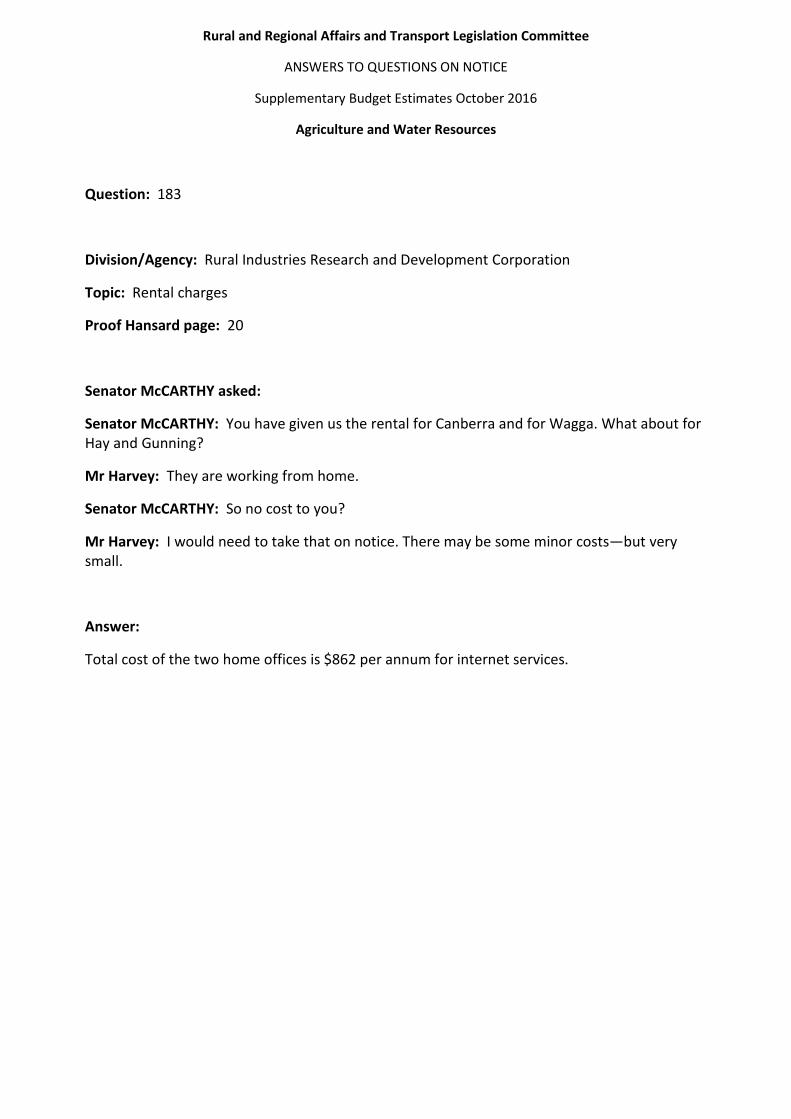
Question: 183
Division/Agency: Rural Industries Research and Development Corporation
Topic: Rental charges
Proof Hansard page: 20
Senator McCARTHY asked:
Senator McCARTHY: You have given us the rental for Canberra and for Wagga. What about for Hay and Gunning?
Mr Harvey: They are working from home.
Senator McCARTHY: So no cost to you?
Mr Harvey: I would need to take that on notice. There may be some minor costs—but very small.
Answer:
Total cost of the two home offices is $862 per annum for internet services.
Rural and Regional Affairs and Transport Legislation Committee
ANSWERS TO QUESTIONS ON NOTICE
Supplementary Budget Estimates October 2016
Agriculture and Water Resources
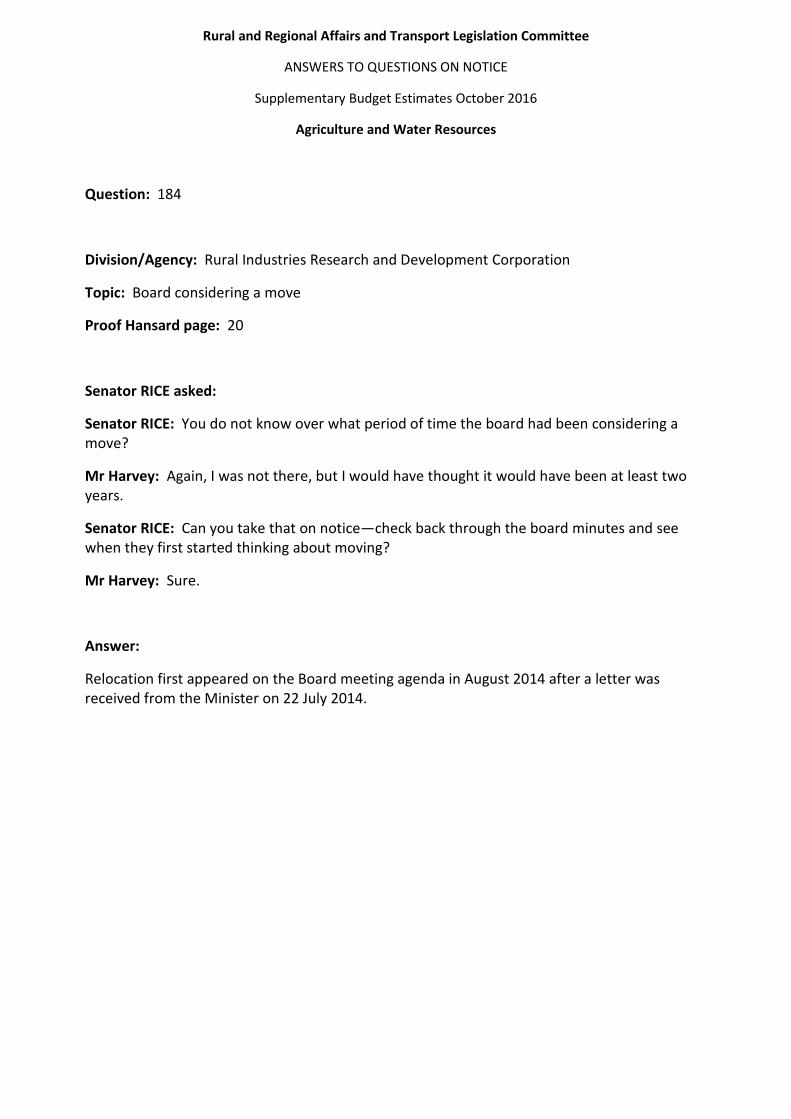
Question: 184
Division/Agency: Rural Industries Research and Development Corporation
Topic: Board considering a move
Proof Hansard page: 20
Senator RICE asked:
Senator RICE: You do not know over what period of time the board had been considering a move?
Mr Harvey: Again, I was not there, but I would have thought it would have been at least two years.
Senator RICE: Can you take that on notice—check back through the board minutes and see when they first started thinking about moving?
Mr Harvey: Sure.
Answer:
Relocation first appeared on the Board meeting agenda in August 2014 after a letter was received from the Minister on 22 July 2014.
Rural and Regional Affairs and Transport Legislation Committee
ANSWERS TO QUESTIONS ON NOTICE
Supplementary Budget Estimates October 2016
Agriculture and Water Resources
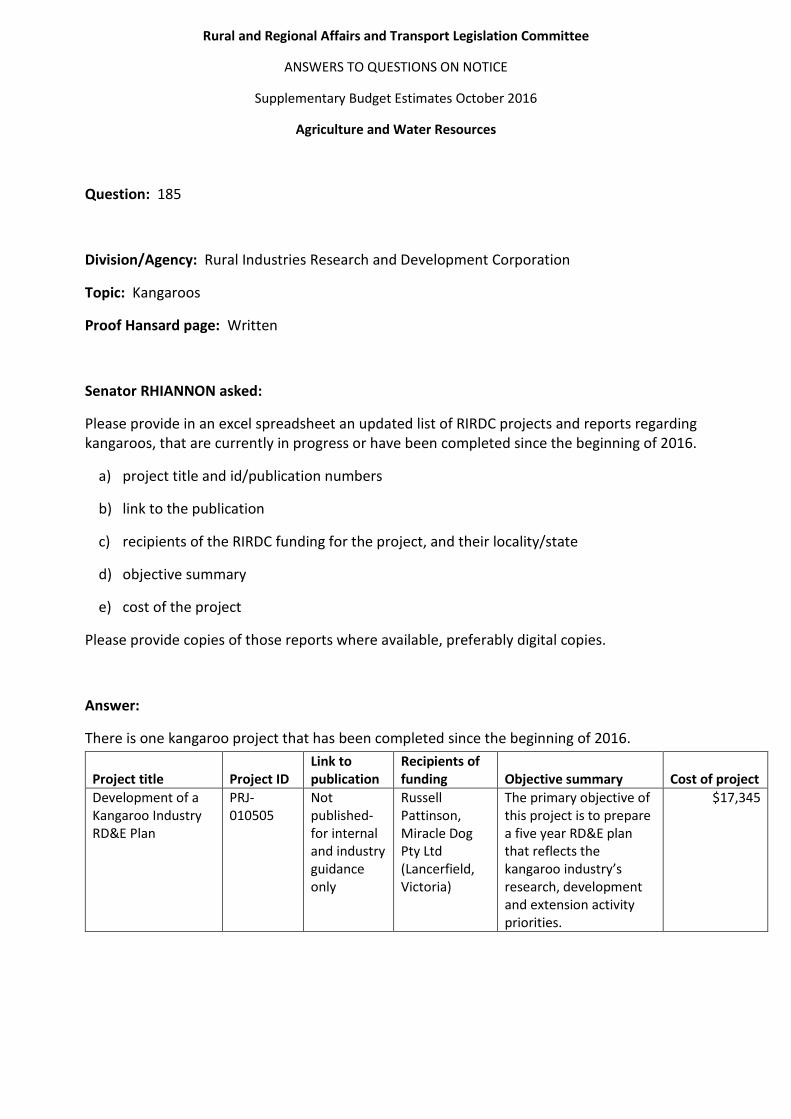
Question: 185
Division/Agency: Rural Industries Research and Development Corporation
Topic: Kangaroos
Proof Hansard page: Written
Senator RHIANNON asked:
Please provide in an excel spreadsheet an updated list of RIRDC projects and reports regarding kangaroos, that are currently in progress or have been completed since the beginning of 2016.
a) project title and id/publication numbers
b) link to the publication
c) recipients of the RIRDC funding for the project, and their locality/state
d) objective summary
e) cost of the project
Please provide copies of those reports where available, preferably digital copies.
Answer:
There is one kangaroo project that has been completed since the beginning of 2016.
Project title Project ID Link to publication
Recipients of funding Objective summary Cost of project
Development of a Kangaroo Industry RD&E Plan
PRJ-010505
Not published-for internal and industry guidance only
Russell Pattinson, Miracle Dog Pty Ltd (Lancerfield, Victoria)
The primary objective of this project is to prepare a five year RD&E plan that reflects the kangaroo industry’s research, development and extension activity priorities.
$17,345
Rural and Regional Affairs and Transport Legislation Committee
ANSWERS TO QUESTIONS ON NOTICE
Supplementary Budget Estimates October 2016
Agriculture and Water Resources
Question: 186
Division/Agency: Rural Industries Research and Development Corporation
Topic: Kangaroos
Proof Hansard page: Written
Senator RHIANNON asked:
DAFF and RIRDC signed a funding agreement for $290,000 from the national Landcare program for the Sustainable Wildlife Project (effective 1 February 2007). The link to that project no longer works on the RIRDC website http://www.rirdc.gov.au/research-project-details/custr10_DRC/PRJ-003171:
a) To whom and how and for what was the grant dispersed?
Please provide copies of any reports or documents resulting from the project, and the internet link to the same if available.
Answer:
Rural Industries Research and Development Corporation contracted Australian Wildlife Services to deliver the project. The project started on 1 March 2007 and finished 30 June 2008. Australian Wildlife Services selected a number of providers, through an open call for providers, to assist in the delivery of the project. George Wilson of Australian Wildlife Services was the principle investigator of the project.
Project objective summary:
To support implementation of the plan for trials of on-farm sustainable wildlife enterprises at two sites -- Maranoa Wildlife Management Conservancy and Murray Darling Rangelands Conservancy.
• define a framework that enables landholders to share the proceeds of harvested wildlife
• estimate kangaroo numbers that enable landholders to more effectively manage populations and integrate wildlife with their property and natural resource management plans
• identify markets for products that are badged as leading to net conservation gain
• share information of experiences from the trial sites and encourage regional collaboration in natural resource management and wildlife planning
Question: 186 (continued)
Copies of the project reports and outputs are attached.
Attachment A: Building connections between kangaroos commerce and conservation in the rangelands - Ampt&Baumber (Journal article)
Attachment B: Building Cooperation and Collaboration in the Kangaroo Industry (published but not available online)
Attachment C: Barrier Ranges Kangaroo Plan May 09 (Journal article)
Attachment D: Landholder Collaboration in Wildlife Management - Cooney Cooperative (published but not available online)
Attachment E: Optimising mixed-grazing strategies for semi-arid Australian rangelands Moloney PhD (hearn) (Journal article)
Attachment F: Sharing Skippy (Journal article)
Attachment G: Sustainable Wildlife Enterprises Trials June 08 Final Report (Journal article)
Attachment H: Marketing Kangaroo Meat from the Maranoa Wildlife Conservancy draft final report.
2
398 AustralianZoologist volume 33 (3)399AustralianZoologist volume 33 (3)
IntroductionNow is an excellent time for revisiting the place of kangaroos in Australia’s rural industries. After 30 years of harvesting under a quota system it is clear that the industry is sustainable and will not lead to the extinction of the four commercial species. The rhetoric of pest control is making way for the rhetoric of sustainable use. Occasional episodes of opposition are having less impact as the community develops greater acceptance of the harvest and its increasingly professional and scientific basis.
Although it is difficult to obtain reliable figures on kangaroo meat consumption, its position in the domestic marketplace is undergoing significant change. It is now available in major Australian supermarket chains in a diversity of products and in much larger volumes than just a few years ago. With supply controlled by harvest quotas and impacted on by drought in recent years, it has been demonstrated that increased demand can lead to an increase in the prices offered by processors.
This is occurring in the context of a declining wool industry with falling sheep numbers and wool returns, declining terms of trade and increased reliance on off-farm incomes. This is exacerbated by periods of extreme drought and the increasing realisation that traditional industries will not provide the economic driver for better natural resource management in many areas. Landholders are moving into meat sheep and goats, and there are increasing calls for diversification into tourism and other enterprises. Incentives are being sought for conservation-orientated management through market-based instruments and programs such
‘enterprise based conservation’. Catchment targets are being set for larger areas of native vegetation and larger areas ‘managed for conservation’.
Kangaroos clearly have a role in this emerging situation. They are abundant, superbly adapted animals that compete less with domestic stock than is conventionally thought. They range across the landscape utilising herbage where it is available, causing localised increases in total grazing pressure. While their numbers fluctuate, they restock themselves after droughts. They provide high quality products with growing demand and an increasing price without global competition.
Despite this, landholders currently have negligible participation in the kangaroo industry and receive little or no economic return from it. They have been willing to cooperate with the harvest regulation system and pass on their potential ownership of the resource to the industry without any expectation of an economic return. Can they carve out a place for themselves in the industry? Do they want to? What are the potential benefits for them and for conservation if they do? And if the potential is there, why aren’t they already doing it? These questions are central to this paper.
So what will it take to get landholders into the industry? While it would be true to say that there is a degree of cultural resistance and significant scepticism towards it, there are landholders who have tried in the past and are willing to try in the future. We believe there are four critical components to facilitating the process:
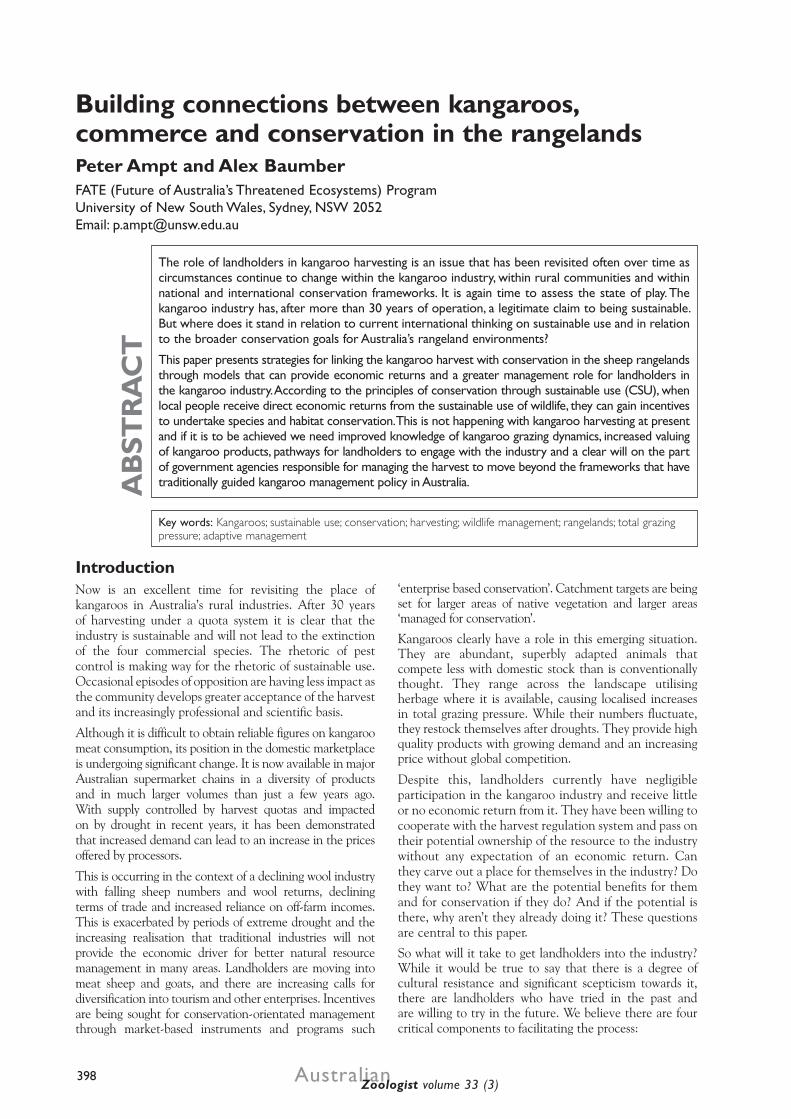
Building connections between kangaroos, commerce and conservation in the rangelandsPeter Ampt and Alex BaumberFATE (Future of Australia’s Threatened Ecosystems) ProgramUniversity of New South Wales, Sydney, NSW 2052Email: [email protected]
AB
STR
AC
T
The role of landholders in kangaroo harvesting is an issue that has been revisited often over time as circumstances continue to change within the kangaroo industry, within rural communities and within national and international conservation frameworks. It is again time to assess the state of play. The kangaroo industry has, after more than 30 years of operation, a legitimate claim to being sustainable. But where does it stand in relation to current international thinking on sustainable use and in relation to the broader conservation goals for Australia’s rangeland environments?
This paper presents strategies for linking the kangaroo harvest with conservation in the sheep rangelands through models that can provide economic returns and a greater management role for landholders in the kangaroo industry. According to the principles of conservation through sustainable use (CSU), when local people receive direct economic returns from the sustainable use of wildlife, they can gain incentives to undertake species and habitat conservation. This is not happening with kangaroo harvesting at present and if it is to be achieved we need improved knowledge of kangaroo grazing dynamics, increased valuing of kangaroo products, pathways for landholders to engage with the industry and a clear will on the part of government agencies responsible for managing the harvest to move beyond the frameworks that have traditionally guided kangaroo management policy in Australia.
Key words: Kangaroos; sustainable use; conservation; harvesting; wildlife management; rangelands; total grazing pressure; adaptive management
398 AustralianZoologist volume 33 (3)399AustralianZoologist volume 33 (3)
1) More accurate knowledge obtained and communicated to stakeholders on kangaroos’ contribution to total grazing pressure and the extent to which they compete with sheep;
2) Increased value of kangaroo products as compared to other products (i.e. wool in particular);
3) More flexible State kangaroo management plans with clearly stated aims and provision for adaptive management trials that encourage rather than inhibit landholder involvement in and returns from harvesting;
4) The development of enterprise models through which landholders can claim a legitimate role in the industry and through which they can gain some economic benefit.
Significant commercial involvement of landholders in the kangaroo industry is unlikely to occur unless there is an increase in end prices paid for kangaroo products. However, increased prices and markets for kangaroo products alone will not provide conservation incentives if landholders are not able or prepared to get involved in the industry. Furthermore, any decision by landholders to become producers of kangaroo products rather than (or as well as) producers of other commodities such as wool will be a business decision and, as such, the potential income from kangaroos needs to be measured accurately alongside the costs of managing kangaroo production on a property. Ideally, these critical components should all be addressed together to achieve conservation benefits through commercial kangaroo harvesting.
In the following section we describe in more detail the trends and issues summarised above that lead us to the conclusion that now is a good time to push for changes in the industry and the way it is regulated. In the subsequent two sections we review the current state of knowledge of kangaroos in rangeland environments and the state of the kangaroo industry, looking at the potential for increasing market demand and thus the value of kangaroo meat. We then explore the current regulatory environment (with greater emphasis on NSW) and outline changes that could lead to a more flexible system. Finally, we describe models for landholder involvement, including a staged model that the FATE Program is developing in collaboration with the Barrier Area Rangecare Group north of Broken Hill.
Is it time for change?
The current situationThe commercial kangaroo harvesting industry in Australia means different things to different stakeholders. To many landholders, it is simply a cost-effective means of reducing their stock’s competition for pasture and water; to some wildlife protection groups it is a threat to the very existence of the kangaroo species it harvests; to some 4000 people employed in the industry (Kelly 2004, 2005a) it is a livelihood; and to advocates of the concept of conservation through sustainable use (CSU), it is a potential way to create incentives to conserve native habitat through commercial returns to landholders.
This paper focuses on the latter point – the potential for creating incentives for conservation through the
commercial returns generated by the sustainable harvesting of kangaroos. This idea is not new and indeed has been debated vigorously, particularly following Grigg’s (1987) call for commercial use of kangaroos to form “a better economic base for our rangelands”. As the viability of the concept is so highly dependent on complex economic, social, ecological and political factors that vary over time, it is only natural that the kangaroo debate be regularly revisited.
At this point in time, a number of factors require integration into the ongoing discourse. The 2004 report into “Kangaroo Management in the Murray-Darling Basin” (Hacker et al. 2004) presented a number of recommendations for managing kangaroos as a component of total grazing pressure, while the 2005-2010 Kangaroo Industry Strategic Plan (Kelly 2005a) outlines the industry’s vision and priorities for the next five years. There are also ongoing ramifications from the Senate Committee Report into Commercial Utilisation of Australian Native Wildlife (Rural and Regional Affairs and Transport References Committee 1998), including the exploration of sustainable wildlife enterprises by the Rural Industries Research and Development Corporation (RIRDC) in response to the Senate Committee’s recommendations.
Furthermore, in the international realm, the Convention on Biological Diversity and IUCN (World Conservation Union) have endorsed the Addis Ababa Principles and Guidelines on Sustainable Use of Biodiversity (Secretariat of the Convention on Biological Diversity 2004), which emphasise the potential for sustainable use activities to lead to sustainable development and create incentives for conservation.
It is clear from the 30-plus years of commercial kangaroo harvesting in Australia, and the extensive research that has been conducted over that time, that this is a use of a renewable natural resource that is demonstrably sustainable in terms of population numbers, species distributions and genetic diversity. The sustainability of the harvest has been demonstrated repeatedly in published research (e.g. Pople and Grigg 1999) and as part of management plan assessment processes, including reviews by the Administrative Appeals Tribunal in 2003 and 2004. The recent situation analysis undertaken as part of the review of the NSW Kangaroo Management Program (Olsen and Low 2006) concludes that “there is little doubt that current rates of harvest are sustainable” and that “any genetic impact of harvesting is minimal” (p7).
Briefly, populations of the four large species commercially harvested across New South Wales, Queensland, South Australia and Western Australian – namely the Eastern Grey Kangaroo Macropus giganteus, Western Grey Kangaroo Macropus fuliginosus, Red Kangaroo Macropus rufus and Wallaroo/Euro Macropus robustus - have been shown to remain viable at the harvest levels of 8-10% that are routinely achieved. Modelling also shows that larger harvests would be sustainable, especially given the significant level of male bias in the harvest (Grigg 2002). As Hacker et al. (2004) asserted, the industry is also capable of a significant degree of self-regulation, as “the commercial industry is not viable at kangaroo densities that might threaten the conservation of the species” (p54).
Building connections with kangaroos, commerce and conservation
400 AustralianZoologist volume 33 (3)401AustralianZoologist volume 33 (3)
Research into the genetics of harvested populations (Tenhumberg et al. 2004) has shown that a moderate level of dispersal from unharvested refuges into harvested areas is sufficient to prevent long-term genetic changes in kangaroo populations that could arise from size-selective harvesting (i.e. targeting the largest males). Dispersal from such refuges is a feature of kangaroo harvesting in each State, due to both land tenure (i.e. National Parks where harvesting is not permitted) and the existence of areas that are uneconomic to harvest (Hacker et al. 2004).
However, while populations of large kangaroos have been shown to be secure under current commercial harvesting regimes, it is less certain that kangaroo harvesting, as it occurs at present, is really a good example of the conservation benefits that can be achieved through the sustainable use of wildlife. The key concept underpinning conservation through sustainable use (CSU) is that by placing a commercial value on a species, we can enhance the conservation of that species and its habitat by creating incentives to use the resource sustainably and protect the ecosystems that support it.
At present it cannot be said that commercial kangaroo harvesting has really led to any deliberate actions by landholders to conserve kangaroos or their habitat. Indeed, the success of the large kangaroo species since European settlement is incidental rather than deliberate, as the conditions that pastoralists have created to maximise sheep production across the Australian rangelands (i.e. creation of artificial watering points, conversion of woodland to grassland and exclusion of predatory dingoes) have also inadvertently favoured the large kangaroo species (Grigg and Pople 2001). Where this has occurred, however, the impact on other aspects of biodiversity has been negative. This is especially true of small mammals such as bilbies, bettongs, bandicoots and potoroos. The loss of these species from the rangelands has removed key ecosystem engineers, with consequent impacts on soil biota, water infiltration, plant diversity and fire regimes (Martin 2003).
It is likely that large kangaroos have prospered in spite of the attitudes of landholders towards them, rather than because of their attitudes. Judging by Grigg’s (2002) statement that “most landholders still regard kangaroos mainly as pests” (p53), if it had been technically and economically feasible – and legally permissible – for pastoralists to eradicate kangaroos from their properties many may have done so by now, in the same way that other perceived pests, such as the Thylacine and Dingo, have been eradicated or severely reduced in numbers. We recognise that the term “pest” carries a lot of connotations and does not necessarily represent the way that all landholders view kangaroos. Undoubtedly many landholders value having kangaroos in the landscape and eradication is not their desire, but what is clear is that perceptions of kangaroos as too numerous and a cost to production are far more prominent amongst landholders than perceptions of kangaroos as an economically desirable presence on their land.
How could commercial kangaroo harvesting lead to conservation outcomes?In contrast to the current situation, a conservation through sustainable use (CSU) approach aims to ensure that species will be conserved because they are valued, not simply because they are difficult to eradicate. The focus of CSU is on ensuring that the use of wildlife is undertaken in a way that is ecologically, economically and socially sustainable and examples of CSU vary with differing ecological, economic and social factors. Some of the best-known examples of CSU include the conservation of southern African wildlife through the creation of numerous private reserves for wildlife tourism and hunting, the contribution of harvesting to the recovery of Saltwater Crocodile populations in the Northern Territory (Webb 2002), and the role of deer stalking estates in preventing Red Deer in Scotland from going the way of other Scottish forest-dwelling mammals and becoming extinct due to forest clearing (Inskipp 2000).
Webb (2002) stated that “the central aim of most CSU programmes is to create incentives for habitat conservation” (p14). A focus on habitats is vital as CSU is not just about conserving the utilised species, but the habitat that supports it and a myriad of other species. Citing the contribution that the controlled harvest of Saltwater Crocodiles and their eggs has made in encouraging landholder protection of habitat for Saltwater Crocodiles in the Northern Territory, Webb (2002) stated that “relatively small economic returns can change the perception of a wildlife species or a patch of habitat from a liability to an asset” (p14).
There are some parallels with this asset vs. liability issue in the case of kangaroos. A preference amongst Eastern Grey Kangaroos for native vegetation mosaics that feature interspersed woodlands, forests and grasslands has been reported in studies of disturbed semi-arid woodlands in Queensland (McAlpine 1999) as well as on farmland in the Australian Capital Territory (Viggers and Hearn 2005). This preference can often lead to reserves or remnant woodlands being perceived to be a liability for the role they play in sheltering kangaroos that then move onto adjacent grazing or cropping land (Viggers and Hearn 2005). This, in turn, can create a disincentive to undertake revegetation activities and even lead to illegal clearance of sheltering vegetation (Grigg and Pople 2001). A commercial return for landholders from kangaroos that utilise these vegetation mosaics could change them from a liability to an asset and provide an incentive for conservation and revegetation activities across the heavily cleared landscapes that coincide with much of the Eastern Grey’s range.
However, in the semi-arid sheep rangelands, which cover about 40% of the continent (Grigg 2002) and where the bulk of the commercial kangaroo harvest takes place, the key issue is total grazing pressure (TGP) rather than revegetation or protection of remnants. This represents a significant deviation from other CSU models such as those shown for crocodiles (Webb 2002), in that kangaroo habitat is not separate from livestock habitat but instead is shared with sheep across much of Australia’s rangelands and actions undertaken to benefit sheep (eg increase in
Ampt and Baumber
400 AustralianZoologist volume 33 (3)401AustralianZoologist volume 33 (3)
Building connections with kangaroos, commerce and conservation
watering points, control of dingoes) have also benefited kangaroos. While kangaroos themselves may be seen as a liability in the rangelands, their habitat is clearly an asset and is valued for its productivity. As such, it is not so much a matter of protecting habitat specifically for kangaroos in the rangelands as it is a matter of better managing the land that supports both livestock and kangaroos.
Gordon Grigg has long advocated the concept of “sheep replacement therapy for rangelands” (Grigg 1987, 1989, 2002) and it may indeed be possible that in some areas, under the right economic conditions, a total shift from sheep to kangaroos could take place. However, this does not mean that total replacement of sheep with kangaroos is the only way for CSU benefits to be achieved, nor does it necessarily mean the goal of any CSU initiative should be to increase kangaroo numbers. Croft (2000) emphasises the importance of considering potential synergies between herbivores and points to experiences in South Africa where springbok and merino sheep are grazed together for economic sustainability. Similarly, strategic cattle grazing has been shown to enhance elk and deer habitat in the western USA (Short and Knight 2003).
The benefits that could result from exploring these synergies in relation to kangaroos and sheep could include;
• reducing disincentives to revegetate or destock areas for conservation that may arise because these activities can lead to localised kangaroo population increases;
• increasing incentives to create more kangaroo-friendly and biodiversity-friendly vegetation mosaics;
• supplementing and diversifying pastoral incomes to resist economic pressures to over-stock; and
• delivering greater flexibility in managing total grazing pressure by reducing the dependence on the existing industry which will only operate in locations where, and at times when, it is profitable to do so.
If landholders come to value kangaroos in the same way as domestic stock and are therefore prepared to invest a greater amount of time and money into kangaroo management, they may be able to adapt some of the best practice stock management approaches to managing kangaroos, such as;
• reducing numbers heavily going into drought;
• maximising breeding potential relative to grazing pressure by harvesting with a strong male and/or juvenile bias; and
• rotating or adjusting grazing pressure through restricting access to watering points.
This may not be a typical approach to CSU but it may well play an important role in facilitating some of the desired shifts towards managing rangelands for improved conservation outcomes. A testable hypothesis of any CSU approach to kangaroo management in the rangelands would be whether commercially valuing kangaroos could lead to the implementation of these sorts of strategies and whether they could improve management of total grazing pressure and improve landscape function and biodiversity in the rangelands.
Links with regional NRM targets and management actionsThe goal of creating incentives for landholders to undertake conservation work is a particularly important one in Australia at the present time. The move to regionalised natural resource management (NRM) under Commonwealth and State government agreements creates requirements for the setting of State-wide and regional NRM targets and for the creation of regional NRM bodies. In the case of NSW for example (Natural Resources Commission 2004), some of the draft State-wide NRM targets for 2015 include:
• a net increase in native vegetation cover, diversity and connectivity;
• a net increase in riparian vegetation extent;
• reduced risks to conservation status of species and communities; and
• deep-rooted perennial vegetation coverage of all critical recharge zones.
There is a need for substantial incentives to deliver these targets on a landscape scale and the potential for some of these incentives, such as trading schemes and auctions, has been explored through a National Market-Based Instruments Pilot Program (Anon 2002). Landholders can incur significant financial costs through the revegetation of land and other management actions, as well as associated lost income from restrictions on clearing, reductions in stocking rate or reductions in areas under cultivation. Conservation incentives can provide a counter to these costs and CSU is one potential way of generating such incentives to protect or restore habitat. In some areas, returns from kangaroo harvesting could encourage the conversion of cleared land to the types of patchy woodland mosaics that have been shown to benefit some kangaroo populations.
State-wide targets are not equally applicable in all regions and in Australia’s arid and semi-arid sheep rangelands, such as the Western and Lower Murray Darling catchments in western NSW, regional NRM targets are less likely to focus on the extent of native vegetation and more likely to focus on quality of cover, biodiversity and landscape function. For example, the draft Catchment Plan for the Western Catchment Management Authority (2005) in northwest NSW, identifies the following land and biodiversity targets which have particular relevance to kangaroo management:
• Quality and quantity of vegetation managed to maintain and/or improve designated cover capable of preventing soil erosion (i.e.: designated cover greater than or equal to 40%).
• Ecological communities of high conservation value are adequately protected.
• In each of the other ecological communities, 12% of the area will be managed for conservation within 10 years of Catchment Plan approval and 25% within 25 years.
These catchment targets have a strong focus on private land and will be delivered through programs aimed
402 AustralianZoologist volume 33 (3)403AustralianZoologist volume 33 (3)
at promoting sustainable agriculture, improving pest management, rehabilitating native pasture vegetation communities and negotiating agreements with landholders to manage lands for conservation (Western Catchment Management Authority 2005). A key element in delivering these outcomes on private pastoral land will be improved management of total grazing pressure (TGP), in which kangaroo harvesting has a key role to play. Reductions in domestic stock across the rangelands are likely to reduce the economic viability of pastoral enterprises unless alternative sources of income are found. Incentives that could be generated by a kangaroo CSU initiative are particularly important for rangelands where traditional production activities are becoming less economically viable.
Of course, amidst this discussion it is important to remember that CSU is only one conservation tool that is available, and is not designed to replace all other approaches or leave conservation entirely up to market forces. There is also a need to consider the possible perverse incentives and other pitfalls of sustainable use approaches. Using an earlier example, while Red Deer populations may have been enhanced due to the value placed on them in Scotland, an overpopulation now threatens rather than protects habitat in some locations (Inskipp 2000). Similarly, a perverse incentive to clear land could arise in relation to red kangaroos, which have been shown in Queensland to prefer areas subject to recent large-scale clearing over woodlands (McAlpine et al. 1999). As such, measures such as land-clearing and threatened species regulations will always be vitally important to back up any incentives from CSU with appropriate regulatory measures.
How can kangaroo harvesting be managed to achieve conservation through sustainable use?Useful guidance in this area comes from the Addis Ababa Principles and Guidelines on Sustainable Use (Secretariat of the Convention on Biological Diversity 2004), which have been endorsed by the Parties to the Convention on Biological Diversity (CBD) and the IUCN. This document states that “encouraging sustainable use can provide incentives to maintain habitats and ecosystems, the species within them, and the genetic variability of the species” (p7) and sets out the principles that need to be followed when managing sustainable use activities. These include complementary regulations, access rights, involvement of local people, removal of perverse incentives, adaptive management, communication and education, and management at appropriate scales (generally devolved as locally as possible).
The Addis Ababa Principles (Secretariat of the Convention on Biological Diversity 2004) highlight the need for the economic benefits of resource use to flow to local people who have legal rights of ownership or access and powers of management over these resources if incentives for conservation are to be created. Similarly, Webb (2002) emphasises the importance of involving local people as active partners if CSU is to be realised
and the Northern Territory Strategy for Conservation through the Sustainable Use of Wildlife has amongst its guiding principles that “landowners must be key beneficiaries from any use of wildlife that takes place on their lands” (Parks and Wildlife Commission of the Northern Territory 1997, p3).
In our view, the fundamental aspect that must be remedied before kangaroo harvesting can truly become an example of CSU is the involvement of landholders and the flow of significant economic returns to them, as they have primary stewardship over kangaroo habitat. While the language of kangaroo harvesting amongst government agencies, scientists and the industry may have changed from pest control to sustainable use in recent years, attitudes are yet to undergo the same transformation for those who are most impacted by kangaroos and in the best position to manage them – landholders. As Croft (2004) comments on the rebadging of kangaroo management as sustainable use: “a change in the purpose for the commercial killing of kangaroos is yet to see a significant change in the value of the end products and the valuing of their producer” (p101).
Grigg (2002) and Dawson and Munn (in press) argue that perceptions of kangaroos as pests or problem animals are often overstated, as the extent of their contribution to total grazing pressure (TGP) and their levels of competition with sheep may have traditionally been over-estimated. However, for as long as a landholder is not making any commercial gain from kangaroos, any cost incurred by the presence of kangaroos on the landholder’s production of valued products such as wool, however small, is bound to tip their view of kangaroos towards the “pest” rather that “resource” side of the equation.
Kangaroos in the rangelandsAustralia’s sheep rangelands provide the most likely site for investigating landholder-based kangaroo enterprises in the near future, due to the high densities of kangaroos, large landholdings, established kangaroo industry presence and decreasing viability of traditional wool production over time. This is an area where landholders are increasingly being squeezed by declining returns and increasing costs, sheep numbers are continuing to fall at a time when higher production levels are needed to stay profitable and recurring government investment is required in the form of drought relief in order to keep many enterprises afloat.
In many parts of the rangelands, overgrazing (by stock, feral and native herbivores) has contributed to loss of vegetation cover, soil erosion and potentially permanent changes in landscape function (Donohue et al. 2005). Many of these impacts have their origins in overgrazing and severe drought in the late 19th century (Australian State of the Environment Committee 2001) and demonstrate the economic and ecological challenges of maintaining production and managing environments that feature highly variable climates and substantial alteration due to 150 or more years of grazing (Eldridge and Koen 2003).
Ampt and Baumber
402 AustralianZoologist volume 33 (3)403AustralianZoologist volume 33 (3)
There has been a significant decline in the last decade in the number of farms involved in extensive sheep production and there is a very high reliance on off-farm income amongst Australian farm businesses with an annual EVAO (estimated value of agricultural output) of less than $100 000 (Synapse Research & Consulting Pty Ltd and Bob Hudson Consulting Pty Ltd 2005). While this situation provides a potential threat to rangeland health through pressure to carry more sheep to break even, it also provides an opportunity through the fact that, as sheep grazing becomes more marginal, alternative sources of income such as kangaroos can become more attractive.
However, before landholders can effectively enter the kangaroo industry, they will need accurate information on the potential costs and returns from a kangaroo enterprise such as modelling of income and expenditure (Stayner 2005) and on the effect of kangaroo density on wool production, land condition and biodiversity (Hacker et al. 2004). If kangaroos can gain an economic value for landholders, even if it is only a small value, it will then become vitally important to accurately quantify the relative use of the land’s pasture and water resources in order to produce a kangaroo as opposed to being used for some other form of production, such as wool.
Much has been written about the flaws of comparing sheep and kangaroos under the traditional model of total grazing pressure (TGP) which measures TGP in terms of dry sheep equivalent (DSE). DSE is based on the forage consumed by a 45kg Merino wether (or ewe without a lamb) and kangaroos are often assumed (eg by Departments of Agriculture) to have a value of 0.7 DSE based on a comparison of the resting metabolic rates of the two animals (i.e. an average kangaroo would consume 70% of the amount of a standard 45kg sheep).
Grigg (2002) observed that this TGP model is flawed in two main ways. Firstly, he noted that an average kangaroo generally weighs a lot less than 45kg, especially in a harvested population. Secondly, if field metabolic rates (FMR) are used instead of resting rates (i.e. metabolic rate across resting, foraging and all other activities), kangaroos may require even less feed again, possibly making the true DSE as low as 0.15-0.2. Olsen and Low (2006) favoured a DSE of 0.48 based on recent empirical data from Dawson and Munn (in press).
Overall, it appears that kangaroo DSE is much less than traditionally thought and competition is only ever really significant at times when pasture resources are scarce. In their recent review, Olsen and Low (2006) concluded that “kangaroos and livestock do not compete strongly for food (at least in the rangelands), that resource availability drives the grazing system, and that mixed species grazing regimes are more productive and ecologically sound” (p65).
An integrated TGP management approach could provide an avenue for improving rangeland health while ensuring continued pastoral income by focusing on strategic use of domestic stock (e.g. rotational or tactical grazing, destocking during drought) and strategic harvesting of kangaroos (e.g. heavier harvesting entering drought, male-bias to optimise harvest, maintaining breeding population
through drought, predicting kangaroo movements as part of a rotational harvesting strategy). Kangaroos could offer landholders potential offsets to loss of income in times of drought, particularly as harvesting going into drought generally represents ‘compensatory mortality’ (i.e. harvesting animals that are likely to die anyway).
Despite these possibilities, Olsen and Low (2006) noted that at present there is “no integration of commercial harvesting with grazing practices” (p54). Landholders are ill-equipped to undertake such integration of sheep and kangaroo management in the absence of the financial incentives required to manage kangaroos for their production value and clear guidance on synergistic grazing strategies.
If landholders start to place a significant resource value on kangaroo production, there could be an incentive to invest more time and money in integrating kangaroos into TGP management, but better knowledge must be made available to landholders on what an optimal mixed grazing system might look like. The undertaking of further research into this area, particularly under an adaptive management approach, and the dissemination of the results of this research to landholders is a vital component of changing kangaroo harvesting into a true example of conservation through sustainable use.
Increased commercial value of kangaroosThe Kangaroo Industry Strategic Plan 2005-2010 (Kelly 2005a) outlines the present state of the industry and the strategies for increasing demand and prices for kangaroo products. Currently, 60-70% of kangaroos taken are processed for pet food due to lack of sufficient demand for meat for human consumption. In addition to this, skin-only shooting, while declining as a proportion of the overall harvest, continues in Queensland due to the prices paid for whole carcasses being outweighed by the costs of transport and storage, particularly in remote areas. In most years, supply outweighs demand and annual harvest quotas are not reached, however, drought in recent times across much of Australia has resulted in population declines and a serious undersupply issue for the kangaroo industry (Kelly 2005a).
A number of avenues are currently being pursued to increase the returns from each kangaroo carcass. These include promotion of the meat’s health qualities and environmental credentials through videos, newsletters and websites (Kelly 2003, 2004) and the introduction of kangaroo meat into the curricula of chef courses (Kelly 2005b). The kangaroo industry also continues to develop new products and recipes and target new markets in Australia and overseas. Acceptance of kangaroo by the domestic smallgoods sector could also contribute significantly to demand.
With regard to kangaroo skins, while the strategic plan identifies a need for improved quality control, Grigg (2002) argued that there is little scope to increase prices, as manufacturers can turn to cheaper leathers such as calf when kangaroo prices rise, as they currently do when shortages occur.
Building connections with kangaroos, commerce and conservation
404 AustralianZoologist volume 33 (3)405AustralianZoologist volume 33 (3)
The Kangaroo Industry Strategic Plan sets a target for 2015 of 80% of kangaroo meat being sold within Australia at prices 10% higher (in real terms) than present (Kelly 2005a, p8). In Australia, a small but relatively stable market exists for human consumption of kangaroo meat despite relatively little promotion, while the overseas market is larger but less stable (Kelly 2005a). In recent times kangaroo products have become more accessible in Australian supermarkets, particularly with a major supermarket chain resuming stocking kangaroo after a hiatus brought about due to protest actions by animal liberationists in the 1980s (Kelly 2004). However, little is known about the market sectors that currently consume kangaroo in Australia and what marketing interventions would be most effective in boosting consumption.
Aside from the obstacles presented by trying to encourage Australians to consume a cute, furry national icon and the animal welfare claims disseminated by animal liberationists, the low consumption of kangaroo meat amongst Australians has been attributed to inherited English ideas, perceptions of kangaroo as a low-quality meat, poor butchering and unfamiliarity with cooking a very lean meat that becomes tough when overcooked (Hercock 2004, Hercock and Tonts 2004). Hercock (2004) also hypothesised that the relatively strong acceptance of kangaroo meat in continental Europe (particularly in France, Belgium and Germany) may be due to an established culture of game meat consumption which is less present in Australia. Supporting this is the assertion by Wynn et al. (2004) that Australians have a bias against darker coloured meats that is not evident amongst German consumers.
Grigg (2002) saw the European and US markets, where game meat has historically been appreciated, as the logical way to expand the market for kangaroo meat. Potential market growth may exist with reduced consumer confidence in farmed and lot-fed meats following outbreaks of ‘mad-cow disease’ and foot-and-mouth disease around the world. There is also an ongoing trend towards free-range, chemical-free and organic meats in developed countries (Hercock 2004). Another potential consideration is the growing trend in consumer-behaviour towards the centrally-conscious consumer, who is more likely to respond to the health attributes of kangaroo products rather than any social or environmental management benefits (Mulcahy 2004).
A sensible way forward on this issue is through detailed studies of consumer choice behaviour in kangaroo consumption to inform marketing approaches tailored towards specific market sectors. A recent study funded by the Rural Industries Research and Development Corporation (RIRDC) looked at the influence of factors such as species, age and handling on taste, tenderness and variability of meat quality (Wynn et al. 2004). Implementation of these findings by processors and harvesters could lead to increased human consumption of kangaroo meat through improved product consistency and consumer satisfaction.
The FATE (Future of Australia’s Threatened Ecosystems) Program at the University of New South Wales, in conjunction with the School of Marketing, University of Technology, Sydney (UTS), is conducting research funded by RIRDC looking at the attributes that influence consumption of kangaroo meat through discrete choice experiments. Such attributes would include price, health benefits and environmental credentials. This proposal has a key focus on the use of kangaroo meat in smallgoods manufacture within Australian, as uptake from the smallgoods industry could improve carcass values overall and lead to returns flowing to landholders.
For the existing kangaroo industry, greater landholder involvement is not currently a priority under the 2005-2010 Strategic Plan (Kelly 2005a). It is the position of the industry generally that landholders can get involved by becoming harvesters (shooters), and the idea of landholders deriving returns as the producers and managers of kangaroos understandably represents a threat to existing industry players through potentially having to share their revenue with landholders. However, in the longer-term, landholder involvement could actually be vital for the industry to grow. While increased landholder involvement is not an objective of the Industry Strategic Plan, improving the supply chain is (Kelly 2005a, p19) and it could be argued that you can’t really have one without the other. Direct landholder-processor engagement could improve quality control and continuity of supply through improved consistency in the age, gender and species of kangaroos harvested and the timing of the harvest.
If conservation benefits can be shown to result from the sustainable use of kangaroos, it could open new markets based on the environmental attributes of kangaroo products and the wildlife stewardship of landholders. Landholder involvement could also potentially increase the size of the harvest and thus supply for the industry, through measures such as creating native vegetation mosaics that support kangaroos, strategic harvesting to maximise compensatory mortality and strategically maintaining breeding populations of kangaroos to repopulate following droughts. Changing perceptions of kangaroos from a pest to a resource at the landholder level may also translate to a greater valuing of kangaroo meat by consumers, as the continuing pest association in the consumer consciousness is likely to reinforce perceptions of low quality and low value products.
Change of focus in Kangaroo Management ProgramsIf incentives for conservation through use are to be generated through commercial kangaroo harvesting then government agencies responsible for managing the harvest need to be more pro-active in facilitating a legitimate role for landholders in the harvesting and post-harvest handling of kangaroos. Conservation agencies have traditionally been most involved in gathering data on kangaroo populations, setting harvest quotas and regulating where, how and by whom the harvest is carried out. This role has emerged as a result
Ampt and Baumber
404 AustralianZoologist volume 33 (3)405AustralianZoologist volume 33 (3)
of balancing landholder desires for pest control with the kangaroo industry’s need for continued supply and the need to demonstrate that the harvested species are adequately protected. In recent years, the terminology of State management plans has switched to sustainable use of a natural resource, with pest control not overtly mentioned, but there is little recognition within the plans of the social and economic factors that are tied to this resource use, or the broader ecosystem context of kangaroo harvesting and the potential for sustainable use to provide incentives that could contribute to regional NRM objectives.
In our opinion, State management plans for the commercial harvest of kangaroos (Queensland Parks and Wildlife Service 2002; New South Wales National Parks and Wildlife Service 2001; Department for Environment and Heritage 2002; Department of Conservation and Land Management 2002a&b) are achieving their goals in relation to protecting and sustaining viable kangaroo populations, but they are also contributing to a system that sidelines landholders, is inflexible for shooters who are tempted to ‘work around’ the system and doesn’t deliver, in the eyes of landholders, adequate control of kangaroo numbers when they need it most. What is needed is a more flexible approach that removes barriers to landholder involvement while maintaining adequate control over the harvest.
Hercock (2004) proposed a model for the management of the kangaroo industry based on a management board with responsibility for the promotion and development of the kangaroo industry as well as its regulation. Different agencies, with responsibilities for conservation, market development and research could all sit on the board and govern the industry overall. Depending on how it was set up, such a model could encounter issues with conflicts of interest as, unlike in other food and fibre industries where supply can be adjusted in accordance with demand and price, kangaroo management will always have a requirement for harvest quotas to be set independently of demand to ensure long-term sustainability. However, this suggestion does draw attention to a point that has been neglected all too long in kangaroo management – that economic and social factors need to be incorporated into harvest management regimes and the aims and policies related to these factors need to be explicitly stated.
As is made clear in the Addis Ababa Principles and Guidelines (Secretariat of the Convention on Biological Diversity 2004), which were developed for use by precisely the sorts of agencies that are involved in managing kangaroo harvesting in Australia, creating the right conditions for the sustainable use of wildlife is about more than just having good scientific data, strong regulatory controls and clearly defined rights of access. It is also about ensuring that the benefits of use are received by those who are in positions of stewardship over the resource and the ecosystems that support it. All kangaroo management programs do not currently, but should, recognise the following key concepts of the Addis Ababa Principles (Secretariat of the Convention on Biological Diversity 2004):
“Sustainable use is a valuable tool to promote conservation of biological diversity, since in many instances it provides incentives for conservation and restoration because of the social, cultural and economic benefits that people derive from that use.” (p5) and
[Managers of sustainable use activities should]: “Require adaptive management plans to incorporate systems to generate sustainable revenue, where the benefits go to indigenous and local communities and local stakeholders to support successful implementation” (p12) and
“Promote economic incentives that will guarantee additional benefits to indigenous and local communities and stakeholders who are involved in the management of any biodiversity components” (p19)
Current State plans do not clearly state the economic and social outcomes they aim to deliver through the sustainable use of kangaroos, but in practice their licensing and quota-setting regimes impact on a wide array of economic and social factors. The ways in which licences and harvest tags are issued affects who can carry out the harvest, where it occurs, when it occurs and how the economic benefits of the harvest are distributed. The historical development of the kangaroo industry has created a licensing regime in which kangaroo processors have the greatest amount of flexibility in generating economic returns and landholders have the least.
Processors carry significant risk, as they have to make substantial investments such as plant and staff and are subject to fluctuations in market demand for kangaroo products as well as fluctuations in supply due to climatic patterns, but they also have the flexibility to manage this risk by changing the prices they pay to shooters as well as shifting their supplier base to other locations. Kangaroo shooters have less flexibility than processors to respond to these fluctuations, but they at least have the ability to refocus their efforts on other areas where the economics of shooting may be more viable. Landholders do not have the flexibility to shift their location and thus are most affected by fluctuations in kangaroo populations and distribution. This uncertainty, combined with poor bargaining power when acting alone, makes it difficult for landholders to negotiate a return from shooters or processors for kangaroos harvested on their properties.
Instead of working to counter these difficulties for landholders, State management programs often create additional barriers which make it hard for landholders to plan ahead or group together to increase their bargaining power and manage kangaroos that move across property boundaries. Licensing regimes vary from State to State, but restrictions such as limiting the period for which harvest tags are valid, making tags non-refundable, limiting the number of shooters that can operate on a property and making tags non-transferable across properties can create barriers to industry entry. Hacker et al. (2004, p54), in their review of kangaroo management in the Murray-Darling basin, also identified a lack of knowledge regarding the “economic conditions required to induce pastoralists to incorporate kangaroos into their enterprise mix”.
Building connections with kangaroos, commerce and conservation
406 AustralianZoologist volume 33 (3)407AustralianZoologist volume 33 (3)
We argue that sustainable use of the harvested kangaroo species, in the full sense of the term, should be the overarching aim of all kangaroo management programs and that the social, economic and ecological sustainability of the resource use should all be taken into account, as per the Addis Ababa Principles and Guidelines. In this light, kangaroo management plans should remove obstacles to landholder involvement and actively explore, through an adaptive management framework, management models that can enable landholders to gain greater flexibility in managing the harvest on their properties, collaborate with their neighbours and begin to incorporate kangaroos into their enterprise mix.
Models for landholder involvementThere are a number of ways in which landholders could attempt to derive a return from kangaroos harvested on their properties. Perhaps the simplest way is for them to undertake the harvesting themselves and sell the product to established processors. A number of landholders already do this and they have the advantages of knowing their territory well and being able to incorporate land-management goals into their activities, even if these represent a cost (e.g. shooting feral animals at the same time or targeting harvesting on areas most in need of grazing reductions rather than areas that are simply easiest).
One major downside to this approach is that landholders generally work long hours during the day on their pastoral enterprises and are likely to be reluctant to undertake night-time kangaroo shooting in addition to this, especially given the increasing average age of landholders and decrease in paid labour on properties. A single property is generally incapable of supplying an acceptable income through kangaroo-shooting alone, meaning that giving up domestic stock in favour of kangaroos will be uneconomical unless there is a large rise in price. The massive fluctuations in kangaroo numbers on a single property over time also create a level of uncertainty that makes such a venture very risky.
A second option is to request some kind of royalty that must be paid when shooting is undertaken. This could be negotiated with a shooter or processor individually in return for access to the landholder’s territory or as part of a blanket royalty scheme imposed at State level. Limited payments to some landholders for the harvest of kangaroos on their properties has taken place in South Australia, where it has emerged as a result of competition between processors for kangaroo supply. These payments, generally $1 per kangaroo, are not covered by the South Australian Kangaroo Management Plan and are a matter of negotiation between landholders, harvesters and processors (Farroway 2005 pers comm).
Generally, competition for kangaroo supply has not been sufficient for landholders to extract such a royalty, as shooters and processors could simply go to another landholder who is not requesting any return and the landholder who misses out could lose their only real means of managing kangaroo grazing pressure. A blanket
royalty scheme would be likely to be met with major opposition from existing processors and harvesters and may prove difficult to administer. Presumably, landholders would still have the right to forgo their royalty payment if they chose, and many may in fact do this if they felt uncomfortable about taking money out of a shooter’s pocket or found that shooters would no longer service their property because it had become uneconomic. Such problems could thus undermine any royalty scheme, but, if any of the State management programs wanted to truly say they were implementing the Addis Ababa Principles and Guidelines relating to generating sustainable revenue and guaranteeing additional benefits to local stakeholders the they would at least have to assess this option.
The third option is for landholders to carve out a role for themselves that adds value to the industry and for which they can expect some remuneration other than from undertaking the harvest themselves or from simply providing access. Landholders could add to the industry by enabling harvesting to become more efficient (e.g. predicting where kangaroos will be and when), by enabling larger harvests (e.g. monitoring populations and maintaining greater breeding potential), ensuring continuity of supply (e.g. working closely with harvesters and processors to supply the right quantities at the right time) or by facilitating marketing opportunities based on land management and wildlife stewardship credentials (e.g. certification as sustainable or organic land managers). These options would generally require a significant degree of collaboration across properties due to the fact that kangaroos are a common pool resource that moves freely across property boundaries.
Despite the lack of focus by government agencies, the kangaroo industry and the pastoral industry in exploring these options, a number of models for collaborative landholder participation in the kangaroo industry have emerged in recent years. The Tilpa Rangelands Investment Company (TRIC) in western NSW entered into a collaborative kangaroo harvesting venture from 1995-1998 (Henry and Watson 1998). TRIC investigated ways for its member landholders to gain returns from kangaroo harvesting with the aim of providing incentives for better total grazing management. TRIC’s kangaroo enterprise, which focussed largely on skins, ultimately failed to secure a stable place in the kangaroo value chain for landholders. This was largely due to:
• the difficulties of establishing a viable value-adding operation on the skin side of the industry without large volumes and established networks; and
• the difficulties of gaining a return for landholders from the low margins on the meat side of the industry.
However, TRIC’s action research identified a number of key factors for gaining industry entry, particularly the importance of landholders undertaking a role that adds value to the existing industry, rather than just expecting to be allowed or legislated in. Many factors affecting the feasibility of kangaroo enterprises have changed since the TRIC experience; such as kangaroo population densities, carcass prices, export and domestic markets and identities
Ampt and Baumber
406 AustralianZoologist volume 33 (3)407AustralianZoologist volume 33 (3)
of industry players. Stayner (2004, 2005) has considered the TRIC experience amongst many other factors in his analysis of the economics of collaborative kangaroo enterprises, providing a knowledge base for further adaptive management projects to build on.
One such project is the establishment of Wildlife Management Conservancies (WMCs) (Wilson and Mitchell 2005) under the Rangelands and Wildlife Subprogram of the Rural Industries Research and Development Corporation (RIRDC). The WMC model consists of neighbouring landholders who “come together voluntarily to pool resources, plan collaboratively and benefit both economically and socially while also enhancing the sustainability of their properties and the region” (p8). WMCs investigating kangaroo enterprises have been established in southwest Queensland (Maranoa WMC) and along the NSW/Victorian border near Mildura (Barkindji WMC).
The FATE program is also working on models for communal landholder management of kangaroo resources and has also obtained funding through RIRDC’s Rangelands and Wildlife Subprogram. The FATE approach is based on a common property resource system whereby neighbouring properties can explore managing a kangaroo enterprise as a single unit, with the benefits distributed on the basis of the proportion of resources each property contributes to the overall enterprise (Williamson et al. 2003).
FATE has embarked on a project involving a group of 27 large pastoral properties that form the Barrier Area Rangecare Group (BARG) in north-western New South Wales (NSW), covering over 1 million hectares in total. These properties, which run sheep and cattle (and also depend on a significant amount of off-farm income) have been collaborating for some time on NRM activities such as feral animal control, weed control and sustainable grazing management. The partnership between BARG and the FATE Program aims to expand this collaboration by managing free-ranging kangaroos as a common property resource, with associated monitoring and management of total grazing pressure across the BARG properties.
BARG and FATE have embarked on an adaptive management trial that seeks to explore ways in which kangaroo enterprises could contribute to both conservation outcomes and economic viability of pastoral properties. Adaptive management is a key principle of managing sustainable use activities (Secretariat of the Convention on Biological Diversity 2004) and involves a cyclic process of continuous improvement with landholders and researchers developing new strategies, putting them into practice and monitoring their impact. The NSW Kangaroo Management Program contains special provisions for approving adaptive management trials and FATE and BARG are negotiating for a greater degree of flexibility in harvesting across property boundaries that will allow BARG to pool harvest tags, undertake harvesting strategically in accordance with total grazing pressure priorities and use their collective bargaining power to enter into more secure financial arrangements with kangaroo harvesters and processors.
Monitoring needs to be a key component of any adaptive management approach to kangaroo management and this trial will monitor kangaroo harvest patterns as well as rangeland health across the trial site using Landscape Function Analysis (LFA) (Tongway and Hindley 2004). Management-induced changes in rangeland health can be very difficult to measure due to high climatic variability and long-term alterations to rangeland health due to grazing (Eldridge and Koen 2003). Collaborative action amongst landholders may provide significant advantages for monitoring through comparisons between neighbouring properties of different ecosystems, stock management strategies and kangaroo harvest strategies and integration with existing data sources such as the Rangeland Assessment Program (RAP), which has operated in NSW since 1989.
ConclusionsWhile demonstrably sustainable, the current kangaroo industry does not yet fit the model of conservation through sustainable use (CSU) and in order for this to happen, greater landholder involvement in the industry is essential. Landholder involvement could drive significant innovation in management of both the kangaroo harvest and kangaroo habitat, resulting in strategies that improve landscape function and biodiversity. Landholder involvement could also improve the supply chain, enhance product quality and reliability and provide marketing opportunities relating to environmental outcomes.
The conservation outcomes that could result from a successful kangaroo CSU strategy are consistent with regional NRM targets such as:
• increasing the area of conservation on private land (by providing an alternative source of income from such land);
• increasing the area of native vegetation (by creating incentives for vegetation mosaics that suit kangaroos); and
• increasing the extent of ground cover in rangelands (through improved control of total grazing pressure).
If it can be demonstrated that CSU is possible via kangaroo harvest, the industry will be able to unambiguously utilise its environmental credentials in marketing and public relations. This could create a self-reinforcing effect, whereby an increased value of kangaroo products leads to greater landholder returns, greater landholder involvement, conservation outcomes, marketing opportunities through environmental credentials and even greater value for kangaroo products.
For these outcomes to result, kangaroo products need a significant jump in value to get the ball rolling, landholders need mechanisms to get involved in the industry and accurate data is required on the costs of kangaroo production and potential synergies with sheep grazing. At the same time, management of the kangaroo harvest must continue to ensure that the sustainability of kangaroo populations is protected from unregulated market forces and that perverse incentives are not created that drive negative conservation outcomes.
Building connections with kangaroos, commerce and conservation
408 AustralianZoologist volume 33 (3)409AustralianZoologist volume 33 (3)
Steps towards the goal of creating a successful CSU model for kangaroo harvesting have been underway for many years and are building in momentum. However, we believe a change in focus is needed from State kangaroo management plans (KMPs) to reflect the principles of sustainable use endorsed in documents such as the Addis Ababa Principles and Guidelines for Sustainable Use
(Secretariat of the Convention on Biological Diversity 2004), which have been developed in the time since the current KMPs were approved. As KMPs come up for review, a broader consideration is needed of the economic and social factors that affect kangaroo harvesting activities and ways that these can be linked with broader conservation goals.
ReferencesAnon 2002. Investigating new approaches: A guide to the National Market-based Instruments Pilot program, National Action Plan for Salinity and Water Quality.
Australian State of the Environment Committee 2001. Thematic findings: Land. Australia: State of the Environment 2001, CSIRO Publishing. Accessed online 17 October 2005: http://www.deh.gov.au/soe/2001/land.html
Croft, D. B. 2000. Sustainable Use of Wildlife in Western New South Wales: Possibilities and Problems. Rangel.J. 22(1): 88-104.
Croft, D. B. 2004. Kangaroo management: individuals and communities. Australian Mammalogy 26: 101-108.
Dawson, T. J. and Munn, A. J. in press. How much do different sized kangaroos eat?: Implications for harvesting. Animals of Arid Australia, edited by C. Dickman, D. Lunney and S. Burgin. Royal Zoological Society of New South Wales, Mosman, NSW.
Donohue, R., Hill, M. J., Holloway, J., Houlder, P., Lesslie, R., Smith, J. and Thackway, R. 2005. Australia’s Rangelands: an analysis of natural resources, patterns of use and community assets. Canberra, Bureau of Rural Sciences.
Eldridge, D. J. and Koen, T. B. 2003. Detecting environmental change in eastern Australia: rangeland health in the semi-arid woodlands. The Science of The Total Environment 310(1-3): 211-219.
Farroway, L. 2005. Ecologist, Kangaroo Management, SA Department for the Environment and Heritage. Personal Communication with A.Baumber, 14 November 2005.
Grigg, G. 1987. Kangaroos - a better economic base for our marginal grazing lands? Australian Zoologist 24(1): 73-80.
Grigg, G. 1989. Kangaroo harvesting and the conservation of arid and semi-arid rangelands. Conservation Biology 3(2): 194-197.
Grigg, G. 2002. Conservation benefit from harvesting kangaroos: status report at the start of a new millennium, pp 53-76 in A Zoological Revolution: Using native fauna to assist in its own survival., edited by D. Lunney and C. Dickman, Royal Zoological Society of New South Wales and Australian Museum, Mosman and Sydney NSW.
Grigg, G. C. and Pople, A. R. 2001. Sustainable use and pest control in conservation: kangaroos as a case study. Conservation of Exploited Species. edited by J. D. Reynolds, G. M. Mace, K. H. Redford and J. G. Robinson, Cambridge University Press: 403-423.
Hacker, R., McLeod, S., Durham, J., Tenhumberg, B. and Pradhan, U. 2004. Kangaroo management options in the Murray-Darling Basin. Canberra, Murray-Darling Basin Commission.
Henry, E. S. and Watson, G. K. 1998. Kangaroo Marketing for Landowners: Exploratory Action Research for Tilpa Rangeland Investment Company. A Report to the Total Catchment Management - Western Catchment Management Committee, Orange Agricultural College, University of Sydney.
Hercock, M. 2004. The Wild Kangaroo Industry: Developing the Potential for Sustainability. The Environmentalist 24(2): 73 - 86.
Hercock, M. and Tonts, M. 2004. From the Rangelands to the Ritz: Geographies of Kangaroo Management and Trade. Geography. 89: 214-225.
Inskipp, C. 2000. Red Deer in Scotland. Data Support Scotland, WWF/Scottish Natural Heritage.
Kelly, J. 2003. The kangaroo industry: its image and market - improving one by improving the other. Barton ACT Australia, Rural Industries Research & Development Corporation.
Kelly, J. 2004. Selling the kangaroo industry to the world: Assisting ongoing kangaroo market growth by facilitating public industry acceptance. Barton ACT Australia, Rural Industries Research and Development Corporation.
Kelly, J. 2005a. Kangaroo Industry Strategic Plan 2005-2010. Barton ACT, Rural Industries Research and Development Corporation.
Kelly, J. 2005b. Executive Officer’s Annual Report, 2004. Natural, Environmentally Wise and Responsible - The Journal of the Australian Kangaroo Industry 41(Feb 2005): 3.
Martin, G. 2003. The role of small ground-foraging mammals in topsoil health and biodiversity: Implications to management and restoration. Ecological Management and Restoration 4(2): 114-119.
McAlpine, C. A., Grigg, G.C., Mott, J.J., Sharma, P. 1999. Influence of landscape structure on kangaroo abundance in a disturbed semi-arid woodland of Queensland. Rangeland Journal 21(1): 104-134.
Mulcahy, N. 2004. Investigating the relationship between consumer societal knowledge and the purchase of socially conscious products: Testing the assumptions of the societal marketing concept. School of Advertising, Marketing and Public Relations, Faculty of Business. Brisbane, Queensland University of Technology.
Natural Resources Commission 2004. Consultation Paper: Draft State-wide Standards and Targets. Sydney, Natural Resources Commission.
Olsen, P. and Low, T. 2006. Situation Analysis Report: Update on Current State of Scientific Knowledge on Kangaroos in the Environment, Including Ecological and Economic Impact and Effect of Culling, Prepared for the Kangaroo Management Advisory Panel.
Parks and Wildlife Commission of the Northern Territory 1997. A Strategy for Conservation through the Sustainable Use of Wildlife in the Northern Territory of Australia, Parks and Wildlife Commission of the Northern Territory.
Pople, T. and Grigg, G. 1999. Commercial Harvesting of Kangaroos in Australia. Canberra, ACT, Australia, Environment Australia: Department of Environment and Heritage.
Rural and Regional Affairs and Transport References Committee 1998. Commercial Utilisation of Australian Native Wildlife. Parliament of Australia; Senate Report. Canberra, Commonwealth of Australia.
Ampt and Baumber
408 AustralianZoologist volume 33 (3)409AustralianZoologist volume 33 (3)
Secretariat of the Convention on Biological Diversity 2004. Addis Ababa Principles and Guidelines for the Sustainable Use of Biodiversity. CBD Guidelines. Montreal, Secretariat of the Convention on Biological Diversity.
Short, J. L. and Knight, J.E. 2003. “Fall grazing affects big game forage on rough fescue grasslands.” Journal of Range Management 56(3): 213-217.
Stayner, R. A. 2004. Economics of conservation through commercial use of wildlife, Rural Industries Research and Development Corporation, Barton ACT.
Stayner, R. A. 2005. Economic Analysis and Business Development of SWE Trial Sites, Rural Industries Research and Development Corporation, Barton ACT.
Synapse Research & Consulting Pty Ltd and Bob Hudson Consulting Pty Ltd 2005. Australian Farm Sector Demography: Analysis of Current Trends and Future Farm Policy Implications, Australian Farm Institute.
Tenhumberg, B., Tyre, A.J., Pople, A.R., Possingham, H.P. 2004. “Do harvest refuges buffer kangaroos against evolutionary responses to selective harvesting?” Ecology 85(7): 2003-2017.
Tongway, D. J. and Hindley, N.L. 2004. Landscape function analysis: procedures for monitoring and assessing landscapes with special reference to minesites and rangelands. CSIRO Sustainable Ecosystems, Canberra.
Viggers, K. L. and Hearn, J.P. 2005. “The kangaroo conundrum: home range studies and implications for land management.” Journal of Applied Ecology 42: 99-107.
Webb, G. J. W. 2002. “Conservation and sustainable use of wildlife - an evolving concept.” Pacific Conservation Biology 8: 12-26.
Western Catchment Management Authority 2005. Summary of Catchment and Management Targets for Western CMA Catchment Plan 2005, Accessed online 21 September 2005: http://www.western.cma.nsw.gov.au/SummaryCatchmentManagementTargets.pdf
Williamson, S., Brunkhorst, D. and Kelly, G. 2003. Reinventing the common: cross-boundary farming for a sustainable future. The Federation Press, Sydney.
Wilson, G. R. and Mitchell, B. 2005. A Strategic Plan for sustainable wildlife enterprises: Guidelines for projects to implement trials of conservation through sustainable commercial use of wildlife. Publication No. 05/106, Rural Industries Research and Development Corporation, Barton ACT.
Wynn, P., Beaton, A. and Spiegel, N. 2004. Meat quality in kangaroos, Publication No. 04/151, Rural Industries Research and Development Corporation, Barton ACT.
Building connections with kangaroos, commerce and conservation
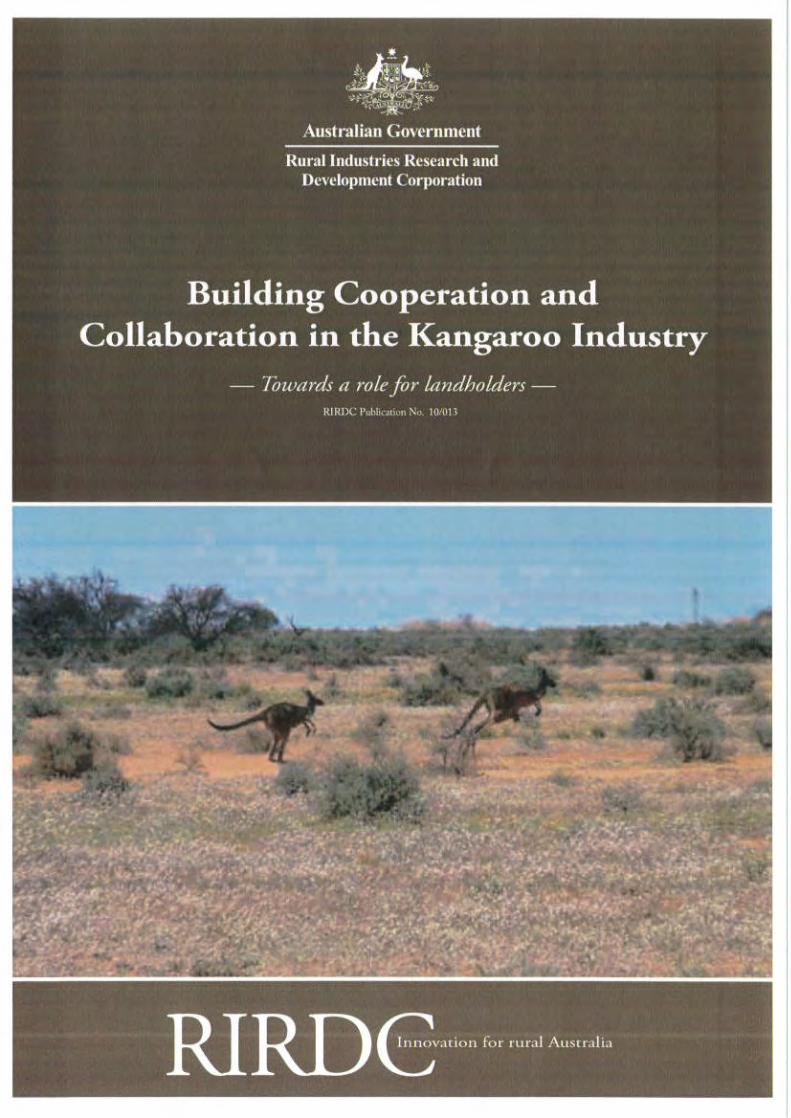


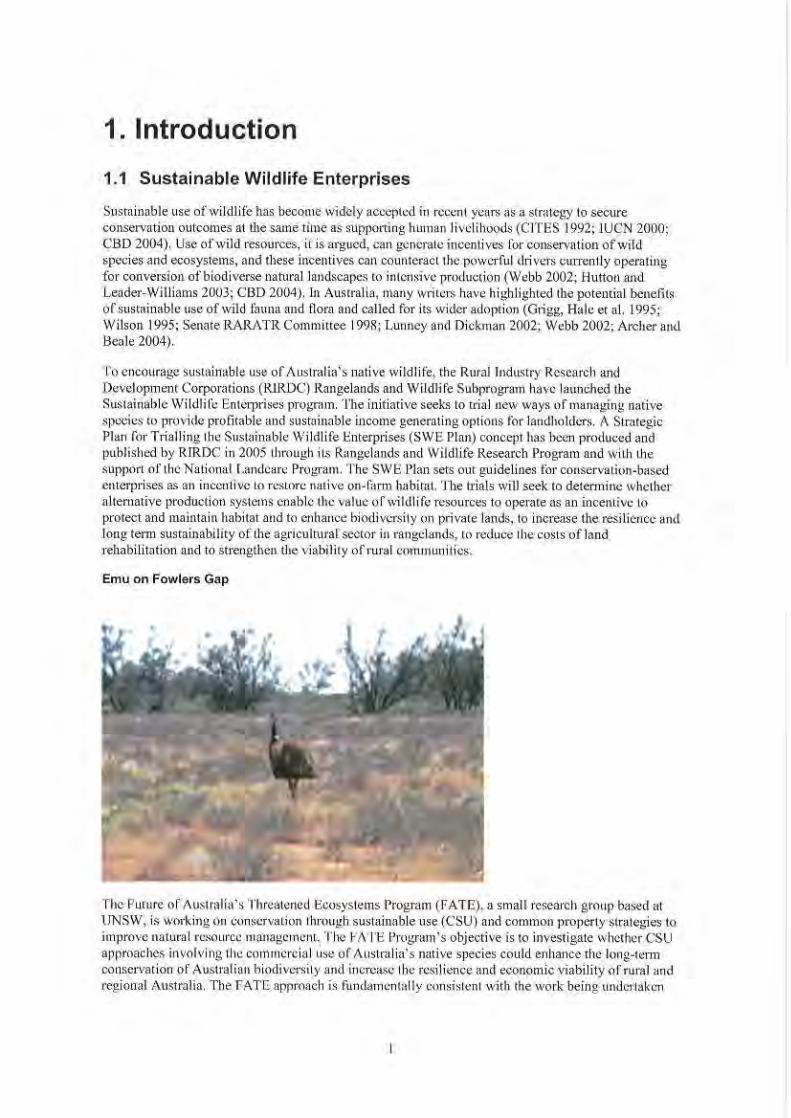
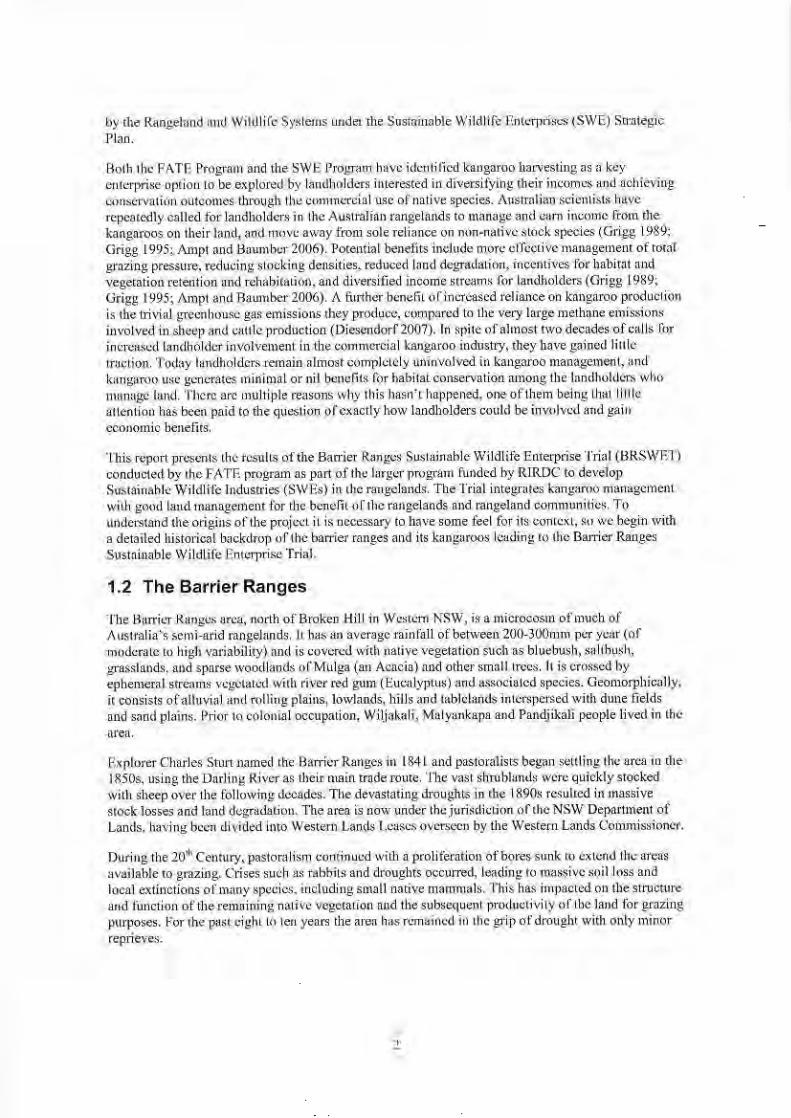
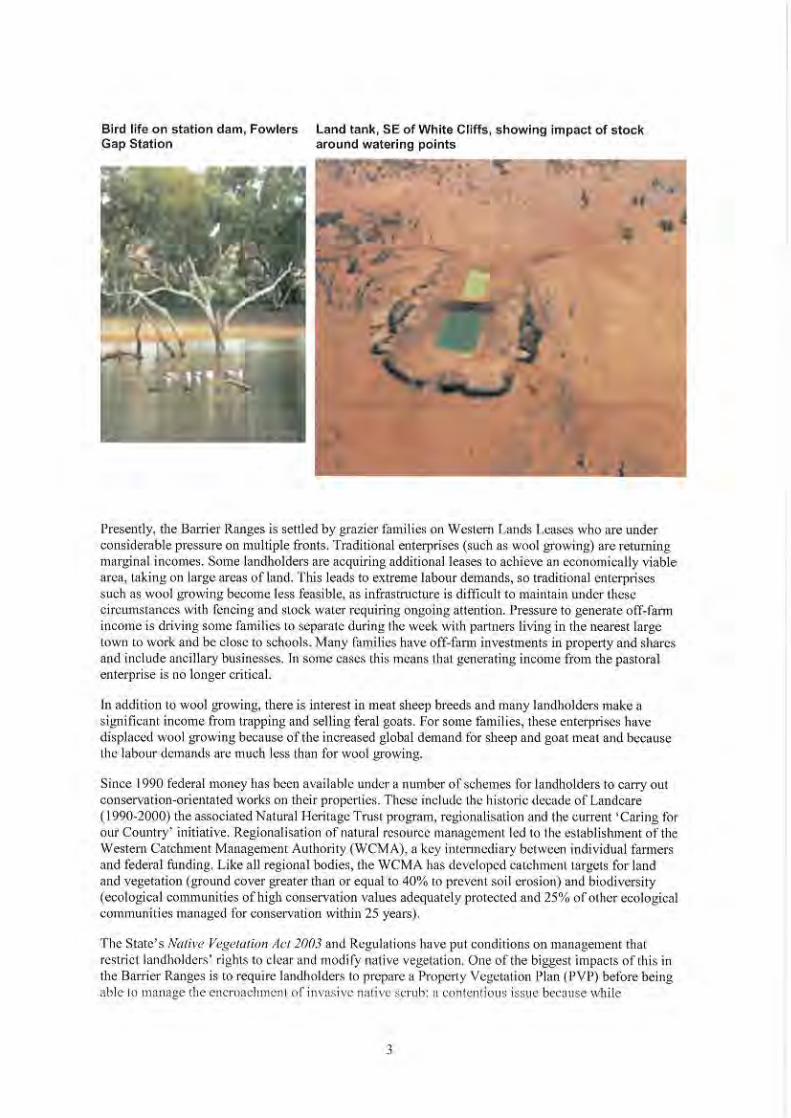
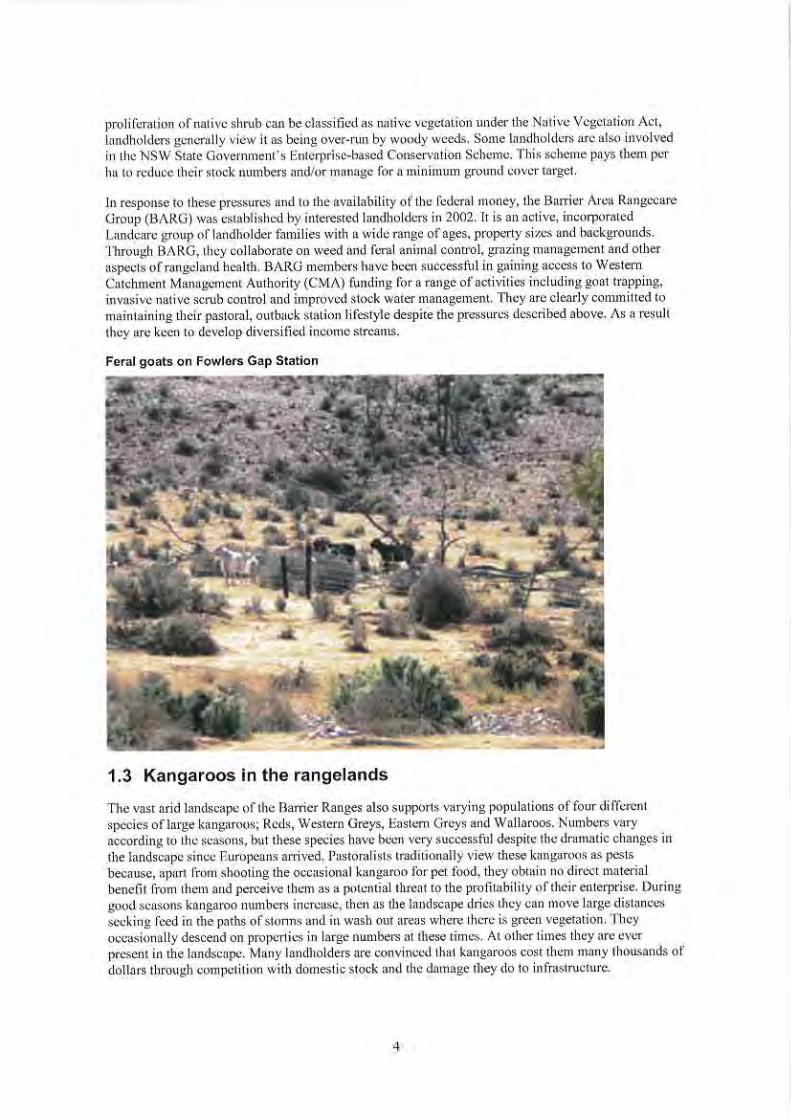
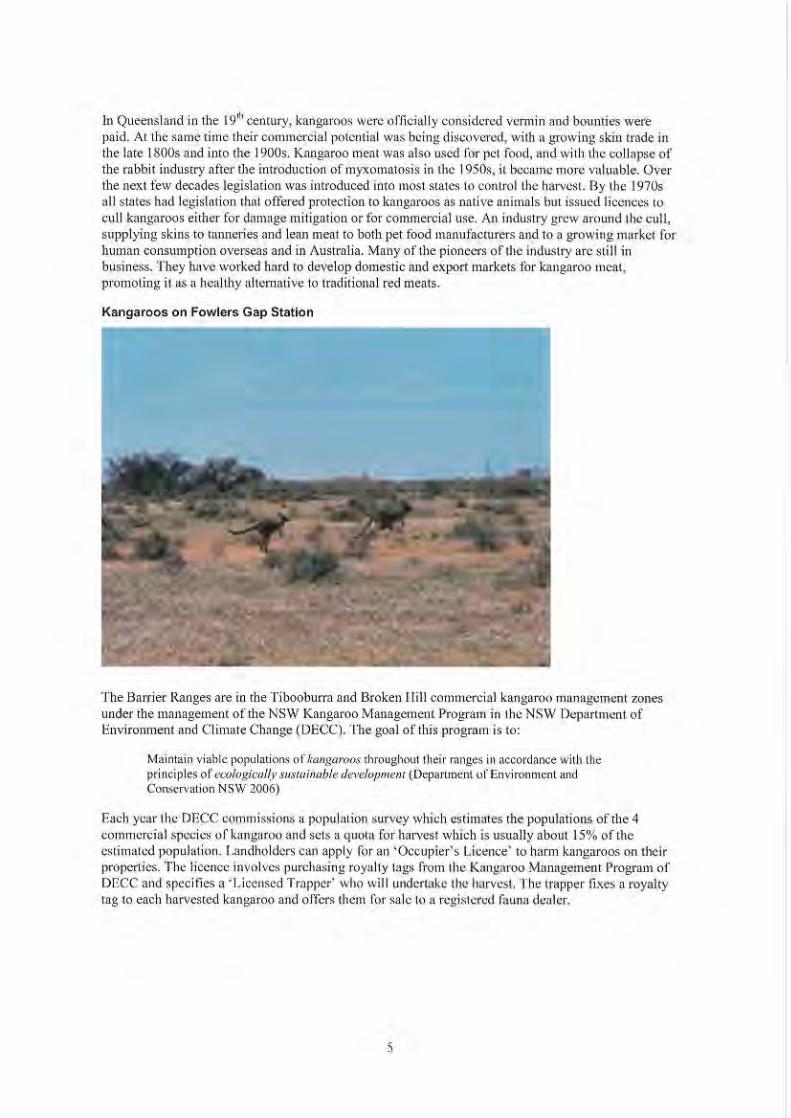
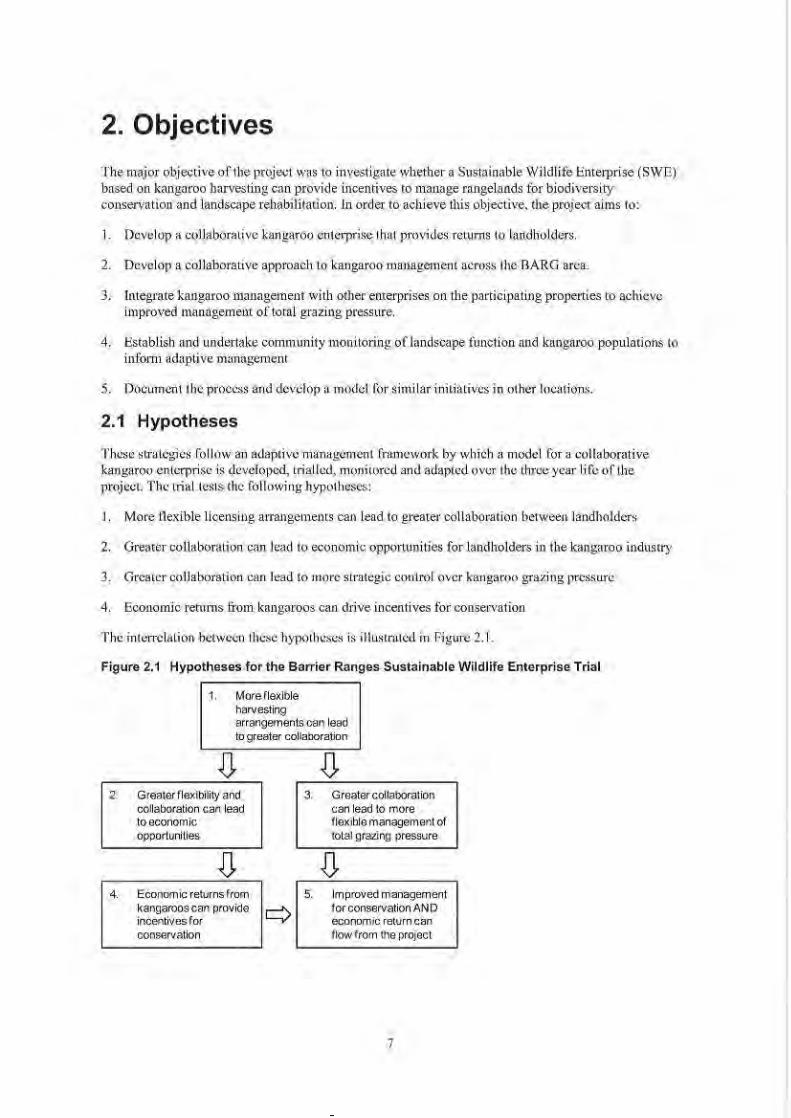
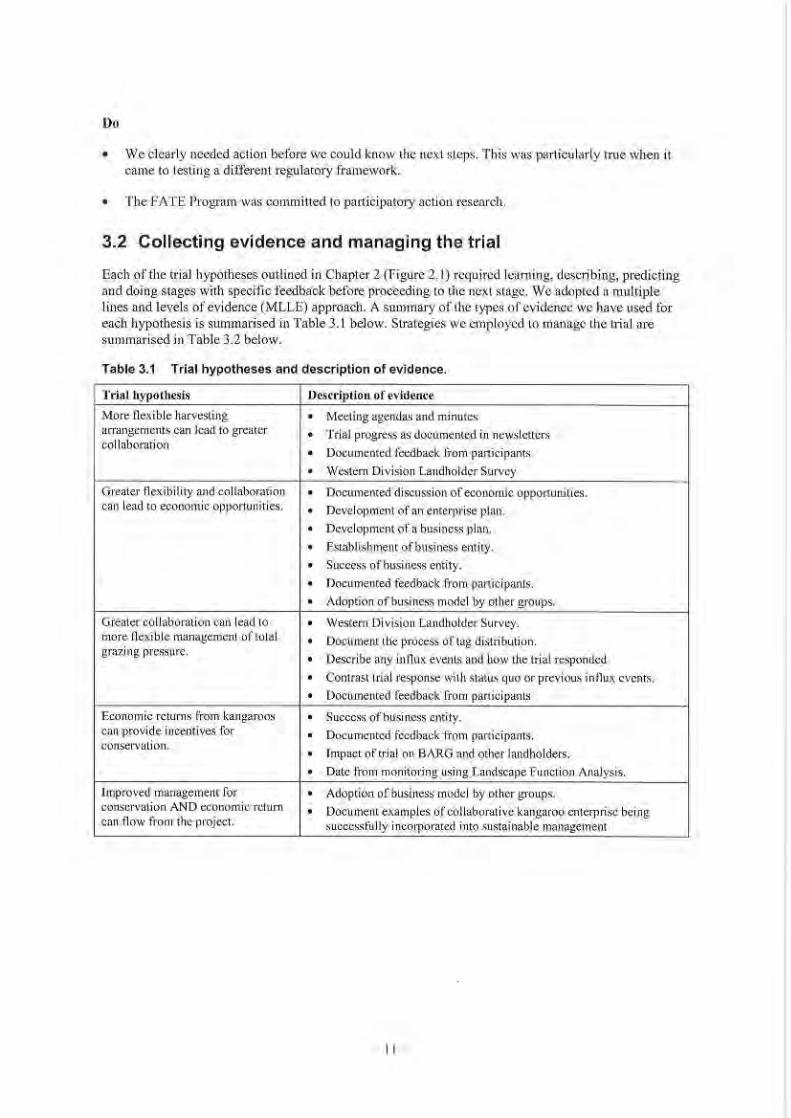
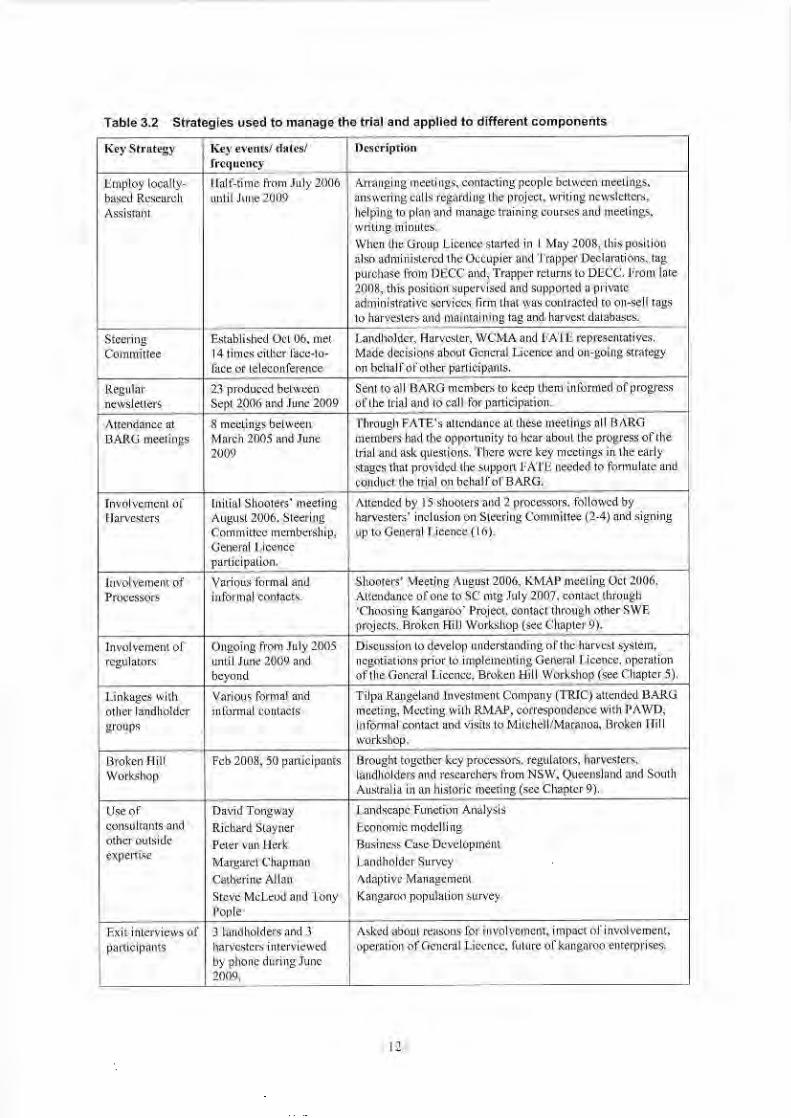
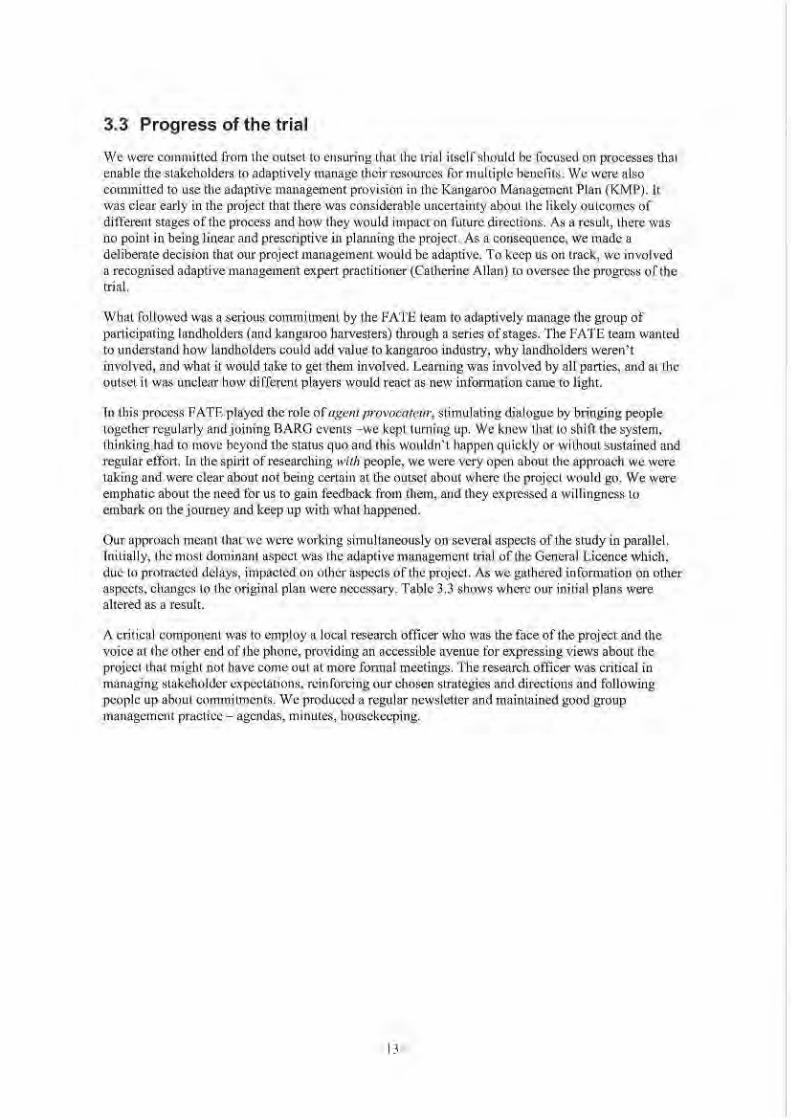
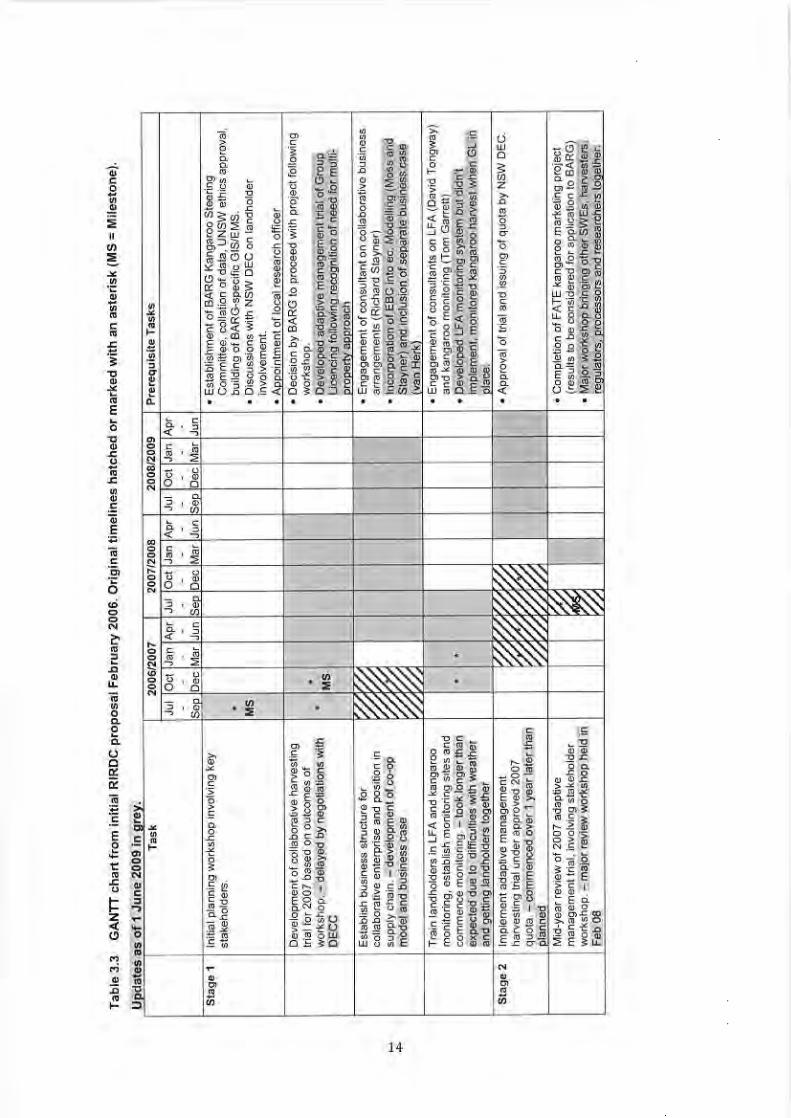
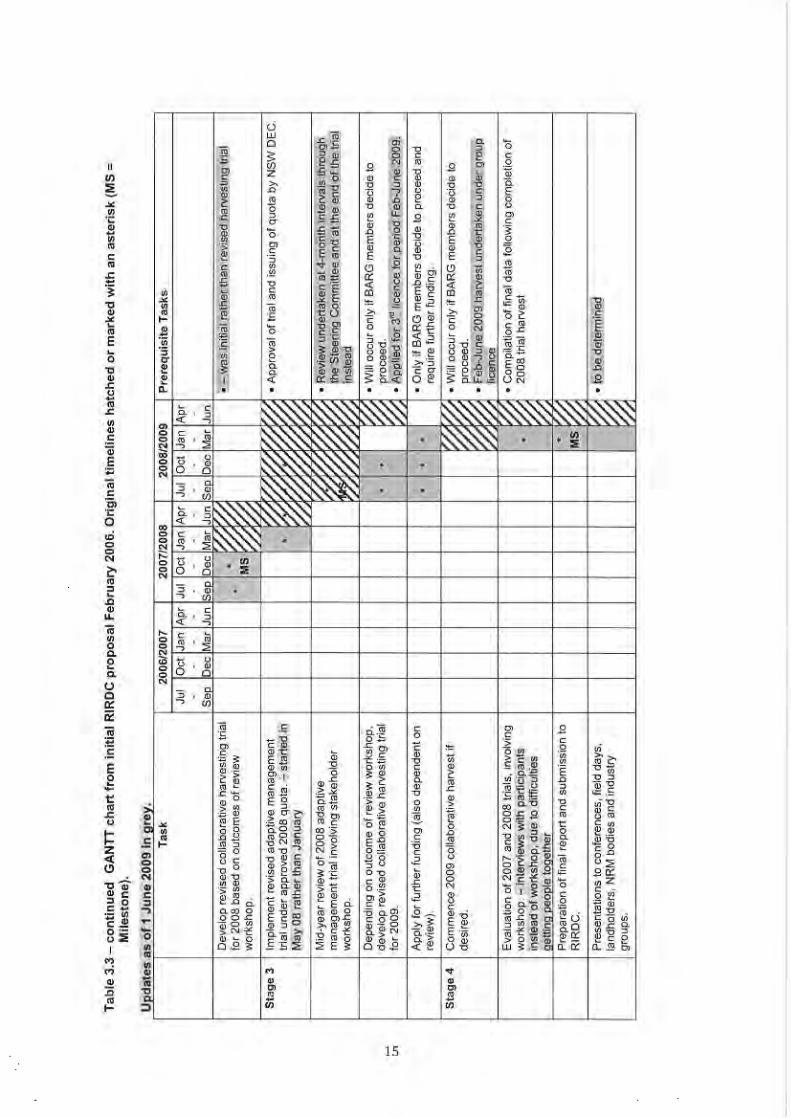
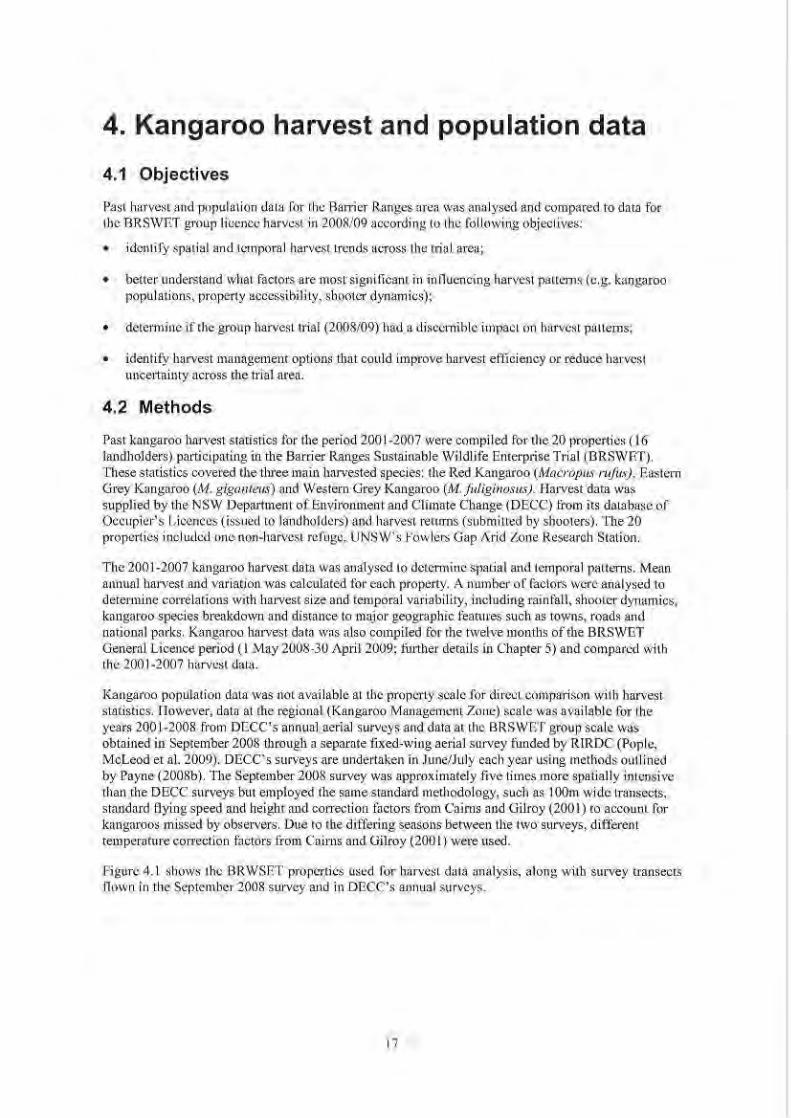
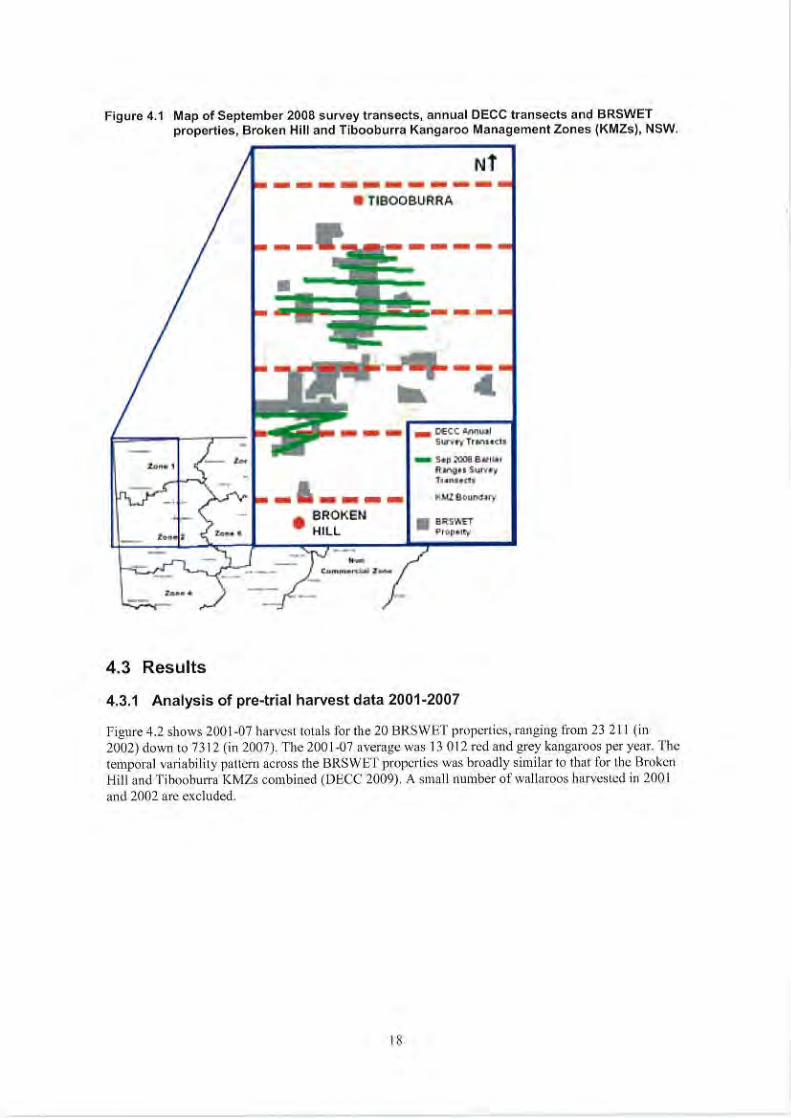
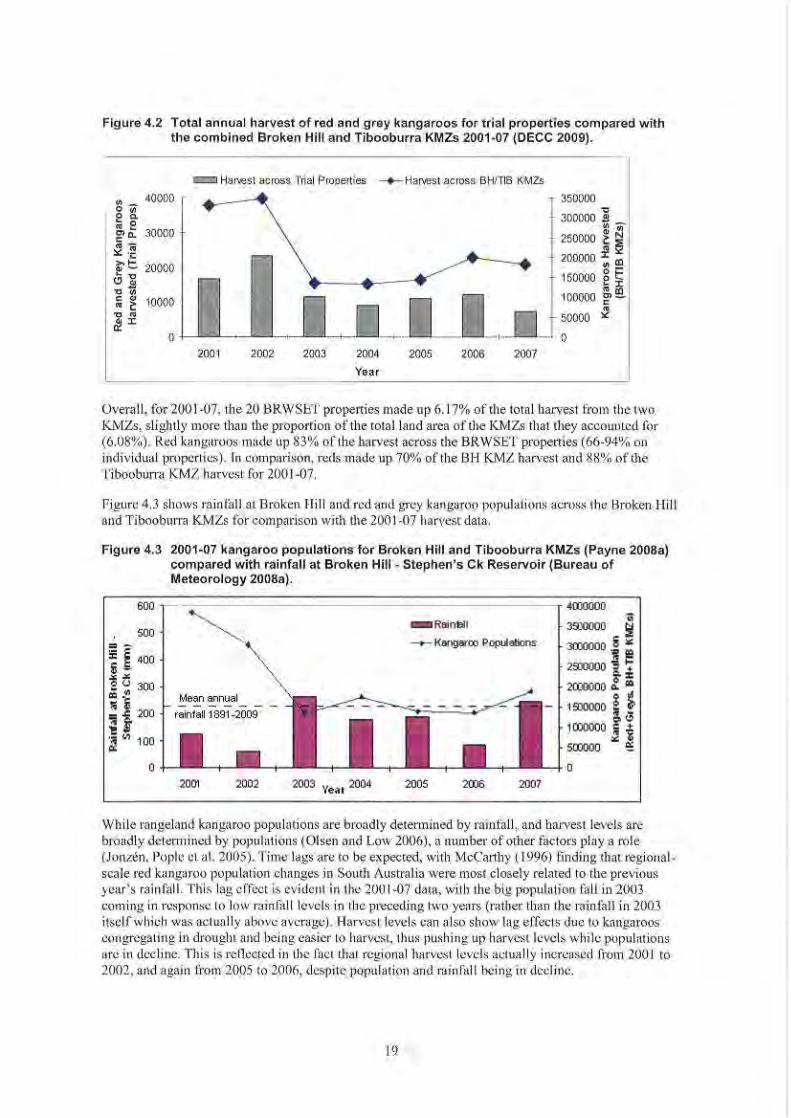
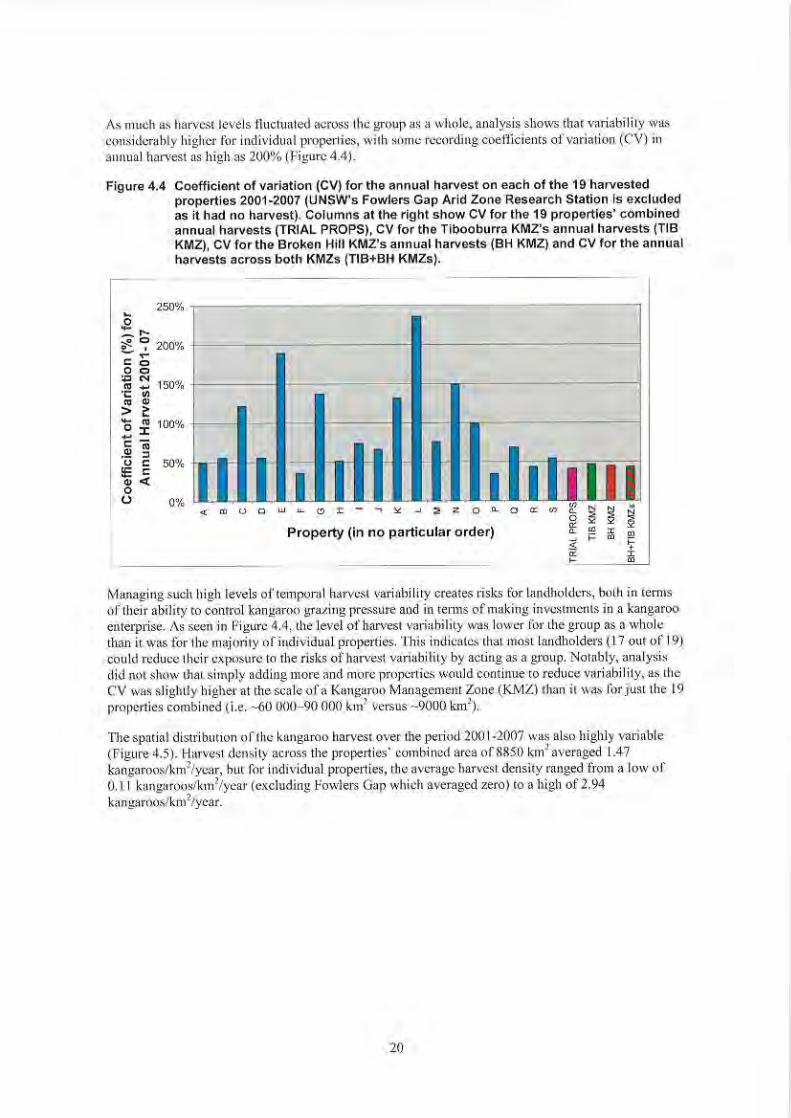
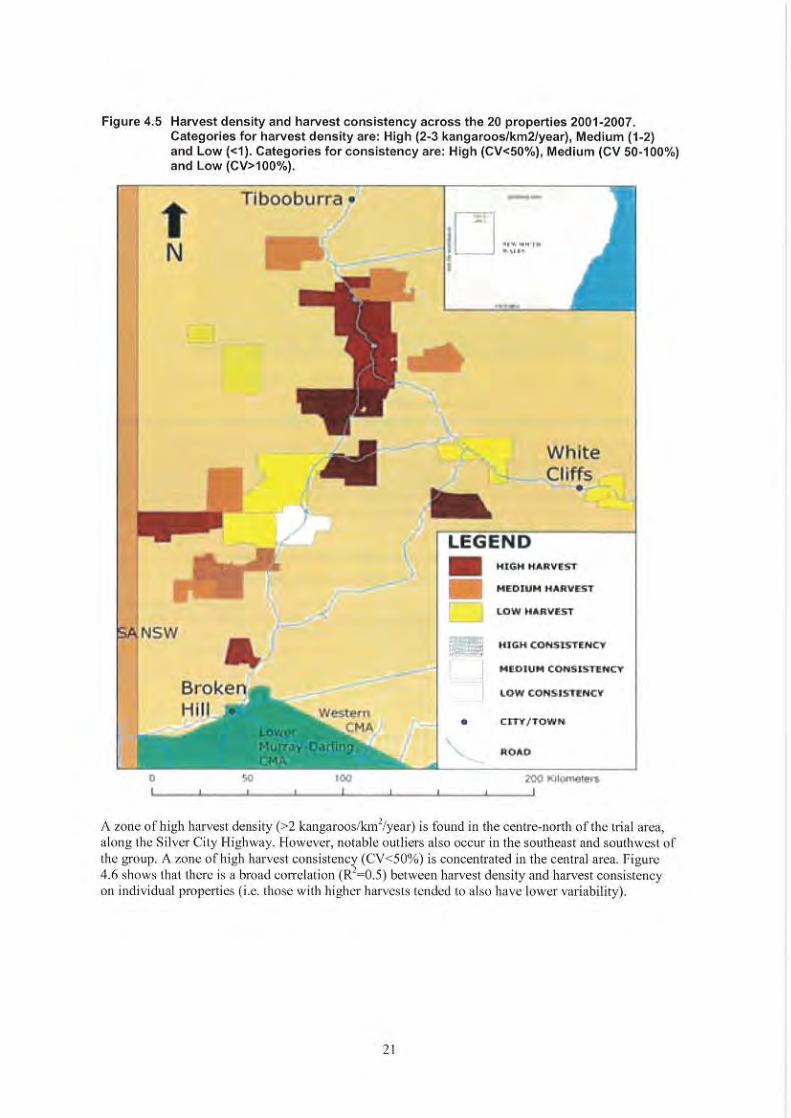
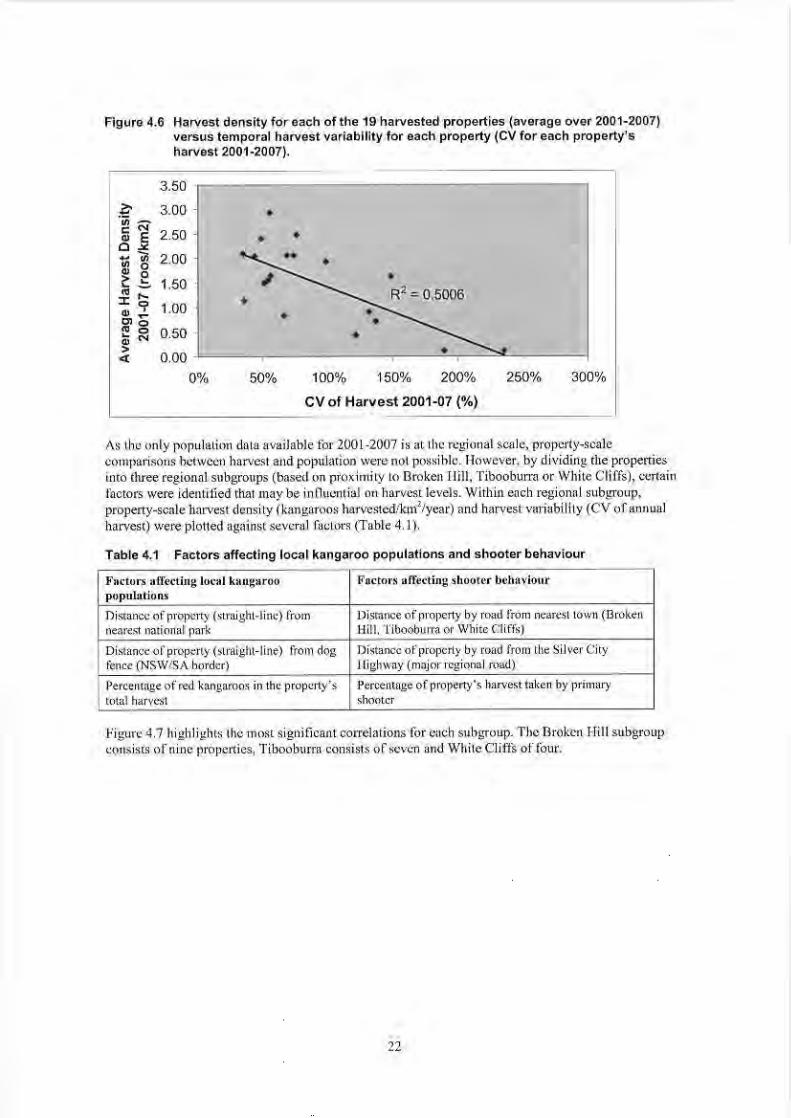
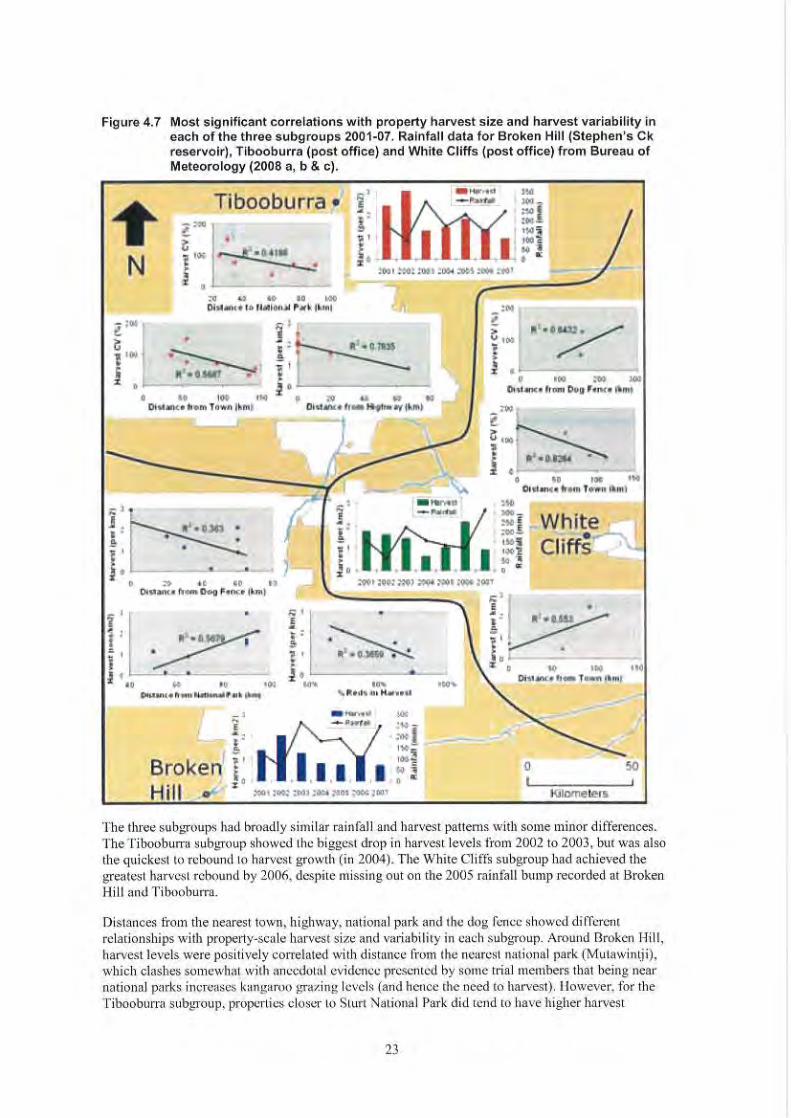
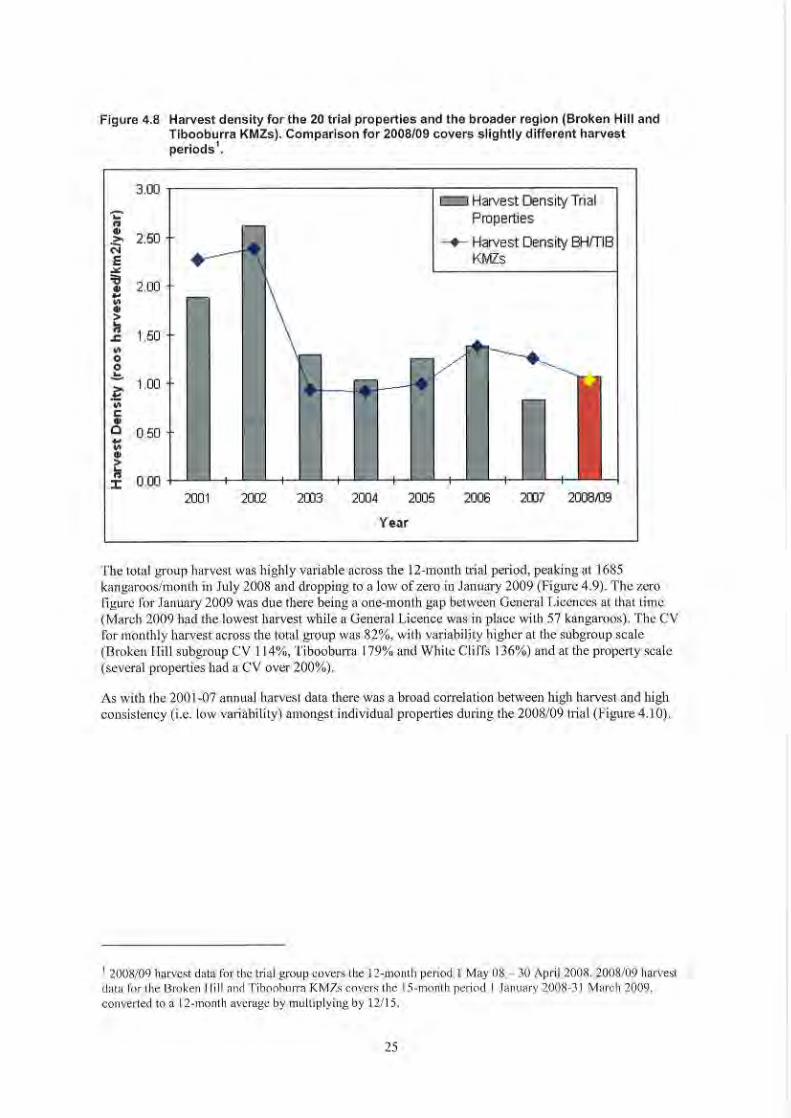
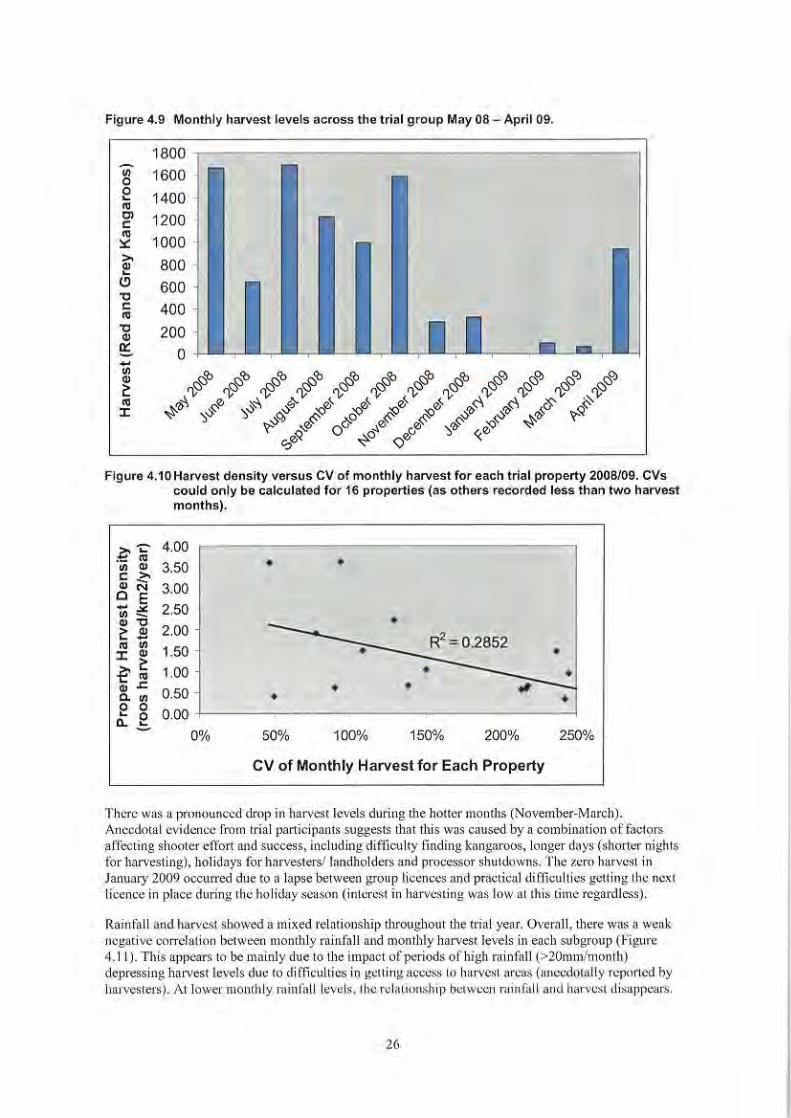
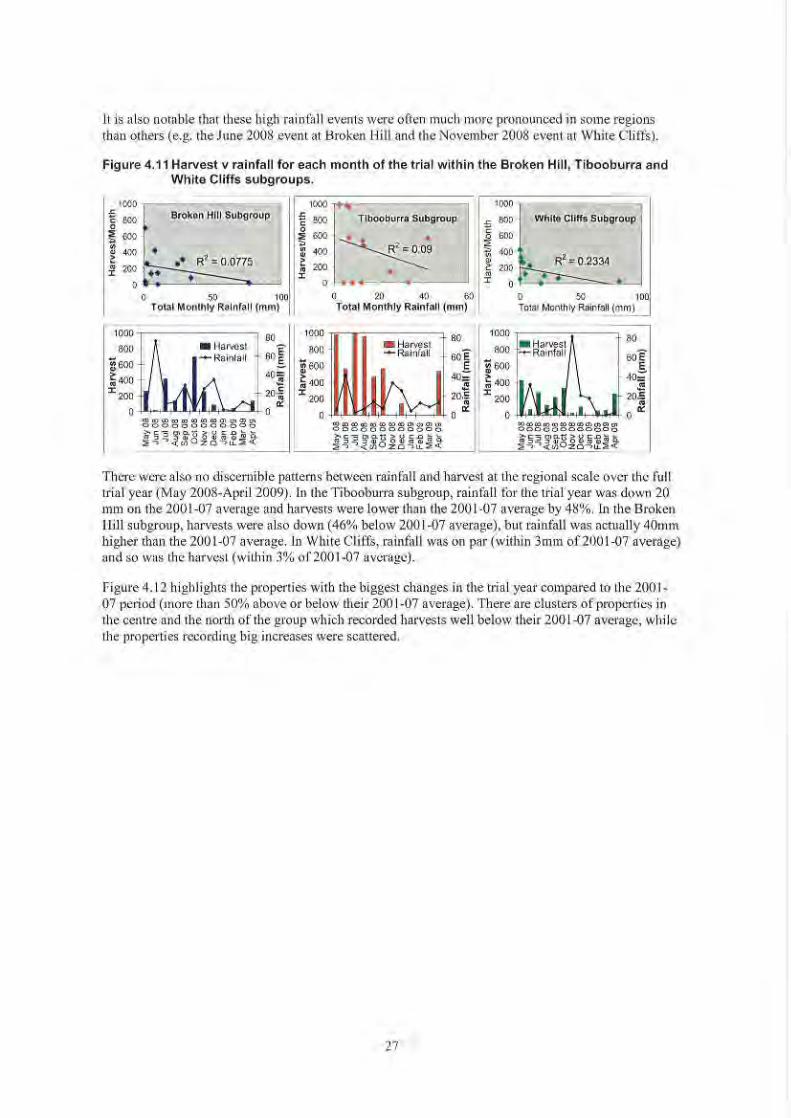
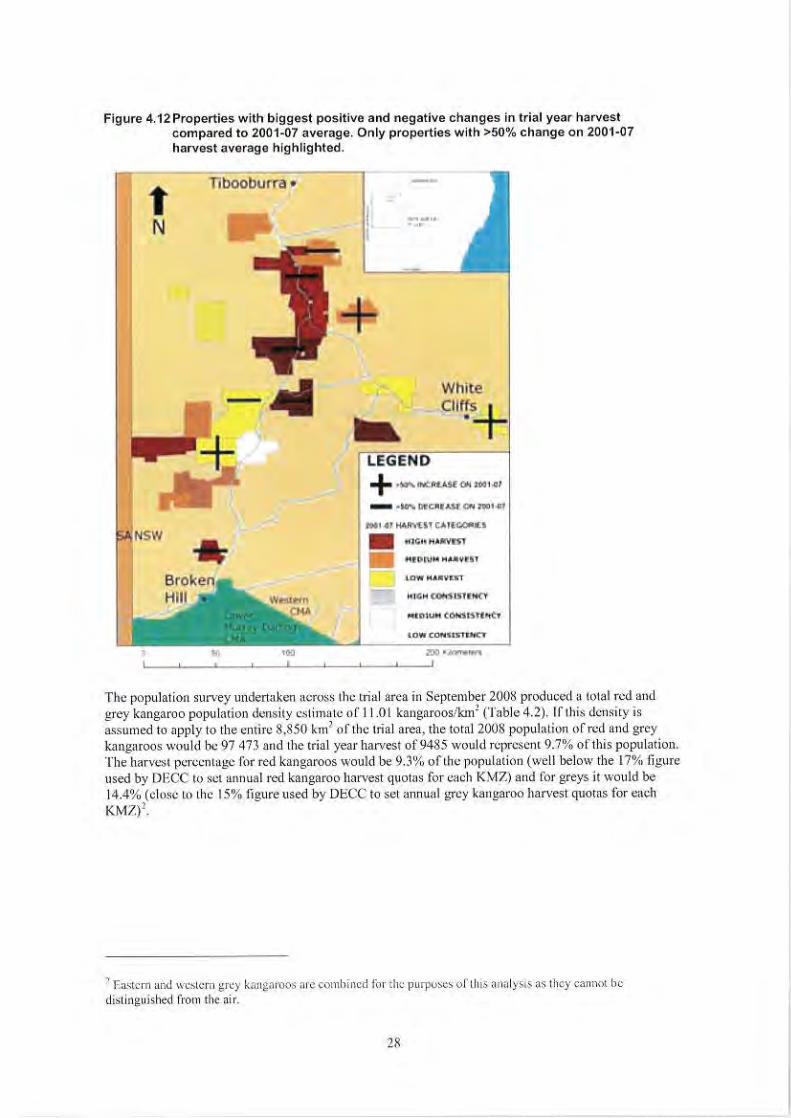
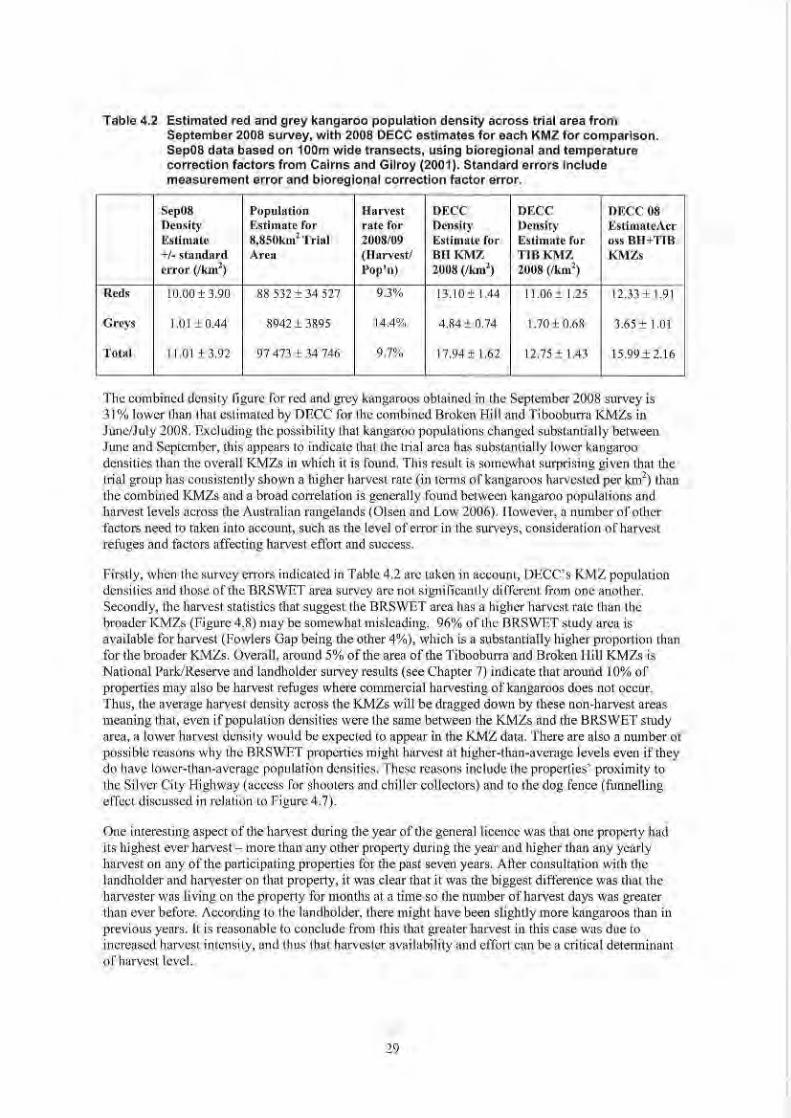
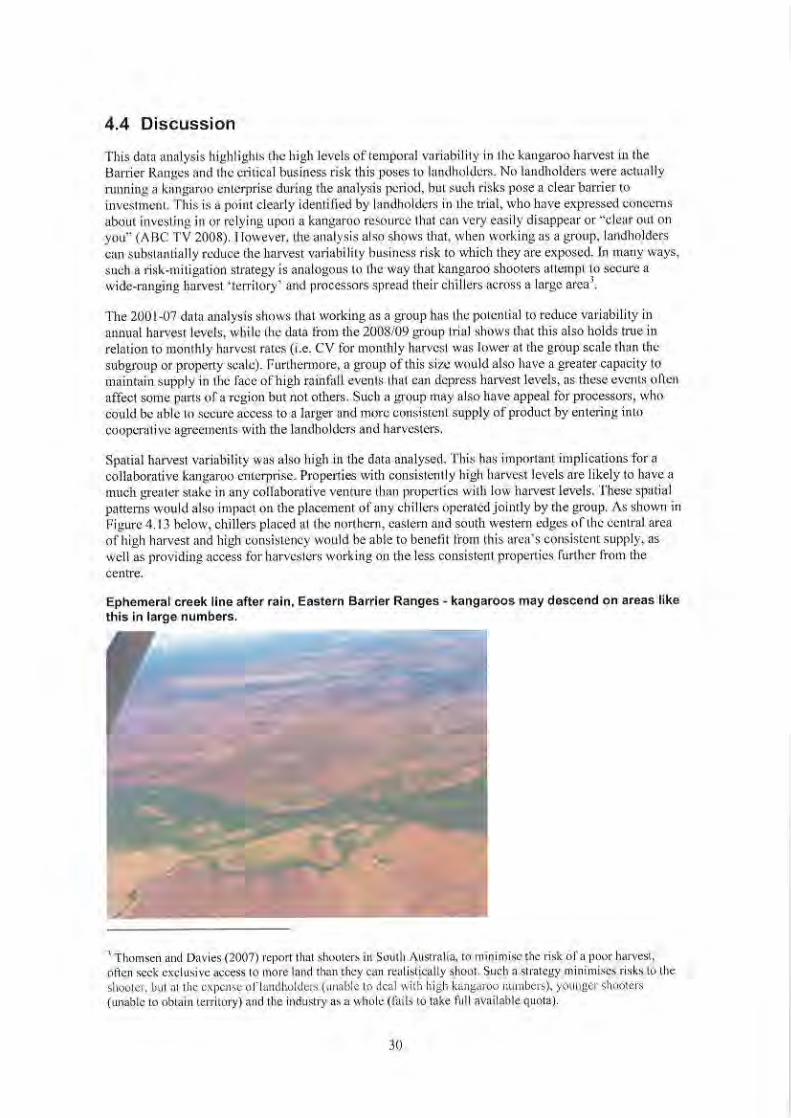
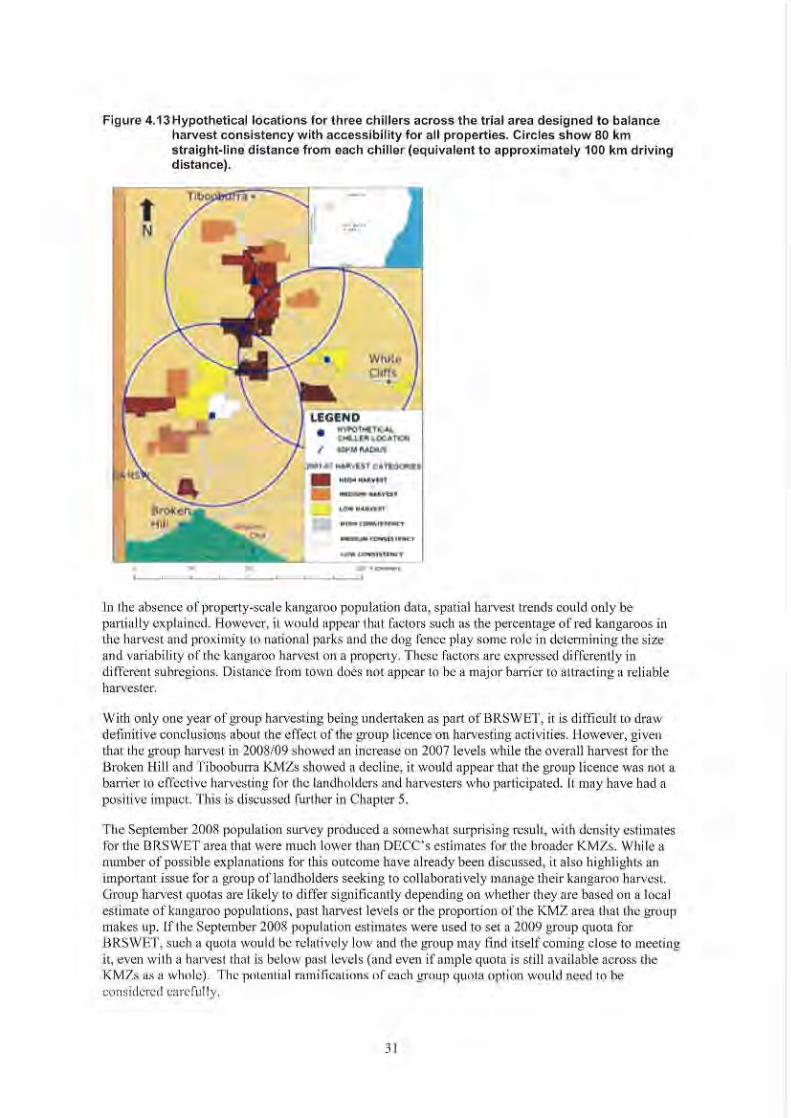
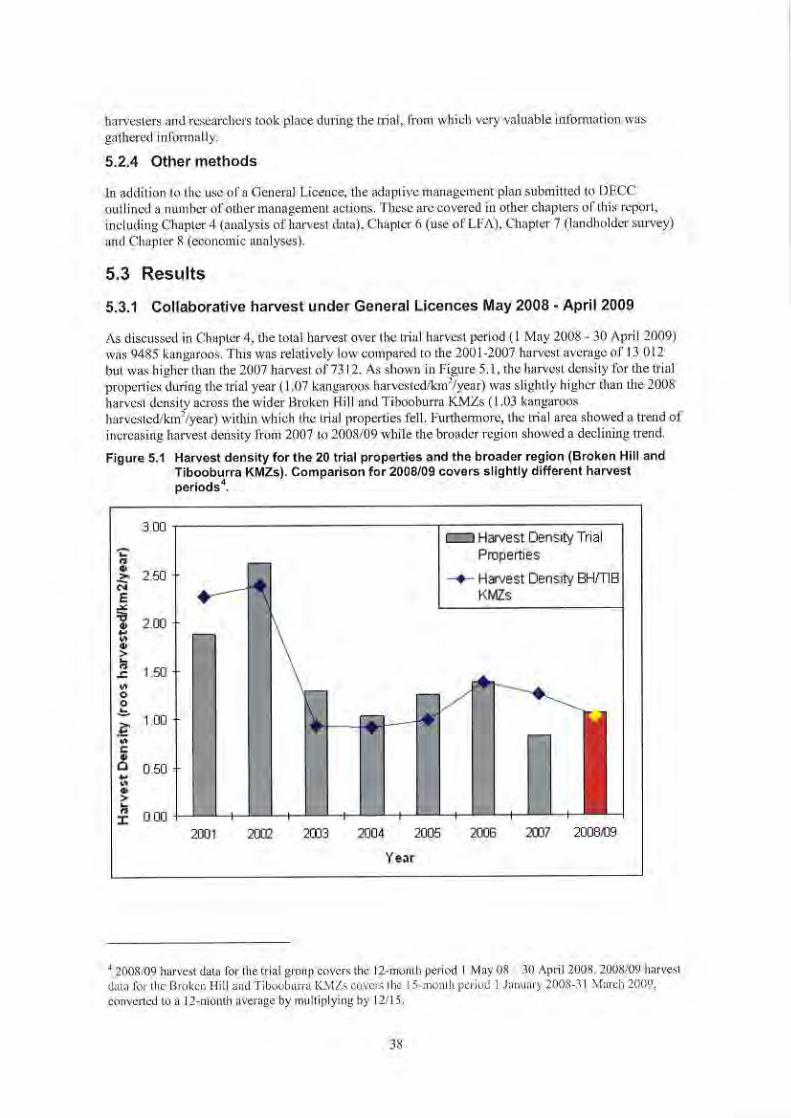
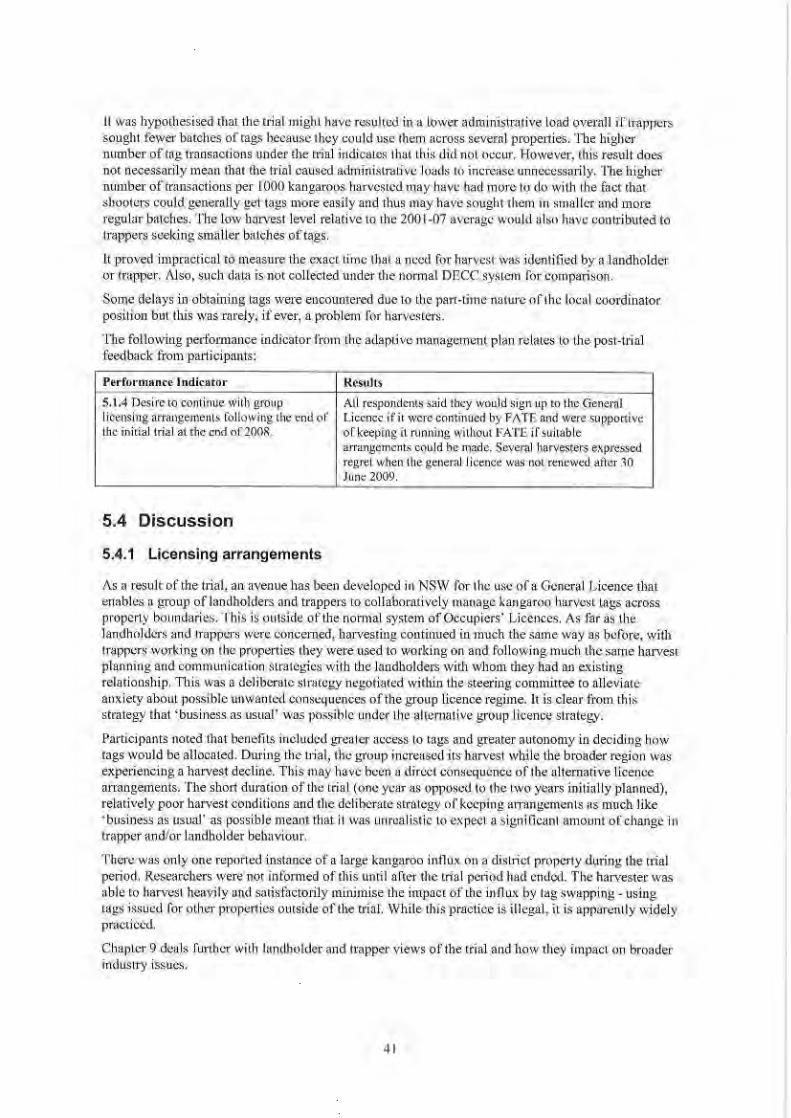
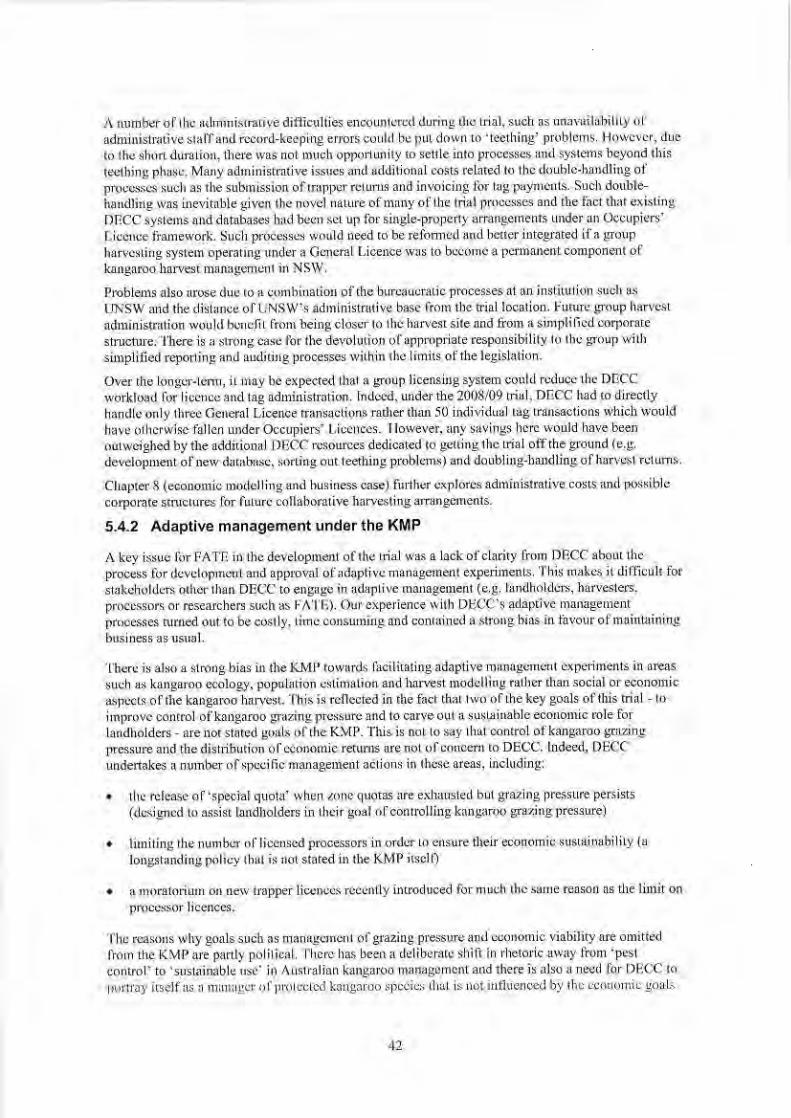
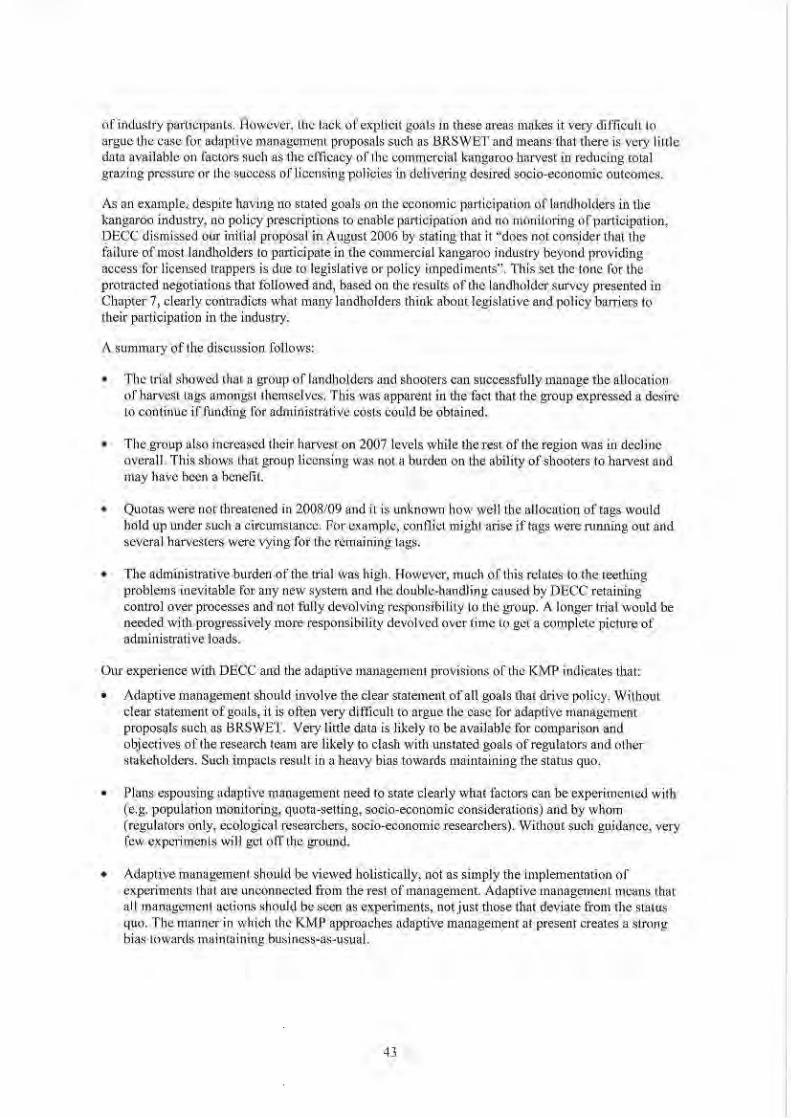
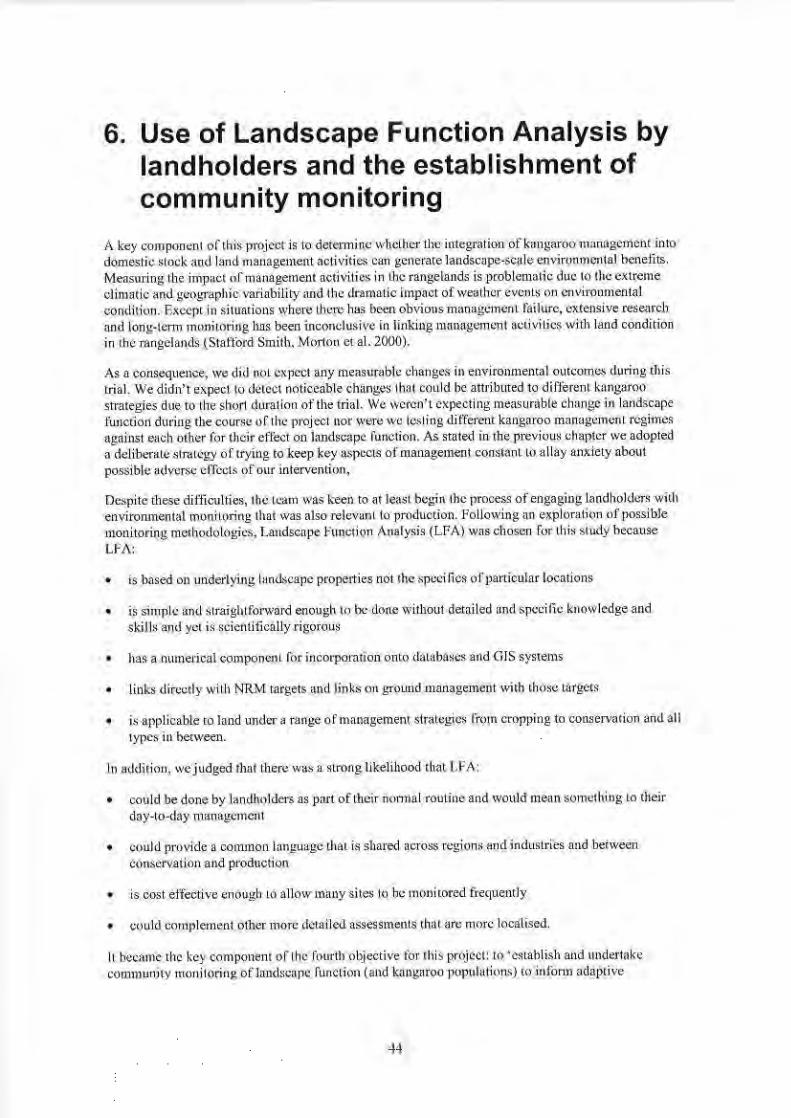
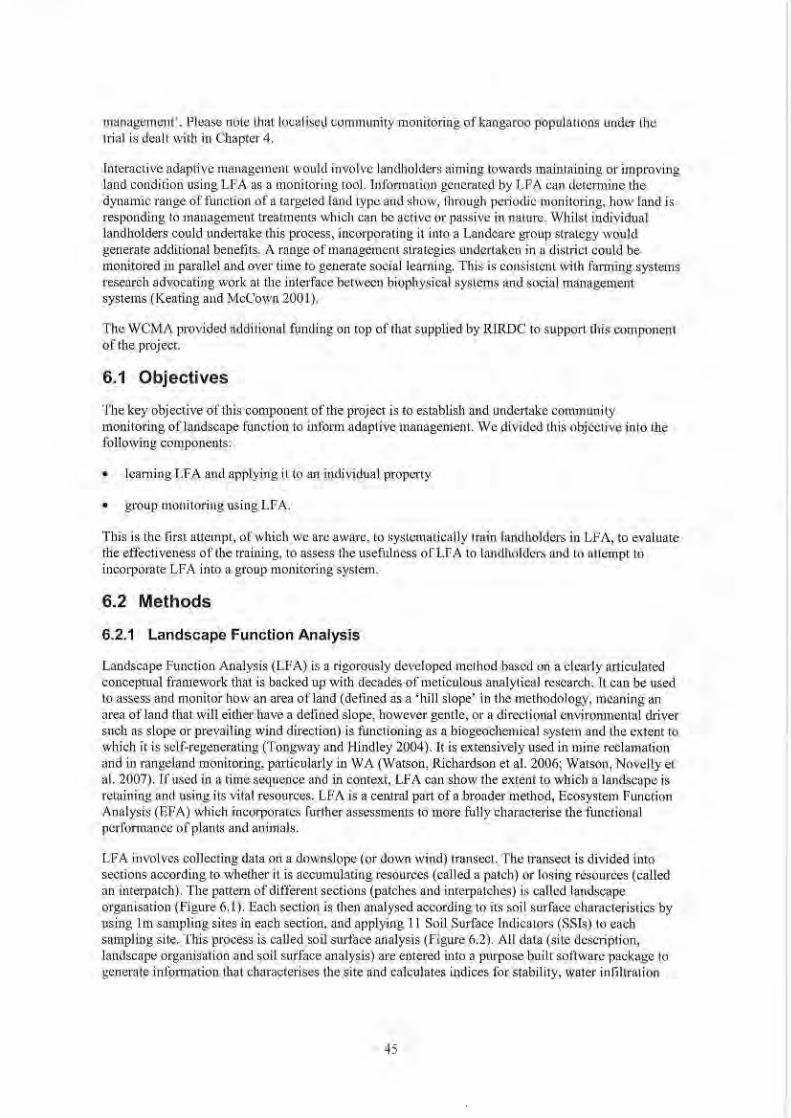
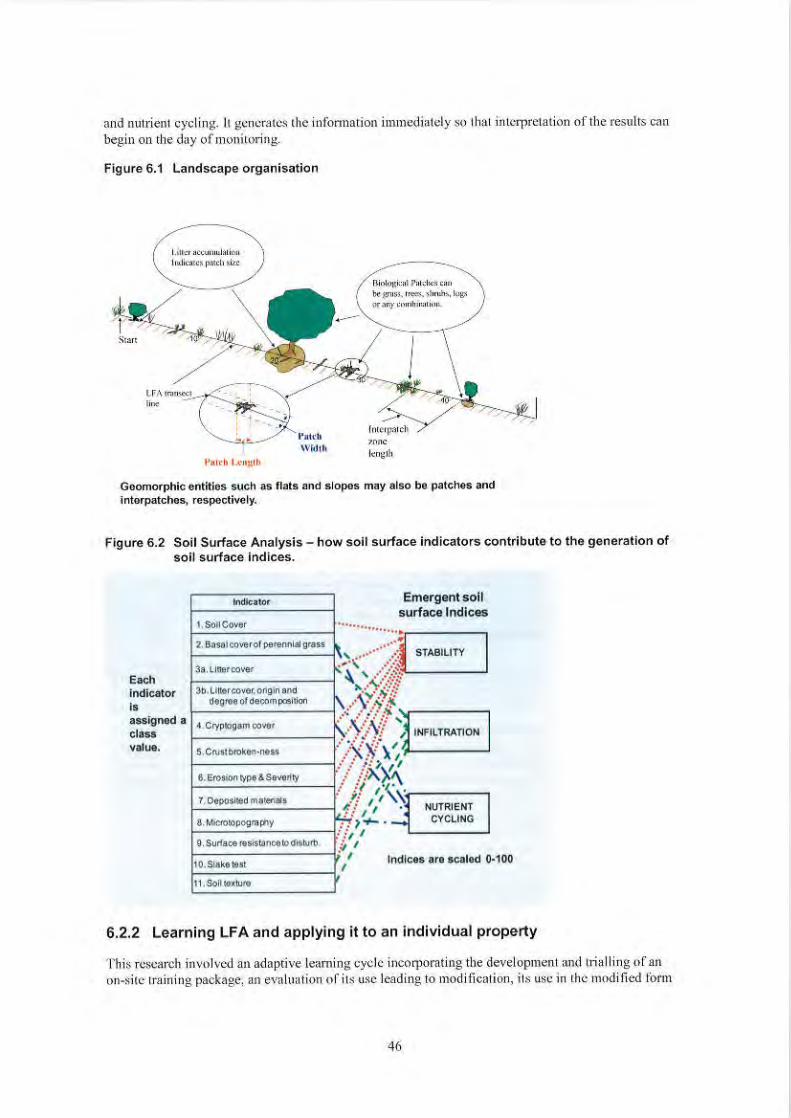
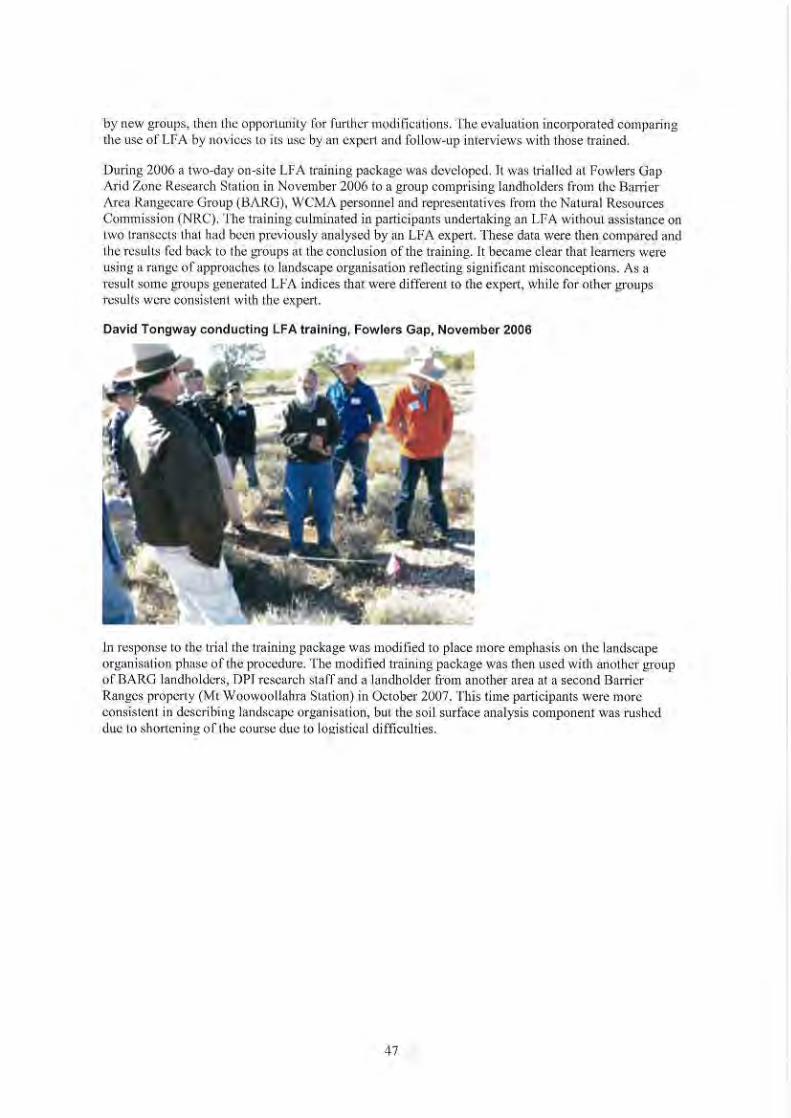
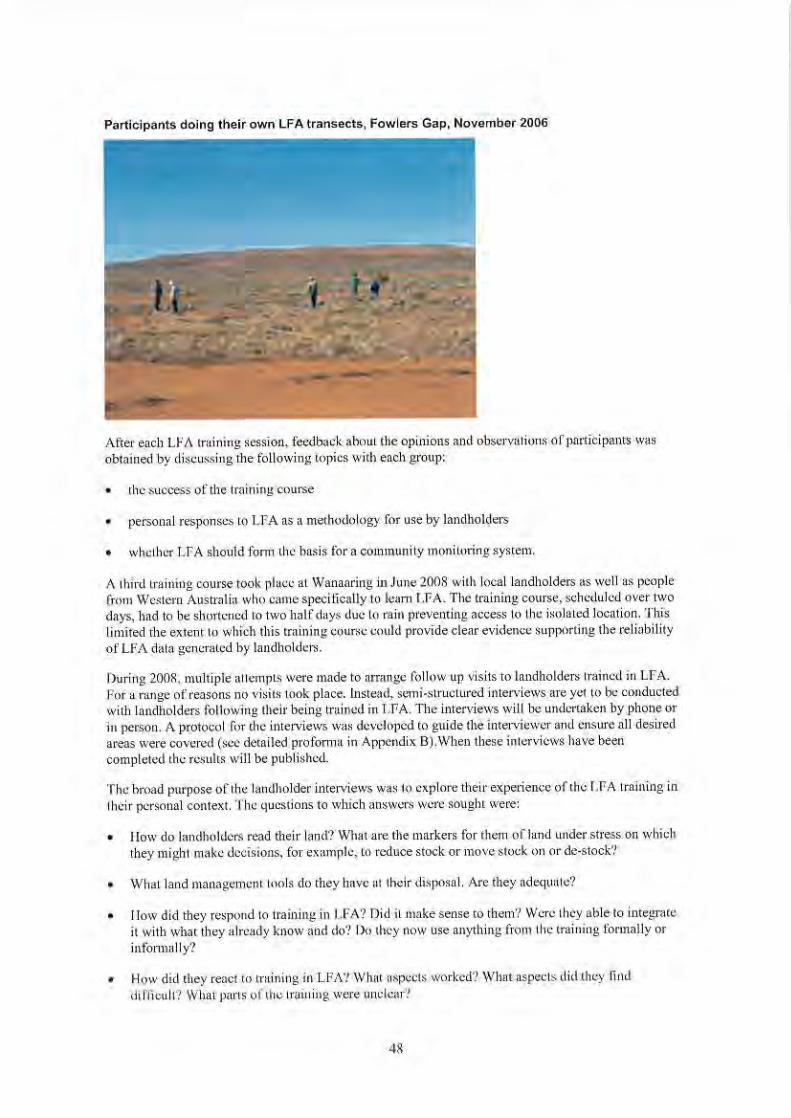
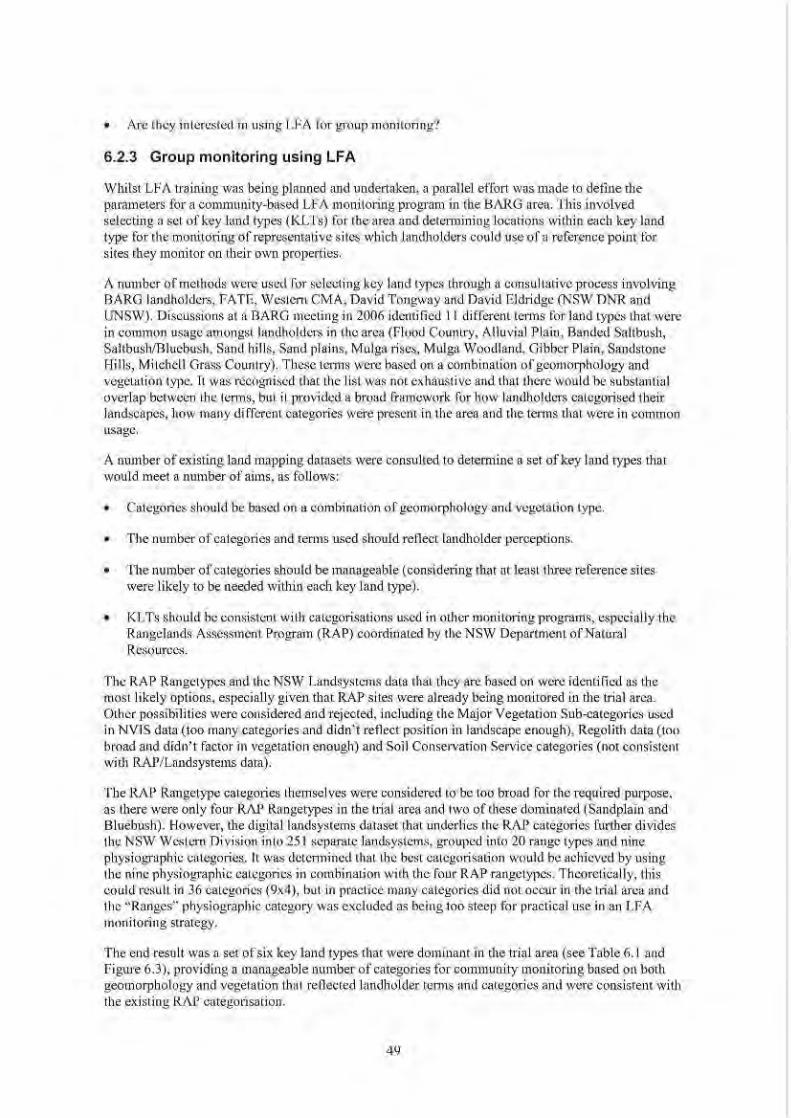
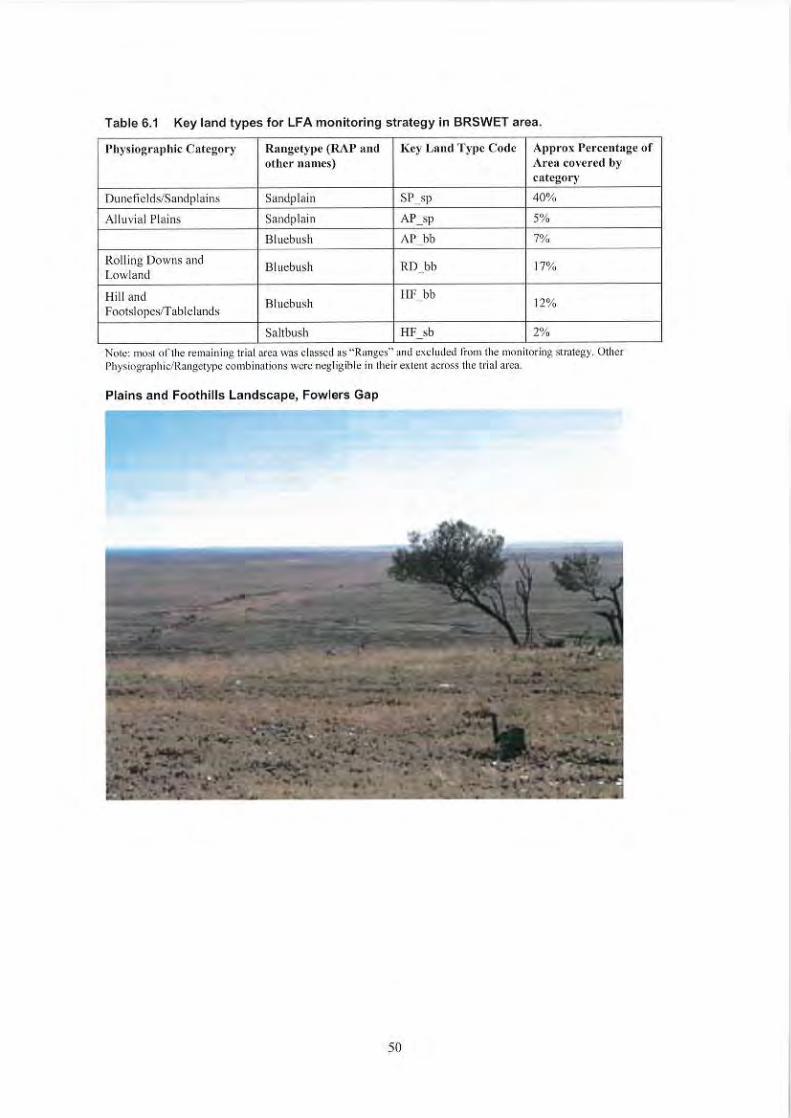
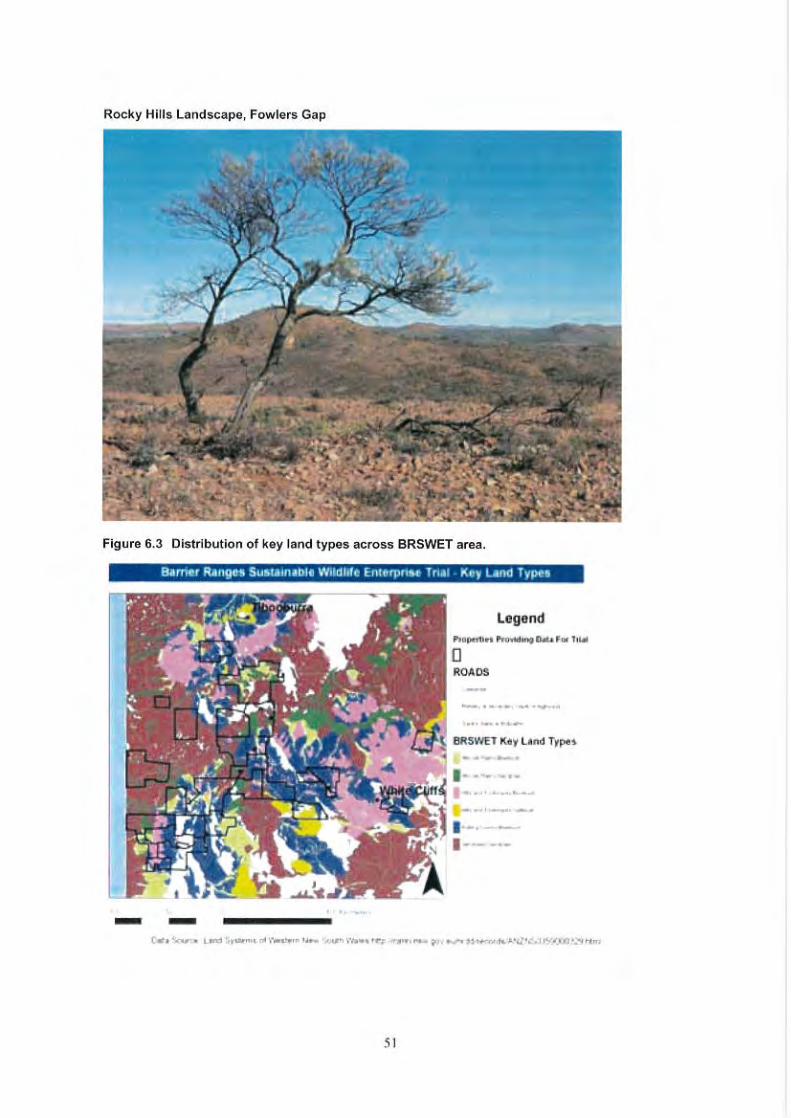
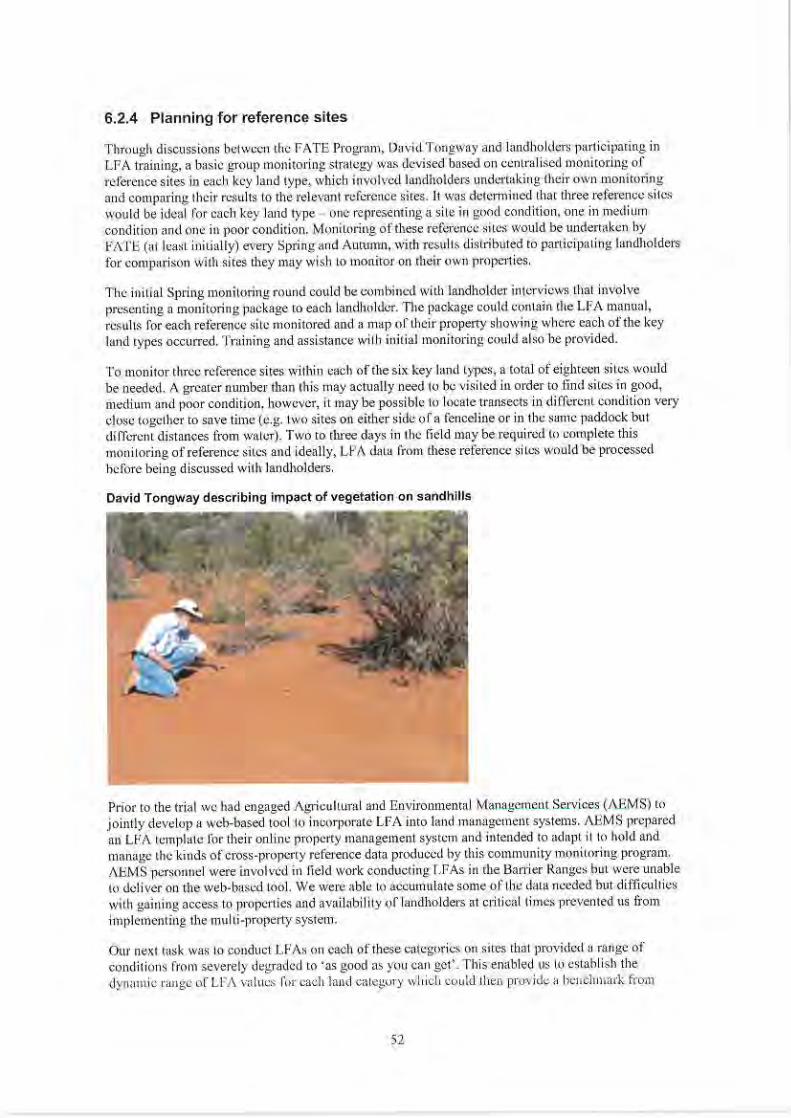
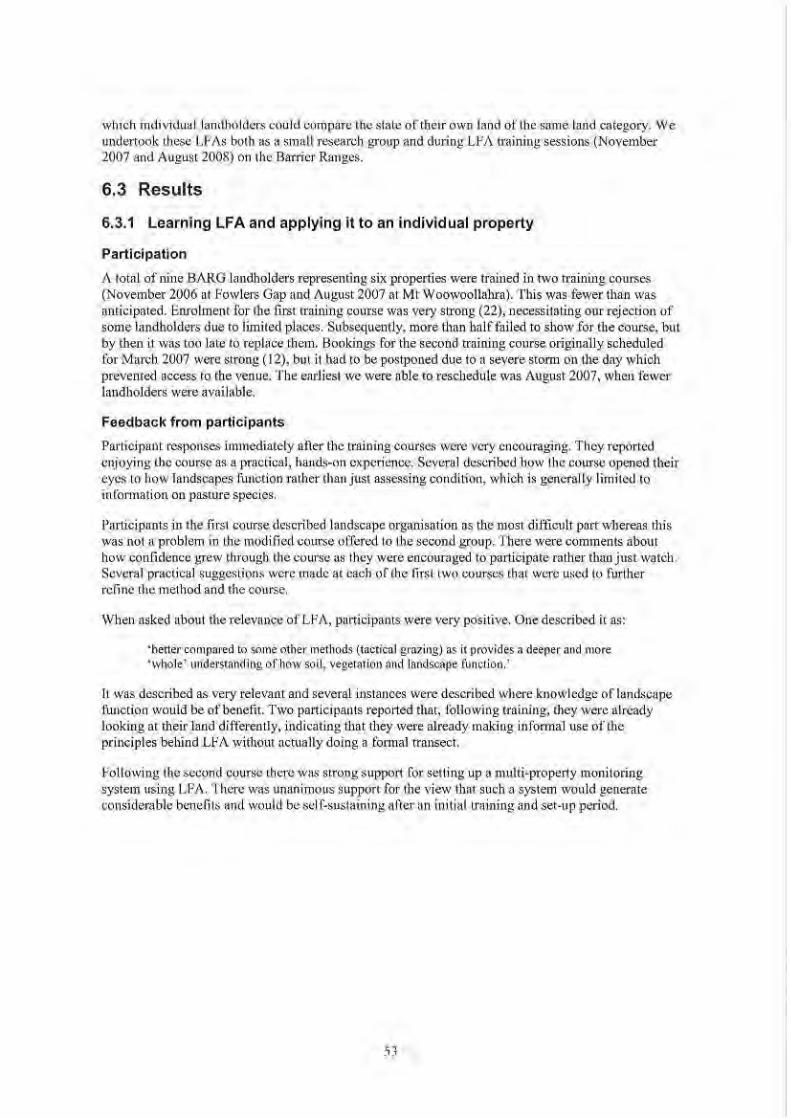
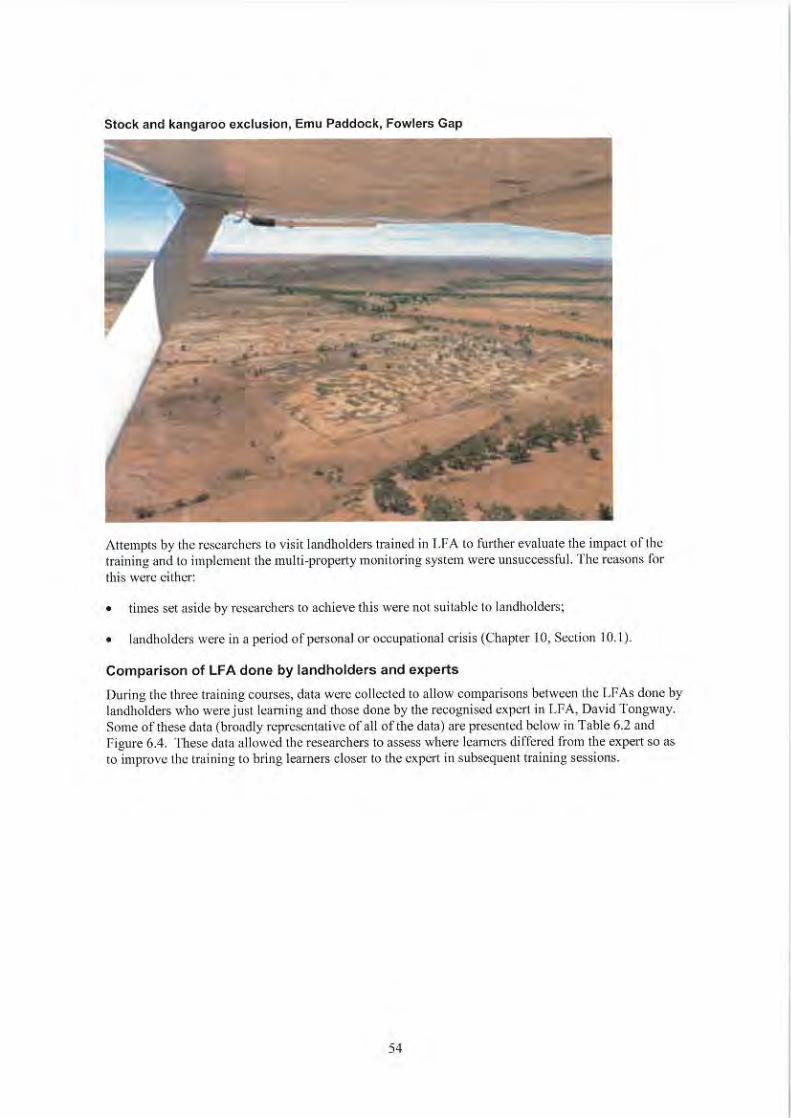
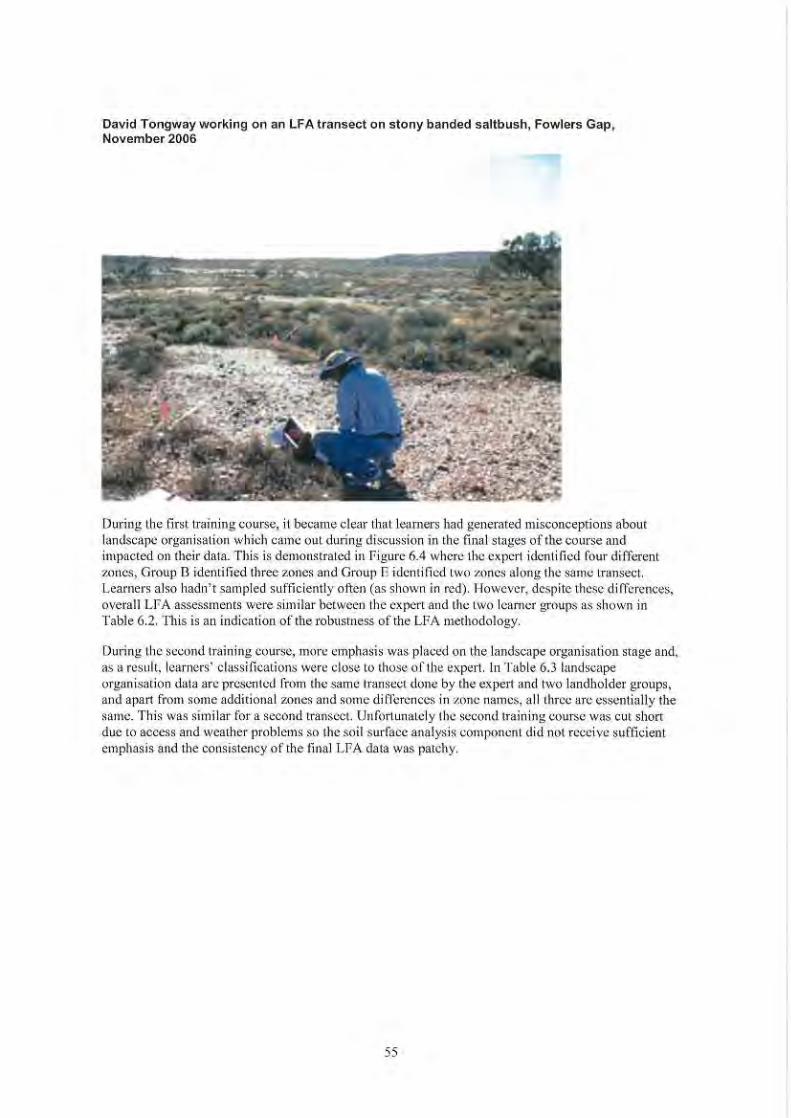
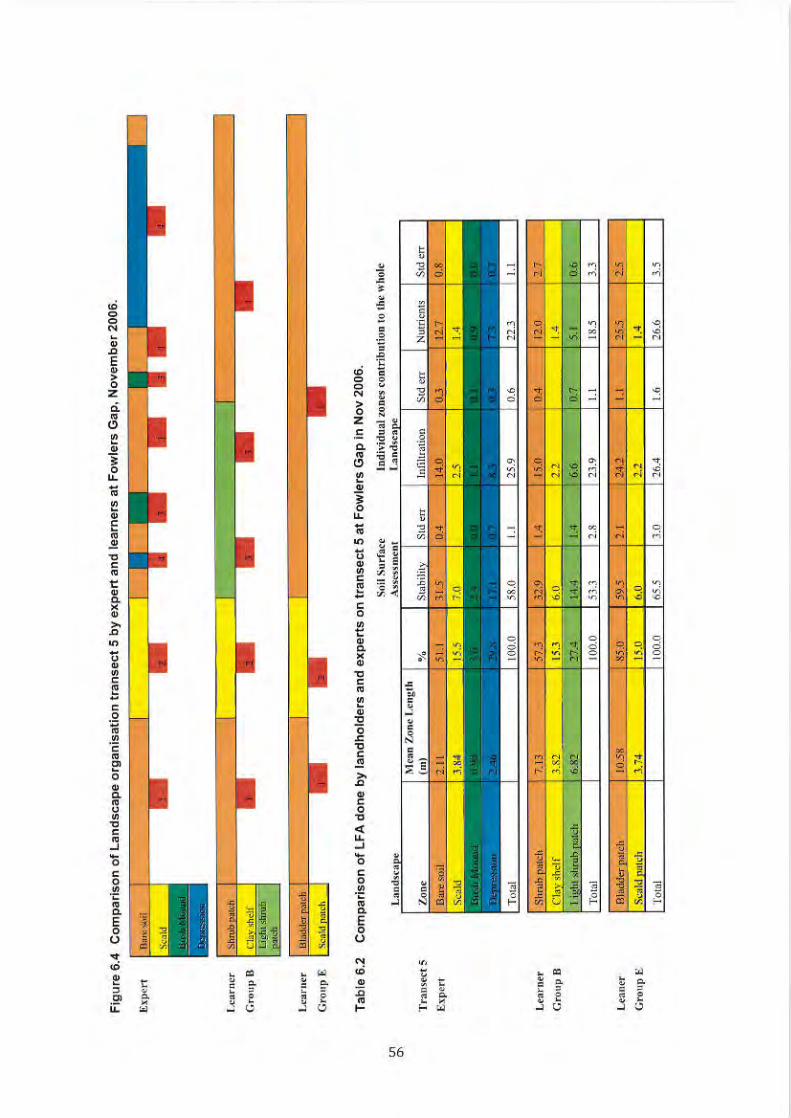
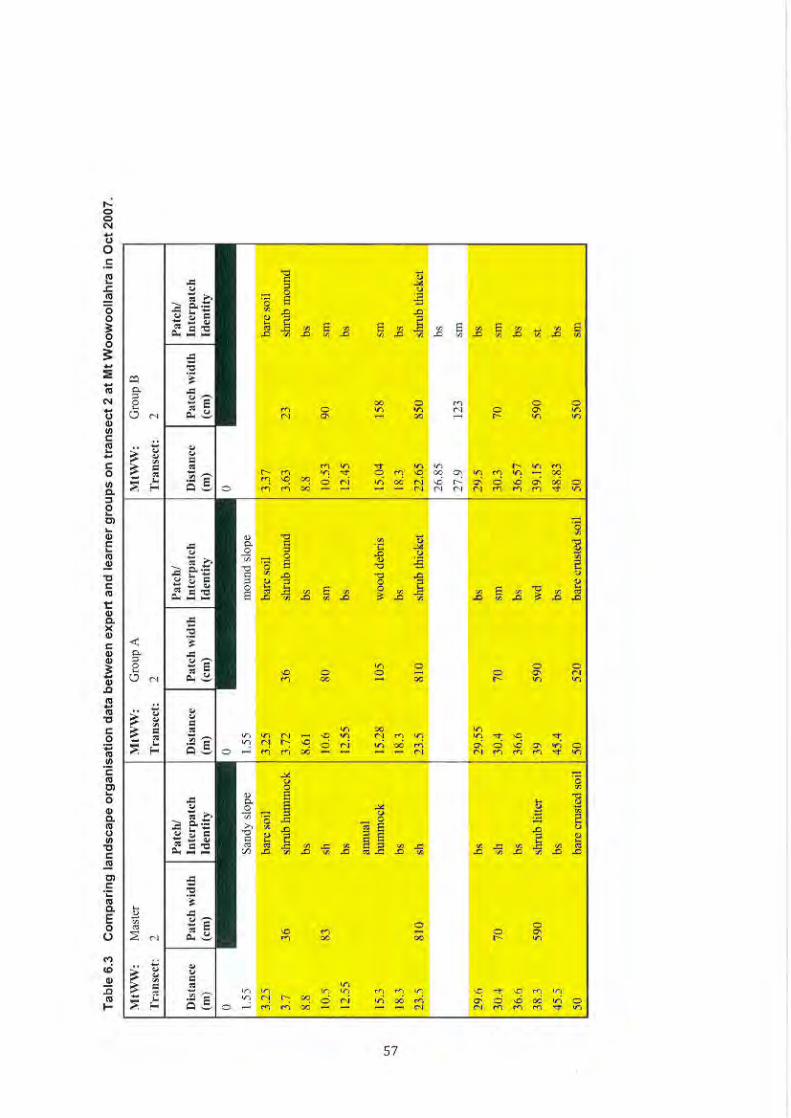
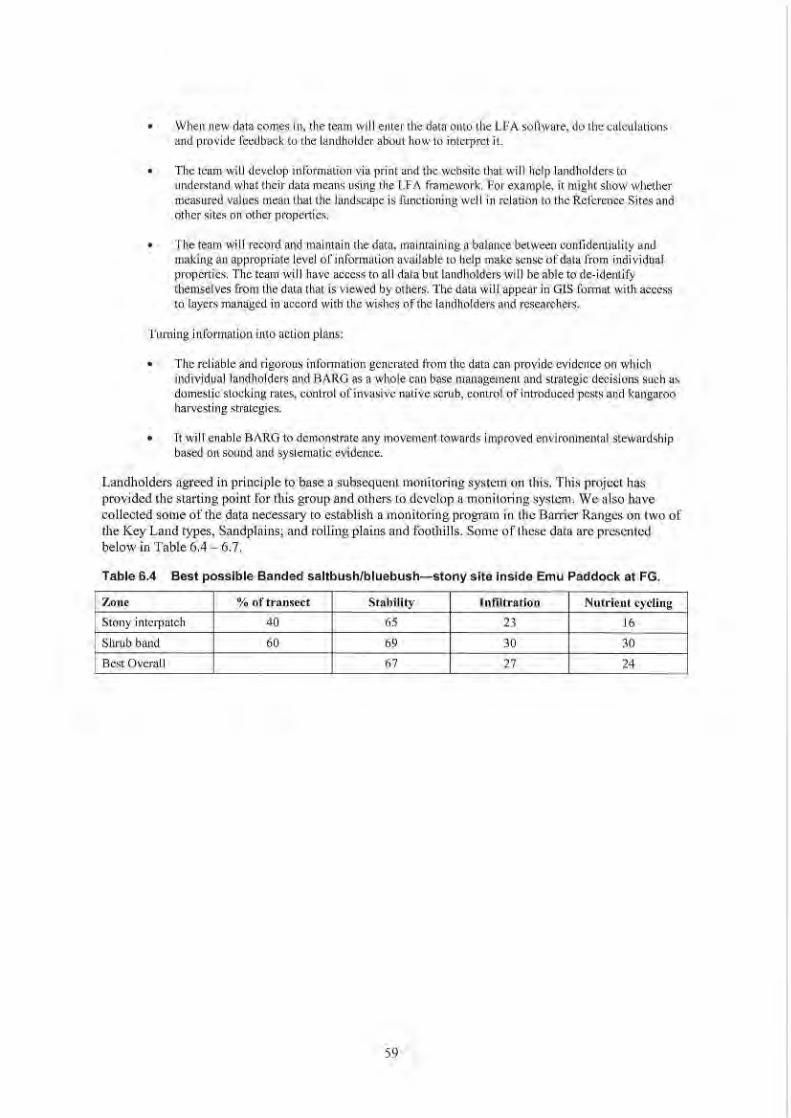
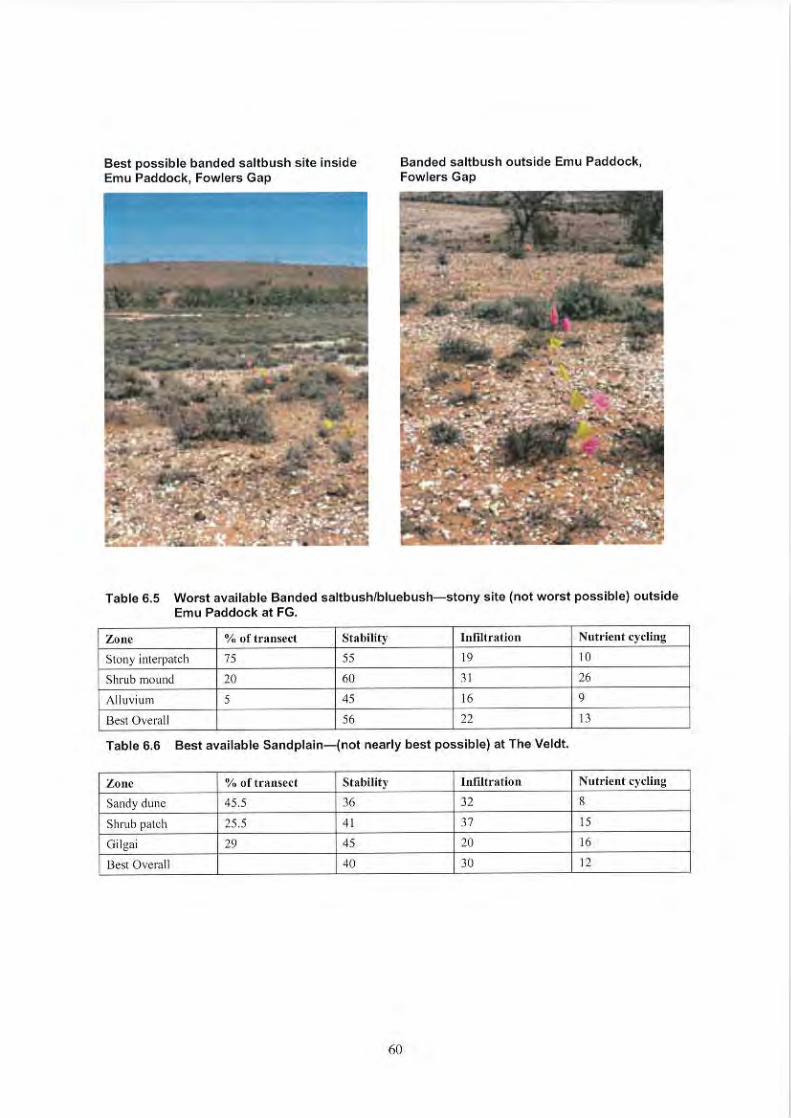
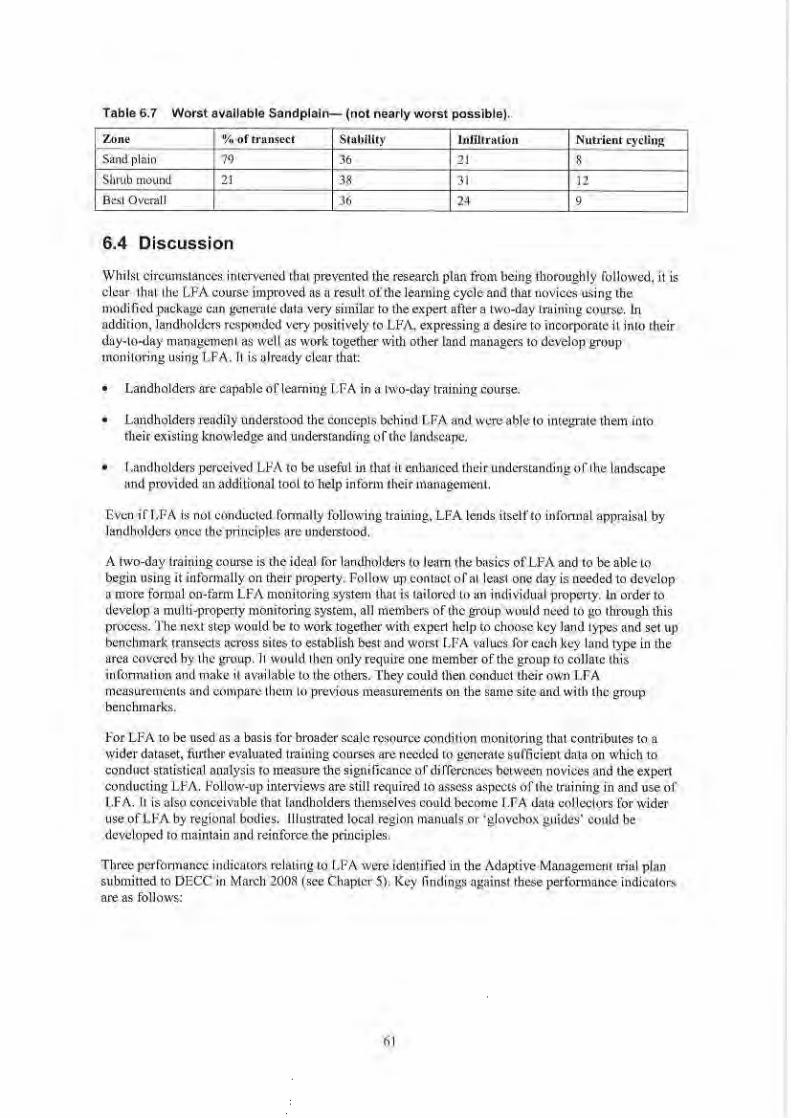
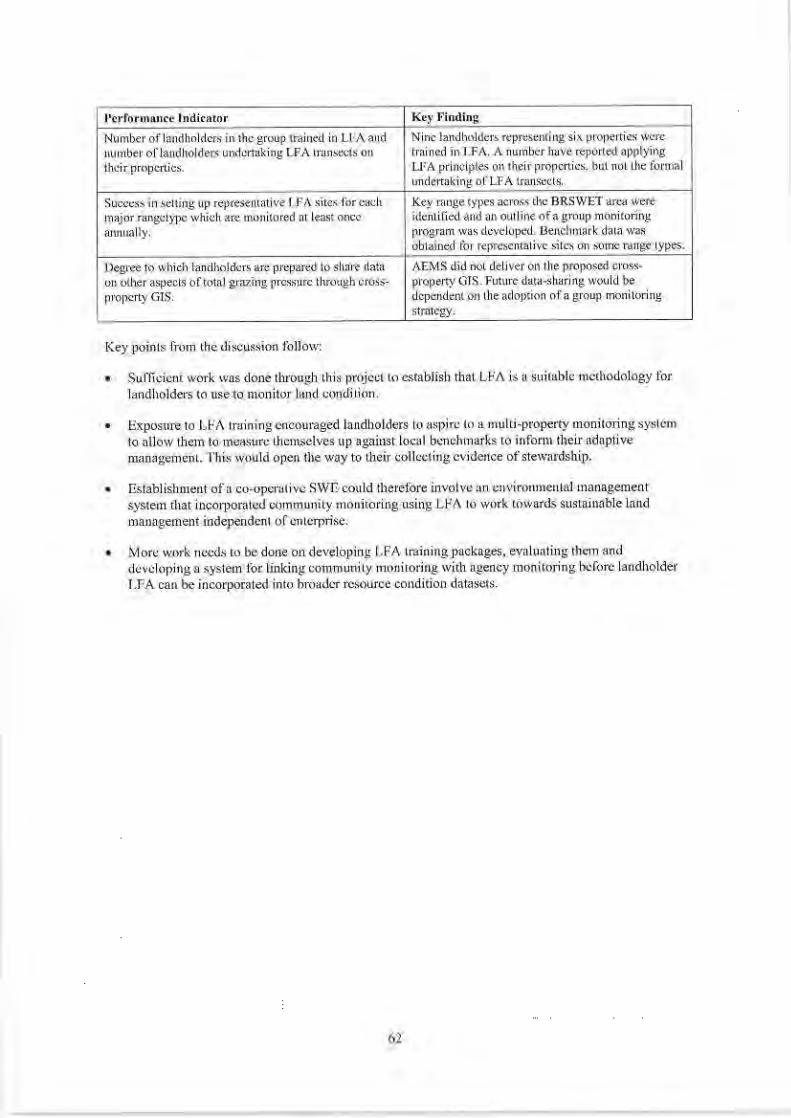
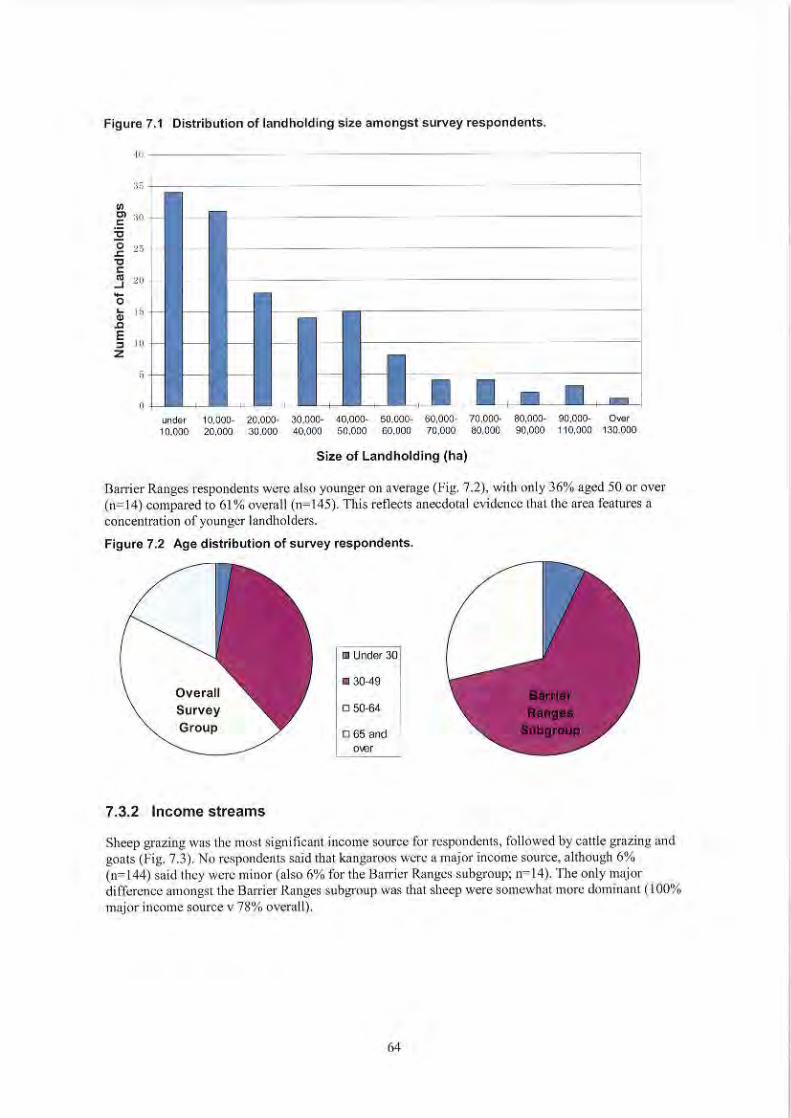
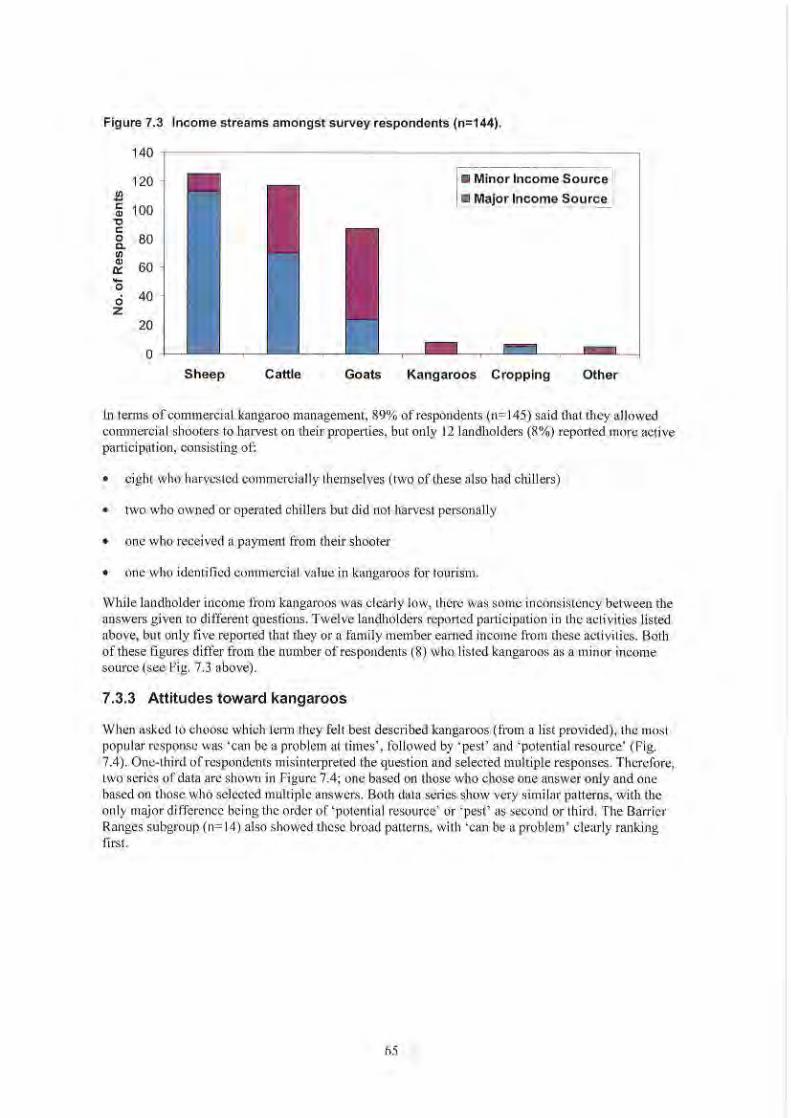
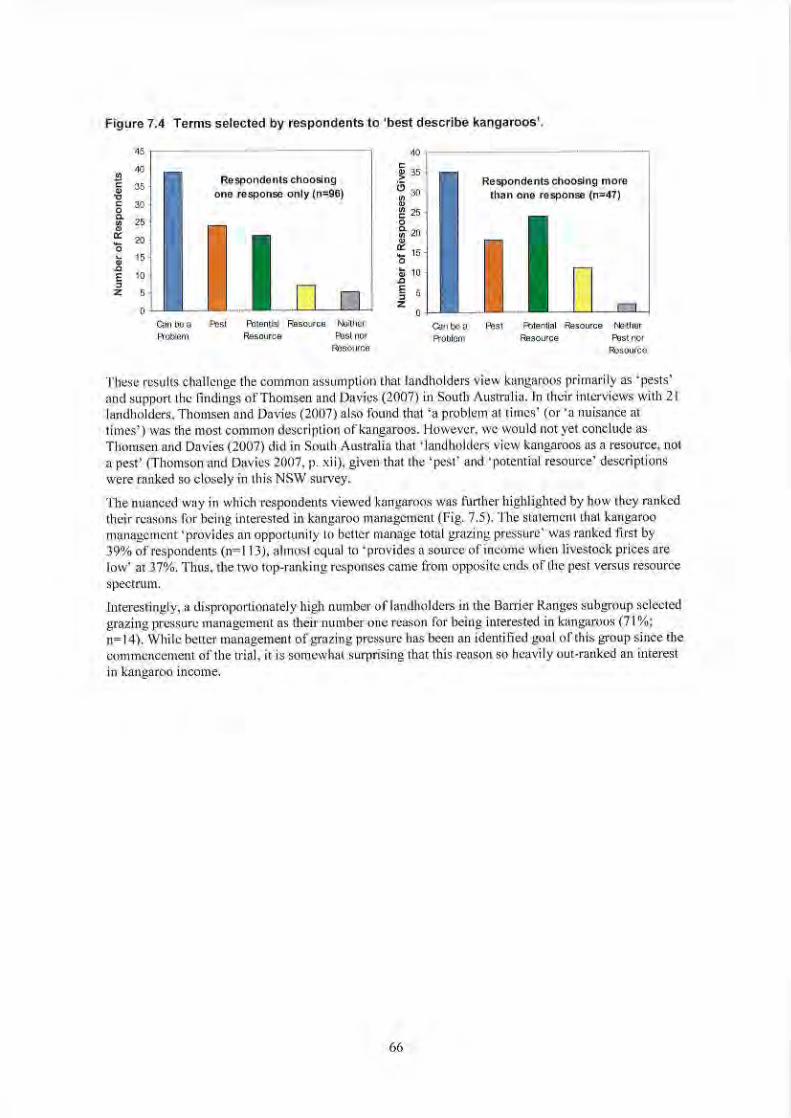
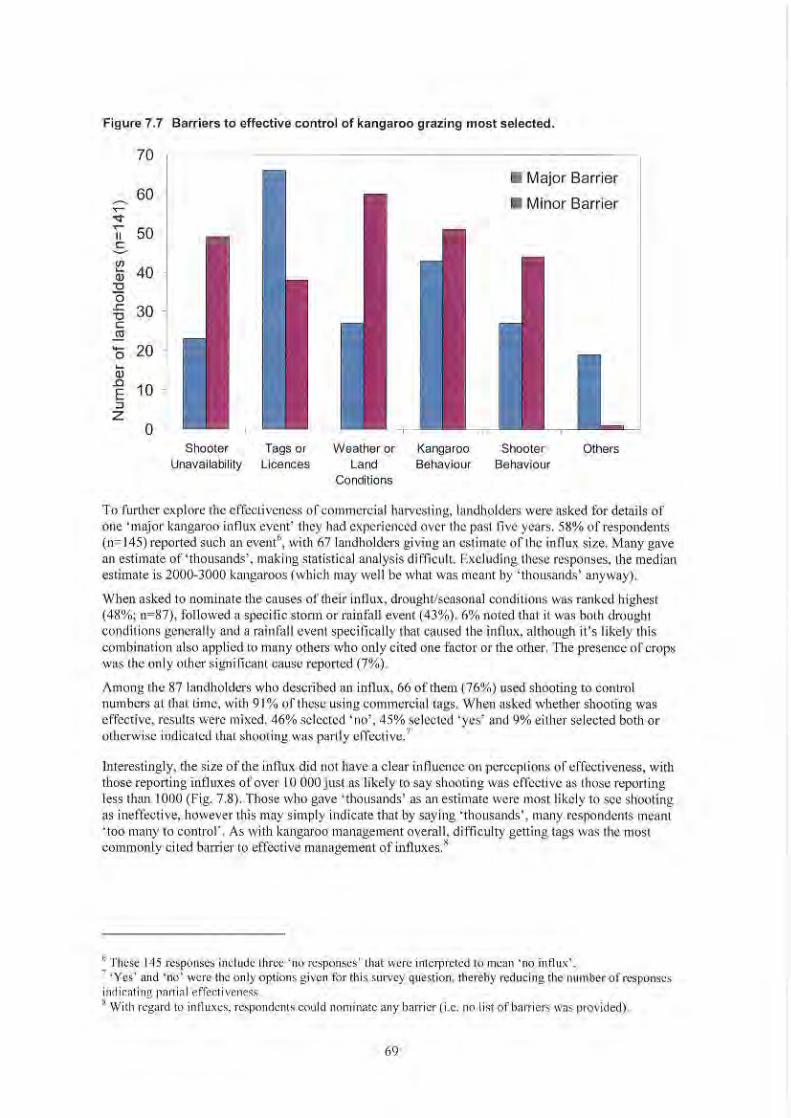
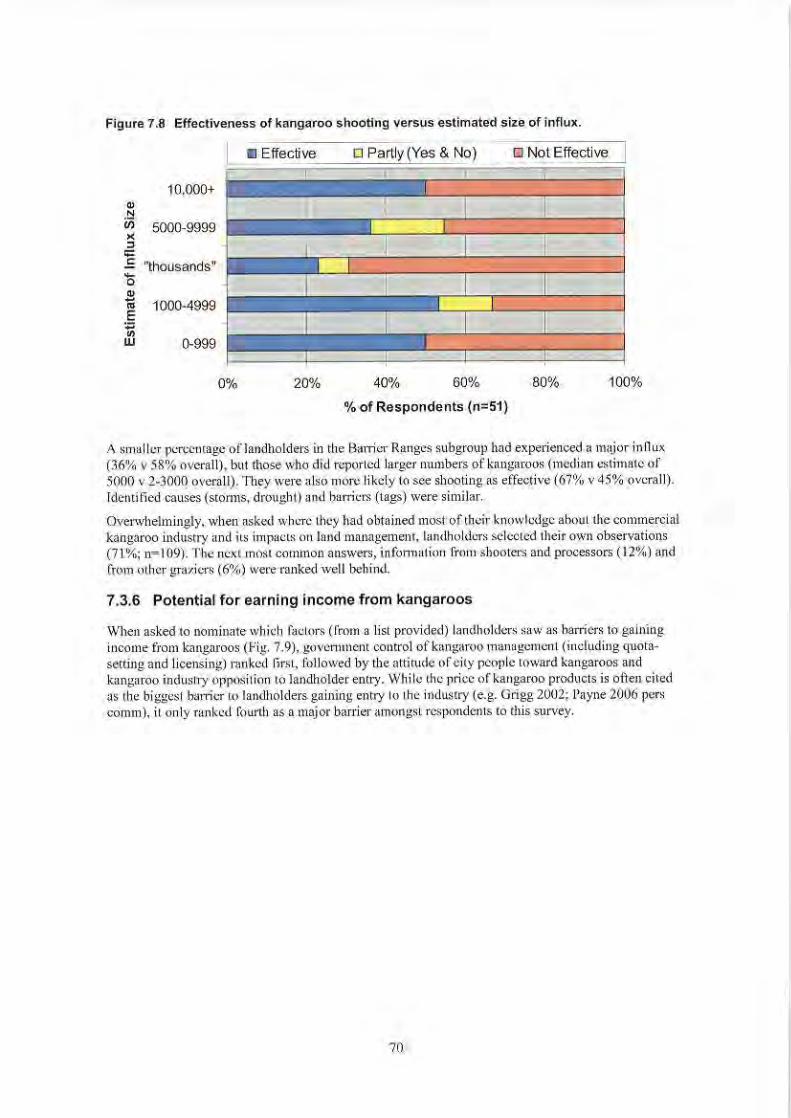
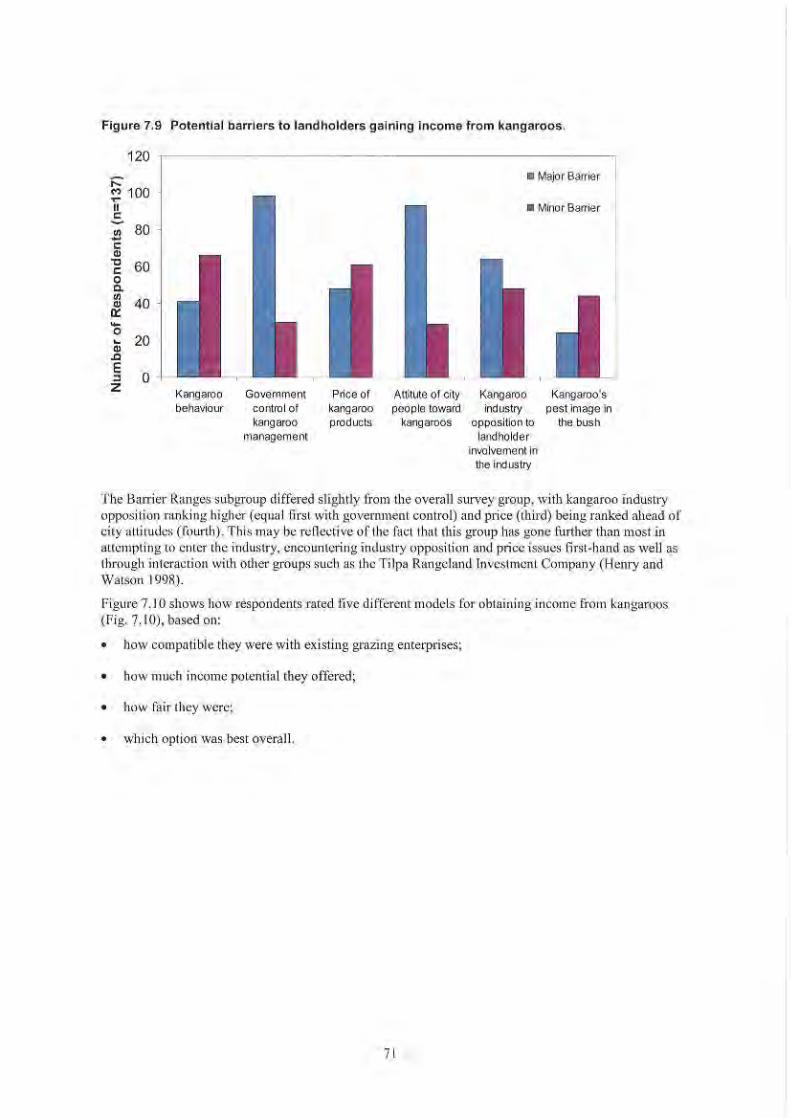
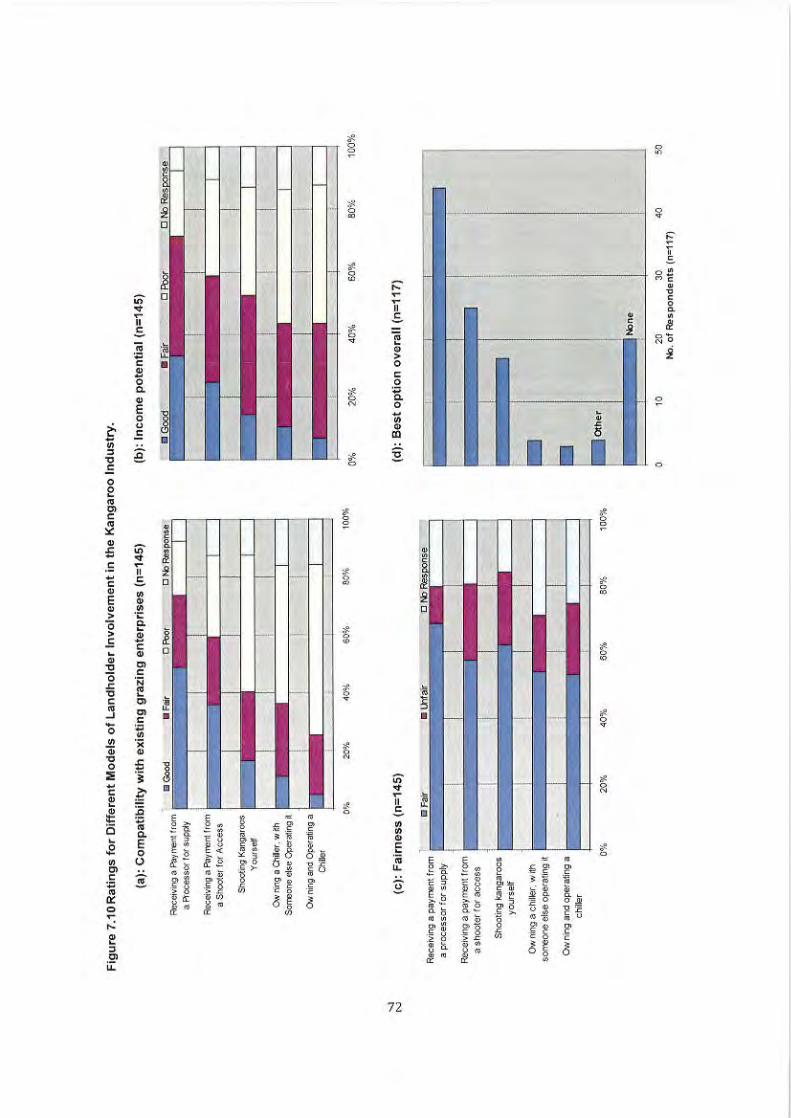
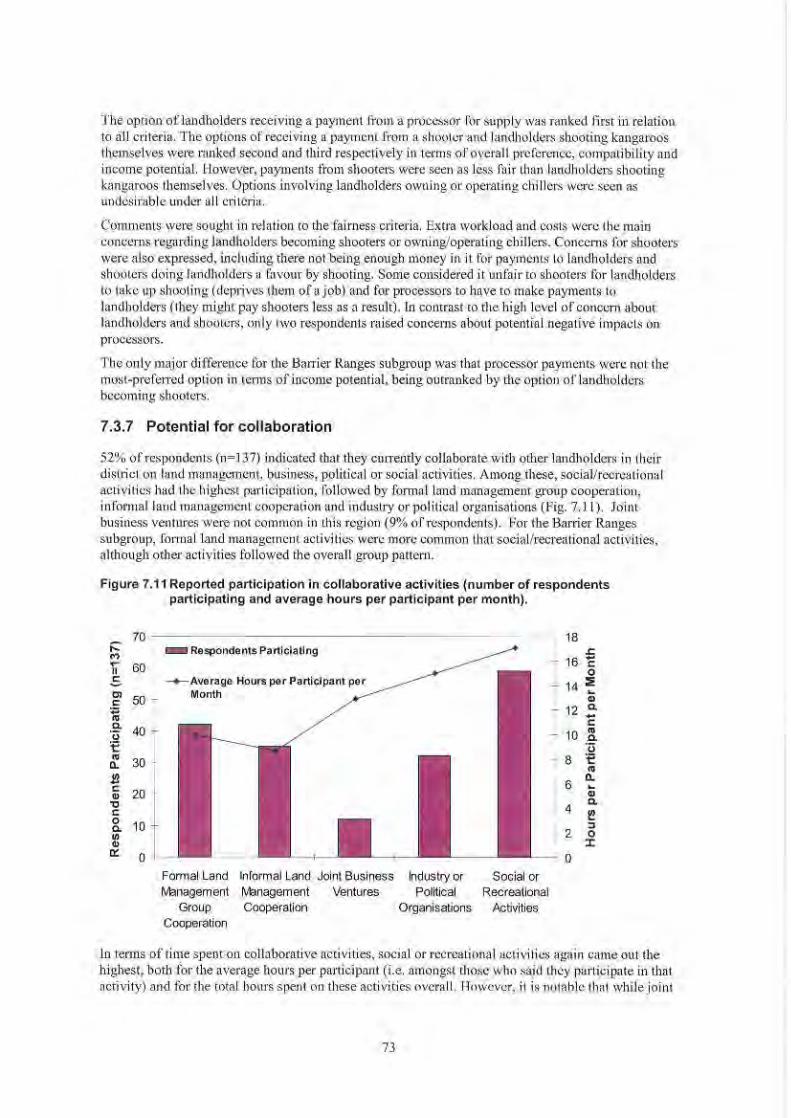
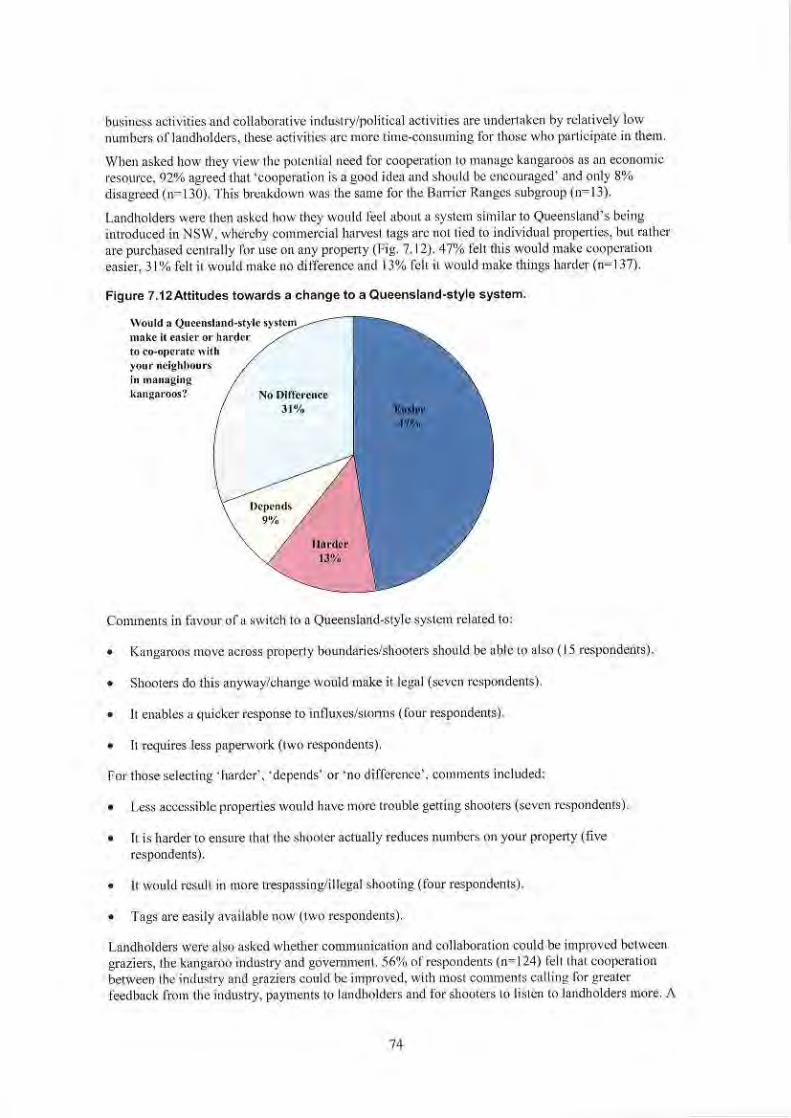

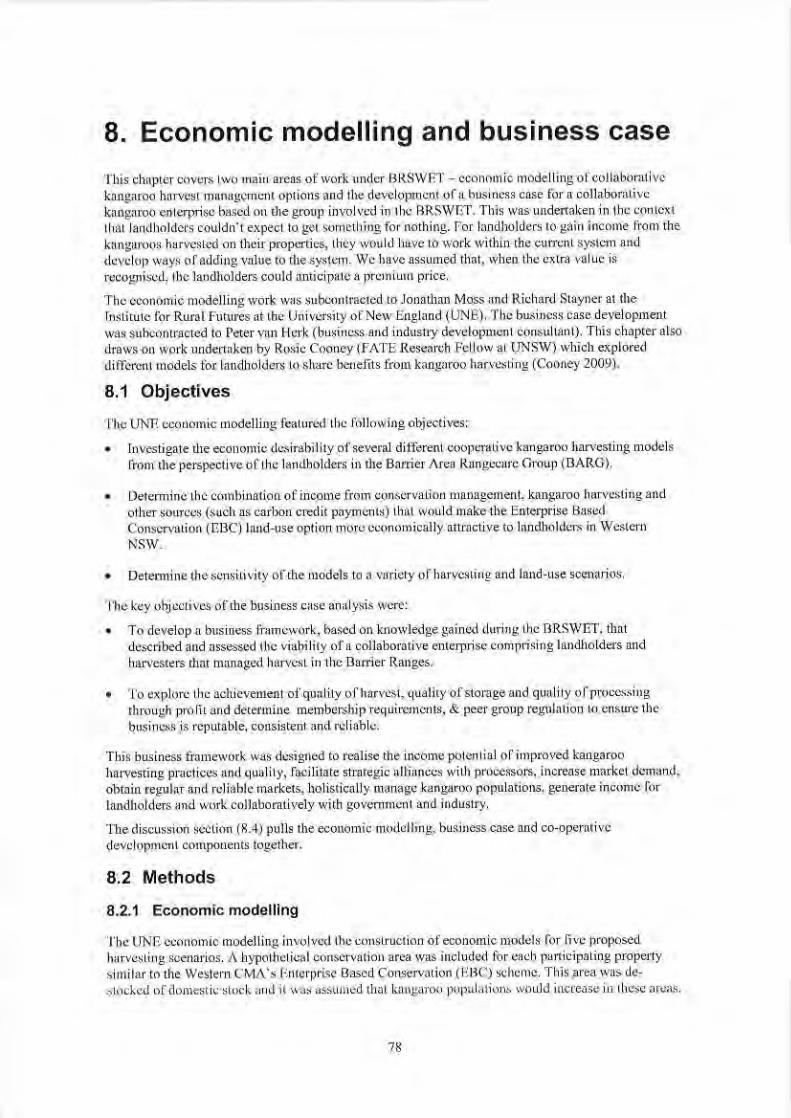
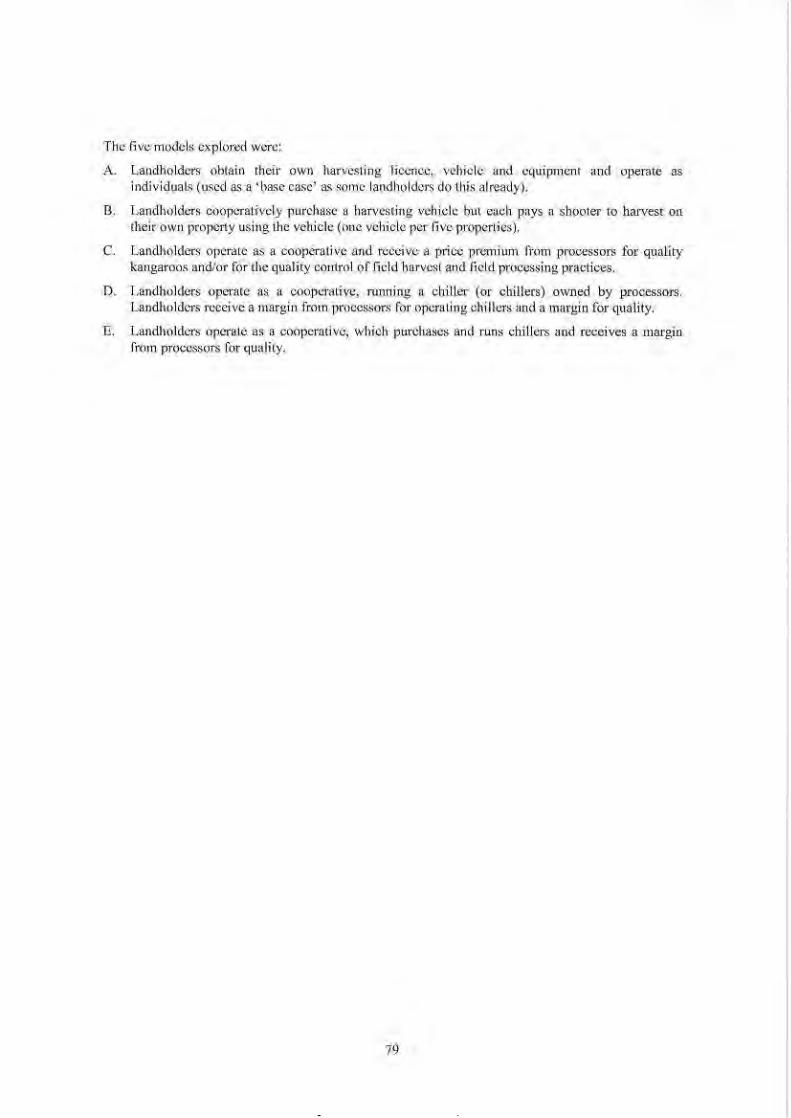
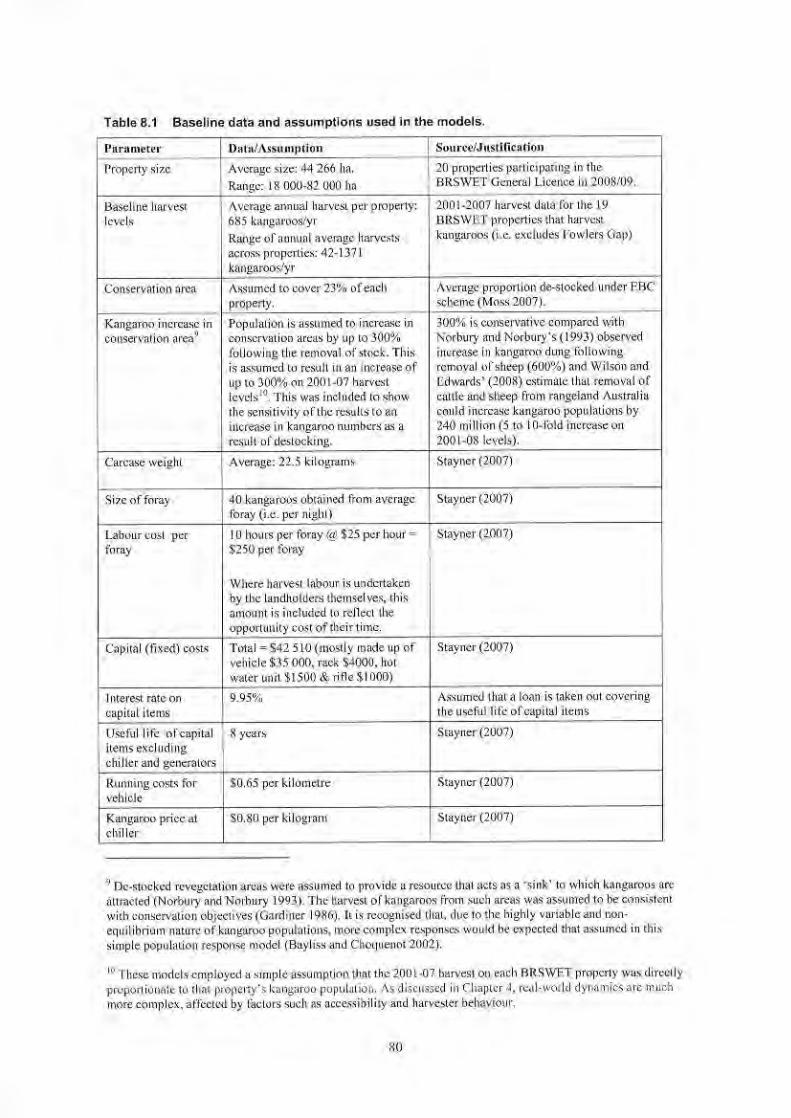
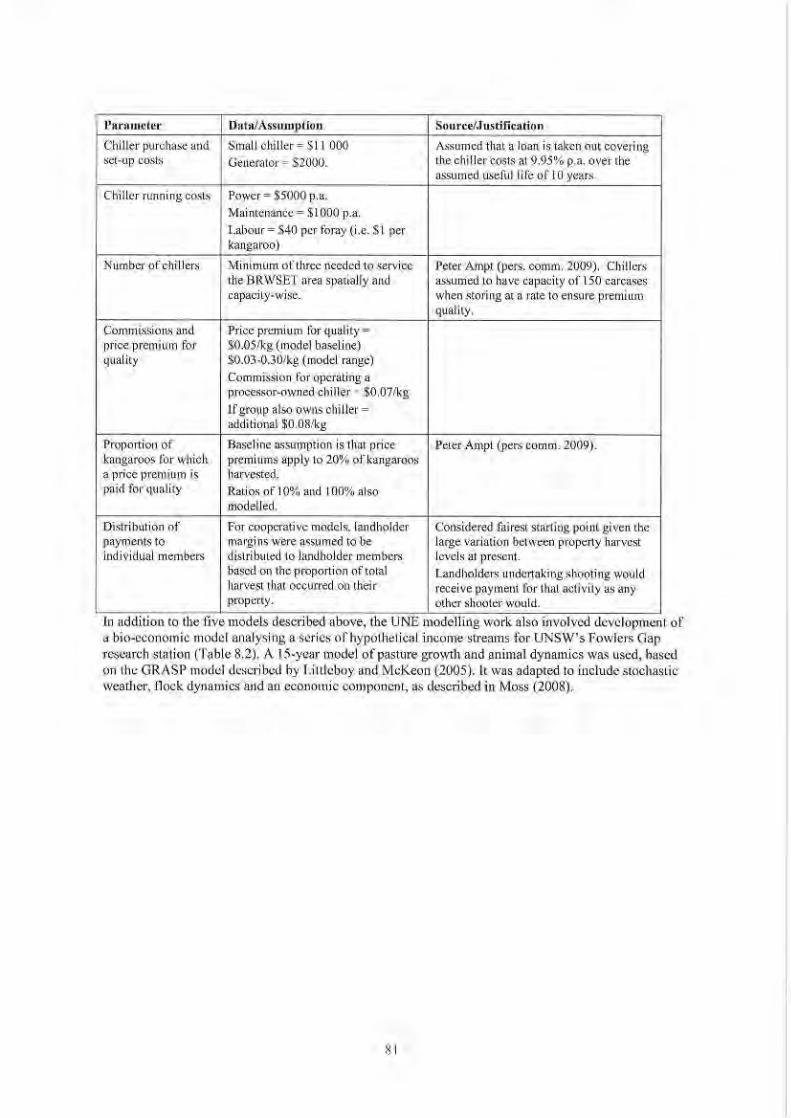
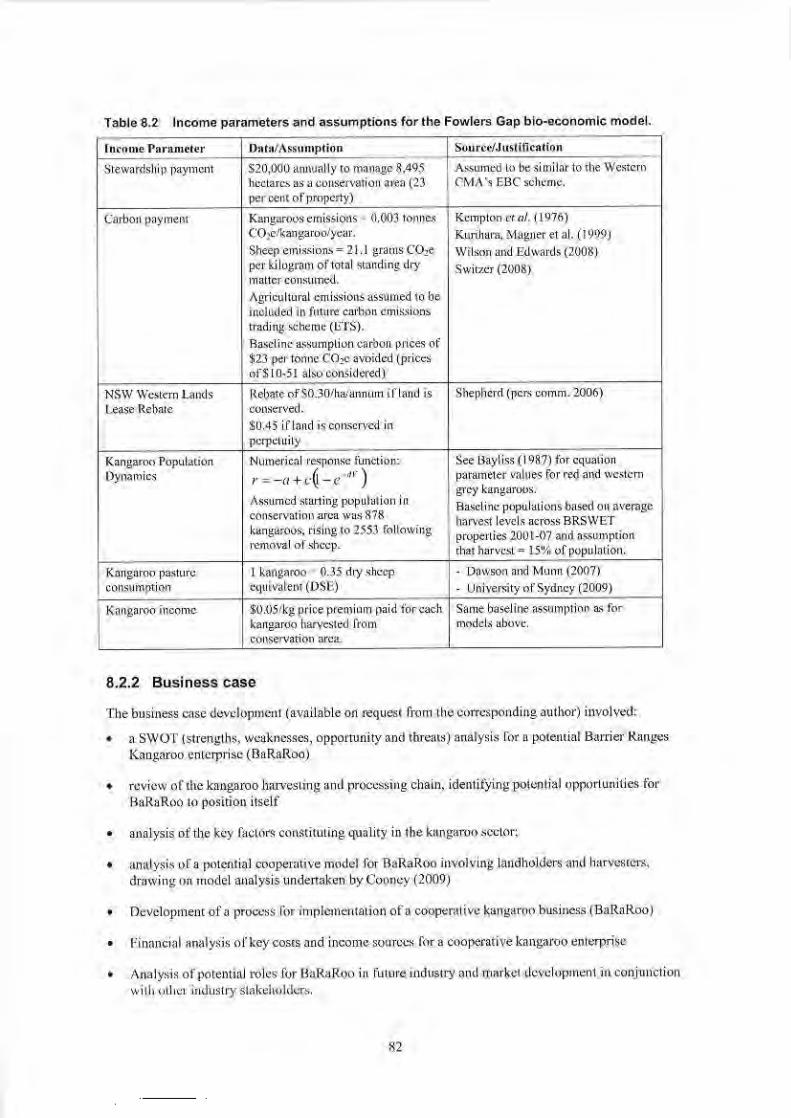
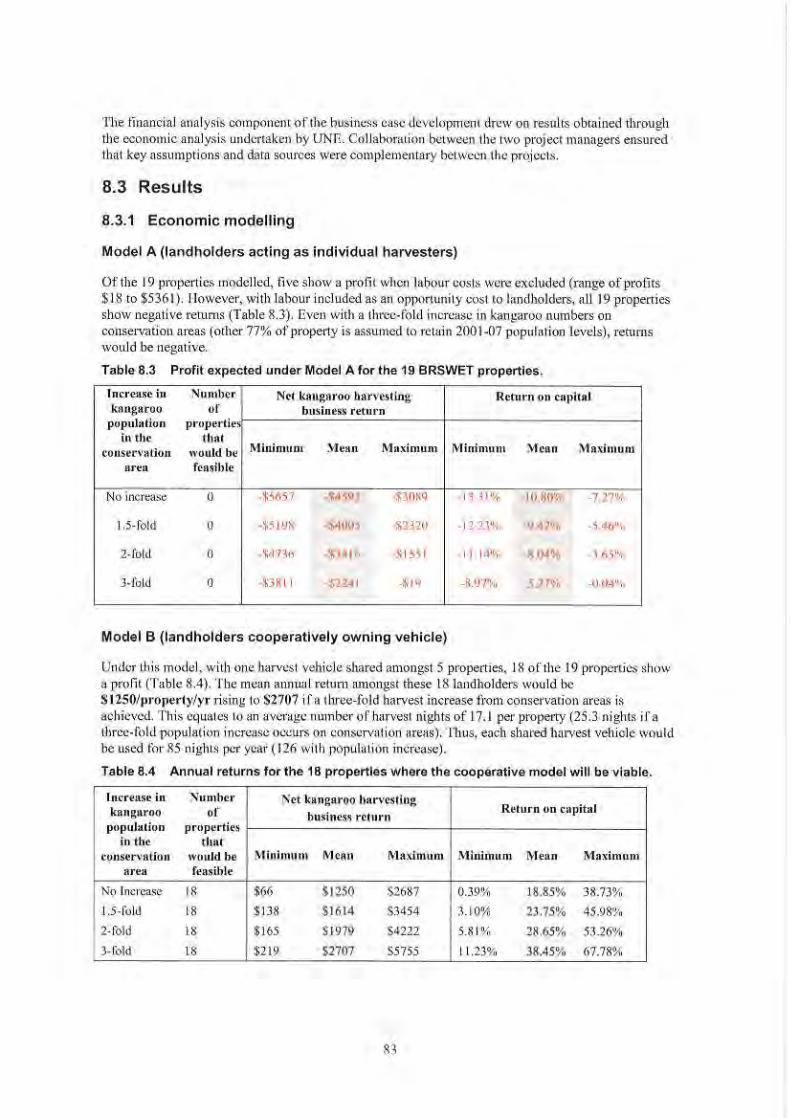
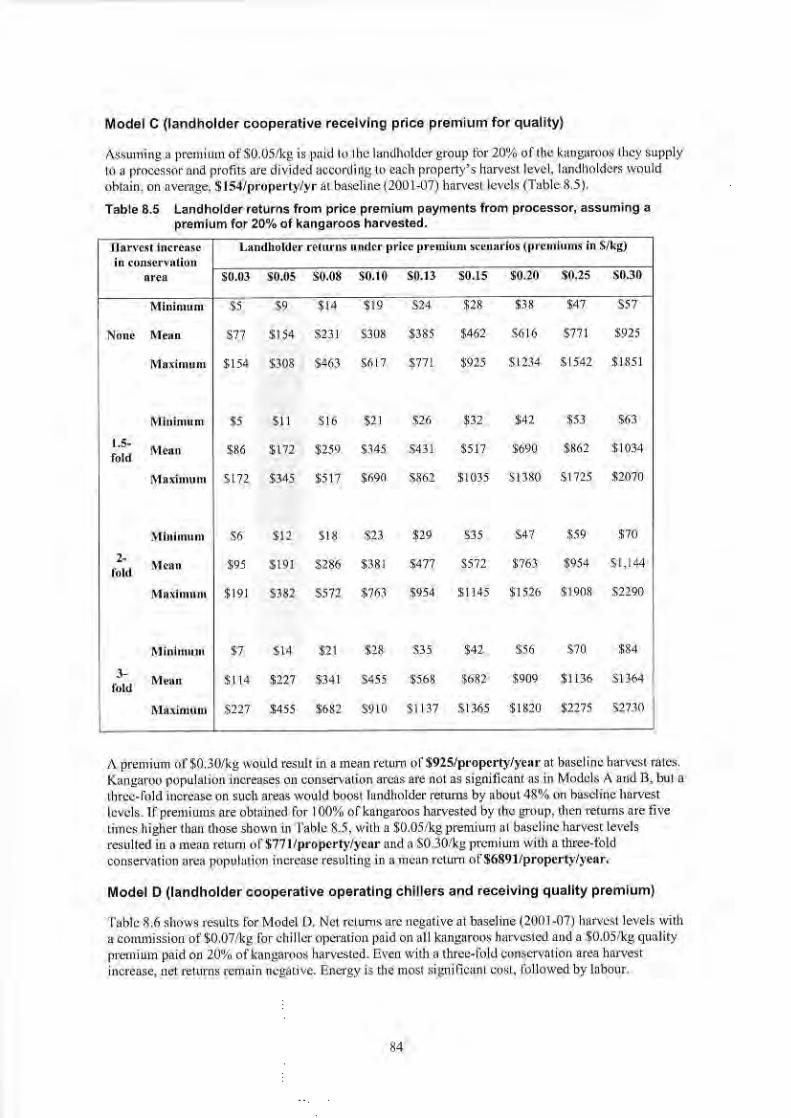
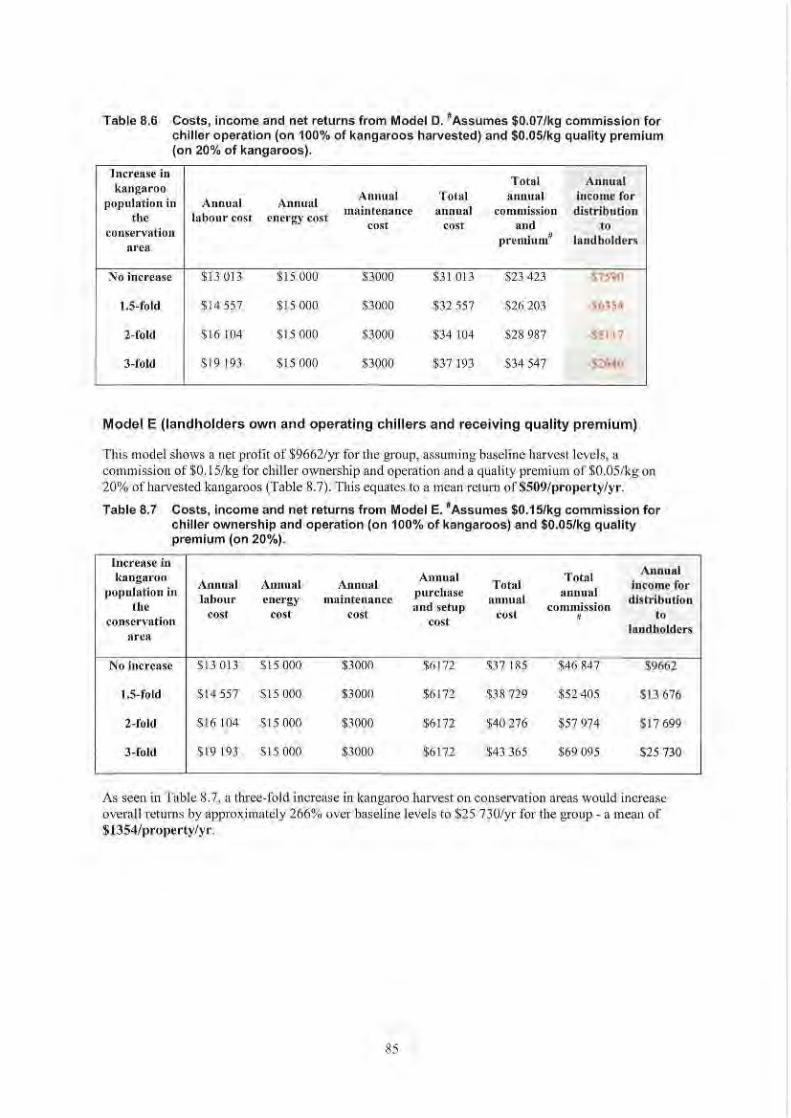
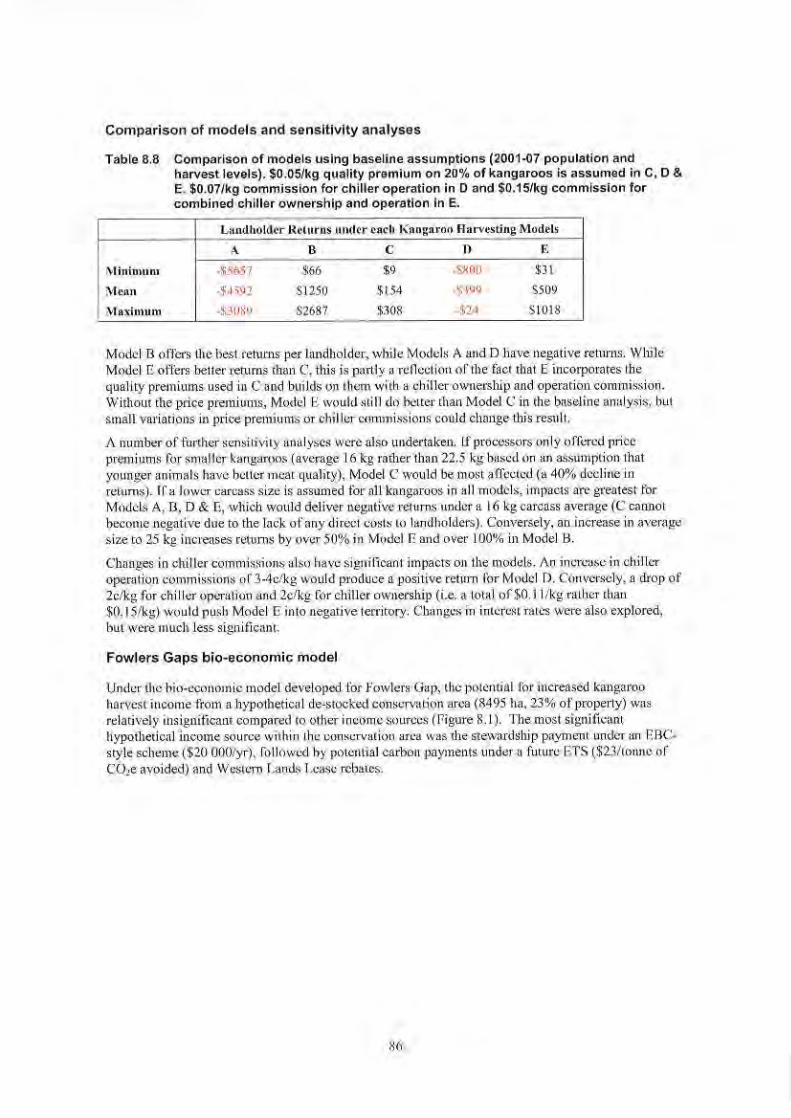
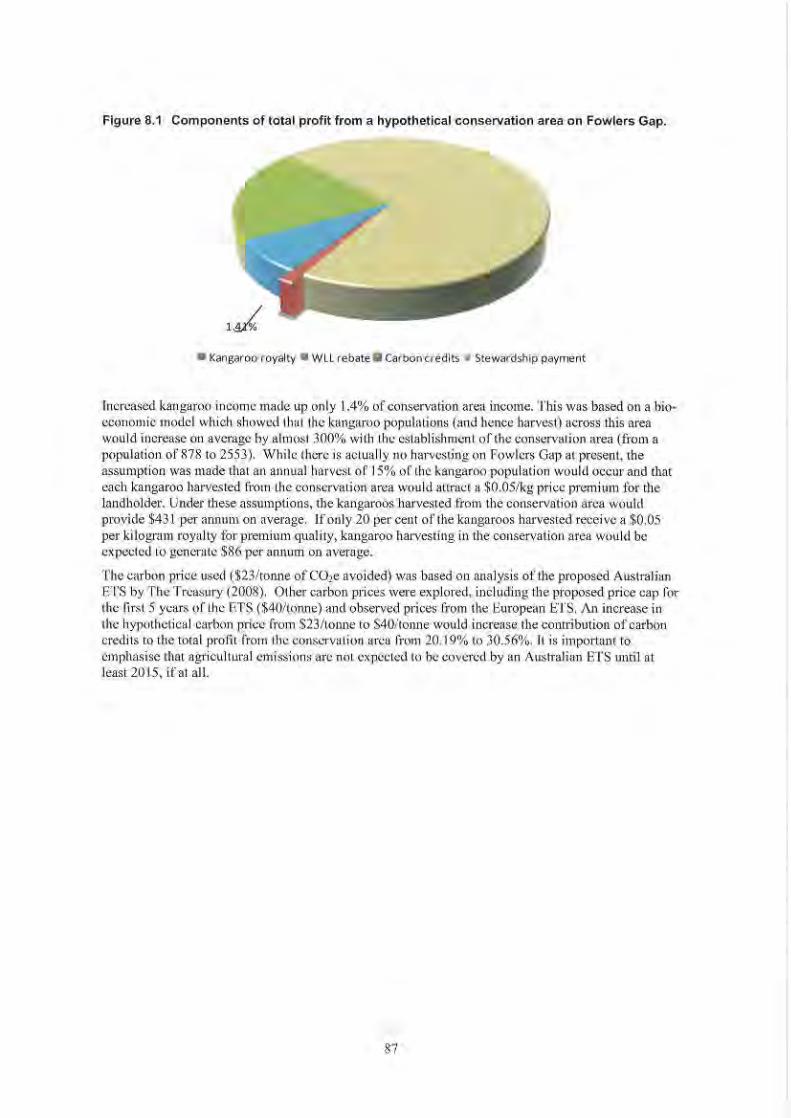
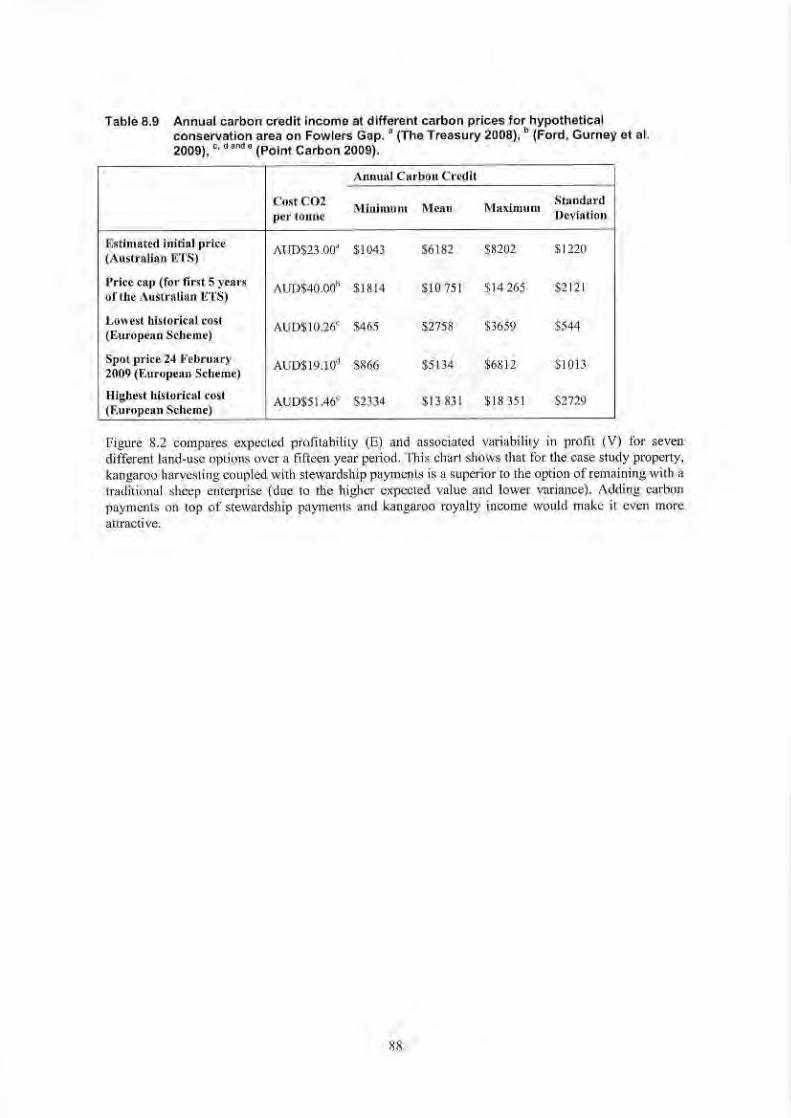
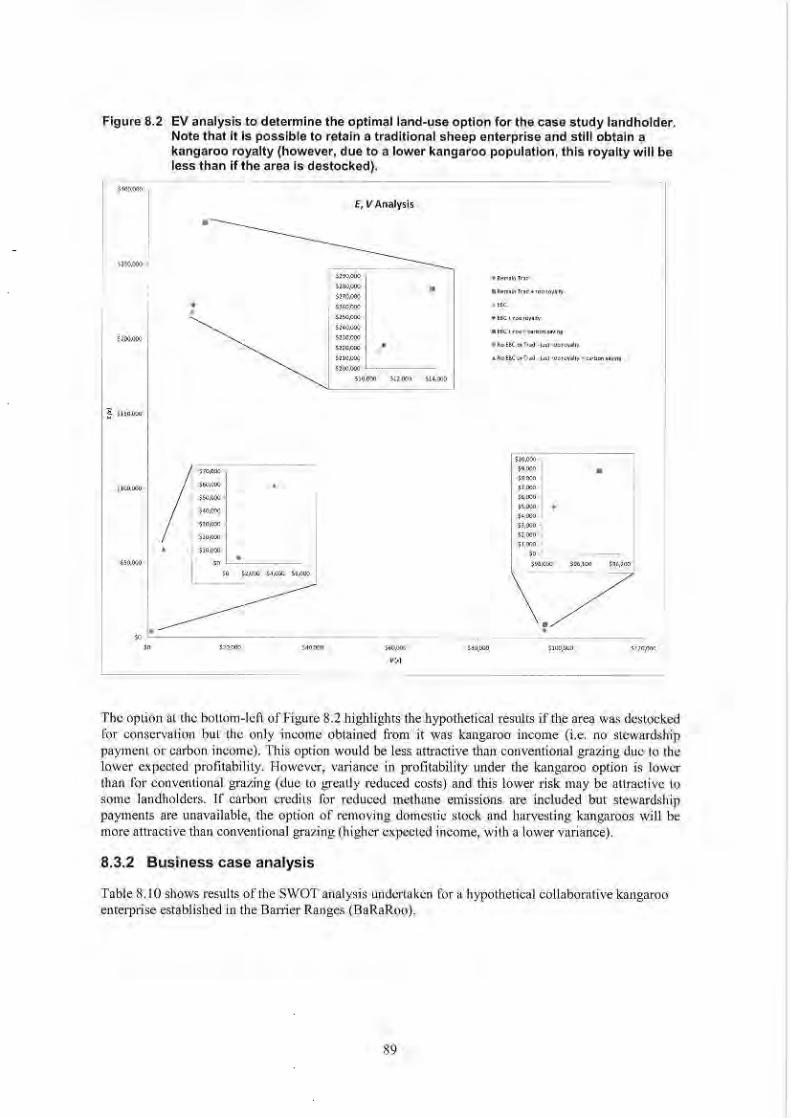
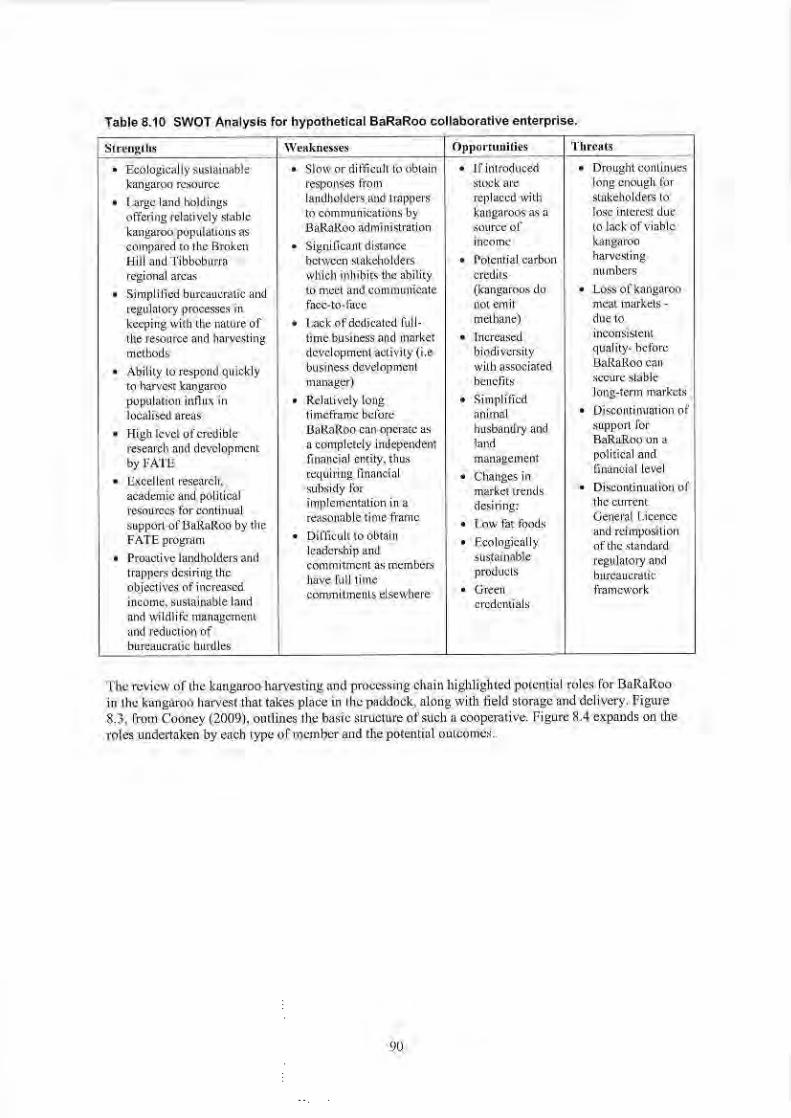
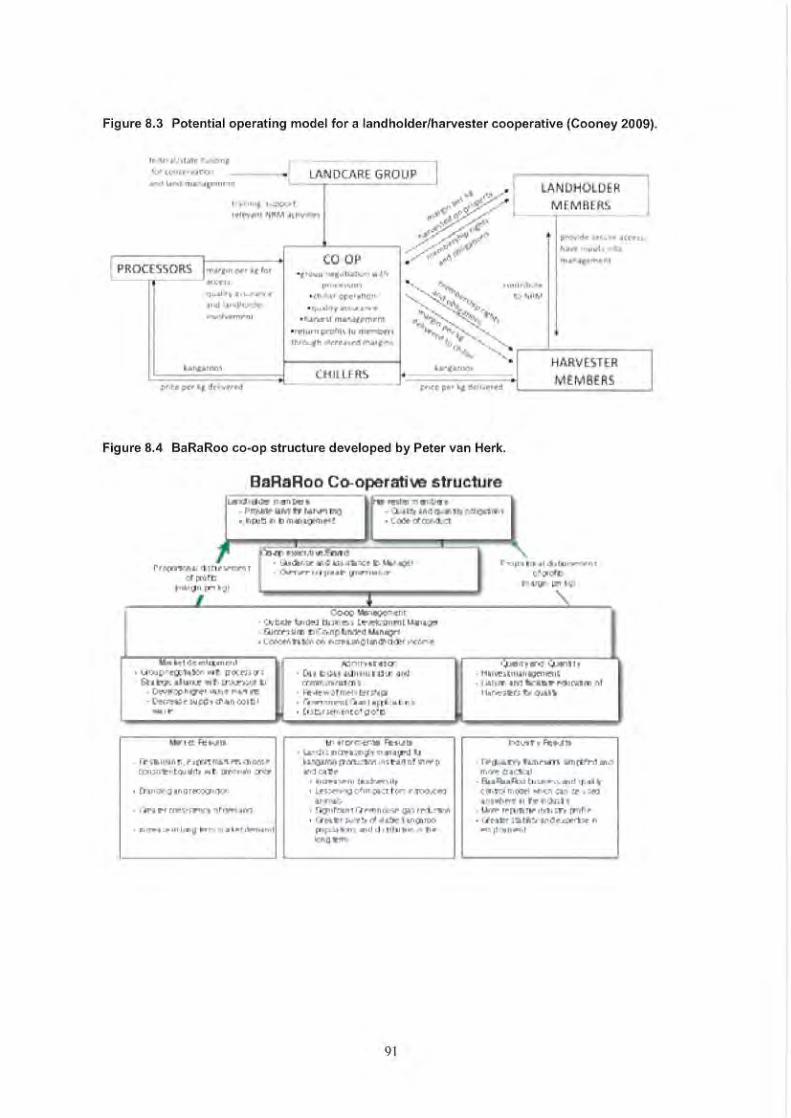
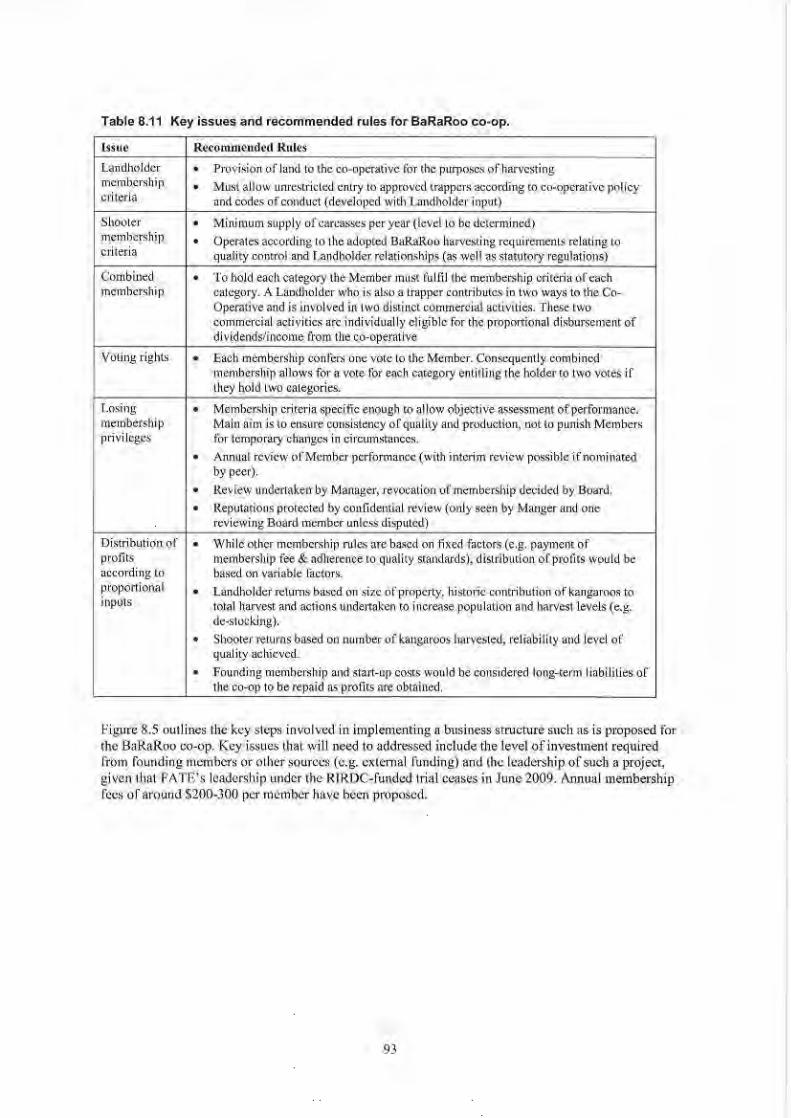
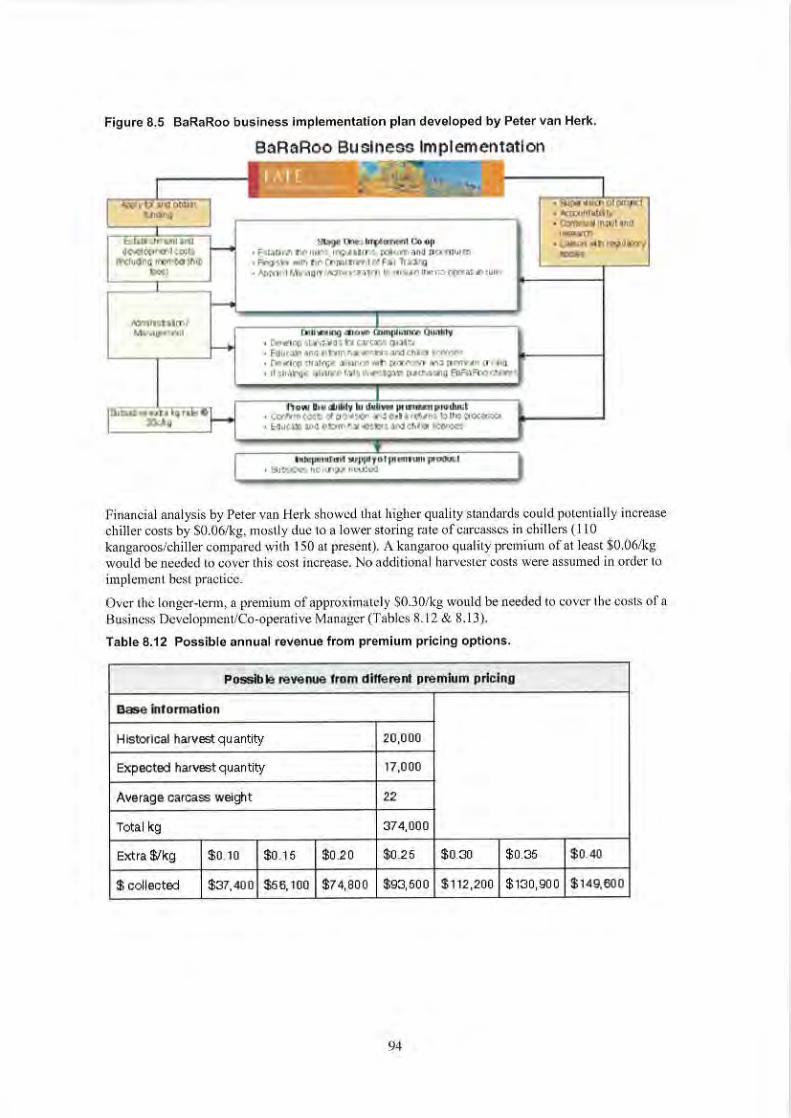
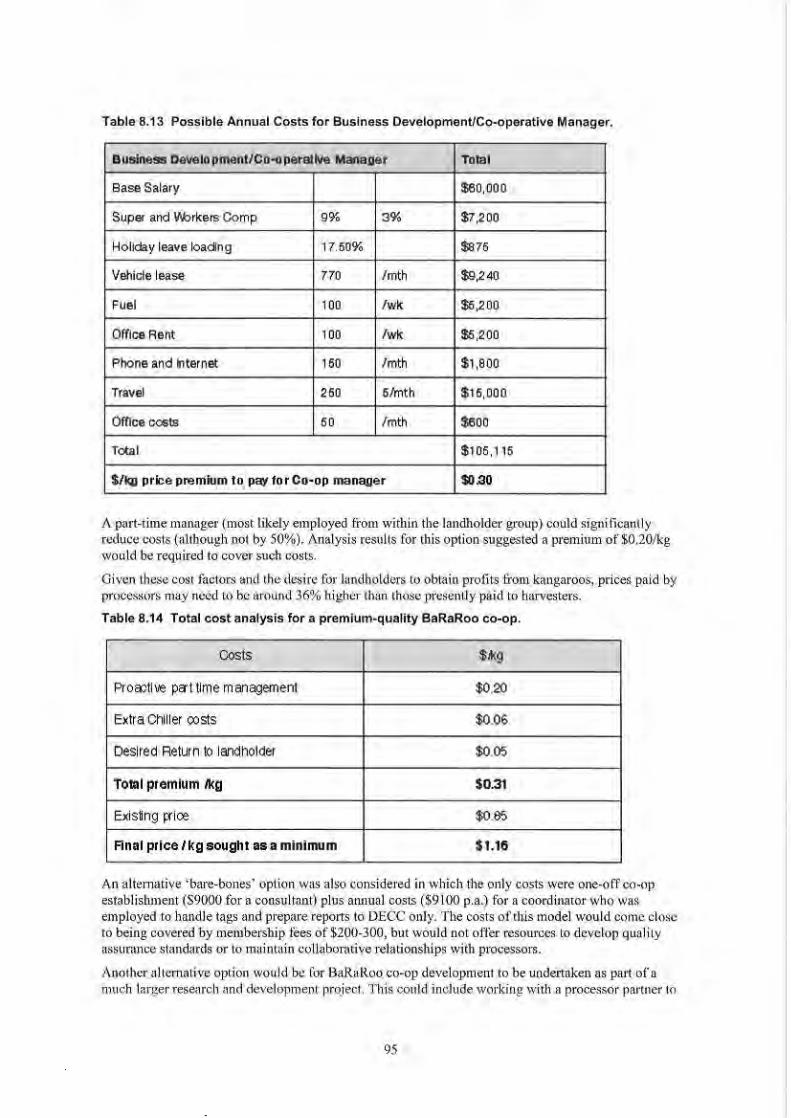
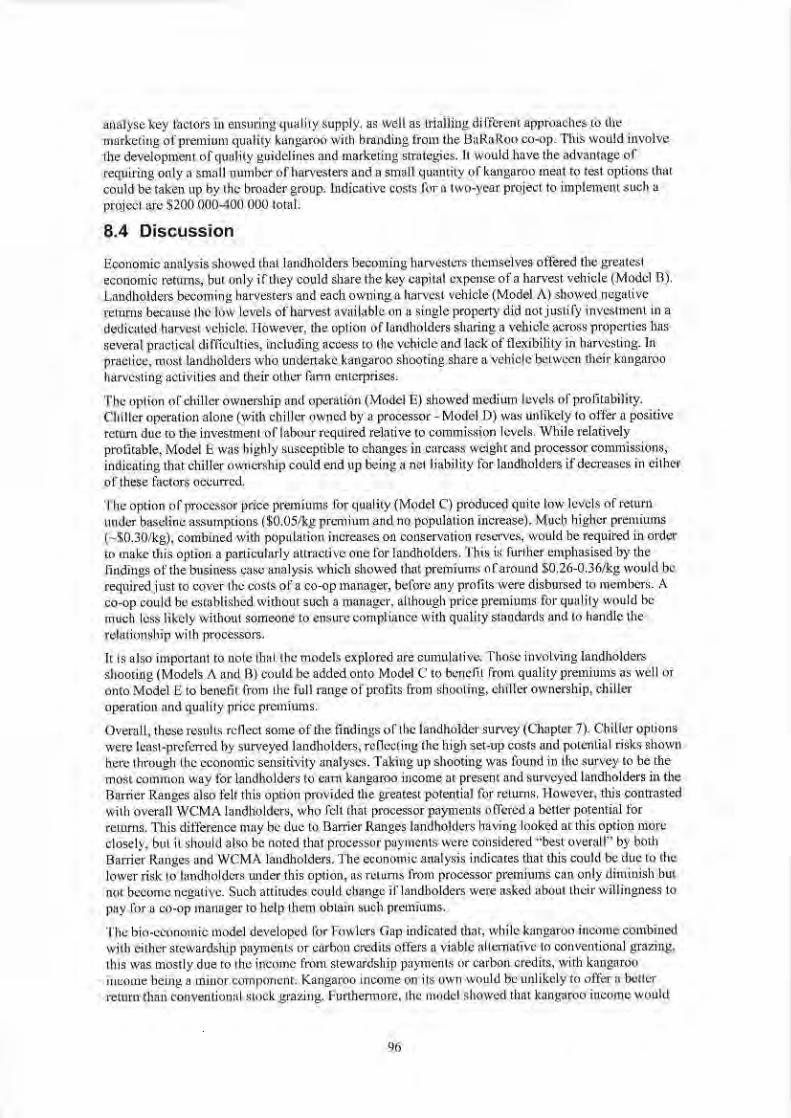

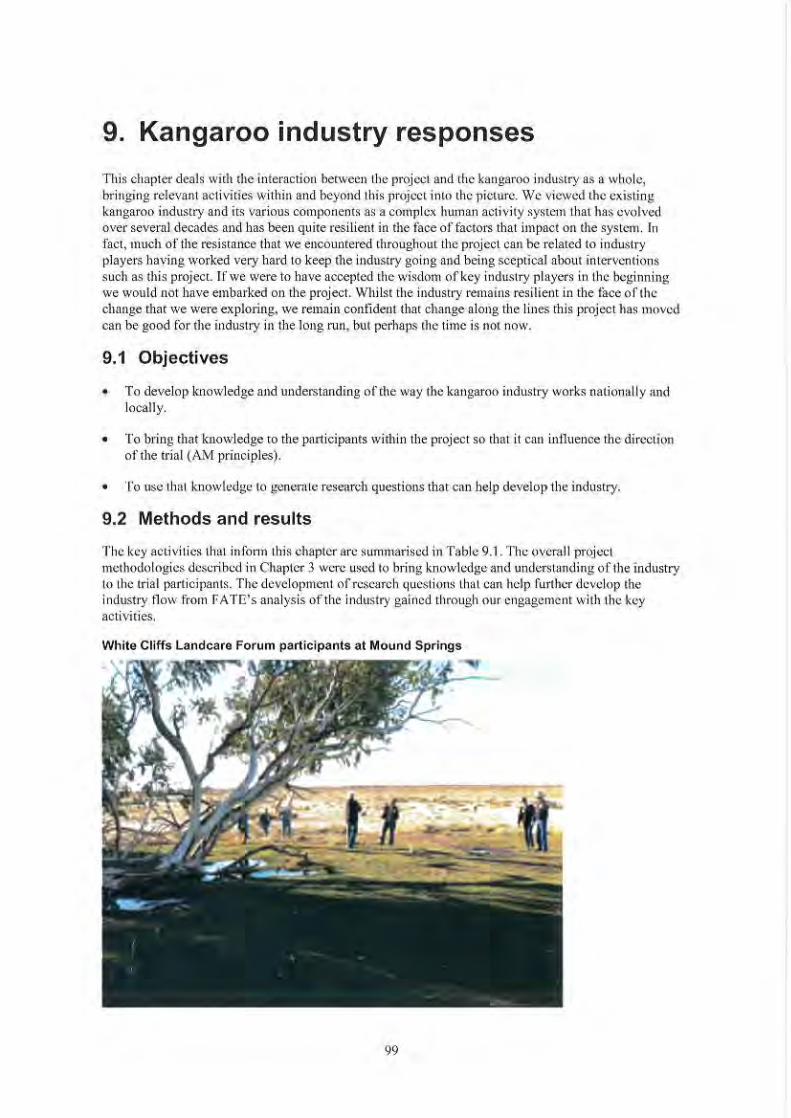
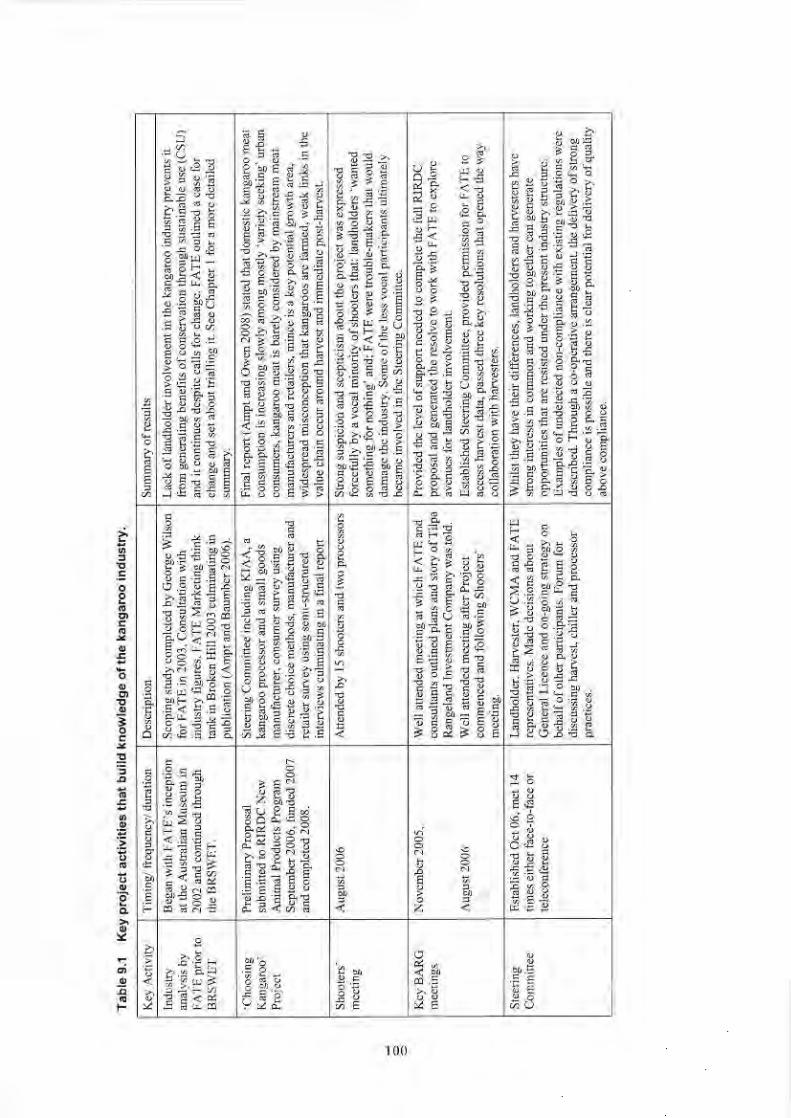
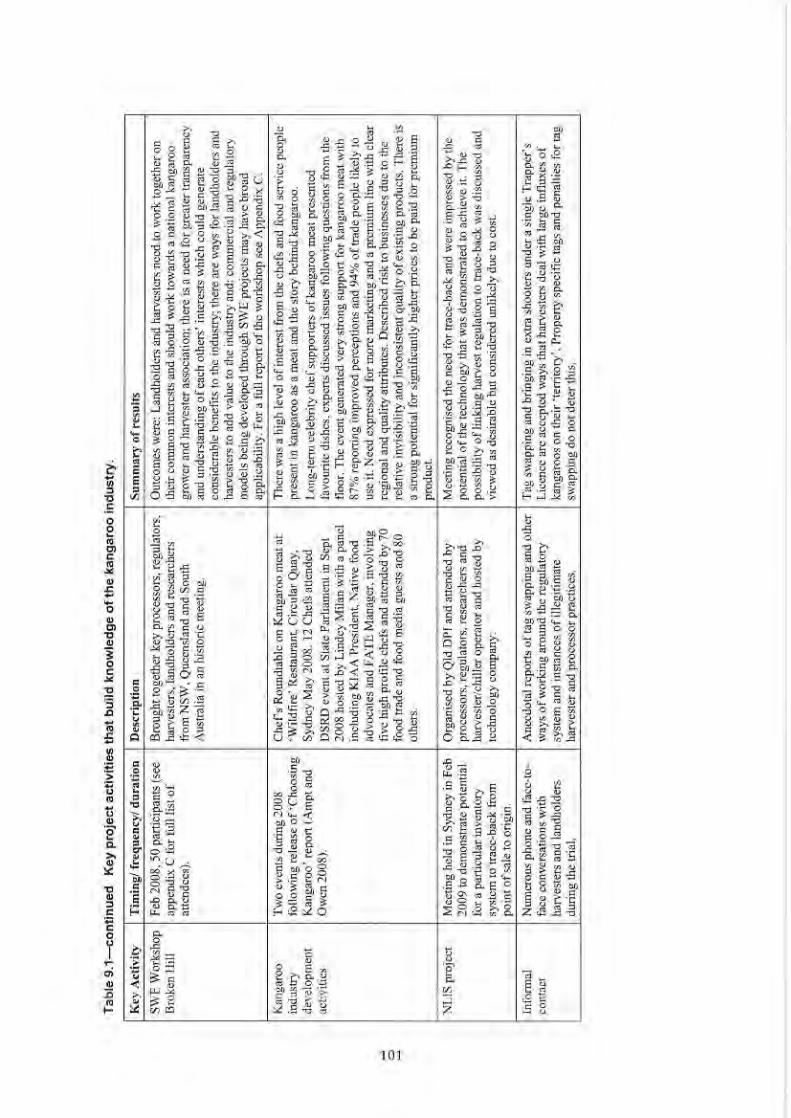
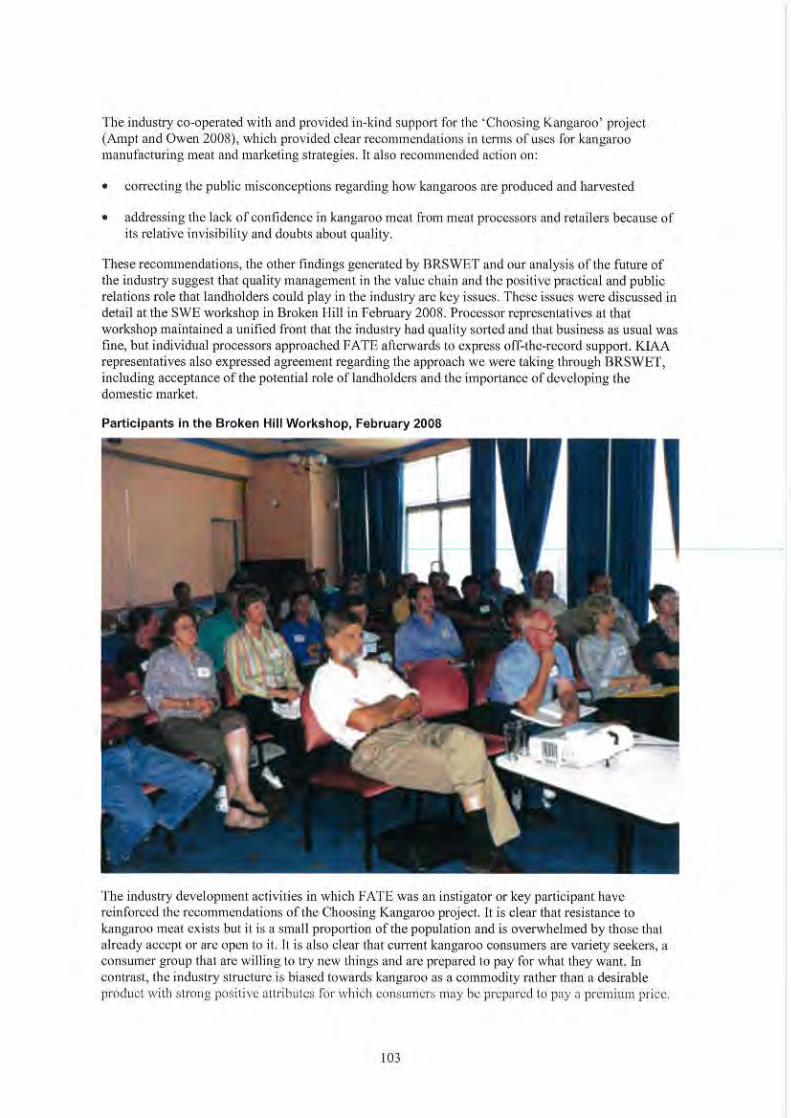
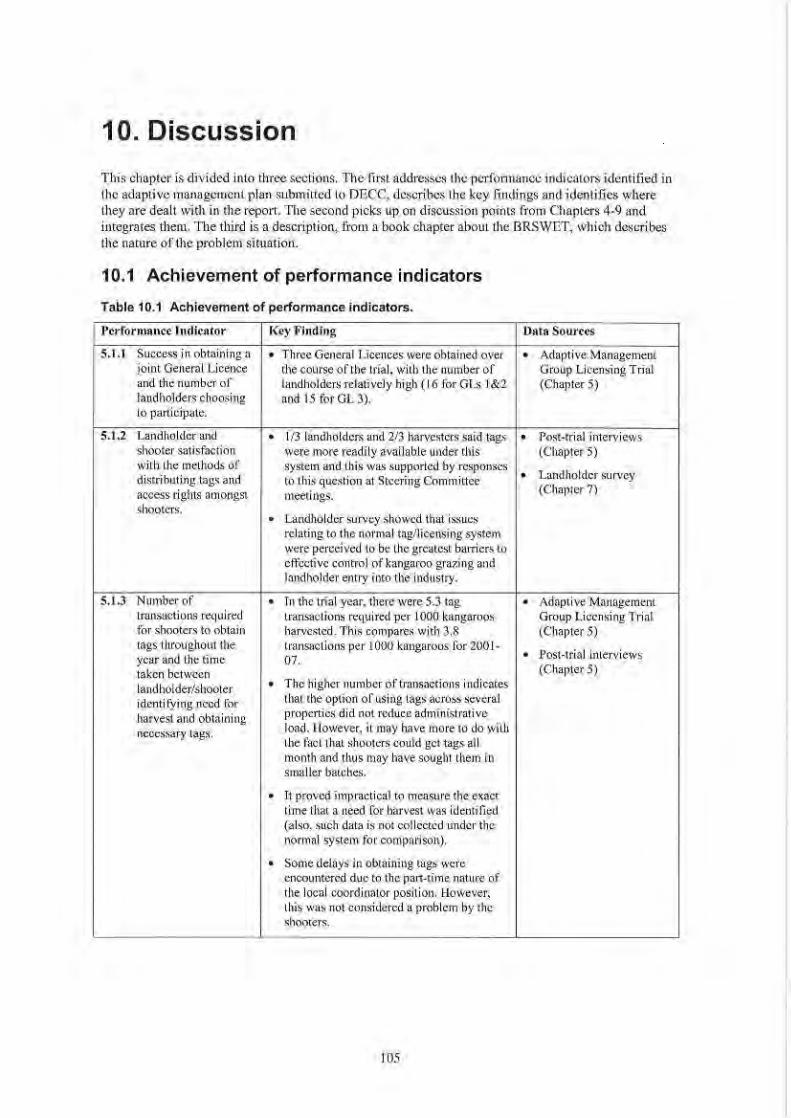
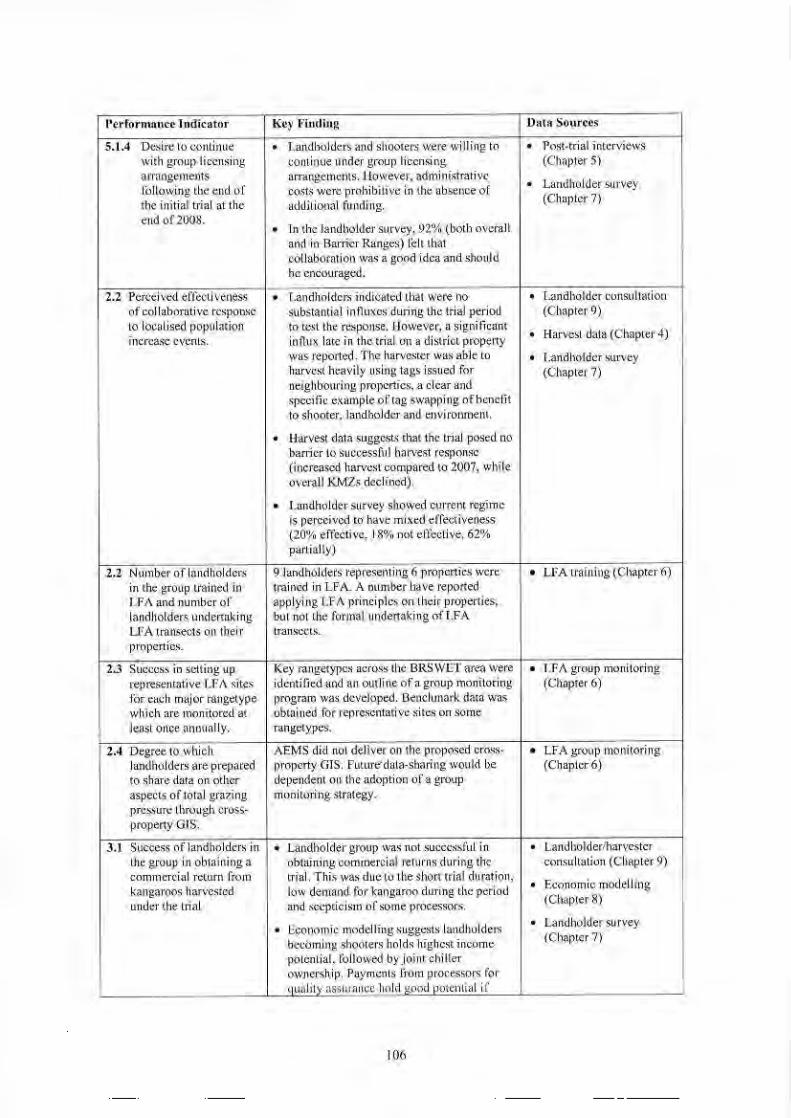
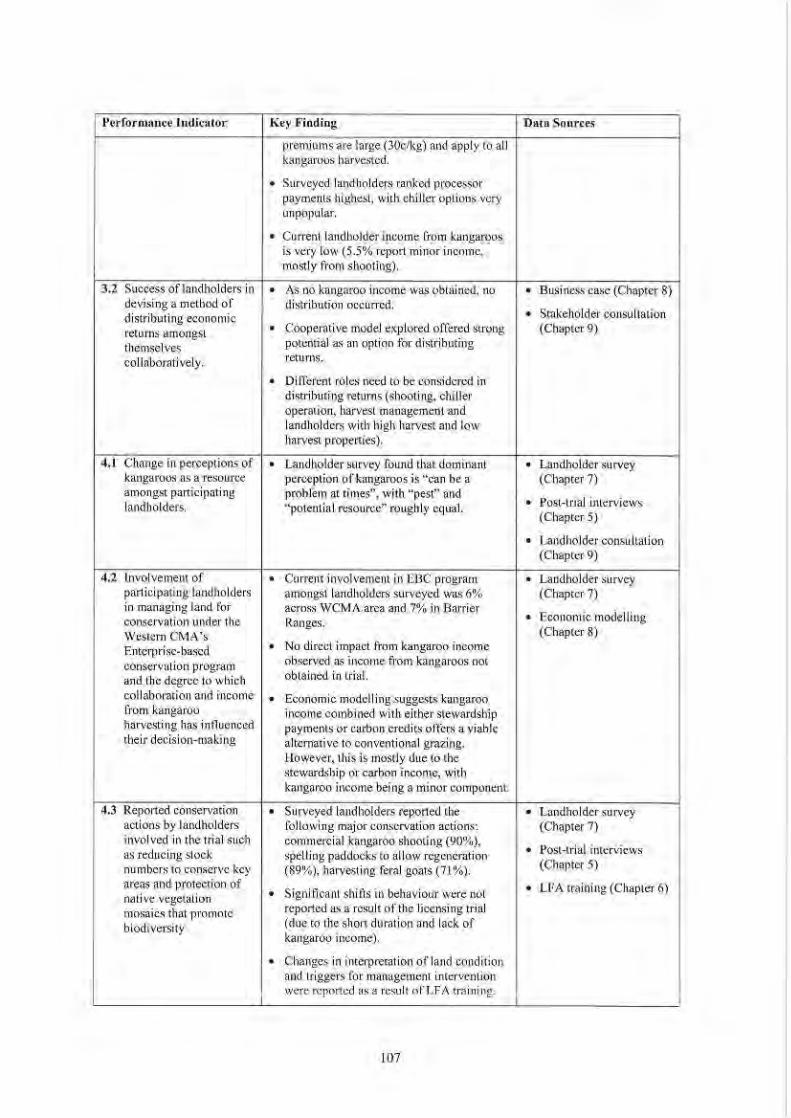
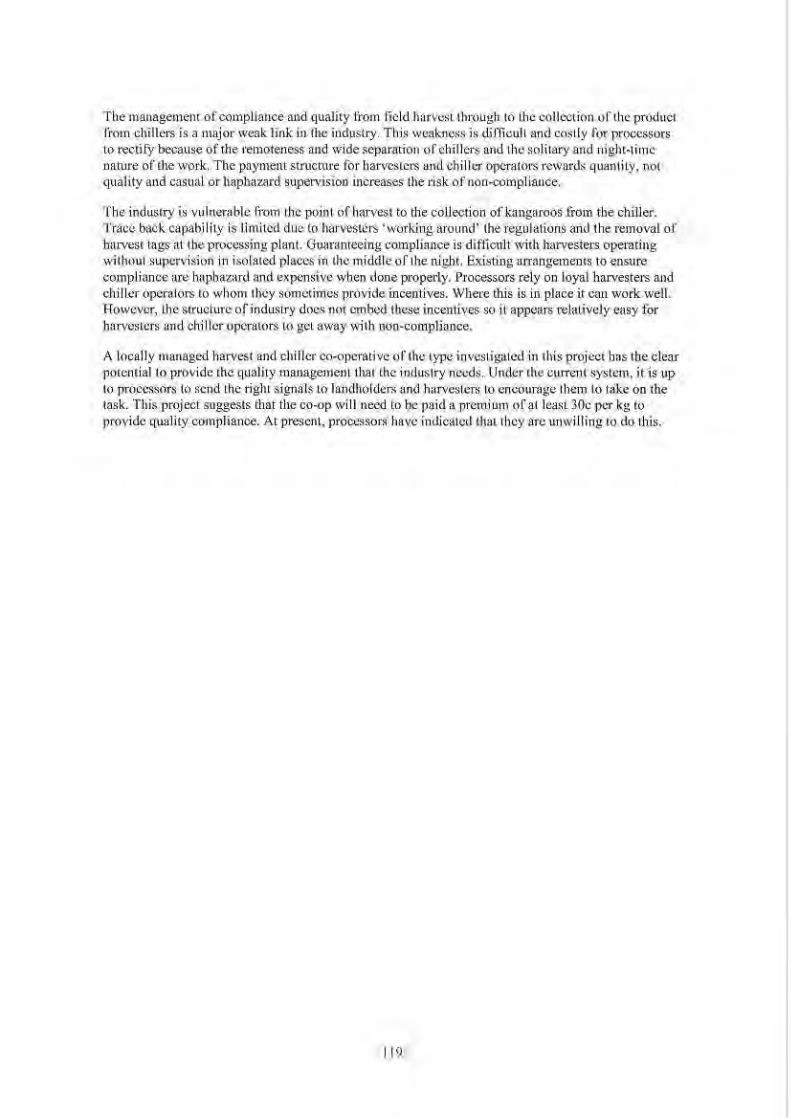
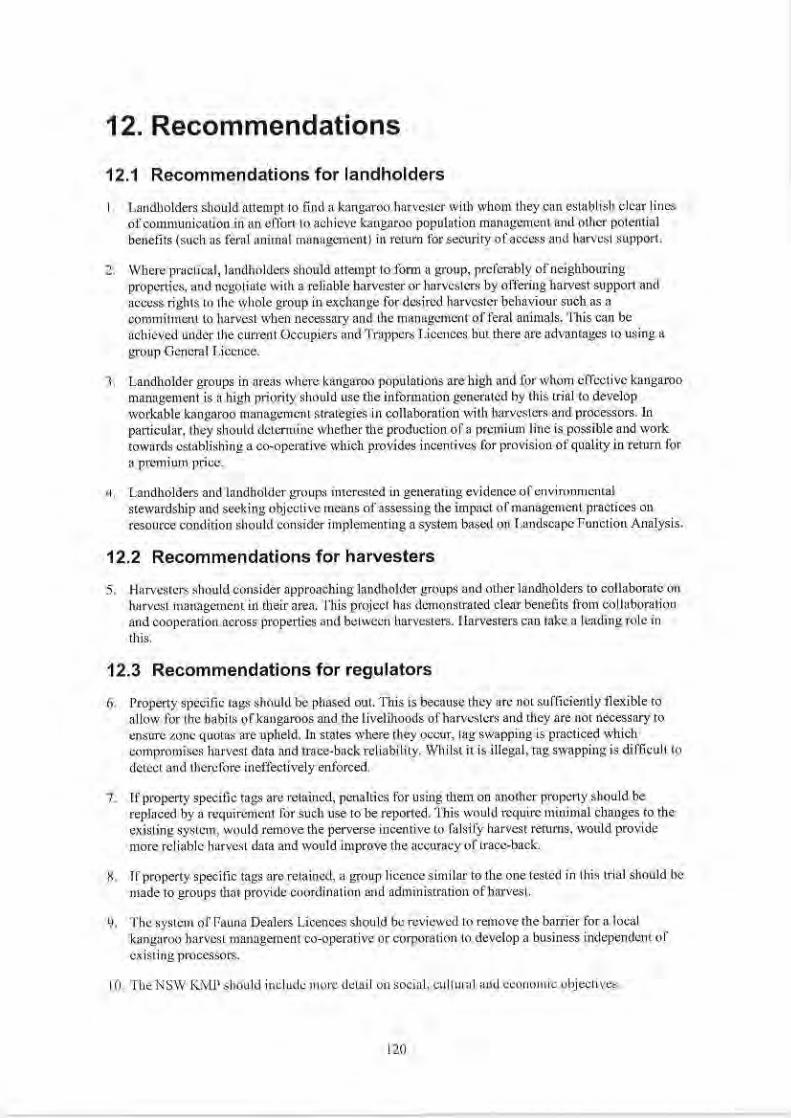
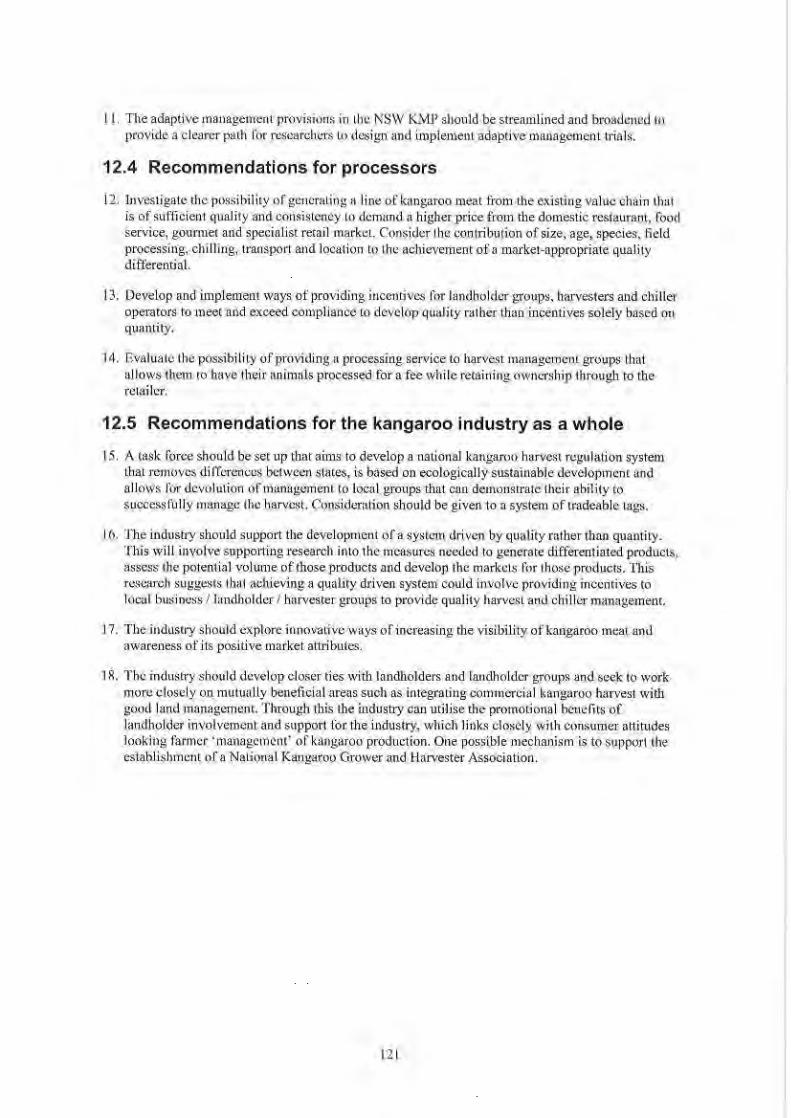
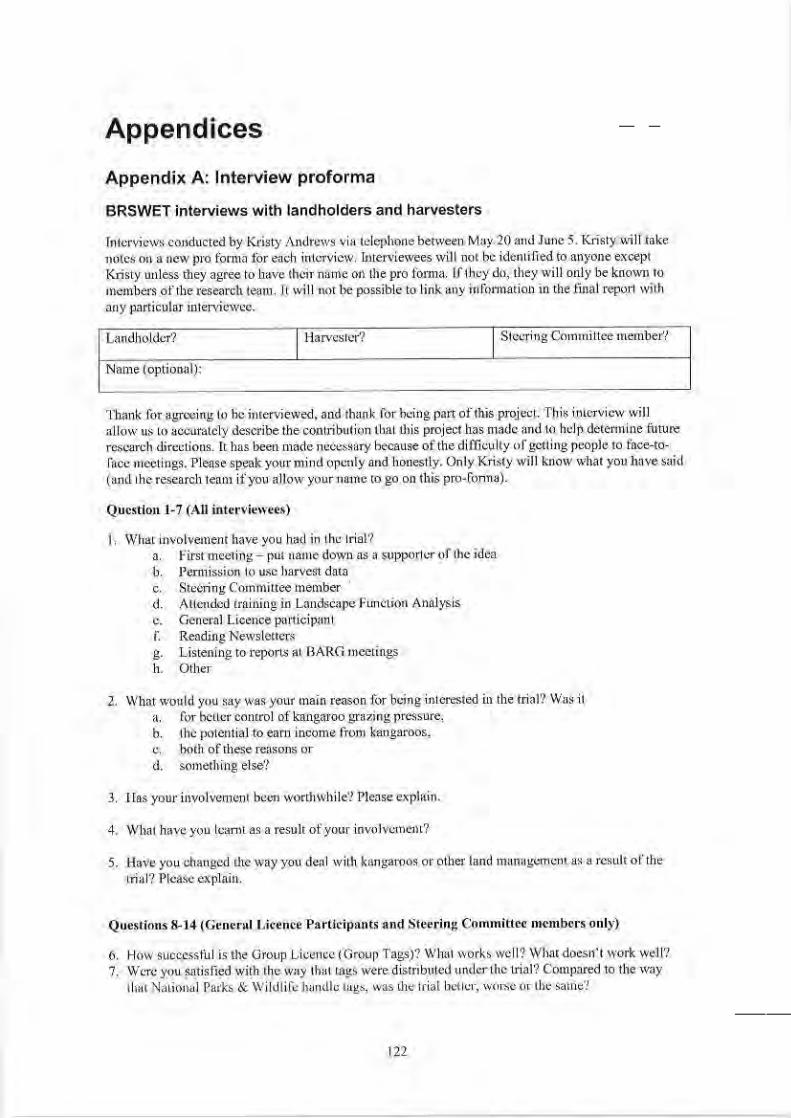


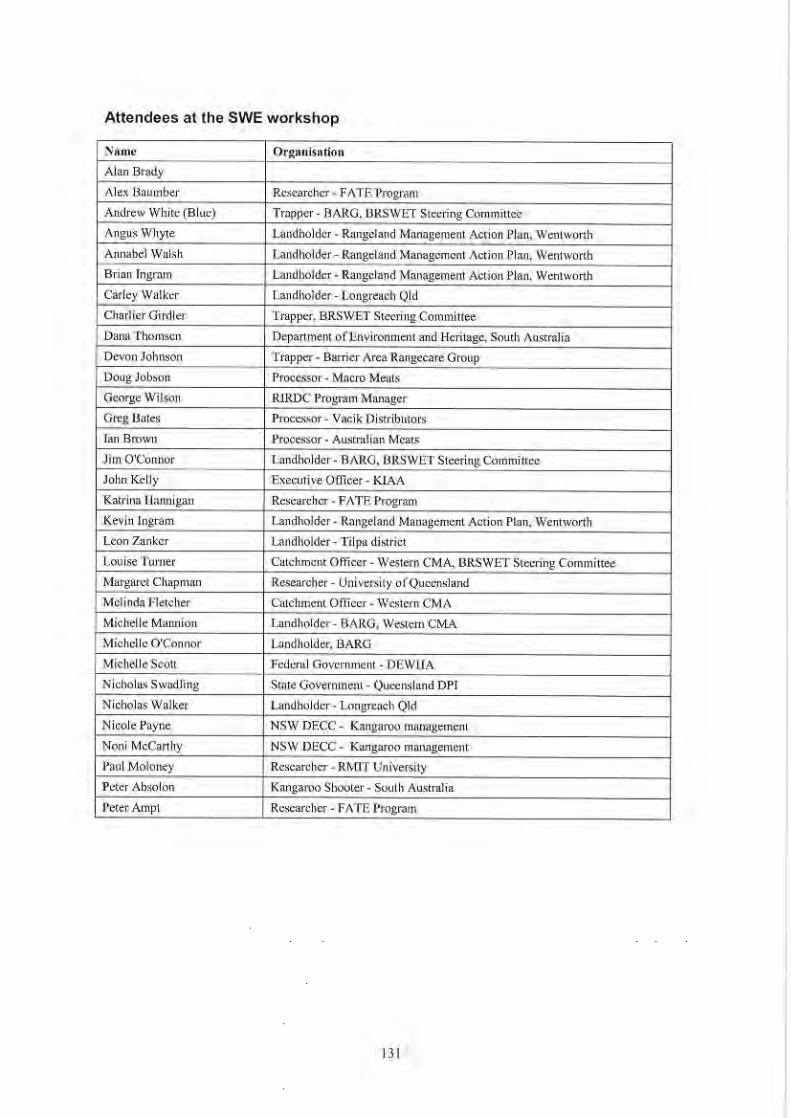
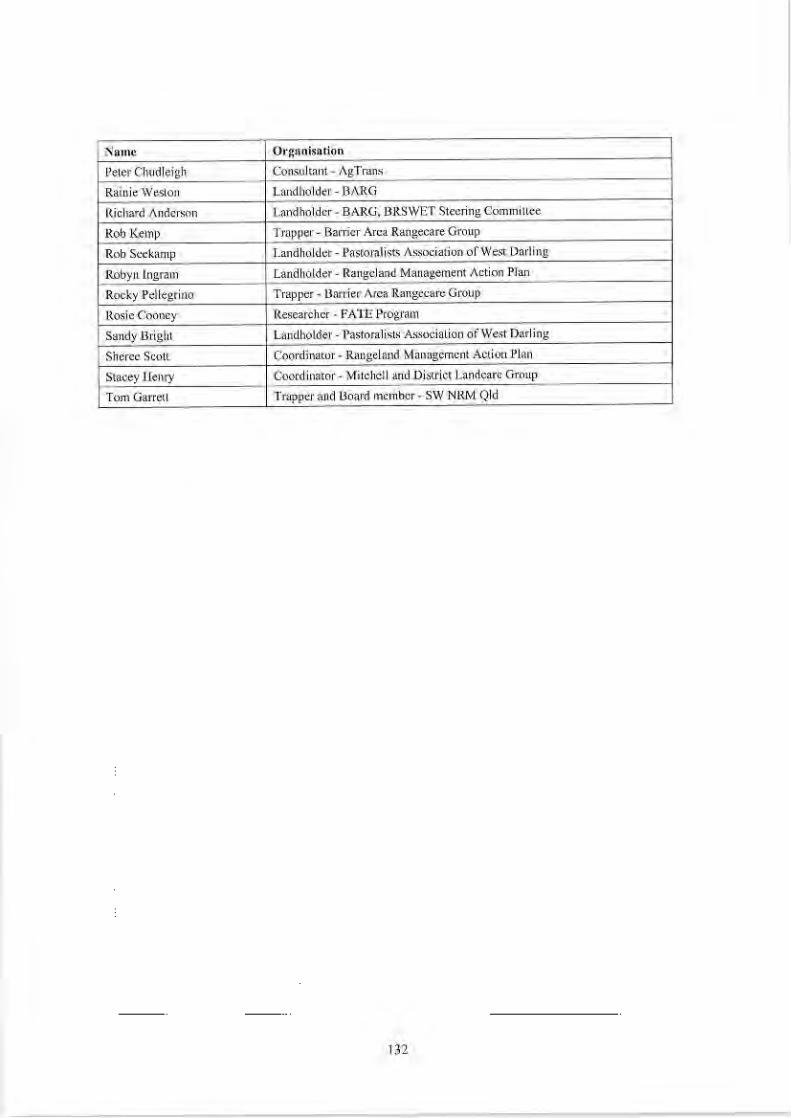

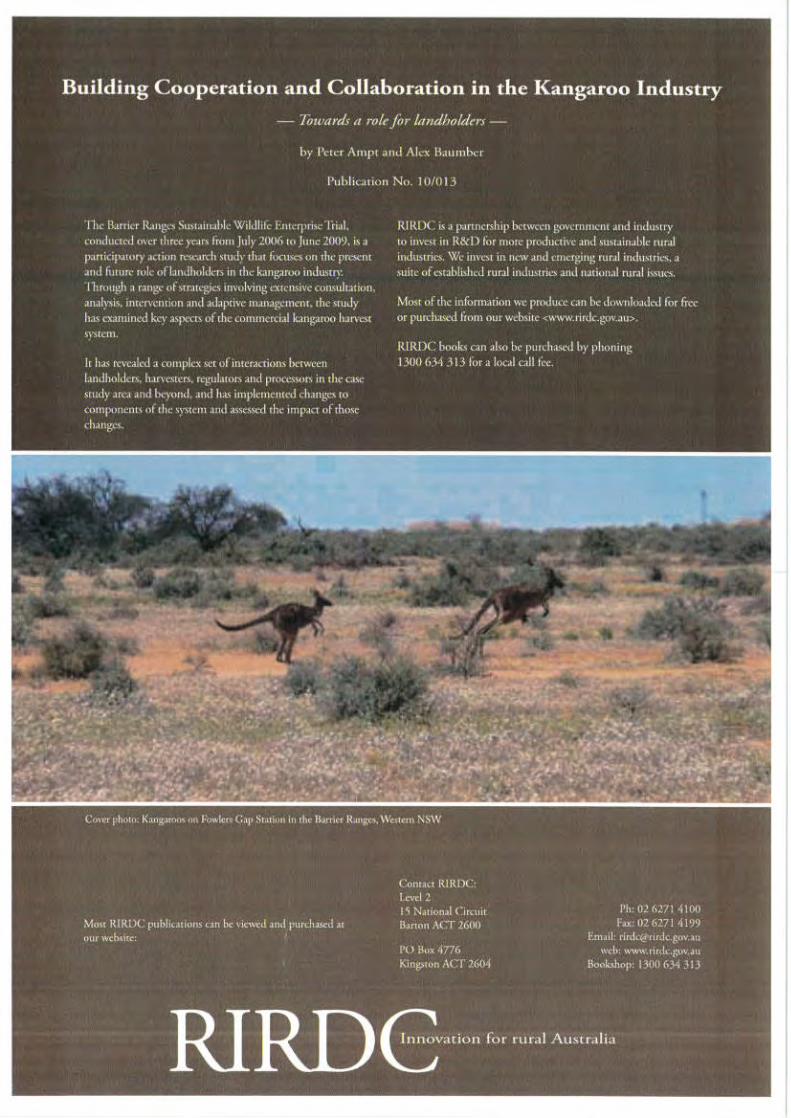

s
Barrier Ranges KangarooQuality you have never had
Quality you can rely on
A business and industry development model.
April 2009
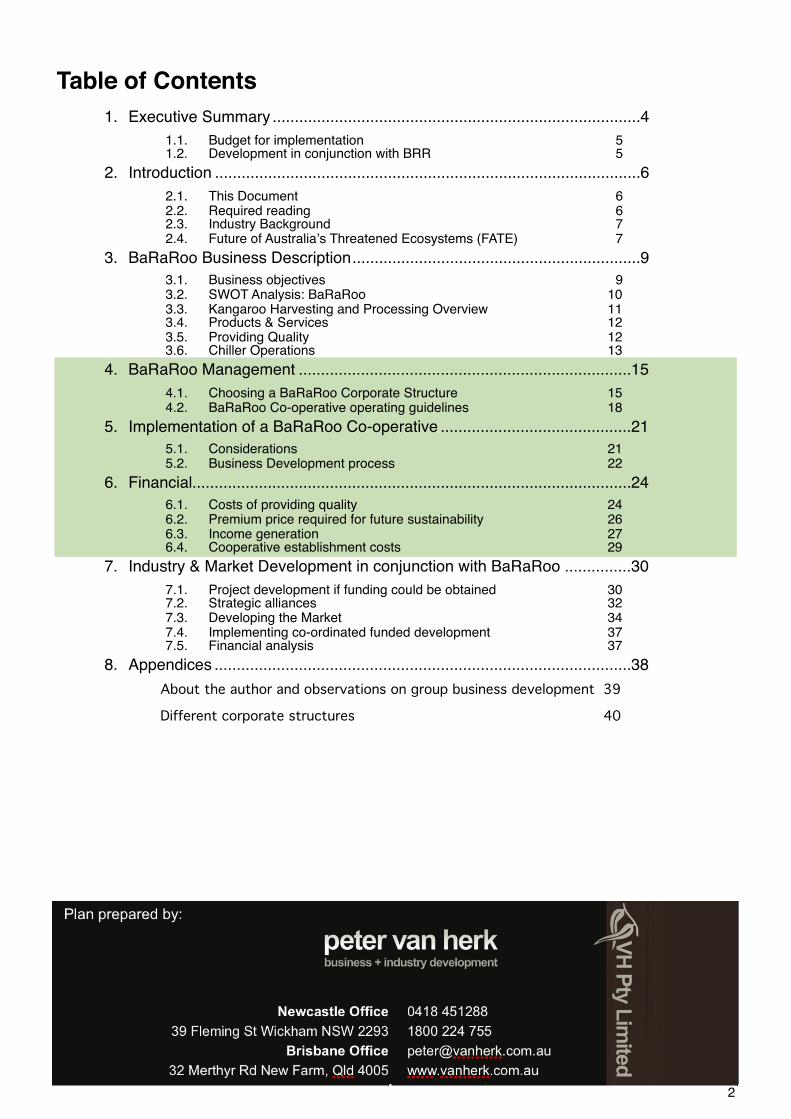
Table of Contents1. ...................................................................................Executive Summary 4
1.1. Budget for implementation 51.2. Development in conjunction with BRR 5
2. ................................................................................................Introduction 62.1. This Document 62.2. Required reading 62.3. Industry Background 72.4. Future of Australiaʼs Threatened Ecosystems (FATE) 7
3. .................................................................BaRaRoo Business Description 93.1. Business objectives 93.2. SWOT Analysis: BaRaRoo 103.3. Kangaroo Harvesting and Processing Overview 113.4. Products & Services 123.5. Providing Quality 123.6. Chiller Operations 13
4. ...........................................................................BaRaRoo Management 154.1. Choosing a BaRaRoo Corporate Structure 154.2. BaRaRoo Co-operative operating guidelines 18
5. ...........................................Implementation of a BaRaRoo Co-operative 215.1. Considerations 215.2. Business Development process 22
6. ...................................................................................................Financial 246.1. Costs of providing quality 246.2. Premium price required for future sustainability 266.3. Income generation 276.4. Cooperative establishment costs 29
7. ...............Industry & Market Development in conjunction with BaRaRoo 307.1. Project development if funding could be obtained 307.2. Strategic alliances 327.3. Developing the Market 347.4. Implementing co-ordinated funded development 377.5. Financial analysis 37
8. ..............................................................................................Appendices 38About the author and observations on group business development 39
Different corporate structures 40
2
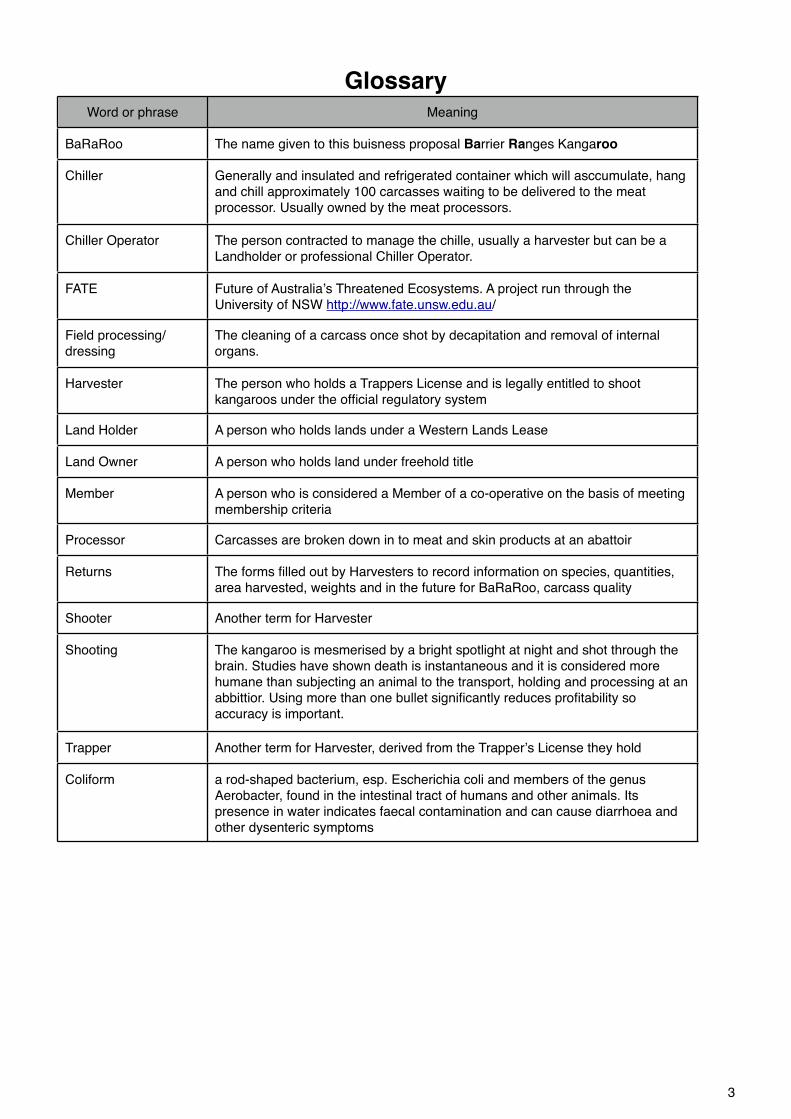
GlossaryWord or phrase Meaning
BaRaRoo The name given to this buisness proposal Barrier Ranges Kangaroo
Chiller Generally and insulated and refrigerated container which will asccumulate, hang and chill approximately 100 carcasses waiting to be delivered to the meat processor. Usually owned by the meat processors.
Chiller Operator The person contracted to manage the chille, usually a harvester but can be a Landholder or professional Chiller Operator.
FATE Future of Australiaʼs Threatened Ecosystems. A project run through the University of NSW http://www.fate.unsw.edu.au/
Field processing/dressing
The cleaning of a carcass once shot by decapitation and removal of internal organs.
Harvester The person who holds a Trappers License and is legally entitled to shoot kangaroos under the official regulatory system
Land Holder A person who holds lands under a Western Lands Lease
Land Owner A person who holds land under freehold title
Member A person who is considered a Member of a co-operative on the basis of meeting membership criteria
Processor Carcasses are broken down in to meat and skin products at an abattoir
Returns The forms filled out by Harvesters to record information on species, quantities, area harvested, weights and in the future for BaRaRoo, carcass quality
Shooter Another term for Harvester
Shooting The kangaroo is mesmerised by a bright spotlight at night and shot through the brain. Studies have shown death is instantaneous and it is considered more humane than subjecting an animal to the transport, holding and processing at an abbittior. Using more than one bullet significantly reduces profitability so accuracy is important.
Trapper Another term for Harvester, derived from the Trapperʼs License they hold
Coliform a rod-shaped bacterium, esp. Escherichia coli and members of the genus Aerobacter, found in the intestinal tract of humans and other animals. Its presence in water indicates faecal contamination and can cause diarrhoea and other dysenteric symptoms
3
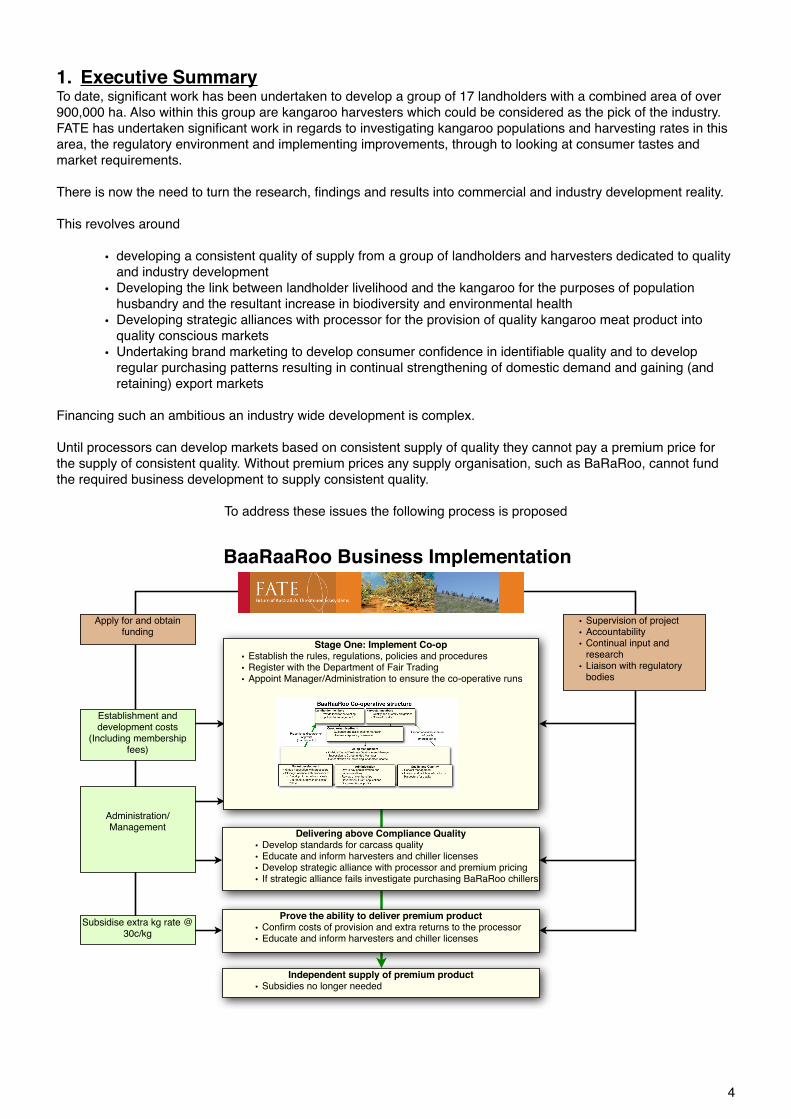
1. Executive Summary To date, significant work has been undertaken to develop a group of 17 landholders with a combined area of over 900,000 ha. Also within this group are kangaroo harvesters which could be considered as the pick of the industry. FATE has undertaken significant work in regards to investigating kangaroo populations and harvesting rates in this area, the regulatory environment and implementing improvements, through to looking at consumer tastes and market requirements.
There is now the need to turn the research, findings and results into commercial and industry development reality.
This revolves around
• developing a consistent quality of supply from a group of landholders and harvesters dedicated to quality and industry development
• Developing the link between landholder livelihood and the kangaroo for the purposes of population husbandry and the resultant increase in biodiversity and environmental health
• Developing strategic alliances with processor for the provision of quality kangaroo meat product into quality conscious markets
• Undertaking brand marketing to develop consumer confidence in identifiable quality and to develop regular purchasing patterns resulting in continual strengthening of domestic demand and gaining (and retaining) export markets
Financing such an ambitious an industry wide development is complex.
Until processors can develop markets based on consistent supply of quality they cannot pay a premium price for the supply of consistent quality. Without premium prices any supply organisation, such as BaRaRoo, cannot fund the required business development to supply consistent quality.
To address these issues the following process is proposed
Delivering above Compliance Quality
• Develop standards for carcass quality
• Educate and inform harvesters and chiller licenses
• Develop strategic alliance with processor and premium pricing
• If strategic alliance fails investigate purchasing BaRaRoo chillers
BaaRaaRoo Business Implementation
Stage One: Implement Co-op
• Establish the rules, regulations, policies and procedures
• Register with the Department of Fair Trading
• Appoint Manager/Administration to ensure the co-operative runs
Prove the ability to deliver premium product
• Confirm costs of provision and extra returns to the processor
• Educate and inform harvesters and chiller licenses
Independent supply of premium product
• Subsidies no longer needed
Establishment and development costs
(Including membership fees)
Administration/Management
Subsidise extra kg rate @ 30c/kg
Apply for and obtain funding
• Supervision of project
• Accountability
• Continual input and research
• Liaison with regulatory bodies
4
1.1. Budget for implementation
1.1.1.Outside expertise and costsImplementation of a cooperative required by BaRaRoo will require consultation and development of
• Membership performance criteria• Disbursement arrangements for profits• Policy and procedure• Dispute resolution• Application for registration
This will cost of approximately $9,000 if outside consultancy is engaged.
1.1.2.Cooperative costs and Income
1.1.2.1. CostsThe Cooperative will cost approximately
1.1.2.2. Income
Income is limited to Membership fees (to be agreed apon) at the initial stages which should generate
17 Landholders @ $200= $3400 15 harvesters @ $300= $4,500
1.2. Development in conjunction with BRRIn conjunction with the above implementation it is proposed FATE will be involved in further industry market development as outlined in Section 7 onwards.
5
2. Introduction
2.1. This Document2.1.1.Document development
This document was commissioned to formulate a business plan for development of a kangaroo supply co-operative which would have the major objective of supplying consistent quality into the markets. During development of the plan it became clear that there were significant interrelated issues that also needed to be addressed if the original objectives were to be met. The issues finally addressed span from the kangaroos harvested through to consumer confidence in the product on the supermarket shelves.
This document attempts to achieve the original intention as a business plan for the formation of a cooperative and Sections 1-6 deal with this. It cannot provide the necessary financial analysis for a normal business implementation plan as reliable income streams cannot be determined until the market is better developed.
2.1.2.To be used byThis document is designed to be used:
• by Landholders wishing to form a co-operative group for the purposes of consistent quality supply• as a guide by a future business development manager (or organisation) engaged to implement all or
part of this document• by organisations (government and private) looking for potential encompassing and long-term solutions
to environmental, social, and economic issues which are, or can be, impacted by kangaroo harvesting.
2.2. Required readingThe rationale behind this business document are provided in two appendices documents. It is strongly recommended that any potential stakeholders read these papers to fully understand the depth of reasoning, logic and rationale that has led to this document.
2.2.1.Sharing Skippy: Models for Involving Landholders in Kangaroo Management in Australia AuthorsRosie Cooney*, Alex Baumber Peter Ampt and George Wilson**
Fate Program, Institute of Environmental Studies, Vallentine Annexe, University of New South Wales, Kensington, 2052.
*Corresponding author: [email protected]**Australian Wildlife Services, 51 Stonehaven Cres, Canberra 2600
2.2.2.Barrier Ranges Sustainable Wildlife Enterprises TrialA joint initiative of the Barrier Area Rangecare Group (BARG) and the Future of Australiaʼs Threatened Ecosystems (FATE) Program, UNSW
This is an internal document outlining the reasons for the kangaroo management trial which has resulted in this business plan.
6
2.3. Industry BackgroundIn the need to balance the aims of nature conservation and the impact on agriculture from abnormally high native animal populations, kangaroo management programs were developed in each State of Australia.
It was recognised by conservation bodies that certain kangaroo species had undergone significant population increases due to human activities. For example, the Eastern Grey Kangaroo lives in woodlands during the day and grazes in open grasslands late evening to morning. Agriculture has significantly increased the habitat and consequently the population of the species. The Red Kangaroo will travel significant distances to graze on new growth as a result of discrete rain events. The introduction of tanks (farm dams) and bore watering points has provided water which allows Red Kangaroo populations to increase and remain relatively sedentary. This can lead to overgrazing and adverse impact on the habitat.
The objectives of the State conservation bodiesʼ regulation of harvesting is to allow reduction in population numbers while still maintaining both population viability and geographic distribution.
Broad area aerial population surveys are undertaken by the New South Wales National Parks and Wildlife Service to ascertain population numbers and distribution on as district and regional level. From the resultant population estimates a yearly harvestable quota is determined (17% of estimated populations).
It is from this point onwards where difficulties in regulation & implementation arise.
In NSW, the state which contains BaRaRoo, Landholders apply to the regulatory body for tags, one tag represents one kangaroo for that specific property and must be attached to the carcass.
In an ideal world, when a request for tags to reduce kangaroo populations is lodged, the licensing authority would
• Consider the overall distribution of the kangaroos• Have specific knowledge of the area• Undertake an inspection to ascertain local impact within days of application• Issue tags and licenses in a frame to address rapid influxes of kangaroos on to crops or new
pastures.
In reality:
• Staff are too restricted to inspect every property• Kangaroos are very mobile and not necessarily present when inspections take place• The application process can be time-consuming and Landholders have become loath to go through
the process of applying for tags• Kangaroo Harvesters are not able to follow kangaroo herds from property to property unless every
property is licensed and have obtained tags• Conservation Department bureaucracies are generally not sympathetic to private enterprise wildlife
Harvesters
2.4. Future of Australiaʼs Threatened Ecosystems (FATE)This organisation has been the instigator and driver for the Barrier Ranges Sustainable Wildlife Enterprises Trial and the development of BaRaRoo. This body operates from the University of New South Wales. Simplistically, FATEʼs overall aims are to investigate and encourage methods of increasing Australiaʼs biodiversity in degraded environments. FATE considers utilising native a natural resources is better for the ecosystem than using introduced species with their associated foreign impacts.
To create a change in western New South Wales land management and utilisation it is better if income can be generated from lower impact native resources with a resultant increase in biodiversity and ecosystem health. For this to be achieved a financial return needs to be obtained by Landholders from native resources such as kangaroos, feral animals, timber, etc.
Consequently, FATE has consistently researched the kangaroo harvesting industry for the purposes of developing a holistic regulatory, harvesting, processing, value adding and marketing framework to
• Decrease bureaucratic hurdles• Increase income to all participants, particularly the Landholders• Successfully manage kangaroo populations for income and conservation values
7
• Increase quality control as an integral aspect of operations• Increase market profile through consistent quality and results in marketing activities
2.4.1.Barrier Ranges Sustainable Wildlife Enterprises trialThis trial was approved under the alternative kangaroo management provision of the NSW kangaroo Adaptive Trial Management provisions and the result has led to the formation of this business plan.
Essentially, the trial involves a number of Landholders with a combined total area of 1 million hectares. Instead of allocating tags on a property by property basis in small lots, tags are issued for the whole area for the whole quota period and used by the Harvesters according to where the populations are affecting the Landholders.
This system can allow: • Harvesters to respond quickly to Landholders with population influxes• Harvesters to follow populations across properties• strategic planning of harvesting over the year to
• smooth out population variations• supply consistent volumes to processors
To justify to the regulatory bodies this change of procedure, research has been undertaken to show how population dynamics over the trial group compare with the population dynamics of the Broken Hill and Tibboburra regions. It was found that the BaRaRoo group has a more stable population dynamic than either the Broken Hill or Tibboburra harvesting regions BRR overlaps.
2.4.1.1. Theory meets practiceIt is the legal requirement for Harvesters to attach a tag issued to a specific property only on the kangaroos harvested on that property. However, considering:
• tags are generally allocated based on broad area population estimates;• Licenses are generally issued without site inspections and may not truly represent
local population distribution;• The practicalities of Harvesters working at night;• Kangaroo populations moving over a number of properties ;
these requirements are generally impractical and often not adhered to by the Harvesters.1
BaRaRoo addresses this inherent regulatory non-compliance.
81 Experiences of the author NSW NPWS District Ranger, Narrabri, Kangaroo industry licensing, 1986
3. BaRaRoo Business Description
3.1. Business objectives
3.1.1. To develop a business framework which encourages quality of harvest, quality of storage, quality of processing through profit, membership requirements, & peer group regulation and encouragement so as to ensure the business is reputable, consistent and reliable.
3.1.2.To realise the potential income which can be derived from kangaroos through better commercial harvesting practices, consistency of quality
3.1.3.To develop a strategic alliance with a processor so BaRaRoo can be involved in the development of a value added premium market through financial and organisational arrangements of mutual advantage
3.1.4.To increase market demand by offering a consistency of quality and supply volume obtained through a self interested co-operative whose Members uphold the objectives of quality, reliability and consistency of supply
3.1.5. To obtain regular and reliable markets based on quality, customer satisfaction and increase market penetration so as to properly utilise surplus kangaroo populations to increase income to Landholders, Harvesters and processes
3.1.6.To holistically manage and harvest kangaroo populations over a broad area in keeping with kangaroo population dynamics in the practicalities of harvest, storage and processing through flexibility in tag allocation, population survey and chiller management
3.1.7.To develop incomes for Landholders from kangaroo populations so that Landholders become positively involved in population and harvesting management
3.1.8.To work closely with the Government, industry, processors and other agencies (eg FATE) to develop the kangaroo industry in regards to supply, quality, branding and regulatory reform.
9
3.2. SWOT Analysis: BaRaRoo
3.2.1. Strengths• Ecologically sustainable kangaroo resource• Large land holdings offering relatively stable kangaroo populations as compared to the
Broken Hill and Tibboburra regional areas• Simplified bureaucratic and regulatory processes in keeping with the nature of the resource
and harvesting methods• Ability to respond quickly to harvest Kangaroo population influx in localised areas• High level of credible research and development by FATE• Excellent research, academic and political resources for continual support of BaRaRoo by the
FATE program• Proactive Landholders and trappers desiring the objectives of
• increased income• sustainable land and wildlife management• Reduction of bureaucratic hurdles
3.2.2.Weaknesses• Slow or difficult to obtain responses from Landholders and trappers to communications by
BaRaRoo administration• Significant distance between stakeholders which inhibits the ability to meet and communicate
face-to-face• Lack of dedicated full-time business and market development activity i.e business
development manager• Relatively long timeframe before BaRaRoo can operate as a completely independent financial
entity, thus requiring financial subsidy for implementation in a reasonable time frame• Difficulty to obtain leadership and commitment as Members have full time commitments
elsewhere
3.2.3.Opportunities• If introduced stock are replaced with kangaroos as a source of income
• Potential carbon credits (kangaroos do not emit methane)• Increased by biodiversity with associated benefits• Simplified animal husbandry and land management
• Changes in market trends desiring• Low fat foods• Ecologically sustainable products• Green credentials
3.2.4.Threats• Drought continues long enough for stakeholders to lose interest due to lack of viable
kangaroo harvesting numbers• Loss of kangaroo meat markets - due to inconsistent quality- before BaRaRoo can secure
stable long-term markets• Discontinuation of support for BaRaRoo on a political and financial level• Discontinuation of the current BaRaRoo kangaroo harvesting regulatory concessions and re-
imposition of the standard regulatory and bureaucratic framework
10
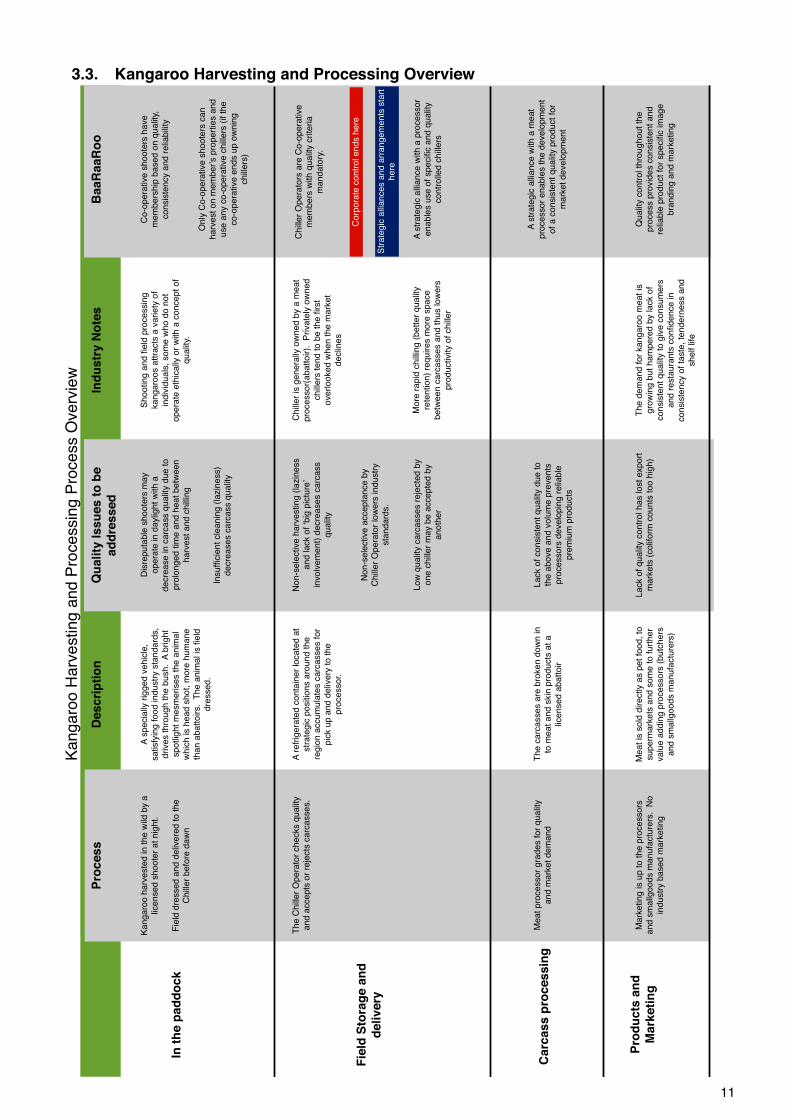
Pro
cess
The C
hill
er
Opera
tor
checks q
ualit
y
and a
ccepts
or
reje
cts
carc
asses.
Chill
er
is g
enera
lly o
wned b
y a
meat
pro
cessor(
abattoir).
P
rivate
ly o
wned
chill
ers
tend to b
e the fi
rst
overlooked w
hen the m
ark
et
declin
es
Meat pro
cessor
gra
des for
qualit
y
and m
ark
et dem
and
Kangaro
o h
arv
este
d in the w
ild b
y a
licensed s
hoote
r at nig
ht.
Fie
ld d
ressed a
nd d
eliv
ere
d to the
Chill
er
befo
re d
aw
n
Ind
ustr
y N
ote
sQ
ua
lity
Iss
ues t
o b
e
ad
dre
ssed
Dis
reputa
ble
shoote
rs m
ay
opera
te in d
aylig
ht w
ith a
decre
ase in c
arc
ass q
ualit
y d
ue to
pro
longed tim
e a
nd h
eat betw
een
harv
est and c
hill
ing
Non-s
ele
ctive h
arv
esting (
lazin
ess
and lack o
f !b
ig p
ictu
re"
involv
em
ent)
decre
ases c
arc
ass
qualit
y
Non-s
ele
ctive a
ccepta
nce b
y
Chill
er
Opera
tor
low
ers
industr
y
sta
ndard
s.
Low
qualit
y c
arc
asses r
eje
cte
d b
y
one c
hill
er
may b
e a
ccepte
d b
y
anoth
er
Lack o
f consis
tent qualit
y d
ue to
the a
bove a
nd v
olu
me p
revents
pro
cessors
develo
pin
g r
elia
ble
pre
miu
m p
roducts
Insuffi
cie
nt cle
anin
g (
lazin
ess)
decre
ases c
arc
ass q
ualit
y
More
rapid
chill
ing (
better
qualit
y
rete
ntion)
requires m
ore
space
betw
een c
arc
asses a
nd thus low
ers
pro
ductivity o
f chill
er
In t
he p
ad
do
ck
Fie
ld S
tora
ge a
nd
delivery
Carc
ass p
rocessin
g
Descri
pti
on
Shooting a
nd fi
eld
pro
cessin
g
kangaro
os a
ttra
cts
a v
ariety
of
indiv
iduals
, som
e w
ho d
o n
ot
opera
te e
thic
ally
or
with a
concept of
qualit
y.
A s
pecia
lly r
igged v
ehic
le,
satisfy
ing food industr
y s
tandard
s,
drives thro
ugh the b
ush. A
bright
spotlig
ht m
esm
erises the a
nim
al
whic
h is h
ead s
hot, m
ore
hum
ane
than a
battoirs. T
he a
nim
al is
field
dre
ssed.
A r
efr
igera
ted c
onta
iner
locate
d a
t
str
ate
gic
positio
ns a
round the
regio
n a
ccum
ula
tes c
arc
asses for
pic
k u
p a
nd d
eliv
ery
to the
pro
cessor.
The c
arc
asses a
re b
roken d
ow
n in
to m
eat and s
kin
pro
ducts
at a
licensed a
battoir
Pro
du
cts
an
d
Mark
eti
ng
Ba
aR
aaR
oo
Only
Co-o
pera
tive s
hoote
rs c
an
harv
est on m
em
ber"s p
ropert
ies a
nd
use a
ny c
o-o
pera
tive c
hill
ers
(if the
co-o
pera
tive e
nds u
p o
wnin
g
chill
ers
)
Co-o
pera
tive s
hoote
rs h
ave
mem
bers
hip
based o
n q
ualit
y,
consis
tency a
nd r
elia
bili
ty
Chill
er
Opera
tors
are
Co-o
pera
tive
mem
bers
with q
ualit
y c
rite
ria
mandato
ry.
A s
trate
gic
alli
ance w
ith a
pro
cessor
enable
s u
se o
f specifi
c a
nd q
ualit
y
contr
olle
d c
hill
ers
A s
trate
gic
alli
ance w
ith a
meat
pro
cessor
enable
s the d
evelo
pm
ent
of a c
onsis
tent qualit
y p
roduct fo
r
mark
et develo
pm
ent
The d
em
and for
kangaro
o m
eat is
gro
win
g b
ut ham
pere
d b
y lack o
f
consis
tent qualit
y to g
ive c
onsum
ers
and r
esta
ura
nts
confidence in
consis
tency o
f ta
ste
, te
ndern
ess a
nd
shelf life
Lack o
f qualit
y c
ontr
ol has lost export
mark
ets
(colif
orm
counts
too h
igh)
Meat is
sold
directly a
s p
et fo
od, to
superm
ark
ets
and s
om
e to furt
her
valu
e a
ddin
g p
rocessors
(butc
hers
and s
mallg
oods m
anufa
ctu
rers
)
Mark
eting is u
p to the p
rocessors
and s
mallg
oods m
anufa
ctu
rers
. N
o
industr
y b
ased m
ark
eting
Qualit
y c
ontr
ol th
roughout th
e
pro
cess p
rovid
es c
onsis
tent and
relia
ble
pro
duct fo
r specifi
c im
age
bra
ndin
g a
nd m
ark
eting
Ka
ng
aro
o H
arv
estin
g a
nd
Pro
ce
ssin
g P
roce
ss O
ve
rvie
w
Corp
ora
te c
ontr
ol ends h
ere
Str
ate
gic
alli
ances a
nd a
rrangem
ents
sta
rt
here
3.3. Kangaroo Harvesting and Processing Overview
11
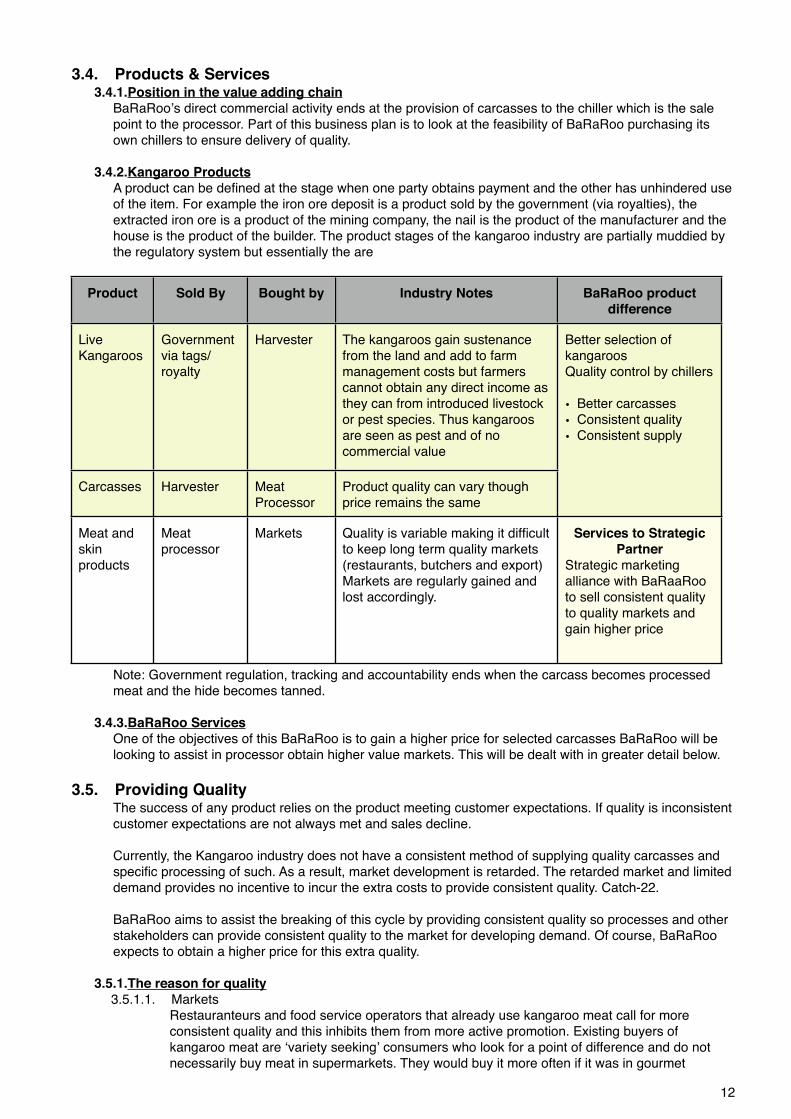
3.4. Products & Services3.4.1.Position in the value adding chain
BaRaRooʼs direct commercial activity ends at the provision of carcasses to the chiller which is the sale point to the processor. Part of this business plan is to look at the feasibility of BaRaRoo purchasing its own chillers to ensure delivery of quality.
3.4.2.Kangaroo ProductsA product can be defined at the stage when one party obtains payment and the other has unhindered use of the item. For example the iron ore deposit is a product sold by the government (via royalties), the extracted iron ore is a product of the mining company, the nail is the product of the manufacturer and the house is the product of the builder. The product stages of the kangaroo industry are partially muddied by the regulatory system but essentially the are
Product Sold By Bought by Industry Notes BaRaRoo product difference
Live Kangaroos
Government via tags/royalty
Harvester The kangaroos gain sustenance from the land and add to farm management costs but farmers cannot obtain any direct income as they can from introduced livestock or pest species. Thus kangaroos are seen as pest and of no commercial value
Better selection of kangaroosQuality control by chillers
• Better carcasses • Consistent quality• Consistent supply
Carcasses Harvester Meat Processor
Product quality can vary though price remains the same
Better selection of kangaroosQuality control by chillers
• Better carcasses • Consistent quality• Consistent supply
Meat and skin products
Meat processor
Markets Quality is variable making it difficult to keep long term quality markets (restaurants, butchers and export) Markets are regularly gained and lost accordingly.
Services to Strategic Partner
Strategic marketing alliance with BaRaaRoo to sell consistent quality to quality markets and gain higher price
Note: Government regulation, tracking and accountability ends when the carcass becomes processed meat and the hide becomes tanned.
3.4.3.BaRaRoo ServicesOne of the objectives of this BaRaRoo is to gain a higher price for selected carcasses BaRaRoo will be looking to assist in processor obtain higher value markets. This will be dealt with in greater detail below.
3.5. Providing QualityThe success of any product relies on the product meeting customer expectations. If quality is inconsistent customer expectations are not always met and sales decline.
Currently, the Kangaroo industry does not have a consistent method of supplying quality carcasses and specific processing of such. As a result, market development is retarded. The retarded market and limited demand provides no incentive to incur the extra costs to provide consistent quality. Catch-22.
BaRaRoo aims to assist the breaking of this cycle by providing consistent quality so processes and other stakeholders can provide consistent quality to the market for developing demand. Of course, BaRaRoo expects to obtain a higher price for this extra quality.
3.5.1.The reason for quality3.5.1.1. Markets
Restauranteurs and food service operators that already use kangaroo meat call for more consistent quality and this inhibits them from more active promotion. Existing buyers of kangaroo meat are ʻvariety seekingʼ consumers who look for a point of difference and do not necessarily buy meat in supermarkets. They would buy it more often if it was in gourmet
12
butchers and premium food distributers and outlets. The current product is not trusted, hindering development of this market.
3.5.1.2. Greater returns To obtain profitability for the development of the group, industry and landholder
3.5.1.3. Current Quality SituationLoin fillet is of consistent quality in terms of tenderness. Other large cuts are tougher from older (larger) animals. The industry can easily sell higher quality cuts but sells other cuts at very low prices, impacting on the profitability of the whole industry. Of the kangaroos delivered at the chiller only a certain proportion are premium carcasses which will provide premium quality cuts of meat. The same price is paid to the harvester regardless of the quality of carcass.
A significant proportion of kangaroo meat is used in pet food, a lower-priced product. Generally, not all of the carcass is used for human consumption as prime cuts are removed and the rest relegated to pet food. This method of processing reduces the overall value of the carcass.
A good-quality carcass can be used completely for human consumption with the prime cuts being sold as large pieces, smaller cuts being sold as diced meat and mince. This is similar to beef scotch fillet, stewing steak and mince respectively.
If good-quality carcasses are separated at time of delivery (or even before delivery), processed independently to ensure the whole carcass enters the higher value markets, the carcass is far more valuable than a carcass which has mixed value or is purchased in the same batch as lower quality carcasses.
3.6. Chiller Operations Chiller ownership by the co-operative for the purposes of convenience and profit must be considered.
3.6.1. Chiller descriptionA chiller is generally an insulated and refrigerated shipping container set up on stilts so its entry and exit doors are on the same level as the refrigerated pickup truck. The chillers are located in townships which are relatively central to the harvesting area and the harvesters.
3.6.2.Throughput and productivityA 20ʼ chiller holds 200-240 carcasses though a rate of 150 carcasses per week is considered to be good chiller throughput. To double the space for each carcass to speed cooling down and consistent temperature (quality), the chiller would hold half that amount brining productivity down to 110 carcasses per week, a 27% decrease in throughput. See Section 6.1.1 for the effect on price.
3.6.3.ProcedureCarcasses are brought to the chiller before sunrise where they can be chilled and accumulated for pickup at a later date. There are relevant Australian standards on how quickly the carcasses need to be chilled and the maximum time they can be kept in storage.
3.6.4.Quality controlKangaroos can be unloaded into a chiller without the chiller operator present however, it is the chiller operator who signs off on the quantity and quality of the carcasses. A good chiller operator will educate the harvester on matters of quality with the ultimate ability of refusing carcasses which are below the standards required.
In reality if a harvesterʼs cull is refused due to low quality the harvester can often ahve the opportunity to drive to another chiller which will accept the inferior product. Maintaining quality standards in the industry is difficult under these circumstances. Thus the industry need for BaRaRoo.
3.6.5.OwnershipThe majority of the chillers are owned by meat processors. The processor will pay a chiller operator rate per kilogram to maintain and staff the chiller. At the time of this plan this rate was $.09 per kilogram.
Some chillers are owned by a harvester and the meat processor will pay an extra amount to the chiller operator in allowance for the costs of infrastructure.
13
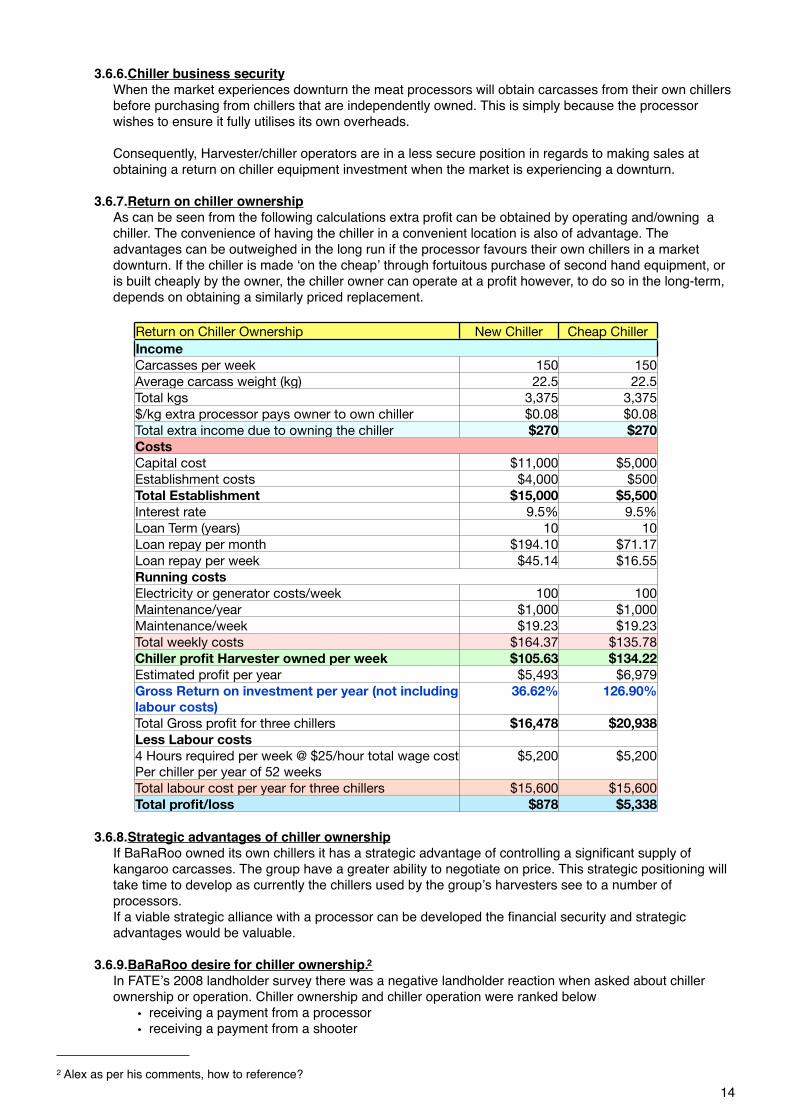
3.6.6.Chiller business securityWhen the market experiences downturn the meat processors will obtain carcasses from their own chillers before purchasing from chillers that are independently owned. This is simply because the processor wishes to ensure it fully utilises its own overheads.
Consequently, Harvester/chiller operators are in a less secure position in regards to making sales at obtaining a return on chiller equipment investment when the market is experiencing a downturn.
3.6.7.Return on chiller ownershipAs can be seen from the following calculations extra profit can be obtained by operating and/owning a chiller. The convenience of having the chiller in a convenient location is also of advantage. The advantages can be outweighed in the long run if the processor favours their own chillers in a market downturn. If the chiller is made ʻon the cheapʼ through fortuitous purchase of second hand equipment, or is built cheaply by the owner, the chiller owner can operate at a profit however, to do so in the long-term, depends on obtaining a similarly priced replacement.
Return on Chiller Ownership New Chiller Cheap ChillerIncomeIncomeIncomeCarcasses per week 150 150Average carcass weight (kg) 22.5 22.5Total kgs 3,375 3,375$/kg extra processor pays owner to own chiller $0.08 $0.08Total extra income due to owning the chiller $270 $270CostsCostsCostsCapital cost $11,000 $5,000Establishment costs $4,000 $500Total Establishment $15,000 $5,500Interest rate 9.5% 9.5%Loan Term (years) 10 10Loan repay per month $194.10 $71.17Loan repay per week $45.14 $16.55Running costsRunning costsRunning costsElectricity or generator costs/week 100 100Maintenance/year $1,000 $1,000Maintenance/week $19.23 $19.23Total weekly costs $164.37 $135.78Chiller profit Harvester owned per week $105.63 $134.22Estimated profit per year $5,493 $6,979Gross Return on investment per year (not including labour costs)
36.62% 126.90%
Total Gross profit for three chillers $16,478 $20,938Less Labour costs4 Hours required per week @ $25/hour total wage costPer chiller per year of 52 weeks
$5,200 $5,200
Total labour cost per year for three chillers $15,600 $15,600Total profit/loss $878 $5,338
3.6.8.Strategic advantages of chiller ownershipIf BaRaRoo owned its own chillers it has a strategic advantage of controlling a significant supply of kangaroo carcasses. The group have a greater ability to negotiate on price. This strategic positioning will take time to develop as currently the chillers used by the groupʼs harvesters see to a number of processors.If a viable strategic alliance with a processor can be developed the financial security and strategic advantages would be valuable.
3.6.9.BaRaRoo desire for chiller ownership.2In FATEʼs 2008 landholder survey there was a negative landholder reaction when asked about chiller ownership or operation. Chiller ownership and chiller operation were ranked below
• receiving a payment from a processor• receiving a payment from a shooter
142 Alex as per his comments, how to reference?
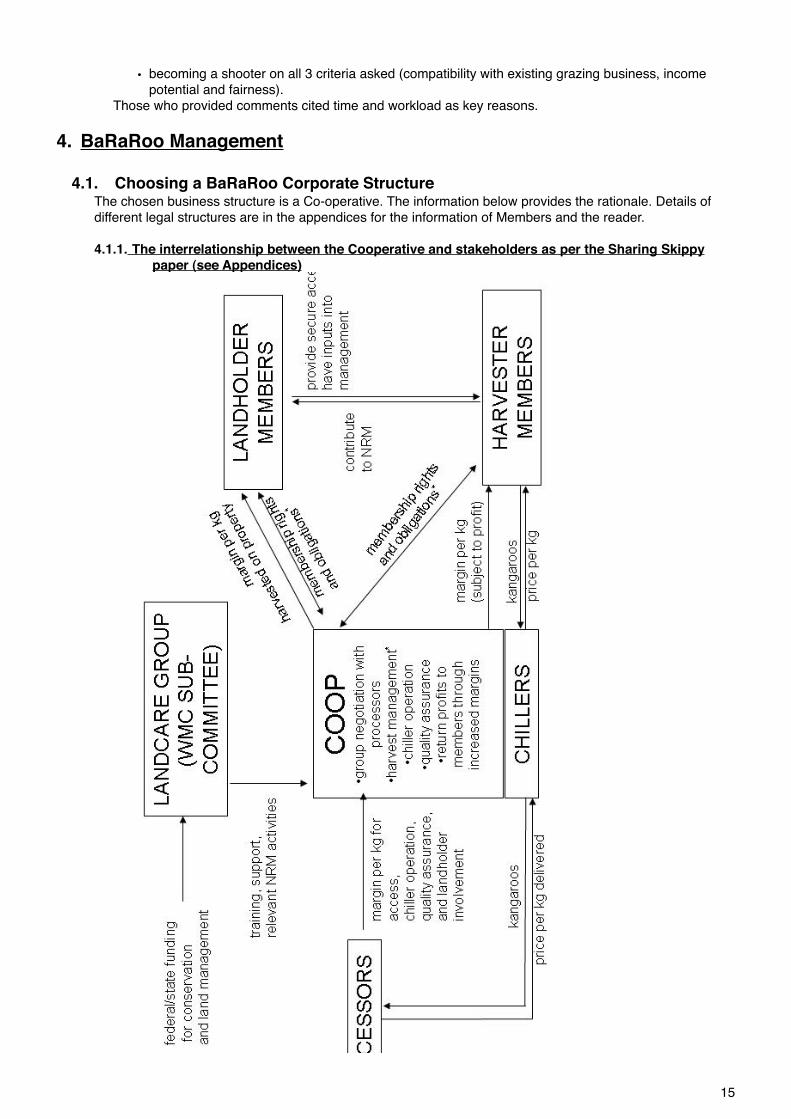
• becoming a shooter on all 3 criteria asked (compatibility with existing grazing business, income potential and fairness).
Those who provided comments cited time and workload as key reasons.
4. BaRaRoo Management
4.1. Choosing a BaRaRoo Corporate StructureThe chosen business structure is a Co-operative. The information below provides the rationale. Details of different legal structures are in the appendices for the information of Members and the reader.
4.1.1. The interrelationship between the Cooperative and stakeholders as per the Sharing Skippy paper (see Appendices)
15
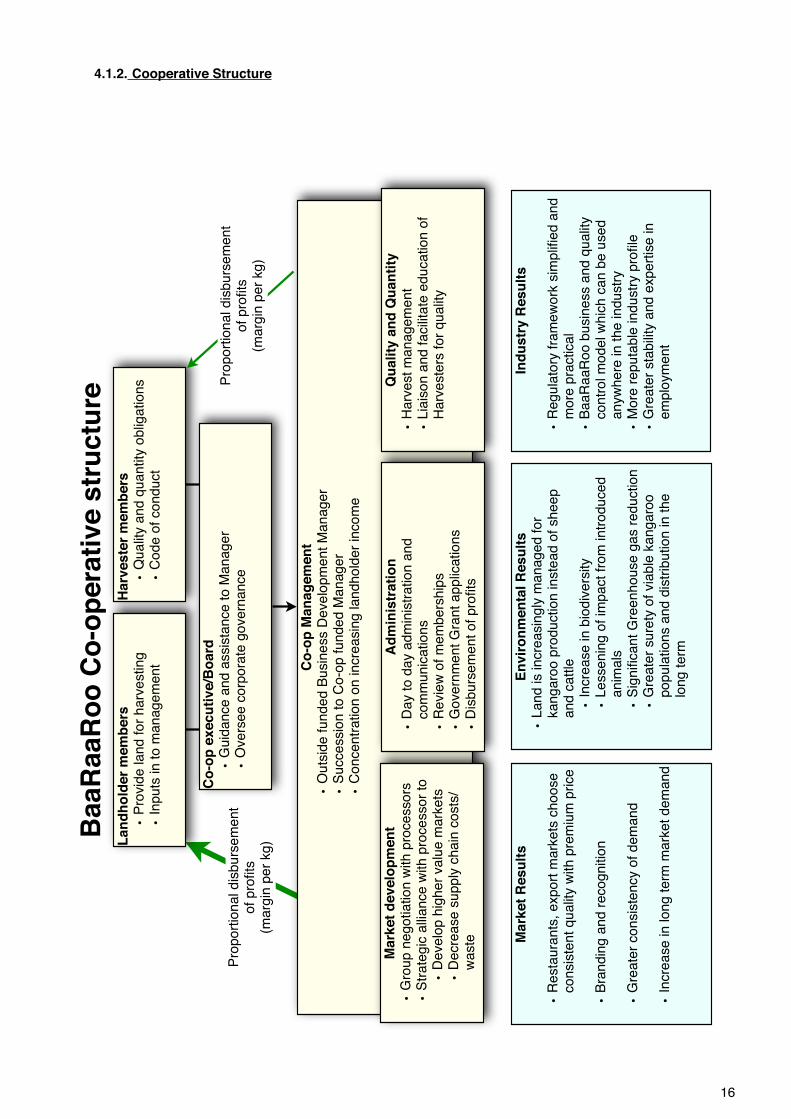
4.1.2. Cooperative Structure
Co
-op
Ma
na
ge
me
nt
•O
uts
ide
fu
nd
ed
Bu
sin
ess D
eve
lop
me
nt
Ma
na
ge
r
•S
ucce
ssio
n t
o C
o-o
p f
un
de
d M
an
ag
er
•C
on
ce
ntr
atio
n o
n in
cre
asin
g la
nd
ho
lde
r in
co
me
Ma
rke
t d
ev
elo
pm
en
t
•G
rou
p n
eg
otia
tio
n w
ith
pro
ce
sso
rs
•S
tra
teg
ic a
llia
nce
with
pro
ce
sso
r to
•D
eve
lop
hig
he
r va
lue
ma
rke
ts
•D
ecre
ase
su
pp
ly c
ha
in c
osts
/w
aste
Qu
ali
ty a
nd
Qu
an
tity
•H
arv
est
ma
na
ge
me
nt
•L
iais
on
an
d f
acili
tate
ed
uca
tio
n o
f H
arv
este
rs f
or
qu
alit
y
Ad
min
istr
ati
on
•D
ay t
o d
ay a
dm
inis
tra
tio
n a
nd
co
mm
un
ica
tio
ns
•R
evie
w o
f m
em
be
rsh
ips
•G
ove
rnm
en
t G
ran
t a
pp
lica
tio
ns
•D
isb
urs
em
en
t o
f p
rofits
La
nd
ho
lde
r m
em
be
rs
•P
rovid
e la
nd
fo
r h
arv
estin
g
•In
pu
ts in
to
ma
na
ge
me
nt
Ha
rve
ste
r m
em
be
rs
•Q
ua
lity a
nd
qu
an
tity
ob
liga
tio
ns
•C
od
e o
f co
nd
uct
Ma
rke
t R
es
ult
s
•R
esta
ura
nts
, e
xp
ort
ma
rke
ts c
ho
ose
co
nsis
ten
t q
ua
lity w
ith
pre
miu
m p
rice
•B
ran
din
g a
nd
re
co
gn
itio
n
•G
rea
ter
co
nsis
ten
cy o
f d
em
an
d
•In
cre
ase
in
lo
ng
te
rm m
ark
et
de
ma
nd
Ind
us
try
Re
su
lts
•R
eg
ula
tory
fra
me
wo
rk s
imp
lifie
d a
nd
m
ore
pra
ctica
l
•B
aa
Ra
aR
oo
bu
sin
ess a
nd
qu
alit
y
co
ntr
ol m
od
el w
hic
h c
an
be
use
d
an
yw
he
re in
th
e in
du
str
y
•M
ore
re
pu
tab
le in
du
str
y p
rofile
•G
rea
ter
sta
bili
ty a
nd
exp
ert
ise
in
e
mp
loym
en
t
En
vir
on
me
nta
l R
es
ult
s
•L
an
d is in
cre
asin
gly
ma
na
ge
d f
or
ka
ng
aro
o p
rod
uctio
n in
ste
ad
of
sh
ee
p
an
d c
att
le
•In
cre
ase
in
bio
div
ers
ity
•L
esse
nin
g o
f im
pa
ct
fro
m in
tro
du
ce
d
an
ima
ls
•S
ign
ifica
nt
Gre
en
ho
use
ga
s r
ed
uctio
n
•G
rea
ter
su
rety
of
via
ble
ka
ng
aro
o
po
pu
latio
ns a
nd
dis
trib
utio
n in
th
e
lon
g t
erm
Pro
po
rtio
na
l d
isb
urs
em
en
t o
f p
rofits
(ma
rgin
pe
r kg
)
Co
-op
ex
ec
uti
ve
/Bo
ard
•G
uid
an
ce
an
d a
ssis
tan
ce
to
Ma
na
ge
r
•O
ve
rse
e c
orp
ora
te g
ove
rna
nce
Pro
po
rtio
na
l d
isb
urs
em
en
t o
f p
rofits
(ma
rgin
pe
r kg
)
Ba
aR
aa
Ro
o C
o-o
pe
rati
ve
str
uc
ture
16
4.1.3.Note on terminology: • ʻMemberʼ generally refers to a person who is a Member of an organisation such as a co-
operative.• ʻOwnerʼ refers to a person who has legal ownership of whole or part, such as a proprietary
company.
4.1.4. Member and business characteristicsA business entity will need to consider the following.
4.1.4.1. Member Activity/role/functionMembers will be
• Landholders or land owners who manage the land kangaroos will be harvested from• Harvesters who will harvest the kangaroos• A combination of any of the above
4.1.4.2. Changing membership over timeWhile it is expected the Members/owners to be relatively stable there will be people leaving and people entering the business who will have vested interests in success and profitability.
4.1.4.3. Founding investment and greater long term returnsThe initial stakeholders have invested significant time in meetings, trials, changing of methods which has been unpaid. This input can be considered as an investment in future business success and the stakeholders would assume to reap rewards commensurate with being founding Members.
As the business evolves new stakeholders will be capitalising on the investment of the founders and with reduced risks.
4.1.4.4. The effects of changing membership commitmentFor a variety of reasons the performance of Members may rise and fall. A once productive Member may become no-co-operative, or simply uninvolved. If this Member has part ownership of corporate assets or significant voting power the business can become dysfunctional.
For example, a proprietary company shareholder may no longer contribute or invest further into the company but still be entitled to shareholders dividends and retains their proportional share of increasing asset values and business profits as a result of the, often unpaid, work of other shareholders. In one case known to the author of this report shareholders are faced with the requirement to borrow funds (on top of their initial founding investments) to buy out a shareholder who did not contributed tangibly to the business assets in the first place.
Such a situation can demoralise other owners who are working diligently but see their investment diluted by the uninvolved shareholders. This situation can create factions (eg destructive voting bloc factions), and encourage the proactive Directors to form alternative business activities and structures to ensure the results of their hard work comes to them and not those who are seen as ʻbludgingʼ.
The ability for the business to be able to give and take away membership on a transparent and objective criteria is important.
4.1.4.5. Quality/performance controlOne of the objectives of BaRaRoo is to maintain a consistency of quality and quantity.
In normal business transactions quality control can be maintained by choosing the desired quality product from the supplier.
This is not so easy in the kangaroo industry where the professionalism of Harvesters and chiller operators varies considerably.
BaRaRoo must be able to encourage, or enforce, quality and consistency as an integral part of its operation.
17
4.1.5. Important practical differences between business structures relevant to BaRaRoo
4.1.5.1. A proprietary companyʼs characteristics relevant to operational requirements of BaRaRoo
• Shareholders hold shares in the company owning as much of the company as their proportion of shares
• It is convoluted and difficult to have shareholders sign away traditional rights of financial ownership
• Various share types can be voting or non voting• A shareholder can vote in proportion to the amount of shares they own (if the shares have
voting rights) and can buy shares from others and increase their influence• Shareholders cannot have their shares taken away from them, they must voluntarily
relinquish the shares (sale or gift)• Shares can be sold to third parties who may not embrace or contribute to the initial
objectives• Shareholders cannot be coerced, because of share ownership, to fulfil conditions of
corporate governance or supplier performance
4.1.5.2. A Co-operativeʼs characteristics relevant to operational requirements of BaRaRoo
• Members have only one vote each• Memberships can be different categories according to the role of the Member eg
supplier, processor, Landholder, harvester• Membership can be conditional on factors such as
• Quality, quantity, reliability of supply• Membership activity (eg attendance at key meetings)• Operation within the guidelines of the co-operative eg
• Code of conduct• Submission of paperwork• Operating in a reputable and legal manner• Co-operation with other Members
4.2. BaRaRoo Co-operative operating guidelinesBelow sets out the basic principles for the development of the co-operativeʼs rules, regulations, policies and procedures.
4.2.1.Fixed and variable factors
4.2.1.1. Fixed factorsThese factors do not change significantly according to circumstance such as variations of production. They can be likened to Fixed Costs in financial terms.
Fixed factors can be considered as the overarching principles and operational parameters which apply to all Members and operations of the Co-Operative.
For BaRaRoo business operations the Fixed Factors are
1. Consistent quality of carcasses for the purpose of establishing higher selling price2. consistency in quantity for the development of reliable markets and strategic alliances
with a processor
4.2.1.2. Variable factorsThese factors can change significantly according to circumstances such as variations of production. They can be likened to Variable Costs in financial terms.
For BaRaRoo business operations the Variable Factors are factors such as
1. Landholders with different land areas2. Landholdings with traditionally and significantly different kangaroo production3. Harvesters with varying production levels4. Future changes in productivity due to deliberate and positive kangaroo
management activity
18
4.2.1.3. Delineation between Fixed and Variable factorsIt is important to separate fixed and variable factors in the same way it is important to separate fixed and variable costs in financial analysis.
The separation will be achieved by the co-operative by
1. Membership structure based on productivity and quality (fixed factors)2. Distribution of profits and benefits according to proportional inputs (variable factors)
4.2.2.Membership structure classes based on productivity and quality As outlined above, ensuring constant participation, productivity and quality is important for the long-term aims of BaRaRoo. Membership based on these features is probably the simplest method of communicating and enforcing these key factors.
4.2.2.1. Landholder membershipMembership criteria
• Provision of land to to the co-operative for the purposes of harvesting• Must allow unrestricted entry to approved trappers according to co-operative policy and
codes of conduct (developed with Landholder input)
4.2.2.2. Trapper membershipMembership criteria
• Minimum supply of carcasses per year (level to be determined)• Operates according to the
• adopted BaRaRoo harvesting requirements• Statutory regulations• Relationship with Landholders
• Quality controls specific to BaRaRoo
4.2.2.3. Combined membership A Member can hold more than one membership category, for example Landholder AND Harvester membership.
To hold each category the Member must fulfil the membership criteria of each category. A Landholder who is also a trapper contributes in two ways to the Co-Operative and is involved in two distinct commercial activities.
These two commercial activities are individually eligible for the proportional disbursement of dividends/income from the co-operative (see below)
4.2.3.Voting rightsEach membership confers one vote to the Member.
Consequently combined membership allows for a vote for each category entitling the holder to two votes if they hold two categories.
4.2.4.Losing membership privilegesThe membership criteria will be specific enough to allow objective assessment of performance and quality so that objective decisions can be made.
Note: The main aim of the membership criteria is to ensure consistency of production and quality, not to penalise Members whose circumstances have temporarily changed.
While policy and procedure detail is to be finalised it is likely the broad guidelines will be:
• Membership performance reviews will be undertaken automatically at the end of each financial year and assessed according to membership criteria
• Member performance is automatically reported in the end of year reports and automatically reviewed by the Board for determination of membership
• Interim breaches of membership criteria by any Member can be requested by any other Member. (encouraging peer regulation)
• The Manager undertakes all interim reviews with verification by a nominated Board Member • Revocation of Membership is a decision of the Board
19
4.2.4.1. Protection of Memberʼs reputationsIn the development of this document examples of poor Harvester professionalism were reported to be
• commencing shooting too early in the day (carcasses stay warm for too long)• not placing carcasses in chillers until well after sunrise (carcasses stay warm for too
long)• providing carcasses not conforming to regulations (not cleaned and dressed to
industry specifications)
Note: the Harvesters given as examples were not Members of BaRaRoo.
Dealing with issues such as these requires enough information and ʻinvestigationʼ to unquestionably revoke membership. If the concerns are found to be unwarranted or un-proven, a personʼs reputation can suffer unnecessarily. Likewise, incorrect or mischievous claims against a Member can also damage reputation.
The Board will consist of Co-Operative Members so confidentiality in any special review of Member performance is important. Consequently, the Manager of the co-operative, who is not a Member, undertakes the review and a nominated Board Member verifies the information to ensure the Manager has been diligent. If it is found that the Member is non conforming the issue is then presented to the Board for action.
4.2.5.Distribution of profits according to proportional inputsEventually the co-operative will generate income and disburse profits and benefits to Members.. It is possible the co-operative will also generate profits derived from expansion into value adding enterprises at a later date.
Landholders who have greater harvesting rates due to• Area• Inherent productivity• De-stocking of introduced animals• Active kangaroo management
contribute a greater income to the co-operative.
Harvesters who • harvest more consistently (reliance on the job as a profession)• harvest at higher volumes (efficiency, knowledge, expertise)• provide better quality (selection of prime animals, adhere better to best practice harvesting methods)
contribute more to the profitability of the co-operative.
4.2.5.1. Determining proportional returns to LandholdersFATE has already analysed properties who will be in the co-operative to determine which are reliably more productive than others and thus obtain greater proportions of profit distribution.
Historical trends or using information on Harvesters records can determine the proportions of contribution.
Mechanisms for determining changes in land management to increase kangaroo populations and harvesting volume will be developed in the Co-operativeʼs policy and procedures.
4.2.5.2. Determining proportional returns to Trappers According to quality and quantity of carcasses delivered and shown on the Shooterʼs returns.
4.2.5.3. Founding members and start up costsFounding members will have invested in start up costs separate to the membership fee. In the development of the detailed Cooperative policies and procedures these funds could be considered
1. As long term liabilities to the Cooperative to be repaid as profits are obtained2. As justification for greater share of profit disbursement over a period of time
as decided by the members.It is likely to be considered that the first option is the simpler due to investment is not lost if the member leaves the cooperative.
20
5. Implementation of a BaRaRoo Co-operative
5.1. ConsiderationsTo instigate BaRaRoo a number of issues confronting business development must be considered. The issues are, or arise from:
• The remoteness and distance between stakeholders• Group dynamics• Individualism of Members• The time and dedication which can be expected to be interested by stakeholders• Availability of Member funds for up front to investment• Short-term cash flow and income issues with Members• Scepticism by Members that the regulatory and market hurdles can be overcome• Business development process• The need to change existing paradigms in the regulatory, harvesting, processing and marketing
environments
5.1.1.Investment by Members
5.1.1.1. Availability of fundsThe Members have been suffering drought and a resultant reduction of incomes in the industry for some time. This does not diminish the long term value of the industry but it does impact on the ability of Members to significantly contribute and invest in new ventures.
5.1.1.2. Wariness of investment in new venturesThe kangaroo industry reputation is considerably influenced by:
• Government regulatory systems considered (rightly or wrongly) as impractical and inefficient by those directly involved and those considering business development in the supply side of the industry
• Industry participants who are reputed to be less than ethical, honest or legal• Adverse press from extremist environmentalists
Note: BaRaRoo considers it is addressing these issues through its formation and anticipated future actions.
The Members of BaRaRoo are in the weakest negotiation position in the industry. They are generally dictated to by the processes and regulators who set the prices, methods of operation, and stifle negotiations and competition. This is fairly typical in the agriculture industry.
With little individual self-determination in the industry BaRaRoo Members need to be shown that they can make changes.
The Members of BaRaRoo have come together with the hope of being able to make changes but until political, regulatory, and commercial success is clearly demonstrated the desire to invest money and time will remain weakened by past experience.
Consequently it is unlikely the Members can afford to invest in the Co-Operative to the level where a dedicated business development manager can be appointed.
5.1.2.LeadershipBaRaRoo, to date has had its leadership provided by the FATE program. This program has developed the project, brought people together, maintained the vision provided the communication and followup, and provided a central focus point.
At the time of this plan this leadership was losing momentum due to
• the cessation of funding• The completion of
• the initial tasks of group formation• Completion of the new regulatory systems• Initial research goals
21
• Lack of resources to progress the project from the research stage to business implementation and development
The development of any group business, cannot be undertaken by a group of people who have full-time commitments in other areas. It must be driven by a dedicated individual (or close knit partners) who has multi-tasking skills in communications, business systems, business operations, logistics, organisation and marketing.
It is rare to find an individual in a group, such as BaRaRoo, who is prepared to sacrifice a portion of their livelihood to develop a business for the group unless they are paid accordingly and their position is clearly recognised. As mentioned above, the historical lack of self determination of Landholders and Harvesters in the kangaroo industry has not bred confidence to tackle the issues.
Consequently, BaRaRoo has been the result of dedicated individuals in FATE ultimately working to address larger scale environmental, economic, and social issues.
This does not imply that Members of BaRaRoo are not dedicated or do not have skills, it just means that it will require some measure of success to engender self-perpetuating enthusiasm in Members so as to encourage investment of time and resources.
Consequently, the long term objectives of BaRaRoo will require a dedicated business development manager to provide the initial skills, time and energy.
5.1.3.Income stream for initial business developmentAs discussed in the financial section of this business plan the main source of future income of the co-operative will be from obtaining a higher price from the sale of carcasses. This cannot be obtained in the first instance as the processor will need to experience the quality and reliability of supply and also be sure they have a market which is prepared to pay for the same.
5.1.4. Management/Administration/Business developmentFor any business entity to operate it must have a clear administration, management and communication.
BaRaRoo suffers from considerable distance between stakeholders, and for a number of Members lack adoption of newer methods of communication such as email and internet. Members have properties to run which includes significant time spent in summer keeping water up to stock. Running a business and the administration and accountability required is difficult for landholders.
FATE has provided this service to date.
5.2. Business Development processIt is relatively inexpensive to set up a co-operative business using volunteerism from the Members. An organisation developed in this manner would be limited in effectiveness due to the reasons above: finances, leadership, and available time.
BaRaRoo business development and ultimate success relies not only on its internal structures and performance but very much on proactive and strategic marketing of a quality product.
The time, skills and costs to properly achieve this are significant. As mentioned above, FATE to date has provided the impetus and insight and energy to bring the project together but FATE has limited ability to take the project into a business reality due to
• Ceasing funding for the project• It is primarily a research body with a different skills set to a business development body
However, BaRaRoo recognises that what it is trying to achieve has major positive outcomes for the economy, industry and the environment of the rangelands and considers that this may gain support from sources of financial support with similar objectives, i.e. Government and industry bodies.
22
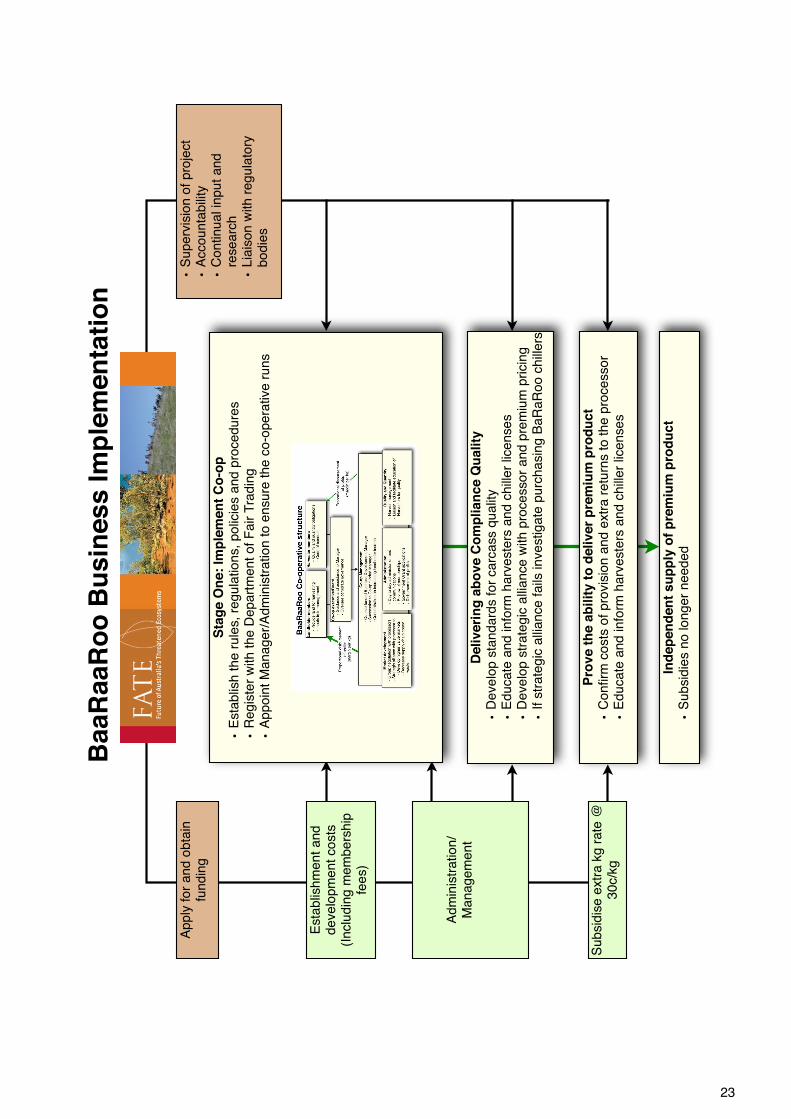
De
liv
eri
ng
ab
ov
e C
om
pli
an
ce
Qu
ali
ty
•D
eve
lop
sta
nd
ard
s f
or
ca
rca
ss q
ua
lity
•E
du
ca
te a
nd
in
form
ha
rve
ste
rs a
nd
ch
ille
r lic
en
se
s
•D
eve
lop
str
ate
gic
alli
an
ce
with
pro
ce
sso
r a
nd
pre
miu
m p
ricin
g
•If
str
ate
gic
alli
an
ce
fa
ils in
ve
stig
ate
pu
rch
asin
g B
aR
aR
oo
ch
ille
rs
Ba
aR
aa
Ro
o B
us
ine
ss
Im
ple
me
nta
tio
n
Sta
ge
On
e:
Imp
lem
en
t C
o-o
p
•E
sta
blis
h t
he
ru
les,
reg
ula
tio
ns,
po
licie
s a
nd
pro
ce
du
res
•R
eg
iste
r w
ith
th
e D
ep
art
me
nt
of
Fa
ir T
rad
ing
•A
pp
oin
t M
an
ag
er/
Ad
min
istr
atio
n t
o e
nsu
re t
he
co
-op
era
tive
ru
ns
Pro
ve
th
e a
bil
ity
to
de
liv
er
pre
miu
m p
rod
uc
t
•C
on
firm
co
sts
of
pro
vis
ion
an
d e
xtr
a r
etu
rns t
o t
he p
roce
sso
r
•E
du
ca
te a
nd
in
form
ha
rve
ste
rs a
nd
ch
ille
r lic
en
se
s
Ind
ep
en
de
nt
su
pp
ly o
f p
rem
ium
pro
du
ct
•S
ub
sid
ies n
o lo
ng
er
ne
ed
ed
Esta
blis
hm
en
t a
nd
d
eve
lop
me
nt
co
sts
(In
clu
din
g m
em
be
rsh
ip
fee
s)
Ad
min
istr
atio
n/
Ma
na
ge
me
nt
Su
bsid
ise
extr
a k
g r
ate
@
30
c/k
g
Ap
ply
fo
r a
nd
ob
tain
fu
nd
ing
•S
up
erv
isio
n o
f p
roje
ct
•A
cco
un
tab
ility
•C
on
tin
ua
l in
pu
t a
nd
re
se
arc
h
•L
iais
on
with
re
gu
lato
ry
bo
die
s
23
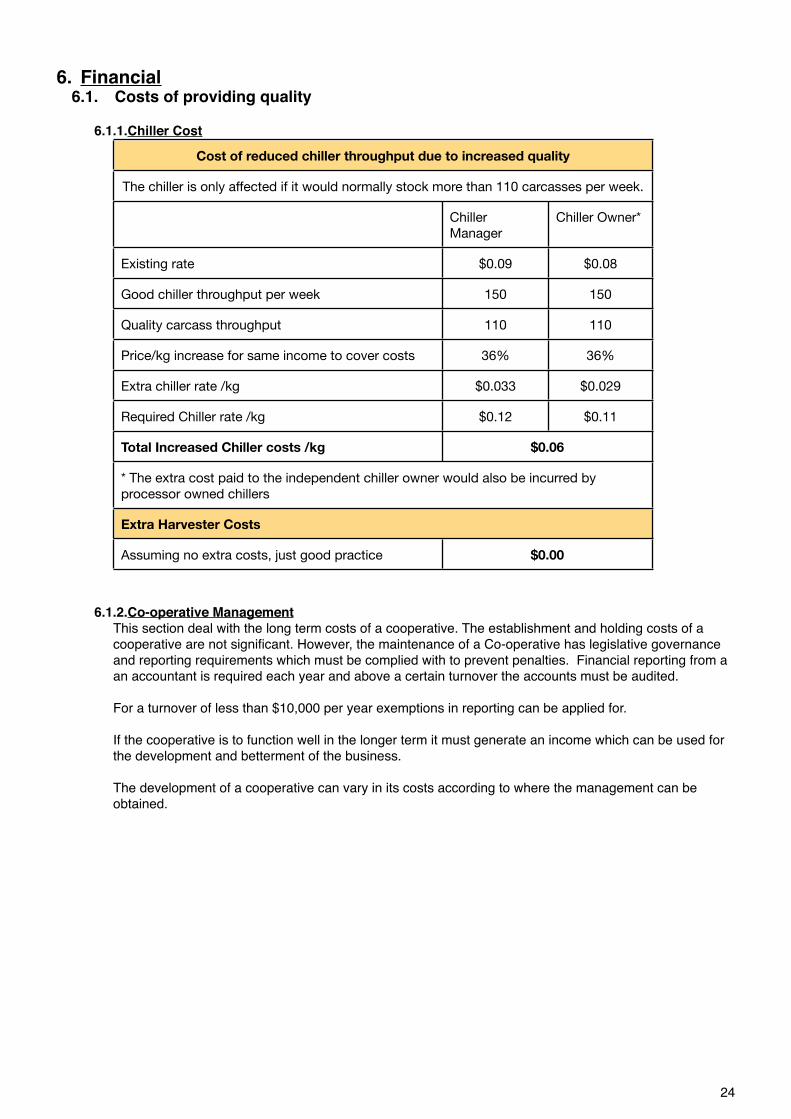
6. Financial 6.1. Costs of providing quality
6.1.1.Chiller Cost
Cost of reduced chiller throughput due to increased qualityCost of reduced chiller throughput due to increased qualityCost of reduced chiller throughput due to increased quality
The chiller is only affected if it would normally stock more than 110 carcasses per week.The chiller is only affected if it would normally stock more than 110 carcasses per week.The chiller is only affected if it would normally stock more than 110 carcasses per week.
Chiller Manager
Chiller Owner*
Existing rate $0.09 $0.08
Good chiller throughput per week 150 150
Quality carcass throughput 110 110
Price/kg increase for same income to cover costs 36% 36%
Extra chiller rate /kg $0.033 $0.029
Required Chiller rate /kg $0.12 $0.11
Total Increased Chiller costs /kg $0.06$0.06
* The extra cost paid to the independent chiller owner would also be incurred by processor owned chillers* The extra cost paid to the independent chiller owner would also be incurred by processor owned chillers* The extra cost paid to the independent chiller owner would also be incurred by processor owned chillers
Extra Harvester CostsExtra Harvester CostsExtra Harvester Costs
Assuming no extra costs, just good practice $0.00$0.00
6.1.2.Co-operative ManagementThis section deal with the long term costs of a cooperative. The establishment and holding costs of a cooperative are not significant. However, the maintenance of a Co-operative has legislative governance and reporting requirements which must be complied with to prevent penalties. Financial reporting from a an accountant is required each year and above a certain turnover the accounts must be audited.
For a turnover of less than $10,000 per year exemptions in reporting can be applied for.
If the cooperative is to function well in the longer term it must generate an income which can be used for the development and betterment of the business.
The development of a cooperative can vary in its costs according to where the management can be obtained.
24
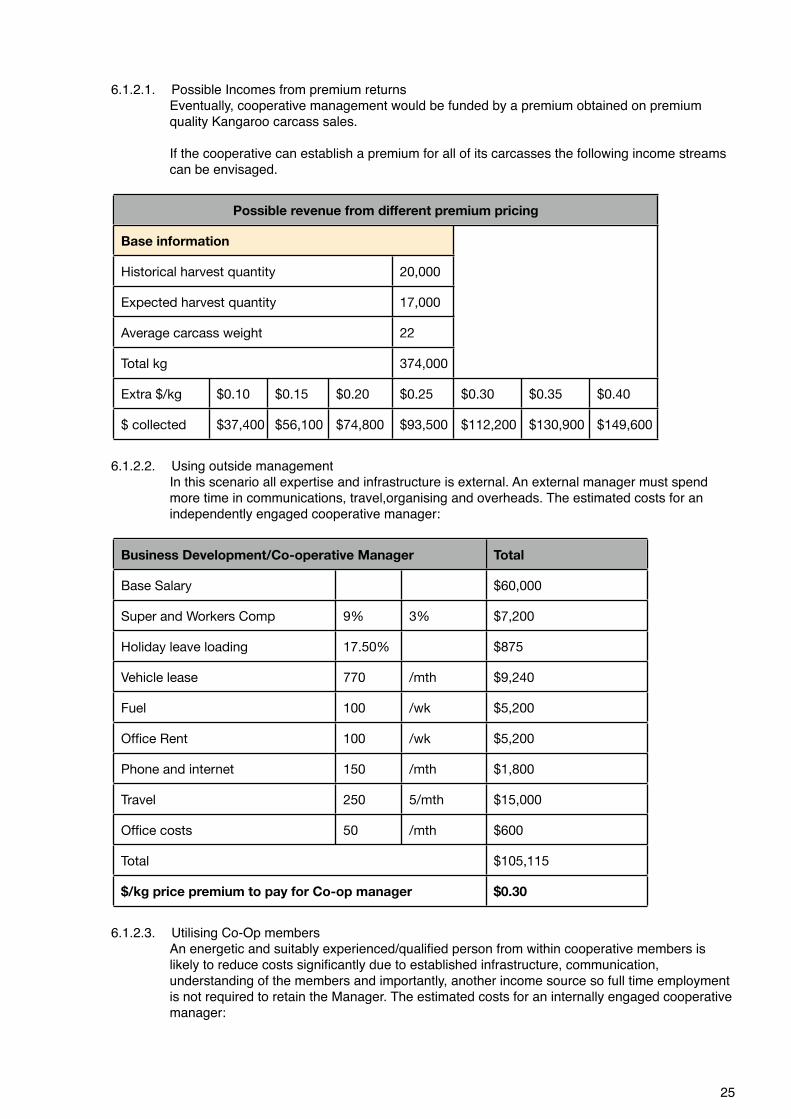
6.1.2.1. Possible Incomes from premium returns Eventually, cooperative management would be funded by a premium obtained on premium quality Kangaroo carcass sales.
If the cooperative can establish a premium for all of its carcasses the following income streams can be envisaged.
Possible revenue from different premium pricing Possible revenue from different premium pricing Possible revenue from different premium pricing Possible revenue from different premium pricing Possible revenue from different premium pricing Possible revenue from different premium pricing Possible revenue from different premium pricing Possible revenue from different premium pricing
Base informationBase informationBase informationBase informationBase information
Historical harvest quantityHistorical harvest quantityHistorical harvest quantityHistorical harvest quantity 20,000
Expected harvest quantityExpected harvest quantityExpected harvest quantityExpected harvest quantity 17,000
Average carcass weightAverage carcass weightAverage carcass weightAverage carcass weight 22
Total kgTotal kgTotal kgTotal kg 374,000
Extra $/kg $0.10 $0.15 $0.20 $0.25 $0.30 $0.35 $0.40
$ collected $37,400 $56,100 $74,800 $93,500 $112,200 $130,900 $149,600
6.1.2.2. Using outside managementIn this scenario all expertise and infrastructure is external. An external manager must spend more time in communications, travel,organising and overheads. The estimated costs for an independently engaged cooperative manager:
Business Development/Co-operative ManagerBusiness Development/Co-operative ManagerBusiness Development/Co-operative Manager Total
Base Salary $60,000
Super and Workers Comp 9% 3% $7,200
Holiday leave loading 17.50% $875
Vehicle lease 770 /mth $9,240
Fuel 100 /wk $5,200
Office Rent 100 /wk $5,200
Phone and internet 150 /mth $1,800
Travel 250 5/mth $15,000
Office costs 50 /mth $600
TotalTotalTotal $105,115
$/kg price premium to pay for Co-op manager$/kg price premium to pay for Co-op manager$/kg price premium to pay for Co-op manager $0.30
6.1.2.3. Utilising Co-Op membersAn energetic and suitably experienced/qualified person from within cooperative members is likely to reduce costs significantly due to established infrastructure, communication, understanding of the members and importantly, another income source so full time employment is not required to retain the Manager. The estimated costs for an internally engaged cooperative manager:
25
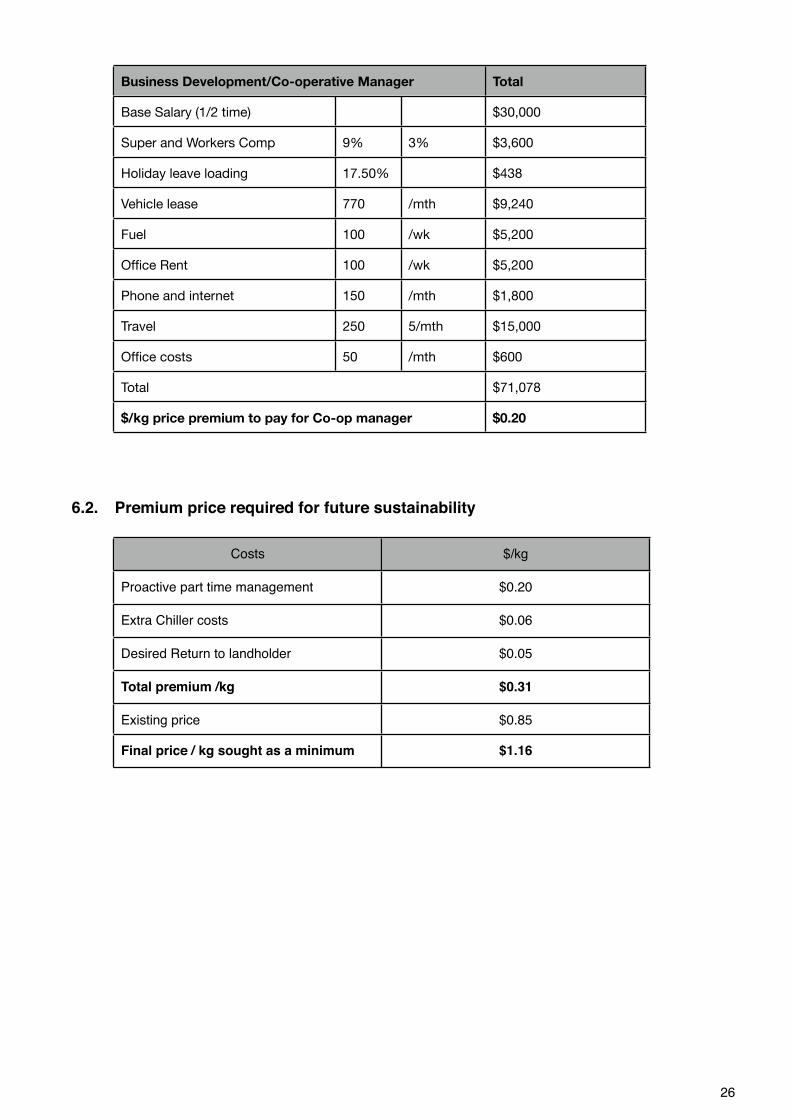
Business Development/Co-operative ManagerBusiness Development/Co-operative ManagerBusiness Development/Co-operative Manager Total
Base Salary (1/2 time) $30,000
Super and Workers Comp 9% 3% $3,600
Holiday leave loading 17.50% $438
Vehicle lease 770 /mth $9,240
Fuel 100 /wk $5,200
Office Rent 100 /wk $5,200
Phone and internet 150 /mth $1,800
Travel 250 5/mth $15,000
Office costs 50 /mth $600
TotalTotalTotal $71,078
$/kg price premium to pay for Co-op manager$/kg price premium to pay for Co-op manager$/kg price premium to pay for Co-op manager $0.20
6.2. Premium price required for future sustainability
Costs $/kg
Proactive part time management $0.20
Extra Chiller costs $0.06
Desired Return to landholder $0.05
Total premium /kg $0.31
Existing price $0.85
Final price / kg sought as a minimum $1.16
26
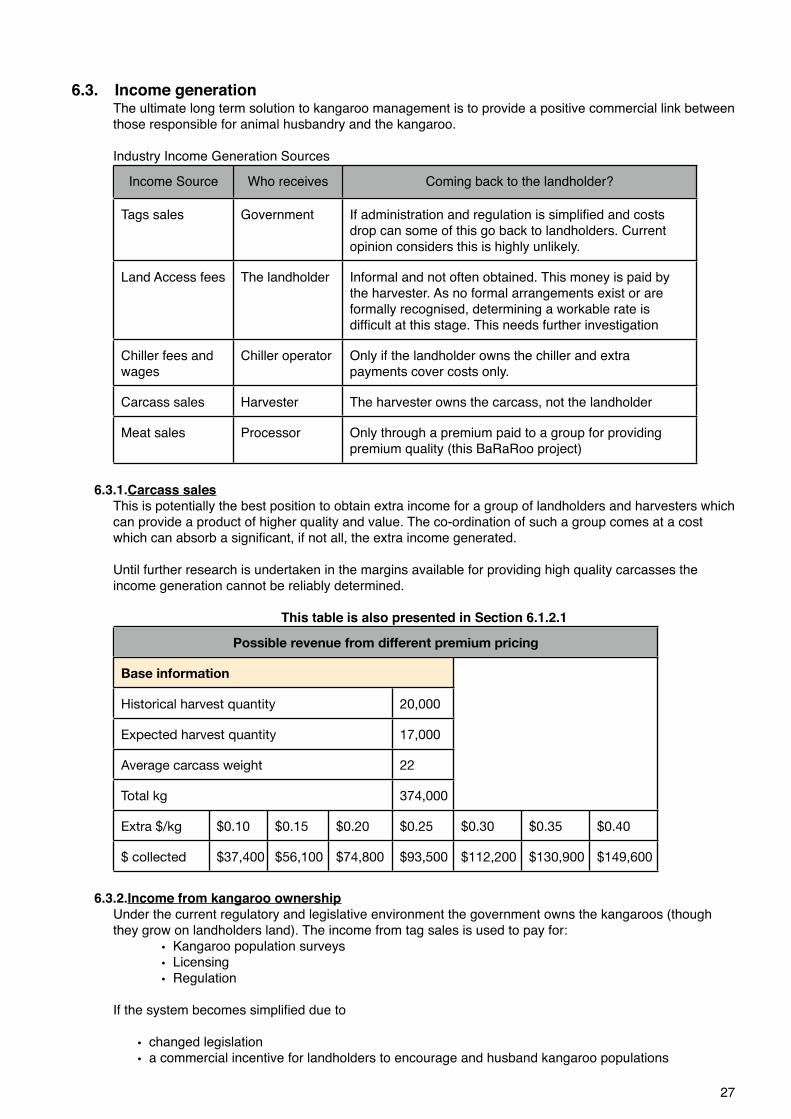
6.3. Income generationThe ultimate long term solution to kangaroo management is to provide a positive commercial link between those responsible for animal husbandry and the kangaroo.
Industry Income Generation Sources
Income Source Who receives Coming back to the landholder?
Tags sales Government If administration and regulation is simplified and costs drop can some of this go back to landholders. Current opinion considers this is highly unlikely.
Land Access fees The landholder Informal and not often obtained. This money is paid by the harvester. As no formal arrangements exist or are formally recognised, determining a workable rate is difficult at this stage. This needs further investigation
Chiller fees and wages
Chiller operator Only if the landholder owns the chiller and extra payments cover costs only.
Carcass sales Harvester The harvester owns the carcass, not the landholder
Meat sales Processor Only through a premium paid to a group for providing premium quality (this BaRaRoo project)
6.3.1.Carcass salesThis is potentially the best position to obtain extra income for a group of landholders and harvesters which can provide a product of higher quality and value. The co-ordination of such a group comes at a cost which can absorb a significant, if not all, the extra income generated.
Until further research is undertaken in the margins available for providing high quality carcasses the income generation cannot be reliably determined.
This table is also presented in Section 6.1.2.1
Possible revenue from different premium pricing Possible revenue from different premium pricing Possible revenue from different premium pricing Possible revenue from different premium pricing Possible revenue from different premium pricing Possible revenue from different premium pricing Possible revenue from different premium pricing Possible revenue from different premium pricing
Base informationBase informationBase informationBase informationBase information
Historical harvest quantityHistorical harvest quantityHistorical harvest quantityHistorical harvest quantity 20,000
Expected harvest quantityExpected harvest quantityExpected harvest quantityExpected harvest quantity 17,000
Average carcass weightAverage carcass weightAverage carcass weightAverage carcass weight 22
Total kgTotal kgTotal kgTotal kg 374,000
Extra $/kg $0.10 $0.15 $0.20 $0.25 $0.30 $0.35 $0.40
$ collected $37,400 $56,100 $74,800 $93,500 $112,200 $130,900 $149,600
6.3.2.Income from kangaroo ownershipUnder the current regulatory and legislative environment the government owns the kangaroos (though they grow on landholders land). The income from tag sales is used to pay for:
• Kangaroo population surveys• Licensing• Regulation
If the system becomes simplified due to
• changed legislation• a commercial incentive for landholders to encourage and husband kangaroo populations
27
• Organisations such as BaRaRoo which provide demonstrated sustainable, environmentally responsible and accountable harvesting regimes
costs are likely to be reduced. Obtaining these savings to strengthen the link between the landholder and kangaroos is ideal but realistically probably very difficult.
6.3.3.Income from ʻland accessʼ feesSome landholders have special arrangements with harvesters who pay so much per kangaroo harvested from the property.
These arrangements are illegal as the Landholder is not recognised under law as having any ownership of the kangaroos and are not allowed to sell Crown property. Such payments are disguised as access fees or ʻcampingʼ fees.
When these fees are paid by harvesters the arrangement gives the Harvester exclusive access to good harvesting areas. However, Landholders who have lower quality harvesting areas or are surrounded by neighbours who did not ask for such fees cannot obtain an income from this source.
Harvesting kangaroos is not a job which in the general population chooses to undertake because of the conditions, the variations of income and sometimes, the bureaucracy that is involved. Reducing the income of harvesters by making them pay for both tags and a price per head to the landholder could potentially upset the viability of harvesting as a profession.
Imposing any levy or fee arbitrarily on harvesters would need significant consultation and research if it was to be considered.
6.3.4.Chiller fees and ownershipAs discussed in other areas of this document operating a chiller is essentially a break even point providing some labour income for the chiller manager. Income derived from chiller managing or ownership does not create a significant profitable income which would be required for industry development or creating the link between landholders and kangaroo.
However ownership of three chillers would return approximately $16,000 per year to the cooperative which would assist with administration in the early stages.
6.3.5.Membership feesMembers would pay a fee to the cooperative each year. Obviously Members will wish to see a net return for this membership fee. The fee is to be determined but at the stage of this plan a yearly fee of $200 per landholder and $300 per shooter is considered. This would need to be agreed to by the Members on formation of the cooperative.
17 Landholders @ $200= $3400 15 harvesters @ $300= $4,500
6.3.6.Meat salesThis section of the market is too removed from the landholder and BaRaRoo to be considered as a potential income source.
28
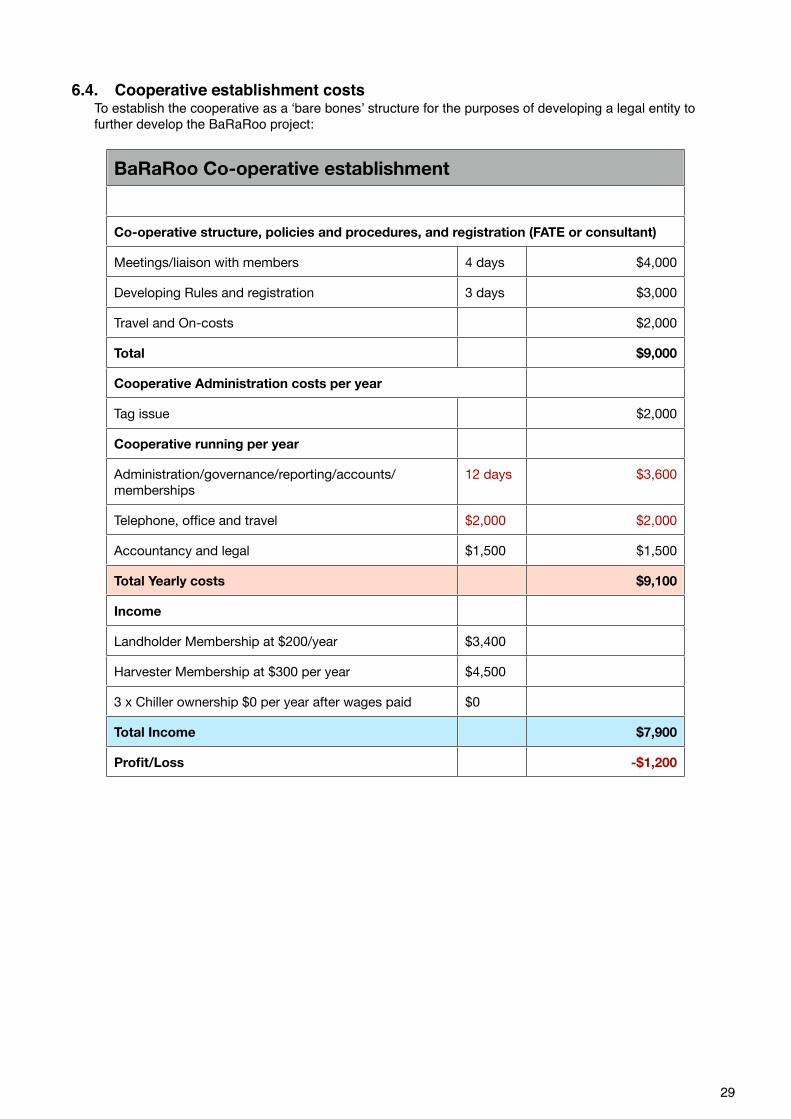
6.4. Cooperative establishment costsTo establish the cooperative as a ʻbare bonesʼ structure for the purposes of developing a legal entity to further develop the BaRaRoo project:
BaRaRoo Co-operative establishmentBaRaRoo Co-operative establishmentBaRaRoo Co-operative establishment
Co-operative structure, policies and procedures, and registration (FATE or consultant)Co-operative structure, policies and procedures, and registration (FATE or consultant)Co-operative structure, policies and procedures, and registration (FATE or consultant)
Meetings/liaison with members 4 days $4,000
Developing Rules and registration 3 days $3,000
Travel and On-costs $2,000
Total $9,000
Cooperative Administration costs per yearCooperative Administration costs per year
Tag issue $2,000
Cooperative running per year
Administration/governance/reporting/accounts/memberships
12 days $3,600
Telephone, office and travel $2,000 $2,000
Accountancy and legal $1,500 $1,500
Total Yearly costs $9,100
Income
Landholder Membership at $200/year $3,400
Harvester Membership at $300 per year $4,500
3 x Chiller ownership $0 per year after wages paid $0
Total Income $7,900
Profit/Loss -$1,200
29
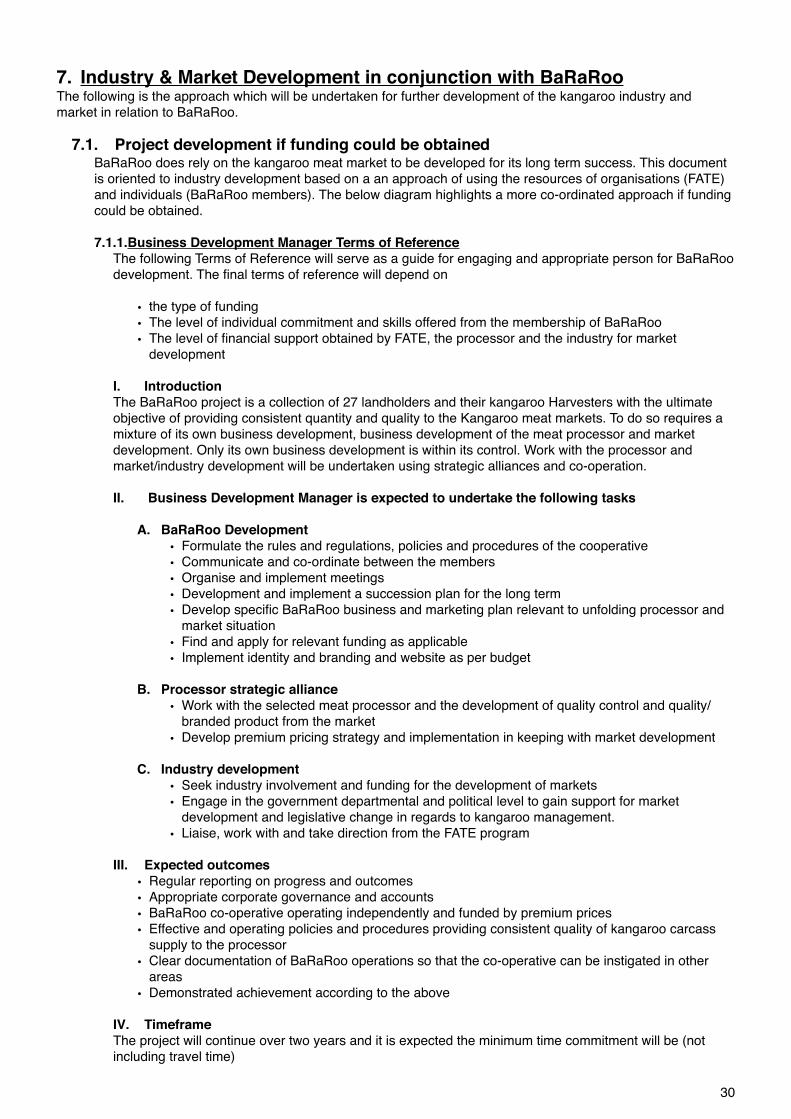
7. Industry & Market Development in conjunction with BaRaRooThe following is the approach which will be undertaken for further development of the kangaroo industry and market in relation to BaRaRoo.
7.1. Project development if funding could be obtainedBaRaRoo does rely on the kangaroo meat market to be developed for its long term success. This document is oriented to industry development based on a an approach of using the resources of organisations (FATE) and individuals (BaRaRoo members). The below diagram highlights a more co-ordinated approach if funding could be obtained.
7.1.1.Business Development Manager Terms of ReferenceThe following Terms of Reference will serve as a guide for engaging and appropriate person for BaRaRoo development. The final terms of reference will depend on
• the type of funding• The level of individual commitment and skills offered from the membership of BaRaRoo• The level of financial support obtained by FATE, the processor and the industry for market
development
I. IntroductionThe BaRaRoo project is a collection of 27 landholders and their kangaroo Harvesters with the ultimate objective of providing consistent quantity and quality to the Kangaroo meat markets. To do so requires a mixture of its own business development, business development of the meat processor and market development. Only its own business development is within its control. Work with the processor and market/industry development will be undertaken using strategic alliances and co-operation.
II. Business Development Manager is expected to undertake the following tasks
A. BaRaRoo Development• Formulate the rules and regulations, policies and procedures of the cooperative• Communicate and co-ordinate between the members• Organise and implement meetings• Development and implement a succession plan for the long term• Develop specific BaRaRoo business and marketing plan relevant to unfolding processor and
market situation• Find and apply for relevant funding as applicable• Implement identity and branding and website as per budget
B. Processor strategic alliance• Work with the selected meat processor and the development of quality control and quality/
branded product from the market• Develop premium pricing strategy and implementation in keeping with market development
C. Industry development• Seek industry involvement and funding for the development of markets• Engage in the government departmental and political level to gain support for market
development and legislative change in regards to kangaroo management.• Liaise, work with and take direction from the FATE program
III. Expected outcomes• Regular reporting on progress and outcomes• Appropriate corporate governance and accounts• BaRaRoo co-operative operating independently and funded by premium prices• Effective and operating policies and procedures providing consistent quality of kangaroo carcass
supply to the processor• Clear documentation of BaRaRoo operations so that the co-operative can be instigated in other
areas• Demonstrated achievement according to the above
IV. TimeframeThe project will continue over two years and it is expected the minimum time commitment will be (not including travel time)
30
• Month 1-6 10 working days per month on average • Month 6-12 7 working days per month on average• Thereafter 5 working days per month on average
V. Project managementThe project manager will report and take direction from
A. FATE in regards to• Industry development• Political and government negotiations• Research and development matters• Market development
B. The Board of BaRaRoo in regards to• Development of quality standards• Policies and procedures• Day-to-day management• Corporate governance• Budgets and finances• Organisational structure• BaRaRoo marketing and identity• Processor strategic alliance and negotiations
The following are to be completed when the Tenders/Applications are called for
VI. Administrative MattersVII. ConfidentialityVIII. PrivacyIX. Contact details
7.1.2.Type of Business Development Manager: Consultant or full time employee?A Business Development Manager could be gained by two methods, a Consultant engaged on a contract or a full time employee.
7.1.2.1. ConsultantThe ʻrightʼ consultant can offer business development expertise and experience which cannot be obtained from employees within an affordable price range. A consultant is generally more expensive on an hourly basis than a full-time employee however:
• They are generally not required on a full-time basis as they can facilitate and achieve tasks in a more efficient and effective manner due to experience and contacts
• Has a ceiling fee covering all of their own on costs so a fledgeling organisation does not have too provide workers compensation, superannuation and other employment on costs.
• The higher skills sets and experiences and contacts can prevent mistakes and inefficiencies from occurring
The consultancy industry is like any other service provider, it has good and bad providers. The “right” consultant would need to show the following characteristics
• Experience in business development ( structures, marketing, product development)• Excellent communication skills with Kangaroo Harvesters, Landholders, bureaucrats, and
politicians• Real business experience, not just academic or consultancy• Project management skills over the long-term• Energy and dedication to tasks and can demonstrate they are task driven not payment/rules
driven• Genuine philosophical and practical alignment with the objectives of the project• Demonstrated mobility (not desk bound)• Approachable, not hidden in a corporate structure• Appropriate qualifications and experience relevant to the project• Approachable manner and not ʻall knowingʼ as the kangaroo industry has a very low ʻbullʼ
tolerance
7.1.2.2. Full time Employee
31
It is more likely that a full-time employee would come after the initial major business and market development simply because of the high expertise required in the initial stages.
However, if there is a possibility of gaining an appropriately skilled manager in the first instance a consultant, if required, can be used to mentor the manager.
The permutations of the arrangements will depend on on the people and skills available closer to implementation.
7.2. Strategic alliancesBaRaRoo at its early stages of formation will not be in the position to be responsible for marketing of a premium meat product as itʼs formal commercial activities end with supply of carcasses to the processor.
However, as BaRaRoo is ultimately trying to establish a market for its products, which exists on the other side of the meat processor, the processor must become engaged in the process.
It will do this through two main strategies
1. A strategic alliance with a processor to ensure supply and have input into the marketing of quality product
2. Working with the industry for the development of branding, marketing, brand awareness, consumer acceptance
7.2.1.BaRaRoo will offer a strategic partner
1. Resources of the FATE program• Market research• Political and market contacts• Assistance in accessing government industry development funding
2. Collaboration in regards to • Selection of quality animals• Specific harvesting and processing requests
3. Priority in• Supply• Communications• Business matters
4. Assistance in marketing such as• Development of brand and identity (depending on funding)• Public appearances• Availability for television and media exposure
32
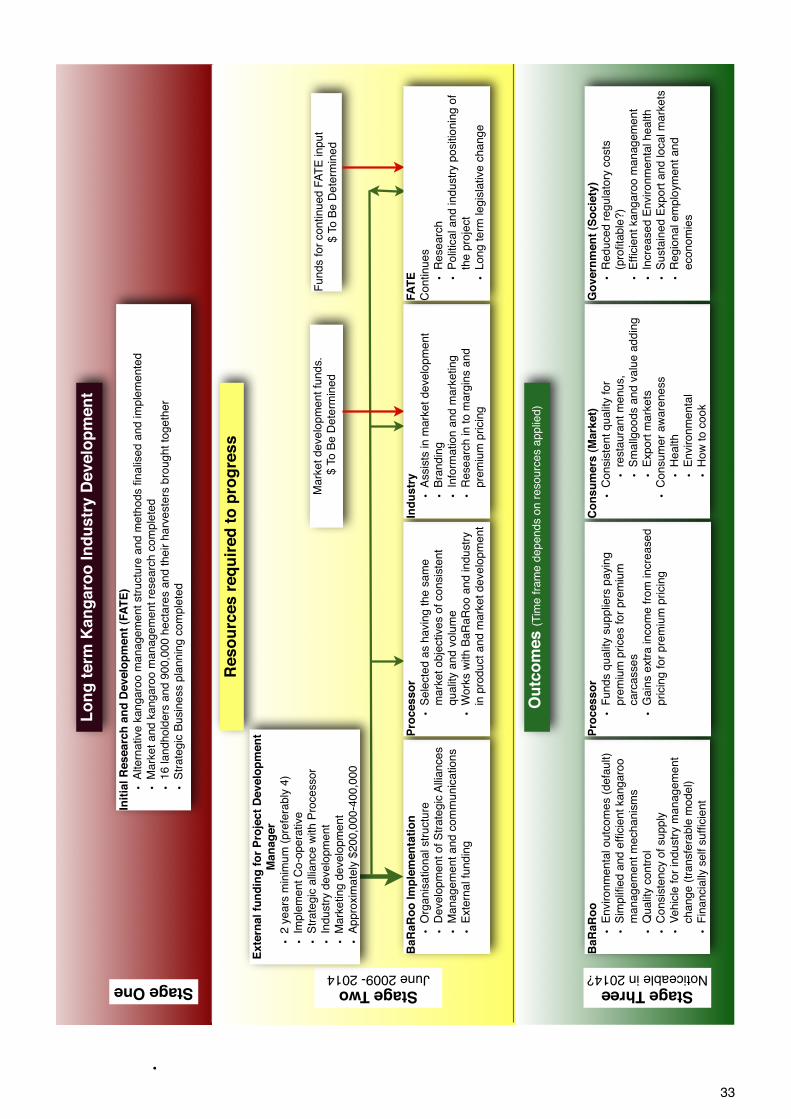
•
Init
ial R
esearc
h a
nd
Develo
pm
en
t (F
AT
E)
•A
ltern
ative k
angaro
o m
anagem
ent str
uctu
re a
nd m
eth
ods fi
nalis
ed a
nd im
ple
mente
d
•M
ark
et and k
angaro
o m
anagem
ent re
searc
h c
om
ple
ted
•16 landhold
ers
and 9
00,0
00 h
ecta
res a
nd their h
arv
este
rs b
rought to
geth
er
•S
trate
gic
Busin
ess p
lannin
g c
om
ple
ted
BaR
aR
oo
•E
nvironm
enta
l outc
om
es (
defa
ult)
•S
implifi
ed a
nd e
fficie
nt kangaro
o
managem
ent m
echanis
ms
•Q
ualit
y c
ontr
ol
•C
onsis
tency o
f supply
•V
ehic
le for
industr
y m
anagem
ent
change (
transfe
rable
model)
•F
inancia
lly s
elf s
uffi
cie
nt
Reso
urc
es r
eq
uir
ed
to
pro
gre
ss
Funds for
continued F
AT
E input
$ T
o B
e D
ete
rmin
ed
Mark
et develo
pm
ent fu
nds.
$ T
o B
e D
ete
rmin
ed
Pro
cesso
r
•F
unds q
ualit
y s
upplie
rs p
ayin
g
pre
miu
m p
rices for
pre
miu
m
carc
asses
•G
ain
s e
xtr
a incom
e fro
m incre
ased
pricin
g for
pre
miu
m p
ricin
g
Co
nsu
mers
(M
ark
et)
•C
onsis
tent qualit
y for
•re
sta
ura
nt m
enus,
•S
mallg
oods a
nd v
alu
e a
ddin
g
•E
xport
mark
ets
•C
onsum
er
aw
are
ness
•H
ealth
•E
nvironm
enta
l
•H
ow
to c
ook
Ou
tco
mes
(T
ime fra
me d
epends o
n r
esourc
es a
pplie
d)
Lo
ng
term
Kan
garo
o In
du
str
y D
evelo
pm
en
t
Stage One Stage TwoJune 2009- 2014
Stage ThreeNoticeable in 2014?
Exte
rnal fu
nd
ing
fo
r P
roje
ct
Develo
pm
en
t
Man
ag
er
•2 y
ears
min
imum
(pre
fera
bly
4)
•Im
ple
ment C
o-o
pera
tive
•S
trate
gic
alli
ance w
ith P
rocessor
•In
dustr
y d
evelo
pm
ent
•M
ark
eting d
evelo
pm
ent
•A
ppro
xim
ate
ly $
200,0
00-4
00,0
00
Go
vern
men
t (S
ocie
ty)
•R
educed r
egula
tory
costs
(p
rofita
ble
?)
•E
fficie
nt kangaro
o m
anagem
ent
•In
cre
ased E
nvironm
enta
l health
•S
usta
ined E
xport
and local m
ark
ets
•R
egio
nal em
plo
ym
ent and
econom
ies
BaR
aR
oo
Im
ple
men
tati
on
•O
rganis
ational str
uctu
re
•D
evelo
pm
ent of S
trate
gic
Alli
ances
•M
anagem
ent and c
om
munic
ations
•E
xte
rnal fu
ndin
g
Pro
cesso
r
•S
ele
cte
d a
s h
avin
g the s
am
e
mark
et obje
ctives o
f consis
tent
qualit
y a
nd v
olu
me
•W
ork
s w
ith B
aR
aR
oo a
nd industr
y
in p
roduct and m
ark
et develo
pm
ent
Ind
ustr
y
•A
ssis
ts in m
ark
et develo
pm
ent
•B
randin
g
•In
form
ation a
nd m
ark
eting
•R
esearc
h in to m
arg
ins a
nd
pre
miu
m p
ricin
g
FA
TE
Continues
•R
esearc
h
•P
olit
ical and industr
y p
ositio
nin
g o
f th
e p
roje
ct
•Long term
legis
lative c
hange
33
7.3. Developing the MarketThe meat industry is a complex industry with many stakeholders. The industry has a number of regulatory arms, industry bodies and associations.
Undertaking an individualistic and solitary marketing campaign is likely to be lost amongst the plethora of activity in the marketplace. However, interest in the Kangaroo industry is growing significantly amongst consumers, processes and the government who are increasingly recognising the health, environment and social advantages of utilising an environmentally low impact and productive animal.
Consequently, it is proposed to galvanise this interest into a co-ordinated and concerted marketing campaign. This campaign would need to be long-term as consumer attitudes take time to develop and export markets need to see consistency and quality over an extended period of time to have the confidence to invest in their own markets.
The proposed marketing process is represented in the diagram below. However, the significant vested interests by various stakeholders is likely to refine this process as the marketing plan is developed.
7.3.1.Government and industry inputGovernment, as part of its role, undertakes activities of social and economic engineering and to do so provides incentives and disincentives accordingly.
This project addresses some very significant issues and eminently corresponds with some of governmentʼs objectives in key areas of social, economic and environmental realms.
If government can see these benefits and assess them as issues they wish to see solved then it is likely the BaRaRoo project can attract funding for appropriate development.
Government programs vary in their amounts, objectives and timeframes and the plethora of programs and the varying eligibility criteria make the searching and application process complicated. It will take commitment of time and resources of current stakeholders to undertake this task.
This plan will be used to gain available funding.
7.3.1.1. Engaging in the industryThe Kangaroo Industry Association of Australia is undertaking industry marketing www.kangaroomeat.net.au was launched on 6th April.
BaRaRoo marketing activities will compliment and utilise, with permission, any industry activity as much as possible. BaRaRoo will only divert from current industry marketing activity to fill voids in marketing directions and activity.
7.3.2.Project managementAny project requires leadership and direction and at the time of this document this leadership was coming from FATE.
As BaRaRoo is the result of FATE the development of the project efficiently comes under the auspices of BaRaRoo, particularly as the supply side is so important.
It is also important that the suppliers (Landholders and Harvesters) are engaged in the process of market development, not only to reinforce the tenets of quality but also to ensure longer term larger goals are met in regards to kangaroo population encouragement for harvesting purposes.
34
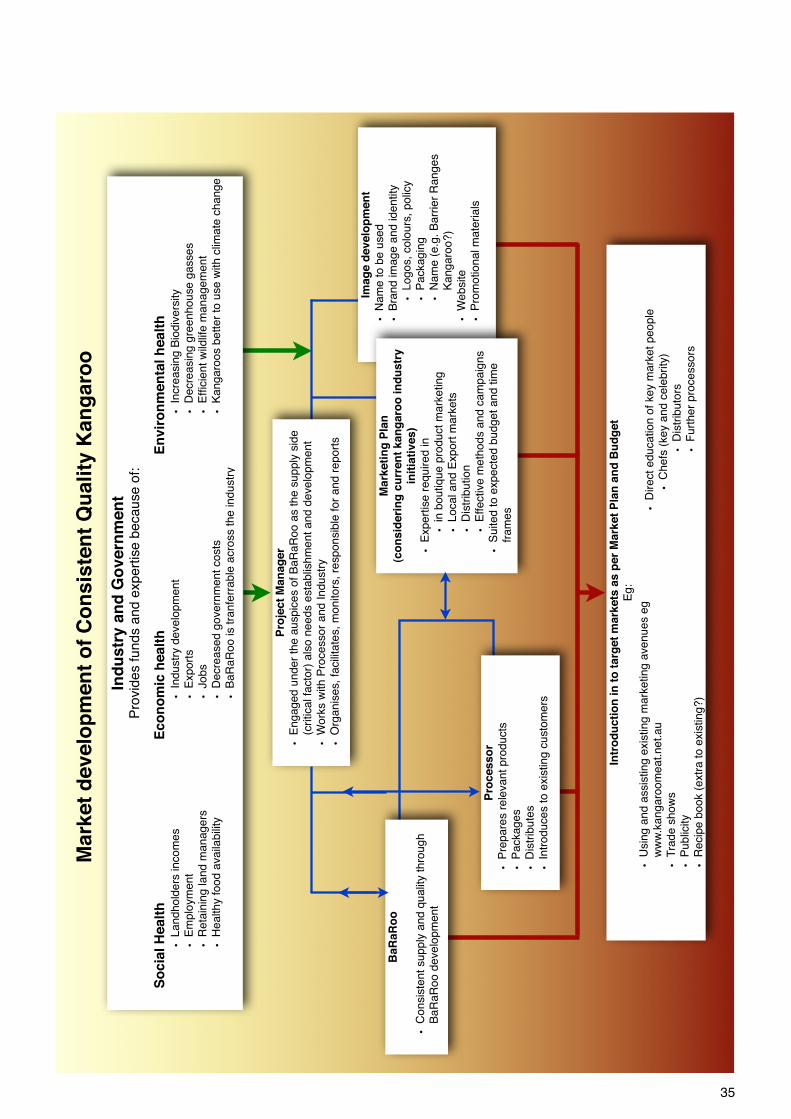
Pro
cesso
r
•P
repare
s r
ele
vant pro
ducts
•P
ackages
•D
istr
ibute
s
•In
troduces to e
xis
ting c
usto
mers
Intr
od
ucti
on
in
to
targ
et
mark
ets
as p
er
Mark
et
Pla
n a
nd
Bu
dg
et
Eg:
BaR
aR
oo
•C
onsis
tent supply
and q
ualit
y thro
ugh
BaR
aR
oo d
evelo
pm
ent
Ind
ustr
y a
nd
Go
vern
men
tP
rovid
es f
un
ds a
nd
exp
ert
ise
be
ca
use
of:
Ec
on
om
ic h
ea
lth
•In
dustr
y d
evelo
pm
ent
•E
xport
s
•Jobs
•D
ecre
ased g
overn
ment costs
•B
aR
aR
oo is tra
nfe
rrable
acro
ss the industr
y
En
vir
on
me
nta
l h
ea
lth
•In
cre
asin
g B
iodiv
ers
ity
•D
ecre
asin
g g
reenhouse g
asses
•E
fficie
nt w
ildlif
e m
anagem
ent
•K
angaro
os b
etter
to u
se w
ith c
limate
change
So
cia
l H
ea
lth
•Landhold
ers
incom
es
•E
mplo
ym
ent
•R
eta
inin
g land m
anagers
•H
ealthy food a
vaila
bili
ty
Imag
e d
evelo
pm
en
t
•N
am
e to b
e u
sed
•B
rand im
age a
nd identity
•Logos, colo
urs
, polic
y
•P
ackagin
g
•N
am
e (
e.g
. B
arr
ier
Ranges
Kangaro
o?)
•W
ebsite
•P
rom
otional m
ate
rials
Mark
eti
ng
Pla
n
(co
nsid
eri
ng
cu
rren
t kan
garo
o in
du
str
y
init
iati
ves)
•E
xpert
ise r
equired in
•in
boutique p
roduct m
ark
eting
•Local and E
xport
mark
ets
•D
istr
ibution
•E
ffective m
eth
ods a
nd c
am
paig
ns
•S
uited to e
xpecte
d b
udget and tim
e
fram
es
Pro
ject
Man
ag
er
•E
ngaged u
nder
the a
uspic
es o
f B
aR
aR
oo a
s the s
upply
sid
e
(critical fa
cto
r) a
lso n
eeds e
sta
blis
hm
ent and d
evelo
pm
ent
•W
ork
s w
ith P
rocessor
and Industr
y
•O
rganis
es, fa
cili
tate
s, m
onitors
, re
sponsib
le for
and r
eport
s
Mark
et
develo
pm
en
t o
f C
on
sis
ten
t Q
uality
Kan
garo
o
•D
irect education o
f key m
ark
et people
•C
hefs
(key a
nd c
ele
brity
)
•D
istr
ibuto
rs
•F
urt
her
pro
cessors
•U
sin
g a
nd a
ssis
ting e
xis
ting m
ark
eting a
venues e
g
ww
w.k
angaro
om
eat.net.au
•T
rade s
how
s
•P
ublic
ity
•R
ecip
e b
ook (
extr
a to e
xis
ting?)
35
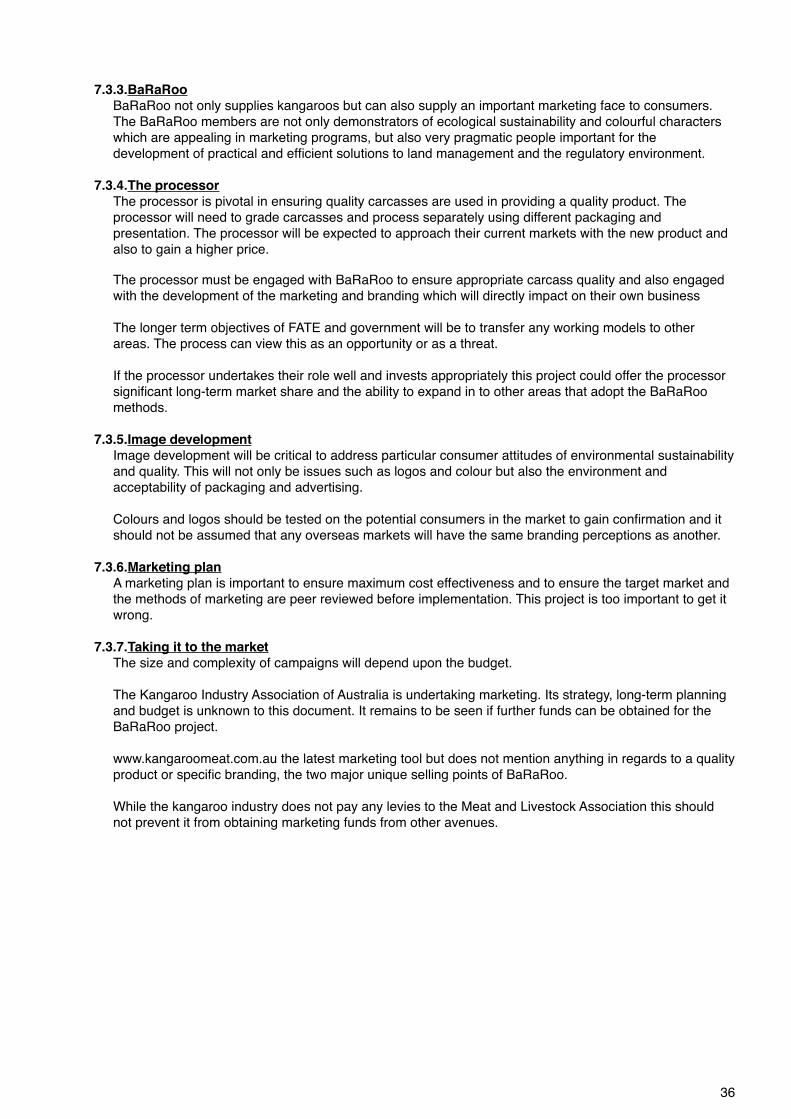
7.3.3.BaRaRoo BaRaRoo not only supplies kangaroos but can also supply an important marketing face to consumers. The BaRaRoo members are not only demonstrators of ecological sustainability and colourful characters which are appealing in marketing programs, but also very pragmatic people important for the development of practical and efficient solutions to land management and the regulatory environment.
7.3.4.The processorThe processor is pivotal in ensuring quality carcasses are used in providing a quality product. The processor will need to grade carcasses and process separately using different packaging and presentation. The processor will be expected to approach their current markets with the new product and also to gain a higher price.
The processor must be engaged with BaRaRoo to ensure appropriate carcass quality and also engaged with the development of the marketing and branding which will directly impact on their own business
The longer term objectives of FATE and government will be to transfer any working models to other areas. The process can view this as an opportunity or as a threat.
If the processor undertakes their role well and invests appropriately this project could offer the processor significant long-term market share and the ability to expand in to other areas that adopt the BaRaRoo methods.
7.3.5.Image development Image development will be critical to address particular consumer attitudes of environmental sustainability and quality. This will not only be issues such as logos and colour but also the environment and acceptability of packaging and advertising.
Colours and logos should be tested on the potential consumers in the market to gain confirmation and it should not be assumed that any overseas markets will have the same branding perceptions as another.
7.3.6.Marketing planA marketing plan is important to ensure maximum cost effectiveness and to ensure the target market and the methods of marketing are peer reviewed before implementation. This project is too important to get it wrong.
7.3.7.Taking it to the marketThe size and complexity of campaigns will depend upon the budget.
The Kangaroo Industry Association of Australia is undertaking marketing. Its strategy, long-term planning and budget is unknown to this document. It remains to be seen if further funds can be obtained for the BaRaRoo project.
www.kangaroomeat.com.au the latest marketing tool but does not mention anything in regards to a quality product or specific branding, the two major unique selling points of BaRaRoo.
While the kangaroo industry does not pay any levies to the Meat and Livestock Association this should not prevent it from obtaining marketing funds from other avenues.
36
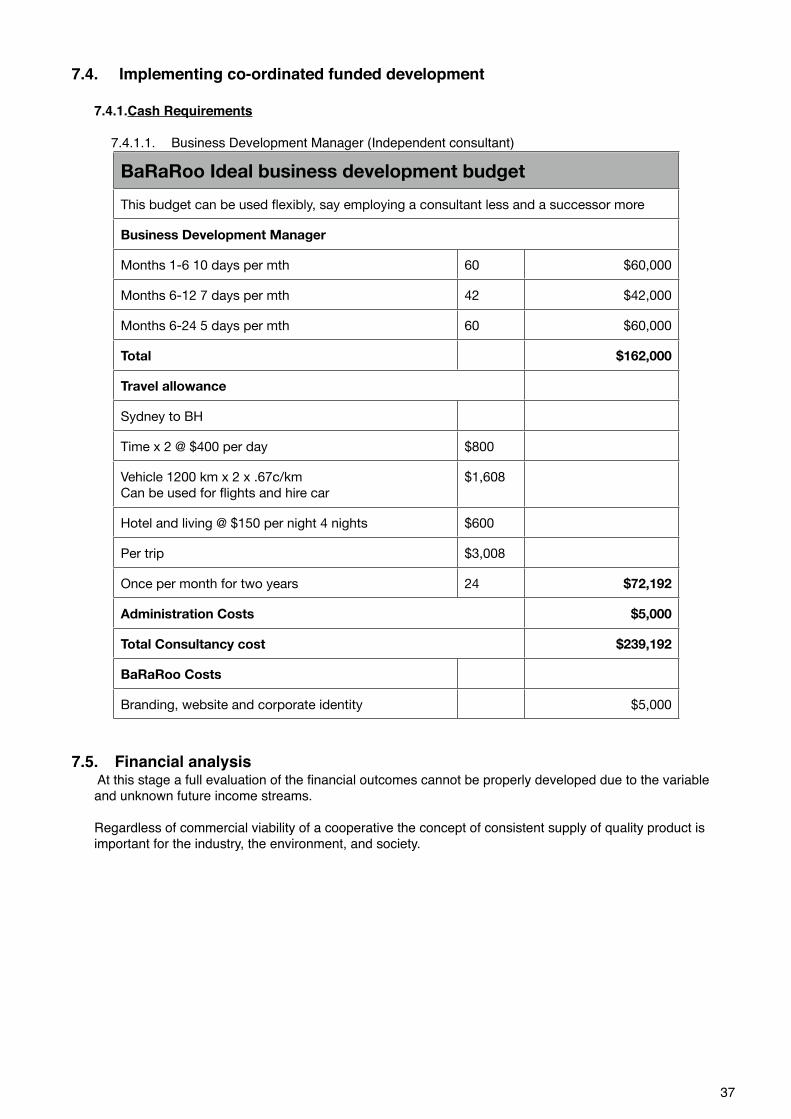
7.4. Implementing co-ordinated funded development
7.4.1.Cash Requirements
7.4.1.1. Business Development Manager (Independent consultant)
BaRaRoo Ideal business development budgetBaRaRoo Ideal business development budgetBaRaRoo Ideal business development budget
This budget can be used flexibly, say employing a consultant less and a successor moreThis budget can be used flexibly, say employing a consultant less and a successor moreThis budget can be used flexibly, say employing a consultant less and a successor more
Business Development ManagerBusiness Development ManagerBusiness Development Manager
Months 1-6 10 days per mth 60 $60,000
Months 6-12 7 days per mth 42 $42,000
Months 6-24 5 days per mth 60 $60,000
Total $162,000
Travel allowanceTravel allowance
Sydney to BH
Time x 2 @ $400 per day $800
Vehicle 1200 km x 2 x .67c/kmCan be used for flights and hire car
$1,608
Hotel and living @ $150 per night 4 nights $600
Per trip $3,008
Once per month for two years 24 $72,192
Administration CostsAdministration Costs $5,000
Total Consultancy costTotal Consultancy cost $239,192
BaRaRoo Costs
Branding, website and corporate identity $5,000
7.5. Financial analysis At this stage a full evaluation of the financial outcomes cannot be properly developed due to the variable and unknown future income streams.
Regardless of commercial viability of a cooperative the concept of consistent supply of quality product is important for the industry, the environment, and society.
37
8. Appendices
38
I. About the Author and observations on group business developmentII. Different Corporate StructuresIII. Sharing SkippyIV. BARGE paper
I. About the author and observations on group business developmentThis business was prepared by Peter van Herk. Mr van Herk has particular experience directly relevant to BaRaRoo.
• 1984-88 District Ranger, Narrabri District. Responsible for the District kangaroo management program, surveys, property inspections, tag allocation, Trappers licenses
• 1988-2000 furniture design and manufacture (business owner/developer)• 1996-1998 instigator and export manager for Daplar, a consortium of value-added timber manufacturers
marketing into Japan• 1995-2002 timber drying and processing (business owner/developer)• 2002 to present: business model and implementation of the Australian Arid Zone Timber project for the
development of markets for timbers in the semi-arid areas of Australia (initially facilitated by FATE). This is a group of land holders working as a group similar to BaRaRoo
• 2002 to present: full-time business development consultancy in business planning and industry development incorporating
• The Broom Bush Industry strategic plan• Industry business, marketing and strategic plans for metal fabricators, agricultural products, community
organisations, restaurants and cafes• Manager of the Bush Food Sensations program. Mentoring and developing 10 Aboriginal businesses in
the food industry and group development
The above experience has directly influenced development of this document.
While business systems, corporate governance, unique selling points, sustainable competitive advantages are very important for business success it is often the skills, personalities and motivations of individuals which can ultimately determine success or failure.
Development of a sole owner business is significantly different to developing a business which is owned by a group. The dynamics and organisational structures are completely different as are the participantʼs motivations, goals and desires.
A sole business owner, or couple, will often mortgage their property, borrow money from the bank and work extraordinary hours to achieve their business and personal goals. A person in a group will rarely do this as they cannot fully control the outcomes, thus the perceived risk is much higher.
There is also a difference in group development characteristics between groups made of business entities and groups made of nonbusiness individuals.
A. Groups formed from business entitiesBusiness entities generally apply business analysis to the objectives which can be achieved in group co-operation. Factors such as group purchasing, greater market dominance, stronger ability to advocate within the industry, entering new markets, lowering costs by sharing capital equipment, increasing sales by selling and purchasing within the group are very strong reasons for business entities to combine. The individual businesses then invest according according to the returns they perceive.
B. Groups formed by non-business entities/peopleA group formed by people relatively unfamiliar with business development can have difficulties in perceiving longer term business development outcomes relative too short term sacrifice. Analysis and decisions are based far more on pre-existing paradigms and emotions rather than new information and analysis. Arranging combined purchasing, meetings, marketing, accounting, corporate governance, communications, and the benefits of group activity are harder to obtain and visualise.
Often individuals in such groups perceive that success is diluted as it is shared with other people.
In the development of groups such as consortiums and co-operatives I have found that it is critical to have at least one main driving person who is accepted by the group on a professional basis. This is generally obtained by employing a motivated person from outside the group who brings objectivity and the appropriate business development skills to the group. Government funding bodies also recognise the strength of having dedicated project managers as compared to group committees comprised of people who have full-time commitments elsewhere.
A business development manager, or project managerʼs, effectiveness is greatly enhanced by having a professional, dedicated and motivated Member of the group as their supervisor. This is preferably the chairperson.
39
II. Different corporate structuresSummary regarding forms of association for cross-property kangaroo (or other wild resource) management
Compiled by Rosie Cooney, August 2007.
Based on initial web-based research supplemented by discussion with UNSW lawyers and participants in collaborative resource management in Australia and southern Africa.
IntroductionWhen people want to work together to achieve various aims, a variety of mechanisms and structures are available. Which of these is used will depend on the context and what they want to achieve. Specifying exactly what the parties want the organisation to achieve is a critical first step. Some of the key factors that will then be important in making a choice of organisational structure to achieve these aims include • flexibility• liability of individuals involved • perpetual succession (whether the organisation persists after its Members die or leave), • financial and administrative burdens of establishment and operation, and • tax implications.
Legal advice will be necessary and should be sought when establishing any structure beyond an incorporated association.
1. Contractual relationshipsA web of contracts could be established between Landholders, Harvesters and processors establishing mutual rights and obligations. This is a less formal structure. However, such a network may be expensive to establish as it would require extensive legal input in contract negotiation period. Substantial change in circumstances would require contract re-negotiation. Exit or entrance of individuals to the collaborating group may require re-negotiation. For these reasons collaborative action based purely on contractual obligations is not considered further.
2. Unincorporated associationsThese have no legal personality: they cannot enter enforceable contracts, sue or be sued, and Members may be personally responsible for debts or other actions against the group. They therefore can be ruled out, as there is strong interest among Landholders in ownership of chiller boxes, establishing contracts, and other activities requiring legal personality.
3. Incorporated associationsThese are incorporated under State/Territory law. Incorporation establishes an organisation as a legal entity, allowing it to continue regardless of changes to membership, accept gifts and bequests, buy and sell property, enter into enforceable contracts, incur debts, sue or be sued in its own name, and establishing limited liability of Members. It may allow a body to apply for Government grants. There are certain costs compared to unincorporated associations, including that books are open to public scrutiny and a public officer must be appointed. An incorporated association can carry on business.
Compared to companies, the advantages of an incorporated association are that it is cheaper and simpler to administer. There is less paperwork and fewer expenses. They are much more lightly regulated than companies. The disadvantage is that any profits made should be used to further the objectives of the association, not provide personal gain for its Members. Additionally, if the association wishes to conduct activities at a national rather than state level (such as selling to processors based in other states, for instance) there may be difficulties as legislation varies across jurisdictions.
Note that Mitchell and District Landcare Association is an Incorporated Association. Some Landcare organisations establish both incorporated associations and companies.
4. CompaniesAnother option is to register under the Commonwealth Corporations Act 2001 as a company. Compared to incorporated associations, advantages of a company include:• can make and distribute profits for its Members or shareholders• ability to conduct national or international activities, under Commonwealth law• ability to apply for federal grants and sponsorship• a more secure and transparent governance system (in terms of financial record-keeping and company
housekeeping) • possibly higher status in public perception.
Disadvantages include:• higher level of regulation means more expensive and complex structure to establish and maintain e.g.
40
o registered office required. This can belong to the representative accountant or lawyer, but may require payment.
o lawyer likely to be required at set-up stage, particularly around development of rules regarding membership and rights and obligations
o financial record-keeping more onerous and likely to require professional accounting services.• decision making process may be more cumbersome • public exposure (disclosure and registration of information and directors, etc.)• additional responsibilities under Corporations Law for any directors associated with the company.
Companies have a choice between a constitution and replaceable rules (or a mix of both). (Replaceable rules are the internal management rules of a company set out under the Corporations Act 2001 (s 141), and replace the need for a constitution). The constitution sets out the governance structure, function and objectives of the company.
There are several forms of relevant companies. They can be limited by guarantee or by shares, and be public or private (proprietary).
a. Public company limited by guaranteeA company limited by guarantee has no share capital. Each Member agrees to guarantee the debts of the company up to a fixed amount specified in writing (usually $2), but is under no obligation to provide capital to the company while it is a going concern. As there are no shareholders, dividends are not distributed.
The governance structure, function and objectives of the company, and the rights and obligations of Members, would be set out in its constitution. This could also specify that membership is limited in specific ways (such as to Harvesters, Landholders or processors). Note that negotiation of rights and obligations of Members would require significant legal input. Rules and requirements for financial record-keeping and reports are stringent. Public companies have greater disclosure and reporting requirements than proprietary companies. Six-monthly and annual disclosure rather than continual (as for a listed company) is required. At least three Directors are required. These companies can not be listed on the ASX.
The company limited by guarantee is not widely used in commercial or trading transactions, as it does not raise share capital. However, where the primary purpose of the company is not to raise capital but to, say facilitate co-operative action and establish a framework for contracting, it may be appropriate. It is very widely used by non-profit organisations where the primary objective is to grant membership and obtain limited liability.
Capital could be raised for establishment and operation of a company limited by guarantee through e.g. attracting a seed grant from regional development bodies, or by exacting a levy on all transactions facilited by it (x c/kg of kangaroo harvested and sold pursuant to its arrangements).
Compared to proprietary companies limited by shares (see below), advantages include:• easier to make rules about membership and specify purposes of company.
b. Proprietary company limited by sharesThis is the most common type of company. Each member’s interest in the company is represented by the number of shares the Member holds in the capital of the company. Among other things, the liability of Members is limited to the unpaid amount (if any) on each share. Creditors of the company cannot access the personal assets of the shareholders. Directors of the company can make a ‘call’ on the shares and require the Members of the company to pay to the company the unpaid amount on their shares. The number of shareholders is restricted (from one to fifty). Proprietary companies cannot be listed on the ASX.
Advantages of proprietary compared to public companies include:• less burdensome reporting and administrative requirements:• no need for AGM• small prop. companies have no need to appoint auditors and have limited financial reporting• annual disclosure of financial information not required.
c. Public company limited by sharesThis structure would primarily be relevant if the intention was to package the venture as an investment opportunity for the public. As this is not the intention here, and this is an expensive process, it will not be considered further.
5. Co-operativesA Co-operative is an entity voluntarily owned and controlled by the people for whom it was established and who use its services. In Australia they are registered under State cooperatives legislation. Coops have legal personality. Coops have a long history in Australia. Coops have been established in the past decade for purposes as diverse as fuel supply, telecommunications provision, farm forestry, organic farming, processing and selling knitting yarn, and marketing lambs (see http://www.coopdevelopment.org.au/).
Key elements of a co-operative include the following:• observance of the ‘co-operative principles’ (see http://www.fairtrading.qld.gov.au/OFT/oftweb.nsf/web+pages/
2C1F1FE194D6B6334A256B570012CAD0?OpenDocument), including
41
o democratic control with each Member possessing an equal voting right (one Member, one vote)o voluntary and open membership o limitation upon the interest received on shareso minimum number of Members required (in Qld, at least five)o economic participation: capital is controlled and distributed in equitable way
• they return value via membership rights (rather than dividends)• Member liability is limited to the fully paid up value of their shares in the co-operative• state legislation set out requirements regarding keeping of records, audit of accounts, establishment of a
registered office• can raise capital by issuing shares or borrowing money• will generally be taxed as companies, but may qualify for special treatment. Compared to companies, they have the advantages of:• less complex and costly establishment• lower reporting requirements• products may be more attractive to buyers who support the coop ethos (reported by SMARTimbers Vic)• they may maintain more Member loyalty, because of the democratic structure. This could be important in the
long-term if the aim is to bind Landholders and Harvesters to operating through the organisation, even if, for instance, there is the opportunity to undercut it by selling outside it
• it is one-Member, one-vote, which may appeal to smaller Members• assistance and advice in establishing a co-operative may be available through http://
www.coopdevelopment.org.au/
However, there are also disadvantages (cf. a company):• they are less flexible in terms of membership and governance structure • lack of uniform regulation across the Commonwealth• decision-making can be slow and unweildy. For instance, SMARTimber have found that making decisions can
be time-consuming• it is one Member, one-vote – arguably some Members, perhaps those with very large landholdings, should
have more voting weight than others.
6. Joint ventureA joint venture is a relationship that exists between parties carrying on a particular commercial undertaking in common for their individual as opposed to mutual gain.
A joint venture is not, in itself, a legal structure, but rather a joint operation between two or more structures. Joint ventures may be between two or more partnerships, companies, or co-operatives, or some combination of the three. They are usually formed to undertake a specific project, particularly in circumstances where the parties would be unable to undertake that project individually. The terms of the joint venture agreement are usually sealed in a contractual arrangement with an operating agreement similar to a partnership agreement.While joint ventures are not appropriate as the primary body to enable collaboration between Landholders, they may be appropriate for the undertaking of specific projects or enterprises that take place within the broader organizational environment provide by the chosen structure. For instance, if the group established a company structure that had among its objectives facilitating development of a premium kangaroo product, some Members might establish a joint venture to carry out a specific enterprise, such as perhaps trialling a value-adding process or selling into a new market. 7. PartnershipA partnership is the relationship that exists between people who are carrying on a business in common with a view to profit. While it has the advantages of being simple and flexible, it is unsuited to the goal of enabling collaboration among Landholders in kangaroo management. It does not establish limited liability, each partner is liable for all of the partnership’s debts, and it does not establish legal personality. It will therefore not be considered further.
42
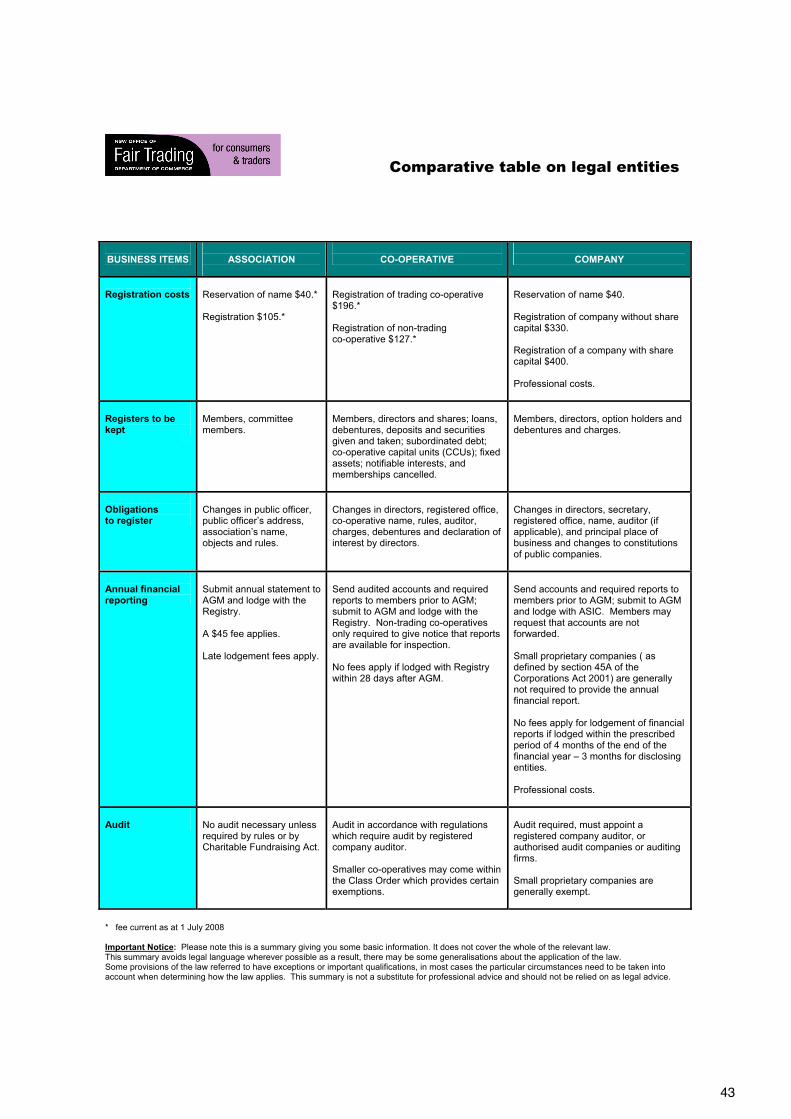
Comparative table on legal entities
BUSINESS ITEMS
ASSOCIATION
CO-OPERATIVE
COMPANY
Registration costs
Reservation of name $40.* Registration $105.*
Registration of trading co-operative $196.* Registration of non-trading co-operative $127.*
Reservation of name $40. Registration of company without share capital $330. Registration of a company with share capital $400. Professional costs.
Registers to be kept
Members, committee members.
Members, directors and shares; loans, debentures, deposits and securities given and taken; subordinated debt; co-operative capital units (CCUs); fixed assets; notifiable interests, and memberships cancelled.
Members, directors, option holders and debentures and charges.
Obligations to register
Changes in public officer, public officer’s address, association’s name, objects and rules.
Changes in directors, registered office, co-operative name, rules, auditor, charges, debentures and declaration of interest by directors.
Changes in directors, secretary, registered office, name, auditor (if applicable), and principal place of business and changes to constitutions of public companies.
Annual financial reporting
Submit annual statement to AGM and lodge with the Registry. A $45 fee applies. Late lodgement fees apply.
Send audited accounts and required reports to members prior to AGM; submit to AGM and lodge with the Registry. Non-trading co-operatives only required to give notice that reports are available for inspection. No fees apply if lodged with Registry within 28 days after AGM.
Send accounts and required reports to members prior to AGM; submit to AGM and lodge with ASIC. Members may request that accounts are not forwarded. Small proprietary companies ( as defined by section 45A of the Corporations Act 2001) are generally not required to provide the annual financial report. No fees apply for lodgement of financial reports if lodged within the prescribed period of 4 months of the end of the financial year – 3 months for disclosing entities. Professional costs.
Audit
No audit necessary unless required by rules or by Charitable Fundraising Act.
Audit in accordance with regulations which require audit by registered company auditor. Smaller co-operatives may come within the Class Order which provides certain exemptions.
Audit required, must appoint a registered company auditor, or authorised audit companies or auditing firms. Small proprietary companies are generally exempt.
* fee current as at 1 July 2008 Important Notice: Please note this is a summary giving you some basic information. It does not cover the whole of the relevant law. This summary avoids legal language wherever possible as a result, there may be some generalisations about the application of the law. Some provisions of the law referred to have exceptions or important qualifications, in most cases the particular circumstances need to be taken into account when determining how the law applies. This summary is not a substitute for professional advice and should not be relied on as legal advice.
43
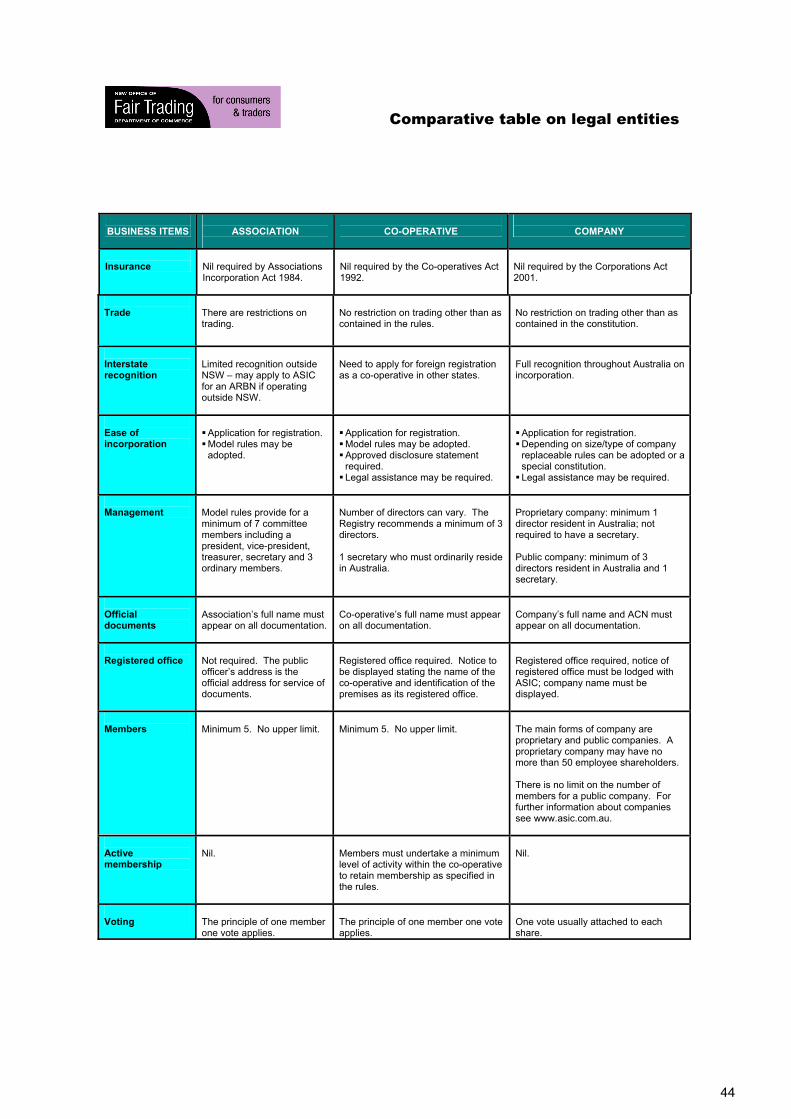
Comparative table on legal entities
BUSINESS ITEMS
ASSOCIATION
CO-OPERATIVE
COMPANY
Insurance
Nil required by Associations Incorporation Act 1984.
Nil required by the Co-operatives Act 1992.
Nil required by the Corporations Act 2001.
Trade
There are restrictions on trading.
No restriction on trading other than as contained in the rules.
No restriction on trading other than as contained in the constitution.
Interstate recognition
Limited recognition outside NSW – may apply to ASIC for an ARBN if operating outside NSW.
Need to apply for foreign registration as a co-operative in other states.
Full recognition throughout Australia on incorporation.
Ease of incorporation
! Application for registration. ! Model rules may be
adopted.
! Application for registration. ! Model rules may be adopted. ! Approved disclosure statement
required. ! Legal assistance may be required.
! Application for registration. ! Depending on size/type of company
replaceable rules can be adopted or a special constitution.
! Legal assistance may be required.
Management
Model rules provide for a minimum of 7 committee members including a president, vice-president, treasurer, secretary and 3 ordinary members.
Number of directors can vary. The Registry recommends a minimum of 3 directors. 1 secretary who must ordinarily reside in Australia.
Proprietary company: minimum 1 director resident in Australia; not required to have a secretary. Public company: minimum of 3 directors resident in Australia and 1 secretary.
Official documents
Association’s full name must appear on all documentation.
Co-operative’s full name must appear on all documentation.
Company’s full name and ACN must appear on all documentation.
Registered office
Not required. The public officer’s address is the official address for service of documents.
Registered office required. Notice to be displayed stating the name of the co-operative and identification of the premises as its registered office.
Registered office required, notice of registered office must be lodged with ASIC; company name must be displayed.
Members
Minimum 5. No upper limit.
Minimum 5. No upper limit.
The main forms of company are proprietary and public companies. A proprietary company may have no more than 50 employee shareholders. There is no limit on the number of members for a public company. For further information about companies see www.asic.com.au.
Active membership
Nil.
Members must undertake a minimum level of activity within the co-operative to retain membership as specified in the rules.
Nil.
Voting
The principle of one member one vote applies.
The principle of one member one vote applies.
One vote usually attached to each share.
44
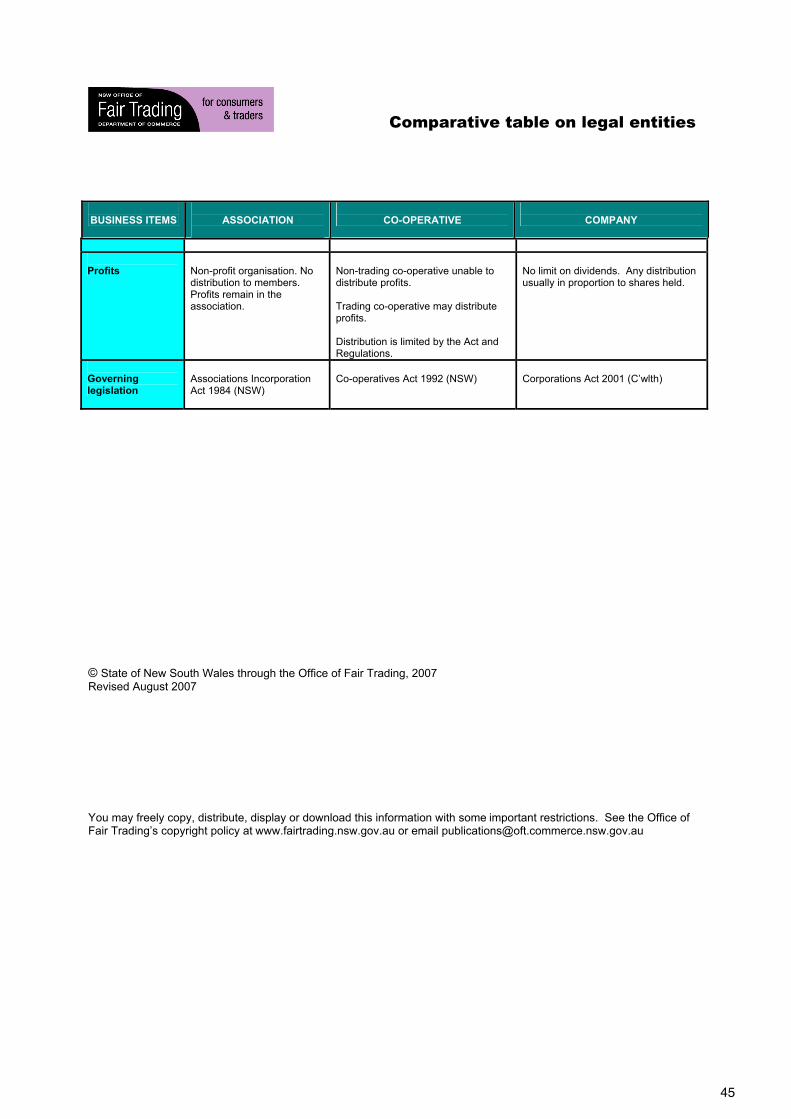
Comparative table on legal entities
BUSINESS ITEMS
ASSOCIATION
CO-OPERATIVE
COMPANY
Profits
Non-profit organisation. No distribution to members. Profits remain in the association.
Non-trading co-operative unable to distribute profits. Trading co-operative may distribute profits. Distribution is limited by the Act and Regulations.
No limit on dividends. Any distribution usually in proportion to shares held.
Governing legislation
Associations Incorporation Act 1984 (NSW)
Co-operatives Act 1992 (NSW)
Corporations Act 2001 (C’wlth)
© State of New South Wales through the Office of Fair Trading, 2007 Revised August 2007
You may freely copy, distribute, display or download this information with some important restrictions. See the Office of Fair Trading’s copyright policy at www.fairtrading.nsw.gov.au or email [email protected]
45


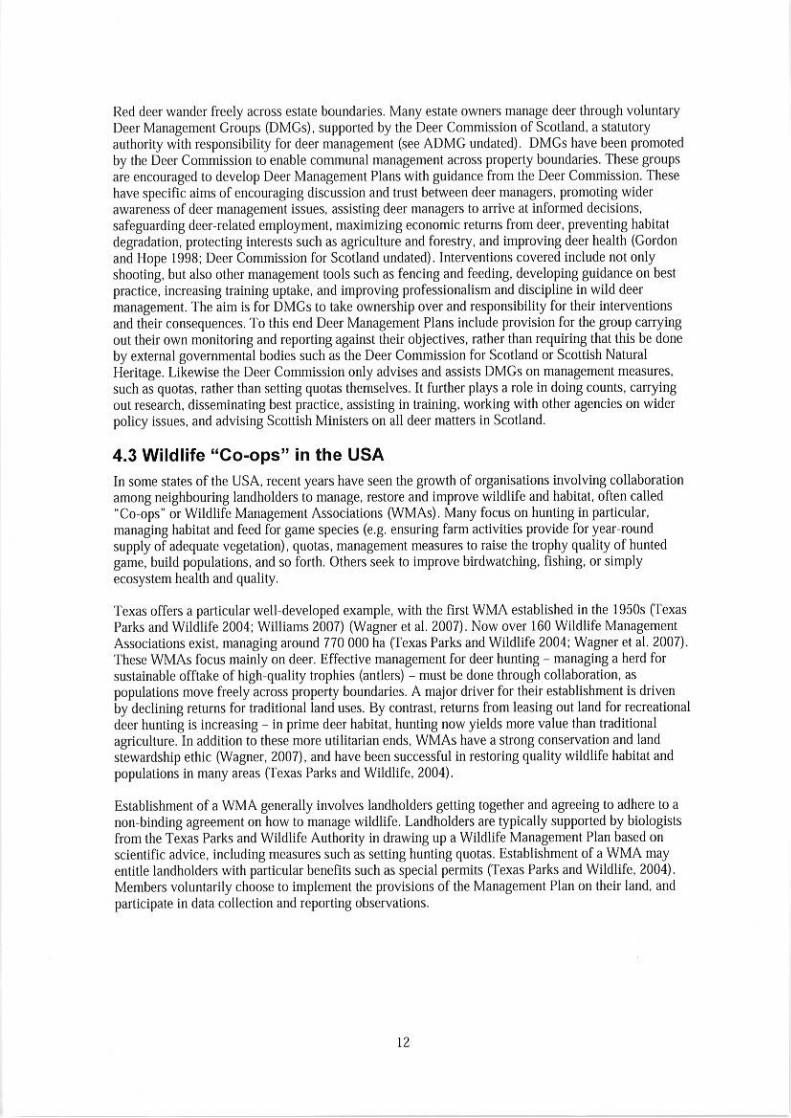
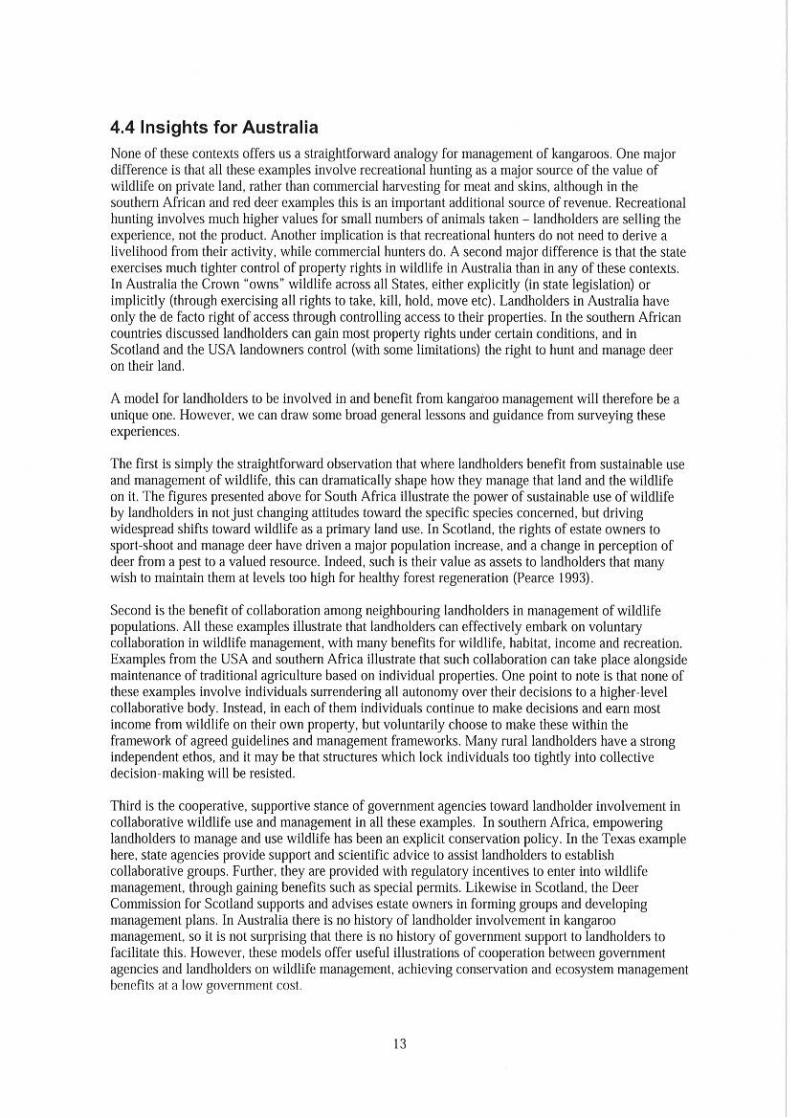
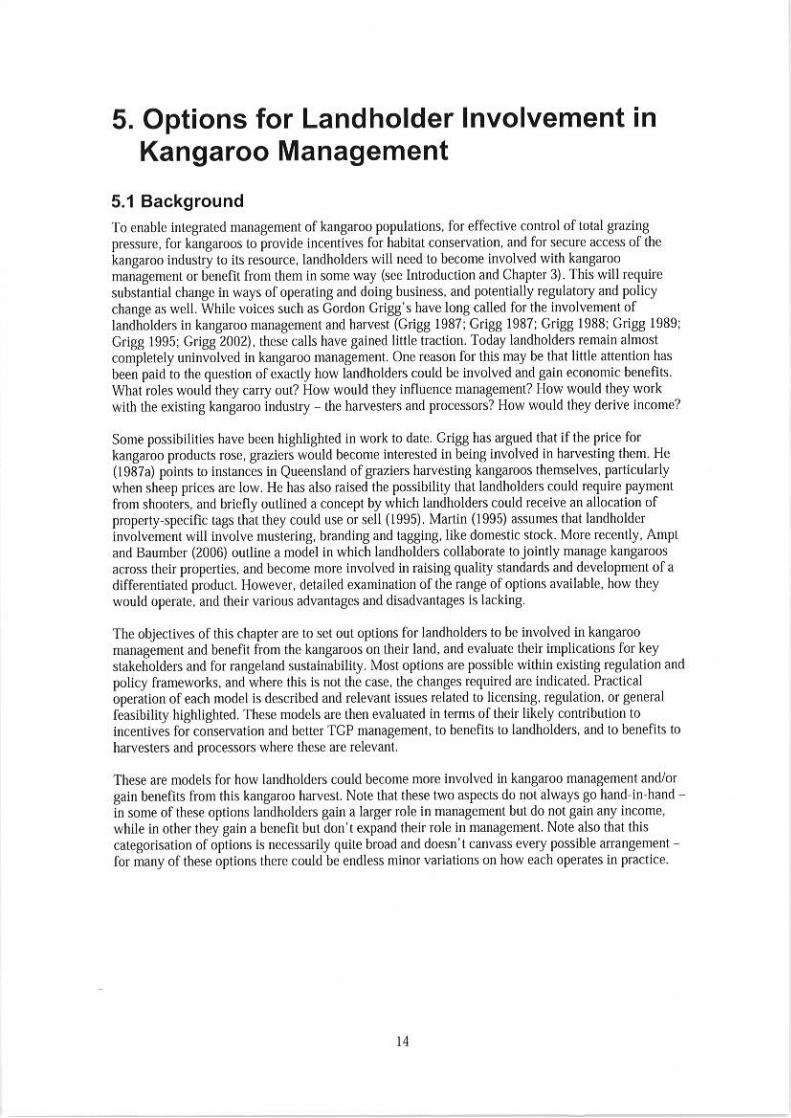
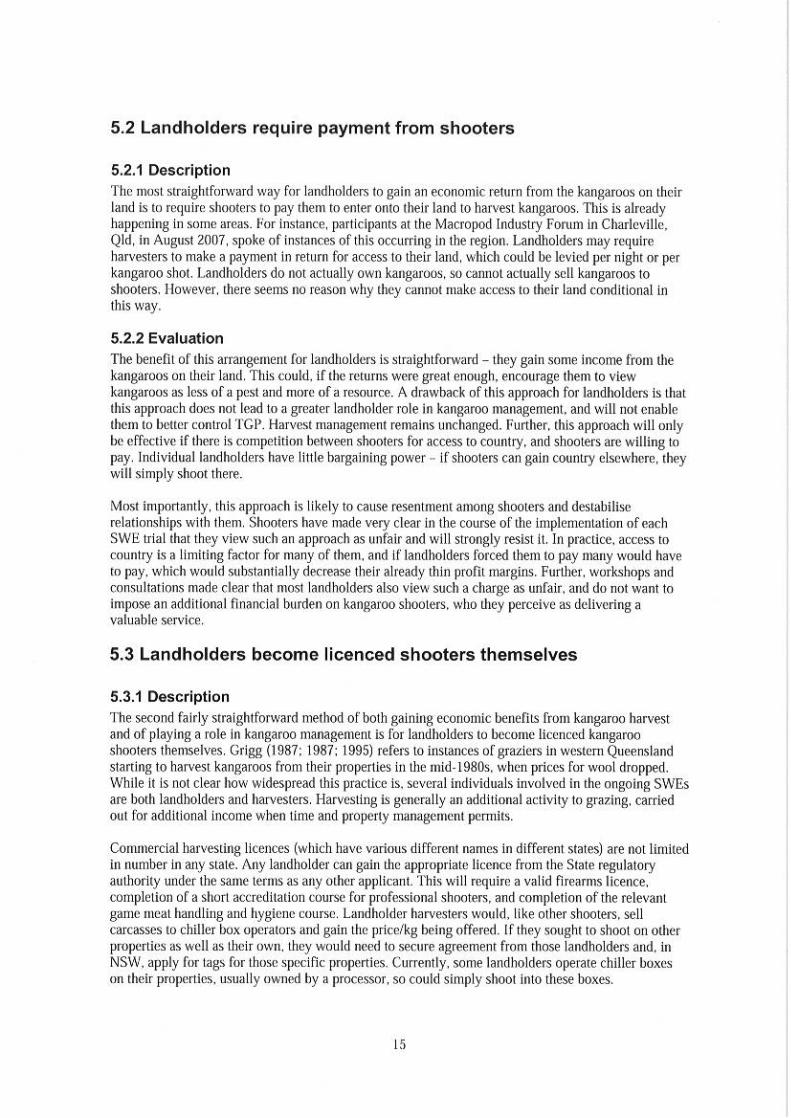
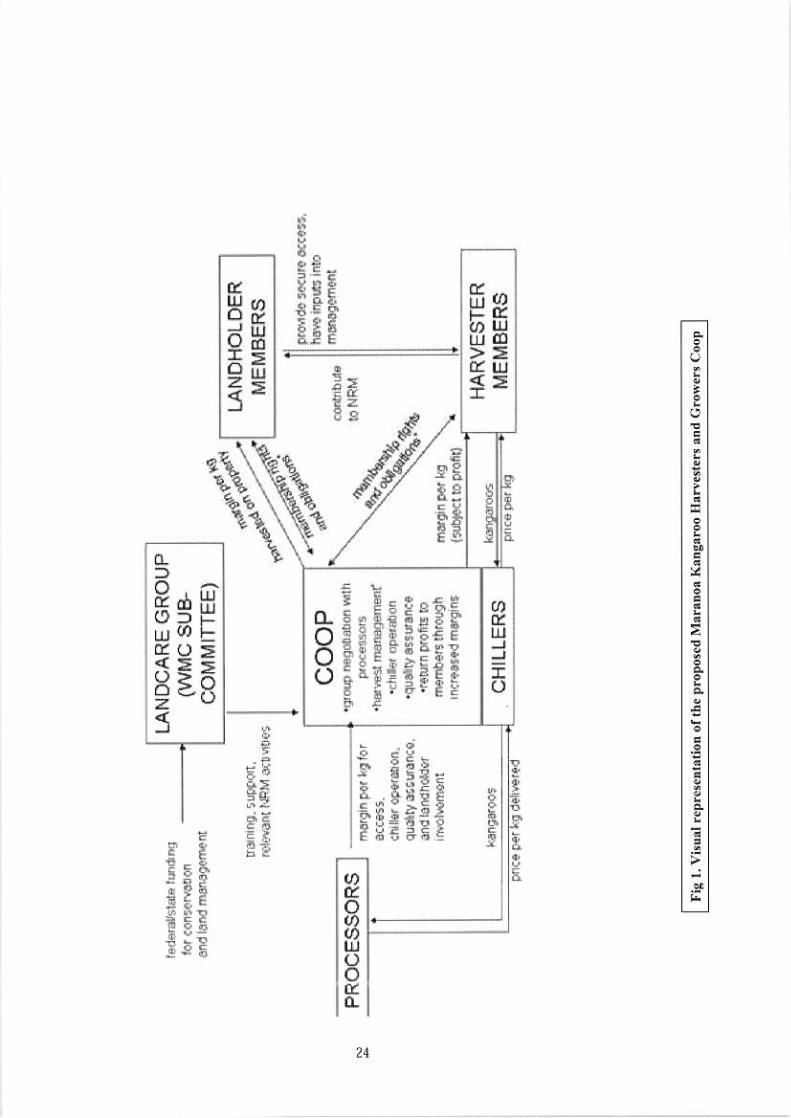
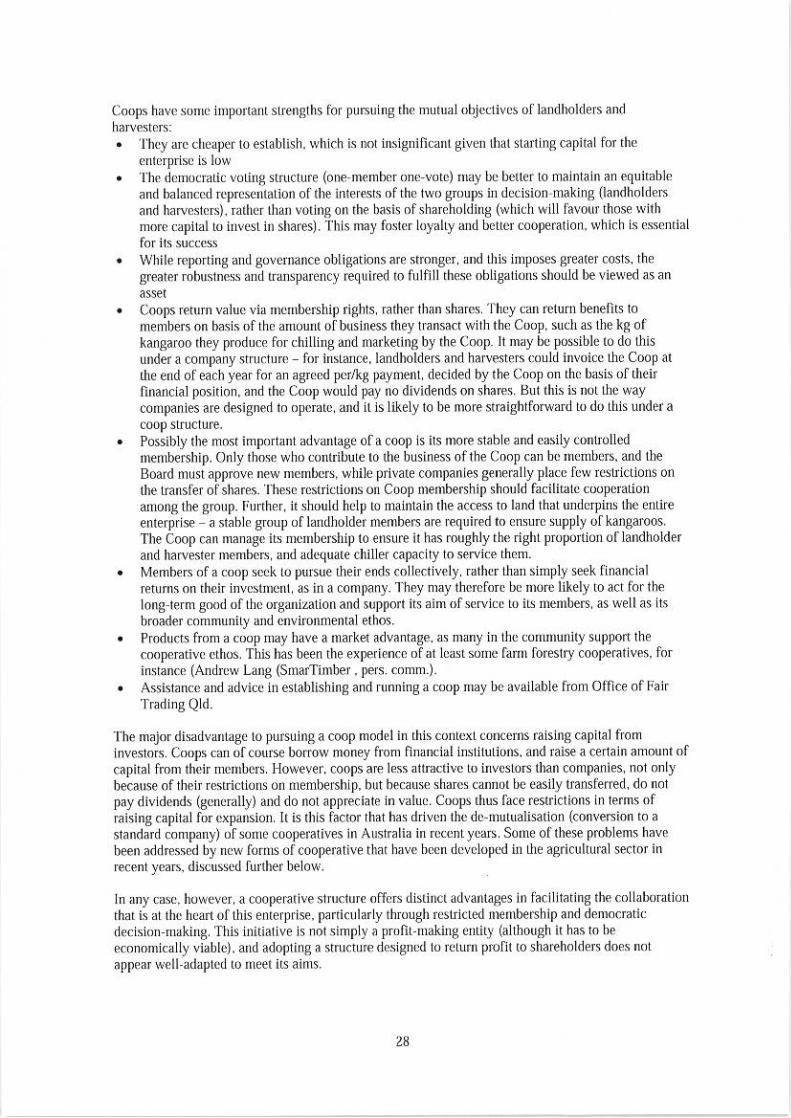
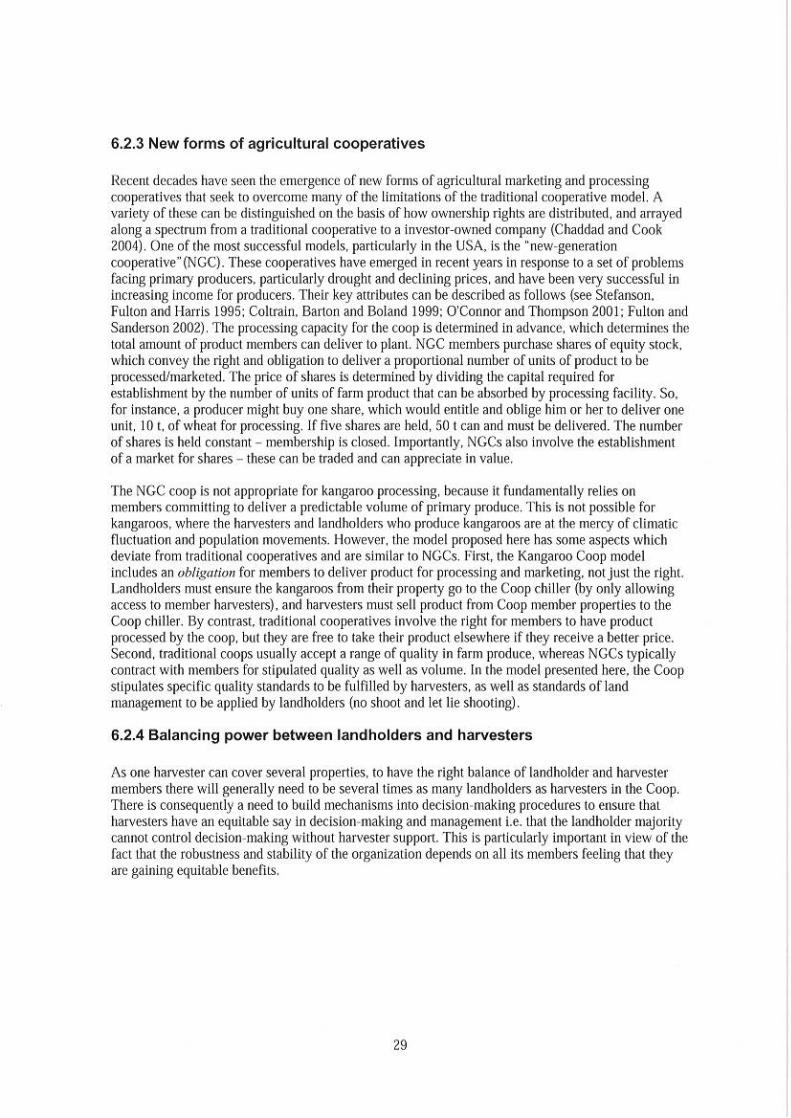
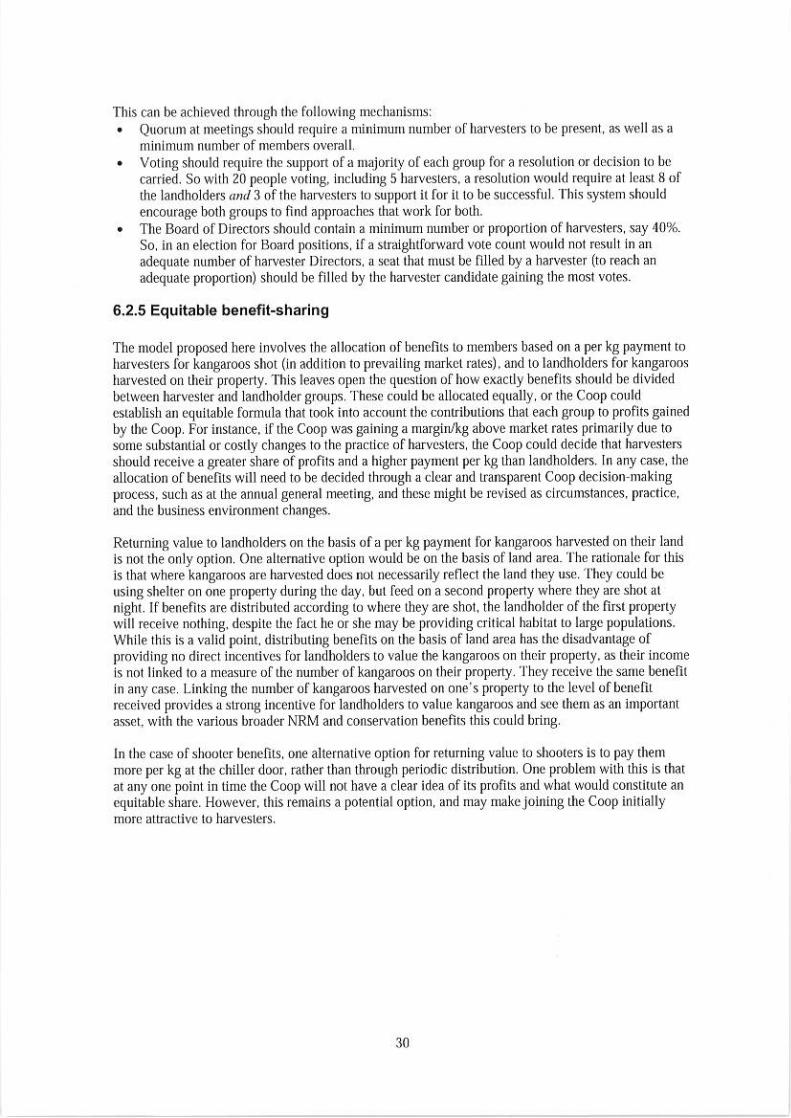
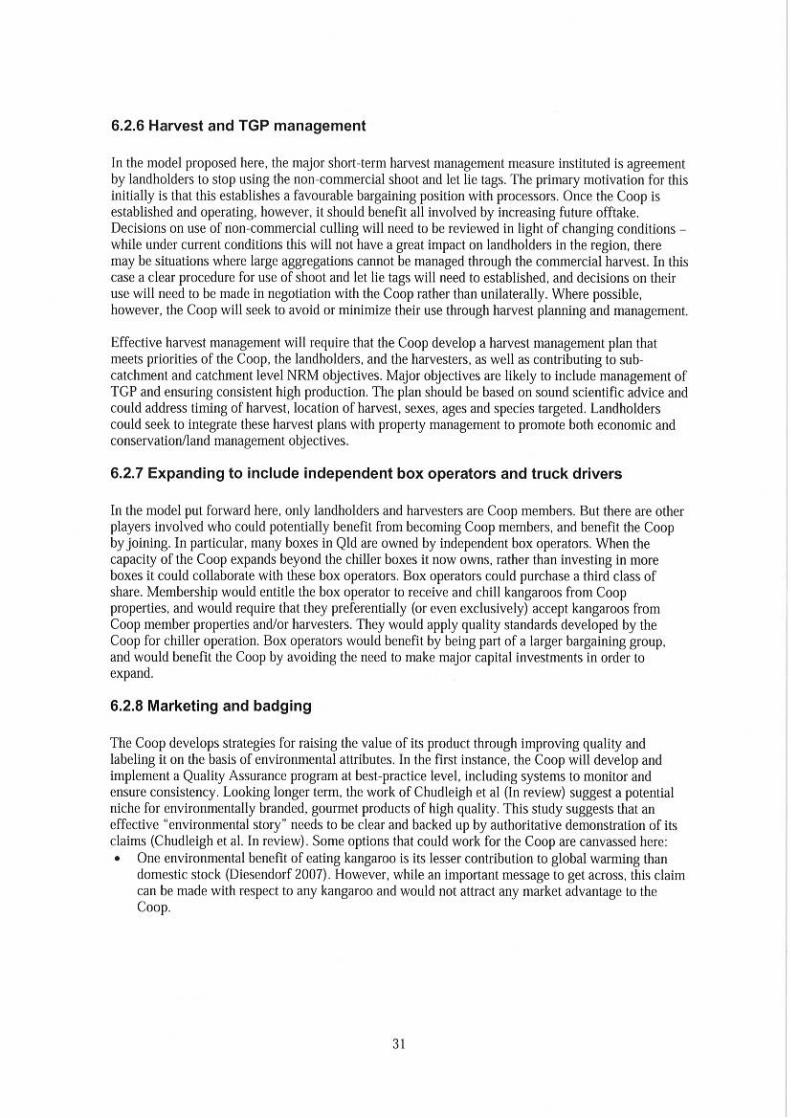
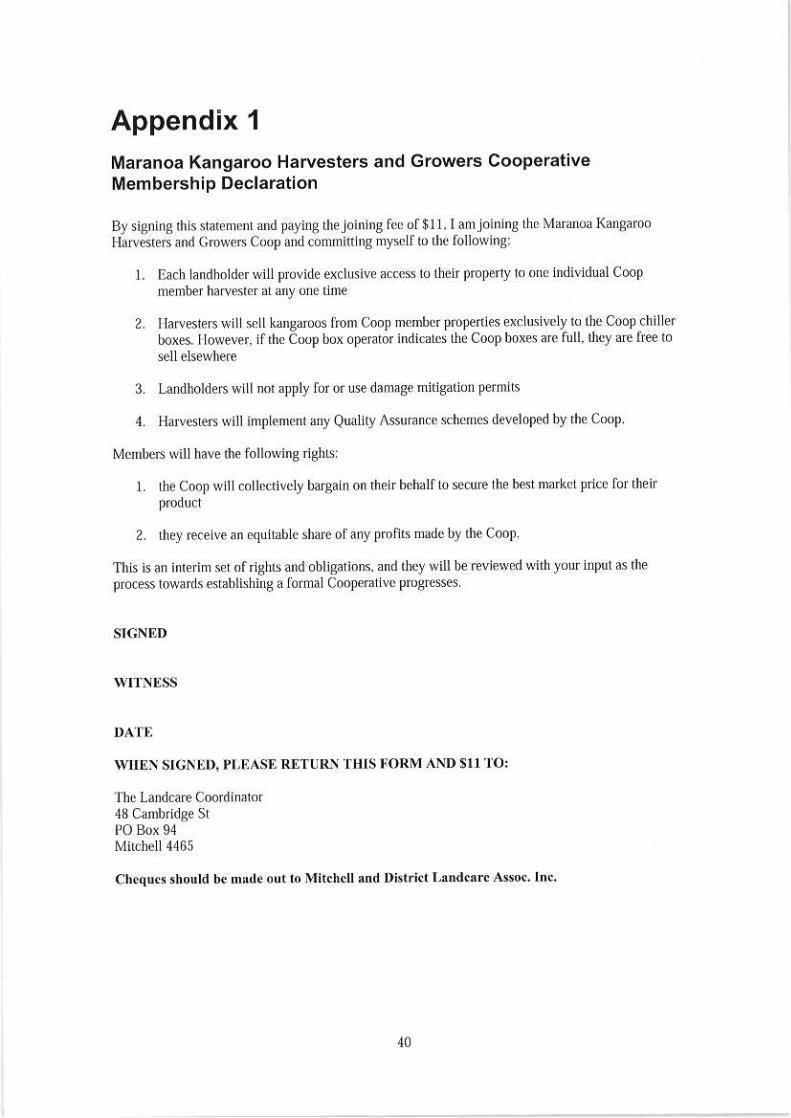
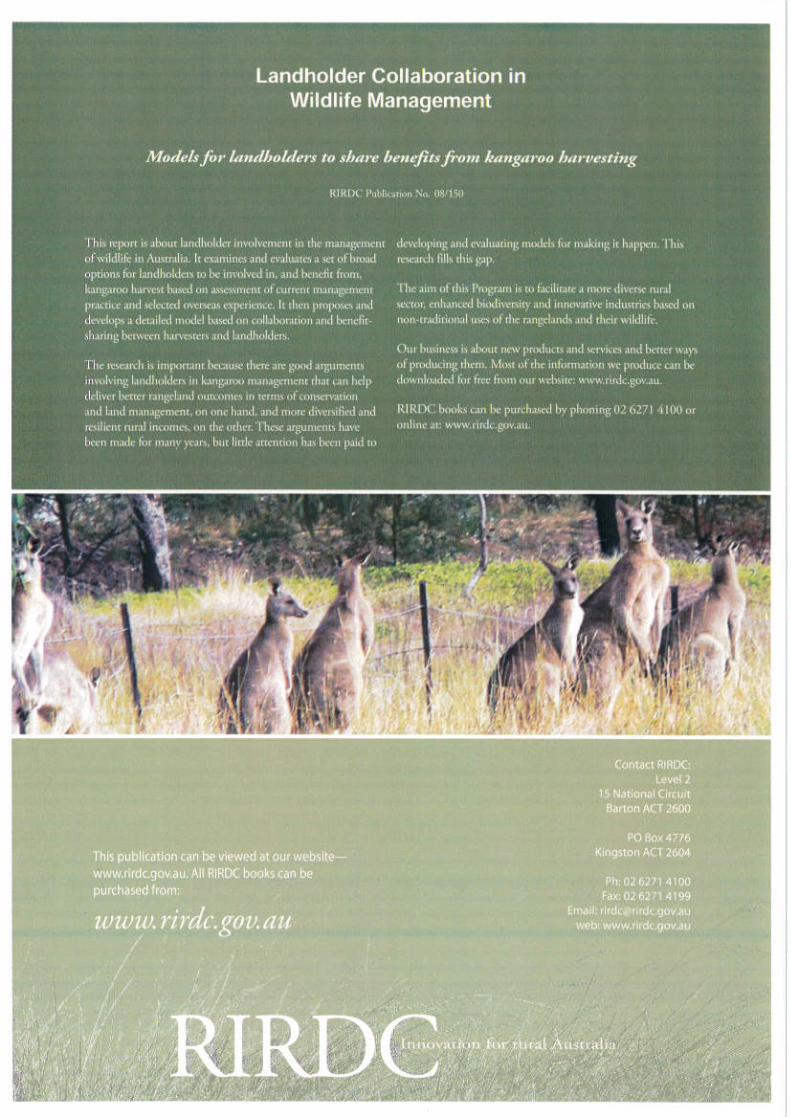

Optimising mixed-grazing
strategies for semi-arid
Australian rangelands
A thesis submitted in fulfillment of the requirements for the degree of
Doctor of Philosophy
Paul D. MoloneyB.Sc., Grad.Dip.Ed., M.App.Sc.
School of Mathematical and Geospatial Sciences
College of Science, Engineering and Health
RMIT University
May 2011
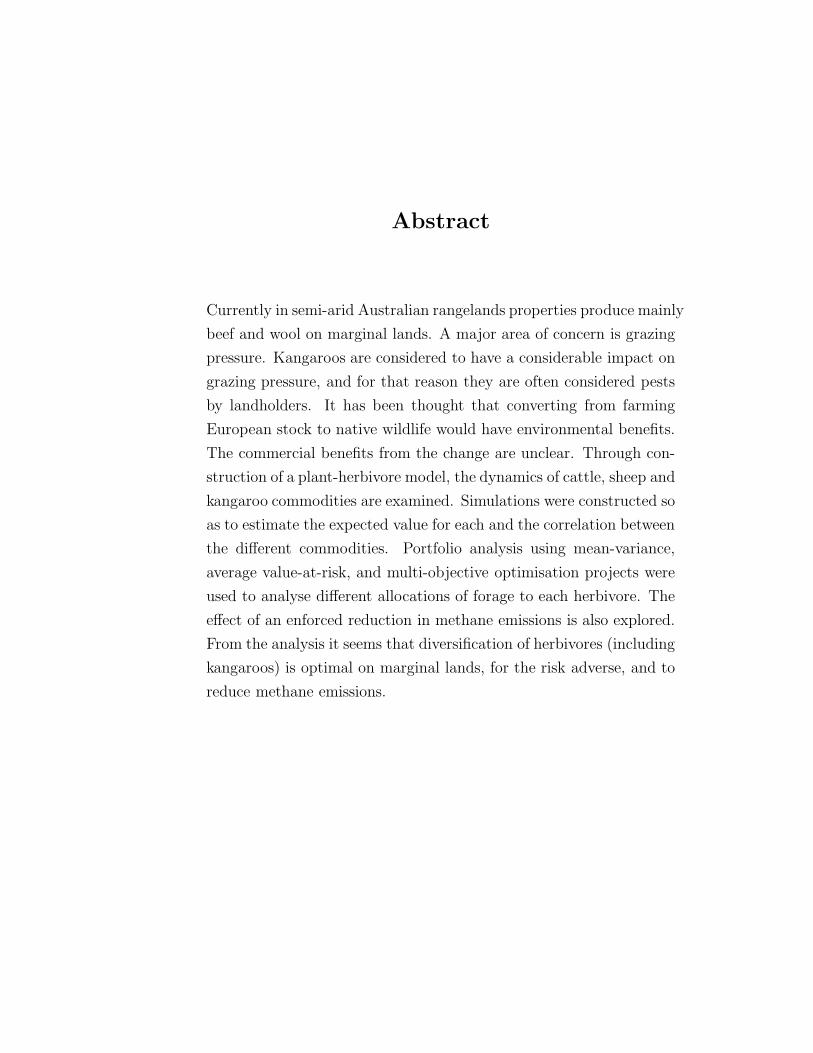
Abstract
Currently in semi-arid Australian rangelands properties produce mainly
beef and wool on marginal lands. A major area of concern is grazing
pressure. Kangaroos are considered to have a considerable impact on
grazing pressure, and for that reason they are often considered pests
by landholders. It has been thought that converting from farming
European stock to native wildlife would have environmental benefits.
The commercial benefits from the change are unclear. Through con-
struction of a plant-herbivore model, the dynamics of cattle, sheep and
kangaroo commodities are examined. Simulations were constructed so
as to estimate the expected value for each and the correlation between
the different commodities. Portfolio analysis using mean-variance,
average value-at-risk, and multi-objective optimisation projects were
used to analyse different allocations of forage to each herbivore. The
effect of an enforced reduction in methane emissions is also explored.
From the analysis it seems that diversification of herbivores (including
kangaroos) is optimal on marginal lands, for the risk adverse, and to
reduce methane emissions.

Declaration
I certify that except where due acknowledgement has been made, the
work is that of the author alone; the work has not been submitted
previously, on whole or part, to qualify for an other academic award;
the content of the thesis is the result of work which has been carried
out since the official commencement date of the approved research
program; any editorial work, paid or unpaid, carried out by a third
party is acknowledged; and ethics procedures and guidelines have been
followed.
Paul D. Moloney
May 26, 2011
I would like to dedicate this work to my family and friends. Without
their support this would never have happened.
Acknowledgements
I would like to acknowledge the support of the Rural Industries Re-
search and Development Company for providing the funding for this
research. Additionally I would like to thank my supervisors, Prof.
John Hearne, Prof. Iain Gordon and Dr. Steven McLeod. Their
ideas and support have helped shape this thesis. I would also like
to thank the staff and students in the School of Mathematical and
Geospatial Sciences at RMIT University for their encouragement and
friendship. I would like to thank Dr. Maryam Esmaeili for our collab-
oration on meat supply chains. I would like to thank Kenneth Read
for assisting in the editing process. Finally I would like to thank my
family, especially Emma who helped edit the final drafts and my son
Bryn, whose early arrival added to the challenge.
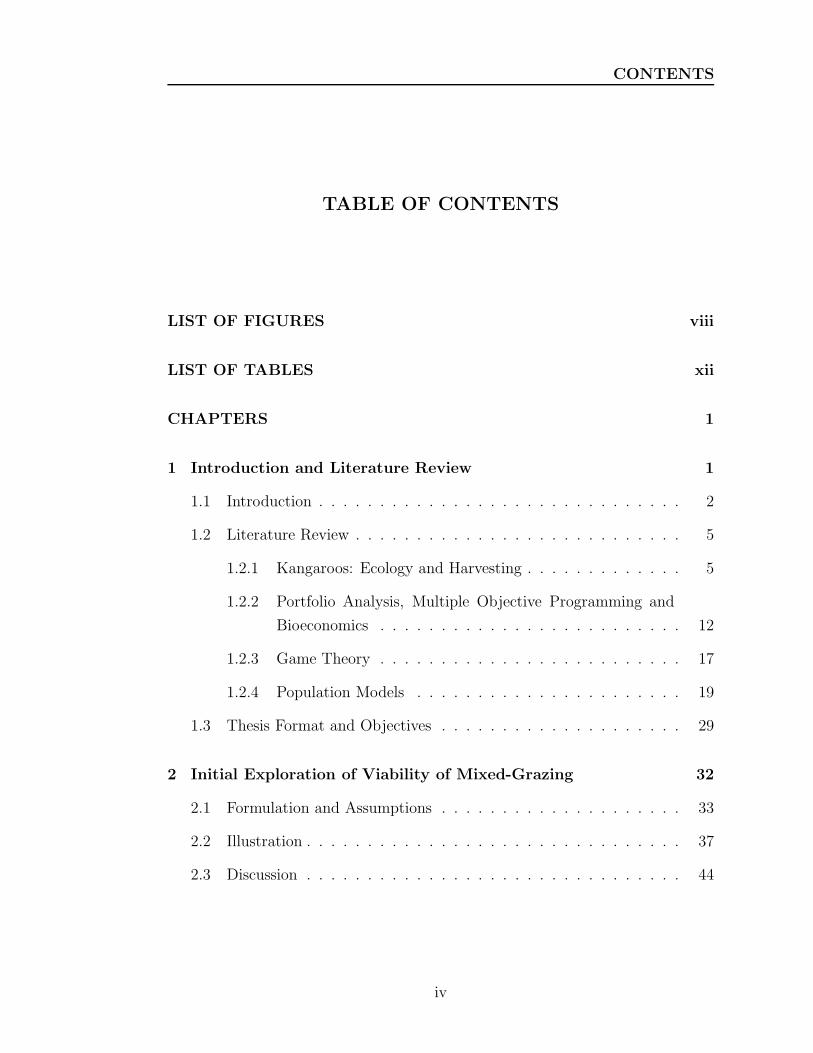
CONTENTS
TABLE OF CONTENTS
LIST OF FIGURES viii
LIST OF TABLES xii
CHAPTERS 1
1 Introduction and Literature Review 1
1.1 Introduction . . . . . . . . . . . . . . . . . . . . . . . . . . . . . . 2
1.2 Literature Review . . . . . . . . . . . . . . . . . . . . . . . . . . . 5
1.2.1 Kangaroos: Ecology and Harvesting . . . . . . . . . . . . . 5
1.2.2 Portfolio Analysis, Multiple Objective Programming and
Bioeconomics . . . . . . . . . . . . . . . . . . . . . . . . . 12
1.2.3 Game Theory . . . . . . . . . . . . . . . . . . . . . . . . . 17
1.2.4 Population Models . . . . . . . . . . . . . . . . . . . . . . 19
1.3 Thesis Format and Objectives . . . . . . . . . . . . . . . . . . . . 29
2 Initial Exploration of Viability of Mixed-Grazing 32
2.1 Formulation and Assumptions . . . . . . . . . . . . . . . . . . . . 33
2.2 Illustration . . . . . . . . . . . . . . . . . . . . . . . . . . . . . . . 37
2.3 Discussion . . . . . . . . . . . . . . . . . . . . . . . . . . . . . . . 44
iv
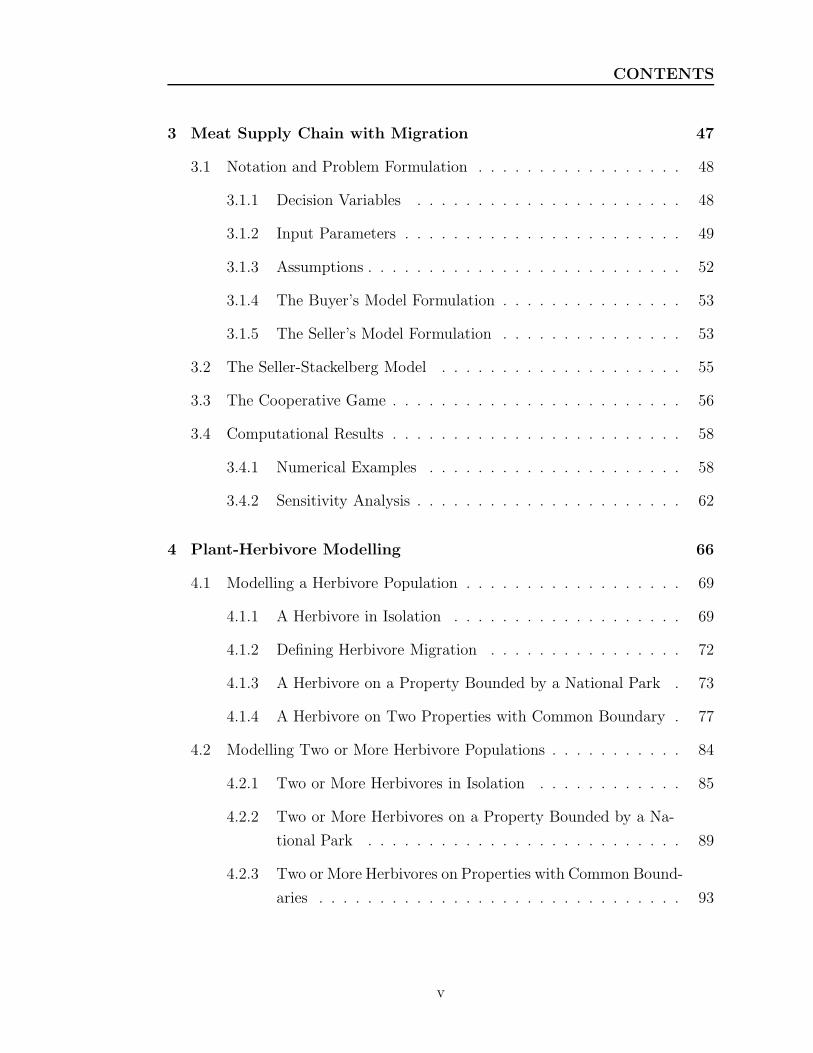
CONTENTS
3 Meat Supply Chain with Migration 47
3.1 Notation and Problem Formulation . . . . . . . . . . . . . . . . . 48
3.1.1 Decision Variables . . . . . . . . . . . . . . . . . . . . . . 48
3.1.2 Input Parameters . . . . . . . . . . . . . . . . . . . . . . . 49
3.1.3 Assumptions . . . . . . . . . . . . . . . . . . . . . . . . . . 52
3.1.4 The Buyer’s Model Formulation . . . . . . . . . . . . . . . 53
3.1.5 The Seller’s Model Formulation . . . . . . . . . . . . . . . 53
3.2 The Seller-Stackelberg Model . . . . . . . . . . . . . . . . . . . . 55
3.3 The Cooperative Game . . . . . . . . . . . . . . . . . . . . . . . . 56
3.4 Computational Results . . . . . . . . . . . . . . . . . . . . . . . . 58
3.4.1 Numerical Examples . . . . . . . . . . . . . . . . . . . . . 58
3.4.2 Sensitivity Analysis . . . . . . . . . . . . . . . . . . . . . . 62
4 Plant-Herbivore Modelling 66
4.1 Modelling a Herbivore Population . . . . . . . . . . . . . . . . . . 69
4.1.1 A Herbivore in Isolation . . . . . . . . . . . . . . . . . . . 69
4.1.2 Defining Herbivore Migration . . . . . . . . . . . . . . . . 72
4.1.3 A Herbivore on a Property Bounded by a National Park . 73
4.1.4 A Herbivore on Two Properties with Common Boundary . 77
4.2 Modelling Two or More Herbivore Populations . . . . . . . . . . . 84
4.2.1 Two or More Herbivores in Isolation . . . . . . . . . . . . 85
4.2.2 Two or More Herbivores on a Property Bounded by a Na-
tional Park . . . . . . . . . . . . . . . . . . . . . . . . . . 89
4.2.3 Two or More Herbivores on Properties with Common Bound-
aries . . . . . . . . . . . . . . . . . . . . . . . . . . . . . . 93
v
CONTENTS
4.3 Modelling Vegetation and a Herbivore Population . . . . . . . . . 96
4.3.1 Vegetation and a Herbivore in Isolation . . . . . . . . . . . 97
4.3.2 Vegetation and a Herbivore with National Park Boundary 98
4.3.3 Vegetation and a Herbivore on Two Properties with Com-
mon Boundary . . . . . . . . . . . . . . . . . . . . . . . . 104
4.4 Discussion . . . . . . . . . . . . . . . . . . . . . . . . . . . . . . . 108
5 Population Modelling with GRASP 110
5.1 The Kangaroo Population Model . . . . . . . . . . . . . . . . . . 111
5.2 Issues with GRASP . . . . . . . . . . . . . . . . . . . . . . . . . . 120
5.3 GRASP Simulations . . . . . . . . . . . . . . . . . . . . . . . . . 122
5.4 Discussion . . . . . . . . . . . . . . . . . . . . . . . . . . . . . . . 124
6 Results and Analysis 126
6.1 Simulation Results . . . . . . . . . . . . . . . . . . . . . . . . . . 127
6.1.1 GRASP Simulation Results . . . . . . . . . . . . . . . . . 129
6.1.2 Pricing Simulation . . . . . . . . . . . . . . . . . . . . . . 130
6.1.3 Relative Returns Simulation . . . . . . . . . . . . . . . . . 131
6.2 Portfolio Optimisation Using the Simulated Results . . . . . . . . 133
6.2.1 Mean-Variance Optimisation . . . . . . . . . . . . . . . . . 133
6.2.2 Average Value at Risk Optimisation . . . . . . . . . . . . . 136
6.2.3 Multi-objective Optimisation Problem . . . . . . . . . . . 139
6.2.4 Portfolios Considering Methane Emissions . . . . . . . . . 141
6.3 Discussion . . . . . . . . . . . . . . . . . . . . . . . . . . . . . . . 147
vi
CONTENTS
7 Conclusion 149
APPENDICES 156
A Proofs and Lemmas 156
A.1 Proof of MSY for alternative harvest function . . . . . . . . . . . 157
A.2 Proposition of Migration equation . . . . . . . . . . . . . . . . . . 159
A.3 Proof of conditions for greater harvest with finite migration . . . . 160
A.4 Proof of the value of the Nash Equilibrium Point for a herbivore
with finite migration . . . . . . . . . . . . . . . . . . . . . . . . . 162
A.5 Proof of stability for single harvested grazer system without mi-
gration . . . . . . . . . . . . . . . . . . . . . . . . . . . . . . . . . 163
B Data Tables 167
GLOSSARY 170
REFERENCES 171
vii
LIST OF FIGURES
LIST OF FIGURES
1.1 The map of the macropod harvest zones in Queensland. The Mara-
noa region is between Charleville and Roma. This map is from
the Queensland Government Department of Environment and Re-
source Management. . . . . . . . . . . . . . . . . . . . . . . . . . 13
1.2 Plot comparing the four types of functional responses. Each has
the same satiation level. . . . . . . . . . . . . . . . . . . . . . . . 23
2.1 The efficient frontier for the optimal solutions to the forage alloca-
tions as shown by the expected percentage return on investments
versus its risk, here measured as the standard deviation so that
the units are equivalent. . . . . . . . . . . . . . . . . . . . . . . . 39
2.2 Plot of expected relative return and the standard deviation of the
relative return as risk aversion, λ, varies, excluding non-stock in-
vestments. . . . . . . . . . . . . . . . . . . . . . . . . . . . . . . . 39
2.3 Plot of proportion of resources allocated to each species as risk
aversion, λ, varies, excluding non-stock investments. . . . . . . . . 40
2.4 Plot of proportion of resources allocated to each species as risk
aversion, λ, varies given a non-stock investment of $2, 500, 000 and
$5, 000, 000. . . . . . . . . . . . . . . . . . . . . . . . . . . . . . . 42
2.5 Plot of proportion of resources allocated to each species as non-
stock investment, NSI in thousands of dollars, varies given a risk
aversion of λ = 0.2 and 0.8. . . . . . . . . . . . . . . . . . . . . . 43
viii
LIST OF FIGURES
2.6 Plot of proportion of resources allocated to each species as the value
of kangaroo dse varies given a non-stock investment of $5, 000, 000
and a risk aversion measure of λ = 0.2 and 0.8 . . . . . . . . . . . 44
3.1 The optimal price for kangaroo meat, pk, dependent on the price
of sheep meat, ps, using the cooperative model. . . . . . . . . . . 60
3.2 The optimal profit for the landholder, Z2, dependent on the price
of sheep meat, ps, using the cooperative model. . . . . . . . . . . 60
3.3 The optimal sheep stocking rate, N∗s , dependent on the price of
sheep meat, ps, using the cooperative model. . . . . . . . . . . . . 61
3.4 The number of kangaroos that immigrate dependent on the price
of sheep meat, ps, when the cooperative model is optimised. . . . 61
3.5 The optimal price for kangaroo meat, pk, dependent on the com-
parative density of kangaroos, φ, using the cooperative model. . . 63
3.6 The optimal profit for the landholder, Z2, dependent on the com-
parative density of kangaroos, φ, using the cooperative model. . . 63
3.7 The optimal sheep stocking rate, N∗s , dependent on the compara-
tive density of kangaroos, φ, using the cooperative model. . . . . . 64
3.8 The number of kangaroos that immigrate dependent on the com-
parative density of kangaroos, φ, when the cooperative model is
optimised. . . . . . . . . . . . . . . . . . . . . . . . . . . . . . . . 64
4.1 An illustration of the affect of perturbing the system above and
below the equilibrium level, under the three different harvesting
regimes and two different values of ς (2 and 4). . . . . . . . . . . . 72
4.2 The optimal herbivore population and harvest rate under the mi-
gration from an infinite external population is compared to the
optimal herbivore population and harvest rate under isolation (no
migration). . . . . . . . . . . . . . . . . . . . . . . . . . . . . . . 76
ix
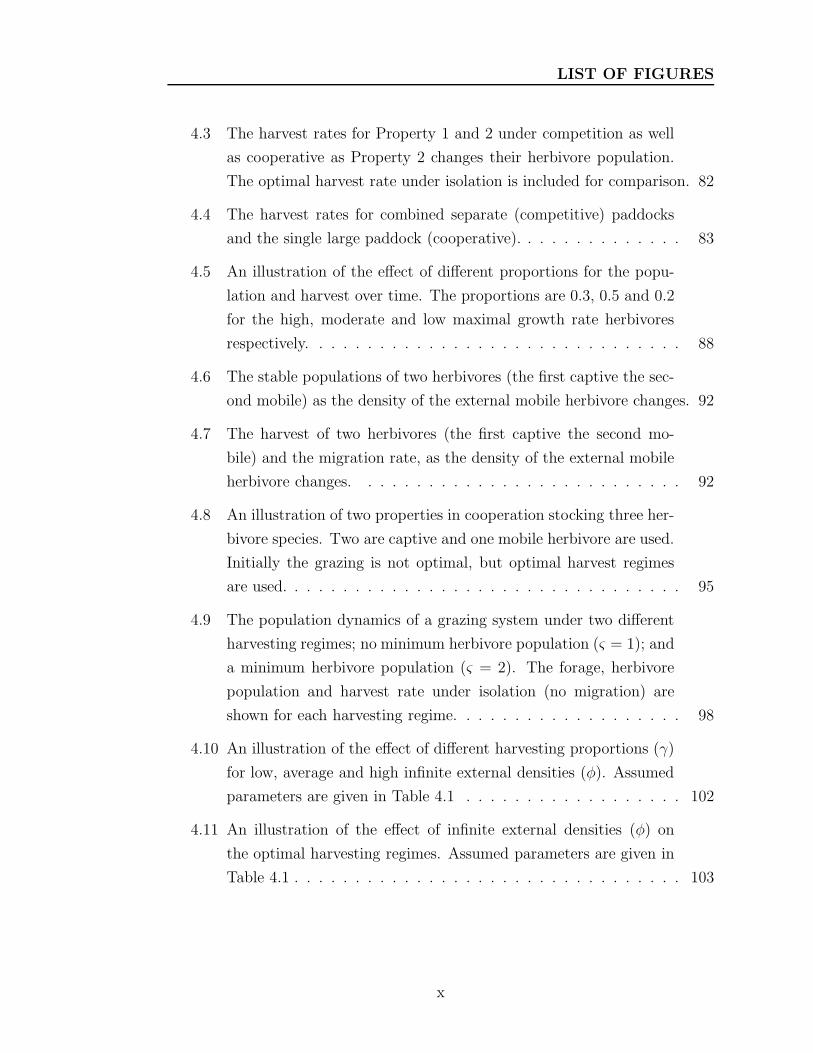
LIST OF FIGURES
4.3 The harvest rates for Property 1 and 2 under competition as well
as cooperative as Property 2 changes their herbivore population.
The optimal harvest rate under isolation is included for comparison. 82
4.4 The harvest rates for combined separate (competitive) paddocks
and the single large paddock (cooperative). . . . . . . . . . . . . . 83
4.5 An illustration of the effect of different proportions for the popu-
lation and harvest over time. The proportions are 0.3, 0.5 and 0.2
for the high, moderate and low maximal growth rate herbivores
respectively. . . . . . . . . . . . . . . . . . . . . . . . . . . . . . . 88
4.6 The stable populations of two herbivores (the first captive the sec-
ond mobile) as the density of the external mobile herbivore changes. 92
4.7 The harvest of two herbivores (the first captive the second mo-
bile) and the migration rate, as the density of the external mobile
herbivore changes. . . . . . . . . . . . . . . . . . . . . . . . . . . 92
4.8 An illustration of two properties in cooperation stocking three her-
bivore species. Two are captive and one mobile herbivore are used.
Initially the grazing is not optimal, but optimal harvest regimes
are used. . . . . . . . . . . . . . . . . . . . . . . . . . . . . . . . . 95
4.9 The population dynamics of a grazing system under two different
harvesting regimes; no minimum herbivore population (ς = 1); and
a minimum herbivore population (ς = 2). The forage, herbivore
population and harvest rate under isolation (no migration) are
shown for each harvesting regime. . . . . . . . . . . . . . . . . . . 98
4.10 An illustration of the effect of different harvesting proportions (γ)
for low, average and high infinite external densities (φ). Assumed
parameters are given in Table 4.1 . . . . . . . . . . . . . . . . . . 102
4.11 An illustration of the effect of infinite external densities (φ) on
the optimal harvesting regimes. Assumed parameters are given in
Table 4.1 . . . . . . . . . . . . . . . . . . . . . . . . . . . . . . . . 103
x
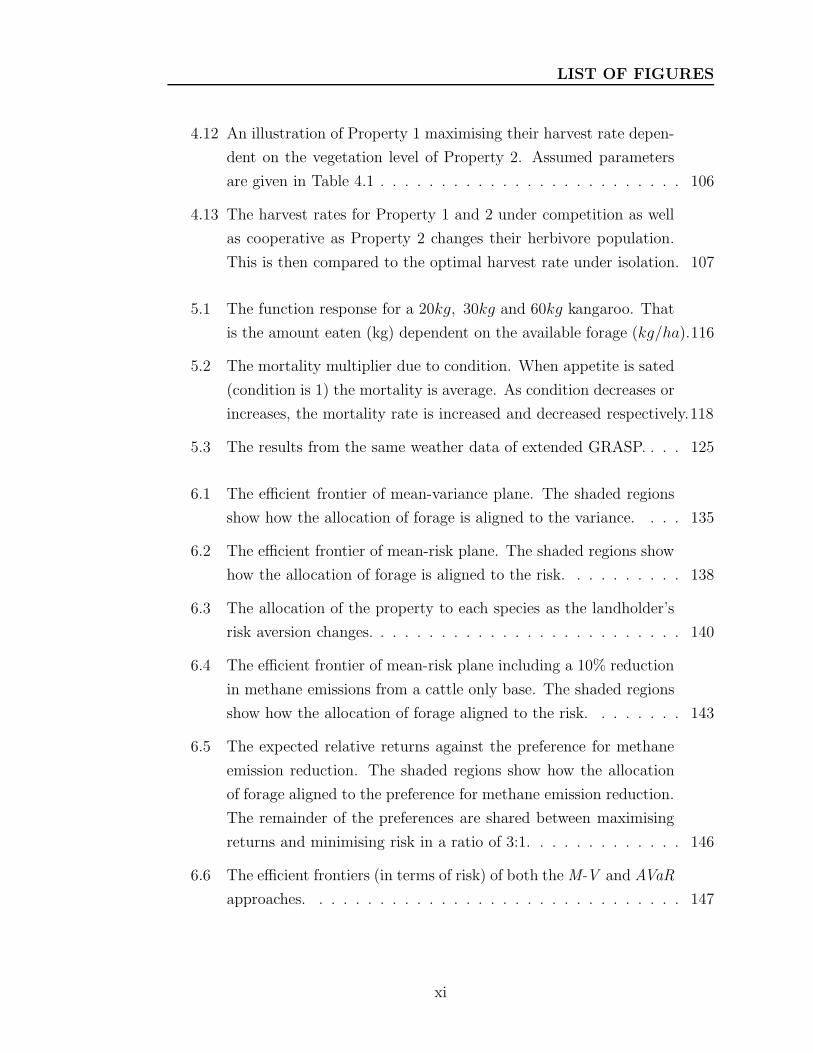
LIST OF FIGURES
4.12 An illustration of Property 1 maximising their harvest rate depen-
dent on the vegetation level of Property 2. Assumed parameters
are given in Table 4.1 . . . . . . . . . . . . . . . . . . . . . . . . . 106
4.13 The harvest rates for Property 1 and 2 under competition as well
as cooperative as Property 2 changes their herbivore population.
This is then compared to the optimal harvest rate under isolation. 107
5.1 The function response for a 20kg, 30kg and 60kg kangaroo. That
is the amount eaten (kg) dependent on the available forage (kg/ha).116
5.2 The mortality multiplier due to condition. When appetite is sated
(condition is 1) the mortality is average. As condition decreases or
increases, the mortality rate is increased and decreased respectively.118
5.3 The results from the same weather data of extended GRASP. . . . 125
6.1 The efficient frontier of mean-variance plane. The shaded regions
show how the allocation of forage is aligned to the variance. . . . 135
6.2 The efficient frontier of mean-risk plane. The shaded regions show
how the allocation of forage is aligned to the risk. . . . . . . . . . 138
6.3 The allocation of the property to each species as the landholder’s
risk aversion changes. . . . . . . . . . . . . . . . . . . . . . . . . . 140
6.4 The efficient frontier of mean-risk plane including a 10% reduction
in methane emissions from a cattle only base. The shaded regions
show how the allocation of forage aligned to the risk. . . . . . . . 143
6.5 The expected relative returns against the preference for methane
emission reduction. The shaded regions show how the allocation
of forage aligned to the preference for methane emission reduction.
The remainder of the preferences are shared between maximising
returns and minimising risk in a ratio of 3:1. . . . . . . . . . . . . 146
6.6 The efficient frontiers (in terms of risk) of both theM-V and AVaR
approaches. . . . . . . . . . . . . . . . . . . . . . . . . . . . . . . 147
xi
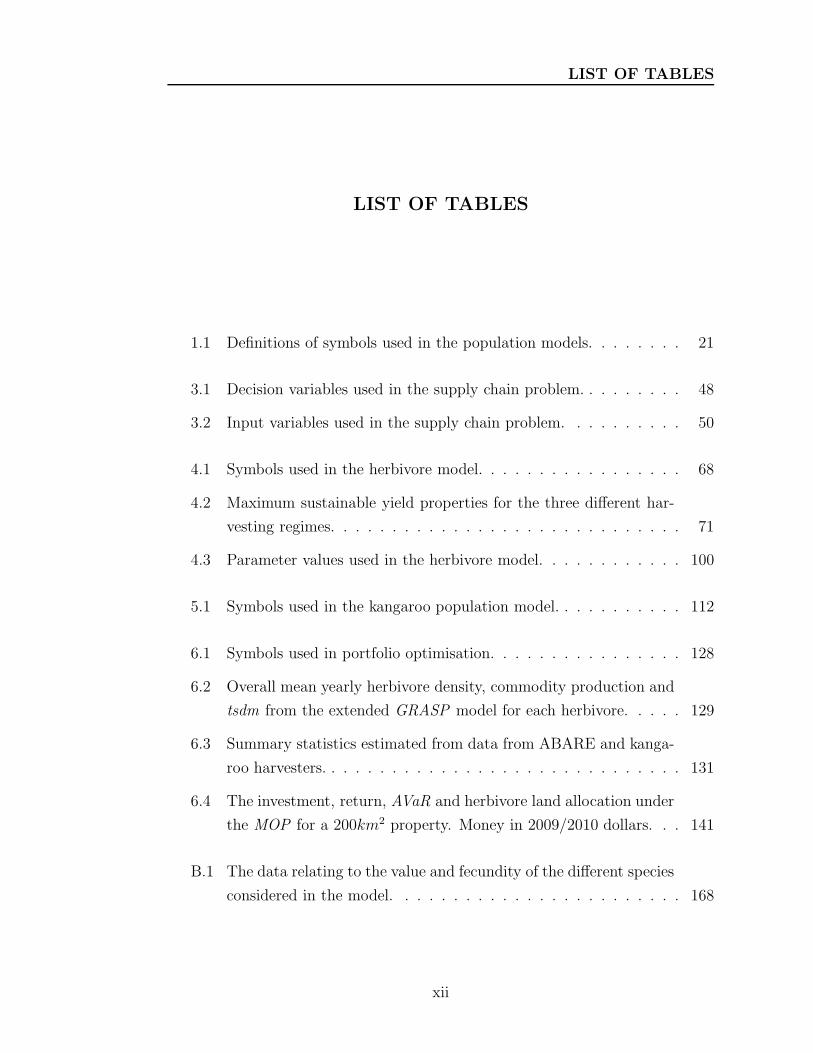
LIST OF TABLES
LIST OF TABLES
1.1 Definitions of symbols used in the population models. . . . . . . . 21
3.1 Decision variables used in the supply chain problem. . . . . . . . . 48
3.2 Input variables used in the supply chain problem. . . . . . . . . . 50
4.1 Symbols used in the herbivore model. . . . . . . . . . . . . . . . . 68
4.2 Maximum sustainable yield properties for the three different har-
vesting regimes. . . . . . . . . . . . . . . . . . . . . . . . . . . . . 71
4.3 Parameter values used in the herbivore model. . . . . . . . . . . . 100
5.1 Symbols used in the kangaroo population model. . . . . . . . . . . 112
6.1 Symbols used in portfolio optimisation. . . . . . . . . . . . . . . . 128
6.2 Overall mean yearly herbivore density, commodity production and
tsdm from the extended GRASP model for each herbivore. . . . . 129
6.3 Summary statistics estimated from data from ABARE and kanga-
roo harvesters. . . . . . . . . . . . . . . . . . . . . . . . . . . . . . 131
6.4 The investment, return, AVaR and herbivore land allocation under
the MOP for a 200km2 property. Money in 2009/2010 dollars. . . 141
B.1 The data relating to the value and fecundity of the different species
considered in the model. . . . . . . . . . . . . . . . . . . . . . . . 168
xii
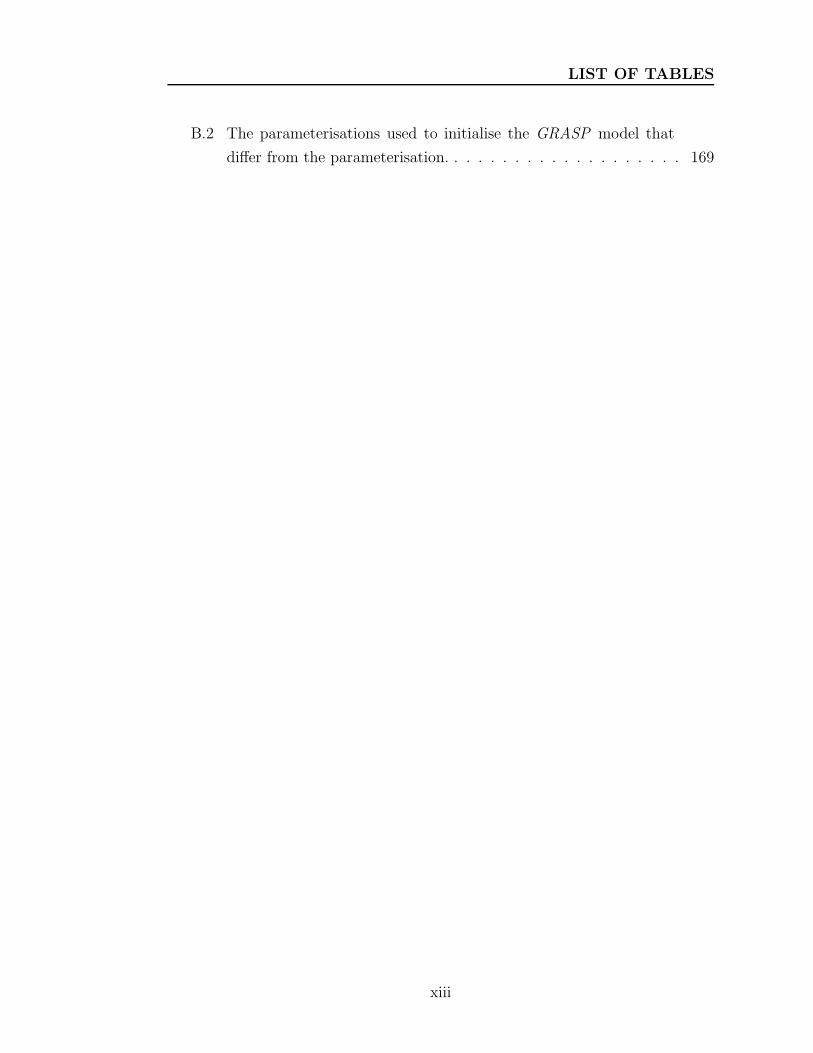
LIST OF TABLES
B.2 The parameterisations used to initialise the GRASP model that
differ from the parameterisation. . . . . . . . . . . . . . . . . . . . 169
xiii

Chapter 1
Introduction and Literature
Review
Historically pastoralists have seen native species as competition for the available
biomass and therefore detrimental to their core business of maintaining a large,
healthy herd of domesticated stock. In Australia the main native species that fall
into this category are kangaroos and wallabies. Since the introduction of Euro-
pean settlement many species of macropod marsupials have declined in number,
some to extinction. However, the larger macropods, Red Kangaroo Macropus
Rufus, Eastern Grey Kangaroo M. giganteus and Western Grey Kangaroo M.
fuliginous, have greatly increased in number (Calaby and Grigg, 1989; Dawson,
1995). In an attempt to control their numbers, culling and then harvesting for
meat and skins has been allowed in most states. Since the 1980’s efforts have
been made to increase the acceptance and scale of the kangaroo harvesting in-
dustry (Grigg, 2002), especially with regards to human consumption of their
1
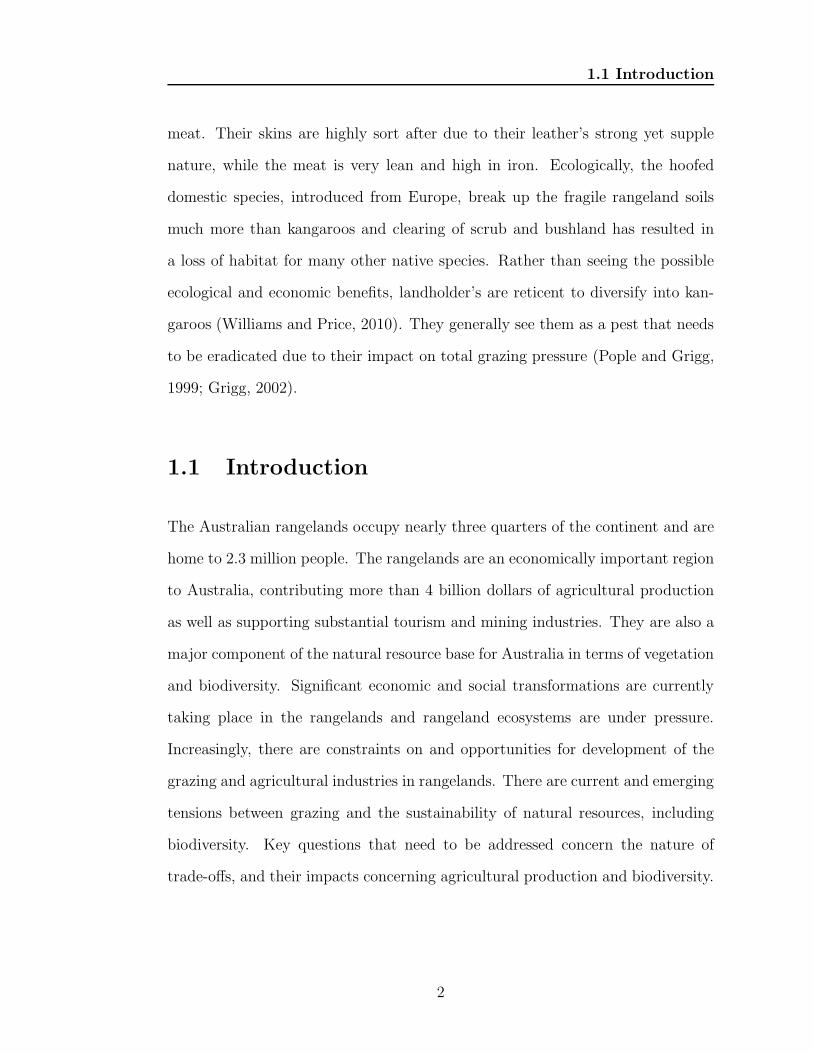
1.1 Introduction
meat. Their skins are highly sort after due to their leather’s strong yet supple
nature, while the meat is very lean and high in iron. Ecologically, the hoofed
domestic species, introduced from Europe, break up the fragile rangeland soils
much more than kangaroos and clearing of scrub and bushland has resulted in
a loss of habitat for many other native species. Rather than seeing the possible
ecological and economic benefits, landholder’s are reticent to diversify into kan-
garoos (Williams and Price, 2010). They generally see them as a pest that needs
to be eradicated due to their impact on total grazing pressure (Pople and Grigg,
1999; Grigg, 2002).
1.1 Introduction
The Australian rangelands occupy nearly three quarters of the continent and are
home to 2.3 million people. The rangelands are an economically important region
to Australia, contributing more than 4 billion dollars of agricultural production
as well as supporting substantial tourism and mining industries. They are also a
major component of the natural resource base for Australia in terms of vegetation
and biodiversity. Significant economic and social transformations are currently
taking place in the rangelands and rangeland ecosystems are under pressure.
Increasingly, there are constraints on and opportunities for development of the
grazing and agricultural industries in rangelands. There are current and emerging
tensions between grazing and the sustainability of natural resources, including
biodiversity. Key questions that need to be addressed concern the nature of
trade-offs, and their impacts concerning agricultural production and biodiversity.
2
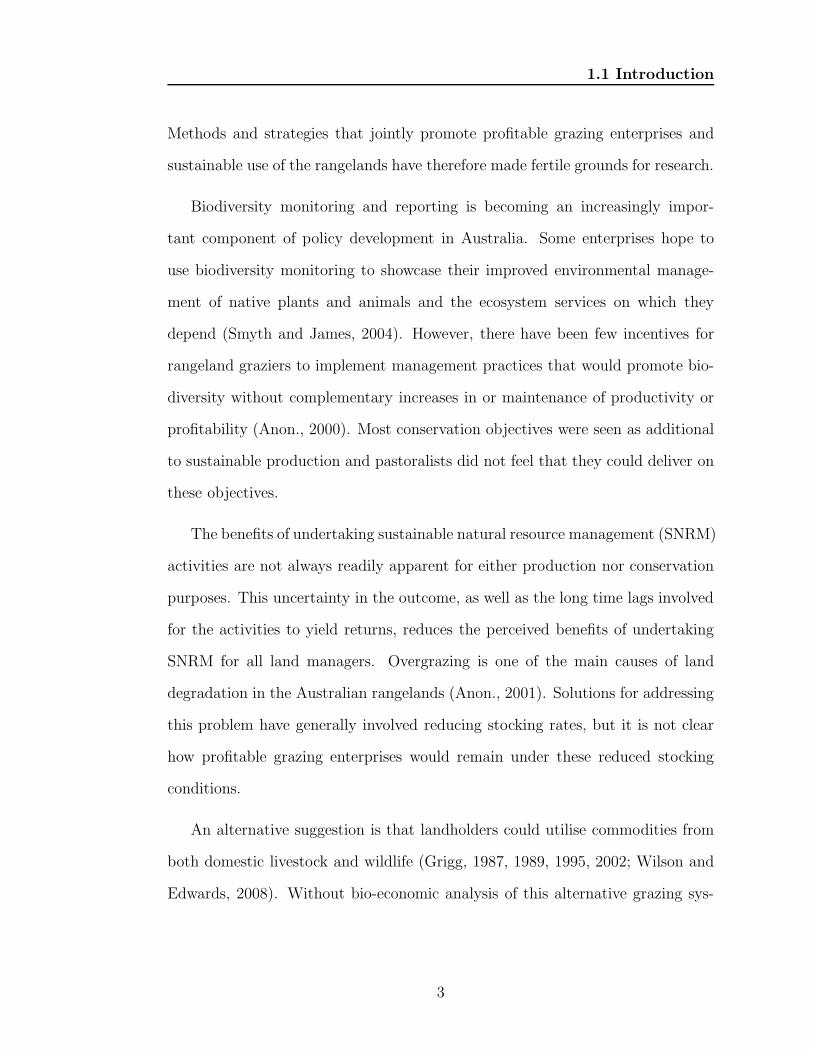
1.1 Introduction
Methods and strategies that jointly promote profitable grazing enterprises and
sustainable use of the rangelands have therefore made fertile grounds for research.
Biodiversity monitoring and reporting is becoming an increasingly impor-
tant component of policy development in Australia. Some enterprises hope to
use biodiversity monitoring to showcase their improved environmental manage-
ment of native plants and animals and the ecosystem services on which they
depend (Smyth and James, 2004). However, there have been few incentives for
rangeland graziers to implement management practices that would promote bio-
diversity without complementary increases in or maintenance of productivity or
profitability (Anon., 2000). Most conservation objectives were seen as additional
to sustainable production and pastoralists did not feel that they could deliver on
these objectives.
The benefits of undertaking sustainable natural resource management (SNRM)
activities are not always readily apparent for either production nor conservation
purposes. This uncertainty in the outcome, as well as the long time lags involved
for the activities to yield returns, reduces the perceived benefits of undertaking
SNRM for all land managers. Overgrazing is one of the main causes of land
degradation in the Australian rangelands (Anon., 2001). Solutions for addressing
this problem have generally involved reducing stocking rates, but it is not clear
how profitable grazing enterprises would remain under these reduced stocking
conditions.
An alternative suggestion is that landholders could utilise commodities from
both domestic livestock and wildlife (Grigg, 1987, 1989, 1995, 2002; Wilson and
Edwards, 2008). Without bio-economic analysis of this alternative grazing sys-
3
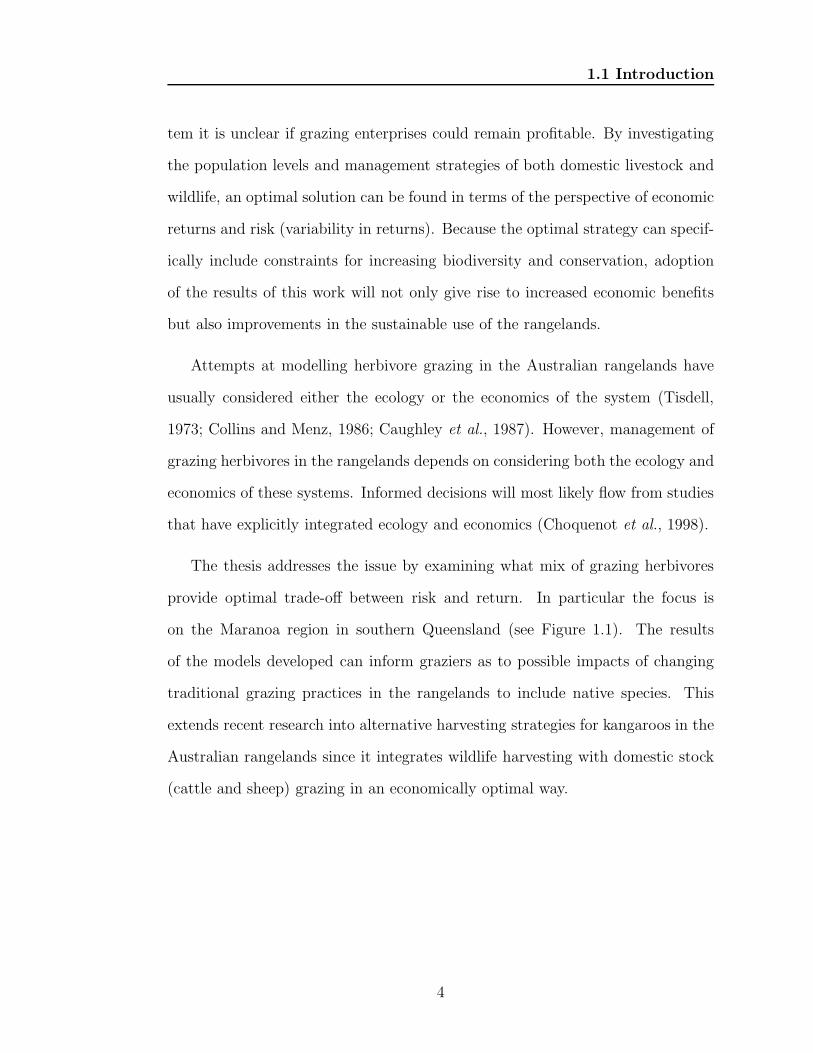
1.1 Introduction
tem it is unclear if grazing enterprises could remain profitable. By investigating
the population levels and management strategies of both domestic livestock and
wildlife, an optimal solution can be found in terms of the perspective of economic
returns and risk (variability in returns). Because the optimal strategy can specif-
ically include constraints for increasing biodiversity and conservation, adoption
of the results of this work will not only give rise to increased economic benefits
but also improvements in the sustainable use of the rangelands.
Attempts at modelling herbivore grazing in the Australian rangelands have
usually considered either the ecology or the economics of the system (Tisdell,
1973; Collins and Menz, 1986; Caughley et al., 1987). However, management of
grazing herbivores in the rangelands depends on considering both the ecology and
economics of these systems. Informed decisions will most likely flow from studies
that have explicitly integrated ecology and economics (Choquenot et al., 1998).
The thesis addresses the issue by examining what mix of grazing herbivores
provide optimal trade-off between risk and return. In particular the focus is
on the Maranoa region in southern Queensland (see Figure 1.1). The results
of the models developed can inform graziers as to possible impacts of changing
traditional grazing practices in the rangelands to include native species. This
extends recent research into alternative harvesting strategies for kangaroos in the
Australian rangelands since it integrates wildlife harvesting with domestic stock
(cattle and sheep) grazing in an economically optimal way.
4
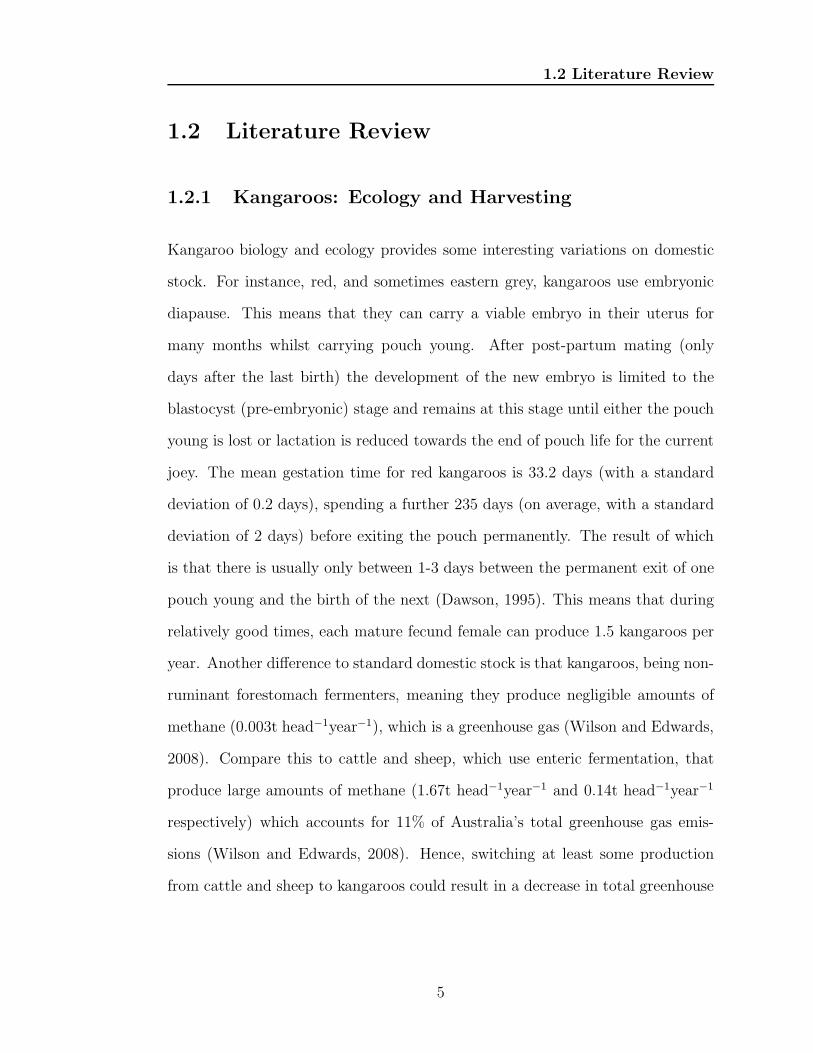
1.2 Literature Review
1.2 Literature Review
1.2.1 Kangaroos: Ecology and Harvesting
Kangaroo biology and ecology provides some interesting variations on domestic
stock. For instance, red, and sometimes eastern grey, kangaroos use embryonic
diapause. This means that they can carry a viable embryo in their uterus for
many months whilst carrying pouch young. After post-partum mating (only
days after the last birth) the development of the new embryo is limited to the
blastocyst (pre-embryonic) stage and remains at this stage until either the pouch
young is lost or lactation is reduced towards the end of pouch life for the current
joey. The mean gestation time for red kangaroos is 33.2 days (with a standard
deviation of 0.2 days), spending a further 235 days (on average, with a standard
deviation of 2 days) before exiting the pouch permanently. The result of which
is that there is usually only between 1-3 days between the permanent exit of one
pouch young and the birth of the next (Dawson, 1995). This means that during
relatively good times, each mature fecund female can produce 1.5 kangaroos per
year. Another difference to standard domestic stock is that kangaroos, being non-
ruminant forestomach fermenters, meaning they produce negligible amounts of
methane (0.003t head−1year−1), which is a greenhouse gas (Wilson and Edwards,
2008). Compare this to cattle and sheep, which use enteric fermentation, that
produce large amounts of methane (1.67t head−1year−1 and 0.14t head−1year−1
respectively) which accounts for 11% of Australia’s total greenhouse gas emis-
sions (Wilson and Edwards, 2008). Hence, switching at least some production
from cattle and sheep to kangaroos could result in a decrease in total greenhouse
5
1.2 Literature Review
gas emissions in Australia (Garnaut, 2008). More generally the native kanga-
roos have less of a negative impact on biodiversity compared to the livestock
introduced by Europeans (Williams and Price, 2010).
Red kangaroos reach sexual maturity between 15 and 20 months for females
and 24 and 48 months for males. Eastern greys take an average of 18 and 48
months for females and males respectively to reach sexual maturity. While males
can continue to make significant contributions to breeding once mature, females
tend to have reduced fecundity after the age of 9 years until becoming infecund
by age 12 to 15 years. Mortality rates are high in juvenile kangaroos, particularly
in males, and the reasons why are not fully understood (Dawson, 1995). In
some areas 83% of mature western grey kangaroo females may have pouch young,
while only 27% also have young at foot (YAF ) (Arnold et al., 1991). The main
factor for this high mortality is thought to be that as much of their nutrients go
into formation of bone and muscle, little goes into fat, making them particularly
susceptible to feed shortages. Another factor is predation by dingoes and foxes.
More recent studies comparing densities either side of dingo fences suggest that
predation by dingoes in semi-arid rangelands is more significant when an area is
in drought when normally abundant prey, namely rabbits, are scarce (Newsome
et al., 2001). Predation by foxes is found to be influential only in temperate
areas (Banks et al., 2000).
Research has been conducted into the feed intake and preferences of kangaroos
and domestic stock so as to enable them to determine the level of competition
between species for the available food supplies. As a result functional responses of
kangaroos, sheep and other animals in arid conditions have been estimated (Short,
6
1.2 Literature Review
1985). The functional responses enables the estimation of feed intake given the
biomass available, which is important in determining the effect of animals on
the available plant life. It was found that kangaroos preferred young grass and
green forbs due to the fact that they are easier to digest Caughley et al. (1987);
Moss and Croft (1999); Davis et al. (2008). More recently Rafferty et al. (2010)
studied the feed preferences of western grey kangaroos, comparing captive and
wild populations. Also of importance is any competition for resources, where
one species has a deleterious effect on another. While competition is possible
between the red and grey kangaroos, the level of competition is unclear as they
have different feed and microhabitat preferences (Dawson, 1995). Dudzinski et al.
(1982) considered interaction between cattle and red kangaroos, and found that
while both consume grass as the mainstay of their diet, the parts that they grazed
differed, except in cases of extreme drought, and hence no competition occurred
when cattle numbers are controlled. They also found a lack of facilitation, in
that the kangaroos were not attracted to areas recently grazed by cattle. Dawson
and Ellis (1994) looked at competition between kangaroos and sheep and found it
only occurred during very dry winters. During these times sheep that grazed with
kangaroos lost more weight and grew slightly less wool than sheep kept separate
from kangaroos. Kangaroos in sheep free paddocks had higher body weights,
although their diets remained the same. A study of population dynamics in
the semi-arid pastoral zones of South Australia by Jonzen et al. (2005) found,
counter intuitively perhaps, that in their best models, sheep and cattle densities
had a positive effect on the population growth rate of red kangaroos, even more
than rainfall. They postulated this was due to the sheep and cattle acting as a
surrogate for the availability of forage.
7
1.2 Literature Review
The functional response of kangaroos has been modelled using several meth-
ods. The functional response is the change in the population size as the density
of its food changes. Bayliss (1985) calculated numerical response functions for
both red and western grey kangaroos using both Michaelis-Menton and Ramp
functions. Caughley et al. (1987) developed numerical response for red kanga-
roos using an Ivlev function to determine growth rate in response to available
forage. Caughley’s numerical response has been used subsequently to explore
population dynamics of kangaroos and possible affects of harvesting at different
rates (Caughley et al., 1987; Bayliss and Choquenot, 2002). Alternative models
have used rainfall (as a proxy to biomass) to predict population growth. These in-
clude stochastic Ricker models (Cairns and Grigg, 1993; McCarthy, 1996; Jonzen
et al., 2005), and spatial kriging models (Pople et al., 2007). Rainfall was found to
be insufficient to produce reasonable estimates for western grey kangaroos (Cairns
et al., 2000). Bayliss (1985) noted that the rates of increase seemed to be de-
pendent on the current age and gender structure of the population. Hacker et al.
(2003) used a physiological structured population model to account for the influ-
ence on age and gender demographics in their model. A more detailed description
of the mathematical models used occurs in Section 1.2.4.
Body condition reflects an animal’s nutritional state. It combines current and
recent differences between required and available food. The body condition of
kangaroos has been monitored and recorded most effectively using a kidney fat
index (Caughley et al., 1987; Moss and Croft, 1999). This procedure requires the
kidney to be assessed for the percentage of fat attached to the kidney. Moss and
Croft (1999) determined that the amount of green grass biomass was the best
8
1.2 Literature Review
predictor for the body condition of red kangaroos. It was also noted that there
was a lag between body condition and pasture biomass of approximately three
months.
Kangaroos, unlike domestic stock and many other wild animals move freely
between farms, national parks and other areas, due to their ability to jump fences.
This leads to the situation of having free-roaming stock within demarcated owner-
ship boundaries (Pople and Grigg, 1999). They will move from location depending
on the availability of food and water. A landholder who reduces their stocking
rate of sheep, and hence increases the availability of food, is likely to receive an
increase in their kangaroo numbers whether that was their desired outcome or
not. Therefore, if a landholder wanted to increase their average kangaroo stocking
rate, reducing its sheep stocking rate could increase the net kangaroo immigration
onto the property Moloney and Hearne (2009). This may make the landholder
in question unpopular with other landholders in the area, as they may believe
that some of the enticed kangaroos may venture onto their property Pople et al.
(2007). Conversely, a landholder may attempt to increase their stocking rate of
sheep to create a net emigration of kangaroos, however, this could increase the
risk of overstocking.
Habitat influences density and social groupings of western grey kangaroos (Coul-
son, 1993). McAlpine et al. (1999) investigated the effect of landscape structure
on the density of red and eastern grey kangaroos, and common wallaroos in par-
tially cleared semi-arid bushland in Queensland. They found linkages with the
abundance of large kangaroo species and tree clearing practices, making it an
important factor in conjunction with pasture productivity. Viggers and Hearn
9
1.2 Literature Review
(2005) monitored eastern grey kangaroos in south eastern Australia, particularly
incursions from reserves onto farmland. They concluded that the kangaroos only
dispersed where cover was available. Martin et al. (2007) argued that method-
ology used by Viggers and Hearn (2005) was flawed and insufficient data was
obtained to draw their conclusions. These claims were rebutted in Viggers and
Lindenmayer (2007), saying that the key claim, that landholders are at a disincen-
tive to conserve remnant native vegetation, still held. Fukuda et al. (2009) found
that fencing watering holes during a draught had little if any effect on the density
of red kangaroos within 4km of the watering hole. Instead food availability was
the main determining factor, as there is usually water within convenient reach
of the kangaroos. Hence, fencing off watering holes during drought is not likely
to have the desired effect of reducing kangaroo densities and allowing vegetation
regeneration. The ideal free distribution IFD is an ecological concept implying
that animals will move between areas so that the ratio of animals to carrying ca-
pacity in each area will be equal (Fretwell and Lucas Jr., 1969). Coulson (2009)
concluded that it is likely that the ideal free distribution holds for kangaroos in
a review of the literature, but did note that further research through different
management practices is required. Wiggins et al. (2010) investigated shifts in
home range after (lethal and exclusion) interventions on two common macropod
species in Tasmania, pademelons (thylogale billardierii) and red-necked wallabies
(macropus rufogriseus rufogriseus). Their results conformed to predictions based
on the ideal free distribution.
Plans are being investigated into how kangaroo harvesting can return some
money to the landholders (Pople and Grigg, 1999; Baumber et al., 2009). Recent
10
1.2 Literature Review
research regarding sustainable harvesting and alternative management strategies
for kangaroos has indicated that the integration of wildlife harvesting and tra-
ditional rangeland enterprises may not be straightforward (Hacker et al., 2003;
Hacker and McLeod, 2003; McLeod et al., 2004; Baumber et al., 2009). For exam-
ple, harvest strategies by individual kangaroo shooters may change the structure
and dynamics of kangaroo populations to such an extent that they compromise
other management goals, such as controlling total grazing pressure. Grazing
pressure is the stress on vegetation, and therefore the ecosystem, from animal
grazing.
Kangaroo (and wallaby) harvesting is controlled by state and federal govern-
ments. State governments set quotas and regulations that must be signed off by
the Federal Government. This is due in part to the fact that as a native species,
kangaroos (and wallabies) are under the protection of the crown. Each state
has different protocols with regards to harvesting kangaroos and wallabies, what
quotas are set and how the quotas are managed (Pople and Grigg, 1999). For
instance, in New South Wales each region is given a quota of tags to be placed
on each harvested kangaroo. These tags are then distributed to property owners,
who can harvest (either themselves or engage external harvesters) until their tags
are exhausted (Hacker and McLeod, 2003). In Queensland, each region is given
a quota but it is the harvesters themselves that can purchase the tags, which can
then be used to harvest kangaroos on private property (Office of the Queensland
Parliamentary Counsel, 2010; Moloney et al., 2011). In addition to the quotas to
control the off-take, there are also conditions that are meant to ensure a stable,
genetically diverse kangaroo population. In Queensland, with similar conditions
11
1.2 Literature Review
elsewhere, these conditions include; minimum kangaroo densities; male off-take
bias; and minimum weight limit for harvested kangaroos. Typically these are set
to; a minimum kangaroo density of 2 kangaroos per km2; a 70% male off-take bias;
and a minimum live weight of 20kg or fully dressed weight of 13kg (Hacker et al.,
2003; Office of the Queensland Parliamentary Counsel, 2010). Fully dressed refers
to a carcass of a harvested macropod with the following parts removed: head;
viscera; each forelimb from the elbow joint; foot of 1 hind limb, from a point
below the tarsal joint; other hind limb from a point midway between the knee
and ankle joints; tail (Office of the Queensland Parliamentary Counsel, 2010).
1.2.2 Portfolio Analysis, Multiple Objective Programming
and Bioeconomics
Often the driving force behind change in agribusinesses derives from the perceived
benefit of that change. To create that leverage there is a need to examine whether
the inclusion of kangaroo harvesting within a mixed grazing strategy for their
enterprise can be financially beneficial to pastoralists. The decision of which
animal to stock and at what levels is analogous to the question of which shares
should be invested in and to what degree. This problem of portfolio optimisation
has had different techniques developed over time to analyse the best strategy for
optimising the return on investment while accounting for the risk involved in the
investment. One of the first ways used to analyse risk and return is classical
mean-variance portfolio selection (Markowitz, 1952, 1991). The scenario is a
limited amount of funds are to be invested in a variety of assets (Steinbach,
2001). The goal is that each asset is allocated funds, y, in such as way as to
12
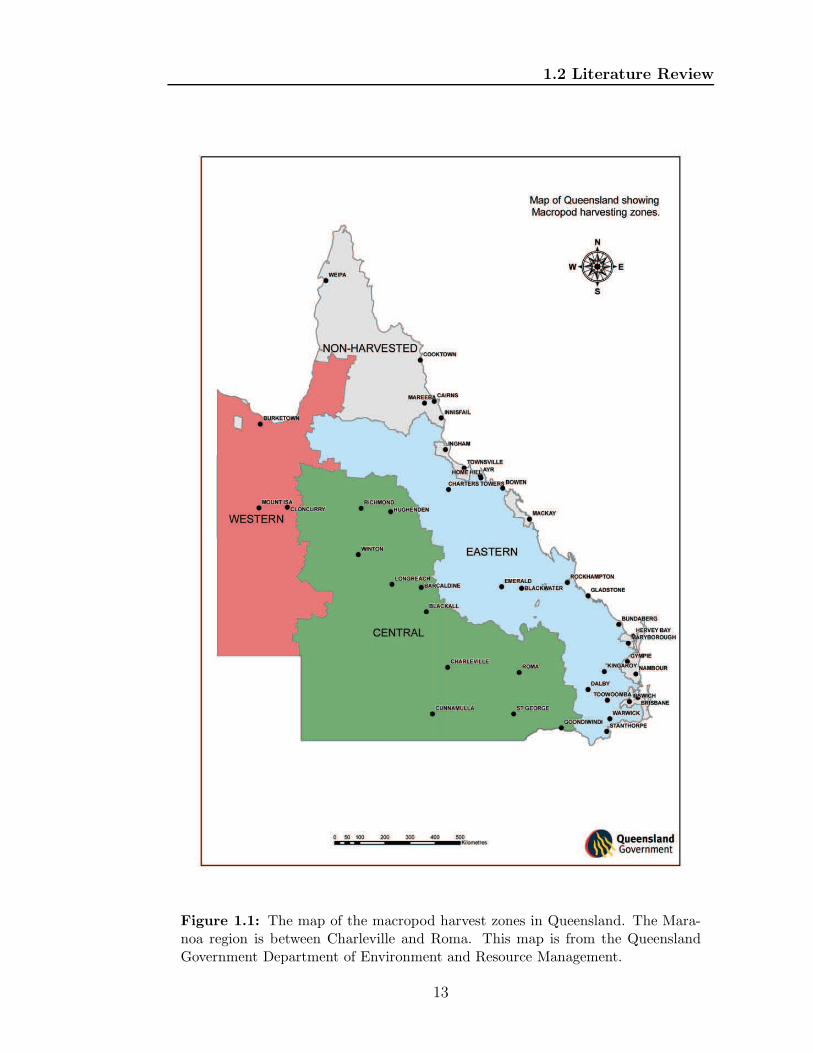
1.2 Literature Review
Figure 1.1: The map of the macropod harvest zones in Queensland. The Mara-noa region is between Charleville and Roma. This map is from the QueenslandGovernment Department of Environment and Resource Management.
13
1.2 Literature Review
trade-off maximising performance, ρ(y), and minimising risk, R(y),
maxy
πρ(y)− 1
2R(y)
s.t.
eTy = 1,
where π is the trade-off parameter, e ∈ Rn denotes the vector of all 1s and the
budget equation eTy = 1 specifies the initial wealth (without loss of generality
set equal to one). This enables the conflicting objectives of maximising returns
and minising risk to be addressed and the set of pareto-optimal portfolios to be
calculated.
But is risk defined? Markowitz (1952, 1991) suggested that variance as a proxy
for risk in mean-variance analysis. However, it has been noted that variance is not
actual a measure of risk, but a measure of uncertainty (Rachev et al., 2008). An
alternative formulation more generally known as mean-risk analysis focuses on
two main principles. Selecting the portfolio(s) with the minimum risk, given they
meet a lower bound on expected performance. Selecting the portfolio(s) with the
maximum performance, given they meet an upper bound on risk. Mathematically
14
1.2 Literature Review
these can be written respectively as
miny
R(y)
s.t. eTy = 1
µTy ≥ µ∗
y ≥ 0 (1.1)
and
maxy
µTy
s.t. eTy = 1
R(y) ≤ R∗
y ≥ 0 (1.2)
where µ∗ is the lower bound on expected performance and R∗ is the upper bound
on risk. A number of different measures for risk aversion related to risk premiums
are discussed by Pratt (1960) and Rubenstein (1973) amongst others. How risk
should be measured is still debated with each method having its own strengths
and weaknesses: asymmetric risk measures including expectation of loss and semi-
variance (Harlow and Rao, 1989); risk models with higher moments (Kraus and
Litzenberger, 1976); and, coherent risk measures (Artzner et al., 1997) have all
been developed. Value at risk (VaR)is one of the most commonly used risk
measures used in finance (Simons, 1996). Average value at risk (also known as
conditional value at risk and expected shortfall) is superior to value at risk as
15
1.2 Literature Review
a measure of risk as shown by Palmquist et al. (2002). AVaR calculates the
expected value of return given the return is in the lowest ε of the distribution
(see Equation 1.3). Multiple time period models in both discrete (Markowitz,
1991; Phelps, 1962) and continuous (Merton, 1971) time have been researched.
AVaRε(X) =1
ε
∫ ε
0
VaRp(X)dp (1.3)
Using a mean-variance approach to analyse agricultural development was in-
vestigated by Freund (1956) and Turvey et al. (1988) while more recently Theron
and van der Honert (2003), where the emphasis was on gross margins and long-
term wealth as well as Hearne et al. (2008) as it related to stocking rates in game
ranches. In the present analysis, risk is defined as the variance in returns and risk
aversion is the degree to which the landholder desires to minimise risk compared
to maximising returns.
Clark (1990) introduces the idea of economically optimal, yet sustainable har-
vesting of populations, in effect maximising growth rates and then harvesting
at a similar rate, often refered to as maximal sustainable yield (MSY ). These
models have included common populations such as fish (Pikitch et al., 2004).
This idea was extended to finding the optimal two-species harvesting policies,
on a Lotka-Volterra competitive model, by Mesterton-Gibbons (1996). He found
that an optimal harvesting policy may drive one species to extinction given it
is sufficiently easier to catch, even if the system would coexist in the absence of
harvesting. Conrad (1999) explored the idea of a marine sanctuary on neighbour-
ing fishing grounds using diffusion of biomass finding variation in biomass was
16
1.2 Literature Review
reduced. Skonhoft (2005); Skonhoft and Olaussen (2005) investigated the eco-
nomic effect of moose migration, where migration is driven by seasonal factors.
The analysis showed that neglecting migration can cause sub-optimal popula-
tion sizes and substantial profit transfer among landholders. Skonhoft (2007)
used biomass to look at the bioeconomics for a park agency and locals for land
animals on conservation reserves and farmers in sub-Saharan Africa.
Kangaroos are like fish and moose in some aspects. They have a common
population available to be harvested by many. They have areas of sanctuary
where harvesting is not allowed. There are even boundaries of where certain
groups can harvest and others can’t with international boundaries being akin
to property boundaries. There are even harvest limits set. However, unlike
fisheries, there is domestic stock to be considered as well, that we have a much
greater control over. Unlike moose, there is competition for resources rather than
predation on saplings for future logging. Skonhoft (2007) used a generalise model
to look at mobile biomass, or a single species, without any captive stock. In the
problem on interest there are both stock that is free-roaming across boundaries
(that is publicly owned) as well as sedentary (privately owned) within the property
competing for common forage.
1.2.3 Game Theory
The present situation is one where most of the power to influence commodity
prices does not reside with the landholder. Game theory has looked into at how
that power influences operational decisions. Game theory assumes that each
player acts rationally and therefore makes decisions about which strategy is opti-
17
1.2 Literature Review
mal given the information they know. It has been used to explore decision making
across many fields including: economics; computer systems; politics; and, genet-
ics (Choi, 1991; Sumaila and Apaloo, 2002; Aliprantis and Chakrabarti, 2011).
A strategic game is one in which n players (labelled 1, 2,..., n) each have a
strategy set (Si, i ∈ {1, 2, ..., n}) and a payoff function (ui, i ∈ {1, 2, ..., n}). All
players choose simultaneously and independently their strategy (si ∈ Si) and re-
ceives payoff ui(s1, s2, ..., sn) for each i ∈ {1, 2, ..., n} (Aliprantis and Chakrabarti,
2011). The concept of Nash equilibrium points (NEPs) Nash (1951) revolu-
tionised strategic game theory. An NEP is where no single player can do better
by changing their strategy while all other players play the same NEP. More for-
mally this can be written as (s∗1, s∗2, ..., s
∗n) is an NEP iff
ui(s∗1, ..., s
∗i−1, s
∗i , s
∗i−1, ..., s
∗n) ≥ ui(s
∗1, ..., s
∗i−1, si, s
∗i−1, ..., s
∗n)
∀si ∈ Si and i ∈ {1, 2, ..., n}. Therefore it is possible to have multiple NEPs in
a strategic game. If the strategy set Si is an interval, the payoff functions are
continuous and have second-order partial derivatives in the interior of Si then
(s∗1, s∗2, ..., s
∗n) is the only interior NEP of the game iff,
1. Each s∗i is in the interior of the interval Si.
2.∂ui
∂si(s∗1, s
∗2, ..., s
∗n) = 0 for each player i.
3. Each s∗i is the only stationary point of the function ui(s∗1, s
∗2, ..., s
∗n), si is in
the interior os Si.
4.∂2ui
∂s2i(s∗1, s
∗2, ..., s
∗n) < 0 for each player i.
18
1.2 Literature Review
Both cooperative and competitive (strategic) game theory has been widely
used in economics and finance (Rosenthal, 1981; Sumaila and Apaloo, 2002).
Game theory as an effective method has been used to describe and solve interac-
tion mechanisms of the seller (landholder) and the buyer (processor) in a supply
chain. For example, Yang and Zhou (2006) consider a two-echelon system with a
seller and two competitive buyers where the seller has more power. They assume
the product of one buyer is a substitute for the product of the other therefore,
their demand function follows the Bertrand model. The optimal wholesale price
and quantity ordered are obtained under different scenarios. A similar model is
presented in Chen et al. (2006) where they also consider the impact of trans-
action costs, while Yao et al. (2005) consider the impact of value adding in the
demand function. Xiao and Qi (2008) and Yang and Zhou (2006) consider similar
demand functions with the former offering two different quantity discounts, an
all-unit quantity and an incremental quantity discount to the buyer. In addition,
propose several models in a supply chain which incorporate elements of compe-
tition and cooperation between a seller and a buyer under non-cooperative and
cooperative games (Esmaeili et al., 2009b,a). A significant shortcoming of all
these models is that they only regard seller or buyer’s profits without considering
any constraints. In other words, to avoid the confounding of effect of constraints,
they consider only a theoretical model.
1.2.4 Population Models
Population models in ecology can fall into several categories. There are many
questions about the population to be answered to find the required category; is
19
1.2 Literature Review
it measured in discrete or continuous time; is it age or size dependent; are stages
discrete or continuous; are births a flow or a pulse; is there intraspecific competi-
tion; is there predation or interspecific competition; do the fertility and mortality
rates change over time, stage or density; is the system deterministic or stochastic;
are the genders significantly different; is spatial location important? Once these
questions have been answered then an appropriate mathematical model can be
selected. Whether it be a discrete system with a series of difference equation, a
continuous process with ordinary differential equations, partial differential equa-
tions, or spatially distributed, there is a model to approximate the dynamic of
interest in the population.
Initially we shall discuss unstructured population models. These are models
where the population(s) can be considered a homogeneous group without los-
ing too much information. Even before Malthus (1798) the idea of exponential
growth in populations being bounded by some external factor due to intraspe-
cific competition had been discussed (Seidl and Tisdell, 1999). Verhulst (1838,
1845) was the first to give this idea an equation, that of logistic growth (Equa-
tion 1.4) where N is the population, r is the relative growth rate (birth rate -
death rate), and κ is the carrying capacity. Since then, the idea of carrying ca-
pacity has changed from an immutable constant upper limit to the population,
possibly unknown, to a more abstract one of maximum density a range is capable
of supporting (Dhondt, 1988), possible of changing over time and environment.
dN
dt= rN
(
κ−N
κ
)
(1.4)
20
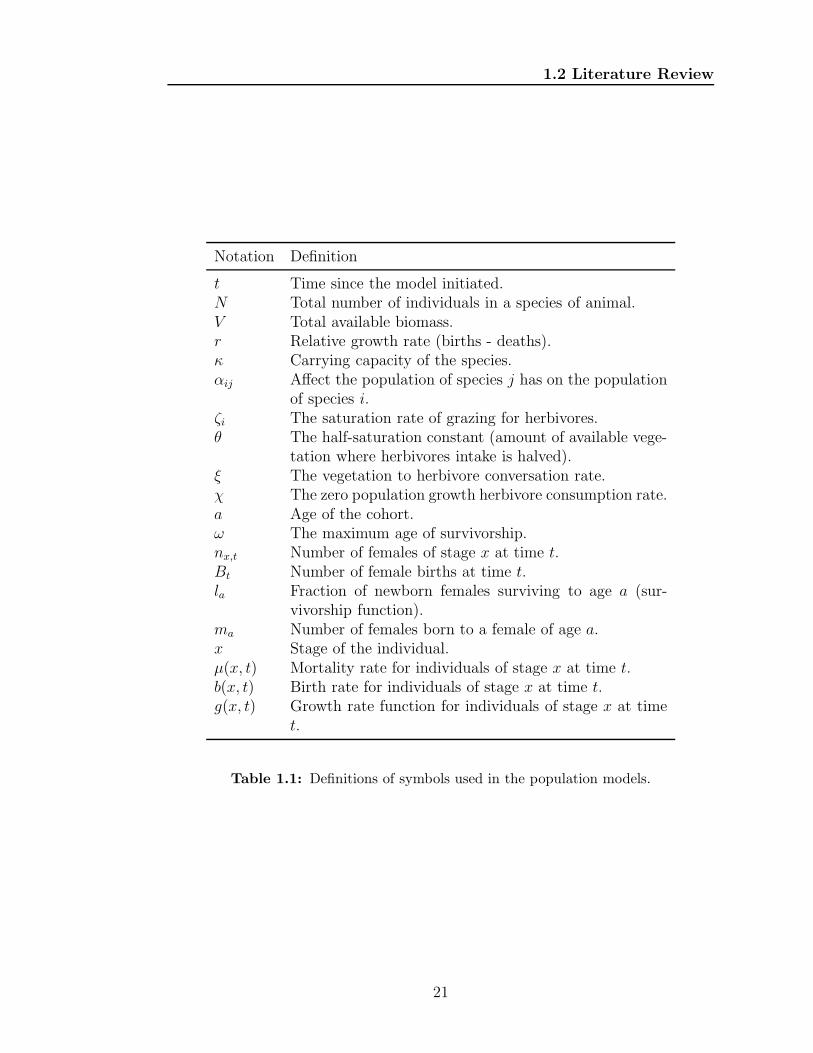
1.2 Literature Review
Notation Definition
t Time since the model initiated.N Total number of individuals in a species of animal.V Total available biomass.r Relative growth rate (births - deaths).κ Carrying capacity of the species.αij Affect the population of species j has on the population
of species i.ζi The saturation rate of grazing for herbivores.θ The half-saturation constant (amount of available vege-
tation where herbivores intake is halved).ξ The vegetation to herbivore conversation rate.χ The zero population growth herbivore consumption rate.a Age of the cohort.ω The maximum age of survivorship.nx,t Number of females of stage x at time t.Bt Number of female births at time t.la Fraction of newborn females surviving to age a (sur-
vivorship function).ma Number of females born to a female of age a.x Stage of the individual.µ(x, t) Mortality rate for individuals of stage x at time t.b(x, t) Birth rate for individuals of stage x at time t.g(x, t) Growth rate function for individuals of stage x at time
t.
Table 1.1: Definitions of symbols used in the population models.
21
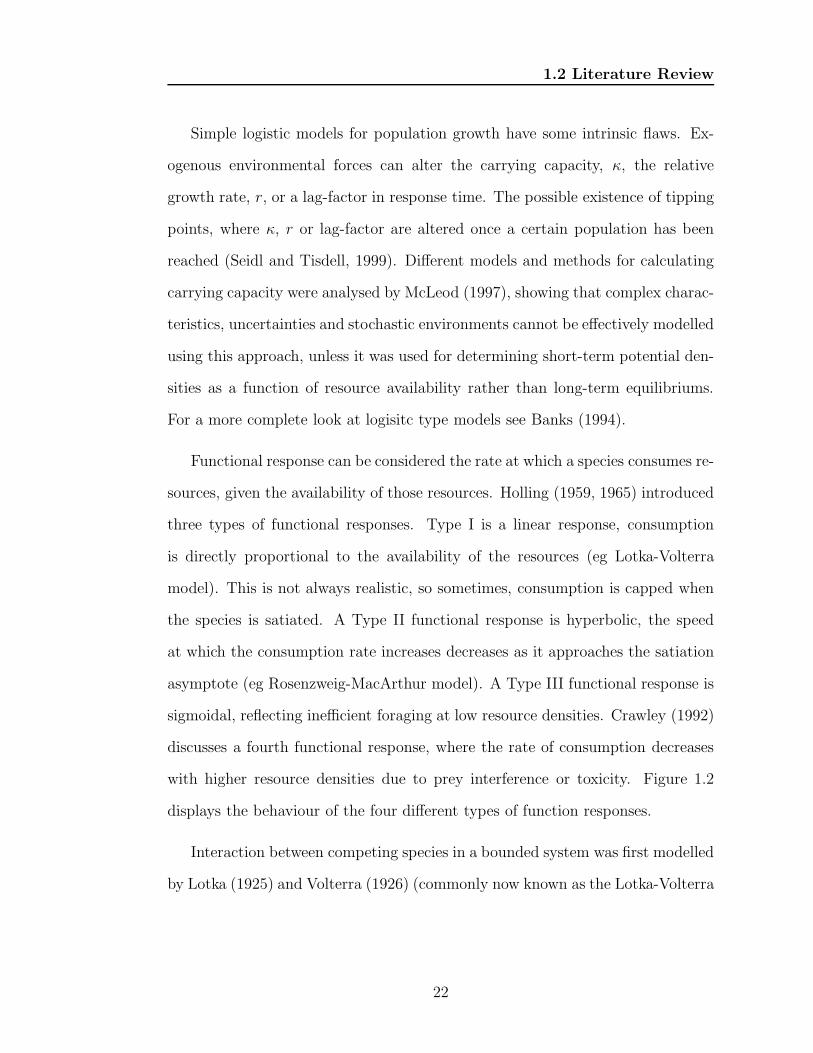
1.2 Literature Review
Simple logistic models for population growth have some intrinsic flaws. Ex-
ogenous environmental forces can alter the carrying capacity, κ, the relative
growth rate, r, or a lag-factor in response time. The possible existence of tipping
points, where κ, r or lag-factor are altered once a certain population has been
reached (Seidl and Tisdell, 1999). Different models and methods for calculating
carrying capacity were analysed by McLeod (1997), showing that complex charac-
teristics, uncertainties and stochastic environments cannot be effectively modelled
using this approach, unless it was used for determining short-term potential den-
sities as a function of resource availability rather than long-term equilibriums.
For a more complete look at logisitc type models see Banks (1994).
Functional response can be considered the rate at which a species consumes re-
sources, given the availability of those resources. Holling (1959, 1965) introduced
three types of functional responses. Type I is a linear response, consumption
is directly proportional to the availability of the resources (eg Lotka-Volterra
model). This is not always realistic, so sometimes, consumption is capped when
the species is satiated. A Type II functional response is hyperbolic, the speed
at which the consumption rate increases decreases as it approaches the satiation
asymptote (eg Rosenzweig-MacArthur model). A Type III functional response is
sigmoidal, reflecting inefficient foraging at low resource densities. Crawley (1992)
discusses a fourth functional response, where the rate of consumption decreases
with higher resource densities due to prey interference or toxicity. Figure 1.2
displays the behaviour of the four different types of function responses.
Interaction between competing species in a bounded system was first modelled
by Lotka (1925) and Volterra (1926) (commonly now known as the Lotka-Volterra
22
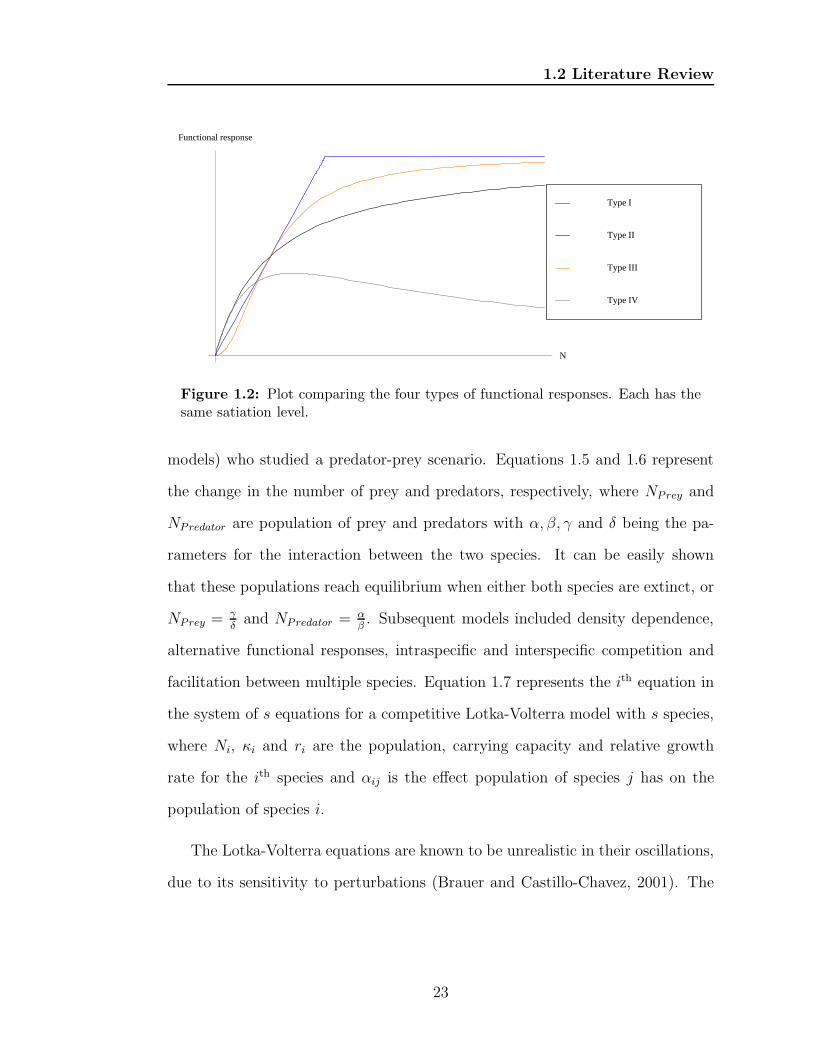
1.2 Literature Review
N
Functional response
Type IV
Type III
Type II
Type I
Figure 1.2: Plot comparing the four types of functional responses. Each has thesame satiation level.
models) who studied a predator-prey scenario. Equations 1.5 and 1.6 represent
the change in the number of prey and predators, respectively, where NPrey and
NPredator are population of prey and predators with α, β, γ and δ being the pa-
rameters for the interaction between the two species. It can be easily shown
that these populations reach equilibrium when either both species are extinct, or
NPrey = γ
δand NPredator = α
β. Subsequent models included density dependence,
alternative functional responses, intraspecific and interspecific competition and
facilitation between multiple species. Equation 1.7 represents the ith equation in
the system of s equations for a competitive Lotka-Volterra model with s species,
where Ni, κi and ri are the population, carrying capacity and relative growth
rate for the ith species and αij is the effect population of species j has on the
population of species i.
The Lotka-Volterra equations are known to be unrealistic in their oscillations,
due to its sensitivity to perturbations (Brauer and Castillo-Chavez, 2001). The
23
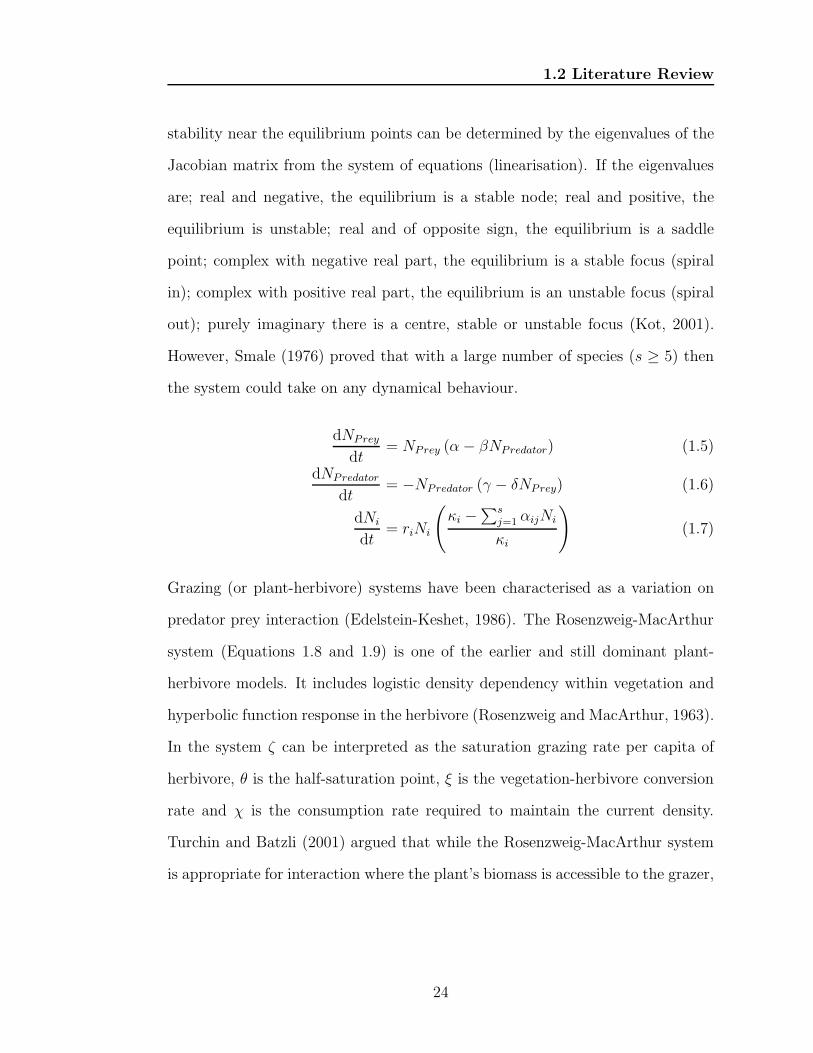
1.2 Literature Review
stability near the equilibrium points can be determined by the eigenvalues of the
Jacobian matrix from the system of equations (linearisation). If the eigenvalues
are; real and negative, the equilibrium is a stable node; real and positive, the
equilibrium is unstable; real and of opposite sign, the equilibrium is a saddle
point; complex with negative real part, the equilibrium is a stable focus (spiral
in); complex with positive real part, the equilibrium is an unstable focus (spiral
out); purely imaginary there is a centre, stable or unstable focus (Kot, 2001).
However, Smale (1976) proved that with a large number of species (s ≥ 5) then
the system could take on any dynamical behaviour.
dNPrey
dt= NPrey (α− βNPredator) (1.5)
dNPredator
dt= −NPredator (γ − δNPrey) (1.6)
dNi
dt= riNi
(
κi −∑s
j=1 αijNi
κi
)
(1.7)
Grazing (or plant-herbivore) systems have been characterised as a variation on
predator prey interaction (Edelstein-Keshet, 1986). The Rosenzweig-MacArthur
system (Equations 1.8 and 1.9) is one of the earlier and still dominant plant-
herbivore models. It includes logistic density dependency within vegetation and
hyperbolic function response in the herbivore (Rosenzweig and MacArthur, 1963).
In the system ζ can be interpreted as the saturation grazing rate per capita of
herbivore, θ is the half-saturation point, ξ is the vegetation-herbivore conversion
rate and χ is the consumption rate required to maintain the current density.
Turchin and Batzli (2001) argued that while the Rosenzweig-MacArthur system
is appropriate for interaction where the plant’s biomass is accessible to the grazer,
24
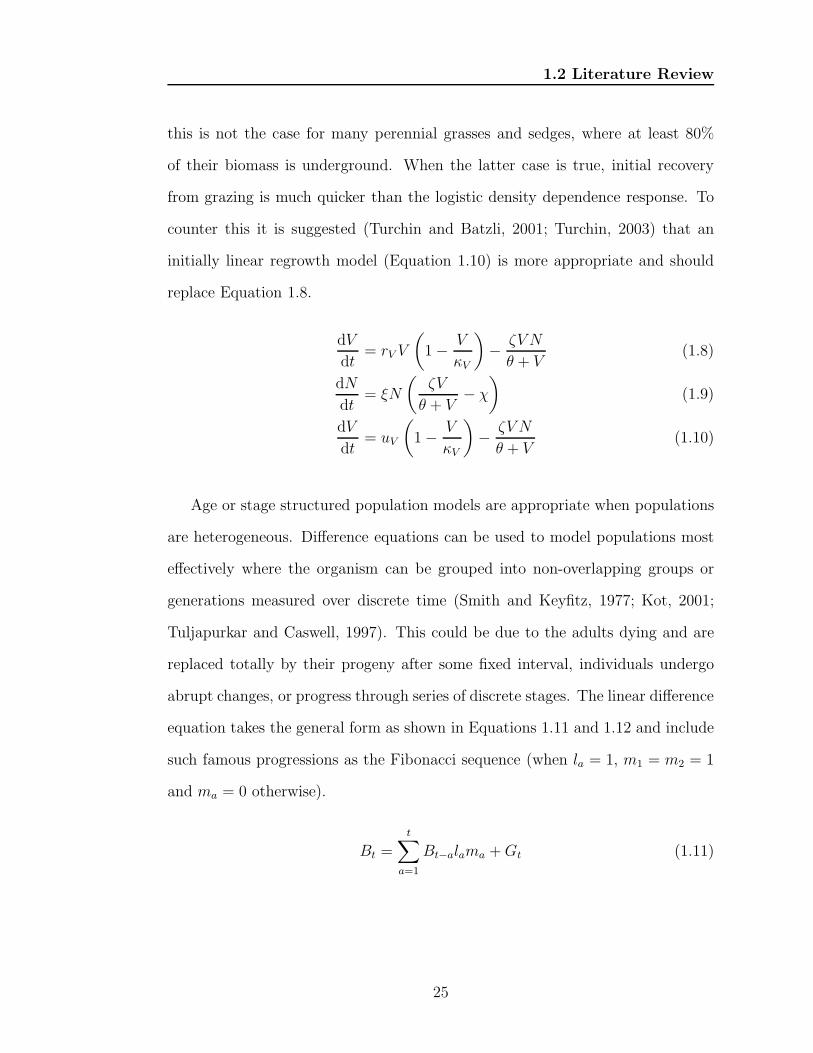
1.2 Literature Review
this is not the case for many perennial grasses and sedges, where at least 80%
of their biomass is underground. When the latter case is true, initial recovery
from grazing is much quicker than the logistic density dependence response. To
counter this it is suggested (Turchin and Batzli, 2001; Turchin, 2003) that an
initially linear regrowth model (Equation 1.10) is more appropriate and should
replace Equation 1.8.
dV
dt= rV V
(
1− V
κV
)
− ζV N
θ + V(1.8)
dN
dt= ξN
(
ζV
θ + V− χ
)
(1.9)
dV
dt= uV
(
1− V
κV
)
− ζV N
θ + V(1.10)
Age or stage structured population models are appropriate when populations
are heterogeneous. Difference equations can be used to model populations most
effectively where the organism can be grouped into non-overlapping groups or
generations measured over discrete time (Smith and Keyfitz, 1977; Kot, 2001;
Tuljapurkar and Caswell, 1997). This could be due to the adults dying and are
replaced totally by their progeny after some fixed interval, individuals undergo
abrupt changes, or progress through series of discrete stages. The linear difference
equation takes the general form as shown in Equations 1.11 and 1.12 and include
such famous progressions as the Fibonacci sequence (when la = 1, m1 = m2 = 1
and ma = 0 otherwise).
Bt =t∑
a=1
Bt−alama +Gt (1.11)
25
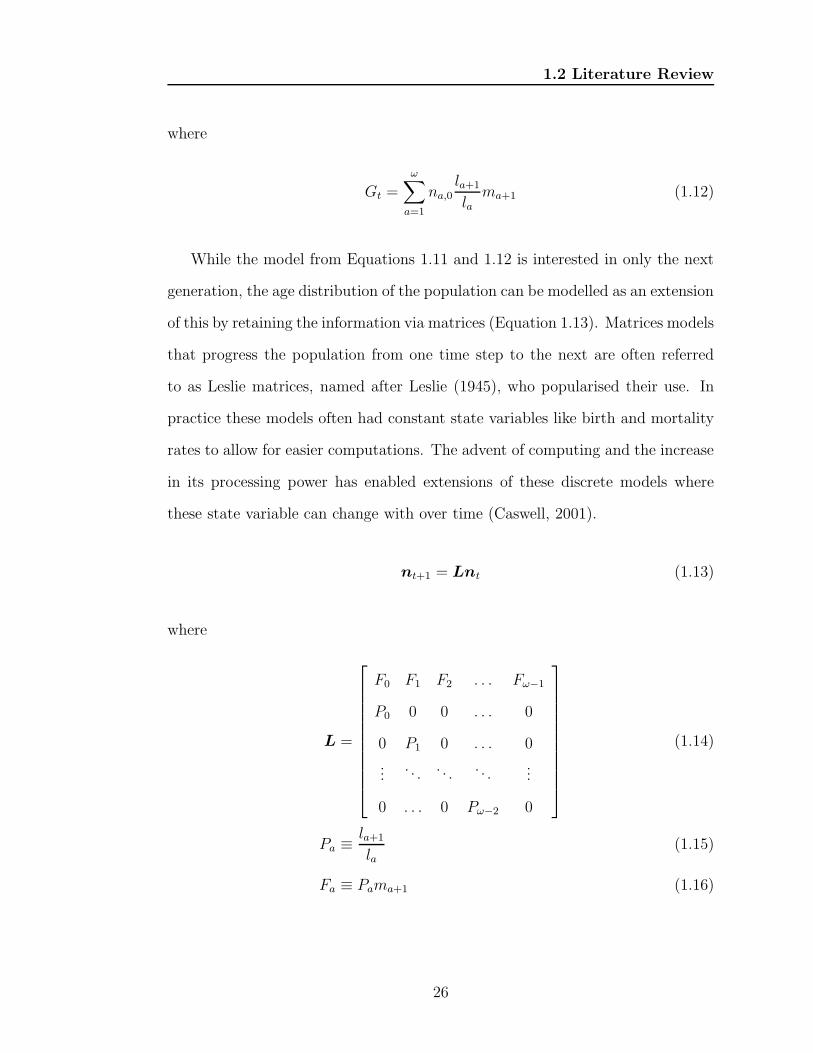
1.2 Literature Review
where
Gt =
ω∑
a=1
na,0la+1
lama+1 (1.12)
While the model from Equations 1.11 and 1.12 is interested in only the next
generation, the age distribution of the population can be modelled as an extension
of this by retaining the information via matrices (Equation 1.13). Matrices models
that progress the population from one time step to the next are often referred
to as Leslie matrices, named after Leslie (1945), who popularised their use. In
practice these models often had constant state variables like birth and mortality
rates to allow for easier computations. The advent of computing and the increase
in its processing power has enabled extensions of these discrete models where
these state variable can change with over time (Caswell, 2001).
nt+1 = Lnt (1.13)
where
L =
F0 F1 F2 . . . Fω−1
P0 0 0 . . . 0
0 P1 0 . . . 0
.... . .
. . .. . .
...
0 . . . 0 Pω−2 0
(1.14)
Pa ≡la+1
la(1.15)
Fa ≡ Pama+1 (1.16)
26
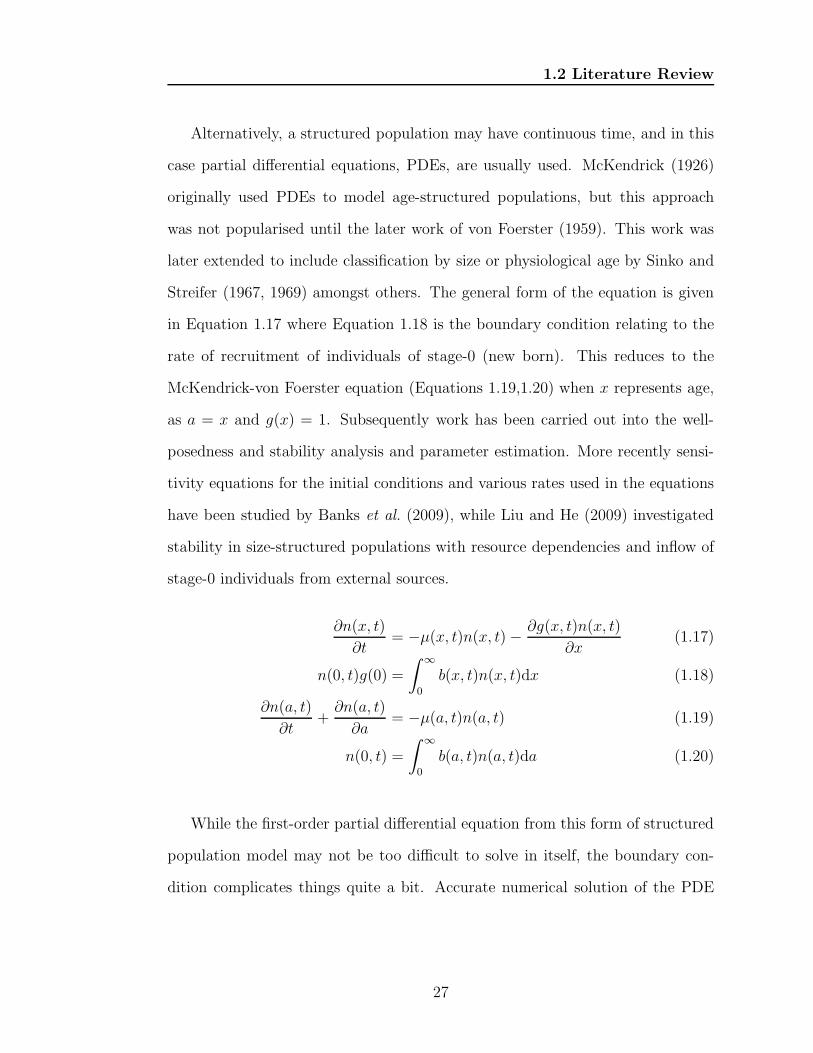
1.2 Literature Review
Alternatively, a structured population may have continuous time, and in this
case partial differential equations, PDEs, are usually used. McKendrick (1926)
originally used PDEs to model age-structured populations, but this approach
was not popularised until the later work of von Foerster (1959). This work was
later extended to include classification by size or physiological age by Sinko and
Streifer (1967, 1969) amongst others. The general form of the equation is given
in Equation 1.17 where Equation 1.18 is the boundary condition relating to the
rate of recruitment of individuals of stage-0 (new born). This reduces to the
McKendrick-von Foerster equation (Equations 1.19,1.20) when x represents age,
as a = x and g(x) = 1. Subsequently work has been carried out into the well-
posedness and stability analysis and parameter estimation. More recently sensi-
tivity equations for the initial conditions and various rates used in the equations
have been studied by Banks et al. (2009), while Liu and He (2009) investigated
stability in size-structured populations with resource dependencies and inflow of
stage-0 individuals from external sources.
∂n(x, t)
∂t= −µ(x, t)n(x, t)− ∂g(x, t)n(x, t)
∂x(1.17)
n(0, t)g(0) =
∫ ∞
0
b(x, t)n(x, t)dx (1.18)
∂n(a, t)
∂t+
∂n(a, t)
∂a= −µ(a, t)n(a, t) (1.19)
n(0, t) =
∫ ∞
0
b(a, t)n(a, t)da (1.20)
While the first-order partial differential equation from this form of structured
population model may not be too difficult to solve in itself, the boundary con-
dition complicates things quite a bit. Accurate numerical solution of the PDE
27
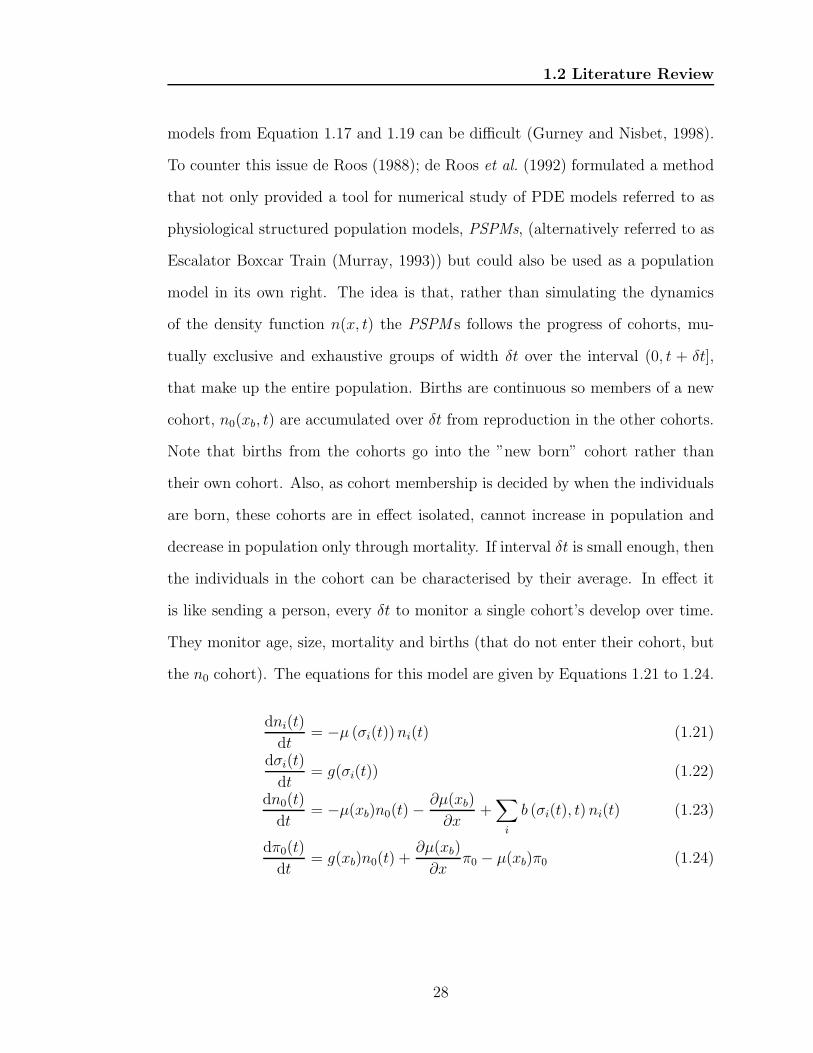
1.2 Literature Review
models from Equation 1.17 and 1.19 can be difficult (Gurney and Nisbet, 1998).
To counter this issue de Roos (1988); de Roos et al. (1992) formulated a method
that not only provided a tool for numerical study of PDE models referred to as
physiological structured population models, PSPMs, (alternatively referred to as
Escalator Boxcar Train (Murray, 1993)) but could also be used as a population
model in its own right. The idea is that, rather than simulating the dynamics
of the density function n(x, t) the PSPM s follows the progress of cohorts, mu-
tually exclusive and exhaustive groups of width δt over the interval (0, t + δt],
that make up the entire population. Births are continuous so members of a new
cohort, n0(xb, t) are accumulated over δt from reproduction in the other cohorts.
Note that births from the cohorts go into the ”new born” cohort rather than
their own cohort. Also, as cohort membership is decided by when the individuals
are born, these cohorts are in effect isolated, cannot increase in population and
decrease in population only through mortality. If interval δt is small enough, then
the individuals in the cohort can be characterised by their average. In effect it
is like sending a person, every δt to monitor a single cohort’s develop over time.
They monitor age, size, mortality and births (that do not enter their cohort, but
the n0 cohort). The equations for this model are given by Equations 1.21 to 1.24.
dni(t)
dt= −µ (σi(t))ni(t) (1.21)
dσi(t)
dt= g(σi(t)) (1.22)
dn0(t)
dt= −µ(xb)n0(t)−
∂µ(xb)
∂x+∑
i
b (σi(t), t)ni(t) (1.23)
dπ0(t)
dt= g(xb)n0(t) +
∂µ(xb)
∂xπ0 − µ(xb)π0 (1.24)
28
1.3 Thesis Format and Objectives
For more details on the models discussed above see either Murray (1993),
Tuljapurkar and Caswell (1997) or Kot (2001).
1.3 Thesis Format and Objectives
Currently in semi-arid Australian rangelands properties produce mainly beef and
wool on marginal lands. A major area of concern is grazing pressure. Kangaroos
are considered to have a substantial impact on grazing pressure, and for that
reason they are often considered pests by landholders. It has been thought that
converting from farming European domesticated stock to native wildlife would
have environmental benefits. The perceived benefits include: restoration of native
ecosystems; decreasing greenhouse gas emissions; and public health (substitution
of other meat products for low fat, high iron, kangaroo meats).The commercial
benefits from the change are unclear. These thoughts lead the three key questions
that inform this thesis. Can the inclusion of kangaroo commodities increase
resilience to landholders in semi-arid regions of Australia? If kangaroos were to be
encouraged on one property, would this have detrimental impact on neighbouring
properties? What impact would a requirement to reduce greenhouse gas emissions
have on the viability of including kangaroo commodities?
Through construction of plant-herbivore models, the dynamics of cattle, sheep
and kangaroo commodities are examined. Simulations were constructed so as to
estimate the expected value for each and the correlation between the different
commodities. Portfolio analysis using mean-variance, average value-at-risk, and
multi-objective optimisation projects were used to analyse different allocations of
29
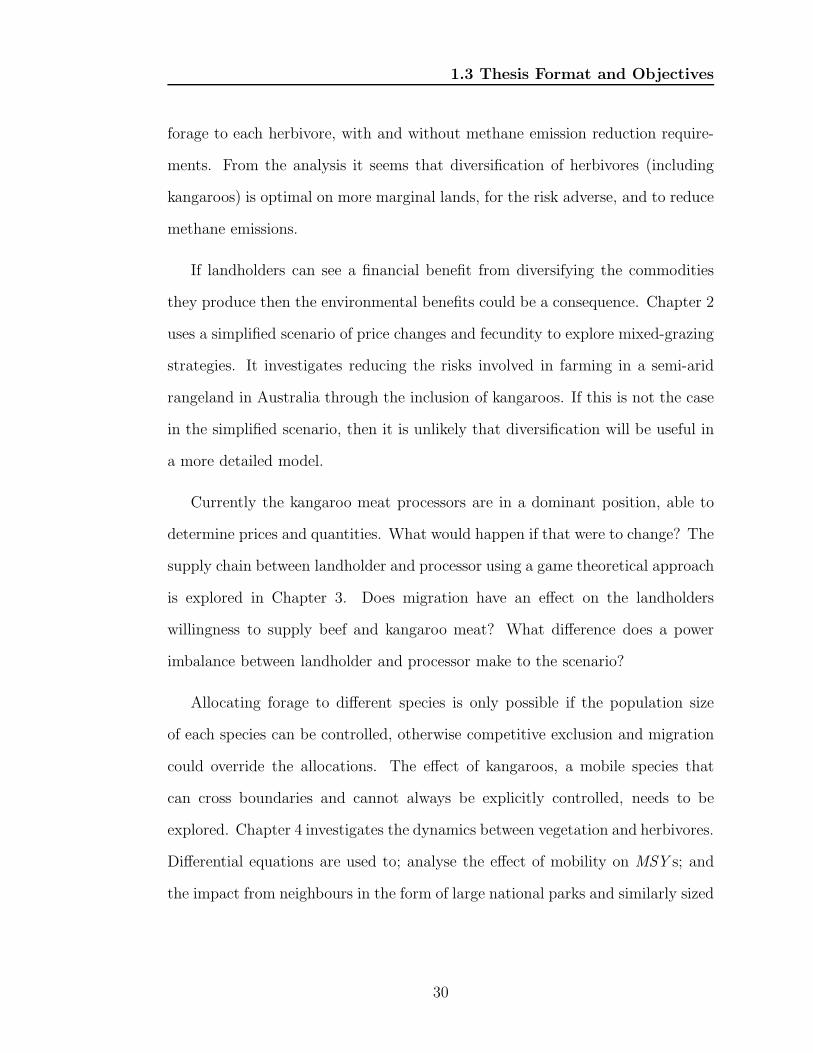
1.3 Thesis Format and Objectives
forage to each herbivore, with and without methane emission reduction require-
ments. From the analysis it seems that diversification of herbivores (including
kangaroos) is optimal on more marginal lands, for the risk adverse, and to reduce
methane emissions.
If landholders can see a financial benefit from diversifying the commodities
they produce then the environmental benefits could be a consequence. Chapter 2
uses a simplified scenario of price changes and fecundity to explore mixed-grazing
strategies. It investigates reducing the risks involved in farming in a semi-arid
rangeland in Australia through the inclusion of kangaroos. If this is not the case
in the simplified scenario, then it is unlikely that diversification will be useful in
a more detailed model.
Currently the kangaroo meat processors are in a dominant position, able to
determine prices and quantities. What would happen if that were to change? The
supply chain between landholder and processor using a game theoretical approach
is explored in Chapter 3. Does migration have an effect on the landholders
willingness to supply beef and kangaroo meat? What difference does a power
imbalance between landholder and processor make to the scenario?
Allocating forage to different species is only possible if the population size
of each species can be controlled, otherwise competitive exclusion and migration
could override the allocations. The effect of kangaroos, a mobile species that
can cross boundaries and cannot always be explicitly controlled, needs to be
explored. Chapter 4 investigates the dynamics between vegetation and herbivores.
Differential equations are used to; analyse the effect of mobility on MSY s; and
the impact from neighbours in the form of large national parks and similarly sized
30
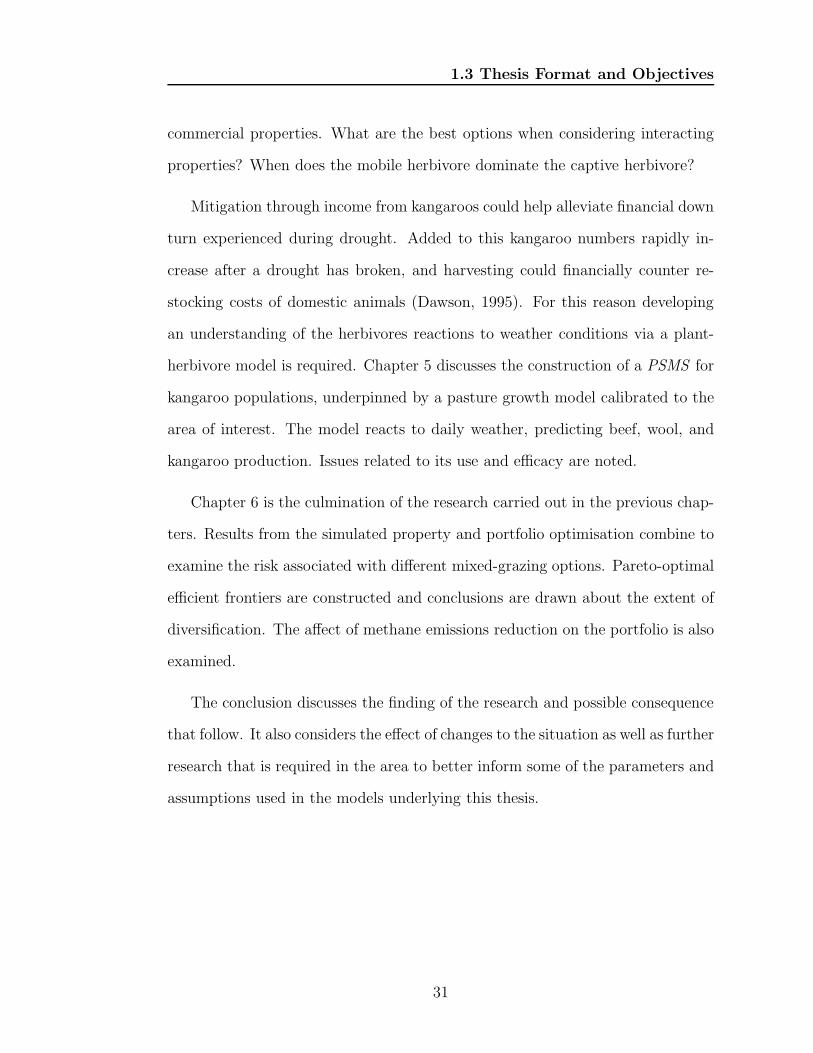
1.3 Thesis Format and Objectives
commercial properties. What are the best options when considering interacting
properties? When does the mobile herbivore dominate the captive herbivore?
Mitigation through income from kangaroos could help alleviate financial down
turn experienced during drought. Added to this kangaroo numbers rapidly in-
crease after a drought has broken, and harvesting could financially counter re-
stocking costs of domestic animals (Dawson, 1995). For this reason developing
an understanding of the herbivores reactions to weather conditions via a plant-
herbivore model is required. Chapter 5 discusses the construction of a PSMS for
kangaroo populations, underpinned by a pasture growth model calibrated to the
area of interest. The model reacts to daily weather, predicting beef, wool, and
kangaroo production. Issues related to its use and efficacy are noted.
Chapter 6 is the culmination of the research carried out in the previous chap-
ters. Results from the simulated property and portfolio optimisation combine to
examine the risk associated with different mixed-grazing options. Pareto-optimal
efficient frontiers are constructed and conclusions are drawn about the extent of
diversification. The affect of methane emissions reduction on the portfolio is also
examined.
The conclusion discusses the finding of the research and possible consequence
that follow. It also considers the effect of changes to the situation as well as further
research that is required in the area to better inform some of the parameters and
assumptions used in the models underlying this thesis.
31
Chapter 2
Initial Exploration of Viability of
Mixed-Grazing
Currently landholders see kangaroos as a pest and of little to no value. There-
fore the possible benefits replacing some cattle and sheep production with native
herbivores is not realised. If landholders can see a financial benefit from diver-
sifying the commodities they produce then the environmental benefits could be
a consequence. As a first step it makes sense to explore whether it is possible
that inclusion of kangaroos into the commodities that a property produces has
some benefit to the landholder. Of particular interest is reducing the variability
of relative returns. Do the relative returns of the property become more resilient
to external forces when the commodities harvested are from both kangaroos and
domestic stock? Also of interest is any possible difference in strategy, dependent
on how marginal the land is. In particular, does the amount of money invested
affect the optimal grazing strategies? The data used in the scenarios explored
32
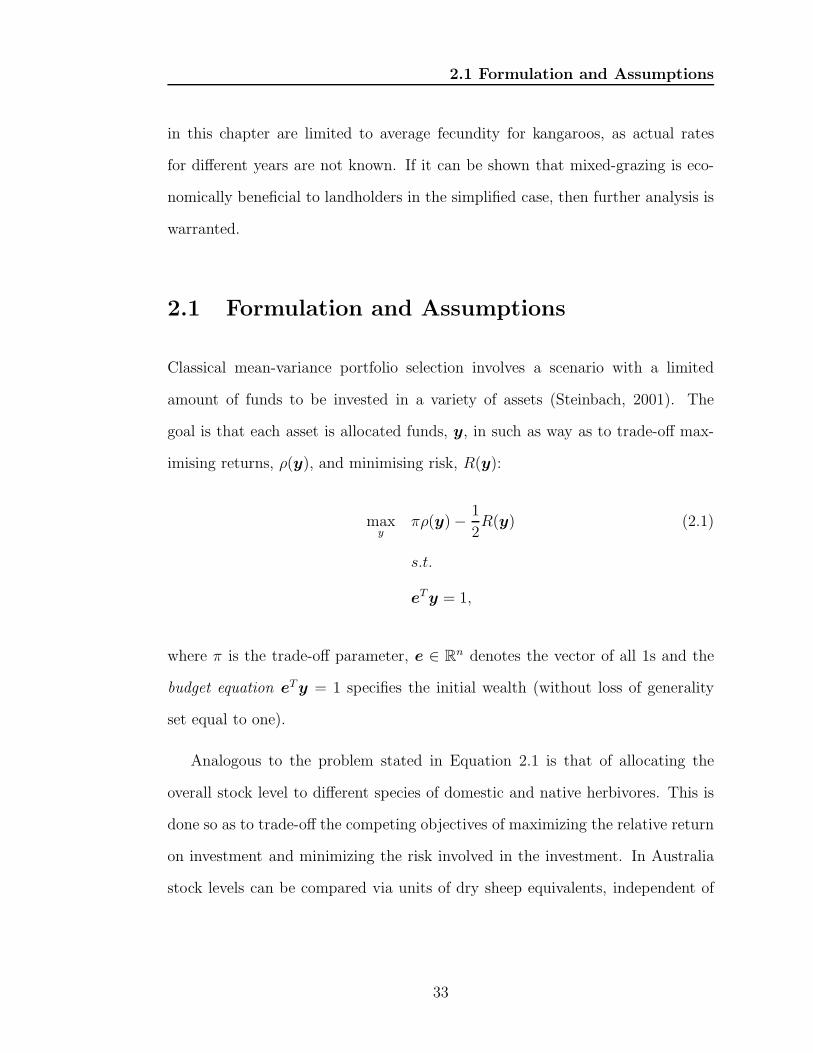
2.1 Formulation and Assumptions
in this chapter are limited to average fecundity for kangaroos, as actual rates
for different years are not known. If it can be shown that mixed-grazing is eco-
nomically beneficial to landholders in the simplified case, then further analysis is
warranted.
2.1 Formulation and Assumptions
Classical mean-variance portfolio selection involves a scenario with a limited
amount of funds to be invested in a variety of assets (Steinbach, 2001). The
goal is that each asset is allocated funds, y, in such as way as to trade-off max-
imising returns, ρ(y), and minimising risk, R(y):
maxy
πρ(y)− 1
2R(y) (2.1)
s.t.
eTy = 1,
where π is the trade-off parameter, e ∈ Rn denotes the vector of all 1s and the
budget equation eTy = 1 specifies the initial wealth (without loss of generality
set equal to one).
Analogous to the problem stated in Equation 2.1 is that of allocating the
overall stock level to different species of domestic and native herbivores. This is
done so as to trade-off the competing objectives of maximizing the relative return
on investment and minimizing the risk involved in the investment. In Australia
stock levels can be compared via units of dry sheep equivalents, independent of
33
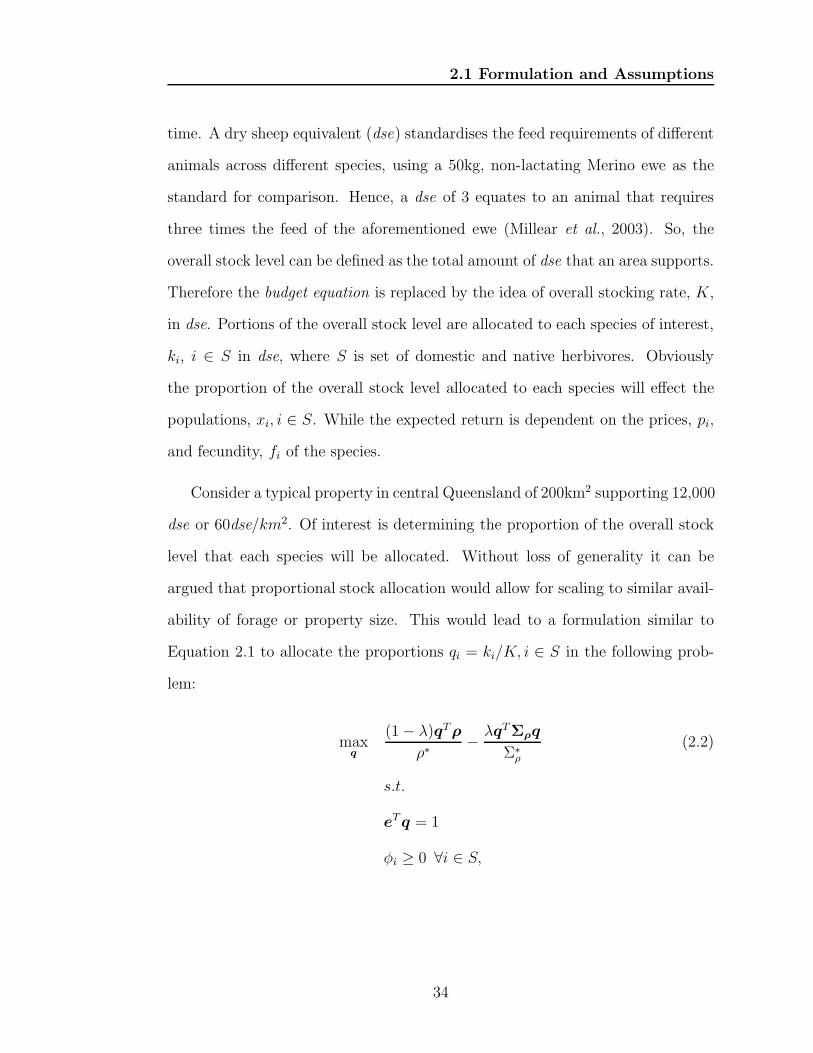
2.1 Formulation and Assumptions
time. A dry sheep equivalent (dse) standardises the feed requirements of different
animals across different species, using a 50kg, non-lactating Merino ewe as the
standard for comparison. Hence, a dse of 3 equates to an animal that requires
three times the feed of the aforementioned ewe (Millear et al., 2003). So, the
overall stock level can be defined as the total amount of dse that an area supports.
Therefore the budget equation is replaced by the idea of overall stocking rate, K,
in dse. Portions of the overall stock level are allocated to each species of interest,
ki, i ∈ S in dse, where S is set of domestic and native herbivores. Obviously
the proportion of the overall stock level allocated to each species will effect the
populations, xi, i ∈ S. While the expected return is dependent on the prices, pi,
and fecundity, fi of the species.
Consider a typical property in central Queensland of 200km2 supporting 12,000
dse or 60dse/km2. Of interest is determining the proportion of the overall stock
level that each species will be allocated. Without loss of generality it can be
argued that proportional stock allocation would allow for scaling to similar avail-
ability of forage or property size. This would lead to a formulation similar to
Equation 2.1 to allocate the proportions qi = ki/K, i ∈ S in the following prob-
lem:
maxq
(1− λ)qTρ
ρ∗− λqTΣρq
Σ∗ρ
(2.2)
s.t.
eTq = 1
φi ≥ 0 ∀i ∈ S,
34
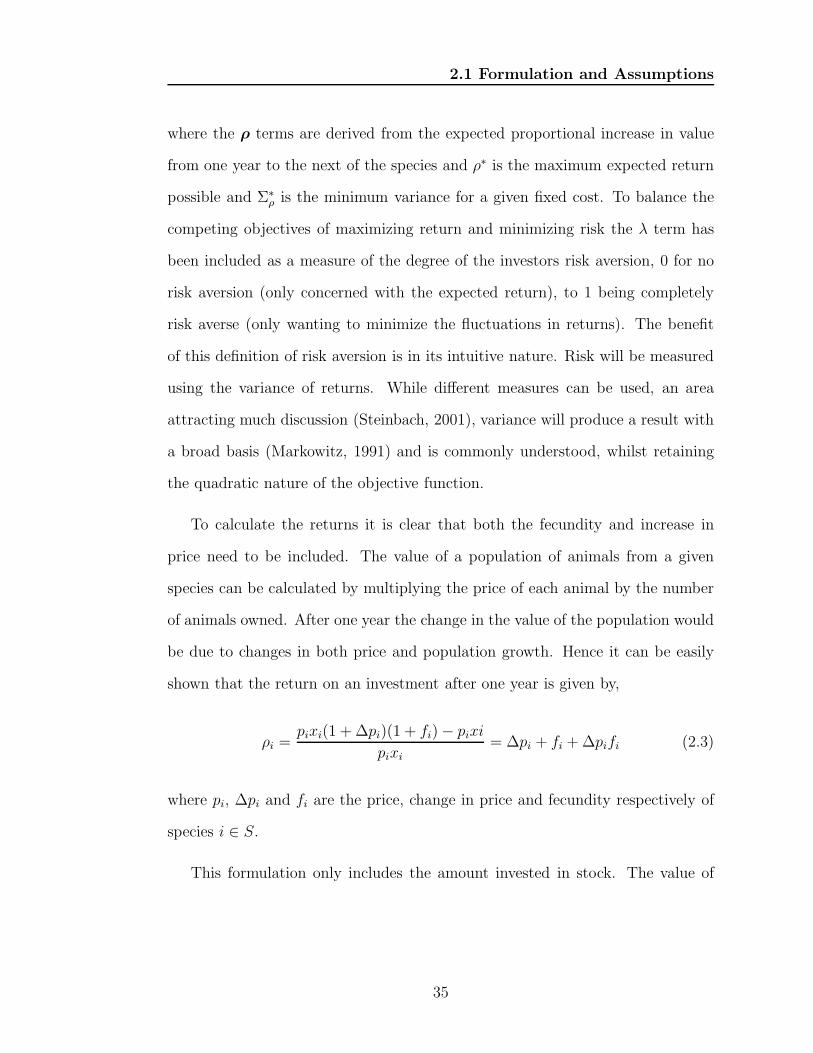
2.1 Formulation and Assumptions
where the ρ terms are derived from the expected proportional increase in value
from one year to the next of the species and ρ∗ is the maximum expected return
possible and Σ∗ρ is the minimum variance for a given fixed cost. To balance the
competing objectives of maximizing return and minimizing risk the λ term has
been included as a measure of the degree of the investors risk aversion, 0 for no
risk aversion (only concerned with the expected return), to 1 being completely
risk averse (only wanting to minimize the fluctuations in returns). The benefit
of this definition of risk aversion is in its intuitive nature. Risk will be measured
using the variance of returns. While different measures can be used, an area
attracting much discussion (Steinbach, 2001), variance will produce a result with
a broad basis (Markowitz, 1991) and is commonly understood, whilst retaining
the quadratic nature of the objective function.
To calculate the returns it is clear that both the fecundity and increase in
price need to be included. The value of a population of animals from a given
species can be calculated by multiplying the price of each animal by the number
of animals owned. After one year the change in the value of the population would
be due to changes in both price and population growth. Hence it can be easily
shown that the return on an investment after one year is given by,
ρi =pixi(1 + ∆pi)(1 + fi)− pixi
pixi
= ∆pi + fi +∆pifi (2.3)
where pi, ∆pi and fi are the price, change in price and fecundity respectively of
species i ∈ S.
This formulation only includes the amount invested in stock. The value of
35
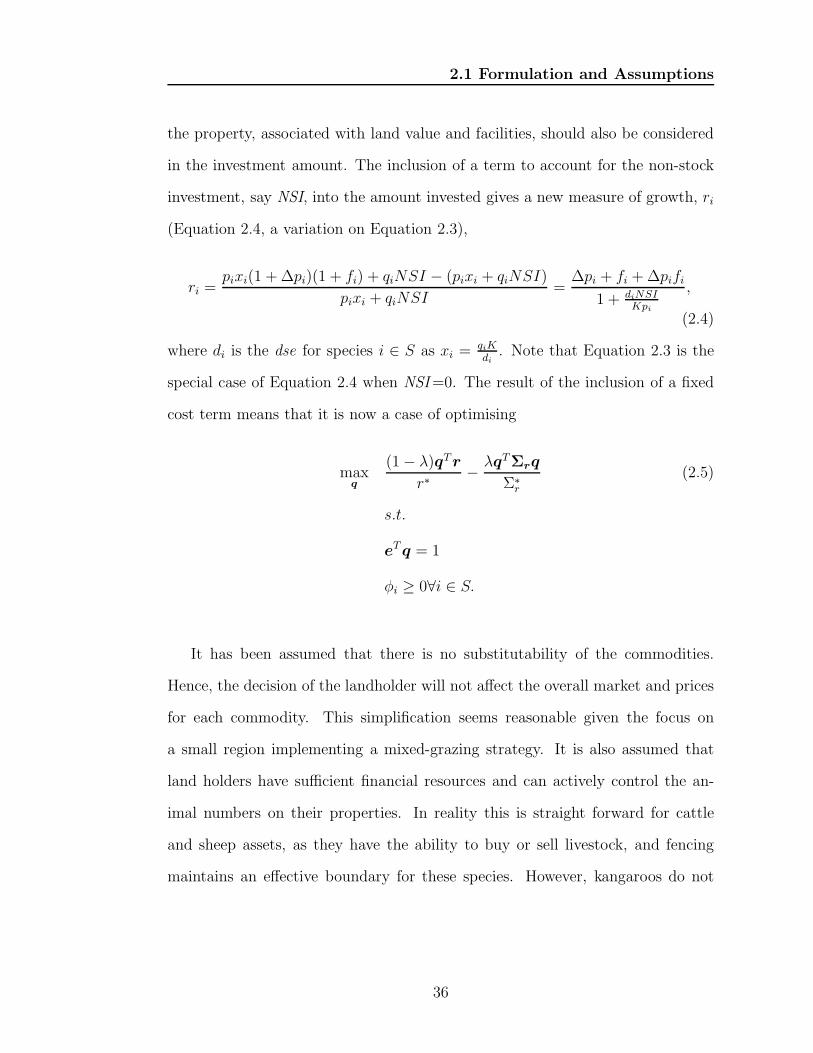
2.1 Formulation and Assumptions
the property, associated with land value and facilities, should also be considered
in the investment amount. The inclusion of a term to account for the non-stock
investment, say NSI, into the amount invested gives a new measure of growth, ri
(Equation 2.4, a variation on Equation 2.3),
ri =pixi(1 + ∆pi)(1 + fi) + qiNSI − (pixi + qiNSI)
pixi + qiNSI=
∆pi + fi +∆pifi
1 + diNSIKpi
,
(2.4)
where di is the dse for species i ∈ S as xi =qiK
di. Note that Equation 2.3 is the
special case of Equation 2.4 when NSI=0. The result of the inclusion of a fixed
cost term means that it is now a case of optimising
maxq
(1− λ)qTr
r∗− λqTΣrq
Σ∗r
(2.5)
s.t.
eTq = 1
φi ≥ 0∀i ∈ S.
It has been assumed that there is no substitutability of the commodities.
Hence, the decision of the landholder will not affect the overall market and prices
for each commodity. This simplification seems reasonable given the focus on
a small region implementing a mixed-grazing strategy. It is also assumed that
land holders have sufficient financial resources and can actively control the an-
imal numbers on their properties. In reality this is straight forward for cattle
and sheep assets, as they have the ability to buy or sell livestock, and fencing
maintains an effective boundary for these species. However, kangaroos do not
36
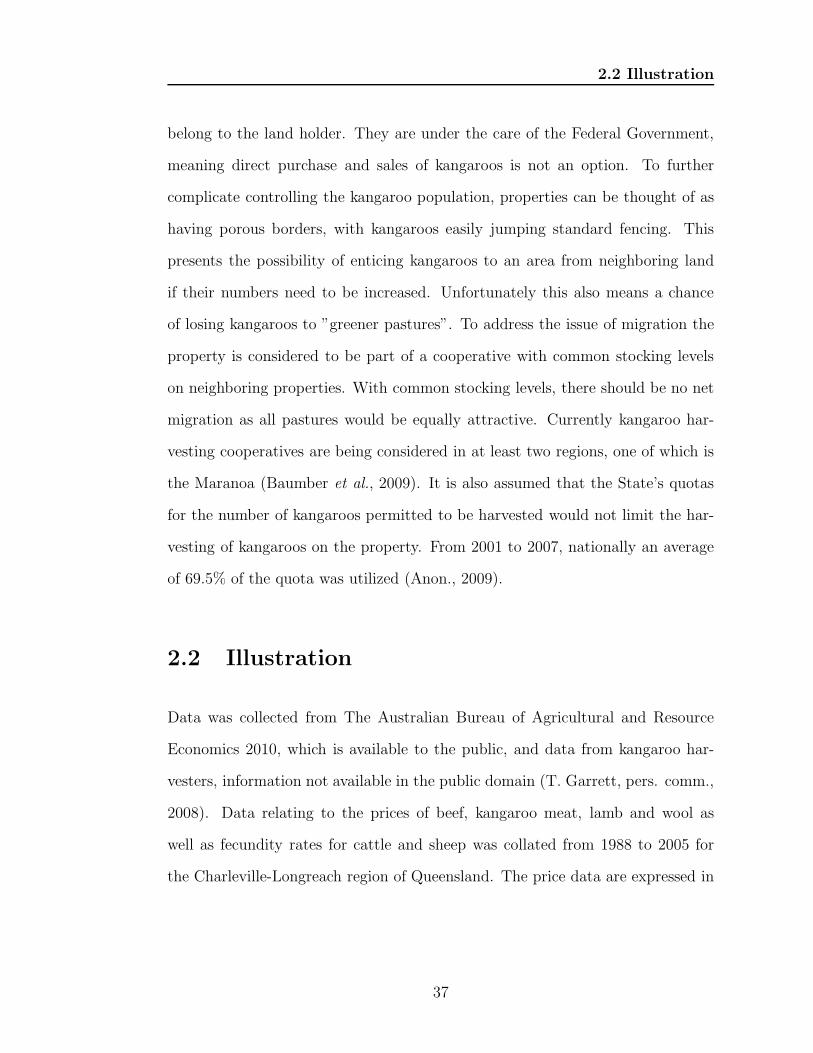
2.2 Illustration
belong to the land holder. They are under the care of the Federal Government,
meaning direct purchase and sales of kangaroos is not an option. To further
complicate controlling the kangaroo population, properties can be thought of as
having porous borders, with kangaroos easily jumping standard fencing. This
presents the possibility of enticing kangaroos to an area from neighboring land
if their numbers need to be increased. Unfortunately this also means a chance
of losing kangaroos to ”greener pastures”. To address the issue of migration the
property is considered to be part of a cooperative with common stocking levels
on neighboring properties. With common stocking levels, there should be no net
migration as all pastures would be equally attractive. Currently kangaroo har-
vesting cooperatives are being considered in at least two regions, one of which is
the Maranoa (Baumber et al., 2009). It is also assumed that the State’s quotas
for the number of kangaroos permitted to be harvested would not limit the har-
vesting of kangaroos on the property. From 2001 to 2007, nationally an average
of 69.5% of the quota was utilized (Anon., 2009).
2.2 Illustration
Data was collected from The Australian Bureau of Agricultural and Resource
Economics 2010, which is available to the public, and data from kangaroo har-
vesters, information not available in the public domain (T. Garrett, pers. comm.,
2008). Data relating to the prices of beef, kangaroo meat, lamb and wool as
well as fecundity rates for cattle and sheep was collated from 1988 to 2005 for
the Charleville-Longreach region of Queensland. The price data are expressed in
37
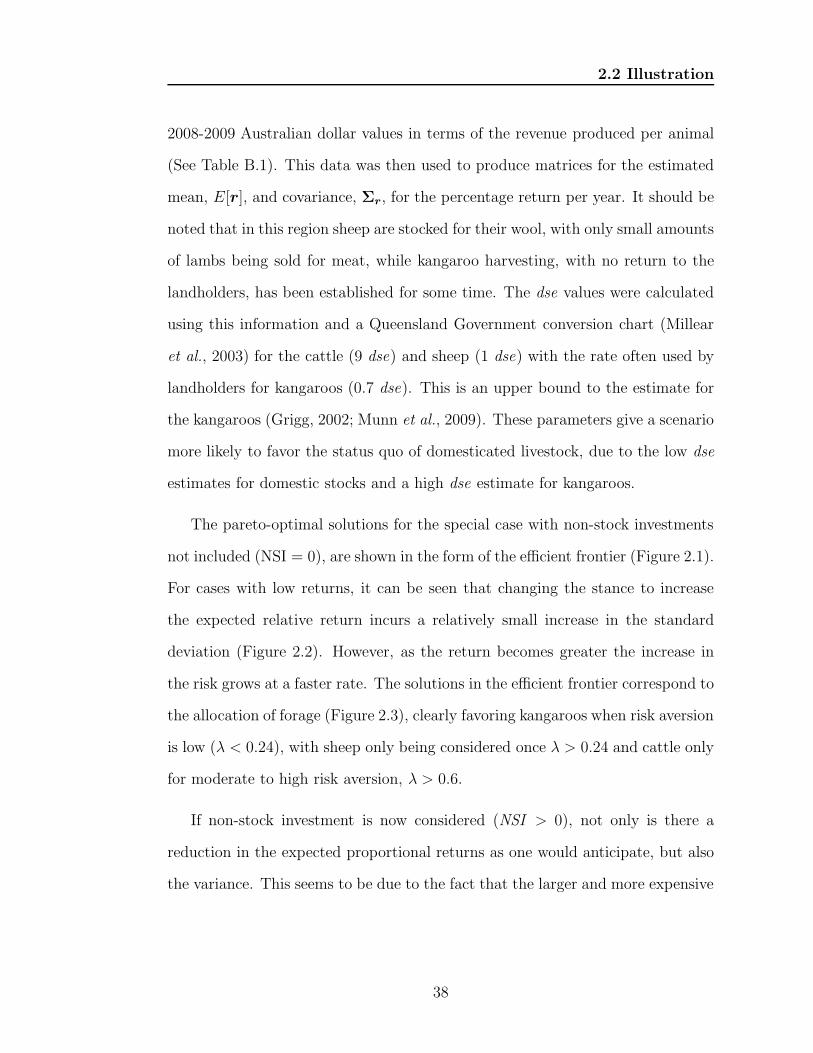
2.2 Illustration
2008-2009 Australian dollar values in terms of the revenue produced per animal
(See Table B.1). This data was then used to produce matrices for the estimated
mean, E[r], and covariance, Σr, for the percentage return per year. It should be
noted that in this region sheep are stocked for their wool, with only small amounts
of lambs being sold for meat, while kangaroo harvesting, with no return to the
landholders, has been established for some time. The dse values were calculated
using this information and a Queensland Government conversion chart (Millear
et al., 2003) for the cattle (9 dse) and sheep (1 dse) with the rate often used by
landholders for kangaroos (0.7 dse). This is an upper bound to the estimate for
the kangaroos (Grigg, 2002; Munn et al., 2009). These parameters give a scenario
more likely to favor the status quo of domesticated livestock, due to the low dse
estimates for domestic stocks and a high dse estimate for kangaroos.
The pareto-optimal solutions for the special case with non-stock investments
not included (NSI = 0), are shown in the form of the efficient frontier (Figure 2.1).
For cases with low returns, it can be seen that changing the stance to increase
the expected relative return incurs a relatively small increase in the standard
deviation (Figure 2.2). However, as the return becomes greater the increase in
the risk grows at a faster rate. The solutions in the efficient frontier correspond to
the allocation of forage (Figure 2.3), clearly favoring kangaroos when risk aversion
is low (λ < 0.24), with sheep only being considered once λ > 0.24 and cattle only
for moderate to high risk aversion, λ > 0.6.
If non-stock investment is now considered (NSI > 0), not only is there a
reduction in the expected proportional returns as one would anticipate, but also
the variance. This seems to be due to the fact that the larger and more expensive
38
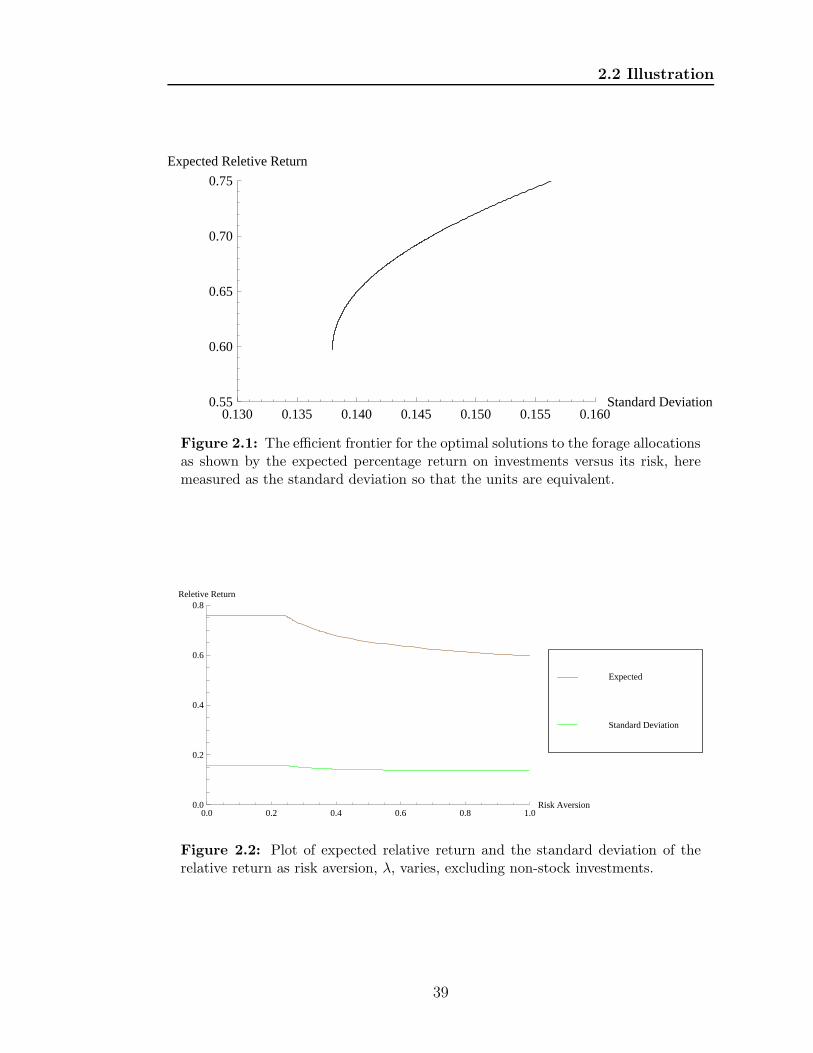
2.2 Illustration
0.130 0.135 0.140 0.145 0.150 0.155 0.160Standard Deviation0.55
0.60
0.65
0.70
0.75
Expected Reletive Return
Figure 2.1: The efficient frontier for the optimal solutions to the forage allocationsas shown by the expected percentage return on investments versus its risk, heremeasured as the standard deviation so that the units are equivalent.
0.0 0.2 0.4 0.6 0.8 1.0Risk Aversion0.0
0.2
0.4
0.6
0.8Reletive Return
Standard Deviation
Expected
Figure 2.2: Plot of expected relative return and the standard deviation of therelative return as risk aversion, λ, varies, excluding non-stock investments.
39
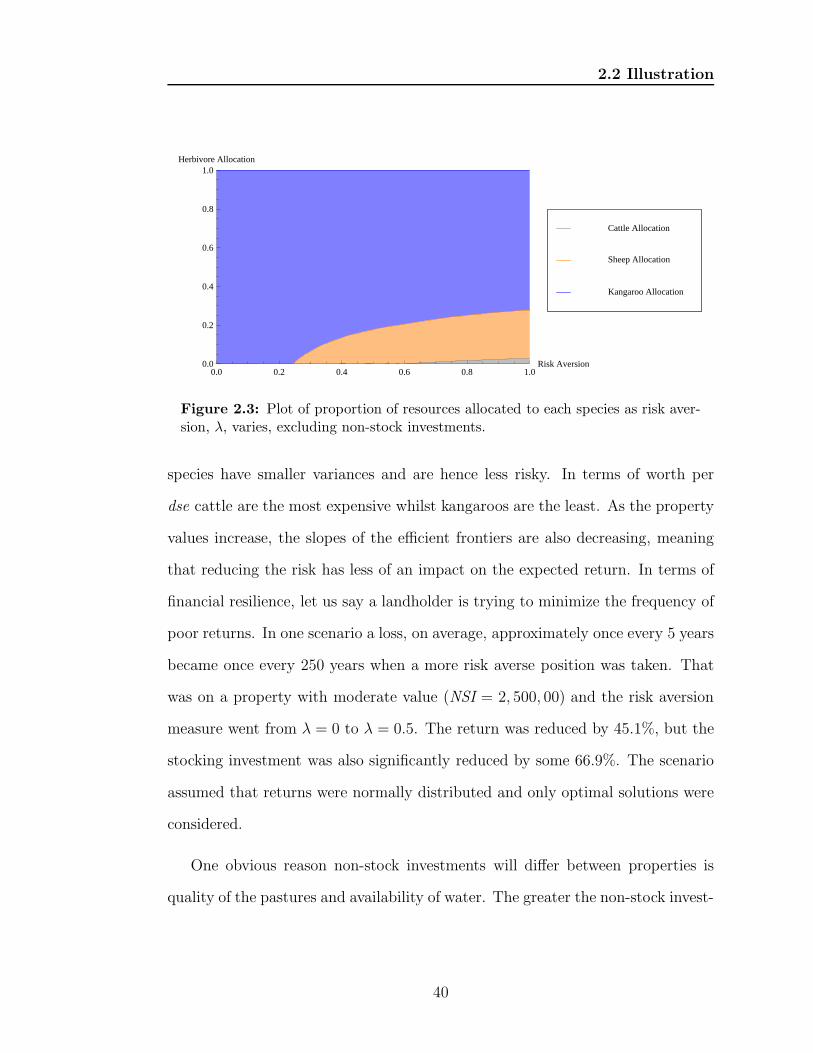
2.2 Illustration
0.0 0.2 0.4 0.6 0.8 1.0Risk Aversion0.0
0.2
0.4
0.6
0.8
1.0Herbivore Allocation
Kangaroo Allocation
Sheep Allocation
Cattle Allocation
Figure 2.3: Plot of proportion of resources allocated to each species as risk aver-sion, λ, varies, excluding non-stock investments.
species have smaller variances and are hence less risky. In terms of worth per
dse cattle are the most expensive whilst kangaroos are the least. As the property
values increase, the slopes of the efficient frontiers are also decreasing, meaning
that reducing the risk has less of an impact on the expected return. In terms of
financial resilience, let us say a landholder is trying to minimize the frequency of
poor returns. In one scenario a loss, on average, approximately once every 5 years
became once every 250 years when a more risk averse position was taken. That
was on a property with moderate value (NSI = 2, 500, 00) and the risk aversion
measure went from λ = 0 to λ = 0.5. The return was reduced by 45.1%, but the
stocking investment was also significantly reduced by some 66.9%. The scenario
assumed that returns were normally distributed and only optimal solutions were
considered.
One obvious reason non-stock investments will differ between properties is
quality of the pastures and availability of water. The greater the non-stock invest-
40
2.2 Illustration
ments the more expensive species begin to be favored because their return on total
costs increases relative to the less expensive species (Figures 2.4 and 2.5). From a
non-stock investments of NSI = 0 (refer to Figure 2.3) to NSI = 2, 168, 350, when
considering purely the returns (λ = 0), a strategy of solely stocking kangaroos
is favored, due to their higher fecundity rate. At higher non-stock investments
though, as seen in Figures 2.4a and 2.4b, where NSI is $2,500,000 and $5,000,000
respectively, cattle are favored when maximizing returns, due to their higher price
per dse.
No matter the non-stock investments, once the landholders become even mod-
erately risk adverse (λ > 0.25) a mixed strategy is preferred. This point is
illustrated in Figure 2.4, where it is clear to see that when greater non-stock
investment is required the forage allocated to cattle increases, reducing the kan-
garoo allocation as the sheep allocation plateau. Comparing the low (2.5a) and
higher (2.5b) risk aversion strategies for different NSI reiterates the preference
for mixed-grazing at both higher levels of risk aversion and NSI.
It is also noted that there is some disagreement in the literature as to the
true value of the kangaroo’s dse, with values from 0.15 to 0.7 quoted by different
sources, the most recent of which suggests ∼0.4 (Munn et al., 2009). If this value
is changed from the 0.7 used above, then the resulting optimal scenarios change
significantly (Figure 2.6). A smaller value of kangaroo dse reduces the resources
allocated to cattle or even eliminates cattle from the optimal solution altogether,
reducing the diversification down to just sheep and kangaroos.
41
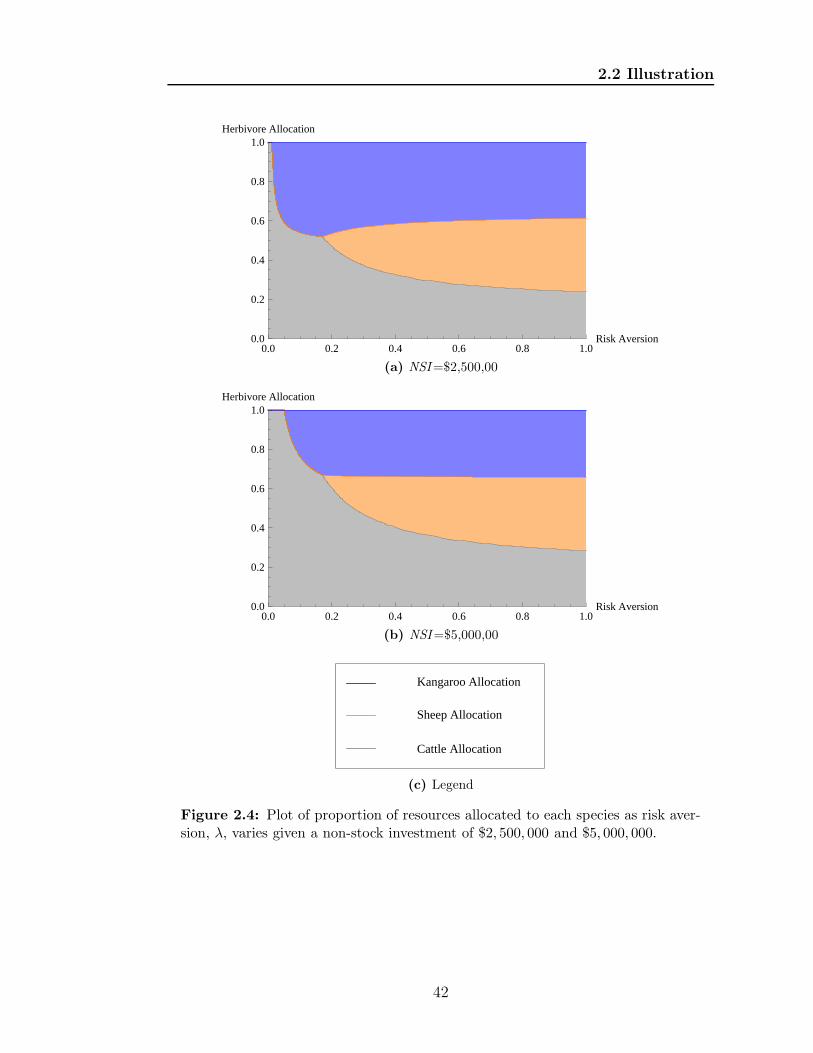
2.2 Illustration
0.0 0.2 0.4 0.6 0.8 1.0Risk Aversion0.0
0.2
0.4
0.6
0.8
1.0Herbivore Allocation
(a) NSI=$2,500,00
0.0 0.2 0.4 0.6 0.8 1.0Risk Aversion0.0
0.2
0.4
0.6
0.8
1.0Herbivore Allocation
(b) NSI=$5,000,00
Cattle Allocation
Sheep Allocation
Kangaroo Allocation
(c) Legend
Figure 2.4: Plot of proportion of resources allocated to each species as risk aver-sion, λ, varies given a non-stock investment of $2, 500, 000 and $5, 000, 000.
42
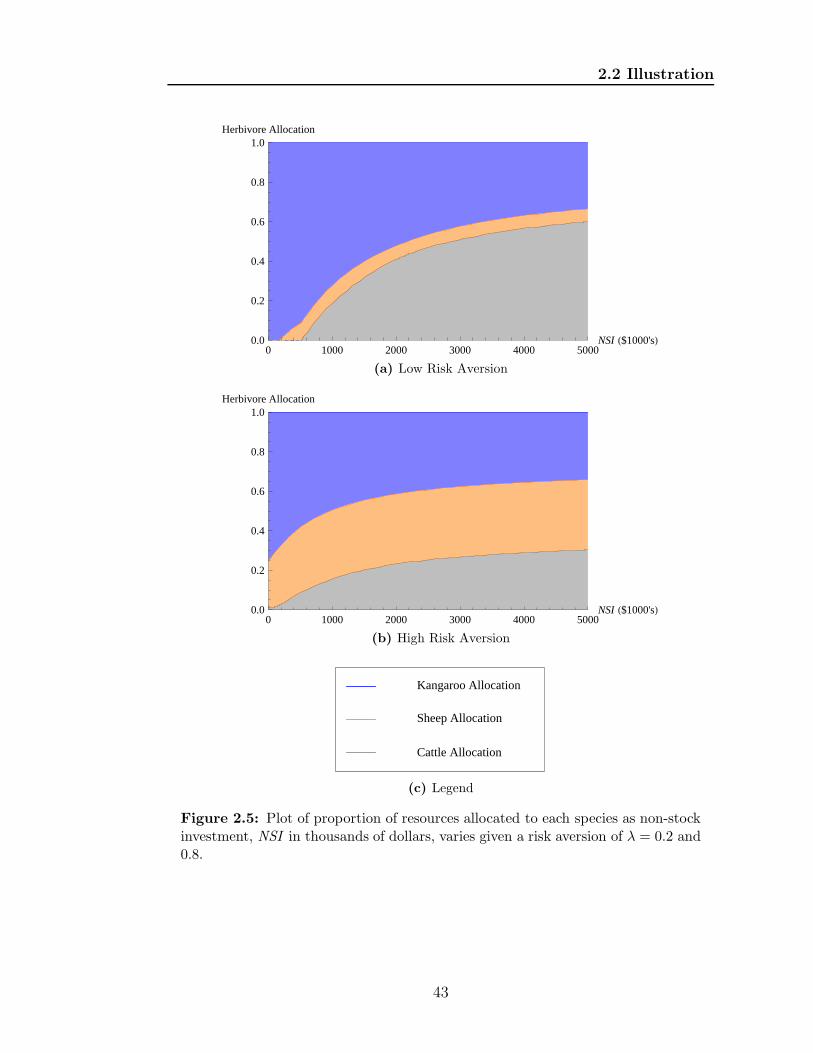
2.2 Illustration
0 1000 2000 3000 4000 5000NSI H$1000'sL0.0
0.2
0.4
0.6
0.8
1.0Herbivore Allocation
(a) Low Risk Aversion
0 1000 2000 3000 4000 5000NSI H$1000'sL0.0
0.2
0.4
0.6
0.8
1.0Herbivore Allocation
(b) High Risk Aversion
Cattle Allocation
Sheep Allocation
Kangaroo Allocation
(c) Legend
Figure 2.5: Plot of proportion of resources allocated to each species as non-stockinvestment, NSI in thousands of dollars, varies given a risk aversion of λ = 0.2 and0.8.
43
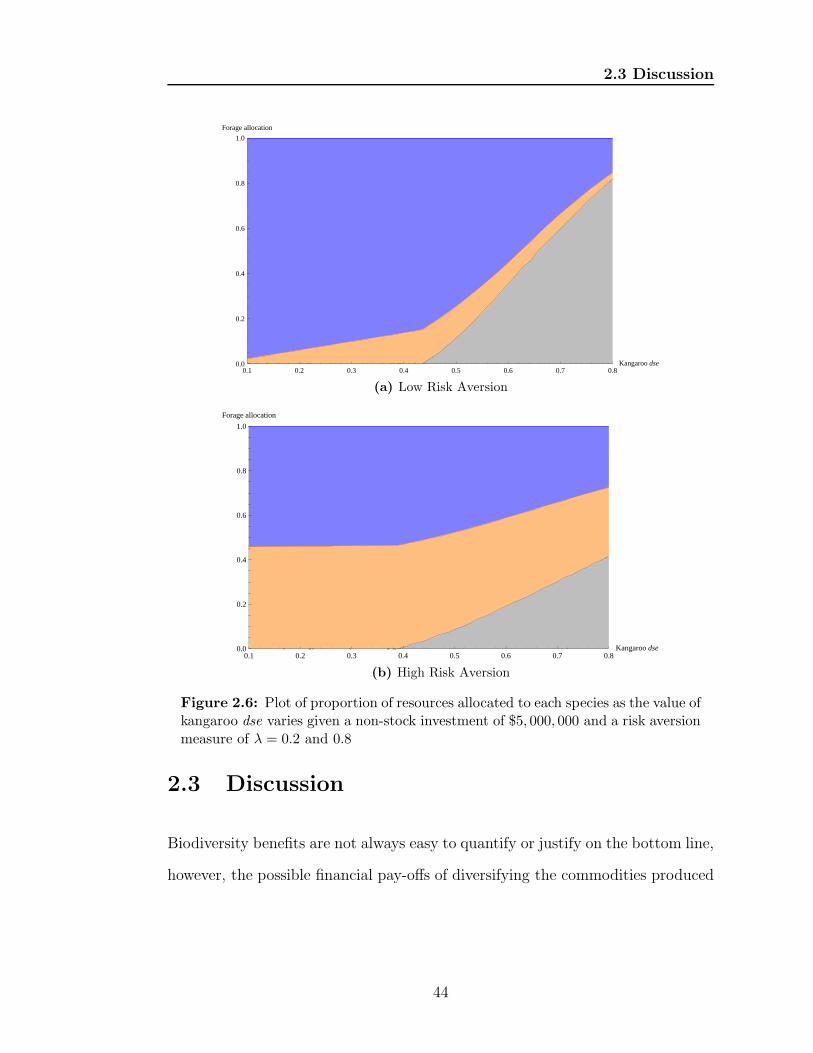
2.3 Discussion
0.1 0.2 0.3 0.4 0.5 0.6 0.7 0.8Kangaroodse0.0
0.2
0.4
0.6
0.8
1.0
Forage allocation
(a) Low Risk Aversion
0.1 0.2 0.3 0.4 0.5 0.6 0.7 0.8Kangaroodse0.0
0.2
0.4
0.6
0.8
1.0
Forage allocation
(b) High Risk Aversion
Figure 2.6: Plot of proportion of resources allocated to each species as the value ofkangaroo dse varies given a non-stock investment of $5, 000, 000 and a risk aversionmeasure of λ = 0.2 and 0.8
2.3 Discussion
Biodiversity benefits are not always easy to quantify or justify on the bottom line,
however, the possible financial pay-offs of diversifying the commodities produced
44
2.3 Discussion
by the enterprize can be quantified. From this analysis it can be seen that, given
the correct circumstances, active management of kangaroos could be a viable way
of increasing the resilience of the land financially as well as ecologically. Diver-
sification in semi-arid Australian rangelands seems to result in less volatility in
returns on average. This is the case even where there is some uncertainty with
regards to the true nature of the comparative impact of kangaroos. Different com-
binations of these parameter values, which seem to cover the plausible spectrum,
all resulted in some form of diversification along the efficient frontier. Further-
more, as the land becomes more marginal, and decreases in value, there seems to
be benefits with respect to returns from the inclusion of kangaroo harvesting.
Additionally it is noted that several practical difficulties need to be overcome
before the systems considered in our model can be implemented. The relation-
ship and distribution of returns between landholders and harvesters needs to be
reviewed. Will harvesters continue to operate as they are currently but with some
return to the landholders or will they work for the cooperative? Compared to
beef sales, kangaroo meat has a very low market share and therefore elasticities
with beef are not clear. Greater acceptance for kangaroo meat within Australia
and internationally could affect its demand. If diversification into kangaroos was
to increase, there may be a point were some of the assumptions may need to be
altered. Further discussion on some of the issues can be found in Cooney et al.
(2009).
Anecdotal evidence suggests that during times of hardship caused by drought,
kangaroo harvesting becomes easier as they are forced to leave their sheltered
bushland for clearings in search of any available forage. It is exactly at this time
45
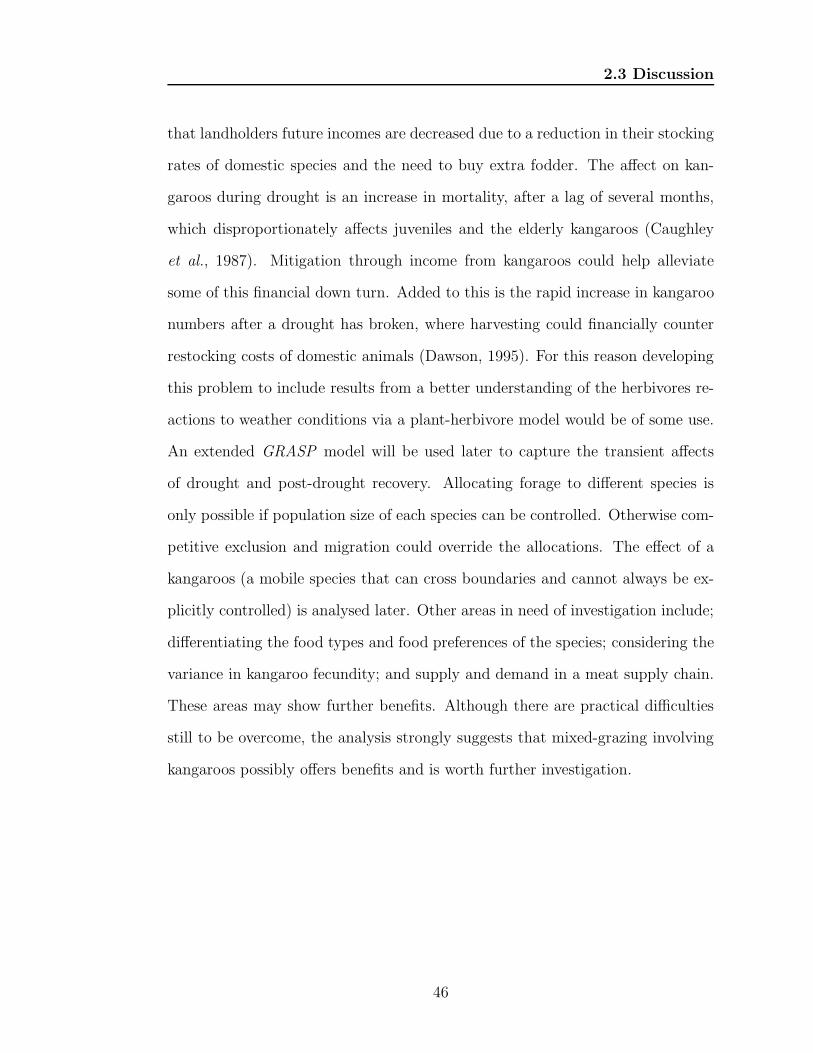
2.3 Discussion
that landholders future incomes are decreased due to a reduction in their stocking
rates of domestic species and the need to buy extra fodder. The affect on kan-
garoos during drought is an increase in mortality, after a lag of several months,
which disproportionately affects juveniles and the elderly kangaroos (Caughley
et al., 1987). Mitigation through income from kangaroos could help alleviate
some of this financial down turn. Added to this is the rapid increase in kangaroo
numbers after a drought has broken, where harvesting could financially counter
restocking costs of domestic animals (Dawson, 1995). For this reason developing
this problem to include results from a better understanding of the herbivores re-
actions to weather conditions via a plant-herbivore model would be of some use.
An extended GRASP model will be used later to capture the transient affects
of drought and post-drought recovery. Allocating forage to different species is
only possible if population size of each species can be controlled. Otherwise com-
petitive exclusion and migration could override the allocations. The effect of a
kangaroos (a mobile species that can cross boundaries and cannot always be ex-
plicitly controlled) is analysed later. Other areas in need of investigation include;
differentiating the food types and food preferences of the species; considering the
variance in kangaroo fecundity; and supply and demand in a meat supply chain.
These areas may show further benefits. Although there are practical difficulties
still to be overcome, the analysis strongly suggests that mixed-grazing involving
kangaroos possibly offers benefits and is worth further investigation.
46
Chapter 3
Meat Supply Chain with
Migration
Currently the kangaroo meat processors are in a dominant position, able to de-
termine prices and quantities. What would happen if that were to change? This
section focuses on the landholder and processing aspects in a supply chain to
determine optimal stocking and harvesting rates. The landholder (seller) wishes
to maximise their return whilst maintaining a sustainable property. They harvest
kangaroos, the free-roaming stock, as well as the domestic stock. Whereas the
meat processor (buyer) is trying to meet demand while minimising their costs.
Several meat supply chain models are proposed and solved. The seller’s model de-
termines the optimal quantities of sheep and kangaroo to offer so as to maximise
their income based on buying price. The property’s carrying capacity, animal
fecundity and mortality and (in the case of kangaroos) migration are taken into
account. The optimal buying price and order quantity are determined for these
47
3.1 Notation and Problem Formulation
substituted goods to minimise the processor’s purchase cost where the order quan-
tity is a function of buying price. The interactions between the processor and the
landholder are modelled by both non-cooperative and cooperative games. The
non-cooperative aspect is a seller-Stackelberg scenario, where the seller has more
power than the buyer. In addition Pareto efficient solutions to the cooperative
game model are provided.
3.1 Notation and Problem Formulation
This section introduces the notation and formulation used in the supply chain
problem. Specifically, all decision variables, input parameters and assumptions
underlying our models will be stated.
3.1.1 Decision Variables
The decision variable are the parameters that the landholder and processor have
control over. Table 3.1 lists these variables and states which player has direct
control of the variable.
Variable Definition
ps The buying price of sheep (processor’s decision variable)($/kg).ps The buying price of kangaroo (processor’s decision variable)($/kg).γs The fraction of sheep to sell (landholder’s decision vari-
able)(dimensionless).γk The fraction of kangaroo to sell (landholder’s decision vari-
able)(dimensionless).
Table 3.1: Decision variables used in the supply chain problem.
48
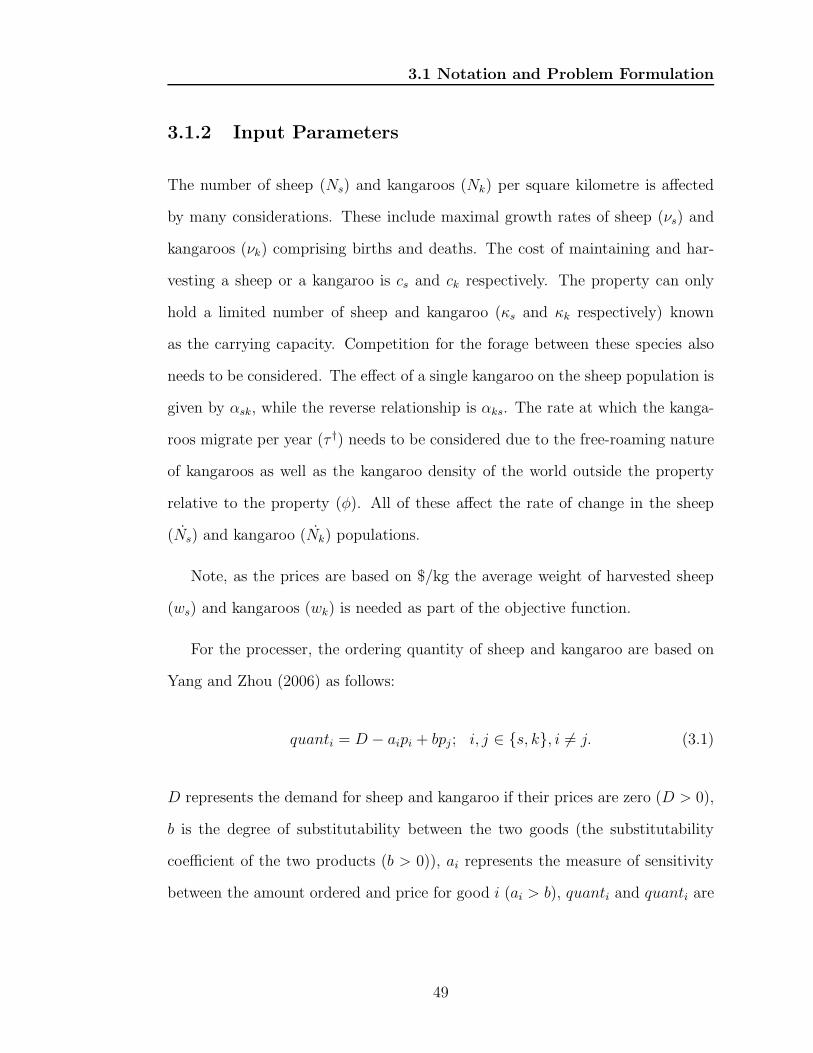
3.1 Notation and Problem Formulation
3.1.2 Input Parameters
The number of sheep (Ns) and kangaroos (Nk) per square kilometre is affected
by many considerations. These include maximal growth rates of sheep (νs) and
kangaroos (νk) comprising births and deaths. The cost of maintaining and har-
vesting a sheep or a kangaroo is cs and ck respectively. The property can only
hold a limited number of sheep and kangaroo (κs and κk respectively) known
as the carrying capacity. Competition for the forage between these species also
needs to be considered. The effect of a single kangaroo on the sheep population is
given by αsk, while the reverse relationship is αks. The rate at which the kanga-
roos migrate per year (τ †) needs to be considered due to the free-roaming nature
of kangaroos as well as the kangaroo density of the world outside the property
relative to the property (φ). All of these affect the rate of change in the sheep
(Ns) and kangaroo (Nk) populations.
Note, as the prices are based on $/kg the average weight of harvested sheep
(ws) and kangaroos (wk) is needed as part of the objective function.
For the processer, the ordering quantity of sheep and kangaroo are based on
Yang and Zhou (2006) as follows:
quanti = D − aipi + bpj ; i, j ∈ {s, k}, i 6= j. (3.1)
D represents the demand for sheep and kangaroo if their prices are zero (D > 0),
b is the degree of substitutability between the two goods (the substitutability
coefficient of the two products (b > 0)), ai represents the measure of sensitivity
between the amount ordered and price for good i (ai > b), quanti and quanti are
49
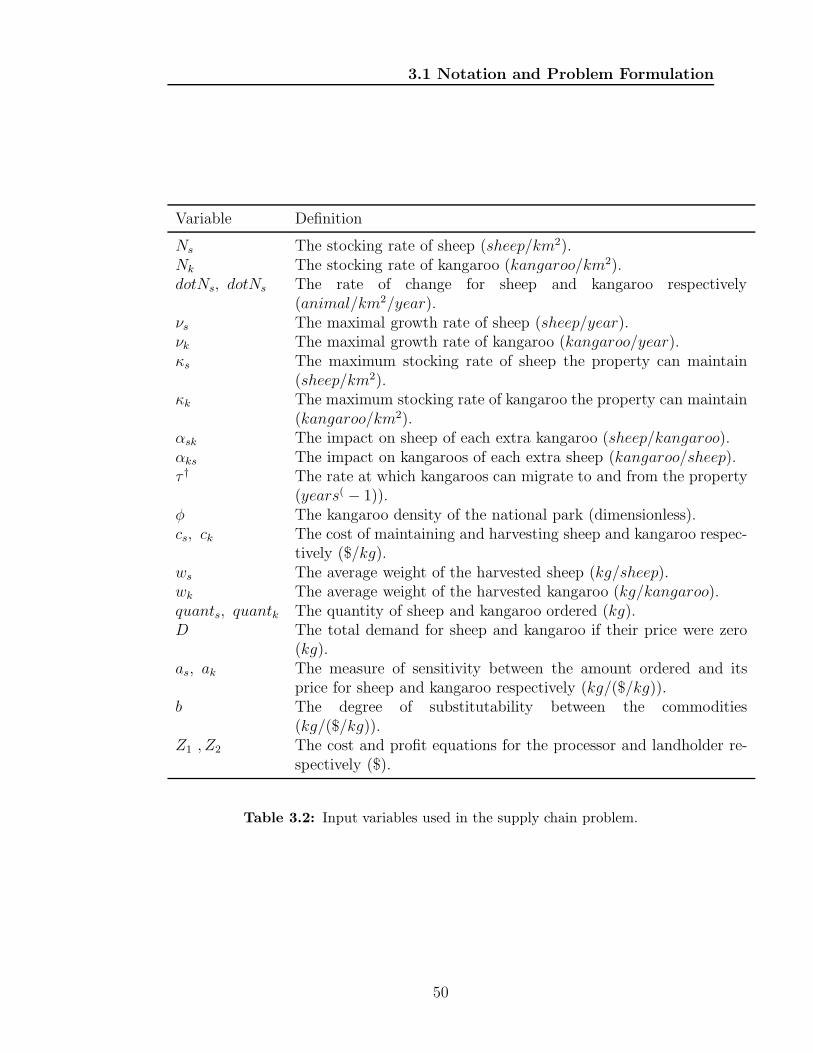
3.1 Notation and Problem Formulation
Variable Definition
Ns The stocking rate of sheep (sheep/km2).Nk The stocking rate of kangaroo (kangaroo/km2).dotNs, dotNs The rate of change for sheep and kangaroo respectively
(animal/km2/year).νs The maximal growth rate of sheep (sheep/year).νk The maximal growth rate of kangaroo (kangaroo/year).κs The maximum stocking rate of sheep the property can maintain
(sheep/km2).κk The maximum stocking rate of kangaroo the property can maintain
(kangaroo/km2).αsk The impact on sheep of each extra kangaroo (sheep/kangaroo).αks The impact on kangaroos of each extra sheep (kangaroo/sheep).τ † The rate at which kangaroos can migrate to and from the property
(years( − 1)).φ The kangaroo density of the national park (dimensionless).cs, ck The cost of maintaining and harvesting sheep and kangaroo respec-
tively ($/kg).ws The average weight of the harvested sheep (kg/sheep).wk The average weight of the harvested kangaroo (kg/kangaroo).quants, quantk The quantity of sheep and kangaroo ordered (kg).D The total demand for sheep and kangaroo if their price were zero
(kg).as, ak The measure of sensitivity between the amount ordered and its
price for sheep and kangaroo respectively (kg/($/kg)).b The degree of substitutability between the commodities
(kg/($/kg)).Z1 , Z2 The cost and profit equations for the processor and landholder re-
spectively ($).
Table 3.2: Input variables used in the supply chain problem.
50
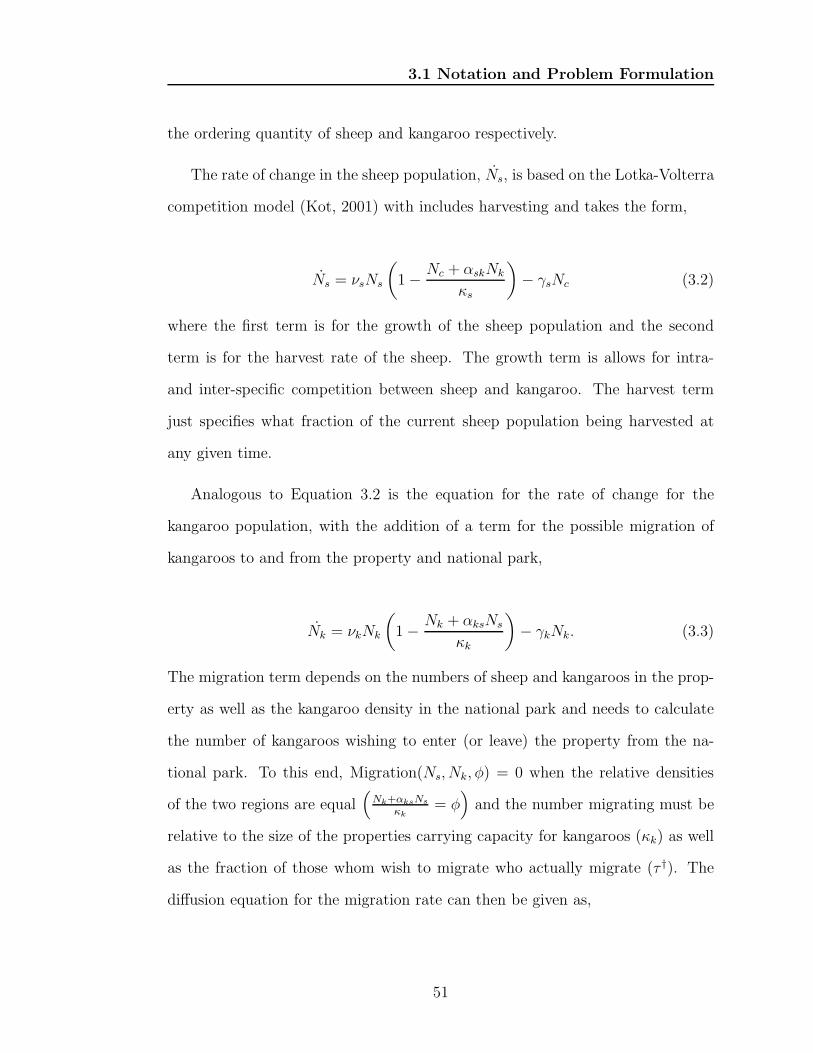
3.1 Notation and Problem Formulation
the ordering quantity of sheep and kangaroo respectively.
The rate of change in the sheep population, Ns, is based on the Lotka-Volterra
competition model (Kot, 2001) with includes harvesting and takes the form,
Ns = νsNs
(
1− Nc + αskNk
κs
)
− γsNc (3.2)
where the first term is for the growth of the sheep population and the second
term is for the harvest rate of the sheep. The growth term is allows for intra-
and inter-specific competition between sheep and kangaroo. The harvest term
just specifies what fraction of the current sheep population being harvested at
any given time.
Analogous to Equation 3.2 is the equation for the rate of change for the
kangaroo population, with the addition of a term for the possible migration of
kangaroos to and from the property and national park,
Nk = νkNk
(
1− Nk + αksNs
κk
)
− γkNk. (3.3)
The migration term depends on the numbers of sheep and kangaroos in the prop-
erty as well as the kangaroo density in the national park and needs to calculate
the number of kangaroos wishing to enter (or leave) the property from the na-
tional park. To this end, Migration(Ns, Nk, φ) = 0 when the relative densities
of the two regions are equal(
Nk+αksNs
κk= φ
)
and the number migrating must be
relative to the size of the properties carrying capacity for kangaroos (κk) as well
as the fraction of those whom wish to migrate who actually migrate (τ †). The
diffusion equation for the migration rate can then be given as,
51
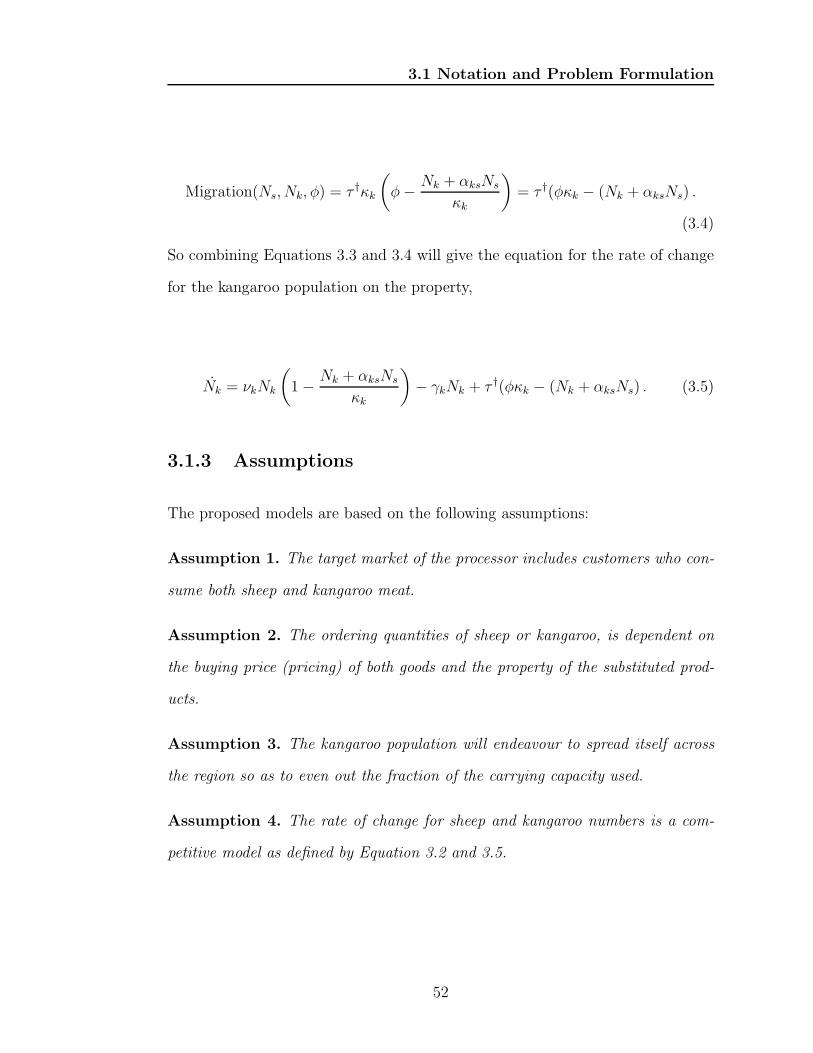
3.1 Notation and Problem Formulation
Migration(Ns, Nk, φ) = τ †κk
(
φ− Nk + αksNs
κk
)
= τ †(φκk − (Nk + αksNs) .
(3.4)
So combining Equations 3.3 and 3.4 will give the equation for the rate of change
for the kangaroo population on the property,
Nk = νkNk
(
1− Nk + αksNs
κk
)
− γkNk + τ †(φκk − (Nk + αksNs) . (3.5)
3.1.3 Assumptions
The proposed models are based on the following assumptions:
Assumption 1. The target market of the processor includes customers who con-
sume both sheep and kangaroo meat.
Assumption 2. The ordering quantities of sheep or kangaroo, is dependent on
the buying price (pricing) of both goods and the property of the substituted prod-
ucts.
Assumption 3. The kangaroo population will endeavour to spread itself across
the region so as to even out the fraction of the carrying capacity used.
Assumption 4. The rate of change for sheep and kangaroo numbers is a com-
petitive model as defined by Equation 3.2 and 3.5.
52
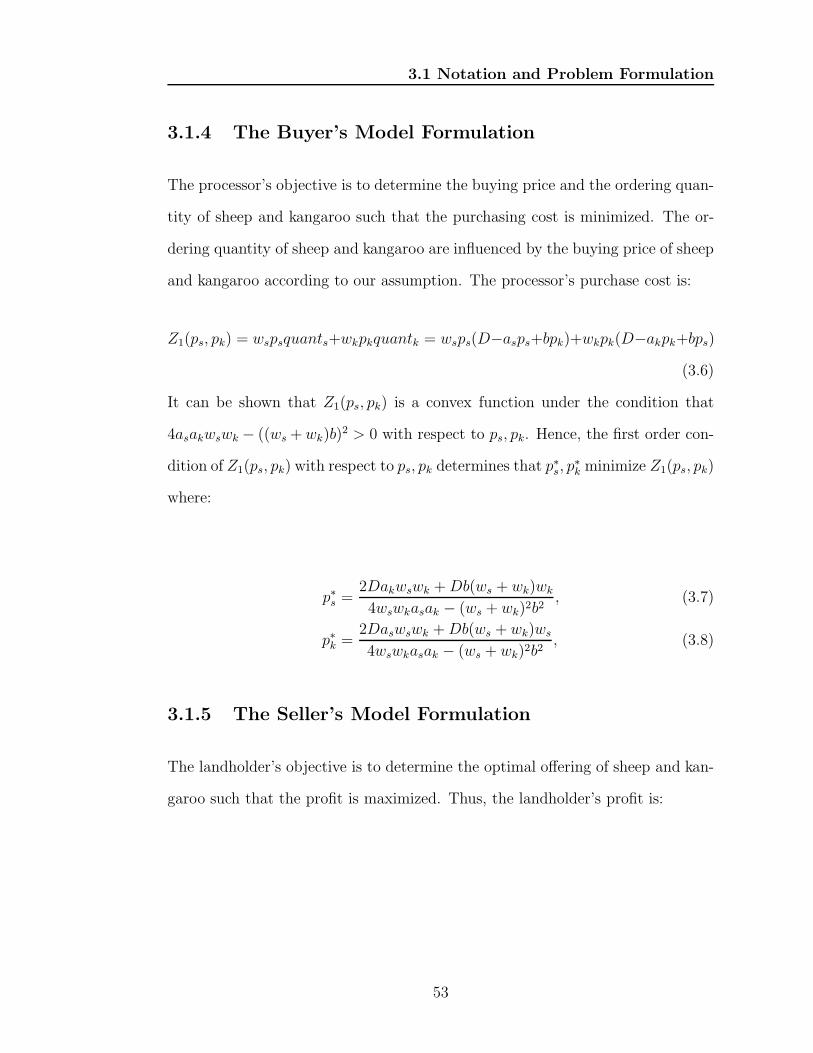
3.1 Notation and Problem Formulation
3.1.4 The Buyer’s Model Formulation
The processor’s objective is to determine the buying price and the ordering quan-
tity of sheep and kangaroo such that the purchasing cost is minimized. The or-
dering quantity of sheep and kangaroo are influenced by the buying price of sheep
and kangaroo according to our assumption. The processor’s purchase cost is:
Z1(ps, pk) = wspsquants+wkpkquantk = wsps(D−asps+bpk)+wkpk(D−akpk+bps)
(3.6)
It can be shown that Z1(ps, pk) is a convex function under the condition that
4asakwswk − ((ws +wk)b)2 > 0 with respect to ps, pk. Hence, the first order con-
dition of Z1(ps, pk) with respect to ps, pk determines that p∗s, p∗k minimize Z1(ps, pk)
where:
p∗s =2Dakwswk +Db(ws + wk)wk
4wswkasak − (ws + wk)2b2, (3.7)
p∗k =2Daswswk +Db(ws + wk)ws
4wswkasak − (ws + wk)2b2, (3.8)
3.1.5 The Seller’s Model Formulation
The landholder’s objective is to determine the optimal offering of sheep and kan-
garoo such that the profit is maximized. Thus, the landholder’s profit is:
53
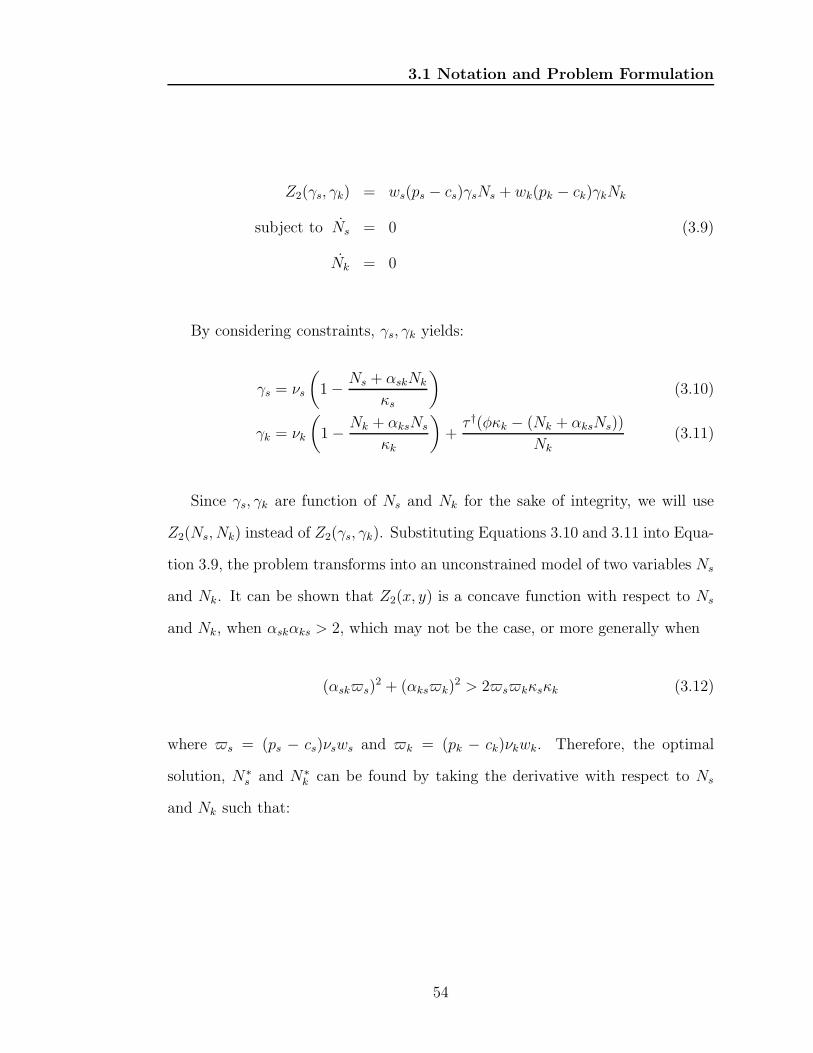
3.1 Notation and Problem Formulation
Z2(γs, γk) = ws(ps − cs)γsNs + wk(pk − ck)γkNk
subject to Ns = 0 (3.9)
Nk = 0
By considering constraints, γs, γk yields:
γs = νs
(
1− Ns + αskNk
κs
)
(3.10)
γk = νk
(
1− Nk + αksNs
κk
)
+τ †(φκk − (Nk + αksNs))
Nk
(3.11)
Since γs, γk are function of Ns and Nk for the sake of integrity, we will use
Z2(Ns, Nk) instead of Z2(γs, γk). Substituting Equations 3.10 and 3.11 into Equa-
tion 3.9, the problem transforms into an unconstrained model of two variables Ns
and Nk. It can be shown that Z2(x, y) is a concave function with respect to Ns
and Nk, when αskαks > 2, which may not be the case, or more generally when
(αsk$s)2 + (αks$k)
2 > 2$s$kκsκk (3.12)
where $s = (ps − cs)νsws and $k = (pk − ck)νkwk. Therefore, the optimal
solution, N∗s and N∗
k can be found by taking the derivative with respect to Ns
and Nk such that:
54
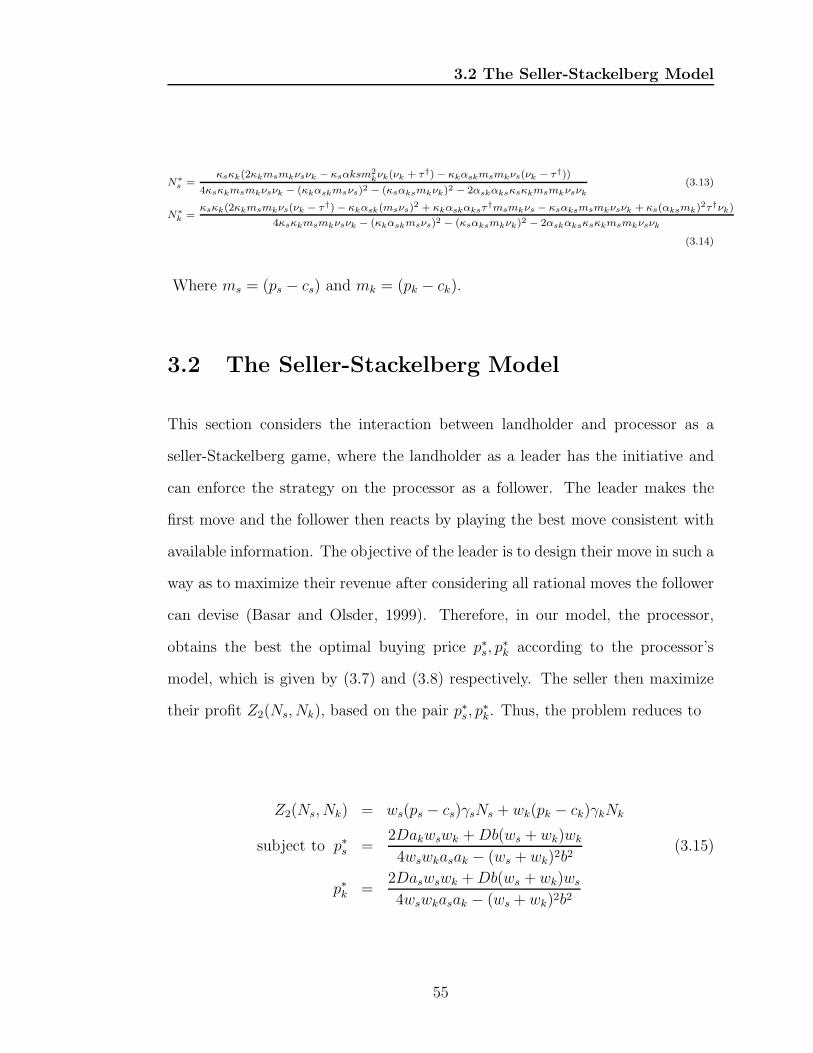
3.2 The Seller-Stackelberg Model
N∗s =
κsκk(2κkmsmkνsνk − κsαksm2
kνk(νk + τ†)− κkαskmsmkνs(νk − τ†))
4κsκkmsmkνsνk − (κkαskmsνs)2 − (κsαksmkνk)2 − 2αskαksκsκkmsmkνsνk(3.13)
N∗k =
κsκk(2κkmsmkνs(νk − τ†)− κkαsk(msνs)2 + κkαskαksτ†msmkνs − κsαksmsmkνsνk + κs(αksmk)
2τ†νk)
4κsκkmsmkνsνk − (κkαskmsνs)2 − (κsαksmkνk)2 − 2αskαksκsκkmsmkνsνk
(3.14)
Where ms = (ps − cs) and mk = (pk − ck).
3.2 The Seller-Stackelberg Model
This section considers the interaction between landholder and processor as a
seller-Stackelberg game, where the landholder as a leader has the initiative and
can enforce the strategy on the processor as a follower. The leader makes the
first move and the follower then reacts by playing the best move consistent with
available information. The objective of the leader is to design their move in such a
way as to maximize their revenue after considering all rational moves the follower
can devise (Basar and Olsder, 1999). Therefore, in our model, the processor,
obtains the best the optimal buying price p∗s, p∗k according to the processor’s
model, which is given by (3.7) and (3.8) respectively. The seller then maximize
their profit Z2(Ns, Nk), based on the pair p∗s, p∗k. Thus, the problem reduces to
Z2(Ns, Nk) = ws(ps − cs)γsNs + wk(pk − ck)γkNk
subject to p∗s =2Dakwswk +Db(ws + wk)wk
4wswkasak − (ws + wk)2b2(3.15)
p∗k =2Daswswk +Db(ws + wk)ws
4wswkasak − (ws + wk)2b2
55
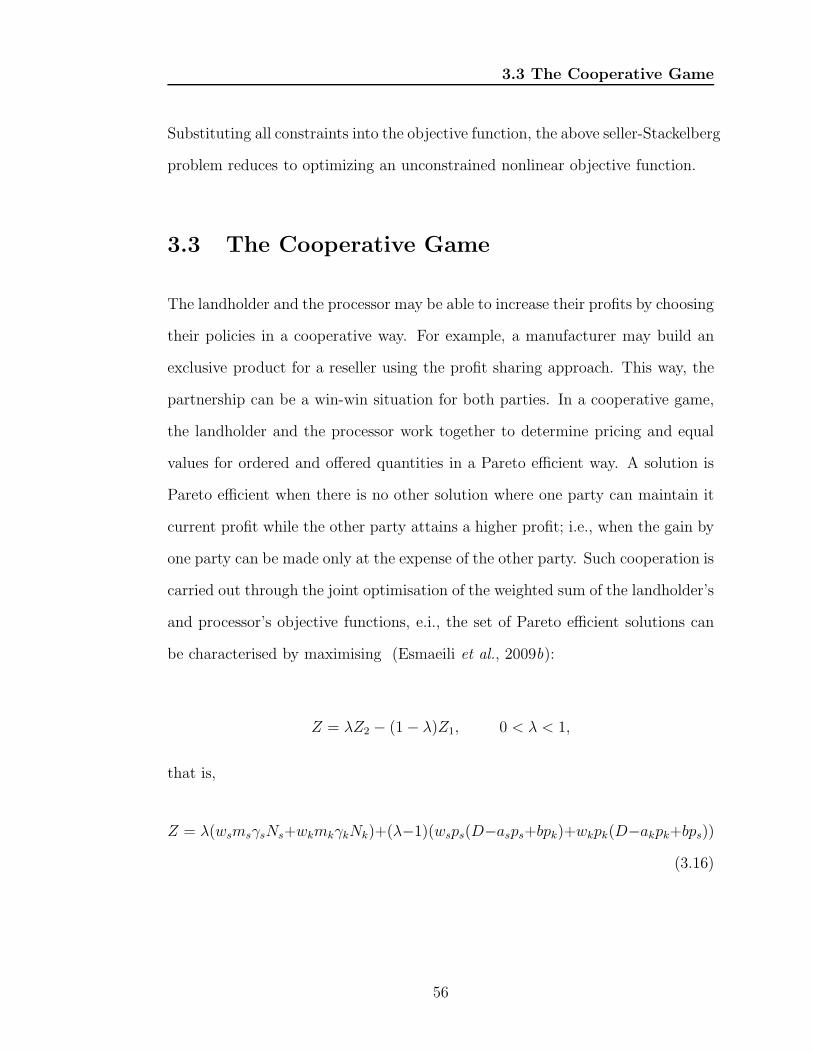
3.3 The Cooperative Game
Substituting all constraints into the objective function, the above seller-Stackelberg
problem reduces to optimizing an unconstrained nonlinear objective function.
3.3 The Cooperative Game
The landholder and the processor may be able to increase their profits by choosing
their policies in a cooperative way. For example, a manufacturer may build an
exclusive product for a reseller using the profit sharing approach. This way, the
partnership can be a win-win situation for both parties. In a cooperative game,
the landholder and the processor work together to determine pricing and equal
values for ordered and offered quantities in a Pareto efficient way. A solution is
Pareto efficient when there is no other solution where one party can maintain it
current profit while the other party attains a higher profit; i.e., when the gain by
one party can be made only at the expense of the other party. Such cooperation is
carried out through the joint optimisation of the weighted sum of the landholder’s
and processor’s objective functions, e.i., the set of Pareto efficient solutions can
be characterised by maximising (Esmaeili et al., 2009b):
Z = λZ2 − (1− λ)Z1, 0 < λ < 1,
that is,
Z = λ(wsmsγsNs+wkmkγkNk)+(λ−1)(wsps(D−asps+bpk)+wkpk(D−akpk+bps))
(3.16)
56
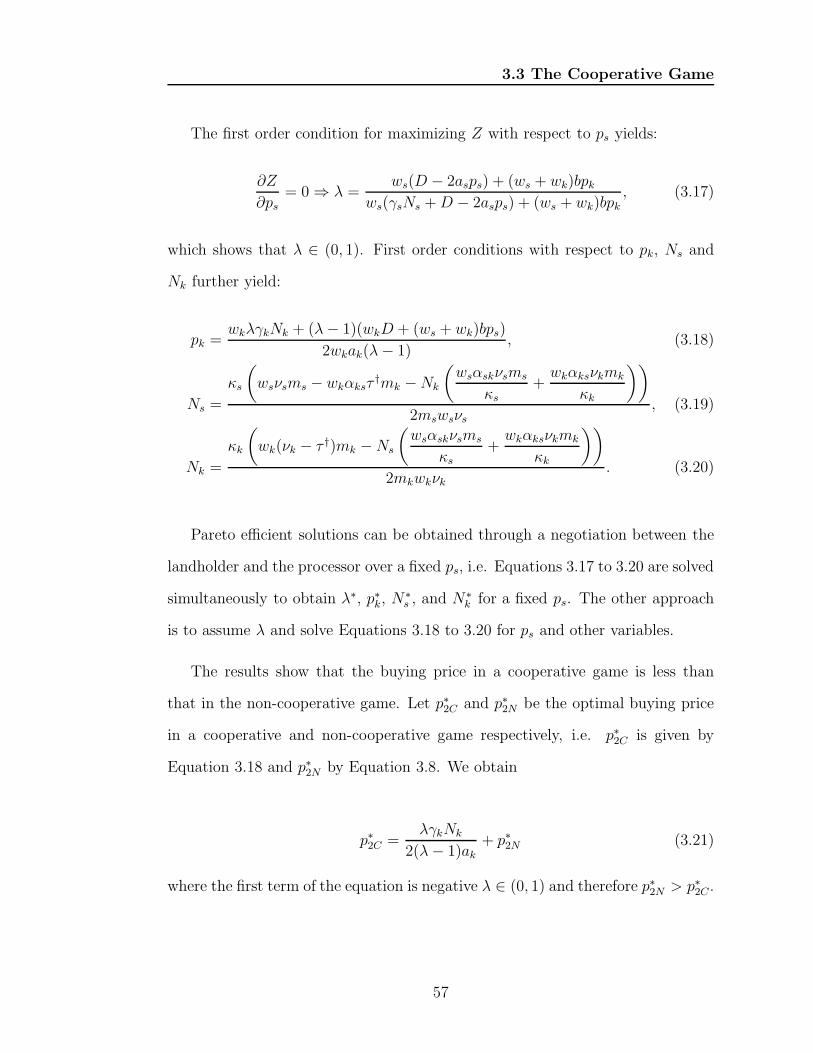
3.3 The Cooperative Game
The first order condition for maximizing Z with respect to ps yields:
∂Z
∂ps= 0 ⇒ λ =
ws(D − 2asps) + (ws + wk)bpkws(γsNs +D − 2asps) + (ws + wk)bpk
, (3.17)
which shows that λ ∈ (0, 1). First order conditions with respect to pk, Ns and
Nk further yield:
pk =wkλγkNk + (λ− 1)(wkD + (ws + wk)bps)
2wkak(λ− 1), (3.18)
Ns =
κs
(
wsνsms − wkαksτ†mk −Nk
(
wsαskνsms
κs
+wkαksνkmk
κk
))
2mswsνs, (3.19)
Nk =
κk
(
wk(νk − τ †)mk −Ns
(
wsαskνsms
κs
+wkαksνkmk
κk
))
2mkwkνk. (3.20)
Pareto efficient solutions can be obtained through a negotiation between the
landholder and the processor over a fixed ps, i.e. Equations 3.17 to 3.20 are solved
simultaneously to obtain λ∗, p∗k, N∗s , and N∗
k for a fixed ps. The other approach
is to assume λ and solve Equations 3.18 to 3.20 for ps and other variables.
The results show that the buying price in a cooperative game is less than
that in the non-cooperative game. Let p∗2C and p∗2N be the optimal buying price
in a cooperative and non-cooperative game respectively, i.e. p∗2C is given by
Equation 3.18 and p∗2N by Equation 3.8. We obtain
p∗2C =λγkNk
2(λ− 1)ak+ p∗2N (3.21)
where the first term of the equation is negative λ ∈ (0, 1) and therefore p∗2N > p∗2C .
57
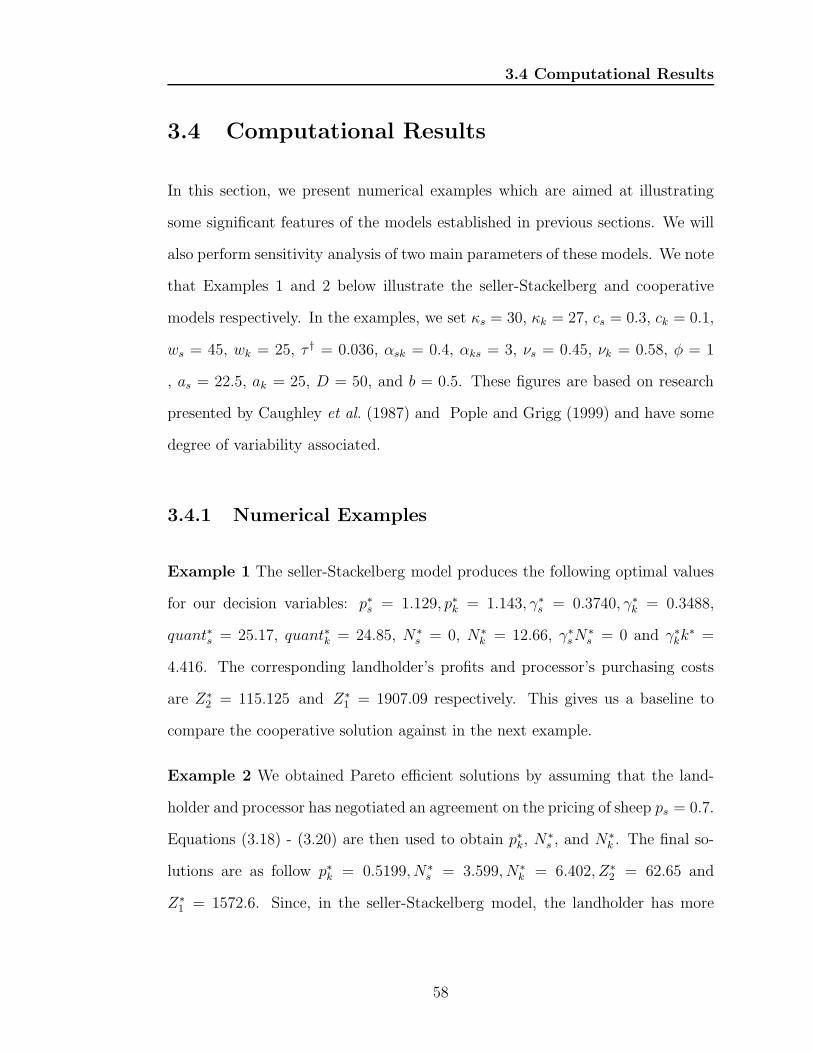
3.4 Computational Results
3.4 Computational Results
In this section, we present numerical examples which are aimed at illustrating
some significant features of the models established in previous sections. We will
also perform sensitivity analysis of two main parameters of these models. We note
that Examples 1 and 2 below illustrate the seller-Stackelberg and cooperative
models respectively. In the examples, we set κs = 30, κk = 27, cs = 0.3, ck = 0.1,
ws = 45, wk = 25, τ † = 0.036, αsk = 0.4, αks = 3, νs = 0.45, νk = 0.58, φ = 1
, as = 22.5, ak = 25, D = 50, and b = 0.5. These figures are based on research
presented by Caughley et al. (1987) and Pople and Grigg (1999) and have some
degree of variability associated.
3.4.1 Numerical Examples
Example 1 The seller-Stackelberg model produces the following optimal values
for our decision variables: p∗s = 1.129, p∗k = 1.143, γ∗s = 0.3740, γ∗
k = 0.3488,
quant∗s = 25.17, quant∗k = 24.85, N∗s = 0, N∗
k = 12.66, γ∗sN
∗s = 0 and γ∗
kk∗ =
4.416. The corresponding landholder’s profits and processor’s purchasing costs
are Z∗2 = 115.125 and Z∗
1 = 1907.09 respectively. This gives us a baseline to
compare the cooperative solution against in the next example.
Example 2 We obtained Pareto efficient solutions by assuming that the land-
holder and processor has negotiated an agreement on the pricing of sheep ps = 0.7.
Equations (3.18) - (3.20) are then used to obtain p∗k, N∗s , and N∗
k . The final so-
lutions are as follow p∗k = 0.5199, N∗s = 3.599, N∗
k = 6.402, Z∗2 = 62.65 and
Z∗1 = 1572.6. Since, in the seller-Stackelberg model, the landholder has more
58
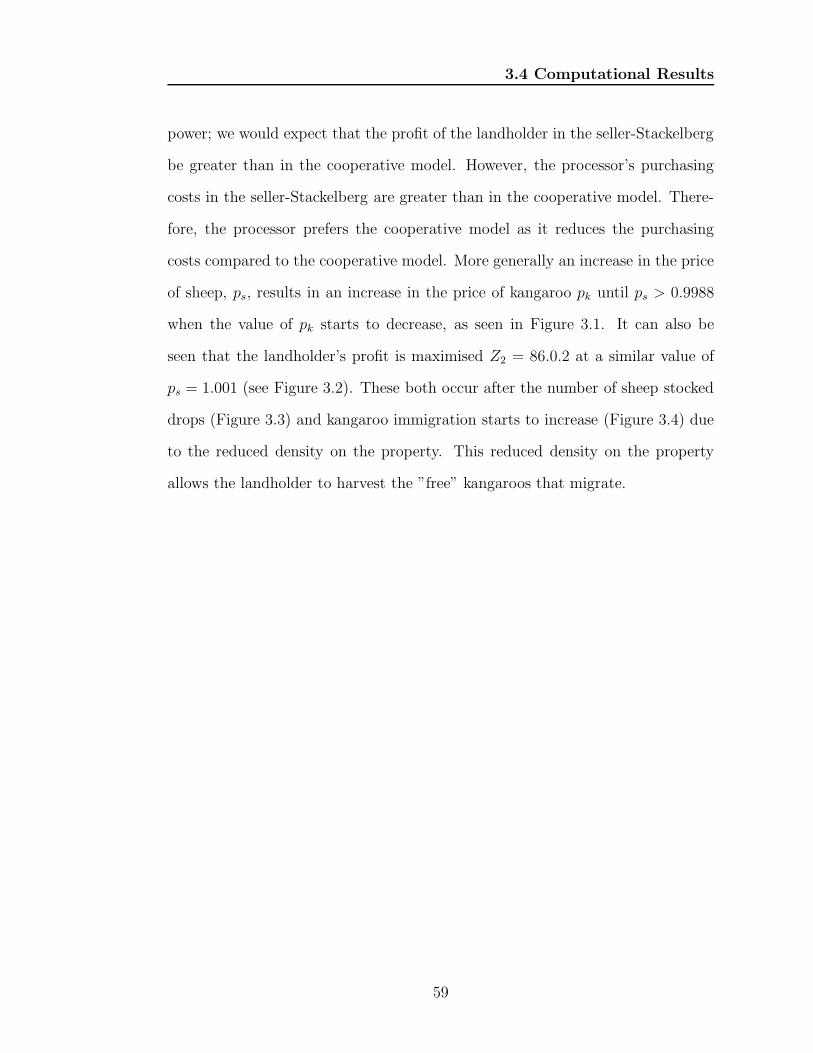
3.4 Computational Results
power; we would expect that the profit of the landholder in the seller-Stackelberg
be greater than in the cooperative model. However, the processor’s purchasing
costs in the seller-Stackelberg are greater than in the cooperative model. There-
fore, the processor prefers the cooperative model as it reduces the purchasing
costs compared to the cooperative model. More generally an increase in the price
of sheep, ps, results in an increase in the price of kangaroo pk until ps > 0.9988
when the value of pk starts to decrease, as seen in Figure 3.1. It can also be
seen that the landholder’s profit is maximised Z2 = 86.0.2 at a similar value of
ps = 1.001 (see Figure 3.2). These both occur after the number of sheep stocked
drops (Figure 3.3) and kangaroo immigration starts to increase (Figure 3.4) due
to the reduced density on the property. This reduced density on the property
allows the landholder to harvest the ”free” kangaroos that migrate.
59
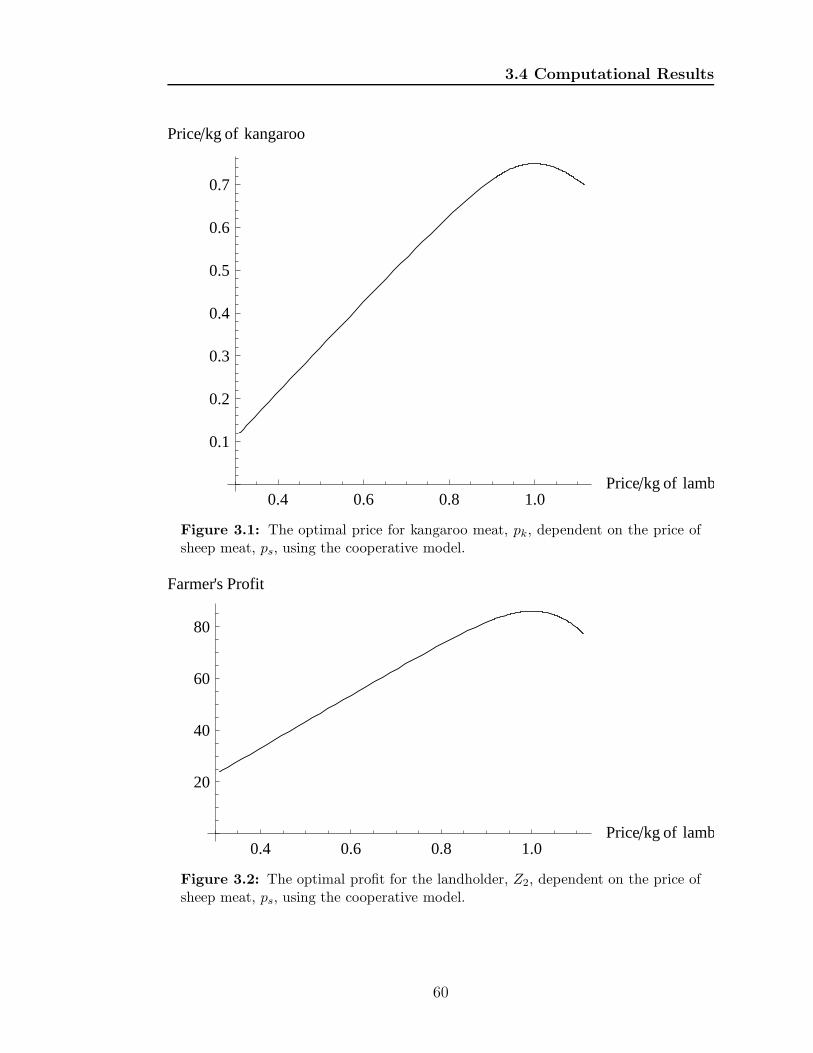
3.4 Computational Results
0.4 0.6 0.8 1.0Price�kg of lamb
0.1
0.2
0.3
0.4
0.5
0.6
0.7
Price�kg of kangaroo
Figure 3.1: The optimal price for kangaroo meat, pk, dependent on the price ofsheep meat, ps, using the cooperative model.
0.4 0.6 0.8 1.0Price�kg of lamb
20
40
60
80
Farmer's Profit
Figure 3.2: The optimal profit for the landholder, Z2, dependent on the price ofsheep meat, ps, using the cooperative model.
60
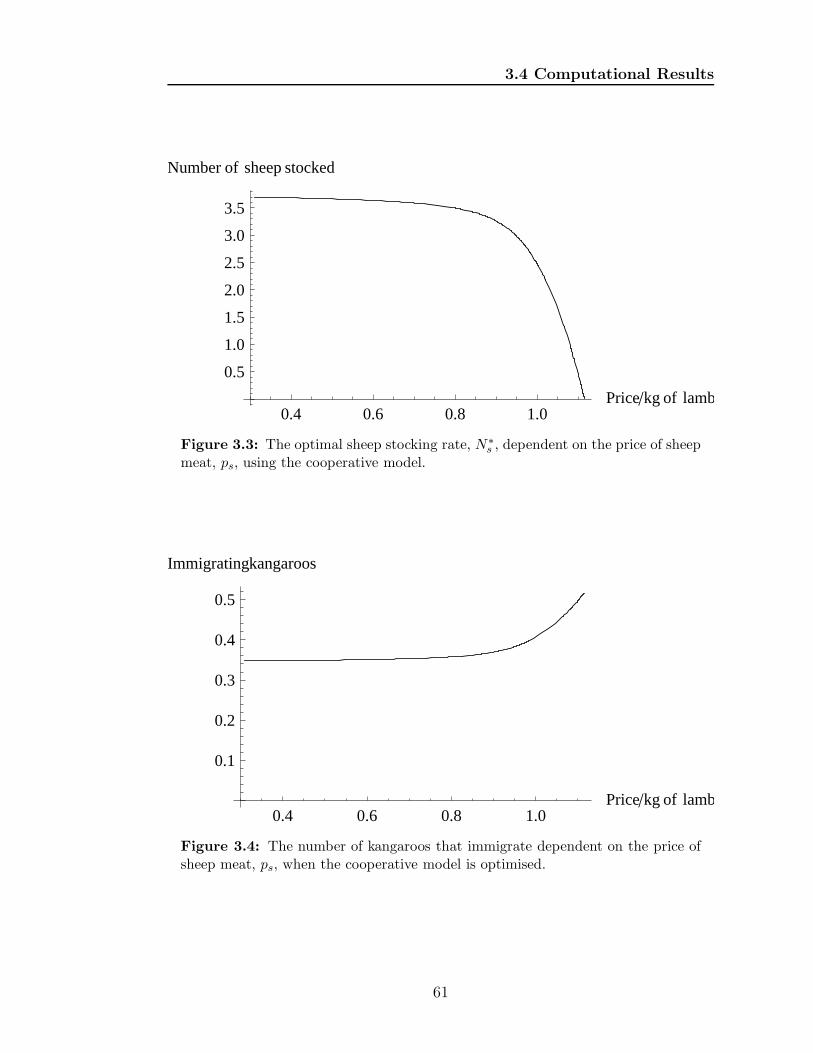
3.4 Computational Results
0.4 0.6 0.8 1.0Price�kg of lamb
0.5
1.0
1.5
2.0
2.5
3.0
3.5
Number of sheep stocked
Figure 3.3: The optimal sheep stocking rate, N∗s , dependent on the price of sheep
meat, ps, using the cooperative model.
0.4 0.6 0.8 1.0Price�kg of lamb
0.1
0.2
0.3
0.4
0.5
Immigratingkangaroos
Figure 3.4: The number of kangaroos that immigrate dependent on the price ofsheep meat, ps, when the cooperative model is optimised.
61
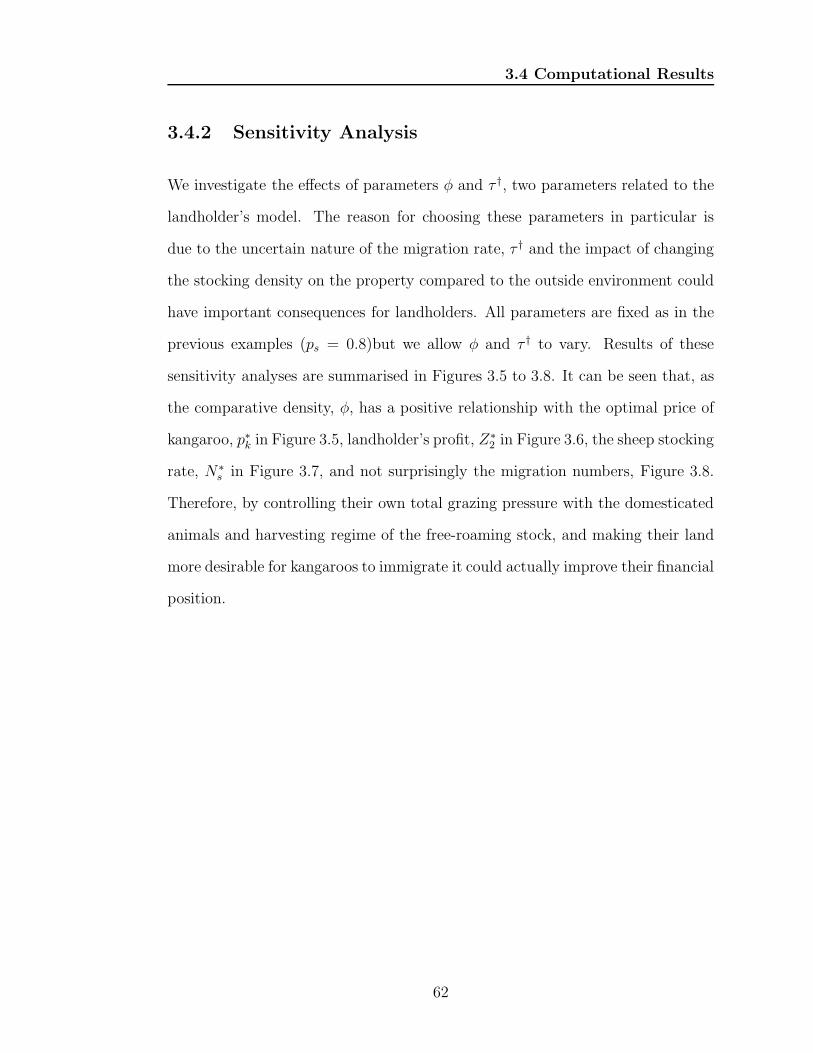
3.4 Computational Results
3.4.2 Sensitivity Analysis
We investigate the effects of parameters φ and τ †, two parameters related to the
landholder’s model. The reason for choosing these parameters in particular is
due to the uncertain nature of the migration rate, τ † and the impact of changing
the stocking density on the property compared to the outside environment could
have important consequences for landholders. All parameters are fixed as in the
previous examples (ps = 0.8)but we allow φ and τ † to vary. Results of these
sensitivity analyses are summarised in Figures 3.5 to 3.8. It can be seen that, as
the comparative density, φ, has a positive relationship with the optimal price of
kangaroo, p∗k in Figure 3.5, landholder’s profit, Z∗2 in Figure 3.6, the sheep stocking
rate, N∗s in Figure 3.7, and not surprisingly the migration numbers, Figure 3.8.
Therefore, by controlling their own total grazing pressure with the domesticated
animals and harvesting regime of the free-roaming stock, and making their land
more desirable for kangaroos to immigrate it could actually improve their financial
position.
62
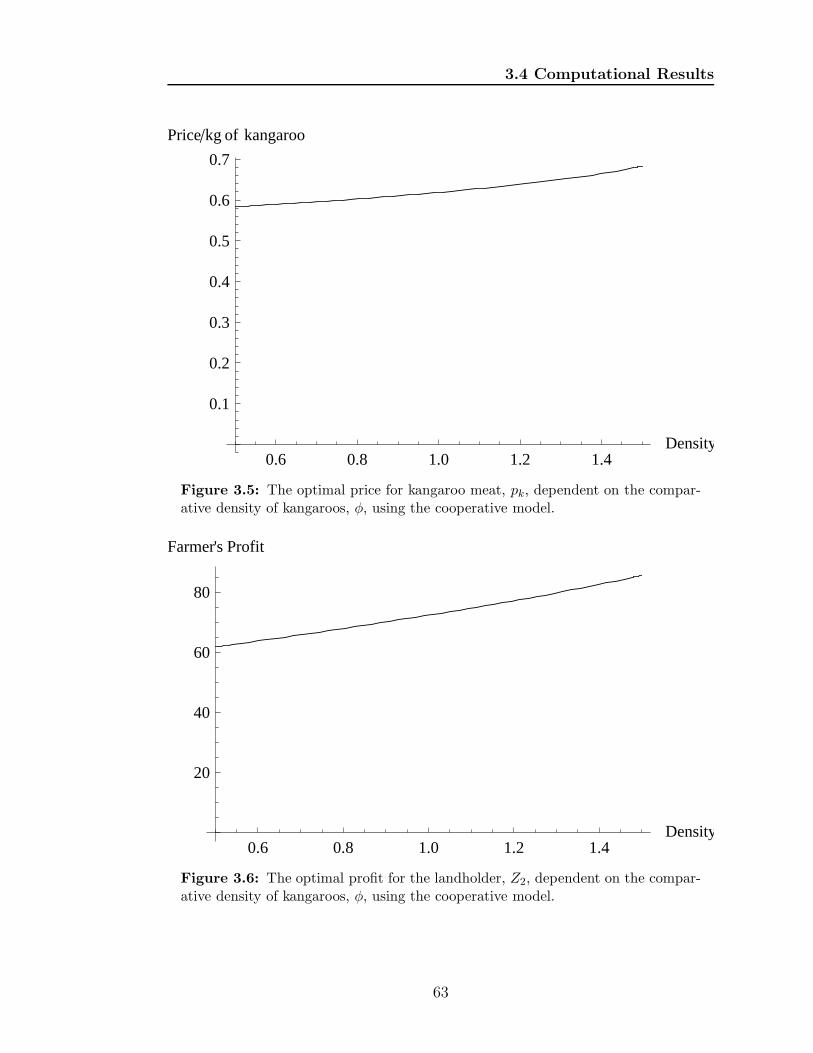
3.4 Computational Results
0.6 0.8 1.0 1.2 1.4Density
0.1
0.2
0.3
0.4
0.5
0.6
0.7
Price�kg of kangaroo
Figure 3.5: The optimal price for kangaroo meat, pk, dependent on the compar-ative density of kangaroos, φ, using the cooperative model.
0.6 0.8 1.0 1.2 1.4Density
20
40
60
80
Farmer's Profit
Figure 3.6: The optimal profit for the landholder, Z2, dependent on the compar-ative density of kangaroos, φ, using the cooperative model.
63
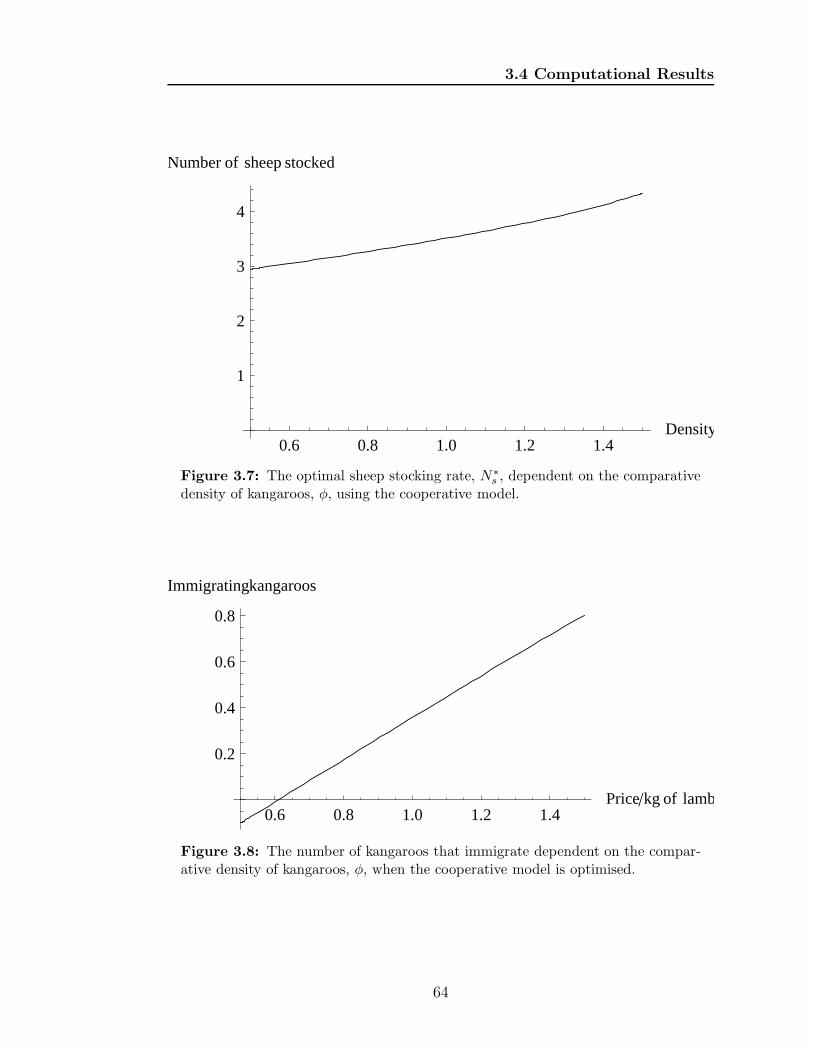
3.4 Computational Results
0.6 0.8 1.0 1.2 1.4Density
1
2
3
4
Number of sheep stocked
Figure 3.7: The optimal sheep stocking rate, N∗s , dependent on the comparative
density of kangaroos, φ, using the cooperative model.
0.6 0.8 1.0 1.2 1.4Price�kg of lamb
0.2
0.4
0.6
0.8
Immigratingkangaroos
Figure 3.8: The number of kangaroos that immigrate dependent on the compar-ative density of kangaroos, φ, when the cooperative model is optimised.
64
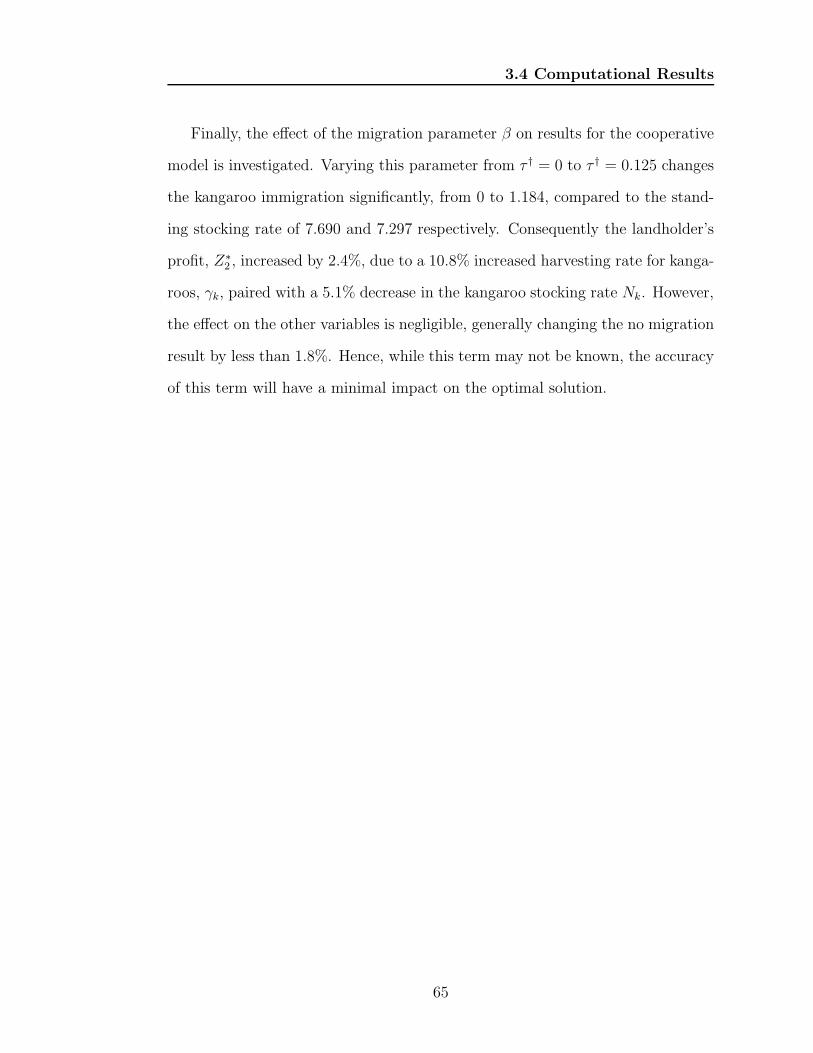
3.4 Computational Results
Finally, the effect of the migration parameter β on results for the cooperative
model is investigated. Varying this parameter from τ † = 0 to τ † = 0.125 changes
the kangaroo immigration significantly, from 0 to 1.184, compared to the stand-
ing stocking rate of 7.690 and 7.297 respectively. Consequently the landholder’s
profit, Z∗2 , increased by 2.4%, due to a 10.8% increased harvesting rate for kanga-
roos, γk, paired with a 5.1% decrease in the kangaroo stocking rate Nk. However,
the effect on the other variables is negligible, generally changing the no migration
result by less than 1.8%. Hence, while this term may not be known, the accuracy
of this term will have a minimal impact on the optimal solution.
65
Chapter 4
Plant-Herbivore Modelling
Allocating forage to different species is only possible if population size of each
species can be controlled. Otherwise competitive exclusion and migration could
override the allocations. The effect of kangaroos (a mobile species that can cross
boundaries and cannot always be explicitly controlled) needs to be explored.
Landholders have concerns that kangaroos negatively impact their operation
through foraging on their properties (Pople and Grigg, 1999; Grigg, 2002). How-
ever, unique opportunities and challenges present themselves if the landholder is
willing to diversify their commodities. Issues related to population dynamics on
and between properties and regions is the focus of this chapter. What is the effect
of a species that can circumvent property boundaries and do not belong to the
landholder? Can decisions taken by the property managers (at least theoretically)
control both native and domestic stock? How will neighbour’s management goals
affect each other? In this section theoretical models are used to explore these
questions.
66
The initial models deal only with herbivores. It is used to investigate different
harvest regimes, the effect of mobile herbivores, national parks and neighbouring
commercial properties. These models can help explain some of the dynamics is
the system, laying the foundation for the plant-herbivore system. The models are
then expanded to include vegetation and it’s affect on the system. When mod-
elling a plant-herbivore system the type of model used will affect the results and
therefore conclusions. For ease of comparison between species dry sheep equiva-
lents will be used to measure the population of each herbivore. The models are for
a square kilometre of semi-arid grazing land. The models use differential models
with both continuous time and population, on an average km2 representative of
the system.
The notation and definition to be used in the plant-herbivore models is collated
in Table 4.1.
67
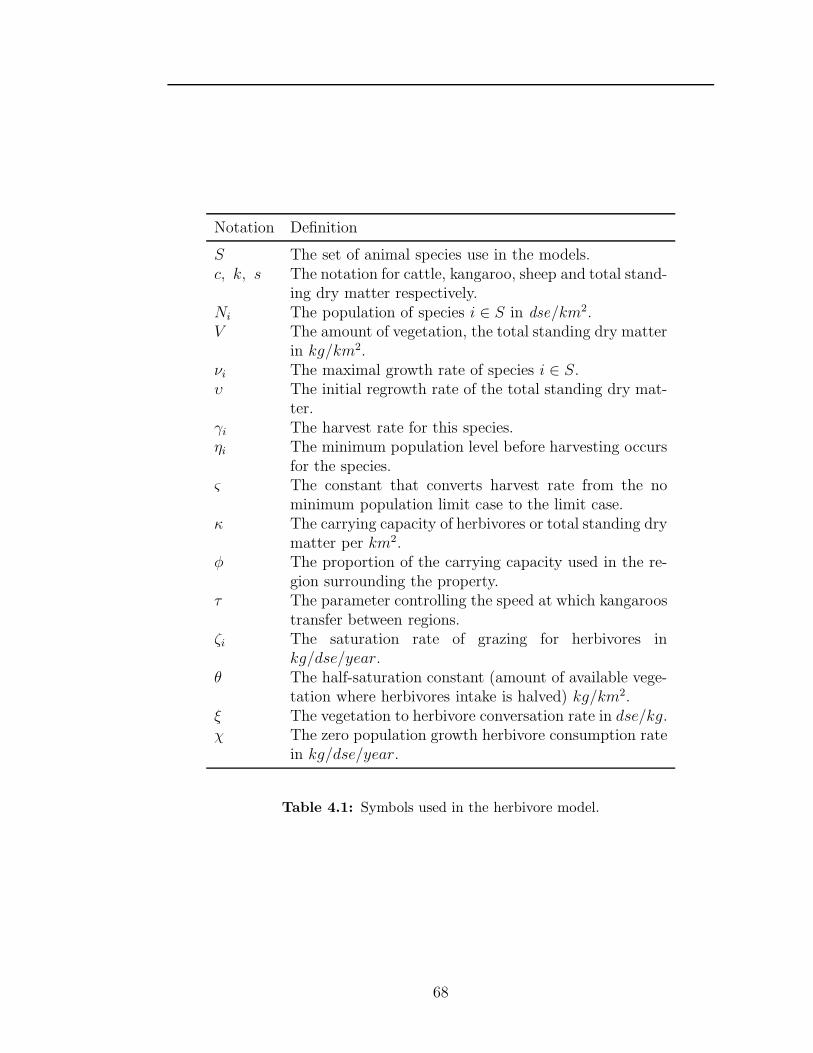
Notation Definition
S The set of animal species use in the models.c, k, s The notation for cattle, kangaroo, sheep and total stand-
ing dry matter respectively.Ni The population of species i ∈ S in dse/km2.V The amount of vegetation, the total standing dry matter
in kg/km2.νi The maximal growth rate of species i ∈ S.υ The initial regrowth rate of the total standing dry mat-
ter.γi The harvest rate for this species.ηi The minimum population level before harvesting occurs
for the species.ς The constant that converts harvest rate from the no
minimum population limit case to the limit case.κ The carrying capacity of herbivores or total standing dry
matter per km2.φ The proportion of the carrying capacity used in the re-
gion surrounding the property.τ The parameter controlling the speed at which kangaroos
transfer between regions.ζi The saturation rate of grazing for herbivores in
kg/dse/year.θ The half-saturation constant (amount of available vege-
tation where herbivores intake is halved) kg/km2.ξ The vegetation to herbivore conversation rate in dse/kg.χ The zero population growth herbivore consumption rate
in kg/dse/year.
Table 4.1: Symbols used in the herbivore model.
68
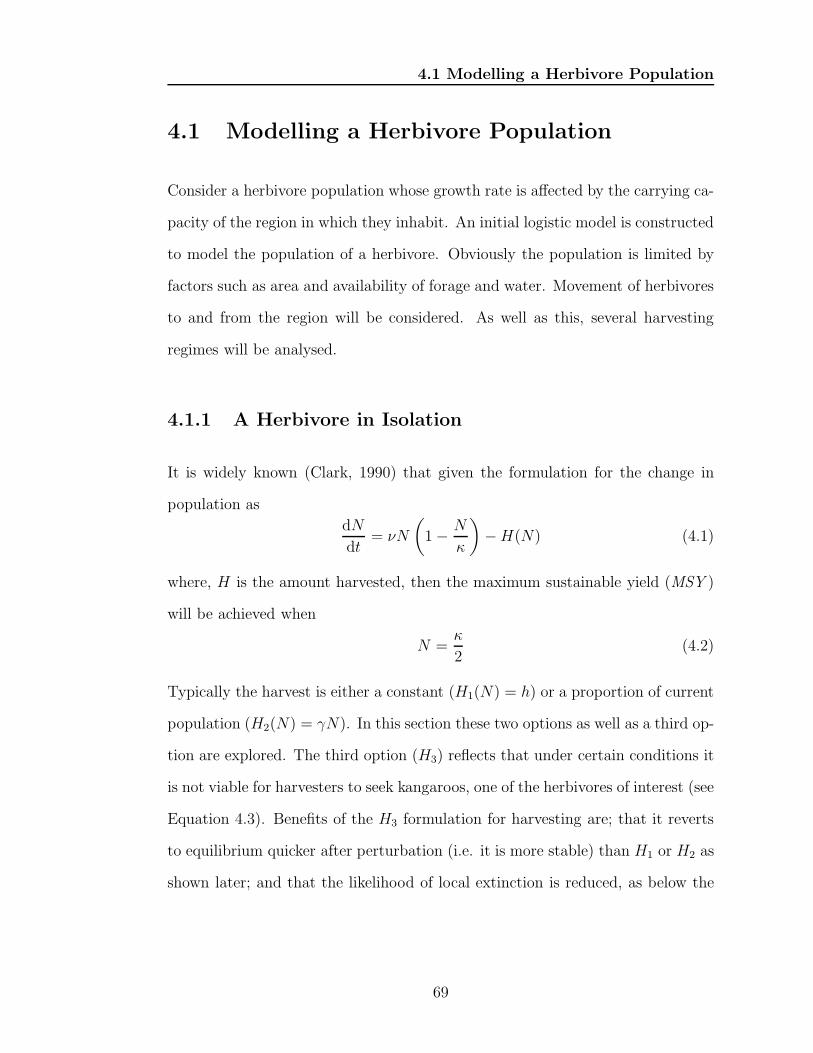
4.1 Modelling a Herbivore Population
4.1 Modelling a Herbivore Population
Consider a herbivore population whose growth rate is affected by the carrying ca-
pacity of the region in which they inhabit. An initial logistic model is constructed
to model the population of a herbivore. Obviously the population is limited by
factors such as area and availability of forage and water. Movement of herbivores
to and from the region will be considered. As well as this, several harvesting
regimes will be analysed.
4.1.1 A Herbivore in Isolation
It is widely known (Clark, 1990) that given the formulation for the change in
population as
dN
dt= νN
(
1− N
κ
)
−H(N) (4.1)
where, H is the amount harvested, then the maximum sustainable yield (MSY )
will be achieved when
N =κ
2(4.2)
Typically the harvest is either a constant (H1(N) = h) or a proportion of current
population (H2(N) = γN). In this section these two options as well as a third op-
tion are explored. The third option (H3) reflects that under certain conditions it
is not viable for harvesters to seek kangaroos, one of the herbivores of interest (see
Equation 4.3). Benefits of the H3 formulation for harvesting are; that it reverts
to equilibrium quicker after perturbation (i.e. it is more stable) than H1 or H2 as
shown later; and that the likelihood of local extinction is reduced, as below the
69
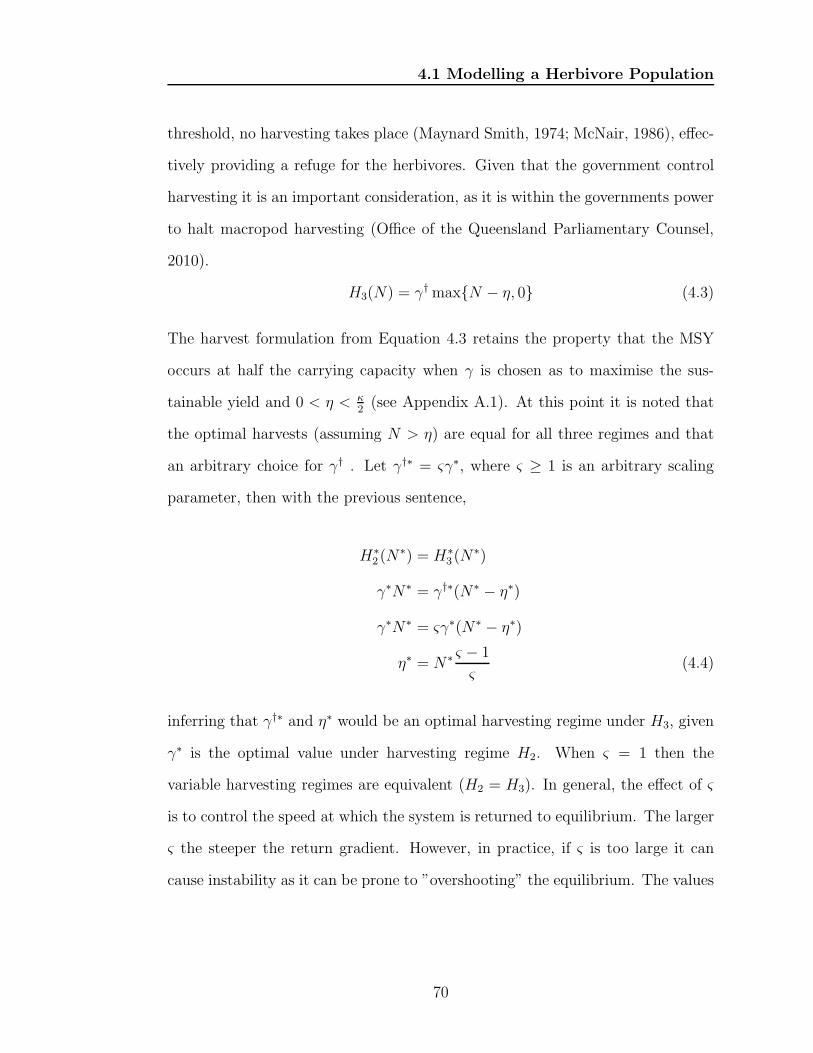
4.1 Modelling a Herbivore Population
threshold, no harvesting takes place (Maynard Smith, 1974; McNair, 1986), effec-
tively providing a refuge for the herbivores. Given that the government control
harvesting it is an important consideration, as it is within the governments power
to halt macropod harvesting (Office of the Queensland Parliamentary Counsel,
2010).
H3(N) = γ† max{N − η, 0} (4.3)
The harvest formulation from Equation 4.3 retains the property that the MSY
occurs at half the carrying capacity when γ is chosen as to maximise the sus-
tainable yield and 0 < η < κ2(see Appendix A.1). At this point it is noted that
the optimal harvests (assuming N > η) are equal for all three regimes and that
an arbitrary choice for γ† . Let γ†∗ = ςγ∗, where ς ≥ 1 is an arbitrary scaling
parameter, then with the previous sentence,
H∗2 (N
∗) = H∗3 (N
∗)
γ∗N∗ = γ†∗(N∗ − η∗)
γ∗N∗ = ςγ∗(N∗ − η∗)
η∗ = N∗ ς − 1
ς(4.4)
inferring that γ†∗ and η∗ would be an optimal harvesting regime under H3, given
γ∗ is the optimal value under harvesting regime H2. When ς = 1 then the
variable harvesting regimes are equivalent (H2 = H3). In general, the effect of ς
is to control the speed at which the system is returned to equilibrium. The larger
ς the steeper the return gradient. However, in practice, if ς is too large it can
cause instability as it can be prone to ”overshooting” the equilibrium. The values
70
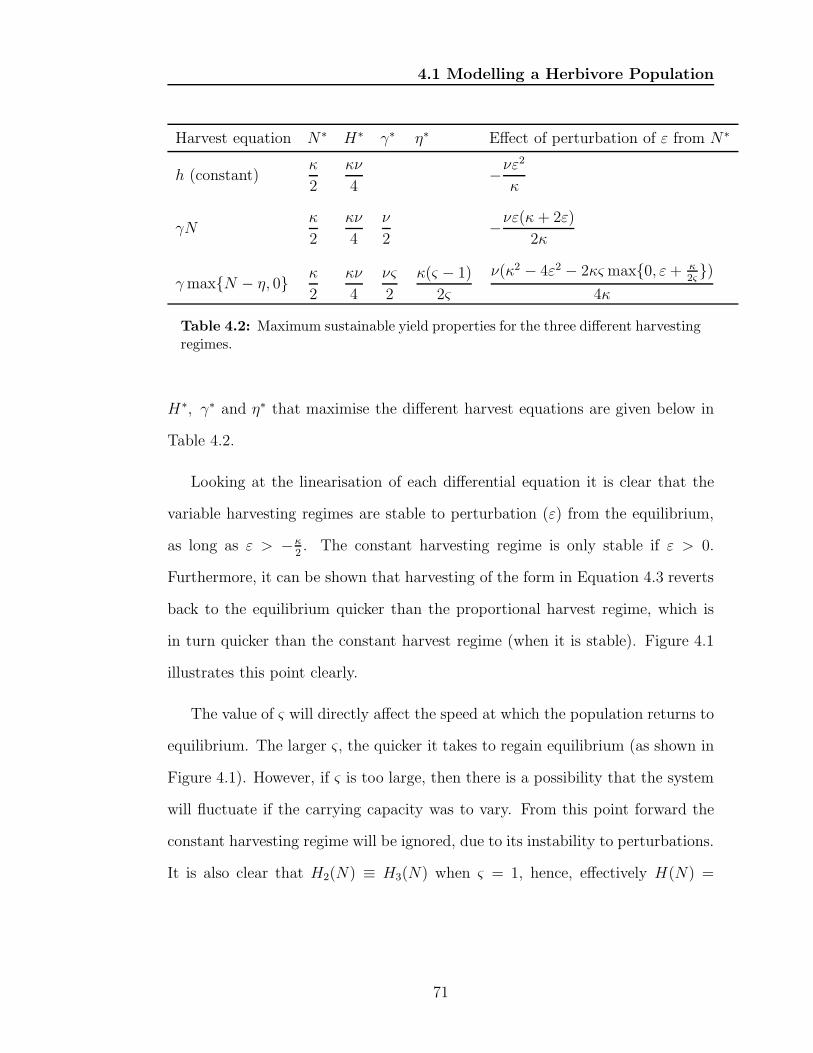
4.1 Modelling a Herbivore Population
Harvest equation N∗ H∗ γ∗ η∗ Effect of perturbation of ε from N∗
h (constant)κ
2
κν
4−νε2
κ
γNκ
2
κν
4
ν
2−νε(κ + 2ε)
2κ
γmax{N − η, 0} κ
2
κν
4
νς
2
κ(ς − 1)
2ς
ν(κ2 − 4ε2 − 2κς max{0, ε+ κ2ς})
4κ
Table 4.2: Maximum sustainable yield properties for the three different harvestingregimes.
H∗, γ∗ and η∗ that maximise the different harvest equations are given below in
Table 4.2.
Looking at the linearisation of each differential equation it is clear that the
variable harvesting regimes are stable to perturbation (ε) from the equilibrium,
as long as ε > −κ2. The constant harvesting regime is only stable if ε > 0.
Furthermore, it can be shown that harvesting of the form in Equation 4.3 reverts
back to the equilibrium quicker than the proportional harvest regime, which is
in turn quicker than the constant harvest regime (when it is stable). Figure 4.1
illustrates this point clearly.
The value of ς will directly affect the speed at which the population returns to
equilibrium. The larger ς, the quicker it takes to regain equilibrium (as shown in
Figure 4.1). However, if ς is too large, then there is a possibility that the system
will fluctuate if the carrying capacity was to vary. From this point forward the
constant harvesting regime will be ignored, due to its instability to perturbations.
It is also clear that H2(N) ≡ H3(N) when ς = 1, hence, effectively H(N) =
71
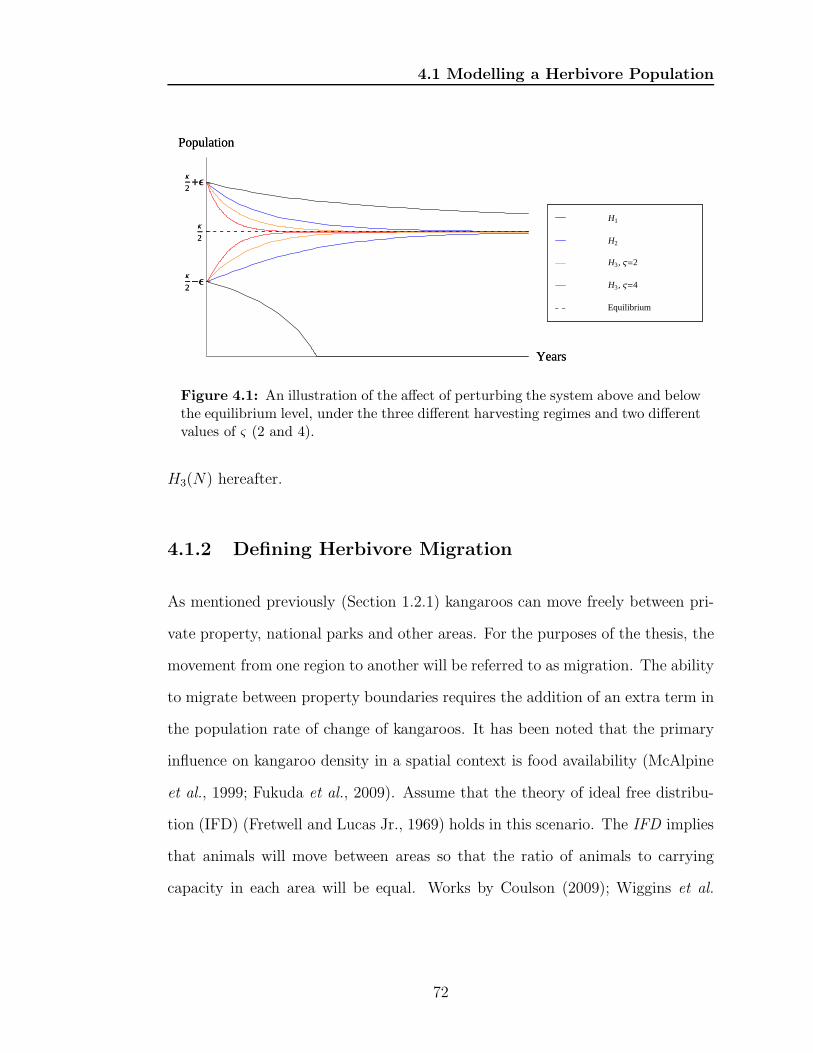
4.1 Modelling a Herbivore Population
Years
Κ
2-Ε
Κ
2
Κ
2+Ε
Population
Equilibrium
H3, ¹=4
H3, ¹=2
H2
H1
Years
Κ
2-Ε
Κ
2
Κ
2+Ε
Population
Equilibrium
H3, ¹=4
H3, ¹=2
H2
H1
Figure 4.1: An illustration of the affect of perturbing the system above and belowthe equilibrium level, under the three different harvesting regimes and two differentvalues of ς (2 and 4).
H3(N) hereafter.
4.1.2 Defining Herbivore Migration
As mentioned previously (Section 1.2.1) kangaroos can move freely between pri-
vate property, national parks and other areas. For the purposes of the thesis, the
movement from one region to another will be referred to as migration. The ability
to migrate between property boundaries requires the addition of an extra term in
the population rate of change of kangaroos. It has been noted that the primary
influence on kangaroo density in a spatial context is food availability (McAlpine
et al., 1999; Fukuda et al., 2009). Assume that the theory of ideal free distribu-
tion (IFD) (Fretwell and Lucas Jr., 1969) holds in this scenario. The IFD implies
that animals will move between areas so that the ratio of animals to carrying
capacity in each area will be equal. Works by Coulson (2009); Wiggins et al.
72
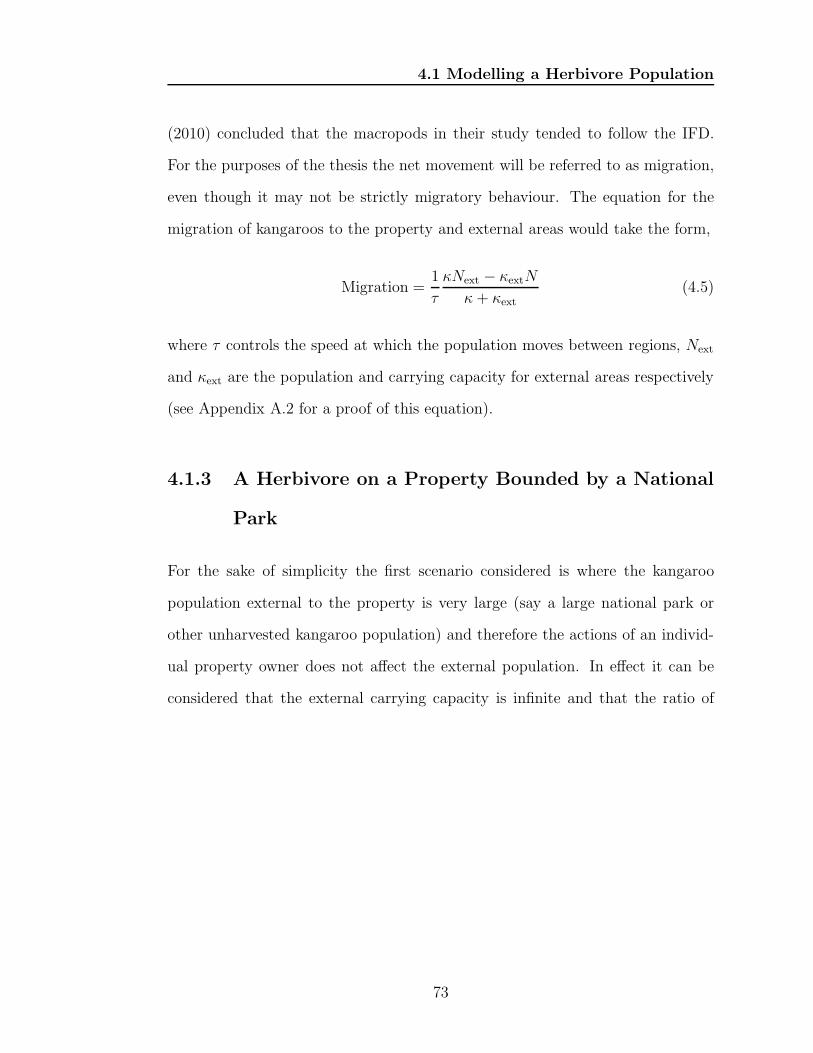
4.1 Modelling a Herbivore Population
(2010) concluded that the macropods in their study tended to follow the IFD.
For the purposes of the thesis the net movement will be referred to as migration,
even though it may not be strictly migratory behaviour. The equation for the
migration of kangaroos to the property and external areas would take the form,
Migration =1
τ
κNext − κextN
κ + κext(4.5)
where τ controls the speed at which the population moves between regions, Next
and κext are the population and carrying capacity for external areas respectively
(see Appendix A.2 for a proof of this equation).
4.1.3 A Herbivore on a Property Bounded by a National
Park
For the sake of simplicity the first scenario considered is where the kangaroo
population external to the property is very large (say a large national park or
other unharvested kangaroo population) and therefore the actions of an individ-
ual property owner does not affect the external population. In effect it can be
considered that the external carrying capacity is infinite and that the ratio of
73
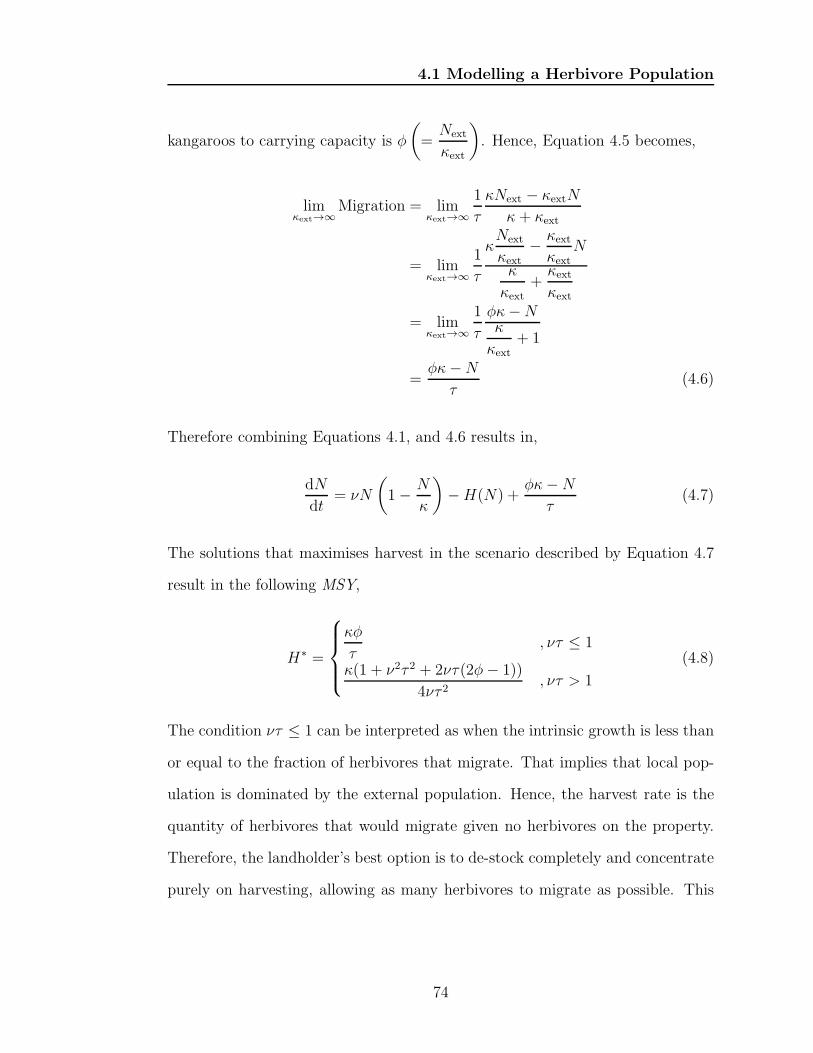
4.1 Modelling a Herbivore Population
kangaroos to carrying capacity is φ
(
=Next
κext
)
. Hence, Equation 4.5 becomes,
limκext→∞
Migration = limκext→∞
1
τ
κNext − κextN
κ + κext
= limκext→∞
1
τ
κNext
κext− κext
κextN
κ
κext
+κext
κext
= limκext→∞
1
τ
φκ−Nκ
κext+ 1
=φκ−N
τ(4.6)
Therefore combining Equations 4.1, and 4.6 results in,
dN
dt= νN
(
1− N
κ
)
−H(N) +φκ−N
τ(4.7)
The solutions that maximises harvest in the scenario described by Equation 4.7
result in the following MSY,
H∗ =
κφ
τ, ντ ≤ 1
κ(1 + ν2τ 2 + 2ντ(2φ− 1))
4ντ 2, ντ > 1
(4.8)
The condition ντ ≤ 1 can be interpreted as when the intrinsic growth is less than
or equal to the fraction of herbivores that migrate. That implies that local pop-
ulation is dominated by the external population. Hence, the harvest rate is the
quantity of herbivores that would migrate given no herbivores on the property.
Therefore, the landholder’s best option is to de-stock completely and concentrate
purely on harvesting, allowing as many herbivores to migrate as possible. This
74
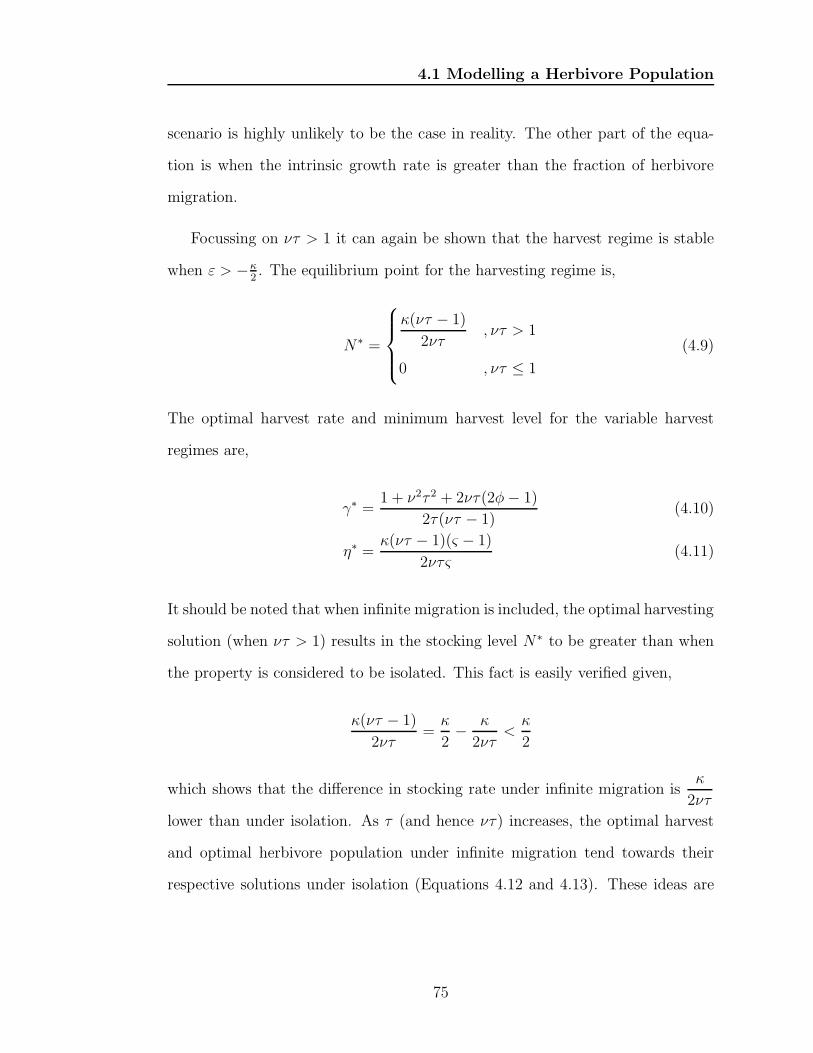
4.1 Modelling a Herbivore Population
scenario is highly unlikely to be the case in reality. The other part of the equa-
tion is when the intrinsic growth rate is greater than the fraction of herbivore
migration.
Focussing on ντ > 1 it can again be shown that the harvest regime is stable
when ε > −κ2. The equilibrium point for the harvesting regime is,
N∗ =
κ(ντ − 1)
2ντ, ντ > 1
0 , ντ ≤ 1
(4.9)
The optimal harvest rate and minimum harvest level for the variable harvest
regimes are,
γ∗ =1 + ν2τ 2 + 2ντ(2φ− 1)
2τ(ντ − 1)(4.10)
η∗ =κ(ντ − 1)(ς − 1)
2ντς(4.11)
It should be noted that when infinite migration is included, the optimal harvesting
solution (when ντ > 1) results in the stocking level N∗ to be greater than when
the property is considered to be isolated. This fact is easily verified given,
κ(ντ − 1)
2ντ=
κ
2− κ
2ντ<
κ
2
which shows that the difference in stocking rate under infinite migration isκ
2ντ
lower than under isolation. As τ (and hence ντ) increases, the optimal harvest
and optimal herbivore population under infinite migration tend towards their
respective solutions under isolation (Equations 4.12 and 4.13). These ideas are
75
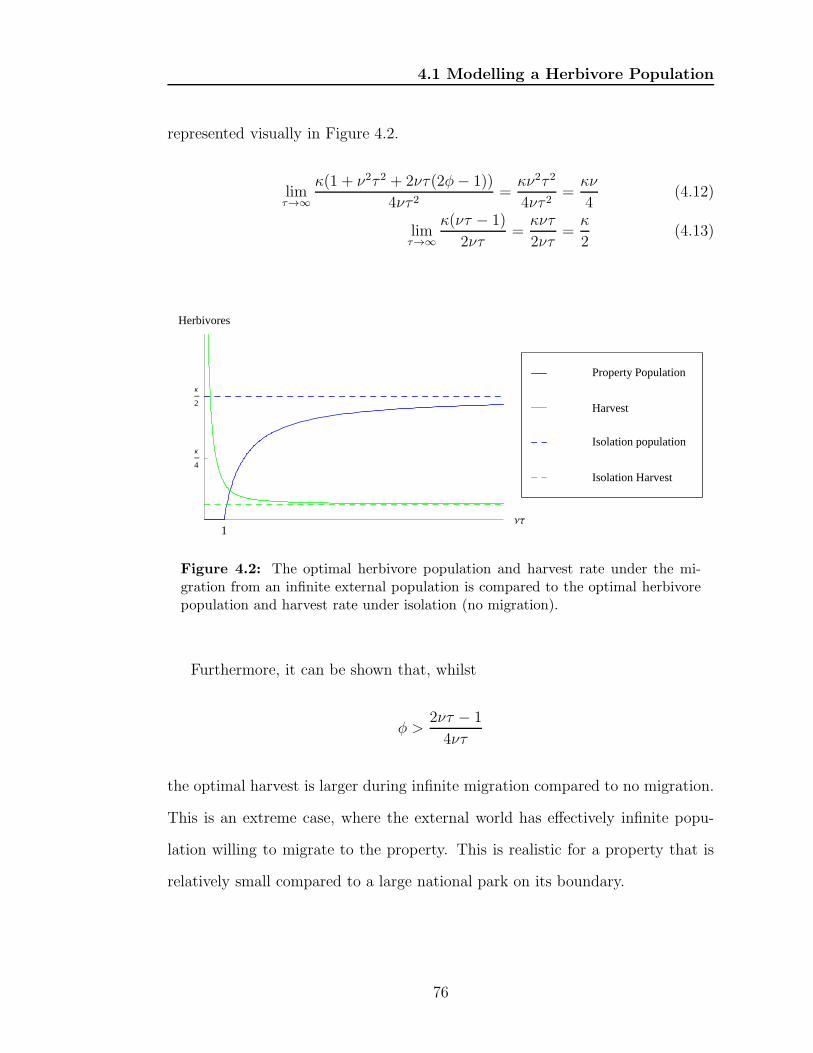
4.1 Modelling a Herbivore Population
represented visually in Figure 4.2.
limτ→∞
κ(1 + ν2τ 2 + 2ντ(2φ− 1))
4ντ 2=
κν2τ 2
4ντ 2=
κν
4(4.12)
limτ→∞
κ(ντ − 1)
2ντ=
κντ
2ντ=
κ
2(4.13)
1ΝΤ
Κ
4
Κ
2
Herbivores
Isolation Harvest
Isolation population
Harvest
Property Population
Figure 4.2: The optimal herbivore population and harvest rate under the mi-gration from an infinite external population is compared to the optimal herbivorepopulation and harvest rate under isolation (no migration).
Furthermore, it can be shown that, whilst
φ >2ντ − 1
4ντ
the optimal harvest is larger during infinite migration compared to no migration.
This is an extreme case, where the external world has effectively infinite popu-
lation willing to migrate to the property. This is realistic for a property that is
relatively small compared to a large national park on its boundary.
76
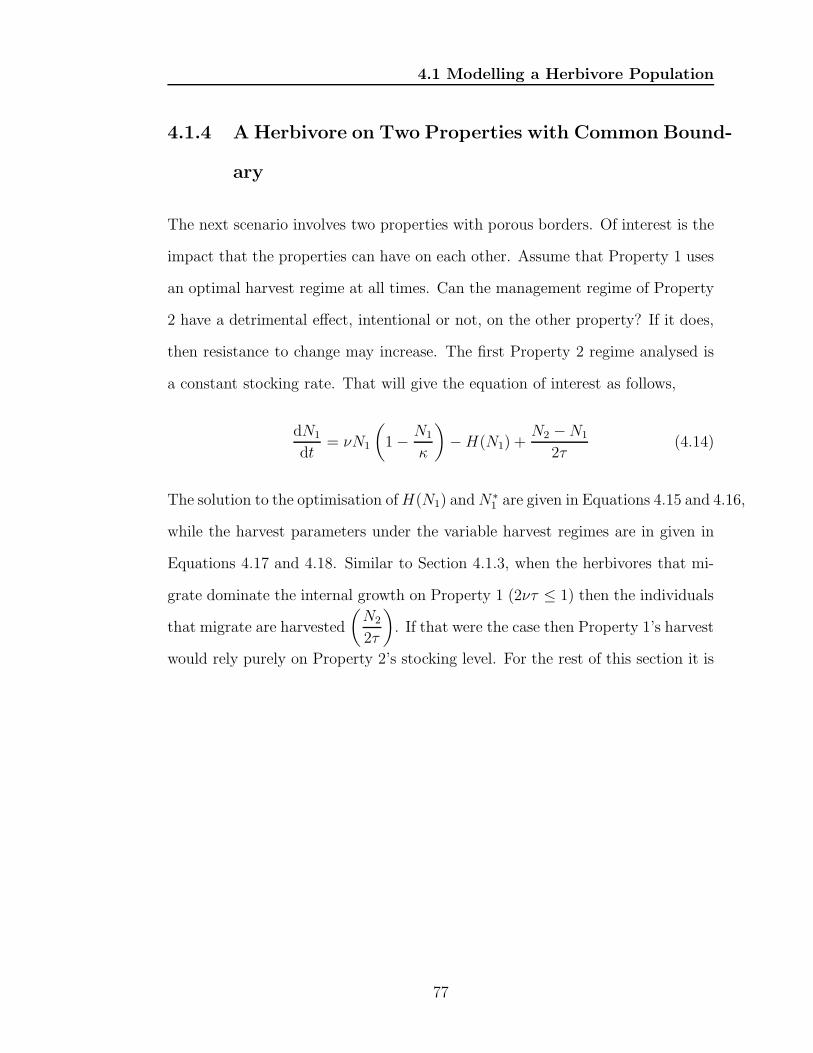
4.1 Modelling a Herbivore Population
4.1.4 A Herbivore on Two Properties with Common Bound-
ary
The next scenario involves two properties with porous borders. Of interest is the
impact that the properties can have on each other. Assume that Property 1 uses
an optimal harvest regime at all times. Can the management regime of Property
2 have a detrimental effect, intentional or not, on the other property? If it does,
then resistance to change may increase. The first Property 2 regime analysed is
a constant stocking rate. That will give the equation of interest as follows,
dN1
dt= νN1
(
1− N1
κ
)
−H(N1) +N2 −N1
2τ(4.14)
The solution to the optimisation ofH(N1) andN∗1 are given in Equations 4.15 and 4.16,
while the harvest parameters under the variable harvest regimes are in given in
Equations 4.17 and 4.18. Similar to Section 4.1.3, when the herbivores that mi-
grate dominate the internal growth on Property 1 (2ντ ≤ 1) then the individuals
that migrate are harvested
(
N2
2τ
)
. If that were the case then Property 1’s harvest
would rely purely on Property 2’s stocking level. For the rest of this section it is
77
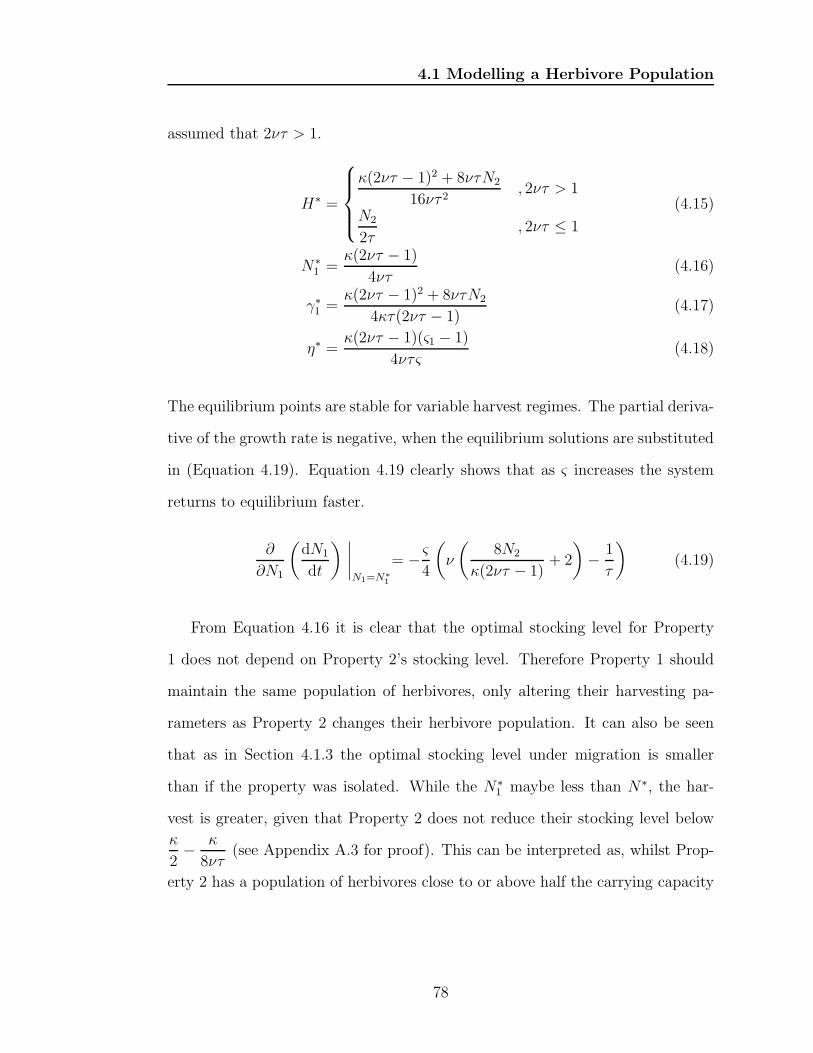
4.1 Modelling a Herbivore Population
assumed that 2ντ > 1.
H∗ =
κ(2ντ − 1)2 + 8ντN2
16ντ 2, 2ντ > 1
N2
2τ, 2ντ ≤ 1
(4.15)
N∗1 =
κ(2ντ − 1)
4ντ(4.16)
γ∗1 =
κ(2ντ − 1)2 + 8ντN2
4κτ(2ντ − 1)(4.17)
η∗ =κ(2ντ − 1)(ς1 − 1)
4ντς(4.18)
The equilibrium points are stable for variable harvest regimes. The partial deriva-
tive of the growth rate is negative, when the equilibrium solutions are substituted
in (Equation 4.19). Equation 4.19 clearly shows that as ς increases the system
returns to equilibrium faster.
∂
∂N1
(
dN1
dt
) ∣
∣
∣
∣
N1=N∗1
= − ς
4
(
ν
(
8N2
κ(2ντ − 1)+ 2
)
− 1
τ
)
(4.19)
From Equation 4.16 it is clear that the optimal stocking level for Property
1 does not depend on Property 2’s stocking level. Therefore Property 1 should
maintain the same population of herbivores, only altering their harvesting pa-
rameters as Property 2 changes their herbivore population. It can also be seen
that as in Section 4.1.3 the optimal stocking level under migration is smaller
than if the property was isolated. While the N∗1 maybe less than N∗, the har-
vest is greater, given that Property 2 does not reduce their stocking level below
κ
2− κ
8ντ(see Appendix A.3 for proof). This can be interpreted as, whilst Prop-
erty 2 has a population of herbivores close to or above half the carrying capacity
78
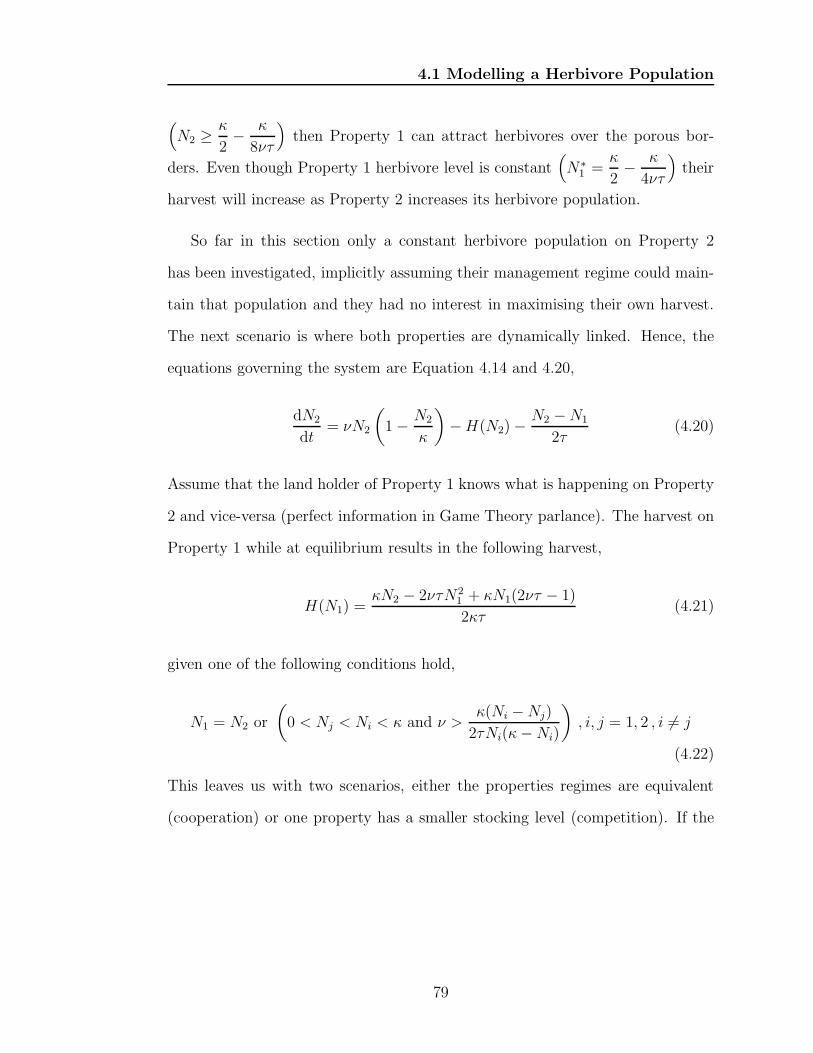
4.1 Modelling a Herbivore Population
(
N2 ≥κ
2− κ
8ντ
)
then Property 1 can attract herbivores over the porous bor-
ders. Even though Property 1 herbivore level is constant(
N∗1 =
κ
2− κ
4ντ
)
their
harvest will increase as Property 2 increases its herbivore population.
So far in this section only a constant herbivore population on Property 2
has been investigated, implicitly assuming their management regime could main-
tain that population and they had no interest in maximising their own harvest.
The next scenario is where both properties are dynamically linked. Hence, the
equations governing the system are Equation 4.14 and 4.20,
dN2
dt= νN2
(
1− N2
κ
)
−H(N2)−N2 −N1
2τ(4.20)
Assume that the land holder of Property 1 knows what is happening on Property
2 and vice-versa (perfect information in Game Theory parlance). The harvest on
Property 1 while at equilibrium results in the following harvest,
H(N1) =κN2 − 2ντN2
1 + κN1(2ντ − 1)
2κτ(4.21)
given one of the following conditions hold,
N1 = N2 or
(
0 < Nj < Ni < κ and ν >κ(Ni −Nj)
2τNi(κ−Ni)
)
, i, j = 1, 2 , i 6= j
(4.22)
This leaves us with two scenarios, either the properties regimes are equivalent
(cooperation) or one property has a smaller stocking level (competition). If the
79
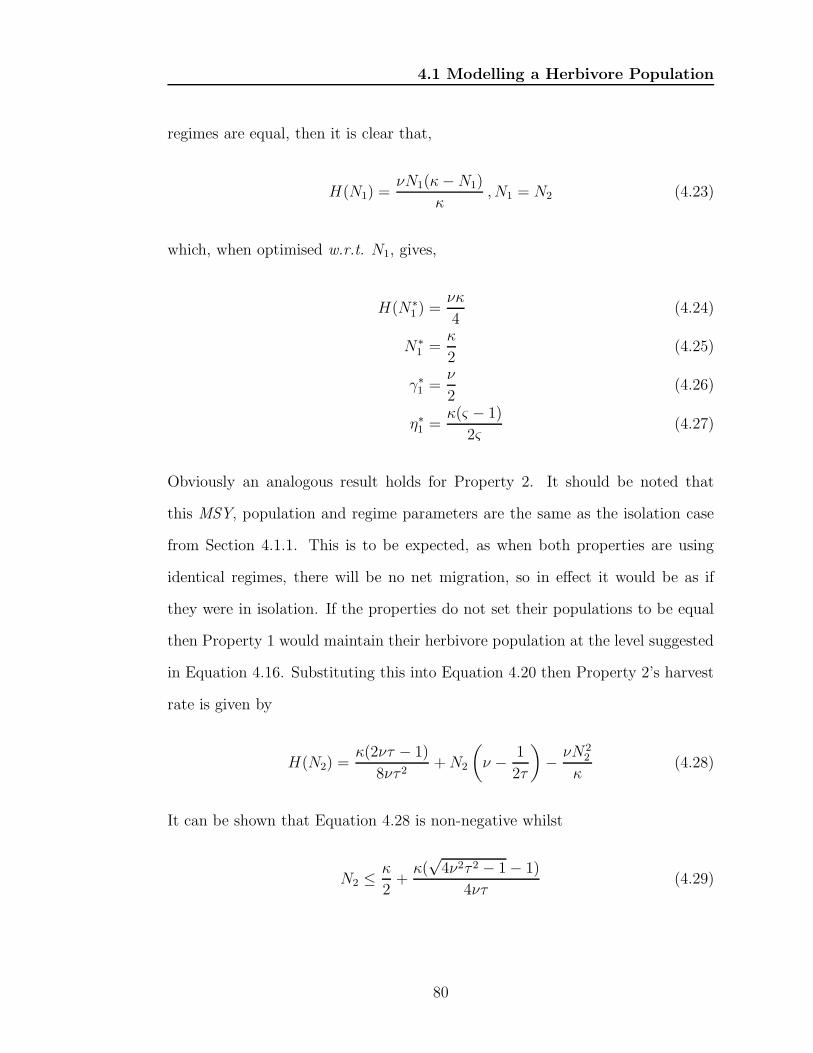
4.1 Modelling a Herbivore Population
regimes are equal, then it is clear that,
H(N1) =νN1(κ−N1)
κ,N1 = N2 (4.23)
which, when optimised w.r.t. N1, gives,
H(N∗1 ) =
νκ
4(4.24)
N∗1 =
κ
2(4.25)
γ∗1 =
ν
2(4.26)
η∗1 =κ(ς − 1)
2ς(4.27)
Obviously an analogous result holds for Property 2. It should be noted that
this MSY, population and regime parameters are the same as the isolation case
from Section 4.1.1. This is to be expected, as when both properties are using
identical regimes, there will be no net migration, so in effect it would be as if
they were in isolation. If the properties do not set their populations to be equal
then Property 1 would maintain their herbivore population at the level suggested
in Equation 4.16. Substituting this into Equation 4.20 then Property 2’s harvest
rate is given by
H(N2) =κ(2ντ − 1)
8ντ 2+N2
(
ν − 1
2τ
)
− νN22
κ(4.28)
It can be shown that Equation 4.28 is non-negative whilst
N2 ≤κ
2+
κ(√4ν2τ 2 − 1− 1)
4ντ(4.29)
80
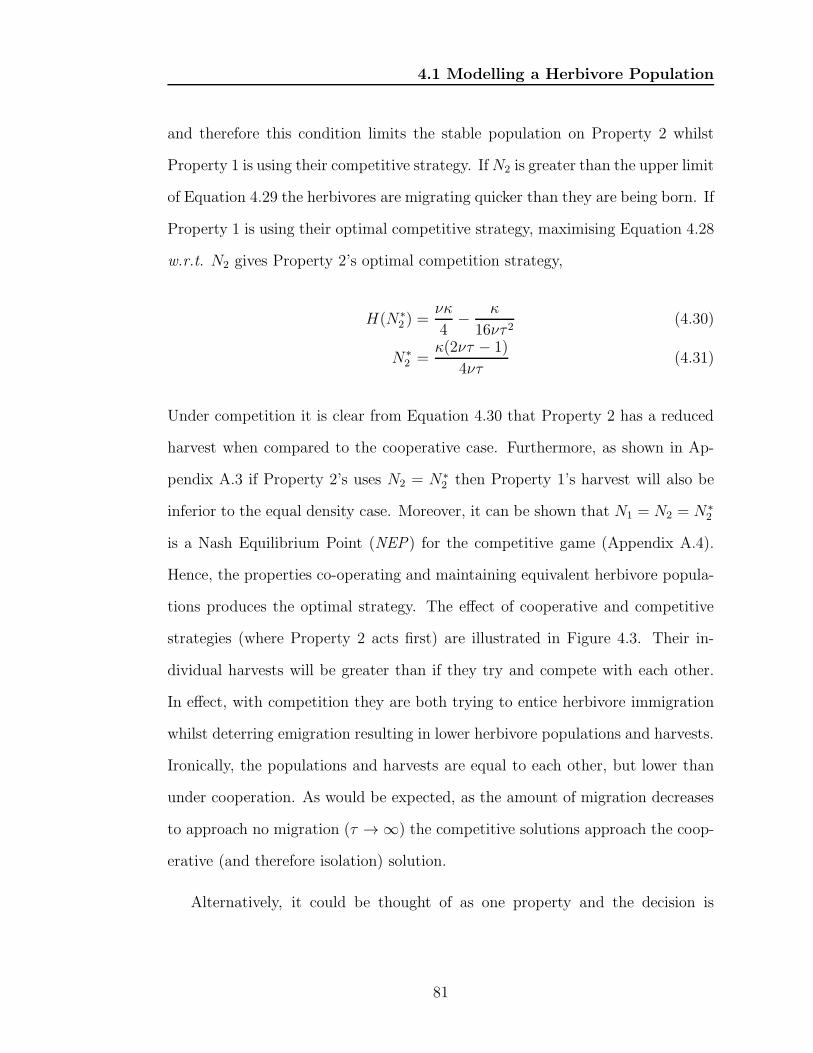
4.1 Modelling a Herbivore Population
and therefore this condition limits the stable population on Property 2 whilst
Property 1 is using their competitive strategy. IfN2 is greater than the upper limit
of Equation 4.29 the herbivores are migrating quicker than they are being born. If
Property 1 is using their optimal competitive strategy, maximising Equation 4.28
w.r.t. N2 gives Property 2’s optimal competition strategy,
H(N∗2 ) =
νκ
4− κ
16ντ 2(4.30)
N∗2 =
κ(2ντ − 1)
4ντ(4.31)
Under competition it is clear from Equation 4.30 that Property 2 has a reduced
harvest when compared to the cooperative case. Furthermore, as shown in Ap-
pendix A.3 if Property 2’s uses N2 = N∗2 then Property 1’s harvest will also be
inferior to the equal density case. Moreover, it can be shown that N1 = N2 = N∗2
is a Nash Equilibrium Point (NEP) for the competitive game (Appendix A.4).
Hence, the properties co-operating and maintaining equivalent herbivore popula-
tions produces the optimal strategy. The effect of cooperative and competitive
strategies (where Property 2 acts first) are illustrated in Figure 4.3. Their in-
dividual harvests will be greater than if they try and compete with each other.
In effect, with competition they are both trying to entice herbivore immigration
whilst deterring emigration resulting in lower herbivore populations and harvests.
Ironically, the populations and harvests are equal to each other, but lower than
under cooperation. As would be expected, as the amount of migration decreases
to approach no migration (τ → ∞) the competitive solutions approach the coop-
erative (and therefore isolation) solution.
Alternatively, it could be thought of as one property and the decision is
81
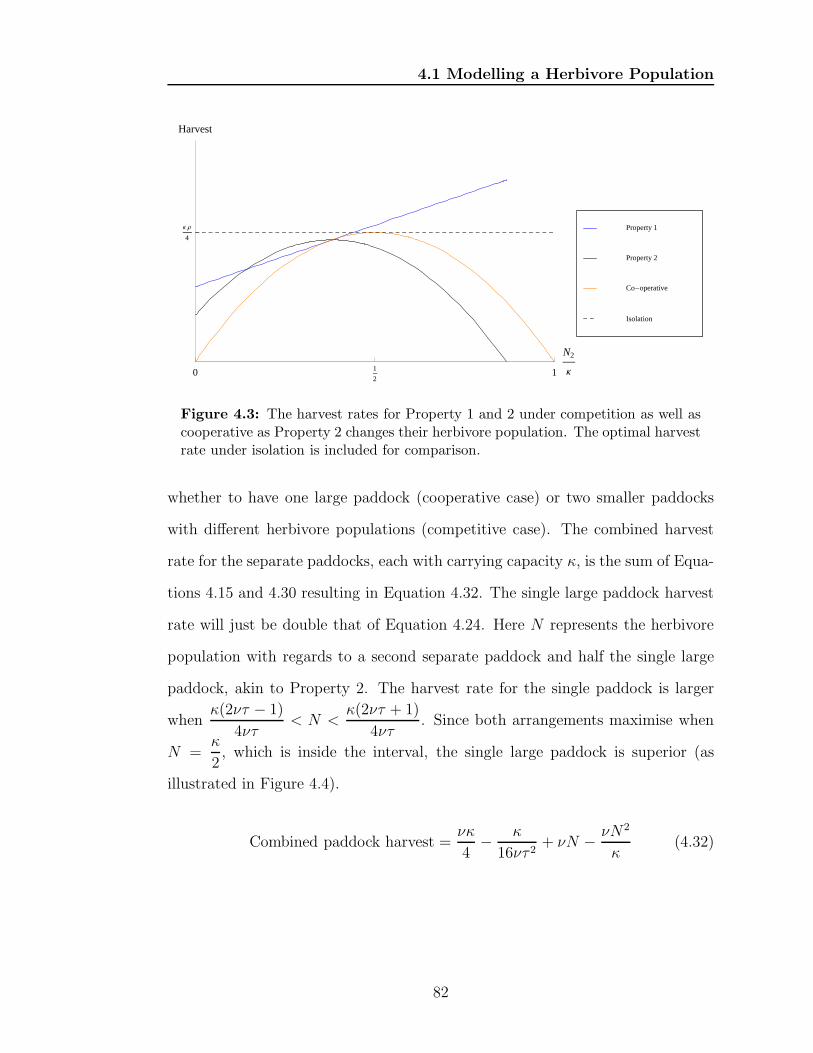
4.1 Modelling a Herbivore Population
0 1
21
N2
Κ
Κ Ρ
4
Harvest
Isolation
Co-operative
Property 2
Property 1
Figure 4.3: The harvest rates for Property 1 and 2 under competition as well ascooperative as Property 2 changes their herbivore population. The optimal harvestrate under isolation is included for comparison.
whether to have one large paddock (cooperative case) or two smaller paddocks
with different herbivore populations (competitive case). The combined harvest
rate for the separate paddocks, each with carrying capacity κ, is the sum of Equa-
tions 4.15 and 4.30 resulting in Equation 4.32. The single large paddock harvest
rate will just be double that of Equation 4.24. Here N represents the herbivore
population with regards to a second separate paddock and half the single large
paddock, akin to Property 2. The harvest rate for the single paddock is larger
whenκ(2ντ − 1)
4ντ< N <
κ(2ντ + 1)
4ντ. Since both arrangements maximise when
N =κ
2, which is inside the interval, the single large paddock is superior (as
illustrated in Figure 4.4).
Combined paddock harvest =νκ
4− κ
16ντ 2+ νN − νN2
κ(4.32)
82
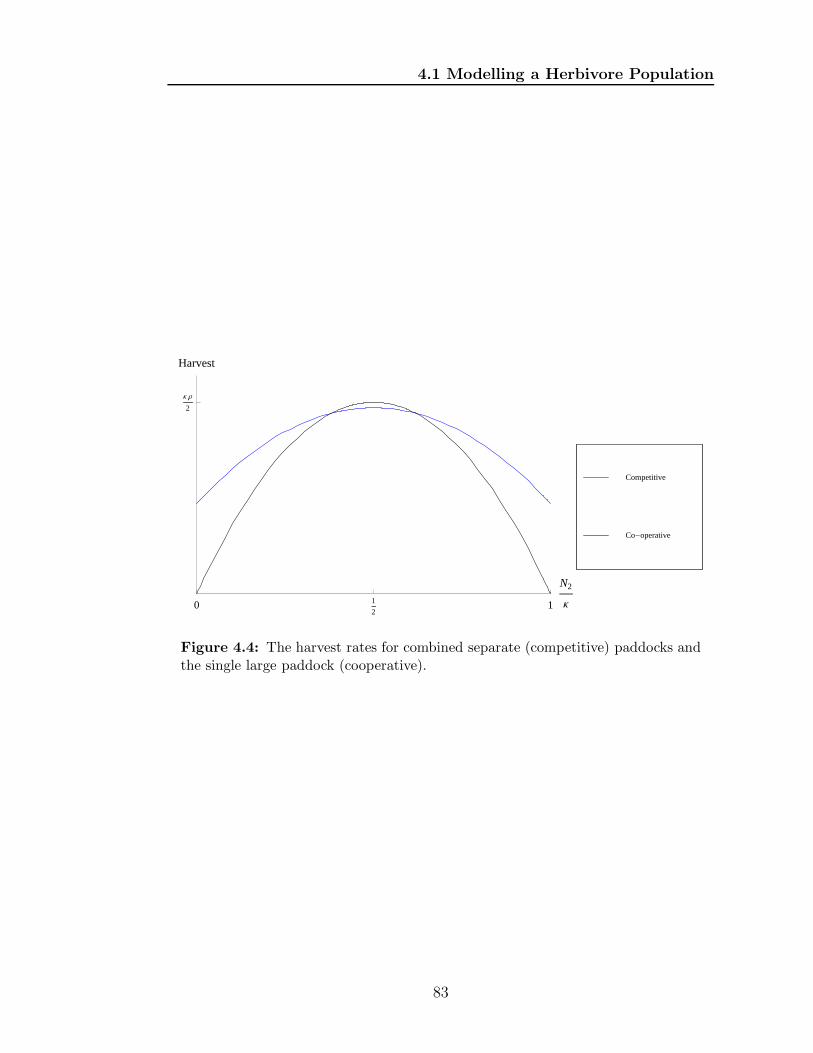
4.1 Modelling a Herbivore Population
0 1
21
N2
Κ
Κ Ρ
2
Harvest
Co-operative
Competitive
Figure 4.4: The harvest rates for combined separate (competitive) paddocks andthe single large paddock (cooperative).
83
4.2 Modelling Two or More Herbivore Populations
4.2 Modelling Two or More Herbivore Popula-
tions
Consider two or more herbivore populations whose growth rates are affected by
the carrying capacity of the region in which they inhabit. The resources that
limit the carrying capacity are now utilised by each herbivore in competition
or facilitation. As particular interest is in the interaction between cattle, sheep
and kangaroos on a commercial property, the herbivores are measured in the stan-
dardised units dse as typically used in Australia. The growth components of each
differential equation take the form of the well known competitive Lotka-Volterra
equations. The harvesting regimes are the same as those used in Section 4.1.2,
with harvesting occurring only when the given population is above a predeter-
mined mark. These considerations result in the following differential equation to
be used for each herbivores population growth;
dNi
dt= νiNi
(
1−∑
j∈S Nj
κ
)
− γmax{Ni − ηi, 0}+Migration Ratei (4.33)
where the migration rate is set to zero when migration is not possible. That
formulation (Equation 4.33) implies that we are considering a scenario where there
are no niches. Gause’s exclusion principle or the principle of competitive exclusion
states that species occupying the same niche cannot coexist (Gause, 1934; Hardin,
1960). However, more recent ideas have called this ”Law of Ecology” into doubt,
allowing for species co-existence without niche separation (Rastetter and Agren,
2002).
84
4.2 Modelling Two or More Herbivore Populations
With different species in the model, the task of maximising becomes more dif-
ficult. In particular, what are we going to maximise, the total number of dse, the
weight harvested, or the revenue created? These questions are better answered in
Chapters 2 and 6. Suffice to say, that without a migratory herbivore, analytically
the two herbivores interact similarly, with analogous solutions. In turn, which
ever metric is optimised, you could think of it as allocating a proportion of the
available total standing dry matter to each herbivore.
If the idea of allocating a proportion of the available forage to each given
species is possible, then the species need to be able to co-exist. Hence, it needs
to be shown that the species can co-exist in predetermined proportions, with and
without the influence of migration.
4.2.1 Two or More Herbivores in Isolation
This scenario examines a property, with two or more herbivore species grazing
on the same plants. The herbivores are restricted to the property, as there is no
migration. Please note, as before, the herbivores populations are being measured
in dse. If each species had the same maximal growth rate (νi) then they could be
considered as one species for population density purposes. It would then follow
that the overall harvest would be optimised in the same way it was optimised in
Section 4.1.1. This is due to the fact that under the optimal harvest regime no
one species could outgrow another species. The herbivore population size of each
herbivore (N∗i ) would be the optimal overall population size (N∗) multiplied by
the proportion of carrying capacity allocated to species i, ωi, where∑
i∈S ωi = 1.
The optimal minimum harvest levels (η∗i ) would also be in the same proportions
85
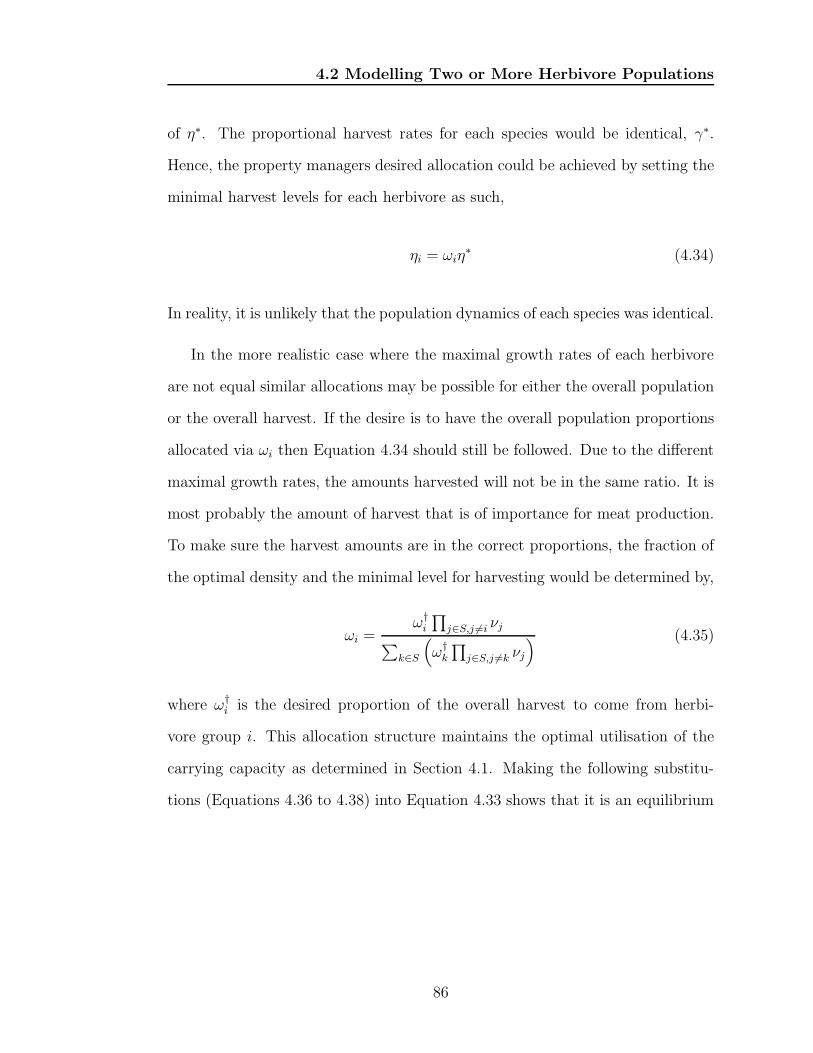
4.2 Modelling Two or More Herbivore Populations
of η∗. The proportional harvest rates for each species would be identical, γ∗.
Hence, the property managers desired allocation could be achieved by setting the
minimal harvest levels for each herbivore as such,
ηi = ωiη∗ (4.34)
In reality, it is unlikely that the population dynamics of each species was identical.
In the more realistic case where the maximal growth rates of each herbivore
are not equal similar allocations may be possible for either the overall population
or the overall harvest. If the desire is to have the overall population proportions
allocated via ωi then Equation 4.34 should still be followed. Due to the different
maximal growth rates, the amounts harvested will not be in the same ratio. It is
most probably the amount of harvest that is of importance for meat production.
To make sure the harvest amounts are in the correct proportions, the fraction of
the optimal density and the minimal level for harvesting would be determined by,
ωi =ω†i
∏
j∈S,j 6=i νj∑
k∈S
(
ω†k
∏
j∈S,j 6=k νj
) (4.35)
where ω†i is the desired proportion of the overall harvest to come from herbi-
vore group i. This allocation structure maintains the optimal utilisation of the
carrying capacity as determined in Section 4.1. Making the following substitu-
tions (Equations 4.36 to 4.38) into Equation 4.33 shows that it is an equilibrium
86
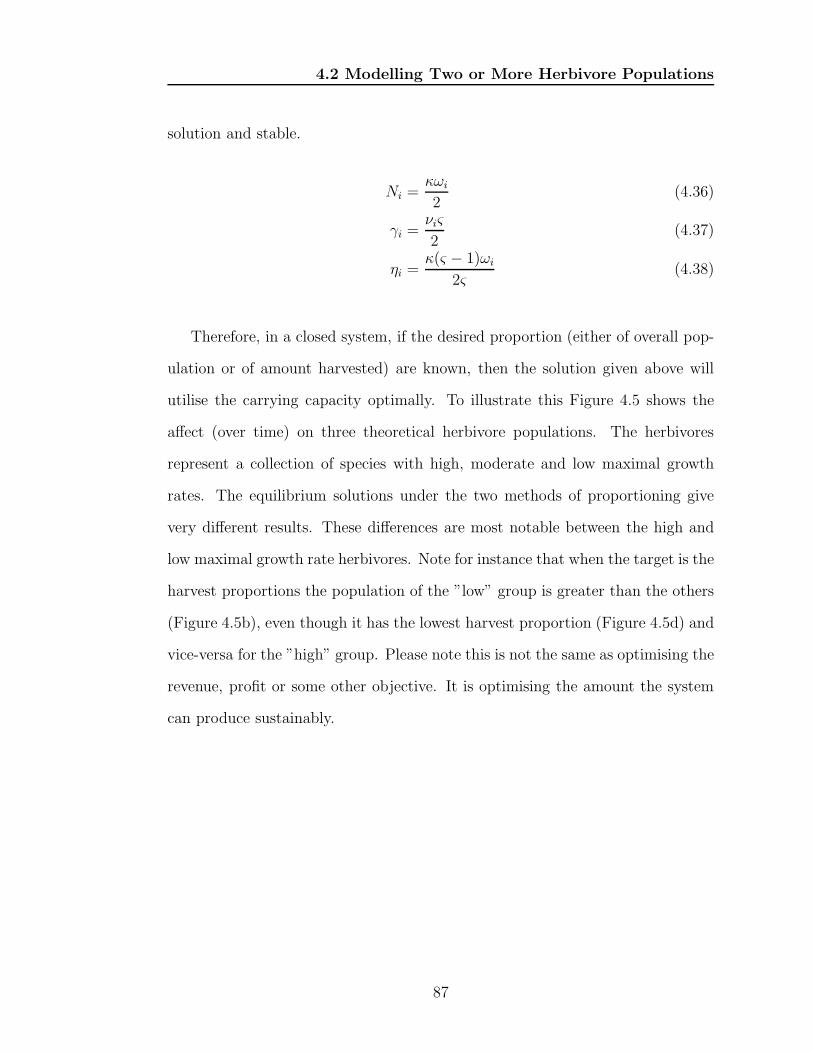
4.2 Modelling Two or More Herbivore Populations
solution and stable.
Ni =κωi
2(4.36)
γi =νiς
2(4.37)
ηi =κ(ς − 1)ωi
2ς(4.38)
Therefore, in a closed system, if the desired proportion (either of overall pop-
ulation or of amount harvested) are known, then the solution given above will
utilise the carrying capacity optimally. To illustrate this Figure 4.5 shows the
affect (over time) on three theoretical herbivore populations. The herbivores
represent a collection of species with high, moderate and low maximal growth
rates. The equilibrium solutions under the two methods of proportioning give
very different results. These differences are most notable between the high and
low maximal growth rate herbivores. Note for instance that when the target is the
harvest proportions the population of the ”low” group is greater than the others
(Figure 4.5b), even though it has the lowest harvest proportion (Figure 4.5d) and
vice-versa for the ”high” group. Please note this is not the same as optimising the
revenue, profit or some other objective. It is optimising the amount the system
can produce sustainably.
87
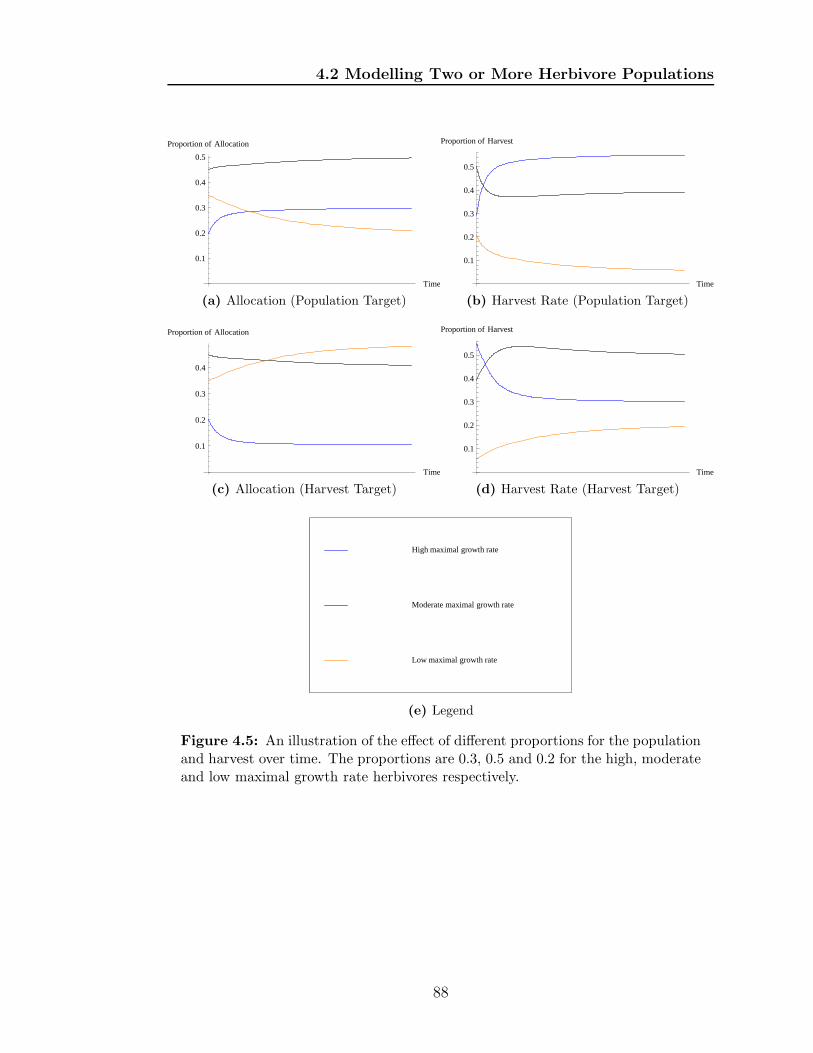
4.2 Modelling Two or More Herbivore Populations
Time
0.1
0.2
0.3
0.4
0.5
Proportion of Allocation
(a) Allocation (Population Target)
Time
0.1
0.2
0.3
0.4
0.5
Proportion of Harvest
(b) Harvest Rate (Population Target)
Time
0.1
0.2
0.3
0.4
Proportion of Allocation
(c) Allocation (Harvest Target)
Time
0.1
0.2
0.3
0.4
0.5
Proportion of Harvest
(d) Harvest Rate (Harvest Target)
Low maximal growth rate
Moderate maximal growth rate
High maximal growth rate
(e) Legend
Figure 4.5: An illustration of the effect of different proportions for the populationand harvest over time. The proportions are 0.3, 0.5 and 0.2 for the high, moderateand low maximal growth rate herbivores respectively.
88
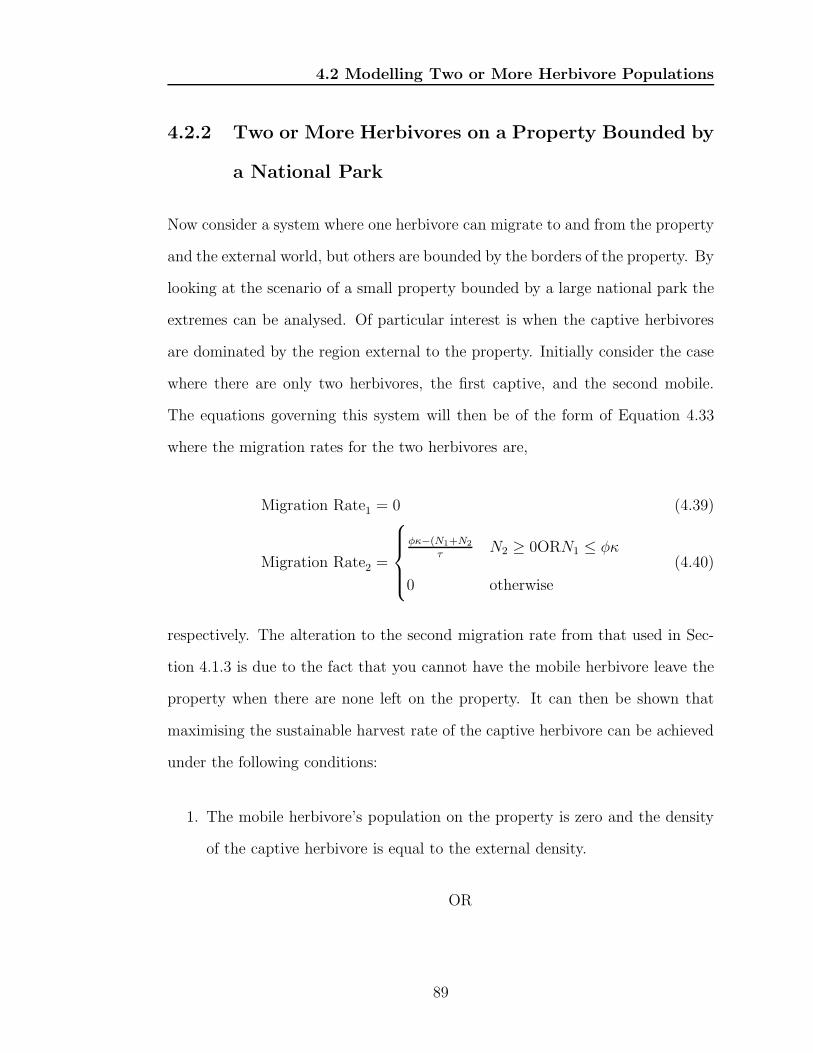
4.2 Modelling Two or More Herbivore Populations
4.2.2 Two or More Herbivores on a Property Bounded by
a National Park
Now consider a system where one herbivore can migrate to and from the property
and the external world, but others are bounded by the borders of the property. By
looking at the scenario of a small property bounded by a large national park the
extremes can be analysed. Of particular interest is when the captive herbivores
are dominated by the region external to the property. Initially consider the case
where there are only two herbivores, the first captive, and the second mobile.
The equations governing this system will then be of the form of Equation 4.33
where the migration rates for the two herbivores are,
Migration Rate1 = 0 (4.39)
Migration Rate2 =
φκ−(N1+N2
τN2 ≥ 0ORN1 ≤ φκ
0 otherwise
(4.40)
respectively. The alteration to the second migration rate from that used in Sec-
tion 4.1.3 is due to the fact that you cannot have the mobile herbivore leave the
property when there are none left on the property. It can then be shown that
maximising the sustainable harvest rate of the captive herbivore can be achieved
under the following conditions:
1. The mobile herbivore’s population on the property is zero and the density
of the captive herbivore is equal to the external density.
OR
89
4.2 Modelling Two or More Herbivore Populations
2. The population of the mobile herbivore is less than the carrying capacity
and the harvest rate for the mobile species must be less than the rate at
which the mobile species would grow in the absence of the captive species.
AND EITHER
• The external density is greater than the internal density of mobile
herbivores AND EITHER the external density is less than one OR the
harvest rate of the mobile herbivore is greater than the migration rate
would be if the property was at the carrying capacity.
OR
• The external density is one or more AND the harvest rate of the mobile
herbivore is greater than the migration rate would be if the property
was at the carrying capacity.
OR
• The density of the mobile herbivore on the property is greater than
the external density AND the mobile herbivore is harvested.
If first of these conditions are met then the system acts as if there is no migration
as internal and external densities are equal. In reality this is unlikely to happen,
as the carrying capacity would not be constant, and the herbivores are likely
to have different growth rates. Of the second set of conditions the most likely
conditions to exist are when the external density is greater than the internal
density of mobile herbivores. An external density less than the carrying capacity
is plausible, if not expected under normal circumstances. Also a harvest rate for
90
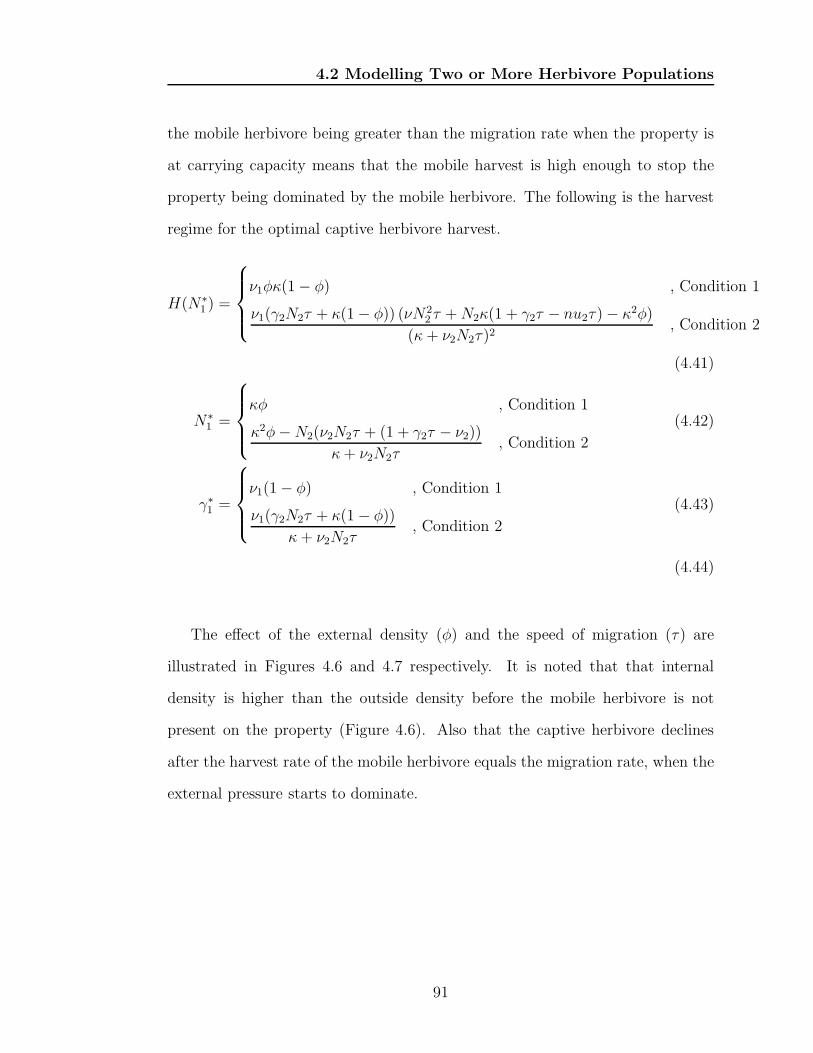
4.2 Modelling Two or More Herbivore Populations
the mobile herbivore being greater than the migration rate when the property is
at carrying capacity means that the mobile harvest is high enough to stop the
property being dominated by the mobile herbivore. The following is the harvest
regime for the optimal captive herbivore harvest.
H(N∗1 ) =
ν1φκ(1− φ) , Condition 1
ν1(γ2N2τ + κ(1− φ)) (νN22 τ +N2κ(1 + γ2τ − nu2τ)− κ2φ)
(κ + ν2N2τ)2, Condition 2
(4.41)
N∗1 =
κφ , Condition 1
κ2φ−N2(ν2N2τ + (1 + γ2τ − ν2))
κ+ ν2N2τ, Condition 2
(4.42)
γ∗1 =
ν1(1− φ) , Condition 1
ν1(γ2N2τ + κ(1− φ))
κ+ ν2N2τ, Condition 2
(4.43)
(4.44)
The effect of the external density (φ) and the speed of migration (τ) are
illustrated in Figures 4.6 and 4.7 respectively. It is noted that that internal
density is higher than the outside density before the mobile herbivore is not
present on the property (Figure 4.6). Also that the captive herbivore declines
after the harvest rate of the mobile herbivore equals the migration rate, when the
external pressure starts to dominate.
91
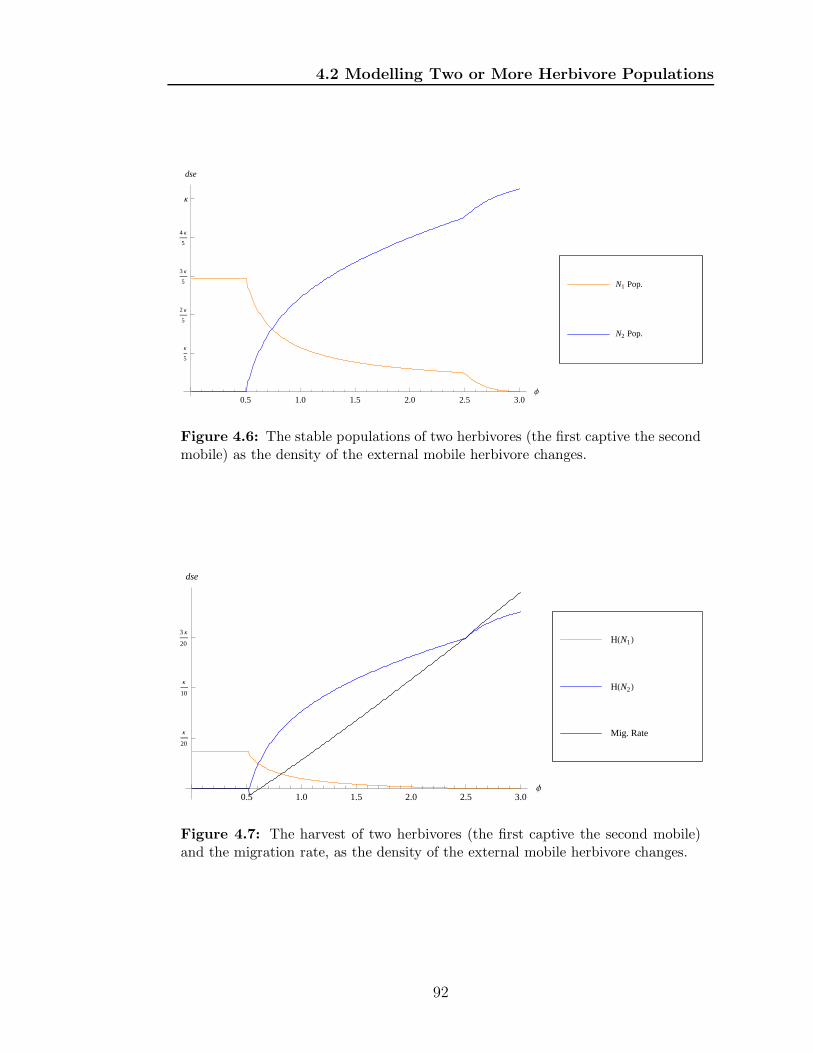
4.2 Modelling Two or More Herbivore Populations
0.5 1.0 1.5 2.0 2.5 3.0Φ
Κ
5
2 Κ
5
3 Κ
5
4 Κ
5
Κ
dse
N2 Pop.
N1 Pop.
Figure 4.6: The stable populations of two herbivores (the first captive the secondmobile) as the density of the external mobile herbivore changes.
0.5 1.0 1.5 2.0 2.5 3.0Φ
Κ
20
Κ
10
3 Κ
20
dse
Mig. Rate
HHN2L
HHN1L
Figure 4.7: The harvest of two herbivores (the first captive the second mobile)and the migration rate, as the density of the external mobile herbivore changes.
92
4.2 Modelling Two or More Herbivore Populations
4.2.3 Two or More Herbivores on Properties with Com-
mon Boundaries
Attention is now turned to the other migration scenario. Consider two properties
with common boundaries and three herbivores, only the third of which is mobile.
The migration rate of the mobile herbivore onto Property 1 is given by,
Migration Rate1,3 =
N2,1 +N2,2 +N2,3 − (N1,1 +N1,2 +N1,3)
2τCondition3
0 otherwise
(4.45)
Condition3 ≡ Nj,3 ≥ 0 AND N3−j,1 +N3−j,2 +N3−j,3 < Nj,1 +Nj,2 +Nj,3, j ∈ {1, 2}
Essentially this only allows emigration from Property 1 only if mobile herbivores
are present and immigration to Property 1 if they are present on Property 2. An
analogous equation to Equation 4.45 is used for Property 2.
Through similar arguments to Section 4.1.4 the cooperative game arrives at
solutions for optimal use of the carrying capacity as the isolation case. Hence, as
long as the optimal strategies given in Section 4.2.1 are used, then the property
owners can set their own internal proportions of each herbivore species. Therefore,
the decisions of which species to stock at which levels will not affect the other
property under cooperation. As an illustration, Figure 4.8 shows a scenario where
the properties work in cooperation. Using the Equations 4.35, 4.37 and 4.38 the
ratio of each herbivore are 5:3:2 and 3:6:1 for Property 1 and 2 respectively.
The initial boundary conditions are non-optimal, however, the system is stable,
93

4.2 Modelling Two or More Herbivore Populations
converging to the desired solutions.
94
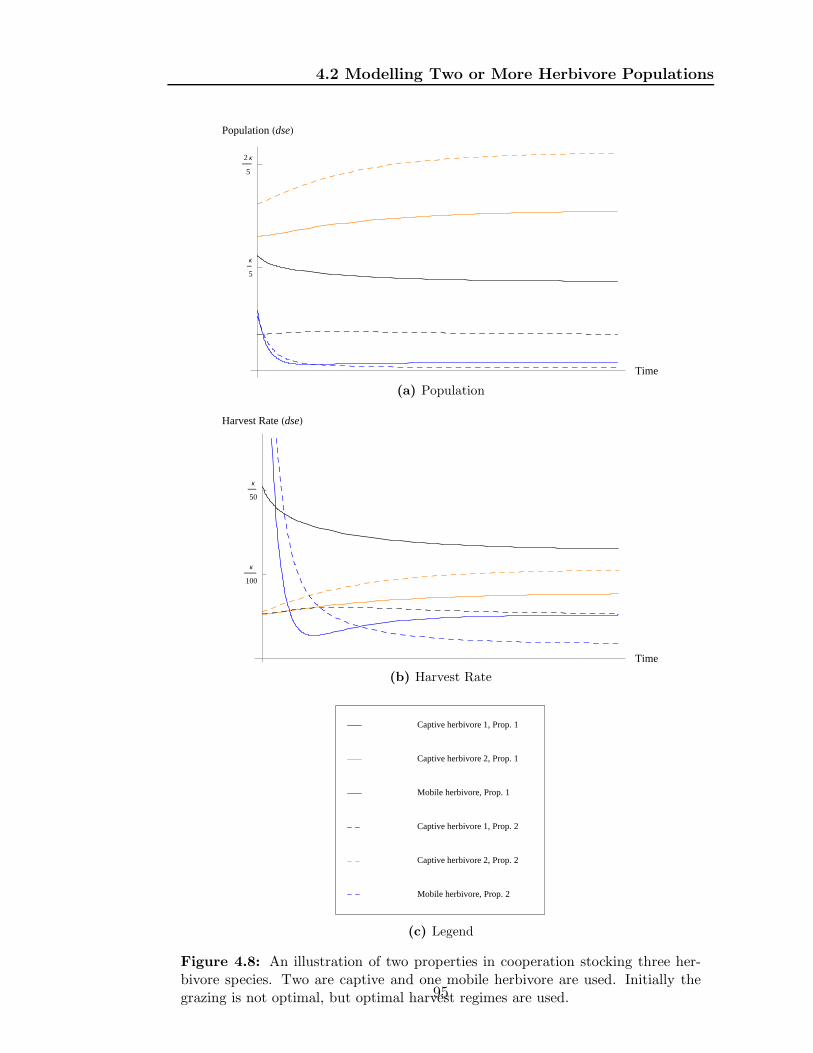
4.2 Modelling Two or More Herbivore Populations
Time
Κ
5
2Κ
5
PopulationHdseL
(a) Population
Time
Κ
100
Κ
50
Harvest RateHdseL
(b) Harvest Rate
Mobile herbivore, Prop. 2
Captive herbivore 2, Prop. 2
Captive herbivore 1, Prop. 2
Mobile herbivore, Prop. 1
Captive herbivore 2, Prop. 1
Captive herbivore 1, Prop. 1
(c) Legend
Figure 4.8: An illustration of two properties in cooperation stocking three her-bivore species. Two are captive and one mobile herbivore are used. Initially thegrazing is not optimal, but optimal harvest regimes are used.95
4.3 Modelling Vegetation and a Herbivore Population
4.3 Modelling Vegetation and a Herbivore Pop-
ulation
So far the models have used a constant carrying capacity. However, the number
of animals an area can sustain depends (to some degree) on the availability of
vegetation. Does having the herbivore population dependent on the available
vegetation impact on the previous conclusions? Therefore next models of interest
involves herbivores and the available forage or tsdm. As discussed in Turchin
(2003) and Rockwood (2009), herbivore grazing can follow two standard forms;
grazing the whole plant, including roots; or grazing on a plant where part of the
plant has refuge, invulnerable to grazing. It can be argued that the grazing on
grasses by cattle, sheep and kangaroos falls into the latter category. Therefore,
a standard set of equations for modelling the dynamics of a grazing system is
an initially linear growth model for the forage (Equation 4.46), with herbivore
growth dependent on the availability of forage with a Type II functional response
(Equation 4.47). Together these equations are known as the herbivory-regrowth
model Turchin (2003).
dV
dt= υ
(
1− V
κV
)
− ζV N
θ + V(4.46)
dN
dt= ξN
(
ζV
θ + V− χ
)
(4.47)
96
4.3 Modelling Vegetation and a Herbivore Population
4.3.1 Vegetation and a Herbivore in Isolation
As in Section 4.1.1 the first scenario considered is where the herbivore is bounded
by impermeable fences. Harvesting is included in the variable form (H3(N))where
there is a minimum population level required prior to harvesting commencing.
This results in the modification of Equation 4.47 so that it becomes,
dN
dt= ξN
(
ζV
θ + V− χ
)
− γς max{0, N − η} (4.48)
Maximising the harvest component whilst Equations 4.46 and 4.48 are set to zero
results in an optimal solution to the isolated vegetation-herbivore system. This
solution is
H(N∗) =ξυ(κζ + θχ− κχ− 2κϕ1)
κζ(4.49)
V ∗ =θχ
ϕ1(4.50)
N∗ =υ(θζ + κϕ1 − θ(2χ+ ϕ1))
κζϕ1(4.51)
γ∗ =ξϕ1(κζ + θχ− κχ− 2κϕ1)
θζ + κϕ1 − θ(2χ+ ϕ1)(4.52)
η∗ =υ(ς − 1)(θζ + κϕ1 − θ(2χ+ ϕ1))
κζϕ1ς(4.53)
ϕ1 =
√
θχ(ζ − χ)
κ(4.54)
when χ <ζκ
θ + κ. The condition can be interpreted as the amount of forage per
herbivore to maintain the status quo must be less than the amount consumed
per herbivore when the vegetation is at its carrying capacity. A perfectly logical
condition. The equilibrium solution is asymptotically stable (see Appendix A.5
97
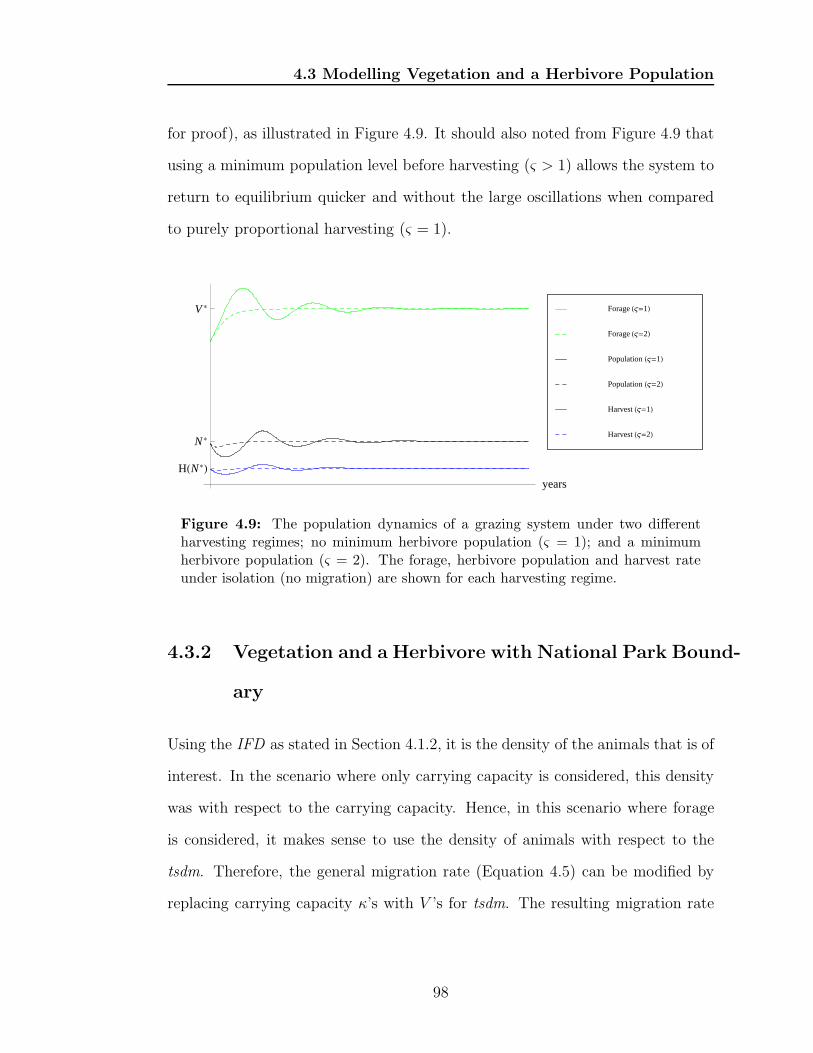
4.3 Modelling Vegetation and a Herbivore Population
for proof), as illustrated in Figure 4.9. It should also noted from Figure 4.9 that
using a minimum population level before harvesting (ς > 1) allows the system to
return to equilibrium quicker and without the large oscillations when compared
to purely proportional harvesting (ς = 1).
years
N*
V *
HHN*L
HarvestH¹=2L
HarvestH¹=1L
PopulationH¹=2L
PopulationH¹=1L
ForageH¹=2L
ForageH¹=1L
Figure 4.9: The population dynamics of a grazing system under two differentharvesting regimes; no minimum herbivore population (ς = 1); and a minimumherbivore population (ς = 2). The forage, herbivore population and harvest rateunder isolation (no migration) are shown for each harvesting regime.
4.3.2 Vegetation and a Herbivore with National Park Bound-
ary
Using the IFD as stated in Section 4.1.2, it is the density of the animals that is of
interest. In the scenario where only carrying capacity is considered, this density
was with respect to the carrying capacity. Hence, in this scenario where forage
is considered, it makes sense to use the density of animals with respect to the
tsdm. Therefore, the general migration rate (Equation 4.5) can be modified by
replacing carrying capacity κ’s with V ’s for tsdm. The resulting migration rate
98
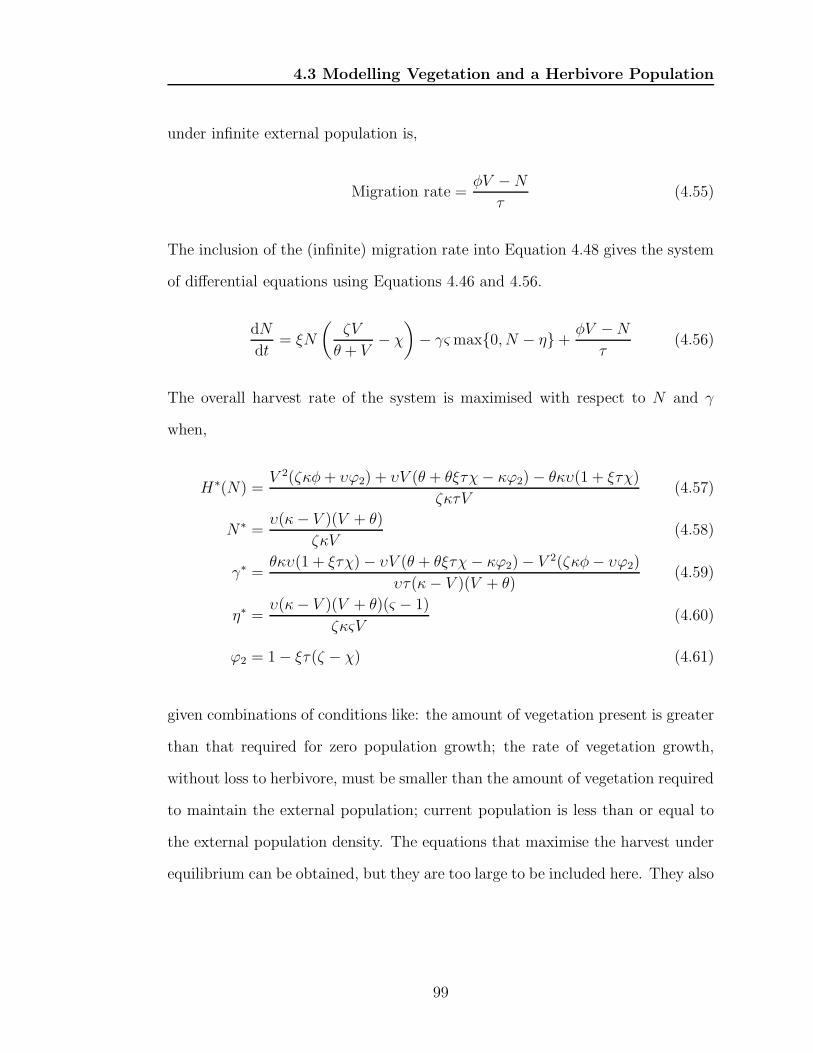
4.3 Modelling Vegetation and a Herbivore Population
under infinite external population is,
Migration rate =φV −N
τ(4.55)
The inclusion of the (infinite) migration rate into Equation 4.48 gives the system
of differential equations using Equations 4.46 and 4.56.
dN
dt= ξN
(
ζV
θ + V− χ
)
− γςmax{0, N − η}+ φV −N
τ(4.56)
The overall harvest rate of the system is maximised with respect to N and γ
when,
H∗(N) =V 2(ζκφ+ υϕ2) + υV (θ + θξτχ− κϕ2)− θκυ(1 + ξτχ)
ζκτV(4.57)
N∗ =υ(κ− V )(V + θ)
ζκV(4.58)
γ∗ =θκυ(1 + ξτχ)− υV (θ + θξτχ− κϕ2)− V 2(ζκφ− υϕ2)
υτ(κ− V )(V + θ)(4.59)
η∗ =υ(κ− V )(V + θ)(ς − 1)
ζκςV(4.60)
ϕ2 = 1− ξτ(ζ − χ) (4.61)
given combinations of conditions like: the amount of vegetation present is greater
than that required for zero population growth; the rate of vegetation growth,
without loss to herbivore, must be smaller than the amount of vegetation required
to maintain the external population; current population is less than or equal to
the external population density. The equations that maximise the harvest under
equilibrium can be obtained, but they are too large to be included here. They also
99
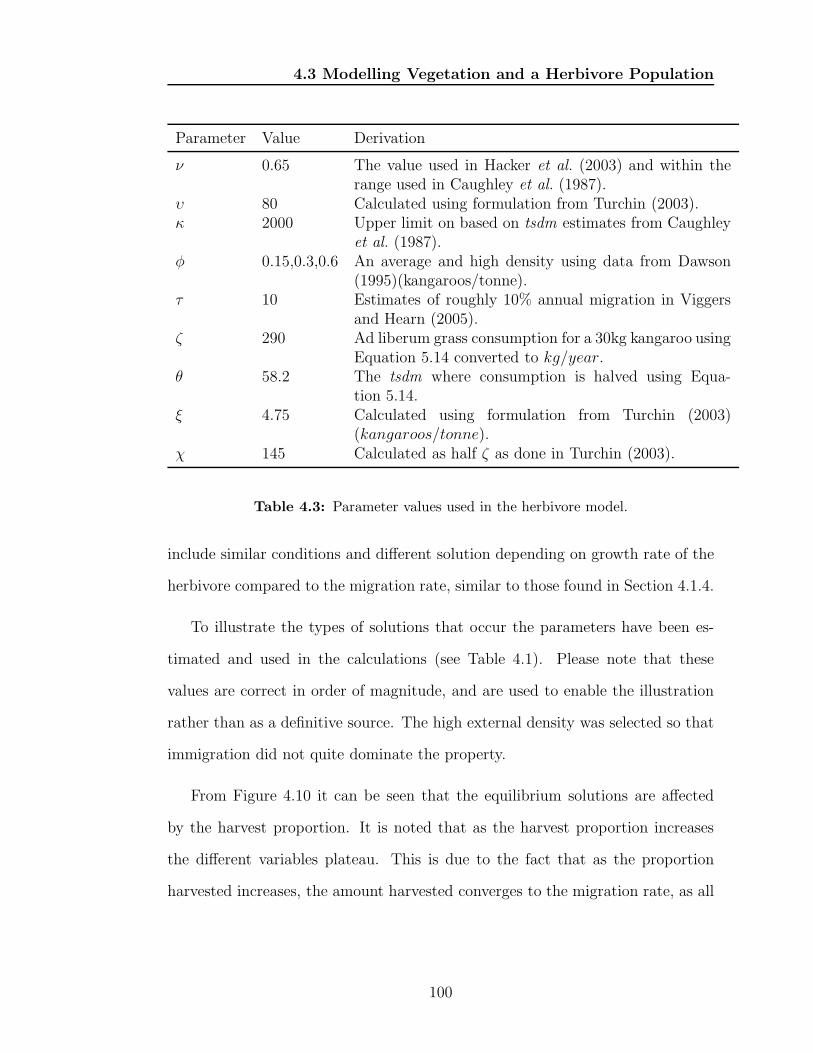
4.3 Modelling Vegetation and a Herbivore Population
Parameter Value Derivation
ν 0.65 The value used in Hacker et al. (2003) and within therange used in Caughley et al. (1987).
υ 80 Calculated using formulation from Turchin (2003).κ 2000 Upper limit on based on tsdm estimates from Caughley
et al. (1987).φ 0.15,0.3,0.6 An average and high density using data from Dawson
(1995)(kangaroos/tonne).τ 10 Estimates of roughly 10% annual migration in Viggers
and Hearn (2005).ζ 290 Ad liberum grass consumption for a 30kg kangaroo using
Equation 5.14 converted to kg/year.θ 58.2 The tsdm where consumption is halved using Equa-
tion 5.14.ξ 4.75 Calculated using formulation from Turchin (2003)
(kangaroos/tonne).χ 145 Calculated as half ζ as done in Turchin (2003).
Table 4.3: Parameter values used in the herbivore model.
include similar conditions and different solution depending on growth rate of the
herbivore compared to the migration rate, similar to those found in Section 4.1.4.
To illustrate the types of solutions that occur the parameters have been es-
timated and used in the calculations (see Table 4.1). Please note that these
values are correct in order of magnitude, and are used to enable the illustration
rather than as a definitive source. The high external density was selected so that
immigration did not quite dominate the property.
From Figure 4.10 it can be seen that the equilibrium solutions are affected
by the harvest proportion. It is noted that as the harvest proportion increases
the different variables plateau. This is due to the fact that as the proportion
harvested increases, the amount harvested converges to the migration rate, as all
100
4.3 Modelling Vegetation and a Herbivore Population
the herbivores on the property are harvested (N → 0). Similar to the results from
Section 4.1.3, when γ is relatively small the herbivore population on the property
is larger than the external density and emigration occurs (Figure 4.10d). While
losing herbivores through emigration is not generally desirable, it is possible that
the optimal harvesting regime may have this occur. The benefit of harvesting from
a higher population on the property (N) outweighed the leaking of the herbivores
(Figure 4.10c). At both the low and average external densities (φ=0.15 and 0.3)
the optimal equilibrium harvest proportion occurred when the migration rate was
negative (migration rate of -0.018 and -0.008 respectively).
As previously noted (Section 4.1.3), when the external density increases the
proportion of the population harvested (γ∗) increases (see Figure 4.11d). In par-
ticular, when the external density increases, immigration begins to dominate the
properties optimal solution. The harvest increases (Figure 4.11c by relying on
encouraging immigration (Figure 4.11e). This is managed through lowering the
properties herbivore density and increasing the amount of vegetation (as seen in
Figures 4.11b and 4.11a respectively) and then effectively harvesting all immi-
grants as they enter the property. When the external density is approximately
0.4 herbivores per tonne of forage the optimal harvesting regime results in neutral
migration (see Figure 4.11e). When comparing the internal and external densities
of herbivores per tonnes forage it can be seen (Figure 4.11f) that the relationship
is not linear, but a negative convex curve, until there are no herbivores on the
property (N∗ = 0). This is to be expected given the external density remains
constant and therefore larger in relative terms when the external density is larger.
So far the optimal dynamics when tsdm is considered is analogous to the
101
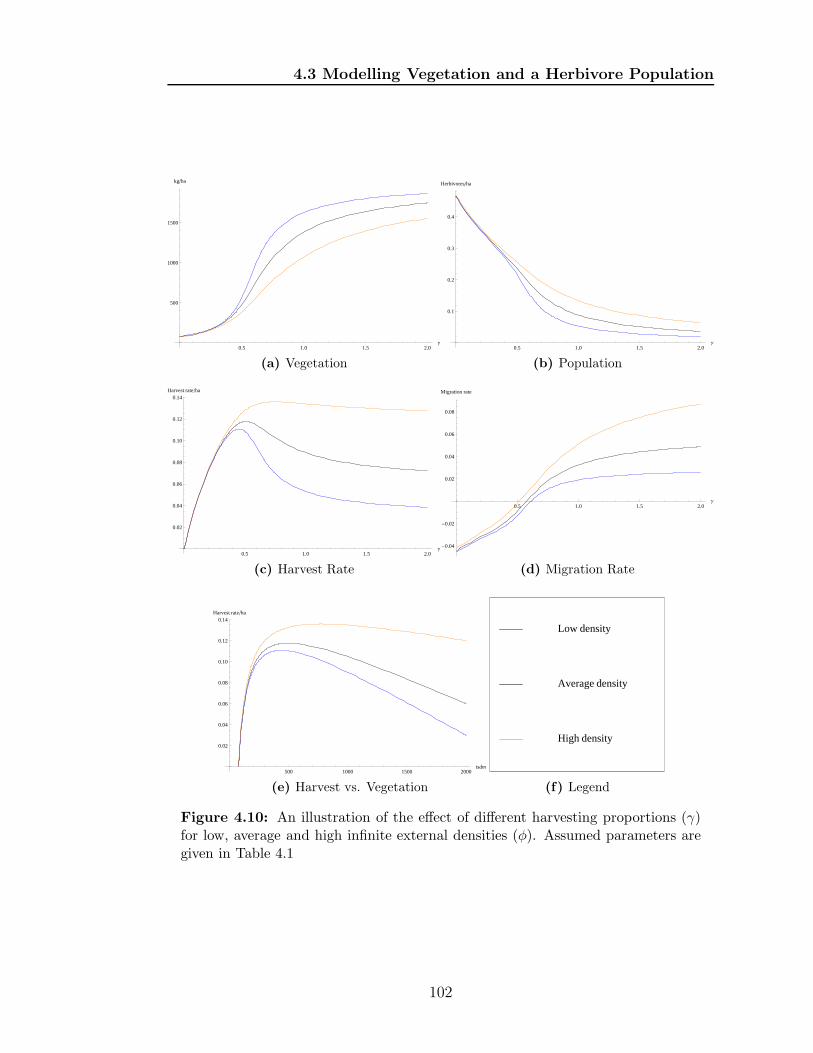
4.3 Modelling Vegetation and a Herbivore Population
0.5 1.0 1.5 2.0Γ
500
1000
1500
kg�ha
(a) Vegetation
0.5 1.0 1.5 2.0Γ
0.1
0.2
0.3
0.4
Herbivores�ha
(b) Population
0.5 1.0 1.5 2.0Γ
0.02
0.04
0.06
0.08
0.10
0.12
0.14Harvest rate�ha
(c) Harvest Rate
0.5 1.0 1.5 2.0Γ
-0.04
-0.02
0.02
0.04
0.06
0.08
Migration rate
(d) Migration Rate
500 1000 1500 2000tsdm
0.02
0.04
0.06
0.08
0.10
0.12
0.14Harvest rate�ha
(e) Harvest vs. Vegetation
High density
Average density
Low density
(f) Legend
Figure 4.10: An illustration of the effect of different harvesting proportions (γ)for low, average and high infinite external densities (φ). Assumed parameters aregiven in Table 4.1
102
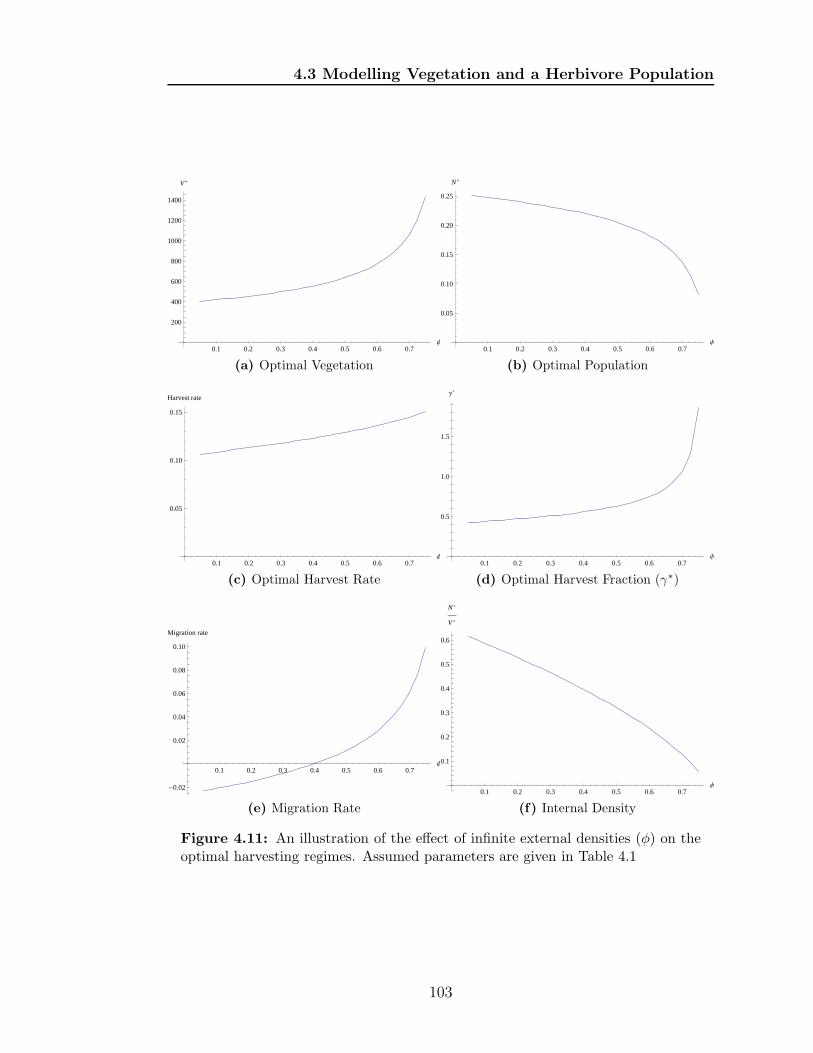
4.3 Modelling Vegetation and a Herbivore Population
0.1 0.2 0.3 0.4 0.5 0.6 0.7Φ
200
400
600
800
1000
1200
1400
V *
(a) Optimal Vegetation
0.1 0.2 0.3 0.4 0.5 0.6 0.7Φ
0.05
0.10
0.15
0.20
0.25
N*
(b) Optimal Population
0.1 0.2 0.3 0.4 0.5 0.6 0.7Φ
0.05
0.10
0.15
Harvest rate
(c) Optimal Harvest Rate
0.1 0.2 0.3 0.4 0.5 0.6 0.7Φ
0.5
1.0
1.5
Γ*
(d) Optimal Harvest Fraction (γ∗)
0.1 0.2 0.3 0.4 0.5 0.6 0.7Φ
-0.02
0.02
0.04
0.06
0.08
0.10
Migration rate
(e) Migration Rate
0.1 0.2 0.3 0.4 0.5 0.6 0.7Φ
0.1
0.2
0.3
0.4
0.5
0.6
N*
V *
(f) Internal Density
Figure 4.11: An illustration of the effect of infinite external densities (φ) on theoptimal harvesting regimes. Assumed parameters are given in Table 4.1
103
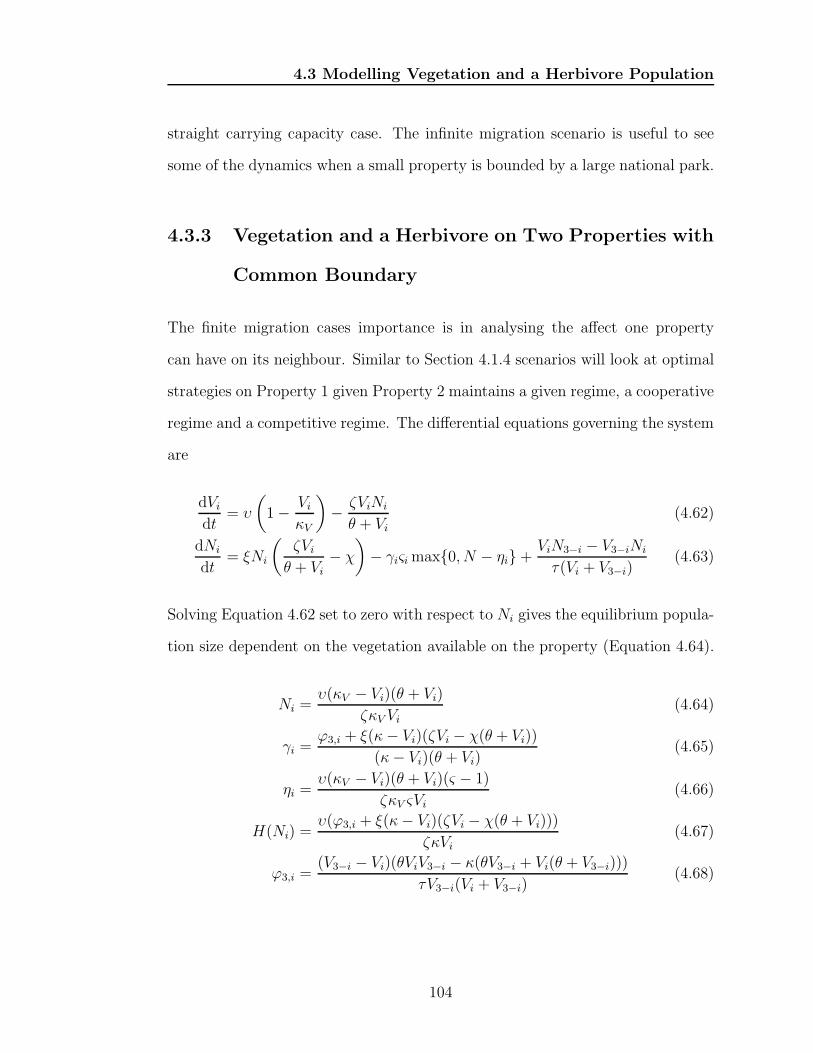
4.3 Modelling Vegetation and a Herbivore Population
straight carrying capacity case. The infinite migration scenario is useful to see
some of the dynamics when a small property is bounded by a large national park.
4.3.3 Vegetation and a Herbivore on Two Properties with
Common Boundary
The finite migration cases importance is in analysing the affect one property
can have on its neighbour. Similar to Section 4.1.4 scenarios will look at optimal
strategies on Property 1 given Property 2 maintains a given regime, a cooperative
regime and a competitive regime. The differential equations governing the system
are
dVi
dt= υ
(
1− Vi
κV
)
− ζViNi
θ + Vi
(4.62)
dNi
dt= ξNi
(
ζVi
θ + Vi
− χ
)
− γiςi max{0, N − ηi}+ViN3−i − V3−iNi
τ(Vi + V3−i)(4.63)
Solving Equation 4.62 set to zero with respect to Ni gives the equilibrium popula-
tion size dependent on the vegetation available on the property (Equation 4.64).
Ni =υ(κV − Vi)(θ + Vi)
ζκV Vi
(4.64)
γi =ϕ3,i + ξ(κ− Vi)(ζVi − χ(θ + Vi))
(κ− Vi)(θ + Vi)(4.65)
ηi =υ(κV − Vi)(θ + Vi)(ς − 1)
ζκV ςVi
(4.66)
H(Ni) =υ(ϕ3,i + ξ(κ− Vi)(ζVi − χ(θ + Vi)))
ζκVi
(4.67)
ϕ3,i =(V3−i − Vi)(θViV3−i − κ(θV3−i + Vi(θ + V3−i)))
τV3−i(Vi + V3−i)(4.68)
104
4.3 Modelling Vegetation and a Herbivore Population
Therefore the equilibrium herbivore population on either property can be written
in terms of just their respective vegetation levels. If Property 2 maintains a given
vegetation level, that implies a certain level of herbivores. Using this premise,
the harvest rate for Property 1 and 2 can be found and equations for the values
of γ1, γ2, η1, and η2 found in terms of V1 and V2 (Equations 4.65 and 4.66).
Equations 4.64 to 4.66 can be used to calculate the harvest rate (Equation 4.67).
The harvest rate for Property 1 can then be maximised given the vegetation level
on Property 2. Due to their length they have not been included. An illustration
of the system designed to maximise Property 1’s harvest rate based on the veg-
etation level is captured in Figure 4.12. Note that the herbivore population on
Property 1 is fairly consistent despite the vegetation level on Property 2. Also
note that migration rate is generally small compared to the harvest rate. Fig-
ure 4.12 highlights the fact that under the initially linear regrowth model, when
vegetation density (compared to the carrying capacity of the vegetation) is low,
then herbivore population is large. Theoretically as Vi → 0 then the equilibrium
solution infers Ni → ∞.
Consider the scenario where both properties co-operate, in effect joining their
two properties. The optimal harvesting regime for the combined property is the
same as a single property in isolation for the reasons discussed in Section 4.3.1.
Therefore, the optimal harvest regime for each property (under cooperation) is
given be Equations 4.49 to 4.54. If the properties are in competition then the har-
vest rates (given perfect knowledge) for each property is given by Equation 4.67.
Figure 4.13 illustrates the case where the two properties are in competition, co-
operation and isolation. Using the parameterisation from Table 4.3, it can be
105
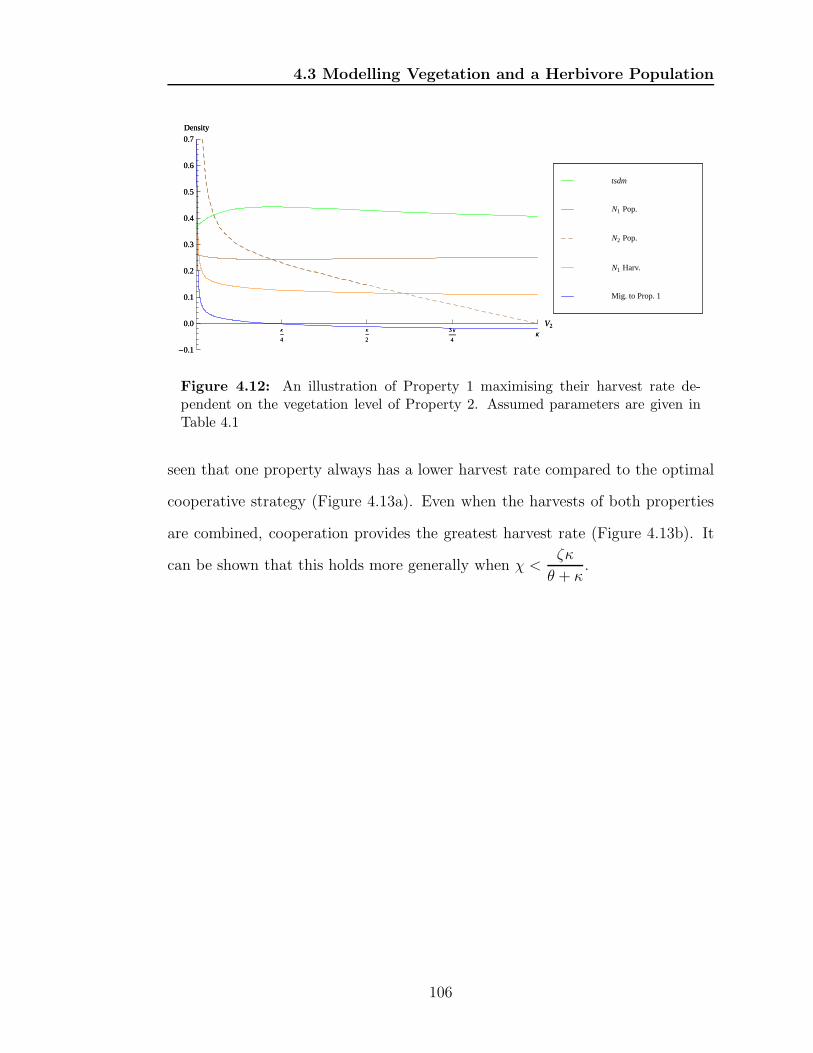
4.3 Modelling Vegetation and a Herbivore Population
Κ
4
Κ
2
3 Κ
4Κ
V2
-0.1
0.0
0.1
0.2
0.3
0.4
0.5
0.6
0.7
Density
Mig. to Prop. 1
N1 Harv.
N2 Pop.
N1 Pop.
tsdm
Κ
4
Κ
2
3 Κ
4Κ
V2
-0.1
0.0
0.1
0.2
0.3
0.4
0.5
0.6
0.7
Density
Mig. to Prop. 1
N1 Harv.
N2 Pop.
N1 Pop.
tsdm
Figure 4.12: An illustration of Property 1 maximising their harvest rate de-pendent on the vegetation level of Property 2. Assumed parameters are given inTable 4.1
seen that one property always has a lower harvest rate compared to the optimal
cooperative strategy (Figure 4.13a). Even when the harvests of both properties
are combined, cooperation provides the greatest harvest rate (Figure 4.13b). It
can be shown that this holds more generally when χ <ζκ
θ + κ.
106
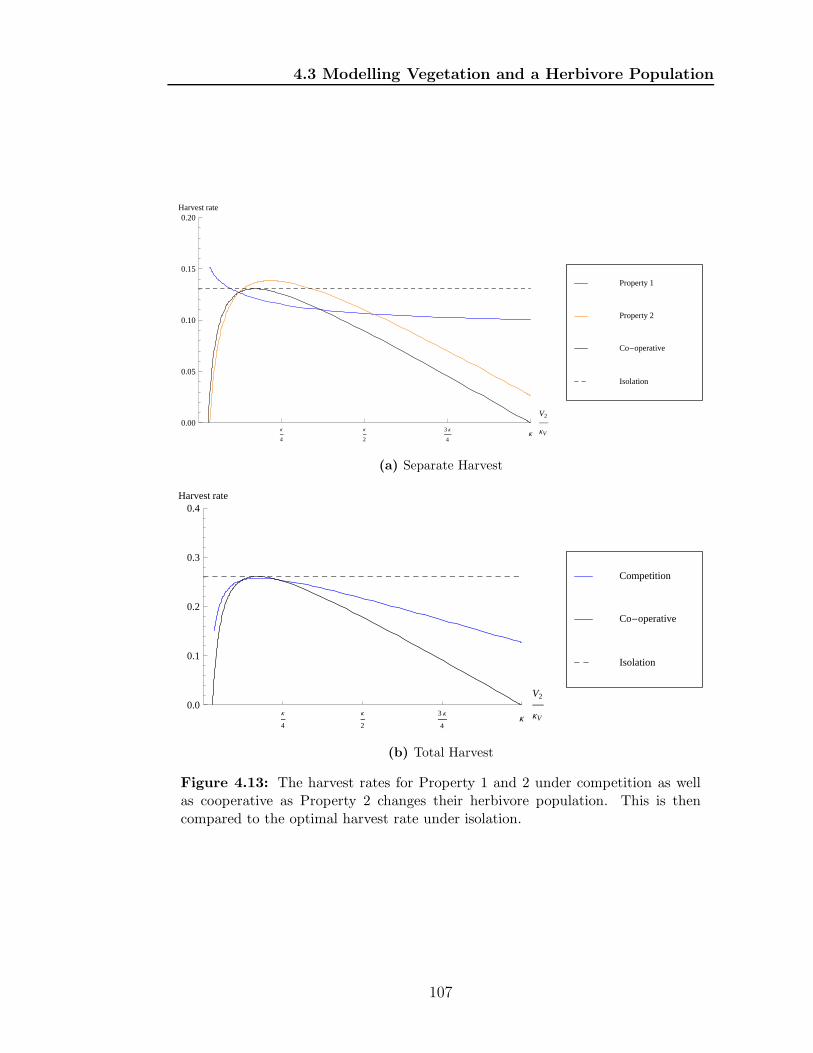
4.3 Modelling Vegetation and a Herbivore Population
Κ
4
Κ
2
3 Κ
4Κ
V2
ΚV
0.00
0.05
0.10
0.15
0.20Harvest rate
Isolation
Co-operative
Property 2
Property 1
(a) Separate Harvest
Κ
4
Κ
2
3 Κ
4Κ
V2
ΚV
0.0
0.1
0.2
0.3
0.4Harvest rate
Isolation
Co-operative
Competition
(b) Total Harvest
Figure 4.13: The harvest rates for Property 1 and 2 under competition as wellas cooperative as Property 2 changes their herbivore population. This is thencompared to the optimal harvest rate under isolation.
107
4.4 Discussion
4.4 Discussion
The models used in this chapter give insight into some of the dynamics of a
deterministic plant-herbivore system. It has been shown theoretically that stable
solutions for plant-herbivore models, excluding and including migration, can be
found. Moreover, these can be optimised in terms of their harvest, including
herbivore preferences for the landholder.
When the property is isolated (herbivores are kept within its boundaries) har-
vests are optimised by leaving half the herbivore population untouched. The
minimum level before harvesting in this scenario can be based purely on the car-
rying capacity and optimal growth rate of the forage. This fact causes competing
needs when optimising revenue based on herbivore harvest and wool production.
However, it is possible to control the herbivore populations so that a given pro-
portion of the forage allocation is utilised by each species. Suppose a landholder
wishes to allocate half their forage to wool production, two-fifths to beef pro-
duction, and the remainder to kangaroo meat production. Then Equations 4.34
suggests harvest rates equal to the maximal growth rates for each species and
setting refuge levels at an eighth, a tenth, and a fortieth of the carrying capacity
respectively for sheep, cattle and kangaroos.
When the property is not isolated the outcomes are affected by what is hap-
pening in the external environment as well as internally. The relationship between
the total dse/km2 and that external environment can have a large effect on op-
timal strategies. Migration rates also have an impact on decision making. When
neighbouring properties use the optimal harvesting strategy, their herbivore pref-
108
4.4 Discussion
erences should not affect the neighbours. Also, under the optimal harvesting
strategies it is possible to have different combinations of herbivores as desired
by the landholder. These two points infer that landholders decisions will have
limited bearing on other properties, whether they utilise kangaroos or not.
The population models used in this chapter have been useful in exploring
the effect of mobile species on internal populations and stability. However, the
simplifications implicit in these models used do not account for external forces
on the carrying capacity or available forage. A model that does account for the
affect of weather and environment is contained in Chapter 5.
109
Chapter 5
Population Modelling with
GRASP
Mitigation through income from kangaroos could help alleviate some of the finan-
cial down turn during drought. With rapid increase in kangaroo numbers after a
drought has broken, harvesting could financially counter restocking costs of do-
mestic animals. Therefore the kangaroos ability to react to changes in weather
could be used to mitigate the affect of droughts and post-drought recovery in
marginal areas. For this possibility to be explored fully a model that responds to
environmental factors such as weather and soil condition needs to be used. The
dynamics are important. When forage is scarce, and fodder has to be bought
to maintain stock, the pest value of kangaroos is at its highest. When forage is
plentiful landholders are not concerned by kangaroo numbers. There is so much
forage it cannot be efficiently utilised. In particular the model needs to capture
some of the nuances of kangaroo ecology conveyed in Chapter 1.2.1.
110
5.1 The Kangaroo Population Model
A model to predict biomass changes over time for Australian conditions was
initially developed by Neil Flood and John Carter as the AussieGRASS model
in 1995. Since then it has developed into what is know as GRASP today, which
is what is used to estimate available biomass. GRASP can simulate the effect of
weather, soil condition, stocking rates for either cattle or sheep and the associated
production of beef or wool (Littleboy and McKeon, 2005). Part of the specified
conditions of use of the GRASP code was that the main program itself was not
to be altered, but changes were allowed to be made via adding sub-programs that
can be included or excluded as required by the users. It is via these sub-programs
that we constructed our kangaroo model. Unfortunately, this limited the ability
of the kangaroo model. As a result, the entire GRASP program was re-coded for
use in Mathematica.
The notation used in the kangaroo population model is collated in Table 5.1
5.1 The Kangaroo Population Model
The kangaroo population model is based on a previous physiological structured
population model used in Hacker et al. (2003). It also includes the effect of the
environmental conditions on the development and mortality of the kangaroo pop-
ulation. This enables dynamic feedback into the system so as to better simulate
the effect of nutritional intake on the mammals. This approach has been used as
we believe that the resilience of the plant-herbivore system is an important factor
in the decision making process. If the non-traditional livestock can increase in
numbers quickly after drought, their presence may help the pastoralist recover
111
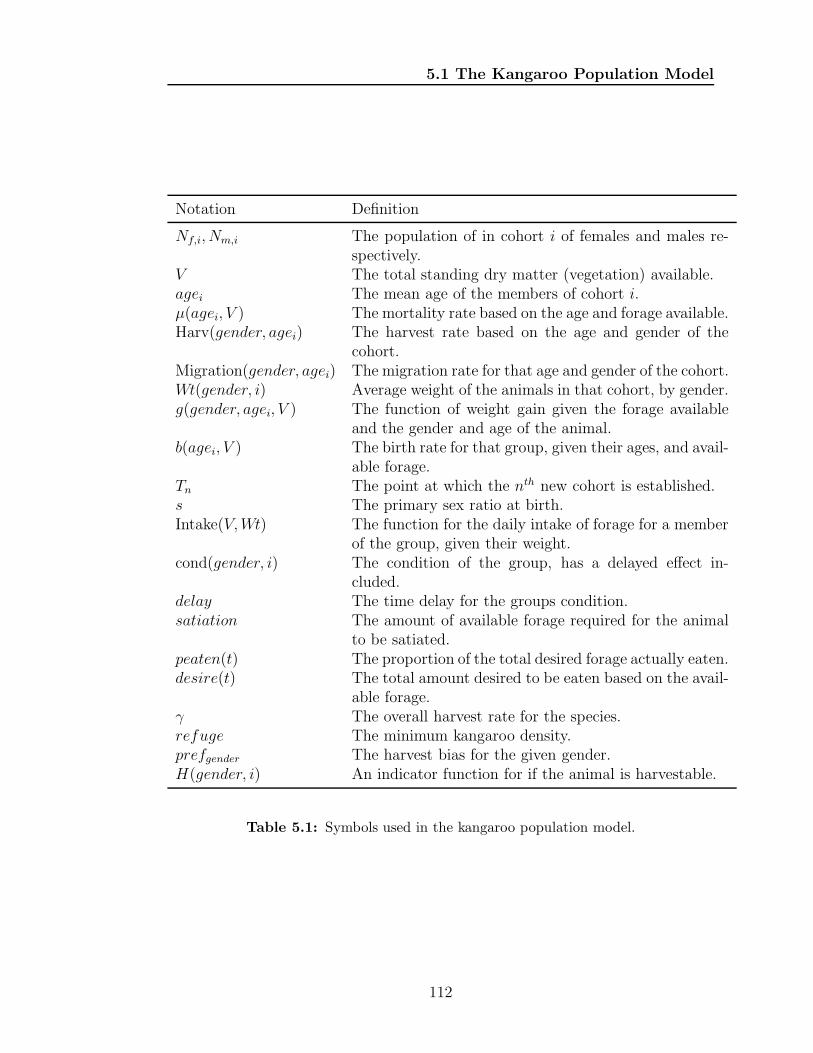
5.1 The Kangaroo Population Model
Notation Definition
Nf,i, Nm,i The population of in cohort i of females and males re-spectively.
V The total standing dry matter (vegetation) available.agei The mean age of the members of cohort i.µ(agei, V ) The mortality rate based on the age and forage available.Harv(gender, agei) The harvest rate based on the age and gender of the
cohort.Migration(gender, agei) The migration rate for that age and gender of the cohort.Wt(gender, i) Average weight of the animals in that cohort, by gender.g(gender, agei, V ) The function of weight gain given the forage available
and the gender and age of the animal.b(agei, V ) The birth rate for that group, given their ages, and avail-
able forage.Tn The point at which the nth new cohort is established.s The primary sex ratio at birth.Intake(V,Wt) The function for the daily intake of forage for a member
of the group, given their weight.cond(gender, i) The condition of the group, has a delayed effect in-
cluded.delay The time delay for the groups condition.satiation The amount of available forage required for the animal
to be satiated.peaten(t) The proportion of the total desired forage actually eaten.desire(t) The total amount desired to be eaten based on the avail-
able forage.γ The overall harvest rate for the species.refuge The minimum kangaroo density.prefgender The harvest bias for the given gender.H(gender, i) An indicator function for if the animal is harvestable.
Table 5.1: Symbols used in the kangaroo population model.
112
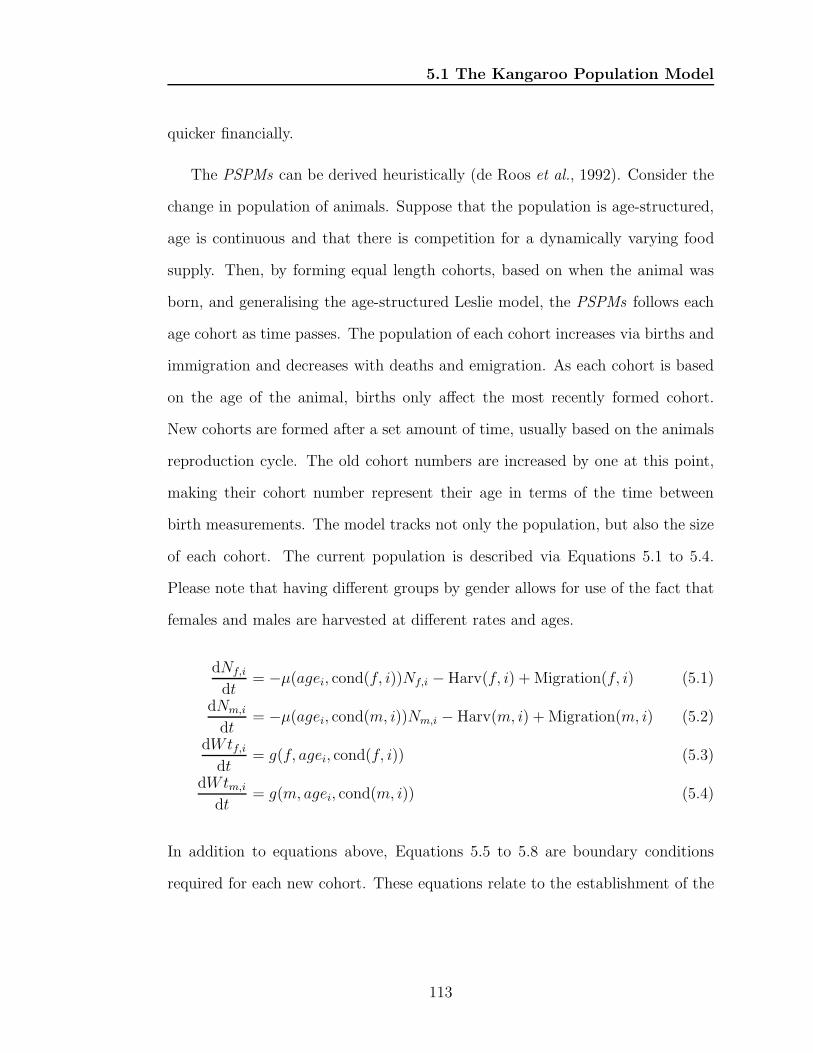
5.1 The Kangaroo Population Model
quicker financially.
The PSPMs can be derived heuristically (de Roos et al., 1992). Consider the
change in population of animals. Suppose that the population is age-structured,
age is continuous and that there is competition for a dynamically varying food
supply. Then, by forming equal length cohorts, based on when the animal was
born, and generalising the age-structured Leslie model, the PSPMs follows each
age cohort as time passes. The population of each cohort increases via births and
immigration and decreases with deaths and emigration. As each cohort is based
on the age of the animal, births only affect the most recently formed cohort.
New cohorts are formed after a set amount of time, usually based on the animals
reproduction cycle. The old cohort numbers are increased by one at this point,
making their cohort number represent their age in terms of the time between
birth measurements. The model tracks not only the population, but also the size
of each cohort. The current population is described via Equations 5.1 to 5.4.
Please note that having different groups by gender allows for use of the fact that
females and males are harvested at different rates and ages.
dNf,i
dt= −µ(agei, cond(f, i))Nf,i −Harv(f, i) + Migration(f, i) (5.1)
dNm,i
dt= −µ(agei, cond(m, i))Nm,i −Harv(m, i) + Migration(m, i) (5.2)
dWtf,idt
= g(f, agei, cond(f, i)) (5.3)
dWtm,i
dt= g(m, agei, cond(m, i)) (5.4)
In addition to equations above, Equations 5.5 to 5.8 are boundary conditions
required for each new cohort. These equations relate to the establishment of the
113
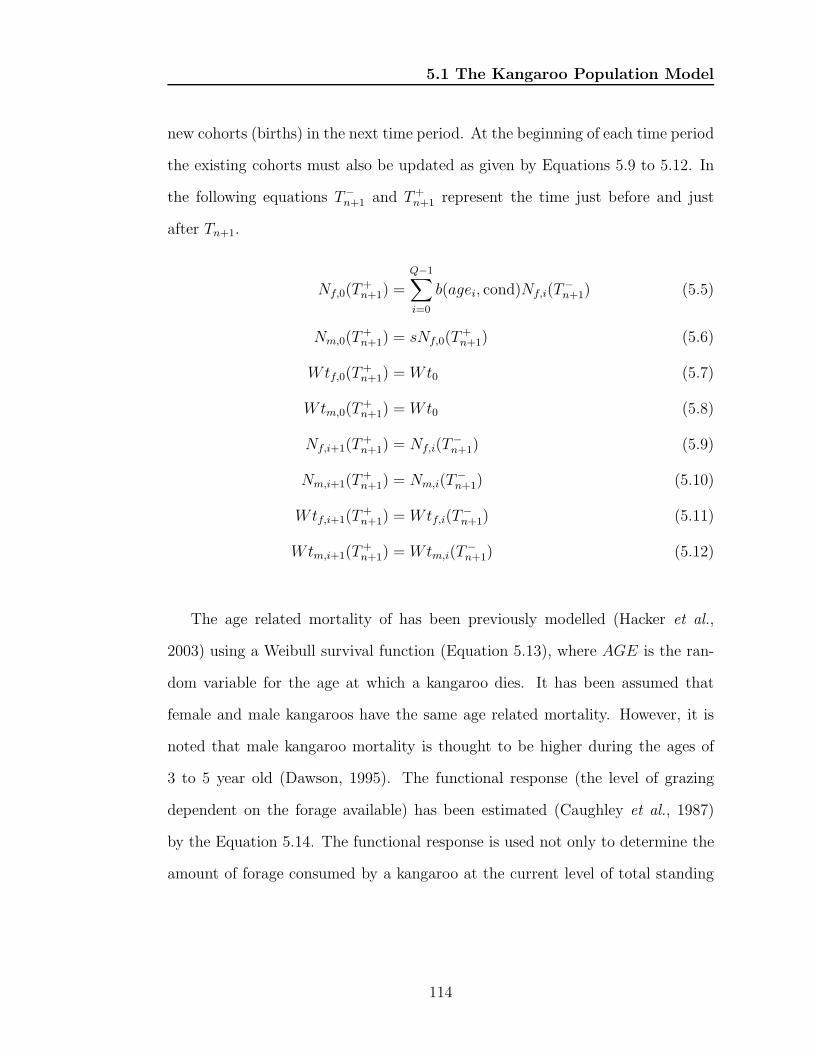
5.1 The Kangaroo Population Model
new cohorts (births) in the next time period. At the beginning of each time period
the existing cohorts must also be updated as given by Equations 5.9 to 5.12. In
the following equations T−n+1 and T+
n+1 represent the time just before and just
after Tn+1.
Nf,0(T+n+1) =
Q−1∑
i=0
b(agei, cond)Nf,i(T−n+1) (5.5)
Nm,0(T+n+1) = sNf,0(T
+n+1) (5.6)
Wtf,0(T+n+1) = Wt0 (5.7)
Wtm,0(T+n+1) = Wt0 (5.8)
Nf,i+1(T+n+1) = Nf,i(T
−n+1) (5.9)
Nm,i+1(T+n+1) = Nm,i(T
−n+1) (5.10)
Wtf,i+1(T+n+1) = Wtf,i(T
−n+1) (5.11)
Wtm,i+1(T+n+1) = Wtm,i(T
−n+1) (5.12)
The age related mortality of has been previously modelled (Hacker et al.,
2003) using a Weibull survival function (Equation 5.13), where AGE is the ran-
dom variable for the age at which a kangaroo dies. It has been assumed that
female and male kangaroos have the same age related mortality. However, it is
noted that male kangaroo mortality is thought to be higher during the ages of
3 to 5 year old (Dawson, 1995). The functional response (the level of grazing
dependent on the forage available) has been estimated (Caughley et al., 1987)
by the Equation 5.14. The functional response is used not only to determine the
amount of forage consumed by a kangaroo at the current level of total standing
114
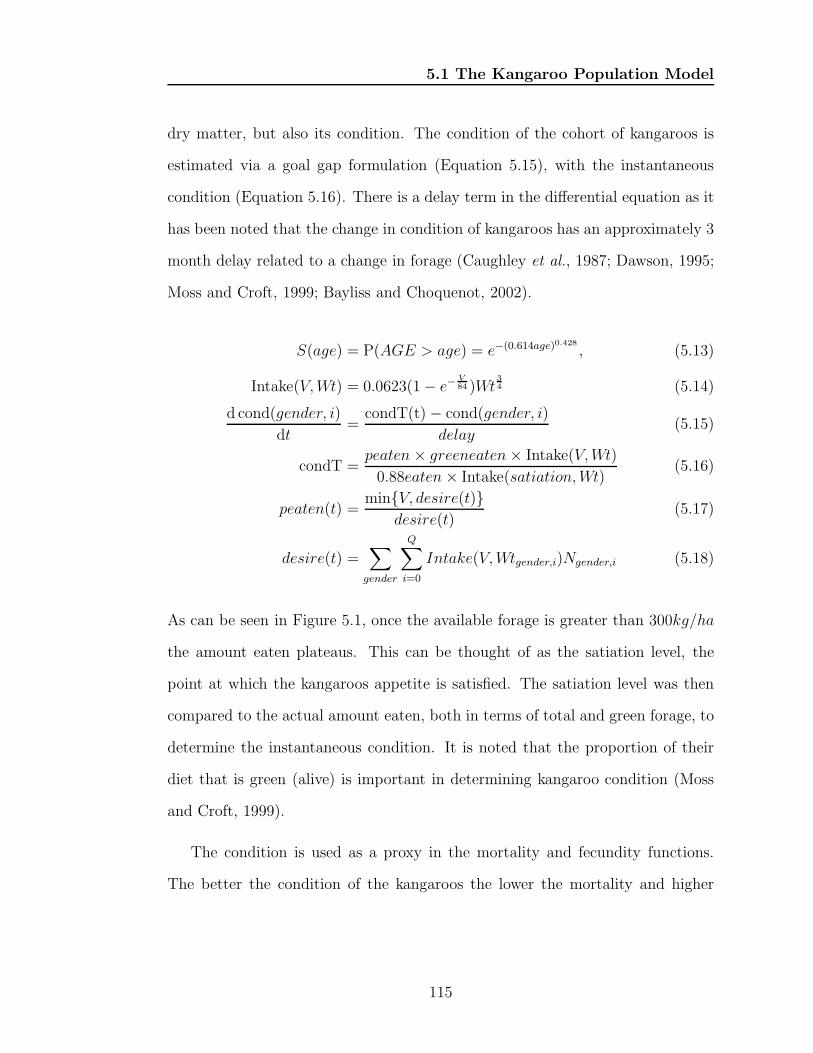
5.1 The Kangaroo Population Model
dry matter, but also its condition. The condition of the cohort of kangaroos is
estimated via a goal gap formulation (Equation 5.15), with the instantaneous
condition (Equation 5.16). There is a delay term in the differential equation as it
has been noted that the change in condition of kangaroos has an approximately 3
month delay related to a change in forage (Caughley et al., 1987; Dawson, 1995;
Moss and Croft, 1999; Bayliss and Choquenot, 2002).
S(age) = P(AGE > age) = e−(0.614age)0.428 , (5.13)
Intake(V,Wt) = 0.0623(1− e−V84 )Wt
3
4 (5.14)
d cond(gender, i)
dt=
condT(t)− cond(gender, i)
delay(5.15)
condT =peaten × greeneaten× Intake(V,Wt)
0.88eaten× Intake(satiation,Wt)(5.16)
peaten(t) =min{V, desire(t)}
desire(t)(5.17)
desire(t) =∑
gender
Q∑
i=0
Intake(V,Wtgender,i)Ngender,i (5.18)
As can be seen in Figure 5.1, once the available forage is greater than 300kg/ha
the amount eaten plateaus. This can be thought of as the satiation level, the
point at which the kangaroos appetite is satisfied. The satiation level was then
compared to the actual amount eaten, both in terms of total and green forage, to
determine the instantaneous condition. It is noted that the proportion of their
diet that is green (alive) is important in determining kangaroo condition (Moss
and Croft, 1999).
The condition is used as a proxy in the mortality and fecundity functions.
The better the condition of the kangaroos the lower the mortality and higher
115
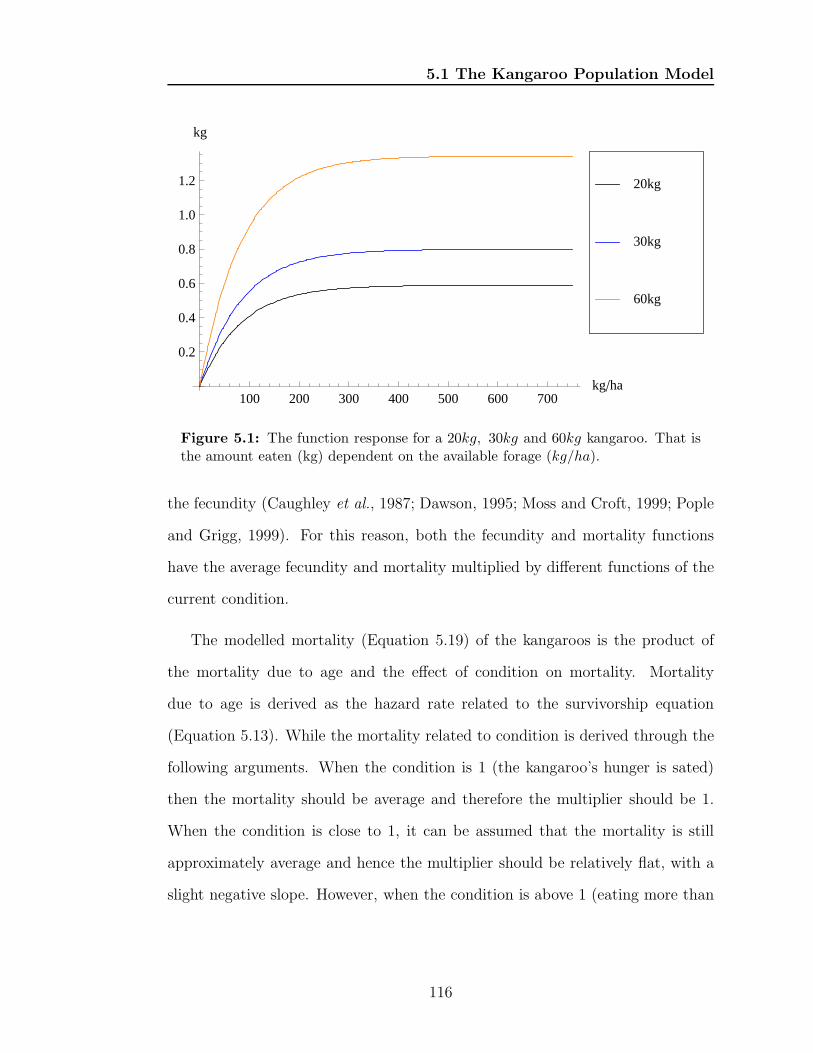
5.1 The Kangaroo Population Model
100 200 300 400 500 600 700kg�ha
0.2
0.4
0.6
0.8
1.0
1.2
kg
60kg
30kg
20kg
Figure 5.1: The function response for a 20kg, 30kg and 60kg kangaroo. That isthe amount eaten (kg) dependent on the available forage (kg/ha).
the fecundity (Caughley et al., 1987; Dawson, 1995; Moss and Croft, 1999; Pople
and Grigg, 1999). For this reason, both the fecundity and mortality functions
have the average fecundity and mortality multiplied by different functions of the
current condition.
The modelled mortality (Equation 5.19) of the kangaroos is the product of
the mortality due to age and the effect of condition on mortality. Mortality
due to age is derived as the hazard rate related to the survivorship equation
(Equation 5.13). While the mortality related to condition is derived through the
following arguments. When the condition is 1 (the kangaroo’s hunger is sated)
then the mortality should be average and therefore the multiplier should be 1.
When the condition is close to 1, it can be assumed that the mortality is still
approximately average and hence the multiplier should be relatively flat, with a
slight negative slope. However, when the condition is above 1 (eating more than
116
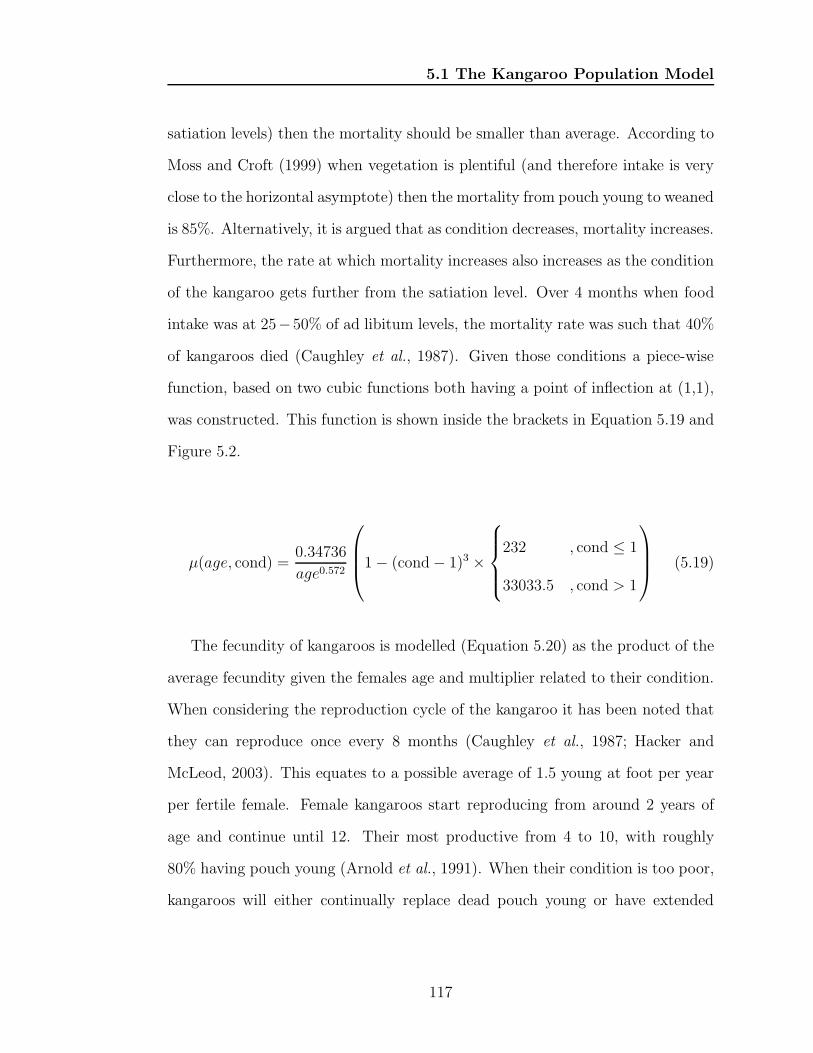
5.1 The Kangaroo Population Model
satiation levels) then the mortality should be smaller than average. According to
Moss and Croft (1999) when vegetation is plentiful (and therefore intake is very
close to the horizontal asymptote) then the mortality from pouch young to weaned
is 85%. Alternatively, it is argued that as condition decreases, mortality increases.
Furthermore, the rate at which mortality increases also increases as the condition
of the kangaroo gets further from the satiation level. Over 4 months when food
intake was at 25−50% of ad libitum levels, the mortality rate was such that 40%
of kangaroos died (Caughley et al., 1987). Given those conditions a piece-wise
function, based on two cubic functions both having a point of inflection at (1,1),
was constructed. This function is shown inside the brackets in Equation 5.19 and
Figure 5.2.
µ(age, cond) =0.34736
age0.572
1− (cond− 1)3 ×
232 , cond ≤ 1
33033.5 , cond > 1
(5.19)
The fecundity of kangaroos is modelled (Equation 5.20) as the product of the
average fecundity given the females age and multiplier related to their condition.
When considering the reproduction cycle of the kangaroo it has been noted that
they can reproduce once every 8 months (Caughley et al., 1987; Hacker and
McLeod, 2003). This equates to a possible average of 1.5 young at foot per year
per fertile female. Female kangaroos start reproducing from around 2 years of
age and continue until 12. Their most productive from 4 to 10, with roughly
80% having pouch young (Arnold et al., 1991). When their condition is too poor,
kangaroos will either continually replace dead pouch young or have extended
117
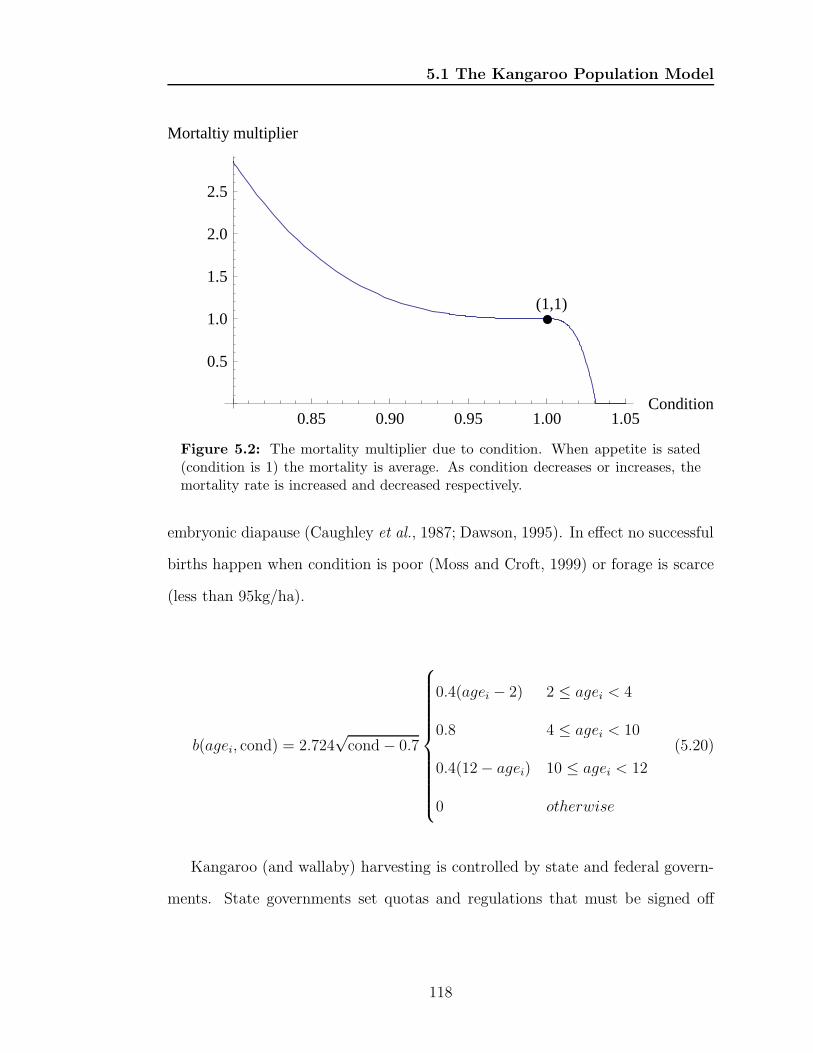
5.1 The Kangaroo Population Model
(1,1)
0.85 0.90 0.95 1.00 1.05Condition
0.5
1.0
1.5
2.0
2.5
Mortaltiy multiplier
Figure 5.2: The mortality multiplier due to condition. When appetite is sated(condition is 1) the mortality is average. As condition decreases or increases, themortality rate is increased and decreased respectively.
embryonic diapause (Caughley et al., 1987; Dawson, 1995). In effect no successful
births happen when condition is poor (Moss and Croft, 1999) or forage is scarce
(less than 95kg/ha).
b(agei, cond) = 2.724√cond− 0.7
0.4(agei − 2) 2 ≤ agei < 4
0.8 4 ≤ agei < 10
0.4(12− agei) 10 ≤ agei < 12
0 otherwise
(5.20)
Kangaroo (and wallaby) harvesting is controlled by state and federal govern-
ments. State governments set quotas and regulations that must be signed off
118
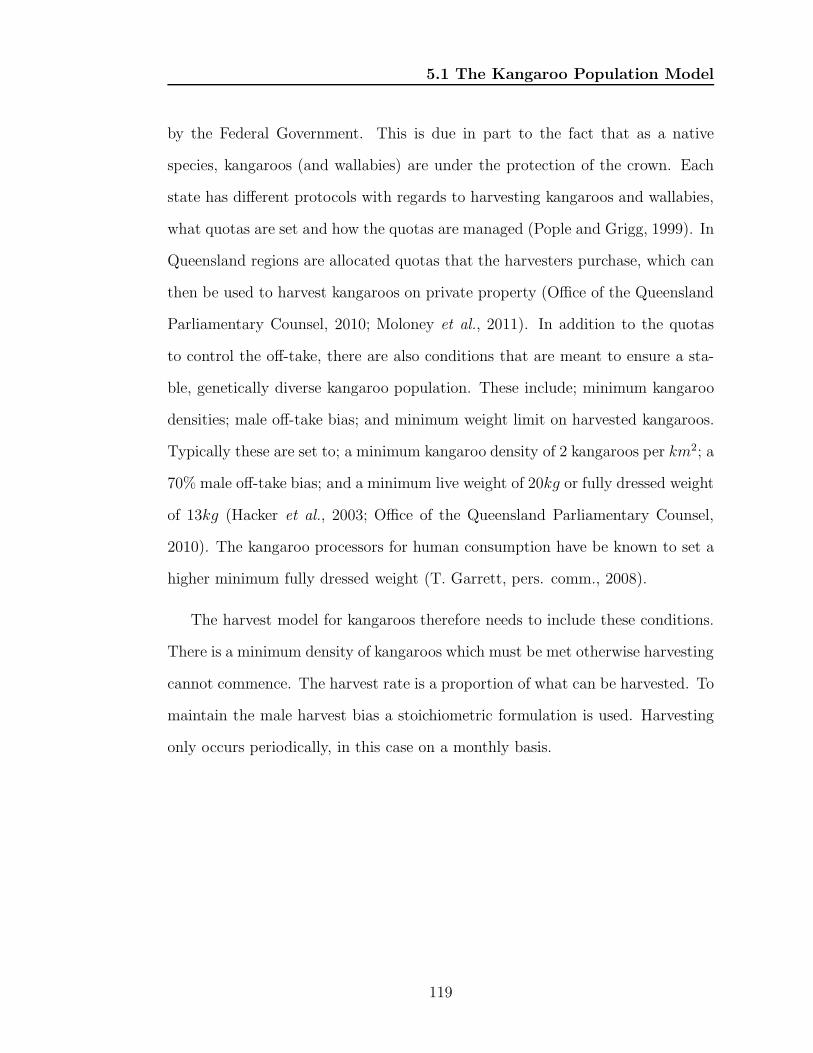
5.1 The Kangaroo Population Model
by the Federal Government. This is due in part to the fact that as a native
species, kangaroos (and wallabies) are under the protection of the crown. Each
state has different protocols with regards to harvesting kangaroos and wallabies,
what quotas are set and how the quotas are managed (Pople and Grigg, 1999). In
Queensland regions are allocated quotas that the harvesters purchase, which can
then be used to harvest kangaroos on private property (Office of the Queensland
Parliamentary Counsel, 2010; Moloney et al., 2011). In addition to the quotas
to control the off-take, there are also conditions that are meant to ensure a sta-
ble, genetically diverse kangaroo population. These include; minimum kangaroo
densities; male off-take bias; and minimum weight limit on harvested kangaroos.
Typically these are set to; a minimum kangaroo density of 2 kangaroos per km2; a
70% male off-take bias; and a minimum live weight of 20kg or fully dressed weight
of 13kg (Hacker et al., 2003; Office of the Queensland Parliamentary Counsel,
2010). The kangaroo processors for human consumption have be known to set a
higher minimum fully dressed weight (T. Garrett, pers. comm., 2008).
The harvest model for kangaroos therefore needs to include these conditions.
There is a minimum density of kangaroos which must be met otherwise harvesting
cannot commence. The harvest rate is a proportion of what can be harvested. To
maintain the male harvest bias a stoichiometric formulation is used. Harvesting
only occurs periodically, in this case on a monthly basis.
119
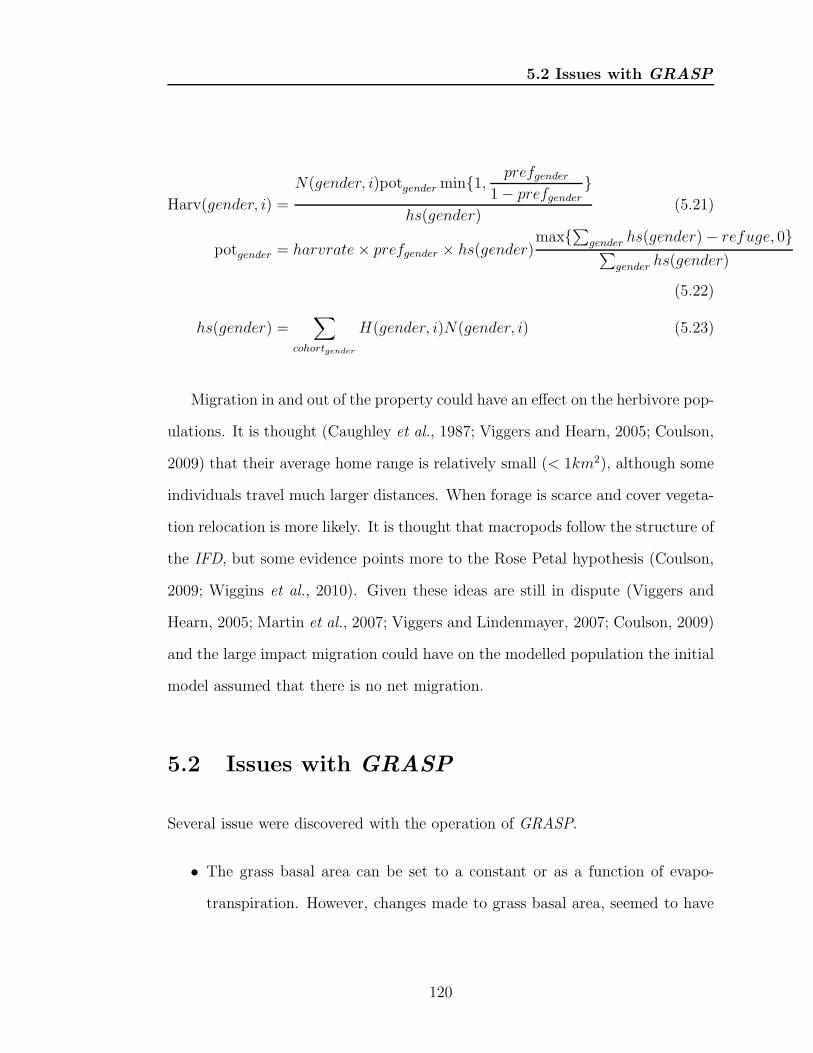
5.2 Issues with GRASP
Harv(gender, i) =
N(gender, i)potgender min{1, prefgender1− prefgender
}
hs(gender)(5.21)
potgender = harvrate× prefgender × hs(gender)max{
∑
gender hs(gender)− refuge, 0}∑
gender hs(gender)
(5.22)
hs(gender) =∑
cohortgender
H(gender, i)N(gender, i) (5.23)
Migration in and out of the property could have an effect on the herbivore pop-
ulations. It is thought (Caughley et al., 1987; Viggers and Hearn, 2005; Coulson,
2009) that their average home range is relatively small (< 1km2), although some
individuals travel much larger distances. When forage is scarce and cover vegeta-
tion relocation is more likely. It is thought that macropods follow the structure of
the IFD, but some evidence points more to the Rose Petal hypothesis (Coulson,
2009; Wiggins et al., 2010). Given these ideas are still in dispute (Viggers and
Hearn, 2005; Martin et al., 2007; Viggers and Lindenmayer, 2007; Coulson, 2009)
and the large impact migration could have on the modelled population the initial
model assumed that there is no net migration.
5.2 Issues with GRASP
Several issue were discovered with the operation of GRASP.
• The grass basal area can be set to a constant or as a function of evapo-
transpiration. However, changes made to grass basal area, seemed to have
120
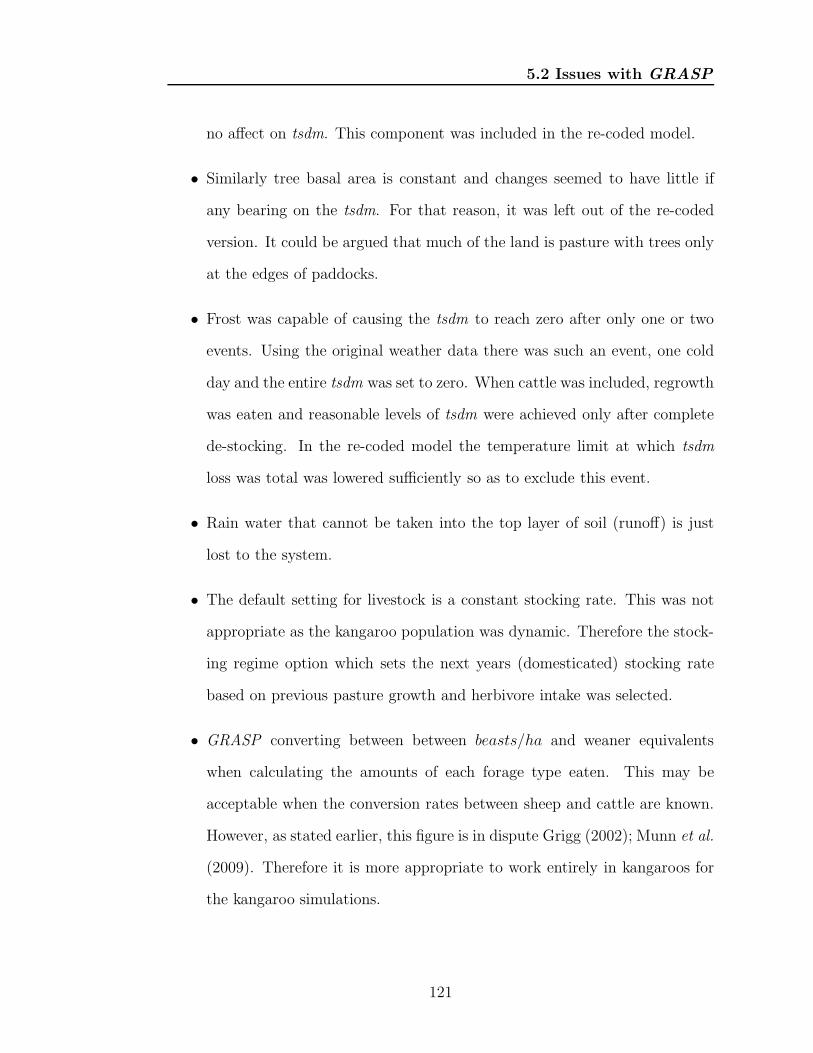
5.2 Issues with GRASP
no affect on tsdm. This component was included in the re-coded model.
• Similarly tree basal area is constant and changes seemed to have little if
any bearing on the tsdm. For that reason, it was left out of the re-coded
version. It could be argued that much of the land is pasture with trees only
at the edges of paddocks.
• Frost was capable of causing the tsdm to reach zero after only one or two
events. Using the original weather data there was such an event, one cold
day and the entire tsdm was set to zero. When cattle was included, regrowth
was eaten and reasonable levels of tsdm were achieved only after complete
de-stocking. In the re-coded model the temperature limit at which tsdm
loss was total was lowered sufficiently so as to exclude this event.
• Rain water that cannot be taken into the top layer of soil (runoff) is just
lost to the system.
• The default setting for livestock is a constant stocking rate. This was not
appropriate as the kangaroo population was dynamic. Therefore the stock-
ing regime option which sets the next years (domesticated) stocking rate
based on previous pasture growth and herbivore intake was selected.
• GRASP converting between between beasts/ha and weaner equivalents
when calculating the amounts of each forage type eaten. This may be
acceptable when the conversion rates between sheep and cattle are known.
However, as stated earlier, this figure is in dispute Grigg (2002); Munn et al.
(2009). Therefore it is more appropriate to work entirely in kangaroos for
the kangaroo simulations.
121
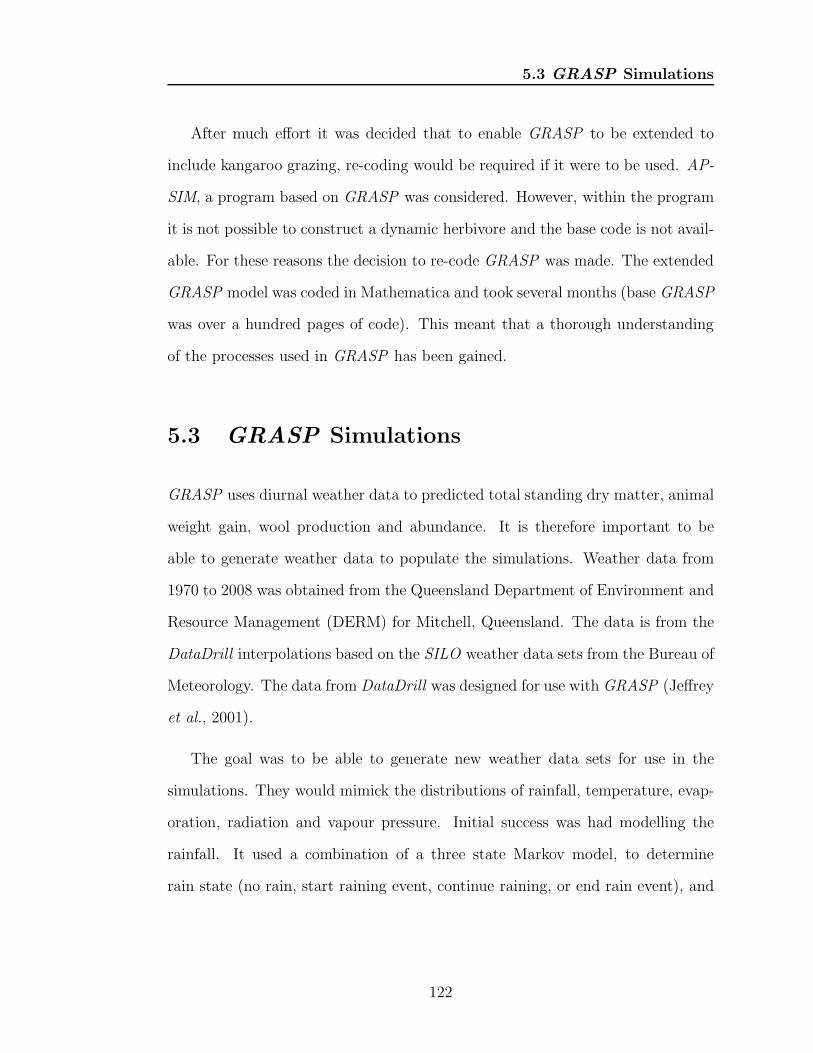
5.3 GRASP Simulations
After much effort it was decided that to enable GRASP to be extended to
include kangaroo grazing, re-coding would be required if it were to be used. AP-
SIM, a program based on GRASP was considered. However, within the program
it is not possible to construct a dynamic herbivore and the base code is not avail-
able. For these reasons the decision to re-code GRASP was made. The extended
GRASP model was coded in Mathematica and took several months (base GRASP
was over a hundred pages of code). This meant that a thorough understanding
of the processes used in GRASP has been gained.
5.3 GRASP Simulations
GRASP uses diurnal weather data to predicted total standing dry matter, animal
weight gain, wool production and abundance. It is therefore important to be
able to generate weather data to populate the simulations. Weather data from
1970 to 2008 was obtained from the Queensland Department of Environment and
Resource Management (DERM) for Mitchell, Queensland. The data is from the
DataDrill interpolations based on the SILO weather data sets from the Bureau of
Meteorology. The data from DataDrill was designed for use with GRASP (Jeffrey
et al., 2001).
The goal was to be able to generate new weather data sets for use in the
simulations. They would mimick the distributions of rainfall, temperature, evap-
oration, radiation and vapour pressure. Initial success was had modelling the
rainfall. It used a combination of a three state Markov model, to determine
rain state (no rain, start raining event, continue raining, or end rain event), and
122
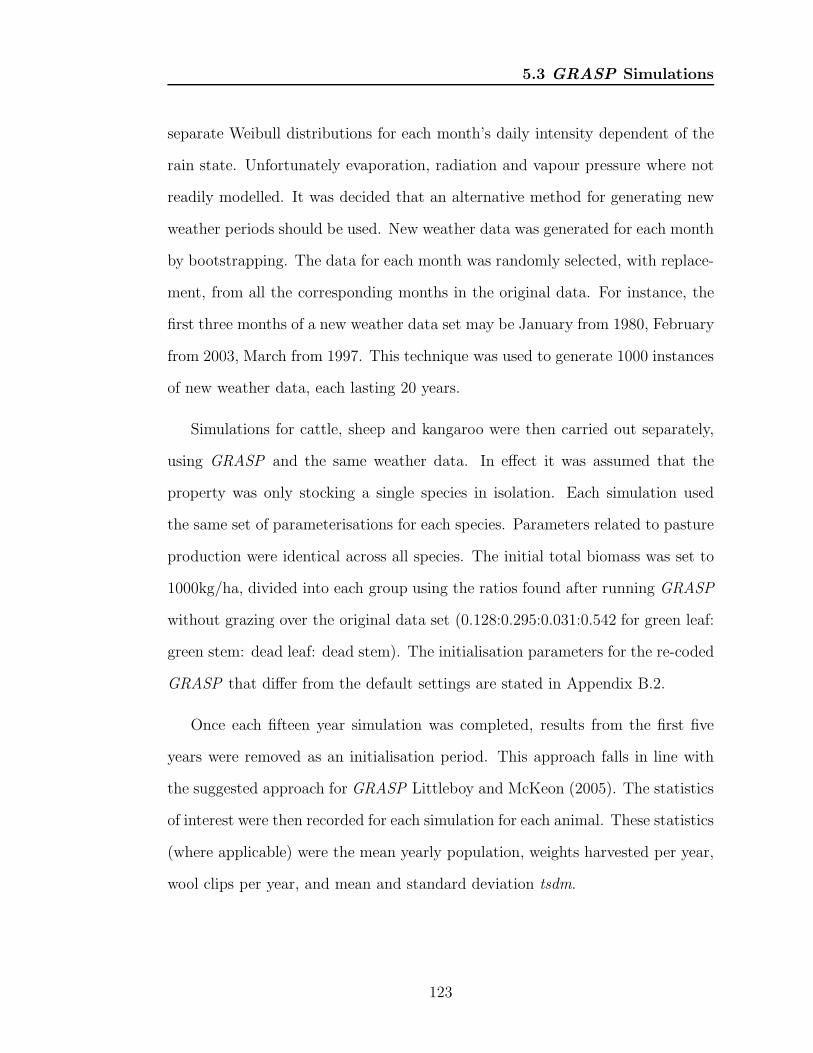
5.3 GRASP Simulations
separate Weibull distributions for each month’s daily intensity dependent of the
rain state. Unfortunately evaporation, radiation and vapour pressure where not
readily modelled. It was decided that an alternative method for generating new
weather periods should be used. New weather data was generated for each month
by bootstrapping. The data for each month was randomly selected, with replace-
ment, from all the corresponding months in the original data. For instance, the
first three months of a new weather data set may be January from 1980, February
from 2003, March from 1997. This technique was used to generate 1000 instances
of new weather data, each lasting 20 years.
Simulations for cattle, sheep and kangaroo were then carried out separately,
using GRASP and the same weather data. In effect it was assumed that the
property was only stocking a single species in isolation. Each simulation used
the same set of parameterisations for each species. Parameters related to pasture
production were identical across all species. The initial total biomass was set to
1000kg/ha, divided into each group using the ratios found after running GRASP
without grazing over the original data set (0.128:0.295:0.031:0.542 for green leaf:
green stem: dead leaf: dead stem). The initialisation parameters for the re-coded
GRASP that differ from the default settings are stated in Appendix B.2.
Once each fifteen year simulation was completed, results from the first five
years were removed as an initialisation period. This approach falls in line with
the suggested approach for GRASP Littleboy and McKeon (2005). The statistics
of interest were then recorded for each simulation for each animal. These statistics
(where applicable) were the mean yearly population, weights harvested per year,
wool clips per year, and mean and standard deviation tsdm.
123
5.4 Discussion
To illustrate what was generated by the extended GRASP program the data
produced for one weather simulation sequence for each herbivore in Figure 5.3.
Note that as expected, the kangaroo population falls sharply when condition is
too low for too long (Figure 5.3a). Also note that commodity production is not
entirely in lock step. Finally, it is clear that by looking at the tsdm under each
herbivore, that different amounts of available forage are utilised, with kangaroos
the most and cattle the least.
5.4 Discussion
After some trials and tribulations GRASP was extended to include kangaroo
grazing and population dynamics. The results from the simulations highlight
the fact that kangaroo population size can dramatically change depending on
the environmental conditions, a feature which may be exploited to mitigate lost
production during and post-drought. This seems to enable then to utilise the
available forage to a greater degree when conditions change. Production levels
for each animal have different lags to external events. This could be partially due
to the fact that domestic stock was only brought and sold annually. To see if
the differences in commodity production enhance resilience an agribusiness need
to be explored. These herbivore simulations integral to the portfolio analysis
conducted in Chapter 6, which will demonstrate to what degree mixed-grazing
can improve resilience.
124
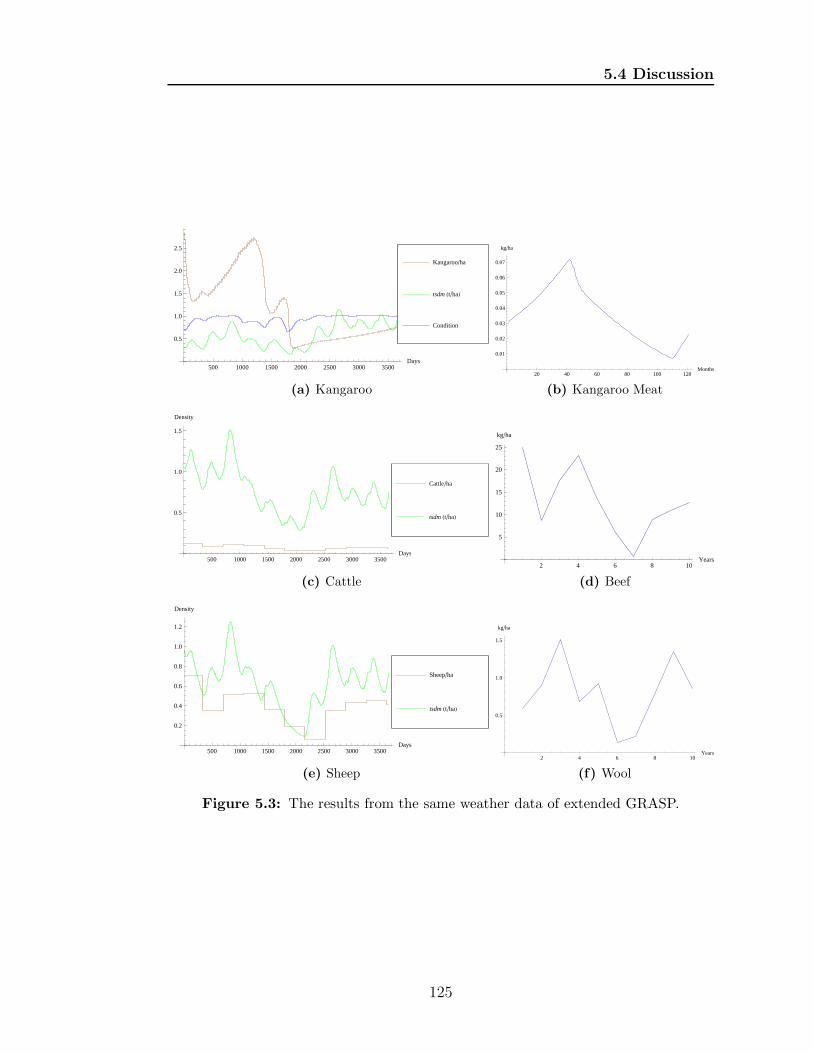
5.4 Discussion
500 1000 1500 2000 2500 3000 3500Days
0.5
1.0
1.5
2.0
2.5
Condition
tsdm Ht�haL
Kangaroo�ha
(a) Kangaroo
20 40 60 80 100 120Months
0.01
0.02
0.03
0.04
0.05
0.06
0.07
kg�ha
(b) Kangaroo Meat
500 1000 1500 2000 2500 3000 3500Days
0.5
1.0
1.5
Density
tsdm Ht�haL
Cattle�ha
(c) Cattle
2 4 6 8 10Years
5
10
15
20
25
kg�ha
(d) Beef
500 1000 1500 2000 2500 3000 3500Days
0.2
0.4
0.6
0.8
1.0
1.2
Density
tsdm Ht�haL
Sheep�ha
(e) Sheep
2 4 6 8 10Years
0.5
1.0
1.5
kg�ha
(f) Wool
Figure 5.3: The results from the same weather data of extended GRASP.
125
Chapter 6
Results and Analysis
This chapter is the culmination of the ideas explored to in the previous chapters.
Is mixed-grazing (including kangaroos) feasible from a financial point of view?
Chapter 2 explored the idea of allocating the available forage in such a way as
to optimise the trade off between possible revenue and consistency using by a
multi-objective optimisation problem (MOP). This used historical data from a
number of sources to estimate the covariance in revenue between cattle, wool
and kangaroo production over time. The production rates of the different com-
modities were considered known and constant. Having a better understanding
of the dynamics of the production of the commodities could influence the results
of the portfolio optimisation. Chapter 4 developed the analysis of the dynamics
between herbivores and the environment. It suggested that the actions of neigh-
bours would not affect properties, whilst they all used an optimal harvesting
regime. This is important as it can help allay landholder fears that an adjacent
property ”encourage” kangaroos could negatively affect their property. Also it
126
6.1 Simulation Results
addresses the concern mentioned in Section 2.1 that porous borders could result
in a net loss or gain of herbivores. Hence a landholder can choose which ratio
of herbivores to stock or harvest without impinging on neighbours. Admittedly
nature reserves are not ”optimally managed” for harvesting commodities, and
therefore could possibly influence outcomes on any property. Chapter 5 intro-
duced the plant-herbivore model GRASP and additional components designed
to model the kangaroo population. This enables a better understanding of the
dynamics of the different herbivores in the environment and the quantity of the
commodities they produce.
Combining sections from the previous three chapters resulted in running sim-
ulations of different weather patterns. The data generated, can then be used in a
MOP to construct an efficient frontier. Landholders can use the efficient frontier
to help decide on the future of their enterprise. What combination of cattle,
sheep and kangaroos will suit them given their level of risk aversion? Finally,
what impact would the enforcement of methane emission reduction have on the
optimal strategies?
6.1 Simulation Results
There are several components that require Monte Carlo simulations for use in
the portfolio optimisation. The extended GRASP model is run with different
simulated weather events to generate commodity production data. The data on
the price (or change in price) of the commodities needs to be simulated. Using a
combination of these results the relative returns can be simulated to inform the
127
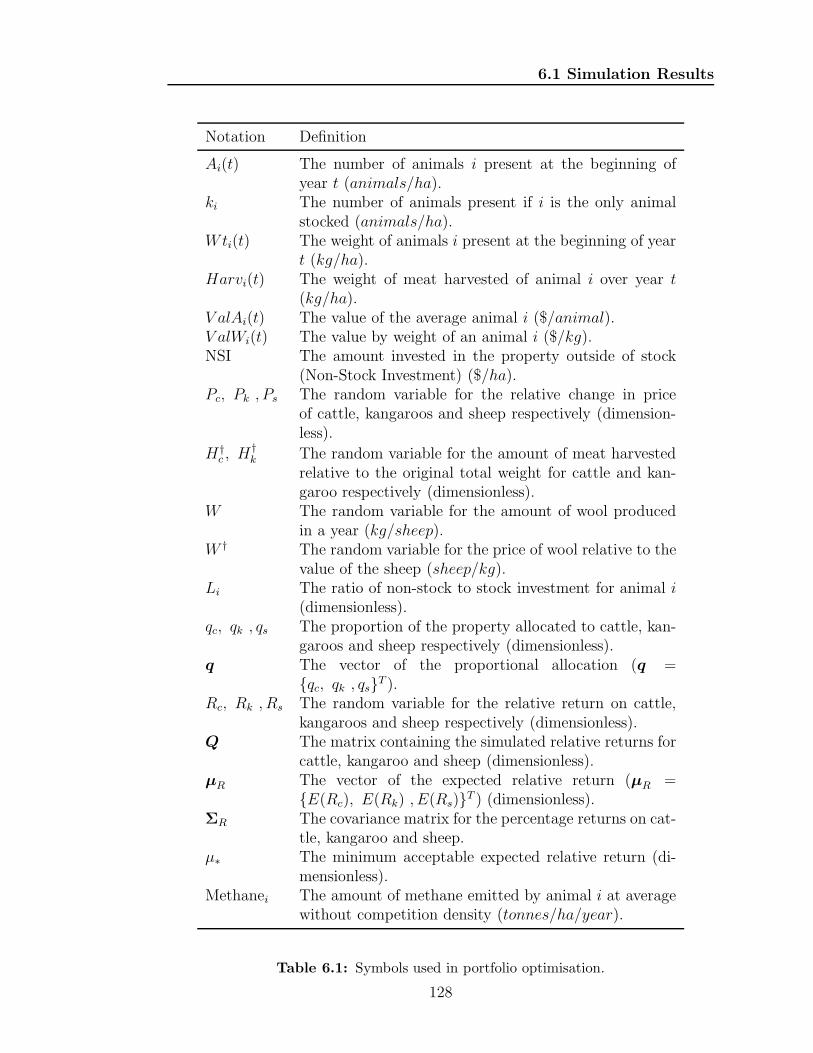
6.1 Simulation Results
Notation Definition
Ai(t) The number of animals i present at the beginning ofyear t (animals/ha).
ki The number of animals present if i is the only animalstocked (animals/ha).
Wti(t) The weight of animals i present at the beginning of yeart (kg/ha).
Harvi(t) The weight of meat harvested of animal i over year t(kg/ha).
V alAi(t) The value of the average animal i ($/animal).V alWi(t) The value by weight of an animal i ($/kg).NSI The amount invested in the property outside of stock
(Non-Stock Investment) ($/ha).Pc, Pk , Ps The random variable for the relative change in price
of cattle, kangaroos and sheep respectively (dimension-less).
H†c , H†
k The random variable for the amount of meat harvestedrelative to the original total weight for cattle and kan-garoo respectively (dimensionless).
W The random variable for the amount of wool producedin a year (kg/sheep).
W † The random variable for the price of wool relative to thevalue of the sheep (sheep/kg).
Li The ratio of non-stock to stock investment for animal i(dimensionless).
qc, qk , qs The proportion of the property allocated to cattle, kan-garoos and sheep respectively (dimensionless).
q The vector of the proportional allocation (q ={qc, qk , qs}T ).
Rc, Rk , Rs The random variable for the relative return on cattle,kangaroos and sheep respectively (dimensionless).
Q The matrix containing the simulated relative returns forcattle, kangaroo and sheep (dimensionless).
µR The vector of the expected relative return (µR ={E(Rc), E(Rk) , E(Rs)}T ) (dimensionless).
ΣR The covariance matrix for the percentage returns on cat-tle, kangaroo and sheep.
µ∗ The minimum acceptable expected relative return (di-mensionless).
Methanei The amount of methane emitted by animal i at averagewithout competition density (tonnes/ha/year).
Table 6.1: Symbols used in portfolio optimisation.
128
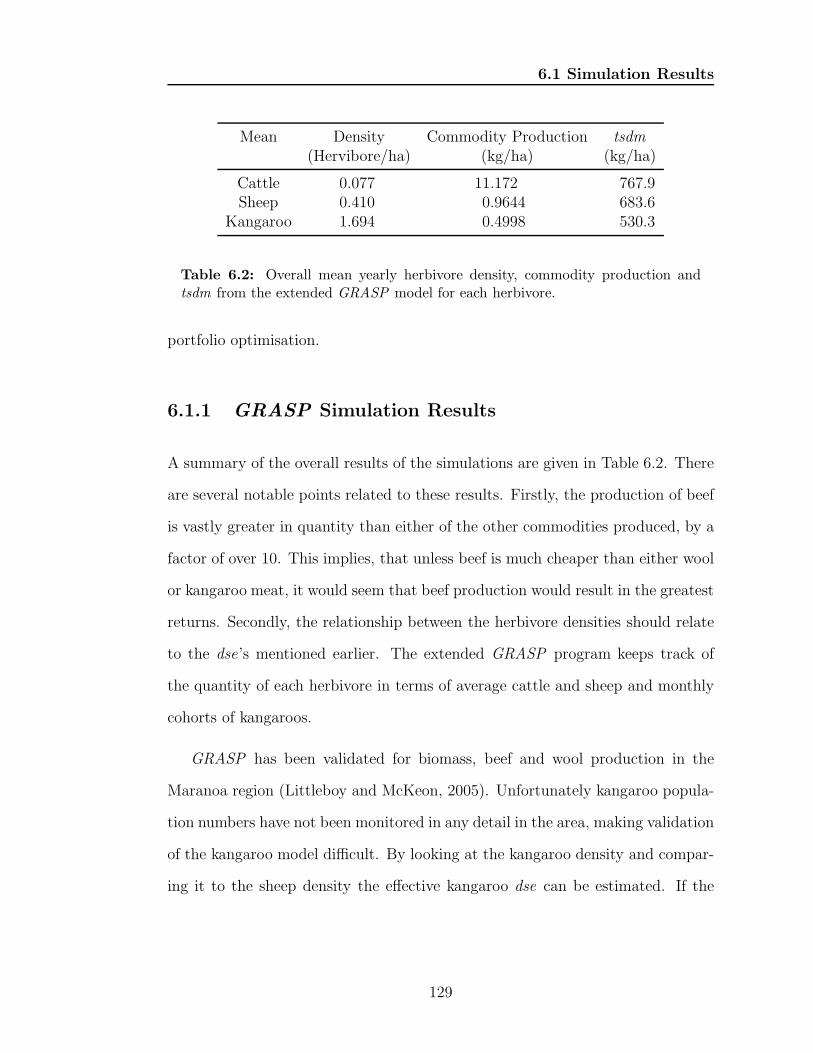
6.1 Simulation Results
Mean Density Commodity Production tsdm(Hervibore/ha) (kg/ha) (kg/ha)
Cattle 0.077 11.172 767.9Sheep 0.410 0.9644 683.6
Kangaroo 1.694 0.4998 530.3
Table 6.2: Overall mean yearly herbivore density, commodity production andtsdm from the extended GRASP model for each herbivore.
portfolio optimisation.
6.1.1 GRASP Simulation Results
A summary of the overall results of the simulations are given in Table 6.2. There
are several notable points related to these results. Firstly, the production of beef
is vastly greater in quantity than either of the other commodities produced, by a
factor of over 10. This implies, that unless beef is much cheaper than either wool
or kangaroo meat, it would seem that beef production would result in the greatest
returns. Secondly, the relationship between the herbivore densities should relate
to the dse’s mentioned earlier. The extended GRASP program keeps track of
the quantity of each herbivore in terms of average cattle and sheep and monthly
cohorts of kangaroos.
GRASP has been validated for biomass, beef and wool production in the
Maranoa region (Littleboy and McKeon, 2005). Unfortunately kangaroo popula-
tion numbers have not been monitored in any detail in the area, making validation
of the kangaroo model difficult. By looking at the kangaroo density and compar-
ing it to the sheep density the effective kangaroo dse can be estimated. If the
129
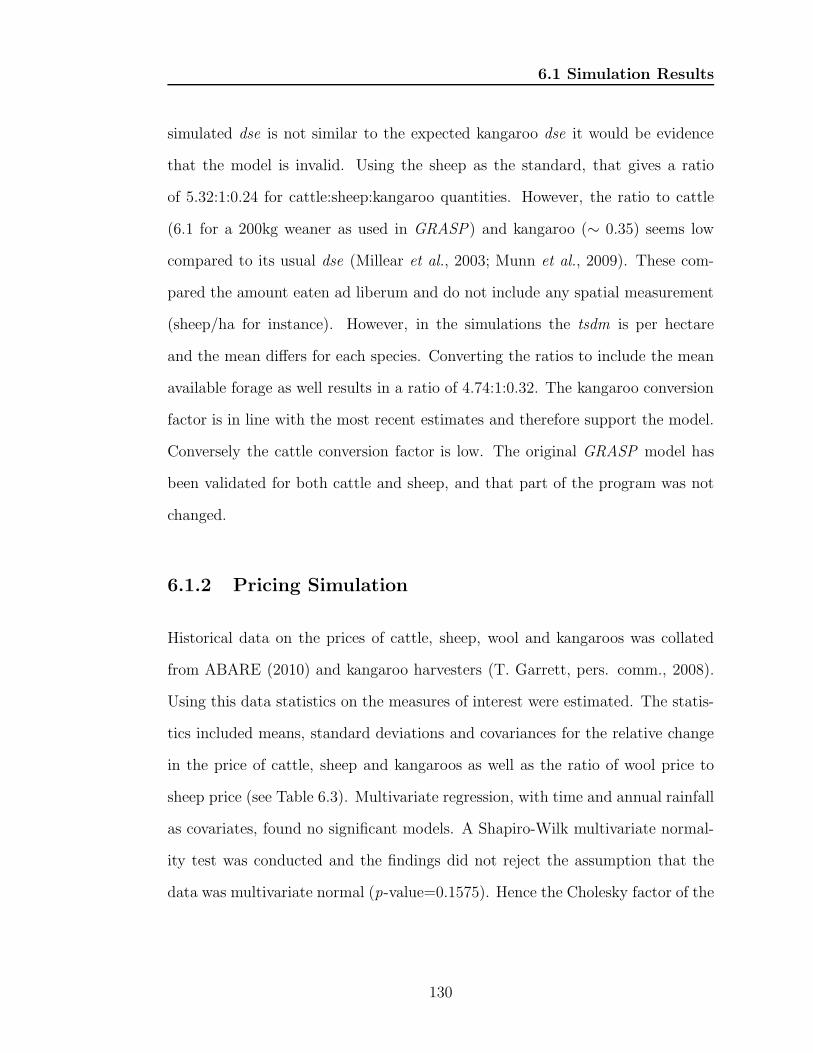
6.1 Simulation Results
simulated dse is not similar to the expected kangaroo dse it would be evidence
that the model is invalid. Using the sheep as the standard, that gives a ratio
of 5.32:1:0.24 for cattle:sheep:kangaroo quantities. However, the ratio to cattle
(6.1 for a 200kg weaner as used in GRASP) and kangaroo (∼ 0.35) seems low
compared to its usual dse (Millear et al., 2003; Munn et al., 2009). These com-
pared the amount eaten ad liberum and do not include any spatial measurement
(sheep/ha for instance). However, in the simulations the tsdm is per hectare
and the mean differs for each species. Converting the ratios to include the mean
available forage as well results in a ratio of 4.74:1:0.32. The kangaroo conversion
factor is in line with the most recent estimates and therefore support the model.
Conversely the cattle conversion factor is low. The original GRASP model has
been validated for both cattle and sheep, and that part of the program was not
changed.
6.1.2 Pricing Simulation
Historical data on the prices of cattle, sheep, wool and kangaroos was collated
from ABARE (2010) and kangaroo harvesters (T. Garrett, pers. comm., 2008).
Using this data statistics on the measures of interest were estimated. The statis-
tics included means, standard deviations and covariances for the relative change
in the price of cattle, sheep and kangaroos as well as the ratio of wool price to
sheep price (see Table 6.3). Multivariate regression, with time and annual rainfall
as covariates, found no significant models. A Shapiro-Wilk multivariate normal-
ity test was conducted and the findings did not reject the assumption that the
data was multivariate normal (p-value=0.1575). Hence the Cholesky factor of the
130
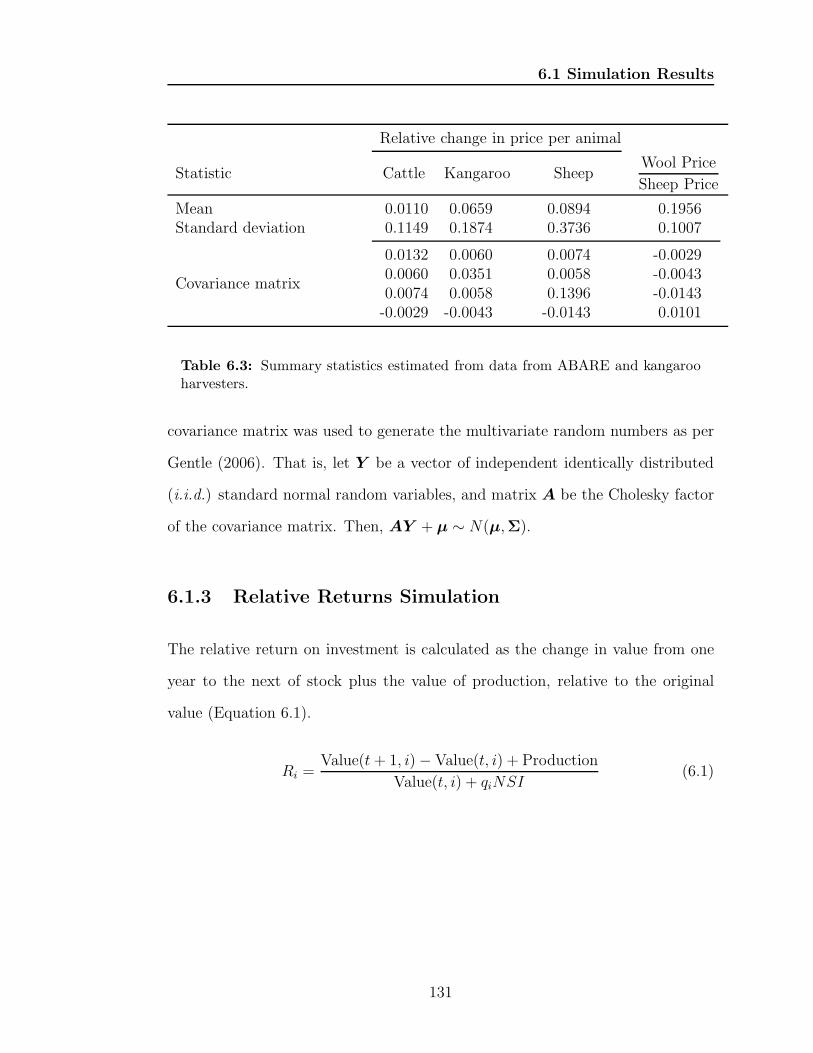
6.1 Simulation Results
Relative change in price per animal
Statistic Cattle Kangaroo SheepWool Price
Sheep Price
Mean 0.0110 0.0659 0.0894 0.1956Standard deviation 0.1149 0.1874 0.3736 0.1007
Covariance matrix
0.0132 0.0060 0.0074 -0.00290.0060 0.0351 0.0058 -0.00430.0074 0.0058 0.1396 -0.0143-0.0029 -0.0043 -0.0143 0.0101
Table 6.3: Summary statistics estimated from data from ABARE and kangarooharvesters.
covariance matrix was used to generate the multivariate random numbers as per
Gentle (2006). That is, let Y be a vector of independent identically distributed
(i.i.d.) standard normal random variables, and matrix A be the Cholesky factor
of the covariance matrix. Then, AY + µ ∼ N(µ,Σ).
6.1.3 Relative Returns Simulation
The relative return on investment is calculated as the change in value from one
year to the next of stock plus the value of production, relative to the original
value (Equation 6.1).
Ri =Value(t+ 1, i)− Value(t, i) + Production
Value(t, i) + qiNSI(6.1)
131
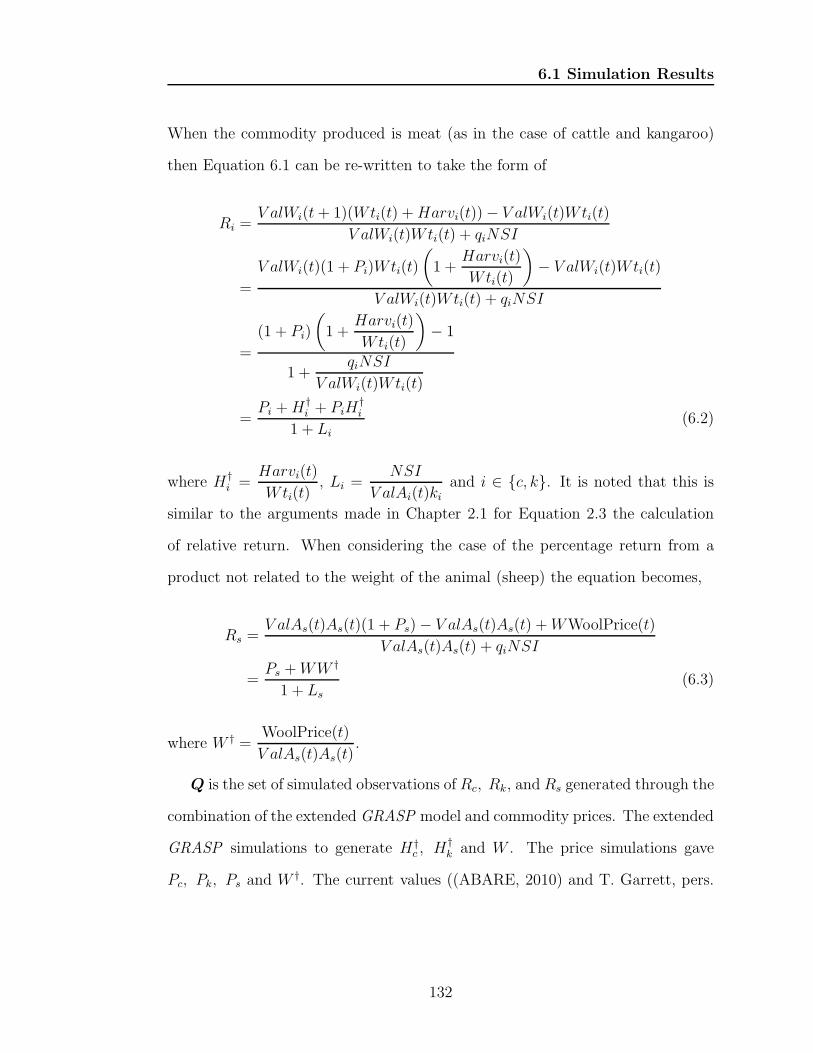
6.1 Simulation Results
When the commodity produced is meat (as in the case of cattle and kangaroo)
then Equation 6.1 can be re-written to take the form of
Ri =V alWi(t+ 1)(Wti(t) +Harvi(t))− V alWi(t)Wti(t)
V alWi(t)Wti(t) + qiNSI
=
V alWi(t)(1 + Pi)Wti(t)
(
1 +Harvi(t)
Wti(t)
)
− V alWi(t)Wti(t)
V alWi(t)Wti(t) + qiNSI
=
(1 + Pi)
(
1 +Harvi(t)
Wti(t)
)
− 1
1 +qiNSI
V alWi(t)Wti(t)
=Pi +H†
i + PiH†i
1 + Li
(6.2)
where H†i =
Harvi(t)
Wti(t), Li =
NSI
V alAi(t)kiand i ∈ {c, k}. It is noted that this is
similar to the arguments made in Chapter 2.1 for Equation 2.3 the calculation
of relative return. When considering the case of the percentage return from a
product not related to the weight of the animal (sheep) the equation becomes,
Rs =V alAs(t)As(t)(1 + Ps)− V alAs(t)As(t) +WWoolPrice(t)
V alAs(t)As(t) + qiNSI
=Ps +WW †
1 + Ls
(6.3)
where W † =WoolPrice(t)
V alAs(t)As(t).
Q is the set of simulated observations of Rc, Rk, and Rs generated through the
combination of the extended GRASP model and commodity prices. The extended
GRASP simulations to generate H†c , H†
k and W . The price simulations gave
Pc, Pk, Ps and W †. The current values ((ABARE, 2010) and T. Garrett, pers.
132
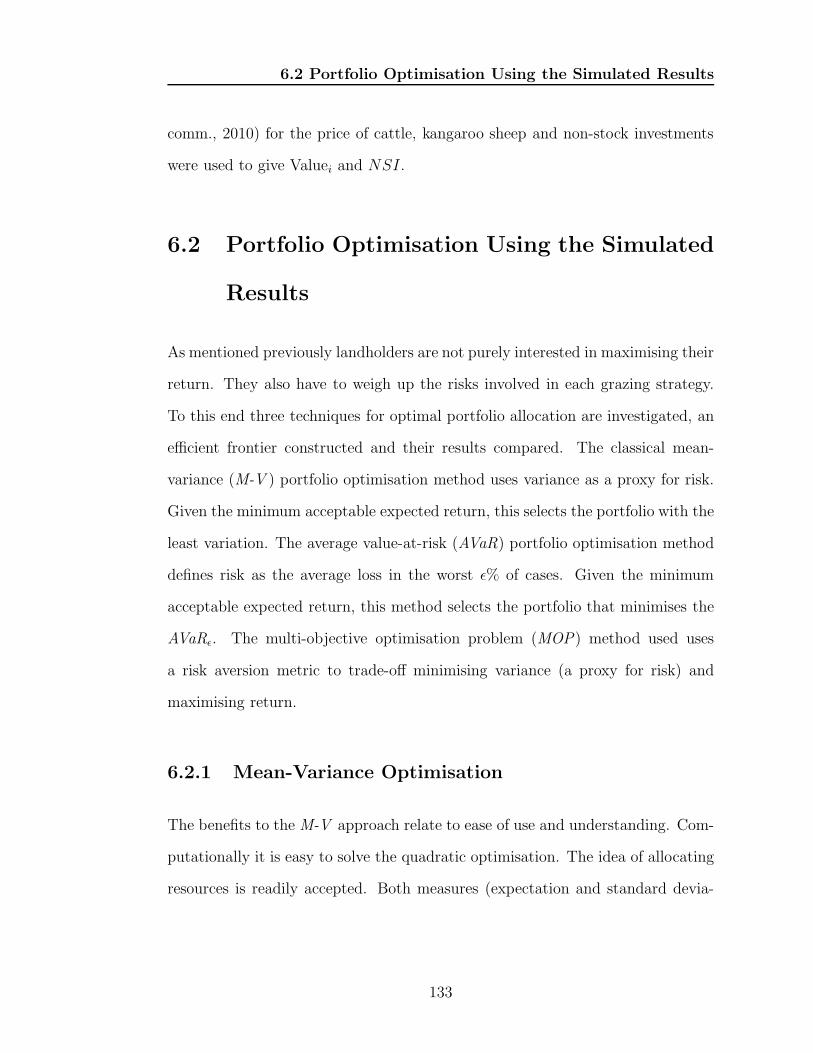
6.2 Portfolio Optimisation Using the Simulated Results
comm., 2010) for the price of cattle, kangaroo sheep and non-stock investments
were used to give Valuei and NSI.
6.2 Portfolio Optimisation Using the Simulated
Results
As mentioned previously landholders are not purely interested in maximising their
return. They also have to weigh up the risks involved in each grazing strategy.
To this end three techniques for optimal portfolio allocation are investigated, an
efficient frontier constructed and their results compared. The classical mean-
variance (M-V ) portfolio optimisation method uses variance as a proxy for risk.
Given the minimum acceptable expected return, this selects the portfolio with the
least variation. The average value-at-risk (AVaR) portfolio optimisation method
defines risk as the average loss in the worst ε% of cases. Given the minimum
acceptable expected return, this method selects the portfolio that minimises the
AVaRε. The multi-objective optimisation problem (MOP) method used uses
a risk aversion metric to trade-off minimising variance (a proxy for risk) and
maximising return.
6.2.1 Mean-Variance Optimisation
The benefits to the M-V approach relate to ease of use and understanding. Com-
putationally it is easy to solve the quadratic optimisation. The idea of allocating
resources is readily accepted. Both measures (expectation and standard devia-
133
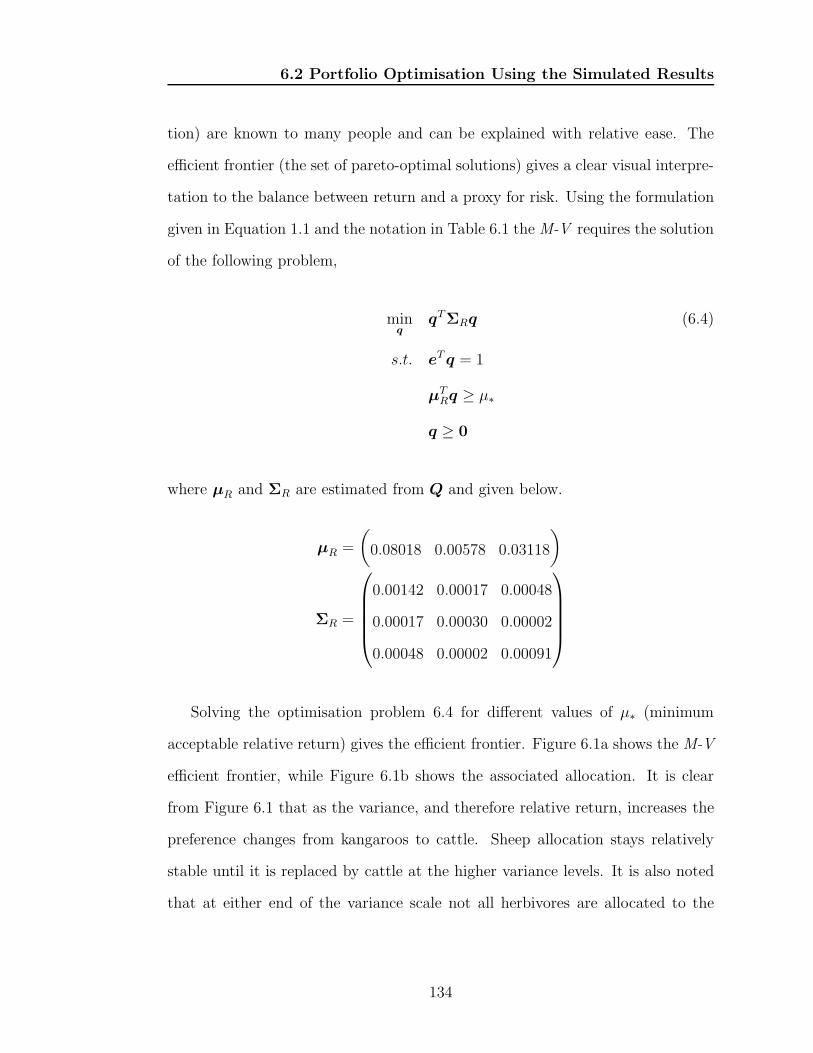
6.2 Portfolio Optimisation Using the Simulated Results
tion) are known to many people and can be explained with relative ease. The
efficient frontier (the set of pareto-optimal solutions) gives a clear visual interpre-
tation to the balance between return and a proxy for risk. Using the formulation
given in Equation 1.1 and the notation in Table 6.1 the M-V requires the solution
of the following problem,
minq
qTΣRq (6.4)
s.t. eTq = 1
µTRq ≥ µ∗
q ≥ 0
where µR and ΣR are estimated from Q and given below.
µR =
(
0.08018 0.00578 0.03118
)
ΣR =
0.00142 0.00017 0.00048
0.00017 0.00030 0.00002
0.00048 0.00002 0.00091
Solving the optimisation problem 6.4 for different values of µ∗ (minimum
acceptable relative return) gives the efficient frontier. Figure 6.1a shows the M-V
efficient frontier, while Figure 6.1b shows the associated allocation. It is clear
from Figure 6.1 that as the variance, and therefore relative return, increases the
preference changes from kangaroos to cattle. Sheep allocation stays relatively
stable until it is replaced by cattle at the higher variance levels. It is also noted
that at either end of the variance scale not all herbivores are allocated to the
134
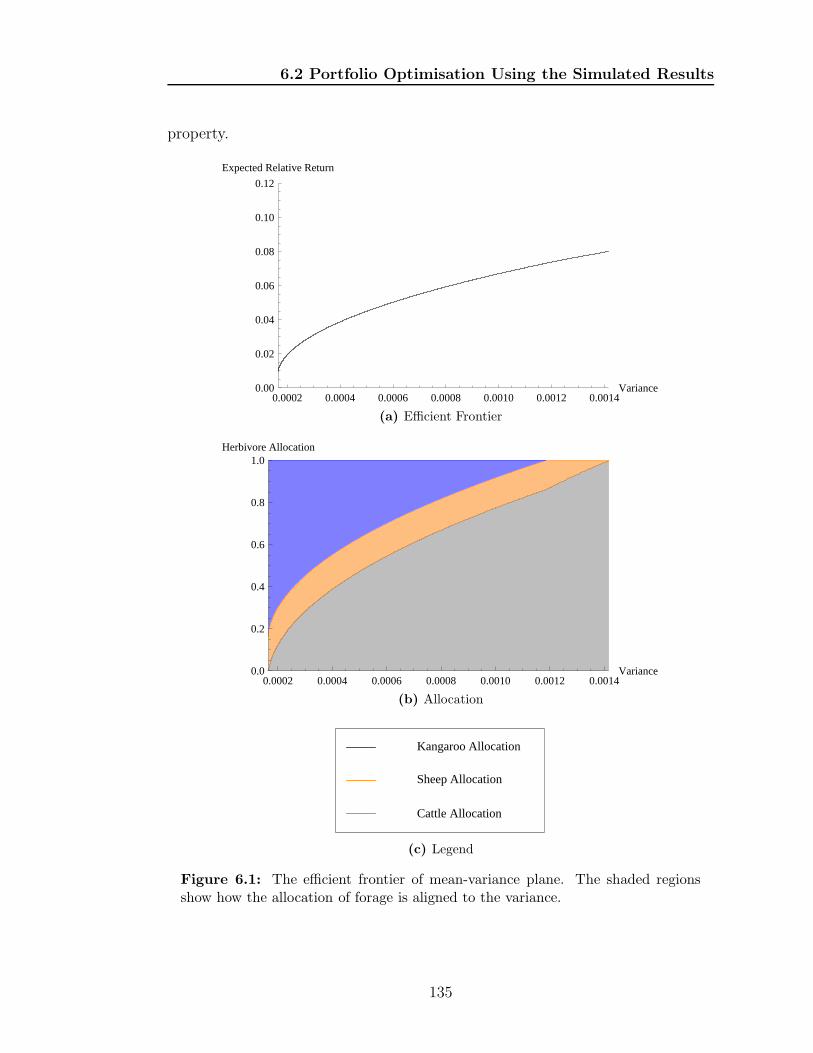
6.2 Portfolio Optimisation Using the Simulated Results
property.
0.0002 0.0004 0.0006 0.0008 0.0010 0.0012 0.0014Variance0.00
0.02
0.04
0.06
0.08
0.10
0.12
Expected Relative Return
(a) Efficient Frontier
0.0002 0.0004 0.0006 0.0008 0.0010 0.0012 0.0014Variance0.0
0.2
0.4
0.6
0.8
1.0Herbivore Allocation
(b) Allocation
Cattle Allocation
Sheep Allocation
Kangaroo Allocation
(c) Legend
Figure 6.1: The efficient frontier of mean-variance plane. The shaded regionsshow how the allocation of forage is aligned to the variance.
135
6.2 Portfolio Optimisation Using the Simulated Results
To put these results in context, consider a landholder who has a 200km2
property and wishes to have an expected relative return of 7%. Their best option
(in a M-V sense) would be an allocation of 162.9km2, 28.4km2 and 8.7km2 to
cattle, sheep and kangaroo respectively. The expected return for this allocation
would be $630, 332 given an investment of $9, 004, 740 with a standard deviation
of $296, 470.
There is one possible problem with the M-V approach in this case. To consis-
tently give the best return for the same variance the underlying distribution of Q
should be multivariate normal. This property is known as second-order stochas-
tic dominance (SSD) (Rachev et al., 2008). Using a Shapiro-Wilk multivariate
normality test on Q gave a p-value = 0.038, which means at the usual significance
level (0.05) the assumption that Q is multivariate normal is rejected. Therefore
the M-V portfolio optimisation is unlikely to be SSD. Hence, it is possible the
best return for the same variance has not been selected.
6.2.2 Average Value at Risk Optimisation
An alternative to classifying risk as variance is using a measure like average value-
at-risk (AVaR, also known as conditional value at risk). AVaR is SSD without
requiring multivariate normal returns (De Giorgi, 2005). AVaR is based on the
expected return given that the return was in the lowest ε of the distribution. If
the distribution is not known, the AVaR of a single return can be estimated from
136
6.2 Portfolio Optimisation Using the Simulated Results
a sample via the Equation 6.5 (Rochafellar and Urasev, 2000).
AVaRε(r) = minϑ∈R
(
ϑ+1
nε
n∑
j=1
max{−rj − ϑ, 0})
(6.5)
where ϑ is an auxiliary variable. Optimising the AVaR for a portfolio can be done
via the following optimisation problem (Palmquist et al., 2002).
minq,ϑ,d
ϑ+qTe
nε(6.6)
s.t. −Qq − ϑe ≤ d
eTq = 1
µTRq ≥ µ∗
q ≥ 0,d ≥ 0, ϑ ∈ R
where d is a vector of auxiliary variables and ϑ is the additional parameter coming
from the minimisation formula. Solving the optimisation problem 6.6 for different
values of µ∗ gives the efficient frontier. Consider the AVaR at a tail probability
of ε = 0.2. That is the (relative) expected loss given that the return is in the
bottom 20% of portfolio returns. Put another way, on average, every five years
you would expect to have a loss this large. Figure 6.2a shows the AVaR0.2 effi-
cient frontier, while Figure 6.2b shows the associated allocation. It is clear from
Figure 6.2 that as the AVaR0.2, and therefore relative return, increases the pref-
erence changes from kangaroos to cattle. Sheep allocation stays relatively stable
until it is replaced by cattle at the higher variance levels. It is also noted that at
either end of the variance scale not all herbivores are allocated to the property.
To put these results in context consider a landholder who has a 200km2 property
137
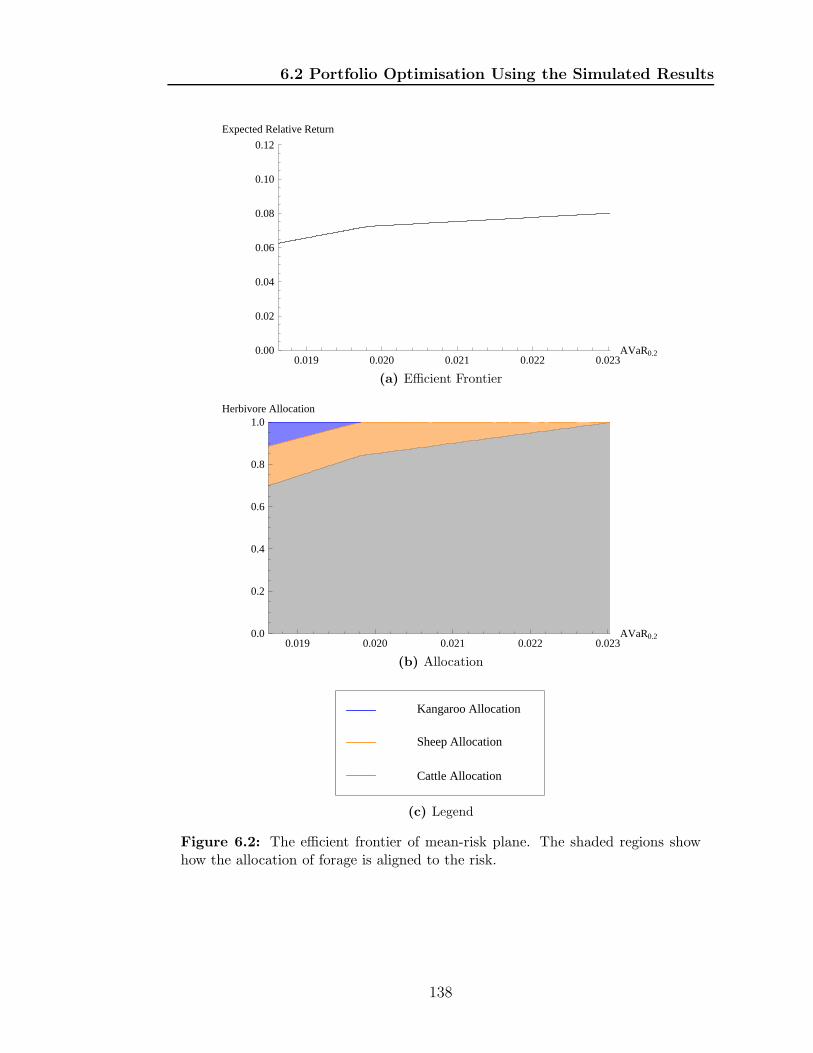
6.2 Portfolio Optimisation Using the Simulated Results
0.019 0.020 0.021 0.022 0.023AVaR0.20.00
0.02
0.04
0.06
0.08
0.10
0.12
Expected Relative Return
(a) Efficient Frontier
0.019 0.020 0.021 0.022 0.023AVaR0.20.0
0.2
0.4
0.6
0.8
1.0Herbivore Allocation
(b) Allocation
Cattle Allocation
Sheep Allocation
Kangaroo Allocation
(c) Legend
Figure 6.2: The efficient frontier of mean-risk plane. The shaded regions showhow the allocation of forage is aligned to the risk.
138
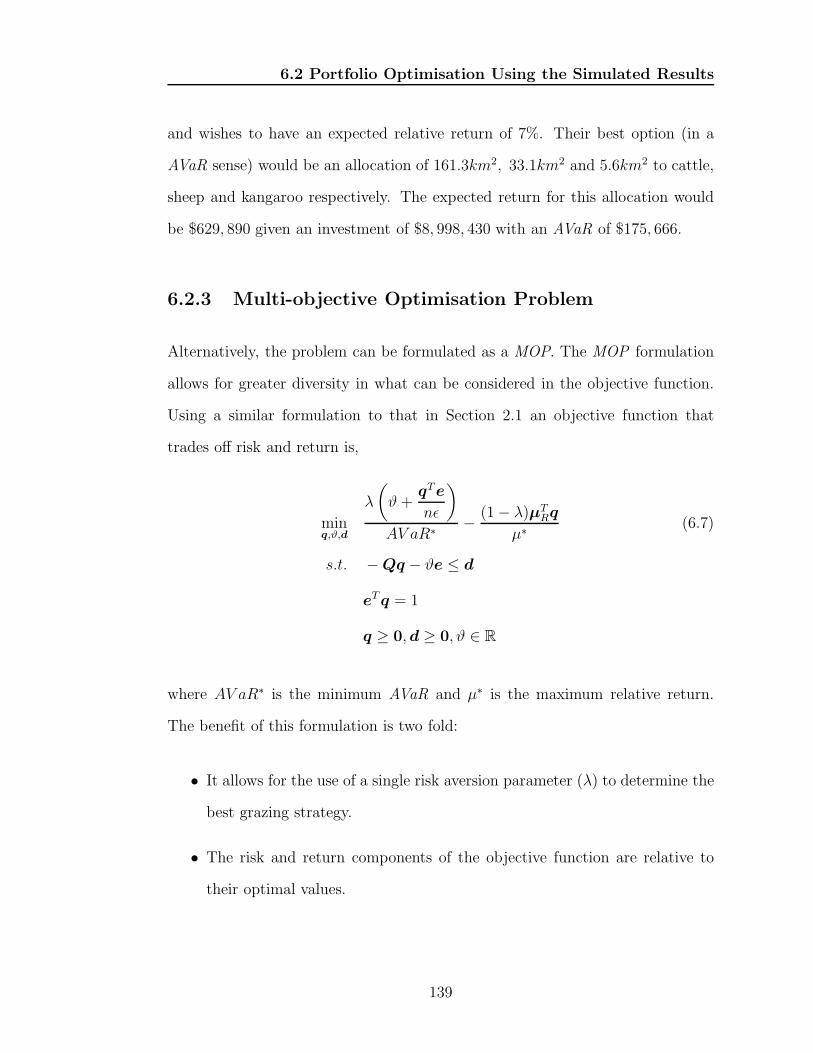
6.2 Portfolio Optimisation Using the Simulated Results
and wishes to have an expected relative return of 7%. Their best option (in a
AVaR sense) would be an allocation of 161.3km2, 33.1km2 and 5.6km2 to cattle,
sheep and kangaroo respectively. The expected return for this allocation would
be $629, 890 given an investment of $8, 998, 430 with an AVaR of $175, 666.
6.2.3 Multi-objective Optimisation Problem
Alternatively, the problem can be formulated as a MOP. The MOP formulation
allows for greater diversity in what can be considered in the objective function.
Using a similar formulation to that in Section 2.1 an objective function that
trades off risk and return is,
minq,ϑ,d
λ
(
ϑ+qTe
nε
)
AV aR∗− (1− λ)µT
Rq
µ∗(6.7)
s.t. −Qq − ϑe ≤ d
eTq = 1
q ≥ 0,d ≥ 0, ϑ ∈ R
where AV aR∗ is the minimum AVaR and µ∗ is the maximum relative return.
The benefit of this formulation is two fold:
• It allows for the use of a single risk aversion parameter (λ) to determine the
best grazing strategy.
• The risk and return components of the objective function are relative to
their optimal values.
139
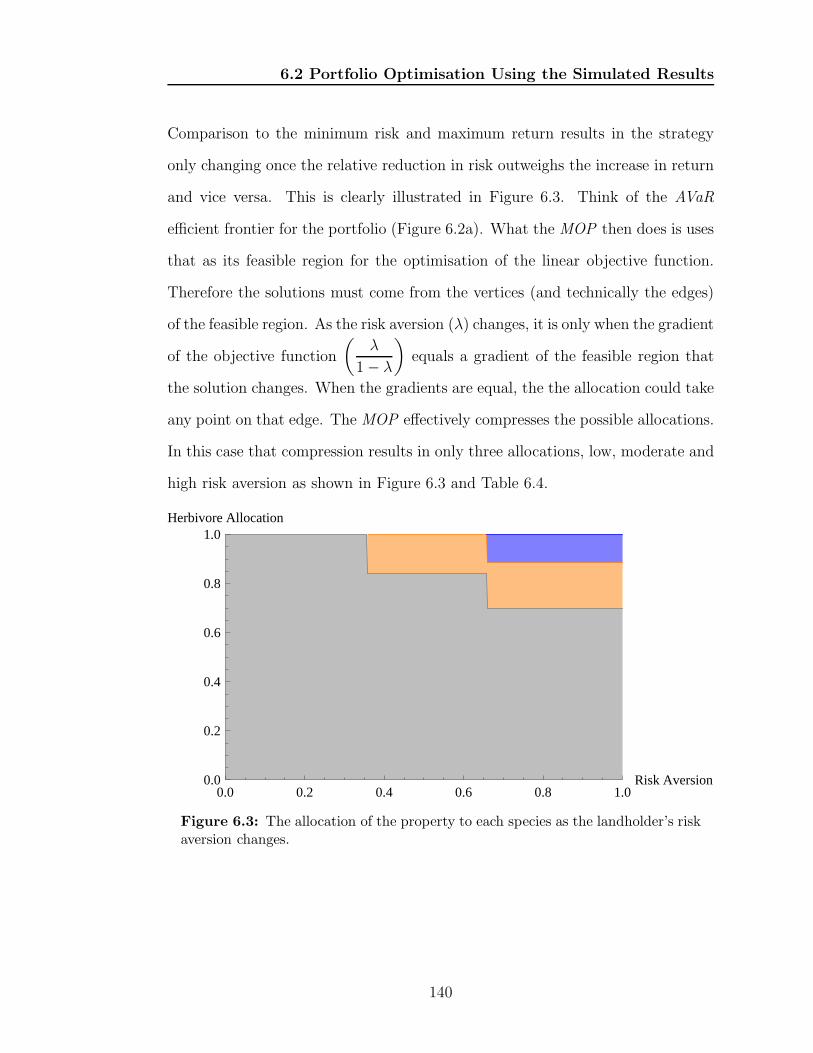
6.2 Portfolio Optimisation Using the Simulated Results
Comparison to the minimum risk and maximum return results in the strategy
only changing once the relative reduction in risk outweighs the increase in return
and vice versa. This is clearly illustrated in Figure 6.3. Think of the AVaR
efficient frontier for the portfolio (Figure 6.2a). What the MOP then does is uses
that as its feasible region for the optimisation of the linear objective function.
Therefore the solutions must come from the vertices (and technically the edges)
of the feasible region. As the risk aversion (λ) changes, it is only when the gradient
of the objective function
(
λ
1− λ
)
equals a gradient of the feasible region that
the solution changes. When the gradients are equal, the the allocation could take
any point on that edge. The MOP effectively compresses the possible allocations.
In this case that compression results in only three allocations, low, moderate and
high risk aversion as shown in Figure 6.3 and Table 6.4.
0.0 0.2 0.4 0.6 0.8 1.0Risk Aversion0.0
0.2
0.4
0.6
0.8
1.0Herbivore Allocation
Figure 6.3: The allocation of the property to each species as the landholder’s riskaversion changes.
140
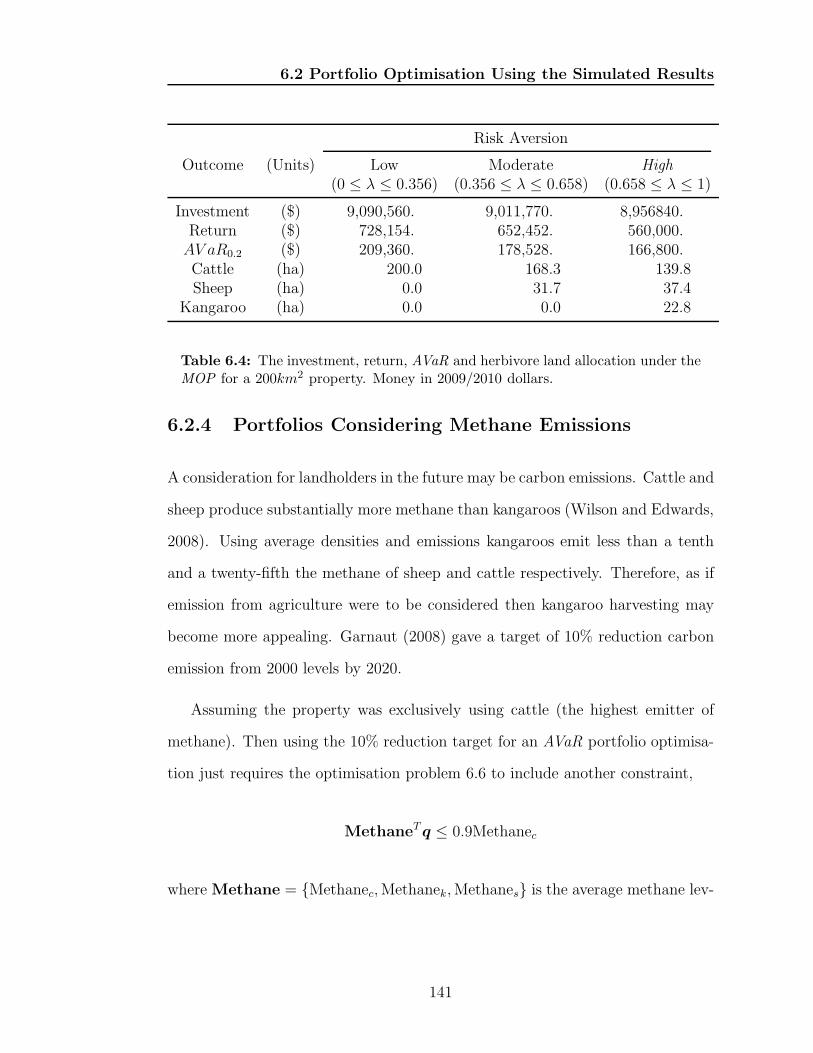
6.2 Portfolio Optimisation Using the Simulated Results
Risk Aversion
Outcome (Units) Low Moderate High(0 ≤ λ ≤ 0.356) (0.356 ≤ λ ≤ 0.658) (0.658 ≤ λ ≤ 1)
Investment ($) 9,090,560. 9,011,770. 8,956840.Return ($) 728,154. 652,452. 560,000.AV aR0.2 ($) 209,360. 178,528. 166,800.Cattle (ha) 200.0 168.3 139.8Sheep (ha) 0.0 31.7 37.4
Kangaroo (ha) 0.0 0.0 22.8
Table 6.4: The investment, return, AVaR and herbivore land allocation under theMOP for a 200km2 property. Money in 2009/2010 dollars.
6.2.4 Portfolios Considering Methane Emissions
A consideration for landholders in the future may be carbon emissions. Cattle and
sheep produce substantially more methane than kangaroos (Wilson and Edwards,
2008). Using average densities and emissions kangaroos emit less than a tenth
and a twenty-fifth the methane of sheep and cattle respectively. Therefore, as if
emission from agriculture were to be considered then kangaroo harvesting may
become more appealing. Garnaut (2008) gave a target of 10% reduction carbon
emission from 2000 levels by 2020.
Assuming the property was exclusively using cattle (the highest emitter of
methane). Then using the 10% reduction target for an AVaR portfolio optimisa-
tion just requires the optimisation problem 6.6 to include another constraint,
MethaneTq ≤ 0.9Methanec
where Methane = {Methanec,Methanek,Methanes} is the average methane lev-
141
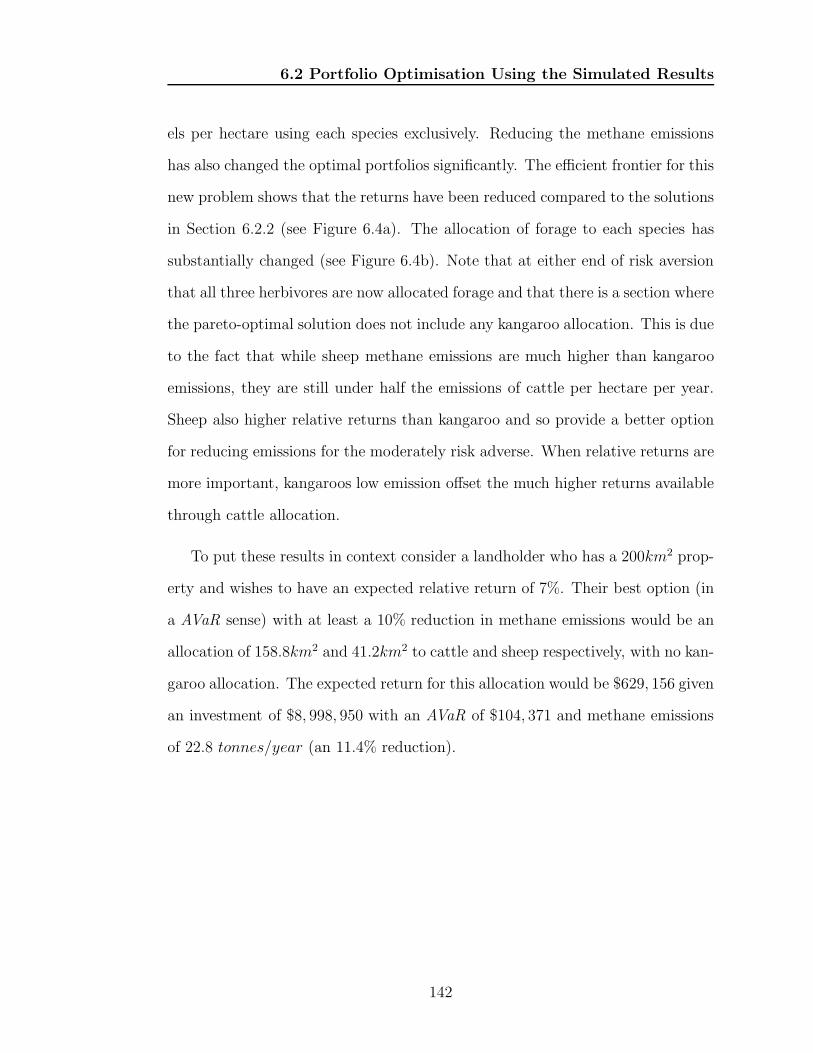
6.2 Portfolio Optimisation Using the Simulated Results
els per hectare using each species exclusively. Reducing the methane emissions
has also changed the optimal portfolios significantly. The efficient frontier for this
new problem shows that the returns have been reduced compared to the solutions
in Section 6.2.2 (see Figure 6.4a). The allocation of forage to each species has
substantially changed (see Figure 6.4b). Note that at either end of risk aversion
that all three herbivores are now allocated forage and that there is a section where
the pareto-optimal solution does not include any kangaroo allocation. This is due
to the fact that while sheep methane emissions are much higher than kangaroo
emissions, they are still under half the emissions of cattle per hectare per year.
Sheep also higher relative returns than kangaroo and so provide a better option
for reducing emissions for the moderately risk adverse. When relative returns are
more important, kangaroos low emission offset the much higher returns available
through cattle allocation.
To put these results in context consider a landholder who has a 200km2 prop-
erty and wishes to have an expected relative return of 7%. Their best option (in
a AVaR sense) with at least a 10% reduction in methane emissions would be an
allocation of 158.8km2 and 41.2km2 to cattle and sheep respectively, with no kan-
garoo allocation. The expected return for this allocation would be $629, 156 given
an investment of $8, 998, 950 with an AVaR of $104, 371 and methane emissions
of 22.8 tonnes/year (an 11.4% reduction).
142
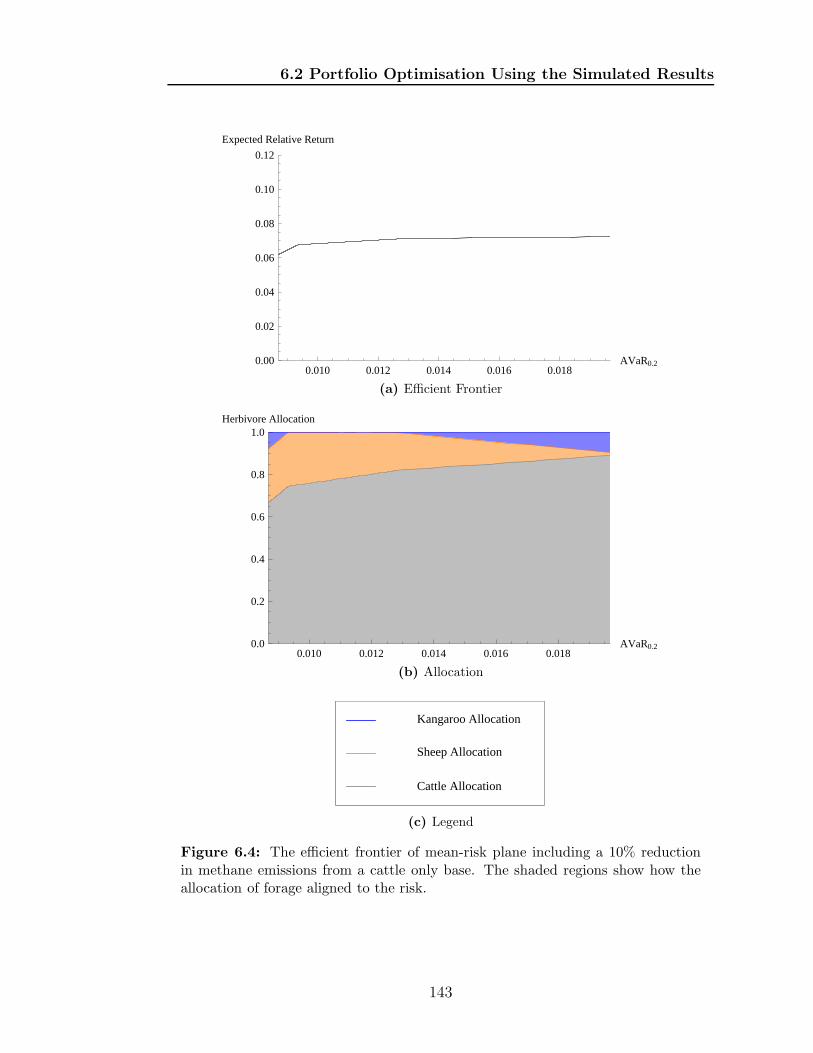
6.2 Portfolio Optimisation Using the Simulated Results
0.010 0.012 0.014 0.016 0.018AVaR0.20.00
0.02
0.04
0.06
0.08
0.10
0.12
Expected Relative Return
(a) Efficient Frontier
0.010 0.012 0.014 0.016 0.018AVaR0.20.0
0.2
0.4
0.6
0.8
1.0Herbivore Allocation
(b) Allocation
Cattle Allocation
Sheep Allocation
Kangaroo Allocation
(c) Legend
Figure 6.4: The efficient frontier of mean-risk plane including a 10% reductionin methane emissions from a cattle only base. The shaded regions show how theallocation of forage aligned to the risk.
143
6.2 Portfolio Optimisation Using the Simulated Results
Presently it is unclear if a 10% reduction in carbon emissions will be en-
forced on agriculture in Australia. Therefore it may be more of a choice that
a landholder may wish to consider their carbon emissions. The relative level of
methane emissions can be dealt with via an MOP. Including a term minimising
the methane emissions (compared to an exclusively cattle emission) results in the
following MOP,
minq,ϑ,d
λA
(
ϑ+qTe
nε
)
AV aR∗− λRµ
TRq
µ∗+
λMMethaneTq
Methanec(6.8)
s.t. −Qq − ϑe ≤ d
eTq = 1
λA + λR + λM = 1
q ≥ 0,d ≥ 0, ϑ ∈ R
where AV aR∗ is the minimum AVaR, µ∗ is the maximum relative return and
λA, λR and λM are the preference weighting for minimising risk, maximising
relative returns and maximising the relative decrease in methane emissions re-
spectively. Two scenarios are used to illustrate the affect of including methane
emission reduction on expected relative returns.
The first scenario involves an equal split of preferences between maximising
returns and emission reduction and minimising risk. The resulting regime on a
200km2 cattle property has; an investment of $8, 935, 790; a reduction in methane
emissions of 21.6%; an expected return of $552, 341 (6.2%); an AVaR of $77, 616
(0.1%); and allocation of 133.4km2, 50.8km2 and 15.8km2 to cattle, sheep and
kangaroo respectively. Note that the reduction in methane emissions quite large.
144
6.2 Portfolio Optimisation Using the Simulated Results
The second scenario involves exploring the affect of the preference for reducing
methane emissions (λM), where the remaining preferences (λR and λR) are split in
a ration of 3:1 respectively. It can be seen that when methane emission reduction
is preferred that expected relative revenue falls (see Figure 6.5a) and the kangaroo
allocation increases (see Figure 6.5b). For most methane emission reduction
preferences (λM < 0.625) the solution is actually the same result as in equal
weighting scenario.
145
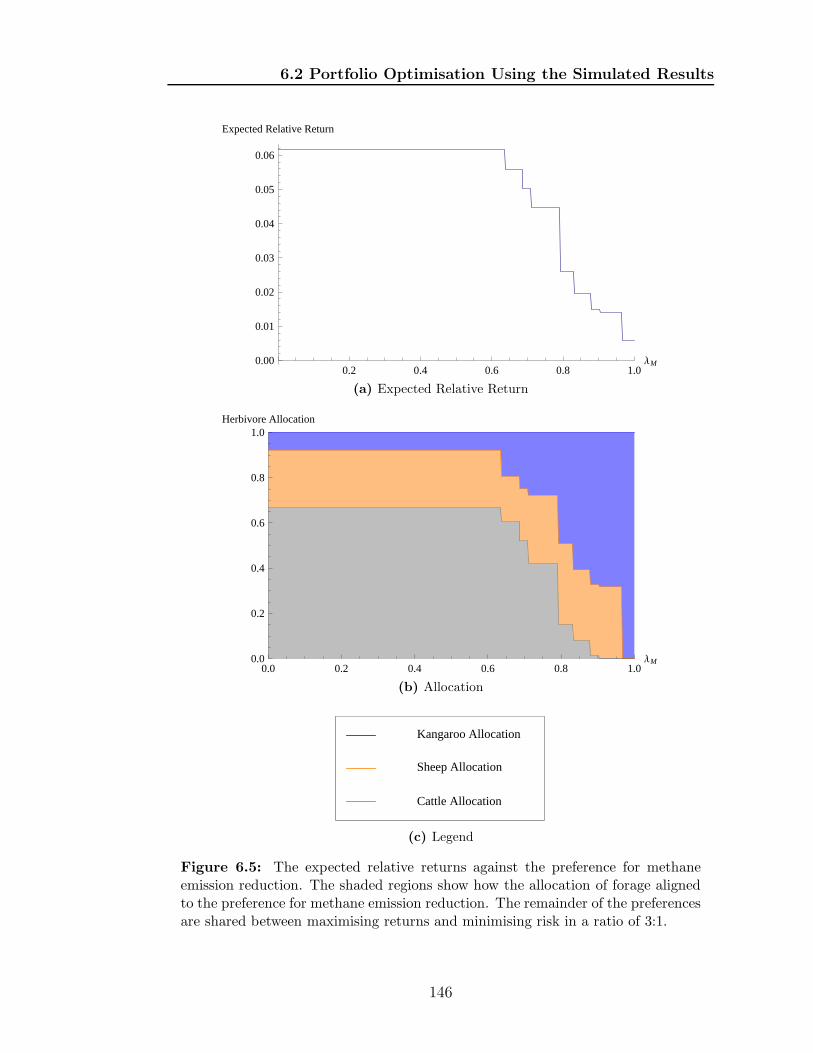
6.2 Portfolio Optimisation Using the Simulated Results
0.2 0.4 0.6 0.8 1.0ΛM0.00
0.01
0.02
0.03
0.04
0.05
0.06
Expected Relative Return
(a) Expected Relative Return
0.0 0.2 0.4 0.6 0.8 1.0ΛM0.0
0.2
0.4
0.6
0.8
1.0Herbivore Allocation
(b) Allocation
Cattle Allocation
Sheep Allocation
Kangaroo Allocation
(c) Legend
Figure 6.5: The expected relative returns against the preference for methaneemission reduction. The shaded regions show how the allocation of forage alignedto the preference for methane emission reduction. The remainder of the preferencesare shared between maximising returns and minimising risk in a ratio of 3:1.
146
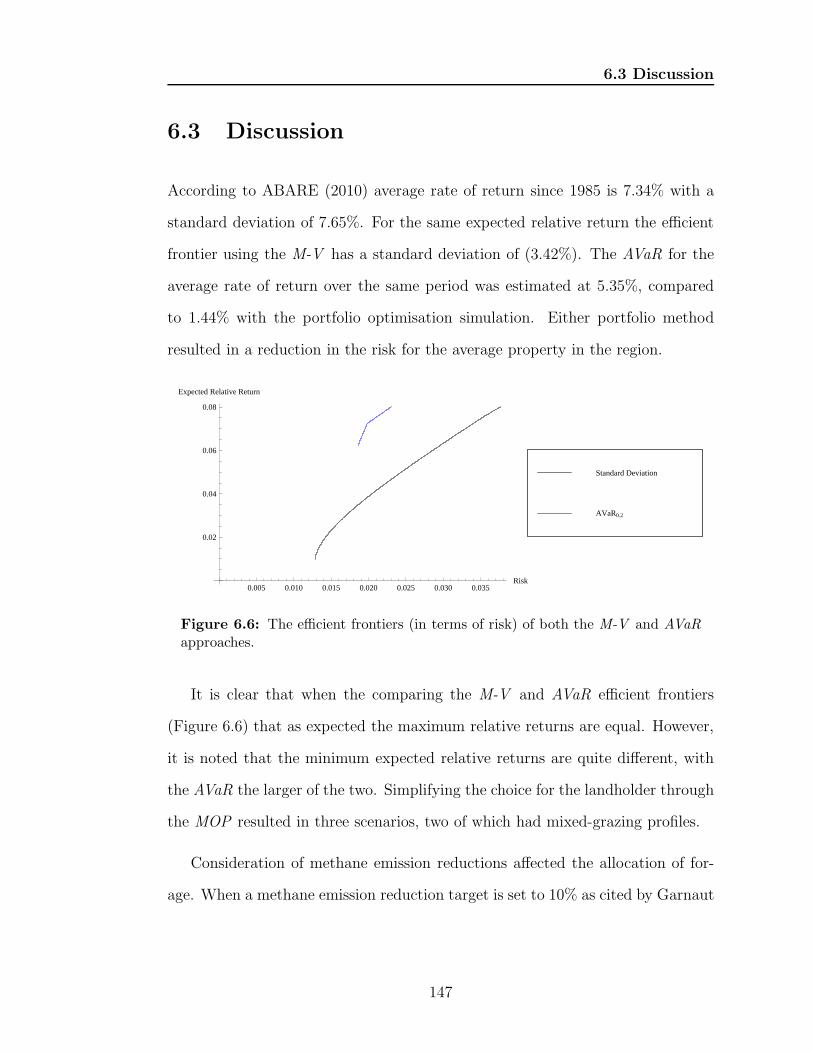
6.3 Discussion
6.3 Discussion
According to ABARE (2010) average rate of return since 1985 is 7.34% with a
standard deviation of 7.65%. For the same expected relative return the efficient
frontier using the M-V has a standard deviation of (3.42%). The AVaR for the
average rate of return over the same period was estimated at 5.35%, compared
to 1.44% with the portfolio optimisation simulation. Either portfolio method
resulted in a reduction in the risk for the average property in the region.
0.005 0.010 0.015 0.020 0.025 0.030 0.035Risk
0.02
0.04
0.06
0.08
Expected Relative Return
AVaR0.2
Standard Deviation
Figure 6.6: The efficient frontiers (in terms of risk) of both the M-V and AVaR
approaches.
It is clear that when the comparing the M-V and AVaR efficient frontiers
(Figure 6.6) that as expected the maximum relative returns are equal. However,
it is noted that the minimum expected relative returns are quite different, with
the AVaR the larger of the two. Simplifying the choice for the landholder through
the MOP resulted in three scenarios, two of which had mixed-grazing profiles.
Consideration of methane emission reductions affected the allocation of for-
age. When a methane emission reduction target is set to 10% as cited by Garnaut
147
6.3 Discussion
(2008) the result for a landholder only concerned with expected relative returns
has; their expected relative return reduced from 8.0% to 7.2%; their AVaR re-
duced from 2.3% to 1.9%; and kangaroos are now included in the optimal port-
folio. If the landholder is particularly concerned with reducing their methane
emissions then kangaroos are an important part of the solution. However, this
comes at considerable expense in substantially reduced expected relative revenue.
The analysis in this chapter highlights several points. Cattle give the best
return to the point of excluding sheep and kangaroo if maximising returns is the
only issue. When minimising risk (which ever way it is measured) a combination
of cattle, sheep and kangaroos is preferred. However, in the majority of cases
the reduction in risk would be considered by most to be too small compared to
the reduction in expected relative return. Hence, it is unlikely in the current
circumstances that landholders would convert much if any of their land over to
kangaroo production. If carbon reduction measures need to be taken by the
landholders in the future two results are clear for those focussing on expected
relative returns; the expected relative returns will be reduced; and, kangaroos
harvesting would increase to counter-balance the high emission herbivores.
148
Chapter 7
Conclusion
The present view amongst the majority of landholders in Australia is that macrop-
ods (kangaroos and wallabies) are pests that increase grazing pressure without any
financial return to them. Hence, landholders allow harvesting to occur on their
properties in order to reduce their numbers. They receive no explicit financial
compensation from the harvesters, seeing it as pest control. However, it has been
argued that converting some production to kangaroo commodities would have
beneficial ecological and environmental consequences. Native species, includ-
ing macropods, cause significantly less damage to fragile soils and the creation
of wooded refuges would enhance kangaroo numbers and increase biodiversity.
Kangaroos emit significantly less methane (a greenhouse gas) than either cattle
or sheep (0.18% and 2.14% per head of their emissions respectively). Logically
then, if it can be shown that diversifying commodities through mixed-grazing (in-
cluding kangaroo) can be beneficial financially, the ecological and environmental
gains would follow consequentially.
149
In the semi-arid rangeland of the Maranoa region of Queensland issues of graz-
ing pressure and land degradation are even more important. In this environment
enhancing a property’s resilience is essential. Resilience can be improved through
sustainable natural resource management and reducing financial risk. One way
to analyse different stock options and their associated risks is through portfolio
optimisation. Portfolio optimisation endeavours to select the strategy with the
least risk for a given return. Each commodity is allocated a fraction of the avail-
able resources. In this case that resource can be considered the available forage,
land or total grazing pressure. An exploratory portfolio analysis (see Chapter 2)
showed that when the non-stock investment (NSI ) was large the portfolio’s pref-
erence was for herbivores of greater value. When the NSI for a property is low
or the landholder was moderately risk adverse mixed-grazing involving all species
was optimal. Effectively, kangaroo allocations were higher on more marginal
properties.
Allocating forage to different species is only possible if population size of each
species can be controlled, otherwise competitive exclusion, where one species
dominates another, and kangaroo population movements could override the al-
locations. Also, concerns were raised during meetings with landholders in the
Maranoa region about the effect of encouraging kangaroos on neighbouring prop-
erties. The effect from kangaroos (a mobile species that can cross boundaries and
cannot always be explicitly controlled) was explored in Chapter 4. It concluded
that, as long as steps are made to use the forage efficiently, then kangaroo move-
ment between properties should not present a problem. Moreover, properties that
border a national park or similar unharvested area could benefit from the kan-
150
garoo movement. Additionally, as long as forage is utilised efficiently and there
is refuge from harvesting, then competitive exclusion should not occur. It was
ultimately shown that a cooperative approach produced better results, an impor-
tant consideration given a kangaroo harvesting cooperative is being established
around Mitchell in the Maranoa region.
It is thought that many landholders over-estimate the impact kangaroos have
on grazing pressure. This is evidenced in the landholder’s belief that the impact
of a kangaroo is 70 − 80% of that of a sheep. More recent studies (Munn et al.,
2009) as well as the kangaroo population model used in this thesis (see Chapter 5)
have the impact of at about half that rate. This point should be brought to the
attention of landholders. A better understanding of the impact of kangaroo’s
may lead to different management strategies by landholders.
The analysis of the ecological and economic model emphasised several features
outlined below. The amount of meat produced per hectare of kangaroo on average
was quite small when compared to beef or even wool production (Table 6.2).
Hence, if maximising returns is the only issue, cattle produce the best return
to the point of excluding sheep and kangaroo. The model reflects that in the
majority of cases the reduction in risk is too small to consider the inclusion of
kangaroos. That is, only for the risk adverse was a combination of cattle, sheep
and kangaroo preferred. Hence, it is unlikely in the current circumstances that
landholders would convert much, if any, of their land over to kangaroo production.
For this conclusion to change substantially would one or more modifications
to the current state-of-play regarding kangaroos, agribusinesses and government
policies would be required. These modifications include;
151
• Reduce methane emission - A requirement to reduce methane emissions
would increase the viability of inclusion of kangaroo because their methane
emissions are very small relative to cattle and sheep (see Section 6.2.4).
• Increase the price paid for kangaroo meat - Kangaroo meat pricing is much
less than that of other commodities produced. When NSI required is large,
allocations of animals of low value (even if their reproduction rate is high)
are reduced. If the price of kangaroo was to increase, its viability would
improve.
• Place a value on kangaroo skins for the landholder or harvester - Currently
the value of the kangaroo to a landholder or harvester does not seem to
include a price for the skin (McLeod et al., 2004). The skin is quite valuable
in itself. If some of this value was to be reflected in the price paid for
kangaroo carcasses, the allocations for kangaroo would increase.
• Reduce the high rate of juvenile mortality in kangaroos - Kangaroo juvenile
mortality is so high that even though they can breed quickly, the quantity
harvestable is relatively small. It is possible that the kangaroo juvenile
mortality rate could be decreased, however, as kangaroos ”belong” to the
government and not the landholder, it is unclear as to why landholders
would incur the expense given they are not the legal owner of the animal.
If more young-at-foot survived, the population demographics would change
and increase the quantity of harvestable kangaroos.
• Increase the rate at which kangaroos gain weight - The rate at which kan-
garoos put on weight is much slower than cattle. This is to be expected, as
152
beef cattle are domesticated and have been selectively bred for weight gain.
However, increased rate of weight gain should not arise through increased
levels of fat as one of the key selling points of kangaroo meat is the fact
that it is very lean. If kangaroos gained weight at a faster rate it would be
more viable for landholders to diversify into kangaroo commodities.
• Amend policies concerning kangaroo population management - Live kanga-
roos cannot be legally bought and sold in Australia. Therefore, increasing
population size on the landholder’s property must be via births, enticement
to immigrate, or reduction in harvest. Any of these options take time, unlike
domestic animals, which can be readily bought and sold. If policy changes,
then kangaroos could be farmed in a more traditional sense, kept within
boundaries and owned by the landholder. That may allay some concerns
landholder have about diversifying into an animal that they cannot own or
control.
The list above addressed changes that may increase the uptake of landholders
diversifying into kangaroo commodities. If diversification becomes more viable
then the following are practical difficulties needing to be addressed: the rela-
tionship between processors and harvesters; the relationship between harvesters
and landholders; and, limitations of harvest quotas. Considering the relationship
between processors and harvesters, all the power is with the processors. They
set the prices and can enforce requirements above that required by the govern-
ment. Working together to ensure supply and quality could be beneficial to both
parties. The relationship between harvesters and landholders also needs consid-
eration. Currently harvesters operate across many properties without explicit
153
financial return to the harvesters and landholders. Harvesters need permission to
enter properties and landholders could harvest for themselves. Alternatively, co-
operation between landholders and harvesters could guarantee access and quality
of supply over a wider range of properties. Harvest quotas may also need to be
redefined in the future. Greater acceptance for kangaroo meat within Australia
and internationally could affect its demand, and this would impact its price and
in term, the incentive to diversify. If diversification into kangaroos was to in-
crease, there may be an issue with harvest quota’s being reached. If the quota is
reached, there is no incentive for the landholders to diversify.
Further research needs to be carried out on the speed at which kangaroos
resettle in different areas. Understanding when and how quickly kangaroo mobs
relocate is key to including migration into the extended GRASP model. That
in turn would enable the construction of a spatial model. The model requires
validation, but it is impracticable at present due to the substantial time and
money that would be required to gather the data. Other areas for continuing
research into mixed-grazing include the effect on the environment under different
strategies. The MOP methodology would be key in the inclusion of biodiversity
and conservation objectives.
A model for the dynamics of the plant-herbivore system and the economics
that underlay grazing in semi-arid Australia has been created. Analysis of this
model shows that under the current circumstances, combining native species into
a mixed-grazing regime is preferable for the risk adverse, more marginal land, or
if greenhouse gas emission reduction is required. If returns are considered more
important, then domestic stock is dominant. When forage is used efficiently
154

or landholders co-operate in setting stocking rates, a mobile species (such as
kangaroo) should not impact neighbouring properties.
155
Appendix A
Proofs and Lemmas
156
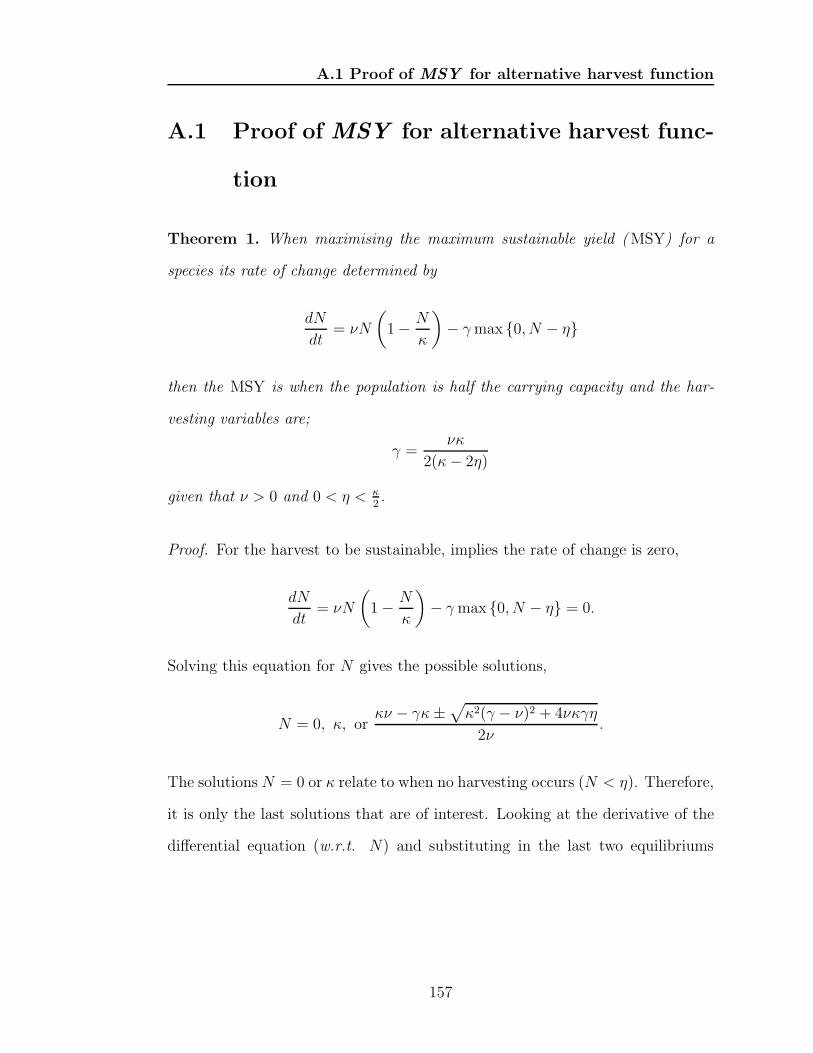
A.1 Proof of MSY for alternative harvest function
A.1 Proof of MSY for alternative harvest func-
tion
Theorem 1. When maximising the maximum sustainable yield (MSY) for a
species its rate of change determined by
dN
dt= νN
(
1− N
κ
)
− γmax {0, N − η}
then the MSY is when the population is half the carrying capacity and the har-
vesting variables are;
γ =νκ
2(κ− 2η)
given that ν > 0 and 0 < η < κ2.
Proof. For the harvest to be sustainable, implies the rate of change is zero,
dN
dt= νN
(
1− N
κ
)
− γmax {0, N − η} = 0.
Solving this equation for N gives the possible solutions,
N = 0, κ, orκν − γκ±
√
κ2(γ − ν)2 + 4νκγη
2ν.
The solutions N = 0 or κ relate to when no harvesting occurs (N < η). Therefore,
it is only the last solutions that are of interest. Looking at the derivative of the
differential equation (w.r.t. N) and substituting in the last two equilibriums
157
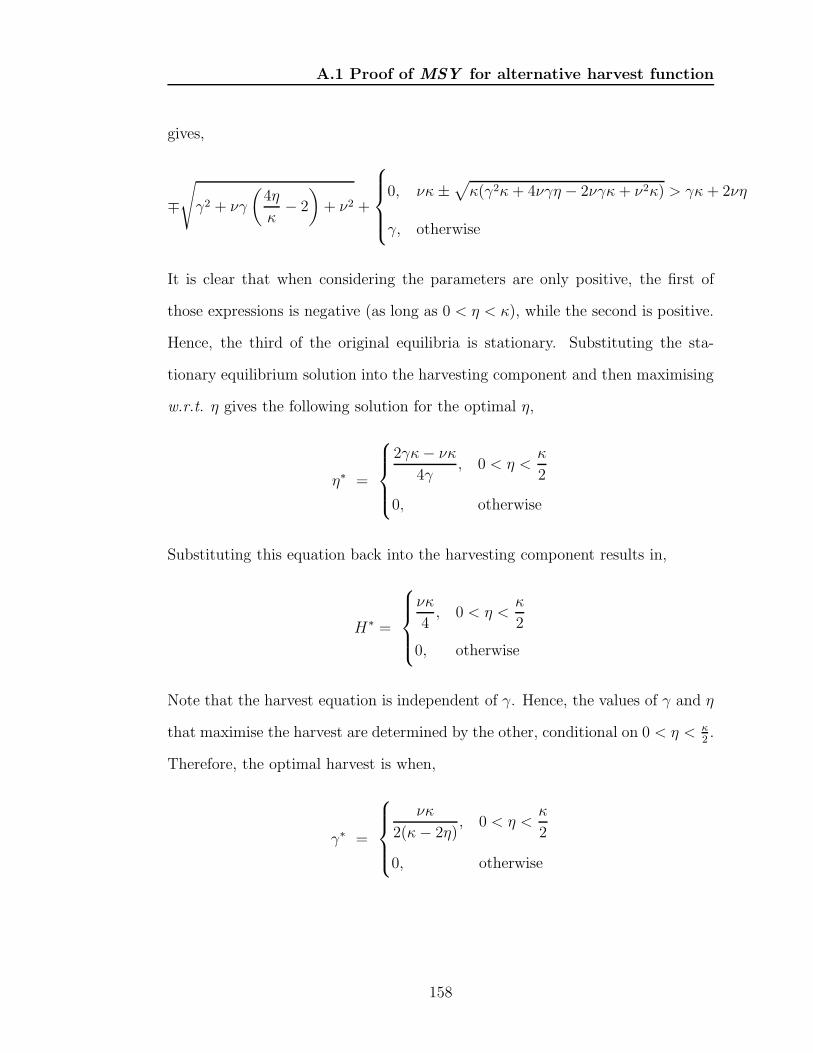
A.1 Proof of MSY for alternative harvest function
gives,
∓√
γ2 + νγ
(
4η
κ− 2
)
+ ν2 +
0, νκ±√
κ(γ2κ + 4νγη − 2νγκ + ν2κ) > γκ + 2νη
γ, otherwise
It is clear that when considering the parameters are only positive, the first of
those expressions is negative (as long as 0 < η < κ), while the second is positive.
Hence, the third of the original equilibria is stationary. Substituting the sta-
tionary equilibrium solution into the harvesting component and then maximising
w.r.t. η gives the following solution for the optimal η,
η∗ =
2γκ− νκ
4γ, 0 < η <
κ
2
0, otherwise
Substituting this equation back into the harvesting component results in,
H∗ =
νκ
4, 0 < η <
κ
2
0, otherwise
Note that the harvest equation is independent of γ. Hence, the values of γ and η
that maximise the harvest are determined by the other, conditional on 0 < η < κ2.
Therefore, the optimal harvest is when,
γ∗ =
νκ
2(κ− 2η), 0 < η <
κ
2
0, otherwise
158
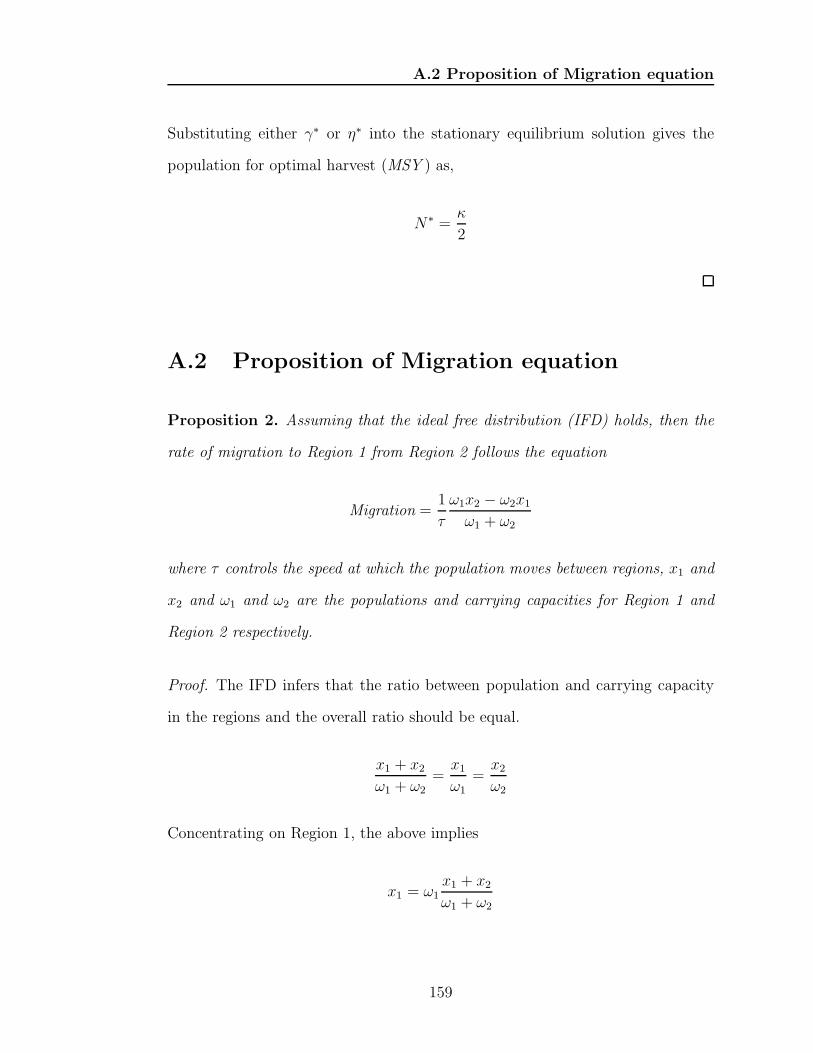
A.2 Proposition of Migration equation
Substituting either γ∗ or η∗ into the stationary equilibrium solution gives the
population for optimal harvest (MSY ) as,
N∗ =κ
2
A.2 Proposition of Migration equation
Proposition 2. Assuming that the ideal free distribution (IFD) holds, then the
rate of migration to Region 1 from Region 2 follows the equation
Migration =1
τ
ω1x2 − ω2x1
ω1 + ω2
where τ controls the speed at which the population moves between regions, x1 and
x2 and ω1 and ω2 are the populations and carrying capacities for Region 1 and
Region 2 respectively.
Proof. The IFD infers that the ratio between population and carrying capacity
in the regions and the overall ratio should be equal.
x1 + x2
ω1 + ω2
=x1
ω1
=x2
ω2
Concentrating on Region 1, the above implies
x1 = ω1x1 + x2
ω1 + ω2
159
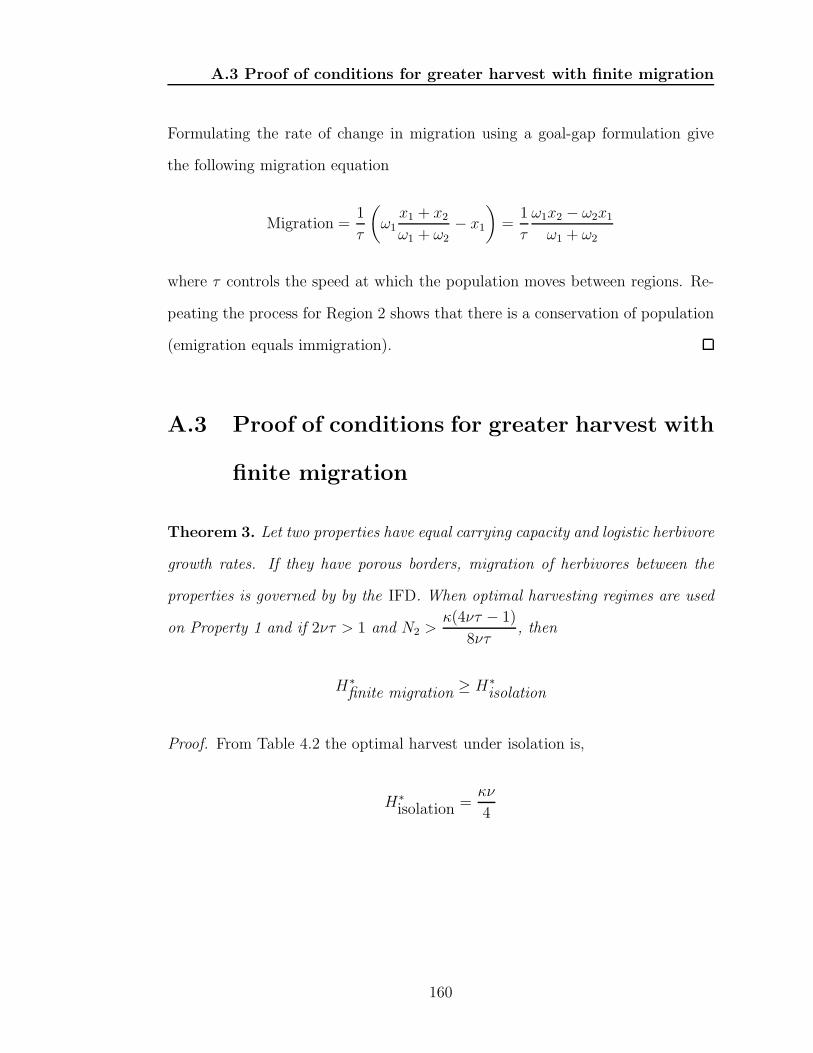
A.3 Proof of conditions for greater harvest with finite migration
Formulating the rate of change in migration using a goal-gap formulation give
the following migration equation
Migration =1
τ
(
ω1x1 + x2
ω1 + ω2
− x1
)
=1
τ
ω1x2 − ω2x1
ω1 + ω2
where τ controls the speed at which the population moves between regions. Re-
peating the process for Region 2 shows that there is a conservation of population
(emigration equals immigration).
A.3 Proof of conditions for greater harvest with
finite migration
Theorem 3. Let two properties have equal carrying capacity and logistic herbivore
growth rates. If they have porous borders, migration of herbivores between the
properties is governed by by the IFD. When optimal harvesting regimes are used
on Property 1 and if 2ντ > 1 and N2 >κ(4ντ − 1)
8ντ, then
H∗
finite migration ≥ H∗
isolation
Proof. From Table 4.2 the optimal harvest under isolation is,
H∗
isolation =κν
4
160
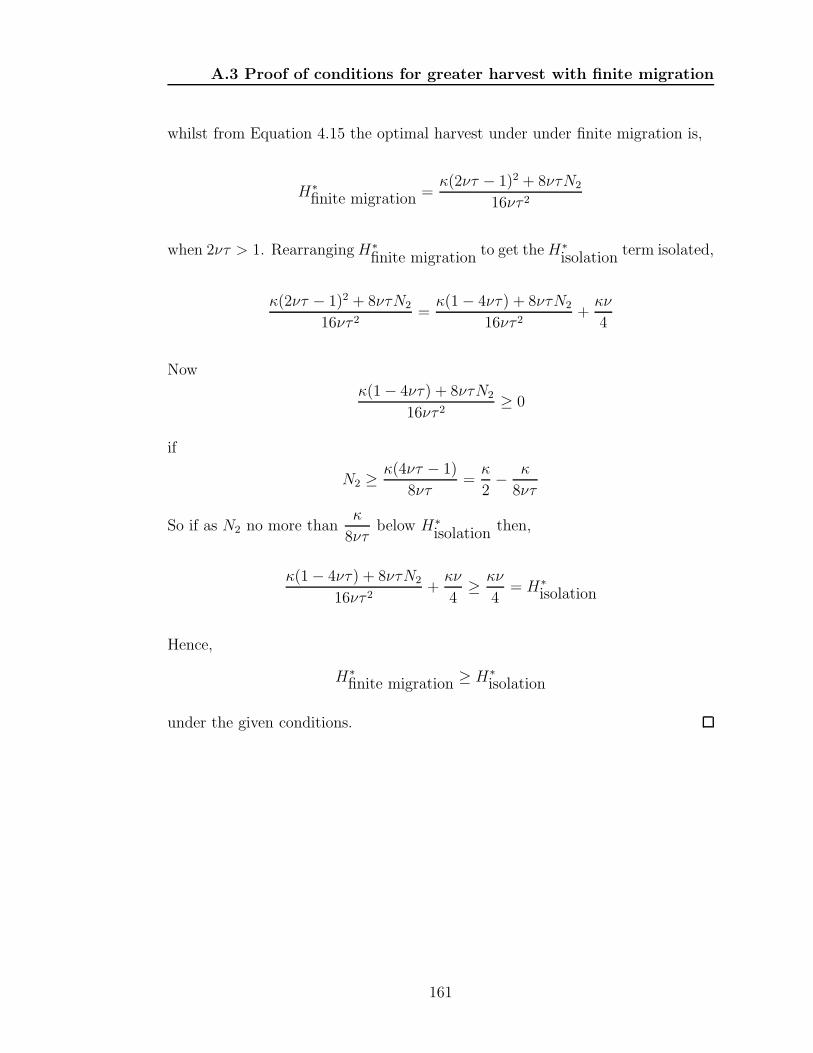
A.3 Proof of conditions for greater harvest with finite migration
whilst from Equation 4.15 the optimal harvest under under finite migration is,
H∗
finite migration =κ(2ντ − 1)2 + 8ντN2
16ντ 2
when 2ντ > 1. RearrangingH∗
finite migration to get theH∗
isolation term isolated,
κ(2ντ − 1)2 + 8ντN2
16ντ 2=
κ(1− 4ντ) + 8ντN2
16ντ 2+
κν
4
Now
κ(1− 4ντ) + 8ντN2
16ντ 2≥ 0
if
N2 ≥κ(4ντ − 1)
8ντ=
κ
2− κ
8ντ
So if as N2 no more thanκ
8ντbelow H∗
isolation then,
κ(1− 4ντ) + 8ντN2
16ντ 2+
κν
4≥ κν
4= H∗
isolation
Hence,
H∗
finite migration ≥ H∗
isolation
under the given conditions.
161
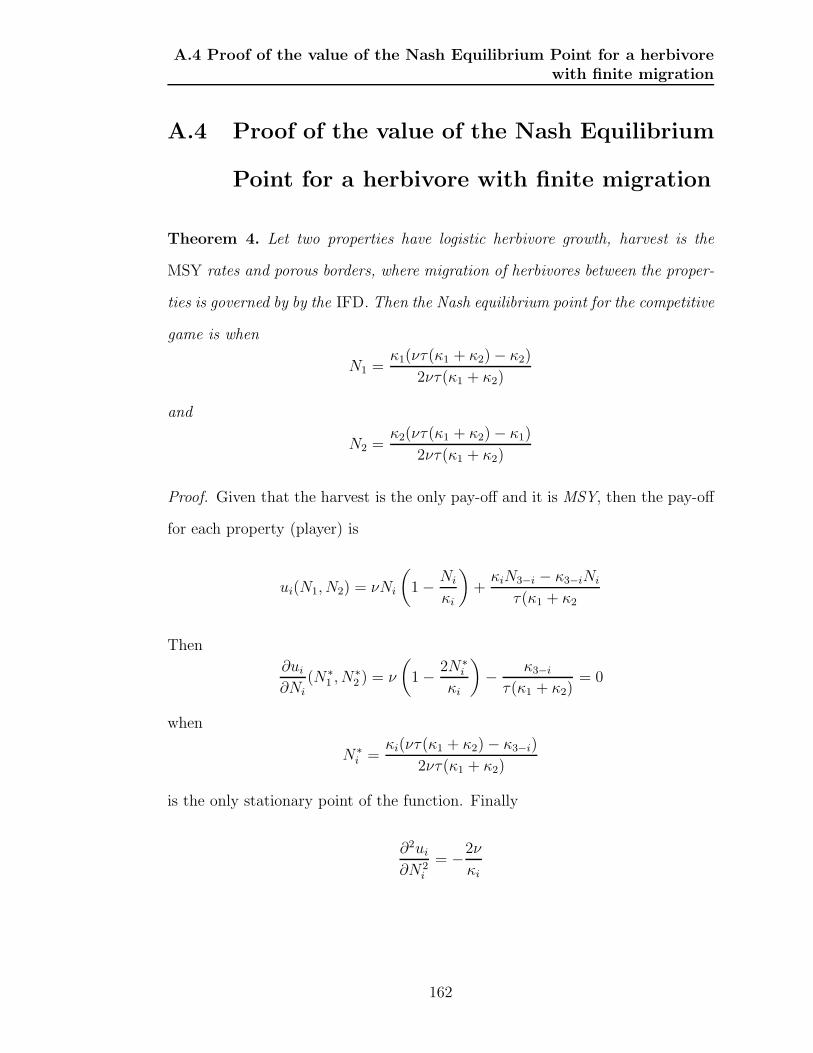
A.4 Proof of the value of the Nash Equilibrium Point for a herbivore
with finite migration
A.4 Proof of the value of the Nash Equilibrium
Point for a herbivore with finite migration
Theorem 4. Let two properties have logistic herbivore growth, harvest is the
MSY rates and porous borders, where migration of herbivores between the proper-
ties is governed by by the IFD. Then the Nash equilibrium point for the competitive
game is when
N1 =κ1(ντ(κ1 + κ2)− κ2)
2ντ(κ1 + κ2)
and
N2 =κ2(ντ(κ1 + κ2)− κ1)
2ντ(κ1 + κ2)
Proof. Given that the harvest is the only pay-off and it is MSY, then the pay-off
for each property (player) is
ui(N1, N2) = νNi
(
1− Ni
κi
)
+κiN3−i − κ3−iNi
τ(κ1 + κ2
Then
∂ui
∂Ni
(N∗1 , N
∗2 ) = ν
(
1− 2N∗i
κi
)
− κ3−i
τ(κ1 + κ2)= 0
when
N∗i =
κi(ντ(κ1 + κ2)− κ3−i)
2ντ(κ1 + κ2)
is the only stationary point of the function. Finally
∂2ui
∂N2i
= −2ν
κi
162
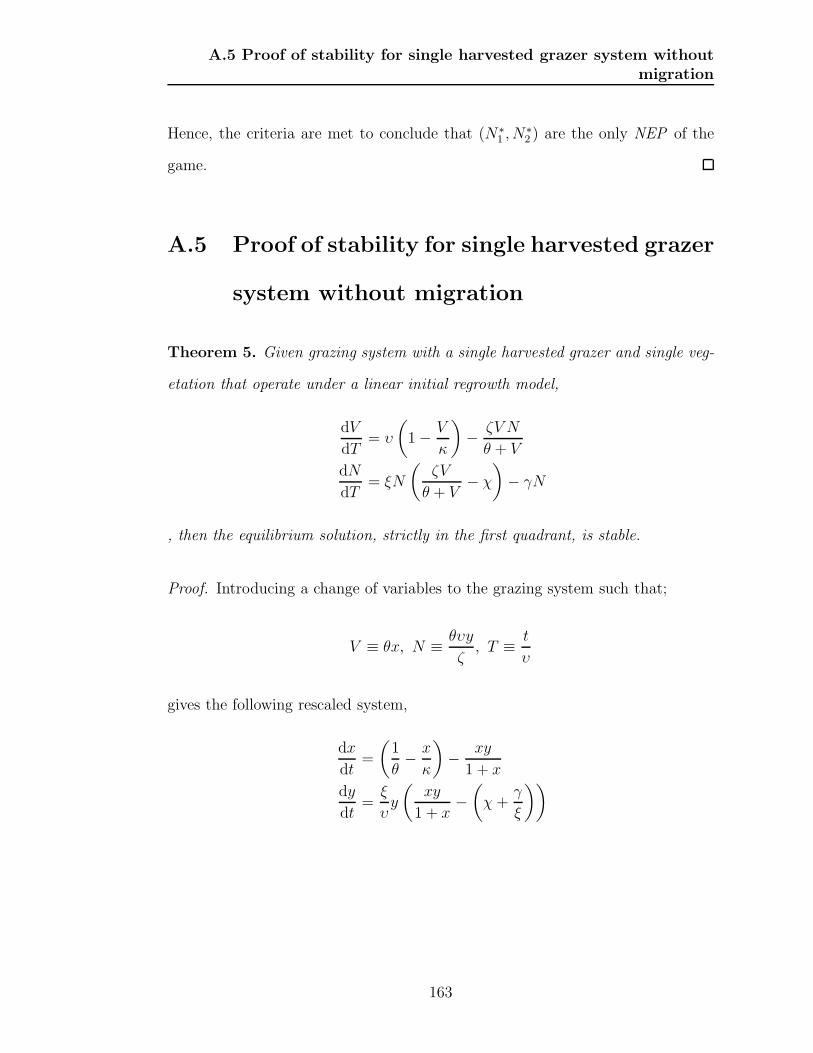
A.5 Proof of stability for single harvested grazer system without
migration
Hence, the criteria are met to conclude that (N∗1 , N
∗2 ) are the only NEP of the
game.
A.5 Proof of stability for single harvested grazer
system without migration
Theorem 5. Given grazing system with a single harvested grazer and single veg-
etation that operate under a linear initial regrowth model,
dV
dT= υ
(
1− V
κ
)
− ζV N
θ + V
dN
dT= ξN
(
ζV
θ + V− χ
)
− γN
, then the equilibrium solution, strictly in the first quadrant, is stable.
Proof. Introducing a change of variables to the grazing system such that;
V ≡ θx, N ≡ θυy
ζ, T ≡ t
υ
gives the following rescaled system,
dx
dt=
(
1
θ− x
κ
)
− xy
1 + x
dy
dt=
ξ
υy
(
xy
1 + x−(
χ +γ
ξ
))
163
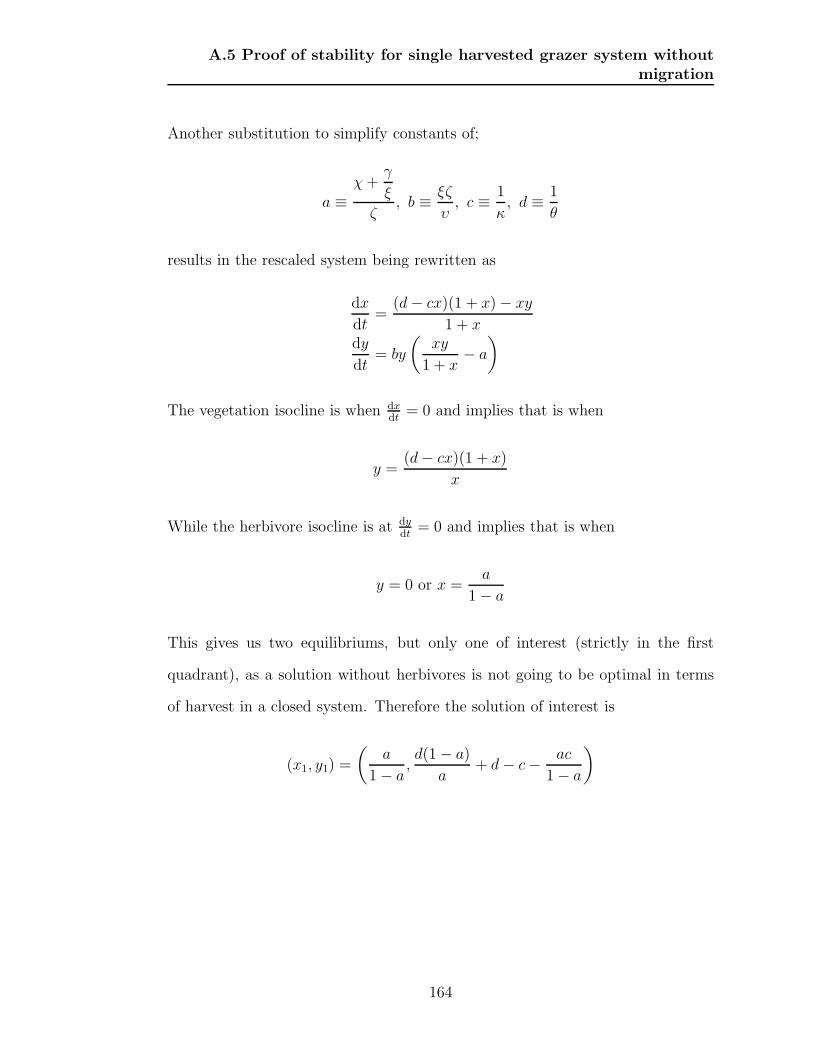
A.5 Proof of stability for single harvested grazer system without
migration
Another substitution to simplify constants of;
a ≡χ+
γ
ξ
ζ, b ≡ ξζ
υ, c ≡ 1
κ, d ≡ 1
θ
results in the rescaled system being rewritten as
dx
dt=
(d− cx)(1 + x)− xy
1 + xdy
dt= by
(
xy
1 + x− a
)
The vegetation isocline is when dxdt
= 0 and implies that is when
y =(d− cx)(1 + x)
x
While the herbivore isocline is at dydt
= 0 and implies that is when
y = 0 or x =a
1− a
This gives us two equilibriums, but only one of interest (strictly in the first
quadrant), as a solution without herbivores is not going to be optimal in terms
of harvest in a closed system. Therefore the solution of interest is
(x1, y1) =
(
a
1− a,d(1− a)
a+ d− c− ac
1− a
)
164
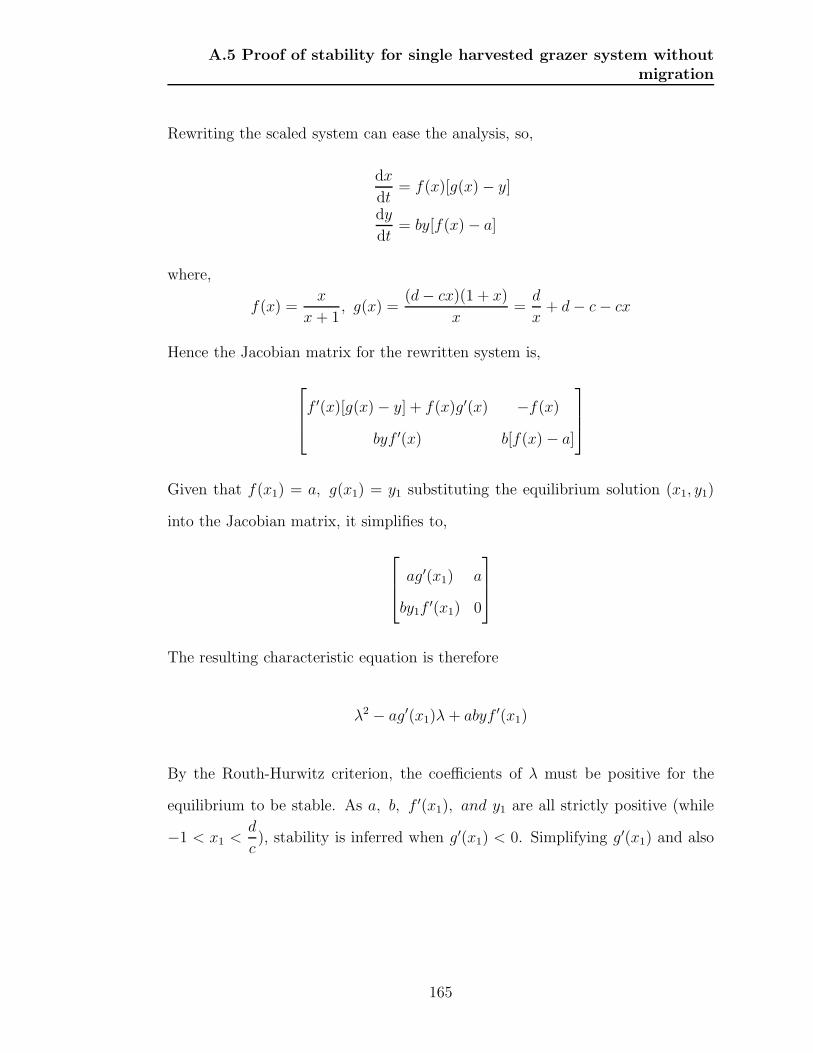
A.5 Proof of stability for single harvested grazer system without
migration
Rewriting the scaled system can ease the analysis, so,
dx
dt= f(x)[g(x)− y]
dy
dt= by[f(x)− a]
where,
f(x) =x
x+ 1, g(x) =
(d− cx)(1 + x)
x=
d
x+ d− c− cx
Hence the Jacobian matrix for the rewritten system is,
f ′(x)[g(x)− y] + f(x)g′(x) −f(x)
byf ′(x) b[f(x)− a]
Given that f(x1) = a, g(x1) = y1 substituting the equilibrium solution (x1, y1)
into the Jacobian matrix, it simplifies to,
ag′(x1) a
by1f′(x1) 0
The resulting characteristic equation is therefore
λ2 − ag′(x1)λ+ abyf ′(x1)
By the Routh-Hurwitz criterion, the coefficients of λ must be positive for the
equilibrium to be stable. As a, b, f ′(x1), and y1 are all strictly positive (while
−1 < x1 <d
c), stability is inferred when g′(x1) < 0. Simplifying g′(x1) and also
165
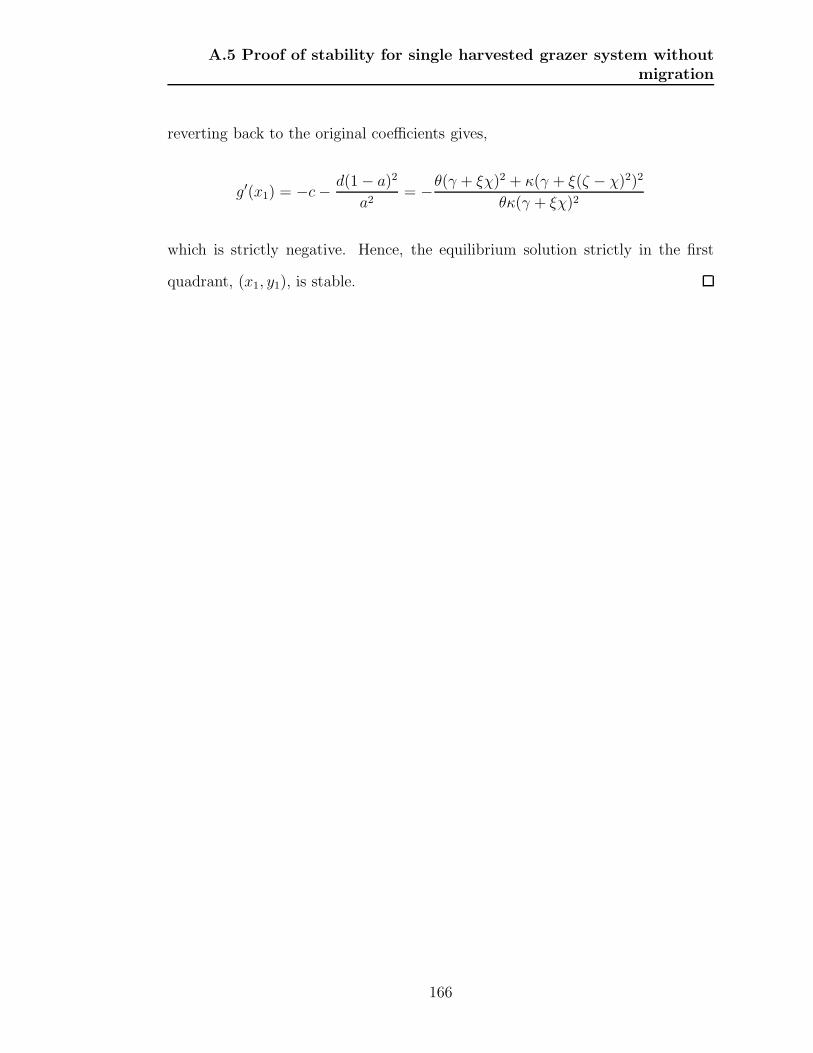
A.5 Proof of stability for single harvested grazer system without
migration
reverting back to the original coefficients gives,
g′(x1) = −c− d(1− a)2
a2= −θ(γ + ξχ)2 + κ(γ + ξ(ζ − χ)2)2
θκ(γ + ξχ)2
which is strictly negative. Hence, the equilibrium solution strictly in the first
quadrant, (x1, y1), is stable.
166
Appendix B
Data Tables
167
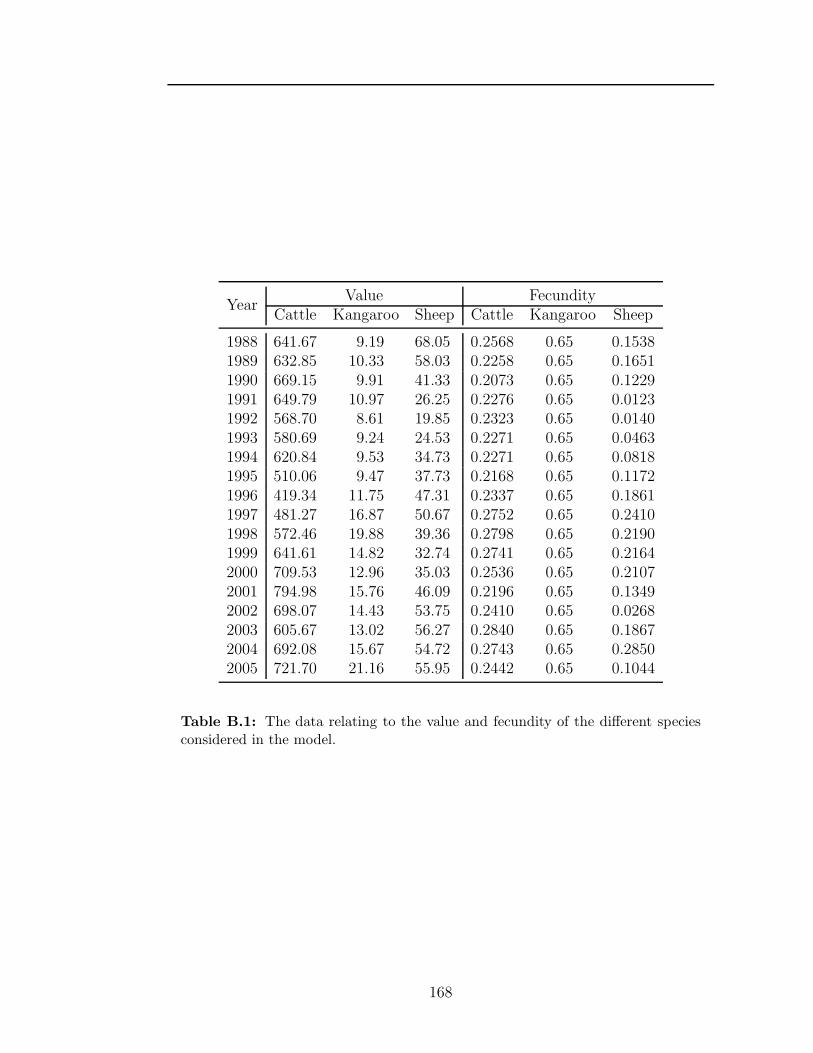
YearValue Fecundity
Cattle Kangaroo Sheep Cattle Kangaroo Sheep
1988 641.67 9.19 68.05 0.2568 0.65 0.15381989 632.85 10.33 58.03 0.2258 0.65 0.16511990 669.15 9.91 41.33 0.2073 0.65 0.12291991 649.79 10.97 26.25 0.2276 0.65 0.01231992 568.70 8.61 19.85 0.2323 0.65 0.01401993 580.69 9.24 24.53 0.2271 0.65 0.04631994 620.84 9.53 34.73 0.2271 0.65 0.08181995 510.06 9.47 37.73 0.2168 0.65 0.11721996 419.34 11.75 47.31 0.2337 0.65 0.18611997 481.27 16.87 50.67 0.2752 0.65 0.24101998 572.46 19.88 39.36 0.2798 0.65 0.21901999 641.61 14.82 32.74 0.2741 0.65 0.21642000 709.53 12.96 35.03 0.2536 0.65 0.21072001 794.98 15.76 46.09 0.2196 0.65 0.13492002 698.07 14.43 53.75 0.2410 0.65 0.02682003 605.67 13.02 56.27 0.2840 0.65 0.18672004 692.08 15.67 54.72 0.2743 0.65 0.28502005 721.70 21.16 55.95 0.2442 0.65 0.1044
Table B.1: The data relating to the value and fecundity of the different speciesconsidered in the model.
168
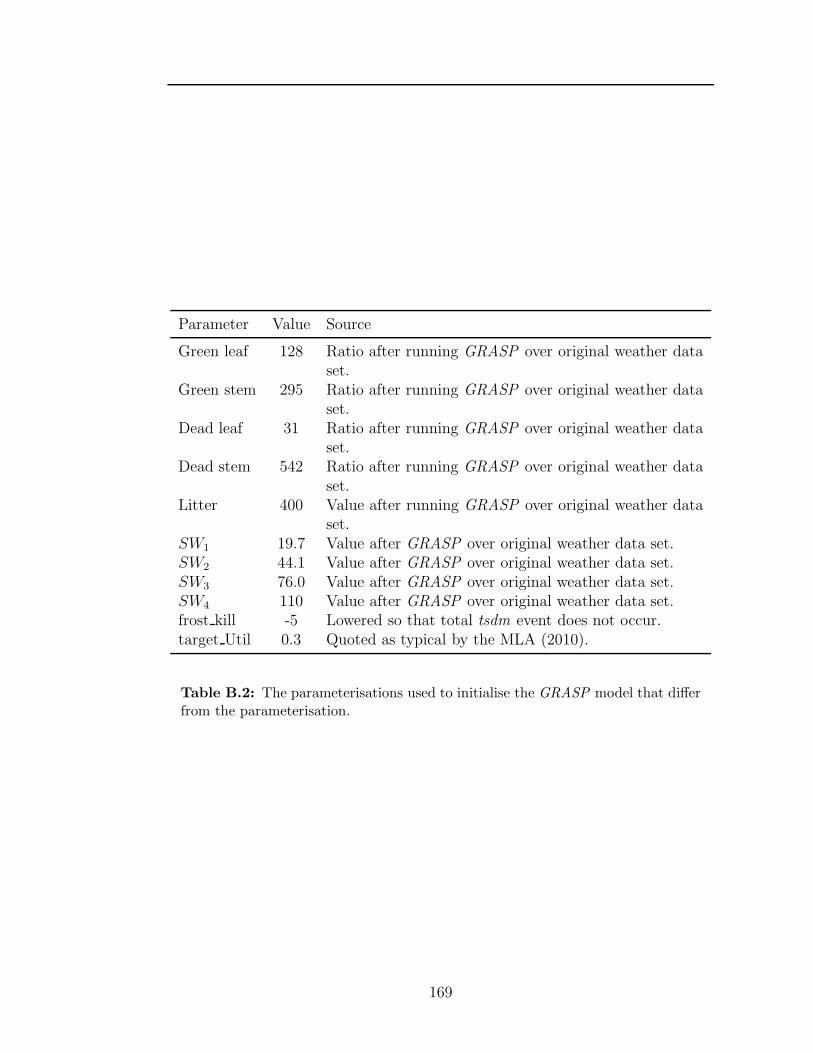
Parameter Value Source
Green leaf 128 Ratio after running GRASP over original weather dataset.
Green stem 295 Ratio after running GRASP over original weather dataset.
Dead leaf 31 Ratio after running GRASP over original weather dataset.
Dead stem 542 Ratio after running GRASP over original weather dataset.
Litter 400 Value after running GRASP over original weather dataset.
SW1 19.7 Value after GRASP over original weather data set.SW2 44.1 Value after GRASP over original weather data set.SW3 76.0 Value after GRASP over original weather data set.SW4 110 Value after GRASP over original weather data set.frost kill -5 Lowered so that total tsdm event does not occur.target Util 0.3 Quoted as typical by the MLA (2010).
Table B.2: The parameterisations used to initialise the GRASP model that differfrom the parameterisation.
169
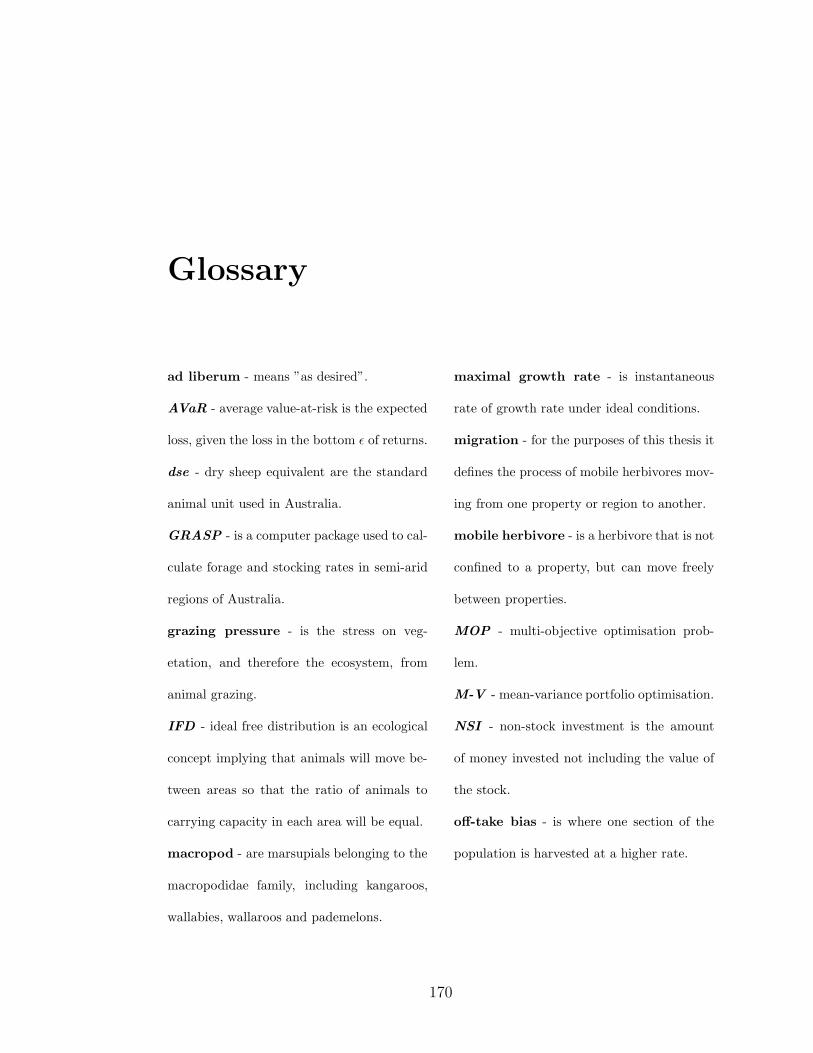
Glossary
ad liberum - means ”as desired”.
AVaR - average value-at-risk is the expected
loss, given the loss in the bottom ε of returns.
dse - dry sheep equivalent are the standard
animal unit used in Australia.
GRASP - is a computer package used to cal-
culate forage and stocking rates in semi-arid
regions of Australia.
grazing pressure - is the stress on veg-
etation, and therefore the ecosystem, from
animal grazing.
IFD - ideal free distribution is an ecological
concept implying that animals will move be-
tween areas so that the ratio of animals to
carrying capacity in each area will be equal.
macropod - are marsupials belonging to the
macropodidae family, including kangaroos,
wallabies, wallaroos and pademelons.
maximal growth rate - is instantaneous
rate of growth rate under ideal conditions.
migration - for the purposes of this thesis it
defines the process of mobile herbivores mov-
ing from one property or region to another.
mobile herbivore - is a herbivore that is not
confined to a property, but can move freely
between properties.
MOP - multi-objective optimisation prob-
lem.
M-V - mean-variance portfolio optimisation.
NSI - non-stock investment is the amount
of money invested not including the value of
the stock.
off-take bias - is where one section of the
population is harvested at a higher rate.
170
REFERENCES
ABARE (2010), “Farm survey data for the beef, slaughter lambs and sheep in-
dustries”, Online database, accessed February 24, 2010.
URL: http://www.abareeconomics.com/AME/mla/mla.asp
Aliprantis, C.D. and Chakrabarti, S.K. (2011), Games and decision making, Ox-
ford University Press.
Anon. (2000), “The rangelands: a synthesis of three reports on sustainable nat-
ural resource management”, Tech. rep., Centre for International Economics,
Canberra.
Anon. (2001), “Australia: State of the environment, 2001”, Tech. rep., Common-
wealth of Australia, Collingwood.
Anon. (2009), “2009 commercial kangaroo and wallaby harvest
quotas”, Tech. rep., Australian Government Department of
the Environment, Water, Heritage and the Arts, accessed Au-
gust 9, 2010, http://www.environment.gov.au/biodiversity/trade-
use/publications/kangaroo/pubs/2009-commercial-harvest-quotas.pdf.
171
REFERENCES
Arnold, G.W., Grassia, A., Steven, D.E. and Weeldenburg, J.R. (1991), “Popu-
lation ecology of western grey kangaroos in a remnant of wandoo woodland at
baker’s hill, southern western australia”, Wildlife Research, 18 2, pp. 561–575.
Artzner, P., Delbaen, F., Eber, J.M. and Heath, D. (1997), “Coherent measures
of risk”, Mathematical Finance, 9, pp. 203–228.
Banks, H.T., Ernstberger, S.L. and Hu, S. (2009), “Sensitivity equations for a
size-structured population model”, Quarterly Of Applied Mathematics, 67 4,
pp. 627–660.
Banks, P.B., Newsome, A.E. and Dickman, C.R. (2000), “Predation by red foxes
limits recruitment in populations of eastern grey kangaroos”, Austral Ecology,
25, pp. 283–291.
Banks, R.B. (1994), Growth and Diffusion Phenomena: Mathematical Frame-
works and Applications, Springer-Verlag.
Basar, T. and Olsder, G.J. (1999), Dynamic Game Theory, Siam Publisher.
Baumber, A., Cooney, R., Ampt, P. and Gepp, K. (2009), “Kangaroos in the
rangelands: opportunities for landholder collaboration”, The Rangeland Jour-
nal, 31, pp. 161–167.
Bayliss, P. (1985), “The population dynamics of red and western grey kangaroos
in arid new south wales, australia. ii. the numerical response function.”, Journal
of Animal Ecology, 54 1, pp. 127–135, cited By (since 1996) 17.
Bayliss, P. and Choquenot, D. (2002), “The numerical response: rate of increase
and food limitation in herbivores and predators”, Philosphical Transactions
172
REFERENCES
of the Royal Society of London Series B-Biologiucal Sciences, 357 1425, pp.
1233–1248.
Brauer, F. and Castillo-Chavez, C. (2001), Mathematical models in population
biology and epidemiology, Springer-Verlag, New York.
Cairns, S.C. and Grigg, G.C. (1993), “Population-dynamics of red kangaroos
(macropus-rufus) in relation to rainfall in the south australian pastoral zone”,
Journal of Applied Ecology, 30, pp. 444–458.
Cairns, S.C., Grigg, G.C., Beard, L.A., Pople, A.R. and Alexander, P. (2000),
“Western grey kangaroos, macropus fuliginosus, in the south australian pastoral
zone: Populations at the edge of their range”, Wildlife Research, 27 3, pp. 309–
318.
Calaby, J.H. and Grigg, G.C. (1989), “Changes in macropodod communities and
populations in the past 200 years, and the future”, in: G. Grigg, P. Jarman
and I. Hume (Eds.) “Kangaroos, Wallabies and Rat-Kangaroos”, Surrey Beatty
and Sons, Sydney.
Caswell, H. (2001), Matrix Population Models, Sinauer Associates Inc., Sunder-
land.
Caughley, G., Shepherd, N. and Short, J. (1987), Kangaroos, their ecology and
management in the sheep rangelands of Australia, Cambridge University Press,
Melbourne.
Chen, M.S., Chang, H.J., Huang, C.W. and Liao, C.N. (2006), “Channel coor-
173
REFERENCES
dination and transaction cost:a game-theoretic analysis”, Industrial Marketing
Management, 35, pp. 178–190.
Choi, S.C. (1991), “Price competition in a channel structure with a common
retailer.”, Marketing Science, 10 4, p. 271.
Choquenot, D., Caughley, J. and McLeod, S.R. (1998), “Scientific, economic and
social issues of commercial use of wild animals in australia”, Tech. rep., Bureau
of Resource Sciences, Canberra.
Clark, C.W. (1990), Mathematical Bioeconomics: the optimal management of
renewable resources, John Wiley and Sons, New York, 2nd edn.
Collins, D. and Menz, K. (1986), “An economic perspective to the population
management of commercially harvested kangaroos”, Australian Rangelands
Journal, 8, pp. 103–109.
Conrad, J. (1999), “The bioeconomics of marine sanctuaries”, Journal of Bioeco-
nomics, 1 2, pp. 205–217.
Cooney, R., Baumber, A., Ampt, P. and Wilson, G. (2009), “Sharing skippy:
how can landholders be involved in kangaroo production in australia?”, The
Rangeland Journal, 31 3, pp. 283–292.
Coulson, G. (1993), “The influence of population-density and habitat on grouping
in the western gray kangaroo, macropus-fuliginosus”, Wildlife Research, 20, pp.
151–162.
Coulson, G. (2009), “Behavioural ecology of red and grey kangaroos: Caughley’s
insights into individuals, associations and dispersion”, Wildlife Research, 36 1,
174
REFERENCES
pp. 57–69, Fenner Conference on Wildlife Population Dynamics and Manage-
ment, Canberra, AUSTRALIA, DEC, 2007.
Crawley, M.J. (1992), Natural enemies: The population biology of predators, par-
asites and disease, Blackwell Scientific Publications.
Davis, N.E., Coulson, G. and Forsyth, D.M. (2008), “Diets of native and in-
troduced mammalian herbivores in shrub-encroached grassy woodland, south-
eastern australia”, Wildlife Research, 35 7, pp. 684–694.
Dawson, T.J. (1995), Kangaroos: biology of the largest marsupisals, University of
New South Wales Press Ltd., Sydney.
Dawson, T.J. and Ellis, B.A. (1994), “Diets of mammalian herbivores in aus-
tralian arid shrublands: seasonal effects on overlap between red kangaroos,
sheep and rabbits and on dietary niche breadths and electivities”, Journal of
Arid Environments, 26 3, pp. 257 – 271.
De Giorgi, E. (2005), “Reward-risk portfolio selection and stochastic dominance”,
Journal of Banking and Finance, 29 4, pp. 895–926, cited By (since 1996) 15.
de Roos, A.M. (1988), “Numerical methods for structured population models:
The escalator boxcar train”, Numerical Methods for Partial Differential Equa-
tions, 4, pp. 173–195.
de Roos, A.M., Diekmann, O. and Metz, J.A.J. (1992), “Studying the dymanics
of structured population models: A versitile technique and its application to
daphina”, American Naturalist, 139, pp. 123–147.
175
REFERENCES
Dhondt, A.A. (1988), “Carrying capacity: a confusing concept.”, Acta Oecologia-
Oecologia Generalis, 9 4, pp. 337–346.
Dudzinski, M.L., Lowe, W.A., Muller, W.J. and Low, B.S. (1982), “Joint use
of habitat by red kangaroos and shorthorn cattle in arid central Australia”,
Australian Journal Of Ecology, 7 1, pp. 69–74.
Edelstein-Keshet, L. (1986), “Mathematical theory for plantherbivore systems”,
Journal of Mathematical Biology, 24, pp. 25–58.
Esmaeili, M., Abad, P.L. and Aryanezhad, M. (2009a), “Seller-buyer relationship
when end demand is sensitive to price and promotion”, Asia Pacific Journal
of Operational Research, In Press.
Esmaeili, M., Aryanezhad, M.B. and Zeephongsekul, P. (2009b), “A game the-
ory approach in seller-buyer supply chain”, European Journal of Operational
Research, 195, pp. 442–448.
Fretwell, S.D. and Lucas Jr., H.L. (1969), “On territorial behavior and other
factors influencing habitat distribution in birds - i. theoretical development”,
Acta Biotheoretica, 19 1, pp. 16–36, cited By (since 1996) 1316.
Freund, R.J. (1956), “The introduction of risk into a programming model”,
Econometrica, 24 3, pp. 253–263.
Fukuda, Y., McCallum, H.I., Grigg, G.C. and Pople, A.R. (2009), “Fencing arti-
ficial waterpoints failed to influence density and distribution of red kangaroos
(Macropus rufus)”, Wildlife Research, 36 6, pp. 457–465.
176
REFERENCES
Garnaut, R. (2008), The Garnaut climate change review, Commonwealth of Aus-
tralia, Canberra.
Gause, G.F. (1934), The struggle for existence, Hafner Press, New York.
Gentle, J.E. (2006), Elements of Computational Statistics, Springer, New York.
Grigg, G.C. (2002), “Conservation benifit from harvesting kangaroos: status re-
port at the start of a new millenium”, in: D. Lunney and C. Dickman (Eds.) “A
Zoological Revolution. Using native fauna to assit in its own survival”, Royal
Zoological Society of New South Wales and Australian Museum, Sydney, pp.
53–76.
Grigg, G.C. (1987), “Kangaroos - a better economic base for our marginal grazing
land?”, Australian Zoololigist, 24, pp. 73–80.
Grigg, G.C. (1989), “Kangaroos harvesting and the conservation of arid and semi-
arid rangelands”, Conservation Biology, 3, pp. 194–197.
Grigg, G.C. (1995), “Kangaroos harvesting for conservation of rangelands, kanga-
roos... and graziers”, in: G. Grigg, P. Hale and D. Lunney (Eds.) “Conservation
theough sustainable use of wildlife”, University of Queensland, Brisbane, pp.
161–165.
Gurney, W.S.C. and Nisbet, R.M. (1998), Ecological Dynamics, Oxford University
Press.
Hacker, R.B. and McLeod, S.R. (2003), “Living with kangaroos: A guide to
kangaroos and their management in the murray-darling basin”, Tech. rep.,
NSW Agriculture, Orange.
177
REFERENCES
Hacker, R.B., McLeod, S.R. and Druhan, J.P. (2003), “Evaluating alternative
management strategies for kangaroos in the murray-darling basin: Final re-
port”, Tech. rep., Murray-Darling Basin Commission, Canberra.
Hardin, G. (1960), “The competitive exclusion principle”, Science, 131 3409, pp.
1292–1297.
Harlow, W.V. and Rao, R.K.S. (1989), “Asset pricing in a generalized mean-
lower partial moment framework: Theory and evidence”, Journal of Financial
Quantitative Analysis, 24, pp. 285–311.
Hearne, J.W., Santika, T. and Goodman, P. (2008), “Portfolio selection theory
and wildlife management.”, ORiON, 24, pp. 101–118.
Holling, C.S. (1959), “The characterisitcs of simple types of predation and para-
sitism”, Canadian Entomologist, 91, pp. 385–398.
Holling, C.S. (1965), “The functional response of predator to prey density and
its role in mimicry and population regulation”, Memoirs of the Entomological
Society of Canada, 45, pp. 5–60.
Jeffrey, S.J., Carter, J.O., Moodie, K.M. and Beswick, A.R. (2001), “Using spatial
interpolation to construct a comprehensive archive of australian climate data”,
Environmental Modelling and Software, 16, pp. 309–330.
Jonzen, N., Pople, A.R., Grigg, G.C. and Possingham, H.P. (2005), “Of sheep
and rain: large-scale population dynamics of the red kangaroo”, Journal of
Animal Ecology, 74, pp. 22–30.
178
REFERENCES
Kot, M. (2001), Elements of mathematical ecology, Cambridge Universtiy Press,
Cambridge.
Kraus, A. and Litzenberger, R.H. (1976), “Skewedness preference and the valua-
tion of risky assets”, Journal of Finance, 31, pp. 1085–1094.
Leslie, P.H. (1945), “On the use of matrices in certain population mathematics”,
Biometrika, 33, pp. 183–212.
Littleboy, M. and McKeon, G.M. (2005), “Appendix 2 subroutine grasp: Grass
production model of evaluating the risks of pasture and land degradation in
native pastures in queensland”, Tech. rep., Rural Industries Research & Devel-
opment Corperation.
Liu, Y. and He, Z.R. (2009), “Stability results for a size-structured population
model with resources-dependence and inflow”, Journal Of Mathematical Anal-
ysis And Applications, 360 2, pp. 665–675.
Lotka, A.J. (1925), Elements of physical biology, Williams and Wilkins Co., Bal-
timore.
Malthus, T.R. (1798), An essay on the theory of population, Oxford University
Press, Oxford.
Markowitz, H.M. (1952), “Portfolio selection”, Journal of Finance, 7, pp. 77–91.
Markowitz, H.M. (1991), Portfolio selection: efficient diversification of invest-
ments, John Wiley, New York, 2nd edn.
179
REFERENCES
Martin, J.K., Coulson, G., Di Stefano, J., Ritchie, E.G., Greenfield, A.,
Catanchin, H. and et al. (2007), “The viggers & hearn conundrum: a kan-
garoo home range study with no implications for land management”, Journal
of Applied Ecology, 44, pp. 1080–1085.
Maynard Smith, J. (1974), Models in Ecology, Cambridge University Press, Cam-
bridge.
McAlpine, C.A., Grigg, G.C., Mott, J.J. and Sharma, P. (1999), “Influence of
landscape structure on kangaroo abundance in a disturbed semi-arid woodland
of Queensland”, Rangeland Journal, 21 1, pp. 104–134.
McCarthy, M. (1996), “Red kangaroo (macropus rufus) dynamics: Effects of rain-
fall, density dependence, harvesting and environmental stochasticity”, Journal
of Applied Ecology, 33 1, pp. 45–53.
McKendrick, A.G. (1926), “Applications of mathematics to medical problems”,
Proceedings of the Edinburgh Mathematical Society, 40, pp. 98–130.
McLeod, S.R. (1997), “Is the concept of carrying capacity useful in variable en-
vironments?”, OIKOS, 79 3, pp. 529–542.
McLeod, S.R., Hacker, R.B. and Druhan, J.P. (2004), “Managing the commercial
harvest of kangaroos in the murray-darling basin”, Australian Mammalogy, 26,
pp. 9–22.
McNair, J. (1986), “The effects of refuges on predator-prey interactions: A re-
consideration”, Theoretical Population Biology, 29 1, pp. 38–63, cited By (since
1996) 56.
180
REFERENCES
Merton, R.C. (1971), “Optimal consumption and portfolio rules in a continuous-
time model”, Journal of Economic Theory, 3, pp. 373–413.
Mesterton-Gibbons, M. (1996), “A technique for finding optimal two-species har-
vesting policies”, Ecological Modelling, 92 2-3, pp. 235–244.
Millear, G., Conway, A. and Mills, T. (2003), “Calculating a gross margin for
sheep, goat and cattle enterprises”, Tech. rep., Queensland Government: De-
partment of Primary Industries and Fisheries, Brisbane.
MLA (2010), “Livestock production: Native pastures”, Meat and Livestock
Australia website, accessed 14/07/2010.
URL: http://www.mla.com.au/Livestock-production/Grazing-and-pasture-
management/Native-pasture
Moloney, P.D., Hearne, J.W., Gordon, I.J. and Mcleod, S.R. (2011), “Portfolio op-
timization techniques for a mixed-grazing scenario for Australia’s rangelands”,
Natural Resource Modeling, 24 1, pp. 102–116.
Moloney, P.D. and Hearne, J.W. (2009), “The population dynamics of converting
properties from cattle to kangaroo production”, in: “Proceeding of the 18th
IMACS World Congress and MODSIM09”, Mathematical Simmulation Society
of Australia and New Zealand.
Moss, G.L. and Croft, D.B. (1999), “Body condition of the red kangaroo (Macro-
pus rufus) in arid Australia: The effect of environmental condition, sex and
reproduction”, Australian Journal of Ecology, 24 2, pp. 97–109.
Munn, A.J., Dawson, T.J., McLeod, S.R., Croft, D.B., Thompson, M.B. and
181
REFERENCES
Dickman, C.R. (2009), “Field metabolic rate and water turnover of red kan-
garoos and sheep in an arid rangeland: an empirically derived dry-sheep-
equivalent for kangaroos”, Australian Journal of Zoology, 57, pp. 23–28.
Murray, J.D. (1993), Matheatical biology (Third Edition ed.), Springer, New York.
Nash, J.R. (1951), “Non-cooperative games”, Annals of Mathematics, 54, pp.
286–295.
Newsome, A.E., Catling, P.C., Cooke, B.D. and Smyth, R. (2001), “Two eco-
logical universes separated by the dingo barrier fence in semi-arid australia:
interactions between landscapes, herbivory and carnivory, with and without
dingoes”, The Rangeland Journal, 23, pp. 71–98.
Office of the Queensland Parliamentary Counsel (2010), “Nature conservation
(macropod harvest period 2011) notice 2010”, Tech. rep., Department of En-
vironmental and Resource Management.
Palmquist, J., Uryasev, S. and Krokhmal, P. (2002), “Portfolio optimization with
conditional value-at-risk objective constraints”, Journal of Risk, 4 2, pp. 43–68.
Phelps, E. (1962), “The accumulation of risky capital: A sequential utility anal-
ysis”, Econometrica, 30, pp. 729–743.
Pikitch, E.K., Santora, C., Babcock, E.A., Bakum, A. and et al. (2004),
“Ecosystem-baded fishery management”, Science, 305, pp. 346–347.
Pople, A.R. and Grigg, G.C. (1999), Commercial harvesting of kangaroos in Aus-
tralia, Environment Australia, Canberra.
182
REFERENCES
Pople, A.R., Phinn, S.R., Menke, N., Grigg, G.C., Possingham, H.P. and
McAlpine, C. (2007), “Spatial patterns of kangaroo density across the south
australian pastoral zone over 26 years: aggregation during drought and sugges-
tions of long distance movement”, Journal of Applied Ecology, 44, pp. 1068–
1079.
Pratt, J.W. (1960), “Risk aversion in the small and in the large”, Econimetrica,
32, pp. 122–136.
Rachev, S.T., Stoyanov, S.V. and Fabozzi, F.J. (2008), Advanced stochastic mod-
els, risk assessment, and portfolio optimization, John Wiley and Sons.
Rafferty, C.M., Lamont, B.B. and Hanley, M.E. (2010), “Herbivore feeding pref-
erences in captive and wild populations”, Austral Ecology, 35 3, pp. 257–263.
Rastetter, E.B. and Agren, G.I. (2002), “Changes in individual allometry can lead
to species coexistence without niche separation”, Ecosystems, 5 8, pp. 789–801,
cited By (since 1996): 6.
Rochafellar, R. and Urasev, S. (2000), “Optimization of conditional value-at-
risk”, Journal of Risk, 2 3, pp. 21–41.
Rockwood, L.L. (2009), Introduction to Population Ecology, John Wiley & Sons,
Ltd., Chichester.
Rosenthal, R. (1981), “Games of perfect information, predatory pricing and the
chain-store paradox”, Journal of Economic Theory, 25 1, pp. 92–100.
Rosenzweig, M.L. and MacArthur, R.H. (1963), “Graphical representations and
183
REFERENCES
stability conditions of predator-prey interactions”, American Naturalist, 97,
pp. 209–223.
Rubenstein, M.E. (1973), “A comparitive statistics analysis of risk premiums”,
Journal of Business, 46, pp. 605–615.
Seidl, I. and Tisdell, C.A. (1999), “Carrying capacity reconsidered: from malthus’
population theory to cultural carrying capacity”, Ecological Economics, 31, pp.
395–408.
Short, J. (1985), “The fucntional response of kangaroos, sheep and rabbits in an
arid grazing system”, Journal of Applied Ecology, 22, pp. 435–447.
Simons, K. (1996), “Value at risk - new approaches to risk management”, New
England Economic Review, 5 5, pp. 1–13.
Sinko, J.W. and Streifer, W. (1967), “A new model for age-size structure of a
population”, Ecology, 48 6, pp. 910–&.
Sinko, J.W. and Streifer, W. (1969), “Applying models incorporating age-size
structure of a population to daphnia”, Ecology, 50 4, pp. 608–629.
Skonhoft, A. (2005), “The costs and benefits of a migratory species under different
management schemes”, Journal of Environmental Management, 76 2, pp. 167–
175.
Skonhoft, A. (2007), “Economic modeling approaches for wildlife and species
conservation”, Ecological Economics, 62 2, pp. 223–231.
Skonhoft, A. and Olaussen, J. (2005), “Managing a migratory species that is both
a value and a pest”, Land Economics, 81 1, pp. 34–50.
184
REFERENCES
Smale, S. (1976), “Differential equations of species in competition”, Journal of
Mathematical Biology, 3 1, pp. 5–7.
Smith, D. and Keyfitz, N. (1977), Mathematical Demography: selected papers,
Springer-Verlag.
Smyth, A.K. and James, C.D. (2004), “Characteristics of australia’s rangelands
and key design issues for monitoring biodiversity”, Austral Ecology, 29 1, pp.
3–15.
Steinbach, M.C. (2001), “Markowitz revisited: Mean-variance models in financial
portfolio analysis”, Siam Review, 43, pp. 31–85.
Sumaila, U. and Apaloo, J. (2002), “A selected survey of traditional and evolu-
tionary game theory”, Working Paper - Chr. Michelsen Institute, 7, pp. 1–14.
Theron, P. and van der Honert, R. (2003), “A mathematical approach to in-
creasing the long-term wealth of an agricultural enterprise”, ORiON, 19, pp.
53–74.
Tisdell, C. (1973), “Kangaroos: the economic management of a common-property
resource involving interdependence or production”, Economic Analysis and
Policy, 4, pp. 59–75.
Tuljapurkar, S. and Caswell, H. (1997), Structured-population models in marine,
terrestrial, and freshwater ecosystems, Chapman and Hall, New York.
Turchin, P. (2003), Complex population dynamics, Princeton University Press,
Princeton.
185
REFERENCES
Turchin, P. and Batzli, G.O. (2001), “Availability of food and the population
dynamics of arvicoline rodents”, Ecology, 82 6, pp. 1521–1534.
Turvey, C.G., Driver, H.C. and Baker, T.G. (1988), “Systematic and nonsystem-
atic risk in farm portfolio selection”, American Journal of Agricultural Eco-
nomics, 70 4, pp. 831–836.
Verhulst, P.F. (1838), “Notice sur la loi que la population suit dans son accroisse-
ment”, Correspondance Math. Phys., 10, pp. 113–121.
Verhulst, P.F. (1845), “Recherches mathmatiques sur la loi daccroissement de la
population”, Mem. Acad. Royale Belg., 18, pp. 1–38.
Viggers, K.L. and Hearn, J.P. (2005), “The kangaroo conundrum: home range
studies and implications for land management”, Journal of Applied Ecology,
42, pp. 99–107.
Viggers, K.L. and Lindenmayer, D.B. (2007), “The kangaroo conundrum re-
mains”, Journal of Applied Ecology, 44, pp. 1086–1088.
Volterra, V. (1926), “Variazioni e fluttuazioni del numero d’individui in specie
animali conviventi”, Mem. R. Accad. Naz. dei Lincei Ser. VI, 2.
von Foerster, H. (1959), “Some remarks on changing populations”, in:
F. Stohlman Jr (Ed.) “The Kinetics of Cellular Proliferation”, Grune and Strat-
ton, pp. 382–407.
Wiggins, N.L., Williamson, G.J., McCallum, H.I., McMahon, C.R. and Bow-
man, D.M.J.S. (2010), “Shifts in macropod home ranges in response to wildlife
management interventions”, Wildlife Research, 37 5, pp. 379–391.
186
REFERENCES
Williams, J.E. and Price, R.J. (2010), “Impacts of red meat production on bio-
diversity in Australia: a review and comparison with alternative protein pro-
duction industries”, Animal Production Science, 50 8, pp. 723–747.
Wilson, G.R. and Edwards, M.J. (2008), “Native wildlife on rangelands to mini-
mize methane and produce lower-emission meat: kangaroos versus livestock”,
Conservation Letters, 1, p. 119128.
Xiao, T. and Qi, X. (2008), “Price competition, cost and demand disruptions
and coordination of a supply chain with one manufacturer and two competing
retailers”, Omega the International Journal of Management Science, 36, pp.
741 – 753.
Yang, S.L. and Zhou, Y.W. (2006), “Two-echelon supply chain mod-
els:considering duopolistic retailers’ different competitive behaviors”, Interna-
tional Journal of Production Economics, 103, pp. 104–116.
Yao, D.Q., Yue, X. and Liu, J. (2005), “Competitive pricing of mixed retail and
e-tail distribution channels”, Omega the International Journal of Management
Science, 33, pp. 838–851.
187
Sharing Skippy: how can landholders be involved in kangarooproduction in Australia?
Rosie CooneyA,C, Alex BaumberA, Peter AmptA and George WilsonB
AFate Program, Institute of Environmental Studies, Vallentine Annexe, University of New South Wales,Kensington, NSW 2052, Australia.
BAustralian Wildlife Services, 51 Stonehaven Crescent, Canberra, ACT 2600, Australia.CCorresponding author. Email: [email protected]
Abstract. For 2 decades, calls for Australian rangeland landholders to expand their reliance on the abundant species ofnative kangaroos and decrease their reliance on introduced stock have been made. These calls have received recentimpetus from the challenge of climate change. Arguments for landholder involvement in kangaroo production includereduced greenhouse gas emissions, better management of total grazing pressure, reduced land degradation, improvedvegetation and biodiversity outcomes, and greater valuation of kangaroos by landholders. However, there is littleunderstanding of how landholders could be involved in kangaroo harvest and production, and there is a widespreadmisconception that this would include domestication, fencing, mustering and trucking. This paper reviews the options forlandholder involvement in managing and harvesting wild kangaroos, and assesses the possible benefits and feasibility ofsuch options. We conclude that collaboration among landholders, as well as between landholders and harvesters, formsthe basis of any preferred option, and set out a proposed operating model based on the formation of a kangaroomanagement, processing and marketing co-operative.
Additional keywords: conservation, co-operative, sustainable use, total grazing pressure, wildlife management.
Introduction
There are several cogent arguments in favour of Australianrangeland landholders expanding their reliance on the abundantspecies of native kangaroos and decreasing their reliance onintroduced sheep, cattle and goats (e.g. Grigg 1987a, 1987b,1995, 2002; Ampt and Baumber 2006; Garnaut 2008; Wilsonand Edwards 2008). One set of arguments relies on reducedemissions of greenhouse gases, and the other builds on theconcept of ‘conservation through sustainable use’ and involvesbetter management of total grazing pressure, reduced landdegradation, improving vegetation and biodiversity outcomesand improved valuing of kangaroos by landholders. However,missing in this debate is examination of the question of howlandholders could be involved in kangaroo management. This isof particular current importance, as Garnaut’s (2008) recentsuggestion that kangaroo production could be increased toreduce emissions from livestock received widespread criticismbased on the impracticability of domesticating kangaroos(e.g. Gray 2008).Work byWilson and Edwards (2008), to whichGarnaut referred, does not in fact advocate domestication ofkangaroos, but rather analysed the production of low carbonmeat from wild-harvested kangaroos on the rangelandswhere the kangaroo industry already operates. This paperreviews the options for landholder involvement in managingand harvesting wild kangaroos, and assesses their benefits andfeasibility.
Why should landholders be involved in kangaroomanagement?
One suite of arguments involves the argument that greater use ofkangaroo in place of stock could contribute to reducing theclimate impact of agriculture (Diesendorf 2007; Garnaut 2008;Wilson and Edwards 2008). In 2007, agriculture contributed~16.3% of Australia’s greenhouse gas emissions, and themajority of methane emissions (58.9%) (Department of ClimateChange 2009). Most (69.3%) of these agricultural emissions aredue to emissions from livestock. By contrast, kangaroos utilise adifferent fermentation process in the gut which does not producemethane (Kempton et al. 1976). Recent analysis indicates that if20% of domestic stock on the rangelands – where the kangarooindustry already exists – were replaced by kangaroos to producethe same amount of meat, Australia’s greenhouse gas emissionswould be reduced by 3% per annum by 2020 (Wilson andEdwards 2008). This proposal received influential endorsementas a greenhouse gas mitigation option for the rural sector in thefinal report of the Garnaut Climate Change Review in September2008 (Garnaut 2008). Although kangaroos are currentlycommercially harvested in large numbers, the option of reducingstock numbers to boost their production relies critically onlandholder involvement.
Another suite of arguments revolves around bettermanagement of total grazing pressure (TGP), a critical priorityfor rangeland management (Hacker et al. 2005). Stocking
� Australian Rangeland Society 2009 10.1071/RJ08025 1036-9872/09/030283
CSIRO PUBLISHING
www.publish.csiro.au/journals/trj The Rangeland Journal, 2009, 31, 283–292

practices and the impact of native and exotic herbivores havecaused severe and widespread land degradation and soil erosionin the rangelands (Condon 2002; Beeton et al. 2006). Currently,landholders effectively feed all these herbivores from their land,but while sheep, cattle, and sometimes goats are sold for profit,kangaroos are essentially ‘given away’ to commercial kangarooharvesters. An initial benefit of landholder involvement inkangaroo harvest is that it may allow greater control over thekangaroo component of TGP by improving communication withharvesters and response times to major kangaroo influxes (Amptand Baumber 2006).
Greater benefits could result if income from kangaroos wasable to influence stock management practices, crucial elementsin rangeland management (Stafford Smith et al. 2000). Iflandholders were able to obtain a return from harvest ofkangaroos they may be able to maintain productivity at a reducedstocking pressure (Grigg 1987b, 1988).Although stock reductioncould drive a commensurate increase in kangaroos, the net resultof these actions if undertaken strategically could be to maintainproductivity at a reduced impact, as kangaroos have muchlower energetic requirements (Grigg 1989, 1995, 2002) and aprobable lower foot pressure due to lack of hard hooves (Grigg2002). There need not be a total shift of the nature suggestedin Grigg’s early calls for ‘sheep replacement therapy forrangelands’ (Grigg 1987a, 1988) in order for these TGP benefitsto be realised.
Further, if landholders derived an income from kangaroos,a major disincentive that currently discourages landholdersfrom conducting some environmentally beneficial practiceswould be removed (Ampt and Baumber 2006). Currently,landholders who destock areas or practice rotational grazingoften face large influxes of kangaroos onto the ‘green pick’ ofdestocked paddocks. This both defeats the aim of regeneration,and discourages similar efforts. A similar disincentive existsin grassy woodland environments, where eastern greykangaroos (Macropus giganteus), the most commerciallyimportant species, prefer mosaics of open grasslandinterspersed with woodland vegetation for cover (Viggersand Hearn 2005). This means that woodland remnants orrevegetation sites can be a liability for landholders as theyincrease kangaroo numbers, resulting in a reluctance to undertakerevegetation activities. To discourage kangaroos, landholdersmay even decide to convert these areas to pasture for stock. Iflandholders were involved in kangaroo harvesting, they wouldbenefit from kangaroos through greater harvesting returns,thereby encouraging maintenance and restoration of remnantvegetation to provide habitat.
Increasing use of kangaroos could also help maintain healthypopulations of kangaroos across their range. Increasingly,methods are emerging to decrease or entirely remove kangaroosfrom properties. Landholders have long been able to gain non-commercial ‘shoot and let lie’ tags to kill kangaroos damagingtheir crops or pasture, but there is great interest in newtechnologies that reduce kangaroo numbers through preventingthem drinking, including through visual recognition at waterpoints (Finch et al. 2006; Foreshew 2007), and research isunderway on methods of immunocontraception (Cooper andLarsen 2006). An increasing number of landholders are movingtowards fencing out kangaroos completely by macropod-proof
fences. This removes kangaroos completely from large areasand will inevitably disrupt foraging and dispersal patterns ofother species, including small macropods of conservationconcern. Grigg has expressed his concern about theattractiveness of a ‘magic bullet’ that would effectively andcheaply reduce kangaroo numbers – should it become available,the pressure for its use by landholders would become irresistible(Grigg 1995).
There are economic as well as environmental arguments infavour of increased landholder involvement in kangaroomanagement, from a variety of perspectives. For landholdersthemselves, earning income from wild kangaroos enablesdiversified income streams, increasing resilience to economic andclimatic shocks. For the current kangaroo industry, there couldbe benefits also through securing an assured future supply ofproduct. Currently the kangaroo industry is in a uniquelyvulnerable position – it is perhaps the only primary industry thatrelies on a product dependent on the resources of people whotypically would like to eliminate it as far as possible. If thevarious efforts for kangaroo reduction outlined above provesuccessful, or the ‘magic bullet’ that Grigg fears does eventuate,supply of kangaroos over the long-term is in doubt. Proposalsto reintroduce dingoes into the rangelands (e.g. Johnson 2006;Glen et al. 2007) could present a further long-term threat tothe industry. Carving out a place for landholders in the valuechain could open the way to establishing co-operativerelationships geared towards a common objective of ensuringabundant and sustainable populations across the rangelands,and open avenues for new marketing approaches (Ampt andOwen 2008).
Why aren’t landholders involved in kangaroomanagement?
With trivial exceptions, landholders currently play little to no rolein kangaroo management, and gain no financial return and noincentives for habitat conservation fromthekangaroopopulationson their land. The commercial harvest of kangaroos in Australiais conducted by licenced commercial harvesters, who are invitedor allowed by landholders to shoot on their properties.Landholders are motivated typically by the wish to reduce thecosts imposed by kangaroo populations, or sometimes to grantaccess for harvesters to secure their livelihoods. Although callsfor the involvement of landholders in kangaroo harvest go backsome 2 decades (Grigg 1987a, 1987b), there has been virtually noprogress towards this goal.
Fromanoutside perspective, this situation appears remarkable– globally, this is perhaps the only terrestrial harvest of acommercially valuable resource that returns no income to thelandholders involved. One reason often provided for lack oflandholder involvement is the relatively low price of kangarooproducts (Grigg 2002). Another possible factor is the structure ofthe product chain, which makes it hard for landholders to securea cut without eating into the incomes of the harvesters they relyon to control their kangaroo grazing pressure. Many of thelandholders themselves cite government regulation of the harvestas the major factor (Chapman 2003). There are cultural factors atplay as well – there is a long-established perception of kangaroosas a pest rather than a resource, and landholders’ expertise and
284 The Rangeland Journal R. Cooney et al.
inclination is focused on stock management rather thanmanagement of wildlife.
However, hampering any effort to move towards greaterlandholder involvement is lack of clarity regarding how theycould become involved. What roles would they conduct?How would they influence management? How would they workwith the existing kangaroo industry – the harvesters andprocessors? How would they derive income? Although somebroad possibilities have been highlighted in work to date(Grigg 1995; Martin 1995; Ampt and Baumber 2006), thiscritical issue has received scant attention. Different modelshave very different implications for the benefits outlined above,and very different chances of being translated into reality. Thispaper is the first to critically review the options and assess theirimplications.
Models for landholder involvement in kangaroomanagement
In this paper we present and discuss a series of potentialmodels that allow rangeland landholders to be involved in andbenefit from kangaroo harvesting, based on desk review andwide stakeholder consultation (see Cooney 2009). Consultationhas been undertaken through Sustainable Wildlife Enterprise(SWE) projects funded primarily by the Rural IndustriesResearch and Development Corporation (Wilson and Mitchell2005), particularly projects involving the Mitchell andDistrict Landcare Association in south-west Queensland andthe Barrier Area Rangecare Group in north-west NSW. Bothgroups have been exploring these issues since 2004 andhave steering groups consisting of landholders, harvesters,regional natural resource managers and researchers from theFATE Program at UNSW and Australian Wildlife Services.The Mitchell group has concentrated on the commercial endof landholder involvement in kangaroo management byinvesting in a chiller and commencing negotiations withprocessors. The Barrier Ranges group has focused primarilyon licensing and regulatory aspects, negotiating a specialgroup licence in 2008 to allow harvest across severalproperties with a secure quota. The models presented here weredeveloped in consultation with members of these groupsand presented to a joint SWE Workshop for feedback inFebruary 2008.
There is a series of options for how landholders couldbecome more involved in kangaroo management and/or gainbenefits from this kangaroo harvest. Several initial points mustbe noted. First, these two aspects – landholder involvement inmanagement and gaining benefits – do not always go hand-in-hand. In some of these options landholders gain a larger role inmanagement but do not gain any income, while in others theygain a benefit but do not expand their role in management.Second, this categorisation of options is necessarily quitebroad; for many of these options there could be endless minorvariations on how each operates in practice. Third, somecommentators assume that landholder management of kangarooswould involve mustering, branding, and tagging, as for domesticstock (e.g. Martin 1995). We believe such domestication is bothhighly undesirable as well as unfeasible. All our options,therefore, assume kangaroos remain as a wild, free-ranging
resource moving across the landscape regardless of propertyboundaries.
Landholders require payment from harvesters
The most straightforward way for landholders to gain aneconomic return from the kangaroos on their land is to requirecommercial harvesters to pay them in order to enter onto theirland to harvest kangaroos. This option was raised by Grigg(1995), and anecdotal accounts and discussions withlandholders indicate that this has happened in certain areas attimes when demand for kangaroo products is high and there isa shortage of either quota or land with harvestable populations.Landholders may require harvesters to make a payment inreturn for access to their land or to their quota – this could belevied per night or per kangaroo. In all states and territoriesof Australia, either the Crown is explicitly recognised inlegislation as owning all wild animals, or this is implicitlyaccepted in practice. Although landholders do not own andcannot sell kangaroos themselves, there seems no legal obstacleto them making access to their land conditional uponpayments such as these. The exact nature of such arrangementsdepends on the licensing and tagging system in the state ofharvest. In Queensland, where tags are issued directly toshooters, payment for access over a period of time might bemost significant, and in states where tags are issued tolandholders for a specific property, such as in NSW and SA,payment could be for the tag itself, representing a right toharvest one kangaroo. Further changes to quota-setting andtagging systems could potentially see trading of tags bylandholders for use elsewhere, as occurred under SA’s briefand under-utilised 1996–2001tradeable quota scheme (Thomsenand Davies 2007).
The benefit of this arrangement for landholders isstraightforward – they gain some income from the kangaroos ontheir land. If the returns were great enough, this could encouragethem to view kangaroos as less of a pest and more of a resource,andpotentiallymotivate actions towards habitat conservation andreduced stocking levels. However, a drawback of this approachfor landholders is that it does not lead to a greater landholder rolein kangaroo management, and will not enable them to bettercontrol TGP. Harvest management remains unchanged. Further,this approach will only be effective if there is competitionbetween harvesters for access to country, and harvesters arewilling to pay. Individual landholders have little bargainingpower– if harvesters can gain country elsewhere, theywill simplyshoot there.
Most importantly, this approach is likely to cause resentmentamong harvesters, and destabilise relationships with them.Harvesters, in general, view this approach as unfair, and willstrongly resist it. Access to country is a limiting factor for manyharvesters, and if paying for access became essential, it wouldsubstantially decrease their already thin profit margins. Inaddition, many landholders also view such a practice as unfair toharvesters, and do not want to impose an additional financialburden on the harvesters who they perceive as delivering avaluable service and as valued members of the community (thisstudy; Chapman 2003; Thomsen andDavies 2007). Thismodel isfor these reasons both undesirable and unlikely to be widely
Sharing Skippy The Rangeland Journal 285
adopted, at least in the absence of a major increase in kangarooprices and harvester profit margins.
Landholders become licenced harvesters themselves
The second fairly straightforward method for landholders to bothgain economic benefits from kangaroo harvest and play a role inkangaroo management is for them to become licenced kangarooharvesters themselves. Grigg (1987a, 1987b, 1995) raises thisoption and refers to instances of graziers in western Queenslandstarting to harvest kangaroos from their properties in the mid-1980s, when prices for wool dropped. Currently, it is uncommonbut not extraordinary for landholders to also conduct somecommercial kangaroo harvesting – several individuals involvedin the RIRDC trials did so. Harvesting is generally an additionalactivity to grazing, conducted for additional income when timeand property management permits.
Landholders would require appropriate licences to carry outcommercial harvesting. Commercial harvesting licences (whichhave various different names in different states) are not limited innumber in any state (although NSW has currently established amoratorium of uncertain duration on new licences (N. Payne,pers. comm.). Gaining a licence will require a valid firearmslicence, completion of a short accreditation course forprofessional harvesters, and completion of the relevant gamemeat handling and hygiene course. Landholders could shoot onother properties as well as their own as long as they securedagreement from those landholders and, in some states, securedtags for those specific properties. Landholders could stillapply for non-commercial ‘shoot-and-let-lie’ permits to manageaggregations of kangaroos which are under the legal weightlimits for commercial harvest, or when annual quotas areexhausted.
Under this model, landholders would gain economic benefitsfrom the sale of kangaroo carcasses that they shoot. This is likelyto contribute to changing their perceptions of kangaroos from apest to a valuable resource, with the potential land managementand habitat conservation benefits linked to this. Further, theywould take over kangaroo management on their own properties,so should be able to better manage TGP. For instance, they mayhave better information than other harvesters about whereaggregations are, and be better able to target these aggregationsin a flexible and timely fashion. They can alsomanage kangaroosaccording to their property management priorities. Landholdersare in a good position to make strategic judgements aboutwhether it is worthwhile reducing stock in some paddocks inorder to increase kangaroo numbers (e.g. if a paddock ismarginalfor stock but reliable for kangaroo harvesting it may makeeconomic sense to destock).
A major disadvantage of this model (as well as the previouspayment-from-harvesters model) is that it provides only forkangaroomanagement at the level of individual properties, ratherthan at the cross-property level required for effectivemanagementof a shared resource. As kangaroos move freely across propertyboundaries at a variety of spatial and temporal scales in responseto changes in local resource availability (Pople et al. 2007),management at the scale of individual properties is unlikelyto be effective, either for reliable kangaroo production or forTGP control, particularly for smaller properties. A further
disadvantage of this model is that harvesting kangaroosinvolves a specially equippedvehicle, extensivework at night andspecialist skills that may be arduous and time-consumingto acquire. Assuming landholders maintain their otheragricultural activities– running stock and cropping– the demandsof these activities mean that landholders may not have the timeor desire to take on additional night work (Thomsen andDavies 2007). For these reasons, particularly the limitationof single-property management, this option is not a favourableone.
Landholders employ kangaroo managers
Onemodel thatmayhelp to overcome the conflicts of the previousmodel is the idea of individual landholders or groups ofneighbouring landholders employing a ‘kangaroo manager’, inthe way that they might employ a specialist feral animal manageror other on-station staff. Such a manager could have the task ofdevising how to best manage kangaroos to maximise revenue tothe landholder(s) and minimise negative impacts on otherproductive activities such as stock production, as well asconducting harvesting, marketing produce to processors andpotentially operating a chiller box on-site. Income from sale ofkangaroo meat and hides could go to the property owner, whilethe manager could receive a salary from the landholder (perhapssupplemented by a per-kg payment as an incentive).
Management could encompass strategies to maximise localkangaroo populations, in areas or under conditions where thiswould yield returns. For instance, some areas of a property mightbe very attractive to kangaroos, but of marginal importancefor cattle or sheep. These areas could be de-stocked in favour ofencouraging kangaroo aggregations for harvest. Harvest couldbe timed to maximise production: for instance, going into adrought, when vast numbers of kangaroos typically starve,managers could seek to harvest at the maximum rate possible, inorder to harvest before individuals lose weight, and to minimiseeffects of drought on remaining populations.
On very large properties with large kangaroo numbers,individual properties might be able to employ kangaroomanagers. In other areas, several neighbouring properties couldemploy a manager to work across their properties. This wouldprobablywork best where there is a basis of collaboration alreadyestablished – for instance, they could be employed towork acrossa group of properties already cooperating in a local Landcaregroup, or across properties owned by family members.Establishing and maintaining such cooperation would, however,no doubt be challenging.
There are some issues to benegotiatedwith thismodel in termsof meeting regulatory requirements. Under state licensinglegislations, kangaroos, once shot, become the legal property ofthe licenced harvester, rather than the property of the landholder.However, akey featureof thismodel is that returns from the sale ofkangaroos flow to the landholder, rather than the harvester.Presumably, this could be resolved through contractualarrangements between landholder and manager.
This model gives landholders full control of kangaroomanagement, either at a property-level or cross-property scale. Itreturns economic benefits to the landholder as long as the returnsfrom kangaroos (plus the benefits from better kangaroo
286 The Rangeland Journal R. Cooney et al.
management, such as reduced grazing pressure at critical times)outweigh the cost of paying a kangaroo manager. It fosterskangaroomanagement as awell thought out component of overallproperty management, integrating it with NRM and agriculturalpriorities. As the kangaroo manager is a property employee, itencourages a strong relationship between him/her and thelandholder which can lead to the harvester contributing to NRMand property management activities such as feral control, weedsmanagement, and checking water points and fences. It iscomparatively simple to implement, particularly if individualproperties are large enough to support a kangaroomanager alone.The benefit for the kangaroo harvester/manager is that they have astable, secure income and no competition for country to shoot on.Although some harvesters undoubtedly prefer to workindependently, this may be attractive to some. This model hasmany strengths, and may have potential where landholders arehighly motivated to improve kangaroo management on theirproperties, particularlywhere they are dealingwith high densitiesof kangaroos.
Collaboration among landholders and harvesters
Landholders could collaborate with each other to play a role inharvest management, chiller box operation, processing andmarketing; and could seek to build relationships with harvestersinterested in working together on these objectives.
With respect to harvest management, a collaborating groupcould develop science-based kangaroo management plans tointegrate the various management priorities for kangaroos: TGPmanagement, kangaroo production, and broader regional,subcatchment and property level priorities. To facilitate goodmanagement thegroupcould share information andcommunicateregularly, gather input on kangaroo densities and priorities fromlandholders, carry out monitoring, collate information on leveland location of harvest, and keep track of collaborating harvestersand pass on landholder input to them. Collaborative harvestmanagement could be facilitated by the group gaining a groupharvest quota – this point is returned to below.
The group could negotiate collectivelywith processors to gainthe best market price for kangaroos supplied. Processors could bewilling to pay the group an additional ‘margin’over and above thestandard market price per kilogram (usually consistent betweendifferent processors and locations) if the group can ‘value-add’. Acollaborating landholder(/harvester) group can offer a processorthe following benefits:(1) exclusive access to kangaroos from collaborating properties.
Informal discussions with processors suggest that a secure,long-term supply of product, if large enough, is an attractiveproposition, as maintaining consistent supply can beproblematic for them. At the moment processors have nodirect contact with landholders, so have no security of supplyfrom particular areas of country;
(2) secure access to high-quality product. Meat quality and shelflife are critically affected by aspects such as how carcassesare handled in the field, how close together they are hungin chiller boxes, and how soon they reach the desiredtemperature. Discussions with industry members indicatehigh-quality carcasses already sometimes attract higherprices. If the collaborating group implements high quality
harvesting/chilling standards, this should be attractive to theprocessors interested in the higher-value end of the market;
(3) a commitment by collaborating landholders to stop or limitthe use of non-commercial culling on their land. Currently‘damage mitigation permits’ or ‘shoot-and-let-lie’ tags arewidely used for non-commercial culling of largeaggregations of kangaroos, and these kangaroos in generalcannot be used commercially. Stopping such culling is ofobvious appeal to processors interested in ensuring long-term, abundant sources of supply; and
(4) collaboration in developing differentiated, premiumkangaroo products that are labelled andmarketed on the basisof high quality standards and/or environmental attributes.Many potential marketing points require the involvement oflandholders.This margin can then be returned to the group, with profits to
be distributed to members in an equitable way.Operation of a chiller box by a landholder(/harvester)
group raises licensing issues in NSW. Here, the group wouldrequire a Fauna Dealer (Wholesaler) licence (‘FD licence’) inorder to buy kangaroos from harvesters (under the NationalParks and Wildlife Act 1974). The number of FD licences isrestricted – no new licences are generally issued (MacarthurAgribusiness and Econsearch P/L 2003). The group couldobtain their own licence only by buying one from an existingholder (licences turn over at about the rate of 1/year), or bymaking a case to the regulatory agency (NSW Department ofEnvironment and Climate Change) to issue an additionallicence [as occurred with the Tilpa Rangeland Investment Co. inthe mid-1990s (Henry and Watson 1998)]. Although this is notimpossible it involves additional uncertainty and effort.Alternatively they could operate as a sub-licensee of one of theprocessors who currently hold the FD licences. However, thislocks them into a single relationship and gives them littleflexibility for bargaining with different processors. In addition,under this arrangement kangaroos would remain the propertyof the licence holder, and not be owned at any stageby landholders, which could restrict options for negotiation,processing and marketing.
The group could gain flexibility and security in harvestmanagement by having a harvest quota (and tags) allocated by theregulator to the group as a whole, rather than to individualproperties or harvesters. This is particularly relevant in NSW,where currently tags can only be used on the specific propertyfor which they are issued, limiting the degree of possiblecollaboration between landholders in harvest management(Ampt and Baumber 2006). Here, for instance, it is difficult forharvest effort to be easily planned and coordinated across thegroup of properties – if kangaroo aggregations move from oneproperty to another, tags for that specific property will need to beapplied for and received before they can be targeted. Recently,the FATE Program at UNSW and members of the BarrierRanges Rangecare Group (BARG) have gained approval for atrial in which tags are allocated to a group of collaboratinglandholders, rather than to individuals. Here, the quota isdetermined by calculating the land area of collaboratingproperties as a proportion of the harvest zone land area– the groupis allocated the corresponding proportion of the annual zonequota. The group then decides how to allocate this quota among
Sharing Skippy The Rangeland Journal 287
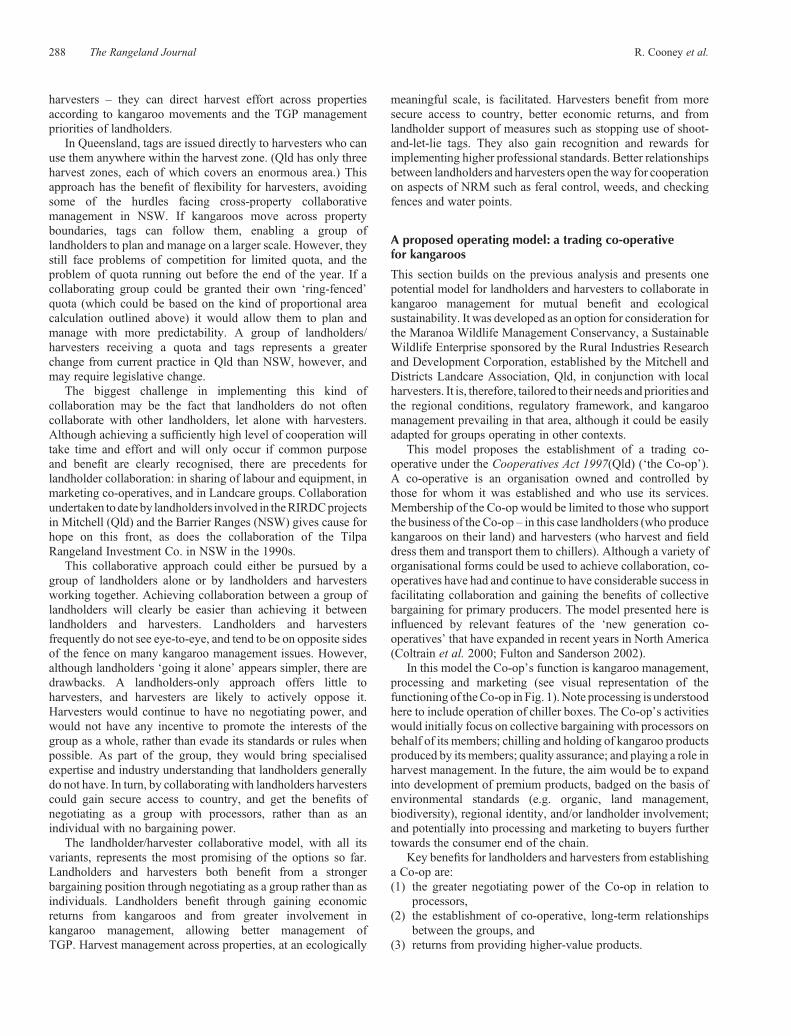
harvesters – they can direct harvest effort across propertiesaccording to kangaroo movements and the TGP managementpriorities of landholders.
In Queensland, tags are issued directly to harvesters who canuse them anywhere within the harvest zone. (Qld has only threeharvest zones, each of which covers an enormous area.) Thisapproach has the benefit of flexibility for harvesters, avoidingsome of the hurdles facing cross-property collaborativemanagement in NSW. If kangaroos move across propertyboundaries, tags can follow them, enabling a group oflandholders to plan and manage on a larger scale. However, theystill face problems of competition for limited quota, and theproblem of quota running out before the end of the year. If acollaborating group could be granted their own ‘ring-fenced’quota (which could be based on the kind of proportional areacalculation outlined above) it would allow them to plan andmanage with more predictability. A group of landholders/harvesters receiving a quota and tags represents a greaterchange from current practice in Qld than NSW, however, andmay require legislative change.
The biggest challenge in implementing this kind ofcollaboration may be the fact that landholders do not oftencollaborate with other landholders, let alone with harvesters.Although achieving a sufficiently high level of cooperation willtake time and effort and will only occur if common purposeand benefit are clearly recognised, there are precedents forlandholder collaboration: in sharing of labour and equipment, inmarketing co-operatives, and in Landcare groups. Collaborationundertaken todate by landholders involved in theRIRDCprojectsin Mitchell (Qld) and the Barrier Ranges (NSW) gives cause forhope on this front, as does the collaboration of the TilpaRangeland Investment Co. in NSW in the 1990s.
This collaborative approach could either be pursued by agroup of landholders alone or by landholders and harvestersworking together. Achieving collaboration between a group oflandholders will clearly be easier than achieving it betweenlandholders and harvesters. Landholders and harvestersfrequently do not see eye-to-eye, and tend to be on opposite sidesof the fence on many kangaroo management issues. However,although landholders ‘going it alone’ appears simpler, there aredrawbacks. A landholders-only approach offers little toharvesters, and harvesters are likely to actively oppose it.Harvesters would continue to have no negotiating power, andwould not have any incentive to promote the interests of thegroup as a whole, rather than evade its standards or rules whenpossible. As part of the group, they would bring specialisedexpertise and industry understanding that landholders generallydo not have. In turn, by collaborating with landholders harvesterscould gain secure access to country, and get the benefits ofnegotiating as a group with processors, rather than as anindividual with no bargaining power.
The landholder/harvester collaborative model, with all itsvariants, represents the most promising of the options so far.Landholders and harvesters both benefit from a strongerbargaining position through negotiating as a group rather than asindividuals. Landholders benefit through gaining economicreturns from kangaroos and from greater involvement inkangaroo management, allowing better management ofTGP. Harvest management across properties, at an ecologically
meaningful scale, is facilitated. Harvesters benefit from moresecure access to country, better economic returns, and fromlandholder support of measures such as stopping use of shoot-and-let-lie tags. They also gain recognition and rewards forimplementing higher professional standards. Better relationshipsbetween landholders and harvesters open theway for cooperationon aspects of NRM such as feral control, weeds, and checkingfences and water points.
A proposed operating model: a trading co-operativefor kangaroos
This section builds on the previous analysis and presents onepotential model for landholders and harvesters to collaborate inkangaroo management for mutual benefit and ecologicalsustainability. It was developed as an option for consideration forthe Maranoa Wildlife Management Conservancy, a SustainableWildlife Enterprise sponsored by the Rural Industries Researchand Development Corporation, established by the Mitchell andDistricts Landcare Association, Qld, in conjunction with localharvesters. It is, therefore, tailored to their needs andpriorities andthe regional conditions, regulatory framework, and kangaroomanagement prevailing in that area, although it could be easilyadapted for groups operating in other contexts.
This model proposes the establishment of a trading co-operative under the Cooperatives Act 1997(Qld) (‘the Co-op’).A co-operative is an organisation owned and controlled bythose for whom it was established and who use its services.Membership of the Co-op would be limited to those who supportthe business of the Co-op – in this case landholders (who producekangaroos on their land) and harvesters (who harvest and fielddress them and transport them to chillers). Although a variety oforganisational forms could be used to achieve collaboration, co-operatives have had and continue to have considerable success infacilitating collaboration and gaining the benefits of collectivebargaining for primary producers. The model presented here isinfluenced by relevant features of the ‘new generation co-operatives’ that have expanded in recent years in North America(Coltrain et al. 2000; Fulton and Sanderson 2002).
In this model the Co-op’s function is kangaroo management,processing and marketing (see visual representation of thefunctioning of theCo-op in Fig. 1).Note processing is understoodhere to include operation of chiller boxes. The Co-op’s activitieswould initially focus on collective bargaining with processors onbehalf of its members; chilling and holding of kangaroo productsproduced by its members; quality assurance; and playing a role inharvest management. In the future, the aim would be to expandinto development of premium products, badged on the basis ofenvironmental standards (e.g. organic, land management,biodiversity), regional identity, and/or landholder involvement;and potentially into processing and marketing to buyers furthertowards the consumer end of the chain.
Key benefits for landholders and harvesters from establishinga Co-op are:(1) the greater negotiating power of the Co-op in relation to
processors,(2) the establishment of co-operative, long-term relationships
between the groups, and(3) returns from providing higher-value products.
288 The Rangeland Journal R. Cooney et al.
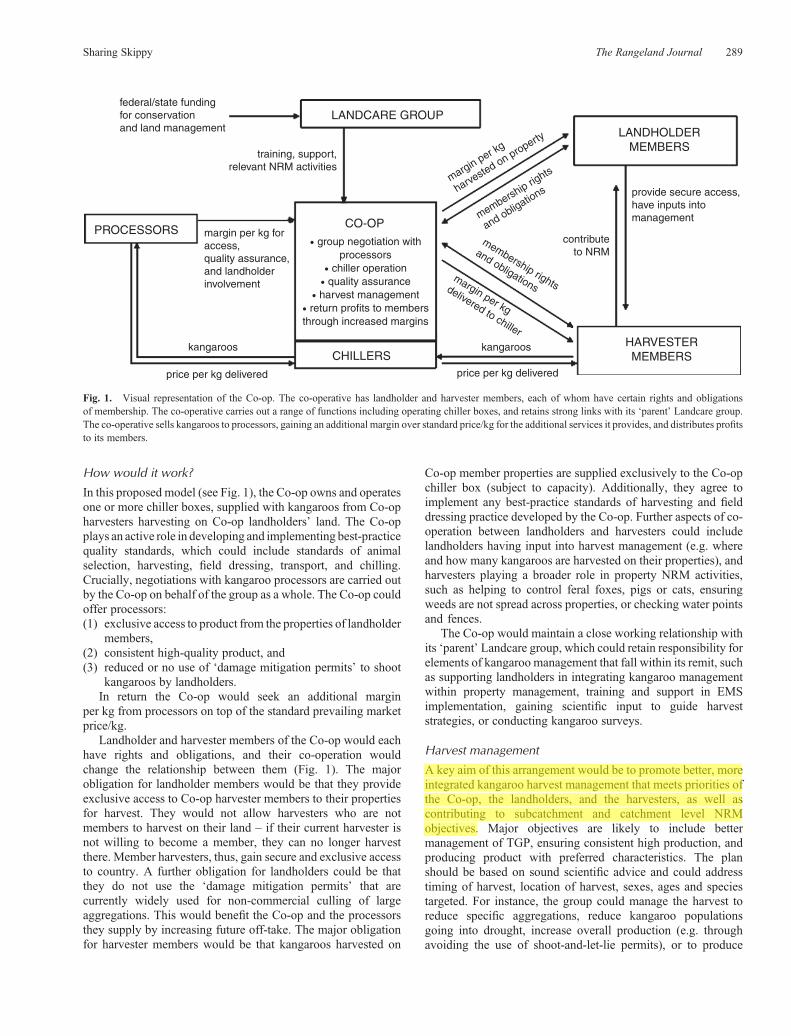
How would it work?
In this proposed model (see Fig. 1), the Co-op owns and operatesone or more chiller boxes, supplied with kangaroos from Co-opharvesters harvesting on Co-op landholders’ land. The Co-opplays an active role in developing and implementing best-practicequality standards, which could include standards of animalselection, harvesting, field dressing, transport, and chilling.Crucially, negotiations with kangaroo processors are carried outby the Co-op on behalf of the group as a whole. The Co-op couldoffer processors:(1) exclusive access to product from the properties of landholder
members,(2) consistent high-quality product, and(3) reduced or no use of ‘damage mitigation permits’ to shoot
kangaroos by landholders.In return the Co-op would seek an additional margin
per kg from processors on top of the standard prevailing marketprice/kg.
Landholder and harvester members of the Co-op would eachhave rights and obligations, and their co-operation wouldchange the relationship between them (Fig. 1). The majorobligation for landholder members would be that they provideexclusive access to Co-op harvester members to their propertiesfor harvest. They would not allow harvesters who are notmembers to harvest on their land – if their current harvester isnot willing to become a member, they can no longer harvestthere. Member harvesters, thus, gain secure and exclusive accessto country. A further obligation for landholders could be thatthey do not use the ‘damage mitigation permits’ that arecurrently widely used for non-commercial culling of largeaggregations. This would benefit the Co-op and the processorsthey supply by increasing future off-take. The major obligationfor harvester members would be that kangaroos harvested on
Co-op member properties are supplied exclusively to the Co-opchiller box (subject to capacity). Additionally, they agree toimplement any best-practice standards of harvesting and fielddressing practice developed by the Co-op. Further aspects of co-operation between landholders and harvesters could includelandholders having input into harvest management (e.g. whereand how many kangaroos are harvested on their properties), andharvesters playing a broader role in property NRM activities,such as helping to control feral foxes, pigs or cats, ensuringweeds are not spread across properties, or checking water pointsand fences.
The Co-op would maintain a close working relationship withits ‘parent’ Landcare group, which could retain responsibility forelements of kangaroo management that fall within its remit, suchas supporting landholders in integrating kangaroo managementwithin property management, training and support in EMSimplementation, gaining scientific input to guide harveststrategies, or conducting kangaroo surveys.
Harvest management
A key aim of this arrangement would be to promote better, moreintegrated kangaroo harvest management that meets priorities ofthe Co-op, the landholders, and the harvesters, as well ascontributing to subcatchment and catchment level NRMobjectives. Major objectives are likely to include bettermanagement of TGP, ensuring consistent high production, andproducing product with preferred characteristics. The planshould be based on sound scientific advice and could addresstiming of harvest, location of harvest, sexes, ages and speciestargeted. For instance, the group could manage the harvest toreduce specific aggregations, reduce kangaroo populationsgoing into drought, increase overall production (e.g. throughavoiding the use of shoot-and-let-lie permits), or to produce
LANDCARE GROUP
PROCESSORS
CHILLERS
LANDHOLDERMEMBERS
HARVESTERMEMBERS
CO-OP. group negotiation with
processors. chiller operation. quality assurance
. harvest management. return profits to membersthrough increased margins
federal/state fundingfor conservationand land management
margin per kg foraccess,quality assurance,and landholderinvolvement
provide secure access,have inputs intomanagement
training, support,relevant NRM activities
kangaroos kangaroos
price per kg delivered price per kg delivered
margin per kg
harvested on property
membership rights
and obligations
membership rights
and obligationsmargin per kg
delivered to chiller
contributeto NRM
Fig. 1. Visual representation of the Co-op. The co-operative has landholder and harvester members, each of whom have certain rights and obligationsof membership. The co-operative carries out a range of functions including operating chiller boxes, and retains strong links with its ‘parent’ Landcare group.The co-operative sells kangaroos to processors, gaining an additional margin over standard price/kg for the additional services it provides, and distributes profitsto its members.
Sharing Skippy The Rangeland Journal 289
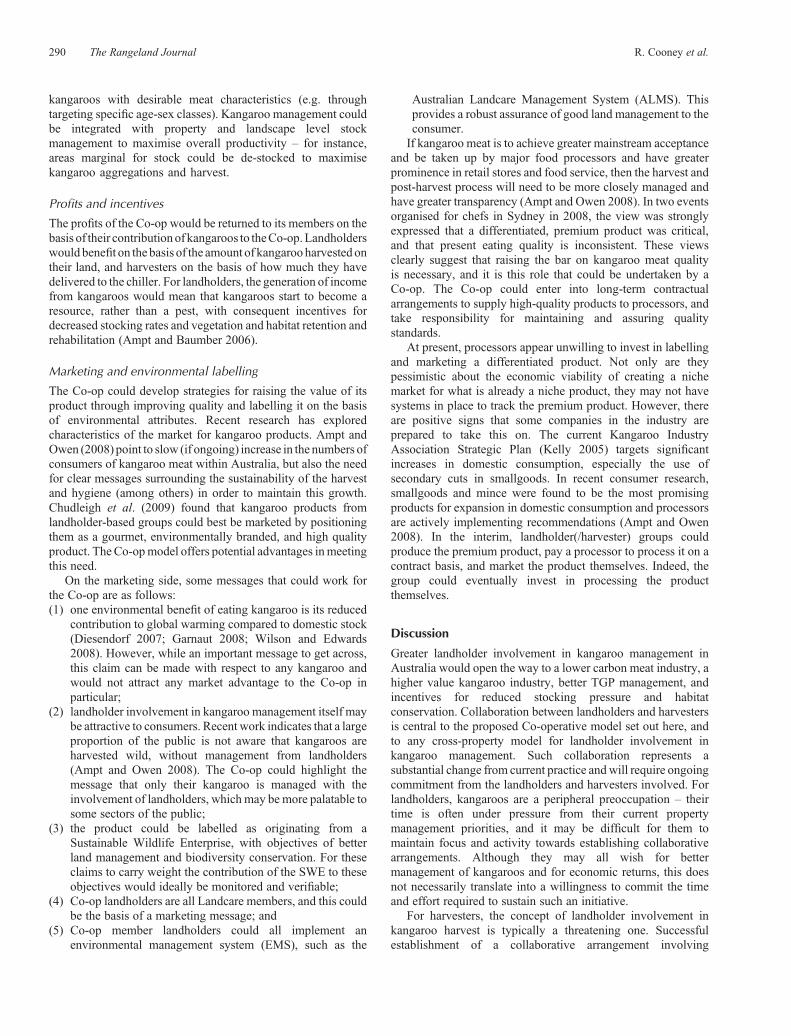
kangaroos with desirable meat characteristics (e.g. throughtargeting specific age-sex classes). Kangaroo management couldbe integrated with property and landscape level stockmanagement to maximise overall productivity – for instance,areas marginal for stock could be de-stocked to maximisekangaroo aggregations and harvest.
Profits and incentives
The profits of the Co-op would be returned to its members on thebasis of their contributionof kangaroos to theCo-op.Landholderswould benefit on the basis of the amount of kangarooharvestedontheir land, and harvesters on the basis of how much they havedelivered to the chiller. For landholders, the generation of incomefrom kangaroos would mean that kangaroos start to become aresource, rather than a pest, with consequent incentives fordecreased stocking rates and vegetation and habitat retention andrehabilitation (Ampt and Baumber 2006).
Marketing and environmental labelling
The Co-op could develop strategies for raising the value of itsproduct through improving quality and labelling it on the basisof environmental attributes. Recent research has exploredcharacteristics of the market for kangaroo products. Ampt andOwen (2008) point to slow (if ongoing) increase in the numbers ofconsumers of kangaroo meat within Australia, but also the needfor clear messages surrounding the sustainability of the harvestand hygiene (among others) in order to maintain this growth.Chudleigh et al. (2009) found that kangaroo products fromlandholder-based groups could best be marketed by positioningthem as a gourmet, environmentally branded, and high qualityproduct. TheCo-opmodel offers potential advantages inmeetingthis need.
On the marketing side, some messages that could work forthe Co-op are as follows:(1) one environmental benefit of eating kangaroo is its reduced
contribution to global warming compared to domestic stock(Diesendorf 2007; Garnaut 2008; Wilson and Edwards2008). However, while an important message to get across,this claim can be made with respect to any kangaroo andwould not attract any market advantage to the Co-op inparticular;
(2) landholder involvement in kangaroo management itself maybe attractive to consumers. Recent work indicates that a largeproportion of the public is not aware that kangaroos areharvested wild, without management from landholders(Ampt and Owen 2008). The Co-op could highlight themessage that only their kangaroo is managed with theinvolvement of landholders, which may be more palatable tosome sectors of the public;
(3) the product could be labelled as originating from aSustainable Wildlife Enterprise, with objectives of betterland management and biodiversity conservation. For theseclaims to carry weight the contribution of the SWE to theseobjectives would ideally be monitored and verifiable;
(4) Co-op landholders are all Landcare members, and this couldbe the basis of a marketing message; and
(5) Co-op member landholders could all implement anenvironmental management system (EMS), such as the
Australian Landcare Management System (ALMS). Thisprovides a robust assurance of good land management to theconsumer.If kangaroo meat is to achieve greater mainstream acceptance
and be taken up by major food processors and have greaterprominence in retail stores and food service, then the harvest andpost-harvest process will need to be more closely managed andhave greater transparency (Ampt and Owen 2008). In two eventsorganised for chefs in Sydney in 2008, the view was stronglyexpressed that a differentiated, premium product was critical,and that present eating quality is inconsistent. These viewsclearly suggest that raising the bar on kangaroo meat qualityis necessary, and it is this role that could be undertaken by aCo-op. The Co-op could enter into long-term contractualarrangements to supply high-quality products to processors, andtake responsibility for maintaining and assuring qualitystandards.
At present, processors appear unwilling to invest in labellingand marketing a differentiated product. Not only are theypessimistic about the economic viability of creating a nichemarket for what is already a niche product, they may not havesystems in place to track the premium product. However, thereare positive signs that some companies in the industry areprepared to take this on. The current Kangaroo IndustryAssociation Strategic Plan (Kelly 2005) targets significantincreases in domestic consumption, especially the use ofsecondary cuts in smallgoods. In recent consumer research,smallgoods and mince were found to be the most promisingproducts for expansion in domestic consumption and processorsare actively implementing recommendations (Ampt and Owen2008). In the interim, landholder(/harvester) groups couldproduce the premium product, pay a processor to process it on acontract basis, and market the product themselves. Indeed, thegroup could eventually invest in processing the productthemselves.
Discussion
Greater landholder involvement in kangaroo management inAustralia would open the way to a lower carbon meat industry, ahigher value kangaroo industry, better TGP management, andincentives for reduced stocking pressure and habitatconservation. Collaboration between landholders and harvestersis central to the proposed Co-operative model set out here, andto any cross-property model for landholder involvement inkangaroo management. Such collaboration represents asubstantial change from current practice andwill require ongoingcommitment from the landholders and harvesters involved. Forlandholders, kangaroos are a peripheral preoccupation – theirtime is often under pressure from their current propertymanagement priorities, and it may be difficult for them tomaintain focus and activity towards establishing collaborativearrangements. Although they may all wish for bettermanagement of kangaroos and for economic returns, this doesnot necessarily translate into a willingness to commit the timeand effort required to sustain such an initiative.
For harvesters, the concept of landholder involvement inkangaroo harvest is typically a threatening one. Successfulestablishment of a collaborative arrangement involving
290 The Rangeland Journal R. Cooney et al.
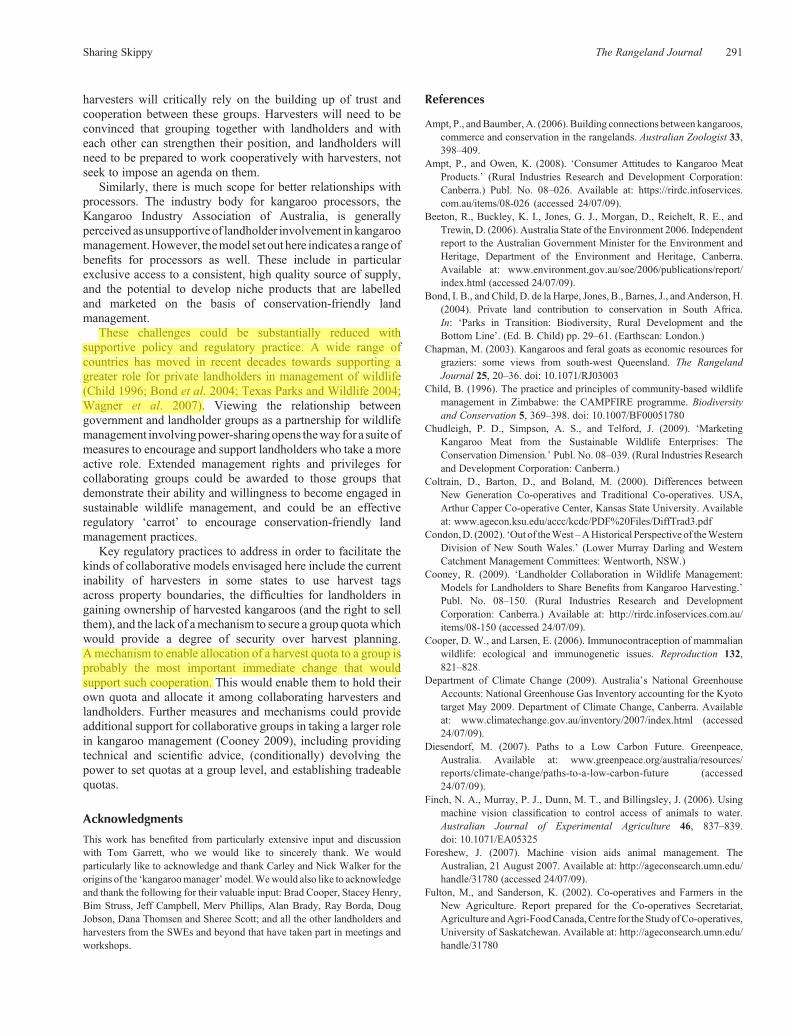
harvesters will critically rely on the building up of trust andcooperation between these groups. Harvesters will need to beconvinced that grouping together with landholders and witheach other can strengthen their position, and landholders willneed to be prepared to work cooperatively with harvesters, notseek to impose an agenda on them.
Similarly, there is much scope for better relationships withprocessors. The industry body for kangaroo processors, theKangaroo Industry Association of Australia, is generallyperceived asunsupportiveof landholder involvement inkangaroomanagement.However, themodel set out here indicates a rangeofbenefits for processors as well. These include in particularexclusive access to a consistent, high quality source of supply,and the potential to develop niche products that are labelledand marketed on the basis of conservation-friendly landmanagement.
These challenges could be substantially reduced withsupportive policy and regulatory practice. A wide range ofcountries has moved in recent decades towards supporting agreater role for private landholders in management of wildlife(Child 1996; Bond et al. 2004; Texas Parks and Wildlife 2004;Wagner et al. 2007). Viewing the relationship betweengovernment and landholder groups as a partnership for wildlifemanagement involvingpower-sharingopens theway for a suite ofmeasures to encourage and support landholders who take a moreactive role. Extended management rights and privileges forcollaborating groups could be awarded to those groups thatdemonstrate their ability and willingness to become engaged insustainable wildlife management, and could be an effectiveregulatory ‘carrot’ to encourage conservation-friendly landmanagement practices.
Key regulatory practices to address in order to facilitate thekinds of collaborative models envisaged here include the currentinability of harvesters in some states to use harvest tagsacross property boundaries, the difficulties for landholders ingaining ownership of harvested kangaroos (and the right to sellthem), and the lack of amechanism to secure a group quotawhichwould provide a degree of security over harvest planning.Amechanism to enable allocation of a harvest quota to a group isprobably the most important immediate change that wouldsupport such cooperation. This would enable them to hold theirown quota and allocate it among collaborating harvesters andlandholders. Further measures and mechanisms could provideadditional support for collaborative groups in taking a larger rolein kangaroo management (Cooney 2009), including providingtechnical and scientific advice, (conditionally) devolving thepower to set quotas at a group level, and establishing tradeablequotas.
Acknowledgments
This work has benefited from particularly extensive input and discussionwith Tom Garrett, who we would like to sincerely thank. We wouldparticularly like to acknowledge and thank Carley and Nick Walker for theorigins of the ‘kangaroomanager’model.Wewould also like to acknowledgeand thank the following for their valuable input: Brad Cooper, Stacey Henry,Bim Struss, Jeff Campbell, Merv Phillips, Alan Brady, Ray Borda, DougJobson, Dana Thomsen and Sheree Scott; and all the other landholders andharvesters from the SWEs and beyond that have taken part in meetings andworkshops.
References
Ampt, P., andBaumber, A. (2006). Building connections between kangaroos,commerce and conservation in the rangelands. Australian Zoologist 33,398–409.
Ampt, P., and Owen, K. (2008). ‘Consumer Attitudes to Kangaroo MeatProducts.’ (Rural Industries Research and Development Corporation:Canberra.) Publ. No. 08–026. Available at: https://rirdc.infoservices.com.au/items/08-026 (accessed 24/07/09).
Beeton, R., Buckley, K. I., Jones, G. J., Morgan, D., Reichelt, R. E., andTrewin, D. (2006). Australia State of the Environment 2006. Independentreport to the Australian Government Minister for the Environment andHeritage, Department of the Environment and Heritage, Canberra.Available at: www.environment.gov.au/soe/2006/publications/report/index.html (accessed 24/07/09).
Bond, I. B., and Child, D. de la Harpe, Jones, B., Barnes, J., and Anderson, H.(2004). Private land contribution to conservation in South Africa.In: ‘Parks in Transition: Biodiversity, Rural Development and theBottom Line’. (Ed. B. Child) pp. 29–61. (Earthscan: London.)
Chapman, M. (2003). Kangaroos and feral goats as economic resources forgraziers: some views from south-west Queensland. The RangelandJournal 25, 20–36. doi: 10.1071/RJ03003
Child, B. (1996). The practice and principles of community-based wildlifemanagement in Zimbabwe: the CAMPFIRE programme. Biodiversityand Conservation 5, 369–398. doi: 10.1007/BF00051780
Chudleigh, P. D., Simpson, A. S., and Telford, J. (2009). ‘MarketingKangaroo Meat from the Sustainable Wildlife Enterprises: TheConservation Dimension.’ Publ. No. 08–039. (Rural Industries Researchand Development Corporation: Canberra.)
Coltrain, D., Barton, D., and Boland, M. (2000). Differences betweenNew Generation Co-operatives and Traditional Co-operatives. USA,Arthur Capper Co-operative Center, Kansas State University. Availableat: www.agecon.ksu.edu/accc/kcdc/PDF%20Files/DiffTrad3.pdf
Condon,D. (2002). ‘Out of theWest–AHistorical Perspective of theWesternDivision of New South Wales.’ (Lower Murray Darling and WesternCatchment Management Committees: Wentworth, NSW.)
Cooney, R. (2009). ‘Landholder Collaboration in Wildlife Management:Models for Landholders to Share Benefits from Kangaroo Harvesting.’Publ. No. 08–150. (Rural Industries Research and DevelopmentCorporation: Canberra.) Available at: http://rirdc.infoservices.com.au/items/08-150 (accessed 24/07/09).
Cooper, D. W., and Larsen, E. (2006). Immunocontraception of mammalianwildlife: ecological and immunogenetic issues. Reproduction 132,821–828.
Department of Climate Change (2009). Australia’s National GreenhouseAccounts: National Greenhouse Gas Inventory accounting for the Kyototarget May 2009. Department of Climate Change, Canberra. Availableat: www.climatechange.gov.au/inventory/2007/index.html (accessed24/07/09).
Diesendorf, M. (2007). Paths to a Low Carbon Future. Greenpeace,Australia. Available at: www.greenpeace.org/australia/resources/reports/climate-change/paths-to-a-low-carbon-future (accessed24/07/09).
Finch, N. A., Murray, P. J., Dunn, M. T., and Billingsley, J. (2006). Usingmachine vision classification to control access of animals to water.Australian Journal of Experimental Agriculture 46, 837–839.doi: 10.1071/EA05325
Foreshew, J. (2007). Machine vision aids animal management. TheAustralian, 21 August 2007. Available at: http://ageconsearch.umn.edu/handle/31780 (accessed 24/07/09).
Fulton, M., and Sanderson, K. (2002). Co-operatives and Farmers in theNew Agriculture. Report prepared for the Co-operatives Secretariat,Agriculture andAgri-FoodCanada,Centre for theStudyofCo-operatives,University of Saskatchewan. Available at: http://ageconsearch.umn.edu/handle/31780
Sharing Skippy The Rangeland Journal 291
Garnaut, R. (2008). ‘The Garnaut Climate Change Review: Final Report.’(Cambridge University Press: Port Melbourne, Vic.)
Glen, A. S., Dickman, C. R., Soule, M. E., and Mackey, B. G. (2007).Evaluating the role of the dingo as a trophic regulator in Australianecosystems. Austral Ecology 32, 492–501. doi: 10.1111/j.1442-9993.2007.01721.x
Gray, B. (2008). But we’ll skip Garnaut’s kangaroo suggestion, farmers say.Farm Weekly, 1 October 2008. Available at: http://fw.farmonline.com.au/news/nationalrural/agribusiness-and-general/general/but-well-skip-garnauts-kangaroo-suggestion-farmers-say/1321947.aspx (accessed24/07/09).
Grigg, G. (1987a). Kangaroo harvesting – a new approach. AustralianNatural History 22, 204–205.
Grigg, G. (1987b). Kangaroos – a better economic base for our marginalgrazing lands? Australian Zoologist 24, 73–80.
Grigg, G. (1988). Kangaroo harvesting and the conservation of arid lands. In:Kangaroo harvesting and the conservation of arid lands: a symposium.(Eds D. Lunney and G. C. Grigg.) Australian Zoologist 24, 124–128.
Grigg, G. (1989). Kangaroo harvesting and the conservation of arid andsemi-arid rangelands. Conservation Biology 3, 194–197. doi: 10.1111/j.1523-1739.1989.tb00072.x
Grigg, G. (1995). Kangaroo harvesting for conservation of rangelands,kangaroos ... and graziers. In: ‘Conservation Through Sustainable Use ofWildlife’. (EdsG.Grigg,P.Hale andD.Lunney.)pp. 161–165. (Centre forConservation Biology, University of Queensland: Brisbane.)
Grigg, G (2002). Conservation benefit from harvesting kangaroos: statusreport at the start of a new millennium. In: ‘A Zoological Revolution:using Native Fauna to Assist in its Own Survival’. (Eds D. Lunney andC. Dickman.) pp. 53–76. (Royal Zoological Society of Australia andAustralian Museum: Sydney.)
Hacker, R., Beange, L., Casburn, G., Curran, G., Gray, P., and Warner, J.(2005). Best Management Practices for Extensive Grazing Enterprises.NSW Department of Primary Industries, Orange, NSW. Available at:www.dpi.nsw.gov.au/__data/assets/pdf_file/0007/175570/best-mgt-ext-graz.pdf (accessed 24/07/09).
Henry,E.S., andWatson,G.K. (1998).KangarooMarketing forLandowners:Exploratory Action Research for Tilpa Rangeland Investment Company.A Report to the Total Catchment Management – Western CatchmentManagement Committee, Orange Agricultural College, University ofSydney, Sydney.
Johnson, C. (2006). ‘Australia’s Mammal Extinctions: A 50 000 YearHistory.’ (Cambridge University Press: Cambridge.)
Kelly, J. (2005). Kangaroo Industry Strategic Plan 2005–2010. RuralIndustries Research and Development Corporation, Canberra. Reportno 05/108. Available at: http://rirdc.infoservices.com.au/items/05-108(accessed 24/07/09).
Kempton, T., Murray, R., and Leng, R. (1976). Methane production anddigestibility measurements in the grey kangaroo and sheep. AustralianJournal of Biological Sciences 29, 209–214.
Macarthur Agribusiness and Econsearch P/L (2003). Review of KangarooFauna Dealer Wholesaler Licensing in NSW. Prepared for WesternDirectorate, NSW National Parks and Wildlife Service, Dubbo, NSW.Available at: www.environment.nsw.gov.au/resources/nature/KMPWholesalerReview.pdf (accessed 24/07/09).
Martin, A. (1995). The pastoralist’s role – where to now? In: ‘ConservationThrough Sustainable Use of Wildlife’. (Eds G. Grigg, P. Hale andD. Lunney.) pp. 6–8. (Centre for Conservation Biology, University ofQueensland: Brisbane.)
Pople, A. R., Phinn, S. R., Menke, N., Grigg, G. C., Possingham, H. P., andMcAlpine, C. (2007). Spatial patterns of kangaroo density across theSouth Australian pastoral zone over 26 years: aggregation duringdrought and suggestions of long distance movement. Journal of AppliedEcology 44, 1068–1079. doi: 10.1111/j.1365-2664.2007.01344.x
Stafford Smith, D. M., Morton, S. R., and Ash, A. J. (2000). Towardssustainable pastoralism in the rangelands. Australian Journal ofEnvironmental Management 7, 190–203.
Texas Parks and Wildlife (2004). A Guide for Wildlife ManagementAssociations and Co-ops. Texas Parks and Wildlife, Making Tracts forTexas Wildlife Private Lands and Habitats Program, Austin, Texas.Available at: www.tpwd.state.tx.us/publications/pwdpubs/media/pwd_bk_w7000_0336.pdf (accessed 24/07/09).
Thomsen, D., and Davies, J. (2007). ‘People and Kangaroos in the SouthAustralian Rangelands: Social and Institutional Considerations forKangaroo Management and the Kangaroo Industry.’ Publ. No. 07–039.(Rural Industries Research and Development Corporation: Canberra.)Available at: http://rirdc.infoservices.com.au/items/07-039 (accessed24/07/09).
Viggers,K.L., andHearn, J. P. (2005).The kangarooconundrum: home rangestudies and implications for land management. Journal of AppliedEcology 42, 99–107. doi: 10.1111/j.1365-2664.2005.01001.x
Wagner, M., Kaiser, R., Kreuter, U., and Wilkins, N. (2007). Managing thecommons Texas style: wildlife management and ground-waterassociations on private lands. Journal of the American Water ResourcesAssociation 43, 698–711. doi: 10.1111/j.1752-1688.2007.00056.x
Wilson, G., and Edwards, M. (2008). Native wildlife on rangelands tominimize methane and produce lower-emission meat: kangaroos versuslivestock. Conservation Letters 1, 119–128. doi: 10.1111/j.1755-263X.2008.00023.x
Wilson,G., andMitchell,B. (2005). ‘AStrategicPlan forTriallingSustainableWildlife Enterprises:Guidelines forConservation-basedEnterprises as anIncentive to Restore On-farm Habitat.’ (Rural Industries Research andDevelopment Corporation: Canberra.)
Manuscript received 6 June 2008; accepted 2 December 2008
292 The Rangeland Journal R. Cooney et al.
http://www.publish.csiro.au/journals/trj
Sustainable Wildlife
Enterprise Trials
Commercial value as an incentive for changing on-
farm land management practices
A report for the National Landcare Program in accordance with the final milestone of the
DAFF Deed of Grant to RIRDC under the Sustainable Wildlife Project
by George Wilson, Margaret Woodrow and Melanie Edwards
June 2008
ii
Researcher Contact Details
George Wilson Australian Wildlife Services 51 Stonehaven Cres, Deakin, ACT, 2600
Phone: (02) 6281 2160
Fax: (02) 6285 1885
Email: [email protected]
In submitting this report, the researcher has agreed to RIRDC publishing this material in its edited form.
RIRDC Contact Details
Rural Industries Research and Development Corporation Level 2, 15 National Circuit
BARTON ACT 2600
PO Box 4776 KINGSTON ACT 2604
Phone: 02 6271 4100 Fax: 02 6271 4199 Email: [email protected]. Web: http://www.rirdc.gov.au
iii
Acknowledgments
This report has been prepared with financial support from the Australian
Government's National Landcare Program. It draws together the results of a group of
project teams engaged to undertake and facilitate the Sustainable Wildlife Enterprise
Trials. We would like to sincerely thank the project teams who have made this report
possible:
Alex Baumber, Project Officer, FATE Program
Deborah Archbold, Deborah Wilson Consulting Services
Jeff Campbell, Landholder and Chairman Mitchell and District Landcare Association
Julia Telford, Border Rivers Catchment Coordinator QMDC
Peter Ampt, Program Manager, FATE Program
Peter Chudleigh and Sarah Simpson, Agtrans Research
Rosie Cooney, Consultant and Research Fellow, FATE, UNSW
Stacey Henry, Mitchell and District Landcare Coordinator
Sheree Scott, RMAP Project Officer, Wentworth
Steven McLeod, NSW Department of Primary Industry
Tom Garrett, Coordinator, Maranoa Wildlife Conservancy, kangaroo harvester and
box operator
The valuable input from the landholders and kangaroo harvesters, box operators and
processors as well as those who participated in meetings and workshops is gratefully
acknowledged. In particular I would like to acknowledge and thank for their valuable
contributions Ray Borda and Doug Jobson, Macro Meats, Adelaide.
iv
Abbreviations
ALMS Australian Landcare Management System
CSU Conservation through Sustainable Use
DMP Damage Mitigation Permit
DSD Qld Department of Sustainable Development
EPA Environmental Protection Agency (Queensland)
FATE Future of Australia‟s Threatened Ecosystems
MDLA Mitchell & District Landcare Association
MWMC Maranoa Wildlife Management Conservancy
MDRC Murray Darling Rangelands Conservancy
NRS National Reserve System
NLP National Landcare Program
NSW New South Wales
Qld Queensland
QMDC Queensland Murray Darling Committee
QDNRW Queensland Department of Natural Resources and Water
QDPIF Queensland Department of Primary Industries and Fisheries
RIRDC Rural Industries Research and Development Corporation
SA South Australia
SWE Sustainable Wildlife Enterprise
SWNRM South West NRM proprietary Ltd
WMC Wildlife Management Conservancy
v
Contents Acknowledgments ................................................................................................................................ iii
Abbreviations ........................................................................................................................................ iv
Executive Summary ............................................................................................................................ vii
1. Introduction ................................................................................................................................. 11
The SWE concept .............................................................................................................................. 12
Increasing pressure on sustainability and biodiversity ..................................................................... 13
SWE Implementation Plan ................................................................................................................ 15
2007-2008 Funding ........................................................................................................................... 15
Methods ............................................................................................................................................. 16
Defining the issues that the Trials sought to address ........................................................................ 17
2. Progress with the SWE Trials .................................................................................................... 22
Maranoa Wildlife Management Conservancy .................................................................................. 22
Murray Darling Rangeland Conservancy .......................................................................................... 36
Barrier Area Rangecare Group - BARG, .......................................................................................... 48
3. Wildlife Stewardship Scheme .................................................................................................... 51
Attributes of an EMS ........................................................................................................................ 51
Australian Landcare Management System ........................................................................................ 52
Aims of a proposed Wildlife Stewardship Scheme........................................................................... 53
4. Models for landholders to share benefits from wildlife harvesting ....................................... 55
Issues identified ................................................................................................................................. 55
Implications and recommendations for relevant stakeholders .......................................................... 57
Trial of the Cooperative model with the Maranoa WMC ................................................................. 58
5. Marketing Kangaroo Products .................................................................................................. 59
Marketing Kangaroo Meat from the WMCs – Chudleigh et al ........................................................ 59
Consumer attitudes to kangaroo meat products – Ampt and Owen................................................... 65
6. SWE Workshop – February 2008 .............................................................................................. 66
Workshop presentations .................................................................................................................... 66
Findings ............................................................................................................................................. 70
7. Discussion ..................................................................................................................................... 72
8. Recommendations ....................................................................................................................... 77
Funding.............................................................................................................................................. 77
Ongoing SWE trial tasks ................................................................................................................... 77
On ground projects ............................................................................................................................ 77
vi
Research Support .............................................................................................................................. 78
Coordination and management .......................................................................................................... 79
References ............................................................................................................................................ 80
Attachments ......................................................................................................................................... 82
Table of Figures
Figure 1 Kangaroo population estimates quotas and harvests for commercial zones 1982 to 2006 .... 18
Figure 2 Map of Maranoa Landcare groups .......................................................................................... 23
Figure 3 One of the two chillers owned by Maranoa WMC and forming the basis of the Coop. ........ 26
Figure 4 Flight lines for the Maranoa aerial survey ............................................................................. 29
Figure 5 The density and distribution of eastern grey kangaroos in the Maranoa WMCs ................... 30
Figure 6 The density and distribution of red kangaroos in Maranoa WMCs ....................................... 31
Figure 7 The density of eastern grey and red kangaroos / km2 and MSY for the north and south side
of the dingo fence in the Maranoa WMC. The figure also shows the density of kangaroos in the
central harvesting zone in Queensland. ................................................................................................. 32
Figure 8 Properties participating in the SWE trial under the banner of Murray Darling Rangeland
Conservancy. ......................................................................................................................................... 36
Figure 9 The density of eastern grey, western grey and red kangaroos / km2 and the MSY for the
properties at the Murray Darling WMC. ............................................................................................... 43
Figure 10 Proposed flight lines for the aerial survey to be carried out at Murray Darling WM .......... 44
Figure 11 Map of Aston kangaroo density estimates 2007 over land types ......................................... 45
Figure 12 Moorna station kangaroo density estimates 2007 over land types ....................................... 45
Figure 13 Wyndham station kangaroo density estimates 2007 over land types ................................... 46
Figure 14 Properties in the Barrier Area SWE operated by UNSW ..................................................... 49
Figure 15 Flight lines for aerial survey of BARG properties ............................................................... 50
Figure 16 Visual representation of the relationship between the participants in Cooperative ............. 56
Figure 17: Structure of the National Association of Kangaroo Growers and Harvesters ..................... 70
Table of Tables
Table 1 Kangaroo populations for commercial harvest areas for 2001 – 200625 ................................ 18
Table 2 Statistics of the Landcare groups comprising the Maranoa WMC ......................................... 24
Table 3 The numbers, densities and Maximum Sustainable Yield (MSY) of kangaroos in the Maranoa
WMC and the central zone of Queensland ........................................................................................... 32
Table 4 The numbers, densities and Maximum Sustainable Yield (MSY) of kangaroos in the Mildura
WMC and the Western Plains harvesting zone in NSW. ...................................................................... 42
Table 5 The steps and processes required to carry out an ALMS EMS and areas which require
modification to include wildlife and biodiversity. ................................................................................ 53
Table 6 A comparison of the activities and aspects in a current ALMS EMS and how it could be
expanded by the WSS ........................................................................................................................... 54
Table 7 Milestones and key performance indicators ............................................................................ 82
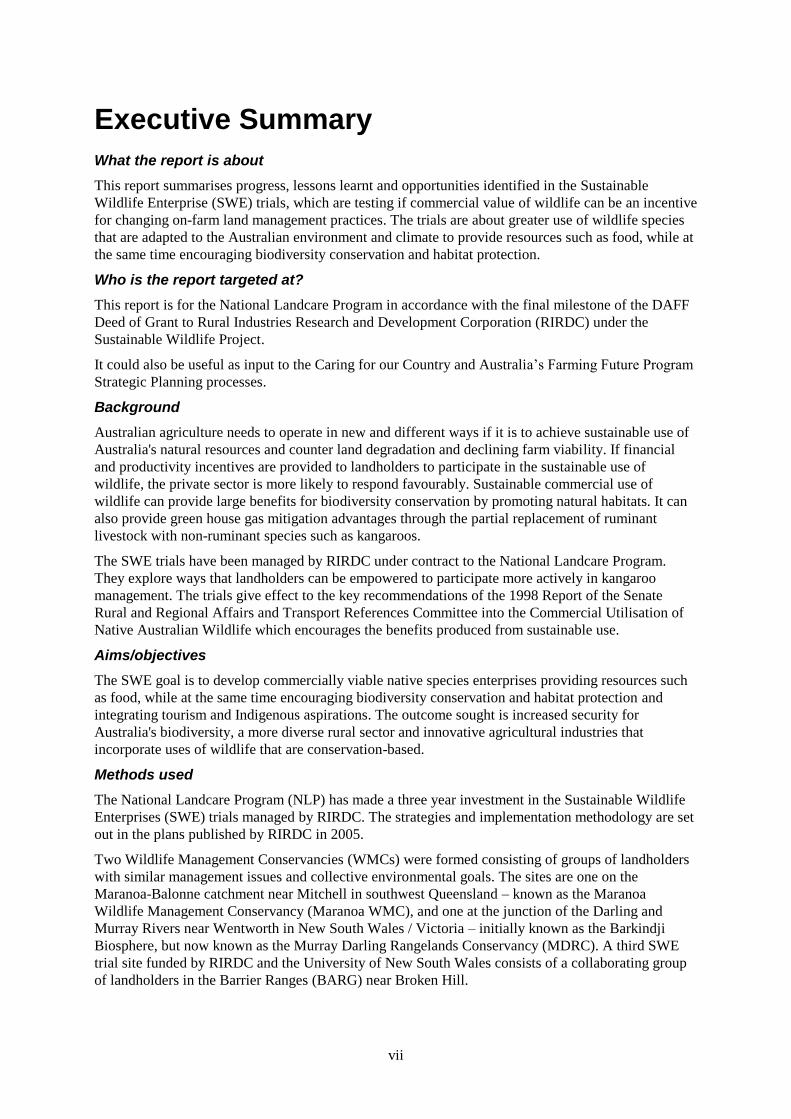
vii
Executive Summary
What the report is about
This report summarises progress, lessons learnt and opportunities identified in the Sustainable
Wildlife Enterprise (SWE) trials, which are testing if commercial value of wildlife can be an incentive
for changing on-farm land management practices. The trials are about greater use of wildlife species
that are adapted to the Australian environment and climate to provide resources such as food, while at
the same time encouraging biodiversity conservation and habitat protection.
Who is the report targeted at?
This report is for the National Landcare Program in accordance with the final milestone of the DAFF
Deed of Grant to Rural Industries Research and Development Corporation (RIRDC) under the
Sustainable Wildlife Project.
It could also be useful as input to the Caring for our Country and Australia‟s Farming Future Program
Strategic Planning processes.
Background
Australian agriculture needs to operate in new and different ways if it is to achieve sustainable use of
Australia's natural resources and counter land degradation and declining farm viability. If financial
and productivity incentives are provided to landholders to participate in the sustainable use of
wildlife, the private sector is more likely to respond favourably. Sustainable commercial use of
wildlife can provide large benefits for biodiversity conservation by promoting natural habitats. It can
also provide green house gas mitigation advantages through the partial replacement of ruminant
livestock with non-ruminant species such as kangaroos.
The SWE trials have been managed by RIRDC under contract to the National Landcare Program.
They explore ways that landholders can be empowered to participate more actively in kangaroo
management. The trials give effect to the key recommendations of the 1998 Report of the Senate
Rural and Regional Affairs and Transport References Committee into the Commercial Utilisation of
Native Australian Wildlife which encourages the benefits produced from sustainable use.
Aims/objectives
The SWE goal is to develop commercially viable native species enterprises providing resources such
as food, while at the same time encouraging biodiversity conservation and habitat protection and
integrating tourism and Indigenous aspirations. The outcome sought is increased security for
Australia's biodiversity, a more diverse rural sector and innovative agricultural industries that
incorporate uses of wildlife that are conservation-based.
Methods used
The National Landcare Program (NLP) has made a three year investment in the Sustainable Wildlife
Enterprises (SWE) trials managed by RIRDC. The strategies and implementation methodology are set
out in the plans published by RIRDC in 2005.
Two Wildlife Management Conservancies (WMCs) were formed consisting of groups of landholders
with similar management issues and collective environmental goals. The sites are one on the
Maranoa-Balonne catchment near Mitchell in southwest Queensland – known as the Maranoa
Wildlife Management Conservancy (Maranoa WMC), and one at the junction of the Darling and
Murray Rivers near Wentworth in New South Wales / Victoria – initially known as the Barkindji
Biosphere, but now known as the Murray Darling Rangelands Conservancy (MDRC). A third SWE
trial site funded by RIRDC and the University of New South Wales consists of a collaborating group
of landholders in the Barrier Ranges (BARG) near Broken Hill.
viii
The NLP investment included supporting research into what is the most effective framework for
landholders to become involved in and share the proceeds of harvested wildlife; a study of potential
market demand for differentiated produce from Wildlife Management Conservancies (WMCs);
surveys of kangaroo populations and consideration of the attributes of a wildlife stewardship scheme,
which might be part of sustainability certification. It also funded a workshop towards the end of the
funding cycle that was designed to share information on the project to date and encourage
collaboration in natural resource management and wildlife management.
Results/key findings
With assistance from the researchers, members of the wildlife management conservancies have:
commenced commercial harvesting on a small scale with their own chillers and harvesters in
operation (Maranoa WMC)
Established a cooperative trading structure that needs to be tested to determine if it can ensure an
economically viable working arrangement between the landholders, harvesters and processors
Commenced a trial with NSW Department of Environment and Climate Change (DECC) of a
group licensed quota and tag system that will give landholders and harvesters involved in the
project the ability to function collaboratively - as though harvesting on one property. (BARG)
Surveyed kangaroo populations, estimated sustainable harvests and are ready to examine varying
strategies for altering sex ratios and age classes
Conducted marketing research that indicates that kangaroo product from SWEs could best be
marketed by positioning it as a gourmet, environmentally branded, and high quality product
Built on a strong "Landcare ethic" and have been closely involved in catchment management
planning
Formed the National Association of Kangaroo Growers and Harvesters to facilitate future
collaboration between landholders, harvesters and Natural Resource Managers to help progress
the SWE concept
Are gradually being accredited under the Australian Landcare Management System (ALMS).
They are ready to implement a proposed wildlife stewardship scheme.
Progress could have been faster. The drought hampered initial progress. Turnover of Landcare project
officers have been regular and disruptive. Continuity of support is most important to maintaining the
commitment of landholders especially when they are under stress. Testing whether landholders can
benefit from the kangaroos on their properties takes a long time because it requires a major change in
land use, making continuity of support even more critical.
Nevertheless the trials have begun to show the promise that commercial value of wildlife can act as an
incentive to engage landholders in wildlife management, conservation of biodiversity, maintenance
and even restoration of on-farm wildlife habitat.
Implications for relevant stakeholders
The trials are well positioned to continue and to expand, particularly in western Queensland. The
number of interested and committed landholders is growing.
Changing the status of kangaroos from a pest to a resource is a paradigm shifting and complex
undertaking involving not only activities which farmers can control but also chain management, and
marketing.
ix
The WMCs also have enthusiastic industry connections; although major sections of the kangaroo
industry feel threatened by the SWE trial developments. Kangaroo harvesters in particular, are
concerned they will be the losers when landholders are in the production process. The project is
addressing their concerns by seeking to increase value by focusing on quality and reliability of supply.
Considerable greenhouse gas (GHG) savings are possible through greater use of kangaroos on the
rangelands in lieu of cattle and sheep.
Given the size of the benefits which could be derived from greater use of native species and the
prospect of contributing to significant carbon savings, a relatively large investment over three years to
continue the SWE trials would seem appropriate.
The SWE concepts could be incorporated into the Caring for our Country Strategic Plan. In 2008/9,
initial carryover support could be provided to the NRM bodies in the SWE trial sites. In subsequent
three years, Caring for our Country could contract outcomes probably with the NRM bodies.
x
Recommendations
An extension of the trials is an option, especially when Australian agriculture is looking for
adaptation strategies for climate change.
Continued support will enable regional cooperative management of kangaroos and other wildlife that
integrates landholders into the industry.
Continuation of the trials could occur in southern QLD and western NSW through collaboration
with NRM bodies - SW NRM, QMDC, Desert Channels and Western CMA
The concepts of extending NLP support could be incorporated into the Caring for our Country
(CoC) Strategic Plan
The initial carryover support could be provided in 2008/9 to the NRM bodies in the SWE trial
sites pending the contracting for subsequent years under the CoC Strategic Plan
A three year program would seek
$450 k in 2008/9 and
$1 m in following three years
Additional support could come from contributions from other sources - e.g. the mining industry,
and philanthropy.
Page 11 of 85
1. Introduction
“Australia faces an unprecedented challenge from climate change. We risk losing our natural
heritage, our rivers, landscapes and biodiversity. We have a brief opportunity to act now to
safeguard and shape our future prosperity”. (Australia 2020 Summit Initial Summit Report April 2008)
Begun in 2004, Sustainable Wildlife Enterprise (SWE) trials are an innovative attempt to meet the
type of challenges highlighted at the Australia 2020 Summit. The trials represent a “bold and
visionary approach to managing and utilising our wildlife and saving and restoring biodiversity in the
process” (Tim Lee, ABC TV's Landline program 9 March 2008).
SWE aims to examine the potential for increased commercial use of native wildlife to act as an
incentive for landholders to retain and restore on-farm habitat and biodiversity. They seek to involve
landholders in wildlife management, increase economic benefits to them from wildlife populations,
and change the status of wildlife from a pest to a valuable resource while at the same time improving
outcomes for wildlife.
The RIRDC Rangelands and Wildlife Program received support from the National Landcare Program
(NLP) to assist with the implementation of SWE. Initial support included 2004 funding for the
preparation of a strategic and implementation plan and 2005 funding for initial implementation of on-
farm sustainable wildlife enterprise trials at two sites. In 2007 funding was provided to continue the
two trials and provide support for research and development and information exchange to help
overcome the challenges associated with the innovative SWE initiative.
This report has been prepared to meet the requirements of the DAFF Deed of Grant to RIRDC for
National Landcare Program funding under the Sustainable Wildlife Project. The final milestone of
the Deed required” a final report is to be provided to the Department of Agriculture Fisheries &
Forestry in accordance with Schedule 4. The report is to address the extent of work completed
measured against the performance indicators, what outcomes have been achieved by the project and
the future benefits of the project”. It presents progress at the two trial SWE sites sponsored by the
NLP and provides information on the RIRDC funded BARG project, results from the supporting
research into establishing a framework for landholders to become involved in and share the proceeds
of harvested wildlife, and marketing the produce from Wildlife Management Conservancies
(WMCs). It also outlines proposals for continuing to support for the trials. Table 7 in the Attachments
provides Schedule 3 from the Deed of Grant, which aligns outcomes, key performance indicators and
milestones for the project.
Chapter 1 contains the background and rationale for the project, its objectives and methods,
highlights the issues facing the project – thereby addressing KPI 1 “Accurate identification of the
issues and options for resource management, licensing, ownership and tenure, royalties, and sharing
of structures.”
Chapter 2 discusses progress at the two NLP sponsored WMCs and the RIRDC sponsored BARG
Group. It addresses KPI 2 “Acceptance by landholders and wildlife agencies of the accuracy of
estimates of distribution and abundance of wildlife populations” by presenting the results of kangaroo
surveys.
Chapter 3 describes the progress in development of the Wildlife Stewardship Scheme which is part of
the outcome associated with KPI 2 “Enhanced capacity of land managers to effectively and
efficiently monitor and manage kangaroos and to integrate property, and natural resource
management plans”.
Chapter 4 presents the results of the supporting research that developed a framework to help
landholders be involved in and share the benefits from kangaroo harvesting. This was the milestone
“Initiation of framework for landholders to share proceeds of harvested wildlife”.
Page 12 of 85
Chapter 5 presents the results of the supporting research on marketing kangaroo products that are
badged as leading to a net conservation gain. This was milestone “Identification of size and location
of markets for produce from WMC enterprises that are badged as leading to a net conservation gain
and processes for supplying those markets” and KPI “Building on the enterprise options outlined in
the earlier study on market viability of products”.
Chapter 6 provides the results of a workshop towards the end of the project that was designed to
share information on the project to date and encourage collaboration in natural resource management
and wildlife management. It addresses KPI “Effective sharing of information and experiences during
the conduct of the trials.”
Chapters 7 and 8 provide implications and recommendations for key stakeholders in a Discussion and
Recommendations.
The SWE concept
Conventional agriculture in Australia typically utilises foreign species of plants and animals, many of
which require significant resource inputs (including land, and chemical inputs such as pesticides and
fertilisers) to achieve production levels competitive with world markets. In combination with
Australia‟s fragile soils and variable climatic conditions, the use of some conventional farming
techniques has seen broad scale environmental degradation, particularly in Australia‟s rangelands
where soil fertility and low rainfall limit natural production capacity.
The rangelands have a disproportionately high proportion of Australian threatened and extinct
wildlife: 61% of mammal extinctions, 83% of threatened mammals and 59% of threatened birds.
Thus climate, ecosystem processes (grazing and productivity) and population-regulating effects of
feral predators interact to have a transformative impact on native wildlife. (Dunlop and Brown 2008,
National Reserve System interim report p55)
Native species are particularly well adapted to Australia‟s unique environment, allowing them to
survive our climatic extremes and thrive in our soils. Native species and the natural landscapes that
support them perform many key functions that maintain the health of our soil, water and air
resources, and so provide the foundation of our landscape productivity.
Attaching a value to native resources through commercial development has the potential to provide
alternative sources of income in areas where conventional farming may no longer be sustainable or
profitable. The SWE initiative seeks to determine whether commercial recognition of these values
can also provide environmental benefits. It seeks to trial whether native species, having evolved in
Australia‟s unique environment, can provide profitable and sustainable production options for
landholders.
SWE Strategic Plan
In June 1998, the Senate Rural and Regional Affairs and Transport References Committee
recommended an experimental management trial, preferably in the rangelands, to investigate
biodiversity conservation based on commercial uses for native flora and fauna. The design of the
trial should draw on the success of similar experiences in southern Africa and elsewhere.
In 2004 the National Landcare Program invested in the preparation of a Strategy and Implementation
plans to give effect to the Senate recommendations. (Wilson, G. & Mitchell, B. 2005) It set out the
SWE goal as commercially viable native species enterprises providing resources such as food, while
at the same time encouraging biodiversity conservation and habitat protection and integrating tourism
and Indigenous aspirations. The mission is increased security for Australia's biodiversity, a more
diverse rural sector and innovative agricultural industries that incorporate uses of wildlife that are
conservation-based.
Page 13 of 85
The plan proposed the formation of Wildlife Management Conservancies consisting of neighbouring
landholders who “come together voluntarily to pool resources, plan collaboratively and benefit both
economically and socially while also enhancing the sustainability of their properties and the region”.
Commencing in 2005, two WMCs‟ were formed consisting of groups of landholders with similar
management issues and collective environmental goals. The sites are one on the Maranoa-Balonne
catchment near Mitchell in southwest Queensland – known as the Maranoa Wildlife Management
Conservancy (Maranoa WMC), and one at the junction of the Darling and Murray Rivers near
Wentworth in New South Wales / Victoria – initially known as the Barkindji Biosphere, but now
known as the Murray Darling Rangelands Conservancy (MDRC).
Conservancy landholders worked closely with their respective regional Landcare Coordinators for
Mitchell and District Landcare Association, and Rangeland Management Action Plan (RMAP) to
achieve environmental outcomes that are in line with regional National Resource Management
(NRM) priorities.
A third SWE trial site funded by RIRDC and the University of New South Wales consists of a
collaborating group of landholders in the Barrier Ranges near Broken Hill. This third project is
carried out by the FATE Program at UNSW in collaboration with the Barrier Ranges Rangecare
Group.
The 2005 funding also enabled the scoping of sustainable wildlife enterprise options with the
potential to become self-supporting economically viable enterprises whilst contributing to
biodiversity conservation. Wildlife enterprises initially considered were far ranging, including
kangaroo harvesting, tourism, forestry, bushfoods, fisheries and biodiversity credits. This preliminary
scoping of landholder aspirations at both sites indicated most interest in enterprises focused on
kangaroo management, with grazing pressure and associated land degradation from kangaroo
populations being identified as a primary land management concern. Due to the broad scale interest
in kangaroo management, both wildlife management conservancies decided to focus on the
commercial harvest of kangaroos as the core initiative. The option is still there for additional
enterprises of interest to individual or select landholders to provide complementary products and
services.
Increasing pressure on sustainability and biodiversity
Since the commencement of the SWE project, there has been increased acknowledgement of the need
to find innovative ways to protect our environment and of the need to increasingly include private
investors and landholders in the process. The Australia 20 20 Summit clearly highlighted the
environmental challenges confronting Australia:
“Australia faces an unprecedented challenge from climate change. We risk losing our natural
heritage, our rivers, landscapes and biodiversity. We have a brief opportunity to act now to
safeguard and shape our future prosperity”. (Australia 2020 Summit Initial Summit Report
April 2008)
Globally, and in Australia, concerns have been raised about the impact of climate change on the
effectiveness of disjoint, fixed protected areas. (Binning and Young, CSIRO briefing Philanthropy
sustaining the land). In their interim report on Australia‟s National Reserve System (NRS) (Dunlop
and Brown 2008) agree with this concern and argue that there is a need to find new ways to conserve
widespread and diverse habitat to conserve species. Dunlop and Brown also highlight the daunting
impact of climate change:
Without significant reductions in GHG emissions, future climate change in Australia will be unlike
any previous changes due to the extensive fragmentation and modification of habitat by human
activities, the presence of exotic species, decreasing (rather than increasing) water availability, and
the rate, magnitude and direction of temperature change (Dunlop and Brown, 2008 p10).
Page 14 of 85
The bioregional framework used to develop the NRS is an excellent process for strategically
developing a system of protected areas that will remain effective under climate change. However, to
be effective the bioregional framework must be implemented as widely as possible through the NRS
and other habitat protection programs.
There is also a need to manage habitat for specific conservation outcomes (facilitating change or
maintaining suitable habitat for vulnerable species) and to reduce threats. Habitat protection may also
be required to maintain the connectivity required for various ecological processes that occur at
landscape scales, including the movement of species in response to disturbance and climate change.
However, in some situations habitat connectivity will facilitate processes with undesirable outcomes,
including the spread of fire and the expansion of species that may exclude threatened species.
Protection of isolated areas of habitat, as well as well-connected ones, would reduce those risks.
Increasing private landholder involvement in conservation
To help meet these challenges, there has been a shift to recognise the vital role that private
landholders can play in national conservation plans.
This recognition has come in a number of forms. The Australian Government‟s $50 million
Environmental Stewardship Programme pays for landholders to protect some of the continent‟s most
endangered ecosystems.
Other projects such as Western Australia‟s Gondwana Link, the Alps in Victoria to Atherton in
Queensland, and the Kosciusko to Coast join up patches of bush on private land to create wildlife
corridors, either by purchasing linking properties, or by offering landholders a range of tenure and
management conditions. Landholders may receive incentives to build wildlife refuges and enter
binding conservation agreements creation of protected areas over important intact linkages, including
conservation covenants on private land, changes to land management such as through leasehold
conditions, or allowing regrowth of native vegetation.
Voluntary Conservation Agreements exist whereby landholders protect special parts of their property
in perpetuity, are the highest and most guaranteed form of protection, but there is also BioBanking –
under which developers pay landholders with high conservation value land to protect areas as
compensation for biodiversity loss arising from development – and regulatory frameworks, such as
new native vegetation protection laws.
Binning and Young take a different approach, arguing that traditional approaches to public
conservation through National Parks will not work in all regions and recommend following the
United States of America approach of using tax incentives to increase the involvement of the private
sector in conservation. In the United States of America, conservation on private lands is supported by
over 1500 Land Trusts that raise funds through corporate and individual donations.
The SWE project is another program that provides incentives for private landholders to become
involved in conservation.
SWE follows a framework, the SWE strategic plan, which sets out mechanisms and processes to
support the development of regional wildlife plans that integrate habitat management, sustainability
and property management plans.
Page 15 of 85
SWE Implementation Plan
The SWE Implementation Plan prepared with NLP support, has four operational sections the first
dealing with Conservation Activities, then Production Initiatives, Marketing and finally Research and
Evaluation.
The Conservation section describes priorities and actions to support the establishment of WMCs
using existing structures such as Landcare groups, and the scope for partnerships for WMC
enterprises. It describes objectives and actions for preparing regional natural resource and wildlife
management plans, survey needs, GIS and data management support, identification of NRM
protection priorities and sustainable harvest estimates.
At the property level, property management planning seeks to integrate wildlife and agricultural
production, enterprise development, conservation works, habitat improvement and threat reduction.
The section on Production Initiatives describes opportunities for wildlife production including plants,
bush foods and plant products, live plants, seeds and tube stock for conservation plantings. It also
covers animals, including meat and skins, and live sales for conservation programs. It flags the need
for projects on managing products along the production chain.
The section describes tourism opportunities, drawing attention to projects and support of nature based
tourism facilities and related services, wildlife spotting and nature based tourism experiences.
Ecosystem services are seen as an emerging production initiative with a wide variety of mechanisms
and markets.
Marketing is the topic which includes sales promotion through branding and labelling strategies and
marketing trials. It recognises the need for differentiated marketing of WMC products. It also deals
with communications, the media and agencies.
The fourth section of the plan focuses on projects in Research and Evaluation, including advice and
training needs, adaptive management processes and sustainability indicators including ecological
economic and sociological monitoring. It defines the need for supporting research contracts on
sustainability certification, quality control and animal welfare.
2007-2008 Funding
In 2007 2008 projects were commissioned to:
to define a framework that enables landholders to share the proceeds of harvested wildlife
estimate kangaroo numbers that enable landholders to more effectively manage populations and
integrate wildlife with their property and natural resource management plans
identify markets for products that are badged as leading to net conservation gain, and
share information and experiences from the trial sites and encourage regional collaboration in
natural resource management and wildlife planning.
These objectives consolidate the aim of the trials as outlined in previous funding which is to provide
site specific and demonstrable information about:
appropriate types of management, organisation and governance arrangements
rates of sustainable use
changes in biodiversity and the natural resource base, enhancement of landscapes and reductions
in land degradation
Page 16 of 85
commercial viability of native species enterprises, particularly those that integrate tourism and
indigenous aspirations
methods for integrating enterprises with existing performance management frameworks such as
EMS
markets for produce from enterprises that lead to a net conservation gain; and options for
resource ownership and tenure, financial systems and alternative capital structures.
The SWE trials strongly align with and support NRM plans. SWE seeks to establish mechanisms and
processes, which in the long run would be self funding, to attain NRM aspirational targets and
resource condition particularly for the assets land and soils, riverine flood plain and wetland,
vegetation and biodiversity, and weeds and pests. SWE seeks to use the value of native species and
wildlife to address the loss of species, dryland salinity, soil erosion and water quality.
SWE is based on the premise that giving landowners more responsibilities and rights over wildlife
and a commercial value to wildlife, will act as incentives to restore habitats, reclaim degraded areas,
maintain landscapes and encourage biodiversity conservation. One of the key attributes for a
successful SWE trial is an existing administrative structure to form the basis of the proposed WMCs.
Existing NRMs and their existing sub-structures (Landcare groups etc) help provide this structure.
NRM plans are established to support practical action by landholders, community, Landcare groups,
Traditional Owners, local government and Industry groups at a regional scale on one hand; and
manage NRM investment from Australian and State governments on the other. This is consistent with
WMCs, which are established to develop regional wildlife plans that integrate habitat management,
sustainability and property management plans. A major challenge for these groups is developing clear
operational models for how landholders could become involved, taking into account relationships
with harvesters and processors, the regulatory context, and land management priorities. Various
models for such involvement have been suggested, but none have been evaluated in detail.
Methods
The SWE trials are a large and complex, multidisciplinary undertaking, taking place over a number of
years. As previously outlined, this SWE project consisted of establishing the two pilot SWE‟s and
providing supporting research advice. Four distinct, but interrelated projects were commissioned by
DAFF.
First, the Maranoa Wildlife Management Conservancy (Maranoa WMC) and Murray Darling
Rangelands Conservancy (MDRC) pilot SWEs were established, where landholders worked with
each other and their local Landcare groups to find ways to estimate, manage and integrate wildlife
with their property and NRM plans. A third SWE trial funded solely by RIRDC has collaborated with
the two SWEs on this project. The third SWE consists of a group of landholders in the Barrier
Ranges near Broken Hill and is carried out by the Future of Australia‟s Threatened Species (FATE)
Program at UNSW in collaboration with the Barrier Ranges Rangecare Group (BARG).
All three SWE sites identified kangaroo management as having the most immediate potential for
landholder involvement in wildlife. This occurred both because a commercial kangaroo industry
already existed and because a common challenge across the groups is the management of macropod
species on their land.
The second 2007_8 project involved a study undertaken by Dr Rosie Cooney of the FATE Program,
to develop, evaluate and trial models for rangeland landholders to be involved in wildlife
management and share the benefits of wildlife harvesting on their lands. The specific focus of the
study was the group of landholders that established the Maranoa WMC, under the auspices of the
Mitchell and District Landcare Association Inc, in Mitchell, Qld. As the major current option for
wildlife-based enterprise for this group involves kangaroo harvesting, the study focused on
Page 17 of 85
kangaroos. Models were examined in terms of their potential to deliver environmental and NRM
benefits, and their impacts on other key players in the product chain, the harvesters and processors.
The third project was marketing research undertaken by Agtrans Research was to identify the size
and location of markets for produce from WMC enterprises that are badged as leading to a net
conservation gain and support the establishment of processes for supplying those markets. This
project was specifically associated with the development of the Maranoa region WMC, and focused
on identifying the characteristics of markets for kangaroo meat from the Maranoa conservancy so that
marketing may best proceed to capture those markets. The focus of the project was on the connection
between environmental management and the demand for kangaroo meat.
Finally, a SWE workshop was run 14 & 15 February 2008 at Broken Hill to share information and
experiences from the trial sites and encourage regional collaboration in natural resource management
and wildlife planning. The meeting brought together members of the three WMCs and representatives
of the kangaroo industry, various state and federal government agencies, regional NRM bodies and
landholder groups.
Defining the issues that the Trials sought to address
The innovative nature of these initiatives means they face a number of challenges. This section
provides a discussion of the sorts of issues that historically made it difficult for landholders to benefit
from the wildlife on their properties. The research work associated with the project aimed to help
overcome these impediments and make it easier for landholder involvement in kangaroo management
and sharing in its benefits. Many of the issues are dealt with in greater detail in the research
publications associated with this project.
The 1998 Senate Committee into Commercial Utilisation of Native Australian Wildlife recognised
some of these issues. It stated that to date factors including regulations and associated lack of
development of markets have inhibited the commercial use of Australian wildlife. It was thought
timely to consider a review of the regulatory constraints affecting the sustainable commercial
utilisation of wildlife in order to assist with further development of sustainable industries and
improve conservation outcomes.
The section begins by describing the current sustainable use of kangaroo in Australia, current
regulation and operating practice for the commercial kangaroo harvest. It then goes on to highlight
some key issues and problems with current arrangements. The focus is on the states in which SWEs
are located – Qld and NSW.
Sustainable use of kangaroos
Although the SWE concept applies to the value of all wildlife, and their value could contribute to
encouraging conservation outcomes, these projects have a specific focus on kangaroos. They are
abundant in the temperate Australian rangelands where cattle and sheep are raised, competing with
them in dry times and being labelled by livestock producers as pests. They are not contained and
roam from property to property seeking out best pastures in response to local rainfall. Under current
arrangements it is rare for landholders to benefit from the kangaroos on their lands or play a role in
their management.
Kangaroo harvesting is the shooting of kangaroos for their meat and skins. It is a process that is
regulated under nationally coordinated wildlife trade management plans. Kangaroos are shot in the
field at night using a high- powered spotlight and a high- powered rifle by certified and licensed
shooters. A Code of Practice requires head shots and instantaneous death. Most carcasses are
processed to human consumption standard and kangaroo meat is currently exported and sold in
Australia to the food service industry, retail outlets and also to the pet food industry. Kangaroo
harvesters are generally independent small businesses paid per kilogram for the kangaroo carcasses
they supply to processors.
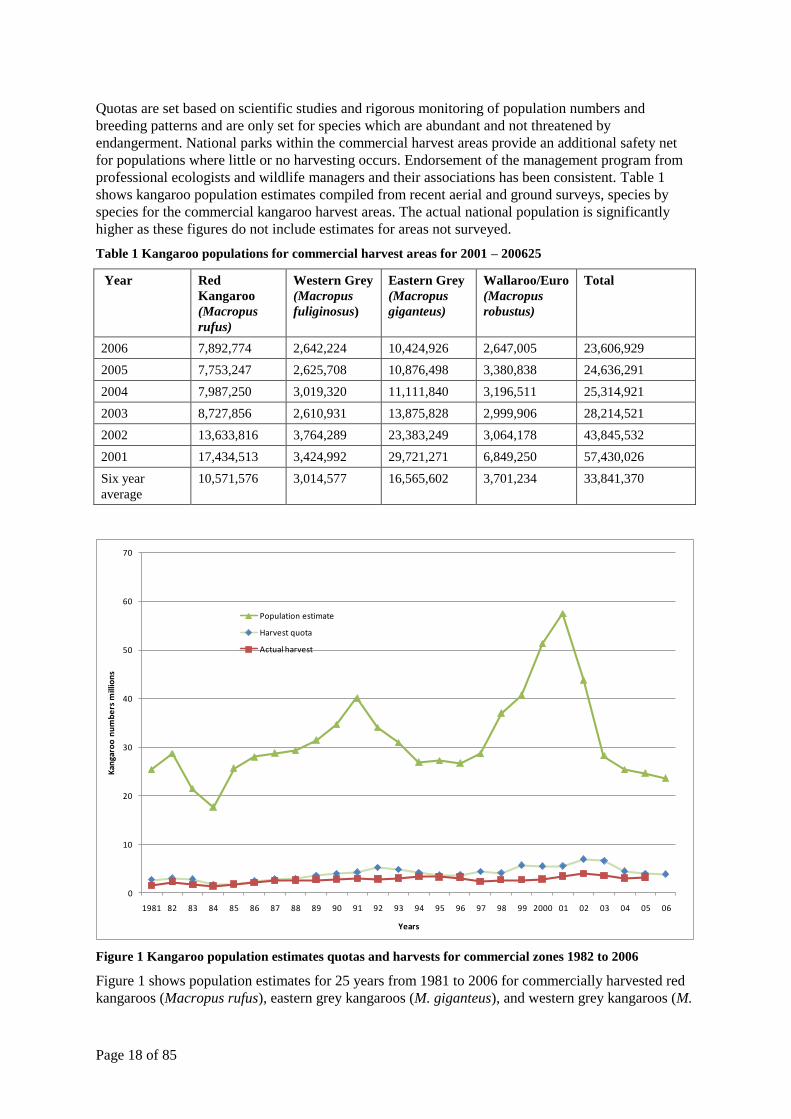
Page 18 of 85
Quotas are set based on scientific studies and rigorous monitoring of population numbers and
breeding patterns and are only set for species which are abundant and not threatened by
endangerment. National parks within the commercial harvest areas provide an additional safety net
for populations where little or no harvesting occurs. Endorsement of the management program from
professional ecologists and wildlife managers and their associations has been consistent. Table 1
shows kangaroo population estimates compiled from recent aerial and ground surveys, species by
species for the commercial kangaroo harvest areas. The actual national population is significantly
higher as these figures do not include estimates for areas not surveyed.
Table 1 Kangaroo populations for commercial harvest areas for 2001 – 200625
Year Red
Kangaroo
(Macropus
rufus)
Western Grey
(Macropus
fuliginosus)
Eastern Grey
(Macropus
giganteus)
Wallaroo/Euro
(Macropus
robustus)
Total
2006 7,892,774 2,642,224 10,424,926 2,647,005 23,606,929
2005 7,753,247 2,625,708 10,876,498 3,380,838 24,636,291
2004 7,987,250 3,019,320 11,111,840 3,196,511 25,314,921
2003 8,727,856 2,610,931 13,875,828 2,999,906 28,214,521
2002 13,633,816 3,764,289 23,383,249 3,064,178 43,845,532
2001 17,434,513 3,424,992 29,721,271 6,849,250 57,430,026
Six year
average
10,571,576 3,014,577 16,565,602 3,701,234 33,841,370
0
10
20
30
40
50
60
70
1981 82 83 84 85 86 87 88 89 90 91 92 93 94 95 96 97 98 99 2000 01 02 03 04 05 06
Kan
garo
o n
um
be
rs m
illio
ns
Years
Population estimate
Harvest quota
Actual harvest
Figure 1 Kangaroo population estimates quotas and harvests for commercial zones 1982 to 2006
Figure 1 shows population estimates for 25 years from 1981 to 2006 for commercially harvested red
kangaroos (Macropus rufus), eastern grey kangaroos (M. giganteus), and western grey kangaroos (M.
Page 19 of 85
fuliginosus) and euros/wallaroos (M. robustus). Populations can grow rapidly in years favourable for
breeding and survival, for example 1996 to 2001, and droughts can depress populations equally
rapidly Harvest quotas are set at 15 % of estimated populations following recommendations of field
investigations. Figure 1 Kangaroo population estimates quotas and harvests for commercial zones
1982 to 2006 also shows that harvests are a small proportion of the population and unrelated to
fluctuations. From 2001 - 2006, harvests took 6 - 13% of the population or 51 - 81% of the available
quota25
.
After 30 years of harvesting under a quota system it is clear that the industry is sustainable and will
not lead to the extinction of the four commercial species. The community is developing greater
acceptance of the harvest and its increasingly professional and scientific basis. (Ampt & Baumber
article) The recent situation analysis undertaken as part of the review of the NSW Kangaroo
Management Program (Olsen and Low 2006) concludes that “there is little doubt that current rates of
harvest are sustainable” and that “any genetic impact of harvesting is minimal” (p7).
Kangaroo harvest regulations
One problem for developing wildlife enterprises is that the government retains control over most
wildlife management functions, and many uses are prohibited. A study carried out in 2006 examined
the regulatory and policy barriers to sustainable use of wildlife, in order to inform the development of
this project.
Kangaroo harvest is regulated at both Federal and state levels in Australia. States have the primary
responsibility for regulation of take, killing and trade of protected species (all macropods are
protected), while the Federal government regulates export. States regulate and manage the
commercial harvest through a wide range of functions, including monitoring of populations through
regular surveys, establishment of sustainable harvest quotas, and implementation and enforcement of
a strict licensing and tagging system. All harvested kangaroos are tagged with a unique, self-locking
tag. Harvesters and processors must be licensed and are subject to reporting requirements. Extensive
animal welfare and food hygiene requirements to be followed by harvesters and processors are also
regulated at state level.
In addition to managing the commercial harvest, States may authorise non-commercial culling to
assist landholders to mitigate damage to crops or land. For damage mitigation culling, landholders
faced with large aggregations can apply for what will be referred to throughout this paper as “shoot
and let lie” tags. These are issued directly to landholders and are not subject to a quota. In general,
carcasses are left in the field and do not enter commercial trade, although Qld and NSW both allow
some to enter commercial trade under a small “special quota” (NSW DECC 2007; Qld Government
2008).
All export of kangaroo products requires approval from the Commonwealth. In practice, States
submit five-year management plans for approval as a “wildlife trade management plan” by the
Commonwealth under s303 of the Environmental Protection Biodiversity Conservation Act 1999.
Kangaroo products from states with an approved plan will be granted export permits.
In all states, shooters require permission from landholders to enter their properties to harvest
kangaroos. Shooters will generally initially contact landholders to request access to their country.
Shooters may shoot on a property from their own motivation or in response to a request from a
landholder, who may direct shooters to areas where they know there are large aggregations. In Qld
this will generally be the only landholder involvement, as tags are issued directly to shooters. These
tags can then be used on any property. In NSW it is technically landholders who are granted an
“occupier‟s licence” to commercial harvest on their land. However, shooters will usually physically
bring the application forms for signature to landholders, submit forms, pay fees, and be given the
tags.
Existing kangaroo management regulations are not conducive to involvement by a group of
landholders wanting to better manage the free ranging kangaroo. Landholders and harvesters involved
Page 20 of 85
in the project would generally prefer a group licence to be issued... The licence would make it
possible for a group of properties to function as one, with tags issued to the group usable on all
group-licensed properties.
Price of Kangaroo products
A problem affecting all stakeholders in kangaroo harvesting, is the comparatively low value and
variable quality of kangaroo meat. There is a lack of financial incentive for landholders to become
involved in the kangaroo industry. Kangaroo still has a small (if growing) market in Australia and
overseas. Macro Meats, a South Australian based game meat processor specialising in Australian
Game meat production demonstrates the growing Australian market with an annual growth of
domestic demand for fresh kangaroo meat of 140% between 2005 and 2007.
The price per kg is substantially lower than for other red meats, and there is little attempt to market
differentiated kangaroo products. It often ends as mince of unknown origin. However Macro Meats
markets their gourmet product, providing in pamphlets with recipes and focusing on their free range
„natural‟ credentials. Some of the obvious marketing points for kangaroo include environmental
messages, such as “free-range”“free-range” living conditions, organic, chemical-free, lower
contribution to greenhouse gases, and environmental management. Critically, however, many of these
marketing opportunities require the involvement of landholders.
On the quality front, regular eaters of kangaroo meat often find high variation in tenderness between
samples of the same cut. Supply of product to discriminating buyers such as high-end restaurants will
require uniformly high quality. Landholder involvement could open up quality management options
such as managing populations to ensure high populations of species species/age/sex combinations
that are of high value to consumers.
Nonetheless, with supply controlled by harvest quotas and impacted on by drought in recent years, it
has been demonstrated that increased demand can lead to an increase in the prices offered by
processors. While kangaroo numbers fluctuate, they restock themselves after droughts. They provide
high quality products with growing demand and an increasing price without global competition.
Another major information gap concerns the demand for kangaroo products. Is there a big potential
demand for a high-value, environmentally friendly product? What sort of perceptions do people
currently have of kangaroo products, and what sort of marketing might affect these perceptions? The
FATE Program at University of New South Wales and the University of Technology, Sydney, has
been carrying out detailed marketing studies, surveying thousands of consumers to help shape
marketing strategies for kangaroo.
Achieving premium prices for premium product
Effective marketing and product differentiation are essential in ensuring market demand and premium
prices are achieved for produce.
The trials are seeking to determine whether accreditation as a sustainable production system will
enable the WMC‟s to obtain premium prices for their products. It is envisaged that WMC members
will gain access to higher valued markets through the development of collective marketing strategies
highlighting the environmental credentials of WMC products, including those derived from
conventional enterprises.
Managing free ranging populations
Arguments that landholders can benefit from kangaroos on their land while improving conservation
have been made for many years, but little attention has been paid to developing and evaluating
models for making it happen. There are clear arguments for applying the concept of CSU to
kangaroos in the Australian rangelands, both to promote economic diversification and resilience and
to promote long-term ecosystem benefits. A key missing element, however, is exactly how
Page 21 of 85
landholders should be involved. This forms the primary subject of this report. The project
commissioned to look at management structure by Dr Rosie Cooney seeks to fills this gap.
Professor Gordon Grigg from University of Qld has called for “sheep replacement therapy” as an
antidote to twin problems: the status of the kangaroo as a pest in graziers‟ minds, despite its high
regard in the public consciousness; and widespread severe land degradation in the rangelands. Grigg
argues that landholders who are earning income from kangaroos will be more likely to perceive them
as a valuable resource. Income from kangaroos would mean landholders could maintain overall
productivity (and better land condition) with reduced levels of stock. If the value of kangaroos rose
to the point that kangaroos became more profitable than sheep, graziers could seek to maximise their
production by de-stocking completely. While kangaroo populations might increase, they would have
less impact on the rangelands than sheep, due both to much lower energetic requirements and a
probable lower foot pressure.
Additional conservation and economic benefits could be gained through landholders having a role in
kangaroo management and gaining income from kangaroos (alongside stock). These benefits include
habitat retention, better total grazing pressure (TGP) management, and income diversification. (Ampt
and Baumber 2006) First, habitat retention would be particularly favoured in areas where eastern
greys dominate. This species favours vegetation mosaics, so if landholder gained benefits from
kangaroos, they would be more likely to maintain or restore areas of native vegetation. Second, the
critical potential benefit is better management of TGP, and Ampt and Baumber develop more detailed
ideas in this respect. Currently, landholders have little flexibility in managing kangaroos for the
purposes of managing TGP - it may be difficult or impossible to find a shooter willing and available
to manage large aggregations in a timely way. If they were themselves involved in management, they
may be able to better target harvest pressure to manage aggregations, and better integrate kangaroo
management with property management priorities. They could carry out a range of actions to reach
TGP goals, such as harvesting heavily going into drought, providing supplementary feed in drought,
or maximising productivity per unit grazing pressure by adjusting age/sex ratio of targeted animals.
Third, diversified incomes mean reduced pressure to over-stock, particularly in drought.
Landholder involvement
To facilitate landholder involvement in the kangaroo industry, the research shows there is a for a
collaborative business structure; to market the product; and to change some regulations. Some of
these are already being trialled. The collaborative structure has the potential to provide a range of
wider benefits to those involved and to the local area, including access to alternative markets such as
the organic meat market and the growing home delivery market. It will also provide an integrated
approach to the management of the kangaroo resource resulting in wider social benefits.
However barriers to collaboration were also identified early on through discussion with harvesters
and landholders from within the groups. In particular there was landholder need to accept they need
to know more about kangaroo ecology and habits. They were also greatly constrained by competition
for their time and the drought.
Page 22 of 85
2. Progress with the SWE Trials
Progress with trials
This Chapter provides an overview of the successes and challenges of the two project sites, the
Maranoa and the Murray Darling Wildlife Management Conservancies. Although the BARG trial is
not funded under this project, a progress report on the BARG site is relevant and is also included.
Maranoa Wildlife Management Conservancy
Location and membership
The Maranoa Wildlife Management Conservancy (Maranoa WMC) is located on the upper reaches of
the Maranoa River in south west Queensland, within Booringa Shire. It extends north of Mitchell
towards the Carnarvon Ranges and the northern extremity of the Murray Darling Basin catchment
area.
The Maranoa WMC is comprised of landholders and properties in the Maranoa River and Box Creek
Landcare groups under the Mitchell & District Landcare Association. In addition to the original 22
landholders making up the Maranoa WMC, interest has expanded further south to the Dunkeld and
Middle Road Landcare groups, where 36 landholders have expressed interest in becoming involved to
some extent, in the Maranoa WMC. Figure 2 below shows the location of the Maranoa Landcare
groups, and Table 2 describes their location and characteristics.
The region is predominantly cattle grazing and kangaroo and wallaby country. Exceptionally high
numbers of kangaroos move through the landscape, and there is often little incentive for land
managers to spell or rest country according to sustainable grazing land management principles. The
impact that macropods are having on the environment is well recognised and is a priority land
management issue for land managers in the region.
Native forest management is also a priority issue for many of the landholders.
The Booringa Shire Council has an active interest in the project. It has been supporting alternative
forestry based enterprises, - there are substantial cypress pine forests in the region, tourism initiatives
both those involving farm stay and town based accommodation. It is a strong supporter of Indigenous
participation and enterprise development.
The latest phase of the on ground SWE trial follows from previous research that investigated the
scope of five possible SWE within the Mitchell & District region – eco and cultural tourism,
sustainable production systems, kangaroo products, native plant products and aquaponics (hybrid
aquaculture and hydroponic system). In 2005, the SWE project settled on the opportunity for
landholder involvement in kangaroo management, as this industry was identified as having the most
potential in the immediate future, both financially and to meet NRM priorities.
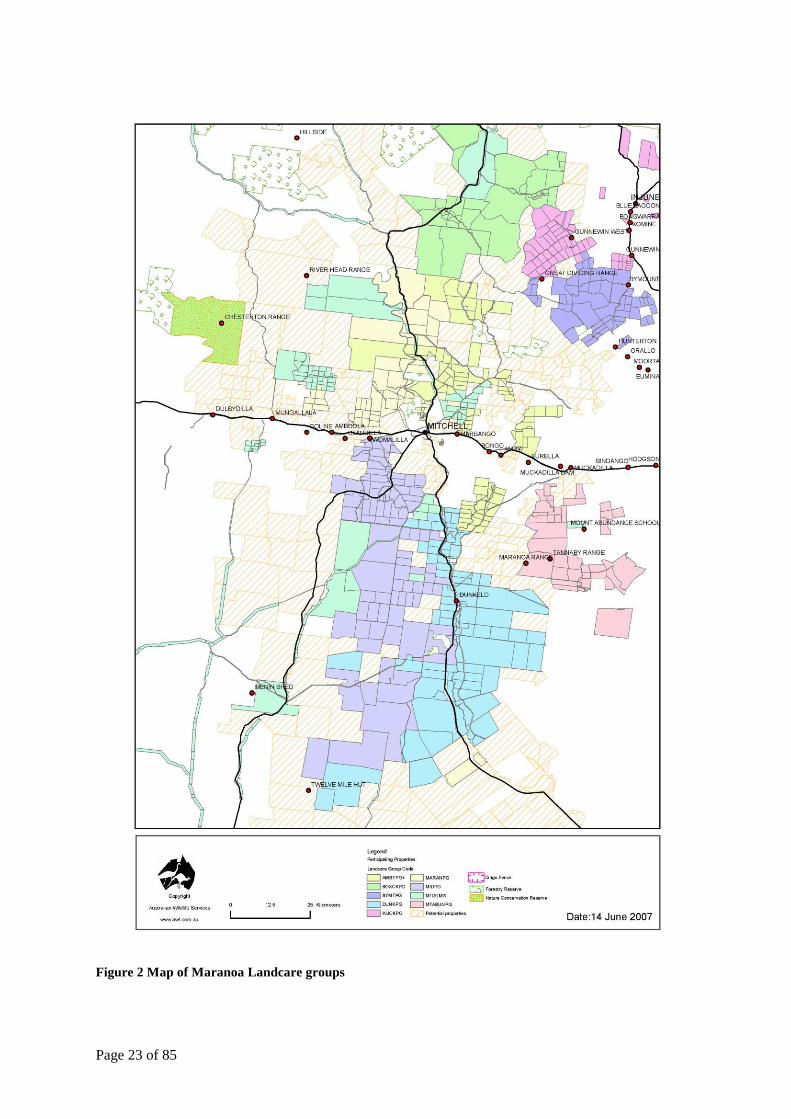
Page 23 of 85
Figure 2 Map of Maranoa Landcare groups
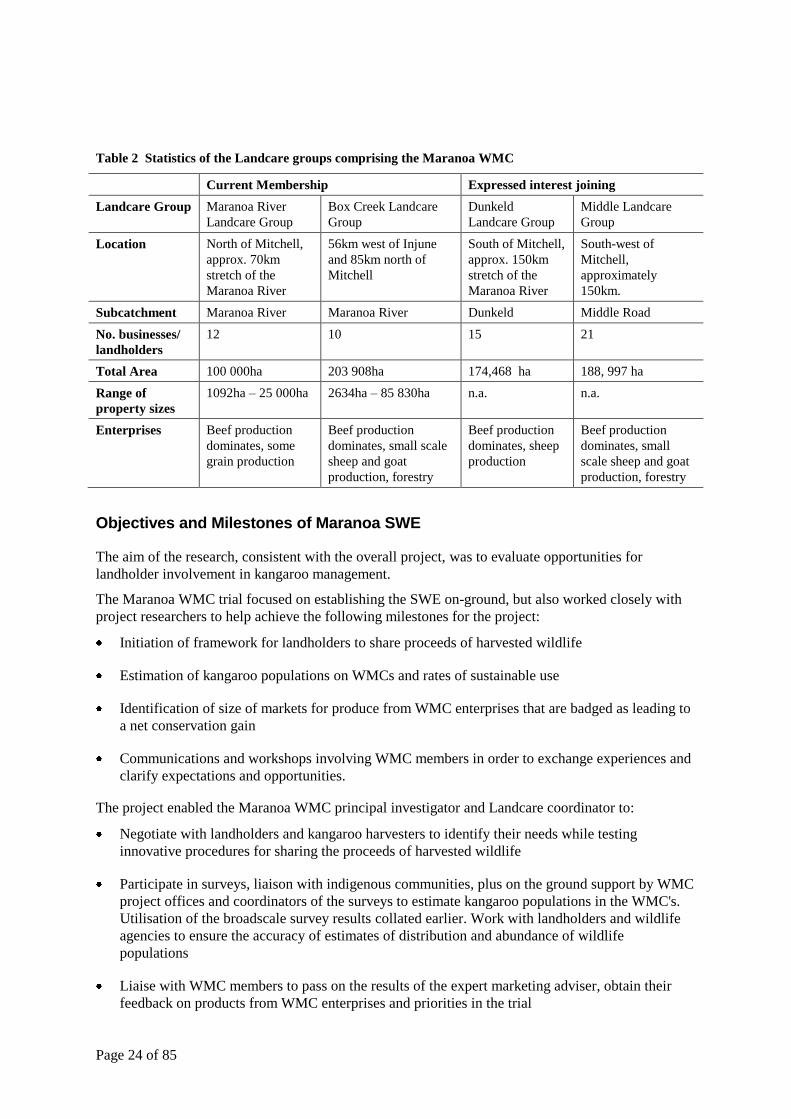
Page 24 of 85
Table 2 Statistics of the Landcare groups comprising the Maranoa WMC
Current Membership Expressed interest joining
Landcare Group Maranoa River
Landcare Group
Box Creek Landcare
Group
Dunkeld
Landcare Group
Middle Landcare
Group
Location North of Mitchell,
approx. 70km
stretch of the
Maranoa River
56km west of Injune
and 85km north of
Mitchell
South of Mitchell,
approx. 150km
stretch of the
Maranoa River
South-west of
Mitchell,
approximately
150km.
Subcatchment Maranoa River Maranoa River Dunkeld Middle Road
No. businesses/
landholders
12 10 15 21
Total Area 100 000ha 203 908ha 174,468 ha 188, 997 ha
Range of
property sizes
1092ha – 25 000ha 2634ha – 85 830ha n.a. n.a.
Enterprises Beef production
dominates, some
grain production
Beef production
dominates, small scale
sheep and goat
production, forestry
Beef production
dominates, sheep
production
Beef production
dominates, small
scale sheep and goat
production, forestry
Objectives and Milestones of Maranoa SWE
The aim of the research, consistent with the overall project, was to evaluate opportunities for
landholder involvement in kangaroo management.
The Maranoa WMC trial focused on establishing the SWE on-ground, but also worked closely with
project researchers to help achieve the following milestones for the project:
Initiation of framework for landholders to share proceeds of harvested wildlife
Estimation of kangaroo populations on WMCs and rates of sustainable use
Identification of size of markets for produce from WMC enterprises that are badged as leading to
a net conservation gain
Communications and workshops involving WMC members in order to exchange experiences and
clarify expectations and opportunities.
The project enabled the Maranoa WMC principal investigator and Landcare coordinator to:
Negotiate with landholders and kangaroo harvesters to identify their needs while testing
innovative procedures for sharing the proceeds of harvested wildlife
Participate in surveys, liaison with indigenous communities, plus on the ground support by WMC
project offices and coordinators of the surveys to estimate kangaroo populations in the WMC's.
Utilisation of the broadscale survey results collated earlier. Work with landholders and wildlife
agencies to ensure the accuracy of estimates of distribution and abundance of wildlife
populations
Liaise with WMC members to pass on the results of the expert marketing adviser, obtain their
feedback on products from WMC enterprises and priorities in the trial
Page 25 of 85
Participate and enable effective sharing of information and experiences during the conduct of the
trials.
Results and emerging challenges for the Maranoa WMC
The Maranoa WMC faced a number of challenges trialling ways of increasing landholder
involvement in kangaroo management.
Landholder membership
While the Conservancy has many members committed to the initiative and eager to trial new ways of
diversifying rural income whilst maintaining conservation, some landholders simply cannot see past
kangaroos as a pest. Many are hesitant to become involved as generally it is seen as time consuming,
and many simply to not understand the concept being proposed.
Nevertheless conservancy membership expanded over the last year, with 35 additional landholders
expressing a commitment to participate in the trials.
Harvester and processor resistance
Since its inception the Maranoa WMC‟s the trial has received its fair share negative feedback and
scepticism by harvesters and processors, particularly about the possibility for landholders to be
involved in kangaroo management.
Three harvesters have made a commitment to work with the group, with an additional 10 having
expressed interest. However, despite increasing numbers of members, it has been difficult to maintain
commitment and enthusiasm about the project.
While there are some harvesters that clearly see the benefits of landholders and harvesters working
collaboratively, harvesters in the Mitchell area generally do not see the opportunity for landholder
involvement in the kangaroo industry. Several reasons have been identified at various meetings to
explain harvesters‟ reluctance to want to see landholders involved including:
there is a general view shared by many that landholders do not deserve to receive money from
kangaroos harvested when it is the harvesters that do all the work
some harvesters are concerned that if they become involved in such an initiative they will be
bound to some sort of contract or other legally binding commitment
some are concerned that if they became members or involved in such an initiative and it failed,
processors would refuse to purchase harvest from them.
As with the landholders, most harvesters simply do not understand the concept being proposed and
what the benefits might be.
Processors have indicated eagerness to work with the Conservancy during meetings and negotiations;
however it appears that they are also reluctant to support landholder involvement in the kangaroo
industry.
The future
The WMC acknowledges the controversy associated with this novel concept. There are always going
to be those who are hesitant to trial new things, especially when there is so much controversy
involved. Changing attitudes is a difficult task and members of the Maranoa WMC have known from
the very beginning that establishing landholder involvement in kangaroo management was never
going to be an easy task. However, as the project has progressed, more and more landholders and
harvesters have become involved and are beginning to understand the benefits that could be gained
from a collaborative approach. The members also worked closely with the researchers to help derive
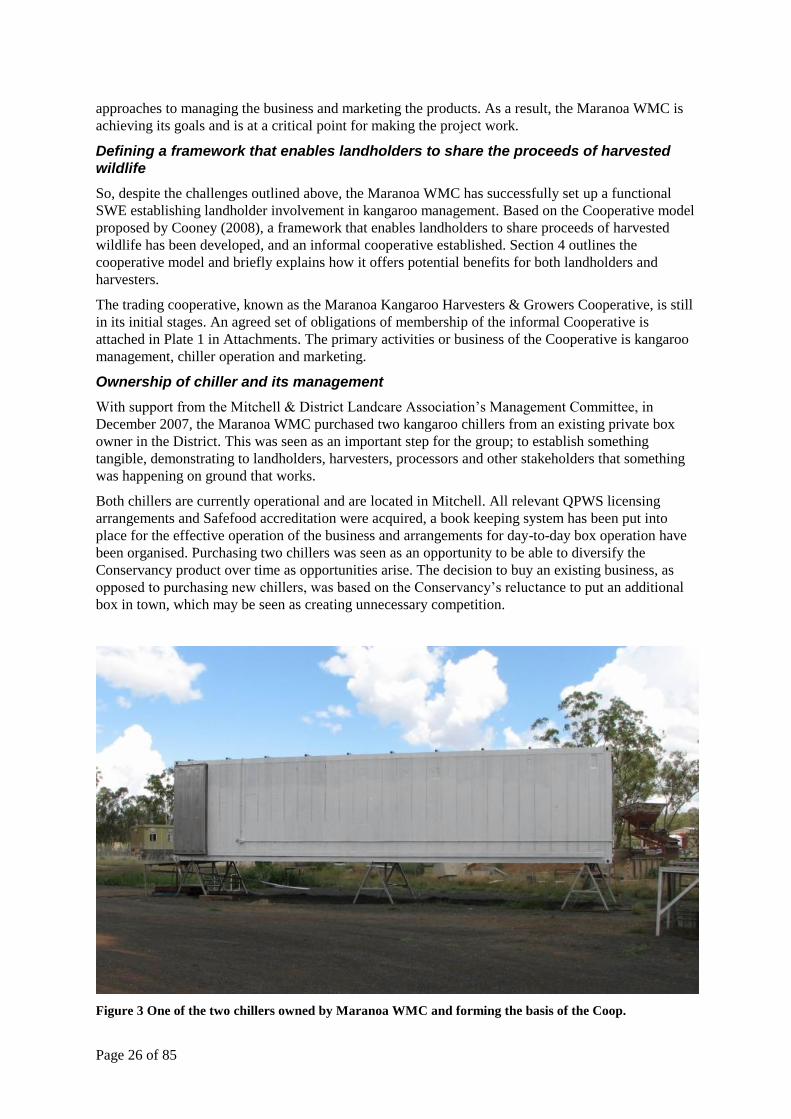
Page 26 of 85
approaches to managing the business and marketing the products. As a result, the Maranoa WMC is
achieving its goals and is at a critical point for making the project work.
Defining a framework that enables landholders to share the proceeds of harvested
wildlife
So, despite the challenges outlined above, the Maranoa WMC has successfully set up a functional
SWE establishing landholder involvement in kangaroo management. Based on the Cooperative model
proposed by Cooney (2008), a framework that enables landholders to share proceeds of harvested
wildlife has been developed, and an informal cooperative established. Section 4 outlines the
cooperative model and briefly explains how it offers potential benefits for both landholders and
harvesters.
The trading cooperative, known as the Maranoa Kangaroo Harvesters & Growers Cooperative, is still
in its initial stages. An agreed set of obligations of membership of the informal Cooperative is
attached in Plate 1 in Attachments. The primary activities or business of the Cooperative is kangaroo
management, chiller operation and marketing.
Ownership of chiller and its management
With support from the Mitchell & District Landcare Association‟s Management Committee, in
December 2007, the Maranoa WMC purchased two kangaroo chillers from an existing private box
owner in the District. This was seen as an important step for the group; to establish something
tangible, demonstrating to landholders, harvesters, processors and other stakeholders that something
was happening on ground that works.
Both chillers are currently operational and are located in Mitchell. All relevant QPWS licensing
arrangements and Safefood accreditation were acquired, a book keeping system has been put into
place for the effective operation of the business and arrangements for day-to-day box operation have
been organised. Purchasing two chillers was seen as an opportunity to be able to diversify the
Conservancy product over time as opportunities arise. The decision to buy an existing business, as
opposed to purchasing new chillers, was based on the Conservancy‟s reluctance to put an additional
box in town, which may be seen as creating unnecessary competition.
Figure 3 One of the two chillers owned by Maranoa WMC and forming the basis of the Coop.
Page 27 of 85
After negotiations with several kangaroo processors, Giuseppe Chisari, Cobar NSW; John Burey,
United Game Processors, Charleville QLD and; Ray Borda, Macro Meats, SA, the group resolved to
sell carcasses to Macro Meats – Gourmet Game based in South Australia. This company is seen to
offer the most potential in the immediate future. A margin on top of the standard price per kg paid to
independent box owners has been negotiated in exchange for committed from Conservancy or Co-op
members to refrain from applying for damage mitigation permits and ensure a consistent supply of
high quality product.
In the longer term, the Maranoa WMC anticipates a higher and more consistent quality of kangaroo
meat to be produced from changed harvesting and handling processes through systems proposed by
the group. These include:
More efficient standards of chiller management through implementation of best practice safe
food measures. This may involve some education and training for participating harvesters and
landholders
Implementation of improved feedback and traceback system. An improved traceback system is
currently being developed for the Conservancy, including GPS and data logging on a paddock
and property basis.
The project has not reached a point where implementation of these systems has been feasible.
However this is something that the group will implement as the cooperative progresses.
Since purchasing the chillers the Maranoa WMC kangaroo carcasses have been purchased from
harvesters who have agreed to become members of the cooperative. Kangaroos were harvested from
landholder‟s properties who have also agreed to become members of the cooperative. The harvest is
currently sold on to Macro Meats. However, only a few animals have been traded between January
2008 and June 2008 due to organisational problems and staff changes.
As a result, the harvest required to maintain a viable business, which is generating enough income to
be able to share any proceeds over and above the normal operation of chiller operation, is not yet
being met. In these early stages, it is unlikely that landholders will derive any proceeds from
kangaroo management. However landholders participating in the trial see the potential and are
committed to persisting with the initiative, with a long term vision of one day earning enough of a
margin to distribute back to landholders.
Landholders although committed do not understand that harvesting of kangaroos in a controlled
manner for profit means the same principles apply as in any business. The solution is to appoint a
manager to apply business principles for the cooperative and who has the authority to make things
happen.
In line with recommendations made by Cooney (2008) the following need to happen to ensure the
effective function the Kangaroo Harvesters & Growers Cooperative in the initial stages:
appoint a Project Manager, to oversee the overall business management of the Cooperative
appoint a Box operator – to manage the chiller boxes in Mitchell, which entails: general cleaning
and maintenance; weighing in harvest each day; payment to kangaroo harvesters; loading out
carcasses and passing on harvest data when processing company does a pick-up, and; pass on
relevant information to Project manager to ensure effected dissemination of information to
relevant parties involved in the Coop
implement a book keeping system – put in place to ensure administration of the Cooperative is
managed effectively. This includes a data base to manage all data obtained from harvested
wildlife (e.g. weight, sex, species, location of harvest) and a system to create all relevant manage
accounting invoicing to relevant parties. It is important that this data base is accessible to all
relevant parties involved with the cooperative and is set up to create relevant reports.
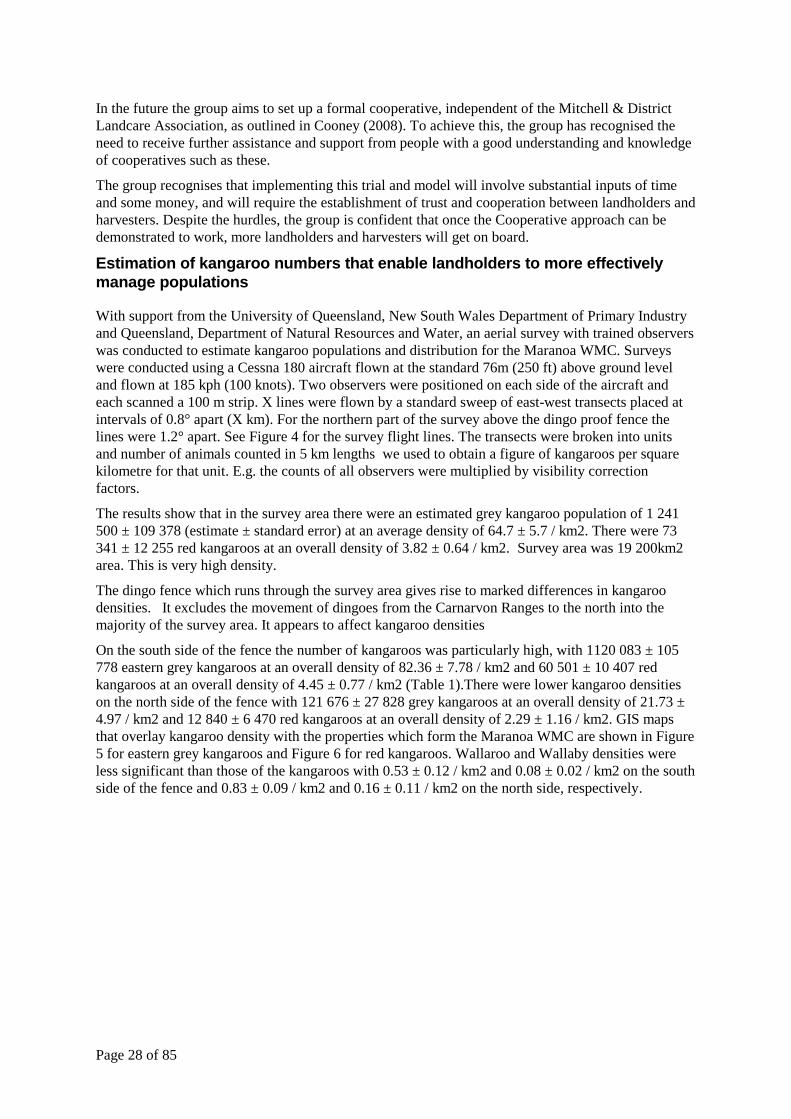
Page 28 of 85
In the future the group aims to set up a formal cooperative, independent of the Mitchell & District
Landcare Association, as outlined in Cooney (2008). To achieve this, the group has recognised the
need to receive further assistance and support from people with a good understanding and knowledge
of cooperatives such as these.
The group recognises that implementing this trial and model will involve substantial inputs of time
and some money, and will require the establishment of trust and cooperation between landholders and
harvesters. Despite the hurdles, the group is confident that once the Cooperative approach can be
demonstrated to work, more landholders and harvesters will get on board.
Estimation of kangaroo numbers that enable landholders to more effectively
manage populations
With support from the University of Queensland, New South Wales Department of Primary Industry
and Queensland, Department of Natural Resources and Water, an aerial survey with trained observers
was conducted to estimate kangaroo populations and distribution for the Maranoa WMC. Surveys
were conducted using a Cessna 180 aircraft flown at the standard 76m (250 ft) above ground level
and flown at 185 kph (100 knots). Two observers were positioned on each side of the aircraft and
each scanned a 100 m strip. X lines were flown by a standard sweep of east-west transects placed at
intervals of 0.8° apart (X km). For the northern part of the survey above the dingo proof fence the
lines were 1.2° apart. See Figure 4 for the survey flight lines. The transects were broken into units
and number of animals counted in 5 km lengths we used to obtain a figure of kangaroos per square
kilometre for that unit. E.g. the counts of all observers were multiplied by visibility correction
factors.
The results show that in the survey area there were an estimated grey kangaroo population of 1 241
500 ± 109 378 (estimate ± standard error) at an average density of 64.7 ± 5.7 / km2. There were 73
341 ± 12 255 red kangaroos at an overall density of 3.82 ± 0.64 / km2. Survey area was 19 200km2
area. This is very high density.
The dingo fence which runs through the survey area gives rise to marked differences in kangaroo
densities. It excludes the movement of dingoes from the Carnarvon Ranges to the north into the
majority of the survey area. It appears to affect kangaroo densities
On the south side of the fence the number of kangaroos was particularly high, with 1120 083 ± 105
778 eastern grey kangaroos at an overall density of 82.36 ± 7.78 / km2 and 60 501 ± 10 407 red
kangaroos at an overall density of 4.45 ± 0.77 / km2 (Table 1).There were lower kangaroo densities
on the north side of the fence with 121 676 ± 27 828 grey kangaroos at an overall density of 21.73 ±
4.97 / km2 and 12 840 ± 6 470 red kangaroos at an overall density of 2.29 ± 1.16 / km2. GIS maps
that overlay kangaroo density with the properties which form the Maranoa WMC are shown in Figure
5 for eastern grey kangaroos and Figure 6 for red kangaroos. Wallaroo and Wallaby densities were
less significant than those of the kangaroos with 0.53 ± 0.12 / km2 and 0.08 ± 0.02 / km2 on the south
side of the fence and 0.83 ± 0.09 / km2 and 0.16 ± 0.11 / km2 on the north side, respectively.
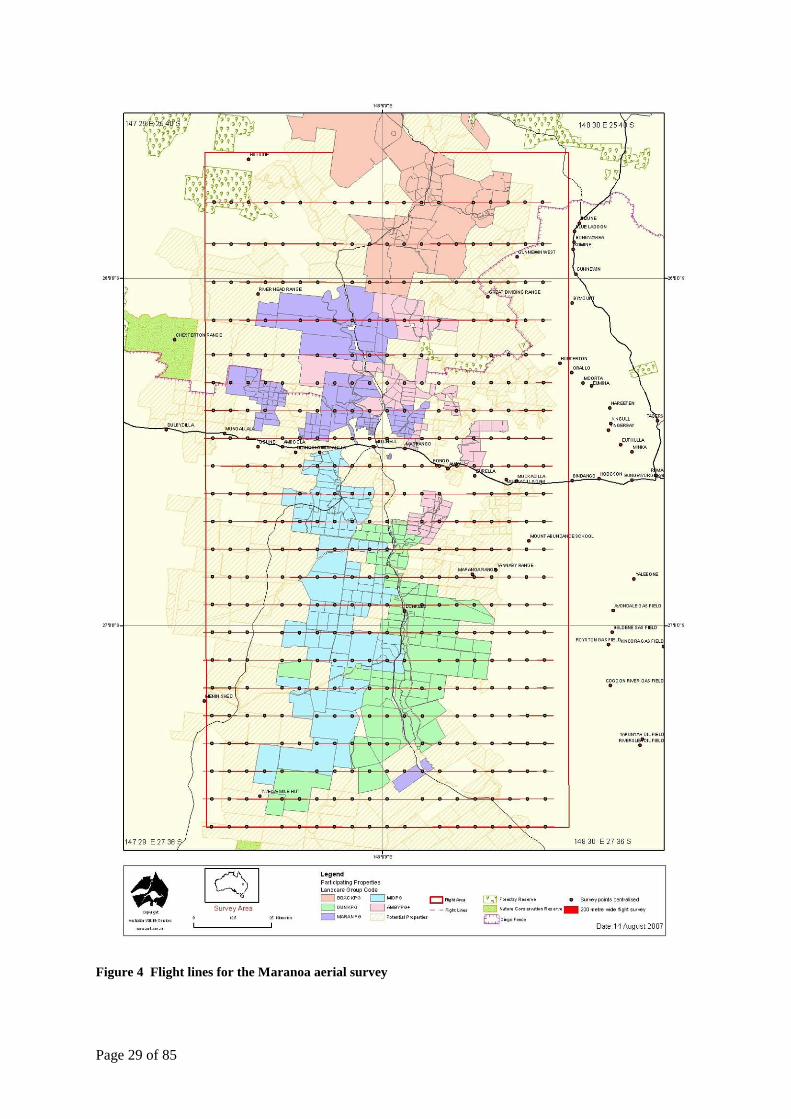
Page 29 of 85
Figure 4 Flight lines for the Maranoa aerial survey
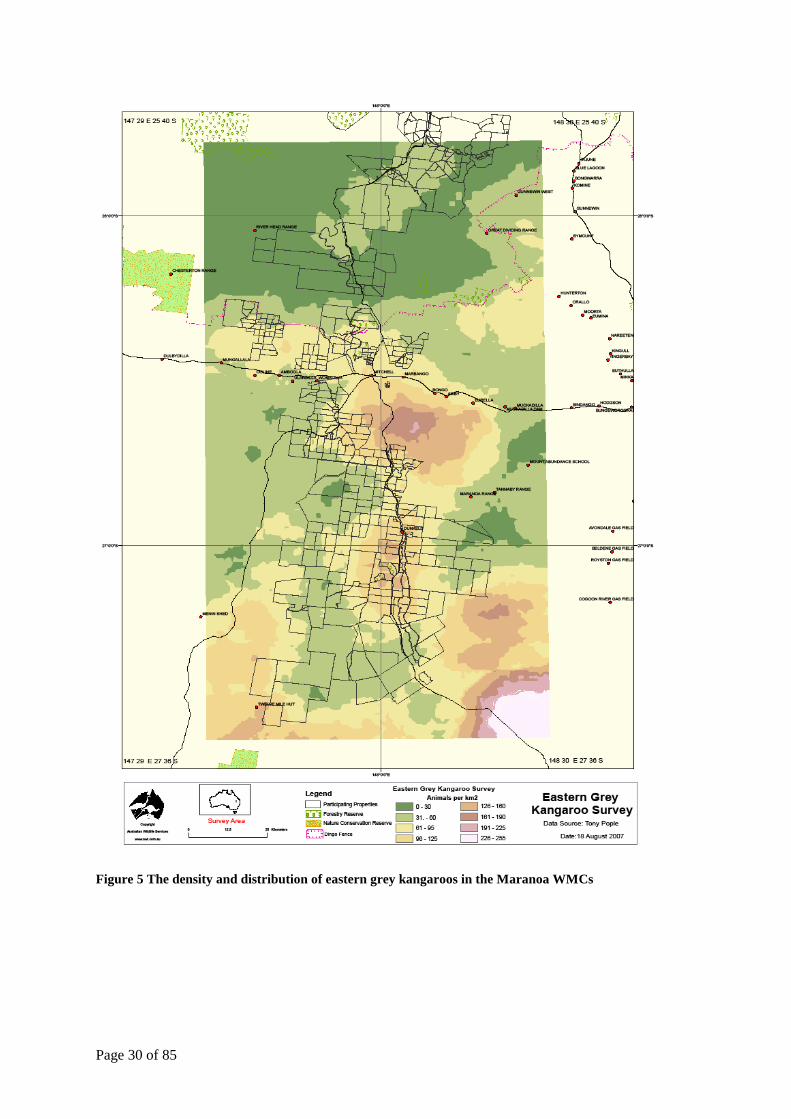
Page 30 of 85
Figure 5 The density and distribution of eastern grey kangaroos in the Maranoa WMCs
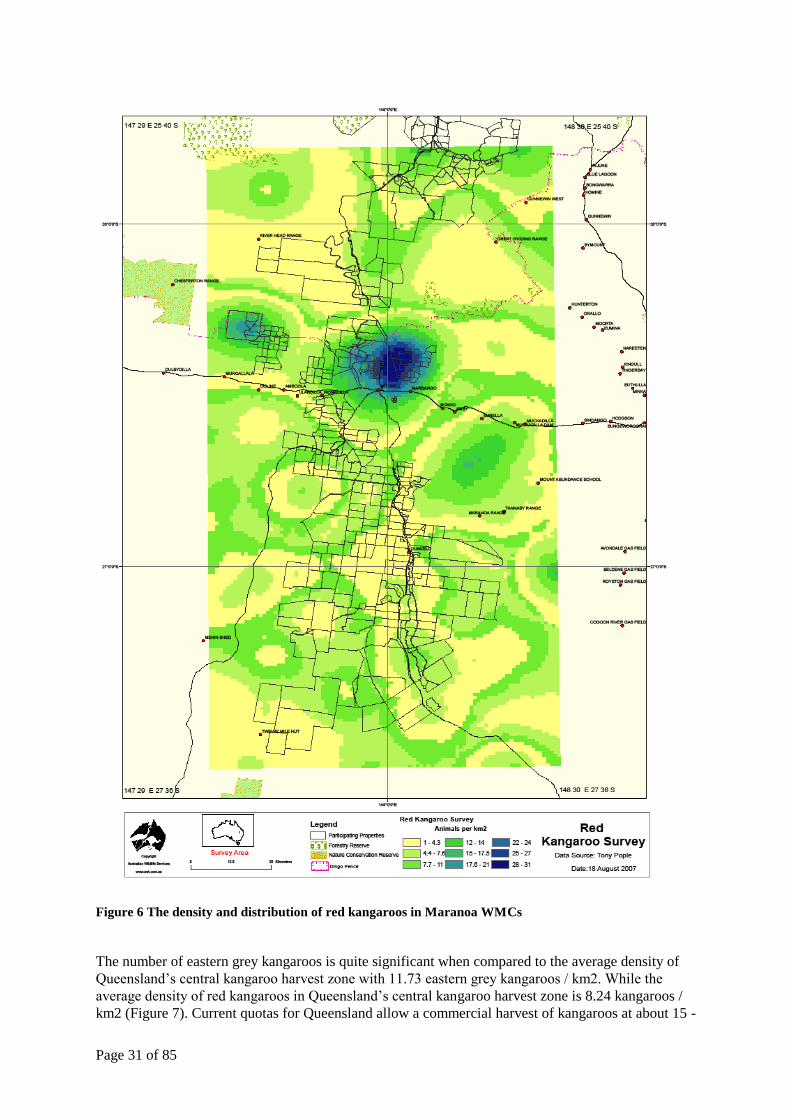
Page 31 of 85
Figure 6 The density and distribution of red kangaroos in Maranoa WMCs
The number of eastern grey kangaroos is quite significant when compared to the average density of
Queensland‟s central kangaroo harvest zone with 11.73 eastern grey kangaroos / km2. While the
average density of red kangaroos in Queensland‟s central kangaroo harvest zone is 8.24 kangaroos /
km2 (Figure 7). Current quotas for Queensland allow a commercial harvest of kangaroos at about 15 -
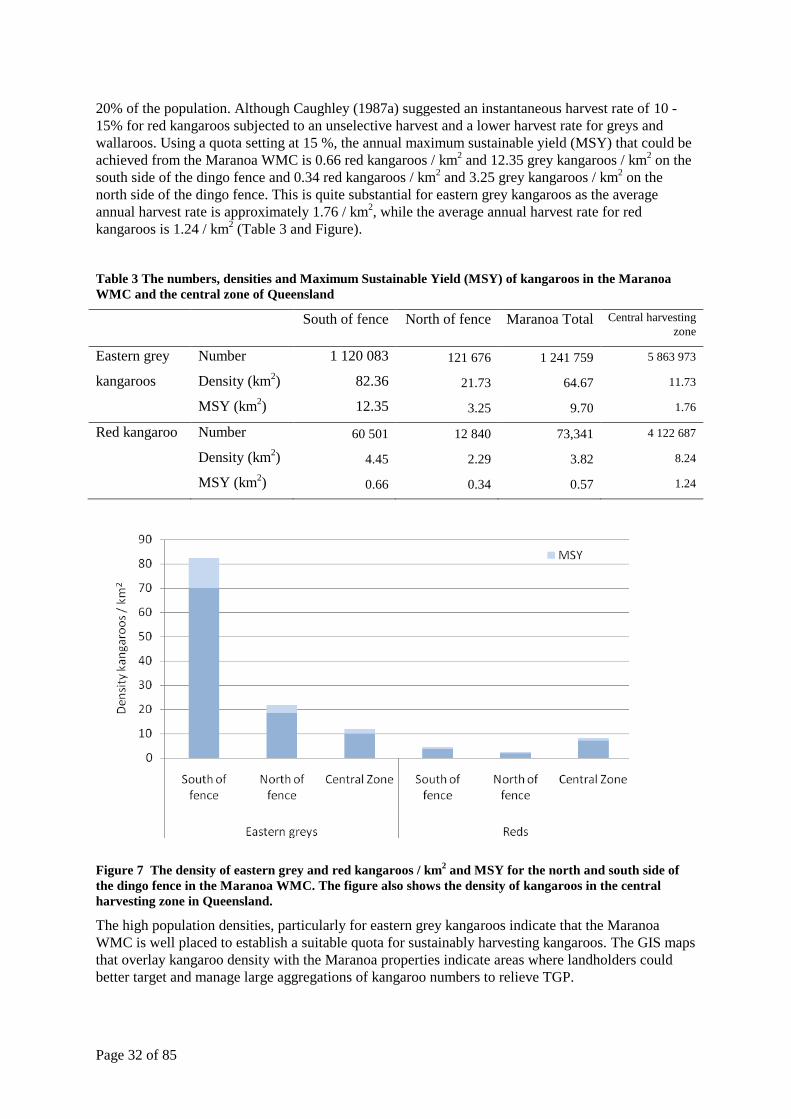
Page 32 of 85
20% of the population. Although Caughley (1987a) suggested an instantaneous harvest rate of 10 -
15% for red kangaroos subjected to an unselective harvest and a lower harvest rate for greys and
wallaroos. Using a quota setting at 15 %, the annual maximum sustainable yield (MSY) that could be
achieved from the Maranoa WMC is 0.66 red kangaroos / km2 and 12.35 grey kangaroos / km
2 on the
south side of the dingo fence and 0.34 red kangaroos / km2 and 3.25 grey kangaroos / km
2 on the
north side of the dingo fence. This is quite substantial for eastern grey kangaroos as the average
annual harvest rate is approximately 1.76 / km2, while the average annual harvest rate for red
kangaroos is 1.24 / km2 (Table 3 and Figure).
Table 3 The numbers, densities and Maximum Sustainable Yield (MSY) of kangaroos in the Maranoa
WMC and the central zone of Queensland
South of fence North of fence Maranoa Total Central harvesting
zone
Eastern grey Number 1 120 083 121 676 1 241 759 5 863 973
kangaroos Density (km2) 82.36 21.73 64.67 11.73
MSY (km2) 12.35 3.25 9.70 1.76
Red kangaroo Number 60 501 12 840 73,341 4 122 687
Density (km2) 4.45 2.29 3.82 8.24
MSY (km2) 0.66 0.34 0.57 1.24
Figure 7 The density of eastern grey and red kangaroos / km2 and MSY for the north and south side of
the dingo fence in the Maranoa WMC. The figure also shows the density of kangaroos in the central
harvesting zone in Queensland.
The high population densities, particularly for eastern grey kangaroos indicate that the Maranoa
WMC is well placed to establish a suitable quota for sustainably harvesting kangaroos. The GIS maps
that overlay kangaroo density with the Maranoa properties indicate areas where landholders could
better target and manage large aggregations of kangaroo numbers to relieve TGP.
Page 33 of 85
Next Steps for the Maranoa WMC
The next steps involve getting information on population numbers, impact of harvesting and the
development of data collection and management systems. The potential exists to use Global
Positioning Systems (GPS), Geographic Information Systems (GIS), and various data collection
techniques and data analysis to combine temporal and spatial data and provide benefits to harvesters,
land owners, processors and industry regulators such as EPA. The collection of data by a harvester on
type of animal harvested, location and time can be integrated with information on land, pasture,
weather and seasonal conditions, information on land and stock management, population dynamics
and animal health to produce information which could be used to simplify harvesting and enhance
landscape and animal management. This has been trialled in the Maranoa WMC, but no equipment is
in place for implementing traceback because not enough kangaroos are currently being traded.
Hardware is available and must link to the cooperative‟s data base to be effective. The industry
association, the Qld Macropod and Wild Game Harvesters Association, has an operating software
system that can be adapted to the Mitchell and District Landcare data base. Permission has been
sought and received for this to happen as soon as the cooperative is fully staffed and operational.
Landholders may use the information to manage numbers and grazing patterns of stock to attract
kangaroos to specific areas, manage total grazing pressure and to facilitate harvesting. The data will
also be used to help manage and ensure kangaroo quality and supply to processors.
Integrate wildlife with their property and natural resource management plans
Landholders within the Maranoa WMC manage similar land types, conduct similar enterprises and
have a long history of involvement in Landcare activities and sub-catchment planning.
Sub-catchment planning involves the Mitchell & District Landcare Association working in
collaboration with QMDC to take a collaborative and coordinated approach to NRM.
The goals and priorities for the region are set out in the Regional Natural Resource Management Plan
prepared by the Queensland Murray Darling Committee Inc. (QMDC) in partnership with South West
NRM Group Inc. and the Border Rivers, Maranoa-Balonne, and Bulloo Catchment Coordinating
Committee.
There are two types of links or common interests between the SWE and the NRM Plans. The first is a
direct connection between more effective management of macropods and control over total grazing
pressure as an NRM objective. The other is a broader contribution to biodiversity conservation and
sustainability through the establishment of other sustainable wildlife enterprises.
Macropod management
Significantly, the South West NRM Plan lists macropods as a pest animal species 'of importance',
recognises lost productivity due to increasing numbers of kangaroos and specifies the following
actions be undertaken to help manage the populations:
Conduct an impact study on lost productivity due to an increase in macropod populations
Support the continuation of existing projects that focus on lost productivity and high macropod
populations and ensure that results from these projects are extended to the broader community
Promote the continuation of a macropod population monitoring programme
Determine conservation requirements which may affect the management of pest macropods.
As a way of gaining recognition for their hard work in environmental management, as well as
ensuring continual improvement of their natural resources, some landholders within the Mitchell &
District area have implemented ALMS. This concept is gaining momentum in the area with three
Landcare groups keen to learn more about it.
Page 34 of 85
Share information of experiences from the trial sites and encourage regional
collaboration in natural resource management and wildlife
Communication between the project teams (Maranoa WMC members and coordinator, other trial
sites, researchers and the project manager) has been vital to achievements made to date. Several
workshops have been organised which enabled the sharing of information and experiences from the
trial sites and encouraged regional collaboration. The various communications maintained throughout
the duration of the project and workshops have motivated project participants to persist with the
initiative.
The group carried out a range of information sharing activities, including
information and awareness-raising activities such as newsletters and letters among landholders
and harvesters to lay a basis for collaboration
workshops to explore issues surrounding collaboration, and
initial negotiations with processors
two landholders, 2 harvesters, the principal investigator and the Mitchell & District Landcare
Coordinator attended the Broken Hill, NSW 14 and 15 February
a follow up meeting was held in Mitchell, where participants from the Broken Hill meeting gave
an overview of the meeting and discussed similarities between the SWE WMCs. The Maranoa
WMC group felt that working together and sharing experiences with other groups trialling similar
approaches to increased landholder involvement in the kangaroo industry to be a real advantage
and support the idea to continue sharing these experiences.
The Mitchell & District Landcare Association Inc works in close collaboration with the regional
Queensland Murray Darling Committee (MDC), assuring regional collaboration in natural resource
management. All Landcare activities happening within the Mitchell & District Landcare area are in
line with regional NRM targets. Regional NRM bodies in surrounding areas are interested in the
concept of sustainable wildlife enterprises and have supported the Maranoa Wildlife Management
Conservancy in its efforts.
A meeting was held in Brisbane in April 2008 to discuss the broader matter of landholder
involvement in the kangaroo industry, the opportunity for regional bodies‟ involvement and the future
of the SWE trials. .Tom Garrett the project officer in the Maranoa has since sought support from
Department of Sustainable Development (DSD) in Queensland for them to assist with aspects of
business management for the co-operative and prepare a cabinet submission for better management of
kangaroo harvests using the cooperative principals identified in the SWE MLC project. A think tank
will be organised by SW NRM Ltd and DSD to progress this initiative
Recommendations from the Maranoa WMC SWE trial experience
For the Maranoa Wildlife Management Conservancy to achieve its goals, the cooperative model
presented in Chapter 6 should be fully implemented. This model involves establishing a harvest
management, processing and marketing cooperative with both landholders and harvesters as
members. While implementing this model will involve substantial inputs of time, effort, and some
money, and will require the establishment of a relationship of trust and cooperation between
landholders and harvesters, it offers the potential for both landholders and harvesters to benefit
through:
collective bargaining to gain best market terms for the product they both play a role in producing
Page 35 of 85
more effective kangaroo management at a cross-property level, both to meet production
objectives and for better management of TGP
more cooperative relationships between landholders and harvesters, including harvester
participation in feral animals control and weed management
more secure and exclusive access to country for harvesters
reduced use of shoot and let lie tags (non-commercial damage mitigation culling), and
equitable sharing of profits.
For Landcare groups and regional/catchment natural resource management bodies, the model
recommended here offers them a potential option to meet objectives of better management of total
grazing pressure, improved diversification of landholder incomes and better socio-economic
resilience, and better management of feral animals and weeds at the local level.
For processors, collaboration between landholders and harvesters in kangaroo management,
according to the recommended model, could offer real benefits to them as well. Establishment of a
cooperative involving landholders and harvesters opens the way to:
assuring an exclusive, consistent source of supply from the properties involved
improved quality management from field to fork, through development and implementation of
best-practice quality assurance programs
harvest management measures that allow improvements to meat quality, such as selection of
specific age/sex/species combinations
implementation of sophisticated, GPS-based traceback systems
Environmental branding based on conservation-friendly land management practices of
landholders.
For relevant regulators and policymakers, particularly managers of state kangaroo management
programs, the implications of this work are that landholder involvement in kangaroo management is
feasible and potentially beneficial in meeting a suite of land management and industry development
objectives. Government support for such initiatives would greatly assist their implementation and
empower landholders to take a more active role in kangaroo management, in cooperation with
relevant government entities. Recommended support includes:
providing advice and technical and scientific support to groups seeking to collaborate on
kangaroo management
providing funding for such initiatives
supporting the allocation of quota to collaborating landholder/harvester groups, subject to certain
conditions such as adequate procedures to ensure chain of custody of tags
exploring other approaches to conditionally devolve more kangaroo management rights to
collaborating groups, in return for these groups taking on a larger role in sustainable
management.
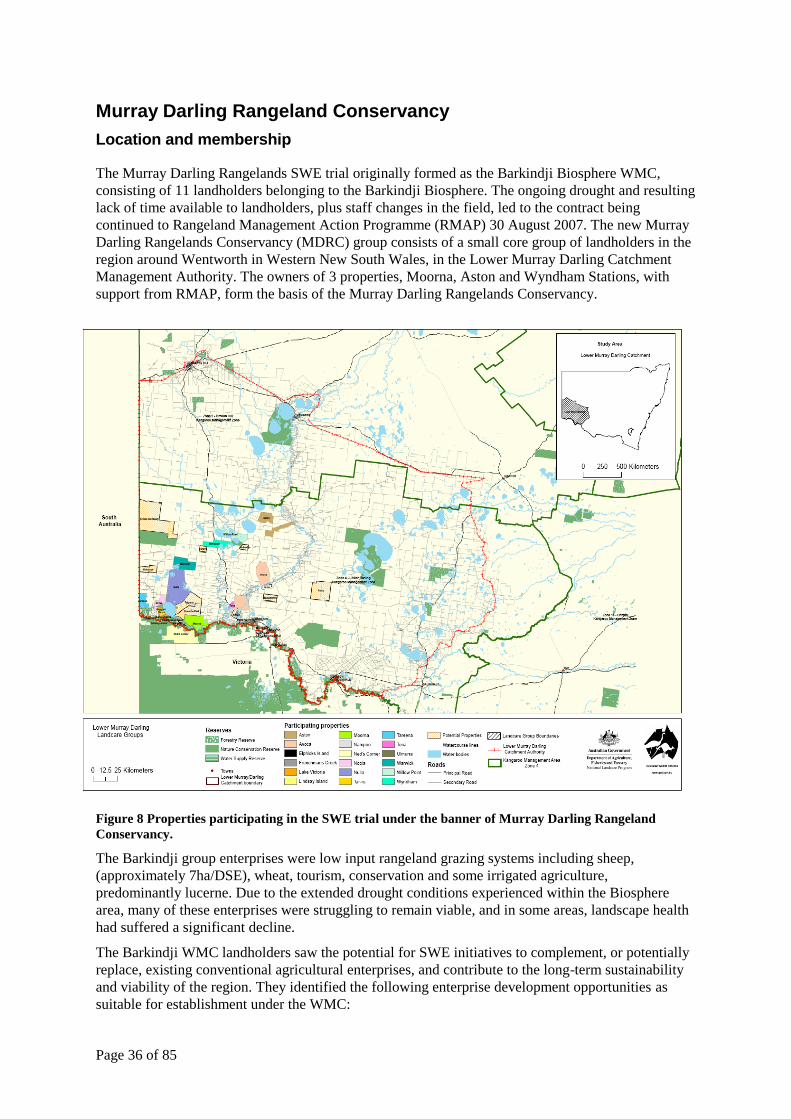
Page 36 of 85
Murray Darling Rangeland Conservancy
Location and membership
The Murray Darling Rangelands SWE trial originally formed as the Barkindji Biosphere WMC,
consisting of 11 landholders belonging to the Barkindji Biosphere. The ongoing drought and resulting
lack of time available to landholders, plus staff changes in the field, led to the contract being
continued to Rangeland Management Action Programme (RMAP) 30 August 2007. The new Murray
Darling Rangelands Conservancy (MDRC) group consists of a small core group of landholders in the
region around Wentworth in Western New South Wales, in the Lower Murray Darling Catchment
Management Authority. The owners of 3 properties, Moorna, Aston and Wyndham Stations, with
support from RMAP, form the basis of the Murray Darling Rangelands Conservancy.
Figure 8 Properties participating in the SWE trial under the banner of Murray Darling Rangeland
Conservancy.
The Barkindji group enterprises were low input rangeland grazing systems including sheep,
(approximately 7ha/DSE), wheat, tourism, conservation and some irrigated agriculture,
predominantly lucerne. Due to the extended drought conditions experienced within the Biosphere
area, many of these enterprises were struggling to remain viable, and in some areas, landscape health
had suffered a significant decline.
The Barkindji WMC landholders saw the potential for SWE initiatives to complement, or potentially
replace, existing conventional agricultural enterprises, and contribute to the long-term sustainability
and viability of the region. They identified the following enterprise development opportunities as
suitable for establishment under the WMC:
Page 37 of 85
tourism/ecotourism and hospitality focusing on river and land based tours and cultural tours
sustainable productions systems (traditional productions systems incorporating alternative
support systems) grazing production systems, e.g. grazing
kangaroo and other native or feral animal (rabbit) harvesting
bush food production
aquaculture incorporating commercial markets and conservation restocking
reintroductions of endemic wildlife to conservation / ecotourism and pastoral enterprises
As for the other SWE trial sites, the Barkindji WMC decided to trial commercial kangaroo harvesting
as it showed the most immediate potential both to gain an economic return for landholders and as a
conservation incentive. Unfortunately the very reasons they saw potential with the project, the
pressures associated with ongoing drought, led to them being unable to continue the project.
The MDRC landholders have an interest in sustainable use of natural resources, and conservation
management of the environment. The region is predominantly sheep and cattle grazing, whilst
landholders are also interested in enhancing and developing their wetlands and riverine systems.
Landholders within the group identified kangaroo management as a key area of focus and have
continued to see the need to have kangaroos viewed as a resource not a pest. They believe there is
potential for landholders to get an economic return from kangaroos without taking money from the
shooters.
The project involved landholders working together with shooters and processors to identify
opportunities for vertical integration of industry opportunities, improving trace back and
differentiating WMC product. The Murray Darling Rangelands Conservancy set out to build on the
ideas and aspirations established within the Barkindji WMC.
Objectives
The SWE trial activities in the project aimed to contribute to the following objectives:
Integration of property level management plans with regional natural resource management plans
Provide a framework for landholders to share proceeds of harvested wildlife
Estimation of kangaroo populations on WMC properties the wider sub -Catchment and rates of
sustainable use
Identification of size of markets for produce from WMC enterprises that are badged as leading to
a net conservation gain
Communication of experiences, expectations and opportunities among WMC members, and
communication of project results to the broader rural community.
Integration of property level plans with regional natural resource management
plans
The trial has worked to integrate kangaroo management with property management plans (PMPS)
developed previously as part of natural resource management and wildlife management planning.
Moorna, Aston and Wyndham Stations already had property management plans and holistic and
rotational grazing practices in place.
Page 38 of 85
The plans reflect the objectives of the Lower Murray Darling Catchment Management Authority
Board, which has five objectives reflecting the community vision of how the catchment should be
managed for the future. The five objectives are of equal importance and listed alphabetically:
Biodiversity
Community Values
Salinity
Soils and Vegetation
Water Quality and Quantity
Within the MDRC, natural resource and environmental management issues faced by the landholders
include:
Grazing Pressure - stock and non-domestic animals notably macropods.
The management of total grazing pressure is seen as a key component to sustainable
development with impacts including loss of ground cover having a significant impact on
landscape health and enterprise viability
Groundwater and salinity impacts
Loss of biodiversity
Water use and water availability
Water quality
Feral animals (goats, rabbits, pigs, foxes, cats)
Pest plants (noxious and woody weeds), including African boxthorn (Lycium ferocissimum),
Cockle burrs (Xanthium spp.), Dodder (Cuscuta campestris), Galvanized burr (Sclerolaena
birchii), Hardhead thistle (Acroptilon repens), Harrisia cactus, (Harrisia spp.) and Johnson grass
(Sorghum halepense).
The trial for the commercial harvest of kangaroos included the use of PMP‟s and management
incorporating rotational grazing.
Aston Station
Aston Station is located on the Darling River, 60km from Pooncarie. Aston is a family run business
running merino sheep on just over 21,230 ha. Aston focuses on managing the natural resource base
on their property through a holistic approach and rotational grazing system.
Moorna Station
Moorna is 10,117 hectares in area and is bounded by the Murray River to the south and is also a
historically significant property, established in 1850. The property is rich in Indigenous heritage
significance and boasts some significant wetlands including Purda Billabong. Conservation planning
and revegetation programs have been implemented over recent years. There is a closely monitored
rotational grazing system in place on Moorna.
Page 39 of 85
Wyndham Station
Angus, Kelly and Mitchell Whyte, the owners of Wyndham Station, 80km north of Wentworth run a
12,740 ha property dominated by chenopod shrubland. Angus and Kelly Whyte have been
implementing a rotation grazing system on the property for several years now and manage their
business with an aim to “graze our land with a system that will increase perennial grass species,
biodiversity and pasture production, while delivering us a high enough net profit to allow for
lots of lifestyle choices”.
Emerging challenges for the MDRC
In particular, the MDRC trial was hampered by indecision over responsibility and changing
management structures. It also faced similar challenges to the Maranoa WMC trialling ways of
increasing landholder involvement in kangaroo management. It faced the same difficulties around
developing cooperation and trust between landholders, harvesters and processors; of landholders
breaking into an existing industry that has relatively small profit margins.
The MDRC found that existing kangaroo management regulations in NSW, which allocates tags to a
shooter for use on one property, are not conducive to involvement by a group of landholders wanting
to better manage the free ranging kangaroo. As part of the outcomes from the project the group hopes
to get a group allocation of quota and tags to overcome this. The BARG SWE trial, described in the
next section of this report, has negotiated with the NSW Department of Environment and Climate
Change (DECC) to trial such a group tag system. The licence would make it possible for a group of
properties to function as one, with tags issued to the group usable on all group-licensed properties.
Application of a resource sharing framework
Based on the work developed by Dr Rosie Cooney Chapter 4 looking at the “Basic model for
collaborative landholder involvement in macropod harvest management”, recommendations for the
operational framework of the group were taken on board. In reference to work completed by Rosie
Cooney, information provided to the group took into consideration the need to delivery high-quality
product to processors. To adequately do this would require cooperation of landholders and harvesters,
and it is assumed here that both these groups are members of the Wildlife Management Conservancy
(WMC). Processors too could potentially be members of this organisation, but this is not currently
being contemplated.
The proposed function of the WMC ranged from a coordinating/facilitating role to direct involvement
in value-adding. More specifically functions included:
negotiating as a single voice on behalf of landholders/shooters with processors to secure terms
and conditions for contracts
negotiating with shooters on behalf of landholders on issues such as safety, standards and NRM
activities (such as weed/feral control)
establishing best-practice standards for harvesting and field processing
establishing guidelines for harvester selection of kangaroos for prime quality product
establishing best-practice standards for chiller operation to produce premium product
facilitating development of, and establishing standards or terms for, contracts between the various
parties
Page 40 of 85
Assisting landholders in integrating commercial macropod harvest into property management
planning.
Returns to landholders and harvesters for improved quality are the key driver in the program. For
landholders and harvesters to derive an economic return from contributing to producing a product of
assured high quality is dependent on processors being willing to pay a premium price for
assured/exclusive access to members‟ kangaroos, of specified quality standards.
A return to the members of the WMC would be negotiated between the WMC and the processors.
This return would be paid to the WMC by processors, and from the return, the group would be able to
pay operating costs, and distribute it as agreed by its governance structures, in this instance as
conservation bonuses to landholders.
Liaison with the kangaroo processing industry
Working to develop close working relationships with the processors involved project members of the
MDRC along with George Wilson on the 14th March 2008 meeting with Macro Meats Owner Ray
Borda and General Manager Doug Jobson at their processing plant in Athol Park SA. They discussed
innovations by the company to enable quality monitoring and management of product from paddock
to the supermarket outlets. The meeting outlined a picture of where the SWE project was heading,
highlighting the points that as groups working towards this common goal they need to enhance the
image of the whole process from harvesting to the healthy advantages of consuming Kangaroo meat.
Macro Meats explained that it was a tough industry to manage and that they needed total control or at
least to be clearly informed in any public announcement or comments on harvesting methods. They
had spent a long time establishing the industry and did not need a hick-up in the chain due to adverse
publicity. They had achieved a very warm reception at the world meat trade fair, which cost over
$100,000 in 2007 and were returning to do an even better job at the 2008 fair.
Currently Macro Meats have established a stable market into France and Germany with prime cuts
and the inferior cuts going to Russia. It is hoped to break into the Chinese market but they have had a
few problems achieving this. The domestic market has increased over the last few years with the
development of different cuts and selections of small goods.
Continuity of supply
A problem faced by the landholders also poses problems for the processors. One of their biggest
problems is a continuous supply of product, when the tags run out Macro Meats have to carry their
labour and last year it cost $1.2 Million to keep their trained staff on during these periods. A benefit
that could be offered to a processor, who has close contact with a group such as the MDRC, is a
commitment to maintain a continuous supply of product flowing through the processing plant. A
group tag allocation system, which is the focus of recommendations from the project, will maintain
continuity of supply to processors. It is anticipated that with a system such as group tag allocations in
place, groups will be able to help out the processors by this action, but may also be able to use this as
a bargaining tool to be able to attract some money back from the processors for the landholders who
are able to participate in this program.
The group is proceeding to implement a plan developed under the sustainable wildlife enterprises
process. A letter was prepared and sent from the group to kangaroo processors. A strong liaison with
shooters and processors will be put in place to develop a model for operation of the conservancy.
Participation in National Kangaroo Growers and Harvesters Association
The Murray Darling Rangelands Conservancy group have identified their commitment to supporting
and becoming involved in a National Kangaroo Growers and Harvesters Association. A united front
working in collaboration with the shooters and the processors is the way forward for landholders to
Page 41 of 85
have an opportunity to gain an economic return from the harvest of kangaroos. Joining forces and
forming the National Kangaroo Growers and Harvesters Association landholders will have collective
bargaining power to negotiate with processors.
Kangaroo population estimates
Surveys were conducted in order to estimate kangaroo numbers so as to enable landholders to more
effectively manage populations and integrate wildlife with their property and natural resource
management plans. Initial densities for the Murray Darling WMC were determined using survey data
from the NSW Department of Environment and Conservation. Species observed were classed as red
kangaroos or grey kangaroos (as eastern grey kangaroos and western grey kangaroos are not
distinguishable from the air). Surveys were conducted using a fixed-wing aircraft with 100 m wide
survey strips (fixed strip-width survey methodologies with correction factors based on helicopter line
transect sampling (see DEC NSW 2007).
Figure 8 Properties participating in the SWE trial under the banner of Murray Darling Rangeland
Conservancy.Kangaroo population estimates are provided for within the Lower Darling Kangaroo
Management Zone 4 (green border) and the Lower Murray Darling Catchment The results show high
numbers of kangaroos in the Lower Darling Management Zone (LMDZ), with 226 569 grey
kangaroos at an overall density of 3.6 / km2 and 118 018 red kangaroos at an overall density of 1.9 /
km2 in a 63 000 km2 area. The survey determined kangaroo densities using a one degree block scale
shows the density of kangaroos in the Murray Darling WMC at a finer scale.
Ground surveys utilising the line transect survey methodology are used to establish a ratio between
the eastern and western grey kangaroos. At Aston the density of kangaroos were 0.63 eastern grey
kangaroos / km2, 2.54 western grey kangaroos / km
2 and 4.82 / km
2 red kangaroos. The densities of
eastern grey kangaroos and western grey kangaroos at Moorna and Wyndham did not differ markedly
from those at Aston with 0.67 / km2 and 2.67 / km
2, respectively. However, the density of red
kangaroos at Moorna and Wyndham (2.07 / km2) was almost half the number at Aston.
In contrast to the density of kangaroos in the Maranoa WMCs, the density of red kangaroos and
eastern grey kangaroos in the Murray Darling WMCs was not considerably higher than that of the
average densities for the Western Plains harvest zone (3.92 / km2 for eastern grey kangaroos and 4.05
/ km2 for red kangaroos; DEC NSW 2007). However, the density for western grey kangaroos in the
Murray Darling WMCs was higher than the average density for the average in the Western Plains
harvesting zones (1.35 western grey kangaroos / km2).
Current quotas for red kangaroos and grey kangaroos are set at 13 and 15 %. The average MSY for
the Western Plains NSW harvesting zone is 0.59 grey kangaroos / km2 and 0.55 red kangaroos / km
2.
Using these quota settings the annual MSY that could be achieved from the following properties are:
Aston – 0.09 eastern grey kangaroos / km2 or 20 on property, 0.35 western grey kangaroos / km
2 or
81on property, and 0.63 red kangaroos / km2 or 133 on property,
Moorna – 0.10 eastern grey kangaroos / km2 or 10 on property, 0.40 western grey kangaroos / km
2 or
40 on property, and 0.27 red kangaroos / km2 or 27 on property, and
Wyndham – 0.10 eastern grey kangaroos / km2 or 12.75 on property, 0.40 western grey kangaroos /
km2 or 51 on property, and 0.27 red kangaroos / km
2 or 40 on property.
Table 4 and Figure 9 show these kangaroo density comparisons. The figure also shows the density of
kangaroos and the MSY for the Western Plains harvesting zone.
While the NSW DEC provides indicative densities of kangaroos, aerial surveys of the properties and
their surrounds will promote the accuracy of the results for determining densities in the Murray
Darling WMC. An aerial survey of the Murray Darling WMC was scheduled in 2007; however it was
delayed due to a late start to the project combined with the early arrival of hot weather, which is not
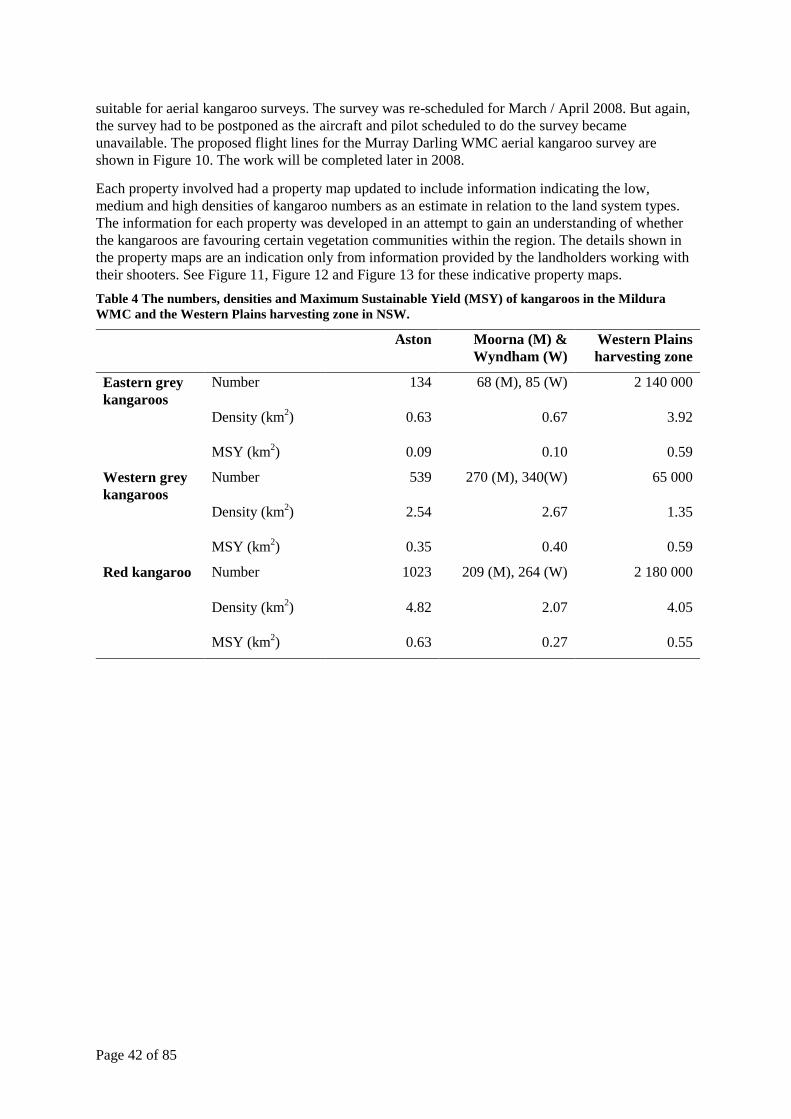
Page 42 of 85
suitable for aerial kangaroo surveys. The survey was re-scheduled for March / April 2008. But again,
the survey had to be postponed as the aircraft and pilot scheduled to do the survey became
unavailable. The proposed flight lines for the Murray Darling WMC aerial kangaroo survey are
shown in Figure 10. The work will be completed later in 2008.
Each property involved had a property map updated to include information indicating the low,
medium and high densities of kangaroo numbers as an estimate in relation to the land system types.
The information for each property was developed in an attempt to gain an understanding of whether
the kangaroos are favouring certain vegetation communities within the region. The details shown in
the property maps are an indication only from information provided by the landholders working with
their shooters. See Figure 11, Figure 12 and Figure 13 for these indicative property maps.
Table 4 The numbers, densities and Maximum Sustainable Yield (MSY) of kangaroos in the Mildura
WMC and the Western Plains harvesting zone in NSW.
Aston Moorna (M) &
Wyndham (W)
Western Plains
harvesting zone
Eastern grey
kangaroos
Number 134 68 (M), 85 (W) 2 140 000
Density (km2) 0.63 0.67 3.92
MSY (km2) 0.09 0.10 0.59
Western grey
kangaroos
Number 539 270 (M), 340(W) 65 000
Density (km2) 2.54 2.67 1.35
MSY (km2) 0.35 0.40 0.59
Red kangaroo Number 1023 209 (M), 264 (W) 2 180 000
Density (km2) 4.82 2.07 4.05
MSY (km2) 0.63 0.27 0.55
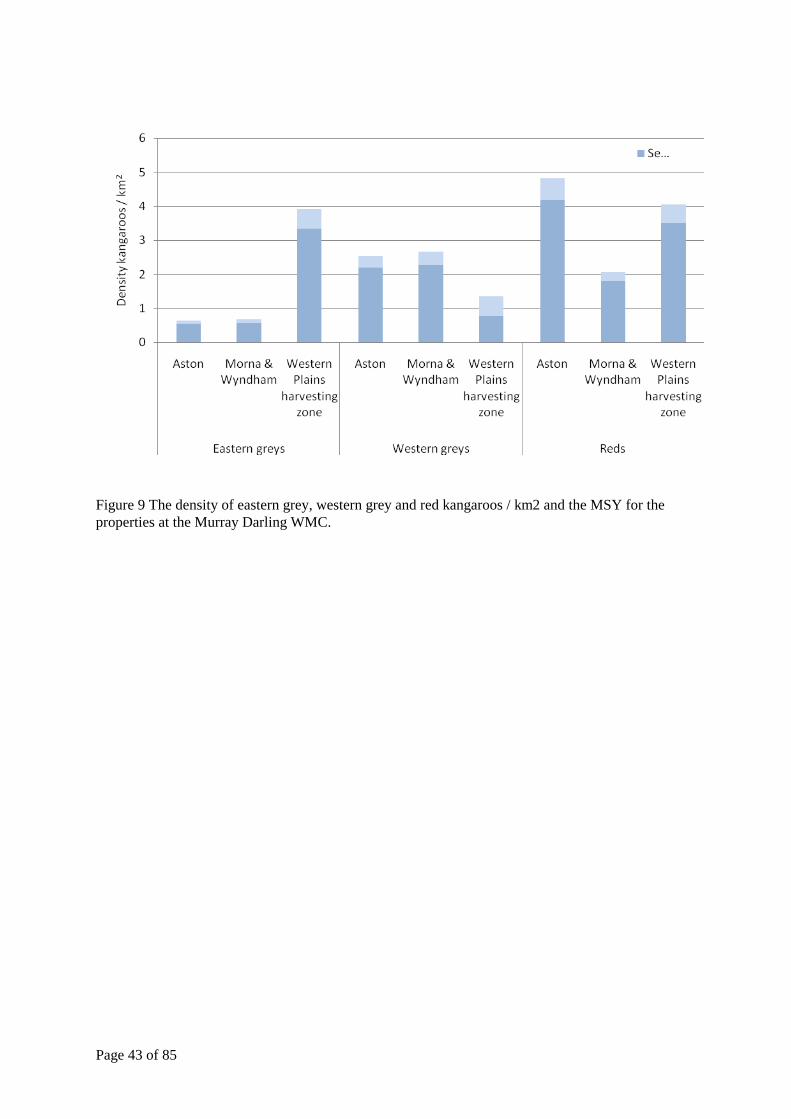
Page 43 of 85
Figure 9 The density of eastern grey, western grey and red kangaroos / km2 and the MSY for the
properties at the Murray Darling WMC.
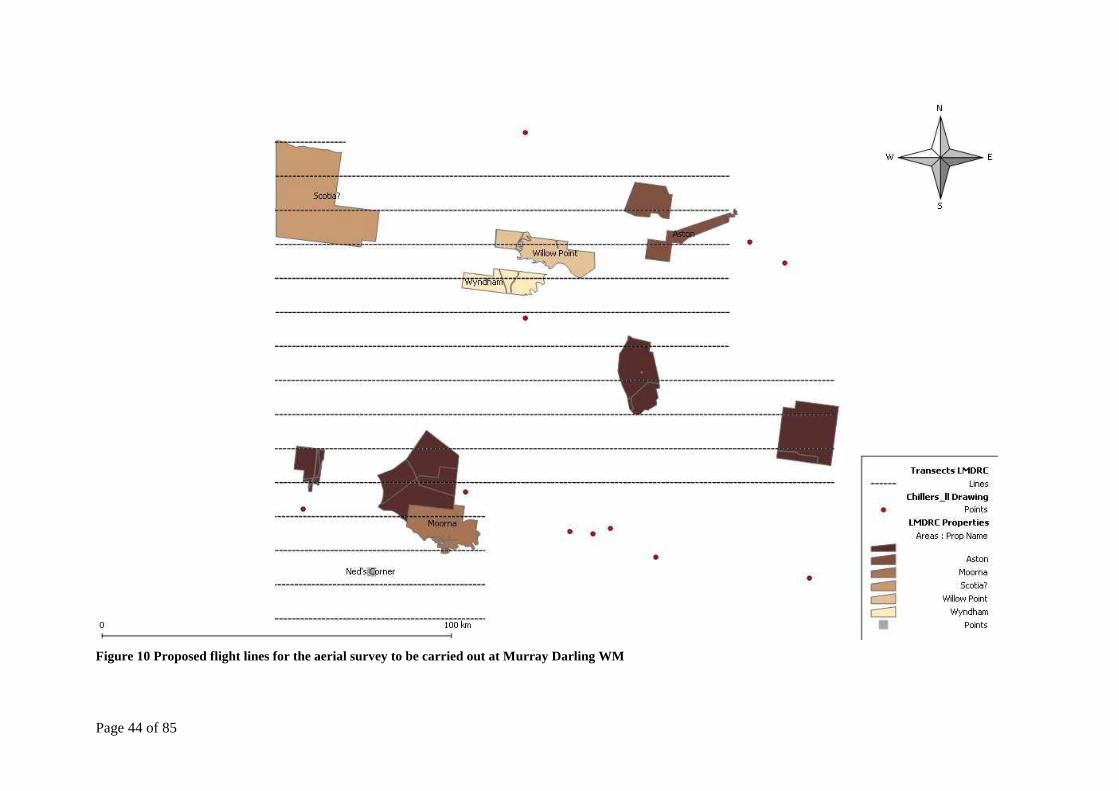
Page 44 of 85
Figure 10 Proposed flight lines for the aerial survey to be carried out at Murray Darling WM
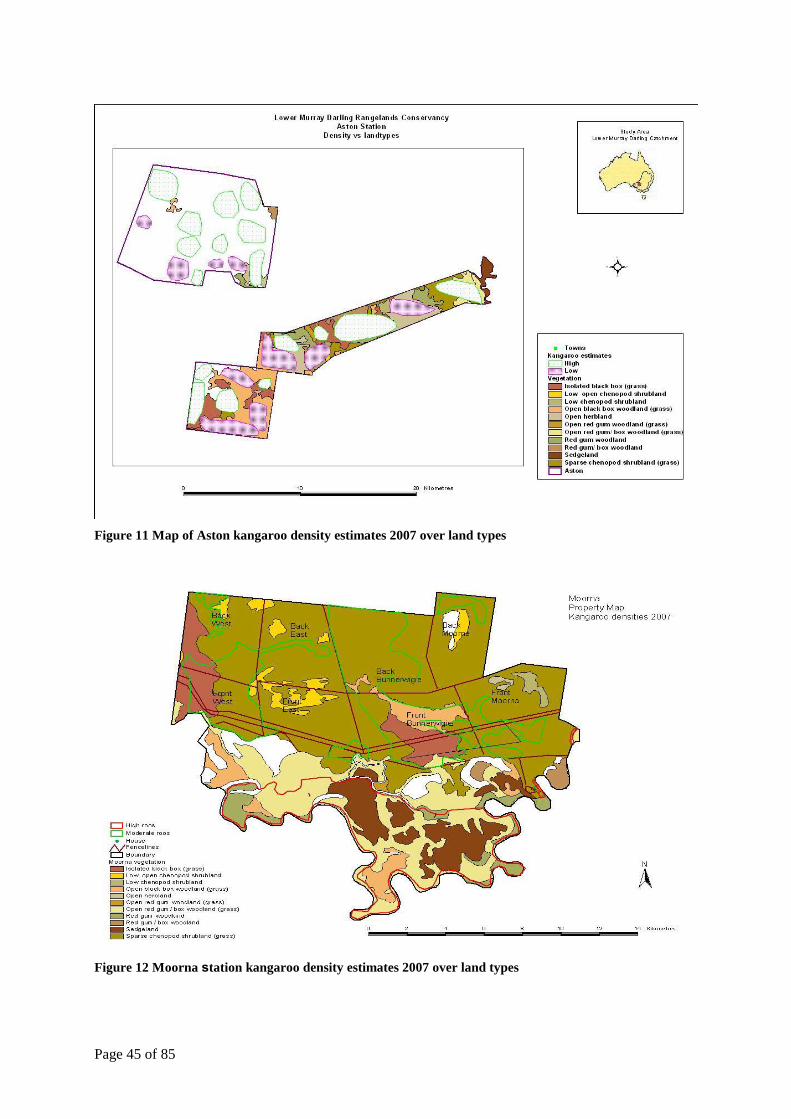
Page 45 of 85
Figure 11 Map of Aston kangaroo density estimates 2007 over land types
Figure 12 Moorna station kangaroo density estimates 2007 over land types
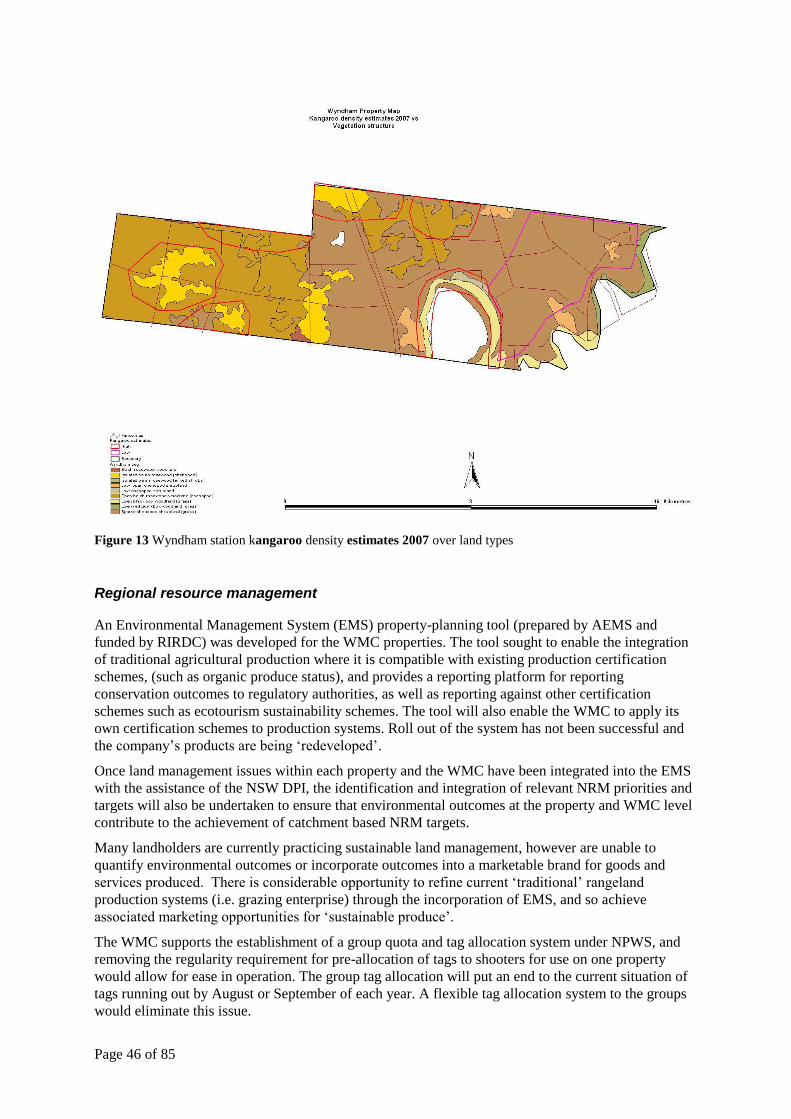
Page 46 of 85
Figure 13 Wyndham station kangaroo density estimates 2007 over land types
Regional resource management
An Environmental Management System (EMS) property-planning tool (prepared by AEMS and
funded by RIRDC) was developed for the WMC properties. The tool sought to enable the integration
of traditional agricultural production where it is compatible with existing production certification
schemes, (such as organic produce status), and provides a reporting platform for reporting
conservation outcomes to regulatory authorities, as well as reporting against other certification
schemes such as ecotourism sustainability schemes. The tool will also enable the WMC to apply its
own certification schemes to production systems. Roll out of the system has not been successful and
the company‟s products are being „redeveloped‟.
Once land management issues within each property and the WMC have been integrated into the EMS
with the assistance of the NSW DPI, the identification and integration of relevant NRM priorities and
targets will also be undertaken to ensure that environmental outcomes at the property and WMC level
contribute to the achievement of catchment based NRM targets.
Many landholders are currently practicing sustainable land management, however are unable to
quantify environmental outcomes or incorporate outcomes into a marketable brand for goods and
services produced. There is considerable opportunity to refine current „traditional‟ rangeland
production systems (i.e. grazing enterprise) through the incorporation of EMS, and so achieve
associated marketing opportunities for „sustainable produce‟.
The WMC supports the establishment of a group quota and tag allocation system under NPWS, and
removing the regularity requirement for pre-allocation of tags to shooters for use on one property
would allow for ease in operation. The group tag allocation will put an end to the current situation of
tags running out by August or September of each year. A flexible tag allocation system to the groups
would eliminate this issue.
Page 47 of 85
Identification of size of markets for produce from WMC enterprises that are
badged as leading to a net conservation gain
The MDRC was required to communicate the results of marketing studies to members. This was done
via a newsletter and at the forum held in Broken Hill. The information was also made readily
available for shooters involved in the program.
The WMC believes the level of information-sharing, transparency, accountability and unity in the
kangaroo industry is less than for other primary production industries. Understanding the business
needs of each stakeholder and the ways in which decisions taken by one player impact on the others,
particularly through business arrangements involving processors, harvesters and landholders, may
help to resolve some of these issues.
As a continuation of the work the group has already undertaken, the Project Coordinator will work
with NSW DPI Project Officer Jessica Gibson to undertake surveys of landholders in the region to
ascertain the production benefits possible from a sustainable commercial harvest of goats and
kangaroos. The data collated from the research will be valuable in the Groups progress. The Murray
Darling Rangelands Conservancy group will work to progress the structure of its organisation and
work on developing the conservancy further.
Communication of experiences, expectations and opportunities among WMC
members, and communication of project results to the broader rural community
As the trial consisted of a small group of landholders, communication between members occurred on
a regular basis with phone calls, emails and newsletters. The members attended the key workshop
held in Broken Hill 14 and 15 February 2008, which brought together members of the three SWE trial
sites, associated research and departmental personnel.
Additional activities which were undertaken by the Murray Darling Rangelands Conservancy trial
included a Landscape Function workshop with Peter Andrews, which looked at the fundamentals of
Peter‟s teaching and how the principles could be applied across the landscape. All participants in the
project attended the workshop along with other interested landholders from the region.
Conclusions
As a result of the project the Murray Darling Rangelands Conservancy is seeking:
Greater regulatory ease to be built into the system
To improve relationships with all stakeholders involved in the process – including landholders,
shooters and processors
More transparency and understanding each others‟ (shooters, processor, and landholders) interests
To support greater accountability for the product along the entire supply chain maintain quality
control and trace back along the entire kangaroo supply chain
Clearer product recognition to consumers and the broader community of the animal form the bush
to the food on the plate
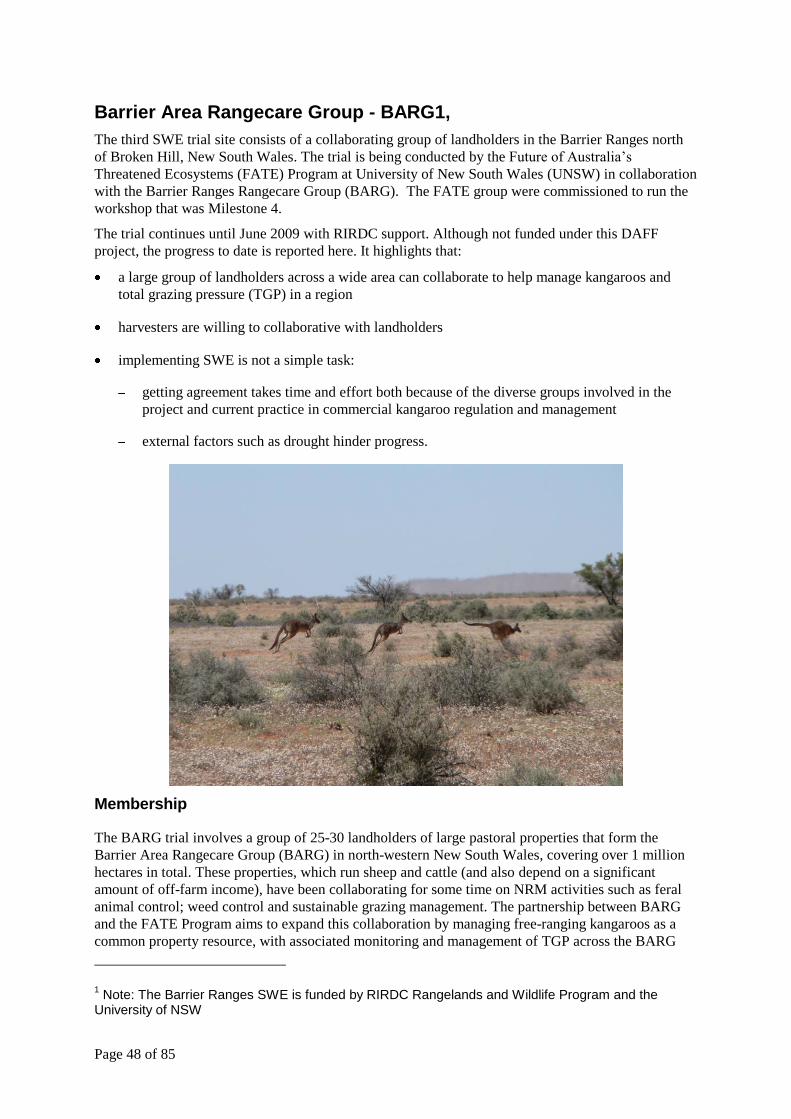
Page 48 of 85
Barrier Area Rangecare Group - BARG1,
The third SWE trial site consists of a collaborating group of landholders in the Barrier Ranges north
of Broken Hill, New South Wales. The trial is being conducted by the Future of Australia‟s
Threatened Ecosystems (FATE) Program at University of New South Wales (UNSW) in collaboration
with the Barrier Ranges Rangecare Group (BARG). The FATE group were commissioned to run the
workshop that was Milestone 4.
The trial continues until June 2009 with RIRDC support. Although not funded under this DAFF
project, the progress to date is reported here. It highlights that:
a large group of landholders across a wide area can collaborate to help manage kangaroos and
total grazing pressure (TGP) in a region
harvesters are willing to collaborative with landholders
implementing SWE is not a simple task:
getting agreement takes time and effort both because of the diverse groups involved in the
project and current practice in commercial kangaroo regulation and management
external factors such as drought hinder progress.
Membership
The BARG trial involves a group of 25-30 landholders of large pastoral properties that form the
Barrier Area Rangecare Group (BARG) in north-western New South Wales, covering over 1 million
hectares in total. These properties, which run sheep and cattle (and also depend on a significant
amount of off-farm income), have been collaborating for some time on NRM activities such as feral
animal control; weed control and sustainable grazing management. The partnership between BARG
and the FATE Program aims to expand this collaboration by managing free-ranging kangaroos as a
common property resource, with associated monitoring and management of TGP across the BARG
1 Note: The Barrier Ranges SWE is funded by RIRDC Rangelands and Wildlife Program and the
University of NSW
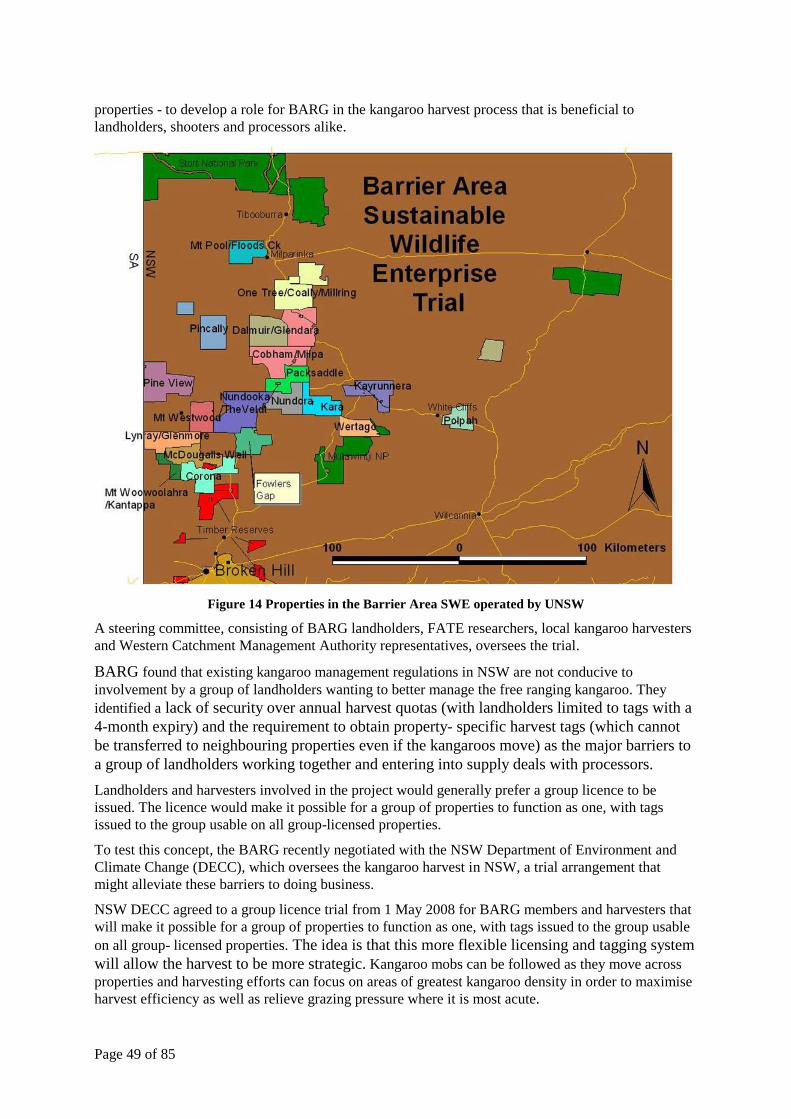
Page 49 of 85
properties - to develop a role for BARG in the kangaroo harvest process that is beneficial to
landholders, shooters and processors alike.
Figure 14 Properties in the Barrier Area SWE operated by UNSW
A steering committee, consisting of BARG landholders, FATE researchers, local kangaroo harvesters
and Western Catchment Management Authority representatives, oversees the trial.
BARG found that existing kangaroo management regulations in NSW are not conducive to
involvement by a group of landholders wanting to better manage the free ranging kangaroo. They
identified a lack of security over annual harvest quotas (with landholders limited to tags with a
4-month expiry) and the requirement to obtain property- specific harvest tags (which cannot
be transferred to neighbouring properties even if the kangaroos move) as the major barriers to
a group of landholders working together and entering into supply deals with processors.
Landholders and harvesters involved in the project would generally prefer a group licence to be
issued. The licence would make it possible for a group of properties to function as one, with tags
issued to the group usable on all group-licensed properties.
To test this concept, the BARG recently negotiated with the NSW Department of Environment and
Climate Change (DECC), which oversees the kangaroo harvest in NSW, a trial arrangement that
might alleviate these barriers to doing business.
NSW DECC agreed to a group licence trial from 1 May 2008 for BARG members and harvesters that
will make it possible for a group of properties to function as one, with tags issued to the group usable
on all group- licensed properties. The idea is that this more flexible licensing and tagging system
will allow the harvest to be more strategic. Kangaroo mobs can be followed as they move across
properties and harvesting efforts can focus on areas of greatest kangaroo density in order to maximise
harvest efficiency as well as relieve grazing pressure where it is most acute.
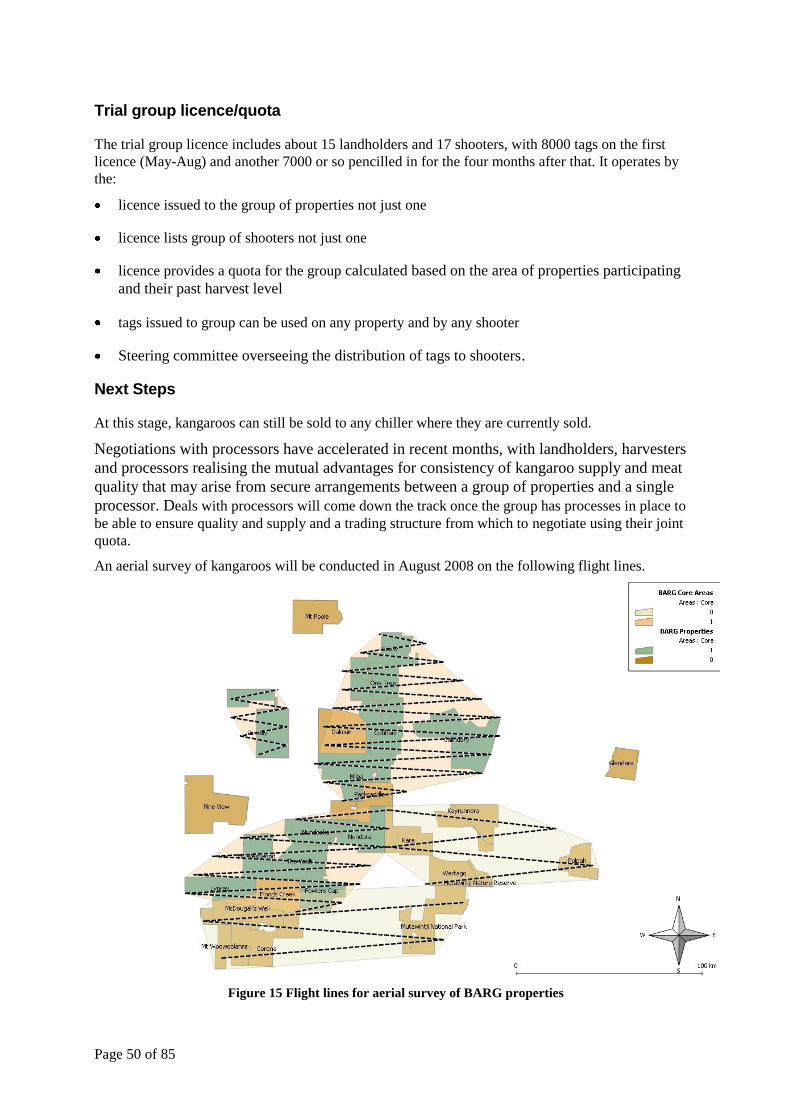
Page 50 of 85
Trial group licence/quota
The trial group licence includes about 15 landholders and 17 shooters, with 8000 tags on the first
licence (May-Aug) and another 7000 or so pencilled in for the four months after that. It operates by
the:
licence issued to the group of properties not just one
licence lists group of shooters not just one
licence provides a quota for the group calculated based on the area of properties participating
and their past harvest level
tags issued to group can be used on any property and by any shooter
Steering committee overseeing the distribution of tags to shooters.
Next Steps
At this stage, kangaroos can still be sold to any chiller where they are currently sold.
Negotiations with processors have accelerated in recent months, with landholders, harvesters
and processors realising the mutual advantages for consistency of kangaroo supply and meat
quality that may arise from secure arrangements between a group of properties and a single
processor. Deals with processors will come down the track once the group has processes in place to
be able to ensure quality and supply and a trading structure from which to negotiate using their joint
quota.
An aerial survey of kangaroos will be conducted in August 2008 on the following flight lines.
Figure 15 Flight lines for aerial survey of BARG properties
Page 51 of 85
3. Wildlife Stewardship Scheme
One aim of the trials is to provide site specific and demonstrable information about: methods for
integrating enterprises with existing performance management frameworks such as EMS.
While the nature of an EMS provides scope to include wildlife management and biodiversity, wildlife
is not one of the key elements identified in most EMS plans. This could be because:
The benefits created by wildlife are not as obvious to the immediate benefits generated by the
effects of improved soil and water quality
Wildlife may be considered a pest
Landholders are unsure about how to include wildlife in an EMS
Landholders already meet legal obligations and do not identify how wildlife could be included in
an EMS
Landholders are unsure of the effort and benefits involved
For landholders that are undertaking an EMS, the significance of an impact that affects wildlife is
not high priority
Wildlife is difficult to measure and mitigate against
In the following paragraphs we consider how biodiversity loss and wildlife management can be
addressed through an Environmental Management System (EMS). In particular, we identify a Wildlife
Stewardship Scheme that sets out how protecting and enhancing wildlife can be used as an
environmental focus point to increase natural resource management and environmental improvement -
one of the key drivers of EMS.
Attributes of an EMS
The key objectives of EMS reflect elements of the broader environmental concerns of the community.
These can be generally grouped into three key drivers for EMS:
Natural resource management and environmental improvement such as conservation of soil,
water, vegetation, and biodiversity
Competitiveness objectives (such as input–output efficiencies, better prices, lower costs, more
efficient production)
Social objectives (landholder and community values such as cultural heritage and occupational
health and safety matters)
While EMS aims to improve environmental management, this is not the only benefit. EMS can have
additional benefits such as:
Landholders improve the environmental impacts of the main farm activities
Landholders may obtain recognition for environmental land management efforts. EMS can be
used to gain internationally accepted management standards so customers overseas as well as
locally know that products that come from certified land holdings have been managed in an
environmentally responsible way
Landholders can improve their market access from being able to use environmental attributes to
differentiate products.
May provide landholders with a basis for „green‟ claims. Currently there is no widely adopted
system that provides a basis for „green‟ claims made by industry organisations and government
representatives on behalf of Australian farmers – this places all Australian farmers at high risk.
Page 52 of 85
Landholders can document their achievements and progress which can then be recognised by
markets and the community
Landholders may improve their productivity from better use of natural and other resources
Landholders may improve their land value
To achieve the objectives listed above, EMS provides a management framework based on a simple:
plan, do, check, and act cycle that achieve continual improvement. A manager uses the system to
identify likely environmental impacts and legal responsibilities, then implements and reviews changes
and improvements in a structured way. The EMS process generally involves:
Initial environmental review
Develop an environmental policy
Develop an environmental management program
Define roles and responsibilities
Carry out appropriate training and communication
Operational control and document control
Australian Landcare Management System
There is much that landholders can achieve to increase environmental performance and quality
assurance in agriculture. Agricultural industries in Australia currently operate under a range of
legislative requirements from all tiers of government, product safety and quality systems, and
marketing and branding schemes. In most cases, established groups exist to assist landholders
undertake an EMS. While the groups usually have a different focus, they all aim to protect and
enhance an aspect of the environment. In this report we look at the Australian Landcare Management
System (ALMS) and discuss how it can be used to assist landholders implement an EMS with a focus
on biodiversity.
ALMS is an EMS with a focus on land management and it has the great advantage of being able to be
used for the management of both agricultural and non agricultural land. It is designed for Australian
land managers and incorporates a whole-of-farm, catchment- linked national certification land
management system that can be used for all enterprises and activities on the farm (Australian
Landcare Management Systems 2008).
ALMS are based on a cycle of planning, action and reviewing. When a landholder joins the ALMS
Group the first thing they will do is develop a plan, which will be their guide to improving
environmental outcomes. Most landholders develop their ALMS action plan over two to four days,
usually in a group and with the help of an ALMS trainer. The plan is then checked to ensure it
complies with ALMS requirements.
External auditors ensure that the plans are being implemented and are meeting the targets established
by landholders with the help of the ALMS trainer. Audits are done by auditors accredited by ALMS
(i.e. auditors meet eligibility criteria, including relevant agricultural and environmental management
experience).
There are three categories of membership within ALMS which allow members to contribute as much
or as little as they can:
Eucalyptus members have participated in an ALMS Training Clinic, have had their ALMS plan
certified by an ALMS accredited auditor and have paid their ALMS Eucalyptus membership fee.
Banksia members have met all the system requirements applying to ALMS Eucalyptus
membership and are exchanging information with the catchment authority in the region. They
have also passed an ALMS Banksia audit and paid the ALMS Banksia membership fee.
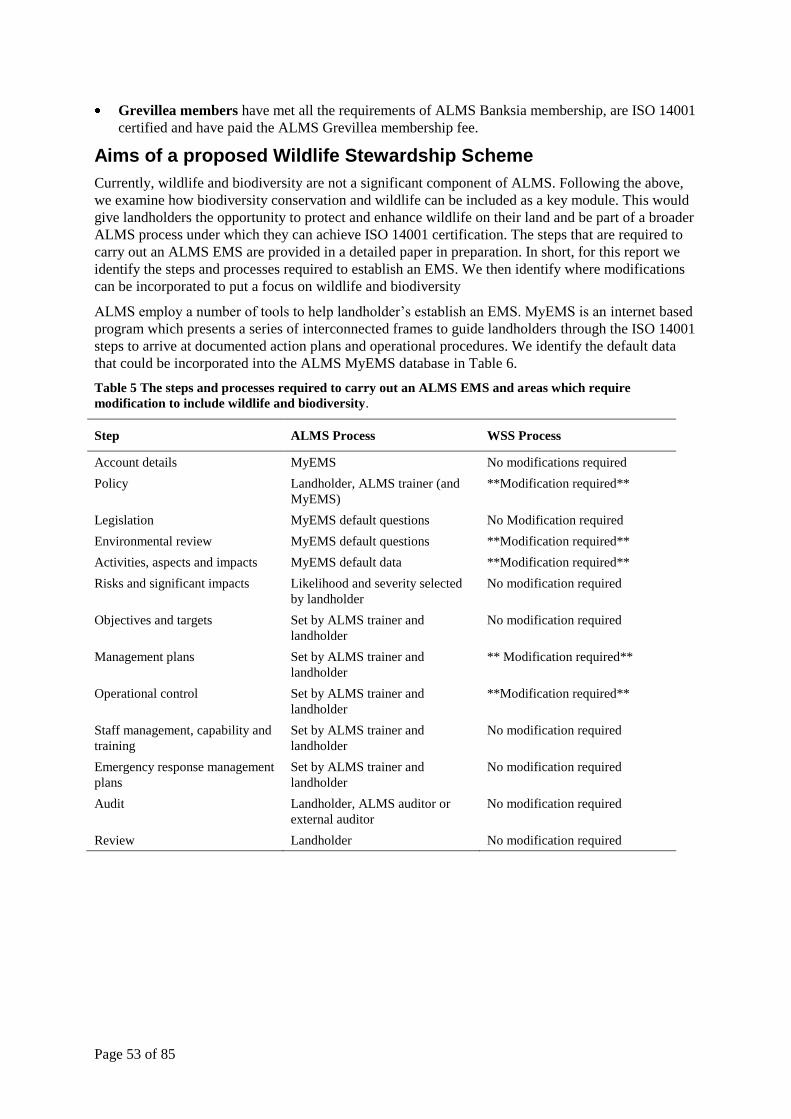
Page 53 of 85
Grevillea members have met all the requirements of ALMS Banksia membership, are ISO 14001
certified and have paid the ALMS Grevillea membership fee.
Aims of a proposed Wildlife Stewardship Scheme
Currently, wildlife and biodiversity are not a significant component of ALMS. Following the above,
we examine how biodiversity conservation and wildlife can be included as a key module. This would
give landholders the opportunity to protect and enhance wildlife on their land and be part of a broader
ALMS process under which they can achieve ISO 14001 certification. The steps that are required to
carry out an ALMS EMS are provided in a detailed paper in preparation. In short, for this report we
identify the steps and processes required to establish an EMS. We then identify where modifications
can be incorporated to put a focus on wildlife and biodiversity
ALMS employ a number of tools to help landholder‟s establish an EMS. MyEMS is an internet based
program which presents a series of interconnected frames to guide landholders through the ISO 14001
steps to arrive at documented action plans and operational procedures. We identify the default data
that could be incorporated into the ALMS MyEMS database in Table 6.
Table 5 The steps and processes required to carry out an ALMS EMS and areas which require
modification to include wildlife and biodiversity.
Step ALMS Process WSS Process
Account details MyEMS No modifications required
Policy Landholder, ALMS trainer (and
MyEMS)
**Modification required**
Legislation MyEMS default questions No Modification required
Environmental review MyEMS default questions **Modification required**
Activities, aspects and impacts MyEMS default data **Modification required**
Risks and significant impacts Likelihood and severity selected
by landholder
No modification required
Objectives and targets Set by ALMS trainer and
landholder
No modification required
Management plans Set by ALMS trainer and
landholder
** Modification required**
Operational control Set by ALMS trainer and
landholder
**Modification required**
Staff management, capability and
training
Set by ALMS trainer and
landholder
No modification required
Emergency response management
plans
Set by ALMS trainer and
landholder
No modification required
Audit Landholder, ALMS auditor or
external auditor
No modification required
Review Landholder No modification required
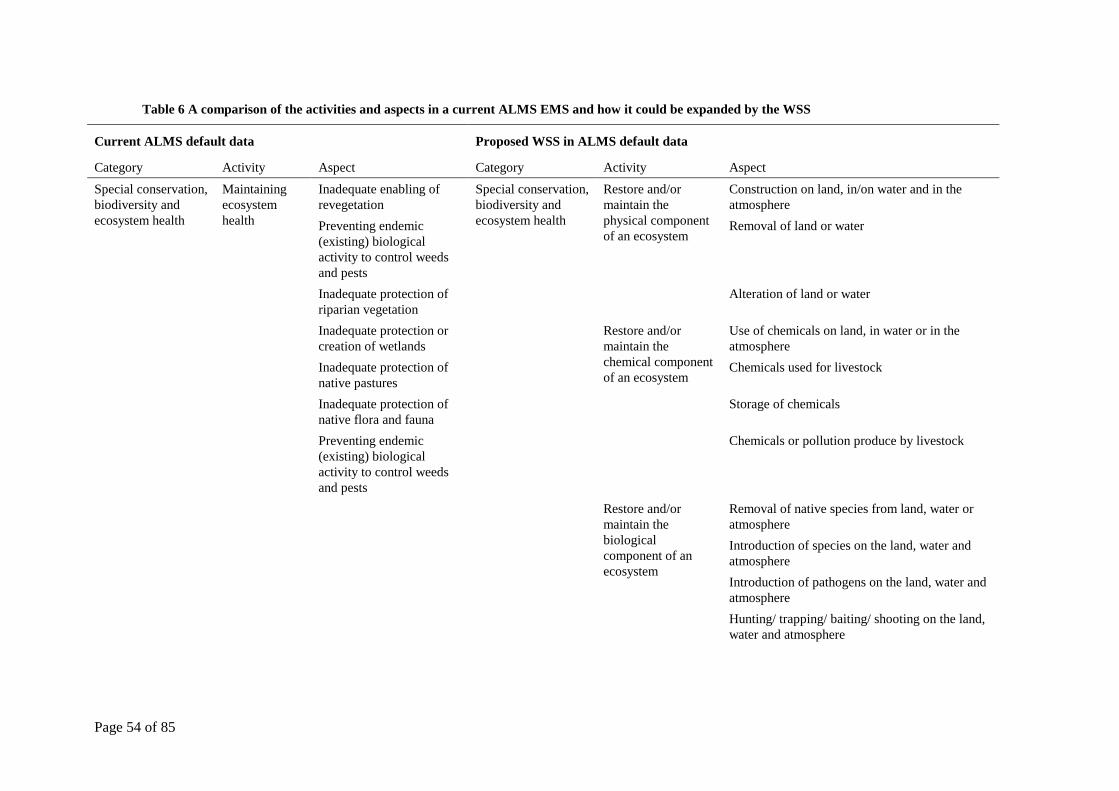
Page 54 of 85
Table 6 A comparison of the activities and aspects in a current ALMS EMS and how it could be expanded by the WSS
Current ALMS default data Proposed WSS in ALMS default data
Category Activity Aspect Category Activity Aspect
Special conservation,
biodiversity and
ecosystem health
Maintaining
ecosystem
health
Inadequate enabling of
revegetation
Special conservation,
biodiversity and
ecosystem health
Restore and/or
maintain the
physical component
of an ecosystem
Construction on land, in/on water and in the
atmosphere
Preventing endemic
(existing) biological
activity to control weeds
and pests
Removal of land or water
Inadequate protection of
riparian vegetation
Alteration of land or water
Inadequate protection or
creation of wetlands
Restore and/or
maintain the
chemical component
of an ecosystem
Use of chemicals on land, in water or in the
atmosphere
Inadequate protection of
native pastures
Chemicals used for livestock
Inadequate protection of
native flora and fauna
Storage of chemicals
Preventing endemic
(existing) biological
activity to control weeds
and pests
Chemicals or pollution produce by livestock
Restore and/or
maintain the
biological
component of an
ecosystem
Removal of native species from land, water or
atmosphere
Introduction of species on the land, water and
atmosphere
Introduction of pathogens on the land, water and
atmosphere
Hunting/ trapping/ baiting/ shooting on the land,
water and atmosphere
Page 55 of 85
4. Models for landholders to share
benefits from wildlife harvesting
A major component for the SWE trials has been considering models of how landholders could
become involved in regional collaboration in natural resource management and wildlife planning with
a view to sharing the benefits of the wildlife on their lands.
Dr Rosie Cooney from the FATE Program, University of New South Wales undertook a contract that
examined organisational structures that would enable collaboration in wildlife management. There is
a range of structures and processes through which this can occur. The research tested options for
structures and local organisation that are most appropriate for coordinating resources to facilitate the
use of native wildlife, while also contributing to enhanced biodiversity conservation, increased
numbers of native species, restoration of landscapes and increased farm productivity. The results are
outlined below and detailed in the companion publication, Landholder collaboration in wildlife
management: Framework for Landholders to Share Proceeds of Harvested Wildlife 2008.
The specific focus of the study was the group of landholders that established the Maranoa Wildlife
Management Conservancy, under the auspices of the Mitchell and District Landcare Association Inc,
in Mitchell, Qld. As the major current option for wildlife-based enterprise for this group involves
kangaroo harvesting, the study focused on kangaroos.
The work proceeded through desk-based literature research and analysis, and discussion and dialogue
with key stakeholders including SWE participants, harvesters, box operators, landholders and
processors. It proceeded through examining current practice in regulation and management of
commercial kangaroo harvest in Australia, drawing out key weaknesses from the perspectives of
environmental sustainability and various stakeholders. Overseas examples of landholder involvement
in wildlife management were examined, in order to seek lessons relevant to the Australian context. A
series of broad options were developed and evaluation. Based on these analyses, a detailed model was
developed and presented to the SWE for implementation based on collaboration and benefit-sharing
between harvesters and landholders.
Issues identified
As highlighted in chapter 1 above, current practice in commercial kangaroo regulation and
management has a number of weaknesses. Landholders gain no benefits from the kangaroos on their
land, and their ability to manage the kangaroo component of total grazing pressure is limited.
Relationships between landholders and harvesters are often poor, and potential for cooperation on
issues such as feral animal control is not realised. Harvesters have little security of access to country
for harvesting and little ability to bargain on price with processors. The processing industry as a
whole relies for supply of their resource on landholders, who would seek to reduce populations as far
as feasible if means became available. Individual processors cannot ensure reliable and consistent
supply, as this would require guaranteed access to country.
Examination of overseas examples of collaborative landholder involvement in wildlife management
revealed no clear analogues for kangaroo management. In particular, the commercial rather than
recreational nature of the harvest, and the particularly tight government control of wildlife in
Australia, strongly suggest that Australia must develop unique models for kangaroo management.
However, three examples presented and discussed in the report illustrate several useful lessons:
where landholders benefit from sustainable use and management of wildlife, this can dramatically
shape how they manage that land and the wildlife on it
that collaboration among neighbouring landholders in management of wildlife populations can be
effective and beneficial
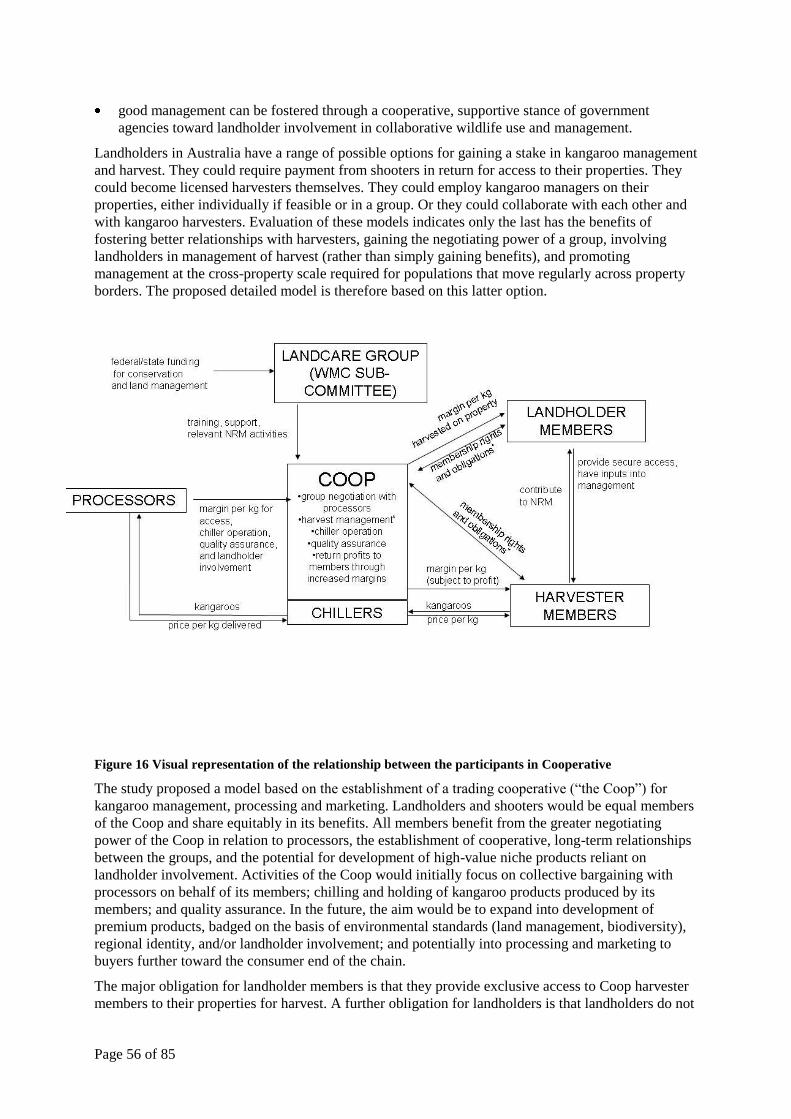
Page 56 of 85
good management can be fostered through a cooperative, supportive stance of government
agencies toward landholder involvement in collaborative wildlife use and management.
Landholders in Australia have a range of possible options for gaining a stake in kangaroo management
and harvest. They could require payment from shooters in return for access to their properties. They
could become licensed harvesters themselves. They could employ kangaroo managers on their
properties, either individually if feasible or in a group. Or they could collaborate with each other and
with kangaroo harvesters. Evaluation of these models indicates only the last has the benefits of
fostering better relationships with harvesters, gaining the negotiating power of a group, involving
landholders in management of harvest (rather than simply gaining benefits), and promoting
management at the cross-property scale required for populations that move regularly across property
borders. The proposed detailed model is therefore based on this latter option.
Figure 16 Visual representation of the relationship between the participants in Cooperative
The study proposed a model based on the establishment of a trading cooperative (“the Coop”) for
kangaroo management, processing and marketing. Landholders and shooters would be equal members
of the Coop and share equitably in its benefits. All members benefit from the greater negotiating
power of the Coop in relation to processors, the establishment of cooperative, long-term relationships
between the groups, and the potential for development of high-value niche products reliant on
landholder involvement. Activities of the Coop would initially focus on collective bargaining with
processors on behalf of its members; chilling and holding of kangaroo products produced by its
members; and quality assurance. In the future, the aim would be to expand into development of
premium products, badged on the basis of environmental standards (land management, biodiversity),
regional identity, and/or landholder involvement; and potentially into processing and marketing to
buyers further toward the consumer end of the chain.
The major obligation for landholder members is that they provide exclusive access to Coop harvester
members to their properties for harvest. A further obligation for landholders is that landholders do not
Page 57 of 85
use damage mitigation permits on their properties. The major obligation for harvester members is that
kangaroos harvested on Coop member properties are supplied exclusively to the Coop chiller box, up
until its capacity is reached. They further commit to implement any quality assurance schemes
developed by the Coop.
A cooperative business structure appears appropriate for a number of reasons. The most salient
reasons are that its limited membership, user-controlled and democratic structure are well suited to an
enterprise where encouraging cooperation is a key objective. The model developed drew on some of
the features that have contributed to the success of “new generation cooperatives” in recent years for
producers in the USA and Canada. Development of a Coop could be substantially assisted by
cooperation and support from government agencies through such mechanisms as allocation of a group
quota to the Coop, for it to manage and allocate among its members.
Implications and recommendations for relevant stakeholders
The recommended collaborative management model for SWE involves establishing a harvest
management, processing and marketing cooperative with both landholders and harvesters as members.
While implementing this model will involve substantial inputs of time, effort, and some money, and
will require the establishment of a relationship of trust and cooperation between landholders and
harvesters, it offers the potential for both landholders and harvesters to benefit through:
collective bargaining to gain best market terms for the product they both play a role in producing
more effective kangaroo management at a cross-property level, both to meet production objectives
and for better management of TGP
more cooperative relationships between landholders and harvesters, including harvester
participation in feral animal control and weed management
more secure and exclusive access to country for harvesters
reduced use of shoot and let lie tags (non-commercial damage mitigation culling), and
equitable sharing of profits.
For Landcare groups and regional/catchment management bodies, the model recommended offers
them a potential option to meet objectives of better management of total grazing pressure, improved
diversification of landholder incomes and better socio-economic resilience, and better management of
feral animals and weeds at the local level.
3. For processors, collaboration between landholders and harvesters in kangaroo management,
according to the recommended model, could offer real benefits to them as well. Establishment of a
cooperative involving landholders and harvesters opens the way to:
assuring an exclusive, consistent source of supply from the properties involved
improved quality management from field to fork, through development and implementation of
best-practice quality assurance programs
harvest management measures that allow improvements to meat quality, such as selection of
specific age/sex/species combinations
implementation of sophisticated, GPS-based traceback systems
environmental branding based on conservation-friendly land management practices of
landholders.
For relevant regulators and policymakers, particularly managers of state kangaroo management
programs, the implications of this work are that landholder involvement in kangaroo management is
feasible and potentially beneficial in meeting a suite of land management and industry development
objectives. Government support for such initiatives would greatly assist their implementation and
Page 58 of 85
empower landholders to take a more active role in kangaroo management, in cooperation with
relevant government entities. Recommended support includes:
providing advice and technical and scientific support to groups seeking to collaborate on
kangaroo management
providing funding for such initiatives
supporting the allocation of quota to collaborating landholder/harvester groups, subject to certain
conditions such as adequate procedures to ensure chain of custody of tags
exploring other approaches to conditionally devolve more kangaroo management rights to
collaborating groups, in return for these groups taking on a larger role in sustainable management.
Trial of the Cooperative model with the Maranoa WMC
The recommended Cooperative model was trialled with its major target group, the Maranoa WMC. It
was presented to a meeting of involved landholders, harvesters and box operators in early February
2008. It was discussed at some length and an in-principle decision was taken by the group to further
examine this model with a view to its implementation. A Working Group was established for this
purpose. The model was then presented and discussed at the February 2008 meeting in Broken Hill
involving participants from all three SWEs, which is summarised in the chapter 6 of this report. The
model received widespread support from many participants. Some long established industry
participants stated that it was the first model they had seen throughout their involvement with the
kangaroo industry that they believed could work. The Maranoa SWE Working Group met again in
early March. At this meeting, as an initial step toward establishing a formal Coop, they agreed a set of
obligations of membership of an informal Coop (see Plate 1 in Attachments) and further actions
toward securing membership were agreed.
By joining the informal Maranoa Kangaroo Harvesters and Growers Coop, members committed to
the following:
Each landholder will provide exclusive access to their property to one individual Coop member
harvester at any one time
Harvesters will sell kangaroos from Coop member properties exclusively to the Coop chiller
boxes. However, if the Coop box operator indicates the Coop boxes are full, they are free to sell
elsewhere
Landholders will not apply for or use damage mitigation permits
Harvesters will implement any Quality Assurance schemes developed by the Coop.
Members have the following rights:
the Coop will collectively bargain on their behalf to secure the best market price for their product
they receive an equitable share of any profits made by the Coop.
These rights and obligations will be reviewed with member input as they establish a formal
Cooperative.
Page 59 of 85
5. Marketing Kangaroo Products
A key component of the SWE strategy is to increase the value of the wildlife products thereby
creating a margin which can flow to the landholder. However commercial business enterprises based
on Australian wildlife usually are associated with tight profit margins. Also, demand for some
products can be limited by perceptions of unsustainable yields and exploitative and inhumane systems
of production. These issues and perceptions led to a commissioning of a contract to examine the size
of the demand and other options and requirements to market the products from WMCs.
Marketing Kangaroo Meat from the WMCs – Chudleigh et al
Peter Chudleigh‟s supporting research Marketing Kangaroo Meat from the Sustainable Wildlife
Enterprises2008, explored whether using the concepts of sustainable yields within a conservancy and
wildlife conservation gains from management of the conservancy may result in a higher acceptability
of products and enhanced marketing effectiveness and margins for kangaroo products. The research
focused on kangaroo marketing because the project was directly targeted at meeting the needs of the
Mitchell and District Landcare Association who are pursuing the Conservancy concept and who had
already purchased two chillers to enter the kangaroo marketing chain
The research provided information on the kangaroo meat market in Australia with regard to strategies
for market development of conservancy produced kangaroo meat and in particular an assessment of
the potential badging of products with some form of environmental accreditation.
The investigation focused on the markets for products labelled as originating from sustainable
enterprises where biodiversity has been enhanced. In particular, market research was carried out
within the study in order to assess and facilitate the development of a marketing strategy for kangaroo
meat emanating from land and wildlife that are managed in a sustainable manner.
The approach was believed necessary, the current marketing arrangements have evolved over a
number of years using the kangaroo resource without much regard to its interaction with land
management. Second, a key question in the minds of the Conservancy representatives was whether
environmental badging could be applied in the market place to attract increased demand for kangaroo
products. Thirdly, this increased demand would in turn assist the rural sector to diversify, especially
in the rangeland areas where new production options are limited.
While other market research activities on kangaroo meat have been undertaken in the past,
information on the potential for differentiation of the market through environmental management
associated with the kangaroo production and harvesting system and its interaction with traditional
grazing enterprise was lacking.
The specific objectives of the research were:
Identify the size and location of markets for produce from Wildlife Management Conservancy
enterprises that are badged as leading to a net conservation gain
Support the establishment of processes for supplying those markets.
The first activity concentrated on describing the characteristics of the Conservancy properties, the
potential supply of kangaroo meat, and features of the Conservancy properties that were thought
would be of interest to current and potential kangaroo meat consumers. This guided the second
activity, appropriate market research with consumers and other participants in the kangaroo marketing
chain (e.g. marketers, restauranteurs, caterers etc). The information attained on the market was
expected to lead to options for market development and in particular alternative forms of potential
badging of products, for example, using some form of accreditation or chain of custody associated
with environmental and wildlife management systems.
The market research was conducted through:
Page 60 of 85
Twenty one interviews with representatives of various segments of the market to provide
feedback on opportunities for the Conservancy product. This covered food service suppliers,
gourmet retailers, supermarket representatives, restaurants, catering organisations, hotels, and
processors
Two focus groups including one focus group of 10 people that had eaten kangaroo four or more
times in the last 12 months; and one group of 9 people that included 4 that had eaten kangaroo at
least once and 5 people that had never eaten kangaroo.
Key findings
The key findings have been developed from market research activities undertaken with existing and
potential kangaroo meat processors, distributors and consumers in Queensland.
Sustainability
There are many activities that could be undertaken on Conservancy properties to improve the
sustainability of traditional livestock management systems. Some of these activities interact with
kangaroo harvesting. The Maranoa Conservancy is already progressed to the stage where a number of
landholders have been accredited under the Australian Land Management System (ALMS). Various
types of improvement to wildlife management are possible on Conservancy properties. One method
would be integrating current kangaroo harvesting more closely with property management of both
wildlife and traditional grazing management of sheep and cattle. There may need to be a financial
incentive to enhance this integration and this incentive could be attracted in various forms. One
avenue by which this may come about is through improved quality of kangaroo meat production, and
marketing the Conservancy product as a conservation gain product.
Conservancy supply and continuity
An estimate of harvest numbers from Conservancy properties is 7,000 to 10,000 head per annum.
While this is only a rough estimate, it is a very small number compared to the whole of Queensland or
the Australian annual supply of kangaroo meat, with 4 to 7 million harvested each year. Consistency
and continuity of supply from the Conservancy may therefore be key issues in market development.
There may be a need to take kangaroo carcasses from other conservancies with similar credentials (if
they exist), or from non–conservancy properties with potential credentials. The main reason that the
Maranoa Conservancy was established was because of the “Landcare ethic” of the landholders
involved and the catchment planning they were doing focusing on other values and threats in their
region. Since that time two other groups in the Mitchell area have commenced similar discussions, so
it is possible that they could also be included in the Conservancy if they undertake subcatchment
planning with their neighbours.
It is likely that more properties in the area would supply if it could be demonstrated there was a price
premium to be captured, for example, if a processor could pay a premium for Conservancy kangaroos.
Apart from total quantity available, continuity and the variability of supply may be key issues in
marketing a Conservancy badged product. Strategies for maintaining a continuous supply or at least
reducing supply variability may include one or more of the following:
Managing the kangaroo population on a whole area of Conservancy basis
Reducing sheep, cattle (and in some cases goat) numbers in drought periods
Utilising smaller kangaroos (and possibly wallabies) and supporting the meat price to
processors/marketers through a reduced price for larger carcasses
Limiting the meat sold under the Conservancy brand in periods of ample supply so that
expectations for supply continuity were not high, and with surplus kangaroo meat sold generically
Page 61 of 85
Form marketing alliances with other like-minded Conservancies, preferably in other regions so
that some form of spatial diversification were in play that may reduce variability.
Attitudes of wholesale purchasers
The potentially small volume of the Conservancy branded product and any problems with stability of
supply will affect opportunities to supply the product into some firms and some segments. The hotels
and supermarkets contacted confirmed that lack of continuous supply would be a barrier to using the
product. Some of the firms in other segments would not be interested in the product if supply is not
reliable or consistent.
Sixteen of the 19 firms surveyed were interested in trialling the product or in receiving more
information on the product but the final decision to use the product would be based on a range of
factors including quality, price and perceived demand. Two firms were not interested in the new
product and one could not comment until they received more information.
When asked to rate the strength of the opportunity for the Conservancy product in the market (on a
scale of 1 to 5 where 1 is poor and 5 is very good), food service companies gave the highest rating
(3.5) followed by hotels (3.3) and supermarkets (2.9).
Food service companies (including game meat suppliers to high quality restaurants and gourmet
butcher shops) felt that there is potential interest in the product. Demand for game meat is „fashion‟
influenced. For this reason, the new product would need to be supported by a concerted promotional
campaign targeting chefs (e.g. chef workshops such as G‟day Chef and targeted marketing) to
encourage trial of the product. Consumer demand is seen as a key driver and promotion to consumers
is also needed.
Restaurants gave a rating of 2.0 out of 5 to the market opportunity. While some were interested,
others were not interested in the product. Significant differentiation on quality and presentation would
be needed. Successful branded products used by restaurants include Meat Standards Australia (MSA)
and other high quality branded meat. Junee Lamb has developed high quality packaging for
restaurants and this approach has lifted demand. Kangaroo is currently supplied to restaurants in clear
plastic, bloody bags and can be much less appealing. Overall, the current presentation of kangaroo
product to restaurants and food service outlets was considered fairly basic and sends the message
kangaroo is just a commodity product. Information from other sources suggests there could be room
for expansion into the domestic restaurant trade.
Hotel interests felt that there is potential demand for a high quality, environmental branded product
(rating of 3.3 out of 5). As with the restaurant segment, promotion to chefs and marketing the product
as a gourmet product is important.
For some firms, the environmental focus is valuable due to the positioning of the business or because
of increased interest from consumers. However, the Conservancy product would need to be positioned
primarily as gourmet and secondly as an environmental brand. Those who did not see value in the
environmental branding believed that the current supply of kangaroo already has good environmental
credentials. Others felt it would be too difficult to differentiate the new product from the existing
supply of kangaroo.
Clear messages are needed about the differences the new product offers. To achieve wider levels of
interest and support, the quality and gourmet positioning will be the main drivers. Few are interested
in a product that is differentiated only by the conservancy approach. Also, the environmentally
branded product must be demonstrated to be superior in quality and packaging. Regarding quality,
tenderness and food safety were considered paramount.
Of the 19 firms surveyed 18 indicated that they would be willing to pay a higher price for the
environmentally branded product. However, the actual price of the product would be determined by
the quality of the kangaroo meat. All segments reported that the Conservancy product initially should
Page 62 of 85
have a similar pricing to existing kangaroo and, once the product is established and successful, the
price could be gradually increased.
Businesses purchasing environmentally branded kangaroo want information on how sustainable
harvesting is managed, credentials of the supplying organisation, firm ownership, food quality and
system capabilities – a full profile on the operation, its capabilities and the benefits it can deliver.
These firms felt that consumers would want information on the origin of the product, nutrition and
health information (confirmation that it is a healthy product), information that kangaroo is tender and
of good quality.
Attitudes of Consumers
Focus groups were presented with the proposition that landholders will carry out enhanced habitat
protection and control of invasive species that diminish biodiversity or reduce damage to land as a
result of better management of the kangaroos and traditional grazing enterprises with sheep.
The Focus Group discussions revealed some difficulties in understanding the Conservancy concept as
perhaps there were too many messages involved and not one issue that could be driven home. Some of
the simple conservation /environmental concepts that appeared important were the maintenance of
sustainable populations of kangaroos, sheep/cattle versus kangaroos, greenhouse gas production, and
some concerns about shooting females and joeys in the pouch.
However, regular buyers of kangaroo meat are generally interested in the concept of an
environmentally branded kangaroo product. For the majority of this group, a gourmet product
positioning is essential. A few people in this regular user focus group purchase kangaroo meat
because it is a cheaper meat option. Overall this group would accept a slightly higher price if they
knew the product was delivering positive results for the environment and was a gourmet product.
Consumers are interested in the „environmental story‟, particularly the fact that the product is
produced in Queensland by Queensland based companies.
Thus it appears important to provide an effective, succinct and positive environmental story to
accompany the product. Although consumers understand concepts such as „organic‟ and „free range‟,
consumers felt that the conservancy concept would need a simple, easy to understand definition.
People did not find the concept or the benefits easy to understand. Some saw the fact that cattle and
sheep production was continuing, along with possible land clearing on properties, was in conflict with
the concept of a net gain to the environment. There was strong interest in the low greenhouse gas
emissions from kangaroos.
The market research showed that for most consumers any animal welfare and harvesting
considerations were not major and these issues are probably best left alone. However, the market
research demonstrated some concern about the residual population if females were harvested, the
harvesting of females with pouch joeys and any genetic implications in the longer term of harvesting
the larger animals. Above all, they want to be assured of quality and food safety. The perception that
kangaroo meat is dog food or pet food is not a positive association for promotion as gourmet product.
Both regular and infrequent users of kangaroo are interested in information on cooking methods for
the best eating result and recipes using kangaroo. Consumers identified opportunities for use of „bush
tucker‟ complementary spices and food products (e.g. marinades, sauces) that could be sold with the
Conservancy kangaroo.
Implications for marketing
Positioning
The Conservancy product would best be promoted as a gourmet and environmentally branded high
quality product; use of all three themes would be vital in the positioning of the product. The
environmental brand would need to be simply communicated.
Page 63 of 85
Establishing a niche product within a niche market (existing kangaroo supply) was seen as a difficult
task. Some firms felt that there was still limited demand for kangaroo at the present time and that
considerable marketing effort would be required to create consumer demand (considered essential for
long term success) and market the new product to different market segments.
Distribution
Gaining market access and providing the necessary support and customer service backup required was
identified as a challenge. Assuming a high quality product is produced, there would be a number of
options for distribution and marketing. The business model chosen would depend on the extent of
product differentiation envisaged, resources available to the Conservancy and the attitude to risk.
Forming a marketing relationship with one processor would have the advantage in the short term in
that there would be an established market for the product while matters of harvesting organisation and
chiller management are developed. The Conservancy could gain knowledge about the market and the
potential market positioning of its product. Also, a single processor is more likely to commit to a new
product with appropriate promotional and educational support.
On the other hand a single processor may be more interested in securing access to a high quality
product for existing markets rather than developing the market for a new product. While a small
premium may be paid for quality in the first instance, this premium may never attain a high level if the
Conservancy product is not well differentiated in the market place. The Conservancy product would
then most likely be sold into the mass market for kangaroo meat (e.g. supermarkets). Some processors
may be more concerned about maintaining throughput in the processing facility in order to cover fixed
costs, rather than developing a premium price in the market place through packaging or promotion.
The possibility remains of a joint market development effort by the Conservancy and the processor.
A second option may be to make the product available to more than one processor, with preferences
given to processors or marketers with ideas for promotion as coming from a conservation gain
production system.
Depending upon the availability of product, and once some security of supply and quality has been
obtained, it may be then viable for the venture to target smaller volume, high value markets. However
these market segments are „unforgiving‟ in terms of their expectations of quality, consistency and
availability of supplies. One option may be to pay for carcasses to be processed under contract and
then market the processed cuts directly to an up-market food service firm that may supply restaurants
or a game meat specialist distributor. Exclusive supply arrangements to game meat suppliers in some
states could also be considered.
In all of these options, it may be possible to obtain a government grant to help develop the packaging,
promotional material, and implement promotional activities, possibly in conjunction with the existing
distributor.
Quality
A very high quality product was considered essential to penetrate all markets, but particularly the
restaurant market, gourmet butchers and game meat specialist distributors.
The Conservancy could improve the arrangements around product integrity. Currently, it is
understood there are no formal supply chain agreements within the kangaroo marketing chain. It is
possible that product quality could be improved from the shooting and field harvesting, handling to
the chiller, chiller management and then transport to the processor. This may involve for example, use
of bar codes and temperature scanning devices. There is currently a code of practice for chiller
management but some industry opinions are that this area of the supply chain could be significantly
improved.
An issue associated with improved chain management is whether improved quality means a higher
cost of supply (e.g. harvesting or chiller costs) and whether there are low cost areas of improvement
that can be made. Stacking and spacing in chillers appear to be an important issue as there is a need to
Page 64 of 85
cool carcasses down quickly but this is not possible when chillers are full. Choices need to be made
therefore between smaller or larger chillers and their number and location, regularity of emptying,
single or double hanging etc. The cost implications of all such changes require estimation. Also, it
would be important to assess how quality could be improved by implementing changes in terms of
less wastage or improved eating quality.
Pricing
The strategy of developing the market for the Conservancy product at existing prices and then
gradually increasing prices once a market niche has been developed is favoured. The potential for
increasing prices to domestic consumers and to the export market is presumed to be limited in the
short term. The Conservancy product has first to be differentiated and proven in terms of quality, food
safety and environmental credentials. Only then would significant price premiums be likely to be
extracted from processors or other distributors.
Supply variability
Maintaining stability of supply was generally important for consumers and for each of the market
segments. A seasonal downturn would be understood by consumers; however patchy supply would
result in consumers not consistently coming back to the product.
Promotion
Consumer acceptance of kangaroo is growing. However it is regarded as a niche product and
consumers do not have a great deal of understanding of this product, particularly as a high quality
gourmet product. Consumer education, in store demonstrations and promotion or endorsements of the
product by chefs needs to be undertaken to appropriately position the product.
Developing effective packaging and a recognisable, attractive branding for the product would be
recommended. It will be important to provide leaflets for recipes when targeting consumers and
provide the necessary information on the product when targeting key market segments, e.g. quality,
food safety and the Conservancy message.
Conclusions
There are four major conclusions relevant to the Conservancy pursuing any market development
through a branding and promotional strategy:
Environmental management as a concept in kangaroo meat marketing has some potential but the
conservation gain concept is difficult to address in a manner that can easily be understood and
believed. This remains a challenge for the SWE trials.
Environmental credentials are not sufficient on their own to develop a market niche for the
Conservancy product. Meat quality and integrity are very important and there need to be reasons
provided as to why the Conservancy product is higher quality than the rest of the kangaroo meat
in the market.
Given the likely Conservancy supply, the product would need to be positioned as a gourmet
product at the top end of the market including such market targets as restaurants and gourmet
butchers. One distribution channel to facilitate this would be through game meat specialist
distributors.
Significant promotion and packaging innovation would most likely be required to develop a niche
market. The difficulties and risks, time and costs for development of a niche market should be
recognised. It is questionable whether the Conservancy could raise the resources required (in the
hundreds of thousands of dollars) for this market development unless there was some partnering with
existing players.
Page 65 of 85
Supply variability will be a constraint in market development, mainly in gaining the required support
from within the distribution system. Potential multiple strategies to overcome some of this variability
have been identified.
It will be important to identify where improved quality and/or cost savings/increases to the total
system are likely to occur from the Conservancy operating its own chillers. There is a need to avoid
pursuing a system that increases costs without net benefits. Demonstrating profitability to the overall
system from changes should be given precedence.
It is recognised that the current marketing chain has evolved over a number of years. Changing it will
lead to more competition which may not be in the interests of current participants. Distrust and
opposition to change has been demonstrated already.
Consumer attitudes to kangaroo meat products – Ampt and Owen
A project commissioned by the RIRDC New Animal Products Program and conducted by the UNSW
FATE Program was relevant to the SWE trials. Domestic consumers‟ current beliefs and attitudes
towards kangaroo meat were surveyed (Ampt and Owen 2008). The information complemented the
study by Peter Chudleigh with its focus on wholesalers and restaurant trade for a niche conservation-
badged product
Ampt and Owen found potential for further increasing consumption of kangaroo amongst Australians
if the kangaroo industry takes pro-active steps to make the product more visible. This should be
achieved with a consistent message that emphasises that there is no risk of harm to the kangaroo
population as a whole, that the harvest process is humane and hygienic, and that the harvest results in
benefits to source communities and environments.
Finding and recommendations
The report recommends that the kangaroo industry needs to take a proactive approach to promoting
kangaroo as a gourmet alternative that carries health benefits and has a wide variety of uses. To make
kangaroo meat and meat products more visible to consumers as an easy to prepare, inviting alternative
to mainstream meats, the industry should work with manufacturers and retailers to develop and test
sample products. The biggest impact is likely to be education about its use in a wide range of meals
that reflect Australia‟s ethnic diversity and the growing interest in gourmet foods.
Of the three kangaroo products investigated, small goods, pies and mince products, kangaroo mince
presents the greatest potential increase in volume of kangaroo manufactured meat as a substitute for
mainstream products (for example trim beef mince). The industry should work with retailers to further
experiment with the key factors emerging from this study in relation to mince:
price differential (that is how much lower than substitutes it needs to cost)
location in store (that is near to substitute to allow direct choice comparison) and
package size (that is potential demand for smaller 500g packages allowing experimentation).
In terms of its profile, the industry needs to generate consistent messages to all stakeholders of a
uniquely Australian resource that is managed through careful harvesting, is humane and sustainable,
and is good for the environment. It needs to separate itself from the culling for pest management that
often attracts strong emotional responses from the community and creates images of poor quality
control. They recommended that the kangaroo industry:
Investigate chain of custody management to improve consistency of industry practice
Investigate the impact of stronger involvement by landholders in harvest management on quality
and stakeholder perceptions of kangaroo meat
Develop and test different approaches to achieving consistent industry messages and branding.
Page 66 of 85
6. SWE Workshop – February 2008
The final undertaking of the current contract for the SWE project was to share information and
experiences from the trial sites and encourage regional collaboration in natural resource management
and wildlife planning. Apart from ongoing collaboration between the various groups involved in the
project, to meet this objective, a SWE workshop was run 14 -15th February 2008 at Broken Hill.
The workshop was advertised in the three SWE areas to raise awareness about the project and
encourage broad participation in the meeting at Broken Hill. A media release on the workshop was
issued and picked up by the Broken Hill ABC radio station, which interviewed landholders and Dr
George Wilson about the SWE project and outcomes of the meeting. The interview was very positive,
noting the challenges the project faced, but that the meeting had discussed ways that these issues
could be addressed. (See Plate 2 in Attachments for the media release). ABC TV Landline
interviewed participants at the meeting
The meeting brought together members of the three Wildlife Management Conservancies (Mitchell
and District Landcare Association, Rangeland Management Action Plan-RMAP2) and Barrier Area
Rangecare Group - BARG3, who have been working on projects under the SWE research program
funded by National Landcare Program, RIRDC, and others.
The workshop also featured invited speakers addressing specific issues affecting kangaroo
management and SWEs, mostly funded by RIRDC. Representatives of the kangaroo industry, various
state and federal government agencies, regional NRM bodies and landholder groups also participated
in the workshop, which culminated in a panel discussion featuring representatives of the different
stakeholder groups present on the topic of “the role of landholders in the kangaroo industry” (See
Plate 3 in Attachments for the meeting agenda). Covering the themes explored the barriers
confronting the project and addressed a number of ways to overcome the barriers. The key outcomes
of the meeting are reported below.
The key themes explored through the workshop were:
Managing risk as individuals or as a group of harvesters and landholders
Commercial models for landholders and harvesters
Aligning regulatory structures with landholder and harvester interests
Capitalising on new marketing opportunities
Issues in the kangaroo supply chain; and
Information exchange and transparency.
Workshop presentations
The issue of risk in the kangaroo industry was revisited a number of times. Paul Moloney of RMIT
University looked at rangeland landholders managing risk by diversifying incomes into different
livestock as well as kangaroos and Alex Baumber of the FATE Program looked at the risks posed to
landholders by high variability in kangaroo numbers. Individual landholders are exposed to risks from
large and unpredictable numbers of kangaroos coming onto their properties and consuming resources
and also, if they are looking to invest in a kangaroo enterprise, they face business risks in trying to
provide a stable supply of kangaroos to market. Data from the Barrier Ranges indicates that individual
2 Generally referred to as the Murray Darling Rangelands Conservancy (MDRC)
3 The Barrier Ranges SWE is funded by RIRDC and the University of NSW
Page 67 of 85
properties had much higher harvest variability than if the properties are grouped and treated as one.
This indicates that landholders can reduce risk due to harvest variability by grouping together.
Commercial models for landholders and harvesters. Dr Rosie Cooney‟s (Cooney 2008) model for
setting up cooperatives involving landholders and harvesters as members generated a large amount of
discussion at the workshop. The cooperative model allows landholders and harvesters to set standards
for hygiene and quality, invest in chillers and other equipment, negotiate collective supply
arrangements with kangaroo processors and potentially market a specific line of kangaroo products
sourced from their group.
The model received mostly positive comments from landholders, harvesters and even processors,
although key questions also arose about the costs of managing a coop, the balance of power between
landholders and harvesters and the need for good communication. Overall, there was a strong interest
in learning more about the model as it develops. The Mitchell and District Landcare Association and
their associated harvesters will be exploring this model in further detail and Dr Cooney will be
working on developing a version of the model for BARG to explore.
The issue of how well regulatory structures work in with the interests of landholders and
harvesters was discussed at length. Margaret Chapman from the University of Queensland,
demonstrated that landholders in Queensland saw government controls over kangaroos as a
disincentive to get involved in the kangaroo industry, although greater discussion overall was
dedicated to the regulatory issues in NSW and South Australia. Dana Thomsen Department of
Environment and Heritage, South Australia, outlined a number of ideas on how legislative and policy
frameworks could be amended to create incentives for landholders and harvesters to revitalize the
industry in SA. Harvester numbers in SA are in decline and the harvest rarely exceeds 50% of the
available quota, yet around 200,000 carcasses are imported from interstate by SA processors annually.
Many reasons were suggested for this at the workshop, including the remoteness of the SA rangelands
and competition for young workers with the mining industry, however, Ms Thomsen argued that
policy changes such as greater tag flexibility, group 3 licensing, reduced barriers to new harvesters
and incentives for major harvesters could all make a difference.
Alex Baumber summarised the experiences of FATE and BARG in developing a group licensing
system under the adaptive management provisions of the Department of Environment and Climate
Change‟s (DECC) NSW Kangaroo Management Program. While this process has been a long and
challenging one, significant progress was made at side meetings during and after the workshop. The
group licence for BARG members and harvesters will make it possible for a group of properties to
function as one, with tags issued to the group usable on all group‐licensed properties. It was also
stressed by people involved with the trial that the group‟s motivation is as much about developing a
more flexible system of licensing and tagging for better land management as it is about generating
economic returns from kangaroos.
The challenges posed by a single property licensing system, as exists in NSW and SA (where tags can
only be used on one property and not transferred), were debated at the workshop. Whilst FATE
argued that such a system makes collaboration more difficult, Nicole Payne of DECC argued that the
current system has a lot of flexibility for landholders, but many aren‟t aware of how it can be used.
Dana Thomsen also argued that tying tags to a specific property works against harvesters‟ interests by
preventing them from focusing their harvest effort where kangaroo numbers are greatest at a given
point in time. Her research reported that harvesters were under pressure to work around the single
property regulations to stay viable and that as a result, considerable tag swapping took place. This left
harvesters open to penalties and meant that harvest data received by the regulatory agencies was not
always accurate.
A number of examples were cited in the workshop of where regulators make decisions based on
ensuring the economic viability of the kangaroo processing industry (e.g. limiting the number of fauna
dealers in NSW, setting minimum carcase weights for economic rather than conservation reasons and
banning skin‐only shooting). This indicates that regulators are clearly prepared to step beyond the
Page 68 of 85
species‐protection role emphasised in their management plans. Harvesters and landholders can
therefore reasonably expect their economic interests to figure in decision‐making too ‐ provided
that they express those interests clearly and lobby for them.
The marketing of kangaroo products with landholder involvement was explored by Peter
Chudleigh of AgTrans and Peter Ampt of FATE. Peter Chudleigh concluded that a market niche could
be developed for environmentally‐badged kangaroo products but it would be challenging and would
require high quality, clear environmental credentials and heavy promotion. Peter Ampt‟s presentation
on FATE‟s consumer choice research showed that attractively‐priced kangaroo mince and deli meats
were the most promising options for increasing the sales of manufacturing meat on the domestic
market.
Peter Ampt also reported that most consumers surveyed were unaware that kangaroos were wild
harvested and suggested that promoting a connection to landholders and a positive environmental
message could offset any negative reaction to the idea of wild harvest. The ideas of regional and
environmental badging received strong support from landholders involved with the SWE program.
There wasn‟t much indication from processors at the workshop regarding whether they thought these
ideas had commercial potential, however, there was discussion on the fact that one processor (Macro
Meats) had recently introduced an environmental badge for its domestic supermarket packages,
highlighting that kangaroos were softer on the environment than sheep or cattle and did not produce
methane, a highly potent greenhouse gas. The issue of kangaroos versus cattle regarding the
production of methane received considerable media attention in late 2007, both in Australia and
overseas.
Supply chain issues in the kangaroo industry were covered in a number of workshop presentations
and also generated a large amount of discussion in their own right. Meat quality, quantity and
consistency of supply and skin size were three of the main areas discussed. The issue of transparency
and accountability in the kangaroo industry came up a number of times and in some ways the
workshop helped to bring about improvements in these areas by attempting to understand supply
chain issues from the points of view of the different stakeholders.
The main issues regarding quality from processors‟ perspective were detailed as: how well dressed a
carcase is; how quickly it enters a chiller after shooting; how it is stored in the chiller; and whether
the carcase has been affected by dust or dirt. The view was expressed that these issues are less about
final product quality reaching the consumer and more about yield – the better condition the carcase is
in when it reaches the plant, the greater the yield of high‐value cuts and the less meat that is wasted
or downgraded. Quantity issues were based around efficiency and reliability of carcase collection – if
a large number of carcases can be collected reliably from fewer locations, this adds value to the
industry through efficiency gains.
The issue of skin size generated considerable discussion. Processors reported a glut of small skins and
a number of measures they have undertaken to address this problem, including refusing to take
smaller kangaroos, encouraging regulators to lift minimum weights and implementing a two‐tied
pricing structure, where kangaroos above the desired weight attract 80c/kg and those below 40c/kg.
Harvesters particularly take issue with the two‐tied pricing system, as it leaves them in the difficult
position where landholders who have concerns about large numbers of small kangaroos (especially in
Qld) are pressuring harvesters to take them , whilst processors are pressuring harvesters not to deliver
small kangaroos through pricing mechanisms which make it uneconomic.
Opportunities were identified for landholder and harvester groups working together to improve a
number of these supply chain issues. The Mitchell group has been negotiating for a return from
processors if certain steps are implemented, such as reducing the number of shoot‐and‐let‐lie
licenses, imposing voluntary weight restrictions and applying standards that exceed regulatory
requirements ‐ all of which would benefit the industry overall. The small skin issue is a clear case
where a better understanding of each stakeholders‟ business needs could be to the benefit to all –
Page 69 of 85
landholders could receive a return for accepting some of the impacts of smaller kangaroos, whilst
processors could pay more to get a consistently larger‐sized skin and a sustainable source of
maturing kangaroos and harvesters could escape being squeezed from both ends.
National Association of Kangaroo Growers and Harvesters
A key output from the meeting that could lead to the project being extended more broadly to the rural
community was the formation of the National Association of Kangaroo Growers and Harvesters.
The association has been formed to:
Consolidate the research efforts of the SWE groups to date
Plan for future collaboration amongst these and other groups, including on potential funding
options; and to
Provide a united voice to represent landholders and harvesters who are interested in collaborating
on kangaroo management to deliver improved economic, social and environmental outcomes.
The Association is being hosted under the umbrella of the FATE Program at the University of New
South Wales, which provides secretariat support. The structure for the association has been devised
and initially involves interested landholder, harvester and NRM representatives from the three SWE
areas, and proposes the inclusion of additional members as the project gets extended to other areas
(See Figure 17 below). The next steps are for member groups to nominate (or confirm) their three
representatives to the association and to establish a set of aims and proposed activities for the
association.
The workshop raised the level of interest in and awareness of the concept of a Wildlife Conservancy
and this project in particular. The workshop benefited immensely from having industry and relevant
government representatives present to provide input. The workshop and the project also benefited
enormously from having visitors from the Mildura WMC and the FATE project and the Desert
Channels NRM present to share their experiences and discuss future options.
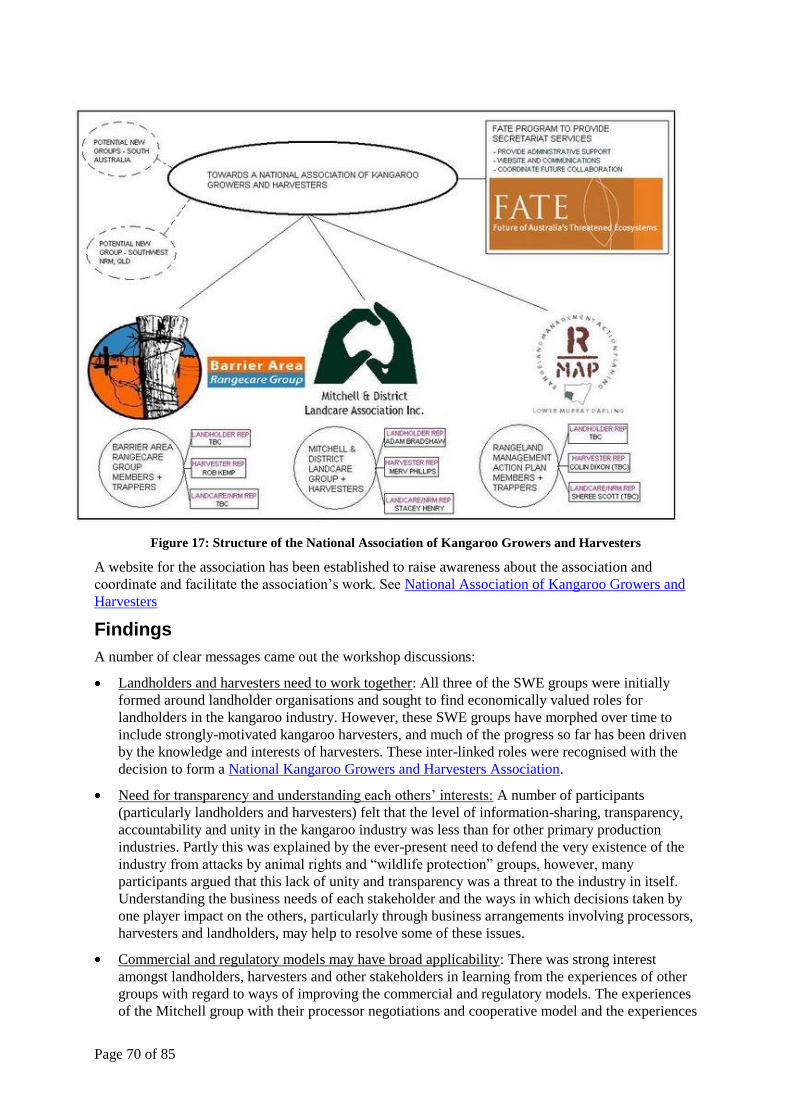
Page 70 of 85
Figure 17: Structure of the National Association of Kangaroo Growers and Harvesters
A website for the association has been established to raise awareness about the association and
coordinate and facilitate the association‟s work. See National Association of Kangaroo Growers and
Harvesters
Findings
A number of clear messages came out the workshop discussions:
Landholders and harvesters need to work together: All three of the SWE groups were initially
formed around landholder organisations and sought to find economically valued roles for
landholders in the kangaroo industry. However, these SWE groups have morphed over time to
include strongly-motivated kangaroo harvesters, and much of the progress so far has been driven
by the knowledge and interests of harvesters. These inter-linked roles were recognised with the
decision to form a National Kangaroo Growers and Harvesters Association.
Need for transparency and understanding each others‟ interests: A number of participants
(particularly landholders and harvesters) felt that the level of information-sharing, transparency,
accountability and unity in the kangaroo industry was less than for other primary production
industries. Partly this was explained by the ever-present need to defend the very existence of the
industry from attacks by animal rights and “wildlife protection” groups, however, many
participants argued that this lack of unity and transparency was a threat to the industry in itself.
Understanding the business needs of each stakeholder and the ways in which decisions taken by
one player impact on the others, particularly through business arrangements involving processors,
harvesters and landholders, may help to resolve some of these issues.
Commercial and regulatory models may have broad applicability: There was strong interest
amongst landholders, harvesters and other stakeholders in learning from the experiences of other
groups with regard to ways of improving the commercial and regulatory models. The experiences
of the Mitchell group with their processor negotiations and cooperative model and the experiences
Page 71 of 85
of the Barrier Ranges group with group licensing arrangements should be shared with other
interested parties. The newly formed National Kangaroo Growers and Harvesters Association
should assist with this process.
Ways to add value: The kangaroo processing industry indicated that, as a whole, it would
continue to be hostile to any proposals that did not add value to the industry. A number of
different ways of adding value to the industry were discussed at the workshop, generally falling
into two categories - increasing the final price paid by consumers or creating efficiency gains for
processors through lower costs or higher yields. If landholder/harvester groups make it clear that
they are focusing their efforts in these areas rather than being seen as simply using their collective
bargaining power to squeeze processors, they may be able to overcome some of this collective
resistance.
Page 72 of 85
7. Discussion
The SWE Implementation Plan (Wilson and Mitchell, October 2005) anticipated that the SWE trials
would be a complex, bold experiment with a need for funding to run for up to six years, by which time
the sites should be self-supporting.
The purpose of the SWE trials is not to seek to abandon conventional agriculture or make major
change to wildlife management policy. Far from it, the intention is to learn incrementally and modify
existing practice and to test these learnings and other issues. Local adaptation and ownership is
critical to their success. The trials proceeded without large amounts of preliminary analysis in the
spirit of adaptive management. The strategic plan identified desired outcomes but rather than go on
with more detailed planning the approach was work „back to front‟ so as to short-cut timelines, reduce
potential costs, and lower the period from time of entry to commercial payback. The focus was to
determine key routes to market; key barriers to success, then research the barriers and opportunities in
detail.
Support was provided by the NLP funding to:
Support the integration of conventional agriculture production, tourism and sustainable
commercial use of wildlife
Establish sustainable harvest rates for the WMC for species being utilised
Develop marketing strategies for produce from enterprises that lead to a net conservation gain and
integrate performance management frameworks such as EMS; and
Enable sharing of experiences and opportunities for collaboration between trials and related
programs.
It also supported the continuing activities of:
Scoping enterprise options and identifying potential support to develop the WMCs‟ component
projects
Providing financial support for WMC Coordination and Management
Enabling regional collaboration in NRM and wildlife planning
Enhancing the capacity of land managers to effectively and efficiently plan, monitor and integrate
NRM plans through use of software and GIS management packages
Enabling easy visualisation of complex data management and attainment of standards
Scheduling and costing conservation works, habitat improvement and wildlife threat reduction.
Critical success factors
Initial consideration in the planning process identified critical success factors as:
Demand will be created for products from the Wildlife Management Conservancies by
emphasizing their conservation benefit
Markets for bush tucker, in particular kangaroo meat, will strengthen
Members of the WMC will remain enthusiastic and continue to make their properties available for
proposed manipulation and detailed scientific investigation
Natural events such as drought and commodity price fluctuations over a 6 year cycle will not be
so extreme as to affect the capacity and willingness of members to participate
Page 73 of 85
Government and philanthropic support will be sufficient to establish the Wildlife Management
Conservancies, to underpin the research, monitoring and evaluation and to back marketing of
products as conservation friendly.
Limitations and achievements
Most of these conditions have not been met. The prolonged drought impacted on all the SWE sites,
but had a profound impact on the Barkindji Biosphere site where anticipated backing of the Biosphere
has not eventuated leading to lack of continuity in project officers. Lack of local administrative
support meant that a number of landholders could no longer participate in the trial as they were
overtaken by other priorities. The Barkindji MWC reformed after some delays with a subset of eight
then three of the original landholders as the Murray Darling Rangelands Conservancy.
After three years significant progress has being made at the Maranoa WMC and at the Broken Hill
BARG site, thanks substantially to continuous local enthusiasm and help from the supporting research
and development staff and in information exchange. The Maranoa WMC has established a
cooperative trading structure, purchased two chillers and commenced trading with a processor.
Progress could be better if the group had a strong manager to get the chillers fully operational and
coordinate the shooters. In May 2008 the Landcare coordinator moved on – the fourth staff change in
the course of the project.
The landholders realise they are unlikely to gain additional income in the short term, and in any event
are proposing the income from the cooperative in the first instance should be utilised by the Landcare
group to support its activities and biodiversity conservation. This is fundamental to the whole model.
Once the chain management and trace back steps are in place, the landholders will be able to move on
to the steps of how to guarantee quality, and present product in such a way as to break into the niche
quality market recommended by the research.
A number of the land holders are well down the track to obtaining ALMS certification. Soon they will
be able to incorporate the wildlife stewardship scheme components. They will then be in a position to
integrate the results of the aerial surveys and regional population estimates into natural resource
management planning.
Murray Darling Rangeland Conservancy has taken steps to integrate knowledge of kangaroo
movements and populations on their properties with other land uses. The next step of taking this
information to the regional level has been slow. This is perhaps partly because cooperation and
communication with the Lower Murray Darling Catchment Management Authority and be NPWS
responsible for kangaroo management could be better.
After extensive and protracted negotiations with the kangaroo management program in the NSW
NPWS the BARG group is making good progress with management of the Kangaroo resource. The
group has 15 landholders and 17 shooters trialling the group tag and quota. They have been issued
with 8000 tags on the first licence (May-Aug 2008) and another 7000 or so pencilled in for the four
months later.
All three groups have established relationships with processors, and one company in particular Macro
Meats is most interested in the project. Selling high quality, consistently is part of their marketing
strategy. They have done considerable work in recent years gaining access to the three supermarket
chains. Their production in recent years has been growing steadily. Reliability of supply and access to
resource is a key requirement to maintaining their hard-won shelf space. The SWE model can assist
in that process.
There remains considerable distrust however from the kangaroo industry as a whole. The SWE
concept seeks to insert landholders in the management structures and hence the wildlife production
value chain. This is a change to existing arrangements which allow the kangaroo industry free-of-
charge access to the properties which produce their resource.
Page 74 of 85
The SWE project seeks to professionalise the kangaroo industry and in particular kangaroo shooters.
While all shooters meet the required minimum standards for marksmanship and hygiene, many are
part-timers and participate in the industry as weekend operators to supplement their incomes. They
too feel threatened by the SWE project and had been ready receptors of rumour and innuendo about
the bona fides and aspirations of the project. The other kangaroo processing companies who have not
been negotiating with the wildlife management conservancies, have seen it in their interests to inflame
this discontent. Their main markets are bulk supply of undifferentiated product, particularly overseas
Threats
Surveys conducted as part of the suite project indicate that kangaroo densities can be very high, up to
250 per square kilometre. Landholders have long complained about this impact on their landscape
especially during drought and their inability to manage it.
In southwest Queensland these views are held very strongly by a number of landholders and
management activities are under way which the antithesis of the SWE concept. They have the specific
aim of reducing kangaroo numbers substantially in many cases to zero. Landholders are so desperate
to have effective management of kangaroos that they are constructing marsupial proof fences, as they
did a century ago, and seeking to exclude kangaroos from their properties. This is a growing
phenomenon and is a measure of the extent of powerlessness which landholders feel over the issue of
kangaroo management.
With the support of the National Feral Animal Programme, the CRC for Invasive Animals and the
University of Queensland have begun a trial to exclude unwanted species from gaining access to
water. This can include kangaroos. Under the system known as Machine Vision, an automatically
operated gate responds to the profile image of animal approaching the water point. It differentiates
between cattle, sheep, kangaroos, goats, emus and pigs and can be set to exclude the unwanted,
including kangaroos. Unable to drink, kangaroos will leave the property. At the regional level this
will have a profound impact on kangaroo populations.
The SWE project aims to turn around this view that kangaroos are pests and ensure conservation and
regional biodiversity in the process. Under the SWE scenario, the Machine Vision Project could be an
asset to kangaroo management and provide indications of populations and movements. It could be an
integrated part of regional kangaroo management.
Importance of integrating wildlife into production processes
Regional wildlife management plans are needed that integrate conventional agriculture production and
natural resource management. Major pressures that threaten biodiversity on a national scale (not in
order of significance) are total grazing pressure, weeds, invasive organisms, changed fire regimes, and
habitat fragmentation. Grazing and modifications to pastures to support it have reduced the extent of
native grasslands in a range of temperate Australian ecosystems to less than two per cent of that
present in 1750 and have simplified the structure and quality of habitat for animals in these systems.
Native species and the natural landscapes that support them perform many key functions that maintain
the health of soils, water and air resources, and so provide the foundation of landscape productivity.
Increasingly there is recognition by the wider community that these functions are so important that
markets and payments for them are emerging.
Climate change will further compound and intensify pressures on biodiversity, especially by affecting
rainfall patterns, and hence fire frequency, affecting regeneration of vegetation, and changing where
plants and animals can live. The size of the problem is so large that industry and the private sector
have a major role in redressing it.
Making greater use of native species adapted to the environment rather than seeking to change the
environment to suit introduced species is the basis of integrating wildlife into production processes.
Page 75 of 85
Opportunity to reduce Greenhouse Gases
Australian agriculture contributes 16 % of the total national greenhouse gas (GHG) emissions, mainly
methane and nitrous oxide*. The methane comes from enteric fermentation, which is microbial
fermentation during digestion of feed by ruminants, mostly domestic livestock - cattle and sheep.
Enteric methane accounts for 67 % of the total agricultural emissions and 11 % of Australia's total
emissions. This means that methane from livestock is equivalent to two thirds the emissions produced
by the Australian transport sector. To reduce GHG emissions, the Australian Government has
committed to implementing a „cap and trade‟ emissions trading scheme (ETS) by 2010 and to consult
with the agriculture and forestry sectors on the terms and time frame for their inclusion in the scheme.
When agriculture is covered in the ETS, ruminant livestock owners or downstream service providers
such as abattoirs and shipping terminals will have to account for livestock emissions.
Research projects to ameliorate the methane problem include changing diets and attempts to replace
the methane-producing bacteria in the rumen by inoculating livestock with kangaroo
microorganisms***
. Modifications to rumen physiology and new feeding regimes may be useful for
intensive industries such as dairying and feedlots but cost effective self sustaining options for cattle
and sheep on the rangelands are not readily apparent. This raises the prospect of a decline in extensive
livestock industries because they continue to produce significant quantities of GHG.
Kangaroos are non-ruminant forestomach fermenters that produce negligible amounts of methane.
One of the ways being trialled by Australia's livestock industries to reduce methane emissions is to
introduce kangaroo gut microorganisms to cattle but this approach has not been successful. Our study
tested another option, particularly for Australia's vast rangelands, that farmers use kangaroos to
produce low-emission meat.
To analyse the option of reducing methane while producing an equivalent quantity of meat, Wilson
and Edwards 2008 developed a spreadsheet model (Microsoft Excel 2007). The model covered the
period 2007 to 2020 and simulated changes in cattle, sheep and kangaroo populations in the kangaroo
harvesting areas of the rangelands. It simulated gradually selling down the cattle and sheep whilst
allowing the kangaroo population to rise.
On the rangelands where kangaroo harvesting currently occurs, increasing the kangaroo population to
175 million from 34 million while reducing the cattle and sheep by 20 % per year to 2020 would
lower Australia's GHG by 16.4 megatonnes or 3 % of Australia's total emissions.
Wilson and Edwards concluded that when livestock are included in Australia's emissions trading
schemes, permits for kangaroo emissions will be significantly cheaper than those for cattle and sheep,
perhaps providing the incentive for farmers to switch to kangaroos. Thus increasing kangaroo
production as an alternative to cattle and sheep production presents a major opportunity for Australia
to reduce its greenhouse gas emissions.
The future
Native species are particularly well adapted to Australia's unique environment, allowing them to
survive our climatic extremes and thrive in our soils. Landholders have an opportunity to make greater
use of them than they have in the past. They also have the opportunity to manage natural resources
and biodiversity on behalf of all Australians and to be paid by the wider community to do so.
The sustainable wildlife enterprises trials aim to achieve those outcomes. They seek to achieve
premium prices for premium wildlife products that can be differentiated in the marketplace as
contributing to net conservation and gain. They should set broad targets for total grazing pressure of
kangaroos and other wildlife taking into account grazing pressure from domestic livestock.
After three years, progress is being made, but the trials are a major paradigm change in land use and
continuing funding is needed. Despite the existence of a commercial kangaroo industry and a tourism
industry in which wildlife is prominent, under current arrangements it is rare for landholders to
Page 76 of 85
benefit from the kangaroos and other wildlife on their lands or play a role in their management. SWE
is trialling ways for farmers to increase the value of the kangaroo product and share in the result.
Work to date shows that farmers can collaborate with one another, support the existing kangaroo
industry and build on the kangaroos‟ conservation and animal welfare attributes. A switch to kangaroo
consumption and production might be prompted when greenhouse gas emissions from livestock are
exposed to their cost and the kangaroos‟ low production of methane leading to “low emission meat”
becomes marketable.
An expansion of the SWE trials to support production of low-emission meat production would require
a significantly larger investment, including a need to monitor closely kangaroo populations and
regional harvesting quotas. The free ranging behaviour of kangaroos makes establishment of
cooperatives to manage them a key issue. Continuing support would enable marketing and advice on
economic, ecological and social issues.
To this point the project has developed the level of interest within the community, identified a range
of opportunities and barriers and taken some steps towards the development of innovative technology
for data transfer and analysis in the kangaroo industry. The project has identified the scarcity of
accurate, locally applicable data in the kangaroo industry and has presented a number of options to be
considered in the way forward.
Cypress Pine management has been identified as an area of significant interest to landholders in the
Maranoa WMC and the project to date has identified a number of future options to change the way in
which this resource is managed. Landholders are engaged on the Cypress Pine issue and would
welcome the opportunity to explore further management options.
The project has identified a number of possible options for future direction. The next step in this
process is to further develop the options which are high priority and which will advance the project
toward the successful operation of a Wildlife Management Conservancy.
A combined proposal from the natural resource management regions with the highest kangaroo
populations, QMDC South West NRM and Desert Channels should be prepared as a matter of
priority. In the interim, the National Association of Kangaroo Growers and Harvesters has also taken
on the role of exploring future funding options.
The SWE trials have benefitted from the existence of interest; expertise and experience within the
groups involved and, of course their ongoing involvement with the NRMs. The future should utilise
the knowledge and skills that exist within the WMC group to develop useful information on kangaroo
numbers and the impact of harvesting, economic benefits to harvesters, landholders and processors
and diversification of landholder income sources.
Negotiations have been under way to continue the SWE trials beyond July 2008 with leadership,
program management and coordination by the catchment management authorities. However, lack of
funding and likely cuts in budgets remains an issue. The National Landcare program is a possibility
for ongoing support but support would need to be initiated at the local level.
Throughout the world, wildlife plays an increasingly significant role in rural production processes and
aiding conservation. Based on this overseas evidence, a significant Parliamentary Report unanimously
recommended trials of landholder involvement in commercial utilisation (Rural and Regional Affairs
and Transport References Committee 1998). Kangaroos are adapted to Australia's variable
environment and could play a large role in the rangelands producing low-emission meat. In southern
Australia, cropping and irrigation areas are likely to reduce in size as a result of climate change and be
replaced by pastoralism on newly reformed rangelands.
Past conventional agriculture in Australia has contributed to biodiversity loss and environmental
damage. This is being exacerbated by drought and climate change and coincides with an increased
reliance on off-farm incomes. One innovative option for rural adjustment is sustainable commercial
use of wildlife which produces less green house gases.
Page 77 of 85
8. Recommendations
An extension of the trials is an option, especially when Australian agriculture is looking for
adaptation strategies for climate change. Continued support from National Landcare Program could be
used to continue the current work.
Funding
Given the size of the benefits which could be derived from greater use of native species and the
prospect of contributing to significant carbon savings, a relatively large investment over three years to
continue the SWE trials would seem appropriate.
Continued support will enable regional cooperative management of kangaroos and other wildlife that
integrates landholders into the industry. Continuation of the trials could occur in southern QLD and
western NSW through collaboration with NRM bodies - SW NRM, QMDC, Desert Channels and
Western CMA.
The concepts of extending NLP support could be incorporated into the Caring for our Country (CoC)
Strategic Plan. The initial carryover support could be provided in 2008/9 to the NRM bodies in the
SWE trial sites pending the contracting for subsequent years under the CoC Strategic Plan.
A three year program would seek:
$450 k in 2008/9 and
$1 m in following three years
Additional support could come from contributions from other sources - e.g. the mining industry, and
philanthropy.
Ongoing SWE trial tasks
The tasks for an extension of the trials could be grouped along the following lines:
On ground projects
Natural Resource Management
Linking regional wildlife and conservation plans to property wildlife plans
Coordinating the development and implementation of regional wildlife management plans
A key concept behind the WMCs is that members collectively manage the wildlife resource
that ranges from property to property
Estimating sustainable harvest estimates and different harvesting strategies
Continuing surveys and population estimates, determining sustainable yield. The task will be
undertaken in collaboration with the researchers below
Assisting landholders enhance wildlife habitat and reduce threats such that ecosystems and
wildlife (not only species being utilised) can thrive
Broadening ALMS certification
Developing the proposed Wildlife Stewardship Scheme Cooperative management
Testing cooperative management and organisational structures
Employing a dedicated coordinator
Advising on legal and management advice on processes including based on overseas experiences
Page 78 of 85
Improving chain management
Defining the steps in the production chain and paths critical to maintaining quality and reliability
of supply and establish partnerships with established processors and retailers
Managing the production chain and connecting producers more effectively with the marketplace
and its requirements
Branding and labelling strategies
Differentiating products from the WMC, both wildlife and non wildlife, through regional
branding that emphasises biodiversity conservation benefits, sustainability, quality and animal
welfare
Assessing the attributes of a wildlife management stewardship scheme that could form the basis
for branding and eco- labelling to highlight the environmental performance of WMC produce
Marketing trials
Undertaking a marketing trial linking regional conservation activities and initiatives by the NLP
to the production and marketing of kangaroos
Research Support
Some activities below are also flagged above. The purpose here is to make provision for researchers
and scientists to work with landholders in supporting monitoring and evaluation
Sustainability indicators
Ecological monitoring
Integrating kangaroo density with other Total Grazing Pressure (TGP) and land management
indicators
Refining the attributes of a wildlife management stewardship scheme
Identifying other ecosystem services
Economic monitoring
Estimating Greenhouse gas savings through greater use of kangaroos in the WMCs in lieu of
cattle and sheep and potential savings in carbon permits
Defining appropriate indicators to assess the impact of enterprises on farm viability and
employment generation, and the impact of WMC accreditation on farm gate prices
Sociological monitoring
Assessing the impact of changing enterprises on the social and cultural well-being of WMC
regions and participating landholders
Certification
Sustainability
Developing a framework / template/ EMS for monitoring ecological, economic and
sociological performance that can be used to certify wildlife management plans, property
management plans and their products
Quality control and animal welfare
Page 79 of 85
Using quality management programs from other industries as models in promoting attention to
detail in wildlife products
Further developing protocols that apply to the harvesting of wildlife to ensure they continue to
meet best practice and highest animal welfare standards
Population surveys
Determining home ranges from movement studies to define the unity of populations being
estimated and managed across property boundaries
Expand the Machine Vision installed on a property in SW NRM
Fit satellite tracking devices to confirm mobility reflecting the landscape-scale movements of
kangaroos
Conduct aerial surveys input to the population quota setting and assessments of the impact of
expanding kangaroo populations
Training and education
Employing innovative software, map displays and GIS technology that enable complex data
management, rapid communication across the region and easy visualisation of outcomes to
support regional and property management planning and accreditation processes
Integrating regional Natural Resource Management plans, Property Management Plans and
Environmental Management Systems with the use of landscape management tools
Communications
Sharing information experiences from the trial sites, workshops, websites and newsletters
including through the newly formed National Association of Kangaroo Growers and Harvesters
Coordination and management
Establishing a Steering Committee to obtain input from stakeholders and funders
Receiving innovative support and high-quality advice, input from an Adaptive Management
Advisory Group that supports monitoring and evaluation
Page 80 of 85
References
Ampt P and Baumber A (2006)Building connections between kangaroos, commerce and conservation in the
rangelands Peter Ampt and Alex Baumber, FATE (Future of Australia‟s Threatened Ecosystems) Program
University of New South Wales, Sydney
Ampt P and K Owen 2008 Consumer Attitudes to Meat Products (Canberra: Rural Industries Research and
Development Corporation)
Archer M 2002 A Zoological Revolution Using Native Fauna to Assist in its Own Survival ed D Lunney and C
Dickman (Mosman: Royal Zoological Society of NSW and Australian Museum) pp 12-52
Archer M and B Beale 2004 Going Native (Sydney: Hachette Livre Australia)
Australasian Wildlife Management Society 2004 Position Paper on the Commercial Harvesting of Macropods
available at http://www.awms.org.nz/positionstatements/kangarooharvesting.html
Bayliss P 1987 Kangaroos their Ecology and Management in the Sheep Rangelands of Australia ed G
Caughley, N Shepherd and J Short (Cambridge: Cambridge University Press) pp 119-33
Binning C and Young M, Management and Conservation of Remnant Vegetation. Environment Australia and the
Land and Water Resources Research and Development Corporation.
Bothma J 1996 Game Ranch Management (Hatfield: J L van Schaik)
Caughley G 1987 Kangaroos their Ecology and Management in the Sheep Rangelands of Australia ed G
Caughley, N Shepherd and J Short (Cambridge: Cambridge University Press) pp 159-87
Chudleigh, P and Deborah Archbold, Sarah Simpson, and Julia Telford 2008 Marketing Kangaroo meat from
the Sustainable Wildlife Enterprises.
Cooney R 2008 Models for Structures for Sharing Wildlife Benefits (Canberra: Rural Industries Research and
Development Corporation)
Department of Climate Change 2002 Living with Climate Change: an Overview of Potential Climate Change
Impacts on Australia (Canberra: Australian Greenhouse Office)
Department of Conservation and Land Management 2002 Red Kangaroo (Macropus rufus) Management Plan for
Western Australia 2003-2007 (Perth: Department of Conservation and Land Management)
Department of the Environment and Water Resources 2005 National Greenhouse Gas Inventory 2005 (Canberra:
Australian Greenhouse Office)
Department of the Environment, Water, Heritage and the Arts 2007 Wildlife Trade and Conservation -
Kangaroos available at http://www.environment.gov.au/biodiversity/trade-use/wild-harvest/kangaroo/index.html
Dunlop Peter and Brown R (2008)Implications of climate change for Australia‟s National Reserve System: A
preliminary assessment Michael, CSIRO Sustainable Ecosystems Report to the Department of Climate Change,
and the Department of the Environment, Water, Heritage and the Arts, March
Garnaut R 2007 Climate Change: Land use - Agriculture and Forestry (Canberra: Australian Greenhouse Office)
Grigg G 1988 Kangaroo Harvesting and the Conservation of Arid and Semi-arid Lands; A Symposium ed D
Lunney and G Grigg (Mosman: Royal Zoological Society of NSW) pp 124-28
Grigg G 2002 A Zoological Revolution: Using Native Fauna to Assist in its Own Survival ed D Lunney and C
Dickman (Mosman: Royal Zoological Society of New South Wales and Australian Museum) pp 53-76
Intergovernmental Panel on Climate Change 1992 Climate Change 1992: The Supplementary Report to the IPCC
Scientific Assessment (New York: Cambridge University Press)
Kelly J 2005 Kangaroo Industry Strategic Plan 2005-2010 (Canberra: Rural Industries Research and
Development Corporation)
Lindenmayer D 2007 On Borrowed Time (Camberwell: Penguin Books)
Peter Ampt and Kate Owen. Consumer Attitudes to Kangaroo Meat Products February 2008. RIRDC Publication
No. 08/026
Pople T and G Grigg 1999 Commercial Harvesting of Kangaroos in Australia Environment (Canberra:
Department of Environment and Heritage)
Queensland Parks and Wildlife Service 2002 Wildlife Trade Management Plan for Export: Commercially
Page 81 of 85
Harvested Macropods 2003-2007 (Brisbane: Environmental Protection Agency)
Senate Rural and Regional Affairs and Transport References Committee 1998 Commercial Utilisation of
Australian Native Wildlife (Canberra: Parliament of Australia)
University of New South Wales 2008 The Future of Australia's Threatened Ecosystems available at
http://www.fate.unsw.edu.au/index.htm
Wilson G R 1974 Parks and Wildlife 1 111-19
Wilson G R and B Mitchell 2005 A Strategic Plan for Trialling Sustainable Wildlife Enterprises (Canberra: Rural
Industries Research and Development Corporation)
Wilson G and Edwards M 2008 Using kangaroos to produce low-emission meat. Conservation Letter s in press
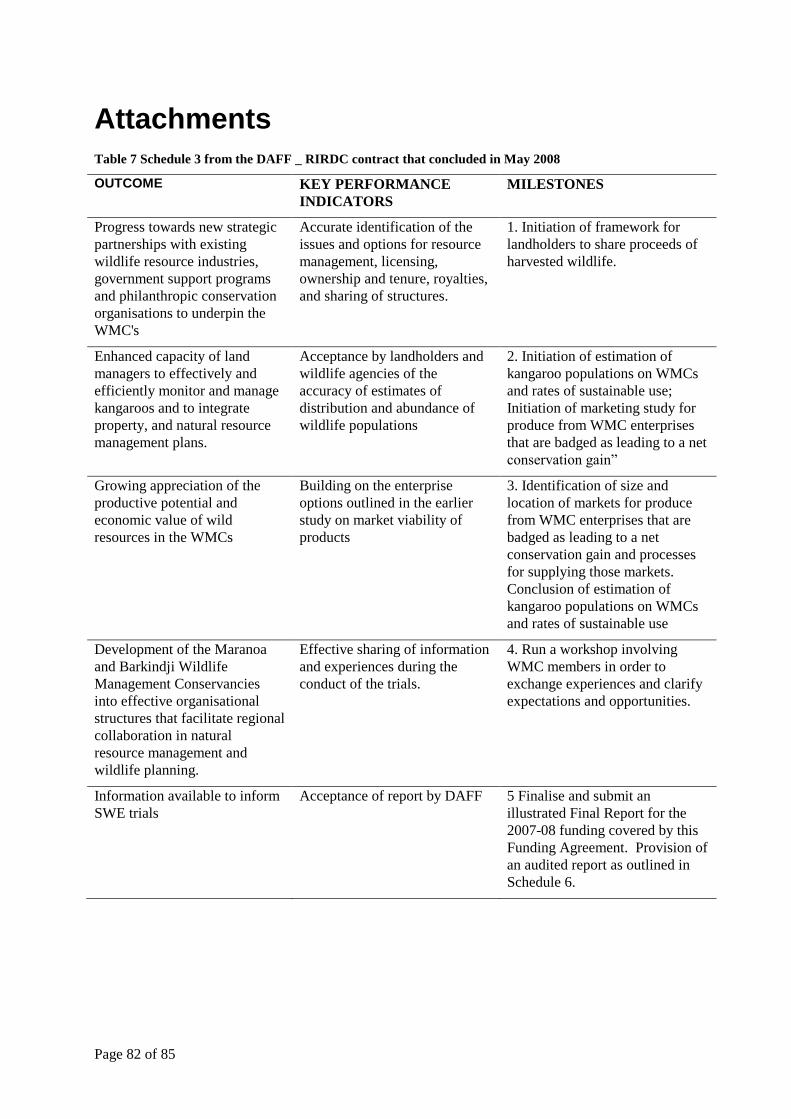
Page 82 of 85
Attachments
Table 7 Schedule 3 from the DAFF _ RIRDC contract that concluded in May 2008
OUTCOME KEY PERFORMANCE
INDICATORS
MILESTONES
Progress towards new strategic
partnerships with existing
wildlife resource industries,
government support programs
and philanthropic conservation
organisations to underpin the
WMC's
Accurate identification of the
issues and options for resource
management, licensing,
ownership and tenure, royalties,
and sharing of structures.
1. Initiation of framework for
landholders to share proceeds of
harvested wildlife.
Enhanced capacity of land
managers to effectively and
efficiently monitor and manage
kangaroos and to integrate
property, and natural resource
management plans.
Acceptance by landholders and
wildlife agencies of the
accuracy of estimates of
distribution and abundance of
wildlife populations
2. Initiation of estimation of
kangaroo populations on WMCs
and rates of sustainable use;
Initiation of marketing study for
produce from WMC enterprises
that are badged as leading to a net
conservation gain”
Growing appreciation of the
productive potential and
economic value of wild
resources in the WMCs
Building on the enterprise
options outlined in the earlier
study on market viability of
products
3. Identification of size and
location of markets for produce
from WMC enterprises that are
badged as leading to a net
conservation gain and processes
for supplying those markets.
Conclusion of estimation of
kangaroo populations on WMCs
and rates of sustainable use
Development of the Maranoa
and Barkindji Wildlife
Management Conservancies
into effective organisational
structures that facilitate regional
collaboration in natural
resource management and
wildlife planning.
Effective sharing of information
and experiences during the
conduct of the trials.
4. Run a workshop involving
WMC members in order to
exchange experiences and clarify
expectations and opportunities.
Information available to inform
SWE trials
Acceptance of report by DAFF 5 Finalise and submit an
illustrated Final Report for the
2007-08 funding covered by this
Funding Agreement. Provision of
an audited report as outlined in
Schedule 6.
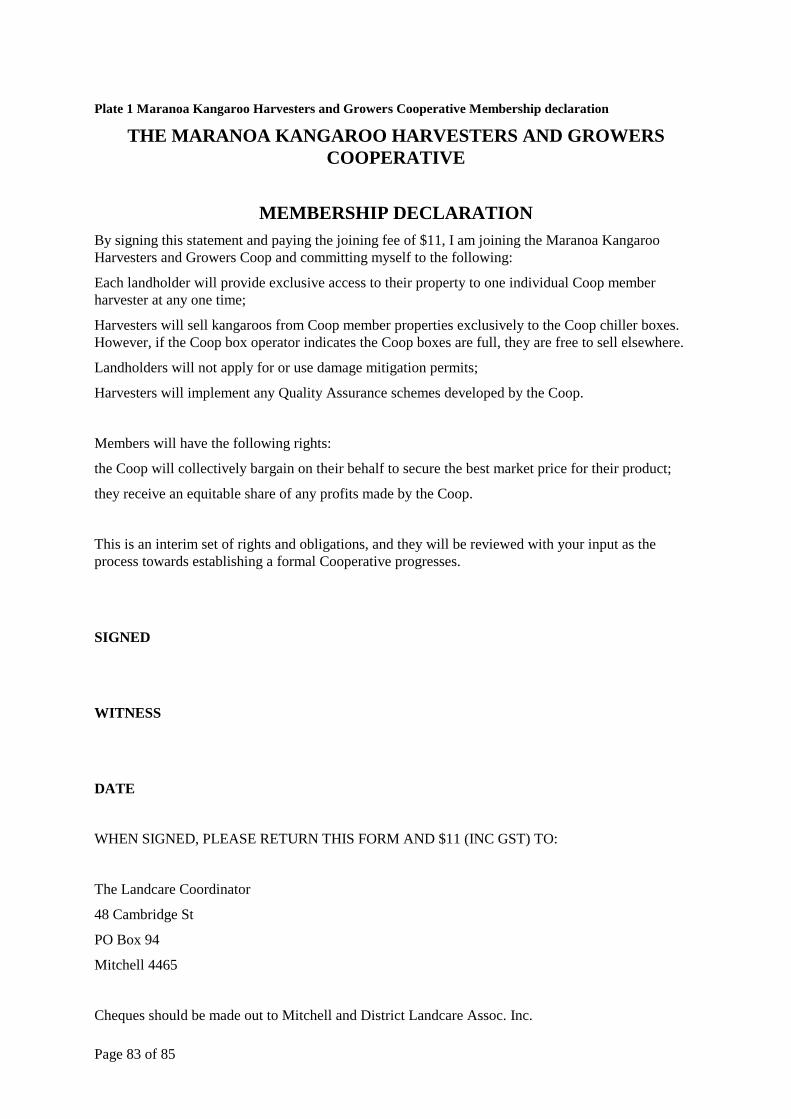
Page 83 of 85
Plate 1 Maranoa Kangaroo Harvesters and Growers Cooperative Membership declaration
THE MARANOA KANGAROO HARVESTERS AND GROWERS
COOPERATIVE
MEMBERSHIP DECLARATION
By signing this statement and paying the joining fee of $11, I am joining the Maranoa Kangaroo
Harvesters and Growers Coop and committing myself to the following:
Each landholder will provide exclusive access to their property to one individual Coop member
harvester at any one time;
Harvesters will sell kangaroos from Coop member properties exclusively to the Coop chiller boxes.
However, if the Coop box operator indicates the Coop boxes are full, they are free to sell elsewhere.
Landholders will not apply for or use damage mitigation permits;
Harvesters will implement any Quality Assurance schemes developed by the Coop.
Members will have the following rights:
the Coop will collectively bargain on their behalf to secure the best market price for their product;
they receive an equitable share of any profits made by the Coop.
This is an interim set of rights and obligations, and they will be reviewed with your input as the
process towards establishing a formal Cooperative progresses.
SIGNED
WITNESS
DATE
WHEN SIGNED, PLEASE RETURN THIS FORM AND $11 (INC GST) TO:
The Landcare Coordinator
48 Cambridge St
PO Box 94
Mitchell 4465
Cheques should be made out to Mitchell and District Landcare Assoc. Inc.
Page 84 of 85
Plate 2 RIRDC Media Release for SWE Workshop, 14 & 15 February 2008 at Broken Hill
Wednesday, 13 February 2008
Workshop to examine commercial wildlife use The commercial use of native flora and fauna to improve bio-diversity and habitat protection will be
examined at a workshop in Broken Hill on Thursday and Friday.
The workshop will review a number of trials being conducted as part of research funded by the Rural
Industries Research and Development Corporation (RIRDC) and the National Landcare Program.
RIRDC‟s Rangeland and Wildlife Systems Research Manager, Dr George Wilson, said three projects
have been underway since 2004 to see whether commercial utilisation of native wildlife, such as
kangaroos, can improve bio-diversity conservation.
“The trials are based on the success of similar programs in southern Africa and elsewhere, where the
commercial value of wild animals has helped in the preservation of the natural environment,” Dr
Wilson said.
“We are currently working with the Barrier Area Rangecare Group (BARG) north of Broken Hill, the
Mitchell and District Landcare Group in Queensland and the Rangeland Management Action Plan
(RMAP) group based along Murray River near Wentworth/Mildura.
“These groups are trialling different land management techniques and the development of wildlife
management plans and habitat protection as part of the projects.
“The drought in many parts of Australia has seriously reduced livestock carrying capacity on the
rangelands and has contributed to biodiversity loss and environmental damage.
“Under current arrangements, wildlife can be seen just as pests over which landholders have little
control. Yet some wildlife produces high quality meat and leather, and appears to be softer on the
environment than equivalent numbers of livestock. Similarly, some wildflowers or other vegetation
could have commercial appeal if further developed.
“Wildlife is also an asset to the tourism industry and the projects aim to show there can be better ways
of integrating wildlife conservation with commercial resource use and development. Giving
landholders the opportunity to make money could be an incentive to restore natural systems.
“The workshop will be an opportunity to monitor and evaluate the projects based on a triple bottom
line approach incorporating environmental, social and economic indicators.
The Future of Australia‟s Threatened Ecosystems (FATE) Program at the University of NSW has
been a key institution in these Sustainable Wildlife Enterprises (SWEs) trials and has been
commissioned by RIRDC to organize the workshop.
In addition to landholders and other SWEs, the workshop will also include representatives of the
kangaroo industry, relevant government departments and researchers working on the sustainable
commercial use of Australian native wildlife.
Media enquiries:
Danny O‟Brien – RIRDC Communications Manager – 02 6271 4175 or 0438 130 445
Page 85 of 85
Plate 3 Agenda for SWE Workshop, 14 & 15 February 2008 at Broken Hill
Sustainable Wildlife Enterprises Workshop
Broken Hill, 14 and 15 February, 2008 - Draft Agenda
Day One – Morning (SWE members)
• Report from each SWE on progress so far
• Discussion of future funding options and aims
• Brainstorm - what do the SWEs want to get from the workshop?
Day One - Afternoon (All participants - Starting at 1:30pm)
• Summary of SWE goals and progress
• Review of landholder experiences with kangaroos in NSW, Qld and SA
• Review of specific RIRDC-funded SWE projects
- Models for collaboration
- Business risks in landholder kangaroo enterprises
- Marketing of kangaroo and other wildlife products from SWEs
- Experiences with commercial use of wildlife overseas
Evening of Day One – Workshop Dinner in Broken Hill
Day Two –Morning (All participants – Finishing by 12:30)
• Panel Discussion - Role of landholders in kangaroo management and industry
• Next steps – Collaborative ways forward for achieving SWE goals
Day Two – Afternoon (SWE members)
• Discussion on workshop outcomes
• Refining funding applications
i
Marketing Kangaroo Meat from
the Maranoa Wildlife
Conservancy: The Conservation Dimension
A report for the Rural Industries Research and Development Corporation
by Peter Chudleigh, Deborah Archbold, Sarah Simpson, and Julia Telford
January 2008
RIRDC Publication No 08/ (added by RIRDC) RIRDC Project No AGT-13A
© 2008 Rural Industries Research and Development Corporation.
i
All rights reserved. ISBN (…RIRDC to assign) ISSN 1440-6845 Title of your publication Publication No. 07/ Project No. AGT-13A The information contained in this publication is intended for general use to assist public knowledge and discussion and to help improve the development of sustainable regions. You must not rely on any information contained in this publication without taking specialist advice relevant to your particular circumstances.
While reasonable care has been taken in preparing this publication to ensure that information is true and correct, the Commonwealth of Australia gives no assurance as to the accuracy of any information in this publication.
The Commonwealth of Australia, the Rural Industries Research and Development Corporation (RIRDC), the authors or contributors expressly disclaim, to the maximum extent permitted by law, all responsibility and liability to any person, arising directly or indirectly from any act or omission, or for any consequences of any such act or omission, made in reliance on the contents of this publication, whether or not caused by any negligence on the part of the Commonwealth of Australia, RIRDC, the authors or contributors.
The Commonwealth of Australia does not necessarily endorse the views in this publication.
This publication is copyright. Apart from any use as permitted under the Copyright Act 1968, all other rights are reserved. However, wide dissemination is encouraged. Requests and inquiries concerning reproduction and rights should be addressed to the RIRDC Publications Manager on phone 02 6271 4165
Researcher Contact Details Peter Chudleigh Agtrans Research Phone: 07 3870 9564 Fax: 07 3371 3381 Email: [email protected]
In submitting this report, the researcher has agreed to RIRDC publishing this material in its edited form. RIRDC Contact Details Rural Industries Research and Development Corporation Level 2, 15 National Circuit BARTON ACT 2600 PO Box 4776 KINGSTON ACT 2604 Phone: 02 6271 4100 Fax: 02 6271 4199 Email: [email protected]. Web: http://www.rirdc.gov.au
Published in ……... 2008 Printed on environmentally friendly paper by Canprint
ii
Foreword
The Australian rangelands are generally considered to be those land areas where the principal land use
is pastoral including the grazing of sheep and cattle, and with limited cropping potential.
The Maranoa Wildlife Management Conservancy covers a group of grazing properties situated in the
rangelands around Mitchell in Queensland. The Conservancy has commenced the development of a
collaborative enterprise between landholders to produce kangaroo meat as a Conservancy product.
Diversifying pastoral income has always been a challenge in the rangelands. The Conservancy
initiative is one attempt to not only enhance the sustainability of production of traditional grazing
products from sheep and cattle but also to take advantage of a national resource where harvesting is
currently controlled by the state.
Macropod numbers in Queensland are controlled through a quota system administered by the
Queensland Parks and Wildlife Service (Department of Environment). The Conservancy concept fits
within this regulatory context. Apart from restricting numbers and species that can be harvested, there
also exists a range of animal welfare, meat hygiene and other regulations that allow kangaroo meat to
be marketed and consumed in Australia as well as exported.
Commercial business enterprises based on Australian wildlife usually are associated with tight profit
margins. Also, demand for some products can be limited by perceptions of unsustainable yields and
exploitative and inhumane systems of production.
Exploring the potential for using the concepts of sustainable yields within a conservancy and wildlife
conservation gains from management of the conservancy may result in a higher acceptability of
products and enhanced marketing effectiveness and margins for kangaroo products.
This research has provided information on the kangaroo meat market in Australia with regard to
strategies for market development of conservancy produced kangaroo meat and in particular an
assesssment of the potential badging of products with some form of environmental accreditation.
This project was funded from a special grant to RIRDC provided by the Department of Agriculture
Fisheries and Forestry and is part of a wider program on Sustainable Wildlife Enterprise Trials that
enables landholders to more effectively manage wildlife populations and integrate wildlife with their
property and natural resource management issues.
The key findings have been developed from market research activities undertaken with existing and
potential kangaroo meat processors, distributors and consumers in Queensland.
This report, an addition to RIRDC’s diverse range of over 1600 research publications, forms part of
our (fill in relevant program) R&D program, which aims to (fill in program’s objective).
Most of our publications are available for viewing, downloading or purchasing online through our
website:
downloads at www.rirdc.gov.au/fullreports/index.html
purchases at www.rirdc.gov.au/eshop
Peter O’Brien
Managing Director
Rural Industries Research and Development Corporation
iii
Acknowledgments This report is the result of the efforts of a project team constructed to fulfil the terms of reference of
the study. The team comprised personnel from Agtrans Research (Peter Chudleigh ad Sarah Simpson),
a market research and marketing specialist (Deborah Archbold) from Deborah Wilson Consulting
Services, and a local NRM consultant (Julia Telford) who is familiar with the conservancy concept
and its history.
The authors would like to thank the following for helpful input into the project:
Peter Ampt, FATE Program Manager, University of NSW
Jeff Campbell, Mitchell Landcare
Rosie Cooney, Consultant and Research Fellow, FATE, UNSW
Tom Garrett, Coordinator, Maranoa Wildlife Conservancy
Jo Hall, Sheep & Wool Policy Director, AgForce
Stacey Henry, Mitchell and District Landcare Coordinator
Nicholas Swadling, Industry Development Officer, Queensland Department of Primary Industries and
Fisheries, West Region
Noela Ward, Booringa Shire Council
George Wilson, Rural Industries R&D Corporation and Australian Wildlife Enterprises
The input from the industry personnel responding to the industry survey, as well as those consumers
who participated in the Focus Groups is gratefully acknowledged.
Abbreviations ALMS Australian Land Management System)
DMP Damage Mitigation Permit
EPA Environmental Protection Agency (Queensland)
QDNRW Queensland Department of Natural Resources and Water
QDPIF Queensland Department of Primary Industries and Fisheries
MDLA Mitchell & District Landcare Association
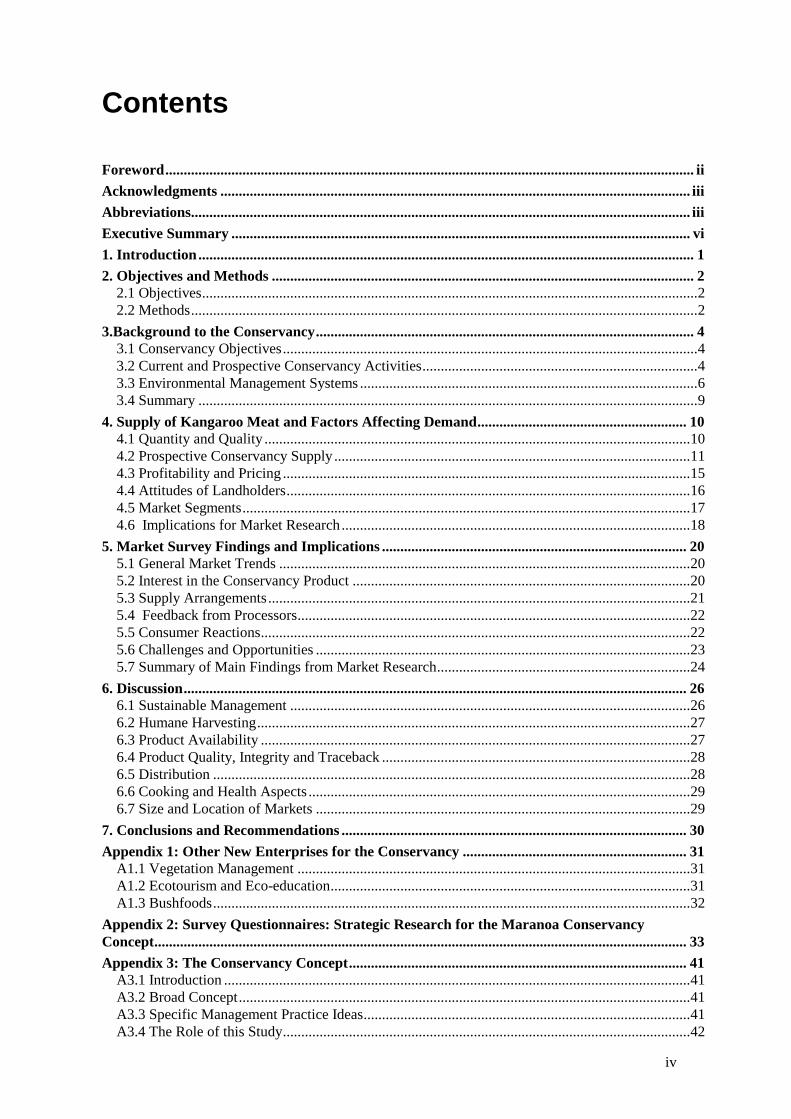
iv
Contents
Foreword ................................................................................................................................................ ii
Acknowledgments ................................................................................................................................ iii
Abbreviations........................................................................................................................................ iii
Executive Summary ............................................................................................................................. vi
1. Introduction ....................................................................................................................................... 1
2. Objectives and Methods ................................................................................................................... 2 2.1 Objectives ....................................................................................................................................... 2 2.2 Methods .......................................................................................................................................... 2
3.Background to the Conservancy ....................................................................................................... 4 3.1 Conservancy Objectives ................................................................................................................. 4 3.2 Current and Prospective Conservancy Activities ........................................................................... 4 3.3 Environmental Management Systems ............................................................................................ 6 3.4 Summary ........................................................................................................................................ 9
4. Supply of Kangaroo Meat and Factors Affecting Demand ......................................................... 10 4.1 Quantity and Quality .................................................................................................................... 10 4.2 Prospective Conservancy Supply ................................................................................................. 11 4.3 Profitability and Pricing ............................................................................................................... 15 4.4 Attitudes of Landholders .............................................................................................................. 16 4.5 Market Segments .......................................................................................................................... 17 4.6 Implications for Market Research ............................................................................................... 18
5. Market Survey Findings and Implications ................................................................................... 20 5.1 General Market Trends ................................................................................................................ 20 5.2 Interest in the Conservancy Product ............................................................................................ 20 5.3 Supply Arrangements ................................................................................................................... 21 5.4 Feedback from Processors ........................................................................................................... 22 5.5 Consumer Reactions ..................................................................................................................... 22 5.6 Challenges and Opportunities ...................................................................................................... 23 5.7 Summary of Main Findings from Market Research ..................................................................... 24
6. Discussion ......................................................................................................................................... 26 6.1 Sustainable Management ............................................................................................................. 26 6.2 Humane Harvesting ...................................................................................................................... 27 6.3 Product Availability ..................................................................................................................... 27 6.4 Product Quality, Integrity and Traceback .................................................................................... 28 6.5 Distribution .................................................................................................................................. 28 6.6 Cooking and Health Aspects ........................................................................................................ 29 6.7 Size and Location of Markets ...................................................................................................... 29
7. Conclusions and Recommendations .............................................................................................. 30
Appendix 1: Other New Enterprises for the Conservancy ............................................................. 31 A1.1 Vegetation Management ........................................................................................................... 31 A1.2 Ecotourism and Eco-education .................................................................................................. 31 A1.3 Bushfoods .................................................................................................................................. 32
Appendix 2: Survey Questionnaires: Strategic Research for the Maranoa Conservancy
Concept ................................................................................................................................................. 33
Appendix 3: The Conservancy Concept ............................................................................................ 41 A3.1 Introduction ............................................................................................................................... 41 A3.2 Broad Concept ........................................................................................................................... 41 A3.3 Specific Management Practice Ideas ......................................................................................... 41 A3.4 The Role of this Study ............................................................................................................... 42
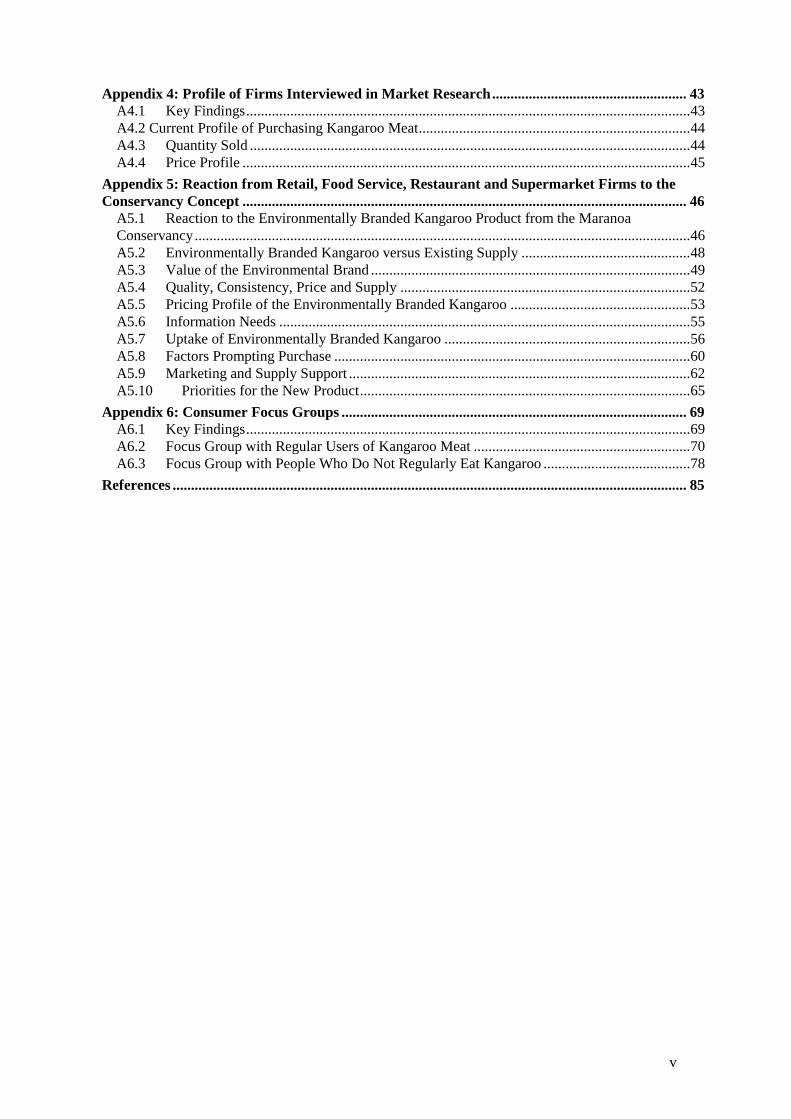
v
Appendix 4: Profile of Firms Interviewed in Market Research ..................................................... 43 A4.1 Key Findings ......................................................................................................................... 43 A4.2 Current Profile of Purchasing Kangaroo Meat.......................................................................... 44 A4.3 Quantity Sold ........................................................................................................................ 44 A4.4 Price Profile .......................................................................................................................... 45
Appendix 5: Reaction from Retail, Food Service, Restaurant and Supermarket Firms to the
Conservancy Concept ......................................................................................................................... 46 A5.1 Reaction to the Environmentally Branded Kangaroo Product from the Maranoa
Conservancy ....................................................................................................................................... 46 A5.2 Environmentally Branded Kangaroo versus Existing Supply .............................................. 48 A5.3 Value of the Environmental Brand ....................................................................................... 49 A5.4 Quality, Consistency, Price and Supply ............................................................................... 52 A5.5 Pricing Profile of the Environmentally Branded Kangaroo ................................................. 53 A5.6 Information Needs ................................................................................................................ 55 A5.7 Uptake of Environmentally Branded Kangaroo ................................................................... 56 A5.8 Factors Prompting Purchase ................................................................................................. 60 A5.9 Marketing and Supply Support ............................................................................................. 62 A5.10 Priorities for the New Product .......................................................................................... 65
Appendix 6: Consumer Focus Groups .............................................................................................. 69 A6.1 Key Findings ......................................................................................................................... 69 A6.2 Focus Group with Regular Users of Kangaroo Meat ........................................................... 70 A6.3 Focus Group with People Who Do Not Regularly Eat Kangaroo ........................................ 78
References ............................................................................................................................................ 85
vi
Executive Summary
What the report is about Exploring the potential for using the concepts of sustainable yields within a conservancy and wildlife
conservation gains from management of the Conservancy may result in a higher acceptability of
products and enhanced marketing effectiveness and margins for kangaroo products.
This research report provides information on the kangaroo meat market in Australia with regard to
strategies for market development of Conservancy produced kangaroo meat and in particular an
assesssment of the potential badging of products with some form of environmental accreditation.
The research is important for two reasons. First, the current marketing chain has evolved over a
number of years using the kangaroo resource without much regard to its interaction with land
management. Second, a key question in the minds of the Conservancy representatives was whether
environmental badging could be exploited in the market place to attract increased demand.
Who does the report target? The report is targeted at those in the Mitchell Landcare Group who are pursuing the Conservancy
concept and who have already purchased two chillers to enter the kangaroo marketing chain.
Background The Maranoa Wildlife Conservancy has been formed by a group of pastoralists, predominantly cattle
producers in central /southern Queensland. The reason behind the Maranoa Conservancy being
established was because of the “Landcare ethic” of the landholders involved and the catchment
planning they had been undertaking.
A key area for improved management of the Conservancy is to focus on general sustainable
management within each of the properties. Maintaining an appropriate balance of traditional livestock
and kangaroo populations is paramount. Conservancy members view kangaroos predominantly as a
resource that can be utilised for both economic and biodiversity reasons, rather than merely as a pest
for control and disposal.
Some kangaroos are harvested within the Conservancy at present (some for human consumption and
some for pet food) under a regional quota system as for other areas in Queensland. Other kangaroos
and wallabies are harvested under a damage mitigation permit (DMP). Kangaroos shot under a DMP
are not allowed to be taken from the field after they are shot, but skins can be taken.
The objective of the Conservancy is to promote biodiversity through:
land, vegetation and animal stewardship at both individual property and Conservancy /catchment
scales
wildlife management through protecting and enhancing the habitats of existing wildlife and
potentially through re-introduction of native species
sustainable commercial livestock management
sustainable kangaroo management including sustainable harvesting rates and utilising sustainable
harvesting practices.
While other market research activities on kangaroo meat have been undertaken in the past,
information on the potential for differentiation of the market through environmental management
associated with the kangaroo production and harvesting system and its interaction with traditional
grazing enterprise was lacking.
Objectives Specific objectives of the research were:
vii
Identify the size and location of markets for produce from Wildlife Management Conservancy
enterprises that are badged as leading to a net conservation gain.
Support the establishment of processes for supplying those markets.
The principal beneficiaries from the research are those supporting the establihsment and devlopment
of the Maranoa Conservancy Group, as well as other like minded groups of landholders who may be
developing similar concepts in environmental management.
Methods used The first activity concentrated on describing the characteristics of the Conservancy properties, the
potential supply of kangaroo meat, and features of the Conservancy properties that were thought
would be of interest to current and potential kangaroo meat consumers. This guided appropriate
market research with consumers and other participants in the marketing chain (e.g. marketers,
restauranteurs, caterers etc). The information on the market was expected to lead to options for
market development and in particular alternative forms of potential badging of products, for example,
using some form of accreditation or chain of custody associated with environmental and wildlife
management systems.
The market research consisted of two major activities:
(i) Twenty one interviews with representatives of various segments of the market to provide feedback
on opportunities for the Conservancy product. This covered food service suppliers, gourmet retailers,
supermarket representatives, restaurants, catering organisations, hotels, and processors.
(ii) Two focus groups including one focus group of 10 people that had eaten kangaroo four or more
times in the last 12 months; and one group of 9 people that included 4 that had eaten kangaroo at least
once and 5 people that had never eaten kangaroo.
Key findings The key findings have been developed from market research activities undertaken with existing and
potential kangaroo meat processors, distributors and consumers in Queensland.
Sustainability There is a range of activities that could be undertaken on Conservancy properties to improve the
sustainability of traditional livestock management systems. Many of these activities interact with
macropod harvesting. The Maranoa Conservancy is already progressed to the stage where a number of
landholders have been accredited under the Australian Land Management System. Various types of
improvement to wildlife management are possible on Conservancy properties. One method would be
by integrating current kangaroo harvesting more closely with property management of both wildlife
and traditional grazing management of sheep and cattle. There may need to be a financial incentive to
enhance this integration and this incentive could be attracted in various forms. This may come about
through improved quality of kangaroo meat production and marketing the Conservancy product as a
net conservation gain product.
Conservancy supply An estimate of harvest numbers from Conservancy properties is 7,000 to 10,000 head per annum.
While this is only a rough estimate, it is a very small number compared to the whole of Queensland or
the Australian annual supply of kangaroo meat. Consistency and continuity of supply from the
Conservancy may therefore be key issues in market development.
There may be a need to take kangaroo carcasses from other conservancies with similar credentials (if
they exist), or from non–conservancy properties with potential credentials. As mentioned earlier, the
main reason that the Maranoa Conservancy was established was because of the “Landcare ethic” of
the landholders involved and the catchment planning they were doing focusing on other values and
threats in their region. Since that time two other groups in the Mitchell area have commenced similar
discussions, so it is possible that they could also be included in the Conservancy if interested and have
undertaken subcatchment planning with their neighbours.
viii
It is likely that more properties in the area would supply if it could be demonstrated there was a price
premium to be captured, for example, if a processor could pay a premium for Conservancy kangaroos.
Apart from total quantity available, continuity and the variability of supply may be key issues in
marketing a Conservancy badged product. Strategies for maintaining a continuous supply or at least
reducing supply variability may include one or more of the following:
Managing the kangaroo population on a whole area of Conservancy basis.
Reducing sheep, cattle (and in some cases goat) numbers in drought periods.
Utilising smaller kangaroos (and possibly wallabies) and subsidising the meat price to
processors/marketers.
Limiting the meat sold under the Conservancy brand in periods of ample supply so that
expectations for supply continuity were not high, and with other kangaroo meat sold generically.
Form marketing alliances with other like-minded Conservancies, preferably in other regions so
that some form of spatial diversification were in play that may reduce variability except in nation
wide droughts.
Findings from Survey of Firms The potentially small volume of the Conservancy branded product and any problems with stability of
supply will affect opportunities to supply the product into some firms and some segments. The hotels
and supermarkets contacted confirmed that lack of continuous supply would be a barrier to using the
product. Some of the firms in other segments would not be interested in the product if supply is not
reliable or consistent.
Sixteen of the 19 firms surveyed were interested in trialling the product or in receiving more
information on the product but the final decision to use the product would be based on a range of
factors including quality, price and perceived demand. Two firms were not interested in the new
product and one could not comment until they received more information.
When asked to rate the strength of the opportunity for the Conservancy product in the market (on a
scale of 1 to 5 where 1 is poor and 5 is very good), food service companies gave the highest rating
(3.5) followed by hotels (3.3) and supermarkets (2.9).
Food service companies (including game meat suppliers to high quality restaurants and gourmet
butcher shops) felt that there is potential interest in the product. Kangaroo was more popular about 7
years ago and demand for game meat is ‘fashion’ influenced. For this reason, the new product would
need to be supported by a concerted promotional campaign targeting chefs (e.g. chef workshops such
as G’day Chef and targeted marketing) to encourage trial of the product. Consumer demand is seen as
a key driver and promotion to consumers is also needed.
Restaurants gave a rating of 2.0 out of 5 to the market opportunity. While some were interested,
others were not interested in the product. Significant differentiation on quality and presentation would
be needed. Successful branded products used by restaurants include MSA and other high quality
branded meat. Junee Lamb has developed high quality packaging for restaurants and this approach has
lifted demand. Kangaroo is currently supplied to restaurants in clear plastic, bloody bags and can be
much less appealing. Overall, the current presentation of kangaroo product to restaurants and food
service outlets was considered fairly basic and sends the message kangaroo is just a commodity
product.
Hotel interests felt that there is potential demand for a high quality, environmental branded product
(rating of 3.3 out of 5). As with the restaurant segment, promotion to chefs and marketing the product
as a gourmet product is important.
For some firms, the environmental focus is valuable due to the positioning of the business or because
of increased interest from consumers. However, the Conservancy product would need to be positioned
ix
primarily as gourmet and secondly as an environmental brand. Those who did not see value in the
environmental branding believed that the current supply of kangaroo already has good environmental
credentials. Others felt it would be too difficult to differentiate the new product from the existing
supply of kangaroo.
Clear messages are needed about the differences the new product offers. To achieve wider levels of
interest and support, the quality and gourmet positioning will be the main driver. Few are interested in
a product that is differentiated only by the conservancy approach. Also, the environmentally branded
product must be demonstrated to be superior in quality and packaging. Regarding quality, tenderness
and food safety were considered paramount.
Of the 19 firms surveyed 18 indicated that they would be willing to pay a higher price for the
environmentally branded product. However, the actual price of the product would be determined by
the quality of the kangaroo meat. All segments reported that the Conservancy product initially should
have a similar pricing to existing kangaroo and, once the product is established and successful, the
price could be gradually increased.
Businesses purchasing environmentally branded kangaroo want information on how sustainable
harvesting is managed, credentials of the supplying organisation, firm ownership, food quality and
system capabilities – a full profile on the operation, its capabilities and the benefits it can deliver.
These firms felt that consumers would want information on the origin of the product, nutrition and
health information (confirmation that it is a healthy product), information that kangaroo is tender and
of good quality.
Findings from Consumer Focus Groups The key proposition conveyed to the Focus Groups was that landholders will carry out enhanced
habitat protection and control of invasive species that diminish biodiversity or reduce damage to land
as a result of better management of the kangaroos and traditional grazing enterprises with sheep.
The Focus Group discussions revealed some difficulties in understanding the Conservancy concept as
perhaps there were too many messages involved and not one issue that could be driven home. Some of
the simple conservation /environmental concepts that appeared important were the maintenance of
sustainable populations of macropods, sheep/cattle versus kangaroos, greenhouse gas production, and
some concerns about shooting females and joeys in the pouch.
However, regular buyers of kangaroo meat are generally interested in the concept of an
environmentally branded kangaroo product. For the majority of this group, a gourmet product
positioning is essential. A few people in this regular user focus group purchase kangaroo meat
because it is a cheaper meat option. Overall this group would accept a slightly higher price if they
knew the product was delivering positive results for the environment and was a gourmet product.
Consumers are interested in the ‘environmental story’, particularly the fact that the product is
produced in Queensland by Queensland based companies.
It is important to provide an effective, succinct and positive environmental story to accompany the
product. Although consumers understand concepts such as ‘organic’ and ‘free range’, consumers felt
that the conservancy concept would need a simple, easy to understand definition. People did not find
the concept or the benefits easy to understand. Some saw the fact that cattle and sheep production was
continuing, along with possible land clearing on properties, was in conflict with the concept of a net
gain to the environment. There was strong interest in the low greenhouse gas emissions from
kangaroos.
The market research showed that for most consumers any animal welfare and harvesting
considerations were not major and these issues are probably best left alone. However, the market
research demonstrated some concern about the residual population if females were harvested, the
harvesting of females with pouch joeys and any genetic implications in the longer term of harvesting
x
the larger animals. Above all, they want to be assured of quality and food safety. The perception that
kangaroo meat is dog food or pet food is not a positive association for promotion as gourmet product.
Both regular and infrequent users of kangaroo are interested in information on cooking methods for
the best eating result and recipes using kangaroo. Consumers identified opportunities for use of ‘bush
tucker’ complementary spices and food products (e.g. marinades, sauces) that could be sold with the
Conservancy kangaroo.
Implications for marketing Positioning The Conservancy product would best be promoted as a gourmet and environmentally branded high
quality product; use of all three themes would be vital in the positioning of the product. The
environmental brand would need to be simply communicated.
Establishing a niche product within a niche market (existing kangaroo supply) was seen as a difficult
task. Some firms felt that there was still limited demand for kangaroo at the present time and that
considerable marketing effort would be required to create consumer demand (considered essential for
long term success) and market the new product to different market segments.
Distribution Gaining market access and providing the necessary support and customer service backup required was
identified as a challenge. Assuming a high quality product is established, there would be a number of
options for distribution and marketing. The business model chosen would depend on the extent of
product differentiation envisaged, resources available to the Conservancy and the attitude to risk.
Forming a marketing relationship with one processor would have the advantage in the short term in
that there would be an established market for the product while matters of harvesting organisation and
chiller management are developed and the Conservancy could gain knowledge about the market and
the potential market positioning of its product. Also, a single processor is more likely to commit to a
new product with appropriate promotional and educational support.
On the other hand a single processor may be more interested in securing access to a high quality
product for existing markets rather than developing the market for a new product. While a small
premium may be paid for quality in the first instance, this premium may never attain a high level if the
Conservancy product is not well differentiated in the market place. The Conservancy product would
then most likely be sold into the mass market for kangaroo meat (e.g. supermarkets). Some processors
may be more concerned about maintaining throughput in the processing facility, rather than
developing a premium price in the market place through packaging or promotion. The possibility
remains of a joint market development effort by the Conservancy and the processor.
A second option may be to make the product available to more than one processor, with preferences
given to processors or marketers with ideas for promotion as coming from a net conservation gain
production system.
Depending upon the availability of product, and once some security of supply and quality has been
obtained, it may be then viable for the venture to target smaller volume, high value markets. However
these market segments are ‘unforgiving’ in terms of their expectations of quality, consistency and
availability of supplies. One option may be to pay for carcasses to be processed under contract and
then market the processed cuts directly to an up-market food service firm that may supply restaurants
or a game meat specialist distributor. Exclusive supply arrangements to game meat suppliers in some
states could also be considered.
In all of these options, it may be possible to obtain a government grant to help develop the packaging,
promotional material, and implement promotional activities, possibly in conjunction with the existing
distributor.
xi
Quality A very high quality product was considered essential to penetrate all markets, but particularly the
restaurant market, gourmet butchers and game meat specialist distributors.
The Conservancy could improve the arrangements around product integrity. Currently there are no
formal supply chain agreements within the kangaroo marketing chain. It is possible that product
quality could be improved from the shooting and field harvesting (gutting etc), handling to the chiller,
chiller management and then transport to the processor. This may involve for example, use of bar
codes and temperature scanning devices. There is currently a code of practice for chiller management
but some industry opinions are that this area of the supply chain could be significantly improved.
An issue associated with improved chain management is whether improved quality means a higher
cost of supply (e.g. harvesting or chiller costs) and whether there are low cost areas of improvement
that can be made. Stacking and spacing in chillers appear to be an important issue as there is a need to
cool carcasses down quickly but this is not possible when chillers are full. Choices need to be made
therefore between smaller or larger chillers and their number and location, regularity of emptying,
single or double hanging etc. The cost implications of all such changes require estimation. Also, it
would be important to assess how quality could be improved by implementing changes in terms of
less wastage or improved eating quality.
Pricing The strategy of developing the market for the Conservancy product at existing prices and then
gradually increasing prices once a market niche has been developed is favoured. The potential for
increasing prices to domestic consumers and to export market is presumed to be limited in the short
term. The Conservancy product has first to be differentiated and proven in terms of quality, food
safety and environmental credentials. Only then should price premiums are likely to be extracted from
processors or other distributors.
Supply variability Maintaining stability of supply was generally important for consumers and for each of the market
segments. A seasonal downturn would be understood by consumers, however patchy supply would
result in consumers not consistently coming back to the product.
Promotion Consumer acceptance of kangaroo is growing. However it is regarded as a niche product and
consumers do not have a great deal of understanding of this product, particularly as a high quality
gourmet product. Consumer education, in store demonstrations and promotion or endorsements of the
product by chefs needs to be undertaken to appropriately position the product.
Developing effective packaging and a recognisable, attractive branding for the product would be
recommended. It will be important to provide leaflets for recipes when targeting consumers and
provide the necessary information on the product when targeting key market segments, e.g. quality,
food safety and the Conservancy message.
Conclusions and recommendations 1. There are four major conclusions relevant to the Conservancy pursuing any market development
through a branding and promotional strategy:
(i) Environmental management as a concept in kangaroo meat marketing has some potential
but the net conservation gain concept is difficult to address in a manner that can easily be
understood and believed. This remains a challenge for the Maranoa Conservancy Group
(ii) Environmental credentials are not sufficient on their own to develop a market niche for
the Conservancy product. Meat quality and integrity are very important and there need to
be reasons provided as to why the Conservancy product is higher quality than the rest of
the kangaroo meat in the market.
xii
(iii) Given the likely Conservancy supply, the product would need to be positioned as a
gourmet product at the top end of the market including such market targets as restaurants
and gourmet butchers. One distribution channel to facilitate this would be through game
meat specialist distributors.
(iv) Significant promotion and packaging innovation would most likely be required to develop
a niche market
2. The difficulties and risks, time and costs for development of a niche market should be recognised. It
is questionable whether the Conservancy could raise the resources required (in the hundreds of
thousands of dollars) for this market development unless there was some partnering with existing
players.
3. Supply variability will be a constraint in market development, mainly in gaining the required
support from within the distribution system. Potential multiple strategies to overcome some of this
variability have been identified.
4. It will be important to identify where improved quality and/or cost savings/increases to the total
system are likely to occur from the Conservancy operating its own chillers. There is a need to avoid
pursuing a system that increases costs without net benefits. Demonstrating profitability to the overall
system from changes should be given precedence.
5. It is recognised that the current marketing chain has evolved over a number of years. There will be
entrenched interests, distrust and opposition to change as has been demonstrated already.
1
1. Introduction
This project focuses on the markets for products labelled as originating from sustainable enterprises
where biodiversity has been enhanced. In particular, market research has been carried out within the
study in order to assess and facilitate the development of a marketing strategy for kangaroo meat
emanating from land and wildlife that are managed in a sustainable manner.
If a viable marketing strategy, based on sound market research, develops from this project, it will
represent another step in the development of sustainable wildlife enterprises. This will in turn assist
the rural sector with diversification, especially in rangeland areas where new production options are
minimal. It could provide RIRDC with a win-win strategy of increasing profits for rural landholders
but at the same time increasing environmental sustainability and strengthening the social fabric of
rural areas.
The marketing study (AGT-13A) funded within the Maranoa Wildlife Conservancy project is part of a
wider RIRDC project on trialling three sustainable wildlife enterprises. The wider project has the
following objectives. AGT-13A addresses the third objective:
1. Define a framework that enables landholders to share the proceeds of harvested wildlife.
2. Estimate kangaroo numbers that enable landholders to more effectively manage populations
and integrate wildlife with their property and natural resource management plans.
3. Identify markets for products that are badged as leading to net conservation gain.
4. Share information of experiences from the trial sites and encourage regional collaboration in
natural resource management and wildlife planning.
The focus of the present project is on the connection between environmental management and the
demand for kangaroo meat. In addressing this connection, substantial preparatory investigation has
been carried out in order to ensure the appropriate questions are pursued when assembling
information from the marketplace.
2
2. Objectives and Methods
2.1 Objectives
The broad objective of the project was to contribute via marketing and market research to a more
diverse rural sector, enhanced biodiversity and innovative industries based on non-traditional uses of
the rangelands and their wildlife. While the project is embedded within a broader RIRDC program
aimed at trialling sustainable wildlife enterprises in several Australian locations, it is specifically
associated with the development of a wildlife management conservancy around Mitchell in the
Maranoa region of Queensland.
Specific objectives of the project were:
Identify the size and location of markets for produce from Wildlife Management Conservancy
enterprises that are badged as leading to a net conservation gain.
Support the establishment of processes for supplying those markets.
The key role of the study was to identify the characteristics of markets for kangaroos from the
Maranoa conservancy that may be potentially penetrated by a net conservation gain interest and how
marketing may best proceed to capture and expand those markets. The views of those involved in
marketing and of existing and prospective consumers of kangaroo meat are of paramount interest in
order to direct the Conservancy focus, particularly the attitudes towards activities and products that
are associated with ‘net conservation gains’. There was a need to explore the reaction to a
conservancy or regional brand to promote the sustainable harvest of kangaroo meat from the
Conservancy (and potentially any other products).
2.2 Methods
The project team was made up of Agtrans Research personnel (Peter Chudleigh and Sarah Simpson,
agricultural economists), a market research and marketing specialist (Deborah Archbold) from
Deborah Wilson Consulting Services, and a local NRM consultant with experience of the
development of the conservancy and its history (Julia Telford). The project commenced in May 2007
with a team meeting to identify roles and the approach to be taken. The first activity concentrated on
describing the characteristics of the Conservancy properties, the potential supply of kangaroo meat,
and features of the Conservancy properties that were thought would be of interest to current and
potential kangaroo meat consumers. This guided appropriate market research with consumers and
other participants in the marketing chain (e.g. marketers, restauranteurs, caterers etc). The
information on the market was expected to lead to options for market development and in particular
alternative forms of potential badging of products, for example, using some form of accreditation or
chain of custody associated with environmental and wildlife management systems.
The first part of this report (Sections 3 and 4) has been compiled from team knowledge and reading
selected material (project and non-project). The report initially focuses on the potential linkages
between the sustainability and environmental credentials of the Conservancy and the market-place,
with emphasis on the market for kangaroo meat. Some brief attention is given to several other
potential Conservancy enterprises (non- kangaroo harvesting enterprises). A brief report on these
other enterprises is provided in Appendix 1.
There was some delay in the project (a two month lag) when the project was paused pending the
outcome of the negotiations of the Maranoa Group with kangaroo meat processors. An initial option
was that the Group would negotiate with one processor, then it changed to three and then it reverted to
one. The project was delayed as it was thought the chosen processor could be consulted regarding the
market strategies before the market research was carried out. However, the negotiations were ongoing
for a long period and it was decided to go ahead with the market research in November 2007.
3
The key aims of the market research were to:
Provide feedback on consumer interest in the Conservancy concept and the extent to which this
would influence buyer behaviour.
Determine the level of acceptance and interest in a Conservancy brand kangaroo product range
amongst delicatessens, high quality food outlets, food service firms, restaurants, and
supermarkets.
Determine processor views on the Conservancy product.
The market research consisted of two major activities:
1. Twenty one interviews with representatives of various segments of the market to provide feedback
on opportunities for the Conservancy product. This covered:
5 food service suppliers
4 gourmet retailers
4 supermarket representatives
2 restaurants
2 catering organisations
2 hotels
2 processors.
Interviews covered firms with operations in Queensland, New South Wales, Victoria, ACT and South
Australia.
2. Two focus groups covering:
One focus group of 10 people that had eaten kangaroo four or more times in the last 12 months.
One group of 9 people that included 4 that had eaten kangaroo at least once and 5 people that had
never eaten kangaroo.
Questionnaires used in interviews with market segment representatives and the focus group
questionnaire are contained in Appendix 2 of this report.
Research results provided insights into key issues affecting uptake of the conservancy product in
various market segments. The focus group research provided qualitative feedback on attitudes to
kangaroo meat and reaction to the Maranoa Conservancy concept.
A short summary of the Conservancy approach that was used to inform those surveyed or
participating in the Focus Groups is included as Appendix 3 of this report.
4
3.Background to the Conservancy
The Maranoa Wildlife Conservancy has been formed by a group of pastoralists, predominantly cattle
producers in central /southern Queensland. The reason behind the Maranoa Conservancy being
established was because of the “Landcare ethic” of the landholders involved and the catchment
planning they had been undertaking.
A key area for improved management of the Conservancy is to focus on general sustainable
management within each of the properties. Maintaining an appropriate balance of traditional livestock
and kangaroo populations is paramount. Conservancy members view kangaroos predominantly as a
resource that can be utilised for both economic and biodiversity reasons, rather than merely as a pest
for control and disposal.
Some kangaroos are harvested within the Conservancy at present (some for human consumption and
some for pet food) under a regional quota system as for other areas in Queensland. Other kangaroos
and wallabies are harvested under a damage mitigation permit (DMP). Kangaroos shot under a DMP
are not allowed to be taken from the field after they are shot, but skins can be taken.
3.1 Conservancy Objectives
The objective of the Conservancy is to promote biodiversity through:
land, vegetation and animal stewardship at both individual property and Conservancy /catchment
scales
wildlife management through protecting and enhancing the habitats of existing wildlife and
potentially through re-introduction of native species
sustainable commercial livestock management
sustainable kangaroo management including sustainable harvesting rates and utilising sustainable
harvesting practices.
3.2 Current and Prospective Conservancy Activities
3.2.1 Grazing Management There is the potential for changing the mix of cattle/sheep and kangaroos on the Conservancy
properties. There is potential for there to be fewer sheep/cattle, watering points, fences etc. Also,
harvesting kangaroos more strategically could allow pastures to regenerate more rapidly. Managing
total grazing pressure especially in drought is a key aspect of kangaroo interaction and integration
with property management.
3.2.2 Harvesting Strategies Location and time of harvest information for each kangaroo could be integrated with information on
land, pasture, weather and seasonal conditions. Kangaroo harvest data assembled on a Conservancy
basis can be used for both livestock and kangaroo management. One idea canvassed was for the
Conservancy to give priority to harvesting kangaroos on spelled regenerating paddocks, with
harvesters being requested to harvest in specific locations on behalf of the Conservancy group. This
does not happen under existing harvesting arrangements. Also, sharing information about location and
aggregation of kangaroos may be beneficial to harvesting efficiency. A coordinated approach may
allow better strategic control of large concentrations and easier shooting.
5
3.2.3 Invasive Species The maintenance of native vegetation by control of weed spread could be improved with kangaroo
harvesters washing down vehicles before entering another property and would be part of an overall
environmental management plan.
Kangaroos are the most common native species within the Conservancy. However, the number of
many other native species has been reduced by invasives such as wild dogs, foxes and cats, and feral
pigs. There is some anecdotal evidence that there has been loss of native birdlife (plains turkeys,
brolgas) as a result of increased numbers of feral animals. The situation may have been worsened by
the DMPs whereby some kangaroos are left to rot and die in the paddock. Kangaroo harvesters
working within the Conservancy may be able to assist with wildlife management by shooting feral
goats, foxes or cats.
If ferals can be controlled, there may be scope for reintroduction programs for native animals like the
bilby program that operated at Charleville.
3.2.4 Greenhouse Gases It is estimated that about 16% of Australia’s total net greenhouse gas emissions originate from the
farm sector. Of this 16%, 71% is contributed by ruminant livestock such as cattle and sheep emitting
methane gas. Methane is a product of ruminants, and kangaroos are not ruminants. Consumption of
kangaroo meat instead of beef or sheepmeat is therefore very greenhouse friendly.
A recent report by Greenpeace on global warming stated that reducing beef consumption by 20 per
cent and putting Skippy on the dinner plate instead would cut 15 megatonnes of greenhouses gases
being emitted to the atmosphere by 2020 (Reference to be inserted).
3.2.5 Meat Quality A higher and more consistent quality of kangaroo meat potentially may result, from changed
harvesting and handling processes, a higher level of chiller management, and an improved feedback
and traceback system. An improved traceback system is currently being developed for the
Conservancy, including GPS and data logging on a paddock and property basis.
Also, if kangaroo harvesting within the Conservancy is organised by a combination of pastoralists and
harvesters with some form of joint control of chillers, one of the benefits may be improved quality
control and an improved product to market.
3.2.6 Harvesting and Chiller Management The Mitchell & District Landcare Association (MDLA) is acting for the Conservancy and has recently
purchased two chillers (one 40 foot and one 20 foot in length), both located in Mitchell. By
purchasing 2 boxes it was seen as an opportunity to be able to diversify the Conservancy product over
time as opportunities arise. A manager of the chillers has been appointed. MDLA took advantage of
local boxes being for sale, rather than trying to purchase new boxes to be located in Mitchell. This
has been seen as an easier way to enter the industry, as locally all other boxes were owned by
processors.
The concept was that landholders involved in the Conservancy see the need to be able to prove itself
initially and then look to growth, with the general agreement that there would be a need to increase
supply for it to be successful and profitable in the long term.
MDLA will be selling product to Ray Borda of Macro Meats, based in South Australia. The MDLA
& Macro Meats have agreed that the product will go through the processing plant, however MDLA
can trade through another processor if it so chooses.
In early January 2008, with the Certificate of Trade issued by EPA in Charleville, MDLA had started
buying kangaroos from local harvesters. However, due to administrative issues and not having the
6
Certificates on site, this ceased. The local harvesters have thus pulled out of shooting to the
“Landcare boxes” and this has created a new round of negative feeling towards the project. As a
result, MDLA is currently in a situation of having no harvesters prepared to supply the boxes. MDLA
is in the process of trying to rectify this situation at least for the short term. It is another bump in the
road between local landholders and harvesters since the Conservancy concept was initiated several
years ago.
As a result of this latest halt to the progress of the project, there has been mixed feeling by
landholders and people involved in the group. One line of thought is that landholders have a right to
refuse harvesters access to their properties, unless they supply the “Landcare boxes”. This is not a
view supported by everyone, as this approach is seen by some to be antagonistic, and therefore
creating more disharmony and negativity towards the Conservancy.
Within the kangaroo industry there is negative sentiment towards landholders being involved in the
production side of the business, with harvesters feeling threatened by this involvement. This is
regardless of the fact that harvesters have not been happy with the prices imposed on them by
processors, and where they have little room to negotiate.
3.3 Environmental Management Systems
3.3.1 General Past Australian experience with environmental management systems in improving access or
extracting premiums in the market place has not been overly positive. For example, the Field
Fresh Nature Conservation Project was established to encourage Tasmanian onion and carrot
growers to develop a conservation program as part of the compliance with Natures Choice
Quality Assurance program (Tesco Supermarket Chain in the UK). An analysis of the program
showed that there needed to be a financial incentive apparent, not just market access, to avoid a
significant drop out from such a scheme; the drop out quickly occurred due to the absence of any
financial incentive.
A survey of 25 influencers of attitudes towards sustainability of Australian woolgrowing
suggested that in the long term sustainable practices could impact on price but more likely on
market access. In the short term (1-10 years), factors affecting price and market access were
thought more likely to be in the areas of animal ethics and chemical use rather than biodiversity.
The issue with kangaroo meat is whether consumers are convinced there are likely to be net
conservation gains from the Conservancy and whether they are prepared to pay a higher price for
meat originating in the Conservancy. It is possible that meat quality and animal welfare issues
may be stronger drivers of differentiation.
3.3.2 Environmental Management Systems in the Conservancy Some landholders within the Conservancy have recently been audited under the ALMS process.
ALMS (Australian Land Management System) is an ISO14001 accredited EMS. At this stage there
are four landholders who have been audited under the ALMS accreditation, with three landholders
awaiting an audit. The two differences between it and any other EMS is that it takes into
consideration catchment targets/issues and it has a focus on biodiversity. No other EMS does this.
As initially anticipated there are now other landholders within the conservancy who are interested in
undertaking an ALMS EMS since the first landholders began. There are three landholders at present
who have said that they would like to undertake the work, with others possibly interested.
There is potential for 3rd party certification if landholders choose to become fully ISO certified. This
has not been flagged as something that is of interest to landholders at present as the cost involved in
7
getting the ISO accreditation is high, and there has been no market incentive to support this cost. To
be able to say that as a result of their ALMS audit that they are ISO compliant has been sufficient.
Consumers can be confident that ISO 14001 is an internationally recognised EMS program, and that
landholders who have passed the audit process are deemed to be compliant with this standard.
ALMS-accredited auditors certify that each ALMS management system complies with the interna-
tionally recognised ISO 14001 environmental management standard. ALMS members are required
also to account for catchment priorities and strategies, and to provide continuous support for
biodiversity conservation.
The SAGGE project represents Scenario Analysis of Grain & Graze Enterprises. One of the
properties in the conservancy was used as the pilot property for this project in the Maranoa Balonne
Catchment.
Some landholders further west of the Conservancy area have done a Pastoral EMS through a project
with the Queensland Department of Primary Industries and Fisheries (QDPIF). However, this project
has now finished and QDPIF has approached Queensland Murray Darling Committee to work with
these landholders. Some landholders have been working with AgForce on property management
plans, however these are not auditable. There are no organic beef producers or organic wool
producers in the Conservancy to the knowledge of the authors.
3.3.3 Wildlife Management and Planning There is no overall wildlife management plan for the Maranoa Wildlife Conservancy as a whole.
Wildlife management is currently integrated into the individual property management on Conservancy
properties by highlighting high value biodiversity and vegetation corridors and managing for this,
along with riparian areas.
Managing total grazing pressure especially in drought is a key aspect of kangaroo interaction and
integration with property management. However, the regional quota system may mean that during
droughts that quota may be reduced just when greater kangaroo control may be required.
Black striped wallabies are not harvestable currently and could compensate by increasing numbers if
kangaroo numbers are better controlled through harvesting, although some of the Conservancy
country will not be suited to their habitat. The black striped wallabies sometimes are culled as a pest
under damage mitigation permits if it can be demonstrated the wallabies are responsible for
significant losses. An approximate number is that around 6,000 may be shot each year around Roma.
One option is to have a small quota for them, on a sub-regional scale, to keep numbers at a
manageable level.
A special case could be made for carcasses to be used rather than being left to rot in the field.
However, information on the size of the cuts and the quality of the meat is not available. Any market
niches that may be filled would need to be weighed up against the higher processing cost per kg of
carcass and the lower value of the smaller skins.
3.3.4 Potential for Wildlife Management Changes A key idea is whether conservation based enterprises can act as an incentive to retain and restore on-
farm habitat. But from where will the incentive come? The propositions raised so far include:
the Conservancy will gain revenue from sharing in the likelihood of domestic consumers paying
more for higher quality kangaroo meat
the Conservancy will gain revenue by selling its product to processors at a small premium price
the demand for kangaroo meat increasing due to the promotion of conservation and environmental
benefits and being produced under a net conservation gain management system
a perceived reduction in damage to land as a result of better management of the kangaroos
8
there could be a government incentive for innovative business ideas, ‘drought’ tolerant
agriculture, etc
a direct payment of consumers for kangaroo meat that is produced on the Conservancy with such
payments being channeled directly for on-farm habitat restoration and conservation enhancement,
not only for kangaroos but also for other native animals
There would be some data available on the current native and feral wildlife on conservancy properties
apart from kangaroos, but much of this may be anecdotal. Local councils would have information on
wild dogs through their baiting program and bounties on dogs. This might also be a source of
information on foxes and cats, and perhaps feral pigs.
There is anecdotal evidence only of the loss of native birdlife (plain turkeys, brolgas) as a result of
increased numbers of feral animals. This is potential for surveys to be done in the area to look at
native species abundance. There would need to be a demand from the Conservancy for funding to be
able to justify such surveys.
There is not much evidence of the impact of effectiveness of control of dingoes, cats, pigs and wild
dogs on native wildlife. Wildlife management does not appear as an integrated part of property
management plans within the Conservancy and this is an area that could be developed further.
There may be scope for reintroduction programs for native animals (e.g. opportunities for
reintroduction of small mammals due to improved control of ferals on a Conservancy wide basis,
similar to the bilby program at Charleville).
3.3.5 Harvesting Macropods and Wildlife and Pastoral Management
Opportunities within a Conservancy Harvesting kangaroos for wild dog baits has been mentioned as a tool to integrate pastoralists and
harvesters, at least in the first instance. This may apply particularly using the DMP animals that are
currently killed and left to rot in the paddock so encouraging populations of feral animals as has been
mentioned earlier.
Kangaroo harvesters may be used to assist with wildlife management e.g. shooting feral goats, foxes
or cats. This has been a thought from the beginning of Conservancy development. With regard to
weeds, harvesters could wash down vehicles before entering another property. While this may
increase costs, it would provide much benefit with regard to weed spread (e.g. parthenium) and could
be part of an overall environmental management plan.
Other potential opportunities and benefits may include:
low weight kangaroos are currently not targeted for harvesting, but if they were this may assist
management of numbers
harvesters may be able to purchase inputs more cheaply if part of a wider Conservancy
kangaroo harvest data assembled on a Conservancy basis can be used for both livestock and
kangaroo management. Location and time of harvest could be integrated with information on land,
pasture, weather and seasonal conditions etc, population dynamics etc
decision making tools could be developed with increased information input from kangaroo
shooters for example, on the kangaroo populations to target, management of native and exotic
animals including pests, state of fences, water levels, pastures etc, managing disease etc.
Reduction of livestock numbers if the value of kangaroo meat harvested on Conservancy
properties increases; this may result in improved livestock welfare, and increased land and pasture
sustainability.
9
3.3.6 Technology to Trace Wildlife Products and Data Management for Kangaroo
Harvesting Information is assembled manually and submitted every month to regulatory authorities by kangaroo
harvesters and includes where a kangaroo is shot, its species, age, sex and weight. This is effected by
harvesters in submitting their harvest information to government. The chiller managers record the
number and species at the point of sale, but presumably property level details are lost at this stage.
An improved traceback system is currently being developed for the Conservancy, including GPS and
data logging on a paddock and property basis with chain of custody at least to the processor (and
possibly further to market).
There has been much animosity about the Landcare group getting involved in the macropod industry,
with the current chiller operators and processors happy with the ‘business as usual’ approach, and not
supportive of any change within the industry. As such the MDLA had decided to take a ‘soft’
approach towards the harvesters, so that they are able to secure supply for the chillers. The bar coding
and trace back system has been placed on hold until the local macropod industry understands that the
development of the Conservancy does not impact on their livelihood. The MDLA have decided that
given the delicate situation at the moment, it is important first to ensure that they are not squeezed out
of the market by the processors, and to become a commercial, viable entity, then to bring in the next
stage of the Conservancy strategy including the trace back and bar coding system.
3.4 Summary
There is a range of activities that could be undertaken on Conservancy properties to improve the
sustainability of traditional livestock management systems. Many of these activities interact with
macropod harvesting. The Maranoa Conservancy is already progressed to the stage where a number of
landholders have been accredited under the Australian Land Management System. Various types of
improvement to wildlife management are possible on Conservancy properties. One method would be
by integrating current kangaroo harvesting more closely with property management of both wildlife
and traditional grazing management of sheep and cattle. There may need to be a financial incentive to
enhance this integration and this incentive could be attracted in various forms. Alternatives would be
improved quality of kangaroo meat production and marketing the Conservancy product as a net
conservation gain product.
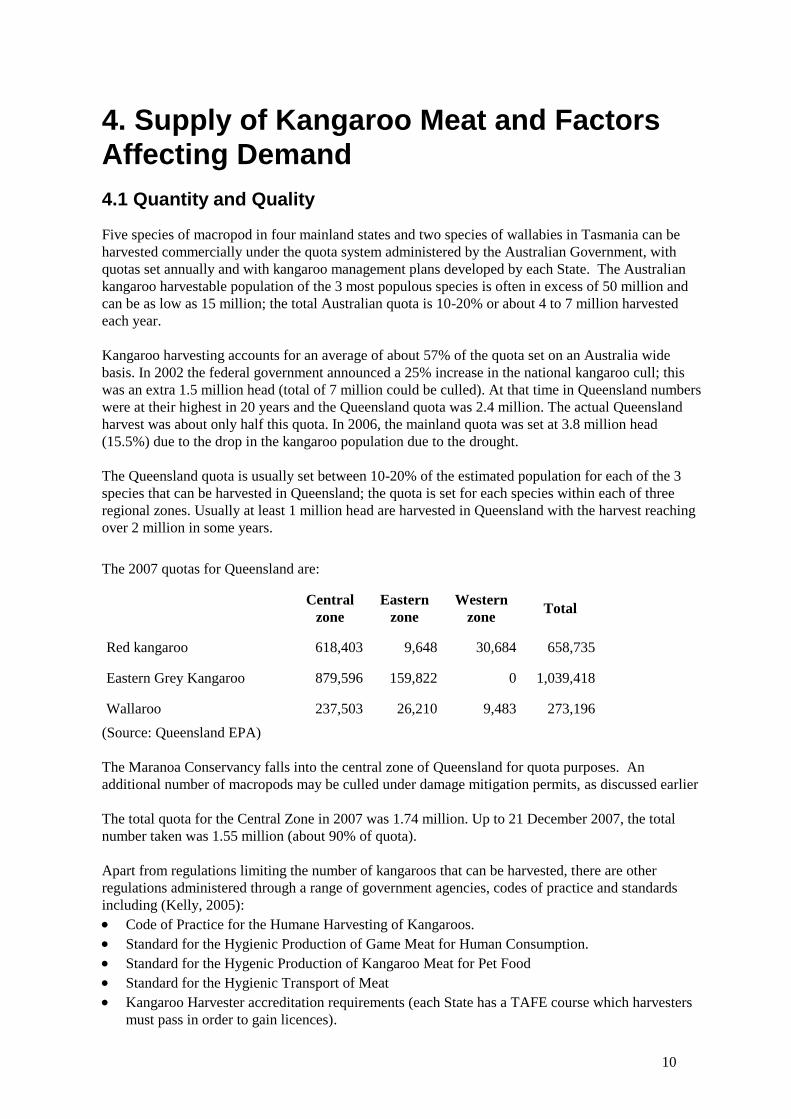
10
4. Supply of Kangaroo Meat and Factors
Affecting Demand
4.1 Quantity and Quality
Five species of macropod in four mainland states and two species of wallabies in Tasmania can be
harvested commercially under the quota system administered by the Australian Government, with
quotas set annually and with kangaroo management plans developed by each State. The Australian
kangaroo harvestable population of the 3 most populous species is often in excess of 50 million and
can be as low as 15 million; the total Australian quota is 10-20% or about 4 to 7 million harvested
each year.
Kangaroo harvesting accounts for an average of about 57% of the quota set on an Australia wide
basis. In 2002 the federal government announced a 25% increase in the national kangaroo cull; this
was an extra 1.5 million head (total of 7 million could be culled). At that time in Queensland numbers
were at their highest in 20 years and the Queensland quota was 2.4 million. The actual Queensland
harvest was about only half this quota. In 2006, the mainland quota was set at 3.8 million head
(15.5%) due to the drop in the kangaroo population due to the drought.
The Queensland quota is usually set between 10-20% of the estimated population for each of the 3
species that can be harvested in Queensland; the quota is set for each species within each of three
regional zones. Usually at least 1 million head are harvested in Queensland with the harvest reaching
over 2 million in some years.
The 2007 quotas for Queensland are:
Central
zone
Eastern
zone
Western
zone Total
Red kangaroo 618,403 9,648 30,684 658,735
Eastern Grey Kangaroo 879,596 159,822 0 1,039,418
Wallaroo 237,503 26,210 9,483 273,196
(Source: Queensland EPA)
The Maranoa Conservancy falls into the central zone of Queensland for quota purposes. An
additional number of macropods may be culled under damage mitigation permits, as discussed earlier
The total quota for the Central Zone in 2007 was 1.74 million. Up to 21 December 2007, the total
number taken was 1.55 million (about 90% of quota).
Apart from regulations limiting the number of kangaroos that can be harvested, there are other
regulations administered through a range of government agencies, codes of practice and standards
including (Kelly, 2005):
Code of Practice for the Humane Harvesting of Kangaroos.
Standard for the Hygienic Production of Game Meat for Human Consumption.
Standard for the Hygenic Production of Kangaroo Meat for Pet Food
Standard for the Hygienic Transport of Meat
Kangaroo Harvester accreditation requirements (each State has a TAFE course which harvesters
must pass in order to gain licences).
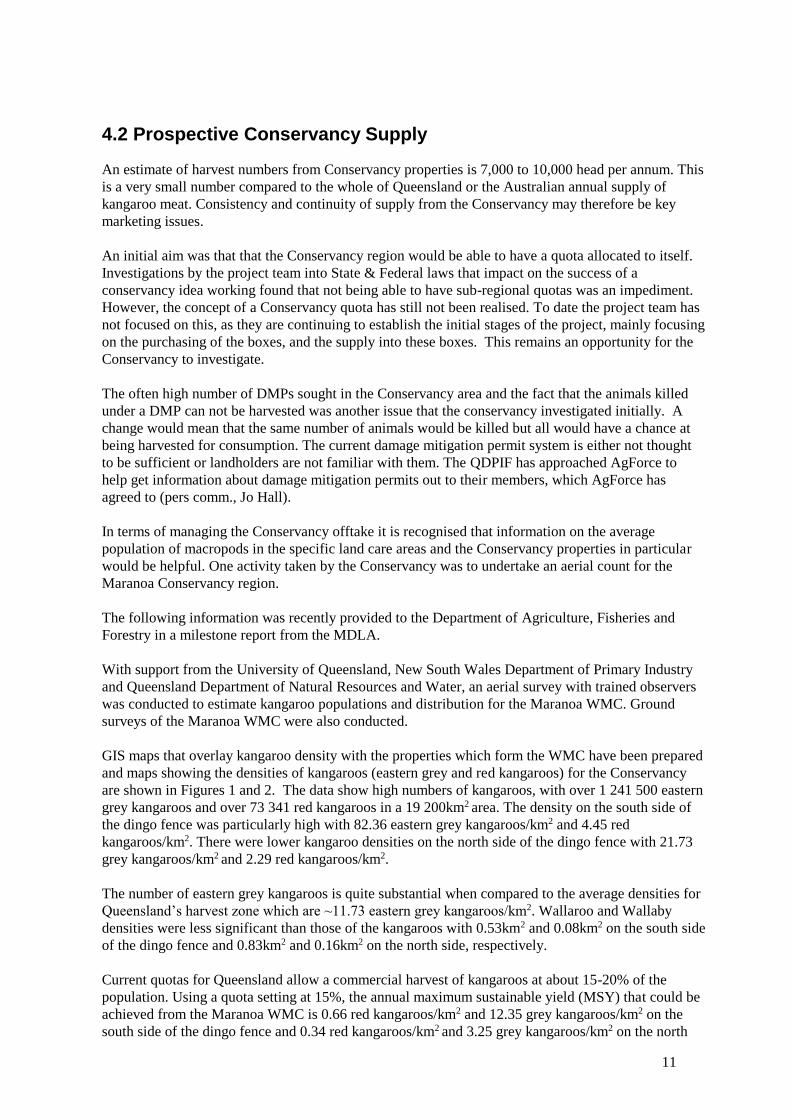
11
4.2 Prospective Conservancy Supply
An estimate of harvest numbers from Conservancy properties is 7,000 to 10,000 head per annum. This
is a very small number compared to the whole of Queensland or the Australian annual supply of
kangaroo meat. Consistency and continuity of supply from the Conservancy may therefore be key
marketing issues.
An initial aim was that that the Conservancy region would be able to have a quota allocated to itself.
Investigations by the project team into State & Federal laws that impact on the success of a
conservancy idea working found that not being able to have sub-regional quotas was an impediment.
However, the concept of a Conservancy quota has still not been realised. To date the project team has
not focused on this, as they are continuing to establish the initial stages of the project, mainly focusing
on the purchasing of the boxes, and the supply into these boxes. This remains an opportunity for the
Conservancy to investigate.
The often high number of DMPs sought in the Conservancy area and the fact that the animals killed
under a DMP can not be harvested was another issue that the conservancy investigated initially. A
change would mean that the same number of animals would be killed but all would have a chance at
being harvested for consumption. The current damage mitigation permit system is either not thought
to be sufficient or landholders are not familiar with them. The QDPIF has approached AgForce to
help get information about damage mitigation permits out to their members, which AgForce has
agreed to (pers comm., Jo Hall).
In terms of managing the Conservancy offtake it is recognised that information on the average
population of macropods in the specific land care areas and the Conservancy properties in particular
would be helpful. One activity taken by the Conservancy was to undertake an aerial count for the
Maranoa Conservancy region.
The following information was recently provided to the Department of Agriculture, Fisheries and
Forestry in a milestone report from the MDLA.
With support from the University of Queensland, New South Wales Department of Primary Industry
and Queensland Department of Natural Resources and Water, an aerial survey with trained observers
was conducted to estimate kangaroo populations and distribution for the Maranoa WMC. Ground
surveys of the Maranoa WMC were also conducted.
GIS maps that overlay kangaroo density with the properties which form the WMC have been prepared
and maps showing the densities of kangaroos (eastern grey and red kangaroos) for the Conservancy
are shown in Figures 1 and 2. The data show high numbers of kangaroos, with over 1 241 500 eastern
grey kangaroos and over 73 341 red kangaroos in a 19 200km2 area. The density on the south side of
the dingo fence was particularly high with 82.36 eastern grey kangaroos/km2 and 4.45 red
kangaroos/km2. There were lower kangaroo densities on the north side of the dingo fence with 21.73
grey kangaroos/km2 and 2.29 red kangaroos/km2.
The number of eastern grey kangaroos is quite substantial when compared to the average densities for
Queensland’s harvest zone which are ~11.73 eastern grey kangaroos/km2. Wallaroo and Wallaby
densities were less significant than those of the kangaroos with 0.53km2 and 0.08km2 on the south side
of the dingo fence and 0.83km2 and 0.16km2 on the north side, respectively.
Current quotas for Queensland allow a commercial harvest of kangaroos at about 15-20% of the
population. Using a quota setting at 15%, the annual maximum sustainable yield (MSY) that could be
achieved from the Maranoa WMC is 0.66 red kangaroos/km2 and 12.35 grey kangaroos/km2 on the
south side of the dingo fence and 0.34 red kangaroos/km2 and 3.25 grey kangaroos/km2 on the north
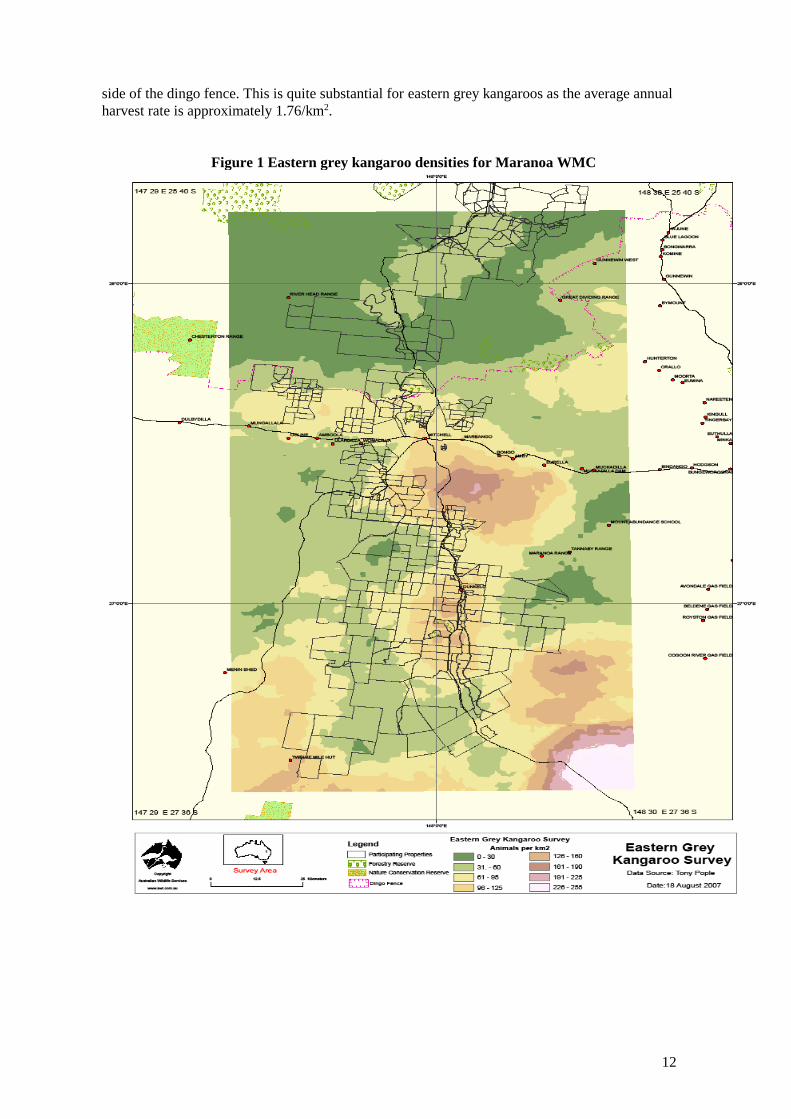
12
side of the dingo fence. This is quite substantial for eastern grey kangaroos as the average annual
harvest rate is approximately 1.76/km2.
Figure 1 Eastern grey kangaroo densities for Maranoa WMC
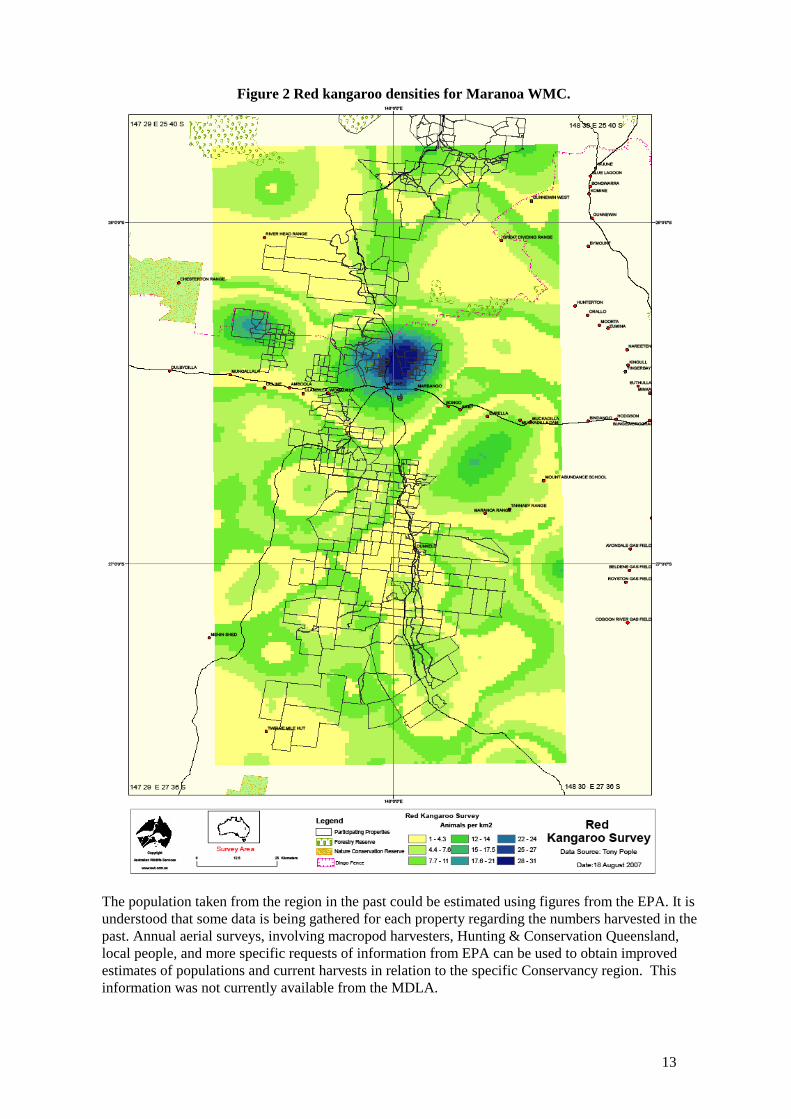
13
Figure 2 Red kangaroo densities for Maranoa WMC.
The population taken from the region in the past could be estimated using figures from the EPA. It is
understood that some data is being gathered for each property regarding the numbers harvested in the
past. Annual aerial surveys, involving macropod harvesters, Hunting & Conservation Queensland,
local people, and more specific requests of information from EPA can be used to obtain improved
estimates of populations and current harvests in relation to the specific Conservancy region. This
information was not currently available from the MDLA.
14
There is an estimate of harvest numbers for Booringa shire near Mitchell of about 80,000 kangaroos
per year, but numbers will vary for each year.
The accuracy of the 7,000 to 10,000 estimate for Conservancy properties is unknown. The mountain
range running through the Conservancy region and the Carnarvon Ranges to the north means that a
number of the macropod species in the region are not harvestable, as opposed to the southern half of
the Booringa Shire where the majority of macropods are harvestable and the habitat is more suited to
the kangaroos (both grey and red).
There may well be a need to be able to justify a sustainable yield each year, not just to fit in with the
regional zone quota, but to demonstrate responsible management of the Conservancy by carrying out
its own monitoring as part of securing a marketing advantage via increased sustainability assurance.
Monitoring yield will also provide data for management purposes e.g. management of total grazing
pressure. There is some monitoring of numbers for most Conservancy properties, so improved
estimates may be available in future.
The implication of these numbers for marketing is that a critical mass of product may need to be
available to support a marketing campaign aimed at developing a market niche. Apart from the initial
supply available, continuity of supply could be a key issue, and perhaps exacerbated by quota
restrictions. Hence spatial diversification of supply may be important.
It is possible that the overall variability in supply could be reduced if Conservancy properties work
together more closely. This may be so if comparisons are made with current variability from the
individual properties. However, variability may increase if comparisons are made with the Central
region as a whole.
There may therefore be a need to take kangaroo carcasses from other conservancies with similar
credentials (if they exist), or from non–conservancy properties with potential credentials. As
mentioned earlier, the main reason that the Maranoa Conservancy was established was because of the
“Landcare ethic” of the landholders involved and the catchment planning they were doing focusing on
other values and threats in their region. Since that time two other groups in the Mitchell area have
commenced similar discussions, so it is possible that they could also be included in the Conservancy
if interested. That was always the idea of the Mitchell Landcare group, that they were happy to have
more landholders involved, but to be involved they must have undertaken subcatchment planning with
their neighbours.
It is likely that more properties in the area would supply if it could be demonstrated there was a price
premium to be captured, for example, if a processor could pay a premium for Conservancy kangaroos.
Another issue is whether the black striped wallabies on Conservancy properties could be harvested.
There has been some attempt to secure regulation change for commercial harvest of this species in
order to increase the sustainable supply of kangaroo meat from the Conservancy and to improve
property management. At the moment they can not be harvested, but they can be destroyed under a
DMP. This is still under investigation.
Supply could be increased if smaller animals were shot. In drought periods, there are many smaller
and lighter animals that increase grazing pressure. Smaller animals have not traditionally been shot
due to their high cost of processing per kg of meat and the lower value of their skin. Processing wages
are often negotiated on a per animal basis so a carcass of 20 kg is not economic to process compared
with one of 60 kg. Also a significant return from a carcass is the skin. Skin buyers will allow some
small skins (say 10% small) but when the proportion increases there are complaints. Skin users can
do more with a large skin as it is more flexible in its end use. On the other hand cuts from smaller
animals may be able to find a market niche.
15
4.3 Profitability and Pricing
It has been reported that the kangaroo processing industry has not been particularly profitable in the
past year or so. The industry has had a tumultuous year, with adjustments in the industry, new pricing
systems and tensions between industry players.
The following points are relevant to kangaroo harvesting and markets for kangaroo products over the
past year:
The higher prices paid to harvesters for most of 2007 result from increased competition
responding to the increase in product demand for human consumption over the last few years,
both domestically and for export, thus having a flow on effect to the pet food processors
chasing product share.
There was a depressing effect on processors returns last year as the demand for Kangaroo
meat met with competition from traditional meats that were able to be sourced at comparable
prices.
The increasing value of the Australian dollar had a significant impact on comparative pricing
against other protein sources.
There were inventories of other protein meats held over in some areas due to warmer than
expected winter temperatures.
While the quota has been reducing for the past two years, it has not been able to be utilised
completely by the industry due to the quota input administrative processes used by the
regulator in Queensland. The number of animals taken was 100,000 short of the quota in 2006
and more than 250,000 in 2007.
The drought has had an effect on unit processing costs as the animals presented were often of
lesser weight for size.
The small skin market has been severely depressed for a number of years, with some
processors receiving invoices for the removal of ‘smalls’. Small skins are being held in
stockpiles in hope of a recovery, which may occur now that the Californian market has
revoked anti- kangaroo skin sale legislation.
In one area, the price reached $1.45 but generally hovered between .85c and $1.20, with one human
consumption processor consistently putting pressure on prices by maintaining a 20 c per kg margin
over competitors.
In 2007 there was a 2 tier pricing structure set up by the processors, with animals above 16kg
receiving 85 c / kg and animals under 16kg receiving 40 c /kg. The introduction of the two tiered
pricing system for this year will see a higher profitability per unit cost to the processors (if there is not
a propensity to harvest small animals) and a reduction of income to the harvesters. It will also
probably see a reduction in harvester numbers from 2089 in 2007 to less than 1800 in 2008. If a
greater accuracy in quota administration is adopted by the EPA, then the quota may be fully utilised at
last year’s quota levels. It will be interesting to see if the differential pricing system is able to be
maintained and what its actual effect on the industry will be.
A pressure point on the macropod demographics could be the harvesting of a lot more animals below
17 kg as harvesters take what they can to cover costs for the night’s harvesting. The introduction (now
reversed) of the decision to restrict skin harvesting in 2008 to between May – August could have had
the effect of exacerbating the situation and reducing competition to a greater degree.
There has not been a loss of shelf presence for kangaroo meat from the retail sector, and the retail
price of kangaroo meat has not dropped, so any drop in profitability in the industry has not been
reflected in the retail sector (Tom Garrett, pers.comm.).
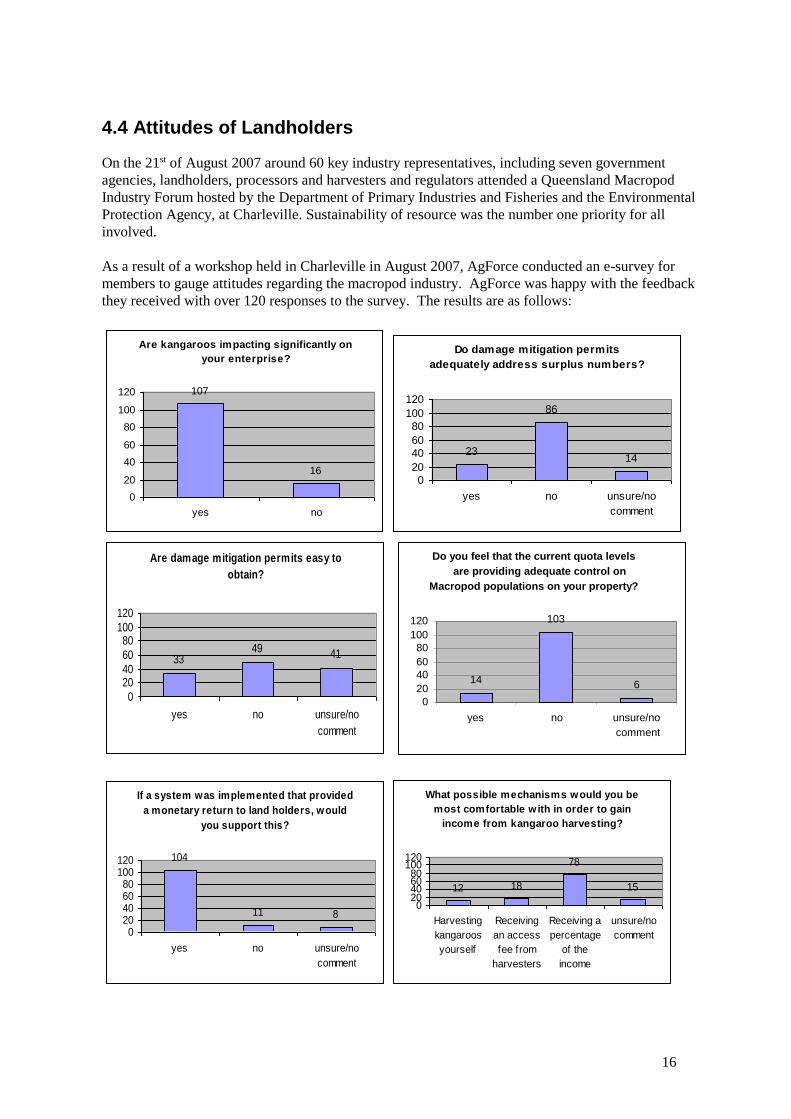
16
4.4 Attitudes of Landholders
On the 21st of August 2007 around 60 key industry representatives, including seven government
agencies, landholders, processors and harvesters and regulators attended a Queensland Macropod
Industry Forum hosted by the Department of Primary Industries and Fisheries and the Environmental
Protection Agency, at Charleville. Sustainability of resource was the number one priority for all
involved.
As a result of a workshop held in Charleville in August 2007, AgForce conducted an e-survey for
members to gauge attitudes regarding the macropod industry. AgForce was happy with the feedback
they received with over 120 responses to the survey. The results are as follows:
Are kangaroos impacting significantly on
your enterprise?
107
16
020
4060
80100
120
yes no
Do damage mitigation permits
adequately address surplus numbers?
23
86
14
020406080
100120
yes no unsure/nocomment
Are damage mitigation permits easy to
obtain?
3349 41
020406080
100120
yes no unsure/nocomment
If a system was implemented that provided
a monetary return to land holders, would
you support this?
104
11 80
20406080
100120
yes no unsure/nocomment
What possible mechanisms would you be
most comfortable with in order to gain
income from kangaroo harvesting?
12 18
78
15
020406080
100120
Harvestingkangaroosyourself
Receivingan accessfee from
harvesters
Receiving apercentage
of theincome
unsure/nocomment
Do you feel that the current quota levels are providing adequate control on
Macropod populations on your property?
14
103
6
0 20 40 60 80
100 120
yes no unsure/no comment
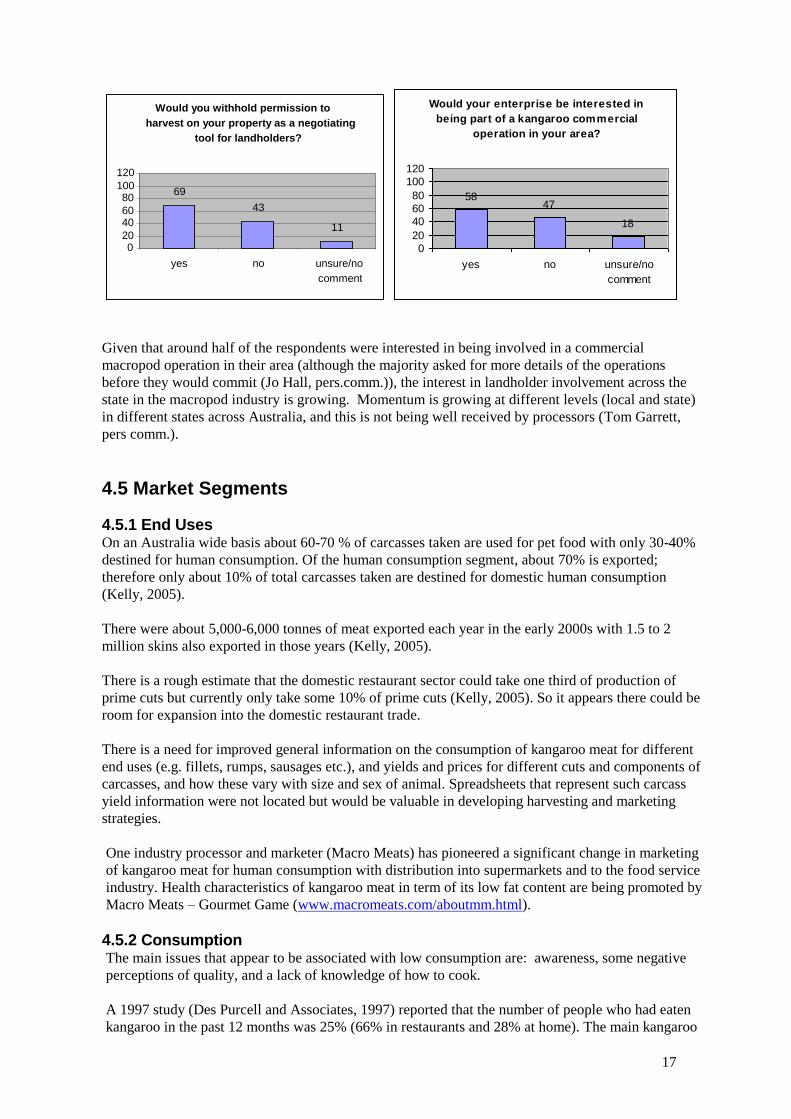
17
Would your enterprise be interested in
being part of a kangaroo commercial
operation in your area?
5847
18
020406080
100120
yes no unsure/nocomment
Given that around half of the respondents were interested in being involved in a commercial
macropod operation in their area (although the majority asked for more details of the operations
before they would commit (Jo Hall, pers.comm.)), the interest in landholder involvement across the
state in the macropod industry is growing. Momentum is growing at different levels (local and state)
in different states across Australia, and this is not being well received by processors (Tom Garrett,
pers comm.).
4.5 Market Segments
4.5.1 End Uses On an Australia wide basis about 60-70 % of carcasses taken are used for pet food with only 30-40%
destined for human consumption. Of the human consumption segment, about 70% is exported;
therefore only about 10% of total carcasses taken are destined for domestic human consumption
(Kelly, 2005).
There were about 5,000-6,000 tonnes of meat exported each year in the early 2000s with 1.5 to 2
million skins also exported in those years (Kelly, 2005).
There is a rough estimate that the domestic restaurant sector could take one third of production of
prime cuts but currently only take some 10% of prime cuts (Kelly, 2005). So it appears there could be
room for expansion into the domestic restaurant trade.
There is a need for improved general information on the consumption of kangaroo meat for different
end uses (e.g. fillets, rumps, sausages etc.), and yields and prices for different cuts and components of
carcasses, and how these vary with size and sex of animal. Spreadsheets that represent such carcass
yield information were not located but would be valuable in developing harvesting and marketing
strategies.
One industry processor and marketer (Macro Meats) has pioneered a significant change in marketing
of kangaroo meat for human consumption with distribution into supermarkets and to the food service
industry. Health characteristics of kangaroo meat in term of its low fat content are being promoted by
Macro Meats – Gourmet Game (www.macromeats.com/aboutmm.html).
4.5.2 Consumption The main issues that appear to be associated with low consumption are: awareness, some negative
perceptions of quality, and a lack of knowledge of how to cook.
A 1997 study (Des Purcell and Associates, 1997) reported that the number of people who had eaten
kangaroo in the past 12 months was 25% (66% in restaurants and 28% at home). The main kangaroo
Would you withhold permission to harvest on your property as a negotiating
tool for landholders?
69 43
11
0 20 40 60 80
100 120
yes no unsure/no comment
18
cuts were strip loin, long fillet, and rump which are all ideally suited to pan frying, barbecuing and
stir frying and all optimally served medium rare. Actual cooking methods used were panfried, grilled
and barbecued. Also the majority of people cooked kangaroo medium and well-done rather than
medium rare or rare. The issue of the perception of hygiene may be one reason that leads to
overcooking in some instances.
Most Australians believe that kangaroos should be harvested (increased from 75% in 1995 to 85
percent in 2005) so the anti-harvest population is only minor, but its voice is loud. It is likely that
consumers worry more about health /hygiene issues, control and checks, etc and that less important in
their minds are the harvesting method and the ‘Eating Skippy Syndrome.
It has been estimated that if all animals taken were consumed domestically, kangaroo consumption
would make up only 4.5% of the domestic red meat market.
In a more recent study funded by RIRDC, Ampt and Owen (2007) investigated the potential for
increasing penetration of kangaroo meat into the smallgoods and processed meat markets (e.g. pies,
sausages). The research targeted manufacturers, retailers and focused groups of meat consumers.
Investigations included their level of awareness and factors influencing purchasing choices including
price and information provided, consumers values, concerns and preferences. Some of the main
findings were:
Kangaroo meat availability has increased and consumption has been growing slowly and steadily;
the meat is now present on most domestic supermarket shelves.
Issues remain concerning the harvesting of animals and meat hygiene.
Many consumers are still cooking kangaroo meat medium to well done.
Kangaroo meat should be promoted as a gourmet alternative, carries health benefits and has a
wide variety of uses.
Kangaroo meat mince has a high volume potential, deli products are likely to be received
positively but kangaroo meat pies are unlikely to receive a significant market share beyond
specialist pie shops.
4.6 Implications for Market Research
Given the foregoing background, the role of the ensuing market research was therefore to assess the
market sensitivities and the characteristics that processors, marketers and consumers (in the wider
sense) place on individual attributes or the mix of attributes such as:
conservation of kangaroos within the Conservancy
production systems for traditional livestock fitting within a broader environmental management
system
quality control along the marketing chain including the ability to traceback
conservation of other valuable native species of animals through control of pest animals
the maintenance of native vegetation with improved control of weeds.
Consumers of kangaroo meat would need to be asked what they see as the key messages/information
that would influence them to purchase kangaroo meat more regularly, order more frequently in
restaurants etc. For example:
knowledge of where it can be purchased
more information on cooking methods
quality assurance including health and hygiene
assurance of source and ability to trace back
humane harvesting methods
sustainable management of kangaroos
sustainable management of pastures and land with a higher level of ground cover
sustainable management of native wildlife.
19
Other specific questions needing some exploration included:
1. would you be inclined to try kangaroo meat, eat more, order more frequently in restaurants etc if
you believed the source of the kangaroos was from a sustainably managed conservancy?
2. would monitoring of kangaroos numbers and offtake within the conservancy provide some
assurance to you of sustainable management?
3. would you be willing to pay more for kangaroos meat it if were sourced from an accredited
sustainably managed land production system (e.g. control of feral animals that destroy wildlife,
processes for reducing the spread of weeds, development of biodiversity corridors)?
4. would you favour product that demonstrated management of an improved balance between
kangaroos and sheep whereby less sheep were carried and more kangaroos were available for
harvest?
20
5. Market Survey Findings and Implications This section is based on the market research carried out with kangaroo meat processors and
representatives of the kangaroo meat marketing chain including consumers. Results are based on a
small sample of firms but the themes raised were consistent. Further details of these results are
contained in Appendices 4, 5, and 6.
5.1 General Market Trends
Some key trends affecting potential demand for the Conservancy product include the following:
The kangaroo industry at present is price competitive and over the past 12 months there has been
intense competition between major processors driving prices down in the marketplace.
Some food service firms specialising in game meat supply have reported shortages of kangaroo
and were interested in the potentially new product for that reason.
Increased sales of kangaroo product through supermarkets is raising consumer awareness of
kangaroo products and increasing consumption.
Kangaroo product is generally seen as a niche product by consumers, retailers, restaurants and
food service companies.
5.2 Interest in the Conservancy Product
Supermarkets, food service companies, hotels, restaurants, caterers and gourmet food retailers
provided the following feedback on their interest in the Conservancy product. It should be noted that
the number of respondents in some market segments was limited and that these responses may not
necessarily be representative.
Sixteen of the 19 firms surveyed were interested in trialling the product or in receiving more
information on the product but the final decision to use the product would be based on a range of
factors including quality, price and perceived demand. Two firms were not interested in the new
product and one could not comment until they received more information.
When asked to rate the strength of the opportunity for the Conservancy product in the market (on
a scale of 1 to 5 where 1 is poor and 5 is very good), food service companies gave the highest
rating (3.5) followed by hotels (3.3) and supermarkets (2.9).
Food service companies (including game meat suppliers to high quality restaurants and gourmet
butcher shops) felt that there is potential interest in the product. Kangaroo was more popular
about 7 years ago and demand for game meat is ‘fashion’ influenced. For this reason, the new
product would need to be supported by a concerted promotional campaign targeting chefs (e.g.
chef workshops such as G’day Chef and targeted marketing) to encourage trial of the product.
Consumer demand is seen as a key driver and promotion to consumers is also needed.
Restaurants gave a rating of 2.0 out of 5 to the market opportunity. While some were interested,
others were not interested in the product. Significant differentiation on quality and presentation
would be needed. Successful branded products used by restaurants include MSA and other high
quality branded meat. Junee Lamb has developed high quality packaging for restaurants and this
approach has lifted demand. Kangaroo is currently supplied to restaurants in clear plastic, bloody
bags and can be much less appealing.
Catering firms (rating of 2.0 out of 5) generally felt that the market was not yet ready for the new
kangaroo product but that there was potential for the product in the future.
21
Hotel interests felt that there is potential demand for a high quality, environmental branded
product (rating of 3.3 out of 5). As with the restaurant segment, promotion to chefs and marketing
the product as a gourmet product is important.
Small gourmet retailers sold very little kangaroo prosciutto or salami and were least likely to be
interested (giving a rating of only 1.5 out of 5 for the strength of the opportunity).
Supermarkets were interested in receiving the product and gave a rating of 2.9 out of 5.
Independent supermarkets were interested in the product because it would provide a point of
differentiation. One major supermarket is interested in seeing the product but consumer demand
from the market would be needed to support sales.
For some firms, the environmental focus is valuable due to the positioning of the business or
because of increased interest from consumers. However, the Conservancy product would need to
be positioned primarily as gourmet and secondly as an environmental brand.
Those who did not see value in the environmental branding believed that the current supply of
kangaroo already has good environmental credentials. Others felt it would be too difficult to
differentiate the new product from the existing supply of kangaroo.
Consumers are interested in the environmental branding but provided feedback that the product
must also be seen as gourmet and high quality to attract interest, particularly from those who
currently do not buy kangaroo meat regularly.
5.3 Supply Arrangements
Key issues to emerge on supply arrangements for the Conservancy product included the following:
The potentially small volume of the Conservancy branded product and any problems with stability
of supply will affect opportunities to supply the product into some firms and some segments. The
hotels and supermarkets contacted confirmed that lack of continuous supply would be a barrier to
using the product. Some of the firms in other segments would not be interested in the product if
supply is not reliable or consistent.
Clear messages are needed about the differences the new product offers. To achieve wider levels
of interest and support, the quality and gourmet positioning will be the main driver. Few are
interested in a product that is differentiated only by the conservancy approach. Also, the
environmentally branded product must be demonstrated to be superior in quality and packaging.
Regarding quality, tenderness and food safety were considered paramount.
Of the 19 firms surveyed 18 indicated that they would be willing to pay a higher price for the
environmentally branded product. Firms stated they were willing to pay between 1% and 20%
more for the environmental brand, but the actual price of the product would be determined by the
quality of the kangaroo meat. All segments reported that the Conservancy product initially should
have a similar pricing to existing kangaroo and, once the product is established and successful, the
price could be gradually increased.
High quality packaging and differentiated marketing is required. The current presentation of
kangaroo product to restaurants and food service outlets was considered fairly basic and sends the
message kangaroo is just a commodity product. Market feedback indicates that care and attention
with packaging will help to differentiate high quality products, particularly in the restaurant
segment.
22
Businesses purchasing environmentally branded kangaroo want information on how sustainable
harvesting is managed, credentials of the supplying organisation, firm ownership, food quality and
system capabilities – a full profile on the operation, its capabilities and the benefits it can deliver.
These firms felt that consumers would want information on the origin of the product, nutrition and
health information (confirmation that it is a healthy product), information that kangaroo is tender
and of good quality.
Specialist game meat suppliers are interested in exclusive state supply arrangements.
While some hotels, restaurants, food service and catering firms want a single point of contact for
supply, others want to access a more sophisticated supply network to service different locations.
Supermarkets want to see distribution support for a wide network of outlets.
5.4 Feedback from Processors
Two processors were interviewed and both felt that the best approach for the Conservancy product
was to link with an existing processor that has established distribution pathways into key markets.
Processors had provided feedback that the market over the last 12 months has been extremely price
competitive with major suppliers discounting prices for market share growth. This extremely
competitive and price driven market can make it difficult for a new niche product to establish in the
marketplace and seek improved returns.
Both processors contacted are interested in talking with the Maranoa Conservancy Group about
providing a supply and distribution linkage.
5.5 Consumer Reactions
Two focus groups provided consumer feedback on the new kangaroo product.
Regular buyers of kangaroo meat are generally interested in the concept of an environmentally
branded kangaroo product. For the majority of this group, a gourmet product positioning is essential.
A few people in this regular user focus group purchase kangaroo meat because it is a cheaper meat
option.
Overall this group would accept a slightly higher price if they knew the product was delivering
positive results for the environment and was a gourmet product.
Consumers are not interested in information on harvesting processes but do want to be assured of
quality and food safety.
Consumers are interested in the ‘environmental story’, particularly the fact that the product is
produced in Queensland by Queensland based companies.
It is important to provide an effective, succinct and positive environmental story to accompany the
product. Although consumers understand concepts such as ‘organic’ and ‘free range’, consumers felt
that the conservancy concept would need a simple, easy to understand definition. People did not find
the concept or the benefits easy to understand. Some saw the fact that cattle and sheep production was
continuing, along with possible land clearing on properties, was in conflict with the concept of a net
gain to the environment.
There was strong interest in the low greenhouse gas emissions from kangaroos.
23
Both regular and infrequent users of kangaroo are interested in information on cooking methods for
the best eating result and recipes using kangaroo. Consumers identified opportunities for use of ‘bush
tucker’ complementary spices and food products (e.g. marinades, sauces) that could be sold with the
Conservancy kangaroo.
Consumers who have not purchased or eaten kangaroo in the past need to be made aware of the
environmental benefits of kangaroo and that it is a high quality, gourmet product. The perception that
kangaroo meat is dog food or pet food is not a positive association for promotion as gourmet product.
This group of non-users felt that the environmental branding, along with the gourmet positioning,
would encourage them to try the Conservancy product.
5.6 Challenges and Opportunities
The research has identified some challenges and also some opportunities for the new Conservancy
branded product. Key challenges for the new venture include:
Gaining market access and providing the necessary support and customer service backup required
was identified as a challenge.
A very high quality product was considered essential to penetrate all markets, but particularly the
restaurant market, gourmet butchers and game meat specialist distributors.
Maintaining stability of supply was generally important for consumers and for each of the market
segments. A seasonal downturn would be understood by consumers, however patchy supply
would result in consumers not consistently coming back to the product.
Although there is potential for the Conservancy branded kangaroo to increase its price compared
with the standard product, the initial supply would need to be price competitive with existing
supplies to build up a market following.
Consumer acceptance of kangaroo is growing. However it is regarded as a niche product and
consumers do not have a great deal of understanding of this product, particularly as a high quality
gourmet product. Consumer education, in store demonstrations and promotion or endorsements
of the product by chefs needs to be undertaken to appropriately position the product.
Establishing a niche product within a niche market (existing kangaroo supply) was seen as a
difficult task. Some firms felt that there was still limited demand for kangaroo at the present time
and that considerable marketing effort would be required to create consumer demand (considered
essential for long term success) and market the new product to different market segments.
Key recommendations based on the market research findings include:
Establishing a partnering arrangement with one of the processors may offer the best fit for the
new venture in the short term in terms of gaining knowledge about the market and its market
positioning.
Exclusive supply arrangements to game meat suppliers in some states could also be considered.
The Conservancy product would need to be promoted as a gourmet and environmentally branded
high quality product; use of all three themes would be vital in the positioning of the product.
The environmental brand would need to be simply communicated.
Developing effective packaging and a recognisable, attractive branding for the product would be
recommended. It will be important to provide leaflets for recipes when targeting consumers and
provide the necessary information on the product when targeting key market segments, e.g.
quality, food safety and the Conservancy message.
It would be highly desirable to undertake a targeted consumer promotion strategy to raise
awareness of the quality of product and its environmental credentials.
Depending upon the availability of product, and once some security of supply and quality has
been obtained, it may be then viable for the venture to target smaller volume, high value markets.
However these market segments are ‘unforgiving’ in terms of their expectations of quality,
consistency and availability of supplies.
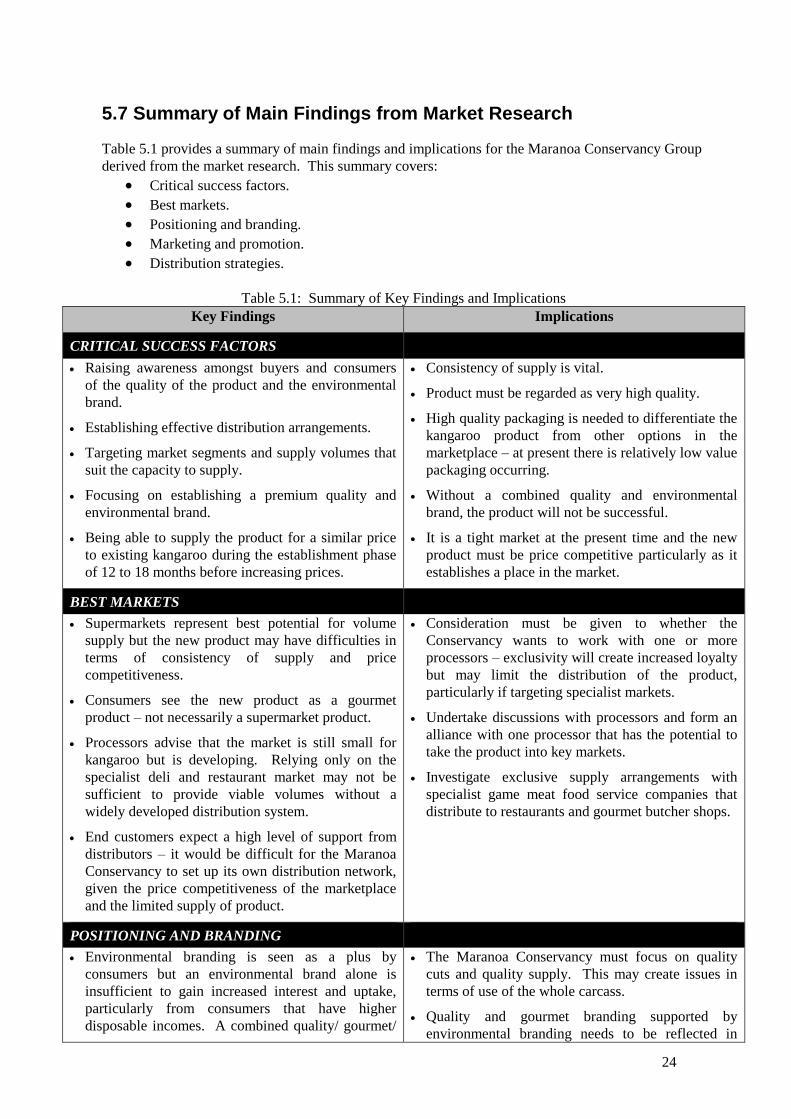
24
5.7 Summary of Main Findings from Market Research
Table 5.1 provides a summary of main findings and implications for the Maranoa Conservancy Group
derived from the market research. This summary covers:
Critical success factors.
Best markets.
Positioning and branding.
Marketing and promotion.
Distribution strategies.
Table 5.1: Summary of Key Findings and Implications
Key Findings Implications
CRITICAL SUCCESS FACTORS
Raising awareness amongst buyers and consumers
of the quality of the product and the environmental
brand.
Establishing effective distribution arrangements.
Targeting market segments and supply volumes that
suit the capacity to supply.
Focusing on establishing a premium quality and
environmental brand.
Being able to supply the product for a similar price
to existing kangaroo during the establishment phase
of 12 to 18 months before increasing prices.
Consistency of supply is vital.
Product must be regarded as very high quality.
High quality packaging is needed to differentiate the
kangaroo product from other options in the
marketplace – at present there is relatively low value
packaging occurring.
Without a combined quality and environmental
brand, the product will not be successful.
It is a tight market at the present time and the new
product must be price competitive particularly as it
establishes a place in the market.
BEST MARKETS
Supermarkets represent best potential for volume
supply but the new product may have difficulties in
terms of consistency of supply and price
competitiveness.
Consumers see the new product as a gourmet
product – not necessarily a supermarket product.
Processors advise that the market is still small for
kangaroo but is developing. Relying only on the
specialist deli and restaurant market may not be
sufficient to provide viable volumes without a
widely developed distribution system.
End customers expect a high level of support from
distributors – it would be difficult for the Maranoa
Conservancy to set up its own distribution network,
given the price competitiveness of the marketplace
and the limited supply of product.
Consideration must be given to whether the
Conservancy wants to work with one or more
processors – exclusivity will create increased loyalty
but may limit the distribution of the product,
particularly if targeting specialist markets.
Undertake discussions with processors and form an
alliance with one processor that has the potential to
take the product into key markets.
Investigate exclusive supply arrangements with
specialist game meat food service companies that
distribute to restaurants and gourmet butcher shops.
POSITIONING AND BRANDING
Environmental branding is seen as a plus by
consumers but an environmental brand alone is
insufficient to gain increased interest and uptake,
particularly from consumers that have higher
disposable incomes. A combined quality/ gourmet/
The Maranoa Conservancy must focus on quality
cuts and quality supply. This may create issues in
terms of use of the whole carcass.
Quality and gourmet branding supported by
environmental branding needs to be reflected in
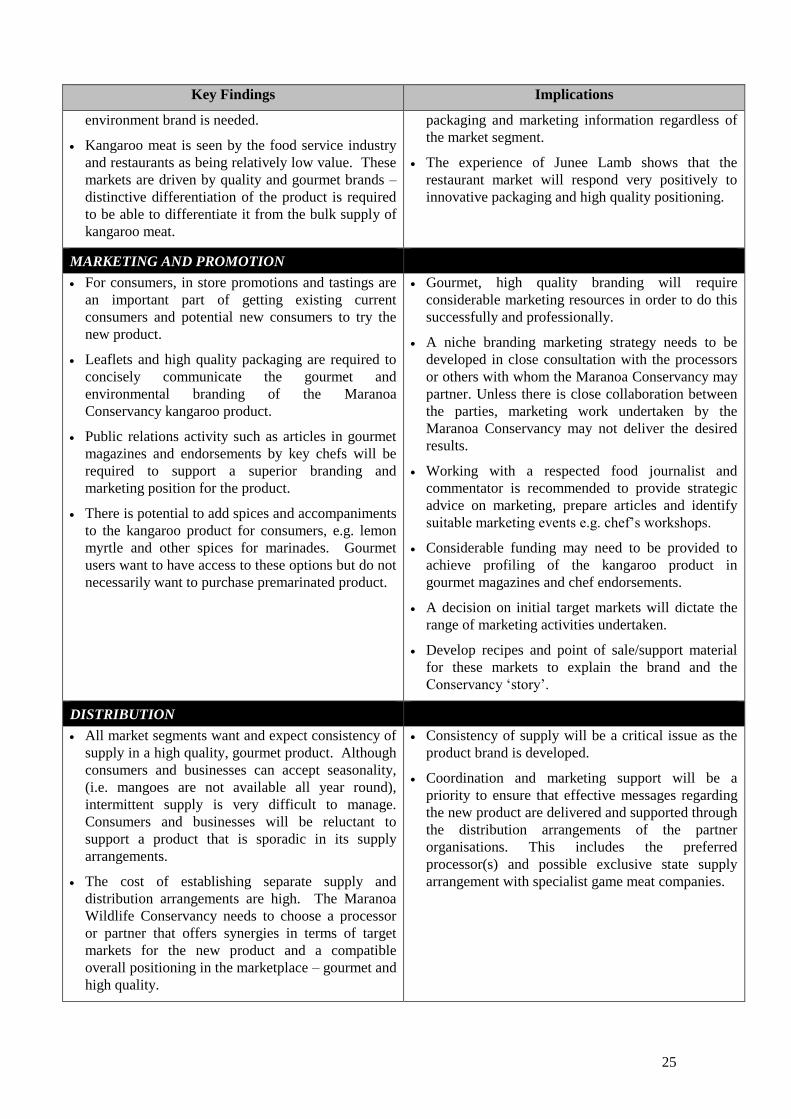
25
Key Findings Implications
environment brand is needed.
Kangaroo meat is seen by the food service industry
and restaurants as being relatively low value. These
markets are driven by quality and gourmet brands –
distinctive differentiation of the product is required
to be able to differentiate it from the bulk supply of
kangaroo meat.
packaging and marketing information regardless of
the market segment.
The experience of Junee Lamb shows that the
restaurant market will respond very positively to
innovative packaging and high quality positioning.
MARKETING AND PROMOTION
For consumers, in store promotions and tastings are
an important part of getting existing current
consumers and potential new consumers to try the
new product.
Leaflets and high quality packaging are required to
concisely communicate the gourmet and
environmental branding of the Maranoa
Conservancy kangaroo product.
Public relations activity such as articles in gourmet
magazines and endorsements by key chefs will be
required to support a superior branding and
marketing position for the product.
There is potential to add spices and accompaniments
to the kangaroo product for consumers, e.g. lemon
myrtle and other spices for marinades. Gourmet
users want to have access to these options but do not
necessarily want to purchase premarinated product.
Gourmet, high quality branding will require
considerable marketing resources in order to do this
successfully and professionally.
A niche branding marketing strategy needs to be
developed in close consultation with the processors
or others with whom the Maranoa Conservancy may
partner. Unless there is close collaboration between
the parties, marketing work undertaken by the
Maranoa Conservancy may not deliver the desired
results.
Working with a respected food journalist and
commentator is recommended to provide strategic
advice on marketing, prepare articles and identify
suitable marketing events e.g. chef’s workshops.
Considerable funding may need to be provided to
achieve profiling of the kangaroo product in
gourmet magazines and chef endorsements.
A decision on initial target markets will dictate the
range of marketing activities undertaken.
Develop recipes and point of sale/support material
for these markets to explain the brand and the
Conservancy ‘story’.
DISTRIBUTION
All market segments want and expect consistency of
supply in a high quality, gourmet product. Although
consumers and businesses can accept seasonality,
(i.e. mangoes are not available all year round),
intermittent supply is very difficult to manage.
Consumers and businesses will be reluctant to
support a product that is sporadic in its supply
arrangements.
The cost of establishing separate supply and
distribution arrangements are high. The Maranoa
Wildlife Conservancy needs to choose a processor
or partner that offers synergies in terms of target
markets for the new product and a compatible
overall positioning in the marketplace – gourmet and
high quality.
Consistency of supply will be a critical issue as the
product brand is developed.
Coordination and marketing support will be a
priority to ensure that effective messages regarding
the new product are delivered and supported through
the distribution arrangements of the partner
organisations. This includes the preferred
processor(s) and possible exclusive state supply
arrangement with specialist game meat companies.
26
6. Discussion
6.1 Sustainable Management
There is a need to demonstrate the value of a conservancy environmental brand that can be promoted
to consumers. As mentioned earlier the concept may be difficult to promote to consumers.
The propositions identified so far by the Conservancy is that landholders will carry out enhanced
habitat protection and control of invasive species that diminish biodiversity or reduce damage to land
as a result of better management of the kangaroos and traditional grazing enterprises with sheep.
The focus group discussions revealed some difficulties in understanding the Conservancy concept as
perhaps there were too many messages involved and not one issue that could be driven home. Some of
the simple conservation /environmental concepts that appeared important were the maintenance of
sustainable populations of macropods, sheep/cattle versus kangaroos, greenhouse gas production, and
some concerns about shooting females and joeys in the pouch.
Possible dimensions to pursue could include:
(i) Sustainable kangaroo management in terms of numbers being able to regenerate quickly (e.g. not
harvesting young females or females with joeys in the pouch) as well as in terms of improved
information on kangaroo numbers and maintaining sustainable yields. For example, sending GPS/GIS
data to Queensland Parks and Wildlife Service (QPWS) to bypass the current paper trail with
electronic data transfer. This will allow more accurate and quicker updates of the macropod database
daily with possible cost savings and a higher level of efficiency of administering the quota. This
would demonstrate to government and consumers that the Conservancy is supportive of an
accreditation system and influencing consumer attitudes by demonstrating the efficacy and
responsiveness of management of sustainability of harvest quotas etc.
(ii) Sustainable land management including grazing pressures, and the balance between traditional
livestock grazing systems and kangaroo management. Maintaining an appropriate balance of
traditional livestock and kangaroo populations could be promoted. This may mean more sheep/cattle
or more kangaroos. There is the potential for there to be fewer sheep/cattle, but on the other hand
harvesting kangaroos more strategically will allow pastures to regenerate more rapidly overall. One
option is to focus on general sustainable management within the conservancy of grass, water and
animals. It could be possible for the same label to be used on cattle, sheep, etc, given that the same
land management that was producing the kangaroo product was also producing other products.
(iii) Sustainable management of other native animal species within the Conservancy and highlight in
general conservation management on properties (e.g. some form of wildlife stewardship certification
label). Also, there is the possibility to promote the benefits of harvesting native animals given
pending climate change. Native animals generally manage better during drier conditions, and given
changes in climate and potential land use, there is a possibility that in years to come there may be
kangaroos grazing where sheep used to graze.
(iv) The relative greenhouse gas emission implications of kangaroos and beef/sheep production could
be used to promote the environmental implications of kangaroo production and harvest.
(v) The possibility of labelling carcasses to differentiate between species and sex may demonstrate
sustainable management. For example, gathering information cost effectively on sex, age and weight
of the harvest so that population models can be used to demonstrate sustainable populations of non-
harvested animals.
27
(vi) It may be possible to produce an explanatory booklet emphasising the benefits to Australia
including those to the environment and to consumers; this would need to be more than a simple
message and may contain elements of each of the themes above
(vii) Much of the explanatory and supporting material as identified above would need to be aimed at
key intermediaries in the market such as chefs and gourmet butchers rather than end consumers.
Since many of the Conservancy properties have already been certified under ALMS, the simplest
strategy would be to claim that certification and provide a simple, short and easy to read explanation
of what ALMS represents. In addition it would be necessary to indicate how the kangaroo
management system under ALMS differs from the traditional system under which kangaroos are
produced. However, only a handful of properties have been certified so far under ALMS. It would be
necessary for this number to be substantially increased in order to legitimately claim some type of
formal accreditation for the product.
6.2 Humane Harvesting
Currently harvesting techniques are generally considered humane by most consumers. For example,
there is a harvesting best practice developed by the Game Harvesters Association, there is required
training of shooters, humane disposal of pouch joeys and other ethical practices.
There is sufficient information at present to conclude that the 10% or so of people who worry about
animal welfare or ethical considerations will not change their opinion anyway and therefore are not
important as a potential market target. Animal welfare issues (and more specifically harvesting issues
and how kangaroos are killed) may therefore not be important in any market development. An
exception to this would be if the shooting of kangaroos on Conservancy properties was perceived to
be more humane than that for the rest of the industry and this would be difficult to address.
The market research showed that for most consumers any animal welfare and harvesting
considerations were not a major issue and these issues are probably best left alone. However, the
market research demonstrated some concern about the residual population if females were harvested,
the harvesting of females with pouch joeys and any genetic implications in the longer term of
harvesting the larger animals.
6.3 Product Availability
The regional or Conservancy quota, and the relatively small size of the Conservancy resource, may
restrict supply of kangaroo meat from the Conservancy. As indicated from the market research, this
may have implications for the commitment to the product of those in many market segments (and
possibly some consumers). There may well be a critical mass of kangaroo meat marketed under the
Conservancy brand that would need to be made available to the market for it to be promoted
effectively. Assuming there was a price premium available for the Conservancy product, there exists
somewhat of a chicken and egg situation whereby a price premium may not be captured until there is
sufficient supply, and that sufficient supply may not be available until a price premium is apparent.
Apart form total quantity available, continuity and the variability of supply may be key issues in
marketing a Conservancy badged product. Strategies for maintaining a continuous supply or at least
reducing supply variability may include one or more of the following:
Managing the kangaroo population on a whole area of Conservancy basis.
Reducing sheep, cattle (and in some cases goat) numbers in drought periods.
Utilising smaller kangaroos (and possibly wallabies) and subsidising the meat price to
processors/marketers.
Limiting the meat sold under the Conservancy brand in periods of ample supply so that
expectations for supply continuity were not high, and with other kangaroo meat sold generically.
28
Form marketing alliances with other like-minded Conservancies, preferably in other regions so
that some form of spatial diversification were in play that may reduce variability except in nation
wide droughts.
6.4 Product Quality, Integrity and Traceback
It is evident from the market research that meat quality and food safety and integrity are key issues. A
member of the Maranoa Conservancy has developed a system of barcoding and electronic data capture
including GIS and GPS information. One benefit of this system could be to stop kangaroos being
taken illegally out of the region with the quota. The new system, if implemented by the Conservancy,
would demonstrate quality control back to the paddock and to the chiller level and may even extend
further down the value chain if that can be organised within the distribution system. The benefits of
the traceback system would be proof of the product coming from the Conservancy as well as a better
ability to quickly trace product back to the source of any quality problem.
Also, the Conservancy could improve the arrangements around product integrity. Currently there are
no formal supply chain agreements within the kangaroo marketing chain. It is possible that product
quality could be improved from the shooting and field harvesting (gutting etc), handling to the chiller,
chiller management and then transport to the processor. This may involve for example, use of bar
codes and temperature scanning devices. There is currently a code of practice for chiller management
but some industry opinions are that this area of the supply chain could be significantly improved.
An issue associated with improved chain management is whether improved quality means a higher
cost of supply (e.g. harvesting or chiller costs) and whether there are low cost areas of improvement
that can be made. Stacking and spacing in chillers appear to be an important issue as there is a need to
cool carcasses down quickly but this is not possible when chillers are full. Choices need to be made
therefore between smaller or larger chillers and their number and location, regularity of emptying,
single or double hanging etc. The cost implications of all such changes require estimation. Also, it
would be important to assess how quality could be improved by implementing changes in terms of
less wastage or improved eating quality.
As mentioned earlier, harvesting smaller kangaroos may not be profitable unless there is a niche
market for smaller cuts, as they have high processing costs per kg and limited skin value. Steps taken
to ensure a high quality product need to be listed and communicated to those harvesting on
Conservancy properties and the operator of the Conservancy chillers.
6.5 Distribution
Assuming a high quality product is established, there would be a number of options for distribution
and marketing. The business model chosen would depend on the extent of product differentiation
envisaged, resources available to the Conservancy and the attitude to risk.
Forming a marketing relationship with one processor would have the advantage in the short term in
that there would be an established market for the product while matters of harvesting organisation and
chiller management are developed. Also, a single processor is more likely to commit to a new product
with appropriate promotional and educational support. On the other hand a single processor may be
more interested in securing access to a high quality product for existing markets rather than
developing the market for a new product. While a small premium may be paid for quality in the first
instance, this premium may never attain a high level if the Conservancy product is not well
differentiated in the market place. The Conservancy product would then most likely be sold into the
mass market for kangaroo meat (e.g, supermarkets).
Some processors may be more concerned about maintaining throughput in the processing facility,
rather than developing a premium price in the market place through packaging or promotion. The
possibility remains of a joint market development effort by the Conservancy and the processor.
29
A second option may be to make the product available to more than one processor, with preferences
given to processors or marketers with ideas for promotion as coming from a net conservation gain
production system.
Another option may be to pay for carcasses to be processed under contract and then market the
processed cuts directly to an up-market food service firm that may supply restaurants or a game meat
specialist distributor.
In all of these options, it may be possible to obtain a government grant to help develop the packaging,
promotional material, and implement promotional activities.
The strategy of developing the market for the Conservancy product at existing prices and then
gradually increasing prices once a market niche has been developed is favoured. The potential for
increasing prices to domestic consumers and to export market is presumed to be limited in the short
term. The Conservancy product has first to be differentiated and proven in terms of quality, food
safety and environmental credentials. Only then should price premiums are likely to be extracted from
processors or other distributors.
6.6 Cooking and Health Aspects
Several studies have suggested that there is still limited knowledge of the best methods of preparing,
cooking and serving kangaroo meat in the home and this may be constraining the home consumption
market.
The market research suggested that overcooking may still be quite prevalent. Specific messages
regarding the integrity of the meat need to be developed that while the meat is ‘game’, there are no
pathogens or parasites that are associated with kangaroo meat. This may be endorsed by some form of
survey including analyses of randomly selected Conservancy product by an accredited laboratory.
Such endorsement may reduce the overcooking tendency some of which is possibly associated with
this fear.
One comment from the focus groups was that some found the gamey flavour of kangaroo very strong
and suggested using marinades and spices to cut the flavour.
Kangaroo meat is endorsed by the Heart Foundation as low fat and this characteristic is currently
being exploited by some involved in kangaroo marketing and by the Kangaroo Industry Association.
This message is well received by consumers and any promotion of Conservancy product will need to
include this message as well.
6.7 Size and Location of Markets
The sizes of the markets identified for targeting are generally sufficient to accommodate the supply of
kangaroo meat from the Conservancy. The key market segment considered appropriate is the
upmarket gourmet sector using highest quality cuts. This key market has a number of sub-segments
that could be targeted by Conservancy marketing, for example, gourmet butchers, restaurants and
hotels. These markets are potentially large but promotion will be required for them to be successfully
penetrated. The location of markets will be dependent on the distribution system chosen. However,
the majority of the upmarket segments are likely to be in NSW and Victoria.
30
7. Conclusions and Recommendations
1. There are four major conclusions relevant to any market development through a branding and
promotional strategy:
(v) Environmental management as a concept in kangaroo meat marketing has some potential
but the net conservation gain concept is difficult to address in a manner that can easily be
understood and believed. This remains a challenge for the Maranoa Conservancy Group
(vi) Environmental credentials are not sufficient on their own to develop a market niche for
the Conservancy product. Meat quality and integrity are very important and there need to
be reasons provided as to why the Conservancy product is higher quality than the rest of
the kangaroo meat in the market.
(vii) Given the likely Conservancy supply, the product would need to be positioned as a
gourmet product at the top end of the market including such market targets as restaurants
and gourmet butchers. One distribution channel to facilitate this would be through game
meat specialist distributors.
(viii) Significant promotion and packaging innovation would most likely be required to develop
a niche market
2. The difficulties and risks, time and costs for development of a niche market should be recognised. It
is unlikely that the Conservancy could raise the resources required (in the hundreds of thousands of
dollars) for this market development unless there was some partnering with existing players.
3. Supply variability will be a constraint in market development, mainly in gaining the required
support from within the distribution system. Potential multiple strategies to overcome some of this
variability have been identified.
4. It will be important to identify where improved quality and/or cost savings/increases to the total
system are likely to occur from the Conservancy operating its own chillers. There is a need to avoid
pursuing a system that increases costs without net benefits. Demonstrating profitability to the overall
system from changes should be given precedence with secondary attention given to the distribution of
any gains or losses, at least in the first instance.
5. It is recognised that the current marketing chain has evolved over a number of years. There will be
entrenched interests, distrust and opposition to change as has been demonstrated already.
31
Appendix 1: Other New Enterprises for the
Conservancy Several other enterprise products and markets were outlined in the earlier study of WMC enterprises.
Apart from adding value to the kangaroo resource, three other opportunities have been identified in
the past for the Maranoa Conservancy. These are ecotourism, cypress pine and other vegetation
management including regrowth control, and bush foods.
A1.1 Vegetation Management
Native vegetation management can be considered a part of property management. One of the more
common native species within many of the Conservancy properties is cypress pine. Because the
conservancy properties are leasehold the cypress pine timber is considered property of the State of
Queensland. Some pastoralists perceive valuable timber is often lost to fire and age, and could be
managed better than currently (via enhancement thinning, pruning). It is possible that this resource
could be better managed under property management plans within an overarching Conservancy plan.
QDNRW has certification under the Australian Forestry Standard (AFS) and presumably this applies
to cypress pine. Also some cypress pine mills we understand have chain of custody certification.
However, individual landholders can not get certified under AFS.
One opportunity would be to assess whether the Conservancy itself could get leasehold rights changed
in order to be able to manage and harvest the cypress pine on their properties. The resource could then
be managed on a Conservancy basis.
Regrowth control (has an impact on pasture resource) and ecological value of the regrowth, and soil
condition is controversial and interacts with the existing vegetation management laws. Regrowth of a
species such as cypress pine could be incorporated into the management plans.
A1.2 Ecotourism and Eco-education
One opportunity is reintroduction of endangered mammals and marsupials due to improved feral
animal control (e.g. via dog baiting). Kangaroo viewing as a feature of ecotourism is another option
that could be considered.
Ecotourism requires either a central feature that is unique or a series of attractive tourist activities
roughly within the same region. There would be a need to have some accredited system of wildlife
management to show off; such may include control of ferals, reintroduction of species, integrated
kangaroo and traditional livestock management systems etc. One constraint to ecotourism is that
vehicle movements would increase so that visitor education regarding weed spread would be required.
Ecotourism could include the Nalingu Aboriginal Corporation with regard to the YUMBA and the
preservation of its history. YUMBA Indigenous Cultural Education and Knowledge Sharing Centre
hosts an interpretive trail and guided tour, an education centre and a plant nursery.
Booringa Shire Council is still interested in the SWE project in the Maranoa. The bird watching trail
is still on the agenda and could include properties in the Maranoa Conservancy but would most likely
be developed as a broader initiative to cover St George, Surat, and Injune areas. This is because the
potential project was developed in the past by Booringa Shire on behalf of 4-5 other shires in the
district. There were 4 ecotours involved: bird watching, fishing, 4WD tour, and cultural heritage.
The next step in the stalled bird watching project is to identify the hot spots for bird watching in the
region, and carry out market research on the type of watching required, accommodation and other
32
infrastructure needs of the potential market. Birds Australia has shown interest in the market research
but funding is needed to take it to the next stage. Also required is a listing of birds in the region in
combination with the scientific name, common names, and indigenous names of birds as well as the
cultural significance of birds to the aboriginal communities (Noela Ward, Booringa Shire Council,
pers. comm., August 2007).
Also investigated has been photography groups from the city, and an opportunity to have a wood
turning weekend, something similar to what is done at Maleny & other places.
Alison Alexander has also done some work with Booringa Shire council to develop some signature
dishes from the local area. There is an opportunity for kangaroo to be one of these dishes. These
signature dishes are then promoted at the local shops, restaurants, pubs, etc.
A1.3 Bushfoods
Australian desert limes grow in the region and could be the basis of a bush food industry. Contacts for
this idea and other bush food prospects include the Booringa Shire Council, Jock Douglas, and
Nalingu Aboriginal Corporation. A key question is how could these prospects be aligned with the
Conservancy.
An investigation into market for native honey could be useful, However, one or two pastoralists could
start such an enterprise on their own and it would not appear to require Conservancy involvement
33
Appendix 2: Survey Questionnaires:
Strategic Research for the Maranoa
Conservancy Concept
INTRODUCTION
Good morning/afternoon, my name is …… from Deborah Wilson Consulting Services. I am
following up on the earlier email about the survey we are conducting for the Maranoa Conservancy
Concept. I wanted to get your feedback on the value of environmentally branded kangaroo meat.
All of the information that you provide is confidential and only summarised information is provided
to the client.
Would you have 10 to 15 minutes now to undertake the survey?
Name: ____________________________________________________________________
Organisation: _______________________________________________________________
Phone No: ________________________________________________________________
Interviewer: __________________________________ Date: _______________________
1. Current Profile of Kangaroo Meat Purchases
1.1 Do you currently buy any kangaroo meat? (Record all answers)
Yes 1 (go to 1.2)
No 2 (go to 2)
1.2 What type of kangaroo meat do you currently sell? (Record all answers)
___________________________________________________________________________
___________________________________________________________________________
2. REACTION TO CONSERVANCY SUPPLY
2.1 I sent through an email on the planned environmentally branded kangaroo from the Maranoa
Conservancy. The benefits offered by the environmentally branded kangaroo also include
improved quality, food safety and humane harvesting. The environmentally branded
kangaroo would represent only 2% of the total kangaroo available for human consumption.
What are your initial thoughts on the concept? (Record all answers)
___________________________________________________________________________
___________________________________________________________________________
2.2 What is your reaction to environmentally branded kangaroo versus the ordinary supply of
kangaroo? (Record all answers)
34
___________________________________________________________________________
___________________________________________________________________________
2.3 What value do you and your customers place on sourcing environmentally branded kangaroo?
(Record all)
___________________________________________________________________________
___________________________________________________________________________
2.4 What benefits do you think the environmentally branded kangaroo needs to deliver to
significantly differentiate this kangaroo meat from existing kangaroo product? (Record all
answers)
___________________________________________________________________________
___________________________________________________________________________
___________________________________________________________________________
2.5 What are the minimum differences you would need to see in the product to support a
distinctive environmentally branded kangaroo product? (Record all)
___________________________________________________________________________
___________________________________________________________________________
___________________________________________________________________________
2.6 What do you expect in terms of quality, consistency and price from this new brand of
kangaroo meat? (Record all answers)
___________________________________________________________________________
___________________________________________________________________________
___________________________________________________________________________
2.7 How important is the sustainable yield approach to you - harvesting to keep the environment
and wildlife balance in the conservation area? (Record all answers)
___________________________________________________________________________
___________________________________________________________________________
2.8 What information would you want about an environmentally branded product? (Record all)
___________________________________________________________________________
___________________________________________________________________________
___________________________________________________________________________
35
2.9 What information do you think consumers would want about the environmentally branded
kangaroo product - what does the brand need to say to consumers? (Record all)
___________________________________________________________________________
___________________________________________________________________________
___________________________________________________________________________
2.10 How interested are you in buying environmentally branded kangaroo product?
___________________________________________________________________________
___________________________________________________________________________
___________________________________________________________________________
2.11 (a) Would you consider trialling environmentally branded kangaroo? Why? Why not?
___________________________________________________________________________
___________________________________________________________________________
(b) What types of organisations do you think would support a trial? (Record all)
___________________________________________________________________________
___________________________________________________________________________
2.12 Would you promote the environmental brand to your customers? (Record all)
___________________________________________________________________________
___________________________________________________________________________
2.13 What contact points and supply arrangements would you need from the conservancy if you
bought the environmentally branded kangaroo? (Record all)
___________________________________________________________________________
___________________________________________________________________________
3. INTEREST IN ENVIRONMENTALLY BRANDED KANGAROO PRODUCT
3.1 Would you still be interested in the environmentally branded kangaroo product if the supply
was limited - the conservancy represents only 2% of the total market? (Record all)
___________________________________________________________________________
___________________________________________________________________________
3.2 What is the minimum quantity of environmentally branded kangaroo that needs to be
available to support you buying the product regularly? (Record all)
___________________________________________________________________________
___________________________________________________________________________
36
3.3 What will drive demand for environmentally branded kangaroo? (Record all)
___________________________________________________________________________
___________________________________________________________________________
3.4 What marketing support is needed to promote the environmentally branded kangaroo product?
(Record all)
___________________________________________________________________________
___________________________________________________________________________
3.5 Would knowing that other customers are using the environmentally branded kangaroo product
be important in your decision to buy it? (Record all)
___________________________________________________________________________
___________________________________________________________________________
3.6 What would prompt you to buy the environmentally branded kangaroo product? (Record all)
___________________________________________________________________________
___________________________________________________________________________
3.7 Would you be prepared to pay a slightly higher price for environmentally branded kangaroo?
What percentage increase would be acceptable? (Record all)
___________________________________________________________________________
___________________________________________________________________________
3.8 Eating kangaroo meat can reduce greenhouse gas emissions compared to eating beef - is this
an important message for you and your customers? (Record all)
___________________________________________________________________________
___________________________________________________________________________
3.9 (a) What kangaroo products and pack sizes would you want in environmentally branded
kangaroo? (Record all)
___________________________________________________________________________
___________________________________________________________________________
3.10 What quantity of kangaroo meat do you sell in a week? (Record all answers)
___________________________________________________________________________
___________________________________________________________________________
3.11 What price per/kg do you pay for the kangaroo meat that you purchase? (Record all answers)
___________________________________________________________________________
37
3.12 What are the most important priorities for the new product to get support from the market?
___________________________________________________________________________
___________________________________________________________________________
3.14 On a scale of 1 to 5 where is poor and 5 is very good, how would you rate the strength of the
opportunity for the environmentally branded kangaroo in the marketplace? Why is that?
___________________________________________________________________________
___________________________________________________________________________
3.15 Thanks for your feedback today. Is there anything else you would like to add?
___________________________________________________________________________
___________________________________________________________________________
Thank you for your help with this important survey.
Just to confirm, my name is…….from Deborah Wilson Consulting Services and this research is
carried out in compliance with the Privacy Act. Information you provided will only be used for research
purposes.
38
Issues to be Covered in Consumer Focus Groups
Current Consumption and Attitude
The focus group will start with a few general questions on kangaroo consumption and awareness.
Specific questions for the focus groups include the following:
How often do you eat kangaroo?
Why/why don’t you eat kangaroo?
What recipes and cooking approaches do you use? What it is best suited for, preferred
cooking (well done, medium rare, rare)?
What is your view on the favour, tenderness/toughness of kangaroo?
How well does kangaroo compare with other meats?
What are the health, nutrition and other benefits of eating kangaroo?
Are there any disadvantages of eating kangaroo meat?
Sources of information on kangaroo meat and cooking/recipes?
What consumers know about how kangaroos are killed and processed?
What do you know about how kangaroos are harvested?
What are your thoughts on wild culling?
Do you know the population of kangaroos and the impact of culling?
What do you know about the processing chain and any concerns about food safety?
Comparison with other meat sources – current concerns (e.g. supermarket storage of meat)
and how kangaroo meat is regarded in terms of safety?
Reaction to the message that there are no food safety risks in eating kangaroo meat?
Any other concerns e.g., humane killing?
Reaction to Conservancy Supply
Reaction to the conservancy concept. The conservancy represents about 2% of kangaroos
culled in Australia.
Reaction to the size and location of the conservancy (map needed) and the fact that kangaroos
can roam wild over a large area.
Did you know that eating kangaroo meat can reduce greenhouse gas emissions compared with
eating beef? How important is this message to you?
What other benefits do you expect the conservancy to deliver e.g. environmental?
What do you think of the sustainable yield approach?
What is your view of a conservancy brand versus an ordinary supply?
39
Are you interest in the conservancy branded kangaroo?
What benefits would the conservancy product need to offer to prompt you to trial it and buy it
on an ongoing basis?
Range of information consumers want about the conservancy brand and its role in sustainable
properties, preserving the environment, sustainability of kangaroo populations.
How conservancy product should be branded compared with other kangaroo.
What does the brand name needs to get across to consumers?
Interest in Conservancy Kangaroo Product
What are the best types of kangaroo products for the conservancy kangaroo e.g. fresh (mince,
cuts), smallgoods, other?
Are you interested in kangaroo smallgoods – interest in different products, positioning as an
every day deli item?
Are you interested in gourmet items/flavours as special occasion purchases?
What factors or information would prompt you to buy conservancy branded kangaroo over
other kangaroo product?
If conservancy kangaroo product is available, would be more interesting or more attractive
than other premium meats e.g. organic beef, corn feed chicken, free range chicken?
What is your view of the conservancy or environmentally branded kangaroo product (good to
buy for environmental reasons, higher quality product, gourmet product, different/better
tasting)?
What information do you want to know about conservancy kangaroo available covering:
- Type of product available e.g. fresh mince, fresh cuts, smallgoods. What consumers think
are the best product types for conservancy and why.
- Availability – does it always need to be available or would consumers still buy it if supply
was intermittent or seasonal. The conservancy may not be able to supply the same volume
all the time. Whether consumers would still buy the product if it was only available
occasionally.
- Differences between conservancy product and other kangaroo product.
- Pricing – kangaroo compared with beef and whether people would pay say 20% more for
conservancy kangaroo.
Why would you try and buy conservancy kangaroo product?
What would prompt you to buy conservancy kangaroo meat – in store tasting/promotion,
magazines, chef endorsement?
What would encourage you to order kangaroo meat more frequently at restaurants or buy it
more frequently at supermarkets?
What are the most important messages to encourage people to order kangaroo meat more
frequently at restaurants or buy it more frequently at supermarkets (unprompted discussion)?
40
How importance are these messages in encouraging people to order kangaroo meat more often
at restaurants or buy it more frequently at supermarket:
- Where people can buy kangaroo.
- More information on how to cook kangaroo and more kangaroo recipes.
- The quality assurance systems used including health and hygiene.
- Assurance about the source and the ability to trace back (as with the beef industry).
- Humane harvesting methods – more humane that intensively reared animals.
- Sustainable management of kangaroos.
- Sustainable management of pastures and land with a higher level of ground cover as a
result of harvesting kangaroos from the conservancy area.
- Sustainable management of wildlife.
- Reducing greenhouse gases by eating kangaroo.
Would you be more inclined to try kangaroo meat, eat more or order more frequently in
restaurants if you believed the source of the kangaroos was from a sustainably managed
conservancy?
Does monitoring of kangaroo numbers and numbers processed from the conservancy give
some assurance to consumers of sustainable management?
Would you be willing to pay more for kangaroo meat if it was sourced from an accredited
sustainably managed land production system (e.g. control of feral animals that destroy
wildlife, processes for reducing the spread of weeds, development of biodiversity corridors,
etc.)?
Is it important to have an improved balance between kangaroos and sheep whereby less sheep
were carried and more kangaroos were available for harvest?
Are there any other important messages or information that would encourage people to try and
buy conservancy kangaroo product?
41
Appendix 3: The Conservancy Concept
A3.1 Introduction
The Maranoa Wildlife Conservancy has been formed by a group of pastoralists, predominantly cattle
producers in central /southern Queensland. The reason behind the Maranoa Conservancy being
established was because of the “Landcare ethic” of the landholders involved and the catchment
planning they have been undertaking.
The group views kangaroos predominantly as a resource that can be utilised for both economic and
biodiversity reasons, rather than as a pest for control and disposal
Some kangaroos are harvested within the Conservancy at present (some for human consumption and
some for pet food) under a regional quota system as for other areas in Queensland. Other kangaroos
and wallabies are harvested under a damage mitigation permit. These macropods are not allowed to be
taken from the field after they are shot.
A number of landholders within the Conservancy have recently been audited under the ALMS
process. ALMS (Australian Land Management System) is an ISO14001 accredited Environmental
Management System or EMS The two differences between it and any other EMS is that it takes into
consideration the catchment targets/ issues and it has a focus on biodiversity. No other EMS does
this.
A3.2 Broad Concept
The objective of the Conservancy is to promote biodiversity through:
Land, vegetation and animal stewardship at both individual property and Conservancy /catchment
scales.
Wildlife management through protecting and enhancing the habitats of existing wildlife and
potentially through re-introduction of native species.
Sustainable commercial livestock management.
Sustainable kangaroo management including sustainable harvesting rates and utilising sustainable
harvesting practices.
A3.3 Specific Management Practice Ideas
Grazing management and overstocking
A key area for improved management of the Conservancy is to focus on general sustainable
management within the conservancy. Maintaining an appropriate balance of traditional livestock and
kangaroo populations is paramount. There is potential for there to be fewer sheep/cattle, watering
points, fences etc. Also, harvesting kangaroos more strategically will allow pastures to regenerate
more rapidly. Managing total grazing pressure especially in drought is a key aspect of kangaroo
interaction and integration with property management.
Location and time of harvest information could be integrated with information on land, pasture,
weather and seasonal conditions. Kangaroo harvest data assembled on a Conservancy basis can be
used for both livestock and kangaroo management. One idea that has been canvassed is for the
42
Conservancy to give priority to harvesting kangaroos on spelled regenerating paddocks, with
harvesters being requested to harvest in specific locations on behalf of the Conservancy group. This
does not happen under existing harvesting arrangements. Also, sharing information about location and
aggregation of kangaroos may be beneficial to harvesting efficiency. A coordinated approach may
allow better strategic control of large concentrations and easier shooting.
Invasive species
The maintenance of native vegetation by control of weed spread could be improved with kangaroo
harvesters washing down vehicles before entering another property and would be part of a an overall
environmental management plan.
Kangaroos are the most common native species within the Conservancy. However, the number of
many other species has been reduced by wild dogs, foxes and cats, and feral pigs. There is some
anecdotal evidence that there has been loss of native birdlife (plains turkeys, brolgas) as a result of
increased numbers of feral animals. The situation may have been worsened by the damage mitigation
permits whereby some kangaroos are left to rot and die in the paddock.
Kangaroo harvesters working within the Conservancy may be able to assist with wildlife management
by shooting feral goats, foxes or cats.
If ferals can be controlled, there is scope for reintroduction programs for native animals like the bilby
program at Charleville.
Greenhouse gases
It is estimated that about 16% of Australia’s total net greenhouse gas emissions originate from the
farm sector. Of this 16%, 71% is contributed by ruminant livestock such as cattle and sheep emitting
methane gas. Methane is a product of ruminants, and kangaroos are not ruminants. Consumption of
kangaroo meat instead of beef or sheepmeat is therefore very greenhouse friendly.
A recent report by Greenpeace on global warming stated that reducing beef consumption by 20 per
cent and putting Skippy on the dinner plate instead would cut 15 megatonnes of greenhouses gases
from the atmosphere by 2020.
Quality
A higher and more consistent quality of kangaroo meat may result, from harvesting processes, chiller
management, and an improved feedback and traceback system. An improved traceback system is
currently being developed for the Conservancy, including GPS and data logging on a paddock and
property basis.
Also, if kangaroo harvesting within the Conservancy is organised by a combination of pastoralists and
harvesters with some form of joint control of chillers, one of the benefits may be improved quality
control and an improved product to market.
A3.4 The Role of this Study
The key role of the study is to identify the characteristics of markets for kangaroos from the Maranoa
conservancy and to support the establishment of processes to supply those markets. We need to focus
on the views of consumers to direct the Conservancy focus, particularly the attitudes towards
activities and products that are associated with ‘net conservation gains’. We need to explore the
reaction to a conservancy or regional brand to promote the sustainable harvest of kangaroo meat from
the Conservancy (and potentially any other products).
43
Appendix 4: Profile of Firms Interviewed in
Market Research
A4.1 Key Findings
Key findings from interviews conducted with restaurants, caterers, food service firms (including game
meat suppliers to restaurants and gourmet butchers), 5 star hotels, gourmet retailers and supermarkets
included the following:
Quality is the dominant driver in purchasing new food products. Firms need to be assured of
quality and consistency.
For some, the environmental focus is valuable due to the positioning of the business or because of
increased interest from consumers. However, the Conservancy product would need to be
positioned primarily as gourmet and secondly as an environmental brand.
Game meat demand is fashion driven. Without consumer interest and supporting promotion, it
will be very difficult to establish the new products.
Game meat suppliers see the product as a specialist item and are seeking exclusive rights to
supply in their state.
Kangaroo is seen as a niche product already and some felt that trying to establish a new niche
product in this thin market would be too difficult.
Supply of kangaroo meat at present in unsophisticated packaging sends the message that kangaroo
is a commodity product. Clear messages are needed about the differences the new product offers.
To achieve wider levels of interest and support, the quality and gourmet positioning will be the
main driver. Few are interested in a product that is only differentiated by the conservancy
approach.
Considerable effort and marketing resources will be needed to support the establishment of the
product. This includes direct promotion to buyers and chefs as well as promotion in gourmet
magazines and other media. A link to a known chef or existing gourmet brand would assist the
product to establish.
Comparative pricing with existing supplies is important in the establishment phase of the
products.
Consistent availability of supply is important for some firms (large catering firms and some
supermarkets) but not for others.
Working with a panel of chefs and businesses to trial the new product will provide valuable
feedback in the product development stage. This approach can also be used very effectively to test
marketing, packaging and positioning for the new product.
Feedback from interviews are summarised in Appendices 5 and 6. Results are based on a small sample
of firms but themes raised are consistent.
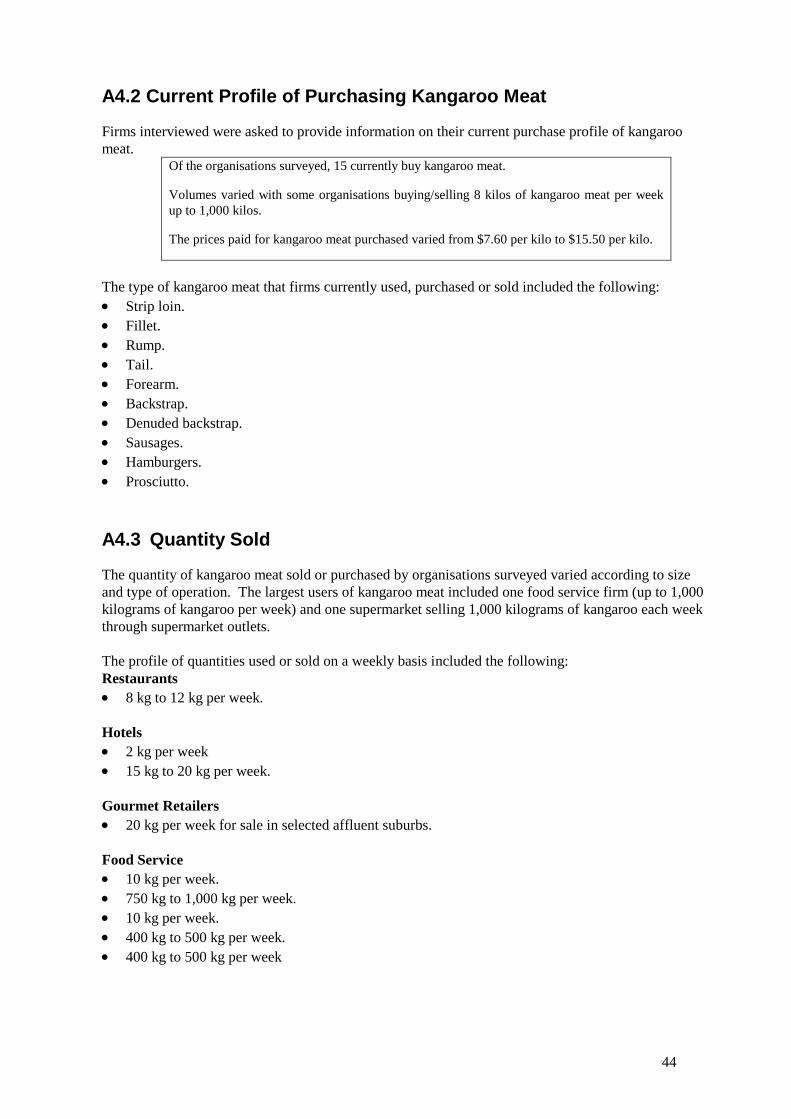
44
A4.2 Current Profile of Purchasing Kangaroo Meat
Firms interviewed were asked to provide information on their current purchase profile of kangaroo
meat. Of the organisations surveyed, 15 currently buy kangaroo meat.
Volumes varied with some organisations buying/selling 8 kilos of kangaroo meat per week
up to 1,000 kilos.
The prices paid for kangaroo meat purchased varied from $7.60 per kilo to $15.50 per kilo.
The type of kangaroo meat that firms currently used, purchased or sold included the following:
Strip loin.
Fillet.
Rump.
Tail.
Forearm.
Backstrap.
Denuded backstrap.
Sausages.
Hamburgers.
Prosciutto.
A4.3 Quantity Sold
The quantity of kangaroo meat sold or purchased by organisations surveyed varied according to size
and type of operation. The largest users of kangaroo meat included one food service firm (up to 1,000
kilograms of kangaroo per week) and one supermarket selling 1,000 kilograms of kangaroo each week
through supermarket outlets.
The profile of quantities used or sold on a weekly basis included the following:
Restaurants
8 kg to 12 kg per week.
Hotels
2 kg per week
15 kg to 20 kg per week.
Gourmet Retailers
20 kg per week for sale in selected affluent suburbs.
Food Service
10 kg per week.
750 kg to 1,000 kg per week.
10 kg per week.
400 kg to 500 kg per week.
400 kg to 500 kg per week
45
Supermarkets
100 kg per week.
1,000 kg per week.
A4.4 Price Profile
The price per kilo paid for kangaroo meat varied from a low of $6 to $7 per kilo through to a high of
$14 to $16 per kilo.
The price per kilo that businesses reported paying included the following:
Restaurants
$14 per/kg direct from the processor.
Hotels
$15.99 per/kg.
$7.60 per/kg.
Food Service
$10.60 per/kg.
$13 per/kg to $14 per/kg for premium cuts and $5 per/kg to $6 per/kg for lesser cuts of meat.
$8.50 per/kg to $15.50 per/kg depending on the cut.
Supermarkets
None of the supermarkets would disclose the price of the kangaroo that they purchase.
46
Appendix 5: Reaction from Retail, Food
Service, Restaurant and Supermarket
Firms to the Conservancy Concept
A5.1 Reaction to the Environmentally Branded Kangaroo Product
from the Maranoa Conservancy
Participants in the research were provided with the following brief outline of the conservancy product:
Deborah Wilson Consulting Services is conducting market research to assess
potential market demand for niche production of high quality kangaroo meat under
an environmental brand.
The Maranoa Wildlife Conservancy which is west and north of Roma in
Queensland has been formed by a group of pastoralists, mainly cattle producers to
sustainably manage the region’s kangaroo population, produce kangaroo meat and
promote biodiversity among wildlife.
The Conservancy product will represent approximately 2% of kangaroos culled
annually within Australia and will offer these benefits over existing kangaroo meat:
Improved Product Quality – more consistent and higher quality kangaroo
product as a result of improved harvesting processes (chiller management,
improved traceback systems using GPS and data logging)
Environmentally Sustainable – the conservancy will use an environmental
management system – managing the stock load on properties and preserving
the existing environment. A number of the conservancy landholders are
ISO14001 Australian Land Management System accredited.
Another benefit is that encouraging kangaroo consumption instead of beef
consumption can reduce greenhouse gases.
Increased Food Safety – kangaroos will be harvested using quality assurance
systems including health, hygiene and food safety.
Humane Harvesting Methods – the size of the region allows wild kangaroos
to be harvested in the most humane method possible.
The research will cover:
Interest in Conservancy brand kangaroo products.
Types of kangaroo products preferred.
Key factors that would encourage use of the Conservancy brand kangaroo.
Information needed about the Conservancy brand kangaroo.
There were varying levels of support for the concept – some organisations saw limited
potential for the product while others saw considerable opportunity for the product.
Support for the concept of environmentally branded kangaroo differs. Those who
saw the concept as a positive initiative have stressed the importance of branding
and supporting the brand to successfully establish and market the product.
Those who do not see value believed that the current supply of kangaroo already

47
has good environmental credentials. Others felt it would be too difficult to
differentiate the new product from the existing supply of kangaroo.
The feedback participants provided on their initial reaction to the concept included the
following:
Restaurants
The concept is ‘silly’. Unless the kangaroo were farmed, the product would not be
any different from the current supply.
The restaurant supported the concept. The brand is the most important aspect for
success in the marketplace.
Caterers
The firm does not know enough about the current supply of kangaroo to make a
comparison.
The firm is unsure about the concept. There is not enough demand for the current
supply of kangaroo meat.
Hotels
The hotel has no problem with the current supply which is highly accredited.
Tenderness of the meat is the most important attribute of the product.
The current process is already well managed and approved.
Gourmet Retailers
Kangaroo is a sideline product. The firm thought the new product would require
significant investment for it to be successful.
There will be no demand for the new supply as it will be more expensive than the
current product and price is important in the kangaroo market.
The concept is a good idea providing it is heavily promoted and well managed.
Food Service
The concept is interesting but success would be difficult to achieve.
Consumers do not see the current supply as being polluted or inhumanely harvested.
The concept is valid. Having the trace back capability is important.
The concept is not viable. The production costs involved in the concept will reduce
any profit margin.
The current volumes of kangaroo sold would not sustain the new branded concept.
The inconsistency in supply of the current product has lead to a reduction in the
amount the firm sells.
Supermarkets
48
There is room in the market for the environmentally branded kangaroo concept. The
current good publicity surrounding kangaroo means that the timing is right.
The concept sounds good. The current supply of kangaroo can not meet the demand
for kangaroo in the market.
It is a positive initiative for industry advancement.
The concept sounds good.
A5.2 Environmentally Branded Kangaroo versus Existing Supply
Some felt that the existing supply of kangaroo already has an environmental brand.
Others were not familiar enough with the existing supply to make a comparison.
Some of the firms surveyed believed that the new brand would compare well and
would find a place in the market.
Feedback on the comparison between environmentally branded kangaroo and the existing
ordinary supply of kangaroo meat included the following:
Restaurants
The ordinary kangaroo supply is environmentally branded. The current supply has
the organic tag, can be exported to the EU and is considered very healthy.
The environmental brand would need to have the backing of a face or a chef.
Caterers
The firm is not familiar enough with the ordinary kangaroo supply to compare the
two.
Hotels
The hotel’s preference for kangaroo meat would be based on the price.
The price of the product is what matters to the hotel. The environmentally branded
meat would need to be price competitive.
Gourmet Retailers
The current kangaroo supply is good. The current supply is government regulated
and there is export quality meat available.
The environmental kangaroo meat sounds like a good concept, however the
organisation is not familiar with the current supply.
The environmental brand name of the new variety would be marketable.
There must be a protocol attached to the environmental brand.
Food Service
The firm would need more information to make a judgement.
49
The environmental branding would be a contradiction, as the ‘greenies’ do not want
any kangaroo harvesting to occur.
The environmental brand would need to be significantly different from the current
supply.
Supermarkets
Any brand related to the environment would be popular with customers.
An environmental brand would work in the marketplace.
The firm has no issues with the current process of kangaroo supply. The industry
appears well organised and controlled.
A5.3 Value of the Environmental Brand
Some felt that the current product is already environmentally managed and
environmentally branded – the new product would not be sufficiently
differentiated.
Others felt that there is strengthening consumer interest in environmentally branded
kangaroo.
Some were concerned about the complexity of getting the message through to
consumers – this could be difficult to do on a hotel menu.
There are differences of opinion on the value of an environmentally branded kangaroo. The
key issue will be the ability to successfully differentiate the environmentally branded
kangaroo from the existing supply, which many regarded as being managed on an
environmental basis.
Feedback on perceived value of sourcing environmentally branded kangaroo included the
following:
Restaurants
The current product already is environmental.
Caterers
Stability in supply and product quality assurance is more important to the firm. The
organisation has a food safety system which has to be used by suppliers.
The environmental brand would be valued by the firm and the customer.
Hotels
The firm previously had organic products which customers did not value.
There is not enough room on the menu to pass on information about the product to
customers.
50
Gourmet Retailers
The firm is yet to test whether customers value environmental branding.
Customers would value the environmental branding to some degree. The price of the
product would be very important.
A big emphasis must be put on product quality.
There is currently some interest from the firm’s customers in environmentally
branded products.
Food Service
The firm is not sure how the environmental brand is valued by customers.
The current supply of kangaroo is environmentally branded.
The current product is environmentally managed and organic.
‘Sourcing kangaroo meat environmentally would not be important to our customers’.
The environmentally branded kangaroo should be highly regarded by the customer.
Sustainable farming is very important to the firm.
Supermarkets
The environment is a priority to the consumer.
Customers would value environmentally branded kangaroo.
The firm is unsure how customers value the environment. Price will be a key
influence.
The firm has confidence in the merits of the existing industry and is not looking for
an improved model for kangaroo harvesting.
Benefits of an Environmental Brand
The benefits that the environmentally branded kangaroo needs to deliver to significantly differentiate
this kangaroo meat from existing kangaroo product focused on quality and a clear, positive
environmental ‘story’ to support the branding.
Feedback on these differentiating benefits included the following:
The only way to produce a different product would be if the kangaroos were fed
differently e.g. corn fed chickens.
Improved quality and consistency.
Tender and uniform in portion size.
Tenderness must be the differentiator between the two brands. Kangaroo meat is too
tough.
Advertising must be the differentiator between the two types of kangaroo meat.
People need to be aware of the new brand.
51
The environmental brand must have a unique packaging. Customers of gourmet
retailers would need to be aware that the product is different. The customers would
need to be educated about the new brand.
Information on where the new brand comes from and the full story about the new
product.
Harvested from a more environmental source, promote animal welfare and be a
cleaner product.
The product needs to be more uniform than the current supply.
Land management is important in differentiating the products.
The environmental brand needs to have a superior product quality and should be
better promoted than the current supply.
Improved level of quality and consumer confidence in the product’s integrity.
Product tracking and traceability will be the only difference between the two types of
kangaroo meat.
Some felt that the new brand will not be different from the current supply as the
kangaroos are still wild.
Minimum Differences
The minimum differences that market representatives would need to see in the product to support a
distinctive environmentally branded kangaroo were not easy for market representatives to define.
Restaurants, caterers and hotels had difficulty specifying a minimum level of differentiation needed.
Others highlighted that marketing, merchandising, packaging and labelling all need to be different
from the current supply.
The environmentally branded product must be demonstrated to be superior in quality and packaging.
Importance of Sustainable Yield
Views on the importance of sustainable harvesting varied – for some organisations, it is very
important but for others, it is unimportant.
Supermarkets more consistently emphasised the importance of sustainable harvesting and the fact that
consumers will expect this sustainability.
Feedback on sustainable yield from individual firms included the following:
Restaurants
Very important - the current supply of kangaroo is harvested sustainably. The
kangaroo quota for harvesting has never been filled.
Caterers
Very important - sourcing products that are harvested sustainably is a company wide
policy.
Very important.
Hotels
52
Not important to the firm.
Very important.
Gourmet Retailers
Very important.
Food Service
A good idea.
Conservationists would not be pleased if any kangaroo harvesting is occurring.
Not important.
Not important - the firm is not aware that kangaroo numbers have an impact on other
wildlife.
Very important for the future.
Supermarkets
Extremely important and very relevant to the customers.
The public would not know.
Very important.
A5.4 Quality, Consistency, Price and Supply
Representatives provided feedback on:
Expectations of product quality and consistency.
Pricing expectations.
Supply requirements.
The majority felt that it was important for the new environmentally branded
kangaroo to be at the same pricing level as the current supply. Some felt that the
price could be increased once the brand or the product had become more strongly
established. In raising the price it will be important to develop a significantly
differentiated product in the minds of consumers based on quality.
The market expects the product to be of consistent quality and be a tender, high
quality product.
Feedback on expectations for quality, consistency and price of the new environmental brand
of kangaroo meat included the following:
Restaurants
The business would not pay any more for the new kangaroo meat. The current
product is very good.
53
Product quality is very important.
Caterers
Product quality and consistency are very important.
Hotels
Product availability is most important, followed by quality. The product must be
uniform in size.
Gourmet Retailers
The product quality must be very specific.
The environmentally branded kangaroo meat needs to be a better quality product with
a similar price to the current supply. In the past, the firm was selling a branded emu
meat. When the supplier raised the price of the emu meat, the demand for the product
fell significantly.
The environmental product must be as good as or better in quality than the current
supply of kangaroo meat.
Quality, consistency and price should be the same as the current supply of kangaroo
meat.
Food Service
The new environmentally branded product can not be too expensive or it will struggle
to sell.
The new product must be uniform, consistent and tender.
The new product will be hard to sell at a premium price and would be limited to
restaurants. The product needs to have packaging, branding and history.
The product must be consistent and uniform.
Supermarkets
The price can not be different from the ordinary kangaroo meat.
Quality and price go hand in hand - the market must be tested. The current product is
well packaged and priced with a mark up.
Value for money is very important when releasing a new product.
The quality, packaging, price and consistency must be as good as the current product.
A5.5 Pricing Profile of the Environmentally Branded Kangaroo
Representatives surveyed were asked if they would be prepared to pay a slightly higher price for the
environmentally branded kangaroo, and by what percentage.
Of the 19 firms surveyed 18 indicated that they would be willing to pay a higher
price for the environmentally branded product. Firms were willing to pay between
54
1% and 20% more for the environmental brand.
For many firms the price of the product would be determined by the quality of the
kangaroo meat.
Of the participants surveyed only one indicated that they would not pay any more for environmentally
branded kangaroo than the current supply. Feedback on perceived value of sourcing environmentally
branded kangaroo included the following:
Restaurants
The firm would not be prepared to pay any more for the new branded kangaroo meat
as the current supply is good quality meat.
The firm would be willing to pay a slightly higher price for branded kangaroo meat.
Caterers
Up to a 1% premium for an environmentally branded product.
Hotels
The firm would pay more for the branded kangaroo. The premium the firm would be
willing to pay would depend on the product quality. The meat must be uniform.
A slightly higher price for the branded kangaroo meat but the price increase could not
be significant.
Gourmet Retailers
The price would be determined by the quality of the product.
The price of kangaroo meat is cut dependent. If the current supply of kangaroo is $8
per/kg and if the branded kangaroo were $11 per/kg, the market would not sustain the
new product.
10% more for an environmentally branded kangaroo meat.
Food Service
No more than 15% extra for environmentally branded kangaroo meat.
The firm would purchase the environmentally branded product if the product had a
premium on the price.
The price will be determined by the product quality.
The price must be competitive with the current kangaroo supply.
Quality, consistency and the strength of the brand within the market place will
determine how much the firm is willing to pay for the branded kangaroo meat.
Supermarkets
Pay slightly more for an environmentally branded product. However, an increase in
price of more than $3 per/kg would be an issue.
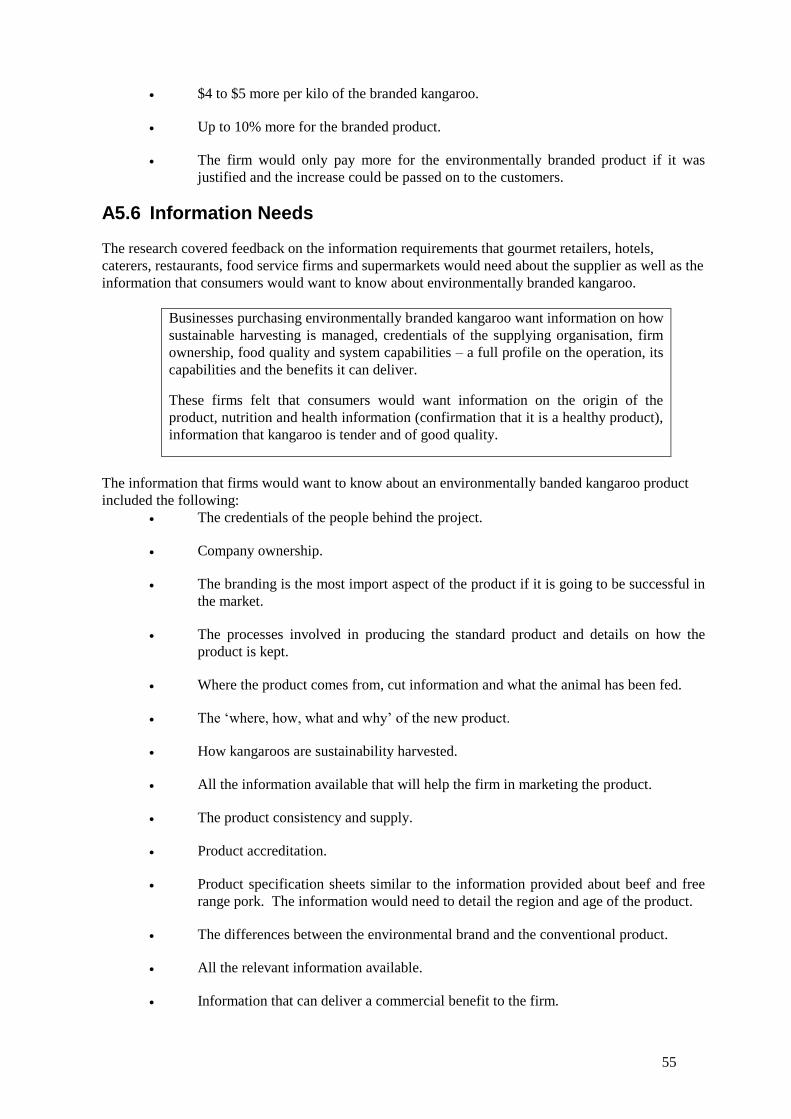
55
$4 to $5 more per kilo of the branded kangaroo.
Up to 10% more for the branded product.
The firm would only pay more for the environmentally branded product if it was
justified and the increase could be passed on to the customers.
A5.6 Information Needs
The research covered feedback on the information requirements that gourmet retailers, hotels,
caterers, restaurants, food service firms and supermarkets would need about the supplier as well as the
information that consumers would want to know about environmentally branded kangaroo.
Businesses purchasing environmentally branded kangaroo want information on how
sustainable harvesting is managed, credentials of the supplying organisation, firm
ownership, food quality and system capabilities – a full profile on the operation, its
capabilities and the benefits it can deliver.
These firms felt that consumers would want information on the origin of the
product, nutrition and health information (confirmation that it is a healthy product),
information that kangaroo is tender and of good quality.
The information that firms would want to know about an environmentally banded kangaroo product
included the following:
The credentials of the people behind the project.
Company ownership.
The branding is the most import aspect of the product if it is going to be successful in
the market.
The processes involved in producing the standard product and details on how the
product is kept.
Where the product comes from, cut information and what the animal has been fed.
The ‘where, how, what and why’ of the new product.
How kangaroos are sustainability harvested.
All the information available that will help the firm in marketing the product.
The product consistency and supply.
Product accreditation.
Product specification sheets similar to the information provided about beef and free
range pork. The information would need to detail the region and age of the product.
The differences between the environmental brand and the conventional product.
All the relevant information available.
Information that can deliver a commercial benefit to the firm.
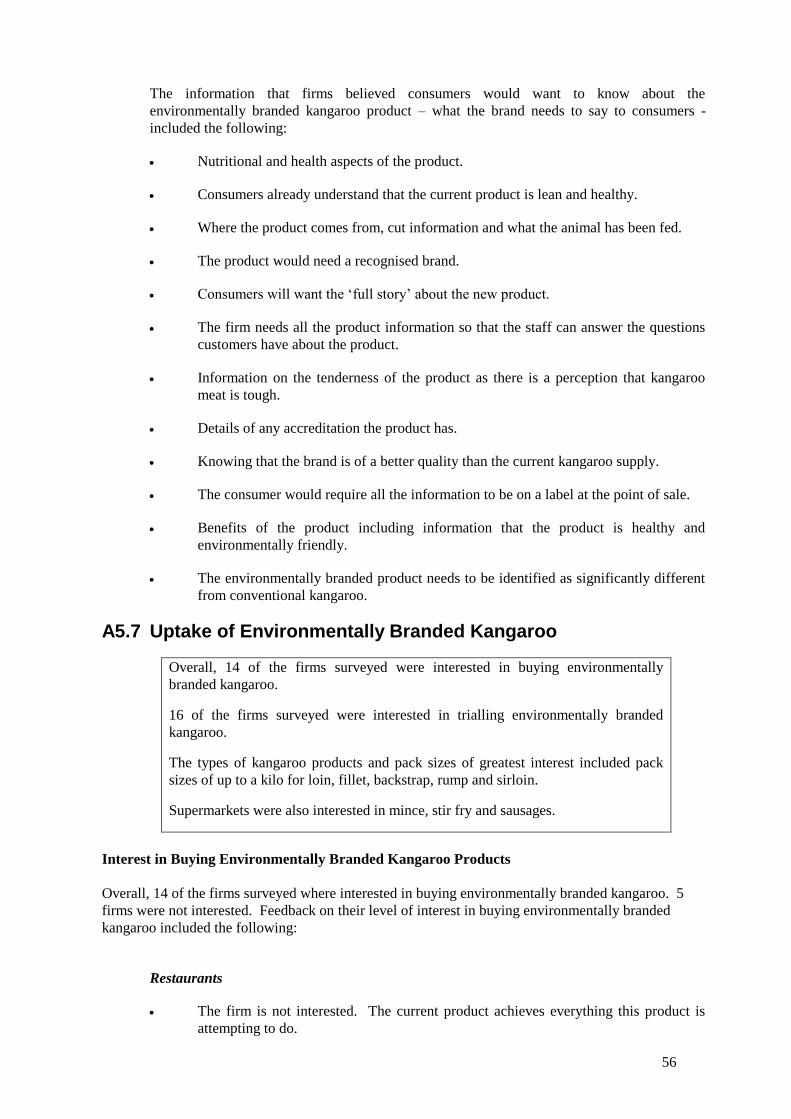
56
The information that firms believed consumers would want to know about the
environmentally branded kangaroo product – what the brand needs to say to consumers -
included the following:
Nutritional and health aspects of the product.
Consumers already understand that the current product is lean and healthy.
Where the product comes from, cut information and what the animal has been fed.
The product would need a recognised brand.
Consumers will want the ‘full story’ about the new product.
The firm needs all the product information so that the staff can answer the questions
customers have about the product.
Information on the tenderness of the product as there is a perception that kangaroo
meat is tough.
Details of any accreditation the product has.
Knowing that the brand is of a better quality than the current kangaroo supply.
The consumer would require all the information to be on a label at the point of sale.
Benefits of the product including information that the product is healthy and
environmentally friendly.
The environmentally branded product needs to be identified as significantly different
from conventional kangaroo.
A5.7 Uptake of Environmentally Branded Kangaroo
Overall, 14 of the firms surveyed were interested in buying environmentally
branded kangaroo.
16 of the firms surveyed were interested in trialling environmentally branded
kangaroo.
The types of kangaroo products and pack sizes of greatest interest included pack
sizes of up to a kilo for loin, fillet, backstrap, rump and sirloin.
Supermarkets were also interested in mince, stir fry and sausages.
Interest in Buying Environmentally Branded Kangaroo Products
Overall, 14 of the firms surveyed where interested in buying environmentally branded kangaroo. 5
firms were not interested. Feedback on their level of interest in buying environmentally branded
kangaroo included the following:
Restaurants
The firm is not interested. The current product achieves everything this product is
attempting to do.
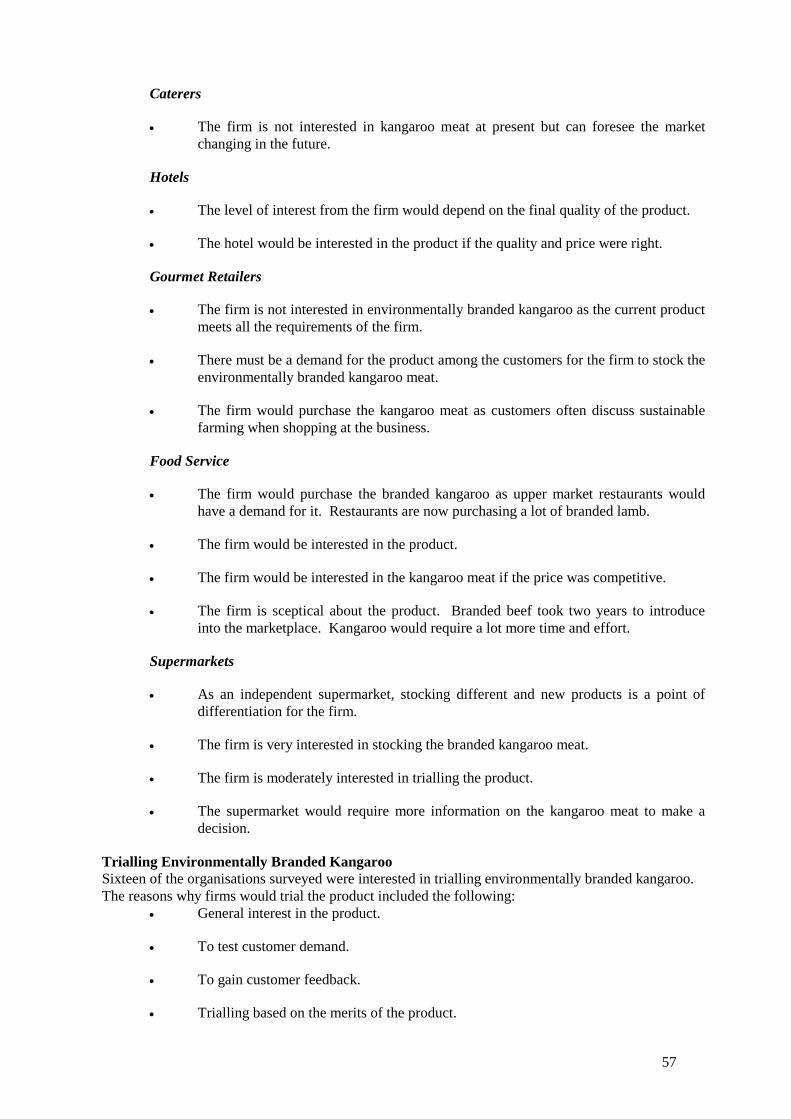
57
Caterers
The firm is not interested in kangaroo meat at present but can foresee the market
changing in the future.
Hotels
The level of interest from the firm would depend on the final quality of the product.
The hotel would be interested in the product if the quality and price were right.
Gourmet Retailers
The firm is not interested in environmentally branded kangaroo as the current product
meets all the requirements of the firm.
There must be a demand for the product among the customers for the firm to stock the
environmentally branded kangaroo meat.
The firm would purchase the kangaroo meat as customers often discuss sustainable
farming when shopping at the business.
Food Service
The firm would purchase the branded kangaroo as upper market restaurants would
have a demand for it. Restaurants are now purchasing a lot of branded lamb.
The firm would be interested in the product.
The firm would be interested in the kangaroo meat if the price was competitive.
The firm is sceptical about the product. Branded beef took two years to introduce
into the marketplace. Kangaroo would require a lot more time and effort.
Supermarkets
As an independent supermarket, stocking different and new products is a point of
differentiation for the firm.
The firm is very interested in stocking the branded kangaroo meat.
The firm is moderately interested in trialling the product.
The supermarket would require more information on the kangaroo meat to make a
decision.
Trialling Environmentally Branded Kangaroo
Sixteen of the organisations surveyed were interested in trialling environmentally branded kangaroo.
The reasons why firms would trial the product included the following:
General interest in the product.
To test customer demand.
To gain customer feedback.
Trialling based on the merits of the product.
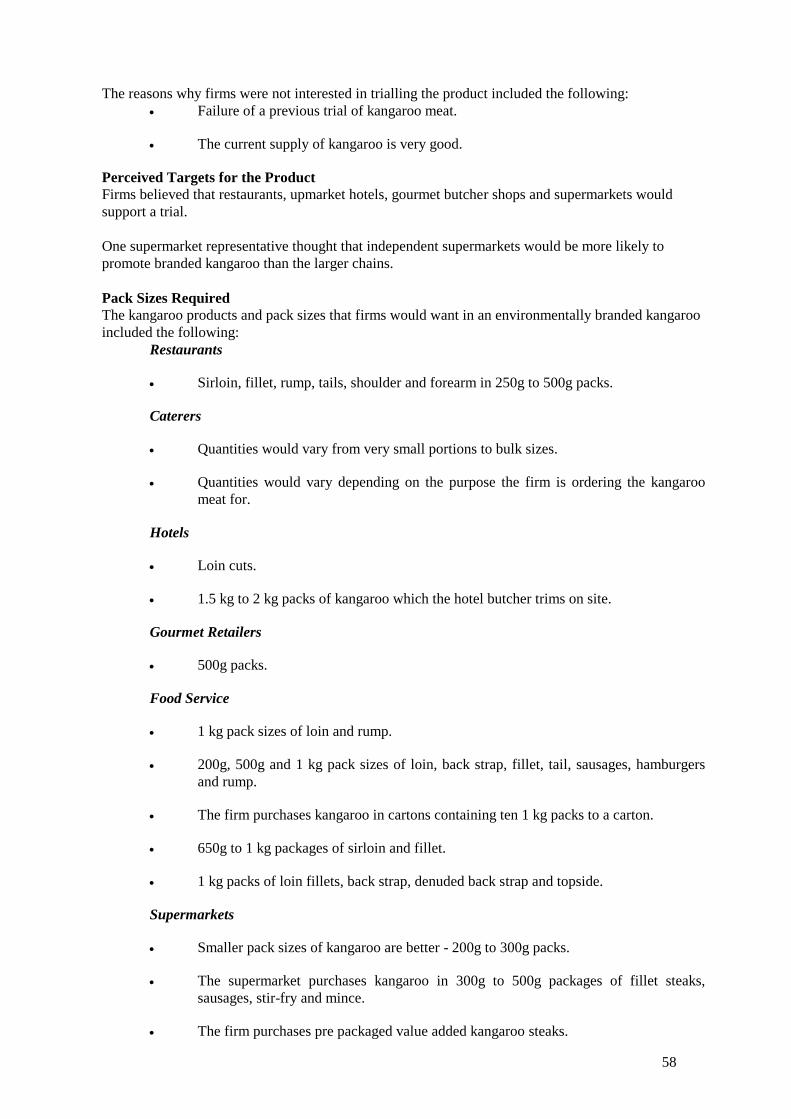
58
The reasons why firms were not interested in trialling the product included the following:
Failure of a previous trial of kangaroo meat.
The current supply of kangaroo is very good.
Perceived Targets for the Product
Firms believed that restaurants, upmarket hotels, gourmet butcher shops and supermarkets would
support a trial.
One supermarket representative thought that independent supermarkets would be more likely to
promote branded kangaroo than the larger chains.
Pack Sizes Required
The kangaroo products and pack sizes that firms would want in an environmentally branded kangaroo
included the following:
Restaurants
Sirloin, fillet, rump, tails, shoulder and forearm in 250g to 500g packs.
Caterers
Quantities would vary from very small portions to bulk sizes.
Quantities would vary depending on the purpose the firm is ordering the kangaroo
meat for.
Hotels
Loin cuts.
1.5 kg to 2 kg packs of kangaroo which the hotel butcher trims on site.
Gourmet Retailers
500g packs.
Food Service
1 kg pack sizes of loin and rump.
200g, 500g and 1 kg pack sizes of loin, back strap, fillet, tail, sausages, hamburgers
and rump.
The firm purchases kangaroo in cartons containing ten 1 kg packs to a carton.
650g to 1 kg packages of sirloin and fillet.
1 kg packs of loin fillets, back strap, denuded back strap and topside.
Supermarkets
Smaller pack sizes of kangaroo are better - 200g to 300g packs.
The supermarket purchases kangaroo in 300g to 500g packages of fillet steaks,
sausages, stir-fry and mince.
The firm purchases pre packaged value added kangaroo steaks.
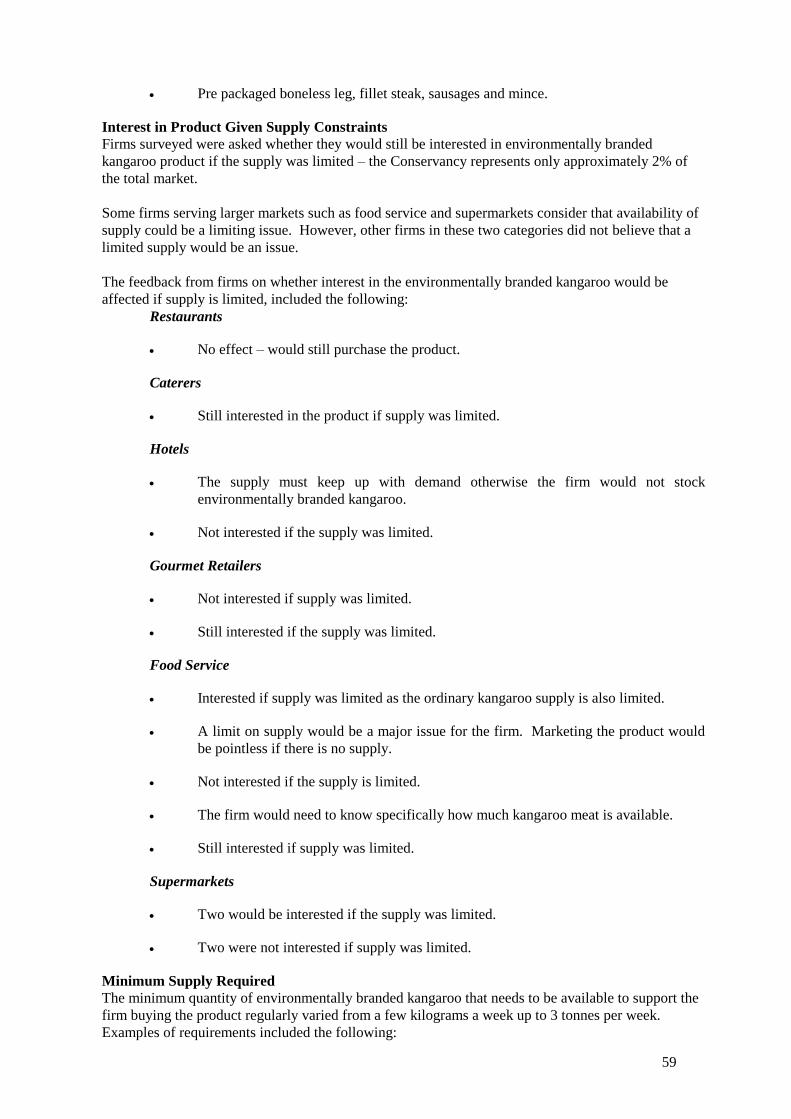
59
Pre packaged boneless leg, fillet steak, sausages and mince.
Interest in Product Given Supply Constraints
Firms surveyed were asked whether they would still be interested in environmentally branded
kangaroo product if the supply was limited – the Conservancy represents only approximately 2% of
the total market.
Some firms serving larger markets such as food service and supermarkets consider that availability of
supply could be a limiting issue. However, other firms in these two categories did not believe that a
limited supply would be an issue.
The feedback from firms on whether interest in the environmentally branded kangaroo would be
affected if supply is limited, included the following:
Restaurants
No effect – would still purchase the product.
Caterers
Still interested in the product if supply was limited.
Hotels
The supply must keep up with demand otherwise the firm would not stock
environmentally branded kangaroo.
Not interested if the supply was limited.
Gourmet Retailers
Not interested if supply was limited.
Still interested if the supply was limited.
Food Service
Interested if supply was limited as the ordinary kangaroo supply is also limited.
A limit on supply would be a major issue for the firm. Marketing the product would
be pointless if there is no supply.
Not interested if the supply is limited.
The firm would need to know specifically how much kangaroo meat is available.
Still interested if supply was limited.
Supermarkets
Two would be interested if the supply was limited.
Two were not interested if supply was limited.
Minimum Supply Required
The minimum quantity of environmentally branded kangaroo that needs to be available to support the
firm buying the product regularly varied from a few kilograms a week up to 3 tonnes per week.
Examples of requirements included the following:
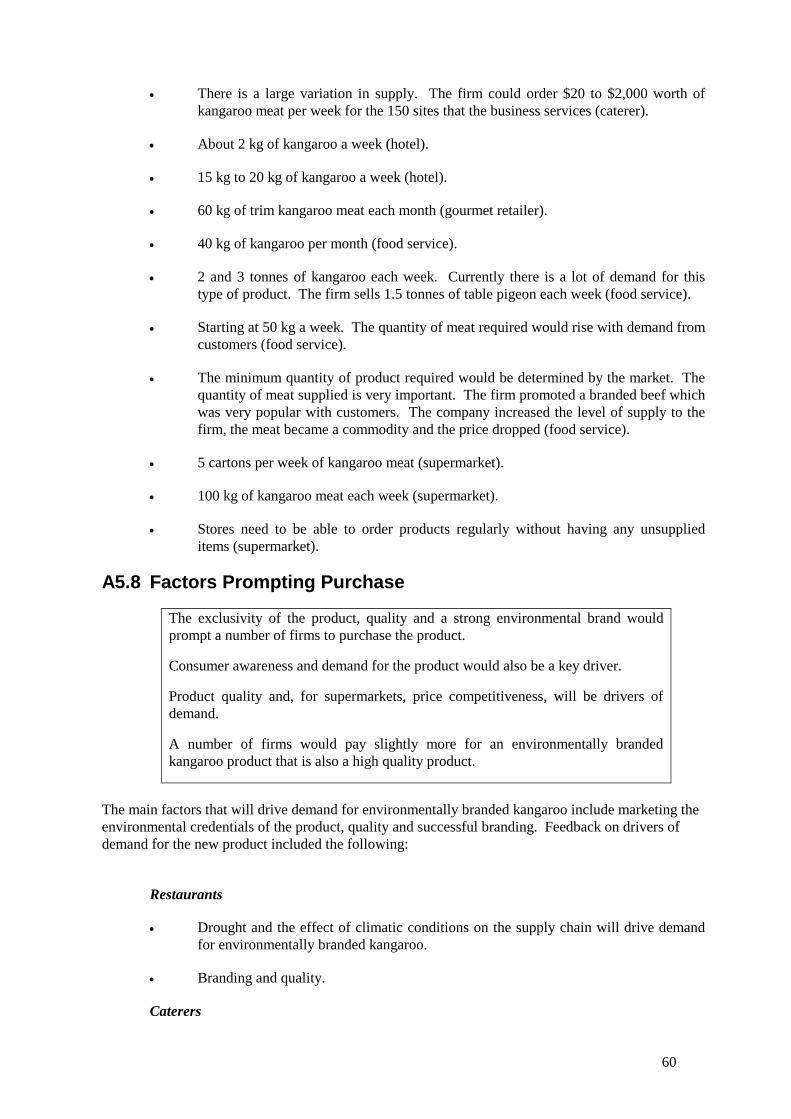
60
There is a large variation in supply. The firm could order $20 to $2,000 worth of
kangaroo meat per week for the 150 sites that the business services (caterer).
About 2 kg of kangaroo a week (hotel).
15 kg to 20 kg of kangaroo a week (hotel).
60 kg of trim kangaroo meat each month (gourmet retailer).
40 kg of kangaroo per month (food service).
2 and 3 tonnes of kangaroo each week. Currently there is a lot of demand for this
type of product. The firm sells 1.5 tonnes of table pigeon each week (food service).
Starting at 50 kg a week. The quantity of meat required would rise with demand from
customers (food service).
The minimum quantity of product required would be determined by the market. The
quantity of meat supplied is very important. The firm promoted a branded beef which
was very popular with customers. The company increased the level of supply to the
firm, the meat became a commodity and the price dropped (food service).
5 cartons per week of kangaroo meat (supermarket).
100 kg of kangaroo meat each week (supermarket).
Stores need to be able to order products regularly without having any unsupplied
items (supermarket).
A5.8 Factors Prompting Purchase
The exclusivity of the product, quality and a strong environmental brand would
prompt a number of firms to purchase the product.
Consumer awareness and demand for the product would also be a key driver.
Product quality and, for supermarkets, price competitiveness, will be drivers of
demand.
A number of firms would pay slightly more for an environmentally branded
kangaroo product that is also a high quality product.
The main factors that will drive demand for environmentally branded kangaroo include marketing the
environmental credentials of the product, quality and successful branding. Feedback on drivers of
demand for the new product included the following:
Restaurants
Drought and the effect of climatic conditions on the supply chain will drive demand
for environmentally branded kangaroo.
Branding and quality.
Caterers
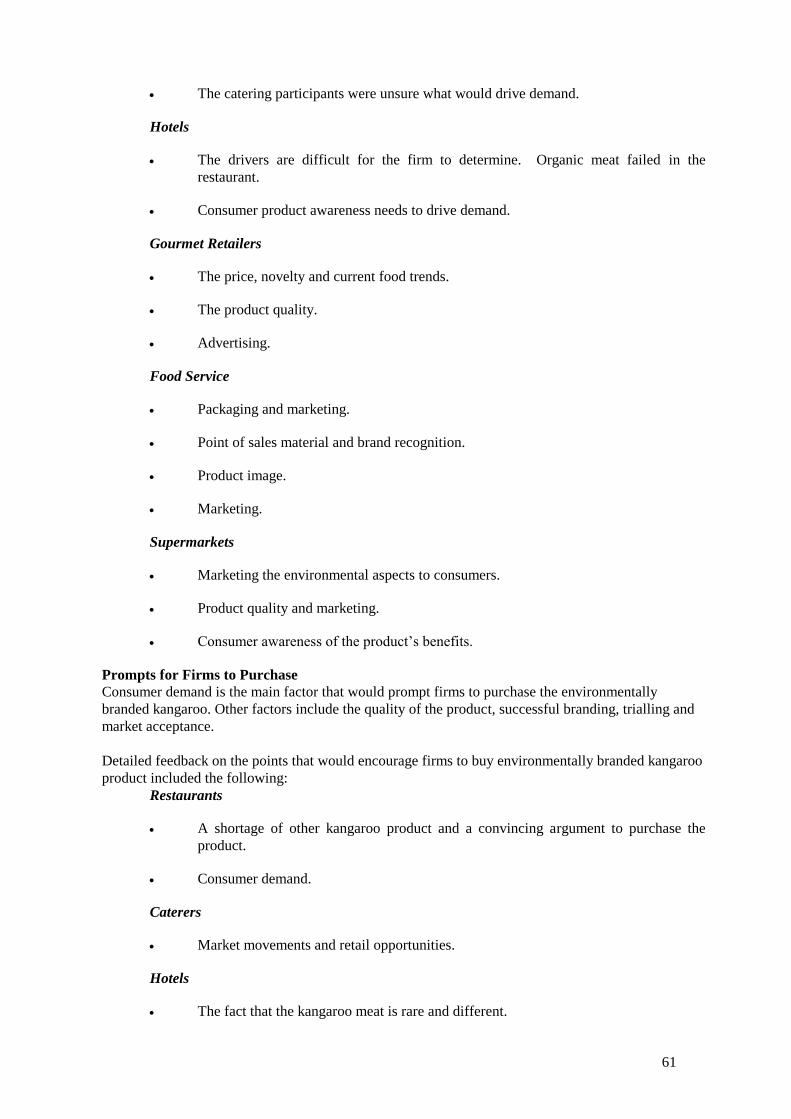
61
The catering participants were unsure what would drive demand.
Hotels
The drivers are difficult for the firm to determine. Organic meat failed in the
restaurant.
Consumer product awareness needs to drive demand.
Gourmet Retailers
The price, novelty and current food trends.
The product quality.
Advertising.
Food Service
Packaging and marketing.
Point of sales material and brand recognition.
Product image.
Marketing.
Supermarkets
Marketing the environmental aspects to consumers.
Product quality and marketing.
Consumer awareness of the product’s benefits.
Prompts for Firms to Purchase
Consumer demand is the main factor that would prompt firms to purchase the environmentally
branded kangaroo. Other factors include the quality of the product, successful branding, trialling and
market acceptance.
Detailed feedback on the points that would encourage firms to buy environmentally branded kangaroo
product included the following:
Restaurants
A shortage of other kangaroo product and a convincing argument to purchase the
product.
Consumer demand.
Caterers
Market movements and retail opportunities.
Hotels
The fact that the kangaroo meat is rare and different.
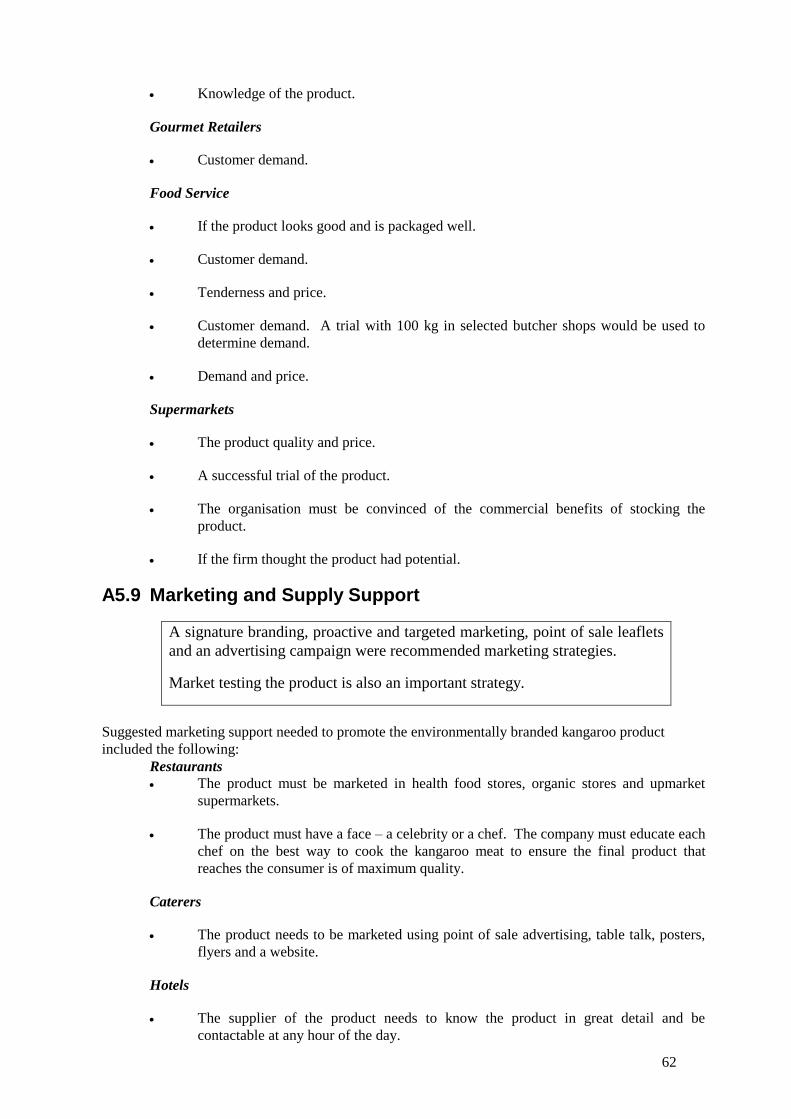
62
Knowledge of the product.
Gourmet Retailers
Customer demand.
Food Service
If the product looks good and is packaged well.
Customer demand.
Tenderness and price.
Customer demand. A trial with 100 kg in selected butcher shops would be used to
determine demand.
Demand and price.
Supermarkets
The product quality and price.
A successful trial of the product.
The organisation must be convinced of the commercial benefits of stocking the
product.
If the firm thought the product had potential.
A5.9 Marketing and Supply Support
A signature branding, proactive and targeted marketing, point of sale leaflets
and an advertising campaign were recommended marketing strategies.
Market testing the product is also an important strategy.
Suggested marketing support needed to promote the environmentally branded kangaroo product
included the following:
Restaurants
The product must be marketed in health food stores, organic stores and upmarket
supermarkets.
The product must have a face – a celebrity or a chef. The company must educate each
chef on the best way to cook the kangaroo meat to ensure the final product that
reaches the consumer is of maximum quality.
Caterers
The product needs to be marketed using point of sale advertising, table talk, posters,
flyers and a website.
Hotels
The supplier of the product needs to know the product in great detail and be
contactable at any hour of the day.
63
The branded meat must be advertised in food magazines to create awareness and
demand for the product.
Gourmet Retailers
In store promotions that educate the customer on the quality and traceability of the
new brand of kangaroo meat.
Advertising to educate the consumer on the attributes of the product.
Food Service
Good packaging and branding will help to market the kangaroo meat. A lamb
supplier from Junee has had increased sales since changing the packaging of their
product.
The packaging and presentation of the product is important. The meat should also be
marketed with recipes.
Effective packaging and flyers with cooking hints.
Advertising campaign and table talkers. The product should be trialled with 10-15
chefs to gain feedback on the taste and quality.
Supermarkets
Leaflets and handouts which can be passed on to the consumer.
Effective branding and product leaflets.
Proactive marketing is needed to create repeat sales.
Provide information about the benefits of environmentally branded kangaroo.
Exclusivity
For 8 of the 19 firms surveyed, knowing that other firms were also using the product would have no
impact on their decision.
Many firms felt that it was a positive development that other firms were using the environmentally
branded kangaroo. A few firms wanted exclusivity of the brand. Of the 4 supermarkets that
participated in the survey, 3 felt the knowledge that other firms are using the product would positively
impact on their decision to purchase branded kangaroo meat.
The fact that other firms are using the product demonstrates a market demand.
Some felt that exclusive distribution in a region is needed as the market would be very small.
Kangaroo Meat and Greenhouse Gases
The majority of firms surveyed felt that the message that eating kangaroo reduces greenhouse gases is
a positive and important message.
Three of the supermarket contacts felt that the reduced greenhouse impact of kangaroo meat is not an
important message to customers.
Promoting the Environmental Brand
The majority of firms surveyed (16 out of 19) reported that they would promote the environmental
brand to their customers.
64
One hotel currently stocks Naturoo kangaroo meat and promotes this brand.
Supply Arrangements
Some firms wanted a central or single contact point for supply arrangements.
Supermarkets were looking for a more sophisticated account management and supply arrangement to
fit in with existing supply chain arrangements.
Feedback on the contact points and supply arrangements that firms would need from the Conservancy
if they bought the environmentally branded kangaroo included the following:
Restaurants
Multiple supply points would be required.
Caterers
Distribution would need to be through the existing supply arrangements in
Queensland and the Northern Territory. The firm has 6-9 butchers within this region.
The organisation would require a number of distributors to purchase the product.
Hotels
One contact point and an account with direct billing.
Supply arrangements are up to the supplier. The firm uses multiple contact points in
their supply arrangements.
Gourmet Retailers
The contact points are up to the supplier to manage.
One contact point is the preferred for simple supply arrangements.
Food Service
Order every month and have direct contact with the supplier. Kangaroo is difficult to
source at present.
Contact from the supplier directly on a regular basis.
The product would need to be delivered to a depot in Melbourne by refrigerated
transport. The price would be determined at the point of pick up from the depot.
Supply arrangements need to be very simple. The firm would require marketing
information, product fact sheets and table talkers.
Supermarkets
The supermarket has a distribution arrangement with a main distribution company.
Delivery once a week in vacuum packed packages.
An account manager, a store contact person and direct to store deliveries.
65
A5.10 Priorities for the New Product
Participants in the research rated the strength of the opportunity for the
environmentally branded kangaroo at 2.8 out of five on a scale where one is
poor and five is very good – just below average. Highest ratings were
recorded for food service organisations (3.5 out of 5), hotels (3.3 out of 5)
and supermarkets (2.9 out of 5).
Key issues that need to be addressed in gaining market support include high
quality branding, delivering a high quality product, good promotion of the
nutritional and environmental benefits of the product and raising public
awareness of the benefits of the product.
Important Priorities
The important priorities for the new product to gain support in the market included the following:
Restaurants
Convincing data on product quality.
Branding and quality.
Caterers
Promoting the health benefits of the product will be an important priority if the
product is to gain market support.
Product promotion.
Hotels
Product quality.
Education of the consumer on the environmental benefits of the product.
Gourmet Retailers
Product quality and the promotion of environmental aspects.
Education.
Food Service
Packaging is important if the product is to be supported and demanded by the market
place.
Continuity of supply and clear messages on the product.
Product quality.
Simple eye catching branding.
66
Product marketing, packaging, consistency and branding are all important if the
product is to be successful in the marketplace.
Supermarkets
Price, marketing and differentiation on packaging.
Good branding and a clear message.
Convincing the consumer of the benefits of the product.
Public awareness of environmentally branded kangaroo.
Strength of the Opportunity
Firms were asked to assess the strength of the opportunity for the new product on a scale of 1
to 5 where 1 is poor and 5 is very good. Sector feedback included the following:
Restaurants (2.0 out of 5)
The environmentally branded product is not necessary as the current product is
already environmentally friendly.
Caterers (2.0 out of 5)
An education process is required for kangaroo in general and not just the
environmental brand to be successful.
The product will not be successful until consumers have a good understanding of the
product.
Hotels (3.3 out of 5)
The environmental aspect of the product is not a big selling point.
The project should be undertaken to change current farming practices.
Gourmet Retailers (1.5 out of 5)
If there is currently no product like environmentally branded kangaroo on the market
than the product has more chance.
Customers discuss the environment and sustainability often in this region.
Food Service (3.5 out of 5)
The product would be popular if correctly marketed.
The product has not been demanded by customers and the current supply of kangaroo
is considered environmental.
The environmental aspect of the product is not important - eating quality is more
important to the consumer.
There is currently a good attitude towards the environment.
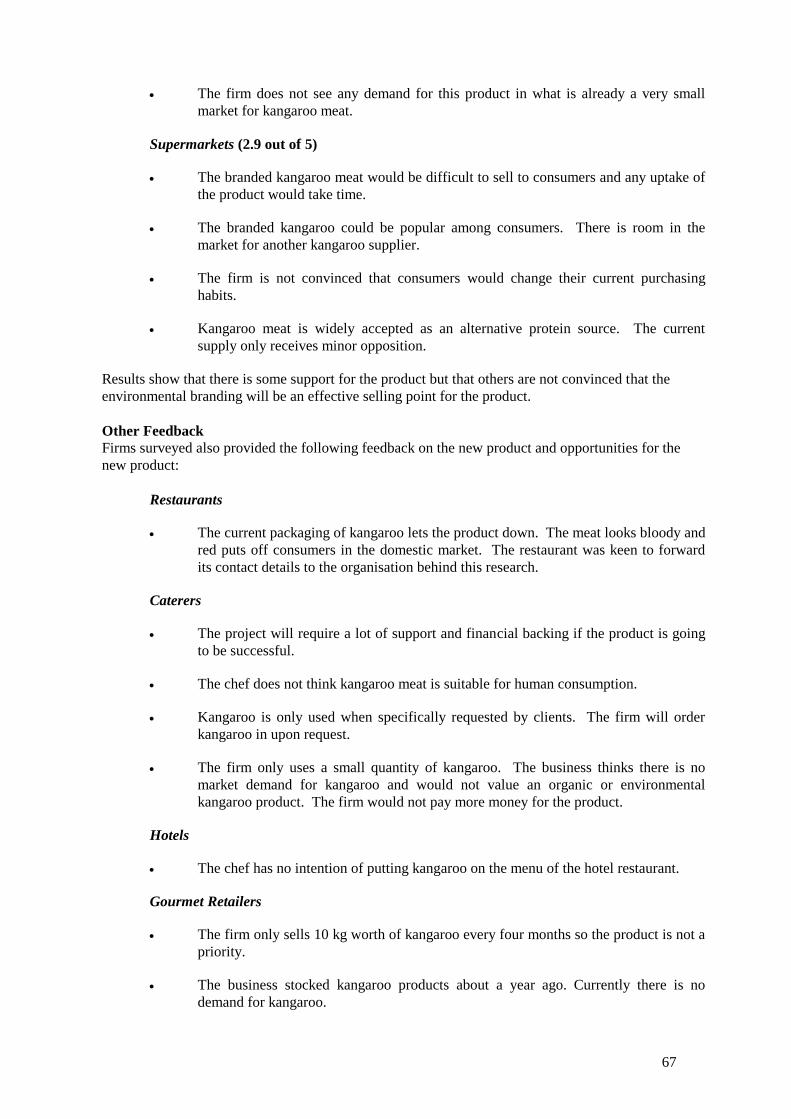
67
The firm does not see any demand for this product in what is already a very small
market for kangaroo meat.
Supermarkets (2.9 out of 5)
The branded kangaroo meat would be difficult to sell to consumers and any uptake of
the product would take time.
The branded kangaroo could be popular among consumers. There is room in the
market for another kangaroo supplier.
The firm is not convinced that consumers would change their current purchasing
habits.
Kangaroo meat is widely accepted as an alternative protein source. The current
supply only receives minor opposition.
Results show that there is some support for the product but that others are not convinced that the
environmental branding will be an effective selling point for the product.
Other Feedback
Firms surveyed also provided the following feedback on the new product and opportunities for the
new product:
Restaurants
The current packaging of kangaroo lets the product down. The meat looks bloody and
red puts off consumers in the domestic market. The restaurant was keen to forward
its contact details to the organisation behind this research.
Caterers
The project will require a lot of support and financial backing if the product is going
to be successful.
The chef does not think kangaroo meat is suitable for human consumption.
Kangaroo is only used when specifically requested by clients. The firm will order
kangaroo in upon request.
The firm only uses a small quantity of kangaroo. The business thinks there is no
market demand for kangaroo and would not value an organic or environmental
kangaroo product. The firm would not pay more money for the product.
Hotels
The chef has no intention of putting kangaroo on the menu of the hotel restaurant.
Gourmet Retailers
The firm only sells 10 kg worth of kangaroo every four months so the product is not a
priority.
The business stocked kangaroo products about a year ago. Currently there is no
demand for kangaroo.
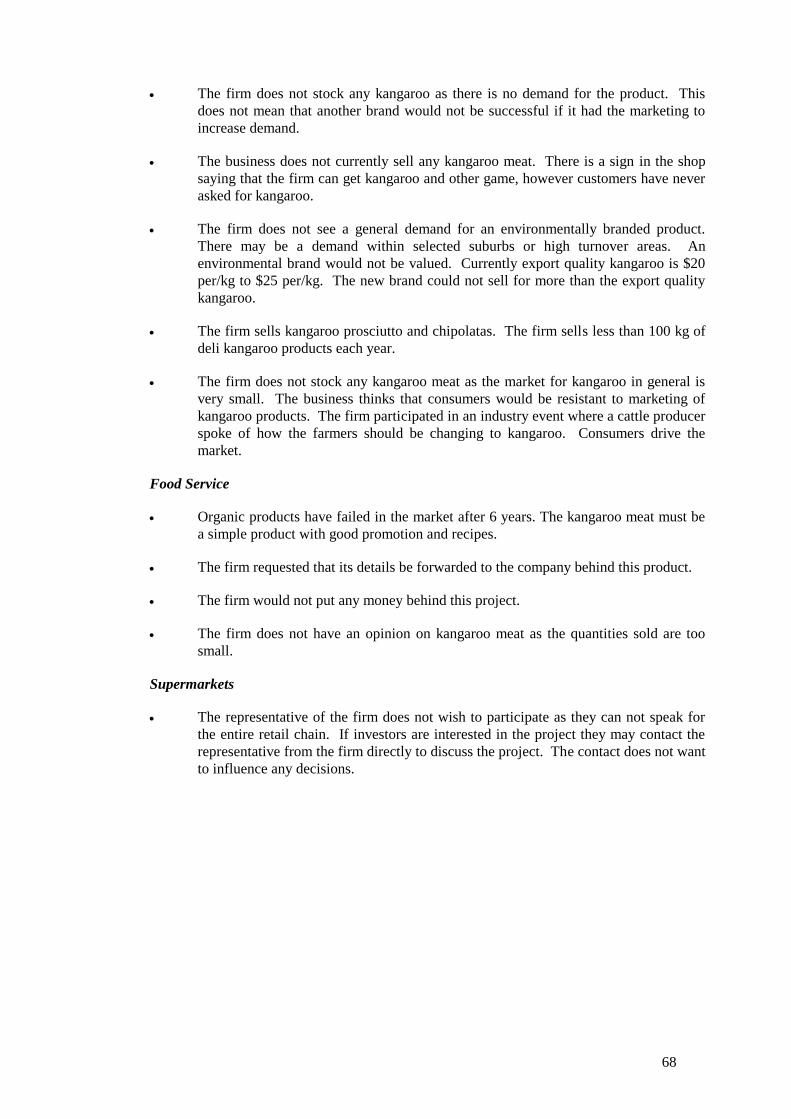
68
The firm does not stock any kangaroo as there is no demand for the product. This
does not mean that another brand would not be successful if it had the marketing to
increase demand.
The business does not currently sell any kangaroo meat. There is a sign in the shop
saying that the firm can get kangaroo and other game, however customers have never
asked for kangaroo.
The firm does not see a general demand for an environmentally branded product.
There may be a demand within selected suburbs or high turnover areas. An
environmental brand would not be valued. Currently export quality kangaroo is $20
per/kg to $25 per/kg. The new brand could not sell for more than the export quality
kangaroo.
The firm sells kangaroo prosciutto and chipolatas. The firm sells less than 100 kg of
deli kangaroo products each year.
The firm does not stock any kangaroo meat as the market for kangaroo in general is
very small. The business thinks that consumers would be resistant to marketing of
kangaroo products. The firm participated in an industry event where a cattle producer
spoke of how the farmers should be changing to kangaroo. Consumers drive the
market.
Food Service
Organic products have failed in the market after 6 years. The kangaroo meat must be
a simple product with good promotion and recipes.
The firm requested that its details be forwarded to the company behind this product.
The firm would not put any money behind this project.
The firm does not have an opinion on kangaroo meat as the quantities sold are too
small.
Supermarkets
The representative of the firm does not wish to participate as they can not speak for
the entire retail chain. If investors are interested in the project they may contact the
representative from the firm directly to discuss the project. The contact does not want
to influence any decisions.
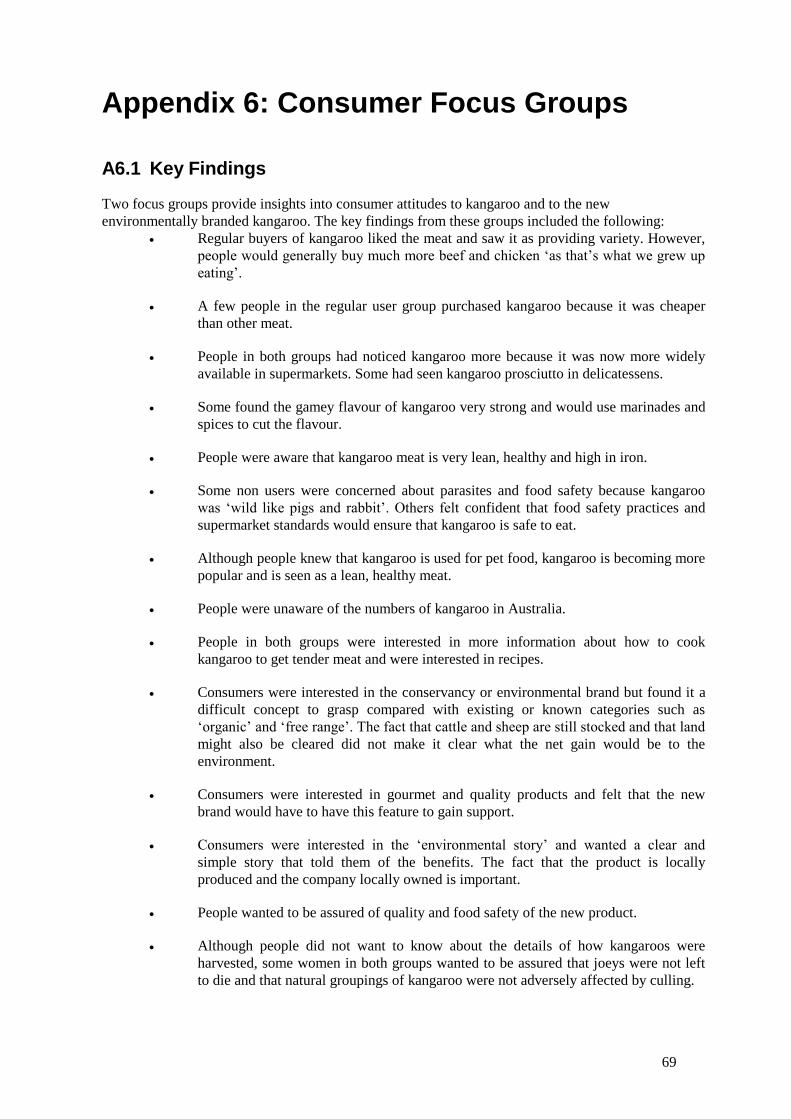
69
Appendix 6: Consumer Focus Groups
A6.1 Key Findings
Two focus groups provide insights into consumer attitudes to kangaroo and to the new
environmentally branded kangaroo. The key findings from these groups included the following:
Regular buyers of kangaroo liked the meat and saw it as providing variety. However,
people would generally buy much more beef and chicken ‘as that’s what we grew up
eating’.
A few people in the regular user group purchased kangaroo because it was cheaper
than other meat.
People in both groups had noticed kangaroo more because it was now more widely
available in supermarkets. Some had seen kangaroo prosciutto in delicatessens.
Some found the gamey flavour of kangaroo very strong and would use marinades and
spices to cut the flavour.
People were aware that kangaroo meat is very lean, healthy and high in iron.
Some non users were concerned about parasites and food safety because kangaroo
was ‘wild like pigs and rabbit’. Others felt confident that food safety practices and
supermarket standards would ensure that kangaroo is safe to eat.
Although people knew that kangaroo is used for pet food, kangaroo is becoming more
popular and is seen as a lean, healthy meat.
People were unaware of the numbers of kangaroo in Australia.
People in both groups were interested in more information about how to cook
kangaroo to get tender meat and were interested in recipes.
Consumers were interested in the conservancy or environmental brand but found it a
difficult concept to grasp compared with existing or known categories such as
‘organic’ and ‘free range’. The fact that cattle and sheep are still stocked and that land
might also be cleared did not make it clear what the net gain would be to the
environment.
Consumers were interested in gourmet and quality products and felt that the new
brand would have to have this feature to gain support.
Consumers were interested in the ‘environmental story’ and wanted a clear and
simple story that told them of the benefits. The fact that the product is locally
produced and the company locally owned is important.
People wanted to be assured of quality and food safety of the new product.
Although people did not want to know about the details of how kangaroos were
harvested, some women in both groups wanted to be assured that joeys were not left
to die and that natural groupings of kangaroo were not adversely affected by culling.
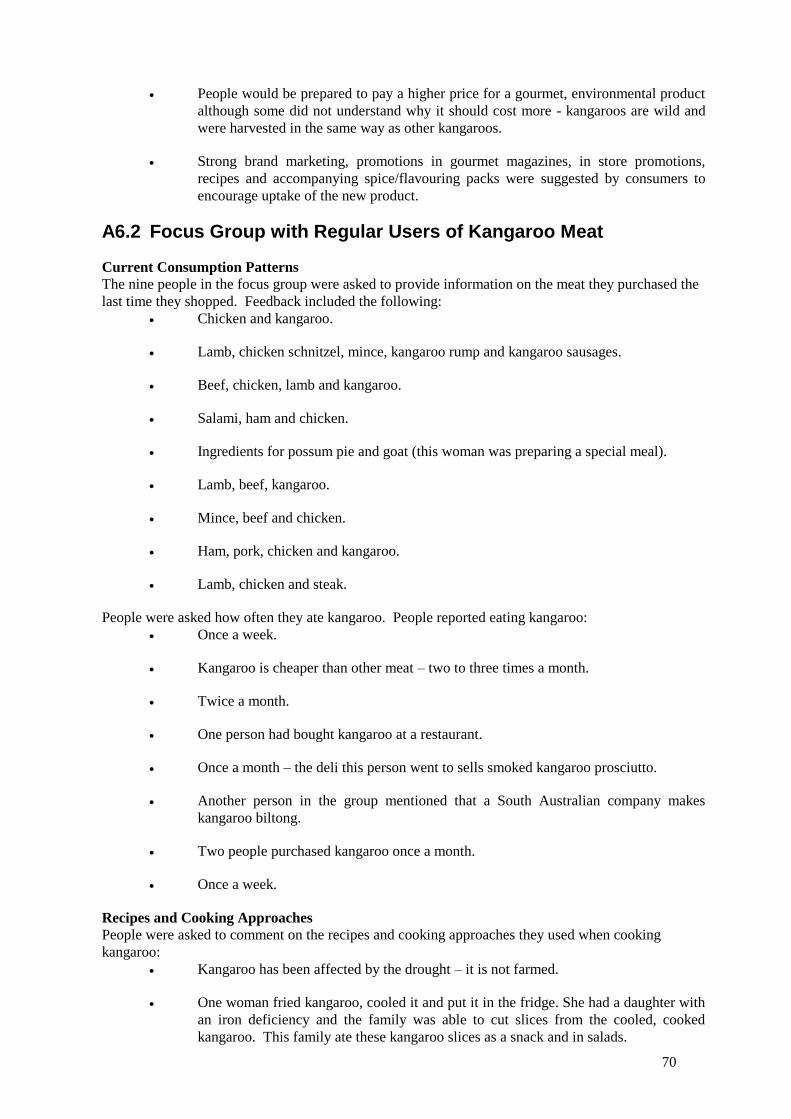
70
People would be prepared to pay a higher price for a gourmet, environmental product
although some did not understand why it should cost more - kangaroos are wild and
were harvested in the same way as other kangaroos.
Strong brand marketing, promotions in gourmet magazines, in store promotions,
recipes and accompanying spice/flavouring packs were suggested by consumers to
encourage uptake of the new product.
A6.2 Focus Group with Regular Users of Kangaroo Meat
Current Consumption Patterns
The nine people in the focus group were asked to provide information on the meat they purchased the
last time they shopped. Feedback included the following:
Chicken and kangaroo.
Lamb, chicken schnitzel, mince, kangaroo rump and kangaroo sausages.
Beef, chicken, lamb and kangaroo.
Salami, ham and chicken.
Ingredients for possum pie and goat (this woman was preparing a special meal).
Lamb, beef, kangaroo.
Mince, beef and chicken.
Ham, pork, chicken and kangaroo.
Lamb, chicken and steak.
People were asked how often they ate kangaroo. People reported eating kangaroo:
Once a week.
Kangaroo is cheaper than other meat – two to three times a month.
Twice a month.
One person had bought kangaroo at a restaurant.
Once a month – the deli this person went to sells smoked kangaroo prosciutto.
Another person in the group mentioned that a South Australian company makes
kangaroo biltong.
Two people purchased kangaroo once a month.
Once a week.
Recipes and Cooking Approaches
People were asked to comment on the recipes and cooking approaches they used when cooking
kangaroo:
Kangaroo has been affected by the drought – it is not farmed.
One woman fried kangaroo, cooled it and put it in the fridge. She had a daughter with
an iron deficiency and the family was able to cut slices from the cooled, cooked
kangaroo. This family ate these kangaroo slices as a snack and in salads.
71
Sausages – they are easy to cook and lean. The taste is ‘not too steaky’.
One person commented that kangaroo can taste a bit like liver.
Using kangaroo meat in spaghetti Bolognese.
Using kangaroo mince in Mexican dishes such as nachos, burritos and tacos.
One person marinated kangaroo for a few hours in wine to make the meat more
tender.
One person had eaten kangaroo at a restaurant and they served small fillets.
One person felt that roasted kangaroo can be overpowering and a bit chewy.
Kangaroo burgers.
Kangaroo sausages.
‘Kangaroo is good on the barbecue.’
One person’s friend has a beef burgundy recipe and kangaroo goes very well in this
recipe.
People commented that kangaroo can be cooked at a lower temperature. It is
important not to cook kangaroo too long – it is important to rest it and let it bleed.
Some felt that the odour of kangaroo was fairly strong. One person used a lemon
juice and pepper dressing to cut the strong odour and taste.
Another person used Middle Eastern spices including cumin to reduce the ‘gamey
flavour’.
When commenting on the flavour, tenderness and toughness of kangaroo, people made the following
comments:
The taste can be a bit like offal.
One person had been out in the bush and had shot and eaten kangaroos.
One person found kangaroo tough ‘if I cook it at home’.
Most people in the group agreed that kangaroo steaks were not too hard to cook.
Sausages were also good.
One person had tried venison ham which had been smoked and salted. She also felt
that kangaroo would be good if smoked and salted.
Some felt that kangaroo could be a pretty tough meat – based on the lifestyle of the
animal.
Kangaroo prosciutto is good.
One person had tried kangaroo jerky and found that it had a strong flavour.
Some people had no problem with the flavour although a few found it a strong
flavour.
72
One person slow cooked kangaroo with olive oil and red wine. Another person used a
red wine marinade and also used kangaroo in shish kebabs.
People agreed that kangaroo ‘does not look like regular meat’.
Five to six people in the group felt that kangaroo had a fairly strong flavour.
Comparison with Other Meats
People made the following comments when comparing kangaroo with other meats:
It is like rabbit and venison – a game meat.
Kangaroo meat is very lean and compares well to other meats because of its low fat
content.
Kangaroo sausages and mince are very good.
Some people liked the dark colour of the meat.
Health, Nutrition and Other Benefits
People felt that the benefits of kangaroo included the following:
The iron content.
The lean meat. It slices well when cold.
People commented that grazing animals had to be taken to an abattoir and at times
there was stress involved. Kangaroos are killed on the spot and there is less stress.
Kangaroos are not genetically modified.
There are more trace elements in kangaroo meat.
There are no antibiotics used in kangaroos. Some were concerned about use of
antibiotics in chicken meat.
‘Kangaroos have a lighter footprint on the earth’ and there is no farming of
kangaroos.
Disadvantages of Eating Kangaroo Meat
People felt that the disadvantages of eating kangaroo meat included the following:
Perceptions that kangaroo is ‘pet meat’ or ‘Skippy’.
One person sometimes cooked meals for guests and did not mention that it was
kangaroo. For this person, it was a price consideration. However the guests never
noticed.
Kangaroos are on the Australian emblem.
One person felt they were vermin like rabbits.
A few people were concerned about the parasite issue – the meat is often still
bleeding when cooked and people did not know whether parasites were an issue.
Some are concerned that kangaroos are killed and not put in the fridge straightaway.
A few had concerns about ‘dirty’ meat because the animals were wild and the way in
which animals are harvested. Others in the group commented that all meat is covered
by food safety regulations.
73
One person in the group had shot kangaroos and commented that kangaroos are shot
at night and refrigerated within 10 hours.
Again a few people in the group raised the issue of parasites.
Cole’s has very high quality control on all of its food and would not sell kangaroo if it
had parasites.
Sources of Information on Kangaroo Meat and Recipes
People used the following sources for information on kangaroo meat and kangaroo cooking and
recipes:
The internet – ‘The Roadkill Recipe Book’.
The CWA cookbook.
The Roma Meatworks sends kangaroos to Russia for meat supply.
Some animals are slaughtered in the halal method but some are concerned that this was not as safe as
having a regular meat inspector.
Dieticians advise that kangaroo meat is healthy because of the low fat and the nutritional profile.
Knowledge of How Kangaroos are Killed and Processed
Some in the group did not know much about how kangaroos are killed and processed.
People in the group knew that kangaroos are not farmed and that they are culled.
Some people in the group knew that shooters go out and use spotlights and shoot kangaroos at night.
There is an image of a ‘tough Aussie out there shooting kangaroos’.
One person commented that kangaroo shooters are professionals and use refrigerated vans – there is a
mother ship to take carcasses.
Only two people in the group felt that they did not know much about how kangaroos are killed and
processed.
Views on Wild Culling
People made the following comments about wild culling of kangaroos:
Some were concerned about joeys being left in the pouch when their mothers were
killed – ‘cows are not pregnant when they kill them’.
Only one young woman in the group wondered whether there was any farming of
kangaroos.
When people drive out west, they run over kangaroos.
Most in the group had no problem with kangaroos being shot.
Sometimes kangaroos are just shot for dog food.
Awareness of the Kangaroo Population
None of the people in the group knew the size of the kangaroo population. One person thought it was
30 million.
Concerns over Humane Killing
74
People in the group felt that shooting kangaroos was more humane than taking cows through a
slaughterhouse. One person was concerned about shooting kangaroos in a limited area – did this
affect the gene pool if large kangaroos were shot, leaving only smaller kangaroos.
Reaction to the Conservancy Concept
Participants were given an outline of the conservancy concept:
Deborah Wilson Consulting Services is conducting market research to assess
potential market demand for niche production of high quality kangaroo meat under
an environmental brand.
The Maranoa Wildlife Conservancy which is west and north of Roma in
Queensland has been formed by a group of pastoralists, mainly cattle producers to
sustainably manage the region’s kangaroo population, produce kangaroo meat and
promote biodiversity among wildlife.
The Conservancy product will represent approximately 2% of kangaroos culled
annually within Australia and will offer these benefits over existing kangaroo meat:
Improved Product Quality – more consistent and higher quality kangaroo
product as a result of improved harvesting processes (chiller management,
improved traceback systems using GPS and data logging)
Environmentally Sustainable – the conservancy will use an environmental
management system – managing the stock load on properties and preserving
the existing environment. A number of the conservancy landholders are
ISO14001 Australian Land Management System accredited.
Another benefit is that encouraging kangaroo consumption instead of beef
consumption can reduce greenhouse gases.
Increased Food Safety – kangaroos will be harvested using quality assurance
systems including health, hygiene and food safety.
Humane Harvesting Methods – the size of the region allows wild kangaroos
to be harvested in the most humane method possible.
The research will cover:
Interest in Conservancy brand kangaroo products.
Types of kangaroo products preferred.
Key factors that would encourage use of the Conservancy brand kangaroo.
Information needed about the Conservancy brand kangaroo.
People’s reaction to the conservancy concept included the following:
Quality is an important aspect.
Some are concerned about the impact on joeys in female kangaroo pouches – some
would pay extra if they knew that joeys were taken care of when the mother was
killed.
‘It is a good spin to be ecologically sound.’
It would be good if the meat is better – ‘I always think of parasites’.
There is more effort gone into it.
75
People in the group felt that it would be a positive thing to have environmentally
branded kangaroo.
One person felt that they would pay extra to not have the same dog meat handling of
kangaroo. People are prepared to pay extra in a delicatessen.
Four people in the group were interested in the conservancy branded kangaroo and were prepared to
pay 10% to 20% more for this kangaroo.
Best Types of Kangaroo Product
Consumers felt that the best types of kangaroo products for the conservancy or environmental brand
included:
Prosciutto.
Smoked kangaroo.
Something different – perhaps adding bush tomato or lemon myrtle in sausages.
One person questioned whether sausages were a good idea – is it supposed to be
cheap?
Smoked kangaroo and kangaroo salami.
Environmentally branded kangaroo should offer basic cuts – like organic meat.
People in the group discussed the fact that organic meat had a similar type of positioning.
One person was interested in kangaroo tail.
The branding could tell people how it is different – people understand what free range eggs are
compared to ordinary eggs but it is harder to understand what the difference is with the
environmentally branded kangaroo.
People knew that kangaroos are already free ranging.
Some felt that the environmentally branded kangaroo would be close in price to the ordinary kangaroo
– there is no hand feeding of the kangaroos.
People acknowledged that they pay more for wild fish.
Some people also noticed other specialist meat such as camel, crocodile and emu.
Benefits of the Conservancy Product
The benefits the conservancy product needs to offer to prompt consumers to trial it and buy it on an
ongoing basis included the following:
Reliability – being able to buy the product and have reliable quality.
Having a very healthy product.
Kangaroo is becoming more mainstream – it is very healthy.
A 20% higher price is still cheaper than other types of meat.
Perhaps it could be used in McDonald’s burgers.
One person suggested using it in meat pies – it promotes Australian pride.
76
One person knew that kangaroo meat is exported to Russia and it is ‘just sold as
meat’.
Pricing
People in the group reported that kangaroo meat sells for $6 to $7 or $8 per kilo.
Brand Name
The brand name needs to get across the following information to consumers:
Local – western Queensland.
Some thought has gone into it.
Food safety.
The food is fit for human consumption and is safe.
The environmental benefits.
That it is a gourmet treat.
Letting people know that shooting does not stress out the kangaroos. One person
commented that cows can get very stressed. The group discussed this and decided that
‘they did not want to know about the killing process’.
Let people know about the iron content.
Information that the product stores well.
Letting people know that the harvesting of kangaroos is not damaging Australia.
Get the Heart Foundation Tick.
Availability
Consumers provided the following feedback on availability of the new product:
Some want it available every day.
People wanted to know when the product was available. People understood that fruit
can be seasonal but did not associate seasonality with meat.
One person in the group mentioned that slow food is all about choosing seasonally
available food – this new product would fit in with slow food.
Consumers wanted a frozen alternative available if fresh was not available.
Smoking the kangaroo will give it a longer shelf life.
Some people wanted to have that ‘hunter gatherer’ link and would feel that buying the
product kept them ‘in touch with the land’.
People suggested including packs of lemon myrtle seasoning and recipe cards with
the kangaroo.
Differentiating the Product
Consumers wanted to know who the people are that will benefit from the product, e.g. is it an
Australian owned farm?
77
People were more interested in supporting a local group of farmers versus a multimillion dollar
business.
‘Does it link in with the indigenous community?’
People wanted to know what the benefits were to the land.
Were the producers local owners?
Trying and Buying the Conservancy Kangaroo Product
People were asked when they would try and buy the conservancy or environmentally branded
kangaroo:
Some would buy it when they had visitors.
Buy it from the deli.
One person made the comment that kangaroo meat is very dark and can get ‘lost in
the black containers’.
Kangaroo steaks are not flat like other steaks.
Australia Day.
The new product could be Cryovaced.
In store promotions encouraged people – cooking the product and giving people a
taste test.
Ethnic festivals – often at festivals there are food from all nations but no truly
Australian foods – perhaps the environmentally branded kangaroo can be promoted as
Australian food.
One person had an Australian food themed dinner party. She had cooked possum and
had to get it from New Zealand. Possum recipes use half possum and half beef.
Perhaps there is an opportunity to use the same approach with the kangaroo – half
kangaroo and half beef.
People buy chicken from the deli department of the supermarket. Environmentally
branded kangaroo could also be sold in the same way.
It is up to the restaurant whether they offer kangaroo. Restaurants offer very high
quality meat, e.g. 1824 Steak, Bangalow Sweet Pork. The environmentally branded
kangaroo can be promoted to restaurants in a similar way.
Organic restaurants in capital cities would probably be interested in the product.
Important Messages
The most important messages to encourage people to order kangaroo meat more frequently at
restaurants or buy it more frequently at supermarkets included the following:
The conservancy message.
Health and environment are the top messages.
Where people can buy the kangaroo.
Information on how to cook kangaroo and providing more kangaroo recipes.
78
The quality assurance systems and food safety.
Humane harvesting methods – however some did not want to know about this
information.
Sustainable management of kangaroos was of interest to some but not to others.
Sustainable management of pastures and land was of interest to some.
Sustainable management of wildlife was important to some.
Trying the New Environmentally Branded Kangaroo Meat
Four of the people in the group would be more inclined to try kangaroo meat, eat more or order it
more frequently in restaurants if kangaroos were from a sustainably managed conservancy.
Monitoring Numbers
People felt that the conservancy approach does show a different approach to culling kangaroos and
sustainable management.
Paying More
The majority of the people in the group felt that they would be willing to pay more if kangaroo was
sourced from a sustainably managed land production system.
Priorities
The priorities and messages to encourage people to try and buy the environmentally branded kangaroo
product included the following:
It should be easy to get – available in a supermarket.
Provide lemon myrtle and other seasoning with the kangaroo.
Focus on the sustainability message – aboriginal people use all of the kangaroo.
Some crops like cotton take too much water to produce. There has been a move to
replace cotton with hemp. The environmentally branded kangaroo would be a more
sustainable approach for the environment than beef.
There is more sustainability in using kangaroos as the leather, bones and other parts
can all be used.
Some felt that kangaroo had a very strong flavour and this would need to be
overcome. Providing seasoning such as lemon myrtle can cut through this strong
flavour and taste which is repellent to some people.
The sausages are fairly mild. Perhaps the group can donate sausages to school fetes
and then let people know that they are kangaroo sausages.
Perhaps get the Australian Boxing Team for the Olympics to eat and endorse the
kangaroo.
People wanted the convenience and ease of being able to buy the kangaroo. It must
also be easy to cook.
A6.3 Focus Group with People Who Do Not Regularly Eat Kangaroo
Current Consumption and Attitude
79
At the start of the group people were asked to comment on the type of meat they had purchased last
time they went shopping. Feedback included the following:
From the organic butcher, roast, steak and chops.
Organic lamb, sausages.
Chicken schnitzel and topside.
Chicken thighs.
Chicken, pork, leg ham, salami and schnitzel.
Organic chicken breasts.
Half a hot chicken.
Steak, rack of lamb, chuck, sausages and roast chicken.
Consumption of Kangaroo
Four of the people in the group had eaten kangaroo at some time in the past. Feedback included the
following:
One person was at a barbecue and had been served very thin slices of kangaroo with
pepper.
One person went to a restaurant that had kangaroo, crocodile, emu, buffalo and camel
on the menu.
Another person had also tried kangaroo at a restaurant.
Feedback on kangaroo included:
‘It’s okay.’
‘You cannot have too much of it.’
Some had not thought about it but had tried it when it was offered.
Some were worried about the fact that it was a wild animal. Feral animals are not
healthy and perhaps there was a health risk.
‘Eating kangaroo is like eating the bald eagle.’
Other people in the group simply had no opportunity to try kangaroo.
Views on Kangaroo
One person who had eaten kangaroo found it more tender than he had thought. The kangaroo meat
was very tender at a restaurant but this person wondered whether they could cook kangaroo well at
home.
Another person felt that kangaroo was good for a change but was not a regular weekly purchase – it is
more of an occasional purchase.
Kangaroo has a strong flavour – much stronger than steak.
People in the group agreed that it had a strong, gamey and rich flavour.
Comparison with Other Meats
Some felt that kangaroo did not compare well with other meats – ‘I don’t love it like I like chicken’.
80
Kangaroo does not compare as highly with other meats because it is not eaten as often.
People were ‘brought up on beef and chicken’. People agreed that getting used to food early on had a
big influence on what they ate today.
Australians eat Vegemite but adults who come to Australia from other countries do not necessarily
like the Vegemite flavour.
One person felt that as kangaroo was a strong meat, people would use less of it because of the strong
flavour.
Health and Nutrition
People made the following comments on the health, nutrition and other benefits of eating kangaroo:
‘There are a heap of them.’
Australia is the only country that eats its national emblem.
Some thought of kangaroos as pests.
Kangaroos are ‘fed to dogs’.
Kangaroo is high in iron.
Eating kangaroos is better for the environment than eating beef. A cow has the
greenhouse gas emissions equivalent to a Land Rover.
Some did not know where to get kangaroo from.
People discussed the fact that when animals are shot, the stress hormone can affect
the condition and quality of the meat. People would want to know the conditions
under which kangaroos are shot.
People knew that kangaroo was lean meat.
Some were not sure what part of the kangaroo was available – is it the rump?
One person commented that ‘they use all of the kangaroo for dog meat’.
Knowledge of Kangaroo Killing and Processing
One person in the group had been out shooting kangaroos.
Shooting kangaroos is a pest control issue in some areas.
Some in the group were not sure what the relationship was between kangaroo numbers and
the land.
Disadvantages of Eating Kangaroo Meat
The high iron content can be a problem for some people.
There can be a perception that kangaroo is ‘roadkill or pet food’.
One person in the group was an American and felt that eating kangaroos was like eating bald
eagles.
81
Some felt sorry for the ‘poor joeys’ when mother kangaroos were shot.
Some had seen information about kangaroo and kangaroo recipes in magazines such as
Gourmet Travellers – exotic magazines.
There was push on promoting kangaroo for human consumption about 10 years ago. It became
more mainstream – Geoff Jansz was cooking kangaroo but then it ‘fizzled out’.
Knowledge of the Kangaroo Population
People were not sure how many kangaroos there were in Australia but felt that there were
‘many’.
Some knew that ‘farmers hate them’.
One person thought there were a million or more kangaroos.
Reaction to Conservancy Supply
People were given information on the conservancy concept.
People provided the following feedback on their initial reaction:
Some were concerned about female kangaroos being shot.
People felt they were more likely to buy kangaroo if they knew what was behind it
e.g. the conservancy brand.
It is important to tell people what to do with kangaroo – how to cook it. People
needed recipes and advice on preparation.
One person would not buy it from Woolworths and Coles – the meat looks ‘old or
dirty’.
The product would need to be in gourmet packaging and the low emissions message
and environmental branding needs to be on the packaging.
Butchers could provide tastings. Wine tastings are popular and butchers could
recommend the environmentally branded kangaroo to people when they are serving
customers.
The kangaroo needs to be packaged – a gourmet pack.
If the meat was just on a slab, it would look ‘diseased’.
Some people will not buy caged eggs so there are already examples where consumers will
make choices for more natural or environmental products.
The product needs to have an image as a delicacy. It could also be promoted to encourage
young people to try the product.
Benefits the Conservancy Would Need to Deliver
The key benefits the conservancy product would need to deliver included:
Integrity of the product.
82
Good quality and consistent quality.
Good quality – killing the animal as soon as it is caught.
Food safety.
Range of Information Consumers Need
The range of information that consumers wanted about the conservancy brand and its role in
sustainable properties, preserving the environment and sustainability of kangaroo populations
included the following:
Price – is it cheaper than (beef) meat.
Why is the price 20% higher than other kangaroo?
The quality and the integrity of the product.
An Australian business – produced by Australians.
Some were concerned about game meat – pigs and rabbits have parasites and some
were concerned about the health of the animal and whether eating kangaroo could
cause harm.
Nutritional information including fat content.
‘Why it is good for you’. The omega-3 message has been a strong one – tell people
why it is good for you.
Good packaging and the story on the pack.
People felt that the product should be sold through butchers and consumers could be
given a booklet explaining the conservancy product.
Safe.
Good for you.
‘Not Skippy or Captain Kangaroo’.
Fresh.
Gourmet.
Organic.
Branding Compared to Other Kangaroo
People felt that the conservancy product should have the following branding compared with other
kangaroo:
Better quality – building the reputation.
People mentioned the ‘eat red meat’ TV ads. These have been very effective.
Develop the cultural approach – kebabs with bush spices. The kangaroo product
could come with sachets or pre prepared marinades or spices.
Include an Aboriginal recipe and a recipe book.
83
Best Types of Products
Consumers felt the following products would be the best types of products for the new kangaroo
product:
Fillets – this is a delicacy.
Kangaroo jerky.
Kebabs.
Rissoles.
Chorizo sausage.
One person suggested mince for tacos but others felt that mince was too down market.
Kangaroo sausages. Stronger style sausages such as Italian or chorizo would be good
as kangaroo has a strong flavour.
Kangaroo prosciutto – this is good.
Attractiveness of the Conservancy Brand
The attractiveness of the kangaroo product compared with other premium meats such as organic beef,
corn fed chicken and free range chicken would depend on the labelling and the promotion.
People would need to understand what the environmental brand actually meant.
People understood what the terms ‘organic’ and corn fed meant but they were not really sure what the
environmental or conservancy message was.
This needs to be a clear message combined with information about safety and quality of the product.
Availability
People felt that it would be okay if the product was seasonally available, e.g. available in winter. If it
is intermittent supply, some would not remain interested.
Information on the Conservancy
Some in the group pointed out that the conservancy farmers would still be producing cattle – cattle
produce methane and farmers clear land. What is the difference or benefit with the conservancy
kangaroo?
Farmers may be looking after the land but are they looking after the kangaroo or the cattle – these
seem to be completely separate.
It will be important to have an environmental message on the cattle issue.
Trying the Conservancy Product
Eight of the people in the group would be prepared to try the new product.
People would be interested in a taste test.
People suggested television advertising, brochures and recipes in the pack to promote the product.
Perhaps the new product could have its own brand of sauce – not on the meat itself but in a pack that
is separate.
The new kangaroo product could also have its own recipe book – this would be very useful.
84
Important Messages
Important messages included the following:
Availability of the product is a big thing.
What does it mean in terms of emissions? There was a lot of talk about emissions and
people would want to know what impact it was having.
Have the options for recipes and recommendations on wine.
‘Will the kids eat it?’
Can it be used at a barbecue – will everyone in the family eat it? If the whole family
would not eat it, some would not buy it.
It would be something new.
People need advice on preparation.
Perhaps there could be a promotion – kangaroos for kids like the pasta shapes at
McDonald’s.
People felt that the following messages were important:
Where people can buy the kangaroo.
More information on how to cook the kangaroo and more kangaroo recipes.
Quality assurance including food safety.
Assurance about the source and the ability to trace back – some felt that general
information was okay but felt that GPS tracking was a bit too much.
Sustainable management of kangaroos.
Sustainable management of pastures and land with a high level of ground cover as a
result of harvesting kangaroos from the conservancy area.
Sustainable management of wildlife.
Reducing greenhouse gases by eating kangaroo – people felt that they would do
anything that will help.
Environmental Balance
People felt that it was important to have an improved balance between kangaroos and sheep but
properties would still continue to carry sheep or cattle.
Top Priorities
‘If the product is a success, it will not make a dent in the 50 million kangaroos out there’.
Top priorities for the new product included the following:
Some did not want mother kangaroos with joeys shot.
Kangaroos are very territorial -If farmers took the fathers, kangaroos, would this
affect family groupings?
How can the suppliers guarantee the quality?
Why is it better than beef?
85
References Ampt P and Owen K (2007), ‘Choosing Kangaroo: Product and Industry Attributes and Consumer
Choice Behaviour”, Draft Report to Rural Industries Research and Development Corporation, July
Kelly J (2005) ‘Kangaroo Industry Strategic Plan 2005-2010’, Report for the Rural Industries
Research and Development Corporation, Lenah Consultancy, RIRDC Publication No 05/108,
Canberra.
Des Purcell and Associates (1997) ‘Improving Consumer Perceptions of Kangaroo Products’, RIRDC
Publication No 97/036, Canberra.
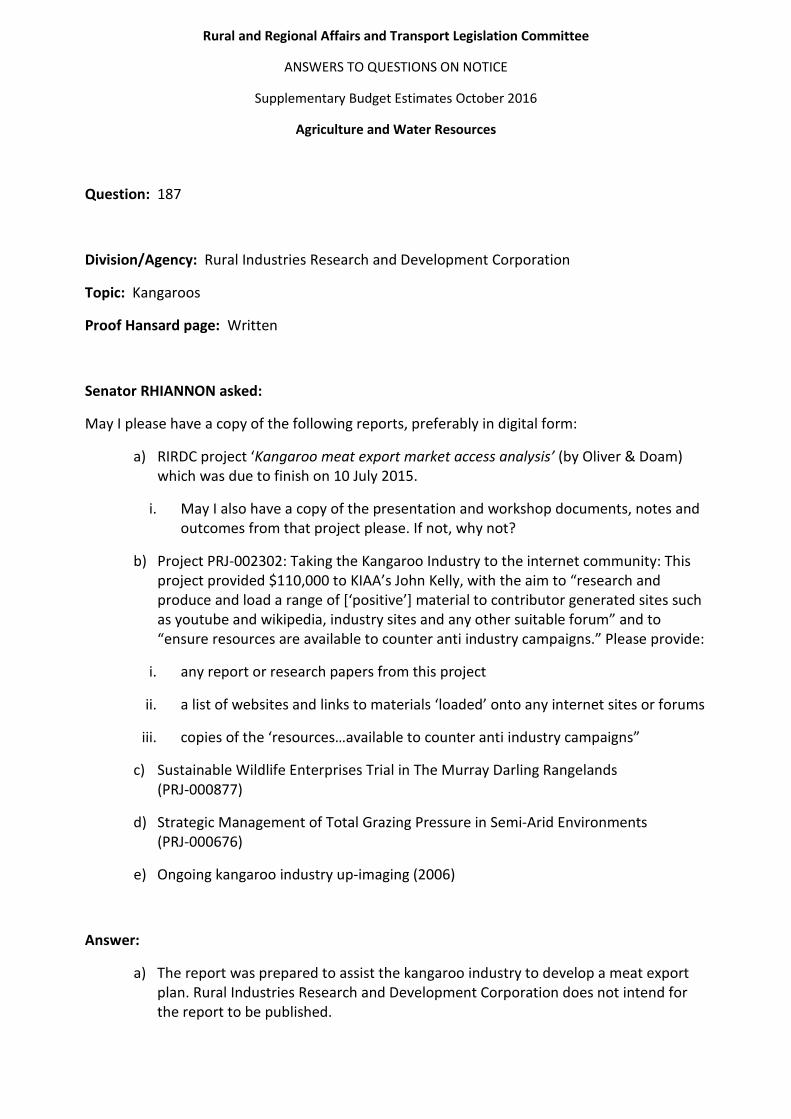
Rural and Regional Affairs and Transport Legislation Committee
ANSWERS TO QUESTIONS ON NOTICE
Supplementary Budget Estimates October 2016
Agriculture and Water Resources
Question: 187
Division/Agency: Rural Industries Research and Development Corporation
Topic: Kangaroos
Proof Hansard page: Written
Senator RHIANNON asked:
May I please have a copy of the following reports, preferably in digital form:
a) RIRDC project ‘Kangaroo meat export market access analysis’ (by Oliver & Doam) which was due to finish on 10 July 2015.
i. May I also have a copy of the presentation and workshop documents, notes and outcomes from that project please. If not, why not?
b) Project PRJ-002302: Taking the Kangaroo Industry to the internet community: This project provided $110,000 to KIAA’s John Kelly, with the aim to “research and produce and load a range of [‘positive’] material to contributor generated sites such as youtube and wikipedia, industry sites and any other suitable forum” and to “ensure resources are available to counter anti industry campaigns.” Please provide:
i. any report or research papers from this project
ii. a list of websites and links to materials ‘loaded’ onto any internet sites or forums
iii. copies of the ‘resources…available to counter anti industry campaigns”
c) Sustainable Wildlife Enterprises Trial in The Murray Darling Rangelands (PRJ-000877)
d) Strategic Management of Total Grazing Pressure in Semi-Arid Environments (PRJ-000676)
e) Ongoing kangaroo industry up-imaging (2006)
Answer:
a) The report was prepared to assist the kangaroo industry to develop a meat export plan. Rural Industries Research and Development Corporation does not intend for the report to be published.
Question: 187 (continued)
b) An industry video developed from this project is available on the KIAA website and Youtube. Nine cooking demonstration videos were also developed for Youtube and the KIAA website. A range of kangaroo recipes and photos of dishes were uploaded to myspace, photobucket, kangaroomeat.net.au and the KIAA website. Kangaroo industry, kangaroo meat and kangaroo leather briefs have been loaded onto Wikipedia. Six kangaroo industry newsletter have been produced, distributed and loaded onto the KIAA website. Several blog groups were established on Facebook including, 'Eat more kangaroo - become a kangatarian' and 'kangaroo youth forum'.
c) No final report was published.
d) No final report was published.
e) This project developed newsletters that were posted to the KIAA website.
2