Embed Size (px)
Citation preview
QUICK EVALUATION STUDY
ON
RLTAP OF KBK DISTRICTS IN ORISSA
Programme Evaluation Organisation Planning Commission Government of India
New Delhi July, 2009
Contents
Chapter Subject Page (1) (2) (3)
Acknowledgement List of Tables List of Annexures Abbreviations Exe Summary i – xvi Chapter-1 Introduction 1-7 1. The KBK Region 1 2. Development Profile of the KBK Region 1 3. Background of RLTAP 3 4. Objectives of the RLTAP and the Path 4 5. Programme Components 5 6. Achievements under RLTAP 5 7. The Study Area 7 Chapter-2 Profile of Study Area 8-17 1. Administrative Units 8 2. Area and Population 8 3. Quality of Life 10 4. Education Profile of Tribals 10 5. Health Care Facilities 12 6. Level of Backwardness 13 7. Cultivable Area 14 8. Drinking Water Supply 15 9. Rural Connectivity 15 10. Forest Resources 16 11. Socio-economic Profile 17 Chapter-3 Study Objectives and Methodology 18-52 1. Reference Period 18 2. Scope of the Study 18 3. Study Objectives and Methodology 20 4. Instructions and Guidelines 51 5. Method of Investigation 51 6. Coordination and Supervision 52
Chapter-4 Study Findings 53-215 Section – 1 : 40 Seated Hostels for ST /
SC Girls in KBK Districts 53
1. Enrolment of SC and ST Girls in Primary Schools
53
2. Impact on Gender Inequality in Primary Schools
55
3. Actual Position of Teachers 55 4. Residential Accommodation 57 5. Delay in Construction, Operation and
Occupancy of Hostel Buildings 59
6.Quality of Construction of Hostel Buildings and Maintenance
59
7. Amenities Provided 61 8. Security Arrangements for Boarders 62 9. Routine and Discipline among Boarders 63 10. Payment of Stipend and Distribution of
Uniforms 64
11. Quality of Food 66 12. Utility of Hostel 66 13. Opinion of Boarders on Hostel Amenities 69 14. Opinion of Key Informants (K.Is) 73 15. Opinion of Programme Managers 77 Section – 2 : Mobile Health Units in KBK
Districts 84
1. Service Area 84 2. Village Visits 85 3. Staff Position 86 4. Equipment and Medicines 87 5. Adequacy of Village Visits 88 6. Other Activities 89 7. Support Services 89 8. Rudimentary Problems 90 9. Opinion of Households 91 10. Opinion of Key Informants 94 11. Opinion of Programme Managers 99 Section – 3 : Emergency Feeding
Programme in KBK Districts 103
1. The Sample Anganwadi Centres 103 2. Beneficiaries in Sample AWCs 103 3. Selection of Beneficiaries 104 4. Supply of Food Components 105 5. Place of Food Service 106 6. Quality of Food Served 107 7. Food Service and Supervision 107 8. Opinion of Beneficiaries 108 9. Opinion of Key Informants (K.Is) 113 10. Opinion of Programme Managers 115 Section – 4 : Afforestation Programme
in KBK Districts 119
1. The Sample Afforestation Sites 119 2. Varieties Planted 119 3. Planning and Implementation 120 4. Nursery Raising 121 5. Plantation of different Species 121 6. Key Activities Undertaken 122 7. Skill Development 123 8. Employment Generation 124 9. Site Supervision 125 10. Survival at the time of Transfer of Sites 125 11. Opinion of Households 126 12. Opinion of Key Informants 129 13. Opinion of Programme Managers 132 Section – 5 : Biju Krushak Vikash Yojana
(BKVY) in KBK Districts 134
1. Physical Progress 134 2. Salient Features of Sample LIPs 135 3. Project Cost and Beneficiary Involvement 136 4. Repair and Maintenance of LI Points 137 5. Difficulties Encountered by Pani
Panchayat (PP) 138
6. Impact of LI Points 138 7. Opinion of Sample Beneficiaries 139 8. Opinion of Beneficiaries 145 9. Opinion of Key Informants 146 Section – 6 : Watershed Programme in
KBK Districts 149
1. The Sample Watersheds 149 2. Assets Created 149 3. Employment Generated 151 4. Irrigation Potential Created 153 5. Skill Development 154 6. Impact Assessment 155 7. Opinion of Households 156 8. Opinion of Knowledgeable Persons 162 9. Opinion of Programme Managers 164 Section – 7 : Rural Connectivity
Programme in KBK Districts 166
1. The Sample Bridges 166 2. Employment Generation 167 3. Quality Control 168 4. Connectivity Established 169 5. Views and Opinion of Gram Panchayats 170 6. Group Discussions 172 7. Opinion of Programme Managers 174 8. Overall Impression 174 Section – 8 : Rural Water Supply
Programme in KBK Districts 175
1. Location of Sample Projects 175
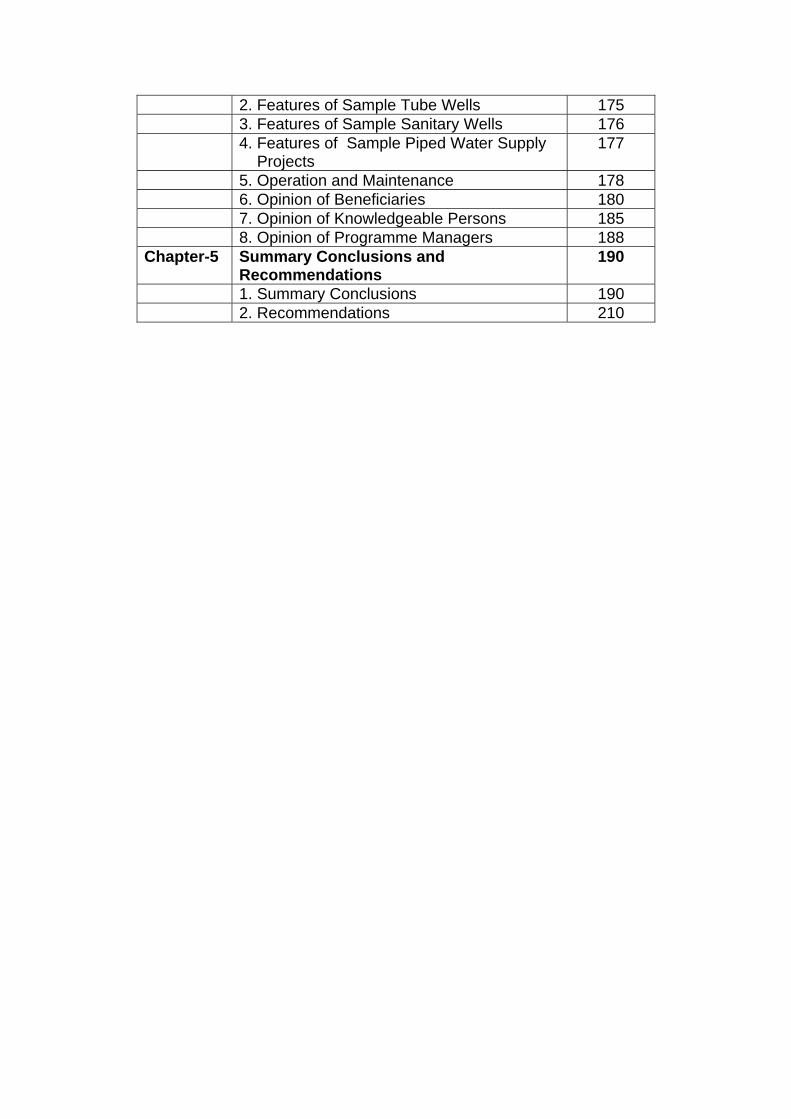
2. Features of Sample Tube Wells 175 3. Features of Sample Sanitary Wells 176 4. Features of Sample Piped Water Supply
Projects 177
5. Operation and Maintenance 178 6. Opinion of Beneficiaries 180 7. Opinion of Knowledgeable Persons 185 8. Opinion of Programme Managers 188 Chapter-5 Summary Conclusions and
Recommendations 190
1. Summary Conclusions 190 2. Recommendations 210
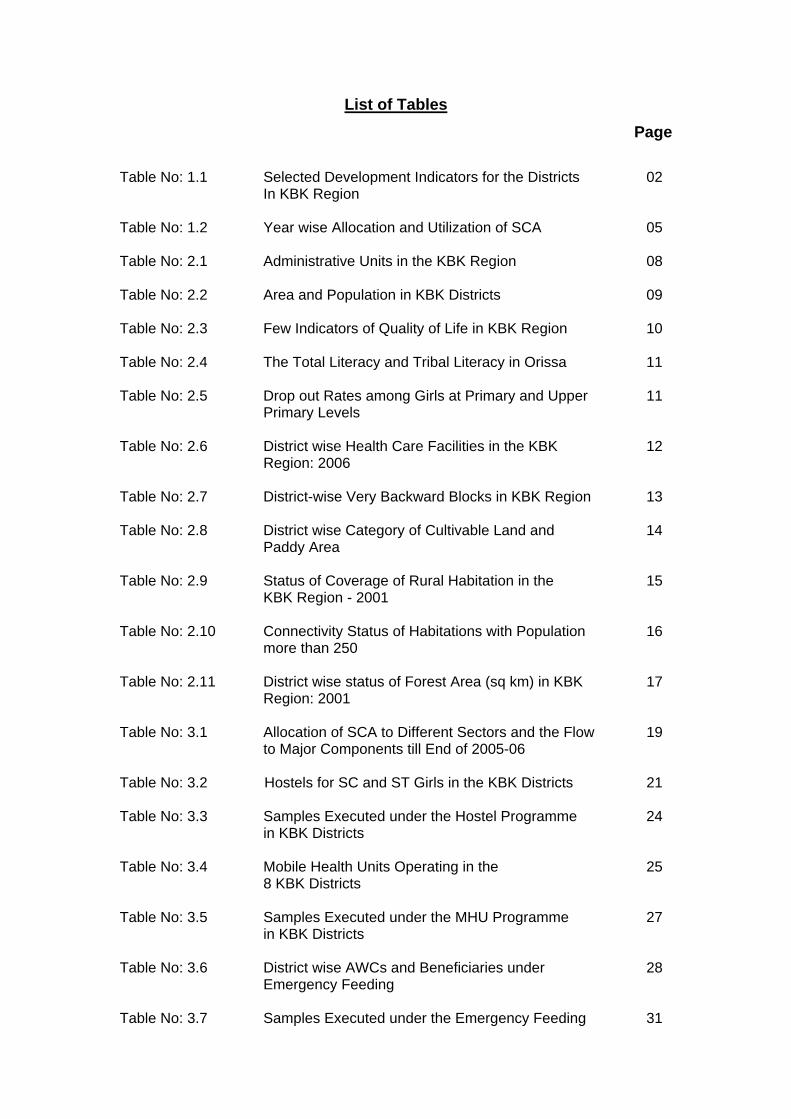
List of Tables Page Table No: 1.1 Selected Development Indicators for the Districts 02 In KBK Region Table No: 1.2 Year wise Allocation and Utilization of SCA 05 Table No: 2.1 Administrative Units in the KBK Region 08 Table No: 2.2 Area and Population in KBK Districts 09 Table No: 2.3 Few Indicators of Quality of Life in KBK Region 10 Table No: 2.4 The Total Literacy and Tribal Literacy in Orissa 11 Table No: 2.5 Drop out Rates among Girls at Primary and Upper 11 Primary Levels Table No: 2.6 District wise Health Care Facilities in the KBK 12 Region: 2006 Table No: 2.7 District-wise Very Backward Blocks in KBK Region 13 Table No: 2.8 District wise Category of Cultivable Land and 14 Paddy Area Table No: 2.9 Status of Coverage of Rural Habitation in the 15 KBK Region - 2001 Table No: 2.10 Connectivity Status of Habitations with Population 16 more than 250 Table No: 2.11 District wise status of Forest Area (sq km) in KBK 17 Region: 2001 Table No: 3.1 Allocation of SCA to Different Sectors and the Flow 19 to Major Components till End of 2005-06 Table No: 3.2 Hostels for SC and ST Girls in the KBK Districts 21 Table No: 3.3 Samples Executed under the Hostel Programme 24 in KBK Districts Table No: 3.4 Mobile Health Units Operating in the 25 8 KBK Districts Table No: 3.5 Samples Executed under the MHU Programme 27 in KBK Districts Table No: 3.6 District wise AWCs and Beneficiaries under 28 Emergency Feeding Table No: 3.7 Samples Executed under the Emergency Feeding 31
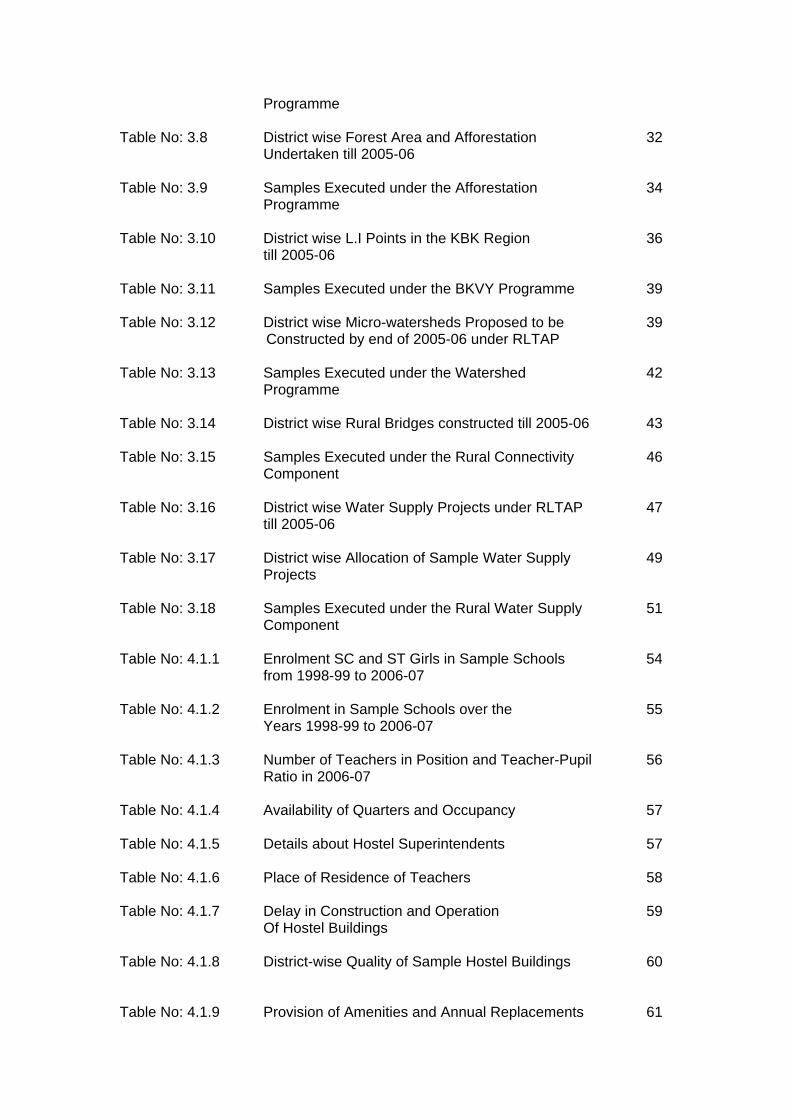
Programme Table No: 3.8 District wise Forest Area and Afforestation 32 Undertaken till 2005-06 Table No: 3.9 Samples Executed under the Afforestation 34 Programme Table No: 3.10 District wise L.I Points in the KBK Region 36 till 2005-06 Table No: 3.11 Samples Executed under the BKVY Programme 39 Table No: 3.12 District wise Micro-watersheds Proposed to be 39 Constructed by end of 2005-06 under RLTAP Table No: 3.13 Samples Executed under the Watershed 42 Programme Table No: 3.14 District wise Rural Bridges constructed till 2005-06 43 Table No: 3.15 Samples Executed under the Rural Connectivity 46 Component Table No: 3.16 District wise Water Supply Projects under RLTAP 47 till 2005-06 Table No: 3.17 District wise Allocation of Sample Water Supply 49 Projects Table No: 3.18 Samples Executed under the Rural Water Supply 51
Component Table No: 4.1.1 Enrolment SC and ST Girls in Sample Schools 54 from 1998-99 to 2006-07 Table No: 4.1.2 Enrolment in Sample Schools over the 55 Years 1998-99 to 2006-07 Table No: 4.1.3 Number of Teachers in Position and Teacher-Pupil 56 Ratio in 2006-07 Table No: 4.1.4 Availability of Quarters and Occupancy 57 Table No: 4.1.5 Details about Hostel Superintendents 57 Table No: 4.1.6 Place of Residence of Teachers 58 Table No: 4.1.7 Delay in Construction and Operation 59 Of Hostel Buildings Table No: 4.1.8 District-wise Quality of Sample Hostel Buildings 60 Table No: 4.1.9 Provision of Amenities and Annual Replacements 61
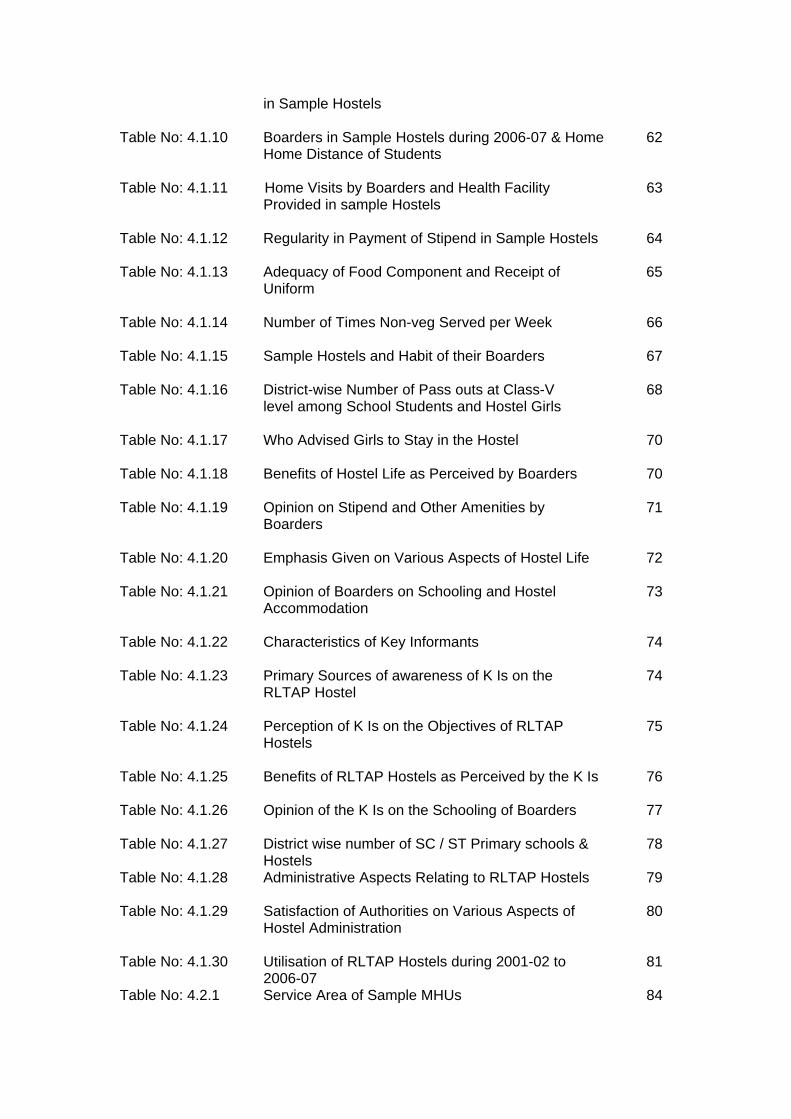
in Sample Hostels Table No: 4.1.10 Boarders in Sample Hostels during 2006-07 & Home 62 Home Distance of Students Table No: 4.1.11 Home Visits by Boarders and Health Facility 63 Provided in sample Hostels Table No: 4.1.12 Regularity in Payment of Stipend in Sample Hostels 64 Table No: 4.1.13 Adequacy of Food Component and Receipt of 65 Uniform Table No: 4.1.14 Number of Times Non-veg Served per Week 66 Table No: 4.1.15 Sample Hostels and Habit of their Boarders 67 Table No: 4.1.16 District-wise Number of Pass outs at Class-V 68 level among School Students and Hostel Girls Table No: 4.1.17 Who Advised Girls to Stay in the Hostel 70 Table No: 4.1.18 Benefits of Hostel Life as Perceived by Boarders 70 Table No: 4.1.19 Opinion on Stipend and Other Amenities by 71 Boarders Table No: 4.1.20 Emphasis Given on Various Aspects of Hostel Life 72 Table No: 4.1.21 Opinion of Boarders on Schooling and Hostel 73 Accommodation Table No: 4.1.22 Characteristics of Key Informants 74 Table No: 4.1.23 Primary Sources of awareness of K Is on the 74 RLTAP Hostel Table No: 4.1.24 Perception of K Is on the Objectives of RLTAP 75 Hostels Table No: 4.1.25 Benefits of RLTAP Hostels as Perceived by the K Is 76 Table No: 4.1.26 Opinion of the K Is on the Schooling of Boarders 77 Table No: 4.1.27 District wise number of SC / ST Primary schools & 78 Hostels Table No: 4.1.28 Administrative Aspects Relating to RLTAP Hostels 79 Table No: 4.1.29 Satisfaction of Authorities on Various Aspects of 80 Hostel Administration Table No: 4.1.30 Utilisation of RLTAP Hostels during 2001-02 to 81 2006-07 Table No: 4.2.1 Service Area of Sample MHUs 84
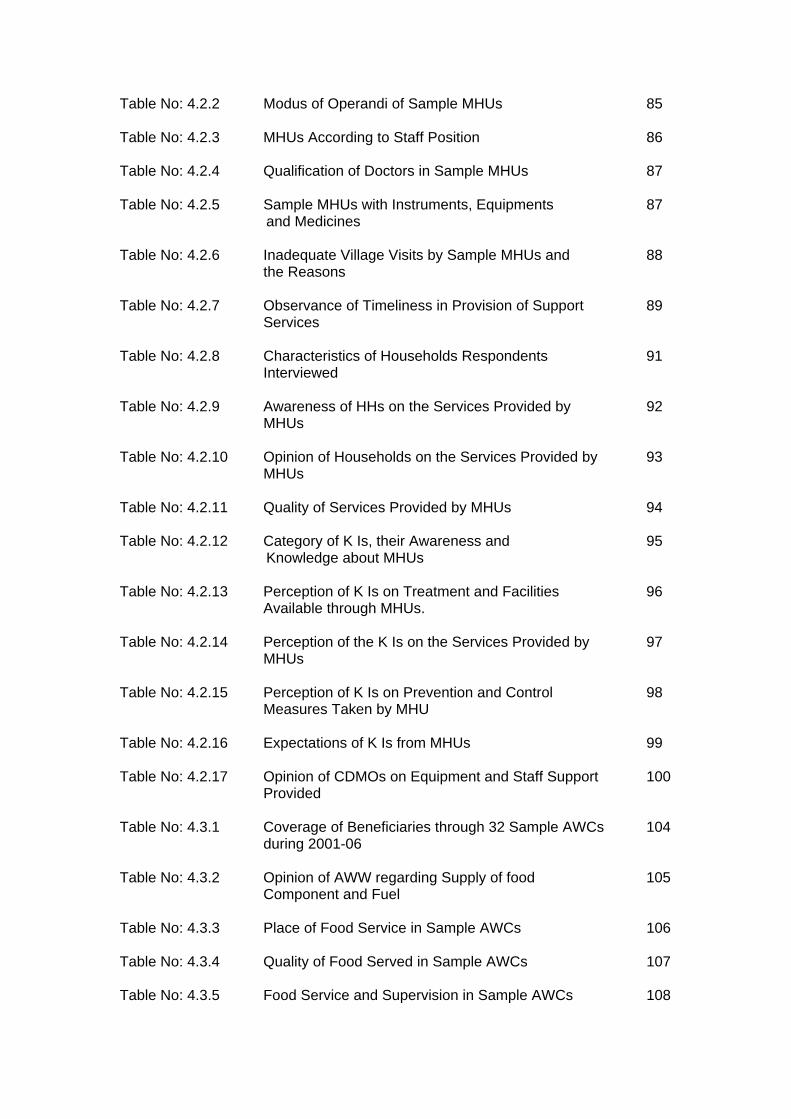
Table No: 4.2.2 Modus of Operandi of Sample MHUs 85 Table No: 4.2.3 MHUs According to Staff Position 86 Table No: 4.2.4 Qualification of Doctors in Sample MHUs 87 Table No: 4.2.5 Sample MHUs with Instruments, Equipments 87 and Medicines Table No: 4.2.6 Inadequate Village Visits by Sample MHUs and 88 the Reasons Table No: 4.2.7 Observance of Timeliness in Provision of Support 89 Services Table No: 4.2.8 Characteristics of Households Respondents 91 Interviewed Table No: 4.2.9 Awareness of HHs on the Services Provided by 92 MHUs Table No: 4.2.10 Opinion of Households on the Services Provided by 93 MHUs Table No: 4.2.11 Quality of Services Provided by MHUs 94 Table No: 4.2.12 Category of K Is, their Awareness and 95 Knowledge about MHUs Table No: 4.2.13 Perception of K Is on Treatment and Facilities 96 Available through MHUs. Table No: 4.2.14 Perception of the K Is on the Services Provided by 97 MHUs Table No: 4.2.15 Perception of K Is on Prevention and Control 98 Measures Taken by MHU Table No: 4.2.16 Expectations of K Is from MHUs 99 Table No: 4.2.17 Opinion of CDMOs on Equipment and Staff Support 100 Provided Table No: 4.3.1 Coverage of Beneficiaries through 32 Sample AWCs 104 during 2001-06 Table No: 4.3.2 Opinion of AWW regarding Supply of food 105 Component and Fuel Table No: 4.3.3 Place of Food Service in Sample AWCs 106 Table No: 4.3.4 Quality of Food Served in Sample AWCs 107 Table No: 4.3.5 Food Service and Supervision in Sample AWCs 108
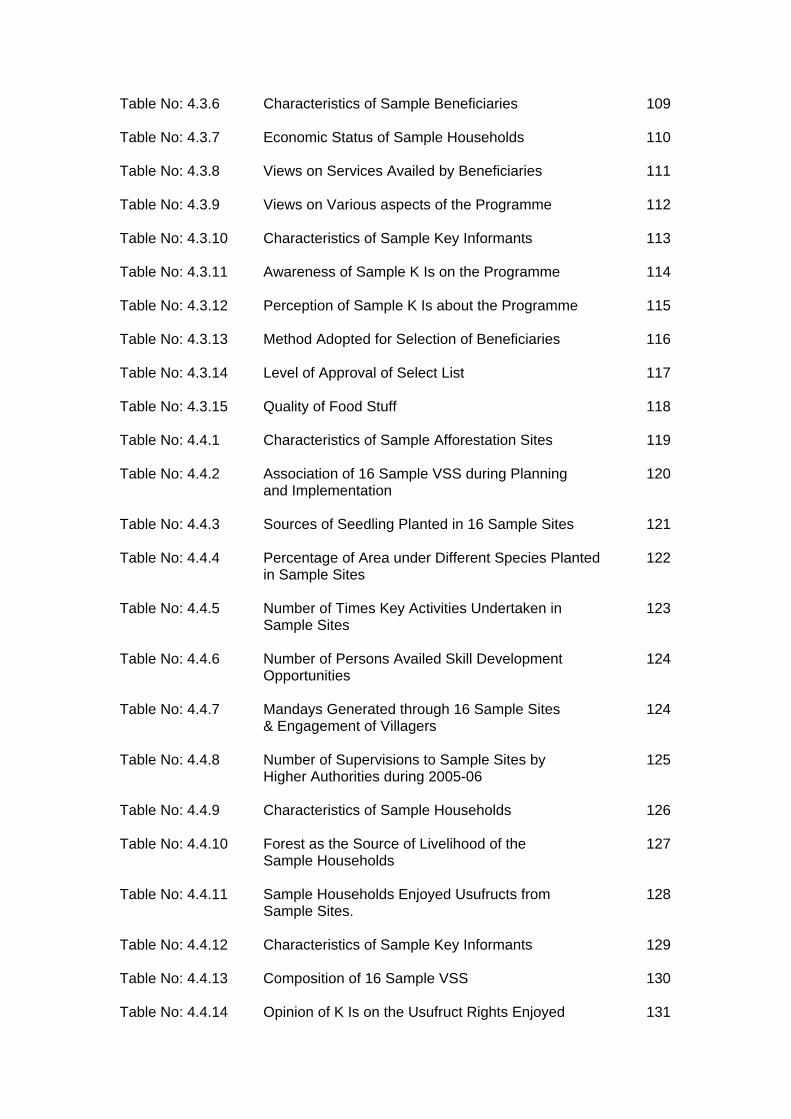
Table No: 4.3.6 Characteristics of Sample Beneficiaries 109 Table No: 4.3.7 Economic Status of Sample Households 110 Table No: 4.3.8 Views on Services Availed by Beneficiaries 111 Table No: 4.3.9 Views on Various aspects of the Programme 112 Table No: 4.3.10 Characteristics of Sample Key Informants 113 Table No: 4.3.11 Awareness of Sample K Is on the Programme 114 Table No: 4.3.12 Perception of Sample K Is about the Programme 115 Table No: 4.3.13 Method Adopted for Selection of Beneficiaries 116 Table No: 4.3.14 Level of Approval of Select List 117 Table No: 4.3.15 Quality of Food Stuff 118 Table No: 4.4.1 Characteristics of Sample Afforestation Sites 119 Table No: 4.4.2 Association of 16 Sample VSS during Planning 120 and Implementation Table No: 4.4.3 Sources of Seedling Planted in 16 Sample Sites 121 Table No: 4.4.4 Percentage of Area under Different Species Planted 122 in Sample Sites Table No: 4.4.5 Number of Times Key Activities Undertaken in 123 Sample Sites Table No: 4.4.6 Number of Persons Availed Skill Development 124 Opportunities Table No: 4.4.7 Mandays Generated through 16 Sample Sites 124 & Engagement of Villagers Table No: 4.4.8 Number of Supervisions to Sample Sites by 125 Higher Authorities during 2005-06 Table No: 4.4.9 Characteristics of Sample Households 126 Table No: 4.4.10 Forest as the Source of Livelihood of the 127 Sample Households Table No: 4.4.11 Sample Households Enjoyed Usufructs from 128 Sample Sites. Table No: 4.4.12 Characteristics of Sample Key Informants 129 Table No: 4.4.13 Composition of 16 Sample VSS 130 Table No: 4.4.14 Opinion of K Is on the Usufruct Rights Enjoyed 131
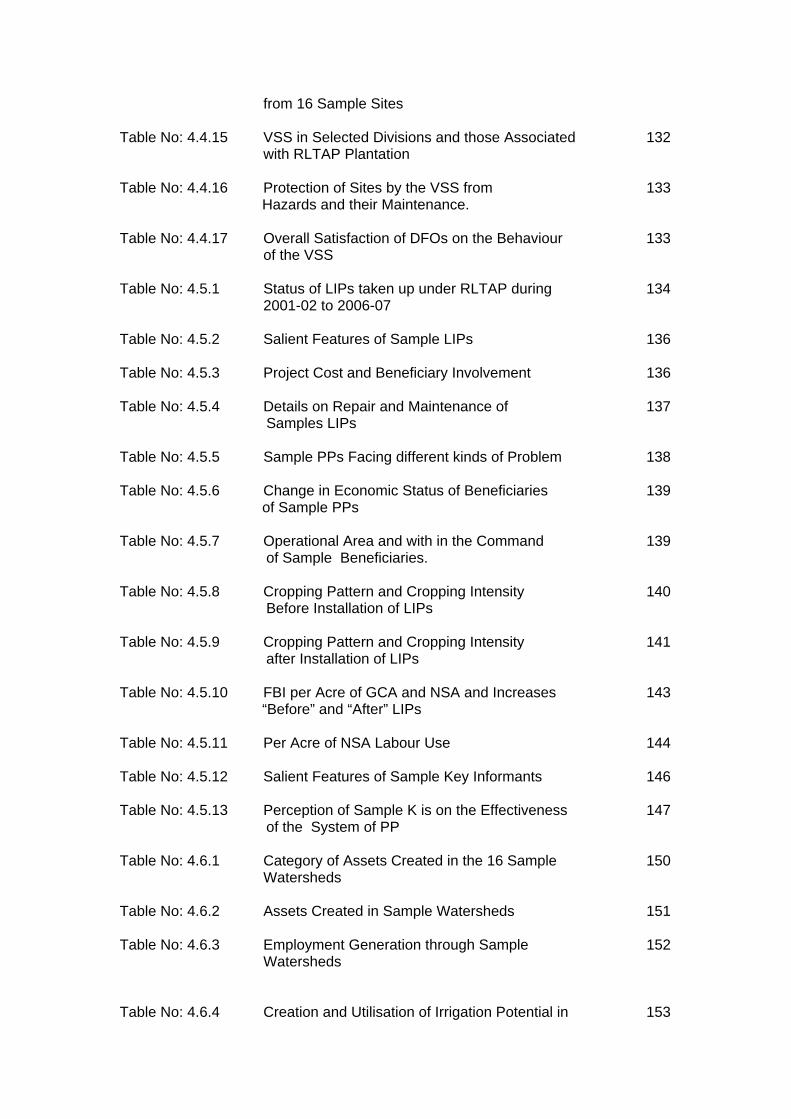
from 16 Sample Sites Table No: 4.4.15 VSS in Selected Divisions and those Associated 132 with RLTAP Plantation Table No: 4.4.16 Protection of Sites by the VSS from 133 Hazards and their Maintenance. Table No: 4.4.17 Overall Satisfaction of DFOs on the Behaviour 133 of the VSS Table No: 4.5.1 Status of LIPs taken up under RLTAP during 134 2001-02 to 2006-07 Table No: 4.5.2 Salient Features of Sample LIPs 136 Table No: 4.5.3 Project Cost and Beneficiary Involvement 136 Table No: 4.5.4 Details on Repair and Maintenance of 137 Samples LIPs Table No: 4.5.5 Sample PPs Facing different kinds of Problem 138 Table No: 4.5.6 Change in Economic Status of Beneficiaries 139 of Sample PPs Table No: 4.5.7 Operational Area and with in the Command 139 of Sample Beneficiaries. Table No: 4.5.8 Cropping Pattern and Cropping Intensity 140 Before Installation of LIPs Table No: 4.5.9 Cropping Pattern and Cropping Intensity 141 after Installation of LIPs Table No: 4.5.10 FBI per Acre of GCA and NSA and Increases 143 “Before” and “After” LIPs Table No: 4.5.11 Per Acre of NSA Labour Use 144 Table No: 4.5.12 Salient Features of Sample Key Informants 146 Table No: 4.5.13 Perception of Sample K is on the Effectiveness 147 of the System of PP Table No: 4.6.1 Category of Assets Created in the 16 Sample 150 Watersheds Table No: 4.6.2 Assets Created in Sample Watersheds 151 Table No: 4.6.3 Employment Generation through Sample 152 Watersheds Table No: 4.6.4 Creation and Utilisation of Irrigation Potential in 153
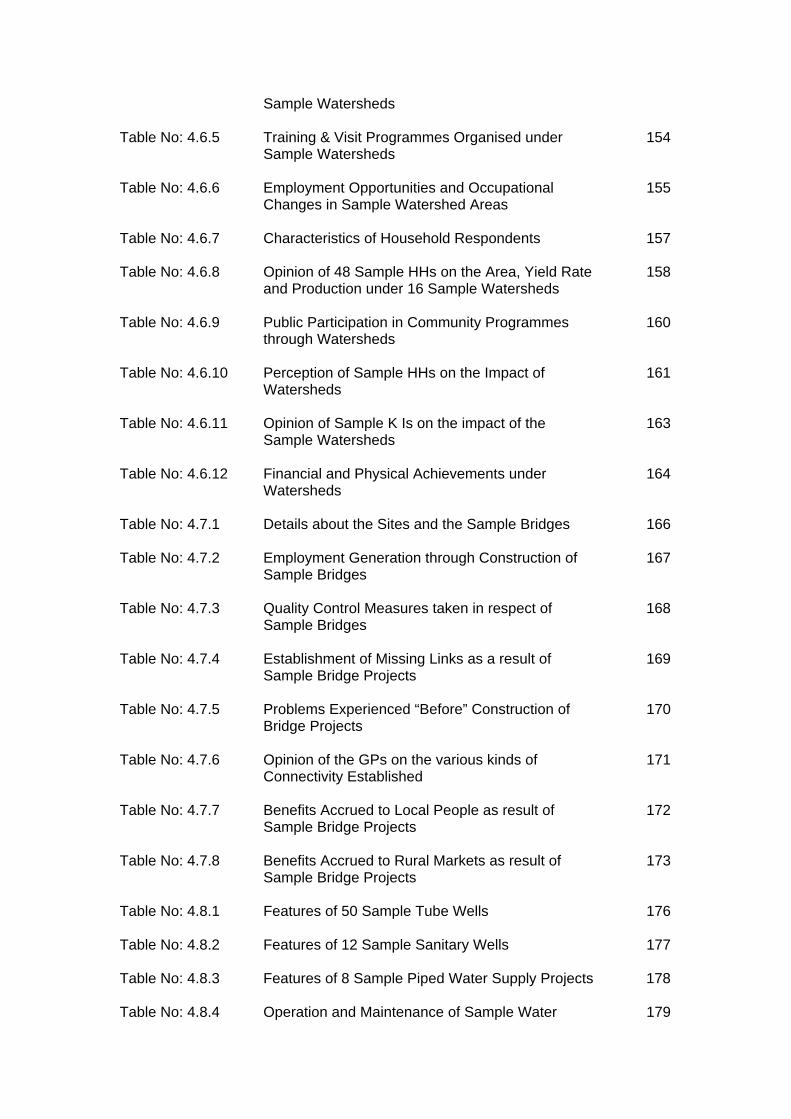
Sample Watersheds Table No: 4.6.5 Training & Visit Programmes Organised under 154 Sample Watersheds Table No: 4.6.6 Employment Opportunities and Occupational 155 Changes in Sample Watershed Areas Table No: 4.6.7 Characteristics of Household Respondents 157 Table No: 4.6.8 Opinion of 48 Sample HHs on the Area, Yield Rate 158 and Production under 16 Sample Watersheds Table No: 4.6.9 Public Participation in Community Programmes 160 through Watersheds Table No: 4.6.10 Perception of Sample HHs on the Impact of 161 Watersheds Table No: 4.6.11 Opinion of Sample K Is on the impact of the 163 Sample Watersheds Table No: 4.6.12 Financial and Physical Achievements under 164 Watersheds Table No: 4.7.1 Details about the Sites and the Sample Bridges 166 Table No: 4.7.2 Employment Generation through Construction of 167 Sample Bridges Table No: 4.7.3 Quality Control Measures taken in respect of 168 Sample Bridges Table No: 4.7.4 Establishment of Missing Links as a result of 169 Sample Bridge Projects Table No: 4.7.5 Problems Experienced “Before” Construction of 170 Bridge Projects Table No: 4.7.6 Opinion of the GPs on the various kinds of 171 Connectivity Established Table No: 4.7.7 Benefits Accrued to Local People as result of 172 Sample Bridge Projects Table No: 4.7.8 Benefits Accrued to Rural Markets as result of 173 Sample Bridge Projects Table No: 4.8.1 Features of 50 Sample Tube Wells 176 Table No: 4.8.2 Features of 12 Sample Sanitary Wells 177 Table No: 4.8.3 Features of 8 Sample Piped Water Supply Projects 178 Table No: 4.8.4 Operation and Maintenance of Sample Water 179
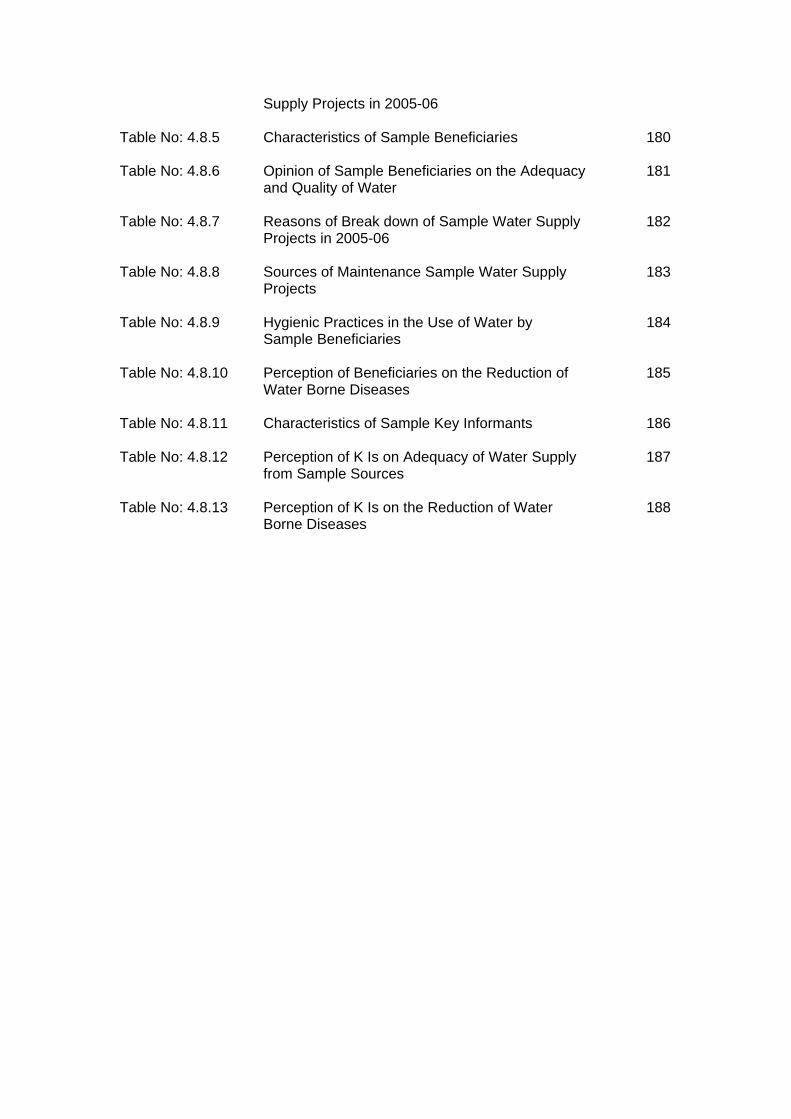
Supply Projects in 2005-06 Table No: 4.8.5 Characteristics of Sample Beneficiaries 180 Table No: 4.8.6 Opinion of Sample Beneficiaries on the Adequacy 181 and Quality of Water Table No: 4.8.7 Reasons of Break down of Sample Water Supply 182 Projects in 2005-06 Table No: 4.8.8 Sources of Maintenance Sample Water Supply 183 Projects Table No: 4.8.9 Hygienic Practices in the Use of Water by 184 Sample Beneficiaries Table No: 4.8.10 Perception of Beneficiaries on the Reduction of 185 Water Borne Diseases Table No: 4.8.11 Characteristics of Sample Key Informants 186 Table No: 4.8.12 Perception of K Is on Adequacy of Water Supply 187 from Sample Sources Table No: 4.8.13 Perception of K Is on the Reduction of Water 188 Borne Diseases
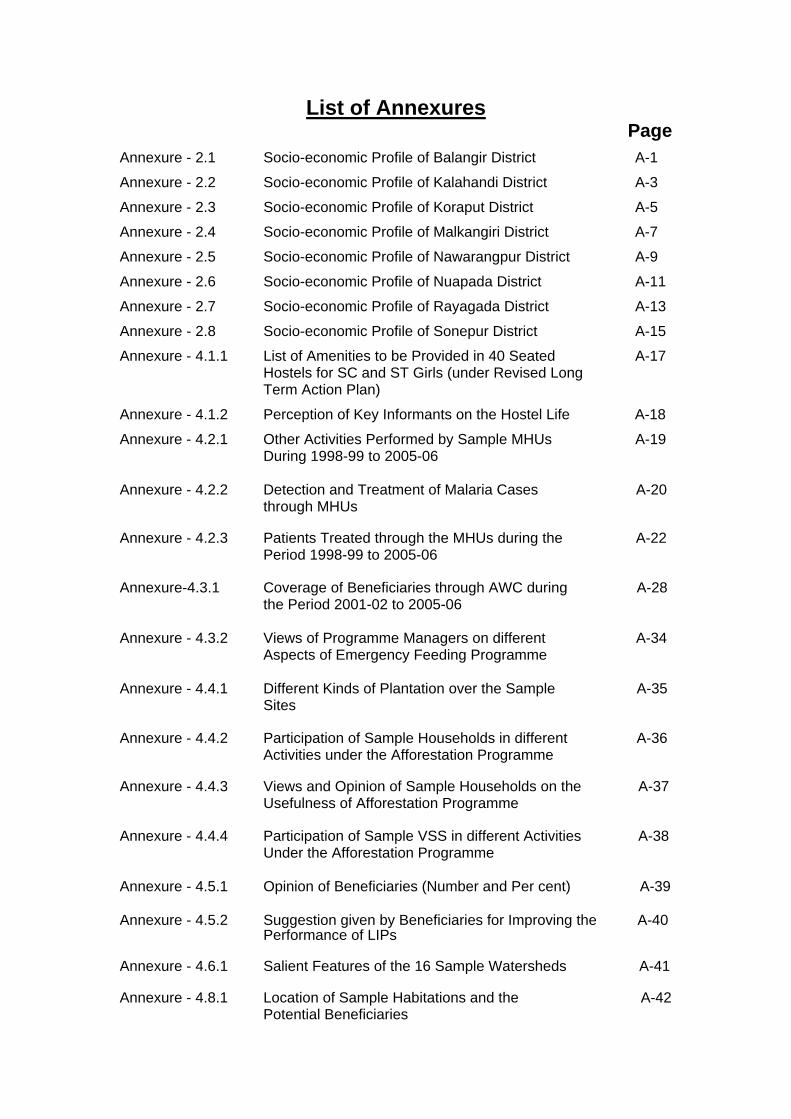
List of Annexures Page
Annexure - 2.1 Socio-economic Profile of Balangir District A-1
Annexure - 2.2 Socio-economic Profile of Kalahandi District A-3
Annexure - 2.3 Socio-economic Profile of Koraput District A-5
Annexure - 2.4 Socio-economic Profile of Malkangiri District A-7
Annexure - 2.5 Socio-economic Profile of Nawarangpur District A-9
Annexure - 2.6 Socio-economic Profile of Nuapada District A-11
Annexure - 2.7 Socio-economic Profile of Rayagada District A-13
Annexure - 2.8 Socio-economic Profile of Sonepur District A-15
Annexure - 4.1.1 List of Amenities to be Provided in 40 Seated A-17 Hostels for SC and ST Girls (under Revised Long Term Action Plan)
Annexure - 4.1.2 Perception of Key Informants on the Hostel Life A-18
Annexure - 4.2.1 Other Activities Performed by Sample MHUs A-19 During 1998-99 to 2005-06 Annexure - 4.2.2 Detection and Treatment of Malaria Cases A-20
through MHUs Annexure - 4.2.3 Patients Treated through the MHUs during the A-22
Period 1998-99 to 2005-06 Annexure-4.3.1 Coverage of Beneficiaries through AWC during A-28
the Period 2001-02 to 2005-06 Annexure - 4.3.2 Views of Programme Managers on different A-34
Aspects of Emergency Feeding Programme Annexure - 4.4.1 Different Kinds of Plantation over the Sample A-35
Sites Annexure - 4.4.2 Participation of Sample Households in different A-36
Activities under the Afforestation Programme Annexure - 4.4.3 Views and Opinion of Sample Households on the A-37 Usefulness of Afforestation Programme Annexure - 4.4.4 Participation of Sample VSS in different Activities A-38 Under the Afforestation Programme Annexure - 4.5.1 Opinion of Beneficiaries (Number and Per cent) A-39 Annexure - 4.5.2 Suggestion given by Beneficiaries for Improving the A-40 Performance of LIPs Annexure - 4.6.1 Salient Features of the 16 Sample Watersheds A-41 Annexure - 4.8.1 Location of Sample Habitations and the A-42
Potential Beneficiaries
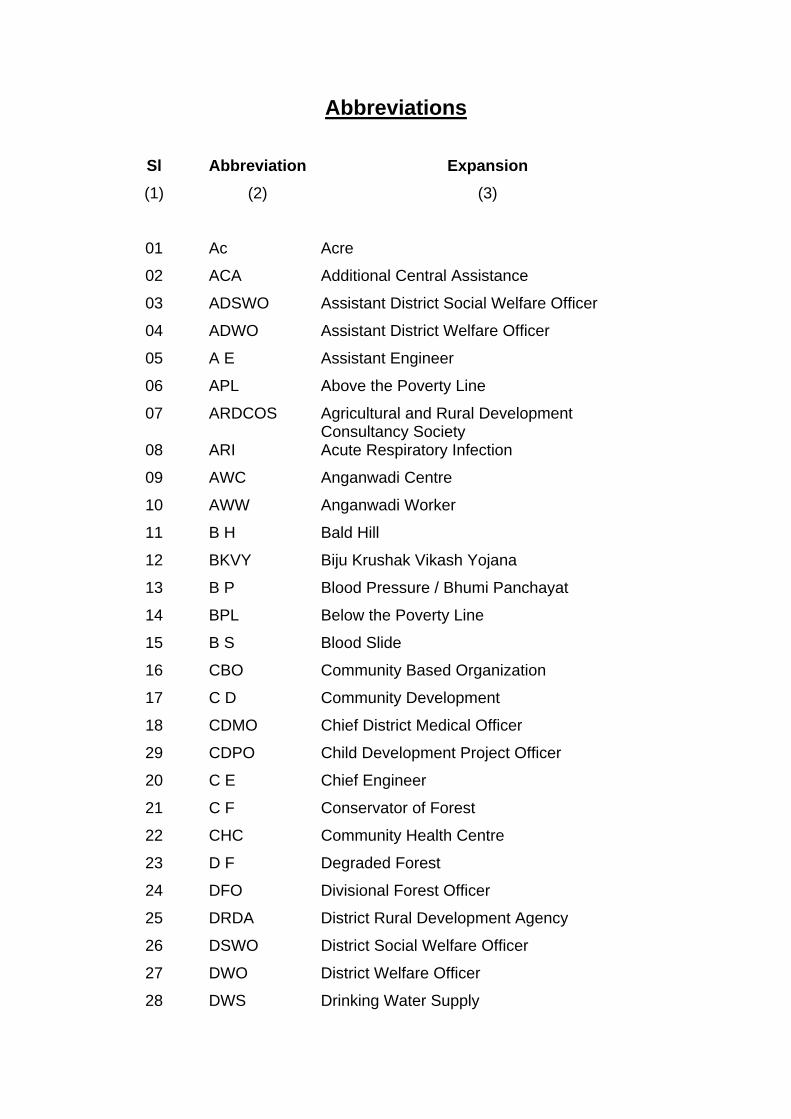
Abbreviations
Sl Abbreviation Expansion (1) (2) (3)
01 Ac Acre
02 ACA Additional Central Assistance
03 ADSWO Assistant District Social Welfare Officer
04 ADWO Assistant District Welfare Officer
05 A E Assistant Engineer
06 APL Above the Poverty Line
07 ARDCOS Agricultural and Rural Development Consultancy Society
08 ARI Acute Respiratory Infection
09 AWC Anganwadi Centre
10 AWW Anganwadi Worker
11 B H Bald Hill
12 BKVY Biju Krushak Vikash Yojana
13 B P Blood Pressure / Bhumi Panchayat
14 BPL Below the Poverty Line
15 B S Blood Slide
16 CBO Community Based Organization
17 C D Community Development
18 CDMO Chief District Medical Officer
29 CDPO Child Development Project Officer
20 C E Chief Engineer
21 C F Conservator of Forest
22 CHC Community Health Centre
23 D F Degraded Forest
24 DFO Divisional Forest Officer
25 DRDA District Rural Development Agency
26 DSWO District Social Welfare Officer
27 DWO District Welfare Officer
28 DWS Drinking Water Supply
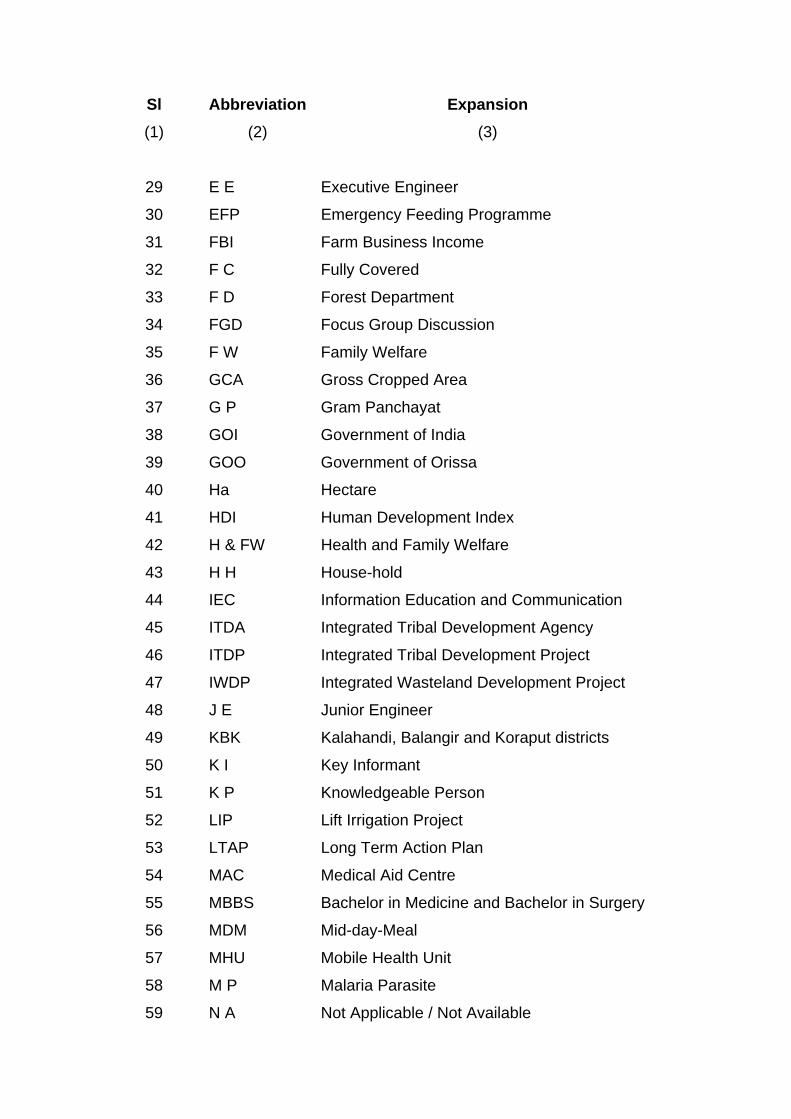
Sl Abbreviation Expansion (1) (2) (3)
29 E E Executive Engineer
30 EFP Emergency Feeding Programme
31 FBI Farm Business Income
32 F C Fully Covered
33 F D Forest Department
34 FGD Focus Group Discussion
35 F W Family Welfare
36 GCA Gross Cropped Area
37 G P Gram Panchayat
38 GOI Government of India
39 GOO Government of Orissa
40 Ha Hectare
41 HDI Human Development Index
42 H & FW Health and Family Welfare
43 H H House-hold
44 IEC Information Education and Communication
45 ITDA Integrated Tribal Development Agency
46 ITDP Integrated Tribal Development Project
47 IWDP Integrated Wasteland Development Project
48 J E Junior Engineer
49 KBK Kalahandi, Balangir and Koraput districts
50 K I Key Informant
51 K P Knowledgeable Person
52 LIP Lift Irrigation Project
53 LTAP Long Term Action Plan
54 MAC Medical Aid Centre
55 MBBS Bachelor in Medicine and Bachelor in Surgery
56 MDM Mid-day-Meal
57 MHU Mobile Health Unit
58 M P Malaria Parasite
59 N A Not Applicable / Not Available
Sl Abbreviation Expansion (1) (2) (3)
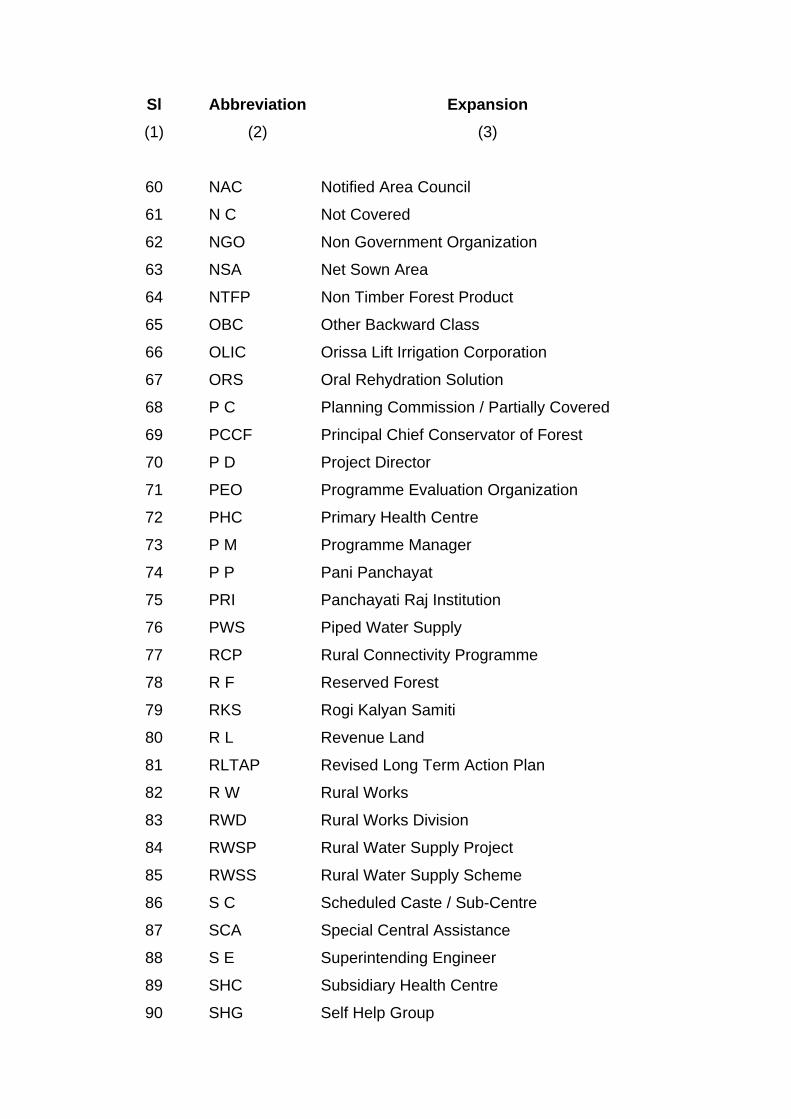
60 NAC Notified Area Council
61 N C Not Covered
62 NGO Non Government Organization
63 NSA Net Sown Area
64 NTFP Non Timber Forest Product
65 OBC Other Backward Class
66 OLIC Orissa Lift Irrigation Corporation
67 ORS Oral Rehydration Solution
68 P C Planning Commission / Partially Covered
69 PCCF Principal Chief Conservator of Forest
70 P D Project Director
71 PEO Programme Evaluation Organization
72 PHC Primary Health Centre
73 P M Programme Manager
74 P P Pani Panchayat
75 PRI Panchayati Raj Institution
76 PWS Piped Water Supply
77 RCP Rural Connectivity Programme
78 R F Reserved Forest
79 RKS Rogi Kalyan Samiti
80 R L Revenue Land
81 RLTAP Revised Long Term Action Plan
82 R W Rural Works
83 RWD Rural Works Division
84 RWSP Rural Water Supply Project
85 RWSS Rural Water Supply Scheme
86 S C Scheduled Caste / Sub-Centre
87 SCA Special Central Assistance
88 S E Superintending Engineer
89 SHC Subsidiary Health Centre
90 SHG Self Help Group
Sl Abbreviation Expansion (1) (2) (3)
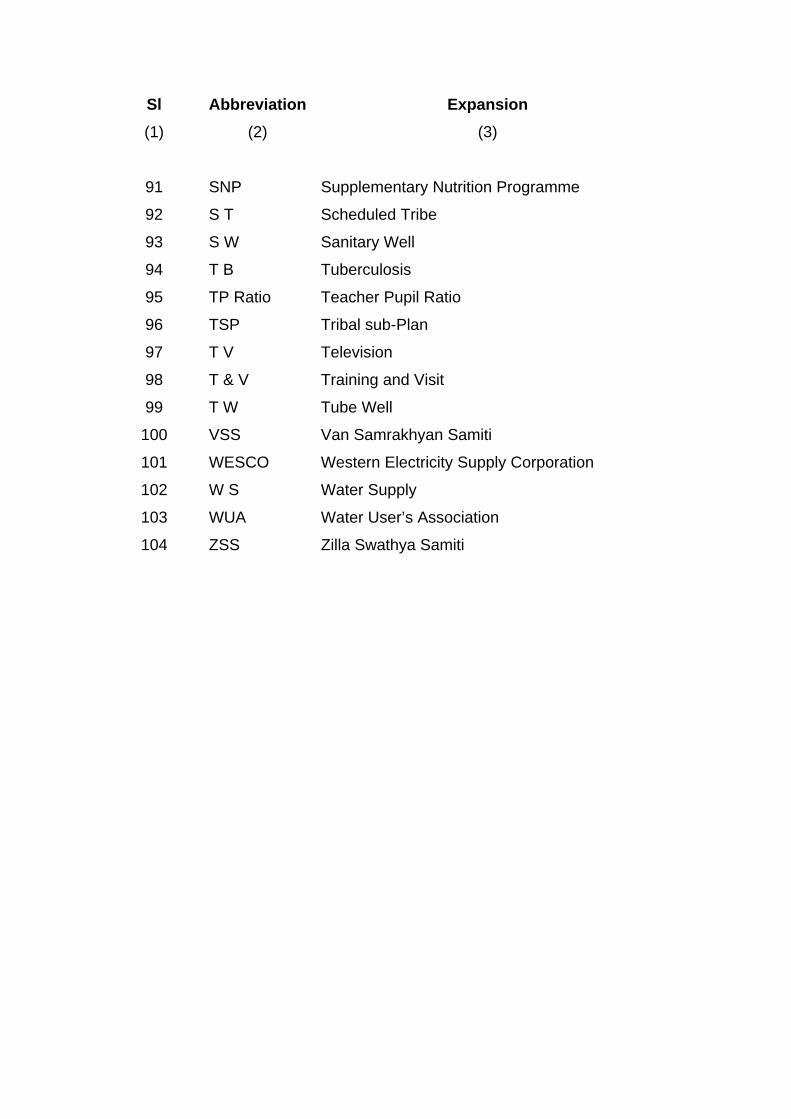
91 SNP Supplementary Nutrition Programme
92 S T Scheduled Tribe
93 S W Sanitary Well
94 T B Tuberculosis
95 TP Ratio Teacher Pupil Ratio
96 TSP Tribal sub-Plan
97 T V Television
98 T & V Training and Visit
99 T W Tube Well
100 VSS Van Samrakhyan Samiti
101 WESCO Western Electricity Supply Corporation
102 W S Water Supply
103 WUA Water User’s Association
104 ZSS Zilla Swathya Samiti
Preface
The KBK region of Orissa comprising of the undivided Koraput, Bolangir
and Kalahandi districts was again reorganized and subdivided into 8
revenue districts namely, Koraput, Rayagada, Nawrangpur,
Malakangiri, Bolangir, Sonepur, Kalahandi and Nuapada. This region of
the State has been suffering from massive poverty and under
development due to its geographical as well as historical reasons. As per
2001 census the total population of KBK district is 72,490,691 which
accounts for 19.80 % population covering over 30.60% geographical area
of the state. 89.95% people of this region still live in villages. Lower
population density (153 persons / sq.km) in comparison to 236 for
Orissa indicates difficult living conditions and an undeveloped economy.
Tribal communities dominate this region. As per 2001 Census, about
38.41% people of these districts belong to the Scheduled Tribes (ST)
communities including four primitive tribal groups (PTG), i.e., Bondas,
Dadai, Langia Sauras and Dangaria Kandhas. 44 CD blocks are
included in Tribal Sub Plan (TSP). In addition, 16.25% population belong
to the Scheduled Castes (SC) communities as per 2001 Census. Literacy
rates are also far below the State as well as National averages. Female
literacy is only 29.10%.
Keeping in view the acute and mass poverty and under development of
the KBK region, a Revised Long Term Action Plan (RLTAP), an extension
of Long Term Action Plan (LTAP), was launched for a period of 9 years
from 1998-99 to 2006-07 with a total outlay of Rs. 6251.06 crore for the
overall development of the area. The main features of the RLTAP was to
adopt an integrated approach for speeding up the socio-economic
development of KBK districts by combining the various developmental
activities and programmes being undertaken by the Central and State
Governments. The objective of the RLTAP for the KBK districts were :
(i) drought proofing,
(ii) poverty alleviation, mobilizing local inhabitants on participatory
development approach and improvement of infrastructure in
rural areas
(iii) improved quality of life for the local people.
As RLTAP was a time-bound plan for effective and result oriented
development of the area, a new base of infrastructure and services have
been created and maintained while implementing the programme.
At the instance of Planning Commission, the Programme Evaluation
Organisation (PEO) outsourced the Evaluation study on RLTAP to
Agricultural and Rural Development Consultancy Society (ARDCOS),
Rasulgarh, Bhubaneswar, Orissa to look into the real achievement of the
objectives. The study was initiated in February, 2006 covering all the
eight districts coming under KBK region. The components selected for
detailed study were :
1. 40 Seated Hostel for S.C / S.T Girls
2. Mobile Health Units (MHU)
3. Emergency Feeding
4. Afforestation
5. Biju Krushak Vikash Yojana (BKVY)
6. Watersheds
7. Rural Connectivity
8. Rural Water Supply Project
The presentation on the findings of the study was made by a team
consisting of Dr. Gyana Chandra Kar, Sri Lokanath Sarangi and Dr.
Arati Nanda of ARDCOS under the Chairmanship of Member
(Evaluation) and in the presence of Deputy Chairman at Planning
Commission on 20th October, 2008. The draft report was revised by the
Institute after addressing the issues that emerged during the
presentation.
The study received constant support and encouragement from Hon’ble
Deputy Chairman, Planning Commission, Member (Evaluation),
Secretary, Planning Commission, Government of India.
The design of the study was prepared by Dr. R.C. Dey, Director (PEO),
Shri K.N. Pathak, Deputy Adviser (SD&TC), Smt Indu Patnaik, Deputy
Adviser (MLP) and Smt Deepti Srivastava, SRO (PEO) under supervision
of Shri V.K. Bhatia and Smt. Sudha P. Rao the then Advisers of PEO.
The study was also coordinated and finalised with the efforts of Smt. G.
Mukherjee, Director, REO, Kolkatta, Shri S. Pradhan, SRO, PEO,
Bhubaneswar, Shri Vipin Kumar, Economic Officer and Shri Bhuwan
Chander, Economic Investigator of PEO, HQs under my guidance. Shri
U.K. Verma, Economic Investigator, Shri K.S. Meena and Shri D.S.
Sajwan, Tab. Clerks of PEO were also associated in completing the
report.
(S. Bhavani)
Senior Adviser (PEO)
New Delhi
Dated: July 13, 2009
EXECUTIVE SUMMARY
1.
Back Ground of RLTAP:
On account of acute poverty and underdevelopment of the KBK region, attention of the Civil Societies, Intellectuals and the Administrators were drawn in the past on many occasions for addressing the key problems and bringing in all round developments of the region. On the initiative of Government of India, a Long Term Action Plan (LTAP) was formulated by the Government of Orissa for a holistic development of the KBK region as a special package spread over a period of 7 years from 1995-96 to 2001-02 with the basic objectives (i) drought and distress proofing and (ii) alleviating poverty and creating conditions for faster sustainable development of the region. Subsequently, in 1998, on the advice of Government of India, a Revised Long Term Action Plan (RLTAP) extended over a period of 9 years from 1998-99 to 2006-07 was formulated and launched in the region with appropriate modifications in the contents of the LTAP. The central features of the RLTAP was to address collectively by adopting integrated approach for speeding up the socio-economic development of KBK region by bringing in synergy among various ongoing developmental activities and programmes being undertaken in the region by the State and the Centre. To fill the critical gaps in developmental efforts, Central Assistance was sought for as a special dispensation in the form of Additional Central Assistance (ACA) and Special Central Assistance (SCA) to meet the financial requirement.
2. The Study Area:
The Revised Long Term Action Plan (RLTAP) in Orissa was a time-bound plan taken up in the KBK region for effective delivery of various development opportunities available around them. In the process of implementation of the programme, a large number of infrastructure and service facilities have been created in the region to foster growth. Requisite provisions have been made for operation and maintenance of assets created from out of RLTAP fund. Since the programmes have already operated in full swing, the objectives of launching the RLTAP in the KBK region must have been achieved to a large extent. Keeping this in view, the Programme Evaluation Organisation, Planning Commission decided to launch a quick evaluation study on programmes of RLTAP in the KBK region to make a realistic assessment of the achievements in the direction of fulfillment of the set objectives with appropriate recommendations for taking policy initiatives as required. Accordingly, the study area covers all the 8 districts coming under the KBK region.
3. Scope of the Study:
The objectives of the Revised Long Term Action Plan (RLTAP) formulated for the KBK districts were (i) drought proofing, (ii) poverty alleviation, mobilizing local inhabitants on participatory development approach and improvement of infrastructure in rural areas (iii) improved quality of life for the local people. The strategic interventions were (i) creation of rural infrastructure, (ii) conservation of natural resources, and (iii) employment generation. Public participation in the process of implementation of the RLTAP through formation of Self-Help Groups (SHGs), Vana Samrakshyana Samities (VSSs), Pani Panchayats (PPs) and Bhumi Panchayats (BPs) were also considered vital and important. In fact, the RLTAP covers a large number of critical areas - Watersheds, Horticulture,
i
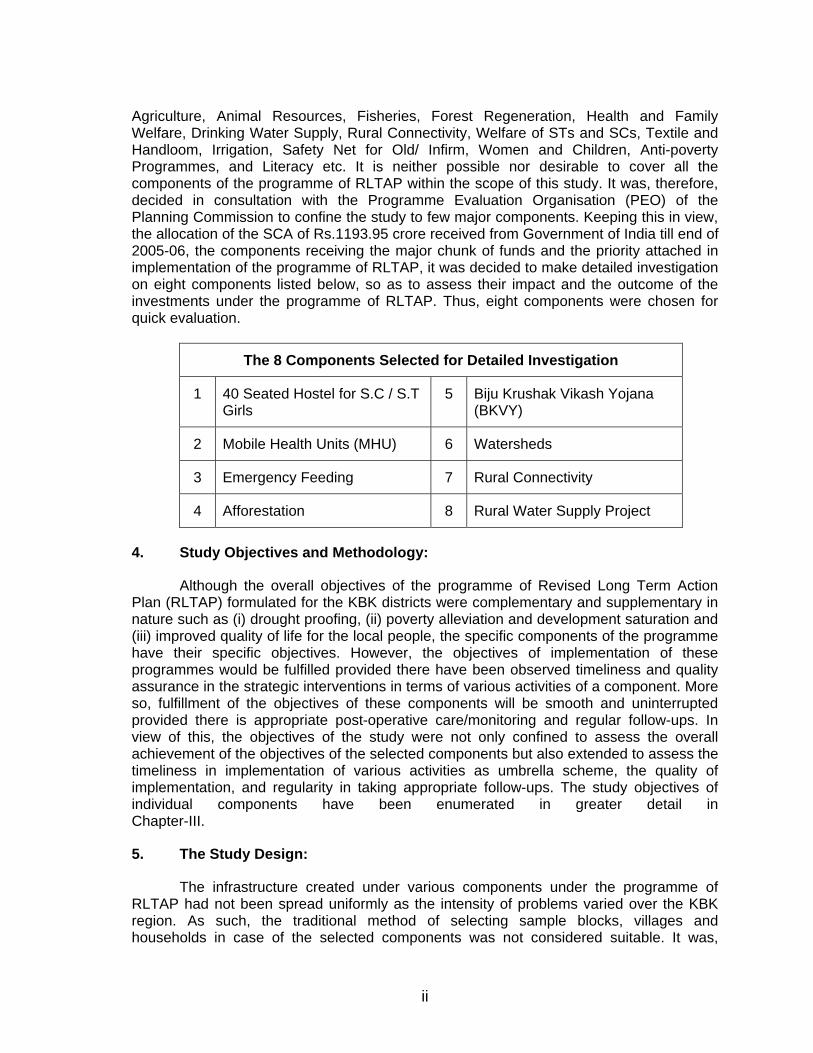
Agriculture, Animal Resources, Fisheries, Forest Regeneration, Health and Family Welfare, Drinking Water Supply, Rural Connectivity, Welfare of STs and SCs, Textile and Handloom, Irrigation, Safety Net for Old/ Infirm, Women and Children, Anti-poverty Programmes, and Literacy etc. It is neither possible nor desirable to cover all the components of the programme of RLTAP within the scope of this study. It was, therefore, decided in consultation with the Programme Evaluation Organisation (PEO) of the Planning Commission to confine the study to few major components. Keeping this in view, the allocation of the SCA of Rs.1193.95 crore received from Government of India till end of 2005-06, the components receiving the major chunk of funds and the priority attached in implementation of the programme of RLTAP, it was decided to make detailed investigation on eight components listed below, so as to assess their impact and the outcome of the investments under the programme of RLTAP. Thus, eight components were chosen for quick evaluation.
The 8 Components Selected for Detailed Investigation
1 40 Seated Hostel for S.C / S.T Girls
5 Biju Krushak Vikash Yojana (BKVY)
2 Mobile Health Units (MHU) 6 Watersheds
3 Emergency Feeding 7 Rural Connectivity
4 Afforestation 8 Rural Water Supply Project
4. Study Objectives and Methodology:
Although the overall objectives of the programme of Revised Long Term Action Plan (RLTAP) formulated for the KBK districts were complementary and supplementary in nature such as (i) drought proofing, (ii) poverty alleviation and development saturation and (iii) improved quality of life for the local people, the specific components of the programme have their specific objectives. However, the objectives of implementation of these programmes would be fulfilled provided there have been observed timeliness and quality assurance in the strategic interventions in terms of various activities of a component. More so, fulfillment of the objectives of these components will be smooth and uninterrupted provided there is appropriate post-operative care/monitoring and regular follow-ups. In view of this, the objectives of the study were not only confined to assess the overall achievement of the objectives of the selected components but also extended to assess the timeliness in implementation of various activities as umbrella scheme, the quality of implementation, and regularity in taking appropriate follow-ups. The study objectives of individual components have been enumerated in greater detail in Chapter-III.
5. The Study Design:
The infrastructure created under various components under the programme of RLTAP had not been spread uniformly as the intensity of problems varied over the KBK region. As such, the traditional method of selecting sample blocks, villages and households in case of the selected components was not considered suitable. It was,
ii
therefore, decided to select few districts, followed by few blocks and then specific number of infrastructure constructed under the programme known as sample projects.
The number of projects to be selected under each component was decided in advance keeping in view the total number of projects undertaken in respect of each component and the spread of projects over the districts. Detailed study design in respect of each component has been enumerated in Chapter-III.
6. Study Instruments:
For collection of data on different components, a set of 4 schedules; (a) the Project Schedule, (b) the Beneficiary / Household Schedule (c) the Key Informant Schedule, and (d) the Programme Manager Schedule were developed and administered in the field. The Project Schedule was administered with the executing functionary responsible for implementation, operation and maintenance of the project in the field, the Beneficiary / Household Schedule with selected beneficiaries / households, who are supposed to get benefits, the Key Informant Schedule with selected knowledgeable persons of the locality to know their perception about the project in question and its impact, and the Programme Manager Schedule was administered with the officer in overall charge of implementation of the programme in the district to get his views and opinion on the problems and prospects of the programme implementation. Detailed discussion on each of the study instruments in respect of each of the 8 selected components have been made in Chapter-III.
7. The Field Work:
The field work was undertaken through a set of well-qualified and experienced persons through personal interview method by way of administering the study instruments with appropriate informants under respective components as primary data base. For each component, a separate team was formed comprising of 4 Field Investigators and a Team Leader. They were given intensive and adequate training for three days. The study tools along with the instructions and guidelines were provided to each member of the team for undertaking the field work. For ensuring adequate mobility, smooth conduct of the study in the field and its timely completion, the team was provided with exclusive transport and all other logistic support. The field work was undertaken during the period from November 2006 to February 2007 with several revisits during March and April 2007.
8. Samples Executed:
For the purpose of detailed investigation all the 8 KBK districts were covered under the 4 components (a) 40 Seated Hostel, (b) MHU, (c) Emergency Feeding, and (d) Rural Water Supply Programme which have direct impact on the quality of life. In case of the remaining 4 components, 4 districts each were covered that had have positive externalities. The number of sample projects executed and the districts covered under each component is presented in the following table. The beneficiaries, households, knowledgeable persons and the Programme Managers interviewed under each component in the process of field investigation has been indicated in Chapter-III.
iii
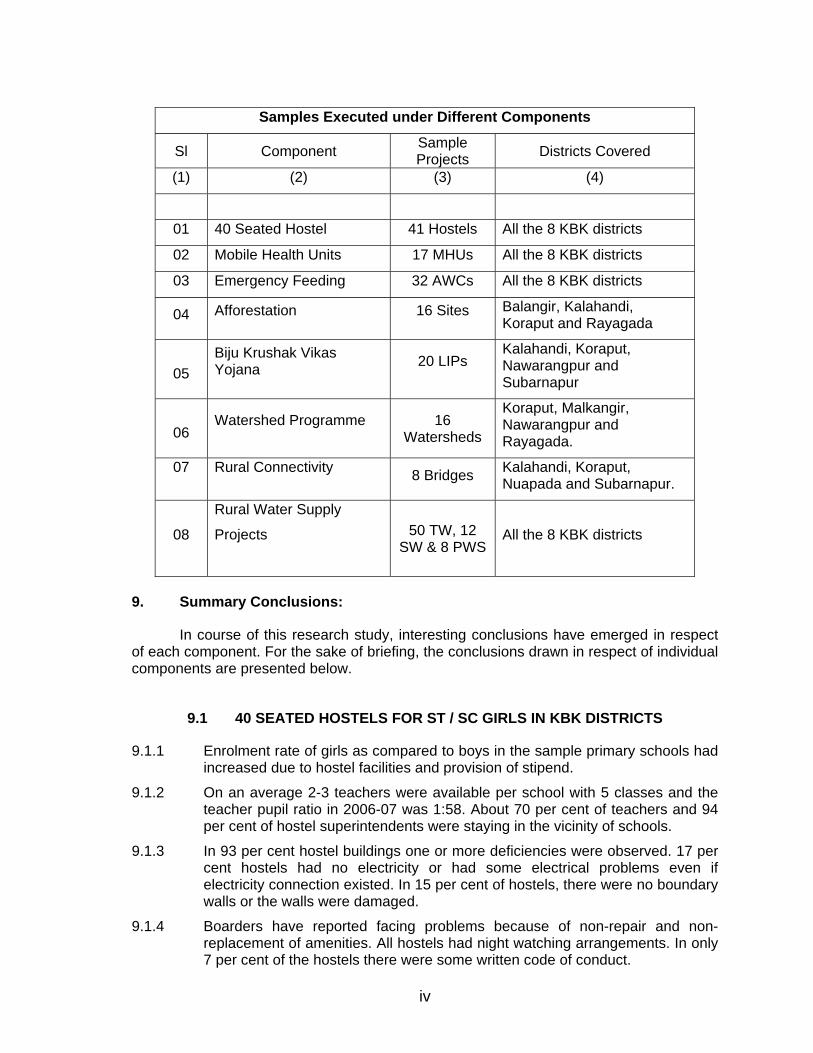
Samples Executed under Different Components
Sl Component Sample Projects Districts Covered
(1) (2) (3) (4)
01 40 Seated Hostel 41 Hostels All the 8 KBK districts
02 Mobile Health Units 17 MHUs All the 8 KBK districts
03 Emergency Feeding 32 AWCs All the 8 KBK districts
04
Afforestation
16 Sites
Balangir, Kalahandi, Koraput and Rayagada
05
Biju Krushak Vikas Yojana
20 LIPs
Kalahandi, Koraput, Nawarangpur and Subarnapur
06
Watershed Programme
16 Watersheds
Koraput, Malkangir, Nawarangpur and Rayagada.
07 Rural Connectivity 8 Bridges Kalahandi, Koraput, Nuapada and Subarnapur.
08
Rural Water Supply
Projects
50 TW, 12 SW & 8 PWS
All the 8 KBK districts
9. Summary Conclusions:
In course of this research study, interesting conclusions have emerged in respect of each component. For the sake of briefing, the conclusions drawn in respect of individual components are presented below.
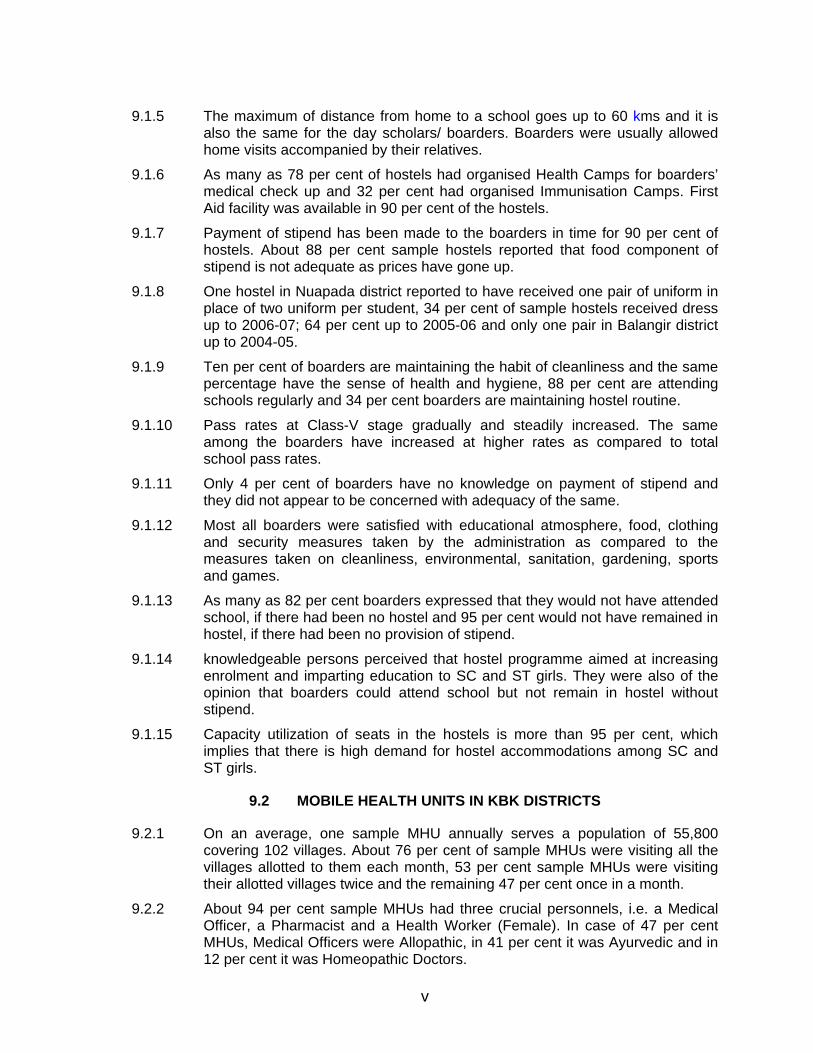
9.1 40 SEATED HOSTELS FOR ST / SC GIRLS IN KBK DISTRICTS
9.1.1 Enrolment rate of girls as compared to boys in the sample primary schools had increased due to hostel facilities and provision of stipend.
9.1.2 On an average 2-3 teachers were available per school with 5 classes and the teacher pupil ratio in 2006-07 was 1:58. About 70 per cent of teachers and 94 per cent of hostel superintendents were staying in the vicinity of schools.
9.1.3 In 93 per cent hostel buildings one or more deficiencies were observed. 17 per cent hostels had no electricity or had some electrical problems even if electricity connection existed. In 15 per cent of hostels, there were no boundary walls or the walls were damaged.
9.1.4 Boarders have reported facing problems because of non-repair and non-replacement of amenities. All hostels had night watching arrangements. In only 7 per cent of the hostels there were some written code of conduct.
iv
9.1.5 The maximum of distance from home to a school goes up to 60 kms and it is also the same for the day scholars/ boarders. Boarders were usually allowed home visits accompanied by their relatives.
9.1.6 As many as 78 per cent of hostels had organised Health Camps for boarders’ medical check up and 32 per cent had organised Immunisation Camps. First Aid facility was available in 90 per cent of the hostels.
9.1.7 Payment of stipend has been made to the boarders in time for 90 per cent of hostels. About 88 per cent sample hostels reported that food component of stipend is not adequate as prices have gone up.
9.1.8 One hostel in Nuapada district reported to have received one pair of uniform in place of two uniform per student, 34 per cent of sample hostels received dress up to 2006-07; 64 per cent up to 2005-06 and only one pair in Balangir district up to 2004-05.
9.1.9 Ten per cent of boarders are maintaining the habit of cleanliness and the same percentage have the sense of health and hygiene, 88 per cent are attending schools regularly and 34 per cent boarders are maintaining hostel routine.
9.1.10 Pass rates at Class-V stage gradually and steadily increased. The same among the boarders have increased at higher rates as compared to total school pass rates.
9.1.11 Only 4 per cent of boarders have no knowledge on payment of stipend and they did not appear to be concerned with adequacy of the same.
9.1.12 Most all boarders were satisfied with educational atmosphere, food, clothing and security measures taken by the administration as compared to the measures taken on cleanliness, environmental, sanitation, gardening, sports and games.
9.1.13 As many as 82 per cent boarders expressed that they would not have attended school, if there had been no hostel and 95 per cent would not have remained in hostel, if there had been no provision of stipend.
9.1.14 knowledgeable persons perceived that hostel programme aimed at increasing enrolment and imparting education to SC and ST girls. They were also of the opinion that boarders could attend school but not remain in hostel without stipend.
9.1.15 Capacity utilization of seats in the hostels is more than 95 per cent, which implies that there is high demand for hostel accommodations among SC and ST girls.
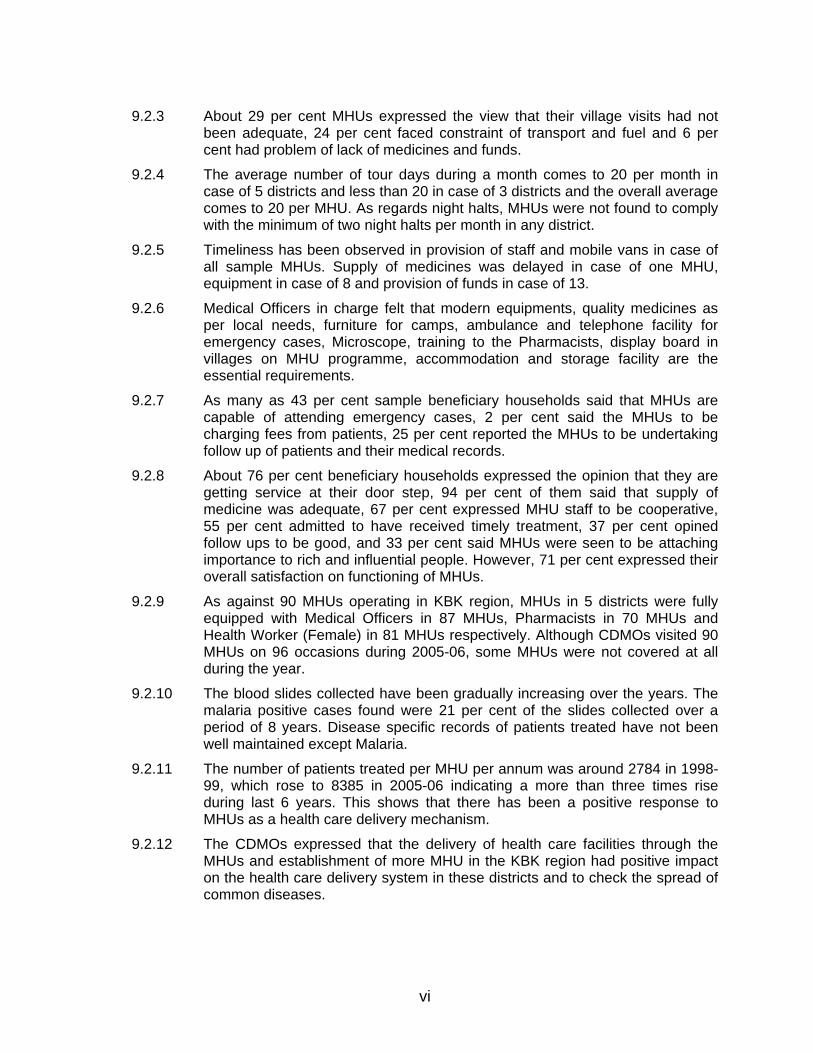
9.2 MOBILE HEALTH UNITS IN KBK DISTRICTS
9.2.1 On an average, one sample MHU annually serves a population of 55,800 covering 102 villages. About 76 per cent of sample MHUs were visiting all the villages allotted to them each month, 53 per cent sample MHUs were visiting their allotted villages twice and the remaining 47 per cent once in a month.
9.2.2 About 94 per cent sample MHUs had three crucial personnels, i.e. a Medical Officer, a Pharmacist and a Health Worker (Female). In case of 47 per cent MHUs, Medical Officers were Allopathic, in 41 per cent it was Ayurvedic and in 12 per cent it was Homeopathic Doctors.
v
9.2.3 About 29 per cent MHUs expressed the view that their village visits had not been adequate, 24 per cent faced constraint of transport and fuel and 6 per cent had problem of lack of medicines and funds.
9.2.4 The average number of tour days during a month comes to 20 per month in case of 5 districts and less than 20 in case of 3 districts and the overall average comes to 20 per MHU. As regards night halts, MHUs were not found to comply with the minimum of two night halts per month in any district.
9.2.5 Timeliness has been observed in provision of staff and mobile vans in case of all sample MHUs. Supply of medicines was delayed in case of one MHU, equipment in case of 8 and provision of funds in case of 13.
9.2.6 Medical Officers in charge felt that modern equipments, quality medicines as per local needs, furniture for camps, ambulance and telephone facility for emergency cases, Microscope, training to the Pharmacists, display board in villages on MHU programme, accommodation and storage facility are the essential requirements.
9.2.7 As many as 43 per cent sample beneficiary households said that MHUs are capable of attending emergency cases, 2 per cent said the MHUs to be charging fees from patients, 25 per cent reported the MHUs to be undertaking follow up of patients and their medical records.
9.2.8 About 76 per cent beneficiary households expressed the opinion that they are getting service at their door step, 94 per cent of them said that supply of medicine was adequate, 67 per cent expressed MHU staff to be cooperative, 55 per cent admitted to have received timely treatment, 37 per cent opined follow ups to be good, and 33 per cent said MHUs were seen to be attaching importance to rich and influential people. However, 71 per cent expressed their overall satisfaction on functioning of MHUs.
9.2.9 As against 90 MHUs operating in KBK region, MHUs in 5 districts were fully equipped with Medical Officers in 87 MHUs, Pharmacists in 70 MHUs and Health Worker (Female) in 81 MHUs respectively. Although CDMOs visited 90 MHUs on 96 occasions during 2005-06, some MHUs were not covered at all during the year.
9.2.10 The blood slides collected have been gradually increasing over the years. The malaria positive cases found were 21 per cent of the slides collected over a period of 8 years. Disease specific records of patients treated have not been well maintained except Malaria.
9.2.11 The number of patients treated per MHU per annum was around 2784 in 1998-99, which rose to 8385 in 2005-06 indicating a more than three times rise during last 6 years. This shows that there has been a positive response to MHUs as a health care delivery mechanism.
9.2.12 The CDMOs expressed that the delivery of health care facilities through the MHUs and establishment of more MHU in the KBK region had positive impact on the health care delivery system in these districts and to check the spread of common diseases.
vi
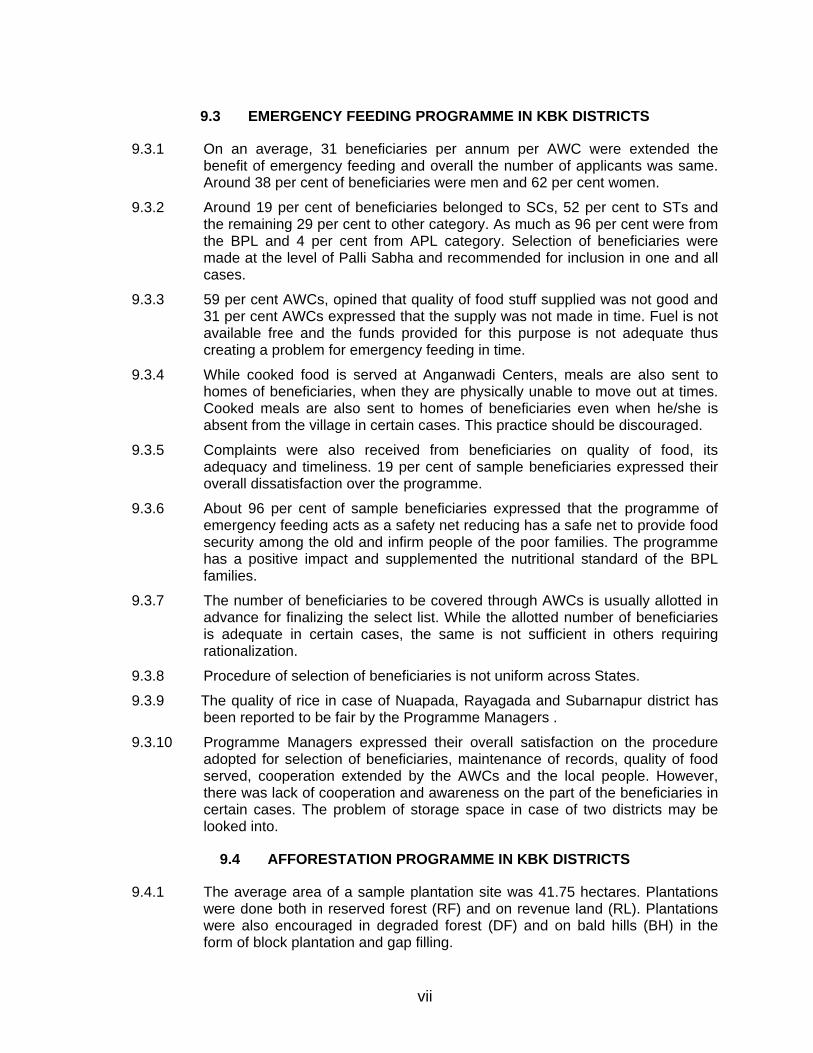
9.3 EMERGENCY FEEDING PROGRAMME IN KBK DISTRICTS
9.3.1 On an average, 31 beneficiaries per annum per AWC were extended the benefit of emergency feeding and overall the number of applicants was same. Around 38 per cent of beneficiaries were men and 62 per cent women.
9.3.2 Around 19 per cent of beneficiaries belonged to SCs, 52 per cent to STs and the remaining 29 per cent to other category. As much as 96 per cent were from the BPL and 4 per cent from APL category. Selection of beneficiaries were made at the level of Palli Sabha and recommended for inclusion in one and all cases.
9.3.3 59 per cent AWCs, opined that quality of food stuff supplied was not good and 31 per cent AWCs expressed that the supply was not made in time. Fuel is not available free and the funds provided for this purpose is not adequate thus creating a problem for emergency feeding in time.
9.3.4 While cooked food is served at Anganwadi Centers, meals are also sent to homes of beneficiaries, when they are physically unable to move out at times. Cooked meals are also sent to homes of beneficiaries even when he/she is absent from the village in certain cases. This practice should be discouraged.
9.3.5 Complaints were also received from beneficiaries on quality of food, its adequacy and timeliness. 19 per cent of sample beneficiaries expressed their overall dissatisfaction over the programme.
9.3.6 About 96 per cent of sample beneficiaries expressed that the programme of emergency feeding acts as a safety net reducing has a safe net to provide food security among the old and infirm people of the poor families. The programme has a positive impact and supplemented the nutritional standard of the BPL families.
9.3.7 The number of beneficiaries to be covered through AWCs is usually allotted in advance for finalizing the select list. While the allotted number of beneficiaries is adequate in certain cases, the same is not sufficient in others requiring rationalization.
9.3.8 Procedure of selection of beneficiaries is not uniform across States.
9.3.9 The quality of rice in case of Nuapada, Rayagada and Subarnapur district has been reported to be fair by the Programme Managers .
9.3.10 Programme Managers expressed their overall satisfaction on the procedure adopted for selection of beneficiaries, maintenance of records, quality of food served, cooperation extended by the AWCs and the local people. However, there was lack of cooperation and awareness on the part of the beneficiaries in certain cases. The problem of storage space in case of two districts may be looked into.
9.4 AFFORESTATION PROGRAMME IN KBK DISTRICTS
9.4.1 The average area of a sample plantation site was 41.75 hectares. Plantations were done both in reserved forest (RF) and on revenue land (RL). Plantations were also encouraged in degraded forest (DF) and on bald hills (BH) in the form of block plantation and gap filling.
vii
9.4.2 Plantations included economic plantation, NTFP, Bamboo, Fuel wood and mixed plantation, and Regeneration of Degraded Forest (RDF). The VSSs were associated in all stages of operation of the afforestation programme.
9.4.3 Except soil work and manuring all other standard activities like weeding, fire tracing, pruning etc were not undertaken in requisite number.
9.4.4 Organisation of training, workshop and field visits were more or less adequate for departmental functionary. For VSS members, their participation in workshops and execution of field visits were quite dismal.
9.4.5 About 77 per cent of man-days generated were contributed by forest fringe villagers and 23 per cent out of that was contributed by women.
9.4.6 The condition of the afforestation sites were reported to be quite good at the time of their transfer to the hands of VSS.
9.4.7 About 56 per cent of sample households reported that they are primarily depending on minor forest resources for their livelihood, which indicates that establishment of afforestation sites in the fringe of their villages are certainly useful.
9.4.8 As much as 63 per cent sample households were enjoying benefits from the afforestation sites like collecting fuel and fodder, NTFP etc. and they would use the sites intensively as they grow older.
9.4.9 Local people were aware of the anticipated benefits of afforestation like (i) green coverage, (ii) environmental improvements, (iii) soil and moisture conservation, (iv) increase in water table, (v) availability fuel and fodder, (vi) availability of NTFP, and (vii) felling of trees on maturity etc.
9.4.10 The condition of the sample sites in terms of survival of trees and the quality of growth was better as compared to the time of transfer to VSS, which implies that the impact of the programme is quite appreciable.
9.4.11 Although the VSSs were protecting the sites from biotic interference, they were unable to protect sites from illicit felling that required legal action.
9.5 BIJU KRUSHAK VIKAS YOJANA IN KBK DISTRICTS
9.5.1 Delay in completion of the LI Points mostly was due to delay in the preparation of estimate, delay in execution of electrical works and non-contribution of beneficiary share.
9.5.2 All beneficiaries contributed their share in terms of physical labour. All members of the Pani Panchayats in the selected sample LIPs were paying water rent regularly.
9.5.3 All the LIPs are being operated by members of Pani Panchayats. The average annual operation and maintenance cost varied between Rs.30,000/- in Nawarangpur district to Rs.50,000/- in Koraput district. In case of 55 per cent LIPs, OLIC undertakes repairs and maintenance and for remaining 45 per cent private mechanics did the job.
9.5.4 The electricity distribution company charges fee as per minimum load factor even if the LIP is not operated during off seasons, which is a cause of resentment among Pani Panchayat members.
viii
9.5.5 In Kalahandi, Nawarangpur and Subarnapur districts, all members of the sample PPs expressed that their economic condition has improved a lot due to LIPs. However, in Koraput district the PP members felt that their economic condition has improved marginally.
9.5.6 Sample beneficiaries of Kalahandi district revealed that their cropping intensity had gone up from 103.6 per cent to 161.2 per cent, in Koraput from 84.77 to 140.3, in Nawarangpur from 92.1 to 171.5, and in Subarnapur from 81.9 to 180.3 due to installation of LIPs. The overall increase for all the district’s crop intensity was from 89.7 per cent to 164.8 per cent.
9.5.7 Area under paddy has gone up and paddy is also being cultivated in Rabi season. There have been significant changes in terms of cropping pattern. Inferior cereals have been replaced by superior cereals, vegetables like cabbage, brinjal, tomato, cash crop like sugarcane etc.
9.5.8 Farm Business Income went up from Rs.944/- to Rs.3297/- per acre of net sown area in Kalahandi district, from Rs.927/- to Rs.2458/- in Koraput, from Rs.2007/- to Rs.2868/- in Nawarangpur and from Rs.1024/- to Rs.2745/- in Subarnapur districts due to installation of LIPs.
9.5.9 Per acre labour employment has gone up from 62 to 168 mandays (171%) in Kalahandi, from 59 to 142 (141%) in Koraput, from 68 to 182 mandays (168%) in Nawarangpur and from 82 to 178 mandays (117%) in Subarnapur districts. Thus, in terms of employment generation, the contribution of BKVY is enormous.
9.5.10 All the key informants expressed the view that there was good cooperation among the PP members followed by the PPs and the OLIC.The PPs were conducting regular meetings. They felt that crop diversification and cultivation of cash crops was possible due to Pani Panchayat wise use of water resources. They opined that the system of Pani Panchayat played a significant role in increasing agricultural productivity.
9.5.11 The key informants suggested that Government should take steps for installation of additional discharge points, provide regular technological assistance, meet the cost of repair and maintenance, see to regular supply of electricity, reduce water rate, increase labour wage etc.
9.6 WATERSHED DEVELOPMENT IN KBK DISTRICTS
9.6.1 The average estimated cost of a sample watershed project was Rs.182.97 lakh. The expenditure incurred was 67.04 per cent of the total allocation, as a number of projects started in 2001-02 and 2002-03 were still incomplete.
9.6.2 The area served under sample watersheds includes land under forest, revenue land, land under cultivation, community land and barren land etc.
9.6.3 The nature of activities undertaken in the sample watersheds were insitu plantation, soil and moisture conservation, plantation and sowing of seeds of multipurpose trees, shrub, grass, legumes, pasture and land development, agro-forestry, horticulture and floriculture, drainage line treatment, small water harvesting structures, development of orchards and pisciculture etc.
ix
9.6.4 Earmarking of funds towards employment generation was 55.25 per cent of the total expenditure. On an average 1048 man-days were generated per Rs.1.00 lakh, equal wage rate was paid both for male and female workers.
9.6.5 About 1352 hectare of irrigation potential was created under the 16 sample watersheds, which was fully utilized in Kharif season of 2005-06. The Rabi season utilization was of 540 hectare that accounted for 40 per cent of irrigation potential.
9.6.6 The visible changes that had taken place due to the watershed projects are as follows:–
(i) Employment opportunities have been created through plantation, agro-forestry, horticulture, floriculture, land development, creation of orchards, taking up pisciculture etc. There had been a change in the cropping pattern including cultivation of summer crops.
(ii) The local people have been able to earn additional income by engaging in new economic activities that has reduced migration of labour to certain extent.
(iii) Health and hygiene condition has improved due to construction of drainage system and installation of safe drinking water sources.
(iv) Interpersonal relationship and public and private partnership has improved because of local people/stakeholders becoming members in different user groups.
9.6.7 The farm business income per acre, the cropping intensity, the crop diversification and the employment generation has gone up due to irrigation from watersheds.
9.6.8 The initial number of 42 SHGs of different types within the area coming under the sample watersheds had gone up to 163 (288%) as a result of watershed programme and involvement of GPs/PRIs.
9.6.9 The households in watershed areas had taken multi-dimensional activities like product development, organization of health camps, distribution of goats, cattle and agricultural implements, plantation, fishery activities, watch and ward etc.
9.6.10 The Key Informants opined that watersheds have been able to create livelihood opportunities, raise the water table, grow fodder and fire wood, enhance the economic growth of the local people through various income generating activities like agricultural activities, pisciculture, plantation etc.
9.6.11 The Programme Managers expressed that impact of the programme of watershed on the local people’s activities and attitudes have been positive. It has a clear demonstration effect through:
i. Better management of natural resources, soil and water conservation, improvement of existing ponds and tanks and taking up of pisciculture, plantation activities and thereby rearing of domestic animals.
ii. Collection of fodder and fuel wood, cultivation of vegetables, cash crops, increased scope for livelihood opportunities and employment generation thereby increasing the economic condition of the people and improvement in interpersonal relationship among the local people.
x
9.7 RURAL CONNECTIVITY PROGRAMME IN KBK DISTRICTS
9.7.1 In case of 6 sample bridges, there was previously no link at all ensuring all weather connectivity. In respect of the other two, the existing links were unsafe masonry bridges.
9.7.2 The physical and financial progress under the programme was satisfactory. Of the total employment generated, 37 per cent related to skilled labour and 63 per cent to unskilled.
9.7.3 Out of the unskilled labour 87 per cent were men and 13 per cent were women. SCs contributed 45 per cent, STs 36 per cent and others 19 per cent of the unskilled labour.
9.7.4 It was observed in the course of field study that incomplete information was furnished in certain cases, which implies that either records are not maintained properly or there was lack of transparency.
9.7.5 All the GPs contacted opined that construction of these bridges has improved connectivity with other villages and the block headquarters. There have been appreciable improvements in the connectivity to GPs, Blocks, District headquarters, Health Centres, Educational Institutions and other Growth Centres including market places. There is a positive improvement in the socio-economic and interpersonal development.
9.7.6 It was the unanimous opinion in all the focus group discussions that local people have been enjoying all weather connectivity, Children are able go to schools across the bridges, local people could go to hospitals, market places, business men could expand their business and contact producers and buyers conveniently, procurement of raw materials and essential commodities were easy due to transport conveniences.
9.7.7 Focus group discussions also revealed that as a result of availing connectivity through the bridge projects, some people have opened/expanded small business within their villages and across the bridges. Besides, people are able to save time and distance to go to other places as a result of these bridges and conduct safe night journey.
9.7.8 The business men of the local rural market could avail easy access to bigger business centres as a result of bridges. Procurement of materials from outside, contact with big buyers, opening of new ventures have become easier. Earlier, the producers were carrying their produce to the buyers or to market places in small quantities through head loads. The situation has changed and the buyers are now coming to the door steps for which the farmers are getting a competitive price for their produce now.
xi
9.8 RURAL WATER SUPPLY PROGRAMME IN KBK DISTRICTS.
9.8.1 The average number of potential beneficiaries per tube well and sanitary well were 167 and 151 respectively and are well within the prescribed norm for KBK districts. But in case of Kalahandi district, one tube well has been installed for an average of 258 population, which seemed to be at higher side.
9.8.2 Of the 50 sample tube wells, only 9 were transferred to Water Users Associations. As against a physical target of 167 beneficiaries per tube well on an average, as many as 153 (92%) are receiving benefit at present.
9.8.3 Of the 12 sample sanitary wells, none was transferred to Water Users Associations. As against a physical target of 151 beneficiaries per sample sanitary well, as many as 129 (85%) on average are receiving benefit at present.
9.8.4 All the 8 sample piped water supply projects were completed. The source was Ground Water, lift in case of 6 and River Lift in case of remaining two. As against a physical target of 2009 beneficiaries per sample piped water supply project, as many as 1927 (96%) on an average, were receiving benefit at present showing less than optimal utilization of projects.
9.8.5 There were in all 117 break downs in case of 70 projects during the previous year that comes to two per project an average. As against a total of 117 break downs, 49 break downs were repaired within a reasonable time period. Even if repaired within reasonable time, the average number of days of interruption was 4 days.
9.8.6 In all, 20 Water User Associations have been formed and projects have been transferred in 9 cases. However, 12 Associations are taking part in operation and maintenance of projects.
9.8.7 Out of 208 beneficiaries contacted, as many as 178 (86%) expressed the view that supply of water through the projects was adequate. In case of inadequate supply, the attributable reasons were frequent break downs, drying up of the source, and delay in repairs etc. About 10 per cent of the break downs were related to electrical problems.
9.8.8 In case of 50 per cent of sample water supply projects, it was the feeling that the RWSS organization is not cooperating with the people for timely repair of the break downs. Operation and maintenance of 87 per cent of the projects is vested in the Panchayats.
9.8.9 Maintenance of hygienic practices like using clean pots to carry water, storing water with a cover and using clean mugs in using water among the beneficiaries is satisfactory. Only 18 per cent of beneficiaries expressed their views that they used disinfectants at the time of epidemic.
9.8.10 About 80 per cent of the sample beneficiaries reported good platforms or stand points have been constructed at water sources. As many as 21 per cent sample beneficiaries reported that waste water is used to irrigate gardens, 15 per cent reported channeling to soak pits, 5 per cent to drains and 59 per cent to open spaces.
xii
9.8.11 As many as 99 per cent of the beneficiaries are satisfied and expressed reduction in prevalence of diarrhea and dysentery cases, while 98 per cent are satisfied on the reduction in prevalence of cholera and jaundice cases.
9.8.12 All Project Managers were of the opinion that there had been drastic reduction in the prevalence of various kinds of water borne diseases and are enjoying improved quality life of people due to safe and portable drinking water.
9.8.13 Majority of the Programme Managers expressed the view that the burden on women to fetch water from distant places has been reduced and the households are getting more water for household consumption.
10. Overall Observation: The over all observation based on this quick-evaluation study as also the impact of
RLTAP is considerable in KBK area.
10.1 In matters of literacy growth rate it is found from the State government. Report (based on current data) that if a comparison is made between KBK districts and non-KBK districts, we find that between 1981-1991 and 1991-2001, over all literacy growth rate in KBK districts has gone up from 47.30 to 73.21 per cent as against 42.53 to 50.96 per cent for non-KBK districts. During the period, State’s over all literacy growth rates has gone up from 43.08 per cent to 53.59 per cent. Significant achievement is found in case of female literacy growth rate which between 1981-91 to 1999-2001 registered an increase from 71.53 per cent to 115.34 per cent. The same was quite low for non-KBK districts which went up from 62.19 per cent to 70.34 per cent while for the State as a whole increased from 63.00 per cent to 74.46 per cent. Much of their achievement could be ascribed to the encouragements given to women education in KBK district through provision of stipends and setting up of hostels for SC / ST girls who comprise a very large share in the total population of KBK district.
10.2 Similarly the benefit of these and other programmes have been reflected in enrolment in primary and upper primary schools. Enrolment rate in primary schools in KBK region went up from 75.89 in 1996-97 to 86.44 per cent in 2001-02 and to 107.05 per cent in 2007-08 against 86.49 per cent to 89.11 per cent to 103.23 per cent on average for the state as a whole. In Upper primary schools the enrolment for KBK went down from 56.39 in 1996-97 to 43.83 in 2001-02, but shot up to 84.99 per cent in 2007-08 as against state average of 59.33, 64.45 and 106.09 for the same years respectively.
10.3 There was remarkable achievement in drop out rate which at primary school level decreased from 57.13 to 46.20 per cent and to 8.57 for the years 1996-97, 2001-02 and 2007-08, as against the State average decrease being 47.60, 41.00 and 7.76 per cent respectively. At the upper primary level the drop out rate which was 79.10 per cent in 1996-97, came down to 66.56 in 2001-02 per cent and to 14.82 per cent in 2007-08 as against State average fall being 59.60, 56.00 and 13.58 per cent respectively.
10.4 Thus, the achievement for KBK districts in matters of primary and upper primary level both in terms of enrolment and drop out rates is very encouraging and the achievement could be ascribed to the substantial
xiii
assistance provided to the STs/SCs boys and girls, particularly to girls in terms of hostel for them.
10.5 As regards general socio-economic well being, Regional income disparities within Orissa have narrowed during 2000-05. Comparison of household expenditure levels in 1999-2000 (NSS 55th round) and 2004-05 (NSS 61st round) shows that per-capita expenditure increased faster in rural areas (by 12 per cent over five years or 2.3 per cent annually), as compared with urban areas (by 4 per cent, over the period or 0.8 per cent annually). In rural areas, the most rapid growth was recorded in the poorest Southern region where per-capita expenditure increased by 25 per cent (4.6 per cent annually), followed by the Coastal region (12 per cent, or 2.3 per cent annually), and then the Northern region (6 per cent, or 1.2 per cent annually). In urban areas, per-capita expenditure grew overall by only 4 percent over the five-year period. Regional distribution of urban expenditure moved in favour of the Northern region, where per-capita expenditure grew by 14 percent (2.7 per cent annually), spurred by mineral-based industrial growth and its multiplier effects. KBK districts form a major chunk of southern and northern districts of Orissa and RLTAP could have been a major contributor to this encouraging development.
10.6 The findings of this quick evaluation have been more or less corroborated by few of studies conducted by independent agencies like NIRD and few reputed agencies engaged by the State Government as also by NHRC. While NIRD, Hyderabad study has found out that RLTAP has been instrumental in increasing both area under cultivation as also increase in water table through its watershed programmes. Both area and yield have gone up remarkably in micro watershed areas and forest coverage has gone up.
10.7 Independent organizations have shown increase in fish production and substantial increase in annual income. Because of provision of drinking water, distance covered (mostly by women) to fetch drinking water has been reduced to about 0.5 kms. Moreover male folk now fetch water (which was not so earlier) for domestic purpose from the supply point (hand pump / stand etc.)
10.8 In spite of few shortcomings and lacunae, the RLTAP has been instrumental in changing the face of KBK region substantially and therefore, require continuance with greater vigor on a long-term basis.
11. Summary Recommendations:
The major recommendations made in respect of each of the components are presented below for taking policy initiatives with a view to bringing in improvements and midway correction in the programme.
11.1 40 SEATED HOSTELS FOR ST / SC GIRLS IN KBK DISTRICTS
11.1.1 For ensuring quality of education, there is an urgent need for appointing at least five teachers for each primary school. If there be any financial constraints, appointment of Shikshya Sahayaks in requisite number could be a viable solution.
11.1.2 Government should ensure facility for stay of Head Masters/Mistresses and Hostel Superintendents at school headquarters.
xiv
11.1.3 Government may consider providing only the non-consumable items to boarders and the consumable items be left to the boarders to purchase. Consumable items may otherwise be provided before the start of the school term. In case of uniform, the time lag needs to be reduced.
11.1.4 All hostels should have night watchmen arrangements and there should be a prescribed common code of conduct for the boarders.
11.1.5 Timely payment of stipend and distribution of two pairs of uniform to all boarders should be ensured.
11.1.6 The question of reducing gender inequality in education front among SCs and STs by way of providing boarding facilities to girls should be highlighted before the local public in different forum.
11.1.7 Additional provisions of infrastructure, amenities and stipends should be made in advance at the prevailing level to accommodate the enhanced hostel capacity from 16000 to 18460 (i.e. more 2460 boarders).
11.1.8 The DWOs opined that if there had been no provision of stipend, girls would not have preferred to stay in hostels, the boarders would not have attended schools without hostel facilities.
11.1.9 There is an urgent need for the hostel authorities to provide good quality of food, maintenance of hostels and study environment by enforcement of discipline among the boarders to have the sense of security.
11.1.10 The boarders should have been encouraged and properly guided for good reading habit , maintenance of cleanliness, surrounding sanitation, gardening, games ,sports etc in the hostels.
11.2 MOBILE HEALTH UNITS IN KBK DISTRICTS
11.2.1 Zilla Swasthya Samitis should ensure a minimum of two visits by MHUs to each village during a month and MHUs should conduct clinics for villages within a radius of 5 kms. All crucial staff of MHUs like Medical Officer, Pharmacist and Health Worker (Female) should be filled in, for efficient functioning of the project.
11.2.2 The CDMOs should review the position at the end of each month and to enforce a minimum of 20 days tour and 2 days of night halts of each MHU to cover the target villages.
11.2.3 Government should examine the possibility of making provisions for modern equipment, quality medicines as per local needs, furniture for camps, ambulance and telephone for emergency cases, Microscope training to the Pharmacists, a display board at the village level, accommodation and storage facility to MHUs for effective functioning.
11.2.4 IEC programme should be re-vitalized to create adequate awareness among the people on the nature and extent of services a MHU provides for the local people.
11.2.5 CDMOs should undertake more of field visits and interact with the villagers which will help increasing attendance to emergency, enhancing follow ups, eliminating the scope of charging fees, and ensuring complete enumeration of expectant mothers and their antenatal check ups.
xv
11.2.6 Visit of CDMOs on clinic days will have adequate impact on providing doorstep services, ensuring good cooperation, providing timely treatment, ensuring cent per cent follow ups, in removing bias of MHUs towards the rich and influential people and to make it a more pro-people activity.
11.2.7 Since treatment of Panchabyadhi is an important popular component of the MHU programme, the MHUs should maintain records of the patients treated under various diseases particularly those coming under Panchabyadhi, which will help in undertaking policy reviews in future.
11.3 EMERGENCY FEEDING PROGRAMME IN KBK DISTRICTS
11.3.1 Provision of accommodations for Anganwadi Centres may be made for efficient management of various ongoing programmes.
11.3.2 The select list along with all relevant details of beneficiaries should be made available to the AWCs for record and future reference.
11.3.3 The practice of providing meals for the absentee beneficiaries should be discontinued.
11.3.4 District administration should take care and ensure provision of quality food, its adequacy and service of food in time.
11.3.5 In fitness of things, allocation-cum-identification of beneficiaries to the districts should be based on a potential survey conducted in advance. Such a survey could be carried out along with the BPL Census for better consistency.
11.3.6 There should be one prescribed authority to approve the selected list with clear criteria, which can be uniformly applicable in all districts. In case it is already prescribed, the same should be enforced.
11.3.7 Since some programme managers have reported the food stuff supplied to be of poor quality, there is need for the State level authorities, as an independent body, to ensure quality of food stuff provided.
11.4 AFFORESTATION PROGRAMME IN KBK DISTRICTS
11.4.1 Forest Department should take adequate care to increase the level of association of VSSs in conducting IEC activities and afforestation on common property resources.
11.4.2 Higher authorities should ensure availability of a checklist of various standard practices to be undertaken in course of plantation and the same should be recorded in the plantation journal.
11.4.3 The departmental authorities should organize more workshops, seminars and demonstration visits for VSS members to sensitize.
11.4.4 Forest Department should take care to engage more of local people and increase participation rate of women in implementing various activities under afforestation programme.
11.4.5 VSSs should be involved from the stage of site selection, so that a sense of their ownership of the site among the VSS members and the villagers will be created.
xvi
11.4.6 To prevent Illicit felling, it would be better, if a coordination committee of the neighboring VSSs could be involved for mutual cooperation and broad based interest.
11.4.7 Participation in training, workshops and execution of field visits are key instruments in enhancing the knowledge and sense of ownership among VSS members should be given top priority.
11.5 BIJU KRUSHAK VIKASH YOJANA IN KBK DISTRICTS
11.5.1 Government should create adequate general awareness on the functional roles and responsibilities of the Pani Panchayats on their efficient operation and timely maintenance of LI points.
11.5.2 Pani Panchayats should be provided a repair kit of spare parts to meet immediate nature of repairs.
11.5.3 Government may issue instructions to Electrical Companies for timely electrical connections to LI points and to charge economic electrical tariff from Pani Panchayats.
11.5.4 Government should organize more training and motivation programmes for the PP members for sustained use of ground water and re-charge of rain water as a scarce resource.
11.5.5. The Agriculture Department has a greater role to play in organizing agriculture extension programme, since crop diversification and cultivation of cash crops need to be provided.
11.6 WATERSHED PROGRAMME IN KBK DISTRICTS
11.6.1 The district authorities should organize training and visit programmes for the user groups, which will help enhancing their participation in a big way.
11.6.2 Impeding problems involved in incomplete micro-watershed projects should be sorted out and resolved
11.6.3 To avoid the running cost escalation and maximizing creation of irrigation potential, the early completion of project is must.
11.6.4 There is need for imparting training on maintenance of records / provision of captive nurseries for replacement of plants.
11.6.5 Low cost agricultural implements should be made available within easy reach.
11.6.6 There should be a forum for all the Watershed Development Committees in a district to meet, interact and learn best practices to improve water use efficiency and to meet the gap between demand and supply of water and a system of award and reward for best performing watersheds should be introduced.
xvii
xviii
11.7 RURAL CONNECTIVITY PROGRAMME IN KBK DISTRICTS
11.7.1 Authorities should consult and also involve the local people in regard to suitability of the site selected for bridge projects.
11.7.2 Executing authorities have to ensure enhanced participation of women and weaker sections of SCs and STs in construction for employment generation.
11.7.3 Executing agencies should maintain records strictly as per prescribed norms.
11.7.4 Supervising authorities should ensure inspections of each project site to ensure good quality.
11.7.5 Administration should consult local representatives in the process of selection of bridge projects.
11.8 RURAL WATER SUPPLY PROGRAMME IN KBK DISTRICTS.
11.8.1 At least two to three persons from each user group should be trained on the operation and maintenance of projects, as water is the vital input for sustaining human life.
11.8.2 Departmental authorities as well as the electrical companies have a greater role to play in regard to timely restoration of power in case of electrical break downs, as it is a community based drinking water supply.
11.8.3 To avoid break downs due to mishandling, early formation of User Groups and transfer of the projects to them is the best alternative.
11.8.4 Formation of Water User Associations, supply of repair kits, and providing training to key members will solve the problem of spare parts and non availability of mechanics and the question of non-cooperation between RWSS and the local people.
11.8.5 Government have to create adequate public awareness on the hazards of waste water disposal to open field and use of disinfectants for treatment of water sources to access for safe drinking water supply.
11.8.6 Construction of toilets near water sources needs to be strictly prohibited and defunct water sources as well as other sources, where water quality is affected should be rectified on priority basis to check surface and ground water pollution.
11.8.7 Government may consider digging more sanitary wells, where water quality is good and more specifically in interior villages. Irregular private connections in case of piped water supply projects should be firmly dealt.
11.8.8 The prevailing perception among the public that Government will continue with operation and maintenance of water supply projects for ever should be removed. The SHGs and NGOs should be encouraged come forward to mobilise the mass to bear the operation and maintenance (O & M) costs.
11.8.9 The overall findings as gathered from this field study as well as those revealed in other studies conducted by various agencies like NIRD, State government etc. as also from the facts revealed from NSS data go to point out that RLTAP has contributed substantially in improving the quality of life of the people of KBK region. It is, therefore, emphatically suggested that the Programme should continue on a long-term basis to further bridge the gap between the KBK districts and the rest of the districts of Orissa.
CHAPTER – I INTRODUCTION
1. The KBK Region:
The region comprising of the undivided Koraput, Balangir and Kalahandi districts
of Orissa is popularly known as the KBK region. In course of reorganization of districts in
Orissa during 1992-93, the three districts of the KBK region were divided into 8 districts
namely the Balangir, Kalahandi, Koraput, Malkangir, Nawarangpur, Nuapada, Rayagada
and Sonepur districts.
2. Development Profile of the KBK Region:
Orissa’s poverty is enormous and it ranks the lowest in terms of per capita
income among major States of the Country. It has maximum percentage of population
living below poverty line. The southern and northern districts of the State are very
backward with high concentration of Scheduled Tribes. The KBK region of the State has
all along been suffering from massive poverty and underdevelopment on account of its
geographical situation as well as for historical reasons. There are as many as 118 tribal
sub-plan blocks against a total of 314 blocks in the State out of which 44 tribal sub-plan
blocks against a total of 80 blocks are in the KBK region. Besides, the Committee on the
Constitution of Separate Development Board in Orissa (1994) have identified 82 out of
314 blocks in the State as very backward. Out of the 82 very backward blocks identified
in the State, as many as 53 are situated in the KBK region.
Human Development Index (HDI) is one of the important indicators that indicate
the quality of life enjoyed by the people living in a region. The Orissa Human
Development Report 2004, shows that out of 30 districts of Orissa the HDI rank of
Balangir is 21st, Kalahandi 11th, Koraput 27th, Malkangiri 30th, Nawarangpur 26th,
Nuapada 14th, Rayagada 25th and Sonepur 16th. This clearly indicates that the districts
coming under the KBK region in general have a lower level of human development index
as compared to rest of the districts in the State. In terms of Health Index Ranking as
calculated in the said report except Kalahandi, Nuapada and Sonepur, the other 5
districts of the KBK region rank very low as compared to the other districts of Orissa.
Selected development indicators relating to the districts in the KBK region vis-à-vis that
for the State of Orissa are presented below in Table No: 1.1 for appreciating the
1
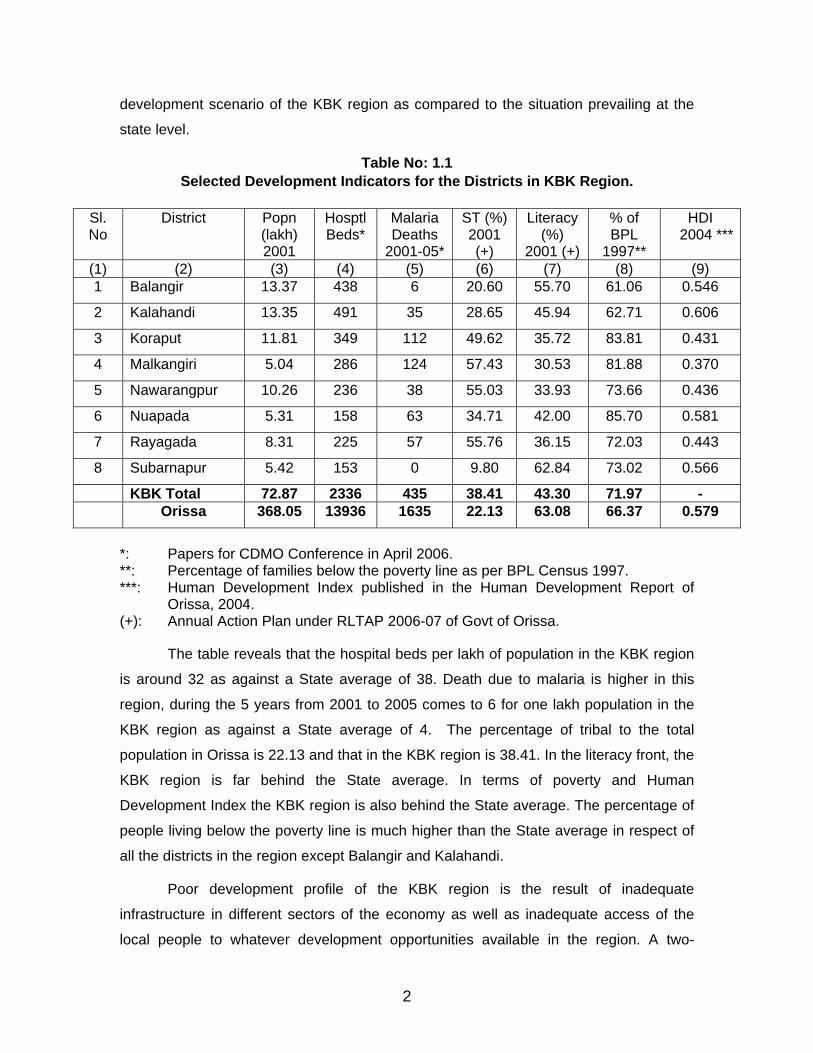
development scenario of the KBK region as compared to the situation prevailing at the
state level.
Table No: 1.1 Selected Development Indicators for the Districts in KBK Region.
Sl. No
District Popn (lakh) 2001
HosptlBeds*
Malaria Deaths
2001-05*
ST (%) 2001 (+)
Literacy (%)
2001 (+)
% of BPL
1997**
HDI 2004 ***
(1) (2) (3) (4) (5) (6) (7) (8) (9) 1 Balangir 13.37 438 6 20.60 55.70 61.06 0.546
2 Kalahandi 13.35 491 35 28.65 45.94 62.71 0.606
3 Koraput 11.81 349 112 49.62 35.72 83.81 0.431
4 Malkangiri 5.04 286 124 57.43 30.53 81.88 0.370
5 Nawarangpur 10.26 236 38 55.03 33.93 73.66 0.436
6 Nuapada 5.31 158 63 34.71 42.00 85.70 0.581
7 Rayagada 8.31 225 57 55.76 36.15 72.03 0.443
8 Subarnapur 5.42 153 0 9.80 62.84 73.02 0.566
KBK Total 72.87 2336 435 38.41 43.30 71.97 - Orissa 368.05 13936 1635 22.13 63.08 66.37 0.579
*: Papers for CDMO Conference in April 2006. **: Percentage of families below the poverty line as per BPL Census 1997. ***: Human Development Index published in the Human Development Report of
Orissa, 2004. (+): Annual Action Plan under RLTAP 2006-07 of Govt of Orissa.
The table reveals that the hospital beds per lakh of population in the KBK region
is around 32 as against a State average of 38. Death due to malaria is higher in this
region, during the 5 years from 2001 to 2005 comes to 6 for one lakh population in the
KBK region as against a State average of 4. The percentage of tribal to the total
population in Orissa is 22.13 and that in the KBK region is 38.41. In the literacy front, the
KBK region is far behind the State average. In terms of poverty and Human
Development Index the KBK region is also behind the State average. The percentage of
people living below the poverty line is much higher than the State average in respect of
all the districts in the region except Balangir and Kalahandi.
Poor development profile of the KBK region is the result of inadequate
infrastructure in different sectors of the economy as well as inadequate access of the
local people to whatever development opportunities available in the region. A two-
2
pronged strategy was, therefore, felt necessary to bring in all round development of the
KBK region, one to bridge the existing gaps in the availability of development
infrastructure and the other to create conducive environment for enhancing the access to
the local people, so that they realise the development opportunities available and derive
benefits out of those programmes.
3. Back Ground of RLTAP:
On account of the acute and widespread poverty and underdevelopment of the
KBK region, attention of the Civil Societies, Intellectuals and the Administrators were
drawn in the past on many occasions to address the key issues and bring in all round
development of the region.
On the initiative of Government of India, a Long Term Action Plan (LTAP) was
formulated by the Government of Orissa for a holistic development of the KBK region.
The LTAP was spread over a period of 7 years from 1995-96 to 2001-02 with principal
objectives in view: (i) drought and distress proofing and (ii) alleviating poverty and
development saturation. Subsequently, in 1998, on the advice of Government of India, a
Revised Long Term Action Plan (RLTAP) extended over a period of 9 years from 1998-
99 to 2006-07 was formulated and launched in the region with a total outlay of
Rs.6251.06 crore. The central features of the RLTAP was to address itself by adopting
integrated approach for speeding up the socio-economic development of KBK region by
bringing in synergy among various developmental activities and programmes being
undertaken in the region by the State and the Centre. The critical gaps in the
developmental efforts as well as dearth of resources were sought to be bridged through
SCA as a special dispensation. However, only a meager allocation of Rs.20.49 crore
was received as additional assistance during the first three yeas from 1995-96 to 1997-
98. Therefore, LTAP (1995-2002) did not take off because of insufficient funds.
4. Objectives of the RLTAP and the Path:
The objectives of the Revised Long Term Action Plan (RLTAP) formulated for the KBK districts were;
(i) Drought proofing of the region
(ii) Poverty alleviation and development saturation and
(iii) Improved quality of life for the local people
3
The following were considered as the most appropriate and strategic
interventions needed for a holistic development of the KBK region in implementing the
programme of RLTAP;
(i) Infrastructure: Construction of rural infrastructure likes roads, bridges,
irrigation projects, water sheds, tanks, ware-houses, markets etc.
(ii) Conservation of natural resources - like forest, soil and water etc.
(iii) Employment Generation on sustainable basis through creation of
productive infrastructure and assets under various programmes.
(iv) Public participation in the process of implementation of the RLTAP
through formation of Self-Help Groups (SHGs), Vana Samrakshana
Samities (VSSs), Pani Panchayats (PPs) and Bhumi Panchayats (BPs)
was also considered vital and important.
(v) Programmes for restructuring and energizing social security system as
emergency feeding programme, special nutrition programme for children
under the age of 3, mobile health units, promotion of education among
STs / SCs etc.
5. Programme Components:
In course of implementation of the programme of RLTAP, the Special Central
Assistance received from Government of India till 2005-06 was spent for creation of
development infrastructure and for undertaking social welfare activities on a wide range
of activities in the KBK region in the following development sectors.
i. Watershed Development, Horticulture and Agriculture,
ii. Animal Resources Development,
iv. Fisheries Development Programme,
iv. Forest Regeneration and Development,
v. Health and Family Welfare Programmes,
vi. Drinking Water Supply,
vii. Connectivity in KBK districts,
viii. Welfare of STs and SCs,
4
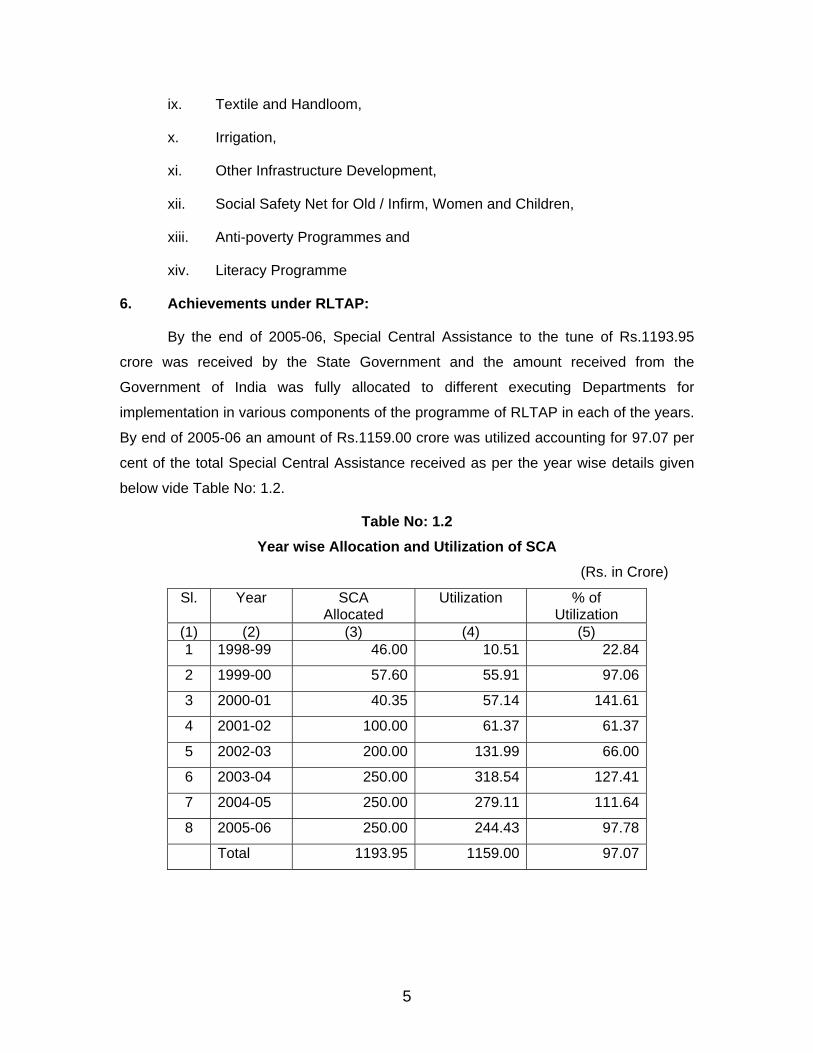
ix. Textile and Handloom,
x. Irrigation,
xi. Other Infrastructure Development,
xii. Social Safety Net for Old / Infirm, Women and Children,
xiii. Anti-poverty Programmes and
xiv. Literacy Programme
6. Achievements under RLTAP:
By the end of 2005-06, Special Central Assistance to the tune of Rs.1193.95
crore was received by the State Government and the amount received from the
Government of India was fully allocated to different executing Departments for
implementation in various components of the programme of RLTAP in each of the years.
By end of 2005-06 an amount of Rs.1159.00 crore was utilized accounting for 97.07 per
cent of the total Special Central Assistance received as per the year wise details given
below vide Table No: 1.2.
Table No: 1.2 Year wise Allocation and Utilization of SCA
(Rs. in Crore)
Sl. Year SCA Allocated
Utilization % of Utilization
(1) (2) (3) (4) (5) 1 1998-99 46.00 10.51 22.84
2 1999-00 57.60 55.91 97.06
3 2000-01 40.35 57.14 141.61
4 2001-02 100.00 61.37 61.37
5 2002-03 200.00 131.99 66.00
6 2003-04 250.00 318.54 127.41
7 2004-05 250.00 279.11 111.64
8 2005-06 250.00 244.43 97.78
Total 1193.95 1159.00 97.07
5
As a result of the utilization of Rs.1159.00 crore of Special Central Assistance
under the programme of RLTAP during the period from 1998-99 to 2005-06 in the KBK
region over and above the normal plan programmes, a lot of development infrastructure
and productive assets were created in the region. The figures incorporated in the Annual
Action Plan under RLTAP in Orissa and the data collected from the executing agencies
revealed that the physical achievements have taken place in the region and are
enumerated below:
a. As many as 936 Lift Irrigation Points (LIPs) were taken up under RLTAP
and most of them have been completed and handed over to the Pani
Panchayats for their operation and maintenance.
b. As many as 13830 tube wells, 632 sanitary wells and 85 piped water
supply projects were executed for providing safe drinking water to the rural
poor.
c. As many as 54 rural bridges were constructed to provide connectivity to
growth centers, schools, health centers, Panchayat, Block and District
headquarters.
d. 400 number of residential hostels exclusively meant for girls were
constructed and operationalised. 16,000 pre-matric scholarships are being
provided annually to girl students.
e. Under various kinds of afforestation activities around 1,25,167 hector of
area was covered by LTAP funds.
f. 314 watersheds were taken up and 39,520 ha. of area has been treated.
g. In 80 blocks of the KBK region, as many as 90 Mobile Health Units were
established through which nearly 13 lakh patients are being treated per
year at their doorstep.
h. About 2.00 lakh beneficiaries on an average were covered under
Emergency Feeding Programme each year. Under this programme old,
infirm and indigent persons are benefited.
6
7. The Study Area:
Needless to emphasize that it is not merely a question of availability and
adequacy of various kinds of infrastructure and amenities, but their accessibility matters
to the poor and economically backward people living in the region. Enhanced
accessibility to improved infrastructure and amenities was considered as one of the
strategic intervention required for all round development of the KBK region. The Revised
Long Term Action Plan (RLTAP) in Orissa have appropriately taken up the challenge of
tackling the issues of inadequate access to various development opportunities available
in the region. In the process of implementation of the programme of Long Term Action
Plan (LTAP) and subsequently the Revised Long Term Action Plan (RLTAP) a large
number of infrastructure and service facilities were created in the KBK region. Requisite
provision was also made for operation and maintenance of the same from RLTAP fund.
Since the programme has already operated in full swing, it was expected to
achieve the objectives of RLTAP in the KBK region to a reasonable extent by now.
Keeping this in view, the Programme Evaluation Organisation of the Planning
Commission decided to launch a quick evaluation study of the programme of RLTAP in
the KBK region to make a realistic assessment of the achievements in the direction of
fulfillment of the set objectives of RLTAP in KBK districts and come up with appropriate
recommendations for taking policy initiatives needed. Accordingly, the study area covers
all the 8 districts coming under the KBK region.
7
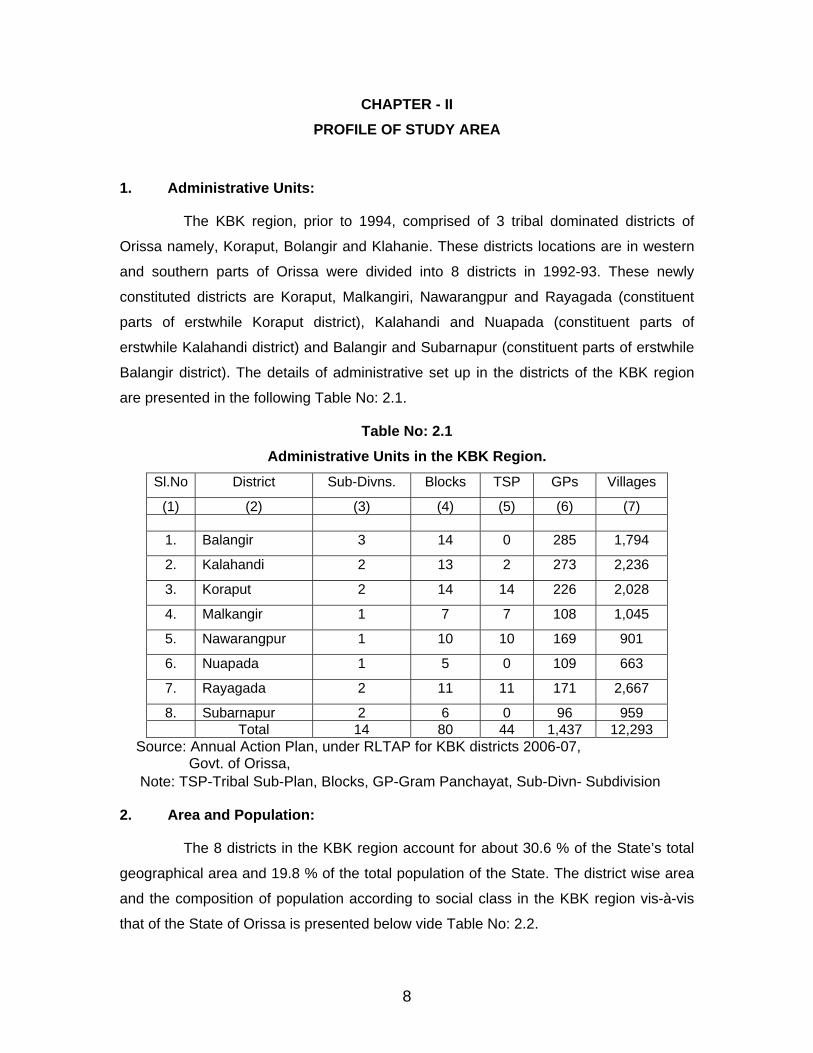
CHAPTER - II PROFILE OF STUDY AREA
1. Administrative Units:
The KBK region, prior to 1994, comprised of 3 tribal dominated districts of
Orissa namely, Koraput, Bolangir and Klahanie. These districts locations are in western
and southern parts of Orissa were divided into 8 districts in 1992-93. These newly
constituted districts are Koraput, Malkangiri, Nawarangpur and Rayagada (constituent
parts of erstwhile Koraput district), Kalahandi and Nuapada (constituent parts of
erstwhile Kalahandi district) and Balangir and Subarnapur (constituent parts of erstwhile
Balangir district). The details of administrative set up in the districts of the KBK region
are presented in the following Table No: 2.1.
Table No: 2.1 Administrative Units in the KBK Region.
Sl.No District Sub-Divns. Blocks TSP GPs Villages
(1) (2) (3) (4) (5) (6) (7)
1. Balangir 3 14 0 285 1,794
2. Kalahandi 2 13 2 273 2,236
3. Koraput 2 14 14 226 2,028
4. Malkangir 1 7 7 108 1,045
5. Nawarangpur 1 10 10 169 901
6. Nuapada 1 5 0 109 663
7. Rayagada 2 11 11 171 2,667
8. Subarnapur 2 6 0 96 959 Total 14 80 44 1,437 12,293
Source: Annual Action Plan, under RLTAP for KBK districts 2006-07, Govt. of Orissa, Note: TSP-Tribal Sub-Plan, Blocks, GP-Gram Panchayat, Sub-Divn- Subdivision
2. Area and Population:
The 8 districts in the KBK region account for about 30.6 % of the State’s total
geographical area and 19.8 % of the total population of the State. The district wise area
and the composition of population according to social class in the KBK region vis-à-vis
that of the State of Orissa is presented below vide Table No: 2.2.
8
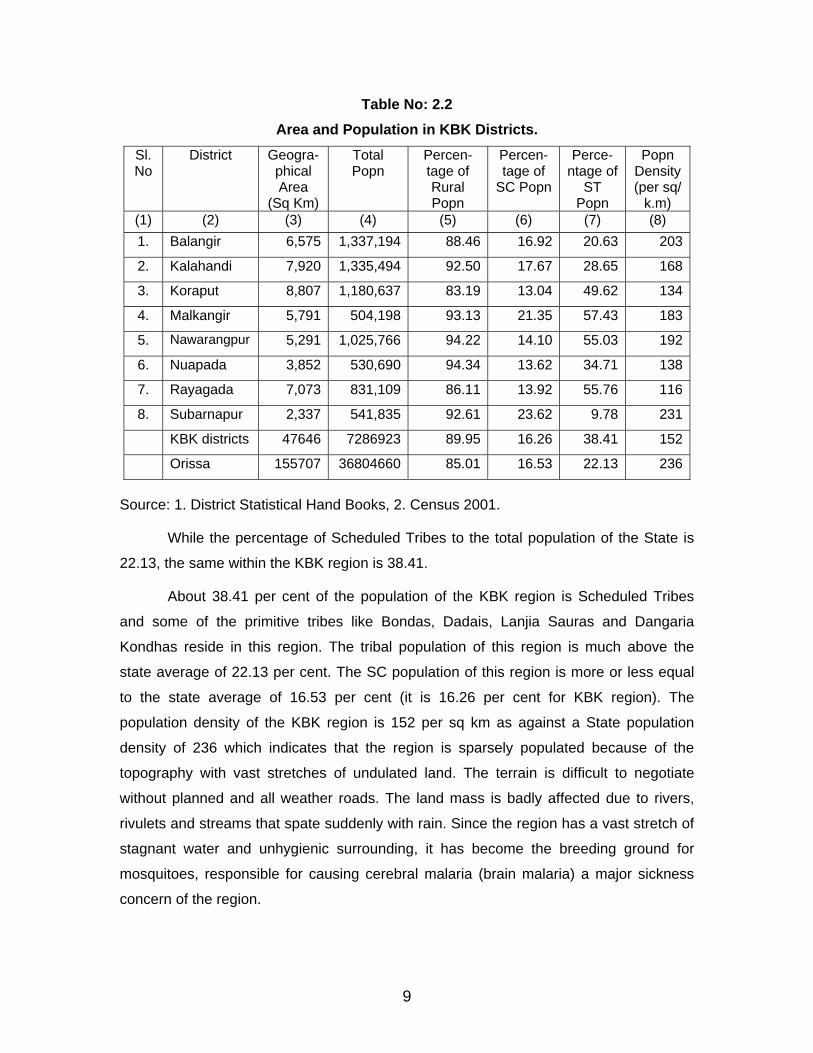
Table No: 2.2 Area and Population in KBK Districts.
Sl.No
District Geogra- phical Area
(Sq Km)
Total Popn
Percen- tage of Rural Popn
Percen-tage of
SC Popn
Perce-ntage of
ST Popn
Popn Density (per sq/
k.m) (1) (2) (3) (4) (5) (6) (7) (8) 1. Balangir 6,575 1,337,194 88.46 16.92 20.63 203
2. Kalahandi 7,920 1,335,494 92.50 17.67 28.65 168
3. Koraput 8,807 1,180,637 83.19 13.04 49.62 134
4. Malkangir 5,791 504,198 93.13 21.35 57.43 183
5. Nawarangpur 5,291 1,025,766 94.22 14.10 55.03 192
6. Nuapada 3,852 530,690 94.34 13.62 34.71 138
7. Rayagada 7,073 831,109 86.11 13.92 55.76 116
8. Subarnapur 2,337 541,835 92.61 23.62 9.78 231
KBK districts 47646 7286923 89.95 16.26 38.41 152
Orissa 155707 36804660 85.01 16.53 22.13 236
Source: 1. District Statistical Hand Books, 2. Census 2001.
While the percentage of Scheduled Tribes to the total population of the State is
22.13, the same within the KBK region is 38.41.
About 38.41 per cent of the population of the KBK region is Scheduled Tribes
and some of the primitive tribes like Bondas, Dadais, Lanjia Sauras and Dangaria
Kondhas reside in this region. The tribal population of this region is much above the
state average of 22.13 per cent. The SC population of this region is more or less equal
to the state average of 16.53 per cent (it is 16.26 per cent for KBK region). The
population density of the KBK region is 152 per sq km as against a State population
density of 236 which indicates that the region is sparsely populated because of the
topography with vast stretches of undulated land. The terrain is difficult to negotiate
without planned and all weather roads. The land mass is badly affected due to rivers,
rivulets and streams that spate suddenly with rain. Since the region has a vast stretch of
stagnant water and unhygienic surrounding, it has become the breeding ground for
mosquitoes, responsible for causing cerebral malaria (brain malaria) a major sickness
concern of the region.
9
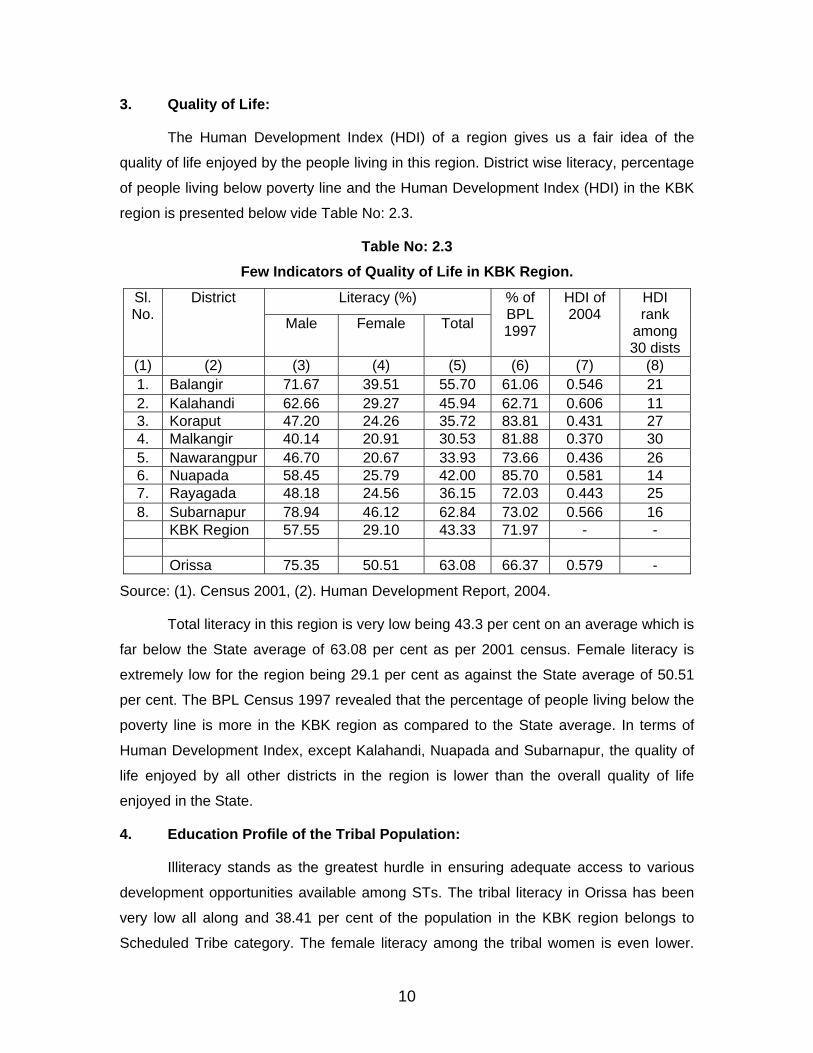
3. Quality of Life:
The Human Development Index (HDI) of a region gives us a fair idea of the
quality of life enjoyed by the people living in this region. District wise literacy, percentage
of people living below poverty line and the Human Development Index (HDI) in the KBK
region is presented below vide Table No: 2.3.
Table No: 2.3 Few Indicators of Quality of Life in KBK Region.
Literacy (%) Sl. No.
District
Male Female Total
% of BPL 1997
HDI of 2004
HDI rank
among 30 dists
(1) (2) (3) (4) (5) (6) (7) (8) 1. Balangir 71.67 39.51 55.70 61.06 0.546 21 2. Kalahandi 62.66 29.27 45.94 62.71 0.606 11 3. Koraput 47.20 24.26 35.72 83.81 0.431 27 4. Malkangir 40.14 20.91 30.53 81.88 0.370 30 5. Nawarangpur 46.70 20.67 33.93 73.66 0.436 26 6. Nuapada 58.45 25.79 42.00 85.70 0.581 14 7. Rayagada 48.18 24.56 36.15 72.03 0.443 25 8. Subarnapur 78.94 46.12 62.84 73.02 0.566 16
KBK Region 57.55 29.10 43.33 71.97 - - Orissa 75.35 50.51 63.08 66.37 0.579 -
Source: (1). Census 2001, (2). Human Development Report, 2004.
Total literacy in this region is very low being 43.3 per cent on an average which is
far below the State average of 63.08 per cent as per 2001 census. Female literacy is
extremely low for the region being 29.1 per cent as against the State average of 50.51
per cent. The BPL Census 1997 revealed that the percentage of people living below the
poverty line is more in the KBK region as compared to the State average. In terms of
Human Development Index, except Kalahandi, Nuapada and Subarnapur, the quality of
life enjoyed by all other districts in the region is lower than the overall quality of life
enjoyed in the State.
4. Education Profile of the Tribal Population:
Illiteracy stands as the greatest hurdle in ensuring adequate access to various
development opportunities available among STs. The tribal literacy in Orissa has been
very low all along and 38.41 per cent of the population in the KBK region belongs to
Scheduled Tribe category. The female literacy among the tribal women is even lower.
10
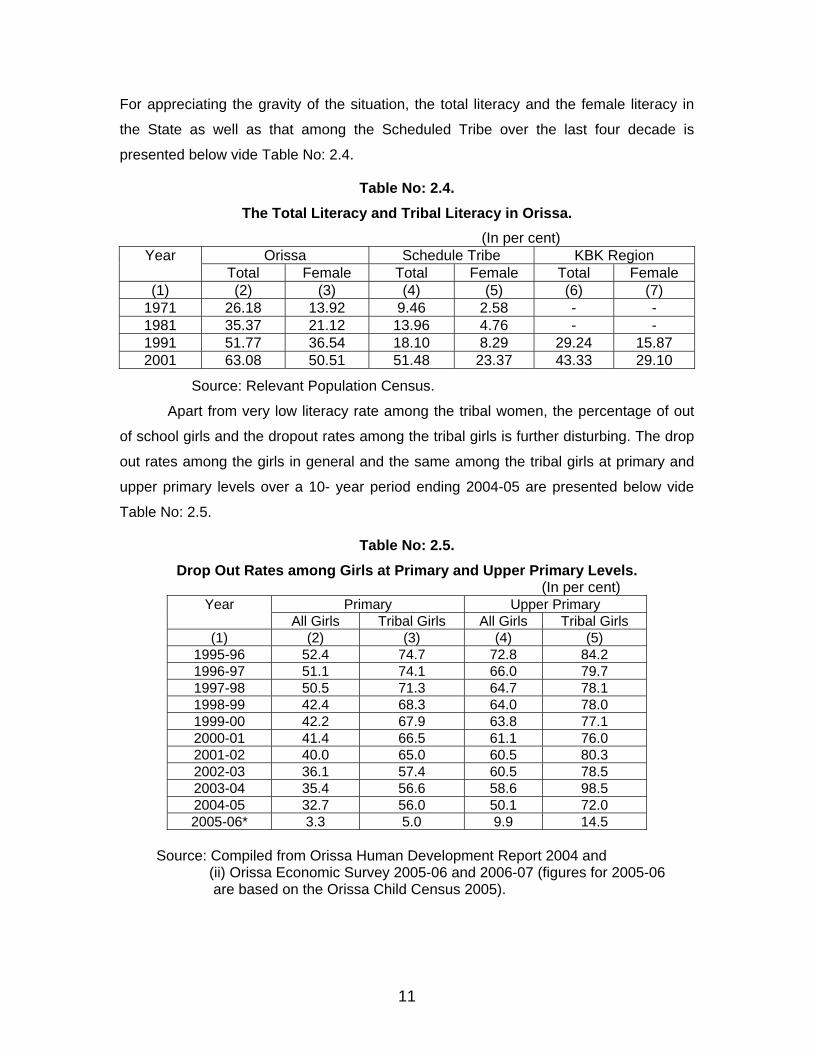
For appreciating the gravity of the situation, the total literacy and the female literacy in
the State as well as that among the Scheduled Tribe over the last four decade is
presented below vide Table No: 2.4.
Table No: 2.4. The Total Literacy and Tribal Literacy in Orissa.
(In per cent) Orissa Schedule Tribe KBK Region Year
Total Female Total Female Total Female (1) (2) (3) (4) (5) (6) (7)
1971 26.18 13.92 9.46 2.58 - - 1981 35.37 21.12 13.96 4.76 - - 1991 51.77 36.54 18.10 8.29 29.24 15.87 2001 63.08 50.51 51.48 23.37 43.33 29.10
Source: Relevant Population Census.
Apart from very low literacy rate among the tribal women, the percentage of out
of school girls and the dropout rates among the tribal girls is further disturbing. The drop
out rates among the girls in general and the same among the tribal girls at primary and
upper primary levels over a 10- year period ending 2004-05 are presented below vide
Table No: 2.5.
Table No: 2.5. Drop Out Rates among Girls at Primary and Upper Primary Levels.
(In per cent) Primary Upper Primary Year
All Girls Tribal Girls All Girls Tribal Girls (1) (2) (3) (4) (5)
1995-96 52.4 74.7 72.8 84.2 1996-97 51.1 74.1 66.0 79.7 1997-98 50.5 71.3 64.7 78.1 1998-99 42.4 68.3 64.0 78.0 1999-00 42.2 67.9 63.8 77.1 2000-01 41.4 66.5 61.1 76.0 2001-02 40.0 65.0 60.5 80.3 2002-03 36.1 57.4 60.5 78.5 2003-04 35.4 56.6 58.6 98.5 2004-05 32.7 56.0 50.1 72.0 2005-06* 3.3 5.0 9.9 14.5
Source: Compiled from Orissa Human Development Report 2004 and (ii) Orissa Economic Survey 2005-06 and 2006-07 (figures for 2005-06 are based on the Orissa Child Census 2005).
11
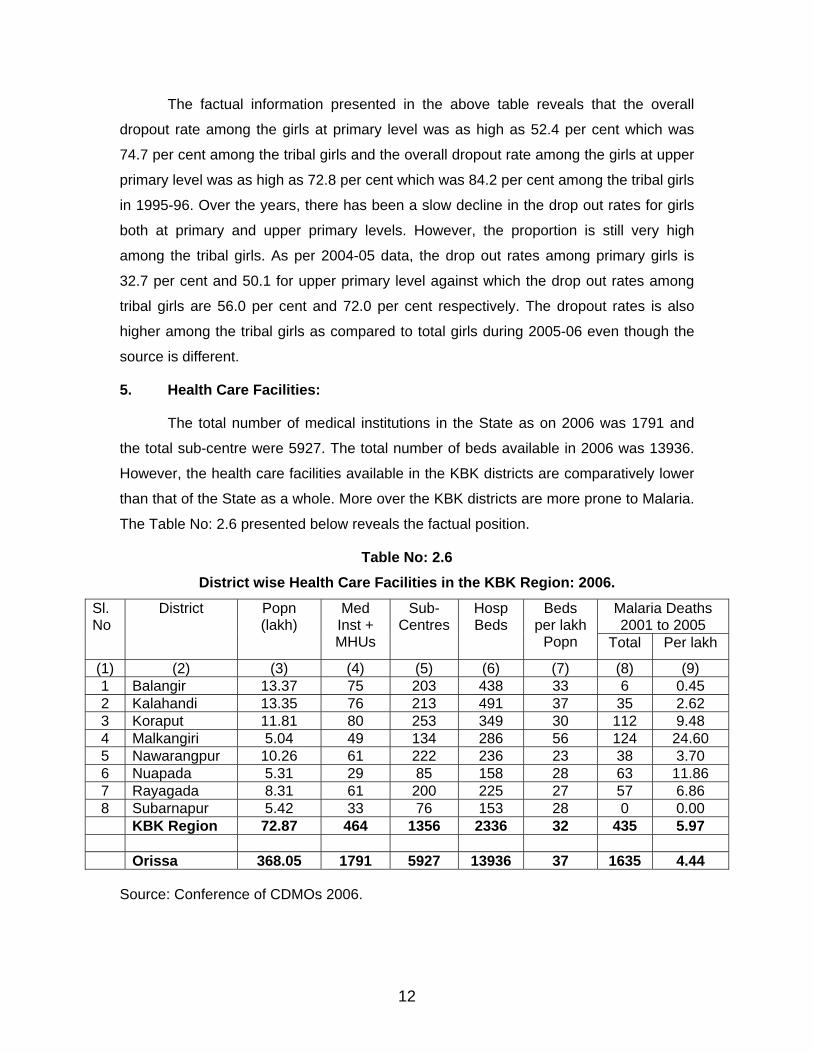
The factual information presented in the above table reveals that the overall
dropout rate among the girls at primary level was as high as 52.4 per cent which was
74.7 per cent among the tribal girls and the overall dropout rate among the girls at upper
primary level was as high as 72.8 per cent which was 84.2 per cent among the tribal girls
in 1995-96. Over the years, there has been a slow decline in the drop out rates for girls
both at primary and upper primary levels. However, the proportion is still very high
among the tribal girls. As per 2004-05 data, the drop out rates among primary girls is
32.7 per cent and 50.1 for upper primary level against which the drop out rates among
tribal girls are 56.0 per cent and 72.0 per cent respectively. The dropout rates is also
higher among the tribal girls as compared to total girls during 2005-06 even though the
source is different.
5. Health Care Facilities:
The total number of medical institutions in the State as on 2006 was 1791 and
the total sub-centre were 5927. The total number of beds available in 2006 was 13936.
However, the health care facilities available in the KBK districts are comparatively lower
than that of the State as a whole. More over the KBK districts are more prone to Malaria.
The Table No: 2.6 presented below reveals the factual position.
Table No: 2.6 District wise Health Care Facilities in the KBK Region: 2006.
Malaria Deaths 2001 to 2005
Sl.No
District Popn (lakh)
Med Inst + MHUs
Sub- Centres
Hosp Beds
Beds per lakh
Popn Total Per lakh
(1) (2) (3) (4) (5) (6) (7) (8) (9) 1 Balangir 13.37 75 203 438 33 6 0.45 2 Kalahandi 13.35 76 213 491 37 35 2.62 3 Koraput 11.81 80 253 349 30 112 9.48 4 Malkangiri 5.04 49 134 286 56 124 24.60 5 Nawarangpur 10.26 61 222 236 23 38 3.70 6 Nuapada 5.31 29 85 158 28 63 11.86 7 Rayagada 8.31 61 200 225 27 57 6.86 8 Subarnapur 5.42 33 76 153 28 0 0.00 KBK Region 72.87 464 1356 2336 32 435 5.97 Orissa 368.05 1791 5927 13936 37 1635 4.44
Source: Conference of CDMOs 2006.
12
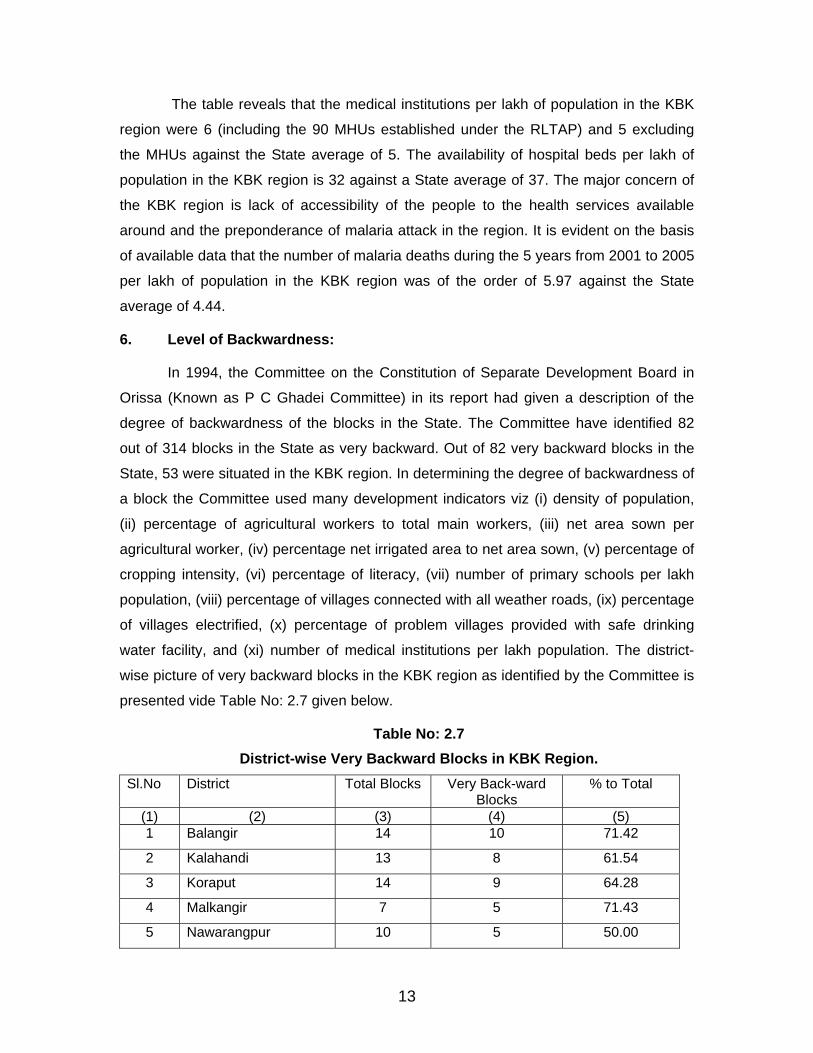
The table reveals that the medical institutions per lakh of population in the KBK
region were 6 (including the 90 MHUs established under the RLTAP) and 5 excluding
the MHUs against the State average of 5. The availability of hospital beds per lakh of
population in the KBK region is 32 against a State average of 37. The major concern of
the KBK region is lack of accessibility of the people to the health services available
around and the preponderance of malaria attack in the region. It is evident on the basis
of available data that the number of malaria deaths during the 5 years from 2001 to 2005
per lakh of population in the KBK region was of the order of 5.97 against the State
average of 4.44.
6. Level of Backwardness:
In 1994, the Committee on the Constitution of Separate Development Board in
Orissa (Known as P C Ghadei Committee) in its report had given a description of the
degree of backwardness of the blocks in the State. The Committee have identified 82
out of 314 blocks in the State as very backward. Out of 82 very backward blocks in the
State, 53 were situated in the KBK region. In determining the degree of backwardness of
a block the Committee used many development indicators viz (i) density of population,
(ii) percentage of agricultural workers to total main workers, (iii) net area sown per
agricultural worker, (iv) percentage net irrigated area to net area sown, (v) percentage of
cropping intensity, (vi) percentage of literacy, (vii) number of primary schools per lakh
population, (viii) percentage of villages connected with all weather roads, (ix) percentage
of villages electrified, (x) percentage of problem villages provided with safe drinking
water facility, and (xi) number of medical institutions per lakh population. The district-
wise picture of very backward blocks in the KBK region as identified by the Committee is
presented vide Table No: 2.7 given below.
Table No: 2.7 District-wise Very Backward Blocks in KBK Region.
Sl.No District Total Blocks Very Back-ward Blocks
% to Total
(1) (2) (3) (4) (5) 1 Balangir 14 10 71.42
2 Kalahandi 13 8 61.54
3 Koraput 14 9 64.28
4 Malkangir 7 5 71.43
5 Nawarangpur 10 5 50.00
13
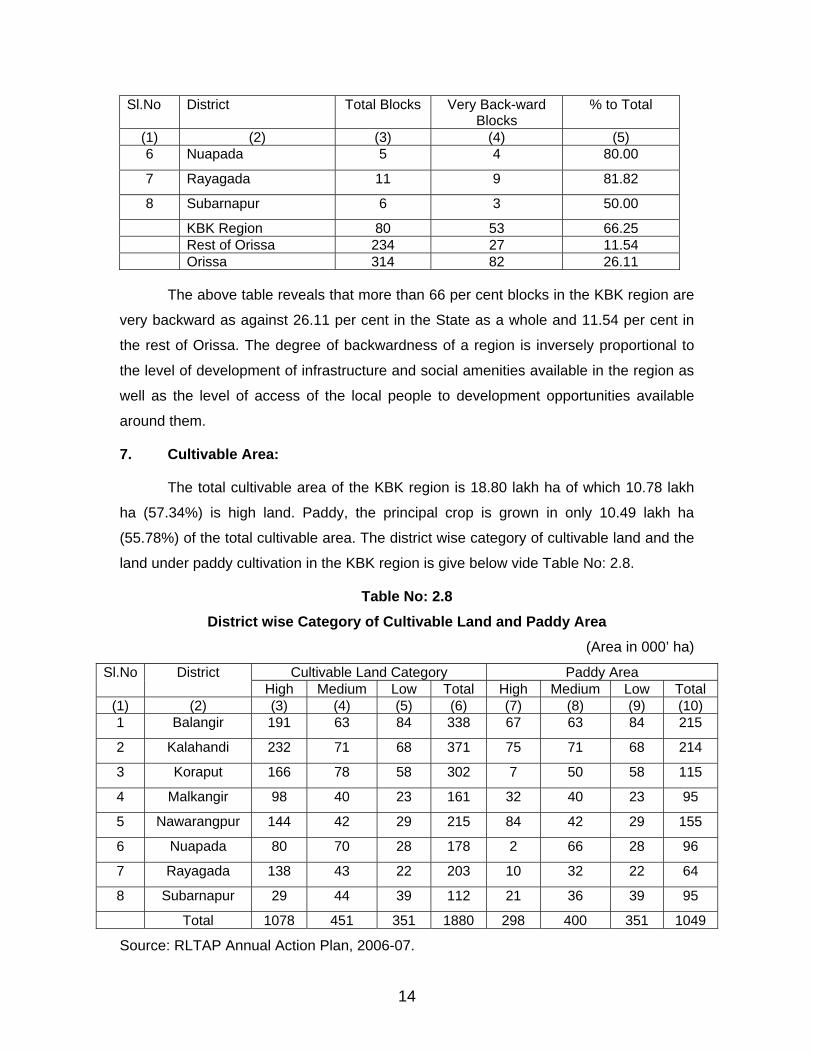
Sl.No District Total Blocks Very Back-ward Blocks
% to Total
(1) (2) (3) (4) (5) 6 Nuapada 5 4 80.00
7 Rayagada 11 9 81.82
8 Subarnapur 6 3 50.00
KBK Region 80 53 66.25 Rest of Orissa 234 27 11.54 Orissa 314 82 26.11
The above table reveals that more than 66 per cent blocks in the KBK region are
very backward as against 26.11 per cent in the State as a whole and 11.54 per cent in
the rest of Orissa. The degree of backwardness of a region is inversely proportional to
the level of development of infrastructure and social amenities available in the region as
well as the level of access of the local people to development opportunities available
around them.
7. Cultivable Area:
The total cultivable area of the KBK region is 18.80 lakh ha of which 10.78 lakh
ha (57.34%) is high land. Paddy, the principal crop is grown in only 10.49 lakh ha
(55.78%) of the total cultivable area. The district wise category of cultivable land and the
land under paddy cultivation in the KBK region is give below vide Table No: 2.8.
Table No: 2.8 District wise Category of Cultivable Land and Paddy Area
(Area in 000’ ha)
Cultivable Land Category Paddy Area Sl.No District High Medium Low Total High Medium Low Total
(1) (2) (3) (4) (5) (6) (7) (8) (9) (10) 1 Balangir 191 63 84 338 67 63 84 215
2 Kalahandi 232 71 68 371 75 71 68 214
3 Koraput 166 78 58 302 7 50 58 115
4 Malkangir 98 40 23 161 32 40 23 95
5 Nawarangpur 144 42 29 215 84 42 29 155
6 Nuapada 80 70 28 178 2 66 28 96
7 Rayagada 138 43 22 203 10 32 22 64
8 Subarnapur 29 44 39 112 21 36 39 95
Total 1078 451 351 1880 298 400 351 1049
Source: RLTAP Annual Action Plan, 2006-07.
14
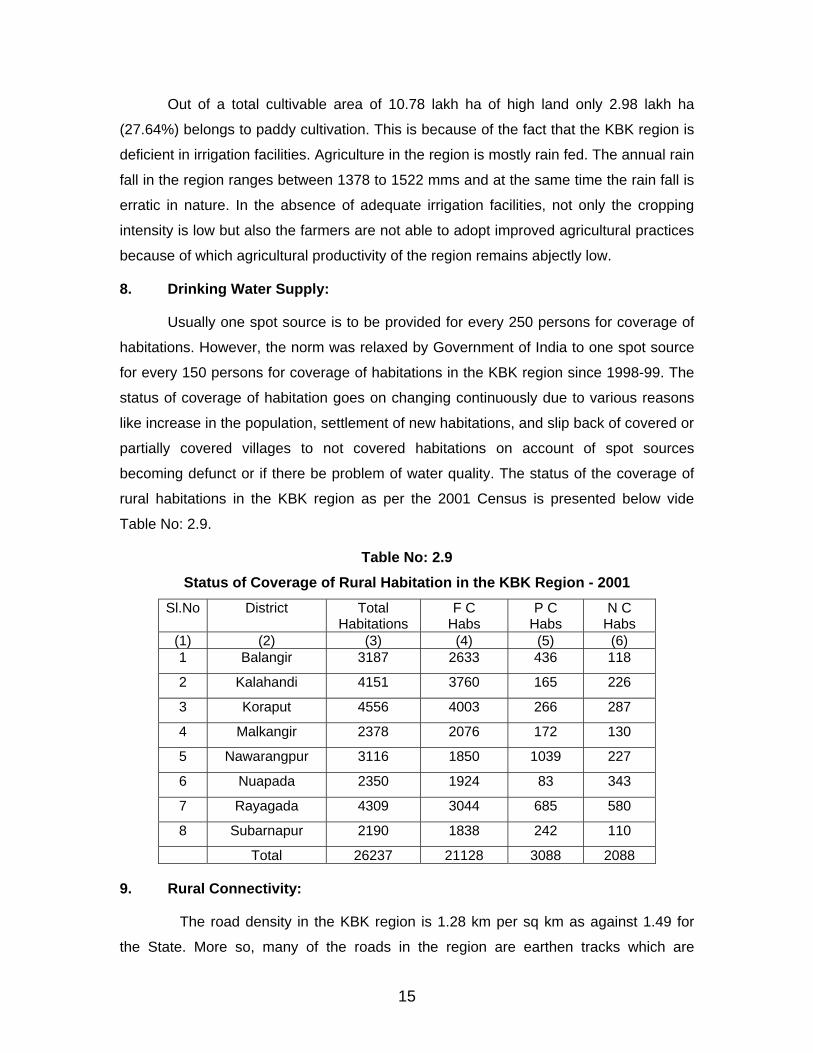
Out of a total cultivable area of 10.78 lakh ha of high land only 2.98 lakh ha
(27.64%) belongs to paddy cultivation. This is because of the fact that the KBK region is
deficient in irrigation facilities. Agriculture in the region is mostly rain fed. The annual rain
fall in the region ranges between 1378 to 1522 mms and at the same time the rain fall is
erratic in nature. In the absence of adequate irrigation facilities, not only the cropping
intensity is low but also the farmers are not able to adopt improved agricultural practices
because of which agricultural productivity of the region remains abjectly low.
8. Drinking Water Supply:
Usually one spot source is to be provided for every 250 persons for coverage of
habitations. However, the norm was relaxed by Government of India to one spot source
for every 150 persons for coverage of habitations in the KBK region since 1998-99. The
status of coverage of habitation goes on changing continuously due to various reasons
like increase in the population, settlement of new habitations, and slip back of covered or
partially covered villages to not covered habitations on account of spot sources
becoming defunct or if there be problem of water quality. The status of the coverage of
rural habitations in the KBK region as per the 2001 Census is presented below vide
Table No: 2.9.
Table No: 2.9 Status of Coverage of Rural Habitation in the KBK Region - 2001
Sl.No District Total Habitations
F C Habs
P C Habs
N C Habs
(1) (2) (3) (4) (5) (6) 1 Balangir 3187 2633 436 118
2 Kalahandi 4151 3760 165 226
3 Koraput 4556 4003 266 287
4 Malkangir 2378 2076 172 130
5 Nawarangpur 3116 1850 1039 227
6 Nuapada 2350 1924 83 343
7 Rayagada 4309 3044 685 580
8 Subarnapur 2190 1838 242 110
Total 26237 21128 3088 2088
9. Rural Connectivity:
The road density in the KBK region is 1.28 km per sq km as against 1.49 for
the State. More so, many of the roads in the region are earthen tracks which are
15
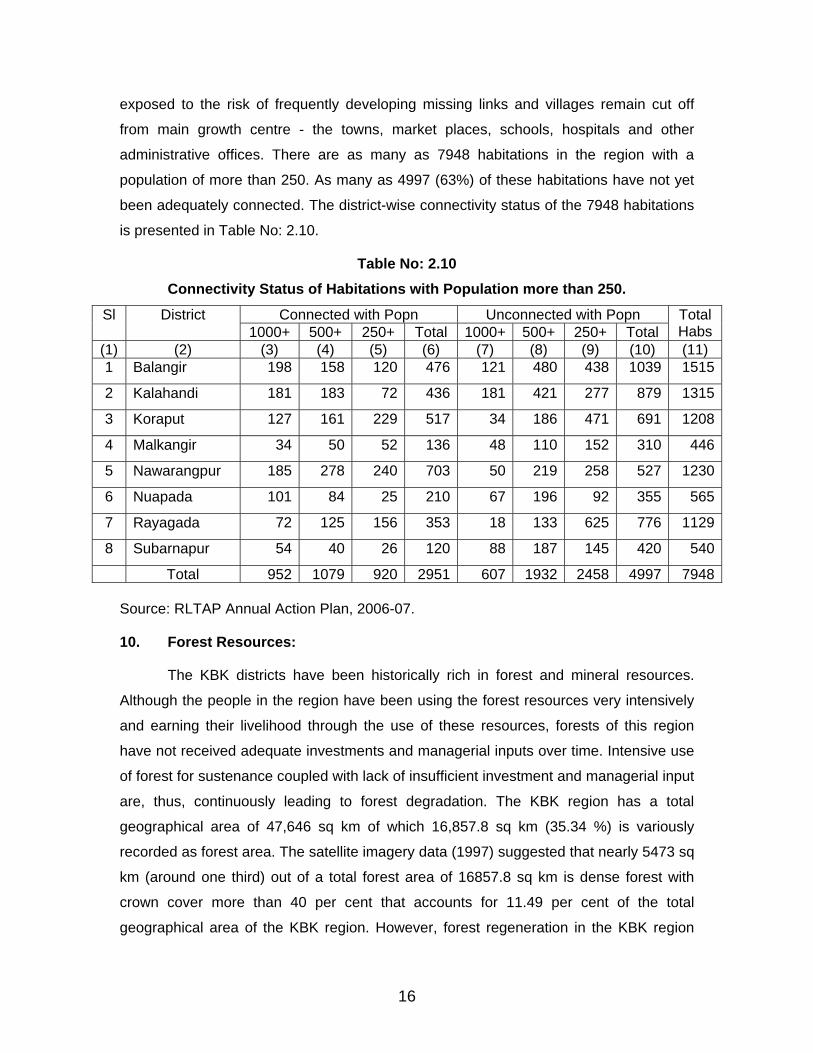
exposed to the risk of frequently developing missing links and villages remain cut off
from main growth centre - the towns, market places, schools, hospitals and other
administrative offices. There are as many as 7948 habitations in the region with a
population of more than 250. As many as 4997 (63%) of these habitations have not yet
been adequately connected. The district-wise connectivity status of the 7948 habitations
is presented in Table No: 2.10.
Table No: 2.10 Connectivity Status of Habitations with Population more than 250.
Connected with Popn Unconnected with Popn Sl District 1000+ 500+ 250+ Total 1000+ 500+ 250+ Total
TotalHabs
(1) (2) (3) (4) (5) (6) (7) (8) (9) (10) (11) 1 Balangir 198 158 120 476 121 480 438 1039 1515
2 Kalahandi 181 183 72 436 181 421 277 879 1315
3 Koraput 127 161 229 517 34 186 471 691 1208
4 Malkangir 34 50 52 136 48 110 152 310 446
5 Nawarangpur 185 278 240 703 50 219 258 527 1230
6 Nuapada 101 84 25 210 67 196 92 355 565
7 Rayagada 72 125 156 353 18 133 625 776 1129
8 Subarnapur 54 40 26 120 88 187 145 420 540
Total 952 1079 920 2951 607 1932 2458 4997 7948 Source: RLTAP Annual Action Plan, 2006-07.
10. Forest Resources:
The KBK districts have been historically rich in forest and mineral resources.
Although the people in the region have been using the forest resources very intensively
and earning their livelihood through the use of these resources, forests of this region
have not received adequate investments and managerial inputs over time. Intensive use
of forest for sustenance coupled with lack of insufficient investment and managerial input
are, thus, continuously leading to forest degradation. The KBK region has a total
geographical area of 47,646 sq km of which 16,857.8 sq km (35.34 %) is variously
recorded as forest area. The satellite imagery data (1997) suggested that nearly 5473 sq
km (around one third) out of a total forest area of 16857.8 sq km is dense forest with
crown cover more than 40 per cent that accounts for 11.49 per cent of the total
geographical area of the KBK region. However, forest regeneration in the KBK region
16
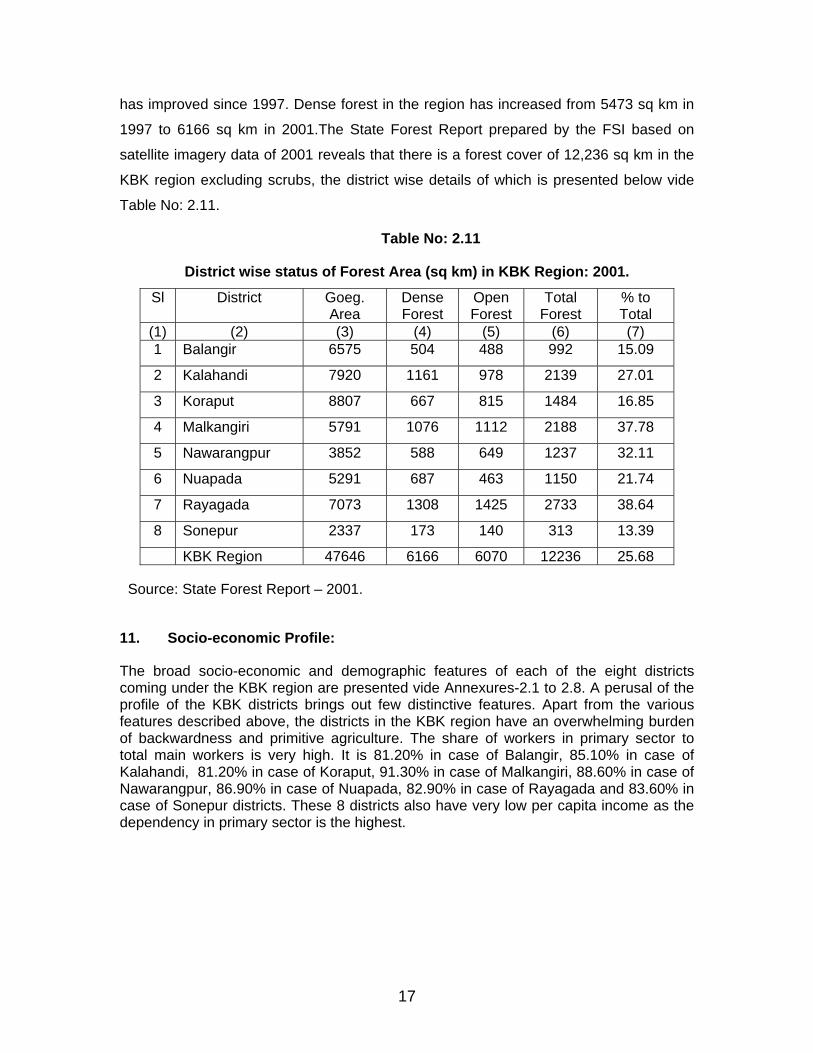
17
has improved since 1997. Dense forest in the region has increased from 5473 sq km in
1997 to 6166 sq km in 2001.The State Forest Report prepared by the FSI based on
satellite imagery data of 2001 reveals that there is a forest cover of 12,236 sq km in the
KBK region excluding scrubs, the district wise details of which is presented below vide
Table No: 2.11.
Table No: 2.11
District wise status of Forest Area (sq km) in KBK Region: 2001.
Sl District Goeg. Area
Dense Forest
Open Forest
Total Forest
% to Total
(1) (2) (3) (4) (5) (6) (7) 1 Balangir 6575 504 488 992 15.09
2 Kalahandi 7920 1161 978 2139 27.01
3 Koraput 8807 667 815 1484 16.85
4 Malkangiri 5791 1076 1112 2188 37.78
5 Nawarangpur 3852 588 649 1237 32.11
6 Nuapada 5291 687 463 1150 21.74
7 Rayagada 7073 1308 1425 2733 38.64
8 Sonepur 2337 173 140 313 13.39
KBK Region 47646 6166 6070 12236 25.68 Source: State Forest Report – 2001. 11. Socio-economic Profile:
The broad socio-economic and demographic features of each of the eight districts coming under the KBK region are presented vide Annexures-2.1 to 2.8. A perusal of the profile of the KBK districts brings out few distinctive features. Apart from the various features described above, the districts in the KBK region have an overwhelming burden of backwardness and primitive agriculture. The share of workers in primary sector to total main workers is very high. It is 81.20% in case of Balangir, 85.10% in case of Kalahandi, 81.20% in case of Koraput, 91.30% in case of Malkangiri, 88.60% in case of Nawarangpur, 86.90% in case of Nuapada, 82.90% in case of Rayagada and 83.60% in case of Sonepur districts. These 8 districts also have very low per capita income as the dependency in primary sector is the highest.
CHAPTER - III
STUDY OBJECTIVES AND METHODOLOGY
1. Reference Period:
The reference period for the quick evaluation study is from 1998 to the end of
2005-06.
2. Scope of the Study:
The objectives of the Revised Long Term Action Plan (RLTAP) formulated for the
KBK districts were (i) drought proofing, (ii) poverty alleviation and development
saturation and (iii) improved quality of life for the local people. The strategic interventions
were (i) creation of rural infrastructure, (ii) conservation of natural resources and (iii)
employment generation. Public participation in the process of implementation of the
RLTAP through formation of Self-Help Groups (SHGs), Vana Samrakshyana Samities
(VSSs), Pani Panchayats (PPs) and Bhumi Panchayats (BPs) were also considered vital
and important.
In fact, the RLTAP covers a large number of activities over almost all
development sectors like Watersheds, Horticulture, Agriculture, Animal Resources,
Fisheries, Forest Regeneration, Health and Family Welfare, Drinking Water Supply,
Rural Connectivity, Welfare of ST and SC, Textile and Handloom, Irrigation, Safety Net
for Old / Infirm, Women and Children, Anti-poverty Programmes, and Literacy etc. It is
neither possible nor desirable to cover one and all the components of the programme of
RLTAP within the scope of this study. It was, therefore, decided in consultation with the
Programme Evaluation Organisation (PEO) of the Planning Commission to selectively
confine the study to few major components. Keeping this in view, the components
receiving the major allocation of SCA till the end of 2005-06 were examined. The
analysis is presented below in Table No: 3.1.
18
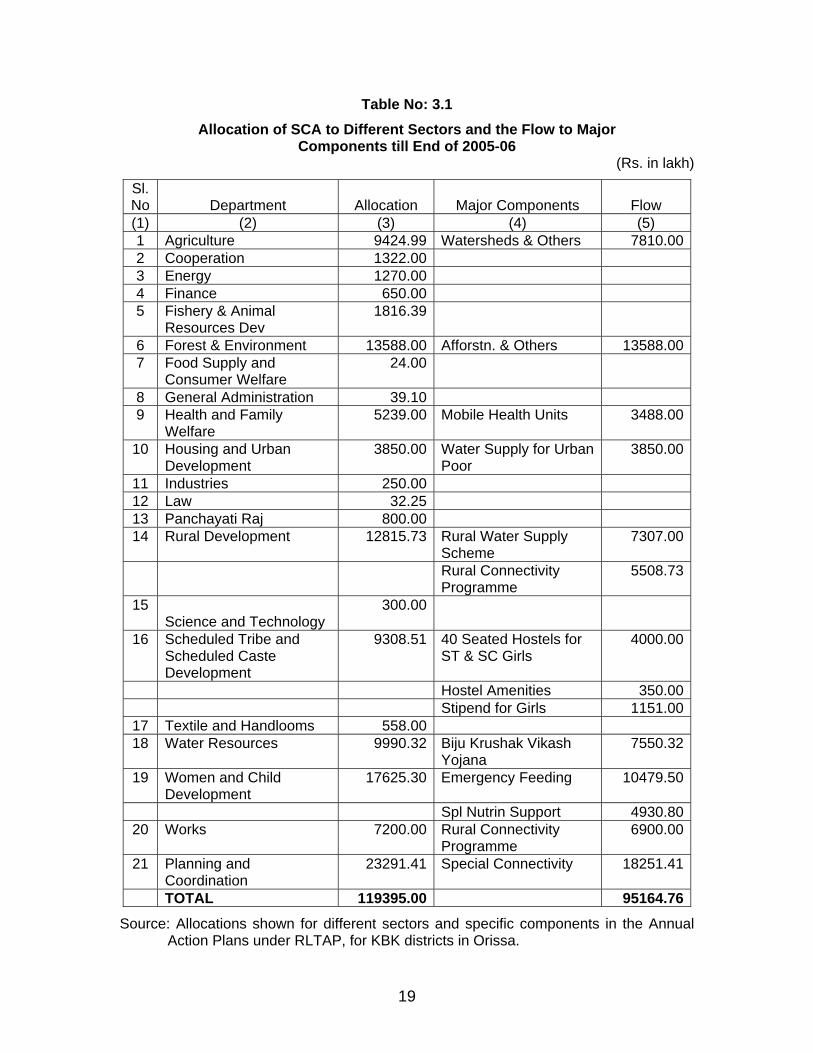
Table No: 3.1 Allocation of SCA to Different Sectors and the Flow to Major
Components till End of 2005-06 (Rs. in lakh)
Sl.No Department Allocation Major Components Flow (1) (2) (3) (4) (5) 1 Agriculture 9424.99 Watersheds & Others 7810.002 Cooperation 1322.00 3 Energy 1270.00 4 Finance 650.00 5
Fishery & Animal Resources Dev
1816.39
6 Forest & Environment 13588.00 Afforstn. & Others 13588.007
Food Supply and Consumer Welfare
24.00
8 General Administration 39.10 9
Health and Family Welfare
5239.00 Mobile Health Units
3488.00
10
Housing and Urban Development
3850.00 Water Supply for Urban Poor
3850.00
11 Industries 250.00 12 Law 32.25 13 Panchayati Raj 800.00 14
Rural Development
12815.73 Rural Water Supply Scheme
7307.00
Rural Connectivity Programme
5508.73
15 Science and Technology
300.00
16
Scheduled Tribe and Scheduled Caste Development
9308.51
40 Seated Hostels for ST & SC Girls
4000.00
Hostel Amenities 350.00 Stipend for Girls 1151.00
17 Textile and Handlooms 558.00 18
Water Resources
9990.32 Biju Krushak Vikash Yojana
7550.32
19
Women and Child Development
17625.30 Emergency Feeding
10479.50
Spl Nutrin Support 4930.8020
Works
7200.00 Rural Connectivity Programme
6900.00
21
Planning and Coordination
23291.41 Special Connectivity
18251.41
TOTAL 119395.00 95164.76
Source: Allocations shown for different sectors and specific components in the Annual Action Plans under RLTAP, for KBK districts in Orissa.
19
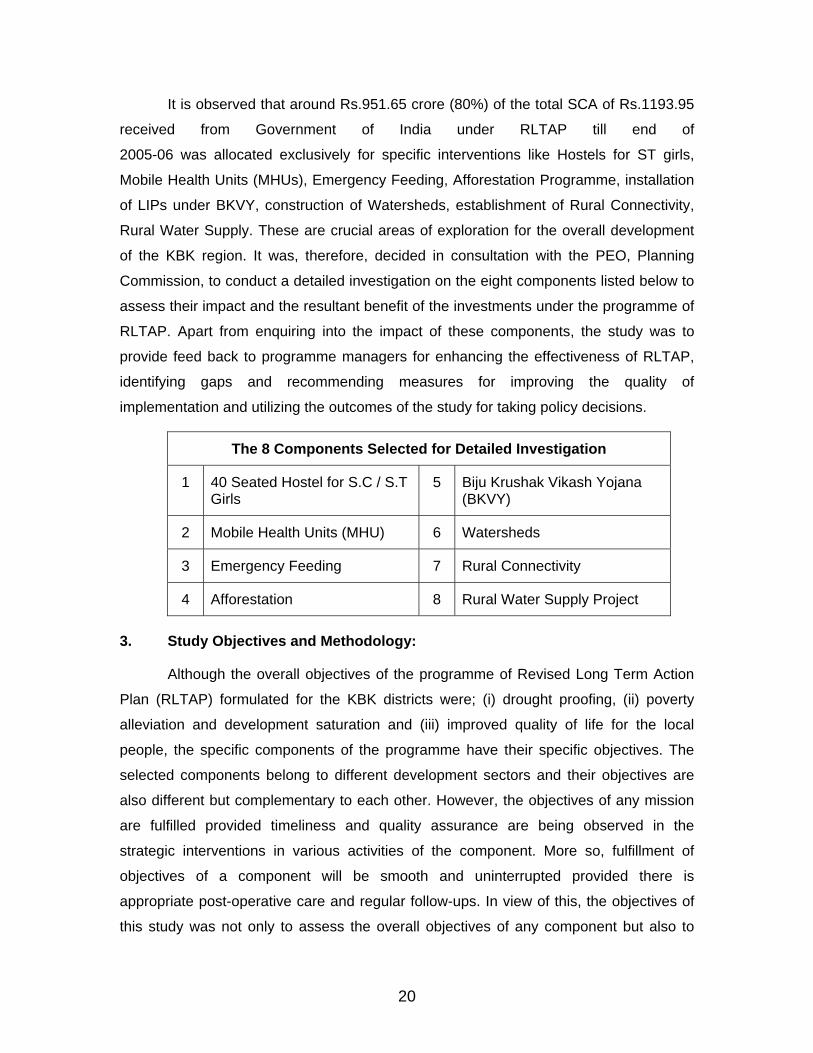
It is observed that around Rs.951.65 crore (80%) of the total SCA of Rs.1193.95
received from Government of India under RLTAP till end of
2005-06 was allocated exclusively for specific interventions like Hostels for ST girls,
Mobile Health Units (MHUs), Emergency Feeding, Afforestation Programme, installation
of LIPs under BKVY, construction of Watersheds, establishment of Rural Connectivity,
Rural Water Supply. These are crucial areas of exploration for the overall development
of the KBK region. It was, therefore, decided in consultation with the PEO, Planning
Commission, to conduct a detailed investigation on the eight components listed below to
assess their impact and the resultant benefit of the investments under the programme of
RLTAP. Apart from enquiring into the impact of these components, the study was to
provide feed back to programme managers for enhancing the effectiveness of RLTAP,
identifying gaps and recommending measures for improving the quality of
implementation and utilizing the outcomes of the study for taking policy decisions.
The 8 Components Selected for Detailed Investigation
1 40 Seated Hostel for S.C / S.T Girls
5 Biju Krushak Vikash Yojana (BKVY)
2 Mobile Health Units (MHU) 6 Watersheds
3 Emergency Feeding 7 Rural Connectivity
4 Afforestation 8 Rural Water Supply Project
3. Study Objectives and Methodology:
Although the overall objectives of the programme of Revised Long Term Action
Plan (RLTAP) formulated for the KBK districts were; (i) drought proofing, (ii) poverty
alleviation and development saturation and (iii) improved quality of life for the local
people, the specific components of the programme have their specific objectives. The
selected components belong to different development sectors and their objectives are
also different but complementary to each other. However, the objectives of any mission
are fulfilled provided timeliness and quality assurance are being observed in the
strategic interventions in various activities of the component. More so, fulfillment of
objectives of a component will be smooth and uninterrupted provided there is
appropriate post-operative care and regular follow-ups. In view of this, the objectives of
this study was not only to assess the overall objectives of any component but also to
20
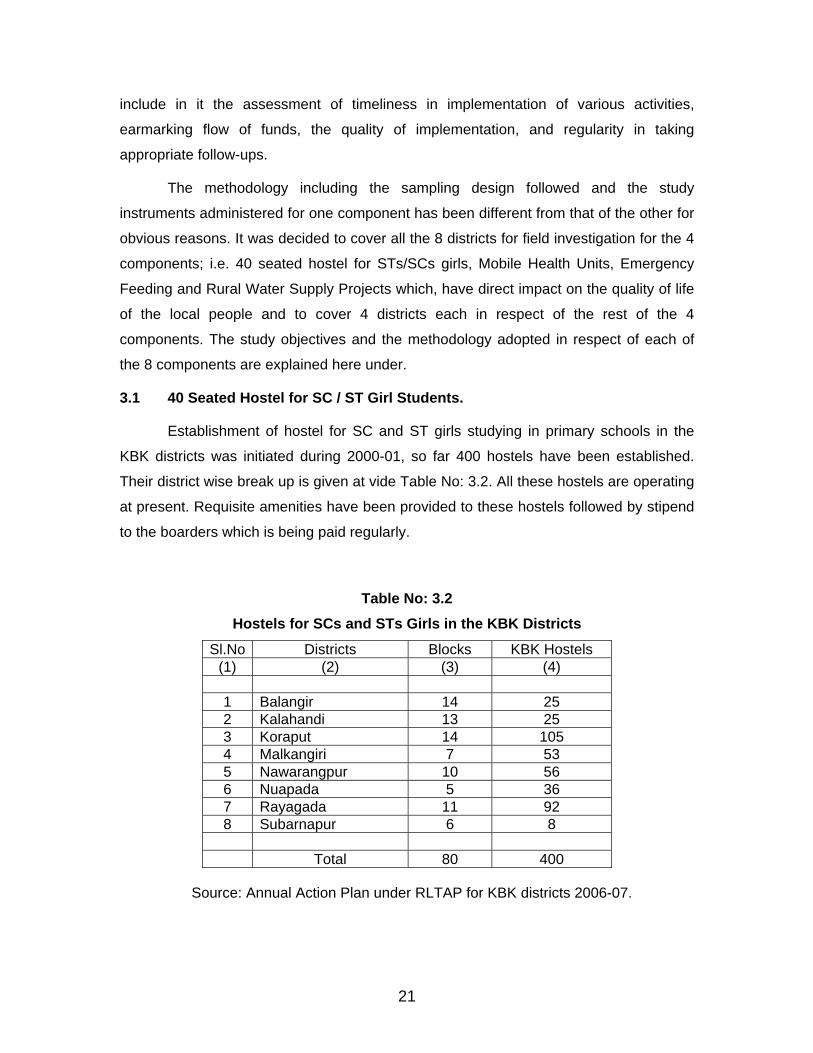
include in it the assessment of timeliness in implementation of various activities,
earmarking flow of funds, the quality of implementation, and regularity in taking
appropriate follow-ups.
The methodology including the sampling design followed and the study
instruments administered for one component has been different from that of the other for
obvious reasons. It was decided to cover all the 8 districts for field investigation for the 4
components; i.e. 40 seated hostel for STs/SCs girls, Mobile Health Units, Emergency
Feeding and Rural Water Supply Projects which, have direct impact on the quality of life
of the local people and to cover 4 districts each in respect of the rest of the 4
components. The study objectives and the methodology adopted in respect of each of
the 8 components are explained here under.
3.1 40 Seated Hostel for SC / ST Girl Students.
Establishment of hostel for SC and ST girls studying in primary schools in the
KBK districts was initiated during 2000-01, so far 400 hostels have been established.
Their district wise break up is given at vide Table No: 3.2. All these hostels are operating
at present. Requisite amenities have been provided to these hostels followed by stipend
to the boarders which is being paid regularly.
Table No: 3.2 Hostels for SCs and STs Girls in the KBK Districts
Sl.No Districts Blocks KBK Hostels (1) (2) (3) (4)
1 Balangir 14 25 2 Kalahandi 13 25 3 Koraput 14 105 4 Malkangiri 7 53 5 Nawarangpur 10 56 6 Nuapada 5 36 7 Rayagada 11 92 8 Subarnapur 6 8 Total 80 400
Source: Annual Action Plan under RLTAP for KBK districts 2006-07.
21
3.1.1 The Study Objectives:
Although the broad objective of establishing hostels for SC and ST girls studying
in Primary Schools is to bring female literacy close to the state average, the proposed
study envisages examining the following aspects.
a. Whether enrolment of SC and ST girls in primary schools in KBK districts
has increased.
b. Whether dropout among the SC and ST girls in the KBK districts has
reduced.
c. Whether there was observed reduction in the gender inequality in getting
education at primary school levels in KBK districts.
d. Adequate number of teachers in primary schools to carry on teaching
activities in I-V classes.
e. Stay of teachers and more specifically the Head Masters and Hostel
Superintendents in the vicinity of Schools.
f. Timely completion of construction of hostel buildings and their operation.
g. Deficiencies observed in the construction of hostel buildings and their
regular maintenance.
h. Security arrangements for the younger boarders residing in the hostel.
i. Maintenance of routine and discipline among the boarders in the hostel.
j. Timely payment of stipend and distribution of uniform to boarders and the
adequacy of various components of the stipend.
k. Inculcation of civic sense and educating social science among the boarders.
l. Perception of the boarders and the local people on the objectives of
establishing hostels for the SC and ST girls in the KBK districts.
m. Opinion of the District Welfare Officers on the effectiveness of the
establishment of hostels for the SC and ST girls studying in primary schools
in KBK districts and the possibilities for improvements.
n. Feasible recommendations on the policy initiatives needed for bringing in
improvements in the management of hostel programme.
22
o. Routine medical check up of inmates in hostels through MHUs.
3.1.2 The Study Design:
Establishment of hostels under the RLTAP has not been uniform over the region.
As such, the traditional procedure of selecting sample blocks, villages and households in
case of this component was not considered adequate. As there was wide difference in
the number of hostels in a district, adoption of a common sampling fraction in each
district was not considered suitable. Keeping in view the distribution of KBK hostels in
each district, it was decided to select 3 blocks from each district at the first instance and
then to select a minimum of 3 and a maximum of 9 hostels from the sample blocks, so
as to cover about 41 hostels in all (Balangir-3, Kalahandi-3, Koraput-9, Malkangiri-5,
Nawarangpur-5, Nuapada-4, Rayagada-9 and Subarnapur-3). Blocks having no KBK
hostel were dropped from the purview of sampling.
3.1.3 Study Instruments:
For collection of data on this component, a set of 4 schedules;
(a) Hostel Schedule, (b) Beneficiary Schedule, (c) Key Informant Schedule and (d)
Programme Manager Schedule were developed and administered in the field. A brief of
these study instruments is given below.
(a) Hostel Schedule: Information in the hostel schedule was collected from the
Headmaster of the school, Superintendent of the hostel and the
observation of the study team during their visit to the school and hostels
in question.
(b) Beneficiary Schedule: Information in the Beneficiary Schedule was collected
through three boarders (preferably from higher classes) each from the
sample hostels on their perceived objectives and benefits of the hostels
for them and the advantages and disadvantages being experienced by
them in the hostel.
(c) K I Schedule: Information in the Key Informant schedule was collected through two
knowledgeable persons of the locality in respect of each sample hostel on
their perceived objectives and benefits of the hostels for SC and ST girls
in the KBK districts.
23
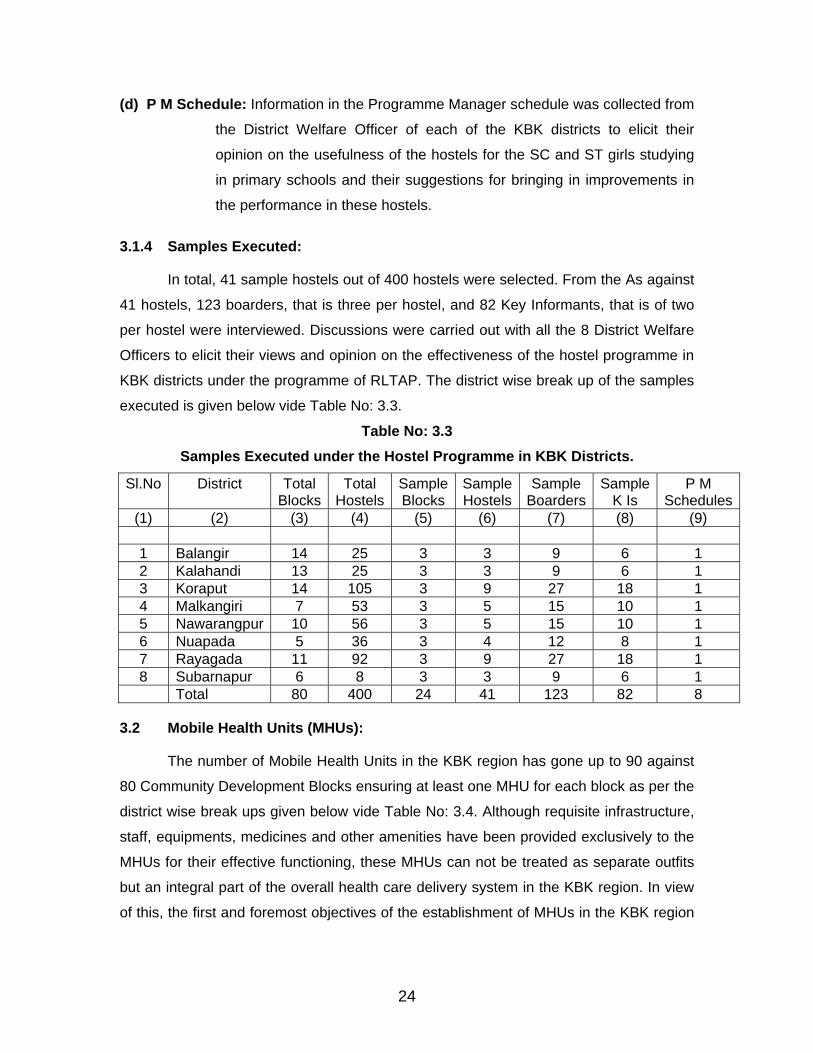
(d) P M Schedule: Information in the Programme Manager schedule was collected from
the District Welfare Officer of each of the KBK districts to elicit their
opinion on the usefulness of the hostels for the SC and ST girls studying
in primary schools and their suggestions for bringing in improvements in
the performance in these hostels.
3.1.4 Samples Executed:
In total, 41 sample hostels out of 400 hostels were selected. From the As against
41 hostels, 123 boarders, that is three per hostel, and 82 Key Informants, that is of two
per hostel were interviewed. Discussions were carried out with all the 8 District Welfare
Officers to elicit their views and opinion on the effectiveness of the hostel programme in
KBK districts under the programme of RLTAP. The district wise break up of the samples
executed is given below vide Table No: 3.3.
Table No: 3.3 Samples Executed under the Hostel Programme in KBK Districts.
Sl.No
District
Total Blocks
Total Hostels
SampleBlocks
SampleHostels
Sample Boarders
Sample K Is
P M Schedules
(1) (2) (3) (4) (5) (6) (7) (8) (9)
1 Balangir 14 25 3 3 9 6 1 2 Kalahandi 13 25 3 3 9 6 1 3 Koraput 14 105 3 9 27 18 1 4 Malkangiri 7 53 3 5 15 10 1 5 Nawarangpur 10 56 3 5 15 10 1 6 Nuapada 5 36 3 4 12 8 1 7 Rayagada 11 92 3 9 27 18 1 8 Subarnapur 6 8 3 3 9 6 1 Total 80 400 24 41 123 82 8
3.2 Mobile Health Units (MHUs):
The number of Mobile Health Units in the KBK region has gone up to 90 against
80 Community Development Blocks ensuring at least one MHU for each block as per the
district wise break ups given below vide Table No: 3.4. Although requisite infrastructure,
staff, equipments, medicines and other amenities have been provided exclusively to the
MHUs for their effective functioning, these MHUs can not be treated as separate outfits
but an integral part of the overall health care delivery system in the KBK region. In view
of this, the first and foremost objectives of the establishment of MHUs in the KBK region
24
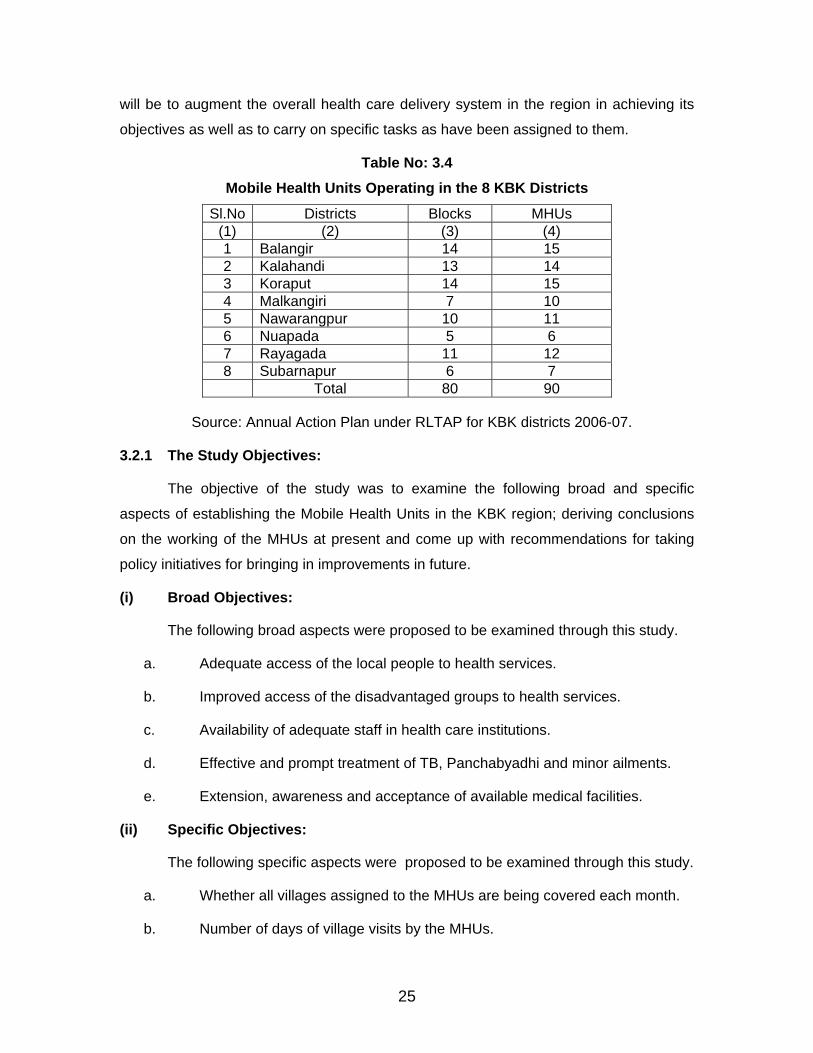
will be to augment the overall health care delivery system in the region in achieving its
objectives as well as to carry on specific tasks as have been assigned to them.
Table No: 3.4 Mobile Health Units Operating in the 8 KBK Districts
Sl.No Districts Blocks MHUs (1) (2) (3) (4) 1 Balangir 14 15 2 Kalahandi 13 14 3 Koraput 14 15 4 Malkangiri 7 10 5 Nawarangpur 10 11 6 Nuapada 5 6 7 Rayagada 11 12 8 Subarnapur 6 7 Total 80 90
Source: Annual Action Plan under RLTAP for KBK districts 2006-07.
3.2.1 The Study Objectives:
The objective of the study was to examine the following broad and specific
aspects of establishing the Mobile Health Units in the KBK region; deriving conclusions
on the working of the MHUs at present and come up with recommendations for taking
policy initiatives for bringing in improvements in future.
(i) Broad Objectives:
The following broad aspects were proposed to be examined through this study.
a. Adequate access of the local people to health services.
b. Improved access of the disadvantaged groups to health services.
c. Availability of adequate staff in health care institutions.
d. Effective and prompt treatment of TB, Panchabyadhi and minor ailments.
e. Extension, awareness and acceptance of available medical facilities.
(ii) Specific Objectives:
The following specific aspects were proposed to be examined through this study.
a. Whether all villages assigned to the MHUs are being covered each month.
b. Number of days of village visits by the MHUs.
25
c. Distance covered to get services from MHUs.
d. Adequacy of staff in the MHUs.
e. Whether the MHUs are well equipped and provided with requisite
medicines.
f. Organisation of community programmes by the MHUs.
g. The objectives and benefits of the MHUs as perceived by the users and the
knowledgeable persons of the locality.
h. Eliciting the views and opinion of the Chief District Medical Officers on the
present level of performance of the MHUs and their suggestions for bringing
in improvements in the programme.
3.2.2 The Study Design:
In each district, there is one MHU in each block except one or two where the
number of MHUs is more than one. As such, the spread of the MHUs is, more or less
uniform over the region. Keeping in view the distribution of MHUs in each district, it was
decided to select 17 sample MHUs (Balangir-3, Kalahandi-3, Koraput-3, Malkangiri-2,
Nawarangpur-2, Nuapada-1, Rayagada-2 and Subarnapur-1) one per sample block after
selecting requisite number of sample blocks from each district with simple random
sampling procedure.
3.2.3 Study Instruments:
For collection of data on the MHU component, a set of 4 schedules;
(a) MHU Schedule, (b) Household Schedule, (c) Key Informant Schedule and (d)
Programme Manager Schedule were developed and administered in the field. A brief of
these study instruments is given below.
(a) MHU Schedule: Information in the MHU schedule was collected from the Secretary
of the Zilla Swasthya Samiti and the Medical Officer in charge of the
sample MHU as well as the field observation made by the study team.
(b) House-hold Schedule: Information in the House-hold Schedule was collected from
5 house-holds each coming under the sample MHU of whom 3 were
beneficiaries and 2 non-beneficiaries of the sample MHU on their
26
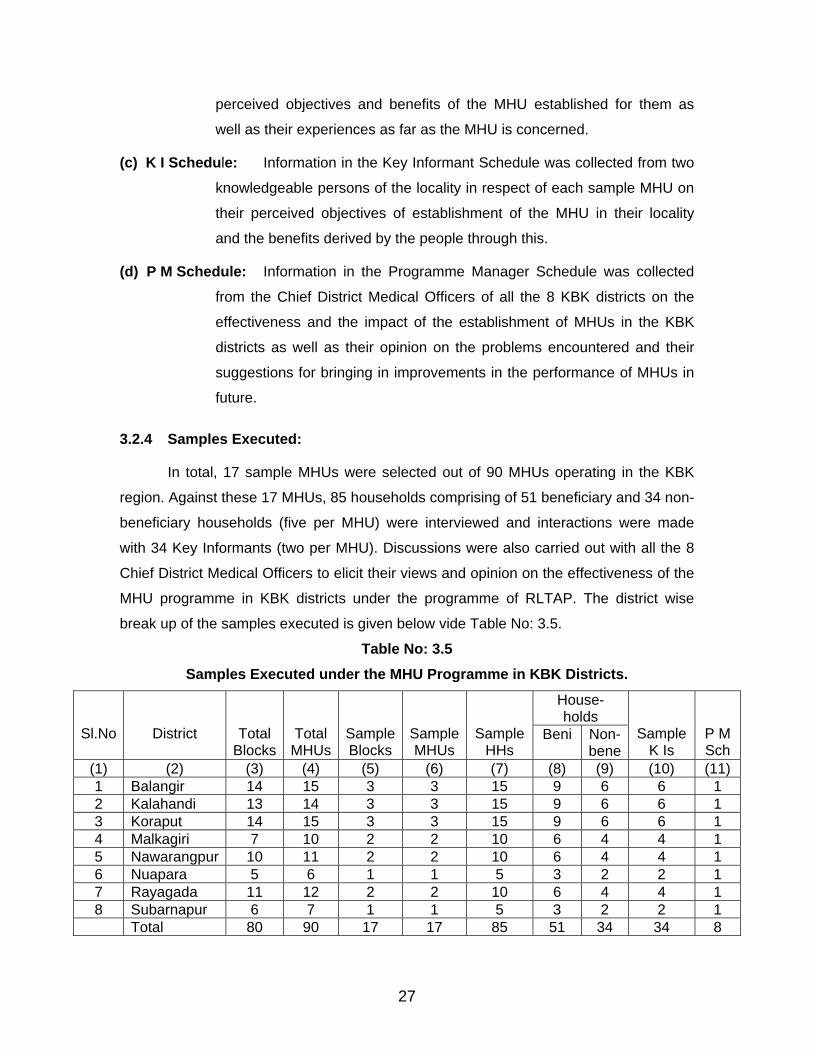
perceived objectives and benefits of the MHU established for them as
well as their experiences as far as the MHU is concerned.
(c) K I Schedule: Information in the Key Informant Schedule was collected from two
knowledgeable persons of the locality in respect of each sample MHU on
their perceived objectives of establishment of the MHU in their locality
and the benefits derived by the people through this.
(d) P M Schedule: Information in the Programme Manager Schedule was collected
from the Chief District Medical Officers of all the 8 KBK districts on the
effectiveness and the impact of the establishment of MHUs in the KBK
districts as well as their opinion on the problems encountered and their
suggestions for bringing in improvements in the performance of MHUs in
future.
3.2.4 Samples Executed:
In total, 17 sample MHUs were selected out of 90 MHUs operating in the KBK
region. Against these 17 MHUs, 85 households comprising of 51 beneficiary and 34 non-
beneficiary households (five per MHU) were interviewed and interactions were made
with 34 Key Informants (two per MHU). Discussions were also carried out with all the 8
Chief District Medical Officers to elicit their views and opinion on the effectiveness of the
MHU programme in KBK districts under the programme of RLTAP. The district wise
break up of the samples executed is given below vide Table No: 3.5.
Table No: 3.5 Samples Executed under the MHU Programme in KBK Districts.
House-holds
Sl.No
District
Total Blocks
Total MHUs
SampleBlocks
SampleMHUs
Sample HHs
Beni
Non- bene
Sample K Is
P M Sch
(1) (2) (3) (4) (5) (6) (7) (8) (9) (10) (11) 1 Balangir 14 15 3 3 15 9 6 6 1 2 Kalahandi 13 14 3 3 15 9 6 6 1 3 Koraput 14 15 3 3 15 9 6 6 1 4 Malkagiri 7 10 2 2 10 6 4 4 1 5 Nawarangpur 10 11 2 2 10 6 4 4 1 6 Nuapara 5 6 1 1 5 3 2 2 1 7 Rayagada 11 12 2 2 10 6 4 4 1 8 Subarnapur 6 7 1 1 5 3 2 2 1 Total 80 90 17 17 85 51 34 34 8
27
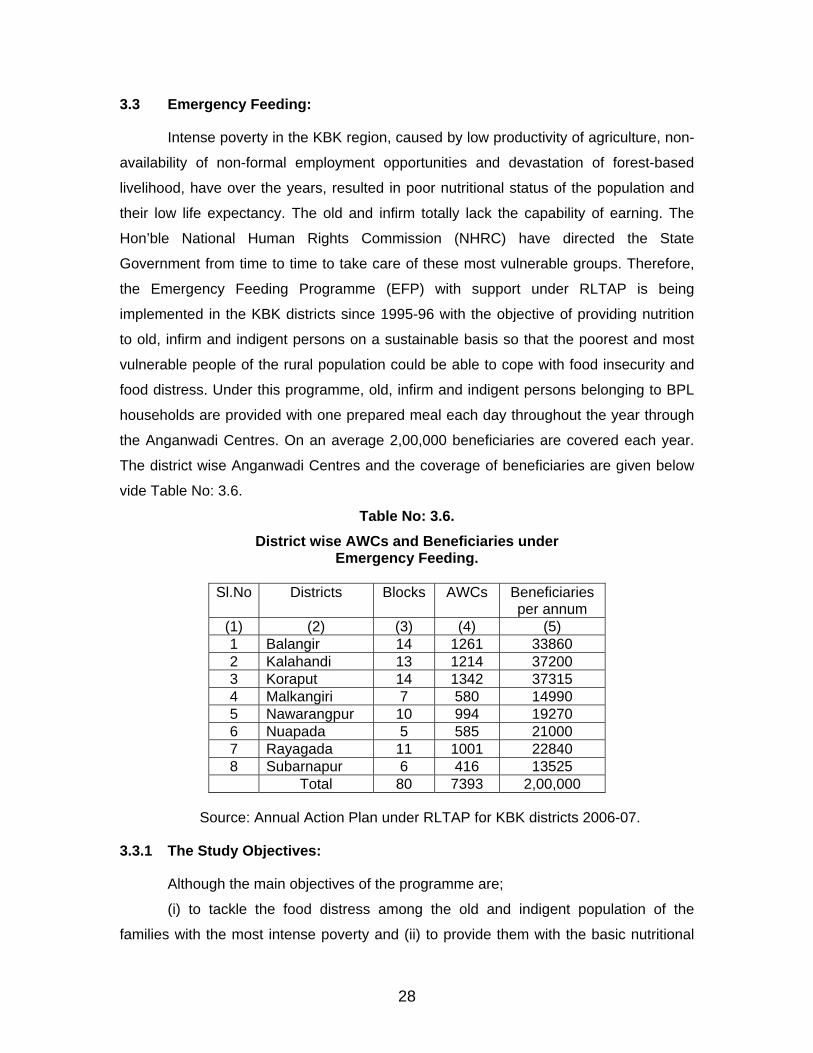
3.3 Emergency Feeding:
Intense poverty in the KBK region, caused by low productivity of agriculture, non-
availability of non-formal employment opportunities and devastation of forest-based
livelihood, have over the years, resulted in poor nutritional status of the population and
their low life expectancy. The old and infirm totally lack the capability of earning. The
Hon’ble National Human Rights Commission (NHRC) have directed the State
Government from time to time to take care of these most vulnerable groups. Therefore,
the Emergency Feeding Programme (EFP) with support under RLTAP is being
implemented in the KBK districts since 1995-96 with the objective of providing nutrition
to old, infirm and indigent persons on a sustainable basis so that the poorest and most
vulnerable people of the rural population could be able to cope with food insecurity and
food distress. Under this programme, old, infirm and indigent persons belonging to BPL
households are provided with one prepared meal each day throughout the year through
the Anganwadi Centres. On an average 2,00,000 beneficiaries are covered each year.
The district wise Anganwadi Centres and the coverage of beneficiaries are given below
vide Table No: 3.6.
Table No: 3.6. District wise AWCs and Beneficiaries under
Emergency Feeding.
Sl.No Districts Blocks AWCs Beneficiaries per annum
(1) (2) (3) (4) (5) 1 Balangir 14 1261 33860 2 Kalahandi 13 1214 37200 3 Koraput 14 1342 37315 4 Malkangiri 7 580 14990 5 Nawarangpur 10 994 19270 6 Nuapada 5 585 21000 7 Rayagada 11 1001 22840 8 Subarnapur 6 416 13525 Total 80 7393 2,00,000
Source: Annual Action Plan under RLTAP for KBK districts 2006-07.
3.3.1 The Study Objectives:
Although the main objectives of the programme are;
(i) to tackle the food distress among the old and indigent population of the
families with the most intense poverty and (ii) to provide them with the basic nutritional
28
needs on a sustainable basis to improve their health and nutritional status and in the
process to improve the average life expectancy in the region, the study specific
objectives are;
i. Whether the programme benefit has reached the target groups.
ii. Timeliness and the quality of food served and the quality of food
materials.
Iii. Administrative arrangements and timeliness in provision of funds and
supply of materials.
iv. Cooperation of the AWC with the beneficiaries and their grievances if any.
v. Impact of the programme on the old, infirm and indigent persons
belonging to BPL category who are barely in need of nutritional support.
vi. Problems encountered in implementation of the programme and the
suggestions for improvement in the programme in future.
vii. Opinion of the beneficiaries on the programme and its social effect on
their families.
viii. The objectives and impact of the programme as perceived by
knowledgeable persons of the locality, their opinion on the programme
and their suggestions for improvements.
ix. Views and opinion of the Programme Managers on the management of
Emergency Feeding Programme in the districts and the impeding
problems with a view to improving the programme.
x. To provide feed back to the administration on the implementation of the
programme in the field and to prescribing a set of feasible
recommendations to take policy initiatives for future improvements in the
programme.
3.3.2 The Study Design:
There are in all 7393 Anganwadi Centres (AWCs) in KBK districts through which
the Emergency Feeding programme is being undertaken. On an average, around 2,
00,000 beneficiaries are covered under the programme each year. The coverage of
beneficiaries under the programmes is more or less even over the KBK districts. Taking
the beneficiaries in the districts as weight, 5 AWCs from districts having more than 22
thousand beneficiaries and 3 AWCs from districts having less than 22 thousand
beneficiaries have been selected. Final selection of AWCs was confined to 3 blocks
29
selected from each district through simple random sampling procedure and thereafter
the sample AWCs were selected from the sample blocks. In the process 32 AWCs were
selected, the district wise break up of which has been indicated vide Table No: 3.7.
3.3.3 Study Instruments:
Information was collected through a set of 4 schedules. The schedules are: (a)
Emergency Feeding Schedule to elicit information on the benefits of the programme, (b)
Beneficiary Schedule to elicit information from the beneficiaries, (c) Key Informant
Schedule to elicit their opinion on the benefits of the programme and (d) Programme
Manager Schedule.
a) Em. Feeding Schedule: Information was collected from Anganwadi Workers in-
charge of selected AWC on the operational details of emergency feeding
programme through the selected AWCs.
(b) Beneficiary Schedule: Against each selected AWCs, 5 beneficiaries (at least 2
women and one infirm if available) were interviewed to get their opinion
on the operation of the progamme of Emergency feeding for them.
(c) K I Schedule: Two knowledgeable persons in respect of each sample AWC were
interviewed to elicit their perception on the objectives of the programme
and the benefits of the programme as well as their suggestions for further
improvements.
(d) P M Schedule: Information was collected from all the 8 District Social Welfare
Officers (DSWO) or Additional District Social Welfare Officers (ADSWO)
on the effective implementation of the Emergency Feeding Programme
within the district, the impeding problems and their suggestions for future
improvements in the programme.
3.3.4 Samples Executed:
In total, 32 sample AWCs were selected of which, 159 beneficiaries comprising
of 71 males, 72 females and 16 infirm were interviewed. Interaction with 61 Key
Informants and the views of the 8 District Social Welfare Officers, on the effectiveness of
the Emergency Feeding programme in their districts along with their suggestions were
30
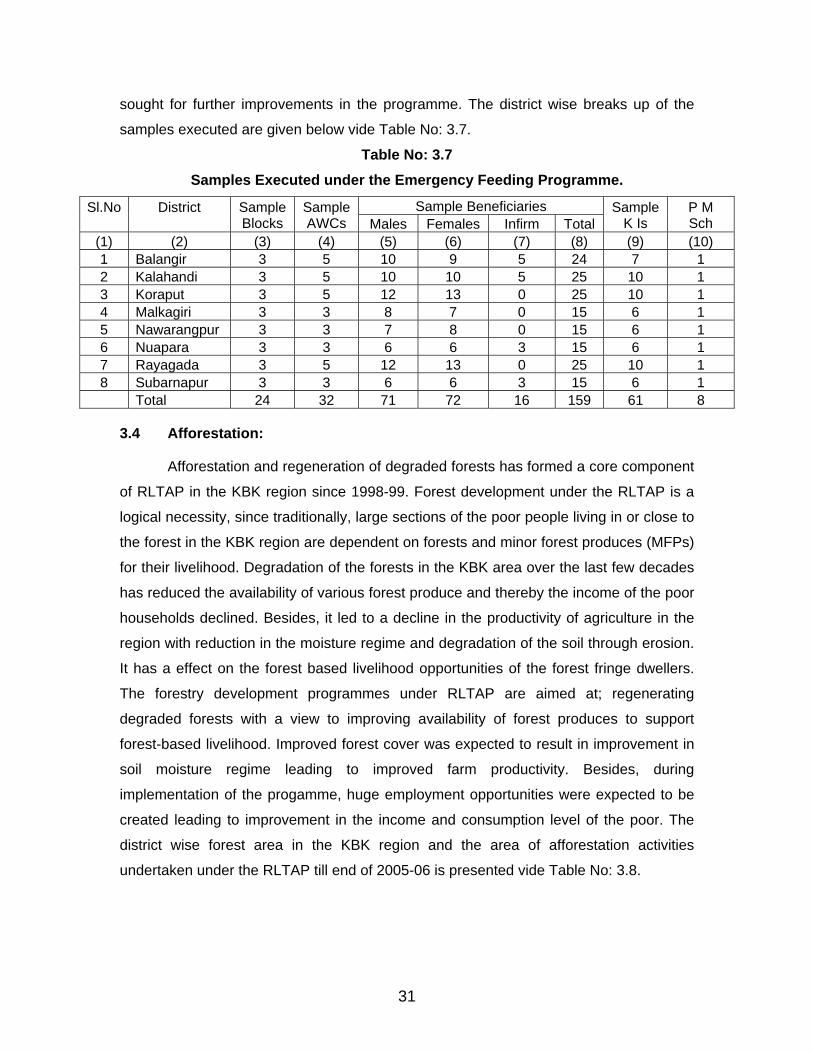
sought for further improvements in the programme. The district wise breaks up of the
samples executed are given below vide Table No: 3.7.
Table No: 3.7 Samples Executed under the Emergency Feeding Programme.
Sample Beneficiaries Sl.No
District
Sample Blocks
SampleAWCs Males Females Infirm Total
SampleK Is
P M Sch
(1) (2) (3) (4) (5) (6) (7) (8) (9) (10) 1 Balangir 3 5 10 9 5 24 7 1 2 Kalahandi 3 5 10 10 5 25 10 1 3 Koraput 3 5 12 13 0 25 10 1 4 Malkagiri 3 3 8 7 0 15 6 1 5 Nawarangpur 3 3 7 8 0 15 6 1 6 Nuapara 3 3 6 6 3 15 6 1 7 Rayagada 3 5 12 13 0 25 10 1 8 Subarnapur 3 3 6 6 3 15 6 1 Total 24 32 71 72 16 159 61 8
3.4 Afforestation:
Afforestation and regeneration of degraded forests has formed a core component
of RLTAP in the KBK region since 1998-99. Forest development under the RLTAP is a
logical necessity, since traditionally, large sections of the poor people living in or close to
the forest in the KBK region are dependent on forests and minor forest produces (MFPs)
for their livelihood. Degradation of the forests in the KBK area over the last few decades
has reduced the availability of various forest produce and thereby the income of the poor
households declined. Besides, it led to a decline in the productivity of agriculture in the
region with reduction in the moisture regime and degradation of the soil through erosion.
It has a effect on the forest based livelihood opportunities of the forest fringe dwellers.
The forestry development programmes under RLTAP are aimed at; regenerating
degraded forests with a view to improving availability of forest produces to support
forest-based livelihood. Improved forest cover was expected to result in improvement in
soil moisture regime leading to improved farm productivity. Besides, during
implementation of the progamme, huge employment opportunities were expected to be
created leading to improvement in the income and consumption level of the poor. The
district wise forest area in the KBK region and the area of afforestation activities
undertaken under the RLTAP till end of 2005-06 is presented vide Table No: 3.8.
31
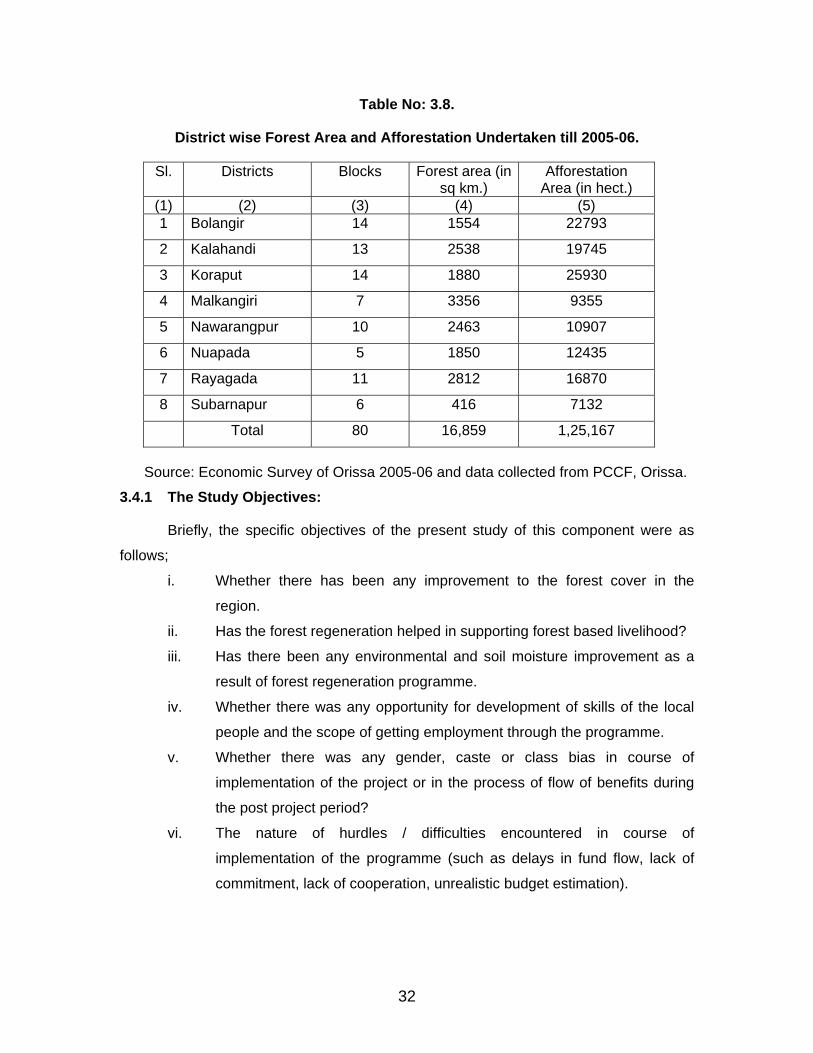
Table No: 3.8.
District wise Forest Area and Afforestation Undertaken till 2005-06.
Sl. Districts Blocks Forest area (in sq km.)
Afforestation Area (in hect.)
(1) (2) (3) (4) (5) 1 Bolangir 14 1554 22793
2 Kalahandi 13 2538 19745
3 Koraput 14 1880 25930
4 Malkangiri 7 3356 9355
5 Nawarangpur 10 2463 10907
6 Nuapada 5 1850 12435
7 Rayagada 11 2812 16870
8 Subarnapur 6 416 7132
Total 80 16,859 1,25,167
Source: Economic Survey of Orissa 2005-06 and data collected from PCCF, Orissa.
3.4.1 The Study Objectives:
Briefly, the specific objectives of the present study of this component were as
follows;
i. Whether there has been any improvement to the forest cover in the
region.
ii. Has the forest regeneration helped in supporting forest based livelihood?
iii. Has there been any environmental and soil moisture improvement as a
result of forest regeneration programme.
iv. Whether there was any opportunity for development of skills of the local
people and the scope of getting employment through the programme.
v. Whether there was any gender, caste or class bias in course of
implementation of the project or in the process of flow of benefits during
the post project period?
vi. The nature of hurdles / difficulties encountered in course of
implementation of the programme (such as delays in fund flow, lack of
commitment, lack of cooperation, unrealistic budget estimation).
32
vii. Overall impact of the programme, like generation of employment
opportunities, increase in forest cover and availability of Non-Timber
Forest Produce (NTFP).
viii. The quality of assets created, involvement of the local people in the
programme and cooperation of the implementing agency.
ix. Quality of post project operation and maintenance of afforestation sites in
the hands of Vana Samrakhyan Samiti (VSS).
x. Views and opinion of stake holders and the programme managers on the
impeding problems and their suggestions for further improvement in the
programme.
xi. Providing feed back to the administration and giving a set of
recommendations for taking policy initiatives.
3.4.2 The Study Design:
The afforestation activity under RLTAP has been undertaken in all the KBK
districts although the coverage is greater in certain districts and less in others. It was,
therefore, been decided to cover only 4 districts with descending order of area covered
afforestation. From the 4 sample districts, 16 afforestation sites were selected in
proportion to the area under afforestation in the sample district. At the first instance, 3
blocks each having undertaken afforestation activities were selected from the sample
districts through simple random sampling procedure and then the requisite number of
afforestation sites were selected. For the purpose of selection of samples sites, the list of
afforestation sites were collected from the concerned DFOs of sample districts. The 16
sample afforestation sites including 4 sites from the district of Balangir, 4 from
Kalahandi, 5 from Koraput and 3 from Rayagada.
3.4.3 Study Instruments:
Information was collected through a set of 4 schedules. The schedules are: (a)
Afforestation Schedule to elicit information on the benefits of the programme of
Afforestation, (b) Household Schedule to elicit information from the beneficiaries, (c)
VSS Schedule to elicit their opinion on the benefits of the programme from the VSS and
knowledgeable persons and (d) Programme Manager Schedule.
(a) Afforestation Schedule: It was designed to elicit information on the effectiveness
of the programme in respect of coverage, species planted, employment
33
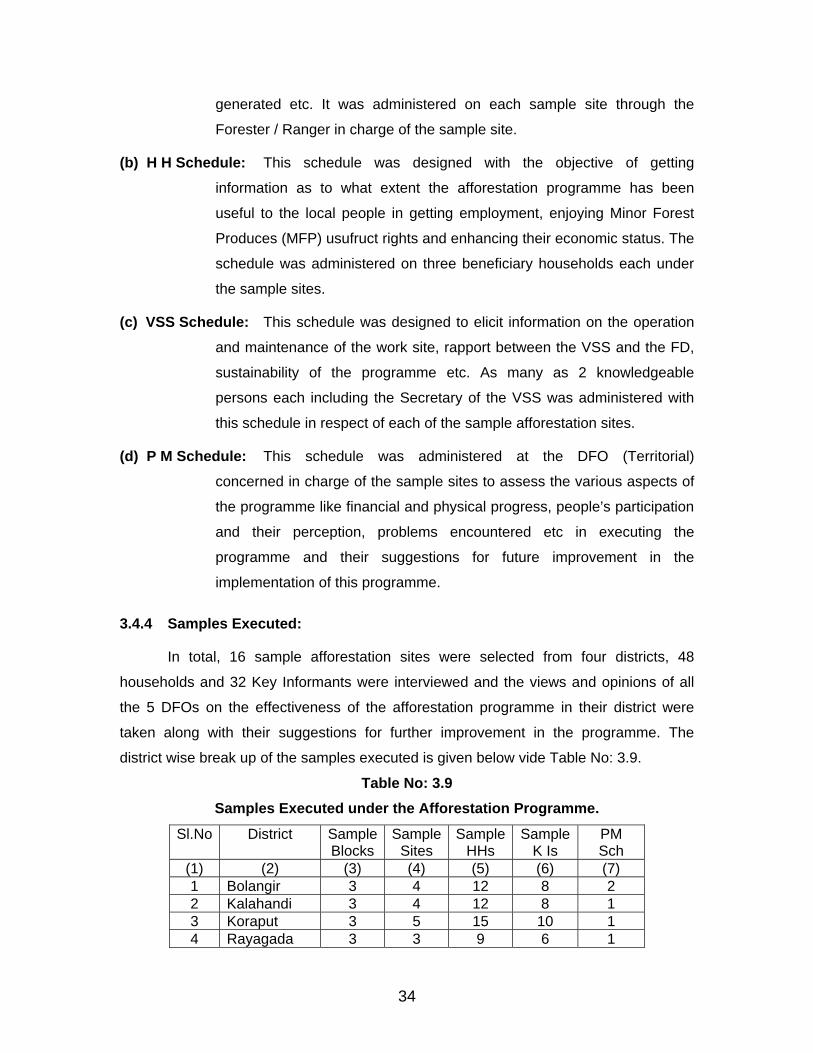
generated etc. It was administered on each sample site through the
Forester / Ranger in charge of the sample site.
(b) H H Schedule: This schedule was designed with the objective of getting
information as to what extent the afforestation programme has been
useful to the local people in getting employment, enjoying Minor Forest
Produces (MFP) usufruct rights and enhancing their economic status. The
schedule was administered on three beneficiary households each under
the sample sites.
(c) VSS Schedule: This schedule was designed to elicit information on the operation
and maintenance of the work site, rapport between the VSS and the FD,
sustainability of the programme etc. As many as 2 knowledgeable
persons each including the Secretary of the VSS was administered with
this schedule in respect of each of the sample afforestation sites.
(d) P M Schedule: This schedule was administered at the DFO (Territorial)
concerned in charge of the sample sites to assess the various aspects of
the programme like financial and physical progress, people’s participation
and their perception, problems encountered etc in executing the
programme and their suggestions for future improvement in the
implementation of this programme.
3.4.4 Samples Executed:
In total, 16 sample afforestation sites were selected from four districts, 48
households and 32 Key Informants were interviewed and the views and opinions of all
the 5 DFOs on the effectiveness of the afforestation programme in their district were
taken along with their suggestions for further improvement in the programme. The
district wise break up of the samples executed is given below vide Table No: 3.9.
Table No: 3.9 Samples Executed under the Afforestation Programme.
Sl.No
District
SampleBlocks
SampleSites
SampleHHs
Sample K Is
PM Sch
(1) (2) (3) (4) (5) (6) (7) 1 Bolangir 3 4 12 8 2 2 Kalahandi 3 4 12 8 1 3 Koraput 3 5 15 10 1 4 Rayagada 3 3 9 6 1
34
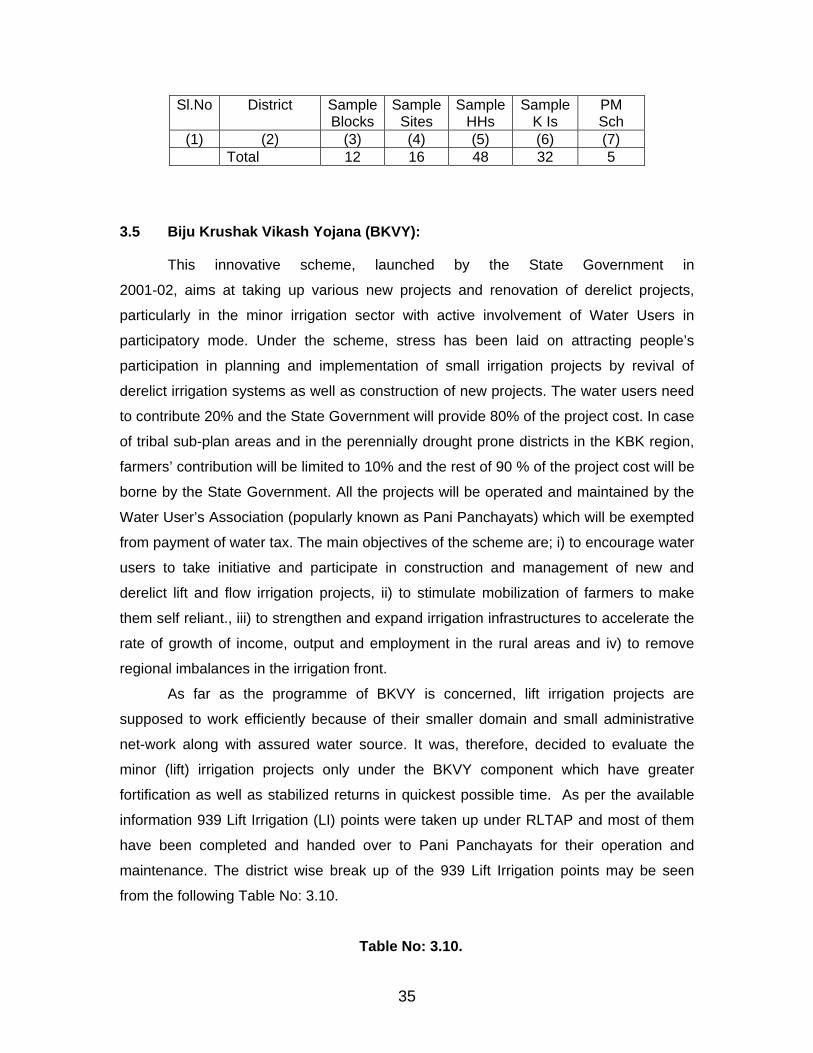
Sl.No
District
SampleBlocks
SampleSites
SampleHHs
Sample K Is
PM Sch
(1) (2) (3) (4) (5) (6) (7) Total 12 16 48 32 5
3.5 Biju Krushak Vikash Yojana (BKVY):
This innovative scheme, launched by the State Government in
2001-02, aims at taking up various new projects and renovation of derelict projects,
particularly in the minor irrigation sector with active involvement of Water Users in
participatory mode. Under the scheme, stress has been laid on attracting people’s
participation in planning and implementation of small irrigation projects by revival of
derelict irrigation systems as well as construction of new projects. The water users need
to contribute 20% and the State Government will provide 80% of the project cost. In case
of tribal sub-plan areas and in the perennially drought prone districts in the KBK region,
farmers’ contribution will be limited to 10% and the rest of 90 % of the project cost will be
borne by the State Government. All the projects will be operated and maintained by the
Water User’s Association (popularly known as Pani Panchayats) which will be exempted
from payment of water tax. The main objectives of the scheme are; i) to encourage water
users to take initiative and participate in construction and management of new and
derelict lift and flow irrigation projects, ii) to stimulate mobilization of farmers to make
them self reliant., iii) to strengthen and expand irrigation infrastructures to accelerate the
rate of growth of income, output and employment in the rural areas and iv) to remove
regional imbalances in the irrigation front.
As far as the programme of BKVY is concerned, lift irrigation projects are
supposed to work efficiently because of their smaller domain and small administrative
net-work along with assured water source. It was, therefore, decided to evaluate the
minor (lift) irrigation projects only under the BKVY component which have greater
fortification as well as stabilized returns in quickest possible time. As per the available
information 939 Lift Irrigation (LI) points were taken up under RLTAP and most of them
have been completed and handed over to Pani Panchayats for their operation and
maintenance. The district wise break up of the 939 Lift Irrigation points may be seen
from the following Table No: 3.10.
Table No: 3.10.
35
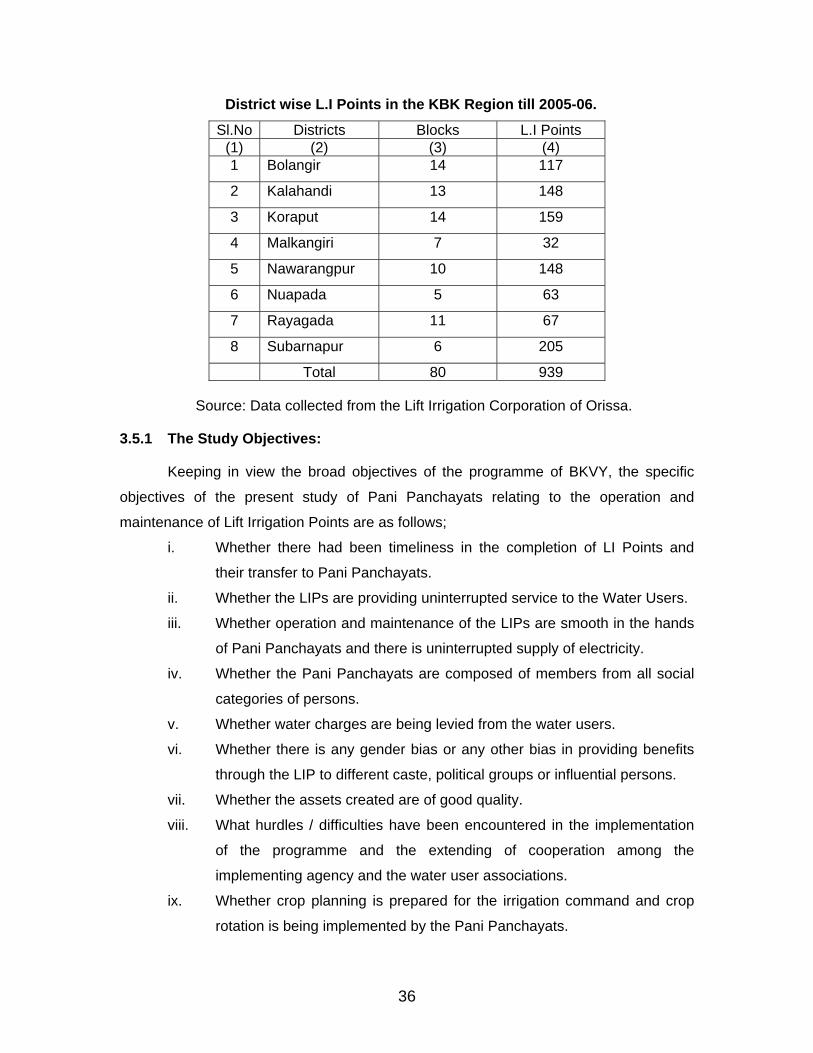
District wise L.I Points in the KBK Region till 2005-06.
Sl.No Districts Blocks L.I Points (1) (2) (3) (4) 1 Bolangir 14 117
2 Kalahandi 13 148
3 Koraput 14 159
4 Malkangiri 7 32
5 Nawarangpur 10 148
6 Nuapada 5 63
7 Rayagada 11 67
8 Subarnapur 6 205
Total 80 939
Source: Data collected from the Lift Irrigation Corporation of Orissa.
3.5.1 The Study Objectives:
Keeping in view the broad objectives of the programme of BKVY, the specific
objectives of the present study of Pani Panchayats relating to the operation and
maintenance of Lift Irrigation Points are as follows;
i. Whether there had been timeliness in the completion of LI Points and
their transfer to Pani Panchayats.
ii. Whether the LIPs are providing uninterrupted service to the Water Users.
iii. Whether operation and maintenance of the LIPs are smooth in the hands
of Pani Panchayats and there is uninterrupted supply of electricity.
iv. Whether the Pani Panchayats are composed of members from all social
categories of persons.
v. Whether water charges are being levied from the water users.
vi. Whether there is any gender bias or any other bias in providing benefits
through the LIP to different caste, political groups or influential persons.
vii. Whether the assets created are of good quality.
viii. What hurdles / difficulties have been encountered in the implementation
of the programme and the extending of cooperation among the
implementing agency and the water user associations.
ix. Whether crop planning is prepared for the irrigation command and crop
rotation is being implemented by the Pani Panchayats.
36
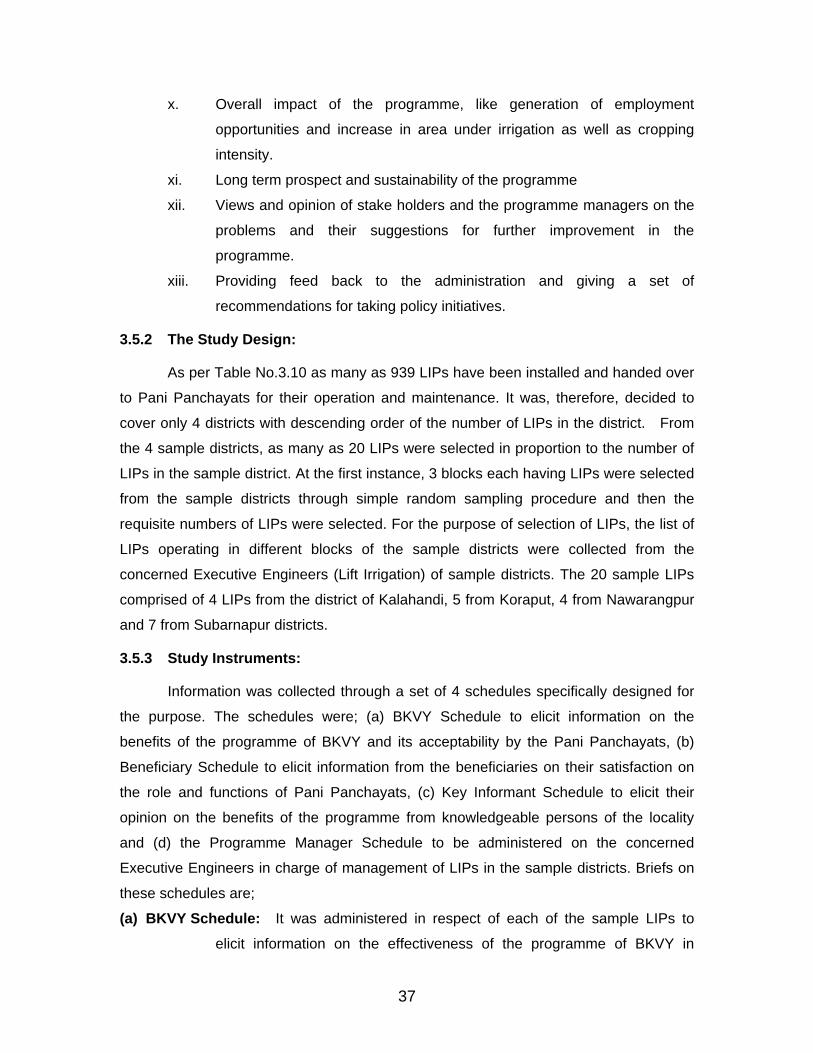
x. Overall impact of the programme, like generation of employment
opportunities and increase in area under irrigation as well as cropping
intensity.
xi. Long term prospect and sustainability of the programme
xii. Views and opinion of stake holders and the programme managers on the
problems and their suggestions for further improvement in the
programme.
xiii. Providing feed back to the administration and giving a set of
recommendations for taking policy initiatives.
3.5.2 The Study Design:
As per Table No.3.10 as many as 939 LIPs have been installed and handed over
to Pani Panchayats for their operation and maintenance. It was, therefore, decided to
cover only 4 districts with descending order of the number of LIPs in the district. From
the 4 sample districts, as many as 20 LIPs were selected in proportion to the number of
LIPs in the sample district. At the first instance, 3 blocks each having LIPs were selected
from the sample districts through simple random sampling procedure and then the
requisite numbers of LIPs were selected. For the purpose of selection of LIPs, the list of
LIPs operating in different blocks of the sample districts were collected from the
concerned Executive Engineers (Lift Irrigation) of sample districts. The 20 sample LIPs
comprised of 4 LIPs from the district of Kalahandi, 5 from Koraput, 4 from Nawarangpur
and 7 from Subarnapur districts.
3.5.3 Study Instruments:
Information was collected through a set of 4 schedules specifically designed for
the purpose. The schedules were; (a) BKVY Schedule to elicit information on the
benefits of the programme of BKVY and its acceptability by the Pani Panchayats, (b)
Beneficiary Schedule to elicit information from the beneficiaries on their satisfaction on
the role and functions of Pani Panchayats, (c) Key Informant Schedule to elicit their
opinion on the benefits of the programme from knowledgeable persons of the locality
and (d) the Programme Manager Schedule to be administered on the concerned
Executive Engineers in charge of management of LIPs in the sample districts. Briefs on
these schedules are;
(a) BKVY Schedule: It was administered in respect of each of the sample LIPs to
elicit information on the effectiveness of the programme of BKVY in
37
respect of timely installation of the LIP, area irrigated, employment
generated etc. Relevant information will be collected from the JE / AE of
the Orissa Lift Irrigation Corporation (OLIC) concerned.
(b) Beneficiary Schedule: Three households each under the sample LIPs having their
land within the command area of the LIP were selected and administered
with this schedule with the objective of getting information as to what
extent the LIP has useful to them in getting employment, enhancing the
area under irrigation, introducing changes in the cropping pattern and
enhancing their economic status.
(c) K I Schedule: Two knowledgeable persons each in respect of each sample LIP
including the Secretary of the Pani Panchayat were administered with this
schedule to elicit information on the operation and maintenance of the
LIPs, interpersonal relationship between the Pani Panchayat (PP) and the
OLIC, sustainability of the programme etc.
(d) P M Schedule: This schedule was administered to the Executive Engineer, OLIC
concerned to get an overall impression of the effectiveness of Pani
Panchayats in the district as well as the operational impediments and the
future prospect of the system of Pani Panchayats.
3.5.4 Samples Executed:
In total, 20 sample LIPs were selected from four districts of which, 60
beneficiaries and 40 Key Informants were interviewed and the views and opinions of all
the 4 Executive Engineers (Lift Irrigation) on the effectiveness of the Pani Panchayats in
their respective districts were taken along with their suggestion for further improvement
in the programme. The district wise break up of the samples executed is given below
vide Table No: 3.11.
Table No: 3.11 Samples Executed under the BKVY Programme.
38
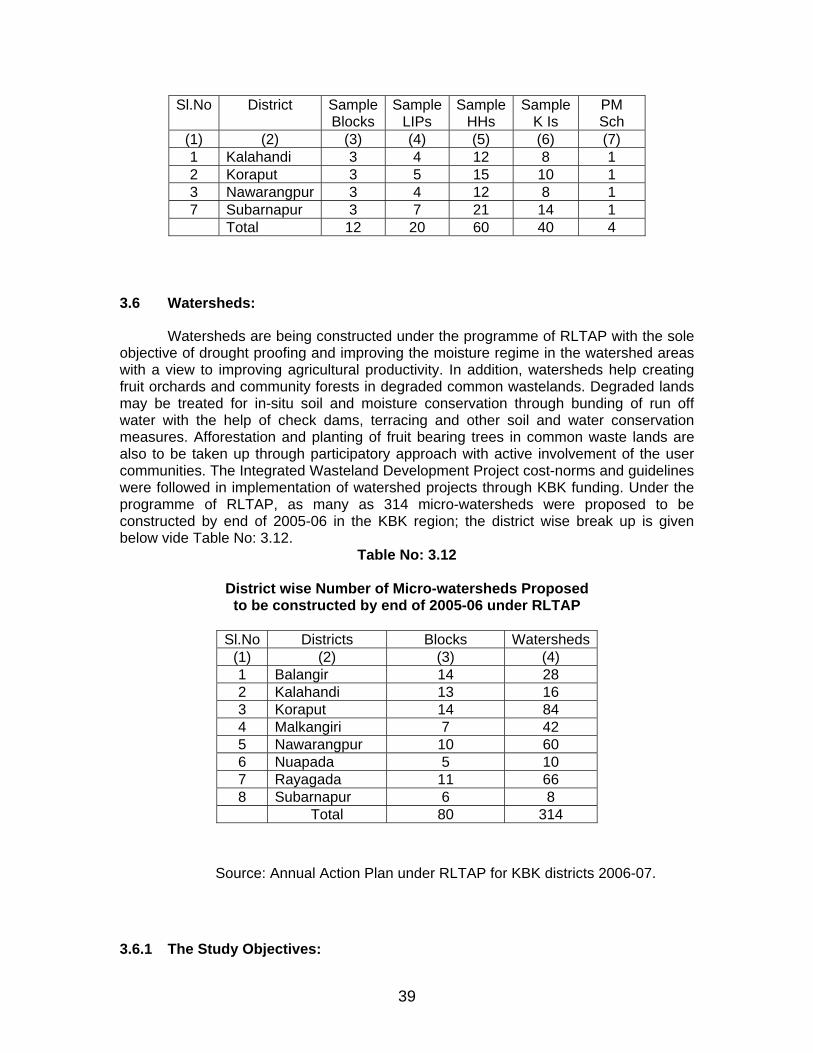
Sl.No
District
SampleBlocks
SampleLIPs
SampleHHs
Sample K Is
PM Sch
(1) (2) (3) (4) (5) (6) (7) 1 Kalahandi 3 4 12 8 1 2 Koraput 3 5 15 10 1 3 Nawarangpur 3 4 12 8 1 7 Subarnapur 3 7 21 14 1 Total 12 20 60 40 4
3.6 Watersheds:
Watersheds are being constructed under the programme of RLTAP with the sole objective of drought proofing and improving the moisture regime in the watershed areas with a view to improving agricultural productivity. In addition, watersheds help creating fruit orchards and community forests in degraded common wastelands. Degraded lands may be treated for in-situ soil and moisture conservation through bunding of run off water with the help of check dams, terracing and other soil and water conservation measures. Afforestation and planting of fruit bearing trees in common waste lands are also to be taken up through participatory approach with active involvement of the user communities. The Integrated Wasteland Development Project cost-norms and guidelines were followed in implementation of watershed projects through KBK funding. Under the programme of RLTAP, as many as 314 micro-watersheds were proposed to be constructed by end of 2005-06 in the KBK region; the district wise break up is given below vide Table No: 3.12.
Table No: 3.12
District wise Number of Micro-watersheds Proposed to be constructed by end of 2005-06 under RLTAP
Sl.No Districts Blocks Watersheds
(1) (2) (3) (4) 1 Balangir 14 28 2 Kalahandi 13 16 3 Koraput 14 84 4 Malkangiri 7 42 5 Nawarangpur 10 60 6 Nuapada 5 10 7 Rayagada 11 66 8 Subarnapur 6 8 Total 80 314
Source: Annual Action Plan under RLTAP for KBK districts 2006-07.
3.6.1 The Study Objectives:
39
Keeping in view, the overall objectives of the watershed programme, the
objectives of the present study of this component are;
i. Whether watersheds in the sample have actually been constructed.
ii. Whether moisture content in the watershed area has increased and there
has been increase in green cover, area under agriculture, fruit orchards,
common forest, fishery etc and whether the users have benefited.
iii. Whether local people have been associated in the process of construction
of watersheds and enjoyed the opportunities of getting employment.
iv. Whether there was any gender, caste or class bias in course of
implementation of the projects or in the process of flow of benefits during
the post project period.
v. What hurdles / difficulties have been encountered in the implementation
of the programme; such as delays in fund flow, lack of commitments, lack
of cooperation etc.
vi. Overall impact of the programme, like generation of employment
opportunities and creation of avenues for taking up new activities which
will help generation of employment as also help increasing income.
vii. In matters of asset creation, whether the assets created are of good
quality.
viii. Opinion of knowledgeable persons of the locality on the problems in
implementation, cooperation of the implementing agency and their
suggestions for improvement in implementation, operation and
management of watersheds.
ix. Opinion and views of programme managers in the districts in overall
charge of the watersheds on their experiences on the problems and
prospects of watersheds in the districts, their sustainability and their
suggestions for efficient management of watersheds.
x. Providing feed back to the administration on the present management
scenario of the watersheds under the programme of RLTAP and giving a
set of feasible recommendations for taking policy initiatives for effecting
further improvements in the watershed programme.
40
3.6.2 The Study Design:
As may be seen from the Table No.3.12, as many as 314 watersheds are
proposed to be constructed in the KBK region and the distribution of watersheds are not
uniform over the districts. It was decided to conduct detailed investigation in 4 districts
with higher number of watersheds in descending order. At the first instance, 3 blocks
were selected from the sample districts. The sample numbers of watersheds were
selected from the sample blocks suitably through simple random sampling procedure in
proportion to the watersheds in the sample districts by obtaining the list of watersheds in
each block from the District Rural Development Agencies, which are in charge of
implementation of watershed projects in the district. Accordingly, it was decided to
conduct detailed investigation of total 16 sample watersheds; 5 watersheds from Koraput
district, 4 from Malkangiri, 4 from Nawarangpur and 3 from Rayagada districts.
3.6.3 Study Instruments:
Field investigation was done with the help of a set of four schedules developed
for the purpose; (a) Watershed Schedule administered in respect of each of the 16
sample watersheds, (b) Household Schedule administered on households which are
supposed to get benefit through the watersheds, (c) Key Informant Schedule
administered on Knowledgeable Persons of the locality and (d) the Programme Manager
Schedule administered to the Project Director, DRDA of the districts, who is in charge of
overall management of the watersheds in the district to elicit information.
(a) Watershed Schedule: This schedule was designed to elicit information on the
effectiveness of the watershed programme in respect of people’s
participation, timely completion of projects, employment generated etc.
The relevant information was collected from the J E / A E of the DRDA or
other Executing Agency in respect of each sample Watershed.
(b) H H Schedule: This schedule was designed to collect the information on the
objectives and benefits as perceived by beneficiary households like
usefulness of the watershed, generation of employment, enhancement of
their capabilities to take up new ventures and enhancing their economic
status. The schedule was administered on three stake holder households
under each sample watershed.
41
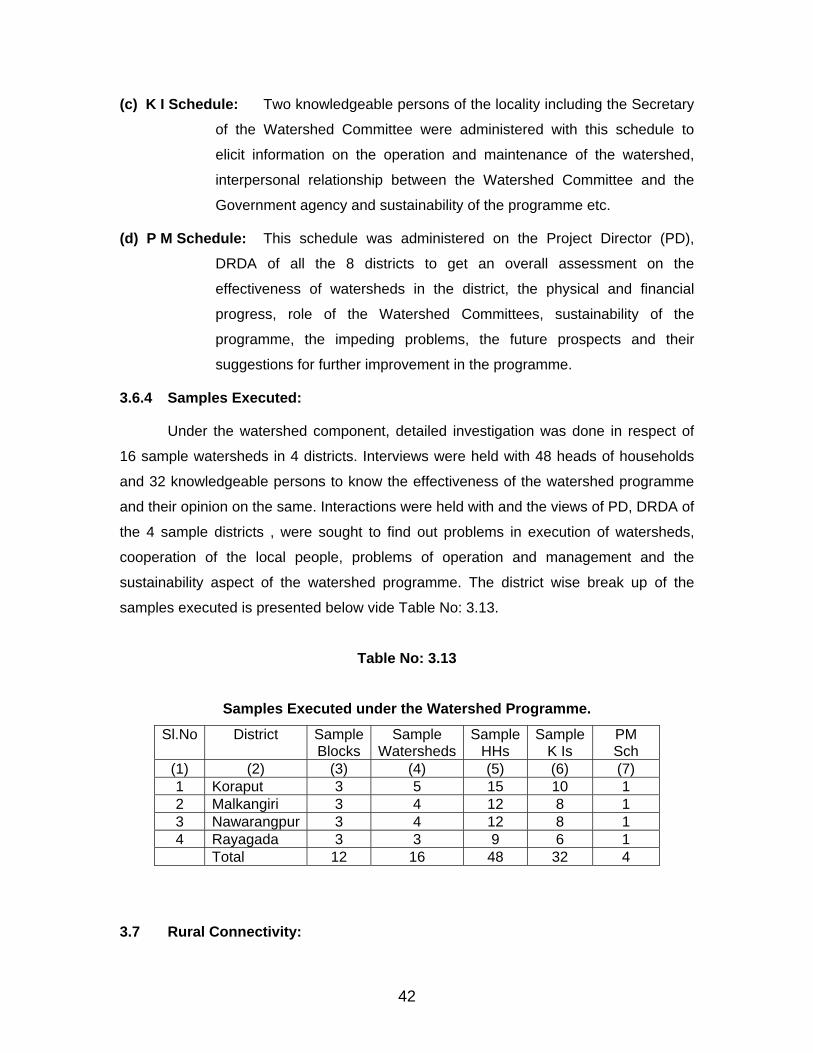
(c) K I Schedule: Two knowledgeable persons of the locality including the Secretary
of the Watershed Committee were administered with this schedule to
elicit information on the operation and maintenance of the watershed,
interpersonal relationship between the Watershed Committee and the
Government agency and sustainability of the programme etc.
(d) P M Schedule: This schedule was administered on the Project Director (PD),
DRDA of all the 8 districts to get an overall assessment on the
effectiveness of watersheds in the district, the physical and financial
progress, role of the Watershed Committees, sustainability of the
programme, the impeding problems, the future prospects and their
suggestions for further improvement in the programme.
3.6.4 Samples Executed:
Under the watershed component, detailed investigation was done in respect of
16 sample watersheds in 4 districts. Interviews were held with 48 heads of households
and 32 knowledgeable persons to know the effectiveness of the watershed programme
and their opinion on the same. Interactions were held with and the views of PD, DRDA of
the 4 sample districts , were sought to find out problems in execution of watersheds,
cooperation of the local people, problems of operation and management and the
sustainability aspect of the watershed programme. The district wise break up of the
samples executed is presented below vide Table No: 3.13.
Table No: 3.13
Samples Executed under the Watershed Programme.
Sl.No
District
SampleBlocks
Sample Watersheds
SampleHHs
Sample K Is
PM Sch
(1) (2) (3) (4) (5) (6) (7) 1 Koraput 3 5 15 10 1 2 Malkangiri 3 4 12 8 1 3 Nawarangpur 3 4 12 8 1 4 Rayagada 3 3 9 6 1 Total 12 16 48 32 4
3.7 Rural Connectivity:
42
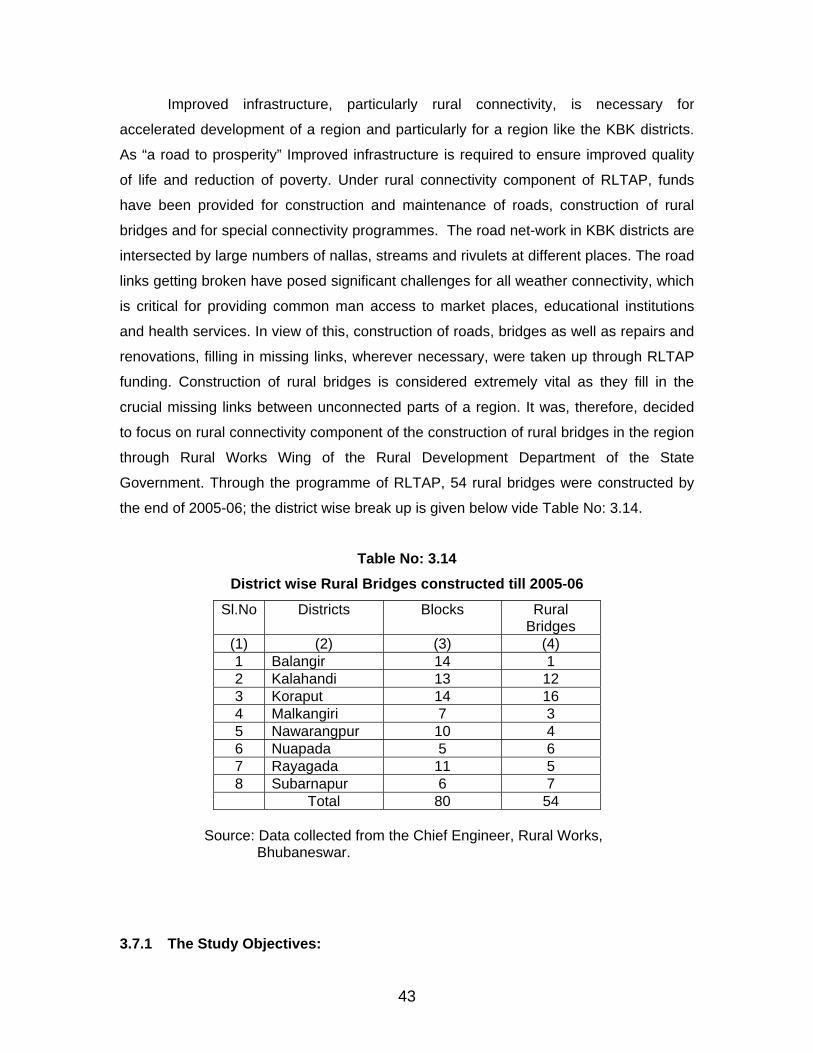
Improved infrastructure, particularly rural connectivity, is necessary for
accelerated development of a region and particularly for a region like the KBK districts.
As “a road to prosperity” Improved infrastructure is required to ensure improved quality
of life and reduction of poverty. Under rural connectivity component of RLTAP, funds
have been provided for construction and maintenance of roads, construction of rural
bridges and for special connectivity programmes. The road net-work in KBK districts are
intersected by large numbers of nallas, streams and rivulets at different places. The road
links getting broken have posed significant challenges for all weather connectivity, which
is critical for providing common man access to market places, educational institutions
and health services. In view of this, construction of roads, bridges as well as repairs and
renovations, filling in missing links, wherever necessary, were taken up through RLTAP
funding. Construction of rural bridges is considered extremely vital as they fill in the
crucial missing links between unconnected parts of a region. It was, therefore, decided
to focus on rural connectivity component of the construction of rural bridges in the region
through Rural Works Wing of the Rural Development Department of the State
Government. Through the programme of RLTAP, 54 rural bridges were constructed by
the end of 2005-06; the district wise break up is given below vide Table No: 3.14.
Table No: 3.14
District wise Rural Bridges constructed till 2005-06
Sl.No Districts Blocks Rural Bridges
(1) (2) (3) (4) 1 Balangir 14 1 2 Kalahandi 13 12 3 Koraput 14 16 4 Malkangiri 7 3 5 Nawarangpur 10 4 6 Nuapada 5 6 7 Rayagada 11 5 8 Subarnapur 6 7 Total 80 54
Source: Data collected from the Chief Engineer, Rural Works, Bhubaneswar.
3.7.1 The Study Objectives:
43
Keeping in view the overall objectives of the programme of rural connectivity, the
objective of the present study of this component are;
i. Whether the sample bridge project was implemented and completed as
per specifications and dedicated for public use in time.
ii. Whether the material used and the work done was of good quality.
iii. Whether the local people were involved in the process of construction of
the bridge and got employment.
iv. Whether there has been better access for local people to growth centres
like the market places, schools, hospitals and other places of interest
through the bridge.
v. What hurdles / difficulties have been encountered in the process of
implementation of the programme; such as delays in fund flow, lack of
commitments, lack of cooperation, local problem etc and the possible
ways adopted to resolve the same.
vi. Perception of the public on the implementation of the bridge projects and
their satisfaction on the level of benefits received.
vii. Have the local people been able to expand their economic activities as a
result of construction of the rural bridges.
viii. Opinion and views of the local people on the construction of rural bridges
and their usefulness.
ix. Opinion and views of the Executive Engineer (R W) on the problems
encountered at different stages of operation of rural bridges and their
suggestions to take precautionary measures in future.
x. Providing feed back to the administration and giving a set of feasible
recommendation for taking policy initiatives to bring in improvement in the
programme in future.
3.7.2 The Study Design: As may be seen from Table No.3.14, 54 rural bridges had been constructed in
the KBK region and the number of bridges constructed is not uniform over the districts. It
was decided to conduct detailed investigation in 4 districts with higher number of rural
bridges constructed. At the first instance, 3 blocks were selected from the sample
44
districts leaving out the blocks having no rural bridges. The sample number of bridges
was selected from requisite number of sample blocks suitably through simple random
sampling procedure in proportion to the number of bridges constructed in the sample
districts by obtaining the list of bridges constructed in the blocks from the office of the
Executive Engineer (Rural Works) who is in charge of implementation of rural bridge
projects in the district. Keeping in view the work load, it was decided to conduct detailed
investigation of total 8 sample rural bridges i.e., 2 bridges from Kalahandi district, 3 from
Koraput, 1 from Nuapada and 2 from Subarnapur district.
3.7.3 Study Instruments: Field investigation was done with the help of a set of four schedules developed
for the purpose; (a) the Rural Connectivity Schedule administered in respect of each of
the 8 sample bridges, (b) Gram Panchayat Schedule administered on Sarpanches of 4
Gram Panchayats (GPs) along the road side, (c) Focus Group Discussion (FGD)
Schedule administered on Persons of the locality in two sample GPs by way of
organizing focus group discussions and (d) the Programme Manager Schedule
administered on the Executive Engineer, who was in charge of construction of rural
bridges in the sample districts to elicit information keeping in view the objectives of the
present study of this component.
(a) R C Schedule: This schedule was designed to elicit information on the
effectiveness of the sample bridge projects in respect of timely
construction, people’s participation, employment generation etc. The
relevant information was collected from the J E / A E of Rural Works
Division of the district.
(b) G P Schedule: Interviews were held with 4 Sarpanches of all the villages along the
road side of each of the sample bridge project. The objective of this
schedule was to obtain their views and opinions on the usefulness of the
related bridges in getting employment, removing their problem of
communication and in expanding their socio-economic activities.
(c) F G D Schedule: Focus group discussions were organised in two of the sample G
Ps under each of the sample bridge projects to elicit information on the
utility of the bridge project in establishing connectivity with schools,
market places, hospitals, growth centres etc outside the village boundary
and involvement of the local people in implementation.
45
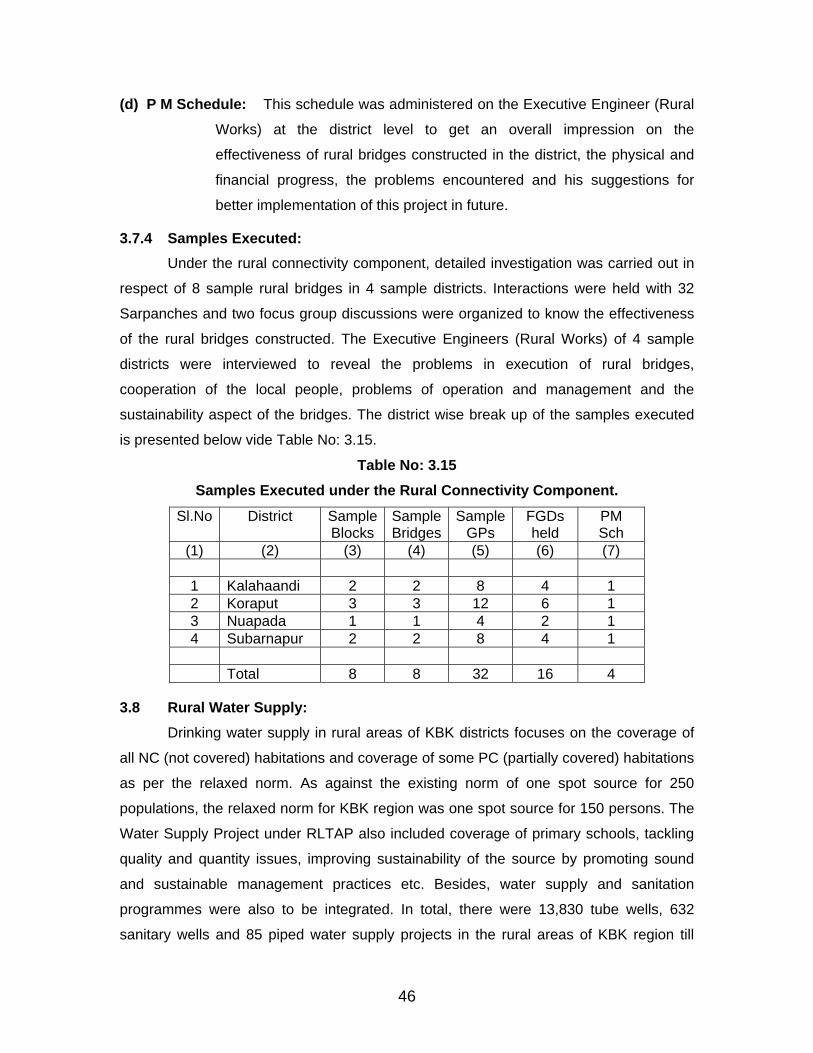
(d) P M Schedule: This schedule was administered on the Executive Engineer (Rural
Works) at the district level to get an overall impression on the
effectiveness of rural bridges constructed in the district, the physical and
financial progress, the problems encountered and his suggestions for
better implementation of this project in future.
3.7.4 Samples Executed: Under the rural connectivity component, detailed investigation was carried out in
respect of 8 sample rural bridges in 4 sample districts. Interactions were held with 32
Sarpanches and two focus group discussions were organized to know the effectiveness
of the rural bridges constructed. The Executive Engineers (Rural Works) of 4 sample
districts were interviewed to reveal the problems in execution of rural bridges,
cooperation of the local people, problems of operation and management and the
sustainability aspect of the bridges. The district wise break up of the samples executed
is presented below vide Table No: 3.15.
Table No: 3.15 Samples Executed under the Rural Connectivity Component.
Sl.No
District
SampleBlocks
SampleBridges
SampleGPs
FGDs held
PM Sch
(1) (2) (3) (4) (5) (6) (7)
1 Kalahaandi 2 2 8 4 1 2 Koraput 3 3 12 6 1 3 Nuapada 1 1 4 2 1 4 Subarnapur 2 2 8 4 1 Total 8 8 32 16 4
3.8 Rural Water Supply: Drinking water supply in rural areas of KBK districts focuses on the coverage of
all NC (not covered) habitations and coverage of some PC (partially covered) habitations
as per the relaxed norm. As against the existing norm of one spot source for 250
populations, the relaxed norm for KBK region was one spot source for 150 persons. The
Water Supply Project under RLTAP also included coverage of primary schools, tackling
quality and quantity issues, improving sustainability of the source by promoting sound
and sustainable management practices etc. Besides, water supply and sanitation
programmes were also to be integrated. In total, there were 13,830 tube wells, 632
sanitary wells and 85 piped water supply projects in the rural areas of KBK region till
46
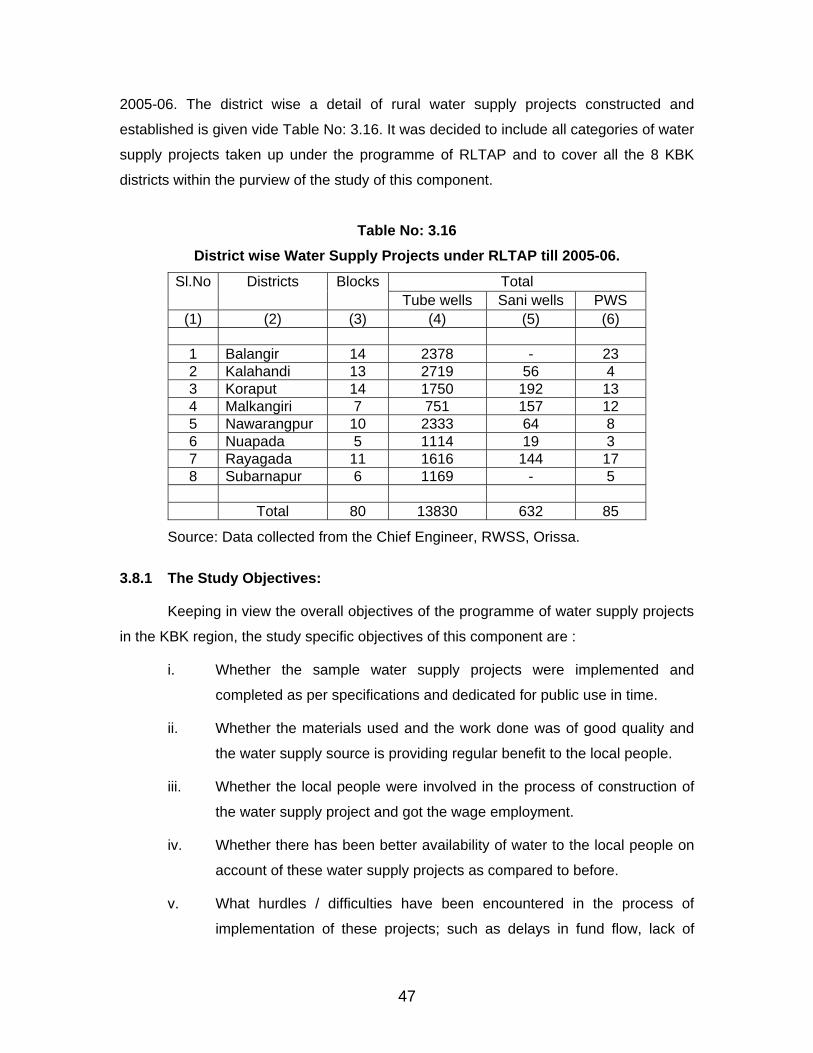
2005-06. The district wise a detail of rural water supply projects constructed and
established is given vide Table No: 3.16. It was decided to include all categories of water
supply projects taken up under the programme of RLTAP and to cover all the 8 KBK
districts within the purview of the study of this component.
Table No: 3.16 District wise Water Supply Projects under RLTAP till 2005-06.
Total Sl.No Districts Blocks Tube wells Sani wells PWS
(1) (2) (3) (4) (5) (6)
1 Balangir 14 2378 - 23 2 Kalahandi 13 2719 56 4 3 Koraput 14 1750 192 13 4 Malkangiri 7 751 157 12 5 Nawarangpur 10 2333 64 8 6 Nuapada 5 1114 19 3 7 Rayagada 11 1616 144 17 8 Subarnapur 6 1169 - 5 Total 80 13830 632 85
Source: Data collected from the Chief Engineer, RWSS, Orissa.
3.8.1 The Study Objectives:
Keeping in view the overall objectives of the programme of water supply projects
in the KBK region, the study specific objectives of this component are :
i. Whether the sample water supply projects were implemented and
completed as per specifications and dedicated for public use in time.
ii. Whether the materials used and the work done was of good quality and
the water supply source is providing regular benefit to the local people.
iii. Whether the local people were involved in the process of construction of
the water supply project and got the wage employment.
iv. Whether there has been better availability of water to the local people on
account of these water supply projects as compared to before.
v. What hurdles / difficulties have been encountered in the process of
implementation of these projects; such as delays in fund flow, lack of
47
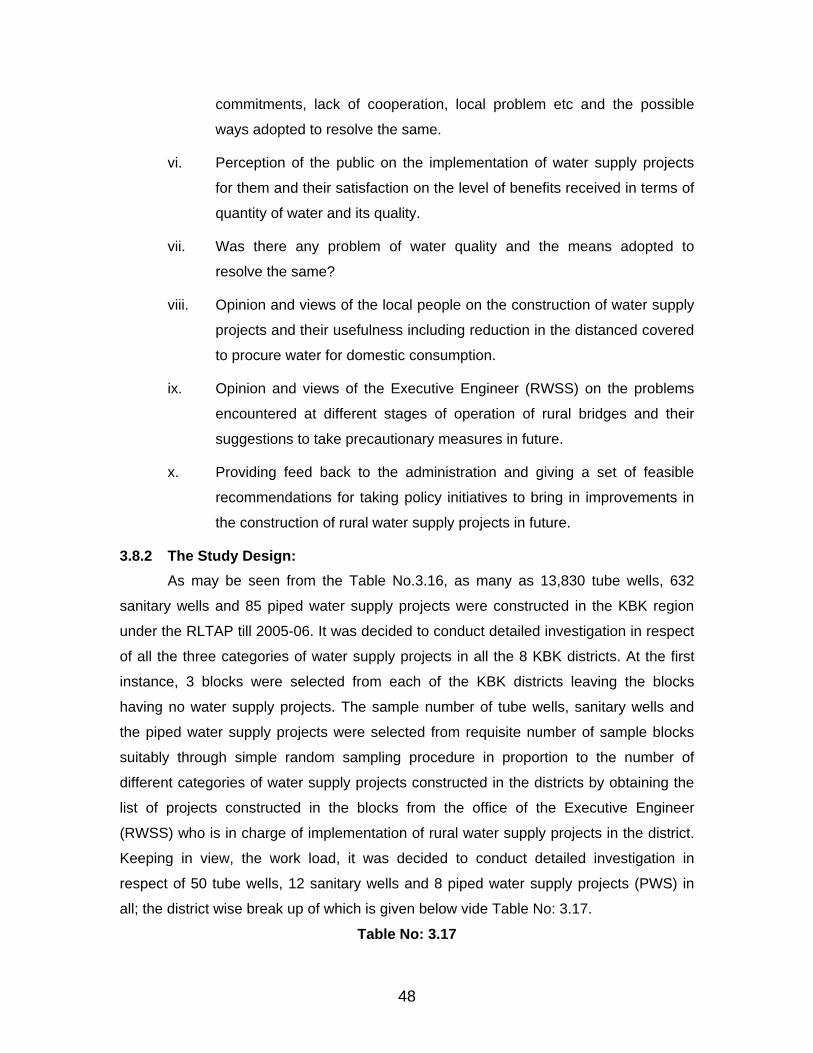
commitments, lack of cooperation, local problem etc and the possible
ways adopted to resolve the same.
vi. Perception of the public on the implementation of water supply projects
for them and their satisfaction on the level of benefits received in terms of
quantity of water and its quality.
vii. Was there any problem of water quality and the means adopted to
resolve the same?
viii. Opinion and views of the local people on the construction of water supply
projects and their usefulness including reduction in the distanced covered
to procure water for domestic consumption.
ix. Opinion and views of the Executive Engineer (RWSS) on the problems
encountered at different stages of operation of rural bridges and their
suggestions to take precautionary measures in future.
x. Providing feed back to the administration and giving a set of feasible
recommendations for taking policy initiatives to bring in improvements in
the construction of rural water supply projects in future.
3.8.2 The Study Design: As may be seen from the Table No.3.16, as many as 13,830 tube wells, 632
sanitary wells and 85 piped water supply projects were constructed in the KBK region
under the RLTAP till 2005-06. It was decided to conduct detailed investigation in respect
of all the three categories of water supply projects in all the 8 KBK districts. At the first
instance, 3 blocks were selected from each of the KBK districts leaving the blocks
having no water supply projects. The sample number of tube wells, sanitary wells and
the piped water supply projects were selected from requisite number of sample blocks
suitably through simple random sampling procedure in proportion to the number of
different categories of water supply projects constructed in the districts by obtaining the
list of projects constructed in the blocks from the office of the Executive Engineer
(RWSS) who is in charge of implementation of rural water supply projects in the district.
Keeping in view, the work load, it was decided to conduct detailed investigation in
respect of 50 tube wells, 12 sanitary wells and 8 piped water supply projects (PWS) in
all; the district wise break up of which is given below vide Table No: 3.17.
Table No: 3.17
48
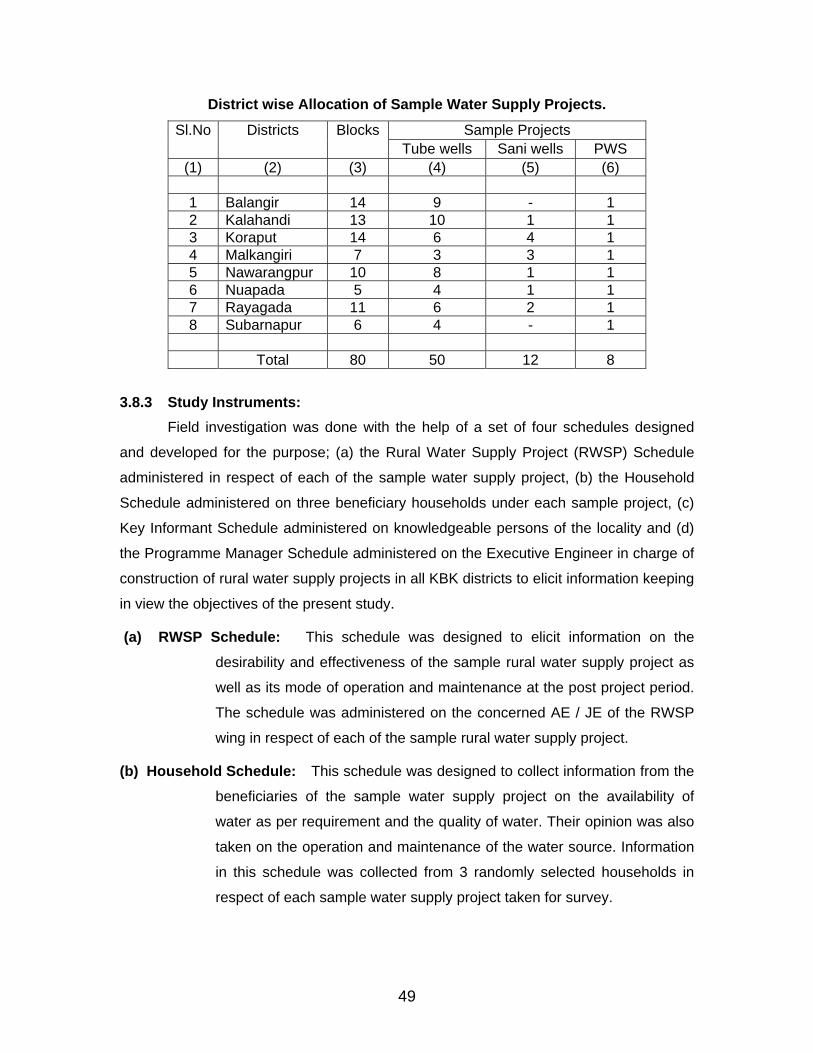
District wise Allocation of Sample Water Supply Projects.
Sample Projects Sl.No Districts Blocks Tube wells Sani wells PWS
(1) (2) (3) (4) (5) (6)
1 Balangir 14 9 - 1 2 Kalahandi 13 10 1 1 3 Koraput 14 6 4 1 4 Malkangiri 7 3 3 1 5 Nawarangpur 10 8 1 1 6 Nuapada 5 4 1 1 7 Rayagada 11 6 2 1 8 Subarnapur 6 4 - 1 Total 80 50 12 8
3.8.3 Study Instruments:
Field investigation was done with the help of a set of four schedules designed
and developed for the purpose; (a) the Rural Water Supply Project (RWSP) Schedule
administered in respect of each of the sample water supply project, (b) the Household
Schedule administered on three beneficiary households under each sample project, (c)
Key Informant Schedule administered on knowledgeable persons of the locality and (d)
the Programme Manager Schedule administered on the Executive Engineer in charge of
construction of rural water supply projects in all KBK districts to elicit information keeping
in view the objectives of the present study.
(a) RWSP Schedule: This schedule was designed to elicit information on the
desirability and effectiveness of the sample rural water supply project as
well as its mode of operation and maintenance at the post project period.
The schedule was administered on the concerned AE / JE of the RWSP
wing in respect of each of the sample rural water supply project.
(b) Household Schedule: This schedule was designed to collect information from the
beneficiaries of the sample water supply project on the availability of
water as per requirement and the quality of water. Their opinion was also
taken on the operation and maintenance of the water source. Information
in this schedule was collected from 3 randomly selected households in
respect of each sample water supply project taken for survey.
49
(c) K I Schedule: Two knowledgeable persons of the locality like the Sarpanch,
school teacher, ward members were contacted in respect of each of the
sample water supply project through administration of this schedule with a
view to eliciting information on the operation and maintenance of the
sample project, the interpersonal relationship between the local people
and the project implementing agency as also the sustainability water
supply source.
(d) P M Schedule: This schedule was administered on the Executive Engineers
(RWSS) of all the 8 districts to get an overall impression on the
effectiveness of the water supply projects constructed, problems like
sustainability of the water source, water quality, public cooperation,
sustainability of the projects and their opinions and suggestions for further
improvement in the programme.
3.8.4 Samples Executed: Under the rural water supply component, detailed investigation was made in
respect of the 50 tube wells, 12 sanitary wells and 8 piped water supply projects.
Interactions was held with 148 households for eliciting information regarding for tube
wells, with 36 households regarding for sanitary wells and with 24 households regarding
piped water supply projects. Similarly, as many as 97 knowledgeable persons for tube
wells, 24 for sanitary wells and 24 for piped water supply projects were contacted to
know their perception and satisfaction over water supply projects installed. Interaction
was also made with the Executive Engineers (RWSS) of all the 8 KBK districts to reveal
the problems in execution of rural water supply projects, cooperation of the local people,
problems of operation and management and the sustainability aspect of the water supply
projects. The district wise break up of the samples executed is presented below vide
Table No: 3.18.
Table No: 3.18
50
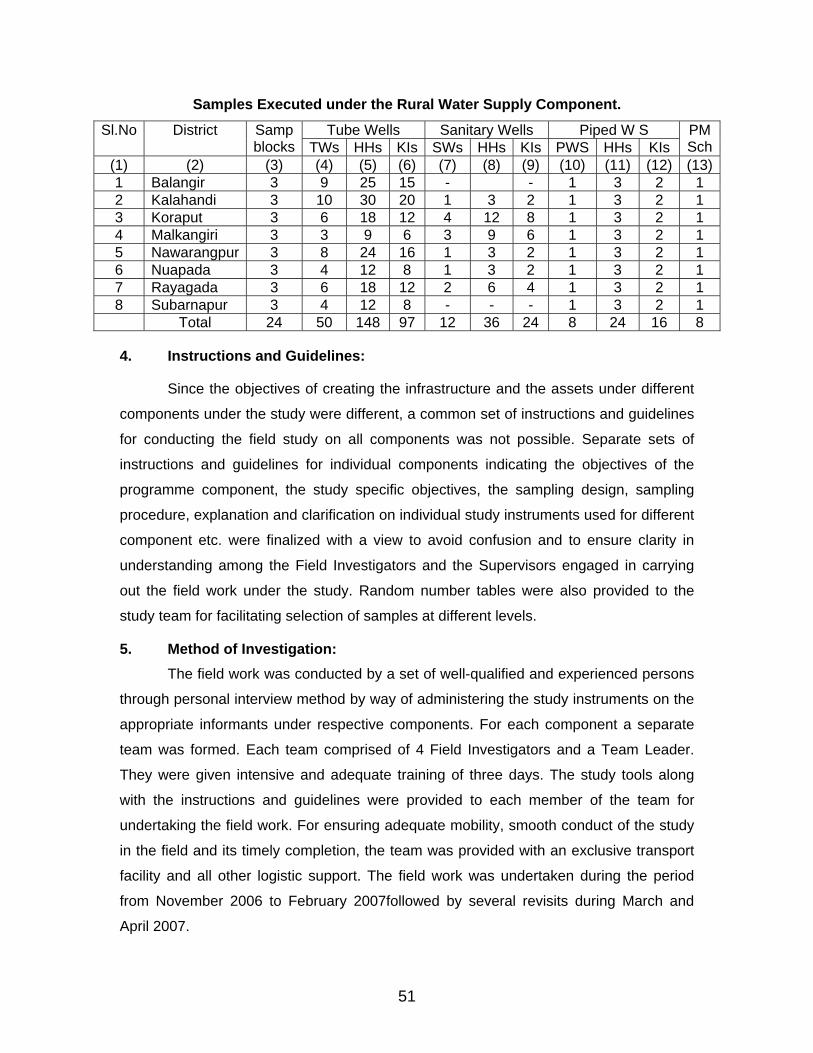
Samples Executed under the Rural Water Supply Component.
Tube Wells Sanitary Wells Piped W S Sl.No District Samp blocks TWs HHs KIs SWs HHs KIs PWS HHs KIs
PMSch
(1) (2) (3) (4) (5) (6) (7) (8) (9) (10) (11) (12) (13)1 Balangir 3 9 25 15 - - 1 3 2 1 2 Kalahandi 3 10 30 20 1 3 2 1 3 2 1 3 Koraput 3 6 18 12 4 12 8 1 3 2 1 4 Malkangiri 3 3 9 6 3 9 6 1 3 2 1 5 Nawarangpur 3 8 24 16 1 3 2 1 3 2 1 6 Nuapada 3 4 12 8 1 3 2 1 3 2 1 7 Rayagada 3 6 18 12 2 6 4 1 3 2 1 8 Subarnapur 3 4 12 8 - - - 1 3 2 1 Total 24 50 148 97 12 36 24 8 24 16 8
4. Instructions and Guidelines:
Since the objectives of creating the infrastructure and the assets under different
components under the study were different, a common set of instructions and guidelines
for conducting the field study on all components was not possible. Separate sets of
instructions and guidelines for individual components indicating the objectives of the
programme component, the study specific objectives, the sampling design, sampling
procedure, explanation and clarification on individual study instruments used for different
component etc. were finalized with a view to avoid confusion and to ensure clarity in
understanding among the Field Investigators and the Supervisors engaged in carrying
out the field work under the study. Random number tables were also provided to the
study team for facilitating selection of samples at different levels.
5. Method of Investigation: The field work was conducted by a set of well-qualified and experienced persons
through personal interview method by way of administering the study instruments on the
appropriate informants under respective components. For each component a separate
team was formed. Each team comprised of 4 Field Investigators and a Team Leader.
They were given intensive and adequate training of three days. The study tools along
with the instructions and guidelines were provided to each member of the team for
undertaking the field work. For ensuring adequate mobility, smooth conduct of the study
in the field and its timely completion, the team was provided with an exclusive transport
facility and all other logistic support. The field work was undertaken during the period
from November 2006 to February 2007followed by several revisits during March and
April 2007.
51
52
6. Coordination and Supervision:
Apart from the Team Leaders supervising the field work in each district, the
senior executives of the Agricultural and Rural Development Consultancy Society
(ARDCOS), Bhubaneswar coordinated to ensure quality output and timely completion of
the study project. For ensuring quality of work and the output under the study, a Subject
Matter Specialist on each of the components was associated right from planning of the
study to drafting of the report. They had also done necessary supervision and provided
technical input to the study at various levels.
CHAPTER - IV
STUDY FINDINGS
The evaluation study on the RLTAP in the KBK Districts of Orissa is based on
detailed investigation on 8 programme components those are crucial for the overall
development of the KBK region. Not only major share of the RLTAP funds were
earmarked for different activities under these components but also the strategic
interventions were made for success. These are supposed to substantially contribute to
the achievements of the set objectives of the programme of RLTAP. Keeping in view, the
overall objectives of the programme of RLTAP, study specific objectives of each of the
components selected for detailed investigation were also set and the field survey was
undertaken accordingly. In the present chapter efforts have been made to analyse the
factual information collected from the field, in order to assess the impact of the
programme of RLTAP in terms of the study objectives. In the process, conclusions are
arrived at and appropriate recommendations will be made for midcourse correction in the
implementation of the programme at different levels. The findings of this study in respect
of the selected components have been discussed in the following sections.
SECTION – 1
40 SEATED HOSTELS FOR ST & SC GIRLS IN KBK DISTRICTS
1. Enrolment of SC and ST Girls in Primary Schools:
From the field study it was observed that, out of a total of 41 Primary Schools, of
which the sample hostels selected were Tribal Schools maintained by the ST, SC and
Minorities Development Department and all have coeducation system with Class- I -V.
The position of enrolment of girls in these schools during the period from 1998-99 to
2006-07 is presented in Table No: 4.1.1.
53
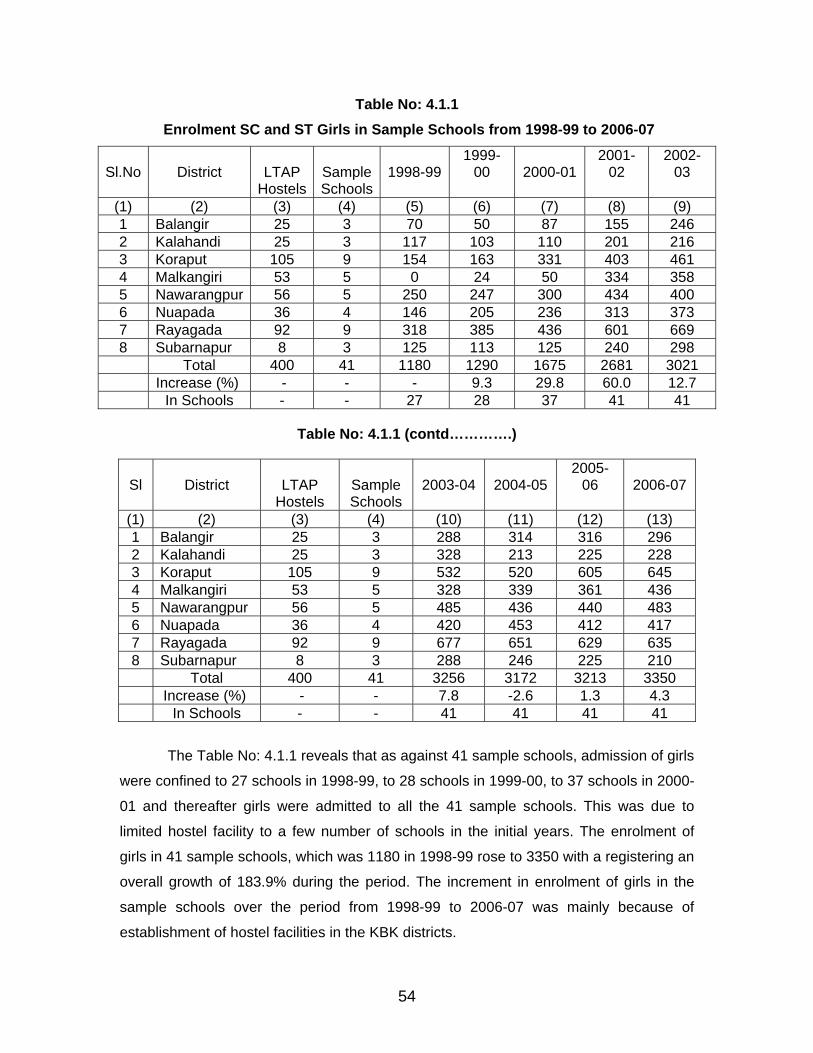
Table No: 4.1.1 Enrolment SC and ST Girls in Sample Schools from 1998-99 to 2006-07
Sl.No
District
LTAP Hostels
Sample Schools
1998-99
1999-00
2000-01
2001-02
2002-03
(1) (2) (3) (4) (5) (6) (7) (8) (9) 1 Balangir 25 3 70 50 87 155 246 2 Kalahandi 25 3 117 103 110 201 216 3 Koraput 105 9 154 163 331 403 461 4 Malkangiri 53 5 0 24 50 334 358 5 Nawarangpur 56 5 250 247 300 434 400 6 Nuapada 36 4 146 205 236 313 373 7 Rayagada 92 9 318 385 436 601 669 8 Subarnapur 8 3 125 113 125 240 298 Total 400 41 1180 1290 1675 2681 3021 Increase (%) - - - 9.3 29.8 60.0 12.7 In Schools - - 27 28 37 41 41
Table No: 4.1.1 (contd………….)
Sl
District
LTAP Hostels
Sample Schools
2003-04
2004-05
2005-06
2006-07
(1) (2) (3) (4) (10) (11) (12) (13) 1 Balangir 25 3 288 314 316 296 2 Kalahandi 25 3 328 213 225 228 3 Koraput 105 9 532 520 605 645 4 Malkangiri 53 5 328 339 361 436 5 Nawarangpur 56 5 485 436 440 483 6 Nuapada 36 4 420 453 412 417 7 Rayagada 92 9 677 651 629 635 8 Subarnapur 8 3 288 246 225 210 Total 400 41 3256 3172 3213 3350 Increase (%) - - 7.8 -2.6 1.3 4.3 In Schools - - 41 41 41 41
The Table No: 4.1.1 reveals that as against 41 sample schools, admission of girls
were confined to 27 schools in 1998-99, to 28 schools in 1999-00, to 37 schools in 2000-
01 and thereafter girls were admitted to all the 41 sample schools. This was due to
limited hostel facility to a few number of schools in the initial years. The enrolment of
girls in 41 sample schools, which was 1180 in 1998-99 rose to 3350 with a registering an
overall growth of 183.9% during the period. The increment in enrolment of girls in the
sample schools over the period from 1998-99 to 2006-07 was mainly because of
establishment of hostel facilities in the KBK districts.
54
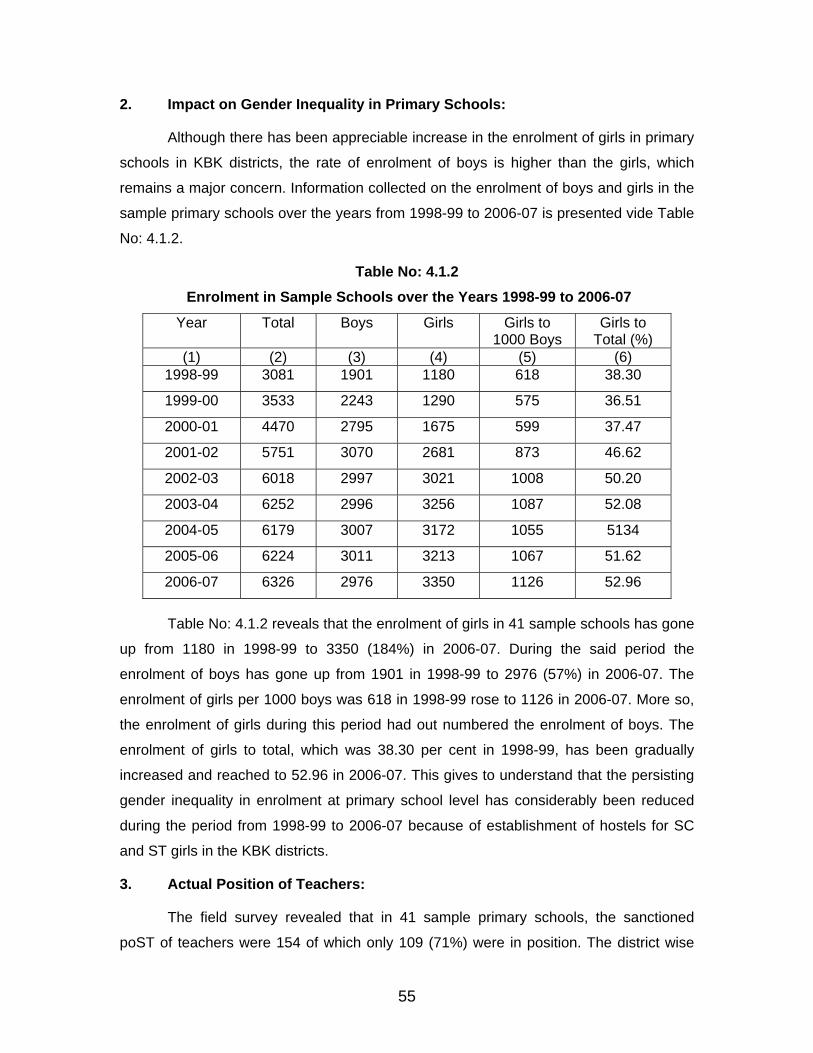
2. Impact on Gender Inequality in Primary Schools:
Although there has been appreciable increase in the enrolment of girls in primary
schools in KBK districts, the rate of enrolment of boys is higher than the girls, which
remains a major concern. Information collected on the enrolment of boys and girls in the
sample primary schools over the years from 1998-99 to 2006-07 is presented vide Table
No: 4.1.2.
Table No: 4.1.2 Enrolment in Sample Schools over the Years 1998-99 to 2006-07
Year
Total
Boys
Girls
Girls to 1000 Boys
Girls to Total (%)
(1) (2) (3) (4) (5) (6) 1998-99 3081 1901 1180 618 38.30
1999-00 3533 2243 1290 575 36.51
2000-01 4470 2795 1675 599 37.47
2001-02 5751 3070 2681 873 46.62
2002-03 6018 2997 3021 1008 50.20
2003-04 6252 2996 3256 1087 52.08
2004-05 6179 3007 3172 1055 5134
2005-06 6224 3011 3213 1067 51.62
2006-07 6326 2976 3350 1126 52.96
Table No: 4.1.2 reveals that the enrolment of girls in 41 sample schools has gone
up from 1180 in 1998-99 to 3350 (184%) in 2006-07. During the said period the
enrolment of boys has gone up from 1901 in 1998-99 to 2976 (57%) in 2006-07. The
enrolment of girls per 1000 boys was 618 in 1998-99 rose to 1126 in 2006-07. More so,
the enrolment of girls during this period had out numbered the enrolment of boys. The
enrolment of girls to total, which was 38.30 per cent in 1998-99, has been gradually
increased and reached to 52.96 in 2006-07. This gives to understand that the persisting
gender inequality in enrolment at primary school level has considerably been reduced
during the period from 1998-99 to 2006-07 because of establishment of hostels for SC
and ST girls in the KBK districts.
3. Actual Position of Teachers:
The field survey revealed that in 41 sample primary schools, the sanctioned
poST of teachers were 154 of which only 109 (71%) were in position. The district wise
55
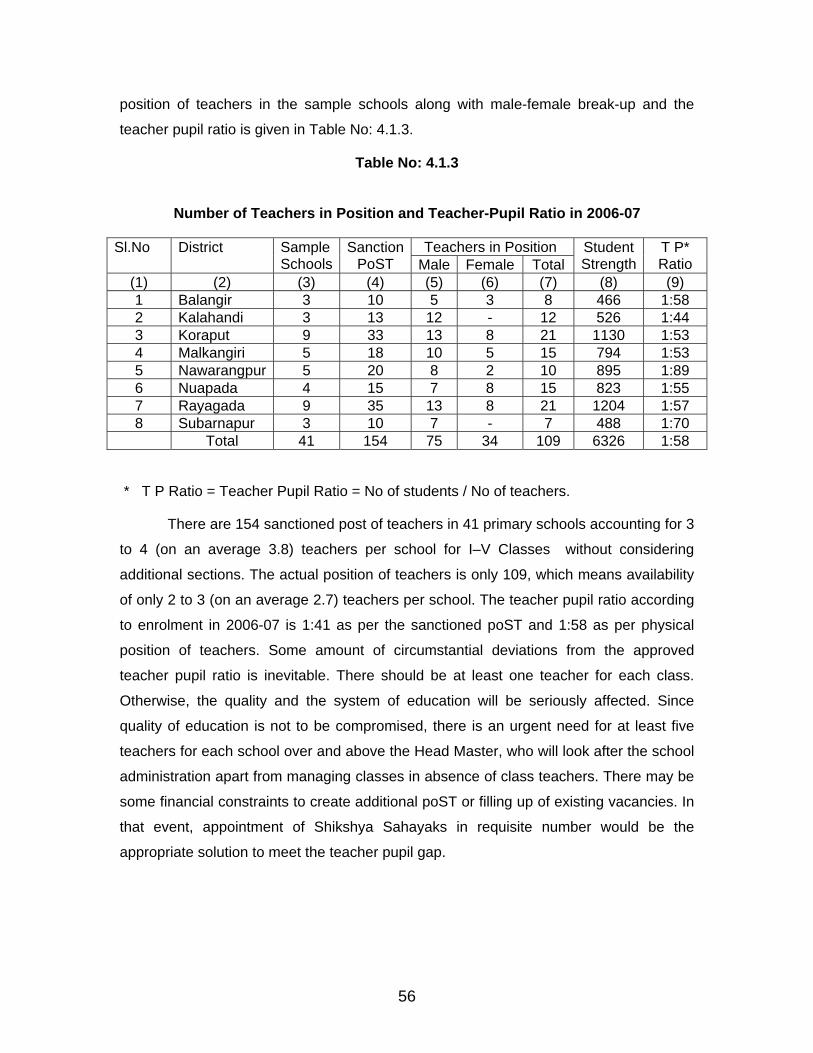
position of teachers in the sample schools along with male-female break-up and the
teacher pupil ratio is given in Table No: 4.1.3.
Table No: 4.1.3
Number of Teachers in Position and Teacher-Pupil Ratio in 2006-07
Teachers in Position Sl.No
District
Sample Schools
SanctionPoST Male Female Total
Student Strength
T P* Ratio
(1) (2) (3) (4) (5) (6) (7) (8) (9) 1 Balangir 3 10 5 3 8 466 1:58 2 Kalahandi 3 13 12 - 12 526 1:44 3 Koraput 9 33 13 8 21 1130 1:53 4 Malkangiri 5 18 10 5 15 794 1:53 5 Nawarangpur 5 20 8 2 10 895 1:89 6 Nuapada 4 15 7 8 15 823 1:55 7 Rayagada 9 35 13 8 21 1204 1:57 8 Subarnapur 3 10 7 - 7 488 1:70 Total 41 154 75 34 109 6326 1:58
* T P Ratio = Teacher Pupil Ratio = No of students / No of teachers.
There are 154 sanctioned post of teachers in 41 primary schools accounting for 3
to 4 (on an average 3.8) teachers per school for I–V Classes without considering
additional sections. The actual position of teachers is only 109, which means availability
of only 2 to 3 (on an average 2.7) teachers per school. The teacher pupil ratio according
to enrolment in 2006-07 is 1:41 as per the sanctioned poST and 1:58 as per physical
position of teachers. Some amount of circumstantial deviations from the approved
teacher pupil ratio is inevitable. There should be at least one teacher for each class.
Otherwise, the quality and the system of education will be seriously affected. Since
quality of education is not to be compromised, there is an urgent need for at least five
teachers for each school over and above the Head Master, who will look after the school
administration apart from managing classes in absence of class teachers. There may be
some financial constraints to create additional poST or filling up of existing vacancies. In
that event, appointment of Shikshya Sahayaks in requisite number would be the
appropriate solution to meet the teacher pupil gap.
56
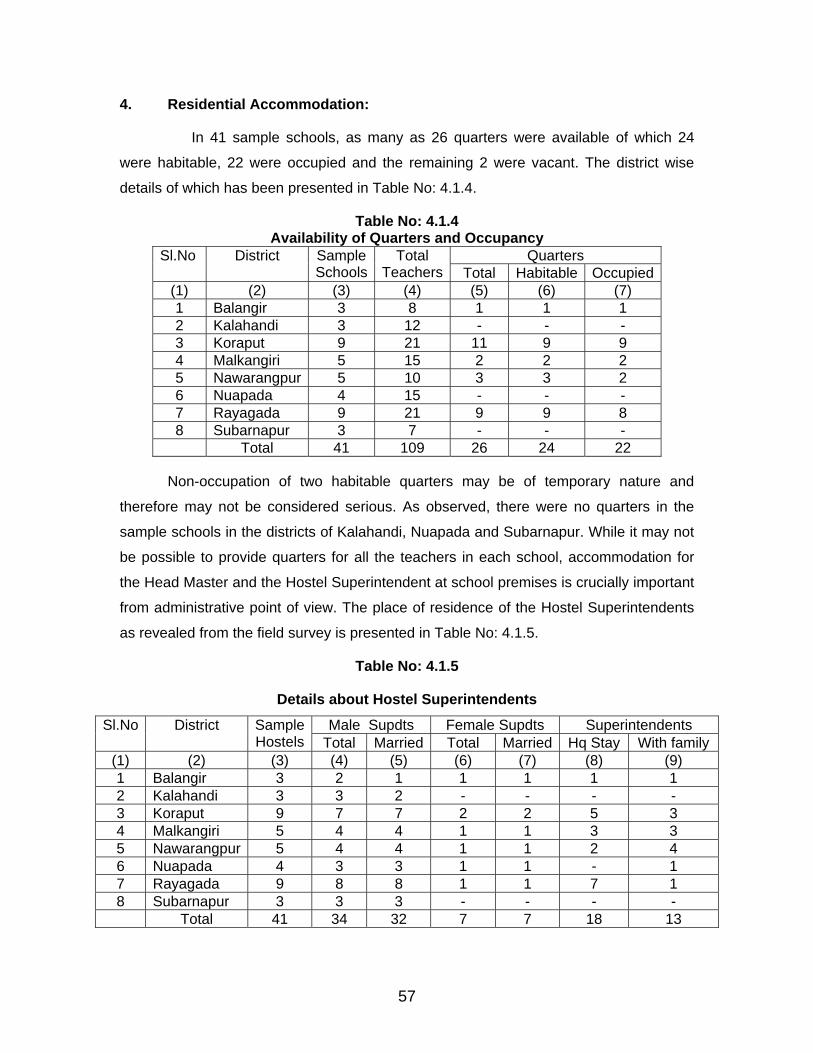
4. Residential Accommodation:
In 41 sample schools, as many as 26 quarters were available of which 24
were habitable, 22 were occupied and the remaining 2 were vacant. The district wise
details of which has been presented in Table No: 4.1.4.
Table No: 4.1.4 Availability of Quarters and Occupancy
Quarters Sl.No
District
Sample Schools
Total Teachers Total Habitable Occupied
(1) (2) (3) (4) (5) (6) (7) 1 Balangir 3 8 1 1 1 2 Kalahandi 3 12 - - - 3 Koraput 9 21 11 9 9 4 Malkangiri 5 15 2 2 2 5 Nawarangpur 5 10 3 3 2 6 Nuapada 4 15 - - - 7 Rayagada 9 21 9 9 8 8 Subarnapur 3 7 - - - Total 41 109 26 24 22
Non-occupation of two habitable quarters may be of temporary nature and
therefore may not be considered serious. As observed, there were no quarters in the
sample schools in the districts of Kalahandi, Nuapada and Subarnapur. While it may not
be possible to provide quarters for all the teachers in each school, accommodation for
the Head Master and the Hostel Superintendent at school premises is crucially important
from administrative point of view. The place of residence of the Hostel Superintendents
as revealed from the field survey is presented in Table No: 4.1.5.
Table No: 4.1.5
Details about Hostel Superintendents
Male Supdts Female Supdts Superintendents Sl.No
District
Sample Hostels Total Married Total Married Hq Stay With family
(1) (2) (3) (4) (5) (6) (7) (8) (9) 1 Balangir 3 2 1 1 1 1 1 2 Kalahandi 3 3 2 - - - - 3 Koraput 9 7 7 2 2 5 3 4 Malkangiri 5 4 4 1 1 3 3 5 Nawarangpur 5 4 4 1 1 2 4 6 Nuapada 4 3 3 1 1 - 1 7 Rayagada 9 8 8 1 1 7 1 8 Subarnapur 3 3 3 - - - - Total 41 34 32 7 7 18 13
57
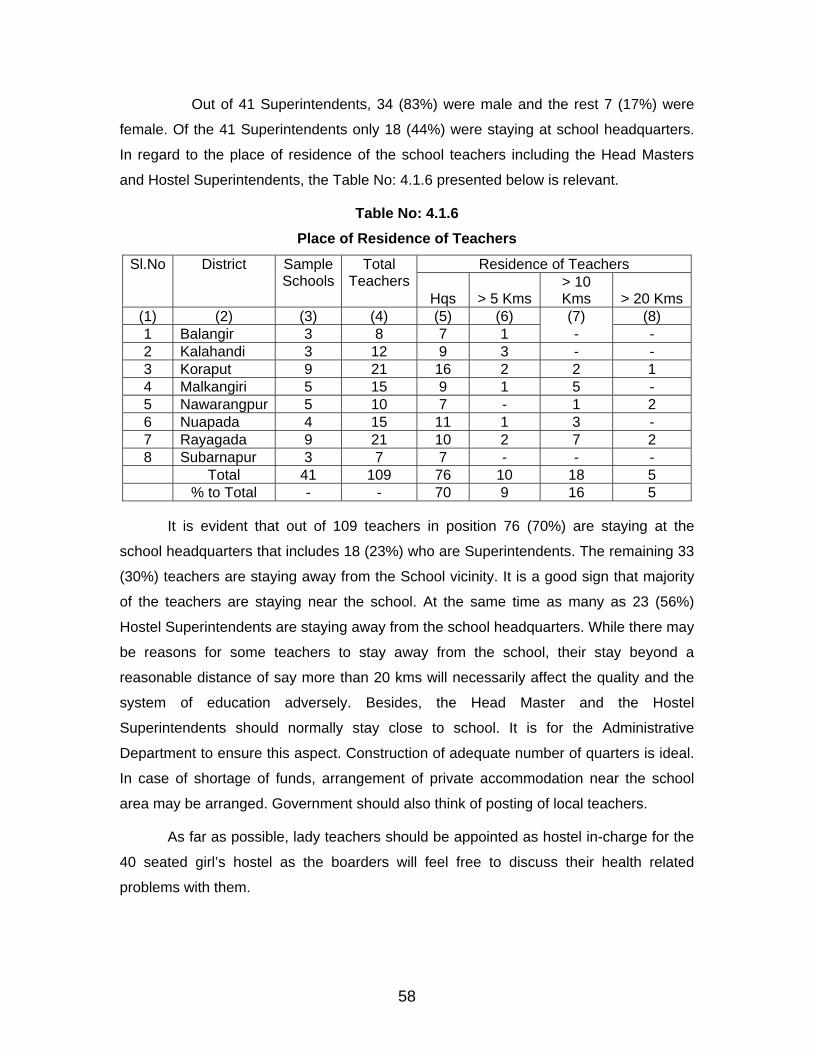
Out of 41 Superintendents, 34 (83%) were male and the rest 7 (17%) were
female. Of the 41 Superintendents only 18 (44%) were staying at school headquarters.
In regard to the place of residence of the school teachers including the Head Masters
and Hostel Superintendents, the Table No: 4.1.6 presented below is relevant.
Table No: 4.1.6 Place of Residence of Teachers
Residence of Teachers Sl.No
District
Sample Schools
Total Teachers
Hqs > 5 Kms> 10 Kms > 20 Kms
(1) (2) (3) (4) (5) (6) (7) (8) 1 Balangir 3 8 7 1 - - 2 Kalahandi 3 12 9 3 - - 3 Koraput 9 21 16 2 2 1 4 Malkangiri 5 15 9 1 5 - 5 Nawarangpur 5 10 7 - 1 2 6 Nuapada 4 15 11 1 3 - 7 Rayagada 9 21 10 2 7 2 8 Subarnapur 3 7 7 - - - Total 41 109 76 10 18 5 % to Total - - 70 9 16 5
It is evident that out of 109 teachers in position 76 (70%) are staying at the
school headquarters that includes 18 (23%) who are Superintendents. The remaining 33
(30%) teachers are staying away from the School vicinity. It is a good sign that majority
of the teachers are staying near the school. At the same time as many as 23 (56%)
Hostel Superintendents are staying away from the school headquarters. While there may
be reasons for some teachers to stay away from the school, their stay beyond a
reasonable distance of say more than 20 kms will necessarily affect the quality and the
system of education adversely. Besides, the Head Master and the Hostel
Superintendents should normally stay close to school. It is for the Administrative
Department to ensure this aspect. Construction of adequate number of quarters is ideal.
In case of shortage of funds, arrangement of private accommodation near the school
area may be arranged. Government should also think of posting of local teachers.
As far as possible, lady teachers should be appointed as hostel in-charge for the
40 seated girl’s hostel as the boarders will feel free to discuss their health related
problems with them.
58
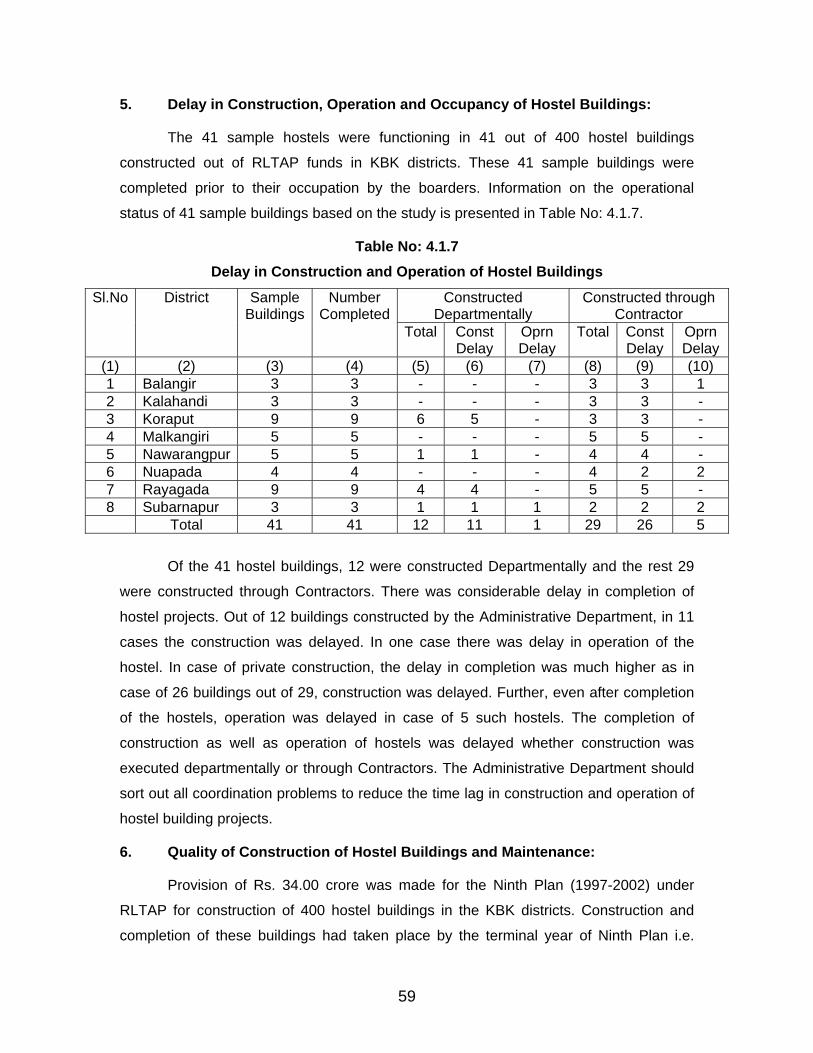
5. Delay in Construction, Operation and Occupancy of Hostel Buildings:
The 41 sample hostels were functioning in 41 out of 400 hostel buildings
constructed out of RLTAP funds in KBK districts. These 41 sample buildings were
completed prior to their occupation by the boarders. Information on the operational
status of 41 sample buildings based on the study is presented in Table No: 4.1.7.
Table No: 4.1.7 Delay in Construction and Operation of Hostel Buildings
Constructed Departmentally
Constructed through Contractor
Sl.No
District
Sample Buildings
Number Completed
Total Const Delay
Oprn Delay
Total Const Delay
Oprn Delay
(1) (2) (3) (4) (5) (6) (7) (8) (9) (10) 1 Balangir 3 3 - - - 3 3 1 2 Kalahandi 3 3 - - - 3 3 - 3 Koraput 9 9 6 5 - 3 3 - 4 Malkangiri 5 5 - - - 5 5 - 5 Nawarangpur 5 5 1 1 - 4 4 - 6 Nuapada 4 4 - - - 4 2 2 7 Rayagada 9 9 4 4 - 5 5 - 8 Subarnapur 3 3 1 1 1 2 2 2 Total 41 41 12 11 1 29 26 5
Of the 41 hostel buildings, 12 were constructed Departmentally and the rest 29
were constructed through Contractors. There was considerable delay in completion of
hostel projects. Out of 12 buildings constructed by the Administrative Department, in 11
cases the construction was delayed. In one case there was delay in operation of the
hostel. In case of private construction, the delay in completion was much higher as in
case of 26 buildings out of 29, construction was delayed. Further, even after completion
of the hostels, operation was delayed in case of 5 such hostels. The completion of
construction as well as operation of hostels was delayed whether construction was
executed departmentally or through Contractors. The Administrative Department should
sort out all coordination problems to reduce the time lag in construction and operation of
hostel building projects.
6. Quality of Construction of Hostel Buildings and Maintenance:
Provision of Rs. 34.00 crore was made for the Ninth Plan (1997-2002) under
RLTAP for construction of 400 hostel buildings in the KBK districts. Construction and
completion of these buildings had taken place by the terminal year of Ninth Plan i.e.
59
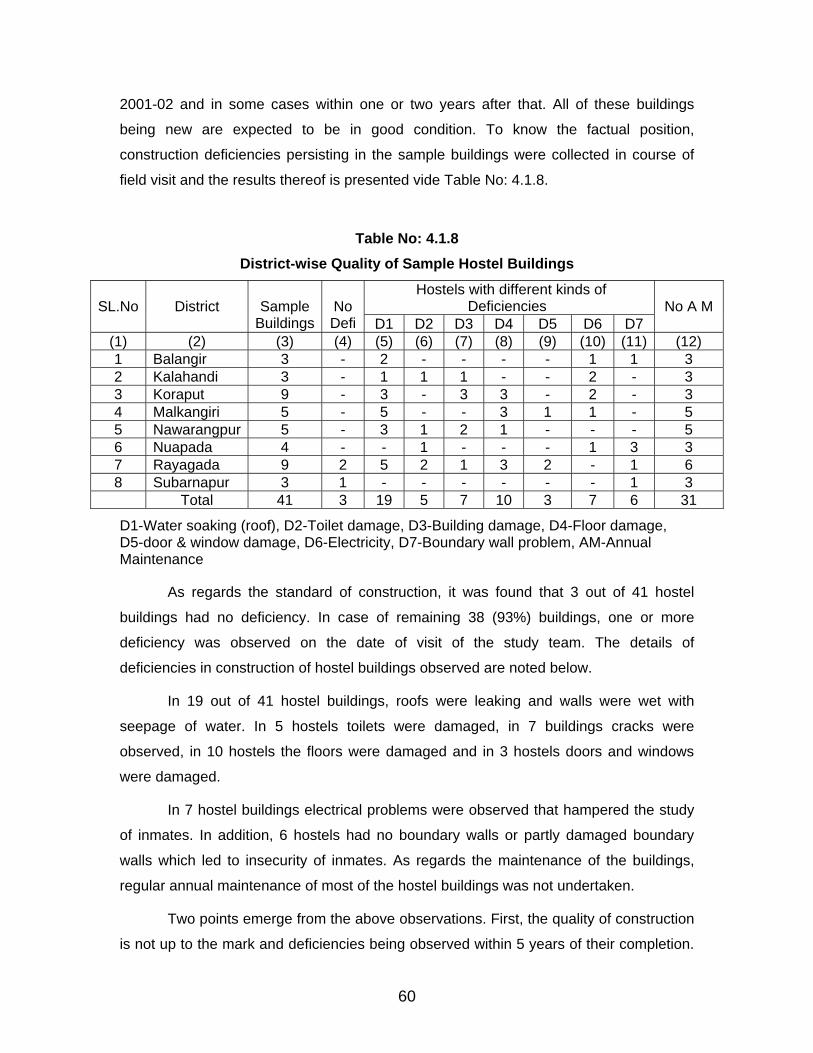
2001-02 and in some cases within one or two years after that. All of these buildings
being new are expected to be in good condition. To know the factual position,
construction deficiencies persisting in the sample buildings were collected in course of
field visit and the results thereof is presented vide Table No: 4.1.8.
Table No: 4.1.8
District-wise Quality of Sample Hostel Buildings
Hostels with different kinds of Deficiencies SL.No
District
Sample
Buildings No Defi D1 D2 D3 D4 D5 D6 D7
No A M
(1) (2) (3) (4) (5) (6) (7) (8) (9) (10) (11) (12) 1 Balangir 3 - 2 - - - - 1 1 3 2 Kalahandi 3 - 1 1 1 - - 2 - 3 3 Koraput 9 - 3 - 3 3 - 2 - 3 4 Malkangiri 5 - 5 - - 3 1 1 - 5 5 Nawarangpur 5 - 3 1 2 1 - - - 5 6 Nuapada 4 - - 1 - - - 1 3 3 7 Rayagada 9 2 5 2 1 3 2 - 1 6 8 Subarnapur 3 1 - - - - - - 1 3 Total 41 3 19 5 7 10 3 7 6 31
D1-Water soaking (roof), D2-Toilet damage, D3-Building damage, D4-Floor damage, D5-door & window damage, D6-Electricity, D7-Boundary wall problem, AM-Annual Maintenance
As regards the standard of construction, it was found that 3 out of 41 hostel
buildings had no deficiency. In case of remaining 38 (93%) buildings, one or more
deficiency was observed on the date of visit of the study team. The details of
deficiencies in construction of hostel buildings observed are noted below.
In 19 out of 41 hostel buildings, roofs were leaking and walls were wet with
seepage of water. In 5 hostels toilets were damaged, in 7 buildings cracks were
observed, in 10 hostels the floors were damaged and in 3 hostels doors and windows
were damaged.
In 7 hostel buildings electrical problems were observed that hampered the study
of inmates. In addition, 6 hostels had no boundary walls or partly damaged boundary
walls which led to insecurity of inmates. As regards the maintenance of the buildings,
regular annual maintenance of most of the hostel buildings was not undertaken.
Two points emerge from the above observations. First, the quality of construction
is not up to the mark and deficiencies being observed within 5 years of their completion.
60
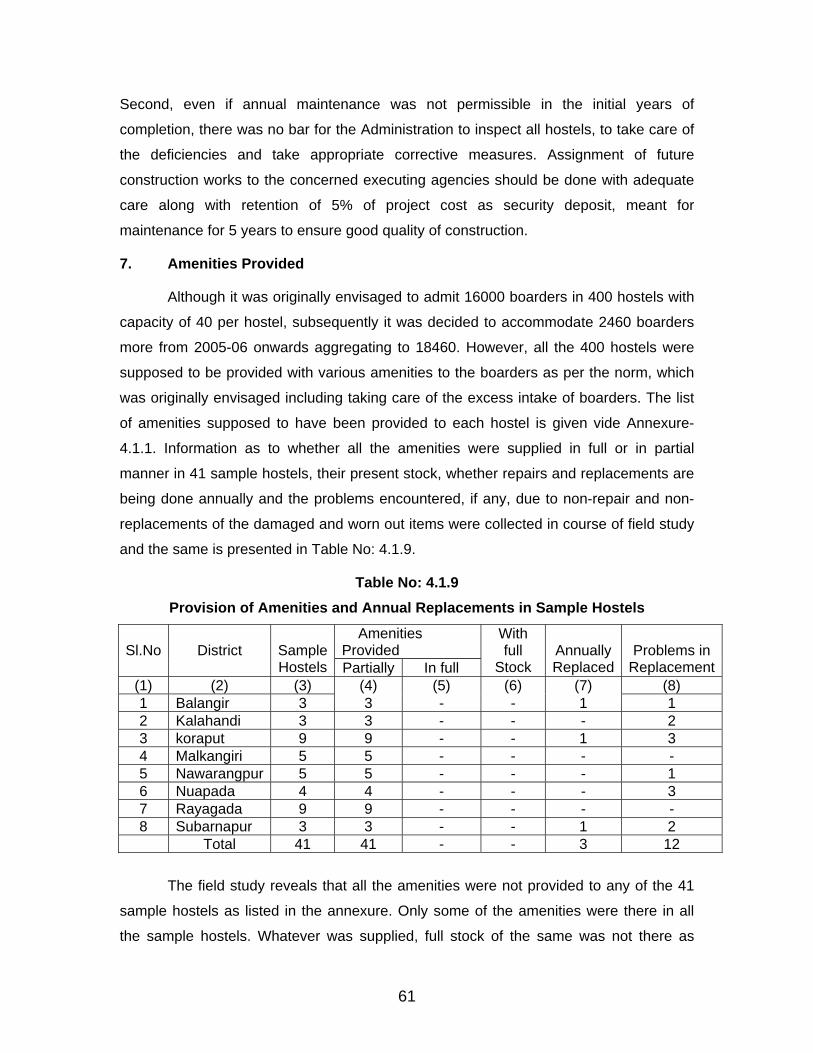
Second, even if annual maintenance was not permissible in the initial years of
completion, there was no bar for the Administration to inspect all hostels, to take care of
the deficiencies and take appropriate corrective measures. Assignment of future
construction works to the concerned executing agencies should be done with adequate
care along with retention of 5% of project cost as security deposit, meant for
maintenance for 5 years to ensure good quality of construction.
7. Amenities Provided
Although it was originally envisaged to admit 16000 boarders in 400 hostels with
capacity of 40 per hostel, subsequently it was decided to accommodate 2460 boarders
more from 2005-06 onwards aggregating to 18460. However, all the 400 hostels were
supposed to be provided with various amenities to the boarders as per the norm, which
was originally envisaged including taking care of the excess intake of boarders. The list
of amenities supposed to have been provided to each hostel is given vide Annexure-
4.1.1. Information as to whether all the amenities were supplied in full or in partial
manner in 41 sample hostels, their present stock, whether repairs and replacements are
being done annually and the problems encountered, if any, due to non-repair and non-
replacements of the damaged and worn out items were collected in course of field study
and the same is presented in Table No: 4.1.9.
Table No: 4.1.9 Provision of Amenities and Annual Replacements in Sample Hostels
Amenities Provided Sl.No
District
SampleHostels Partially In full
With full
Stock Annually Replaced
Problems in Replacement
(1) (2) (3) (4) (5) (6) (7) (8) 1 Balangir 3 3 - - 1 1 2 Kalahandi 3 3 - - - 2 3 koraput 9 9 - - 1 3 4 Malkangiri 5 5 - - - - 5 Nawarangpur 5 5 - - - 1 6 Nuapada 4 4 - - - 3 7 Rayagada 9 9 - - - - 8 Subarnapur 3 3 - - 1 2 Total 41 41 - - 3 12
The field study reveals that all the amenities were not provided to any of the 41
sample hostels as listed in the annexure. Only some of the amenities were there in all
the sample hostels. Whatever was supplied, full stock of the same was not there as
61
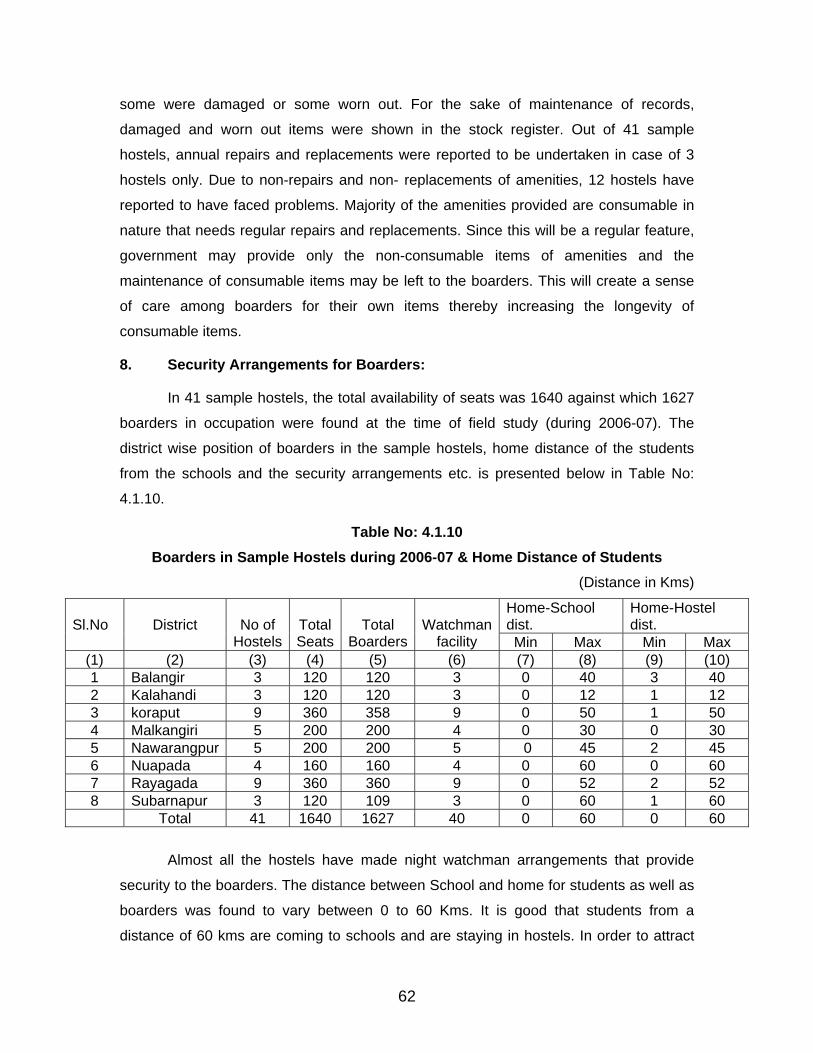
some were damaged or some worn out. For the sake of maintenance of records,
damaged and worn out items were shown in the stock register. Out of 41 sample
hostels, annual repairs and replacements were reported to be undertaken in case of 3
hostels only. Due to non-repairs and non- replacements of amenities, 12 hostels have
reported to have faced problems. Majority of the amenities provided are consumable in
nature that needs regular repairs and replacements. Since this will be a regular feature,
government may provide only the non-consumable items of amenities and the
maintenance of consumable items may be left to the boarders. This will create a sense
of care among boarders for their own items thereby increasing the longevity of
consumable items.
8. Security Arrangements for Boarders:
In 41 sample hostels, the total availability of seats was 1640 against which 1627
boarders in occupation were found at the time of field study (during 2006-07). The
district wise position of boarders in the sample hostels, home distance of the students
from the schools and the security arrangements etc. is presented below in Table No:
4.1.10.
Table No: 4.1.10 Boarders in Sample Hostels during 2006-07 & Home Distance of Students
(Distance in Kms)
Home-School dist.
Home-Hostel dist. Sl.No
District
No of
Hostels Total Seats
Total Boarders
Watchman facility Min Max Min Max
(1) (2) (3) (4) (5) (6) (7) (8) (9) (10) 1 Balangir 3 120 120 3 0 40 3 40 2 Kalahandi 3 120 120 3 0 12 1 12 3 koraput 9 360 358 9 0 50 1 50 4 Malkangiri 5 200 200 4 0 30 0 30 5 Nawarangpur 5 200 200 5 0 45 2 45 6 Nuapada 4 160 160 4 0 60 0 60 7 Rayagada 9 360 360 9 0 52 2 52 8 Subarnapur 3 120 109 3 0 60 1 60 Total 41 1640 1627 40 0 60 0 60
Almost all the hostels have made night watchman arrangements that provide
security to the boarders. The distance between School and home for students as well as
boarders was found to vary between 0 to 60 Kms. It is good that students from a
distance of 60 kms are coming to schools and are staying in hostels. In order to attract
62
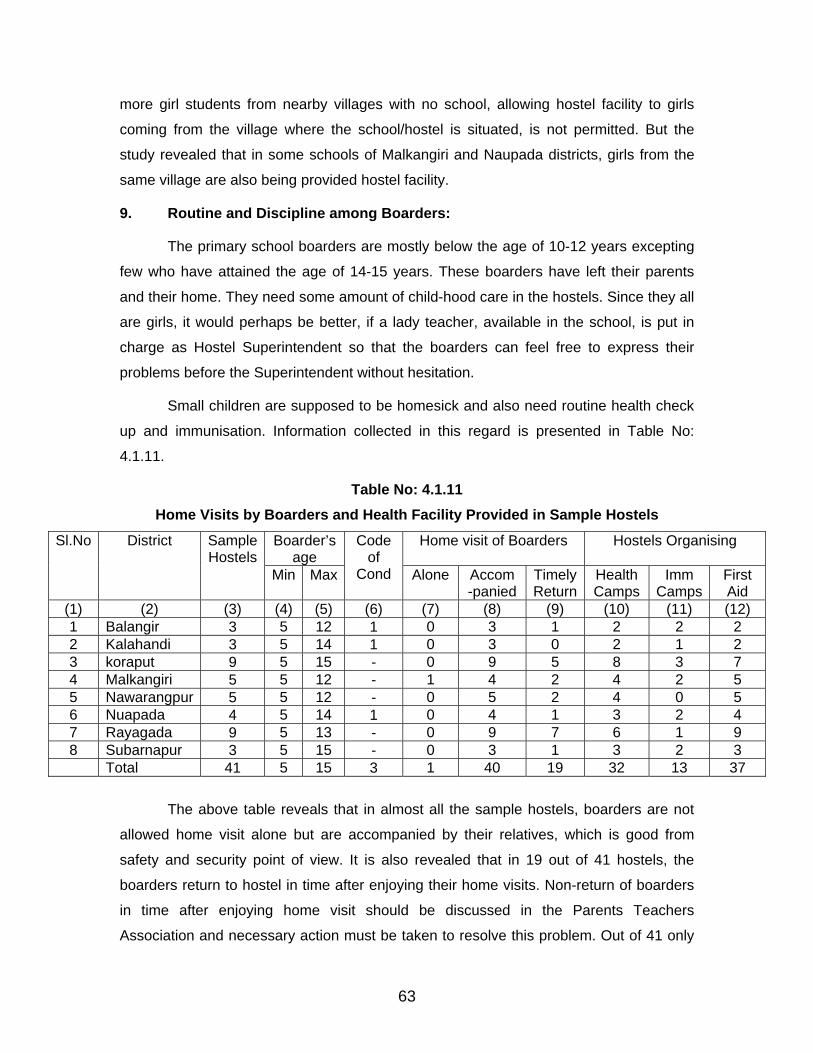
more girl students from nearby villages with no school, allowing hostel facility to girls
coming from the village where the school/hostel is situated, is not permitted. But the
study revealed that in some schools of Malkangiri and Naupada districts, girls from the
same village are also being provided hostel facility.
9. Routine and Discipline among Boarders:
The primary school boarders are mostly below the age of 10-12 years excepting
few who have attained the age of 14-15 years. These boarders have left their parents
and their home. They need some amount of child-hood care in the hostels. Since they all
are girls, it would perhaps be better, if a lady teacher, available in the school, is put in
charge as Hostel Superintendent so that the boarders can feel free to express their
problems before the Superintendent without hesitation.
Small children are supposed to be homesick and also need routine health check
up and immunisation. Information collected in this regard is presented in Table No:
4.1.11.
Table No: 4.1.11 Home Visits by Boarders and Health Facility Provided in Sample Hostels
Boarder’sage
Home visit of Boarders Hostels Organising Sl.No District Sample Hostels
Min Max
Codeof
Cond Alone
Accom-panied
Timely Return
Health Camps
Imm Camps
First Aid
(1) (2) (3) (4) (5) (6) (7) (8) (9) (10) (11) (12) 1 Balangir 3 5 12 1 0 3 1 2 2 2 2 Kalahandi 3 5 14 1 0 3 0 2 1 2 3 koraput 9 5 15 - 0 9 5 8 3 7 4 Malkangiri 5 5 12 - 1 4 2 4 2 5 5 Nawarangpur 5 5 12 - 0 5 2 4 0 5 6 Nuapada 4 5 14 1 0 4 1 3 2 4 7 Rayagada 9 5 13 - 0 9 7 6 1 9 8 Subarnapur 3 5 15 - 0 3 1 3 2 3
Total 41 5 15 3 1 40 19 32 13 37
The above table reveals that in almost all the sample hostels, boarders are not
allowed home visit alone but are accompanied by their relatives, which is good from
safety and security point of view. It is also revealed that in 19 out of 41 hostels, the
boarders return to hostel in time after enjoying their home visits. Non-return of boarders
in time after enjoying home visit should be discussed in the Parents Teachers
Association and necessary action must be taken to resolve this problem. Out of 41 only
63
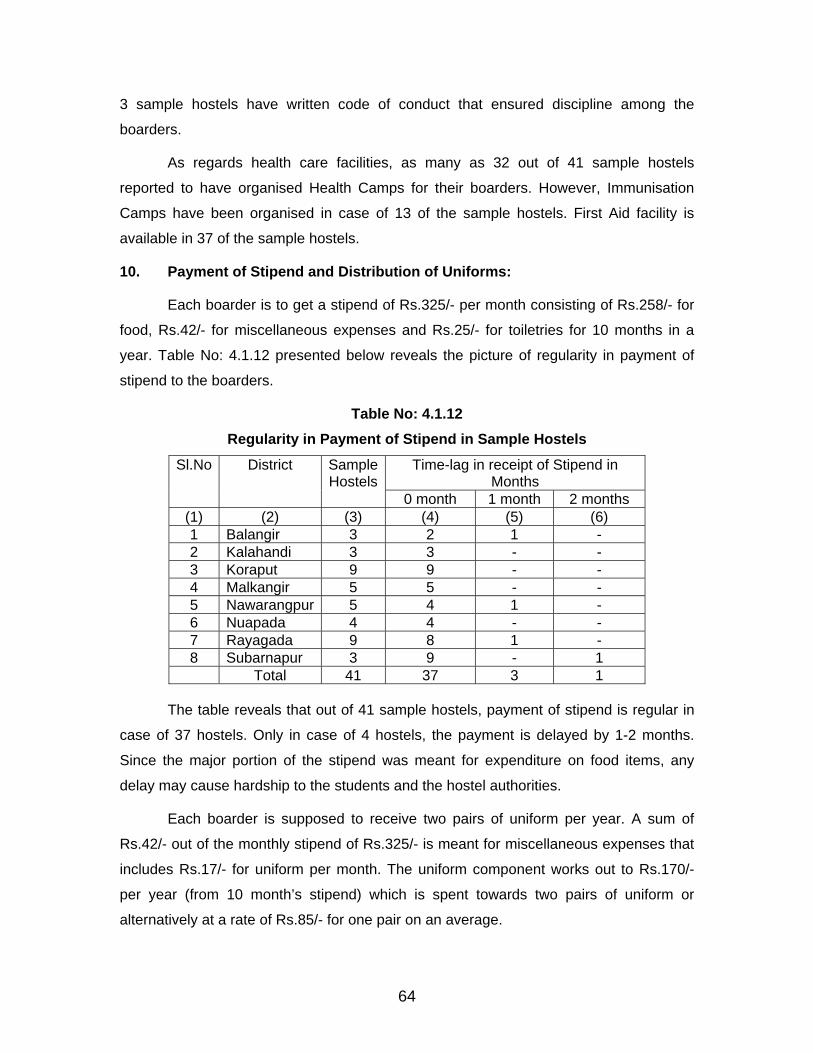
3 sample hostels have written code of conduct that ensured discipline among the
boarders.
As regards health care facilities, as many as 32 out of 41 sample hostels
reported to have organised Health Camps for their boarders. However, Immunisation
Camps have been organised in case of 13 of the sample hostels. First Aid facility is
available in 37 of the sample hostels.
10. Payment of Stipend and Distribution of Uniforms:
Each boarder is to get a stipend of Rs.325/- per month consisting of Rs.258/- for
food, Rs.42/- for miscellaneous expenses and Rs.25/- for toiletries for 10 months in a
year. Table No: 4.1.12 presented below reveals the picture of regularity in payment of
stipend to the boarders.
Table No: 4.1.12 Regularity in Payment of Stipend in Sample Hostels
Time-lag in receipt of Stipend in Months
Sl.No
District
SampleHostels
0 month 1 month 2 months (1) (2) (3) (4) (5) (6) 1 Balangir 3 2 1 - 2 Kalahandi 3 3 - - 3 Koraput 9 9 - - 4 Malkangir 5 5 - - 5 Nawarangpur 5 4 1 - 6 Nuapada 4 4 - - 7 Rayagada 9 8 1 - 8 Subarnapur 3 9 - 1 Total 41 37 3 1
The table reveals that out of 41 sample hostels, payment of stipend is regular in
case of 37 hostels. Only in case of 4 hostels, the payment is delayed by 1-2 months.
Since the major portion of the stipend was meant for expenditure on food items, any
delay may cause hardship to the students and the hostel authorities.
Each boarder is supposed to receive two pairs of uniform per year. A sum of
Rs.42/- out of the monthly stipend of Rs.325/- is meant for miscellaneous expenses that
includes Rs.17/- for uniform per month. The uniform component works out to Rs.170/-
per year (from 10 month’s stipend) which is spent towards two pairs of uniform or
alternatively at a rate of Rs.85/- for one pair on an average.
64
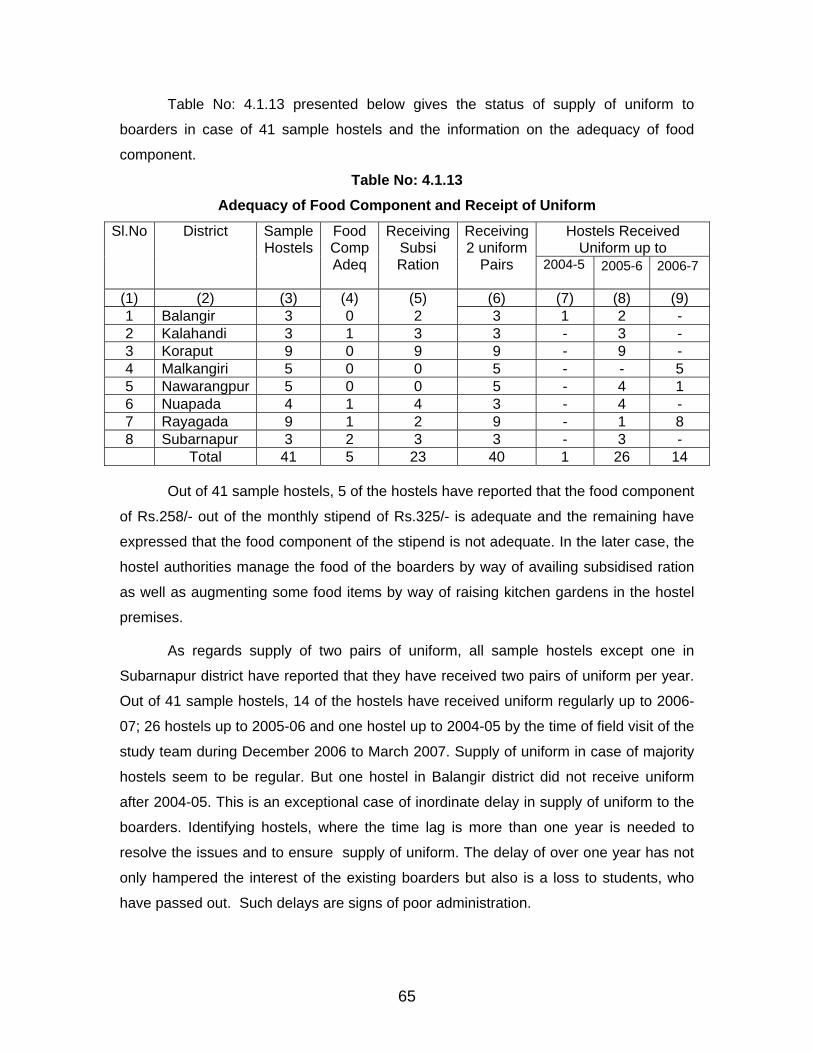
Table No: 4.1.13 presented below gives the status of supply of uniform to
boarders in case of 41 sample hostels and the information on the adequacy of food
component.
Table No: 4.1.13 Adequacy of Food Component and Receipt of Uniform
Hostels Received Uniform up to
Sl.No
District
Sample Hostels
Food Comp Adeq
ReceivingSubsi Ration
Receiving2 uniform
Pairs 2004-5
2005-6
2006-7
(1) (2) (3) (4) (5) (6) (7) (8) (9) 1 Balangir 3 0 2 3 1 2 - 2 Kalahandi 3 1 3 3 - 3 - 3 Koraput 9 0 9 9 - 9 - 4 Malkangiri 5 0 0 5 - - 5 5 Nawarangpur 5 0 0 5 - 4 1 6 Nuapada 4 1 4 3 - 4 - 7 Rayagada 9 1 2 9 - 1 8 8 Subarnapur 3 2 3 3 - 3 - Total 41 5 23 40 1 26 14
Out of 41 sample hostels, 5 of the hostels have reported that the food component
of Rs.258/- out of the monthly stipend of Rs.325/- is adequate and the remaining have
expressed that the food component of the stipend is not adequate. In the later case, the
hostel authorities manage the food of the boarders by way of availing subsidised ration
as well as augmenting some food items by way of raising kitchen gardens in the hostel
premises.
As regards supply of two pairs of uniform, all sample hostels except one in
Subarnapur district have reported that they have received two pairs of uniform per year.
Out of 41 sample hostels, 14 of the hostels have received uniform regularly up to 2006-
07; 26 hostels up to 2005-06 and one hostel up to 2004-05 by the time of field visit of the
study team during December 2006 to March 2007. Supply of uniform in case of majority
hostels seem to be regular. But one hostel in Balangir district did not receive uniform
after 2004-05. This is an exceptional case of inordinate delay in supply of uniform to the
boarders. Identifying hostels, where the time lag is more than one year is needed to
resolve the issues and to ensure supply of uniform. The delay of over one year has not
only hampered the interest of the existing boarders but also is a loss to students, who
have passed out. Such delays are signs of poor administration.
65
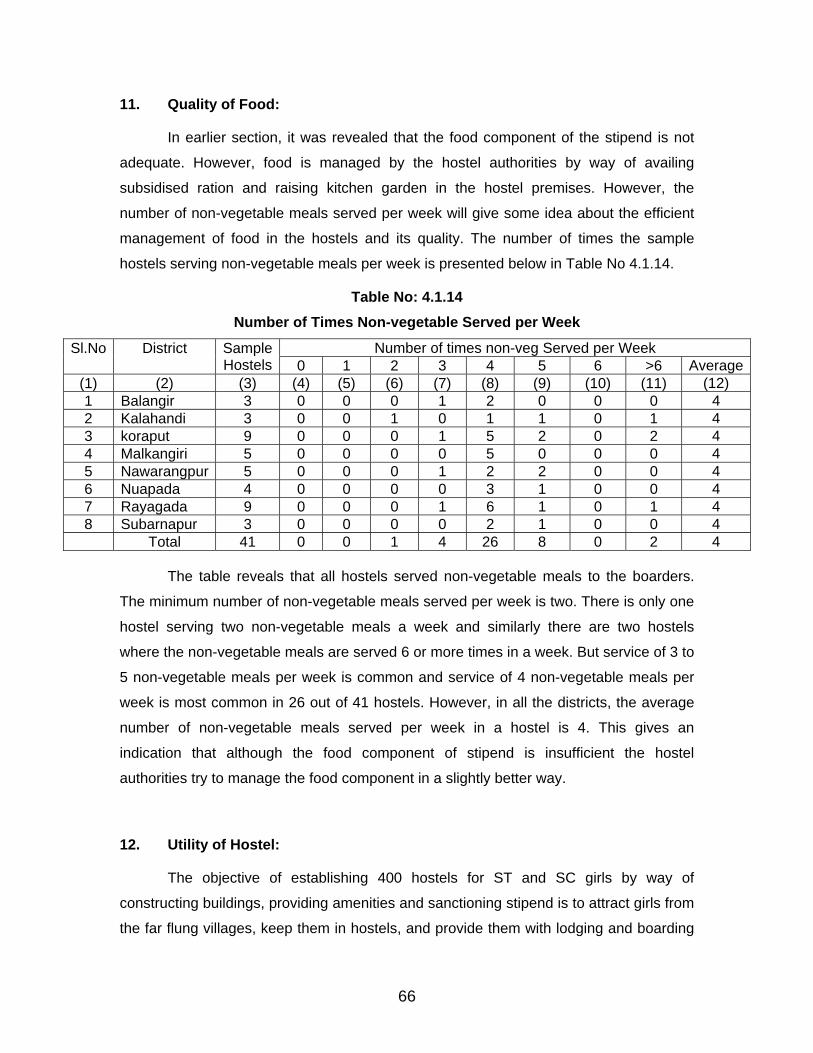
11. Quality of Food:
In earlier section, it was revealed that the food component of the stipend is not
adequate. However, food is managed by the hostel authorities by way of availing
subsidised ration and raising kitchen garden in the hostel premises. However, the
number of non-vegetable meals served per week will give some idea about the efficient
management of food in the hostels and its quality. The number of times the sample
hostels serving non-vegetable meals per week is presented below in Table No 4.1.14.
Table No: 4.1.14 Number of Times Non-vegetable Served per Week
Number of times non-veg Served per Week Sl.No
District
Sample Hostels 0 1 2 3 4 5 6 >6 Average
(1) (2) (3) (4) (5) (6) (7) (8) (9) (10) (11) (12) 1 Balangir 3 0 0 0 1 2 0 0 0 4 2 Kalahandi 3 0 0 1 0 1 1 0 1 4 3 koraput 9 0 0 0 1 5 2 0 2 4 4 Malkangiri 5 0 0 0 0 5 0 0 0 4 5 Nawarangpur 5 0 0 0 1 2 2 0 0 4 6 Nuapada 4 0 0 0 0 3 1 0 0 4 7 Rayagada 9 0 0 0 1 6 1 0 1 4 8 Subarnapur 3 0 0 0 0 2 1 0 0 4 Total 41 0 0 1 4 26 8 0 2 4
The table reveals that all hostels served non-vegetable meals to the boarders.
The minimum number of non-vegetable meals served per week is two. There is only one
hostel serving two non-vegetable meals a week and similarly there are two hostels
where the non-vegetable meals are served 6 or more times in a week. But service of 3 to
5 non-vegetable meals per week is common and service of 4 non-vegetable meals per
week is most common in 26 out of 41 hostels. However, in all the districts, the average
number of non-vegetable meals served per week in a hostel is 4. This gives an
indication that although the food component of stipend is insufficient the hostel
authorities try to manage the food component in a slightly better way.
12. Utility of Hostel:
The objective of establishing 400 hostels for ST and SC girls by way of
constructing buildings, providing amenities and sanctioning stipend is to attract girls from
the far flung villages, keep them in hostels, and provide them with lodging and boarding
66
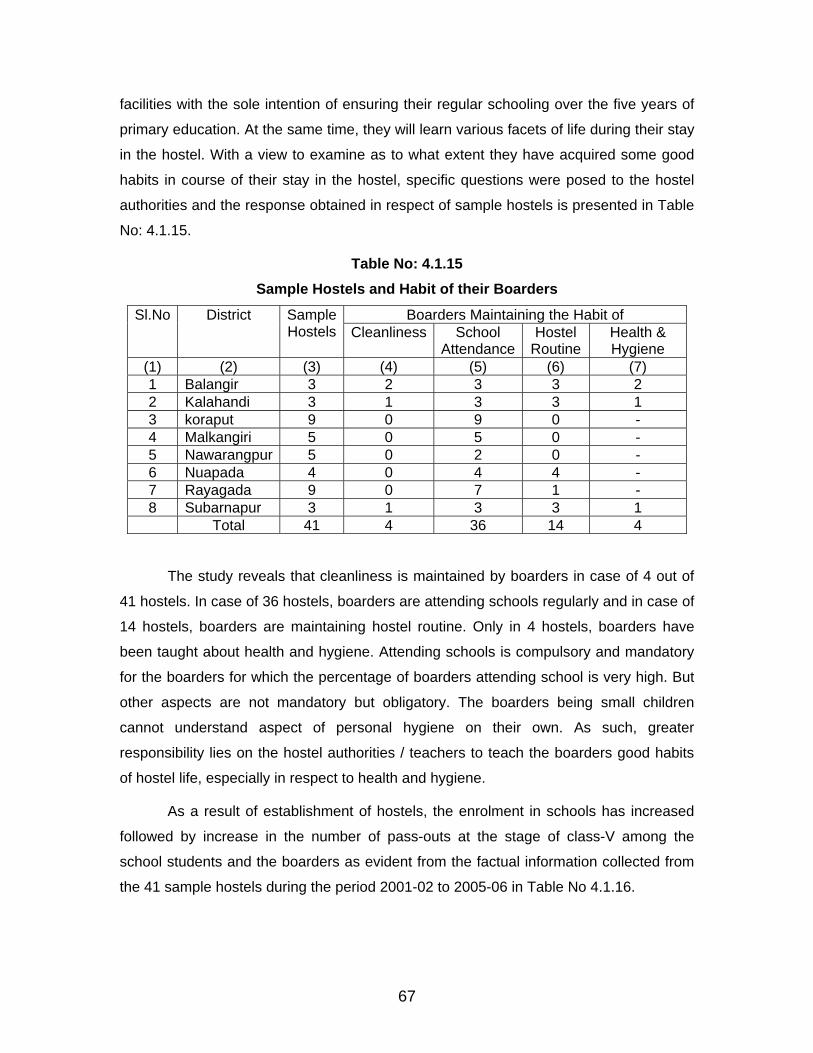
facilities with the sole intention of ensuring their regular schooling over the five years of
primary education. At the same time, they will learn various facets of life during their stay
in the hostel. With a view to examine as to what extent they have acquired some good
habits in course of their stay in the hostel, specific questions were posed to the hostel
authorities and the response obtained in respect of sample hostels is presented in Table
No: 4.1.15.
Table No: 4.1.15 Sample Hostels and Habit of their Boarders
Boarders Maintaining the Habit of Sl.No
District
SampleHostels
Cleanliness
School
AttendanceHostel
Routine Health & Hygiene
(1) (2) (3) (4) (5) (6) (7) 1 Balangir 3 2 3 3 2 2 Kalahandi 3 1 3 3 1 3 koraput 9 0 9 0 - 4 Malkangiri 5 0 5 0 - 5 Nawarangpur 5 0 2 0 - 6 Nuapada 4 0 4 4 - 7 Rayagada 9 0 7 1 - 8 Subarnapur 3 1 3 3 1 Total 41 4 36 14 4
The study reveals that cleanliness is maintained by boarders in case of 4 out of
41 hostels. In case of 36 hostels, boarders are attending schools regularly and in case of
14 hostels, boarders are maintaining hostel routine. Only in 4 hostels, boarders have
been taught about health and hygiene. Attending schools is compulsory and mandatory
for the boarders for which the percentage of boarders attending school is very high. But
other aspects are not mandatory but obligatory. The boarders being small children
cannot understand aspect of personal hygiene on their own. As such, greater
responsibility lies on the hostel authorities / teachers to teach the boarders good habits
of hostel life, especially in respect to health and hygiene.
As a result of establishment of hostels, the enrolment in schools has increased
followed by increase in the number of pass-outs at the stage of class-V among the
school students and the boarders as evident from the factual information collected from
the 41 sample hostels during the period 2001-02 to 2005-06 in Table No 4.1.16.
67
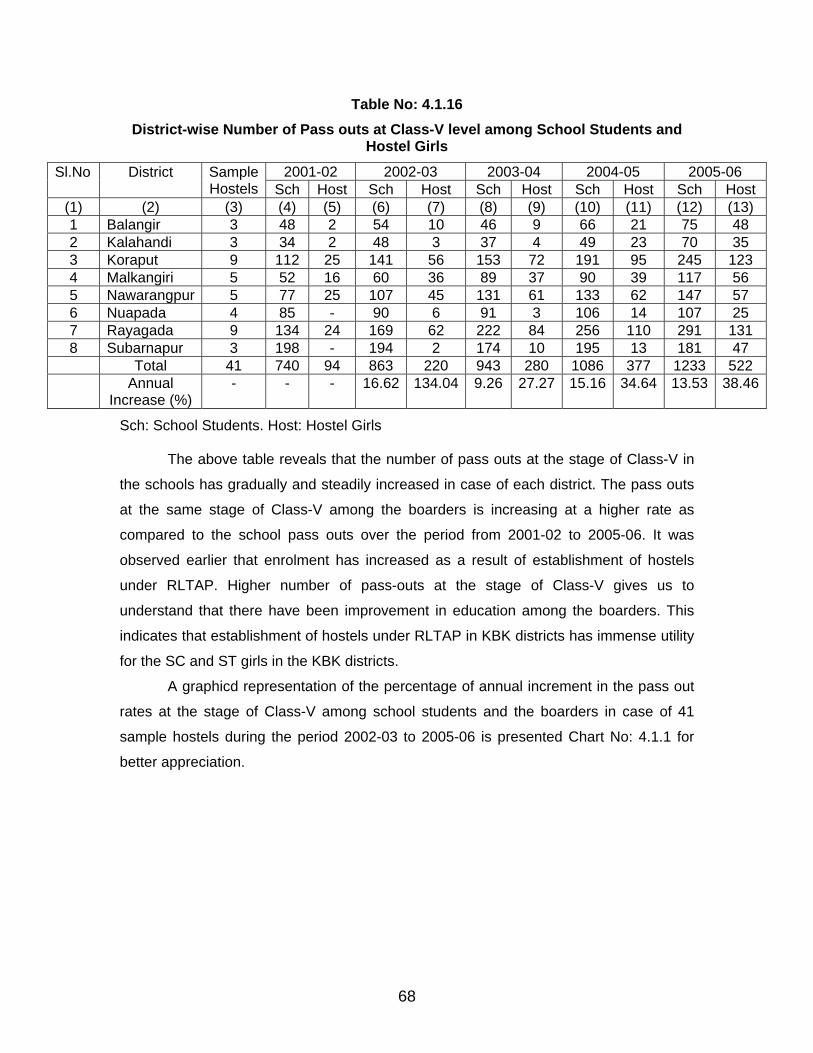
Table No: 4.1.16 District-wise Number of Pass outs at Class-V level among School Students and
Hostel Girls
2001-02 2002-03 2003-04 2004-05 2005-06 Sl.No
District
Sample Hostels Sch Host Sch Host Sch Host Sch Host Sch Host
(1) (2) (3) (4) (5) (6) (7) (8) (9) (10) (11) (12) (13) 1 Balangir 3 48 2 54 10 46 9 66 21 75 48 2 Kalahandi 3 34 2 48 3 37 4 49 23 70 35 3 Koraput 9 112 25 141 56 153 72 191 95 245 123 4 Malkangiri 5 52 16 60 36 89 37 90 39 117 56 5 Nawarangpur 5 77 25 107 45 131 61 133 62 147 57 6 Nuapada 4 85 - 90 6 91 3 106 14 107 25 7 Rayagada 9 134 24 169 62 222 84 256 110 291 131 8 Subarnapur 3 198 - 194 2 174 10 195 13 181 47 Total 41 740 94 863 220 943 280 1086 377 1233 522
Annual
Increase (%) -
-
-
16.62
134.04
9.26
27.27
15.16
34.64
13.53
38.46
Sch: School Students. Host: Hostel Girls
The above table reveals that the number of pass outs at the stage of Class-V in
the schools has gradually and steadily increased in case of each district. The pass outs
at the same stage of Class-V among the boarders is increasing at a higher rate as
compared to the school pass outs over the period from 2001-02 to 2005-06. It was
observed earlier that enrolment has increased as a result of establishment of hostels
under RLTAP. Higher number of pass-outs at the stage of Class-V gives us to
understand that there have been improvement in education among the boarders. This
indicates that establishment of hostels under RLTAP in KBK districts has immense utility
for the SC and ST girls in the KBK districts.
A graphicd representation of the percentage of annual increment in the pass out
rates at the stage of Class-V among school students and the boarders in case of 41
sample hostels during the period 2002-03 to 2005-06 is presented Chart No: 4.1.1 for
better appreciation.
68
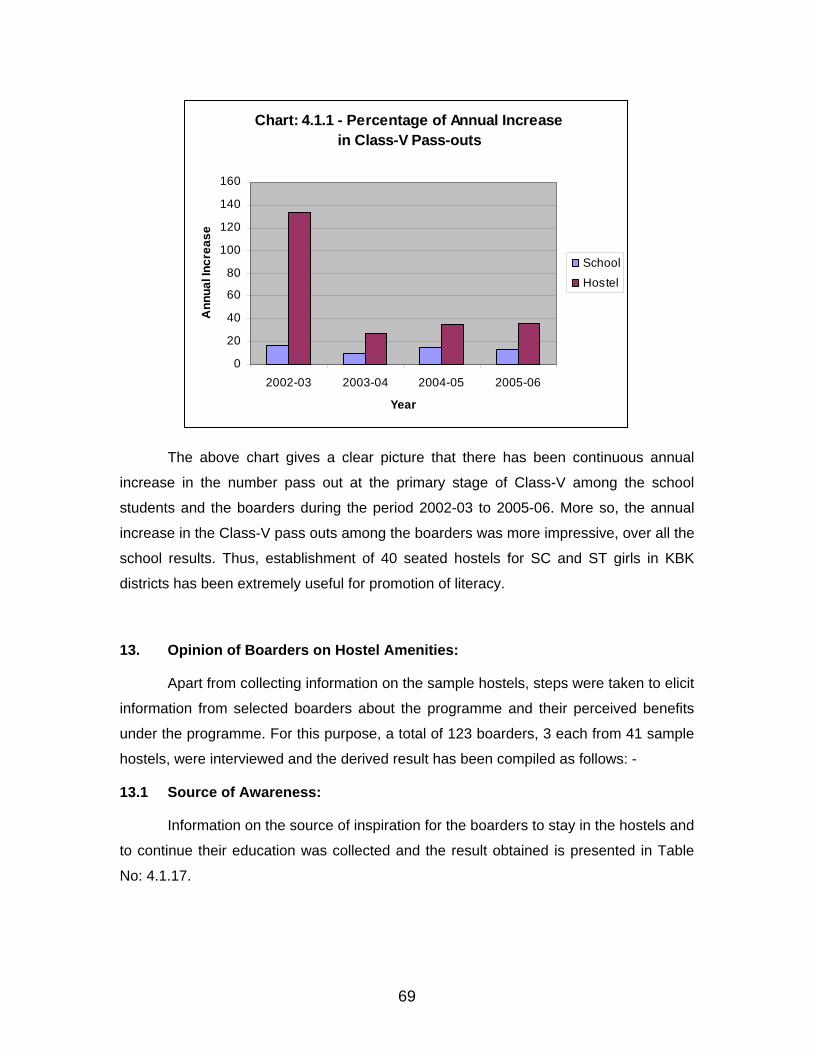
Chart: 4.1.1 - Percentage of Annual Increasein Class-V Pass-outs
0
20
40
60
80
100
120
140
160
2002-03 2003-04 2004-05 2005-06
Year
Ann
ual I
ncre
ase
School
Hostel
The above chart gives a clear picture that there has been continuous annual
increase in the number pass out at the primary stage of Class-V among the school
students and the boarders during the period 2002-03 to 2005-06. More so, the annual
increase in the Class-V pass outs among the boarders was more impressive, over all the
school results. Thus, establishment of 40 seated hostels for SC and ST girls in KBK
districts has been extremely useful for promotion of literacy.
13. Opinion of Boarders on Hostel Amenities:
Apart from collecting information on the sample hostels, steps were taken to elicit
information from selected boarders about the programme and their perceived benefits
under the programme. For this purpose, a total of 123 boarders, 3 each from 41 sample
hostels, were interviewed and the derived result has been compiled as follows: -
13.1 Source of Awareness:
Information on the source of inspiration for the boarders to stay in the hostels and
to continue their education was collected and the result obtained is presented in Table
No: 4.1.17.
69
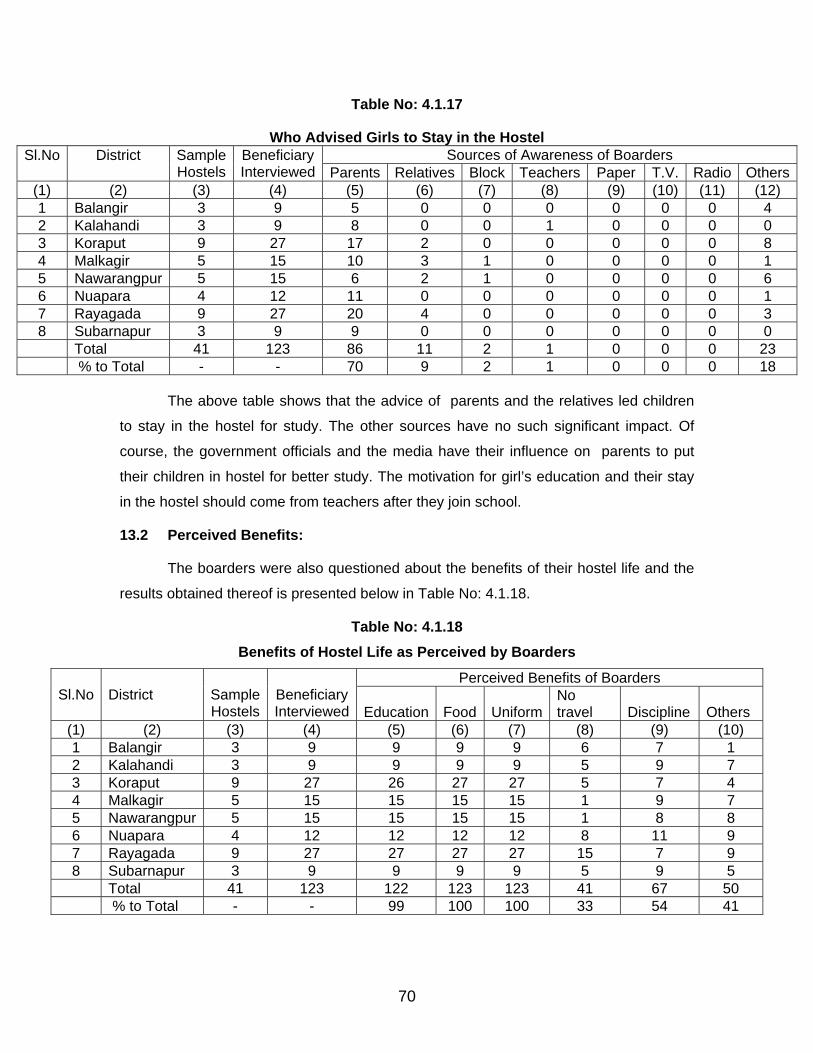
Table No: 4.1.17
Who Advised Girls to Stay in the Hostel Sources of Awareness of Boarders Sl.No
District Sample
Hostels Beneficiary Interviewed Parents Relatives Block Teachers Paper T.V. Radio Others
(1) (2) (3) (4) (5) (6) (7) (8) (9) (10) (11) (12) 1 Balangir 3 9 5 0 0 0 0 0 0 4
3 2 Kalahandi 9 8 0 0 1 0 0 0 0 9 3 Koraput 27 17 2 0 0 0 0 0 8
4 Malkagir 5 15 10 3 1 0 0 0 0 1 5 Nawarangpur 5 15 6 2 1 0 0 0 0 6
Nuapara 4 12 11 0 0 0 6 0 0 0 1 7 Rayagada 9 27 20 4 0 0 0 0 0 3 8 Subarnapur 3 9 9 0 0 0 0 0 0 0 41 123 86 11 2 1 0 Total 0 0 23
% to Total - - 70 9 2 1 0 0 0 18
The above table shows that the advice of parents and the relatives led children
to stay in the hostel for study. The other sources have no such significant impact. Of
course, the government officials and the media have their influence on parents to put
their children in hostel for better study. The motivation for girl’s education and their stay
in the hostel should come from teachers after they join school.
13.2 Perceived Benefits:
The boarders were also questioned about the benefits of their hostel life and the
results obtained thereof is presented below in Table No: 4.1.18.
Table No: 4.1.18 Benefits of Hostel Life as Perceived by Boarders
Perceived Benefits of Boarders Sl.No
District
Sample Hostels
Beneficiary Interviewed Education Food Uniform
No travel Discipline Others
(1) (2) (3) (4) (5) (6) (7) (8) (9) (10) Balangir 3 9 9 9 9 1 6 7 1
2 Kalahandi 3 9 9 9 9 5 9 7 3 Koraput 9 27 26 27 27 5 7 4 4 Malkagir 5 15 15 15 15 1 9 7 5 Nawarangpur 5 15 15 15 15 1 8 8 6 Nuapara 4 12 12 12 12 8 11 9 7 Rayagada 9 27 27 27 27 15 7 9 8 Subarnapur 3 9 9 9 9 5 9 5 Total 41 123 122 123 123 41 67 50
% to Total - - 99 100 100 33 54 41
70
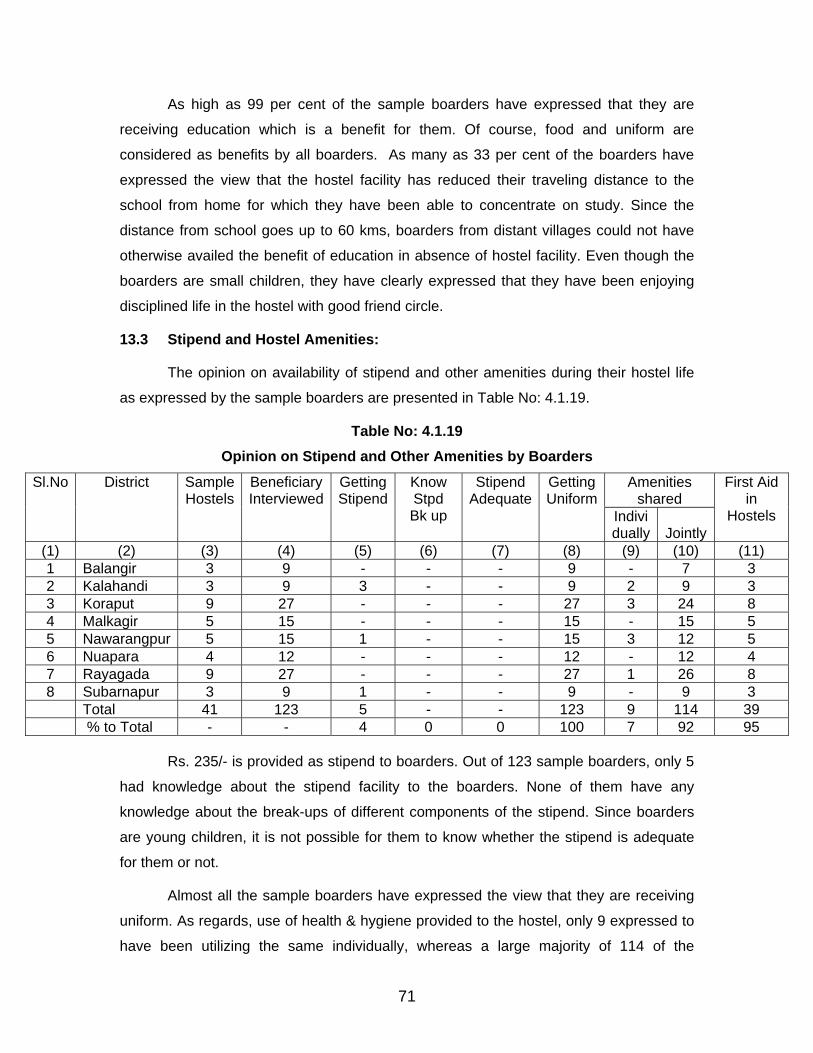
As high as 99 per cent of the sample boarders have expressed that they are
receiving education which is a benefit for them. Of course, food and uniform are
considered as benefits by all boarders. As many as 33 per cent of the boarders have
expressed the view that the hostel facility has reduced their traveling distance to the
school from home for which they have been able to concentrate on study. Since the
distance from school goes up to 60 kms, boarders from distant villages could not have
otherwise availed the benefit of education in absence of hostel facility. Even though the
boarders are small children, they have clearly expressed that they have been enjoying
disciplined life in the hostel with good friend circle.
13.3 Stipend and Hostel Amenities:
The opinion on availability of stipend and other amenities during their hostel life
as expressed by the sample boarders are presented in Table No: 4.1.19.
Table No: 4.1.19 Opinion on Stipend and Other Amenities by Boarders
Amenities shared
Sl.No
District
Sample Hostels
Beneficiary Interviewed
Getting Stipend
Know Stpd Bk up
Stipend Adequate
Getting Uniform
Indivi dually Jointly
First Aid in
Hostels
(1) (2) (3) (4) (5) (6) (7) (8) (9) (10) (11) 1 Balangir 3 9 - - - 9 - 7 3 2 Kalahandi 3 9 3 - - 9 2 9 3 3 Koraput 9 27 - - - 27 3 24 8 4 Malkagir 5 15 - - - 15 - 15 5 5 Nawarangpur 5 15 1 - - 15 3 12 5 6 Nuapara 4 12 - - - 12 - 12 4 7 Rayagada 9 27 - - - 27 1 26 8 8 Subarnapur 3 9 1 - - 9 - 9 3 Total 41 123 5 - - 123 9 114 39
% to Total - - 4 0 0 100 7 92 95
Rs. 235/- is provided as stipend to boarders. Out of 123 sample boarders, only 5
had knowledge about the stipend facility to the boarders. None of them have any
knowledge about the break-ups of different components of the stipend. Since boarders
are young children, it is not possible for them to know whether the stipend is adequate
for them or not.
Almost all the sample boarders have expressed the view that they are receiving
uniform. As regards, use of health & hygiene provided to the hostel, only 9 expressed to
have been utilizing the same individually, whereas a large majority of 114 of the
71
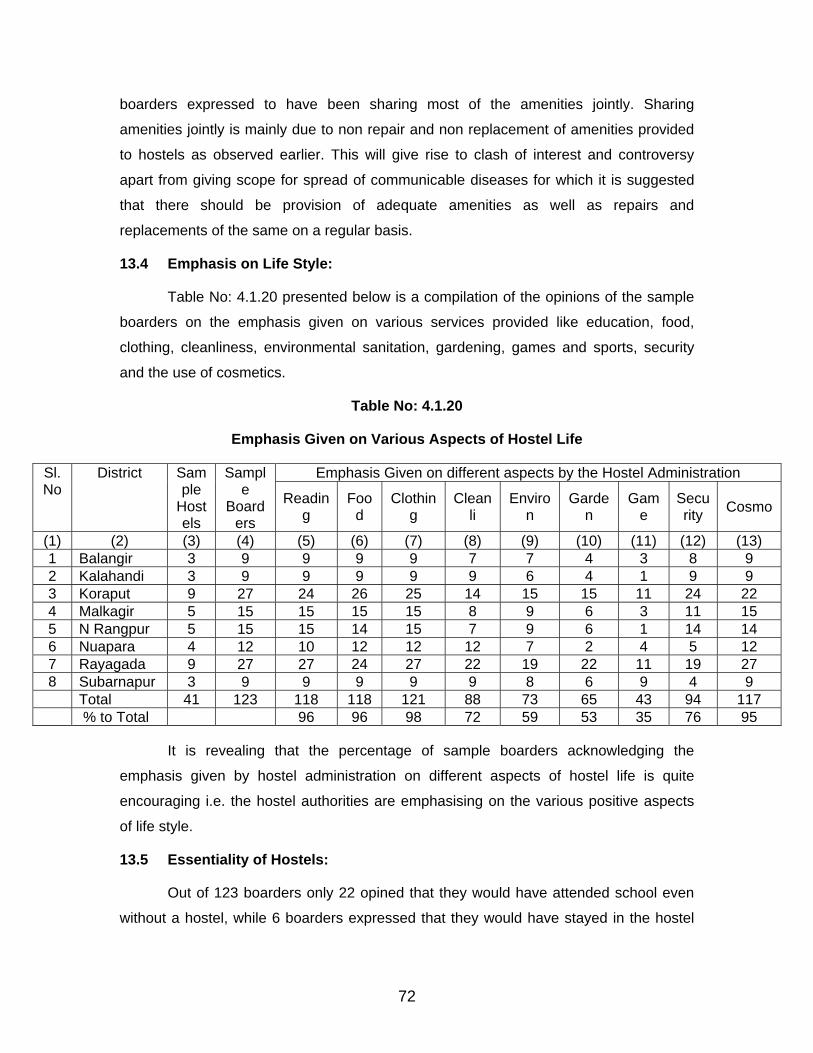
boarders expressed to have been sharing most of the amenities jointly. Sharing
amenities jointly is mainly due to non repair and non replacement of amenities provided
to hostels as observed earlier. This will give rise to clash of interest and controversy
apart from giving scope for spread of communicable diseases for which it is suggested
that there should be provision of adequate amenities as well as repairs and
replacements of the same on a regular basis.
13.4 Emphasis on Life Style:
Table No: 4.1.20 presented below is a compilation of the opinions of the sample
boarders on the emphasis given on various services provided like education, food,
clothing, cleanliness, environmental sanitation, gardening, games and sports, security
and the use of cosmetics.
Table No: 4.1.20
Emphasis Given on Various Aspects of Hostel Life
Emphasis Given on different aspects by the Hostel Administration Sl.No
District
Sample
Hostels
Sample
Boarders
Reading
Food
Clothing
Cleanli
Environ
Garden
Game
Security Cosmo
(1) (2) (3) (4) (5) (6) (7) (8) (9) (10) (11) (12) (13) 1 Balangir 3 9 9 9 9 7 7 4 3 8 9 2 Kalahandi 3 9 9 9 9 9 6 4 1 9 9 3 Koraput 9 27 24 26 25 14 15 15 11 24 22 4 Malkagir 5 15 15 15 15 8 9 6 3 11 15 5 N Rangpur 5 15 15 14 15 7 9 6 1 14 14 6 Nuapara 4 12 10 12 12 12 7 2 4 5 12 7 Rayagada 9 27 27 24 27 22 19 22 11 19 27 8 Subarnapur 3 9 9 9 9 9 8 6 9 4 9 Total 41 123 118 118 121 88 73 65 43 94 117
% to Total 96 96 98 72 59 53 35 76 95
It is revealing that the percentage of sample boarders acknowledging the
emphasis given by hostel administration on different aspects of hostel life is quite
encouraging i.e. the hostel authorities are emphasising on the various positive aspects
of life style.
13.5 Essentiality of Hostels:
Out of 123 boarders only 22 opined that they would have attended school even
without a hostel, while 6 boarders expressed that they would have stayed in the hostel
72
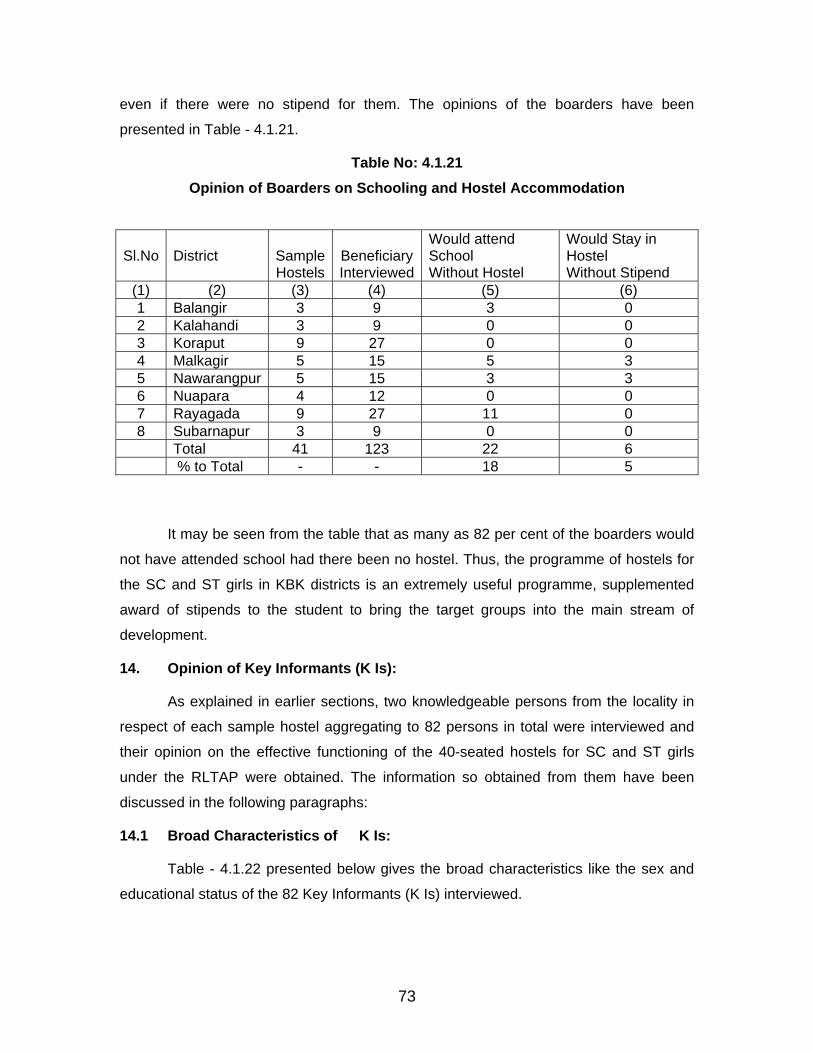
even if there were no stipend for them. The opinions of the boarders have been
presented in Table - 4.1.21.
Table No: 4.1.21 Opinion of Boarders on Schooling and Hostel Accommodation
Sl.No
District
Sample Hostels
Beneficiary Interviewed
Would attend School Without Hostel
Would Stay in Hostel Without Stipend
(1) (2) (3) (4) (5) (6) 1 Balangir 3 9 3 0 2 Kalahandi 3 9 0 0 3 Koraput 9 27 0 0 4 Malkagir 5 15 5 3 5 Nawarangpur 5 15 3 3 6 Nuapara 4 12 0 0 7 Rayagada 9 27 11 0 8 Subarnapur 3 9 0 0 Total 41 123 22 6
% to Total - - 18 5
It may be seen from the table that as many as 82 per cent of the boarders would
not have attended school had there been no hostel. Thus, the programme of hostels for
the SC and ST girls in KBK districts is an extremely useful programme, supplemented
award of stipends to the student to bring the target groups into the main stream of
development.
14. Opinion of Key Informants (K Is):
As explained in earlier sections, two knowledgeable persons from the locality in
respect of each sample hostel aggregating to 82 persons in total were interviewed and
their opinion on the effective functioning of the 40-seated hostels for SC and ST girls
under the RLTAP were obtained. The information so obtained from them have been
discussed in the following paragraphs:
14.1 Broad Characteristics of K Is:
Table - 4.1.22 presented below gives the broad characteristics like the sex and
educational status of the 82 Key Informants (K Is) interviewed.
73
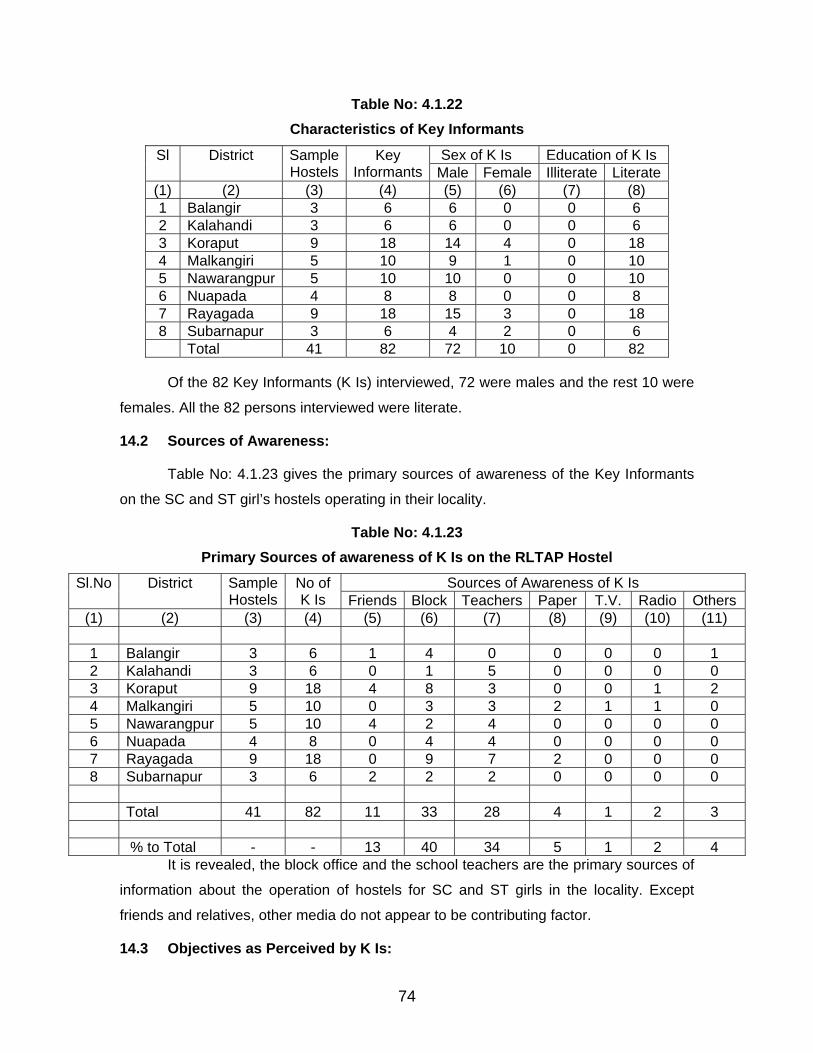
Table No: 4.1.22 Characteristics of Key Informants
Sex of K Is Education of K Is Sl
District
SampleHostels
Key Informants Male Female Illiterate Literate
(1) (2) (3) (4) (5) (6) (7) (8) 1 Balangir 3 6 6 0 0 6 2 Kalahandi 3 6 6 0 0 6 3 Koraput 9 18 14 4 0 18 4 Malkangiri 5 10 9 1 0 10 5 Nawarangpur 5 10 10 0 0 10 6 Nuapada 4 8 8 0 0 8 7 Rayagada 9 18 15 3 0 18 8 Subarnapur 3 6 4 2 0 6
Total 41 82 72 10 0 82
Of the 82 Key Informants (K Is) interviewed, 72 were males and the rest 10 were
females. All the 82 persons interviewed were literate.
14.2 Sources of Awareness:
Table No: 4.1.23 gives the primary sources of awareness of the Key Informants
on the SC and ST girl’s hostels operating in their locality.
Table No: 4.1.23 Primary Sources of awareness of K Is on the RLTAP Hostel
Sources of Awareness of K Is Sl.No
District
Sample Hostels
No of K Is Friends Block Teachers Paper T.V. Radio Others
(1) (2) (3) (4) (5) (6) (7) (8) (9) (10) (11)
1 Balangir 3 6 1 4 0 0 0 0 1 2 Kalahandi 3 6 0 1 5 0 0 0 0 3 Koraput 9 18 4 8 3 0 0 1 2 4 Malkangiri 5 10 0 3 3 2 1 1 0 5 Nawarangpur 5 10 4 2 4 0 0 0 0 6 Nuapada 4 8 0 4 4 0 0 0 0 7 Rayagada 9 18 0 9 7 2 0 0 0 8 Subarnapur 3 6 2 2 2 0 0 0 0 Total 41 82 11 33 28 4 1 2 3
% to Total - - 13 40 34 5 1 2 4
It is revealed, the block office and the school teachers are the primary sources of
information about the operation of hostels for SC and ST girls in the locality. Except
friends and relatives, other media do not appear to be contributing factor.
14.3 Objectives as Perceived by K Is:
74
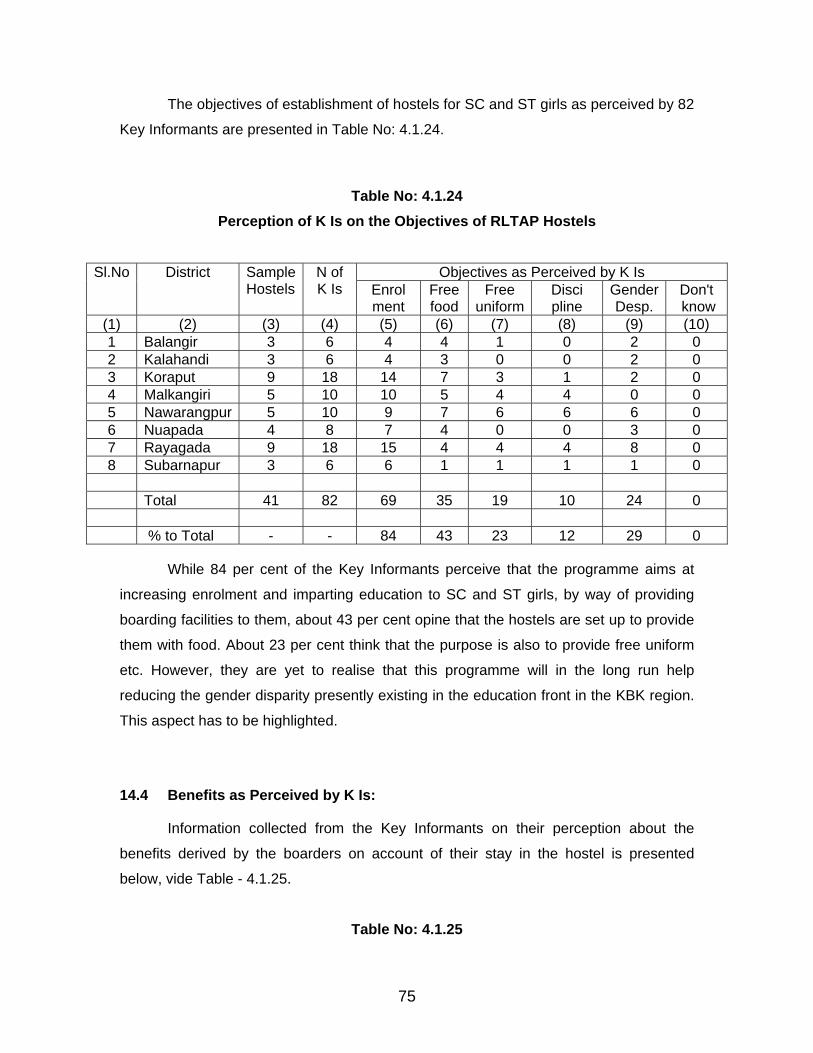
The objectives of establishment of hostels for SC and ST girls as perceived by 82
Key Informants are presented in Table No: 4.1.24.
Table No: 4.1.24 Perception of K Is on the Objectives of RLTAP Hostels
Objectives as Perceived by K Is Sl.No
District
Sample Hostels
N of K Is Enrol
ment Free food
Free uniform
Disci pline
Gender Desp.
Don't know
(1) (2) (3) (4) (5) (6) (7) (8) (9) (10) 1 Balangir 3 6 4 4 1 0 2 0 2 Kalahandi 3 6 4 3 0 0 2 0 3 Koraput 9 18 14 7 3 1 2 0 4 Malkangiri 5 10 10 5 4 4 0 0 5 Nawarangpur 5 10 9 7 6 6 6 0 6 Nuapada 4 8 7 4 0 0 3 0 7 Rayagada 9 18 15 4 4 4 8 0 8 Subarnapur 3 6 6 1 1 1 1 0
Total 41 82 69 35 19 10 24 0 % to Total - - 84 43 23 12 29 0
While 84 per cent of the Key Informants perceive that the programme aims at
increasing enrolment and imparting education to SC and ST girls, by way of providing
boarding facilities to them, about 43 per cent opine that the hostels are set up to provide
them with food. About 23 per cent think that the purpose is also to provide free uniform
etc. However, they are yet to realise that this programme will in the long run help
reducing the gender disparity presently existing in the education front in the KBK region.
This aspect has to be highlighted.
14.4 Benefits as Perceived by K Is:
Information collected from the Key Informants on their perception about the
benefits derived by the boarders on account of their stay in the hostel is presented
below, vide Table - 4.1.25.
Table No: 4.1.25
75
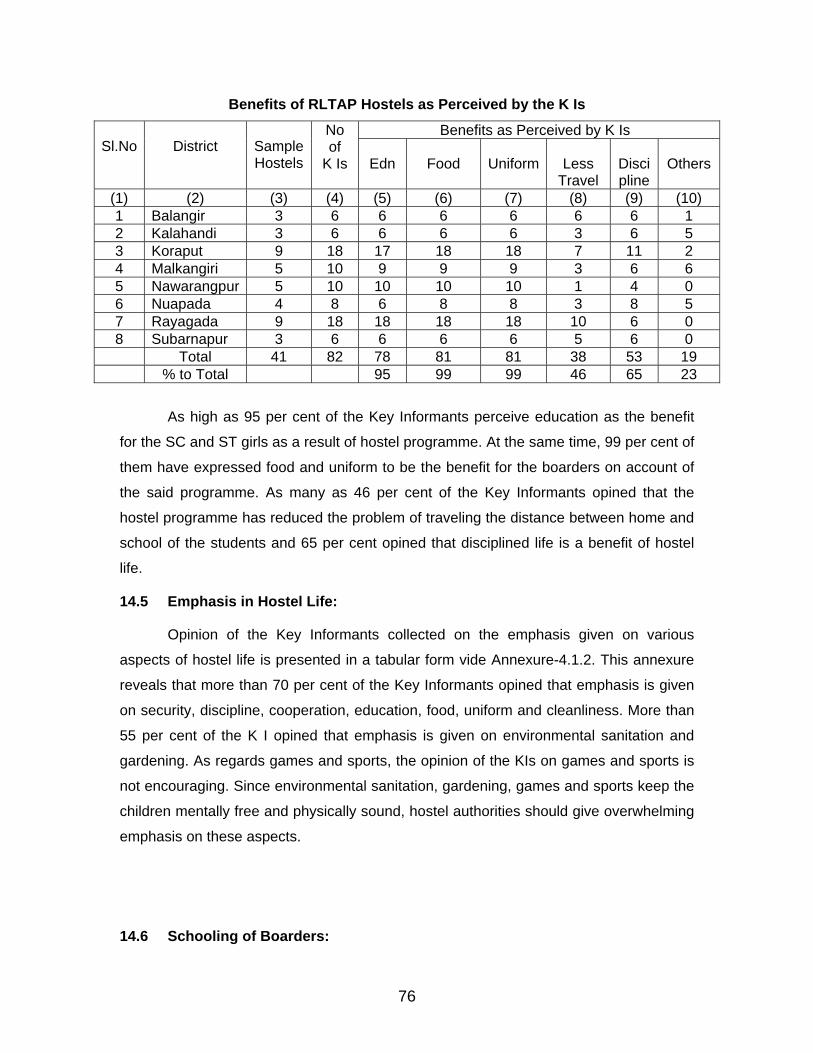
Benefits of RLTAP Hostels as Perceived by the K Is
Benefits as Perceived by K Is Sl.No
District
Sample Hostels
No of
K Is
Edn
Food
Uniform
Less Travel
Disci pline
Others
(1) (2) (3) (4) (5) (6) (7) (8) (9) (10) 1 Balangir 3 6 6 6 6 6 6 1 2 Kalahandi 3 6 6 6 6 3 6 5 3 Koraput 9 18 17 18 18 7 11 2 4 Malkangiri 5 10 9 9 9 3 6 6 5 Nawarangpur 5 10 10 10 10 1 4 0 6 Nuapada 4 8 6 8 8 3 8 5 7 Rayagada 9 18 18 18 18 10 6 0 8 Subarnapur 3 6 6 6 6 5 6 0 Total 41 82 78 81 81 38 53 19 % to Total 95 99 99 46 65 23
As high as 95 per cent of the Key Informants perceive education as the benefit
for the SC and ST girls as a result of hostel programme. At the same time, 99 per cent of
them have expressed food and uniform to be the benefit for the boarders on account of
the said programme. As many as 46 per cent of the Key Informants opined that the
hostel programme has reduced the problem of traveling the distance between home and
school of the students and 65 per cent opined that disciplined life is a benefit of hostel
life.
14.5 Emphasis in Hostel Life:
Opinion of the Key Informants collected on the emphasis given on various
aspects of hostel life is presented in a tabular form vide Annexure-4.1.2. This annexure
reveals that more than 70 per cent of the Key Informants opined that emphasis is given
on security, discipline, cooperation, education, food, uniform and cleanliness. More than
55 per cent of the K I opined that emphasis is given on environmental sanitation and
gardening. As regards games and sports, the opinion of the KIs on games and sports is
not encouraging. Since environmental sanitation, gardening, games and sports keep the
children mentally free and physically sound, hostel authorities should give overwhelming
emphasis on these aspects.
14.6 Schooling of Boarders:
76
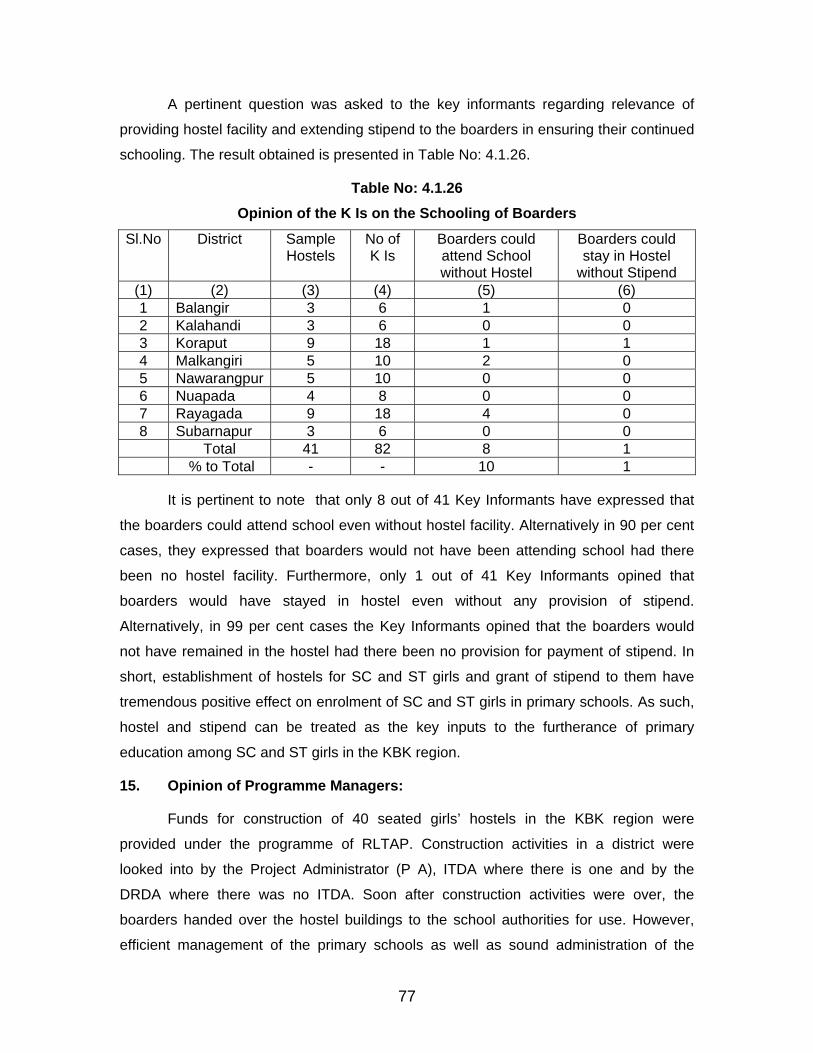
A pertinent question was asked to the key informants regarding relevance of
providing hostel facility and extending stipend to the boarders in ensuring their continued
schooling. The result obtained is presented in Table No: 4.1.26.
Table No: 4.1.26 Opinion of the K Is on the Schooling of Boarders
Sl.No
District
Sample Hostels
No of K Is
Boarders could attend School without Hostel
Boarders could stay in Hostel
without Stipend (1) (2) (3) (4) (5) (6) 1 Balangir 3 6 1 0 2 Kalahandi 3 6 0 0 3 Koraput 9 18 1 1 4 Malkangiri 5 10 2 0 5 Nawarangpur 5 10 0 0 6 Nuapada 4 8 0 0 7 Rayagada 9 18 4 0 8 Subarnapur 3 6 0 0 Total 41 82 8 1 % to Total - - 10 1
It is pertinent to note that only 8 out of 41 Key Informants have expressed that
the boarders could attend school even without hostel facility. Alternatively in 90 per cent
cases, they expressed that boarders would not have been attending school had there
been no hostel facility. Furthermore, only 1 out of 41 Key Informants opined that
boarders would have stayed in hostel even without any provision of stipend.
Alternatively, in 99 per cent cases the Key Informants opined that the boarders would
not have remained in the hostel had there been no provision for payment of stipend. In
short, establishment of hostels for SC and ST girls and grant of stipend to them have
tremendous positive effect on enrolment of SC and ST girls in primary schools. As such,
hostel and stipend can be treated as the key inputs to the furtherance of primary
education among SC and ST girls in the KBK region.
15. Opinion of Programme Managers:
Funds for construction of 40 seated girls’ hostels in the KBK region were
provided under the programme of RLTAP. Construction activities in a district were
looked into by the Project Administrator (P A), ITDA where there is one and by the
DRDA where there was no ITDA. Soon after construction activities were over, the
boarders handed over the hostel buildings to the school authorities for use. However,
efficient management of the primary schools as well as sound administration of the
77
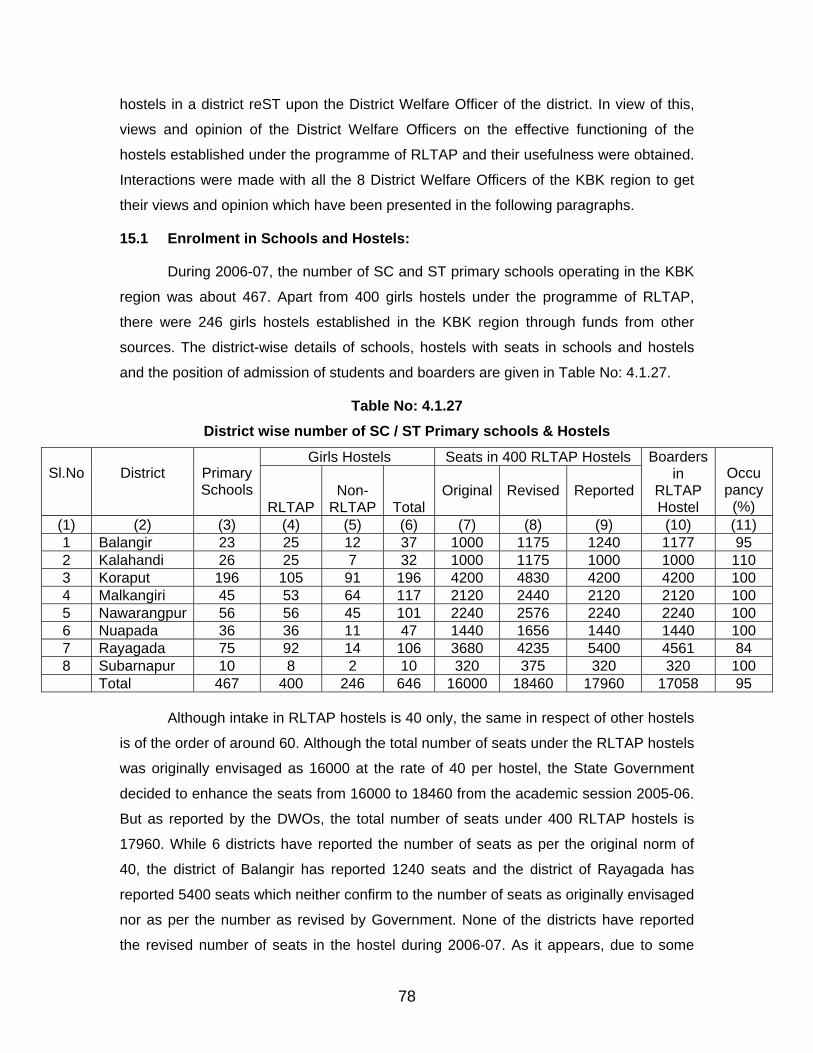
hostels in a district reST upon the District Welfare Officer of the district. In view of this,
views and opinion of the District Welfare Officers on the effective functioning of the
hostels established under the programme of RLTAP and their usefulness were obtained.
Interactions were made with all the 8 District Welfare Officers of the KBK region to get
their views and opinion which have been presented in the following paragraphs.
15.1 Enrolment in Schools and Hostels:
During 2006-07, the number of SC and ST primary schools operating in the KBK
region was about 467. Apart from 400 girls hostels under the programme of RLTAP,
there were 246 girls hostels established in the KBK region through funds from other
sources. The district-wise details of schools, hostels with seats in schools and hostels
and the position of admission of students and boarders are given in Table No: 4.1.27.
Table No: 4.1.27 District wise number of SC / ST Primary schools & Hostels
Girls Hostels Seats in 400 RLTAP Hostels Sl.No
District
Primary Schools
RLTAP Non-
RLTAP Total Original
Revised
Reported
Boardersin
RLTAP Hostel
Occupancy
(%) (1) (2) (3) (4) (5) (6) (7) (8) (9) (10) (11) 1 Balangir 23 25 12 37 1000 1175 1240 1177 95 2 Kalahandi 26 25 7 32 1000 1175 1000 1000 110 3 Koraput 196 105 91 196 4200 4830 4200 4200 100 4 Malkangiri 45 53 64 117 2120 2440 2120 2120 100 5 Nawarangpur 56 56 45 101 2240 2576 2240 2240 100 6 Nuapada 36 36 11 47 1440 1656 1440 1440 100 7 Rayagada 75 92 14 106 3680 4235 5400 4561 84 8 Subarnapur 10 8 2 10 320 375 320 320 100
Total 467 400 246 646 16000 18460 17960 17058 95
Although intake in RLTAP hostels is 40 only, the same in respect of other hostels
is of the order of around 60. Although the total number of seats under the RLTAP hostels
was originally envisaged as 16000 at the rate of 40 per hostel, the State Government
decided to enhance the seats from 16000 to 18460 from the academic session 2005-06.
But as reported by the DWOs, the total number of seats under 400 RLTAP hostels is
17960. While 6 districts have reported the number of seats as per the original norm of
40, the district of Balangir has reported 1240 seats and the district of Rayagada has
reported 5400 seats which neither confirm to the number of seats as originally envisaged
nor as per the number as revised by Government. None of the districts have reported
the revised number of seats in the hostel during 2006-07. As it appears, due to some
78
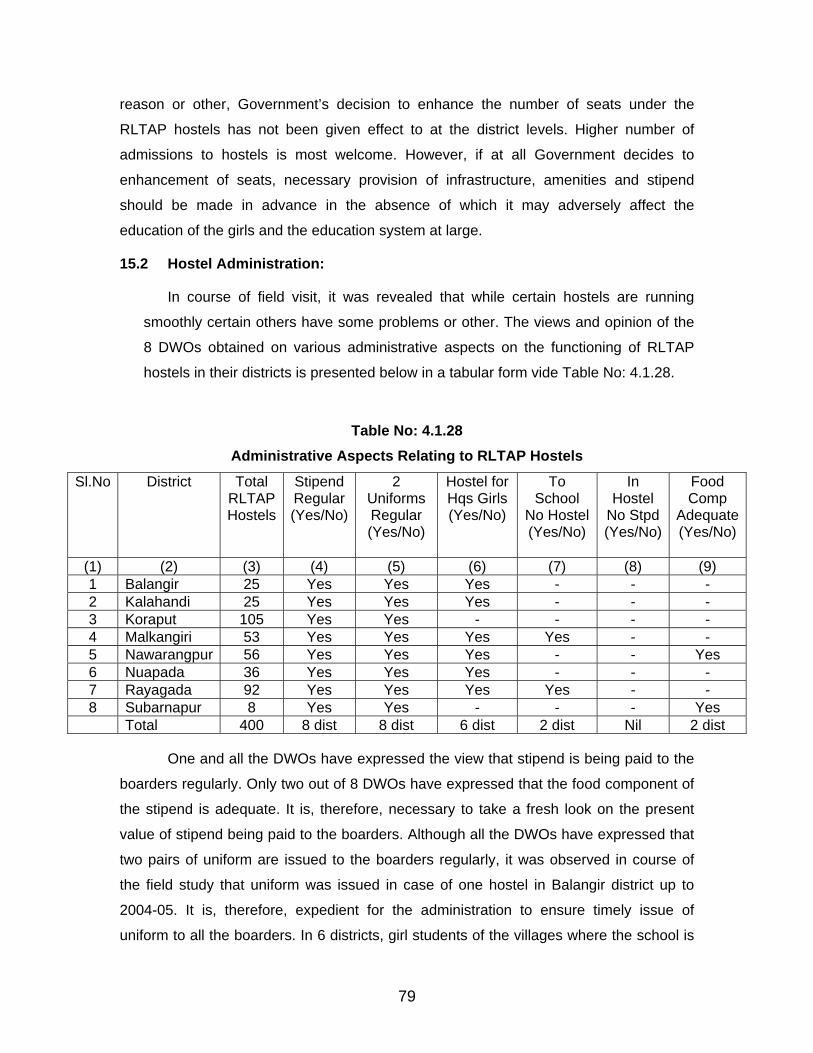
reason or other, Government’s decision to enhance the number of seats under the
RLTAP hostels has not been given effect to at the district levels. Higher number of
admissions to hostels is most welcome. However, if at all Government decides to
enhancement of seats, necessary provision of infrastructure, amenities and stipend
should be made in advance in the absence of which it may adversely affect the
education of the girls and the education system at large.
15.2 Hostel Administration:
In course of field visit, it was revealed that while certain hostels are running
smoothly certain others have some problems or other. The views and opinion of the
8 DWOs obtained on various administrative aspects on the functioning of RLTAP
hostels in their districts is presented below in a tabular form vide Table No: 4.1.28.
Table No: 4.1.28 Administrative Aspects Relating to RLTAP Hostels
Sl.No
District
Total RLTAP Hostels
Stipend Regular (Yes/No)
2 Uniforms Regular (Yes/No)
Hostel for Hqs Girls (Yes/No)
To School
No Hostel (Yes/No)
In Hostel
No Stpd (Yes/No)
Food Comp
Adequate(Yes/No)
(1) (2) (3) (4) (5) (6) (7) (8) (9) 1 Balangir 25 Yes Yes Yes - - - 2 Kalahandi 25 Yes Yes Yes - - - 3 Koraput 105 Yes Yes - - - - 4 Malkangiri 53 Yes Yes Yes Yes - - 5 Nawarangpur 56 Yes Yes Yes - - Yes 6 Nuapada 36 Yes Yes Yes - - - 7 Rayagada 92 Yes Yes Yes Yes - - 8 Subarnapur 8 Yes Yes - - - Yes
Total 400 8 dist 8 dist 6 dist 2 dist Nil 2 dist
One and all the DWOs have expressed the view that stipend is being paid to the
boarders regularly. Only two out of 8 DWOs have expressed that the food component of
the stipend is adequate. It is, therefore, necessary to take a fresh look on the present
value of stipend being paid to the boarders. Although all the DWOs have expressed that
two pairs of uniform are issued to the boarders regularly, it was observed in course of
the field study that uniform was issued in case of one hostel in Balangir district up to
2004-05. It is, therefore, expedient for the administration to ensure timely issue of
uniform to all the boarders. In 6 districts, girl students of the villages where the school is
79
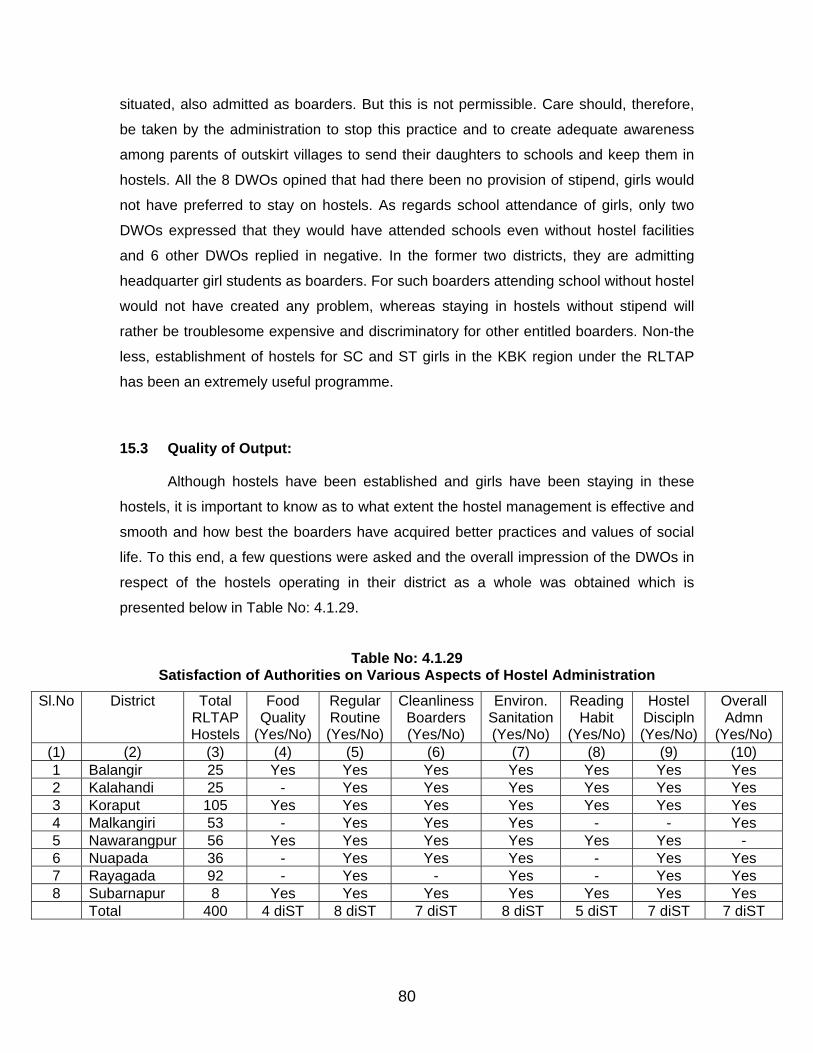
situated, also admitted as boarders. But this is not permissible. Care should, therefore,
be taken by the administration to stop this practice and to create adequate awareness
among parents of outskirt villages to send their daughters to schools and keep them in
hostels. All the 8 DWOs opined that had there been no provision of stipend, girls would
not have preferred to stay on hostels. As regards school attendance of girls, only two
DWOs expressed that they would have attended schools even without hostel facilities
and 6 other DWOs replied in negative. In the former two districts, they are admitting
headquarter girl students as boarders. For such boarders attending school without hostel
would not have created any problem, whereas staying in hostels without stipend will
rather be troublesome expensive and discriminatory for other entitled boarders. Non-the
less, establishment of hostels for SC and ST girls in the KBK region under the RLTAP
has been an extremely useful programme.
15.3 Quality of Output:
Although hostels have been established and girls have been staying in these
hostels, it is important to know as to what extent the hostel management is effective and
smooth and how best the boarders have acquired better practices and values of social
life. To this end, a few questions were asked and the overall impression of the DWOs in
respect of the hostels operating in their district as a whole was obtained which is
presented below in Table No: 4.1.29.
Table No: 4.1.29 Satisfaction of Authorities on Various Aspects of Hostel Administration
Sl.No
District
Total RLTAP Hostels
Food Quality
(Yes/No)
Regular Routine (Yes/No)
CleanlinessBoarders (Yes/No)
Environ. Sanitation(Yes/No)
Reading Habit
(Yes/No)
Hostel Discipln (Yes/No)
Overall Admn
(Yes/No) (1) (2) (3) (4) (5) (6) (7) (8) (9) (10) 1 Balangir 25 Yes Yes Yes Yes Yes Yes Yes 2 Kalahandi 25 - Yes Yes Yes Yes Yes Yes 3 Koraput 105 Yes Yes Yes Yes Yes Yes Yes 4 Malkangiri 53 - Yes Yes Yes - - Yes 5 Nawarangpur 56 Yes Yes Yes Yes Yes Yes - 6 Nuapada 36 - Yes Yes Yes - Yes Yes 7 Rayagada 92 - Yes - Yes - Yes Yes 8 Subarnapur 8 Yes Yes Yes Yes Yes Yes Yes
Total 400 4 diST 8 diST 7 diST 8 diST 5 diST 7 diST 7 diST
80
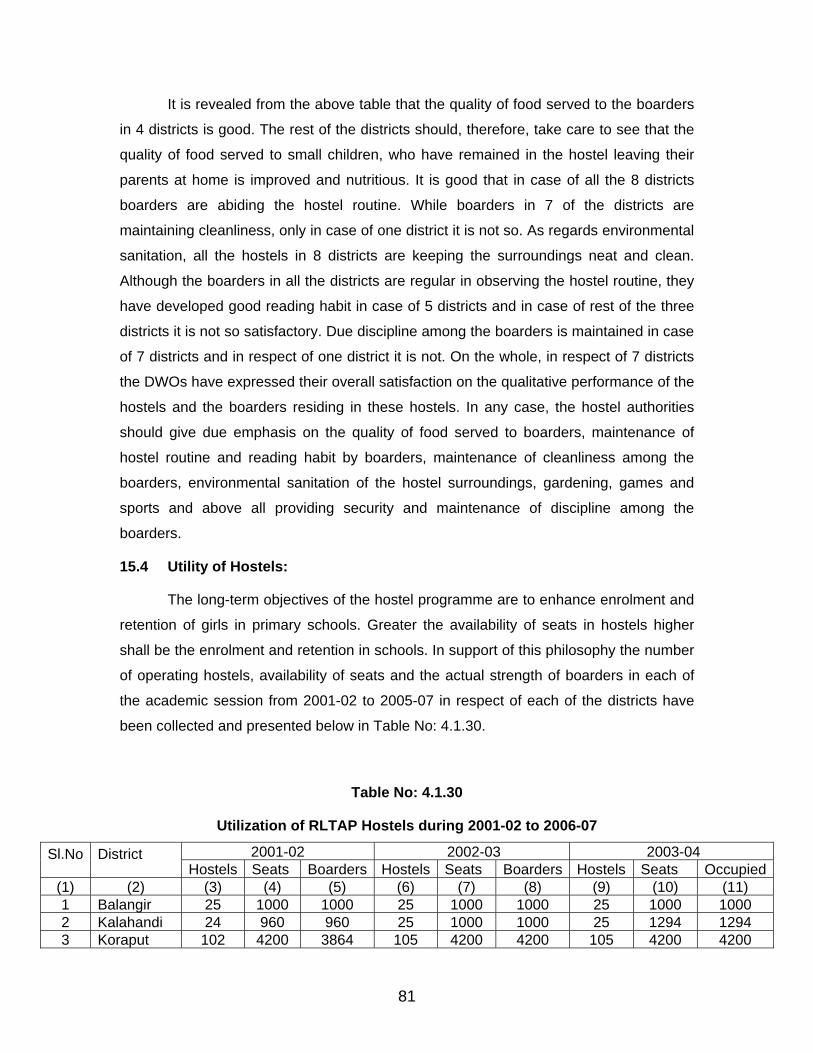
It is revealed from the above table that the quality of food served to the boarders
in 4 districts is good. The rest of the districts should, therefore, take care to see that the
quality of food served to small children, who have remained in the hostel leaving their
parents at home is improved and nutritious. It is good that in case of all the 8 districts
boarders are abiding the hostel routine. While boarders in 7 of the districts are
maintaining cleanliness, only in case of one district it is not so. As regards environmental
sanitation, all the hostels in 8 districts are keeping the surroundings neat and clean.
Although the boarders in all the districts are regular in observing the hostel routine, they
have developed good reading habit in case of 5 districts and in case of rest of the three
districts it is not so satisfactory. Due discipline among the boarders is maintained in case
of 7 districts and in respect of one district it is not. On the whole, in respect of 7 districts
the DWOs have expressed their overall satisfaction on the qualitative performance of the
hostels and the boarders residing in these hostels. In any case, the hostel authorities
should give due emphasis on the quality of food served to boarders, maintenance of
hostel routine and reading habit by boarders, maintenance of cleanliness among the
boarders, environmental sanitation of the hostel surroundings, gardening, games and
sports and above all providing security and maintenance of discipline among the
boarders.
15.4 Utility of Hostels:
The long-term objectives of the hostel programme are to enhance enrolment and
retention of girls in primary schools. Greater the availability of seats in hostels higher
shall be the enrolment and retention in schools. In support of this philosophy the number
of operating hostels, availability of seats and the actual strength of boarders in each of
the academic session from 2001-02 to 2005-07 in respect of each of the districts have
been collected and presented below in Table No: 4.1.30.
Table No: 4.1.30
Utilization of RLTAP Hostels during 2001-02 to 2006-07
2001-02 2002-03 2003-04 Sl.No
District Hostels Seats Boarders Hostels Seats Boarders Hostels Seats Occupied
(1) (2) (3) (4) (5) (6) (7) (8) (9) (10) (11) 1 Balangir 25 1000 1000 25 1000 1000 25 1000 1000 2 Kalahandi 24 960 960 25 1000 1000 25 1294 1294 3 Koraput 102 4200 3864 105 4200 4200 105 4200 4200
81
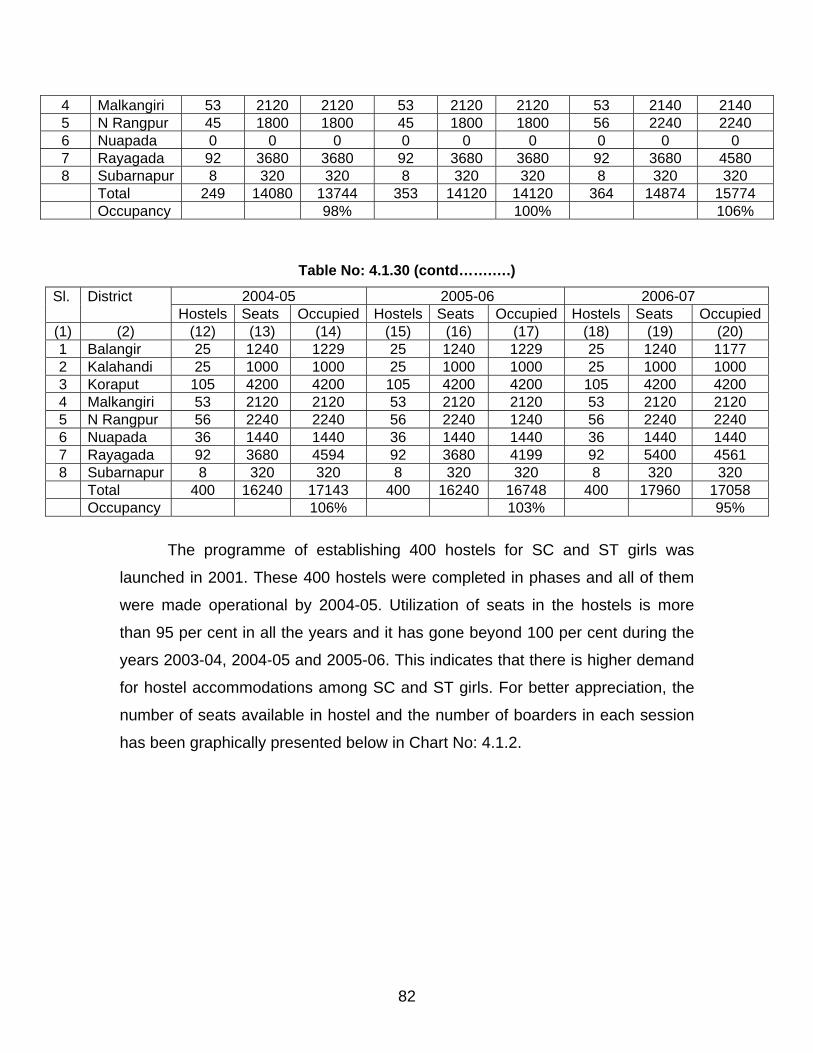
4 Malkangiri 53 2120 2120 53 2120 2120 53 2140 2140 5 N Rangpur 45 1800 1800 45 1800 1800 56 2240 2240 6 Nuapada 0 0 0 0 0 0 0 0 0 7 Rayagada 92 3680 3680 92 3680 3680 92 3680 4580 8 Subarnapur 8 320 320 8 320 320 8 320 320
Total 249 14080 13744 353 14120 14120 364 14874 15774 Occupancy 98% 100% 106%
Table No: 4.1.30 (contd…….….)
2004-05 2005-06 2006-07 Sl.
District Hostels Seats Occupied Hostels Seats Occupied Hostels Seats Occupied
(1) (2) (12) (13) (14) (15) (16) (17) (18) (19) (20) 1 Balangir 25 1240 1229 25 1240 1229 25 1240 1177 2 Kalahandi 25 1000 1000 25 1000 1000 25 1000 1000 3 Koraput 105 4200 4200 105 4200 4200 105 4200 4200 4 Malkangiri 53 2120 2120 53 2120 2120 53 2120 2120 5 N Rangpur 56 2240 2240 56 2240 1240 56 2240 2240 6 Nuapada 36 1440 1440 36 1440 1440 36 1440 1440 7 Rayagada 92 3680 4594 92 3680 4199 92 5400 4561 8 Subarnapur 8 320 320 8 320 320 8 320 320
Total 400 16240 17143 400 16240 16748 400 17960 17058 Occupancy 106% 103% 95%
The programme of establishing 400 hostels for SC and ST girls was
launched in 2001. These 400 hostels were completed in phases and all of them
were made operational by 2004-05. Utilization of seats in the hostels is more
than 95 per cent in all the years and it has gone beyond 100 per cent during the
years 2003-04, 2004-05 and 2005-06. This indicates that there is higher demand
for hostel accommodations among SC and ST girls. For better appreciation, the
number of seats available in hostel and the number of boarders in each session
has been graphically presented below in Chart No: 4.1.2.
82
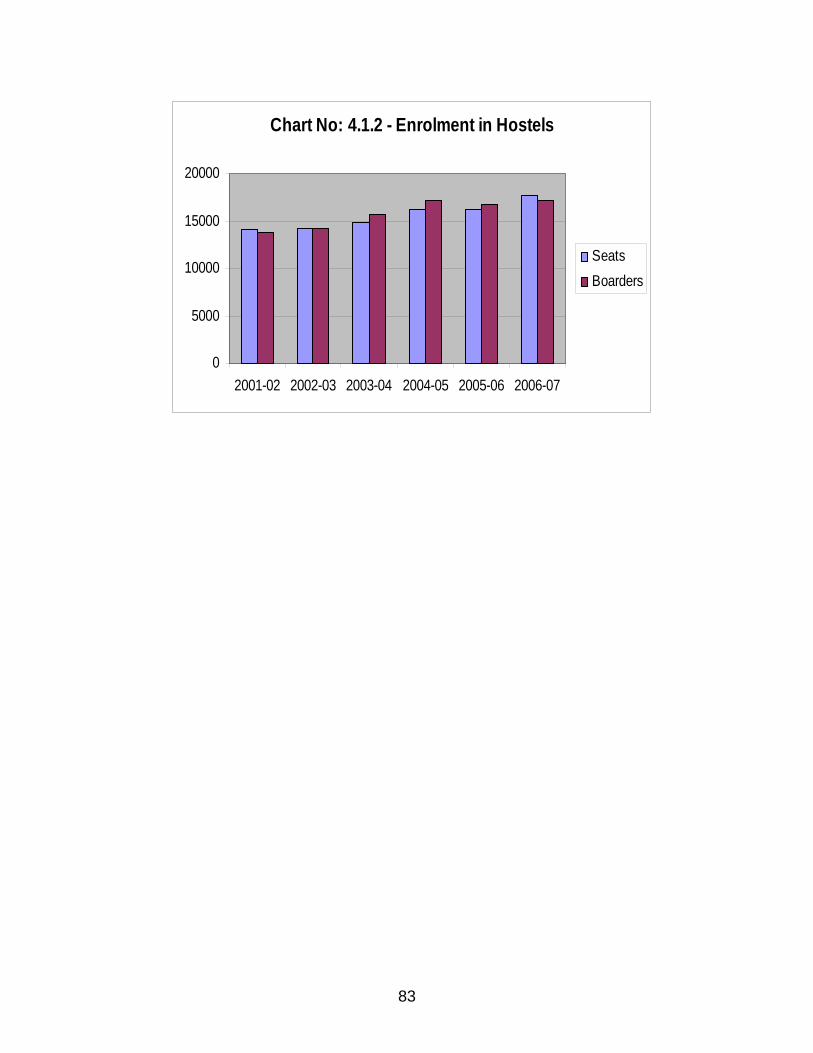
Chart No: 4.1.2 - Enrolment in Hostels
0
5000
10000
15000
20000
2001-02 2002-03 2003-04 2004-05 2005-06 2006-07
SeatsBoarders
83
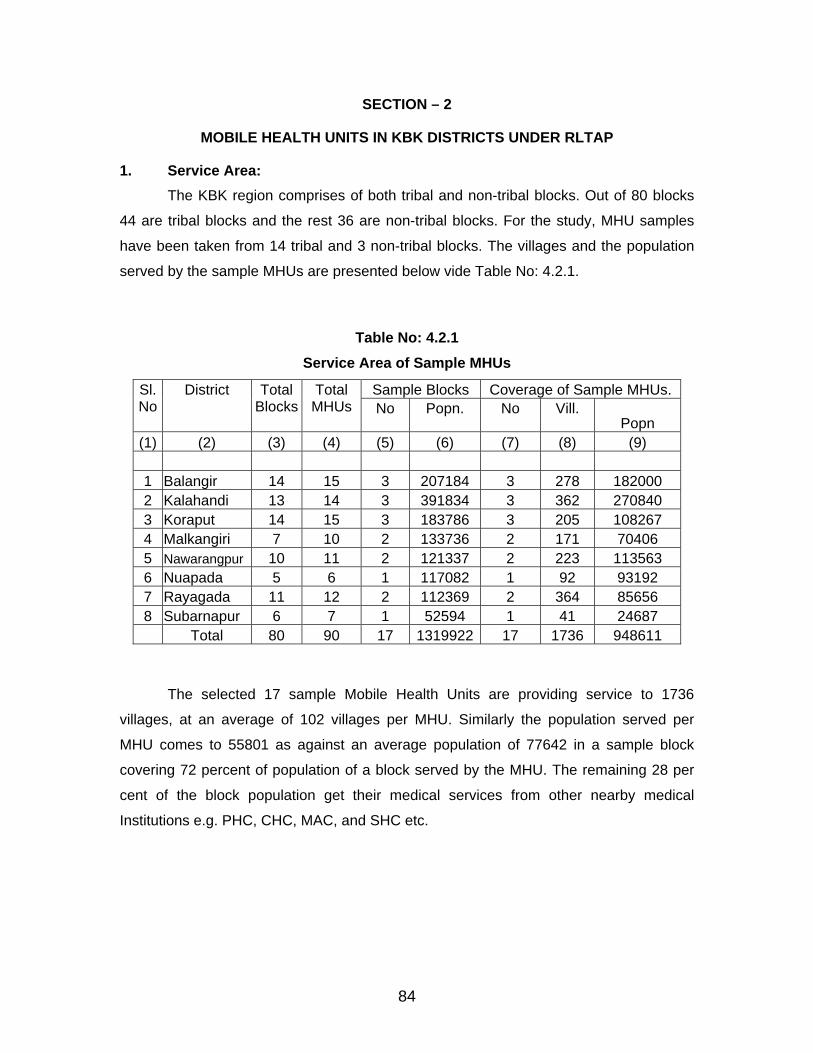
SECTION – 2
MOBILE HEALTH UNITS IN KBK DISTRICTS UNDER RLTAP
1. Service Area: The KBK region comprises of both tribal and non-tribal blocks. Out of 80 blocks
44 are tribal blocks and the rest 36 are non-tribal blocks. For the study, MHU samples
have been taken from 14 tribal and 3 non-tribal blocks. The villages and the population
served by the sample MHUs are presented below vide Table No: 4.2.1.
Table No: 4.2.1 Service Area of Sample MHUs
Sample Blocks Coverage of Sample MHUs. Sl.No
District
Total Blocks
Total MHUs No Popn. No Vill.
Popn (1) (2) (3) (4) (5) (6) (7) (8) (9) 1 Balangir 14 15 3 207184 3 278 182000 2 Kalahandi 13 14 3 391834 3 362 270840 3 Koraput 14 15 3 183786 3 205 108267 4 Malkangiri 7 10 2 133736 2 171 70406 5 Nawarangpur 10 11 2 121337 2 223 113563 6 Nuapada 5 6 1 117082 1 92 93192 7 Rayagada 11 12 2 112369 2 364 85656 8 Subarnapur 6 7 1 52594 1 41 24687 Total 80 90 17 1319922 17 1736 948611
The selected 17 sample Mobile Health Units are providing service to 1736
villages, at an average of 102 villages per MHU. Similarly the population served per
MHU comes to 55801 as against an average population of 77642 in a sample block
covering 72 percent of population of a block served by the MHU. The remaining 28 per
cent of the block population get their medical services from other nearby medical
Institutions e.g. PHC, CHC, MAC, and SHC etc.
84
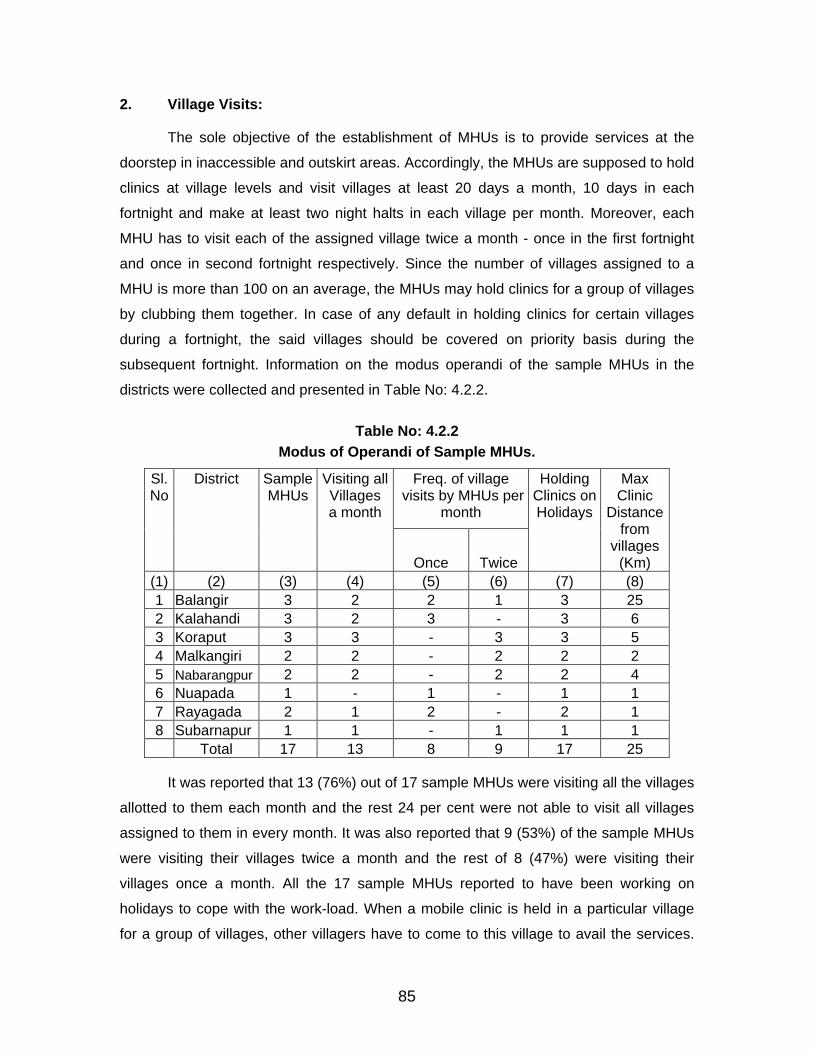
2. Village Visits:
The sole objective of the establishment of MHUs is to provide services at the
doorstep in inaccessible and outskirt areas. Accordingly, the MHUs are supposed to hold
clinics at village levels and visit villages at least 20 days a month, 10 days in each
fortnight and make at least two night halts in each village per month. Moreover, each
MHU has to visit each of the assigned village twice a month - once in the first fortnight
and once in second fortnight respectively. Since the number of villages assigned to a
MHU is more than 100 on an average, the MHUs may hold clinics for a group of villages
by clubbing them together. In case of any default in holding clinics for certain villages
during a fortnight, the said villages should be covered on priority basis during the
subsequent fortnight. Information on the modus operandi of the sample MHUs in the
districts were collected and presented in Table No: 4.2.2.
Table No: 4.2.2 Modus of Operandi of Sample MHUs.
Freq. of village visits by MHUs per
month
Sl.No
District
Sample MHUs
Visiting all Villages a month
Once Twice
Holding Clinics on Holidays
Max Clinic
Distance from
villages (Km)
(1) (2) (3) (4) (5) (6) (7) (8) 1 Balangir 3 2 2 1 3 25 2 Kalahandi 3 2 3 - 3 6 3 Koraput 3 3 - 3 3 5 4 Malkangiri 2 2 - 2 2 2 5 Nabarangpur 2 2 - 2 2 4 6 Nuapada 1 - 1 - 1 1 7 Rayagada 2 1 2 - 2 1 8 Subarnapur 1 1 - 1 1 1 Total 17 13 8 9 17 25
It was reported that 13 (76%) out of 17 sample MHUs were visiting all the villages
allotted to them each month and the rest 24 per cent were not able to visit all villages
assigned to them in every month. It was also reported that 9 (53%) of the sample MHUs
were visiting their villages twice a month and the rest of 8 (47%) were visiting their
villages once a month. All the 17 sample MHUs reported to have been working on
holidays to cope with the work-load. When a mobile clinic is held in a particular village
for a group of villages, other villagers have to come to this village to avail the services.
85
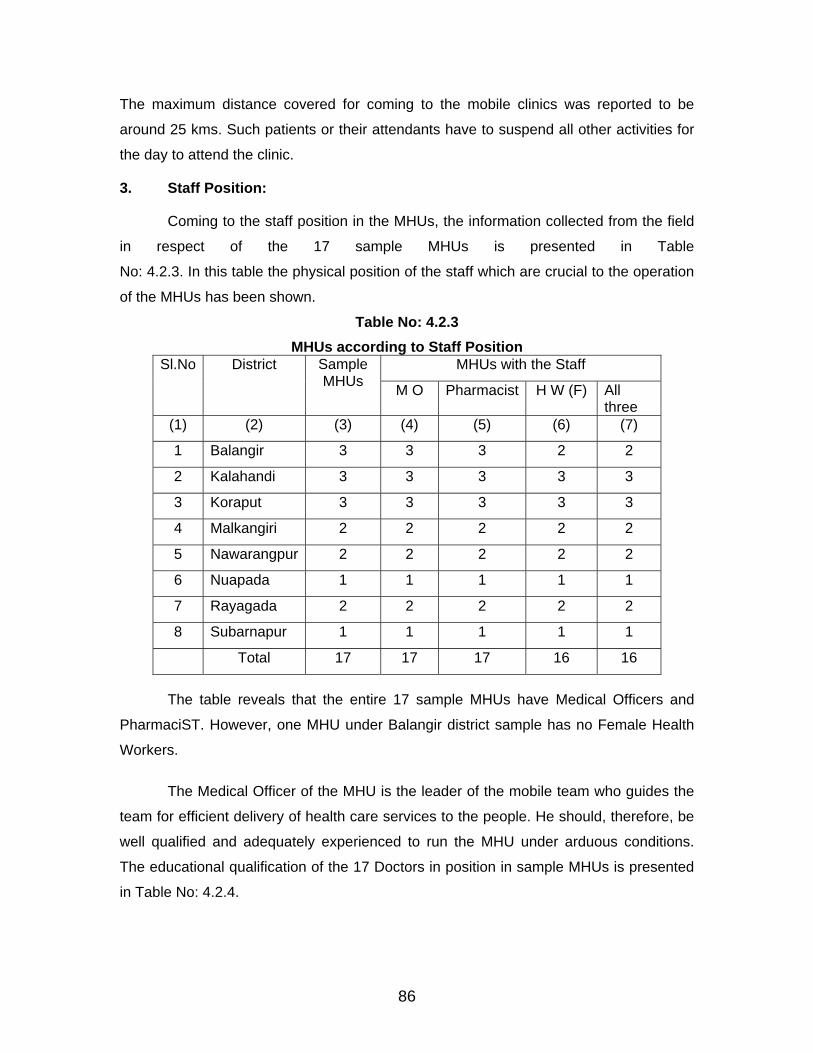
The maximum distance covered for coming to the mobile clinics was reported to be
around 25 kms. Such patients or their attendants have to suspend all other activities for
the day to attend the clinic.
3. Staff Position:
Coming to the staff position in the MHUs, the information collected from the field
in respect of the 17 sample MHUs is presented in Table
No: 4.2.3. In this table the physical position of the staff which are crucial to the operation
of the MHUs has been shown.
Table No: 4.2.3 MHUs according to Staff Position
MHUs with the Staff Sl.No
District
Sample MHUs M O Pharmacist H W (F) All
three (1) (2) (3) (4) (5) (6) (7)
1 Balangir 3 3 3 2 2
2 Kalahandi 3 3 3 3 3
3 Koraput 3 3 3 3 3
4 Malkangiri 2 2 2 2 2
5 Nawarangpur 2 2 2 2 2
6 Nuapada 1 1 1 1 1
7 Rayagada 2 2 2 2 2
8 Subarnapur 1 1 1 1 1
Total 17 17 17 16 16
The table reveals that the entire 17 sample MHUs have Medical Officers and
PharmaciST. However, one MHU under Balangir district sample has no Female Health
Workers.
The Medical Officer of the MHU is the leader of the mobile team who guides the
team for efficient delivery of health care services to the people. He should, therefore, be
well qualified and adequately experienced to run the MHU under arduous conditions.
The educational qualification of the 17 Doctors in position in sample MHUs is presented
in Table No: 4.2.4.
86
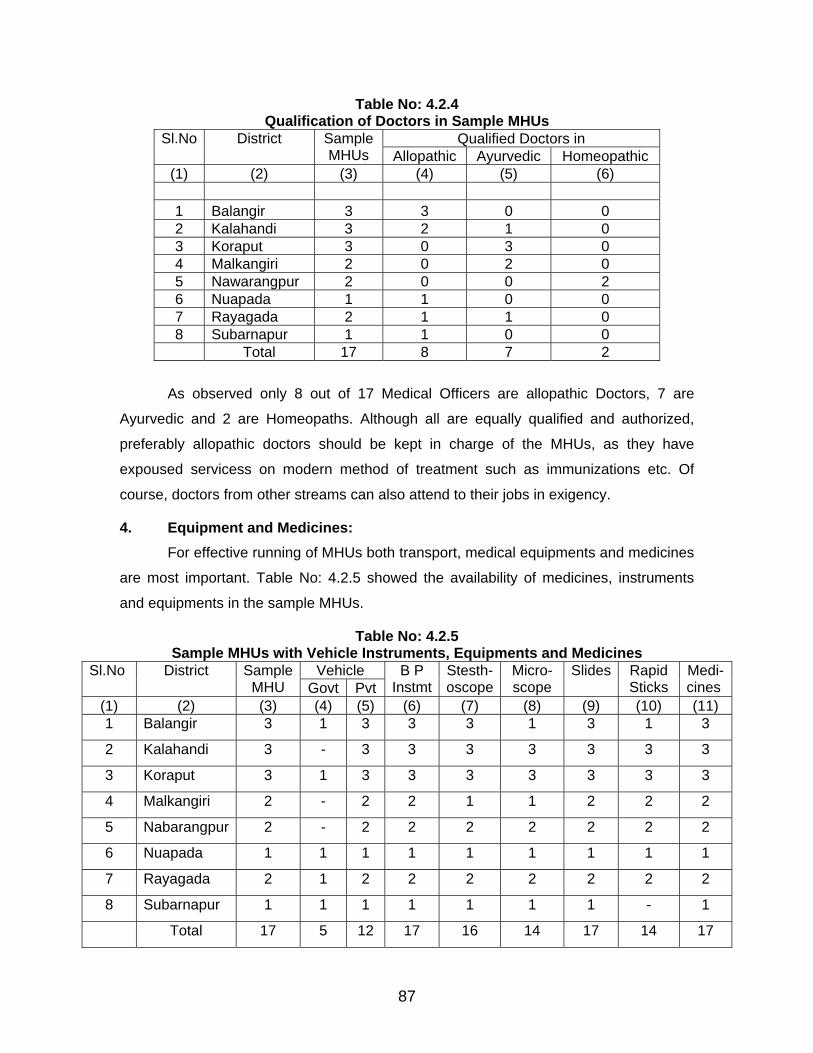
Table No: 4.2.4 Qualification of Doctors in Sample MHUs
Qualified Doctors in Sl.No
District
Sample MHUs Allopathic Ayurvedic Homeopathic
(1) (2) (3) (4) (5) (6) 1 Balangir 3 3 0 0 2 Kalahandi 3 2 1 0 3 Koraput 3 0 3 0 4 Malkangiri 2 0 2 0 5 Nawarangpur 2 0 0 2 6 Nuapada 1 1 0 0 7 Rayagada 2 1 1 0 8 Subarnapur 1 1 0 0 Total 17 8 7 2
As observed only 8 out of 17 Medical Officers are allopathic Doctors, 7 are
Ayurvedic and 2 are Homeopaths. Although all are equally qualified and authorized,
preferably allopathic doctors should be kept in charge of the MHUs, as they have
expoused servicess on modern method of treatment such as immunizations etc. Of
course, doctors from other streams can also attend to their jobs in exigency.
4. Equipment and Medicines: For effective running of MHUs both transport, medical equipments and medicines
are most important. Table No: 4.2.5 showed the availability of medicines, instruments
and equipments in the sample MHUs.
Table No: 4.2.5 Sample MHUs with Vehicle Instruments, Equipments and Medicines
Vehicle Sl.No District Sample MHU Govt Pvt
B P Instmt
Stesth-oscope
Micro-scope
Slides RapidSticks
Medi-cines
(1) (2) (3) (4) (5) (6) (7) (8) (9) (10) (11) 1 Balangir 3 1 3 3 3 1 3 1 3
2 Kalahandi 3 - 3 3 3 3 3 3 3
3 Koraput 3 1 3 3 3 3 3 3 3
4 Malkangiri 2 - 2 2 1 1 2 2 2
5 Nabarangpur 2 - 2 2 2 2 2 2 2
6 Nuapada 1 1 1 1 1 1 1 1 1
7 Rayagada 2 1 2 2 2 2 2 2 2
8 Subarnapur 1 1 1 1 1 1 1 - 1
Total 17 5 12 17 16 14 17 14 17
87
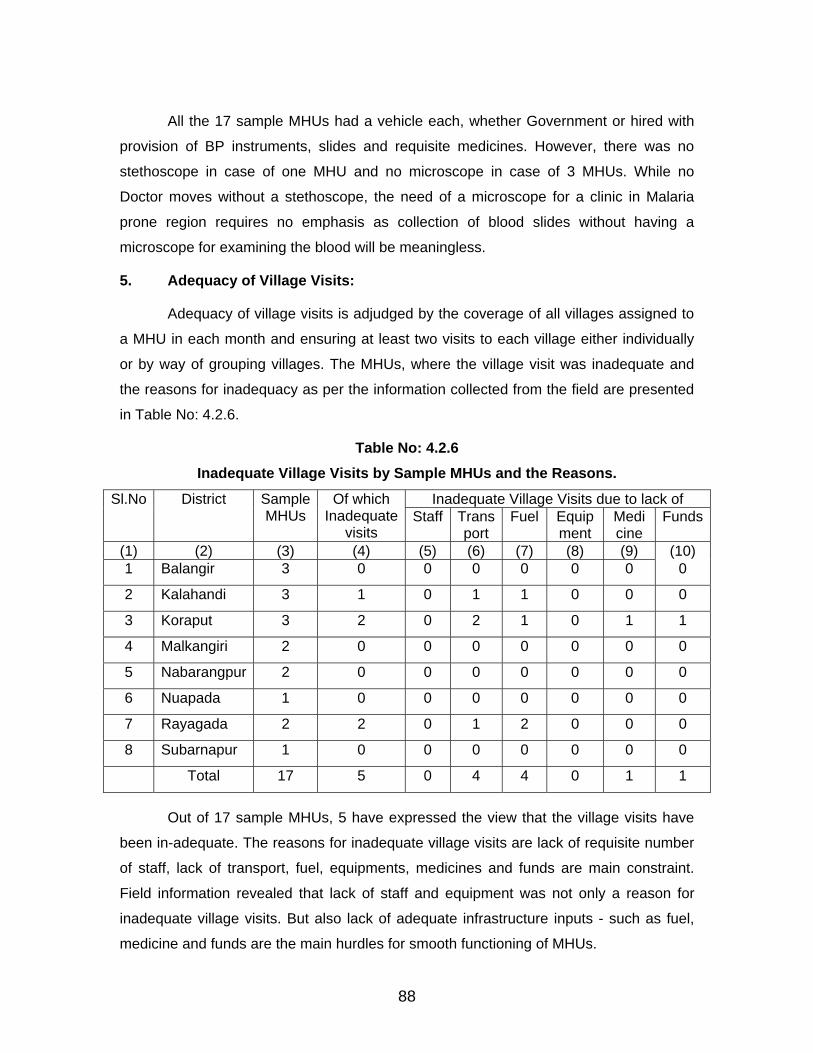
All the 17 sample MHUs had a vehicle each, whether Government or hired with
provision of BP instruments, slides and requisite medicines. However, there was no
stethoscope in case of one MHU and no microscope in case of 3 MHUs. While no
Doctor moves without a stethoscope, the need of a microscope for a clinic in Malaria
prone region requires no emphasis as collection of blood slides without having a
microscope for examining the blood will be meaningless.
5. Adequacy of Village Visits:
Adequacy of village visits is adjudged by the coverage of all villages assigned to
a MHU in each month and ensuring at least two visits to each village either individually
or by way of grouping villages. The MHUs, where the village visit was inadequate and
the reasons for inadequacy as per the information collected from the field are presented
in Table No: 4.2.6.
Table No: 4.2.6 Inadequate Village Visits by Sample MHUs and the Reasons.
Inadequate Village Visits due to lack of Sl.No
District
Sample MHUs
Of which Inadequate
visits Staff
Transport
Fuel
Equip ment
Medi cine
Funds
(1) (2) (3) (4) (5) (6) (7) (8) (9) (10) 1 Balangir 3 0 0 0 0 0 0 0
2 Kalahandi 3 1 0 1 1 0 0 0
3 Koraput 3 2 0 2 1 0 1 1
4 Malkangiri 2 0 0 0 0 0 0 0
5 Nabarangpur 2 0 0 0 0 0 0 0
6 Nuapada 1 0 0 0 0 0 0 0
7 Rayagada 2 2 0 1 2 0 0 0
8 Subarnapur 1 0 0 0 0 0 0 0
Total 17 5 0 4 4 0 1 1
Out of 17 sample MHUs, 5 have expressed the view that the village visits have
been in-adequate. The reasons for inadequate village visits are lack of requisite number
of staff, lack of transport, fuel, equipments, medicines and funds are main constraint.
Field information revealed that lack of staff and equipment was not only a reason for
inadequate village visits. But also lack of adequate infrastructure inputs - such as fuel,
medicine and funds are the main hurdles for smooth functioning of MHUs.
88
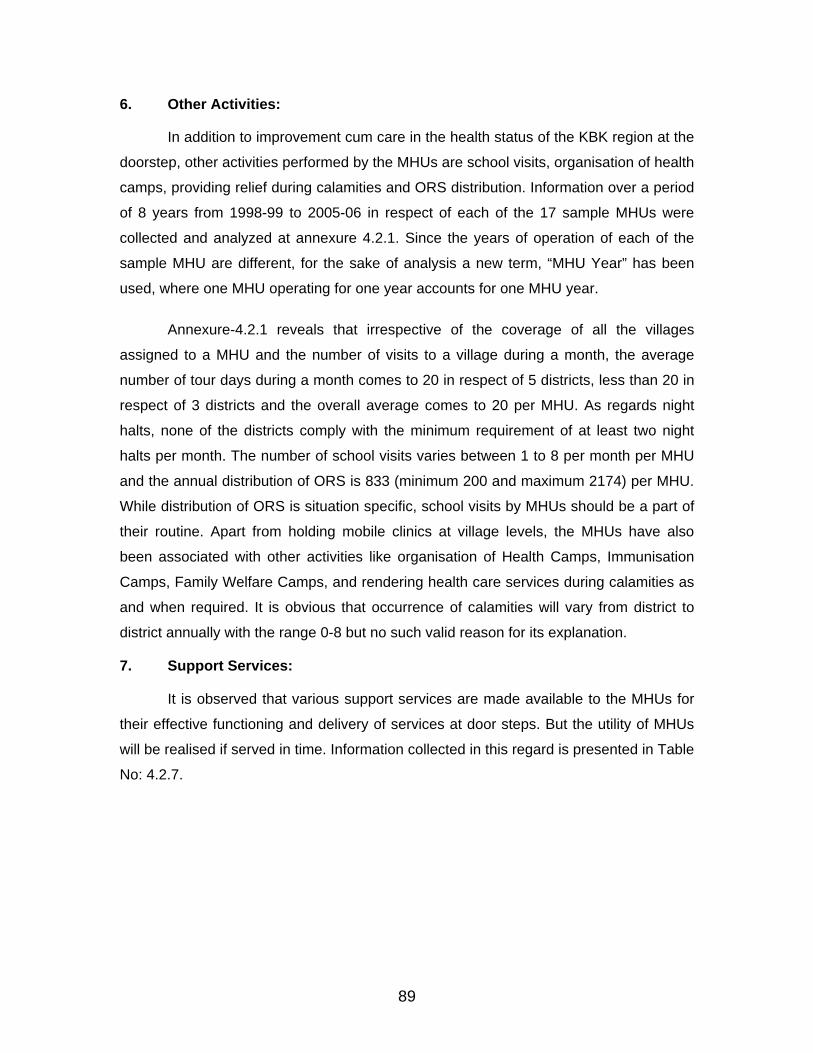
6. Other Activities:
In addition to improvement cum care in the health status of the KBK region at the
doorstep, other activities performed by the MHUs are school visits, organisation of health
camps, providing relief during calamities and ORS distribution. Information over a period
of 8 years from 1998-99 to 2005-06 in respect of each of the 17 sample MHUs were
collected and analyzed at annexure 4.2.1. Since the years of operation of each of the
sample MHU are different, for the sake of analysis a new term, “MHU Year” has been
used, where one MHU operating for one year accounts for one MHU year.
Annexure-4.2.1 reveals that irrespective of the coverage of all the villages
assigned to a MHU and the number of visits to a village during a month, the average
number of tour days during a month comes to 20 in respect of 5 districts, less than 20 in
respect of 3 districts and the overall average comes to 20 per MHU. As regards night
halts, none of the districts comply with the minimum requirement of at least two night
halts per month. The number of school visits varies between 1 to 8 per month per MHU
and the annual distribution of ORS is 833 (minimum 200 and maximum 2174) per MHU.
While distribution of ORS is situation specific, school visits by MHUs should be a part of
their routine. Apart from holding mobile clinics at village levels, the MHUs have also
been associated with other activities like organisation of Health Camps, Immunisation
Camps, Family Welfare Camps, and rendering health care services during calamities as
and when required. It is obvious that occurrence of calamities will vary from district to
district annually with the range 0-8 but no such valid reason for its explanation.
7. Support Services:
It is observed that various support services are made available to the MHUs for
their effective functioning and delivery of services at door steps. But the utility of MHUs
will be realised if served in time. Information collected in this regard is presented in Table
No: 4.2.7.
89
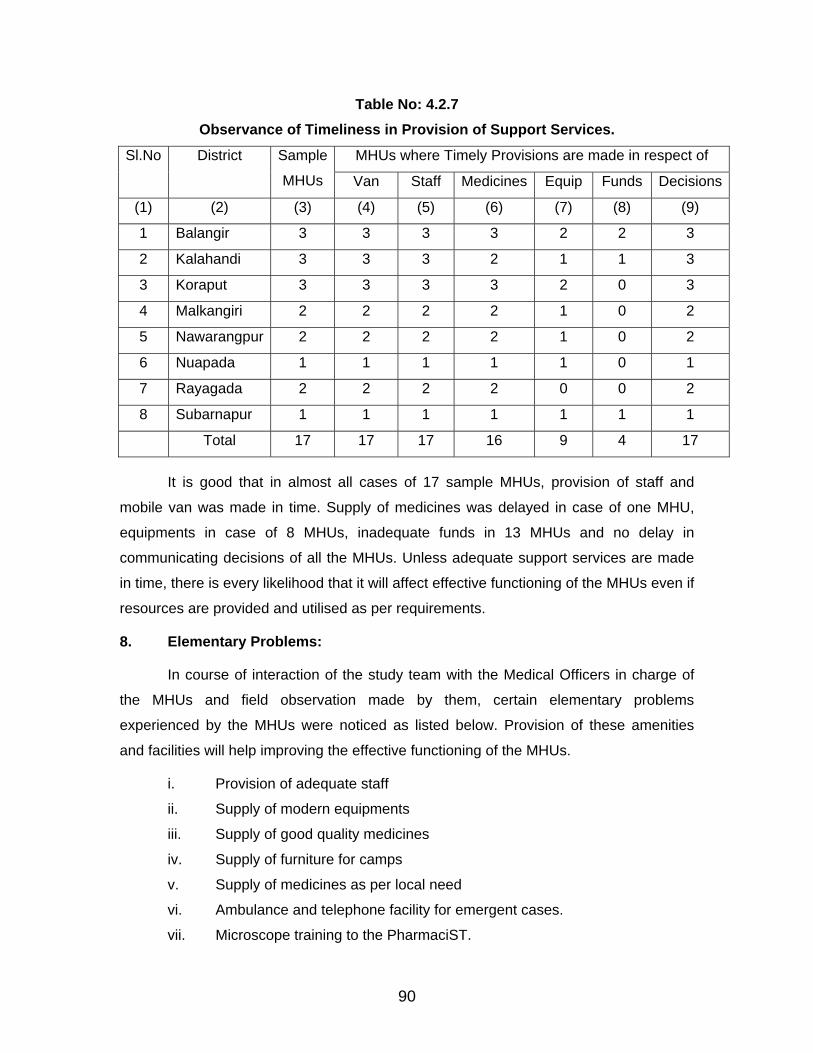
Table No: 4.2.7 Observance of Timeliness in Provision of Support Services.
MHUs where Timely Provisions are made in respect of Sl.No
District
Sample
MHUs Van Staff Medicines Equip Funds Decisions
(1) (2) (3) (4) (5) (6) (7) (8) (9)
1 Balangir 3 3 3 3 2 2 3
2 Kalahandi 3 3 3 2 1 1 3
3 Koraput 3 3 3 3 2 0 3
4 Malkangiri 2 2 2 2 1 0 2
5 Nawarangpur 2 2 2 2 1 0 2
6 Nuapada 1 1 1 1 1 0 1
7 Rayagada 2 2 2 2 0 0 2
8 Subarnapur 1 1 1 1 1 1 1
Total 17 17 17 16 9 4 17
It is good that in almost all cases of 17 sample MHUs, provision of staff and
mobile van was made in time. Supply of medicines was delayed in case of one MHU,
equipments in case of 8 MHUs, inadequate funds in 13 MHUs and no delay in
communicating decisions of all the MHUs. Unless adequate support services are made
in time, there is every likelihood that it will affect effective functioning of the MHUs even if
resources are provided and utilised as per requirements.
8. Elementary Problems:
In course of interaction of the study team with the Medical Officers in charge of
the MHUs and field observation made by them, certain elementary problems
experienced by the MHUs were noticed as listed below. Provision of these amenities
and facilities will help improving the effective functioning of the MHUs.
i. Provision of adequate staff
ii. Supply of modern equipments
iii. Supply of good quality medicines
iv. Supply of furniture for camps
v. Supply of medicines as per local need
vi. Ambulance and telephone facility for emergent cases.
vii. Microscope training to the PharmaciST.
90
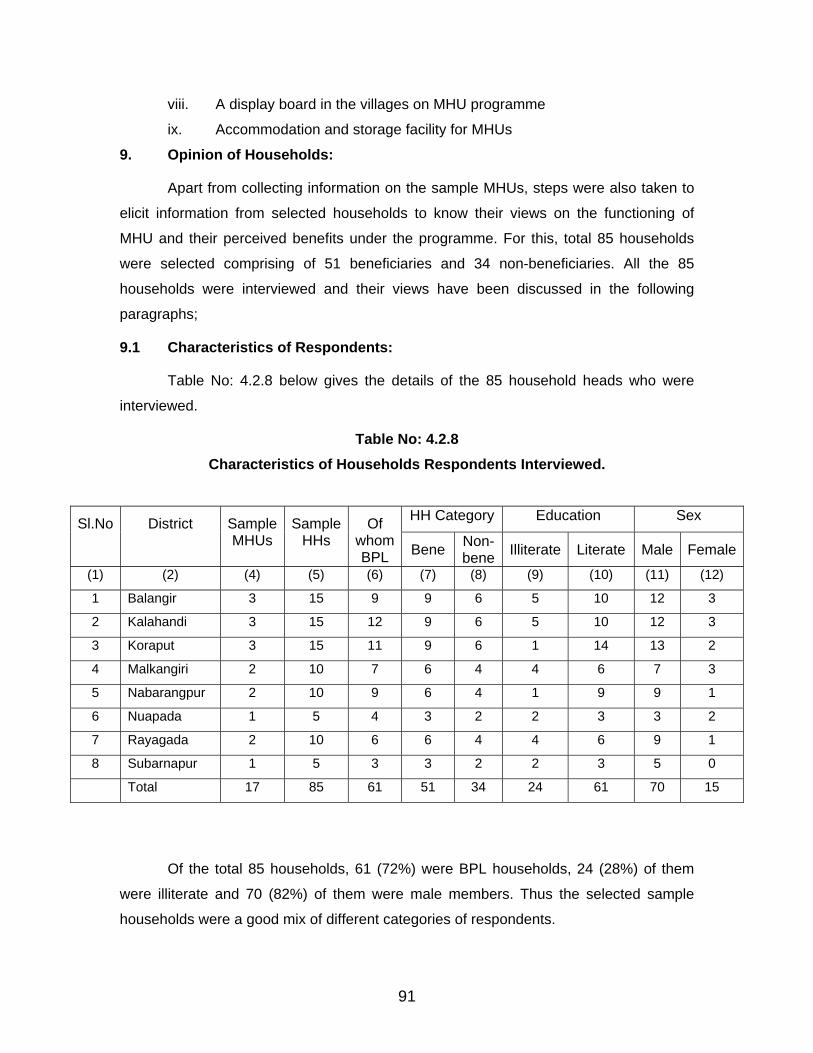
viii. A display board in the villages on MHU programme
ix. Accommodation and storage facility for MHUs
9. Opinion of Households:
Apart from collecting information on the sample MHUs, steps were also taken to
elicit information from selected households to know their views on the functioning of
MHU and their perceived benefits under the programme. For this, total 85 households
were selected comprising of 51 beneficiaries and 34 non-beneficiaries. All the 85
households were interviewed and their views have been discussed in the following
paragraphs;
9.1 Characteristics of Respondents:
Table No: 4.2.8 below gives the details of the 85 household heads who were
interviewed.
Table No: 4.2.8 Characteristics of Households Respondents Interviewed.
HH Category Education Sex Sl.No
District
Sample MHUs
SampleHHs
Of whomBPL Bene Non-
bene Illiterate Literate Male Female
(1) (2) (4) (5) (6) (7) (8) (9) (10) (11) (12)
1 Balangir 3 15 9 9 6 5 10 12 3
2 Kalahandi 3 15 12 9 6 5 10 12 3
3 Koraput 3 15 11 9 6 1 14 13 2
4 Malkangiri 2 10 7 6 4 4 6 7 3
5 Nabarangpur 2 10 9 6 4 1 9 9 1
6 Nuapada 1 5 4 3 2 2 3 3 2
7 Rayagada 2 10 6 6 4 4 6 9 1
8 Subarnapur 1 5 3 3 2 2 3 5 0
Total 17 85 61 51 34 24 61 70 15
Of the total 85 households, 61 (72%) were BPL households, 24 (28%) of them
were illiterate and 70 (82%) of them were male members. Thus the selected sample
households were a good mix of different categories of respondents.
91
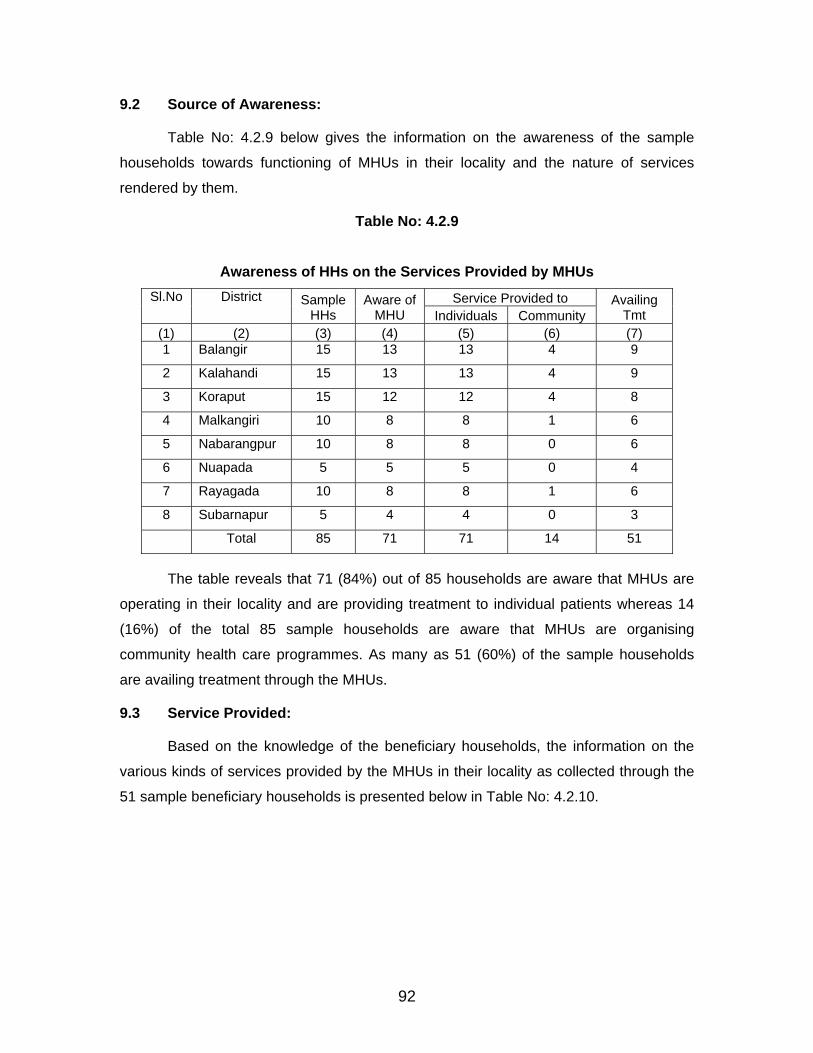
9.2 Source of Awareness:
Table No: 4.2.9 below gives the information on the awareness of the sample
households towards functioning of MHUs in their locality and the nature of services
rendered by them.
Table No: 4.2.9
Awareness of HHs on the Services Provided by MHUs
Service Provided to Sl.No District Sample HHs
Aware of MHU Individuals Community
Availing Tmt
(1) (2) (3) (4) (5) (6) (7) 1 Balangir 15 13 13 4 9
2 Kalahandi 15 13 13 4 9
3 Koraput 15 12 12 4 8
4 Malkangiri 10 8 8 1 6
5 Nabarangpur 10 8 8 0 6
6 Nuapada 5 5 5 0 4
7 Rayagada 10 8 8 1 6
8 Subarnapur 5 4 4 0 3
Total 85 71 71 14 51
The table reveals that 71 (84%) out of 85 households are aware that MHUs are
operating in their locality and are providing treatment to individual patients whereas 14
(16%) of the total 85 sample households are aware that MHUs are organising
community health care programmes. As many as 51 (60%) of the sample households
are availing treatment through the MHUs.
9.3 Service Provided:
Based on the knowledge of the beneficiary households, the information on the
various kinds of services provided by the MHUs in their locality as collected through the
51 sample beneficiary households is presented below in Table No: 4.2.10.
92
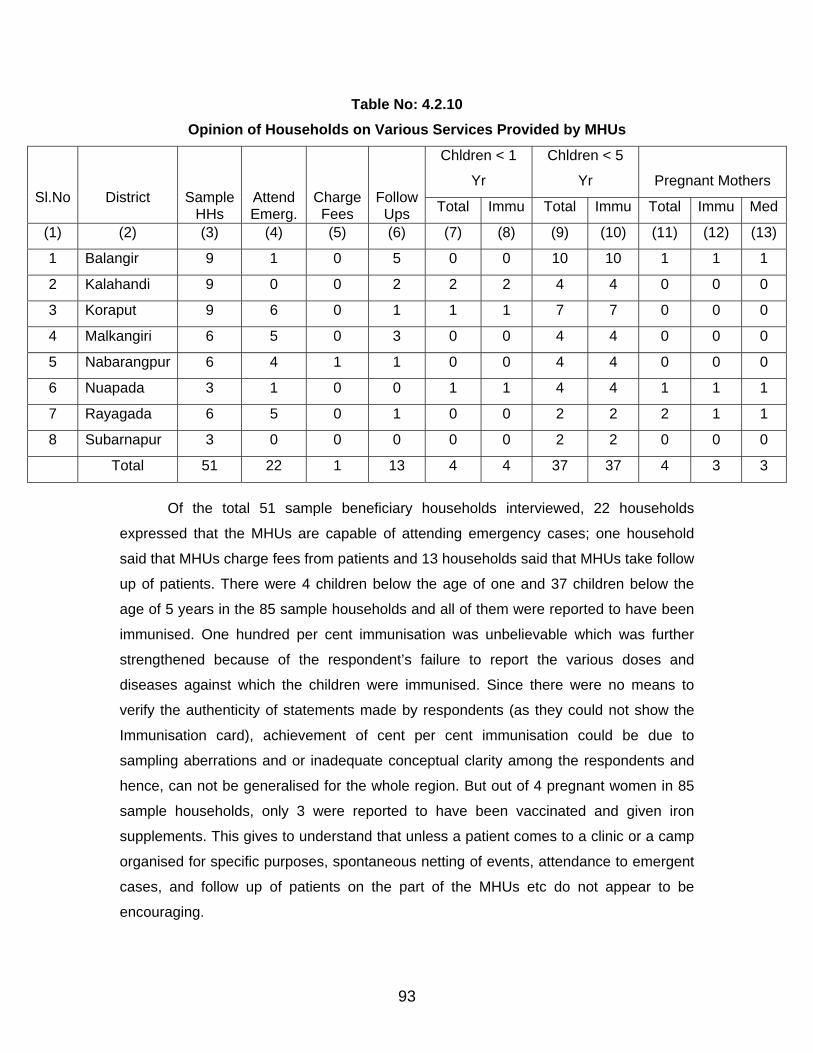
Table No: 4.2.10 Opinion of Households on Various Services Provided by MHUs
Chldren < 1
Yr
Chldren < 5
Yr Pregnant Mothers Sl.No
District
Sample
HHs Attend Emerg.
ChargeFees
FollowUps Total Immu Total Immu Total Immu Med
(1) (2) (3) (4) (5) (6) (7) (8) (9) (10) (11) (12) (13)
1 Balangir 9 1 0 5 0 0 10 10 1 1 1
2 Kalahandi 9 0 0 2 2 2 4 4 0 0 0
3 Koraput 9 6 0 1 1 1 7 7 0 0 0
4 Malkangiri 6 5 0 3 0 0 4 4 0 0 0
5 Nabarangpur 6 4 1 1 0 0 4 4 0 0 0
6 Nuapada 3 1 0 0 1 1 4 4 1 1 1
7 Rayagada 6 5 0 1 0 0 2 2 2 1 1
8 Subarnapur 3 0 0 0 0 0 2 2 0 0 0
Total 51 22 1 13 4 4 37 37 4 3 3
Of the total 51 sample beneficiary households interviewed, 22 households
expressed that the MHUs are capable of attending emergency cases; one household
said that MHUs charge fees from patients and 13 households said that MHUs take follow
up of patients. There were 4 children below the age of one and 37 children below the
age of 5 years in the 85 sample households and all of them were reported to have been
immunised. One hundred per cent immunisation was unbelievable which was further
strengthened because of the respondent’s failure to report the various doses and
diseases against which the children were immunised. Since there were no means to
verify the authenticity of statements made by respondents (as they could not show the
Immunisation card), achievement of cent per cent immunisation could be due to
sampling aberrations and or inadequate conceptual clarity among the respondents and
hence, can not be generalised for the whole region. But out of 4 pregnant women in 85
sample households, only 3 were reported to have been vaccinated and given iron
supplements. This gives to understand that unless a patient comes to a clinic or a camp
organised for specific purposes, spontaneous netting of events, attendance to emergent
cases, and follow up of patients on the part of the MHUs etc do not appear to be
encouraging.
93
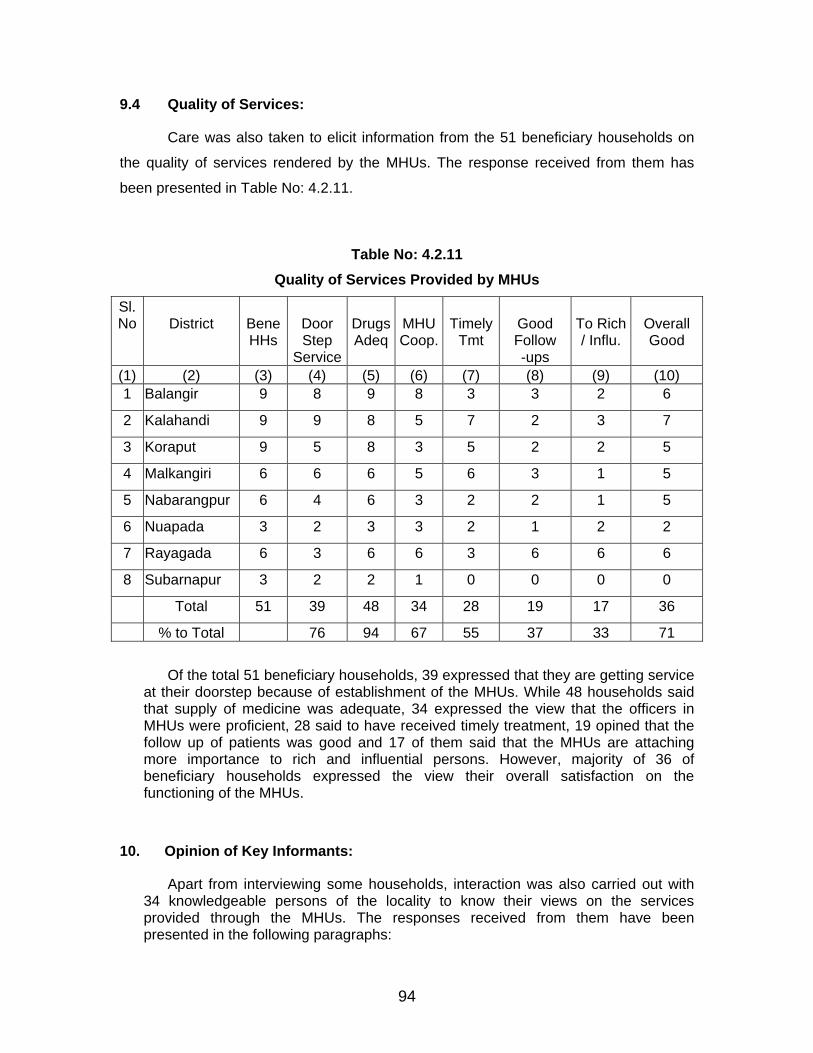
9.4 Quality of Services:
Care was also taken to elicit information from the 51 beneficiary households on
the quality of services rendered by the MHUs. The response received from them has
been presented in Table No: 4.2.11.
Table No: 4.2.11 Quality of Services Provided by MHUs
Sl. No
District
Bene HHs
Door Step
Service
DrugsAdeq
MHUCoop.
TimelyTmt
Good Follow -ups
To Rich / Influ.
Overall Good
(1) (2) (3) (4) (5) (6) (7) (8) (9) (10) 1 Balangir 9 8 9 8 3 3 2 6
2 Kalahandi 9 9 8 5 7 2 3 7
3 Koraput 9 5 8 3 5 2 2 5
4 Malkangiri 6 6 6 5 6 3 1 5
5 Nabarangpur 6 4 6 3 2 2 1 5
6 Nuapada 3 2 3 3 2 1 2 2
7 Rayagada 6 3 6 6 3 6 6 6
8 Subarnapur 3 2 2 1 0 0 0 0
Total 51 39 48 34 28 19 17 36
% to Total 76 94 67 55 37 33 71
Of the total 51 beneficiary households, 39 expressed that they are getting service at their doorstep because of establishment of the MHUs. While 48 households said that supply of medicine was adequate, 34 expressed the view that the officers in MHUs were proficient, 28 said to have received timely treatment, 19 opined that the follow up of patients was good and 17 of them said that the MHUs are attaching more importance to rich and influential persons. However, majority of 36 of beneficiary households expressed the view their overall satisfaction on the functioning of the MHUs.
10. Opinion of Key Informants:
Apart from interviewing some households, interaction was also carried out with 34 knowledgeable persons of the locality to know their views on the services provided through the MHUs. The responses received from them have been presented in the following paragraphs:
94
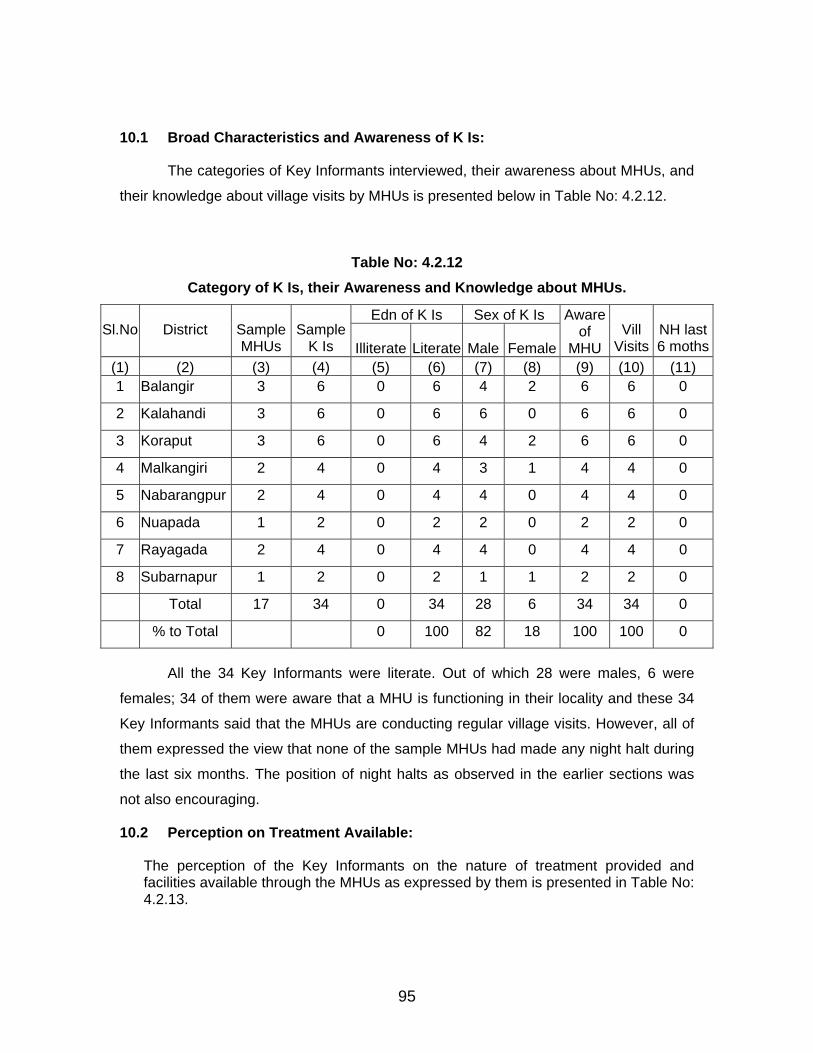
10.1 Broad Characteristics and Awareness of K Is:
The categories of Key Informants interviewed, their awareness about MHUs, and
their knowledge about village visits by MHUs is presented below in Table No: 4.2.12.
Table No: 4.2.12 Category of K Is, their Awareness and Knowledge about MHUs.
Edn of K Is Sex of K Is Sl.No
District
Sample MHUs
SampleK Is Illiterate Literate Male Female
Aware of
MHU Vill
Visits NH last6 moths
(1) (2) (3) (4) (5) (6) (7) (8) (9) (10) (11) 1 Balangir 3 6 0 6 4 2 6 6 0
2 Kalahandi 3 6 0 6 6 0 6 6 0
3 Koraput 3 6 0 6 4 2 6 6 0
4 Malkangiri 2 4 0 4 3 1 4 4 0
5 Nabarangpur 2 4 0 4 4 0 4 4 0
6 Nuapada 1 2 0 2 2 0 2 2 0
7 Rayagada 2 4 0 4 4 0 4 4 0
8 Subarnapur 1 2 0 2 1 1 2 2 0
Total 17 34 0 34 28 6 34 34 0
% to Total 0 100 82 18 100 100 0
All the 34 Key Informants were literate. Out of which 28 were males, 6 were
females; 34 of them were aware that a MHU is functioning in their locality and these 34
Key Informants said that the MHUs are conducting regular village visits. However, all of
them expressed the view that none of the sample MHUs had made any night halt during
the last six months. The position of night halts as observed in the earlier sections was
not also encouraging.
10.2 Perception on Treatment Available:
The perception of the Key Informants on the nature of treatment provided and facilities available through the MHUs as expressed by them is presented in Table No: 4.2.13.
95
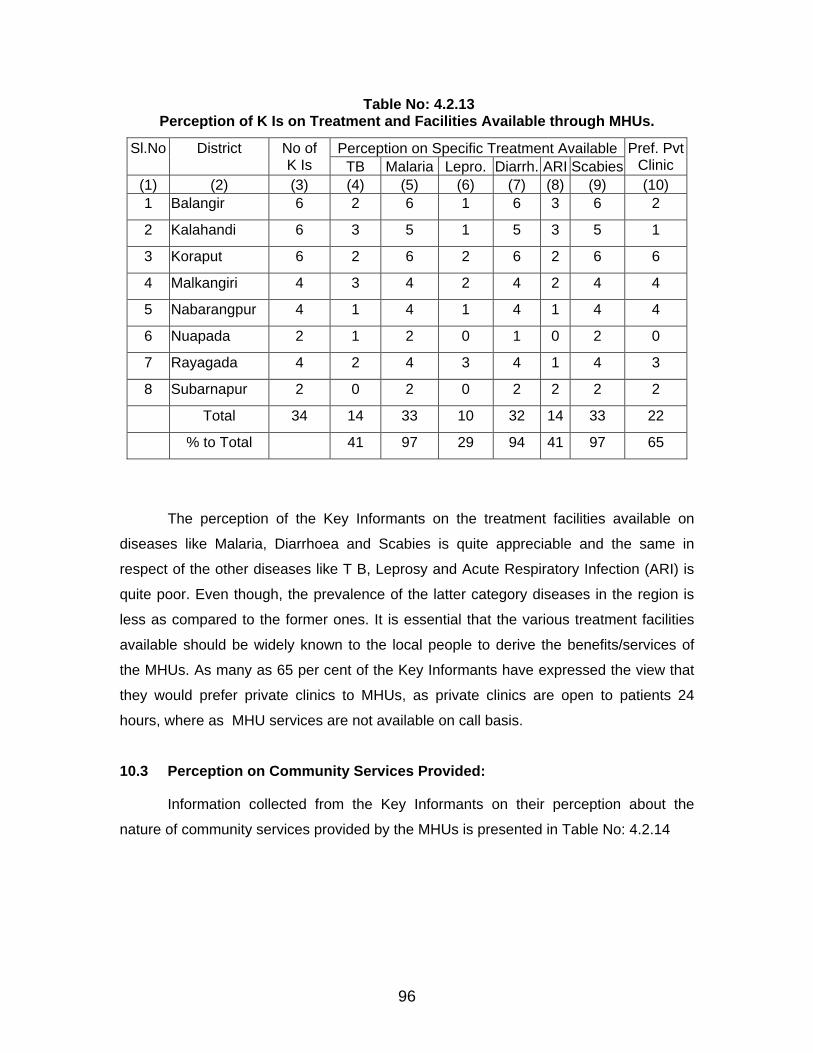
Table No: 4.2.13 Perception of K Is on Treatment and Facilities Available through MHUs.
Perception on Specific Treatment Available Sl.No
District
No of K Is TB Malaria Lepro. Diarrh. ARI Scabies
Pref. PvtClinic
(1) (2) (3) (4) (5) (6) (7) (8) (9) (10) 1 Balangir 6 2 6 1 6 3 6 2
2 Kalahandi 6 3 5 1 5 3 5 1
3 Koraput 6 2 6 2 6 2 6 6
4 Malkangiri 4 3 4 2 4 2 4 4
5 Nabarangpur 4 1 4 1 4 1 4 4
6 Nuapada 2 1 2 0 1 0 2 0
7 Rayagada 4 2 4 3 4 1 4 3
8 Subarnapur 2 0 2 0 2 2 2 2
Total 34 14 33 10 32 14 33 22
% to Total 41 97 29 94 41 97 65
The perception of the Key Informants on the treatment facilities available on
diseases like Malaria, Diarrhoea and Scabies is quite appreciable and the same in
respect of the other diseases like T B, Leprosy and Acute Respiratory Infection (ARI) is
quite poor. Even though, the prevalence of the latter category diseases in the region is
less as compared to the former ones. It is essential that the various treatment facilities
available should be widely known to the local people to derive the benefits/services of
the MHUs. As many as 65 per cent of the Key Informants have expressed the view that
they would prefer private clinics to MHUs, as private clinics are open to patients 24
hours, where as MHU services are not available on call basis.
10.3 Perception on Community Services Provided:
Information collected from the Key Informants on their perception about the
nature of community services provided by the MHUs is presented in Table No: 4.2.14
96
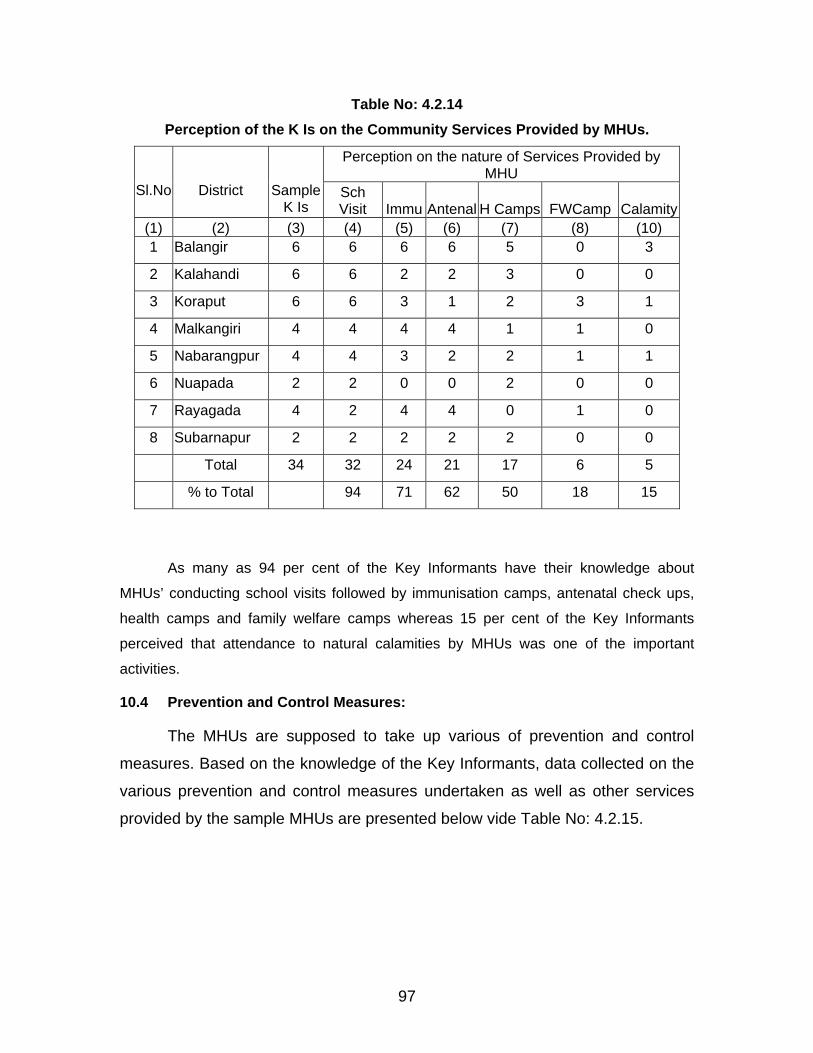
Table No: 4.2.14 Perception of the K Is on the Community Services Provided by MHUs.
Perception on the nature of Services Provided by MHU
Sl.No
District
Sample K Is
Sch Visit Immu Antenal H Camps FWCamp Calamity
(1) (2) (3) (4) (5) (6) (7) (8) (10) 1 Balangir 6 6 6 6 5 0 3
2 Kalahandi 6 6 2 2 3 0 0
3 Koraput 6 6 3 1 2 3 1
4 Malkangiri 4 4 4 4 1 1 0
5 Nabarangpur 4 4 3 2 2 1 1
6 Nuapada 2 2 0 0 2 0 0
7 Rayagada 4 2 4 4 0 1 0
8 Subarnapur 2 2 2 2 2 0 0
Total 34 32 24 21 17 6 5
% to Total 94 71 62 50 18 15
As many as 94 per cent of the Key Informants have their knowledge about
MHUs’ conducting school visits followed by immunisation camps, antenatal check ups,
health camps and family welfare camps whereas 15 per cent of the Key Informants
perceived that attendance to natural calamities by MHUs was one of the important
activities.
10.4 Prevention and Control Measures:
The MHUs are supposed to take up various of prevention and control
measures. Based on the knowledge of the Key Informants, data collected on the
various prevention and control measures undertaken as well as other services
provided by the sample MHUs are presented below vide Table No: 4.2.15.
97
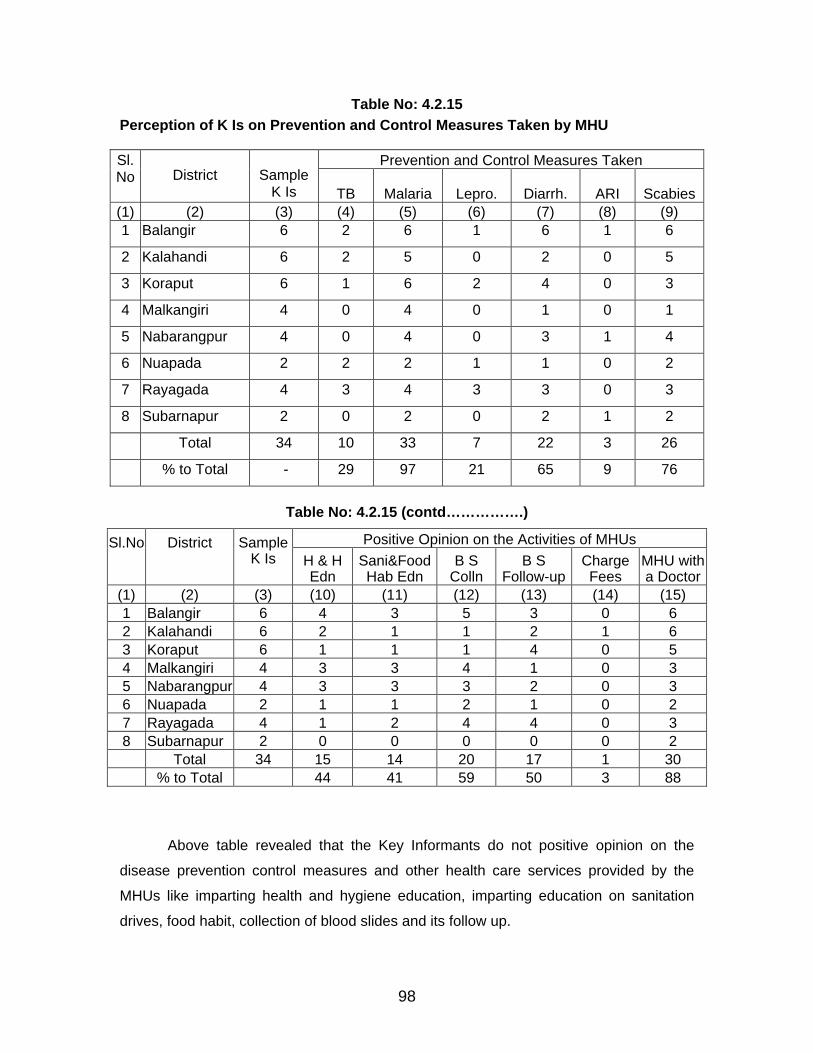
Table No: 4.2.15 Perception of K Is on Prevention and Control Measures Taken by MHU
Prevention and Control Measures Taken Sl. No
District
Sample K Is TB Malaria Lepro. Diarrh. ARI Scabies
(1) (2) (3) (4) (5) (6) (7) (8) (9) 1 Balangir 6 2 6 1 6 1 6
2 Kalahandi 6 2 5 0 2 0 5
3 Koraput 6 1 6 2 4 0 3
4 Malkangiri 4 0 4 0 1 0 1
5 Nabarangpur 4 0 4 0 3 1 4
6 Nuapada 2 2 2 1 1 0 2
7 Rayagada 4 3 4 3 3 0 3
8 Subarnapur 2 0 2 0 2 1 2
Total 34 10 33 7 22 3 26
% to Total - 29 97 21 65 9 76
Table No: 4.2.15 (contd…………….)
Positive Opinion on the Activities of MHUs Sl.No
District
Sample K Is
H & H Edn
Sani&FoodHab Edn
B S Colln
B S Follow-up
Charge Fees
MHU witha Doctor
(1) (2) (3) (10) (11) (12) (13) (14) (15) 1 Balangir 6 4 3 5 3 0 6 2 Kalahandi 6 2 1 1 2 1 6 3 Koraput 6 1 1 1 4 0 5 4 Malkangiri 4 3 3 4 1 0 3 5 Nabarangpur 4 3 3 3 2 0 3 6 Nuapada 2 1 1 2 1 0 2 7 Rayagada 4 1 2 4 4 0 3 8 Subarnapur 2 0 0 0 0 0 2 Total 34 15 14 20 17 1 30 % to Total 44 41 59 50 3 88
Above table revealed that the Key Informants do not positive opinion on the
disease prevention control measures and other health care services provided by the
MHUs like imparting health and hygiene education, imparting education on sanitation
drives, food habit, collection of blood slides and its follow up.
98
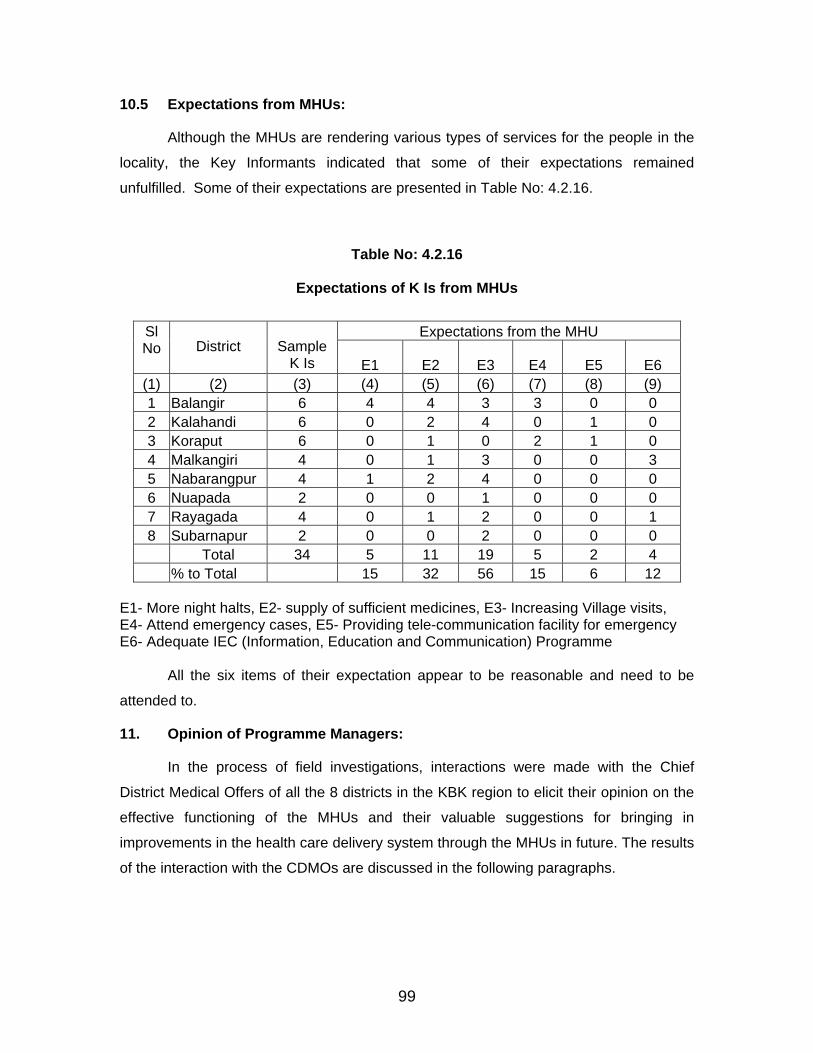
10.5 Expectations from MHUs:
Although the MHUs are rendering various types of services for the people in the
locality, the Key Informants indicated that some of their expectations remained
unfulfilled. Some of their expectations are presented in Table No: 4.2.16.
Table No: 4.2.16
Expectations of K Is from MHUs
Expectations from the MHU Sl No
District
Sample K Is E1 E2 E3 E4 E5 E6
(1) (2) (3) (4) (5) (6) (7) (8) (9) 1 Balangir 6 4 4 3 3 0 0 2 Kalahandi 6 0 2 4 0 1 0 3 Koraput 6 0 1 0 2 1 0 4 Malkangiri 4 0 1 3 0 0 3 5 Nabarangpur 4 1 2 4 0 0 0 6 Nuapada 2 0 0 1 0 0 0 7 Rayagada 4 0 1 2 0 0 1 8 Subarnapur 2 0 0 2 0 0 0 Total 34 5 11 19 5 2 4 % to Total 15 32 56 15 6 12
E1- More night halts, E2- supply of sufficient medicines, E3- Increasing Village visits, E4- Attend emergency cases, E5- Providing tele-communication facility for emergency E6- Adequate IEC (Information, Education and Communication) Programme
All the six items of their expectation appear to be reasonable and need to be
attended to.
11. Opinion of Programme Managers:
In the process of field investigations, interactions were made with the Chief
District Medical Offers of all the 8 districts in the KBK region to elicit their opinion on the
effective functioning of the MHUs and their valuable suggestions for bringing in
improvements in the health care delivery system through the MHUs in future. The results
of the interaction with the CDMOs are discussed in the following paragraphs.
99
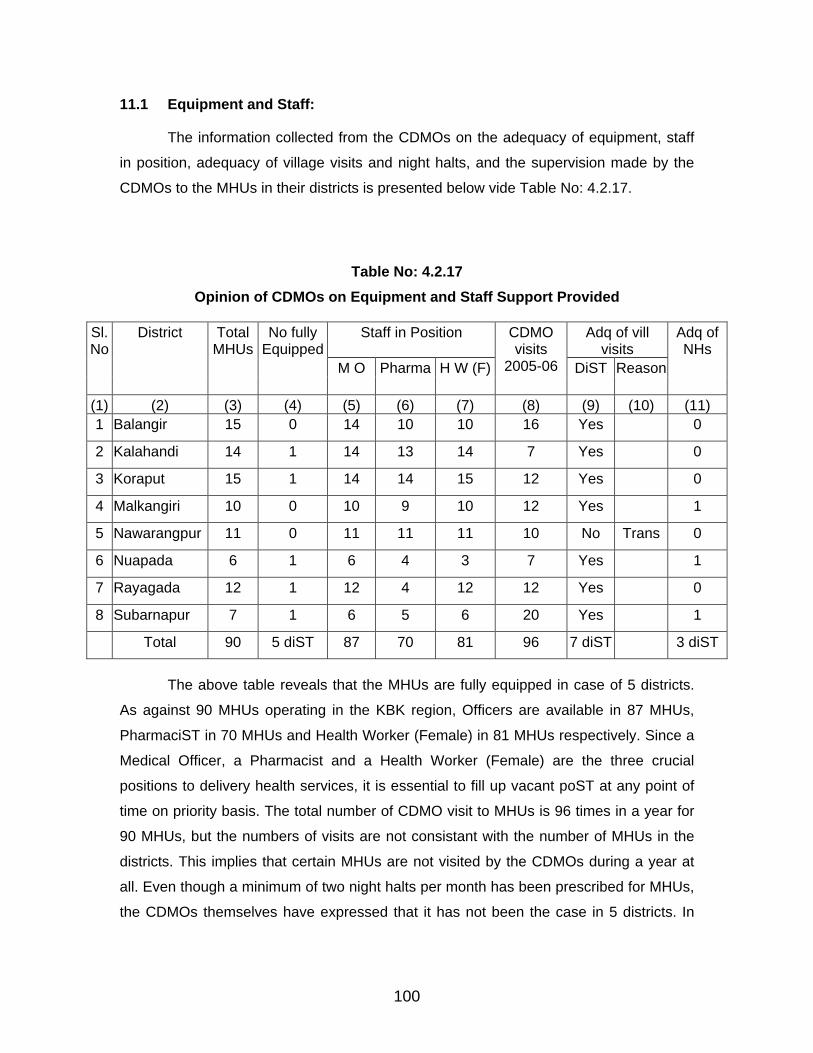
11.1 Equipment and Staff:
The information collected from the CDMOs on the adequacy of equipment, staff
in position, adequacy of village visits and night halts, and the supervision made by the
CDMOs to the MHUs in their districts is presented below vide Table No: 4.2.17.
Table No: 4.2.17 Opinion of CDMOs on Equipment and Staff Support Provided
Staff in Position Adq of vill
visits Sl. No
District
Total MHUs
No fully Equipped
M O
Pharma
H W (F)
CDMO visits
2005-06
DiST
Reason
Adq ofNHs
(1) (2) (3) (4) (5) (6) (7) (8) (9) (10) (11) 1 Balangir 15 0 14 10 10 16 Yes 0
2 Kalahandi 14 1 14 13 14 7 Yes 0
3 Koraput 15 1 14 14 15 12 Yes 0
4 Malkangiri 10 0 10 9 10 12 Yes 1
5 Nawarangpur 11 0 11 11 11 10 No Trans 0
6 Nuapada 6 1 6 4 3 7 Yes 1
7 Rayagada 12 1 12 4 12 12 Yes 0
8 Subarnapur 7 1 6 5 6 20 Yes 1
Total 90 5 diST 87 70 81 96 7 diST 3 diST
The above table reveals that the MHUs are fully equipped in case of 5 districts.
As against 90 MHUs operating in the KBK region, Officers are available in 87 MHUs,
PharmaciST in 70 MHUs and Health Worker (Female) in 81 MHUs respectively. Since a
Medical Officer, a Pharmacist and a Health Worker (Female) are the three crucial
positions to delivery health services, it is essential to fill up vacant poST at any point of
time on priority basis. The total number of CDMO visit to MHUs is 96 times in a year for
90 MHUs, but the numbers of visits are not consistant with the number of MHUs in the
districts. This implies that certain MHUs are not visited by the CDMOs during a year at
all. Even though a minimum of two night halts per month has been prescribed for MHUs,
the CDMOs themselves have expressed that it has not been the case in 5 districts. In
100
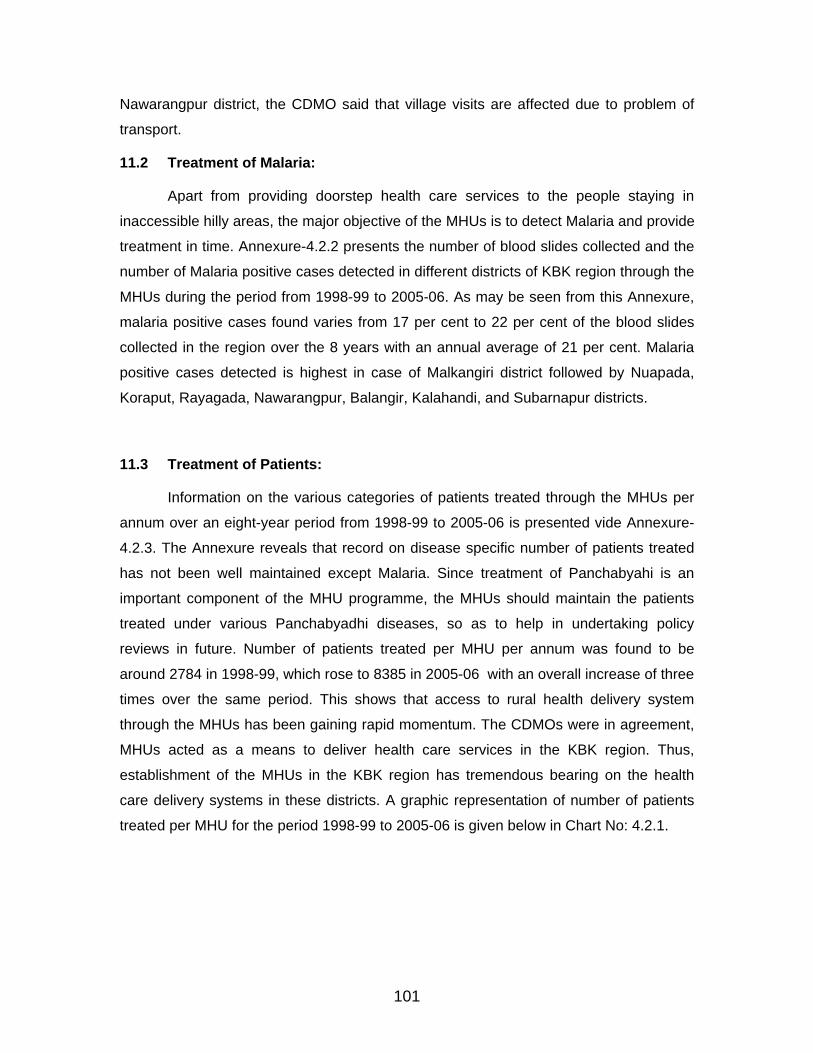
Nawarangpur district, the CDMO said that village visits are affected due to problem of
transport.
11.2 Treatment of Malaria:
Apart from providing doorstep health care services to the people staying in
inaccessible hilly areas, the major objective of the MHUs is to detect Malaria and provide
treatment in time. Annexure-4.2.2 presents the number of blood slides collected and the
number of Malaria positive cases detected in different districts of KBK region through the
MHUs during the period from 1998-99 to 2005-06. As may be seen from this Annexure,
malaria positive cases found varies from 17 per cent to 22 per cent of the blood slides
collected in the region over the 8 years with an annual average of 21 per cent. Malaria
positive cases detected is highest in case of Malkangiri district followed by Nuapada,
Koraput, Rayagada, Nawarangpur, Balangir, Kalahandi, and Subarnapur districts.
11.3 Treatment of Patients:
Information on the various categories of patients treated through the MHUs per
annum over an eight-year period from 1998-99 to 2005-06 is presented vide Annexure-
4.2.3. The Annexure reveals that record on disease specific number of patients treated
has not been well maintained except Malaria. Since treatment of Panchabyahi is an
important component of the MHU programme, the MHUs should maintain the patients
treated under various Panchabyadhi diseases, so as to help in undertaking policy
reviews in future. Number of patients treated per MHU per annum was found to be
around 2784 in 1998-99, which rose to 8385 in 2005-06 with an overall increase of three
times over the same period. This shows that access to rural health delivery system
through the MHUs has been gaining rapid momentum. The CDMOs were in agreement,
MHUs acted as a means to deliver health care services in the KBK region. Thus,
establishment of the MHUs in the KBK region has tremendous bearing on the health
care delivery systems in these districts. A graphic representation of number of patients
treated per MHU for the period 1998-99 to 2005-06 is given below in Chart No: 4.2.1.
101
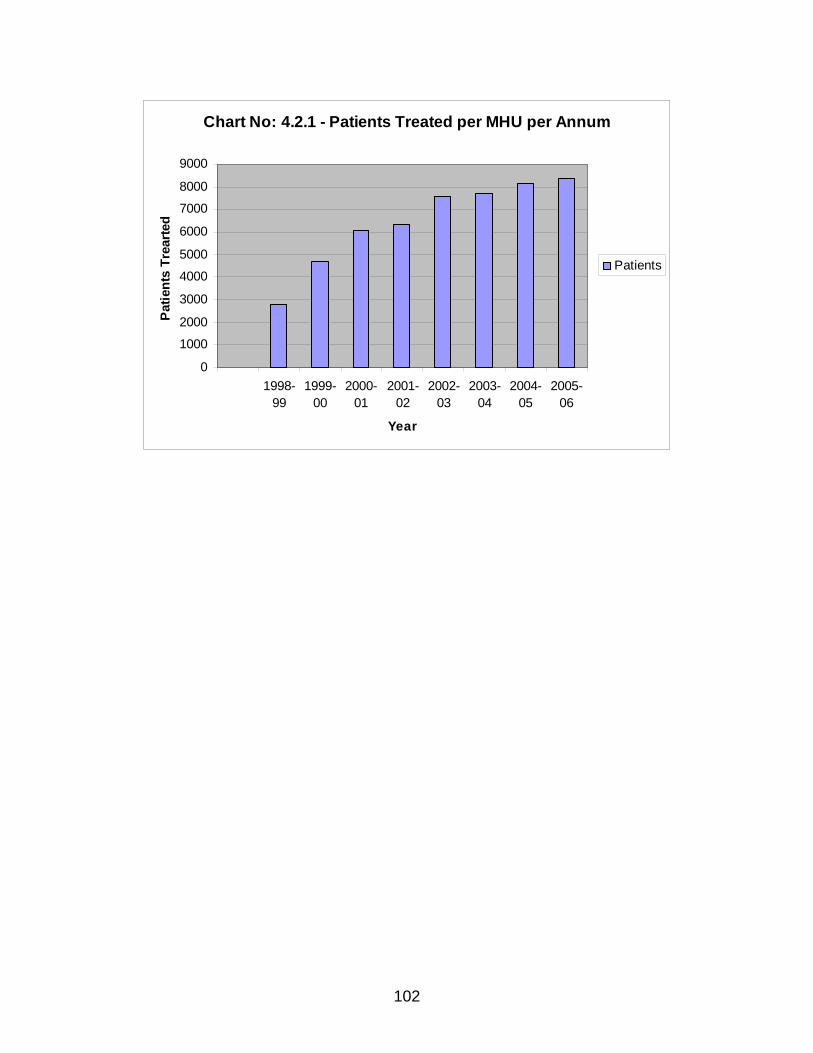
Chart No: 4.2.1 - Patients Treated per MHU per A
0
1000
2000
3000
4000
5000
6000
7000
8000
9000
1998-99
1999-00
2000-01
2001-02
2002-03
2003-04
2004-05
2005-06
Year
Patie
nts
Trea
rted
nnum
Patients
102
SECTION – 3
EMERGENCY FEEDING PROGRAMME IN KBK DISTRICTS UNDER RLTAP
1. The Sample Anganwadi Centres: Out of the 32 sample Anganwadi Centres, 26 were functioning in Government
accommodations and 6 in private and rented accommodation. Of these 32 Anganwadi
Centres 24 were running in pucca, 5 in semi-pucca and 3 in kutcha buildings. For an
accommodation to be suitable for running an Anganwadi Centre, it should be easily
approachable by the villagers. Based on taken criteria 30 out of 32 sample Anganwadi
Centres were fit for running a Centre and the remaining two were not. It will necessarily
affect efficient operation of a number of programmes aimed at providing service to the
old, infirm, children and the pregnant women in the locality, even though the sample
units are small.
As regards the educational qualification of the 32 Anganwadi Workers, 2 were
Matriculates, 7 were under Matriculates and the remaining 23 were below Matriculation.
Though all the workers were not highly educated, but it is enough for them to go through
the literature on the contents of various programmes to implement in the locality as per
guidelines and to enable to provide appropriate services.
2. Beneficiaries in Sample AWCs:
An enquiry was made to know the number of applicants desirous of availing the
benefit of emergency feeding programme or else their names were recommended for
extending benefit under the programme vis-à-vis the number of persons actually availing
the benefit. Table No: 4.3.1 presented below shows year wise from 2001-02 to 2005-06
the number of applicants in respect of 32 sample AWCs, the actual number of
beneficiaries along with their social category and economic status.
103
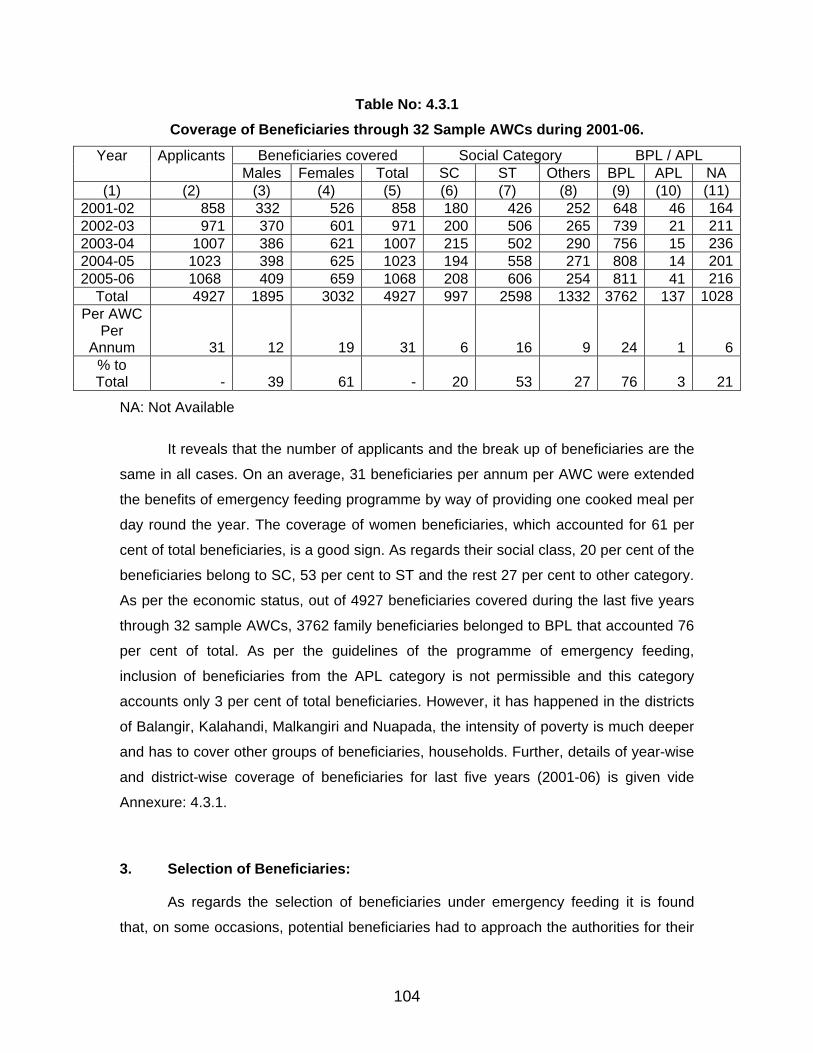
Table No: 4.3.1 Coverage of Beneficiaries through 32 Sample AWCs during 2001-06.
Beneficiaries covered Social Category BPL / APL Year
Applicants Males Females Total SC ST Others BPL APL NA
(1) (2) (3) (4) (5) (6) (7) (8) (9) (10) (11) 2001-02 858 332 526 858 180 426 252 648 46 1642002-03 971 370 601 971 200 506 265 739 21 2112003-04 1007 386 621 1007 215 502 290 756 15 2362004-05 1023 398 625 1023 194 558 271 808 14 2012005-06 1068 409 659 1068 208 606 254 811 41 216
Total 4927 1895 3032 4927 997 2598 1332 3762 137 1028Per AWC
Per Annum 31 12 19 31 6 16 9 24 1 6
% to Total - 39 61 - 20 53 27 76 3 21
NA: Not Available
It reveals that the number of applicants and the break up of beneficiaries are the
same in all cases. On an average, 31 beneficiaries per annum per AWC were extended
the benefits of emergency feeding programme by way of providing one cooked meal per
day round the year. The coverage of women beneficiaries, which accounted for 61 per
cent of total beneficiaries, is a good sign. As regards their social class, 20 per cent of the
beneficiaries belong to SC, 53 per cent to ST and the rest 27 per cent to other category.
As per the economic status, out of 4927 beneficiaries covered during the last five years
through 32 sample AWCs, 3762 family beneficiaries belonged to BPL that accounted 76
per cent of total. As per the guidelines of the programme of emergency feeding,
inclusion of beneficiaries from the APL category is not permissible and this category
accounts only 3 per cent of total beneficiaries. However, it has happened in the districts
of Balangir, Kalahandi, Malkangiri and Nuapada, the intensity of poverty is much deeper
and has to cover other groups of beneficiaries, households. Further, details of year-wise
and district-wise coverage of beneficiaries for last five years (2001-06) is given vide
Annexure: 4.3.1.
3. Selection of Beneficiaries:
As regards the selection of beneficiaries under emergency feeding it is found
that, on some occasions, potential beneficiaries had to approach the authorities for their
104
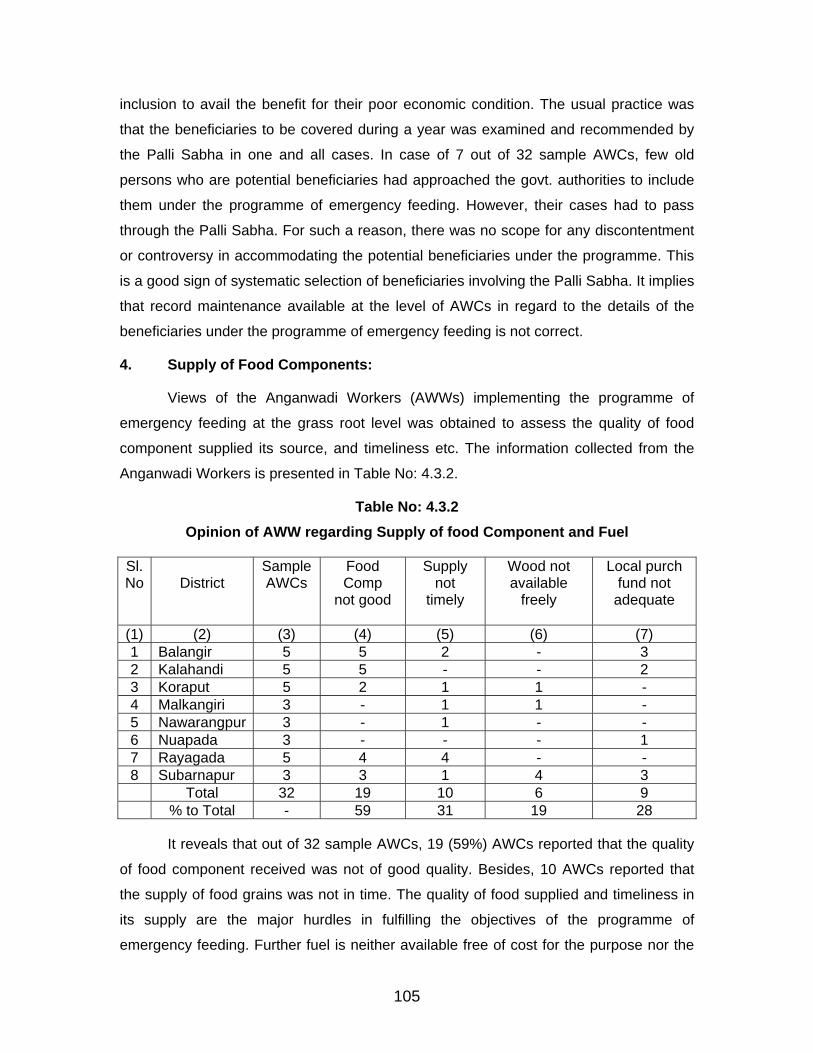
inclusion to avail the benefit for their poor economic condition. The usual practice was
that the beneficiaries to be covered during a year was examined and recommended by
the Palli Sabha in one and all cases. In case of 7 out of 32 sample AWCs, few old
persons who are potential beneficiaries had approached the govt. authorities to include
them under the programme of emergency feeding. However, their cases had to pass
through the Palli Sabha. For such a reason, there was no scope for any discontentment
or controversy in accommodating the potential beneficiaries under the programme. This
is a good sign of systematic selection of beneficiaries involving the Palli Sabha. It implies
that record maintenance available at the level of AWCs in regard to the details of the
beneficiaries under the programme of emergency feeding is not correct.
4. Supply of Food Components:
Views of the Anganwadi Workers (AWWs) implementing the programme of
emergency feeding at the grass root level was obtained to assess the quality of food
component supplied its source, and timeliness etc. The information collected from the
Anganwadi Workers is presented in Table No: 4.3.2.
Table No: 4.3.2 Opinion of AWW regarding Supply of food Component and Fuel
Sl. No
District
Sample AWCs
Food Comp
not good
Supply not
timely
Wood not available
freely
Local purch fund not
adequate
(1) (2) (3) (4) (5) (6) (7) 1 Balangir 5 5 2 - 3 2 Kalahandi 5 5 - - 2 3 Koraput 5 2 1 1 - 4 Malkangiri 3 - 1 1 - 5 Nawarangpur 3 - 1 - - 6 Nuapada 3 - - - 1 7 Rayagada 5 4 4 - - 8 Subarnapur 3 3 1 4 3 Total 32 19 10 6 9
% to Total - 59 31 19 28
It reveals that out of 32 sample AWCs, 19 (59%) AWCs reported that the quality
of food component received was not of good quality. Besides, 10 AWCs reported that
the supply of food grains was not in time. The quality of food supplied and timeliness in
its supply are the major hurdles in fulfilling the objectives of the programme of
emergency feeding. Further fuel is neither available free of cost for the purpose nor the
105
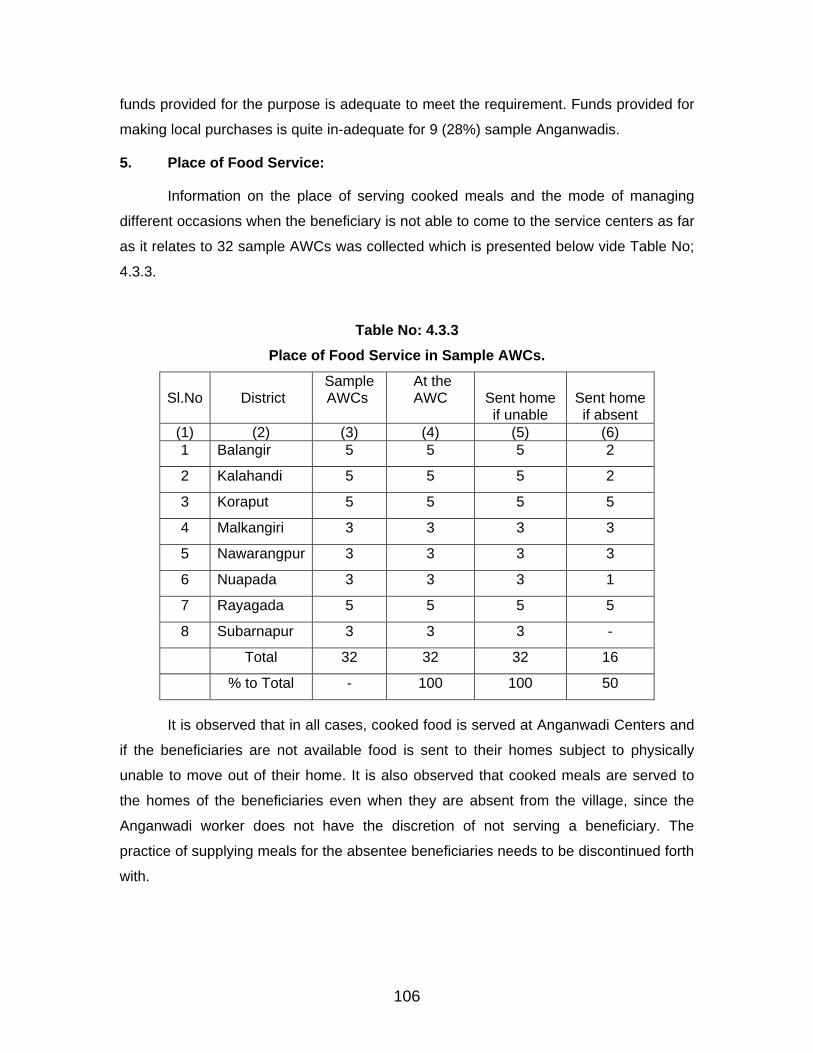
funds provided for the purpose is adequate to meet the requirement. Funds provided for
making local purchases is quite in-adequate for 9 (28%) sample Anganwadis.
5. Place of Food Service:
Information on the place of serving cooked meals and the mode of managing
different occasions when the beneficiary is not able to come to the service centers as far
as it relates to 32 sample AWCs was collected which is presented below vide Table No;
4.3.3.
Table No: 4.3.3
Place of Food Service in Sample AWCs.
Sl.No
District
Sample AWCs
At the AWC
Sent home if unable
Sent home if absent
(1) (2) (3) (4) (5) (6) 1 Balangir 5 5 5 2
2 Kalahandi 5 5 5 2
3 Koraput 5 5 5 5
4 Malkangiri 3 3 3 3
5 Nawarangpur 3 3 3 3
6 Nuapada 3 3 3 1
7 Rayagada 5 5 5 5
8 Subarnapur 3 3 3 -
Total 32 32 32 16
% to Total - 100 100 50
It is observed that in all cases, cooked food is served at Anganwadi Centers and
if the beneficiaries are not available food is sent to their homes subject to physically
unable to move out of their home. It is also observed that cooked meals are served to
the homes of the beneficiaries even when they are absent from the village, since the
Anganwadi worker does not have the discretion of not serving a beneficiary. The
practice of supplying meals for the absentee beneficiaries needs to be discontinued forth
with.
106
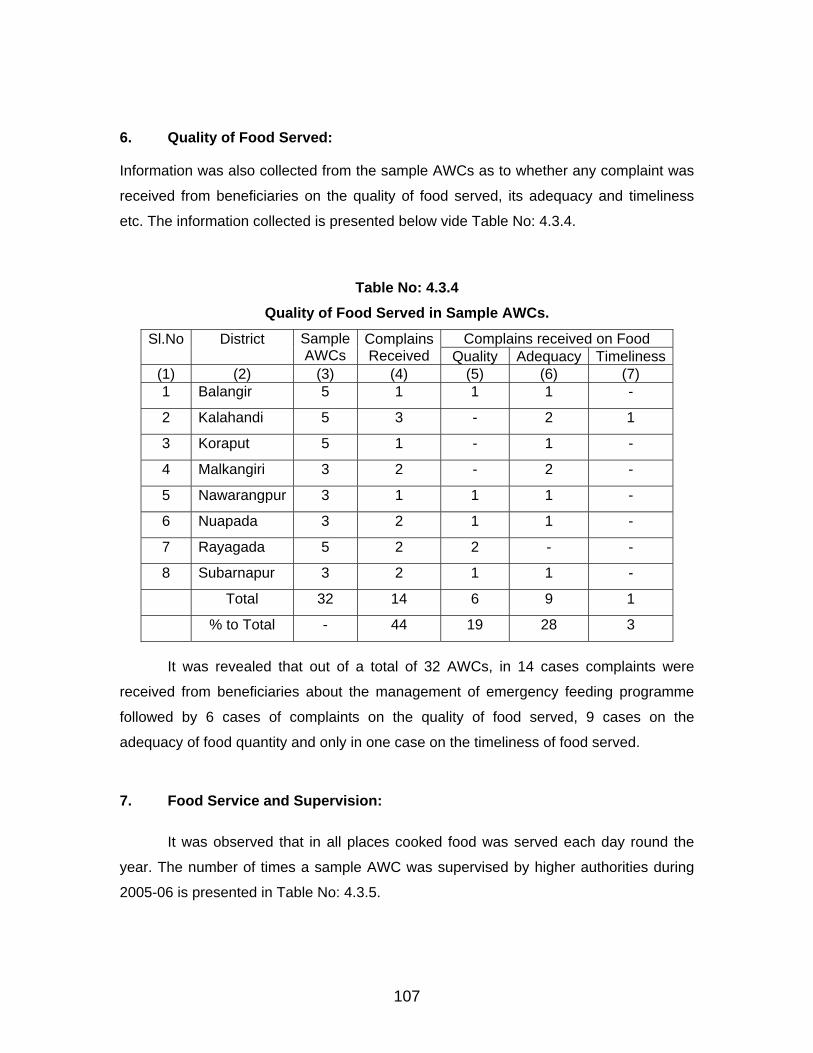
6. Quality of Food Served:
Information was also collected from the sample AWCs as to whether any complaint was
received from beneficiaries on the quality of food served, its adequacy and timeliness
etc. The information collected is presented below vide Table No: 4.3.4.
Table No: 4.3.4 Quality of Food Served in Sample AWCs.
Complains received on Food Sl.No
District
Sample AWCs
Complains Received Quality Adequacy Timeliness
(1) (2) (3) (4) (5) (6) (7) 1 Balangir 5 1 1 1 -
2 Kalahandi 5 3 - 2 1
3 Koraput 5 1 - 1 -
4 Malkangiri 3 2 - 2 -
5 Nawarangpur 3 1 1 1 -
6 Nuapada 3 2 1 1 -
7 Rayagada 5 2 2 - -
8 Subarnapur 3 2 1 1 -
Total 32 14 6 9 1
% to Total - 44 19 28 3
It was revealed that out of a total of 32 AWCs, in 14 cases complaints were
received from beneficiaries about the management of emergency feeding programme
followed by 6 cases of complaints on the quality of food served, 9 cases on the
adequacy of food quantity and only in one case on the timeliness of food served.
7. Food Service and Supervision:
It was observed that in all places cooked food was served each day round the
year. The number of times a sample AWC was supervised by higher authorities during
2005-06 is presented in Table No: 4.3.5.
107
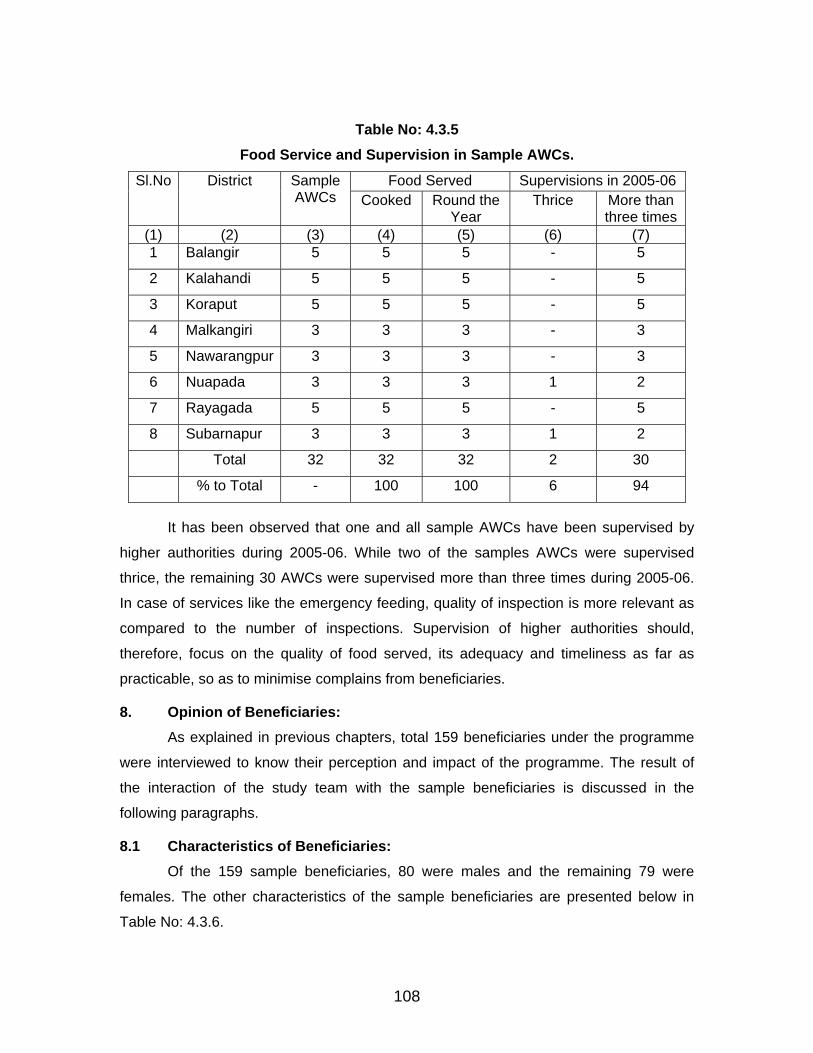
Table No: 4.3.5
Food Service and Supervision in Sample AWCs.
Food Served Supervisions in 2005-06 Sl.No
District
Sample AWCs Cooked Round the
Year Thrice More than
three times(1) (2) (3) (4) (5) (6) (7) 1 Balangir 5 5 5 - 5
2 Kalahandi 5 5 5 - 5
3 Koraput 5 5 5 - 5
4 Malkangiri 3 3 3 - 3
5 Nawarangpur 3 3 3 - 3
6 Nuapada 3 3 3 1 2
7 Rayagada 5 5 5 - 5
8 Subarnapur 3 3 3 1 2
Total 32 32 32 2 30
% to Total - 100 100 6 94
It has been observed that one and all sample AWCs have been supervised by
higher authorities during 2005-06. While two of the samples AWCs were supervised
thrice, the remaining 30 AWCs were supervised more than three times during 2005-06.
In case of services like the emergency feeding, quality of inspection is more relevant as
compared to the number of inspections. Supervision of higher authorities should,
therefore, focus on the quality of food served, its adequacy and timeliness as far as
practicable, so as to minimise complains from beneficiaries.
8. Opinion of Beneficiaries: As explained in previous chapters, total 159 beneficiaries under the programme
were interviewed to know their perception and impact of the programme. The result of
the interaction of the study team with the sample beneficiaries is discussed in the
following paragraphs.
8.1 Characteristics of Beneficiaries: Of the 159 sample beneficiaries, 80 were males and the remaining 79 were
females. The other characteristics of the sample beneficiaries are presented below in
Table No: 4.3.6.
108
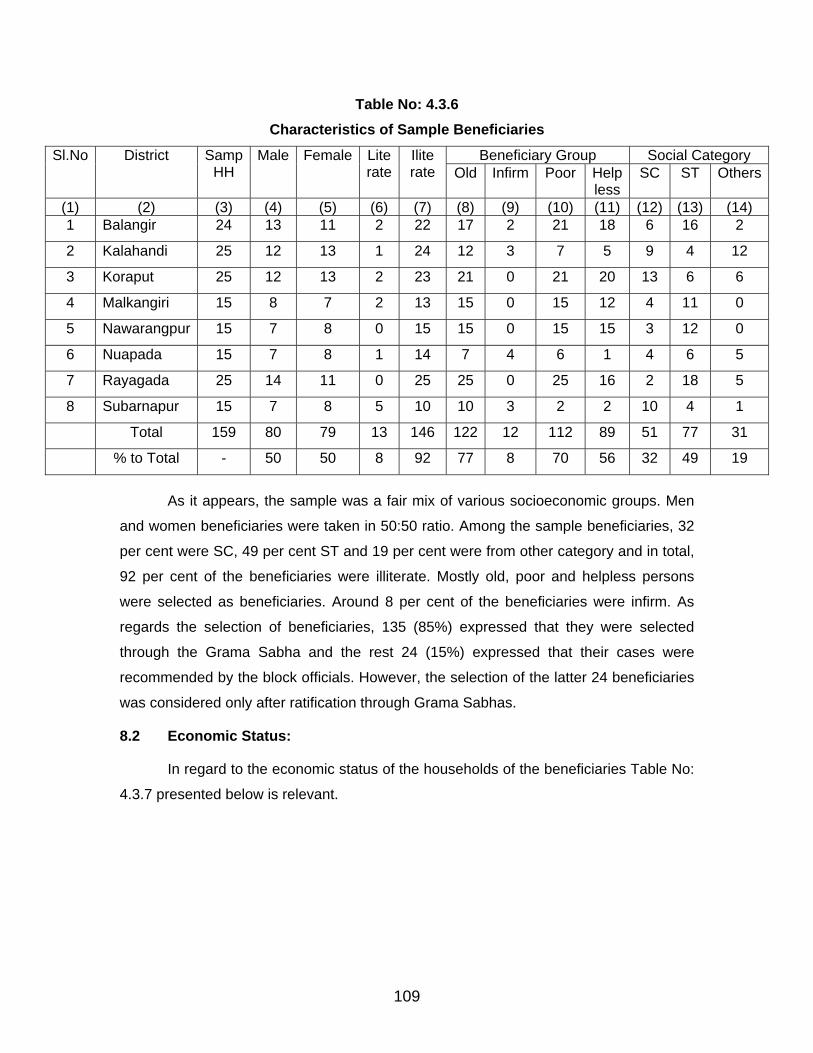
Table No: 4.3.6 Characteristics of Sample Beneficiaries
Beneficiary Group Social Category Sl.No
District
Samp HH
Male Female Literate
Iliterate
Old
Infirm
Poor
Help less
SC
ST
Others
(1) (2) (3) (4) (5) (6) (7) (8) (9) (10) (11) (12) (13) (14) 1 Balangir 24 13 11 2 22 17 2 21 18 6 16 2
2 Kalahandi 25 12 13 1 24 12 3 7 5 9 4 12
3 Koraput 25 12 13 2 23 21 0 21 20 13 6 6
4 Malkangiri 15 8 7 2 13 15 0 15 12 4 11 0
5 Nawarangpur 15 7 8 0 15 15 0 15 15 3 12 0
6 Nuapada 15 7 8 1 14 7 4 6 1 4 6 5
7 Rayagada 25 14 11 0 25 25 0 25 16 2 18 5
8 Subarnapur 15 7 8 5 10 10 3 2 2 10 4 1
Total 159 80 79 13 146 122 12 112 89 51 77 31
% to Total - 50 50 8 92 77 8 70 56 32 49 19
As it appears, the sample was a fair mix of various socioeconomic groups. Men
and women beneficiaries were taken in 50:50 ratio. Among the sample beneficiaries, 32
per cent were SC, 49 per cent ST and 19 per cent were from other category and in total,
92 per cent of the beneficiaries were illiterate. Mostly old, poor and helpless persons
were selected as beneficiaries. Around 8 per cent of the beneficiaries were infirm. As
regards the selection of beneficiaries, 135 (85%) expressed that they were selected
through the Grama Sabha and the rest 24 (15%) expressed that their cases were
recommended by the block officials. However, the selection of the latter 24 beneficiaries
was considered only after ratification through Grama Sabhas.
8.2 Economic Status:
In regard to the economic status of the households of the beneficiaries Table No:
4.3.7 presented below is relevant.
109
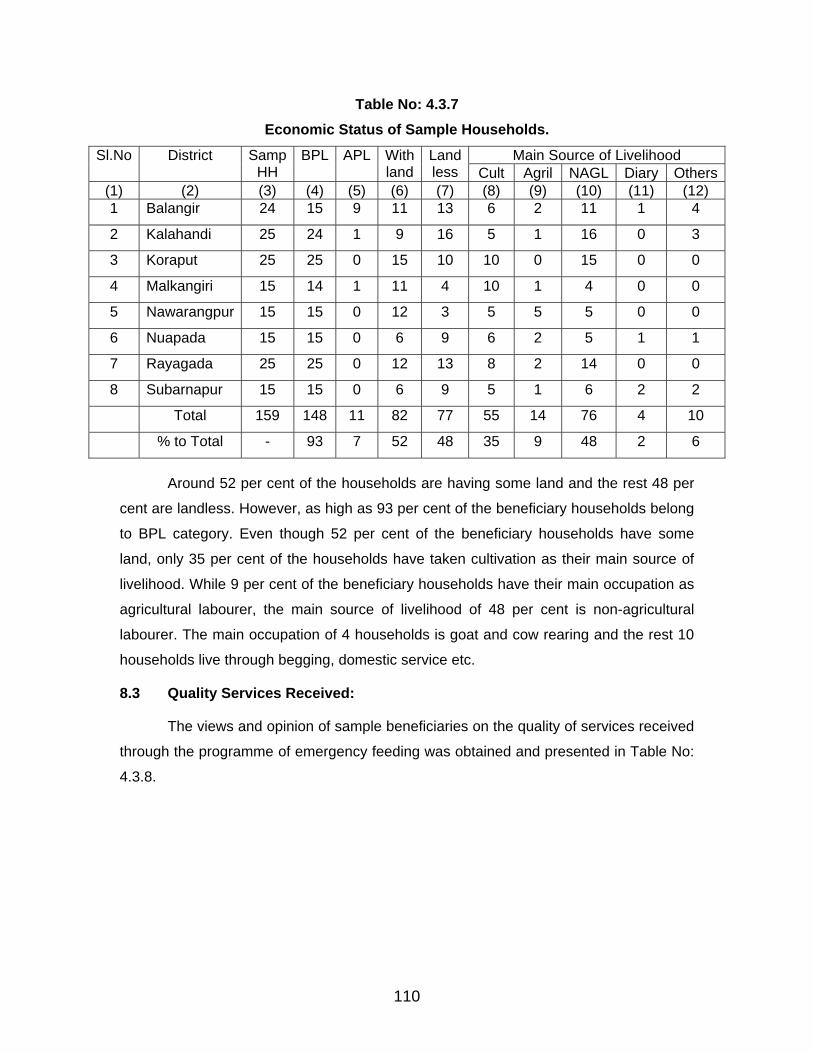
Table No: 4.3.7 Economic Status of Sample Households.
Main Source of Livelihood Sl.No
District
Samp HH
BPL APL Withland
Landless Cult Agril NAGL Diary Others
(1) (2) (3) (4) (5) (6) (7) (8) (9) (10) (11) (12) 1 Balangir 24 15 9 11 13 6 2 11 1 4
2 Kalahandi 25 24 1 9 16 5 1 16 0 3
3 Koraput 25 25 0 15 10 10 0 15 0 0
4 Malkangiri 15 14 1 11 4 10 1 4 0 0
5 Nawarangpur 15 15 0 12 3 5 5 5 0 0
6 Nuapada 15 15 0 6 9 6 2 5 1 1
7 Rayagada 25 25 0 12 13 8 2 14 0 0
8 Subarnapur 15 15 0 6 9 5 1 6 2 2
Total 159 148 11 82 77 55 14 76 4 10
% to Total - 93 7 52 48 35 9 48 2 6
Around 52 per cent of the households are having some land and the rest 48 per
cent are landless. However, as high as 93 per cent of the beneficiary households belong
to BPL category. Even though 52 per cent of the beneficiary households have some
land, only 35 per cent of the households have taken cultivation as their main source of
livelihood. While 9 per cent of the beneficiary households have their main occupation as
agricultural labourer, the main source of livelihood of 48 per cent is non-agricultural
labourer. The main occupation of 4 households is goat and cow rearing and the rest 10
households live through begging, domestic service etc.
8.3 Quality Services Received:
The views and opinion of sample beneficiaries on the quality of services received
through the programme of emergency feeding was obtained and presented in Table No:
4.3.8.
110
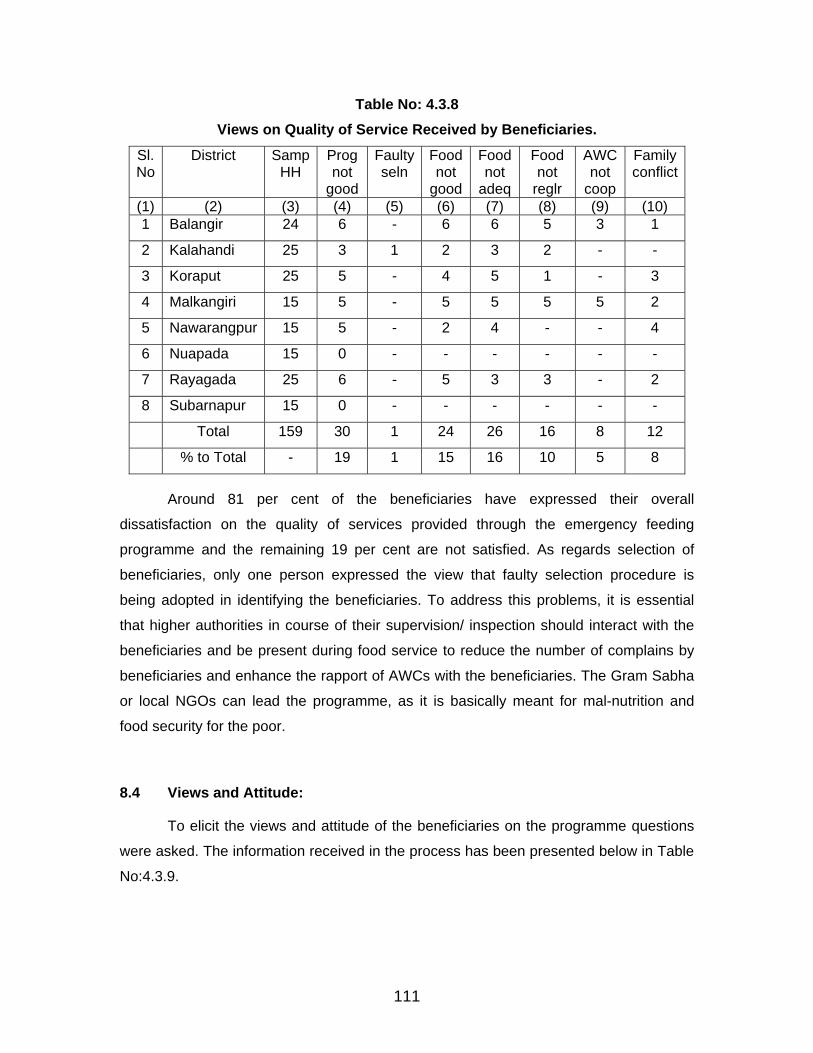
Table No: 4.3.8 Views on Quality of Service Received by Beneficiaries.
Sl. No
District
Samp HH
Prognot
good
Faultyseln
Foodnot
good
Foodnot
adeq
Foodnot
reglr
AWC not
coop
Familyconflict
(1) (2) (3) (4) (5) (6) (7) (8) (9) (10) 1 Balangir 24 6 - 6 6 5 3 1
2 Kalahandi 25 3 1 2 3 2 - -
3 Koraput 25 5 - 4 5 1 - 3
4 Malkangiri 15 5 - 5 5 5 5 2
5 Nawarangpur 15 5 - 2 4 - - 4
6 Nuapada 15 0 - - - - - -
7 Rayagada 25 6 - 5 3 3 - 2
8 Subarnapur 15 0 - - - - - -
Total 159 30 1 24 26 16 8 12
% to Total - 19 1 15 16 10 5 8
Around 81 per cent of the beneficiaries have expressed their overall
dissatisfaction on the quality of services provided through the emergency feeding
programme and the remaining 19 per cent are not satisfied. As regards selection of
beneficiaries, only one person expressed the view that faulty selection procedure is
being adopted in identifying the beneficiaries. To address this problems, it is essential
that higher authorities in course of their supervision/ inspection should interact with the
beneficiaries and be present during food service to reduce the number of complains by
beneficiaries and enhance the rapport of AWCs with the beneficiaries. The Gram Sabha
or local NGOs can lead the programme, as it is basically meant for mal-nutrition and
food security for the poor.
8.4 Views and Attitude:
To elicit the views and attitude of the beneficiaries on the programme questions
were asked. The information received in the process has been presented below in Table
No:4.3.9.
111
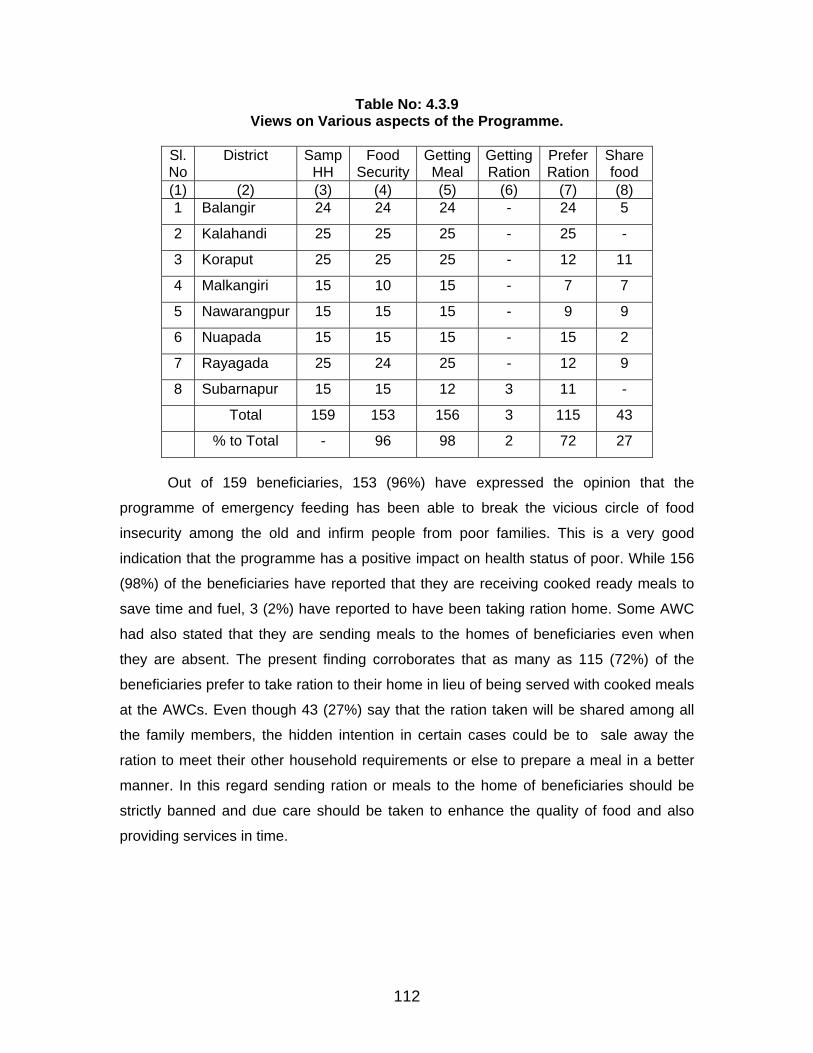
Table No: 4.3.9 Views on Various aspects of the Programme.
Sl. No
District
SampHH
Food Security
GettingMeal
GettingRation
Prefer Ration
Share food
(1) (2) (3) (4) (5) (6) (7) (8) 1 Balangir 24 24 24 - 24 5
2 Kalahandi 25 25 25 - 25 -
3 Koraput 25 25 25 - 12 11
4 Malkangiri 15 10 15 - 7 7
5 Nawarangpur 15 15 15 - 9 9
6 Nuapada 15 15 15 - 15 2
7 Rayagada 25 24 25 - 12 9
8 Subarnapur 15 15 12 3 11 -
Total 159 153 156 3 115 43
% to Total - 96 98 2 72 27
Out of 159 beneficiaries, 153 (96%) have expressed the opinion that the
programme of emergency feeding has been able to break the vicious circle of food
insecurity among the old and infirm people from poor families. This is a very good
indication that the programme has a positive impact on health status of poor. While 156
(98%) of the beneficiaries have reported that they are receiving cooked ready meals to
save time and fuel, 3 (2%) have reported to have been taking ration home. Some AWC
had also stated that they are sending meals to the homes of beneficiaries even when
they are absent. The present finding corroborates that as many as 115 (72%) of the
beneficiaries prefer to take ration to their home in lieu of being served with cooked meals
at the AWCs. Even though 43 (27%) say that the ration taken will be shared among all
the family members, the hidden intention in certain cases could be to sale away the
ration to meet their other household requirements or else to prepare a meal in a better
manner. In this regard sending ration or meals to the home of beneficiaries should be
strictly banned and due care should be taken to enhance the quality of food and also
providing services in time.
112
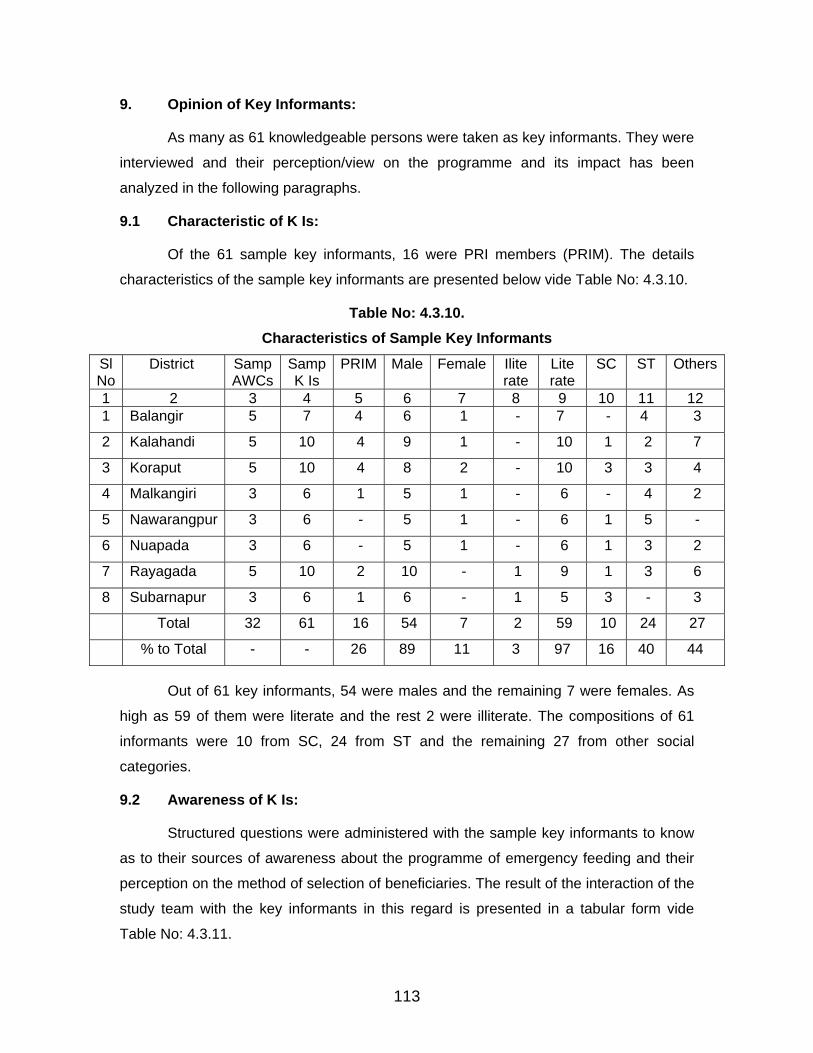
9. Opinion of Key Informants:
As many as 61 knowledgeable persons were taken as key informants. They were
interviewed and their perception/view on the programme and its impact has been
analyzed in the following paragraphs.
9.1 Characteristic of K Is:
Of the 61 sample key informants, 16 were PRI members (PRIM). The details
characteristics of the sample key informants are presented below vide Table No: 4.3.10.
Table No: 4.3.10. Characteristics of Sample Key Informants
Sl No
District
Samp AWCs
Samp K Is
PRIM
Male
Female
Iliterate
Lite rate
SC
ST
Others
1 2 3 4 5 6 7 8 9 10 11 12 1 Balangir 5 7 4 6 1 - 7 - 4 3
2 Kalahandi 5 10 4 9 1 - 10 1 2 7
3 Koraput 5 10 4 8 2 - 10 3 3 4
4 Malkangiri 3 6 1 5 1 - 6 - 4 2
5 Nawarangpur 3 6 - 5 1 - 6 1 5 -
6 Nuapada 3 6 - 5 1 - 6 1 3 2
7 Rayagada 5 10 2 10 - 1 9 1 3 6
8 Subarnapur 3 6 1 6 - 1 5 3 - 3
Total 32 61 16 54 7 2 59 10 24 27
% to Total - - 26 89 11 3 97 16 40 44
Out of 61 key informants, 54 were males and the remaining 7 were females. As
high as 59 of them were literate and the rest 2 were illiterate. The compositions of 61
informants were 10 from SC, 24 from ST and the remaining 27 from other social
categories.
9.2 Awareness of K Is:
Structured questions were administered with the sample key informants to know
as to their sources of awareness about the programme of emergency feeding and their
perception on the method of selection of beneficiaries. The result of the interaction of the
study team with the key informants in this regard is presented in a tabular form vide
Table No: 4.3.11.
113

Table No: 4.3.11. Awareness of Sample K Is on the Programme.
Sources of Awareness Perception on the method of Selection
Sl.No
District
Samp K Is AWC Reln Media Old Infirm Poor
Help less Others
(1) (2) (3) (4) (5) (6) (7) (8) (9) (10) (11) 1 Balangir 7 7 - 2 7 7 7 6 2
2 Kalahandi 10 10 - - 10 10 10 10 -
3 Koraput 10 9 - 3 10 - 10 8 -
4 Malkangiri 6 4 1 2 6 1 6 5 -
5 Nawarangpur 6 2 - 4 6 - 6 6 -
6 Nuapada 6 6 - - 6 6 6 6 -
7 Rayagada 10 5 - 8 10 - 10 10 -
8 Subarnapur 6 4 2 - 6 6 6 6 -
Total 61 45 3 19 61 30 61 57 2
% to Total - 74 5 31 100 49 100 93 3
Majority of key informants i.e. 45 (74%) came to know about the emergency
feeding programme from the AWCs and 19 (31%) from media. Hardly, 3 (5%) of them
could know about the programme from their relations and the village men. In regard to
their perception as to the method of selection of beneficiaries, one and all expressed that
the old and the poor are usually given priority. As many as 30 (49%) of the key
informants expressed that importance is also given on infirm and 57 (93%) expressed
that selection of helpless persons are given due weightage. Only 2 (3%) of them
expressed that influential people try to pass through the selection process to get the
benefit under the programme even though were not eligible. As such the views
expressed by the key informants on the process of selection of beneficiaries adopted at
the field level is more fair and genuine.
9.3 Perception of K Is:
In regard to the overall opinion of the key informants on the proper
implementation of the programme at the village level, 41 (67%) expressed their
satisfaction and the rest 20 (33%) expressed their dissatisfaction as evident from the
Table No: 4.3.12 presented below.
114
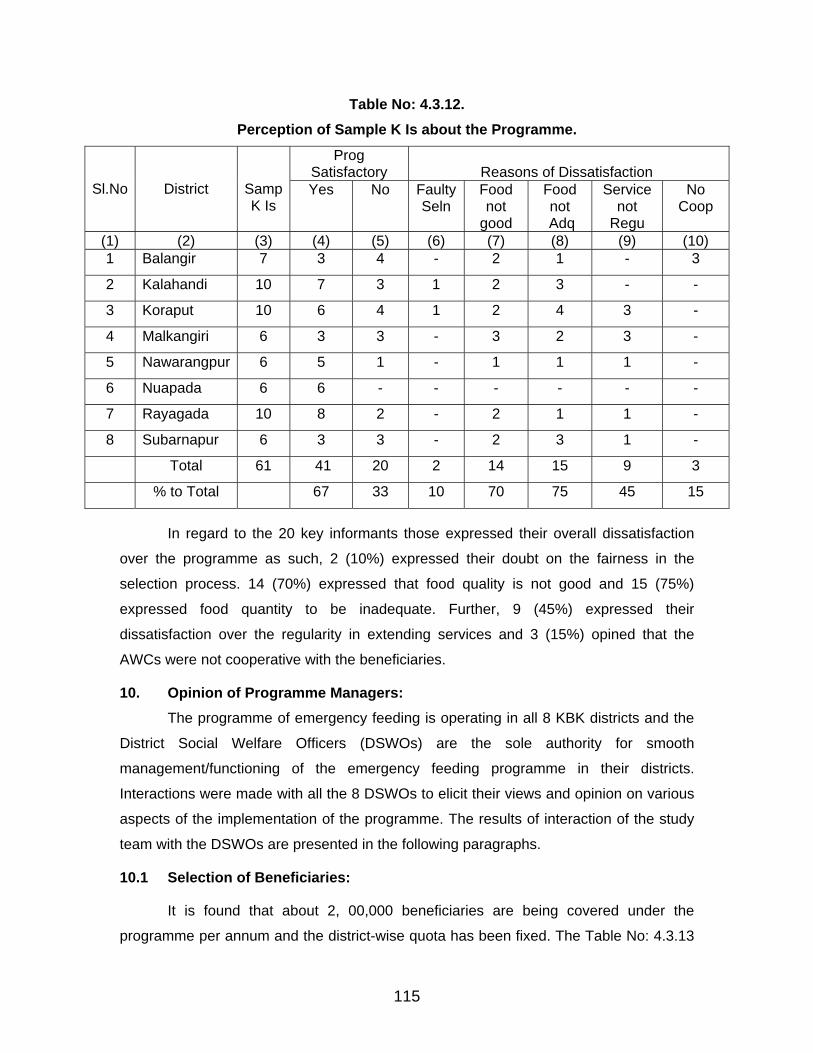
Table No: 4.3.12. Perception of Sample K Is about the Programme.
Prog Satisfactory Reasons of Dissatisfaction
Sl.No
District
Samp K Is
Yes
No FaultySeln
Food not
good
Food not
Adq
Service not
Regu
No Coop
(1) (2) (3) (4) (5) (6) (7) (8) (9) (10) 1 Balangir 7 3 4 - 2 1 - 3
2 Kalahandi 10 7 3 1 2 3 - -
3 Koraput 10 6 4 1 2 4 3 -
4 Malkangiri 6 3 3 - 3 2 3 -
5 Nawarangpur 6 5 1 - 1 1 1 -
6 Nuapada 6 6 - - - - - -
7 Rayagada 10 8 2 - 2 1 1 -
8 Subarnapur 6 3 3 - 2 3 1 -
Total 61 41 20 2 14 15 9 3
% to Total 67 33 10 70 75 45 15
In regard to the 20 key informants those expressed their overall dissatisfaction
over the programme as such, 2 (10%) expressed their doubt on the fairness in the
selection process. 14 (70%) expressed that food quality is not good and 15 (75%)
expressed food quantity to be inadequate. Further, 9 (45%) expressed their
dissatisfaction over the regularity in extending services and 3 (15%) opined that the
AWCs were not cooperative with the beneficiaries.
10. Opinion of Programme Managers: The programme of emergency feeding is operating in all 8 KBK districts and the
District Social Welfare Officers (DSWOs) are the sole authority for smooth
management/functioning of the emergency feeding programme in their districts.
Interactions were made with all the 8 DSWOs to elicit their views and opinion on various
aspects of the implementation of the programme. The results of interaction of the study
team with the DSWOs are presented in the following paragraphs.
10.1 Selection of Beneficiaries:
It is found that about 2, 00,000 beneficiaries are being covered under the
programme per annum and the district-wise quota has been fixed. The Table No: 4.3.13
115
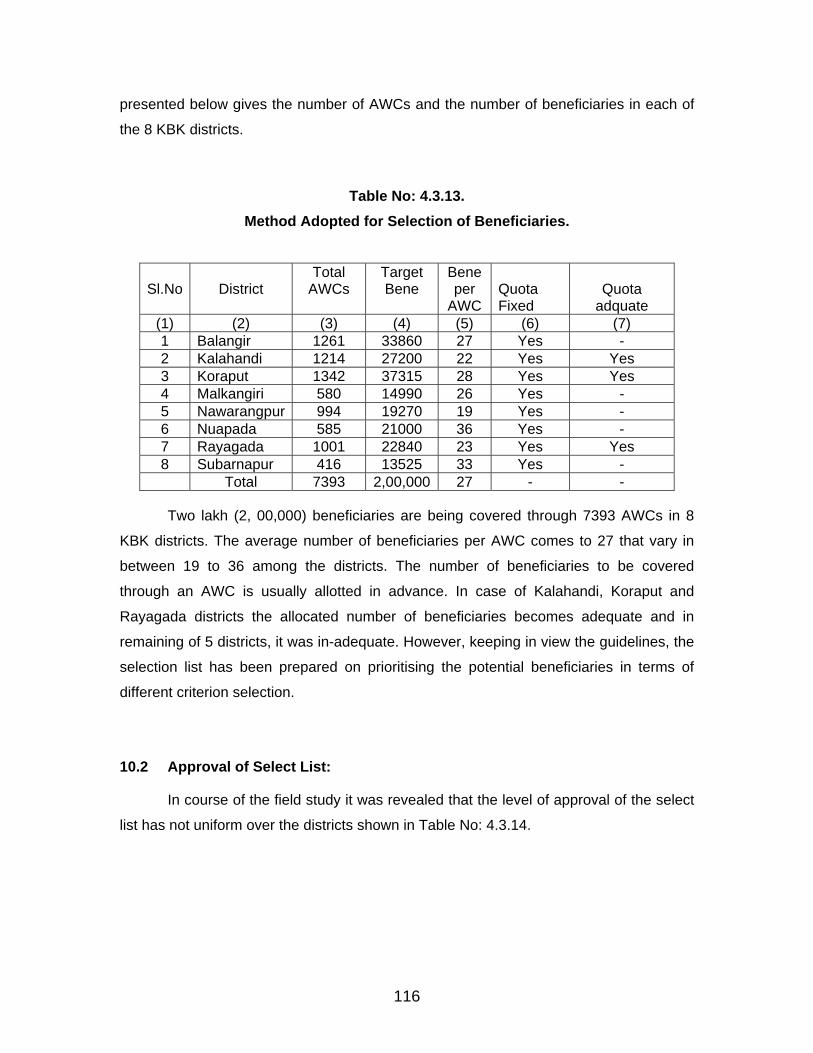
presented below gives the number of AWCs and the number of beneficiaries in each of
the 8 KBK districts.
Table No: 4.3.13. Method Adopted for Selection of Beneficiaries.
Sl.No
District
Total AWCs
Target Bene
Bene per
AWC Quota Fixed
Quota adquate
(1) (2) (3) (4) (5) (6) (7) 1 Balangir 1261 33860 27 Yes - 2 Kalahandi 1214 27200 22 Yes Yes 3 Koraput 1342 37315 28 Yes Yes 4 Malkangiri 580 14990 26 Yes - 5 Nawarangpur 994 19270 19 Yes - 6 Nuapada 585 21000 36 Yes - 7 Rayagada 1001 22840 23 Yes Yes 8 Subarnapur 416 13525 33 Yes - Total 7393 2,00,000 27 - -
Two lakh (2, 00,000) beneficiaries are being covered through 7393 AWCs in 8
KBK districts. The average number of beneficiaries per AWC comes to 27 that vary in
between 19 to 36 among the districts. The number of beneficiaries to be covered
through an AWC is usually allotted in advance. In case of Kalahandi, Koraput and
Rayagada districts the allocated number of beneficiaries becomes adequate and in
remaining of 5 districts, it was in-adequate. However, keeping in view the guidelines, the
selection list has been prepared on prioritising the potential beneficiaries in terms of
different criterion selection.
10.2 Approval of Select List:
In course of the field study it was revealed that the level of approval of the select
list has not uniform over the districts shown in Table No: 4.3.14.
116
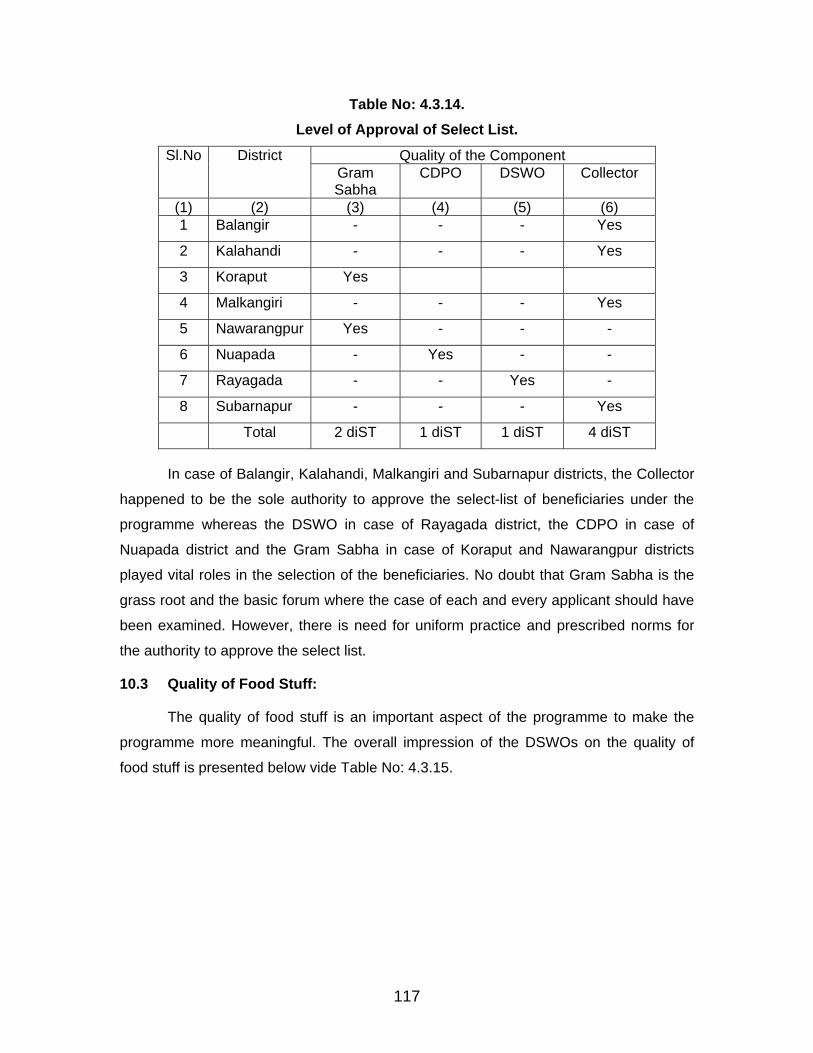
Table No: 4.3.14. Level of Approval of Select List.
Quality of the Component Sl.No
District Gram
Sabha CDPO
DSWO
Collector
(1) (2) (3) (4) (5) (6) 1 Balangir - - - Yes
2 Kalahandi - - - Yes
3 Koraput Yes
4 Malkangiri - - - Yes
5 Nawarangpur Yes - - -
6 Nuapada - Yes - -
7 Rayagada - - Yes -
8 Subarnapur - - - Yes
Total 2 diST 1 diST 1 diST 4 diST
In case of Balangir, Kalahandi, Malkangiri and Subarnapur districts, the Collector
happened to be the sole authority to approve the select-list of beneficiaries under the
programme whereas the DSWO in case of Rayagada district, the CDPO in case of
Nuapada district and the Gram Sabha in case of Koraput and Nawarangpur districts
played vital roles in the selection of the beneficiaries. No doubt that Gram Sabha is the
grass root and the basic forum where the case of each and every applicant should have
been examined. However, there is need for uniform practice and prescribed norms for
the authority to approve the select list.
10.3 Quality of Food Stuff:
The quality of food stuff is an important aspect of the programme to make the
programme more meaningful. The overall impression of the DSWOs on the quality of
food stuff is presented below vide Table No: 4.3.15.
117
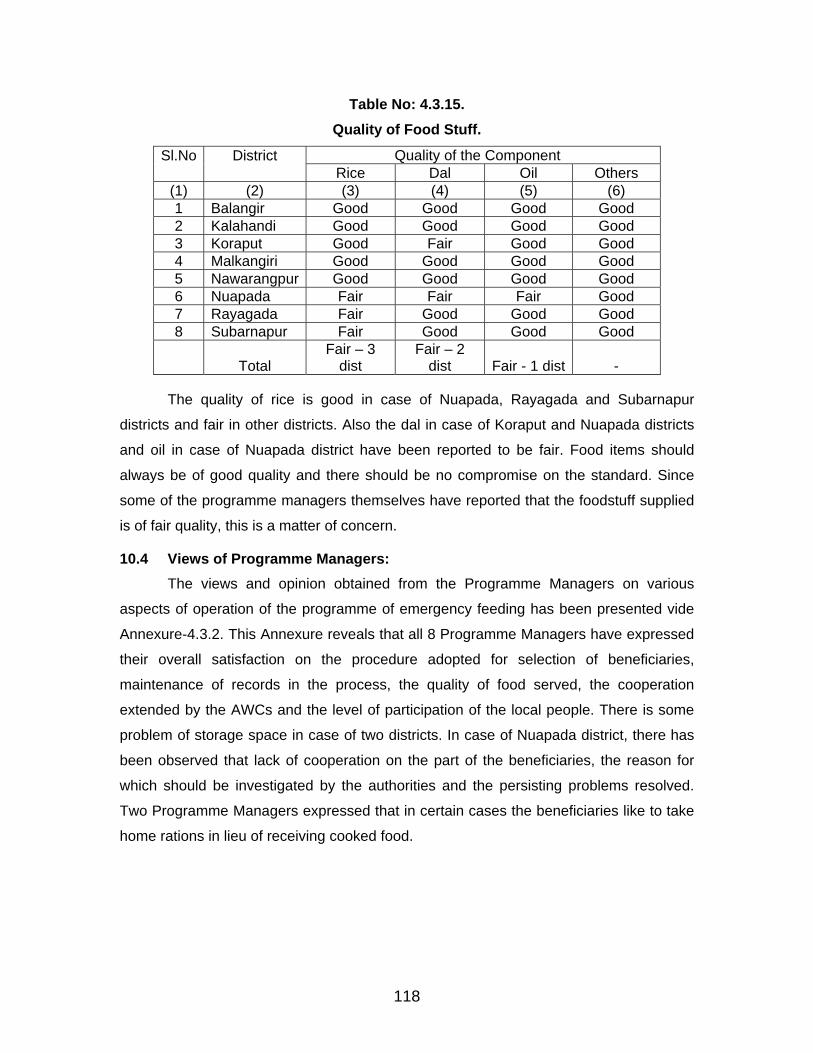
Table No: 4.3.15. Quality of Food Stuff.
Quality of the Component Sl.No
District Rice Dal Oil Others
(1) (2) (3) (4) (5) (6) 1 Balangir Good Good Good Good 2 Kalahandi Good Good Good Good 3 Koraput Good Fair Good Good 4 Malkangiri Good Good Good Good 5 Nawarangpur Good Good Good Good 6 Nuapada Fair Fair Fair Good 7 Rayagada Fair Good Good Good 8 Subarnapur Fair Good Good Good
Total Fair – 3
dist Fair – 2
dist Fair - 1 dist -
The quality of rice is good in case of Nuapada, Rayagada and Subarnapur
districts and fair in other districts. Also the dal in case of Koraput and Nuapada districts
and oil in case of Nuapada district have been reported to be fair. Food items should
always be of good quality and there should be no compromise on the standard. Since
some of the programme managers themselves have reported that the foodstuff supplied
is of fair quality, this is a matter of concern.
10.4 Views of Programme Managers: The views and opinion obtained from the Programme Managers on various
aspects of operation of the programme of emergency feeding has been presented vide
Annexure-4.3.2. This Annexure reveals that all 8 Programme Managers have expressed
their overall satisfaction on the procedure adopted for selection of beneficiaries,
maintenance of records in the process, the quality of food served, the cooperation
extended by the AWCs and the level of participation of the local people. There is some
problem of storage space in case of two districts. In case of Nuapada district, there has
been observed that lack of cooperation on the part of the beneficiaries, the reason for
which should be investigated by the authorities and the persisting problems resolved.
Two Programme Managers expressed that in certain cases the beneficiaries like to take
home rations in lieu of receiving cooked food.
118
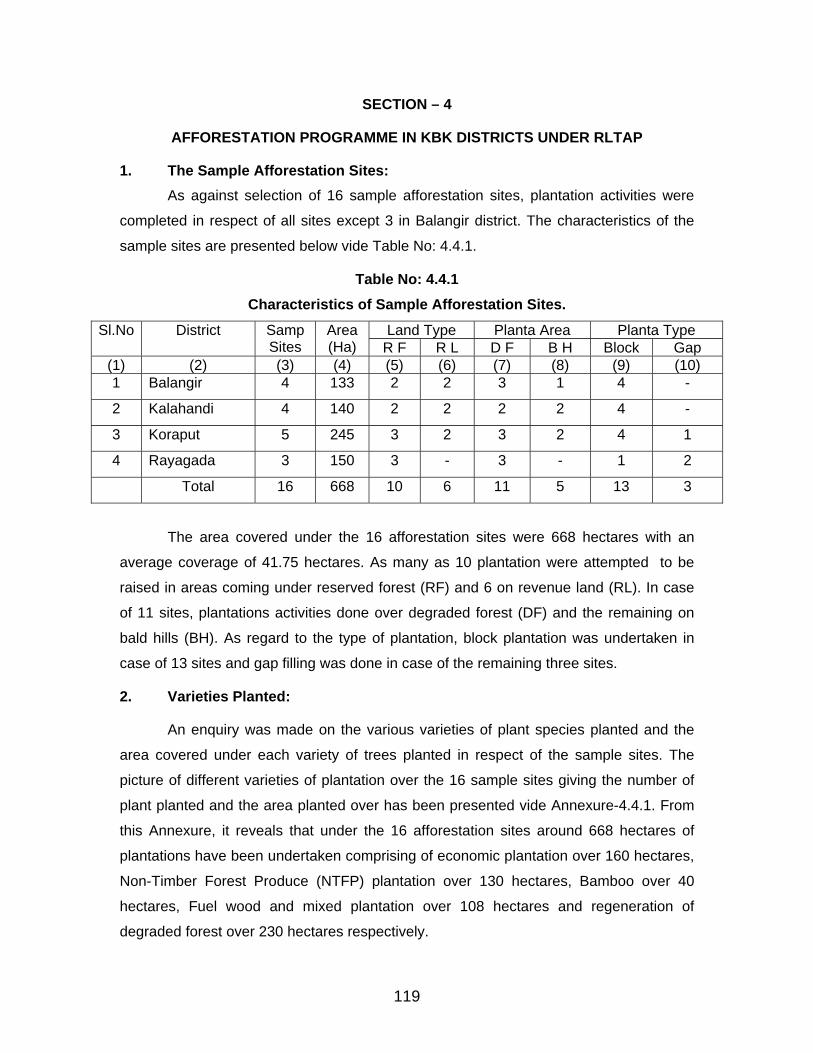
SECTION – 4
AFFORESTATION PROGRAMME IN KBK DISTRICTS UNDER RLTAP
1. The Sample Afforestation Sites: As against selection of 16 sample afforestation sites, plantation activities were
completed in respect of all sites except 3 in Balangir district. The characteristics of the
sample sites are presented below vide Table No: 4.4.1.
Table No: 4.4.1 Characteristics of Sample Afforestation Sites.
Land Type Planta Area Planta Type Sl.No District Samp Sites
Area(Ha) R F R L D F B H Block Gap
(1) (2) (3) (4) (5) (6) (7) (8) (9) (10) 1 Balangir 4 133 2 2 3 1 4 -
2 Kalahandi 4 140 2 2 2 2 4 -
3 Koraput 5 245 3 2 3 2 4 1
4 Rayagada 3 150 3 - 3 - 1 2
Total 16 668 10 6 11 5 13 3
The area covered under the 16 afforestation sites were 668 hectares with an
average coverage of 41.75 hectares. As many as 10 plantation were attempted to be
raised in areas coming under reserved forest (RF) and 6 on revenue land (RL). In case
of 11 sites, plantations activities done over degraded forest (DF) and the remaining on
bald hills (BH). As regard to the type of plantation, block plantation was undertaken in
case of 13 sites and gap filling was done in case of the remaining three sites.
2. Varieties Planted:
An enquiry was made on the various varieties of plant species planted and the
area covered under each variety of trees planted in respect of the sample sites. The
picture of different varieties of plantation over the 16 sample sites giving the number of
plant planted and the area planted over has been presented vide Annexure-4.4.1. From
this Annexure, it reveals that under the 16 afforestation sites around 668 hectares of
plantations have been undertaken comprising of economic plantation over 160 hectares,
Non-Timber Forest Produce (NTFP) plantation over 130 hectares, Bamboo over 40
hectares, Fuel wood and mixed plantation over 108 hectares and regeneration of
degraded forest over 230 hectares respectively.
119
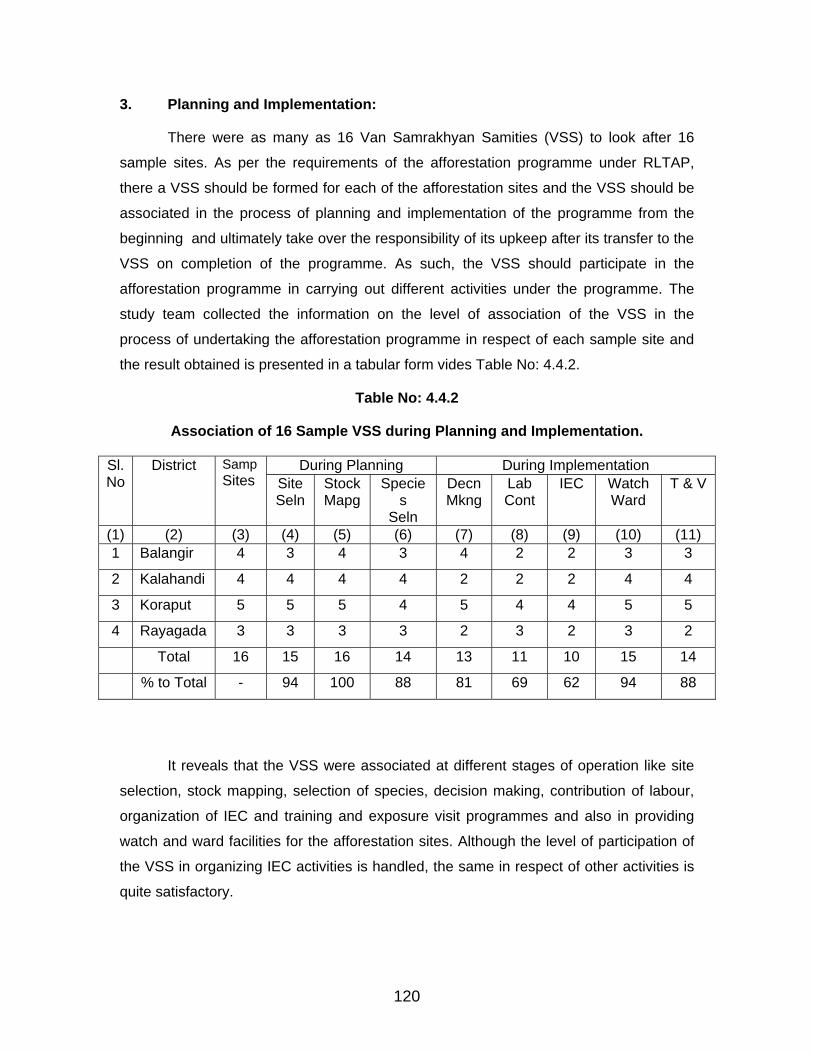
3. Planning and Implementation:
There were as many as 16 Van Samrakhyan Samities (VSS) to look after 16
sample sites. As per the requirements of the afforestation programme under RLTAP,
there a VSS should be formed for each of the afforestation sites and the VSS should be
associated in the process of planning and implementation of the programme from the
beginning and ultimately take over the responsibility of its upkeep after its transfer to the
VSS on completion of the programme. As such, the VSS should participate in the
afforestation programme in carrying out different activities under the programme. The
study team collected the information on the level of association of the VSS in the
process of undertaking the afforestation programme in respect of each sample site and
the result obtained is presented in a tabular form vides Table No: 4.4.2.
Table No: 4.4.2
Association of 16 Sample VSS during Planning and Implementation.
During Planning During Implementation Sl.No
District Samp Sites Site
Seln StockMapg
Species
Seln
DecnMkng
Lab Cont
IEC Watch Ward
T & V
(1) (2) (3) (4) (5) (6) (7) (8) (9) (10) (11) 1 Balangir 4 3 4 3 4 2 2 3 3
2 Kalahandi 4 4 4 4 2 2 2 4 4
3 Koraput 5 5 5 4 5 4 4 5 5
4 Rayagada 3 3 3 3 2 3 2 3 2
Total 16 15 16 14 13 11 10 15 14
% to Total - 94 100 88 81 69 62 94 88
It reveals that the VSS were associated at different stages of operation like site
selection, stock mapping, selection of species, decision making, contribution of labour,
organization of IEC and training and exposure visit programmes and also in providing
watch and ward facilities for the afforestation sites. Although the level of participation of
the VSS in organizing IEC activities is handled, the same in respect of other activities is
quite satisfactory.
120
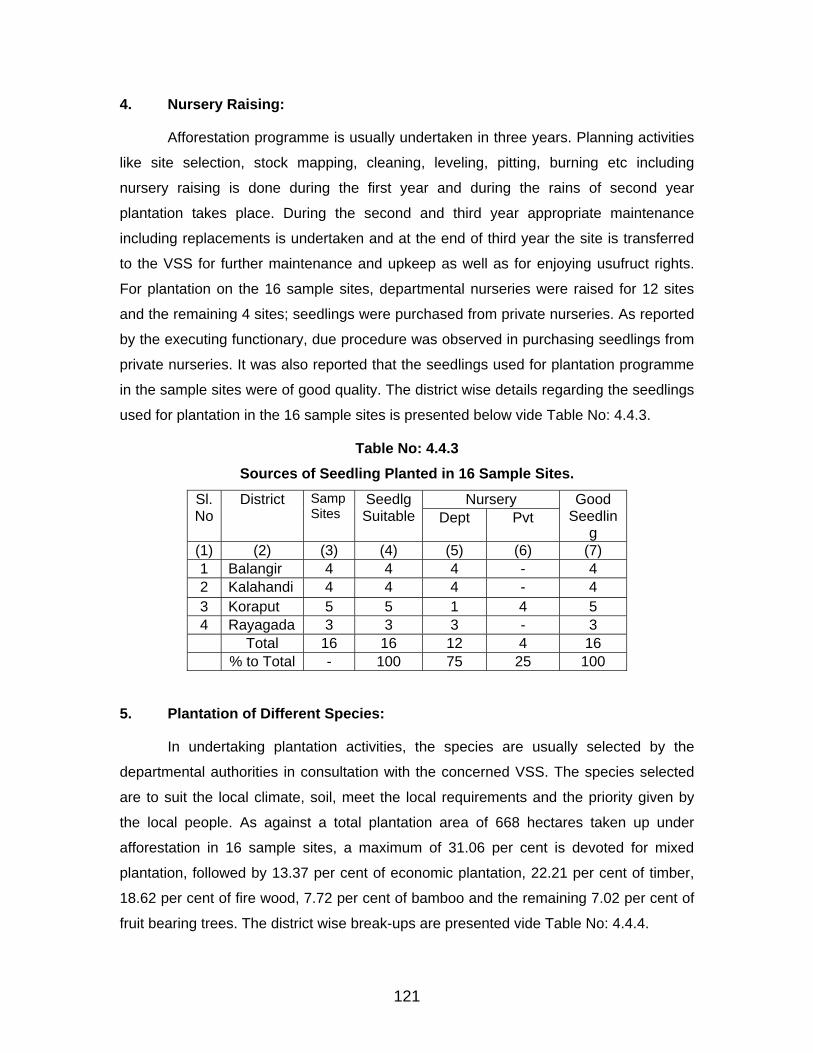
4. Nursery Raising:
Afforestation programme is usually undertaken in three years. Planning activities
like site selection, stock mapping, cleaning, leveling, pitting, burning etc including
nursery raising is done during the first year and during the rains of second year
plantation takes place. During the second and third year appropriate maintenance
including replacements is undertaken and at the end of third year the site is transferred
to the VSS for further maintenance and upkeep as well as for enjoying usufruct rights.
For plantation on the 16 sample sites, departmental nurseries were raised for 12 sites
and the remaining 4 sites; seedlings were purchased from private nurseries. As reported
by the executing functionary, due procedure was observed in purchasing seedlings from
private nurseries. It was also reported that the seedlings used for plantation programme
in the sample sites were of good quality. The district wise details regarding the seedlings
used for plantation in the 16 sample sites is presented below vide Table No: 4.4.3.
Table No: 4.4.3 Sources of Seedling Planted in 16 Sample Sites.
Nursery Sl.No
District SampSites
SeedlgSuitable Dept Pvt
Good Seedlin
g (1) (2) (3) (4) (5) (6) (7) 1 Balangir 4 4 4 - 4 2 Kalahandi 4 4 4 - 4 3 Koraput 5 5 1 4 5 4 Rayagada 3 3 3 - 3 Total 16 16 12 4 16 % to Total - 100 75 25 100
5. Plantation of Different Species:
In undertaking plantation activities, the species are usually selected by the
departmental authorities in consultation with the concerned VSS. The species selected
are to suit the local climate, soil, meet the local requirements and the priority given by
the local people. As against a total plantation area of 668 hectares taken up under
afforestation in 16 sample sites, a maximum of 31.06 per cent is devoted for mixed
plantation, followed by 13.37 per cent of economic plantation, 22.21 per cent of timber,
18.62 per cent of fire wood, 7.72 per cent of bamboo and the remaining 7.02 per cent of
fruit bearing trees. The district wise break-ups are presented vide Table No: 4.4.4.
121
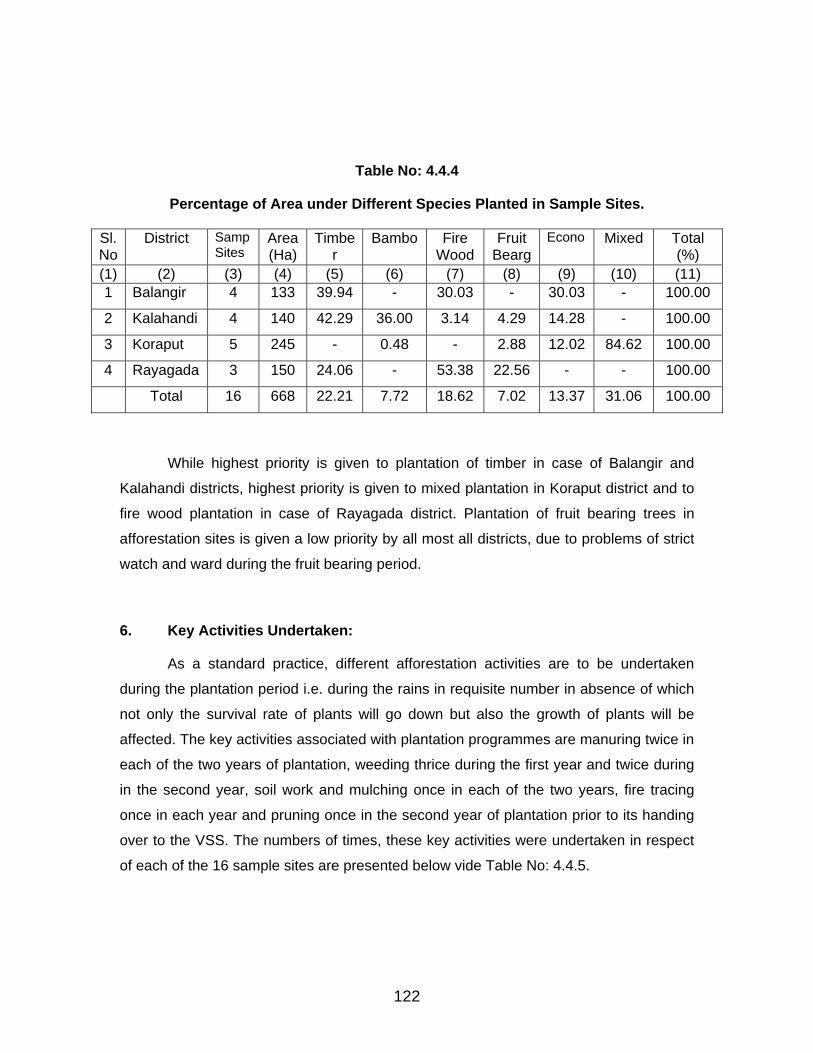
Table No: 4.4.4
Percentage of Area under Different Species Planted in Sample Sites.
Sl.No
District Samp Sites
Area (Ha)
Timber
Bambo Fire Wood
Fruit Bearg
Econo Mixed Total (%)
(1) (2) (3) (4) (5) (6) (7) (8) (9) (10) (11) 1 Balangir 4 133 39.94 - 30.03 - 30.03 - 100.00
2 Kalahandi 4 140 42.29 36.00 3.14 4.29 14.28 - 100.00
3 Koraput 5 245 - 0.48 - 2.88 12.02 84.62 100.00
4 Rayagada 3 150 24.06 - 53.38 22.56 - - 100.00
Total 16 668 22.21 7.72 18.62 7.02 13.37 31.06 100.00
While highest priority is given to plantation of timber in case of Balangir and
Kalahandi districts, highest priority is given to mixed plantation in Koraput district and to
fire wood plantation in case of Rayagada district. Plantation of fruit bearing trees in
afforestation sites is given a low priority by all most all districts, due to problems of strict
watch and ward during the fruit bearing period.
6. Key Activities Undertaken:
As a standard practice, different afforestation activities are to be undertaken
during the plantation period i.e. during the rains in requisite number in absence of which
not only the survival rate of plants will go down but also the growth of plants will be
affected. The key activities associated with plantation programmes are manuring twice in
each of the two years of plantation, weeding thrice during the first year and twice during
in the second year, soil work and mulching once in each of the two years, fire tracing
once in each year and pruning once in the second year of plantation prior to its handing
over to the VSS. The numbers of times, these key activities were undertaken in respect
of each of the 16 sample sites are presented below vide Table No: 4.4.5.
122
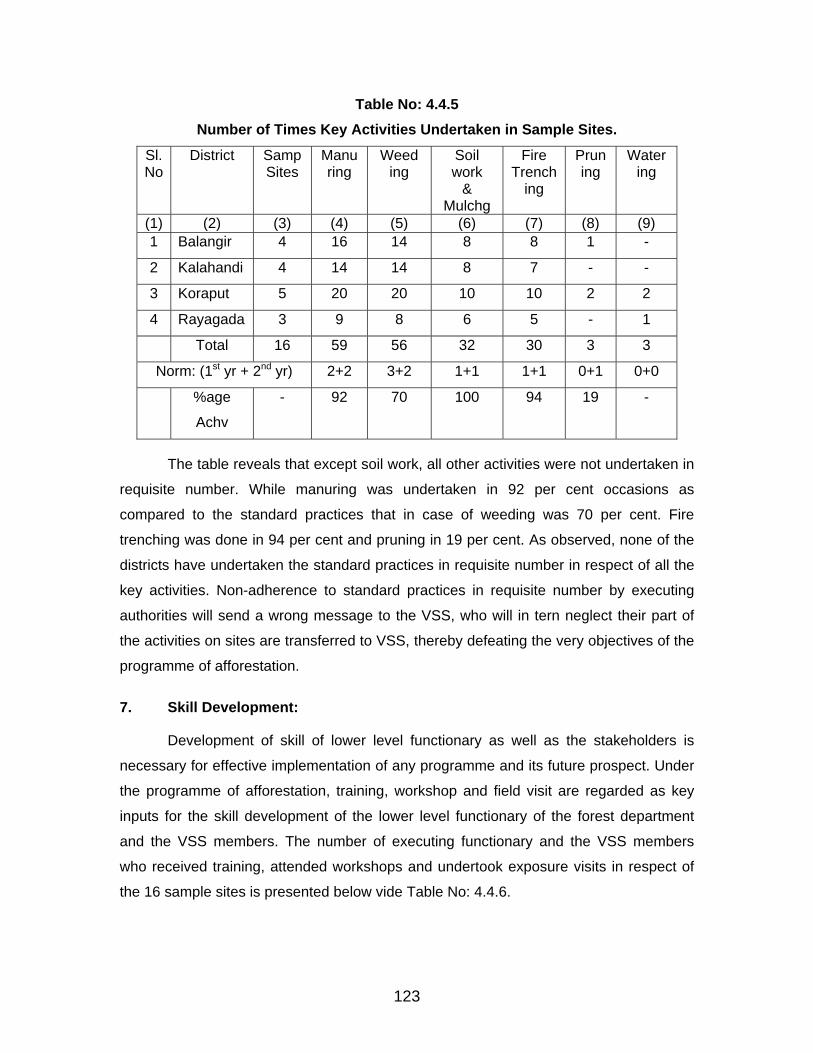
Table No: 4.4.5 Number of Times Key Activities Undertaken in Sample Sites.
Sl.No
District Samp Sites
Manuring
Weed ing
Soil work
& Mulchg
Fire Trench
ing
Prun ing
Watering
(1) (2) (3) (4) (5) (6) (7) (8) (9) 1 Balangir 4 16 14 8 8 1 -
2 Kalahandi 4 14 14 8 7 - -
3 Koraput 5 20 20 10 10 2 2
4 Rayagada 3 9 8 6 5 - 1
Total 16 59 56 32 30 3 3
Norm: (1st yr + 2nd yr) 2+2 3+2 1+1 1+1 0+1 0+0
%age
Achv
- 92 70 100 94 19 -
The table reveals that except soil work, all other activities were not undertaken in
requisite number. While manuring was undertaken in 92 per cent occasions as
compared to the standard practices that in case of weeding was 70 per cent. Fire
trenching was done in 94 per cent and pruning in 19 per cent. As observed, none of the
districts have undertaken the standard practices in requisite number in respect of all the
key activities. Non-adherence to standard practices in requisite number by executing
authorities will send a wrong message to the VSS, who will in tern neglect their part of
the activities on sites are transferred to VSS, thereby defeating the very objectives of the
programme of afforestation.
7. Skill Development:
Development of skill of lower level functionary as well as the stakeholders is
necessary for effective implementation of any programme and its future prospect. Under
the programme of afforestation, training, workshop and field visit are regarded as key
inputs for the skill development of the lower level functionary of the forest department
and the VSS members. The number of executing functionary and the VSS members
who received training, attended workshops and undertook exposure visits in respect of
the 16 sample sites is presented below vide Table No: 4.4.6.
123
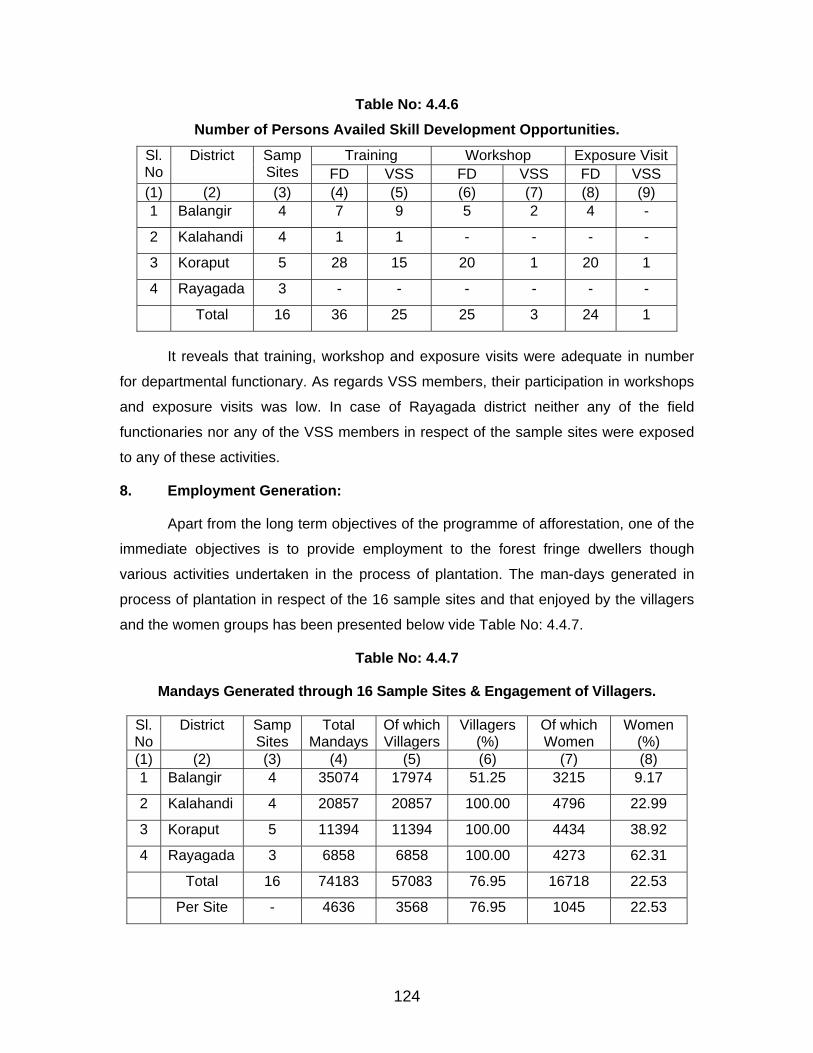
Table No: 4.4.6 Number of Persons Availed Skill Development Opportunities.
Training Workshop Exposure Visit Sl.No
District Samp Sites FD VSS FD VSS FD VSS
(1) (2) (3) (4) (5) (6) (7) (8) (9) 1 Balangir 4 7 9 5 2 4 -
2 Kalahandi 4 1 1 - - - -
3 Koraput 5 28 15 20 1 20 1
4 Rayagada 3 - - - - - -
Total 16 36 25 25 3 24 1
It reveals that training, workshop and exposure visits were adequate in number
for departmental functionary. As regards VSS members, their participation in workshops
and exposure visits was low. In case of Rayagada district neither any of the field
functionaries nor any of the VSS members in respect of the sample sites were exposed
to any of these activities.
8. Employment Generation:
Apart from the long term objectives of the programme of afforestation, one of the
immediate objectives is to provide employment to the forest fringe dwellers though
various activities undertaken in the process of plantation. The man-days generated in
process of plantation in respect of the 16 sample sites and that enjoyed by the villagers
and the women groups has been presented below vide Table No: 4.4.7.
Table No: 4.4.7
Mandays Generated through 16 Sample Sites & Engagement of Villagers.
Sl.No
District Samp Sites
Total Mandays
Of whichVillagers
Villagers(%)
Of which Women
Women (%)
(1) (2) (3) (4) (5) (6) (7) (8) 1 Balangir 4 35074 17974 51.25 3215 9.17
2 Kalahandi 4 20857 20857 100.00 4796 22.99
3 Koraput 5 11394 11394 100.00 4434 38.92
4 Rayagada 3 6858 6858 100.00 4273 62.31
Total 16 74183 57083 76.95 16718 22.53
Per Site - 4636 3568 76.95 1045 22.53
124
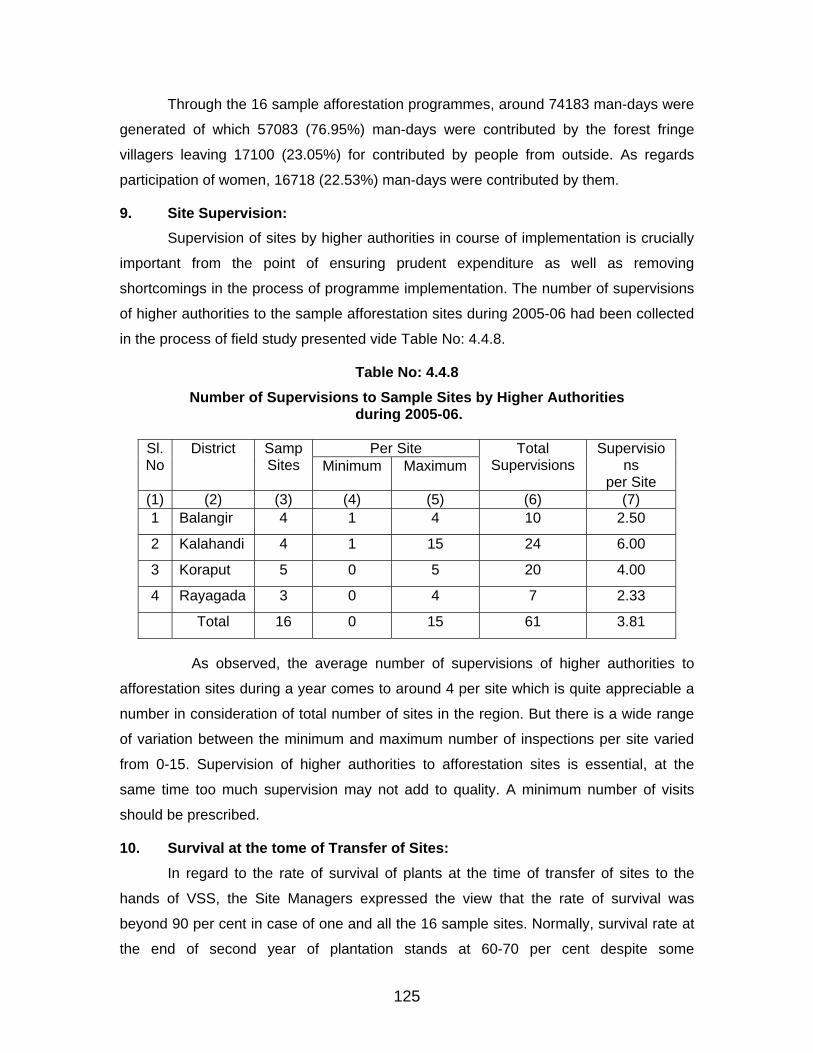
Through the 16 sample afforestation programmes, around 74183 man-days were
generated of which 57083 (76.95%) man-days were contributed by the forest fringe
villagers leaving 17100 (23.05%) for contributed by people from outside. As regards
participation of women, 16718 (22.53%) man-days were contributed by them.
9. Site Supervision: Supervision of sites by higher authorities in course of implementation is crucially
important from the point of ensuring prudent expenditure as well as removing
shortcomings in the process of programme implementation. The number of supervisions
of higher authorities to the sample afforestation sites during 2005-06 had been collected
in the process of field study presented vide Table No: 4.4.8.
Table No: 4.4.8 Number of Supervisions to Sample Sites by Higher Authorities
during 2005-06.
Per Site Sl.No
District Samp Sites Minimum Maximum
Total Supervisions
Supervisions
per Site (1) (2) (3) (4) (5) (6) (7) 1 Balangir 4 1 4 10 2.50
2 Kalahandi 4 1 15 24 6.00
3 Koraput 5 0 5 20 4.00
4 Rayagada 3 0 4 7 2.33
Total 16 0 15 61 3.81
As observed, the average number of supervisions of higher authorities to
afforestation sites during a year comes to around 4 per site which is quite appreciable a
number in consideration of total number of sites in the region. But there is a wide range
of variation between the minimum and maximum number of inspections per site varied
from 0-15. Supervision of higher authorities to afforestation sites is essential, at the
same time too much supervision may not add to quality. A minimum number of visits
should be prescribed.
10. Survival at the tome of Transfer of Sites: In regard to the rate of survival of plants at the time of transfer of sites to the
hands of VSS, the Site Managers expressed the view that the rate of survival was
beyond 90 per cent in case of one and all the 16 sample sites. Normally, survival rate at
the end of second year of plantation stands at 60-70 per cent despite some
125
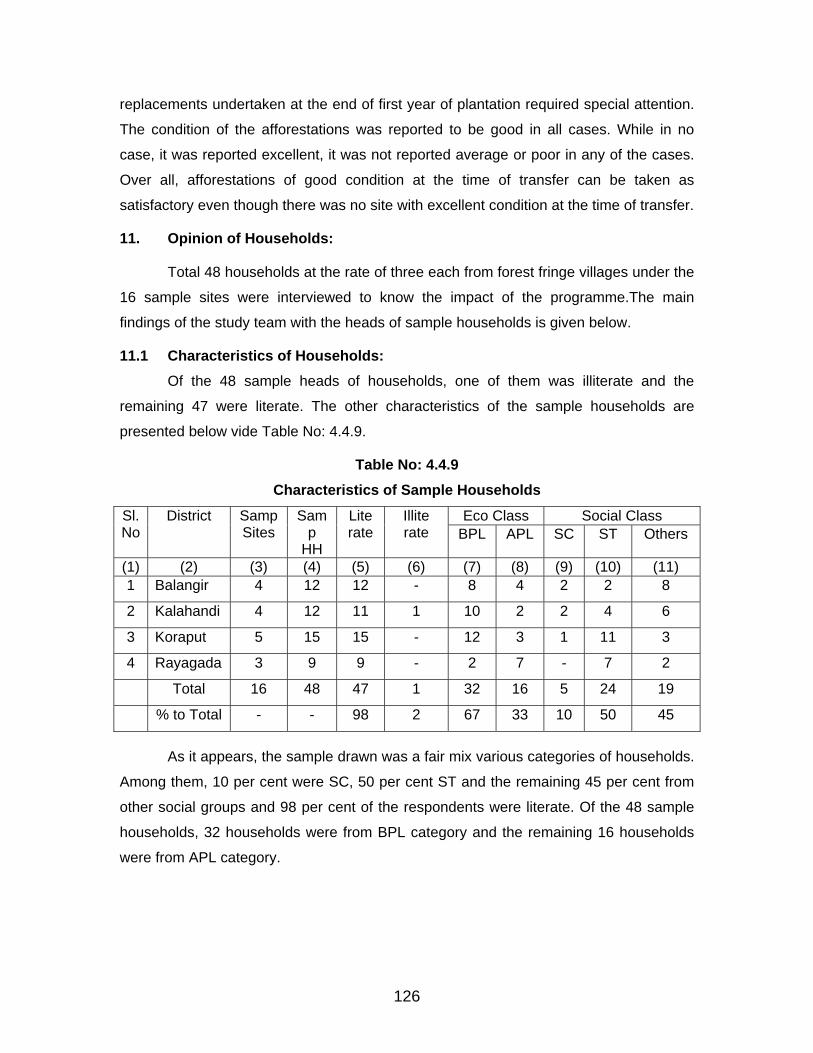
replacements undertaken at the end of first year of plantation required special attention.
The condition of the afforestations was reported to be good in all cases. While in no
case, it was reported excellent, it was not reported average or poor in any of the cases.
Over all, afforestations of good condition at the time of transfer can be taken as
satisfactory even though there was no site with excellent condition at the time of transfer.
11. Opinion of Households:
Total 48 households at the rate of three each from forest fringe villages under the
16 sample sites were interviewed to know the impact of the programme.The main
findings of the study team with the heads of sample households is given below.
11.1 Characteristics of Households: Of the 48 sample heads of households, one of them was illiterate and the
remaining 47 were literate. The other characteristics of the sample households are
presented below vide Table No: 4.4.9.
Table No: 4.4.9 Characteristics of Sample Households
Eco Class Social Class Sl.No
District Samp Sites
Samp
HH
Literate
Illite rate BPL APL SC ST Others
(1) (2) (3) (4) (5) (6) (7) (8) (9) (10) (11) 1 Balangir 4 12 12 - 8 4 2 2 8
2 Kalahandi 4 12 11 1 10 2 2 4 6
3 Koraput 5 15 15 - 12 3 1 11 3
4 Rayagada 3 9 9 - 2 7 - 7 2
Total 16 48 47 1 32 16 5 24 19
% to Total - - 98 2 67 33 10 50 45
As it appears, the sample drawn was a fair mix various categories of households.
Among them, 10 per cent were SC, 50 per cent ST and the remaining 45 per cent from
other social groups and 98 per cent of the respondents were literate. Of the 48 sample
households, 32 households were from BPL category and the remaining 16 households
were from APL category.
126
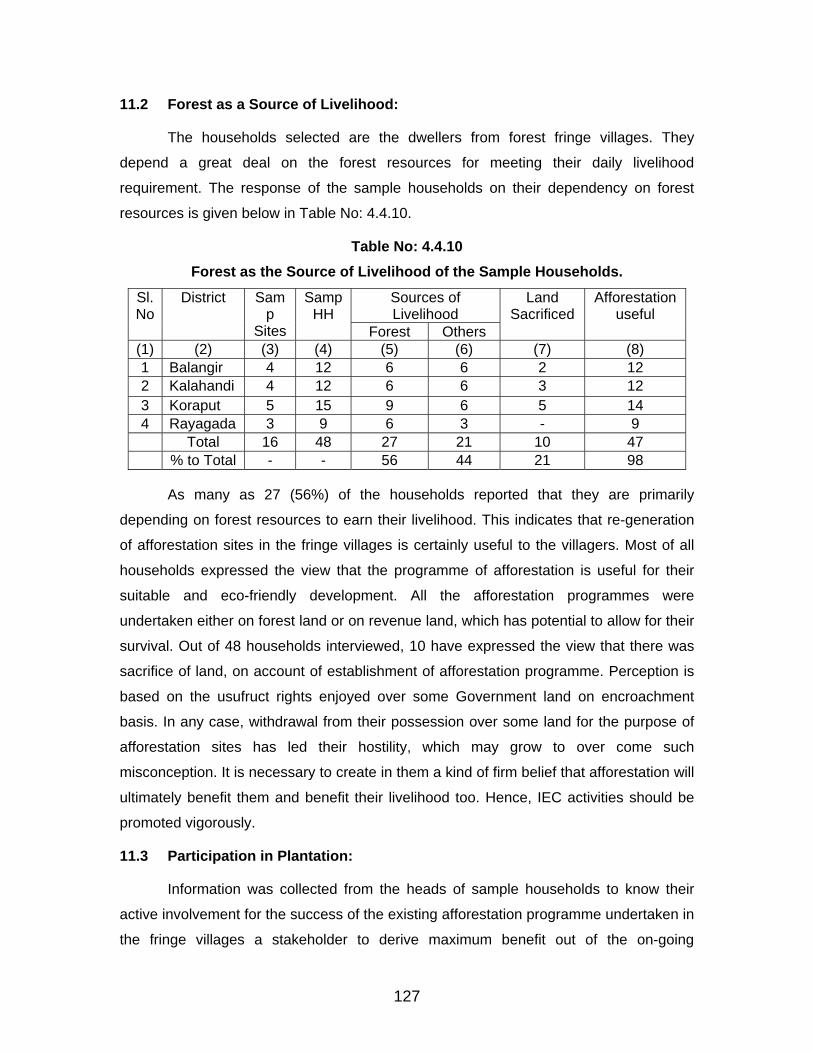
11.2 Forest as a Source of Livelihood:
The households selected are the dwellers from forest fringe villages. They
depend a great deal on the forest resources for meeting their daily livelihood
requirement. The response of the sample households on their dependency on forest
resources is given below in Table No: 4.4.10.
Table No: 4.4.10 Forest as the Source of Livelihood of the Sample Households.
Sources of Livelihood
Sl.No
District Samp
Sites
SampHH
Forest Others
Land Sacrificed
Afforestationuseful
(1) (2) (3) (4) (5) (6) (7) (8) 1 Balangir 4 12 6 6 2 12 2 Kalahandi 4 12 6 6 3 12 3 Koraput 5 15 9 6 5 14 4 Rayagada 3 9 6 3 - 9 Total 16 48 27 21 10 47 % to Total - - 56 44 21 98
As many as 27 (56%) of the households reported that they are primarily
depending on forest resources to earn their livelihood. This indicates that re-generation
of afforestation sites in the fringe villages is certainly useful to the villagers. Most of all
households expressed the view that the programme of afforestation is useful for their
suitable and eco-friendly development. All the afforestation programmes were
undertaken either on forest land or on revenue land, which has potential to allow for their
survival. Out of 48 households interviewed, 10 have expressed the view that there was
sacrifice of land, on account of establishment of afforestation programme. Perception is
based on the usufruct rights enjoyed over some Government land on encroachment
basis. In any case, withdrawal from their possession over some land for the purpose of
afforestation sites has led their hostility, which may grow to over come such
misconception. It is necessary to create in them a kind of firm belief that afforestation will
ultimately benefit them and benefit their livelihood too. Hence, IEC activities should be
promoted vigorously.
11.3 Participation in Plantation:
Information was collected from the heads of sample households to know their
active involvement for the success of the existing afforestation programme undertaken in
the fringe villages a stakeholder to derive maximum benefit out of the on-going
127
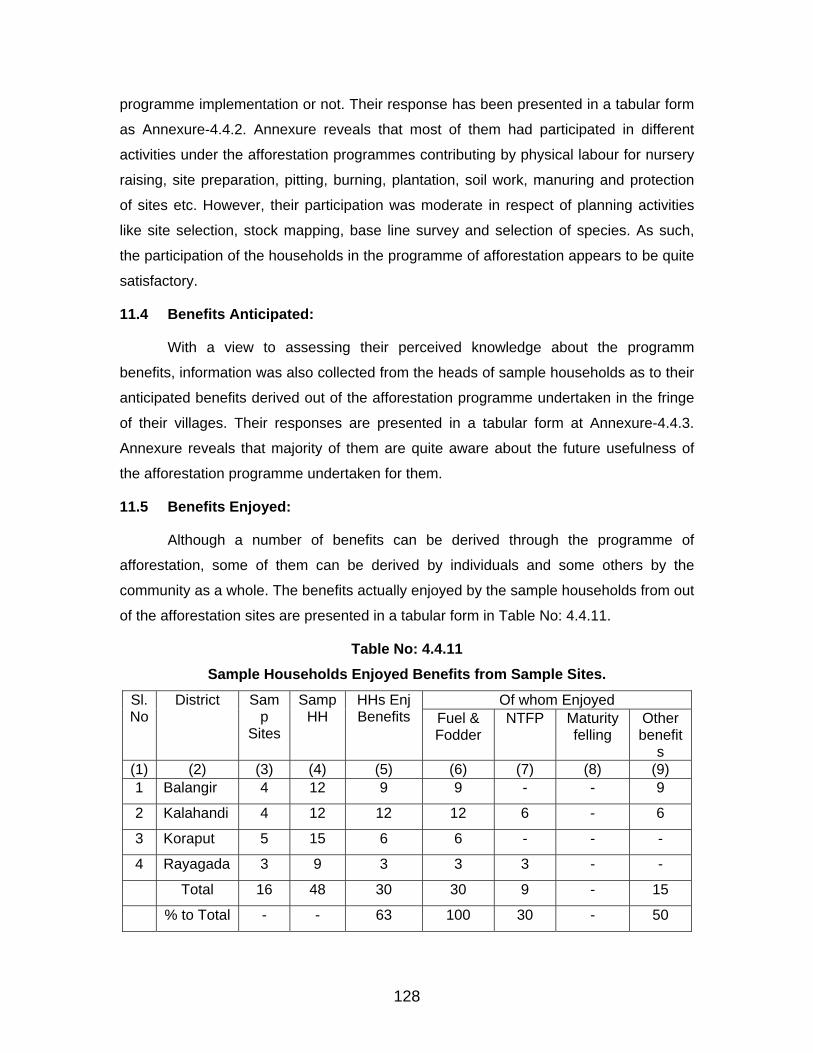
programme implementation or not. Their response has been presented in a tabular form
as Annexure-4.4.2. Annexure reveals that most of them had participated in different
activities under the afforestation programmes contributing by physical labour for nursery
raising, site preparation, pitting, burning, plantation, soil work, manuring and protection
of sites etc. However, their participation was moderate in respect of planning activities
like site selection, stock mapping, base line survey and selection of species. As such,
the participation of the households in the programme of afforestation appears to be quite
satisfactory.
11.4 Benefits Anticipated:
With a view to assessing their perceived knowledge about the programm
benefits, information was also collected from the heads of sample households as to their
anticipated benefits derived out of the afforestation programme undertaken in the fringe
of their villages. Their responses are presented in a tabular form at Annexure-4.4.3.
Annexure reveals that majority of them are quite aware about the future usefulness of
the afforestation programme undertaken for them.
11.5 Benefits Enjoyed:
Although a number of benefits can be derived through the programme of
afforestation, some of them can be derived by individuals and some others by the
community as a whole. The benefits actually enjoyed by the sample households from out
of the afforestation sites are presented in a tabular form in Table No: 4.4.11.
Table No: 4.4.11 Sample Households Enjoyed Benefits from Sample Sites.
Of whom Enjoyed Sl.No
District Samp
Sites
SampHH
HHs EnjBenefits Fuel &
Fodder NTFP Maturity
felling Other benefit
s (1) (2) (3) (4) (5) (6) (7) (8) (9) 1 Balangir 4 12 9 9 - - 9
2 Kalahandi 4 12 12 12 6 - 6
3 Koraput 5 15 6 6 - - -
4 Rayagada 3 9 3 3 3 - -
Total 16 48 30 30 9 - 15
% to Total - - 63 100 30 - 50
128
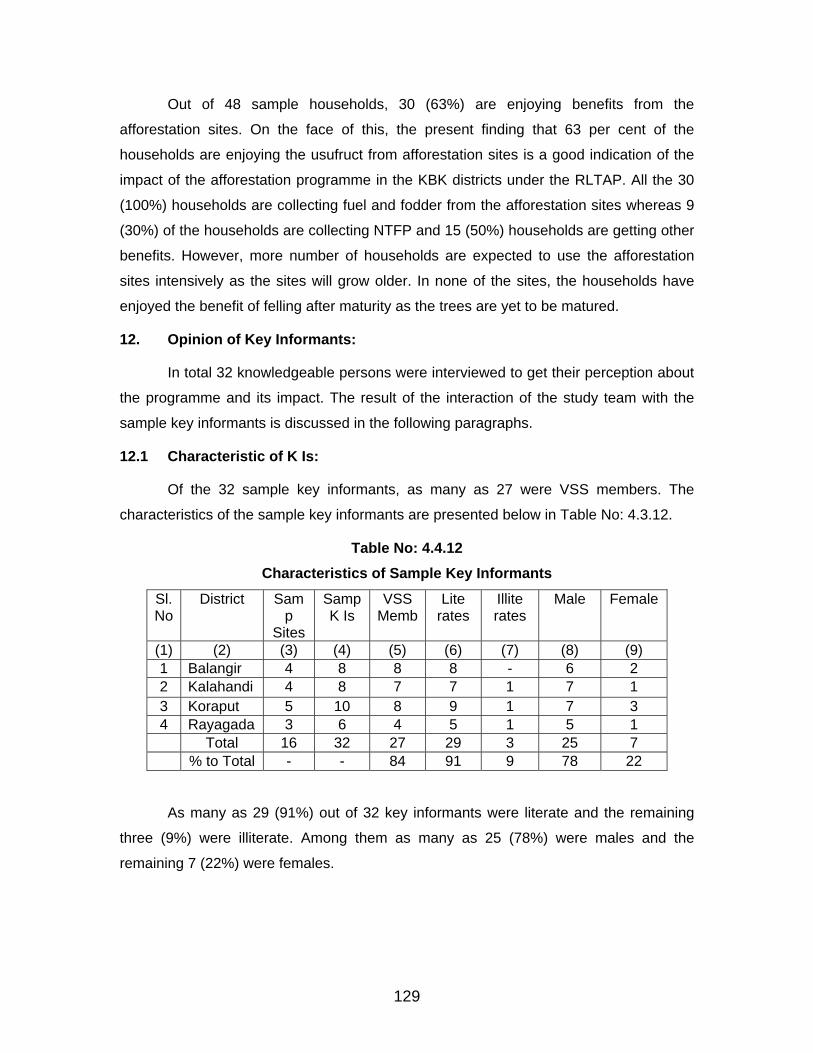
Out of 48 sample households, 30 (63%) are enjoying benefits from the
afforestation sites. On the face of this, the present finding that 63 per cent of the
households are enjoying the usufruct from afforestation sites is a good indication of the
impact of the afforestation programme in the KBK districts under the RLTAP. All the 30
(100%) households are collecting fuel and fodder from the afforestation sites whereas 9
(30%) of the households are collecting NTFP and 15 (50%) households are getting other
benefits. However, more number of households are expected to use the afforestation
sites intensively as the sites will grow older. In none of the sites, the households have
enjoyed the benefit of felling after maturity as the trees are yet to be matured.
12. Opinion of Key Informants:
In total 32 knowledgeable persons were interviewed to get their perception about
the programme and its impact. The result of the interaction of the study team with the
sample key informants is discussed in the following paragraphs.
12.1 Characteristic of K Is:
Of the 32 sample key informants, as many as 27 were VSS members. The
characteristics of the sample key informants are presented below in Table No: 4.3.12.
Table No: 4.4.12 Characteristics of Sample Key Informants
Sl.No
District Samp
Sites
SampK Is
VSS Memb
Lite rates
Illite rates
Male Female
(1) (2) (3) (4) (5) (6) (7) (8) (9) 1 Balangir 4 8 8 8 - 6 2 2 Kalahandi 4 8 7 7 1 7 1 3 Koraput 5 10 8 9 1 7 3 4 Rayagada 3 6 4 5 1 5 1 Total 16 32 27 29 3 25 7 % to Total - - 84 91 9 78 22
As many as 29 (91%) out of 32 key informants were literate and the remaining
three (9%) were illiterate. Among them as many as 25 (78%) were males and the
remaining 7 (22%) were females.
129
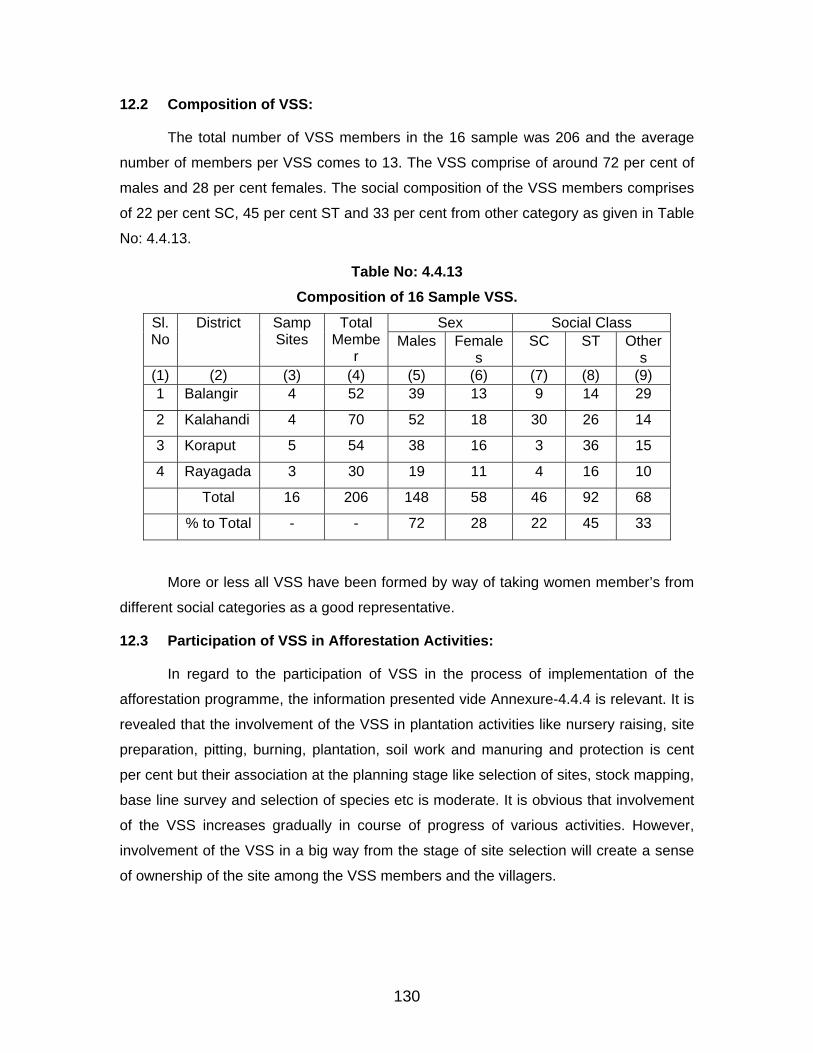
12.2 Composition of VSS:
The total number of VSS members in the 16 sample was 206 and the average
number of members per VSS comes to 13. The VSS comprise of around 72 per cent of
males and 28 per cent females. The social composition of the VSS members comprises
of 22 per cent SC, 45 per cent ST and 33 per cent from other category as given in Table
No: 4.4.13.
Table No: 4.4.13 Composition of 16 Sample VSS.
Sex Social Class Sl.No
District Samp Sites
Total Membe
r Males Female
s SC ST Other
s (1) (2) (3) (4) (5) (6) (7) (8) (9) 1 Balangir 4 52 39 13 9 14 29
2 Kalahandi 4 70 52 18 30 26 14
3 Koraput 5 54 38 16 3 36 15
4 Rayagada 3 30 19 11 4 16 10
Total 16 206 148 58 46 92 68
% to Total - - 72 28 22 45 33
More or less all VSS have been formed by way of taking women member’s from
different social categories as a good representative.
12.3 Participation of VSS in Afforestation Activities:
In regard to the participation of VSS in the process of implementation of the
afforestation programme, the information presented vide Annexure-4.4.4 is relevant. It is
revealed that the involvement of the VSS in plantation activities like nursery raising, site
preparation, pitting, burning, plantation, soil work and manuring and protection is cent
per cent but their association at the planning stage like selection of sites, stock mapping,
base line survey and selection of species etc is moderate. It is obvious that involvement
of the VSS increases gradually in course of progress of various activities. However,
involvement of the VSS in a big way from the stage of site selection will create a sense
of ownership of the site among the VSS members and the villagers.
130
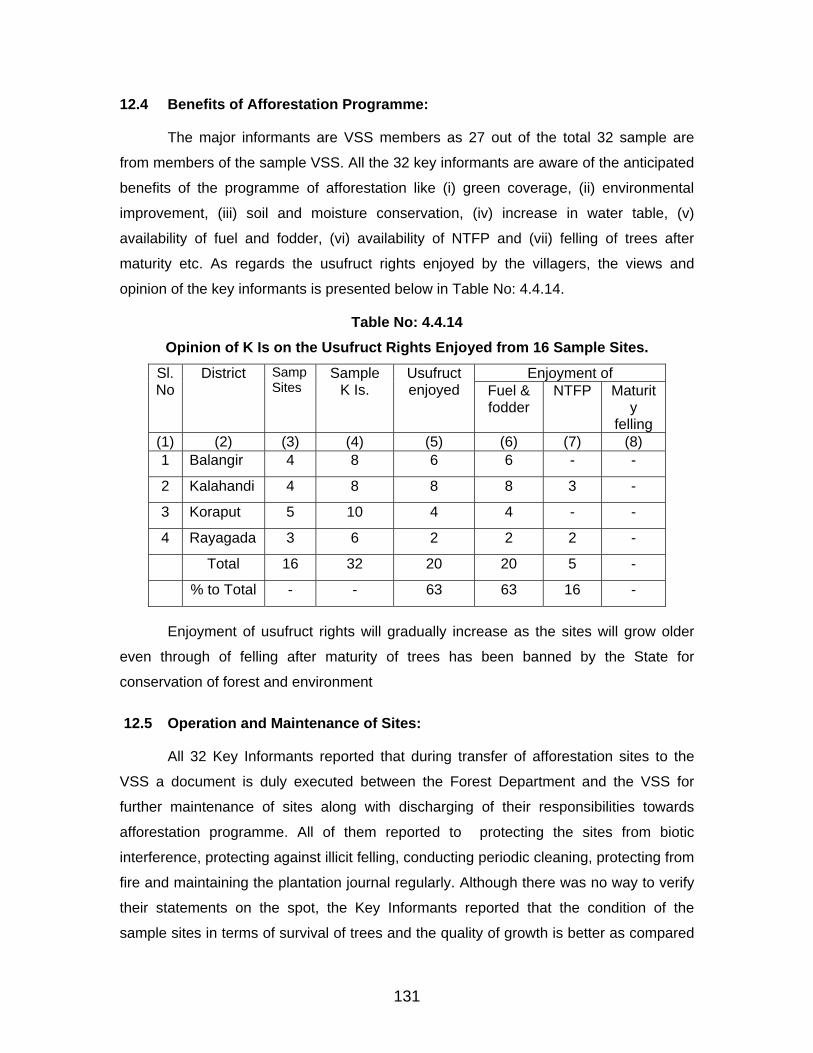
12.4 Benefits of Afforestation Programme:
The major informants are VSS members as 27 out of the total 32 sample are
from members of the sample VSS. All the 32 key informants are aware of the anticipated
benefits of the programme of afforestation like (i) green coverage, (ii) environmental
improvement, (iii) soil and moisture conservation, (iv) increase in water table, (v)
availability of fuel and fodder, (vi) availability of NTFP and (vii) felling of trees after
maturity etc. As regards the usufruct rights enjoyed by the villagers, the views and
opinion of the key informants is presented below in Table No: 4.4.14.
Table No: 4.4.14 Opinion of K Is on the Usufruct Rights Enjoyed from 16 Sample Sites.
Enjoyment of Sl.No
District Samp Sites
Sample K Is.
Usufruct enjoyed Fuel &
fodder NTFP Maturit
y felling
(1) (2) (3) (4) (5) (6) (7) (8) 1 Balangir 4 8 6 6 - -
2 Kalahandi 4 8 8 8 3 -
3 Koraput 5 10 4 4 - -
4 Rayagada 3 6 2 2 2 -
Total 16 32 20 20 5 -
% to Total - - 63 63 16 -
Enjoyment of usufruct rights will gradually increase as the sites will grow older
even through of felling after maturity of trees has been banned by the State for
conservation of forest and environment
12.5 Operation and Maintenance of Sites:
All 32 Key Informants reported that during transfer of afforestation sites to the
VSS a document is duly executed between the Forest Department and the VSS for
further maintenance of sites along with discharging of their responsibilities towards
afforestation programme. All of them reported to protecting the sites from biotic
interference, protecting against illicit felling, conducting periodic cleaning, protecting from
fire and maintaining the plantation journal regularly. Although there was no way to verify
their statements on the spot, the Key Informants reported that the condition of the
sample sites in terms of survival of trees and the quality of growth is better as compared
131
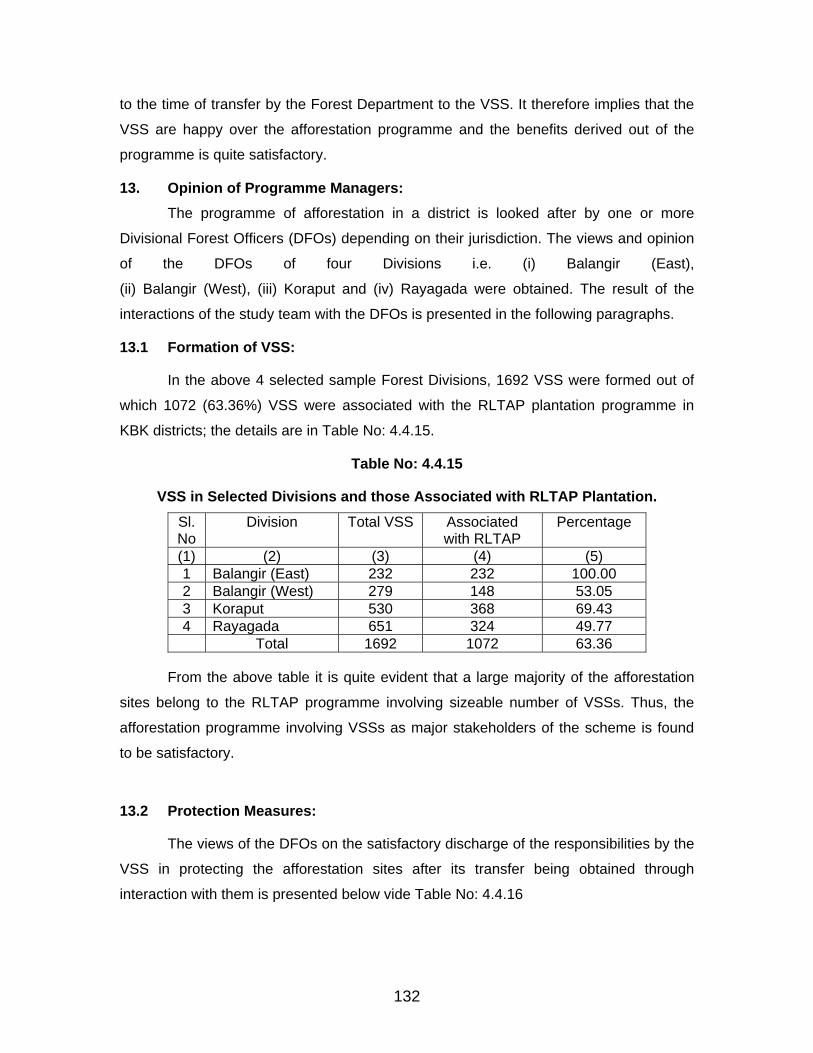
to the time of transfer by the Forest Department to the VSS. It therefore implies that the
VSS are happy over the afforestation programme and the benefits derived out of the
programme is quite satisfactory.
13. Opinion of Programme Managers: The programme of afforestation in a district is looked after by one or more
Divisional Forest Officers (DFOs) depending on their jurisdiction. The views and opinion
of the DFOs of four Divisions i.e. (i) Balangir (East),
(ii) Balangir (West), (iii) Koraput and (iv) Rayagada were obtained. The result of the
interactions of the study team with the DFOs is presented in the following paragraphs.
13.1 Formation of VSS:
In the above 4 selected sample Forest Divisions, 1692 VSS were formed out of
which 1072 (63.36%) VSS were associated with the RLTAP plantation programme in
KBK districts; the details are in Table No: 4.4.15.
Table No: 4.4.15
VSS in Selected Divisions and those Associated with RLTAP Plantation.
Sl.No
Division Total VSS Associated with RLTAP
Percentage
(1) (2) (3) (4) (5) 1 Balangir (East) 232 232 100.00 2 Balangir (West) 279 148 53.05 3 Koraput 530 368 69.43 4 Rayagada 651 324 49.77 Total 1692 1072 63.36
From the above table it is quite evident that a large majority of the afforestation
sites belong to the RLTAP programme involving sizeable number of VSSs. Thus, the
afforestation programme involving VSSs as major stakeholders of the scheme is found
to be satisfactory.
13.2 Protection Measures:
The views of the DFOs on the satisfactory discharge of the responsibilities by the
VSS in protecting the afforestation sites after its transfer being obtained through
interaction with them is presented below vide Table No: 4.4.16
132
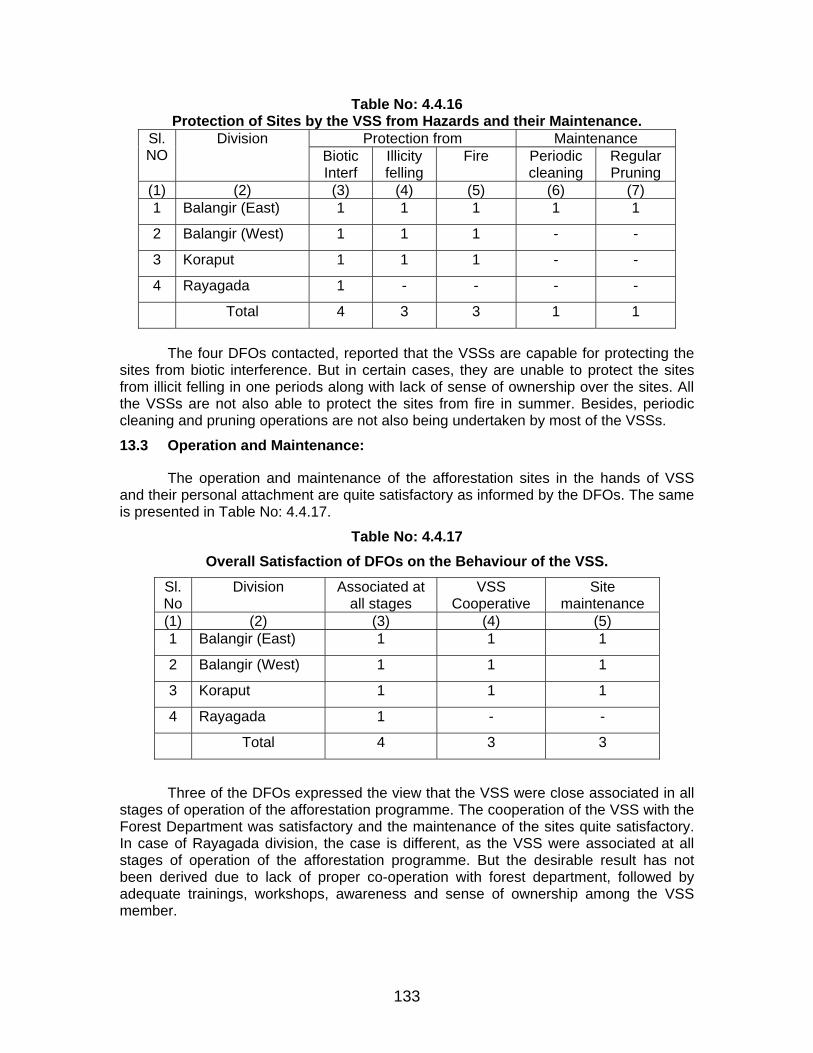
Table No: 4.4.16 Protection of Sites by the VSS from Hazards and their Maintenance.
Protection from Maintenance Sl.NO
Division Biotic Interf
Illicity felling
Fire Periodic cleaning
Regular Pruning
(1) (2) (3) (4) (5) (6) (7) 1 Balangir (East) 1 1 1 1 1
2 Balangir (West) 1 1 1 - -
3 Koraput 1 1 1 - -
4 Rayagada 1 - - - -
Total 4 3 3 1 1
The four DFOs contacted, reported that the VSSs are capable for protecting the sites from biotic interference. But in certain cases, they are unable to protect the sites from illicit felling in one periods along with lack of sense of ownership over the sites. All the VSSs are not also able to protect the sites from fire in summer. Besides, periodic cleaning and pruning operations are not also being undertaken by most of the VSSs.
13.3 Operation and Maintenance:
The operation and maintenance of the afforestation sites in the hands of VSS and their personal attachment are quite satisfactory as informed by the DFOs. The same is presented in Table No: 4.4.17.
Table No: 4.4.17 Overall Satisfaction of DFOs on the Behaviour of the VSS.
Sl.No
Division Associated atall stages
VSS Cooperative
Site maintenance
(1) (2) (3) (4) (5) 1 Balangir (East) 1 1 1
2 Balangir (West) 1 1 1
3 Koraput 1 1 1
4 Rayagada 1 - -
Total 4 3 3
Three of the DFOs expressed the view that the VSS were close associated in all stages of operation of the afforestation programme. The cooperation of the VSS with the Forest Department was satisfactory and the maintenance of the sites quite satisfactory. In case of Rayagada division, the case is different, as the VSS were associated at all stages of operation of the afforestation programme. But the desirable result has not been derived due to lack of proper co-operation with forest department, followed by adequate trainings, workshops, awareness and sense of ownership among the VSS member.
133
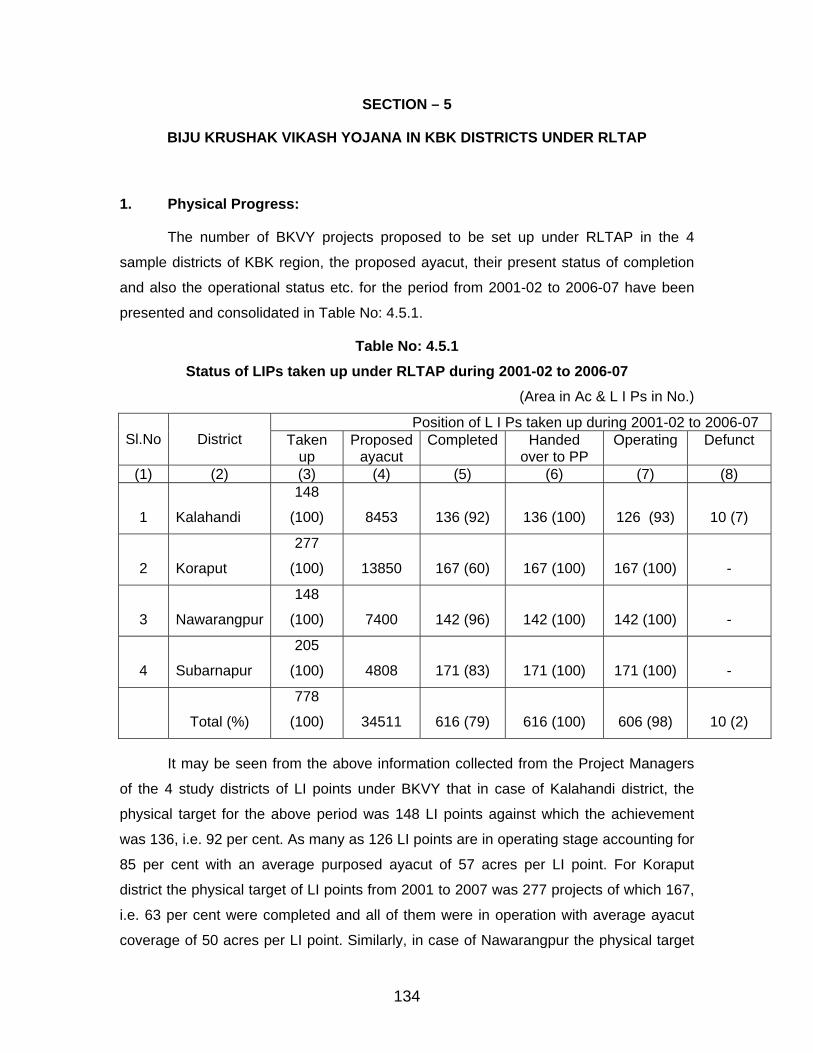
SECTION – 5
BIJU KRUSHAK VIKASH YOJANA IN KBK DISTRICTS UNDER RLTAP
1. Physical Progress:
The number of BKVY projects proposed to be set up under RLTAP in the 4
sample districts of KBK region, the proposed ayacut, their present status of completion
and also the operational status etc. for the period from 2001-02 to 2006-07 have been
presented and consolidated in Table No: 4.5.1.
Table No: 4.5.1 Status of LIPs taken up under RLTAP during 2001-02 to 2006-07
(Area in Ac & L I Ps in No.)
Position of L I Ps taken up during 2001-02 to 2006-07 Sl.No
District
Taken
up Proposed
ayacut Completed
Handed over to PP
Operating
Defunct
(1) (2) (3) (4) (5) (6) (7) (8)
1 Kalahandi
148
(100) 8453 136 (92) 136 (100) 126 (93) 10 (7)
2 Koraput
277
(100) 13850 167 (60) 167 (100) 167 (100) -
3 Nawarangpur
148
(100) 7400 142 (96) 142 (100) 142 (100) -
4 Subarnapur
205
(100) 4808 171 (83) 171 (100) 171 (100) -
Total (%)
778
(100) 34511 616 (79) 616 (100) 606 (98) 10 (2)
It may be seen from the above information collected from the Project Managers
of the 4 study districts of LI points under BKVY that in case of Kalahandi district, the
physical target for the above period was 148 LI points against which the achievement
was 136, i.e. 92 per cent. As many as 126 LI points are in operating stage accounting for
85 per cent with an average purposed ayacut of 57 acres per LI point. For Koraput
district the physical target of LI points from 2001 to 2007 was 277 projects of which 167,
i.e. 63 per cent were completed and all of them were in operation with average ayacut
coverage of 50 acres per LI point. Similarly, in case of Nawarangpur the physical target
134
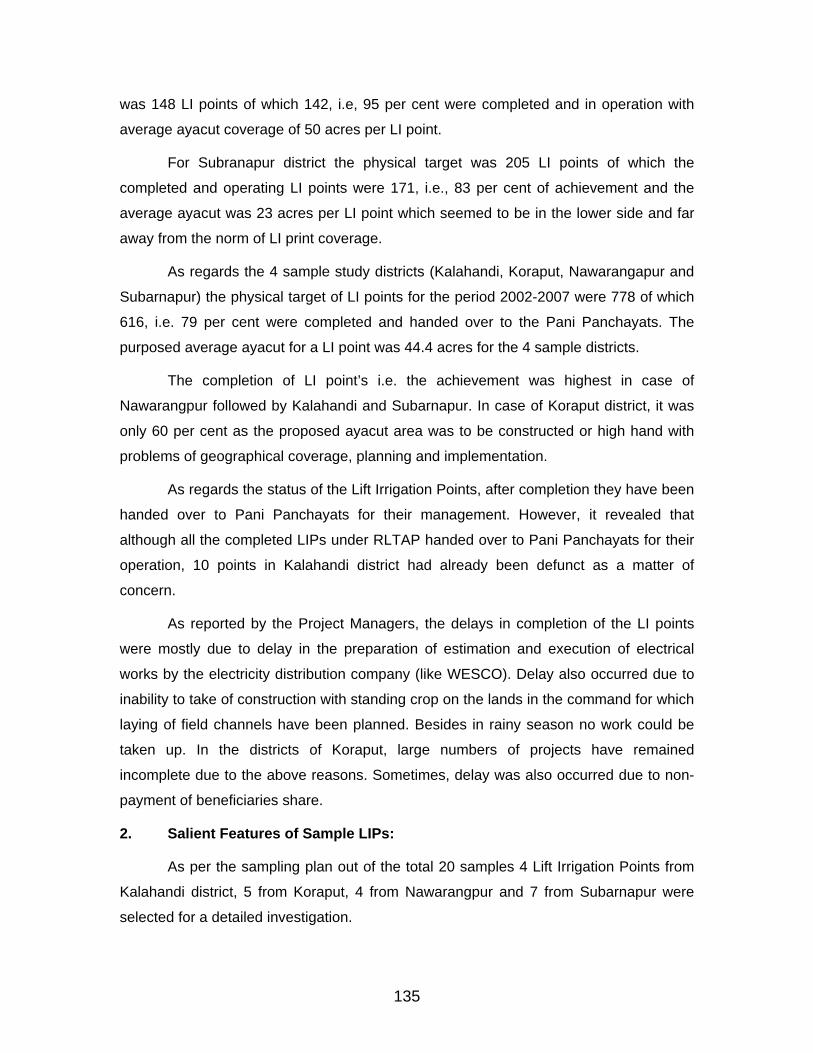
was 148 LI points of which 142, i.e, 95 per cent were completed and in operation with
average ayacut coverage of 50 acres per LI point.
For Subranapur district the physical target was 205 LI points of which the
completed and operating LI points were 171, i.e., 83 per cent of achievement and the
average ayacut was 23 acres per LI point which seemed to be in the lower side and far
away from the norm of LI print coverage.
As regards the 4 sample study districts (Kalahandi, Koraput, Nawarangapur and
Subarnapur) the physical target of LI points for the period 2002-2007 were 778 of which
616, i.e. 79 per cent were completed and handed over to the Pani Panchayats. The
purposed average ayacut for a LI point was 44.4 acres for the 4 sample districts.
The completion of LI point’s i.e. the achievement was highest in case of
Nawarangpur followed by Kalahandi and Subarnapur. In case of Koraput district, it was
only 60 per cent as the proposed ayacut area was to be constructed or high hand with
problems of geographical coverage, planning and implementation.
As regards the status of the Lift Irrigation Points, after completion they have been
handed over to Pani Panchayats for their management. However, it revealed that
although all the completed LIPs under RLTAP handed over to Pani Panchayats for their
operation, 10 points in Kalahandi district had already been defunct as a matter of
concern.
As reported by the Project Managers, the delays in completion of the LI points
were mostly due to delay in the preparation of estimation and execution of electrical
works by the electricity distribution company (like WESCO). Delay also occurred due to
inability to take of construction with standing crop on the lands in the command for which
laying of field channels have been planned. Besides in rainy season no work could be
taken up. In the districts of Koraput, large numbers of projects have remained
incomplete due to the above reasons. Sometimes, delay was also occurred due to non-
payment of beneficiaries share.
2. Salient Features of Sample LIPs:
As per the sampling plan out of the total 20 samples 4 Lift Irrigation Points from
Kalahandi district, 5 from Koraput, 4 from Nawarangpur and 7 from Subarnapur were
selected for a detailed investigation.
135
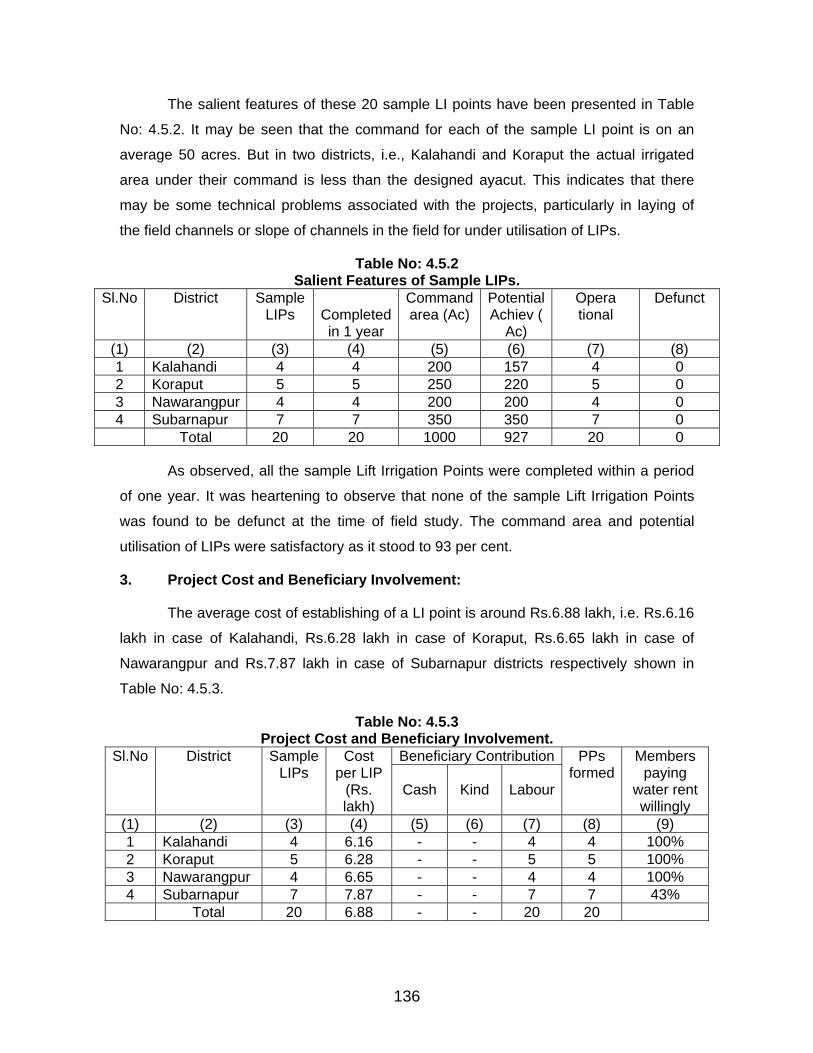
The salient features of these 20 sample LI points have been presented in Table
No: 4.5.2. It may be seen that the command for each of the sample LI point is on an
average 50 acres. But in two districts, i.e., Kalahandi and Koraput the actual irrigated
area under their command is less than the designed ayacut. This indicates that there
may be some technical problems associated with the projects, particularly in laying of
the field channels or slope of channels in the field for under utilisation of LIPs.
Table No: 4.5.2 Salient Features of Sample LIPs.
Sl.No District Sample LIPs Completed
in 1 year
Commandarea (Ac)
Potential Achiev (
Ac)
Opera tional
Defunct
(1) (2) (3) (4) (5) (6) (7) (8) 1 Kalahandi 4 4 200 157 4 0 2 Koraput 5 5 250 220 5 0 3 Nawarangpur 4 4 200 200 4 0 4 Subarnapur 7 7 350 350 7 0 Total 20 20 1000 927 20 0
As observed, all the sample Lift Irrigation Points were completed within a period
of one year. It was heartening to observe that none of the sample Lift Irrigation Points
was found to be defunct at the time of field study. The command area and potential
utilisation of LIPs were satisfactory as it stood to 93 per cent.
3. Project Cost and Beneficiary Involvement:
The average cost of establishing of a LI point is around Rs.6.88 lakh, i.e. Rs.6.16
lakh in case of Kalahandi, Rs.6.28 lakh in case of Koraput, Rs.6.65 lakh in case of
Nawarangpur and Rs.7.87 lakh in case of Subarnapur districts respectively shown in
Table No: 4.5.3.
Table No: 4.5.3 Project Cost and Beneficiary Involvement.
Beneficiary ContributionSl.No District Sample LIPs
Cost per LIP
(Rs. lakh)
Cash
Kind
Labour
PPs formed
Members paying
water rent willingly
(1) (2) (3) (4) (5) (6) (7) (8) (9) 1 Kalahandi 4 6.16 - - 4 4 100% 2 Koraput 5 6.28 - - 5 5 100% 3 Nawarangpur 4 6.65 - - 4 4 100% 4 Subarnapur 7 7.87 - - 7 7 43% Total 20 6.88 - - 20 20
136
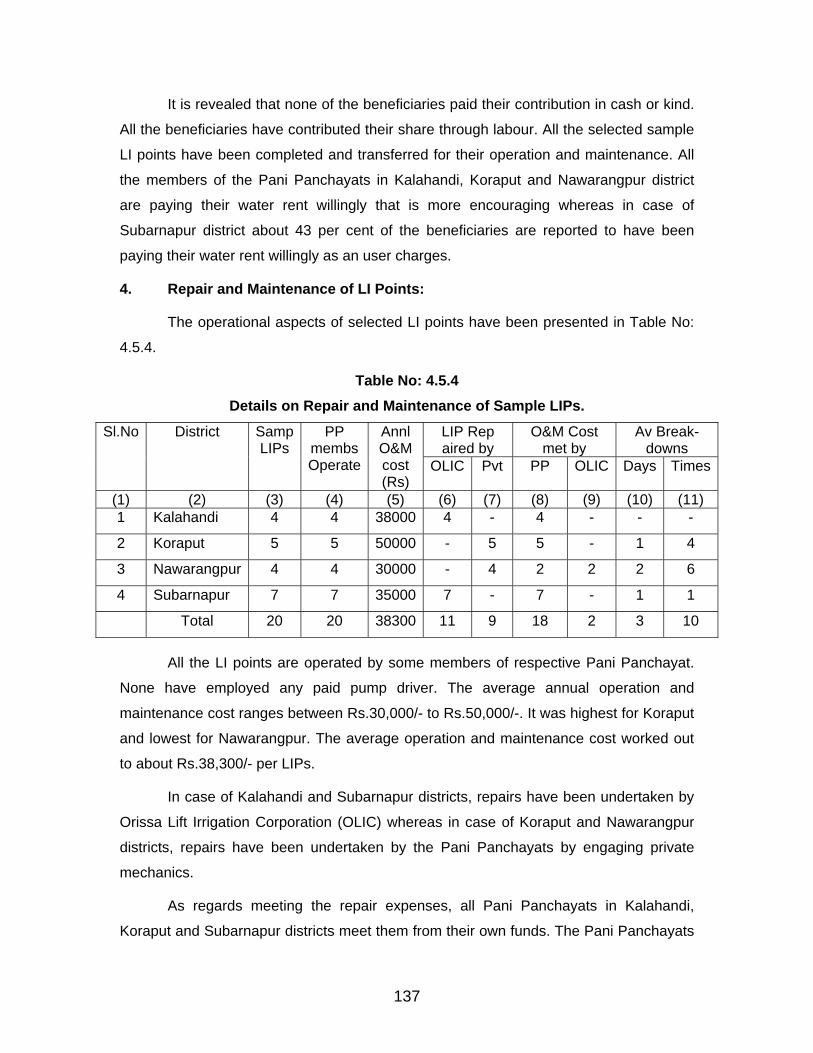
It is revealed that none of the beneficiaries paid their contribution in cash or kind.
All the beneficiaries have contributed their share through labour. All the selected sample
LI points have been completed and transferred for their operation and maintenance. All
the members of the Pani Panchayats in Kalahandi, Koraput and Nawarangpur district
are paying their water rent willingly that is more encouraging whereas in case of
Subarnapur district about 43 per cent of the beneficiaries are reported to have been
paying their water rent willingly as an user charges.
4. Repair and Maintenance of LI Points:
The operational aspects of selected LI points have been presented in Table No:
4.5.4.
Table No: 4.5.4 Details on Repair and Maintenance of Sample LIPs.
LIP Rep aired by
O&M Cost met by
Av Break- downs
Sl.No
District
Samp LIPs
PP membsOperate
Annl O&Mcost (Rs)
OLIC Pvt PP OLIC Days Times
(1) (2) (3) (4) (5) (6) (7) (8) (9) (10) (11) 1 Kalahandi 4 4 38000 4 - 4 - - -
2 Koraput 5 5 50000 - 5 5 - 1 4
3 Nawarangpur 4 4 30000 - 4 2 2 2 6
4 Subarnapur 7 7 35000 7 - 7 - 1 1
Total 20 20 38300 11 9 18 2 3 10
All the LI points are operated by some members of respective Pani Panchayat.
None have employed any paid pump driver. The average annual operation and
maintenance cost ranges between Rs.30,000/- to Rs.50,000/-. It was highest for Koraput
and lowest for Nawarangpur. The average operation and maintenance cost worked out
to about Rs.38,300/- per LIPs.
In case of Kalahandi and Subarnapur districts, repairs have been undertaken by
Orissa Lift Irrigation Corporation (OLIC) whereas in case of Koraput and Nawarangpur
districts, repairs have been undertaken by the Pani Panchayats by engaging private
mechanics.
As regards meeting the repair expenses, all Pani Panchayats in Kalahandi,
Koraput and Subarnapur districts meet them from their own funds. The Pani Panchayats
137
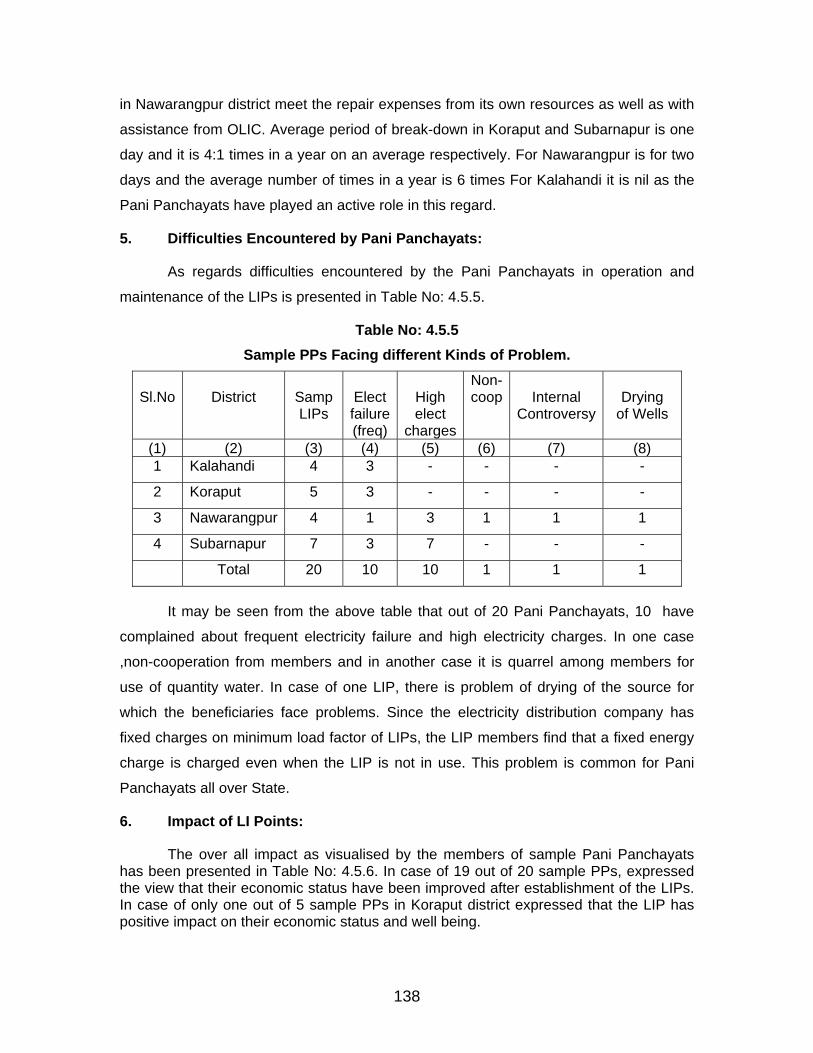
in Nawarangpur district meet the repair expenses from its own resources as well as with
assistance from OLIC. Average period of break-down in Koraput and Subarnapur is one
day and it is 4:1 times in a year on an average respectively. For Nawarangpur is for two
days and the average number of times in a year is 6 times For Kalahandi it is nil as the
Pani Panchayats have played an active role in this regard.
5. Difficulties Encountered by Pani Panchayats:
As regards difficulties encountered by the Pani Panchayats in operation and
maintenance of the LIPs is presented in Table No: 4.5.5.
Table No: 4.5.5 Sample PPs Facing different Kinds of Problem.
Sl.No
District
SampLIPs
Electfailure(freq)
High elect
charges
Non-coop
Internal Controversy
Drying of Wells
(1) (2) (3) (4) (5) (6) (7) (8) 1 Kalahandi 4 3 - - - -
2 Koraput 5 3 - - - -
3 Nawarangpur 4 1 3 1 1 1
4 Subarnapur 7 3 7 - - -
Total 20 10 10 1 1 1
It may be seen from the above table that out of 20 Pani Panchayats, 10 have
complained about frequent electricity failure and high electricity charges. In one case
,non-cooperation from members and in another case it is quarrel among members for
use of quantity water. In case of one LIP, there is problem of drying of the source for
which the beneficiaries face problems. Since the electricity distribution company has
fixed charges on minimum load factor of LIPs, the LIP members find that a fixed energy
charge is charged even when the LIP is not in use. This problem is common for Pani
Panchayats all over State.
6. Impact of LI Points:
The over all impact as visualised by the members of sample Pani Panchayats has been presented in Table No: 4.5.6. In case of 19 out of 20 sample PPs, expressed the view that their economic status have been improved after establishment of the LIPs. In case of only one out of 5 sample PPs in Koraput district expressed that the LIP has positive impact on their economic status and well being.
138
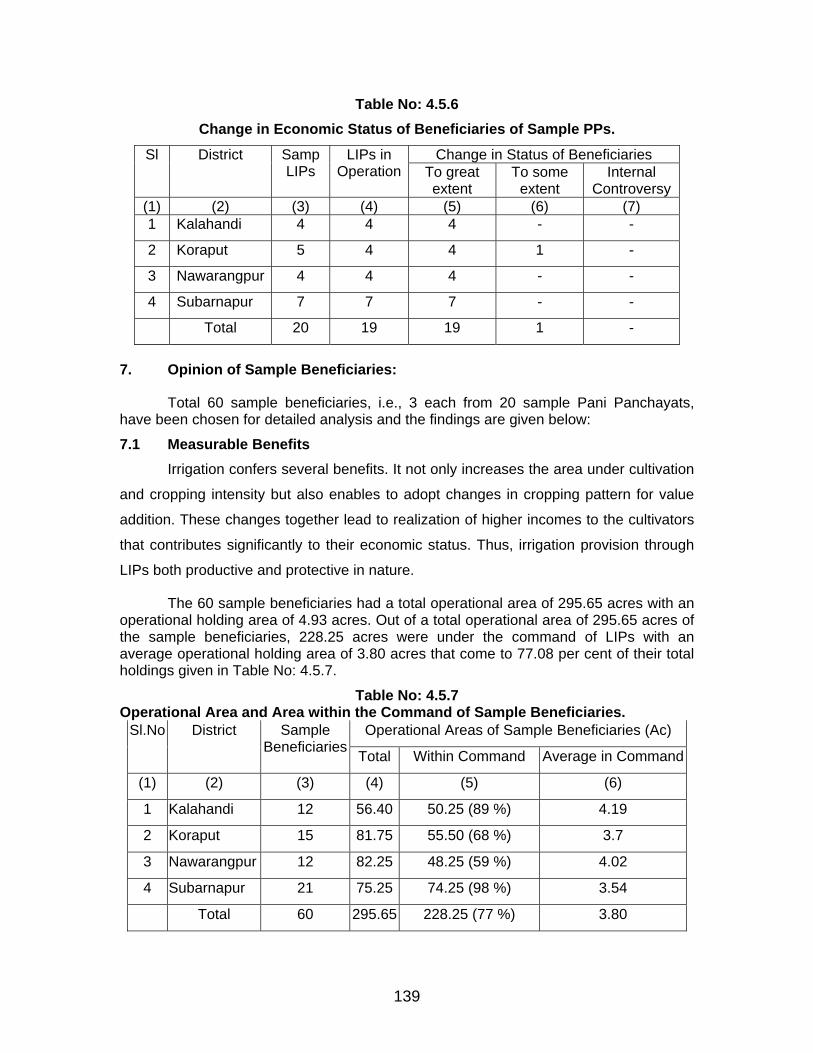
Table No: 4.5.6 Change in Economic Status of Beneficiaries of Sample PPs.
Change in Status of Beneficiaries Sl
District
Samp LIPs
LIPs in Operation
To great extent
To some extent
Internal Controversy
(1) (2) (3) (4) (5) (6) (7) 1 Kalahandi 4 4 4 - -
2 Koraput 5 4 4 1 -
3 Nawarangpur 4 4 4 - -
4 Subarnapur 7 7 7 - -
Total 20 19 19 1 -
7. Opinion of Sample Beneficiaries:
Total 60 sample beneficiaries, i.e., 3 each from 20 sample Pani Panchayats, have been chosen for detailed analysis and the findings are given below:
7.1 Measurable Benefits Irrigation confers several benefits. It not only increases the area under cultivation
and cropping intensity but also enables to adopt changes in cropping pattern for value
addition. These changes together lead to realization of higher incomes to the cultivators
that contributes significantly to their economic status. Thus, irrigation provision through
LIPs both productive and protective in nature.
The 60 sample beneficiaries had a total operational area of 295.65 acres with an operational holding area of 4.93 acres. Out of a total operational area of 295.65 acres of the sample beneficiaries, 228.25 acres were under the command of LIPs with an average operational holding area of 3.80 acres that come to 77.08 per cent of their total holdings given in Table No: 4.5.7.
Table No: 4.5.7 Operational Area and Area within the Command of Sample Beneficiaries.
Operational Areas of Sample Beneficiaries (Ac) Sl.No District Sample Beneficiaries Total Within Command Average in Command
(1) (2) (3) (4) (5) (6)
1 Kalahandi 12 56.40 50.25 (89 %) 4.19
2 Koraput 15 81.75 55.50 (68 %) 3.7
3 Nawarangpur 12 82.25 48.25 (59 %) 4.02
4 Subarnapur 21 75.25 74.25 (98 %) 3.54
Total 60 295.65 228.25 (77 %) 3.80
139
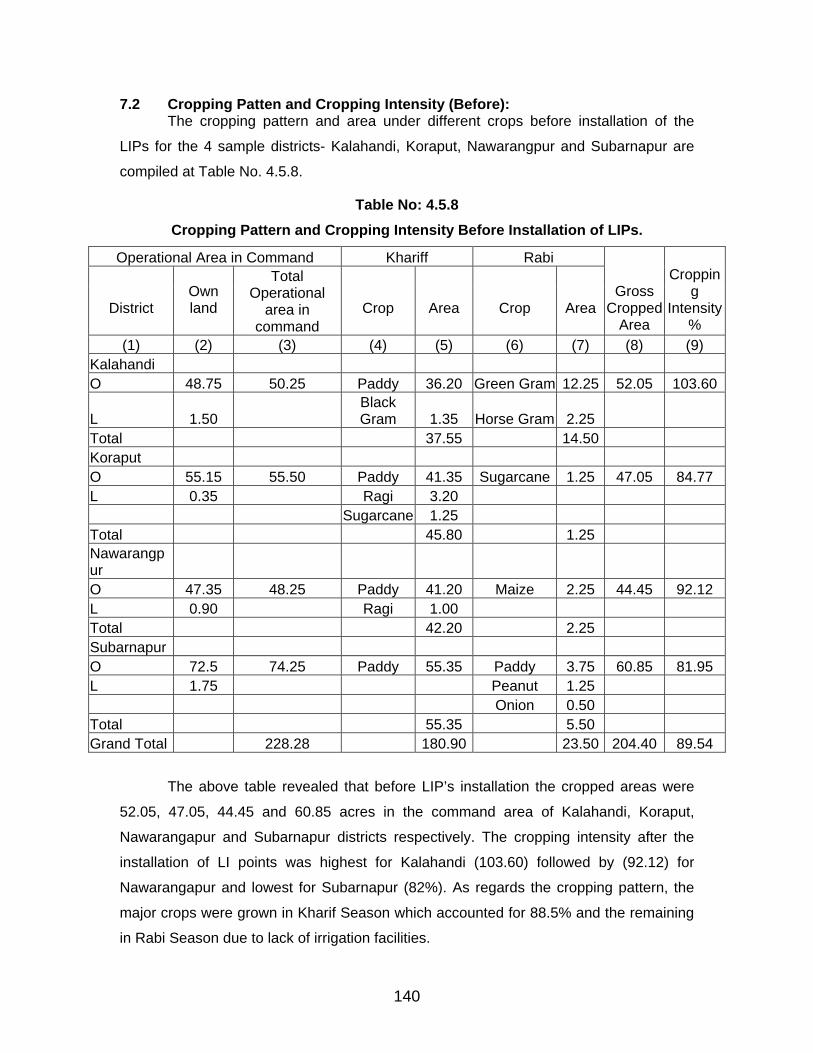
7.2 Cropping Patten and Cropping Intensity (Before): The cropping pattern and area under different crops before installation of the
LIPs for the 4 sample districts- Kalahandi, Koraput, Nawarangpur and Subarnapur are
compiled at Table No. 4.5.8.
Table No: 4.5.8 Cropping Pattern and Cropping Intensity Before Installation of LIPs.
Operational Area in Command Khariff Rabi
District
Own land
Total Operational
area in command
Crop
Area
Crop
Area
Gross Cropped
Area
Cropping
Intensity%
(1) (2) (3) (4) (5) (6) (7) (8) (9) Kalahandi O 48.75 50.25 Paddy 36.20 Green Gram 12.25 52.05 103.60
L 1.50 Black Gram 1.35 Horse Gram 2.25
Total 37.55 14.50 Koraput O 55.15 55.50 Paddy 41.35 Sugarcane 1.25 47.05 84.77 L 0.35 Ragi 3.20 Sugarcane 1.25 Total 45.80 1.25 Nawarangpur O 47.35 48.25 Paddy 41.20 Maize 2.25 44.45 92.12 L 0.90 Ragi 1.00 Total 42.20 2.25 Subarnapur O 72.5 74.25 Paddy 55.35 Paddy 3.75 60.85 81.95 L 1.75 Peanut 1.25 Onion 0.50 Total 55.35 5.50 Grand Total 228.28 180.90 23.50 204.40 89.54
The above table revealed that before LIP’s installation the cropped areas were
52.05, 47.05, 44.45 and 60.85 acres in the command area of Kalahandi, Koraput,
Nawarangapur and Subarnapur districts respectively. The cropping intensity after the
installation of LI points was highest for Kalahandi (103.60) followed by (92.12) for
Nawarangapur and lowest for Subarnapur (82%). As regards the cropping pattern, the
major crops were grown in Kharif Season which accounted for 88.5% and the remaining
in Rabi Season due to lack of irrigation facilities.
140
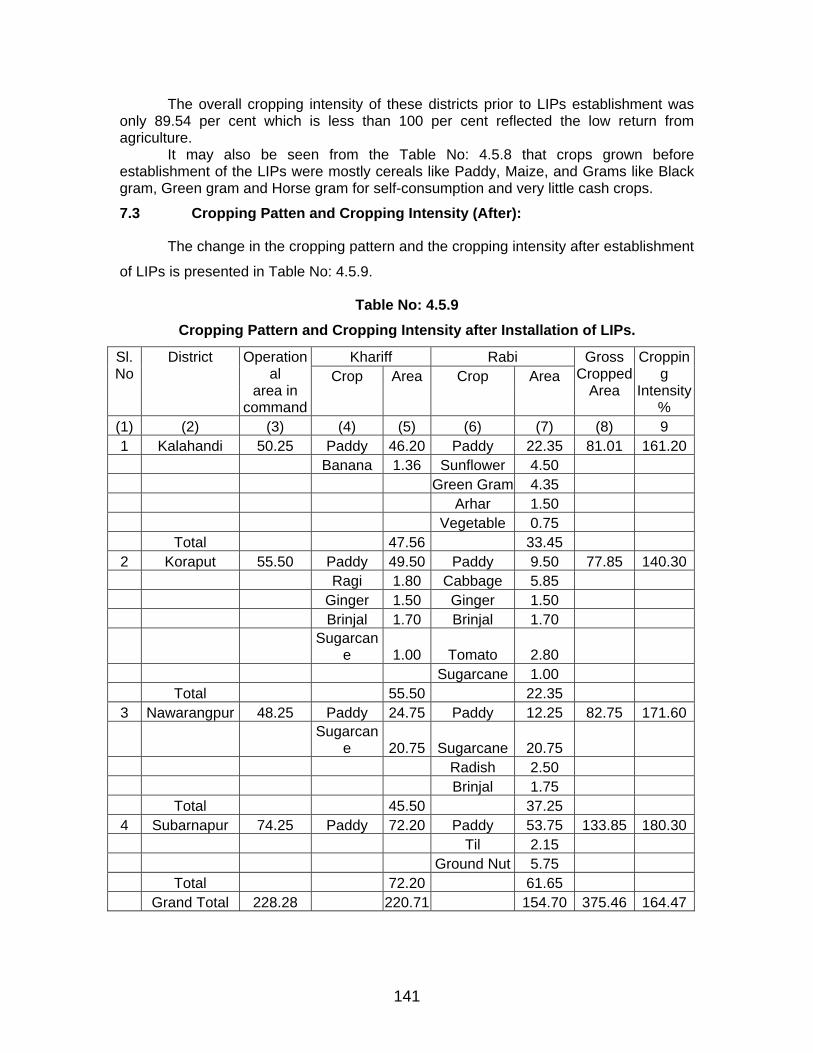
The overall cropping intensity of these districts prior to LIPs establishment was only 89.54 per cent which is less than 100 per cent reflected the low return from agriculture.
It may also be seen from the Table No: 4.5.8 that crops grown before establishment of the LIPs were mostly cereals like Paddy, Maize, and Grams like Black gram, Green gram and Horse gram for self-consumption and very little cash crops.
7.3 Cropping Patten and Cropping Intensity (After):
The change in the cropping pattern and the cropping intensity after establishment
of LIPs is presented in Table No: 4.5.9.
Table No: 4.5.9 Cropping Pattern and Cropping Intensity after Installation of LIPs.
Khariff Rabi Sl. No
District
Operational
area in command
Crop
Area
Crop
Area
Gross Cropped
Area
Cropping
Intensity%
(1) (2) (3) (4) (5) (6) (7) (8) 9 1 Kalahandi 50.25 Paddy 46.20 Paddy 22.35 81.01 161.20 Banana 1.36 Sunflower 4.50 Green Gram 4.35 Arhar 1.50 Vegetable 0.75 Total 47.56 33.45
2 Koraput 55.50 Paddy 49.50 Paddy 9.50 77.85 140.30 Ragi 1.80 Cabbage 5.85 Ginger 1.50 Ginger 1.50 Brinjal 1.70 Brinjal 1.70
Sugarcan
e 1.00 Tomato 2.80 Sugarcane 1.00 Total 55.50 22.35
3 Nawarangpur 48.25 Paddy 24.75 Paddy 12.25 82.75 171.60
Sugarcan
e 20.75 Sugarcane 20.75 Radish 2.50 Brinjal 1.75 Total 45.50 37.25
4 Subarnapur 74.25 Paddy 72.20 Paddy 53.75 133.85 180.30 Til 2.15 Ground Nut 5.75 Total 72.20 61.65 Grand Total 228.28 220.71 154.70 375.46 164.47
141
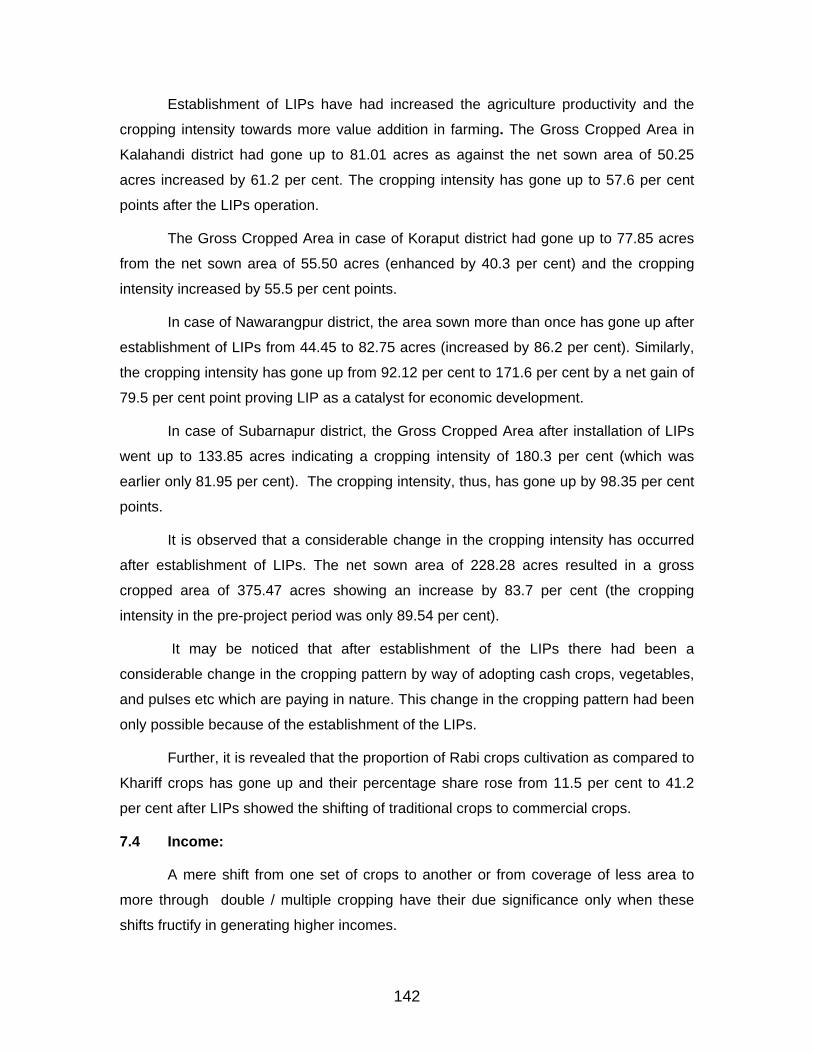
Establishment of LIPs have had increased the agriculture productivity and the
cropping intensity towards more value addition in farming. The Gross Cropped Area in
Kalahandi district had gone up to 81.01 acres as against the net sown area of 50.25
acres increased by 61.2 per cent. The cropping intensity has gone up to 57.6 per cent
points after the LIPs operation.
The Gross Cropped Area in case of Koraput district had gone up to 77.85 acres
from the net sown area of 55.50 acres (enhanced by 40.3 per cent) and the cropping
intensity increased by 55.5 per cent points.
In case of Nawarangpur district, the area sown more than once has gone up after
establishment of LIPs from 44.45 to 82.75 acres (increased by 86.2 per cent). Similarly,
the cropping intensity has gone up from 92.12 per cent to 171.6 per cent by a net gain of
79.5 per cent point proving LIP as a catalyst for economic development.
In case of Subarnapur district, the Gross Cropped Area after installation of LIPs
went up to 133.85 acres indicating a cropping intensity of 180.3 per cent (which was
earlier only 81.95 per cent). The cropping intensity, thus, has gone up by 98.35 per cent
points.
It is observed that a considerable change in the cropping intensity has occurred
after establishment of LIPs. The net sown area of 228.28 acres resulted in a gross
cropped area of 375.47 acres showing an increase by 83.7 per cent (the cropping
intensity in the pre-project period was only 89.54 per cent).
It may be noticed that after establishment of the LIPs there had been a
considerable change in the cropping pattern by way of adopting cash crops, vegetables,
and pulses etc which are paying in nature. This change in the cropping pattern had been
only possible because of the establishment of the LIPs.
Further, it is revealed that the proportion of Rabi crops cultivation as compared to
Khariff crops has gone up and their percentage share rose from 11.5 per cent to 41.2
per cent after LIPs showed the shifting of traditional crops to commercial crops.
7.4 Income:
A mere shift from one set of crops to another or from coverage of less area to
more through double / multiple cropping have their due significance only when these
shifts fructify in generating higher incomes.
142
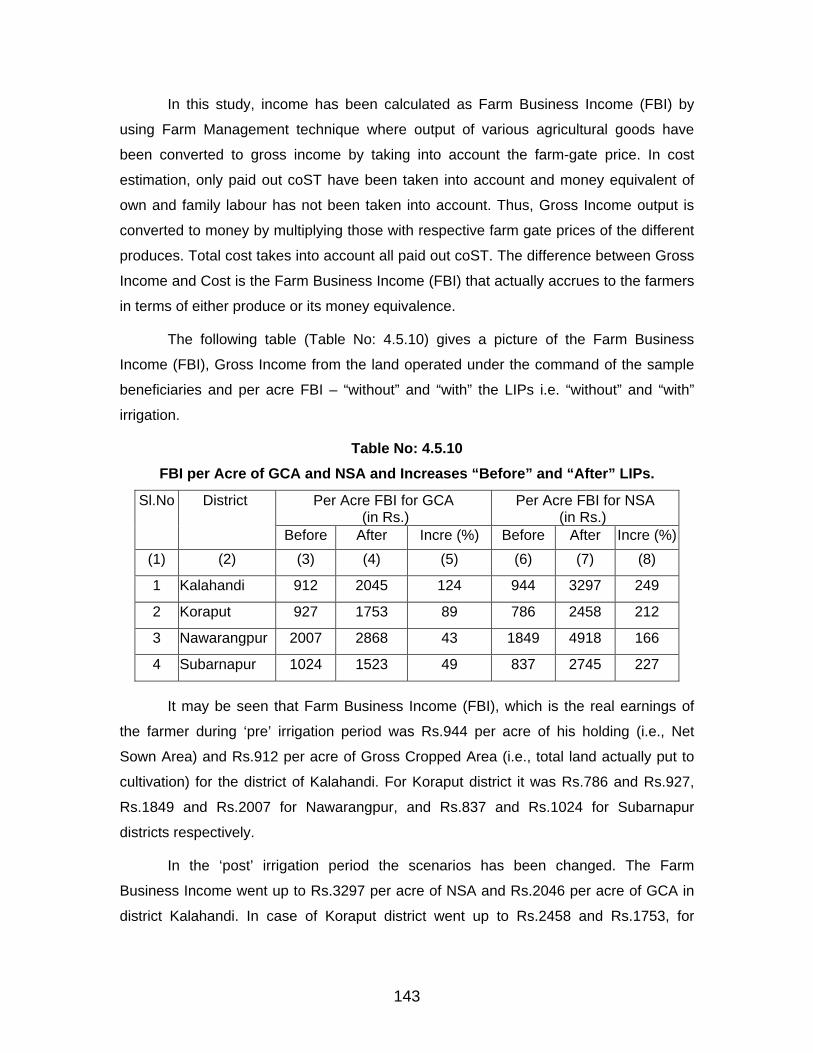
In this study, income has been calculated as Farm Business Income (FBI) by
using Farm Management technique where output of various agricultural goods have
been converted to gross income by taking into account the farm-gate price. In cost
estimation, only paid out coST have been taken into account and money equivalent of
own and family labour has not been taken into account. Thus, Gross Income output is
converted to money by multiplying those with respective farm gate prices of the different
produces. Total cost takes into account all paid out coST. The difference between Gross
Income and Cost is the Farm Business Income (FBI) that actually accrues to the farmers
in terms of either produce or its money equivalence.
The following table (Table No: 4.5.10) gives a picture of the Farm Business
Income (FBI), Gross Income from the land operated under the command of the sample
beneficiaries and per acre FBI – “without” and “with” the LIPs i.e. “without” and “with”
irrigation.
Table No: 4.5.10 FBI per Acre of GCA and NSA and Increases “Before” and “After” LIPs.
Per Acre FBI for GCA (in Rs.)
Per Acre FBI for NSA (in Rs.)
Sl.No District
Before After Incre (%) Before After Incre (%)(1) (2) (3) (4) (5) (6) (7) (8)
1 Kalahandi 912 2045 124 944 3297 249
2 Koraput 927 1753 89 786 2458 212
3 Nawarangpur 2007 2868 43 1849 4918 166
4 Subarnapur 1024 1523 49 837 2745 227
It may be seen that Farm Business Income (FBI), which is the real earnings of
the farmer during ‘pre’ irrigation period was Rs.944 per acre of his holding (i.e., Net
Sown Area) and Rs.912 per acre of Gross Cropped Area (i.e., total land actually put to
cultivation) for the district of Kalahandi. For Koraput district it was Rs.786 and Rs.927,
Rs.1849 and Rs.2007 for Nawarangpur, and Rs.837 and Rs.1024 for Subarnapur
districts respectively.
In the ‘post’ irrigation period the scenarios has been changed. The Farm
Business Income went up to Rs.3297 per acre of NSA and Rs.2046 per acre of GCA in
district Kalahandi. In case of Koraput district went up to Rs.2458 and Rs.1753, for
143
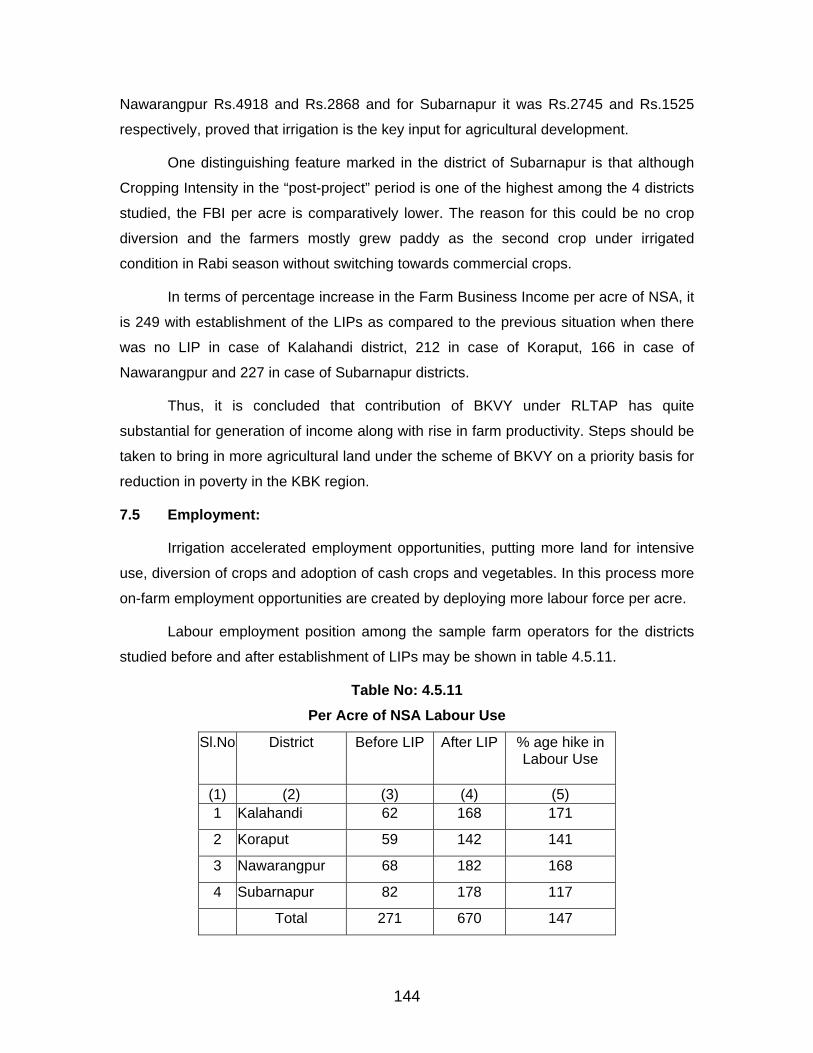
Nawarangpur Rs.4918 and Rs.2868 and for Subarnapur it was Rs.2745 and Rs.1525
respectively, proved that irrigation is the key input for agricultural development.
One distinguishing feature marked in the district of Subarnapur is that although
Cropping Intensity in the “post-project” period is one of the highest among the 4 districts
studied, the FBI per acre is comparatively lower. The reason for this could be no crop
diversion and the farmers mostly grew paddy as the second crop under irrigated
condition in Rabi season without switching towards commercial crops.
In terms of percentage increase in the Farm Business Income per acre of NSA, it
is 249 with establishment of the LIPs as compared to the previous situation when there
was no LIP in case of Kalahandi district, 212 in case of Koraput, 166 in case of
Nawarangpur and 227 in case of Subarnapur districts.
Thus, it is concluded that contribution of BKVY under RLTAP has quite
substantial for generation of income along with rise in farm productivity. Steps should be
taken to bring in more agricultural land under the scheme of BKVY on a priority basis for
reduction in poverty in the KBK region.
7.5 Employment:
Irrigation accelerated employment opportunities, putting more land for intensive
use, diversion of crops and adoption of cash crops and vegetables. In this process more
on-farm employment opportunities are created by deploying more labour force per acre.
Labour employment position among the sample farm operators for the districts
studied before and after establishment of LIPs may be shown in table 4.5.11.
Table No: 4.5.11 Per Acre of NSA Labour Use
Sl.No District Before LIP After LIP % age hike in Labour Use
(1) (2) (3) (4) (5) 1 Kalahandi 62 168 171
2 Koraput 59 142 141
3 Nawarangpur 68 182 168
4 Subarnapur 82 178 117
Total 271 670 147
144
It is observed that in Kalahandi district per acre labour employment has gone up
from 62 per acre to 168 per acre registering a growth of 171 per cent. In Koraput district,
it went up from 59 per acre to 142 after irrigation registering a 141 per cent rise. In
Nawarangpur district it went up from 68 per acre to 182 showing a rise of 168 per cent
and for Subarnapur district it went up from 82 per acre to 178 per acre registering a
growth of 117 per cent.
Thus, in terms of employment generation the contribution of BKVY is enormous.
That provision of water for irrigation creates substantial employment opportunities is
proved beyond doubt.
Taking into account cropping intensity, crop diversification, employment
generation and above all income-generation, it is found that BKVY is a very successful
programme to tackle the poverty.
8. Opinion of Beneficiaries:
8.1 Timely Water Availability:
Opinion of 60 beneficiaries about the smooth operation and maintenance of the
sample LIPs have been collected and presented in Annexure-4.5.1. It may be seen from
this Annexure that out of the total beneficiaries in Kalahandi, one complained about non-
availability of water in time. In Koraput, it was 6 (40%), in Nawarangpur one (8%) and in
Subarnapur 5 (24%) made similar complaint. About 22 per cent of the beneficiaries
expressed that timely non-availability of water as the main constraint.
8.2 Sufficiency of Water:
As regards adequacy of available water, no complaint was received in Kalahandi
and Subarnapur districts, while 5 complaints in Koraput and one in Nawarangpur district
was received. Thus, while 90 per cent considered supply of water for agricultural use to
be adequate, only 10 per cent considered it inadequate.
8.3 Breakdown:
As regards breakdown of LIPs only one complaint in Subarnapur district while
none else in the rest 3 districts. The Pani Panchayats are the sole authority to look after
LIPs.
145
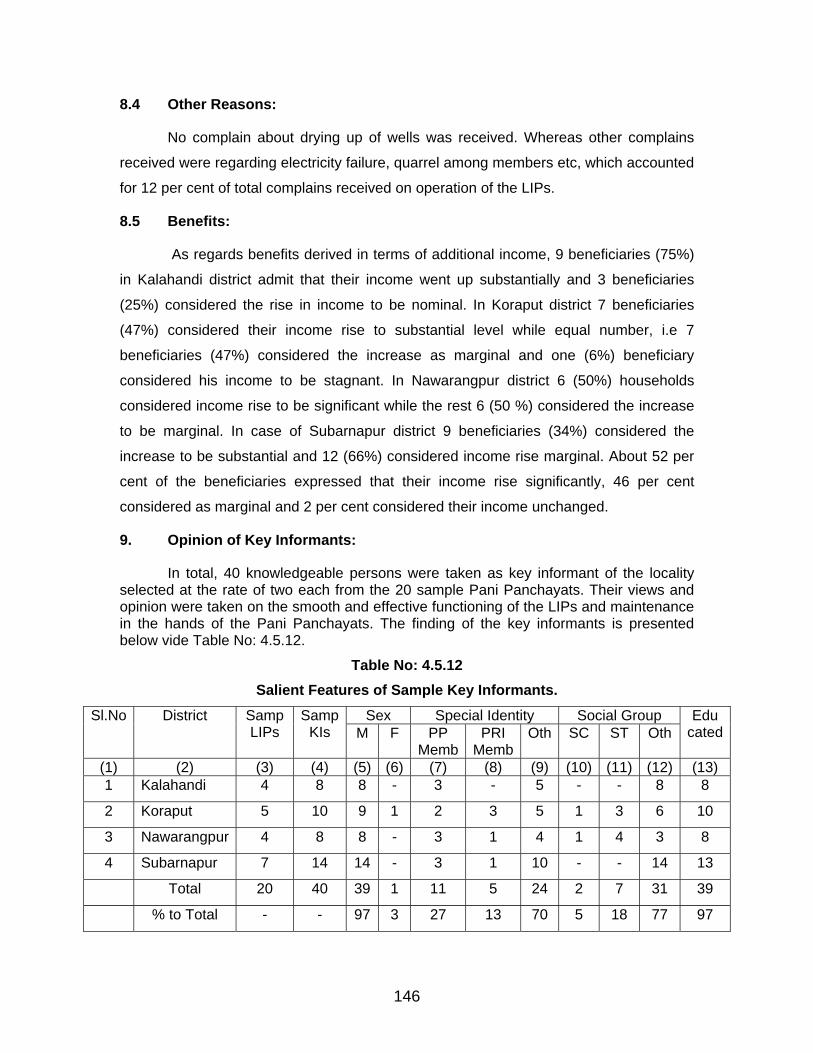
8.4 Other Reasons:
No complain about drying up of wells was received. Whereas other complains
received were regarding electricity failure, quarrel among members etc, which accounted
for 12 per cent of total complains received on operation of the LIPs.
8.5 Benefits:
As regards benefits derived in terms of additional income, 9 beneficiaries (75%)
in Kalahandi district admit that their income went up substantially and 3 beneficiaries
(25%) considered the rise in income to be nominal. In Koraput district 7 beneficiaries
(47%) considered their income rise to substantial level while equal number, i.e 7
beneficiaries (47%) considered the increase as marginal and one (6%) beneficiary
considered his income to be stagnant. In Nawarangpur district 6 (50%) households
considered income rise to be significant while the rest 6 (50 %) considered the increase
to be marginal. In case of Subarnapur district 9 beneficiaries (34%) considered the
increase to be substantial and 12 (66%) considered income rise marginal. About 52 per
cent of the beneficiaries expressed that their income rise significantly, 46 per cent
considered as marginal and 2 per cent considered their income unchanged.
9. Opinion of Key Informants:
In total, 40 knowledgeable persons were taken as key informant of the locality selected at the rate of two each from the 20 sample Pani Panchayats. Their views and opinion were taken on the smooth and effective functioning of the LIPs and maintenance in the hands of the Pani Panchayats. The finding of the key informants is presented below vide Table No: 4.5.12.
Table No: 4.5.12 Salient Features of Sample Key Informants.
Sex Special Identity Social Group Sl.No District Samp LIPs
SampKIs M F PP
MembPRI
MembOth SC ST Oth
Educated
(1) (2) (3) (4) (5) (6) (7) (8) (9) (10) (11) (12) (13) 1 Kalahandi 4 8 8 - 3 - 5 - - 8 8
2 Koraput 5 10 9 1 2 3 5 1 3 6 10
3 Nawarangpur 4 8 8 - 3 1 4 1 4 3 8
4 Subarnapur 7 14 14 - 3 1 10 - - 14 13
Total 20 40 39 1 11 5 24 2 7 31 39
% to Total - - 97 3 27 13 70 5 18 77 97
146
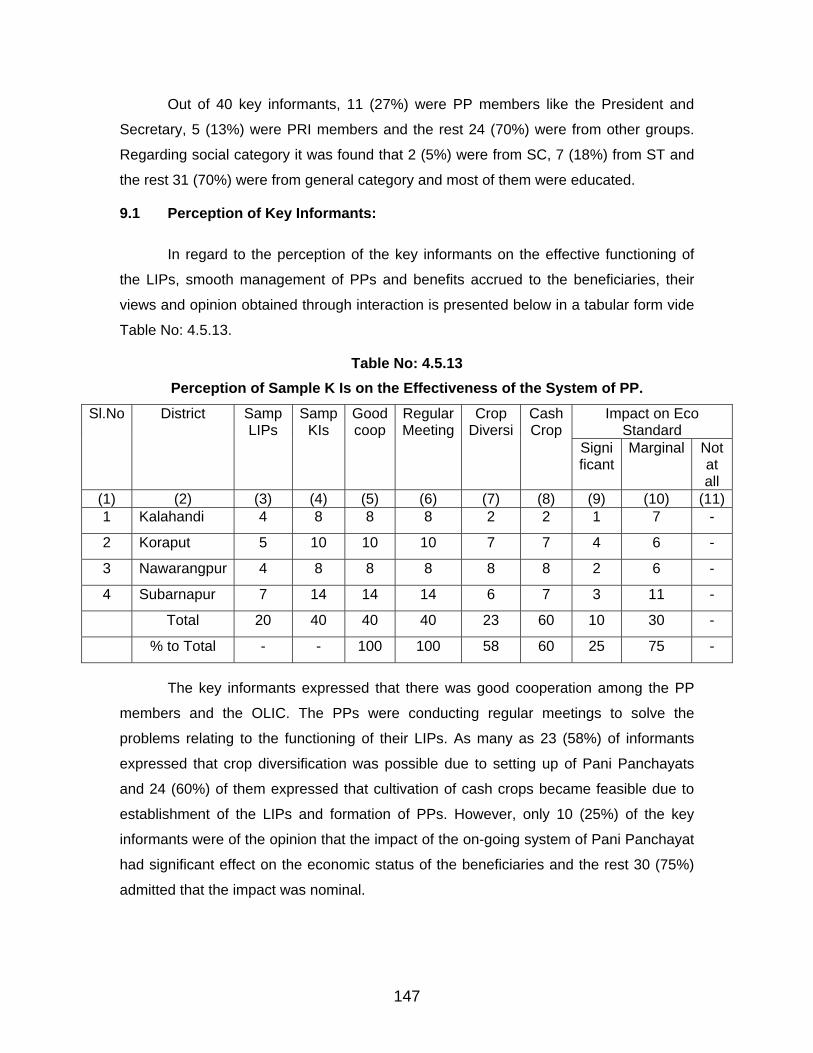
Out of 40 key informants, 11 (27%) were PP members like the President and
Secretary, 5 (13%) were PRI members and the rest 24 (70%) were from other groups.
Regarding social category it was found that 2 (5%) were from SC, 7 (18%) from ST and
the rest 31 (70%) were from general category and most of them were educated.
9.1 Perception of Key Informants:
In regard to the perception of the key informants on the effective functioning of
the LIPs, smooth management of PPs and benefits accrued to the beneficiaries, their
views and opinion obtained through interaction is presented below in a tabular form vide
Table No: 4.5.13.
Table No: 4.5.13 Perception of Sample K Is on the Effectiveness of the System of PP.
Impact on Eco Standard
Sl.No
District
Samp LIPs
SampKIs
Goodcoop
RegularMeeting
Crop Diversi
CashCrop
Signi ficant
Marginal Notat all
(1) (2) (3) (4) (5) (6) (7) (8) (9) (10) (11)1 Kalahandi 4 8 8 8 2 2 1 7 -
2 Koraput 5 10 10 10 7 7 4 6 -
3 Nawarangpur 4 8 8 8 8 8 2 6 -
4 Subarnapur 7 14 14 14 6 7 3 11 -
Total 20 40 40 40 23 60 10 30 -
% to Total - - 100 100 58 60 25 75 -
The key informants expressed that there was good cooperation among the PP
members and the OLIC. The PPs were conducting regular meetings to solve the
problems relating to the functioning of their LIPs. As many as 23 (58%) of informants
expressed that crop diversification was possible due to setting up of Pani Panchayats
and 24 (60%) of them expressed that cultivation of cash crops became feasible due to
establishment of the LIPs and formation of PPs. However, only 10 (25%) of the key
informants were of the opinion that the impact of the on-going system of Pani Panchayat
had significant effect on the economic status of the beneficiaries and the rest 30 (75%)
admitted that the impact was nominal.
147
9.2 Suggestion of the K Is:
Majority of the key informants have given suggestions regarding how to bring
improvement in the effectiveness of Pani Panchayat’s functioning. Some of suggestions
were that the Government should take steps to instal of additional points, provide
regular technological assistance, meet the cost of repair and maintenance, ensure
regular supply of electricity, reduce water tariff etc. From the suggestions of the key
informants it transpires that they have not very well understood the objectives of the
system of Pani Panchayats and are still hopeful that Government will go on meeting the
cost of repair and maintenance as well as bear the water charges. They are still to
comprehend that operation & maintenance of LIPs is no more the responsibility of the
Government after its transfer and it is the sole responsibility of the PPs in future.
Continuance this impression will have adverse effect on the smooth operation and
management of the system of Pani Panchayat.
148
SECTION – 6
WATERSHED PROGRAMME IN KBK DISTRICTS UNDER RLTAP
1. The Sample Watersheds: The details of the 16 sample watersheds projects benefiting a number of villages,
population served, the nature of land covered etc have been presented at Annexure-
4.6.1. This annexure reveals that about 15,916 people residing in 39 villages are the
potential beneficiaries covered by 16 sample watershed projects. It is seen, one
watershed covers an area spread over two to three villages inhabited by around 995
people on an average. Of the 16 sample watersheds, 10 (62%) have been completed
and the rest 6 (38%) are still ongoing. Out of the 6 ongoing watersheds, 5 were started
in 2002-03 and one in 2001-02. Since these are all micro watersheds, their completion
should not extend beyond 4 years. In all these cases, the financial expenditure incurred
so far has been Rs.122.66 lakh against their estimated cost of Rs.182.97 lakh that
accounts for 67.04 per cent. The progress of the projects seemed to be slow even after
4 years of execution.
The area treated under watersheds includes forest, revenue land, land under
cultivation, community land and barren land. While most of watersheds include forest
land, revenue land, land under cultivation and community land within their command
area as many as 8 sample watersheds (50%) include only barren land.
2. Assets Created:
A number of agriculture and allied activities are usually undertaken in a
watershed area depending upon its topography. Even though various assets created
within a watershed served multi purposes, the assets created under the 16 sample
watersheds classified into 14 broad categories. The number of sample watersheds out of
16 in which these activities were undertaken is given below vide Table No.4.6.1
149
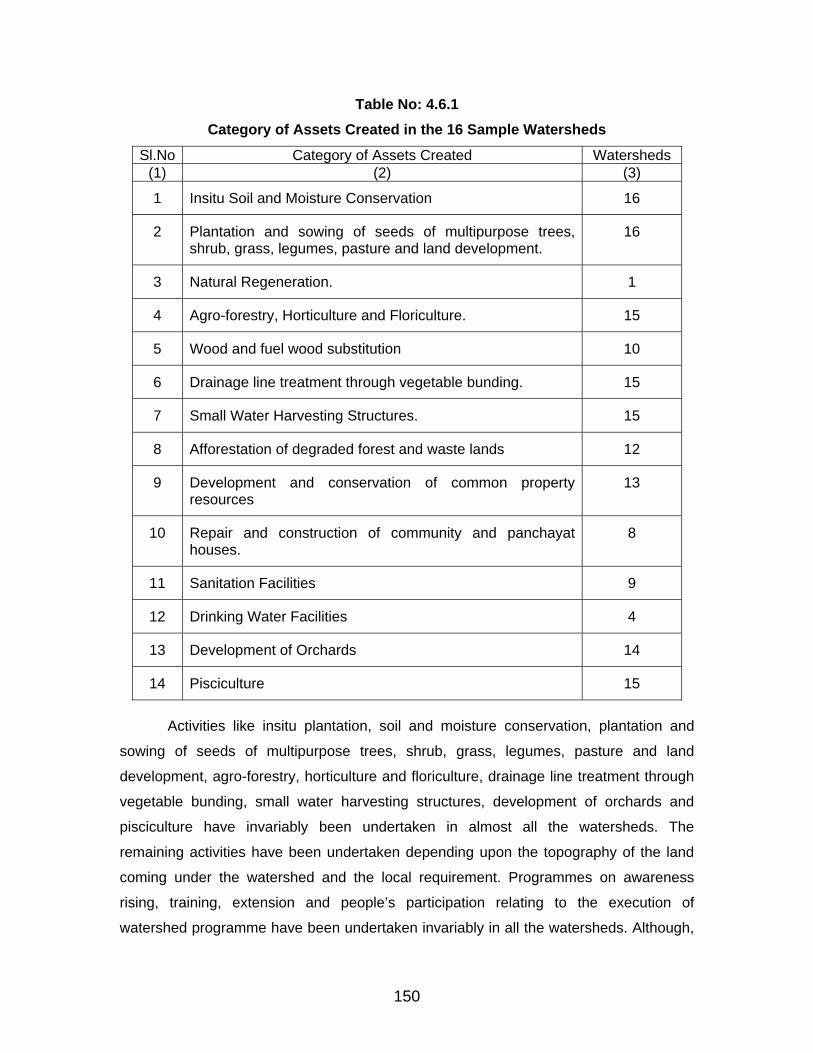
Table No: 4.6.1 Category of Assets Created in the 16 Sample Watersheds
Sl.No Category of Assets Created Watersheds (1) (2) (3)
1 Insitu Soil and Moisture Conservation 16
2 Plantation and sowing of seeds of multipurpose trees, shrub, grass, legumes, pasture and land development.
16
3 Natural Regeneration. 1
4 Agro-forestry, Horticulture and Floriculture. 15
5 Wood and fuel wood substitution 10
6 Drainage line treatment through vegetable bunding. 15
7 Small Water Harvesting Structures. 15
8 Afforestation of degraded forest and waste lands 12
9 Development and conservation of common property resources
13
10 Repair and construction of community and panchayat houses.
8
11 Sanitation Facilities 9
12 Drinking Water Facilities 4
13 Development of Orchards 14
14 Pisciculture 15
Activities like insitu plantation, soil and moisture conservation, plantation and
sowing of seeds of multipurpose trees, shrub, grass, legumes, pasture and land
development, agro-forestry, horticulture and floriculture, drainage line treatment through
vegetable bunding, small water harvesting structures, development of orchards and
pisciculture have invariably been undertaken in almost all the watersheds. The
remaining activities have been undertaken depending upon the topography of the land
coming under the watershed and the local requirement. Programmes on awareness
rising, training, extension and people’s participation relating to the execution of
watershed programme have been undertaken invariably in all the watersheds. Although,
150
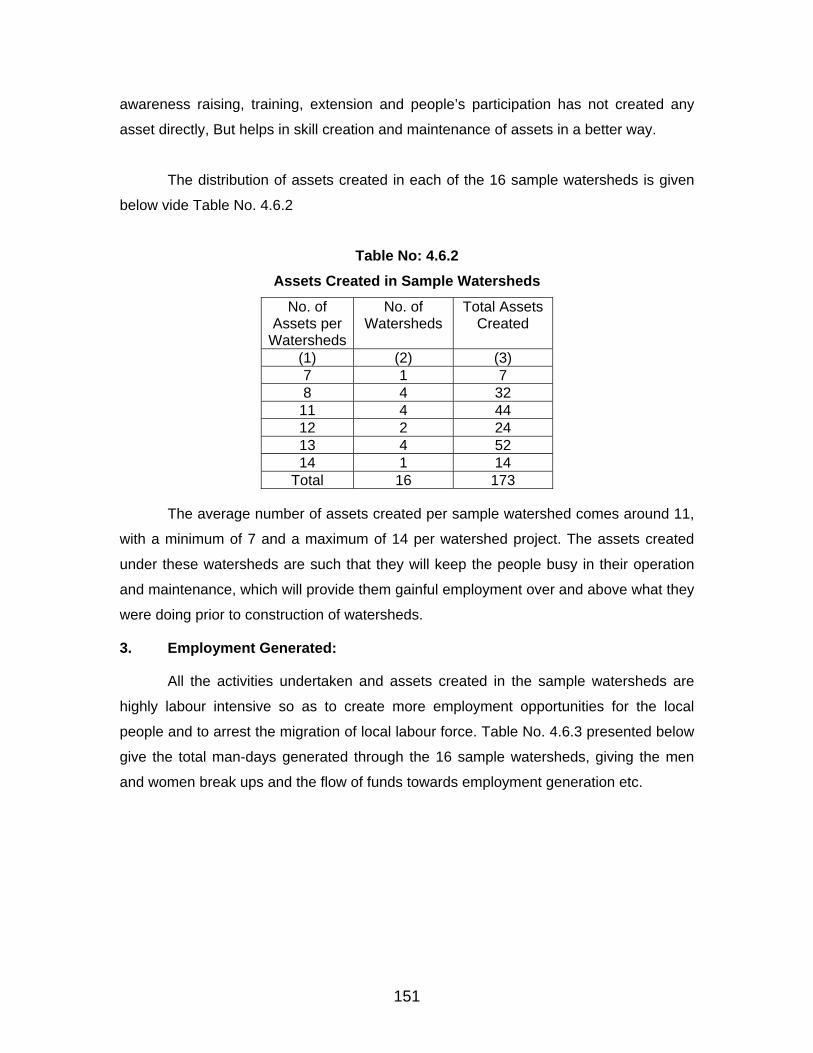
awareness raising, training, extension and people’s participation has not created any
asset directly, But helps in skill creation and maintenance of assets in a better way.
The distribution of assets created in each of the 16 sample watersheds is given
below vide Table No. 4.6.2
Table No: 4.6.2 Assets Created in Sample Watersheds
No. of Assets per
Watersheds
No. of Watersheds
Total Assets Created
(1) (2) (3) 7 1 7 8 4 32
11 4 44 12 2 24 13 4 52 14 1 14
Total 16 173
The average number of assets created per sample watershed comes around 11,
with a minimum of 7 and a maximum of 14 per watershed project. The assets created
under these watersheds are such that they will keep the people busy in their operation
and maintenance, which will provide them gainful employment over and above what they
were doing prior to construction of watersheds.
3. Employment Generated:
All the activities undertaken and assets created in the sample watersheds are
highly labour intensive so as to create more employment opportunities for the local
people and to arrest the migration of local labour force. Table No. 4.6.3 presented below
give the total man-days generated through the 16 sample watersheds, giving the men
and women break ups and the flow of funds towards employment generation etc.
151
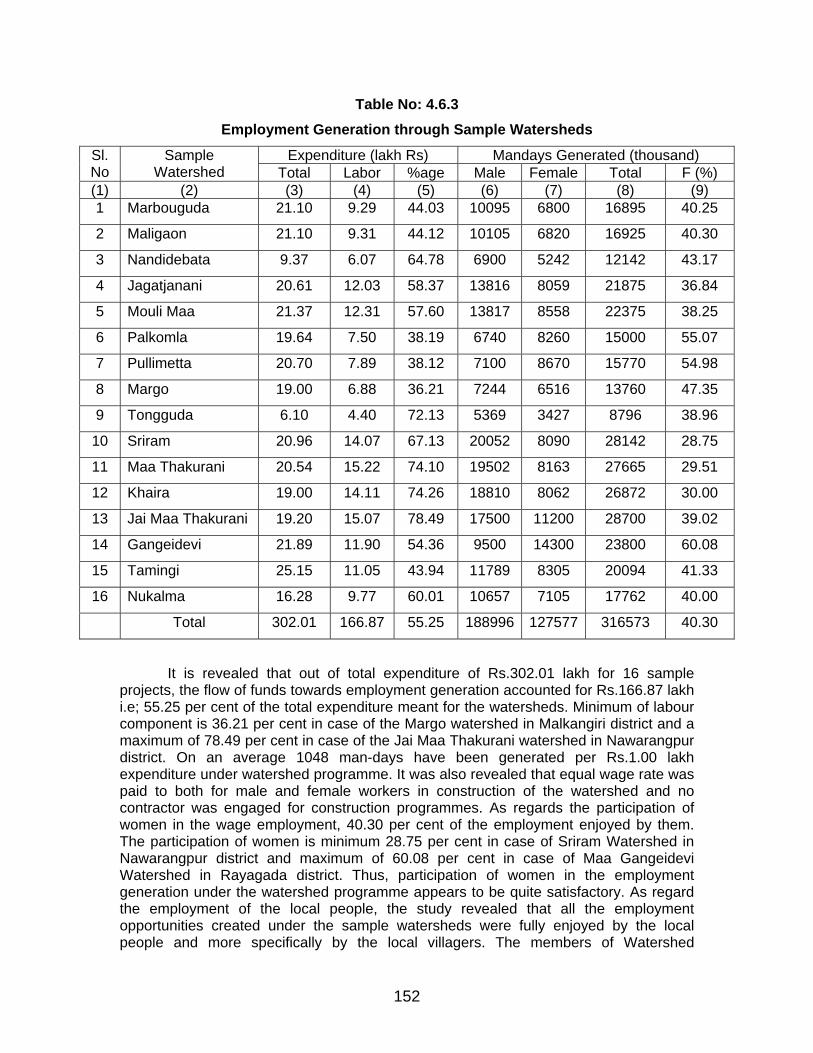
Table No: 4.6.3 Employment Generation through Sample Watersheds
Expenditure (lakh Rs) Mandays Generated (thousand) Sl.No
Sample Watershed Total Labor %age Male Female Total F (%)
(1) (2) (3) (4) (5) (6) (7) (8) (9) 1 Marbouguda 21.10 9.29 44.03 10095 6800 16895 40.25
2 Maligaon 21.10 9.31 44.12 10105 6820 16925 40.30
3 Nandidebata 9.37 6.07 64.78 6900 5242 12142 43.17
4 Jagatjanani 20.61 12.03 58.37 13816 8059 21875 36.84
5 Mouli Maa 21.37 12.31 57.60 13817 8558 22375 38.25
6 Palkomla 19.64 7.50 38.19 6740 8260 15000 55.07
7 Pullimetta 20.70 7.89 38.12 7100 8670 15770 54.98
8 Margo 19.00 6.88 36.21 7244 6516 13760 47.35
9 Tongguda 6.10 4.40 72.13 5369 3427 8796 38.96
10 Sriram 20.96 14.07 67.13 20052 8090 28142 28.75
11 Maa Thakurani 20.54 15.22 74.10 19502 8163 27665 29.51
12 Khaira 19.00 14.11 74.26 18810 8062 26872 30.00
13 Jai Maa Thakurani 19.20 15.07 78.49 17500 11200 28700 39.02
14 Gangeidevi 21.89 11.90 54.36 9500 14300 23800 60.08
15 Tamingi 25.15 11.05 43.94 11789 8305 20094 41.33
16 Nukalma 16.28 9.77 60.01 10657 7105 17762 40.00
Total 302.01 166.87 55.25 188996 127577 316573 40.30
It is revealed that out of total expenditure of Rs.302.01 lakh for 16 sample projects, the flow of funds towards employment generation accounted for Rs.166.87 lakh i.e; 55.25 per cent of the total expenditure meant for the watersheds. Minimum of labour component is 36.21 per cent in case of the Margo watershed in Malkangiri district and a maximum of 78.49 per cent in case of the Jai Maa Thakurani watershed in Nawarangpur district. On an average 1048 man-days have been generated per Rs.1.00 lakh expenditure under watershed programme. It was also revealed that equal wage rate was paid to both for male and female workers in construction of the watershed and no contractor was engaged for construction programmes. As regards the participation of women in the wage employment, 40.30 per cent of the employment enjoyed by them. The participation of women is minimum 28.75 per cent in case of Sriram Watershed in Nawarangpur district and maximum of 60.08 per cent in case of Maa Gangeidevi Watershed in Rayagada district. Thus, participation of women in the employment generation under the watershed programme appears to be quite satisfactory. As regard the employment of the local people, the study revealed that all the employment opportunities created under the sample watersheds were fully enjoyed by the local people and more specifically by the local villagers. The members of Watershed
152
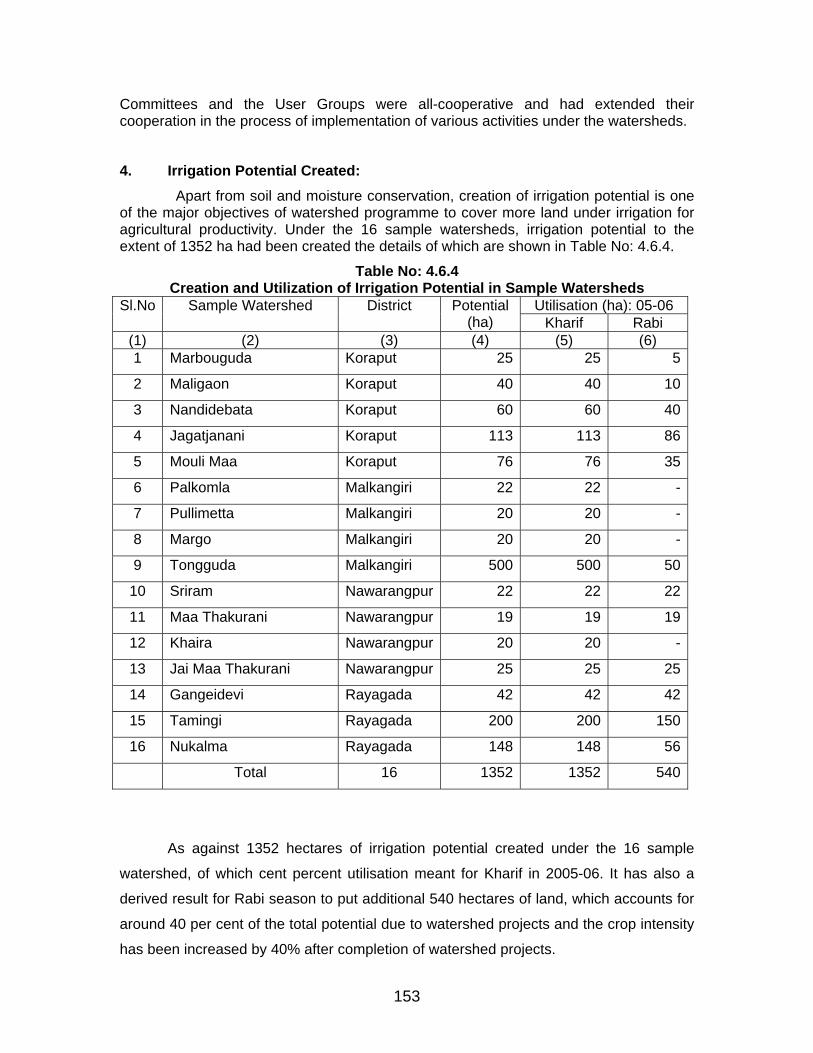
Committees and the User Groups were all-cooperative and had extended their cooperation in the process of implementation of various activities under the watersheds.
4. Irrigation Potential Created: Apart from soil and moisture conservation, creation of irrigation potential is one
of the major objectives of watershed programme to cover more land under irrigation for agricultural productivity. Under the 16 sample watersheds, irrigation potential to the extent of 1352 ha had been created the details of which are shown in Table No: 4.6.4.
Table No: 4.6.4 Creation and Utilization of Irrigation Potential in Sample Watersheds
Utilisation (ha): 05-06 Sl.No Sample Watershed District Potential(ha) Kharif Rabi
(1) (2) (3) (4) (5) (6) 1 Marbouguda Koraput 25 25 5
2 Maligaon Koraput 40 40 10
3 Nandidebata Koraput 60 60 40
4 Jagatjanani Koraput 113 113 86
5 Mouli Maa Koraput 76 76 35
6 Palkomla Malkangiri 22 22 -
7 Pullimetta Malkangiri 20 20 -
8 Margo Malkangiri 20 20 -
9 Tongguda Malkangiri 500 500 50
10 Sriram Nawarangpur 22 22 22
11 Maa Thakurani Nawarangpur 19 19 19
12 Khaira Nawarangpur 20 20 -
13 Jai Maa Thakurani Nawarangpur 25 25 25
14 Gangeidevi Rayagada 42 42 42
15 Tamingi Rayagada 200 200 150
16 Nukalma Rayagada 148 148 56
Total 16 1352 1352 540
As against 1352 hectares of irrigation potential created under the 16 sample
watershed, of which cent percent utilisation meant for Kharif in 2005-06. It has also a
derived result for Rabi season to put additional 540 hectares of land, which accounts for
around 40 per cent of the total potential due to watershed projects and the crop intensity
has been increased by 40% after completion of watershed projects.
153
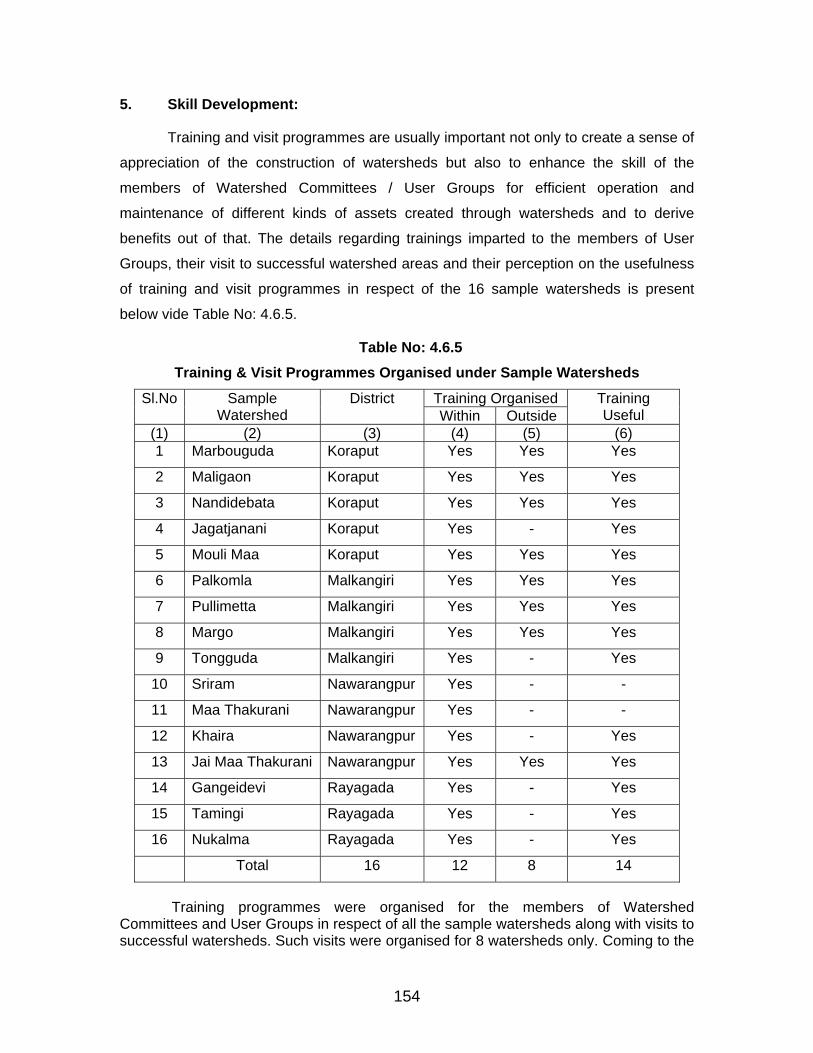
5. Skill Development:
Training and visit programmes are usually important not only to create a sense of
appreciation of the construction of watersheds but also to enhance the skill of the
members of Watershed Committees / User Groups for efficient operation and
maintenance of different kinds of assets created through watersheds and to derive
benefits out of that. The details regarding trainings imparted to the members of User
Groups, their visit to successful watershed areas and their perception on the usefulness
of training and visit programmes in respect of the 16 sample watersheds is present
below vide Table No: 4.6.5.
Table No: 4.6.5 Training & Visit Programmes Organised under Sample Watersheds
Training Organised Sl.No Sample Watershed
District Within Outside
Training Useful
(1) (2) (3) (4) (5) (6) 1 Marbouguda Koraput Yes Yes Yes
2 Maligaon Koraput Yes Yes Yes
3 Nandidebata Koraput Yes Yes Yes
4 Jagatjanani Koraput Yes - Yes
5 Mouli Maa Koraput Yes Yes Yes
6 Palkomla Malkangiri Yes Yes Yes
7 Pullimetta Malkangiri Yes Yes Yes
8 Margo Malkangiri Yes Yes Yes
9 Tongguda Malkangiri Yes - Yes
10 Sriram Nawarangpur Yes - -
11 Maa Thakurani Nawarangpur Yes - -
12 Khaira Nawarangpur Yes - Yes
13 Jai Maa Thakurani Nawarangpur Yes Yes Yes
14 Gangeidevi Rayagada Yes - Yes
15 Tamingi Rayagada Yes - Yes
16 Nukalma Rayagada Yes - Yes
Total 16 12 8 14
Training programmes were organised for the members of Watershed Committees and User Groups in respect of all the sample watersheds along with visits to successful watersheds. Such visits were organised for 8 watersheds only. Coming to the
154
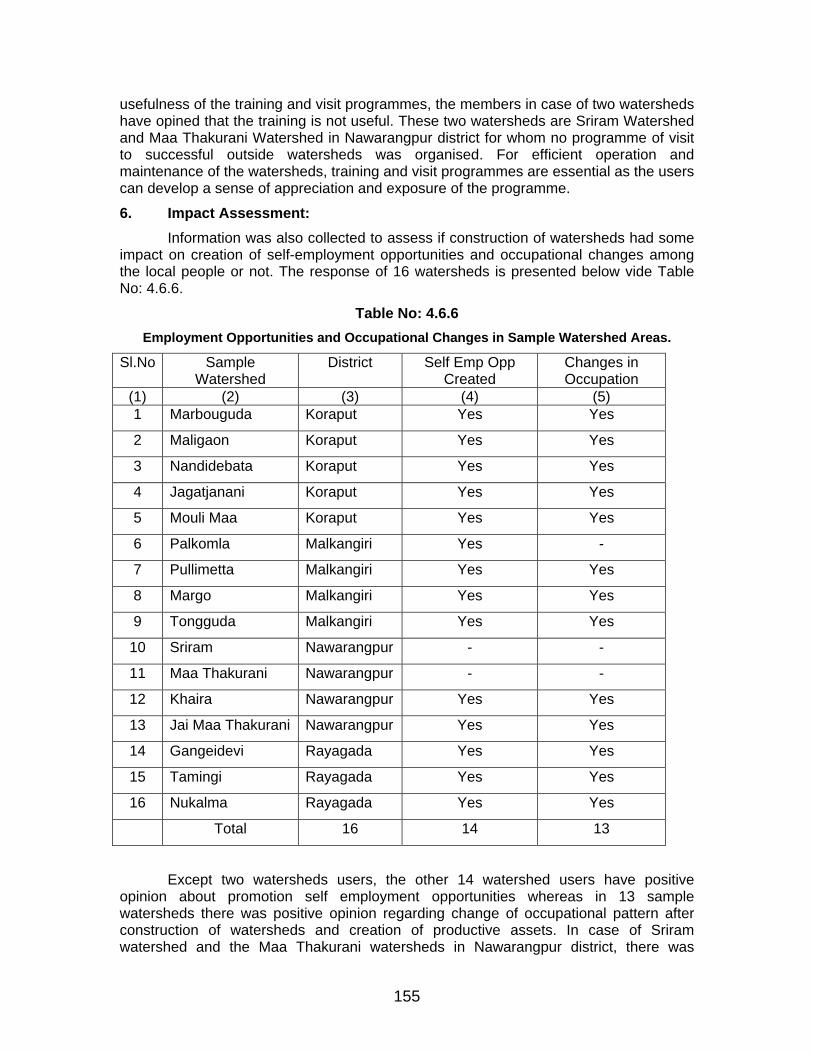
usefulness of the training and visit programmes, the members in case of two watersheds have opined that the training is not useful. These two watersheds are Sriram Watershed and Maa Thakurani Watershed in Nawarangpur district for whom no programme of visit to successful outside watersheds was organised. For efficient operation and maintenance of the watersheds, training and visit programmes are essential as the users can develop a sense of appreciation and exposure of the programme.
6. Impact Assessment: Information was also collected to assess if construction of watersheds had some
impact on creation of self-employment opportunities and occupational changes among the local people or not. The response of 16 watersheds is presented below vide Table No: 4.6.6.
Table No: 4.6.6 Employment Opportunities and Occupational Changes in Sample Watershed Areas.
Sl.No Sample Watershed
District Self Emp Opp Created
Changes in Occupation
(1) (2) (3) (4) (5) 1 Marbouguda Koraput Yes Yes
2 Maligaon Koraput Yes Yes
3 Nandidebata Koraput Yes Yes
4 Jagatjanani Koraput Yes Yes
5 Mouli Maa Koraput Yes Yes
6 Palkomla Malkangiri Yes -
7 Pullimetta Malkangiri Yes Yes
8 Margo Malkangiri Yes Yes
9 Tongguda Malkangiri Yes Yes
10 Sriram Nawarangpur - -
11 Maa Thakurani Nawarangpur - -
12 Khaira Nawarangpur Yes Yes
13 Jai Maa Thakurani Nawarangpur Yes Yes
14 Gangeidevi Rayagada Yes Yes
15 Tamingi Rayagada Yes Yes
16 Nukalma Rayagada Yes Yes
Total 16 14 13
Except two watersheds users, the other 14 watershed users have positive opinion about promotion self employment opportunities whereas in 13 sample watersheds there was positive opinion regarding change of occupational pattern after construction of watersheds and creation of productive assets. In case of Sriram watershed and the Maa Thakurani watersheds in Nawarangpur district, there was
155
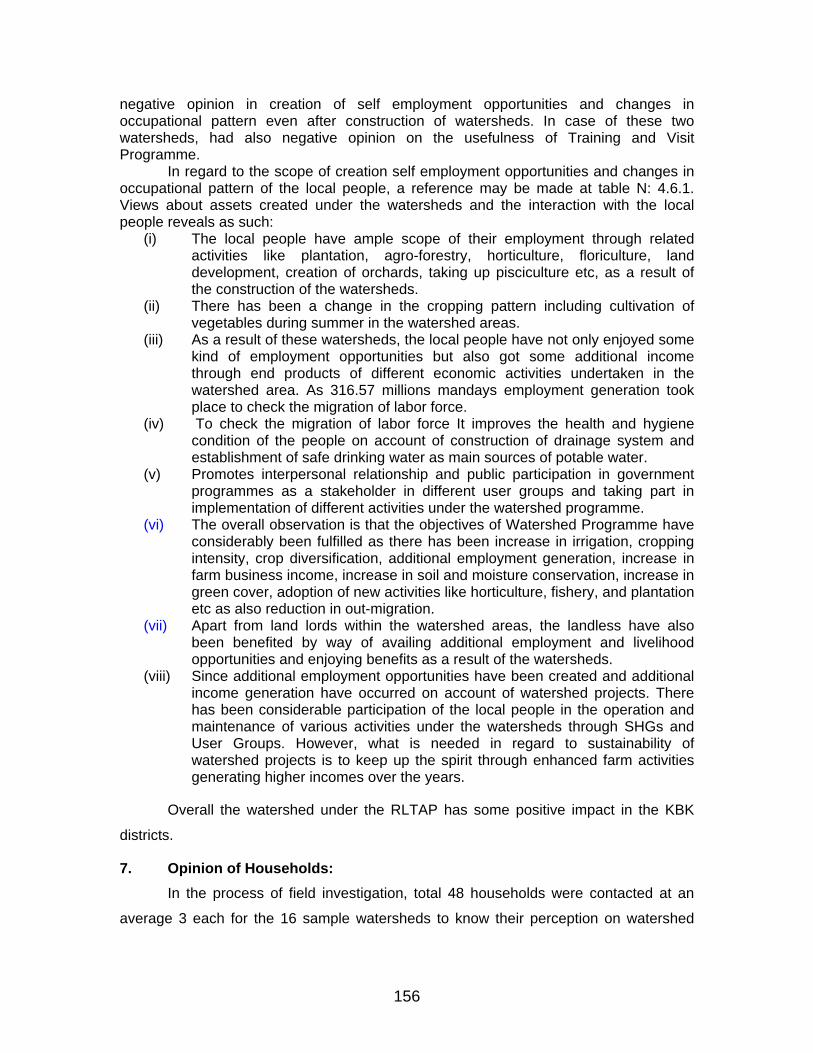
negative opinion in creation of self employment opportunities and changes in occupational pattern even after construction of watersheds. In case of these two watersheds, had also negative opinion on the usefulness of Training and Visit Programme.
In regard to the scope of creation self employment opportunities and changes in occupational pattern of the local people, a reference may be made at table N: 4.6.1. Views about assets created under the watersheds and the interaction with the local people reveals as such:
(i) The local people have ample scope of their employment through related activities like plantation, agro-forestry, horticulture, floriculture, land development, creation of orchards, taking up pisciculture etc, as a result of the construction of the watersheds.
(ii) There has been a change in the cropping pattern including cultivation of vegetables during summer in the watershed areas.
(iii) As a result of these watersheds, the local people have not only enjoyed some kind of employment opportunities but also got some additional income through end products of different economic activities undertaken in the watershed area. As 316.57 millions mandays employment generation took place to check the migration of labor force.
(iv) To check the migration of labor force It improves the health and hygiene condition of the people on account of construction of drainage system and establishment of safe drinking water as main sources of potable water.
(v) Promotes interpersonal relationship and public participation in government programmes as a stakeholder in different user groups and taking part in implementation of different activities under the watershed programme.
(vi) The overall observation is that the objectives of Watershed Programme have considerably been fulfilled as there has been increase in irrigation, cropping intensity, crop diversification, additional employment generation, increase in farm business income, increase in soil and moisture conservation, increase in green cover, adoption of new activities like horticulture, fishery, and plantation etc as also reduction in out-migration.
(vii) Apart from land lords within the watershed areas, the landless have also been benefited by way of availing additional employment and livelihood opportunities and enjoying benefits as a result of the watersheds.
(viii) Since additional employment opportunities have been created and additional income generation have occurred on account of watershed projects. There has been considerable participation of the local people in the operation and maintenance of various activities under the watersheds through SHGs and User Groups. However, what is needed in regard to sustainability of watershed projects is to keep up the spirit through enhanced farm activities generating higher incomes over the years.
Overall the watershed under the RLTAP has some positive impact in the KBK
districts.
7. Opinion of Households: In the process of field investigation, total 48 households were contacted at an
average 3 each for the 16 sample watersheds to know their perception on watershed
156
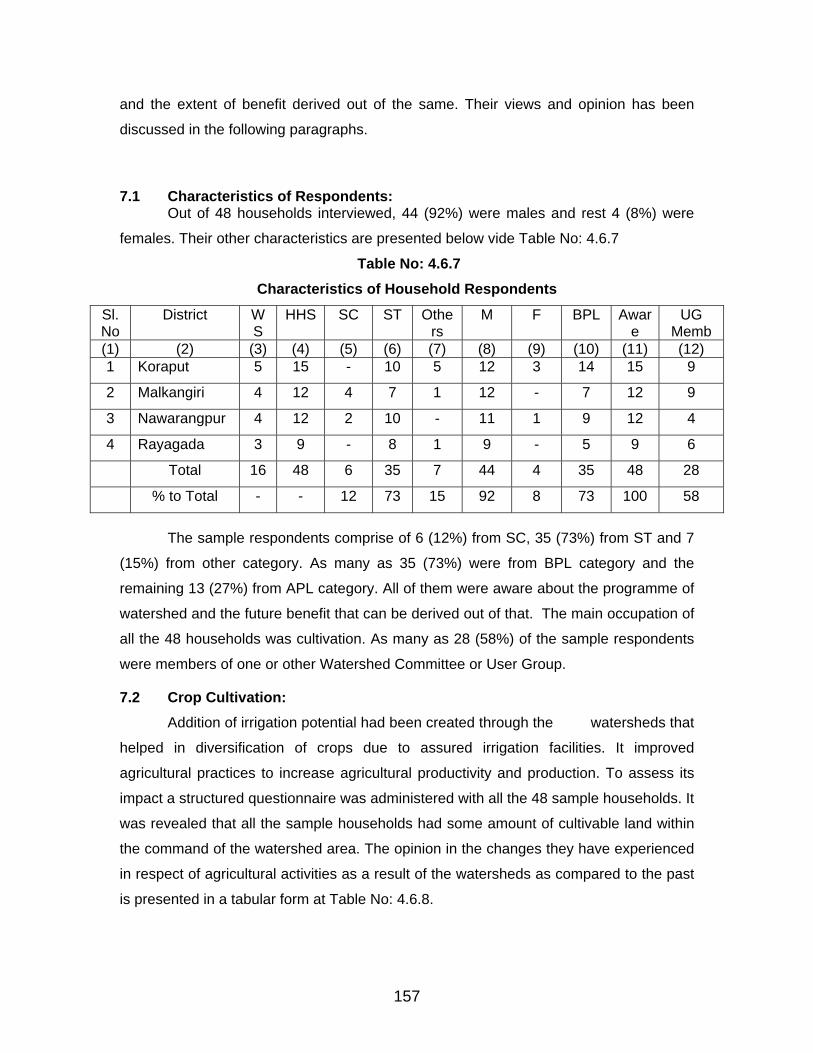
and the extent of benefit derived out of the same. Their views and opinion has been
discussed in the following paragraphs.
7.1 Characteristics of Respondents:
Out of 48 households interviewed, 44 (92%) were males and rest 4 (8%) were
females. Their other characteristics are presented below vide Table No: 4.6.7
Table No: 4.6.7 Characteristics of Household Respondents
Sl.No
District WS
HHS SC ST Others
M F BPL Aware
UG Memb
(1) (2) (3) (4) (5) (6) (7) (8) (9) (10) (11) (12) 1 Koraput 5 15 - 10 5 12 3 14 15 9
2 Malkangiri 4 12 4 7 1 12 - 7 12 9
3 Nawarangpur 4 12 2 10 - 11 1 9 12 4
4 Rayagada 3 9 - 8 1 9 - 5 9 6
Total 16 48 6 35 7 44 4 35 48 28
% to Total - - 12 73 15 92 8 73 100 58
The sample respondents comprise of 6 (12%) from SC, 35 (73%) from ST and 7
(15%) from other category. As many as 35 (73%) were from BPL category and the
remaining 13 (27%) from APL category. All of them were aware about the programme of
watershed and the future benefit that can be derived out of that. The main occupation of
all the 48 households was cultivation. As many as 28 (58%) of the sample respondents
were members of one or other Watershed Committee or User Group.
7.2 Crop Cultivation: Addition of irrigation potential had been created through the watersheds that
helped in diversification of crops due to assured irrigation facilities. It improved
agricultural practices to increase agricultural productivity and production. To assess its
impact a structured questionnaire was administered with all the 48 sample households. It
was revealed that all the sample households had some amount of cultivable land within
the command of the watershed area. The opinion in the changes they have experienced
in respect of agricultural activities as a result of the watersheds as compared to the past
is presented in a tabular form at Table No: 4.6.8.
157
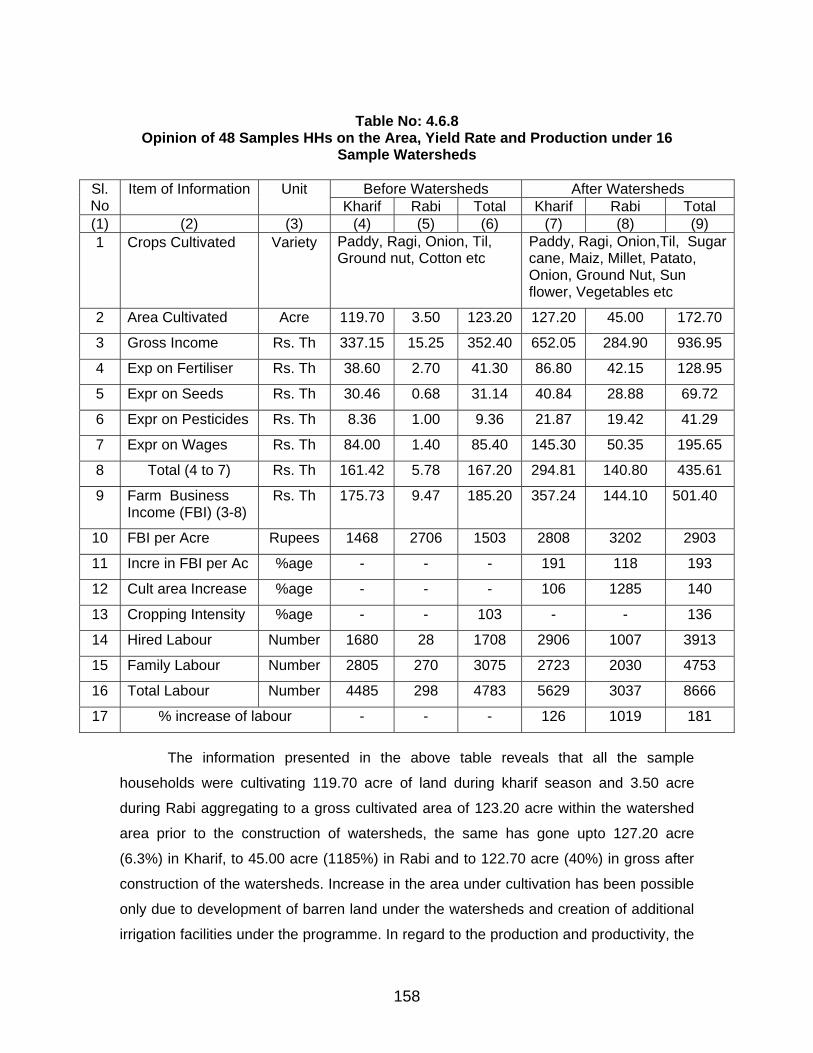
Table No: 4.6.8
Opinion of 48 Samples HHs on the Area, Yield Rate and Production under 16 Sample Watersheds
Before Watersheds After Watersheds Sl.
No Item of Information Unit
Kharif Rabi Total Kharif Rabi Total (1) (2) (3) (4) (5) (6) (7) (8) (9) 1
Crops Cultivated
Variety
Paddy, Ragi, Onion, Til, Ground nut, Cotton etc
Paddy, Ragi, Onion,Til, Sugar cane, Maiz, Millet, Patato, Onion, Ground Nut, Sun flower, Vegetables etc
2 Area Cultivated Acre 119.70 3.50 123.20 127.20 45.00 172.70
3 Gross Income Rs. Th 337.15 15.25 352.40 652.05 284.90 936.95
4 Exp on Fertiliser Rs. Th 38.60 2.70 41.30 86.80 42.15 128.95
5 Expr on Seeds Rs. Th 30.46 0.68 31.14 40.84 28.88 69.72
6 Expr on Pesticides Rs. Th 8.36 1.00 9.36 21.87 19.42 41.29
7 Expr on Wages Rs. Th 84.00 1.40 85.40 145.30 50.35 195.65
8 Total (4 to 7) Rs. Th 161.42 5.78 167.20 294.81 140.80 435.61
9 Farm Business Income (FBI) (3-8)
Rs. Th 175.73 9.47 185.20 357.24 144.10 501.40
10 FBI per Acre Rupees 1468 2706 1503 2808 3202 2903
11 Incre in FBI per Ac %age - - - 191 118 193
12 Cult area Increase %age - - - 106 1285 140
13 Cropping Intensity %age - - 103 - - 136
14 Hired Labour Number 1680 28 1708 2906 1007 3913
15 Family Labour Number 2805 270 3075 2723 2030 4753
16 Total Labour Number 4485 298 4783 5629 3037 8666
17 % increase of labour - - - 126 1019 181
The information presented in the above table reveals that all the sample
households were cultivating 119.70 acre of land during kharif season and 3.50 acre
during Rabi aggregating to a gross cultivated area of 123.20 acre within the watershed
area prior to the construction of watersheds, the same has gone upto 127.20 acre
(6.3%) in Kharif, to 45.00 acre (1185%) in Rabi and to 122.70 acre (40%) in gross after
construction of the watersheds. Increase in the area under cultivation has been possible
only due to development of barren land under the watersheds and creation of additional
irrigation facilities under the programme. In regard to the production and productivity, the
158
farm business income (FBI) per acre was Rs.1468/- in Kharif, Rs.2706/- in Rabi and
Rs.1503/- on the whole prior to the construction of watersheds, the same has gone up to
Rs.2808/- (91%), Rs.3202/- (18%) and Rs.2903/- ((93%) respectively as a result of
establishment of watersheds. While the cropping intensity was only 103 per cent prior to
construction of watersheds, the same has gone up to 136 per cent after construction of
watersheds. While the 48 sample households were required to engage labour to an
extent of 4783 (hired-1708 and family-3075) for agricultural activities within the
watershed area prior to their construction, the same has gone up to 8666 (hired-3913
and family-4753) which is 81 per cent of the former requirement after construction of the
watersheds. Besides, there had been diversification of crops including growing of cash
crops and vegetables after construction of watersheds. It, therefore, gives a clear cut
message that the programme of watershed development has a positive impact on the
production and productivity of agricultural crops in the watershed area in terms of
diversification of crops, cultivation of cash crops and vegetables, production and
productivity, cropping intensity as also generation of employment through various
agricultural and allied activities.
7.3 Public Participation:
The extent of public participation in the process of implementation watershed
programme can be judged from the involvement of the local people in different activities
relating to the watershed and their participation in community based organizations.
Information on public participation in different community programmes in the watershed
area is complied in the Table No: 4.6.9.
159
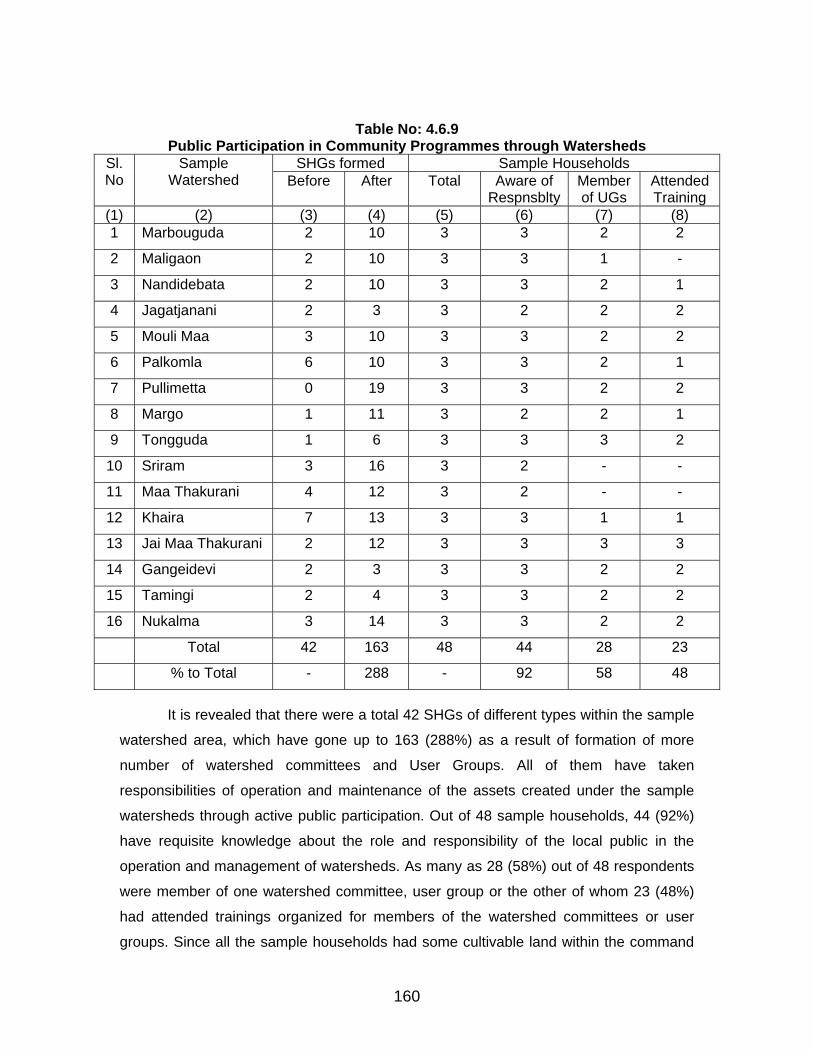
Table No: 4.6.9 Public Participation in Community Programmes through Watersheds
SHGs formed Sample Households Sl.No
Sample Watershed Before After Total Aware of
RespnsbltyMember of UGs
Attended Training
(1) (2) (3) (4) (5) (6) (7) (8) 1 Marbouguda 2 10 3 3 2 2
2 Maligaon 2 10 3 3 1 -
3 Nandidebata 2 10 3 3 2 1
4 Jagatjanani 2 3 3 2 2 2
5 Mouli Maa 3 10 3 3 2 2
6 Palkomla 6 10 3 3 2 1
7 Pullimetta 0 19 3 3 2 2
8 Margo 1 11 3 2 2 1
9 Tongguda 1 6 3 3 3 2
10 Sriram 3 16 3 2 - -
11 Maa Thakurani 4 12 3 2 - -
12 Khaira 7 13 3 3 1 1
13 Jai Maa Thakurani 2 12 3 3 3 3
14 Gangeidevi 2 3 3 3 2 2
15 Tamingi 2 4 3 3 2 2
16 Nukalma 3 14 3 3 2 2
Total 42 163 48 44 28 23
% to Total - 288 - 92 58 48
It is revealed that there were a total 42 SHGs of different types within the sample
watershed area, which have gone up to 163 (288%) as a result of formation of more
number of watershed committees and User Groups. All of them have taken
responsibilities of operation and maintenance of the assets created under the sample
watersheds through active public participation. Out of 48 sample households, 44 (92%)
have requisite knowledge about the role and responsibility of the local public in the
operation and management of watersheds. As many as 28 (58%) out of 48 respondents
were member of one watershed committee, user group or the other of whom 23 (48%)
had attended trainings organized for members of the watershed committees or user
groups. Since all the sample households had some cultivable land within the command
160
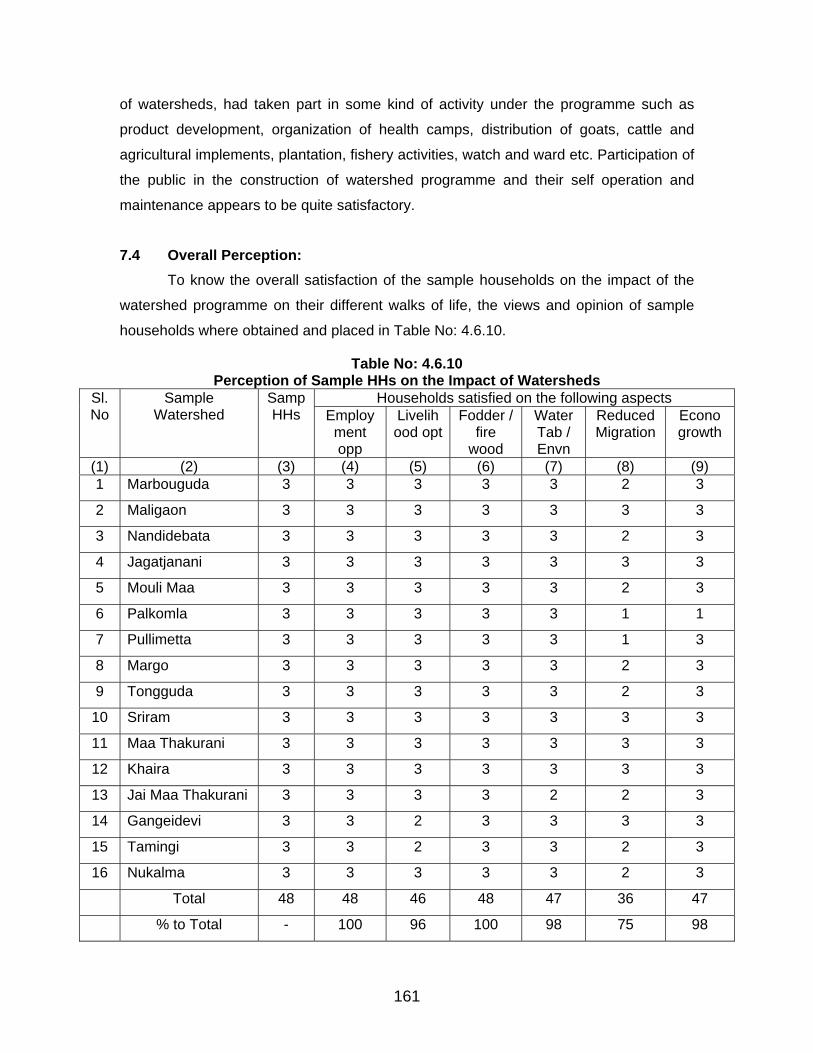
of watersheds, had taken part in some kind of activity under the programme such as
product development, organization of health camps, distribution of goats, cattle and
agricultural implements, plantation, fishery activities, watch and ward etc. Participation of
the public in the construction of watershed programme and their self operation and
maintenance appears to be quite satisfactory.
7.4 Overall Perception:
To know the overall satisfaction of the sample households on the impact of the
watershed programme on their different walks of life, the views and opinion of sample
households where obtained and placed in Table No: 4.6.10.
Table No: 4.6.10 Perception of Sample HHs on the Impact of Watersheds
Households satisfied on the following aspects Sl.No
Sample Watershed
Samp HHs Employ
ment opp
Livelihood opt
Fodder / fire
wood
Water Tab / Envn
Reduced Migration
Econo growth
(1) (2) (3) (4) (5) (6) (7) (8) (9) 1 Marbouguda 3 3 3 3 3 2 3
2 Maligaon 3 3 3 3 3 3 3
3 Nandidebata 3 3 3 3 3 2 3
4 Jagatjanani 3 3 3 3 3 3 3
5 Mouli Maa 3 3 3 3 3 2 3
6 Palkomla 3 3 3 3 3 1 1
7 Pullimetta 3 3 3 3 3 1 3
8 Margo 3 3 3 3 3 2 3
9 Tongguda 3 3 3 3 3 2 3
10 Sriram 3 3 3 3 3 3 3
11 Maa Thakurani 3 3 3 3 3 3 3
12 Khaira 3 3 3 3 3 3 3
13 Jai Maa Thakurani 3 3 3 3 2 2 3
14 Gangeidevi 3 3 2 3 3 3 3
15 Tamingi 3 3 2 3 3 2 3
16 Nukalma 3 3 3 3 3 2 3
Total 48 48 46 48 47 36 47
% to Total - 100 96 100 98 75 98
161
The table reveales that all the sample households expressed that the scope of
getting additional employment has been increased as a result of construction of
watersheds in their locality. All of them are collecting fire wood for cooking purpose and
fodder for their animals from the watershed area. However, 46 households (98%)
expressed that they have been enjoying enhanced livelihood opportunities due to
watersheds. About 98 per cent of respondents are of the opinion that the water table in
the watershed area has gone up, environmental improvements have been noticed and
the various economic activities undertaken in the project area has been improved their
economic status. 75 per cent of the households expressed the view that due to
watershed projects, there has been drastic cut in migration of the local people in search
of labour. This gives a clear cut picture on the positive impact of the watershed
programme on the local people in the KBK districts is not only to improve their socio-
economic conditions but also the environmental balance.
8. Opinion of Knowledgeable persons:
All the 32 sample key informants were aware of the aims and objectives of the
watershed programme and also very much aware on the number and varieties of assets
created under the watershed constructed in their locality. Besides, they expressed the
view that various components of the programme of watersheds were implemented
departmentally with the help of the local people.
8.1 Opinion on the Impact:
The information collected from the sample key informants on the impact of the
watershed programmes in terms of selected parameters is presented below vide Table
No: 4.6.11.
162
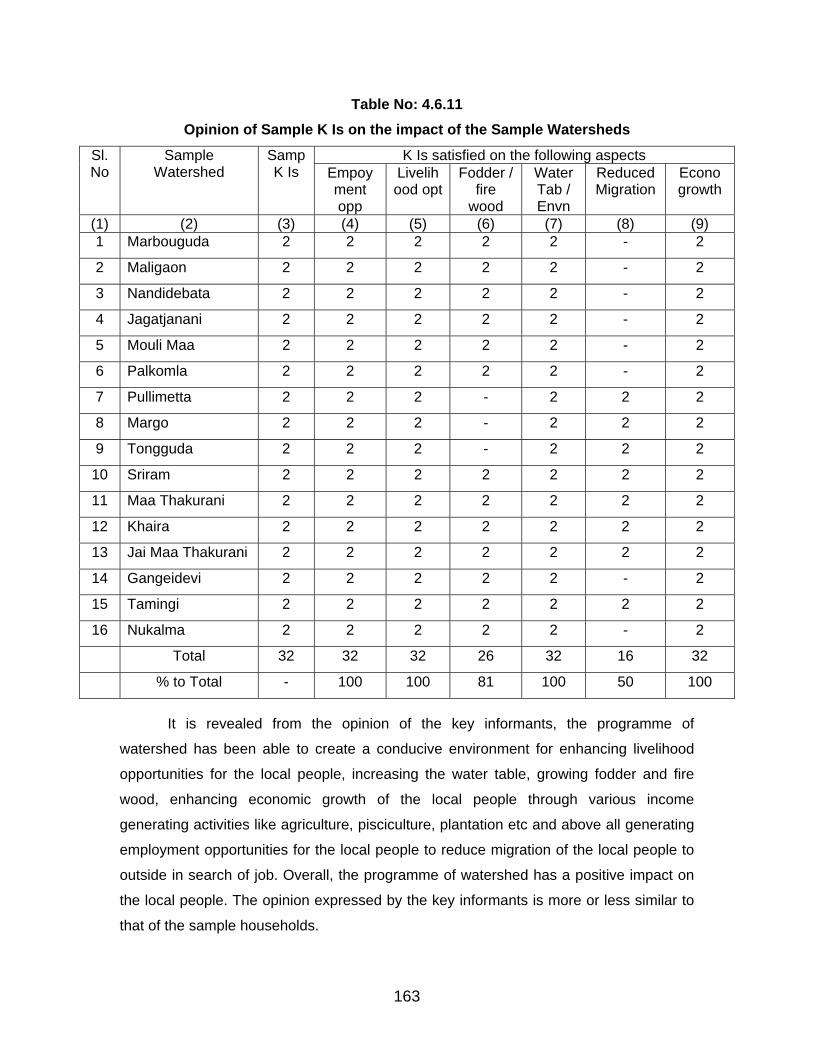
Table No: 4.6.11 Opinion of Sample K Is on the impact of the Sample Watersheds
K Is satisfied on the following aspects Sl.No
Sample Watershed
Samp K Is Empoy
ment opp
Livelihood opt
Fodder / fire
wood
Water Tab / Envn
Reduced Migration
Econo growth
(1) (2) (3) (4) (5) (6) (7) (8) (9) 1 Marbouguda 2 2 2 2 2 - 2
2 Maligaon 2 2 2 2 2 - 2
3 Nandidebata 2 2 2 2 2 - 2
4 Jagatjanani 2 2 2 2 2 - 2
5 Mouli Maa 2 2 2 2 2 - 2
6 Palkomla 2 2 2 2 2 - 2
7 Pullimetta 2 2 2 - 2 2 2
8 Margo 2 2 2 - 2 2 2
9 Tongguda 2 2 2 - 2 2 2
10 Sriram 2 2 2 2 2 2 2
11 Maa Thakurani 2 2 2 2 2 2 2
12 Khaira 2 2 2 2 2 2 2
13 Jai Maa Thakurani 2 2 2 2 2 2 2
14 Gangeidevi 2 2 2 2 2 - 2
15 Tamingi 2 2 2 2 2 2 2
16 Nukalma 2 2 2 2 2 - 2
Total 32 32 32 26 32 16 32
% to Total - 100 100 81 100 50 100
It is revealed from the opinion of the key informants, the programme of
watershed has been able to create a conducive environment for enhancing livelihood
opportunities for the local people, increasing the water table, growing fodder and fire
wood, enhancing economic growth of the local people through various income
generating activities like agriculture, pisciculture, plantation etc and above all generating
employment opportunities for the local people to reduce migration of the local people to
outside in search of job. Overall, the programme of watershed has a positive impact on
the local people. The opinion expressed by the key informants is more or less similar to
that of the sample households.
163
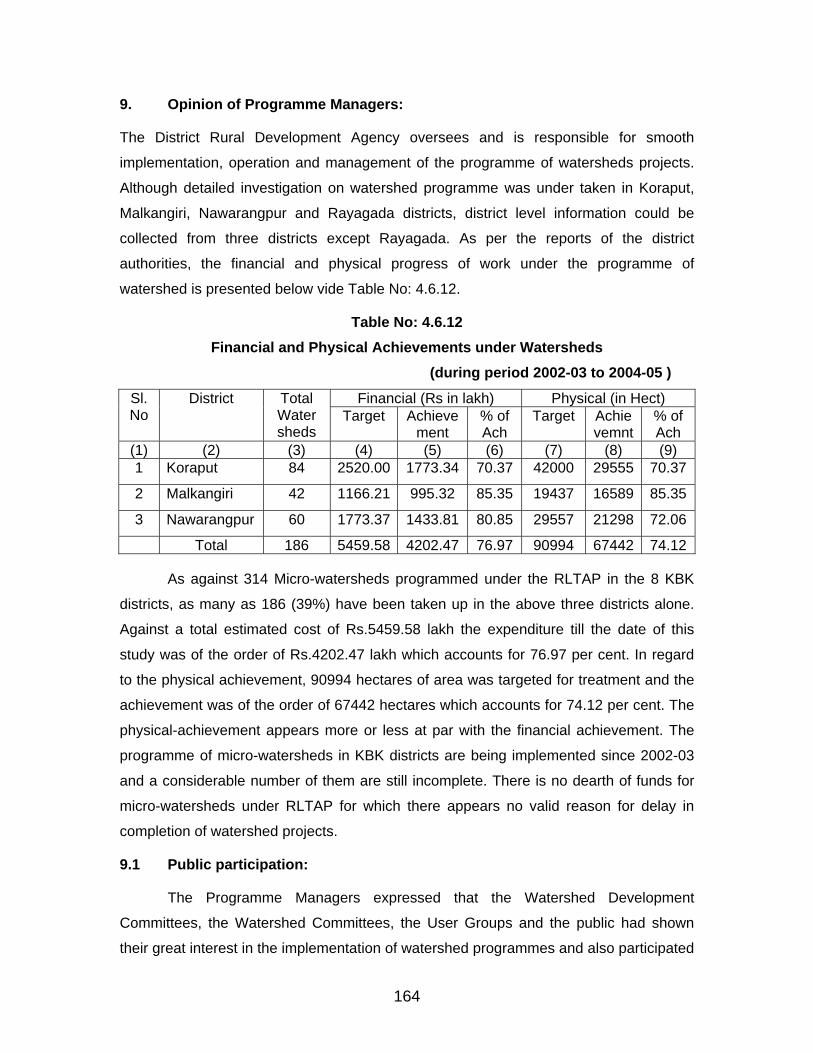
9. Opinion of Programme Managers:
The District Rural Development Agency oversees and is responsible for smooth
implementation, operation and management of the programme of watersheds projects.
Although detailed investigation on watershed programme was under taken in Koraput,
Malkangiri, Nawarangpur and Rayagada districts, district level information could be
collected from three districts except Rayagada. As per the reports of the district
authorities, the financial and physical progress of work under the programme of
watershed is presented below vide Table No: 4.6.12.
Table No: 4.6.12 Financial and Physical Achievements under Watersheds
(during period 2002-03 to 2004-05 )
Financial (Rs in lakh) Physical (in Hect) Sl.No
District Total Water sheds
Target Achievement
% of Ach
Target Achievemnt
% of Ach
(1) (2) (3) (4) (5) (6) (7) (8) (9) 1 Koraput 84 2520.00 1773.34 70.37 42000 29555 70.37
2 Malkangiri 42 1166.21 995.32 85.35 19437 16589 85.35
3 Nawarangpur 60 1773.37 1433.81 80.85 29557 21298 72.06
Total 186 5459.58 4202.47 76.97 90994 67442 74.12
As against 314 Micro-watersheds programmed under the RLTAP in the 8 KBK
districts, as many as 186 (39%) have been taken up in the above three districts alone.
Against a total estimated cost of Rs.5459.58 lakh the expenditure till the date of this
study was of the order of Rs.4202.47 lakh which accounts for 76.97 per cent. In regard
to the physical achievement, 90994 hectares of area was targeted for treatment and the
achievement was of the order of 67442 hectares which accounts for 74.12 per cent. The
physical-achievement appears more or less at par with the financial achievement. The
programme of micro-watersheds in KBK districts are being implemented since 2002-03
and a considerable number of them are still incomplete. There is no dearth of funds for
micro-watersheds under RLTAP for which there appears no valid reason for delay in
completion of watershed projects.
9.1 Public participation:
The Programme Managers expressed that the Watershed Development
Committees, the Watershed Committees, the User Groups and the public had shown
their great interest in the implementation of watershed programmes and also participated
164
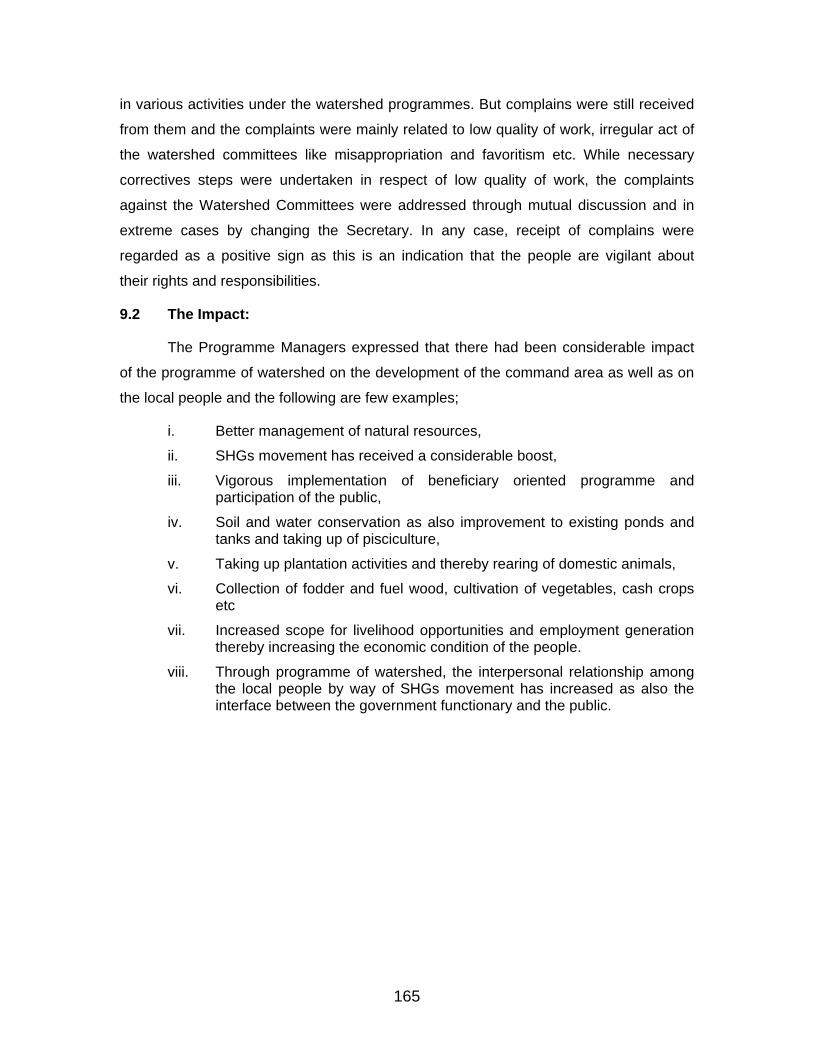
in various activities under the watershed programmes. But complains were still received
from them and the complaints were mainly related to low quality of work, irregular act of
the watershed committees like misappropriation and favoritism etc. While necessary
correctives steps were undertaken in respect of low quality of work, the complaints
against the Watershed Committees were addressed through mutual discussion and in
extreme cases by changing the Secretary. In any case, receipt of complains were
regarded as a positive sign as this is an indication that the people are vigilant about
their rights and responsibilities.
9.2 The Impact:
The Programme Managers expressed that there had been considerable impact
of the programme of watershed on the development of the command area as well as on
the local people and the following are few examples;
i. Better management of natural resources,
ii. SHGs movement has received a considerable boost,
iii. Vigorous implementation of beneficiary oriented programme and participation of the public,
iv. Soil and water conservation as also improvement to existing ponds and tanks and taking up of pisciculture,
v. Taking up plantation activities and thereby rearing of domestic animals,
vi. Collection of fodder and fuel wood, cultivation of vegetables, cash crops etc
vii. Increased scope for livelihood opportunities and employment generation thereby increasing the economic condition of the people.
viii. Through programme of watershed, the interpersonal relationship among the local people by way of SHGs movement has increased as also the interface between the government functionary and the public.
165
SECTION – 7
RURAL CONNECTIVITY PROGRAMME IN KBK DISTRICTS UNDER RLTAP
1. The Sample Bridges:
Construction of bridge projects is necessary for bring all weather connectivity due
to missing road links or else the existing link over nallha and stream is rather unsafe. Out
of construction of the 8 sample bridges, in case of 6 sites there was no link at all, for
which communication through out the year was not possible except summer and winter.
In regard to the rest two sample bridges, there were no road links to the bridge.
However, the existing links were unsafe masonry bridges. Further details on these
sample bridge projects is presented below vide Table No: 4.7.1.
Table No: 4.7.1 Details about the Sites and the Sample Bridges.
Financial Progress (lakh Rs.) Sl. No
Sample Bridge
District ExistingLink
ExecutingAgency Estimate Expr % Expr
Compl eted
(1) (2) (3) (4) (5) (6) (7) (8) (9) 1 SB over
Jamuna Bahal Kalahandi No
Bridge Contractor 37.32 36.02 96.52 No
2
SB over Bileikani
Kalahandi Unsafe Bridge
Contractor 44.50 44.50 100 Yes
3 HL Bridge at Biriguda
Koraput No Bridge
Contractor 94.92 94.92 100 Yes
4 Bridge over Daldala Nallah
Koraput Unsafe Bridge
Dept 42.66 42.66 100 Yes
5 Bridge over Palliguda
Koraput No Bridge
Dept 106.45 106.45 100 Yes
6 HL Bridge over Sundar
Nuapada No Bridge
Contractor 120.59 120.59 100 Yes
7 Ganeshpur Bridge
Subarnap-ur No Bridge
Contractor 40.92 40.92 100 Yes
8 SB over Bijepur
Subarnap-ur No Bridge
Contractor 45.22 45.22 100 Yes
Total 8 6 + 2 2 + 6 532.58 531.28 99.76 7
Even though the sites were selected and plan estimates were prepared by
departmental authorities, construction of 6 sample bridges were entrusted to private
party contractors and 2 were executed departmentally. It was good that 7 (88 per cent)
out of the 8 sample bridges were completed and put to operation. In one case (i.e. the
sub-merge bridge over Jamuna Bahal), in Kalahandi district, the construction was
delayed due to stagnation of water on the site. It was a double crop area and there was
166
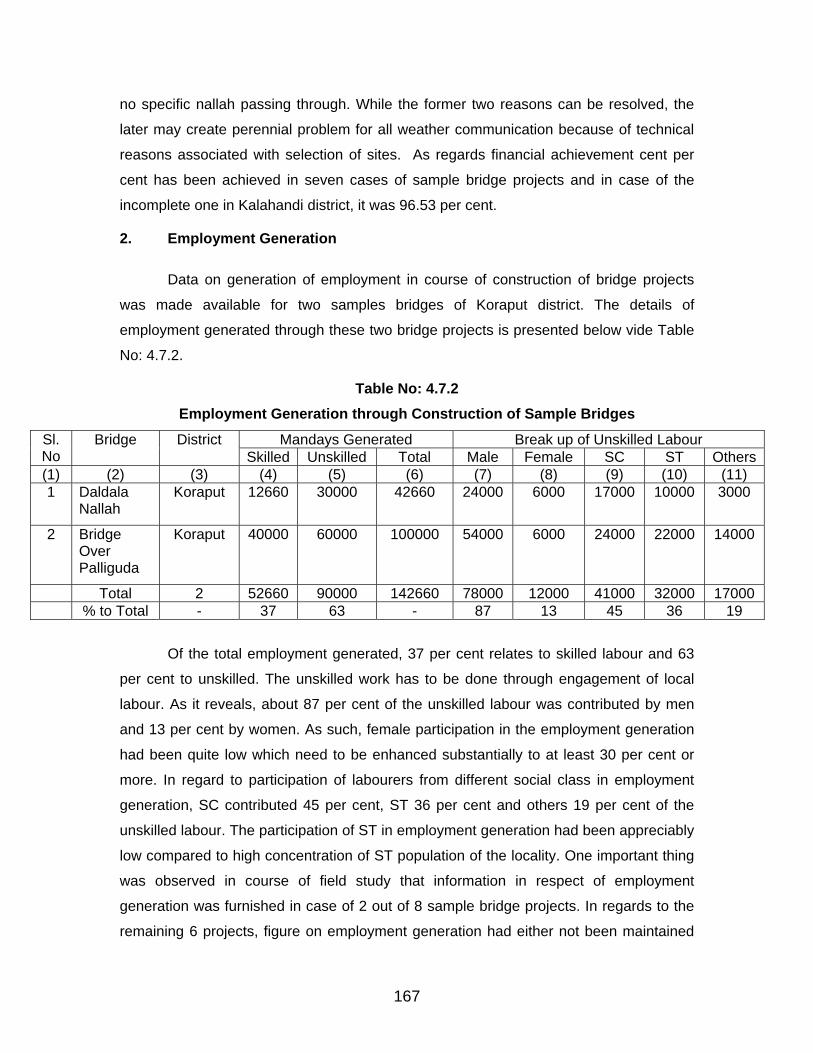
no specific nallah passing through. While the former two reasons can be resolved, the
later may create perennial problem for all weather communication because of technical
reasons associated with selection of sites. As regards financial achievement cent per
cent has been achieved in seven cases of sample bridge projects and in case of the
incomplete one in Kalahandi district, it was 96.53 per cent.
2. Employment Generation
Data on generation of employment in course of construction of bridge projects
was made available for two samples bridges of Koraput district. The details of
employment generated through these two bridge projects is presented below vide Table
No: 4.7.2.
Table No: 4.7.2 Employment Generation through Construction of Sample Bridges
Mandays Generated Break up of Unskilled Labour Sl.No
Bridge District Skilled Unskilled Total Male Female SC ST Others
(1) (2) (3) (4) (5) (6) (7) (8) (9) (10) (11) 1 Daldala
Nallah Koraput 12660 30000 42660 24000 6000 17000 10000 3000
2 Bridge Over Palliguda
Koraput 40000 60000 100000 54000 6000 24000 22000 14000
Total 2 52660 90000 142660 78000 12000 41000 32000 17000 % to Total - 37 63 - 87 13 45 36 19
Of the total employment generated, 37 per cent relates to skilled labour and 63
per cent to unskilled. The unskilled work has to be done through engagement of local
labour. As it reveals, about 87 per cent of the unskilled labour was contributed by men
and 13 per cent by women. As such, female participation in the employment generation
had been quite low which need to be enhanced substantially to at least 30 per cent or
more. In regard to participation of labourers from different social class in employment
generation, SC contributed 45 per cent, ST 36 per cent and others 19 per cent of the
unskilled labour. The participation of ST in employment generation had been appreciably
low compared to high concentration of ST population of the locality. One important thing
was observed in course of field study that information in respect of employment
generation was furnished in case of 2 out of 8 sample bridge projects. In regards to the
remaining 6 projects, figure on employment generation had either not been maintained
167
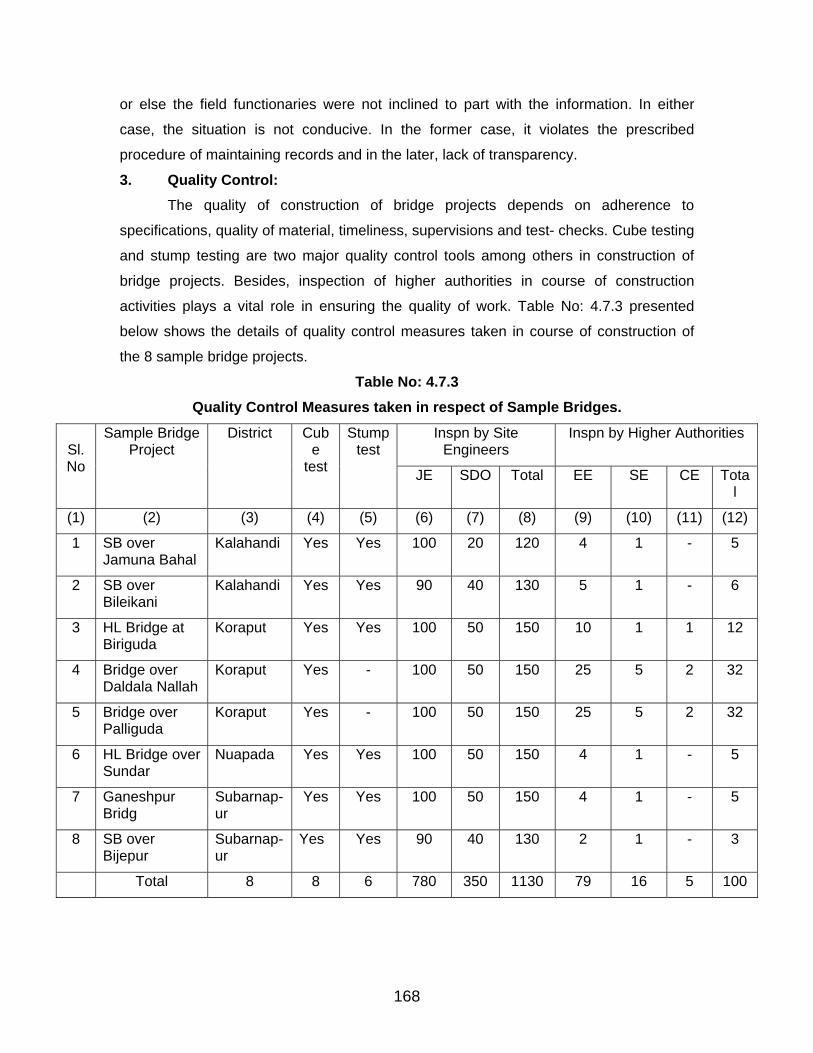
or else the field functionaries were not inclined to part with the information. In either
case, the situation is not conducive. In the former case, it violates the prescribed
procedure of maintaining records and in the later, lack of transparency.
3. Quality Control: The quality of construction of bridge projects depends on adherence to
specifications, quality of material, timeliness, supervisions and test- checks. Cube testing
and stump testing are two major quality control tools among others in construction of
bridge projects. Besides, inspection of higher authorities in course of construction
activities plays a vital role in ensuring the quality of work. Table No: 4.7.3 presented
below shows the details of quality control measures taken in course of construction of
the 8 sample bridge projects.
Table No: 4.7.3 Quality Control Measures taken in respect of Sample Bridges.
Inspn by Site Engineers
Inspn by Higher Authorities Sl.No
Sample Bridge Project
District Cube
test
Stumptest
JE SDO Total EE SE CE Total
(1) (2) (3) (4) (5) (6) (7) (8) (9) (10) (11) (12)
1 SB over Jamuna Bahal
Kalahandi Yes Yes 100 20 120 4 1 - 5
2 SB over Bileikani
Kalahandi Yes Yes 90 40 130 5 1 - 6
3 HL Bridge at Biriguda
Koraput Yes Yes 100 50 150 10 1 1 12
4 Bridge over Daldala Nallah
Koraput Yes - 100 50 150 25 5 2 32
5 Bridge over Palliguda
Koraput Yes - 100 50 150 25 5 2 32
6 HL Bridge over Sundar
Nuapada Yes Yes 100 50 150 4 1 - 5
7 Ganeshpur Bridg
Subarnap-ur
Yes Yes 100 50 150 4 1 - 5
8 SB over Bijepur
Subarnap-ur
Yes Yes 90 40 130 2 1 - 3
Total 8 8 6 780 350 1130 79 16 5 100
168
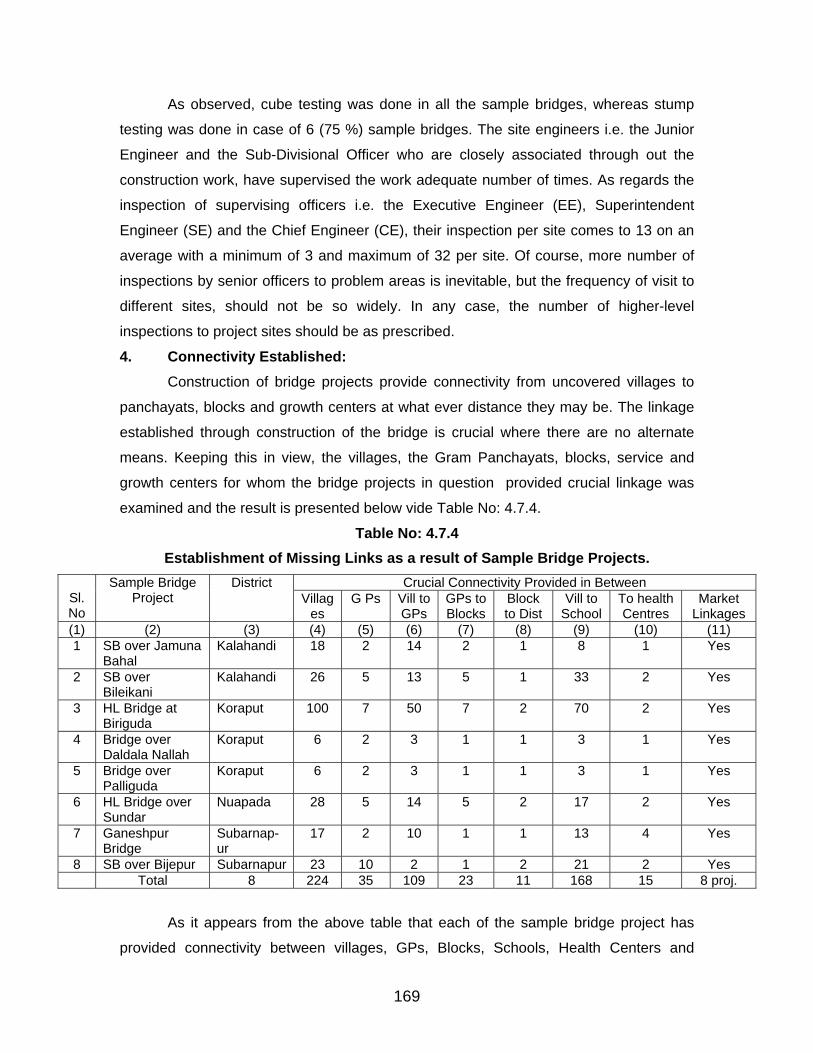
As observed, cube testing was done in all the sample bridges, whereas stump
testing was done in case of 6 (75 %) sample bridges. The site engineers i.e. the Junior
Engineer and the Sub-Divisional Officer who are closely associated through out the
construction work, have supervised the work adequate number of times. As regards the
inspection of supervising officers i.e. the Executive Engineer (EE), Superintendent
Engineer (SE) and the Chief Engineer (CE), their inspection per site comes to 13 on an
average with a minimum of 3 and maximum of 32 per site. Of course, more number of
inspections by senior officers to problem areas is inevitable, but the frequency of visit to
different sites, should not be so widely. In any case, the number of higher-level
inspections to project sites should be as prescribed.
4. Connectivity Established: Construction of bridge projects provide connectivity from uncovered villages to
panchayats, blocks and growth centers at what ever distance they may be. The linkage
established through construction of the bridge is crucial where there are no alternate
means. Keeping this in view, the villages, the Gram Panchayats, blocks, service and
growth centers for whom the bridge projects in question provided crucial linkage was
examined and the result is presented below vide Table No: 4.7.4.
Table No: 4.7.4 Establishment of Missing Links as a result of Sample Bridge Projects.
Crucial Connectivity Provided in Between Sl.No
Sample Bridge Project
District Villag
es G Ps Vill to
GPs GPs to Blocks
Block to Dist
Vill to School
To health Centres
Market Linkages
(1) (2) (3) (4) (5) (6) (7) (8) (9) (10) (11) 1 SB over Jamuna
Bahal Kalahandi 18 2 14 2 1 8 1 Yes
2 SB over Bileikani
Kalahandi 26 5 13 5 1 33 2 Yes
3 HL Bridge at Biriguda
Koraput 100 7 50 7 2 70 2 Yes
4 Bridge over Daldala Nallah
Koraput 6 2 3 1 1 3 1 Yes
5 Bridge over Palliguda
Koraput 6 2 3 1 1 3 1 Yes
6 HL Bridge over Sundar
Nuapada 28 5 14 5 2 17 2 Yes
7 Ganeshpur Bridge
Subarnap-ur
17 2 10 1 1 13 4 Yes
8 SB over Bijepur Subarnapur 23 10 2 1 2 21 2 Yes Total 8 224 35 109 23 11 168 15 8 proj.
As it appears from the above table that each of the sample bridge project has
provided connectivity between villages, GPs, Blocks, Schools, Health Centers and
169
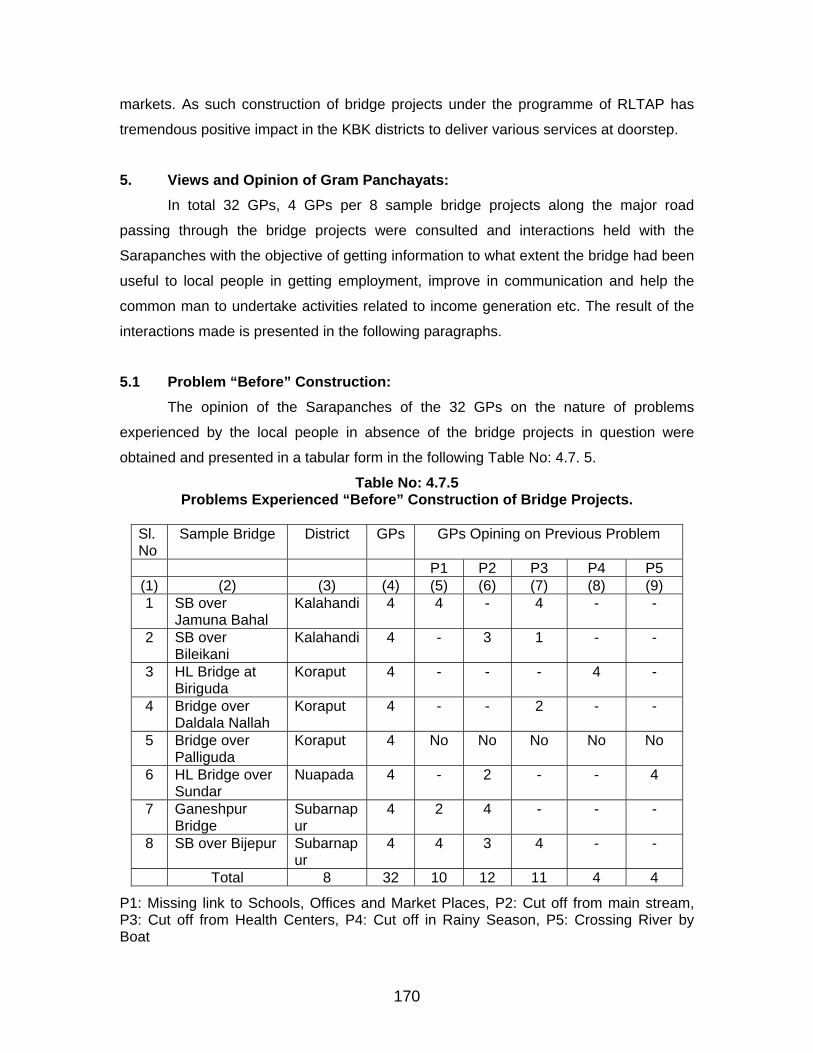
markets. As such construction of bridge projects under the programme of RLTAP has
tremendous positive impact in the KBK districts to deliver various services at doorstep.
5. Views and Opinion of Gram Panchayats:
In total 32 GPs, 4 GPs per 8 sample bridge projects along the major road
passing through the bridge projects were consulted and interactions held with the
Sarapanches with the objective of getting information to what extent the bridge had been
useful to local people in getting employment, improve in communication and help the
common man to undertake activities related to income generation etc. The result of the
interactions made is presented in the following paragraphs.
5.1 Problem “Before” Construction:
The opinion of the Sarapanches of the 32 GPs on the nature of problems
experienced by the local people in absence of the bridge projects in question were
obtained and presented in a tabular form in the following Table No: 4.7. 5.
Table No: 4.7.5 Problems Experienced “Before” Construction of Bridge Projects.
Sl.No
Sample Bridge District GPs GPs Opining on Previous Problem
P1 P2 P3 P4 P5 (1) (2) (3) (4) (5) (6) (7) (8) (9) 1 SB over
Jamuna Bahal Kalahandi 4 4 - 4 - -
2 SB over Bileikani
Kalahandi 4 - 3 1 - -
3 HL Bridge at Biriguda
Koraput 4 - - - 4 -
4 Bridge over Daldala Nallah
Koraput 4 - - 2 - -
5 Bridge over Palliguda
Koraput 4 No No No No No
6 HL Bridge over Sundar
Nuapada 4 - 2 - - 4
7 Ganeshpur Bridge
Subarnapur
4 2 4 - - -
8 SB over Bijepur Subarnapur
4 4 3 4 - -
Total 8 32 10 12 11 4 4
P1: Missing link to Schools, Offices and Market Places, P2: Cut off from main stream, P3: Cut off from Health Centers, P4: Cut off in Rainy Season, P5: Crossing River by Boat
170
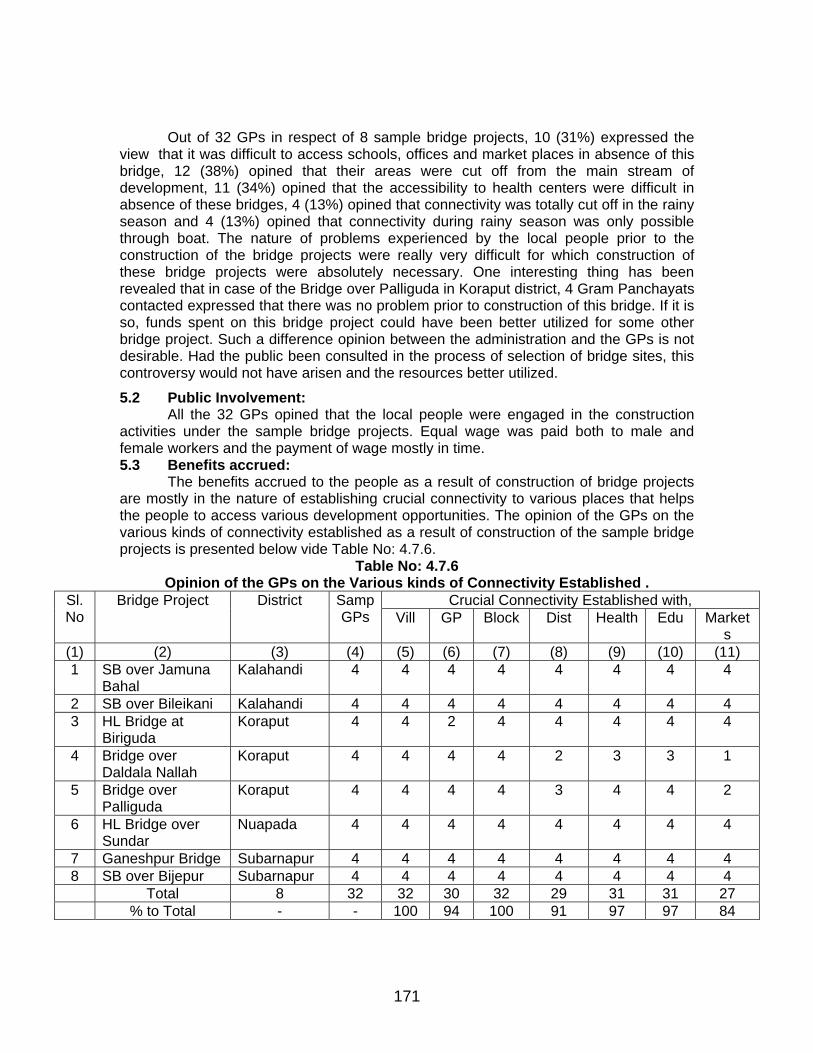
Out of 32 GPs in respect of 8 sample bridge projects, 10 (31%) expressed the view that it was difficult to access schools, offices and market places in absence of this bridge, 12 (38%) opined that their areas were cut off from the main stream of development, 11 (34%) opined that the accessibility to health centers were difficult in absence of these bridges, 4 (13%) opined that connectivity was totally cut off in the rainy season and 4 (13%) opined that connectivity during rainy season was only possible through boat. The nature of problems experienced by the local people prior to the construction of the bridge projects were really very difficult for which construction of these bridge projects were absolutely necessary. One interesting thing has been revealed that in case of the Bridge over Palliguda in Koraput district, 4 Gram Panchayats contacted expressed that there was no problem prior to construction of this bridge. If it is so, funds spent on this bridge project could have been better utilized for some other bridge project. Such a difference opinion between the administration and the GPs is not desirable. Had the public been consulted in the process of selection of bridge sites, this controversy would not have arisen and the resources better utilized.
5.2 Public Involvement: All the 32 GPs opined that the local people were engaged in the construction
activities under the sample bridge projects. Equal wage was paid both to male and female workers and the payment of wage mostly in time. 5.3 Benefits accrued:
The benefits accrued to the people as a result of construction of bridge projects are mostly in the nature of establishing crucial connectivity to various places that helps the people to access various development opportunities. The opinion of the GPs on the various kinds of connectivity established as a result of construction of the sample bridge projects is presented below vide Table No: 4.7.6.
Table No: 4.7.6 Opinion of the GPs on the Various kinds of Connectivity Established .
Crucial Connectivity Established with, Sl.No
Bridge Project District SampGPs Vill GP Block Dist Health Edu Market
s (1) (2) (3) (4) (5) (6) (7) (8) (9) (10) (11) 1 SB over Jamuna
Bahal Kalahandi 4 4 4 4 4 4 4 4
2 SB over Bileikani Kalahandi 4 4 4 4 4 4 4 4 3 HL Bridge at
Biriguda Koraput 4 4 2 4 4 4 4 4
4 Bridge over Daldala Nallah
Koraput 4 4 4 4 2 3 3 1
5 Bridge over Palliguda
Koraput 4 4 4 4 3 4 4 2
6 HL Bridge over Sundar
Nuapada 4 4 4 4 4 4 4 4
7 Ganeshpur Bridge Subarnapur 4 4 4 4 4 4 4 4 8 SB over Bijepur Subarnapur 4 4 4 4 4 4 4 4 Total 8 32 32 30 32 29 31 31 27 % to Total - - 100 94 100 91 97 97 84
171
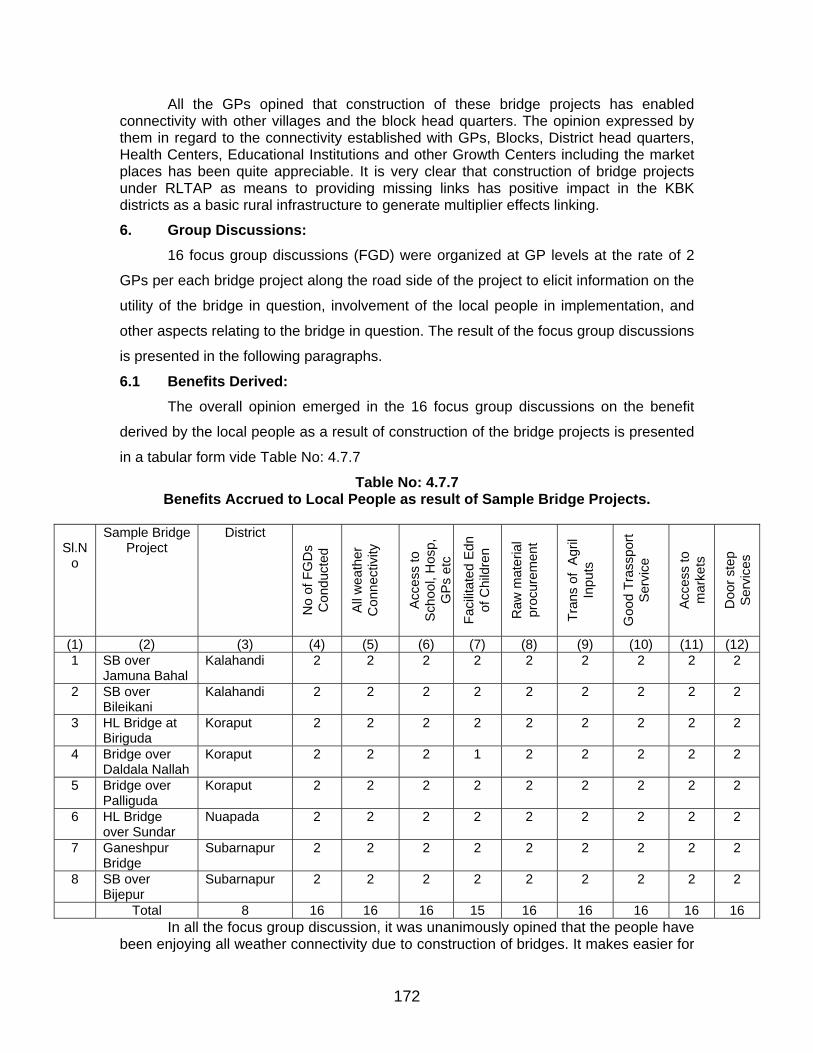
All the GPs opined that construction of these bridge projects has enabled connectivity with other villages and the block head quarters. The opinion expressed by them in regard to the connectivity established with GPs, Blocks, District head quarters, Health Centers, Educational Institutions and other Growth Centers including the market places has been quite appreciable. It is very clear that construction of bridge projects under RLTAP as means to providing missing links has positive impact in the KBK districts as a basic rural infrastructure to generate multiplier effects linking.
6. Group Discussions: 16 focus group discussions (FGD) were organized at GP levels at the rate of 2
GPs per each bridge project along the road side of the project to elicit information on the
utility of the bridge in question, involvement of the local people in implementation, and
other aspects relating to the bridge in question. The result of the focus group discussions
is presented in the following paragraphs.
6.1 Benefits Derived: The overall opinion emerged in the 16 focus group discussions on the benefit
derived by the local people as a result of construction of the bridge projects is presented
in a tabular form vide Table No: 4.7.7
Table No: 4.7.7 Benefits Accrued to Local People as result of Sample Bridge Projects.
Sl.No
Sample Bridge Project
District
No
of F
GD
s C
ondu
cted
All
wea
ther
C
onne
ctiv
ity
Acce
ss to
S
choo
l, H
osp,
G
Ps e
tc
Faci
litat
ed E
dn
of C
hild
ren
Raw
mat
eria
l pr
ocur
emen
t
Tran
s of
Agr
il In
puts
Goo
d Tr
assp
ort
Ser
vice
Acce
ss to
m
arke
ts
Doo
r ste
p Se
rvic
es
(1) (2) (3) (4) (5) (6) (7) (8) (9) (10) (11) (12) 1 SB over
Jamuna Bahal Kalahandi 2 2 2 2 2 2 2 2 2
2 SB over Bileikani
Kalahandi 2 2 2 2 2 2 2 2 2
3 HL Bridge at Biriguda
Koraput 2 2 2 2 2 2 2 2 2
4 Bridge over Daldala Nallah
Koraput 2 2 2 1 2 2 2 2 2
5 Bridge over Palliguda
Koraput 2 2 2 2 2 2 2 2 2
6 HL Bridge over Sundar
Nuapada 2 2 2 2 2 2 2 2 2
7 Ganeshpur Bridge
Subarnapur 2 2 2 2 2 2 2 2 2
8 SB over Bijepur
Subarnapur 2 2 2 2 2 2 2 2 2
Total 8 16 16 16 15 16 16 16 16 16 In all the focus group discussion, it was unanimously opined that the people have
been enjoying all weather connectivity due to construction of bridges. It makes easier for
172
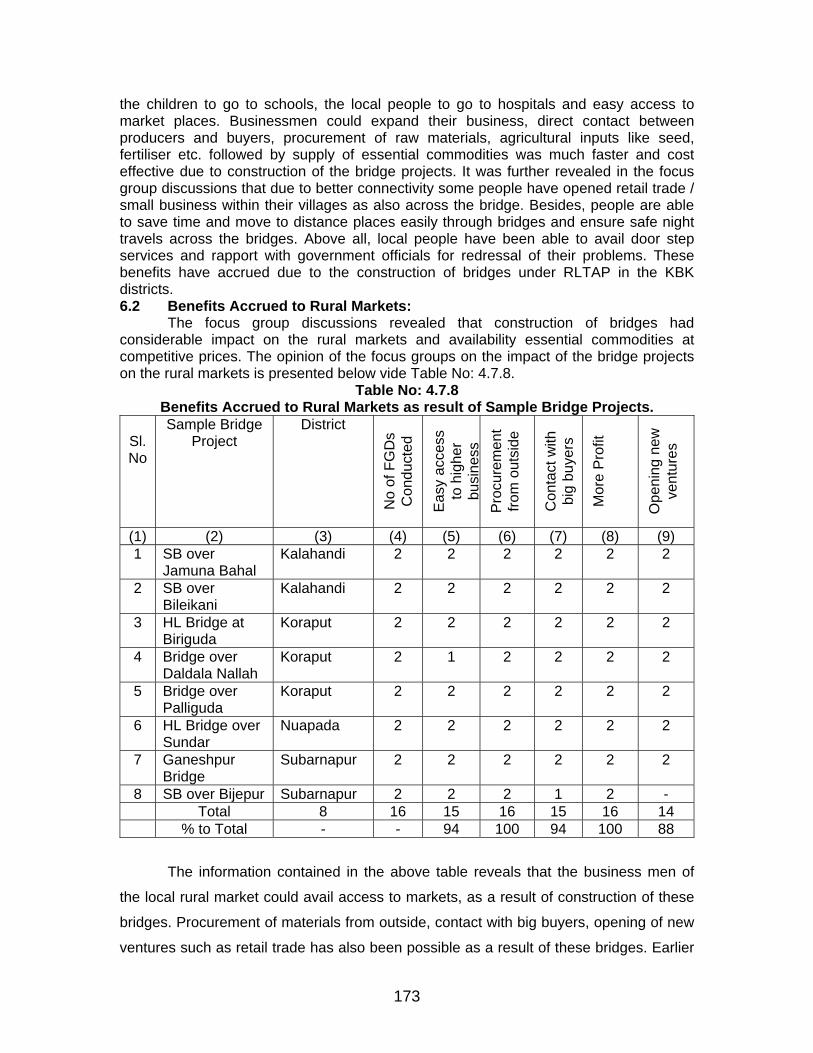
the children to go to schools, the local people to go to hospitals and easy access to market places. Businessmen could expand their business, direct contact between producers and buyers, procurement of raw materials, agricultural inputs like seed, fertiliser etc. followed by supply of essential commodities was much faster and cost effective due to construction of the bridge projects. It was further revealed in the focus group discussions that due to better connectivity some people have opened retail trade / small business within their villages as also across the bridge. Besides, people are able to save time and move to distance places easily through bridges and ensure safe night travels across the bridges. Above all, local people have been able to avail door step services and rapport with government officials for redressal of their problems. These benefits have accrued due to the construction of bridges under RLTAP in the KBK districts. 6.2 Benefits Accrued to Rural Markets:
The focus group discussions revealed that construction of bridges had considerable impact on the rural markets and availability essential commodities at competitive prices. The opinion of the focus groups on the impact of the bridge projects on the rural markets is presented below vide Table No: 4.7.8.
Table No: 4.7.8 Benefits Accrued to Rural Markets as result of Sample Bridge Projects.
Sl.No
Sample Bridge Project
District
No
of F
GD
s C
ondu
cted
Eas
y ac
cess
to
hig
her
busi
ness
P
rocu
rem
ent
from
out
side
Con
tact
with
bi
g bu
yers
Mor
e P
rofit
Ope
ning
new
ve
ntur
es
(1) (2) (3) (4) (5) (6) (7) (8) (9) 1 SB over
Jamuna Bahal Kalahandi 2 2 2 2 2 2
2 SB over Bileikani
Kalahandi 2 2 2 2 2 2
3 HL Bridge at Biriguda
Koraput 2 2 2 2 2 2
4 Bridge over Daldala Nallah
Koraput 2 1 2 2 2 2
5 Bridge over Palliguda
Koraput 2 2 2 2 2 2
6 HL Bridge over Sundar
Nuapada 2 2 2 2 2 2
7 Ganeshpur Bridge
Subarnapur 2 2 2 2 2 2
8 SB over Bijepur Subarnapur 2 2 2 1 2 - Total 8 16 15 16 15 16 14 % to Total - - 94 100 94 100 88
The information contained in the above table reveals that the business men of
the local rural market could avail access to markets, as a result of construction of these
bridges. Procurement of materials from outside, contact with big buyers, opening of new
ventures such as retail trade has also been possible as a result of these bridges. Earlier
173
the producers were carrying their products to the buyers or to market places. The
situation has been changed; the buyers are now coming to pickup his ware produce at
market prices.
7. Opinion of Programme Managers: As per the available reports a total of 54 bridge projects were sanctioned under
the programme of RLTAP in KBK districts of which 4, i.e., 76% are located in the sample
districts i.e. Kalahandi-12, Koraput-16, Nuapada-6 and Subarnapur-7. The bridge
projects of all these 4 sample districts sanctioned under RLTAP have been completed
except 2 in Koraput district as per the reports received from the Executive Engineers.
Rural Works Divisions of the districts are in overall charge of execution of rural bridge
projects. The delay in completion of bridge project in Koraput district is due to
cancellation of previous tenders and finalisation of fresh one.
7.1 Quality Control Measures: In regard to the quality control measures, all Executive Engineers of the 4 sample
districts expressed that cube testing and stump testing has invariably done in case of all
bridge projects. They are all satisfied on the quality of material used and adherence to
specifications of the projects in question. Besides, the time schedule for completion of
the bridge projects was more or less adhered to in all cases. The public cooperation in
all cases had been good and thus not received any complaints in implementation of the
bridge projects.
8. Overall Impression: As per the opinion expressed by the Gram Panchayats, the focus group and the
programme managers, the programme of Rural Connectivity by way of providing all
weather road communication for the villages through construction of bridge projects
under the programme of RLTAP in the KBK districts has had positive impact on the way
of life of the local people due to the improvement in the accessibility.
174
SECTION – 8
RURAL WATER SUPPLY PROGRAMME IN KBK DISTRICTS
1. Location of Sample Projects:
The location of 50 sample tube wells, 12 sample sanitary wells and 8 sample
piped water supply projects as far as they are supposed to provide service to the
potential beneficiaries is presented vide Annexure-4.8.1. As it is seen from the said
annexure, 56 per cent of the tube wells have been installed within the habitations and
the remaining 44 per cent at the end of habitations. In the case of sanitary wells, 83 per
cent are located within the habitation and the remaining 17 per cent at the boundary of
habitations. Installation of tube wells and sanitary wells on the borders of habitation
becomes imperative due to the locational advantages, availability of space and
discharge of waste water through drain. Installation of water source at the end of a
village becomes necessary when some points have already been located within the
habitation. However, in case of piped water supply projects, location of the projects is
usually outside villages as the project has to provide water to more than one village. In
regard to potential beneficiaries, the average number of potential beneficiaries per tube
well is 167 and 151 in case of sanitary wells which is more or less well within the norm
prescribed for KBK districts. But in case of Kalahandi, one tube well has been installed
for a population of 258 on an average which is quite high as compared to the prescribed
norm of 150 for the KBK region. In case of piped water supply projects, the average
number of people served per project is 2009 and there may not be any problem in
providing water to them through the piped water supply projects.
2. Features of Sample Tube Wells:
As many as 50 sample tube wells were examined under the study 49 (98%) of
which were found complete as on the date of survey. However, all the 50 points were in
operation, the details of which is presented below vide Table No: 4.8.1.
175
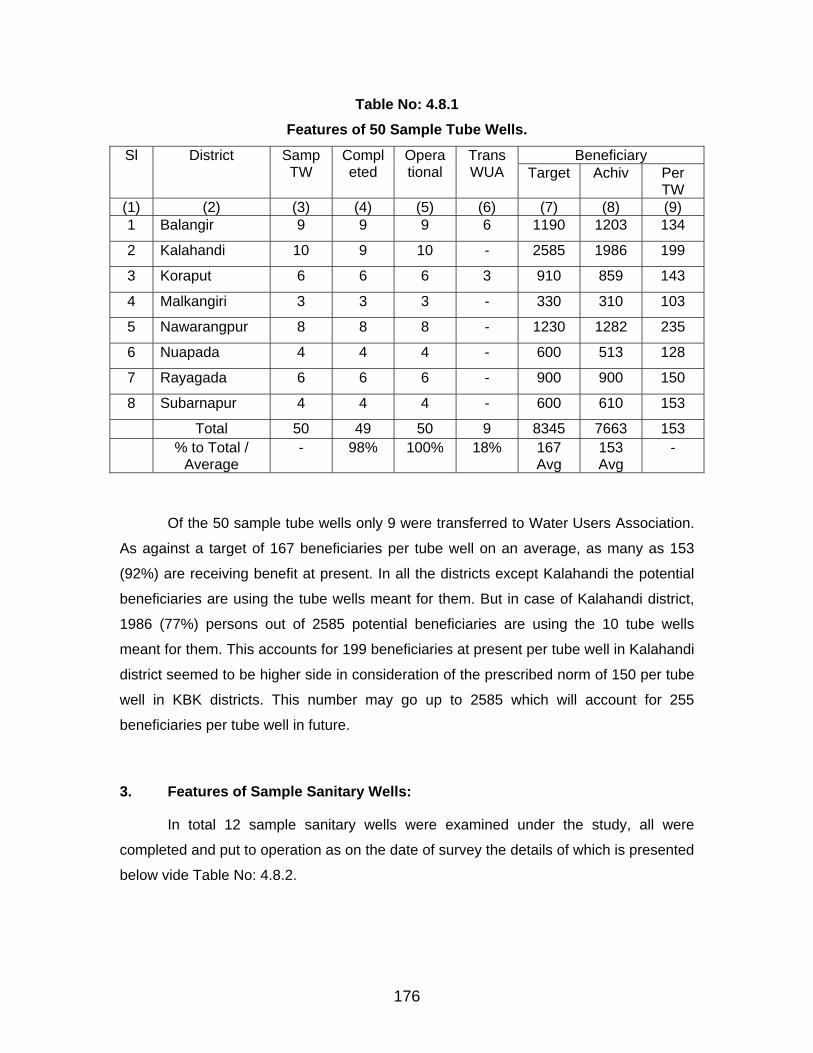
Table No: 4.8.1 Features of 50 Sample Tube Wells.
Beneficiary Sl District Samp TW
Operational
Trans WUA Target Achiv Per
TW
Completed
(1) (2) (3) (4) (5) (6) (7) (8) (9) 1 Balangir 9 9 9 6 1190 1203 134
2 Kalahandi 10 9 10 - 2585 1986 199
3 Koraput 6 6 6 3 910 859 143
4 Malkangiri 3 3 3 - 330 310 103
5 Nawarangpur 8 8 8 - 1230 1282 235
6 Nuapada 4 4 4 - 600 513 128
7 Rayagada 6 6 6 - 900 900 150
8 Subarnapur 4 4 4 - 600 610 153
Total 50 49 50 9 8345 7663 153 % to Total /
Average - 98% 100% 18% 167
Avg 153 Avg
-
Of the 50 sample tube wells only 9 were transferred to Water Users Association.
As against a target of 167 beneficiaries per tube well on an average, as many as 153
(92%) are receiving benefit at present. In all the districts except Kalahandi the potential
beneficiaries are using the tube wells meant for them. But in case of Kalahandi district,
1986 (77%) persons out of 2585 potential beneficiaries are using the 10 tube wells
meant for them. This accounts for 199 beneficiaries at present per tube well in Kalahandi
district seemed to be higher side in consideration of the prescribed norm of 150 per tube
well in KBK districts. This number may go up to 2585 which will account for 255
beneficiaries per tube well in future.
3. Features of Sample Sanitary Wells:
In total 12 sample sanitary wells were examined under the study, all were
completed and put to operation as on the date of survey the details of which is presented
below vide Table No: 4.8.2.
176
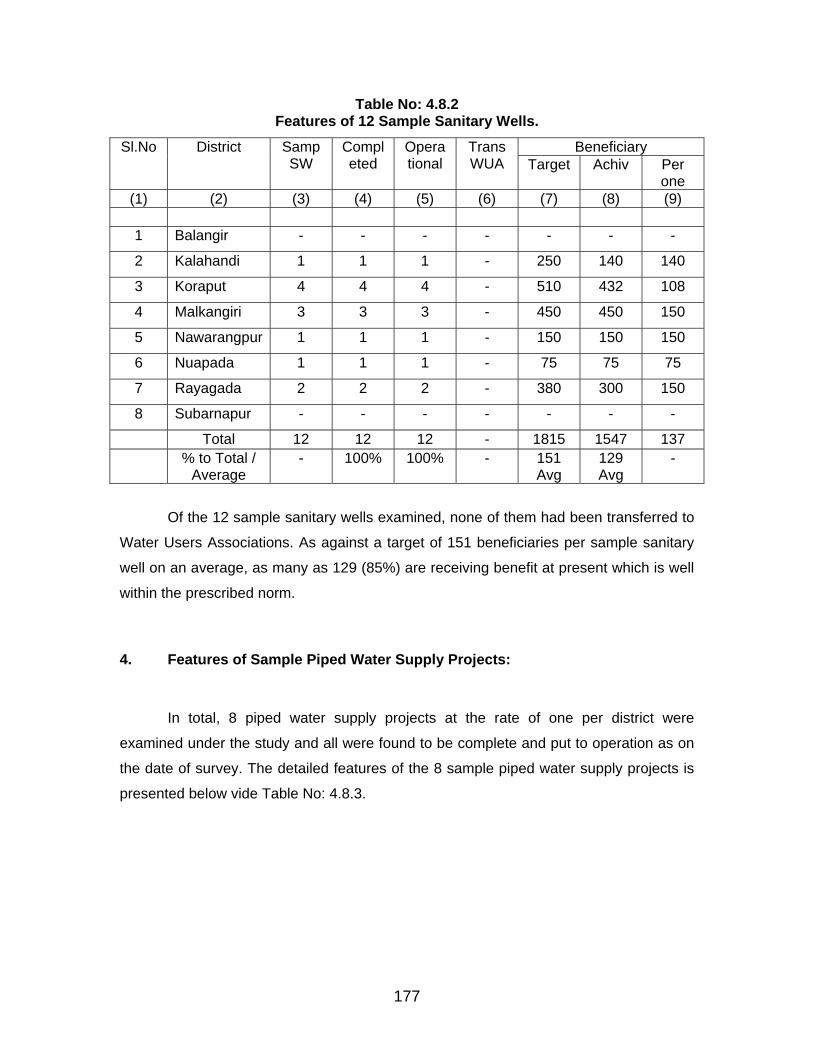
Table No: 4.8.2 Features of 12 Sample Sanitary Wells.
Beneficiary Sl.No District Samp SW
Completed
Operational
Trans WUA Target Achiv Per
one (1) (2) (3) (4) (5) (6) (7) (8) (9)
1 Balangir - - - - - - -
2 Kalahandi 1 1 1 - 250 140 140
3 Koraput 4 4 4 - 510 432 108
4 Malkangiri 3 3 3 - 450 450 150
5 Nawarangpur 1 1 1 - 150 150 150
6 Nuapada 1 1 1 - 75 75 75
7 Rayagada 2 2 2 - 380 300 150
8 Subarnapur - - - - - - -
Total 12 12 12 - 1815 1547 137 % to Total /
Average - 100% 100% - 151
Avg 129 Avg
-
Of the 12 sample sanitary wells examined, none of them had been transferred to
Water Users Associations. As against a target of 151 beneficiaries per sample sanitary
well on an average, as many as 129 (85%) are receiving benefit at present which is well
within the prescribed norm.
4. Features of Sample Piped Water Supply Projects:
In total, 8 piped water supply projects at the rate of one per district were
examined under the study and all were found to be complete and put to operation as on
the date of survey. The detailed features of the 8 sample piped water supply projects is
presented below vide Table No: 4.8.3.
177
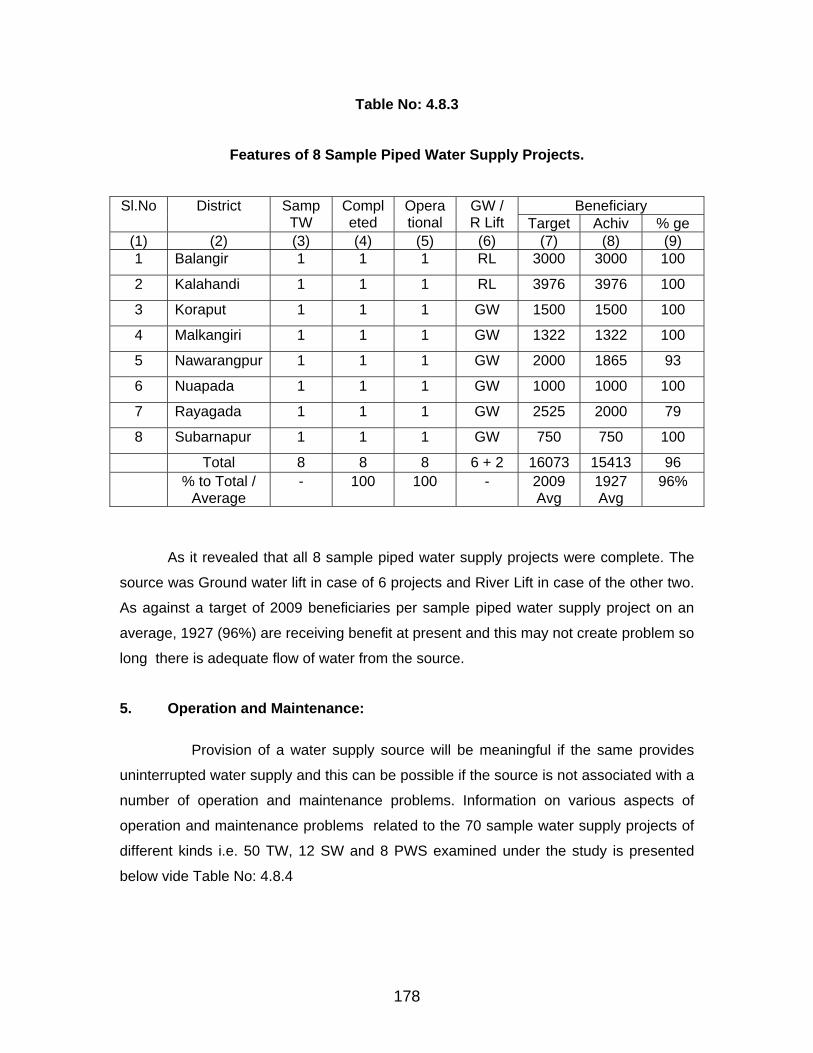
Table No: 4.8.3
Features of 8 Sample Piped Water Supply Projects.
Beneficiary Sl.No District Samp TW
Completed
Operational
GW / R Lift Target Achiv % ge
(1) (2) (3) (4) (5) (6) (7) (8) (9) 1 Balangir 1 1 1 RL 3000 3000 100
2 Kalahandi 1 1 1 RL 3976 3976 100
3 Koraput 1 1 1 GW 1500 1500 100
4 Malkangiri 1 1 1 GW 1322 1322 100
5 Nawarangpur 1 1 1 GW 2000 1865 93
6 Nuapada 1 1 1 GW 1000 1000 100
7 Rayagada 1 1 1 GW 2525 2000 79
8 Subarnapur 1 1 1 GW 750 750 100
Total 8 8 8 6 + 2 16073 15413 96 % to Total /
Average - 100 100 - 2009
Avg 1927 Avg
96%
As it revealed that all 8 sample piped water supply projects were complete. The
source was Ground water lift in case of 6 projects and River Lift in case of the other two.
As against a target of 2009 beneficiaries per sample piped water supply project on an
average, 1927 (96%) are receiving benefit at present and this may not create problem so
long there is adequate flow of water from the source.
5. Operation and Maintenance:
Provision of a water supply source will be meaningful if the same provides
uninterrupted water supply and this can be possible if the source is not associated with a
number of operation and maintenance problems. Information on various aspects of
operation and maintenance problems related to the 70 sample water supply projects of
different kinds i.e. 50 TW, 12 SW and 8 PWS examined under the study is presented
below vide Table No: 4.8.4
178
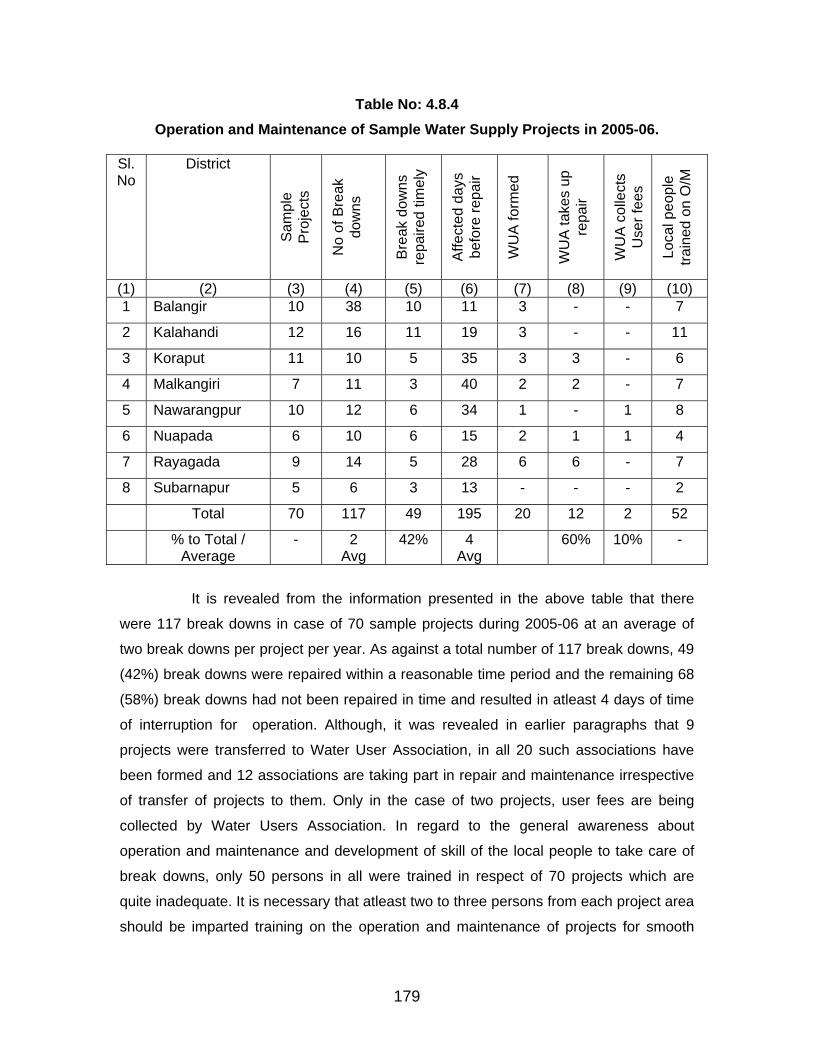
Table No: 4.8.4 Operation and Maintenance of Sample Water Supply Projects in 2005-06.
Sl.No
District
Sam
ple
Pro
ject
s
No
of B
reak
do
wns
Bre
ak d
owns
re
paire
d tim
ely
Affe
cted
day
s be
fore
repa
ir
WU
A fo
rmed
WU
A ta
kes
up
repa
ir
WU
A c
olle
cts
Use
r fee
s
Loca
l peo
ple
train
ed o
n O
/M
(1) (2) (3) (4) (5) (6) (7) (8) (9) (10) 1 Balangir 10 38 10 11 3 - - 7
2 Kalahandi 12 16 11 19 3 - - 11
3 Koraput 11 10 5 35 3 3 - 6
4 Malkangiri 7 11 3 40 2 2 - 7
5 Nawarangpur 10 12 6 34 1 - 1 8
6 Nuapada 6 10 6 15 2 1 1 4
7 Rayagada 9 14 5 28 6 6 - 7
8 Subarnapur 5 6 3 13 - - - 2
Total 70 117 49 195 20 12 2 52
% to Total / Average
- 2 Avg
42% 4 Avg
60% 10% -
It is revealed from the information presented in the above table that there
were 117 break downs in case of 70 sample projects during 2005-06 at an average of
two break downs per project per year. As against a total number of 117 break downs, 49
(42%) break downs were repaired within a reasonable time period and the remaining 68
(58%) break downs had not been repaired in time and resulted in atleast 4 days of time
of interruption for operation. Although, it was revealed in earlier paragraphs that 9
projects were transferred to Water User Association, in all 20 such associations have
been formed and 12 associations are taking part in repair and maintenance irrespective
of transfer of projects to them. Only in the case of two projects, user fees are being
collected by Water Users Association. In regard to the general awareness about
operation and maintenance and development of skill of the local people to take care of
break downs, only 50 persons in all were trained in respect of 70 projects which are
quite inadequate. It is necessary that atleast two to three persons from each project area
should be imparted training on the operation and maintenance of projects for smooth
179
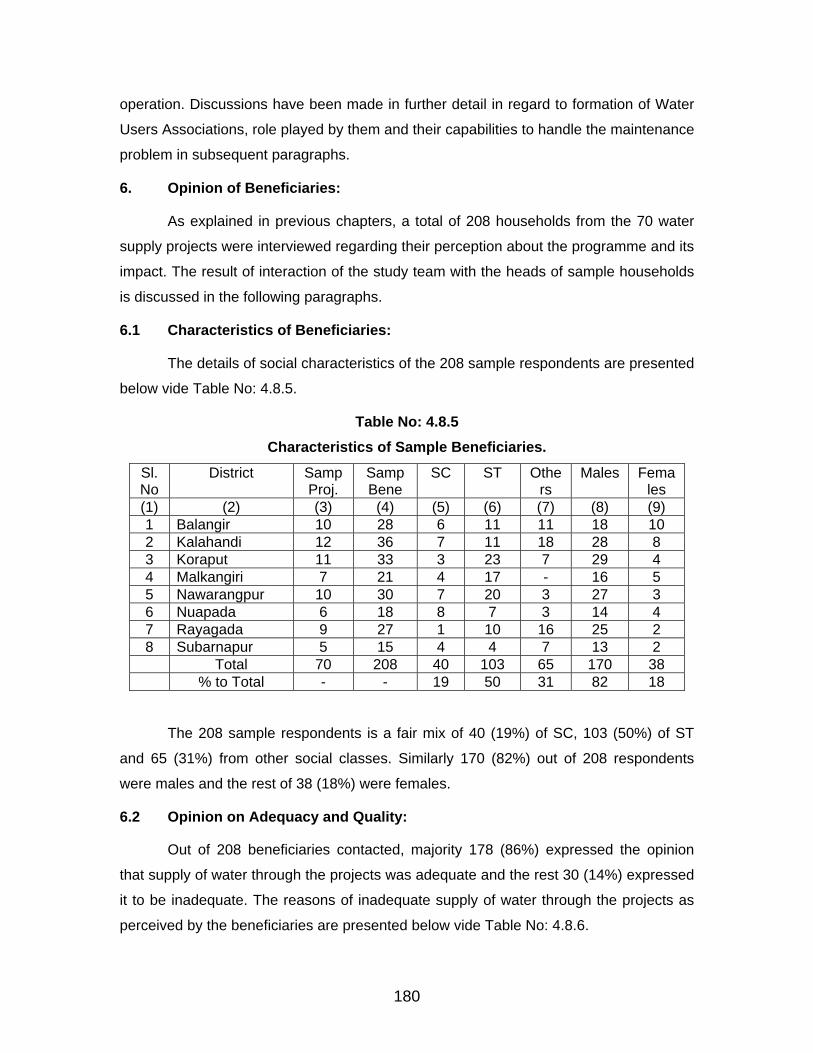
operation. Discussions have been made in further detail in regard to formation of Water
Users Associations, role played by them and their capabilities to handle the maintenance
problem in subsequent paragraphs.
6. Opinion of Beneficiaries:
As explained in previous chapters, a total of 208 households from the 70 water
supply projects were interviewed regarding their perception about the programme and its
impact. The result of interaction of the study team with the heads of sample households
is discussed in the following paragraphs.
6.1 Characteristics of Beneficiaries:
The details of social characteristics of the 208 sample respondents are presented
below vide Table No: 4.8.5.
Table No: 4.8.5 Characteristics of Sample Beneficiaries.
Sl.No
District SampProj.
Samp Bene
SC ST Others
Males Females
(1) (2) (3) (4) (5) (6) (7) (8) (9) 1 Balangir 10 28 6 11 11 18 10 2 Kalahandi 12 36 7 11 18 28 8 3 Koraput 11 33 3 23 7 29 4 4 Malkangiri 7 21 4 17 - 16 5 5 Nawarangpur 10 30 7 20 3 27 3 6 Nuapada 6 18 8 7 3 14 4 7 Rayagada 9 27 1 10 16 25 2 8 Subarnapur 5 15 4 4 7 13 2 Total 70 208 40 103 65 170 38 % to Total - - 19 50 31 82 18
The 208 sample respondents is a fair mix of 40 (19%) of SC, 103 (50%) of ST
and 65 (31%) from other social classes. Similarly 170 (82%) out of 208 respondents
were males and the rest of 38 (18%) were females.
6.2 Opinion on Adequacy and Quality:
Out of 208 beneficiaries contacted, majority 178 (86%) expressed the opinion
that supply of water through the projects was adequate and the rest 30 (14%) expressed
it to be inadequate. The reasons of inadequate supply of water through the projects as
perceived by the beneficiaries are presented below vide Table No: 4.8.6.
180
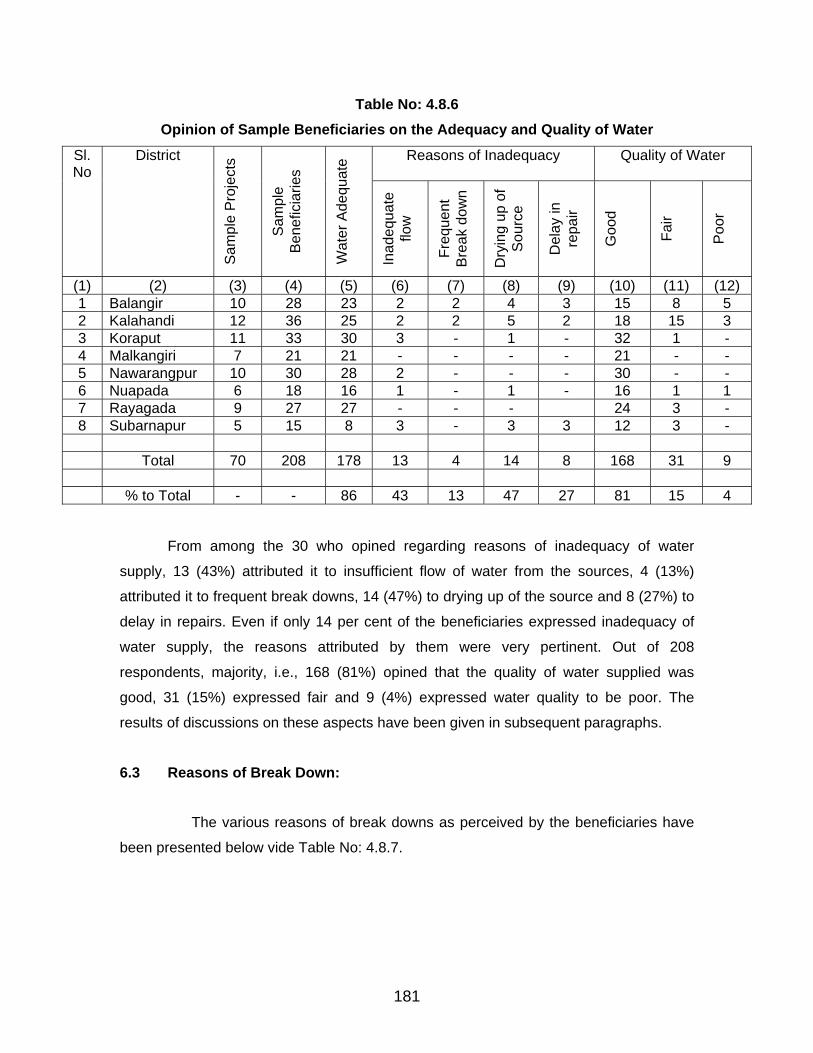
Table No: 4.8.6 Opinion of Sample Beneficiaries on the Adequacy and Quality of Water
Reasons of Inadequacy Quality of Water Sl.No
District
Sam
ple
Pro
ject
s
Sam
ple
Ben
efic
iarie
s
Wat
er A
dequ
ate
Inad
equa
te
flow
Freq
uent
B
reak
dow
n
Dry
ing
up o
f S
ourc
e
Del
ay in
re
pair
Goo
d
Fair
Poo
r
(1) (2) (3) (4) (5) (6) (7) (8) (9) (10) (11) (12) 1 Balangir 10 28 23 2 2 4 3 15 8 5 2 Kalahandi 12 36 25 2 2 5 2 18 15 3 3 Koraput 11 33 30 3 - 1 - 32 1 - 4 Malkangiri 7 21 21 - - - - 21 - - 5 Nawarangpur 10 30 28 2 - - - 30 - - 6 Nuapada 6 18 16 1 - 1 - 16 1 1 7 Rayagada 9 27 27 - - - 24 3 - 8 Subarnapur 5 15 8 3 - 3 3 12 3 - Total 70 208 178 13 4 14 8 168 31 9 % to Total - - 86 43 13 47 27 81 15 4
From among the 30 who opined regarding reasons of inadequacy of water
supply, 13 (43%) attributed it to insufficient flow of water from the sources, 4 (13%)
attributed it to frequent break downs, 14 (47%) to drying up of the source and 8 (27%) to
delay in repairs. Even if only 14 per cent of the beneficiaries expressed inadequacy of
water supply, the reasons attributed by them were very pertinent. Out of 208
respondents, majority, i.e., 168 (81%) opined that the quality of water supplied was
good, 31 (15%) expressed fair and 9 (4%) expressed water quality to be poor. The
results of discussions on these aspects have been given in subsequent paragraphs.
6.3 Reasons of Break Down:
The various reasons of break downs as perceived by the beneficiaries have
been presented below vide Table No: 4.8.7.
181
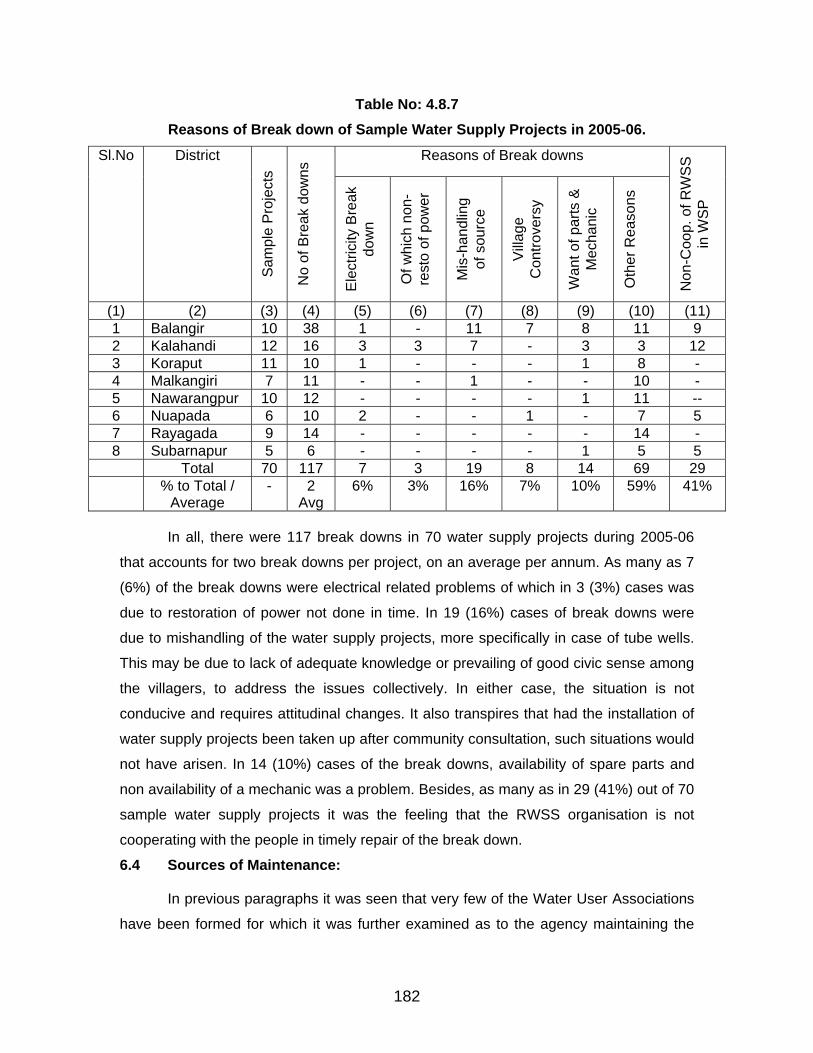
Table No: 4.8.7 Reasons of Break down of Sample Water Supply Projects in 2005-06.
Reasons of Break downs Sl.No District
Sam
ple
Pro
ject
s
No
of B
reak
dow
ns
Ele
ctric
ity B
reak
do
wn
Of w
hich
non
-re
sto
of p
ower
Mis
-han
dlin
g of
sou
rce
Vill
age
Con
trove
rsy
Wan
t of p
arts
&
Mec
hani
c
Oth
er R
easo
ns
Non
-Coo
p. o
f RW
SS
in
WS
P
(1) (2) (3) (4) (5) (6) (7) (8) (9) (10) (11) 1 Balangir 10 38 1 - 11 7 8 11 9 2 Kalahandi 12 16 3 3 7 - 3 3 12 3 Koraput 11 10 1 - - - 1 8 - 4 Malkangiri 7 11 - - 1 - - 10 - 5 Nawarangpur 10 12 - - - - 1 11 -- 6 Nuapada 6 10 2 - - 1 - 7 5 7 Rayagada 9 14 - - - - - 14 - 8 Subarnapur 5 6 - - - - 1 5 5 Total 70 117 7 3 19 8 14 69 29 % to Total /
Average - 2
Avg 6% 3% 16% 7% 10% 59% 41%
In all, there were 117 break downs in 70 water supply projects during 2005-06
that accounts for two break downs per project, on an average per annum. As many as 7
(6%) of the break downs were electrical related problems of which in 3 (3%) cases was
due to restoration of power not done in time. In 19 (16%) cases of break downs were
due to mishandling of the water supply projects, more specifically in case of tube wells.
This may be due to lack of adequate knowledge or prevailing of good civic sense among
the villagers, to address the issues collectively. In either case, the situation is not
conducive and requires attitudinal changes. It also transpires that had the installation of
water supply projects been taken up after community consultation, such situations would
not have arisen. In 14 (10%) cases of the break downs, availability of spare parts and
non availability of a mechanic was a problem. Besides, as many as in 29 (41%) out of 70
sample water supply projects it was the feeling that the RWSS organisation is not
cooperating with the people in timely repair of the break down.
6.4 Sources of Maintenance:
In previous paragraphs it was seen that very few of the Water User Associations
have been formed for which it was further examined as to the agency maintaining the
182
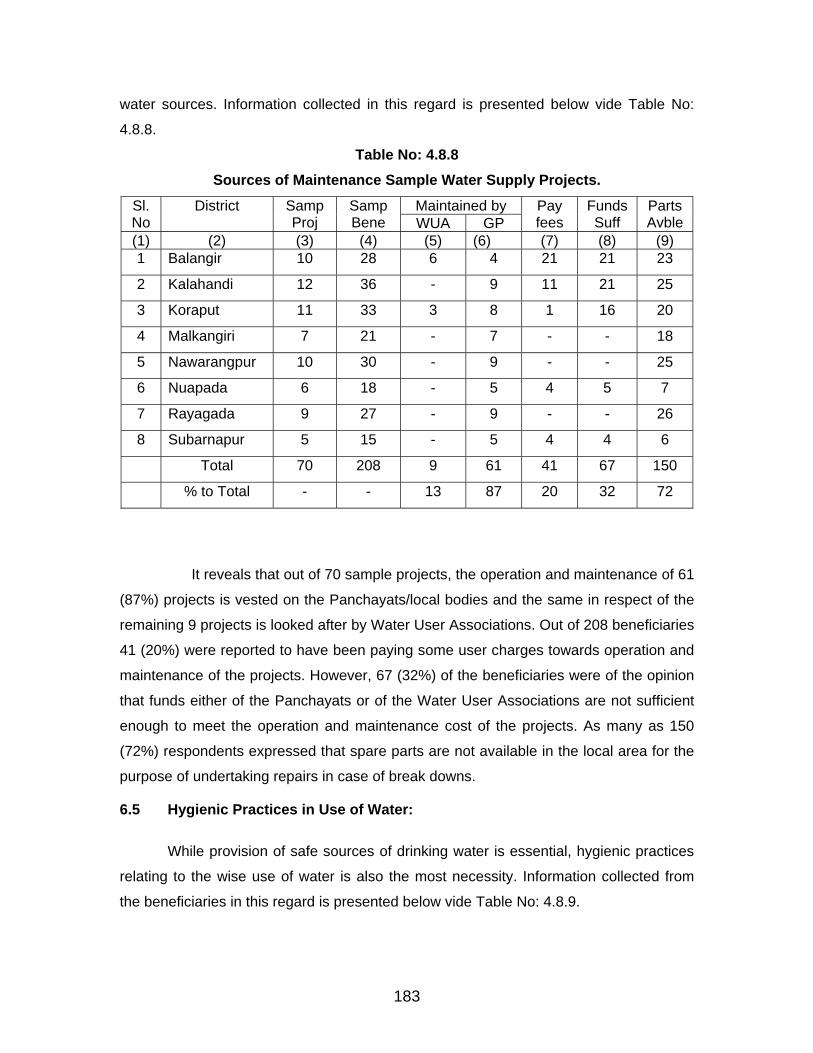
water sources. Information collected in this regard is presented below vide Table No:
4.8.8.
Table No: 4.8.8 Sources of Maintenance Sample Water Supply Projects.
Maintained by Sl.No
District Samp Proj
Samp Bene WUA GP
Pay fees
Funds Suff
PartsAvble
(1) (2) (3) (4) (5) (6) (7) (8) (9) 1 Balangir 10 28 6 4 21 21 23
2 Kalahandi 12 36 - 9 11 21 25
3 Koraput 11 33 3 8 1 16 20
4 Malkangiri 7 21 - 7 - - 18
5 Nawarangpur 10 30 - 9 - - 25
6 Nuapada 6 18 - 5 4 5 7
7 Rayagada 9 27 - 9 - - 26
8 Subarnapur 5 15 - 5 4 4 6
Total 70 208 9 61 41 67 150
% to Total - - 13 87 20 32 72
It reveals that out of 70 sample projects, the operation and maintenance of 61
(87%) projects is vested on the Panchayats/local bodies and the same in respect of the
remaining 9 projects is looked after by Water User Associations. Out of 208 beneficiaries
41 (20%) were reported to have been paying some user charges towards operation and
maintenance of the projects. However, 67 (32%) of the beneficiaries were of the opinion
that funds either of the Panchayats or of the Water User Associations are not sufficient
enough to meet the operation and maintenance cost of the projects. As many as 150
(72%) respondents expressed that spare parts are not available in the local area for the
purpose of undertaking repairs in case of break downs.
6.5 Hygienic Practices in Use of Water:
While provision of safe sources of drinking water is essential, hygienic practices
relating to the wise use of water is also the most necessity. Information collected from
the beneficiaries in this regard is presented below vide Table No: 4.8.9.
183
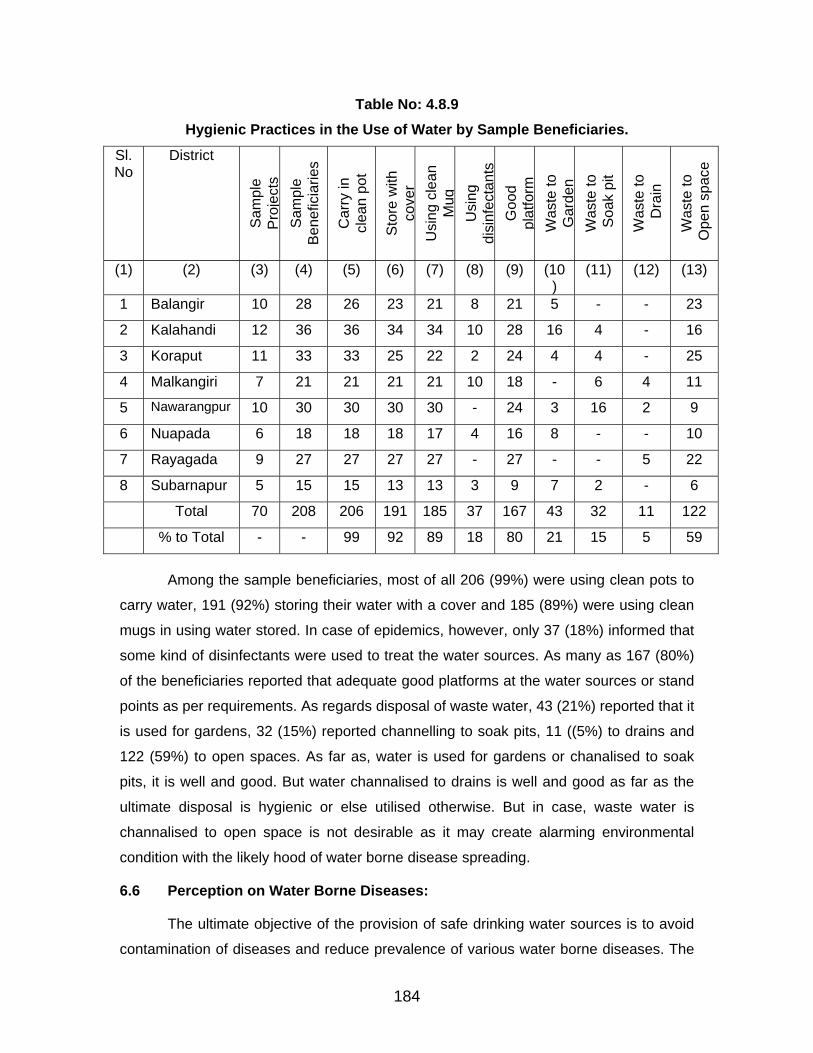
Table No: 4.8.9 Hygienic Practices in the Use of Water by Sample Beneficiaries.
Sl.No
District
Sam
ple
Pro
ject
s S
ampl
e B
enef
icia
ries
Car
ry in
cl
ean
pot
Sto
re w
ith
cove
r U
sing
cle
an
Mug
U
sing
di
sinf
ecta
nts
Goo
d pl
atfo
rm
Was
te to
G
arde
n W
aste
to
Soa
k pi
t
Was
te to
D
rain
Was
te to
O
pen
spac
e
(1) (2) (3) (4) (5) (6) (7) (8) (9) (10)
(11) (12) (13)
1 Balangir 10 28 26 23 21 8 21 5 - - 23
2 Kalahandi 12 36 36 34 34 10 28 16 4 - 16
3 Koraput 11 33 33 25 22 2 24 4 4 - 25
4 Malkangiri 7 21 21 21 21 10 18 - 6 4 11
5 Nawarangpur 10 30 30 30 30 - 24 3 16 2 9
6 Nuapada 6 18 18 18 17 4 16 8 - - 10
7 Rayagada 9 27 27 27 27 - 27 - - 5 22
8 Subarnapur 5 15 15 13 13 3 9 7 2 - 6
Total 70 208 206 191 185 37 167 43 32 11 122
% to Total - - 99 92 89 18 80 21 15 5 59
Among the sample beneficiaries, most of all 206 (99%) were using clean pots to
carry water, 191 (92%) storing their water with a cover and 185 (89%) were using clean
mugs in using water stored. In case of epidemics, however, only 37 (18%) informed that
some kind of disinfectants were used to treat the water sources. As many as 167 (80%)
of the beneficiaries reported that adequate good platforms at the water sources or stand
points as per requirements. As regards disposal of waste water, 43 (21%) reported that it
is used for gardens, 32 (15%) reported channelling to soak pits, 11 ((5%) to drains and
122 (59%) to open spaces. As far as, water is used for gardens or chanalised to soak
pits, it is well and good. But water channalised to drains is well and good as far as the
ultimate disposal is hygienic or else utilised otherwise. But in case, waste water is
channalised to open space is not desirable as it may create alarming environmental
condition with the likely hood of water borne disease spreading.
6.6 Perception on Water Borne Diseases:
The ultimate objective of the provision of safe drinking water sources is to avoid
contamination of diseases and reduce prevalence of various water borne diseases. The
184
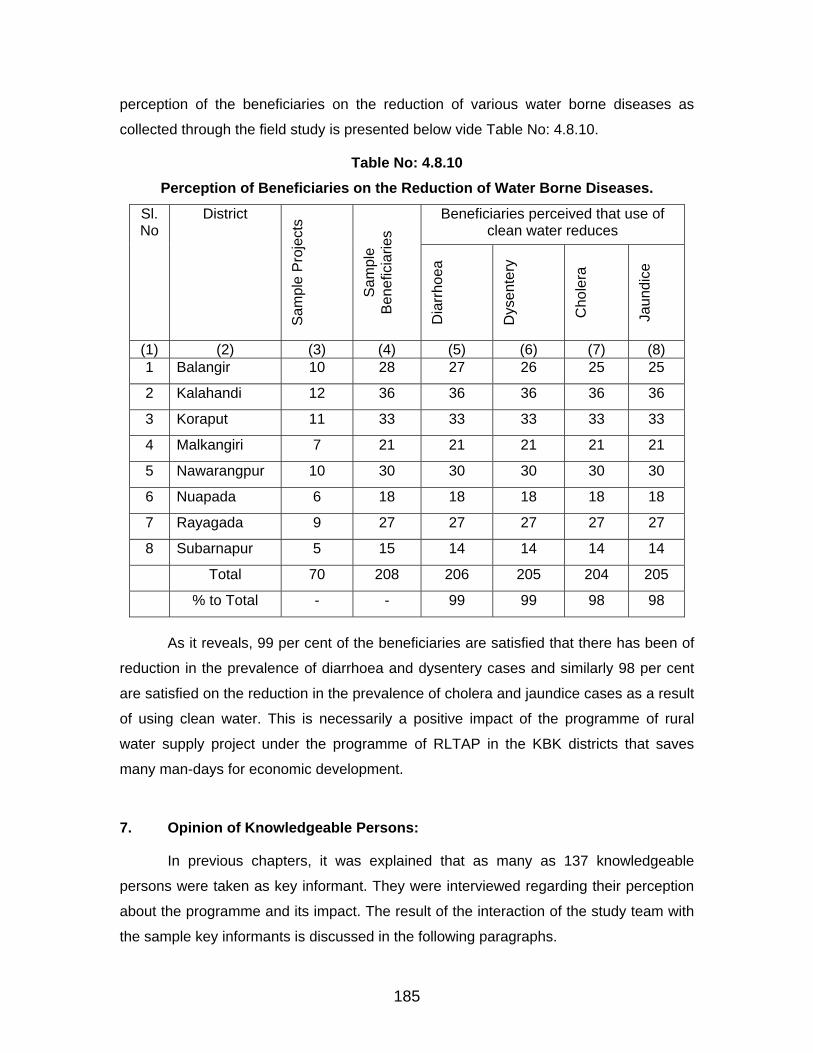
perception of the beneficiaries on the reduction of various water borne diseases as
collected through the field study is presented below vide Table No: 4.8.10.
Table No: 4.8.10 Perception of Beneficiaries on the Reduction of Water Borne Diseases.
Beneficiaries perceived that use of clean water reduces
Sl.No
District
Sam
ple
Pro
ject
s
Sam
ple
Ben
efic
iarie
s
Dia
rrho
ea
Dys
ente
ry
Cho
lera
Jaun
dice
(1) (2) (3) (4) (5) (6) (7) (8) 1 Balangir 10 28 27 26 25 25
2 Kalahandi 12 36 36 36 36 36
3 Koraput 11 33 33 33 33 33
4 Malkangiri 7 21 21 21 21 21
5 Nawarangpur 10 30 30 30 30 30
6 Nuapada 6 18 18 18 18 18
7 Rayagada 9 27 27 27 27 27
8 Subarnapur 5 15 14 14 14 14
Total 70 208 206 205 204 205
% to Total - - 99 99 98 98
As it reveals, 99 per cent of the beneficiaries are satisfied that there has been of
reduction in the prevalence of diarrhoea and dysentery cases and similarly 98 per cent
are satisfied on the reduction in the prevalence of cholera and jaundice cases as a result
of using clean water. This is necessarily a positive impact of the programme of rural
water supply project under the programme of RLTAP in the KBK districts that saves
many man-days for economic development.
7. Opinion of Knowledgeable Persons:
In previous chapters, it was explained that as many as 137 knowledgeable
persons were taken as key informant. They were interviewed regarding their perception
about the programme and its impact. The result of the interaction of the study team with
the sample key informants is discussed in the following paragraphs.
185
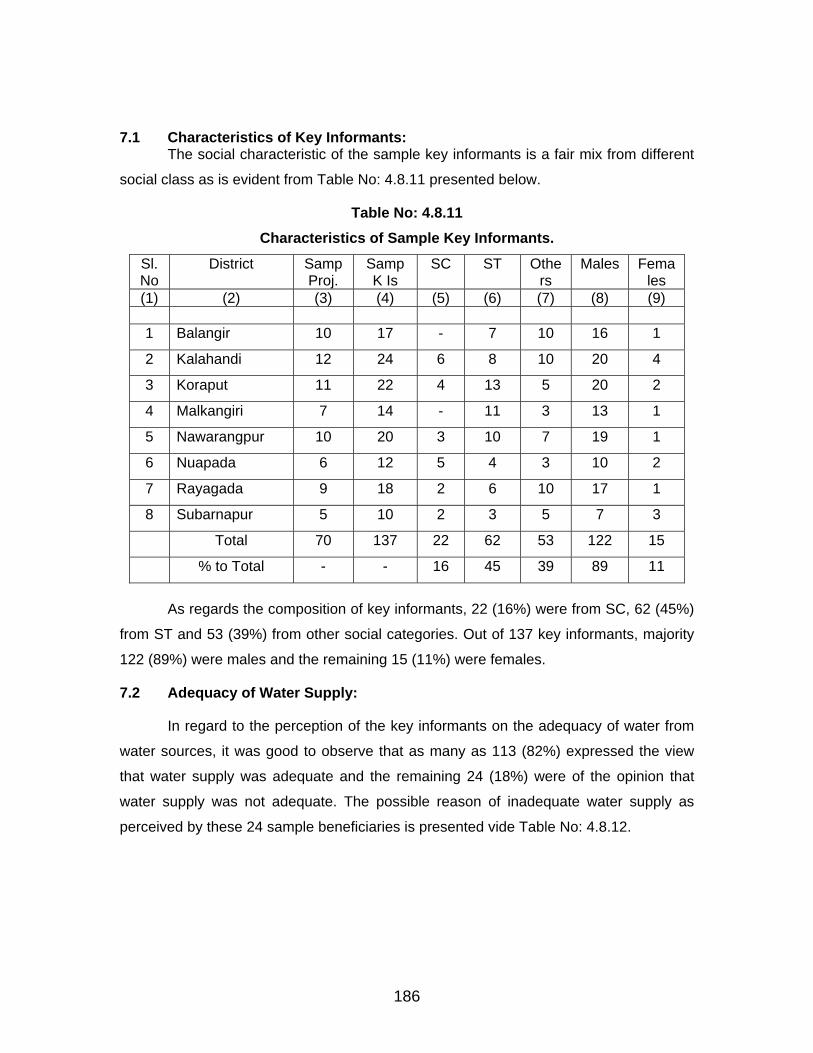
7.1 Characteristics of Key Informants: The social characteristic of the sample key informants is a fair mix from different
social class as is evident from Table No: 4.8.11 presented below.
Table No: 4.8.11 Characteristics of Sample Key Informants.
Sl.No
District SampProj.
Samp K Is
SC ST Others
Males Females
(1) (2) (3) (4) (5) (6) (7) (8) (9)
1 Balangir 10 17 - 7 10 16 1
2 Kalahandi 12 24 6 8 10 20 4
3 Koraput 11 22 4 13 5 20 2
4 Malkangiri 7 14 - 11 3 13 1
5 Nawarangpur 10 20 3 10 7 19 1
6 Nuapada 6 12 5 4 3 10 2
7 Rayagada 9 18 2 6 10 17 1
8 Subarnapur 5 10 2 3 5 7 3
Total 70 137 22 62 53 122 15
% to Total - - 16 45 39 89 11
As regards the composition of key informants, 22 (16%) were from SC, 62 (45%)
from ST and 53 (39%) from other social categories. Out of 137 key informants, majority
122 (89%) were males and the remaining 15 (11%) were females.
7.2 Adequacy of Water Supply:
In regard to the perception of the key informants on the adequacy of water from
water sources, it was good to observe that as many as 113 (82%) expressed the view
that water supply was adequate and the remaining 24 (18%) were of the opinion that
water supply was not adequate. The possible reason of inadequate water supply as
perceived by these 24 sample beneficiaries is presented vide Table No: 4.8.12.
186
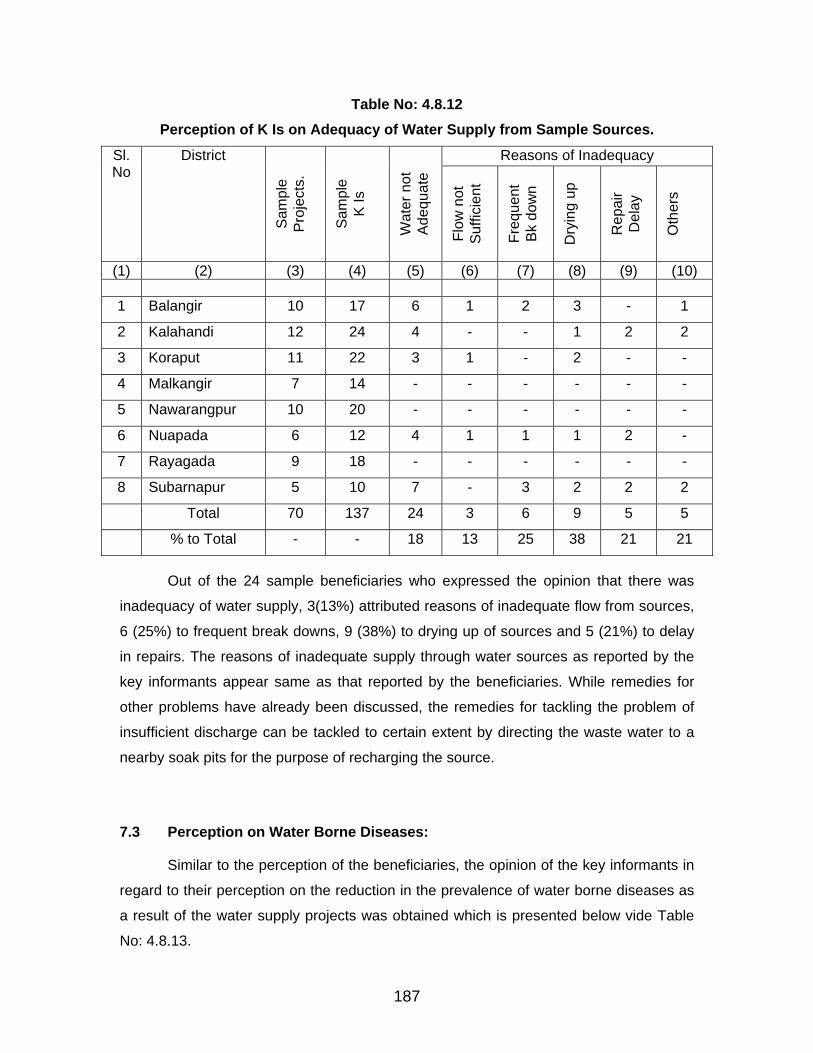
Table No: 4.8.12 Perception of K Is on Adequacy of Water Supply from Sample Sources.
Reasons of Inadequacy Sl.No
District
Sam
ple
Pro
ject
s.
Sam
ple
K Is
Wat
er n
ot
Ade
quat
e
Flow
not
S
uffic
ient
Freq
uent
B
k do
wn
Dry
ing
up
Rep
air
Del
ay
Oth
ers
(1) (2) (3) (4) (5) (6) (7) (8) (9) (10)
1 Balangir 10 17 6 1 2 3 - 1
2 Kalahandi 12 24 4 - - 1 2 2
3 Koraput 11 22 3 1 - 2 - -
4 Malkangir 7 14 - - - - - -
5 Nawarangpur 10 20 - - - - - -
6 Nuapada 6 12 4 1 1 1 2 -
7 Rayagada 9 18 - - - - - -
8 Subarnapur 5 10 7 - 3 2 2 2
Total 70 137 24 3 6 9 5 5
% to Total - - 18 13 25 38 21 21
Out of the 24 sample beneficiaries who expressed the opinion that there was
inadequacy of water supply, 3(13%) attributed reasons of inadequate flow from sources,
6 (25%) to frequent break downs, 9 (38%) to drying up of sources and 5 (21%) to delay
in repairs. The reasons of inadequate supply through water sources as reported by the
key informants appear same as that reported by the beneficiaries. While remedies for
other problems have already been discussed, the remedies for tackling the problem of
insufficient discharge can be tackled to certain extent by directing the waste water to a
nearby soak pits for the purpose of recharging the source.
7.3 Perception on Water Borne Diseases:
Similar to the perception of the beneficiaries, the opinion of the key informants in
regard to their perception on the reduction in the prevalence of water borne diseases as
a result of the water supply projects was obtained which is presented below vide Table
No: 4.8.13.
187
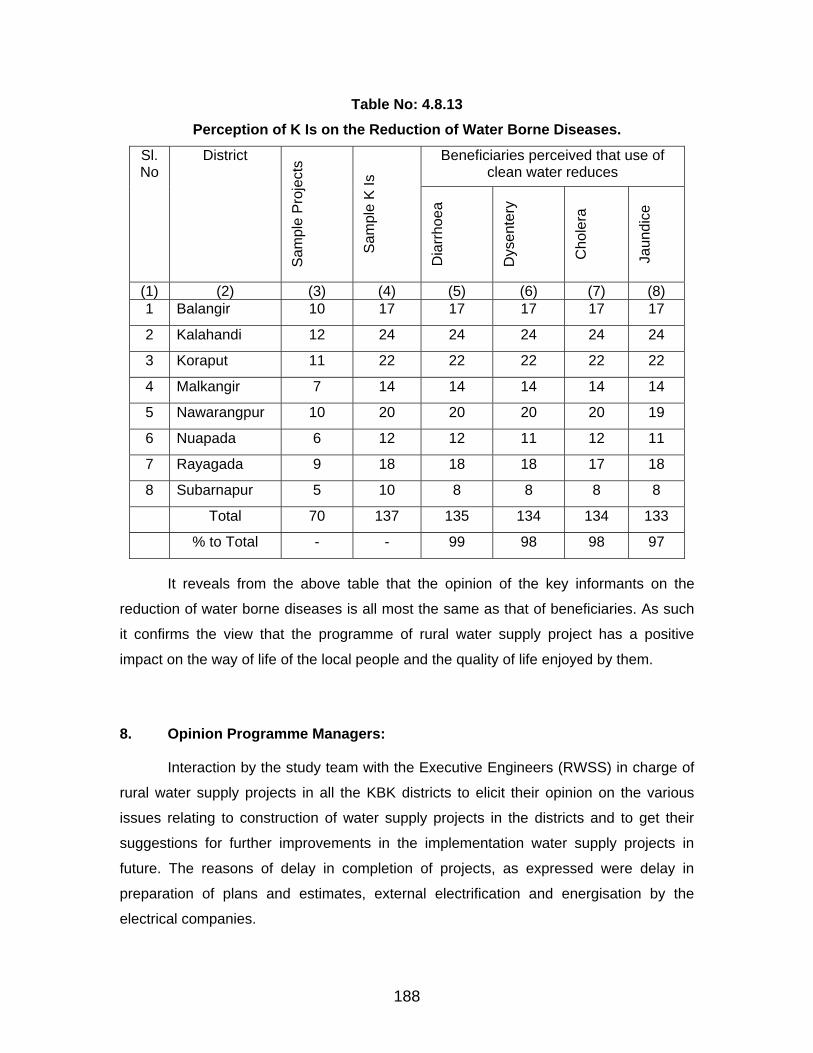
Table No: 4.8.13 Perception of K Is on the Reduction of Water Borne Diseases.
Beneficiaries perceived that use of clean water reduces
Sl.No
District
Sam
ple
Pro
ject
s
Sam
ple
K Is
Dia
rrho
ea
Dys
ente
ry
Cho
lera
Jaun
dice
(1) (2) (3) (4) (5) (6) (7) (8) 1 Balangir 10 17 17 17 17 17
2 Kalahandi 12 24 24 24 24 24
3 Koraput 11 22 22 22 22 22
4 Malkangir 7 14 14 14 14 14
5 Nawarangpur 10 20 20 20 20 19
6 Nuapada 6 12 12 11 12 11
7 Rayagada 9 18 18 18 17 18
8 Subarnapur 5 10 8 8 8 8
Total 70 137 135 134 134 133
% to Total - - 99 98 98 97
It reveals from the above table that the opinion of the key informants on the
reduction of water borne diseases is all most the same as that of beneficiaries. As such
it confirms the view that the programme of rural water supply project has a positive
impact on the way of life of the local people and the quality of life enjoyed by them.
8. Opinion Programme Managers:
Interaction by the study team with the Executive Engineers (RWSS) in charge of
rural water supply projects in all the KBK districts to elicit their opinion on the various
issues relating to construction of water supply projects in the districts and to get their
suggestions for further improvements in the implementation water supply projects in
future. The reasons of delay in completion of projects, as expressed were delay in
preparation of plans and estimates, external electrification and energisation by the
electrical companies.
188
189
8.1 Perception on the Impact:
All the project managers were of the opinion that there has been reduction in
various kinds of water borne diseases and the people are enjoying improved quality of
life due to installation of water supply projects in the KBK districts under the programme
of RLTAP. In regard to reduction in the prevalence of cattle brone diseases, 6 out of 8
programme managers expressed that the impact was positive. The burden on the
women to fetch water from distant places has been lessened and households are getting
more of water for cleaning purposes besides also saving time. This gives an indication
that the programme of rural water supply projects has a positive impact on the quality of
life of the local people.
CHAPTER - V SUMMARY CONCLUSIONS AND RECOMMENDATIONS
The performance of the scheme can be judged by the efficiency of
delivery mechanism and the level of satisfaction of the beneficiaries.
Based on the field visits, and interaction with the field level executing
functionary, selected beneficiaries as the stakeholders, knowledgeable persons of
the locality and also district level officers in overall charge of execution /
implementation of various components of the programme of RLTAP in the KBK
districts, some conclusions have been derived and appropriate recommendations
have been made as a feedback for midcourse correction. The conclusions drawn on
the basis of factual information have almost remained the same on different
occasions. However, the views and opinion expressed by the beneficiaries, key
informants and Programme Managers being qualitative in nature, have varied from
person to person depending on their level of knowledge, perception, appreciation,
and satisfaction level derived from on-going provision of amenity services etc. Their
views and opinion may vary. But these form vital feed back from the point of view for
taking appropriate policy initiatives in future to revise the existing schemes due to
dynamic nature of socio-economic realities, so as to achieve the objectives.
Overall Observation:
The over all observation based on this quick-evaluation study as also the
impact of RLTAP is considerable in KBK area.
In matters of literacy growth rate it is found from the State government's
Report (bases on current data) that if a comparison is made between KBK
districts(past undivided) and non-KBK districts, we find that between 1981-1991 and
1991-2001, over all literacy growth rate in KBK districts has gone up from 47.30 to
73.21 per cent as against 42.53 to 50.96 per cent for non-KBK districts. During the
same period, State’s over all literacy growth rate has gone up from 43.08 per cent to
53.59 per cent. Significant achievement is found in case of female literacy growth
rate which between 1981-91 to 1999-2001 registered an increase from 71.53 per
cent to 115.34 per cent. The same growth rate was quite lower for non-KBK districts
which went up from 62.19 per cent to 70.34 per cent while for the State as a whole
increased from 63.00 per cent to 74.46 per cent. Much of their achievement could be
ascribed to the encouragements given to women education in KBK district through
provision of stipends and setting up of hostels for SCs / STs girls who comprise a
very large chunk in the total population of KBK district.
190
Similarly the benefit of these and other programmes have been reflected in
enrolment in primary and upper primary schools. Enrolment rate in primary schools in
KBK region went up from 75.89 in 1996-97 to 86.44 per cent in 2001-02 and to
107.05 per cent in 2007 respectively against 86.49 per cent to 89.11 per cent to 103
per cent on average for the state as a whole. In Upper primary schools the enrolment
for KBK went down from 56.39 in 1996-97 to 43.83 per cent in 2001-02, but shot up
to 84.99 per cent in 2007-08 as against state average of 59.33, 64.45 and 106.09 per
cent for the same years respectively.
There was remarkable achievement in drop out rate which at primary school
level decreased from 57.13 to 46.20 per cent and to 8.57 for the years 1996-97,
2001-02 and 2007-08 respectively as against the State average decrease being
47.60, 41.00 and 7.76 per cent. At the upper primary level the drop out rate which
was 79.10 per cent in 1996-97, came down to 66.56 per cent in 2001-02 and to 14.82
per cent in 2007-08 as against State average fall being 59.60, 56.00 and 13.58 per
cent respectively.
Thus, the achievement for KBK districts in matters of primary and upper
primary level both in terms of enrolment and drop out rates is very encouraging and
the achievement could be ascribed to the substantial assistance provided to the
ST/SC boys and girls, particularly to girls in terms of hostel for them.
As regards general socio-economic well being, Regional income disparities
within Orissa have narrowed during 2000-05. Comparison of household expenditure
levels in 1999-2000 (NSS 55th round) and 2004-05 (NSS 61st round) shows that per-
capita expenditure increased faster in rural areas (by 12 per cent over five years or
2.3 per cent annually), as compared with urban areas (by 4 per cent, over the period
or 0.8 per cent annually). In rural areas, the most rapid growth was recorded in the
poorest Southern region where per-capita expenditure increased by 25 per cent (4.6
per cent annually), followed by the Coastal region (12 per cent, or 2.3 per cent
annually), and then the Northern region (6 per cent, or 1.2 per cent annually). In
urban areas, per-capita expenditure grew overall by only 4 percent over the five-year
period. Regional distribution of urban expenditure moved in favour of the Northern
region, where per-capita expenditure grew by 14 percent (2.7 per cent annually),
spurred by mineral-based industrial growth and its multiplier effects. KBK districts
from a major chunk of southern and northern districts of Orissa and RLTAP could
have been a major contributor to this encouraging development.
The findings of this quick evaluation have been more or less corroborated by
few of studies conducted by independent agencies like NIRD and few reputed
agencies engaged by the State Government as also by NHRC. While NIRD,
Hyderabad study has found out that RLTAP has been instrumental in increasing both
area under cultivation as also increase in water table through its watershed
programmes. Both area and yield have gone up remarkably in micro watershed
areas and forest coverage has gone up.
Independent organisations have shown increase in fish production and
substantial increase in annual income. Because of provision of drinking water,
distance covered (mostly by women) to fetch drinking water has been reduced to
about 0.5 kms. while male folk now fetch water (which was not so) for domestic
purpose from the supply point (hand pump / stand etc.)
In spite of few shortcomings and lacunae, the RLTAP has been instrumental
in changing the face of KBK region substantially and therefore, require continuance
with quarter vigor on a long-term basis.
The key findings of the quick evaluation study in respect of 8 components
examined and presented below for greater appreciation.
1. Summary Conclusions:
Conclusions drawn in respect of individual components surveyed are
presented below separately component-wise.
1.1 40 SEATED HOSTELS FOR ST / SC GIRLS IN KBK DISTRICTS
1.1.1 Enrolment ratio of girls as compared to 1000 boys in the sample primary schools rose to 1126 which was due to hostel facilities and provision of stipend for SCs and STs girls residing in hostels to bridge all gender and social disparities at the primary stage.
1.1.2 On an average 2-3 (2.7) teachers were available per school with 5 classes and the teacher pupil ratio in 2006-07 was 1:58 as against the norm of 1:40.
1.1.3 Seventy per cent of the teachers and 94 per cent of the hostel superintendents were staying in the vicinity of school premises.
1.1.4 Construction of hostel buildings were faster when executed through contractors and once completed, their operation was faster if executed departmentally.
1.1.5 In cases of 93 per cent hostel buildings, one or more deficiencies were observed. Roof leaking and wall soaking was seen in case of 46 per cent of buildings, toilets damaged in 12 per cent cases, cracks in the building in
17 per cent cases, floors damaged in 24 per cent cases, and doors and windows damaged in 7 per cent buildings.
1.1.6 In 17 per cent of hostels, there was either no electricity or some electrical problems even if electricity connection was there. In 15 per cent of hostels, there was either no boundary wall or damaged beyond repairs.
1.1.7 Annual maintenance of hostel buildings was not being undertaken in 76 per cent of hostel buildings and those in perishable condition required urgent attention.
1.1.8 Amenities were provided to all most all the hostels, but in a partial manner and full stock of the amenities provided were not there as some items were damaged or thoroughly worn out.
1.1.9 Due to non-repairs and non- replacement of amenities, 29 per cent of the hostels have reported to have been facing problems.
1.1.10 Almost all the hostels had night watchmen arrangements and in 7 per cent of the hostels, there were some written code of conduct for the boarders for enforcement of discipline further encouraged.
1.1.11 The minimum distance of home from school of a student in school is 0 km and the maximum of 60 kms. Admissions of girls from headquarter villages as boarders have been allowed.
1.1.12 Boarders are usually allowed home visits accompanied by their relatives. In 46 percentage cases, boarders return to hostel in time after their home visits.
1.1.13 Seventy eight per cent of hostels had organised Health Camps for their boarders and 32 per cent had organised Immunisation Camps. First Aid facility was available in 90 per cent of the hostels.
1.1.14 Payment of stipend is made to the boarders without any time lag in case of 90 per cent of hostels. In 10 per cent cases, payment is made within a time lag of one to two months.
1.1.15 About 88 per cent sample hostels, reported that food component of stipend is not adequate. Hostel authorities manage the food by way of availing subsidised ration as well by raising kitchen gardens.
1.1.16 One of the hostels in Nuapada district reported to have been receiving one pair of uniform in place of two. As many as 34 per cent of sample hostels received dress up to 2006-07; 64 per cent up to 2005-06 and only one pair in Balangir district up to 2004-05.
1.1.17 On an average, 4 non-vegetable meals are served per week in the sample hostels.
1.1.18 Ten per cent of boarders are maintaining cleanliness and 88 per cent attending schools regularly. About 34 per cent boarders are maintaining hostel routine and 10 per cent have acquired sense of health and hygiene.
1.1.19 Pass outs at Class-V stage gradually and steadily increased. The proportionate share of pass percentage is higher as compared to school pass outs among the boarders which indicates, establishment of RLTAP hostels has positive impact on the enrolment of SCs and STs girls and their retention.
1.1.20 Parents and their relatives are the major sources of information and inspiration based on which the boarders have stayed in hostels. They perceive that getting food and dress followed by education with good
environment as their benefit of staying in hostels. They do not consider disciplined life and overcoming the problem of travel to school as their benefits.
1.1.21 Only 4 per cent of boarders have no knowledge on payment of stipend and they did not appear to be concerned with adequacy of the same.
1.1.22 Majority of boarders were sharing hostel amenities jointly as a result of non repair and non replacement of amenities.
1.1.23 Higher percentage of boarders are satisfied with educational atmosphere, food, clothing and security aspects and lesser percentage are satisfied on cleanliness, environmental, sanitation, gardening, sports and games.
1.1.24 About 82 per cent boarders expressed the view that they would not have attended school had there been no hostel and 95 per cent would not have remained in hostel had there been no provision of stipend which indicates that RLTAP hostels are extremely useful.
1.1.25 Key Informants perceived that the hostel programme aims at increasing enrolment and imparting education to SCs and STs girls. However, majority of them are yet to realise that this programme will in the long run help reducing the gender disparity in education front.
1.1.26 Key Informants expressed the view that the boarders could attend school but not remained in hostel without stipend that indicates that establishment of hostels and grant of stipend has tremendous effect on the enrolment of SC and ST girls as an incentive.
1.1.27 Although intake per RLTAP hostels is 40 only, the same in respect of other hostels is of around 60. Although the total number of seats under the RLTAP hostels was originally envisaged as 16000 at the rate of 40 per hostel, the State Government decided to enhance the seats from 16000 to 18460 from the educational session 2005-06.
1.1.28 The DWOs reported that total number of seats under 400 RLTAP hostels is 17960 although revised to 18460 from 2006-07 which indicates that Government’s decision to enhance seats has not been given effect to.
1.1.29 The DWOs have expressed that the food component of the stipend is not adequate.
1.1.30 Out of 8, as many as 6 DWOs have expressed to have admitted girl students from headquarter villages as boarders.
1.1.31 Occupancy of seats in the hostels is more than 95 per cent all along that implies there is higher demand for hostel acaccommodations among SC and ST girls.
1.2 MOBILE HEALTH UNITS IN KBK DISTRICTS
1.2.1 On an average, one sample MHU serves a population of 55,800 in about
102 villages.
1.2.2 About 76 per cent of sample MHUs were visiting all the villages’ assigned
to them in each month and the remaining 24 per cent were not doing so
for many constraints.
1.2.3 As much as 53 per cent sample MHUs were visiting their villages twice a
month and the remaining 47 per cent once a month. All sample MHUs
reported to have been working on holidays to cope with workload.
1.2.4 As many as 94 per cent sample MHUs had three crucial staff positions i.e.
a Medical Officers, a Pharmacist and a Health Worker (Female) filled in.
As regard the medical officers in 47 per cent MHUs were Allopathic
Doctors, 41 per cent Ayurvedic Doctors and 12 per cent Homeopathic
Doctors.
1.2.5 All the sample MHUs had a vehicle each, whether Government or hired.
All sample MHUs had B P instruments, Slides and requisite medicines.
However, there was no stethoscope in one and no Microscope in 3
sample MHUs.
1.2.6 About 29 per cent MHUs expressed that village visits had not been
adequate, 24 per cent faced constraints of transport and fuel and 4 per
cent had problem of medicines and funds.
1.2.7 The average number of tour days came to 20 per month in case of 5
districts and less than 20 in case of 3 districts. None the district complied
with the minimum of two night halts per month.
1.2.8 School visits per MHU varied from 1 to 8 per month and distribution of
ORS ranged 200 to 2174. The MHUs had also been associated with other
activities like organisation of Health Camps, Immunisation Camps, Family
Welfare Camps, and rendering services during calamities.
1.2.9 Timeliness has been observed in provision of staff and mobile vans in
case of all sample MHUs. Supply of medicines was delayed in case of
one MHU, equipments in case of 8 and provision of funds in case of 13.
1.2.10 Medical Officers in charge felt that modern equipments, quality medicines
as per local needs, furniture for camps, ambulance and telephone facility
for emergency cases are badly required. Microscope training to the
Pharmacists, display board in villages on MHU programme,
accommodation and storage facility are the essential requirements.
1.2.11 As many as 84 per cent sample households interviewed were aware of
the functioning of a MHU in their locality and providing treatment to
individual patients and 16 per cent were aware that MHU is organising
community health programmes. 72 per cent sample house-holds are
availing treatment from MHU.
1.2.12 As many as 43 per cent sample beneficiary house-holds said that MHUs
are capable of attending emergency cases, 2 per cent said the MHUs to
be charging fees from patients, 25 per cent said the MHUs to be
undertaking follow up of patients.
1.2.13 All children below the age of 5 in sample households were immunised.
Out of 4 pregnant women in these households, only 3 reported to have
been vaccinated and given iron supplements.
1.2.14 About 76 per cent beneficiary households expressed that they are getting
service at their door step. 94 per cent of them said that supply of medicine
was adequate, 67 per cent expressed MHUs to be cooperative, 55 per
cent said to have received timely treatment, 37 per cent opined follow ups
to be good, and 33 per cent said MHUs put importance to rich and
influential families. However, 71 per cent expressed their overall
satisfaction on ongoing MHUs.
1.2.15 All Key Informants, all were aware of the functioning of a MHU in their
locality and they said that MHUs are conducting village visits but not
making night halts.
1.2.16 As much as 94 per cent of the Key Informants have their knowledge on
MHUs conducting school visits, 71 per cent on immunisation camps, 62
per cent on antenatal check ups, 50 per cent on health camps and 18 per
cent on family welfare camps. However, their observation is not
encouraging on the prevention and control measures taken and the health
hygiene education imparted by the MHUs.
1.2.17 MHUs in 5 districts were fully equipped Medical Officers in position in 87
MHUs, Pharmacists in 70 MHUs and Health Worker (Female) in 81
MHUs. Although CDMOs visited 90 MHUs on 96 occasions during 2005-
06, some MHUs were not visited during the year at all.
1.2.18 The blood slides collected has been gradually increasing over the years.
The malaria positive cases found were 21 per cent of the slides collected
in past 8 years. Disease specific number of patients treated has not been
well maintained except Malaria.
1.2.19 Number of patients treated per MHU per annum was around 2784 in 1998-
99, which has gradually increased to 8385 in 2005-06 which is more than
three times in span of 6 years.
1.2.20 The CDMOs also expressed that the delivery of health care facilities at
hospitals, Primary Health Centers etc. would not have gained momentum
in these districts. But establishment of MHUs in the KBK region has
positive impact on the health care delivery system at door steps in these
districts.
1.3 EMERGENCY FEEDING PROGRAMME IN KBK DISTRICTS
1.3.1 Out of 32 sample Anganwadi Centers, 26 were functioning in Government
accommodations and 6 in private or rented accommodations. 24 Centers
were running in pucca, 5 in semi-pucca and 3 in kutcha buildings. 30 out
of 32 sample Centers were suitable for running Anganwadis.
1.3.2 Only 2 Anganwadi Workers out of 32 were Matriculates, 7 were under
Matriculates and the rest 23 were below Matriculation and none was
illiterate.
1.3.3 On an average, 31 beneficiaries per annum per AWC were extended the
benefit of emergency feeding and the number of applicants was same as
the number of beneficiaries in most of the cases. Around 38 per cent of
beneficiaries were men and 62 per cent women.
1.3.4 Around 20 per cent of beneficiaries belong to SCs, 53 per cent to STs and
the remaining 27 per cent to other category. 96 per cent were from the
BPL and 4 per cent from APL category. Selection of beneficiaries was
made at the level of Palli Sabha and recommended for inclusion in one
and all cases.
1.3.5 Certain AWCs, opined that quality of food stuff supplied was not good and
timeliness of its supply was not ensured. Fuel is neither available free nor
funds provided for the purpose.
1.3.6 While cooked food is served at Anganwadi Centers, meals are also sent
to homes of beneficiaries when they are not physically able to move out.
Cooked meals are also sent to homes of beneficiaries even when he/she
is absent from the village in certain cases.
1.3.7 Complaints were also received from beneficiaries in regard to quality of
food, its adequacy and timeliness. 19 per cent of sample beneficiaries
expressed their overall dissatisfaction over the programme.
1.3.8 About 5 per cent of beneficiaries expressed that AWCs are not
cooperative with the beneficiaries. At the same time, 12 per cent of
beneficiary expressed that conflict has been culminated among their
family members as a result of the emergency feeding programme as it
leads to idleness.
1.3.9 As many as 96 per cent of sample beneficiaries expressed that the
programme of emergency feeding as a tool to break the vicious circle of
food insecurity among the old and infirm people of the poor families have
benefited immensely.
1.3.10 About 27 per cent of sample beneficiaries preferred taking rations to their
homes saying that the ration will be shared among other family members.
1.3.11 Key informants opined that the old, poor, infirm and helpless are usually
selected as beneficiaries. However, in rare occasions, views of rich and
influential persons prevail to select beneficiaries. Some of the key
informants opined that AWCs were not cooperative with the problems of
the beneficiaries.
1.3.12 The number of beneficiaries to be covered through AWCs is usually
allotted in advance for finalising the selection list. While the allotted
number of beneficiaries is adequate in certain cases, the same is not
sufficient in others as the reality varies from area to area.
1.3.13 Authority approving the select list differs from district to district.
1.3.14 Quality of rice in case of most districts has been reported to be fair by the
Programme Managers.
1.3.15 Programme Managers expressed overall satisfaction on the procedure
adopted for selection of beneficiaries, maintenance of records in the
process, the quality of food served, the cooperation extended by the
AWCs and the mutual cooperation extended by the local people.
However, there was lack of cooperation on the part of the beneficiaries in
certain cases. There was also the problem of inadequate storage space in
two districts.
1.4 AFFORESTATION PROGRAMME IN KBK DISTRICTS
1.4.1 The average area of a sample plantation site was 41.75 hectares. Out of
total 16 sample sites, 10 were in reserved forest (RF) and 6 on revenue
land (RL). 11 plantations were done over degraded forest (DF) and 5 on
bald hills (BH). Block plantation was undertaken in case of 13 sites and
gap filling in case of remaining three sites.
1.4.2 Out of 668 ha in 16 sample sites, economic plantation was done over 160
ha, NTFP over 130 ha, Bamboo over 40 ha, Fuel wood and mixed
plantation over 108 ha, and RDF on 230 ha. In total 16 Van Samrakhyan
Samitis (VSS), one in respect of each sample site existed.
1.4.3 The VSSs were closely associated in all stages of operation like site
selection, stock mapping, selection of species, decision making,
contribution of labour, organization of IEC and training and visit
programmes as also in providing watch and ward facilities.
1.4.4 Departmental nurseries were raised for plantation in 12 sites and
seedlings were purchased from private nurseries for the remaining 4 sites.
While highest priority was given to plantation of timber in case of Balangir
and Kalahandi districts, highest priority was given to mixed plantation in
Koraput district and to fire wood plantation in case of Rayagada district.
Plantation of fruit bearing trees is given a low priority by all most all
districts should be relooked.
1.4.5 Except soil work, all other activities were not undertaken in requisite
number. While manuring was undertaken in 92 per cent occasions as
compared to the standard practices that in case of weeding was 70 per
cent. Fire tracing was done in 94 per cent cases and pruning in 19 per
cent cases. Standard practices were not undertaken in requisite number
in respect of key activities.
1.4.6 Organisation of training, workshop and field visits were more or less
adequate for departmental functionary. For VSS members, their
participation in workshops and execution of field visits were quite dismal.
1.4.7 Around 74,183 man-days in all was generated of which 77 per cent were
contributed by the forest fringe villagers and 23 per cent by people from
outside. Against man-days generated by villagers, 23 per cent was
contributed by women seemed to be on the lower side.
1.4.8 The average number of supervision by higher authorities during 2005-06
came to 4 per site. However, in case of certain cites, there had been no
supervision at all.
1.4.9 The condition of the afforestation sites was reported to be quite good at
the time of their transfer to the hands of VSS.
1.4.10 56 per cent of sample households reported that they are primarily
depending on forest resources for their livelihood which indicates that
establishment of afforestation sites in the fringe of their villages are
certainly useful and virtually, 98 per cent of the sample households
expressed that the programme of afforestation is useful as a major source
of livelihood.
1.4.11 21 per cent sample households expressed to have sacrificed some land
on account of afforestation programme. However, all the sample
households had participated in implementation of various activities
involving physical labour like nursery raising, site preparation, pitting,
burning, plantation, soil work, manuring and protection of sites etc. but
their participation was moderate in site selection, stock mapping, base line
survey and selection of species.
1.4.12 About 63 per cent sample house-holds were enjoying usufructs from the
afforestation sites like collecting fuel and fodder, NTFP etc and they will
use the sites intensively as they will grow older.
1.4.13 Average number of members per VSS was 13 comprising around 72 per
cent of males and 28 per cent females. The social composition of VSS
was 22 per cent SCs, 45 per cent STs and 33 per cent from other
category.
1.4.14 Involvement of the VSS in plantation activities like nursery raising, site
preparation, pitting, burning, plantation, soil work and manuring and
protection is cent per cent, whereas their participation at the planning
stage was moderate.
1.4.15 All the 32 key informants were aware of the anticipated benefits of
afforestation like (i) green coverage, (ii) environmental improvements, (iii)
soil and moisture conservation, (iv) increase in water table, (v) availability
of fuel and fodder, (vi) availability of NTFP, and (vii) felling of trees on
maturity etc.
1.4.16 It was reported that during transfer of afforestation sites to the VSS a
document was executed between the Forest Department and the VSS
along with transfer of a copy of the plantation journal. It was also reported
that the VSSs were also discharging their responsibilities like protecting
the sites from biotic interference, against illicit felling, from fire, conducting
periodic cleaning, and maintaining plantation journal.
1.4.17 Condition of the sample sites in terms of survival of trees and the quality
of growth was better as compared to the time of transfer to VSS which
implies that the impact of the programme is quite appreciable.
1.4.18 In 4 Forest Divisions, 1692 VSSs were formed of which 1072 (63.36%)
were involved with RLTAP plantation. It is, therefore, quite evident that the
intervention under RLTAP is quite appreciable.
1.4.19 Although the VSSs were protecting the sites from biotic interference, they
were unable protect sites from illicit felling.
1.4.20 Three out of four DFOs expressed that the VSS were associated at all
stages of operation and their cooperation was satisfactory. They are also
maintaining sites in good condition. In case of Rayagada, it was reported
that although VSSs were associated at all stages, their cooperation was
not encouraging and they are also not maintaining the sites satisfactorily.
1.5 BIJU KRUSHAK VIKAS YOJANA IN KBK DISTRICTS
1.5.1 Incompletion of the LI points has been mostly due to delay in the
preparation of estimate, execution of electrical works and non-contribution
of beneficiary share.
1.5.2 In Kalahandi, the actual irrigated area under the command of sample LIPs
was 78.5 per cent, in Koraput it was 88 per cent and in Nawarangpur and
Subarnapur districts it was cent per cent. In most of the cases, installation
of LI points was completed within one year and the average cost of one
sample LIP was around Rs.6.16 lakh.
1.5.3 All beneficiaries contributed their share in terms of physical labour. All
members of the Pani Panchayats in the selected sample LIPs were
paying water rent regularly.
1.5.4 All the LIPs are being operated/supervised by members of Pani
Panchayats. The average annual operation and maintenance cost ranges
between Rs.30,000/- in Nawarangpur district to Rs.50,000/- in Koraput
district. For 55 per cent LIPs, OLIC undertakes repair works and for
remaining 45 per cent private mechanics do the job.
1.5.5 Kalahandi and Koraput districts are meeting repair expenses from PP
funds and in Nawarangpur and Subarnapur districts jointly by PP and the
OLIC.
1.5.6 20 per cent of the PPs complain about frequent electricity failure and 50
per cent complain about high electricity fees. In 50 per cent PPs there has
been observed internal conflict among the PP members.
1.5.7 The electricity distribution company charges fee as per minimum load
factor even if the LIP is not in use which is a cause of resentment among
PP members.
1.5.8 In Kalahandi, Nawarangpur and Subarnapur districts, all members of the
sample PPs expressed that their economic condition has been improved
to a great extent due to LIPs. However, in Koraput district the PP
members expressed that their economic condition has marginally
changed.
1.5.9 Sample beneficiaries of Kalahandi district revealed that their cropping
intensity had gone up from 103.6 per cent to 161.2 per cent, in Koraput
from 84.77 to 140.3, in Nawarangpur from 92.1 to 171.5, and in
Subarnapur from 81.9 to 180.3 as a result of installation of LIPs. The
overall increase for all the districts was from 89.7 per cent to 164.8 per
cent showing a very positive impact of the programme.
1.5.10 Area under paddy has gone up and paddy is also being cultivated in Rabi
season now. There have been significant changes in terms of cropping
pattern. Inferior cereals have been replaced by superior HYV cereals and
commercial crops like cabbage, brinjal, tomato, cash crop like sugarcane
etc. have been adopted.
1.5.11 As a result of the installation of LIPs under RLTAP, the Farm Business
Income went up significantly from Rs.944/- to Rs.3297/- per acre of net
sown area in Kalahandi district, from Rs.927/- to Rs.2458/- in Koraput,
from Rs.2007/- to Rs.2868/- in Nawarangpur and from Rs.1024/- to
Rs.2745/- in Subarnapur districts respectively.
1.5.12 One distinguishing feature marked in the district of Subarnapur is that
although Cropping Intensity in the “post-project” period is one of the
highest, the FBI per acre is comparatively lower. The reason for this could
be that there has not been much crop diversion and the farmers are
growing mostly the traditional paddy in Rabi season.
1.5.13 Per acre labour employment intensity has gone up from 62 to 168 (171%)
in Kalahandi, from 59 to 142 (141%) in Koraput, from 68 to 182 (168%) in
Nawarangpur and from 82 to 178 (117%) in Subarnapur districts. Thus, in
terms of employment generation, the contribution of BKVY is enormous.
1.5.14 On the whole, 10 per cent of the sample beneficiaries considered water
supplied for irrigation to be inadequate and 2 per cent considered
breakdown as a problem. None complained about drying up of wells,
whereas only in one case there was complain like electrically failure,
quarrel among members etc.
1.5.15 In case of sample districts, 52 per cent beneficiaries considered their
income rising significantly, 46 per cent considered it to be a marginal rise
while 2 per cent considered the income to have remained stagnat.
1.5.16 About 15 per cent of the beneficiaries wanted the field channels to be
repaired and realigned so that all the fields get adequate water.
1.5.17 All the key informants expressed that there was good cooperation among
the PP members as well as between the PPs and the OLIC, and the PPs
were conducting regular meetings. They expressed that crop
diversification and cultivation of cash crops was feasible as a result of the
system of Pani Panchayats. They opined that the impact of the system of
Pani Panchayat had been significant.
1.5.18 The key informants suggested that Government should take steps for
installation of additional points, provide regular technological assistance,
meet the cost of repair and maintenance, see to regular supply of
electricity, reduce water rate, increase labour wage etc. Government
should think of installing additional points, providing technological
assistance, ensuring regular supply of electricity etc.
1.5.19 From the suggestions of the key informants transpires one important thing
that they have not very well understood the very objectives of the system
of Pani Panchayats.
1.6 WATERSHED DEVELOPMENT IN KBK DISTRICTS
1.6.1 The estimated cost of a sample watershed was Rs.182.97 lakh on an
average against which the financial achievement was Rs.122.66 lakh,
which accounts for 67.04 per cent and this appears to be under
utilisation even after 4 years of execution. 10 sample watersheds had
been completed and the remaining 6 were still continuing. The 6 ongoing
watersheds include 5, started in 2002-03 and one in 2001-02.
1.6.2 The area treated under sample watersheds include land under forest,
revenue land, land under cultivation, community land and barren land.
1.6.3 The nature of activities undertaken in the sample watersheds were insitu
plantation, soil and moisture conservation, plantation and sowing of
seeds of multipurpose trees, shrub, grass, legumes, pasture and land
development, agro-forestry, horticulture and floriculture, drainage line
treatment, small water harvesting structures, development of orchards
and pisciculture etc.
1.6.4 Awareness raising programmes like training, extension and people’s
participation been undertaken in respect of all watersheds.
1.6.5 On an average 11 assets were created per sample watershed with a
minimum of 7 and maximum of 14 relating to eco-restoration. The assets
created under watersheds are likely to provide them gainful employment
to the local people.
1.6.6 Flow of funds towards employment generation had been of the order of
55.25 per cent of the total expenditure. On an average 1048 mandays
was generated per Rs.1.00 lakh equal wage rate was adopted both for
male and female workers. No contractor was engaged for construction of
watersheds. The employment generated was totally enjoyed by the local
people and 40.30 per cent of the same was women component.
1.6.7 Around 1352 ha of irrigation potential was created under the 16 sample
watershed, which was fully utilized in Kharif crops 2005-06. The Rabi
crops utilisation was of the order of 540 ha that accounted for 40 per
cent.
1.6.8 While no training and visits were organized in case of two watersheds, it
was not useful in respect of two watersheds where organized.
1.6.9 The visible changes that have taken place as a result of the watersheds
are of the following nature;
(i) Employment opportunities have been created through activities like plantation, agro-forestry, horticulture, floriculture, land development, creation of orchards, taking up pisciculture etc.
(ii) There has been a change in the cropping pattern including cultivation of summer crops.
(iii) The local people have been able to earn additional income through the end product of different economic activities that has reduced migration of local labours.
(iv) Health and hygiene condition has improved due to construction of drainage system and installation of safe drinking water sources.
(v) Interpersonal relationship and public and private partnership has been improved as a result of local people becoming members in different user groups.
1.6.10 The Farm Business Income per acre, cropping intensity, crop
diversification and the employment generation has gone up as a result of
watershed projects.
1.6.11 There were as many as 42 SHGs of different types within the area
coming under the sample watersheds which have gone up to 163
(288%) as a result of watershed programme. The have learnt the
concept of self management in process of development.
1.6.12 Households in watershed areas had taken part in some kind of activity
or the other like product development, organization of health camps,
distribution of goats, cattle and agricultural implements, plantation,
fishery activities, watch and ward etc.
1.6.13 Sample households expressed that the scope of getting some additional
employment has increased. All of them are collecting fire wood and
fodder from watersheds. They opined that the water table has increased,
environmental improvements have been noticed and there had been
diversification of economic activities.
1.6.14 The Key Informants opined that watersheds have been able to create
livelihood opportunities, increase the water table, grow fodder and fire
wood, enhance the economic growth of the local people through various
income generating activities like agricultural activities, pisciculture,
plantation etc.
1.6.15 The programme of micro-watersheds in KBK districts are being
implemented since 2002-03 and a considerable number of them are still
incomplete. Their completion may be expedited.
1.6.16 The Programme Managers expressed that there had been considerable
positive impact of the programme of watershed on the local people and
the following are few examples;
i. Better management of natural resources and SHG movement in a big way.
ii. Vigorous implementation of beneficiary oriented programme through PPP.
iii. Soil and water conservation, renovation of existing ponds and tanks and taking up of pisciculture.
iv. Taking up plantation activities and thereby rearing of domestic animals,
v. Collection of fodder and fuel wood, cultivation of vegetables, cash crops etc
vi. Increased scope for livelihood opportunities and employment generation thereby increasing the economic condition of the people.
vii. Improvement in interpersonal relationship among the local people.
vii. The overall observation is that the objectives of Watershed Programme have considerably been fulfilled as there has been increase in irrigation, cropping intensity, crop diversification, additional employment generation, increase in farm business income, increase in soil and moisture conservation, increase in green cover, adoption of new activities like horticulture, fishery, and plantation etc as also reduction in out-migration.
viii. Apart from land lords within the watershed areas, the landless have also been benefited by way of availing additional employment and livelihood opportunities and enjoying usufructs as a result of the watersheds.
ix. In regard to sustainability of watershed projects, the prospect is bright since additional employment opportunities have been created and additional income generation have occurred on account of watershed projects and there has been considerable participation of the local people in the operation and maintenance of various activities under the watersheds through SHGs and User Groups. However, what is needed is to keep up the spirit through enhanced farm activities generating higher and higher incomes over the years.
1.7 RURAL CONNECTIVITY PROGRAMME IN KBK DISTRICTS
1.7.1 In case of 6 sample bridges, there was no link at all ensuring all weather
connectivity. In respect of the other two, the existing links were unsafe
masonry bridges. Construction of 6 sample bridges was entrusted to
contractors and 2 executed departmentally. As many as 7 out of 8 sample
bridges were completed and put to operation as on the date of field study.
1.7.2 In case of one (i.e. the SB over Jamuna Bahal) bridge in Kalahandi
district, the construction was delayed due to water logging as no specific
drainage channel (nallah) passing through the site was existing creating
perennial problem because of technical reasons.
1.7.3 The physical and financial progress under the programme had been
satisfactory. Of the total employment generated, 37 per cent related to
skilled labour and 63 per cent to unskilled.
1.7.4 About 87 per cent of the unskilled labour was contributed by men and 13
per cent by women. SCs contributed 45 per cent, STs 36 per cent and
others 19 per cent of the unskilled labour.
1.7.5 It was observed in course of field study that incomplete information was
furnished in certain cases, which implies that either records are not
maintained properly or there was lack of transparency.
1.7.6 As observed, cube testing was done in case of all the sample bridges
whereas stump testing was done in case of 6 (75 %) sample bridges.
1.7.7 There was adequate number of inspections on construction of bridge
projects by the local Engineers. Inspection by supervising officers i.e. the
EE, SE and the CE per site came to 13 on an average with a minimum of
3 and maximum of 32 per site.
1.7.8 The nature of problems faced by the local people prior to the construction
of the bridge projects were really enormous as expressed by the GPs for
which construction of these bridge projects were absolutely necessary.
1.7.9 In case of the Bridge over Palliguda in Koraput district, the 4 Gram
Panchayats contacted expressed that there was no problem prior to
construction of this bridge. If this fund was spent on other bridge more
benefits would have been derived.
1.7.10 One and all the GPs contacted opined that construction of these bridge
projects have improved connectivity with other villages and the block
headquarters. There has been appreciable improvement in accessibility to
GPs, Blocks, District headquarters and Health Centres, Educational
Institutions and other Growth Centres including the market places etc. that

makes clear that construction of bridge projects as a matter of providing
the missing links had positive impact on local rural economy.
1.7.11 It was the unanimous opinion in all the focus group discussions that local
people have been enjoying all weather connectivity. Children could go to
schools across the bridges, local people could go to hospitals and market
places, business men could expand business as direct link with producers
and buyers developed, procurement of raw materials and essential
commodities were much easier by reducing transport cost and save time
as a result of construction of these bridges.
1.7.12 Focus group discussions also revealed that as a result of availing
connectivity through the bridge projects, some people have opened small
business within their villages as also across the bridges. Besides, people
are able to save time and distance to go to far places as a result of these
bridges and conduct safe night journey across the bridges.
1.7.13 The business men of the local rural market could avail easy access to
higher business centres as a result of bridges in question. Procurement of
materials from outside, contact with big buyers, opening of new ventures
has also been possible. Earlier, the producers were carrying their
produces to the buyers or to market places. The situation has been
changed and the buyers are coming to the door step with a good
competitive price.
1.8 RURAL WATER SUPPLY PROGRAMME IN KBK DISTRICTS.
1.8.1 Majority of the water supply projects have been installed within the
middle of habitations and few at the end of habitations because of
location advantages and availability of space.
1.8.2 The average number of potential beneficiaries per tube well was 167 and
151 for sanitary wells which is within the prescribed norm for KBK
districts. But in case of Kalahandi district, one tube well has been
installed for an average of 258 populations. This was certainly in the
higher side.
1.8.3 Of the 50 sample tube wells, so far 9 were transferred to Water Users
Associations. As against a target of 167 beneficiaries per tube well on an
average, as many as 153 (92%) are receiving benefit at present.
1.8.4 Of the 12 sample sanitary wells, none was transferred to Water Users
Associations. As against a target of 151beneficiaries per sample sanitary
well, 129 (85%) on an average are receiving benefit at present.
1.8.5 All the 8 sample piped water supply projects were completed. The
source was mostly Ground Water lift in case of 6 and River Lift in
remaining two. As against a target of 2009 beneficiaries per sample
piped water supply project, 1927 (96%) on an average are receiving
benefit at present.
1.8.6 There were in all 117 break downs in case of 70 projects during the
previous year that comes to two per project on an average. As against a
total of 117 break downs, 49 break downs were repaired within a
reasonable time period. Even if repaired within reasonable time, the
average number of days of interruption was 4 days.
1.8.7 In all, 20 Water User Associations have been formed out of which 9
projects have been transferred so far. However, 12 Associations are
taking part in operation and maintenance of projects.
1.8.8 Only in case of two projects, user fees are being collected by WUAs. In
total 50 persons were trained in respect of 70 projects on operation and
maintenance and on development of skill of local people to take care of
break downs. This number appears to be inadequate.
1.8.9 Out of 208 beneficiaries contacted, 178 (86%) expressed that supply of
water through the projects was adequate. In case of inadequate supply,
the attributable reasons were frequent break downs, drying up of the
source, and delay in repairs etc. 10 per cent of the break downs were
related to electrical problems.
1.8.10 About 27 per cent of the break downs were related to mishandling water
supply projects, especially the tube wells which is mostly due to lack of
knowledge or good civic sense among users.
1.8.11 In case of 50 per cent of sample water supply projects, it was the feeling
that the RWSS organization is not extending cooperation with the people
for timely repair of the break downs. Operation and maintenance of 87
per cent of the projects is vested on the Panchayats.
1.8.12 About 20 per cent of the sample beneficiaries reported to have been
making payments towards operation and maintenance. However, 32 per
cent sample beneficiaries are of the opinion that funds either of the
panchayats or of the water user associations are inadequate to meet the
maintenance cost.
1.8.13 Maintenance of hygienic practices like using clean pots to carry water,
storing water with a cover and using clean mugs etc. among the
beneficiaries is satisfactory. In case of epidemics, however, only in 18
per cent cases disinfectants were used for purification of the water
sources.
1.8.14 As much as 80 per cent of the sample beneficiaries reported that there
has been constructed good platforms or stand points at water sources.
43 per cent sample beneficiaries reported that waste water is used for
gardens, 15 per cent reported channeling to soak pits, 5 per cent to
drains and 59% per cent to open spaces.
1.8.15 As many as 99 per cent of the beneficiaries are satisfied that there has
been a drastic reduction in prevalence of diarrhea and dysentery cases
and 98 per cent are satisfied on the reduction in prevalence of cholera
and jaundice cases.
1.8.16 The opinion of the key informants on the reduction of water borne
diseases is al most the same as that of sample beneficiaries.
1.8.17 All Project Managers were of the opinion that there has been reduction in
the prevalence of various kinds of water borne diseases and the people
are enjoying improved quality of life.
1.8.18 Majority of the Programme Managers expressed that the burden on
women to fetch water from distant places has been reduced and time
has been saved for other household works.
2. Recommendations:
Based on the conclusions arrived at through field study, a set of
recommendations have been made in respect of each component. The summary of
the recommendations made are presented below separately for each component.
2.1 40 SEATED HOSTELS FOR ST / SC GIRLS IN KBK DISTRICTS
2.1.1 For ensuring quality education, there is an urgent need for appointing at least five teachers in each school over and above the Head Master. If
there be any financial constraints, appointment of Shikshya Sahayaks in requisite number could be a viable solution.
2.1.2 For administrative reasons, Government should ensure stay of Head Masters/Mistress and Hostel Superintendents at school headquarters. Due to lack of residential accommodations, Government may adopt viable solutions like posting of local teachers in these schools.
2.1.3 Government should ensure effective cooperation between the administrative department, executing agency and school authorities for reducing time lag in execution and operation of building projects in future. Executing agencies delivering poor quality constructions should not be given any work in future and have a provision to retain 5% of project cost as security deposit for five years in time of tender.
2.1.4 Even if annual maintenance is not permissible in the initial years of construction, there is no bar for the administration to inspect hostel buildings and take appropriate corrective measures as a special case.
2.1.5 Since majority of the amenities provided are consumable and recurring in nature require repairs and replacements in time. Cares should be taken to undertake necessary repairs and replacements annually.
2.1.6 Government may consider providing only the non-consumable items and the consumable items be left to the boarders or else purchased and given to them as in case of uniform so that they shall care for their own items.
2.1.7 All hostels should ensure night watching arrangements and there should be a prescribed common code of conduct for the boarders.
2.1.8 Hostel admission to girls from headquarters villages may be discontinued and awareness and motivation camps in outskirt villages be organised to persuade more of outside girls to join schools and take admission in hostels.
2.1.9 Non-return of boarders in time after enjoying home visits should be discussed in meetings of Parents Teachers Association and the parents should be impressed to send back their children to hostel in time.
2.1.10 Hostel authorities should take care to organise Immunisation Camps for boarders and provide First Aid facilities in hostels.
2.1.11 Timely payment of stipend and distribution of two pairs of uniform to all boarders should be ensured.
2.1.12 With a view to avoiding misuse and misappropriation of stipend, the amount of stipend should be received by authorized persons of the boarders on their behalf and more preferably by their parents.
2.1.13 Sharing amenities jointly will give rise to clash of interest and controversy apart from spread of communicable diseases among boarders. It is recommended that there should be adequate provision of amenities and timely repairs and replacements of utensils, study materials, furniture etc. annually.
2.1.14 The question of reducing gender inequality in education among SCs and STs by way of providing boarding facilities to girls should be highlighted before the local public in different flora.
2.1.15 Hostel authorities should give emphasis on environmental sanitation, gardening, games and sports that keeps the children mentally free and physically sound.
2.1.16 Additional provisions of infrastructure, amenities and stipend should be made in advance to give effect to the enhancement of hostel seats from 16000 to 18460.
2.1.17 The DWOs opined that had there been no provision of stipend, girls would not have preferred to stay in hostels and the boarders would not have attended schools without hostel facilities. According to their opinion, establishment of hostels for SCs and STs girls in the KBK region under the RLTAP is a useful step to raise literacy among females.
2.1.18 There is a need for the hostel authorities to give emphasis on the quality of food, maintenance of hostel routine and reading habit of boarders, awareness of cleanliness, environmental sanitation, gardening, games and sports and above all providing security and enforcement of discipline among the boarders.
2.1.19 All hostels should develop kitchen garden in collaboration with the horticulture department. Gardening will not only provide vegetables to the inmates, but also the inmates can develop a sense of pro-nature and eco-friendly activities.
2.1.20 The following are few points that emerged in course of field investigation may be considered by Government as a follow up action;
i. All hostels should be provided with drinking water facility and electricity. The possibility of providing fans need be explored. The existing system of charging electricity dues at commercial rates may be waved.
ii. There is need for provision for television and news paper for enhancing exposure of boarders and also provision of play, games and sports materials for their entertainment and physical exercise.
iii. Female teachers should preferably be kept as Hostel Superintendents and there need be a female attendant who will continue to stay with the boarders as an Aya-cum-watcher.
2.2 MOBILE HEALTH UNITS IN KBK DISTRICTS
2.2.1 Zilla Swasthya Samitis should ensure a minimum of two visits by MHUs to
each village during a month. Impeding problems, if any, should be
resolved.
2.2.2 MHUs should arrange clinics for villages within a radius of 5 kms. All
crucial manpower of MHUs like the Medical Officer, the Pharmacist and
the Health Worker (Female) should be maintained.
2.2.3 Although Allopathic, Ayurvedic as well as Homeopathic Doctors are
equally qualified and authorized, preferably allopathic doctors should be
kept in charge of the MHUs. Of course, doctors from other streams can
attend to their job in exigency.
2.2.4 The District Authorities should regularly review and ensure full provision of
equipments including Stethoscope and Microscope in the MHUs. If
necessary, repairs and replacements should be done at once.
2.2.5 District Authorities should review the adequacy of village visits by MHUs
and the impeding problems like transport, fuel, equipment and medicine
should be sorted out. More so, adequate fuel need be purchased in
advance and kept as reserve to avoid short supply in rural areas in time of
emergency.
2.2.6 The CDMOs should review the position at the end of each month and
enforce fulfillment of a minimum of 20 days tour and 2 days of night halts
in case of each MHU.
2.2.7 Like tour days and night halts norms, Departmental authorities should
prescribe a minimum number of school visits, health camps, immunization
camps, and family welfare camps to be organized by MHUs per month for
better coverage.
2.2.8 It is expedient for the supervisory authority to review the position and
ensure provision of support services like supply of medicines, equipments,
provision of funds etc to the MHUs strictly in time for their effective
functioning.
2.2.9 Keeping in view the existing arrangements, Government should examine
the possibility of making provisions for modern equipments, quality
medicines as per local needs, furniture for camps, ambulance and
telephone for emergency cases, Microscope training to the Pharmacists, a
display board at the village level, accommodation and storage facility for
MHUs.
2.2.10 IEC programme should be further more vigorously taken up to create
adequate awareness among the people on the nature and extent of
services a MHU provides for the local people.
2.2.11 To bring in improvements in the quality of services delivery, CDMOs
should undertake more of field visits and interaction with villagers which
will help increasing attendance to emergency, enhancing follow ups,
eliminating the scope of charging fees, and ensuring complete
enumeration of expectant mothers and their antenatal check ups.
2.2.12 Visit of CDMOs on clinic days will have adequate impact on providing
doorstep services, ensuring good cooperation, providing timely treatment,
ensuring cent per cent follow ups, and in removing bias of MHUs towards
the rich and influential people, if any.
2.2.13 Even though, the prevalence of T B, Leprosy and ARI in the region is less
as compared to Malaria, Diarrhoea and Scabies, it is essential that the
various treatment facilities and the community programmes available
should be widely publicized through vigorous IEC programme.
2.2.14 The MHUs should undertake adequate prevention and control measures
on TB, Malaria, Leprosy, Diarrhea, ARI, and Scabies as well as organize
various health and hygiene education programmes. More specifically,
doctors should invariably lead the mobile team in conducting mobile
clinics.
2.2.15 Since treatment of Panchabyadhi is an important and popular component
of the MHU programme, the MHUs should maintain records of the
patients treated under various diseases particularly those coming under
Panchabyadhi which will help in undertaking policy reviews in future.
2.2.16 Government may take appropriate action on some of the valuable
suggestions given by the CDMOs as listed below for bringing
improvements in the health care delivery System through MHUs.
i. Provision of accommodation for office, staff and store.
ii. Establishment of one additional MHU in large-sized blocks.
iii. The tour days having been increased from 20 to 24 per month, with adequate funds provision.
iv. Periodical training for both Medical and Para-medical staff of the MHUs should be organised.
v. Posting of adequate number of MBBS Doctors for MHUs.
vi. A mechanism need to be evolved to associate PRIs in the programme of MHUs.
2.3 EMERGENCY FEEDING PROGRAMME IN KBK DISTRICTS
2.3.1 Accommodations found unsuitable for Anganwadi Centres may be
addressed for efficient management of various programmes aimed at
providing service to the old, infirm, children and pregnant women.
2.3.2 The select list along with all relevant details of beneficiaries should be
made available to the AWCs for record and future reference.
2.3.3 Requisite provision of funds not only for purchase of fuel but also for all
other local purchases including vegetables.
2.3.4 The practice of providing meals for the absentee beneficiaries should be
discontinued.
2.3.5 District administration should take care to see that the quality of food
served is good, adequate and there is timeliness in food service. More of
supervision by higher authorities and their interaction with the
beneficiaries as well as their presence during food service will reduce the
number of complains.
2.3.6 The Gram Sabha or the local NGOs have leading role to counsel and
pacify situations if they come across any kind of conflicts among the
family members on account of emergency feeding programme.
2.3.7 In fitness of things, district-wise selection of beneficiaries should be based
on a potential survey conducted in advance. Such a survey could be
carried out along with the BPL Census for better consistency.
2.3.8 There shall be prescribed specific authority to approve the selected list
along with uniform norm in all districts. In case it is already prescribed, the
same should be enforced.
2.3.9 Since some programme managers have reported the food stuff supplied
to be of fair quality, there is need for the State level authorities to take
appropriate steps to ensure the quality of food stuff.
2.3.10 The administration should look into the accommodation problem of the
AWCs and its storage space.
2.3.11 The following suggestions which came forth in course of the field survey
need be examined and appropriate action taken by the administration;
i. Anganwadi Workers should stay in the AWC headquarters.
ii. Anganwadi Centres should have adequate space for storage, cooking and dining.
iii. Providing of two meals in a day and providing requisite utensils to AWCs.
iv. Provision of extra staff in AWC to deal with emergency feeding.
v. Provision of contingency and remuneration for the Cook.
vi. Provision of safe drinking water facility at the AWCs.
vii. Allow ration to beneficiaries from inaccessible areas.
viii. Increasing the number of beneficiaries where needed, i.e., especially at times of natural calamities.
2.4 AFFORESTATION PROGRAMME IN KBK DISTRICTS
2.4.1 Forest Department should take due care to increase the level of
association of VSSs in conducting IEC activities under afforestation
programme.
2.4.2 Higher implementing authorities should make a check list of various
standard practices to be undertaken in course of plantation and the same
should be recorded in the plantation journal under joint signature of the
executing functionary of the Forest Department and the VSS.
2.4.3 Since audio-visual exposure is more effective for villagers, the
departmental authorities should organize more of workshops and
demonstration visits for VSS members in course of plantation and
necessarily before transfer of sites to the hands of VSS.
2.4.4 Forest Department should involve more of local people and increase
participation of women in implementing various activities under
afforestation programme for its success.
2.4.5 Forest Department should prescribe and enforce minimum supervisions in
course of plantation to ensure standard practices of plantation.
2.4.6 To remove hostility in the minds of persons sacrificing their land for the
purpose of afforestation, the IEC programme should strategically address
the issue in a participatory mode with the help of VSS as their long term
asset.
2.4.7 VSSs should be involved in a big way from the stage of site selection so
that a sense of their ownership of the site among the VSS members and
the villagers will be created.
2.4.8 To prevent Illicit felling of trees, a coordination committee of the
neighboring VSSs should be organized. The very presence of this
committee will facilitate mutual cooperation and broad base interest of the
member VSS over a larger green area.
2.4.9 Participation in training, workshops and execution of field visits to know
the success stories are key instruments in enhancing the knowledge and
sense of ownership among VSS members which should be given due
priority.
2.4.10 Few suggestions across the field study are listed below that may be
examined and reconsidered by Government;
i. Permission to take up afforestation on revenue land should be accorded in time.
ii. Fencing by way of plantation of quick growing non-grazing species will help reducing biotic interference as also reduce cost.
iii. Among fruit bearing species, plantation of mango, jack fruits trees could be considered if suitable soil and moisture conditions are available in the proposed site.
iv. Soil and water conservation measures including construction of check dams if feasible could be a part of the afforestation programme that helped in survival rate of the plantations undertaken and re-charge of ground water.
v. There should be organised meetings of different VSS for sharing their experience and learning better practices.
vi. For reducing illicit felling and biotic pressure on the afforestation sites, back-yard plantation should be encouraged and there should be provision for award of prizes.
vii. Even after transfer of afforestation sites to VSS, Forest Department should continue its association for ensuring sound growth and protection of afforestation sites by way of extending their technical guidance and advice.
2.5 BIJU KRUSHAK VIKASH YOJANA IN KBK DISTRICTS
2.5.1 Government should create adequate general awareness on the roles and
responsibilities of the Pani Panchayats on the efficient operation and
maintenance of LI points for higher agricultural productivity.
2.5.2 Few aspects on operation and maintenance of Pani Panchayats as listed
below came to notice that needs immediate attention of Government;
i. Pani Panchayats should have a repair kit of spare parts to meet immediate nature of repairs as spare parts are not available locally.
ii. Governmant may issue instructions to Electrical Distribution Companies for timely preparation of cost estimate and supply of electrical connections to LI points without charging commercial electrical tariff from Pani Panchayats.
iii. Government should organize more number of trainings/workshops and motivation programmes for the PP members with a view to encouraging their enhanced participation in the operation and maintenance of the system of Pani Panchayats even during disaster and natural calamity as also make payment of their water user charges spontaneously.
iv. The Agriculture Department has a vital role to play in organizing agriculture extension programme since crop diversification and cultivation of cash crops have yet to receive priority in case of certain Pani Panchayats despite creation of assured irrigation facilities through installation of LI points.
2.6 WATERSHED PROGRAMME IN KBK DISTRICTS
2.6.1 The district authorities should organize training and visit programmes to
the user groups in case of all watersheds for good exposure.
2.6.2 Impeding problems involved in all incomplete micro-watershed projects
should be sorted out and resolved for their early completion. A specific
date line for completion of incomplete projects should be drawn up so as
to avoid escalation of project cost.
2.6.3 In course of conducting the field study and interaction with various
stakeholders few suggestions listed below which may be examined and
reconsidered by Government.
i. There is need for imparting training on maintenance of records by the User Groups under the watershed programme,
ii. In each watershed, a small nursery may be raised or else there may a central nursery for replacement of trees or plants in time when required.
iii. Low cost agricultural implements should be made available within easy reach for micro-watersheds.
iv. The positions of the members of the Watershed Development Team should not be kept vacant at any point of time
v. There should be a system of reward to the best performing watershed project in a district each year should be introduced with a view to make watershed development a peoples’ movement.
vi. There should be a forum for all the Watershed Development Committees in a district to meet, interact and learn best practices/ success stories from each other.
2.7 RURAL CONNECTIVITY PROGRAMME IN KBK DISTRICTS
2.7.1 Project authorities should involve the local people in the selection of site
for the bridge project to derive maximum cooperation and thus confer
maximum benefits from the scheme.
2.7.2 Executing authorities have to ensure enhanced participation of women in
the employment generation and it should not fall below 30 per cent.
Participation of SCs and STs in employment generation should be
ensured at par with their representation in the district population.
2.7.3 Executing agencies should maintain records strictly as prescribed and
maintain transparency in providing information.
2.7.4 Supervising authorities should ensure uniform number of inspections to
project sites with some amount of stress on projects having some
problems of critical nature. In any case, the number of higher-level
inspections to project sites should not fall below a specific number as
would be prescribed.
2.8 RURAL WATER SUPPLY PROGRAMME IN KBK DISTRICTS.
2.8.1 Government should take care to provide one tube well for 150 persons in
case of KBK districts.
2.8.2 At least two to three persons from each user group should be given
training on the operation and maintenance of projects.
2.8.3 Departmental authorities and the electrical companies have a greater role
to play in regard to timely restoration of power in case of electrical break
downs.
2.8.4 To avoid break downs due to mishandling, early formation of User Groups
and transfer of the projects to them is the best alternative for general
awareness and motivation of the programmes.
2.8.5 Advance programme on awareness raising, training and motivation
programmes are the best ways to generate demand. Although the system
is a basic need of life for the rural mass, it should be made more effective
and the best course of action through the Community Based
Organisations (CBOs), be practised in order to generate confidence
among the stakeholders and make the programme a mass movement.
2.8.6 Formation of water user associations, supply of repair kits, providing
training to few members and transferring the points to these associations
will solve the problem of spare parts and non availability of mechanics as
well as removing the feeling of non-cooperation of the RWSS organisation
with the local people.
2.8.7 It is essential for the Government to create adequate public awareness on
the hazards of waste water disposal in open space and non-use of
disinfectants for treatment of water sources. For management of waste
water, effective mechanism with adoption of advance technology be
followed and training on this aspect be given to the management
managing the safe drinking water source.
2.8.8 The remedies for tackling the problem of insufficient discharge can be
tackled to certain extent by directing the waste water to a nearby soak pit
for the purpose of recharging the source. Care should be taken to
disinfect the discharge water as it may contaminate sources of safe
drinking water.
2.8.9 Few suggestions which came forth in course of the field study as listed
below may be examined and considered by Government;
i. Toilets are usually constructed nearby water sources in rural areas that are likely to pollute source. Awareness campaign should emphasize on the hazards of these practices.
ii. When a water source is defunct or water quality is affected, local people use water from nearby pond or river. There should be annual verification of water sources in accordance with the books to identify defunct sources as well as to rectify the problems to minimize the water born diseases in rural areas.
iii. Open defecation pollutes water sources for which installation of toilets under the Total Sanitation Campaign (TSC) should be encouraged and the NGOs may also be involved in the campaign.
iv. People prefer sanitary wells to tube wells for the simple reasons of easy maintenance and apparently for no break downs. In view of this, Government may consider installing more of sanitary wells where water quality is good and more specifically in interior villages.
v. In case of piped water supply projects, there are some irregular connections to private households which should be checked.
vi. Rural water supply projects are usually demand driven and local people should own the same for their operation and maintenance. But the people’s perception at various levels still prevails that Government have to continue with operation and maintenance of the same. The programme to be sustainable, there is need to break through this wrong notion by active involvement of GPs/PRIs.
***
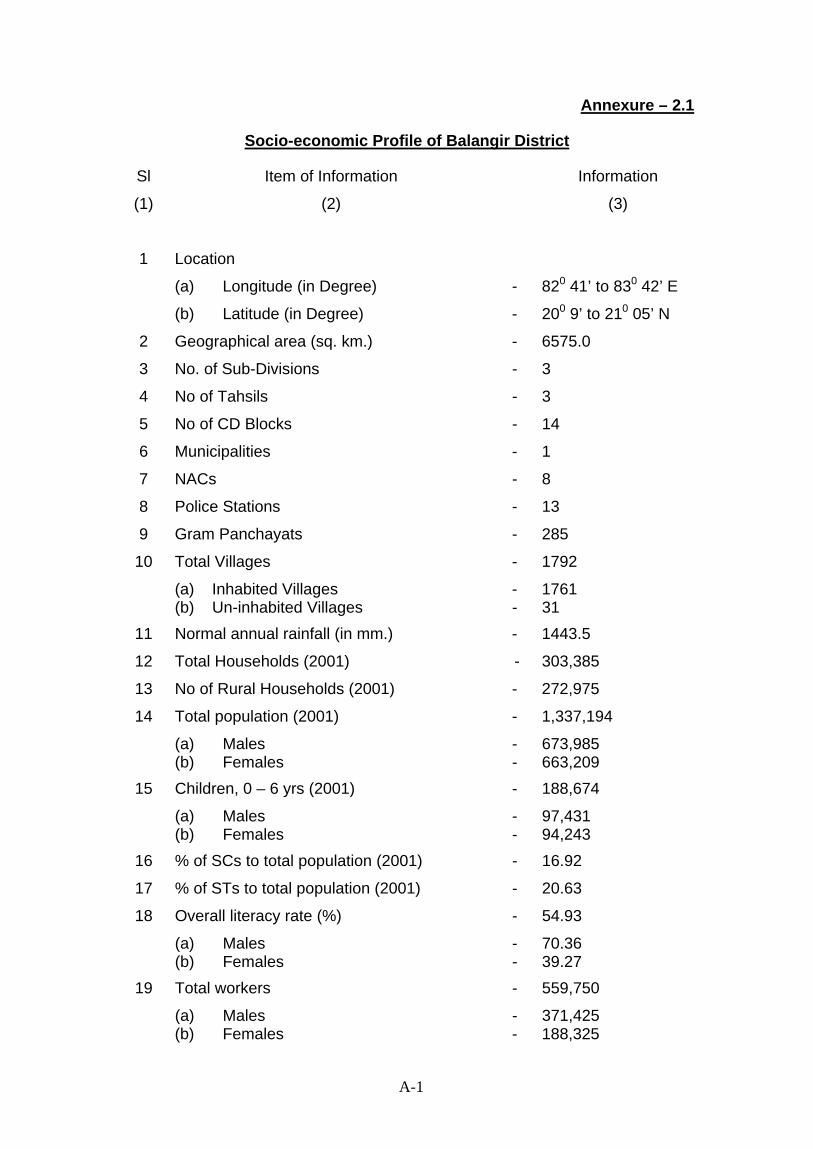
Annexure – 2.1
Socio-economic Profile of Balangir District
Sl Item of Information Information
(1) (2) (3)
1 Location
(a) Longitude (in Degree) - 820 41’ to 830 42’ E
(b) Latitude (in Degree) - 200 9’ to 210 05’ N
2 Geographical area (sq. km.) - 6575.0
3 No. of Sub-Divisions - 3
4 No of Tahsils - 3
5 No of CD Blocks - 14
6 Municipalities - 1
7 NACs - 8
8 Police Stations - 13
9 Gram Panchayats - 285
10 Total Villages - 1792
(a) Inhabited Villages - 1761 (b) Un-inhabited Villages - 31
11 Normal annual rainfall (in mm.) - 1443.5
12 Total Households (2001) - 303,385
13 No of Rural Households (2001) - 272,975
14 Total population (2001) - 1,337,194
(a) Males - 673,985 (b) Females - 663,209
15 Children, 0 – 6 yrs (2001) - 188,674
(a) Males - 97,431 (b) Females - 94,243
16 % of SCs to total population (2001) - 16.92
17 % of STs to total population (2001) - 20.63
18 Overall literacy rate (%) - 54.93
(a) Males - 70.36 (b) Females - 39.27
19 Total workers - 559,750
(a) Males - 371,425 (b) Females - 188,325
A-1
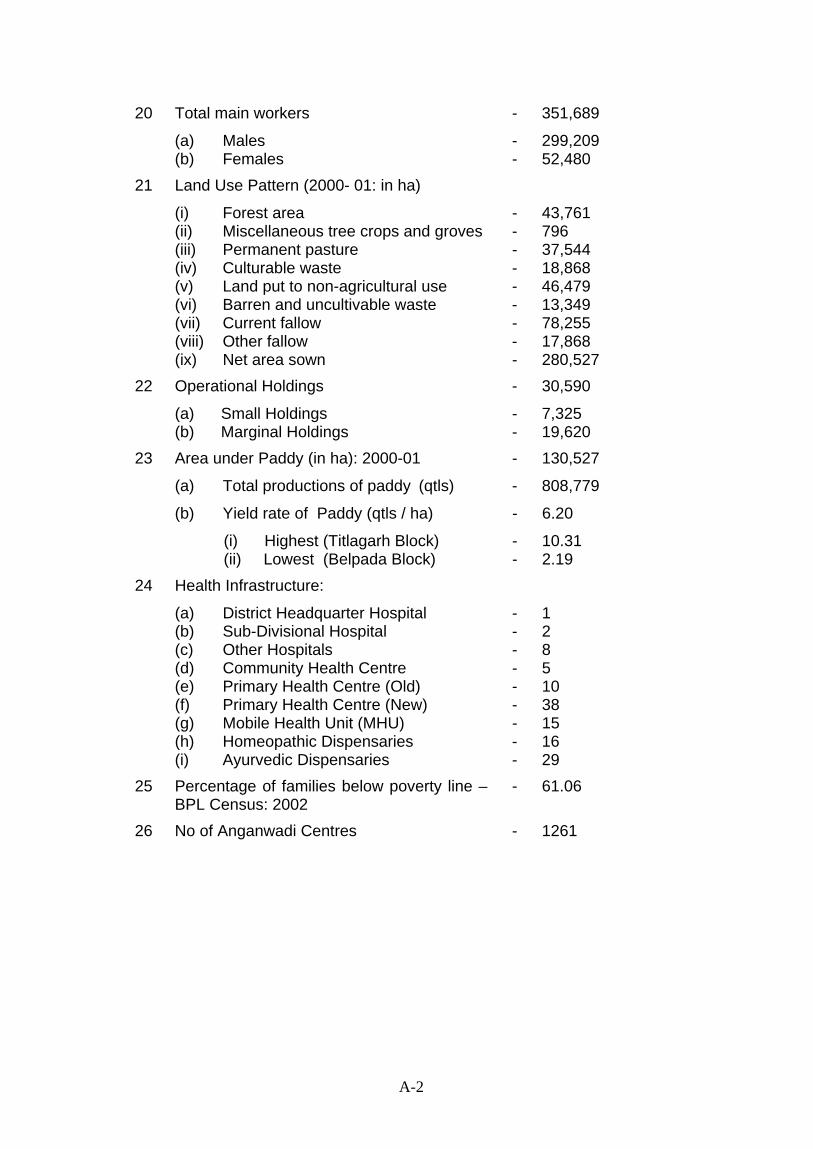
20 Total main workers - 351,689
(a) Males - 299,209 (b) Females - 52,480
21 Land Use Pattern (2000- 01: in ha)
(i) Forest area - 43,761 (ii) Miscellaneous tree crops and groves - 796 (iii) Permanent pasture - 37,544 (iv) Culturable waste - 18,868 (v) Land put to non-agricultural use - 46,479 (vi) Barren and uncultivable waste - 13,349 (vii) Current fallow - 78,255 (viii) Other fallow - 17,868 (ix) Net area sown - 280,527
22 Operational Holdings - 30,590
(a) Small Holdings - 7,325 (b) Marginal Holdings - 19,620
23 Area under Paddy (in ha): 2000-01 - 130,527
(a) Total productions of paddy (qtls) - 808,779
(b) Yield rate of Paddy (qtls / ha) - 6.20
(i) Highest (Titlagarh Block) - 10.31 (ii) Lowest (Belpada Block) - 2.19
24 Health Infrastructure:
(a) District Headquarter Hospital - 1 (b) Sub-Divisional Hospital - 2 (c) Other Hospitals - 8 (d) Community Health Centre - 5 (e) Primary Health Centre (Old) - 10 (f) Primary Health Centre (New) - 38 (g) Mobile Health Unit (MHU) - 15 (h) Homeopathic Dispensaries - 16 (i) Ayurvedic Dispensaries - 29
25 Percentage of families below poverty line – BPL Census: 2002
- 61.06
26 No of Anganwadi Centres - 1261
A-2

Annexure – 2.2
Socio-economic Profile of Kalahandi District
Sl Item of Information Information
(1) (2) (3)
1 Location
(a) Longitude (in Degree) - 820 32’ to 830 47’ E
(b) Latitude (in Degree) - 190 8’ to 200 25’ N
2 Geographical area (sq. km.) - 7920.0
3 No. of Sub-Divisions - 2
4 No of Tahsils - 7
5 No of CD Blocks - 13
6 Municipalities - 1
7 NACs - 2
8 Police Stations - 12
9 Gram Panchayats - 273
10 Total Villages - 2205
(a) Inhabited Villages - 2068 (b) Un-inhabited Villages - 137
11 Normal annual rainfall (in mm.) - 1378.2
12 Total Households (2001) - 320,624
13 No of Rural Households (2001) - 299,942
14 Total population (2001) - 1,335,494
(a) Males - 667,526 (b) Females - 667,968
15 Children, 0 – 6 yrs (2001) - 217,889
(a) Males - 109,807 (b) Females - 108,082
16 % of SCs to total population (2001) - 17.67
17 % of STs to total population (2001) - 28.65
18 Overall literacy rate (%) - 46.20
(a) Males - 62.88 (b) Females - 29.56
19 Total workers - 620,590
(a) Males - 381,444 (b) Females - 239,506
A-3

20 Total main workers - 382,050
(a) Males - 313,670 (b) Females - 68,380
21 Land Use Pattern (2000- 01: in ha)
(i) Forest area - 64,271 (ii) Miscellaneous tree crops and groves - 2,667 (iii) Permanent pasture - 20,418 (iv) Culturable waste - 21,434 (v) Land put to non-agricultural use - 43,351 (vi) Barren and uncultivable waste - 33,151 (vii) Current fallow - 60,575 (viii) Other fallow - 16,593 (ix) Net area sown - 290,901
22 Operational Holdings - 27,214
(a) Small Holdings - 7,697 (b) Marginal Holdings - 15,394
23 Area under Paddy (in ha): 2000-01 - 265,642
(a) Total productions of paddy (qtls) - 5,181,757
(b) Yield rate of Paddy (qtls / ha) - 19.50
(i) Highest (Jaipatna Block) - 32.17 (ii) Lowest (Golamunda Block) - 5.97
24 Health Infrastructure:
(a) District Headquarter Hospital - 1 (b) Sub-Divisional Hospital - 1 (c) Other Hospitals - 5 (d) Community Health Centre - 6 (e) Primary Health Centre (Old) - 8 (f) Primary Health Centre (New) - 39 (g) Mobile Health Unit (MHU) - 14 (h) Homeopathic Dispensaries - 14 (i) Ayurvedic Dispensaries - 18
25 Percentage of families below poverty line – BPL Census: 2002
- 62.71
26 No of Anganwadi Centres - 1214
A-4

Annexure – 2.3
Socio-economic Profile of Koraput District
Sl Item of Information Information
(1) (2) (3)
1 Location
(a) Longitude (in Degree) - 820 5’ to 830 23’ E
(b) Latitude (in Degree) - 180 13’ to 190 10’ N
2 Geographical area (sq. km.) - 8807.0
3 No. of Sub-Divisions - 2
4 No of Tahsils - 7
5 No of CD Blocks - 14
6 Municipalities - 1
7 NACs - 3
8 Police Stations - 21
9 Gram Panchayats - 226
10 Total Villages - 1997
(a) Inhabited Villages - 1915 (b) Un-inhabited Villages - 82
11 Normal annual rainfall (in mm.) - 1521.8
12 Total Households (2001) - 284,876
13 No of Rural Households (2001) - 240,294
14 Total population (2001) - 1,180,637
(a) Males - 590,743 (b) Females - 589,894
15 Children, 0 – 6 yrs (2001) - 200,689
(a) Males - 101,181 (b) Females - 99,508
16 % of SCs to total population (2001) - 13.04
17 % of STs to total population (2001) - 49.61
18 Overall literacy rate (%) - 36.20
(a) Males - 47.58 (b) Females - 24.81
19 Total workers - 570,435
(a) Males - 332,014 (b) Females - 238,421
A-5
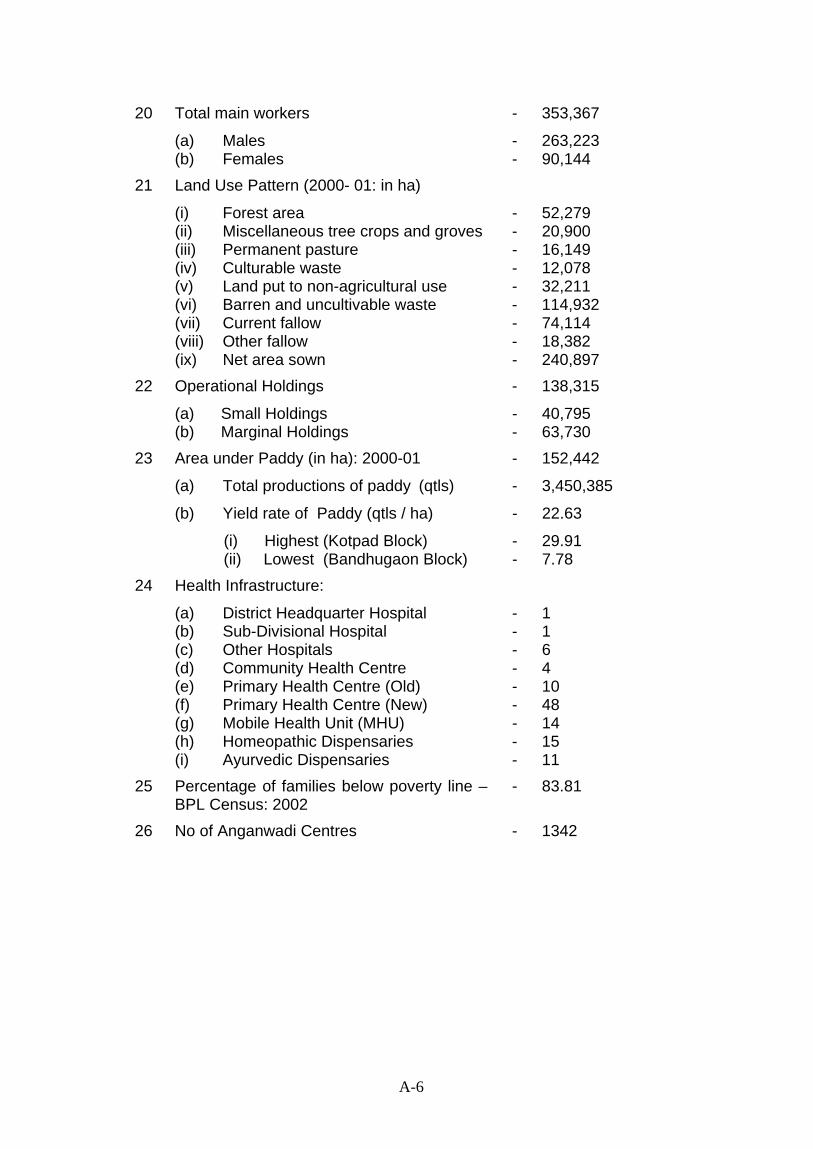
20 Total main workers - 353,367
(a) Males - 263,223 (b) Females - 90,144
21 Land Use Pattern (2000- 01: in ha)
(i) Forest area - 52,279 (ii) Miscellaneous tree crops and groves - 20,900 (iii) Permanent pasture - 16,149 (iv) Culturable waste - 12,078 (v) Land put to non-agricultural use - 32,211 (vi) Barren and uncultivable waste - 114,932 (vii) Current fallow - 74,114 (viii) Other fallow - 18,382 (ix) Net area sown - 240,897
22 Operational Holdings - 138,315
(a) Small Holdings - 40,795 (b) Marginal Holdings - 63,730
23 Area under Paddy (in ha): 2000-01 - 152,442
(a) Total productions of paddy (qtls) - 3,450,385
(b) Yield rate of Paddy (qtls / ha) - 22.63
(i) Highest (Kotpad Block) - 29.91 (ii) Lowest (Bandhugaon Block) - 7.78
24 Health Infrastructure:
(a) District Headquarter Hospital - 1 (b) Sub-Divisional Hospital - 1 (c) Other Hospitals - 6 (d) Community Health Centre - 4 (e) Primary Health Centre (Old) - 10 (f) Primary Health Centre (New) - 48 (g) Mobile Health Unit (MHU) - 14 (h) Homeopathic Dispensaries - 15 (i) Ayurvedic Dispensaries - 11
25 Percentage of families below poverty line – BPL Census: 2002
- 83.81
26 No of Anganwadi Centres - 1342
A-6

Annexure – 2.4
Socio-economic Profile of Malkangiri District
Sl Item of Information Information
(1) (2) (3)
1 Location
(a) Longitude (in Degree) - 810 22’ to 820 25’ E
(b) Latitude (in Degree) - 170 40’ to 180 43’ N
2 Geographical area (sq. km.) - 5791.0
3 No. of Sub-Divisions - 1
4 No of Tahsils - 3
5 No of CD Blocks - 7
6 Municipalities - 0
7 NACs - 2
8 Police Stations - 10
9 Gram Panchayats - 108
10 Total Villages - 928
(a) Inhabited Villages - 878 (b) Un-inhabited Villages - 50
11 Normal annual rainfall (in mm.) - 1521.8
12 Total Households (2001) - 109,483
13 No of Rural Households (2001) - 102,076
14 Total population (2001) - 504,198
(a) Males - 252,507 (b) Females - 251,691
15 Children, 0 – 6 yrs (2001) - 89,813
(a) Males - 45,315 (b) Females - 44,498
16 % of SCs to total population (2001) - 21.35
17 % of STs to total population (2001) - 57.42
18 Overall literacy rate (%) - 31.26
(a) Males - 41.21 (b) Females - 21.28
19 Total workers - 247,624
(a) Males - 141,190 (b) Females - 106,434
A-7
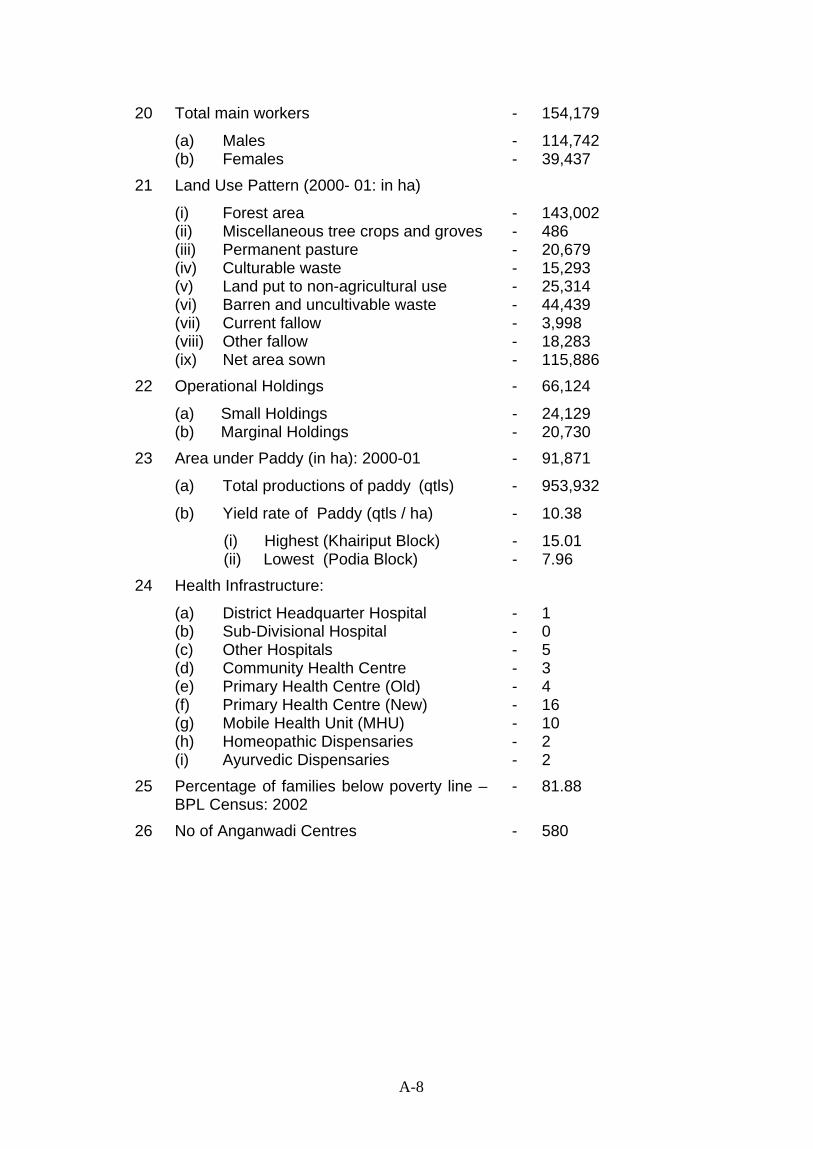
20 Total main workers - 154,179
(a) Males - 114,742 (b) Females - 39,437
21 Land Use Pattern (2000- 01: in ha)
(i) Forest area - 143,002 (ii) Miscellaneous tree crops and groves - 486 (iii) Permanent pasture - 20,679 (iv) Culturable waste - 15,293 (v) Land put to non-agricultural use - 25,314 (vi) Barren and uncultivable waste - 44,439 (vii) Current fallow - 3,998 (viii) Other fallow - 18,283 (ix) Net area sown - 115,886
22 Operational Holdings - 66,124
(a) Small Holdings - 24,129 (b) Marginal Holdings - 20,730
23 Area under Paddy (in ha): 2000-01 - 91,871
(a) Total productions of paddy (qtls) - 953,932
(b) Yield rate of Paddy (qtls / ha) - 10.38
(i) Highest (Khairiput Block) - 15.01 (ii) Lowest (Podia Block) - 7.96
24 Health Infrastructure:
(a) District Headquarter Hospital - 1 (b) Sub-Divisional Hospital - 0 (c) Other Hospitals - 5 (d) Community Health Centre - 3 (e) Primary Health Centre (Old) - 4 (f) Primary Health Centre (New) - 16 (g) Mobile Health Unit (MHU) - 10 (h) Homeopathic Dispensaries - 2 (i) Ayurvedic Dispensaries - 2
25 Percentage of families below poverty line – BPL Census: 2002
- 81.88
26 No of Anganwadi Centres - 580
A-8
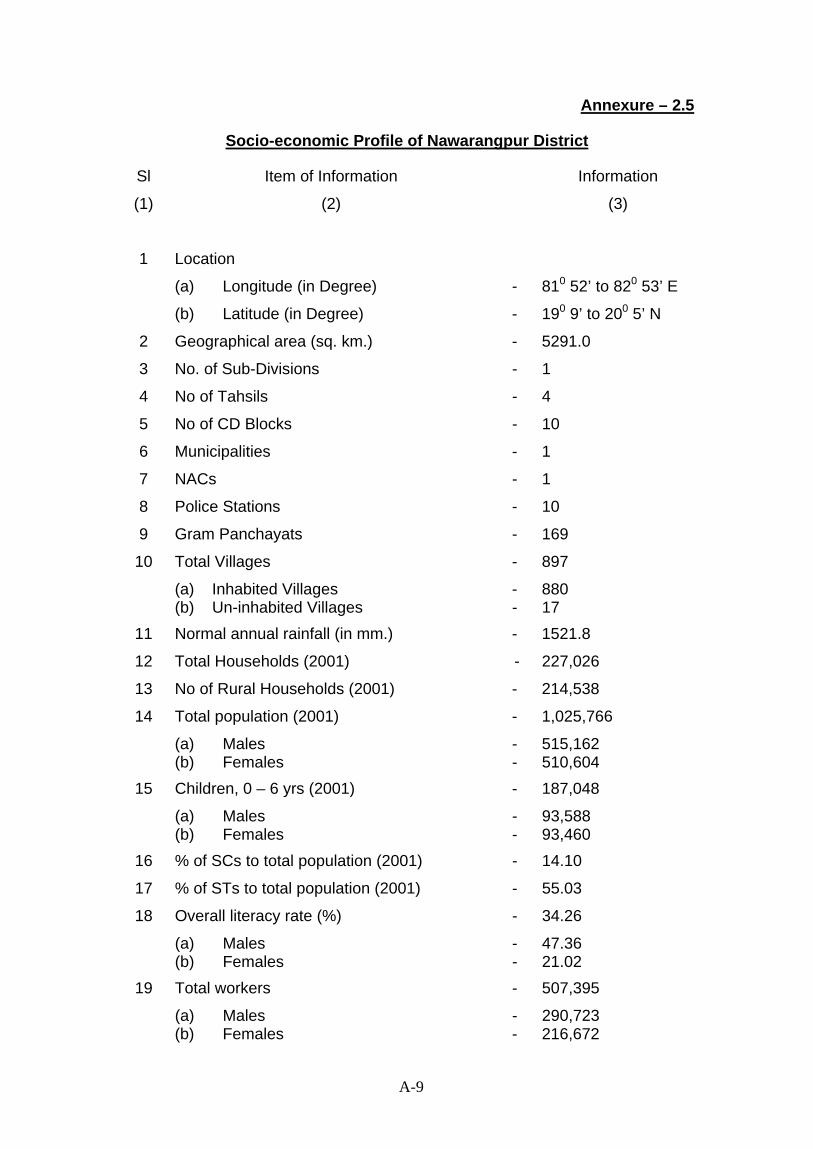
Annexure – 2.5
Socio-economic Profile of Nawarangpur District
Sl Item of Information Information
(1) (2) (3)
1 Location
(a) Longitude (in Degree) - 810 52’ to 820 53’ E
(b) Latitude (in Degree) - 190 9’ to 200 5’ N
2 Geographical area (sq. km.) - 5291.0
3 No. of Sub-Divisions - 1
4 No of Tahsils - 4
5 No of CD Blocks - 10
6 Municipalities - 1
7 NACs - 1
8 Police Stations - 10
9 Gram Panchayats - 169
10 Total Villages - 897
(a) Inhabited Villages - 880 (b) Un-inhabited Villages - 17
11 Normal annual rainfall (in mm.) - 1521.8
12 Total Households (2001) - 227,026
13 No of Rural Households (2001) - 214,538
14 Total population (2001) - 1,025,766
(a) Males - 515,162 (b) Females - 510,604
15 Children, 0 – 6 yrs (2001) - 187,048
(a) Males - 93,588 (b) Females - 93,460
16 % of SCs to total population (2001) - 14.10
17 % of STs to total population (2001) - 55.03
18 Overall literacy rate (%) - 34.26
(a) Males - 47.36 (b) Females - 21.02
19 Total workers - 507,395
(a) Males - 290,723 (b) Females - 216,672
A-9

20 Total main workers - 264,800
(a) Males - 215,836 (b) Females - 48,964
21 Land Use Pattern (2000- 01: in ha)
(i) Forest area - 93,468 (ii) Miscellaneous tree crops and groves - 16,820 (iii) Permanent pasture - 6,297 (iv) Culturable waste - 10,454 (v) Land put to non-agricultural use - 17,385 (vi) Barren and uncultivable waste - 6,704 (vii) Current fallow - 32,023 (viii) Other fallow - 6,509 (ix) Net area sown - 207,806
22 Operational Holdings - 128,074
(a) Small Holdings - 35,449 (b) Marginal Holdings - 68,602
23 Area under Paddy (in ha): 2000-01 - 153,577
(a) Total productions of paddy (qtls) - 2,631,368
(b) Yield rate of Paddy (qtls / ha) - 17.13
(i) Highest (Umerkote Block) - 24.90 (ii) Lowest (Papadahandi Block) - 13.17
24 Health Infrastructure:
(a) District Headquarter Hospital - 1 (b) Sub-Divisional Hospital - 0 (c) Other Hospitals - 3 (d) Community Health Centre - 5 (e) Primary Health Centre (Old) - 5 (f) Primary Health Centre (New) - 37 (g) Mobile Health Unit (MHU) - 11 (h) Homeopathic Dispensaries - 13 (i) Ayurvedic Dispensaries - 16
25 Percentage of families below poverty line – BPL Census: 2002
- 73.66
26 No of Anganwadi Centres - 994
A-10

Annexure – 2.6
Socio-economic Profile of Nuapada District
Sl Item of Information Information
(1) (2) (3)
1 Location
(a) Longitude (in Degree) - 820 20’ to 820 53’ E
(b) Latitude (in Degree) - 200 0’ to 210 5’ N
2 Geographical area (sq. km.) - 3852.0
3 No. of Sub-Divisions - 1
4 No of Tahsils - 2
5 No of CD Blocks - 5
6 Municipalities - 0
7 NACs - 2
8 Police Stations - 6
9 Gram Panchayats - 109
10 Total Villages - 659
(a) Inhabited Villages - 643 (b) Un-inhabited Villages - 16
11 Normal annual rainfall (in mm.) - 1378.2
12 Total Households (2001) - 122,601
13 No of Rural Households (2001) - 116,329
14 Total population (2001) - 530,690
(a) Males - 264,396 (b) Females - 266,294
15 Children, 0 – 6 yrs (2001) - 84,521
(a) Males - 42,927 (b) Females - 41,594
16 % of SCs to total population (2001) - 13.62
17 % of STs to total population (2001) - 34.71
18 Overall literacy rate (%) - 42.29
(a) Males - 58.78 (b) Females - 26.01
19 Total workers - 244,360
(a) Males - 146,378 (b) Females - 97,982
A-11

20 Total main workers - 131,561
(a) Males - 108,561 (b) Females - 22,654
21 Land Use Pattern (2000- 01: in ha)
(i) Forest area - 29,521 (ii) Miscellaneous tree crops and groves - 1,607 (iii) Permanent pasture - 12,587 (iv) Culturable waste - 9,156 (v) Land put to non-agricultural use - 18,713 (vi) Barren and uncultivable waste - 8,653 (vii) Current fallow - 26,264 (viii) Other fallow - 7,156 (ix) Net area sown - 130,653
22 Operational Holdings - 27,675
(a) Small Holdings - 10,520 (b) Marginal Holdings - 8,450
23 Area under Paddy (in ha): 2000-01 - 105,743
(a) Total productions of paddy (qtls) - 482,495
(b) Yield rate of Paddy (qtls / ha) - 4.56
(i) Highest (Nuapada Block) - 5.53 (ii) Lowest (Khariar Block) - 2.94
24 Health Infrastructure:
(a) District Headquarter Hospital - 1 (b) Sub-Divisional Hospital - 0 (c) Other Hospitals - 3 (d) Community Health Centre - 4 (e) Primary Health Centre (Old) - 2 (f) Primary Health Centre (New) - 12 (g) Mobile Health Unit (MHU) - 6 (h) Homeopathic Dispensaries - 5 (i) Ayurvedic Dispensaries - 9
25 Percentage of families below poverty line – BPL Census: 2002
- 72.03
26 No of Anganwadi Centres - 585
A-12

Annexure – 2.7
Socio-economic Profile of Rayagada District
Sl Item of Information Information
(1) (2) (3)
1 Location
(a) Longitude (in Degree) - 820 54’ to 840 2’ E
(b) Latitude (in Degree) - 190 0’ to 190 58’ N
2 Geographical area (sq. km.) - 7073.0
3 No. of Sub-Divisions - 2
4 No of Tahsils - 4
5 No of CD Blocks - 11
6 Municipalities - 1
7 NACs - 2
8 Police Stations - 12
9 Gram Panchayats - 171
10 Total Villages - 2667
(a) Inhabited Villages - 2445 (b) Un-inhabited Villages - 222
11 Normal annual rainfall (in mm.) - 1521
12 Total Households (2001) - 190,381
13 No of Rural Households (2001) - 165,257
14 Total population (2001) - 831,109
(a) Males - 409,792 (b) Females - 421,371
15 Children, 0 – 6 yrs (2001) - 145,493
(a) Males - 73,451 (b) Females - 72,042
16 % of SCs to total population (2001) - 13.91
17 % of STs to total population (2001) - 55.75
18 Overall literacy rate (%) - 35.16
(a) Males - 47.35 (b) Females - 24.31
19 Total workers - 399,184
(a) Males - 225,367 (b) Females - 173,817
A-13

20 Total main workers - 249,909
(a) Males - 179,932 (b) Females - 69,977
21 Land Use Pattern (2000- 01: in ha)
(i) Forest area - 100,767 (ii) Miscellaneous tree crops and groves - 5,457 (iii) Permanent pasture - 8,309 (iv) Culturable waste - 8,466 (v) Land put to non-agricultural use - 24,192 (vi) Barren and uncultivable waste - 160,232 (vii) Current fallow - 40,320 (viii) Other fallow - 16,704 (ix) Net area sown - 138,951
22 Operational Holdings - 100,396
(a) Small Holdings - 27,413 (b) Marginal Holdings - 52,155
23 Area under Paddy (in ha): 2000-01 - 69,443
(a) Total productions of paddy (qtls) - 1,106,918
(b) Yield rate of Paddy (qtls / ha) - 15.94
(i) Highest (Padampur Block) - 26.05 (ii) Lowest (Muniguda Block) - 11.42
24 Health Infrastructure:
(a) District Headquarter Hospital - 1 (b) Sub-Divisional Hospital - 1 (c) Other Hospitals - 3 (d) Community Health Centre - 11 (e) Primary Health Centre (Old) - 11 (f) Primary Health Centre (New) - 58 (g) Mobile Health Unit (MHU) - 12 (h) Homeopathic Dispensaries - 9 (i) Ayurvedic Dispensaries - 16
25 Percentage of families below poverty line – BPL Census: 2002
- 73.02
26 No of Anganwadi Centres - 1001
A-14

Annexure – 2.8
Socio-economic Profile of Sonepur District
Sl Item of Information Information
(1) (2) (3)
1 Location
(a) Longitude (in Degree) - 830 27’ to 840 15’ E
(b) Latitude (in Degree) - 200 30’ to 200 10’ N
2 Geographical area (sq. km.) - 2337.0
3 No. of Sub-Divisions - 2
4 No of Tahsils - 4
5 No of CD Blocks - 6
6 Municipalities - 1
7 NACs - 2
8 Police Stations - 7
9 Gram Panchayats - 96
10 Total Villages - 959
(a) Inhabited Villages - 808 (b) Un-inhabited Villages - 151
11 Normal annual rainfall (in mm.) - 1443.5
12 Total Households (2001) - 115,533
13 No of Rural Households (2001) - 107,292
14 Total population (2001) - 541,835
(a) Males - 275,601 (b) Females - 266,234
15 Children, 0 – 6 yrs (2001) - 77,259
(a) Males - 39,275 (b) Females - 37,984
16 % of SCs to total population (2001) - 23.62
17 % of STs to total population (2001) - 9.78
18 Overall literacy rate (%) - 64.07
(a) Males - 80.30 (b) Females - 47.28
19 Total workers - 236,980
(a) Males - 149,776 (b) Females - 87,204
A-15
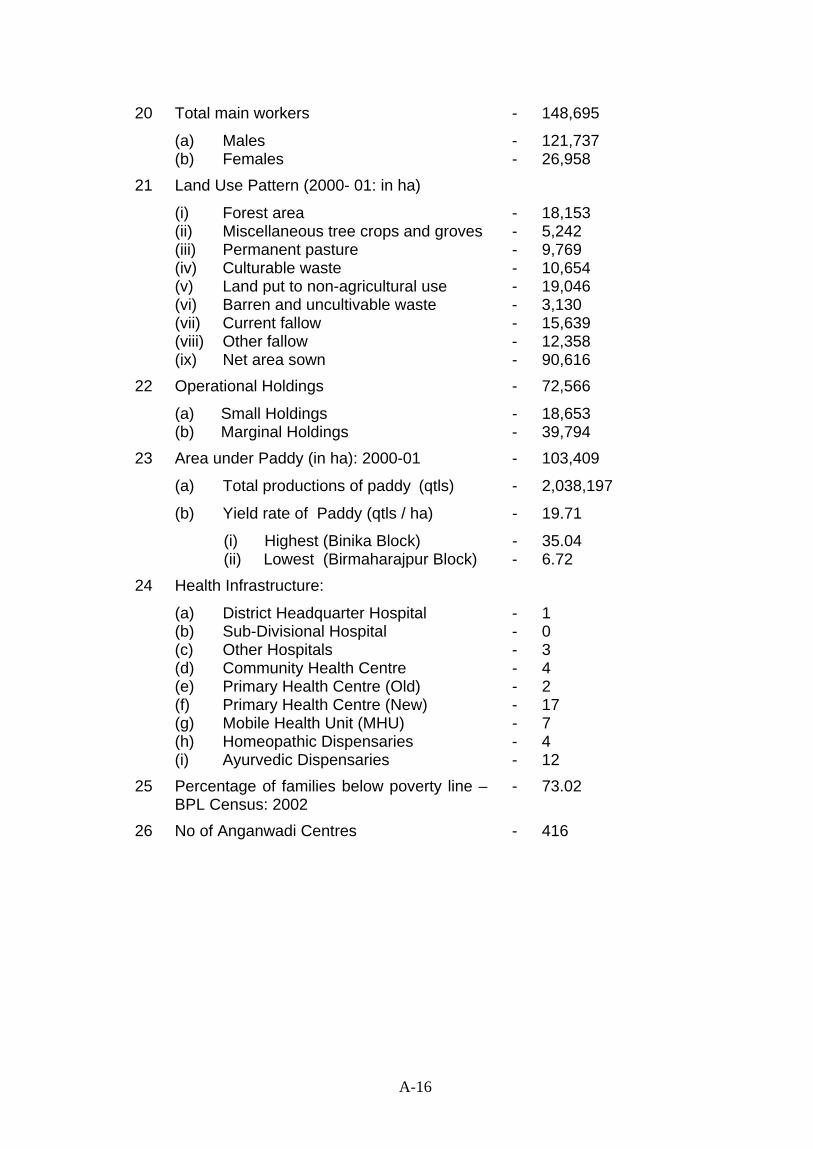
A-16
20 Total main workers - 148,695
(a) Males - 121,737 (b) Females - 26,958
21 Land Use Pattern (2000- 01: in ha)
(i) Forest area - 18,153 (ii) Miscellaneous tree crops and groves - 5,242 (iii) Permanent pasture - 9,769 (iv) Culturable waste - 10,654 (v) Land put to non-agricultural use - 19,046 (vi) Barren and uncultivable waste - 3,130 (vii) Current fallow - 15,639 (viii) Other fallow - 12,358 (ix) Net area sown - 90,616
22 Operational Holdings - 72,566
(a) Small Holdings - 18,653 (b) Marginal Holdings - 39,794
23 Area under Paddy (in ha): 2000-01 - 103,409
(a) Total productions of paddy (qtls) - 2,038,197
(b) Yield rate of Paddy (qtls / ha) - 19.71
(i) Highest (Binika Block) - 35.04 (ii) Lowest (Birmaharajpur Block) - 6.72
24 Health Infrastructure:
(a) District Headquarter Hospital - 1 (b) Sub-Divisional Hospital - 0 (c) Other Hospitals - 3 (d) Community Health Centre - 4 (e) Primary Health Centre (Old) - 2 (f) Primary Health Centre (New) - 17 (g) Mobile Health Unit (MHU) - 7 (h) Homeopathic Dispensaries - 4 (i) Ayurvedic Dispensaries - 12
25 Percentage of families below poverty line – BPL Census: 2002
- 73.02
26 No of Anganwadi Centres - 416
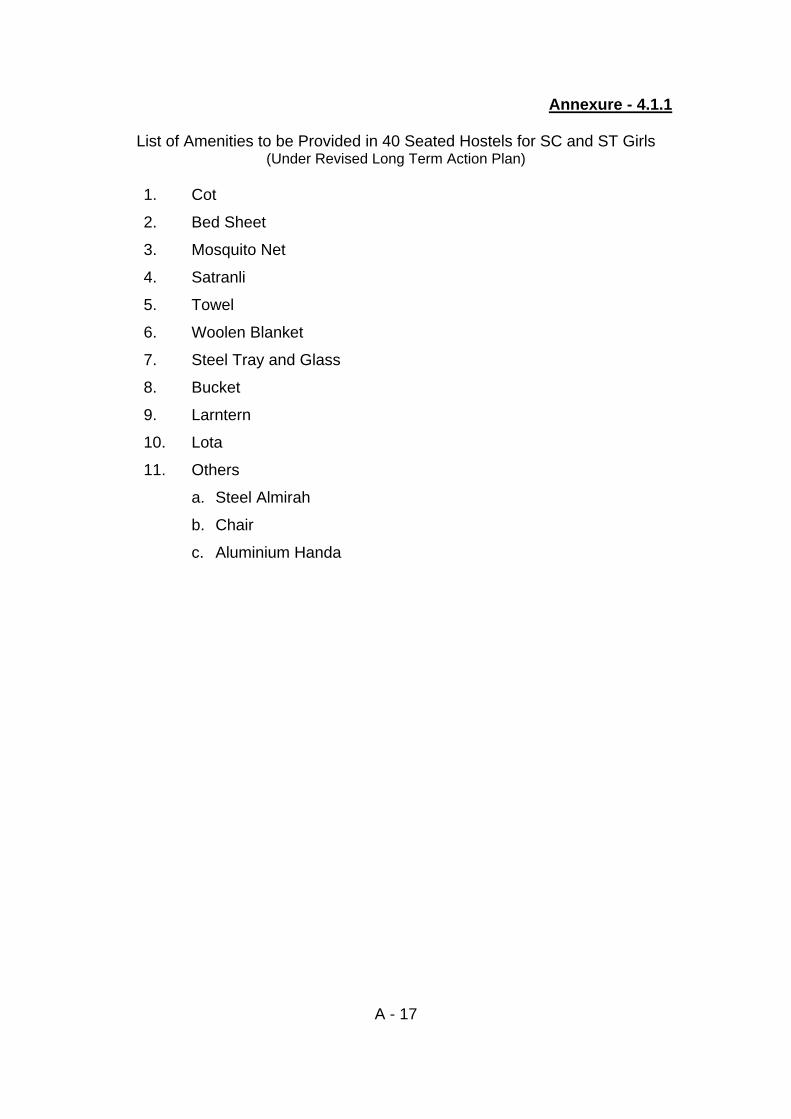
A - 17
Annexure - 4.1.1
List of Amenities to be Provided in 40 Seated Hostels for SC and ST Girls (Under Revised Long Term Action Plan)
1. Cot
2. Bed Sheet
3. Mosquito Net
4. Satranli
5. Towel
6. Woolen Blanket
7. Steel Tray and Glass
8. Bucket
9. Larntern
10. Lota
11. Others
a. Steel Almirah
b. Chair
c. Aluminium Handa
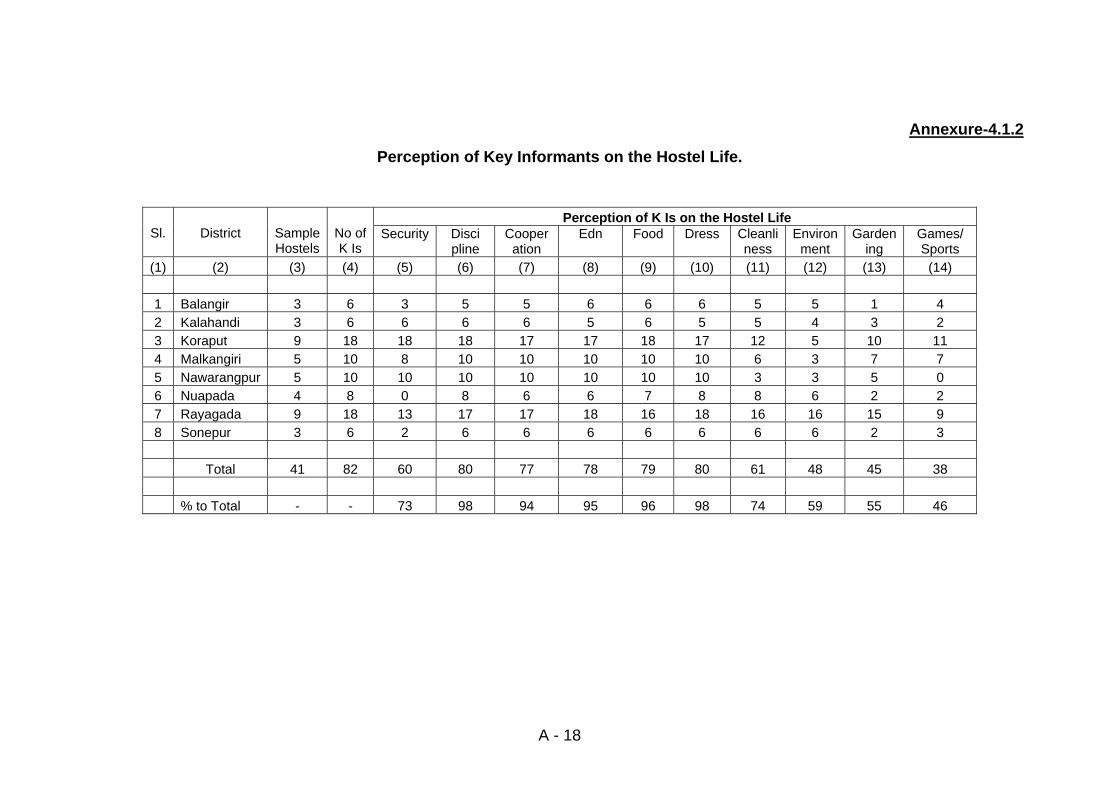
Annexure-4.1.2 Perception of Key Informants on the Hostel Life.
Perception of K Is on the Hostel Life
Sl.
District
Sample Hostels
No ofK Is
Security
Disci pline
Cooperation
Edn
Food
Dress
Cleanliness
Environment
Gardening
Games/ Sports
(1) (2) (3) (4) (5) (6) (7) (8) (9) (10) (11) (12) (13) (14) 1 Balangir 3 6 3 5 5 6 6 6 5 5 1 4 2 Kalahandi 3 6 6 6 6 5 6 5 5 4 3 2 3 Koraput 9 18 18 18 17 17 18 17 12 5 10 11 4 Malkangiri 5 10 8 10 10 10 10 10 6 3 7 7 5 Nawarangpur 5 10 10 10 10 10 10 10 3 3 5 0 6 Nuapada 4 8 0 8 6 6 7 8 8 6 2 2 7 Rayagada 9 18 13 17 17 18 16 18 16 16 15 9 8 Sonepur 3 6 2 6 6 6 6 6 6 6 2 3 Total 41 82 60 80 77 78 79 80 61 48 45 38 % to Total - - 73 98 94 95 96 98 74 59 55 46
A - 18
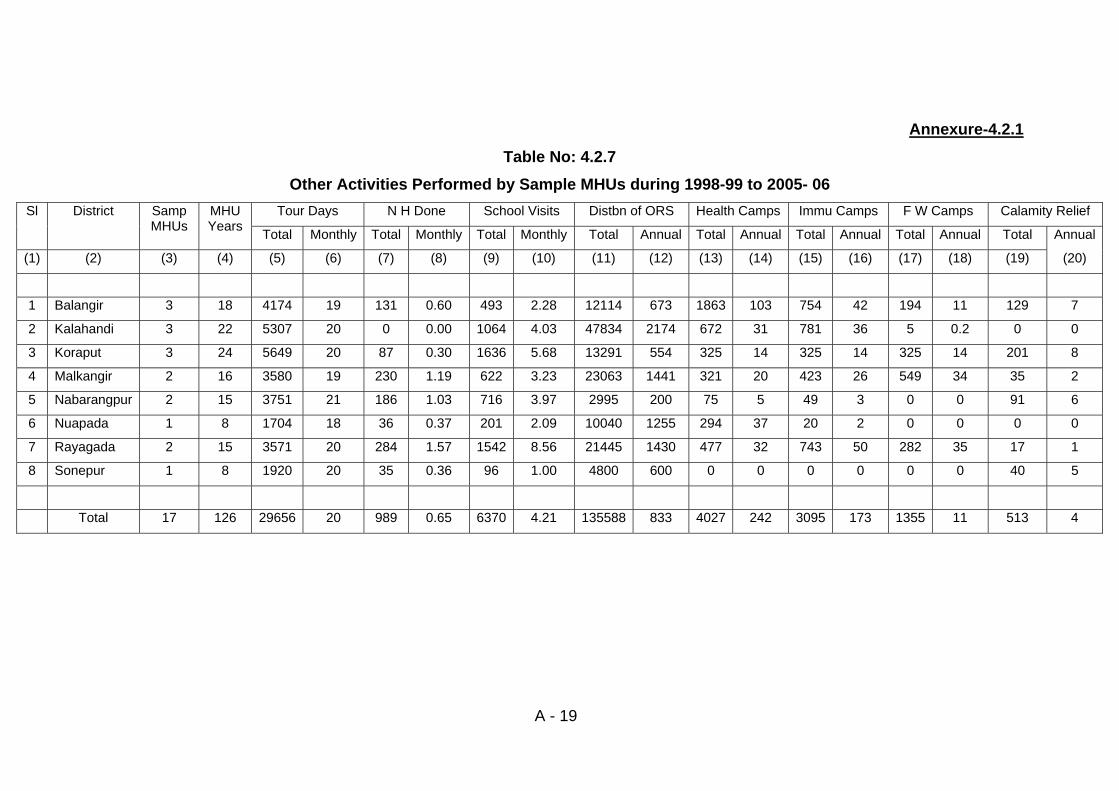
Annexure-4.2.1 Table No: 4.2.7
Other Activities Performed by Sample MHUs during 1998-99 to 2005- 06 Tour Days N H Done School Visits Distbn of ORS Health Camps Immu Camps F W Camps Calamity Relief Sl
District
Samp MHUs
MHU Years
Total Monthly Total Monthly Total Monthly Total Annual Total Annual Total Annual Total Annual Total Annual
(1) (2) (3) (4) (5) (6) (7) (8) (9) (10) (11) (12) (13) (14) (15) (16) (17) (18) (19) (20)
1 Balangir 3 18 4174 19 131 0.60 493 2.28 12114 673 1863 103 754 42 194 11 129 7
2 Kalahandi 3 22 5307 20 0 0.00 1064 4.03 47834 2174 672 31 781 36 5 0.2 0 0
3 Koraput 3 24 5649 20 87 0.30 1636 5.68 13291 554 325 14 325 14 325 14 201 8
4 Malkangir 2 16 3580 19 230 1.19 622 3.23 23063 1441 321 20 423 26 549 34 35 2
5 Nabarangpur 2 15 3751 21 186 1.03 716 3.97 2995 200 75 5 49 3 0 0 91 6
6 Nuapada 1 8 1704 18 36 0.37 201 2.09 10040 1255 294 37 20 2 0 0 0 0
7 Rayagada 2 15 3571 20 284 1.57 1542 8.56 21445 1430 477 32 743 50 282 35 17 1
8 Sonepur 1 8 1920 20 35 0.36 96 1.00 4800 600 0 0 0 0 0 0 40 5
Total 17 126 29656 20 989 0.65 6370 4.21 135588 833 4027 242 3095 173 1355 11 513 4
A - 19
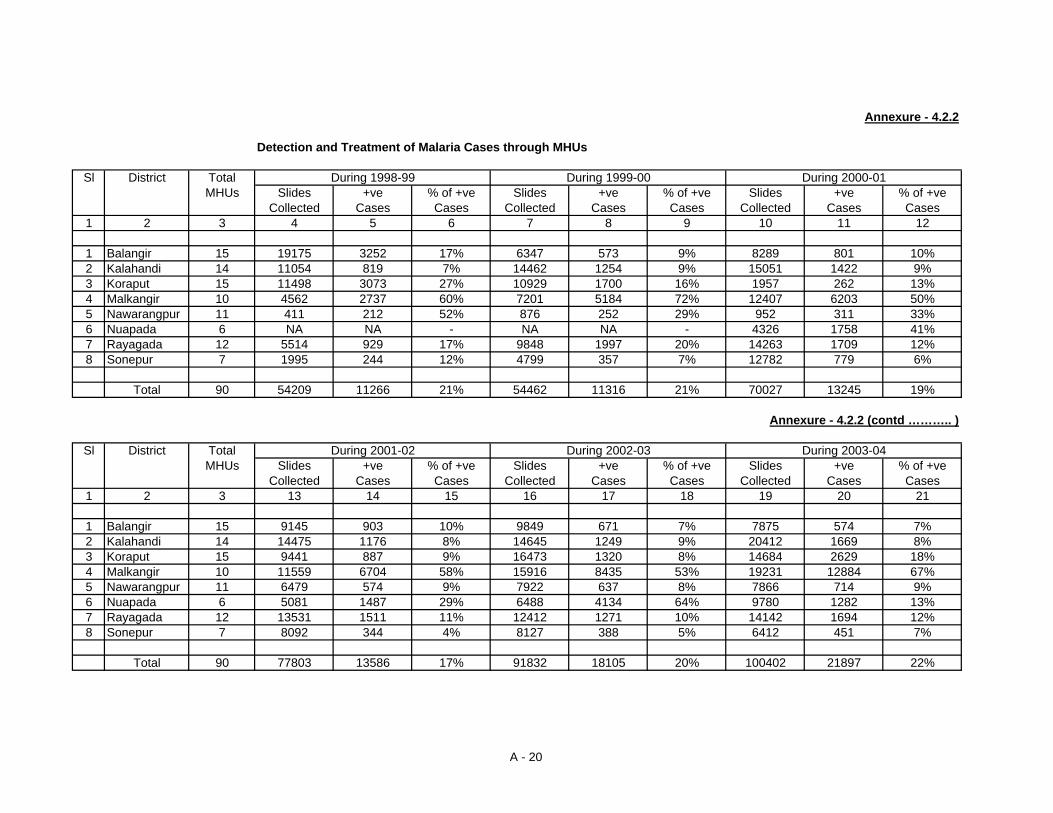
Annexure - 4.2.2
Detection and Treatment of Malaria Cases through MHUs
Sl District Total During 1998-99 During 1999-00 During 2000-01MHUs Slides +ve % of +ve Slides +ve % of +ve Slides +ve % of +ve
Collected Cases Cases Collected Cases Cases Collected Cases Cases1 2 3 4 5 6 7 8 9 10 11 12
1 Balangir 15 19175 3252 17% 6347 573 9% 8289 801 10%2 Kalahandi 14 11054 819 7% 14462 1254 9% 15051 1422 9%3 Koraput 15 11498 3073 27% 10929 1700 16% 1957 262 13%4 Malkangir 10 4562 2737 60% 7201 5184 72% 12407 6203 50%5 Nawarangpur 11 411 212 52% 876 252 29% 952 311 33%6 Nuapada 6 NA NA - NA NA - 4326 1758 41%7 Rayagada 12 5514 929 17% 9848 1997 20% 14263 1709 12%8 Sonepur 7 1995 244 12% 4799 357 7% 12782 779 6%
Total 90 54209 11266 21% 54462 11316 21% 70027 13245 19%
Annexure - 4.2.2 (contd ……….. )
Sl District Total During 2001-02 During 2002-03 During 2003-04MHUs Slides +ve % of +ve Slides +ve % of +ve Slides +ve % of +ve
Collected Cases Cases Collected Cases Cases Collected Cases Cases1 2 3 13 14 15 16 17 18 19 20 21
1 Balangir 15 9145 903 10% 9849 671 7% 7875 574 7%2 Kalahandi 14 14475 1176 8% 14645 1249 9% 20412 1669 8%3 Koraput 15 9441 887 9% 16473 1320 8% 14684 2629 18%4 Malkangir 10 11559 6704 58% 15916 8435 53% 19231 12884 67%5 Nawarangpur 11 6479 574 9% 7922 637 8% 7866 714 9%6 Nuapada 6 5081 1487 29% 6488 4134 64% 9780 1282 13%7 Rayagada 12 13531 1511 11% 12412 1271 10% 14142 1694 12%8 Sonepur 7 8092 344 4% 8127 388 5% 6412 451 7%
Total 90 77803 13586 17% 91832 18105 20% 100402 21897 22%
A - 20
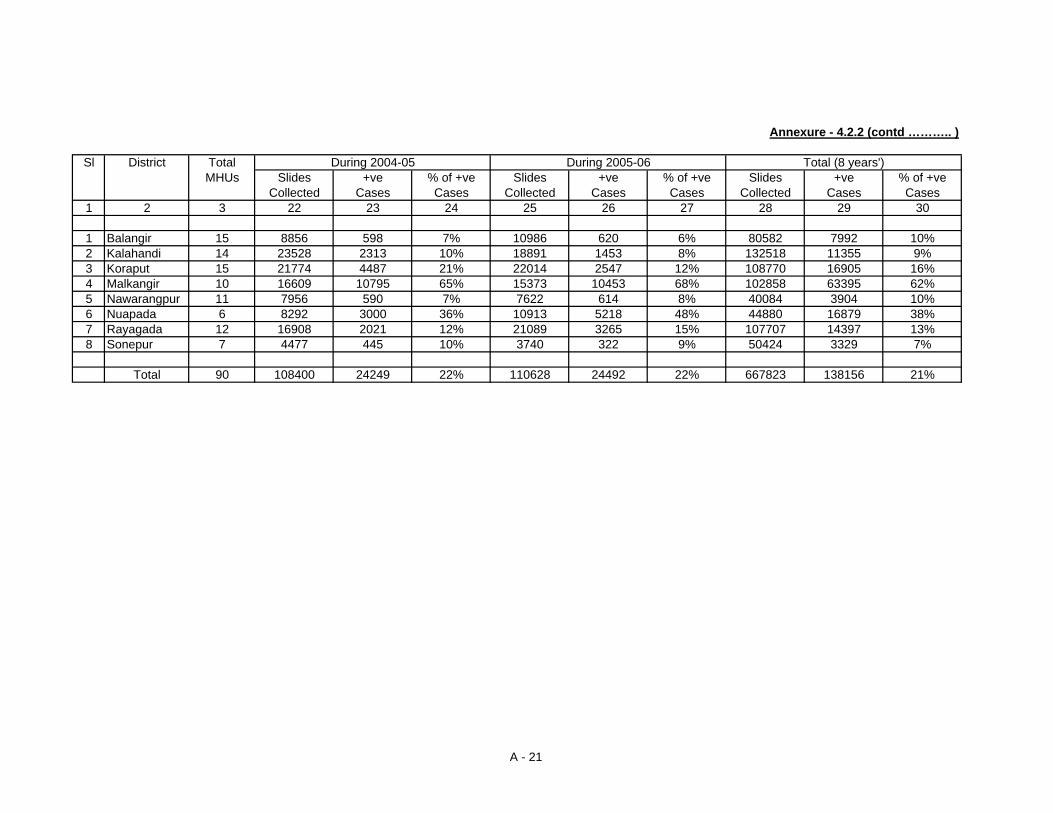
Annexure - 4.2.2 (contd ……….. )
Sl District Total During 2004-05 During 2005-06 Total (8 years')MHUs Slides +ve % of +ve Slides +ve % of +ve Slides +ve % of +ve
Collected Cases Cases Collected Cases Cases Collected Cases Cases1 2 3 22 23 24 25 26 27 28 29 30
1 Balangir 15 8856 598 7% 10986 620 6% 80582 7992 10%2 Kalahandi 14 23528 2313 10% 18891 1453 8% 132518 11355 9%3 Koraput 15 21774 4487 21% 22014 2547 12% 108770 16905 16%4 Malkangir 10 16609 10795 65% 15373 10453 68% 102858 63395 62%5 Nawarangpur 11 7956 590 7% 7622 614 8% 40084 3904 10%6 Nuapada 6 8292 3000 36% 10913 5218 48% 44880 16879 38%7 Rayagada 12 16908 2021 12% 21089 3265 15% 107707 14397 13%8 Sonepur 7 4477 445 10% 3740 322 9% 50424 3329 7%
Total 90 108400 24249 22% 110628 24492 22% 667823 138156 21%
A - 21
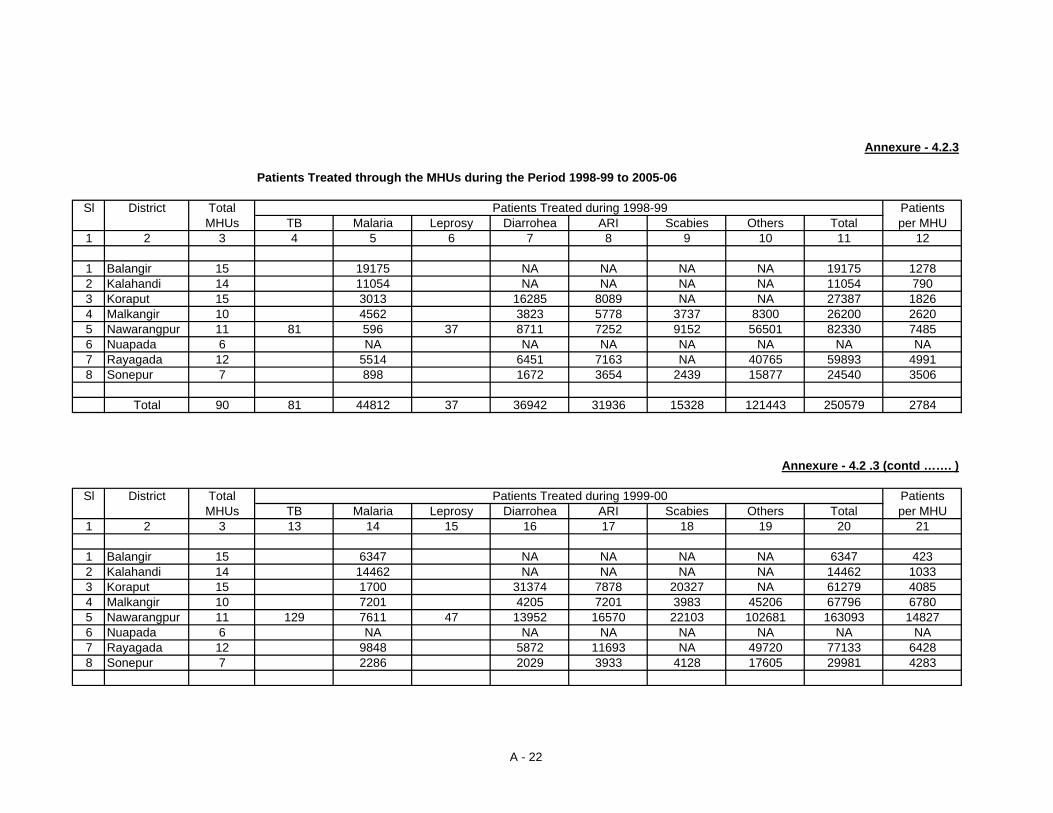
Annexure - 4.2.3
Patients Treated through the MHUs during the Period 1998-99 to 2005-06
Sl District Total Patients Treated during 1998-99 PatientsMHUs TB Malaria Leprosy Diarrohea ARI Scabies Others Total per MHU
1 2 3 4 5 6 7 8 9 10 11 12
1 Balangir 15 19175 NA NA NA NA 19175 12782 Kalahandi 14 11054 NA NA NA NA 11054 7903 Koraput 15 3013 16285 8089 NA NA 27387 18264 Malkangir 10 4562 3823 5778 3737 8300 26200 26205 Nawarangpur 11 81 596 37 8711 7252 9152 56501 82330 74856 Nuapada 6 NA NA NA NA NA NA NA7 Rayagada 12 5514 6451 7163 NA 40765 59893 49918 Sonepur 7 898 1672 3654 2439 15877 24540 3506
Total 90 81 44812 37 36942 31936 15328 121443 250579 2784
Annexure - 4.2 .3 (contd ……. )
Sl District Total Patients Treated during 1999-00 PatientsMHUs TB Malaria Leprosy Diarrohea ARI Scabies Others Total per MHU
1 2 3 13 14 15 16 17 18 19 20 21
1 Balangir 15 6347 NA NA NA NA 6347 4232 Kalahandi 14 14462 NA NA NA NA 14462 10333 Koraput 15 1700 31374 7878 20327 NA 61279 40854 Malkangir 10 7201 4205 7201 3983 45206 67796 67805 Nawarangpur 11 129 7611 47 13952 16570 22103 102681 163093 148276 Nuapada 6 NA NA NA NA NA NA NA7 Rayagada 12 9848 5872 11693 NA 49720 77133 64288 Sonepur 7 2286 2029 3933 4128 17605 29981 4283
A - 22
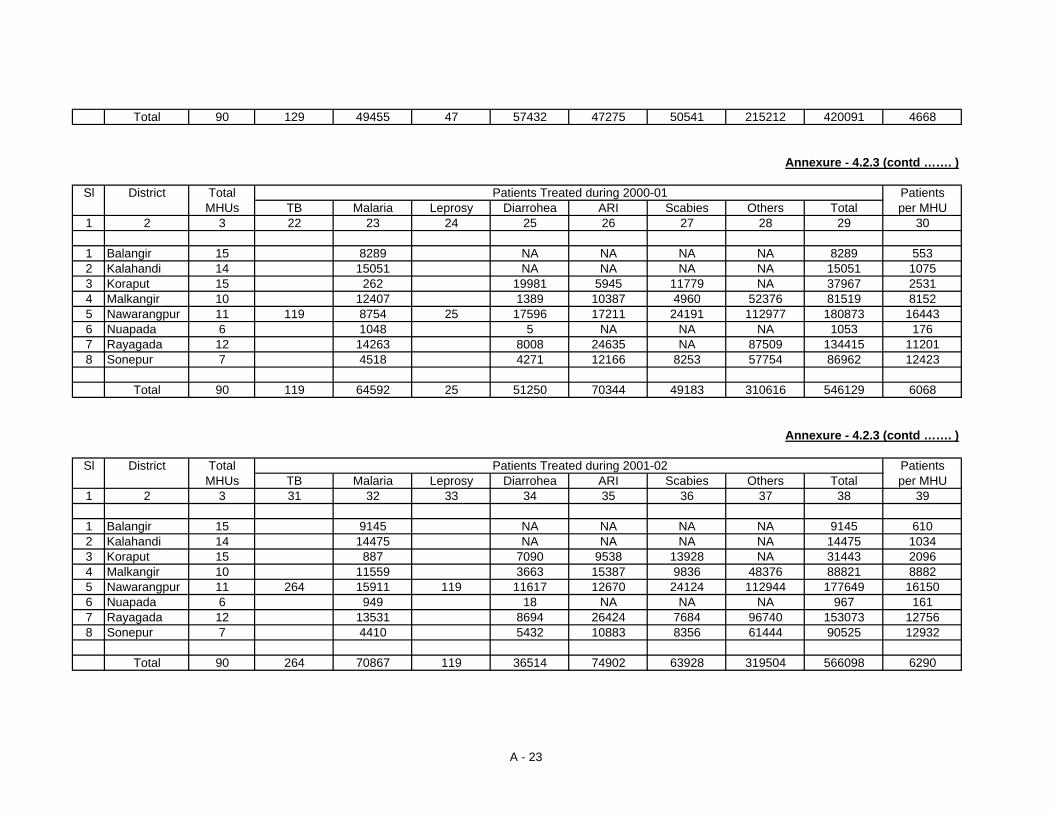
Total 90 129 49455 47 57432 47275 50541 215212 420091 4668
Annexure - 4.2.3 (contd ……. )
Sl District Total Patients Treated during 2000-01 PatientsMHUs TB Malaria Leprosy Diarrohea ARI Scabies Others Total per MHU
1 2 3 22 23 24 25 26 27 28 29 30
1 Balangir 15 8289 NA NA NA NA 8289 5532 Kalahandi 14 15051 NA NA NA NA 15051 10753 Koraput 15 262 19981 5945 11779 NA 37967 25314 Malkangir 10 12407 1389 10387 4960 52376 81519 81525 Nawarangpur 11 119 8754 25 17596 17211 24191 112977 180873 164436 Nuapada 6 1048 5 NA NA NA 1053 1767 Rayagada 12 14263 8008 24635 NA 87509 134415 112018 Sonepur 7 4518 4271 12166 8253 57754 86962 12423
Total 90 119 64592 25 51250 70344 49183 310616 546129 6068
Annexure - 4.2.3 (contd ……. )
Sl District Total Patients Treated during 2001-02 PatientsMHUs TB Malaria Leprosy Diarrohea ARI Scabies Others Total per MHU
1 2 3 31 32 33 34 35 36 37 38 39
1 Balangir 15 9145 NA NA NA NA 9145 6102 Kalahandi 14 14475 NA NA NA NA 14475 10343 Koraput 15 887 7090 9538 13928 NA 31443 20964 Malkangir 10 11559 3663 15387 9836 48376 88821 88825 Nawarangpur 11 264 15911 119 11617 12670 24124 112944 177649 161506 Nuapada 6 949 18 NA NA NA 967 1617 Rayagada 12 13531 8694 26424 7684 96740 153073 127568 Sonepur 7 4410 5432 10883 8356 61444 90525 12932
Total 90 264 70867 119 36514 74902 63928 319504 566098 6290
A - 23
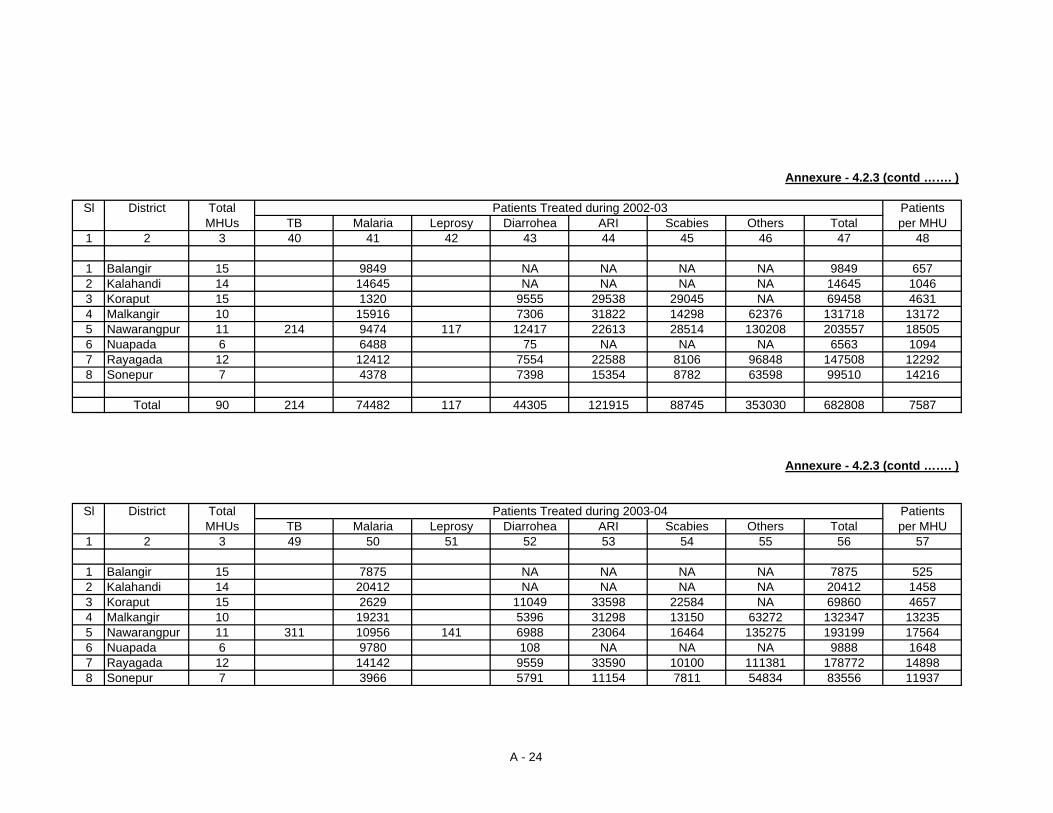
Annexure - 4.2.3 (contd ……. )
Sl District Total Patients Treated during 2002-03 PatientsMHUs TB Malaria Leprosy Diarrohea ARI Scabies Others Total per MHU
1 2 3 40 41 42 43 44 45 46 47 48
1 Balangir 15 9849 NA NA NA NA 9849 6572 Kalahandi 14 14645 NA NA NA NA 14645 10463 Koraput 15 1320 9555 29538 29045 NA 69458 46314 Malkangir 10 15916 7306 31822 14298 62376 131718 131725 Nawarangpur 11 214 9474 117 12417 22613 28514 130208 203557 185056 Nuapada 6 6488 75 NA NA NA 6563 10947 Rayagada 12 12412 7554 22588 8106 96848 147508 122928 Sonepur 7 4378 7398 15354 8782 63598 99510 14216
Total 90 214 74482 117 44305 121915 88745 353030 682808 7587
Annexure - 4.2.3 (contd ……. )
Sl District Total Patients Treated during 2003-04 PatientsMHUs TB Malaria Leprosy Diarrohea ARI Scabies Others Total per MHU
1 2 3 49 50 51 52 53 54 55 56 57
1 Balangir 15 7875 NA NA NA NA 7875 5252 Kalahandi 14 20412 NA NA NA NA 20412 14583 Koraput 15 2629 11049 33598 22584 NA 69860 46574 Malkangir 10 19231 5396 31298 13150 63272 132347 132355 Nawarangpur 11 311 10956 141 6988 23064 16464 135275 193199 175646 Nuapada 6 9780 108 NA NA NA 9888 16487 Rayagada 12 14142 9559 33590 10100 111381 178772 148988 Sonepur 7 3966 5791 11154 7811 54834 83556 11937
A - 24
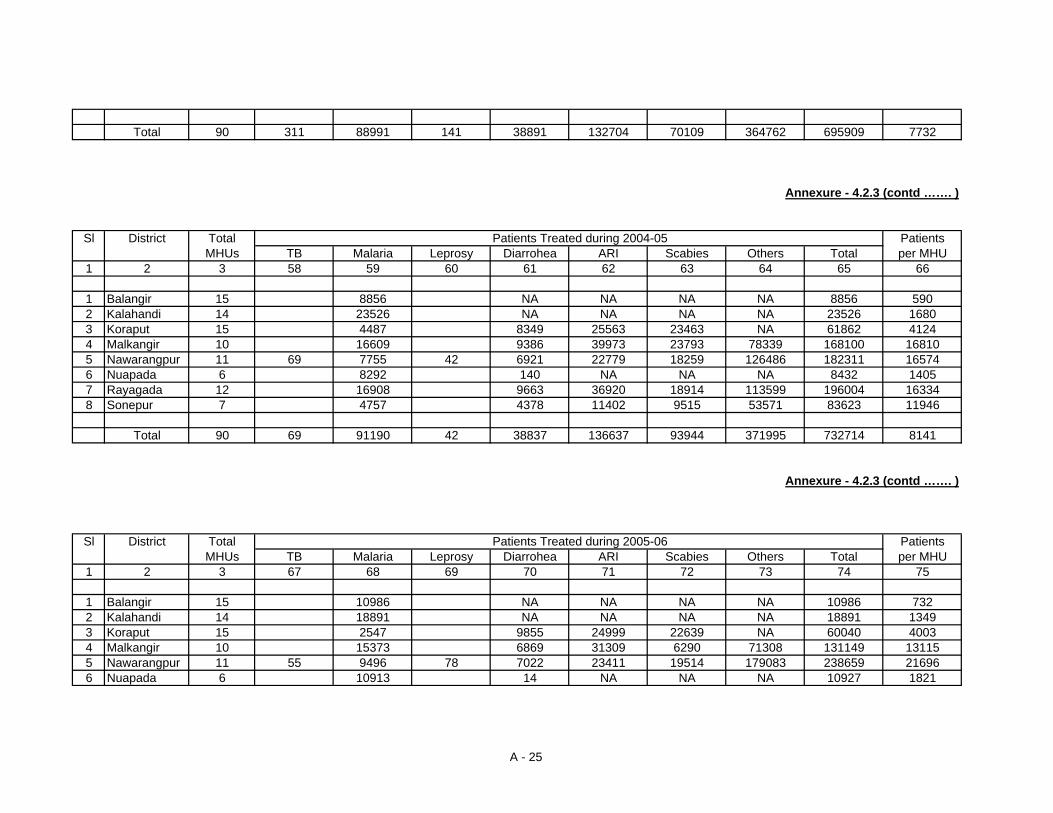
Total 90 311 88991 141 38891 132704 70109 364762 695909 7732
Annexure - 4.2.3 (contd ……. )
Sl District Total Patients Treated during 2004-05 PatientsMHUs TB Malaria Leprosy Diarrohea ARI Scabies Others Total per MHU
1 2 3 58 59 60 61 62 63 64 65 66
1 Balangir 15 8856 NA NA NA NA 8856 5902 Kalahandi 14 23526 NA NA NA NA 23526 16803 Koraput 15 4487 8349 25563 23463 NA 61862 41244 Malkangir 10 16609 9386 39973 23793 78339 168100 168105 Nawarangpur 11 69 7755 42 6921 22779 18259 126486 182311 165746 Nuapada 6 8292 140 NA NA NA 8432 14057 Rayagada 12 16908 9663 36920 18914 113599 196004 163348 Sonepur 7 4757 4378 11402 9515 53571 83623 11946
Total 90 69 91190 42 38837 136637 93944 371995 732714 8141
Annexure - 4.2.3 (contd ……. )
Sl District Total Patients Treated during 2005-06 PatientsMHUs TB Malaria Leprosy Diarrohea ARI Scabies Others Total per MHU
1 2 3 67 68 69 70 71 72 73 74 75
1 Balangir 15 10986 NA NA NA NA 10986 7322 Kalahandi 14 18891 NA NA NA NA 18891 13493 Koraput 15 2547 9855 24999 22639 NA 60040 40034 Malkangir 10 15373 6869 31309 6290 71308 131149 131155 Nawarangpur 11 55 9496 78 7022 23411 19514 179083 238659 216966 Nuapada 6 10913 14 NA NA NA 10927 1821
A - 25
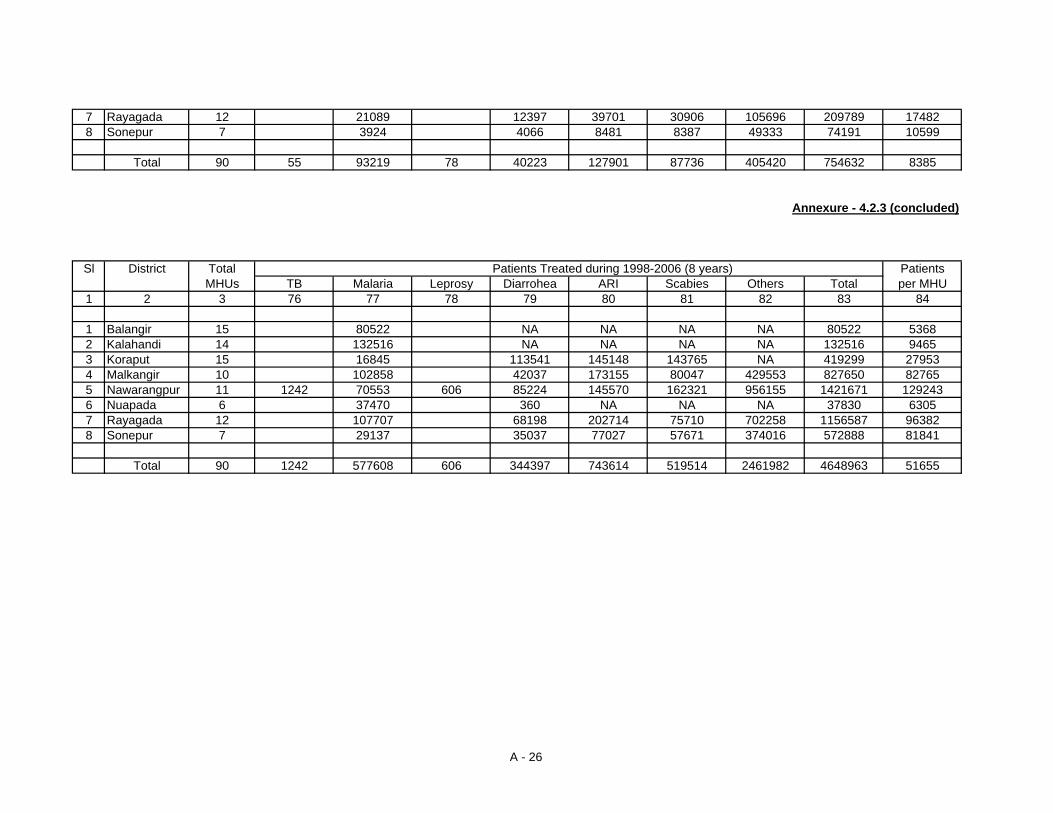
7 Rayagada 12 21089 12397 39701 30906 105696 209789 174828 Sonepur 7 3924 4066 8481 8387 49333 74191 10599
Total 90 55 93219 78 40223 127901 87736 405420 754632 8385
Annexure - 4.2.3 (concluded)
Sl District Total Patients Treated during 1998-2006 (8 years) PatientsMHUs TB Malaria Leprosy Diarrohea ARI Scabies Others Total per MHU
1 2 3 76 77 78 79 80 81 82 83 84
1 Balangir 15 80522 NA NA NA NA 80522 53682 Kalahandi 14 132516 NA NA NA NA 132516 94653 Koraput 15 16845 113541 145148 143765 NA 419299 279534 Malkangir 10 102858 42037 173155 80047 429553 827650 827655 Nawarangpur 11 1242 70553 606 85224 145570 162321 956155 1421671 1292436 Nuapada 6 37470 360 NA NA NA 37830 63057 Rayagada 12 107707 68198 202714 75710 702258 1156587 963828 Sonepur 7 29137 35037 77027 57671 374016 572888 81841
Total 90 1242 577608 606 344397 743614 519514 2461982 4648963 51655
A - 26
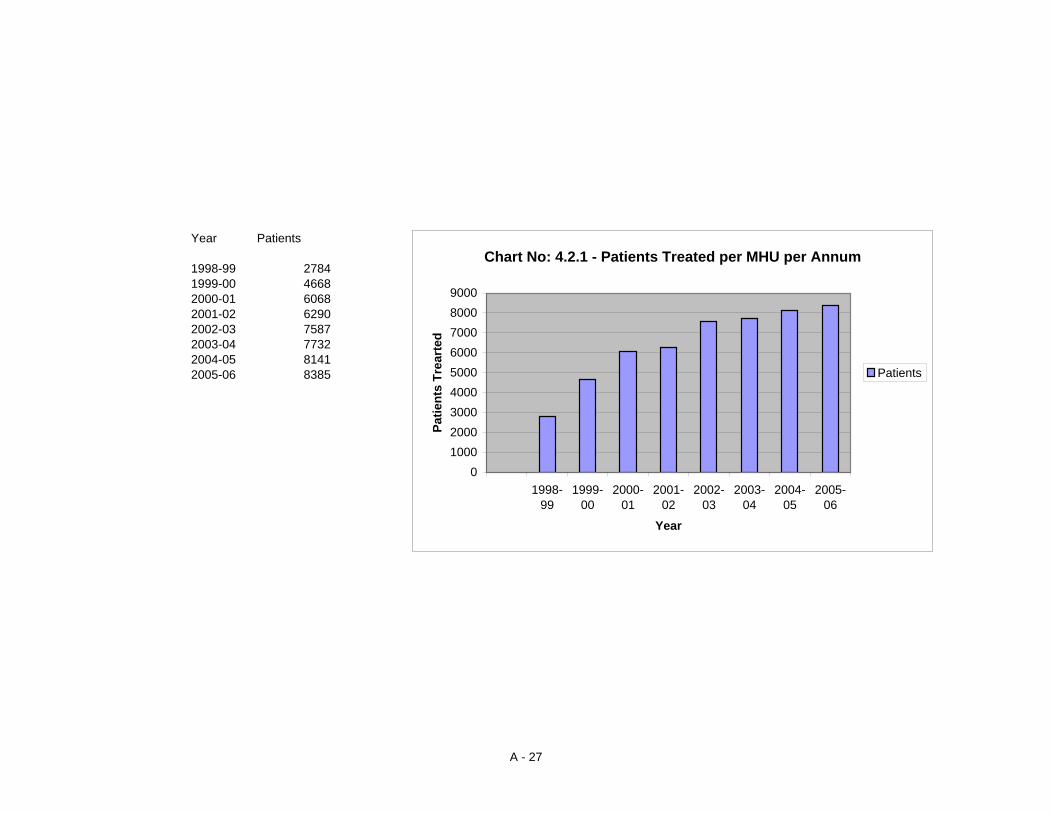
Year Patients
1998-99 27841999-00 46682000-01 60682001-02 62902002-03 75872003-04 77322004-05 81412005-06 8385
Chart No: 4.2.1 - Patients Treated per MHU per Annum
0100020003000400050006000700080009000
1998-99
1999-00
2000-01
2001-02
2002-03
2003-04
2004-05
2005-06
Year
Patie
nts
Trea
rted
Patients
A - 27
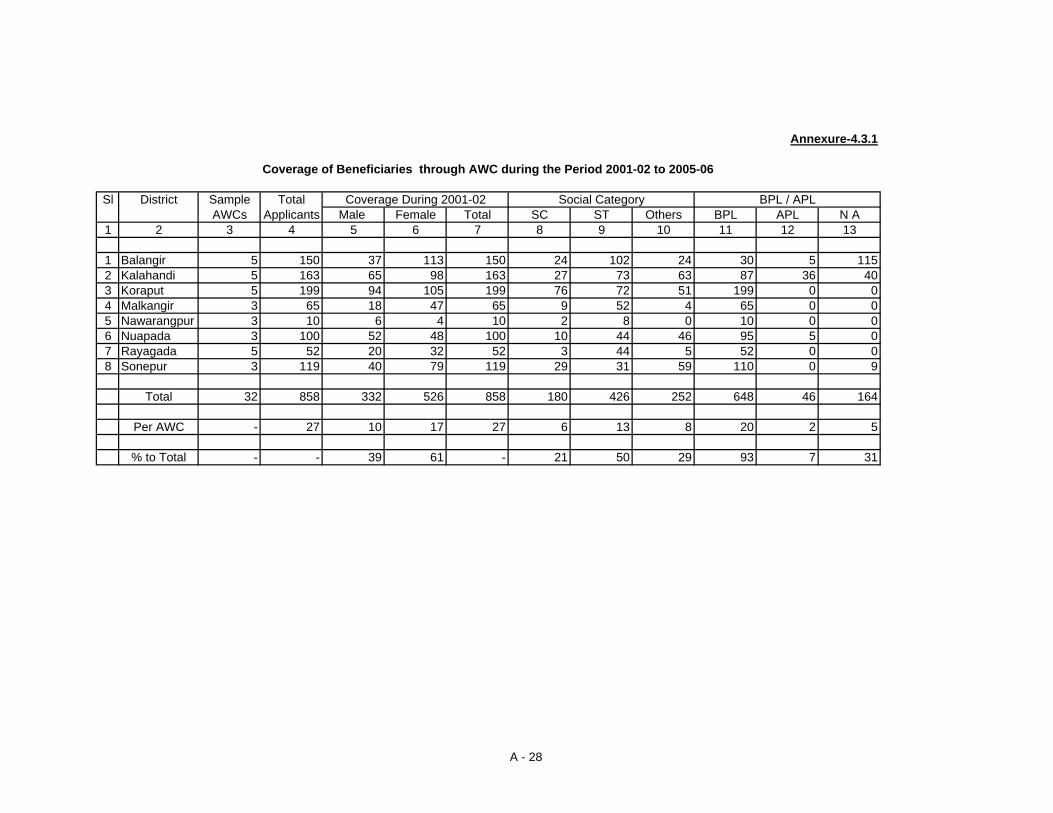
Annexure-4.3.1
Coverage of Beneficiaries through AWC during the Period 2001-02 to 2005-06
Sl District Sample Total Coverage During 2001-02 Social Category BPL / APLAWCs Applicants Male Female Total SC ST Others BPL APL N A
1 2 3 4 5 6 7 8 9 10 11 12 13
1 Balangir 5 150 37 113 150 24 102 24 30 5 1152 Kalahandi 5 163 65 98 163 27 73 63 87 36 403 Koraput 5 199 94 105 199 76 72 51 199 0 04 Malkangir 3 65 18 47 65 9 52 4 65 0 05 Nawarangpur 3 10 6 4 10 2 8 0 10 0 06 Nuapada 3 100 52 48 100 10 44 46 95 5 07 Rayagada 5 52 20 32 52 3 44 5 52 0 08 Sonepur 3 119 40 79 119 29 31 59 110 0 9
Total 32 858 332 526 858 180 426 252 648 46 164
Per AWC - 27 10 17 27 6 13 8 20 2 5
% to Total - - 39 61 - 21 50 29 93 7 31
A - 28
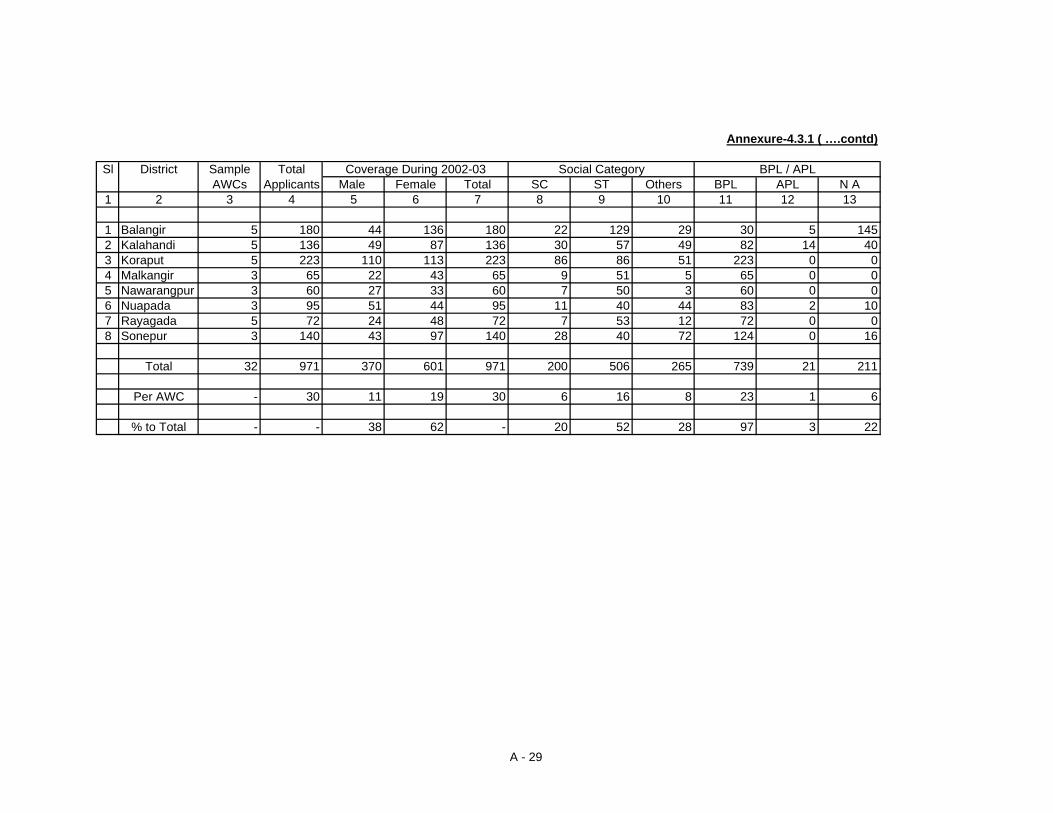
Annexure-4.3.1 ( ….contd)
Sl District Sample Total Coverage During 2002-03 Social Category BPL / APLAWCs Applicants Male Female Total SC ST Others BPL APL N A
1 2 3 4 5 6 7 8 9 10 11 12 13
1 Balangir 5 180 44 136 180 22 129 29 30 5 1452 Kalahandi 5 136 49 87 136 30 57 49 82 14 403 Koraput 5 223 110 113 223 86 86 51 223 0 04 Malkangir 3 65 22 43 65 9 51 5 65 0 05 Nawarangpur 3 60 27 33 60 7 50 3 60 0 06 Nuapada 3 95 51 44 95 11 40 44 83 2 107 Rayagada 5 72 24 48 72 7 53 12 72 0 08 Sonepur 3 140 43 97 140 28 40 72 124 0 16
Total 32 971 370 601 971 200 506 265 739 21 211
Per AWC - 30 11 19 30 6 16 8 23 1 6
% to Total - - 38 62 - 20 52 28 97 3 22
A - 29

Annexure-4.3.1 ( ….contd)
Sl District Sample Total Coverage During 2003-04 Social Category BPL / APLAWCs Applicants Male Female Total SC ST Others BPL APL N A
1 2 3 4 5 6 7 8 9 10 11 12 13
1 Balangir 5 195 53 142 195 23 146 26 50 0 1452 Kalahandi 5 147 54 93 147 32 57 58 92 15 403 Koraput 5 223 109 114 223 86 87 50 223 0 04 Malkangir 3 65 18 47 65 26 25 14 30 0 355 Nawarangpur 3 60 27 33 60 7 50 3 60 0 06 Nuapada 3 105 60 45 105 11 44 50 105 0 07 Rayagada 5 72 24 48 72 5 55 12 72 0 08 Sonepur 3 140 41 99 140 25 38 77 124 0 16
Total 32 1007 386 621 1007 215 502 290 756 15 236
Per AWC - 31 12 19 31 7 15 9 23 1 7
% to Total - - 38 62 - 21 50 29 98 2 23
A - 30

Annexure-4.3.1 ( ….contd)
Sl District Sample Total Coverage During 2004-05 Social Category BPL / APLAWCs Applicants Male Female Total SC ST Others BPL APL N A
1 2 3 4 5 6 7 8 9 10 11 12 13
1 Balangir 5 200 62 138 200 23 149 28 55 0 1452 Kalahandi 5 147 51 96 147 33 61 53 93 14 403 Koraput 5 223 109 114 223 86 87 50 223 0 04 Malkangir 3 65 19 46 65 7 54 4 65 0 05 Nawarangpur 3 60 26 34 60 5 52 3 60 0 06 Nuapada 3 115 67 48 115 12 58 45 115 0 07 Rayagada 5 72 24 48 72 5 56 11 72 0 08 Sonepur 3 141 40 101 141 23 41 77 125 0 16
Total 32 1023 398 625 1023 194 558 271 808 14 201
Per AWC - 32 12 20 32 6 17 9 25 1 6
% to Total - - 39 61 - 19 55 26 98 2 20
A - 31
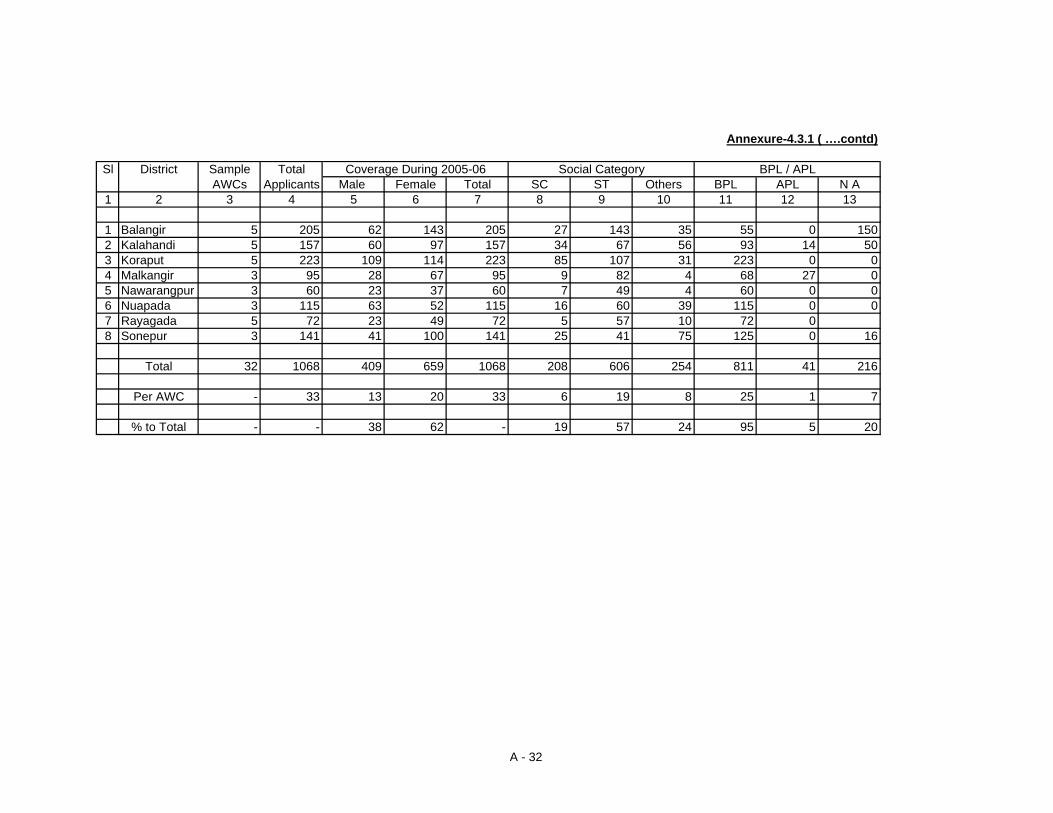
Annexure-4.3.1 ( ….contd)
Sl District Sample Total Coverage During 2005-06 Social Category BPL / APLAWCs Applicants Male Female Total SC ST Others BPL APL N A
1 2 3 4 5 6 7 8 9 10 11 12 13
1 Balangir 5 205 62 143 205 27 143 35 55 0 1502 Kalahandi 5 157 60 97 157 34 67 56 93 14 503 Koraput 5 223 109 114 223 85 107 31 223 0 04 Malkangir 3 95 28 67 95 9 82 4 68 27 05 Nawarangpur 3 60 23 37 60 7 49 4 60 0 06 Nuapada 3 115 63 52 115 16 60 39 115 0 07 Rayagada 5 72 23 49 72 5 57 10 72 08 Sonepur 3 141 41 100 141 25 41 75 125 0 16
Total 32 1068 409 659 1068 208 606 254 811 41 216
Per AWC - 33 13 20 33 6 19 8 25 1 7
% to Total - - 38 62 - 19 57 24 95 5 20
A - 32
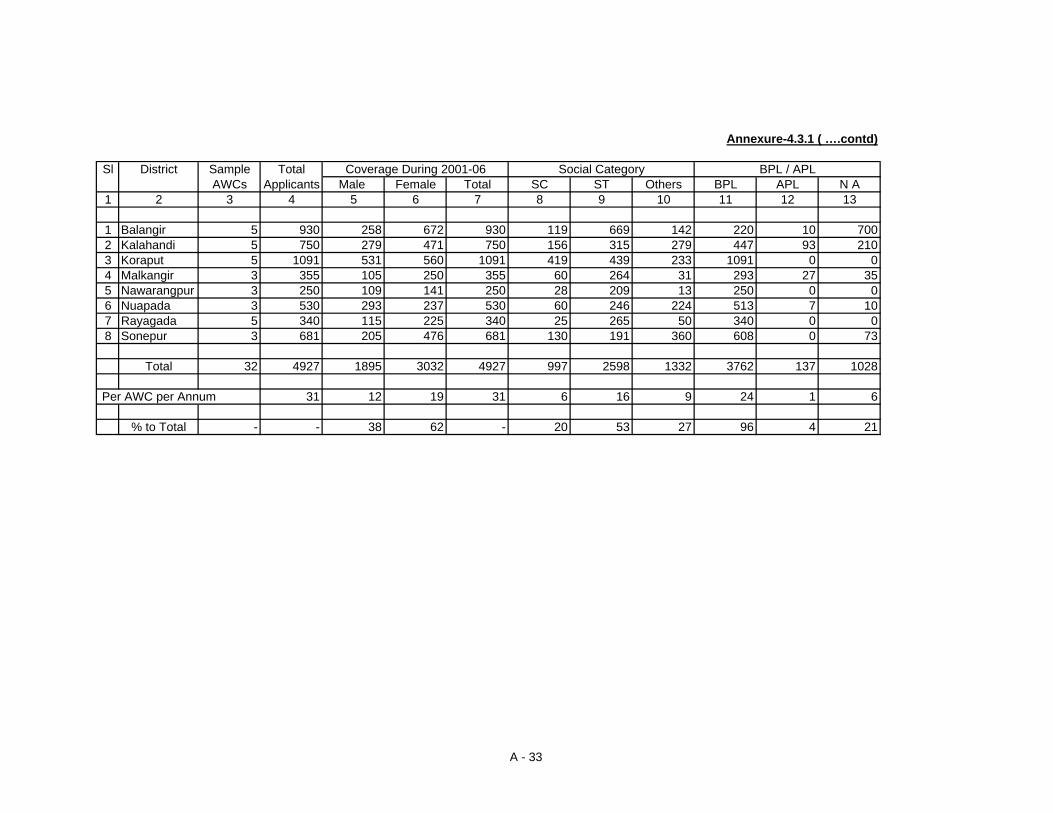
Annexure-4.3.1 ( ….contd)
Sl District Sample Total Coverage During 2001-06 Social Category BPL / APLAWCs Applicants Male Female Total SC ST Others BPL APL N A
1 2 3 4 5 6 7 8 9 10 11 12 13
1 Balangir 5 930 258 672 930 119 669 142 220 10 7002 Kalahandi 5 750 279 471 750 156 315 279 447 93 2103 Koraput 5 1091 531 560 1091 419 439 233 1091 0 04 Malkangir 3 355 105 250 355 60 264 31 293 27 355 Nawarangpur 3 250 109 141 250 28 209 13 250 0 06 Nuapada 3 530 293 237 530 60 246 224 513 7 107 Rayagada 5 340 115 225 340 25 265 50 340 0 08 Sonepur 3 681 205 476 681 130 191 360 608 0 73
Total 32 4927 1895 3032 4927 997 2598 1332 3762 137 1028
Per AWC per Annum 31 12 19 31 6 16 9 24 1 6
% to Total - - 38 62 - 20 53 27 96 4 21
A - 33
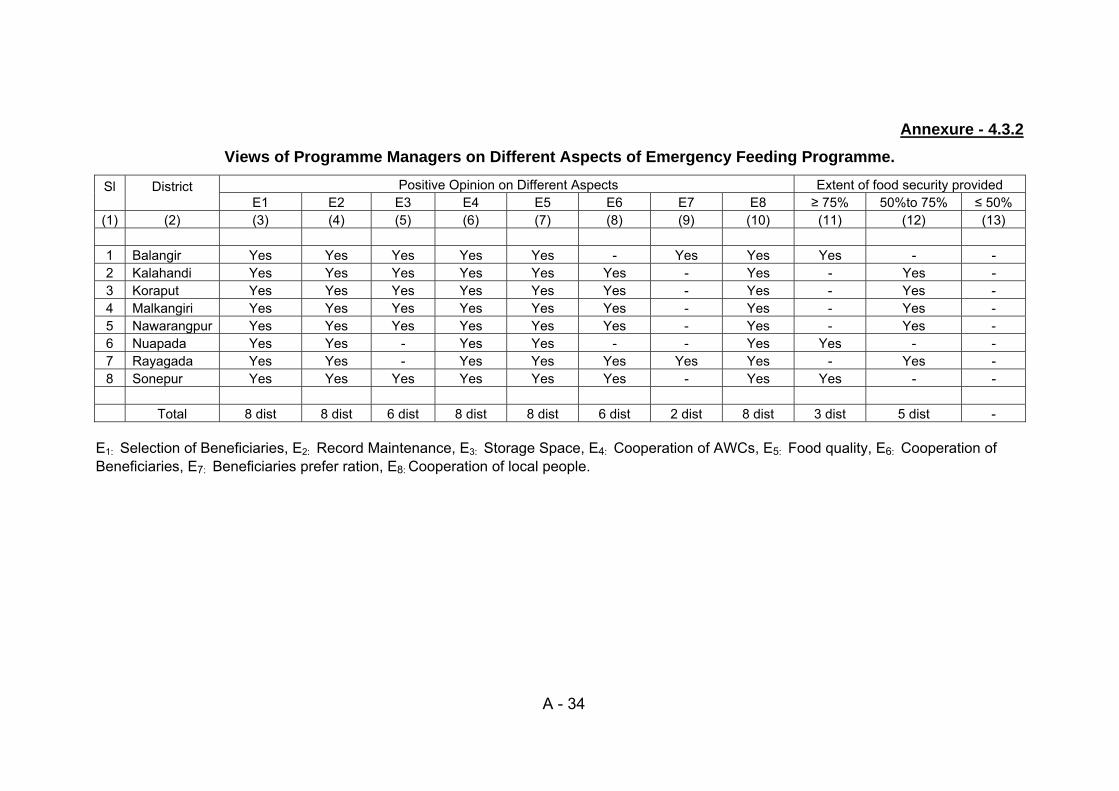
Annexure - 4.3.2 Views of Programme Managers on Different Aspects of Emergency Feeding Programme.
Positive Opinion on Different Aspects Extent of food security provided Sl
District E1 E2 E3 E4 E5 E6 E7 E8 ≥ 75% 50%to 75% ≤ 50%
(1) (2) (3) (4) (5) (6) (7) (8) (9) (10) (11) (12) (13) 1 Balangir Yes Yes Yes Yes Yes - Yes Yes Yes - - 2 Kalahandi Yes Yes Yes Yes Yes Yes - Yes - Yes - 3 Koraput Yes Yes Yes Yes Yes Yes - Yes - Yes - 4 Malkangiri Yes Yes Yes Yes Yes Yes - Yes - Yes - 5 Nawarangpur Yes Yes Yes Yes Yes Yes - Yes - Yes - 6 Nuapada Yes Yes - Yes Yes - - Yes Yes - - 7 Rayagada Yes Yes - Yes Yes Yes Yes Yes - Yes - 8 Sonepur Yes Yes Yes Yes Yes Yes - Yes Yes - -
Total 8 dist 8 dist 6 dist 8 dist 8 dist 6 dist 2 dist 8 dist 3 dist 5 dist -
E1: Selection of Beneficiaries, E2: Record Maintenance, E3: Storage Space, E4: Cooperation of AWCs, E5: Food quality, E6: Cooperation of Beneficiaries, E7: Beneficiaries prefer ration, E8: Cooperation of local people.
A - 34
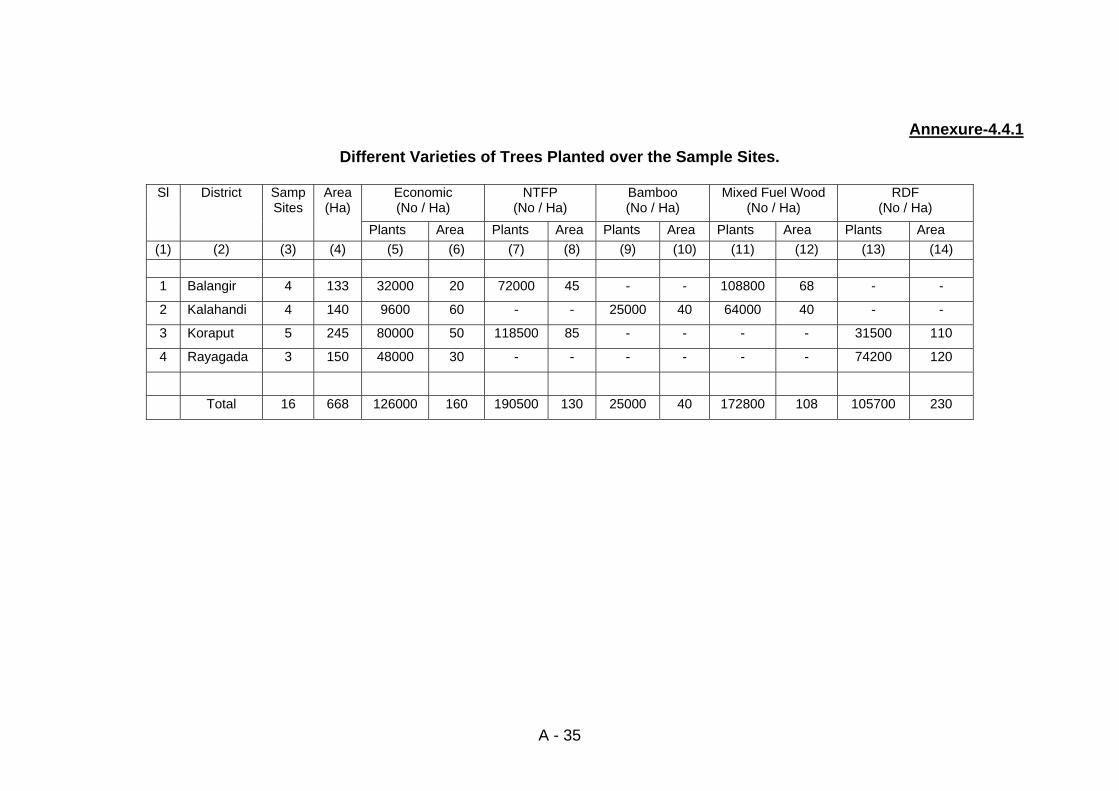
Annexure-4.4.1 Different Varieties of Trees Planted over the Sample Sites.
Economic (No / Ha)
NTFP (No / Ha)
Bamboo (No / Ha)
Mixed Fuel Wood (No / Ha)
RDF (No / Ha)
Sl District Samp Sites
Area(Ha)
Plants Area Plants Area Plants Area Plants Area Plants Area (1) (2) (3) (4) (5) (6) (7) (8) (9) (10) (11) (12) (13) (14)
1 Balangir 4 133 32000 20 72000 45 - - 108800 68 - -
2 Kalahandi 4 140 9600 60 - - 25000 40 64000 40 - -
3 Koraput 5 245 80000 50 118500 85 - - - - 31500 110
4 Rayagada 3 150 48000 30 - - - - - - 74200 120
Total 16 668 126000 160 190500 130 25000 40 172800 108 105700 230
A - 35
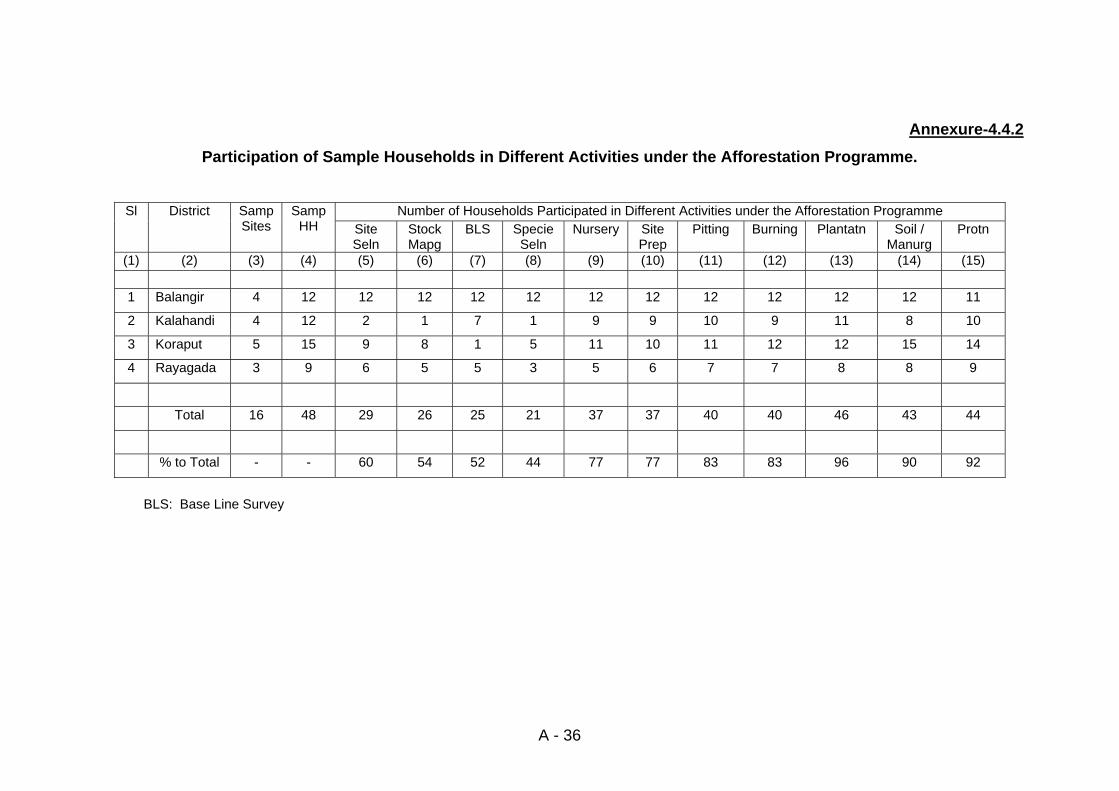
Annexure-4.4.2 Participation of Sample Households in Different Activities under the Afforestation Programme.
Number of Households Participated in Different Activities under the Afforestation Programme Sl District Samp
Sites Samp
HH Site Seln
StockMapg
BLS SpecieSeln
Nursery Site Prep
Pitting Burning Plantatn Soil / Manurg
Protn
(1) (2) (3) (4) (5) (6) (7) (8) (9) (10) (11) (12) (13) (14) (15) 1 Balangir 4 12 12 12 12 12 12 12 12 12 12 12 11
2 Kalahandi 4 12 2 1 7 1 9 9 10 9 11 8 10
3 Koraput 5 15 9 8 1 5 11 10 11 12 12 15 14
4 Rayagada 3 9 6 5 5 3 5 6 7 7 8 8 9
Total 16 48 29 26 25 21 37 37 40 40 46 43 44
% to Total - - 60 54 52 44 77 77 83 83 96 90 92
BLS: Base Line Survey
A - 36
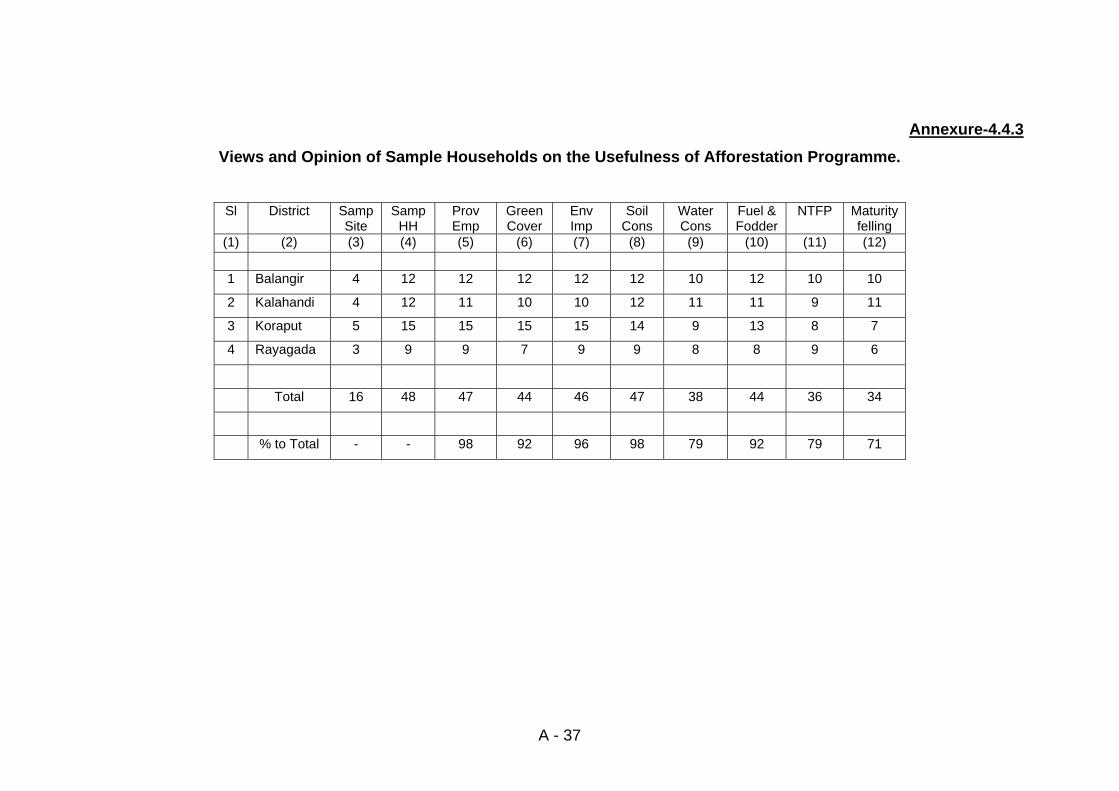
Annexure-4.4.3 Views and Opinion of Sample Households on the Usefulness of Afforestation Programme.
Sl District Samp
Site Samp
HH Prov Emp
GreenCover
Env Imp
Soil Cons
Water Cons
Fuel &Fodder
NTFP Maturityfelling
(1) (2) (3) (4) (5) (6) (7) (8) (9) (10) (11) (12) 1 Balangir 4 12 12 12 12 12 10 12 10 10
2 Kalahandi 4 12 11 10 10 12 11 11 9 11
3 Koraput 5 15 15 15 15 14 9 13 8 7
4 Rayagada 3 9 9 7 9 9 8 8 9 6
Total 16 48 47 44 46 47 38 44 36 34
% to Total - - 98 92 96 98 79 92 79 71
A - 37
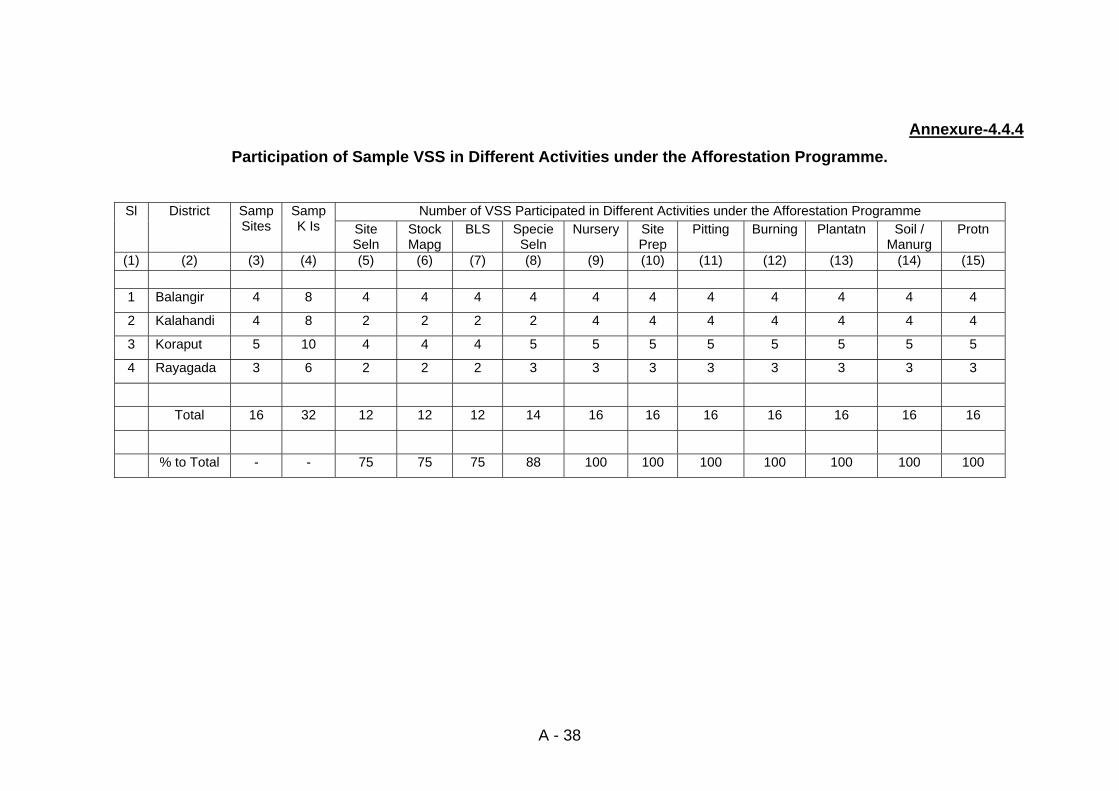
A - 38
Annexure-4.4.4 Participation of Sample VSS in Different Activities under the Afforestation Programme.
Number of VSS Participated in Different Activities under the Afforestation Programme Sl District Samp
Sites Samp K Is Site
Seln StockMapg
BLS SpecieSeln
Nursery Site Prep
Pitting Burning Plantatn Soil / Manurg
Protn
(1) (2) (3) (4) (5) (6) (7) (8) (9) (10) (11) (12) (13) (14) (15) 1 Balangir 4 8 4 4 4 4 4 4 4 4 4 4 4
2 Kalahandi 4 8 2 2 2 2 4 4 4 4 4 4 4
3 Koraput 5 10 4 4 4 5 5 5 5 5 5 5 5
4 Rayagada 3 6 2 2 2 3 3 3 3 3 3 3 3
Total 16 32 12 12 12 14 16 16 16 16 16 16 16
% to Total - - 75 75 75 88 100 100 100 100 100 100 100
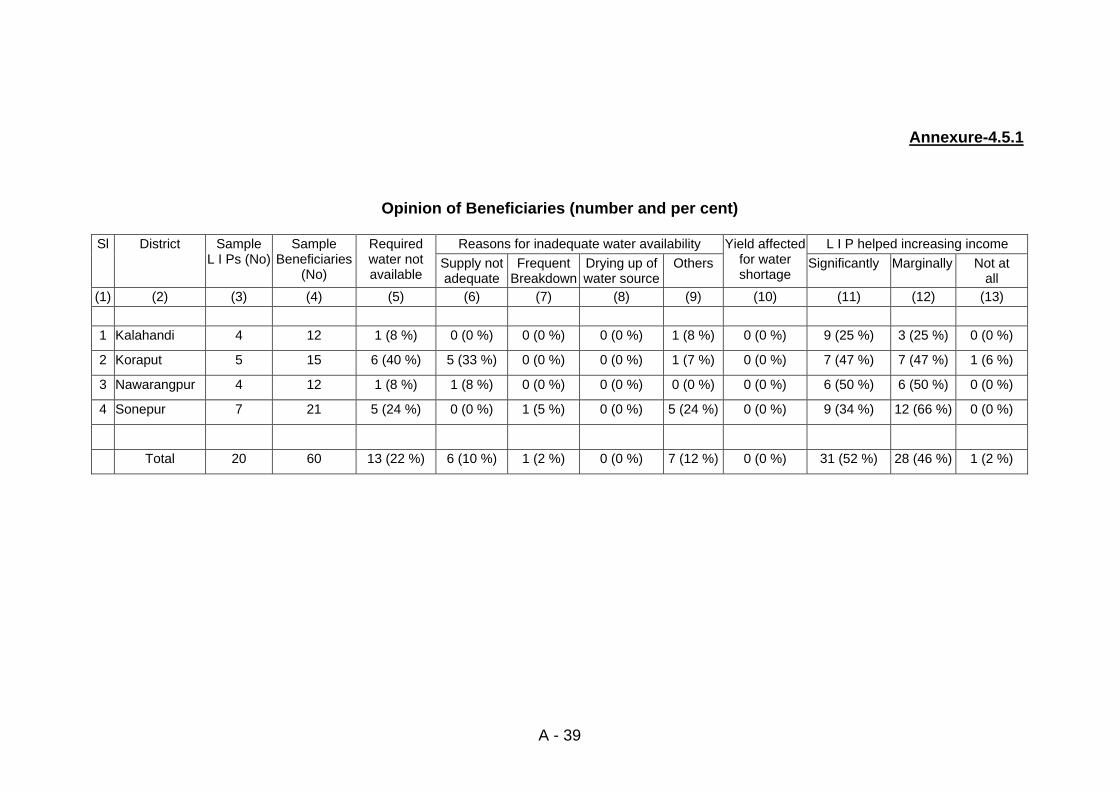
Annexure-4.5.1
Opinion of Beneficiaries (number and per cent)
Reasons for inadequate water availability L I P helped increasing income Sl District Sample L I Ps (No)
Sample Beneficiaries
(No)
Required water not available
Supply not adequate
Frequent Breakdown
Drying up of water source
Others Yield affected
for water shortage
Significantly Marginally Not at all
(1) (2) (3) (4) (5) (6) (7) (8) (9) (10) (11) (12) (13) 1 Kalahandi 4 12 1 (8 %) 0 (0 %) 0 (0 %) 0 (0 %) 1 (8 %) 0 (0 %) 9 (25 %) 3 (25 %) 0 (0 %)
2 Koraput 5 15 6 (40 %) 5 (33 %) 0 (0 %) 0 (0 %) 1 (7 %) 0 (0 %) 7 (47 %) 7 (47 %) 1 (6 %)
3 Nawarangpur 4 12 1 (8 %) 1 (8 %) 0 (0 %) 0 (0 %) 0 (0 %) 0 (0 %) 6 (50 %) 6 (50 %) 0 (0 %)
4 Sonepur 7 21 5 (24 %) 0 (0 %) 1 (5 %) 0 (0 %) 5 (24 %) 0 (0 %) 9 (34 %) 12 (66 %) 0 (0 %)
Total 20 60 13 (22 %) 6 (10 %) 1 (2 %) 0 (0 %) 7 (12 %) 0 (0 %) 31 (52 %) 28 (46 %) 1 (2 %)
A - 39
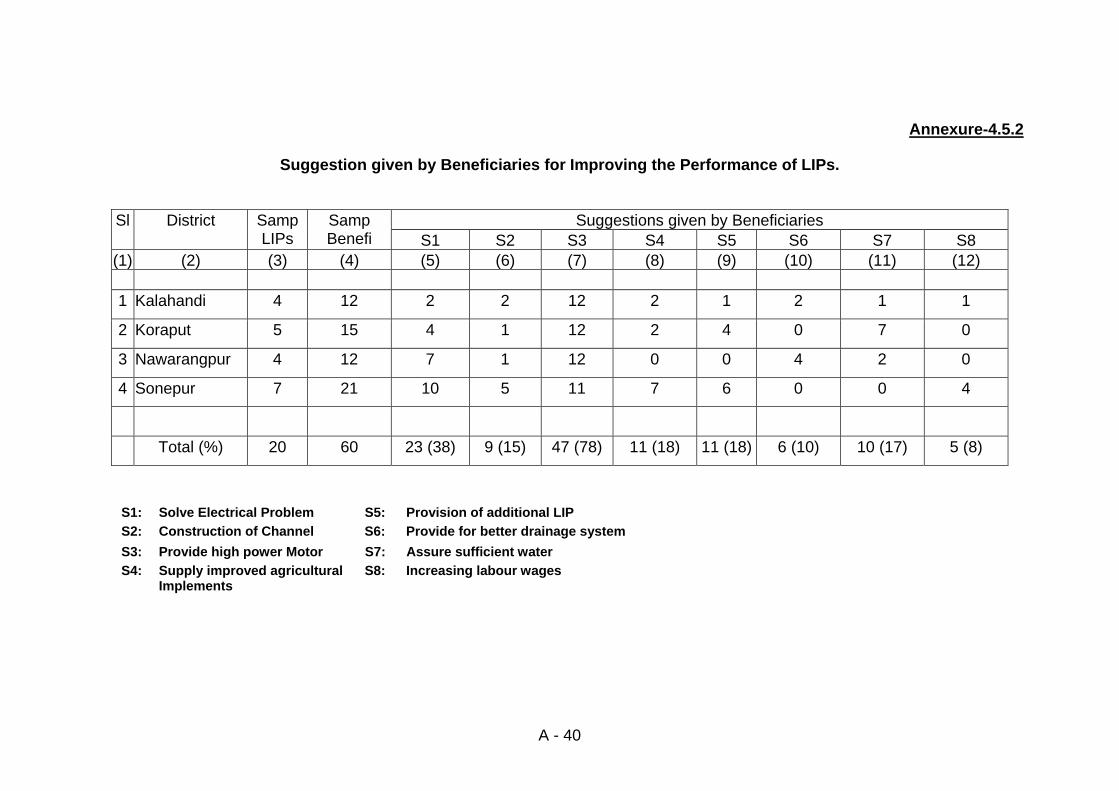
A - 40
Annexure-4.5.2
Suggestion given by Beneficiaries for Improving the Performance of LIPs.
Suggestions given by Beneficiaries Sl District Samp
LIPs Samp Benefi S1 S2 S3 S4 S5 S6 S7 S8
(1) (2) (3) (4) (5) (6) (7) (8) (9) (10) (11) (12) 1 Kalahandi 4 12 2 2 12 2 1 2 1 1
2 Koraput 5 15 4 1 12 2 4 0 7 0
3 Nawarangpur 4 12 7 1 12 0 0 4 2 0
4 Sonepur 7 21 10 5 11 7 6 0 0 4
Total (%) 20 60 23 (38) 9 (15) 47 (78) 11 (18) 11 (18) 6 (10) 10 (17) 5 (8)
S1: Solve Electrical Problem S5: Provision of additional LIP S2: Construction of Channel S6: Provide for better drainage system S3: Provide high power Motor S7: Assure sufficient water S4: Supply improved agricultural
Implements S8: Increasing labour wages
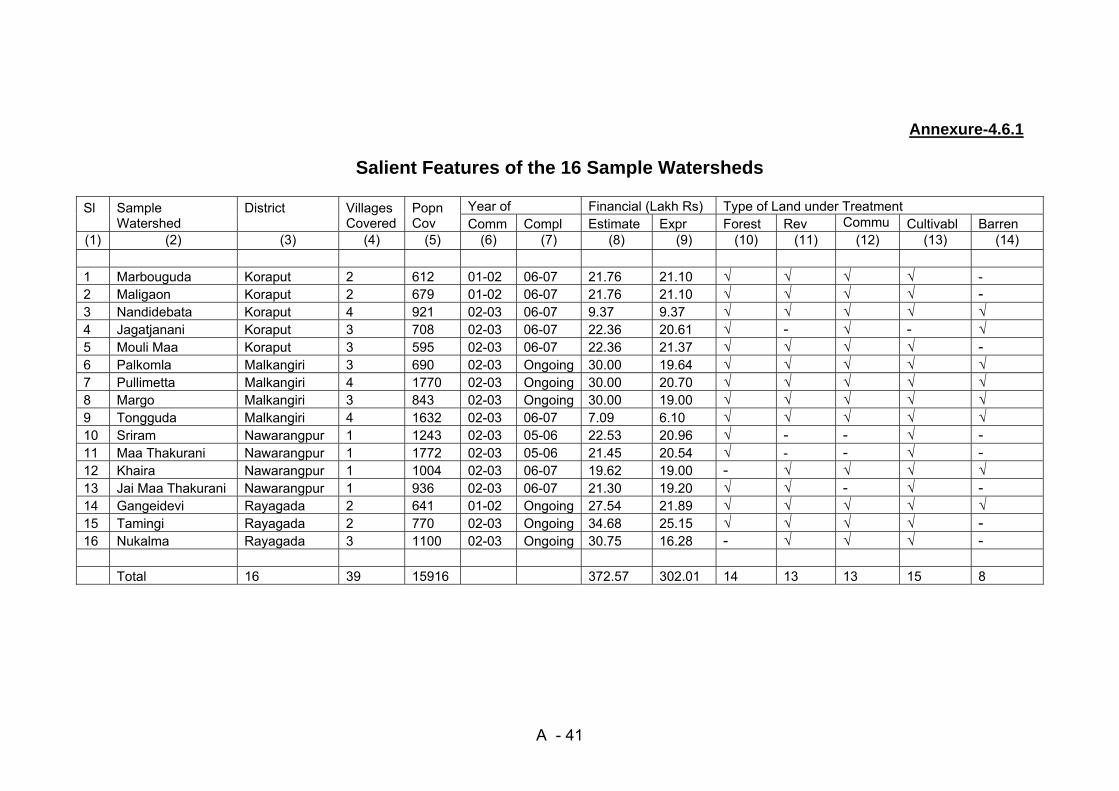
Annexure-4.6.1
Salient Features of the 16 Sample Watersheds
Year of Financial (Lakh Rs) Type of Land under Treatment Sl
Sample Watershed
District
Villages Covered
Popn Cov Comm Compl Estimate Expr Forest Rev Commu Cultivabl Barren
(1) (2) (3) (4) (5) (6) (7) (8) (9) (10) (11) (12) (13) (14) 1 Marbouguda Koraput 2 612 01-02 06-07 21.76 21.10 √ √ √ √ - 2 Maligaon Koraput 2 679 01-02 06-07 21.76 21.10 √ √ √ √ - 3 Nandidebata Koraput 4 921 02-03 06-07 9.37 9.37 √ √ √ √ √ 4 Jagatjanani Koraput 3 708 02-03 06-07 22.36 20.61 √ - √ - √ 5 Mouli Maa Koraput 3 595 02-03 06-07 22.36 21.37 √ √ √ √ - 6 Palkomla Malkangiri 3 690 02-03 Ongoing 30.00 19.64 √ √ √ √ √ 7 Pullimetta Malkangiri 4 1770 02-03 Ongoing 30.00 20.70 √ √ √ √ √ 8 Margo Malkangiri 3 843 02-03 Ongoing 30.00 19.00 √ √ √ √ √ 9 Tongguda Malkangiri 4 1632 02-03 06-07 7.09 6.10 √ √ √ √ √ 10 Sriram Nawarangpur 1 1243 02-03 05-06 22.53 20.96 √ - - √ - 11 Maa Thakurani Nawarangpur 1 1772 02-03 05-06 21.45 20.54 √ - - √ - 12 Khaira Nawarangpur 1 1004 02-03 06-07 19.62 19.00 - √ √ √ √ 13 Jai Maa Thakurani Nawarangpur 1 936 02-03 06-07 21.30 19.20 √ √ - √ - 14 Gangeidevi Rayagada 2 641 01-02 Ongoing 27.54 21.89 √ √ √ √ √ 15 Tamingi Rayagada 2 770 02-03 Ongoing 34.68 25.15 √ √ √ √ - 16 Nukalma Rayagada 3 1100 02-03 Ongoing 30.75 16.28 - √ √ √ - Total 16 39 15916 372.57 302.01 14 13 13 15 8
A - 41
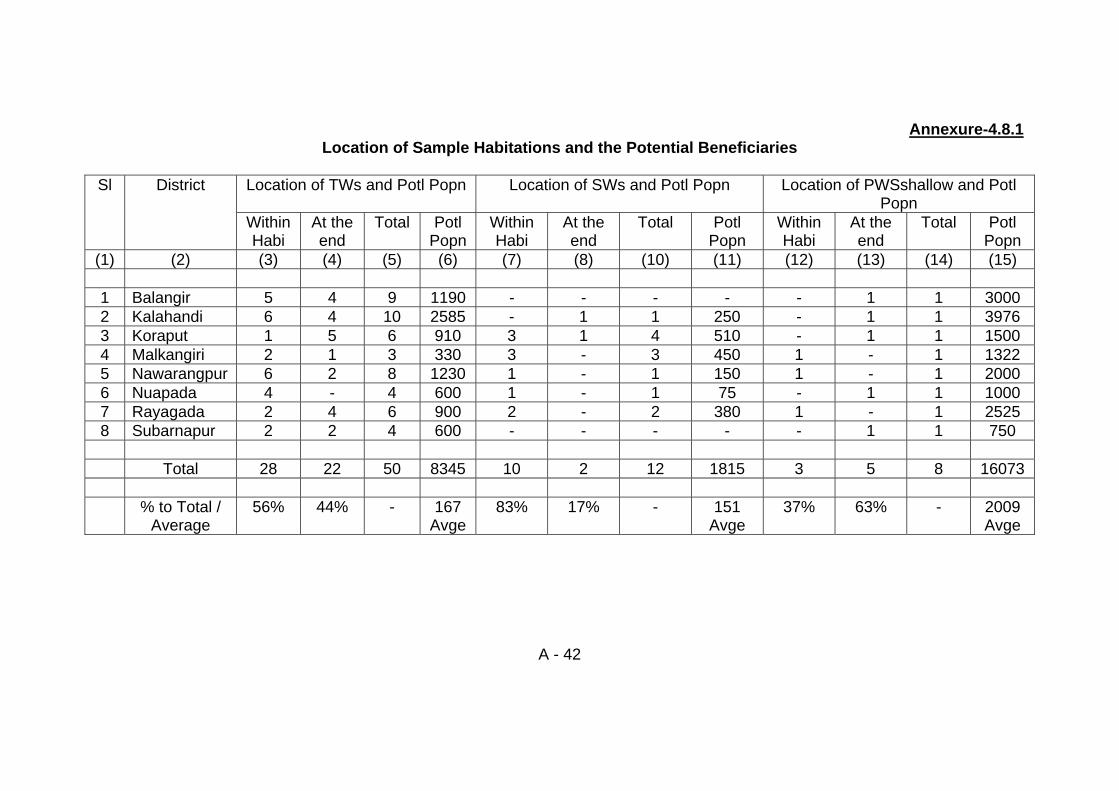
Annexure-4.8.1 Location of Sample Habitations and the Potential Beneficiaries
Location of TWs and Potl Popn Location of SWs and Potl Popn Location of PWSshallow and Potl
Popn Sl District
Within Habi
At theend
Total Potl Popn
Within Habi
At the end
Total Potl Popn
Within Habi
At the end
Total Potl Popn
(1) (2) (3) (4) (5) (6) (7) (8) (10) (11) (12) (13) (14) (15)
1 Balangir 5 4 9 1190 - - - - - 1 1 3000 2 Kalahandi 6 4 10 2585 - 1 1 250 - 1 1 3976 3 Koraput 1 5 6 910 3 1 4 510 - 1 1 1500 4 Malkangiri 2 1 3 330 3 - 3 450 1 - 1 1322 5 Nawarangpur 6 2 8 1230 1 - 1 150 1 - 1 2000 6 Nuapada 4 - 4 600 1 - 1 75 - 1 1 1000 7 Rayagada 2 4 6 900 2 - 2 380 1 - 1 2525 8 Subarnapur 2 2 4 600 - - - - - 1 1 750 Total 28 22 50 8345 10 2 12 1815 3 5 8 16073 % to Total /
Average 56% 44% - 167
Avge 83% 17% - 151
Avge 37% 63% - 2009
Avge
A - 42


