Embed Size (px)
Citation preview

© 2011 Ed. Univ. „Al. I. Cuza” Iași. All rights reserved Corresponding author’s e-mail: [email protected]
Available online at http://geology.uaic.ro/auig/
Analele Stiintifice ale Universitatii “Al. I. Cuza” din Iasi Seria Geologie 57 (2) (2011) 35–58
AUI GEOLOGIE
Raman and infrared spectroscopy of kaersutite and certain common amphiboles Andrei Ionuț Apopei1, Nicolae Buzgar1, Andrei Buzatu1 1 “Al. I. Cuza” University of Iaşi, Faculty of Geography and Geology, Department of Geology, 20A Carol I Blv., 700505 Iaşi, Romania Abstract Raman and infrared spectral studies were performed on six natural minerals from the double-chain silicate group. We analyzed samples of grunerite, actinolite, tremolite, pargasite (+kaersutite) and riebeckite in order to determine the spectral differences between them and to identify the vibrations that occur. Also, for one sample thought to be pargasite we obtained the Raman spectrum of kaersutite, while another sample was determined as a Ti-rich pargasite, since the difference between these two minerals consists in the presence of more than 0.50 apfu VITi in kaersutite (titaniferous calcic amphibole). The Raman spectrum of kaersutite exhibits characteristic bands of the VITi-OH vibration around 580–590 cm-1 and 750 cm-1. These two bands are stronger than the symmetric stretching vibration of the Si-Ob-Si (ν1), which arises as the strongest band in all other amphibole minerals of the present study, around 650–670 cm-1. Both Raman and infrared spectra of all the analyzed samples reveal the presence of Fe2+, Mg2+ or other cations in the octahedral sites, displaying distinct bands in the ~300-450 cm-1 spectral region, as well as in the OH stretching region (3600–3700 cm-1). Copyright © 2011 Published by Ed. Univ. „Al. I. Cuza” Iași. All rights reserved. Keywords: kaersutite, Ti-rich pargasite, amphiboles, Raman, infrared, Spectroscopy, OH-
stretching, double-chain silicates.
Introduction
In the present study, six amphiboles (grunerite, tremolite-actinolite, pargasite, kaersutite and riebeckite) were analyzed through vibrational spectroscopy (Raman and IR, without any chemical analysis) with the aim of identifying and discriminating between the minerals of the amphibole group.

36 Apopei A.I. et al.
AUI–G, 57, 2, (2011) 35–58
Several studies based on Raman spectroscopy have been carried out on the minerals dealt with in the present paper (see Apopei and Buzgar, 2010 for a complete list of references). Furthermore, for the IR spectroscopic studies of the amphiboles listed above, numerous vibrational spectra have been reported and discussion by Burns and Strens (1966), Ernst and Wai (1970), Burns and Greaves (1971), Raudsepp et al. (1987), Wang et al. (1988a,b,c), Della Ventura et al. (1991, 1993, 1997, 1998, 1999, 2003, 2005, 2007, 2008), Skogby and Rossman (1991), Libowitzky (1999), Andrut et al. (2000), Hawthorne et al. (2000), Kloprogge et al. (2001a,b), Shurvell et al. (2001), Ishida et al. (2002, 2008), Jenkins et al. (2003), Gopal et al. (2004), Driscall et al. (2005), Iezzi et al. (2005a,b, 2007), Libowitzky and Beran (2006), Makreski et al. (2006), Rinaudo et al. (2006), Theodosoglou et al. (2007), Jovanovski et al. (2009), Su et al. (2009). Several of these studies have focused on hydroxyl stretching vibrations (3600–3700 cm-1 spectral domain), very useful in the determination of the cation site population, and, therefore, in the discriminatation between the members of the same series (see e.g. tremolite-actinolite). To the best of our knowledge, only the Raman spectra of kaersutite from Mt. Etna (Italy) (Downs, 2006) and Raman discussions on the kaersutite from a Martian meteorite (Mikouchi and Miyamoto, 2000; Minitti et al., 2008), without any data regarding the OH- stretching region, have been published yet. Up to the present moment, no IR data regarding kaersutite have been published.
The aim of the present work is to identify the structural characteristics for each mineral studied by means of Raman and IR spectroscopy and to continue building an online database (rdrs.uaic.ro – Buzgar et al., 2009a). Currently, this online database covers four main mineral classes (studied especially through Raman spectroscopy analyses): carbonates (Buzgar and Apopei, 2009), sulfates (Buzgar et al., 2009b), single chain silicates (Buzatu and Buzgar, 2010) and double chain silicates (Apopei and Buzgar, 2010). Experimental
Samples The samples used in the present study, listed in Table 1, belong to the collection of the
“Grigore Cobâlcescu” Mineralogy and Petrography Museum of the “Alexandru Ioan Cuza” University, Iasi. The structure of the studied amphiboles (clinoamphiboles) corresponds to the space group C2/m.
Raman spectra The Raman data on tremolite, kaersutite and riebeckite were collected using a Bruker FT-
Raman spectrometer in the 46–3700 cm-1 spectral range at University of Ghent, Belgium. For the grunerite, actinolite and pargasite samples, the Raman spectra were obtained at room
temperature, with a Horiba Jobin-Yvon RPA-HE 532 Raman spectrometer with a multichannel air cooled (–70°C) CCD detector, using a Nd-Yag laser 532nm as excitation source and a nominal power of 100mW. The spectra were obtained in the spectral range between 210 and 3400 cm-1, with a spectral resolution of 3 cm-1. The Raman system includes a “Superhead” fibre optic Raman probe for non-contact measurements, with a 50X LWD Olympus visible objective, NA=0.50 WD=10.6 mm. Sulphur and ciclohexane bands were used for the calibration of the wavenumbers of the Raman spectra. The data were acquired at a 10–100 second exposure time (in most cases an exposure of 4–10 seconds was sufficient to obtain a good spectra), through 10–100 acquisitions, at a laser magnification of 70–100%, in order to improve the signal-to-noise ratio. Spectra manipulations consisted in a basic data treatment, such as baseline adjustment and peak fitting (Lorentz function). However, some spectra are presented as acquired for a better interpretation.
Raman and infrared spectroscopy of kaersutite and certain common amphiboles 37
AUI–G, 57, 2, (2011) 35–58
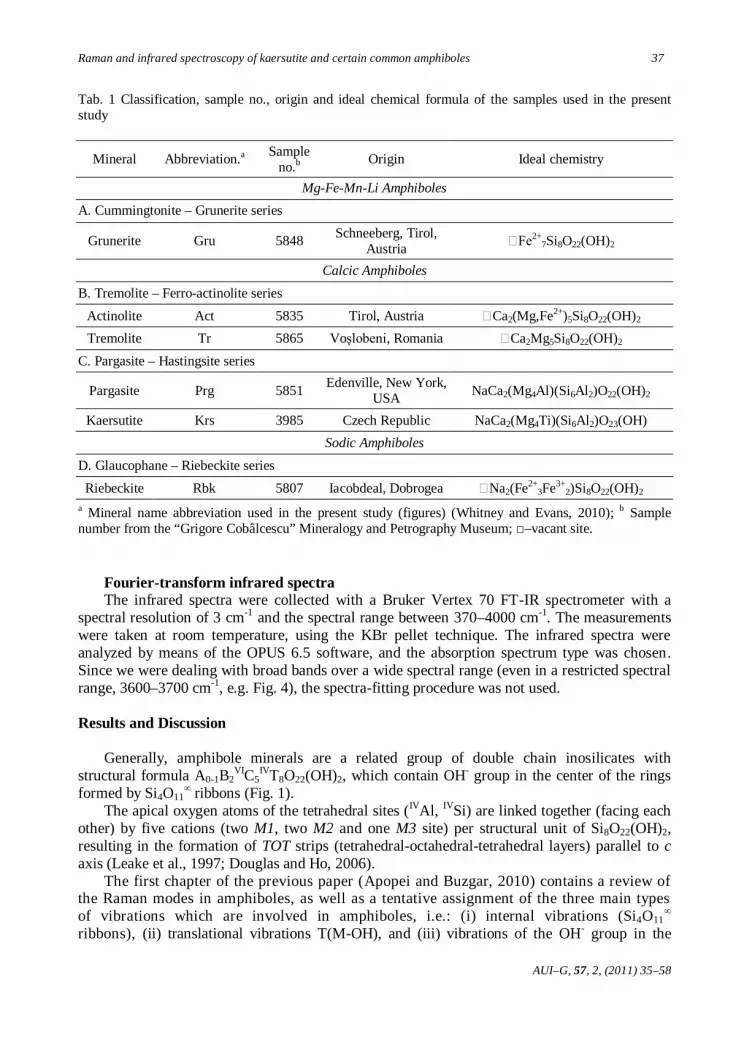
Tab. 1 Classification, sample no., origin and ideal chemical formula of the samples used in the present study
Fourier-transform infrared spectra The infrared spectra were collected with a Bruker Vertex 70 FT-IR spectrometer with a
spectral resolution of 3 cm-1 and the spectral range between 370–4000 cm-1. The measurements were taken at room temperature, using the KBr pellet technique. The infrared spectra were analyzed by means of the OPUS 6.5 software, and the absorption spectrum type was chosen. Since we were dealing with broad bands over a wide spectral range (even in a restricted spectral range, 3600–3700 cm-1, e.g. Fig. 4), the spectra-fitting procedure was not used. Results and Discussion
Generally, amphibole minerals are a related group of double chain inosilicates with structural formula A0-1B2
VIC5IVT8O22(OH)2, which contain OH- group in the center of the rings
formed by Si4O11∞ ribbons (Fig. 1).
The apical oxygen atoms of the tetrahedral sites (IVAl, IVSi) are linked together (facing each other) by five cations (two M1, two M2 and one M3 site) per structural unit of Si8O22(OH)2, resulting in the formation of TOT strips (tetrahedral-octahedral-tetrahedral layers) parallel to c axis (Leake et al., 1997; Douglas and Ho, 2006).
The first chapter of the previous paper (Apopei and Buzgar, 2010) contains a review of the Raman modes in amphiboles, as well as a tentative assignment of the three main types of vibrations which are involved in amphiboles, i.e.: (i) internal vibrations (Si4O11
∞ ribbons), (ii) translational vibrations T(M-OH), and (iii) vibrations of the OH- group in the
Mineral Abbreviation.a Sample no.b Origin Ideal chemistry
Mg-Fe-Mn-Li Amphiboles A. Cummingtonite – Grunerite series
Grunerite Gru 5848 Schneeberg, Tirol, Austria Fe2+
7Si8O22(OH)2
Calcic Amphiboles B. Tremolite – Ferro-actinolite series
Actinolite Act 5835 Tirol, Austria Ca2(Mg,Fe2+)5Si8O22(OH)2 Tremolite Tr 5865 Voşlobeni, Romania Ca2Mg5Si8O22(OH)2
C. Pargasite – Hastingsite series
Pargasite Prg 5851 Edenville, New York, USA NaCa2(Mg4Al)(Si6Al2)O22(OH)2
Kaersutite Krs 3985 Czech Republic NaCa2(Mg4Ti)(Si6Al2)O23(OH) Sodic Amphiboles
D. Glaucophane – Riebeckite series Riebeckite Rbk 5807 Iacobdeal, Dobrogea Na2(Fe2+
3Fe3+2)Si8O22(OH)2
a Mineral name abbreviation used in the present study (figures) (Whitney and Evans, 2010); b Sample number from the “Grigore Cobâlcescu” Mineralogy and Petrography Museum; □–vacant site.

38 Apopei A.I. et al.
AUI–G, 57, 2, (2011) 35–58
3600–3700 cm-1 spectral region. By far, the assignment of the internal vibrations is the most complicated process which is due to both the multiple types of bonds (e.g. Si-Ob-Si, O-Si-O etc.) and isomorphous substitutions (e.g. IVSi ↔ IVAl, in the tetrahedral sites). Similarly, the arrangements and complex chemical substitutions of the cations (e.g. VIAl + IVAl ↔ VIMg + IVSi) cause difficulties in the interpretation of vibrations due to the cation-hydroxyl bonds. The following factors must also be taken into account in the assignment process: the sample orientation, impurities and high fluorescence.
Fig. 1 Graphical representation of TOT strips, where the hydroxyl group is directly bonded with two M1 and one M3 sites; the A site, which can be either vacant ( ) or occupied, is above each tetrahedral ring, but have been omitted for the sake of simplicity (created in Jmol, after Hawthorne and Grundy, 1976; from Downs and Hall-Wallace, 2003).
In the case of infrared spectra, vibrational bands are generally broader and highest than the corresponding vibrations in Raman spectra (e.g. Fig. 2), especially in regions where bending and asymmetric vibrations of the Si4O11 group arise, i. e., 425–625 cm-1 and 950–1125 cm-1, respectively (OH- stretching region is an exception). These observations are based on the fact that, as a general rule, symmetric vibrations are more intense in Raman spectra and asymmetric vibrations – in IR spectra (Smith and Dent, 2005).
Raman and Infrared results The Raman bands of all the samples presented in the study are identified on the basis of the
description pruposed in a previous paper (Fig. 2 and 3, in Apopei and Buzgar, 2010).

Raman and infrared spectroscopy of kaersutite and certain common amphiboles 39
AUI–G, 57, 2, (2011) 35–58
According to Wang et al. (1988a), the primitive cell which is represented by M7Si8O22(OH)2 leads to 120 degrees of vibrational freedom for the optical modes and the reduced representation has the following structure:
Гvib = 30Ag + 30Bg + 27Au + 33Bu (Wang et al., 1988a)
From these modes, 60 are Raman active (Ag and Bg), whereas 60 ungerade species are IR active (Wang et al., 1988a; Smith and Dent, 2005).
In the case of the infrared absorption bands, an assignment of the all the spectral lines is highly debatable, and nomerous aspects related to the mid-IR spectra of amphiboles remain to be understood. According to Andrut et al. (2000), and based on the assignments carried out by Lazarev (1972), the spectral bands between 900–1150 cm-1 are assigned to the asymmetric stretching (νas) of the Si-O-Si and O-Si-O vibrations, also due to the symmetric stretching (νs) of the O-Si-O and Si-O vibrations. Furthermore, for the lower region (600–775 cm-1), the vibrations observed in this spectral domain are assigned to the νs of the Si-O-Si linkage. Moreover, Andrut et al. (2000) suggest that in the 650–800 cm-1spectral range, additional bending modes of the OH group may appear. Strens (1974) assign all the bands from the 550–750 cm-1 spectral domain to the Si-O-Si bending mode, while for the 950–1200 cm-1 region vibrations are assigned to the Si-Ot stretching mode (where, Ot is the terminal oxygen).
Shurvell et al. (2001) assign the absorbance band at around 1100 cm-1 to the Si-O stretching and the bands between 950–1050 cm-1 – to the stretching modes of Si-O-Si and O-Si-O (without specifying whether it is symmetrical or asymmetrical; we assume that they refers to "asymmetric"). The peak near 920 cm-1 is assigned to Si-O, while the bands between 660–760 cm-1 are attributed to the stretching modes of Si-O-Si (again, we assume that they refer to "symmetric" for this region). Finally, Shurvell et al. (2001) assign the bands bellow 500 cm-1 to the Si-O and Si-O-Si bending modes.
According to Ishida et al. (2008), the mid-IR region of calcic amphiboles is most strongly influenced by tetrahedral substitution. The bands observed in the highest region of the spectra (850–1200 cm-1 for tremolite and 760–1200 cm-1 for pargasite) are due to Si-O stretching bands. Furthermore, the shoulder peaks observed in pargasite at 815 cm-1 and 895 cm-1 are assigned by Ishida et al. (2008) to Al-O stretching bands (due to the increasing content of Al toward pargasite). According to Gopal et al. (2004), the absorption band observed around the 460 cm-1 wavenumber is due to Si-O bending, while the bands at 685 and 757 cm-1 are attributed to the symmetrical stretching of the Si-O-Si linkage. Gopal et al. (2004) also assign the band at 955 cm-1 to in-plane Si-O stretching, and the 1101 cm-1 peak to asymmetric Si-O-Si stretching.
Makreski et al. (2006) and Jovanovski et al. (2009) make the following assumption related to the infrared spectra: the bands between 350–420 cm-1 are due to the T(M-OH) vibrations. The bending modes of the Si-O-Si linkage arise between 450–600 cm-1, while the νs vibrations of Si-O-Si are found between 600–920 cm-1. Going toward higher frequencies, the same authors (Makreski et al., 2006; Jovanovski et al., 2009) assign the absorption bands between 980–1160 cm-
1 to three asymmetric stretching vibrations of the Si-O-Si bridge and three asymmetric stretching vibrations of the O-Si-O linkage. Furthermore, Kloprogge et al. (2001a,b) purpose the same assignment of the νas vibrations of the Si-O-Si and O-Si-O linkage to the 980–1160 cm-1 spectral region. Della Ventura et al. (1993) have assigned all the bands in the 1000–1200 cm-1 spectral region to the asymmetric stretching SiO4 vibrations for potassic richterite, while, in an earlier paper (Della Ventura et al., 1991), they assigned the absorption bands observed in the 800–1200 cm-1 region to the Si-Ob-Si and Ob-Si-Ob asymmetric vibrations (where, Ob is the bridge oxygen) and Si-Ot stretching vibrations.
According to Della Ventura et al. (1998, 1999, 2003) and Hawthorne et al. (2000), in the 3600–3700 cm-1 spectral region, the hydroxyl group-metal ion bonds are present. As can be seen

40 Apopei A.I. et al.
AUI–G, 57, 2, (2011) 35–58
in Figure 1, the OH- group is bonded to two M1 and one M3 cation, forming a nearly equilateral triangle, and the H atom projectes into the hexagonal cavity toward the A site (which is either vacant – or occupied by K or Na).
In other words, the substitution of different cations can be seen in the 3600–3700 cm-1 spectral domain (in both Raman and IR spectra), where the disappearing, shifting and/or splitting of the bands are used in order to gain information about cation ordering, as well as supplementary details necessary in the discrimination between the minerals from the same series. Furthermore, whether there is a vacant or occupied A site reflects the number and position of the bands in the 3600–3700 cm-1 spectral region. These observations are based on the differences between the spectral bands of grunerite, tremolite, actinolite and riebeckite (see Figs. 3, 4 and 12) compared to those of pargasite and kaersutite (Fig. 11), where the A site is filled with Na and K ions. Moreover, the spectra of pargasite and kaersutite (in this higher spectral region) are broader, with less well-resolved bands than the other spectra. The presence of IVAl in the ideal formula of pargasite and kaersutite, which, theoretically, is missing in the other amphiboles from the present study (see Table 1), should be regarded in the same manner.
1. Grunerite
The term grunerite, Fe2+7Si8O22(OH)2 represent the end member of the cummingtonite-
grunerite series, with Mg/(Mg+Fe2+) < 0.5 (Leake et al., 1997, 2003, 2004), and is commercially known as amosite. Figure 2 shows a comparison between the Raman (Gru(a)) and infrared spectrum (Gru(b)) of grunerite, in the 210–1300 cm-1 region, which is in good agreement with the data from the literature (Burns and Strens, 1966; Skogby and Rossman, 1991; Downs, 2006; Apopei and Buzgar, 2010).
The Raman spectrum exhibit a very intense band at 665 cm-1, due to the symmetric stretching (νs) vibration of the Si-Ob-Si bridge. The bands situated at 533 and 566 cm-1 may be assigned to the deformation modes of Si4O11. Bearing in mind the Raman spectrum of cummingtonite (R070245) – Mg2+
7Si8O22(OH)2 (Downs, 2006), the difference between it and the Raman spectrum of grunerite (Fig. 2) consists in the appearance of new vibrations at 263, 338 and 385 cm-1, as well as in the shifting of the 363 cm-1band (present in grunerite) to 385 cm-1 (in reference cummingtonite), due to the increase of Mg2+. In the grunerite sample, the band at 1027 cm-1, assigned to the νas of the Si-Ob-Si, is shifted to a higher frequency in the cummingtonite reference spectrum, at 1040 cm-1. The doublet consisting of the 411 cm-1 and 430 cm-1 peaks from the cummingtonite reference spectrum, is overlapped by a band at 415 cm-1 in the Raman spectrum of grunerite. This band is also found in the Raman spectrum of tremolite, actinolite, pargasite and kaersutite, all of these minerals having Mg and Fe2+ in the M1M1M3 configuration. Another observation needs to be made about the band exhibiting around 415 cm-1, that does not appear in the Raman spectrum of riebeckite (see Fig. 10), which lacks the Mg2+ cation in the M sites. This suggests that the Raman band around 363 cm-1 is due to the Fe2+-OH vibration, while the ~415 cm-1 band is due to the Mg2+-OH. The last observation is based on the fact that riebeckite (ideally) contains only Na, Fe2+ and Fe3+ in the cation sites (without Mg2+).
It should be noted that, apart from regular ions, other ions, such as Ca2+, Mg2+, Mn2+, Fe2+, Fe3+, Al3+ and Ti4+, can also enter the cation sites (B2
VIC5), in a small percentage, indeed, but enough to influence the Raman spectrum in the spectral domain where the vibrations of M-OH exhibit (~300–430 cm-1).
According to Makreski et al. (2006) and Jovanovski et al. (2009), the absorption bands which appear between 375–450 cm-1 are due to the translational vibration between cation and hyodroxyl group; the bands at 489 cm-1 and 512 cm-1 are due to the bending modes of Si-O-Si. Going toward higher frequencies, the bands between 600 cm-1 and 920 cm-1 can be assigned to the

Raman and infrared spectroscopy of kaersutite and certain common amphiboles 41
AUI–G, 57, 2, (2011) 35–58
symmetric stretching (νs) of the Si-Ob-Si linkage. The absorption bands between 980–1160 cm-1 are assigned, according to Makreski et al. (2006) and Jovanovski et al. (2009), to the asymmetric stretching (νas) vibrations ofthe Si-O-Si bridge, and the asymmetric stretching vibrations of the O-Si-O linkage.
Fig. 2 Gru(a) – Raman spectrum of grunerite 5848; and Gru(b) – infrared spectrum of the same sample in the 120–1300 cm-1 spectral region.

42 Apopei A.I. et al.
AUI–G, 57, 2, (2011) 35–58
Tab. 2 Assignment of the bands observed in the Raman and infrared spectrum of grunerite (Gru(b)), in the 80–1300 cm-1 and 3600–3700 cm-1 spectral domains
Raman Infrared Band position (cm-1) Assignment Band position (cm-1) Assignment Grunerite Grunerite
242 lattice mode
294 T(M-OH), where M = Mg or Fe2+
375, 380, 392, 395, 405, 414, 421, 431, 450
T(M- OH), where M = Fe2+ and Mg2+ 363 T(Fe2+-OH)
415 T(Mg2+-OH)
533, 566 deformation modes of Si4O11
489, 512 bending Si-O-Si
665 νs of the Si-Ob-Si (ν1) 643, 654, 697, 733, 777 νs (Si-Ob-Si) 747, 761, 785, 909? νs of the O-Si-O 896 ?νs (Si-Ob-Si)
971 νas of the O-Si-O 977, 997 νas Si-Ob-Si and νas O-Si-O 999, 1027, 1098 νas of the Si-Ob-Si 1086
1130 3618 (3Fe2+)-OH 3630 ? (2Fe2++Mg2+)-OH 3637 (2Fe2++Mg2+)-OH 3653 (2Mg2++Fe2+)-OH 3667 (3Mg2+)-OH
T–Transational modes; ?–questionable interpretation; νs–symmetric stretching; νas–asymmetric stretching.
The IR spectrum of natural grunerite, in the frequency region between 3600–3700 cm-1 is illustrated in Figure 3. According to Ernst and Wai (1970), the OH group is coordinated by three cations (two M1 sites and one M3), and, if at least two cations were different in the M1M1M3 configuration, it would reflect more than one vibration in the OH- stretching region. In our spectrum, four bands arise at 3618, 3637, 3653 and 3667 cm-1 (A, B, C, E notation; where the B’ band, at 3630 cm-1 is a shoulder of the B band). All of these bands are in good agreement with the data from the literature (Burns and Strens, 1966; Skogby and Rossman, 1991) and with the assignment of the bands based on the distribution of Fe2+ and Mg2+ cations in M1, M2 and M3 sites.
Moreover, according to Burns and Strens (1966), the shifting of the bands in the lower wavenumbers are correlated with an increase of the electronegativity of the substituting element, i.e. from Mg2+ to Fe2+; which is useful in the derivation of the numbers of substituents from the number of peaks and their intensities. Taking into account the band assignment process carried out by Burns and Strens (1966), band A is due to the presence of FeFeFe in M1 and M3 sites, B=FeFeMg, C=MgMgFe, and E=MgMgMg. The same authors assign the spectra obtained from minerals with a Fe2+ percentage of 53.4–65.1%, to the cummingtonite term. However, the most recent nomenclature recommends the division of the Mg/(Mg+Fe2+) ratio into two. Considering this, the shape of the spectra obtained in the present study (Fig. 3) can be similar (in terms of bands position and intensity), somewhere between 53.4% Fe2+ and 65.1% Fe2+, which points to grunerite. This argument is supported by the major differences between the Raman spectra of grunerite and cummingtonite (discussed above). What should be pointed out at this point is the fact that another difference between the Raman spectrum of grunerite and that of cummingtonite

Raman and infrared spectroscopy of kaersutite and certain common amphiboles 43
AUI–G, 57, 2, (2011) 35–58
consists in a shifting of the ν1 band (due to the symmetric stretching of Si-Ob-Si) to a higher frequency in cummingtonite (namely, from 665 cm-1 to 671 cm-1).
The band positions and the tentative assignments of bands observed in both vibrational spectra (Raman and IR) are illustrated in Table 2.
Fig. 3 Gru(b)–infrared spectrum of 5848 grunerite in the OH- stretching region (3600–3700 cm-1).
Fig. 4 Bottom: the µ-Raman spectrum of tremolite (Tr(a)) in the OH stretching region. Top: infrared spectra of tremolite (Tr(b)) and actinolite (Act(c)) in the same spectral region (3600–3700 cm-1).
2. Tremolite and actinolite
The solid solution composition (actinolite) is situated, in terms of composition, between the end-members of the tremolite – ferro-actinolite series. According to Deer et al. (1997) and in good agreement with the last amphibole nomenclature (Leake et al., 1997, 2003, 2004), the term "tremolite" is used when the ratio of Mg/(Mg+Fe2+) ≥ 0.90, "actinolite" when Mg/(Mg+Fe2+) is

44 Apopei A.I. et al.
AUI–G, 57, 2, (2011) 35–58
between 0.50–0.90 and "ferro-actinolite" when Mg/(Mg+Fe2+) is less than 0.50. Therefore, tremolite extends from Ca2Mg5Si8O22(OH)2 to Ca2Mg4.5Fe0.5Si8O22(OH)2, actinolite extends from this composition to Ca2Mg2.5Fe2.5Si8O22(OH)2 (mid-point), and ferro-actinolite – from this mid-point to Ca2Fe5Si22(OH)2.
Both the vibrational spectra of tremolite and actinolite proved difficult to discriminate in the 46–1300 cm-1 spectral region (see Figs. 5 and 6), while in the region of hydroxyl group stretching vibrations (3600–3700 cm-1, Fig. 4) these spectra are different and prove more easily distinguishable.
Given the Raman spectra from our work conducted by the authors of the present paper (Figs. 5 and 7, in Apopei and Buzgar, 2010), as well as the µ-Raman spectra from Figure 5, the differences between tremolite and actinolite in the low spectral region are the following: (i) a most intense band, which is assigned to the symmetric stretching of the Si-Ob-Si linkage (ν1), is shifted with 4–5 cm-1, i.e. tremolite 675 cm-1 and actinolite 670 cm-1; (ii) the presence, in the tremolite spectra, of the band at 1087 cm-1 (discussed in the previous paper as well), which is due to the symmetric stretching of the CO3 group (ν1) from the calcite mineral (see Buzgar and Apopei, 2009). In other words, the presence of calcite can be an additional piece of information in the identification of the tremolite mineral, but it is not sufficient. Taking into account the discussion on the Raman spectrum of grunerite, two spectral lines can be assigned specifically, as follows: (i) the 371 cm-1 band from tremolite and the 369 cm-1 band from actinolite are due to the Fe2+-OH vibration; and (ii) the 417 cm-1 and 415 cm-1 bands can be assigned to Mg2+-OH. In the region between 900–1100 cm-1 (Fig. 5), two symmetric stretching modes of the O-Si-O linkage and two asymmetric stretching vibration modes of the Si-Ob-Si bridges are exhibited. The assignment of the Raman bands is summarized in Table 3.
For the infrared spectra (370–1300 cm-1) of these two minerals (Fig. 6), the absorption bands between both IR spectra are very close. Only a very small difference can be observed between 370–400 cm-1, where, as in the case of the Raman spectra, the bands of the tremolite spectrum are better-resolved, compared to those of the actinolite sample. Therefore, this lower spectral region (370–1300 cm-1) could not be used in distinguishing between tremolite and actinolite. The assignment of the bands in this region follows the previous assignment of the infrared spectrum of grunerite (Table 3).
Of great importance in the discrimination between these minerals is the 3600–3700 cm-1 spectral domain, where the vibrations due to the stretching of M-OH arise in both vibrational spectra. Although the center of inversion is present in all clinoamphiboles (the C2/m space group), in the 3600–3700 cm-1 domain IR-Raman doublets arise, as explained by Makreski et al. (2006), due to the presence, in their structure, of the TOT strips whose symmetry dominates over the symmetry of the crystal. This observation precludes the coincidence of the OH- stretching vibrations in both vibrational spectra of clinoamphiboles (e.g. Fig 4) (Wang et al., 1988b,c). The infrared bands from the 3600–3700 cm-1 spectral region (Fig. 4) are in good agreement with the data from the literature (Burns and Strens, 1966; Burns and Greaves, 1971; Raudsepp et al., 1987; Wang et al., 1988c; Skogby and Rossman, 1991; Hawthorne et al., 2000; Ishida et al., 2002; Jenkins et al., 2003; Gopal et al., 2004; Driscall et al., 2005), which assign the weak band D around 3660 cm-1 to the presence of Mg in M1 sites and of Fe2+ in the M3 site, and the stronger band at 3675 cm-1 to the (3Mg2+)-OH vibration (where the Mg2+ ion is present in all nearest-neighbor octahedral sites, i.e. M1M1M3). The broader and very weak band labeled with the letter C’ (Fig. 4) arises from the OH stretching combination related to the (2Fe2+Mg2+)-OH configuration. In other words, these absorption bands tend to shift the OH stretching bands towards a lower frequency, starting with the replacement of Mg2+ by Fe2+ in the M1M1M3 configuration (see the discussion on grunerite, as well as Burns and Strens, 1966; Ishida et al., 2002).

Raman and infrared spectroscopy of kaersutite and certain common amphiboles 45
AUI–G, 57, 2, (2011) 35–58
Fig. 5 Tr(a)–µ-Raman spectrum of tremolite in the 46–1300 cm-1spectral region; and Act(c)–Raman spectrum of actinolite in the 210–1300 cm-1 spectral region.
Fig. 6 Tr(b), Act(c)–Infrared spectrum of tremolite and actinolite, respectively, in the 370–1300 cm-1 spectral domain.

46 Apopei A.I. et al.
AUI–G, 57, 2, (2011) 35–58
Tab. 3 Assignment of the bands observed in the Raman and infrared spectra of tremolite (Tr(a)) and actinolite (Act(c)), in the 80–1300 cm-1 and 3600– 3700 cm-1spectral domains
Raman Infrared Band position (cm-1) Assignment Band position (cm-1) Assignment Tremolite Actinolite Tremolite Actinolite
84, 123, 144, 161, 179, 193, 215, 224, 233, 251, 265, 291
226, 247, 294 lattice mode 376, 390,
401, 420 372, 390, 401, 420
T(M- OH), where M = Ca, Mg and Fe2+
334, 345, 352 ?overlapping ? T(M-OH),
where M = Ca, Mg and Fe2+
450, 460, 509, 528,
544
446, 462, 508, 525,
544 bending Si-O-Si
371 369 T(Fe2+-OH)
396, 437 369, 392 T(M- OH), where M = Ca, Mg and
Fe2+
647, 666, 686, 728, 740, 757
645, 663, 685, 726, 738, 758
νs (Si-Ob-Si)
417 415 T(Mg2+-OH) 920 920 ? νs(Si-Ob-Si) 487, 516, 531,
587 482, 522,
577 deformation
modes of Si4O11 951 996 1016 1041 1067 1105
951 995 1016 1041 1065 1102
νas Si-Ob-Si and νas O-Si-O
675 670 νs (Si-Ob-Si) 742, 752 744 ? νs (Si-Ob-Si) 932, 948 929, 949 νs (O-Si-O)
1031, 1062 1027, 1059 νas (Si-Ob-Si) 1087 - νs - CO3 groupa 3675 3674 (3Mg2+)-OH 3675 (3Mg2+)-OH 3660 3660 (2Mg2+Fe2+)-OH 3661 (2Mg2+Fe2+)-OH 3647 (2Fe2+Mg2+)-OH
T–Transational modes; a–symmetric stretching (ν1) of the CO3 group, after Buzgar and Apopei (2009); ?–questionable interpretation; νs–symmetric stretching; νas–asymmetric stretching.
3. Pargasite and kaersutite
The ideal chemistry of pargasite is NaCa2(Mg4Al)Si6Al2O22(OH)2 while that of kaersutite is NaCa2(Mg4Ti)Si6Al2O23(OH), where Ti need to be ≥ 0.50 (after Leake et al., 1997). Kaersutite is a titaniferous calcic amphibole, typically associated with alkaline igneous rocks, common as phenocrysts in those type of rocks. Ti can be incorporated into this clinoamphibole through at least two types of mechanisms, one of them involves M sites only (Hawthorne and Grundy, 1976; Oberti et al., 1992).
The Raman spectra for six natural amphiboles are shown in Figure 7, where Prg(d) and Krs(e) are the samples analyzed in the present study (Prg–Pargasite; Krs–Kaersutite; abbreviation after Whitney and Evans, 2010), while Prg(a), Prg(b), Prg(c) and Krs(f) are reference Raman spectra from the RRUFF project (Downs, 2006). The measured composition (Tabs. 4a, 4b) were also confirmed through X-ray diffraction. The main Raman spectral feature is represented by the appearance of two well-resolved bands between 455–620 cm-1 (region 1) and 715–850 cm-1 (region 3), respectively. Moreover, region 2 (between 620–715 cm-1) seems to be very useful in the approximation of IVSi and IVAl apfu (see further discussion).
A closer inspection of region 1 (455–620 cm-1) revealed the presence of two types of vibrations: (i) the first type are due to the deformation modes of the Si4O11 group, which appear slightly broader in all the pargasite samples, while in the kaersutite samples are present as

Raman and infrared spectroscopy of kaersutite and certain common amphiboles 47
AUI–G, 57, 2, (2011) 35–58
shoulders (at 514, 544 cm-1 in Krs(e), and 516, 544 cm-1 in the Raman spectrum of reference kaersutite; see Fig. 7); (ii) the second type of bonds are present in the Raman spectrum of kaersutite and represent stronger peaks (in term of intensity), even compared to the ν1 vibration (νs Si-Ob-Si bridge, at 669 cm-1). The important observation at this point is the appearance of a new band, of an increase in intensity, and of wavenumbers with a gradual substitution of VIAl3+ by VITi4+ in the C sites (i.e. from pargasite – NaCa2(Mg4Al)(Si6Al2)O22(OH)2 to kaersutite – NaCa2(Mg4Ti)(Si6Al2)O23(OH)). By analyzing the chemical composition (especially in the C sites, see Tabs. 4a, 4b), one can see that, for Prg(c), which exhibit a weakly-masked peak at 582 cm-1, Ti4+ is 0.22 apfu in the C sites (Ti-rich pargasite), while reference kaersutite, with the highest peak at 581 cm-1, exhibits Ti4+ 0.64 apfu; respectively 590 cm-1 in the Raman spectrum of the kaersutite analyzed in the present paper. It is also possible to consider our pargasite mineral (Prg(d)), with the shoulder band at 582 cm-1, Ti-rich pargasite.
Tab. 4a Chemical formula for reference minerals (Pargasite R060072, R050321, R060632 and Kaersutite R070128) (after Downs, 2006)
Pargasite (A0-1B2 sites) - NaCa2 (C5 sites) - Mg4Al R060072 (Prg(a)) (Na0.81K0.19)Σ=1 (Ca1.90Na0.10)Σ=2
(Mg3.46Al0.45 Fe2+
0.05Ti0.04)Σ=4 Al1.00
R050321 (Prg(b)) (Na0.77K0.23)Σ=1 (Ca1.90Na0.10)Σ=2 Mg4.00
(Al0.58Fe3+0.07
Ti0.05Mg0.30)Σ=1 R060632 (Prg(c)) (Na0.61K0.34 0.05)Σ=1 (Ca1.82Na0.18)Σ=2 (Mg3.12Fe2+
0.88)Σ=4 (Al0.78Ti0.22)Σ=1
Kaersutite NaCa2 Mg4Ti R070128 (Prg(f)) (Na0.65K0.15 0.20)Σ=1 (Ca1.82Na0.18)Σ=2 (Mg2.64Fe2+
1.36)Σ=4 (Ti0.64Fe2+
0.15 Al0.10Fe3+
0.09Mn0.02)Σ=1
Tab. 4b Chemical formula for reference minerals (Pargasite R060072, R050321, R060632 and Kaersutite R070128) (after Downs, 2006)
Pargasite (T8 sites) - Si6Al2 O22(OH)2 R060072
(a) (Si5.57Al2.43)Σ=8 O22(OH)2
R050321 (b) (Si6.24Al1.76)Σ=8 O22((OH)0.69F0.31)2
R060632 (c) (Si6.00Al2.00)Σ=8 O22((OH)0.84F0.16)2
Kaersutite Si6Al2 O23(OH) R070128
(f) (Si5.91Al2.09)Σ=8 O22O(OH)
Region 2 exhibits the symmetric stretching vibration of the Si-Ob-Si linkage and the substitution of IVAl by IVSi in tetrahedral sites which involve the presence of the νs of the Si-Ob-Al or the Al-Ob-Si bridge as a shoulder peak around 690 cm-1. This consideration can be correlated with the linear increase of the wavenumbers (see Figs. 8a, 8b). By analogy, the substitution of IVAl by IVSi (increasing the IVAl apfu with the increase in wavenumber) causes the splitting of this very sharp band into two components, one of which shifts to a higher frequency and forms a

48 Apopei A.I. et al.
AUI–G, 57, 2, (2011) 35–58
weakly-resolved band due to the νs of the Si-Ob-Al or Al-Ob-Si linkage, since, according to Oberti et al. (1995), the Al-O-Al linkages are highly unfavorable (see Prg(a) spectrum with band at 692 cm-1, Fig. 7).
.
Fig. 7 Prg(d)–Raman spectrum of 5851 pargasite; and Krs(e)–µ-Raman spectrum of 3985 kaersutite in the 120–1300 cm-1region; Prg(a,b,c)–reference Raman spectra of pargasite R060072, R050321 and R060632; Krs(f)–reference Raman spectra of kaersutite R070128 with different chemical composition (the reference spectra are from the RRUFF project, Downs, 2006).

Raman and infrared spectroscopy of kaersutite and certain common amphiboles 49
AUI–G, 57, 2, (2011) 35–58
Fig. 8a IVSi atoms per formula unit versus wave-number.
Fig. 8b IVAl atoms per formula unit versus wave-number.
Region 3 is characterized by the appearance of two peaks, the first at 750 cm-1, which is well-resolved, and the second at around 780 cm-1, a shoulder of the first. These bands are present just in those spectra with a high content of VITi (analogous to the presence of the 582 cm-1 band).
The following conclusions could be formulated in relation to the comparison between the Raman spectra (in the 455–850 cm-1 range) of different pargasite (in terms of chemical composition) and kaersutite samples: (i) considering that the only difference between pargasite and kaersutite is the VIAl/VITi ratio from the C site and the IVSi/IVAl ratio from the T site, the Prg(d) sample can be assumed to be Ti-rich pargasite, since its Raman spectrum is very close to that of the reference pargasite sample with a high content of VITi (0.22 apfu) in the C site; (ii) considering previous discussions, it is clear that the Raman spectrum described by us for Krs(e) is almost identical to that of reference kaersutite (even outside the 455–850 cm-1 domain). However, in the literature, the Raman spectra of kaersutite in the lower frequency region (40–1300 cm-1) have been highlighted by Mikouchi and Miyamoto (2000) and Minitti et al. (2008) for Martian meteorites, without any data related to the OH- stretching region being mentioned. Another source of Raman data on kaersutite in the literature is a natural mineral from Italy (Mt. Etna), which provides our reference spectrum (Fig. 7; from the RRUFF project; Downs, 2006). It should be pointed out that the Raman spectra of kaersutite, both terrestrial and Martian, determined by Mikouchi and Miyamoto (2000), displays a broad band in the 737–749 cm-1 range. In the spectrum established in the present study, as well as in the reference spectrum of kaersutite, the band arises at 764 cm-1 (with a shoulder peak at 788 cm-1), and 756 cm-1 and 786sh cm-1 (sh–shoulder), respectively. Since these two components (~760 cm-1 and its shoulder, 788 cm-1) also arise in Ti-rich pargasite, we will assume that the peaks result from the presence of VITi in the M sites, due to the VITi-OH vibration. Furthermore, Minitti et al. (2008) have carried out shock experiments on kaersutite samples and concluded that, in terms of crystal structure, there is a lack of shock-induced alteration and that the spectral bands are observed at frequencies very similar to those

50 Apopei A.I. et al.
AUI–G, 57, 2, (2011) 35–58
described in the Caltech Raman library (now part of the RRUFF project; Downs, 2006). Details on the Raman bands and suggested assignments are reported in Table 5.
The infrared spectra of pargasite and kaersutite (Fig. 9) present the common characteristics of calcic amphiboles in the 350–1300 cm-1 spectral range. For both samples (pargasite and kaersutite), the low-frequency region of the IR spectra does not display major differences which could be used as a fingerprint so as to easily discriminate between these minerals, as Raman spectroscopy can (see discussion above). Taking into account the previous discussion regarding infrared vibration assignment in the spectral region between 350–1300 cm-1, the positions of the bands observed, together with their assignments, are summarized in Table 6.
Fig. 9 Infrared spectra of pargasite (Prg(d)) and kaersutite (Krs(e)) in the 370–1300 cm-1 spectral range.
Robinson et al. (1973) studied the cation distribution of amphiboles, and, based on the M1-O and M3-O distances, which are longer than the mean M2-O distance, suggested that Ti atoms are concentrated in the M2 sites.The behavior of Ti in oxy-amphiboles was studied by Kitamura et al. (1975), who suggested that Ti is enriched in the M2 sites and also present in the M1 and M3 sites. Whittaker (1971), on the other hand, claims that Ti has a preference for the M1 site. Based on the distribution of mainly cations with different electronegativity and ionic radii over the NN (nearest-neighbor) octahedral sites, differences will be observed in the weavenumber of the OH stretching modes.
For the pargasite and kaersutite samples, the region with wavenumbers between 3600–3700 cm-1, OH and metal ion bonds are present (Fig. 11). According to Burns and Strens (1966), in common

Raman and infrared spectroscopy of kaersutite and certain common amphiboles 51
AUI–G, 57, 2, (2011) 35–58
hornblende minerals, the absorption bands which arise in the OH stretching region appear as a single, broad and jagged band. Tab. 5 Wavenumbers and assignments for the Raman spectra of pargasite and kaersutite samples (a-f) in the 120–1300 cm-1 spectral region
This study (cm-1) Refference (cm-1)
Tentative assignment
Sample no. Downs (2006) Pargasite
5851 (d)
Kaersutite 3985 (e)
Pargasite R060072
(a)
Pargasite R050321
(b)
Pargasite R060632
(c)
Kaersutite R070128
(f)
- 125, 144, 157, 189, 168, 186 140,
167, 186
123, 144,
164, 187 156, 188 lattice mode
227 249 226, 253 239 229 243 269, 292 292, 306 - - 293 290
T(M-OH), where M = Ca, Mg, Fe2+
, Al, Mn
323 331, 347 344 324 326 371 363 378 388 381 349 418 423 421 419 426 420 474, 514,
536, 582 516, 544 516, 552 513 519, 544 516, 544
deformation modes of
Si4O11 582 590 - - 582? 581 VITi-OH
664 666 650 670 665 691 νs of the Si-Ob-Si (ν1)
691 ~ 690 692 ?685 689 ~ 687 νs of the
Si-Ob-Al or Al-Ob-Si
758, 788 764, 788 745? 763? 750, 787 756, 786 VITi-OH
885, 909 893 914 921 920 894 νs of the O-Si-O
971 975 962 - 971 ~ 975 νas of the O-Si-O
1011, 1048, 1094
1013, 1063
1010, 1070 1021 1017 1011 νas of the
Si-Ob-Si
- 1183 - - - 1208 ? T–Transational modes; ?–questionable interpretation; νs–symmetric stretching; νas–asymmetric stretching.
The most striking difference between the infrared spectra of pargasite and kaersutite in the OH stretching region (Fig. 11) lies in the shape of the bands. Thus, in the case of the pargasite samples, the IR spectra are broader than in that of kaersutite. Moreover, the IR spectra of kaersutite are very jagged. On the other side, the µ-Raman spectrum of kaersutite in the 3600–3700 cm-1 region is also broader, but with a lower noise-to-signal ratio and two well-resolved peaks at 3658 cm-1 (D) and 3685 cm-1 (G). The 3645 cm-1 (C’) band is a shoulder of the D band, while the 3697 cm-1 band is a shoulder of the 3697 cm-1 band. According to Su et al. (2009) and Iezzi et al. (2007), the appearance of the bands in the higher region of the hydroxyl stretching

52 Apopei A.I. et al.
AUI–G, 57, 2, (2011) 35–58
vibrations (around 3700 cm-1) indicates the presence of a partial occupation of the A-site (by Na or even K). Tab. 6 Assignment of the bands observed in the infrared spectra of pargasite (Prg(d)) and kaersutite (Krs(e)), in the 350–1300 cm-1 spectral domain
Infrared Band position (cm-1) Assignment Pargasite Kaersutite
405 392, 406 T(M- OH), where M = Fe2+ and Mg2+
460, 511 455, 507, 516 bending Si-O-Si 616, 628, 637, 663, 684, 704,
730, 739, 764 605, 616, 628, 637, 650, 663, 685, 693,
704, 730, 739, 764 νs (Si-Ob-Si)
894 894 ?νs (Si-Ob-Si)
944, 977, 1050 943, 977, 1032, 1055 νas Si-Ob-Si and νas O-Si-O
T–Transational modes; ?–questionable interpretation; νs–symmetric stretching; νas–asymmetric stretching.
According to Jenkins et al. (2003) and Della Ventura et al. (1999, 2003), the infrared spectrum of pargasite from the OH stretching region displays two broad bands of approximately equal intensity, at ~3712 cm-1 and ~3680 cm-1. Della Ventura et al. (2007) have made a comparison between the IR spectra of pargasite and Ti-rich pargasite in the OH stretching region. In the case of Ti-rich pargasite, the IR spectrum exhibits a broad band with the maxima around 3686 cm-1, and shoulders at 3710 cm-1 and ~3660 cm-1.
The infrared spectra obtained on the pargasite and kaersutite samples in the OH stretching region, presented in Figure 11, clearly require further investigation.
The incertitude regarding the pargasite sample (Prg(d)) used in the present study, which we assume to be a Ti-rich pargasite (see discussion above), could be resolved through a mere chemical analysis. However, given the fact that the sample belongs to a museum, such an analysis could not be carried out as part of the present work.
4. Riebeckite
Figure 10 compares the µ-Raman spectrum of riebeckite with the infrared spectrum of the same sample. The Raman spectrum obtained is much better than that from previous work, obtained on the same sample (see Apopei and Buzgar, 2010). Taking into account the discussions of the Raman spectrum of grunerite above, the spectral line at 363 cm-1 from the Raman spectrum of riebeckite is due to the presence of Fe2+ in the M sites (Fe2+-OH vibration). The other bands, 325 cm-1 and 431 cm-1, are assigned to the general translational vibration between the cation and the hydroxyl group (T(M-OH)). The symmetric stretching vibration of the Si-Ob-Si bridge is present at 666 cm-1; the 885 cm-1 band can be assigned to the νs of the O-Si-O linkage; the 966 cm-1 band, with the shoulder at 980 cm-1, is due to the νas of the O-Si-O, while the band at 1084 cm-1, which is very weak and exact position of whose peak is debatable, can be assigned to the νas of the Si-Ob-Si linkage.
The variations in band position and intensity across the riebeckite and magnesioriebeckite samples may be followed in Figure 12, where the bands are labeled A’-E in both vibrational

Raman and infrared spectroscopy of kaersutite and certain common amphiboles 53
AUI–G, 57, 2, (2011) 35–58
spectra. These variations are due to the substitution of Fe2+ and Mg2+ in the M1 and M3 sites. According to Su et al. (2009) and Della Ventura et al. (2005), the narrow band at 3619 cm-1 can be assigned to the Fe2+Fe2+Fe2+-OH vibration, where Fe2+ can be in the M(1,3) site; the 3635 cm-1 band – to MgFe2+Fe2+-OH; the 3651 cm-1 band – to MgMgFe2+-OH, and the 3665 cm-1 band – to MgMgMg-OH. These types of variation between members of a series are also observed in the spectra of the grunerite-cummingtonite and tremolite-actinolite series, in the OH stretching region. The decrease in intensity of the bands, coupled with an increase in frequency, is observed in both vibrational spectra of riebeckite, which is another argument supporting the idea that the symmetry of the TOT strips dominates over the symmetry of the crystal, and the coincidence of the OH stretching vibrations (with a minor difference) in both vibrational spectra of clinoamphiboles. Tab. 7 Assignment of the bands observed in the Raman and infrared spectrum of riebeckite (Rbk(a)), in the 120–1300 cm-1 spectral domain
Raman Infrared
Band position (cm-1) Assignment Band position (cm-1) Assignment Riebeckite Riebeckite 140, 171, 198, 222,
244 lattice mode 375, 451 T(M- OH), where M = Fe2+ and/or Mg2+
325, 431 T(M-OH), where M = Fe2+ or Mg 499, 538 bending Si-O-Si
363 T(Fe2+-OH)
537, 576 deformation modes of Si4O11
635, 660, 692, 773 νs (Si-Ob-Si)
666 νs of the Si-Ob-Si (ν1) 879 ?νs (Si-Ob-Si) 885 νs of the O-Si-O 972, 987
νas Si-Ob-Si and νas O-Si-O
966, 980 νas of the O-Si-O ? 1084 νas of the Si-Ob-Si 1033
1100 1137
T–Transational modes; ?–questionable interpretation; νs–symmetric stretching; νas–asymmetric stretching. Tab. 8 Assignment of the bands observed in both vibrational spectra of riebeckite and IR spectra of magnesioriebeckite in the OH stretching region (3600–3700 cm-1)
Raman Infrared This study
Assignment This study Downs (2006)
Assignment Band position (cm-1) Band position (cm-1) Riebeckite Riebeckite Magnesioriebeckite
3608 ? 3609 - ? 3620 Fe2+Fe2+Fe2+-OH 3620 - Fe2+Fe2+Fe2+-OH 3636 MgFe2+Fe2+-OH 3630, 3635 3635 MgFe2+Fe2+-OH
3646, 3658 MgMgFe2+ 3651, 3656 3651 MgMgFe2+ ? - 3665 MgMgMg-OH
?–questionable interpretation.

54 Apopei A.I. et al.
AUI–G, 57, 2, (2011) 35–58
Fig. 10 Rbk(a)–Raman spectrum of 5807 riebeckite; and Rbk(b)–infrared spectrum of the same sample in the 120–1300 cm-1 region Summary and conclusions
Both vibrational spectra illustrated in the present study are in good agreement with those from the literature, with the exception of the infrared spectrum of kaersutite (210–3700 cm-1) and the OH stretching region (3600–3700 cm-1) of the Raman spectrum, which, to the best of our knowledge, have not been reported so far. The main characteristics of the Raman spectrum of kaersutite are the following: (i) a stronger and broader band, with the maxima between 580–590 cm-1, due to the presence of Ti4+ in octahedral sites; a medium and broader band around 750 cm-1, probably due to the presence of VITi; and (ii) a medium band of the main vibrations in amphiboles, around 666–670 cm-1, assigned to the Si-Ob-Si vibration. These features are also present in two Raman spectra of pargasite which can be considered Ti-rich, one of them (reference Prg(c)) with VITi 0.22 apfu, and the other (our sample, Prg(d)) without analysis. Moreover, the pargasite-kaersutite members display a good correlation between IVSi and IVAl apfu, with an increase or decrease in weavenumber.

Raman and infrared spectroscopy of kaersutite and certain common amphiboles 55
AUI–G, 57, 2, (2011) 35–58
Fig. 11 Bottom: Krs(e)–µ-Raman spectrum of kaersutite in the OH stretching region. Top: infrared spectra of pargasite, kaersutite (Prg(d1, d2), and Prg(e1, e2)), in the same spectral region (3600–3700 cm-1)
Fig. 12 Bottom: Rbk(a)–µ-Raman spectrum of riebeckite in the OH stretching region. Top: infrared spectra of riebeckite (b, c), Rbk(d) reference riebeckite and Mrbk(e) – reference magnesioriebeckite from the RRUFF project (Downs, 2006), in the same spectral region (3600–3700 cm-1)
The OH stretching region from the IR spectra of clinoamphiboles can serve as a complementary (or, in some cases, essential) tool for the reliable discrimination between the
56 Apopei A.I. et al.
AUI–G, 57, 2, (2011) 35–58
members of the same series, where the only difference consists in the Mg/(Mg+Fe2+) ratio. It is based on the presence of different cations in the M1 and M3 sites. The only exceptions are the infrared spectra of the OH stretching region for the pargasite and kaersutite samples, an aspect which clearly requires further investigation, since the spectra are broad and very jagged. Acknowledgements
The authors wish to express their gratitude toward P. Vandenabeele (University of Ghent, Belgium) for the micro-Raman analyses of some amphibole samples. References Andrut, M., Gottschalk, M., Melzer, S., Najorka, J., 2000. Lattice vibrational modes in synthetic tremolite-Sr-tremolite
and tremolite-richterite solid solutions. Phys Chem Miner, 27, 301–309. Apopei, A.I., Buzgar, N., 2010. The Raman study of amphiboles. An. Şt. Univ. „Al. I. Cuza” Iaşi, Geologie, LVI, 57–84. Burns, R.G., Greaves, C., 1971. Correlations of infrared and mossbauer site population measurements of actinolites.
American Mineralogist, 56, 2010–2033. Burns, R.G., Strens, R.G., 1966. Infrared study of the hydroxyl bands in clinoamphiboles. Science, 153, 890–892. Buzatu, A., Buzgar, N., 2010. The Raman study of single-chain silicates, An. Şt. Univ. „Al. I. Cuza” Iaşi, Geologie,
LVI, 107–126. Buzgar, N., Apopei, A.I., 2009. The Raman study of certain carbonates. An. Şt. Univ. „Al. I. Cuza” Iaşi, Geologie, LV,
98–112. Buzgar, N., Apopei, A.I., Buzatu, A., 2009a. Romanian Database of Raman Spectroscopy (http://rdrs.uaic.ro). Buzgar, N., Buzatu, A., Sanislav, I.V., 2009b. The Raman study on certain sulfates. An. Şt. Univ. „Al. I. Cuza” Iaşi,
Geologie, LV, 5–23. Deer, W.A., Howie, R.A., Zussman, J., 1997. Rock-forming minerals. Volume 2B: Double-chain silicates (second
edition), Geological Society of London. Della Ventura, G., Robert, J.-L., Bény, J.-M., 1991. Tetrahedrally coordinated Ti4+ in synthetic Ti-rich potassic
richterite; evidence from XRD, FTIR, and Raman studies. American Mineralogist, 76, 1134–1140. Della Ventura, G., Robert, J.L., Hawthorne, F.C., 1998. Characterization of OH-F short-range order in potassium-fluor-
richterite by infrared spectroscopy in the OH-stretching region. Canadian Mineralogist, 36, 181–185. Della Ventura, G., Hawthorne, F.C., Robert, J.L., Iezzi, G., 2003. Synthesis and infrared spectroscopy of amphiboles
along the tremolite-pargasite join. Eur. J. Mineral., 15, 341–347. Della Ventura, G., Oberti, R., Hawthorne, F.C., Bellatreccia, F., 2007. FTIR spectroscopy of Ti-rich pargasite from
Lherz and the detection of O2- at the anionic O3 site in amphiboles. American Mineralogist, 92, 1645–1651. Della Ventura, G., Robert, J.-L., Beny, J.-M., Raudsepp, M., Hawthorne, F.C., 1993. The OH-F substitution in Ti-rich
potassium richterite: Rietveld structure refinement and FTIR and micro-Raman spectroscopic studies of synthetic amphiboles in the system K2O-Na2O-CaO-MgO-SiO2-TiO2-H2O-HF. American Mineralogist, 78, 980–987.
DellaVentura, G., Robert, J.L., Raudsepp, M., Hawthorne, F.C., Welch, M.D., 1997. Site occupancies in synthetic monoclinic amphiboles: Rietveld structure refinement and infrared spectroscopy of (nickel, magnesium, cobalt)-richterite. American Mineralogist, 82, 291–301.
Della Ventura, G., Hawthorne, F.C., Robert, J.L., Delbove, F., Welch, M.F., Raudsepp, M., 1999. Short-range order of cations in synthetic amphiboles along the richterite-pargasite join, Eur. J. Mineral., 11, 79–94.
Della Ventura, G., Redhammer, G.J., Iezzi, G., Hawthorne, F.C., Papin, A., Robert, J.-L., 2005. A Mössbauer and FTIR study of synthetic amphiboles along the magnesioriebeckite ferri-clinoholmquistite join. Phys. Chem. Minerals, 32, 103–113.
Della Ventura, G., Bellatreccia, F., Iezzi, G., Oberti, R., Càmara, F., 2008. The P21/m-C2/m phase transition in synthetic amphiboles in the system Li2O–Na2O–MgO–SiO2–H2O: a high-T FTIR study. Eur. J. Mineral., 20, 1019–1026.
Douglas, B., Ho, S.-M., 2006. Structure and Chemistry of Crystalline Solids. Springer, New York. Downs, R.T., 2006. The RRUFF Project: an integrated study of the chemistry, crystallography, Raman and infrared
spectroscopy of minerals. Program and Abstracts of the 19th General Meeting of the International Mineralogical Association in Kobe, Japan. O03–13.
Downs, R.T., Hall-Wallace, M., 2003. The American mineralogist crystal structure database. American Mineralogist, 88, 247–250.
Driscall, J., Jenkins, D.M., Dyar, M.D., Bozhilov, K.N., 2005. Cation ordering in synthetic low-calcium actinolite. American Mineralogist, 90, 900–911.
Ernst, W.G., Wai, C.M., 1970. Mössbauer, infrared, X-ray and optical study of cation ordering and dehydrogenation in natural and heat-treated sodic amphiboles. American Mineralogist, 55, 1226–1258.

Raman and infrared spectroscopy of kaersutite and certain common amphiboles 57
AUI–G, 57, 2, (2011) 35–58
Gopal, N.O., Narasimhulu, K.V., Rao, J.L., 2004. EPR, optical, infrared and Raman spectral studies of Actinolite mineral. Spectrochimica Acta, Part A, Molecular and biomolecular spectroscopy, 60, 2441–2448.
Hawthorne, F.C., Grundy, H.D., 1976. The crystal chemistry of the amphiboles, IV, X-ray and neutron refinements of the crystal structure of tremolite. Canadian Mineralogist, 14, 334–345.
Hawthorne, F.C., Welch, M.D., Della Ventrua, G., Liu, S.X., Robert, J.L., Jenkins, D.M., 2000. Short-range order in synthetic aluminous tremolites: An infrared and triple-quantum MAS NMR study. American Mineralogist, 85, 1716–1724.
Iezzi, G., Gatta, G.D., Kockelmann, W., Della Ventura, G., Rinaldi, R., Schäfer, W., Piccinini, M., Gaillard, F., 2005a. Low-T neutron powder-diffraction and synchrotron-radiation IR study of synthetic amphibole Na(NaMg)Mg5Si8O22(OH)2. American Mineralogist, 90, 695–700.
Iezzi, G., Tribaudino, M., Ventura, G.D., Nestola, F., Bellatreccia, F., 2005b. High-T phase transition of synthetic ANaB(LiMg)CMg5Si8O22(OH)2 amphibole: an X-ray synchrotron powder diffraction and FTIR spectroscopic study. Phys. Chem. Miner., 32, 515–523.
Iezzi, G., Della Ventura, G., Bellatreccia, F., Lo Mastro, S., Bandli, B.R., Gunter, M.E., 2007. Site occupancy in richterite-winchite from Libby, Montana, USA, by FTIR spectroscopy. Mineral. Mag., 71, 93–104.
Ishida, K., Hawthorne, F.C., Ando, Y., 2002. Fine structure of infrared OH-stretching bands in natural and heat-treated amphiboles of the tremolite-ferro-actinolite series. American Mineralogist, 87, 891–898.
Ishida, K., Jenkins, D.M., Hawthorne, F.C., 2008. Mid-IR bands of synthetic calcic amphiboles of tremolite-pargasite series and of natural calcie amphiboles. American Mineralogist, 93, 1112–1118.
Jenkins, D.M., Bozhilov, K.N., Ishida, K., 2003. Infrared and TEM characterization of amphiboles synthesized near the tremolite-pargasite join in the ternary system tremolite-pargasite-cummingtonite. American Mineralogist, 88, 1104–1114.
Jmol – an open-source Java viewer for chemical structures in 3D. (http://www.jmol.org/). Jovanovski, G., Makreski, P., Kaitner, B., Boev, B., 2009. Silicate Minerals from Macedonia. Complementary Use of
Vibrational Spectroscopy and X-ray Powder Diffraction for Identification and Detection Purposes. Croatia Chemica Acta, 82, 363–386.
Kitamura, M., Tokonami, M., Morimoto, N., 1975. Distribution of Titanium Atoms in Oxy-Kaersutite. Contrib. Mineral. Petr., 51, 167–172.
Kloprogge, J.T., Case, M.H., Frost, R.L., 2001a. Raman microscopic study of the Li amphibole holmquistite, from the Martin Marietta Quarry, Bessemer City, NC, USA. Mineral. Mag., 65, 775–785.
Kloprogge, J.T., Visser, D., Ruan, H., Frost, L., 2001b. Infrared and Raman spectroscopy of holmquistite, Li2(Mg,Fe2+)3(Al,Fe3+)2(Si,Al)8O22(OH)2. Journal of Materials Science Letters., 20, 1497–1499.
Lazarev, A.N., 1972. Vibrational Spectra and Structure of Silicates. Consultants Bureau, New York and London. Leake, B.E., Woolley, A.R., Birch, W.D., Burke, E.A.J., Ferraris, G., Grice, J.D., Hawthorne, F.C., Kisch, H.J.,
Krivovichev, V.G., Schumacher, J.C., Stephenson, N.C.N., Whittaker, E.J.W., 2003. Nomenclature of amphiboles: additions and revisions to the international mineralogical association’s 1997 recommendations. Canadian Mineralogist, 41, 1355–1362.
Leake, B.E., Woolley, A.R., Birch, W.D., Burke, E.A.J., Ferraris, G., Grice, J.D., Hawthorne, F.C., Kisch, H.J., Krivovichev, V.G., Schumacher, J.C., Stephenson, N.C.N., Whittaker, E.J.W., 2004. Nomenclature of amphiboles: Additions and revisions to the International Mineralogical Association’s amphibole nomenclature. American Mineralogist, 89, 883–887.
Leake, B.E., Woolley, A.R., Arps, C.E.S., Birch, W.D., Gilbert, M.C., Grice, J.D., Hawthorne, F.C., Kato, A., Kisch, H.J., Krivovichev, V.G., Linthout, K., Laird, J., Mandarino, J.A., Maresh, V.W., Nickel, E.H., Rock, N.M.S., Schumacher, J.C., Smith, D.C., Stephenson, N.N., Ungaretti, L., Whittaker, E.J.W., Youzhi, G., 1997. Nomenclature of amphiboles: report of the subcommittee on amphiboles of the International Mineralogical Association, Commission on New Minerals and Mineral Names. Canadian Mineralogist, 35, 219–246.
Libowitzky, E., 1999. Correlation of O-H Stretching Frequencies and O-H•••O Hydrogen Bond Lengths in Minerals. Monatshefte für Chemie, 130, 1047–1059.
Libowitzky, E., Beran, A., 2006. The structure of hydrous species in nominally anhydrous minerals: Information from polarized IR spectroscopy. Rev. Mineral. Geochem., 62, 29–52.
Makreski, P., Jovanovski, G., Gajovic, A., 2006. Minerals from Macedonia - XVII. Vibrational spectra of some common appearing amphiboles. Vibrational Spectroscopy, 40, 98–109.
Mikouchi, T., Miyamoto, M., 2000. Micro Raman spectroscopy of amphiboles and pyroxenes in the martian meteorites Zagami and Lewis Cliff 88516. Meteorit Planet Sci., 35, 155–159.
Minitti, M.E., Leshin, L.A., Dyar, M.D., Ahrens, T.J., Guan, Y., Luo, S.N., 2008. Assessment of shock effects on amphibole water contents and hydrogen isotope compositions, 2, Kaersutitic amphibole experiments. Earth Planet Sc. Lett., 266, 288–302.
Mottana, A., Paris, E., Della Ventura, G., Robert, J.-L., 1990. Spectroscopic evidence for tetrahedrally-coordinated titanium in richteritic amphiboles. Rend. Fis. Acc. Lincei, 1, 387–392.
Oberti, R., Ungaretti, L., Cannillo, E., Hawthorne, F.C., 1992. The Behavior of Ti in Amphiboles .1. 4-Coordinate and 6-Coordinate Ti in Richterite, Eur. J. Mineral., 4, 425–439.
Oberti, R., Hawthorne, F.C., Ungaretti, L., Cannillo, E., 1995. Al-[6] Disorder in Amphiboles from Mantle Peridotites. Canadian Mineralogist, 33, 867–878.

58 Apopei A.I. et al.
AUI–G, 57, 2, (2011) 35–58
Raudsepp, M., Turnock, A.C., Hawthorne, F.C., Sherriff, B.L., Hartman, J.S., 1987. Characterization of synthethic pargasitic amphiboles (NaCa2Mg4M3+Si6Al2O22(OH,F)2; M3+ = Al, Cr3+, Ga, Fe3+, Sc, In) by infrared spectroscopy, Rietveld structure refinement and 27Al and 29Si MAS NMR spectroscopy. American Mineralogist, 72, 580–593.
Rinaudo, C., Cairo, S., Gastaldi, D., Gianfagna, A., Tagliani, S.M., Tosi, G., Conti, C., 2006. Characterization of fluoro-edenite by µ-Raman and µ-FTIR spectroscopy. Mineral. Mag., 70, 291–298.
Robinson, K., Gibbs, G.V., Ribbe, P.H., Hall, M.R., 1973. Cation distribution in three hornblendes. American Journal of Science, 273, 522–535.
Shurvell, H.F., Rintoul, L., Fredericks, P.M., 2001. Infrared and Raman spectra of jade and jade minerals. Internet Journal of Vibrational Spectroscopy (www.ijvs.com) 5, 4.
Skogby, H., Rossman, G.R., 1991. The Intensity of Amphiboles OH Bands in the Infrared Absorption Spectrum. Phys. Chem. Minerals., 18, 64–68.
Smith, E., Dent, G., 2005. Modern Raman Spectroscopy – A Practical Approach. John Wiley and Sons, England. Strens, R.G.J., 1974. The common chain, ribbon, and ring silicates. In: Farmer, V.C. (Ed.), (1974). The infrared spectra
of minerals, Mineralogical Society, London, 305–330. Su, W., Zhang, M., Redfern, S.A.T., Gao, J., Klemd, R., 2009. OH in zoned amphiboles of eclogite from the western
Tianshan, NW-China. Int. J. Earth Sci., 98, 1299–1309. Theodosoglou, E., Koroneos, A., Paraskevopoulos, K.M., Christofides, G., Papadopoulou, L.T.Z., 2007. Comparative
infrared sprectroscopic study of Ca-amphiboles. Bulletin of the Geological Society of Greece, XXXX, 984–995. Wang, A., Dhamelincourt, P., Turrell, G., 1988a. Infrared and Low-Temperature Micro-Raman Spectra of the Oh
Stretching Vibrations in Cummingtonite. Journal of Applied Spectroscopy, 42, 1451–1457. Wang, A., Dhamelincourt, P., Turrell, G., 1988b. Raman and Infrared Spectroscopic Investigation of the Cation
Distributions in Amphiboles. Journal of Molecular Structure., 175, 183–188. Wang, A., Dhamelincourt, P., Turrell, G., 1988c. Raman Microspectroscopic Study of the Cation Distribution in
Amphiboles. Journal of Applied Spectroscopy, 42, 1441–1450. Whitney, D.L., Evans, B.W., 2010. Abbreviations for names of rock-forming minerals. American Mineralogist, 95, 185–187. Whittaker, E.J.W., 1971. Madelung energies and site preferences in amphiboles. American Mineralogist, 56, 980–996. Received December, 2011 Revised: December, 2011 Accepted: January, 2012


