Embed Size (px)
Citation preview

Neurobiology of Disease 73 (2015) 96–105
Contents lists available at ScienceDirect
Neurobiology of Disease
j ourna l homepage: www.e lsev ie r .com/ locate /ynbd i
Rapamycin reveals anmTOR-independent repression of Kv1.1 expressionduring epileptogenesis
Natasha M. Sosanya a,b, Darrin H. Brager a, Sarah Wolfe b,c, Farr Niere a, Kimberly F. Raab-Graham a,b,c,⁎a Center for Learning and Memory, Department of Neuroscience, University of Texas at Austin, USAb Institute for Cell and Molecular Biology, University of Texas at Austin, USAc Waggoner Center for Alcohol and Addiction Research, University of Texas at Austin University Station C7000, Austin, TX 78712, USA
⁎ Corresponding author at: University of Texas at AuAustin, TX 78712, USA. Fax: +1 512 475 8000.
E-mail address: [email protected] (K.F. RAvailable online on ScienceDirect (www.sciencedir
http://dx.doi.org/10.1016/j.nbd.2014.09.0110969-9961/Published by Elsevier Inc.
a b s t r a c t
a r t i c l e i n f oArticle history:Received 21 May 2014Revised 11 August 2014Accepted 21 September 2014Available online 28 September 2014
Keywords:Potassium channelsmiRNARapamycinmTORTemporal lobe epilepsy
Changes in ion channel expression are implicated in the etiology of epilepsy. However, the molecular leading tolong-term aberrant expression of ion channels are not well understood. The mechanistic/mammalian target ofrapamycin (mTOR) is a serine/threonine protein kinase that mediates activity-dependent protein synthesis inneurons. mTOR is overactive in epilepsy, suggesting that excessive protein synthesis may contribute to theneuronal pathology. In contrast, we found that mTOR activity and the microRNA miR-129-5p reduce the ex-pression of the voltage-gated potassium channel Kv1.1 in an animal model of temporal lobe epilepsy (TLE).When mTOR activity is low, Kv1.1 expression is high and the frequency of behavioral seizures is low. Howev-er, as behavioral seizure activity rises, mTOR activity increases and Kv1.1 protein levels drop. In CA1 pyrami-dal neurons, the reduction in Kv1.1 lowers the threshold for action potential firing. Interestingly, blockingmTOR activity with rapamycin reduces behavioral seizures and temporarily keeps Kv1.1 levels elevated. Over-time, seizure activity increases and Kv1.1 protein decreases in all animals, even those treated with rapamycin.Notably, the concentration of miR-129-5p, the negative regulator of Kv1.1 mRNA translation, increases by21 days post-status epilepticus (SE), sustaining Kv1.1 mRNA translational repression. Our results suggestthat following kainic-acid induced status epilepticus there are two phases of Kv1.1 repression: (1) an initialmTOR-dependent repression of Kv1.1 that is followed by (2) a miR-129-5p persistent reduction of Kv1.1.
Published by Elsevier Inc.
Introduction
Changes in intracellular signaling often follow neuronal insult or in-jury leading to a persistent state of neuronal hyperexcitability, as intemporal lobe epilepsy (TLE). The mechanistic/mammalian target ofrapamycin (mTOR) is a serine/threonine protein kinase that is overac-tive following status epilepticus (SE) (Brewster et al., 2013; Zeng et al.,2009). Best characterized for its role in promoting translation ofmRNAs, overactive mTOR in neurological disorders is often hypothe-sized to result in excessive protein synthesis (Hoeffer and Klann,2010). However, a number of studies suggest that there is a reductionin the expression of voltage-gated ion channels in models of temporallobe epilepsy (Poolos and Johnston, 2012). Interestingly, activation ofmTOR represses the local translation of the delayed rectifier potassiumchannel Kv1.1 (Raab-Graham et al., 2006). Furthermore, increased
stin University Station C7000,
aab-Graham).ect.com).
seizure susceptibility directly correlates with a decrease in Kv1.1 geneexpression (Rho et al., 1999; Smart et al., 1998; Robbins and Tempel,2012); and overexpression of Kv1.1 eliminates seizures in a rat modelof focal epilepsy (Wykes et al., 2012).
Identifying themechanisms throughwhichmTOR activity repressesthe translation of ion channelmRNA is important for understanding thecause of epilepsy. RNA-binding proteins and microRNAs can bind to thesame target mRNAs and antagonize each other's function (Meisner andFilipowicz, 2011). We recently determined that the microRNA, miR-129-5p, and the RNA binding protein, HuD, compete for binding andtranslational regulation of Kv1.1 mRNA (Sosanya et al., 2013). WhenmTOR activity is elevated, Kv1.1 mRNA translation is repressed bymiR-129-5p binding. In contrast, when mTOR activity is reduced, miR-129-5p binding is relieved and HuD restores translation (Sosanyaet al., 2013). These findings have led us to ask the following questions:(1) Does overactive mTOR following status epilepticus lead to reducedKv1.1 protein expression? (2) What is the physiological consequenceof changes in Kv1.1 protein expression? (3) Are HuD and miR-129-5p,the RNA-binding factors that regulate Kv1.1 mRNA translation, aber-rantly expressed in epilepsy?
Herein we report that hippocampal expression of Kv1.1 protein isdynamic over the course of several days following kainic acid-induced

97N.M. Sosanya et al. / Neurobiology of Disease 73 (2015) 96–105
status epilepticus (SE), a critical period duringwhich neuronal remodel-ing occurs. Expression of Kv1.1 gradually increases over 14 days post-SE.On day 15 there is a dramatic decrease of Kv1.1 expression and Kv1.1protein continues to decline well below control levels by 21–30 dayspost-SE. The decrease in Kv1.1 on day 15 is blocked by rapamycin, sug-gesting that overactivemTOR is responsible. However, the sustained de-crease in Kv1.1 expression beyond day 15 is rapamycin-insensitive andconsistent with the function of the Kv1.1 repressor miR-129-5p. In linewith changes in Kv1.1 protein expression, the threshold for actionpotential firing in CA1 pyramidal neurons is depolarized at day 14post-SE when Kv1.1 expression is elevated, and hyperpolarized on day28–30, when Kv1.1 expression is reduced. Collectively, these data sug-gest that both mTOR- and miR-129-5p-mediated repressions of Kv1.1mRNA translation contribute to the neuronal hyperexcitability observedfollowing status epilepticus.
Methods
Animals
Status epilepticus (SE) was induced in 8-week old male Sprague–Dawley rats by intraperitoneal injection of kainic acid (10 mg/kg,Abcam). The behavior of the animals was observed, and seizures werescored according to the Racine scale (Racine, 1972). One hour afterthe onset of SE (ClassV on the Racine scale indicated by rearing followedby falling down as seen for a fullmotor seizure), seizureswere terminat-ed by subcutaneous injection of sodium pentobarbital (PB; 30 mg/kg).Control rats received the appropriate volume of saline vehicle followedby PB 1 h later. For rapamycin (LC Laboratories) injection,we followed amodified protocol reported by Meikle et al. (Meikle et al., 2008).Rapamycin was dissolved at 50 mg/ml in ethanol and stored at−20 °C. Before each administration, rapamycin was diluted in 7%Tween 80, 7% polyethylene glycol 400 (PEG-400) and water to final6% ethanol (Brewster et al., 2013). Rapamycin or vehicle (7% Tween80, 7% PEG-400, 6% ethanol) was given at 6 mg/kg intraperitoneallyevery 4 days. All animal experiments were performed in accordancewith guidelines approved by the Institutional Animal Care and UseCommittee (IACUC) at The University of Texas-Austin.
Continuous video monitoring
Kainic acid-injected rats (KA) were video monitored from day 2 today 21 post-SE and were scored from 7 am to 3 pm (Fig. 1) or from4:30–7 pm (Fig. 7) by an individual blind to the condition. Behavioralseizures ranging from Class III (dog shake) to Class V (full rearingfollowed by falling down) on the Racine scale were scored.
Slice preparation
Hippocampal slices were prepared from control and post-SE rats asdescribed previously (Shin et al., 2008). Briefly, animals were anesthe-tized using a lethal dose of ketamine and xylazine. Once deeply anesthe-tized, animals were perfused intracardially with ice-cold modified ACSFcontaining (in mM) 210 sucrose, 2.5 KCl, 1.2 NaH2PO4, 25 NaHCO3, 0.5CaCl2, 7.0 MgCl2, and 7.0 dextrose bubbled with 95%O2/5%CO2. Thebrain was removed and bisected along the midline. One hemispherewas used for slice preparation for electrophysiological recording andthe other hemisphere was used for biochemical analyses (see Westernblot analysis, immunohistochemistry, and RT-qPCR). The hemispherewas mounted and 350 μm thick slices were made using a microtome(Vibratome, St. Louis MO). Slices were placed in a holding chamberfilled with ACSF containing (mM): 125 NaCl, 2.5 KCl, 1.25 NaH2PO4,25 NaHCO3, 2 CaCl2, 2 MgCl2, and 12.5 dextrose warmed to 35 °C for20 min and then placed at room temperature for b6 h until needed forrecording.
Electrophysiology
Slices were placed individually as needed into a submerged record-ing chamber continuously perfused with control extracellular saline(see below). Slices were viewed with a Zeiss Axioskop using infraredvideo microscopy and differential interference contrast (DIC) optics.For all recordings, the ACSF solution contained (mM): 125 NaCl, 3 KCl,1.25 NaH2PO4, 25 NaHCO3, 2 CaCl2, 1 MgCl2, and 12.5 dextrose andwas bubbled continuously with 95%O2/5% CO2 at 31–33 °C. Fast gluta-matergic andGABAergic synaptic transmissionswere blocked by a com-bination of 20 μM DNQX, 50 μM AP5, 2 μM gabazine, and 5 μMCGP55845.
Patch pipettes were pulled from borosilicate glass and had a resis-tance of 4–8 MΩ when filled with the internal recording solution con-taining (in mM): 120 potassium gluconate, 20 KCl, 10 HEPES, 4 NaCl, 4MgATP, 0.3 Na-GTP and 7 phosphocreatine (pH 7.3 with KOH). Wholecell recordings were made from the soma of CA1 pyramidal neuronsusing a Multiclamp 700A or Dagan BVC in current clamp mode. Seriesresistance was monitored throughout the recording, and experimentsin which the series resistance exceeded 30 MΩ were discarded.
Data acquisition and analysis
Data were sampled at 40 kHz, filtered at 5 kHz and digitized by anITC-18 interface connected to computer running Axograph X. Data anal-yses were performed with Axograph X.
Western blot analysis
The hippocampus was immediately dissected from the hemisphereof the brain not used for physiology (see Slice preparation).Synaptoneurosomal (SN) protein and RNAwere prepared from the hip-pocampus as outlined (Sosanya et al., 2013). Proteinswere separated bySDS-PAGE, transferred to nitrocellulose, and blocked with 5% milk +Tween 20. Blots were then probed with antibodies against Kv1.1(1:500; Neuromab K36/15), p-mTOR (1:500, Cell Signaling 5536),mTOR (1:500, Invitrogen AHO1232), HuD (1:500; Millipore AB5971),and tubulin (1:2000; Abcam ab15246). Anti-p-mTOR (rabbit) andanti-total mTOR (mouse) were probed and detected with an anti-mouse-IR-Dye 800 (1:2000; LICOR 926-32210) and anti-rabbit-Alexa680 secondary antibodies (1:2000; Invitrogen A-21084). Dualcolor imaging for within blot analysis for P-mTOR and total mTOR aswell as Kv1.1 and tubulinwas performed on the LICOROdyssey imagingsystem.AllWestern blotswere imaged such that pixel intensitieswithinthe band were in the linear range, as indicated by LICOR detection soft-ware. Densitometry of the immunoreactive bands was performed usingthe NIH Image software (Image J) using the profile function.
Immunohistochemistry
Control and KA-injected rats were perfused with ice cold PBS andpost-fixedwith 4% formaldehyde overnight at 4 °C. 80 μm thick coronalsections of the hippocampuswere taken on a vibratome and placed freefloating in PBS. Hippocampal slices with similar morphology were dou-ble stained for Kv1.1 and tubulin. Slices were blocked overnight at 4 °Cin blocking solution (10% goat serumwith 0.3% Triton X-100 in PBS) andthen incubated with mouse-anti-Kv1.1 (1:200, Neuromab K36/15) andrabbit anti-tubulin (1:200, Abcam) overnight at RT in blocking solution.The following day, slices werewashed in PBS for 1 × 10min, 1 × 30min,and 1 × 40 min and then incubated in blocking solution for 2 h at RT.Slices were then incubated overnight at 4 °C in secondary antibodyfollowed by same washing protocol as above. Once mounted on glassslides slices were imaged on a Leica SP5 confocal microscope (LeicaDM6000 CFS 20×/0.70 objective HC PL APO 0.17/C). Images were ac-quired based on relative tubulin signal and the same settings in thesame imaging session. A z-series of 20, 1 μm sections were collected

98 N.M. Sosanya et al. / Neurobiology of Disease 73 (2015) 96–105
and projected. An equal size region of interest (ROI) box was drawn ineither the CA1 or CA3 regions and the ratio of Kv1.1 to tubulin signalwas measured. Quantification was done using the NIH ImageJ softwareplugin T-functions Ratio ROI Manager.
Reverse transcription-quantitative PCR (RT-qPCR)
SN RNAwas isolated using Zymogen Direct-zol RNAminiprep kit ac-cording to the manufacturer's directions. RT-quantitative PCRs for miR-129-5p, miR-145-5p, or 5S rRNA were done using the miRCURY LNAUniversal RT microRNA PCR kits (Exiqon; universal cDNA #203300and Sybr green master mix #203450) using specific primers (Exiqon)starting with 22 ng of total RNA according to the manufacturer'sdirections and previously described and verified by Northern blotanalysis (Sosanya et al., 2013). RT-qPCRs for Kv1.1 and GAPDHwere performed using the iQ cDNA synthesis (170-8890) and SYBRgreen (170-8880) kits from Biorad following the manufacturer'sdirections (Raab-Graham et al., 2006; Sosanya et al., 2013). Foldchangeswere calculated as outlined (Raab-Grahamet al., 2006; Sosanyaet al., 2013). Relative ratios were calculated by the model as previ-ously described (Pfaffl, 2001) and calculated by the equation: ratio =(2ΔCPtarget (control-sample) ÷ 2ΔCPreference (control-sample)),where CP is the threshold cycle, the target is the transcript of interest,and the reference is either 5S rRNA or GAPDH. Internal control (5SrRNA or GAPDH), no-RT control, and miR-129-5p RT-PCR were run inparallel and in duplicate. Validation of product was determined bymelt curve analysis at the completion of the PCR amplification. Ct valuesof duplicates were averaged and compared between animals.
Statistical analyses
All data are expressed as mean ± S.E.M. Statistical comparisonswere made using one-way or two-way ANOVA followed by Tukey–Kramer or Dunnett's multiple comparisons post-hoc test or Student'st-test (paired or unpaired as appropriate) with Prism software(GraphPad). Linear fits and correlations were made using Prism. Datawere considered statistically significant if p b 0.05.
# of
Beh
avio
ral S
eizu
res
Clas
s III
-V(p
er h
our)
Days post-SE
*
d2 d5d14 d15 d17 d21
0.0
0.5
1.0
1.5
Fig. 1. Number of behavioral seizures increases at 21 days post-SE. Three KA-injected ratswere placed in an isolated room where they were continuously video monitored for theprogression of behavioral seizures until day 21 post-SE. KA rats were scored by numberof behavioral seizures ranging from Class III–V by an individual blind to treatment. * day2 to day 21: p b 0.01; day 5 to day 21: p b 0.01; day 14 to day 21: p b 0.01; day 15 today 21: p b 0.05; day 17 to day 21: p b 0.05 by one-way ANOVA, Newman–Keuls posthoc test.
Results
Behavioral seizures increase between 15 and 21 days post-SE
The kainic acid (KA) model of TLE is useful for identifying molecularchanges that occur during epileptogenesis leading to recurrent, chronicseizures (Aronica et al., 1997; Friedman et al., 1997; Grooms et al., 2000;Misonou et al., 2006; Mohapatra et al., 2009; Schauwecker et al., 2000;Tongiorgi et al., 2004). Shortly after periods of intense activity, neuronsmay undergo homeostatic changes in ion channel function and/or ex-pression that can reduce the overall activity of the neuron (Fan et al.,2005; Narayanan and Johnston, 2010; Shin et al., 2008; Baram, 2012;Krook-Magnuson et al., 2013; Patterson et al., 2014). In some casesthese changes are transient, and what follows are persistent states ofneuronal hyperexcitability, ultimately leading to the onset of recurrentseizure activity (Sun et al., 2013). To determine when these dynamicchanges in ion channel expression and/or function may occur, we firstdetermined the onset of seizure activity, as measured by behavioral sei-zures. Rats were continuously video monitored and behavioral seizuresranging from Class III–V (Racine, 1972) were scored from 2 to 21 dayspost-SE. We found that although seizure number remained low for thefirst 2 weeks post-SE, there was a sharp increase in seizure occurrencebetween days 14 and 15. Furthermore, seizure frequency continued toclimb fromday 15 to day 21, where seizure number became significant-ly higher when compared to all other time points (Fig. 1).
IncreasedmTOR activity corresponds to peak number of behavioral seizures
Activation ofmTOR is elevated in severalmodels of TLE, includingKA(Brewster et al., 2013; Zeng et al., 2009). Increases in mTOR activity re-press the expression of several voltage-gated ion channels, includingKv1.1 (Brewster et al., 2013; Lee et al., 2011; Raab-Graham et al.,2006; Sosanya et al., 2013). In light of the behavioral seizure progression(Fig. 1), we set out to determinewhenmTOR became hyperactive post-SE. To address this question, we measured mTOR activity in thehippocampus of control and KA rats at time points that correspondedto observed behavioral seizure activity. Synaptoneurosomes isolatedfrom the hippocampus were subjected to Western blot analysisfor phosphorylated-mTOR (p-mTOR) and total mTOR. The ratio ofp-mTOR/mTOR served as a readout for mTOR activity. Consistent withbehavioral seizure occurrence,mTOR activitywas significantly depressed14 days post-SE. This was followed by a sharp, significant increase15 days post-SE which remained elevated through 30 days (0 day:1.00 ± 0.05, 2 days post-SE: 0.86 ± 0.07, 5 days post-SE: 1.07 ± 0.02;14 days post-SE: 0.52 ± 0.16, 15 days post-SE: 1.19 ± 0.17; control:1.00 ± 0.06, 21–30 days post-SE: 1.88 ± 0.275; Figs. 2A–B). Thechange in p-mTOR/mTOR ratio was not due to changes in total mTORexpression (Fig. S1). These data suggest a switch in mTOR activity be-tween day 14 post-SE, when mTOR activity is 38.7% lower than control,and days 21–30 post-SE, when mTOR activity is 37% higher than control(Fig. 1C). Furthermore, the onset of hyperactive mTOR correlated withthe significant increase in behavioral seizure occurrence.
Bidirectional changes in Kv1.1 expression in TLE
The overexpression of Kv1.1 can provide protection against seizuresin drug-resistant, focal, neocortical epilepsy (Wykes et al., 2012). Wetherefore asked if Kv1.1 expression underwent changes that paralleledchanges in seizure and mTOR activity following SE. As predicted, Kv1.1expression gradually increased over 14 days post-SE, peaking at ~71%above control levels and precipitously dropping back to control levelsby 15 days (0 day SA + PB: 1.00 ± 0.03, 2 days post-SE: 1.07 ± 0.08,5 days post-SE: 1.27 ± 0.09; 14 days post-SE: 1.77 ± 0.12; 15 dayspost-SE: 0.98 ± 0.05; Fig. 3A). By 21–30 days post-SE, Kv1.1 levelswere further reduced by ~50% relative to control (control SA + PB:1.00 ± 0.06; 21–30 day post-SE: 0.54 ± 0.15; Fig. 3B). A comparison

p-m
TOR/
mTO
R(n
orm
aliz
ed to
0d)
0d 5d2d
post-SE
14d15d
**
days post-SE
Control30d
BA
p-m
TOR/
mTO
R(n
orm
aliz
ed to
Con
trol
) **
p-m
TOR/
mTO
R(%
of C
ontr
ol) *
days post-SE
C
14d
21-30
d-100
-50
0
50
100
0d 2d 5d 14d
15d
0.0
0.5
1.0
1.5 ***
Control
21-30
d0.0
0.5
1.0
1.5
2.0
2.5
Fig. 2. Differential mTOR activity occurs post-SE. (A) Hippocampal SN protein was isolatedfrom 0 day (saline+ PB, euthanized 1 day post-injection) and kainic acid-(KA+PB) treatedanimals at 2, 5, 14, and 15 days post-SE. Top, representative Western blot of a SDS-PAGEgradient gel probed with antibodies against p-mTOR and mTOR. Quantification of p-mTOR/mTOR levels normalized by tubulin, relative to 0 day is shown below. 0 day: n = 14,2 days post-SE: n = 6, 5 days post-SE: n = 5, 14 days post-SE: n = 3, 15 days post-SE:n = 3; * b 0.05, ** b 0.01 by one-way ANOVA, Dunnett's post hoc test. (B) Hippocampal SNprotein was isolated from control (saline + PB, euthanized 21–30 days post-injection) andkainic acid-(KA + PB) treated animals 21–30 days post-SE. Top, representative Westernblot of a SDS-PAGE gradient gel probed with antibodies against p-mTOR andmTOR. Quanti-fication of p-mTOR/mTOR normalized by tubulin and relative to control is shown below.Control: n = 9; 21–30 day post-SE: n = 9; * b 0.05. (C) Percent of control for p-mTOR/mTOR of 14 days and 21–30 days post SE animals from Figs. 2A–B is shown. * b 0.05,significance determined by Student's t-test for both B and C. Error bars are SEM.
A
Kv1.
1/Tu
bulin
(nor
mal
ized
to 0
d)
*******
*
***
**
days post-SE
0d 5d2d
Tubulin
post-SE
14d 15d
30dControl
Kv1.
1/Tu
bulin
(nor
mal
ized
to C
ontr
ol)
Kv1.
1/Tu
bulin
(% o
f Con
trol
)
***
days post-SE
B
Tubulin
C
14d
21-30
d-100
-50
0
50
100
Control
21-30
d0.0
0.5
1.0
1.5
2.0
0d 2d 5d 14d
15d
0.0
0.5
1.0
1.5
2.0
Fig. 3. Kv1.1 protein levels peak at 14 days post-SE, followed by a significant drop at21–30dayspost-SE. (A)Hippocampal SNproteinwas isolated from0day (saline+PB, eu-thanized 1 day post-injection) and kainic acid-(KA + PB) treated animals 2, 5, 14, and15 days post SE. Top, representative Western blot of a SDS-PAGE gradient gel probedwith antibodies against Kv1.1 and tubulin. Quantification of Kv1.1 signal normalized by tu-bulin levels and relative to 0 day is shown below. *p b 0.05, ***p b 0.005 by one-wayANOVA, Tukey's post hoc test. 0 day: n = 16, 2 days post-SE: n = 6, 5 days post-SE:n = 5, 14 days post-SE: n = 4, 15 days post-SE: n = 3, 21–30 days post-SE: n = 5.Error bars represent SEM. (B) Hippocampal SN protein was isolated from control(saline + PB, euthanized 21–30 days post-injection) and kainic acid-(KA + PB) treatedanimals 2, 5, 14, and 15 days post SE. Top, representative Western blot of a SDS-PAGEgradient gel probedwith antibodies against Kv1.1 and tubulin. Quantification of Kv1.1 sig-nal normalized by tubulin levels and relative to control is shown below. **p b 0.001, sig-nificance determined by Student's t-test. Control: n = 7; 21–30 days post-SE: n = 5.Error bars represent SEM. (C) Percent of control for Kv1.1/tubulin of 14 days and 21–30days post-SE animals from Figs. 3A–B is shown. *** b 0.005, significance determinedby Student's t-test. Error bars are SEM.
99N.M. Sosanya et al. / Neurobiology of Disease 73 (2015) 96–105
of Kv1.1 protein revealed an opposite switch in Kv1.1 levels from14days to 21–30 days post-SE compared to the change inmTOR activity(Fig. 3C). These results are consistentwithmTOR-mediated suppressionof Kv1.1 expression. The drop in Kv1.1 expressionmay contribute to thegradual increase in behavioral seizures from day 15 to day 21 post-SE asmTOR activity increases.
To determine the regional distribution of the changes in Kv1.1 ex-pression post-SE, we stained hippocampal sections for Kv1.1 from con-trol and KA rats 14 and 30 days post-SE. In agreementwith ourWesternblot results, we found that the intensity of Kv1.1 staining increased by~50% in both areas CA1 and CA3 14 days post-SE when compared today 0 (Figs. 4A, C). By 30 days Kv1.1 staining was reduced by ~60% inCA1 and ~45% in CA3 of KA rats compared to control rats (Figs. 4B, D).
Dynamic changes in Kv1.1 expression post-SE alter the threshold for actionpotential firing
In cortical neurons, dynamic changes in Kv1 channels reset thethreshold for action potential firing (VTH) (Higgs and Spain, 2011).Based on our biochemical results, we hypothesized that an increase on
day 14, and a decrease on day 28, in Kv1.1 expression would be accom-panied by a depolarization and hyperpolarization of VTH respectively. Totest if VTH is altered, we recorded single action potentials (APs) elicitedin CA1 pyramidal neurons from KA- and saline-injected rats at13–14 days post-SE, when Kv1.1 expression is highest, and21–30 days post-SE, when Kv1.1 expression is reduced. Single APswere elicited using small amplitude, 100-msec current injections(which is sensitive to Kv1.1 expression) and large amplitude, 2-mseccurrent injections (which are not sensitive to Kv1.1 expression)(Higgs and Spain, 2011). The amplitude of the 100-msec current pulsewas adjusted so that a single action potential occurred in the middle(~50 msec latency) of the current injection. Using the 100-msec injec-tion, we found that VTH in CA1 pyramidal neurons was significantlydepolarized at 5 days and 13–14 days post-SE (Figs. 5 and S2). In con-trast, VTH at 21–30 days post-SE in CA1 pyramidal neurons washyperpolarized by ~3 mV compared to control and ~9 mV comparedto 13–14 days post-SE (Figs. 5A and B). There was no significant differ-ence in VTHmeasured with the 2-msec current injections in control andpost-SE animals (Figs. 5C and D). These results are consistent with ourobserved changes in Kv1.1 expression.

A
CA3
B
Cont
rol
KA 30
d po
st-S
E
CA1
KA 14
d po
st-S
E
CA1
Kv1.1/ Tubulin
CA3
0dKA
14d
post
-SE
Cont
rol
KA 30
d po
st-S
E0d
CA1
**
CA3
Kv1.
1/Tu
bulin
(nor
mal
ized
to C
ontr
ol)
C
**
21-30d
14d
21-30d
Kv1.1 Tubulin
Kv1.1/ TubulinKv1.1 Tubulin
Kv1.1/ TubulinKv1.1 Tubulin
Kv1.1/ TubulinKv1.1 Tubulin
Kv1.
1/Tu
bulin
(nor
mal
ized
to 0
d)Kv
1.1/
Tubu
lin(n
orm
aliz
ed to
0d)
Kv1.
1/Tu
bulin
(nor
mal
ized
to C
ontr
ol)
D
Control
0.0
0.5
1.0
1.5
2.0
0d
0.0
0.5
1.0
1.5
2.0
0.0
0.5
1.0
1.5
2.0
Control
0.0
0.5
1.0
1.5
2.0
14d 0d
CA1
CA3***
*
Fig. 4. Kv1.1 protein increases 14 days post-SE and decreases 30 days post-SE in hippocampal CA1 and CA3 regions. (A) Coronal slices from control and 14 days post-SE rats were immu-nostained for Kv1.1 and tubulin (volume control) followed by imagingwith the Leica SP5 confocalmicroscope 20×objective. Representative slices CA1 and CA3 regions from14 days post-SE rats are shown. Kv1.1 is indicated by green signal and tubulin is indicated by red signal. Scale bar = 100 μm. (B) Coronal slices from control and 21–30 days post-SE rats were immu-nostained for Kv1.1 and tubulin (volume control) followed by confocalmicroscopywith a 20× objective. Representative slices of CA1 and CA3 regions from 30 days post-SE rat are shown.Kv1.1 is indicated by green signal and tubulin is indicated by red signal. Scale bar = 100 μm. (C) Quantification of CA1 and CA3 regions at 14 days post-SE. Kv1.1/tubulin is normalized tocontrol. 0 day: n = 4, 14 days: n = 4. (D) Quantification of CA1 and CA3 regions at 21–30 days post-SE. Kv1.1/tubulin is normalized to control. control: n = 4, 21–30 day: n = 4.
100 N.M. Sosanya et al. / Neurobiology of Disease 73 (2015) 96–105
To test whether the changes in Kv1 expression contributed tothe observed differences in VTH, we bath applied a low concentrationof 4-aminopyridine (4-AP, 50 μM), a potassium channel blocker. 4-APsignificantly hyperpolarized VTH measured with 100-msec injectionsat all time points except 21–30 days post-SE, when Kv1 expression is
lowest (Figs. 5A, B and D). VTHmeasuredwith 2-msec injectionswas in-sensitive to 4-AP in both control and post-SE animals. These data sup-port the hypothesis that an increase in functional expression Kv1.1-containing channels occurs after SE peaking at 14 days post-SE. Thisincrease is transient and is reduced by 21–30 days post-SE. The loss of

101N.M. Sosanya et al. / Neurobiology of Disease 73 (2015) 96–105
functional Kv1.1-containing channels at 21–30 days post-SE rendersCA1 pyramidal neurons hyperexcitable by reducing the threshold foraction potential firing.
Rapamycin treatment reveals an mTOR-independent change in seizure andKv1.1 expression
The mTORC1 inhibitor rapamycin is effective at reducing seizure ac-tivity (Zeng et al., 2009; Brewster et al., 2013;Wong, 2012). In addition,
control14 d
post-SE28 d
post-SE
Baseline
-65 mV
-65 mV
50 µM 4-AP10 ms
5 mV
5 ms
5 mV
C
B
A
Cha
nge
in th
resh
old
afte
r4-
AP
(%of
base
line)
D100 msec 2 msec
cont
rol
14d
post-
SE
28d
post-
SE
cont
rol
14d
post-
SE
28d
post-
SE-20
-15
-10
-5
0
5
10
Thr
esho
ld2-
ms
puls
e(m
V)
50 µM 4-AP +– – + – +
control 28 dpost-SE
14 dpost-SE
-60
-65
-55
-50
-45
-40
50 µM 4-AP +– – + – +
Thr
esho
ld10
0-m
s pu
lse
(mV)
control28 d
post-SE14 d
post-SE
-65
-60
-55
-50
-45
-40
-35 * **
***
**
*
****
**n.s.
we found that acute rapamycin treatment increases the local translationof Kv1.1mRNA in neuronal hippocampal dendrites (Raab-Grahamet al.,2006; Sosanya et al., 2013). Based on these data, we hypothesized thatrapamycin treatment should increase Kv1.1 expression and reduce sei-zure frequency.We chose to start rapamycin treatment on day 14 post-SE when mTOR levels were lowwith the idea that we will block the in-crease in mTOR activity and concomitant reduction of Kv1.1 expressionat day 15.
Consistent with previous results, rapamycin reduced seizure num-ber by ~60 and ~50% by days 17 and 21, respectively (Fig. 6B). Despitethis reduction in seizure occurrence, there remained an mTOR-independent increase in seizure frequency between days 17 and 21(Fig. 6C, KA: 9.00±3.5, p b 0.01 KA+ Rapa: 4.2±1.8, p b 0.05). To con-firm that rapamycin effectively blocked mTOR activation, we measuredthe p-mTOR/total mTOR ratio in hippocampi of KA- and rapamycin-treated KA rats. Rapamycin reduced mTOR activity by ~50% at bothdays 17 and 21 post-SE (Figs. 6D–E; mTOR Rapa: 1.08± 0.26). Interest-ingly, although Kv1.1 expression remained elevated at 17 days post-SEwith rapamycin, by 21 days post-SE with rapamycin Kv1.1 expressionwas lower than untreated KA rats (Figs. 6D–E; Kv1.1 Rapa: 0.54 ±0.09). These data suggest a secondary, mTOR-independent mechanismthat represses Kv1.1 protein expression.
Increased expression of the microRNA miR-129-5p contributes to the latephase repression of Kv1.1 expression
The rapid rise in mTOR activity occurring between days 14 and 15post-SE corresponds to a drop in Kv1.1 expression. By day 21 post-SE,Kv1.1 expression remains low even when mTOR is blocked byrapamycin. What is the molecular mechanism that maintains the re-duced Kv1.1 expression in TLE? Changes in transcription of manymRNAs occur during epileptogenesis (Ozbas-Gerçeker et al., 2006). Todetermine if changes in Kv1.1 protein expression are due to an effecton transcription, we measured Kv1.1 mRNA levels by RT-qPCR. Wefound that levels of Kv1.1 mRNA change after SE in a pattern oppositeto Kv1.1 protein: when Kv1.1 protein levels peak at 14 days post-SE,Kv1.1 mRNAs are reduced by ~50% (Fig. 7A; control: 1.00 ± 0.06,2 days post-SE: 0.84 ± 0.03, 5 days post-SE: 1.06 ± 0.11, 14 dayspost-SE: 0.49 ± 0.14, 15 days post-SE: 1.05 ± .13). Furthermore, asmTOR activity increased and Kv1.1 protein levels dropped, Kv1.1mRNA expression returned to control levels (Figs. 7A and B). This in-verse relationship between Kv1.1 protein andmRNA suggests that tran-scription rates are likely to be relatively constant throughoutepileptogenesis and that the bidirectional changes in Kv1.1 proteinlevels may be regulated at the translational level.
Recently, our laboratory determined that the microRNA, miR-129-5p negatively regulates the expression of Kv1.1 in neurons whenmTOR is active and that the RNA-binding protein HuD positively regu-lates the translation of Kv1.1 mRNA when mTOR is inhibited (Sosanyaet al., 2013). With acute inhibition of mTOR activity, the levels of theRNA-binding factors do not change; however, several HuD mRNA
Fig. 5. Action potential threshold (VTH) bidirectionally changes in CA1 pyramidal neuronsexpressing TLE. (A) Voltage recordings showing a single action potential elicited by a 100-msec (top) and 2-msec (bottom) current injections before (thin line) and after (thick line)application of 50 μM 4-AP from control (black), 13–14 days post-SE (gray), and 21–30 days post-SE (red) CA1 neurons. (B) The threshold of action potentials elicited by100-msec current injection is significantly depolarized at 14 days post-SE andhyperpolarized at 21–30 day post-SE relative to control. 4-AP application significantlyhyperpolarized VTH in control and 14 days post-SE but not 21–30 days post-SE neurons.**p b 0.01, ****p b 0.001 by one-way ANOVA. (C) There is no significant difference in ac-tion potential threshold elicited during the 2-msec steps between control and 21–30 days post-SE CA1 neurons. 4-AP has no significant effect on action potential thresholdin either control or 21–30 days post-SE neurons. (D) Summary data showing that 4-APsignificantly hyperpolarized action potential threshold in control and 14 days, but not21–30 days post-SE neurons for the 100-msec current injection. **p b 0.01 compared to14 days post-SE. ****p b 0.001 compared to 21–30 days post-SE.

B
A
C
D
E
mTO
R In
sens
itive
cha
nge
in
seiz
ure
freq
uenc
y(fr
om D
17 to
D21
)Tubulin
KA Day 17
SE Veh/RapaInj
0d 14d 17d
Rapa
Day 21
KAKA+Rapa
# Be
havi
oral
sei
zure
s cl
ass
III-V
(per
hou
r)
Days post-SE
***
21d
Veh/Rapa Inj
18d
Harvest Harvest
Days post-SE
Kv1.
1 Le
vels
and
mTO
R Ac
tivity
(nor
mal
ized
to K
A)
***
Days post-SE
17 210
5
10
15 KAKA+Rapa r2=0.98
p<0.01
r2=0.86p<0.05
17 21
0.5
1.0
1.5
Kv1.1 rapamTOR rapa
r2=0.99p<0.01
r2=0.2n.s.
D17 D210
2
4
6*
Fig. 6.mTOR inhibits Kv1.1 in early but not late TLE. (A) Timeline indicating date of SE (at 0 day), vehicle or rapamycin injection (at 14 days post-SE) followed by harvest of hippocampalsynaptoneurosomal protein (at 17 days post-SE) or a second injection with vehicle or rapamycin (at 18 days post-SE) followed by harvest of hippocampal synaptoneurosomal protein (at21 days post-SE). (B) Video monitoring of KA rats indicate that rapamycin injection inhibits ~50% of behavioral seizure activity (Class III–V) at 17 and 21 days post-SE. * b 0.05. Error barsare SEM. (C) Plot demonstrating rise in seizure activity in both KA rats and rapamycin-treated KA rats between day 17 and 21. Note the rise in seizure activity in all groups is significantlydifferent between 17 and 21 days. KA: p b 0.01; KA+ rapa: p b 0.05 as determined by linear regression. (D) Hippocampal SN protein was isolated from KA animals 17 days and 21 dayspost-SE, and 3 days post vehicle or rapaymcyin injection. RepresentativeWestern blots of a SDS-PAGE gradient gel probedwith antibodies against p-mTOR,mTOR, Kv1.1, and tubulin. Notethe decrease in p-mTOR and the increase in Kv1.1 expression when KA rats are treatedwith rapamycin at 17 days. In contrast, at 21 days p-mTOR remains reducedwith rapamycin treat-ment while Kv1.1 expression returns to KA levels. (E) Plot demonstrating the mTOR-independent change in Kv1.1 expression in KA rats treated with rapamycin between 17 and 21 dayspost-SE (r2= 0.99; p b 0.01)whereas the ratio of p-mTORover totalmTORdoes not change over time (R2= 0.02; n.s.=not significant). Error bars represent SEM. KA: n=2;KA+ Rapa:n = 2. Error bars represent SD.
102 N.M. Sosanya et al. / Neurobiology of Disease 73 (2015) 96–105
targets degrade, allowing HuD to bind to Kv1.1 mRNA and promote itstranslation (Sosanya et al., 2013). Shifting the balance of either ofthese RNA-binding factors (i.e. increasingmiR-129-5p levels or decreas-ing HuD levels) favors the repression of Kv1.1 mRNA translation. To de-termine if a shift in the balance between these RNA binding factorsoccurs in TLE, we measured miR-129-5p and HuD levels. We foundthat both miR-129-5p and HuD levels remain unchanged at both 14and 15 days post-SE (Figs. 7C, D). However, by 21–30 days post-SE,miR-129-5p levels increased by ~76%, while HuD levels remained con-stant (Figs. 7E, F). This change is specific for miR-129-5p, as expressionof miR-145-5p does not change. Taken together these data suggest thatan increase in miR-129-5p expression with no change in HuD favors re-pression of Kv1.1 mRNA translation.
To determine if rapamycin affects the expression of miR-129-5p wecompared KA rats to KA rats treated with rapamycin. Unexpectedly,miR-129-5p levels are significantly higher in hippocampi isolatedfrom KA rats treated with rapamycin 21 days post-SE compared toKA treatment alone, with no change in miR-145-5p (Fig. 7H; Day 21:KA: 1.00 ± 0.25, KA + Rapa: 2.02 ± 0.19). There was no effect ofrapamycin on miR-129-5p levels at 17 days post-SE (Fig. 7G). These
results are consistent with the observed reduction in Kv1.1 protein inthe presence of rapamycin at 21 days post-SE. Together these data sug-gest that increased levels ofmiR-129-5punderlie the late phase, post-SErepression of Kv1.1 translation.
Discussion
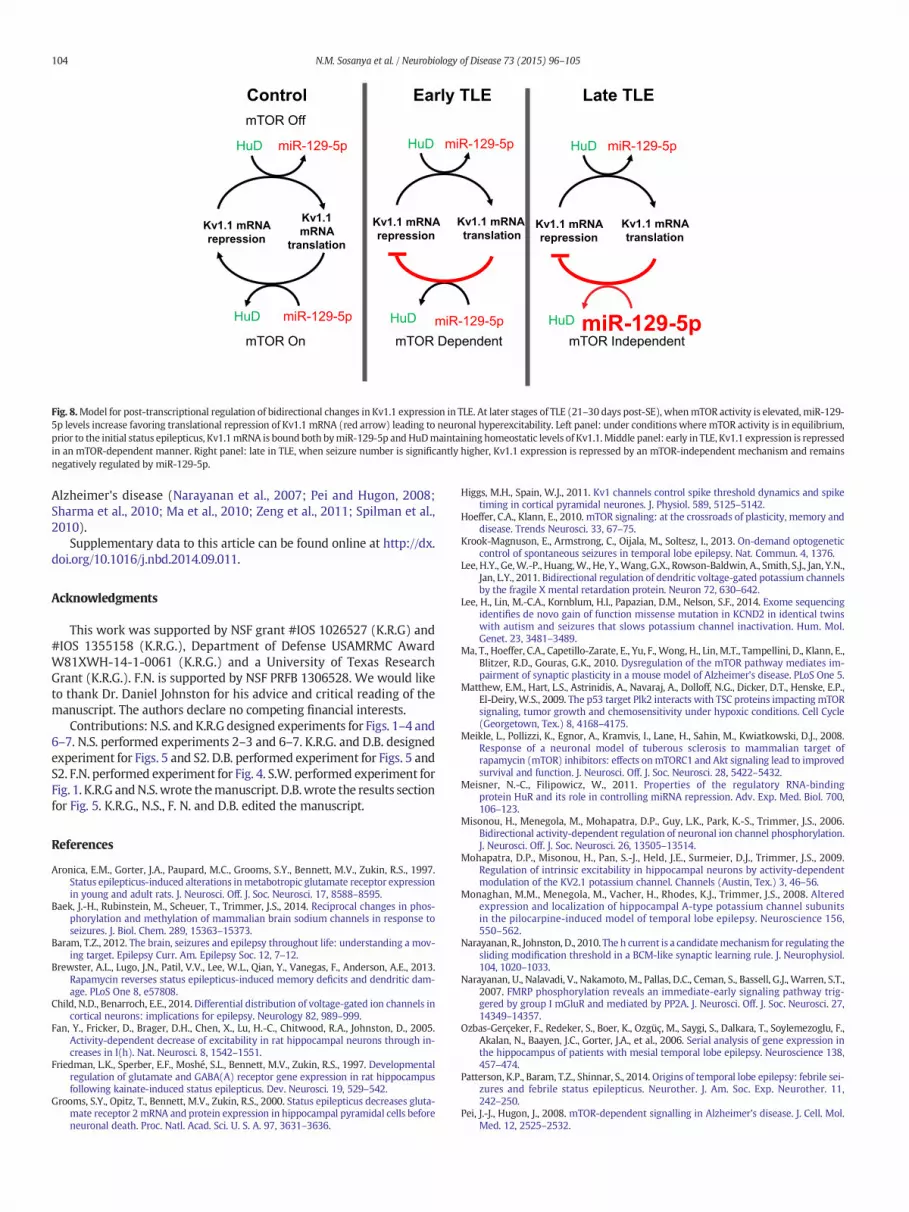
Many ion channels are dynamically regulated during epileptogenesis(Baek et al., 2014; Child and Benarroch, 2014; Lee et al., 2014;Monaghan et al., 2008; Poolos and Johnston, 2012; Powell et al., 2014)and a growing number are linked to changes in mTOR activity(Brewster et al., 2013; Lee et al., 2011; Raab-Graham et al., 2006). Werecently described a mechanism by which mTOR can influence the ex-pression of Kv1.1 by regulating two RNA-binding factors, miR-129-5pand HuD (Sosanya et al., 2013). In this study, we found that hippocam-pal expression of Kv1.1 is elevated 14 days post-SE. This increase inKv1.1 expression is likely due to the low levels of mTOR activity, a con-dition that favors the release of miR-129-5p repression by the RNAbinding protein HuD (Fig. 8, middle panel). In contrast, miR-129-5plevels are elevated 21–30 days post-SE, shifting the balance toward

103N.M. Sosanya et al. / Neurobiology of Disease 73 (2015) 96–105
Kv1.1mRNA repression, thus leading to reduced Kv1.1 expression and ahyperpolarized action potential threshold (Fig. 8, right panel, LateTLE, red arrow). This shift may contribute to CA1 pyramidal neuronhyperexcitability, during a timewhen recurrent, spontaneous behavior-al seizures occur (Fig. 1). Our findings support a bimodal, posttranscrip-tional regulation of Kv1.1-containing delayed rectifier potassiumchannels bymTOR andmiR-129-5p in a model of TLE (Fig. 8). In the pi-locarpinemodel of epilepsy, Brewster et al. found that the chronic use ofthemTORC1 inhibitor rapamycin did not reverse interictal epileptiformactivity or increase the levels of Kv1.1 in the hippocampus of epileptic
BA
miR
-129
-5p/
5S rR
NA
(nor
mal
ized
to 0
d)
*
Days post-SE
miR
-129
-5p/
5S rR
NA
KA KA+Rapa
**
Day 21
miR
-129
-5p/
5S rR
NA
(nor
mal
ized
to C
ontr
ol)
DC
Control
21-30
d0.0
0.5
1.0
1.5
2.0
2.5
0.0
0.5
1.0
1.5
2.0
2.5
0.0
0.5
1.0
1.5
2.0
2.5
KA KA+Rapa
Day 17
miR
-129
-5p/
5S rR
NA
HuD
/Tub
ulin
(nor
mal
ized
to 0
d)
E F
Control
21-30
d0.0
0.5
1.0
1.5
2.0
2.5
HuD
/Tub
ulin
(nor
mal
ized
to C
ontr
ol)
Days post-SE
HuDTubulin
Control30d
HuDTubulin
0d 14d15d
0d 14d
15d
0.0
0.5
1.0
1.5
2.0
2.5
0d 14d
15d
0.0
0.5
1.0
1.5
2.0
2.5
0.0
0.5
1.0
1.5
2.0
2.5
miR
-145
-5p/
5S rR
NA
(nor
mal
ized
to C
ontr
ol)
Control
21-30
d
0.0
0.5
1.0
1.5
days post-SE
Kv1.
1/G
APD
H m
RNA
(nor
mal
ized
to 0
d) ****
***
0.0
0.5
1.0
1.5
Control
21-30
d
Kv1.
1/G
APD
H m
RNA
(nor
mal
ized
to C
ontr
ol)
0d 2d 5d 14d
15d
G H
0.0
0.5
1.0
1.5
2.0
2.5
KA KA+Rapa
Day 21
miR
-145
-5p/
5S rR
NA
rats (Brewster et al., 2013). Our findings may explain these results bydemonstrating a second mechanism that represses Kv1.1 expression,independent of mTOR activity. We found that despite long-term treat-ment with rapamycin, miR-129-5p levels increase post-SE resulting inthe repression of its targets such as Kv1.1.
The initial rise in ion channel expression in TLE, reported in thisstudy for Kv1.1 and previously seen with HCN channels (Shin et al.,2008), may help explain the reduced numbers of behavioral seizuresduring the latent period. However, the failure to sustain elevated levelsof these channels may lead to chronic epilepsy. The concurrent increasein mTOR activity coincides with the decline in channel expression.WhymTOR activity fails to renormalize in TLE is an open question. Interest-ingly, a recent report suggests that mTOR activity also inhibits the ex-pression of the homeostasis protein polo-like kinase 2 (PLK2) in aneonatal seizure model (Sun et al., 2013). Although the mechanism ofrepression has not been established, it has been shown that PLK2down regulates mTOR signaling through its interaction with the up-stream inhibitor tuberous sclerosis complex 1 (Matthew et al., 2009).Collectively, these studies suggest that mRNAs repressed by mTOR ac-tivity may play a critical role in epileptogenesis. However, thosemRNAs that undergo a secondmode of repression, likemiR-129-5p reg-ulation of Kv1.1, may explain an mTOR-insensitive phase of TLE.
In summary, increased or decreased expression of RNA binding fac-tors, which alters the competition for target ion channel mRNAs, canshift the balance between repression and promotion of translation andlead to diseases. The present study shows that following SE, elevated ex-pression of miR-129-5p that is not properly counter balanced by HuDleads to reduced Kv1.1 expression and hyperpolarization of action po-tential threshold resulting in CA1 pyramidal neuron hyperexcitability.These studies provide a unique model of regulating ion channel expres-sionwhichmay be relevant to othermTOR-relateddiseases that presentepilepsy, such as tuberous sclerosis complex, fragile X syndrome, and
Fig. 7. miR-129-5p increases independent of mTOR activity in TLE. (A) Hippocampal SNprotein was isolated from 0 day (saline+ PB, euthanized 1 day post-injection) and kainicacid-(KA+PB) treated animals 2, 5, 14, and 15days post SE. RT-qPCRwasperformedwithspecific Kv1.1 and GAPDH primers. Quantification of Kv1.1 mRNA relative to GAPDH andnormalized to 0 day. 0 day: n = 14; 2 days post-SE: n = 5; 5 days post-SE: n = 5;14 days post-SE: n = 4; 15 days post-SE: n = 3; * b 0.05, ** b 0.01, *** b 0.005 as deter-mined by one-way ANOVA, Newman–Keuls post hoc test. (B) Hippocampal SN proteinwas isolated from control (saline+ PB, euthanized 21–30 days post-injection), and kainicacid-(KA+ PB) treated animals 21–30 days post-SE. RT-qPCRwas performedwith specif-ic Kv1.1 and GAPDH primers. Quantification of Kv1.1 mRNA relative to GAPDH and nor-malized to control. Control: n = 5, 21–30 days post-SE: n = 5. (C) Hippocampal SNprotein was isolated from 0 day (saline+ PB, euthanized 1 day post injection) and kainicacid-(KA + PB) treated animals 14 and 15 days post-SE. Quantification of miR-129-5pnormalized to 5S rRNA and relative to 0 day is shown. 0 day: n = 5, 14 days post-SE:n = 4, 15 days post-SE: n = 3. Error bars represent SEM. (D) Hippocampal SN proteinwas isolated from 0 day (saline + PB, euthanized 1 day post-injection) and kainic acid-(KA + PB) treated animals 14 and 15 days post-SE. Top, representative Western blot ofa SDS-PAGE gradient gel probed with antibodies against HuD and tubulin. Quantificationof HuD signal normalized by tubulin levels and relative to 0 day. 0 day: n = 3, 14 dayspost-SE: n = 2, 15 days post-SE: n = 3. Error bars represent SEM. (E) Hippocampal SNprotein was isolated from control (saline + PB, euthanized 21–30 days post-injection)and kainic acid-(KA + PB) treated animals 21–30 days post-SE. Quantification of miR-129-5p normalized to 5S rRNA and relative to control is shown. Right, quantification ofmiR-145-5p normalized to 5S rRNA is shown. Note, miR-129-5p levels are elevated 21-30 days post-SE. Control: n = 9, 21–30 days post-SE: n = 10. miR-145-5p: Control:n = 5, 21–30 day post-SE: n = 4. * b 0.05 by Student's t-test. Error bars represent SEM.(F) Hippocampal SN protein was isolated from Control (saline + PB, euthanized21–30 days post-injection) and kainic acid-(KA + PB) treated animals 21–30 days post-SE. Top, representative Western blot of a SDS-PAGE gradient gel probed with antibodiesagainst HuD and tubulin. Quantification of HuD signal normalized by tubulin levels andrelative to control. Error bars represent SEM. Control: n = 7, 21–30 days post-SE: 7.(G) Hippocampal SN protein was isolated from KA and KA+ rapamycin-injected animals17 days post-SE following timeline in Fig. 6A. Quantification ofmiR-129-5p normalized to5S rRNA and relative to KA is shown. KA: n = 2, KA + Rapa: n = 2. Error bars representSEM. (H) Hippocampal SN protein was isolated from KA and KA + rapamycin-injectedanimals 21 days post-SE following timeline in Fig. 6A. Quantification of miR-129-5p nor-malized to 5S rRNA and relative to KA is shown. KA: n=3, KA+ Rapa: n=5. ** b 0.01 byStudent's t-test. Error bars represent SEM.
Kv1.1mRNA
translationKv1.1 mRNArepression
miR-129-5p
mTOR Off
HuD
miR-129-5p
mTOR On
HuD
Control
Kv1.1 mRNArepression
Kv1.1 mRNAtranslation
miR-129-5pHuD
mTOR Dependent
HuD miR-129-5p
Late TLE
Kv1.1 mRNArepression
Kv1.1 mRNAtranslation
miR-129-5pHuD
mTOR IndependentHuD miR-129-5p
Early TLE
Fig. 8.Model for post-transcriptional regulation of bidirectional changes in Kv1.1 expression in TLE. At later stages of TLE (21–30 days post-SE), whenmTOR activity is elevated, miR-129-5p levels increase favoring translational repression of Kv1.1 mRNA (red arrow) leading to neuronal hyperexcitability. Left panel: under conditions wheremTOR activity is in equilibrium,prior to the initial status epilepticus, Kv1.1mRNA is bound both bymiR-129-5p andHuDmaintaining homeostatic levels of Kv1.1. Middle panel: early in TLE, Kv1.1 expression is repressedin an mTOR-dependent manner. Right panel: late in TLE, when seizure number is significantly higher, Kv1.1 expression is repressed by an mTOR-independent mechanism and remainsnegatively regulated by miR-129-5p.
104 N.M. Sosanya et al. / Neurobiology of Disease 73 (2015) 96–105
Alzheimer's disease (Narayanan et al., 2007; Pei and Hugon, 2008;Sharma et al., 2010; Ma et al., 2010; Zeng et al., 2011; Spilman et al.,2010).
Supplementary data to this article can be found online at http://dx.doi.org/10.1016/j.nbd.2014.09.011.
Acknowledgments
This work was supported by NSF grant #IOS 1026527 (K.R.G) and#IOS 1355158 (K.R.G.), Department of Defense USAMRMC AwardW81XWH-14-1-0061 (K.R.G.) and a University of Texas ResearchGrant (K.R.G.). F.N. is supported by NSF PRFB 1306528. We would liketo thank Dr. Daniel Johnston for his advice and critical reading of themanuscript. The authors declare no competing financial interests.
Contributions: N.S. and K.R.G designed experiments for Figs. 1–4 and6–7. N.S. performed experiments 2–3 and 6–7. K.R.G. and D.B. designedexperiment for Figs. 5 and S2. D.B. performed experiment for Figs. 5 andS2. F.N. performed experiment for Fig. 4. S.W. performed experiment forFig. 1. K.R.G andN.S.wrote themanuscript. D.B.wrote the results sectionfor Fig. 5. K.R.G., N.S., F. N. and D.B. edited the manuscript.
References
Aronica, E.M., Gorter, J.A., Paupard, M.C., Grooms, S.Y., Bennett, M.V., Zukin, R.S., 1997.Status epilepticus-induced alterations inmetabotropic glutamate receptor expressionin young and adult rats. J. Neurosci. Off. J. Soc. Neurosci. 17, 8588–8595.
Baek, J.-H., Rubinstein, M., Scheuer, T., Trimmer, J.S., 2014. Reciprocal changes in phos-phorylation and methylation of mammalian brain sodium channels in response toseizures. J. Biol. Chem. 289, 15363–15373.
Baram, T.Z., 2012. The brain, seizures and epilepsy throughout life: understanding a mov-ing target. Epilepsy Curr. Am. Epilepsy Soc. 12, 7–12.
Brewster, A.L., Lugo, J.N., Patil, V.V., Lee, W.L., Qian, Y., Vanegas, F., Anderson, A.E., 2013.Rapamycin reverses status epilepticus-induced memory deficits and dendritic dam-age. PLoS One 8, e57808.
Child, N.D., Benarroch, E.E., 2014. Differential distribution of voltage-gated ion channels incortical neurons: implications for epilepsy. Neurology 82, 989–999.
Fan, Y., Fricker, D., Brager, D.H., Chen, X., Lu, H.-C., Chitwood, R.A., Johnston, D., 2005.Activity-dependent decrease of excitability in rat hippocampal neurons through in-creases in I(h). Nat. Neurosci. 8, 1542–1551.
Friedman, L.K., Sperber, E.F., Moshé, S.L., Bennett, M.V., Zukin, R.S., 1997. Developmentalregulation of glutamate and GABA(A) receptor gene expression in rat hippocampusfollowing kainate-induced status epilepticus. Dev. Neurosci. 19, 529–542.
Grooms, S.Y., Opitz, T., Bennett, M.V., Zukin, R.S., 2000. Status epilepticus decreases gluta-mate receptor 2 mRNA and protein expression in hippocampal pyramidal cells beforeneuronal death. Proc. Natl. Acad. Sci. U. S. A. 97, 3631–3636.
Higgs, M.H., Spain, W.J., 2011. Kv1 channels control spike threshold dynamics and spiketiming in cortical pyramidal neurones. J. Physiol. 589, 5125–5142.
Hoeffer, C.A., Klann, E., 2010. mTOR signaling: at the crossroads of plasticity, memory anddisease. Trends Neurosci. 33, 67–75.
Krook-Magnuson, E., Armstrong, C., Oijala, M., Soltesz, I., 2013. On-demand optogeneticcontrol of spontaneous seizures in temporal lobe epilepsy. Nat. Commun. 4, 1376.
Lee, H.Y., Ge,W.-P., Huang,W., He, Y.,Wang, G.X., Rowson-Baldwin, A., Smith, S.J., Jan, Y.N.,Jan, L.Y., 2011. Bidirectional regulation of dendritic voltage-gated potassium channelsby the fragile X mental retardation protein. Neuron 72, 630–642.
Lee, H., Lin, M.-C.A., Kornblum, H.I., Papazian, D.M., Nelson, S.F., 2014. Exome sequencingidentifies de novo gain of function missense mutation in KCND2 in identical twinswith autism and seizures that slows potassium channel inactivation. Hum. Mol.Genet. 23, 3481–3489.
Ma, T., Hoeffer, C.A., Capetillo-Zarate, E., Yu, F., Wong, H., Lin,M.T., Tampellini, D., Klann, E.,Blitzer, R.D., Gouras, G.K., 2010. Dysregulation of the mTOR pathway mediates im-pairment of synaptic plasticity in a mouse model of Alzheimer's disease. PLoS One 5.
Matthew, E.M., Hart, L.S., Astrinidis, A., Navaraj, A., Dolloff, N.G., Dicker, D.T., Henske, E.P.,El-Deiry,W.S., 2009. The p53 target Plk2 interacts with TSC proteins impacting mTORsignaling, tumor growth and chemosensitivity under hypoxic conditions. Cell Cycle(Georgetown, Tex.) 8, 4168–4175.
Meikle, L., Pollizzi, K., Egnor, A., Kramvis, I., Lane, H., Sahin, M., Kwiatkowski, D.J., 2008.Response of a neuronal model of tuberous sclerosis to mammalian target ofrapamycin (mTOR) inhibitors: effects onmTORC1 and Akt signaling lead to improvedsurvival and function. J. Neurosci. Off. J. Soc. Neurosci. 28, 5422–5432.
Meisner, N.-C., Filipowicz, W., 2011. Properties of the regulatory RNA-bindingprotein HuR and its role in controlling miRNA repression. Adv. Exp. Med. Biol. 700,106–123.
Misonou, H., Menegola, M., Mohapatra, D.P., Guy, L.K., Park, K.-S., Trimmer, J.S., 2006.Bidirectional activity-dependent regulation of neuronal ion channel phosphorylation.J. Neurosci. Off. J. Soc. Neurosci. 26, 13505–13514.
Mohapatra, D.P., Misonou, H., Pan, S.-J., Held, J.E., Surmeier, D.J., Trimmer, J.S., 2009.Regulation of intrinsic excitability in hippocampal neurons by activity-dependentmodulation of the KV2.1 potassium channel. Channels (Austin, Tex.) 3, 46–56.
Monaghan, M.M., Menegola, M., Vacher, H., Rhodes, K.J., Trimmer, J.S., 2008. Alteredexpression and localization of hippocampal A-type potassium channel subunitsin the pilocarpine-induced model of temporal lobe epilepsy. Neuroscience 156,550–562.
Narayanan, R., Johnston, D., 2010. The h current is a candidatemechanism for regulating thesliding modification threshold in a BCM-like synaptic learning rule. J. Neurophysiol.104, 1020–1033.
Narayanan, U., Nalavadi, V., Nakamoto, M., Pallas, D.C., Ceman, S., Bassell, G.J., Warren, S.T.,2007. FMRP phosphorylation reveals an immediate-early signaling pathway trig-gered by group I mGluR and mediated by PP2A. J. Neurosci. Off. J. Soc. Neurosci. 27,14349–14357.
Ozbas-Gerçeker, F., Redeker, S., Boer, K., Ozgüç, M., Saygi, S., Dalkara, T., Soylemezoglu, F.,Akalan, N., Baayen, J.C., Gorter, J.A., et al., 2006. Serial analysis of gene expression inthe hippocampus of patients with mesial temporal lobe epilepsy. Neuroscience 138,457–474.
Patterson, K.P., Baram, T.Z., Shinnar, S., 2014. Origins of temporal lobe epilepsy: febrile sei-zures and febrile status epilepticus. Neurother. J. Am. Soc. Exp. Neurother. 11,242–250.
Pei, J.-J., Hugon, J., 2008. mTOR-dependent signalling in Alzheimer's disease. J. Cell. Mol.Med. 12, 2525–2532.
105N.M. Sosanya et al. / Neurobiology of Disease 73 (2015) 96–105
Pfaffl, M.W., 2001. A new mathematical model for relative quantification in real-timeRT-PCR. Nucleic acids research 29, e45.
Poolos, N.P., Johnston, D., 2012. Dendritic ion channelopathy in acquired epilepsy.Epilepsia 53 (Suppl. 9), 32–40.
Powell, K.L., Jones, N.C., Kennard, J.T., Ng, C., Urmaliya, V., Lau, S., Tran, A., Zheng, T.,Ozturk, E., Dezsi, G., et al., 2014. HCN channelopathy and cardiac electrophysiologicdysfunction in genetic and acquired rat epilepsy models. Epilepsia 55, 609–620.
Raab-Graham, K.F., Haddick, P.C.G., Jan, Y.N., Jan, L.Y., 2006. Activity- and mTOR-dependent suppression of Kv1.1 channel mRNA translation in dendrites. Science314, 144–148.
Racine, R.J., 1972. Modification of seizure activity by electrical stimulation. II. Motor sei-zure. Electroencephalogr. Clin. Neurophysiol. 32, 281–294.
Rho, J.M., Szot, P., Tempel, B.L., Schwartzkroin, P.A., 1999. Developmental seizure suscep-tibility of kv1.1 potassium channel knockout mice. Dev. Neurosci. 21, 320–327.
Robbins, C.A., Tempel, B.L., 2012. Kv1.1 and Kv1.2: similar channels, different seizuremodels. Epilepsia 53 (Suppl. 1), 134–141.
Schauwecker, P.E., Ramirez, J.J., Steward, O., 2000. Genetic dissection of the signals that in-duce synaptic reorganization. Exp. Neurol. 161, 139–152.
Sharma, A., Hoeffer, C.A., Takayasu, Y., Miyawaki, T., McBride, S.M., Klann, E., Zukin, R.S.,2010. Dysregulation of mTOR signaling in fragile X syndrome. J. Neurosci. Off. J. Soc.Neurosci. 30, 694–702.
Shin, M., Brager, D., Jaramillo, T.C., Johnston, D., Chetkovich, D.M., 2008. Mislocalization ofh channel subunits underlies h channelopathy in temporal lobe epilepsy. Neurobiol.Dis. 32, 26–36.
Smart, S.L., Lopantsev, V., Zhang, C.L., Robbins, C.A., Wang, H., Chiu, S.Y., Schwartzkroin, P.A.,Messing, A., Tempel, B.L., 1998. Deletion of the K(V)1.1 potassium channel causes epi-lepsy in mice. Neuron 20, 809–819.
Sosanya, N.M., Huang, P.P.C., Cacheaux, L.P., Chen, C.J., Nguyen, K., Perrone-Bizzozero, N.I.,Raab-Graham, K.F., 2013. Degradation of high affinity HuD targets releases Kv1.1mRNA from miR-129 repression by mTORC1. J. Cell Biol. 202, 53–69.
Spilman, P., Podlutskaya, N., Hart, M.J., Debnath, J., Gorostiza, O., Bredesen, D., Richardson,A., Strong, R., Galvan, V., 2010. Inhibition of mTOR by rapamycin abolishes cognitivedeficits and reduces amyloid-beta levels in a mouse model of Alzheimer's disease.PLoS One 5, e9979.
Sun, H., Kosaras, B., Klein, P.M., Jensen, F.E., 2013. Mammalian target of rapamycin com-plex 1 activation negatively regulates Polo-like kinase 2-mediated homeostatic com-pensation following neonatal seizures. Proc. Natl. Acad. Sci. U. S. A. 110, 5199–5204.
Tongiorgi, E., Armellin, M., Giulianini, P.G., Bregola, G., Zucchini, S., Paradiso, B., Steward,O., Cattaneo, A., Simonato, M., 2004. Brain-derived neurotrophic factor mRNA andprotein are targeted to discrete dendritic laminas by events that triggerepileptogenesis. J. Neurosci. Off. J. Soc. Neurosci. 24, 6842–6852.
Wong, M., 2012. mTOR as a potential treatment target for epilepsy. Future Neurol. 7,537–545.
Wykes, R.C., Heeroma, J.H., Mantoan, L., Zheng, K., MacDonald, D.C., Deisseroth, K.,Hashemi, K.S., Walker, M.C., Schorge, S., Kullmann, D.M., 2012. Optogenetic and po-tassium channel gene therapy in a rodent model of focal neocortical epilepsy. Sci.Transl. Med. 4, 161ra152.
Zeng, L.-H., Rensing, N.R., Wong, M., 2009. The mammalian target of rapamycin signalingpathway mediates epileptogenesis in a model of temporal lobe epilepsy. J. Neurosci.Off. J. Soc. Neurosci. 29, 6964–6972.
Zeng, L.-H., Rensing, N.R., Zhang, B., Gutmann, D.H., Gambello, M.J., Wong, M., 2011. Tsc2gene inactivation causes a more severe epilepsy phenotype than Tsc1 inactivation ina mouse model of tuberous sclerosis complex. Hum. Mol. Genet. 20, 445–454 (72,630–642).


