Embed Size (px)
Citation preview

Chemistry and Physics of
LIPIDS ELSEVIER SCIENCE Chemistry and Physics of Lipids
IRELAND 70 (1994) 63-74
Re-evaluation of the structure of low density lipoproteins *
E. Schnitzer, D. Lichtenberg* Department of Physiology and Pharmacology, Sackler School of Medicine, Tel Aviv University, Ramat Aviv, Tel Aviv, 69978 Israel
(Received 30 June 1993; revision received 11 November 1993; accepted I1 November 1993)
Abstract
Low density lipoprotein (LDL) is .an established atherogenic factor. Much effort has therefore been devoted to elucidation of its structure, yielding the generally accepted model according to which the neutral lipids (cholesterol ester and triglycerides) form a lipid core emulsified by phospholipids, cholesterol and the amphipathic Apolipoprotein B. Yet, the detailed structure of LDL is not clear. The present work was carried out with the aim of re-evaluating the LDL structure using the minimal number of assumptions: in view of the previously noted surface deficit (lack of suffi- cient PL and cholesterol to cover the surface of the lipidic core) we have assumed that polar head groups are not covered by apo B. Other than that, we have 'allowed' APO B to penetrate into the PL monolayers and the lipidic core and to pertrude into the solution (be elevated above the PL head group level). We have also 'allowed' neutral lipid penetration into the monolayer and variation of the thickness of the phospholipid monolayers within reasonable boun- daries. Based on the established values of relevant constants (molecular weights and volumes, densities and surface areas) we have computed the radius of the particle, the penetration of APO B into lipidic milieus and the fraction of the surface area covered by APO B as functions of the LDL composition, the monolayer thickness and the 'elevation' of Apo B above this monolayer. These computations show that at least 40% of the LDL surface must be covered by protein and that the protein penetrates, on the average, only about a half of the PL monolayer. Thus it is not very likely to penetrate into the lipidic core. These general features are preserved in the smaller LDL particles of hyper- triglyceridemic patients. Assuming that no PL head group is covered by Apo B, the previously described immobili- zation of 20% of the phospholipids is likely to result from the interaction of Apo B with neighboring PL. According to our computations this can be regarded consistent with the previously proposed arrangement of the apo B as a '3-4 domain structure' or a long string configuration but inconsistent with 'one domain' or 'twenty domain' structures.
Key words: LDL; Lipoprotein structure
* Corresponding author. ~This work constitutes a part of E. Schnitzer's Ph.D. Thesis. Abbreviations: Apo B, Apolipoprotein B; AUC, analytical ultracentrifugation; CE, cholesterylesters; EM, electron microscopy; FC, free cholesterol; LDL, low density lipopro- teins; NL; neutral lipids (= TG + CE); PCS, photon correlation spectroscopy; PL, phospholipids; SANS, Small angle neutron scattering; SAXS-Small angle X-ray scattering; TG, trigly- ceddes.
1. Introduction
LOW density lipoproteins (LDL) are oil/water microemulsion particles composed of an oily core made o f esterified cholesterol (CE) and triglycer- ides (TG), which are emulsified by a monolayer made of phospholipid (PL), unesferified choles-
0009-3084/94/$07.00 © 1994 Elsevier Science Ireland Ltd. All rights reserved. SSDI 0009-3084(93)02287-2

64 E. Schnitzer, D. Lichtenberg / Chem. Phys. Lipids 70 (1994) 63-74
terol (FC) and 1 molecule of Apolipoprotein B (Apo B-100; mol wt. = 513 000 [1,2]). Being the major atherogenic factor, LDL attracted the in- terest of many researchers and its composition in health and disease is the subject of many papers [3-71.
Yet, the details of LDL structure are not very clear and the following specific questions have been only partially answered: (1) how is the Apo B attached to the LDL surface? Do parts of this large hydrophobic protein reside within the oily core of the LDL particles? (2) What fraction of the suface area of the LDL particle is actually covered by Apo B? [8-10]. (3) How do the size and struc- ture of the LDL particles change with changes of its composition in various LDL subfractions and under a variety of pathological conditions? [3-7,9,11].
Several models have been proposed to describe the LDL particle. According to all the models accepted presently, the protein resides at the outer surface of the particle (e.g.[12]), thus reducing the 'surface deficit', explicitly described by Laggner et al. [10]. This 'deficit' occurs because the total surface area of the phospholipids and cholesterol is insufficient to cover all the surface of the spher- ical shell at the level of the phospholipid polar headgroups. The amino acid sequence of Apolipo- protein B [1,2] is consistent with many of the Apo B residues residing at the interface and extending over at least a 'hemisphere of the LDL surface' [13].
Two additional, more recently considered, fac- tors contribute to the severity of the 'surace defic- it': (i) only about two-thirds of the free cholesterol molecules reside at the surface of the LDL particle in phospholipid-cholesterol monolayers, the re- maining cholesterol residing in the oily core [14]; and (ii) the area occupied by each phospholipid molecule on the surface of the LDL particle is reduced by the interaction with cholesterol. Based on monolayer studies [15] a value of 65 A, 2 can be assumed. While on the surface of LDL particles the actual surface area per phospholipid head- group may be somewhat different, this value is likely to be a better approximation than the value of 71 A, 2 previously assumed on the basis of stud- ies of PC monolayers at the air-water interface [121.
In view of these factors, it seems reasonable that the protein does not cover the phospholipid head groups, as depicted in several models [9,16]. This would mean that the previously described 'immo- bilization' of about 20% of the phospholipid head groups [17,18], is caused by the interaction of Apo B with neighbouring phospholipid molecules [14] rather than by coverage of these molecules by Apo B [9,16].
In re-evaluating the LDL structure, we have assumed that all the polar head groups of the phospholipids face the external aqueous solution, uncovered by protein residues. Other than this, we have adopted a minimal number of assumptions, in an attempt to gain estimated answers for the specific questions raised above.
2. Theoretical considerations
Our model is based on the following assump- tions: (i) none of the polar headgroups of the phospholipids is covered by protein residues; (ii) LDL particles are spherical; (iii) all the PL and two-thirds of the FC are contained in the outer monolayer; (iv) the hydrophobic core contains most of the CE and TG, one-third of the free cho- lesterol and may also contain a part of the Apo B sequence; and (v) part of the TG and CE may pen- etrate into the outer monolayer.
The model adopted for our calculations is schematically described in Fig. 1. In this scheme: (a) Rs represents the radius of the phospholipid interface, Le. the average distance from the center of the lipidic core (of a radius R) to the phosphate groups on the LDL surface; (b) M is the thickness of the phospholipid monolayer (i.e. M = R s - R); (c) Rp is the distance from the center of lipidic core to the outermost protein residues on the sur- face (thus P = Rp - R s is the distance of the outer part of the protein from the phospholipid surface); and (d) Re is the average distance between the center of the particle and the innermost Apo B moieties.
Following the above assumptions and defini- tions, the volume and surface area of the LDL par- ticle can be described as functions of the number of molecules of the various components (Ncz, NTO, NFC , NpL), their molecular volumes (VcE,

E. Schnitzer, D. Lichtenberg / Chem. Phys. Lipids 70 (1994) 63-74 65
Fig. i. Schematic presentation of the model used in our com- putations. Note that R s and R correspond to the average distances of the center of the spherical particle from the head group and the terminal methyl groups of the PL, respectively. M, the monolayer thickness (M = R s - R), and P, the protein elevation above R s (P = Rp - Rs), are treated as ' independent' variables. The penetration of protein into the monolayer is, on the average, up to a distance R c from the center, i.e. into a dis- tance R s - R e. Penetration of Apo B into the lipidic core will be expressed by R s - R c > M. i.e. R c < R. The special angle corresponds to the surface area occupied by a 'cap' made of the
protein (dotted area) h denotes the height of this 'cap'.
VTO, VFC) and the surface areas of surface com- ponents (SpL and SFC).
The total volume of the lipids within the core is given by
VLI p = N c E V c E + NVGVTG + 1/3 NFC VFC (1)
The surface area covered by lipids is given by
SLI P = NpL SpL -t- 2/3 NFC SFC (2)
The particle contains a protein of a mass Mp and a specific density Dp. The core lipids have a density DLIP and a mass MLIP (given by a sum of masses of the various components, each given by a product of the number of molecules and molecu- lar weight).
The ratio of volumes of protein to core lipids is therefore given by
Hence,
V' = (MpDLIP)/[ Dp [ N c E M c E + NTGMTG
+ (1/3)NFcMFc]I (3)
In an attempt to evaluate the surface area covered by Apo B, we have first assumed that this area is a continuum, which can be described as a cap of a central angle ot (Fig. 1). While this assumption has no physical justification, it can lead to a rough estimation of the fraction of sur- face covered by Apo B. The angle a and the radii R and R c can be described as functions of several constants (molecular weights, volumes, densities and surface areas) and a number of variable factors, which we defined as being 'independent parameters' (numbers of molecules, the thickness of the phospholipid monolayer M and the protein 'elevation' above this monolayer, P).
The dependencies of ~, R and R c on the latter 'independent parameters' can be derived from the following three established correlations:
(I) The surface occupied by lipids is the differ- ence between the total surface area and the surface area covered by ApoB.
SLI P = 47r(R + M) 2 - Sp (4)
where the surface of the protein cap (Sp) can be derived from geometrical relationships as follows:
Sp = 2rRsh = 27r(R + M) h (5)
where h, the height of the cap (Fig. 1), is given by
h = (R + M)[1 - cos(od2)] (6)
hence, the surface at Rs (i.e. at the polar headgroup level) is given by:
Sp --- 2~'(R + M)2[1 - cos(cd2)]. (7)
Substituting Sp in eqn. (4) by its value given in eqn. (7) yields:
V' = Vp/VLI p = (Mp/Dp)/(MLIp/DLIP) SLIP = 4w(R + M) 2 - 2~r(R + M)2[I - cos(od2)]

66
Hence
Sup = 2 r ( R + M)2[I + cos(od2)] (8)
(II) The total volume o f the pro te in is given by:
Vp = (4x/3)(Rp 3 - Re 3) (cd360)
i.e.
Vp = (4~r/3)[(R + M + p)3 _ Rc3](od360) (9)
(III) The volume occupied in the core by neutral lipids is the difference given by:
VLIP = (47/3)R 3 - (4~r/3)(R 3 - Rc 3)(tx/360)
i.e. (10)
VLIp = (4 r /3 ) lR3[ l - (od360)] + [Rc 3 (od360)]]
Based on the above cons idera t ions (eqns. 8, 9 and 10), it can be shown (appendix) that
lrR 3 - cos -I UI(R + M + p)3 _ R 3 ]
= (3VLip/4) (I + V') (11)
E. Schnitzer, D. Lichtenberg / Chem. Phys. Lipids 70 (1994) 63-74
where
U = [SLlp/2f(R + M ) 2] - 1
F o r any given series o f values o f the ' indepen- dent parameters ' (numbers o f molecules, M and P) the value o f R can be compu ted (see appendix) and f rom each such value, ot and R c can also be computed.
Two addi t ional factors o f interest can be com- puted from R, R e and or. Those are:
1. 'S inking ' o f the pro te in into the hydroca rbon environment , which in Fig. 1 is given by
R s - Rc = R + M - R e (12)
(Note that R and Rc are variables. 'S inking ' of the prote in into the l ipidic core o f a rad ius R will
be expressed by R e < R) 2. The fract ion o f the surface covered by pro te in
(%S) is given by
%S = 10012r(R + M)2[I - cos(or/2)] }/
4~r(R + M) 2 (13)
Thus
%S = 1/211 - cos(cd2)] 100 (14)
Table I Factors used in computations a
Component Number of molecules Constants
Minimal Maximal Weighted Molecular Molecular Surface Density value value average weight c volume (A 3) area (A 2) (g/cm 3)
Protein 1 1 1 513 000 1.3 FC 345 930 600 387 PL 550 950 1 750 CE 1120 2090 1500 650 1090 0.92 TG 80 610 250 850 1600 0.91 NL b 1200 2700 1750 679 1163 0.91
aln our computations, M was varied within the range of 15-23 A,; P was varied from 0 to 10 A. bNNL = NeE + NTG; the values of molecular weight, volume and density of neutral lipids are sums of the weighted averages of the corresponding values of CE and TG. CThe molecular weight of the LDL particle, as computed from the molecular weight of the components and the number of molecules of each component varies between 1 855 015 and 3 462 410 daltons, with an average of 2 480 200.
E. Schnitzer, D. LichteWoerg / Chem. Phys. Lipids 70 (1994) 63-74 67
and as 7o
6o 1 - cos a = 2 sin2(cd2) (15)
5 0
%S = 100 sin 2 (a/4) (16) 4o %S
3O
3. Sensitivity of the 'dependent parameters' to the 2o 'independent parameters'
3.1. The effects of LDL composition on LDL struc- tural parameters
Table 1 presents constants and important com- positional determinants of LDL structure, as given in the existing literature [3,4,9,10,12,19-24].
Since the protein density (Dp) has not been experimentally determined, we have computed it from the density of LDL and the densities of the lipid components. The computed value varied within the range of 1.1-1.3 g/cm 3 depending on the values of densities of LDL and the lipid com- ponents as given in the literature. The computed parameters (R, ot and Re) varied only slightly by varying Dp within these boundaries. Hence, a value of 1.3 was given to Dp, in agreement with the normal range of protein densities of 1.3-1.45 g/cm 3 .
Preliminary computations also indicated that variation of the major two 'core components' (CE and TG) had very similar effects on R, ot and Re. Computations were therefore carried out for vary- ing numbers of 'neutral lipid molecules' (the sum of TG and CE molecules).
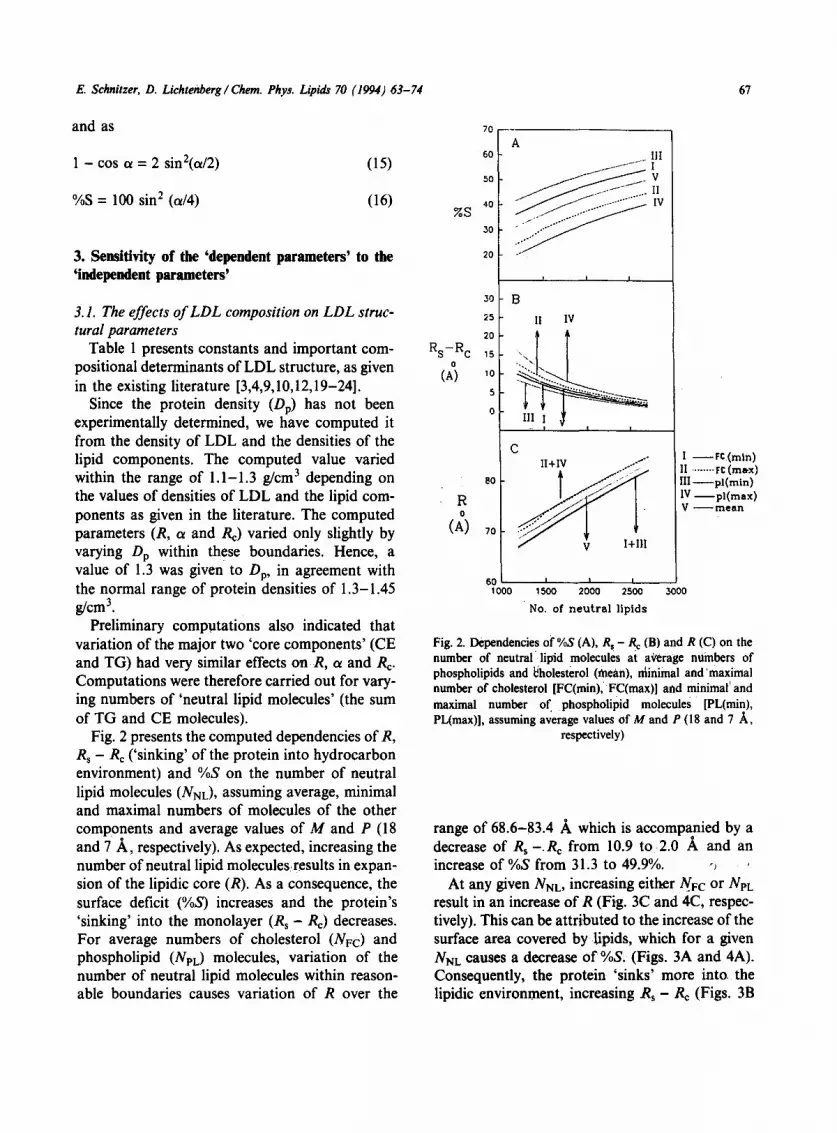
Fig. 2 presents the computed dependencies of R, R s - Re ('sinking' of the protein into hydrocarbon environment) and %S on the number of neutral lipid molecules (NNL), assuming average, minimal and maximal numbers of molecules of the other components and average values of M and P (18 and 7 A, respectively). As expected, increasing the number of neutral lipid molecules~results in expan- sion of the lipidic core (R). As a consequence, the surface deficit (%S) increases and the protein's 'sinking' into the monolayer (R s - Re) decreases. For average numbers of cholesterol (NFc) and phospholipid (NpL) molecules, variation of the number of neutral lipid molecules within reason- able boundaries causes variation of R over the
Rs-R c o
(A)
R o
(A)
30
25
20
15
10
$
0
8 0
7 0
A .I..I= ................. IlI
~ V ~ / . l J - J IV
i i i
B
II IV
i. ....
c
60 ' ~ , 1000 1500 2000 2500 3000
No. of neutral liplds
I - - r e (rain) II ........ rC (m~x) llI - - p l ( m i n ) 1V - - p l ( m a x ) V -- mean
Fig. 2. Dependencies of %S (A), R s - R e (B) and R (C) on the number of neutral lipid molecules at average numbers of phospholipids and ~holesterol (inca.n), niinimal and'maximal number of cholesterol [FC(min), FC(max)] and minimal and maximal number of phospholipid molecules [PL(min), PL(max)], assuming average values of M and P (18 and 7 ,~,
respectively)
range of 68.6-83.4 A which is accompanied by a decrease of Rs --Re from 10.9 to 2.0 A and an increase of %S from 31.3 to 49.9%. -~
At any given NNL, increasing either NFC or NeL result in an increase of R (Fig. 3C and 4C, respec- tively). This can be attributed to the increase of the surface area covered bylipids, which for a given NNL causes a decrease of %S. (Figs. 3A and 4A). Consequently, the protein 'sinks' more into the lipidic environment, increasing Rs - Re (Figs, 3B

68 E. Schnitzer, D. Lichtenberg / Chem. Phys. Lipids 70 (1994) 63-74
60
50
%S 4o
30
12
10
Rs-R c 8 o 5
(A) ,
2
8O R 0
(A) , o
A
ll+lil" ............. =:- ....
iv i I I I I I I
B
. . . . . . . . . . . . . . . . . . . . . . . . . . . . . . . . . . . . . . . . . . . . . . .~- . . . . . . . V
.............................................................................. Ill
.................................................... ]I
I ) I I I I
C . . . . . . . . . . . . . . . . . . . . . . 'II
I IV ~ V ............. I11
60 I I I I I I
3 00 400 S00 coo 700 800 9oo tooo
No. of c h o l e s t e r o l m o ] e c .
I --nl(rnln) II ....... hi(max) lIl--.--pl(rnin) IV--pl(mex) V --mean
Fig. 3. Dependencies of %S (A), R s - R c (B) and R (C) on the number of cholesterol molecules at average numbers of phos- pholipid and neutral lipids (mean), minimal and maximal num- ber of neutral iipids [NL(min), NL(max)] and minimal and maximal number of phospholipid molecules [PL(min), PL(max)l assuming average values of M and P (18 and 7 A.
respectively).
R s - R c
7O
6O
5O
%S 40
30
20
R 0
(A)
15
~0
5
8 0
7 0
60 500
A
iJ:ii:ii:ii:":.i~:.i.i.i~ii~i.i~ ...........
) I I I
]3
....................... II
I I I I
c . . . . . . . . . . . . . . . . . . . . . . . . . I I
I
I]I+V
I I I I
600 7oo 800 900 ~ooo
No. of phospholipid molec.
I - - h i ( r e | n )
II ....... hi(max) IlI ........... FC(rnin) [V - - F C ( m a x )
V --mean
Fig. 4. Dependencies of S% (A), R s - R c (B) and R (C) on the number of phospholipid molecules at average number of neu- tral iipids and cholesterol (mean), minimal and maximal num- ber of neutral lipids [NL(min), NL(max)] and minimal and maximal number of cholesterol molecules [FC(min), FC(max)], assuming average values of M and P (I 8 and 7 A, respectively).
and 4B) and by that increasing R. Both the %S and R s - Rc are more sensitive to variation of NpL than to variation of NFo which can be attributed to the larger surface area of the phospholipids. However, R is affected to a similar extent by varia- tion of NpL and NFO because a third of the cholesterol distributes into the inner core, thus in- creasing the volume of the core components, which results in a further increase of R.
Interestingly, the effects of both NpL and NF¢
on R and %S depend only slightly o n NNL. In contrast, the effects of NpL and NFC on Rs - Rc arc much larger at low NNL than at high NNL. As evident from Figs. 3 and 4 the predominant para- meter in determining R is NNL, whereas Nec and NFc has much smaller effects. The 'sinking' of protein into the monolaycr ( R s - Re) is also markedly affected by NNL, but this effect is especially pronounced at high NpL and low NNL (Fig. 4B), that is when the 'surface deficit' is not severe.

E. Schnitzer, D. Lichtenberg / Chem. Phys. Lipids 70 (1994) 63-74 69
In conclusion, NNL is the most influential com- positional parameter with respect to R, (Rs - R~) and %S. For any given NpL and NFO increasing NNL results not only in an increase of R but also in a need to cover excess surface. This, in turn, re- suits in two effects: (i) increasing %S; and (ii) in- creasing neutral lipid penetration into the monolayer. Consequently, the 'sinking' of protein into the monolayer decreases. In contrast, increas- ing NpL markedly reduces %S, which results in an increase of R , - Re, while increasing R only slightly. The effects of varying the cholesterol con-
6O
5O
%S 40
30
~2
Rs-Rc 8
(2) ,
80
R
(L ,o
6 0
A 111
lI
..................................... IIl
Ill
........ II
i i
15 20 25
Monolayer thickness (M) o
(A)
I - - n l ( m e a n )
II ....... n l ( m i n )
1II n l ( m a x )
Fig. 5. Dependencies of %S (A), R s - R c (B) and R (C) on monolayer thickness (214) at average, minimal and maximal number of neutral lipid molecules [NL(mean), NL(min) and NL(max)] assuming average values for phospholipids (NpL = 730), cholesterol molecules (NFc = 600) and P (7 A).
tent are qualitatively similar but smaller. This can be attributed to the smaller area per cholesterol head group on the surface of the monolayers and the distribution of cholesterol between the surface and core. The net effect is governed by cholesterol addition to the surface but reduced by its addition to the core.
3.2. The effects o f surface monolayer thickness ( M = R s - R)
To demonstrate the effects of the monolayer thickness on the 'dependent parameters', as defin- ed above, we have computed these parameters as functions of the monolayer thickness, at different values of the most important compositional par- ameter, NrqL, at mean values of NpL, NFC and P. The results of such computations for M = 15-23 A are given in Fig. 5.
These results can be rationalized as follows: 'thinning' of the monolayer (reducing Rs - R) re- suits in a smaller 'surface deficit', i.e. decreasing %S. Under these conditions (constant P) this re- suits in 'deeper' penetration of the protein into the monolayer (increasing R s - Rc). Consequently, less neutral lipids penetrate into the monolayer, which results in a larger core (increasing R). The opposite effects are expected when the monolayer is expanded. Noticeably, the dependence of both R and %S on the monolayer thickness is apparently independent of NNL (nearly parallel dependencies are obtained in Figs. 5A and C). In contrast, the dependence of Rs - Re on M (Fig. 5B) is more pronounced at low values of NNL than at higher values of this 'independent parameter'.
Altogether, for any composition and P value, reasonable changes in the thickness of the mono- layer may result in alteration of the 'sinking' of protein into the monolayer (Fig. 5B) of up to 3A. This change is accompanied by alteration of R by up to 5.5 A whereas the resultant changes of %S is merely 4%.
3.3. The effect of 'protein elevation' ( P = Rp - Rs) As can be expected, varying the protein 'eleva-
tion' above the PL monolayer (P = Rp - R,) over the range of 0-10 A has a large effect on the pene- tration of the protein into the monolayer (and, under extreme conditions, into the lipid core). For

70 E. Schnitzer, D. Lichtenberg/ Chem. Phys. Lipids 70 (1994) 63-74
any given composition and monolayer thickness, reducing P results in two obvious effects, namely an increase of Rs - Rc and a consequent increase of the number of neutral lipids in the core. This re- sults in an increase of R and a consequent increase of %S. These effects are described in Fig. 6. As shown in this figure, Rs - R¢ changes by up to 11 A, (Fig. 6B), whereas R (Fig. 6C) and %S (Fig. 6A) are less affected.
It is of interest to note that the sensitivity of Rs - P,c to reasonable changes in P is larger than its sensitivity to the monolayer thickness M (cf. Figs. 5B and 6B). This larger sensitivity can be ra-
6 0
5 0
A
. . . . . 111
4o ~ I %S
3o ...... 1I
B 2O
Rs-Rc lo o II (a)
I 0 Ill
• I - - h i ( m e a n )
C " Ill H ....... n l (min ) 8 0
R 11I ..... n l ( m a x )
0 ~ I (A) 70 : ..............................
II
6 0 I ~ I I I 2 4 fi 8 10 12
Pro te in "elevaLion" (P)
Fig. 6. Dependencies o f % S (A), R s - R c (B) and R (C) on pro- tein 'e levat ion ' (P) at average, minimal and ma×imal number of neutral l ipids [NL(mean), NL(min) and NL(max) l assuming
average values of NpL, NFC and M (18 A.).
tionalized as follows: upon increasing M, a larger surface area has to be covered by protein (increas- ing %S). At constant P, this means that the free volume due to the expansion of the monolayer will only partially be filled by protein and partially by neutral lipid. On the other hand, at constant M, in- creasing P results in a free volume within the monolayer which can only be filled by neutral lip- ids, yielding a very pronounced effect on Rs - Re.
4. Analysis of existing data in terms of the above model
Table 2 lists the experimentally determined com- positions and sizes of normal and hyperlipidemic patients and of modified human LDL particles [3-6,9,10]. This table lists the experimentally determined size (Rp) in comparison to the values computed from the published compositions assuming that P = 7 ~, and M = 18 A. In most cases the agreement was quite reasonable (up to 10% differences) and the trends predicted by the model for subfractions of LDL are consistent with the experimentally observed trends, although in many cases the model yields underestimations of the sizes.
For comparison of Rp with the values derived from quasielastic laser light scattering (Photon Correlation Sprectroscopy, PCS) and Analytical Ultracentrifugation (AUC) measurements, it should be recalled that these experimental techni- ques yield the particle hydrodynamic radius R h, which can be expected to be higher than Rp, as the hydrated surface contributes to the hydrodynamic radius (Rh). Furthermore, R h de- rived from PCS is computed from diffusion coeffi- cients, as calculated from correlation functions of the scattered light. For an assembly of particles of different sizes, this renders larger weight to the larger particles in the dispersion (which scatter more photons than smaller particles). In view of these factors, we consider the agreement between PCS and AUC data and the computed values to be quite satisfactory.
Larger discrepancies were observed between the computed diameters and published electron micro- scopic (EM) data, which were in most cases larger than the predicted values. In fact, the diameters of

F,. $chnitzer, D. Lichtenberg / Chem. Phys. Lipids 70 (1994) 63-74
Table 2 Comparison of experimental date with theoretical Rp values, calculated on the basis of the model given in Fig. 1
71
Source Numbers of molecules Rp*(model) Experimental size
Reference LDL NNL NFC NpL ( ]k ) Rp ( A, ) Determined by
Laggner [10 ] Normal 1460 631 722 96.2 110 ± 5 SANS Baumstark [9]
LDL-I Normal 2688 917 975 112.2 112 ± 1 SAXS LDL-2 Normal 2165 741 815 104.7 111 ± 1.1 LDL-3 Normal 1802 561 665 99 105 ± 2.3
Packard [4] LDL-2 Normal 1821 716 858 101.2 I15 ± 3 LDL-3 Normal 1841 627 637 99.46 102 ± 4 LDL-2 Type II1 2254 493 836 105.5 118 ± 4 LDL-3 Hyperlipoproteinemia 2708 490 975 110 110 ± 3 LDL-2 Type IV 1699 492 695 98.2 113 ± 7 LDL-3 Hyperlipoproteinemia 1393 293 586 92.8 101 ± 4
Eisenberg [3] Normal 1667 561 683 97.6 105 ± 5 Hypertriglyeeridemic 1209 319 495 89.8 83.5 (1)
Deckelbaum [5] Normal 1828 531 866 100.8 107 ± 7 Modified (2) 1089 533 500 90.8 102.5 ± 6
Oranot [6] Normal 1704 559 718 98.1 113.5 ± 11 Modified (3) 1458 341 614 96.7 121 ± 12 Modified (4) 1055 171 238 84.5 101 ± 11
Chapman [11] parent LDL Normal 1729 644 686 97.4 110.5 ± 1.5
LDL-5 Normal 2060 872 791 103.9 113.5 ± I LDL-10 Normal 1609 572 583 95.9 107 ± 2
PCS
EM
EM
EM
AUC
*Computations were done for P = 7 A, and M = 18 A. (1) The value of the smallest LDL. (2) Modified by incubation with VLDL and subsequent treatment with lipase. (3) Modified by incubation with washed Intralipid. (4) Modified by treatment of (3) with lipase.
LDL, as determined by EM, have previously been shown to be larger than the corresponding hydrodynamic diameter [13,26,27], due to 'flatten- ing of the LDL on the EM grid' [13]. The values of R and Rs determined by small angle Neutron Scattering (SANS)were 75 ± 5 A and 103 ± 5 A respectively, in comparison to the computed values of 71.2 A, and 89.2 A, respectively.
5. Concluding remarks
1. The model described above minimizes the number of assumptions made in LDL studies. Yet,
it is important to emphasise that none of the assumptions made here were in fact proven. Par- tial 'covering' of phospholipid headgroups by pro- tein residues may still occur, in spite of the 'surface deficit'. Thus, the surface coverage by Apo B, which according to our computations is about 40%, may in fact be somewhat larger. Moreover, the assumption that one-third of the free choles- terol resides in the oily core is based on NMR data [14], which are also consistent with this fraction of cholesterol 'residing' in the outer monolayer but covered by apolar parts of the protein. In terms of our model this would mean that this one-third of

72 E. Sehnitzer, D. Liehtenberg / Chem. Phys. Lipids 70 (1994) 63-74
cholesterol constitutes a part of the 'oily core' which 'penetrates' into the monolayer (i.e. between R and Re). According to our computations, this volume element is sufficiently large to accommo- date all this cholesterol as Apo B penetrate only partially into the monolayer (up to 50% of the
% Lip
50
40
30
20
lO
i i i i i i i
/
0 I I L _ - - I I I . _ 1 . _ _ _ - -
0 2 4 6 8 10 12 14 16
No. of d o m a i n s
Fig. 7. Theoretical dependence of the fraction of phospholipid in an LDL particle which neighbors Apo B (%Lip) on the (hypothetical) 'number of caps' made of Apo B. Computations were based on the following considerations: the area occupied by the protein (Sprot) in the form of n 'caps' (domains) is inde- Pendent of the number of domains. For each such domain, the perimeter is given by
L = 2~'~I1 - (¢/2Rs) 2] I/2
The radius ¢ of a 'flattend cap' of a surface S. is given by
= (Sp,ot)/r)I/2
For n caps of an equal surface S, Sprot = rtS
Thus, the sum of perimeters of these n caps (L) is given by:
L = 2xn(Sprot/nx)I/211 - [(Sprot /nx)l/2/2Rsl21 I/2
This means that the number of PL molecules of a diameter of 9.1 /~ (SpL=65 /~2) which neighbor Apo B is given by N = L/9. I and for an average value of NpL = 730, the fraction of PL which neighbors ADo B is given by % Lip = (L/66)%.
thickness). Furthermore, Apo B is not very likely to penetrate into the lipidic core to any significant depth. The latter being the case, the value of R, as expected from space filling considerations [12,25], is similar to the values computed by our model, although we get somewhat smaller values in those cases where the protein's penetration into the monolayer is small (low R s - R e values). In the latter cases, a significant fraction of the neutral lipids reside in the monolayer underneath the protein.
2. It is of interest to note that the LDL particles of hypertriglyceridemic patients are smaller than those of normal subjects (Table 2). According to our model this should not result in major organi- zational changes since the hydrolysis of the excess TG and the consequent reduction of the volume of the core is also accompanied by a reduction of NpL. We find it tempting to speculate that %S is not merely a reflection of the 'surface deficit' but represents an optimal organization of APO B for its function.
3. In our model we have assumed that none of the PL head groups is covered by proteins and that the protein is arranged as one 'cap'. While the lat- ter assumption is questionable, it has no effect on any of our computed values. However, if the former assumption is valid, it would mean that the immobilization of 20% of the PL, previously sug- gested on the basis of NMR studies [17,18], must involve those PL molecules which neighbor the Apo B rather than those residing underneath the protein [9,161. For a single Apo B cap, only about 9% of the PL can be immobilized through such a mechanism as presented in Fig. 7. In this Fig. the percent of PL molecules which neighbor Apo B (% Lip) is described as a function of the (hypothetical) number of caps (domains) which the protein forms. This figure shows that immobilization of 20% of the phospholipid can be expected when the Apo B is organized in the form of three domains. This is consistent with the three-domain structure previously proposed [28]. The alternative pro- posals of a four-domain [291 or a long string con- figuration [13,27] of Apo B on the LDL surface can not be ruled out. In contrast, our model (and interpretation) is inconsistent with either one [30] or 20 [31] domains.

E. Schnitzer, D. Lichtenberg / Chem. Phys. Lipids 70 (1994) 63-74 73
6. References
1 T.J. Knott, R.J. Please, L.M. Powell, S.C. Wallis, S.C. Rail, T.L. Innerarity, B. Blackhart, W.H. Taylor, Y. Marcel, R. Milne, D. Johnson, M. Fuller, A.J. Lusis, B.J. MacCarthy, R.W. Mahley, B. Levy-Wilson and J. Scott (1986) Nature 323, 734-738.
2 C.Y. Yang, S.H. Chen, S.H. Gianturco, W.A. Bradley, J.T. Sparrow, M. Tarimura, W.H. Li, D.A. Sparrow, H. Deloof, M. Rosseneu, F.H. Lee, Z.W. Gu, A.M. Gotto and L. Chan (1986) Nature 323, 738-742.
3 S. Eisenberg, D. Gavish, Y. Oschry, M. Fainaru and R.J. Deckelbaum (1984). J. Clin. Invest. 74, 470-482.
4 C.J. Packard, J. Shepherd, S. Joerns, A.M. Gotto and O.D. Taunton (1979) Biochim. Biophys. Acta 572, 269-282.
5 R.J. Deckeibaum, S. Eisenberg, Y. Oschry, E. Butbul, H. Sharon and T. Olivecrona (1982). J. Biol. Chem. 257, 6509-6517.
6 E. Granot, R.J. Deckelbaum, S. Eisenberg, Y. Oschry and J.B. Oivcrona (1985). Biochim. Biophys. Aeta 833, 308-315.
7 R.J. Deckelbaum, S. Eisenberg, Y. Oschry and L.L. Rudel (1988). Biochim. Biophys. Acta 961,223-233.
8 D. Atkinson, D.M. Small and G.G. Shipley (1982). Ann. NY Acad. SCi. 348, 248-298.
9 M.W. Baumstark, W. Kreutz, A. Berg, I. Frey and J. Keul (1990). Biochim. Biophys. Acta 1037, 48-57.
10 P. Laggner, G.M. Kostner, U. Rakusch and D. Worcester (1981) J. Biol. Chem. 256, 11832-11839.
11 M.J. Chapman, P.M. Laplaud, G. Luc, P. Forgez, E. Bruckert, S. Goulinet and D. Lagrange (1988) J. Lipid. Res. 29, 442-458.
12 B.W. Shen, A.M. Scanu and F.J. Kezdy (1977) Proc. Natl. Acad. Sci. USA. 74, 837-841.
13 J.E. Chatterton, M.L. Phillips, L.K. Curtiss, R.W. Milne, Y.L. Marcel and V.N. Schumaker (1991) J. Biol. Chem. 266, 5955-5962.
14 S. Lund-Katz and M.C. Phillips (1986) Biochemistry 25, 1562-1568.
15 J.A. lbdah, S. Lund-Katz and M.C. Phillips (1989) Biochemistry 28, ! 126-1133.
16 P. Laggner and K.W. Muller (1978) Q. Rev. Biophys. I 1, 371-425.
17 E.G. Finer, R. Henry, R.B. Leslie and R.N. Robertson (1975) Biochim. Biophys. Acta 380, 320-337.
18 P.L. Yeagie, R.G. Langdon and R.B. Martin (1977) Biochemistry 16, 3487-3491.
19 L. Chan and H.A. Dresel (1990) Lab. Invest. 62, 522-537.
20 J.P. Segrest and J.J. Albers, in Plasma Lipoproteins- preparation, Structure and Molecular Biology, Academic Press, Inc., Orlando, Florida. p. 95.
21 M.J. Champman, S. Goldstein, D. Lagrang and P.M. Laplaud, (1981) J. Lipid. Res. 22, 339-358.
22 D.M. Lee and P. Alayporic (1970) Biochemistry 9, 2244-2252.
23 L.L. Rudel, J.A. Lee, M.D. Morris and J.M. Felts (1974) J. Biochem. 139, 89-95.
24 B.A. Griffin, M.J. Caslake, B. Yip, G.W. Tait, CJ. Packard and J. Shepherd (1990) Atherosclerosis 83, 59-67.
25 C. Tanford (1980) The hydrophobic effect. Formation of Micelles and Biological Membranes, 2nd edn., John Wiley and Sons, New York, pp. 51-59.
26 M.M.S. Shen, R.M. Krauss, F.T. Lindgren and T. Forte (1981) J. Lipid. Res. 22, 236-244.
27 M.L. Phillips and V.N. Schumaker (1989) J. Lipid. Res. 30, 415-422.
28 G.C. Chen, S. Zhu, D.A. Hardman, J.W. Schilling, K. Lau and J.P. Kane (1988) J. Biol. Chem. 264, 14369-14375.
29 V. Luzzati, A. Tardieu and L.P. Aggerbeck (1979) J. Mol. Biol. 131,435-473.
30 D.M. Lee, D.L. Stiers and T. Mok (1987) Biochem. Biophys. Res. Commun. 144, 210-216.
31 H. Pollard, A.M. Scanu and E.M. Taylor (1969) Proc. Natl. Acad. Sci. USA 64, 304-310.
7. Appendix
The correlations given by the eqns. 8, 9 and 10 in the text can be transferred as follows
SLI P ---- 2a'(R + M)2[1 + cos(od2)] (8)
Thus ,
cos(c~/2) = [SLIp/2~r(R + M ) 2] - 1
c~= 2cos-1{ [SLIr,/2x(R + M ) 2] - 1 ]
and w h e n ot is expressed in r ad ians c¢°/360 =
Otrad/2~
i.e. (I) Otr~d/27r = (I/Tr)cos-l{lSLle/21r(R + M) 2] - I}
Vp = (4~/3)[(R + M + p)3 _ Rc3] (~/360)
-Re3[(c~/360)(4~r/3)] = Vp - [(47r/3) (R + M
+ P)3(c~/360)1
(9)

74
i.e. (II) Re3 (a/360) = [(R + M + p)3 (ot/360)1
- (3 vp/ar)
VLIp = (4~r/3)R 3 - [(4~r/3)(R 3 - Re3) (c¢/360)] (10)
Hence
VLW = (4x/3) [R 3 - (od360) (R 3 - Re3)]
i.e. (III) Vup = (4r/3) {R 3 [I - (a/360)]
+ Rc 3 (od360)1
Substituting Re3 (od360) by its value given by eqn. II yield eqn. IV.
IV. VLI P = (4~r/3){R3I 1 - (cd360)] + [(R + M
+ P)3(cd360)] - (3 Vp/4~r) ]
VLIP = (4~'/3) I R3[1 - (od360)] + [(R + M
+ P)3(od360)]l - [3 Vp/4~r) (4r/3)]
Hence,
VLW + Vp = (4a'/3) [R 3 [1 - (od360)] + [(R
+ M + p)3 (od360)] } (Vp = V' Vup)
ILia (I + V') = (4a'/3)[R3[1 - (od360)]
+ [(R + M + e)3 (c~/30)] ]
Substituting a f rom eqn. I and defining
[SLIp/2x(R + M) 2] - 1 as U yields eqn. V.
V. VLIp (1 + V') = (4~r/3){R3[l
- ( l / l r)cos-IU] + [(R + M
+ P)3(l/~-)cos-1 U] }
Hence, VI
xR 3 + cos - lU[ (R + M + p)3 _ R 3 ] = [(3VLIP)
(1 + V')l /4
E. Schnitzer, D. Lichtenberg / Chem. Phys. Lipids 70 (1994) 63-74
This equat ion has only one dependent factor, R. According to Neuton ' s approximat ion:
Rn+l = Rt¢ - [Y(RN)/y" (RN)]
This equation can be solved by differentiation. First we will define:
dU/dR = [ -SLtp / f (R + M) 3] = W
As d(F 1 × F2) = F l d F 2 + F2dFi
it follows that:
y ' = -3a-R 2 + 3R2cos - IU - R3(1 - 0"2)-0.5
W - 3(R + M + p)2cos-I U
+ (R + M + P)3(1 - U2)-°'SW
defining:
V = (1 - U 2 ) -0"5
and
Z = c o s - l U
Yields, y ' = 3~rR 2 + 3R2Z - R 3 V W - 3(R + M
+ p)2 Z + (R + M + p ) 3 V W
and
y = [(3VLIP)(I + V')]/4 - xR 3 + R3Z
- ( R + M + P ) 3 Z
Solving this equat ion yields the value of R. Subse- quently, ~ and Re can also be computed:
Otra d - - 2cos - 11 [SLIp/2"x(R + M) 2] - 1 } = 2 Z
O~deg = 2Z × (180/~) = Z(360/x)
Re= [(R + M + P) 3
- 1(3/4x)( V' VLW)(360/~)] ] I/3


