Embed Size (px)
Citation preview

Explanation of the supplemental tablesThe supplemental materials include tabulations of data from flume erosion tests and jet erosion
tests that were discussed in the main text, as follows:
Table S1: Boston Harbor midchannel (Roberts et al., 2001)
Table S2: Boston Harbor “open cell” (Roberts et al., 2001).
Table S3: Canaveral sample CDS-1 (Jepsen et al., 2001)
Table S4: Canaveral sample CDS-2 (Jepsen et al., 2001)
Table S5: Canaveral sample CHB-2 (Jepsen et al., 2001)
Table S6: Canaveral sample CH-EC-S-1 (Jepsen et al., 2001)
Table S7: Quartz particles (Roberts et al., 1998)
Table S8: Detroit River (Jepsen et al., 1997)
Table S9: Synthetic silty sands (Fujisawa et al., 2008, 2011)
Table S10: Mobile Bay (Gailani et al., 2001)
Table S11: Test 8/8.1/8.4/1 of Mazurek (2001)
Table S12: Test 8/14.5/9.0/4 of Mazurek (2001).
Parameters listed in Tables S1 to S8 and Table S10 are bulk dry specific density , applied
shear stress (in Pa), erosion rate E (in m/s), and critical shear stress (in Pa). Table S7 lists
median grain size (in mm). Table S9 lists the parameter , the mass fraction of “mud”
(material finer than sand). Critical shear stress values given in tables S1 to S10 were variously
derived: Fujisawa et al. (2008) gave values of as a function of for the synthetic mixtures
with 22% mud. Values for the Fujisawa et al. (2011) experiments were estimated by
extrapolating log-transformed plots of vs. to a value . For the other tables,
was estimated using the method described in the main text.
The time series data of Tables S11 and S12 include elapsed test time (in s), scour depth
(in m), total distance H from nozzle to bottom of scour hole (in m), and dimensionless time
and distance , where the definitions of the characteristic time and distance are given in the

main text. Also shown in these files are values of nozzle diameter d (in m); initial distance
of nozzle from the sediment (in m); and mean jet speed at the nozzle (in m/s).

TABLE S1: Conditions for flume-erosion test of Boston Harbor midchannel sediment. is
bulk dry specific gravity, is applied mean shear stress, E is erosion rate, and c is inferred critical shear stress.
Pa m/sE Pac
1.375 1.0 100 0.301.382 1.0 70 0.341.388 1.0 30 0.391.390 1.0 50 0.411.393 1.0 25 0.431.395 1.0 13 0.451.398 1.0 17 0.481.400 1.0 6 0.501.405 1.0 3 0.551.387 2.0 300 0.381.390 2.0 130 0.411.392 2.0 160 0.421.394 2.0 220 0.441.398 2.0 130 0.481.402 2.0 200 0.521.406 2.0 40 0.571.408 2.0 90 0.591.410 2.0 100 0.611.414 2.0 85 0.671.420 2.0 35 0.751.427 2.0 25 0.871.430 2.0 13 0.921.434 2.0 9 1.001.444 2.0 8 1.231.446 2.0 3 1.281.412 4.0 900 0.641.428 4.0 100 0.891.432 4.0 90 0.961.436 4.0 120 1.041.444 4.0 90 1.231.446 4.0 80 1.281.448 4.0 81 1.331.450 4.0 40 1.38

TABLE S2: Conditions for flume-erosion test of Boston Harbor “open cell” sediment. is
bulk dry specific gravity, is applied mean shear stress, E is erosion rate, and c is inferred
critical shear stress.
Pa m/sE Pac
1.480 0.5 10 0.291.482 0.5 3 0.301.495 0.5 1 0.361.497 0.5 3 0.381.485 1.0 40 0.311.488 1.0 25 0.331.490 1.0 25 0.341.495 1.0 40 0.361.497 1.0 30 0.381.540 1.0 5 0.721.542 1.0 1 0.741.545 1.0 4 0.781.552 1.0 1 0.861.514 1.0 10 0.491.518 1.0 8 0.521.522 1.0 10 0.551.490 2.0 350 0.341.492 2.0 400 0.351.494 2.0 500 0.361.498 2.0 120 0.381.515 2.0 90 0.491.520 2.0 80 0.531.522 2.0 75 0.551.538 2.0 75 0.701.540 2.0 60 0.721.542 2.0 60 0.741.552 2.0 20 0.861.560 2.0 10 0.971.566 2.0 9 1.061.525 4.0 250 0.581.545 4.0 140 0.781.557 4.0 120 0.931.560 4.0 150 0.971.565 4.0 30 1.051.567 4.0 30 1.08

TABLE S3: Conditions for flume-erosion test of Canaveral CDS-1 sediment. is bulk dry
specific gravity, is applied mean shear stress, E is erosion rate, and c is inferred critical shear stress.
Pa m/sE Pac
1.335 0.5 12 0.221.336 0.5 7 0.221.336 0.5 10 0.231.342 0.5 8 0.251.331 1.0 62 0.211.332 1.0 39 0.211.334 1.0 31 0.221.336 1.0 62 0.221.336 1.0 50 0.231.337 1.0 32 0.231.338 1.0 43 0.231.340 1.0 22 0.241.348 1.0 17 0.271.368 1.0 10 0.351.400 1.0 4 0.551.332 2.0 172 0.211.333 2.0 101 0.221.334 2.0 140 0.221.336 2.0 194 0.221.336 2.0 194 0.231.337 2.0 152 0.231.337 2.0 101 0.231.342 2.0 76 0.251.348 2.0 67 0.271.366 2.0 50 0.341.390 2.0 20 0.481.414 2.0 11 0.661.416 2.0 13 0.681.335 4.0 459 0.221.336 4.0 406 0.221.344 4.0 541 0.251.348 4.0 406 0.271.368 4.0 194 0.351.380 4.0 165 0.421.410 4.0 105 0.631.412 4.0 70 0.641.418 4.0 73 0.69

TABLE S4: Conditions for flume-erosion test of Canaveral CDS-2 sediment. is bulk dry
specific gravity, is applied mean shear stress, E is erosion rate, and c is inferred critical shear stress.
Pa m/sE Pac1.550 0.5 2 0.211.560 0.5 3 0.241.550 1.0 50 0.211.552 1.0 17 0.211.554 1.0 25 0.221.562 1.0 19 0.251.570 1.0 20 0.281.582 1.0 3 0.341.592 1.0 3 0.401.598 1.0 2 0.441.608 1.0 3 0.511.610 1.0 2 0.531.611 1.0 2 0.541.552 2.0 170 0.211.554 2.0 133 0.221.558 2.0 93 0.241.562 2.0 150 0.251.576 2.0 100 0.311.584 2.0 47 0.351.590 2.0 65 0.391.592 2.0 21 0.401.594 2.0 33 0.411.596 2.0 31 0.431.598 2.0 25 0.441.604 2.0 14 0.481.606 2.0 12 0.501.608 2.0 11 0.511.610 2.0 8 0.531.611 2.0 7 0.541.612 2.0 10 0.551.614 2.0 5 0.561.620 2.0 5 0.621.622 2.0 9 0.641.560 4.0 930 0.241.582 4.0 220 0.341.592 4.0 110 0.401.596 4.0 70 0.431.598 4.0 130 0.441.600 4.0 160 0.451.606 4.0 91 0.50

1.608 4.0 50 0.511.610 4.0 84 0.531.611 4.0 71 0.541.612 4.0 81 0.551.614 4.0 68 0.561.616 4.0 37 0.581.618 4.0 55 0.601.620 4.0 67 0.621.622 4.0 52 0.641.624 4.0 36 0.661.626 4.0 33 0.68

TABLE S5: Conditions for flume-erosion test of Canaveral CHB-2 sediment. is bulk dry
specific gravity, is applied mean shear stress, E is erosion rate, and c is inferred critical shear stress.
Pa m/sE Pac1.208 0.5 16 0.151.210 0.5 23 0.161.214 0.5 19 0.191.212 0.5 7 0.181.216 0.5 7 0.201.208 1.0 63 0.151.212 1.0 69 0.181.214 1.0 69 0.191.213 1.0 49 0.181.215 1.0 54 0.191.216 1.0 43 0.201.218 1.0 41 0.221.220 1.0 41 0.231.230 1.0 18 0.331.244 1.0 3 0.521.250 1.0 3 0.641.252 1.0 3 0.691.213 2.0 391 0.181.214 2.0 373 0.191.216 2.0 324 0.201.210 2.0 281 0.161.212 2.0 212 0.181.215 2.0 202 0.191.218 2.0 168 0.221.236 2.0 52 0.401.250 2.0 49 0.641.252 2.0 41 0.681.254 2.0 22 0.741.250 4.0 233 0.64

TABLE S6: Conditions for flume-erosion test of Canaveral CH-EC-S-1 sediment. is bulk
dry specific gravity, is applied mean shear stress, E is erosion rate, and c is inferred critical shear stress.
Pa m/sE Pac 1.200 0.50 5 0.251.202 0.50 7 0.271.204 0.50 4 0.291.210 0.50 3 0.351.200 1.00 37 0.251.202 1.00 20 0.271.204 1.00 37 0.281.206 1.00 31 0.311.208 1.00 29 0.331.210 1.00 33 0.351.212 1.00 27 0.371.214 1.00 10 0.401.228 1.00 2 0.621.204 2.00 280 0.281.206 2.00 189 0.311.208 2.00 117 0.321.210 2.00 139 0.351.214 2.00 75 0.401.230 2.00 15 0.661.238 2.00 7 0.851.228 4.00 139 0.621.232 4.00 102 0.711.234 4.00 72 0.75

Table S7: Conditions for flume-erosion tests of crushed quartz. 50D is mean grain size, is bulk dry specific gravity, is applied mean shear stress, E is erosion rate, and c is inferred critical shear stress.
50 mmD Pa m/sE Pac0.015 1.640 0.2 12 0.080.015 1.680 0.2 7 0.100.015 1.716 0.2 4 0.130.015 1.676 0.4 25 0.100.015 1.686 0.4 33 0.110.015 1.700 0.4 12 0.120.015 1.720 0.4 22 0.130.015 1.732 0.4 11 0.150.015 1.774 0.4 3 0.200.015 1.790 0.4 4 0.220.015 1.808 0.4 4 0.250.015 1.820 0.4 4 0.270.015 1.822 0.4 3 0.270.015 1.828 0.4 2 0.280.015 1.662 0.8 150 0.090.015 1.732 0.8 50 0.150.015 1.746 0.8 53 0.160.015 1.760 0.8 38 0.180.015 1.766 0.8 31 0.190.015 1.782 0.8 28 0.210.015 1.804 0.8 13 0.240.015 1.810 0.8 12 0.250.015 1.822 0.8 19 0.270.015 1.832 0.8 14 0.290.015 1.834 0.8 15 0.290.015 1.836 0.8 14 0.300.015 1.840 0.8 6 0.300.015 1.842 0.8 13 0.310.015 1.844 0.8 9 0.310.015 1.846 0.8 10 0.320.015 1.854 0.8 14 0.330.015 1.856 0.8 10 0.340.015 1.858 0.8 8 0.340.015 1.860 0.8 10 0.350.015 1.862 0.8 11 0.350.015 1.864 0.8 8 0.360.015 1.870 0.8 7 0.370.015 1.872 0.8 4 0.370.015 1.874 0.8 6 0.380.015 1.880 0.8 6 0.39

0.015 1.882 0.8 5 0.400.015 1.888 0.8 4 0.420.015 1.894 0.8 4 0.430.015 1.730 1.6 170 0.140.015 1.750 1.6 283 0.170.015 1.788 1.6 71 0.220.015 1.796 1.6 79 0.230.015 1.810 1.6 50 0.250.015 1.816 1.6 60 0.260.015 1.830 1.6 91 0.290.015 1.832 1.6 67 0.290.015 1.836 1.6 75 0.300.015 1.838 1.6 50 0.300.015 1.840 1.6 38 0.300.015 1.846 1.6 58 0.320.015 1.848 1.6 78 0.320.015 1.850 1.6 42 0.330.015 1.854 1.6 54 0.330.015 1.856 1.6 33 0.340.015 1.858 1.6 22 0.340.015 1.860 1.6 54 0.350.015 1.864 1.6 49 0.360.015 1.868 1.6 21 0.370.015 1.870 1.6 19 0.370.015 1.872 1.6 46 0.370.015 1.878 1.6 17 0.390.015 1.880 1.6 25 0.390.015 1.882 1.6 28 0.400.015 1.884 1.6 30 0.410.015 1.886 1.6 19 0.410.015 1.894 1.6 16 0.430.015 1.836 3.2 450 0.300.015 1.844 3.2 275 0.310.015 1.848 3.2 380 0.320.015 1.854 3.2 280 0.330.015 1.858 3.2 116 0.340.015 1.860 3.2 110 0.350.015 1.862 3.2 284 0.350.015 1.864 3.2 163 0.360.015 1.866 3.2 83 0.360.015 1.872 3.2 75 0.370.015 1.878 3.2 75 0.390.015 1.880 3.2 87 0.390.015 1.884 3.2 187 0.410.015 1.890 3.2 88 0.420.015 1.892 3.2 86 0.43

0.015 1.894 3.2 140 0.430.015 1.882 6.4 117 0.400.015 1.890 6.4 200 0.420.075 1.752 0.2 6 0.090.075 1.758 0.2 4 0.090.075 1.768 0.2 4 0.090.075 1.780 0.2 4 0.100.075 1.822 0.2 3 0.130.075 1.822 0.4 12 0.130.075 1.834 0.4 8 0.140.075 1.844 0.4 9 0.150.075 1.854 0.4 13 0.160.075 1.860 0.4 11 0.160.075 1.872 0.4 9 0.170.075 1.878 0.4 5 0.180.075 1.894 0.4 4 0.200.075 1.924 0.4 4 0.230.075 1.928 0.4 3 0.240.075 1.934 0.4 3 0.240.075 1.808 0.8 71 0.120.075 1.812 0.8 50 0.120.075 1.830 0.8 36 0.140.075 1.834 0.8 61 0.140.075 1.856 0.8 37 0.160.075 1.862 0.8 25 0.160.075 1.872 0.8 38 0.170.075 1.874 0.8 20 0.180.075 1.876 0.8 36 0.180.075 1.878 0.8 22 0.180.075 1.882 0.8 35 0.180.075 1.884 0.8 20 0.190.075 1.886 0.8 33 0.190.075 1.890 0.8 27 0.190.075 1.894 0.8 33 0.200.075 1.900 0.8 25 0.200.075 1.902 0.8 25 0.200.075 1.904 0.8 18 0.210.075 1.908 0.8 21 0.210.075 1.910 0.8 17 0.210.075 1.912 0.8 21 0.220.075 1.914 0.8 17 0.220.075 1.918 0.8 19 0.220.075 1.920 0.8 17 0.230.075 1.922 0.8 12 0.230.075 1.924 0.8 16 0.230.075 1.926 0.8 17 0.23
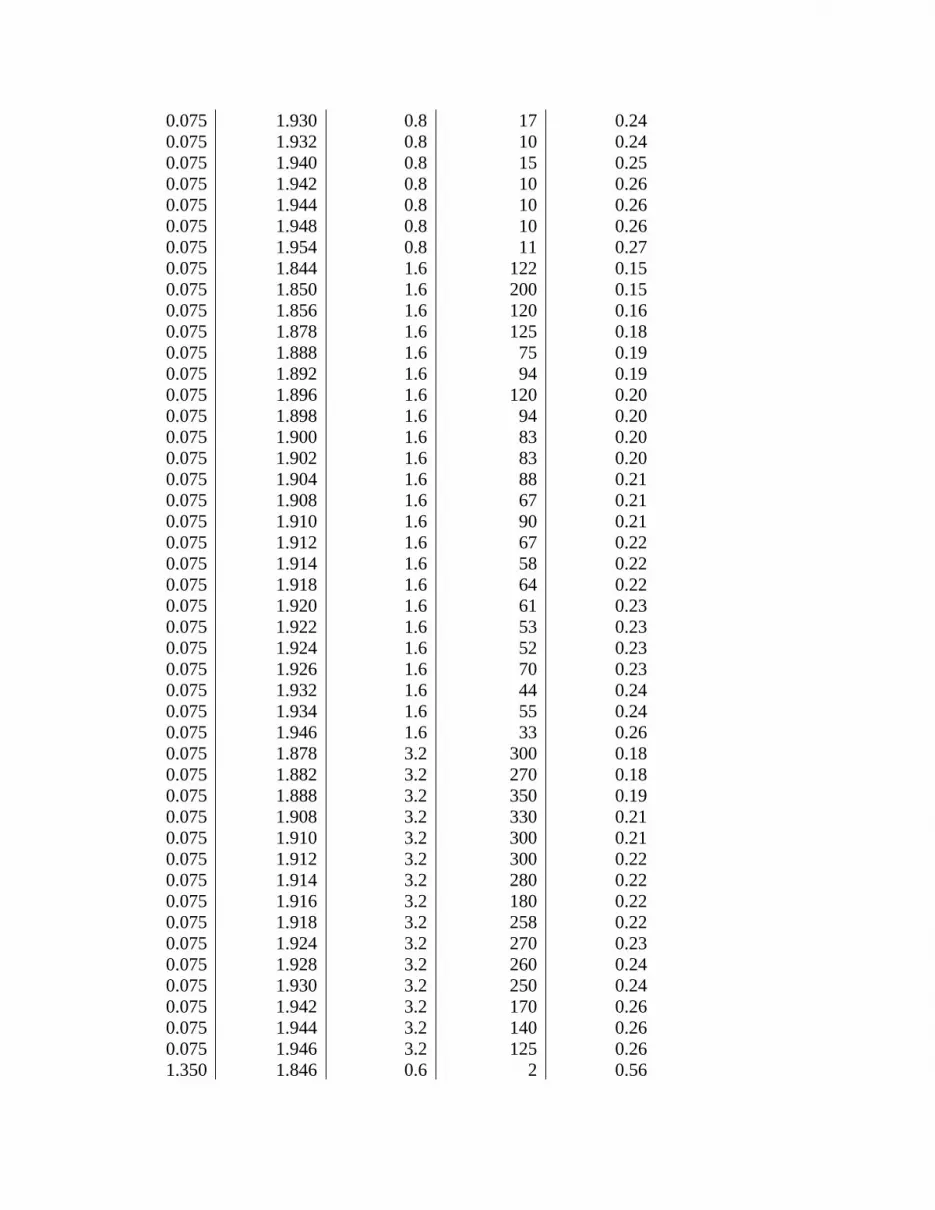
0.075 1.930 0.8 17 0.240.075 1.932 0.8 10 0.240.075 1.940 0.8 15 0.250.075 1.942 0.8 10 0.260.075 1.944 0.8 10 0.260.075 1.948 0.8 10 0.260.075 1.954 0.8 11 0.270.075 1.844 1.6 122 0.150.075 1.850 1.6 200 0.150.075 1.856 1.6 120 0.160.075 1.878 1.6 125 0.180.075 1.888 1.6 75 0.190.075 1.892 1.6 94 0.190.075 1.896 1.6 120 0.200.075 1.898 1.6 94 0.200.075 1.900 1.6 83 0.200.075 1.902 1.6 83 0.200.075 1.904 1.6 88 0.210.075 1.908 1.6 67 0.210.075 1.910 1.6 90 0.210.075 1.912 1.6 67 0.220.075 1.914 1.6 58 0.220.075 1.918 1.6 64 0.220.075 1.920 1.6 61 0.230.075 1.922 1.6 53 0.230.075 1.924 1.6 52 0.230.075 1.926 1.6 70 0.230.075 1.932 1.6 44 0.240.075 1.934 1.6 55 0.240.075 1.946 1.6 33 0.260.075 1.878 3.2 300 0.180.075 1.882 3.2 270 0.180.075 1.888 3.2 350 0.190.075 1.908 3.2 330 0.210.075 1.910 3.2 300 0.210.075 1.912 3.2 300 0.220.075 1.914 3.2 280 0.220.075 1.916 3.2 180 0.220.075 1.918 3.2 258 0.220.075 1.924 3.2 270 0.230.075 1.928 3.2 260 0.240.075 1.930 3.2 250 0.240.075 1.942 3.2 170 0.260.075 1.944 3.2 140 0.260.075 1.946 3.2 125 0.261.350 1.846 0.6 2 0.56

1.350 1.878 0.6 2 0.561.350 1.894 0.6 3 0.561.350 1.910 0.6 2 0.561.350 1.838 0.8 22 0.561.350 1.842 0.8 28 0.561.350 1.850 0.8 33 0.561.350 1.852 0.8 33 0.561.350 1.866 0.8 46 0.561.350 1.880 0.8 33 0.561.350 1.892 0.8 42 0.561.350 1.908 0.8 33 0.561.350 1.838 1.6 420 0.561.350 1.840 1.6 430 0.561.350 1.842 1.6 230 0.561.350 1.862 1.6 250 0.561.350 1.864 1.6 240 0.561.350 1.870 1.6 270 0.561.350 1.892 1.6 200 0.561.350 1.894 1.6 230 0.561.350 1.910 1.6 320 0.561.350 1.860 3.2 1620 0.561.350 1.862 3.2 2000 0.561.350 1.870 3.2 1633 0.56

TABLE S8: Conditions for flume-erosion test of Detroit River sediment. is bulk dry specific
gravity, is applied mean shear stress, E is erosion rate, and c is inferred critical shear stress.
Pa m/sE Pac1.380 0.2 2 0.131.380 0.4 10 0.131.385 0.4 7 0.151.390 0.4 8 0.161.394 0.4 8 0.171.398 0.4 5 0.181.402 0.4 6 0.191.405 0.4 4 0.201.408 0.4 4 0.211.410 0.4 3 0.221.380 0.8 70 0.131.390 0.8 35 0.161.397 0.8 25 0.181.400 0.8 30 0.191.402 0.8 35 0.191.404 0.8 22 0.201.406 0.8 21 0.211.408 0.8 17 0.211.411 0.8 13 0.221.412 0.8 10 0.231.417 0.8 12 0.251.419 0.8 10 0.261.421 0.8 15 0.261.423 0.8 7 0.271.425 0.8 16 0.281.427 0.8 8 0.291.429 0.8 10 0.301.435 0.8 10 0.331.440 0.8 6 0.361.433 0.8 5 0.321.437 0.8 4 0.341.441 0.8 4 0.361.443 0.8 3 0.381.388 1.6 180 0.151.394 1.6 130 0.171.398 1.6 200 0.181.399 1.6 110 0.181.402 1.6 130 0.191.404 1.6 130 0.20

1.407 1.6 65 0.211.409 1.6 70 0.221.410 1.6 95 0.221.412 1.6 59 0.231.418 1.6 50 0.251.413 1.6 120 0.231.419 1.6 110 0.261.423 1.6 80 0.271.425 1.6 70 0.281.427 1.6 70 0.291.430 1.6 55 0.311.430 1.6 27 0.311.436 1.6 30 0.341.437 1.6 18 0.341.433 1.6 47 0.321.437 1.6 50 0.341.442 1.6 43 0.371.440 1.6 28 0.361.443 1.6 20 0.381.446 1.6 28 0.391.448 1.6 35 0.411.450 1.6 27 0.421.452 1.6 12 0.431.453 1.6 17 0.441.455 1.6 22 0.461.458 1.6 30 0.481.460 1.6 8 0.491.460 1.6 11 0.491.462 1.6 12 0.511.463 1.6 11 0.521.466 1.6 16 0.541.468 1.6 8 0.561.470 1.6 10 0.581.474 1.6 6 0.621.476 1.6 7 0.641.482 1.6 5 0.701.485 1.6 5 0.731.390 3.2 500 0.161.400 3.2 400 0.191.402 3.2 450 0.191.403 3.2 350 0.201.406 3.2 400 0.211.407 3.2 300 0.211.409 3.2 230 0.221.411 3.2 370 0.221.413 3.2 240 0.23

1.415 3.2 230 0.241.417 3.2 330 0.251.420 3.2 360 0.261.421 3.2 230 0.261.423 3.2 230 0.271.425 3.2 150 0.281.428 3.2 180 0.301.430 3.2 150 0.311.433 3.2 160 0.321.438 3.2 150 0.351.436 3.2 90 0.341.444 3.2 95 0.381.441 3.2 110 0.361.444 3.2 95 0.381.446 3.2 130 0.391.448 3.2 140 0.411.450 3.2 50 0.421.452 3.2 95 0.431.454 3.2 60 0.451.450 3.2 55 0.421.459 3.2 65 0.491.461 3.2 85 0.501.464 3.2 38 0.531.468 3.2 32 0.561.466 3.2 62 0.541.472 3.2 33 0.601.475 3.2 55 0.631.477 3.2 65 0.651.482 3.2 28 0.701.484 3.2 22 0.721.486 3.2 29 0.741.500 3.2 22 0.921.504 3.2 14 0.981.436 6.4 600 0.341.438 6.4 450 0.351.445 6.4 700 0.391.450 6.4 250 0.421.454 6.4 450 0.451.456 6.4 440 0.461.460 6.4 410 0.491.466 6.4 400 0.541.462 6.4 200 0.511.464 6.4 180 0.531.468 6.4 160 0.561.500 6.4 190 0.921.472 6.4 130 0.60

1.474 6.4 130 0.621.476 6.4 95 0.641.478 6.4 110 0.661.482 6.4 120 0.701.486 6.4 75 0.741.488 6.4 50 0.771.494 6.4 70 0.84

TABLE S9: Conditions for flume-erosion test of synthetic silty sands. The fraction of “mud”—
that is, silt- and clay-sized particles—is denoted mf . is bulk dry specific gravity, is
applied mean shear stress, E is erosion rate, and c is inferred critical shear stress.
mf Pa m/sE Pac0.22 1.68 1.8 68 1.210.22 1.68 1.8 86 1.210.22 1.66 2.5 170 1.210.22 1.68 2.4 170 1.210.22 1.67 3.0 270 1.210.22 1.67 3.0 260 1.210.22 1.67 3.1 240 1.210.22 1.78 1.7 23 1.390.22 1.76 1.7 35 1.390.22 1.78 2.5 120 1.390.22 1.76 2.5 130 1.390.22 1.78 3.6 230 1.390.22 1.76 3.7 220 1.390.22 1.77 4.2 330 1.390.22 1.79 4.2 280 1.390.22 1.86 2.0 11 1.440.22 1.88 3.2 82 1.440.22 1.87 4.0 110 1.440.22 1.86 5.2 140 1.440.22 1.93 3.1 23 1.600.22 1.91 3.0 20 1.600.22 1.93 4.2 46 1.600.22 1.91 5.2 55 1.600.22 1.93 5.2 55 1.600.30 1.58 5.7 83 0.300.30 1.58 4.2 82 0.300.30 1.58 3.0 12 0.300.30 1.58 2.0 35 0.300.30 1.58 0.9 317 0.300.30 1.58 7.3 549 0.300.30 1.58 7.2 189 0.300.30 1.69 2.7 31 0.470.30 1.69 2.7 62 0.470.30 1.69 4.1 3 0.470.30 1.69 5.7 258 0.470.30 1.69 7.3 623 0.470.30 1.69 7.4 488 0.47

0.30 1.69 9.4 509 0.470.30 1.69 7.3 211 0.470.30 1.69 8.3 53 0.470.40 1.59 9.2 255 0.300.40 1.59 5.9 138 0.300.40 1.59 4.6 78 0.300.40 1.59 3.0 29 0.300.40 1.59 1.9 10 0.300.40 1.59 1.9 458 0.300.40 1.59 0.8 504 0.300.40 1.69 1.5 16 0.600.40 1.69 3.3 24 0.600.40 1.69 4.5 37 0.600.40 1.69 2.8 77 0.600.40 1.69 1.7 91 0.600.40 1.69 2.3 128 0.600.40 1.69 0.9 245 0.600.40 1.78 4.6 100 0.600.40 1.78 6.2 143 0.600.40 1.78 5.6 151 0.600.40 1.78 5.6 84 0.600.40 1.78 3.6 49 0.600.40 1.78 1.9 24 0.60

TABLE S10: Conditions for flume-erosion test of Mobile Bay sediment. is bulk dry specific
gravity, is applied mean shear stress, E is erosion rate, and c is inferred critical shear stress.
Pa m/sE Pac1.439 0.8 0.3 0.641.445 0.8 0.3 0.751.445 0.8 0.4 0.751.447 0.8 0.4 0.791.453 0.8 0.4 0.921.453 0.8 1.1 0.921.454 0.8 0.2 0.941.454 0.8 1.2 0.941.498 0.8 0.3 2.951.502 0.8 0.3 3.261.442 1.6 4.6 0.691.445 1.6 6.0 0.751.445 1.6 7.7 0.751.448 1.6 5.0 0.811.45 1.6 2.8 0.85
1.453 1.6 1.6 0.921.457 1.6 1.6 1.021.463 1.6 1.6 1.201.466 1.6 0.4 1.291.471 1.6 0.5 1.471.473 1.6 0.6 1.551.436 1.6 31.6 0.591.442 1.6 40.6 0.691.446 1.6 142.0 0.771.448 1.6 29.1 0.811.457 1.6 24.6 1.021.458 1.6 11.6 1.051.461 1.6 6.5 1.131.469 1.6 6.0 1.401.493 1.6 11.6 2.591.497 1.6 2.2 2.871.438 3.2 154.3 0.621.441 3.2 234.2 0.671.442 3.2 276.7 0.691.443 3.2 586.3 0.711.447 3.2 110.5 0.791.448 3.2 167.7 0.811.448 3.2 215.4 0.811.45 3.2 215.4 0.85

1.455 3.2 154.3 0.971.455 3.2 215.4 0.971.459 3.2 355.4 1.081.454 3.2 57.0 0.941.454 3.2 43.6 0.941.457 3.2 55.5 1.021.447 3.2 92.3 0.791.464 3.2 65.2 1.231.465 3.2 117.4 1.261.465 3.2 43.6 1.261.468 3.2 23.6 1.361.471 3.2 65.2 1.471.478 3.2 3.4 1.761.476 3.2 11.7 1.681.479 3.2 4.5 1.811.483 3.2 4.2 2.011.487 3.2 30.8 2.221.488 3.2 17.1 2.281.488 3.2 4.0 2.281.488 3.2 1.5 2.281.492 3.2 4.5 2.531.498 3.2 15.3 2.951.501 3.2 6.9 3.181.505 3.2 1.5 3.521.507 3.2 1.7 3.701.519 3.2 0.6 5.011.513 3.2 40.2 4.311.515 3.2 14.5 4.531.434 6.4 307.9 0.561.45 6.4 1000.0 0.851.45 6.4 851.6 0.85
1.452 6.4 898.4 0.901.454 6.4 324.8 0.941.46 6.4 585.4 1.11
1.463 6.4 170.8 1.201.465 6.4 153.5 1.261.471 6.4 291.8 1.471.476 6.4 190.1 1.681.479 6.4 68.7 1.811.482 6.4 276.6 1.961.484 6.4 342.7 2.061.492 6.4 276.6 2.531.483 6.4 18.0 2.011.493 6.4 23.6 2.591.496 6.4 55.5 2.80
1.5 6.4 61.8 3.10

1.506 6.4 18.0 3.611.507 6.4 14.5 3.701.508 6.4 111.3 3.801.521 6.4 1.4 5.271.522 6.4 49.9 5.401.54 6.4 0.3 8.46
1.545 6.4 1.1 9.571.487 12.8 235.6 2.221.497 12.8 1113.0 2.871.521 12.8 26.2 5.271.527 12.8 381.4 6.121.541 12.8 9.0 8.671.544 12.8 4.5 9.34

Table S11: Data from jet-erosion test 8/8.1/8.4/1 of Mazurek (2001). The material contained
40% clay, 53% silt and 7% fine sand, with a water content of 26%. Nozzle diameter 8 mmd ,
at an initial height above the sample 0 65 mmH , with jet speed 0 8.95 m/sU at the nozzle.
HeightH of the nozzle above the bottom of the scour hole, as a function of time t , is defined as
0H H , where is scour depth. Dimensionless time *t and nozzle height *H are
calculated using scalings defined in the main text.
st m mH *t *H0 0.000 0.065 0 1.00
120 0.008 0.073 816 1.12300 0.015 0.080 2041 1.22900 0.023 0.088 6122 1.35
1800 0.024 0.089 12245 1.363600 0.027 0.092 24490 1.417200 0.030 0.095 48980 1.46
14400 0.033 0.098 97959 1.5021600 0.033 0.098 146939 1.5186400 0.036 0.101 587755 1.55
167820 0.039 0.104 1141633 1.59260820 0.041 0.106 1774286 1.62337500 0.041 0.106 2295918 1.62416760 0.041 0.106 2835102 1.62

Table S12: Data from jet-erosion test 8/14.5/9.0/4 of Mazurek (2001). The material contained
40% clay, 53% silt and 7% fine sand, with a water content of 26%. Nozzle diameter 8 mmd ,
at an initial height above the sample 0 65 mmH , with jet speed 0 8.95 m/sU at the nozzle.
HeightH of the nozzle above the bottom of the scour hole, as a function of time t , is defined as
0H H , where is scour depth. Dimensionless time *t and nozzle height *H are
calculated using scalings defined in the main text.
st m mmH *t *H0 0.0000 0.1160 0 1.000
1200 0.0025 0.1185 2756 1.0222400 0.0045 0.1205 5513 1.0393600 0.0050 0.1210 8269 1.0437200 0.0050 0.1210 16539 1.043
14400 0.0050 0.1210 33077 1.04331200 0.0065 0.1225 71667 1.05676200 0.0070 0.1230 175032 1.060
112020 0.0070 0.1230 257312 1.060175020 0.0075 0.1235 402023 1.065246840 0.0075 0.1235 566995 1.065


