Embed Size (px)
Citation preview

This article appeared in a journal published by Elsevier. The attachedcopy is furnished to the author for internal non-commercial researchand education use, including for instruction at the authors institution
and sharing with colleagues.
Other uses, including reproduction and distribution, or selling orlicensing copies, or posting to personal, institutional or third party
websites are prohibited.
In most cases authors are permitted to post their version of thearticle (e.g. in Word or Tex form) to their personal website orinstitutional repository. Authors requiring further information
regarding Elsevier’s archiving and manuscript policies areencouraged to visit:
http://www.elsevier.com/authorsrights

Author's personal copy
Reconstruction ofWisconsinan-age ice dynamics and compositions of southernOntarioglacial diamictons, glaciofluvial/lacustrine, and deltaic sediment
W.C. Mahaney a,b,⁎, R.G.V. Hancock c, Alison Milan b, Coren Pulleyblank b, Pedro J.M. Costa d,e, M.W. Milner f
a Quaternary Surveys, 26 Thornhill Ave, Thornhill, Ontario L4J 1J4, Canadab Department of Geography, York University, 4700 Keele St., North York, Ontario M3J 1P3, Canadac Medical Physics and Applied Radiation Sciences, Department of Anthropology, McMaster University, Hamilton, Ontario L8S 4K1, Canadad Centro de Geologia da Universidade de Lisboa, Faculdade de Ciências da Universidade de Lisboa, Edifício C6, Campo Grande, Lisboa 1749-016, Portugale Department of Geography, School of the Environment, University of Dundee, Nethergate, Dundee, Scotland DD1 4HN, United Kingdomf MWM Consulting, 182 Gough Ave, Toronto, Ontario M4K3P1, Canada
a b s t r a c ta r t i c l e i n f o
Article history:Received 1 June 2013Received in revised form 4 October 2013Accepted 5 October 2013Available online 23 October 2013
Keywords:Clast fabric analysisWisconsinan-age ice dynamicsGeochemical sediment sourcingSEM microtextures of glacial grains
Macrofabric analysis of till sections in south-central Ontario confirms that clast orientation yields information re-lated to changing ice dynamics during theWisconsinan glaciation. Test stations in six sections yield unimodal tomultimodal macrofabrics that indicate ice flow direction, ranging from SE–NW vectors when ice was thin andflowing radially to variable NE–SW, NNE–SSW, and N–S vectors when ice thickened. Ice loci appear to rangefrom the Lake Ontario basin and southern Quebec (thin ice), Labrador Ungava (thicker ice), and Hudson Bay(thickest ice). The north–south fabric may identify the intergrowth of Keewatin–Labrador ice, presumably themaximum ice thickness of the Last Glacial Maximum (LGM). The preliminary data support the theory that topog-raphy directed icemovement during preliminary and closing stages of glaciation in southern Ontario, while thickice generated flow vectors largely unaffected by underlying topography; hence, leading to clast azimuthal varia-tions reflecting changing ice loci with glacier growth. The fabrics analyzed suggest that inferring difference be-tween ductile and brittle lodgement tills is possible as well as to identifying possible glacial tectonic action/overburden loading that disturbs the least friction-fit position of clasts in till. The changing dynamics withintill sheets are supported, in part, by variations in glacial crushing seen in SEM imagery that depict a range ofmicrotextures from full-scale fractures under brittle conditions to those indicating less viscous transport underductile regimes. To some degree, changes in flow direction are further supported by geochemical variationsthat relate to bedrock/regolith up-glacier controlling Ca-dilution and variable concentrations of Rare EarthElements (REEs).
© 2013 Elsevier B.V. All rights reserved.
1. Introduction
The glacial geology of theOntario lobe of the Laurentide ice sheet hasbeen studied by numerous workers (e.g., Karrow, 1967; Prest, 1968;Maclachlan and Eyles, 2013, amongst others) with emphasis on ad-vance and decline over ~90 ka–12 ka. More recently, Occhietti et al.(2011) outlined the growth and decay of the Labrador ice dome andits relation to Keewatin ice. The stratigraphy of two major southernOntario Wisconsinan lithostratigraphic units–Sunnybrook and Halton–has been the subject of several investigations for over a century, includ-ing Hind (1856, 1859), Coleman (1895, 1926), Dreimanis and Terasmae(1958), Terasmae (1960), Karrow (1967), Eyles et al. (1983), Berger(1984), and Sharpe (1987), to mention a few. The question of whetherthe ‘tills’ were deposited directly by glacial ice or by rainout in a
glaciolacustrine environment was the center of attention in the 1980s(Sharpe and Barnett, 1985; Eyles and Eyles, 1987) until Hicock andDreimanis (1989) showed that deposition of till was largely lodgementin character. The addition ofmacrofabric analysis to themix of literatureon the subject is rather scanty and limited to Ostry (1962), Marsh(1974), Hicock and Dreimanis (1989), and Mahaney (1990a). The fur-ther question of whether or not clast fabric analysis could be invokedto shed light on the dynamics of the Sunnybrook and Halton ice hasnot been asked, possibly because of criticism of fabric analysis in thepursuit of glacial dynamic history reconstruction. In other areas ofNorth America, however, Drake (1974) and Rappol (1985, 1989) dem-onstrated how till fabrics could be used to reconstruct ice sheet dynam-ics. In the northern Andes, till fabric has been used to reconstructchanges in flow direction during the early stade of the last glaciation(Early Mérida glaciation stratotype; Mahaney et al., 2001), specificallyto establish the growth and demise of an ice cap on the Sierra deSanta Domingo (Mahaney et al., 2010a) and the pre-Mérida glaciation(Mahaney et al., 2010b). In Europe, till fabric analysis appears to havebegun with Miller (1884) and has evolved with numerous studies by
Geomorphology 206 (2014) 421–439
⁎ Corresponding author.E-mail addresses: [email protected] (W.C. Mahaney), [email protected]
(R.G.V. Hancock), [email protected] (P.J.M. Costa), [email protected](M.W. Milner).
0169-555X/$ – see front matter © 2013 Elsevier B.V. All rights reserved.http://dx.doi.org/10.1016/j.geomorph.2013.10.014
Contents lists available at ScienceDirect
Geomorphology
j ourna l homepage: www.e lsev ie r .com/ locate /geomorph

Author's personal copy
422 W.C. Mahaney et al. / Geomorphology 206 (2014) 421–439

Author's personal copy
Andrews (1971); Andrews and Shimizu (1966); Andrews and Smith(1970), Andrews and King (1968), Hicock et al. (1996), Bennett et al.(1999), and Larsen and Piotrowski (2003), to name a few.
Previous stratigraphic work in several local drainages and at Scar-borough Bluffs (Hicock and Dreimanis, 1989; Mahaney, 1990a) indi-cates that clast azimuths tend to show a pattern, section to section,that reflect thin versus thick ice, with lower beds of each till body con-taining clasts assuming a SE–NW orientation and with intermediatebeds assuming azimuths depicting changing ice loci toward the NE,NNE and N. These studies raise the question of whether or not clast fab-rics in two local catchments adjacent to the Scarborough Bluffs mightregister similar variations reflecting changes in ice loci during stagesof the growth and demise of the Halton and Sunnybrook glaciers(Fig. 1A). If the Ontario lobe of the Laurentide ice acted as a separate en-tity during recession at the end of the last glaciation (Barnett, 1992;Barnett et al., 1998), flow vectors around the western icemargin appar-ently would have been radial, with a clast fabric signature of NW–SE ex-pected in till sections along the present northwestern shore of LakeOntario. Presumably, this exit strategy would have been repeatedmany times in the past; and if the ice exited the basin as a shrinkinglobe of the main ice sheet, it might have entered the same way andwith the same clast fabric imprint. Fabrics oriented to the NE, NNE,and N associated with intermediate stages of both glacial events like-wise bear a similarity to the current understanding of the buildup anddemise of Labrador and Keewatin ice (Mahaney, 1990a; Maclachlanand Eyles, 2013). As the ice sheet thickened through accumulationand merging, clast fabric vectors could become less responsive to topo-graphic control and more directly represent the up-glacial region(s) ofaccumulation.
If these clast fabric observations during startup anddemise of the LGMindicate radial flow out of the Ontario basin, they are expected to bear acertain similarity to striations interpreted as radial streamlines of flowregistered by striae in the marginal areas of glacial lobes as interpretedby Chamberlin (1888). Clast fabric analysis of the Sunnybrook Till (EarlyWisconsinan), carried out by Marsh (1974), showed a similar radial pat-tern during this glacial stade. This observation suggests that clast orienta-tion might shed light on the growth and demise of Wisconsinan ice insouth-central Ontario. Hence, the theory that clast fabric might be a toolto reconstruct glacial dynamics is tested here using early and late bedsof the Sunnybrook Till and full sections of the Halton Till at several sitesalong Little Rouge Creek andRougeRiver in the newest proposedNationalPark of Canada.
Till fabric represents the least friction fit of inhomogeneous clastsmeasured at a single station, with mean orientation a response toshear stress. A well-developed till fabric is thought to reflect shearingaction at the base of a glacierwhen till is deposited. Elongate pebbles be-come aligned parallel with either the strike or dip of inconspicuousshear planes cutting through the till. The fabric thus created is consid-ered penecontemporaneous with deposition of the till, with clast orien-tation indicating the direction of flow. Subsequent reworking of tillfollowing deposition or a shift in ice-movement direction could alteror destroy the original fabric, thus resetting the fabric. In an ice sheet,tension increases proportionally to the sine of the angle of the glacialbed (Flint, 1971). In mountain and in continental ice, density and accel-eration fromgravity remain the same; only thickness and the sine of thebed angle are different. In continental ice, increasing ice column thick-ness is offset by a reduced sine of the bed angle, which reduces tensionandmayexplainwhy continental ice tends to producemoremultimodalfabrics comparedwithmountain ice, a situation that crops up in the datadiscussed below. While tension is generally reduced, continental icemay also undergo increased localized compression caused by thrusting,stick–slip processes, and differential movement of fast vs. slow ice.Transverse fabrics possibly are generated by these increased forces.
The most common till fabric is parallel to ice movement, with a ma-jority of pebbles plunging at a slight angle in the up-ice direction. Fewerpebbles plunge slightly down-ice. Still fewer pebbles may lie approxi-mately transverse to ice flow which in water-saturated conditions, isthought to produce Jeffrey-type clast rotations that appear nearlygirdle-like on stereo plots (Lian et al., 2003). The transverse till fabricis rarer but still appears often enough to warrant discussion. Of thetransverse type, occasional pebble axes lie perpendicular to presumedflowwithin a vertical string of stations and are divided about equally be-tween near-horizontal and very slight declivities. Mixed or ambiguoustill fabrics also occur but are of limited use for establishing ice move-ment direction.
Prior research suggests that clast orientation may prove useful inreconstructing the growth and demise of Wisconsinan ice in south-central Ontario and, more particularly, may enhance current under-standing of the separating/thinning of Ontario basin ice and the thicken-ing of Labrador and Keewatin ice. If consistent with other analyses suchas geochemical and SEM microtextural methods, it is possible that theradial and variable NE/N patterns could indicate changing thicknessand provenance of regional ice and can be used as a tool for further in-vestigations of regional ice dynamics. Therefore, the question of wheth-er the observed SE–NW fabrics correspond to thin ice flowing radiallyfrom the Ontario basin during early and late stades of each glaciationwhile variable NE-N vectors represent the thickening of ice in Labradorand the eventual merging of Labrador and Keewatin ice is tested hereusing a combination of fabric-geochemical controls on source areas(Fig. 1B) and SEMmicrotextures of the sand fraction. Six sites along Lit-tle Rouge Creek and Rouge River containing early and late beds of theSunnybrook Till and full sections of theHalton Till were examined,mak-ing it possible to compare fabrics associated with the two advances.
2. Regional geology
Inmost sections (R45, R48, R49, R61, R15B, Fig. 2)weathering, eitherof till or lag gravel (i.e., R61; Mahaney and Sanmugadas, 1986) and/orfluviatile deposits (Mahaney and Hancock, 1993) in the upper beds, isconsidered to have started at the end of the Halton Glaciation whenthe climatewasbriefly cold/dry, later reverting towarmer temperaturesduring the Holocene. Thus, these pedons are relict paleosols, the prod-uct mostly of cold and warm climates. The soil/buried soil profile inR47 is younger than Pleistocene and hence is a ground soil complex(Mahaney and Hancock, 1993). Within the Late Pleistocene stratigra-phy, deposits are ordered from oldest to youngest: Scarborough Forma-tion, Sunnybrook Till, Thorncliffe Formation, glaciofluvial sand/brecciainterbeddedwithin Halton Till and Halton Till. The Scarborough Forma-tion of deltaic sediment is considered alongwith Sunnybrook Till to rep-resent the Early Wisconsinan glaciation (~90 ka–~60 ka) equivalent tomarine isotope stage 4. The onset of glaciolacustrine events representedby the Thorncliffe Formation of Middle Wisconsinan age (marine iso-tope stage 3), while poorly dated (Barnett, 1992), is known to haveended ca. 25 ka with the onset of colder climate and ingress of Haltonice representing marine isotope stage 2.
Quaternary stratigraphic investigations in southern Ontario tra-ditionally have used the mineralogy and physical/chemical charac-teristics of sediment (Karrow, 1967; Mahaney and Hancock, 1993)and fabrics (Hicock and Dreimanis, 1989; Mahaney, 1990a); to de-termine lithostratigraphic differences and provenance of differentdiamictons in the glacial succession. Although a legion of researchershave studied the succession of diamictons at Scarborough Bluffs(Coleman, 1895; Karrow, 1967; Eyles et al., 1983; Mahaney, 1990a)and others have concentrated on areas around Oshawa at Port Hope(Martini et al., 1984) and in the Rouge River basin (Westgate et al.,
Fig. 1. (A) Location of the Lake Ontario Basin and adjoining ice source areas with generalized azimuthal directions of ice streams frommajor source areas. Map constructed by GIS;(B) Geologic map showing relative distributions of carbonate (Ca track) and PC (PC track) rock in source areas and idealized glacial flow patterns (base map after Douglas, 1970).
423W.C. Mahaney et al. / Geomorphology 206 (2014) 421–439

Author's personal copy
1987; Mahaney, 1990a), none have concentrated on combinations offabric-particle size-geochemical-SEM image analysis of the diamictons.
3. Materials and methods
Clast fabrics were taken per station at each site as shown on the fol-lowing figures, with each station comprising a vertical slice of till some15–20 cm thick. Some sections required stepwise excavation throughfan debris from crest to stream level to open up a complete vertical ex-posure. Sectionswere cleaned to variable depths and cut back ~0.5m toobtain undisturbed sediment samples. Fabrics were collected immedi-ately to insure that clast ‘artifacts’ did not develop from dewatering ondrying out after exposure to the atmosphere (Dowdeswell and Sharp,1986). Deposits and overlying paleosol profiles were checked for colorvariations using the soil color charts of Oyama and Takehara (1970).Soils (paleosols) in the surface of sections were described according tothe NRCS (2004) but are not fully analyzed here. Clast weathered/fresh states were described as indicated at each till sampling station. Agenetic code for diamicts was assigned to deposits in some sections fol-lowing the system of Krüger and Kjær (1999). Approximately 250 gsamples were collected to obtain particle size and chemical andmineralanalyses. For the most part these beds, upon observation, showed littlesign of deformation (van derMeer et al., 2003;Menzies et al., 2006), butmicromorphological samples were not collected.
The long axis orientation of elongated pebbles embedded within tillwere measured (typically 50 clasts per station; Benn, 1995), althoughother workers use 25 clasts (Lawson, 1979) or 30 (Hart and Smith,1997). The azimuths and inclinations for each collected pebble weretaken with a Brunton compass. Only clasts with the a-axis 2.5× the b-axis were used in the analysis. Limestone was encountered approxi-mately 80% of the time (with ±10% variations in some sections), sili-cates the remainder and the carbonate fraction increasing slightly atthe beginning and end of each glaciation.
Once in the laboratory, sampleswere separated into pebbles for lith-ic analysis and b2mm fraction for particle size, mineral, and chemicalanalyses. Samples were oven treated to obtainmoisture content follow-ed by determination of the air dry weight of the oven dry sample re-quired for particle size analysis (Day, 1965; Mahaney, 1990b). Particlesize analysis was completed by hydrometer for the b63 μm fraction;the 63–2000μm fractions were determined by dry sieving.
The collected fabric data was processed using the Stereo 32 orienta-tion programdeveloped byK. Roller at Institut fürGeologie,Mineralogieund Geophysik, Ruhr-Universitat Bochum, Germany. Stereo 32 offersdifferent representations of orientation data (data table, equal-angle and -area projections, density plots, rose diagrams) and op-tions to sort and manipulate (rotate) orientation data. The unregis-tered version may be used freely by students or members ofeducational institutions.
For each fabric, clast axis measurements were plotted as points on astereonet. The data points were then contoured to show the pattern ofdata density. Density plots on polar stereo plots map fabric measure-ments as primary and secondary vectors, with contour spread indicat-ing degrees of tightly constrained or unconstrained orientations. Thecloseness of contours to the pole on the stereo net indicates the degreeof clast inclination. The data were also plotted on traditional rose dia-grams to depict primary and secondary orientations.
Microscope analysis was carried out using the binocular microscopeand the scanning electron microscope (SEM) following proceduresoutlined by Vortisch et al. (1987) and Mahaney (2002). Across the sixsections, subsamples from each particle size station were selected forimage analysis of the fine (63–250 μm), medium (250–500 μm), andcoarse (500–2000μm) sand fractions.
Geochemical analysis of the sampleswas performedby instrumentalneutron activation analysis (INAA) carried out in the SLOWPOKE Reac-tor at the University of Toronto (Hancock, 1984). Appropriate standardswere employed to calibrate the equipment (Harrison and Hancock,2005).
Fig. 2. GIS topographic map of the study area along the northwestern shore of Lake Ontario.
424 W.C. Mahaney et al. / Geomorphology 206 (2014) 421–439

Author's personal copy
4. Results
4.1. R45 and R61, Little Rouge Creek
Collected at separate locations along Little Rouge Creek, the R45 andR61 sections represent the upper (R45) and lower (R61) beds in theHalton Till. The R61 beds collected lie immediately above the ThorncliffeFormation and, hence, represent the onset of the Halton Glaciation. TheR45 beds lie just below the tableland surface of the Halton and, given
the thickness of 15m (usual Halton Till thickness is ~25m), probablyrepresent part of the middle and upper members of the Halton. Thus,in these two sections and in the other four, the Halton is subdividedinto lower, middle, and upper members of the Halton Till. In this in-stance clast fabric collected from select beds in the lower Halton Till(R61; Fig. 3) can be considered alongside fabrics from the middle tolater member of theHalton (R45; Fig. 4) to test the theory that clast fab-ric can be used to interpret changes in ice sheet thickness in southernOntario prior to and during the LGM.
Fig. 3. The R61 section with various members and fabric from lower beds of the Halton Till in the upper 4m.
425W.C. Mahaney et al. / Geomorphology 206 (2014) 421–439

Author's personal copy
The base of theHalton drift in R61 is a boulder/cobble bed comprisedof 75% limestone and 25%mixed granite and gneiss in a clast-supportedsediment ±20 cm thick (4.5m depth). The boulder bed fabric (Fig. 3),based on a population of 35 clasts, depicts primary azimuths of WSW,NW, and a smaller secondary orientation NNW and suggests possibledewatering effects, and/or shifting dynamics (Jeffrey-type rotation) atthe ingress of Halton ice. Immediately above the boulder/cobble bedat 4.1m depth, clast fabric becomes tightly constrainedwith a unimodalazimuth of 035°, confirmed by closely packed contours and little azi-muthal deviation among the 50 clasts measured. Assuming no erosionor loss of till, the clast fabric swings from NW–SE to NE–SW indicatesa rapid thickening of ice emanating from southern Quebec. Twenty-five centimeters above, at 3.85 m depth, fabric becomes quadrimodalbut with one very strong heading of 045°, suggesting a slight southwardswing of primary ice activity. The near 360o contour spread, a full girdle,indicates a secondary clast orientation is approaching randomness. Thisdistribution may be attributable to Jeffrey-type rotations or possibly toglacial tectonics/dewatering effects.
Farther above in R61, at ~2mdepth, clast fabric is again quadrimodalbut with one strong azimuth of near north, a considerable departurefrom the mean fabric at 3.85 m depth (Fig. 3). The density diagrams
again show widely spaced contours but with ~70% of the populationof clasts measured showing a north orientation. The minor transversefabricswith headings ofW–E andNW–SE, although of little use in deter-mining ice flowdirection,may result from compression in selected bedswithin the ~25 cm slice of till from which measurements were taken.Immediately below the lag gravel (~1.4 m depth), a pentagonal clastfabric dominates but with one preferred azimuthal orientation of NNE,implying a shift to the south of the locus of thickest ice. The minorazimuths recorded here may be related to glacial tectonics, dewatering,or possibly to overburden pressure during emplacement of the lag grav-el during the early stage of valley construction at the end of the Pleisto-cene/beginning of the Holocene, the event following the slow recessionof Glacial Lake Iroquois.
Two additional sampling stations in R61 (Fig. 3) were used to collectclast fabric data, from the Sunnybrook Till (6.1 m depth) and from adropstone bed in a glaciolacustrine deposit sandwiched betweenmem-bers of the Sunnybrook Till (8m depth). Despite the multimodal fabricand two preferred orientations in the glaciolacustrine bed, clast fabricextends 360o producing a girdle, with contours on the density diagramindicating randomness and near horizontal clast inclinations. In theupper bed of the Sunnybrook Till, the rose diagram depicts a unimodal
Fig. 4. R45 section showing fabric stations and fabric density and rose diagrams below intertill subglacial beds of sand and gravel. Above the stratified beds, till extends towithin 2m of theland surface.
426 W.C. Mahaney et al. / Geomorphology 206 (2014) 421–439

Author's personal copy
fabric which is shown to include awide spread of clast orientationswithslight inclination in the density diagram.
The lower portion of the R45 section (Fig. 4) continues the up-section progression seen in R61. Three fabrics were taken in the lodge-ment till beneath a 2-m thick bed of subglacial gravel and sand seen inthe section. The bottommost fabric at 10.5m depth shows a dominantazimuth of 035° with a tight range of lesser orientations, ranging from355° to 065°, while the fabric above (9 m depth) is mainly bimodalwith several deviant minor orientations. These minor departures ofanomalous clast orientations widen the spread of contours. Below thesubglacial gravel beds, fabric remains to the north and east, with a mul-timodal orientation showing dominant azimuths every 05°, rangingfrom 05° to 045°. Some of theseminor clast fabric orientationsmay pos-sibly relate to perturbations resulting from loading of overlying brecciabeds. Prior to deposition of the subglacial gravel/sand beds above, fab-rics in the 3-m-thick bed below show preferred orientations of a major-ity of the clasts measured to oscillate between 30o and 40o betweennear north to NE, withmultimodal fabrics dominating closer to the sub-glacial gravel/sand beds.
Because clasts within the subglacial gravel beds were slightly imbri-cated and rounded, no fabric was measured, as the degree of roundingfell short of the 2.5:1 ratio of the a:b axis requirement (Lawson, 1979)that is unsuitable for reliable fabric measurement. Sands show a degreeof rounding similar to the gravel beds.
Above the subglacial gravel and sand beds, three additional fabricswere spaced at intervals of ~2m. The first (4.5mdepth) shows azimuth-al headings ranging from N-NNE with tight contour control. Above, at3 m depth, the fabric becomes multimodal with the density diagramshowing widely spaced contours that indicate trimodal conditionsfrom NW to near N. The fabric in station six above at 1.5-m depth de-picts a clast fabric shift to a unimodal patternwith very steep inclina-tions indicated by contours reaching the pole in the density diagram.The fabric progression upward from the subglacial beds depicts bi-and trimodal fabrics becoming unimodal in the upper station of thesection, suggesting a rapid shift of ice direction near the end of theLGM.
Tills overlying the glaciofluvial beds of R45 carry fabrics indicatingNNE–SSW and N–S orientations indicating the shifting of clast fabricequated to shifts in glacial loci, schematically drawn by Flint (1971, p.92, diagram ‘b’). The unimodal NW–SE fabric at 1.5-m depth depictedin Fig. 4 is typical of late stage glacial fabrics observed in several sections.
4.2. R47 section, Little Rouge Creek
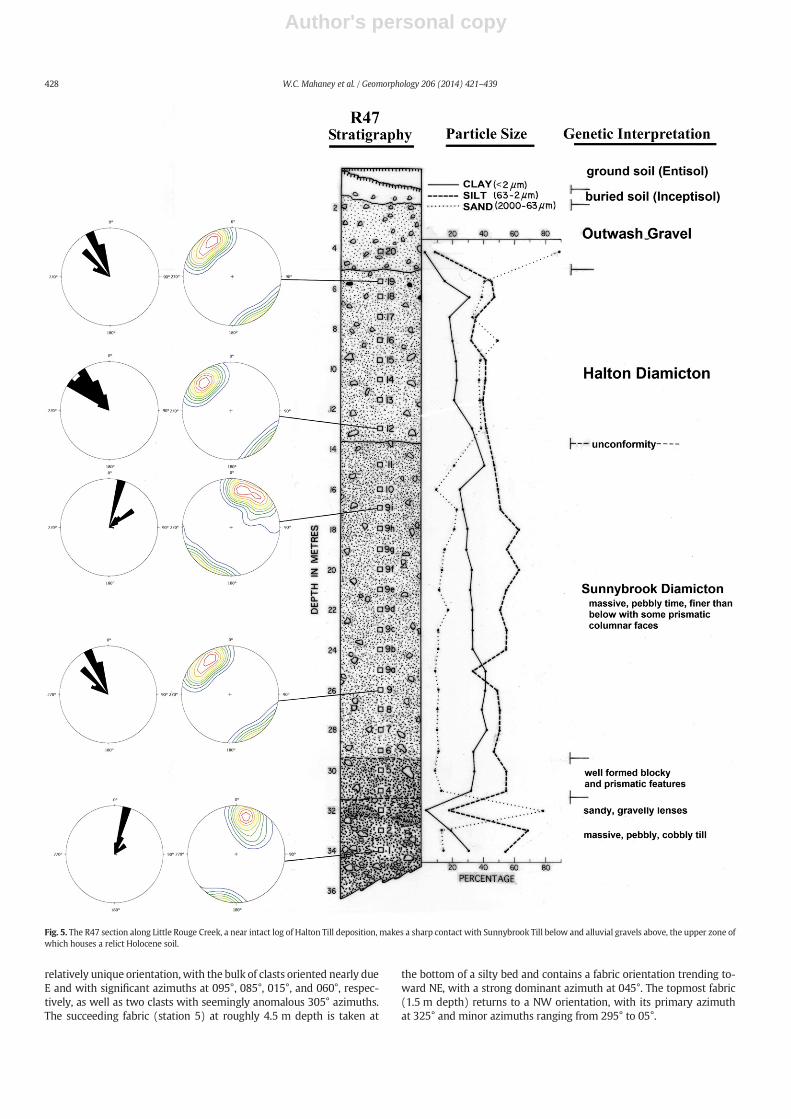
The R47 section (Fig. 5) depicts clear variations in the orientation andepisodic variations of ice flow, within the Halton and the Sunnybrookglacial diamictons. The section is principally silty with pronouncedcoarse particle size spikes at the very top and bottom of the section. Atbase (33mdepth), the Sunnybrook Till displays a clast-supportedmatrixof pebbles and cobbles. This is overlain by deformed beds of partly strat-ified gravelly sandmaking a sharp contact with lodgement till, the latteryielding well-formed columnar and prismatic features on the surfacetypical of the Sunnybrook (Karrow, 1967). These features disappear asthe dried surface is removed to reveal a darker and moist till matrixwith a lower frequency of prismatic/columnar forms. The bottom bed ofthe Sunnybrook depicts fabric showing a unimodal NNE orientation at015°, with some contours indicating clastswith high inclinations. The de-formed beds of sand and gravel above this station are similar in kind tothe subglacial gravel and sand seen in R45 (Fig. 4), although with lessstratification. Presumably this 22-m-thick section of Sunnybrook Tilldoes not reach to the startup of glaciation.
A clast fabric sample in R47 taken at station 9 at a 26mdepth depictsa tightly constrained bimodal fabric oriented NW–SE, and the densityshowing a wide dispersal of clast orientations with less inclinationthan in the underlying sample (Fig. 5). The upper portion of theSunnybrook (station 9i at 17 m depth) displays widely dispersed
azimuths of NE to NNE exhibiting a weakly constrained bimodal fabricwith a dominant azimuth at 020° and increased clast inclination thatconvincingly indicates a change in glacial dynamics. The NW–SE fabricat station 9 (26m depth) may relate to a thinning of the Sunnybrookice as indicated in the R61 section where Sunnybrook Till is separatedinto lower and upper members. If so, then the NW–SE clast orientationmay relate to the upper or lower beds of the Sunnybrook (cf., depths 9.5vs. 7.5m in R61; Fig. 3).
Above the unconformity separating the two tills (Fig. 5; 13.5 mdepth), two fabrics were taken from the Halton Till at stations 12 and19, both with orientations to the NW. The lower station, at ~13 mdepth, shows a multimodal spread in clast direction with prominentazimuths ranging from 305° to 335°. The roughly trimodal fabric atthe top of the section indicates similar ice flow, with significantazimuths at 335°, 315°, and 345°, respectively. As shown in the densitydiagrams, both fabrics yield clasts with low inclinations. From the bot-tom of the Halton, particle size distributions become somewhat coarserupward in the section.
4.3. R48 Section, Little Rouge Creek
Collected along Little Rouge Creek, the R48 section (Fig. 6) was sam-pled to analyze glacial dynamics in the Rouge basin during the terminalstage of the EarlyWisconsinan Sunnybrook glaciation and the LGM. Theone fabric from the upper Sunnybrook bed at station 31 (29.2m depth)yields a NW fabric oriented at 325o with considerable clast orientationspread indicated by the density diagram. Particle size ranges from fineto considerably coarse within both the Sunnybrook and the Thorncliffe;whereas sand, silt, and clay fractions remain relatively constant in theHalton above.
Above the Thorncliffe Formation up-section, stations in the HaltonTill yieldmore dominant NW fabricswith greater proportions of steeplyinclined clasts compared with the Sunnybrook below. Station 24(24.1 m depth) displays a WNW unimodal fabric with wide dispersalof clast orientations from near W to NW, some with steep inclinations.At station 23 (23 m depth) the fabric is multimodal, the majority ofclasts oriented NW and W, with a slight subordinate orientation ofNNE, the latter fabric almost certainly a typical Jeffrey-type rotation. Sta-tion 14 (12.5m depth) yields a unimodal fabric centered at about 320o,again with secondary headings near NW and aminor orientation NE. Atstation 07 (6.2 m depth) a strong multimodal fabric oriented at 310–330o also exhibits two minor departures oriented near W and NE.All fabrics yield some clasts with steep inclinations but none meetthe inclination record at station 02 near the top of the section andclose to the end of the LGM. The orientation here, however, isunimodal with clasts oriented NNE, with a subordinate departureoriented ENE. The fractures (shown in Fig. 6) proved ephemeral asa year after the section was described they disappeared. They weremost likely dewatering features.
4.4. R49 section, Rouge River
Comprised of a thick segment of the Halton Till (17m), the R49 sec-tion (Fig. 7) from the Rouge River is similar to R47 in Little Rouge Creek,its clast fabric following a similar pattern possibly attributed to similarglacial dynamics. The fabric taken at the bottom of the section (17 mdepth) is unimodal with clast orientation tightly constrained around adominant 330° vector. Five samples taken just above this 17m stationshow dissimilar patterns, but generally trending toward NE. The firstfabric, taken at 16m depth (station 14), is tightly constrained and cen-tered around 040°. The density diagram indicates some steeply inclinedclasts. Clast fabric becomes multimodal at station 10 (10 m depth)shifting farther E. Comparatively, the fabric at station 7 (7.5 m depth)is more tightly constrained but still oriented NE, and the fabric centersaround 055° with a range of strong azimuths from 045° to 085°.Above 6 m depth (station 6), the multimodal fabric taken shows a
427W.C. Mahaney et al. / Geomorphology 206 (2014) 421–439
Author's personal copy
relatively unique orientation,with the bulk of clasts oriented nearly dueE and with significant azimuths at 095°, 085°, 015°, and 060°, respec-tively, as well as two clasts with seemingly anomalous 305° azimuths.The succeeding fabric (station 5) at roughly 4.5 m depth is taken at
the bottom of a silty bed and contains a fabric orientation trending to-ward NE, with a strong dominant azimuth at 045°. The topmost fabric(1.5 m depth) returns to a NW orientation, with its primary azimuthat 325° and minor azimuths ranging from 295° to 05°.
Fig. 5. The R47 section along Little Rouge Creek, a near intact log of Halton Till deposition, makes a sharp contact with Sunnybrook Till below and alluvial gravels above, the upper zone ofwhich houses a relict Holocene soil.
428 W.C. Mahaney et al. / Geomorphology 206 (2014) 421–439

Author's personal copy
4.5. R15B Section, Rouge River
Section R15B (Fig. 8) includes the bottom of the Halton, comprisedhere of a boulder bed lodged into a deformed sand member of the
Thorncliffe Formation, a stratigraphic situation similar to what is de-scribed at the base of the Halton Till at R61 (Fig. 3). The fabric retrievedfrom the boulder bed was recovered from a matrix material thatshowedminor folds, one of the few fully deformed beds of all examined.
Fig. 6. The R48 section located between R47 and R61 in Little Rouge Creekmaintains what appears to be a complete Halton Till log but with a variable NW–SE fabric suggestive of the latestage of the Halton, presumably with earlier beds eroded.
429W.C. Mahaney et al. / Geomorphology 206 (2014) 421–439

Author's personal copy
Fig. 7. The R49 section along the Rouge River is an unconformable sedimentary log housing Scarborough Formation overlainwith theHalton Till yielding a near complete logwith a typicalBrunisol (Inceptisol) weathered into the upper beds. The Thorncliffe Formation and Sunnybrook Till are is missing in this sequence.
430 W.C. Mahaney et al. / Geomorphology 206 (2014) 421–439

Author's personal copy
The fabric is remarkably unimodal, oriented to about 030º, with someclasts showing very high inclinations. Above this, station 3 (3.5 mdepth) shows a quadrimodal fabric ranging from 350o to 040o withminor departures oriented NW and E, the latter presumably transverseto the ice stream direction. As indicated by the density diagram, themain fabric is oriented near N. At 3.3 m depth, the till makes a sharptransition with noticeable changes in grain size and color, the upperbeds exhibiting the usual light 10YR colors in contrast with the normal5Y hues lower down, representing a transition between beds with dif-ferent redox histories in the Halton. Above, in (station 2, 2.2m depth),the primary fabric swings to 325o with subordinate orientations of355o, 015o, and 030o. The prime orientation of 325o is taken to indicateice flow to the NW. At 1m depth (station 4), the fabric is similar (mul-timodal) with the density distribution a near carbon copy to that of theunderlying station 2 and indicating very high clast inclinations.
The bottommost fabric, in the boulder pavement, shows ice flow di-rected fromNNE. The sample above shows a change in glacial dynamicswhere the fabric becomesmultimodal, with azimuths ranging through-out the northern hemisphere, predominantly directed N/NNW, signify-ing the beginning of the Halton event. The two fabrics taken in theHalton at the top of the section have very similar orientations, moststrongly to the NNW. This range of secondary azimuths, from N to NE,coupledwith the primary azimuth in the NNW suggests Jeffrey-type ro-tations, compression effects, or glacial tectonics.
4.6. Particle size
Particle size trends follow Link (1966) and are shown in Figs. 3–8. Asreported previously by Karrow (1967), the Halton Till contains highersand content (~30%) compared with the Sunnybrook Till (~20%). Clay
Fig. 8. The R15B section lies within the ~15m terrace (Rouge formation; Mahaney and Sanmugadas, 1986), the R15 soil weathered into lag gravel and sand deposited during the initialfluvial equilibrium stage of stream erosion following glacial retreat. Overlying the Scarborough Formation, as in R49, glaciolacustrine beds merge with a boulder/cobble bed at the baseof the Sunnybrook Till, a sedimentary complex similar to what is recorded in R61 for the onset of the Halton advance.
431W.C. Mahaney et al. / Geomorphology 206 (2014) 421–439

Author's personal copy
content differs between the two tills, offset by ~10% on average, althoughboth units show anomalies at various depths. Thin sand beds in R47 andR48 in the Sunnybrook and Halton deposits are offset somewhat by thethicker and variegated upper to lower flow regime breccia and sandsubglacial beds in R45 (Fig. 9). Comparatively, these sandy/breccia bedsare joined by occasional silty anomalies suggestive of possible meltoutfacies or local variations of source materials. Variations in particle sizedistributions (cf. R49 with anomalously low clay vs. R47 with higherpercentages) are indicative of source area sediment/bedrock differencesaffecting glacial loads or different porosities/surface to groundwatertransfers affecting rates of diagenesis.
Variations in the clay mineral composition of Sunnybrook andHalton tills (Mahaney and Hancock, 1993) indicate slightly elevated ka-olinite, metahalloysite, illite, illite–smectite, vermiculite, and chlorite inthe older Sunnybrook Till compared with the younger Halton. This dis-tribution, although tentative, is suggestive of the redistribution of bed-rock/weathered regolith source materials from previously weatheredSangamonian-age surfaces and/or diagenesis. Higher amounts of il-lite–smectite and illite in the Sunnybrook strongly indicate contactwith underlying shales (see Table 6 in Mahaney and Hancock (1993)for chemical composition), just as increased metahalloysite and kaolin-ite in the oldest deposit may relate to Sangamonian paleosol sedimentreworked by Early Wisconsinan ice.
4.7. SEM imagery
The SEM imagerywas inventoried through all six sectionswith a viewto testing the degree of glacial crushing correlated with fabrics rangingfrom NW–SE (basin ice) through NE–SW thicker ice to N–S (thickestice). In addition, glacial and glaciolacustrine/deltaic microtextures werecompared to determine if fractures/abrasion microfeatures could beused to distinguish the different sedimentary environments.
Because sands, like pebbles, are inhomogeneous inclusions in tillsubjected to shear stresses and stick–slip processes occurring withinthe ice sheet as well as contact with other mineral grains with variousmoduli of elasticity properties, there is the factor of random chance in-volved in how much damage a grain may receive (Mahaney, 2002). Asindicated in this analysis, some grains appear to sojourn in the ice with-out receivingmuchor any damage aside fromdistinct fracture faces thatprobably result frombedrock release at somepoint between the locus ofice accumulation and position in a deposit. Such occurrences are welldocumented elsewhere (Mahaney, 1995, 2002). Perhaps 10% of allgrains analyzed fall in this category. Another 15–25%of all grains receiveless damage to perhaps 30–50% of grain surfaces. This leaves ~60% of allgrains in the till sheets displaying severe crushing to more than ~50% ofgrain surfaces.
Deltaic sediments, in three out of six sections (R15B (Fig. 10), R49and R61), show the highest degree of weathered or preweatheredgrains, a high ratio of subround/subangular plagioclase, and occasionalmica, the latter not generally seen in the population of glaciolacustrine,glaciofluvial and glacial grains. Approximately 30–40% of grains ana-lyzed exhibit v-shaped percussion cracks, a characteristic microtextureindicating high velocity aqueous flow. Adhering particles within thedeltaic grain population are noticeably reduced compared to grainsfrom other proglacial and glacial environments, most probably due tominimal glacial crushing (Mahaney, 2002).
Younger glacial grains from the Sunnybrook Till show amicrotextureassemblage similar to that of the still youngerHalton Till, with the excep-tion that the limited population of samples available in R61, R47, and R48display minor weathering effects (principally etching and dissolution ef-fects presumably from diagenesis). While fabric changes through thesesections show similar variations of NW–SE ice movement in the begin-ning andwaning stages of the Sunnybrook, there is little change in glacialcrushing microfeatures that could be used to support the fabric analysis.
Fig. 9. Particle size distributions of till and subglacial gravel/sand beds in the R45 section. The lower three till stations (8–11.5m) are clay rich; upper till stations (1.5–4.5m) contain lessclay (~10%) and more silt. The till distributions are nearly linear and similar to particle size distributions of tills in all other sections. The upper subglacial gravel bed has a bulk b2mmparticle size similar to the tills. The lower subglacial gravel and sand beds are typical fluviatile parabolic grain size curves. Slight variations in the tails of the curves represent clay fluctu-ations that are either related to source material variations or to post-depositional weathering.
432 W.C. Mahaney et al. / Geomorphology 206 (2014) 421–439

Author's personal copy
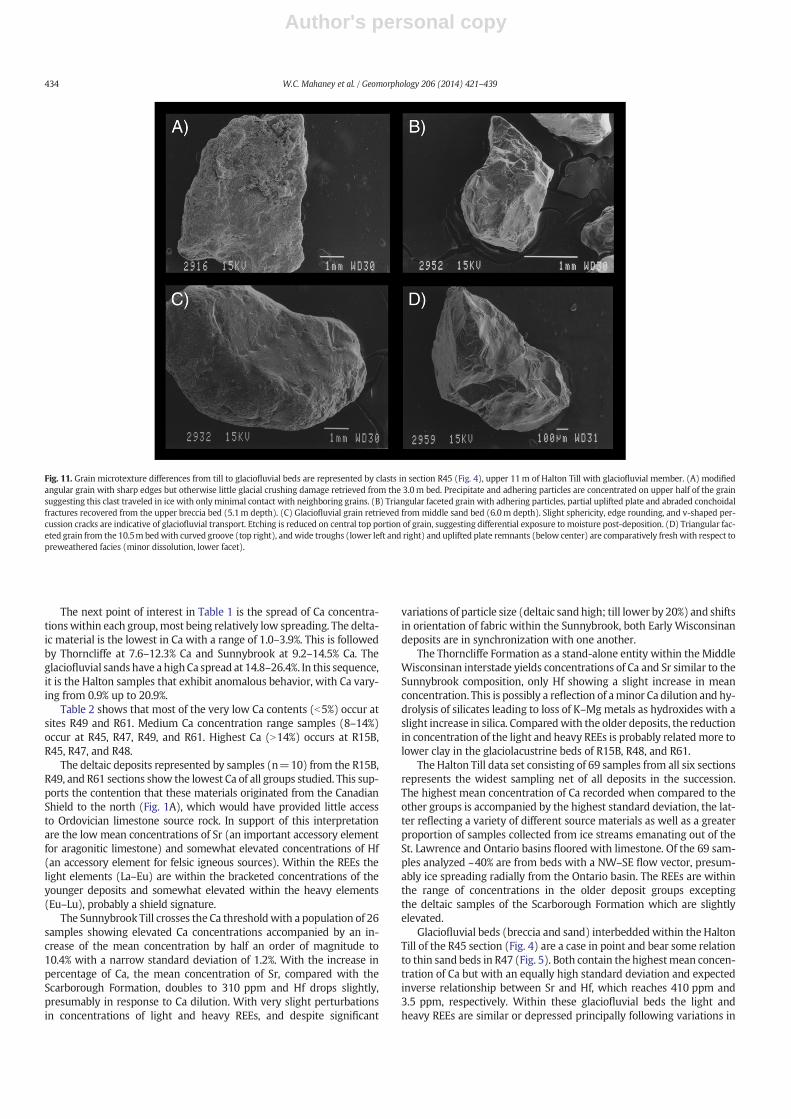
MiddleWisconsinan glaciolacustrine grains on the other hand showa marked difference sandwiched between Early and Late Wisconsinantills. As distilled from the analysis of sands in R48, R61, and R15B, it ispossible to use a heightened frequency of occurrence of edge roundness,sphericity, v-shaped percussion cracks, and reduction in occurrence ofadhering particles to distinguish these clasts from their glacial neigh-bors. These glaciolacustrine grains bear a similarity with glaciofluvialgrains recovered within tills at R47 and R45 (Fig. 11) and with a sandlens in R48 (station 12). Noticeably different is the character of theupper and lower breccias in R45 when compared with the sand bedsthere and in R48 and R47 (Figs. 12 and 13), with the breccias carryinghigher angularity and fewer v-shaped percussion cracks.
A summary of SEM microtextures on grains analyzed within theHalton Till sections reveals a similar pattern to that observed in theSunnybrook population, the only difference being a somewhat freshercollection of sand in the younger deposit, one subjected to less diagen-esis. Boulder/cobble bed pavements at the base of the Halton Till inR15B and R61 reveal 10–15% greater abrasion when compared withgrains retrieved from higher in the sections, but otherwise grain dam-age from glacial crushing is similar in these contact sediments. Risingupward in sections R61, R47, R49, and R15B-above respective contactswith the underlying deltaic, glaciolacustrine, or till beds- glacial quartzgrains analyzed carry the usual assemblage of conchoidal and subparal-lel fractures, thin striae, deep grooves, sharp edges, variable abrasionand increased adhering particles, all hallmarks of glacial crushing(Mahaney, 2002). The majority of grains cluster within the subangularclass. As fabrics in these beds most often show a NW orientation, sug-gesting radial flow and the presence of thin ice, it is plausible that grainsdeposited in these beds were subject to lower shear stress and reduced
tendency for stick–slip processes to severely damage grains. An attemptwas therefore made to determine if such changes in damage might bevisible on the populations studied. Outside of slightly lower abrasion,fewer fractures, absence of upturned plates, general lack of striae andgrooves, and lower percentages of adhering particles in the lowerbeds of the Halton, no other major differences were recorded. Movingupward into these till bodies, the normal trend involved increased fre-quency of crushingmicrofeatures, especially notable increases of adher-ing particles, increased abrasion and fracture counts, along withoccasional upturned plates, all suggesting adjustments to increasedshear stress and possibly stick–slip processes at the ice/bed contact.
4.8. Geochemistry
Samples from the six sections were pooled under the labels Halton,glaciofluvial, Thorncliffe, Sunnybrook, and deltaic sediments; and the el-emental concentration means and standard deviations were calculatedto identify chemical element differences between groups that mightbe used to determine source areas, degrees of mixing, and dilution be-tween the tills and associated glaciofluvial and deltaic deposits.
The summary data (group means and standard deviations) are pre-sented in Table 1. Major andminor elements are listed first, followed bytrace elements (all in alphabetical order) and then by the rare-earth el-ements (ordered by atomic number). Clearly, the primary source of dif-ferences in the numbers arises from CaCO3 dilution effects: as Cacontents increase, the concentrations of most other elements decrease.The only other element that behaves somewhat akin to the Ca is Sr, im-plying that a significant amount of Sr is associated with additionalCaCO3 in the sediments.
Fig. 10. Overview of quartz clasts in the R15B Section represent the degree of damage inflicted from deltaic, through glaciolacustrine environments, to the end (Halton) stage ofWisconsinan glaciation. (A) Grains from the Scarborough Formation sand member, including samples of well-preserved mica (e.g. center top). The majority of grains are subangularand fairly fresh. Highly weathered samples are calcite. (B) Extensively abraded subangular quartz grain (medium grade, center left) from lower Thorncliffe Formation sand member.Edge rounding and v-shaped percussion cracks prominent on upper fracture face indicate water processing. Two smaller, very fine quartz grains show variable dissolution stages (ad-vanced center, fresher right). Grain to right contains deep troughs that could be glacially crushed. (C) Glacial grain retrieved from the base (3.7m depth) of theHalton Till. Curved grooves,abraded faces, and high frequency fractures that grade into linear steps suggest significant levels of grinding during the early stage of deposition. Preweathered edges and dissolution cav-ities (upper left) indicate a complex history. (D) Quartz grain retrieved from the 2.2m bed in Halton Till, completely surfaced with v-shaped percussion cracks, suggests either a previousfluvial history followed by a sojourn in the ice with little glacial crushing or a moulin history.
433W.C. Mahaney et al. / Geomorphology 206 (2014) 421–439
Author's personal copy
The next point of interest in Table 1 is the spread of Ca concentra-tionswithin each group,most being relatively low spreading. The delta-ic material is the lowest in Ca with a range of 1.0–3.9%. This is followedby Thorncliffe at 7.6–12.3% Ca and Sunnybrook at 9.2–14.5% Ca. Theglaciofluvial sands have a highCa spread at 14.8–26.4%. In this sequence,it is the Halton samples that exhibit anomalous behavior, with Ca vary-ing from 0.9% up to 20.9%.
Table 2 shows that most of the very low Ca contents (b5%) occur atsites R49 and R61. Medium Ca concentration range samples (8–14%)occur at R45, R47, R49, and R61. Highest Ca (N14%) occurs at R15B,R45, R47, and R48.
The deltaic deposits represented by samples (n=10) from the R15B,R49, and R61 sections show the lowest Ca of all groups studied. This sup-ports the contention that these materials originated from the CanadianShield to the north (Fig. 1A), which would have provided little accessto Ordovician limestone source rock. In support of this interpretationare the low mean concentrations of Sr (an important accessory elementfor aragonitic limestone) and somewhat elevated concentrations of Hf(an accessory element for felsic igneous sources). Within the REEs thelight elements (La–Eu) are within the bracketed concentrations of theyounger deposits and somewhat elevated within the heavy elements(Eu–Lu), probably a shield signature.
The Sunnybrook Till crosses the Ca thresholdwith a population of 26samples showing elevated Ca concentrations accompanied by an in-crease of the mean concentration by half an order of magnitude to10.4% with a narrow standard deviation of 1.2%. With the increase inpercentage of Ca, the mean concentration of Sr, compared with theScarborough Formation, doubles to 310 ppm and Hf drops slightly,presumably in response to Ca dilution. With very slight perturbationsin concentrations of light and heavy REEs, and despite significant
variations of particle size (deltaic sandhigh; till lower by 20%) and shiftsin orientation of fabric within the Sunnybrook, both Early Wisconsinandeposits are in synchronization with one another.
The Thorncliffe Formation as a stand-alone entity within the MiddleWisconsinan interstade yields concentrations of Ca and Sr similar to theSunnybrook composition, only Hf showing a slight increase in meanconcentration. This is possibly a reflection of aminor Ca dilution and hy-drolysis of silicates leading to loss of K–Mgmetals as hydroxides with aslight increase in silica. Comparedwith the older deposits, the reductionin concentration of the light and heavy REEs is probably relatedmore tolower clay in the glaciolacustrine beds of R15B, R48, and R61.
The Halton Till data set consisting of 69 samples from all six sectionsrepresents the widest sampling net of all deposits in the succession.The highest mean concentration of Ca recorded when compared to theother groups is accompanied by the highest standard deviation, the lat-ter reflecting a variety of different source materials as well as a greaterproportion of samples collected from ice streams emanating out of theSt. Lawrence and Ontario basins floored with limestone. Of the 69 sam-ples analyzed ~40% are from beds with a NW–SE flow vector, presum-ably ice spreading radially from the Ontario basin. The REEs are withinthe range of concentrations in the older deposit groups exceptingthe deltaic samples of the Scarborough Formation which are slightlyelevated.
Glaciofluvial beds (breccia and sand) interbedded within the HaltonTill of the R45 section (Fig. 4) are a case in point and bear some relationto thin sand beds in R47 (Fig. 5). Both contain the highestmean concen-tration of Ca but with an equally high standard deviation and expectedinverse relationship between Sr and Hf, which reaches 410 ppm and3.5 ppm, respectively. Within these glaciofluvial beds the light andheavy REEs are similar or depressed principally following variations in
Fig. 11. Grain microtexture differences from till to glaciofluvial beds are represented by clasts in section R45 (Fig. 4), upper 11m of Halton Till with glaciofluvial member. (A) modifiedangular grain with sharp edges but otherwise little glacial crushing damage retrieved from the 3.0m bed. Precipitate and adhering particles are concentrated on upper half of the grainsuggesting this clast traveled in ice with onlyminimal contact with neighboring grains. (B) Triangular faceted grain with adhering particles, partial uplifted plate and abraded conchoidalfractures recovered from the upper breccia bed (5.1m depth). (C) Glaciofluvial grain retrieved from middle sand bed (6.0m depth). Slight sphericity, edge rounding, and v-shaped per-cussion cracks are indicative of glaciofluvial transport. Etching is reduced on central top portion of grain, suggesting differential exposure to moisture post-deposition. (D) Triangular fac-eted grain from the 10.5m bedwith curved groove (top right), andwide troughs (lower left and right) and uplifted plate remnants (below center) are comparatively freshwith respect topreweathered facies (minor dissolution, lower facet).
434 W.C. Mahaney et al. / Geomorphology 206 (2014) 421–439

Author's personal copy
Fig. 12. Range of damaged clasts within the till member of Section R47. (A) Well-weathered grain with glaciofluvial characteristics and minor glacial crushing (upper left) retrieved fromthe base (34m depth) of the R47 Section. Enlargement (5×) shows comparatively fresh fracture faces (center right) with minor glacial crushing (lower right). Some fracture remnantscontain v-shaped percussion cracks. Grains at top right and lower left background show fresh fractures, abrasion, glacial grooves, and sharp edges. (B) Partially abraded angular grainwith multidirectional striations, indicating orientation of motive force changes within the till body when crushing was produced. Change in particle size with high sand percentage sug-gests upper flow regime glaciofluvial transport. Enlargement (10x) shows highlights including the abundance of adhering particles characteristic of this and other sand members withinthe recovered till. (C) amix of quartz (Q) and potassium feldspar (KF) grainswith representative glacial crushing/abrasion from top (site 9i, 16.5m depth) in Sunnybrook Till. (D) Angulargrain retrieved from top of the Sunnybrook Till. Multiple upturned plates are indicative of substantial forces possibly generated by stick–slip processes. Enlargement (10×) shows detail offracture pattern, abundant adhering particles and preweathered surface (enhanced enlargement) that probably weakened the grain fabric.
Fig. 13.Quartz record in section R48. (A) Subangular grain retrieved from just below lag gravel at 1.0m depth. Abundant adhering particles, crescentic gouges, and partial abrasion are charac-teristic of glacial grinding. Crescent-shapedgougesmaybe archives of previousmechanicalweathering.Minor dissolution features top center are suggestive of diagenesis in upper beds. Enlarge-ment is 10×. (B) Complex subangular grain characteristic of well abraded clasts in various sand lens. Bulbous edges suggest a previous aeolian history, while v-shaped percussion scars at lowerleft and few adhering particles indicate subsequent glaciofluvial processing. (C)Well-fractured grain from till immediately below sand lens (site 13, 11.4m depth). Radial and conchoidal frac-tures grade to crescentic steps. Edges showminorweathering, possibly caused bywater percolating through an overlying bed of a subglacialmeltwater channel. (No v-shaped percussion scars)Enlargement is 10×. (D) Probable glaciolacustrine grain overwrittenwithminor crushing retrieved from theHalton just above contactwith Thorncliffe Formation (24.5mdepth). Striations andlinear steps (top center) indicate glacial grinding, while bulbous edges, sphericity, and v-shaped percussion cracks suggest water transport antedated by aeolian processing. Microfeatures in ‘D’are similar to those in the R48 sand lens (B above). The aqueous history suggested from grain microtextures may explain the multimodal fabric described.
435W.C. Mahaney et al. / Geomorphology 206 (2014) 421–439

Author's personal copy
particle size (till with elevated clay at ~20%; glaciofluvial beds with clayat ~5%).
5. Discussion
As discussed by Flint (1971), quoting Chamberlin (1888), individualstriations, like individual clast fabrics, should ideally be radial near themargin of ice, especially thin ice housed in a structural basin (seeFig. 5.3 (c) in Flint, 1971). A perfect radial pattern is not to be expected,as meltout, postulated to be more frequent in the ablation zone or gla-cial thrusting over dead ice, may interfere with clast orientation.These, allied with variable geothermal release and dewatering effectsin postglacial time, may also affect glacial fabric, producing multimodalorientations, sometimes to near random clast distributions. Becauseflow can be altered by minor topographic irregularities (Demorest,1938), in this case with topographic roughness across the Ontariobasin, it is understandable that some fabric might depart from themain ice flow vectors changing over time, even varying within an~25-cm thick slice of till.
Like striae, clast fabric has been used for over a century and half toregister the least friction fit for clasts carried as load in glaciers. Clastfragments within the ice are relatively well preserved and are likely tosuffer fracture or abrasion because of mutual contact or contact withbedrock. As foreign bodieswithin the ice, clasts formmisfitting inhomo-geneous inclusions that respond to stresses and strains from far up-glacier and become elastic inhomogeneities in an applied stress field(Mahaney, 1995). Depending on the fit of clasts within the ice, thedata reported here show they may contact one another and generatehigh stress leading to fracture, and may assume a least friction positionapproximating direction of ice flow.
Fabric analysis as used here identifies and interprets clast orientationfrom tightly constrained unimodal to widely oscillating multimodalgroupings, both depicted by rose and density diagrams. Reducing athree-dimensional orientation net to two dimensions, produces a
softened database but one capable of reconstructing mean ice flowvectors within a glaciation nonetheless. Sampling within a mean verti-cal distance of b20–25 cm (per station) as reported here is subject toabout the tightest time control possible to obtain information onwhat direction ice flowed during the time the bed in question wasdeposited. Because it is not always possible to determine unconfor-mities within glacial sections, it is possible that the time frame be-tween sampling stations is anything but conformable, as outlinedin this database.
Till fabric observations carried out in conjunction with other strati-graphic analyses in the Rouge Basin indicate that while clast fabric inthe Sunnybrook and Halton tills is preferentially ordered N–S, NNE–SSW, and NE–SW, the beginning and end of both glaciations are differ-ent, with clasts carrying a NW–SE orientation, one that might reflectthin ice flowing radially out of the Lake Ontario basin. Previous workcarried out by Ostry (1962) and Marsh (1974) also suggested similarpatterns, but the study of sections carrying both Sunnybrook andHaltondeposits awaited future investigation.Other later investigations showedeither that fabric alone with SEM microtexture analysis (Mahaney,1990a) or fabric compared with clast striae (Hicock and Dreimanis,1989) could yield important information about glacial vectors in thelocal area.
As a limited test of clast fabric to respond to a low viscous fluidmedium with hydrostatic pressure, fabric was taken from a matrix-supported glaciolacustrine dropstone deposit (R61; Fig. 3). Despite anumber of clasts accounting for a preferred orientation NW–SE, the re-mainder present a random fabric with widely spaced contours across360o of the stereo net and with little inclination, as might be expectedof clasts settling out of a fluid medium.
The Sunnybrook Till, where present (R61, R47, R48), exhibits onlynear full sections at R61 and R47 and upper beds at R48. Where sam-pled, the base or top of the Sunnybrook revealed NW–SE fabrics (R61,R48), consistent with radial flow out of the Ontario basin as predictedby Marsh (1974). The R47 section presents some interesting fabric var-iations from base to contact with the Halton Till. The NNE–SSW fabric atthe base of R47 is consistent with flow from the main Labrador ice andprobably does not represent clast fabric orientation at the base of theice, such beds being unrecoverable. The NW–SE multimodal fabricabove at 26m depth might relate to thinning of the ice with underlyingtopography directing flow vectors or tomeltout, contours in the densitydiagram depicting nearly half a hemisphere of variation. The fabric at17m depth is bimodal, NNE–NE-depicting flow from the full Labradorice. Fabric in the upper Sunnybrook of R48, juxtaposed with the lowerThorncliffe beds, is trimodal with a strong preferential orientationNNW–SSE, which fits a radial flow model for the Late Sunnybrook inR47 and R48 that is close to the findings of Marsh (1974).
Analysis of the Halton succession shows a reasonable fit with a NW–
SE flow during early and late stages of deposition, although complicatedwith multimodal fabrics that could be related to possible meltout pro-cesses producing clast rotation in a flowing till matrix, thrusting,dewatering effects, and/or compression effects. However, taking thedata at face value, R61 (Fig. 3) depicts an overall NW–SE fabric in theboulder bed at the deposit base, followed by fabric showing clast
Table 1Summary data for Rouge River deposits. Calcium concentrations are presented in italics toprovide relative diluting effects unit to unit.
Halton Glaciofluvial Thorncliffe Sunnybrook Deltaic
Till sand Formation Till
69 samples 4 samples 9 samples 26 samples 10 samples
Al % 4.6± 1.6 2.8± 0.6 4.6± 0.5 5.2± 0.4 6.8± 1.4Ca % 13.1± 6.6 21.0± 5.4 9.5± 1.4 10.4± 1.2 1.9± 1.0Fe % 2.4± 1.2 1.7± 0.3 2.1± 0.4 2.6± 0.4 4.1± 1.3Mg % 1.8± 0.6 – 1.9± 0.3 2.3± 0.4 2.2± 0.5K % 1.5± 0.3 0.9± 0.2 1.7± 0.1 2.0± 0.2 1.8± 0.5Na % 1.2± 0.3 0.8± 0.3 1.3± 0.2 1.2± 0.1 1.6± 0.3Ti % 0.26±0.11 0.19± 0.05 0.24±0.04 0.28±0.04 0.41± 0.15Ba ppm 450±100 310± 80 470±40 540±50 470± 150Co ppm 7.9±6.1 5.4± 0.7 6.6± 1.4 9.1± 1.5 15.4± 6.4Cr ppm 50±64 31±20 35±8 48±8 93± 35Cs ppm 1.4±0.9 0.5± 0.3 1.1± 0.4 2.0± 0.5 2.3± 0.9Hf ppm 5.8±2.3 3.5± 2.2 6.8± 1.3 5.1± 0.8 6.2± 1.4Mn ppm 540±190 510± 60 510±70 570±60 770± 250Rb ppm 53±19 32±6 51±6 73±12 84± 22Sc ppm 8.5±5.9 5.2± 0.9 6.7± 1.1 8.5± 1.1 15.7± 5.2Sr ppm 320±130 410± 20 300±20 310±40 140± 120Ta ppm 0.57±0.36 0.31± 0.14 0.52±0.08 0.59±0.07 1.1± 0.4Th ppm 4.5±2.2 2.8± 1.1 3.9± 1.2 6.1± 1.4 7.9± 2.6U ppm 1.3±0.8 0.9± 0.3 1.1± 0.8 1.5± 0.3 2.3± 0.7V ppm 56±39 34±6 43±6 58±10 94± 30La ppm 21±7 15±4 20±4 27±4 28± 9Ce ppm 42±13 32±7 38±7 52±8 55± 14Nd ppm 16±5 18±3 16±5 26±6 18± 6Sm ppm 3.7±1.1 2.8± 0.3 3.8± 0.6 4.8± 0.7 4.7± 1.3Eu ppm 1.1±0.4 0.7± 0.1 1.0± 0.2 1.1± 0.1 1.8± 0.4Tb ppm 0.58±0.24 0.55± 0.05 0.57±0.13 0.73±0.12 0.84± 0.28Yb ppm 2.3±1.0 1.7± 0.7 2.1± 0.2 2.3± 0.2 3.6± 1.0Lu ppm 0.35±0.14 0.24± 0.08 0.31±0.03 0.34±0.05 0.46± 0.12
Table 2Distribution of Ca concentrations in samples from different sites.
Ca Percentage
Site 0–5 5–10 10–15 15–21R15B – – 2 2R45 – – 6 4R47 – – 2 6R48 – – – 24R49 14 1 2 –
R61 2 1 – 3Total 16 2 12 39
436 W.C. Mahaney et al. / Geomorphology 206 (2014) 421–439

Author's personal copy
orientations to the NE, eventually residing N–S, which is similar to fab-rics at Scarborough Bluffs (Mahaney, 1990a). At R45 (Fig. 4), this N-NEfabric orientation continues in the lower part of the section, sometimeswith tightly constrained unimodal fabric and other times with multi-modal orientations or transverse fabrics, which might be mixed bedsnot useful for direction analysis. This trend continues up-section to a2-m-thick bed of subglacial gravel and sand that could bemoulin chan-nel deposits or subglacial stream channel sedimentation of unknownlength but with an E–W orientation. Above the subglacial beds, till re-sumes with clast fabrics oriented approximately north, varying toNW–SE at the very top of the section.
The R47 section contains NW–SE fabrics near the bottom and top ofthe section, totally in agreement with radial flow out of the Ontariobasin. The R48 section, on the other hand, is a peculiar case in pointwhere clast fabric orientations from the base of the Halton at 24m tonear the top at 6 m depth show a multimodal print of approximatelyNW–SE fabric orientations that are difficult to explain. They may betransverse fabrics, or they may represent only the last phase of Haltonice movement.
The R49 section is the perfectmodel for fabric depicting a radial flowat inception and end of the Halton event, both nearly exact replicas ofone another oriented NW–SE with tightly constrained clast azimuths.Fabrics in mid-section are either tightly constrained or multimodalwith densities suggesting either transverse fabrics or possible divergentice stream fluctuations across ±25–30-cm-thick slices of section. Theswitch back to a NW signature at the top of the section coupled with asharp increase in silt and decrease in sand just below is indicative of achange in glacial dynamics that may have incorporated more liquidwater resulting in intense weathering. The single anomalous stationfabric trending E could represent an unexplained ice buildup orcompression at the till bed from ice moving out of the north. Somewhatdifferently, the boulder bed in R15B yields a NNE–SSW fabric, whichmay indicate that incoming Halton ice thickened rapidly out of theOntario basin or that part of the record was truncated prior to theingress of ice from the main Labrador ice sheet. The R15B fabric succes-sion above the Halton pavement is multimodal with the strongestorientation registering NW–SE and probably represents a transversesignature.
The above analysis assumes that till is deposited incrementally frombottom to top but cannot account for deposition followed by erosionevents producing unconformities that would be difficult to observe. Itis only possible to assume that some sediments may be lost due to ice/meltwater activity during the actual glacial event deposition process,leaving only a net thickness of till following deglaciation. A case inpoint among the six sections analyzed is R48 where fabric from abovethe contact with the Thorncliffe Formation suggests a NW–SE orienta-tion with ice moving out of the Ontario basin through the entire LateWisconsinan stade. Because we have no direct means of dating thebase and top of the Halton Till deposit, it is possible (assuming thatthe fabric analyses are correct) that the entire section or most of itwas deposited at or close to the end of the Halton event. Looking tothe SEM analysis for support of this assertion, it is only possible to in-voke reduced crushing effects, particularly lower fracture counts, re-duced striae, and lower frequencies of adhering particles to support amassive deposition of till during the later stages of the Halton Glaciationat R48.
To somedegree, iceflowdirection inferred by clast fabric orientationis also supported by drumlin orientation in southern Ontario and west-ern NY State (Maclachlan and Eyles, 2013). Endmoraine shapes report-ed by Muller and Calkin (1993), especially in the Vinemount and FortErie regions, reveal that the likely ice vector in the terminal areas wasto the SW. Detailed clast fabric is not available; however, these regionsmight likely yield a clast fabric record similar to what is reported here.Recent bedform analysis (Hess and Briner, 2009) west of the FingerLakes in NY State reveals a southwesterly orientation that might corre-late with clast fabric when it becomes available.
A familiar criticism of till fabric analysis is that databases are oftennot consistent (Bennett et al., 1999), sample populations are sometimesfewer than 50 samples, and investigators might wish for more fabricsper section to fully understand flow vector variance bed by bed. Samplesize and sampling frequency within sections are two criticisms thatmake it difficult to correlate between sections in different areas. Howev-er, if unencumbered with high clast frequency at the glacial bed, thestresses and strains inflicted on inhomogeneous inclusions (rock frag-ments) should theoretically produce a least friction fit (azimuth) paral-lel with the ice flow, one that is transmitted to the depositing sediment.With the normal till sampling station of~10–30cmvertical extent, a col-lector cannot be certain of uniform flow vectors or basal temperaturefluctuations that could produce meltout or flowtill variants. However,while rose diagrams have been used for the last several decades todepict variations in glacial flow, the new orientation software (Stereo-32) demonstrated here provides sample distribution plots, rose dia-grams, anddensity plotswith contours, the lattermarking a discrete ori-entation (unimodal fabric) or orientations (bi- or multimodal).
While there are still problems with the interpretation of clast fabricand the use of such to discriminate glacigenic facies, somemight say im-possible (Bennett et al., 1999), data presented here show that tightlyconstrained uni- to trimodal fabrics with moderate inclinations proba-bly reference consistent flow direction with little azimuthal variationfor the time required to deposit the beds analyzed. Amultimodal till fab-ric is a conundrum in that it may well represent changing ice vectorsover short time periods, meltout facies or Jeffrey-type rotations; or itcould relate to multiple thrusting events over the vertical extent of thetill body analyzed. It may also represent dewatering effects, which aredependent upon water content at time of deposition and clay content.Lastly, if compression dominates over tension, clasts may be left nearlynormal to flow. Transverse fabrics reported here, some with very widegirdles, bear certain similarities to Jeffrey-type rotations (Davies,2009), which may suggest clast rotation in a ductile water-saturatedtill matrix (Lian et al., 2003; Neudorf et al., 2013). Perhaps deformingbeds (Menzies et al., 2006) are more common in Laurentide sectionsthan Piotrowski et al. (2001) believed.
The Ca-dilution, which affects the chemical element distributions inthe till, glaciolacustrine, and deltaic facies analyzed here, also providesthe location of targeted source areas for various ice streams enteringand leaving the eastern end of the Lake Ontario basin. Initial and closingstages of the Sunnybrook and Halton glaciations were accompanied bydeposition of till with high Ca concentrations that could only be derivedfrom movement over a long stretch of limestone. This supports an ap-proximate NE–SW icemovement from the St. Lawrence into theOntariobasin culminating in a radialflowof ice at thewestern endof the trough.The high Ca concentration in the glaciofluvial beds of R45 suggests thatthe sediment load came largely from bedrock sources off to the NE dur-ing the waning stage of the Halton Glaciation. Similar Ca-concentrationspikes in sand beds in R47 and R48 carry like signatures. The inverse re-lation between REEs plus Hf against Ca/Sr to distinguish shield vs. lime-stone sources needs additional work for verification. In all, the fabricscorrelate well with what is known of ice streams—fast ice reconstruc-tion of the Laurentide Ice Sheet (Winsborrow et al., 2004).
6. Conclusions
The fabric analysis discussed here supports the existing interpreta-tion of the recession that occurred at the end of the last glaciation,whereupon the Wisconsinan ice sheet separated into separate lobes,the Ontario lobe receding from the Niagara Escarpment with theInterlobate Moraine extending northeastward toward the St. Lawrence.Clast fabric orientations are in complete agreement with the recessionphase reconstructed by other researchers. The path of the ingress ofice during the Last Glacial Maximum (Halton Glaciation) is unknown,but clast fabric analysis from beds at the base of the Halton Till suggests
437W.C. Mahaney et al. / Geomorphology 206 (2014) 421–439

Author's personal copy
that the Ontario lobe preceded the growth of the entire ice sheet as itenveloped southern Ontario.
The growth and demise of the Sunnybrook ice are less certain, butthe end phase of glaciation appears to have followed a similar patternof radial deposition (R48 and R61).
The number of multimodal fabrics, if real models of compression ef-fects and/or stone rotation in a ductile till matrix, open up questions re-lated to stress–strain processes at the base of both ice sheets as well asgeothermal heat fluctuations that might have accelerated meltout andstick–slip events. The presence or absence of multimodal fabric appearsunrelated to particle size as shown in the figures. The presence of sub-glacial gravel and sand beds in R45 (Halton) and thinner sand beds inR47 (Sunnybrook) and R48 (Halton) register deformation in somecases and the presence of variable upper and lower aqueous flow re-gimes in others, likely corresponding to the beginning (R47) and end(R45)when icewas presumably thin. At the very least, thesemultimod-al fabrics suggest that tightening of the vertical slice of till examined inthe field to b10 cm might tend to produce more tightly constrainedfabrics.
Image analysis by SEM of grains recovered from six sections showsdiagenesis/weathering and fracture/abrasion trends through majorWisconsinan-age deposits in south-central Ontario—ScarboroughFormation, Sunnybrook Till, Thorncliffe Formation, and Halton Till. Themajor microtexture characteristics of sand grade size sediment withinthese units include a tendency for angularity, abrasion, and frequencyof fracture microfeatures to increase with glacial crushing and signifi-cant attenuation of these features in the glaciolacustrine and deltaicfacies.
The geochemistry shows not only distinct variations between dif-ferent deposits in the stratigraphic succession but clearly indicatesthat additional carbonates affect the concentrations of other ele-ments in the chemical matrix. The Ca dilution unit to unit is strongestwithin the Halton, illustrating the range of sourcematerials with higherCa in the opening and closing stages of ice ingress into the Ontario basin.The lower mean concentration of Ca in the Sunnybrook vs. the Haltonprobably reflects diagenesis and greater dilution over time. The REE dis-tributions between the tills showoverall highermean concentrations inthe Sunnybrook compared with the Halton, presumably reflecting thehigher clay concentration in the former.
Acknowledgments
This research was funded by Quaternary Surveys, Toronto and byminor research grants to WCM from York University. The GIS mapwas constructed by Andrew Stewart (Strata Consulting, Toronto). Wethank Jaap van der Meer (University of London), two anonymousreviewers and Richard Marston (Kansas State U.) for their critical com-ments that greatly improved the manuscript. We gratefully acknowl-edge the assistance of Larry Gowland during field work and of KlausFecher (deceased, Geology Inst., Marburg University, Germany) for pro-ducing the imagery in Figs. 12 and 13.
References
Andrews, J.T., 1971. Techniques of till fabric analysis. British geomorphological. Res.Group Tech. Bull. 6 (43 pp.).
Andrews, J.T., King, C.A.M., 1968. Comparative till fabrics and till fabric variability in a tillsheet and drumlin: a small scale study. Proc. Yorks. Geol. Soc. 59 (2), 435–461.
Andrews, J.T., Shimizu, K., 1966. Three-dimensional vector technique for analyzing tillfabrics: discussion and FORTRAN program. Geogr. Bull. 8 (2), 151–165.
Andrews, J.T., Smith, D.I., 1970. Statistical analysis of till fabric: methodology local andregional variability (with particular reference to the north Yorkshire till cliffs). Q.J. Geol. Soc. Lond. 125, 503–542.
Barnett, P.J., 1992. Quaternary geology of Ontario. In: Thurston, P.C., Williams, H.R.,Sutcliffe, R.H., Stott, G.M. (Eds.), Geology of Ontario, Special Volume 4, Part 2, OntarioGeological Survey. Ontario Ministry of Northern Development and Mines,pp. 1011–1088 (Chapter 21).
Barnett, P.J., Sharpe, D.R., Russell, H.A.J., Brennand, T.A., Gorrell, G., Kenny, F., Pugin, A.,1998. On the origin of the Oak Ridges moraine. Can. J. Earth Sci. 35, 1152–1167.
Benn, D.I., 1995. Fabric signature of till deformation. Breidamerkurjökull, Iceland. Sedi-mentology 42, 735–747.
Bennett, M.R., Waller, R.I., Glasser, N.F., Hambrey, M.J., Huddart, D., 1999. Glacigenic clastfabrics: genetic fingerprint or wishful thinking? J. Quat. Sci. 14, 125–135.
Berger, G.W., 1984. Thermoluminescence dating studies of glacial silts from Ontario. Can.J. Earth Sci. 21, 1393–1399.
Chamberlin, T.C., 1888. The rock-scorings of the great ice invasions. United States Geolog-ical Survey, 7th Annual Report, 1885–86 147–248.
Coleman, A.P., 1895. Glacial and interglacial deposits near Toronto (Ontario). J. Geol. 3,622–645.
Coleman, A.P., 1926. Ice Ages Recent and Ancient. , 2. The Macmillan Company, NewYork.
Davies, B.J., 2009. British and Fennoscandian Ice-Sheet Interactions during the Quaterna-ry. Department of Geography, Durham U, Durham, UK (Ph.D. Thesis, 502 pp.).
Day, P.E., 1965. Particle fractionation and particle size analysis. In: Black, C.A. (Ed.),Methods of Soil Analysis. American Society of Agronomy, Madison, Wi, pp. 545–567.
Demorest, M., 1938. Ice flowage. J. Geol. 46, 700–725.Douglas, R.J.W., 1970. Geology and Economic Minerals of Canada. Geological Survey of
Canada, Ottawa, Ontario 838 pp.Dowdeswell, J.A., Sharp, M.J., 1986. Characterization of pebble fabrics in modern terrestri-
al glacigenic sediments. Sedimentology 33, 699–710.Drake, L.D., 1974. Till fabric control by clast shape. Bull. Geol. Soc. Am. 85 (2), 247–250.Dreimanis, A., Terasmae, J., 1958. Stratigraphy of Wisconsin glacial deposits of Toronto
area, Ontario. Geol. Assoc. Can. Proc. 10, 119–135.Eyles, C.H., Eyles, N., 1987. Sedimentation in a large lake: a reinterpretation of the late
Pleistocene stratigraphy at Scarborough Bluffs, Ontario, Canada. Geology 11,146–152.
Eyles, N., Eyles, C.H., Miall, A.D., 1983. Lithofacies types and vertical profile models: an al-ternative approach to the description and environmental interpretation of glacialdiamicton and diamictite sequences. Sedimentology 30, 393–410.
Flint, R.F., 1971. Glacial and Quaternary Geology. Wiley, NY 892 pp.Hancock, R.G.V., 1984. On the source of clay used for Cologne Romanpottery. Archaeometry
26, 210–217.Harrison, T.P., Hancock, R.G.V., 2005. Geochemical analysis and sociocultural com-
plexity: a case study from Early Iron Age Megiddo, (Israel). Archaeometry 47(4), 705–722.
Hart, J., Smith, B., 1997. Subglacial deformation associated with fast ice flow, from theColumbia Glacier, Alaska. Sediment. Geol. 111, 177–197.
Hess, D.P., Briner, J.P., 2009. Geospatial analysis of controls on subglacial bedform mor-phometry in the NY drumlin field-implications for Laurentide ice sheet dynamics.Earth Surf. Process. Landf. 34, 1126–1135.
Hicock, S.R., Dreimanis, A., 1989. Sunnybrook drift indicates a grounded early Wisconsinglacier in the Lake Ontario basin. Geology 17, 169–172.
Hicock, S.R., Goff, J.R., Lian, O.B., Little, E.C., 1996. On the interpretation of subglacial tillfabric. J. Sediment. Res. 66, 928–934.
Hind, H.Y., 1856. On the blue clay of Toronto. Canadian Journal, reported without volumeand page numbers in Elson, J.A., Early discoverers XXIII, 1966. Till-stone orientation,Henry Youle Hind (1823–1908). J. Glaciol. 6 (44), 303–306.
Hind, H.Y., 1859. A Preliminary and General Report on the Assiniboine and SaskatchewanExploring Expedition. , 19. Legislative Assembly Journal, Canada (Appendix 36).
Karrow, P., 1967. Pleistocene geology of the Scarborough area. Geological Rept, 46. Ontar-io Dept. Mines, Toronto, On (108 pp.).
Krüger, J., Kjær, K.H., 1999. A data chart for field description and genetic interpretation ofglacial diamicts and associated sediments—with examples from Greenland, Iceland,and Denmark. Boreas 28, 386–402.
Larsen, N.K., Piotrowski, J.A., 2003. Fabric pattern in a basal till succession and itssignificance for reconstructing subglacial processes. J. Sediment. Res. 73 (5),725–734.
Lawson, D.E., 1979. A comparison of the pebble orientations in and deposits of the Mata-nuska Glacier, Alaska. J. Geol. 87, 629–645.
Lian, O.B., Hicock, S., Dreimanis, A., 2003. Laurentide and Cordilleran fast ice flow: somesedimentological evidence from Wisconsinan subglacial till and its substrate. Boreas32, 102–113.
Link, A.G., 1966. The textural classification of sediments. Sedimentology 7 (3),249–254.
Maclachlan, J.C., Eyles, C.H., 2013. Quantitative geomorphological analysis of drum-lins in the Peterborough drumlin field, Ontario, Canada. Geogr. Ann. Ser. A 95,125–144.
Mahaney, W.C., 1990a. Macrofabrics and quartz microstructures confirm glacial origin ofSunnybrook drift in the Lake Ontario basin. Geology 18, 145–148.
Mahaney, W.C., 1990b. Ice on the Equator. Wm Caxton Ltd, Ellison Bay, WI (386 pp.).Mahaney, W.C., 1995. Pleistocene and Holocene glacier thickness and/or transport histo-
ries inferred from microtextures on quartz particles. Boreas 24, 293–304.Mahaney, W.C., 2002. Atlas of Sand Grain Surface Textures and Applications. Oxford Uni-
versity Press, Oxford, UK (237 pp.).Mahaney, W.C., Hancock, R.G.V., 1993. Late Quaternary stratigraphy and geochemistry of
the R47 section, Rouge River Basin, south-central Ontario, Canada: correlation withScarborough Bluffs. J. Quat. Sci. 8, 167–178.
Mahaney, W.C., Sanmugadas, K., 1986. Soil development as a function of time in theRouge River basin, south-central Ontario. Géog. Phys. Quatern. 40, 207–216.
Mahaney, W.C., Kalm, V., Bezada, M., Hütt, G., Milner, M.W., 2001. Stratotype for theMérida glaciation at Pueblo Llano in the northern Venezuelan Andes. J. S. Am. EarthSci. 13, 761–774.
Mahaney,W.C., Kalm, V., Menzies, J., Hancock, R.G.V., Milner, M.W., 2010a. Reconstruction ofthe pre-Mérida glaciation, northwestern Venezuelan Andes. Sediment. Geol. 230,10–20.
438 W.C. Mahaney et al. / Geomorphology 206 (2014) 421–439

Author's personal copy
Mahaney, W.C., Kalm, V., Menzies, J., Milner, M.W., 2010b. Reconstruction of the EarlyMérida, pre-LGM glaciation, northwestern Venezuelan Andes. Sediment. Geol. 226(1–4), 29–41.
Marsh, P., 1974. Fabric Analysis of the Sunnybrook Till at Scarborough Bluffs, Ontario.York University, Toronto (MA Thesis).
Martini, I.P., Brookfield, M.E., Gwyn, Q.H.J., 1984. Quaternary stratigraphy of the coastalbluffs of Lake Ontario east of Oshawa. In: Mahaney, W.C. (Ed.), Quaternary DatingMethods. Elsevier, Amsterdam (427 pp.).
Menzies, J., van der Meer, J.J.M., Rose, J., 2006. Till — as a glacial ‘tectonic’, its internal ar-chitecture, and the development of a ‘typing’method for till differentiation. Geomor-phology 75, 172–200.
Miller, H., 1884. On boulder-glaciation. Proc. R. Phys. Soc.Edinb. 8 (16), 156–189.Muller, E.H., Calkin, P.E., 1993. Timing of Pleistocene glacial events in New York State. Can.
J. Earth Sci. 30, 1829–1845.Neudorf, C.M., Brennand, T.A., Lian, O.B., 2013. Till-forming processes beneath parts of the
Cordilleran ice sheet, British Columbia, Canada: macroscale and microscale evidenceand a new statistical technique for analysing microstructure data. Boreas. http://dx.doi.org/10.1111/bor.12009.
NRCS, 2004. Soil survey laboratory methods manual. In: Burt, R. (Ed.), Soil Survey Inves-tigations Report No. 42, Version 4.0, U.S.D.A. (700 pp.).
Occhietti, S., Parent, M., Lajeunesse, P., Robert, F., Govare, É., 2011. Late Pleistocene–EarlyHolocene decay of the Laurentide ice sheet in Québec–Labrador. In: Ehlers, J., Gibbard,P.L., Hughes, P.D. (Eds.), Developments in Quaternary Science. , Vol. 15. Elsevier,Amsterdam, The Netherlands, pp. 601–630.
Ostry, R.C., 1962. An Analysis of Some Tills in Scarborough Township and Vicinity. Dept ofGeology, University of Toronto (M.A. Thesis, 65 pp.).
Oyama, M., Takehara, H., 1970. Standard Soil Color Charts. Japan Research Council for Ag-riculture, Forestry and Fisheries.
Piotrowski, J.A., Mickelson, D.M., Tulaczyk, S., Krzyszkowski, D., Junge, F.W., 2001. Weredeforming subglacial beds beneath past ice sheets really widespread? Quat. Int. 86,139–150.
Prest, V.K., Grant, D.R., Rampton, V., 1968. Glacial Map of Canada. Map 1253A, scale 1:5000 000, Geological Survey of Canada, Ottawa, On.
Rappol, M., 1985. Clast-fabric strength in tills and debris flows compared for different en-vironments. Geol. Mijnb. 64, 327–332.
Rappol, M., 1989. Glacial history and stratigraphy of northwestern New Brunswick. Géog.Phys. Quatern. 43, 191–206.
Sharpe, D.R., 1987. Quaternary Geology of Toronto Area, Ontario. Geological Society ofAmerica Centennial Field Guide, Northeastern Section 339–344.
Sharpe, D.R., Barnett, P.J., 1985. Significance of sedimentological studies on theWisconsinanstratigraphy of southern Ontario. Géog. Phys. Quatern. 39, 255–273.
Terasmae, J., 1960. A palynological study of Pleistocene interglacial beds at Toronto,Ontario. Geol. Surv. Can. Bull. 56, 24–40.
van der Meer, J.J.M., Menzies, J., Rose, J., 2003. Subglacial till: the deforming glacier bed.Quat. Sci. Rev. 22, 1659–1685.
Vortisch, W., Mahaney, W.C., Fecher, K., 1987. Lithology and weathering in a paleosol se-quence on Mt. Kenya, East Africa. Geol. Paleontol. 21, 245–255.
Westgate, J.A., Chen, F.-J., Delorme, L.D., 1987. Lacustrine ostracodes in the late Pleisto-cene Sunnybrook diamicton of southern Ontario, Canada. Can. J. Earth Sci. 24 (22),2330–2335.
Winsborrow, M.C.M., Clark, C.D., Stokes, C.R., 2004. Ice streams of the Laurentide ice sheet.Géog. Phys. Quatern. 58, 269–280.
439W.C. Mahaney et al. / Geomorphology 206 (2014) 421–439


