Embed Size (px)
Citation preview

Red Cell Distribution Width and Other Red Blood CellParameters in Patients with Cancer: Association with Riskof Venous Thromboembolism and MortalityJulia Riedl1, Florian Posch1, Oliver Konigsbrugge1, Felix Lotsch1, Eva-Maria Reitter1, Ernst Eigenbauer2,
Christine Marosi3, Ilse Schwarzinger4, Christoph Zielinski3, Ingrid Pabinger1, Cihan Ay1*
1 Clinical Division of Haematology and Haemostaseology, Department of Medicine I, Comprehensive Cancer Center Vienna, Medical University of Vienna, Vienna, Austria,
2 Center for Medical Statistics, Informatics, and Intelligent Systems, Medical University of Vienna, Vienna, Austria, 3 Clinical Division of Oncology, Department of Medicine
I, Comprehensive Cancer Center Vienna, Medical University of Vienna, Vienna, Austria, 4 Department of Laboratory Medicine, Medical University of Vienna, Vienna, Austria
Abstract
Background: Cancer patients are at high risk of developing venous thromboembolism (VTE). Red cell distribution width(RDW) has been reported to be associated with arterial and venous thrombosis and mortality in several diseases. Here, weanalyzed the association between RDW and other red blood cell (RBC) parameters with risk of VTE and mortality in patientswith cancer.
Methods: RBC parameters were measured in 1840 patients with cancers of the brain, breast, lung, stomach, colon, pancreas,prostate, kidney; lymphoma, multiple myeloma and other tumor sites, that were included in the Vienna Cancer andThrombosis Study (CATS), which is an ongoing prospective, observational cohort study of patients with newly diagnosed orprogressive cancer after remission. Primary study outcome is occurrence of symptomatic VTE and secondary outcome isdeath during a maximum follow-up of 2 years.
Results: During a median follow-up of 706 days, 131 (7.1%) patients developed VTE and 702 (38.2%) died. High RDW (.16%) was not associated with a higher risk of VTE in the total study cohort; in competing risk analysis accounting for deathas competing variable the univariable subhazard ratio (SHR) was 1.34 (95% confidence interval [CI]: 0.80–2.23, p = 0.269).There was also no significant association between other RBC parameters and risk of VTE. High RDW was associated with anincreased risk of mortality in the total study population (hazard ratio [HR, 95% CI]: 1.72 [1.39–2.12], p,0.001), and thisassociation prevailed after adjustment for age, sex, hemoglobin, leukocyte and platelet count (HR [95% CI]: 1.34 [1.06–1.70],p = 0.016).
Conclusions: RDW and other RBC parameters were not independently associated with risk of VTE in patients with cancerand might therefore not be of added value for estimating risk of VTE in patients with cancer. We could confirm that highRDW is an independent predictor of poor overall survival in cancer.
Citation: Riedl J, Posch F, Konigsbrugge O, Lotsch F, Reitter E-M, et al. (2014) Red Cell Distribution Width and Other Red Blood Cell Parameters in Patients withCancer: Association with Risk of Venous Thromboembolism and Mortality. PLoS ONE 9(10): e111440. doi:10.1371/journal.pone.0111440
Editor: Hugo ten Cate, Maastricht University Medical Center, Netherlands
Received July 9, 2014; Accepted September 28, 2014; Published October 27, 2014
Copyright: � 2014 Riedl et al. This is an open-access article distributed under the terms of the Creative Commons Attribution License, which permitsunrestricted use, distribution, and reproduction in any medium, provided the original author and source are credited.
Data Availability: The authors confirm that all data underlying the findings are fully available without restriction. All relevant data are within the paper and itsSupporting Information files.
Funding: This study was supported by funds of the ‘‘Oesterreichische Nationalbank’’ (Anniversary Fund, project number 14744) and by a grant from the‘‘Hochschuljubilaumsstiftung der Stadt Wien’’ (http://www.oenb.at/en/About-Us/Research-Promotion/The-OeNB-Anniversary-Fund.html). The funders had no rolein study design, data collection and analysis, decision to publish, or preparation of the manuscript.
Competing Interests: The Vienna Cancer and Thrombosis Study (CATS) was supported by funds from the ‘‘Oesterreichische Nationalbank’’ (Anniversary Fund,project number 14744) and by a grant from the ‘‘Hochschuljubilaumsstiftung der Stadt Wien’’. This does not alter the authors’ adherence to PLOS ONE policies onsharing data and materials.
* Email: [email protected]
Introduction
Red cell distribution width (RDW) is a parameter of the
complete blood count (CBC) that describes the size variation of red
blood cells (RBC). It is routinely measured by most of the modern
hemocytometers and is calculated by dividing the standard
deviation of the mean corpuscular volume (MCV) by the
respective actual MCV, and is expressed as percentage. A high
RDW represents a large variation of the RBC volume, called
anisocytosis, and is found in conditions with an increased number
of small or large RBC. Hence, RDW can be used to discriminate
between different forms of anemia, since iron deficiency anemia or
megaloblastic anemia are accompanied with elevated RDW,
whereas in thalassemia RDW is usually normal [1–3]. Other
parameters routinely given by CBC that provide information
about RBC are hematocrit, hemoglobin concentration, MCV,
mean corpuscular hemoglobin (MCH) and mean corpuscular
hemoglobin concentration (MCHC).
PLOS ONE | www.plosone.org 1 October 2014 | Volume 9 | Issue 10 | e111440
Besides the conventional use of RDW for discriminating
between different forms of anemia, a number of studies have
suggested that RDW could be a potentially useful marker in a
variety of other diseases, such as heart failure [4], atrial fibrillation
[5], lung cancer [6] or inflammatory disorders [7], frequently
associated with a worse prognosis. Also an association between
high RDW and risk of cardiovascular thrombotic disorders, as well
as with increased mortality in patients with cardiovascular diseases
has been described [1]. Interestingly, in a population-based study
high RDW was reported to predispose to venous thromboembo-
lism (VTE) [8]. Two case-control studies found a high RDW in
patients with deep venous thrombosis [9,10]. Furthermore, high
RDW was correlated with a poor outcome in patients who suffered
pulmonary embolism [11]. Moreover, in a meta-analysis of seven
community-based studies of older individuals high RDW was
described to increase risk of mortality [12]. In a subgroup analysis
of the latter study RDW was also associated with an increased risk
of death in patients with cancer.
Studies that have investigated other RBC parameters and their
association with the risk of thrombosis are limited. In non-cancer
patients, a high hematocrit was found to be associated with
increased risk of first [13] and recurrent VTE [14]. Increasing
levels of MCV and MCH were associated with VTE in a case-
control study [9]. In patients with cancer, a low hemoglobin level
was reported to be a risk factor for development of VTE [15].
As patients with cancer have a high risk of developing VTE, a
complication that is associated with high morbidity and mortality
[16], a number of studies over the past years have focused on the
identification of laboratory and clinical parameters associated with
risk of VTE. Khorana et al. developed a scoring model for risk
stratification of VTE in patients with cancer [15] that includes
laboratory parameters of CBC (hemoglobin levels, leukocyte
count, platelet count). This risk scoring model could be validated
in subsequent studies [17,18].
While previous studies indicated that RDW or hematocrit might
have a predictive value for risk of VTE in the general population
[8,13] no data are available for patients with cancer. Therefore,
we aimed to investigate whether RDW, hematocrit and other
RBC parameters are associated with the development of VTE in
patients with cancer. Furthermore, we analyzed the association
between RBC parameters and mortality in patients with different
types of cancer included in our study.
Materials and Methods
Study design and study populationThis study was performed within the framework of the Vienna
Cancer and Thrombosis Study (CATS), an ongoing prospective,
single-centre, observational cohort study that started in 2003 at the
Medical University of Vienna, Austria. Patients with newly
diagnosed cancer or progression of disease after remission are
included in the study and followed for a maximum of 2 years.
Exact methods, inclusion and exclusion criteria of CATS have
been described in previous publications [19,20]. Briefly, patients
with cancer of the brain, breast, lung, upper or lower gastroin-
testinal tract, pancreas, kidney, prostate or gynecological system;
sarcoma and hematologic malignancies (lymphoma, multiple
myeloma) were included in the study. Patients with a thrombo-
embolic event or chemotherapy within the last three months,
surgery or radiotherapy within the last two weeks or continuous
anticoagulation with vitamin K antagonists or low molecular
weight heparin were excluded. After written informed consent, a
structured interview about the patients’ medical history was
performed and a single blood sample was drawn. Follow-up was
performed regularly approximately every 3 months as described in
previous publications [19,20]. The observation period started from
the time of blood sampling and lasted for 2 years or until the
occurrence of VTE, death, loss of follow-up or withdrawal of
consent. Once a year, the Austrian death registry was searched for
entries about study participants.
No routine screening for VTE was performed. Diagnosis of
VTE had to be confirmed by duplex sonography or venography
for deep vein thrombosis (DVT) or by computed tomography or
ventilation/perfusion lung scan for pulmonary embolism (PE),
respectively. In patients who died during follow-up, death
certificates and, if available, autopsy findings were checked for
diagnosis of fatal PE.
Until December 2013, 2030 patients had been included in the
study. Of this cohort, 190 patients had to be excluded, either
because they did not fulfill the exact in- and exclusion criteria after
re-evaluation (n = 94), or because no follow-up information
(n = 87) or no adequate materials for laboratory measurements
were available (n = 9).
Healthy control subjects. Healthy individuals (n = 25,
median age: 56 years [25th–75th percentile: 46–60], 17 [68%]
female) without a history of venous or arterial thrombosis and
cancer from the same geographic region served as controls for
comparison of RBC/RDW parameters.
Ethics statementEthical approval for the study was received from the institu-
tional ethics committee of the Medical University of Vienna and
the study has been conducted in accordance with the Declaration
of Helsinki.
Outcome measure of the studyPrimary endpoint of the study was occurrence of symptomatic
or fatal VTE. The secondary outcome measure was death of any
cause within 2 years after study inclusion.
Blood sampling and laboratory analysis of RDWAt the day of study inclusion, venous blood samples were
collected in Vacutainer K3-EDTA tubes (Vacuette; Greiner-Bio
One) by sterile venipuncture and analyzed within 2 hours from
sampling. RBC parameters were routinely determined using a
Sysmex XE-2100 hematology analyzer. RDW-CV (coefficient of
variance) was used for all analyses in the current study. RDW-CV
was calculated automatically by dividing the standard deviation of
the MCV through the actual MCV, multiplied by 100. This allows
illustration of size variation of red blood cell size around their
mean size (i.e. around the MCV), expressed as percentage. The
reference range for RDW-CV in the routine lab of the Vienna
General Hospital of the Medical University of Vienna was based
on evaluation of this parameter in the local normal, healthy
population according to standardized procedures. The reference
range of RDW at our hospital is 11%–16%.
Statistical analysisStatistical analyses were performed using SPSS (Windows
Version 21.0, Armonk, NY: IBM Corp.), STATA (Windows
Version 12.0, Stata Corp., TX, USA), and R (Windows Version
3.0.2., R Core Development Team). Continuous variables were
summarized with the median and the interquartile range (IQR),
and categorical variables by absolute frequencies and percentages.
The correlation between continuous variables was assessed using
Spearman’s correlation coefficient. The Kruskal-Wallis test was
used to test for differences in continuous variables between the
Red Blood Cell Parameters and Risk of Venous Thromboembolism in Cancer
PLOS ONE | www.plosone.org 2 October 2014 | Volume 9 | Issue 10 | e111440

different tumor types. The Wilcoxon-Mann-Whitney test was used
to test for differences in continuous variables between patients and
healthy controls and between patients with different cancer stages.
Median survival time was calculated using the reverse Kaplan-
Meier method. Cumulative incidence functions (CIFs) for VTE
risk with point estimates and 95% confidence intervals were
estimated non-parametrically using the estimators proposed by
Marubini & Valsecchi, and Choudhury, respectively (implemented
in Stata’s stcompet suite). Death-from-any-cause was incorporated
as the competing event of interest in all following CR calculations.
CIFs between patients with high and low baseline RDW were
compared using Gray’s test (CumIncidence package in R).
Univariable and multivariable proportional subdistribution haz-
ards regression models for competing risk data according to Fine
Table 1. Characteristics of the total study population, of patients who developed venous thromboembolism (VTE) and of patientswho died during the observation period, as recorded at the time of entry into the study.
All study patientsn = 1840
VTE duringfollow-upa n = 131 (7.1%)
Death during follow-upa n = 702 (38.2%)
Median Age, y (IQR) 62 (52–68) 61 (51–67) 63 (55–70)
Sex, n
Female 843 55 (6.5%) 284 (33.7%)
Male 997 76 (7.6%) 418 (41.9%)
Site of cancer, n
Lung 309 21 (6.8%) 194 (62.8%)
Breast 273 7 (2.6%) 45 (16.5%)
Lymphoma 260 12 (4.6%) 40 (15.4%)
Brain 245 32 (13.1%) 131 (53.5%)
Colon/Rectum 182 14 (7.7%) 63 (34.6%)
Prostate 157 3 (1.9%) 31 (19.7%)
Pancreas 130 19 (14.6%) 84 (64.6%)
Stomach 63 8 (12.7%) 45 (71.4%)
Kidney 42 1 (2.4%) 10 (23.8%)
Multiple myeloma 49 3 (6.1%) 6 (12.2%)
Others 130 11 (8.5%) 53 (40.8%)
Newly diagnosed vs.recurrent disease, n
Newly diagnosed 1353 89 (8%) 486 (35.9%)
Recurrent disease 487 25 (5.9%) 216 (44.4%)
Tumor group, n
Localized solid tumor 715 40 (5.6%) 153 (21.4%)
Solid tumors with distantmetastasis
571 44 (7.7%) 372 (65.1%)
Not classifiableb 554 47 (8.5%) 177 (31.9%)
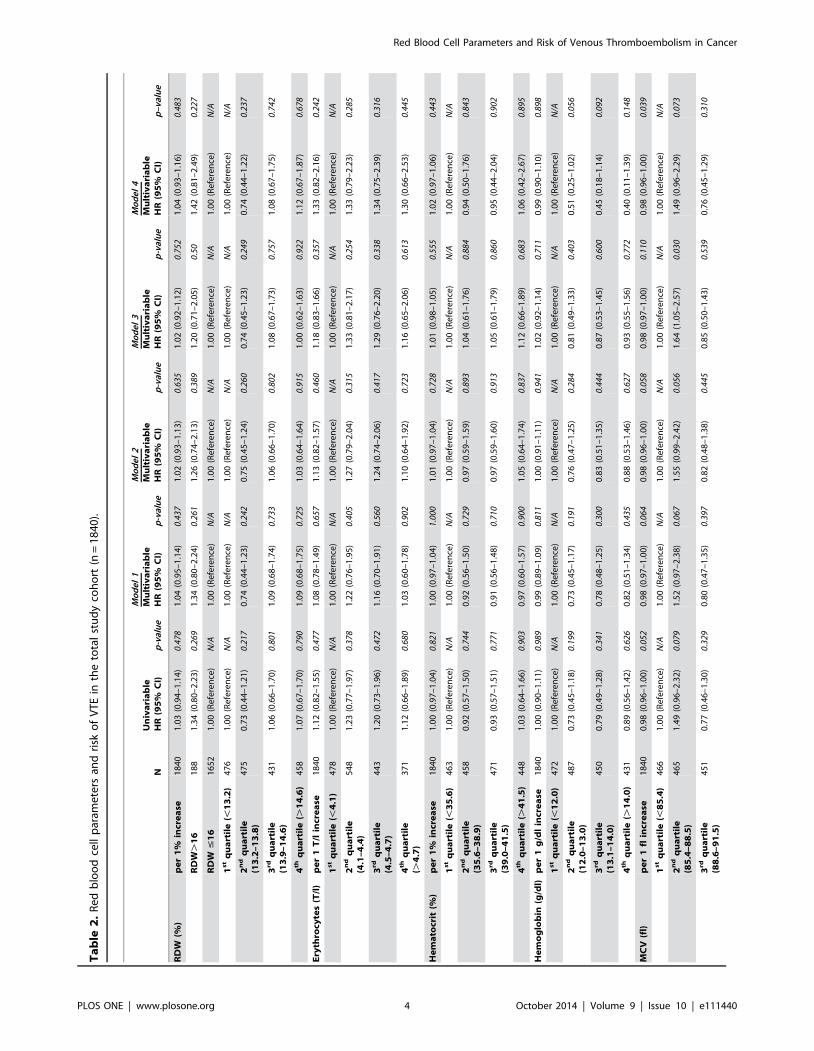
Median RDW, % (IQR) 13.8 (13.1–14.6) 14 (13.1–14.8) 14.1 (13.3–15.0)
RDW.16%, n 188 17 (9%) 102 (54.3%)
RDW #16%, n 1652 114 (6.5%) 600 (36.3%)
Median erythocytecount, T/l (IQR)
4.40 (4.00–4.70) 4.4 (4.1–4.7) 4.3 (3.9–4.6)
Median hematocrit,% (IQR)
38.9 (35.5–41.5) 39 (35.3–41.7) 37.9 (34.2–40.8)
Median hemoglobinconcentration, g/dl (IQR)
12.8 (11.8–14.1) 13.1 (11.5–14.1) 12.7 (11.4–13.8)
Median MCV, fl (IQR) 88.6 (85.4–91.7) 87.7 (85.4–90.7) 88.4 (85.0–91.7)
Median MCH, pg (IQR) 29.9 (28.6–31.0) 29.9 (28.6–30.8) 29.9 (28.3–31.0)
Median MCHC, g/dl (IQR) 33.7 (32.9–34.4) 33.7 (33.1–34.5) 33.7 (32.8–34.3)
Use of ESA, nc 54 9 (16.7%) 38 (70.4%)
aPercentages are related to numbers given in the first column of the same line.bBrain tumor, lymphoma and multiple myeloma.cDuring the time period of one month before until 3 months after entry into the study.Abbreviations: IQR = interquartile range (i.e. 25th–75th percentile), RDW = red cell distribution width, MCV = mean corpuscular volume, MCH = mean corpuscularhemoglobin, MCHC = mean corpuscular hemoglobin concentration, ESA = erythropoiesis-stimulting agent.doi:10.1371/journal.pone.0111440.t001
Red Blood Cell Parameters and Risk of Venous Thromboembolism in Cancer
PLOS ONE | www.plosone.org 3 October 2014 | Volume 9 | Issue 10 | e111440
Ta
ble
2.
Re
db
loo
dce
llp
aram
ete
rsan
dri
sko
fV
TE
inth
eto
tal
stu
dy
coh
ort
(n=
18
40
).
NU
niv
ari
ab
leH
R(9
5%
CI)
p-v
alu
e
Mo
de
l1
Mu
ltiv
ari
ab
leH
R(9
5%
CI)
p-v
alu
e
Mo
de
l2
Mu
ltiv
ari
ab
leH
R(9
5%
CI)
p-v
alu
e
Mo
de
l3
Mu
ltiv
ari
ab
leH
R(9
5%
CI)
p-v
alu
e
Mo
de
l4
Mu
ltiv
ari
ab
leH
R(9
5%
CI)
p–v
alu
e
RD
W(%
)p
er
1%
incr
ea
se1
84
01
.03
(0.9
4–
1.1
4)
0.47
81
.04
(0.9
5–
1.1
4)
0.43
71
.02
(0.9
3–
1.1
3)
0.63
51
.02
(0.9
2–
1.1
2)
0.75
21
.04
(0.9
3–
1.1
6)
0.48
3
RD
W.
16
18
81
.34
(0.8
0–
2.2
3)
0.26
91
.34
(0.8
0–
2.2
4)
0.26
11
.26
(0.7
4–
2.1
3)
0.38
91
.20
(0.7
1–
2.0
5)
0.50
1.4
2(0
.81
–2
.49
)0.
227
RD
W#
16
16
52
1.0
0(R
efe
ren
ce)
N/A
1.0
0(R
efe
ren
ce)
N/A
1.0
0(R
efe
ren
ce)
N/A
1.0
0(R
efe
ren
ce)
N/A
1.0
0(R
efe
ren
ce)
N/A
1s
tq
ua
rtil
e(,
13
.2)
47
61
.00
(Re
fere
nce
)N
/A1
.00
(Re
fere
nce
)N
/A1
.00
(Re
fere
nce
)N
/A1
.00
(Re
fere
nce
)N
/A1
.00
(Re
fere
nce
)N
/A
2n
dq
ua
rtil
e(1
3.2
–1
3.8
)4
75
0.7
3(0
.44
–1
.21
)0.
217
0.7
4(0
.44
–1
.23
)0.
242
0.7
5(0
.45
–1
.24
)0.
260
0.7
4(0
.45
–1
.23
)0.
249
0.7
4(0
.44
–1
.22
)0.
237
3rd
qu
art
ile
(13
.9–
14
.6)
43
11
.06
(0.6
6–
1.7
0)
0.80
11
.09
(0.6
8–
1.7
4)
0.73
31
.06
(0.6
6–
1.7
0)
0.80
21
.08
(0.6
7–
1.7
3)
0.75
71
.08
(0.6
7–
1.7
5)
0.74
2
4th
qu
art
ile
(.1
4.6
)4
58
1.0
7(0
.67
–1
.70
)0.
790
1.0
9(0
.68
–1
.75
)0.
725
1.0
3(0
.64
–1
.64
)0.
915
1.0
0(0
.62
–1
.63
)0.
922
1.1
2(0
.67
–1
.87
)0.
678
Ery
thro
cyte
s(T
/l)
pe
r1
T/l
incr
ea
se1
84
01
.12
(0.8
2–
1.5
5)
0.47
71
.08
(0.7
8–
1.4
9)
0.65
71
.13
(0.8
2–
1.5
7)
0.46
01
.18
(0.8
3–
1.6
6)
0.35
71
.33
(0.8
2–
2.1
6)
0.24
2
1s
tq
ua
rtil
e(,
4.1
)4
78
1.0
0(R
efe
ren
ce)
N/A
1.0
0(R
efe
ren
ce)
N/A
1.0
0(R
efe
ren
ce)
N/A
1.0
0(R
efe
ren
ce)
N/A
1.0
0(R
efe
ren
ce)
N/A
2n
dq
ua
rtil
e(4
.1–
4.4
)5
48
1.2
3(0
.77
–1
.97
)0.
378
1.2
2(0
.76
–1
.95
)0.
405
1.2
7(0
.79
–2
.04
)0.
315
1.3
3(0
.81
–2
.17
)0.
254
1.3
3(0
.79
–2
.23
)0.
285
3rd
qu
art
ile
(4.5
–4
.7)
44
31
.20
(0.7
3–
1.9
6)
0.47
21
.16
(0.7
0–
1.9
1)
0.56
01
.24
(0.7
4–
2.0
6)
0.41
71
.29
(0.7
6–
2.2
0)
0.33
81
.34
(0.7
5–
2.3
9)
0.31
6
4th
qu
art
ile
(.4
.7)
37
11
.12
(0.6
6–
1.8
9)
0.68
01
.03
(0.6
0–
1.7
8)
0.90
21
.10
(0.6
4–
1.9
2)
0.72
31
.16
(0.6
5–
2.0
6)
0.61
31
.30
(0.6
6–
2.5
3)
0.44
5
He
ma
tocr
it(%
)p
er
1%
incr
ea
se1
84
01
.00
(0.9
7–
1.0
4)
0.82
11
.00
(0.9
7–
1.0
4)
1.00
01
.01
(0.9
7–
1.0
4)
0.72
81
.01
(0.9
8–
1.0
5)
0.55
51
.02
(0.9
7–
1.0
6)
0.44
3
1s
tq
ua
rtil
e(,
35
.6)
46
31
.00
(Re
fere
nce
)N
/A1
.00
(Re
fere
nce
)N
/A1
.00
(Re
fere
nce
)N
/A1
.00
(Re
fere
nce
)N
/A1
.00
(Re
fere
nce
)N
/A
2n
dq
ua
rtil
e(3
5.6
–3
8.9
)4
58
0.9
2(0
.57
–1
.50
)0.
744
0.9
2(0
.56
–1
.50
)0.
729
0.9
7(0
.59
–1
.59
)0.
893
1.0
4(0
.61
–1
.76
)0.
884
0.9
4(0
.50
–1
.76
)0.
843
3rd
qu
art
ile
(39
.0–
41
.5)
47
10
.93
(0.5
7–
1.5
1)
0.77
10
.91
(0.5
6–
1.4
8)
0.71
00
.97
(0.5
9–
1.6
0)
0.91
31
.05
(0.6
1–
1.7
9)
0.86
00
.95
(0.4
4–
2.0
4)
0.90
2
4th
qu
art
ile
(.4
1.5
)4
48
1.0
3(0
.64
–1
.66
)0.
903
0.9
7(0
.60
–1
.57
)0.
900
1.0
5(0
.64
–1
.74
)0.
837
1.1
2(0
.66
–1
.89
)0.
683
1.0
6(0
.42
–2
.67
)0.
895
He
mo
glo
bin
(g/d
l)p
er
1g
/dl
incr
ea
se1
84
01
.00
(0.9
0–
1.1
1)
0.98
90
.99
(0.8
9–
1.0
9)
0.81
11
.00
(0.9
1–
1.1
1)
0.94
11
.02
(0.9
2–
1.1
4)
0.71
10
.99
(0.9
0–
1.1
0)
0.89
8
1s
tq
ua
rtil
e(,
12
.0)
47
21
.00
(Re
fere
nce
)N
/A1
.00
(Re
fere
nce
)N
/A1
.00
(Re
fere
nce
)N
/A1
.00
(Re
fere
nce
)N
/A1
.00
(Re
fere
nce
)N
/A
2n
dq
ua
rtil
e(1
2.0
–1
3.0
)4
87
0.7
3(0
.45
–1
.18
)0.
199
0.7
3(0
.45
–1
.17
)0.
191
0.7
6(0
.47
–1
.25
)0.
284
0.8
1(0
.49
–1
.33
)0.
403
0.5
1(0
.25
–1
.02
)0.
056
3rd
qu
art
ile
(13
.1–
14
.0)
45
00
.79
(0.4
9–
1.2
8)
0.34
10
.78
(0.4
8–
1.2
5)
0.30
00
.83
(0.5
1–
1.3
5)
0.44
40
.87
(0.5
3–
1.4
5)
0.60
00
.45
(0.1
8–
1.1
4)
0.09
2
4th
qu
art
ile
(.1
4.0
)4
31
0.8
9(0
.56
–1
.42
)0.
626
0.8
2(0
.51
–1
.34
)0.
435
0.8
8(0
.53
–1
.46
)0.
627
0.9
3(0
.55
–1
.56
)0.
772
0.4
0(0
.11
–1
.39
)0.
148
MC
V(f
l)p
er
1fl
incr
ea
se1
84
00
.98
(0.9
6–
1.0
0)
0.05
20
.98
(0.9
7–
1.0
0)
0.06
40
.98
(0.9
6–
1.0
0)
0.05
80
.98
(0.9
7–
1.0
0)
0.11
00
.98
(0.9
6–
1.0
0)
0.03
9
1s
tq
ua
rtil
e(,
85
.4)
46
61
.00
(Re
fere
nce
)N
/A1
.00
(Re
fere
nce
)N
/A1
.00
(Re
fere
nce
)N
/A1
.00
(Re
fere
nce
)N
/A1
.00
(Re
fere
nce
)N
/A
2n
dq
ua
rtil
e(8
5.4
–8
8.5
)4
65
1.4
9(0
.96
–2
.32
)0.
079
1.5
2(0
.97
–2
.38
)0.
067
1.5
5(0
.99
–2
.42
)0.
056
1.6
4(1
.05
–2
.57
)0.
030
1.4
9(0
.96
–2
.29
)0.
073
3rd
qu
art
ile
(88
.6–
91
.5)
45
10
.77
(0.4
6–
1.3
0)
0.32
90
.80
(0.4
7–
1.3
5)
0.39
70
.82
(0.4
8–
1.3
8)
0.44
50
.85
(0.5
0–
1.4
3)
0.53
90
.76
(0.4
5–
1.2
9)
0.31
0
Red Blood Cell Parameters and Risk of Venous Thromboembolism in Cancer
PLOS ONE | www.plosone.org 4 October 2014 | Volume 9 | Issue 10 | e111440

Ta
ble
2.
Co
nt.
NU
niv
ari
ab
leH
R(9
5%
CI)
p-v
alu
e
Mo
de
l1
Mu
ltiv
ari
ab
leH
R(9
5%
CI)
p-v
alu
e
Mo
de
l2
Mu
ltiv
ari
ab
leH
R(9
5%
CI)
p-v
alu
e
Mo
de
l3
Mu
ltiv
ari
ab
leH
R(9
5%
CI)
p-v
alu
e
Mo
de
l4
Mu
ltiv
ari
ab
leH
R(9
5%
CI)
p–v
alu
e
4th
qu
art
ile
(.9
1.5
)4
58
0.7
7(0
.45
–1
.29
)0.
313
0.7
8(0
.46
–1
.32
)0.
356
0.7
8(0
.46
–1
.31
)0.
349
0.8
3(0
.49
–1
.40
)0.
480
0.7
5(0
.45
–1
.25
)0.
270
MC
H(p
g)
pe
r1
pg
incr
ea
se1
84
00
.96
(0.9
0–
1.0
3)
0.23
50
.96
(0.9
0–
1.0
2)
0.22
10
.96
(0.9
0–
1.0
3)
0.24
30
.97
(0.9
1–
1.0
4)
0.36
80
.95
(0.8
8–
1.0
2)
0.17
8
1s
tq
ua
rtil
e(,
28
.6)
47
11
.00
(Re
fere
nce
)N
/A1
.00
(Re
fere
nce
)N
/A1
.00
(Re
fere
nce
)N
/A1
.00
(Re
fere
nce
)N
/A1
.00
(Re
fere
nce
)N
/A
2n
dq
ua
rtil
e(2
8.6
–2
9.8
)4
61
1.0
5(0
.65
–1
.69
)0.
848
1.0
6(0
.65
–1
.72
)0.
812
1.0
8(0
.66
–1
.76
)0.
749
1.1
3(0
.70
–1
.84
)0.
622
1.0
4(0
.65
-1.6
6)
0.87
0
3rd
qu
art
ile
(29
.9–
30
.9)
45
01
.19
(0.7
5–
1.9
0)
0.45
71
.20
(0.7
5–
1.9
1)
0.45
31
.22
(0.7
7–
1.9
5)
0.39
81
.27
(0.8
0–
2.0
4)
0.31
1.1
9(0
.74
–1
.90
)0.
477
4th
qu
art
ile
(.3
0.9
)4
58
0.8
0(0
.48
–1
.34
)0.
392
0.7
9(0
.47
–1
.32
)0.
371
0.8
0(0
.48
–1
.34
)0.
402
0.8
3(0
.50
–1
.40
)0.
493
0.7
9(0
.47
–1
.33
)0.
374
MC
HC
(g/d
l)p
er
1g
/dl
incr
ea
se1
84
01
.04
(0.9
0–
1.2
1)
0.60
11
.03
(0.8
9–
1.1
9)
0.71
81
.03
(0.8
9–
1.2
0)
0.65
31
.06
(0.9
1–
1.2
3)
0.46
51
.07
(0.9
0–
1.2
6)
0.46
3
1s
tq
ua
rtil
e(,
32
.9)
49
61
.00
(Re
fere
nce
)N
/A1
.00
(Re
fere
nce
)N
/A1
.00
(Re
fere
nce
)N
/A1
.00
(Re
fere
nce
)N
/A1
.00
(Re
fere
nce
)N
/A
2n
dq
ua
rtil
e(3
2.9
–3
3.6
)4
91
1.1
7(0
.72
–1
.88
)0.
530
1.1
7(0
.72
–1
.89
)0.
533
1.2
0(0
.73
–1
.95
)0.
471
1.2
3(0
.75
–2
.01
)0.
405
1.2
4(0
.76
–2
.03
)0.
386
3rd
qu
art
ile
(33
.7–
34
.3)
43
21
.08
(0.6
5–
1.7
9)
0.78
01
.05
(0.6
3–
1.7
5)
0.85
51
.07
(0.6
4–
1.7
9)
0.80
51
.15
(0.6
8–
1.9
4)
0.60
41
.17
(0.6
8–
2.0
1)
0.57
6
4th
qu
art
ile
(.3
4.3
)4
21
1.3
3(0
.82
–2
.15
)0.
249
1.2
7(0
.79
–2
.07
)0.
326
1.2
9(0
.80
–2
.10
)0.
297
1.3
7(0
.84
–2
.23
)0.
214
1.4
7(0
.87
–2
.51
)0.
154
Mo
del
1:ad
just
ed
for
age
and
sex;
Mo
del
2:ad
just
ed
for
age
,se
xan
dtu
mo
rg
rou
p(l
oca
lize
dso
lidtu
mo
rvs
.so
lidtu
mo
rw
ith
dis
tan
tm
eta
stas
isvs
.n
on
-cla
ssif
iab
le[b
rain
tum
or
or
he
mat
olo
gic
alm
alig
nan
cy])
;M
od
el3:
adju
ste
dfo
rag
e,
sex
and
use
of
ESA
;M
od
el4:
adju
ste
dfo
rag
e,
sex,
he
mo
glo
bin
leve
l,le
uko
cyte
cou
nt
and
pla
tele
tco
un
t.A
bb
revi
ati
on
s:SH
R=
sub
haz
ard
rati
o,
CI=
con
fid
en
cein
terv
al,
RD
W=
red
cell
dis
trib
uti
on
wid
th,
MC
V=
me
anco
rpu
scu
lar
volu
me
,M
CH
=m
ean
corp
usc
ula
rh
em
og
lob
in,
MC
HC
=m
ean
corp
usc
ula
rh
em
og
lob
inco
nce
ntr
atio
n,
ESA
=e
ryth
rop
oie
sis-
stim
ula
tin
gag
en
t.d
oi:1
0.1
37
1/j
ou
rnal
.po
ne
.01
11
44
0.t
00
2
Red Blood Cell Parameters and Risk of Venous Thromboembolism in Cancer
PLOS ONE | www.plosone.org 5 October 2014 | Volume 9 | Issue 10 | e111440

and Gray [21] were used to model the risk of VTE. The
multivariable competing risk regression analyses comprised the
variable of main interest (RDW or other RBC parameters), either
analyzed as a continuous variable or divided into four groups
according to quartiles of the variable in the corresponding study
population, and it comprised also the following variables: In the
first model we adjusted for age and sex, in the second model for
age, sex and different groups of tumors (divided into localized solid
tumors, solid tumors with distant metastasis, brain tumors and
hematological malignancy); in the third model we adjusted for age,
sex and use of erythropoiesis-stimulating agents (ESA) during the
time period of one month before until 3 months after entry into
the study; and the fourth model was adjusted for age, sex,
hemoglobin level, leukocyte count and platelet count. Continuous
co-variables were centered at the mean (age, hemoglobin). To
allow illustration with cumulative incidence curves, we defined 2
groups of patients with high or non-elevated RDW. The cut-off for
this categorized variable was set at 16%, which is the upper limit of
the reference range for RDW (reference range: 11%-16%) in our
hospital’s routine laboratory.
Univariable and multivariable Cox Regression models were
used to evaluate the influence of RDW and other RBC parameters
on overall survival. Death of any cause was considered as the event
of interest. Data were censored at the end of the study period (after
two years) or loss to follow-up. The multivariable Cox regression
models comprised the same variables as the above-described
competing risk regression analyses. For visualization of survival
probabilities in patients with high or non-elevated RDW, Kaplan-
Meier curves were used, again taking RDW.16% as the cut-off
for categorization.
Two-sided p-values less than 0.05 were regarded as statistically
significant. No adjustment for multiplicity was done. The
proportional (sub-)hazards assumption was examined for both
VTE and mortality models by fitting an interaction between each
variable of interest and the natural logarithm of continuous follow-
up time. No evidence for interactions between the study variables
was observed.
Results
Study PopulationTable 1 shows the detailed characteristics of the patients
included in the study (n = 1840; 843 [45.8%] female and 997
male [54.2%]). The median age of the total study population was
62 years (25th–75th percentile: 52–68). A solid tumor was
diagnosed in 1286 (69.9%) patients, 245 patients (13.3%) had a
brain tumor (mainly high grade glioma) and 309 (16.8%) had a
hematological malignancy (lymphoma or multiple myeloma).
Twenty-five healthy individuals (median age: 56 years [25th–75th
percentile: 46–60], 17 [68%] female) from the same geographical
region served as controls.
Thromboembolic events and death during theobservation period
During a median follow-up time of 706 (95% CI: 653–730)
days, 131 (7.1%) patients developed VTE and 702 (38.2%) died.
Detailed characteristics of these patients are listed in table 1.
Overall, 53 patients had an isolated DVT of the lower extremity,
53 an isolated PE, 7 a combined DVT of the lower extremity and
PE; 4 patients each had a thrombosis of either the portal vein or
the jugular vein; 6 patients had an isolated DVT of the upper
extremity, and 1 patient each had a sinus vein thrombosis,
combined DVT of the lower extremity and portal vein thrombosis,
combined PE and DVT of the upper extremity or a thrombosis of
the inferior caval vein. In 4 cases PE was fatal (3.1% of VTE
events).
The cumulative probability of VTE in the total study
population was 5.3% after 6 months, 6.5% after one year and
7.4% after two years. The cumulative probability of survival was
87.7% after 6 months, 74.2% after one year and 58% after two
years.
Distribution of RDW and other RBC parameters in thetotal study population
Median RDW (%) of the total study cohort was 13.8 (25th–75th
percentile: 13.1–14.6). RDW levels differed significantly between
the various groups of different tumor types (p,0.001). The highest
median RDW values were observed in patients with colorectal
(14.2 [13.4–15.3]) and gastric cancer (14.2 [13.6–15.2]). Patients
with solid tumors and distant metastasis had a significantly higher
median RDW than those with localized solid tumors (14.1 [13.3–
15.1] vs. 13.6 [13–14.2], p,0.001). Distribution of RDW and
other RBC parameters in our study population is indicated in
Table 1.
There was a weak to moderate correlation between RDW and
the other RBC parameters measured by CBC: hemoglobin (r = 2
0.41, p,0.001), erythrocyte count (r = 20.18, p,0.001), hemat-
ocrit (r = 20.33, p,0.001), mean corpuscular volume (MCV; r =
20.23, p,0.001), mean corpuscular hemoglobin (MCH; r = 2
0.40, p,0.001) and mean corpuscular hemoglobin concentration
(MCHC; r = 20.47, p,0.001). Furthermore, the correlation
between RDW and CRP was analyzed. Data about CRP levels
were available from 1533 study patients (83% of the total study
population). A weak correlation between RDW and CRP was
observed (r = 0.213, p,0.001).
In total, 188 patients (10.22% of the total study cohort) had a
RDW above the upper reference range of our hospitals routine
laboratory (.16%). The 188 patients with RDW.16% also had
lower median hemoglobin levels, lower median hematocrit and a
Figure 1. Cumulative incidence of venous thromboembolism(VTE), accounting for competing risk (death of any cause) inthe total study cohort, grouped into patients with red celldistribution width (RDW).16% and below (#16%), respective-ly. In competing risk analysis (accounting for death of any cause), theprobability of VTE was not significantly different between patients withhigh RDW (.16%) and patients with non-elevated RDW (Gray’s testp = 0.267). Numbers in parentheses indicate numbers of VTE events inthe respective group and time period.doi:10.1371/journal.pone.0111440.g001
Red Blood Cell Parameters and Risk of Venous Thromboembolism in Cancer
PLOS ONE | www.plosone.org 6 October 2014 | Volume 9 | Issue 10 | e111440

Ta
ble
3.
Re
db
loo
dce
llp
aram
ete
rsan
dri
sko
fV
TE
inp
atie
nts
wit
hso
lidtu
mo
rs(n
=1
28
6).
Sig
nif
ican
tre
sult
sar
eh
igh
ligh
ted
inb
old
.
NU
niv
ari
ab
leH
R(9
5%
CI)
p–v
alu
e
Mo
de
l1
Mu
ltiv
ari
ab
leH
R(9
5%
CI)
p-v
alu
e
Mo
de
l2
Mu
ltiv
ari
ab
leH
R(9
5%
CI)
p-v
alu
e
Mo
de
l3
Mu
ltiv
ari
ab
leH
R(9
5%
CI)
p-v
alu
e
Mo
de
l4
Mu
ltiv
ari
ab
leH
R(9
5%
CI)
p-v
alu
e
RD
W(%
)p
er
1%
incr
ea
se1
28
61
.07
(0.9
6–
1.1
9)
0.25
01
.07
(0.9
6–
1.1
9)
0.22
81
.06
(0.9
4–
1.1
8)
0.35
61
.04
(0.9
3–
1.1
6)
0.52
21
.02
(0.8
9–
1.1
7)
0.76
6
RD
W.
16
12
31
.80
(0.9
9–
3.2
6)
0.0
53
1.8
2(0
.99
–3
.32
)0
.05
31
.70
(0.9
1–
3.1
9)
0.09
71
.57
(0.8
3–
2.9
4)
0.16
41
.57
(0.8
1–
3.0
4)
0.18
2
RD
W#
16
11
63
1.0
0(R
efe
ren
ce)
N/A
1.0
0(R
efe
ren
ce)
N/A
1.0
0(R
efe
ren
ce)
N/A
1.0
0(R
efe
ren
ce)
N/A
1.0
0(R
efe
ren
ce)
N/A
1s
tq
ua
rtil
e(,
13
.2)
32
81
.00
(Re
fere
nce
)N
/A1
.00
(Re
fere
nce
)N
/A1
.00
(Re
fere
nce
)N
/A1
.00
(Re
fere
nce
)N
/A1
.00
(Re
fere
nce
)N
/A
2n
dq
ua
rtil
e(1
3.2
–1
3.7
)3
16
0.5
2(0
.27
–1
.02
)0.
056
0.5
3(0
.27
–1
.03
)0.
060
0.5
2(0
.27
–1
.02
)0.
056
0.5
1(0
.26
–0
.97
)0.
040
0.5
2(0
.27
–1
.02
)0.
058
3rd
qu
art
ile
(13
.8–
14
.5)
32
10
.84
(0.4
7–
1.5
1)
0.56
40
.86
(0.4
8–
1.5
2)
0.59
70
.84
(0.4
7–
1.4
9)
0.55
30
.94
(0.5
3–
1.6
6)
0.82
10
.82
(0.4
6–
1.4
6)
0.49
7
4th
qu
art
ile
(.1
4.5
)3
21
1.0
1(0
.58
–1
.75
)0.
978
1.0
2(0
.58
–1
.79
)0.
934
0.9
5(0
.54
–1
.67
)0.
865
0.8
8(0
.48
–1
.62
)0.
687
0.8
5(0
.46
–1
.56
)0.
599
Ery
thro
cyte
s(T
/l)
pe
r1
T/l
incr
ea
se1
28
60
.97
(0.6
1–
1.5
3)
0.88
00
.91
(0.5
8–
1.4
4)
0.69
60
.97
(0.6
1–
1.5
4)
0.89
11
.03
(0.6
3–
1.6
8)
0.91
01
.49
(0.7
7–
2.8
7)
0.23
7
1s
tq
ua
rtil
e(,
4.2
)4
15
1.0
0(R
efe
ren
ce)
N/A
1.0
0(R
efe
ren
ce)
N/A
1.0
0(R
efe
ren
ce)
N/A
1.0
0(R
efe
ren
ce)
N/A
1.0
0(R
efe
ren
ce)
N/A
2n
dq
ua
rtil
e(4
.2–
4.4
)3
11
1.5
2(0
.88
–2
.64
)0.
132
1.5
1(0
.87
–2
.61
)0.
144
1.5
4(0
.89
–2
.67
)0.
125
1.4
4(0
.80
–2
.60
)0.
226
1.9
5(1
.08
–3
.51
)0.
026
3rd
qu
art
ile
(4.5
–4
.7)
31
40
.99
(0.5
4–
1.8
2)
0.96
60
.95
(0.5
2–
1.7
5)
0.87
91
.01
(0.5
4–
1.8
7)
0.98
51
.05
(0.5
3–
2.0
8)
0.88
01
.44
(0.7
5–
2.7
8)
0.27
3
4th
qu
art
ile
(.4
.7)
24
61
.04
(0.5
5–
1.9
9)
0.89
80
.95
(0.4
9–
1.8
4)
0.88
91
.02
(0.5
2–
1.9
9)
0.95
81
.06
(0.5
1–
2.2
1)
0.86
81
.78
(0.8
2–
3.8
5)
0.14
4
He
ma
tocr
it(%
)p
er
1%
incr
ea
se1
28
60
.97
(0.9
3–
1.0
2)
0.30
80
.97
(0.9
3–
1.0
2)
0.22
80
.98
(0.9
3–
1.0
3)
0.38
10
.99
(0.9
4–
1.0
4)
0.59
11
.02
(0.9
8–
1.0
7)
0.33
7
1s
tq
ua
rtil
e(,
35
.8)
33
11
.00
(Re
fere
nce
)N
/A1
.00
(Re
fere
nce
)N
/A1
.00
(Re
fere
nce
)N
/A1
.00
(Re
fere
nce
)N
/A1
.00
(Re
fere
nce
)N
/A
2n
dq
ua
rtil
e(3
5.8
–3
8.9
)3
23
0.6
1(0
.34
–1
.12
)0.
112
0.6
1(0
.33
–1
.12
)0.
111
0.6
3(0
.34
-1.1
7)
0.14
10
.75
(0.3
9–
1.4
5)
0.39
50
.71
(0.3
3–
1.5
4)
0.39
2
3rd
qu
art
ile
(39
.0–
41
.4)
31
10
.75
(0.4
3–
1.3
4)
0.33
70
.74
(0.4
2–
1.3
3)
0.31
90
.79
(0.4
3–
1.4
4)
0.44
50
.85
(0.4
4–
1.6
5)
0.62
80
.94
(0.3
7–
2.3
7)
0.89
9
4th
qu
art
ile
(.4
1.4
)3
21
0.6
8(0
.38
–1
.22
)0.
195
0.6
4(0
.36
–1
.14
)0.
128
0.6
9(0
.38
–1
.27
)0.
233
0.8
1(0
.42
–1
.55
)0.
519
0.9
4(0
.31
–2
.83
)0.
905
He
mo
glo
bin
(g/d
l)p
er
1g
/dl
incr
ea
se1
28
60
.91
(0.8
0–
1.0
4)
0.16
50
.90
(0.7
9–
1.0
2)
0.10
30
.91
(0.8
0–
1.0
5)
0.19
80
.94
(0.8
1–
1.0
8)
0.39
00
.92
(0.8
1–
1.0
5)
0.22
8
1s
tq
ua
rtil
e(,
11
.9)
34
31
.00
(Re
fere
nce
)N
/A1
.00
(Re
fere
nce
)N
/A1
.00
(Re
fere
nce
)N
/A1
.00
(Re
fere
nce
)N
/A1
.00
(Re
fere
nce
)N
/A
2n
dq
ua
rtil
e(1
1.9
–1
3.1
)3
19
0.5
4(0
.30
–0
.99
)0
.04
70
.54
(0.2
9–
0.9
9)
0.0
47
0.5
5(0
.30
–1
.02
)0.
058
0.6
9(0
.37
–1
.29
)0.
247
0.5
3(0
.23
–1
.21
)0.
129
3rd
qu
art
ile
(13
.2–
14
.1)
31
30
.62
(0.3
4–
1.1
0)
0.10
10
.59
(0.3
3–
1.0
7)
0.08
30
.63
(0.3
4–
1.1
6)
0.13
90
.72
(0.3
8–
1.3
7)
0.32
10
.58
(0.2
1–
1.6
2)
0.29
9
4th
qu
art
ile
( .1
4.1
)3
11
0.6
6(0
.37
–1
.16
)0.
147
0.6
1(0
.35
–1
.08
)0.
090
0.6
6(0
.36
–1
.18
)0.
162
0.7
3(0
.37
–1
.42
)0.
352
0.6
0(0
.15
–2
.34
)0.
463
MC
V(f
l)p
er
1fl
incr
ea
se1
28
60
.98
(0.9
6–
1.0
0)
0.0
22
0.9
8(0
.96
–1
.00
)0
.03
20
.98
(0.9
6–
1.0
0)
0.0
40
0.9
8(0
.96
–1
.00
)0.
078
0.9
8(0
.96
–1
.01
)0.
140
Red Blood Cell Parameters and Risk of Venous Thromboembolism in Cancer
PLOS ONE | www.plosone.org 7 October 2014 | Volume 9 | Issue 10 | e111440

Ta
ble
3.
Co
nt.
NU
niv
ari
ab
leH
R(9
5%
CI)
p–v
alu
e
Mo
de
l1
Mu
ltiv
ari
ab
leH
R(9
5%
CI)
p-v
alu
e
Mo
de
l2
Mu
ltiv
ari
ab
leH
R(9
5%
CI)
p-v
alu
e
Mo
de
l3
Mu
ltiv
ari
ab
leH
R(9
5%
CI)
p-v
alu
e
Mo
de
l4
Mu
ltiv
ari
ab
leH
R(9
5%
CI)
p-v
alu
e
1s
tq
ua
rtil
e(,
85
.5)
32
31
.00
(Re
fere
nce
)N
/A1
.00
(Re
fere
nce
)N
/A1
.00
(Re
fere
nce
)N
/A1
.00
(Re
fere
nce
)N
/A1
.00
(Re
fere
nce
)N
/A
2n
dq
ua
rtil
e(8
5.5
–8
8.6
)3
30
1.1
0(0
.64
–1
.88
)0.
732
1.1
2(0
.65
–1
.94
)0.
680
1.1
5(0
.67
–1
.99
)0.
609
1.2
6(0
.74
–2
.17
)0.
396
1.2
0(0
.71
–2
.03
)0.
491
3rd
qu
art
ile
(88
.7–
91
.7)
31
60
.72
(0.3
9–
1.3
2)
0.29
00
.75
(0.4
0–
1.3
9)
0.35
90
.79
(0.4
3–
1.4
7)
0.45
50
.71
(0.3
7–
1.3
3)
0.28
40
.80
(0.4
3–
1.4
9)
0.48
4
4th
qu
art
ile
( .9
1.7
)3
17
0.5
2(0
.27
–1
.02
)0.
056
0.5
4(0
.27
–1
.05
)0.
071
0.5
5(0
.28
–1
.08
)0.
083
0.6
0(0
.30
–1
.20
)0.
149
0.5
9(0
.30
–1
.16
)0.
128
MC
H(p
g)
pe
r1
pg
incr
ea
se1
28
60
.92
(0.8
5–
1.0
0)
0.0
44
0.9
2(0
.85
–1
.00
)0
.04
70
.93
(0.8
5–
1.0
1)
0.07
20
.94
(0.8
6–
1.0
2)
0.15
20
.95
(0.8
6–
1.0
4)
0.26
0
1s
tq
ua
rtil
e(,
28
.7)
33
61
.00
(Re
fere
nce
)N
/A1
.00
(Re
fere
nce
)N
/A1
.00
(Re
fere
nce
)N
/A1
.00
(Re
fere
nce
)N
/A1
.00
(Re
fere
nce
)N
/A
2n
dq
ua
rtil
e(2
8.8
–2
9.9
)3
17
0.9
1(0
.52
–1
.62
)0.
759
0.9
3(0
.52
–1
.66
)0.
807
0.9
7(0
.54
–1
.75
)0.
916
1.0
5(0
.59
–1
.89
)0.
864
1.0
4(0
.59
–1
.84
)0.
899
3rd
qu
art
ile
(30
.0–
31
.0)
31
71
.04
(0.6
0–
1.8
1)
0.89
41
.05
(0.6
0–
1.8
3)
0.87
01
.10
(0.6
3–
1.9
4)
0.73
51
.14
(0.6
4–
2.0
1)
0.65
61
.21
(0.6
6–
2.2
2)
0.53
0
4th
qu
art
ile
(.3
1.0
)3
16
0.4
9(0
.25
–0
.99
)0
.04
60
.49
(0.2
5–
0.9
9)
0.0
46
0.5
2(0
.26
–1
.05
)0.
067
0.5
4(0
.26
–1
.12
)0.
097
0.6
0(0
.28
–1
.26
)0.
177
MC
HC
(g/d
l)p
er
1g
/dl
incr
ea
se1
28
60
.92
(0.7
6–
1.1
2)
0.40
80
.91
(0.7
5–
1.1
0)
0.31
90
.92
(0.7
6–
1.1
1)
0.40
30
.96
(0.7
9–
1.1
7)
0.68
31
.01
(0.8
1–
1.2
5)
0.94
9
1s
tq
ua
rtil
e(,
33
.0)
33
21
.00
(Re
fere
nce
)N
/A1
.00
(Re
fere
nce
)N
/A1
.00
(Re
fere
nce
)N
/A1
.00
(Re
fere
nce
)N
/A1
.00
(Re
fere
nce
)N
/A
2n
dq
ua
rtil
e(3
3.0
–3
3.7
)3
31
1.0
4(0
.57
–1
.89
)0.
889
1.0
5(0
.57
–1
.93
)0.
869
1.1
0(0
.59
–2
.03
)0.
765
1.2
8(0
.70
–2
.31
)0.
421
1.3
0(0
.71
–2
.39
)0.
399
3rd
qu
art
ile
(33
.8–
34
.4)
32
21
.13
(0.6
2–
2.0
4)
0.69
11
.11
(0.6
1–
2.0
2)
0.74
31
.15
(0.6
2–
2.1
1)
0.66
11
.18
(0.6
2–
2.2
5)
0.61
01
.49
(0.7
8–
2.8
5)
0.22
5
4th
qu
art
ile
(.3
4.4
)3
01
0.9
3(0
.49
–1
.74
)0.
816
0.8
8(0
.47
–1
.66
)0.
701
0.9
2(0
.49
–1
.73
)0.
800
1.0
4(0
.53
–2
.04
)0.
902
1.3
1(0
.65
–2
.63
)0.
445
Mo
del
1:ad
just
ed
for
age
and
sex;
Mo
del
2:ad
just
ed
for
age
,se
xan
dtu
mo
rg
rou
p(l
oca
lize
dso
lidtu
mo
rvs
.so
lidtu
mo
rw
ith
dis
tan
tm
eta
stas
isvs
.n
on
-cla
ssif
iab
le[b
rain
tum
or
or
he
mat
olo
gic
alm
alig
nan
cy])
;M
od
el3:
adju
ste
dfo
rag
e,
sex
and
use
of
ESA
;M
od
el4:
adju
ste
dfo
rag
e,
sex,
he
mo
glo
bin
leve
l,le
uko
cyte
cou
nt
and
pla
tele
tco
un
t.A
bb
revi
ati
on
s:SH
R=
sub
haz
ard
rati
o,
CI=
con
fid
en
cein
terv
al,
RD
W=
red
cell
dis
trib
uti
on
wid
th,
MC
V=
me
anco
rpu
scu
lar
volu
me
,M
CH
=m
ean
corp
usc
ula
rh
em
og
lob
in,
MC
HC
=m
ean
corp
usc
ula
rh
em
og
lob
inco
nce
ntr
atio
n,
ESA
=e
ryth
rop
oie
sis-
stim
ula
tin
gag
en
t.d
oi:1
0.1
37
1/j
ou
rnal
.po
ne
.01
11
44
0.t
00
3
Red Blood Cell Parameters and Risk of Venous Thromboembolism in Cancer
PLOS ONE | www.plosone.org 8 October 2014 | Volume 9 | Issue 10 | e111440

lower erythrocyte count compared to patients with normal RDW
levels. Detailed numbers can be found in Table S1. Moreover,
patients with RDW.16% were more frequently taking ESAs and
iron supplementary therapy in comparison to patients who had
lower RDW levels (ESAs: 20 [10.6%] vs. 34 [2.1%]; p,0.001;
iron supplementary therapy: 12 [6.4%] vs. 12 [0.7%]; p,0.001).
Cancer patients had significantly higher RDW levels compared
to healthy controls (median RDW: 13.8 [25th–75th Percentile:
13.1–14.6] vs. 13.0 [12.5–13.4], p,0.001).
RDW, other RBC parameters and risk of VTE in the totalstudy cohort
The association between RDW or other RBC parameters and
risk of VTE was calculated using proportional subdistribution
hazards models (applying competing risk analysis) in order to
adjust for death as a competing factor for occurrence of VTE. The
univariable subhazard ratio (SHR) for occurrence of VTE was
1.03 (95% CI: 0.94–1.14, p = 0.478) per 1% increase in RDW.
Patients were divided into 2 groups to compare patients with
high RDW (cut-off value was set at.16%, which is the upper limit
of the reference range for RDW [reference range: 11%–16%] in
our hospital’s routine laboratory) to those with a lower RDW (#
16%). Patients with high RDW (n = 188, 10.2% of the total study
population) had a similar risk of developing VTE as patients with
lower RDW; the univariable SHR was 1.34 (95% CI: 0.80–2.23,
p = 0.269). In different multivariable analyses, including the
variables age and sex, tumor group (localized solid tumor vs.
solid tumor with distant metastasis vs. non-classifiable [brain
tumor or hematological malignancy]), use of ESA (during the time
period of one month before until 3 months after entry into the
study), hemoglobin level, leukocyte count, platelet count also no
significant association between high RDW and increased risk of
VTE was observed (data are shown in table 2). In patients with
high RDW, the cumulative probability of VTE was 7.5% after
6 months, 8.7% after one year and 9.3% after two years in
comparison to patients with a lower RDW with a probability of
5.0% after 6 months, 6.2% after one year and 7.2% after two
years in those patients who had a lower RDW (Gray’s test
p = 0.267; Figure 1).
Furthermore, also the association between other RBC param-
eters (erythrocyte count, hematocrit, hemoglobin, MCV, MCH,
MCHC) and risk of VTE was analyzed. We did not observe a
significant association between these parameters and risk of VTE,
neither when analyzed as continuous variables nor when analyzed
as categorized variables according to quartiles of the respective
parameter in the total study population (Table 2). Since low
hemoglobin was found to be a risk factor for VTE in previous
studies and was incorporated into the Khorana-Score [15], we
divided patients into two groups, according to their hemoglobin
levels (based on the Khorana-Score the cut-off was set at ,10 g/
dl). Also in this analysis, hemoglobin levels were not associated
with risk of VTE (data are not shown, but can be provided upon
request).
RDW, other RBC parameters and risk of VTE in subgroupsof cancer patients
As our study population consists of a very heterogeneous group
of patients with different cancer sites, including hematological
malignancies or brain tumors, we conducted a subgroup analysis
of patients with solid tumors only. In this subgroup high RDW was
associated with an 80% increase in risk of VTE compared to lower
RDW (SHR [95% CI]: 1.80 [0.99–3.26], p = 0.053). However, in
multivariable analyses (adjusting for the same variables as in our
analyses conducted in the total study cohort) we did not observe a
significant association between RDW and risk of VTE (data are
shown in table 3). The cumulative probability of VTE in patients
with high RDW was 8.3% after 6 months, 10.0% after one year
and 11.0% after two years in comparison to 4.5%, 5.5% and
6.4%, respectively in those patients who had a lower RDW (Gray’s
test p = 0.051; Figure 2).
Increasing levels of hemoglobin, MCV and MCH were
associated with a reduced risk of VTE in univariable and also in
some multivariable analyses. However, these associations did not
remain statistically significant after adjustment for tumor group or
Figure 2. Cumulative incidence of venous thromboembolism(VTE), accounting for competing risk (death of any cause) inpatients with solid tumors, grouped into patients with red celldistribution width (RDW).16% and below (#16%), respective-ly. The probability of VTE was higher in patients with high RDW (.16%)compared to patients with lower RDW (Gray’s test p = 0.051). Numbersin parentheses indicate numbers of VTE events in the respective groupand time period.doi:10.1371/journal.pone.0111440.g002
Figure 3. Kaplan-Meier estimates for cumulative survivalprobability of cancer patients (total study cohort) with redblood cell distribution width (RDW).16% and below (#16%),respectively. Survival rates were significantly lower in patients withhigh RDW in comparison to those with a non-elevated RDW (p,0.001).Numbers in parentheses indicate numbers of deaths in the respectivegroup and time period.doi:10.1371/journal.pone.0111440.g003
Red Blood Cell Parameters and Risk of Venous Thromboembolism in Cancer
PLOS ONE | www.plosone.org 9 October 2014 | Volume 9 | Issue 10 | e111440

Ta
ble
4.
Re
db
loo
dce
llp
aram
ete
rsan
dri
sko
fm
ort
alit
yin
the
tota
lst
ud
yco
ho
rt(n
=1
84
0).
Sig
nif
ican
tre
sult
sar
eh
igh
ligh
ted
inb
old
.
NU
niv
ari
ab
leH
R(9
5%
CI)
p-v
alu
e
Mo
de
l1
Mu
ltiv
ari
ab
leH
R(9
5%
CI)
p-v
alu
e
Mo
de
l2
Mu
ltiv
ari
ab
leH
R(9
5%
CI)
p-v
alu
e
Mo
de
l3
Mu
ltiv
ari
ab
leH
R(9
5%
CI)
p-v
alu
e
Mo
de
l4
Mu
ltiv
ari
ab
leH
R(9
5%
CI)
p-v
alu
e
RD
W(%
)p
er
1%
incr
ea
se1
84
01
.11
(1.0
8–
1.1
5)
,0
.00
11
.10
(1.0
6–
1.1
4)
,0
.00
11
.05
(1.0
1–
1.0
9)
0.0
18
1.0
8(1
.04
–1
.13
),
0.0
01
1.0
4(0
.99
–1
.08
)0
.09
7
RD
W.
16
18
81
.72
(1.3
9–
2.1
2)
,0
.00
11
.59
(1.2
9–
1.9
7)
,0
.00
11
.27
(1.0
3–
1.5
8)
0.0
27
1.5
1(1
.22
–1
.87
),
0.0
01
1.3
4(1
.06
–1
.70
)0
.01
6
RD
W#
16
16
52
1.0
0(R
efe
ren
ce)
N/A
1.0
0(R
efe
ren
ce)
N/A
1.0
0(R
efe
ren
ce)
N/A
1.0
0(R
efe
ren
ce)
N/A
1.0
0(R
efe
ren
ce)
N/A
1s
tq
ua
rtil
e( ,
13
.2)
47
61
.00
(Re
fere
nce
)N
/A1
.00
(Re
fere
nce
)N
/A1
.00
(Re
fere
nce
)N
/A1
.00
(Re
fere
nce
)N
/A1
.00
(Re
fere
nce
)N
/A
2n
dq
ua
rtil
e(1
3.2
–1
3.8
)4
75
0.9
9(0
.79
–1
.25
)0.
950
0.9
5(0
.75
–1
.20
)0.
654
0.9
0(0
.71
–1
.13
)0.
360
0.9
5(0
.76
–1
.20
)0.
685
0.9
7(0
.77
–1
.23
)0
.82
7
3rd
qu
art
ile
(13
.9–
14
.6)
43
11
.61
(1.2
9–
2.0
0)
,0
.00
11
.48
(1.1
9–
1.8
4)
0.0
01
1.3
2(1
.06
–1
.65
)0
.01
31
.47
(1.1
8–
1.8
3)
0.0
01
1.5
5(1
.24
–1
.93
),
0.0
01
4th
qu
art
ile
(.1
4.6
)4
58
1.9
0(1
.54
–2
.35
),
0.0
01
1.7
2(1
.39
–2
.13
),
0.0
01
1.3
6(1
.09
–1
.69
)0
.00
61
.65
(1.3
3–
2.0
5)
,0
.00
11
.62
(1.2
8–
2.0
5)
,0
.00
1
Ery
thro
cyte
s(T
/l)
pe
r1
T/l
incr
ea
se1
84
00
.66
(0.5
7–
0.7
5)
,0
.00
10
.66
(0.5
8–
0.7
5)
,0
.00
10
.70
(0.6
1–
0.8
1)
,0
.00
10
.69
(0.6
0–
0.7
9)
,0
.00
10
.75
(0.6
0–
0.9
5)
0.0
15
1s
tq
ua
rtil
e(,
4.1
)4
78
1.0
0(R
efe
ren
ce)
N/A
1.0
0(R
efe
ren
ce)
N/A
1.0
0(R
efe
ren
ce)
N/A
1.0
0(R
efe
ren
ce)
N/A
1.0
0(R
efe
ren
ce)
N/A
2n
dq
ua
rtil
e(4
.1–
4.4
)5
48
0.7
6(0
.63
–0
.91
)0
.00
40
.78
(0.6
5–
0.9
4)
0.0
09
0.8
0(0
.67
–0
.97
)0
.02
20
.80
(0.6
7–
0.9
7)
0.0
23
0.8
5(0
.69
–1
.05
)0
.13
1
3rd
qu
art
ile
(4.5
–4
.7)
44
30
.55
(0.4
5–
0.6
8)
,0
.00
10
.56
(0.4
5–
0.6
9)
,0
.00
10
.63
(0.5
1–
0.7
8)
,0
.00
10
.58
(0.4
7–
0.7
2)
,0
.00
10
.67
(0.5
2–
0.8
8)
0.0
04
4th
qu
art
ile
(.4
.7)
37
10
.58
(0.4
6–
0.7
2)
,0
.00
10
.57
(0.4
5–
0.7
1)
,0
.00
10
.65
(0.5
2–
0.8
2)
,0
.00
10
.59
(0.4
7–
0.7
4)
,0
.00
10
.77
(0.5
6–
1.0
4)
0.0
90
He
ma
tocr
it(%
)p
er
1%
incr
ea
se1
84
00
.95
(0.9
4–
0.9
6)
,0
.00
10
.95
(0.9
4–
0.9
6)
,0
.00
10
.96
(0.9
5–
0.9
8)
,0
.00
10
.95
(0.9
4–
0.9
7)
,0
.00
10
.96
(0.9
3–
0.9
9)
0.0
15
1s
tq
ua
rtil
e(,
35
.6)
46
31
.00
(Re
fere
nce
)N
/A1
.00
(Re
fere
nce
)N
/A1
.00
(Re
fere
nce
)N
/A1
.00
(Re
fere
nce
)N
/A1
.00
(Re
fere
nce
)N
/A
2n
dq
ua
rtil
e(3
5.6
–3
8.9
)4
58
0.8
2(0
.67
–0
.99
)0
.03
80
.86
(0.7
1–
1.0
4)
0.12
70
.89
(0.7
3–
1.0
8)
0.23
00
.91
(0.7
4–
1.1
0)
0.32
30
.85
(0.6
6–
1.1
1)
0.2
30
3rd
qu
art
ile
(39
.0–
41
.5)
47
10
.55
(0.4
5–
0.6
8)
,0
.00
10
.57
(0.4
7–
0.7
1)
,0
.00
10
.70
(0.5
6–
0.8
6)
0.0
01
0.6
1(0
.49
–0
.75
),
0.0
01
0.6
0(0
.43
–0
.83
)0
.00
2
4th
qu
art
ile
(.4
1.5
)4
48
0.5
2(0
.42
–0
.64
),
0.0
01
0.5
0(0
.41
–0
.63
),
0.0
01
0.6
2(0
.50
–0
.78
),
0.0
01
0.5
3(0
.43
–0
.66
),
0.0
01
0.5
8(0
.38
–0
.89
)0
.01
2
He
mo
glo
bin
(g/d
l)p
er
1g
/dl
incr
ea
se1
84
00
.88
(0.8
4–
0.9
1)
,0
.00
10
.88
(0.8
4–
0.9
1)
,0
.00
10
.91
(0.8
7–
0.9
5)
,0
.00
10
.89
(0.8
5–
0.9
2)
,0
.00
10
.88
(0.8
5–
0.9
2)
,0
.00
1
1s
tq
ua
rtil
e(,
12
.0)
47
21
.00
(Re
fere
nce
)N
/A1
.00
(Re
fere
nce
)N
/A1
.00
(Re
fere
nce
)N
/A1
.00
(Re
fere
nce
)N
/A1
.00
(Re
fere
nce
)N
/A
2n
dq
ua
rtil
e(1
2.0
–1
3.0
)4
87
0.7
9(0
.65
–0
.95
)0.
013
0.8
4(0
.70
–1
.02
)0.
077
0.8
8(0
.72
–1
.06
)0.
175
0.8
9(0
.73
–1
.08
)0.
236
0.8
5(0
.64
–1
.12
)0
.24
4
3rd
qu
art
ile
(13
.1–
14
.0)
45
00
.51
(0.4
1–
0.6
3)
,0
.00
10
.53
(0.4
3–
0.6
6)
,0
.00
10
.65
(0.5
2–
0.8
0)
,0
.00
10
.56
(0.4
5–
0.7
0)
,0
.00
10
.58
(0.3
9–
0.8
4)
0.0
05
4th
qu
art
ile
(.1
4.0
)4
31
0.5
5(0
.45
–0
.68
),
0.0
01
0.5
4(0
.43
–0
.67
),
0.0
01
0.7
0(0
.56
–0
.87
)0
.00
20
.57
(0.4
6–
0.7
1)
,0
.00
10
.66
(0.4
0–
1.0
7)
0.0
94
MC
V(f
l)p
er
1fl
incr
ea
se1
84
01
.00
(0.9
9–
1.0
1)
0.52
50
.99
(0.9
8–
1.0
1)
0.30
31
.00
(0.9
9–
1.0
1)
0.90
01
.00
(0.9
9–
1.0
1)
0.44
61
.01
(1.0
0–
1.0
2)
0.1
62
Red Blood Cell Parameters and Risk of Venous Thromboembolism in Cancer
PLOS ONE | www.plosone.org 10 October 2014 | Volume 9 | Issue 10 | e111440

Ta
ble
4.
Co
nt.
NU
niv
ari
ab
leH
R(9
5%
CI)
p-v
alu
e
Mo
de
l1
Mu
ltiv
ari
ab
leH
R(9
5%
CI)
p-v
alu
e
Mo
de
l2
Mu
ltiv
ari
ab
leH
R(9
5%
CI)
p-v
alu
e
Mo
de
l3
Mu
ltiv
ari
ab
leH
R(9
5%
CI)
p-v
alu
e
Mo
de
l4
Mu
ltiv
ari
ab
leH
R(9
5%
CI)
p-v
alu
e
1s
tq
ua
rtil
e(,
85
.4)
46
61
.00
(Re
fere
nce
)N
/A1
.00
(Re
fere
nce
)N
/A1
.00
(Re
fere
nce
)N
/A1
.00
(Re
fere
nce
)N
/A1
.00
(Re
fere
nce
)N
/A
2n
dq
ua
rtil
e(8
5.4
–8
8.5
)4
65
0.9
4(0
.76
–1
.15
)0.
529
0.9
1(0
.74
–1
.12
)0.
390
1.0
4(0
.84
–1
.27
)0.
731
0.9
6(0
.78
–1
.19
)0.
718
1.1
3(0
.91
–1
.40
)0
.26
5
3rd
qu
art
ile
(88
.6–
91
.5)
45
10
.82
(0.6
7–
1.0
2)
0.07
20
.79
(0.6
4–
0.9
8)
0.03
20
.96
(0.7
7–
1.1
8)
0.68
00
.83
(0.6
7–
1.0
2)
0.08
21
.00
(0.8
0–
1.2
4)
0.9
81
4th
qu
art
ile
(.9
1.5
)4
58
0.9
0(0
.73
–1
.11
)0.
320
0.8
5(0
.69
–1
.05
)0.
133
0.9
7(0
.79
–1
.19
)0.
752
0.8
8(0
.71
–1
.08
)0.
222
1.0
8(0
.87
–1
.34
)0
.48
9
MC
H(p
g)
pe
r1
pg
incr
ea
se1
84
00
.97
(0.9
5–
1.0
0)
0.06
20
.97
(0.9
4–
1.0
0)
0.0
44
1.0
0(0
.97
–1
.03
)0.
996
0.9
8(0
.95
–1
.01
)0.
109
1.0
2(1
.00
–1
.04
)0
.09
4
1s
tq
ua
rtil
e(,
28
.6)
47
11
.00
(Re
fere
nce
)N
/A1
.00
(Re
fere
nce
)N
/A1
.00
(Re
fere
nce
)N
/A1
.00
(Re
fere
nce
)N
/A1
.00
(Re
fere
nce
)N
/A
2n
dq
ua
rtil
e(2
8.6
–2
9.8
)4
61
0.7
7(0
.62
–0
.94
)0
.01
10
.78
(0.6
3–
0.9
6)
0.0
19
0.9
1(0
.74
–1
.12
)0.
395
0.8
0(0
.65
–0
.99
)0.
040
0.9
5(0
.76
–1
.18
)0
.64
1
3rd
qu
art
ile
(29
.9–
30
.9)
45
00
.78
(0.6
4–
0.9
6)
0.0
18
0.7
7(0
.63
–0
.95
)0
.01
30
.93
(0.7
5–
1.1
4)
0.45
90
.79
(0.6
4–
0.9
7)
0.0
26
1.0
3(0
.82
–1
.29
)0
.78
3
4th
qu
art
ile
(.3
0.9
)4
58
0.7
9(0
.64
–0
.96
)0
.02
00
.77
(0.6
3–
0.9
4)
0.0
12
0.9
6(0
.78
–1
.18
)0.
675
0.7
9(0
.64
–0
.97
)0
.02
31
.04
(0.8
3–
1.3
0)
0.7
23
MC
HC
(g/d
l)p
er
1g
/dl
incr
ea
se1
84
00
.95
(0.9
0–
1.0
1)
0.12
20
.96
(0.9
1–
1.0
2)
0.22
71
.02
(0.9
6–
1.0
8)
0.52
80
.98
(0.9
2–
1.0
4)
0.44
11
.14
(1.0
6–
1.2
2)
,0
.00
1
1s
tq
ua
rtil
e(,
32
.9)
49
61
.00
(Re
fere
nce
)N
/A1
.00
(Re
fere
nce
)N
/A1
.00
(Re
fere
nce
)N
/A1
.00
(Re
fere
nce
)N
/A1
.00
(Re
fere
nce
)N
/A
2n
dq
ua
rtil
e(3
2.9
–3
3.6
)4
91
0.8
0(0
.65
–0
.98
)0
.02
90
.82
(0.6
7–
1.0
0)
0.0
50
0.9
2(0
.75
–1
.12
)0.
393
0.8
3(0
.68
–1
.02
)0.
078
1.0
6(0
.85
–1
.31
)0
.62
8
3rd
qu
art
ile
(33
.7–
34
.3)
43
20
.88
(0.7
2–
1.0
8)
0.22
10
.91
(0.7
4–
1.1
2)
0.36
91
.07
(0.8
7–
1.3
1)
0.53
10
.95
(0.7
7–
1.1
7)
0.63
01
.26
(1.0
0–
1.5
9)
0.0
51
4th
qu
art
ile
(.3
4.3
)4
21
0.8
1(0
.65
–0
.99
)0
.04
40
.82
(0.6
6–
1.0
1)
0.06
20
.97
(0.7
8–
1.2
0)
0.77
80
.84
(0.6
8–
1.0
4)
0.11
11
.24
(0.9
7–
1.5
9)
0.0
83
Mo
del
1:ad
just
ed
for
age
and
sex;
Mo
del
2:ad
just
ed
for
age
,se
xan
dtu
mo
rg
rou
p(l
oca
lize
dso
lidtu
mo
rvs
.so
lidtu
mo
rw
ith
dis
tan
tm
eta
stas
isvs
.n
on
-cla
ssif
iab
le[b
rain
tum
or
or
he
mat
olo
gic
alm
alig
nan
cy])
;M
od
el3:
adju
ste
dfo
rag
e,
sex
and
use
of
ESA
;M
od
el4:
adju
ste
dfo
rag
e,
sex,
he
mo
glo
bin
leve
l,le
uko
cyte
cou
nt
and
pla
tele
tco
un
t.A
bb
revi
ati
on
s:SH
R=
sub
haz
ard
rati
o,
CI=
con
fid
en
cein
terv
al,
RD
W=
red
cell
dis
trib
uti
on
wid
th,
MC
V=
me
anco
rpu
scu
lar
volu
me
,M
CH
=m
ean
corp
usc
ula
rh
em
og
lob
in,
MC
HC
=m
ean
corp
usc
ula
rh
em
og
lob
inco
nce
ntr
atio
n,
ESA
=e
ryth
rop
oie
sis-
stim
ula
tin
gag
en
t.d
oi:1
0.1
37
1/j
ou
rnal
.po
ne
.01
11
44
0.t
00
4
Red Blood Cell Parameters and Risk of Venous Thromboembolism in Cancer
PLOS ONE | www.plosone.org 11 October 2014 | Volume 9 | Issue 10 | e111440

other CBC parameters (hemoglobin, leukocyte count, platelet
count) in multivariable analyses (Table 3). We did not observe a
significant association of erythrocyte count, hematocrit or MCHC
with the risk of VTE, neither when analyzed as continuous
variables nor when analyzed as categorized variables according to
quartiles of the respective parameter (Table 3).
Furthermore, we analyzed RDW and other RBC parameters in
subgroups of patients with different tumor sites (brain, breast, lung,
colon, pancreas or lymphoma [analyses of other tumor sites was
not possible due to the limited number of patients and/or
thrombotic events in these subgroups, respectively]). There was no
significant association between RBC parameters and the risk of
VTE in these subgroups (data are not shown, but can be provided
upon request).
RDW, other RBC parameters and risk of mortality inpatients with cancer
Increasing RDW was associated with a significantly increased
risk of mortality; the hazard ratio (HR) per 1% increase of RDW
was 1.11 (95% CI: 1.08–1.15, p,0.001). For further analyses,
patients were again divided into two groups to compare patients
with high RDW (.16%) to those with non-elevated RDW (#
16%). High RDW was associated with an increased risk of
mortality (HR [95% CI]: 1.72 [1.39–2.12], p,0.001). In
multivariable analyses, adjusted for age, sex, tumor group
(localized solid tumor vs. solid tumor with distant metastasis vs.
non-classifiable [brain tumor or hematological malignancy]), use
of ESA, hemoglobin level, leukocyte count or platelet count, the
impact of RDW on mortality was attenuated. However, in all
multivariable models higher RDW was associated with a
significantly increased risk of mortality (Table 4).
The cumulative probability of survival in patients with high
RDW (.16%) was 78.5% after 6 months, 66.2% after one year
and 41.3% after two years. In comparison, patients with non-
elevated RDW levels had a cumulative survival probability of
88.7% after 6 months, 75.1% after one year and 66.2% after two
years (Log-rank p,0.001; Figure 3).
Associations of other RBC parameters with risk of mortality in
the total study cohort are shown in table 4. Higher levels of
erythrocyte counts, hematocrit, hemoglobin, MCH and MCHC
were associated with a reduced risk of mortality (Table 4).
Discussion
In this prospective, observational cohort study of patients with
various types of cancer we did not observe an independent
association between RDW or other RBC parameters (erythrocyte
count, hematocrit, hemoglobin, MCV, MCH, MCHC) and the
risk of future VTE. As our study population consists of a very
heterogeneous group of cancer patients, including patients with
hematological malignancies and patients with malignant brain
tumors, we conducted a subgroup analysis of solid tumors only. In
this patient group, elevated RDW (.16%) was associated with an
80% higher risk of VTE compared to patients with non-elevated
RDW. However, this association was only borderline significant
and did not prevail after adjustment for age, sex, tumor group, use
of ESA or other parameters of the CBC. Furthermore, higher
levels of hemoglobin, MCV and MCH were associated with a
reduced risk of VTE in patients with solid tumors in some
analyses; however, none of these associations remained statistically
significant in multivariable analyses.
Our findings are in contrast to previous studies, which had
shown that high RDW [8] and also high hematocrit [13] are
associated with an increased risk of VTE in the general
population. However, our results might in fact not be conflicting
after all, since our study cohort consists of patients with cancer and
these patients were either excluded [8] or under-represented (only
23% of VTE events were related to cancer) in the aforementioned
studies [13]. Although reported in previous studies [15], we did
not observe an association between levels of hemoglobin and risk
of cancer-associated VTE. A low hemoglobin level was incorpo-
rated in the Khorana-Score for risk assessment of VTE in patients
with cancer [15]. However, in this score one point is given for the
presence of low hemoglobin levels and/or the use of ESA; and the
use of ESA is known to lead to a high thrombotic risk [22,23]. ESA
were only very rarely used in our study population (only 2.9% of
study patients were using ESA), in contrast to the cohorts on
whom the Khorana-Score was established (in these cohorts almost
one third of patients received ESA), which might in part explain
the discrepancies between the studies. In our study adjustment for
use of ESA did not influence the association of RBC parameters
with VTE risk.
RBCs are major constituents of venous blood clots [24] and
experimental data indicate that they are not only inactive, random
cell material trapped during clotting but might also actively
participate in thrombus formation [25,26]. RBC have an impact
on blood viscosity, they release pro-coagulatory factors and they
can expose phosphatidylserine on their surface and thereby
promote activation of coagulation [25]. However, whether there
is a direct biological link between RBC and VTE or whether
altered RBC parameters represent surrogate markers of concom-
itant conditions associated with risk of VTE, such as inflammation,
is yet unknown [1].
Alterations of RDW are related to reduced RBC survival or
disturbed erythropoiesis. It is known that inflammatory states and
release of inflammatory cytokines, such as tumor necrosis factor
(TNF)-alpha or interleukin-6, disrupt erythropoiesis [27,28].
Therefore, RDW is closely related to a variety of conditions, such
as anemia, inflammation, oxidative stress or malnutrition [12]. As
these conditions are all frequently found in patients with cancer,
we believe that a change in RDW is most probably a weaker risk
factors for VTE in patients with cancer than other parameters that
better reflect specific hypercoagulatory conditions. Cancer patients
represent a group of patients with high VTE risk ranging up to
20% per year [29]. This high thrombotic risk is mediated and
modulated by a multitude of factors, such as tumor biology [30],
cancer spread [31], the presence of varicose veins [32] or different
treatment modalities [33]. Tumor biology itself seems to have a
major influence on risk of VTE, as cancer type, histological
grading and stage of cancer disease have all been found to be risk
factors for cancer-associated VTE [34]. Weak risk factors for VTE
that are found in healthy individuals might therefore only have an
only minor influence on the overall VTE risk in patients with
cancer [35].
As a second finding of our study we confirmed the results of
previous investigations showing that high RDW is associated with
an increased risk of mortality [12]. For each 1% increase in RDW,
the mortality risk increased by 11%. RDW was higher in patients
with solid tumors who had metastases than in those with localized
tumors, a finding that is consistent with a previous report on
patients with lung cancer [6]. To account for this finding we
adjusted for tumor stage in our multivariable model and still an
independent association between high RDW and increased
mortality was observed. Furthermore, consistent with the fact that
anemia is a risk factor for poor prognosis in patients with cancer
[36], in our study we found that increasing levels of erythrocyte
count, hematocrit and hemoglobin were associated with an
improved survival, and all to a similar extent. Underlying
Red Blood Cell Parameters and Risk of Venous Thromboembolism in Cancer
PLOS ONE | www.plosone.org 12 October 2014 | Volume 9 | Issue 10 | e111440

mechanisms that connect anemia and alterations of RBC
parameters to increased mortality are not fully understood.
Dysregulation of erythropoiesis due to oxidative stress and
inflammatory states were proposed to play a role [12], and
proinflammatory cytokines were shown to disrupt erythropoiesis.
CRP is a known predictor of increased mortality [37], however, in
the current study we found only a weak correlation between RDW
and CRP, suggesting that inflammatory states, as measured by
CRP levels, cannot sufficiently explain the association between
RDW and increased mortality.
Some strengths and limitations of our study have to be
addressed. First of all, levels of RDW are instrument-specific
and can differ between laboratories and also populations.
Therefore, the reference values used in our study cannot be
applied to other populations and studies. However, we analyzed
the association of RDW with risk of VTE and mortality using
different cut-off values and RDW also as continuous variable.
Furthermore, blood transfusions can affect RDW, but unfortu-
nately in our study we do not have complete information about
blood transfusions in study patients. However, the vast majority of
study patients (73.5%) entered the study after newly diagnosis of a
cancer disease and before beginning of treatment with chemo-
therapy, and therefore administration of blood transfusions prior
to inclusion into our study that might affect RDW are very likely
limited to a minority of study patients.
A further limitation of our study is the relatively small sample
size and event rate within selected tumor types. We therefore
cannot exclude a more pronounced effect of RDW on risk of VTE
in these subgroups. Another limitation of our study is that we only
recorded symptomatic VTE events, as we did not screen for VTE
and we might therefore underestimate incidence of VTE in our
study. A strength of our study is its prospective and observational
design, which was chosen to specifically investigate risk factors for
the development of VTE in patients with cancer.
In conclusion, the association between RDW and other RBC
parameters and development of VTE in patients with cancer
seems to be weak and not independent of other, already
established risk factors, e.g. dissemination of cancer. We therefore
suggest that RDW and other RBC parameters can rather not be
considered as useful parameters for predicting risk of VTE in
patients with cancer. As VTE is amongst the leading causes of
death in patients with cancer [16], risk prediction of VTE might
potentially be a major clinical benefit for cancer patients in terms
of identifying patients at a very high risk, who might benefit from
primary thromboprophylaxis. Therefore, the identification of
parameters associated with high risk of VTE, especially of
parameters that are readily available in routine praxis and
inexpensive, such as parameters of the CBC, seems very
reasonable. In a risk score published by Khorana et al. a low
hemoglobin level was incorporated as a factor of increased VTE
risk [15]. In contrast, our data suggest that several RBC
parameters of the CBC, including hemoglobin levels, might not
contribute to improved risk stratification of cancer-associated
VTE, as they were not associated with VTE risk. Further studies
are needed to clarify inconsistencies between studies. However, we
could confirm findings of previous studies [12] showing that high
RDW and low hemoglobin levels are significant and independent
predictors of poor survival in patients with cancer and might
therefore be relevant prognostic factors in these patients.
Supporting Information
Table S1 Characteristics of patients with RDW.16%and below.(PDF)
Acknowledgments
We thank Tanja Altreiter (Clinical Division of Haematology and
Haemostaseology, Department of Medicine I, Medical University of
Vienna) for proof-reading this manuscript. We thank the members of the
adjudication committee: Andrea Willfort-Ehringer (Department of Angi-
ology, Medical University of Vienna) and Sylvia Metz-Schimmerl
(Department of Diagnostic Radiology, Medical University of Vienna).
Author Contributions
Conceived and designed the experiments: IP CA. Analyzed the data: JR
FP. Contributed reagents/materials/analysis tools: JR OK FL ER EE CM
IS. Wrote the paper: JR FP OK FL ER EE CM IS CZ IP CA.
References
1. Montagnana M, Cervellin G, Meschi T, Lippi G (2012) The role of red blood
cell distribution width in cardiovascular and thrombotic disorders. Clin Chem
Lab Med 50: 635–641. doi:10.1515/cclm.2011.831.
2. Bessman JD, Gilmer PR Jr, Gardner FH (1983) Improved classification of
anemias by MCV and RDW. Am J Clin Pathol 80: 322–326.
3. Tefferi A, Hanson CA, Inwards DJ (2005) How to interpret and pursue an
abnormal complete blood cell count in adults. Mayo Clin Proc 80: 923–936.
doi:10.4065/80.7.923.
4. Felker GM, Allen LA, Pocock SJ, Shaw LK, McMurray JJV, et al. (2007) Red
cell distribution width as a novel prognostic marker in heart failure: data from
the CHARM Program and the Duke Databank. J Am Coll Cardiol 50: 40–47.
doi:10.1016/j.jacc.2007.02.067.
5. Adamsson Eryd S, Borne Y, Melander O, Persson M, Smith JG, et al. (2014)
Red blood cell distribution width is associated with incidence of atrial fibrillation.
J Intern Med 275: 84–92. doi:10.1111/joim.12143.
6. Koma Y, Onishi A, Matsuoka H, Oda N, Yokota N, et al. (2013) Increased red
blood cell distribution width associates with cancer stage and prognosis in
patients with lung cancer. PLoS ONE 8: e80240. doi:10.1371/journal.-
pone.0080240.
7. Song CS, Park DI, Yoon MY, Seok HS, Park JH, et al. (2012) Association
between red cell distribution width and disease activity in patients with
inflammatory bowel disease. Dig Dis Sci 57: 1033–1038. doi:10.1007/s10620-
011-1978-2.
8. Zoller B, Melander O, Svensson P, Engstrom G (2014) Red cell distribution
width and risk for venous thromboembolism: a population-based cohort study.
Thromb Res 133: 334–339. doi:10.1016/j.thromres.2013.12.013.
9. Rezende SM, Lijfering WM, Rosendaal FR, Cannegieter SC (2014) Hemato-
logic variables and venous thrombosis: red cell distribution width and blood
monocyte count are associated with an increased risk. Haematologica 99: 194–
200. doi:10.3324/haematol.2013.083840.
10. Cay N, Unal O, Kartal MG, Ozdemir M, Tola M (2013) Increased level of red
blood cell distribution width is associated with deep venous thrombosis. Blood
Coagul Fibrinolysis 24: 727–731. doi:10.1097/MBC.0b013e32836261fe.
11. Sen HS, Abakay O, Tanrikulu AC, Sezgi C, Taylan M, et al. (2014) Is a
complete blood cell count useful in determining the prognosis of pulmonary
embolism? Wien Klin Wochenschr. doi:10.1007/s00508-014-0537-1.
12. Patel KV, Semba RD, Ferrucci L, Newman AB, Fried LP, et al. (2010) Red cell
distribution width and mortality in older adults: a meta-analysis. J Geronto-
l A Biol Sci Med Sci 65: 258–265. doi:10.1093/gerona/glp163.
13. Braekkan SK, Mathiesen EB, Njølstad I, Wilsgaard T, Hansen J-B (2010)
Hematocrit and risk of venous thromboembolism in a general population. The
Tromso study. Haematologica 95: 270–275. doi:10.3324/haematol.2009.008417.
14. Eischer L, Tscholl V, Heinze G, Traby L, Kyrle PA, et al. (2012) Hematocrit
and the risk of recurrent venous thrombosis: a prospective cohort study. PLoS
ONE 7: e38705. doi:10.1371/journal.pone.0038705.
15. Khorana AA, Kuderer NM, Culakova E, Lyman GH, Francis CW (2008)
Development and validation of a predictive model for chemotherapy-associated
thrombosis. Blood 111: 4902–4907. doi:10.1182/blood-2007-10-116327.
16. Khorana AA (2010) Venous thromboembolism and prognosis in cancer.
Thrombosis Research 125: 490–493. doi:10.1016/j.thromres.2009.12.023.
17. Ay C, Dunkler D, Marosi C, Chiriac A-L, Vormittag R, et al. (2010) Prediction
of venous thromboembolism in cancer patients. Blood 116: 5377–5382.
doi:10.1182/blood-2010-02-270116.
18. Thaler J, Ay C, Pabinger I (2012) Venous thromboembolism in cancer patients –
Risk scores and recent randomised controlled trials. Thrombosis and
Haemostasis 108: 1042–1048. doi:10.1160/TH12-04-0241.
Red Blood Cell Parameters and Risk of Venous Thromboembolism in Cancer
PLOS ONE | www.plosone.org 13 October 2014 | Volume 9 | Issue 10 | e111440

19. Ay C, Simanek R, Vormittag R, Dunkler D, Alguel G, et al. (2008) High plasma
levels of soluble P-selectin are predictive of venous thromboembolism in cancerpatients: results from the Vienna Cancer and Thrombosis Study (CATS). Blood
112: 2703–2708. doi:10.1182/blood-2008-02-142422.
20. Ay C, Vormittag R, Dunkler D, Simanek R, Chiriac A-L, et al. (2009) D-dimerand prothrombin fragment 1+2 predict venous thromboembolism in patients
with cancer: results from the Vienna Cancer and Thrombosis Study. J ClinOncol 27: 4124–4129. doi:10.1200/JCO.2008.21.7752.
21. Fine JP, Gray RJ (1999) A Proportional Hazards Model for the Subdistribution
of a Competing Risk. Journal of the American Statistical Association 94: 496–509. doi:10.1080/01621459.1999.10474144.
22. Bennett CL, Silver SM, Djulbegovic B, Samaras AT, Blau CA, et al. (2008)Venous thromboembolism and mortality associated with recombinant erythro-
poietin and darbepoetin administration for the treatment of cancer-associatedanemia. JAMA 299: 914–924. doi:10.1001/jama.299.8.914.
23. Gao S, Ma J-J, Lu C (2014) Venous thromboembolism risk and erythropoiesis-
stimulating agents for the treatment of cancer-associated anemia: a meta-analysis. Tumour Biol 35: 603–613. doi:10.1007/s13277-013-1084-5.
24. Sevitt S (1974) The structure and growth of valve-pocket thrombi in femoralveins. J Clin Pathol 27: 517–528.
25. Andrews DA, Low PS (1999) Role of red blood cells in thrombosis. Curr Opin
Hematol 6: 76–82.26. Barr JD, Chauhan AK, Schaeffer GV, Hansen JK, Motto DG (2013) Red blood
cells mediate the onset of thrombosis in the ferric chloride murine model. Blood121: 3733–3741. doi:10.1182/blood-2012-11-468983.
27. Levine B, Kalman J, Mayer L, Fillit HM, Packer M (1990) Elevated circulatinglevels of tumor necrosis factor in severe chronic heart failure. N Engl J Med 323:
236–241. doi:10.1056/NEJM199007263230405.
28. Fornal M, Wizner B, Cwynar M, Krolczyk J, Kwater A, et al. (2013) Associationof red blood cell distribution width, inflammation markers and morphological as
well as rheological erythrocyte parameters with target organ damage inhypertension. Clin Hemorheol Microcirc. doi:10.3233/CH-131745.
29. Horsted F, West J, Grainge MJ (2012) Risk of venous thromboembolism in
patients with cancer: a systematic review and meta-analysis. PLoS Med 9:e1001275. doi:10.1371/journal.pmed.1001275.
30. Ahlbrecht J, Dickmann B, Ay C, Dunkler D, Thaler J, et al. (2012) Tumor grade
is associated with venous thromboembolism in patients with cancer: results fromthe Vienna Cancer and Thrombosis Study. J Clin Oncol 30: 3870–3875.
doi:10.1200/JCO.2011.40.1810.31. Dickmann B, Ahlbrecht J, Ay C, Dunkler D, Thaler J, et al. (2013) Regional
lymph node metastases are a strong risk factor for venous thromboembolism:
results from the Vienna Cancer and Thrombosis Study. Haematologica 98:1309–1314. doi:10.3324/haematol.2012.073338.
32. Konigsbrugge O, Lotsch F, Reitter E-M, Brodowicz T, Zielinski C, et al. (2013)Presence of varicose veins in cancer patients increases the risk for occurrence of
venous thromboembolism. J Thromb Haemost 11: 1993–2000. doi:10.1111/jth.12408.
33. Khorana AA, Dalal M, Lin J, Connolly GC (2013) Incidence and predictors of
venous thromboembolism (VTE) among ambulatory high-risk cancer patientsundergoing chemotherapy in the United States. Cancer 119: 648–655.
doi:10.1002/cncr.27772.34. Konigsbrugge O, Pabinger I, Ay C (2014) Risk factors for venous thromboem-
bolism in cancer: novel findings from the Vienna Cancer and Thrombosis Study
(CATS). Thromb Res 133 Suppl 2: S39–43. doi:10.1016/S0049-3848(14)50007-2.
35. Konigsbrugge O, Lotsch F, Zielinski C, Pabinger I, Ay C (2014) Chronic kidneydisease in patients with cancer and its association with occurrence of venous
thromboembolism and mortality. Thromb Res. doi:10.1016/j.thromres.2014.04.002.36. Caro JJ, Salas M, Ward A, Goss G (2001) Anemia as an independent prognostic
factor for survival in patients with cancer: a systemic, quantitative review.
Cancer 91: 2214–2221.37. Kanz R, Vukovich T, Vormittag R, Dunkler D, Ay C, et al. (2011) Thrombosis
risk and survival in cancer patients with elevated C-reactive protein. J ThrombHaemost 9: 57–63. doi:10.1111/j.1538-7836.2010.04069.x.
Red Blood Cell Parameters and Risk of Venous Thromboembolism in Cancer
PLOS ONE | www.plosone.org 14 October 2014 | Volume 9 | Issue 10 | e111440


