Embed Size (px)
Citation preview

Tropical cyclones and their associated precipitation under climate change conditions from a set of RCA projections over the Central America/Mexico CORDEX domain
Ramón Fuentes Franco, Erik Kjellström, Grigory Nikulin
Ninth ICTP workshop on theory and use of Regional Climate Models

Objectives
To evaluate the representation of Tropical Cyclones (TCs) on the
RCA simulations.
Identify processes involved on the good (or bad) representation of
the spatial distribution of TCs.
To identify climate change signals from the ensemble of GCM and
RCA projections, which are related to changes on the distribution of
TCs and their associated precipitation.
To assess changes in the contribution of TCs-induced precipitation
to total precipitation.2

RCA Configuration
Based on Hirlam
Bechtold-KainFritsch convection scheme (Bechtold et al., 2001).
A few additional modifications including a diluted CAPE (Convective Available
Potential Energy) profile for calculating the CAPE closure have also been
implemented (Jiao and Jones, 2008).
Cloud formation following Tiedtke (1996).
Physiography data bases as ECOCLIMAP (Masson et al., 2003) for vegetation.
Gtopo30 (USGS, 1996) for topography,

GCM simulations
List of GCMs CanESM2 CSIRO-Mk3-6-0 CNRM-CM5 EC-Earth GFDL-ESM2M HadGEM2-ES IPSL-CM5A-MR MIROC5 MPI-ESM-LR NorESM1-M
Forcings: Historical simulation.
RCP8.5 (2.6,4.5,6,8.5)
4
Periods analyzed:
Historical: 1976-2005.
RCP8.5: 2071-2100.

Tropical Cyclones tracker
https://github.com/kyklop-climate/kyklop

Historical period (1976-2005)

SST bias for MJJASON (GCMs minus ERA-Interim)

Mean wind shear MJJASON (U200 – U850) on GCM driven RCA historical simulations

TCs in RCA (1976-2005)

Biases of TCs in RCA compared with observations
RCA (EIN) - OBS
RCA (ENSEMBLE) - OBS
RCA (ENSEMBLE) – RCA (EIN)

Precipitation associated to tropical cyclones
Khouakhim, Villarini and Vecchi 2017
mm>400
100
200
100
300
Yasi- Jan 30 to Feb 04, 2011 Kathleen- Sep 7 -11, 1976
Irene Aug 24-30, 2011 Tip Oct 9-20, 1979
Kathleen- Sep 7 -11, 1976
Examples of TCs and their induced rainfall totals (mm). Each panel shows the TC track (black line)and the recorded amount of rain (colors) at stations located within 500 km (dashed line) from the center of eachstorm track.
Kathleen- Sep 7 -11, 1976

Relative contribution of TCs to the mean seasonal rainfall (100 * TC precipitation/Total precipitation )
12
Khouakhim, Villarini and Vecchi 2017

Mean precipitation associated to tropical cyclones in RCA (1976-2005)
mm/day

Relative contribution of TCs to the mean seasonal rainfall (100 * TC precipitation/Total precipitation )
%

Future period (2071-2100)

16
SST change (2071-2100 minus 1976-2005)
C

Fuentes Franco et al. 2015
SST change: the main driver for precipitation change. Future(2071-2100)- Hist (1976-2005)
SST
PrecipitationGCMs
PrecipitationRegCM
PrecipitationRegCM

18m/s
Wind shear change (2071-2100 minus 1976-2005)

Change on density of TC Future(2071-2100)- Hist (1976-2005)

TCs density and its change Future(2071-2100)- Hist (1976-2005)
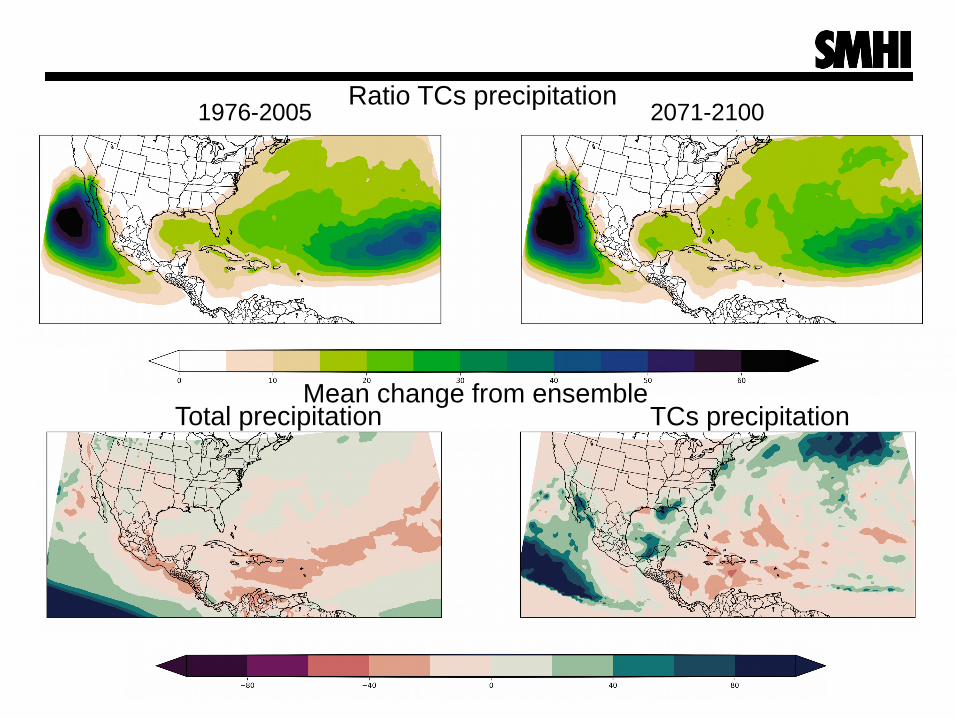
Ratio TCs precipitation
Mean change from ensemble Total precipitation TCs precipitation
1976-2005 2071-2100
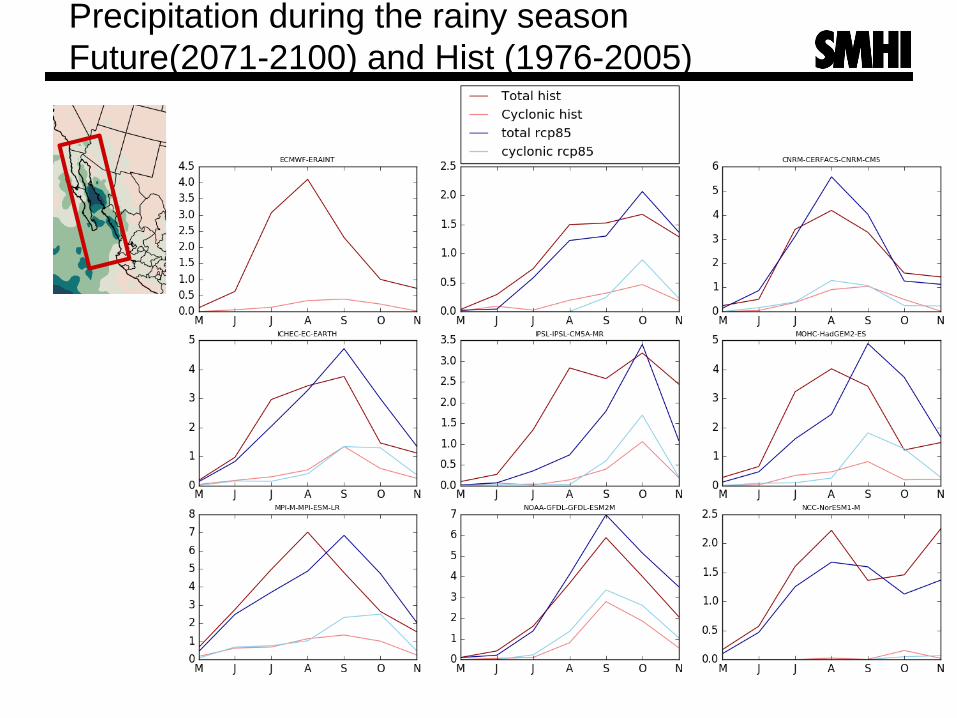
Precipitation during the rainy season Future(2071-2100) and Hist (1976-2005)

Mexico is the Top 7 in agriculture exports in the world. Total agricultural production reached a total value greater than US$20 billion in 2012. Of the 2,457 municipalities of Mexico, 35 contributed with one quarter of that total.
Information from: Servicio de Información Agroalimentaria y Pesquera (SIAP) at http://www.campomexicano.gob.mx/boletinsiap/014-i.html
Agricultural production susceptible for changes on precipitation changes

Conclusions
The RCA ensemble shows a overestimation of TCs over the North Atlantic, and an underestimation over the Eastern Tropical Pacific.
The TCs-associated precipitation is comparable with observations, especially on those showing good representation of TCs spatial distribution.
For the future period, the GCMs ensemble shows a warmer eastern tropical Pacific ocean compared to the tropical north Atlantic. This is in-line with previous studies.

The GCMs scenario ensemble shows a decrease of precipitation over Mexico and Central America, which is robust across ensemble members (8/10). This decrease appears to be due to a more intense easterly winds over the Caribbean and therefore an increased vertical wind shear.
The density of TCs in the future show a change towards a higher concentration towards the North subtropical Atlantic ocean, and a decrease over the Tropical Atlantic. Similarly it is found a higher concentration away from the Mexican coasts and a decrease of TCs concentration close to coastal regions.
Although the total precipitation shows a decrease all along Mexico, the TCs-associated precipitation shows an increase over Northwest Mexico, especially over the Gulf of California, increasing the contribution of TCs-associated precipitation to total precipitation over that region.
To be submitted to Climate Dynamics.
Conclusions


