Embed Size (px)
Citation preview
Relationships among forest age, composition and elementaldynamics of Adirondack northern hardwood forests1
Gregory G. McGee2,3, Myron J. Mitchell, Donald J. Leopold, and Dudley J. RaynalSUNY, College of Environmental Science and Forestry, 1 Forestry Drive, Syracuse, NY 13210-2778 U.S.A.
Monday MbilaAlabama A&M University, School of Agricultural and Environmental Sciences, Normal, AL,
35762-0700 U.S.A.
MCGEE, G. G., M. J. MITCHELL, D. J. LEOPOLD AND D. J. RAYNAL (SUNY, College of EnvironmentalScience and Forestry, 1 Forestry Drive, Syracuse, NY 13210-2778) AND M. MBILA (Alabama A&MUniversity, School of Agricultural and Environmental Sciences, Normal, AL, 35762-0700). Relationshipsamong forest age, composition and elemental dynamics of Adirondack northern hardwood forests. J. TorreyBot. Soc. 134: 253–268. 2007.—We conducted a biogeochemical analysis of four Adirondack northernhardwood forests (two old-growth and two maturing second-growth) to elucidate correlations among standage, site conditions and several nutrient cycling processes. One each of the old-growth and maturing forestswere located on base-rich sites, while the other two were on base-poor sites. At each site we analyzed soilsolution chemistry and estimated nutrient flux rates; measured annual litter production, and nutrient andlignin content; measured annual N mineralization and nitrification rates; and characterized herb- andcanopy-layer vegetation, and coarse woody debris volumes. Vascular plant communities of the two base-richsites were dominated by several rich-site indicator species, while such indicators were lacking at the base-poor sites. Tree basal areas and annual litter production did not differ among the study sites, but the old-growth stands contained 3-fold more coarse woody debris than the maturing stands. Foliar litter Nconcentrations did not differ among the study sites, but foliar litter from the base-rich sites had higher Ca2+
and lower lignin concentrations than the base-poor sites. Differences in foliar litter quality among the siteswere due, in part, to intraspecific variation in litter chemistry. There were no consistent differences betweenthe old-growth and maturing stands in soil solution nutrient concentrations or fluxes. Soil solution H+
concentrations were higher and Ca:Al ratios lower at the two base-poor sites. Annual, net N mineralizationrates did not differ among the sites, but net nitrification rates in the organic soil horizons at the rich old-growth site were more than twice those at the other sites. High levels of net nitrification and N leaching wereobserved only in the base-rich old-growth site. Our data suggest that net forest nutrient retention may bea function of interacting mechanisms associated with forest developmental stage, community compositionand site conditions.
Key words: lignin, litter quality, nitrification, nitrogen, nutrient cycling, old-growth, stand development.
A complete understanding of temporal and
spatial patterns of nutrient cycling in forest
ecosystems requires consideration of forest
maturation and site conditions. Some investi-
gators have suggested that old-growth forests
should exhibit zero net nutrient retention,
while younger, aggrading forests should have
a greater capability to retain nutrients, espe-
cially nitrogen (N) (e.g., Vitousek and Reiners
1975). When forest primary productivity is N-
limited, net nitrification and nitrate (NO32)
leaching rates from forests should be low
because either (1) plants out-compete nitrify-
ing bacteria for ammonium (NH4+) thereby
leading to lower gross nitrification rates; or (2)
gross nitrification rates are equally high under
N-limited conditions, but microbial assimila-
tion of NO32 reduces net nitrification rates
and NO32 leaching losses (Fenn et al. 1998).
Several studies have corroborated that nutri-
ent retention decreases as forests mature
(Vitousek and Reiners 1975, Leak and Martin
1975, Peet 1992, Pardo et al. 1995, Perakis and
Hedin 2001), while others have not (e.g.,
Martin 1979, Fisk et al. 2002). In particular,
recent research has suggested that greater
detrital biomass pools (primarily due to
greater amounts of coarse woody debris) in
1 This research was supported through a grantfrom the New York State Energy Research andDevelopment Authority (NYSERDA) and throughfunding by the National Science Foundation.
2 Thanks to the NY Dept. of EnvironmentalConservation for granting access to study sites. B.Tabor, L. Machut, S. Christopher, P. Kwait, E.Gausch, J. Piskorz and J. Forrester assisted withfield sampling. P. McHale and D. Lyons assisted inlaboratory analyses and S. Stehman providedstatistical advice.
3 Author for correspondence: E mail: [email protected]
Received for publication January 8, 2005, and inrevised form January 15, 2007.
Journal of the Torrey Botanical Society 134(2), 2007, pp. 253–268
253
old-growth forests result in greater microbial
N immobilization compared to second-growth
forests (Fisk et al. 2002). Furthermore,
declines in surface water NO32 concentrations
have recently been observed in the northeast
U.S. (Goodale et al. 2003) including water-
sheds composed mostly of old-growth forests
(Martin et al. 2000), thereby further confusing
the relationships between forest development
and nutrient retention.
Factors other than forest age/development
also affect forest N retention. For instance,
low forest floor C:N ratios (, 25) have been
correlated with increased NO32 leaching rates
(Johnson and Linberg 1992, Fenn et al. 1998).
Litter decomposition and N turnover rates are
further affected by foliar litter ‘‘quality’’ (the
decomposability of carbon compounds). Litter
high in lignin decomposes slowly thereby
limiting mineralization rates (Aber and Melillo
1982, Ferrari 1999). Nitrification rates, and
subsequent NO32 leaching potential, also
appear to be affected by soil pH, base
saturation and/or calcium (Ca) availability
(Geary and Driscoll 1996, Bailey et al. 2004).
In addition, nutrient cycling processes are
influenced by forest overstory composition
(e.g., Finzi et al. 1998a). For instance, Lovett
and Rueth (1999) and Lovett et al. (2000,
2004) reported greater N leaching and nitrifi-
cation rates from Acer saccharum Marsh.
dominated forests, relative to forests dominat-
ed by Fagus grandifolia Ehrh. The presence of
A. saccharum likely plays a key role in
affecting nutrient cycling in hardwood forests
of the northeast U.S. (Templer et al. 2003,
Lovett and Mitchell 2004) and southeast
Canada (Mitchell et al. 1992a). Mechanisms
leading to greater nitrification and NO32
leaching rates in A. saccharum-dominated
forests may be related to differences in litter
quality, thereby suggesting that plant species
can influence nutrient cycling processes (Finzi
et al. 1998a). Conversely, some observed
differences in nutrient cycling processes may
covary with site requirements among species.
Fagus grandifolia often dominates dry mesic,
base-poor sites, while Fraxinus americana L.,
Tilia americana L., and A. saccharum domi-
nate base-rich, mesic sites (Heimburger 1934,
Burns and Honkala 1990, Kobe et al. 1995,
Bakken and Cook 1998). Therefore, where
rich-site indicator species dominate, site con-
ditions happen to permit greater nitrification
rates, leading to higher NO32 leaching rates.
Thus vegetation alone may not control the
nutrient cycling processes, but rather micro-
bially mediated nutrient fluxes along with
vascular plant species composition are corre-
lated with site conditions.
The objective of our study was to examine
the relationships between forest age, species
composition, site conditions and nutrient
retention with particular focus on N. Our
study focused on (1) whether old-growth
northern hardwood forests exhibit greater
nitrification and nutrient leaching rates than
younger, aggrading forests and (2) whether
forests on base-rich sites exhibit greater
nitrification and nutrient leaching rates than
those on more acidic sites.
Methods. RESEARCH SETTING AND STUDY
SITES. We conducted our study in northern
hardwood forests in the Adirondack Moun-
tains, New York, USA (Fig. 1). Forests within
Adirondack Park are a mosaic of stands of
varying maturity and anthropogenic distur-
bance. But as a whole, forests of this region
are advancing in age since the Park’s estab-
lishment in the 1890’s. Rates of atmospheric
NO32 and NH4
+ deposition to this region are
among the highest in North America (Stod-
dard 1994, National Atmospheric Deposition
Program/National Trends Network 2005), and
high NO32 leaching rates and surface water
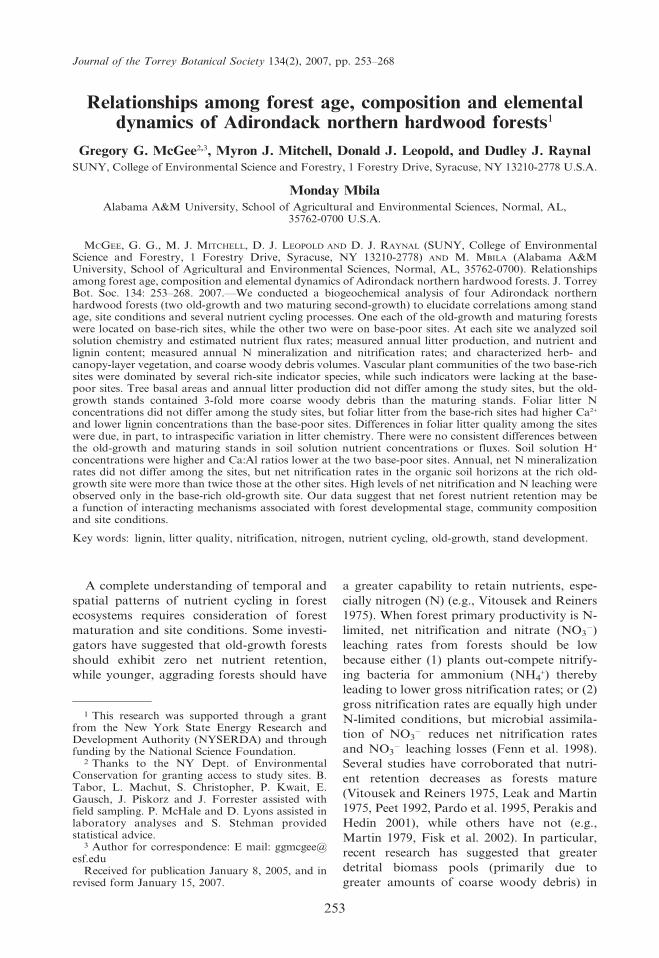
FIG. 1. Location of the four northern hardwoodforest study sites in Adirondack Park, New York:Ampersand Mountain (ORAM), Hennessy Moun-tain (MRHM), Catlin Lake (OPCL), and HuntingtonForest (MPHF). Subscripts are explained in Meth-ods: Research Setting and Study Sites.
254 JOURNAL OF THE TORREY BOTANICAL SOCIETY [VOL. 134
NO32 concentrations in some watersheds
suggest that forests here are becoming N-
saturated (Stoddard 1994, Mitchell et al.
2003).
The study sites are characterized as Adi-
rondack northern hardwood forests (Braun
1950), which occur below 980 m and are
generally dominated by A. saccharum, F.
grandifolia, and Betula alleghaniensis Britton.
Common canopy associates include Picea
rubens Sarg., Tsuga canadensis (L.) Carr., Acer
rubrum (L.), F. americana, T. americana, and
Prunus serotina Ehrh. Understory trees and
shrubs include Acer pensylvanicum (L.), Ostrya
virginiana (Mill.) Koch, and Viburnum lanta-
noides Michx. (nomenclature follows Mitchell
and Tucker 1997).
The Adirondack climate is humid and
continental. Weather stations in Tupper Lake
(elevation 966 m), Lake Placid (591 m) and
Indian Lake (506 m), which bound the limits
of the study sites, have recorded mean January
temperatures of 29 to 210 uC and mean July
temperatures of 17 to 18 uC for periods
spanning 1897–1996 (Hoare 2005). Average
annual precipitation during approximately the
same time period at the three weather stations
ranged from 96–103 cm (Hoare 2005). The
soils at the sites are spodosols that developed
from glacial till overlaying Precambrian gran-
ite (Cline and Marshall 1992).
Two of the four study sites, Ampersand
Mountain and Catlin Lake, have previously
been described as old-growth forests (Woods
and Cogbill 1994, McGee et al. 1999), having
an uneven-aged canopy with dominant trees
averaging 198 and 209 years, respectively
(McGee 1998). The Catlin Lake site was never
logged (SUNY-ESF Huntington Forest Wild-
life Research Station records), but it is likely
that the Ampersand Mt. site was selectively
logged , 1850–1890 for large-diameter P.
rubens, T. canadensis, and/or Pinus strobus L.
prior to its incorporation into Adirondack
Park (McMartin 1994). The other two sites,
Hennessy Mt. and the Huntington Forest
Integrated Forest Study site, are maturing,
100-year-old, second-growth forests that re-
generated following catastrophic wildfires
during the early 1900s and have not been
logged since their establishment (McGee 1998,
SUNY-ESF Huntington Forest Wildlife Re-
search Station records). Increment core data
confirmed that the oldest trees of the post-
disturbance cohorts at Hennessy and Hun-
tington were 97 and 95 years, respectively, in
1999 (McGee 1998 for Hennessy, McGee
unpublished data for Huntington).
All four study sites have been extensively
researched (e.g., Johnson and Lindberg 1992,
Mitchell et al. 1992b, Woods and Cogbill
1994, McGee et al. 1999) and were selected
from a set of previously studied Adirondack
old-growth and maturing forest stands
(McGee et al. 1999) based upon their stand
histories and site conditions. We considered
the Ampersand Mt. old-growth and Hennessy
Mt. maturing stands to be base-rich, mesic
sites given their topographic positions (mid- to
lower slopes), and the presence/abundance of
species indicative of rich, moist site conditions
(following Heimburger 1934). In addition to
Heimburger’s forest type indicator species,
we included Acer saccharum as a base-rich
site indicator. Although A. saccharum occurs
across a range of soil textures pH and fertility,
it is sensitive to decline on soils having low
base saturation (Horsley et al. 2002), has
demonstrated more vigorous positive growth
response to experimental liming (Long et al.
1997), and dominates regeneration in mesic/
rich habitat types (Kobe et al. 1995, Bakken
and Cook 1998). Conversely, the absence of
indicator species and the positions of stands at
mid and upper slopes led us to consider the
Catlin Lake old-growth and Huntington
Forest maturing forests to be less mesic and
base poor. Hereafter, we refer to the Amper-
sand Mt., Catlin Lake, Hennessy Mt., and
Huntington Forest sites as ORAM, OPCL,
MRHM, and MPHF, respectively. The abbre-
viations reference each stand’s age (old growth
versus maturing) and site conditions (base rich
versus base poor).
SOIL SOLUTION SAMPLING. Soil solution
samples were collected from porous cup
tension lysimeters placed below the forest
floor (15 cm deep) and below the maximum
rooting depth (50 cm deep). Similar tension
lysimeters have been used extensively to study
relationships between soil solution and ele-
mental cycling in forest ecosystems (Shepard
et al. 1990, Mitchell et al. 2001a). Twelve
lysimeter clusters were installed at each site
during summer, 1999. Each cluster consisted
of two pairs of 15 cm and 50 cm lysimeters.
The two lysimeters in each pair were placed
30–40 cm apart. The pairs within each cluster
were , 1–2 m from each other. The lysimeters
2007] MCGEE ET AL.: DYNAMICS OF NORTHERN HARDWOOD FORESTS 255
were installed at a 45u angle to minimize
preferential flow of surface water to the
lysimeter porous cup (Mitchell et al. 2001a).
Soil solution was collected from the lysimeters
after setting the vacuum overnight at 40 kPa.
At this tension both interstitial soil solution
that is available to plants via transpiration
(Brady and Weil 2002: 208–210) and gravita-
tional water were sampled. Lysimeters were
sampled monthly between May and Novem-
ber, 2000. Soil solution samples were bulked
by depth for each lysimeter cluster.
All samples were transported on ice and
stored at 4 uC prior to analyses. Samples were
analyzed for NO32, Cl2 and SO4
22 (detection
limit 0.2 meq L21) on a Dionex 2000 ion
chromatograph and for NH4+ (detection limit
0.003 meq L21) on a Bran Luebbe AA3 auto
analyzer. Total dissolved nitrogen (TDN) was
determined on a Bran Luebbe AA3 auto
analyzer after persulfate oxidation (Ameel et
al. 1993), and dissolved organic nitrogen
(DON) was calculated as the TDN (total
dissolved nitrogen) – (NO32 + NH4
+). Soil
solution pH was determined potentiometri-
cally. Exchangeable cations were analyzed
using a Perkin Elmer 3300 DV ICP-AES.
Many samples were analyzed in duplicate to
monitor precision. Certified solutions were
included in each run for quality control.
SOIL NUTRIENT FLUX ESTIMATION. Solution
flux rates were estimated by combining the
monthly solution concentrations obtained
from tension lysimeters with monthly water
flux estimates using the BROOK90 simulation
model (Federer 1995). We have successfully
used the BROOK2 and BROOK90 models to
estimate water fluxes in several Adirondack
watersheds and forest stands (Mitchell et al.
1996, 2001b). For this study water flux was
estimated using inputs of daily precipitation
and minimum and maximum temperatures.
For OPCL and MPHF weather data were used
from Newcomb, NY, which is 1 and 4 km,
respectively, from these sites. For ORAMP and
MRHM weather data were used from the
Saranac Lake, NY weather station, which is
12 and 6 km, respectively, from each of these
sites. Monthly soil water fluxes at 15 and
50 cm were multiplied by concentrations to
obtain monthly solute fluxes. Monthly fluxes
were summed over the soil solution sampling
period (May–November, 2000) to estimate
total nutrient fluxes.
VEGETATION AND WOODY DEBRIS SAMPLING.
Trees ($5 cm diameter at breast height, dbh)
were inventoried at each site on two randomly-
placed 0.1 ha quadrats. Understory vegetation
(. 1 m tall; , 5.0 cm dbh) was sampled in
four 25 m2 subplots located within each 0.1 ha
quadrat. Stems were identified and their
diameters measured at breast height (1.4 m),
or in the case of understory stems 1.0–1.4 m
tall, at the base of the current year’s growth.
Relative Importance Values (RIV) were cal-
culated at each site for trees and for un-
derstory vegetation where:
RIV ~ relative density½ �
z relative basal area½ �=2:
Percent cover of each herb layer species
(herbaceous and woody stems # 1.0 m tall)
was estimated on twenty-five 1 m2 plots placed
randomly in each of the 0.1 ha quadrats. In
addition, the entire 0.1 ha quadrats were
surveyed to list all vascular plant species
present on the quadrats but not included in
the sample. Tree species were characterized
based upon their tolerance for understory
competition (Burns and Honkala 1990). Tree,
shrub, and herbaceous species were character-
ized as ‘‘base-rich’’ site indicators, ‘‘acid’’ site
indicators, or non-indicators (Heimburger
1933, Burns and Honkala 1990, Kobe et al.
1995, Bakken and Cook 1998).
Decaying logs $ 10 cm diameter were
measured on each 0.1 ha plot. The ORAM,
MRHM, and OPCL sites were sampled during
an earlier study (McGee et al. 1999) and the
MPHF site was sampled in 1999. Total log
volumes were estimated for each site as per
McGee et al. (1999).
LEAF LITTER SAMPLING AND NUTRIENT ANAL-
YSES. Litter was collected monthly during
snow-free periods (October 1998–August
2000) using twenty randomly-placed 0.25 m2
litter traps. Litter collections were dried at 65
uC to a constant mass. The litter was sorted
into deciduous hardwood leaves, twigs (,
1 cm diameter) and other material. During the
first year’s collection only (October 1998–
September 1999) deciduous hardwood leaves
were further sorted by species. After dry mass
was determined for each litter component
from each litter trap, like litter material was
composited for each site for chemical analyses.
A subsample of the composited litter was
256 JOURNAL OF THE TORREY BOTANICAL SOCIETY [VOL. 134
ground in a WileyH mill to pass a 2 mm screen
prior to microwave digestion for mineral
nutrient determination, and further pulverized
in a Wiggle-L-BugH amalgamator prior to
total C and N analyses. Carbon and N
concentrations were determined using a Per-
kin-Elmer 2400 CHN Analyzer. Leaf litter
cation concentrations were determined using
ICP spectroscopy following microwave di-
gestion of 0.25 g tissue sample in 1 ml 37%
HCl and 4 ml 70% HNO3. Leaf litter lignin
concentrations were determined through acid-
detergent digestion using a Daisy II Incubator
system (Ankom Technology 2002). Nutrient
and lignin concentrations were determined for
individual hardwood species for the first year’s
collection, and on bulked hardwood leaf litter
for the second year’s collection.
NITROGEN MINERALIZATION AND NITRIFICA-
TION DETERMINATIONS. Net N mineralization
and nitrification rates were estimated for the
forest floor (Oe + Oa horizons) and upper
10 cm of mineral soil at each study site using in
situ incubations in buried polyethylene bags
(Nadelhoffer et al. 1983). Eight 25 m transects
were constructed at each site. One set of buried
bags was incubated at a random location along
each transect during each incubation period.
Soil bags were incubated at seven monthly
intervals from May–November 2000, with
a final incubation conducted over the winter
until May 2001. Incubations were prepared by
removing a 10 3 10 cm area of forest floor and
placing it in a bag, which was folded closed,
but not sealed. Similarly, a sample of the
underlying mineral soil was removed and
placed in a bag. The bag with mineral soil
was then returned to the hole, the bag contain-
ing the forest floor placed on top, and both
were covered with leaf litter. Adjacent to these
bags similarly sized samples of forest floor and
mineral soil were removed, placed in bags,
stored on ice, and taken directly to the
laboratory for immediate analyses. Samples
were retrieved for analyses following each
incubation. At the time the samples were
retrieved, new incubations were initiated. Net
mineralization rates (g21 soil dry mass) were
calculated by finding the difference between
initial and final NH4+ + NO3
2 concentrations
of each incubation. Net nitrification rates (g21
soil dry mass) were calculated by finding the
differences between initial and final NO32
concentrations for each incubation.
STATISTICAL DESIGN AND ANALYSES. Twelve
replicates of bulked soil solution from the 15-
and 50-cm lysimeter clusters were obtained
during each monthly sampling period at each
study site. Monthly soil solution solute con-
centrations were averaged across the 2000
snow-free season (May–November) for each
of the lysimeter clusters. These snow-free
season averages were then compared among
the four study sites using one-way ANOVA
(PROC GLM, SAS Institute 2001). Differ-
ences in mean solute concentrations among
the four study sites were determined using
Tukey’s studentized range test to control
experiment-wise error rates.
Eight replicate estimates of N mineraliza-
tion and nitrification were obtained at each
study site during each incubation period for
the organic and mineral soil horizons. Rates
were summed across the entire annual in-
cubation period (May 2000–May 2001) for
each of the eight transects at each study site.
Annual N mineralization and nitrification
rates were then compared among the four
study sites using one-way ANOVA (PROC
GLM, SAS Institute 2001). Differences in
mean annual rates among the four study sites
were determined using Tukey’s studentized
range test to control experiment-wise error
rates.
Weighted averages of litter chemistry were
determined for each of two sampling periods,
Oct. 1998 to Sept. 1999, and Oct. 1999 to Sept.
2000. Weighted averages for the first period
were based upon biomass and litter chemistry
determinations for leaves of each deciduous
hardwood species, twigs, and other miscella-
neous litter. Weighted averages for the second
sample period were based upon the same
categories except leaves from all deciduous
species were combined. The two annual
weighted averages served as replicate observa-
tions of litter quality (%N, %lignin, %C, C:N,
lignin:N, base cation concentrations) at each
site. Litter chemistries were compared among
the sites using one-way ANOVA (PROC
GLM, SAS Institute 2001). Differences in
mean annual rates of litter elemental and mass
fluxes among the four study sites were de-
termined using Tukey’s studentized range test
to control experiment-wise error rates. Statis-
tical comparisons of litter quality for the
respective hardwood species could not be
conducted since species-level analyses were
conducted only in the first year.
2007] MCGEE ET AL.: DYNAMICS OF NORTHERN HARDWOOD FORESTS 257
It should be noted that each stand condi-
tion, old-base rich, old-base poor, maturing-
base rich, and maturing-base poor is repre-
sented only once. Therefore conclusions re-
garding differences in nutrient cycling pro-
cesses and retention rates due to stand
developmental stage and site condition cannot
be extended beyond the respective case studies.
Even so, these data will help inform a growing
understanding of processes regulating forest
nutrient retention.
Results. VEGETATION STRUCTURE AND COM-
POSITION. Live tree basal areas ranged from
29.8–40.1 m2 ha21, but did not differ between
the old-growth (35.0 6 5.2 m2 ha21, average
6 1 S.E.) and maturing (35.0 6 0.1 m2 ha21)
stands. The old-growth stands contained
approximately 58 stems . 55 cm dbh ha21
compared to approximately 10 trees .
55 cm dbh ha21 in the maturing stands. Tree
core data indicated that members of the post-
fir cohorts in the maturing stands were
approximately 30–45 cm dbh. The larger
stems in the maturing stands were residuals
that survived the stand-initiating fires (McGee
1998 for MRHM, McGee unpublished data for
MPHF).
Acer saccharum (RIV range: 0.26–0.50) and
Fagus grandifolia (RIV range: 0.21–0.61)
attained the highest importance values of all
tree species at the four sites. A. saccharum
consistently had the highest basal area, while
F. grandifolia had the greatest densities. Mid-
successional species (i.e., Acer rubrum, Betula
alleghaniensis, Fraxinus americana, Prunus
serotina) were more important in the canopies
of the maturing stands (cumulative RIV
equaled 0.29 and 0.21 at MRHM and MPHF,
respectively) than in the old-growth stands
(cumulative RIV equaled 0.03 and 0.09 at
ORAM and OPCL, respectively). The woody
understories of all sites were dominated by
shade-tolerant, late-successional species, but
the sites differed in their dominance by
understory base-rich site indicator species.
The understories of the base-poor sites (OPCL
and MPHF) were comprised solely of species
tolerant of base-poor conditions (i.e., Fagus
grandifolia, Picea rubens, Viburnum lanta-
noides), while base-rich site indicator species
(Acer saccharum, Fraxinus americana, Ostrya
virginiana) attained cumulative importance
values of 0.27 and 0.30 at the base-rich sites
(ORAM and MRHM).
The herbaceous layer species richness was
lower at the base-poor sites (20 and 29 species
in OPCL and MPHF) than at the base-rich sites
(44 and 35 species in ORAM and MRHM). In
addition, the herbaceous layers of the base-
poor sites had fewer base-rich site indicator
species (1 and 2 species at OPCL and MPHF)
compared to the base-rich sites (11 and 5
species at ORAM and MRHM), and lower
cumulative percent cover of rich-site indicator
species (1 and 3 percent cover at OPCL and
MPHF) compared to the base-rich sites (13 and
12 percent cover at ORAM and MRHM).
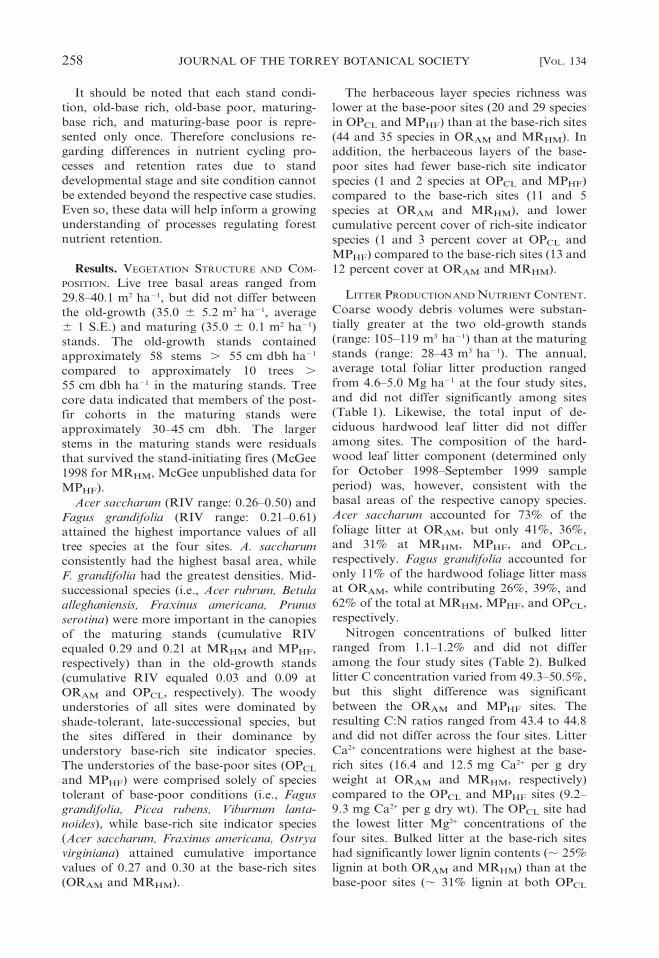
LITTER PRODUCTION AND NUTRIENT CONTENT.
Coarse woody debris volumes were substan-
tially greater at the two old-growth stands
(range: 105–119 m3 ha21) than at the maturing
stands (range: 28–43 m3 ha21). The annual,
average total foliar litter production ranged
from 4.6–5.0 Mg ha21 at the four study sites,
and did not differ significantly among sites
(Table 1). Likewise, the total input of de-
ciduous hardwood leaf litter did not differ
among sites. The composition of the hard-
wood leaf litter component (determined only
for October 1998–September 1999 sample
period) was, however, consistent with the
basal areas of the respective canopy species.
Acer saccharum accounted for 73% of the
foliage litter at ORAM, but only 41%, 36%,
and 31% at MRHM, MPHF, and OPCL,
respectively. Fagus grandifolia accounted for
only 11% of the hardwood foliage litter mass
at ORAM, while contributing 26%, 39%, and
62% of the total at MRHM, MPHF, and OPCL,
respectively.
Nitrogen concentrations of bulked litter
ranged from 1.1–1.2% and did not differ
among the four study sites (Table 2). Bulked
litter C concentration varied from 49.3–50.5%,
but this slight difference was significant
between the ORAM and MPHF sites. The
resulting C:N ratios ranged from 43.4 to 44.8
and did not differ across the four sites. Litter
Ca2+ concentrations were highest at the base-
rich sites (16.4 and 12.5 mg Ca2+ per g dry
weight at ORAM and MRHM, respectively)
compared to the OPCL and MPHF sites (9.2–
9.3 mg Ca2+ per g dry wt). The OPCL site had
the lowest litter Mg2+ concentrations of the
four sites. Bulked litter at the base-rich sites
had significantly lower lignin contents (, 25%
lignin at both ORAM and MRHM) than at the
base-poor sites (, 31% lignin at both OPCL
258 JOURNAL OF THE TORREY BOTANICAL SOCIETY [VOL. 134
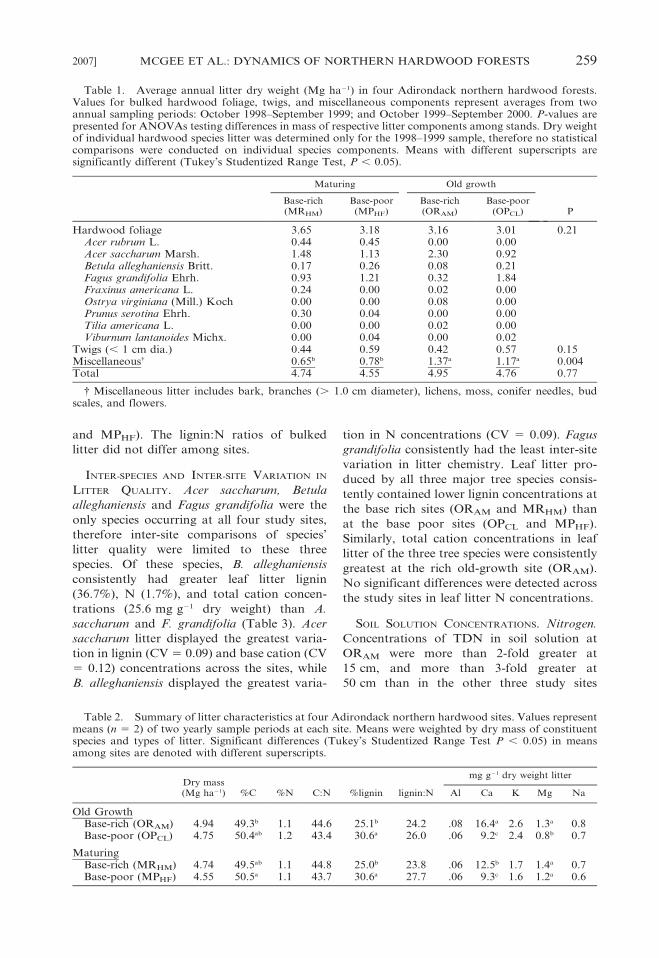
and MPHF). The lignin:N ratios of bulked
litter did not differ among sites.
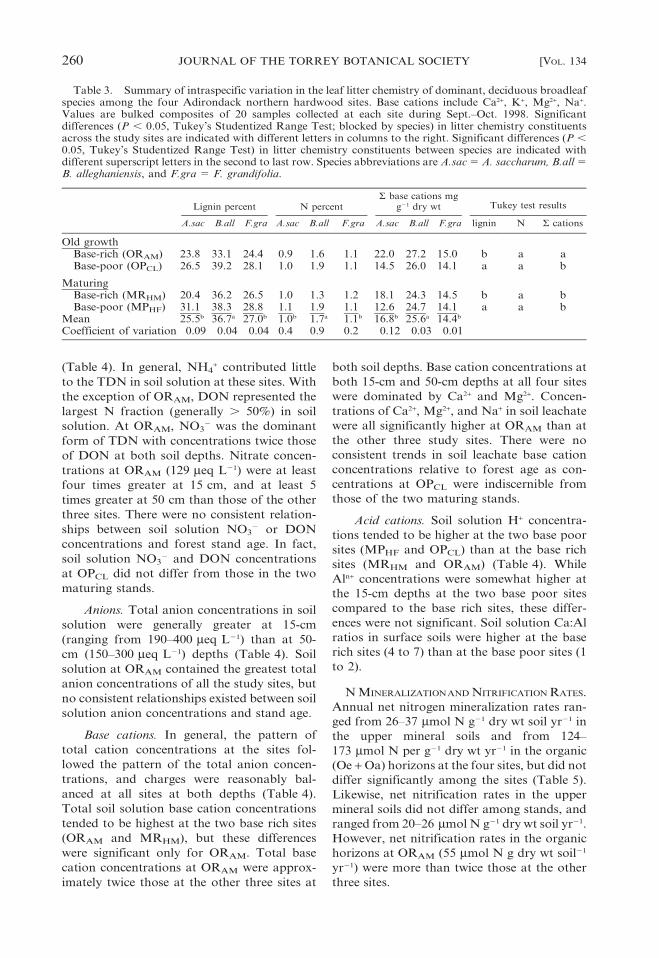
INTER-SPECIES AND INTER-SITE VARIATION IN
LITTER QUALITY. Acer saccharum, Betula
alleghaniensis and Fagus grandifolia were the
only species occurring at all four study sites,
therefore inter-site comparisons of species’
litter quality were limited to these three
species. Of these species, B. alleghaniensis
consistently had greater leaf litter lignin
(36.7%), N (1.7%), and total cation concen-
trations (25.6 mg g21 dry weight) than A.
saccharum and F. grandifolia (Table 3). Acer
saccharum litter displayed the greatest varia-
tion in lignin (CV 5 0.09) and base cation (CV
5 0.12) concentrations across the sites, while
B. alleghaniensis displayed the greatest varia-
tion in N concentrations (CV 5 0.09). Fagus
grandifolia consistently had the least inter-site
variation in litter chemistry. Leaf litter pro-
duced by all three major tree species consis-
tently contained lower lignin concentrations at
the base rich sites (ORAM and MRHM) than
at the base poor sites (OPCL and MPHF).
Similarly, total cation concentrations in leaf
litter of the three tree species were consistently
greatest at the rich old-growth site (ORAM).
No significant differences were detected across
the study sites in leaf litter N concentrations.
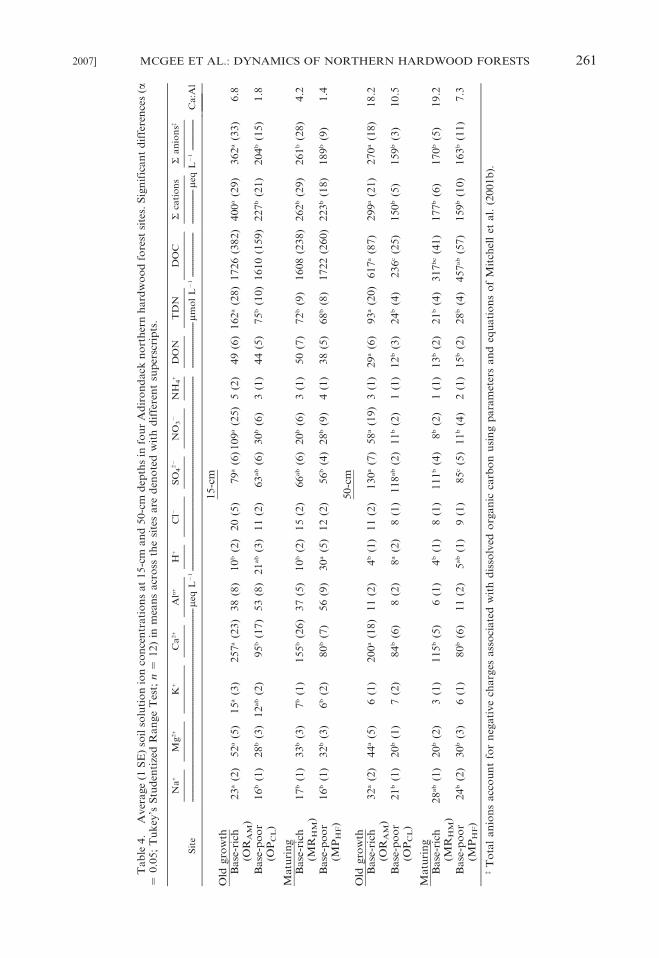
SOIL SOLUTION CONCENTRATIONS. Nitrogen.
Concentrations of TDN in soil solution at
ORAM were more than 2-fold greater at
15 cm, and more than 3-fold greater at
50 cm than in the other three study sites
Table 1. Average annual litter dry weight (Mg ha21) in four Adirondack northern hardwood forests.Values for bulked hardwood foliage, twigs, and miscellaneous components represent averages from twoannual sampling periods: October 1998–September 1999; and October 1999–September 2000. P-values arepresented for ANOVAs testing differences in mass of respective litter components among stands. Dry weightof individual hardwood species litter was determined only for the 1998–1999 sample, therefore no statisticalcomparisons were conducted on individual species components. Means with different superscripts aresignificantly different (Tukey’s Studentized Range Test, P , 0.05).
Maturing Old growth
PBase-rich(MRHM)
Base-poor(MPHF)
Base-rich(ORAM)
Base-poor(OPCL)
Hardwood foliage 3.65 3.18 3.16 3.01 0.21Acer rubrum L. 0.44 0.45 0.00 0.00Acer saccharum Marsh. 1.48 1.13 2.30 0.92Betula alleghaniensis Britt. 0.17 0.26 0.08 0.21Fagus grandifolia Ehrh. 0.93 1.21 0.32 1.84Fraxinus americana L. 0.24 0.00 0.02 0.00Ostrya virginiana (Mill.) Koch 0.00 0.00 0.08 0.00Prunus serotina Ehrh. 0.30 0.04 0.00 0.00Tilia americana L. 0.00 0.00 0.02 0.00Viburnum lantanoides Michx. 0.00 0.04 0.00 0.02
Twigs (, 1 cm dia.) 0.44 0.59 0.42 0.57 0.15Miscellaneous{ 0.65b 0.78b 1.37a 1.17a 0.004Total 4.74 4.55 4.95 4.76 0.77
{ Miscellaneous litter includes bark, branches (. 1.0 cm diameter), lichens, moss, conifer needles, budscales, and flowers.
Table 2. Summary of litter characteristics at four Adirondack northern hardwood sites. Values representmeans (n 5 2) of two yearly sample periods at each site. Means were weighted by dry mass of constituentspecies and types of litter. Significant differences (Tukey’s Studentized Range Test P , 0.05) in meansamong sites are denoted with different superscripts.
Dry mass(Mg ha21) %C %N C:N %lignin lignin:N
mg g21 dry weight litter
Al Ca K Mg Na
Old GrowthBase-rich (ORAM) 4.94 49.3b 1.1 44.6 25.1b 24.2 .08 16.4a 2.6 1.3a 0.8Base-poor (OPCL) 4.75 50.4ab 1.2 43.4 30.6a 26.0 .06 9.2c 2.4 0.8b 0.7
MaturingBase-rich (MRHM) 4.74 49.5ab 1.1 44.8 25.0b 23.8 .06 12.5b 1.7 1.4a 0.7Base-poor (MPHF) 4.55 50.5a 1.1 43.7 30.6a 27.7 .06 9.3c 1.6 1.2a 0.6
2007] MCGEE ET AL.: DYNAMICS OF NORTHERN HARDWOOD FORESTS 259
(Table 4). In general, NH4+ contributed little
to the TDN in soil solution at these sites. With
the exception of ORAM, DON represented the
largest N fraction (generally . 50%) in soil
solution. At ORAM, NO32 was the dominant
form of TDN with concentrations twice those
of DON at both soil depths. Nitrate concen-
trations at ORAM (129 meq L21) were at least
four times greater at 15 cm, and at least 5
times greater at 50 cm than those of the other
three sites. There were no consistent relation-
ships between soil solution NO32 or DON
concentrations and forest stand age. In fact,
soil solution NO32 and DON concentrations
at OPCL did not differ from those in the two
maturing stands.
Anions. Total anion concentrations in soil
solution were generally greater at 15-cm
(ranging from 190–400 meq L21) than at 50-
cm (150–300 meq L21) depths (Table 4). Soil
solution at ORAM contained the greatest total
anion concentrations of all the study sites, but
no consistent relationships existed between soil
solution anion concentrations and stand age.
Base cations. In general, the pattern of
total cation concentrations at the sites fol-
lowed the pattern of the total anion concen-
trations, and charges were reasonably bal-
anced at all sites at both depths (Table 4).
Total soil solution base cation concentrations
tended to be highest at the two base rich sites
(ORAM and MRHM), but these differences
were significant only for ORAM. Total base
cation concentrations at ORAM were approx-
imately twice those at the other three sites at
both soil depths. Base cation concentrations at
both 15-cm and 50-cm depths at all four sites
were dominated by Ca2+ and Mg2+. Concen-
trations of Ca2+, Mg2+, and Na+ in soil leachate
were all significantly higher at ORAM than at
the other three study sites. There were no
consistent trends in soil leachate base cation
concentrations relative to forest age as con-
centrations at OPCL were indiscernible from
those of the two maturing stands.
Acid cations. Soil solution H+ concentra-
tions tended to be higher at the two base poor
sites (MPHF and OPCL) than at the base rich
sites (MRHM and ORAM) (Table 4). While
Aln+ concentrations were somewhat higher at
the 15-cm depths at the two base poor sites
compared to the base rich sites, these differ-
ences were not significant. Soil solution Ca:Al
ratios in surface soils were higher at the base
rich sites (4 to 7) than at the base poor sites (1
to 2).
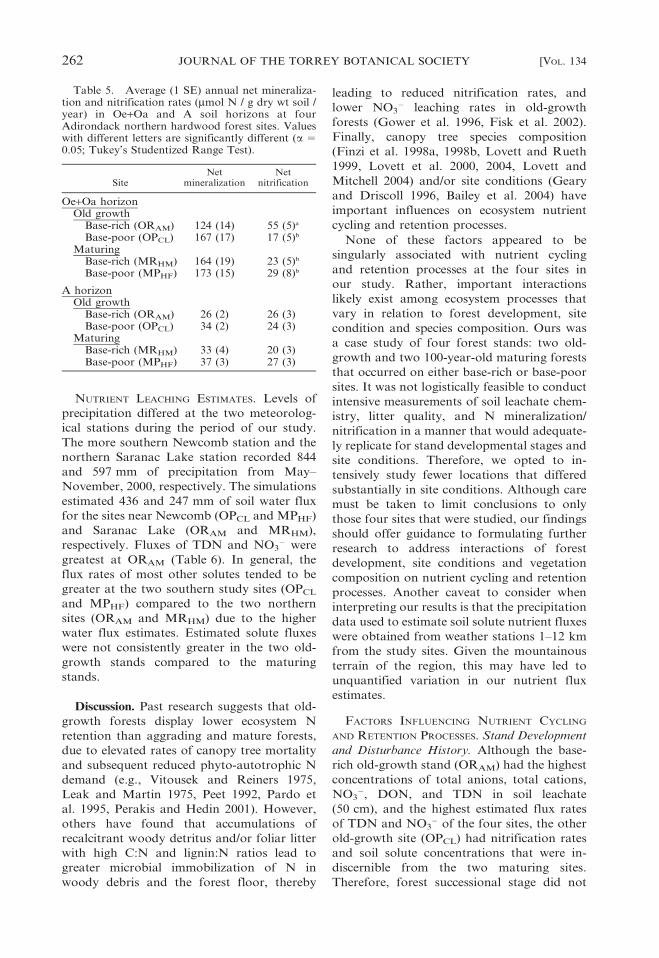
N MINERALIZATION AND NITRIFICATION RATES.
Annual net nitrogen mineralization rates ran-
ged from 26–37 mmol N g21 dry wt soil yr21 in
the upper mineral soils and from 124–
173 mmol N per g21 dry wt yr21 in the organic
(Oe + Oa) horizons at the four sites, but did not
differ significantly among the sites (Table 5).
Likewise, net nitrification rates in the upper
mineral soils did not differ among stands, and
ranged from 20–26 mmol N g21 dry wt soil yr21.
However, net nitrification rates in the organic
horizons at ORAM (55 mmol N g dry wt soil21
yr21) were more than twice those at the other
three sites.
Table 3. Summary of intraspecific variation in the leaf litter chemistry of dominant, deciduous broadleafspecies among the four Adirondack northern hardwood sites. Base cations include Ca2+, K+, Mg2+, Na+.Values are bulked composites of 20 samples collected at each site during Sept.–Oct. 1998. Significantdifferences (P , 0.05, Tukey’s Studentized Range Test; blocked by species) in litter chemistry constituentsacross the study sites are indicated with different letters in columns to the right. Significant differences (P ,0.05, Tukey’s Studentized Range Test) in litter chemistry constituents between species are indicated withdifferent superscript letters in the second to last row. Species abbreviations are A.sac 5 A. saccharum, B.all 5B. alleghaniensis, and F.gra 5 F. grandifolia.
Lignin percent N percentS base cations mg
g21 dry wt Tukey test results
A.sac B.all F.gra A.sac B.all F.gra A.sac B.all F.gra lignin N S cations
Old growthBase-rich (ORAM) 23.8 33.1 24.4 0.9 1.6 1.1 22.0 27.2 15.0 b a aBase-poor (OPCL) 26.5 39.2 28.1 1.0 1.9 1.1 14.5 26.0 14.1 a a b
MaturingBase-rich (MRHM) 20.4 36.2 26.5 1.0 1.3 1.2 18.1 24.3 14.5 b a bBase-poor (MPHF) 31.1 38.3 28.8 1.1 1.9 1.1 12.6 24.7 14.1 a a b
Mean 25.5b 36.7a 27.0b 1.0b 1.7a 1.1b 16.8b 25.6a 14.4b
Coefficient of variation 0.09 0.04 0.04 0.4 0.9 0.2 0.12 0.03 0.01
260 JOURNAL OF THE TORREY BOTANICAL SOCIETY [VOL. 134
Tab
le4.
Aver
age
(1S
E)
soil
solu
tio
nio
nco
nce
ntr
ati
on
sat
15-c
man
d50-c
md
epth
sin
fou
rA
dir
on
dack
no
rth
ern
hard
wo
od
fore
stsi
tes.
Sig
nif
ican
td
iffe
ren
ces
(a5
0.0
5;
Tu
key
’sS
tud
enti
zed
Ran
ge
Tes
t;n
512)
inm
ean
sacr
oss
the
site
sare
den
ote
dw
ith
dif
fere
nt
sup
ersc
rip
ts.
Sit
e
Na
+M
g2+
K+
Ca
2+
Aln
+H
+C
l2S
O4
22
NO
32
NH
4+
DO
NT
DN
DO
CS
cati
on
sS
an
ion
s{
Ca:A
l---
------
------
------
------
------
------
------
------
------
------
------
------
------
------
------
----me
qL
21---
------
------
------
------
------
------
------
------
------
------
------
------
------
------
------
-----
------
------
------
-----
mmo
lL
21
------
------
------
----
------
------
-----
meq
L2
1---
------
------
--
15-c
mO
ldgro
wth
Base
-ric
h(O
RA
M)
23
a(2
)52
a(5
)15
a(3
)257
a(2
3)
38
(8)
10
b(2
)20
(5)
79
a(6
)109
a(2
5)
5(2
)49
(6)
162
a(2
8)
1726
(382)
400
a(2
9)
362
a(3
3)
6.8
Base
-po
or
(OP
CL)
16
b(1
)28
b(3
)12
ab
(2)
95
b(1
7)
53
(8)
21
ab
(3)
11
(2)
63
ab
(6)
30
b(6
)3
(1)
44
(5)
75
b(1
0)
1610
(159)
227
b(2
1)
204
b(1
5)
1.8
Matu
rin
gB
ase
-ric
h(M
RH
M)
17
b(1
)33
b(3
)7
b(1
)155
b(2
6)
37
(5)
10
b(2
)15
(2)
66
ab
(6)
20
b(6
)3
(1)
50
(7)
72
b(9
)1608
(238)
262
b(2
9)
261
b(2
8)
4.2
Base
-po
or
(MP
HF)
16
b(1
)32
b(3
)6
b(2
)80
b(7
)56
(9)
30
a(5
)12
(2)
56
b(4
)28
b(9
)4
(1)
38
(5)
68
b(8
)1722
(260)
223
b(1
8)
189
b(9
)1.4
50-c
mO
ldgro
wth
Base
-ric
h(O
RA
M)
32
a(2
)44
a(5
)6
(1)
200
a(1
8)
11
(2)
4b
(1)
11
(2)
130
a(7
)58
a(1
9)
3(1
)29
a(6
)93
a(2
0)
617
a(8
7)
299
a(2
1)
270
a(1
8)
18.2
Base
-po
or
(OP
CL)
21
b(1
)20
b(1
)7
(2)
84
b(6
)8
(2)
8a
(2)
8(1
)118
ab
(2)
11
b(2
)1
(1)
12
b(3
)24
b(4
)236
c(2
5)
150
b(5
)159
b(3
)10.5
Matu
rin
gB
ase
-ric
h(M
RH
M)
28
ab
(1)
20
b(2
)3
(1)
115
b(5
)6
(1)
4b
(1)
8(1
)111
b(4
)8
b(2
)1
(1)
13
b(2
)21
b(4
)317
bc
(41)
177
b(6
)170
b(5
)19.2
Base
-po
or
(MP
HF)
24
b(2
)30
b(3
)6
(1)
80
b(6
)11
(2)
5ab
(1)
9(1
)85
c(5
)11
b(4
)2
(1)
15
b(2
)28
b(4
)457
ab
(57)
159
b(1
0)
163
b(1
1)
7.3
{T
ota
lan
ion
sacc
ou
nt
for
neg
ati
ve
charg
esass
oci
ate
dw
ith
dis
solv
edo
rgan
icca
rbo
nu
sin
gp
ara
met
ers
an
deq
uati
on
so
fM
itch
ell
etal.
(2001b
).
2007] MCGEE ET AL.: DYNAMICS OF NORTHERN HARDWOOD FORESTS 261
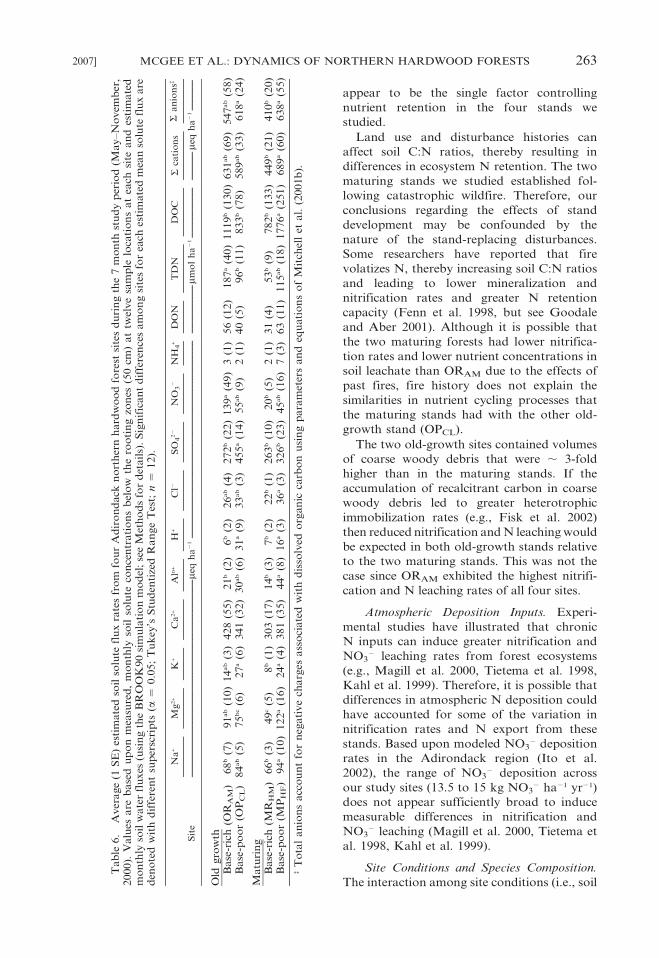
NUTRIENT LEACHING ESTIMATES. Levels of
precipitation differed at the two meteorolog-
ical stations during the period of our study.
The more southern Newcomb station and the
northern Saranac Lake station recorded 844
and 597 mm of precipitation from May–
November, 2000, respectively. The simulations
estimated 436 and 247 mm of soil water flux
for the sites near Newcomb (OPCL and MPHF)
and Saranac Lake (ORAM and MRHM),
respectively. Fluxes of TDN and NO32 were
greatest at ORAM (Table 6). In general, the
flux rates of most other solutes tended to be
greater at the two southern study sites (OPCL
and MPHF) compared to the two northern
sites (ORAM and MRHM) due to the higher
water flux estimates. Estimated solute fluxes
were not consistently greater in the two old-
growth stands compared to the maturing
stands.
Discussion. Past research suggests that old-
growth forests display lower ecosystem N
retention than aggrading and mature forests,
due to elevated rates of canopy tree mortality
and subsequent reduced phyto-autotrophic N
demand (e.g., Vitousek and Reiners 1975,
Leak and Martin 1975, Peet 1992, Pardo et
al. 1995, Perakis and Hedin 2001). However,
others have found that accumulations of
recalcitrant woody detritus and/or foliar litter
with high C:N and lignin:N ratios lead to
greater microbial immobilization of N in
woody debris and the forest floor, thereby
leading to reduced nitrification rates, and
lower NO32 leaching rates in old-growth
forests (Gower et al. 1996, Fisk et al. 2002).
Finally, canopy tree species composition
(Finzi et al. 1998a, 1998b, Lovett and Rueth
1999, Lovett et al. 2000, 2004, Lovett and
Mitchell 2004) and/or site conditions (Geary
and Driscoll 1996, Bailey et al. 2004) have
important influences on ecosystem nutrient
cycling and retention processes.
None of these factors appeared to be
singularly associated with nutrient cycling
and retention processes at the four sites in
our study. Rather, important interactions
likely exist among ecosystem processes that
vary in relation to forest development, site
condition and species composition. Ours was
a case study of four forest stands: two old-
growth and two 100-year-old maturing forests
that occurred on either base-rich or base-poor
sites. It was not logistically feasible to conduct
intensive measurements of soil leachate chem-
istry, litter quality, and N mineralization/
nitrification in a manner that would adequate-
ly replicate for stand developmental stages and
site conditions. Therefore, we opted to in-
tensively study fewer locations that differed
substantially in site conditions. Although care
must be taken to limit conclusions to only
those four sites that were studied, our findings
should offer guidance to formulating further
research to address interactions of forest
development, site conditions and vegetation
composition on nutrient cycling and retention
processes. Another caveat to consider when
interpreting our results is that the precipitation
data used to estimate soil solute nutrient fluxes
were obtained from weather stations 1–12 km
from the study sites. Given the mountainous
terrain of the region, this may have led to
unquantified variation in our nutrient flux
estimates.
FACTORS INFLUENCING NUTRIENT CYCLING
AND RETENTION PROCESSES. Stand Development
and Disturbance History. Although the base-
rich old-growth stand (ORAM) had the highest
concentrations of total anions, total cations,
NO32, DON, and TDN in soil leachate
(50 cm), and the highest estimated flux rates
of TDN and NO32 of the four sites, the other
old-growth site (OPCL) had nitrification rates
and soil solute concentrations that were in-
discernible from the two maturing sites.
Therefore, forest successional stage did not
Table 5. Average (1 SE) annual net mineraliza-tion and nitrification rates (mmol N / g dry wt soil /year) in Oe+Oa and A soil horizons at fourAdirondack northern hardwood forest sites. Valueswith different letters are significantly different (a 50.05; Tukey’s Studentized Range Test).
SiteNet
mineralizationNet
nitrification
Oe+Oa horizonOld growth
Base-rich (ORAM) 124 (14) 55 (5)a
Base-poor (OPCL) 167 (17) 17 (5)b
MaturingBase-rich (MRHM) 164 (19) 23 (5)b
Base-poor (MPHF) 173 (15) 29 (8)b
A horizonOld growth
Base-rich (ORAM) 26 (2) 26 (3)Base-poor (OPCL) 34 (2) 24 (3)
MaturingBase-rich (MRHM) 33 (4) 20 (3)Base-poor (MPHF) 37 (3) 27 (3)
262 JOURNAL OF THE TORREY BOTANICAL SOCIETY [VOL. 134
appear to be the single factor controlling
nutrient retention in the four stands we
studied.
Land use and disturbance histories can
affect soil C:N ratios, thereby resulting in
differences in ecosystem N retention. The two
maturing stands we studied established fol-
lowing catastrophic wildfire. Therefore, our
conclusions regarding the effects of stand
development may be confounded by the
nature of the stand-replacing disturbances.
Some researchers have reported that fire
volatizes N, thereby increasing soil C:N ratios
and leading to lower mineralization and
nitrification rates and greater N retention
capacity (Fenn et al. 1998, but see Goodale
and Aber 2001). Although it is possible that
the two maturing forests had lower nitrifica-
tion rates and lower nutrient concentrations in
soil leachate than ORAM due to the effects of
past fires, fire history does not explain the
similarities in nutrient cycling processes that
the maturing stands had with the other old-
growth stand (OPCL).
The two old-growth sites contained volumes
of coarse woody debris that were , 3-fold
higher than in the maturing stands. If the
accumulation of recalcitrant carbon in coarse
woody debris led to greater heterotrophic
immobilization rates (e.g., Fisk et al. 2002)
then reduced nitrification and N leaching would
be expected in both old-growth stands relative
to the two maturing stands. This was not the
case since ORAM exhibited the highest nitrifi-
cation and N leaching rates of all four sites.
Atmospheric Deposition Inputs. Experi-
mental studies have illustrated that chronic
N inputs can induce greater nitrification and
NO32 leaching rates from forest ecosystems
(e.g., Magill et al. 2000, Tietema et al. 1998,
Kahl et al. 1999). Therefore, it is possible that
differences in atmospheric N deposition could
have accounted for some of the variation in
nitrification rates and N export from these
stands. Based upon modeled NO32 deposition
rates in the Adirondack region (Ito et al.
2002), the range of NO32 deposition across
our study sites (13.5 to 15 kg NO32 ha21 yr21)
does not appear sufficiently broad to induce
measurable differences in nitrification and
NO32 leaching (Magill et al. 2000, Tietema et
al. 1998, Kahl et al. 1999).
Site Conditions and Species Composition.
The interaction among site conditions (i.e., soil
Tab
le6.
Aver
age
(1S
E)
esti
mate
dso
ilso
lute
flu
xra
tes
fro
mfo
ur
Ad
iro
nd
ack
no
rth
ern
hard
wo
od
fore
stsi
tes
du
rin
gth
e7
mo
nth
stu
dy
per
iod
(May–N
ovem
ber
,2000).
Valu
esare
base
du
po
nm
easu
red
,m
on
thly
soil
solu
teco
nce
ntr
ati
on
sb
elo
wth
ero
oti
ng
zon
es(5
0cm
)at
twel
ve
sam
ple
loca
tio
ns
at
each
site
an
des
tim
ate
dm
on
thly
soil
wate
rfl
uxes
(usi
ng
the
BR
OO
K90
sim
ula
tio
nm
od
el;
see
Met
ho
ds
for
det
ail
s).
Sig
nif
ican
td
iffe
ren
ces
am
on
gsi
tes
for
each
esti
mate
dm
ean
solu
tefl
ux
are
den
ote
dw
ith
dif
fere
nt
sup
ersc
rip
ts(a
50.0
5;
Tu
key
’sS
tud
enti
zed
Ran
ge
Tes
t;n
512).
Sit
e
Na
+M
g2+
K+
Ca
2+
Aln
+H
+C
l2S
O4
22
NO
32
NH
4+
DO
NT
DN
DO
CS
cati
on
sS
an
ion
s{
------
------
------
------
------
------
------
------
------
------
------
------
------
------
------
------
---me
qh
a2
1---
------
------
------
------
------
------
------
------
------
------
------
------
------
------
------
------
------
------
------
------
mmo
lh
a2
1---
------
------
------
----
------
------
--me
qh
a2
1---
------
------
Old
gro
wth
Base
-ric
h(O
RA
M)
68
b(7
)91
ab
(10)
14
ab
(3)
428
(55)
21
b(2
)6
b(2
)26
ab
(4)
272
b(2
2)
139
a(4
9)
3(1
)56
(12)
187
a(4
0)
1119
b(1
30)
631
ab
(69)
547
ab
(58)
Base
-po
or
(OP
CL)
84
ab
(5)
75
bc
(6)
27
a(6
)341
(32)
30
ab
(6)
31
a(9
)33
ab
(3)
455
a(1
4)
55
ab
(9)
2(1
)40
(5)
96
b(1
1)
833
b(7
8)
589
ab
(33)
618
a(2
4)
Matu
rin
gB
ase
-ric
h(M
RH
M)
66
b(3
)49
c(5
)8
b(1
)303
(17)
14
b(3
)7
b(2
)22
b(1
)263
b(1
0)
20
b(5
)2
(1)
31
(4)
53
b(9
)782
b(1
33)
449
b(2
1)
410
b(2
0)
Base
-po
or
(MP
HF)
94
a(1
0)
122
a(1
6)
24
a(4
)381
(35)
44
a(8
)16
a(3
)36
a(3
)326
b(2
3)
45
ab
(16)
7(3
)63
(11)
115
ab
(18)
1776
a(2
51)
689
a(6
0)
638
a(5
5)
{T
ota
lan
ion
sacc
ou
nt
for
neg
ati
ve
charg
esass
oci
ate
dw
ith
dis
solv
edo
rgan
icca
rbo
nu
sin
gp
ara
met
ers
an
deq
uati
on
so
fM
itch
ell
etal.
(2001b
).
2007] MCGEE ET AL.: DYNAMICS OF NORTHERN HARDWOOD FORESTS 263
fertility and moisture), vegetation composi-
tion, and N cycling process (particularly
nitrification) are complex and interrelated. It
has long been known that stand-level forest
community composition is regulated by topo-
edaphic conditions, and therefore site fertility
can often be inferred through species compo-
sition (e.g., Heimburger 1934, Finzi et al.
1998b, Bigelow & Canham 2002). Our study
sites were chosen to reflect a range of
perceived topo-edaphic conditions within
northern hardwood stand types. The ORAM
and MRHM sites possessed species composi-
tions indicative of Heimburger’s (1934) rich
‘‘Arisaema type’’ northern hardwoods, which
contain higher lime content in the organic soil
horizons. The lower H+ concentrations and
higher Ca:Al ratios in soil solution at ORAM
and MRHM reflect base-rich site conditions
there. The other sites (OPCL and MPHF) were
equated to Heimburger’s more acidic ‘‘Vibur-
num type’’ northern hardwoods.
It remains unclear how soil fertility and
vegetation influence nitrogen cycling processes,
and in particular, nitrification and subsequent
NO32 leaching rates. For instance, observa-
tional and experimental studies have demon-
strated that nitrification rates are positively
correlated with soil pH (Heimburger 1934, Zak
et al. 1986, Williard et al. 1997, see also review
by Haynes 1986) or phosphorus availability
(Pastor et al. 1984). This relationship may
reflect physiological ranges of tolerance for
most nitrifying bacteria, bacterial limitation by
P (which declines in solubility in soils of pH
below pH 6.0) or bacterial Al toxicity under
acidic soil conditions (Haynes 1986). Data
from our study were consistent with this
previous work. The ORAM site, which had
the lowest H+ concentrations, highest Ca2+ and
total cation concentrations and highest Ca:Al
ratio in shallow (15 cm) soil solution of the
four sites had significantly higher net nitrifica-
tion rates in the organic soil horizons and the
highest soil solution NO32 fluxes. Other studies
that have measured ecosystem-level NO32
losses in relation to site conditions have
reported positive correlations between soil pH
and nitrification rates and NO32 leaching rates
(e.g., Nyborg and Hoyt 1978, Vitousek and
Matson 1985, Geary and Driscoll 1996, but see
Finzi and others 1998b, Lovett et al. 2004).
Leaf Litter Quality. Nitrification processes
may not be regulated solely by abiotic, edaphic
factors (e.g., soil pH). Rather, nitrification
rates could be influenced by composition of
the forest vegetation. Other studies have found
important differences in N cycling processes in
northern hardwood forests of differing com-
position and soil types (Nadelhoffer et al.
1983, Pastor et al. 1984, Zak et al. 1989, Reich
et al. 1997). Lovett et al. (2000) found that
vegetation composition in the Catkskill
Mountains (New York, USA) was a major
determinant of NO32 concentrations in stream
water. Catskill sites in which Quercus rubra L.
was the predominant overstory species had the
lowest NO32 concentrations in stream water.
Lovett and Rueth (1999) found that potential
nitrification rates were significantly higher in
Acer saccharum stands compared to Fagus
grandifolia stands in the Catskills. These
reported relationships between forest vegeta-
tion, nitrification rates, and N-retention ca-
pacity may be mediated by foliar litter quality.
Foliar litter chemistry differs among forest
tree species (Pastor et al. 1984, Stump and
Binkley 1993, Ferrari 1999, Lovett et al. 2000,
2004, this study), and these differences can
influence N cycling processes. For instance,
litter lignin:N ratios are negatively correlated
with mineralization/nitrification rates (Pastor
et al. 1984, Finzi et al. 1998a, Scott and
Binkley 1997, Ferrari 1999). Although there
were important differences among our sites in
the dominance by base-rich site indicator
species, and although the base-rich forests
produced leaf litter having lower lignin con-
centrations than the acid site forests, the
differences in litter quality could not be
attributed solely to differences in species
composition. Rather, all three common hard-
wood species (Acer saccharum, Fagus grand-
ifolia, Betula alleghaniensis) exhibited a degree
of plasticity in leaf litter chemistry. Leaf litter
cation concentrations for these species were
generally highest and lignin concentrations
lowest at the two base-rich sites (ORAM and
MRHM). Fagus grandifolia, a base-poor site
and shade-tolerant species (Burns and Hon-
kala 1990), was generally the least plastic of
the three species. Bailey et al. (2004) also
reported intraspecific variation in A. sac-
charum foliar Ca and Mg concentrations in
association with soil exchangeable cations.
This site-related plasticity in litter quality
may be a function of nutrient stress. Cellular
lignification in plants is a phenotypic response
to nutrient stress, and decreasing soil fertility
264 JOURNAL OF THE TORREY BOTANICAL SOCIETY [VOL. 134
leads to increased foliar lignin content (Chapin
1991). This stress response may lead to
ensuing positive feedback mechanisms by
reducing mineralization and nitrification rates,
and thereby reducing nutrient losses from the
site.
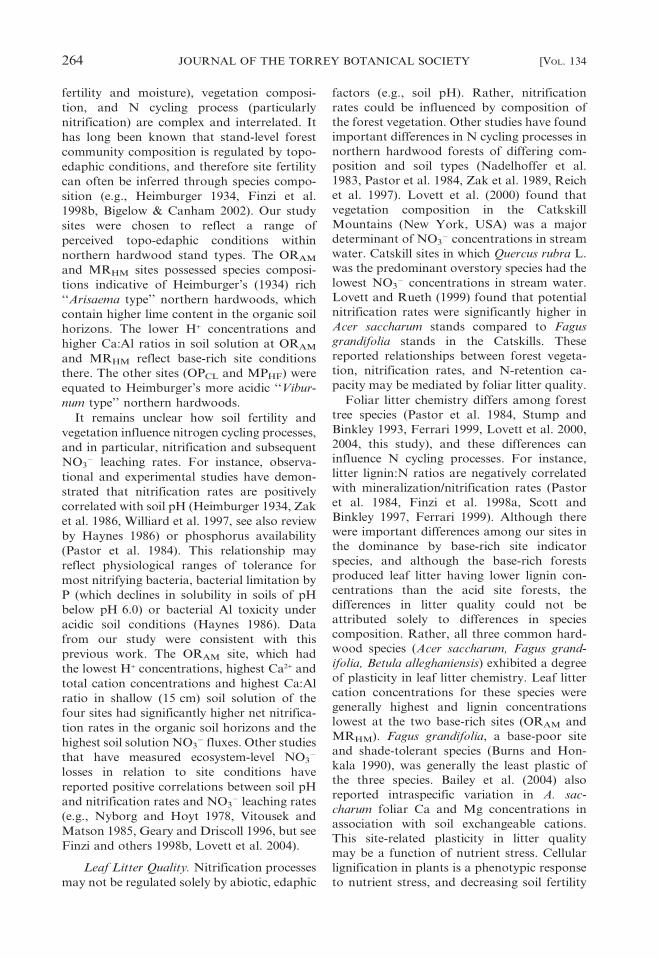
POTENTIAL INTERACTIONS OF SITE AND
FOREST DEVELOPMENT. Neither forest develop-
mental stage nor site conditions/forest compo-
sition appeared to be solely associated with N
cycling processes and nutrient retention in the
four northern hardwood forests we studied.
Rather the differences we observed in ecosys-
tem N cycling and retention processes may be
the result of several interacting biotic and
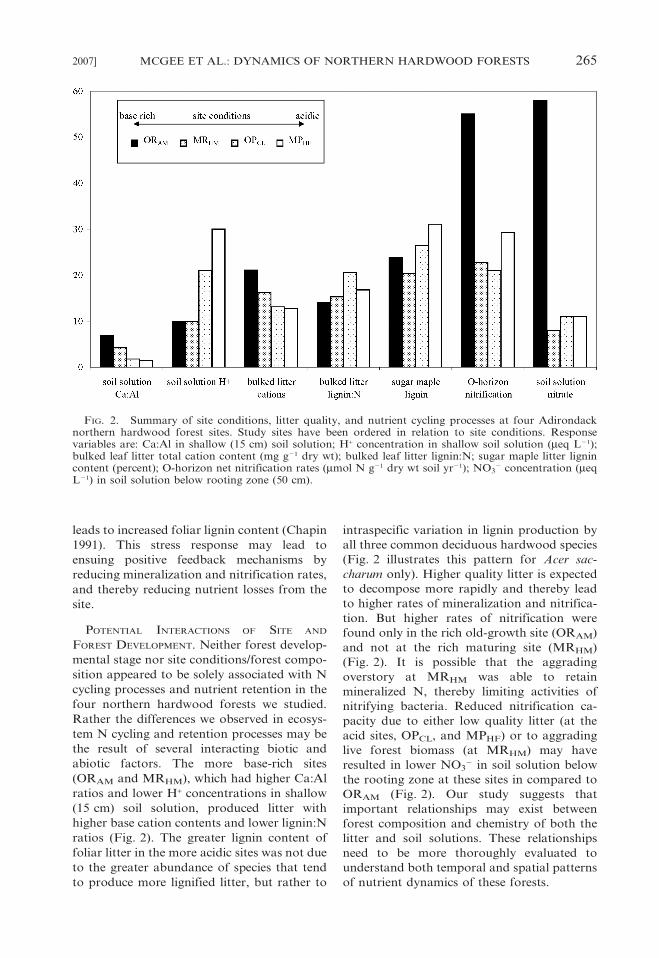
abiotic factors. The more base-rich sites
(ORAM and MRHM), which had higher Ca:Al
ratios and lower H+ concentrations in shallow
(15 cm) soil solution, produced litter with
higher base cation contents and lower lignin:N
ratios (Fig. 2). The greater lignin content of
foliar litter in the more acidic sites was not due
to the greater abundance of species that tend
to produce more lignified litter, but rather to
intraspecific variation in lignin production by
all three common deciduous hardwood species
(Fig. 2 illustrates this pattern for Acer sac-
charum only). Higher quality litter is expected
to decompose more rapidly and thereby lead
to higher rates of mineralization and nitrifica-
tion. But higher rates of nitrification were
found only in the rich old-growth site (ORAM)
and not at the rich maturing site (MRHM)
(Fig. 2). It is possible that the aggrading
overstory at MRHM was able to retain
mineralized N, thereby limiting activities of
nitrifying bacteria. Reduced nitrification ca-
pacity due to either low quality litter (at the
acid sites, OPCL, and MPHF) or to aggrading
live forest biomass (at MRHM) may have
resulted in lower NO32 in soil solution below
the rooting zone at these sites in compared to
ORAM (Fig. 2). Our study suggests that
important relationships may exist between
forest composition and chemistry of both the
litter and soil solutions. These relationships
need to be more thoroughly evaluated to
understand both temporal and spatial patterns
of nutrient dynamics of these forests.
FIG. 2. Summary of site conditions, litter quality, and nutrient cycling processes at four Adirondacknorthern hardwood forest sites. Study sites have been ordered in relation to site conditions. Responsevariables are: Ca:Al in shallow (15 cm) soil solution; H+ concentration in shallow soil solution (meq L21);bulked leaf litter total cation content (mg g21 dry wt); bulked leaf litter lignin:N; sugar maple litter lignincontent (percent); O-horizon net nitrification rates (mmol N g21 dry wt soil yr21); NO3
2 concentration (meqL21) in soil solution below rooting zone (50 cm).
2007] MCGEE ET AL.: DYNAMICS OF NORTHERN HARDWOOD FORESTS 265
Literature Cited
ABER, J. D. AND J. M. MELILLO. 1982. Nitrogenimmobilization in decaying hardwood leaf litteras a function of initial nitrogen and lignincontent. Can. J. Bot. 60: 2263–2269.
AMEEL, J. J., R. P. AXLER, AND C. J. OWEN. 1993.Persulfate digestion for determination of totalnitrogen and phosphorus in low-nutrient waters.Am. Environ. Lab. 10: 1–11.
ANKOM TECHNOLOGY. 2002. Method for determiningacid detergent lignin in the Daisy II Incubator.Retrieved December 8, 2002. ,http://www.ankom.com.
BAILEY, S. W., S. B. HORSLEY, R. P. LONG, AND R.A. HALLETT. 2004. Influence of edaphic factorson sugar maple nutrition and health on theAllegheny Plateau. Soil Sci. Soc. Am. J. 68:243–252.
BAKKEN, P. N. AND J. E. COOK. 1998. Regenerationpotential of six habitat types common to north-central Wisconsin. N. J. Appl. For. 15: 116–123.
BIGELOW, S. W. AND C. D. CANHAM. 2002. Commu-nity organization of tree species along soilgradients in a north-eastern USA forest. J. Ecol.90: 188–200.
BRADY, N. C. AND R. R. WEIL. 2002. The nature andproperties of soils. Prentice Hall, Upper SaddleRiver, NJ. 960 p.
BRAUN, E. L. 1950. Deciduous forests of easternNorth America. Free Press, New York, NY.596 p.
BURNS, R. M. AND B. H. HONKALA, tECH. COORDS.1990. Silvics of North America: 1. Conifers; 2.Hardwoods. Agriculture Handbook 654. U.S.Department of Agriculture, Forest Service,Washington, DC.
CHAPIN, F. S.,III. 1991. Effects of multiple environ-mental stresses on nutrient availability and use,p. 67–88. In H. A. Mooney, W. E. Winner, andE. J. Pell [eds.], Response of plants to multiplestresses. Academic Press, San Diego, CA.
CLINE, M. G. AND R. L. MARSHALL. 1992. Soils ofNew York landscapes. Bull. 119. NYS College ofAgriculture and Life Science, Ithaca, NY. 61 p.
FEDERER, C. A. 1995. BROOK90: a simulationmodel for evaporation, soil water and streamflow. USDA Forest Service, Durham, NH.
FENN, M. E., M. A. POTH, J. D. ABER, J. S. BARON,B. T. BORMANN, D. W. JOHNSON, A. D. LEMLY, S.G. MCNULTY, D. F. RYAN, AND R. STOTTLEMYER.1998. Nitrogen excess in North American eco-systems: predisposing factors, ecosystem re-sponses and management strategies. Ecol. Appl.8: 706–733.
FERARRI, J. B. 1999. Fine-scale patterns of leaflitterfall and nitrogen cycling in an old-growthforest. Can. J. For. Res. 29: 291–302.
FINZI, A. C., C. D. CANHAM, AND N. VAN BREMEN.1998a. Canopy tree-soil interactions within tem-perate forests: species effects on soil carbon andnitrogen. Ecol. Appl. 8: 440–446.
FINZI, A. C., C. D. CANHAM, AND N. VAN BREMEN.1998b. Canopy tree-soil interactions withintemperate forests: species effects on pH andcations. Ecol. Appl. 8: 447–454.
FISK, M. C., D. R. ZAK, AND T. R. CROW. 2002.Nitrogen storage and cycling in old- and second-growth northern hardwood forests. Ecology 83:73–87.
GEARY, R. J. AND C. T. DRISCOLL. 1996. Forest soilsolutions: acid/base chemistry and response tocalcite treatments. Biogeochemistry 32: 195–220.
GOODALE, C. L. AND J. D. ABER. 2001. The long-term effects of land-use history on nitrogencycling in northern hardwood forests. Ecol.Appl. 11: 253–267.
GOODALE, C. L., J. D. ABER, AND P. M. VITOUSEK.2003. An unexpected nitrate decline in NewHampshire streams. Ecosystems 6: 75–86.
GOWER, S. T., R. E. MCMURTRIE, AND D. MURTY.1996. Aboveground net primary productiondecline with stand age: potential causes. TrendsEcol. Evol. 11: 378–382.
HAYNES, R. J. 1986. Nitrification, p. 127–165. In K.C. Cameron, K. M. Goh, and R. R. Sherlock[eds.], Mineral nutrition in the plant-soil system.Academic Press, Inc., Orlando, FL.
HEIMBURGER, C. C. 1934. Forest type studies in theAdirondack region. Cornell University Agricul-ture Experiment Station Memoir 165., 122 p.
HOARE, R. 2005. World Climate [on-line database].Retrieved December 2, 2005. ,http://www.worldclimate.com.
HORSLEY, S. B., R. P. LONG, S. W. BAILEY, R. A.HALLETT, AND P. M. WARGO. 2002. Health ofeastern North American sugar maple forests andfactors affecting decline. N. J. Appl. For. 19:34–44.
ITO, M., M. J. MITCHELL, AND C. T. DRISCOLL. 2002.Spatial patterns of precipitation quantity andchemistry and air temperature in the Adirondackregion of New York. Atmosph. Env. 36:1051–1062.
JOHNSON, D. W. AND S. E. LINDBERG, eds. 1992.Atmospheric deposition and forest nutrientcycling. Ecological Studies 91. Springer-Verlag,New York, NY. 707 p.
KAHL, J., S. NORTON, I. FERNANDEZ, L. RUSTAD, AND
M. HANDLEY. 1999. Nitrogen and sulfur input-output budgets in the experimental and referencewatersheds, Bear Brook Watershed in Maine(BBWM). Environ. Monitoring Assess. 55:113–131.
KOBE, R. K., S. W. PACALA, J. A. SILANDER, JR, AND
C. D. CANHAM. 1995. Juvenile tree survivorshipas a component of shade tolerance. Ecol. Appl. 5:517–532.
LEAK, W. B. AND C. W. MARTIN. 1975. Relationshipof stand age to streamwater nitrate in NewHampshire. USDA Forest Service ResearchNote NE-211. US Department of Agriculture,Forest Service, Northeastern Research Station,Newtown Square, PA.
LONG, R. P., S. B. HORSLEY, AND P. R. LILJN. 1997.Impact of forest liming on growth and crownvigor of sugar maple and associated hardwoods.Can. J. For. Res. 27: 1560–1573.
LOVETT, G. AND M. J. MITCHELL. 2004. Sugar mapleand nitrogen cycling in the forests of easternNorth America. Frontiers Ecol. Environ. 2:81–88.
266 JOURNAL OF THE TORREY BOTANICAL SOCIETY [VOL. 134
LOVETT, G. M. AND H. RUETH. 1999. Soil nitrogentransformations in beech and maple stands alonga nitrogen deposition gradient. Ecol. Appl. 9:1330–1344.
LOVETT, G. M., K. C. WEATHERS, AND W. V.SOBCZAK. 2000. Nitrogen saturation and reten-tion in forested watersheds of the CatskillMountains, New York. Ecol. Appl. 10: 73–84.
LOVETT, G. M., K. C. WEATHERS, M. A. ARTHUR,AND J. C. SCHULTZ. 2004. Nitrogen cycling ina northern hardwood forest: Do species matter?Biogeochemistry 67: 289–308.
MAGILL, A. H., J. D. ABER, G. M. BERNTSON, W. H.MCDOWELL, K. J. NADELHOFFER, J. M. MELILLO,AND P. STEUDLER. 2000. Long-term nitrogenadditions and nitrogen saturation in two temper-ate forests. Ecosystems 3: 238–253.
MARTIN, C. W. 1979. Precipitation and streamwaterchemistry in an undisturbed forested watershedin New Hampshire. Ecology 60: 36–42.
MARTIN, C. W., C. T. DRISCOLL, AND T. J. FAHEY.2000. Changes in streamwater chemistry after20 years from forested watersheds in NewHampshire, USA. Can. J. For. Res. 30:1206–1213.
MCGEE, G. G. 1998. Structural characteristics ofAdirondack northern hardwood forests: implica-tions for ecosystem management: Ph.D. thesis.State University of New York, College ofEnvironmental Science and Forestry, Syracuse,NY.
MCGEE, G. G., D. J. LEOPOLD, AND R. D. NYLAND.1999. Structural characteristics of old-growth,maturing and partially cut northern hardwoodforests. Ecol. Appl. 9: 1316–1329.
MCMARTIN, B. 1994. The great forests of theAdirondacks. North Country Books, Utica,New York, USA.
MITCHELL, M. J., N. W. FOSTER, J. P. SHEPARD, AND
I. K. MORRISON. 1992a. Nutrient cycling inHuntington Forest and Turkey Lakes deciduousstands: nitrogen and sulfur. Can. J. For. Res. 22:457–464.
MITCHELL, M. J., M. K. BURKE, AND J. P. SHEPARD.1992b. Seasonal and spatial patterns of S, Ca andN dynamics of a northern hardwood forestecosystem. Biogeochemistry 17: 165–189.
MITCHELL, M. J., C. T. DRISCOLL, S. INAMDAR, G.MCGEE, M. MBILA, AND D. RAYNAL. 2003.Nitrogen biogeochemistry in the AdirondackMountains of New York: hardwood ecosystemsand associated surface waters. Environ. Pollut.123: 355–364.
MITCHELL, M. J., G. MCGEE, P. MCHALE, AND K. C.WEATHERS. 2001a. Experimental design andinstrumentation for analyzing solute concentra-tions and fluxes for quantifying biogeochemicalprocesses in watersheds. Methodology paperseries of the 4th International Conference onILTER in East Asia and Pacific Region,Ulaanbaatar-Hatgal, Mongolia. 2001, pp. 15–21E 2001 ILTER Network.
MITCHELL, M. J., B. MAYER, S. W. BAILEY, J. W.HORNBECK, C. ALEWELL, C. T. DRISCOLL, AND G.E. LIKENS. 2001b. Use of stable isotope ratios forevaluating sulfur sources and losses at theHubbard Brook Experiment Forest. Proceedings
of Acid Rain 2000, Japan. Water, Air and SoilPollut. 130: 75–86.
MITCHELL, M. J., D. J. RAYNAL, AND C. T. DRISCOLL.1996. Biogeochemistry of forested watershed inthe central Adirondack Mountains: Temporalchanges and mass balances. Water, Air, and SoilPollut. 88: 355–369.
MITCHELL, R. S. AND G. C. TUCKER. 1997. Revisedchecklist of New York State plants. New YorkState Museum Bulletin No. 490, Albany, NY.400 p.
NATIONAL ATMOSPHERIC DEPOSITION PROGRAM/NA-
TIONAL TRENDS NETWORK. 2005. Online database.Retrieved December 5, 2005. ,http://nadp.sws.uiuc.edu.
NADELHOFFER, K. J., J. D. ABER, AND J. M.MELILLO. 1983. Leaf-litter production and soilorganic matter dynamics along a nitrogen-avail-ability gradient in southern Wisconsin (USA).Can. J. For. Res. 13: 12–21.
NYBORG, M. AND P. B. HOYT. 1978. Effects of soilacidity and liming on mineralization of soilnitrogen. Can. J. Soil Sci. 58: 331–38.
PARDO, L. H., C. T. DRISCOLL, AND G. E. LIKENS.1995. Patterns of nitrate loss from a chronose-quence of clear-cut watersheds. Water, Air andSoil Pollut. 85: 1659–1664.
PASTOR, J., J. D. ABER, C. A. MCCLAUGHERTY, AND
J. M. MELILLO. 1984. Aboveground productionand N and P cycling along a nitrogen mineral-ization gradient on Blackhawk Island, Wiscon-sin. Ecology 65: 256–268.
PEET, R. K. 1992. Community structure andecosystem properties, p. 102–151. In D. C.Glenn-Lewin, R. K. Peet, and T. T. Veblen[eds.], Plant succession: theory and prediction.Chapman and Hall, London, UK.
PERAKIS, S. S. AND L. O. HEDIN. 2001. Fluxes andfates of nitrogen in soil of an unpolluted old-growth temperate forest, Southern Chile. Ecolo-gy 82: 2245–2260.
REICH, P. B., D. F. GRIGOL, J. D. ABER, AND S. T.GOWER. 1997. Nitrogen mineralization and pro-ductivity in fifty hardwood and conifer stands ondiverse soils. Ecology 78: 335–347.
SAS INSTITUTE. 2001. SAS/STAT users’ guideversion 8. SAS Institute., Cary, NC.
SCOTT, N. A. AND D. BINKLEY. 1997. Foliage litterquality and annual net N mineralization: com-parison across North American forest sites.Oecologia 111: 151–159.
SHEPARD, J. P., M. J. MITCHELL, T. J. SCOTT, AND C.T. DRISCOLL. 1990. Soil solution chemistry of anAdirondack spodosol: lysimetry and N dynam-ics. Can. J. For. Res. 20: 818–824.
STODDARD, J. C. 1994. Long tern changes inwatershed retention of N: its causes and aquaticconsequences, p. 223–284. In L. A. Baker [ed.],Environmental chemistry of lakes and reservoirs.Advances in Chemistry Series 237. AmericanChemical Society, Washington, DC.
STUMP, L. AND D. BINKLEY. 1993. Relationshipsbetween litter quality and nitrogen availability inRocky Mountain forests. Can. J. For. Res. 23:492–503.
TEMPLER, P., S. FINDLAY, AND G. LOVETT. 2003. Soilmicrobial biomass and nitrogen transformations
2007] MCGEE ET AL.: DYNAMICS OF NORTHERN HARDWOOD FORESTS 267
among five species of the Catskill Mountains,New York, USA. Soil Biol. and Biochem. 35:607–613.
TIETEMA, A., A. W. BOXMAN, M. BREDEMEIER, B. A.EMMETT, F. MOLDAN, P. GUNDERSEN, P.SCHLEPPI, AND R. F. WRIGHT. 1998. Nitrogensaturation experiments (NITREX) in coniferousforest ecosystems in Europe: a summary ofresults. Environ. Pollut. 102: 433–437.
VITOUSEK, P. M. AND P. A. MATSON. 1985.Disturbance, N availability, and N losses in anintensively managed loblolly pine plantation.Ecology 66: 1360–1376.
VITOUSEK, P. M. AND W. A. REINERS. 1975.Ecosystem succession and nutrient retention:a hypothesis. Science 25: 376–381.
WILLIARD, K. W. J., D. R. DEWALLE, P. J. EDWARDS,AND R. R. SCHNABEL. 1997. Indicators of nitrateexport from forested watersheds of the mid-Appalachians, United States of America. GlobalBiogeochemical Cycles. 11: 649–656.
WOODS, K. D. AND C. V. COGBILL. 1994. Uplandold-growth forests of Adirondack Park, NewYork, USA. Nat. Areas J. 14: 241–257.
ZAK, D. R., G. E. HOST, AND K. S. PREGITZER. 1989.Regional variability in nitrogen mineralization,nitrification and overstory biomass in northernlower Michigan. Can. J. For. Res. 19: 1521–1526.
ZAK, D. R., K. S. PREGITZER, AND G. E. HOST. 1986.Landscape variation in nitrogen mineralizationand nitrification. Can. J. For. Res. 16:1258–1263.
268 JOURNAL OF THE TORREY BOTANICAL SOCIETY [VOL. 134