Embed Size (px)
Citation preview
Hearing Research 241 (2008) 34–42
Contents lists available at ScienceDirect
Hearing Research
journal homepage: www.elsevier .com/locate /heares
Research paper
Relationships between behavior, brainstem and cortical encoding of seen andheard speech in musicians and non-musicians
Gabriella Musacchia a,*, Dana Strait a,b, Nina Kraus a,c
a Auditory Neuroscience Laboratory, Department of Communication Sciences, Northwestern University, 2240 Campus Drive, Evanston, IL 60208, USAb School of Music, Northwestern University, Evanston, IL 60208, USAc Departments of Neurobiology and Physiology and Otolaryngology, Northwestern University, Evanston, IL, USA
a r t i c l e i n f o
Article history:Received 31 October 2007Received in revised form 16 April 2008Accepted 24 April 2008Available online 17 May 2008
Keywords:LanguageMusicMultisensoryAuditoryVisualABRFFRPlasticity
0378-5955/$ - see front matter � 2008 Elsevier B.V. Adoi:10.1016/j.heares.2008.04.013
* Corresponding author. Tel.: +1 847 491 2465; faxE-mail address: [email protected] (G
a b s t r a c t
Musicians have a variety of perceptual and cortical specializations compared to non-musicians. Recentstudies have shown that potentials evoked from primarily brainstem structures are enhanced in musi-cians, compared to non-musicians. Specifically, musicians have more robust representations of pitch peri-odicity and faster neural timing to sound onset when listening to sounds or both listening to and viewinga speaker. However, it is not known whether musician-related enhancements at the subcortical level arecorrelated with specializations in the cortex. Does musical training shape the auditory system in a coor-dinated manner or in disparate ways at cortical and subcortical levels? To answer this question, werecorded simultaneous brainstem and cortical evoked responses in musician and non-musician subjects.Brainstem response periodicity was related to early cortical response timing across all subjects, and thisrelationship was stronger in musicians. Peaks of the brainstem response evoked by sound onset and tim-bre cues were also related to cortical timing. Neurophysiological measures at both levels correlated withmusical skill scores across all subjects. In addition, brainstem and cortical measures correlated with theage musicians began their training and the years of musical practice. Taken together, these data implythat neural representations of pitch, timing and timbre cues and cortical response timing are shapedin a coordinated manner, and indicate corticofugal modulation of subcortical afferent circuitry.
� 2008 Elsevier B.V. All rights reserved.
1. Introduction
Playing music is a cognitively complex task that requires, atminimum, sensations from the sound he or she is playing, the sightof sheet music and the touch of the instrument to be utilized andintegrated. Proficiency at doing so accumulates over years of con-sistent training, even in cases of high innate talent. Not surpris-ingly, instrumental musicians exhibit behavioral and perceptualadvantages over non-musicians in music-related areas such aspitch discrimination (Tervaniemi et al., 2005) and fine motor con-trol skills (Kincaid et al., 2002). Musicians have also shown percep-tual improvements over non-musicians in both native and foreignlinguistic domains (Magne et al., 2006; Marques et al., 2007). It isthought that neural plasticity related to musical training underliesmany of these differences (Hannon and Trainor, 2007).
Highly-trained musicians exhibit anatomical, functional andevent-related specializations compared to non-musicians. Froman anatomical perspective, musicians have more neural cell bodies(grey matter volume) in auditory, motor and visual cortical areas of
ll rights reserved.
: +1 847 491 2523.. Musacchia).
the brain (Gaser and Schlaug, 2003) and have more axonal projec-tions that connect the right and left hemispheres (Schlaug et al.,1995). Not surprisingly, professional instrumentalists, comparedto amateurs or untrained controls, have more activation in audi-tory areas such as Heschel’s gyrus (Schneider et al., 2002) andthe planum temporale (Ohnishi et al., 2001) to sound. Musicaltraining also promotes plasticity in somatosensory regions; withstring players demonstrating larger areas of finger representationthan untrained controls (Elbert et al., 1995). With regard to evokedpotentials (EPs) thought to arise primarily from cortical structures,musicians show enhancements of the P1–N1–P2 complex to pitch,timing and timbre features of music, relative to non-musicians(Pantev et al., 2001). Trained musicians show particularly largeenhancements when listening to the instruments that they them-selves play (Munte et al., 2003; Pantev et al., 2003). Musicians’ cor-tical EP measures are also more apt to register fine-grainedchanges in complex auditory patterns and are more sensitive topitch and interval changes in a melodic contour than non-musi-cians (Fujioka et al., 2004a; Pantev et al., 2003). Moreover, musi-cian-related plasticity is implicated in these and other studiesbecause enhanced cortical EP measures have been correlated tothe length of musical training or musical skill.

G. Musacchia et al. / Hearing Research 241 (2008) 34–42 35
Recent studies from our laboratory have suggested that playinga musical instrument also ‘‘tunes” neural activity peripheral tocortical structures (Musacchia et al., 2007; Wong et al., 2007).These studies showed that evoked responses thought to arisepredominantly from brainstem structures were more robust inmusicians than in non-musician controls. The observed musician-related enhancements corresponded to stimulus features thatmay be particularly important for processing music. One suchexample is observed with the frequency following response(FFR), which is thought to be generated primarily in the inferiorcolliculus and consists of phase-locked inter-spike intervals occur-ring at the fundamental frequency (F0) of a sound (Hoormannet al., 1992; Krishnan et al., 2005). Because F0 is understood tounderlie the percept of pitch, this response is hypothesized to berelated to the ability to accurately encode acoustic cues for pitch.Enhanced encoding of this aspect of the stimulus would clearlybe beneficial to pitch perception of music. Accordingly, our previ-ous studies demonstrated larger peak amplitudes at F0 and betterpitch tracking in musicians relative to non-musicians. Anotherexample was observed with Wave d (�8 ms post-acoustic onset)of the brainstem response to sound onset, which has been hypoth-esized to be important for encoding stimulus onset (Musacchiaet al., 2006, 2007). Stimulus onset is an attribute of music impor-tant for denoting instrument attack and rhythm, and therefore itis perhaps unsurprising that we observed earlier Wave d responsesin musicians than non-musicians. More importantly, FFR and Waved enhancement in musicians was observed with both music andspeech stimuli and was largest when subjects engaged multiplesenses by simultaneously lip-reading or watching a musician play.This suggests that while these enhancements may be motivated bymusic-related tasks, they are pervasive and apply to other stimulithat possess those stimulus characteristics.
A key point to be noted regarding prior EP studies showingmusician-related enhancements is that none have attempted to re-late enhancements in measures thought to arise from brainstemstructures (e.g., the FFR) with measures thought to arise largelyfrom cortical regions (e.g., P1, N1 and P2 potentials). One crucialpiece of information that could be gleaned from this approachwould be that we may be able to determine which stimulus fea-tures are relevant to cortical EP enhancements in musicians. Suchdeterminations could be made because musician-related enhance-ments in brainstem responses correspond to representations ofspecific stimulus features (e.g. pitch, timing and timbre).
The implications of these data could be strengthened consider-ably if the EP data were also correlated with performance on mu-sic-related behavioral tasks. Previous work has suggested thatshort and long-term experience with complex auditory tasks (e.g.language, music, auditory training) may shape subcortical circuitrylikely through corticofugal modulation of sensory function (Krausand Banai, 2007; Russo et al., 2005; Song et al., 2008; Krishnanet al., 2005). Correlations between measures of brainstem and cor-tical EPs that coincide with improved performance on a musicaltask would provide support for the notion that specific neural ele-ments are recruited to perform a given task, and that such selec-tions are mediated in a top-down manner through experience(e.g., Reverse Hierarchy Theory; Ahissar and Hochstein, 2004), pre-sumably via reciprocal cortical–subcortical interactions. AlthoughReverse Hierarchy Theory (RHT) has been used to consider visualcortical function, it is our view that this mechanism applies to sub-cortical sensory processing and that the application of its princi-ples can explain the malleability of early sensory levels.
The idea of a cognitive-sensory interplay between subcorticaland cortical plasticity is not new, and theories of learning increas-ingly posit a co-operation between ‘‘bottom-up” ad ‘‘top-down”plasticity [for review, see (Kral and Eggermont, 2007)]. Galbraithwas one of the first to recognize that human brainstem function
is sensitive to cognitive states and functions and can be modulatedby selective auditory attention (Galbraith et al., 2003), and whenreaction times to auditory stimuli are shorter (Galbraith et al.,2000). The FFR is also selectively activated when verbal stimuliare consciously perceived as speech (Galbraith et al., 1997) and islarger to a speech syllable than to a time-reversed version of itself(Galbraith et al., 2004). In addition, several lines of research suggestthat subcortical activity is enhanced in people who have had pro-tracted linguistic (Krishnan et al., 2005; Xu et al., 2006) or musicaltraining (Musacchia et al., 2007; Wong et al., 2007) and degraded inpeople with certain communication disorders (Banai et al., 2005;Russo et al., in press). Malleability of the human brainstem responseis not restricted to lifelong training, however, as short-term audi-tory training has also been shown to enhance the FFR in childrenand adults (Russo et al., 2005; Song et al., 2008). Physiological workin animals demonstrates that improved signal processing in subcor-tical structures is mediated by the corticofugal system during pas-sive and active auditory exposure (Yan and Suga, 1998; Zhou andJen, 2000). Prior anatomical findings suggest several potentialroutes that propagate action potentials from the auditory cortexto subcortical centers such as the medial geniculate body and infe-rior colliculus (IC) (Kelly and Wong, 1981; Saldana et al., 1996;Huffman and Henson, 1990). Consistent with this notion of recipro-cal cortical–subcortical interaction, the current work investigatesthe relationship between experience and the representation ofstimulus features at the sensory and cortical level.
In order to examine the relationship between evoked-potentialsand experience, we recorded simultaneous brainstem and corticalEPs in musicians and non-musician controls. Because previous datashowed that musician-related effects extend to speech and multisen-sory stimuli, the speech syllable ‘‘da” was presented in three condi-tions: when subjects listened to the auditory sound alone, whenthe subjects simultaneously watched a video of a male speaker saying‘‘da”, and when they viewed the video alone. Our analysis focused oncomparing measures of the speech-evoked brainstem response thathave been previously reported as enhanced in musicians with well-established measurements of cortical activity (e.g., the P1–N1–P2complex). Thus, we were particularly interested in the representationof the timing of sound onset, pitch and timbre in the brainstem re-sponse. By correlating these neurophysiological measures and com-paring them to behavioral scores on tests of musical skill andauditory perception, we were able to establish links between brain-stem measures, cortical measures and behavioral performance andto show which relationships were strengthened by musical training.
2. Materials and methods
2.1. Subjects
Participants in this study consisted of 26 adults (mean age25.6 ± 4.1 years, 14 females) with normal hearing (<15 dB HLpure-tone thresholds from 500 to 4000 Hz). We assume that all lis-teners had similar audiometric profiles because we are unaware ofany data suggesting that normal-hearing musicians have a differ-ent audiometric profile than normal-hearing non-musicians. Par-ticipants were selected to have normal or corrected-to-normalvision (Snellen Eye Chart, 2001) and no history of neurological dis-orders. All participants gave their informed consent before partic-ipating in this study in accordance with the NorthwesternUniversity Institutional Review Board regulations. Subjects catego-rized as musicians (N = 14) were self-identified, began playing aninstrument before the age of five, had 10 or more years of musicalexperience, and practiced more than three times weekly for four ormore hours consistently over the last 10 years. Controls (N = 12)were categorized by the failure to meet the musician criteria.

36 G. Musacchia et al. / Hearing Research 241 (2008) 34–42
2.2. Musical aptitude measures
We administered two in-house measures of auditory and musi-cal skill: Seashore’s Test of Musical Talents (Seashore, 1919) and Col-well’s Musical Achievement Test (MAT-3) (Colwell, 1970). Seashore’stest consists of six subtests: Pitch, Rhythm, Loudness, Time, Timbreand Tonal Memory. Each subtest is a two-alternative forced choiceauditory discrimination task that asks listeners to judge whetherthe second sound (or sequence) is different from the first. Becauseof its use of pure and complex sine waves, and the method of eval-uation, the Seashore battery of listening tests is widely-understoodto measure basic psychoacoustic skills rather than actual musicalaptitude. The MAT-3 consists of five subtests and was designedas an entrance exam for post-secondary instrumental students.Accordingly, some MAT-3 tests were too advanced for the non-musicians. We administered MAT-3 subtests of Tonal Memoryand Solo Instrument Recognition (I) to all subjects. Musicians werealso given MAT-3 tests of Melody Recognition, Polyphonic ChordRecognition and Ensemble Instrument Recognition (II). Introduc-tory verbal instruction was provided at the start of each test andsubtest, with musical examples for each question provided via aportable stereo system. Bivariate correlation tests among tests ofmusical skill and neurophysiological measures were conductedand independent t-tests between groups were conducted to deter-mine the extent of musician-related differences.
2.3. Stimuli and recording procedure
Stimuli were presented binaurally via insert earphones (ER-3;Etymotic Research, Elk Grove Village, IL) while the subject sat ina comfortable chair centered 2.3 m from a 15.2 cm � 19.2 cm pro-jection screen. The speech syllable ‘‘da” was presented in threeconditions: (1) when subjects heard the sound alone and simulta-neously watched a captioned video (A); (2) when, instead of a cap-tioned movie, subjects viewed a video token of a male speakersaying ‘‘da” simultaneously (AV); and (3) when subjects viewedthe video of the speaker without sound (V). The synthesized speechsyllable (Klatt Software, 1980) was 350 ms in duration with a fun-damental frequency of 100 Hz. F1and F2 of the steady state were720 Hz and 1240 Hz, respectively. Video clips of a speaker’s facesaying ‘‘da” were edited to 850 ms durations (FinalCut Pro 4, AppleSoftware). When auditory and visual stimuli were presented to-gether, the sound onset occurred 460 ms after the onset of the firstvideo frame. The acoustic onset occurred synchronously with thevisual release of consonant closure.
Stimuli were presented in 12 blocks of 600 stimulus repetitionswith a 5-min break between blocks (Neurobehavioral Systems Inc.,2001). Each block consisted of either A, V or AV stimuli, withmodality of presentation order randomized across all subjects.Auditory stimuli were presented at 84 dB SPL in alternating polar-ities. This presentation level insured that the signal was clearlyaudible and well above threshold to all subjects. To control forattention, subjects were asked to silently count the number of tar-get stimuli they saw or heard and to report that number at the endof each block. Target stimuli were slightly longer in duration thanthe standards (auditory target = 380 ms, visual target = 890 ms)and occurred 4.5 ± 0.5% of the time. Performance accuracy wasmeasured by counting how many targets the subject missed(error%).
2.4. General neurophysiology recording procedure
Electroencephalographic (EEG) data were recorded from Ag–AgCl scalp electrode Cz (10–20 International System, earlobe refer-ence, forehead ground) with a filter passband of 0.5–2000 Hz and asampling rate of 20 kHz (Compumedics, El Paso, TX, USA). Follow-
ing acquisition, the EEG data were highpass and lowpass filteredoffline to emphasize brainstem or cortical activity, respectively(see below).
Although there is ample evidence that generators in brainstemstructures figure prominently in what we refer to as the ‘‘brain-stem” and ‘‘cortical” responses, it is worth noting that these far-field evoked potentials do not reflect the activity of brainstem orcortical structures exclusively. Because far-field responses recordthe sum of all neuroelectric activity, higher-level activity (e.g. tha-lamic, cortical) may be concomitantly captured to some degree inboth the onset and FFR measures and vice-versa. Neural generatorsthat contribute to the human brainstem response have been iden-tified primarily through simultaneous surface and intracranialrecordings of responses to clicks during neurosurgery (Hall,1992; Jacobson, 1985). The cochlear nucleus, the superior olivarycomplex, the lateral lemniscus, and the inferior colliculi have beenshown to predominantly contribute to the first five transient peaks(Waves I–V, �1–6 ms post-acoustic onset) recorded from the scalp.Pure tones and complex sounds evoke the FFR which is thought toprimarily reflect phase-locked activity from the inferior colliculus(Smith et al., 1975; Hoormann et al., 1992; Krishnan et al., 2005).Moreover, the FFR can emerge at latency of �6 ms, which precedesthe initial excitation of primary auditory cortex (�12 ms) (Mou-shegian et al., 1973; Celesia, 1968). Finally, and perhaps most con-vincingly, cryogenic cooling of the IC greatly decreases oreliminates the FFR (Smith et al., 1975). Despite this evidence, it ispossible that evoked FFR activity may reflect concomitant corticalactivity after cortical regions have been activated (e.g. �12 ms). Atlonger latencies, the FFR most likely reflects a mix of afferent brain-stem activity, cortically modulated efferent effects, and synchro-nous cortical activity. According to these data and for the sake ofparsimony and accord with previous studies, we utilize the terms‘‘brainstem” and ‘‘cortical” in this study to denote high-and low-pass filtered EP responses, respectively.
2.5. Brainstem response analysis
After acquisition, a highpass filter of 70 Hz was applied to theEEG data. Typically, this type of passband is employed to empha-size the relatively fast and high-frequency neural activity of puta-tive brainstem structures. After filtering, the data were epochedfrom �100 to 450 ms, relative to acoustic onset. A rejection crite-rion of ±35 lV was applied to the epoched file so that responsescontaining high myogenic or extraneous activity above or belowthe criterion were excluded. The first 2000 epochs that were notartifact-rejected from each condition (A, V, AV) were then averagedfor each individual. We then assessed measures of the brainstemresponse that reflect stimulus features that have been shown todiffer between musicians and non-musicians. Brainstem onset re-sponse peak, Wave d, was picked from each individual’s responses,yielding latency and amplitude information. The FFR portion of thebrainstem response was submitted to a fast Fourier transform(FFT). Strength of pitch encoding was measured by peak ampli-tudes at F0 (100 Hz) and timbre representation by peak amplitudesat harmonics H2 (200 Hz), H3 (300 Hz), H4 (400 Hz), and H5(500 Hz) as picked by an automatic peak-detection program. Be-cause we assessed measures that have previously been shown todiffer between musicians and non-musicians, we used one-tailedindependent t-tests to assess group differences in brainstem re-sponse measures.
2.6. Cortical response analysis
EEG data were lowpass filtered offline at 40 Hz. This passband isemployed to emphasize the relatively slow and low-frequencyneural activity of putative cortical origin. Responses were epoched

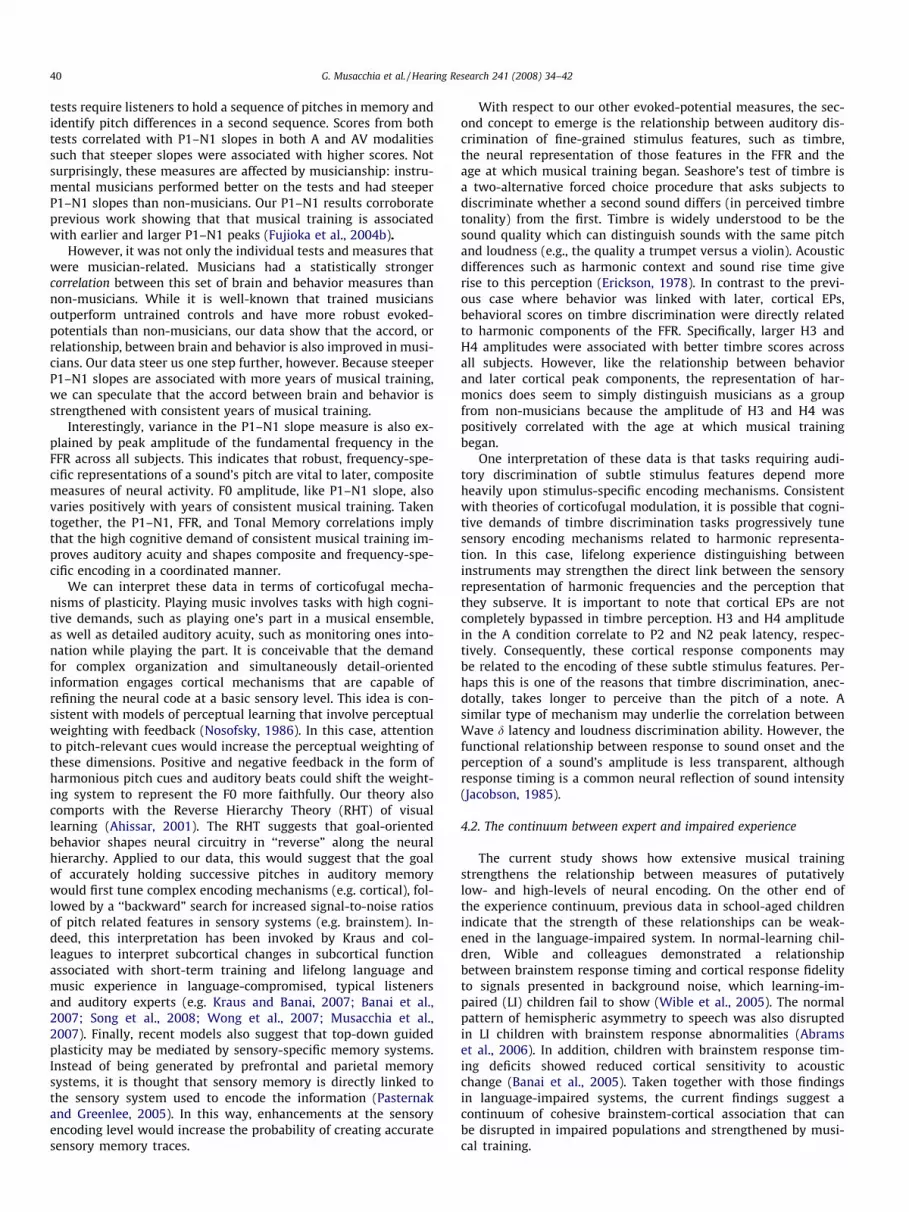
Fig. 2. Musician and non-musician grand average cortical responses to speech inthe AV condition. The speech syllable ‘‘da” in both A and AV conditions elicited foursequential peaks of alternating positive and negative deflections labeled P1, N1, P2,and N2, respectively. The slope between P1 and N1 was calculated to assess thesynchrony of positive to negative deflection in the early portion of the corticalresponse. Peaks of cortical activity were earlier and larger in musicians (grey) thanin non-musicians (black). In addition, P1–N1 slope was steeper in musicianscompared to non-musicians. Similar effects were seen in the A condition.
G. Musacchia et al. / Hearing Research 241 (2008) 34–42 37
and averaged with an artifact rejection criterion of ±65 lV and thefirst 2000 artifact-free sweeps were averaged in each condition.Cortical response peaks (P1, N1, P2 and N2) were chosen from eachsubject’s averages, providing amplitude and latency information.Strength of neural synchrony in response to a given stimulus wasassessed by P1–N1 and P2–N2 peak-to-peak slopes.
2.7. Description of brainstem and cortical responses
The brainstem response to a speech syllable mimics stimuluscharacteristics with high fidelity (Johnson et al., 2005; Kraus andNicol, 2005; Russo et al., 2004). The beginning portion of the brain-stem response to speech (�0–30 ms) encodes the onset of sound ina series of peaks, the first five of which are analogous to responsesobtained in hearing clinics with click or tone stimuli (e.g. Waves I–V) (Hood, 1998). With this stimulus, a large peak is also typicallyobserved at �8–12 ms, called Wave d (Musacchia et al., 2006;Musacchia et al., 2007). Other laboratories have demonstrated sim-ilar relationships between the temporal characteristics of tonalstimuli in the human brainstem response (Galbraith and Doan,1995; Galbraith et al., 1997, 2003, 2004; Krishnan et al., 2005;Akhoun et al., 2008). In the current study, we restricted our peaklatency and amplitude analyses to Wave d because it was the onlybrainstem peak to sound onset that previously differed betweenmusicians and non-musicians. The voiced portion of the speechsyllable evokes an FFR, which reflects neural phase-locking to thestimulus F0. Fig. 1 shows the grand average brainstem responsesof musicians and non-musicians in A and AV conditions. The grandaverage FFTs are shown in insets.
Grand average cortical responses are shown in Fig. 2. Speechstimuli, presented in either the A or AV condition, elicited foursequential peaks of alternating positive and negative polarity andare labeled P1, N1, P2, and N2, respectively. As is typically observedin cortical responses to sound, these components occurred within�75–250 ms post-acoustic stimulation (Hall, 1992).
To investigate relationships between musical training andbrainstem and cortical processing, Pearson’s r correlations were
Fig. 1. Grand average brainstem responses to speech. (A) Musicians (red) have more roInitial peaks of deflection (0–30 ms) represent the brainstem response to sound onset. Wreflects phase-locking to stimulus periodicity (frequency following response). Seeing a speAlone grand average (grey). Non-musicians showed the same type of visual response, buAuditory condition. Frequency spectra of the group averages, as assessed by Fast Fourie
run between all measures of musicianship and brainstem and cor-tical responses.
3. Results
3.1. Differences between musicians and non-musicians
As has been shown in previous studies, musicians had more ro-bust encoding of speech periodicity in the FFR. Musicians had lar-ger F0 peak amplitudes, in both the A (t = 2.42, p = 0.012) and AVconditions (t = 2.33, p = 0.015, compared to non-musicians. Groupdifferences were also observed on measures of timbre representa-tion (tH3 = 2.00, p = 0.029; tH4 = 1.784, p = 0.045; tH5 = 1.767,p = 0.045) and onset timing (tdLatency = 1.95, p = 0.032) in the AVcondition.
Overall, P1 and N1 peaks were earlier and larger in the musiciangroup (Fig. 2). Musicians had larger amplitudes at P1 in the A
bust responses than non-musicians (black) in the Audiovisual (Panel A) condition.ave Delta of the response to sound onset are noted. The subsequent periodic portionaker say ‘‘da” elicited little brainstem activity, as illustrated by the musician’s Visualt for clarity, are not shown. (B) The same musician-related effect is observed in ther Transforms, are inset in each panel.

Fig. 3. Relationship between P1–N1 slope and FFR encoding of pitch cues. (A) Peakamplitude of the fundamental frequency (F0) correlated negatively with P1–N1slope, indicating an association of larger F0 amplitude with steeper P1–N1 slope.Overall, musicians (circles) had larger F0 amplitudes and steeper slopes than non-musicians (squares). (B) This relationship was also observed in the Audiovisualcondition. Group means (crossed symbols) show that musicians have larger F0amplitudes and steeper P1–N1 slopes than non-musicians in both stimulusconditions.
Table 2Pearson correlation coefficients for relationships between FFR harmonic encoding andlate EP measures across all subjects
Brainstem harmonic encoding
A H4 amplitude AV H3 amplitude
Cortcial P1–N1 slope �0.05 �0.27P2 latency 0.21 �0.40*
N2 latency 0.42* �0.36
* p < 0.05.
Table 3Pearson correlation coefficients for relationships between peaks of the ABR to soundonset and late EP measures across all subjects
ABR onset timing
38 G. Musacchia et al. / Hearing Research 241 (2008) 34–42
(t = 2.106, p = 0.046) and AV (t = 3.001, p = 0.006) conditions and atN1 in the AV condition (t = 2.099, p = 0.047). P1–N1 slope, our mea-sure of early aggregate cortical timing, was steeper in musicianscompared to non-musicians for both the A (t = 2.90, p = 0.01) andAV conditions (t = 5.01, p < 0.001). Later components, as measuredby P2 and N2 latency and P2–N2 slope, did not differ betweengroups.
Perceptual test scores showed that musicians scored better thannon-musicians on both the Seashore and MAT tests of tonal mem-ory (MAT-3: Mmusicians = 18.07, Mnon-musicians = 12.25, t = 4.50,p < 0.001; Seashore: Mmusicians = 97.86, Mnon-musicians = 87.78,t = 3.44, p = 0.002).
3.2. Relationships between brainstem and cortical measures
Among brainstem response measures that differ between musi-cians and non-musicians, periodicity encoding correlated withmeasures of P1–N1 slope and P2 and N2 latency most consistently(Table 1, Fig. 3). Across all subjects (n = 26), larger F0 peak ampli-tudes of the brainstem response were associated with steeper cor-tical P1–N1 slopes in both A (r = �0.47, p = 0.02) and AV (r = �0.50,p = 0.01) conditions. F0 amplitude in the AV condition also corre-lated with measures of later cortical peaks, P2 and N2(rP2 = �0.49, p = 0.01; rN2 = �0.44, p = 0.02), such that larger F0amplitudes were associated with earlier latencies. Correlations be-tween F0 amplitude and P2–N2 latencies did not reach statisticalsignificance in the A condition. Taken together, correlations be-tween F0, P1–N1 slope and P2 latency suggest that faithful and ro-bust representation of F0 is associated with pervasively fastercortical timing.
Measures of harmonic encoding correlated more specifically tolater cortical peak timing. H3 peak amplitude correlated with P2latency (r = �0.40, p = 0.04) in the AV condition and H4 peakamplitude correlated with N2 latency in the A condition (r = 0.42,p = 0.03) (Table 2).
Table 3 shows that P1–N1 slope in the AV condition and N2peak latency in the A condition correlated with brainstem onsettiming (Wave d latency). That is, steeper P1–N1 slope and earlierN2 latency correlate with earlier brainstem onset responses.
In order to determine whether the relationships between brain-stem and cortical measures were stronger in musicians than non-musicians, we conducted an heterogeneity of regression line teston values from pairs of measures that significantly correlatedacross all subjects. Results from these tests indicated that theregression-line slopes differed between the musicians andnon-musicians for the F0 and P1–N1 slope relationship in the Acondition (F = 8.61, p < 0.01). Examination of the within-groupcorrelation values for F0 and P1–N1 slope revealed that the musi-cians had a stronger correlation than non-musicians (r = �0.70 vs.r = 0.13, respectively). This same trend, though not significant, wasseen in the AV condition (r = �0.42 for musicians vs. r = 0.05 fornon-musicians).
Table 1Pearson correlation coefficients for relationships between measures of FFR periodicityand late EP measures in all subjects
FFR periodicity encoding
A F0 amplitude AV F0 amplitude
Cortcial P1–N1 slope �0.47* �0.50**
P2 latency 0.24 �0.49*
N2 latency 0.21 �0.44*
* p < 0.05.** p < 0.01.
A delta latency AV delta latency
Cortcial P1–N1 slope 0.01 0.51**
P2 latency 0.3 0.26N2 latency 0.50** 0.18
** p < 0.01.
3.3. Relationships between perceptual scores and neurophysiologicalmeasures
P1–N1 slope related to perceptual measures of tonal memoryfrom the MAT-3 and Seashore tests (Table 4). In both tests, subjectswere presented with two successive sequences of tones and askedto choose which tone was different in the second sequence they

Table 4Pearson correlation coefficients for relationships between cortical measures andperceptual scores across all subjects
Cortical
A P1–N1 slope AV P1–N2 slope
Test scores Loudness 0.18 �0.16Timbre 0.15 0.16SEA tonal mem �0.34 �0.47*
MAT tonal mem �0.43* �0.50*
* p < 0.05.
Table 5Pearson correlation coefficients for relationships between brainstem responsemeasures and perceptual scores across all subjects
Brainstem response
Timing Harmonic
A delta latency A H2 amplitude
Test scores Loudness �0.41* 0.25Timbre �0.04 0.47*
SEA tonal mem �0.37 0.23MAT tonal mem �0.36 0.11
* p < 0.05.Fig. 4. Relationships between neurophysiological measures and musical training inmusicians. (A) More years of consistent musical practice were associated withsteeper P1–N1 slope values in the Auditory condition (r = �0.68, p = 0.007). (B)Years of consistent musical practice also correlated with brainstem measures of F0amplitude in the Auditory and Audiovisual conditions (rA = 0.78, p = 0.001;rAV = 0.72, p = 0.003). Only data from the Auditory condition are depicted in panel B.
G. Musacchia et al. / Hearing Research 241 (2008) 34–42 39
heard. The Seashore test presented pure tones, while the MAT-3consisted of musical notes played on the piano. Across the entiresubject population, standardized tonal memory scores correlatedwith P1–N1 slope measures for both tests in both modalities (A:rMAT-3 = �0.43, p = 0.03; AV: rMAT-3 = �0.50, p = 0.01; rSEA = �0.47,p = 0.02). Correlations between neurophysiological and behavioralmeasures were observed between Wave d latency and Seashore’sloudness subtest (r = �0.41, p = 0.04), as well as between H2 peakamplitude and Seashore’s test of timbre discrimination (r = 0.47,p = 0.02) in the A condition (Table 5).
Heterogeneity of regression slope analysis showed that the rela-tionship between Seashore tonal memory scores and AV P1–N1slope differed between musicians and non-musicians (F = 4.99,p < 0.05). Within group correlations showed that musicians hadstronger correlations between these measures than non-musicians(r = �0.52 vs. r = 0.11, respectively).
3.4. Relationships between neurophysiological measures and extent ofmusical training
Subject history reports of musical training were assessed onlyfor individuals in the musician group. Therefore, analysis of musi-cal training measures was restricted to musicians. F0 amplitude,onset response latency and P1–N1 slope correlated with years ofconsistent musical practice while measures of harmonic represen-tation correlated with the age that musicians began their training.Consistent practice among musicians was measured by the self-re-ported number of years, within the last ten, each player practicedhis or her instrument (>3 times per week for >4 h per day). This
Table 6Pearson correlation coefficients for relationships between EP measures and two metrics o
Brainstem
Timing Periodicity
AV delta latency A F0 amplitude AV F0 am
Age began 0.27 �0.41 �0.26Musical practice �0.72** 0.79** �0.72**
* p < 0.05.** p < 0.01.
measure of musical training strongly correlated with F0 amplitude,onset response latency and P1–N1 slope in both modalities (Table6, Fig. 4). More years of consistent musical practice was associatedwith larger F0 peak amplitudes in both conditions (rA = 0.79,p = 0.001; rAV = 0.72, p = 0.003). This measure of musical trainingalso correlated with Wave d latency, such that earlier latencieswere associated with more years of practice. Similarly, more yearsof consistent practice was associated with steeper P1–N1 slopes inthe A condition (r = �0.68, p = 0.007). The age that musicians beganplaying correlated negatively with timbre representation, as mea-sured by H3 and H4 peak amplitude in the A condition (Table 6).That is, earlier beginning age was associated with larger harmonicpeak amplitudes (rH3 = �0.60, p = 0.047; rH4 = �0.63, p = 0.02).
4. Discussion
4.1. Musician-related plasticity and corticofugal modulation
The first picture that emerges from our data is that recentmusical training improves one’s auditory memory and shapescomposite (P1–N1) and pitch-specific encoding (F0) in a co-coordi-nated manner. Our EP and behavior correlations suggest thatcomplex auditory task performance is related to the strength ofthe P1–N1 response. Both the Seashore and MAT-3 Tonal Memory
f musical experience
Cortical
Harmonics Timing
plitude A H3 amplitude A H4 amplitude A P1–N1 slope
�0.60* �0.63* 0.370.36 0.40 �0.68*
40 G. Musacchia et al. / Hearing Research 241 (2008) 34–42
tests require listeners to hold a sequence of pitches in memory andidentify pitch differences in a second sequence. Scores from bothtests correlated with P1–N1 slopes in both A and AV modalitiessuch that steeper slopes were associated with higher scores. Notsurprisingly, these measures are affected by musicianship: instru-mental musicians performed better on the tests and had steeperP1–N1 slopes than non-musicians. Our P1–N1 results corroborateprevious work showing that that musical training is associatedwith earlier and larger P1–N1 peaks (Fujioka et al., 2004b).
However, it was not only the individual tests and measures thatwere musician-related. Musicians had a statistically strongercorrelation between this set of brain and behavior measures thannon-musicians. While it is well-known that trained musiciansoutperform untrained controls and have more robust evoked-potentials than non-musicians, our data show that the accord, orrelationship, between brain and behavior is also improved in musi-cians. Our data steer us one step further, however. Because steeperP1–N1 slopes are associated with more years of musical training,we can speculate that the accord between brain and behavior isstrengthened with consistent years of musical training.
Interestingly, variance in the P1–N1 slope measure is also ex-plained by peak amplitude of the fundamental frequency in theFFR across all subjects. This indicates that robust, frequency-spe-cific representations of a sound’s pitch are vital to later, compositemeasures of neural activity. F0 amplitude, like P1–N1 slope, alsovaries positively with years of consistent musical training. Takentogether, the P1–N1, FFR, and Tonal Memory correlations implythat the high cognitive demand of consistent musical training im-proves auditory acuity and shapes composite and frequency-spe-cific encoding in a coordinated manner.
We can interpret these data in terms of corticofugal mecha-nisms of plasticity. Playing music involves tasks with high cogni-tive demands, such as playing one’s part in a musical ensemble,as well as detailed auditory acuity, such as monitoring ones into-nation while playing the part. It is conceivable that the demandfor complex organization and simultaneously detail-orientedinformation engages cortical mechanisms that are capable ofrefining the neural code at a basic sensory level. This idea is con-sistent with models of perceptual learning that involve perceptualweighting with feedback (Nosofsky, 1986). In this case, attentionto pitch-relevant cues would increase the perceptual weighting ofthese dimensions. Positive and negative feedback in the form ofharmonious pitch cues and auditory beats could shift the weight-ing system to represent the F0 more faithfully. Our theory alsocomports with the Reverse Hierarchy Theory (RHT) of visuallearning (Ahissar, 2001). The RHT suggests that goal-orientedbehavior shapes neural circuitry in ‘‘reverse” along the neuralhierarchy. Applied to our data, this would suggest that the goalof accurately holding successive pitches in auditory memorywould first tune complex encoding mechanisms (e.g. cortical), fol-lowed by a ‘‘backward” search for increased signal-to-noise ratiosof pitch related features in sensory systems (e.g. brainstem). In-deed, this interpretation has been invoked by Kraus and col-leagues to interpret subcortical changes in subcortical functionassociated with short-term training and lifelong language andmusic experience in language-compromised, typical listenersand auditory experts (e.g. Kraus and Banai, 2007; Banai et al.,2007; Song et al., 2008; Wong et al., 2007; Musacchia et al.,2007). Finally, recent models also suggest that top-down guidedplasticity may be mediated by sensory-specific memory systems.Instead of being generated by prefrontal and parietal memorysystems, it is thought that sensory memory is directly linked tothe sensory system used to encode the information (Pasternakand Greenlee, 2005). In this way, enhancements at the sensoryencoding level would increase the probability of creating accuratesensory memory traces.
With respect to our other evoked-potential measures, the sec-ond concept to emerge is the relationship between auditory dis-crimination of fine-grained stimulus features, such as timbre,the neural representation of those features in the FFR and theage at which musical training began. Seashore’s test of timbre isa two-alternative forced choice procedure that asks subjects todiscriminate whether a second sound differs (in perceived timbretonality) from the first. Timbre is widely understood to be thesound quality which can distinguish sounds with the same pitchand loudness (e.g., the quality a trumpet versus a violin). Acousticdifferences such as harmonic context and sound rise time giverise to this perception (Erickson, 1978). In contrast to the previ-ous case where behavior was linked with later, cortical EPs,behavioral scores on timbre discrimination were directly relatedto harmonic components of the FFR. Specifically, larger H3 andH4 amplitudes were associated with better timbre scores acrossall subjects. However, like the relationship between behaviorand later cortical peak components, the representation of har-monics does seem to simply distinguish musicians as a groupfrom non-musicians because the amplitude of H3 and H4 waspositively correlated with the age at which musical trainingbegan.
One interpretation of these data is that tasks requiring audi-tory discrimination of subtle stimulus features depend moreheavily upon stimulus-specific encoding mechanisms. Consistentwith theories of corticofugal modulation, it is possible that cogni-tive demands of timbre discrimination tasks progressively tunesensory encoding mechanisms related to harmonic representa-tion. In this case, lifelong experience distinguishing betweeninstruments may strengthen the direct link between the sensoryrepresentation of harmonic frequencies and the perception thatthey subserve. It is important to note that cortical EPs are notcompletely bypassed in timbre perception. H3 and H4 amplitudein the A condition correlate to P2 and N2 peak latency, respec-tively. Consequently, these cortical response components maybe related to the encoding of these subtle stimulus features. Per-haps this is one of the reasons that timbre discrimination, anec-dotally, takes longer to perceive than the pitch of a note. Asimilar type of mechanism may underlie the correlation betweenWave d latency and loudness discrimination ability. However, thefunctional relationship between response to sound onset and theperception of a sound’s amplitude is less transparent, althoughresponse timing is a common neural reflection of sound intensity(Jacobson, 1985).
4.2. The continuum between expert and impaired experience
The current study shows how extensive musical trainingstrengthens the relationship between measures of putativelylow- and high-levels of neural encoding. On the other end ofthe experience continuum, previous data in school-aged childrenindicate that the strength of these relationships can be weak-ened in the language-impaired system. In normal-learning chil-dren, Wible and colleagues demonstrated a relationshipbetween brainstem response timing and cortical response fidelityto signals presented in background noise, which learning-im-paired (LI) children fail to show (Wible et al., 2005). The normalpattern of hemispheric asymmetry to speech was also disruptedin LI children with brainstem response abnormalities (Abramset al., 2006). In addition, children with brainstem response tim-ing deficits showed reduced cortical sensitivity to acousticchange (Banai et al., 2005). Taken together with those findingsin language-impaired systems, the current findings suggest acontinuum of cohesive brainstem-cortical association that canbe disrupted in impaired populations and strengthened by musi-cal training.

G. Musacchia et al. / Hearing Research 241 (2008) 34–42 41
5. Conclusion
Overall, our data indicate that the effects of musical experienceon the nervous system include relationships between brainstemand cortical EPs recorded simultaneously in the same subject toseen and heard speech. Moreover, these relationships were relatedto behavioral measures of auditory perception and were strongerin the audiovisual condition. This implies that musical trainingpromotes plasticity throughout the auditory and multisensorypathways. This includes encoding mechanisms that are relevantfor musical sounds as well as for the processing of linguistic cuesand multisensory information. This is in line with previous workwhich has shown that experience which engages cortical activity(language, music, auditory training) shapes subcortical circuitry,likely through corticofugal modulation of sensory function. Thatis, brainstem activity is affected by lifelong language expertise(Krishnan et al., 2005), its disruption (reviewed in Banai et al.,2007) and music experience (Musacchia et al., 2007; Wong et al.,2007) as well as by short term training (Russo et al., 2005; Songet al., 2008; Russo et al., 2005). Consistent with this notion of reci-procal cortical–subcortical interaction, the current work shows arelationship between sensory representation of stimulus featuresand cortical peaks. Specifically, we find that musical training tunesstimulus feature-specific (e.g. onset response/FFR) and composite(e.g. P1–N2) encoding of auditory and multi-sensory stimuli in acoordinated manner. We propose that the evidence for corticofugalmechanisms of plasticity [e.g. (Suga and Ma, 2003)] as well as thetheories that these data drive (Ahissar and Hochstein, 2004), com-bined with theories of music acquisition and training [e.g. (Hannonand Trainor, 2007)] provide a theoretical framework for our find-ings. Further research is needed to determine directly how top-down or bottom-up mechanisms may contribute to music-relatedplasticity in the cortical/subcortical auditory pathway axis. Exper-iments, such as recording the time course of brainstem-corticalinteractions could prove to be especially fruitful in this area.
Acknowledgements
NSF 0544846 and NIH R01 DC01510 supported this work. Theauthors wish to thank Scott Lipscomb, Ph.D. for his musicalbackground, Matthew Fitzgerald, Ph.D. and Trent Nicol for theircritical commentary, and the subjects who participated in thisexperiment.
References
Abrams, D.A., Nicol, T., Zecker, S.G., Kraus, N., 2006. Auditory brainstem timingpredicts cerebral asymmetry for speech. J. Neurosci. 26 (43), 11131–11137.
Ahissar, M., 2001. Perceptual training: a tool for both modifying the brain andexploring it. Proc. Natl. Acad. Sci. USA 98 (21), 11842–11843.
Ahissar, M., Hochstein, S., 2004. The reverse hierarchy theory of visual perceptuallearning. Trends Cogn. Sci. 8 (10), 457–464.
Akhoun, I., Gallégo, S., Moulin, A., Ménard, M., Veuillet, E., Berger-Vachon, C., Collet,L., Thai-Van, H., 2008. The temporal relationship between speech auditorybrainstem responses and the acoustic pattern of the phoneme /ba/ in normal-hearing adults. Clin. Neurophysiol. 119 (4), 922–933.
Banai, K., Abrams, D., Kraus, N., 2007. Sensory-based learning disability: insightsfrom brainstem processing of speech sounds. Int. J. Audiol. 46 (9), 524–532.
Banai, K., Nicol, T., Zecker, S.G., Kraus, N., 2005. Brainstem timing: implications forcortical processing and literacy. J. Neurosci. 25 (43), 9850–9857.
Celesia, G.G., 1968. Auditory evoked responses. Intracranial and extracranialaverage evoked responses. Arch. Neurol. 19, 430–437.
Colwell, R., 1970. Musical Achievement Test 3 and 4. Interpretive Manual. FolletEducation Corpopration.
Elbert, T., Pantev, C., Wienbruch, C., Rockstroh, B., Taub, E., 1995. Increased corticalrepresentation of the fingers of the left hand in string players. Science 270(5234), 305–307.
Erickson, R., 1978. Sound Structure in Music. University of California Press, Berkeley.Fujioka, T., Trainor, L.J., Ross, B., Kakigi, R., Pantev, C., 2004a. Musical training
enhances automatic encoding of melodic contour and interval structure. J. Cogn.Neurosci. 16 (6), 1010–1021.
Fujioka, T., Trainor, L.J., Ross, B., Kakigi, R., Pantev, C., 2004b. Musical trainingenhances automatic encoding of melodic contour and interval structure. J. Cogn.Neurosci. 16 (6), 1010–1021.
Galbraith, G.C., Doan, B.Q., 1995. Brainstem frequency-following and behavioralresponses during selective attention to pure tone and missing fundamentalstimuli. Int. J. Psychophysiol. 19 (3), 203–214.
Galbraith, G.G., Jhaveri, S.P., Kuo, J., 1997. Speech-evoked brainstem frequency-following responses during verbal transformations due to word repetition.Electroencephalogr. Clin. Neurophysiol. 102, 46–53.
Galbraith, G.C., Chae, B.C., Cooper, J.R., Gindi, M.M., Ho, T.N., Kim, B.S., Mankowski,D.A., Lunde, S.E., 2000. Brainstem frequency-following response and simplemotor reaction time. Int. J. Psychophysiol. 36 (1), 35–44.
Galbraith, G.C., Olfman, D.M., Huffman, T.M., 2003. Selective attention affectshuman brain stem frequency-following response. Neuroreport 14 (5),735–738.
Galbraith, G.C., Amaya, E.M., de Rivera, J.M., Donan, N.M., Duong, M.T., Hsu, J.N.,Tran, K., Tsang, L.P., 2004. Brain stem evoked response to forward and reversedspeech in humans. Neuroreport 15 (13), 2057–2060.
Gaser, C., Schlaug, G., 2003. Brain structures differ between musicians and non-musicians. J. Neurosci. 23 (27), 9240–9245.
Hall, J.W.I.I., 1992. Handbook of Auditory Evoked Responses. Allyn and Bacon,Needham Heights, MA.
Hannon, E.E., Trainor, L.J., 2007. Music acquisition: effects of enculturation andformal training on development. Trends Cogn. Sci. 11 (11), 466–472.
Huffman, R.F., Henson Jr., O.W., 1990. The descending auditory pathway andacousticomotor systems: connections with the inferior colliculus. Brain Res.Rev. 15, 295–323.
Hood, L.J., 1998. Clinical Applications of the Auditory Brainstem Response. Singular,San Diego.
Hoormann, J., Falkenstein, M., Hohnsbein, J., Blanke, L., 1992. The human frequency-following response (FFR): normal variability and relation to the click-evokedbrainstem response. Hear. Res. 59 (2), 179–188.
Jacobson, J.T., 1985. The Auditory Brainstem Response. College-Hill Press, San Diego.Johnson, K.L., Nicol, T.G., Kraus, N., 2005. Brain stem response to speech: a biological
marker of auditory processing. Ear Hear. 26 (5), 424–434.Kral, A., Eggermont, J.J., 2007. What’s to lose and what’s to learn: development
under auditory deprivation, cochlear implants and limits of cortical plasticity.Brain Res. Rev. 56, 259–269.
Kelly, J.P., Wong, D., 1981. Laminar connections of the cat’s auditory cortex. BrainRes. 212, 1–15.
Kincaid, A.E., Duncan, S., Scott, S.A., 2002. Assessment of fine motor skill inmusicians and nonmusicians: differences in timing versus sequence accuracy ina bimanual fingering task. Percept. Motor Skill. 95 (1), 245–257.
Kraus, N., Banai, K., 2007. Auditory Processing Malleability: focus on language andmusic. Curr. Dir. Psychol. Sci. 16 (2), 105–109.
Kraus, N., Nicol, T., 2005. Brainstem origins for cortical ‘what’ and ‘where’ pathwaysin the auditory system. Trends Neurosci. 28 (4), 176–181.
Krishnan, A., Xu, Y., Gandour, J., Cariani, P., 2005. Encoding of pitch in the humanbrainstem is sensitive to language experience. Brain Res. Cogn. Brain Res. 25 (1),161–168.
Magne, C., Schon, D., Besson, M., 2006. Musician children detect pitch violations inboth music and language better than nonmusician children: behavioral andelectrophysiological approaches. J. Cogn. Neurosci. 18 (2), 199–211.
Marques, C., Moreno, S., Luis, C.S., Besson, M., 2007. Musicians detect pitch violationin a foreign language better than nonmusicians: behavioral andelectrophysiological evidence. J. Cogn. Neurosci. 19 (9), 1453–1463.
Munte, T.F., Nager, W., Beiss, T., Schroeder, C., Altenmuller, E., 2003. Specializationof the specialized: electrophysiological investigations in professional musicians.Ann. N.Y. Acad. Sci. 999, 131–139.
Moushegian, G., Rupert, A.L., Stillman, R.D., 1973. Scalp-recorded early responses inman to frequencies in the speech range. Electroencephalogr. Clin. Neurophysiol.35, 665–667.
Musacchia, G., Sams, M., Nicol, T., Kraus, N., 2006. Seeing speech affects acousticinformation processing in the human brainstem. Exp. Brain Res. 168 (1–2), 1–10.
Musacchia, G., Sams, M., Skoe, E., Kraus, N., 2007. Musicians have enhancedsubcortical auditory and audiovisual processing of speech and music. Proc. Natl.Acad. Sci. USA 104 (40), 15894–15898.
Nosofsky, R.M., 1986. Attention, similarity, and the identification-categorizationrelationship. J. Exp. Psychol. Gen. 115 (1), 39–61.
Ohnishi, T., Matsuda, H., Asada, T., Aruga, M., Hirakata, M., Nishikawa, M., Katoh, A.,Imabayashi, E., 2001. Functional anatomy of musical perception in musicians.Cereb. Cortex 11 (8), 754–760.
Pantev, C., Roberts, L.E., Schulz, M., Engelien, A., Ross, B., 2001. Timbre-specificenhancement of auditory cortical representations in musicians. Neuroreport 12(1), 169–174.
Pantev, C., Ross, B., Fujioka, T., Trainor, L.J., Schulte, M., Schulz, M., 2003. Music andlearning-induced cortical plasticity. Ann. N.Y. Acad. Sci. 999, 438–450.
Pasternak, T., Greenlee, M.W., 2005. Working memory in primate sensory systems.Nat. Rev. Neurosci. 6 (2), 97–107.
Russo, N., Nicol, T., Musacchia, G., Kraus, N., 2004. Brainstem responses to speechsyllables. Clin. Neurophysiol. 115 (9), 2021–2030.
Russo, N.M., Nicol, T.G., Zecker, S.G., Hayes, E.A., Kraus, N., 2005. Auditory trainingimproves neural timing in the human brainstem. Behav. Brain Res. 156 (1), 95–103.

42 G. Musacchia et al. / Hearing Research 241 (2008) 34–42
Russo, N.M., Bradlow, A.R., Skoe, E., Trommer, B.L., Nicol, T., Zecker, S., Kraus, N., inpress. Deficient brainstem encoding of pitch in children with autism spectrumdisorders. Clin. Neurophys.
Schlaug, G., Jancke, L., Huang, Y., Staiger, J.F., Steinmetz, H., 1995. Increased corpuscallosum size in musicians. Neuropsychologia 33 (8), 1047–1055.
Schneider, P., Scherg, M., Dosch, H.G., Specht, H.J., Gutschalk, A., Rupp, A., 2002.Morphology of Heschl’s gyrus reflects enhanced activation in the auditorycortex of musicians. Nat. Neurosci. 5 (7), 688–694.
Seashore, C.E., 1919. The Psychology of Musical Talent. Silver, Burdett and Company.Saldana, E., Feliciano, M., Mugnaini, E., 1996. Distribution of descending projections
from primary auditory neocortex to inferior colliculus mimics the topographyof the intracollicular projections. J. Comp. Neurol. 371, 15–40.
Smith, J.C., Marsh, J.T., Brown, W.S., 1975. Far-field recorded frequency-followingresponses: evidence for the locus of brainstem sources. Electroencephalogr.Clin. Neurophysiol. 39, 465–472.
Song, J.H., Skoe, E., Wong, P.C., Kraus, N., 2008. Plasticity in the adult humanbrainstem following short-term linguistic training. J. Cogn Neurosci. March 27.[Epub ahead of print].
Suga, N., Ma, X., 2003. Multiparametric corticofugal modulation and plasticity in theauditory system. Nat. Rev. Neurosci. 4 (10), 783–794.
Tervaniemi, M., Just, V., Koelsch, S., Widmann, A., Schroger, E., 2005. Pitchdiscrimination accuracy in musicians vs nonmusicians: an event-relatedpotential and behavioral study. Exp. Brain Res. 161 (1), 1–10.
Wible, B., Nicol, T., Kraus, N., 2005. Correlation between brainstem and corticalauditory processes in normal and language-impaired children. Brain 128 (Pt 2),417–423.
Wong, P.C., Skoe, E., Russo, N.M., Dees, T., Kraus, N., 2007. Musical experience shapeshuman brainstem encoding of linguistic pitch patterns. Nat. Neurosci. 10 (4),420–422.
Xu, T., Krishnan, A., Gandour, J.T., 2006. Specificity of experience-dependent pitchrepresentation in the brainstem. Neuroreport 17 (15), 1601–1605.
Yan, W., Suga, N., 1998. Corticofugal modulation of the midbrain frequency map inthe bat auditory system. Nat. Neurosci. 1 (1), 54–58.
Zhou, X., Jen, P.H., 2000. Brief and short-term corticofugal modulation of subcorticalauditory responses in the big brown bat, Eptesicus fuscus. J. Neurophysiol. 84 (6),3083–3087.


