Embed Size (px)
Citation preview
Reliability Analysis and Deterministic Validation with
Experimental Data of a Historical R.C. Bridge.
K. Islami, F. Carturan, C. Pellegrino & C. Modena Department of Civil, Environmental & Architectural Engineering, University of Padua,
Padua, Italy
SUMMARY:
In a project developed in north-east Italy, a R.C. bridge was subject to analytical and dynamic investigations to
evaluate static and dynamic characteristics, due to live-cycle damage. It has a typical cross-section with girders
bearing a thin slab and characterized by three spans. A reliability analysis has been done using the OpenSees
reliability package. At critical cross sections the reliability index has been calculated to assess safety. At a
second stage the analysis has been updated with data about material. Severe damage on the edge girders was
revealed recently, so lots of destructive tests and ambient-modal-tests were executed. The vulnerability analysis
showed consistent deficiency and suggested the installation of a SHM system.
Keywords: Safety evaluation, R.C. bridge, damage assessment, destructive tests, dynamic identification, SHM.
1. INTRODUCTION
To contain the inconveniences due to a live-cycle damage it is necessary to study in depth the causes
of damage of infrastructures and in particular of bridges. Old and historical reinforced concrete
bridges currently represent a great proportion of the European road and railway bridge stock; the
public network authorities are responsible not only for routine maintenance but also for retrofitting
interventions. For many bridges, the intrinsic weakness of some structural elements, the deterioration
occurrences and the updating of structural codes, evidenced inadequate structural performance and
necessity to be upgraded to the standards of the current seismic codes.
The assessment of the actual structural behaviour by means of experimental and theoretical
investigations helps in choosing the proper intervention both in terms of materials and application
techniques. In this framework structural characterization via dynamic tests is immediate and cheap for
reinforced concrete bridges, in order to help understand the structural behaviour and damage of the
structure before taking any decision of drastic intervention on it.
In the context of a large project developed between the University of Padua and the Regional Road
Authority of Veneto, in the East-North of Italy, a great number of bridges were subject to structural
investigation in order to examine their safety evaluation. The project initiated with the visual
inspection and cataloguing of a total of 500 bridges of various structural kinds from masonry to
reinforced and steel bridges. The further step was to extend to 80 bridges the investigation by
destructive and non-destructive tests in order to increase the material characterization of all kind of
structures available in the database. After that a simplified procedure to evaluate the structural
behavior of the entire fixed network has been developed by the team of University of Padua. During
this step parameterization of the safety levels and indexing of the structures not satisfying the National
Code levels was carried out. This latter phase stimulated also the Individuation of the first bridges to
execute deeper structural identification and to simulate the response through numerical models.
In particular, the work presented here is concentrated on a reinforced concrete bridge highly damaged.
Due to non-workmanlike details and not scheduled maintenance since constructed in 1945, recently
the bridge has revealed severe damage on the edge girders at the middle of the spans. Before taking
any provision or deciding to retrofit it, the state of the bridge has been analysed. It includes the
description and more importantly the damage of the structure but also the dynamic characterization
and sensitivity analysis done in order to best understand the bridge’s reserve in resistance terms.
A reliability analysis has been performed by means of OpenSees Reliability package. The
reliability index in critical cross sections has been calculated to assess safety of entire bridge. In
a second stage data about materials and geometry have been obtained from in-situ testing and the
analysis has been updated.
2. DESCRIPTION OF THE BRIDGE
The original bridge situated in the centre of Verona in Italy was destroyed in 1945 by the Second
World War bombarding and a new bridge was completely rebuilt the following year. The main
structure component is a reinforced concrete segmental beam with external stone facing.
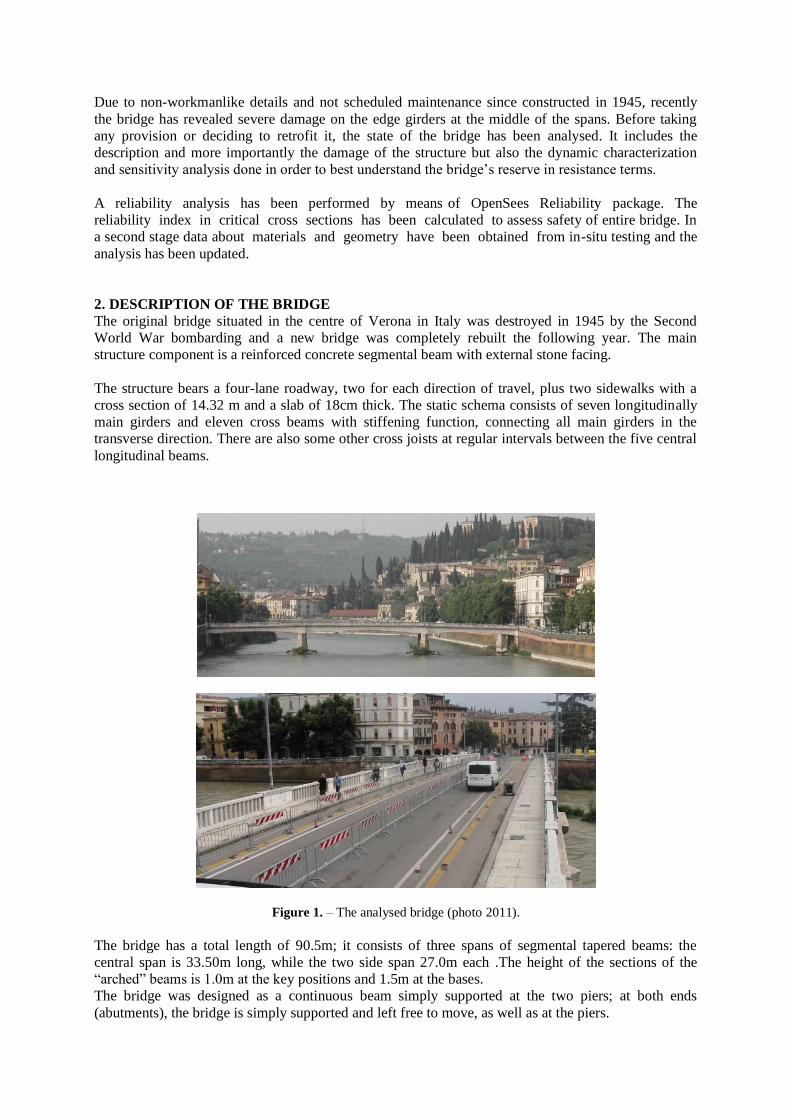
The structure bears a four-lane roadway, two for each direction of travel, plus two sidewalks with a
cross section of 14.32 m and a slab of 18cm thick. The static schema consists of seven longitudinally
main girders and eleven cross beams with stiffening function, connecting all main girders in the
transverse direction. There are also some other cross joists at regular intervals between the five central
longitudinal beams.
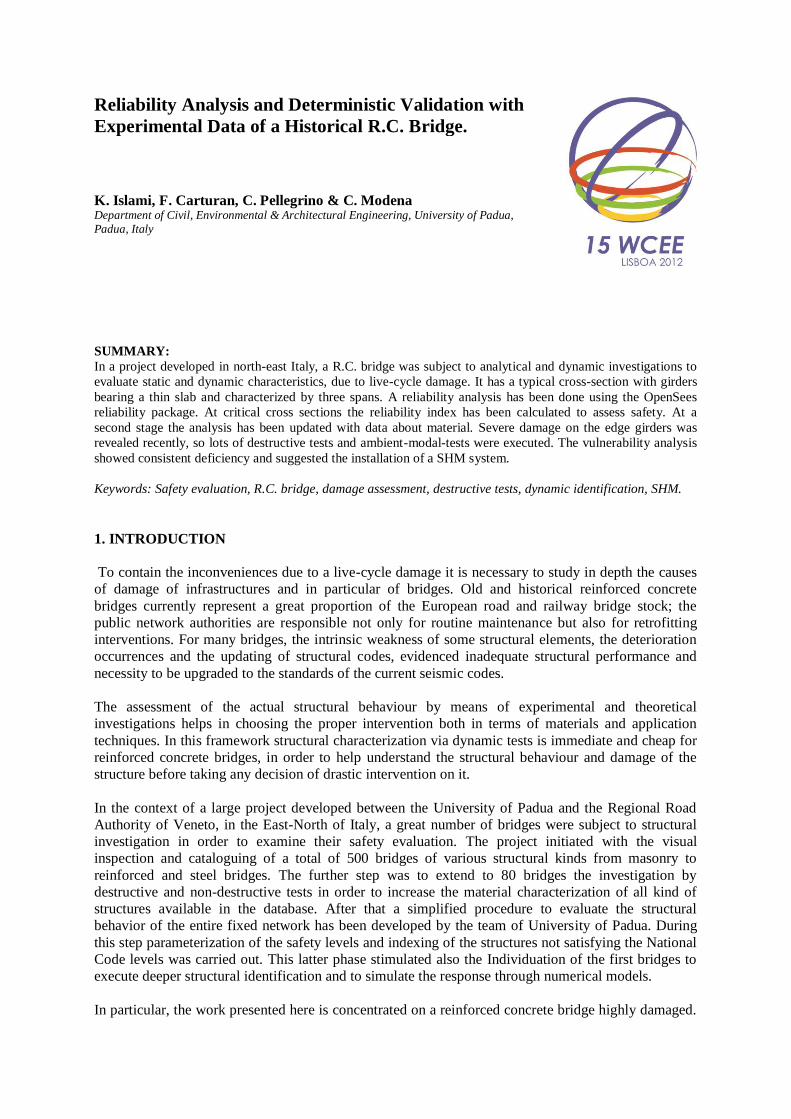
Figure 1. – The analysed bridge (photo 2011).
The bridge has a total length of 90.5m; it consists of three spans of segmental tapered beams: the
central span is 33.50m long, while the two side span 27.0m each .The height of the sections of the
“arched” beams is 1.0m at the key positions and 1.5m at the bases.
The bridge was designed as a continuous beam simply supported at the two piers; at both ends
(abutments), the bridge is simply supported and left free to move, as well as at the piers.
A two-day detailed experimental investigation was also carried out in order to provide all the
dimensional information about the bridge structural elements and the materials characterization.
3. DAMAGE DETECTION AND MATERIAL CHARACTERIZATION
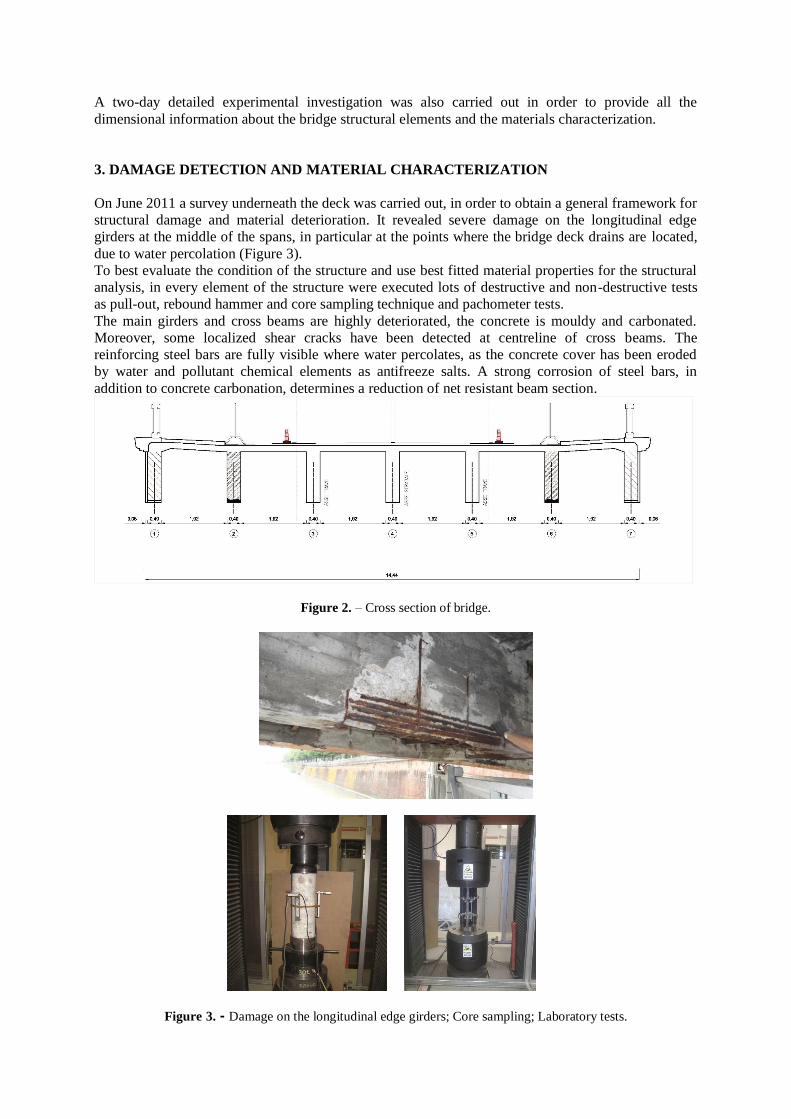
On June 2011 a survey underneath the deck was carried out, in order to obtain a general framework for
structural damage and material deterioration. It revealed severe damage on the longitudinal edge
girders at the middle of the spans, in particular at the points where the bridge deck drains are located,
due to water percolation (Figure 3).
To best evaluate the condition of the structure and use best fitted material properties for the structural
analysis, in every element of the structure were executed lots of destructive and non-destructive tests
as pull-out, rebound hammer and core sampling technique and pachometer tests.
The main girders and cross beams are highly deteriorated, the concrete is mouldy and carbonated.
Moreover, some localized shear cracks have been detected at centreline of cross beams. The
reinforcing steel bars are fully visible where water percolates, as the concrete cover has been eroded
by water and pollutant chemical elements as antifreeze salts. A strong corrosion of steel bars, in
addition to concrete carbonation, determines a reduction of net resistant beam section.
Figure 2. – Cross section of bridge.
Figure 3. - Damage on the longitudinal edge girders; Core sampling; Laboratory tests.
Four kinds of rebar were extracted and subjected to tensile tests which revealed an actual tensile
strength of 360.2MPa and a Young’s elastic modulus of 144000MPa. In addition, 10 circular concrete
core samples were taken and subjected to compression tests resulting in 21.9MPa for the main girders
and 19.1MPa for the cross beams, while the secant elasticity modulus is 33040MPa. All destructive
tests were performed at the Laboratory of Structural and Transportation Engineering, University of
Padua, Italy.
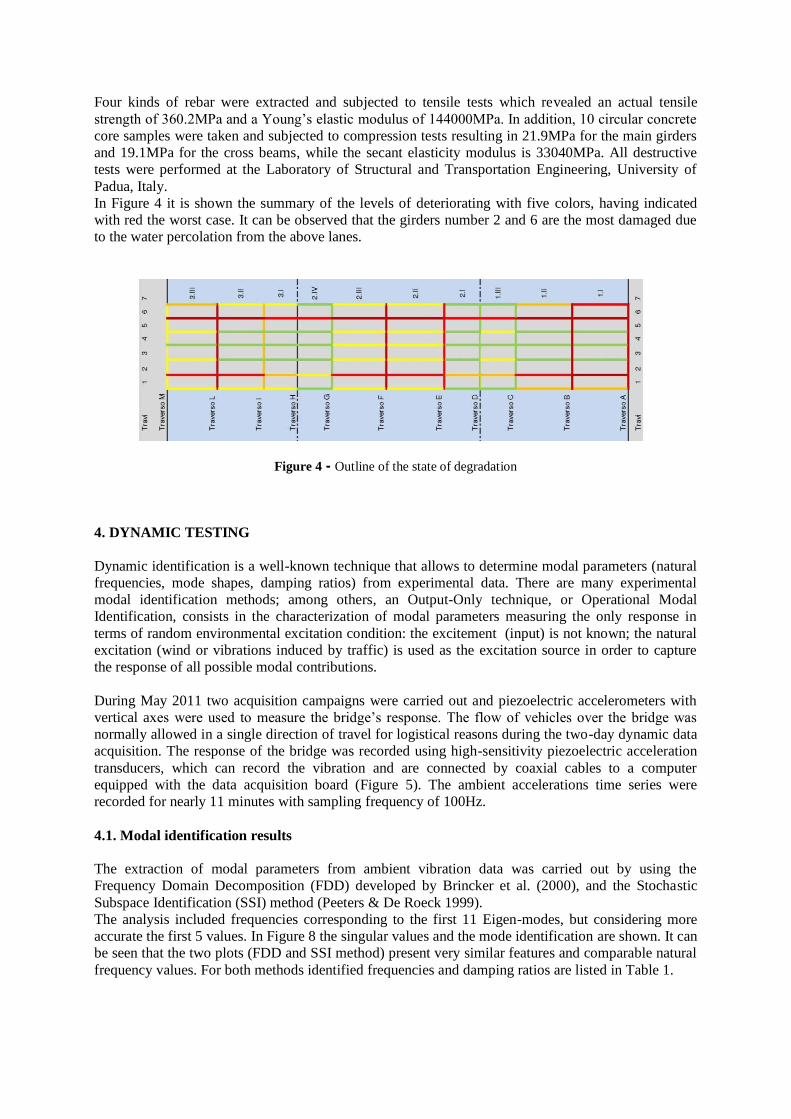
In Figure 4 it is shown the summary of the levels of deteriorating with five colors, having indicated
with red the worst case. It can be observed that the girders number 2 and 6 are the most damaged due
to the water percolation from the above lanes.
Figure 4 - Outline of the state of degradation
4. DYNAMIC TESTING
Dynamic identification is a well-known technique that allows to determine modal parameters (natural
frequencies, mode shapes, damping ratios) from experimental data. There are many experimental
modal identification methods; among others, an Output-Only technique, or Operational Modal
Identification, consists in the characterization of modal parameters measuring the only response in
terms of random environmental excitation condition: the excitement (input) is not known; the natural
excitation (wind or vibrations induced by traffic) is used as the excitation source in order to capture
the response of all possible modal contributions.
During May 2011 two acquisition campaigns were carried out and piezoelectric accelerometers with
vertical axes were used to measure the bridge’s response. The flow of vehicles over the bridge was
normally allowed in a single direction of travel for logistical reasons during the two-day dynamic data
acquisition. The response of the bridge was recorded using high-sensitivity piezoelectric acceleration
transducers, which can record the vibration and are connected by coaxial cables to a computer
equipped with the data acquisition board (Figure 5). The ambient accelerations time series were
recorded for nearly 11 minutes with sampling frequency of 100Hz.
4.1. Modal identification results
The extraction of modal parameters from ambient vibration data was carried out by using the
Frequency Domain Decomposition (FDD) developed by Brincker et al. (2000), and the Stochastic
Subspace Identification (SSI) method (Peeters & De Roeck 1999).
The analysis included frequencies corresponding to the first 11 Eigen-modes, but considering more
accurate the first 5 values. In Figure 8 the singular values and the mode identification are shown. It can
be seen that the two plots (FDD and SSI method) present very similar features and comparable natural
frequency values. For both methods identified frequencies and damping ratios are listed in Table 1.
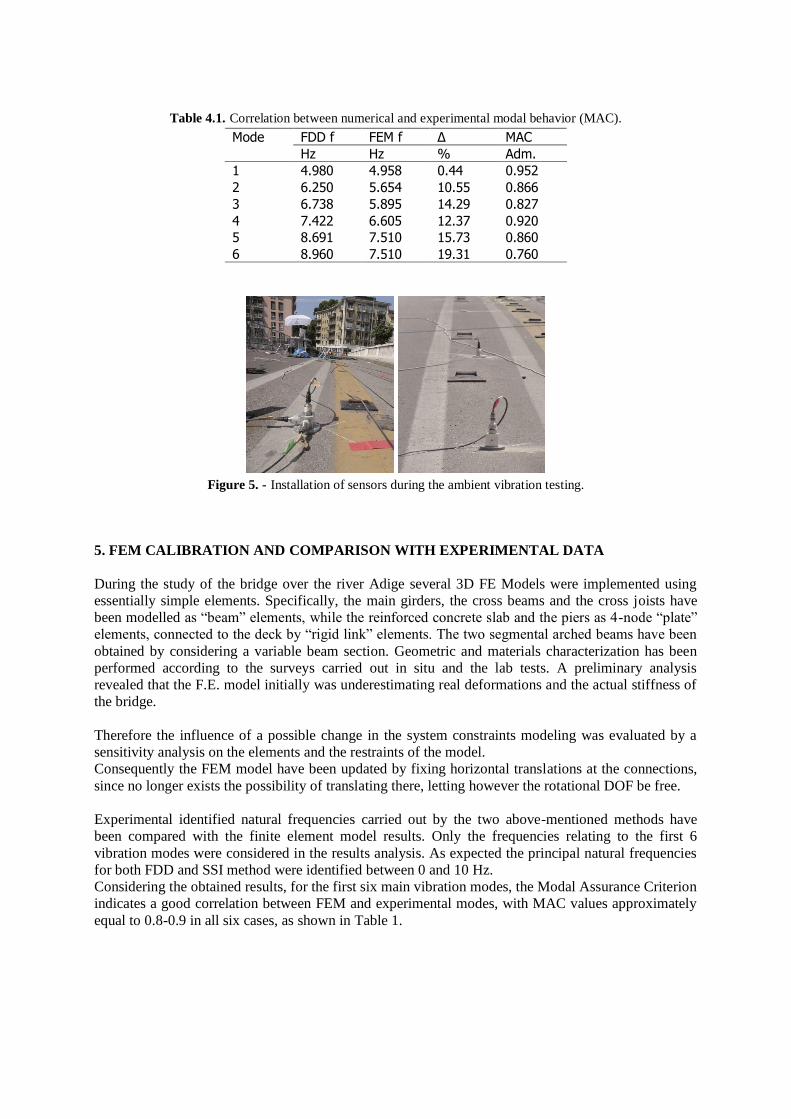
Table 4.1. Correlation between numerical and experimental modal behavior (MAC).
Mode FDD f FEM f Δ MAC
Hz Hz % Adm.
1 4.980 4.958 0.44 0.952
2 6.250 5.654 10.55 0.866
3 6.738 5.895 14.29 0.827
4 7.422 6.605 12.37 0.920
5 8.691 7.510 15.73 0.860
6 8.960 7.510 19.31 0.760
Figure 5. - Installation of sensors during the ambient vibration testing.
5. FEM CALIBRATION AND COMPARISON WITH EXPERIMENTAL DATA
During the study of the bridge over the river Adige several 3D FE Models were implemented using
essentially simple elements. Specifically, the main girders, the cross beams and the cross joists have
been modelled as “beam” elements, while the reinforced concrete slab and the piers as 4-node “plate”
elements, connected to the deck by “rigid link” elements. The two segmental arched beams have been
obtained by considering a variable beam section. Geometric and materials characterization has been
performed according to the surveys carried out in situ and the lab tests. A preliminary analysis
revealed that the F.E. model initially was underestimating real deformations and the actual stiffness of
the bridge.
Therefore the influence of a possible change in the system constraints modeling was evaluated by a
sensitivity analysis on the elements and the restraints of the model.
Consequently the FEM model have been updated by fixing horizontal translations at the connections,
since no longer exists the possibility of translating there, letting however the rotational DOF be free.
Experimental identified natural frequencies carried out by the two above-mentioned methods have
been compared with the finite element model results. Only the frequencies relating to the first 6
vibration modes were considered in the results analysis. As expected the principal natural frequencies
for both FDD and SSI method were identified between 0 and 10 Hz.
Considering the obtained results, for the first six main vibration modes, the Modal Assurance Criterion
indicates a good correlation between FEM and experimental modes, with MAC values approximately
equal to 0.8-0.9 in all six cases, as shown in Table 1.
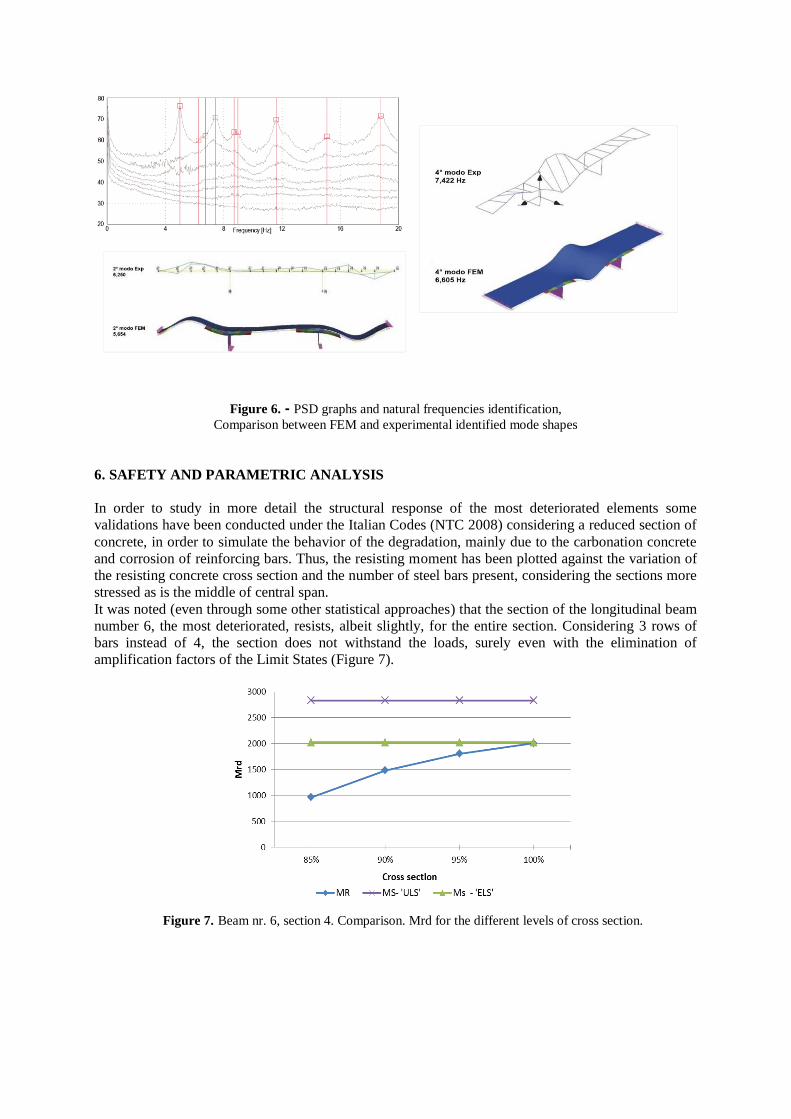
Figure 6. - PSD graphs and natural frequencies identification,
Comparison between FEM and experimental identified mode shapes
6. SAFETY AND PARAMETRIC ANALYSIS
In order to study in more detail the structural response of the most deteriorated elements some
validations have been conducted under the Italian Codes (NTC 2008) considering a reduced section of
concrete, in order to simulate the behavior of the degradation, mainly due to the carbonation concrete
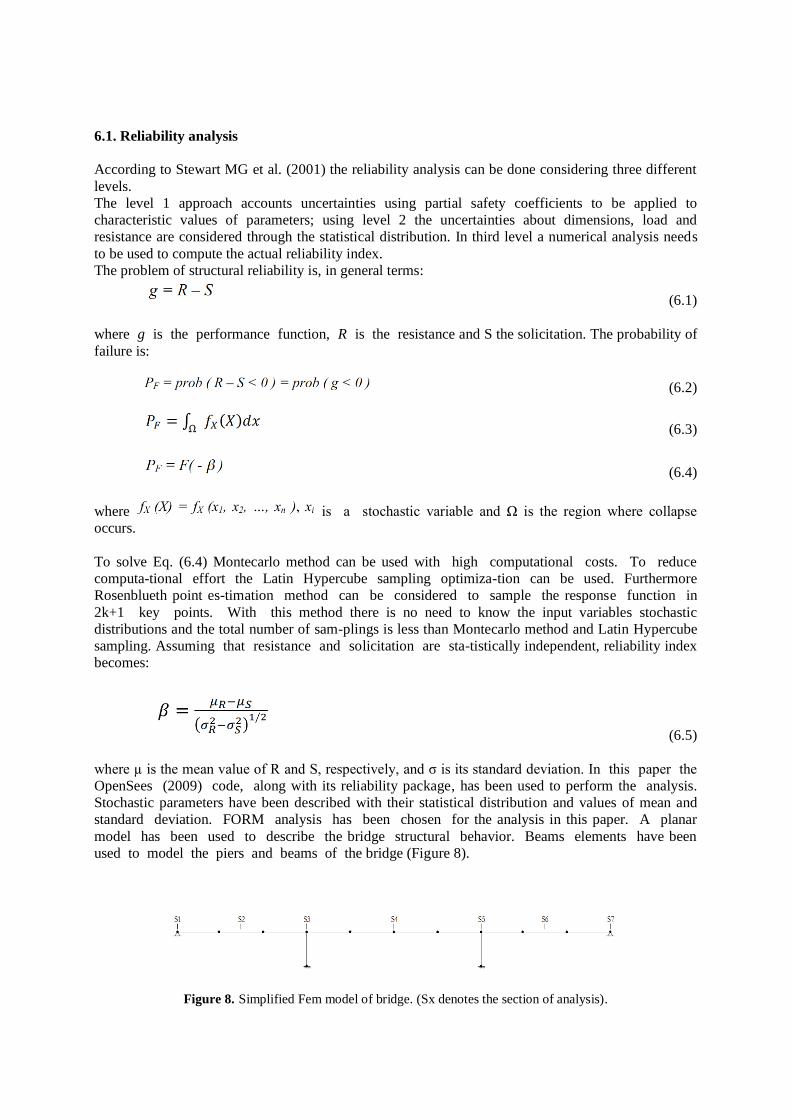
and corrosion of reinforcing bars. Thus, the resisting moment has been plotted against the variation of
the resisting concrete cross section and the number of steel bars present, considering the sections more
stressed as is the middle of central span.
It was noted (even through some other statistical approaches) that the section of the longitudinal beam
number 6, the most deteriorated, resists, albeit slightly, for the entire section. Considering 3 rows of
bars instead of 4, the section does not withstand the loads, surely even with the elimination of
amplification factors of the Limit States (Figure 7).
Figure 7. Beam nr. 6, section 4. Comparison. Mrd for the different levels of cross section.
6.1. Reliability analysis
According to Stewart MG et al. (2001) the reliability analysis can be done considering three different
levels.
The level 1 approach accounts uncertainties using partial safety coefficients to be applied to
characteristic values of parameters; using level 2 the uncertainties about dimensions, load and
resistance are considered through the statistical distribution. In third level a numerical analysis needs
to be used to compute the actual reliability index.
The problem of structural reliability is, in general terms:
(6.1)
where g is the performance function, R is the resistance and S the solicitation. The probability of
failure is:
(6.2)
(6.3)
(6.4)
where is a stochastic variable and Ω is the region where collapse
occurs.
To solve Eq. (6.4) Montecarlo method can be used with high computational costs. To reduce
computa-tional effort the Latin Hypercube sampling optimiza-tion can be used. Furthermore
Rosenblueth point es-timation method can be considered to sample the response function in
2k+1 key points. With this method there is no need to know the input variables stochastic
distributions and the total number of sam-plings is less than Montecarlo method and Latin Hypercube
sampling. Assuming that resistance and solicitation are sta-tistically independent, reliability index
becomes:
(6.5)
where µ is the mean value of R and S, respectively, and σ is its standard deviation. In this paper the
OpenSees (2009) code, along with its reliability package, has been used to perform the analysis.
Stochastic parameters have been described with their statistical distribution and values of mean and
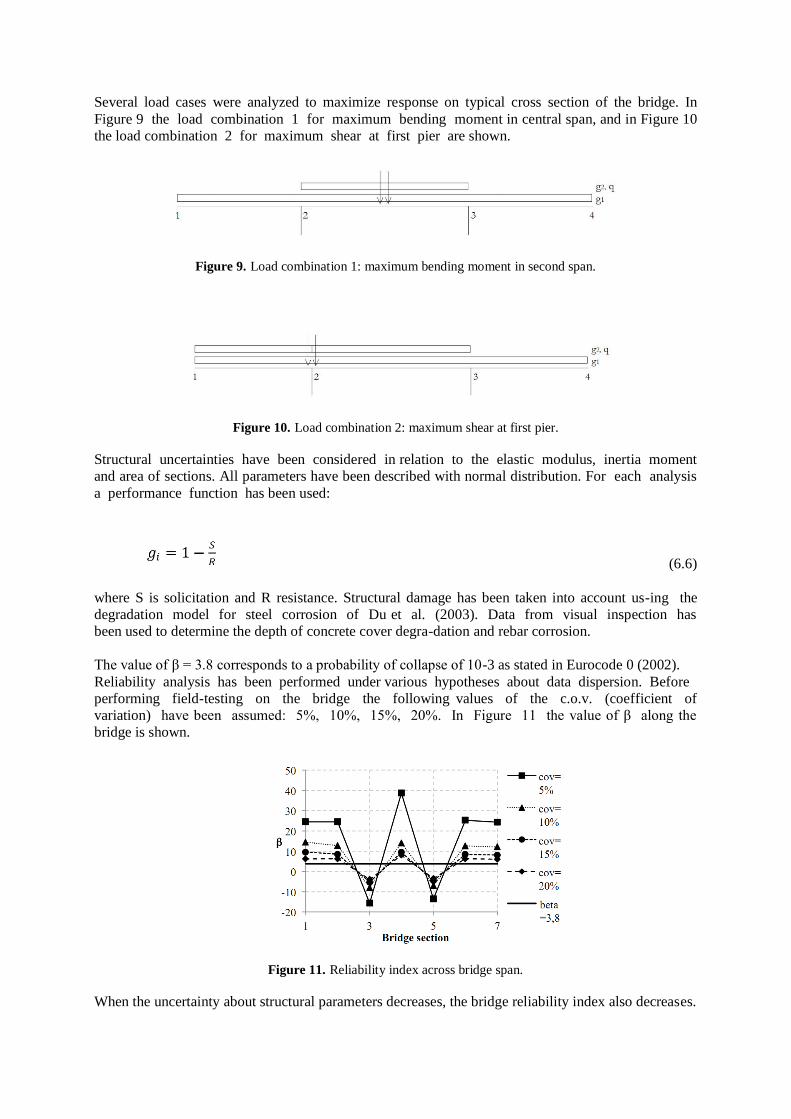
standard deviation. FORM analysis has been chosen for the analysis in this paper. A planar
model has been used to describe the bridge structural behavior. Beams elements have been
used to model the piers and beams of the bridge (Figure 8).
Figure 8. Simplified Fem model of bridge. (Sx denotes the section of analysis).
Several load cases were analyzed to maximize response on typical cross section of the bridge. In
Figure 9 the load combination 1 for maximum bending moment in central span, and in Figure 10
the load combination 2 for maximum shear at first pier are shown.
Figure 9. Load combination 1: maximum bending moment in second span.
Figure 10. Load combination 2: maximum shear at first pier.
Structural uncertainties have been considered in relation to the elastic modulus, inertia moment
and area of sections. All parameters have been described with normal distribution. For each analysis
a performance function has been used:
(6.6)
where S is solicitation and R resistance. Structural damage has been taken into account us-ing the
degradation model for steel corrosion of Du et al. (2003). Data from visual inspection has
been used to determine the depth of concrete cover degra-dation and rebar corrosion.
The value of β = 3.8 corresponds to a probability of collapse of 10-3 as stated in Eurocode 0 (2002).
Reliability analysis has been performed under various hypotheses about data dispersion. Before
performing field-testing on the bridge the following values of the c.o.v. (coefficient of
variation) have been assumed: 5%, 10%, 15%, 20%. In Figure 11 the value of β along the
bridge is shown.
Figure 11. Reliability index across bridge span.
When the uncertainty about structural parameters decreases, the bridge reliability index also decreases.
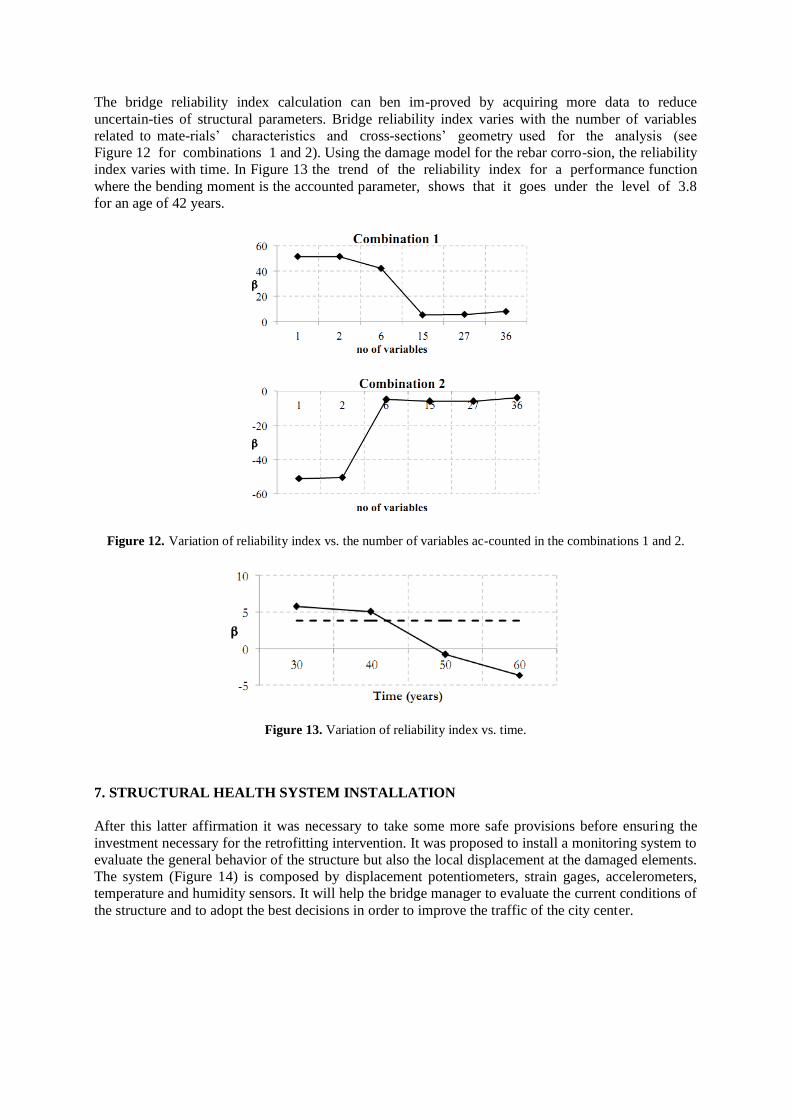
The bridge reliability index calculation can ben im-proved by acquiring more data to reduce
uncertain-ties of structural parameters. Bridge reliability index varies with the number of variables
related to mate-rials’ characteristics and cross-sections’ geometry used for the analysis (see
Figure 12 for combinations 1 and 2). Using the damage model for the rebar corro-sion, the reliability
index varies with time. In Figure 13 the trend of the reliability index for a performance function
where the bending moment is the accounted parameter, shows that it goes under the level of 3.8
for an age of 42 years.
Figure 12. Variation of reliability index vs. the number of variables ac-counted in the combinations 1 and 2.
Figure 13. Variation of reliability index vs. time.
7. STRUCTURAL HEALTH SYSTEM INSTALLATION
After this latter affirmation it was necessary to take some more safe provisions before ensuring the
investment necessary for the retrofitting intervention. It was proposed to install a monitoring system to
evaluate the general behavior of the structure but also the local displacement at the damaged elements.
The system (Figure 14) is composed by displacement potentiometers, strain gages, accelerometers,
temperature and humidity sensors. It will help the bridge manager to evaluate the current conditions of
the structure and to adopt the best decisions in order to improve the traffic of the city center.
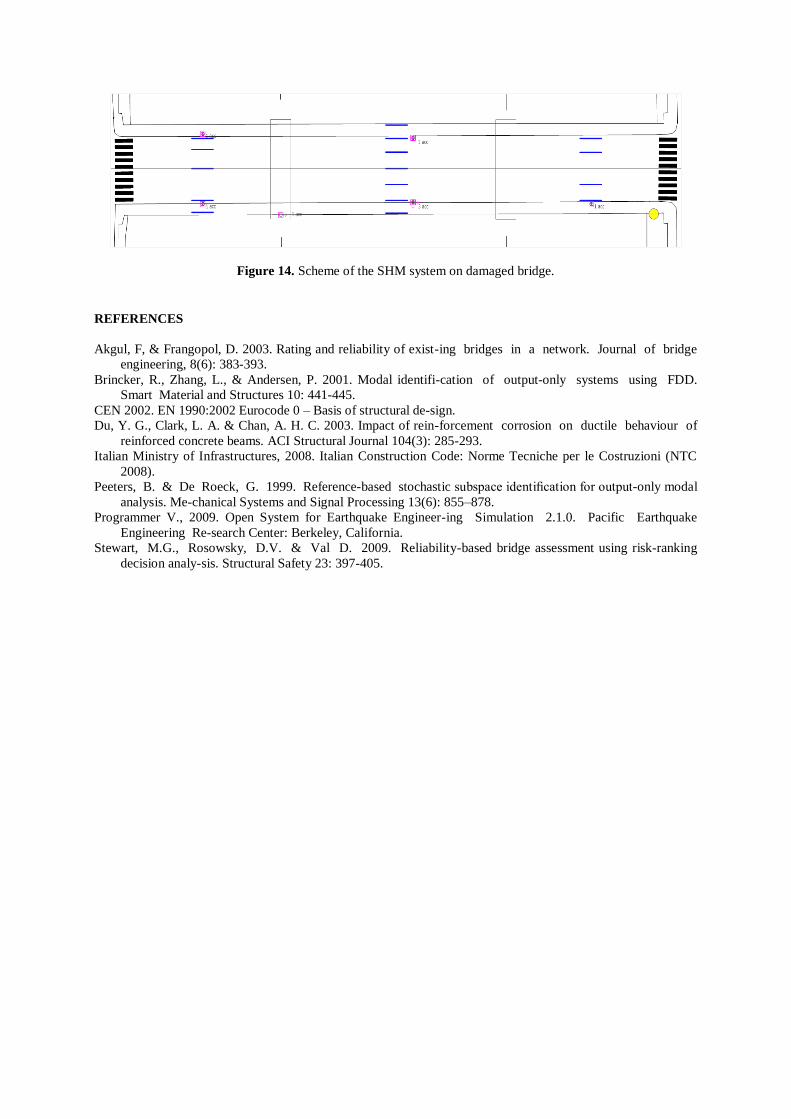
Figure 14. Scheme of the SHM system on damaged bridge.
REFERENCES
Akgul, F, & Frangopol, D. 2003. Rating and reliability of exist-ing bridges in a network. Journal of bridge
engineering, 8(6): 383-393.
Brincker, R., Zhang, L., & Andersen, P. 2001. Modal identifi-cation of output-only systems using FDD.
Smart Material and Structures 10: 441-445.
CEN 2002. EN 1990:2002 Eurocode 0 – Basis of structural de-sign.
Du, Y. G., Clark, L. A. & Chan, A. H. C. 2003. Impact of rein-forcement corrosion on ductile behaviour of
reinforced concrete beams. ACI Structural Journal 104(3): 285-293.
Italian Ministry of Infrastructures, 2008. Italian Construction Code: Norme Tecniche per le Costruzioni (NTC
2008).
Peeters, B. & De Roeck, G. 1999. Reference-based stochastic subspace identification for output-only modal
analysis. Me-chanical Systems and Signal Processing 13(6): 855–878.
Programmer V., 2009. Open System for Earthquake Engineer-ing Simulation 2.1.0. Pacific Earthquake
Engineering Re-search Center: Berkeley, California.
Stewart, M.G., Rosowsky, D.V. & Val D. 2009. Reliability-based bridge assessment using risk-ranking
decision analy-sis. Structural Safety 23: 397-405.


