Embed Size (px)
Citation preview
333 SW 5th Avenue, Suite 700 Portland, OR 97204
(503) 542-1080
July 24, 2009
Prepared for
Lejar Enterprises, LLC P.O. Box 56027
Portland, Oregon 97218
Remedial Design/ Remedial Action Work Plan Former Oregon Fir Supply Site
Portland, Oregon
09/08/09 I:\Projects\918\001\FileRm\R\020\RD-RA WP\Final\Final_Work Plan_rpt_a.doc LANDAU ASSOCIATES
ii
TABLE OF CONTENTS
Page
1.0 INTRODUCTION 1-1 1.1 SITE DESCRIPTION AND BACKGROUND 1-1 1.2 WORK PLAN ORGANIZATION 1-3
2.0 OBJECTIVE AND EVALUATION CRITERIA 2-1
3.0 REMEDIATION SYSTEM AND BIODEGRADATION DESCRIPTION 3-1
4.0 SYSTEM DESIGN AND CONSTRUCTION 4-1 4.1 IN SITU DELIVERY SYSTEM AND CONVEYANCE LINE INSTALLATION 4-1 4.2 WELL INSTALLATION 4-2 4.3 PERMITTING 4-3
5.0 IN SITU DELIVERY SYSTEM STARTUP AND OPERATION 5-1 5.1 STARTUP AND SHAKEDOWN 5-1 5.2 OPERATIONS AND MAINTENANCE 5-2
6.0 MONITORING 6-1 6.1 BIOREMEDIATION GROUNDWATER MONITORING 6-1
6.1.1 Groundwater Monitoring Parameters 6-2 6.2 SUB-SLAB VAPOR MONITORING 6-2
7.0 INVESTIGATION-DERIVED WASTE 7-1
8.0 DATA EVALUATION AND REPORTING 8-1
9.0 SCHEDULE 9-1
10.0 USE OF THIS WORK PLAN 10-1
11.0 REFERENCES 11-1
09/08/09 I:\Projects\918\001\FileRm\R\020\RD-RA WP\Final\Final_Work Plan_rpt_a.doc LANDAU ASSOCIATES
iii
LIST OF FIGURES
Figure Title
1 Vicinity Map 2 Groundwater Treatment Areas 3 Cross Section Location Map Deep Overbank Deposits (Plume 2) 4 Cross Section Location Map Shallow Overbank Deposits (Plumes 3 and 4) 5 Cross Section A-A’ 6 Cross Section B-B’ 7 Cross Section C-C’ 8 Cross Section D-D’ 9 Proposed Bioremediation System Plume 2 10 Proposed Bioremediation System Plumes 3 and 4 11 In Situ Delivery Equipment Process and Information Diagram 12 Bioremediation System Engineering Details 13 Detailed Project Schedule - 2009 14 Generalized Project Schedule
LIST OF TABLES
Table Title
1 Treatment Area Remedial Action Objectives 2 Historical Summary of Groundwater Analytical Data
LIST OF APPENDICES
Appendix Title
A Health and Safety Plan B Soil Management Plan C Sampling and Analysis Plan D Forms
09/08/09 I:\Projects\918\001\FileRm\R\020\RD-RA WP\Final\Final_Work Plan_rpt_a.doc LANDAU ASSOCIATES
iv
LIST OF ABBREVIATIONS AND ACRONYMS
CarBstrate™ Proprietary nutrient-amended carbohydrate substrate cis-1,2-DCE cis-1,2-Dichloroethene COCs Contaminants of Concern DEQ Oregon Department of Environmental Quality DO Dissolved Oxygen DOD Deep Overbank Deposits Fe(III) Ferric Iron HASP Health and Safety Plan HVAC Heating, Ventilation, and Air Conditioning IDW Investigation-Derived Waste ISD™ In Situ Delivery System ORP Oxidation-reduction Potential PCE Tetrachloroethene PCP Pentachlorophenol PLC Programmable Logic Controller PVC Polyvinyl chloride PPE Personal Protective Equipment QA/QC Quality Assurance/Quality Control RAO Remedial Action Objective RBC Risk-based Concentration RD/RA Remedial Design/Remedial Action Redox Reduction Oxidation ROD Record of Decision ROI Radius of Injection SAP Sampling and Analysis Plan SMP Soil Management Plan SO4 Sulfate SOD Shallow Overbank Deposits TCE Trichloroethene TGA Troutdale Gravel Aquifer TOC Total Organic Carbon trans-1,2-DCE trans-1,2-Dichloroethene VC Vinyl Chloride 1,1-DCE 1,1-Dichloroethene
09/08/09 I:\Projects\918\001\FileRm\R\020\RD-RA WP\Final\Final_Work Plan_rpt_a.doc LANDAU ASSOCIATES
1-1
1.0 INTRODUCTION
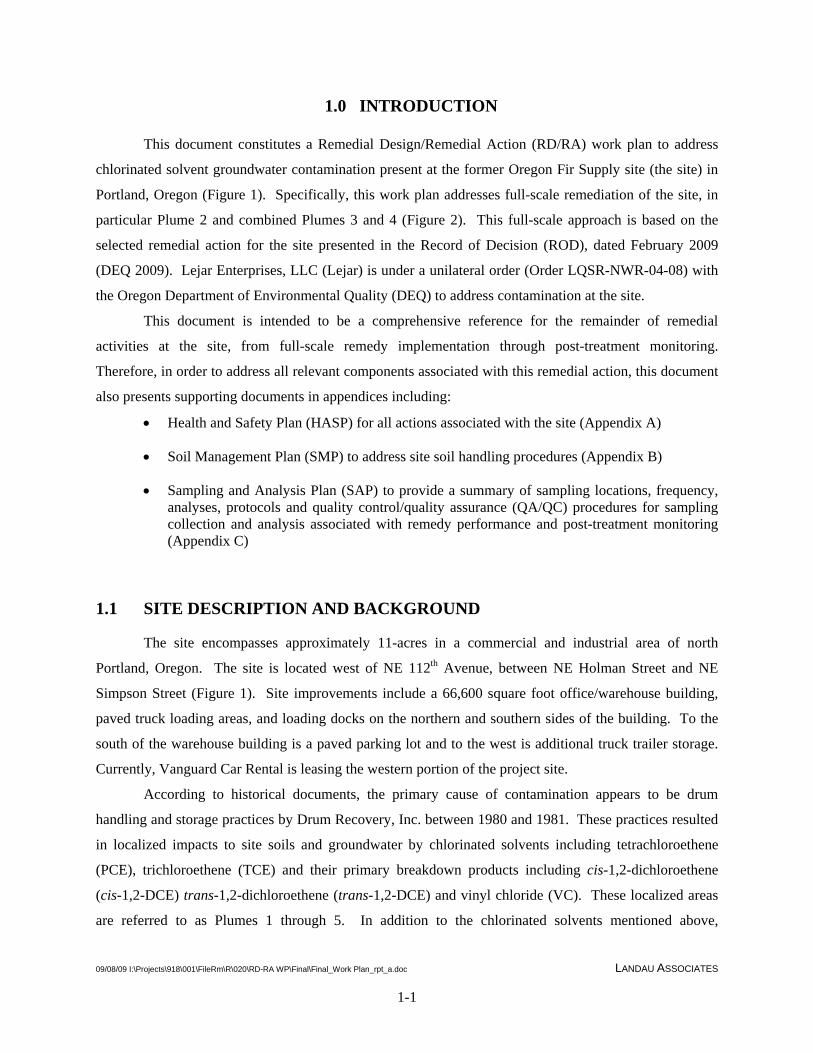
This document constitutes a Remedial Design/Remedial Action (RD/RA) work plan to address
chlorinated solvent groundwater contamination present at the former Oregon Fir Supply site (the site) in
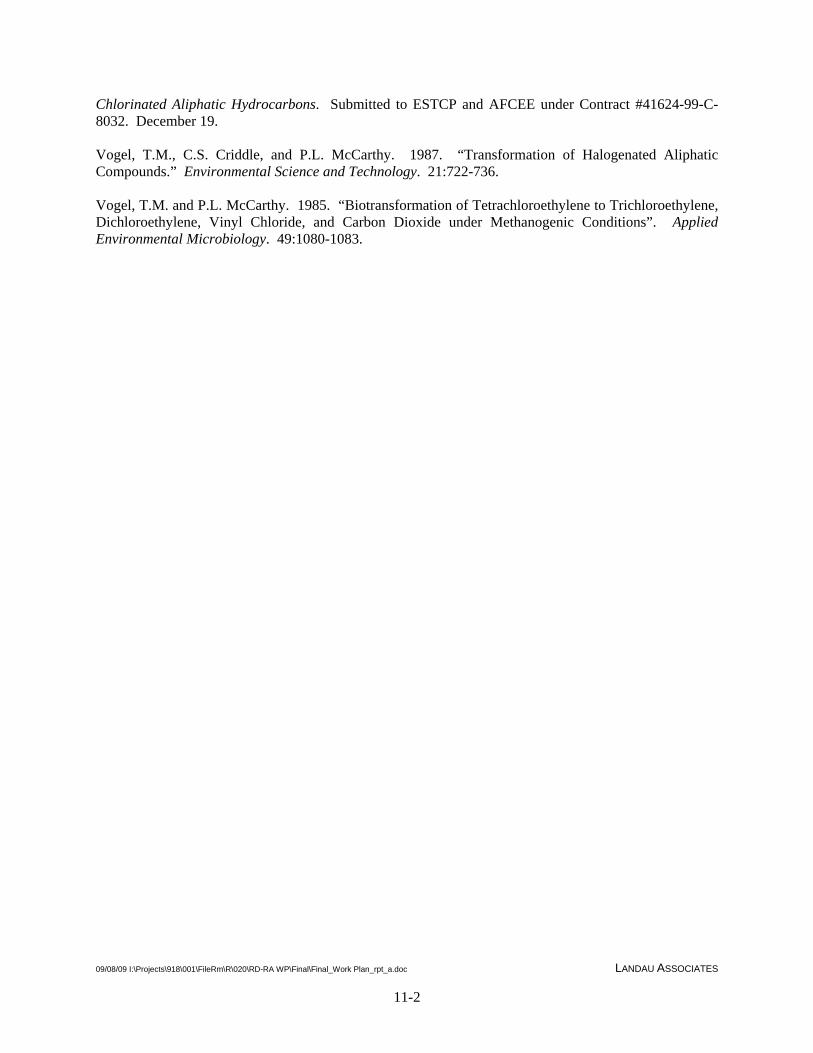
Portland, Oregon (Figure 1). Specifically, this work plan addresses full-scale remediation of the site, in
particular Plume 2 and combined Plumes 3 and 4 (Figure 2). This full-scale approach is based on the
selected remedial action for the site presented in the Record of Decision (ROD), dated February 2009
(DEQ 2009). Lejar Enterprises, LLC (Lejar) is under a unilateral order (Order LQSR-NWR-04-08) with
the Oregon Department of Environmental Quality (DEQ) to address contamination at the site.
This document is intended to be a comprehensive reference for the remainder of remedial
activities at the site, from full-scale remedy implementation through post-treatment monitoring.
Therefore, in order to address all relevant components associated with this remedial action, this document
also presents supporting documents in appendices including:
• Health and Safety Plan (HASP) for all actions associated with the site (Appendix A)
• Soil Management Plan (SMP) to address site soil handling procedures (Appendix B)
• Sampling and Analysis Plan (SAP) to provide a summary of sampling locations, frequency, analyses, protocols and quality control/quality assurance (QA/QC) procedures for sampling collection and analysis associated with remedy performance and post-treatment monitoring (Appendix C)
1.1 SITE DESCRIPTION AND BACKGROUND
The site encompasses approximately 11-acres in a commercial and industrial area of north
Portland, Oregon. The site is located west of NE 112th Avenue, between NE Holman Street and NE
Simpson Street (Figure 1). Site improvements include a 66,600 square foot office/warehouse building,
paved truck loading areas, and loading docks on the northern and southern sides of the building. To the
south of the warehouse building is a paved parking lot and to the west is additional truck trailer storage.
Currently, Vanguard Car Rental is leasing the western portion of the project site.
According to historical documents, the primary cause of contamination appears to be drum
handling and storage practices by Drum Recovery, Inc. between 1980 and 1981. These practices resulted
in localized impacts to site soils and groundwater by chlorinated solvents including tetrachloroethene
(PCE), trichloroethene (TCE) and their primary breakdown products including cis-1,2-dichloroethene
(cis-1,2-DCE) trans-1,2-dichloroethene (trans-1,2-DCE) and vinyl chloride (VC). These localized areas
are referred to as Plumes 1 through 5. In addition to the chlorinated solvents mentioned above,
09/08/09 I:\Projects\918\001\FileRm\R\020\RD-RA WP\Final\Final_Work Plan_rpt_a.doc LANDAU ASSOCIATES
1-2
pentachlorophenol (PCP) is also a site contaminant within Plume 5, but not in Plumes 1 through 4. These
compounds represent site contaminants of concern (COCs).
Extensive site investigation has been performed by previous and current consultants, culminating
in a focused feasibility study submitted to DEQ in April 2007 (Landau Associates 2007a). In subsequent
meetings between DEQ, Lejar, and Landau Associates in the fall of 2007, DEQ encouraged expedited
cleanup for the site for Plumes 3 through 5 using bioremediation, provided a pilot test being conducted at
Plume 5 was successful. Landau Associates submitted a report to DEQ detailing the operation and results
of the pilot test (Landau Associates 2008a) and stating that data objectives were met, resulting in a
recommendation that the system be expanded to full-scale operation. A combination of bioremediation
using recirculation, institutional and engineering controls, and monitored natural attenuation was selected
as the preferred remedial alternative for Plumes 2, 3 and 4 in the focused feasibility study addendum
(Landau Associates 2008b), and was written into the ROD. The ROD also describes anticipated future
action for Plumes 1 and 5.
Remedial action, if necessary, in southwestern Plume 1 will be postponed until the remediation of
the more shallow contamination in Plumes 2, 3, and 4 is completed, or will be used only as a contingency
should contaminant concentrations in the Troutdale Gravel Aquifer (TGA) increase above drinking water
standards. Should the pump-and-treat system at Plume 1 need to be activated, the system will be operated
as detailed in the work plan for southwest Plumes 1 and 2 (Landau Associates 2007b).
Due to the successful treatment resulting from the in situ bioremediation pilot test in Plume 5, no
further Plume 5 remediation is anticipated. This plume is currently being monitored for a period of 2
years (through April 2010) in accordance with the SAP (Appendix C) to confirm results.
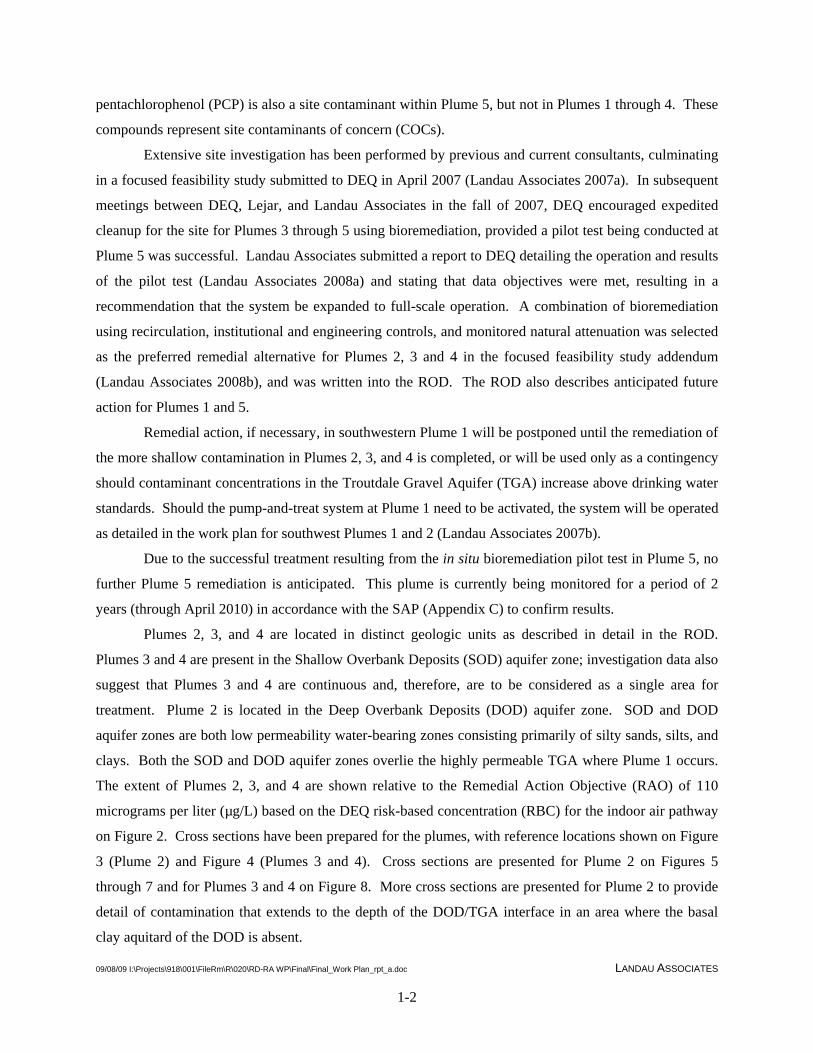
Plumes 2, 3, and 4 are located in distinct geologic units as described in detail in the ROD.
Plumes 3 and 4 are present in the Shallow Overbank Deposits (SOD) aquifer zone; investigation data also
suggest that Plumes 3 and 4 are continuous and, therefore, are to be considered as a single area for
treatment. Plume 2 is located in the Deep Overbank Deposits (DOD) aquifer zone. SOD and DOD
aquifer zones are both low permeability water-bearing zones consisting primarily of silty sands, silts, and
clays. Both the SOD and DOD aquifer zones overlie the highly permeable TGA where Plume 1 occurs.
The extent of Plumes 2, 3, and 4 are shown relative to the Remedial Action Objective (RAO) of 110
micrograms per liter (µg/L) based on the DEQ risk-based concentration (RBC) for the indoor air pathway
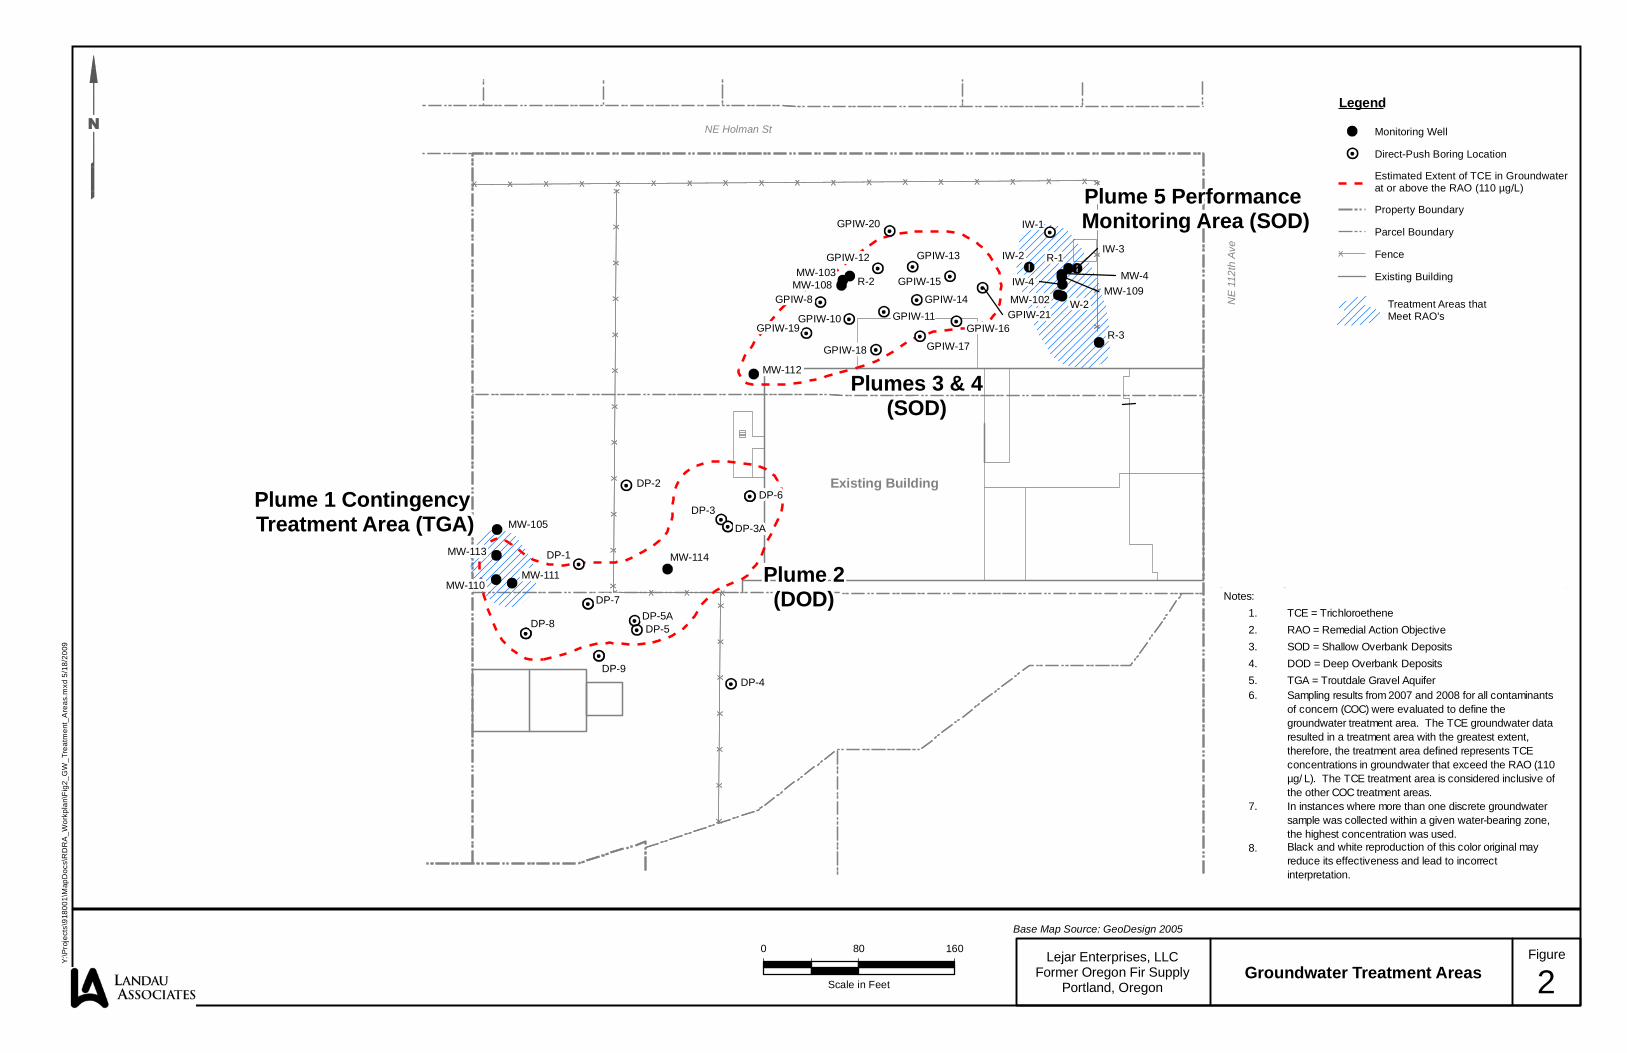
on Figure 2. Cross sections have been prepared for the plumes, with reference locations shown on Figure
3 (Plume 2) and Figure 4 (Plumes 3 and 4). Cross sections are presented for Plume 2 on Figures 5
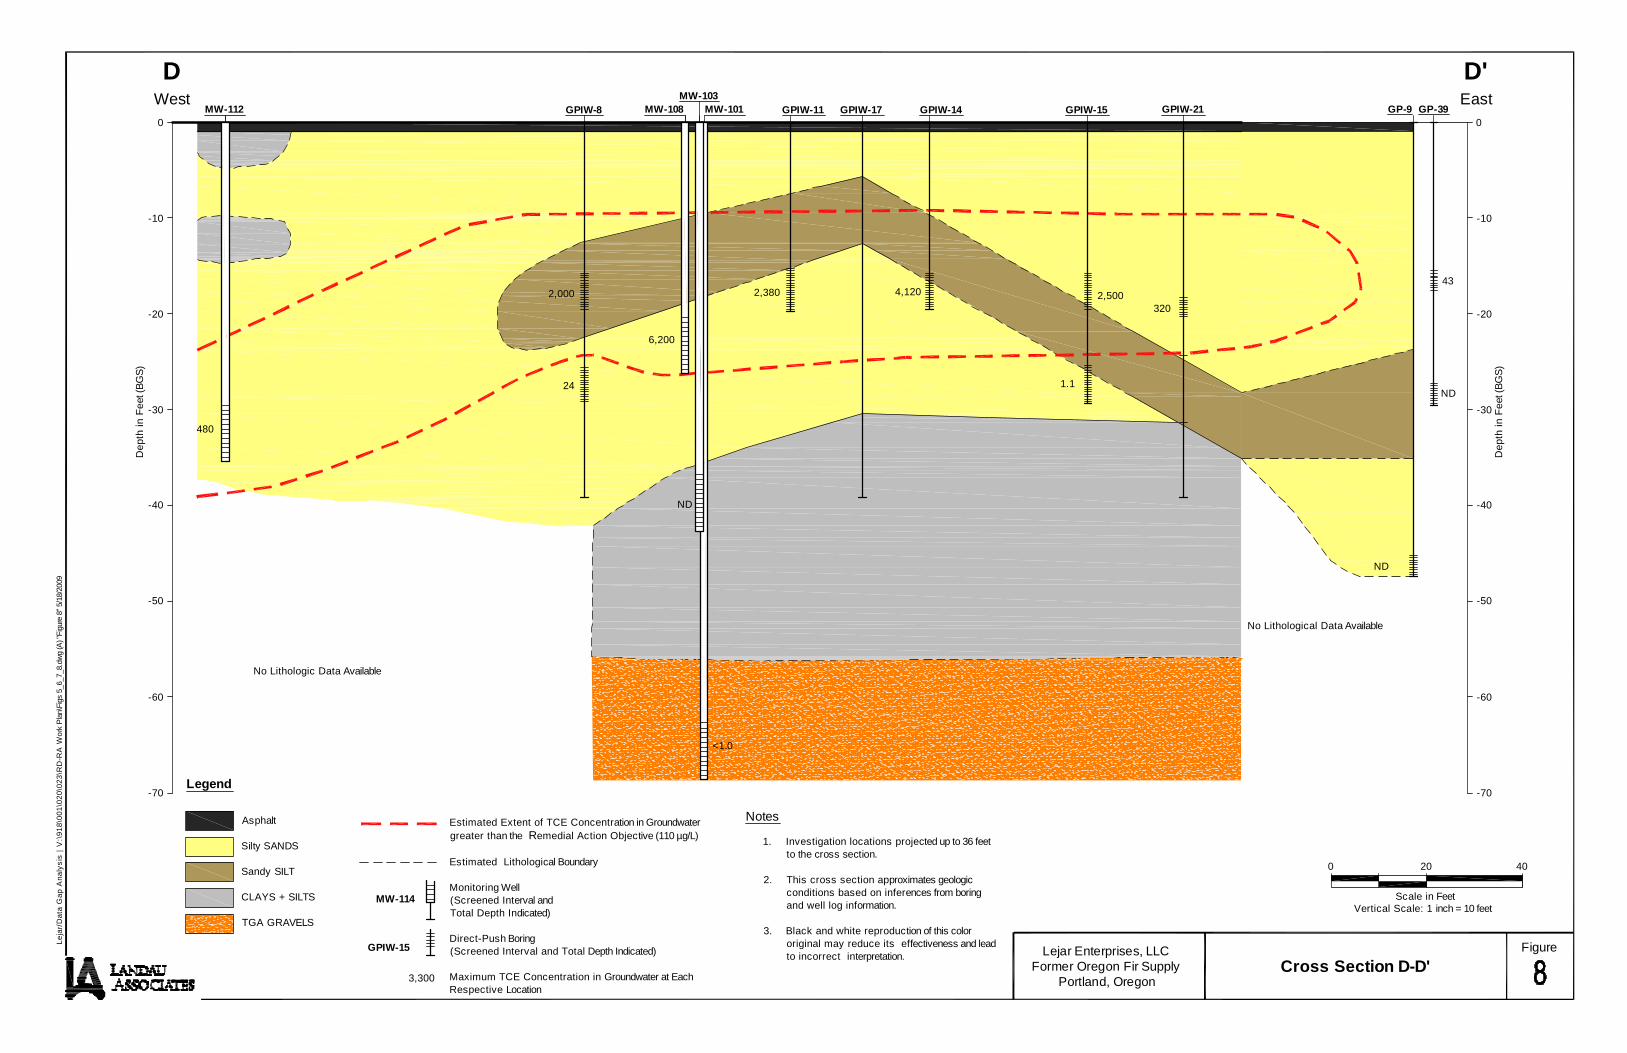
through 7 and for Plumes 3 and 4 on Figure 8. More cross sections are presented for Plume 2 to provide
detail of contamination that extends to the depth of the DOD/TGA interface in an area where the basal
clay aquitard of the DOD is absent.
09/08/09 I:\Projects\918\001\FileRm\R\020\RD-RA WP\Final\Final_Work Plan_rpt_a.doc LANDAU ASSOCIATES
1-3
1.2 WORK PLAN ORGANIZATION
Following this introductory section, the work plan is divided into 10 sections as follows:
• Section 2.0: Defines treatment objectives and evaluation criteria
• Section 3.0: Describes the bioremediation system and biodegradation processes
• Section 4.0: Discusses system design and construction
• Section 5.0: Describes system startup and operation
• Section 6.0: Discusses groundwater monitoring
• Section 7.0: Discusses handling of investigation-derived wastes
• Section 8.0: Describes data evaluation and reporting
• Section 9.0: Outlines the implementation schedule
• Section 10.0: Describes the proper uses of this work plan
• Section 11.0: Presents references.
09/08/09 I:\Projects\918\001\FileRm\R\020\RD-RA WP\Final\Final_Work Plan_rpt_a.doc LANDAU ASSOCIATES
2-1
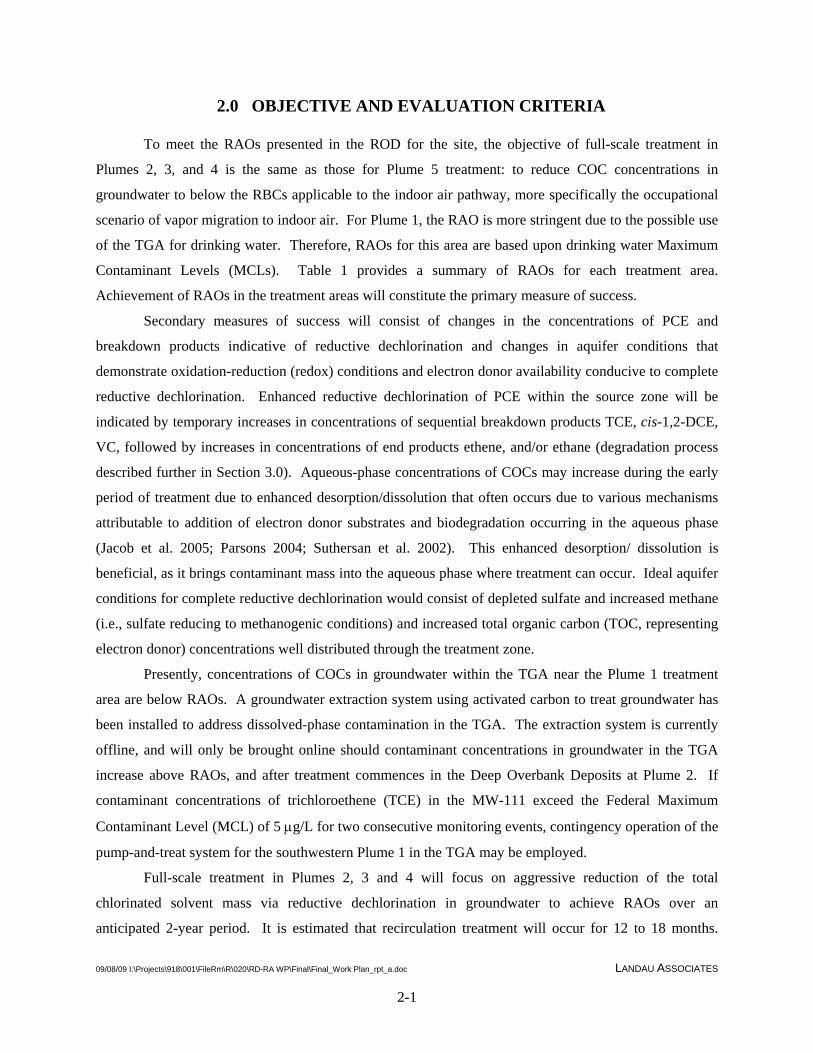
2.0 OBJECTIVE AND EVALUATION CRITERIA
To meet the RAOs presented in the ROD for the site, the objective of full-scale treatment in
Plumes 2, 3, and 4 is the same as those for Plume 5 treatment: to reduce COC concentrations in
groundwater to below the RBCs applicable to the indoor air pathway, more specifically the occupational
scenario of vapor migration to indoor air. For Plume 1, the RAO is more stringent due to the possible use
of the TGA for drinking water. Therefore, RAOs for this area are based upon drinking water Maximum
Contaminant Levels (MCLs). Table 1 provides a summary of RAOs for each treatment area.
Achievement of RAOs in the treatment areas will constitute the primary measure of success.
Secondary measures of success will consist of changes in the concentrations of PCE and
breakdown products indicative of reductive dechlorination and changes in aquifer conditions that
demonstrate oxidation-reduction (redox) conditions and electron donor availability conducive to complete
reductive dechlorination. Enhanced reductive dechlorination of PCE within the source zone will be
indicated by temporary increases in concentrations of sequential breakdown products TCE, cis-1,2-DCE,
VC, followed by increases in concentrations of end products ethene, and/or ethane (degradation process
described further in Section 3.0). Aqueous-phase concentrations of COCs may increase during the early
period of treatment due to enhanced desorption/dissolution that often occurs due to various mechanisms
attributable to addition of electron donor substrates and biodegradation occurring in the aqueous phase
(Jacob et al. 2005; Parsons 2004; Suthersan et al. 2002). This enhanced desorption/ dissolution is
beneficial, as it brings contaminant mass into the aqueous phase where treatment can occur. Ideal aquifer
conditions for complete reductive dechlorination would consist of depleted sulfate and increased methane
(i.e., sulfate reducing to methanogenic conditions) and increased total organic carbon (TOC, representing
electron donor) concentrations well distributed through the treatment zone.
Presently, concentrations of COCs in groundwater within the TGA near the Plume 1 treatment
area are below RAOs. A groundwater extraction system using activated carbon to treat groundwater has
been installed to address dissolved-phase contamination in the TGA. The extraction system is currently
offline, and will only be brought online should contaminant concentrations in groundwater in the TGA
increase above RAOs, and after treatment commences in the Deep Overbank Deposits at Plume 2. If
contaminant concentrations of trichloroethene (TCE) in the MW-111 exceed the Federal Maximum
Contaminant Level (MCL) of 5 µg/L for two consecutive monitoring events, contingency operation of the
pump-and-treat system for the southwestern Plume 1 in the TGA may be employed.
Full-scale treatment in Plumes 2, 3 and 4 will focus on aggressive reduction of the total
chlorinated solvent mass via reductive dechlorination in groundwater to achieve RAOs over an
anticipated 2-year period. It is estimated that recirculation treatment will occur for 12 to 18 months.
09/08/09 I:\Projects\918\001\FileRm\R\020\RD-RA WP\Final\Final_Work Plan_rpt_a.doc LANDAU ASSOCIATES
2-2
Based on monitoring results, the recirculation system may be operated intermittently to distribute donor
then allow donor diffusion and in situ treatment to occur under natural hydraulic gradients. A 2-year
period of post-treatment monitoring will be required to evaluate potential concentration rebound
following depletion of the injected electron donor.
09/08/09 I:\Projects\918\001\FileRm\R\020\RD-RA WP\Final\Final_Work Plan_rpt_a.doc LANDAU ASSOCIATES
3-1
3.0 REMEDIATION SYSTEM AND BIODEGRADATION DESCRIPTION
Electron donor will be recirculated in the aquifer treatment zones utilizing ETEC’s In Situ
Delivery System (ISD™) process to extract and reinject groundwater amended with a proprietary mixture
of electron donor and nutrients for stimulation of microorganisms present in the aquifer. This is the same
treatment performed in the pilot test for Plume 5 (Landau Associates 2008a). Aquifer microorganisms
will degrade the target COCs to harmless compounds through the reductive dechlorination process.
ISD is an automated process for extracting groundwater from the aquifer, adding electron donor
and nutrients, and reinjection of the amended water to the aquifer. The recirculation provides not only
continuous supply of electron donor, but allows for improved uniformity of donor distribution within the
target treatment zone and allows targeting of zones that may have higher or persistent concentrations of
COCs. The recirculation loop also has the added benefit of providing a degree of hydraulic plume control
to protect downgradient receptors and limit further aqueous-phase COC migration. Recirculation may be
continuous or intermittent based on monitoring results.
Reductive dechlorination occurs through microbially mediated reactions whereby
microorganisms obtain energy through oxidation-reduction reactions. Electron donors are used by
microbes to reduce various electron acceptors [oxygen, nitrate, manganese, ferric iron (Fe[III]),
sulfate(SO4), and carbon dioxide] to obtain energy. These redox reactions can be compared to the process
whereby humans obtain energy through consumption of food (electron donor) and oxygen (electron
acceptor). Bacteria obtain the greatest energy yield by using oxygen as an acceptor, as it is highly
oxidized and, therefore, can be reduced easily and to a large degree. When oxygen is depleted in an
uncontaminated aquifer, bacteria sequentially use the less oxidized electron acceptors in the following
order: nitrate; manganese; ferric iron; sulfate; and carbon dioxide. Chloroethenes can also be used as
electron acceptors by specific microorganisms and thereby be degraded to harmless products. During
biodegradation, chlorine ions present on the chlorinated hydrocarbon molecule are replaced with
hydrogen, resulting in the formation of successively less chlorinated molecules. By this process PCE is
degraded to breakdown products TCE, cis-1,2-DCE, and VC, and then to innocuous end products ethene
and ethane. PCE is the strongest oxidant in groundwater systems following oxygen (Vogel et al. 1987)
and, therefore, can be reduced as soon as oxygen is depleted. TCE, DCE, and VC require successively
more reducing aquifer conditions for degradation. TCE can be degraded under Fe(III)-reducing
conditions (Chapelle 1996), cis-1,2-DCE under SO4-reducing or methanogenic conditions (Chapelle
1996; Vogel et al. 1987) and the degradation of VC occurs under highly reducing, methanogenic
conditions (Ballapragada et al. 1997; Freedman and Gosset 1989; Maymó-Gatell et al. 1995; Vogel and
McCarthy 1985).
09/08/09 I:\Projects\918\001\FileRm\R\020\RD-RA WP\Final\Final_Work Plan_rpt_a.doc LANDAU ASSOCIATES
4-1
4.0 SYSTEM DESIGN AND CONSTRUCTION
Two separate ISD systems will be constructed to treat COCs present in Plume 2, and in Plumes 3
and 4 combined. New injection and extraction wells will be installed in both areas to execute the full-
scale remedy. Groundwater monitoring will be performed utilizing existing monitoring wells and system
extraction wells and injection wells. No new monitoring wells are anticipated to be installed beyond
those extraction and injection wells for Plumes 2 through 4. An update to the original HASP included in
the Work Plan for Data Gap Closure (Landau Associates 2006a) is provided in Appendix A. This HASP
is applicable to all site-related activities involved in implementing this remedy, extending to installation
and operation of the remediation system wells and equipment, and related monitoring.
4.1 IN SITU DELIVERY SYSTEM AND CONVEYANCE LINE INSTALLATION
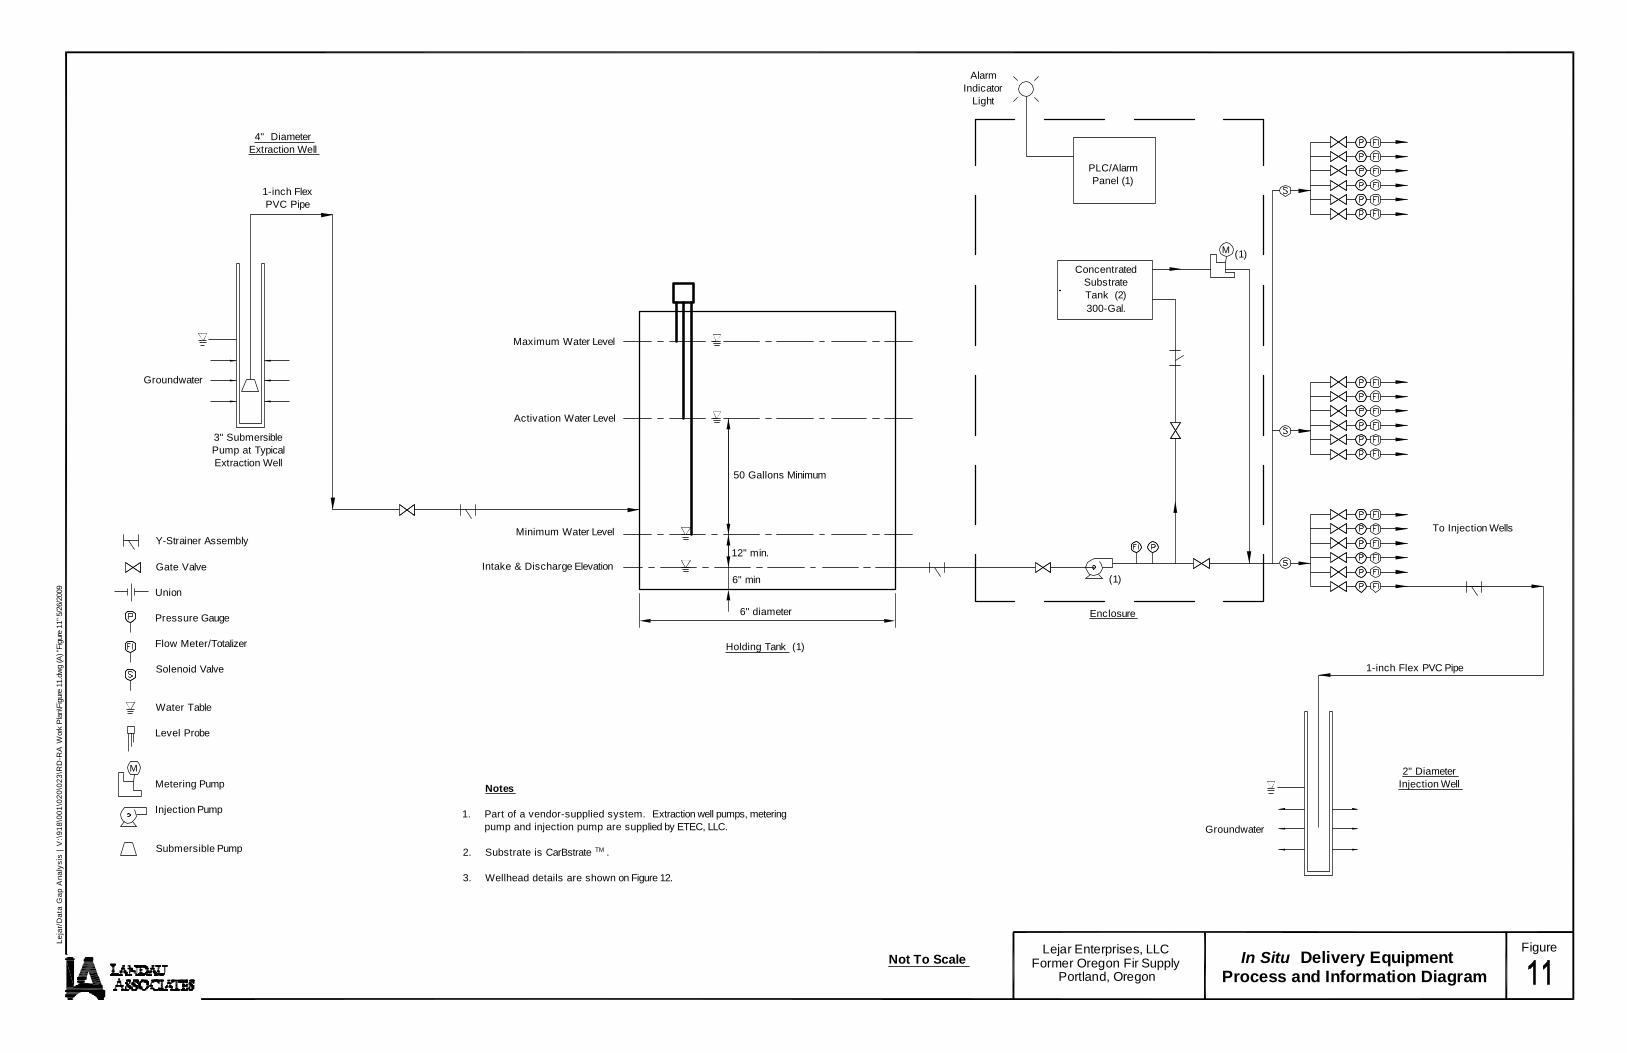
The ISD system is an automated, programmable equipment platform connected to groundwater
extraction and injection wells for recirculation of amended groundwater. Two separate ISD systems will
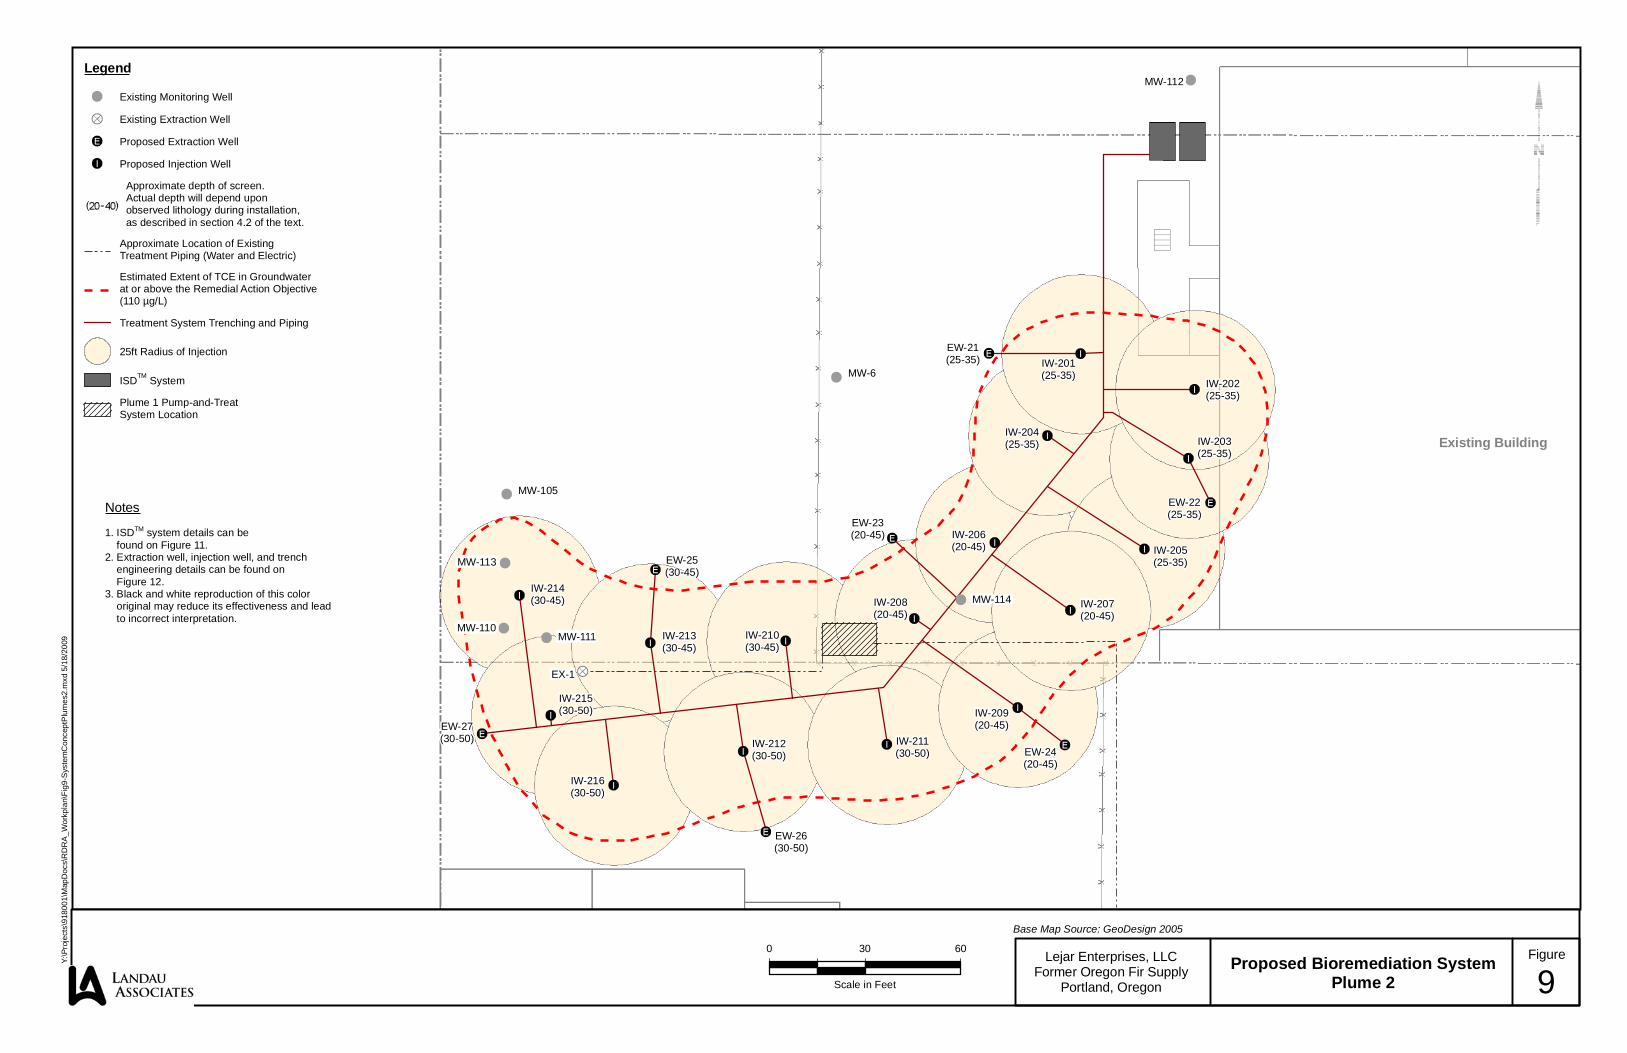
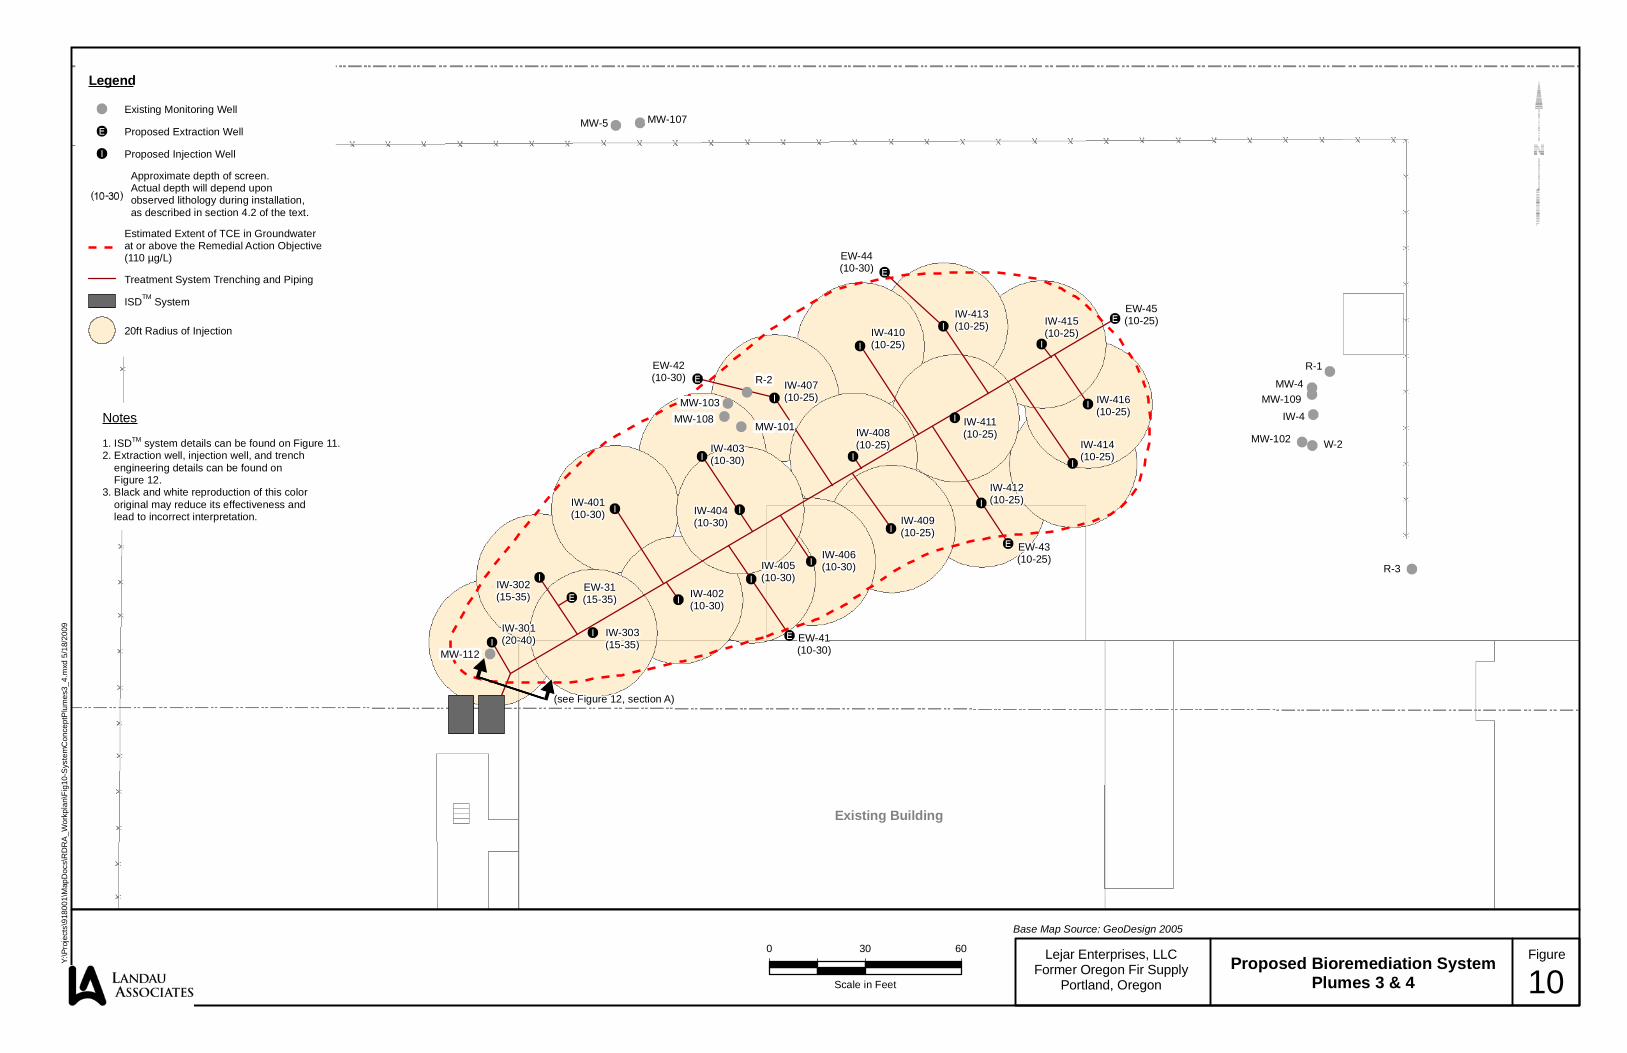
be installed in the approximate locations shown on Figure 9 (Plume 2) and Figure 10 (Plumes 3 and 4).
ISD equipment will be housed in separate insulated, weatherproof enclosures (8 x 10 ft dimensions) that
provide walk-in access to all equipment, and a heating and fan system to control internal temperatures. A
minimum of two polyethylene tanks at each location will be utilized to store extracted groundwater and
concentrated donor/nutrient substrate. Electronic controls will operate the 3-inch diameter, 6-amp, 220V,
and one-half horsepower submersible Grundfos pumps in each extraction well and control batch
injections. Figure 11 presents a process and instrumentation diagram of the injection system.
New infrastructure will be constructed for water conveyance between the ISD system and
extraction/injection wells, and for electrical connection between the ISD and extraction wells.
Groundwater conveyance piping will be constructed of 1-inch flexible polyvinyl chloride (PVC) pipe
buried a minimum of 24 inches below grade in excavated trenches. Wiring will be in PVC electrical
conduit that will be installed in excavated trenches above water piping. Pipes will be bedded in sand,
with the remainder of the trench backfilled with excavated soils or other suitable material and compacted
for asphalt patching. Individual pipes will be extended from the ISD enclosure to each extraction well
and injection well; construction of the system with individual piping, valves, and metering will allow
control of injection and extraction from the enclosure instead of at the well head, minimizing disruption
of site activities during the period of treatment. Groundwater conveyance lines will be installed on a
minimal slope of no more than 0.01 ft/ft. The shallow slope is necessary to maintain the shallow grade of
the trenches; a greater slope is not needed because the extraction and injection water will be pumped
09/08/09 I:\Projects\918\001\FileRm\R\020\RD-RA WP\Final\Final_Work Plan_rpt_a.doc LANDAU ASSOCIATES
4-2
under pressure to and from the treatment system. Aboveground piping will require insulation and heat
tracing. Y-strainers will be installed on the influent and effluent lines above ground to act as cleanouts to
address possible iron or biological fouling of the conveyance piping or injection wells. System
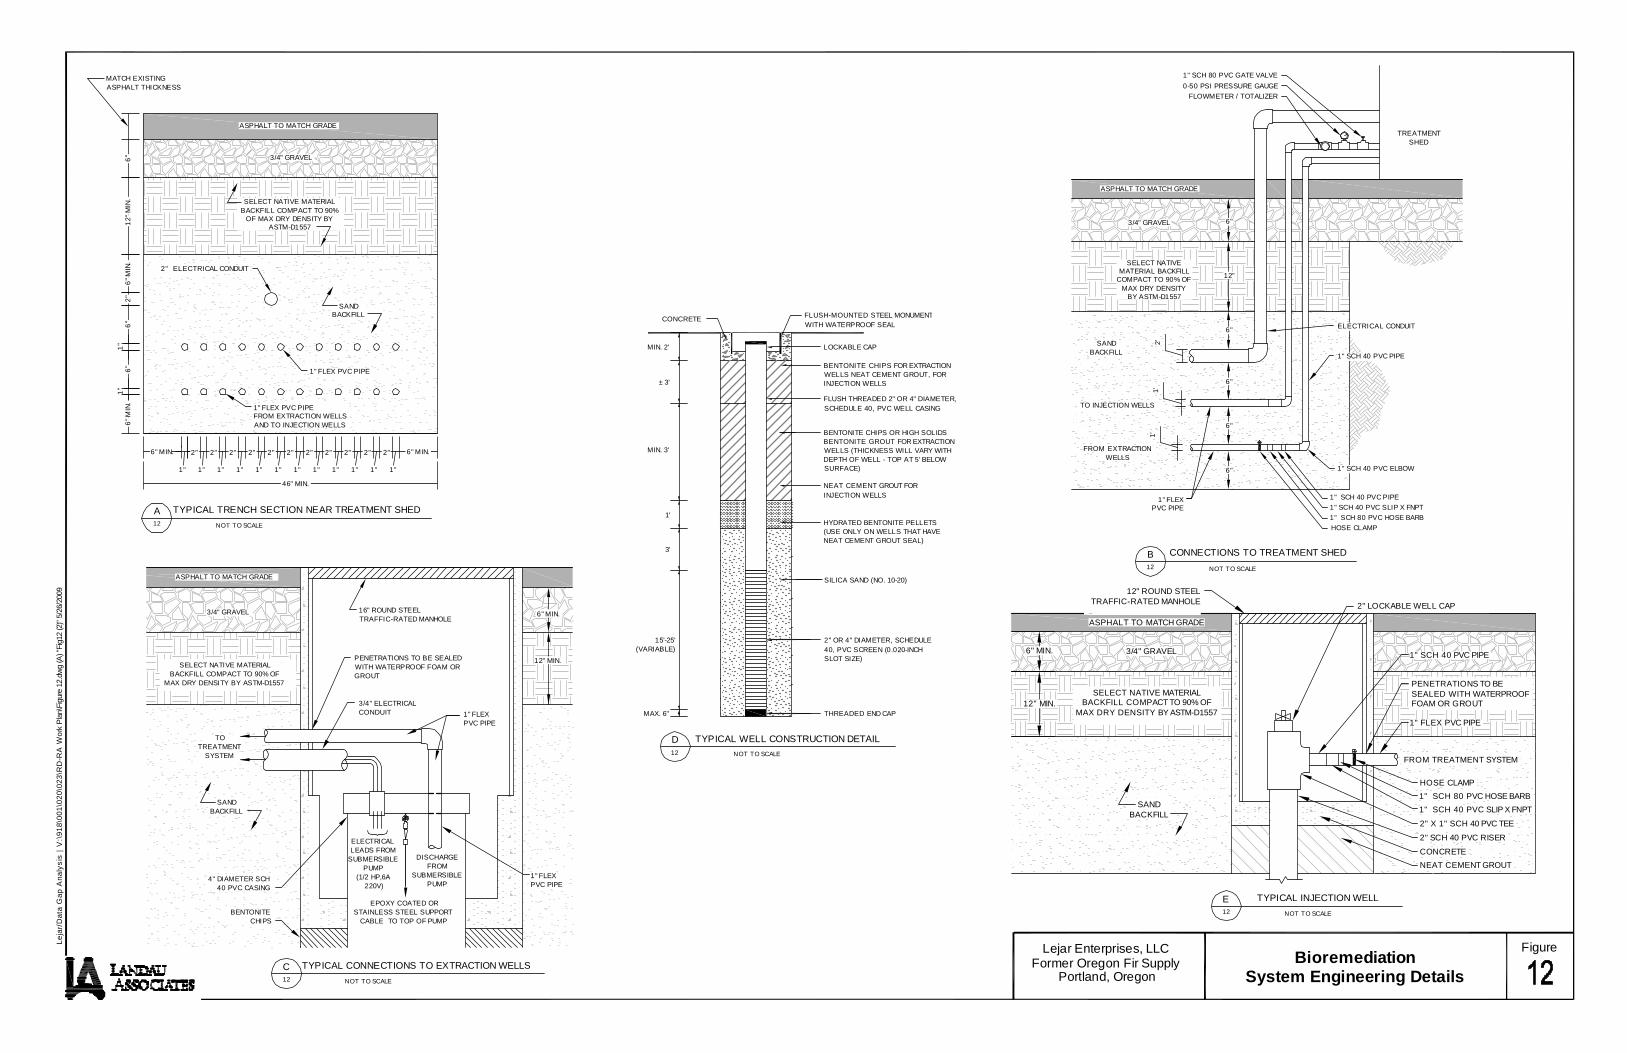
engineering details including typical trench cross sections and piping details are shown on Figure 12.
4.2 WELL INSTALLATION
Recirculation and distribution of electron donor will be accomplished utilizing a total of 35
injection wells and 13 extraction wells at the treatment areas for Plumes 2 through 4. These wells will
also be used for groundwater monitoring and no new, sole-purpose monitoring wells will be needed.
Well borings will be drilled using a hollow-stem auger drill rig, collecting split-spoon soil samples for
lithological logging at 5-ft intervals to within 10 ft of the anticipated total depth of the boring, with
samples collected at 2.5-ft intervals over the final 10 ft of the boring. Soil samples will be field-screened
with a photoionization detector. Extraction wells (4-inch diameter) and injection wells (2-inch diameter)
will be constructed of Schedule 40 PVC casing. A Log of Exploration (Appendix D) will be used to
record observations during soil logging. Extraction well and injection well screens will consist of 0.020- inch machine-slotted PVC screen. A filter pack will be installed around the screen extending from
the end cap to a minimum of 3 ft above the screen. Filter pack material will consist of 10-20 Colorado
silica sand or equivalent. During filter pack placement, the distribution and depth of the filter pack will
be monitored with a weighted tape. For extraction wells, the annular seal above the filter pack will be
constructed of bentonite chips and/or a tremied high-solids bentonite grout (grout to be used for deeper
Plume 2 wells). For injection wells, where the seal needs to be more resistant to potential injection
pressures, the seal will be constructed of neat cement grout. The surface will be completed with a
concrete seal minimum 2 ft thick with embedded steel flush-mounted monuments or vaults. Well design
details are shown on Figure 12.
As practical, the wells will be installed beginning in the least contaminated area; down-hole
drilling equipment will be decontaminated between borings. Prior to the start of installation, both a
private and a public utility locate will be performed in the drilling and trenching areas to mark subsurface
utilities. Soils will be handled as described in the SMP (Appendix B), and disposed of as outlined in
Section 7.0.
In Plume 2, 16 injection wells and 7 extraction wells will be installed. This number of injection
wells is based on an estimated 25 ft radius of injection (ROI) for each injection well. Within the footprint
of this plume, there is substantial variation in the depth of the shallow clay unit, thickness of the
contaminated aquifer zone, depth to lower clay aquitard (Figures 5 through 7). Additionally, the clay
aquitard that separates contamination present in silty sands and sandy silts from the underlying TGA is
09/08/09 I:\Projects\918\001\FileRm\R\020\RD-RA WP\Final\Final_Work Plan_rpt_a.doc LANDAU ASSOCIATES
4-3
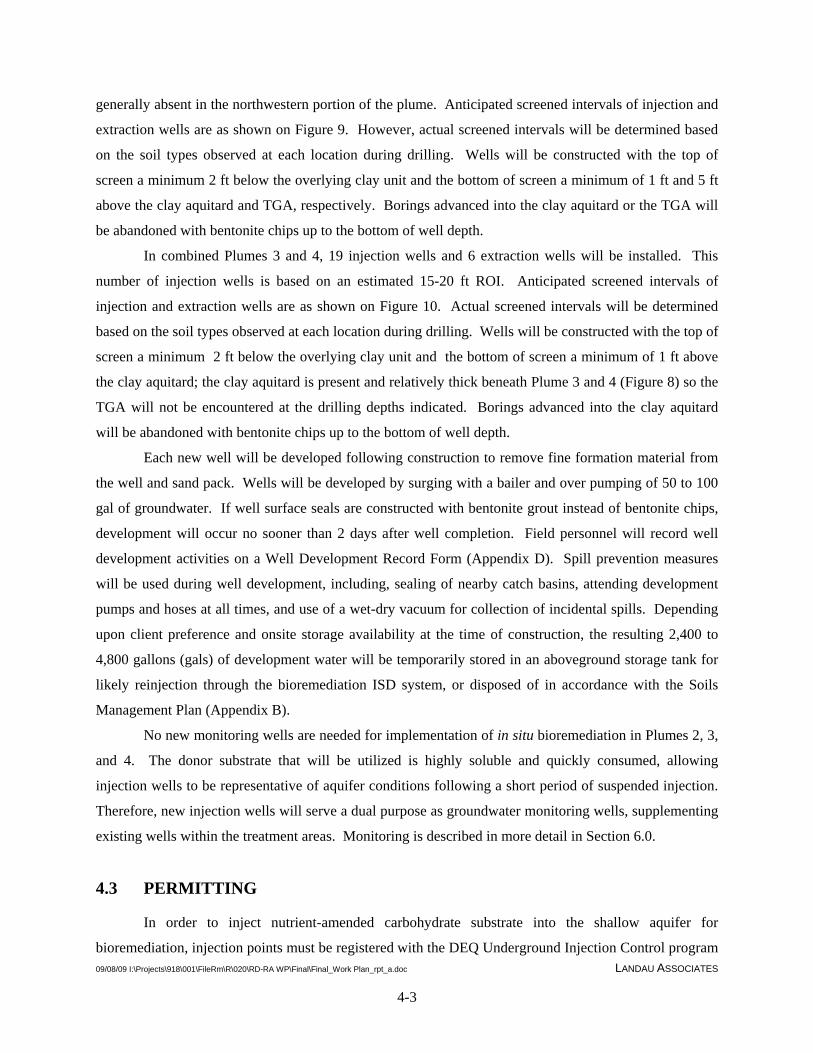
generally absent in the northwestern portion of the plume. Anticipated screened intervals of injection and
extraction wells are as shown on Figure 9. However, actual screened intervals will be determined based
on the soil types observed at each location during drilling. Wells will be constructed with the top of
screen a minimum 2 ft below the overlying clay unit and the bottom of screen a minimum of 1 ft and 5 ft
above the clay aquitard and TGA, respectively. Borings advanced into the clay aquitard or the TGA will
be abandoned with bentonite chips up to the bottom of well depth.
In combined Plumes 3 and 4, 19 injection wells and 6 extraction wells will be installed. This
number of injection wells is based on an estimated 15-20 ft ROI. Anticipated screened intervals of
injection and extraction wells are as shown on Figure 10. Actual screened intervals will be determined
based on the soil types observed at each location during drilling. Wells will be constructed with the top of
screen a minimum 2 ft below the overlying clay unit and the bottom of screen a minimum of 1 ft above
the clay aquitard; the clay aquitard is present and relatively thick beneath Plume 3 and 4 (Figure 8) so the
TGA will not be encountered at the drilling depths indicated. Borings advanced into the clay aquitard
will be abandoned with bentonite chips up to the bottom of well depth.
Each new well will be developed following construction to remove fine formation material from
the well and sand pack. Wells will be developed by surging with a bailer and over pumping of 50 to 100
gal of groundwater. If well surface seals are constructed with bentonite grout instead of bentonite chips,
development will occur no sooner than 2 days after well completion. Field personnel will record well
development activities on a Well Development Record Form (Appendix D). Spill prevention measures
will be used during well development, including, sealing of nearby catch basins, attending development
pumps and hoses at all times, and use of a wet-dry vacuum for collection of incidental spills. Depending
upon client preference and onsite storage availability at the time of construction, the resulting 2,400 to
4,800 gallons (gals) of development water will be temporarily stored in an aboveground storage tank for
likely reinjection through the bioremediation ISD system, or disposed of in accordance with the Soils
Management Plan (Appendix B).
No new monitoring wells are needed for implementation of in situ bioremediation in Plumes 2, 3,
and 4. The donor substrate that will be utilized is highly soluble and quickly consumed, allowing
injection wells to be representative of aquifer conditions following a short period of suspended injection.
Therefore, new injection wells will serve a dual purpose as groundwater monitoring wells, supplementing
existing wells within the treatment areas. Monitoring is described in more detail in Section 6.0.
4.3 PERMITTING
In order to inject nutrient-amended carbohydrate substrate into the shallow aquifer for
bioremediation, injection points must be registered with the DEQ Underground Injection Control program
09/08/09 I:\Projects\918\001\FileRm\R\020\RD-RA WP\Final\Final_Work Plan_rpt_a.doc LANDAU ASSOCIATES
4-4
(Priest, B., 2007, personal communication). Landau Associates will file an application on behalf of Lejar
with DEQ providing relevant information for registration for full-scale aquifer remediation as appropriate
for Plumes 2 through 4 treatment.
Other permits are construction related. The appropriate electrical permits will be obtained by the
electrical subcontractor to run 230V, 100-amp power service to the ISD treatment area. Because there is
no discharge to sanitary sewer or city storm sewer, no plumbing permits are required.
09/08/09 I:\Projects\918\001\FileRm\R\020\RD-RA WP\Final\Final_Work Plan_rpt_a.doc LANDAU ASSOCIATES
5-1
5.0 IN SITU DELIVERY SYSTEM STARTUP AND OPERATION
During system operation, the ISD system will provide automated groundwater extraction, mixing,
and reinjection, with infrequent site visits required to modify recirculation patterns. Extracted
groundwater will be pumped to a holding tank(s), and then automatically pumped to injection wells when
the tank(s) is/are full. Substrates and nutrients held in a tank of concentrated solution will be metered into
injected groundwater as it is pumped from the 100 gallon groundwater holding tank(s). The ISD has a
Programmable Logic Controller (PLC) system that will allow flexible programming of
injection/extraction scenarios, and can be used to monitor alarm conditions. Alarm lights will be placed
on the outside of the two enclosures to provide a visual signal to Lejar staff in the event of abnormal
operating conditions. General system features are presented on Figure 11.
For a recirculation system, important electron donor substrate characteristics are high water
solubility and a low retardation factor in order to maximize mobility and distribution within the target
treatment zone. ETEC’s proprietary nutrient-amended carbohydrate substrate (CarBstrate™) will be used
in this process. CarBstrate has high solubility and a low retardation factor, and is a non-toxic food-grade
product that includes micro and macronutrients to optimize biological dechlorination. The mass of donor
delivered to the aquifer is dependent upon actual baseline monitoring conditions and extraction rates, but
is expected to be between 500 lbs and 150 lbs of substrate per week, corresponding to an injectant donor
concentration of approximately 600 milligrams per liter (mg/L).
The use of CarBstrate as the sole electron donor will be evaluated throughout the treatment. It
may be determined that addition of a longer lasting substrate (e.g., sodium lactate, vegetable oil emulsion)
would be appropriate to allow intermittent operation of the recirculation system and diffusion of electron
donor to additional aquifer pore spaces.
5.1 STARTUP AND SHAKEDOWN
Startup of the system will consist of filling the holding tank(s) with potable water, and injecting at
a rate of approximately 1 to 2 gallons per minute to simulate the batch treatment cycle. In addition, each
extraction pump will be briefly started to confirm operation. The volume pumped from the holding
tank(s) and the pumping time will be used to check totalizer flow rates. Level switches, flow meters,
pressure gauges, and metering pumps will be tested. Each well will be individually injected with a small
volume of unamended potable water to determine they are operable and able to accept injectant as
anticipated. Alarm conditions will be simulated to ensure that the PLC and the visual alarm on the
outside of the enclosure are operating properly. Metering pumps will be observed to confirm that nutrient
and substrate feed rates are appropriate.
09/08/09 I:\Projects\918\001\FileRm\R\020\RD-RA WP\Final\Final_Work Plan_rpt_a.doc LANDAU ASSOCIATES
5-2
5.2 OPERATIONS AND MAINTENANCE
Following startup and shakedown, extraction of groundwater and reinjection will commence. At
that time, the extraction well pumps will be activated causing the holding tank(s) to fill with water for
amendment and treatment. When the tank has reached a minimum of 50 gallons (activation level) the
water in the tank will be discharged and amended in-line with nutrients prior to injection. The extraction
wells are expected to operate continuously (with the exception of low water conditions caused in part by
the tight formation and possible low recharge rates). Amended groundwater is expected to be injected as
a batch operation, because the rate of injection will deplete the holding tank(s) more quickly than the
extraction wells will fill the tank. Flow rates may be adjusted on a regular (weekly) basis to allow
optimal balancing of the system. In addition, changes in pumping rates and injection pressures that may
be indicative of biological fouling may be observed and addressed appropriately. Daily activities will be
recorded on a Field Report (Appendix D).
The treatment system has the flexibility to operate using “zones”, meaning that a select set of
extraction and injection wells may be utilized at a time. This allows collection and injection of water
from/to a concentrated area, allowing specific adjustments to nutrients and injection volumes per each
treatment zone. Given the relatively flat gradient in the DOD, the extraction wells are expected to easily
affect a radius of influence that allows even distribution of injectant throughout the treatment area. With
one exception (EW-31), the extraction wells will help to pull injectant through the treatment area from the
center to the outer edge. This allows the injectant to have contact with the center of the plume during
injection, and then help distribute the injectant outward. In an effort to reduce the number of extraction
wells for installation, EW-31 is configured similarly to the Plume 5 pilot test, where injectant is brought
into the center of the plume through a forced gradient. Either way, the extraction wells help to maintain
hydraulic control of the injectant, and distribute donor throughout the plume.
Each treatment zone consists of one extraction well, and 4 to 5 neighboring injection wells.
During the pilot test at Plume 5, a startup extraction rate of 2 gallons per minute was observed. Based on
that rate, the holding tank(s) will discharge to the injection wells every 25 minutes. This means that a
minimum of 10 gallons of injectant will be delivered to each injection well every 25 minutes. After 12
months of operation, it is expected that three pore volumes of donor will have been added to the
subsurface.
The system will require weekly site checks to ensure that feed delivery rates of substrate are
appropriate, and that extraction and injection rates are balanced. In addition, response to system alarms
may be required. The system will automatically interrupt operations if an alarm condition is observed
such as a pump failure, high tank level alarm, or high injection pressure (indicating fouling of the
09/08/09 I:\Projects\918\001\FileRm\R\020\RD-RA WP\Final\Final_Work Plan_rpt_a.doc LANDAU ASSOCIATES
5-3
injection well). Alarm conditions will be monitored visually by noting whether the alarm light located on
the exterior of the enclosure is illuminated. If the light is on, Landau Associates will be notified by Lejar
staff and will respond to the alarm, troubleshoot the system, repair the problem, and return the system to
operation as quickly as possible. Site visit records will be kept in a bound, project-specific notebook, as
well as a daily summary completed in a Field Report (Appendix D). Nutrient addition rates,
extraction/injection rates with totals, hour meters, and pressure readings will be recorded. These records
will be used in conjunction with performance monitoring results (Section 6.0) to adjust nutrient
amendment rates and extraction and injection flow rates, as needed, to achieve targeted treatment in
specific zones.
It is not expected that the injection wells will foul during operation based on system observations
during the pilot test at Plume 5. In an effort to prevent biological fouling, injection of amended water will
be followed by a flush of unamended water to clear the lines after each injection. However, if biological
fouling of the injection and/or extraction wells occurs, the system may need to be shut down for cleaning
and re-evaluation of nutrient dosing. In this instance, the wells will be redeveloped by surging the
injection point with unamended water. If redevelopment of the well in this manner is not sufficient to
clear the screen, a 5 percent hydrogen peroxide solution (approximately 300 gals per injection point) will
be added to loosen biological growth from the screen; hydrogen peroxide would remain in the wells for 2
days prior to resuming injection. By design, although the addition of hydrogen peroxide will stop
biological growth in the immediate vicinity of the well, this will be a localized phenomenon and will not
adversely affect biotreatment and groundwater geochemistry in the bulk of the aquifer treatment zone.
09/08/09 I:\Projects\918\001\FileRm\R\020\RD-RA WP\Final\Final_Work Plan_rpt_a.doc LANDAU ASSOCIATES
6-1
6.0 MONITORING
This section summarizes groundwater monitoring related to bioremediation of Plumes 2, 3, and 4
and sub-slab vapor monitoring required by the site ROD. Other site groundwater monitoring comprised
of semiannual groundwater monitoring, Plume 5 post-treatment groundwater monitoring, and monitoring
associated with contingency operation of the Plume 1 pump-and-treat system is described in the SAP
(Appendix C). The SAP also contains matrices of groundwater monitoring locations, frequency, and
analytes, as well as monitoring procedures.
6.1 BIOREMEDIATION GROUNDWATER MONITORING
Groundwater monitoring will be performed to evaluate treatment progress and achievement of the
RAO treatment goals. Groundwater monitoring will consist of baseline monitoring, bulk aquifer
monitoring through extraction well sampling, and discrete aquifer monitoring through sampling of
existing monitoring wells and injection wells. Sampling matrices, methods and procedures to be used
during sampling and analysis are included in the SAP (Appendix C). Monitoring parameters are
described further in Section 6.1.1.
At Plumes 2 through 4, baseline monitoring will be performed at existing monitoring wells,
injection wells, and extraction wells within the treatment areas. All existing monitoring wells and
injection wells will be sampled prior to system startup for a short list of VOCs corresponding to site
COCs and breakdown products. Approximately one-third of the monitoring/injection wells will be
analyzed for the full list of parameters as outlined in the SAP (Appendix C). This baseline monitoring of
wells within the treatment zone will provide a detailed view of contaminant distribution and provide
representative data for aquifer redox parameters and TOC. Extraction wells will be sampled to evaluate
bulk aquifer conditions within the zones of influence for each well; samples will be analyzed for a
comprehensive list of parameters as explained in the SAP (Appendix C). Extraction well samples will be
collected approximately 48 hours following system startup, time enough for extraction well zones of
influence to be established but before substantial aquifer changes should occur due to donor injection.
Bulk aquifer monitoring (performance monitoring) through analysis of extraction well samples
will be performed regularly to evaluate changing conditions and COC concentrations within the treatment
zones during active treatment. Bulk aquifer monitoring will be performed monthly, with possible
transition to every other month or quarterly, dependent on monitoring results and progress of treatment.
Samples from each extraction well will initially be analyzed for the full list of parameters, with possible
discontinuation or reduction in the frequency of some analyses (e.g., nitrate, sulfate), depending on
monitoring results. The monitoring discussed here provides data for evaluation of treatment progress.
09/08/09 I:\Projects\918\001\FileRm\R\020\RD-RA WP\Final\Final_Work Plan_rpt_a.doc LANDAU ASSOCIATES
6-2
This monitoring can be performed without direct access to wells within the treatment zones, thereby
limiting disruption of site activities as much as possible.
Discrete aquifer monitoring will be performed at existing monitoring wells and injection wells
within the treatment zones when RAOs have been achieved in all or most of the bulk aquifer (extraction
well) samples. Discrete aquifer monitoring is intended to confirm the results of bulk aquifer monitoring
and to identify zones of higher concentration, if any, requiring additional focused treatment. All samples
will be analyzed for the short list of VOCs only, with other redox and TOC parameters potentially
analyzed in selected samples. For injection well samples to be representative of the aquifer and not of the
injectant, all injections will be suspended for 6 to 8 weeks prior to sampling to allow depletion of injected
donor and for equilibrium to be reestablished between the soil and aqueous phases; depletion of injection
donor will be confirmed by TOC analytical results for the monitoring round.
Semiannual monitoring will continue at selected representative treatment zone wells for 2 years
following achievement of RAOs and the end of active treatment to evaluate COC concentration rebound
as the aquifer returns to ambient conditions. Representative wells will be selected with DEQ input and
are likely to be a subset of the baseline monitoring locations.
6.1.1 GROUNDWATER MONITORING PARAMETERS
Groundwater will be monitored for selected VOCs, dissolved gases, aquifer redox parameters
[dissolved oxygen (DO), oxidation-reduction potential (ORP), nitrate, Fe(II), SO4, and pH], and total
organic carbon (TOC). Laboratory analysis will be performed for VOCs, methane/ethene/ethane, nitrate,
sulfate, and TOC. VOC analyses will be for a short list of COC VOCs consisting of PCE, TCE,
cis-1,2-DCE; trans-1,2-DCE, 1,1-DCE, and VC only, based on historical detections (Table 2). Other
parameters (ferrous iron, DO, ORP, pH, temperature, and conductivity) will be measured in the field.
Groundwater levels will also be measured at all performance monitoring wells prior to sampling. SAP
Tables C-1 through C-3 present matrices showing schedule and parameters for groundwater monitoring
for Plumes 1 through 5.
6.2 SUB-SLAB VAPOR MONITORING
As a condition of the ROD, sub-slab vapor sampling ports located within the warehouse building
will be tested on a semi-annual schedule during implementation of in situ remediation. Four vapor probes
were installed previously (VP-1 through VP-4) in the floor of the warehouse to collect samples of sub-
slab vapors. These probes will be used to collect samples of sub-slab vapors once per year in April,
correlating with the high-water semiannual groundwater monitoring event, during active treatment. In
09/08/09 I:\Projects\918\001\FileRm\R\020\RD-RA WP\Final\Final_Work Plan_rpt_a.doc LANDAU ASSOCIATES
6-3
addition, one final sub-slab vapor sample will be collected along with the final round of post-treatment
monitoring to gain site closure, as requested by DEQ. The air samples will be collected using Summa
canisters, and submitted under chain of custody procedures to Environmental Analytical Services in San
Luis Obispo, California for analysis by TO-15 for PCE, TCE, cis-1,2-DCE, trans-1,2-DCE, 1,1,-DCE,
and VC. The samples will not be analyzed for PCP, as this COC is not anticipated to volatize to indoor
air given its low vapor pressure (0.00011 millimeters at 20 degrees C). In the event that sub-slab vapor
monitoring data indicate that concentrations of COCs beneath the warehouse exceed their vapor screening
levels (RBC for indoor air x 1000 attenuation factor for occupational exposure), then the HVAC system
may be evaluated and modified to assure continuous positive air pressure flows out of the building. The
SAP in Appendix C provides additional sampling details.
09/08/09 I:\Projects\918\001\FileRm\R\020\RD-RA WP\Final\Final_Work Plan_rpt_a.doc LANDAU ASSOCIATES
7-1
7.0 INVESTIGATION-DERIVED WASTE
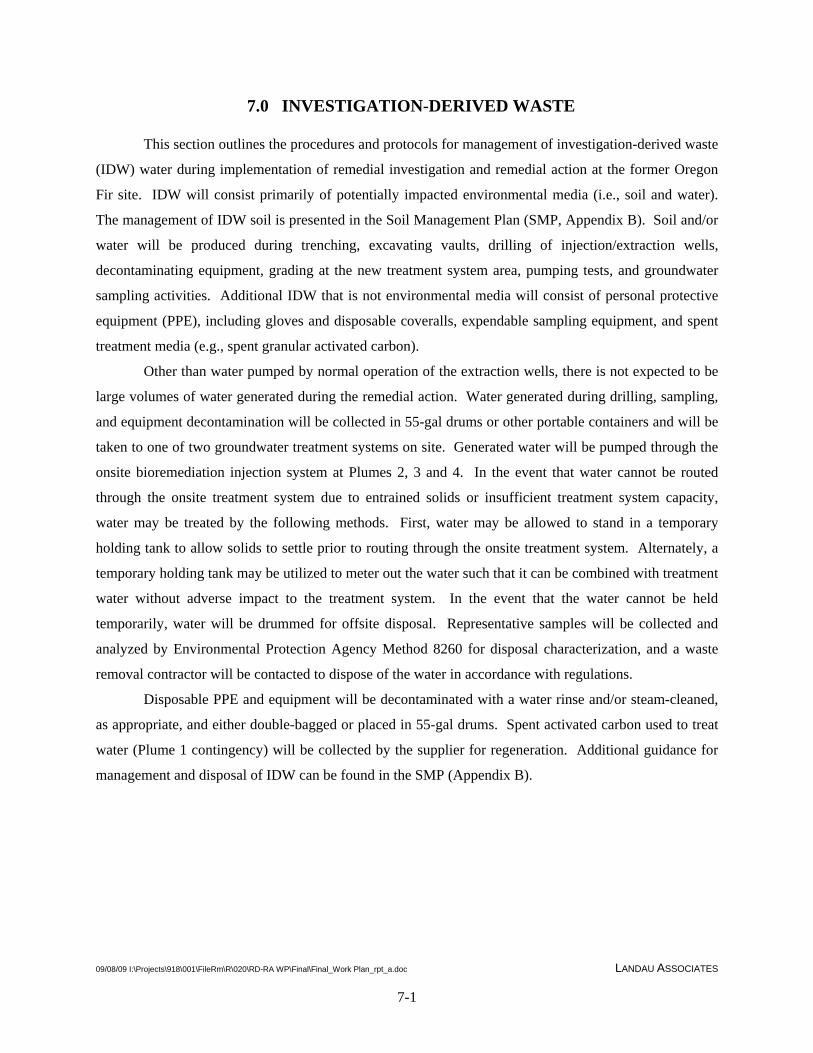
This section outlines the procedures and protocols for management of investigation-derived waste
(IDW) water during implementation of remedial investigation and remedial action at the former Oregon
Fir site. IDW will consist primarily of potentially impacted environmental media (i.e., soil and water).
The management of IDW soil is presented in the Soil Management Plan (SMP, Appendix B). Soil and/or
water will be produced during trenching, excavating vaults, drilling of injection/extraction wells,
decontaminating equipment, grading at the new treatment system area, pumping tests, and groundwater
sampling activities. Additional IDW that is not environmental media will consist of personal protective
equipment (PPE), including gloves and disposable coveralls, expendable sampling equipment, and spent
treatment media (e.g., spent granular activated carbon).
Other than water pumped by normal operation of the extraction wells, there is not expected to be
large volumes of water generated during the remedial action. Water generated during drilling, sampling,
and equipment decontamination will be collected in 55-gal drums or other portable containers and will be
taken to one of two groundwater treatment systems on site. Generated water will be pumped through the
onsite bioremediation injection system at Plumes 2, 3 and 4. In the event that water cannot be routed
through the onsite treatment system due to entrained solids or insufficient treatment system capacity,
water may be treated by the following methods. First, water may be allowed to stand in a temporary
holding tank to allow solids to settle prior to routing through the onsite treatment system. Alternately, a
temporary holding tank may be utilized to meter out the water such that it can be combined with treatment
water without adverse impact to the treatment system. In the event that the water cannot be held
temporarily, water will be drummed for offsite disposal. Representative samples will be collected and
analyzed by Environmental Protection Agency Method 8260 for disposal characterization, and a waste
removal contractor will be contacted to dispose of the water in accordance with regulations.
Disposable PPE and equipment will be decontaminated with a water rinse and/or steam-cleaned,
as appropriate, and either double-bagged or placed in 55-gal drums. Spent activated carbon used to treat
water (Plume 1 contingency) will be collected by the supplier for regeneration. Additional guidance for
management and disposal of IDW can be found in the SMP (Appendix B).
09/08/09 I:\Projects\918\001\FileRm\R\020\RD-RA WP\Final\Final_Work Plan_rpt_a.doc LANDAU ASSOCIATES
8-1
8.0 DATA EVALUATION AND REPORTING
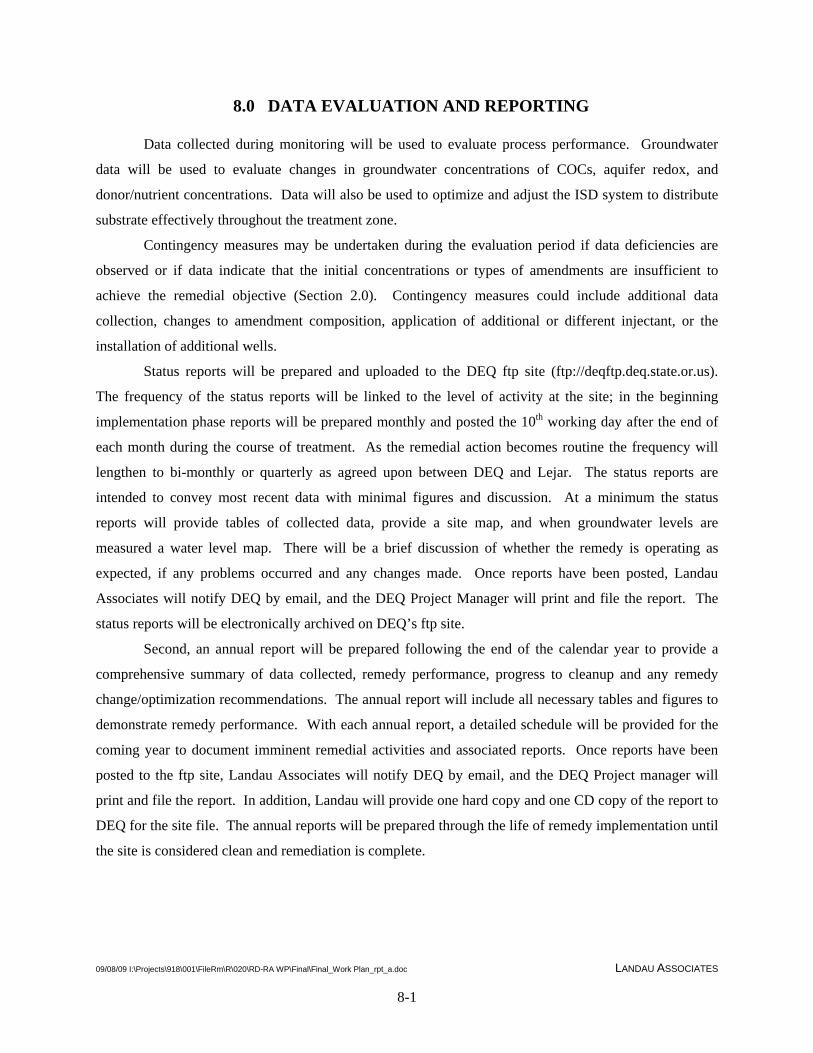
Data collected during monitoring will be used to evaluate process performance. Groundwater
data will be used to evaluate changes in groundwater concentrations of COCs, aquifer redox, and
donor/nutrient concentrations. Data will also be used to optimize and adjust the ISD system to distribute
substrate effectively throughout the treatment zone.
Contingency measures may be undertaken during the evaluation period if data deficiencies are
observed or if data indicate that the initial concentrations or types of amendments are insufficient to
achieve the remedial objective (Section 2.0). Contingency measures could include additional data
collection, changes to amendment composition, application of additional or different injectant, or the
installation of additional wells.
Status reports will be prepared and uploaded to the DEQ ftp site (ftp://deqftp.deq.state.or.us).
The frequency of the status reports will be linked to the level of activity at the site; in the beginning
implementation phase reports will be prepared monthly and posted the 10th working day after the end of
each month during the course of treatment. As the remedial action becomes routine the frequency will
lengthen to bi-monthly or quarterly as agreed upon between DEQ and Lejar. The status reports are
intended to convey most recent data with minimal figures and discussion. At a minimum the status
reports will provide tables of collected data, provide a site map, and when groundwater levels are
measured a water level map. There will be a brief discussion of whether the remedy is operating as
expected, if any problems occurred and any changes made. Once reports have been posted, Landau
Associates will notify DEQ by email, and the DEQ Project Manager will print and file the report. The
status reports will be electronically archived on DEQ’s ftp site.
Second, an annual report will be prepared following the end of the calendar year to provide a
comprehensive summary of data collected, remedy performance, progress to cleanup and any remedy
change/optimization recommendations. The annual report will include all necessary tables and figures to
demonstrate remedy performance. With each annual report, a detailed schedule will be provided for the
coming year to document imminent remedial activities and associated reports. Once reports have been
posted to the ftp site, Landau Associates will notify DEQ by email, and the DEQ Project manager will
print and file the report. In addition, Landau will provide one hard copy and one CD copy of the report to
DEQ for the site file. The annual reports will be prepared through the life of remedy implementation until
the site is considered clean and remediation is complete.
09/08/09 I:\Projects\918\001\FileRm\R\020\RD-RA WP\Final\Final_Work Plan_rpt_a.doc LANDAU ASSOCIATES
9-1
9.0 SCHEDULE
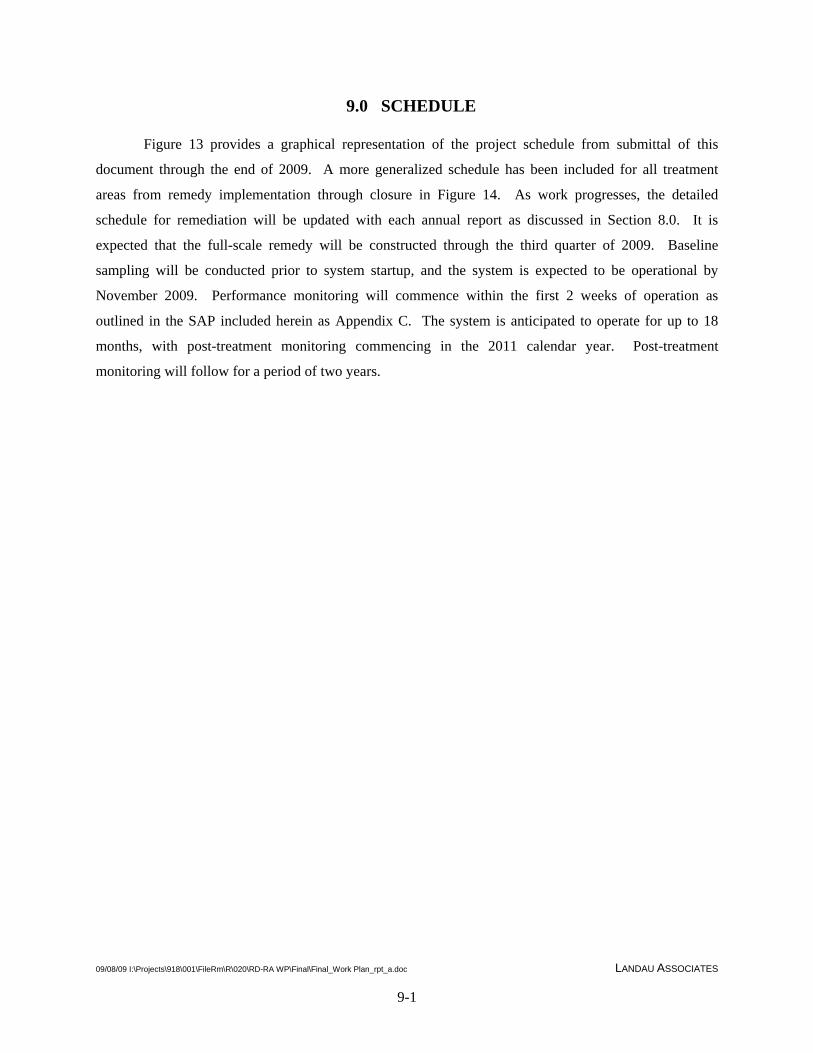
Figure 13 provides a graphical representation of the project schedule from submittal of this
document through the end of 2009. A more generalized schedule has been included for all treatment
areas from remedy implementation through closure in Figure 14. As work progresses, the detailed
schedule for remediation will be updated with each annual report as discussed in Section 8.0. It is
expected that the full-scale remedy will be constructed through the third quarter of 2009. Baseline
sampling will be conducted prior to system startup, and the system is expected to be operational by
November 2009. Performance monitoring will commence within the first 2 weeks of operation as
outlined in the SAP included herein as Appendix C. The system is anticipated to operate for up to 18
months, with post-treatment monitoring commencing in the 2011 calendar year. Post-treatment
monitoring will follow for a period of two years.
09/08/09 I:\Projects\918\001\FileRm\R\020\RD-RA WP\Final\Final_Work Plan_rpt_a.doc LANDAU ASSOCIATES
10-1
10.0 USE OF THIS WORK PLAN
This RD/RA Work Plan has been prepared for the exclusive use of Lejar Enterprises, LLC for
specific application to the former Oregon Fir site. No other party is entitled to rely on the information,
conclusions, and recommendations included in this document without the express written consent of
Landau Associates. Further, the reuse of information, conclusions, and recommendations provided herein
for extensions of the project or for any other project, without review and authorization by Landau
Associates, shall be at the user’s sole risk. Landau Associates warrants that within the limitations of
scope, schedule, and budget, our services have been provided in a manner consistent with that level of
care and skill ordinarily exercised by members of the profession currently practicing in the same locality
under similar conditions as this project. We make no other warranty, either express or implied.
This document has been prepared under the supervision and direction of the following key staff.
LANDAU ASSOCIATES, INC.
Benni Jonsson Project Engineer
Jessica R. Kruczek, P.E. Senior Project Engineer
Heidi Bullock Senior Hydrogeologist JRK/BJ/HB/cak
09/08/09 I:\Projects\918\001\FileRm\R\020\RD-RA WP\Final\Final_Work Plan_rpt_a.doc LANDAU ASSOCIATES
11-1
11.0 REFERENCES
Ballapragada, B. S., H.D. Stensel, J.A. Puhakka, J.F. Ferguson. 1997. “Effect of Hydrogen on Reductive Dechlorination of Chlorinated Ethenes.” Environmental Science and Technology. 31:1728-1734. Chapelle, F.H. 1996. “Identifying Redox Conditions that Favor the Natural Attenuation of Chlorinated Ethenes in Contaminated Ground-Water Systems.” Symposium on Natural Attenuation of Chlorinated Organics in Ground Water. EPA/540/R-96/509. p. 17. Freedman, D.L., and J.M. Gossett. 1989. “Biological Reductive Dechlorination of Tetrachloroethylene and Trichloroethylene to Ethylene under Methanogenic Conditions.” Applied and Environmental Microbiology. 55:2144-2151. Jacob, C.L., E.F. Weber, J.N. Bet, and A.K. Macnair. 2005. “Full-Scale Enhanced Reductive Dechlorination Using Sodium Lactate and Vegetable Oil”. In: In Situ and Onsite Bioremediation, Proceedings of the Eighth International In Situ and On-Site Biormediation Symposium, June 2005, Baltimore, Massachusetts. B.C. Alleman and M.E. Kelley (Conference Chairs). Battelle Press, Columbus, Ohio. Landau Associates. 2006. Work Plan for Data Gap Closure, Former Oregon Fir Supply Site, Portland, Oregon. Prepared for Lejar Enterprises, LLC. March 15. Landau Associates. 2007a. Agency Review Draft Report: Focused Feasibility Study, Former Oregon Fir Supply Site, Portland, Oregon. Prepared for Lejar Enterprises, LLC. April 20. Landau Associates. 2007b. Work Plan, Interim Remedial Action Measure for Southwest Plumes 1 and 2, Former Oregon Fir Supply Site, Portland, Oregon. Prepared for Lejar Enterprises, LLC. July 2. Landau Associates. 2008a. Plume 5 Bioremediation Pilot Test Results, Former Oregon Fir Supply Site. Prepared for Lejar Enterprises, LLC. January 23. Landau Associates. 2008b. Focused Feasibility Study Addendum, Former Oregon Fir Supply Site. Prepared for Lejar Enterprises, LLC. October 10. Maymó-Gatell, X., V. Tandoi, J.M. Gossett, and S.H. Zinder. 1995. “Characterization of an H2-utilizing Enrichment Culture that Reductively Dechlorinates Tetrachloroethene to Vinyl Chloride and Ethene in the Absence of Methanogenesis and Acetogenesis.” Applied and Environmental Microbiology. 61:3928-3933. Parsons Corp. 2004. Principles and Practices of Enhanced Anaerobic Bioremediation of Chlorinated Solvents. Prepared for Air Force Center of Environmental Excellence, Naval Facilities Engineering Service Center, and Environmental Security Technology Certification Program. August. Priest, B. 2007. Personal communication (telephone conversation with Jessica Kruczek P.E., Landau Associates, Portland, Oregon). Barbara Priest, Underground Injection Control Program Coordinator, Oregon Department of Environmental Quality, Portland, Oregon. Re: Permit Requirements for Bioremediation Testing. April 11. Suthersan, S.S., C.C. Lutes, P.L. Palmer, F. Lenzo, F.C. Payne, D.S. Liles, and J. Burdick. 2002. Final Technical Protocol for Using Soluble Carbohydrates to Enhance Reductive Dechlorination of
09/08/09 I:\Projects\918\001\FileRm\R\020\RD-RA WP\Final\Final_Work Plan_rpt_a.doc LANDAU ASSOCIATES
11-2
Chlorinated Aliphatic Hydrocarbons. Submitted to ESTCP and AFCEE under Contract #41624-99-C-8032. December 19. Vogel, T.M., C.S. Criddle, and P.L. McCarthy. 1987. “Transformation of Halogenated Aliphatic Compounds.” Environmental Science and Technology. 21:722-736. Vogel, T.M. and P.L. McCarthy. 1985. “Biotransformation of Tetrachloroethylene to Trichloroethylene, Dichloroethylene, Vinyl Chloride, and Carbon Dioxide under Methanogenic Conditions”. Applied Environmental Microbiology. 49:1080-1083.

Portland
Vancouver
Maywood Park
84
205
84205
213
213
213
Marine
Airport
102n
d
30 Bus
Prescott12
2nd
Columbia
Alderwood
Fremont
92nd
Airport
122n
d
Airport
Marine
Portland IntlPortland Intl
Rocky Butte State ParkRocky Butte State ParkGlenhaven ParkGlenhaven Park
Argay ParkArgay Park
Beech ParkBeech Park
Knott Street ParkKnott Street ParkJohn Luby ParkJohn Luby Park
Sacajawea ParkSacajawea Park
Columbia RiverColumbia River
Columbia SloughColumbia Slough
Data Source: ESRI 2006
Lejar Enterprises, LLCFormer Oregon Fir Supply
Portland, OregonVicinity Map
Figure
1
0 0.5 1
Miles
Y:\P
roje
cts\
9180
01\M
apD
ocs\
Fig1
.mxd
5/2
6/20
09
Portland
O r e g o nO r e g o n
Tacoma
ProjectLocation
Bend
Medford
Eugene
Klamath Falls
Salem
Project Location
Plume 1 Contingency Treatment Area (TGA)
Plume 2(DOD)
Plumes 3 & 4(SOD)
Plume 5 Performance Monitoring Area (SOD)
NE Holman St
NE 11
2th Av
e
DP-2
DP-5
DP-3
DP-1
DP-4
DP-6
DP-8
DP-7
DP-9
DP-3A
DP-5A
MW-114MW-113
MW-110
MW-105
MW-103
MW-102
MW-111
MW-112
GPIW-19
GPIW-18 GPIW-17
GPIW-16
GPIW-8
GPIW-10 GPIW-11GPIW-14
GPIW-20
MW-108 R-2
GPIW-12 GPIW-13
GPIW-15
GPIW-21
IW-2
IW-4
R-3
MW-109MW-4
IW-3R-1
IW-1
W-2
0 80 160
Scale in Feet
FigureLejar Enterprises, LLCFormer Oregon Fir Supply
Portland, OregonGroundwater Treatment Areas
Base Map Source: GeoDesign 2005
Y:\P
roje
cts\
9180
01\M
apD
ocs\
RD
RA
_Wor
kpla
n\F
ig2_
GW
_Tre
atm
ent_
Are
as.m
xd 5
/18/
2009
Existing Building
2
Legend
Monitoring Well
Direct-Push Boring Location
Estimated Extent of TCE in Groundwaterat or above the RAO (110 µg/L)
Property Boundary
Parcel Boundary
Fence
Existing Building
Treatment Areas thatMeet RAO's
Notes:1. TCE = Trichloroethene2. RAO = Remedial Action Objective3. SOD = Shallow Overbank Deposits4. DOD = Deep Overbank Deposits5. TGA = Troutdale Gravel Aquifer6. Sampling results from 2007 and 2008 for all contaminants
of concern (COC) were evaluated to define the groundwater treatment area. The TCE groundwater data resulted in a treatment area with the greatest extent, therefore, the treatment area defined represents TCE concentrations in groundwater that exceed the RAO (110 µg/ L). The TCE treatment area is considered inclusive of the other COC treatment areas.
7. In instances where more than one discrete groundwater sample was collected within a given water-bearing zone, the highest concentration was used.
8. Black and white reproduction of this color original may reduce its effectiveness and lead to incorrect interpretation.
C
C'
B
B'
A'
A
MW-113
DP-5
DP-3
DP-1
DP-6
DP-7
DP-9
DP-3A
DP-5A
MW-114
EX-1
MW-110
DP-10
MW-111
0 30 60
Scale in Feet
FigureLejar Enterprises, LLCFormer Oregon Fir Supply
Portland, Oregon
Cross Section Location MapDeep Overbank Deposits
(Plume 2)
Base Map Source: GeoDesign 2005
Y:\P
roje
cts\
9180
01\M
apD
ocs\
RD
RA
_Wor
kpla
n\Fi
g3_C
ross
_Sec
tion_
Loca
tion.
mxd
5/2
6/20
09
Existing Building
3
Plume 2
Legend
Monitoring Well
Extraction Well
Direct-Push Boring
Estimated Extent of TCE in Groundwaterat or above the RAO (110 µg/L)
Property Boundary
Parcel Boundary
Fence
Existing Building
Cross Section Orientation
A A'
Notes:1. TCE = Trichloroethene2. RAO = Remedial Action Objective3. Sampling results from 2007 and 2008 for all contaminants of
concern (COC) were evaluated to define the groundwater treatment area. The TCE groundwater data resulted in a treatment area with the greatest extent, therefore, the treatment area defined represents TCE concentrations in groundwater that exceed the RAO (110 µg/ L). The TCE treatment area is considered inclusive of the other COC treatment areas.
4. In instances where more than one discrete groundwater sample was collected within a given water-bearing zone, the highest concentration was used.
5. Black and white reproduction of this color original may reduce its effectiveness and lead to incorrect interpretation.
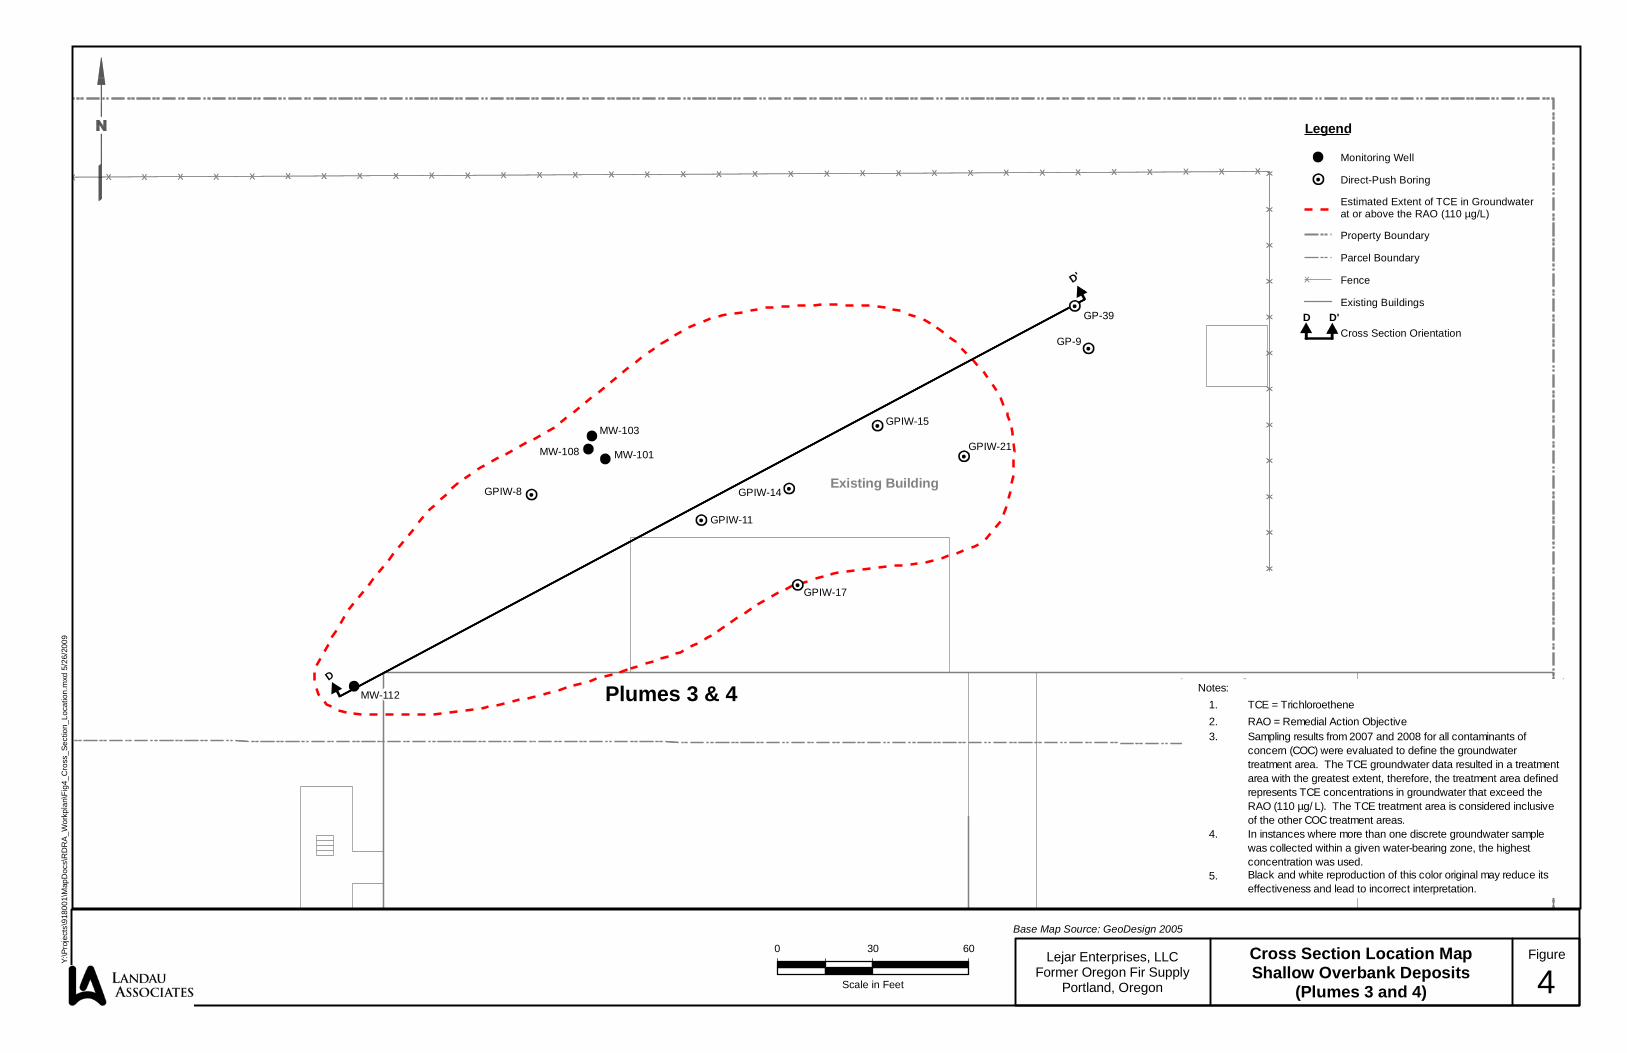
D
D'
MW-103
MW-108
NE Holman St
NE 11
2th Av
e
GP-9
GPIW-8
MW-112
GPIW-15
GPIW-14
GPIW-11
GPIW-21
GPIW-17
MW-101
GP-39
0 30 60
Scale in Feet
FigureLejar Enterprises, LLCFormer Oregon Fir Supply
Portland, Oregon
Cross Section Location MapShallow Overbank Deposits
(Plumes 3 and 4)
Base Map Source: GeoDesign 2005
Y:\P
roje
cts\
9180
01\M
apD
ocs\
RD
RA
_Wor
kpla
n\Fi
g4_C
ross
_Sec
tion_
Loca
tion.
mxd
5/2
6/20
09
Existing Building
4
Plumes 3 & 4
Legend
Monitoring Well
Direct-Push Boring
Estimated Extent of TCE in Groundwaterat or above the RAO (110 µg/L)
Property Boundary
Parcel Boundary
Fence
Existing BuildingsD D'
Cross Section Orientation
Notes:1. TCE = Trichloroethene2. RAO = Remedial Action Objective3. Sampling results from 2007 and 2008 for all contaminants of
concern (COC) were evaluated to define the groundwater treatment area. The TCE groundwater data resulted in a treatment area with the greatest extent, therefore, the treatment area defined represents TCE concentrations in groundwater that exceed the RAO (110 µg/ L). The TCE treatment area is considered inclusive of the other COC treatment areas.
4. In instances where more than one discrete groundwater sample was collected within a given water-bearing zone, the highest concentration was used.
5. Black and white reproduction of this color original may reduce its effectiveness and lead to incorrect interpretation.
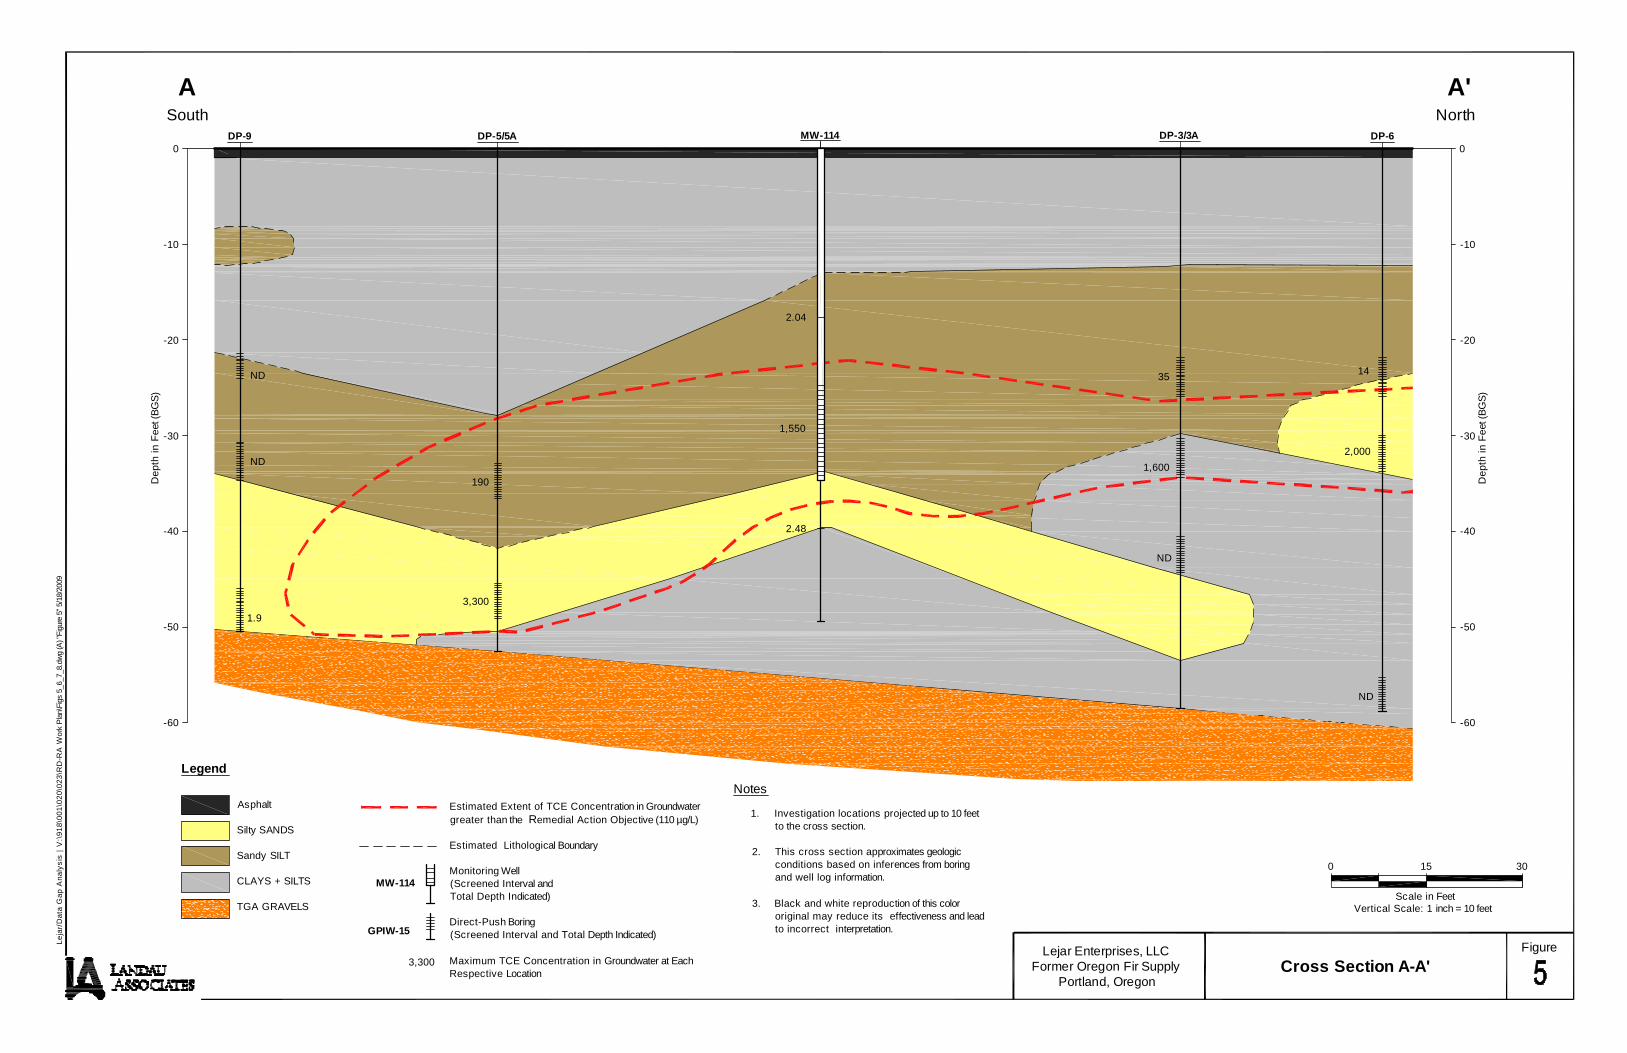
-40
-10
-50
-20
-30
Dep
th in
Fee
t (BG
S)
SouthA
0
NorthA'
-60
-40
-10
-50
-20
-30
Dep
th in
Fee
t (BG
S)
0
-60
DP-9 MW-114DP-5/5A DP-3/3A DP-6
ND
1.9
1,550
ND
2,000
14
ND
ND
2.04
190
2.48
3,300
1,600
35
0 15 30
Scale in FeetVertical Scale: 1 inch = 10 feet
Notes
1. Investigation locations projected up to 10 feetto the cross section.
2. This cross section approximates geologicconditions based on inferences from boringand well log information.
3. Black and white reproduction of this colororiginal may reduce its effectiveness and leadto incorrect interpretation.
Lejar Enterprises, LLCFormer Oregon Fir Supply
Portland, OregonCross Section A-A'
FigureLeja
r/D
ata
Gap
Ana
lysi
s | V
:\918
\001
\020
\023
\RD
-RA
Wor
k P
lan\
Figs
5_6
_7_8
.dw
g (A
) "Fi
gure
5" 5
/18/
2009
Legend
Asphalt
Silty SANDS
Sandy SILT
CLAYS + SILTS
TGA GRAVELS
Estimated Extent of TCE Concentration in Groundwatergreater than the Remedial Action Objective (110 µg/L)
Estimated Lithological Boundary
Monitoring Well(Screened Interval andTotal Depth Indicated)
Direct-Push Boring(Screened Interval and Total Depth Indicated)
Maximum TCE Concentration in Groundwater at EachRespective Location
GPIW-15
3,300
MW-114
-40
-10
-50
-20
-30
Dep
th in
Fee
t (BG
S)
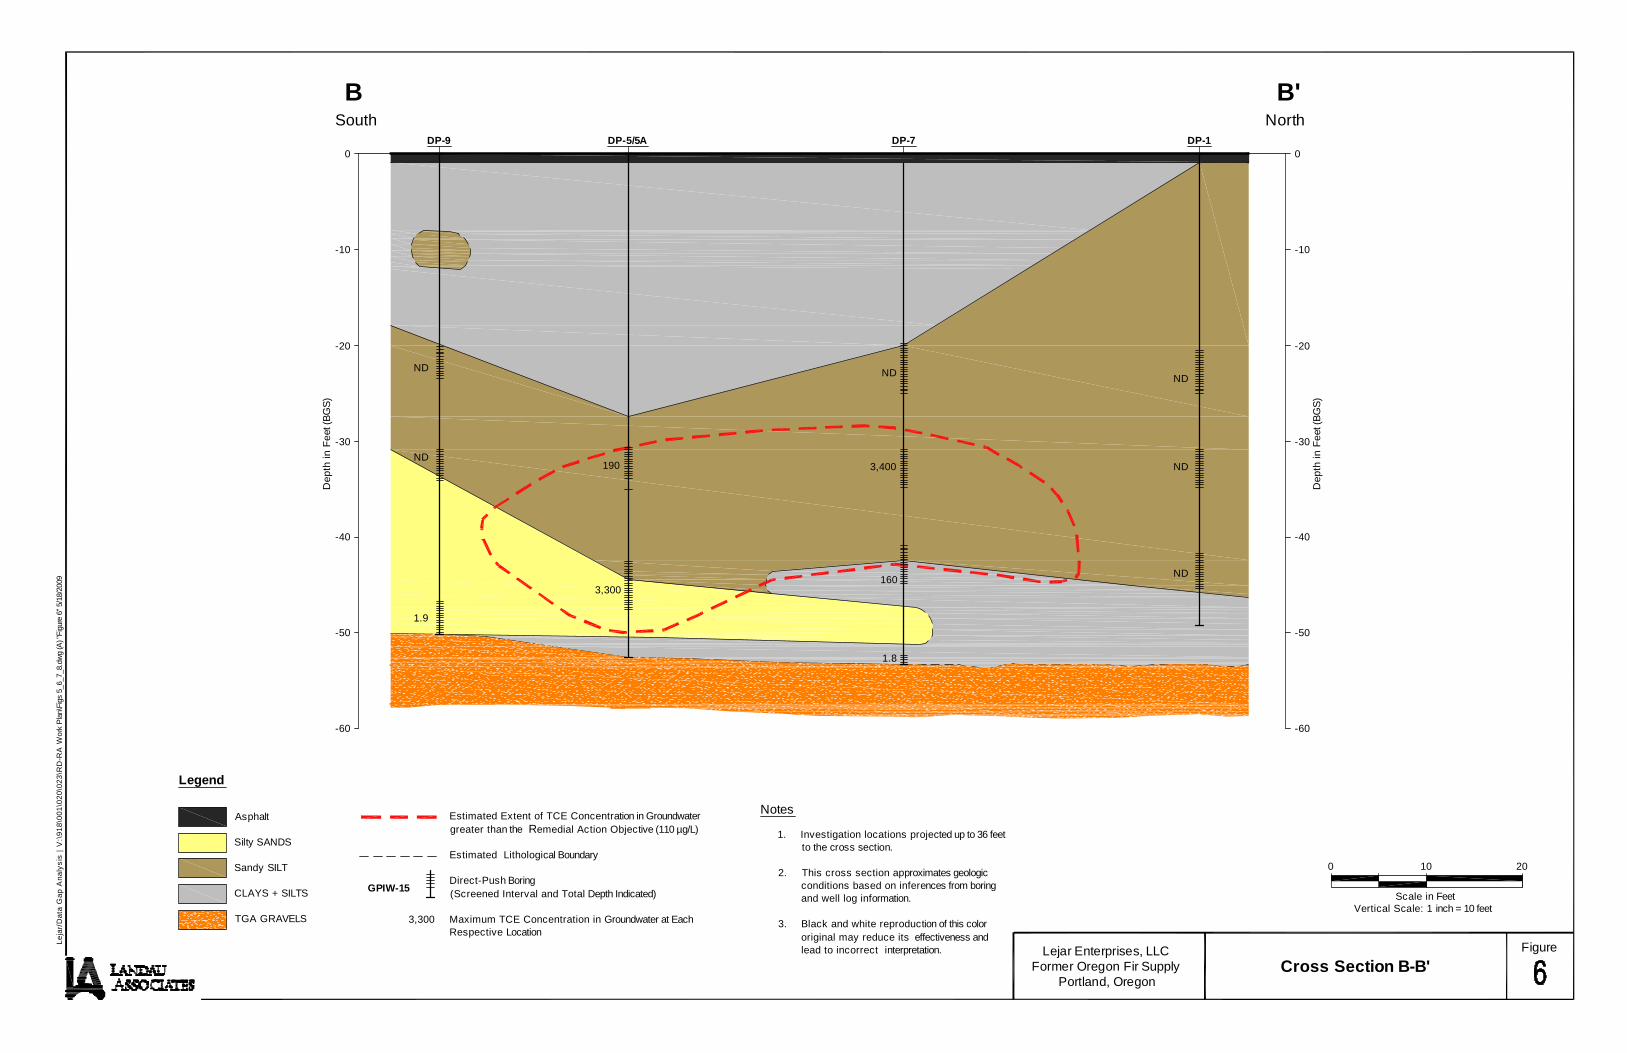
B
0
-60
-40
-10
-50
-20
-30
Dep
th in
Fee
t (BG
S)
-60
B'
0DP-1DP-7DP-9 DP-5/5A
1.9
ND
ND
190
3,300
ND
3,400
160
ND
ND
ND
South North
1.8
0 10 20
Scale in FeetVertical Scale: 1 inch = 10 feet
Notes
1. Investigation locations projected up to 36 feetto the cross section.
2. This cross section approximates geologicconditions based on inferences from boringand well log information.
3. Black and white reproduction of this colororiginal may reduce its effectiveness andlead to incorrect interpretation. Lejar Enterprises, LLC
Former Oregon Fir SupplyPortland, Oregon
Cross Section B-B'FigureLe
jar/
Dat
a G
ap A
naly
sis
| V:\9
18\0
01\0
20\0
23\R
D-R
A W
ork
Pla
n\Fi
gs 5
_6_7
_8.d
wg
(A) "
Figu
re 6
" 5/1
8/20
09
Legend
Asphalt
Silty SANDS
Sandy SILT
CLAYS + SILTS
TGA GRAVELS
Estimated Extent of TCE Concentration in Groundwatergreater than the Remedial Action Objective (110 µg/L)
Estimated Lithological Boundary
Direct-Push Boring(Screened Interval and Total Depth Indicated)
Maximum TCE Concentration in Groundwater at EachRespective Location
GPIW-15
3,300
-40
-10
-50
-20
-30
Dep
th in
Fee
t (BG
S)
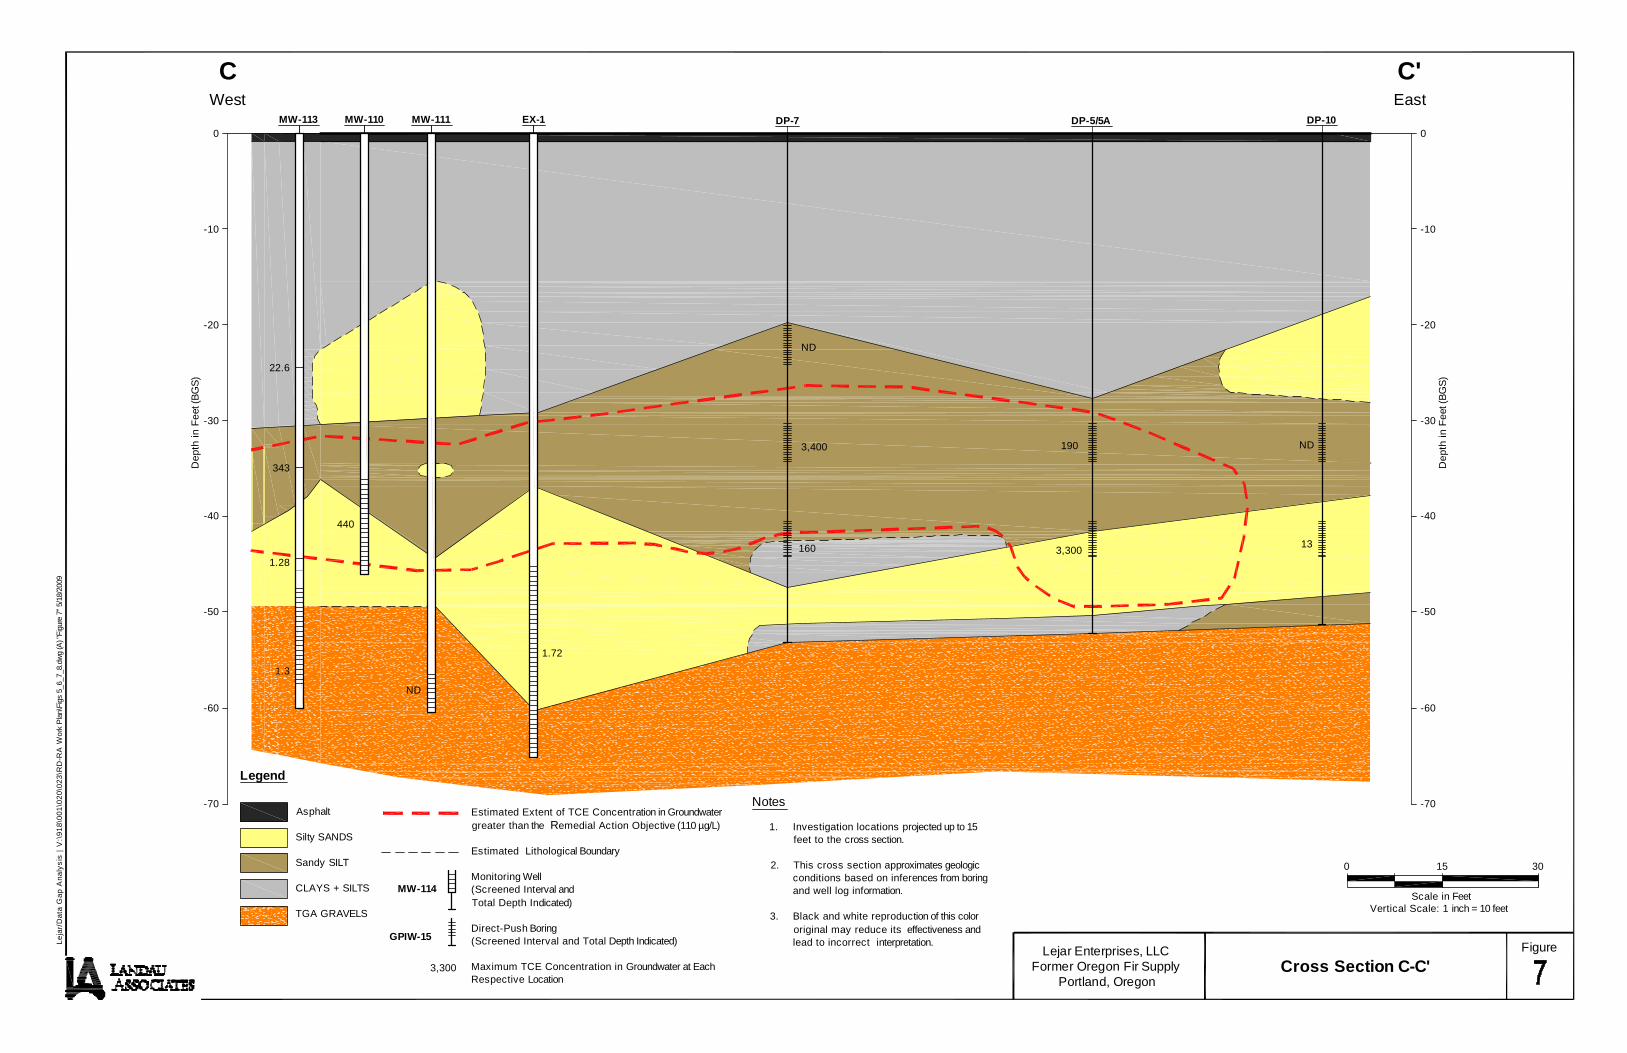
WestC
0
EastC'
-60
-40
-10
-50
-20
-30
Dep
th in
Fee
t (BG
S)
0
-60
DP-5/5AEX-1 DP-7 DP-10MW-111MW-110
13
ND
440
ND190
3,300
ND
3,400
160
1.72
-70 -70
MW-113
22.6
1.28
1.3
343
0 15 30
Scale in FeetVertical Scale: 1 inch = 10 feet
Notes
1. Investigation locations projected up to 15feet to the cross section.
2. This cross section approximates geologicconditions based on inferences from boringand well log information.
3. Black and white reproduction of this colororiginal may reduce its effectiveness andlead to incorrect interpretation.
Lejar Enterprises, LLCFormer Oregon Fir Supply
Portland, OregonCross Section C-C'
FigureLeja
r/D
ata
Gap
Ana
lysi
s | V
:\918
\001
\020
\023
\RD
-RA
Wor
k P
lan\
Figs
5_6
_7_8
.dw
g (A
) "Fi
gure
7" 5
/18/
2009
Legend
Asphalt
Silty SANDS
Sandy SILT
CLAYS + SILTS
TGA GRAVELS
Estimated Extent of TCE Concentration in Groundwatergreater than the Remedial Action Objective (110 µg/L)
Estimated Lithological Boundary
Monitoring Well(Screened Interval andTotal Depth Indicated)
Direct-Push Boring(Screened Interval and Total Depth Indicated)
Maximum TCE Concentration in Groundwater at EachRespective Location
GPIW-15
3,300
MW-114
-40
-10
-50
-20
-30
Dep
th in
Fee
t (BG
S)
WestD
0
EastD'
-60
-40
-10
-50
-20
-30
Dep
th in
Fee
t (BG
S)
0
-60
GPIW-8MW-112 GPIW-21 GP-39GPIW-11 GPIW-14 GPIW-15GPIW-17MW-101
-70 -70
480
ND24
2,000 2,380 4,120 2,500
1.1
43
No Lithologic Data Available
MW-108MW-103
6,200
ND
320
GP-9
No Lithological Data Available
ND
<1.0
0 20 40
Scale in FeetVertical Scale: 1 inch = 10 feet
Notes
1. Investigation locations projected up to 36 feetto the cross section.
2. This cross section approximates geologicconditions based on inferences from boringand well log information.
3. Black and white reproduction of this colororiginal may reduce its effectiveness and leadto incorrect interpretation. Lejar Enterprises, LLC
Former Oregon Fir SupplyPortland, Oregon
Cross Section D-D'FigureLe
jar/
Dat
a G
ap A
naly
sis
| V:\9
18\0
01\0
20\0
23\R
D-R
A W
ork
Pla
n\Fi
gs 5
_6_7
_8.d
wg
(A) "
Figu
re 8
" 5/1
8/20
09
Legend
Asphalt
Silty SANDS
Sandy SILT
CLAYS + SILTS
TGA GRAVELS
Estimated Extent of TCE Concentration in Groundwatergreater than the Remedial Action Objective (110 µg/L)
Estimated Lithological Boundary
Monitoring Well(Screened Interval andTotal Depth Indicated)
Direct-Push Boring(Screened Interval and Total Depth Indicated)
Maximum TCE Concentration in Groundwater at EachRespective Location
GPIW-15
3,300
MW-114
EX-1
MW-6
MW-114
MW-113
MW-111MW-110
MW-105
MW-112
EW-21(25-35)
EW-25(30-45)
EW-24(20-45)
EW-22(25-35)
EW-23(20-45)
EW-26(30-50)
EW-27(30-50)
IW-202(25-35)
IW-201(25-35)
IW-203(25-35)
IW-207(20-45)
IW-205(25-35)
IW-204(25-35)
IW-206(20-45)
IW-209(20-45)
IW-211(30-50)
IW-212(30-50)
IW-208(20-45)
IW-210(30-45)
IW-216(30-50)
IW-213(30-45)
IW-215(30-50)
IW-214(30-45)
0 30 60
Scale in Feet
FigureLejar Enterprises, LLCFormer Oregon Fir Supply
Portland, Oregon
Proposed Bioremediation SystemPlume 2
Base Map Source: GeoDesign 2005
Y:\P
roje
cts\
9180
01\M
apD
ocs\
RD
RA
_Wor
kpla
n\Fi
g9-S
yste
mC
once
ptP
lum
es2.
mxd
5/1
8/20
09Legend
Existing Monitoring Well
Existing Extraction Well
Proposed Extraction Well
Proposed Injection Well
Approximate depth of screen.Actual depth will depend uponobserved lithology during installation,as described in section 4.2 of the text.
Approximate Location of ExistingTreatment Piping (Water and Electric)
Estimated Extent of TCE in Groundwaterat or above the Remedial Action Objective(110 µg/L)
Treatment System Trenching and Piping
25ft Radius of Injection
ISDTM System
Plume 1 Pump-and-TreatSystem Location
Existing Building
9
Notes
1. ISDTM system details can be found on Figure 11.2. Extraction well, injection well, and trench engineering details can be found on Figure 12.3. Black and white reproduction of this color original may reduce its effectiveness and lead to incorrect interpretation.
R-3
(see Figure 12, section A)
NE Holman St
W-2
R-2R-1
IW-4
MW-4
MW-5 MW-107
MW-103
MW-102MW-101
MW-112
MW-109
MW-108
EW-31(15-35)
EW-41(10-30)
EW-42(10-30)
EW-43(10-25)
EW-44(10-30)
EW-45(10-25)
IW-416(10-25)
IW-415(10-25)
IW-414(10-25)
IW-413(10-25)
IW-412(10-25)
IW-411(10-25)
IW-410(10-25)
IW-409(10-25)
IW-408(10-25)
IW-406(10-30)IW-405
(10-30)
IW-404(10-30)
IW-403(10-30)
IW-402(10-30)
IW-401(10-30)
IW-303(15-35)
IW-302(15-35)
IW-301(20-40)
IW-407(10-25)
0 30 60
Scale in Feet
FigureLejar Enterprises, LLCFormer Oregon Fir Supply
Portland, OregonProposed Bioremediation System
Plumes 3 & 4
Base Map Source: GeoDesign 2005
Y:\P
roje
cts\
9180
01\M
apD
ocs\
RD
RA
_Wor
kpla
n\Fi
g10-
Sys
tem
Con
cept
Plu
mes
3_4.
mxd
5/1
8/20
09
Legend
Existing Monitoring Well
Proposed Extraction Well
Proposed Injection Well
Approximate depth of screen.Actual depth will depend uponobserved lithology during installation,as described in section 4.2 of the text.
Estimated Extent of TCE in Groundwaterat or above the Remedial Action Objective(110 µg/L)
Treatment System Trenching and Piping
ISDTM System
20ft Radius of Injection
Existing Building
10
Notes
1. ISDTM system details can be found on Figure 11.2. Extraction well, injection well, and trench engineering details can be found on Figure 12.3. Black and white reproduction of this color original may reduce its effectiveness and lead to incorrect interpretation.
M
Groundwater
4" DiameterExtraction Well
Holding Tank (1)
Groundwater
PLC/AlarmPanel (1)
AlarmIndicator
Light
ConcentratedSubstrateTank (2)300-Gal.
2" DiameterInjection Well
M
1-inch FlexPVC Pipe
(1)
Maximum Water Level
Activation Water Level
Minimum Water Level
Intake & Discharge Elevation
50 Gallons Minimum
12" min.
6" min
6" diameter
Y-Strainer Assembly
Gate Valve
Union
Pressure Gauge
Flow Meter/Totalizer
Solenoid Valve
Water Table
Level Probe
Metering Pump
Injection Pump
Submersible Pump
(1)
To Injection Wells
3" SubmersiblePump at TypicalExtraction Well
Enclosure
1-inch Flex PVC Pipe
Delivery EquipmentProcess and Information Diagram
Lejar Enterprises, LLCFormer Oregon Fir Supply
Portland, Oregon
FigureLeja
r/D
ata
Gap
Ana
lysi
s | V
:\918
\001
\020
\023
\RD
-RA
Wor
k P
lan\
Figu
re 1
1.dw
g (A
) "Fi
gure
11"
5/2
6/20
09
Notes
Part of a vendor-supplied system. Extraction well pumps, meteringpump and injection pump are supplied by ETEC, LLC.
Substrate is CarBstrate .
Wellhead details are shown on Figure 12.
Not To Scale
1.
2.
3.
TM
In Situ
6"12
" MIN
.2"
1"1"
6" M
IN.
6"6"
6" MIN.
1"
2" 2" 2" 2" 2" 2" 2"
1" 1" 1" 1" 1" 1"
2" 2"
1" 1" 1"
1" FLEX PVC PIPEFROM EXTRACTION WELLSAND TO INJECTION WELLS
SANDBACKFILL
2" ELECTRICAL CONDUIT
46" MIN.
6" M
IN.
ASPHALT TO MATCH GRADE
3/4" GRAVEL
SELECT NATIVE MATERIALBACKFILL COMPACT TO 90%
OF MAX DRY DENSITY BYASTM-D1557
1" FLEX PVC PIPE
2" 2"
1" 1"
6" MIN.
MATCH EXISTINGASPHALT THICKNESS
1" FLEXPVC PIPE
ELECTRICALLEADS FROM
SUBMERSIBLEPUMP
(1/2 HP,6A220V)
DISCHARGEFROM
SUBMERSIBLEPUMP
PENETRATIONS TO BE SEALEDWITH WATERPROOF FOAM ORGROUT
3/4" ELECTRICALCONDUIT
4" DIAMETER SCH40 PVC CASING
TOTREATMENT
SYSTEM
EPOXY COATED ORSTAINLESS STEEL SUPPORT
CABLE TO TOP OF PUMP
1" FLEXPVC PIPE
SANDBACKFILL
ASPHALT TO MATCH GRADE
3/4" GRAVEL 6" MIN.
12" MIN.
16" ROUND STEELTRAFFIC-RATED MANHOLE
SELECT NATIVE MATERIALBACKFILL COMPACT TO 90% OF
MAX DRY DENSITY BY ASTM-D1557
BENTONITECHIPS
HOSE CLAMP
1" FLEX PVC PIPE
FROM TREATMENT SYSTEM
PENETRATIONS TO BESEALED WITH WATERPROOFFOAM OR GROUT
1" SCH 80 PVC HOSE BARB
2" SCH 40 PVC RISER
CONCRETE
2" X 1" SCH 40 PVC TEE
SANDBACKFILL
ASPHALT TO MATCH GRADE
3/4" GRAVEL
SELECT NATIVE MATERIALBACKFILL COMPACT TO 90% OF
MAX DRY DENSITY BY ASTM-D1557
6" MIN.
12" MIN.
1" SCH 40 PVC SLIP X FNPT
12" ROUND STEELTRAFFIC-RATED MANHOLE 2" LOCKABLE WELL CAP
NEAT CEMENT GROUT
1" SCH 40 PVC PIPE
2" OR 4" DIAMETER, SCHEDULE40, PVC SCREEN (0.020-INCHSLOT SIZE)
HYDRATED BENTONITE PELLETS(USE ONLY ON WELLS THAT HAVENEAT CEMENT GROUT SEAL)
BENTONITE CHIPS OR HIGH SOLIDSBENTONITE GROUT FOR EXTRACTIONWELLS (THICKNESS WILL VARY WITHDEPTH OF WELL - TOP AT 5' BELOWSURFACE)
FLUSH THREADED 2" OR 4" DIAMETER,SCHEDULE 40, PVC WELL CASING
FLUSH-MOUNTED STEEL MONUMENTWITH WATERPROOF SEAL
MAX. 6" THREADED END CAP
SILICA SAND (NO. 10-20)
CONCRETE
LOCKABLE CAPMIN. 2'
± 3'
1'
3'
15'-25'(VARIABLE)
MIN. 3'
NEAT CEMENT GROUT FORINJECTION WELLS
BENTONITE CHIPS FOR EXTRACTIONWELLS NEAT CEMENT GROUT, FORINJECTION WELLS
ASPHALT TO MATCH GRADE
3/4" GRAVEL
SELECT NATIVEMATERIAL BACKFILL
COMPACT TO 90% OFMAX DRY DENSITY
BY ASTM-D1557
SANDBACKFILL
TREATMENTSHED
6"
12"
6"
6"
6"
6"
1'1'
2'
TO INJECTION WELLS
FROM EXTRACTIONWELLS
1" FLEXPVC PIPE
HOSE CLAMP
1" SCH 40 PVC PIPE1" SCH 40 PVC SLIP X FNPT1" SCH 80 PVC HOSE BARB
FLOWMETER / TOTALIZER
1" SCH 80 PVC GATE VALVE0-50 PSI PRESSURE GAUGE
1" SCH 40 PVC PIPE
ELECTRICAL CONDUIT
1" SCH 40 PVC ELBOW
TYPICAL CONNECTIONS TO EXTRACTION WELLSNOT TO SCALE12
CBioremediation
System Engineering Details
Lejar Enterprises, LLCFormer Oregon Fir Supply
Portland, Oregon
FigureLeja
r/D
ata
Gap
Ana
lysi
s | V
:\918
\001
\020
\023
\RD
-RA
Wor
k P
lan\
Figu
re 1
2.dw
g (A
) "Fi
g12
(2)"
5/26
/200
9
TYPICAL TRENCH SECTION NEAR TREATMENT SHEDNOT TO SCALE12
A
CONNECTIONS TO TREATMENT SHEDNOT TO SCALE12
B
TYPICAL INJECTION WELLNOT TO SCALE12
E
TYPICAL WELL CONSTRUCTION DETAILNOT TO SCALE12
D
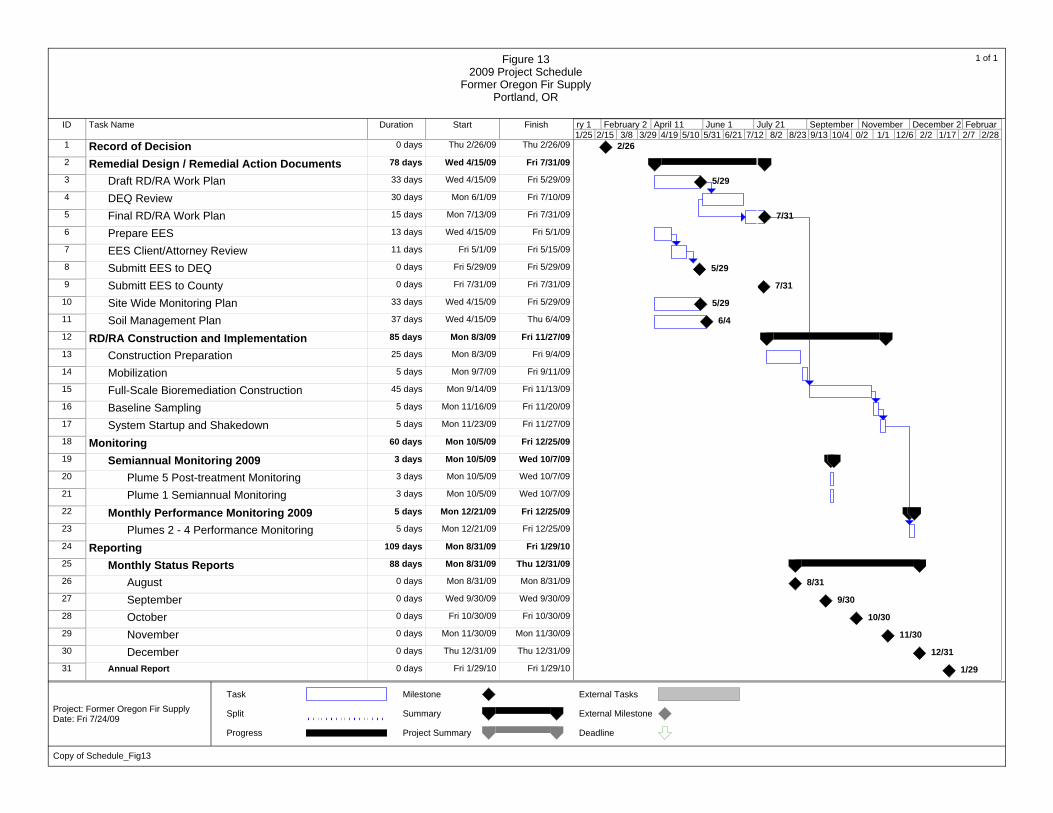
ID Task Name Duration Start Finish
1 Record of Decision 0 days Thu 2/26/09 Thu 2/26/09
2 Remedial Design / Remedial Action Documents 78 days Wed 4/15/09 Fri 7/31/09
3 Draft RD/RA Work Plan 33 days Wed 4/15/09 Fri 5/29/09
4 DEQ Review 30 days Mon 6/1/09 Fri 7/10/09
5 Final RD/RA Work Plan 15 days Mon 7/13/09 Fri 7/31/09
6 Prepare EES 13 days Wed 4/15/09 Fri 5/1/09
7 EES Client/Attorney Review 11 days Fri 5/1/09 Fri 5/15/09
8 Submitt EES to DEQ 0 days Fri 5/29/09 Fri 5/29/09
9 Submitt EES to County 0 days Fri 7/31/09 Fri 7/31/09
10 Site Wide Monitoring Plan 33 days Wed 4/15/09 Fri 5/29/09
11 Soil Management Plan 37 days Wed 4/15/09 Thu 6/4/09
12 RD/RA Construction and Implementation 85 days Mon 8/3/09 Fri 11/27/09
13 Construction Preparation 25 days Mon 8/3/09 Fri 9/4/09
14 Mobilization 5 days Mon 9/7/09 Fri 9/11/09
15 Full-Scale Bioremediation Construction 45 days Mon 9/14/09 Fri 11/13/09
16 Baseline Sampling 5 days Mon 11/16/09 Fri 11/20/09
17 System Startup and Shakedown 5 days Mon 11/23/09 Fri 11/27/09
18 Monitoring 60 days Mon 10/5/09 Fri 12/25/09
19 Semiannual Monitoring 2009 3 days Mon 10/5/09 Wed 10/7/09
20 Plume 5 Post-treatment Monitoring 3 days Mon 10/5/09 Wed 10/7/09
21 Plume 1 Semiannual Monitoring 3 days Mon 10/5/09 Wed 10/7/09
22 Monthly Performance Monitoring 2009 5 days Mon 12/21/09 Fri 12/25/09
23 Plumes 2 - 4 Performance Monitoring 5 days Mon 12/21/09 Fri 12/25/09
24 Reporting 109 days Mon 8/31/09 Fri 1/29/10
25 Monthly Status Reports 88 days Mon 8/31/09 Thu 12/31/09
26 August 0 days Mon 8/31/09 Mon 8/31/09
27 September 0 days Wed 9/30/09 Wed 9/30/09
28 October 0 days Fri 10/30/09 Fri 10/30/09
29 November 0 days Mon 11/30/09 Mon 11/30/09
30 December 0 days Thu 12/31/09 Thu 12/31/09
31 Annual Report 0 days Fri 1/29/10 Fri 1/29/10
2/26
5/29
7/31
5/29
7/31
5/29
6/4
8/31
9/30
10/30
11/30
12/31
1/29
1/25 2/15 3/8 3/29 4/19 5/10 5/31 6/21 7/12 8/2 8/23 9/13 10/4 0/2 1/1 12/6 2/2 1/17 2/7 2/28ry 1 February 2 April 11 June 1 July 21 September November December 2 Februar
Task
Split
Progress
Milestone
Summary
Project Summary
External Tasks
External Milestone
Deadline
Figure 132009 Project Schedule
Former Oregon Fir SupplyPortland, OR
1 of 1
Copy of Schedule_Fig13
Project: Former Oregon Fir SupplyDate: Fri 7/24/09
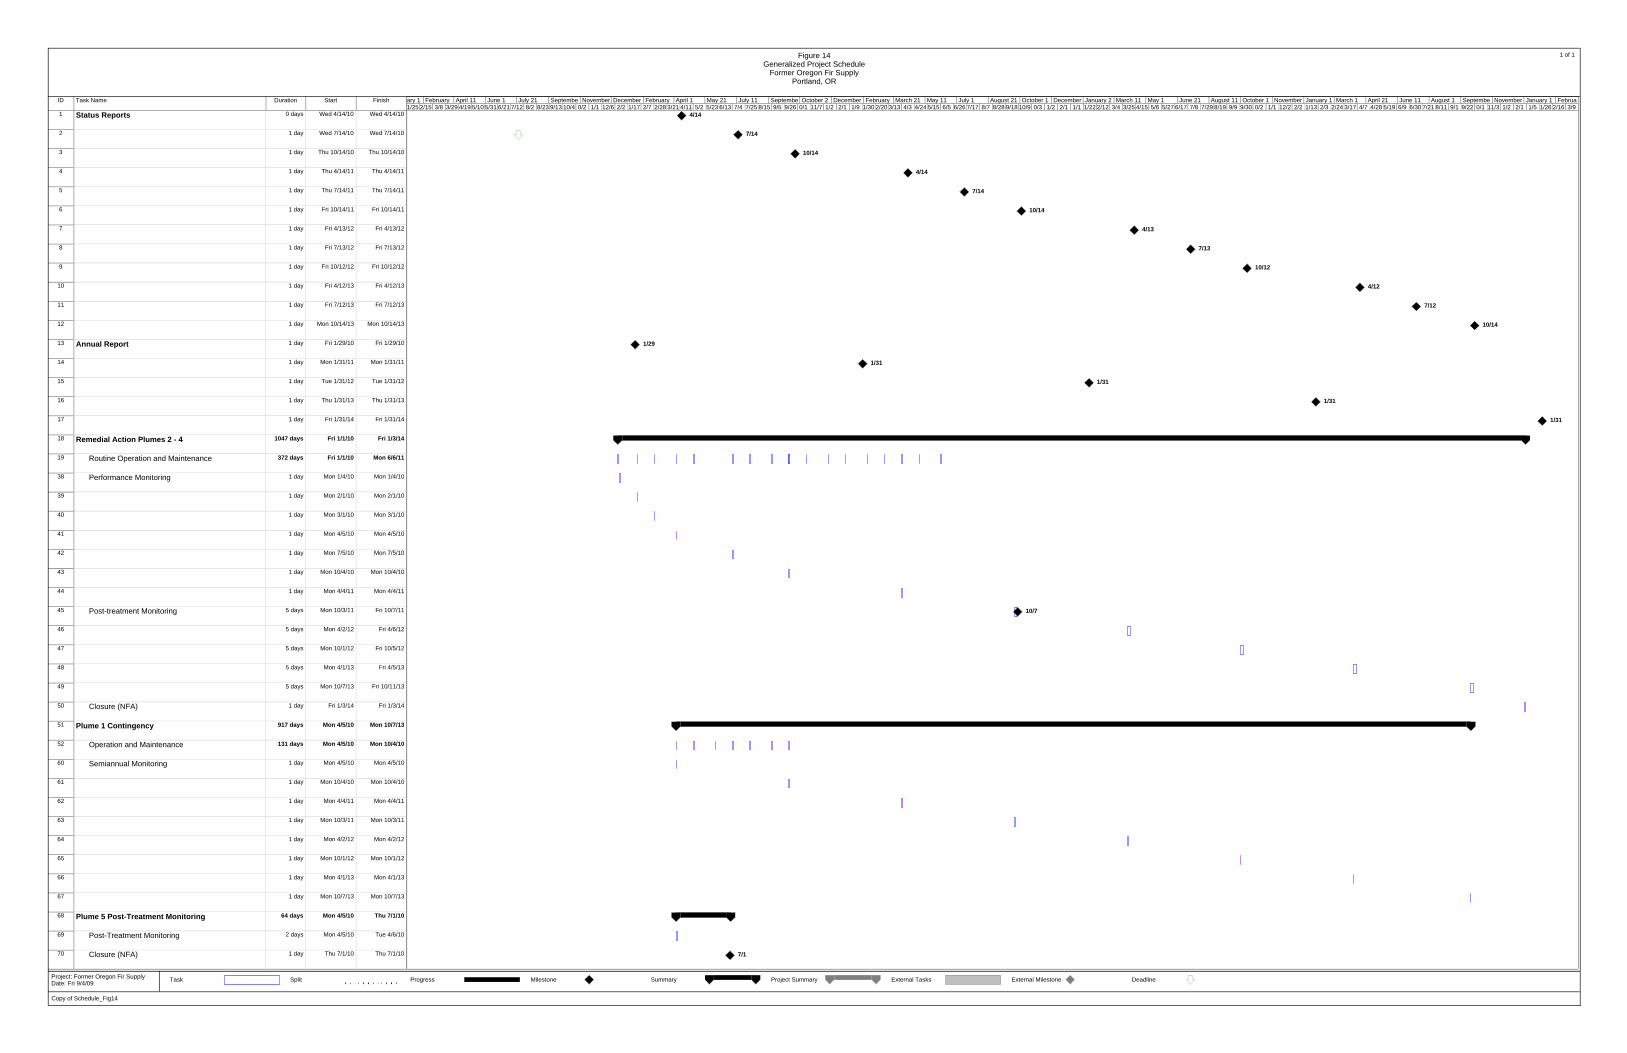
ID Task Name Duration Start Finish
1 Status Reports 0 days Wed 4/14/10 Wed 4/14/10
2 1 day Wed 7/14/10 Wed 7/14/10
3 1 day Thu 10/14/10 Thu 10/14/10
4 1 day Thu 4/14/11 Thu 4/14/11
5 1 day Thu 7/14/11 Thu 7/14/11
6 1 day Fri 10/14/11 Fri 10/14/11
7 1 day Fri 4/13/12 Fri 4/13/12
8 1 day Fri 7/13/12 Fri 7/13/12
9 1 day Fri 10/12/12 Fri 10/12/12
10 1 day Fri 4/12/13 Fri 4/12/13
11 1 day Fri 7/12/13 Fri 7/12/13
12 1 day Mon 10/14/13 Mon 10/14/13
13 Annual Report 1 day Fri 1/29/10 Fri 1/29/10
14 1 day Mon 1/31/11 Mon 1/31/11
15 1 day Tue 1/31/12 Tue 1/31/12
16 1 day Thu 1/31/13 Thu 1/31/13
17 1 day Fri 1/31/14 Fri 1/31/14
18 Remedial Action Plumes 2 - 4 1047 days Fri 1/1/10 Fri 1/3/14
19 Routine Operation and Maintenance 372 days Fri 1/1/10 Mon 6/6/11
38 Performance Monitoring 1 day Mon 1/4/10 Mon 1/4/10
39 1 day Mon 2/1/10 Mon 2/1/10
40 1 day Mon 3/1/10 Mon 3/1/10
41 1 day Mon 4/5/10 Mon 4/5/10
42 1 day Mon 7/5/10 Mon 7/5/10
43 1 day Mon 10/4/10 Mon 10/4/10
44 1 day Mon 4/4/11 Mon 4/4/11
45 Post-treatment Monitoring 5 days Mon 10/3/11 Fri 10/7/11
46 5 days Mon 4/2/12 Fri 4/6/12
47 5 days Mon 10/1/12 Fri 10/5/12
48 5 days Mon 4/1/13 Fri 4/5/13
49 5 days Mon 10/7/13 Fri 10/11/13
50 Closure (NFA) 1 day Fri 1/3/14 Fri 1/3/14
51 Plume 1 Contingency 917 days Mon 4/5/10 Mon 10/7/13
52 Operation and Maintenance 131 days Mon 4/5/10 Mon 10/4/10
60 Semiannual Monitoring 1 day Mon 4/5/10 Mon 4/5/10
61 1 day Mon 10/4/10 Mon 10/4/10
62 1 day Mon 4/4/11 Mon 4/4/11
63 1 day Mon 10/3/11 Mon 10/3/11
64 1 day Mon 4/2/12 Mon 4/2/12
65 1 day Mon 10/1/12 Mon 10/1/12
66 1 day Mon 4/1/13 Mon 4/1/13
67 1 day Mon 10/7/13 Mon 10/7/13
68 Plume 5 Post-Treatment Monitoring 64 days Mon 4/5/10 Thu 7/1/10
69 Post-Treatment Monitoring 2 days Mon 4/5/10 Tue 4/6/10
70 Closure (NFA) 1 day Thu 7/1/10 Thu 7/1/10
4/14
7/14
10/14
4/14
7/14
10/14
4/13
7/13
10/12
4/12
7/12
10/14
1/29
1/31
1/31
1/31
1/31
10/7
7/1
1/25 2/15 3/8 3/29 4/19 5/10 5/31 6/21 7/12 8/2 8/23 9/13 10/4 0/2 1/1 12/6 2/2 1/17 2/7 2/28 3/21 4/11 5/2 5/23 6/13 7/4 7/25 8/15 9/5 9/26 0/1 11/7 1/2 2/1 1/9 1/30 2/20 3/13 4/3 4/24 5/15 6/5 6/26 7/17 8/7 8/28 9/18 10/9 0/3 1/2 2/1 1/1 1/22 2/12 3/4 3/25 4/15 5/6 5/27 6/17 7/8 7/29 8/19 9/9 9/30 0/2 1/1 12/2 2/2 1/13 2/3 2/24 3/17 4/7 4/28 5/19 6/9 6/30 7/21 8/11 9/1 9/22 0/1 11/3 1/2 2/1 1/5 1/26 2/16 3/9ary 1 February April 11 June 1 July 21 Septembe November December February April 1 May 21 July 11 Septembe October 2 December February March 21 May 11 July 1 August 21 October 1 December January 2 March 11 May 1 June 21 August 11 October 1 November January 1 March 1 April 21 June 11 August 1 Septembe November January 1 Februa
Task Split Progress Milestone Summary Project Summary External Tasks External Milestone Deadline
Figure 14Generalized Project Schedule
Former Oregon Fir SupplyPortland, OR
1 of 1
Copy of Schedule_Fig14
Project: Former Oregon Fir SupplyDate: Fri 9/4/09
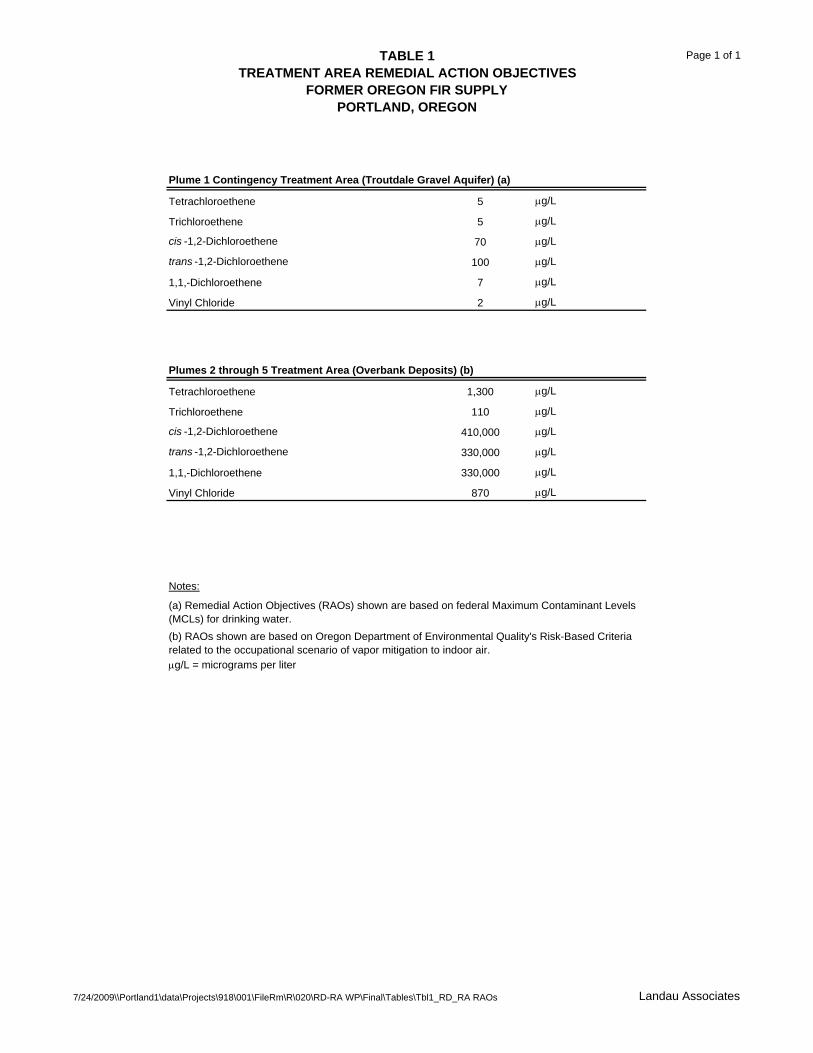
TABLE 1TREATMENT AREA REMEDIAL ACTION OBJECTIVES
FORMER OREGON FIR SUPPLYPORTLAND, OREGON
Page 1 of 1
Plume 1 Contingency Treatment Area (Troutdale Gravel Aquifer) (a)
Tetrachloroethene 5 g/L
Trichloroethene 5 g/L
cis -1,2-Dichloroethene 70 g/L
trans -1,2-Dichloroethene 100 g/L
1,1,-Dichloroethene 7 g/L
Vinyl Chloride 2 g/L
Plumes 2 through 5 Treatment Area (Overbank Deposits) (b)
Tetrachloroethene 1,300 g/L
Trichloroethene 110 g/L
cis -1,2-Dichloroethene 410,000 g/L
trans -1,2-Dichloroethene 330,000 g/L
1,1,-Dichloroethene 330,000 g/L
Vinyl Chloride 870 g/L
Notes:
g/L = micrograms per liter
(a) Remedial Action Objectives (RAOs) shown are based on federal Maximum Contaminant Levels (MCLs) for drinking water.(b) RAOs shown are based on Oregon Department of Environmental Quality's Risk-Based Criteria related to the occupational scenario of vapor mitigation to indoor air.
7/24/2009\\Portland1\data\Projects\918\001\FileRm\R\020\RD-RA WP\Final\Tables\Tbl1_RD_RA RAOs Landau Associates
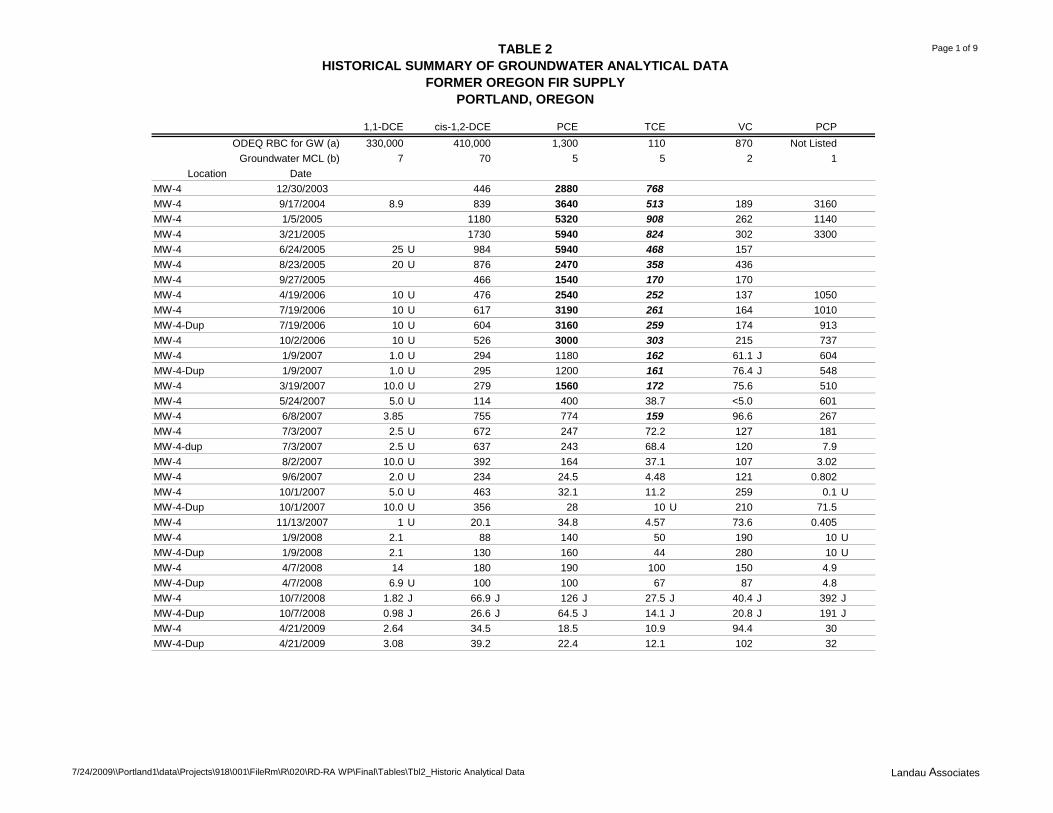
TABLE 2HISTORICAL SUMMARY OF GROUNDWATER ANALYTICAL DATA
FORMER OREGON FIR SUPPLYPORTLAND, OREGON
Page 1 of 9
7/24/2009\\Portland1\data\Projects\918\001\FileRm\R\020\RD-RA WP\Final\Tables\Tbl2_Historic Analytical Data Landau Associates
1,1-DCE cis-1,2-DCE PCE TCE VC PCPODEQ RBC for GW (a) 330,000 410,000 1,300 110 870 Not Listed
Groundwater MCL (b) 7 70 5 5 2 1Location Date
MW-4 12/30/2003 446 2880 768MW-4 9/17/2004 8.9 839 3640 513 189 3160MW-4 1/5/2005 1180 5320 908 262 1140MW-4 3/21/2005 1730 5940 824 302 3300MW-4 6/24/2005 25 U 984 5940 468 157MW-4 8/23/2005 20 U 876 2470 358 436MW-4 9/27/2005 466 1540 170 170MW-4 4/19/2006 10 U 476 2540 252 137 1050MW-4 7/19/2006 10 U 617 3190 261 164 1010MW-4-Dup 7/19/2006 10 U 604 3160 259 174 913MW-4 10/2/2006 10 U 526 3000 303 215 737MW-4 1/9/2007 1.0 U 294 1180 162 61.1 J 604MW-4-Dup 1/9/2007 1.0 U 295 1200 161 76.4 J 548MW-4 3/19/2007 10.0 U 279 1560 172 75.6 510MW-4 5/24/2007 5.0 U 114 400 38.7 <5.0 601MW-4 6/8/2007 3.85 755 774 159 96.6 267MW-4 7/3/2007 2.5 U 672 247 72.2 127 181MW-4-dup 7/3/2007 2.5 U 637 243 68.4 120 7.9MW-4 8/2/2007 10.0 U 392 164 37.1 107 3.02MW-4 9/6/2007 2.0 U 234 24.5 4.48 121 0.802MW-4 10/1/2007 5.0 U 463 32.1 11.2 259 0.1 UMW-4-Dup 10/1/2007 10.0 U 356 28 10 U 210 71.5MW-4 11/13/2007 1 U 20.1 34.8 4.57 73.6 0.405MW-4 1/9/2008 2.1 88 140 50 190 10 UMW-4-Dup 1/9/2008 2.1 130 160 44 280 10 UMW-4 4/7/2008 14 180 190 100 150 4.9MW-4-Dup 4/7/2008 6.9 U 100 100 67 87 4.8MW-4 10/7/2008 1.82 J 66.9 J 126 J 27.5 J 40.4 J 392 JMW-4-Dup 10/7/2008 0.98 J 26.6 J 64.5 J 14.1 J 20.8 J 191 JMW-4 4/21/2009 2.64 34.5 18.5 10.9 94.4 30MW-4-Dup 4/21/2009 3.08 39.2 22.4 12.1 102 32
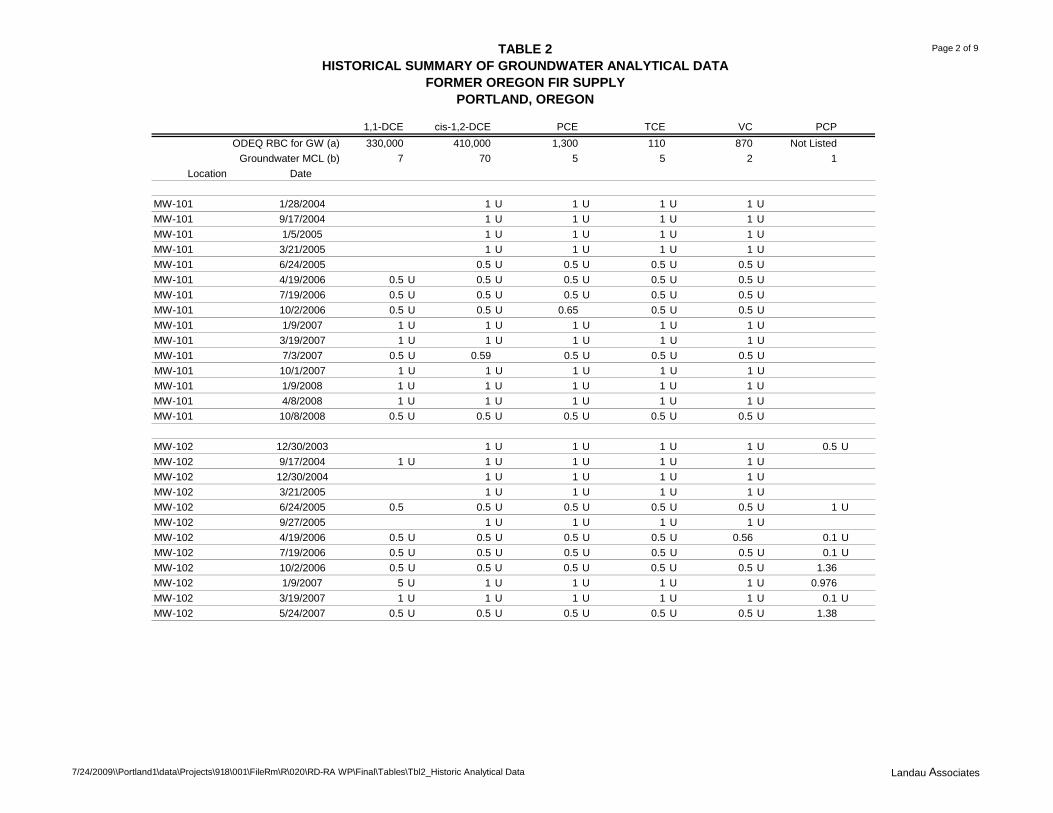
TABLE 2HISTORICAL SUMMARY OF GROUNDWATER ANALYTICAL DATA
FORMER OREGON FIR SUPPLYPORTLAND, OREGON
Page 2 of 9
7/24/2009\\Portland1\data\Projects\918\001\FileRm\R\020\RD-RA WP\Final\Tables\Tbl2_Historic Analytical Data Landau Associates
1,1-DCE cis-1,2-DCE PCE TCE VC PCPODEQ RBC for GW (a) 330,000 410,000 1,300 110 870 Not Listed
Groundwater MCL (b) 7 70 5 5 2 1Location Date
MW-101 1/28/2004 1 U 1 U 1 U 1 UMW-101 9/17/2004 1 U 1 U 1 U 1 UMW-101 1/5/2005 1 U 1 U 1 U 1 UMW-101 3/21/2005 1 U 1 U 1 U 1 UMW-101 6/24/2005 0.5 U 0.5 U 0.5 U 0.5 UMW-101 4/19/2006 0.5 U 0.5 U 0.5 U 0.5 U 0.5 UMW-101 7/19/2006 0.5 U 0.5 U 0.5 U 0.5 U 0.5 UMW-101 10/2/2006 0.5 U 0.5 U 0.65 0.5 U 0.5 UMW-101 1/9/2007 1 U 1 U 1 U 1 U 1 UMW-101 3/19/2007 1 U 1 U 1 U 1 U 1 UMW-101 7/3/2007 0.5 U 0.59 0.5 U 0.5 U 0.5 UMW-101 10/1/2007 1 U 1 U 1 U 1 U 1 UMW-101 1/9/2008 1 U 1 U 1 U 1 U 1 UMW-101 4/8/2008 1 U 1 U 1 U 1 U 1 UMW-101 10/8/2008 0.5 U 0.5 U 0.5 U 0.5 U 0.5 U
MW-102 12/30/2003 1 U 1 U 1 U 1 U 0.5 UMW-102 9/17/2004 1 U 1 U 1 U 1 U 1 UMW-102 12/30/2004 1 U 1 U 1 U 1 UMW-102 3/21/2005 1 U 1 U 1 U 1 UMW-102 6/24/2005 0.5 0.5 U 0.5 U 0.5 U 0.5 U 1 UMW-102 9/27/2005 1 U 1 U 1 U 1 UMW-102 4/19/2006 0.5 U 0.5 U 0.5 U 0.5 U 0.56 0.1 UMW-102 7/19/2006 0.5 U 0.5 U 0.5 U 0.5 U 0.5 U 0.1 UMW-102 10/2/2006 0.5 U 0.5 U 0.5 U 0.5 U 0.5 U 1.36MW-102 1/9/2007 5 U 1 U 1 U 1 U 1 U 0.976MW-102 3/19/2007 1 U 1 U 1 U 1 U 1 U 0.1 UMW-102 5/24/2007 0.5 U 0.5 U 0.5 U 0.5 U 0.5 U 1.38
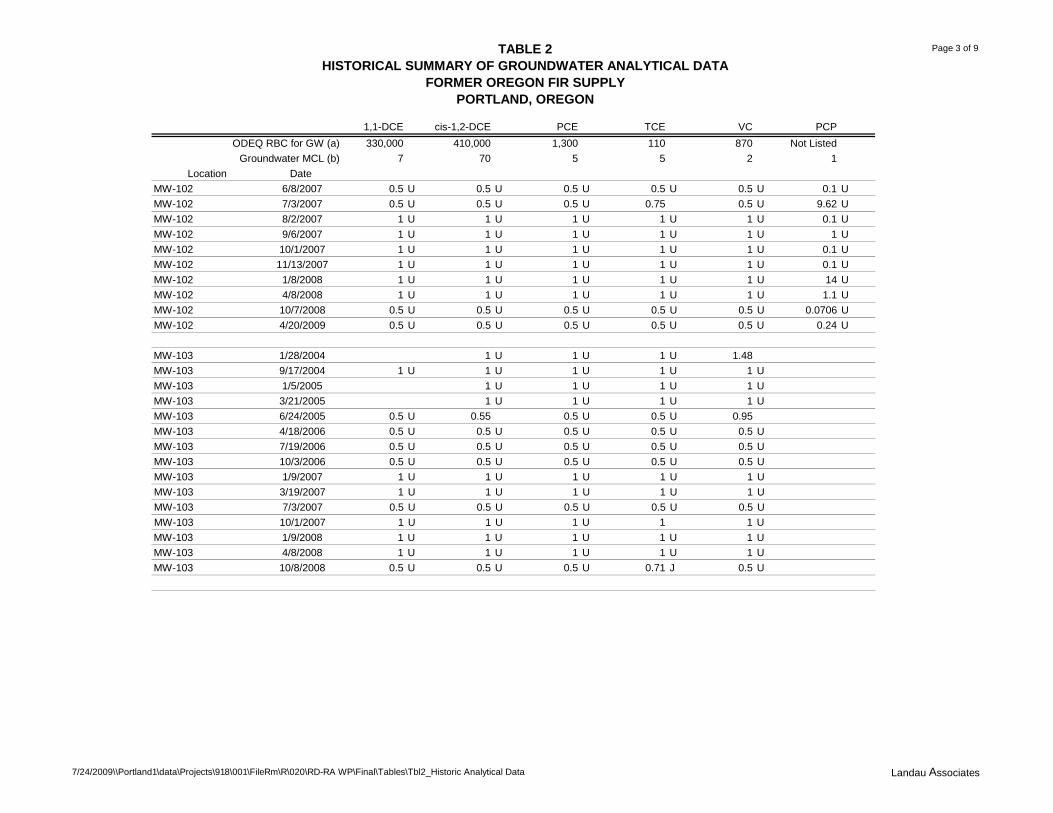
TABLE 2HISTORICAL SUMMARY OF GROUNDWATER ANALYTICAL DATA
FORMER OREGON FIR SUPPLYPORTLAND, OREGON
Page 3 of 9
7/24/2009\\Portland1\data\Projects\918\001\FileRm\R\020\RD-RA WP\Final\Tables\Tbl2_Historic Analytical Data Landau Associates
1,1-DCE cis-1,2-DCE PCE TCE VC PCPODEQ RBC for GW (a) 330,000 410,000 1,300 110 870 Not Listed
Groundwater MCL (b) 7 70 5 5 2 1Location Date
MW-102 6/8/2007 0.5 U 0.5 U 0.5 U 0.5 U 0.5 U 0.1 UMW-102 7/3/2007 0.5 U 0.5 U 0.5 U 0.75 0.5 U 9.62 UMW-102 8/2/2007 1 U 1 U 1 U 1 U 1 U 0.1 UMW-102 9/6/2007 1 U 1 U 1 U 1 U 1 U 1 UMW-102 10/1/2007 1 U 1 U 1 U 1 U 1 U 0.1 UMW-102 11/13/2007 1 U 1 U 1 U 1 U 1 U 0.1 UMW-102 1/8/2008 1 U 1 U 1 U 1 U 1 U 14 UMW-102 4/8/2008 1 U 1 U 1 U 1 U 1 U 1.1 UMW-102 10/7/2008 0.5 U 0.5 U 0.5 U 0.5 U 0.5 U 0.0706 UMW-102 4/20/2009 0.5 U 0.5 U 0.5 U 0.5 U 0.5 U 0.24 U
MW-103 1/28/2004 1 U 1 U 1 U 1.48MW-103 9/17/2004 1 U 1 U 1 U 1 U 1 UMW-103 1/5/2005 1 U 1 U 1 U 1 UMW-103 3/21/2005 1 U 1 U 1 U 1 UMW-103 6/24/2005 0.5 U 0.55 0.5 U 0.5 U 0.95MW-103 4/18/2006 0.5 U 0.5 U 0.5 U 0.5 U 0.5 UMW-103 7/19/2006 0.5 U 0.5 U 0.5 U 0.5 U 0.5 UMW-103 10/3/2006 0.5 U 0.5 U 0.5 U 0.5 U 0.5 UMW-103 1/9/2007 1 U 1 U 1 U 1 U 1 UMW-103 3/19/2007 1 U 1 U 1 U 1 U 1 UMW-103 7/3/2007 0.5 U 0.5 U 0.5 U 0.5 U 0.5 UMW-103 10/1/2007 1 U 1 U 1 U 1 1 UMW-103 1/9/2008 1 U 1 U 1 U 1 U 1 UMW-103 4/8/2008 1 U 1 U 1 U 1 U 1 UMW-103 10/8/2008 0.5 U 0.5 U 0.5 U 0.71 J 0.5 U
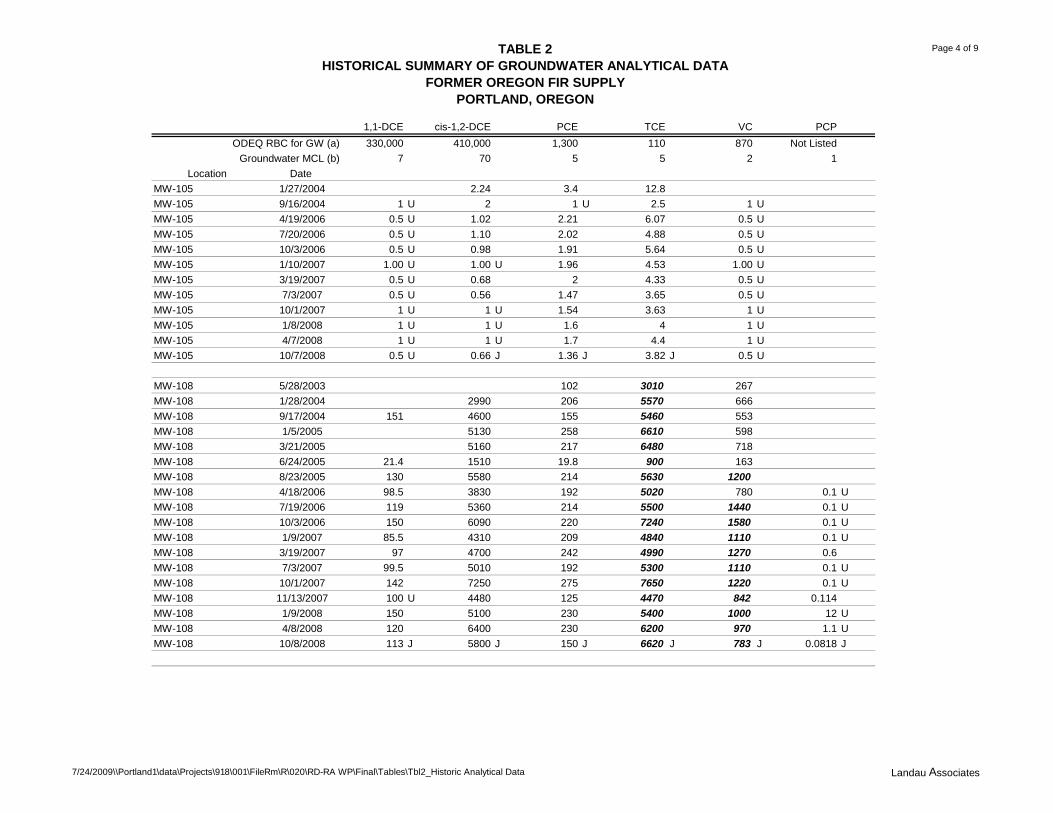
TABLE 2HISTORICAL SUMMARY OF GROUNDWATER ANALYTICAL DATA
FORMER OREGON FIR SUPPLYPORTLAND, OREGON
Page 4 of 9
7/24/2009\\Portland1\data\Projects\918\001\FileRm\R\020\RD-RA WP\Final\Tables\Tbl2_Historic Analytical Data Landau Associates
1,1-DCE cis-1,2-DCE PCE TCE VC PCPODEQ RBC for GW (a) 330,000 410,000 1,300 110 870 Not Listed
Groundwater MCL (b) 7 70 5 5 2 1Location Date
MW-105 1/27/2004 2.24 3.4 12.8MW-105 9/16/2004 1 U 2 1 U 2.5 1 UMW-105 4/19/2006 0.5 U 1.02 2.21 6.07 0.5 UMW-105 7/20/2006 0.5 U 1.10 2.02 4.88 0.5 UMW-105 10/3/2006 0.5 U 0.98 1.91 5.64 0.5 UMW-105 1/10/2007 1.00 U 1.00 U 1.96 4.53 1.00 UMW-105 3/19/2007 0.5 U 0.68 2 4.33 0.5 UMW-105 7/3/2007 0.5 U 0.56 1.47 3.65 0.5 UMW-105 10/1/2007 1 U 1 U 1.54 3.63 1 UMW-105 1/8/2008 1 U 1 U 1.6 4 1 UMW-105 4/7/2008 1 U 1 U 1.7 4.4 1 UMW-105 10/7/2008 0.5 U 0.66 J 1.36 J 3.82 J 0.5 U
MW-108 5/28/2003 102 3010 267MW-108 1/28/2004 2990 206 5570 666MW-108 9/17/2004 151 4600 155 5460 553MW-108 1/5/2005 5130 258 6610 598MW-108 3/21/2005 5160 217 6480 718MW-108 6/24/2005 21.4 1510 19.8 900 163MW-108 8/23/2005 130 5580 214 5630 1200MW-108 4/18/2006 98.5 3830 192 5020 780 0.1 UMW-108 7/19/2006 119 5360 214 5500 1440 0.1 UMW-108 10/3/2006 150 6090 220 7240 1580 0.1 UMW-108 1/9/2007 85.5 4310 209 4840 1110 0.1 UMW-108 3/19/2007 97 4700 242 4990 1270 0.6MW-108 7/3/2007 99.5 5010 192 5300 1110 0.1 UMW-108 10/1/2007 142 7250 275 7650 1220 0.1 UMW-108 11/13/2007 100 U 4480 125 4470 842 0.114MW-108 1/9/2008 150 5100 230 5400 1000 12 UMW-108 4/8/2008 120 6400 230 6200 970 1.1 UMW-108 10/8/2008 113 J 5800 J 150 J 6620 J 783 J 0.0818 J
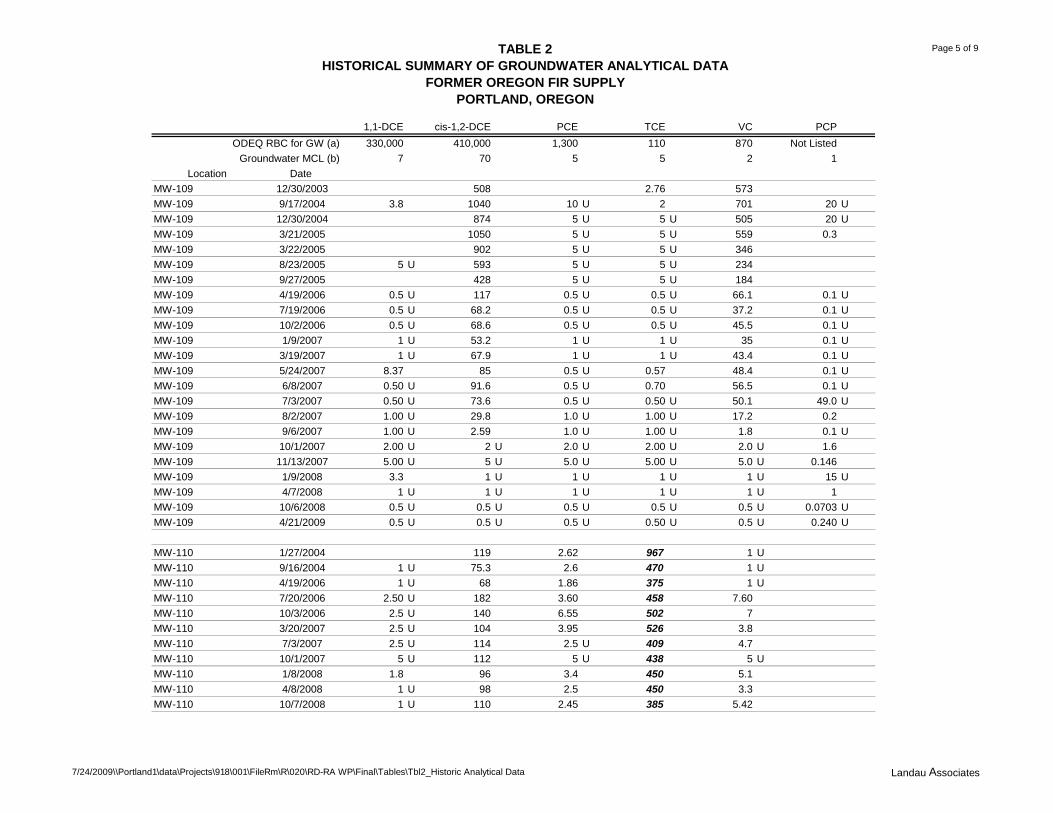
TABLE 2HISTORICAL SUMMARY OF GROUNDWATER ANALYTICAL DATA
FORMER OREGON FIR SUPPLYPORTLAND, OREGON
Page 5 of 9
7/24/2009\\Portland1\data\Projects\918\001\FileRm\R\020\RD-RA WP\Final\Tables\Tbl2_Historic Analytical Data Landau Associates
1,1-DCE cis-1,2-DCE PCE TCE VC PCPODEQ RBC for GW (a) 330,000 410,000 1,300 110 870 Not Listed
Groundwater MCL (b) 7 70 5 5 2 1Location Date
MW-109 12/30/2003 508 2.76 573MW-109 9/17/2004 3.8 1040 10 U 2 701 20 UMW-109 12/30/2004 874 5 U 5 U 505 20 UMW-109 3/21/2005 1050 5 U 5 U 559 0.3MW-109 3/22/2005 902 5 U 5 U 346MW-109 8/23/2005 5 U 593 5 U 5 U 234MW-109 9/27/2005 428 5 U 5 U 184MW-109 4/19/2006 0.5 U 117 0.5 U 0.5 U 66.1 0.1 UMW-109 7/19/2006 0.5 U 68.2 0.5 U 0.5 U 37.2 0.1 UMW-109 10/2/2006 0.5 U 68.6 0.5 U 0.5 U 45.5 0.1 UMW-109 1/9/2007 1 U 53.2 1 U 1 U 35 0.1 UMW-109 3/19/2007 1 U 67.9 1 U 1 U 43.4 0.1 UMW-109 5/24/2007 8.37 85 0.5 U 0.57 48.4 0.1 UMW-109 6/8/2007 0.50 U 91.6 0.5 U 0.70 56.5 0.1 UMW-109 7/3/2007 0.50 U 73.6 0.5 U 0.50 U 50.1 49.0 UMW-109 8/2/2007 1.00 U 29.8 1.0 U 1.00 U 17.2 0.2MW-109 9/6/2007 1.00 U 2.59 1.0 U 1.00 U 1.8 0.1 UMW-109 10/1/2007 2.00 U 2 U 2.0 U 2.00 U 2.0 U 1.6MW-109 11/13/2007 5.00 U 5 U 5.0 U 5.00 U 5.0 U 0.146MW-109 1/9/2008 3.3 1 U 1 U 1 U 1 U 15 UMW-109 4/7/2008 1 U 1 U 1 U 1 U 1 U 1MW-109 10/6/2008 0.5 U 0.5 U 0.5 U 0.5 U 0.5 U 0.0703 UMW-109 4/21/2009 0.5 U 0.5 U 0.5 U 0.50 U 0.5 U 0.240 U
MW-110 1/27/2004 119 2.62 967 1 UMW-110 9/16/2004 1 U 75.3 2.6 470 1 UMW-110 4/19/2006 1 U 68 1.86 375 1 UMW-110 7/20/2006 2.50 U 182 3.60 458 7.60MW-110 10/3/2006 2.5 U 140 6.55 502 7MW-110 3/20/2007 2.5 U 104 3.95 526 3.8MW-110 7/3/2007 2.5 U 114 2.5 U 409 4.7MW-110 10/1/2007 5 U 112 5 U 438 5 UMW-110 1/8/2008 1.8 96 3.4 450 5.1MW-110 4/8/2008 1 U 98 2.5 450 3.3MW-110 10/7/2008 1 U 110 2.45 385 5.42
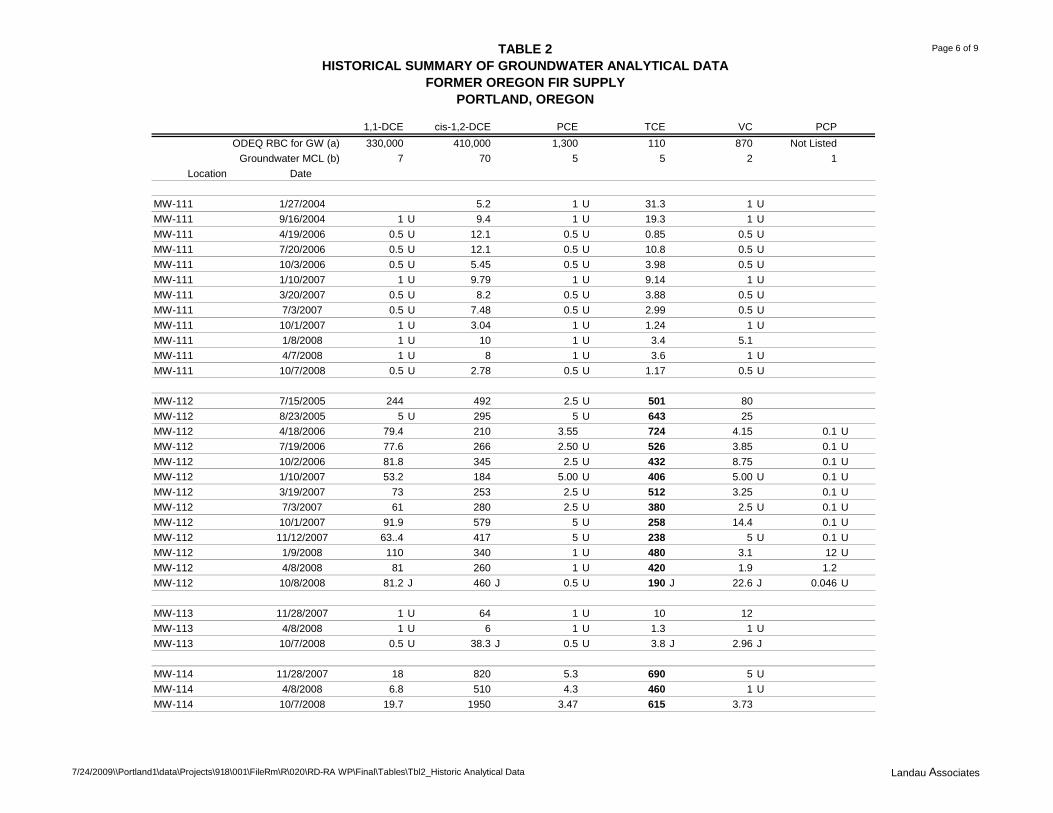
TABLE 2HISTORICAL SUMMARY OF GROUNDWATER ANALYTICAL DATA
FORMER OREGON FIR SUPPLYPORTLAND, OREGON
Page 6 of 9
7/24/2009\\Portland1\data\Projects\918\001\FileRm\R\020\RD-RA WP\Final\Tables\Tbl2_Historic Analytical Data Landau Associates
1,1-DCE cis-1,2-DCE PCE TCE VC PCPODEQ RBC for GW (a) 330,000 410,000 1,300 110 870 Not Listed
Groundwater MCL (b) 7 70 5 5 2 1Location Date
MW-111 1/27/2004 5.2 1 U 31.3 1 UMW-111 9/16/2004 1 U 9.4 1 U 19.3 1 UMW-111 4/19/2006 0.5 U 12.1 0.5 U 0.85 0.5 UMW-111 7/20/2006 0.5 U 12.1 0.5 U 10.8 0.5 UMW-111 10/3/2006 0.5 U 5.45 0.5 U 3.98 0.5 UMW-111 1/10/2007 1 U 9.79 1 U 9.14 1 UMW-111 3/20/2007 0.5 U 8.2 0.5 U 3.88 0.5 UMW-111 7/3/2007 0.5 U 7.48 0.5 U 2.99 0.5 UMW-111 10/1/2007 1 U 3.04 1 U 1.24 1 UMW-111 1/8/2008 1 U 10 1 U 3.4 5.1MW-111 4/7/2008 1 U 8 1 U 3.6 1 UMW-111 10/7/2008 0.5 U 2.78 0.5 U 1.17 0.5 U
MW-112 7/15/2005 244 492 2.5 U 501 80MW-112 8/23/2005 5 U 295 5 U 643 25MW-112 4/18/2006 79.4 210 3.55 724 4.15 0.1 UMW-112 7/19/2006 77.6 266 2.50 U 526 3.85 0.1 UMW-112 10/2/2006 81.8 345 2.5 U 432 8.75 0.1 UMW-112 1/10/2007 53.2 184 5.00 U 406 5.00 U 0.1 UMW-112 3/19/2007 73 253 2.5 U 512 3.25 0.1 UMW-112 7/3/2007 61 280 2.5 U 380 2.5 U 0.1 UMW-112 10/1/2007 91.9 579 5 U 258 14.4 0.1 UMW-112 11/12/2007 63..4 417 5 U 238 5 U 0.1 UMW-112 1/9/2008 110 340 1 U 480 3.1 12 UMW-112 4/8/2008 81 260 1 U 420 1.9 1.2MW-112 10/8/2008 81.2 J 460 J 0.5 U 190 J 22.6 J 0.046 U
MW-113 11/28/2007 1 U 64 1 U 10 12MW-113 4/8/2008 1 U 6 1 U 1.3 1 UMW-113 10/7/2008 0.5 U 38.3 J 0.5 U 3.8 J 2.96 J
MW-114 11/28/2007 18 820 5.3 690 5 UMW-114 4/8/2008 6.8 510 4.3 460 1 UMW-114 10/7/2008 19.7 1950 3.47 615 3.73
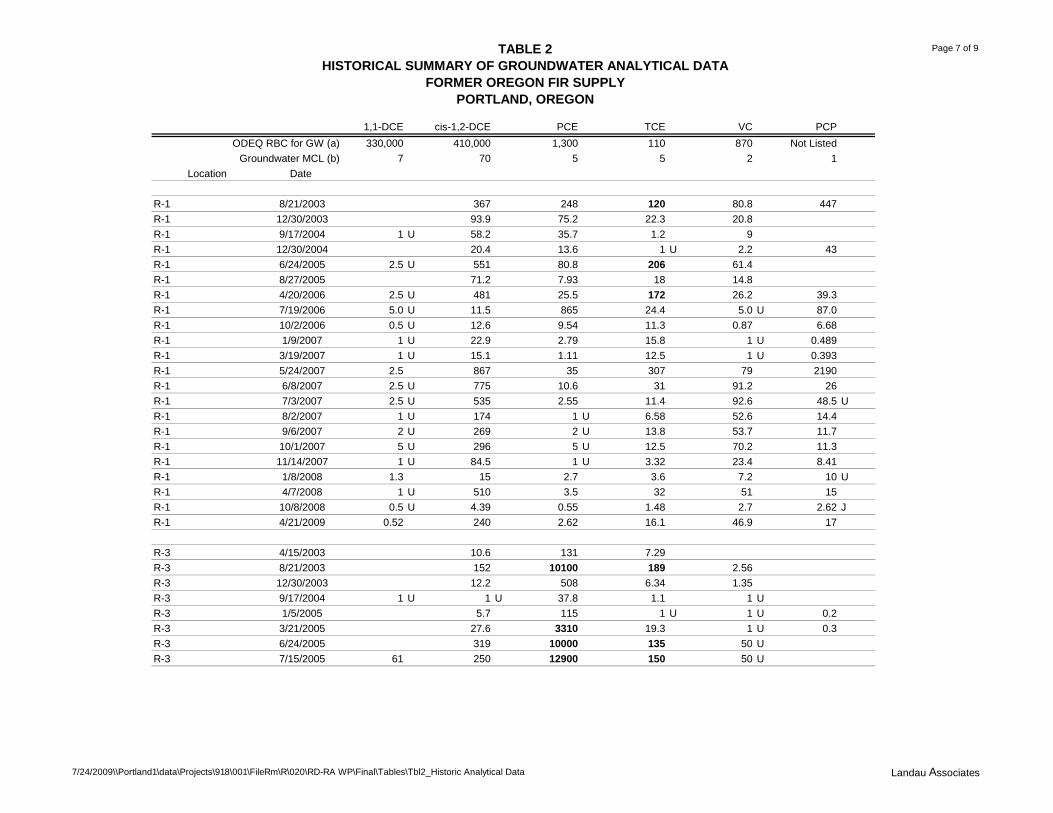
TABLE 2HISTORICAL SUMMARY OF GROUNDWATER ANALYTICAL DATA
FORMER OREGON FIR SUPPLYPORTLAND, OREGON
Page 7 of 9
7/24/2009\\Portland1\data\Projects\918\001\FileRm\R\020\RD-RA WP\Final\Tables\Tbl2_Historic Analytical Data Landau Associates
1,1-DCE cis-1,2-DCE PCE TCE VC PCPODEQ RBC for GW (a) 330,000 410,000 1,300 110 870 Not Listed
Groundwater MCL (b) 7 70 5 5 2 1Location Date
R-1 8/21/2003 367 248 120 80.8 447R-1 12/30/2003 93.9 75.2 22.3 20.8R-1 9/17/2004 1 U 58.2 35.7 1.2 9R-1 12/30/2004 20.4 13.6 1 U 2.2 43R-1 6/24/2005 2.5 U 551 80.8 206 61.4R-1 8/27/2005 71.2 7.93 18 14.8R-1 4/20/2006 2.5 U 481 25.5 172 26.2 39.3R-1 7/19/2006 5.0 U 11.5 865 24.4 5.0 U 87.0R-1 10/2/2006 0.5 U 12.6 9.54 11.3 0.87 6.68R-1 1/9/2007 1 U 22.9 2.79 15.8 1 U 0.489R-1 3/19/2007 1 U 15.1 1.11 12.5 1 U 0.393R-1 5/24/2007 2.5 867 35 307 79 2190R-1 6/8/2007 2.5 U 775 10.6 31 91.2 26R-1 7/3/2007 2.5 U 535 2.55 11.4 92.6 48.5 UR-1 8/2/2007 1 U 174 1 U 6.58 52.6 14.4R-1 9/6/2007 2 U 269 2 U 13.8 53.7 11.7R-1 10/1/2007 5 U 296 5 U 12.5 70.2 11.3R-1 11/14/2007 1 U 84.5 1 U 3.32 23.4 8.41R-1 1/8/2008 1.3 15 2.7 3.6 7.2 10 UR-1 4/7/2008 1 U 510 3.5 32 51 15R-1 10/8/2008 0.5 U 4.39 0.55 1.48 2.7 2.62 JR-1 4/21/2009 0.52 240 2.62 16.1 46.9 17
R-3 4/15/2003 10.6 131 7.29R-3 8/21/2003 152 10100 189 2.56R-3 12/30/2003 12.2 508 6.34 1.35R-3 9/17/2004 1 U 1 U 37.8 1.1 1 UR-3 1/5/2005 5.7 115 1 U 1 U 0.2R-3 3/21/2005 27.6 3310 19.3 1 U 0.3R-3 6/24/2005 319 10000 135 50 UR-3 7/15/2005 61 250 12900 150 50 U
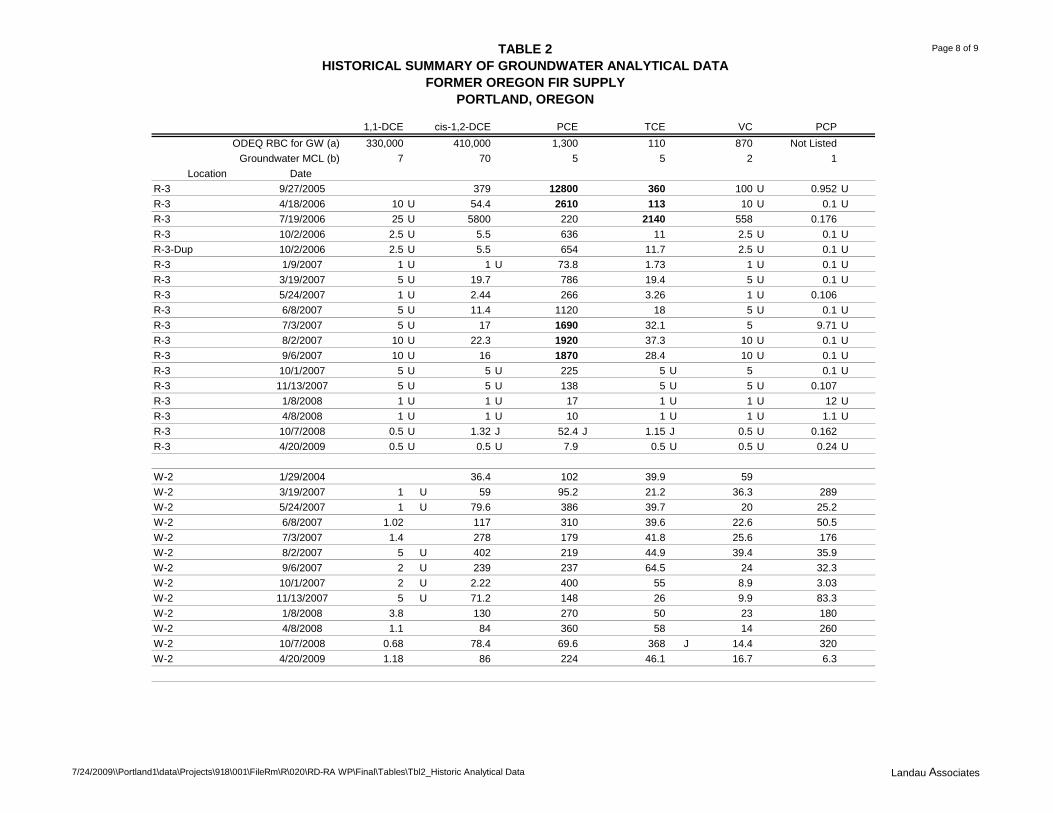
TABLE 2HISTORICAL SUMMARY OF GROUNDWATER ANALYTICAL DATA
FORMER OREGON FIR SUPPLYPORTLAND, OREGON
Page 8 of 9
7/24/2009\\Portland1\data\Projects\918\001\FileRm\R\020\RD-RA WP\Final\Tables\Tbl2_Historic Analytical Data Landau Associates
1,1-DCE cis-1,2-DCE PCE TCE VC PCPODEQ RBC for GW (a) 330,000 410,000 1,300 110 870 Not Listed
Groundwater MCL (b) 7 70 5 5 2 1Location Date
R-3 9/27/2005 379 12800 360 100 U 0.952 UR-3 4/18/2006 10 U 54.4 2610 113 10 U 0.1 UR-3 7/19/2006 25 U 5800 220 2140 558 0.176R-3 10/2/2006 2.5 U 5.5 636 11 2.5 U 0.1 UR-3-Dup 10/2/2006 2.5 U 5.5 654 11.7 2.5 U 0.1 UR-3 1/9/2007 1 U 1 U 73.8 1.73 1 U 0.1 UR-3 3/19/2007 5 U 19.7 786 19.4 5 U 0.1 UR-3 5/24/2007 1 U 2.44 266 3.26 1 U 0.106R-3 6/8/2007 5 U 11.4 1120 18 5 U 0.1 UR-3 7/3/2007 5 U 17 1690 32.1 5 9.71 UR-3 8/2/2007 10 U 22.3 1920 37.3 10 U 0.1 UR-3 9/6/2007 10 U 16 1870 28.4 10 U 0.1 UR-3 10/1/2007 5 U 5 U 225 5 U 5 0.1 UR-3 11/13/2007 5 U 5 U 138 5 U 5 U 0.107R-3 1/8/2008 1 U 1 U 17 1 U 1 U 12 UR-3 4/8/2008 1 U 1 U 10 1 U 1 U 1.1 UR-3 10/7/2008 0.5 U 1.32 J 52.4 J 1.15 J 0.5 U 0.162R-3 4/20/2009 0.5 U 0.5 U 7.9 0.5 U 0.5 U 0.24 U
W-2 1/29/2004 36.4 102 39.9 59W-2 3/19/2007 1 U 59 95.2 21.2 36.3 289W-2 5/24/2007 1 U 79.6 386 39.7 20 25.2W-2 6/8/2007 1.02 117 310 39.6 22.6 50.5W-2 7/3/2007 1.4 278 179 41.8 25.6 176W-2 8/2/2007 5 U 402 219 44.9 39.4 35.9W-2 9/6/2007 2 U 239 237 64.5 24 32.3W-2 10/1/2007 2 U 2.22 400 55 8.9 3.03W-2 11/13/2007 5 U 71.2 148 26 9.9 83.3W-2 1/8/2008 3.8 130 270 50 23 180W-2 4/8/2008 1.1 84 360 58 14 260W-2 10/7/2008 0.68 78.4 69.6 368 J 14.4 320W-2 4/20/2009 1.18 86 224 46.1 16.7 6.3
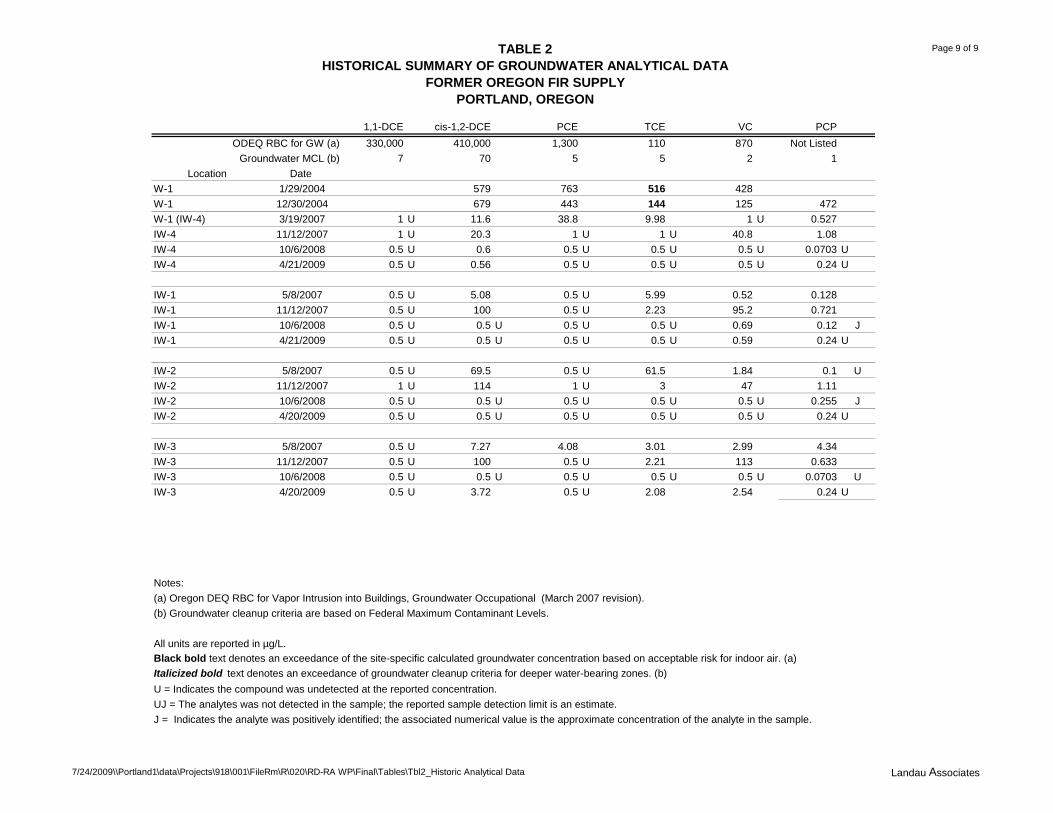
TABLE 2HISTORICAL SUMMARY OF GROUNDWATER ANALYTICAL DATA
FORMER OREGON FIR SUPPLYPORTLAND, OREGON
Page 9 of 9
7/24/2009\\Portland1\data\Projects\918\001\FileRm\R\020\RD-RA WP\Final\Tables\Tbl2_Historic Analytical Data Landau Associates
1,1-DCE cis-1,2-DCE PCE TCE VC PCPODEQ RBC for GW (a) 330,000 410,000 1,300 110 870 Not Listed
Groundwater MCL (b) 7 70 5 5 2 1Location Date
W-1 1/29/2004 579 763 516 428W-1 12/30/2004 679 443 144 125 472W-1 (IW-4) 3/19/2007 1 U 11.6 38.8 9.98 1 U 0.527IW-4 11/12/2007 1 U 20.3 1 U 1 U 40.8 1.08IW-4 10/6/2008 0.5 U 0.6 0.5 U 0.5 U 0.5 U 0.0703 UIW-4 4/21/2009 0.5 U 0.56 0.5 U 0.5 U 0.5 U 0.24 U
IW-1 5/8/2007 0.5 U 5.08 0.5 U 5.99 0.52 0.128IW-1 11/12/2007 0.5 U 100 0.5 U 2.23 95.2 0.721IW-1 10/6/2008 0.5 U 0.5 U 0.5 U 0.5 U 0.69 0.12 JIW-1 4/21/2009 0.5 U 0.5 U 0.5 U 0.5 U 0.59 0.24 U
IW-2 5/8/2007 0.5 U 69.5 0.5 U 61.5 1.84 0.1 UIW-2 11/12/2007 1 U 114 1 U 3 47 1.11IW-2 10/6/2008 0.5 U 0.5 U 0.5 U 0.5 U 0.5 U 0.255 JIW-2 4/20/2009 0.5 U 0.5 U 0.5 U 0.5 U 0.5 U 0.24 U
IW-3 5/8/2007 0.5 U 7.27 4.08 3.01 2.99 4.34IW-3 11/12/2007 0.5 U 100 0.5 U 2.21 113 0.633IW-3 10/6/2008 0.5 U 0.5 U 0.5 U 0.5 U 0.5 U 0.0703 UIW-3 4/20/2009 0.5 U 3.72 0.5 U 2.08 2.54 0.24 U
Notes:(a) Oregon DEQ RBC for Vapor Intrusion into Buildings, Groundwater Occupational (March 2007 revision).(b) Groundwater cleanup criteria are based on Federal Maximum Contaminant Levels.
All units are reported in µg/L.Black bold text denotes an exceedance of the site-specific calculated groundwater concentration based on acceptable risk for indoor air. (a)Italicized bold text denotes an exceedance of groundwater cleanup criteria for deeper water-bearing zones. (b)U = Indicates the compound was undetected at the reported concentration.UJ = The analytes was not detected in the sample; the reported sample detection limit is an estimate.J = Indicates the analyte was positively identified; the associated numerical value is the approximate concentration of the analyte in the sample.
APPENDIX A
Health and Safety Plan
333 SW 5th Avenue, Suite 700 Portland, OR 97204
(503) 542-1080
July 24, 2009
Prepared for
Lejar Enterprises, LLC P.O. Box 56027
Portland, Oregon 97218
Health and Safety Plan Former Oregon Fir Supply Site
Portland, Oregon
7/24/09 \\Portland1\data\Projects\918\001\FileRm\R\020\RD-RA WP\Final\Appendices\AppA - HASP\Oregon Fir_RDRA-HASP.doc LANDAU ASSOCIATES A-ii
TABLE OF CONTENTS
Page
LIST OF ABBREVIATIONS AND ACRONYMS A-iv
1.0 INTRODUCTION AND SCOPE 1-1 1.1 INTRODUCTION 1-1 1.2 MODIFICATION OF PLAN 1-2 1.3 PERSONNEL REQUIREMENTS 1-2 1.4 SITE DESCRIPTION 1-2 1.5 SCOPE OF WORK 1-3
2.0 PROJECT SAFETY AUTHORITY 2-1 2.1 PROJECT MANAGER 2-1 2.2 CORPORATE HEALTH AND SAFETY MANAGER 2-1 2.3 SITE SAFETY COORDINATOR 2-1 2.4 FIELD PERSONNEL 2-1 2.5 SUBCONTRACTORS AND THIRD PARTIES 2-2
3.0 PROJECT HAZARD ASSESSMENT 3-1 3.1 GENERAL 3-1 3.2 CHEMICAL HAZARDS 3-1
3.2.1 Chlorinated Hydrocarbons 3-1 3.3 PHYSICAL HAZARDS 3-2
3.3.1 General Safety Practices for Field Personnel 3-2 3.3.2 Slip/Trip/Hit/Fall 3-3 3.3.3 Noise 3-3 3.3.4 Utilities 3-4 3.3.5 Drilling Safety 3-4 3.3.6 Vehicle Traffic 3-5 3.3.7 Lifting Hazards 3-5
3.4 ENVIRONMENTAL HAZARDS 3-5 3.4.1 Heat Stress 3-5
3.4.1.1 Work Practices 3-6 3.4.1.2 Worker Information and Training 3-6
3.4.2 Cold Stress 3-7 3.4.3 Thunderstorms and Lightning 3-7 3.4.4 Winter Storm Safety 3-8 3.4.5 Animal Bite Prevention/Actions 3-9 3.4.6 Insect Hazards 3-9 3.4.7 Biological Agents 3-10
4.0 AIR MONITORING PLAN 4-1 4.1 GENERAL PRECAUTIONS 4-1 4.2 AIR MONITORING ACTION LEVELS 4-1
5.0 PERSONAL PROTECTION EQUIPMENT 5-1 5.1 LEVEL D PROTECTION 5-1 5.2 LEVEL C PROTECTION 5-1
7/24/09 \\Portland1\data\Projects\918\001\FileRm\R\020\RD-RA WP\Final\Appendices\AppA - HASP\Oregon Fir_RDRA-HASP.doc LANDAU ASSOCIATES A-iii
6.0 DECONTAMINATION PROCEDURES 6-1 6.1 GENERAL 6-1 6.2 DECONTAMINATION 6-1 6.3 CONTAMINATION PREVENTION 6-2
7.0 EMERGENCY PROCEDURES 7-1 7.1 GENERAL 7-1 7.2 ACCIDENT, INJURY, AND ILLNESS REPORTING AND INVESTIGATION 7-1 7.3 EMERGENCY EQUIPMENT/FIRST AID 7-3 7.4 EMERGENCY DECONTAMINATION OF PERSONNEL 7-4
8.0 GENERAL SAFE WORKING PRACTICES 8-1
9.0 PERSONNEL MEDICAL AND TRAINING REQUIREMENTS 9-1 9.1 MEDICAL SURVEILLANCE REQUIREMENTS 9-1 9.2 TRAINING REQUIREMENTS 9-1
9.2.1 General Training 9-1 9.2.2 Site-Specific Training 9-1
9.2.2.1 Initial Training 9-1 9.2.2.2 Continuing Training 9-2
LIST OF FIGURES
Figure Title
A-1 Route to Hospital 7-3
LIST OF FORMS
Form Title
A-1 Health and Safety Plan Modifications Form A-2 Health and Safety Plan Acknowledgment Form A-3 Employee Exposure/Injury Incident Report
7/24/09 \\Portland1\data\Projects\918\001\FileRm\R\020\RD-RA WP\Final\Appendices\AppA - HASP\Oregon Fir_RDRA-HASP.doc LANDAU ASSOCIATES A-iv
LIST OF ABBREVIATIONS AND ACRONYMS
ACGIH American Conference of Governmental Industrial Hygienists AIHA American Industrial Hygiene Association ANSI American National Standards Institute cis-1,2-DCE cis-1,2-Dichloroethene DEQ Oregon Department of Environmental Quality CFR Code of Federal Regulations EPA U.S. Environmental Protection Agency °F Degrees Fahrenheit ft Feet ft2
gal Gallon Square Feet
HASP Health and Safety Plan lb Pound NIOSH National Institute of Occupational Safety and Health OAR Oregon Administrative Rules OSHA Occupational Safety and Health Administration PCE Tetrachloroethene PCP Pentachlorophenol PEL Permissible exposure limit PID Photoionization detector PPE Personal Protective Equipment PPM Parts per Million SSC Site Safety Coordinator TCE Trichloroethene TLV Threshold limit value trans-1,2-DCE trans-1,2-Dichloroethene TWA Time-weighted average VC Vinyl Chloride VOCs Volatile Organic Compounds 1,1-DCE 1,1-Dichloroethene 1,1-DCA 1,1-Dichloroethane
7/24/09 \\Portland1\data\Projects\918\001\FileRm\R\020\RD-RA WP\Final\Appendices\AppA - HASP\Oregon Fir_RDRA-HASP.doc LANDAU ASSOCIATES A-1-1
1.0 INTRODUCTION AND SCOPE
1.1 INTRODUCTION
This Health and Safety Plan (HASP) was developed to inform Landau Associates personnel of
the potential health and safety hazards associated with operations and maintenance and sampling
activities at the former Oregon Fir supply site in Portland, Oregon.
The purpose of the HASP is to provide specific guidelines and establish procedures for the
protection of personnel performing the scope of work described in Section 1.5 of this HASP. Information
in this HASP has been developed in accordance with applicable standards and, to the extent possible,
based on previous studies and information available to date. This HASP is intended to be a living
document in that it must continually evolve as site conditions and knowledge of the site work activities
develop further. The HASP, as originally prepared, will provide the guidance necessary to initiate the
work and allow monitoring of site conditions to determine the required protection. Continual updating of
the HASP, based on review and adjustment of HASP requirements to respond to actual conditions and
hazards observed in the field as the project proceeds, will provide for the required results.
The provisions of this plan apply to all Landau Associates employees who may be exposed to
safety and health hazards while implementing this project. The following documents were used in
developing this plan:
• 29 Code of Federal Regulations (CFR) 1910.120
• Oregon Administrative Rules (OAR) Chapter 437, Division 2, General Occupational Safety and Health Rules, Subdivision H: Hazardous Materials
• Occupational Safety and Health Guidance Manual for Hazardous Waste Site Activities, National Institute for Occupational Safety and Health, United States Coast Guard, Occupational Safety and Health Administration (OSHA), United States Environmental Protection Agency, Publication No. 85-115, October 1985
• Standard Operating Safety Guides, U.S. Environmental Protection Agency (EPA), July 1988
• Threshold Limit Values for Chemical Substances and Physical Agents and Biological Exposure Indices for 2001, American Conference of Governmental Industrial Hygienists (ACGIH), 2001
• Site Safety Plan Guidance Document for Site Assessment and Site Mitigation Projects, John G. Danby, California Department of Health Services, Toxic Substances Control Division, August 1988.
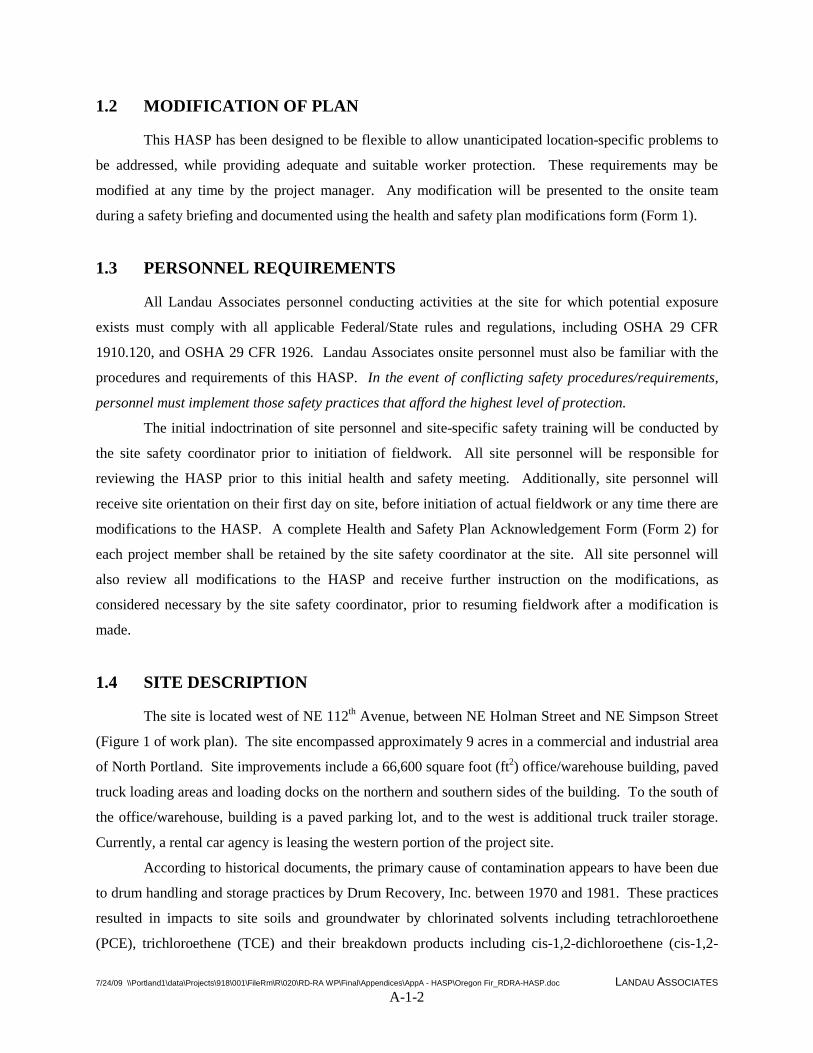
7/24/09 \\Portland1\data\Projects\918\001\FileRm\R\020\RD-RA WP\Final\Appendices\AppA - HASP\Oregon Fir_RDRA-HASP.doc LANDAU ASSOCIATES A-1-2
1.2 MODIFICATION OF PLAN
This HASP has been designed to be flexible to allow unanticipated location-specific problems to
be addressed, while providing adequate and suitable worker protection. These requirements may be
modified at any time by the project manager. Any modification will be presented to the onsite team
during a safety briefing and documented using the health and safety plan modifications form (Form 1).
1.3 PERSONNEL REQUIREMENTS
All Landau Associates personnel conducting activities at the site for which potential exposure
exists must comply with all applicable Federal/State rules and regulations, including OSHA 29 CFR
1910.120, and OSHA 29 CFR 1926. Landau Associates onsite personnel must also be familiar with the
procedures and requirements of this HASP. In the event of conflicting safety procedures/requirements,
personnel must implement those safety practices that afford the highest level of protection.
The initial indoctrination of site personnel and site-specific safety training will be conducted by
the site safety coordinator prior to initiation of fieldwork. All site personnel will be responsible for
reviewing the HASP prior to this initial health and safety meeting. Additionally, site personnel will
receive site orientation on their first day on site, before initiation of actual fieldwork or any time there are
modifications to the HASP. A complete Health and Safety Plan Acknowledgement Form (Form 2) for
each project member shall be retained by the site safety coordinator at the site. All site personnel will
also review all modifications to the HASP and receive further instruction on the modifications, as
considered necessary by the site safety coordinator, prior to resuming fieldwork after a modification is
made.
1.4 SITE DESCRIPTION
The site is located west of NE 112th Avenue, between NE Holman Street and NE Simpson Street
(Figure 1 of work plan). The site encompassed approximately 9 acres in a commercial and industrial area
of North Portland. Site improvements include a 66,600 square foot (ft2
According to historical documents, the primary cause of contamination appears to have been due
to drum handling and storage practices by Drum Recovery, Inc. between 1970 and 1981. These practices
resulted in impacts to site soils and groundwater by chlorinated solvents including tetrachloroethene
(PCE), trichloroethene (TCE) and their breakdown products including cis-1,2-dichloroethene (cis-1,2-
) office/warehouse building, paved
truck loading areas and loading docks on the northern and southern sides of the building. To the south of
the office/warehouse, building is a paved parking lot, and to the west is additional truck trailer storage.
Currently, a rental car agency is leasing the western portion of the project site.
7/24/09 \\Portland1\data\Projects\918\001\FileRm\R\020\RD-RA WP\Final\Appendices\AppA - HASP\Oregon Fir_RDRA-HASP.doc LANDAU ASSOCIATES A-1-3
DCE) and vinyl chloride (VC). It is also important to note pentachlorophenol (PCP) has been identified
as a site contaminant of concern, though unrelated to the presence of the chlorinated solvents.
1.5 SCOPE OF WORK
The scope of work will consist of the installation, operation, and maintenance of a full-scale
bioremediation system to treat dissolved-phase groundwater in the Overbank Deposits, as well as possible
operation of a groundwater extraction system to treat groundwater in the Troutdale Gravel Aquifer. In
addition, this HASP covers activities associated with groundwater monitoring and collecting sub-slab
vapor samples.
7/24/09 \\Portland1\data\Projects\918\001\FileRm\R\020\RD-RA WP\Final\Appendices\AppA - HASP\Oregon Fir_RDRA-HASP.doc LANDAU ASSOCIATES A-2-1
2.0 PROJECT SAFETY AUTHORITY
2.1 PROJECT MANAGER
Landau Associates’ project manager, Heidi Bullock, has the overall project responsibility for the
development, coordination, and implementation of the project fieldwork in a safe manner and is the
central point of contact with the client, Lejar Enterprises, LLC, and the Oregon Department of
Environmental Quality (DEQ). The project manager is responsible for implementing the HASP, as well
as supervising the field team members. In addition, she is responsible for consulting with site safety
coordinator (SSC) regarding any changes that may affect the health and safety of the field team members.
2.2 CORPORATE HEALTH AND SAFETY MANAGER
Landau Associates’ regional health and safety manager, Christine Kimmel R.G., has the overall
responsibility for the development, coordination, and implementation of the HASP. This includes the
medical surveillance program, training requirements, and monitoring procedures. The health and safety
manager shall work with the project manager and the SSC on modifications to the site HASP and will be
available for consultation as necessary.
2.3 SITE SAFETY COORDINATOR
Landau Associates’ SSC is responsible for ensuring compliance with the site HASP, including
health and safety procedures for work sites, personal protective equipment and clothing, and consulting
with the project manager regarding the HASP. The SSC is designated by the Landau Associates project
manager for each phase of fieldwork.
The SSC will also be responsible for field implementation of the HASP. This will include
communicating site requirements to all Landau Associates project personnel and consultation with the
project manager. The SSC is also responsible for coordinating and enforcing health and safety activities
for all Landau Associates employees on site. The project manager will be responsible for informing the
SSC of any potential changes in the work plan, so that those changes may be properly addressed.
2.4 FIELD PERSONNEL
Landau Associates field personnel are responsible for understanding and adhering to this HASP,
and should be alert to unsafe conditions or practices that may affect their safety. Safety deficiencies
should be immediately communicated to the SSC. If personnel safety is threatened, the SSC or project
manager will be contacted immediately.
7/24/09 \\Portland1\data\Projects\918\001\FileRm\R\020\RD-RA WP\Final\Appendices\AppA - HASP\Oregon Fir_RDRA-HASP.doc LANDAU ASSOCIATES A-2-2
2.5 SUBCONTRACTORS AND THIRD PARTIES
Equipment operators, laborers, and other parties subcontracted by Landau Associates will be
responsible for developing their own health and safety plans for their specific scopes or work based upon
29 CFR 1910. Landau Associates will provide its HASP to each involved party to help inform them of
the potential site hazards. Landau Associates will provide project supervision and establish
decontamination areas; however, each subcontractor is responsible for the safe conduct of its employees.
Subcontractors and third parties engaged in work at the site will be required to provide their own work
equipment and personal protective gear. Subcontractors will also be required to provide Landau
Associates with documentation that their employees have completed the OSHA-required 40-hr health and
safety training program (and the annual 8-hr refresher course, if appropriate) before working on this
project. The fieldwork will require that physical labor tasks be performed.
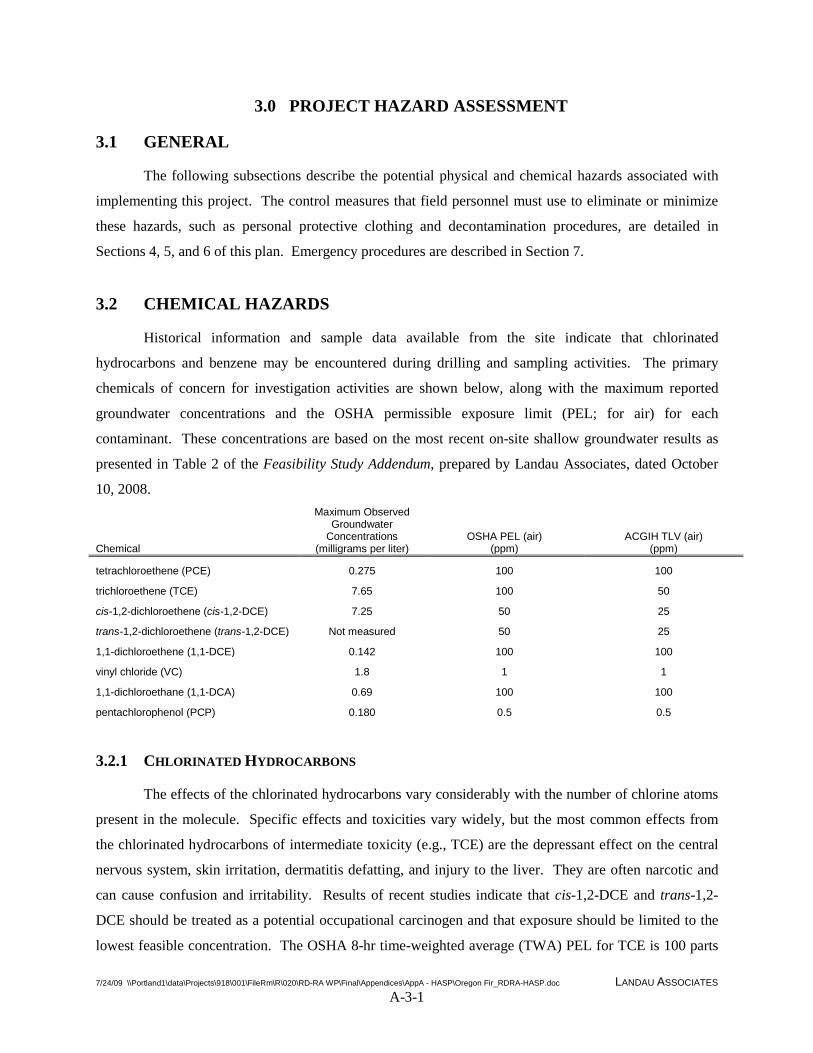
7/24/09 \\Portland1\data\Projects\918\001\FileRm\R\020\RD-RA WP\Final\Appendices\AppA - HASP\Oregon Fir_RDRA-HASP.doc LANDAU ASSOCIATES A-3-1
3.0 PROJECT HAZARD ASSESSMENT
3.1 GENERAL
The following subsections describe the potential physical and chemical hazards associated with
implementing this project. The control measures that field personnel must use to eliminate or minimize
these hazards, such as personal protective clothing and decontamination procedures, are detailed in
Sections 4, 5, and 6 of this plan. Emergency procedures are described in Section 7.
3.2 CHEMICAL HAZARDS
Historical information and sample data available from the site indicate that chlorinated
hydrocarbons and benzene may be encountered during drilling and sampling activities. The primary
chemicals of concern for investigation activities are shown below, along with the maximum reported
groundwater concentrations and the OSHA permissible exposure limit (PEL; for air) for each
contaminant. These concentrations are based on the most recent on-site shallow groundwater results as
presented in Table 2 of the Feasibility Study Addendum, prepared by Landau Associates, dated October
10, 2008.
Chemical
Maximum Observed Groundwater
Concentrations (milligrams per liter)
OSHA PEL (air) (ppm)
ACGIH TLV (air) (ppm)
tetrachloroethene (PCE) 0.275 100 100
trichloroethene (TCE) 7.65 100 50
cis-1,2-dichloroethene (cis-1,2-DCE) 7.25 50 25
trans-1,2-dichloroethene (trans-1,2-DCE) Not measured 50 25
1,1-dichloroethene (1,1-DCE) 0.142 100 100
vinyl chloride (VC) 1.8 1 1
1,1-dichloroethane (1,1-DCA) 0.69 100 100
pentachlorophenol (PCP) 0.180 0.5 0.5
3.2.1 CHLORINATED HYDROCARBONS
The effects of the chlorinated hydrocarbons vary considerably with the number of chlorine atoms
present in the molecule. Specific effects and toxicities vary widely, but the most common effects from
the chlorinated hydrocarbons of intermediate toxicity (e.g., TCE) are the depressant effect on the central
nervous system, skin irritation, dermatitis defatting, and injury to the liver. They are often narcotic and
can cause confusion and irritability. Results of recent studies indicate that cis-1,2-DCE and trans-1,2-
DCE should be treated as a potential occupational carcinogen and that exposure should be limited to the
lowest feasible concentration. The OSHA 8-hr time-weighted average (TWA) PEL for TCE is 100 parts
7/24/09 \\Portland1\data\Projects\918\001\FileRm\R\020\RD-RA WP\Final\Appendices\AppA - HASP\Oregon Fir_RDRA-HASP.doc LANDAU ASSOCIATES A-3-2
per million (ppm) and an ACGIH TLV TWA of 50 ppm. The OSHA PEL TWA for cis-1,2-DCE and
trans-1,2-DCE is 50 ppm; the ACGIH recommends a 25 ppm TWA limit. Vinyl chloride is a confirmed
human carcinogen and has an OSHA PEL TWA of 1 ppm and an ACGIH threshold limit value (TLV)
TWA of 1 ppm.
3.3 PHYSICAL HAZARDS
Physical agents that field personnel can reasonably expect to encounter and mitigation measures
to reduce effects of these agents are discussed below.
3.3.1 GENERAL SAFETY PRACTICES FOR FIELD PERSONNEL
Field operations for this project shall be conducted in accordance with the minimum safety
practices described below required for all Landau Associates employees.
• Eating, drinking, chewing gum or tobacco, smoking, or any practice that increases the probability of hand-to-mouth transfer and ingestion of materials is prohibited in any area where the possibility of contamination exists.
• Hands must be thoroughly washed when leaving a contaminated or suspected contaminated area before eating, drinking, or any other activity.
• Contaminated protective equipment shall not be removed from the work area until it has been properly decontaminated or containerized onsite.
• Avoid activities that may cause dust. Removal of materials from protective clothing or equipment by blowing, shaking, or any means that may disperse materials into the air is prohibited.
• Field personnel must use the “buddy system” when wearing any respiratory protective devices. Communications between members must be maintained at all times. Emergency communications shall be prearranged in case unexpected situations arise. Visual contact must be maintained between pairs on site, and team members should stay close enough to assist each other in the event of an emergency.
• Personnel should be cautioned to inform each other of subjective symptoms of chemical exposure such as headache, dizziness, nausea, and irritation of the respiratory tract.
• No excessive facial hair that interferes with a satisfactory fit of the facepiece-to-face seal will be allowed on personnel required to wear respiratory protective equipment.
• The selection, use, and maintenance of respiratory protective equipment shall meet the requirements of established Landau Associates procedures, recognized consensus standards (AIHA, ANSI, NIOSH), and 29 CFR 1910.134.
7/24/09 \\Portland1\data\Projects\918\001\FileRm\R\020\RD-RA WP\Final\Appendices\AppA - HASP\Oregon Fir_RDRA-HASP.doc LANDAU ASSOCIATES A-3-3
• At sites with known or suspected contamination, appropriate work areas for field personnel support, contaminant reduction, and exclusion will be designated and maintained.
• Landau Associates field personnel are to be thoroughly briefed on the anticipated hazards, equipment requirements, safety practices, emergency procedures, and communications methods, both initially and in daily briefings.
• All Landau Associates field vehicles shall contain a first aid kit and multipurpose portable fire extinguisher.
• All field personnel will, whenever possible, remain upwind of drilling rigs, open excavations, boreholes, etc.
• Subsurface work shall not be performed at any location until the area has been cleared by a utility locator firm to be free of underground utilities or other obstructions.
• Field personnel are specifically prohibited from entering into excavations, trenches, or other confined spaces deeper than 4 feet (ft). Unattended boreholes must be properly covered or otherwise protected.
3.3.2 SLIP/TRIP/HIT/FALL
Slip/trip/hit/fall injuries occur for a wide variety of reasons and are the most frequent of all
injuries to workers. They can be minimized by the following prudent practices:
• Spot check the work area to identify hazards
• Establish and use a pathway that is most free of slip and trip hazards
• Beware of trip hazards such as wet floors, slippery floors, and uneven surfaces of terrain
• Carry only loads over which you can see
• Keep work areas clean and free of clutter, especially in storage rooms and walkways
• Communicate hazards to onsite personnel
• Secure all loose clothing, ties, and remove jewelry while around machinery.
• Report and/or remove hazards.
• Keep a safe buffer zone between workers using equipment and tools
• Fall protection shall be provided if a worker is exposed to a potential fall of 6 ft or more.
3.3.3 NOISE
The effects of noise on humans include psychological effects (interference with communication
by speech, job performance, and safety) and physiological effects such as temporary and permanent
7/24/09 \\Portland1\data\Projects\918\001\FileRm\R\020\RD-RA WP\Final\Appendices\AppA - HASP\Oregon Fir_RDRA-HASP.doc LANDAU ASSOCIATES A-3-4
hearing loss. The most debilitating is permanent hearing loss. The factors that affect the degree and
extent of hearing loss are intensity or loudness of the noise, type of noise, period of exposure each day,
total work duration, and distance from the noise source. To minimize the effects of noise, all field
personnel will be required to wear hearing protection during drilling activities.
3.3.4 UTILITIES
Electrical injury to workers is possible. Caution should be exercised in using small portable
electrical equipment and field monitoring equipment. Also, be alert to buried electric lines when
conducting any activities that disturb soil. A local utility locator service must be contacted and notified
before any drilling activities and must be contracted to identify and mark all underground utilities in the
vicinity of the drilling locations. ASSUME ALL ELECTRICAL LINES ARE ENERGIZED unless a
suitable lockout/tagout procedure has been employed to render the lines safe.
The following precautions must be taken:
• Elevated equipment (e.g., drill rig) shall remain a distance of 10 ft away from overhead utility lines and 20 ft away from overhead power lines. Distance from utility lines may be adjusted by the SSC depending on actual voltage of the lines.
• During all intrusive activities (e.g., drilling, excavating, and probing), the utility locator service should be contacted to mark underground utilities before any work is started.
• Personnel involved in intrusive work shall determine the minimum distance from marked utilities that work can be conducted with the assistance of the utility locator.
3.3.5 DRILLING SAFETY
The following practices shall be adhered to by drilling personnel:
• Equipment should be inspected daily by the operator to ensure that there are no operational problems.
• Before leaving the controls, shift the transmission controlling the rotary drive into neutral and place the feed level in neutral. Before leaving the vicinity of the drill, shut down the drill engine.
• Do not drive the drill rig with the mast in the raised position.
• Before raising the mast, check for overhead obstructions.
• Before the mast of a drill rig is raised, the drill rig must first be leveled and stabilized with leveling jacks and/or cribbing. Re-level the drill rig if it settles after initial set up. Lower the mast only when the leveling jacks are down, and do not raise the leveling jack pads until the mast is lowered completely.
7/24/09 \\Portland1\data\Projects\918\001\FileRm\R\020\RD-RA WP\Final\Appendices\AppA - HASP\Oregon Fir_RDRA-HASP.doc LANDAU ASSOCIATES A-3-5
• Employees involved in the operation shall not wear any loose-fitting clothing that has the potential to get caught in moving machinery.
• During freezing weather, do not touch any metal parts of the drill rig with exposed flesh. Freezing of moist skin to metal can occur almost instantaneously.
• Adequately cover or protect all unattended boreholes to prevent drill rig personnel or site visitors from stepping or falling into the borehole.
• Personnel shall wear steel-toed shoes, safety glasses, hearing protection and hard hats during drilling operations.
• The area shall be roped off, marked, or posted, to keep the area clear of pedestrian traffic or spectators.
• All personnel should be instructed in the use of the emergency kill switch on the drill rig.
3.3.6 VEHICLE TRAFFIC
The work area will be clearly delineated and lit, if necessary, and access by unauthorized
personnel or vehicles will be limited by traffic cones and barricades. All personnel on site will wear high
visibility orange safety vests with reflective striping when they are working in areas with vehicle traffic.
3.3.7 LIFTING HAZARDS
The field operations will require that physical labor tasks be performed. All field personnel
should utilize proper bending and lifting procedures. Whenever an object is to be lifted, personnel should
bend at the knees and lift the object using the legs. Additionally, personnel should not attempt to lift
bulky or heavy objects (more than 30 lbs) without assistance.
3.4 ENVIRONMENTAL HAZARDS
Potential environmental hazards on site include biological hazards (e.g., wild animals, insects,
and poisonous plants), natural occurrences (i.e., earthquakes, thunderstorms, and lightning storms), and
temperature hazards.
3.4.1 HEAT STRESS
Heat stress is a common illness at hazardous waste sites. The risk of heat stress is high for
persons working in impermeable Level C personal protective garments. Because this equipment does not
allow evaporation of sweat, workers required to wear these suits will be monitored for heat stress when
the ambient temperature is above or equal to 70 degrees Fahrenheit (°F). The degree of risk associated
7/24/09 \\Portland1\data\Projects\918\001\FileRm\R\020\RD-RA WP\Final\Appendices\AppA - HASP\Oregon Fir_RDRA-HASP.doc LANDAU ASSOCIATES A-3-6
with working in these garments is directly related to numerous factors: ambient temperature, length of
time in the suits, availability of shade, acclimatization of personnel, adequate fluid intake by workers, and
length of rest periods. Personnel should follow appropriate guidelines if any personnel exhibit these
symptoms:
• Heat Rash – Redness of skin. Frequent rest and change of clothing
• Heat Cramps – Painful muscle spasms in hands, feet, and/or abdomen. Administer lightly-salted water by mouth, unless there are medical restrictions
• Heat Exhaustion – Clammy, moist, pale skin, along with dizziness, nausea, rapid pulse, fainting. Remove to cooler area and administer fluids
• Heat Stroke – Hot dry skin; red, spotted or bluish; high body temperature of 104
3.4.1.1 Work Practices
degrees F, mental confusion, loss of consciousness, convulsions, or coma. Immediately cool victim by immersion in cool water. Wrap with wet sheet while fanning; sponge with cool liquid while fanning; treat for shock. DO NOT DELAY TREATMENT. COOL BODY WHILE AWAITING AMBULANCE.
The following procedures will be carried out to reduce heat stress:
• Heat stress monitoring
• Acclimatization
• Work/rest regimes
• Liquids that replace electrolytes/salty foods available during rest
• Use of buddy system.
The level of heat stress at which excessive heat stress will result depends on the heat tolerance capabilities
of the worker. Each worker has an upper limit for heat stress beyond which the resulting heat strain can
cause the worker to become a heat casualty. In most workers, appropriate repeated exposure to elevated
heat stress causes a series of physiologic adaptations called acclimatization, whereby the body becomes
more efficient in coping with the heat stress. Work/rest regimes will be partially determined by the
degree of acclimatization provided.
3.4.1.2 Worker Information and Training
All employees who work in areas where there is a reasonable likelihood of heat injury or illness
should be kept informed, through continuing education programs for the following:
• Heat stress hazards
7/24/09 \\Portland1\data\Projects\918\001\FileRm\R\020\RD-RA WP\Final\Appendices\AppA - HASP\Oregon Fir_RDRA-HASP.doc LANDAU ASSOCIATES A-3-7
• Predisposing factors and relevant signs and symptoms of heat injury and illness
• Potential health effects of excessive heat stress and first aid procedures
• Proper precautions for work in heat stress areas
• Worker responsibilities for following proper work practices and control procedures to help protect the health and safety of themselves and their fellow workers, including instruction to immediately report to the employer the development of signs or symptoms of heat stress or over exposure
• The effects of therapeutic drugs, over-the-counter medications, or social drugs may increase the risk of heat injury or illness by reducing heat tolerance.
3.4.2 COLD STRESS
Outdoor work may result in cold exposure, especially during the winter months in the Pacific
Northwest. When the body loses more heat than it produces, the body temperature may be lowered to
dangerous levels. This condition is known as hypothermia and can be serious. The symptoms of
hypothermia include shivering, sleepiness, numbness (i.e., frostbite), difficulty in movement, impaired
ability to work, and diminished eyesight. If the condition is allowed to progress, heart failure may occur.
First aid procedure for hypothermia is to seek immediate medical attention.
In order to prevent hypothermia, field personnel must:
• Wear multilayer cold weather outfits
• Be aware of wind chill factors
• Have access to a readily available warm shelter
• Alternate scheduled work and rest periods
• Drink warm fluids (no alcoholic beverages)
• Use the buddy system, and
• Monitor conditions of fellow workers.
3.4.3 THUNDERSTORMS AND LIGHTNING
Lightning causes around 100 deaths in the United States annually. It can strike up to several
miles away from the thunderstorm. Monitor weather conditions and obtain weather forecasts before
beginning work each day. If thunderstorms are forecast, observe weather trends continuously. Stop all
work if lightning is noted in the area, and seek shelter. If drilling, lower the rig’s mast if feasible and
leave the vicinity of the drill rig.
7/24/09 \\Portland1\data\Projects\918\001\FileRm\R\020\RD-RA WP\Final\Appendices\AppA - HASP\Oregon Fir_RDRA-HASP.doc LANDAU ASSOCIATES A-3-8
If caught outdoors:
• Go to a safe shelter immediately, such as inside a sturdy building. A hard top automobile with the windows up can also offer fair protection.
• If you are in a wooded area, seek shelter under a thick growth of relatively small trees.
• If you feel your hair standing on end, squat with your feet as close together as possible and lace you head between you knees. DO NOT LIE FLAT ON THE GROUND.
• Avoid isolated trees or other tall objects, bodies of water, sheds, fences, convertible automobiles, and motorcycles.
3.4.4 WINTER STORM SAFETY
If a winter storm warning has been issued for your area, that means that hazardous winter weather
conditions (such as snow greater than 6 inches in 24 hours, winds gusting over 35 mph, or visibility less
than one quarter mile) are expected within the next 12 hours or are already occurring. A winter storm
watch means that these same conditions may occur within 12 to 36 hours. If freezing rain occurs,
personnel must pay special attention to slip/trip/hit/fall hazards.
If a winter storm warning or watch has been issued, a winter storm survival kit should be
assembled that contains the following items: blankets/sleeping bags; flashlight with extra batteries; knife;
high calorie, non-perishable food; sand or cat litter; shovel; windshield scraper; tool kit; tow rope; jumper
cables; water container; and road maps.
It is important to wear layers of loose-fitting, lightweight clothing and to eat and drink to prevent
dehydration. If you are caught outside during a winter storm, find a dry shelter immediately. If stranded
in a building with no heat, close off unneeded rooms and stuff towels or rags in cracks under doors. If
using kerosene heaters, maintain ventilation to avoid build-up of toxic fumes. Keep heaters at least 3 ft
from flammable objects. Refuel kerosene heaters outside.
If stranded in a car or truck:
• Stay in the vehicle, pull off the road, and set hazard lights to flashing
• Contact the office and Emergency Service Personnel for assistance
• Run the motor about 10 minutes each hour. Open the windows a little for fresh air to avoid carbon monoxide poisoning. Make sure the exhaust pipe is not blocked
• Make yourself visible to rescuers by turning on the dome light at night when running the engine and tying a colored cloth to your antenna or door. Raise the hood after the snow stops falling.
7/24/09 \\Portland1\data\Projects\918\001\FileRm\R\020\RD-RA WP\Final\Appendices\AppA - HASP\Oregon Fir_RDRA-HASP.doc LANDAU ASSOCIATES A-3-9
3.4.5 ANIMAL BITE PREVENTION/ACTIONS
If confronted by a wild animal (e.g., raccoon) or a loose, threatening domestic animal (e.g., dog),
it is important to stay calm. It is best to stand still, do not run. Talk softly to the animal and back away
slowly.
To prevent animal bites:
• Always leave animals alone when they are eating and drinking
• Never tease or scare animals; remember animals guard their owners, territory, and property
• Never pet animals when they have babies
• Never try to stop an animal fight
• Leave injured, sick, or dead animals alone, and get help
• Leave all wild animals alone, especially when seen during the day
If bitten by an animal:
• Immediately wash the wound with lots of soap and running water
• If the animal is wild, capture or kill it, if possible, so it can be tested for rabies. Take care to prevent additional bites or damage to the animal’s head (Do not freeze.)
• If the animal is a pet, obtain the owner’s name, address, and telephone number. Find out if the animal has a current rabies vaccination, and write down the rabies tab number. The owner is responsible to quarantine the animal
• Get medical attention. Go to the nearest emergency room.
3.4.6 INSECT HAZARDS
The primary insects of concern for this area are mosquitoes, bees, hornets, and ticks. To treat a
mosquito/hornet bite or bee sting:
• Remove the bee stinger if possible.
• Clean the area of the bite/sting carefully to prevent infection. Wash the area with soap and water. For mosquito bites, apply calamine lotion or a cortisone cream to lessen the itching. For bee stings, apply an ice pack for approximately 15 minutes to minimize swelling and relieve pain.
• Seek medical attention if you notice that you have developed symptoms away from the bite or sting site. Hives, itching, swelling, vomiting, dizziness, and difficulty swallowing or breathing could be signs of a life-threatening allergy that requires immediate attention.
7/24/09 \\Portland1\data\Projects\918\001\FileRm\R\020\RD-RA WP\Final\Appendices\AppA - HASP\Oregon Fir_RDRA-HASP.doc LANDAU ASSOCIATES A-3-10
A tick bite may manifest itself as circular skin eruption, which occurs after you have been in a
place where ticks live (mainly wooded areas or tall grasses). The eruption might occur even though you
did not see the tick. The principal risk is not from the tick bite itself but from a bacteria that is carried by
the insect, which can cause Lyme disease. To treat a tick infestation:
• Remove the tick from your skin. If the tick has buried itself underneath your skin, try to remove it with tweezers.
• When removing the tick, make sure that you have removed all of the tick’s body.
• Be careful not to squeeze the tick as you remove it because this may release bacteria from it into your bloodstream.
• After removing the tick, alcohol should be applied to the spot, and medical attention should be obtained.
3.4.7 BIOLOGICAL AGENTS
There are five general categories of biological agents capable of causing infection or disease in
exposed individuals. They are viral, rickettsial/chlamydial, bacterial, fungal, and parasitic. Like chemical
hazards, they may be dispersed throughout the environment via wind and water.
Many biological agents have complex life cycles that require host and intermediate (carrier) host
organisms to complete their growth cycles. Rodents, for example, which are commonly found at
landfills, act as carriers for the rabies virus. Likewise, the Rocky Mountain Spotted Fever tick can carry
the bacillus that produces this disease in man.
The same perennial protective requirements that are used against other environmental hazards can
be applied to biological hazards. Body coverings and respiratory protective equipment should be used.
Personal protective clothing and thoroughly washing exposed body parts, including hands and face,
should help remove residual contamination.
7/24/09 \\Portland1\data\Projects\918\001\FileRm\R\020\RD-RA WP\Final\Appendices\AppA - HASP\Oregon Fir_RDRA-HASP.doc LANDAU ASSOCIATES A-4-1
4.0 AIR MONITORING PLAN
4.1 GENERAL PRECAUTIONS
All work should be performed upwind of contaminated areas whenever possible. Particulates
from soil also pose potential heavy metal and semivolatile inhalation hazards. Implement dust control
measures whenever visible dust is generated by work activities.
4.2 AIR MONITORING ACTION LEVELS
Based on the chemical concentrations found in the soil and groundwater, site workers may
encounter elevated atmospheric concentrations of volatile organic compounds (VOCs) while performing
the scope of work outlined in this plan. Air quality monitoring will be conducted during any activity that
disturbs the soil or groundwater in order to ensure that workers are not exposed to elevated concentrations
of VOCs.
Exposure monitoring for VOCs will be conducted in the workers’ breathing zone before
beginning work and every 15 minutes thereafter using a calibrated photoionization detector (PID)
equipped with a 10.2 eV detector lamp (this lamp is sufficient to detect TCE, DCE, and VC, which have
ionization potentials of 9.47, 9.32, and 9.995 eV, respectively). Exposure monitoring will also be
conducted more frequently during drilling when removing the diverter assembly to add or remove drill
rods, or to install or remove sampling equipment. All PID readings will be recorded in a field notebook.
If air concentrations of organic vapors in the breathing zone are greater than 1 ppm of background
VOC concentrations for 5 consecutive minutes, workers will be required to upgrade to Level C personal
protective equipment, including the use of air-purifying respirators, until the situation can be adequately
characterized using chemical-specific detector tubes for TCE and VC.
If VC is found at levels above 1 ppm, the work area will be evacuated and the project manager
will be contacted concerning the use of Level B supplied air respirators.
If VC is below 1 ppm but TCE is present, the following actions shall be taken: if TCE is below 25
ppm, continue working using an organic vapor air-purifying respirator and continue to monitor air quality.
If TCE is present above 100 ppm, the work area will be evacuated and the project manager contacted
regarding the use of Level B supplied air. Required personal protective equipment and levels of
protection are described in Section 5.
The discovery of any condition that would suggest the existence of a situation more hazardous
than anticipated shall result in the evacuation of site personnel and re-evaluation by the SSC and project
manager of the hazard and the level of protection. If PID readings exceed 100 ppm in the breathing zone,
7/24/09 \\Portland1\data\Projects\918\001\FileRm\R\020\RD-RA WP\Final\Appendices\AppA - HASP\Oregon Fir_RDRA-HASP.doc LANDAU ASSOCIATES A-4-2
the work area will be evacuated and the project manager will be contacted concerning the use of Level B
supplied air respirators.
All air monitoring equipment used at this site must be calibrated daily and operated by trained
personnel. The PID will be calibrated using relevant response factors and a 100 ppm concentration of
isobutylene. The calibration of the equipment should be recorded on a calibration log.
7/24/09 \\Portland1\data\Projects\918\001\FileRm\R\020\RD-RA WP\Final\Appendices\AppA - HASP\Oregon Fir_RDRA-HASP.doc LANDAU ASSOCIATES A-5-1
5.0 PERSONAL PROTECTION EQUIPMENT
5.1 LEVEL D PROTECTION
The majority of the anticipated scope of work will be completed under EPA modified Level D
protection. It is important to avoid contact with contaminated soil and groundwater by wearing nitrile or
neoprene gloves. Level D (modified) protection will include:
• Chemical protective overalls or tyvek during drilling activities, chemical splash suits, raingear, or tychem during injection, development and groundwater sampling activities
• Safety boots with steel toe and shank
• Safety glasses with side shields or goggles
• Nitrile and/or neoprene gloves when handling samples
• Hard hat
• High-visibility orange safety vest with reflective striping when working in areas with vehicle traffic
• Hearing protection when drill rig or other noisy equipment is operating
• Rain gear as needed.
5.2 LEVEL C PROTECTION
If organic vapor concentrations in the breathing zone of field personnel are greater than 1 ppm of
background VOC concentrations for five consecutive minutes, workers will be required to upgrade to
Level C personal protective equipment until the situation can be adequately characterized using chemical
specific detector tubes for TCE and VC.
The work area should be evacuated and the project manager contacted if VC breathing zone
concentrations are found to be at or above 1 ppm.
If VC is below 1 ppm but TCE is present, the following actions shall be taken: if TCE is below 25
ppm, continue working using Level C protection and continue to monitor air quality. If TCE is present
above 25 ppm, contact the project manager. If TCE is present above 100 ppm, the work area will be
evacuated and the project manager contacted regarding the use of Level B supplied air.
In addition to the requirements of Level D, Level C protection will include dual-cartridge air
purifying half-face or full-face respirators equipped with organic vapor cartridges and high efficiency
particulate air filters.
7/24/09 \\Portland1\data\Projects\918\001\FileRm\R\020\RD-RA WP\Final\Appendices\AppA - HASP\Oregon Fir_RDRA-HASP.doc LANDAU ASSOCIATES A-5-2
If organic vapor concentrations in the workers’ breathing zones drop back down to below 1 ppm,
the level of personal protective equipment will be downgraded to Level D protection. The downgrade
must be approved by the SSC.
7/24/09 \\Portland1\data\Projects\918\001\FileRm\R\020\RD-RA WP\Final\Appendices\AppA - HASP\Oregon Fir_RDRA-HASP.doc LANDAU ASSOCIATES A-6-1
6.0 DECONTAMINATION PROCEDURES
6.1 GENERAL
Before beginning fieldwork, the SSC will establish the decontamination area and procedures for
the specific activity and location. All personnel leaving areas designated as potentially contaminated
(exclusion zone) must follow the decontamination procedures established by the SSC. Most of the
protective clothing for Level D and C protection is disposable and should be removed, bagged, and
properly disposed. If nondisposable clothing is used, it must be decontaminated with detergent and water
before reuse. If respirators are worn, they must be cleaned daily. Respirator cartridges will not be reused
and will be discarded when load up occurs. All personnel will be required to wash hands and face
thoroughly before eating or drinking, and at the end of each work shift. All personnel will be advised to
shower as soon as possible after leaving the site.
When leaving designated exclusion zones with surface contamination, boot soles must be
thoroughly cleaned before entering field vehicles. As needed, equipment for personal decontamination
may include wash basin, rinse water, soap or detergent, scrub brushes, benches or stools, and clean
towels.
It is the responsibility of the SSC to ensure that all personnel and pieces of equipment coming
offsite are properly decontaminated according to the procedures outlined below. Documentation of
decontamination must be made in the field log notebook that will become part of the permanent project
file.
6.2 DECONTAMINATION
The Exclusion Zone will extend up to 50 ft around the drill rig and/or work area. The
Contamination Reduction Zone is the decontamination area next to the Exclusion Zone and next to the
Landau Associates field vehicle. The Clean Zone is the remainder of the site. The Exclusion Zone and
Contamination Reduction Zone will be marked and controlled, as needed, with tape and barriers.
Decontamination procedures will be followed by all personnel exiting the Exclusion Zone
directly into the Contamination Reduction Zone. Personnel will not be allowed to leave the site before
decontamination, except in the case of emergency evacuation or other medical emergencies.
All personal protection equipment (PPE) will be disposed and/or decontaminated at the
conclusion of each workday as described below. The most contaminated PPE will be
disposed/decontaminated first.
All disposable equipment shall be removed before meal breaks and at the conclusion of the work
day and replaced with new equipment prior to commencing work. In addition, respirator cartridges will
7/24/09 \\Portland1\data\Projects\918\001\FileRm\R\020\RD-RA WP\Final\Appendices\AppA - HASP\Oregon Fir_RDRA-HASP.doc LANDAU ASSOCIATES A-6-2
be changed if breakthrough occurs or as directed by the SSC. Designated containers for Tyvek suits and
other disposables will be located in the Contamination Reduction Zone.
Respiratory equipment and other non-disposables will be fully decontaminated and then placed in
a clean storage area. Respirator decontamination will be conducted daily. The face pieces will be taken
from the drop area and disassembled. The cartridges will be set aside, and all other parts will be placed in
or wiped with a cleansing solution. Face pieces will be allowed to air dry before placing in sanitized
bags. Personnel will inspect their respirator on a daily basis to ensure its proper operation.
6.3 CONTAMINATION PREVENTION
One of the most important aspects of decontamination is the prevention of the spread of
contamination. Good contamination prevention will minimize field personnel and public exposure, and
help ensure valid sample results by eliminating cross-contamination. Proper decontamination procedures
and the following procedures for contamination avoidance, which reduce the potential spread of
contamination, include:
• Do not walk through areas of obvious or known contamination
• Do not handle or touch contaminated materials directly
• Fasten all closures on suits, covering with tape if necessary
• Take particular care to protect any skin injuries
• Stay upwind of airborne contaminants, when possible.
7/24/09 \\Portland1\data\Projects\918\001\FileRm\R\020\RD-RA WP\Final\Appendices\AppA - HASP\Oregon Fir_RDRA-HASP.doc LANDAU ASSOCIATES A-7-1
7.0 EMERGENCY PROCEDURES
7.1 GENERAL
Emergencies can range from minor to serious conditions. Various procedures for responding to
site emergencies are listed in this section. The project manager or the SSC is responsible for contacting
local emergency services when emergency situations occur. Various individual site characteristics will
determine preliminary action to be taken to assure that these emergency procedures are successfully
implemented in the event of an emergency.
7.2 ACCIDENT, INJURY, AND ILLNESS REPORTING AND INVESTIGATION
In the case of any work-related incident, accident, injury, illness, exposure, property loss, or
motor vehicle accident, seek appropriate medical attention first and report the incident to Landau
Associates’ Corporate Health and Safety Manager or her assistant, Terry McGourty, as soon as possible.
Should an onsite accident or spill occur, the SSC will immediately notify, the Landau Associates
project manager, and the project manager to investigate the cause. Any recommended hazard control
measures must be discussed with the SSC before implementation. Any chemical exposures or
occupational injuries and illnesses shall also be reported to the project manager. Following the incident,
an Employee Injury Incident Report (Form 3) shall be completed by the SSC and submitted to the
corporate health and safety manager and the project manager. Additionally, records of recordable work
place injuries and illnesses will be maintained for at least 5 years, as required by OSHA.
The following Emergency Information table lists emergency phone numbers for the fire
department, ambulance service, and nearest emergency medical clinic/hospital. The fastest route to the
clinic/hospital, along with emergency telephone numbers, will be prominently posted in the work area.
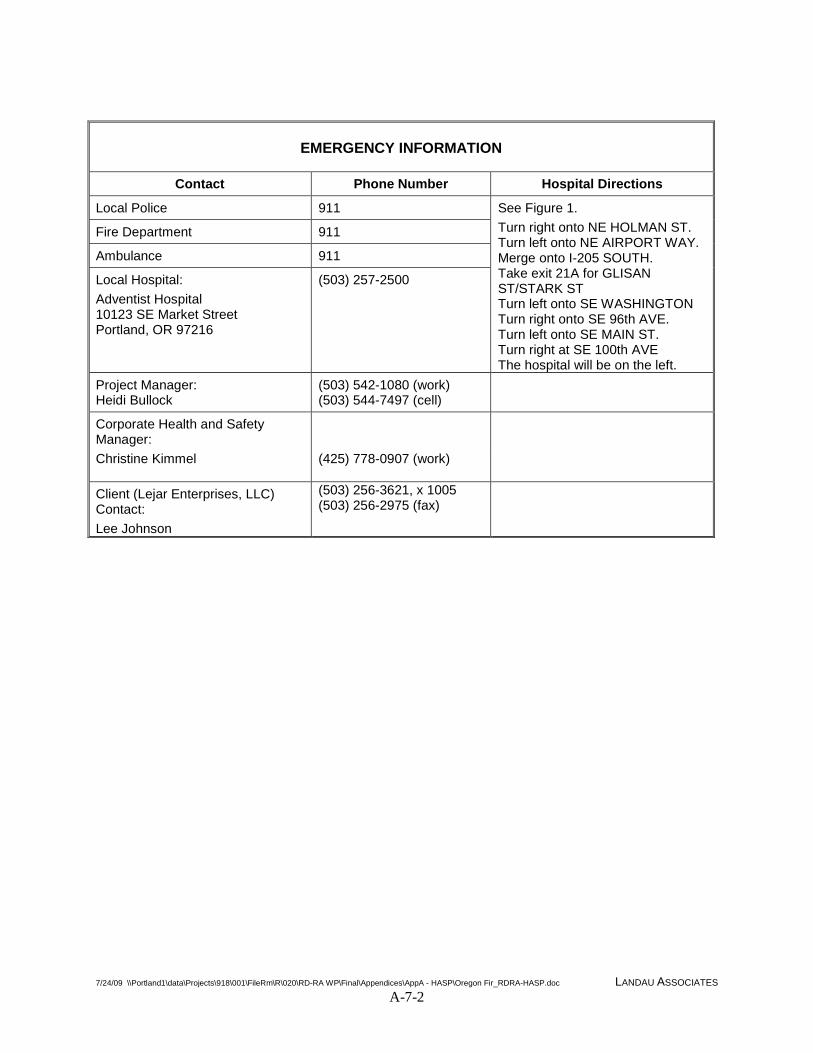
7/24/09 \\Portland1\data\Projects\918\001\FileRm\R\020\RD-RA WP\Final\Appendices\AppA - HASP\Oregon Fir_RDRA-HASP.doc LANDAU ASSOCIATES A-7-2
EMERGENCY INFORMATION
Contact Phone Number Hospital Directions
Local Police 911 See Figure 1. Turn right onto NE HOLMAN ST. Turn left onto NE AIRPORT WAY. Merge onto I-205 SOUTH. Take exit 21A for GLISAN ST/STARK ST Turn left onto SE WASHINGTON Turn right onto SE 96th AVE. Turn left onto SE MAIN ST. Turn right at SE 100th AVE The hospital will be on the left.
Fire Department 911
Ambulance 911
Local Hospital: Adventist Hospital 10123 SE Market Street Portland, OR 97216
(503) 257-2500
Project Manager: Heidi Bullock
(503) 542-1080 (work) (503) 544-7497 (cell)
Corporate Health and Safety Manager:
Christine Kimmel
(425) 778-0907 (work)
Client (Lejar Enterprises, LLC) Contact: Lee Johnson
(503) 256-3621, x 1005 (503) 256-2975 (fax)
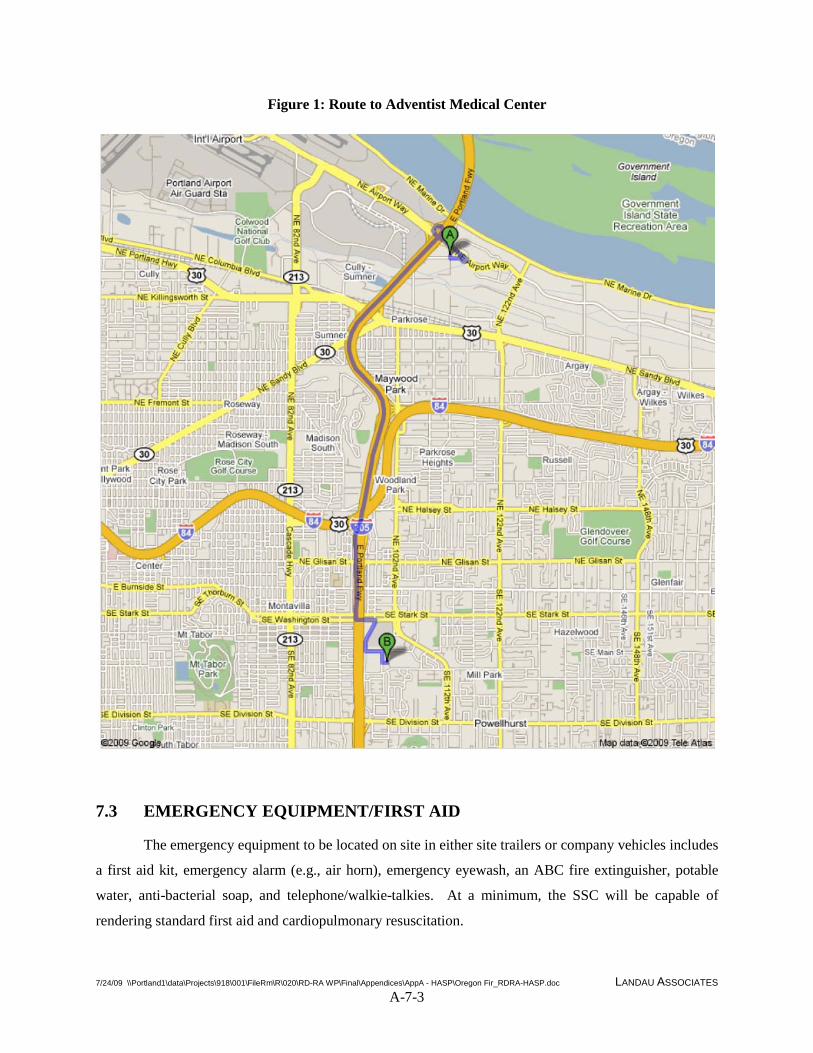
7/24/09 \\Portland1\data\Projects\918\001\FileRm\R\020\RD-RA WP\Final\Appendices\AppA - HASP\Oregon Fir_RDRA-HASP.doc LANDAU ASSOCIATES A-7-3
Figure 1: Route to Adventist Medical Center
7.3 EMERGENCY EQUIPMENT/FIRST AID
The emergency equipment to be located on site in either site trailers or company vehicles includes
a first aid kit, emergency alarm (e.g., air horn), emergency eyewash, an ABC fire extinguisher, potable
water, anti-bacterial soap, and telephone/walkie-talkies. At a minimum, the SSC will be capable of
rendering standard first aid and cardiopulmonary resuscitation.
7/24/09 \\Portland1\data\Projects\918\001\FileRm\R\020\RD-RA WP\Final\Appendices\AppA - HASP\Oregon Fir_RDRA-HASP.doc LANDAU ASSOCIATES A-7-4
7.4 EMERGENCY DECONTAMINATION OF PERSONNEL
Whenever possible, personnel should be decontaminated in the contamination reduction zone
before administering first aid.
• Skin Contact: Remove contaminated clothing, wash immediately with water, and use soap, if available.
• Inhalation: Remove victim from contaminated atmosphere. Remove any respiratory protection equipment. Initiate artificial respiration, if necessary. Transport to the hospital.
• Ingestion: Remove from contaminated atmosphere. Do not induce vomiting if victim is unconscious. Also, never induce vomiting when acids, alkalis, or petroleum products are suspected. Transport to the hospital, if necessary.
7/24/09 \\Portland1\data\Projects\918\001\FileRm\R\020\RD-RA WP\Final\Appendices\AppA - HASP\Oregon Fir_RDRA-HASP.doc LANDAU ASSOCIATES A-8-1
8.0 GENERAL SAFE WORKING PRACTICES
Field operations shall be conducted in accordance with the minimum safety practices described
below, which are required for all Landau Associates personnel.
• Eating, drinking, chewing gum or tobacco, smoking, or any practice that increases the probability of hand-to-mouth transfer and ingestion of materials is prohibited in any area where the possibility of contamination exists.
• Hands must be thoroughly washed when leaving a contaminated or suspected contaminated area before eating, drinking, or any other activity.
• Contaminated protective equipment shall not be removed from the work area until it has been properly decontaminated or containerized on site.
• Avoid activities that may cause dust. Removal of materials from protective clothing or equipment by blowing, shaking, or any means that may disperse materials into the air is prohibited.
• Field personnel must use the “buddy system” when wearing any respiratory protective devices. Communications between members must be maintained at all times. Emergency communications shall be prearranged in case unexpected situations arise. Visual contact must be maintained between pairs on site, and team members should stay close enough to assist each other in the event of an emergency.
• Personnel should be cautioned to inform each other of subjective symptoms of chemical exposure such as headache, dizziness, nausea, and irritation of the respiratory tract.
• No excessive facial hair that interferes with a satisfactory fit of the facepiece-to-face seal will be allowed on personnel required to wear respiratory protective equipment.
• The selection, use, and maintenance of respiratory protective equipment shall meet the requirements of established Landau Associates procedures, recognized consensus standards (AIHA, ANSI, NIOSH), and shall comply with the requirements set forth in 29 CFR 1910.134.
• At sites with known or suspected contamination, appropriate work areas for field personnel support, contaminant reduction, and exclusion will be designated and maintained.
• Landau Associates field personnel are to be thoroughly briefed on the anticipated hazards, equipment requirements, safety practices, emergency procedures, and communications methods, both initially and in daily briefings.
The SSC will be responsible for maintaining a clean job site free from hazards and providing safe
egress from the site. Cones and/or barricades and high visibility surveyor tape will be used, as needed,
for traffic control and for limiting access to hazardous and restricted areas.
7/24/09 \\Portland1\data\Projects\918\001\FileRm\R\020\RD-RA WP\Final\Appendices\AppA - HASP\Oregon Fir_RDRA-HASP.doc LANDAU ASSOCIATES A-9-1
9.0 PERSONNEL MEDICAL AND TRAINING REQUIREMENTS
9.1 MEDICAL SURVEILLANCE REQUIREMENTS
Landau Associates personnel engaging in field activities shall participate in Landau Associates’
medical monitoring program in accordance with 29 CFR 1910.120(f).
9.2 TRAINING REQUIREMENTS
9.2.1 GENERAL TRAINING
All personnel conducting environmental sampling activities shall have completed at least 40
hours of classroom-style health and safety training and 3 days of onsite training (i.e., site safety
meetings), as required by OSHA 29 CFR 1910.120. In addition, the SSC or project manager shall have
received an additional 8 hours of supervisory training. Landau Associates employees shall also be current
in their annual 8-hour HAZWOPER refresher training.
9.2.2 SITE-SPECIFIC TRAINING
9.2.2.1 Initial Training
All personnel conducting environmental sampling activities shall read and understand the HASP
and so indicate by signing the Health and Safety Plan Acknowledgement Form (Form 2). An initial site-
specific training session or briefing shall be conducted by the SSC or project manager before
commencement of work and/or entering the exclusion zone. During the initial training session,
employees shall be instructed on the following topics:
• Personnel responsibilities
• Content and implementation of the HASP
• Site hazards and controls
• Site-specific hazardous procedures (i.e., intrusive activities, etc.)
• Medical and training requirements
• Use of direct reading monitoring equipment
• Levels of protection
• Action levels for upgrading/downgrading levels of PPE
7/24/09 \\Portland1\data\Projects\918\001\FileRm\R\020\RD-RA WP\Final\Appendices\AppA - HASP\Oregon Fir_RDRA-HASP.doc LANDAU ASSOCIATES A-9-2
• Emergency information, including local emergency phone numbers and emergency response procedures
• Instruction in the completion of required forms.
9.2.2.2 Continuing Training
Safety briefings will be held in the field every day before beginning work and when the nature of
onsite operations changes.
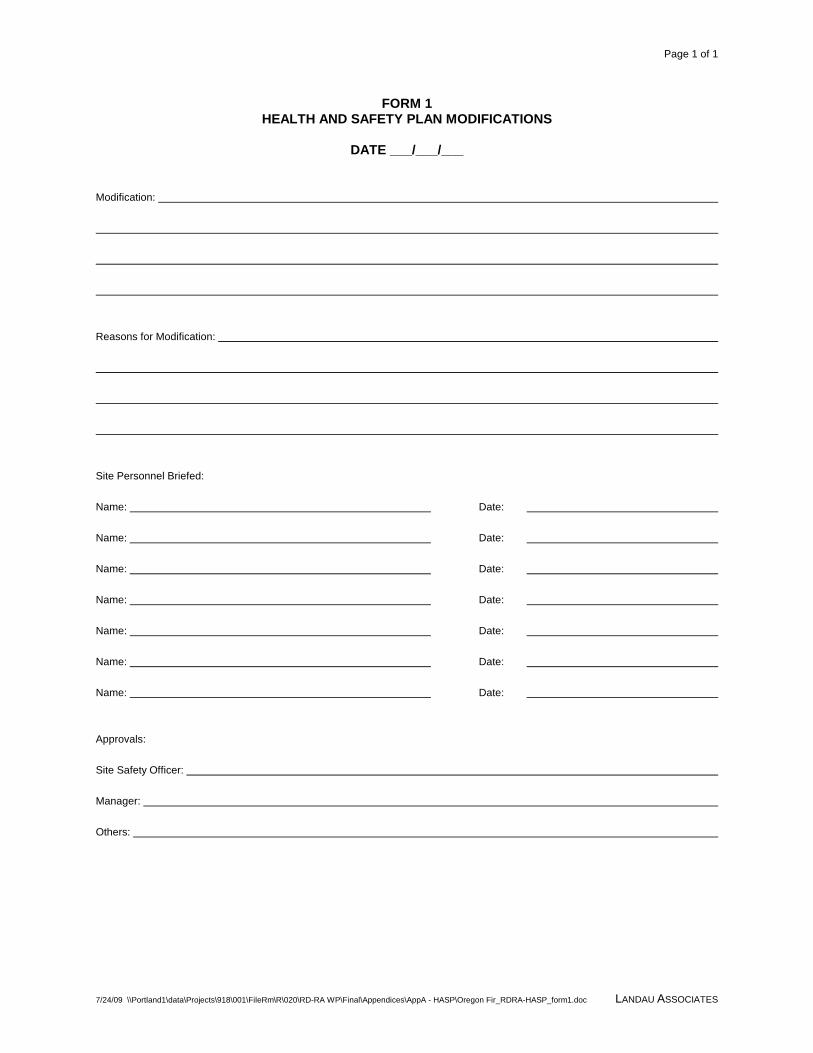
Page 1 of 1
7/24/09 \\Portland1\data\Projects\918\001\FileRm\R\020\RD-RA WP\Final\Appendices\AppA - HASP\Oregon Fir_RDRA-HASP_form1.doc LANDAU ASSOCIATES
FORM 1 HEALTH AND SAFETY PLAN MODIFICATIONS
DATE ___/___/___
Modification: Reasons for Modification: Site Personnel Briefed: Name: Date: Name: Date: Name: Date: Name: Date: Name: Date: Name: Date: Name: Date: Approvals: Site Safety Officer: Manager: Others:
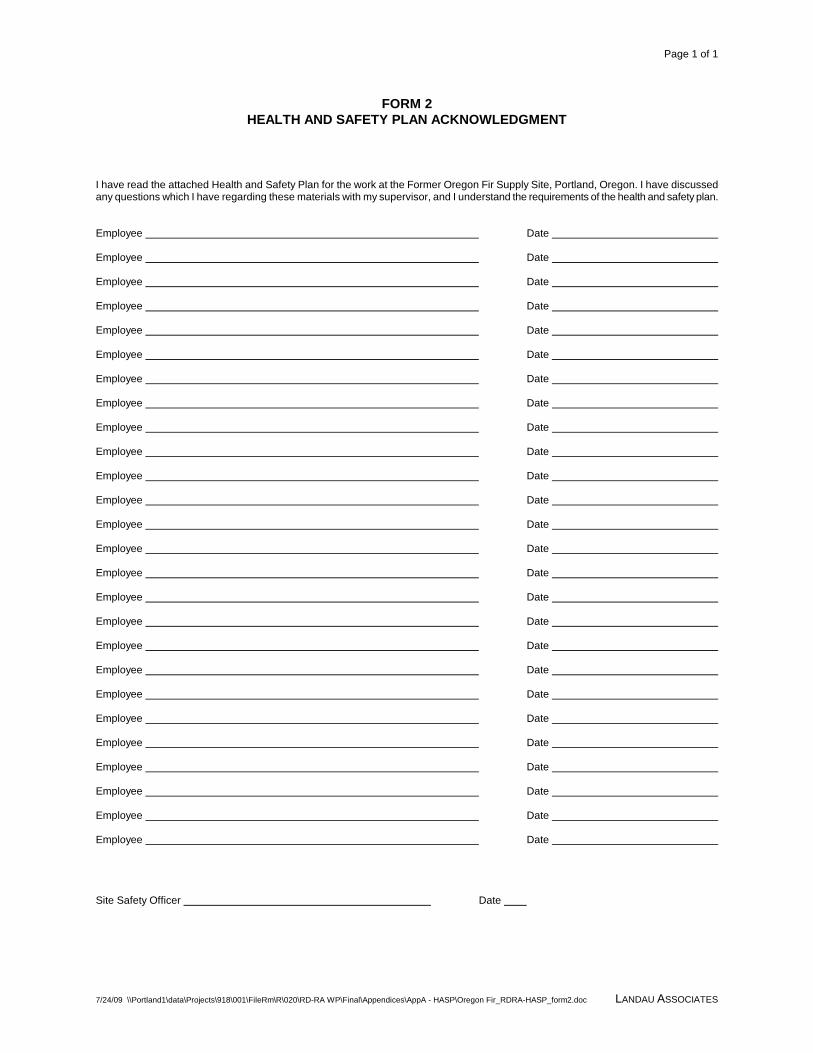
Page 1 of 1
7/24/09 \\Portland1\data\Projects\918\001\FileRm\R\020\RD-RA WP\Final\Appendices\AppA - HASP\Oregon Fir_RDRA-HASP_form2.doc LANDAU ASSOCIATES
FORM 2 HEALTH AND SAFETY PLAN ACKNOWLEDGMENT
I have read the attached Health and Safety Plan for the work at the Former Oregon Fir Supply Site, Portland, Oregon. I have discussed any questions which I have regarding these materials with my supervisor, and I understand the requirements of the health and safety plan. Employee Date Employee Date Employee Date Employee Date Employee Date Employee Date Employee Date Employee Date Employee Date Employee Date Employee Date Employee Date Employee Date Employee Date Employee Date Employee Date Employee Date Employee Date Employee Date Employee Date Employee Date Employee Date Employee Date Employee Date Employee Date Employee Date Site Safety Officer Date
Page 1 of 1
7/24/09 \\Portland1\data\Projects\918\001\FileRm\R\020\RD-RA WP\Final\Appendices\AppA - HASP\Oregon Fir_RDRA-HASP_form3.doc LANDAU ASSOCIATES
FORM 3 EMPLOYEE EXPOSURE/INJURY INCIDENT REPORT
(Use additional page if necessary)
Date: Time:
Name: Employer:
Site Name and Location:
Site Weather (clear, rain, snow, etc.):
Nature of Illness/Injury:
Symptoms:
Action Taken: Rest: First Aid: Medical
Transported by:
Witnessed by:
Hospital’s Name:
Treatment:
Comments:
What was the person doing at the time of the accident/incident?
Personal Protective Equipment Worn:
Cause of Accident/Incident:
What immediate action was taken to prevent recurrence?
Additional comments
Employee’s Signature/Date: Supervisor’s Signature/Date
Site Safety Representative’s Signature/Date
APPENDIX B
Soil Management Plan

333 SW 5th Avenue, Suite 700 Portland, OR 97204
(503) 542-1080
July 24, 2009
Prepared for Lejar Enterprises, LLC
P.O. Box 56027 Portland, Oregon 97218
Soil Management Plan Former Oregon Fir Supply Site
Portland, Oregon
5/18/2009 I:\Projects\918\001\FileRm\R\020\RD-RA WP\Final\Appendices\AppB - SMP\Soil Management Plan_rpt.doc LANDAU ASSOCIATES B-ii
TABLE OF CONTENTS
Page
LIST OF ABBREVIATIONS AND ACRONYMS B-iii
1.0 INTRODUCTION 1-1
2.0 POTENTIAL HAZARDOUS SUBSTANCES IN SITE MEDIA 2-1 2.1 SOIL 2-1 2.2 WATER 2-1
3.0 HEALTH AND SAFETY 3-1 3.1 HEALTH AND SAFETY PLANNING 3-1 3.2 PERSONAL PROTECTIVE EQUIPMENT 3-2
4.0 FIELD-SCREENING METHODS AND FREQUENCY 4-1 4.1 FIELD-SCREENING METHODS 4-1
4.1.1 Actions if Contaminated Soil is Encountered 4-1 4.2 EVALUATION OF POTENTIALLY HAZARDOUS WASTE 4-2
5.0 SAMPLE COLLECTION METHODS AND FREQUENCY 5-1 5.1 CONFIRMATION SOIL SAMPLE COLLECTION 5-1 5.2 STOCKPILE SAMPLE COLLECTION AND FREQUENCY 5-2 5.3 WATER CHARACTERIZATION SAMPLE COLLECTION 5-2
6.0 MANAGEMENT AND DISPOSAL 6-1 6.1 SOIL 6-1
6.1.1 Shoring Deeper Excavations 6-2 6.1.2 Reuse of Soil 6-2
6.2 GROUNDWATER 6-2 6.3 PERSONAL PROTECTIVE EQUIPMENT AND EQUIPMENT DISPOSAL 6-3
7.0 RECORDKEEPING AND REPORTING 7-1
8.0 USE OF THIS REPORT 8-1
9.0 REFERENCES 9-1
LIST OF FIGURES
Figure Title
B-1 Adjacent Properties and Historical Drum Handling Areas
5/18/2009 I:\Projects\918\001\FileRm\R\020\RD-RA WP\Final\Appendices\AppB - SMP\Soil Management Plan_rpt.doc LANDAU ASSOCIATES B-iii
LIST OF ABBREVIATIONS AND ACRONYMS
cis-1,2-DCE cis-1,2-Dichloroethene COCs Contaminants of Concern DEQ Oregon Department of Environmental Quality Ecology Washington State Department of Ecology EPA U.S. Environmental Protection Agency ft Feet gal Gallon IC Institutional Control Lejar Lejar Enterprises, LLC mg/kg Milligrams per kilogram mg/L Milligrams per Liter PCE Tetrachloroethene PCP Pentachlorophenol PID Photoionization Detector PPE Personal Protective Equipment ppm Parts per Million RBC Risk-Based Concentration ROD Record of Decision SMP Soil Management Plan SVOC Semivolatile Organic Compound TCE Trichloroethene TCLP Toxicity Characteristic Leaching Procedure USGS U.S. Geological Survey VOC Volatile Organic Compound yd3 Cubic Yards
5/18/2009 I:\Projects\918\001\FileRm\R\020\RD-RA WP\Final\Appendices\AppB - SMP\Soil Management Plan_rpt.doc LANDAU ASSOCIATES B-1-1
1.0 INTRODUCTION
This Soil Management Plan (SMP) describes specific institutional controls (ICs) for management
of soil and groundwater following implementation of the remedial action and any subsequent
development at the Lejar Enterprises, LLC (Lejar) site, also known as the former Oregon Fir Supply site.
The controls presented in this SMP are based on the measures recommended in the Record of Decision
(ROD) for Selected Remedial Action, dated February 2009 (DEQ 2009) for Lejar. The ROD lists ICs for
Lejar as including Easement and Equitable Servitudes, an SMP, and a Remedy Performance Monitoring
Plan. An IC is a legal or administrative tool or action taken to reduce the potential for exposure to a
hazardous substance. ICs may include, but are not limited to, use restrictions, environmental monitoring
requirements, and site access and security measurements.
This SMP provides protocols for management of potentially contaminated soil and groundwater
during any future, post-treatment, invasive site development activities such as building construction or
repair, or utility installation. Soil and/or groundwater will be removed during trenching, excavating,
drilling of wells, and produced during decontamination of equipment, and soil sampling activities. This
SMP provides field-screening methods, soil and groundwater management procedures, and disposal and
reuse protocols.
Figure B-1 depicts historical drum handling areas and other areas of interest on the site. This
figure also shows the locations of adjacent properties as well as the City of Portland drinking water wells.
This figure should be consulted when determining management activities for subsequent investigations at
the Lejar property.
5/18/2009 I:\Projects\918\001\FileRm\R\020\RD-RA WP\Final\Appendices\AppB - SMP\Soil Management Plan_rpt.doc LANDAU ASSOCIATES B-2-1
2.0 POTENTIAL HAZARDOUS SUBSTANCES IN SITE MEDIA
For purposes of this discussion, the term “soil” includes soil, rock chips, and sediment. Water
includes groundwater, surface water, and stormwater encountered during trenching, drilling, or
excavation activities.
2.1 SOIL
The primary constituents of concern in site media are pentachlorophenol (PCP), tetrachloroethene
(PCE), trichloroethene (TCE), cis-1,2-dichloroethene (cis-1,2-DCE), and vinyl chloride. Additional
volatile organic compounds (VOCs) detected at low concentrations in soil samples during preliminary
investigations were acetone, benzene, ethylbenzene, xylenes, methylene chloride, toluene, and
1,1,1-trichloroethane. Additional semivolatile organic compounds (SVOCs) detected in only two soil
samples during preliminary investigations were di-n-butylphthalate and 2-butanone. Based on the
minimal low-level detection of these SVOCs, it is not anticipated that these constituents will require
consideration for waste management purposes during this project.
Metals have also been detected in soil samples collected during previous investigations. Detected
metals were arsenic, beryllium, barium, cadmium, chromium, copper, lead, manganese, mercury, nickel,
and zinc. These metals also occur naturally in soils and the presence of metals is not necessarily an
indication of a release to the environment.
2.2 WATER
Primary constituents of concern for groundwater include PCE; TCE; cis-1,2-DCE; trans-1,2-
dichloroethene; 1,1-dichloroethene; and vinyl chloride. In addition, concentrations of PCP were detected
in relation to Plumes 3 through 5. Decontamination water and other water generated during investigation,
well installation, and remediation activities may include tap water with non-phosphate detergents, in
addition to groundwater.
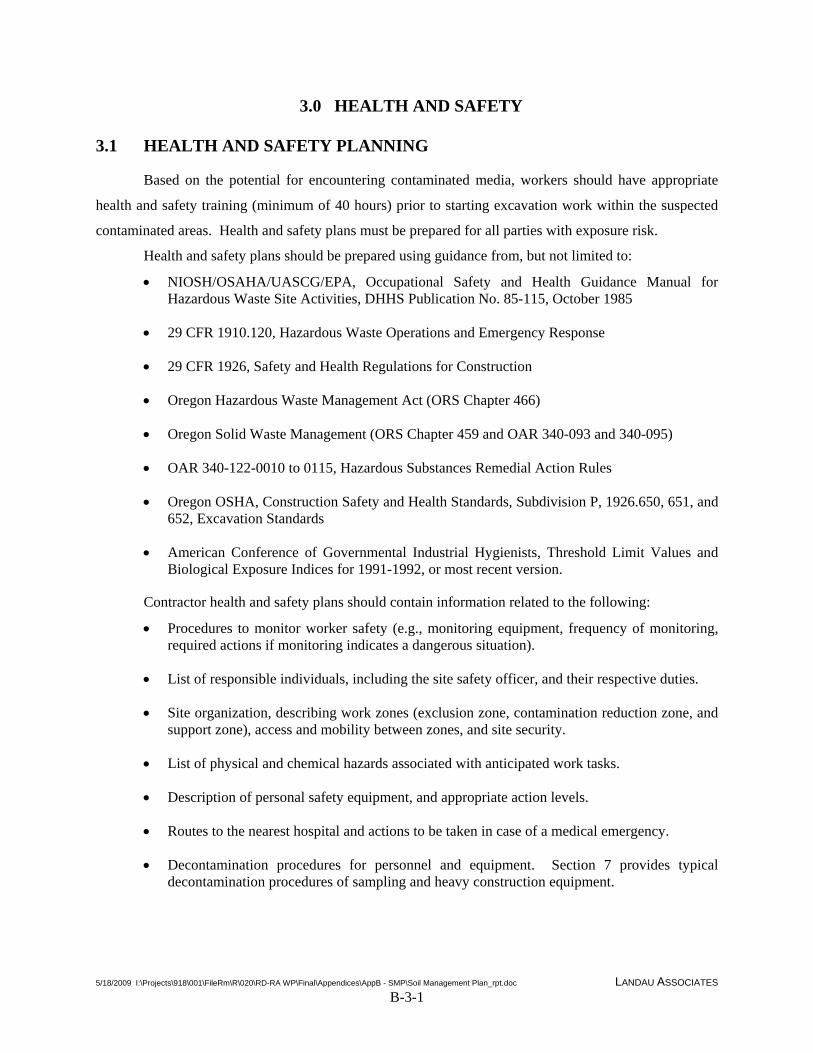
5/18/2009 I:\Projects\918\001\FileRm\R\020\RD-RA WP\Final\Appendices\AppB - SMP\Soil Management Plan_rpt.doc LANDAU ASSOCIATES B-3-1
3.0 HEALTH AND SAFETY
3.1 HEALTH AND SAFETY PLANNING
Based on the potential for encountering contaminated media, workers should have appropriate
health and safety training (minimum of 40 hours) prior to starting excavation work within the suspected
contaminated areas. Health and safety plans must be prepared for all parties with exposure risk.
Health and safety plans should be prepared using guidance from, but not limited to:
• NIOSH/OSAHA/UASCG/EPA, Occupational Safety and Health Guidance Manual for Hazardous Waste Site Activities, DHHS Publication No. 85-115, October 1985
• 29 CFR 1910.120, Hazardous Waste Operations and Emergency Response
• 29 CFR 1926, Safety and Health Regulations for Construction
• Oregon Hazardous Waste Management Act (ORS Chapter 466)
• Oregon Solid Waste Management (ORS Chapter 459 and OAR 340-093 and 340-095)
• OAR 340-122-0010 to 0115, Hazardous Substances Remedial Action Rules
• Oregon OSHA, Construction Safety and Health Standards, Subdivision P, 1926.650, 651, and 652, Excavation Standards
• American Conference of Governmental Industrial Hygienists, Threshold Limit Values and Biological Exposure Indices for 1991-1992, or most recent version.
Contractor health and safety plans should contain information related to the following:
• Procedures to monitor worker safety (e.g., monitoring equipment, frequency of monitoring, required actions if monitoring indicates a dangerous situation).
• List of responsible individuals, including the site safety officer, and their respective duties.
• Site organization, describing work zones (exclusion zone, contamination reduction zone, and support zone), access and mobility between zones, and site security.
• List of physical and chemical hazards associated with anticipated work tasks.
• Description of personal safety equipment, and appropriate action levels.
• Routes to the nearest hospital and actions to be taken in case of a medical emergency.
• Decontamination procedures for personnel and equipment. Section 7 provides typical decontamination procedures of sampling and heavy construction equipment.
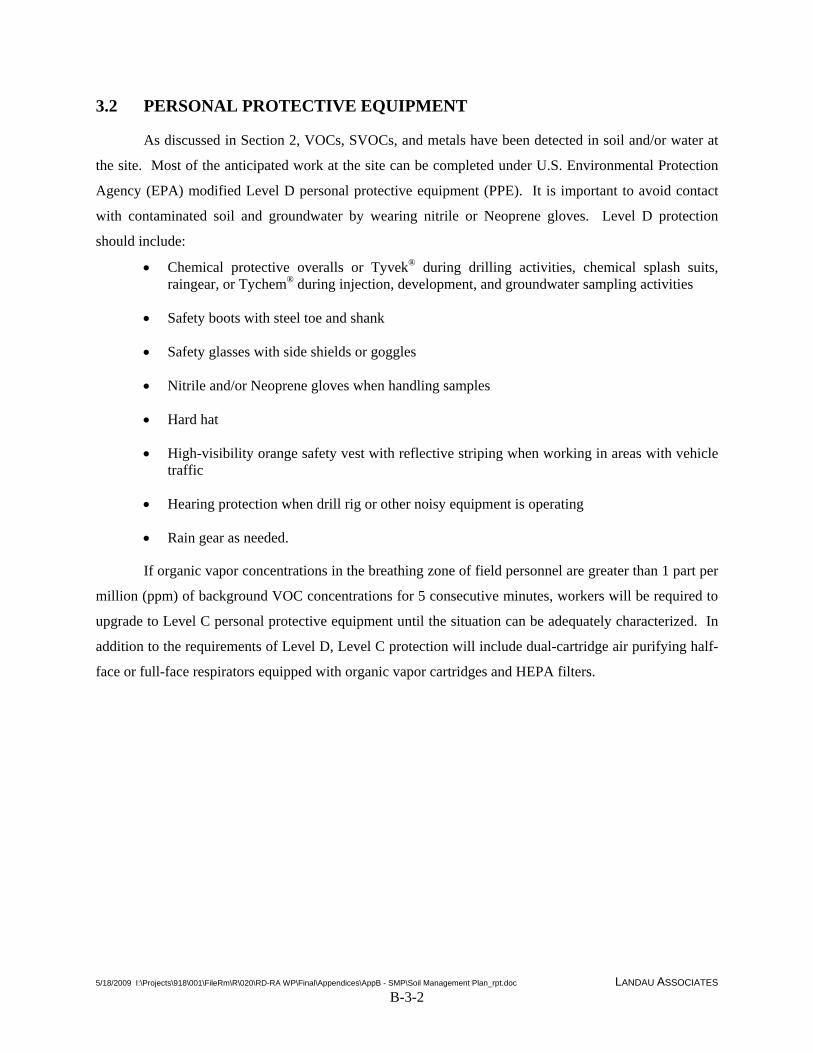
5/18/2009 I:\Projects\918\001\FileRm\R\020\RD-RA WP\Final\Appendices\AppB - SMP\Soil Management Plan_rpt.doc LANDAU ASSOCIATES B-3-2
3.2 PERSONAL PROTECTIVE EQUIPMENT
As discussed in Section 2, VOCs, SVOCs, and metals have been detected in soil and/or water at
the site. Most of the anticipated work at the site can be completed under U.S. Environmental Protection
Agency (EPA) modified Level D personal protective equipment (PPE). It is important to avoid contact
with contaminated soil and groundwater by wearing nitrile or Neoprene gloves. Level D protection
should include:
• Chemical protective overalls or Tyvek® during drilling activities, chemical splash suits, raingear, or Tychem® during injection, development, and groundwater sampling activities
• Safety boots with steel toe and shank
• Safety glasses with side shields or goggles
• Nitrile and/or Neoprene gloves when handling samples
• Hard hat
• High-visibility orange safety vest with reflective striping when working in areas with vehicle traffic
• Hearing protection when drill rig or other noisy equipment is operating
• Rain gear as needed.
If organic vapor concentrations in the breathing zone of field personnel are greater than 1 part per
million (ppm) of background VOC concentrations for 5 consecutive minutes, workers will be required to
upgrade to Level C personal protective equipment until the situation can be adequately characterized. In
addition to the requirements of Level D, Level C protection will include dual-cartridge air purifying half-
face or full-face respirators equipped with organic vapor cartridges and HEPA filters.
5/18/2009 I:\Projects\918\001\FileRm\R\020\RD-RA WP\Final\Appendices\AppB - SMP\Soil Management Plan_rpt.doc LANDAU ASSOCIATES B-4-1
4.0 FIELD-SCREENING METHODS AND FREQUENCY
4.1 FIELD-SCREENING METHODS
Landau Associates will work with the contractor to screen excavated soil for signs of
contamination. The results of the field screening will be recorded on the excavation monitoring log. The
following field-screening methods will be used to identify evidence of potential contamination:
• Visual and olfactory examinations. Visual and olfactory examinations will consist of observing the soil for discolorations and noting any type(s) of odor.
• Chemical vapor screening with a photoionization detector (PID) or similar equipment. Screening with the PID will be conducted by placing a representative sample of the soil in a sealed plastic bag. The soil in the bag will be agitated, allowed to stand for 5 minutes, and then a headspace reading will be taken with the PID meter of the vapor within the bag. A reading that is 20 ppm or greater above background will be used as a general indication of potential contamination. The PID will be calibrated on a daily basis using a standard of 100 ppm isobutylene or by using a comparable standard. The PID will be equipped with a 10.6 electron volt lamp, which is capable of detecting most common aromatic and aliphatic hydrocarbon compounds.
• Sheen testing. Sheen testing will be conducted by placing a representative sample of the soil in a clear glass jar with tap water. The amount of sheen (light, medium, or heavy) will be observed and recorded.
Field screening for contaminated soil will be conducted approximately every 100 cubic yards
(yd3) of excavated soil or whenever an area of possible contamination is suspected or observed.
Estimates of excavated yardage will be verified by truck hauling records or by measuring the excavation
area. Yardage estimates will be recorded with the field-screening observations on the excavation
monitoring log.
Proper management of vapors from excavations and/or stockpiles can be a significant issue,
especially if the weather is warm, concentrations are high, and there is little wind (or if there is an “air
alert” in progress). The Oregon Department of Environmental Quality (DEQ) and the Northwest Air
Pollution Authority will be consulted for proper guidance on controlling vapors, as needed. If stockpile
vapors exceed action levels established in the Health and Safety Plan, then control measures will be
implemented, such as covering the stockpiles to reduce vapor emissions.
4.1.1 ACTIONS IF CONTAMINATED SOIL IS ENCOUNTERED
If soil is encountered that, due to color, texture, sheen, laboratory results, field-screening
measurements, or odor, appears contaminated, the following steps should be taken:
• Implement appropriate health and safety measures
5/18/2009 I:\Projects\918\001\FileRm\R\020\RD-RA WP\Final\Appendices\AppB - SMP\Soil Management Plan_rpt.doc LANDAU ASSOCIATES B-4-2
• Document location and characteristics of affected soil
• If soil has already been excavated:
– Stage at a designated location and segregate from other “clean” excavated soil to allow sampling and evaluation, or send off site for treatment/disposal, provided the proper arrangements have been made.
– Line each stockpile area with 30-mil-thick plastic to prevent infiltration of water to the underlying soil, and berm to prevent surface water runon/runoff. The contractor will maintain the stockpile area(s) and be prepared to cover stockpiles(s) with 6-mil-thick plastic to protect the soil from precipitation.
• If the soil has not been excavated, but excavation is part of construction:
– The soil should be excavated and handled as described above.
• If soil has not been excavated and excavation is not planned as part of construction:
– The soil should not be disturbed unless excavation is necessary to prevent construction delays.
• Collect and analyze samples of excavation sidewalls and bottoms to document soil quality.
• Collect and chemically analyze samples of the excavated soil for contaminants based on observed characteristics and constituents already present or likely to be present at the work area based on site history. Procedures for stockpile sample collection are discussed in Section 5.2.
4.2 EVALUATION OF POTENTIALLY HAZARDOUS WASTE
The EPA considers contaminated environmental media to no longer contain hazardous waste: 1)
when they no longer exhibit a characteristic of hazardous waste; and 2) when concentrations of hazardous
constituents from listed hazardous wastes are below health-based levels. This site does not contain
contaminated media that are representative of a listed waste. Therefore, determination of disposal of
material as hazardous shall be based upon laboratory analytical results for VOCs only, as discussed in
Section 6.0.
Soil will be sampled and analyzed for PCE and TCE by EPA Method 8260. The PCE and TCE
concentrations will then be compared with the leaching criteria for protection of groundwater listed
below. Leaching to groundwater criteria are used in the determination of hazardous waste because they
are the most conservative criteria.
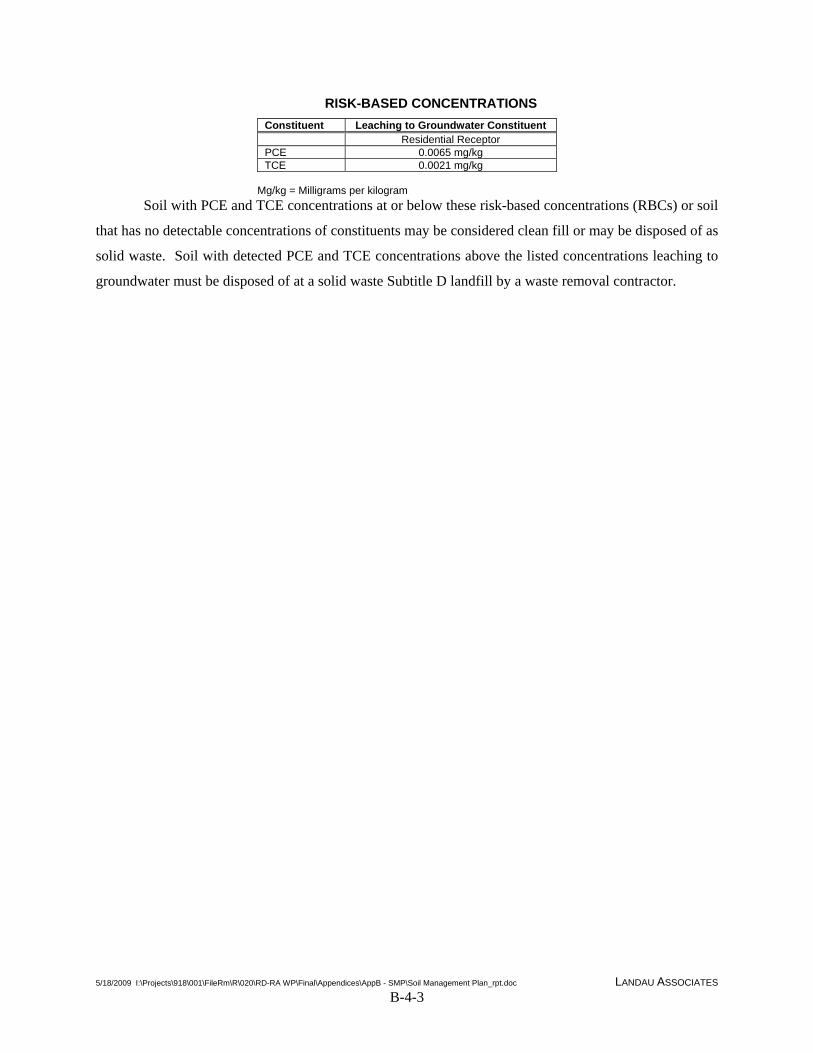
5/18/2009 I:\Projects\918\001\FileRm\R\020\RD-RA WP\Final\Appendices\AppB - SMP\Soil Management Plan_rpt.doc LANDAU ASSOCIATES B-4-3
RISK-BASED CONCENTRATIONS Constituent Leaching to Groundwater Constituent Residential Receptor PCE 0.0065 mg/kg TCE 0.0021 mg/kg
Mg/kg = Milligrams per kilogram
Soil with PCE and TCE concentrations at or below these risk-based concentrations (RBCs) or soil
that has no detectable concentrations of constituents may be considered clean fill or may be disposed of as
solid waste. Soil with detected PCE and TCE concentrations above the listed concentrations leaching to
groundwater must be disposed of at a solid waste Subtitle D landfill by a waste removal contractor.
5/18/2009 I:\Projects\918\001\FileRm\R\020\RD-RA WP\Final\Appendices\AppB - SMP\Soil Management Plan_rpt.doc LANDAU ASSOCIATES B-5-1
5.0 SAMPLE COLLECTION METHODS AND FREQUENCY
The following sections describe the types of samples to be collected and the frequency of the
sampling. Samples will be collected by Landau Associates personnel or their authorized representative.
Sample collection and handling is described in detail in the site Sampling and Analysis Plan (Landau
Associates 2009).
Samples will be collected for the following purposes:
• To document contaminant concentrations in the soil remaining in place and allow for assessment of the need for additional cleanup activities, if warranted
• To document appropriate disposition of excavated soil including consistency with waste disposal profiles and identification of soil for reuse on site
• To evaluate disposal options for contained groundwater and surface water runoff.
5.1 CONFIRMATION SOIL SAMPLE COLLECTION
Discrete soil confirmation samples will be collected along the sidewalls and bottom of
excavations and analyzed for site contaminants of concern (COCs) to document the concentrations
present in the soil left in place. Observations of the location, depth, and field-screening results (PID,
sheen test, visual, and olfactory) will be noted on the daily field log. Contamination will not be removed
beyond the planned limits of the excavation (for construction purposes) unless there is specific direction
from the Project Engineer. During excavation activities, the excavation will continue both vertically and
laterally until undisturbed soil is evaluated as “clean” based on field-screening results.
Confirmation soil samples of the limits of an excavation will be collected from the sidewalls
and/or bottom of the excavation where field-screening results indicate possible contamination.
Confirmation soil samples collected from the extent of an excavation are typically collected along the
four sidewalls from the interval where contamination was present or from directly above the water table,
as applicable. The base confirmation sample is typically collected from the bottom of an excavation.
Samples are then analyzed for site COCs.
Depending on field-screening results, one confirmation sample will be collected every 50 to 100
feet (ft) along trenches within areas of suspected contamination. Samples for confirmation purposes will
be selected from the most impacted soil within the 50- to 100-ft area based on field-screening
measurements.
Confirmation soil samples will be collected directly from the exposed face or from near the
middle of the excavator bucket. Samples will be collected using a decontaminated stainless steel spade.
Soil for VOC, SVOC, and metals analyses will be directly packed into laboratory-supplied containers.
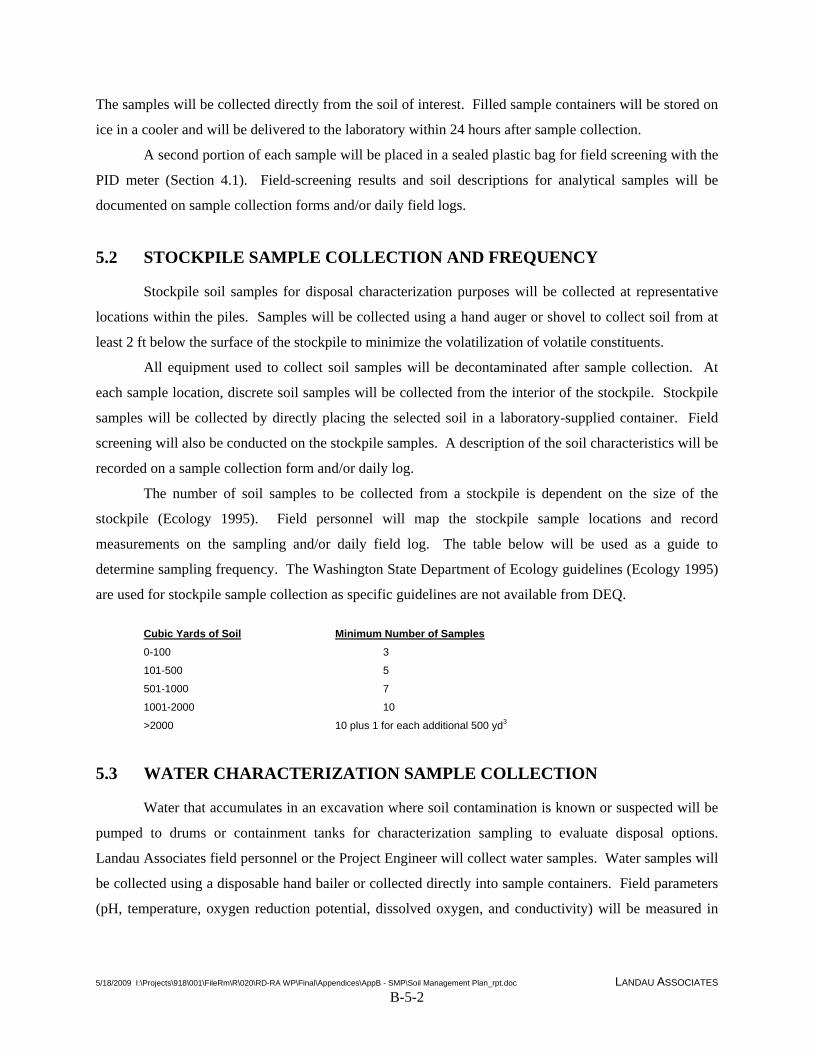
5/18/2009 I:\Projects\918\001\FileRm\R\020\RD-RA WP\Final\Appendices\AppB - SMP\Soil Management Plan_rpt.doc LANDAU ASSOCIATES B-5-2
The samples will be collected directly from the soil of interest. Filled sample containers will be stored on
ice in a cooler and will be delivered to the laboratory within 24 hours after sample collection.
A second portion of each sample will be placed in a sealed plastic bag for field screening with the
PID meter (Section 4.1). Field-screening results and soil descriptions for analytical samples will be
documented on sample collection forms and/or daily field logs.
5.2 STOCKPILE SAMPLE COLLECTION AND FREQUENCY
Stockpile soil samples for disposal characterization purposes will be collected at representative
locations within the piles. Samples will be collected using a hand auger or shovel to collect soil from at
least 2 ft below the surface of the stockpile to minimize the volatilization of volatile constituents.
All equipment used to collect soil samples will be decontaminated after sample collection. At
each sample location, discrete soil samples will be collected from the interior of the stockpile. Stockpile
samples will be collected by directly placing the selected soil in a laboratory-supplied container. Field
screening will also be conducted on the stockpile samples. A description of the soil characteristics will be
recorded on a sample collection form and/or daily log.
The number of soil samples to be collected from a stockpile is dependent on the size of the
stockpile (Ecology 1995). Field personnel will map the stockpile sample locations and record
measurements on the sampling and/or daily field log. The table below will be used as a guide to
determine sampling frequency. The Washington State Department of Ecology guidelines (Ecology 1995)
are used for stockpile sample collection as specific guidelines are not available from DEQ.
Cubic Yards of Soil Minimum Number of Samples 0-100 3
101-500 5
501-1000 7
1001-2000 10
>2000 10 plus 1 for each additional 500 yd3
5.3 WATER CHARACTERIZATION SAMPLE COLLECTION
Water that accumulates in an excavation where soil contamination is known or suspected will be
pumped to drums or containment tanks for characterization sampling to evaluate disposal options.
Landau Associates field personnel or the Project Engineer will collect water samples. Water samples will
be collected using a disposable hand bailer or collected directly into sample containers. Field parameters
(pH, temperature, oxygen reduction potential, dissolved oxygen, and conductivity) will be measured in
5/18/2009 I:\Projects\918\001\FileRm\R\020\RD-RA WP\Final\Appendices\AppB - SMP\Soil Management Plan_rpt.doc LANDAU ASSOCIATES B-5-3
the field at the time of sample collection using a portable field meter. Field data parameters will be
recorded on a water sample collection form.
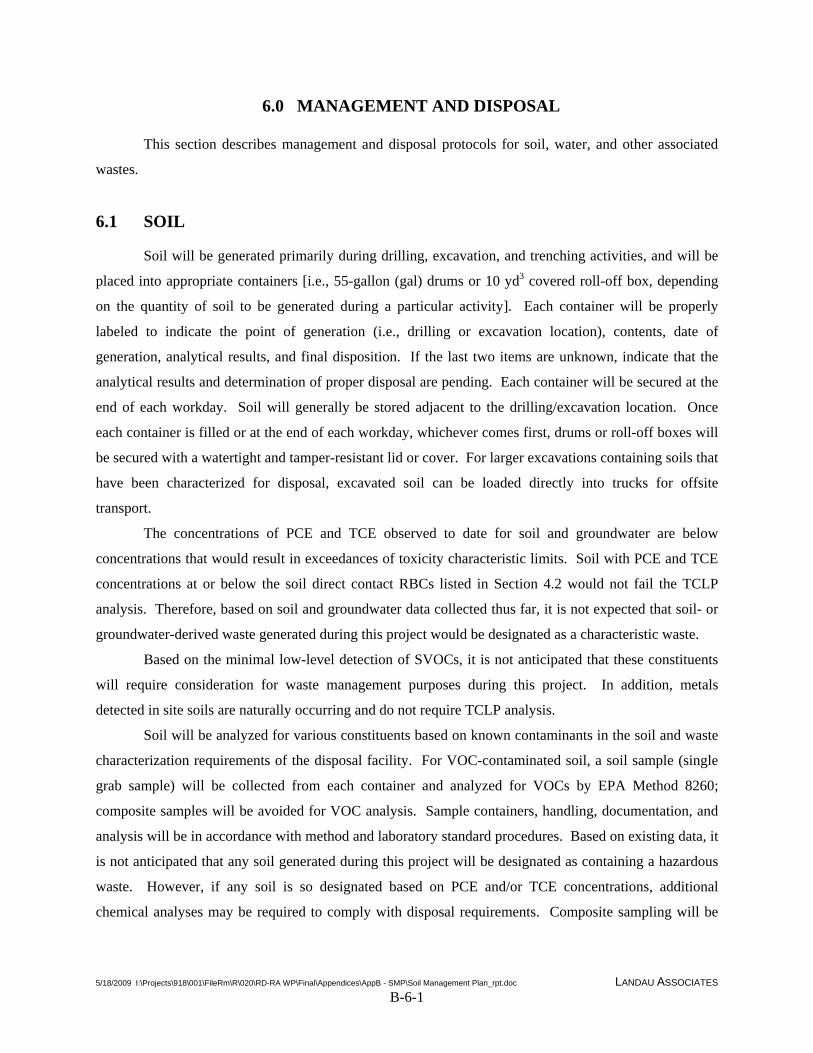
5/18/2009 I:\Projects\918\001\FileRm\R\020\RD-RA WP\Final\Appendices\AppB - SMP\Soil Management Plan_rpt.doc LANDAU ASSOCIATES B-6-1
6.0 MANAGEMENT AND DISPOSAL
This section describes management and disposal protocols for soil, water, and other associated
wastes.
6.1 SOIL
Soil will be generated primarily during drilling, excavation, and trenching activities, and will be
placed into appropriate containers [i.e., 55-gallon (gal) drums or 10 yd3 covered roll-off box, depending
on the quantity of soil to be generated during a particular activity]. Each container will be properly
labeled to indicate the point of generation (i.e., drilling or excavation location), contents, date of
generation, analytical results, and final disposition. If the last two items are unknown, indicate that the
analytical results and determination of proper disposal are pending. Each container will be secured at the
end of each workday. Soil will generally be stored adjacent to the drilling/excavation location. Once
each container is filled or at the end of each workday, whichever comes first, drums or roll-off boxes will
be secured with a watertight and tamper-resistant lid or cover. For larger excavations containing soils that
have been characterized for disposal, excavated soil can be loaded directly into trucks for offsite
transport.
The concentrations of PCE and TCE observed to date for soil and groundwater are below
concentrations that would result in exceedances of toxicity characteristic limits. Soil with PCE and TCE
concentrations at or below the soil direct contact RBCs listed in Section 4.2 would not fail the TCLP
analysis. Therefore, based on soil and groundwater data collected thus far, it is not expected that soil- or
groundwater-derived waste generated during this project would be designated as a characteristic waste.
Based on the minimal low-level detection of SVOCs, it is not anticipated that these constituents
will require consideration for waste management purposes during this project. In addition, metals
detected in site soils are naturally occurring and do not require TCLP analysis.
Soil will be analyzed for various constituents based on known contaminants in the soil and waste
characterization requirements of the disposal facility. For VOC-contaminated soil, a soil sample (single
grab sample) will be collected from each container and analyzed for VOCs by EPA Method 8260;
composite samples will be avoided for VOC analysis. Sample containers, handling, documentation, and
analysis will be in accordance with method and laboratory standard procedures. Based on existing data, it
is not anticipated that any soil generated during this project will be designated as containing a hazardous
waste. However, if any soil is so designated based on PCE and/or TCE concentrations, additional
chemical analyses may be required to comply with disposal requirements. Composite sampling will be
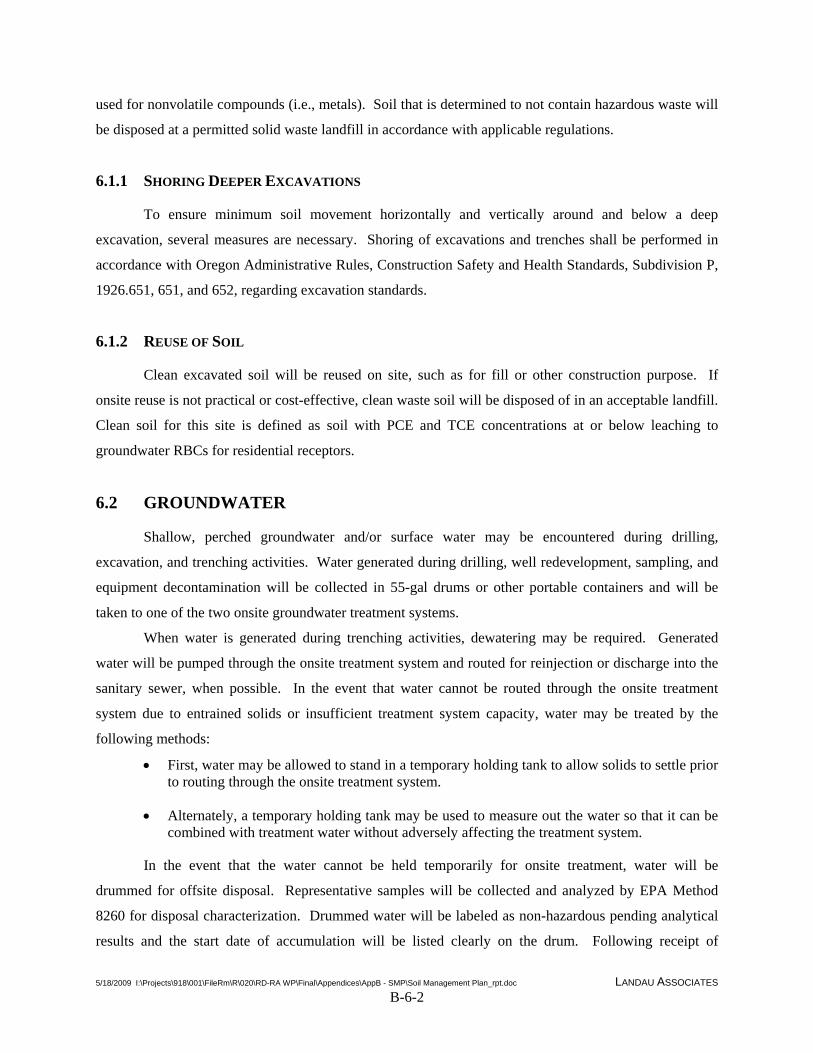
5/18/2009 I:\Projects\918\001\FileRm\R\020\RD-RA WP\Final\Appendices\AppB - SMP\Soil Management Plan_rpt.doc LANDAU ASSOCIATES B-6-2
used for nonvolatile compounds (i.e., metals). Soil that is determined to not contain hazardous waste will
be disposed at a permitted solid waste landfill in accordance with applicable regulations.
6.1.1 SHORING DEEPER EXCAVATIONS
To ensure minimum soil movement horizontally and vertically around and below a deep
excavation, several measures are necessary. Shoring of excavations and trenches shall be performed in
accordance with Oregon Administrative Rules, Construction Safety and Health Standards, Subdivision P,
1926.651, 651, and 652, regarding excavation standards.
6.1.2 REUSE OF SOIL
Clean excavated soil will be reused on site, such as for fill or other construction purpose. If
onsite reuse is not practical or cost-effective, clean waste soil will be disposed of in an acceptable landfill.
Clean soil for this site is defined as soil with PCE and TCE concentrations at or below leaching to
groundwater RBCs for residential receptors.
6.2 GROUNDWATER
Shallow, perched groundwater and/or surface water may be encountered during drilling,
excavation, and trenching activities. Water generated during drilling, well redevelopment, sampling, and
equipment decontamination will be collected in 55-gal drums or other portable containers and will be
taken to one of the two onsite groundwater treatment systems.
When water is generated during trenching activities, dewatering may be required. Generated
water will be pumped through the onsite treatment system and routed for reinjection or discharge into the
sanitary sewer, when possible. In the event that water cannot be routed through the onsite treatment
system due to entrained solids or insufficient treatment system capacity, water may be treated by the
following methods:
• First, water may be allowed to stand in a temporary holding tank to allow solids to settle prior to routing through the onsite treatment system.
• Alternately, a temporary holding tank may be used to measure out the water so that it can be combined with treatment water without adversely affecting the treatment system.
In the event that the water cannot be held temporarily for onsite treatment, water will be
drummed for offsite disposal. Representative samples will be collected and analyzed by EPA Method
8260 for disposal characterization. Drummed water will be labeled as non-hazardous pending analytical
results and the start date of accumulation will be listed clearly on the drum. Following receipt of
5/18/2009 I:\Projects\918\001\FileRm\R\020\RD-RA WP\Final\Appendices\AppB - SMP\Soil Management Plan_rpt.doc LANDAU ASSOCIATES B-6-3
analytical results of wastewater, action levels of 0.7 mg/L for PCE and 0.5 milligrams per liter (mg/L) for
TCE will be used to determine if the wastewater can be disposed of without considering it as hazardous
waste. A waste removal contractor will be contacted to dispose of the water in accordance with
applicable regulations.
6.3 PERSONAL PROTECTIVE EQUIPMENT AND EQUIPMENT DISPOSAL
Disposable PPE will be double-bagged or placed in 55-gal drums and will then be disposed of as
a solid waste in an appropriate solid waste facility. Equipment will be decontaminated with a water rinse
and/or steam-cleaned, as appropriate.
5/18/2009 I:\Projects\918\001\FileRm\R\020\RD-RA WP\Final\Appendices\AppB - SMP\Soil Management Plan_rpt.doc LANDAU ASSOCIATES B-7-1
7.0 RECORDKEEPING AND REPORTING
Recordkeeping associated with soil management will include sampling and analysis
documentation (i.e., chain-of-custody forms, sampling logs); entries in field notebooks regarding
container identification and disposition, and dates of water treatment and discharge; analytical results for
soil samples; and documentation of proper soil disposal. This information will be compiled and
submitted to DEQ with the quarterly progress reports.
5/18/2009 I:\Projects\918\001\FileRm\R\020\RD-RA WP\Final\Appendices\AppB - SMP\Soil Management Plan_rpt.doc LANDAU ASSOCIATES B-8-1
8.0 USE OF THIS REPORT
This Soil Management Plan has been prepared for the exclusive use of Lejar Enterprises, LLC
and its designated agents for specific application to the former Oregon Fir Supply site. No other party is
entitled to rely on the information, conclusions, and recommendations included in this document without
the express written consent of Landau Associates. Further, the reuse of information, conclusions, and
recommendations provided herein for extensions of the project or for any other project, without review
and authorization by Landau Associates, shall be at the user’s sole risk. Landau Associates warrants that
within the limitations of scope, schedule, and budget, our services have been provided in a manner
consistent with that level of care and skill ordinarily exercised by members of the profession currently
practicing in the same locality under similar conditions as this project. We make no other warranty, either
express or implied.
This document has been prepared under the supervision and direction of the following key staff.
LANDAU ASSOCIATES, INC.
Jessica R. Kruczek, P.E. Project Engineer JRK/ccy
5/18/2009 I:\Projects\918\001\FileRm\R\020\RD-RA WP\Final\Appendices\AppB - SMP\Soil Management Plan_rpt.doc LANDAU ASSOCIATES B-9-1
9.0 REFERENCES
DEQ. 2009. Record of Decision, Selected Remedial Action for Oregon Fir Supply Site, Portland, Oregon, ECSI #1220. Oregon Department of Environmental Quality. February 26. Ecology. 1995. Guidance for Remediation of Petroleum-Contaminated Soils. Publication No. 91-30. Washington State Department of Ecology, Toxics Cleanup Program. Updated November. Landau Associates. 2009. Sampling and Analysis Plan, Former Oregon Fir Supply Site, Portland, Oregon. Prepared for Lejar Enterprises, LLC. May 19.
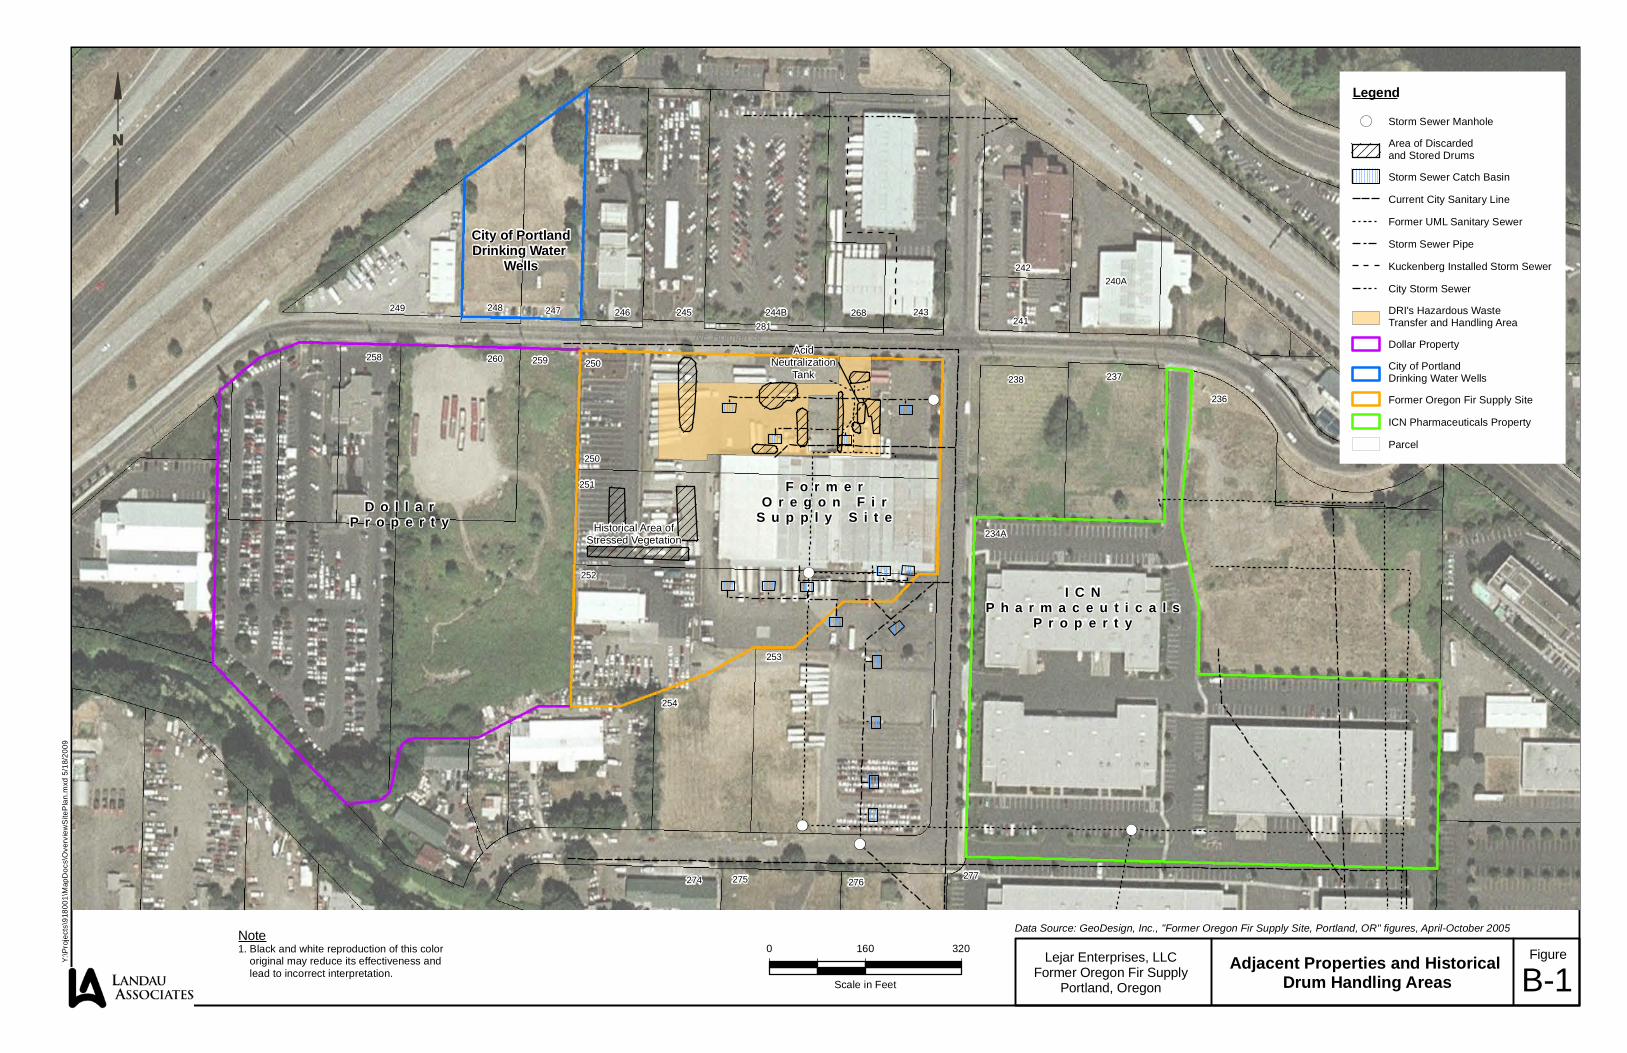
NE Holman St
NE 11
2th Av
e
252
253
254
250
251
250
247 246 245 244B 268 243
I C NP h a r m a c e u t i c a l s
P r o p e r t y
F o r m e rO r e g o n F i r
S u p p l y S i t e
City of PortlandDrinking Water
Wells
D o l l a rP r o p e r t y Historical Area of
Stressed Vegetation
248249
281
242
241
240A
238 237
236
234A
259260258
274 275 276277
AcidNeutralization
Tank
0 160 320
Scale in Feet
Data Source: GeoDesign, Inc., "Former Oregon Fir Supply Site, Portland, OR" figures, April-October 2005
Lejar Enterprises, LLCFormer Oregon Fir Supply
Portland, Oregon
Adjacent Properties and Historical Drum Handling Areas
Figure
B-1
Y:\P
roje
cts\
9180
01\M
apD
ocs\
Ove
rvie
wS
iteP
lan.
mxd
5/1
8/20
09
Legend
Storm Sewer Manhole
Area of Discardedand Stored Drums
Storm Sewer Catch Basin
Current City Sanitary Line
Former UML Sanitary Sewer
Storm Sewer Pipe
Kuckenberg Installed Storm Sewer
City Storm Sewer
DRI's Hazardous WasteTransfer and Handling Area
Dollar Property
City of PortlandDrinking Water Wells
Former Oregon Fir Supply Site
ICN Pharmaceuticals Property
Parcel
Note1. Black and white reproduction of this color original may reduce its effectiveness and lead to incorrect interpretation.
APPENDIX C
Sampling and Analysis Plan
333 SW 5th Avenue, Suite 700 Portland, OR 97204
(503) 542-1080
July 24, 2009
Prepared for
Lejar Enterprises, LLC P.O. Box 56027
Portland, Oregon 97218
Sampling and Analysis Plan Former Oregon Fir Supply Site
Portland, Oregon
9/08/09 I:\Projects\918\001\FileRm\R\020\RD-RA WP\Final\Appendices\AppC - SAP\RDRA_SAP_rpt_a.doc LANDAU ASSOCIATES C-ii
TABLE OF CONTENTS
Page
LIST OF ABREVIATIONS AND ACRONYMS C-iv
1.0 INTRODUCTION 1-1
2.0 IMPLEMENTATION COMPONENTS 2-1
3.0 FIELD PROCEDURES 3-1 3.1 SOIL SAMPLING PROCEDURES 3-2 3.2 GROUNDWATER SAMPLING PROCEDURES 3-2
3.2.1 Plume 1 Compliance and Post- Treatment Monitoring 3-2 3.2.2 Plumes 2 through 4 Baseline, Performance, and Post-Treatment Monitoring 3-3 3.2.3 Semiannual and Plume 5 Post-Treatment Monitoring 3-3
3.3 SUB-SLAB VAPOR SAMPLING PROCEDURES 3-4
4.0 SAMPLE DOCUMENTATION AND HANDLING 4-1 4.1 SAMPLE DOCUMENTATION 4-1 4.2 SAMPLE CONTAINERS AND LABELS 4-1
4.2.1 Containers 4-1 4.2.2 Labels 4-1
4.3 SAMPLE STORAGE AND TRANSPORT 4-2
5.0 EQUIPMENT DECONTAMINATION 5-1 5.1 DECONTAMINATION 5-1 5.2 MANAGEMENT OF DECONTAMINATION RESIDUALS 5-1
6.0 QUALITY ASSURANCE/QUALITY CONTROL 6-1 6.1 FIELD AND LABORATORY INSTRUMENT QUALITY ASSURANCE / QUALITY
CONTROL PROCEDURES 6-2 6.2 QUALITY ASSURANCE PROCEDURES FOR SAMPLE ANALYSES 6-3 6.3 QUALITY CONTROL SAMPLES 6-3
6.3.1 Field Quality Control Samples 6-3 6.3.2 Laboratory Quality Control Samples 6-4
6.4 QUALITY ASSURANCE / QUALITY CONTROL PROCEDURES USED TO ASSESS DATA 6-5 6.4.1 Precision 6-5 6.4.2 Accuracy 6-5 6.4.3 Representativeness 6-6 6.4.4 Completeness 6-6 6.4.5 Comparability 6-6
6.5 LABORATORY DATA REPORTS 6-6 6.6 DATA VALIDATION 6-7
7.0 USE OF THIS REPORT 7-1
8.0 REFERENCES 8-1
9/08/09 I:\Projects\918\001\FileRm\R\020\RD-RA WP\Final\Appendices\AppC - SAP\RDRA_SAP_rpt_a.doc LANDAU ASSOCIATES C-iii
LIST OF FIGURES
Figure Title
C-1 Vicinity Map C-2 Site Plan and Well Location Map
LIST OF TABLES
Table Title
C-1 Plume 1 Sampling Matrix C-2 Plumes 2 through 4 Sampling Matrix C-3 Plume 5 Post-Treatment Sampling Matrix C-4 Sample Containers and Preservatives C-5 Analytical Methods and Quantitation Limit Goals
LIST OF ATTACHMENTS
Attachment Title
C-1 Field Forms C-2 EPA Low Stress (Low Flow ) Sampling Procedure
9/08/09 I:\Projects\918\001\FileRm\R\020\RD-RA WP\Final\Appendices\AppC - SAP\RDRA_SAP_rpt_a.doc LANDAU ASSOCIATES C-iv
LIST OF ABBREVIATIONS AND ACRONYMS
CFR Code of Federal Regulations COCs Contaminants of Concern DEQ Oregon Department of Environmental Quality DQI Data Quality Indicator DQO Data Quality Objective EPA U.S. Environmental Protection Agency IC Institutional Control Lejar Lejar Enterprises, LLC PARCC Precision, Accuracy, Representativeness, Completeness, and Comparability PCE Tetrachloroethene PCP Pentachlorophenol PID Photoionization Detector RAO Remedial Action Objective RBC Risk-Based Concentration RD/RA Remedial Design/Remedial Action RPD Relative Percent Difference SAP Sampling and Analysis Plan SVOC Semivolatile Organic Compound TCE Trichloroethene TCLP Toxicity Characteristic Leaching Procedure TGA Troutdale Gravel Aquifer VOC Volatile Organic Compound µg/L Micrograms per Liter
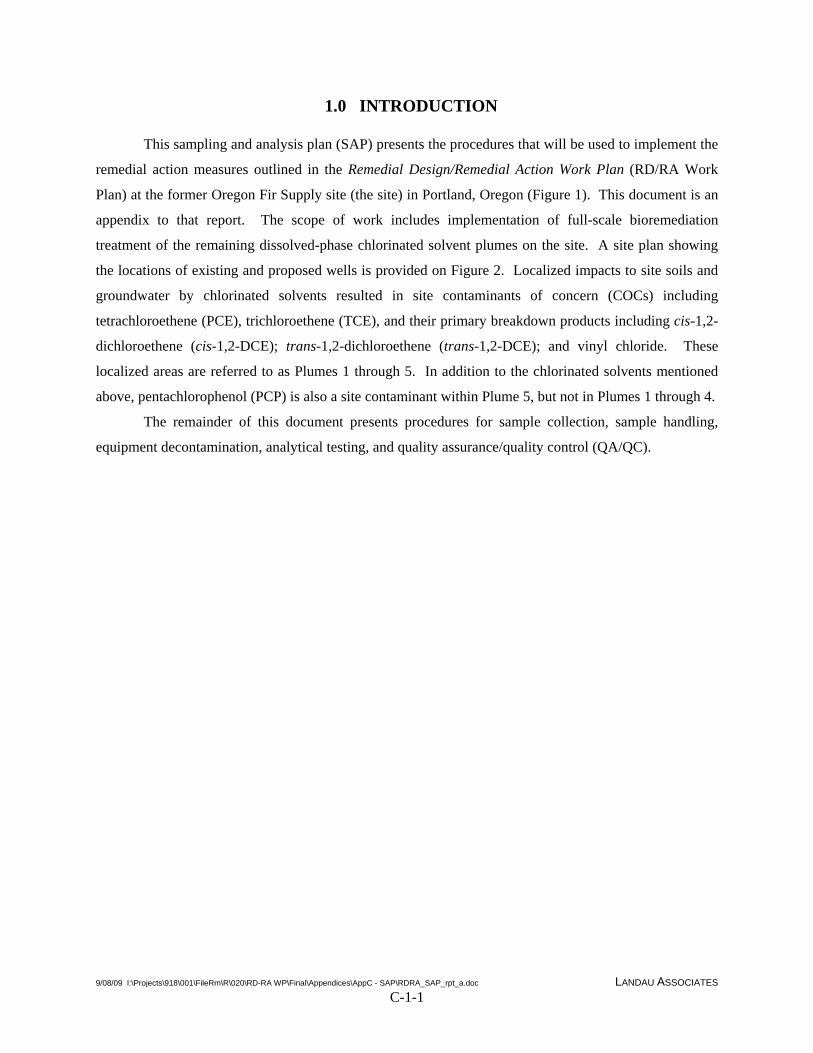
9/08/09 I:\Projects\918\001\FileRm\R\020\RD-RA WP\Final\Appendices\AppC - SAP\RDRA_SAP_rpt_a.doc LANDAU ASSOCIATES C-1-1
1.0 INTRODUCTION
This sampling and analysis plan (SAP) presents the procedures that will be used to implement the
remedial action measures outlined in the Remedial Design/Remedial Action Work Plan (RD/RA Work
Plan) at the former Oregon Fir Supply site (the site) in Portland, Oregon (Figure 1). This document is an
appendix to that report. The scope of work includes implementation of full-scale bioremediation
treatment of the remaining dissolved-phase chlorinated solvent plumes on the site. A site plan showing
the locations of existing and proposed wells is provided on Figure 2. Localized impacts to site soils and
groundwater by chlorinated solvents resulted in site contaminants of concern (COCs) including
tetrachloroethene (PCE), trichloroethene (TCE), and their primary breakdown products including cis-1,2-
dichloroethene (cis-1,2-DCE); trans-1,2-dichloroethene (trans-1,2-DCE); and vinyl chloride. These
localized areas are referred to as Plumes 1 through 5. In addition to the chlorinated solvents mentioned
above, pentachlorophenol (PCP) is also a site contaminant within Plume 5, but not in Plumes 1 through 4.
The remainder of this document presents procedures for sample collection, sample handling,
equipment decontamination, analytical testing, and quality assurance/quality control (QA/QC).
9/08/09 I:\Projects\918\001\FileRm\R\020\RD-RA WP\Final\Appendices\AppC - SAP\RDRA_SAP_rpt_a.doc LANDAU ASSOCIATES C-2-1
2.0 IMPLEMENTATION COMPONENTS
The implementation of Remedial Action at the site will be composed of the following elements:
• System construction of a full-scale bioremediation system to address dissolved-phase contamination across the site. This includes drilling new extraction and injection wells; excavation of trenches for plumbing and electrical connections between wells and the bioremediation treatment system; system component installation and site restoration.
• Water samples will be collected after installation of the system to establish baseline conditions at treatment areas. Performance monitoring will be conducted after the system startup and through the end of treatment. Post-treatment semiannual groundwater monitoring will occur for a period of 2 years after treatment is completed to verify sustained cleanup levels.
• MW-111 will be monitored on a semiannual basis to track contaminant concentrations in the Troutdale Gravel Aquifer (TGA). If contaminant concentrations of trichloroethene (TCE) in the MW-111 exceed the Federal Maximum Contaminant Level (MCL) of 5 µg/L for two consecutive monitoring events, contingency operation of the pump-and-treat system for the southwestern Plume 1 in the TGA may be employed. Operation of the Plume 1 system includes associated compliance monitoring consisting of monthly discharge sampling and reporting to the City of Portland, Oregon.
• Continued post-treatment monitoring for the pilot test conducted for Plume 5 on a semiannual basis until 2 years post-treatment meet criteria.
• Vapor samples will be collected annually during active remediation from the four sub-slab vapor ports in the onsite warehouse. Samples will be collected in Summa canisters and sent to Environmental Analytical Services, Inc. in San Luis Obispo, California for standard turnaround analysis.
• Reporting of the investigation results to Lejar Enterprises, LLC and the Oregon Department of Environmental Quality (DEQ) via status reports and an annual report.
• Once post-treatment monitoring for all treatment areas meet criteria for a period of 2 years, a request for No Further Action will be submitted to DEQ.
9/08/09 I:\Projects\918\001\FileRm\R\020\RD-RA WP\Final\Appendices\AppC - SAP\RDRA_SAP_rpt_a.doc LANDAU ASSOCIATES C-3-1
3.0 FIELD PROCEDURES
Field activities associated with this SAP include the installation of the remediation system and
subsequent groundwater and sub-slab vapor monitoring. These activities are summarized below and
related sampling procedures are described in the following sections.
Remediation system installation consists primarily of well installation and trenching activities.
Drilling activities to install injection and extraction wells will be recorded on a Log of Exploration
(Attachment 1), which will indicate recovery, soil lithology, the presence of groundwater, any evidence of
contamination observed during activities, and any other information pertinent to the investigation. Each
log will also identify the name of the operator(s), the type of equipment used to recover a sample, starting
and finishing dates and times for explorations, and sampling locations. Previous explorations indicated
the subsurface material is silty sand to sandy silt, with sand and clay lenses. Excavation activities for the
trenches to connect the wells to the treatment building will be documented by Landau Associates
representatives.
Groundwater monitoring at the site will include baseline, performance, and post-treatment
monitoring. Baseline monitoring of the new and existing wells will be performed to determine conditions
prior to treatment. When startup of the treatment system commences, performance monitoring will begin.
Treatment systems include the pump-and-treat system addressing Plume 1 and the in situ bioremediation
systems addressing Plumes 2 though 5. A final round of performance monitoring will occur at the end of
treatment, and then monitoring will transition to post-treatment monitoring when groundwater monitoring
will occur semiannually. In addition, groundwater monitoring includes semiannual events that include
monitoring wells not otherwise accounted for as part of treatment system performance monitoring. The
purpose of including these semiannual wells is to assess possible contaminant impacts to the TGA,
downgradient of treatment areas, and along the property boundaries.
As a condition of the ROD, sub-slab vapor sampling ports located within the warehouse building
will be tested on a semi-annual schedule during implementation of in situ remediation. Four vapor probes
were installed previously (VP-1 through VP-4) in the floor of the warehouse to collect samples of sub-
slab vapors. These probes will be used to collect samples of sub-slab vapors once per year in April,
correlating with the high-water semiannual groundwater monitoring event, during active treatment. In
addition, one final sub-slab vapor sample will be collected along with the final round of post-treatment
monitoring to gain site closure, as requested by DEQ.
9/08/09 I:\Projects\918\001\FileRm\R\020\RD-RA WP\Final\Appendices\AppC - SAP\RDRA_SAP_rpt_a.doc LANDAU ASSOCIATES C-3-2
3.1 SOIL SAMPLING PROCEDURES
Soil samples will be collected from material generated from drilling and trenching activities.
In-field screening with a photoionization detector (PID) will indicate the presence of contaminants and be
used to determine any necessary upgrades in the level of safety. Generated soil will be contained in
55-gallon drums, roll-off boxes, or stockpiled. One composite sample per boring/well and per roll-off
box will be collected to characterize the soil for disposal per the Soil Management Plan, included as
Appendix B of the RD/RA Work Plan.
Soil samples will be collected and placed in laboratory-supplied sampling containers for
laboratory analysis. Each sample will be properly labeled, identifying each sample by name/location (see
Section 4.2), date and time, and sampler’s initials. Material will be stored in a designated area on the
former Oregon Fir site until analytical results are received and disposal is coordinated.
3.2 GROUNDWATER SAMPLING PROCEDURES
Groundwater sampling will occur from various wells including extraction wells, injection wells,
and monitoring wells. At Plumes 2 through 4, bulk aquifer samples will be collected at the treatment
system from extraction wells by placing the sample container beneath the designated sample port.
Groundwater samples from injection and monitoring wells will be collected using clean, dedicated
polyethylene tubing, and a peristaltic pump. Samples will be collected in laboratory-provided containers.
Prior to sample collection, water levels are measured and recorded site-wide, including adjacent
Dollar property monitoring wells DMW-1, DMW-2, DMW-3, DMW-4, DMW-5, DMW-6, DMW-7,
DMW-8, DMW-9, and DMW-10. For baseline and semiannual post-treatment sampling directly from
injection and monitoring wells, groundwater samples will be collected using low-flow sampling
techniques (Attachment 2; EPA 1996). Extraction well samples will be collected from sample valves in
the ISD™ equipment enclosure. Samples will be analyzed for volatile organic compounds (VOCs), PCP,
nitrate, sulfate, methane/ethane/ethene, total organic carbon, and total phosphorus. Field parameters will
be collected, including pH, specific conductivity, temperature, dissolved oxygen, and oxidation reduction
potential using a flow-through cell. Ferrous iron will be testing using a Hach field sampling kit. A
summary of sampling parameters for each area of the site is provided on Tables 1 through 4.
3.2.1 PLUME 1 COMPLIANCE AND POST- TREATMENT MONITORING
Currently, a groundwater extraction system using activated carbon to treat groundwater has been
installed to address dissolved-phase contamination in the TGA in the southwestern area of the site (known
as Plume 1). The extraction system is currently offline, and will only be brought online should
9/08/09 I:\Projects\918\001\FileRm\R\020\RD-RA WP\Final\Appendices\AppC - SAP\RDRA_SAP_rpt_a.doc LANDAU ASSOCIATES C-3-3
contaminant concentrations in groundwater in the TGA increase above remedial action objectives
(RAOs), and after treatment commences in the Deep Overbank Deposits at Plume 2. If contaminant
concentrations of trichloroethene (TCE) in the MW-111 exceed the Federal Maximum Contaminant Level
(MCL) of 5 µg/L for two consecutive monitoring events, contingency operation of the pump-and-treat
system for the southwestern Plume 1 in the TGA may be employed. After the first exceedance of MCLs
for TCE, discharge options for the carbon treatment system will be re-evaluated to ensure the most cost-
effective method for disposal of discharge water is utilized.
If the groundwater extraction system is put into operation, the extraction system will need to be
sampled monthly to assure compliance with stormwater benchmarks at the point of discharge. In
addition, system influent (EX-1) and mid-carbon samples will be collected and analyzed for VOCs to
assess treatment efficiency and monitor the carbon units for breakthrough.
Monitoring wells in the Plume 1 treatment area include MW-105, MW-110, MW-111, and
MW-113 and are shown on Figure 3. These wells will be monitored on a semiannual basis until 2 years
after cleanup levels are met, per DEQ requirements for closure. A matrix summarizing samples for
collection, monitoring frequency and parameters for analysis is provided in Table 1.
3.2.2 PLUMES 2 THROUGH 4 BASELINE, PERFORMANCE, AND POST-TREATMENT MONITORING
Groundwater monitoring will consist of baseline, performance, and post-treatment monitoring to
evaluate treatment progress and achievement of the RAO treatment goals. Baseline monitoring will
involve sampling of all monitoring wells and extraction wells and one-third of the injection wells selected
based on field-screening results and spatial distribution. Performance monitoring will involve bulk
aquifer monitoring through extraction well sampling, and discrete aquifer monitoring through sampling of
monitoring wells and injection wells. At the end of active treatment, a final performance monitoring
event will be conducted, and then monitoring will transition to semiannual, post-treatment monitoring.
Post-treatment monitoring will involve sampling of all monitoring wells and up to one-third of injection
wells; injection wells sampled are anticipated to be wells for which baseline monitoring was performed.
Table 2 presents the sampling schedule and parameters of analysis for this area of the site.
3.2.3 SEMIANNUAL AND PLUME 5 POST-TREATMENT MONITORING
After an initial treatment period of 6 months for site COCs and PCP, the bioremediation pilot test
in the Plume 5 area was restarted as a polishing step during the high groundwater season between March
15 and May 26, 2008, at which point active remediation in Plume 5 was considered complete pending
9/08/09 I:\Projects\918\001\FileRm\R\020\RD-RA WP\Final\Appendices\AppC - SAP\RDRA_SAP_rpt_a.doc LANDAU ASSOCIATES C-3-4
closure monitoring. The latest round of post-remediation monitoring was conducted the week of April
20, 2009. Groundwater monitoring at Plume 5 will continue through April 2010 on a semiannual basis in
conjunction with semiannual monitoring at the rest of the site, as outlined in Table 3 and at location
shown on Figure 4.
3.3 SUB-SLAB VAPOR SAMPLING PROCEDURES
As a condition of the ROD, sub-slab vapor sampling ports located within the warehouse building
will be tested on a semi-annual schedule during implementation of in situ remediation. Four vapor probes
were installed previously (VP-1 through VP-4) in the floor of the warehouse to collect samples of sub-
slab vapors. These probes will be used to collect samples of sub-slab vapors once per year in April,
correlating with the high-water semiannual groundwater monitoring event, during active treatment. In
addition, one final sub-slab vapor sample will be collected along with the final round of post-treatment
monitoring to gain site closure, as requested by DEQ.
The existing sample ports will be fitted with a hose-barb that can be connected via dedicated
silicon tubing to the Summa canister forming an airtight connection. When the Summa canister is
uncapped and the valve opened, the vacuum will pull the air from the well up and into the canister.
Sample collection is complete when air can no longer be heard entering the vacuum canister and the
vacuum gauge indicates zero vacuum. After the canister is full, the valve will be tightly closed and the
sample port sealed. Samples will be shipped under chain-of-custody procedures to the laboratory for
TO-15 analysis of site COCs. The samples will not be analyzed for PCP, as this COC is not anticipated
to volatilize to indoor air given its low vapor pressure (0.00011 millimeters at 20°C). Sample locations,
frequency and analytical methods are summarized in Table 3.
9/08/09 I:\Projects\918\001\FileRm\R\020\RD-RA WP\Final\Appendices\AppC - SAP\RDRA_SAP_rpt_a.doc LANDAU ASSOCIATES C-4-1
4.0 SAMPLE DOCUMENTATION AND HANDLING
The following sections describe sample documentation and sampling procedures.
4.1 SAMPLE DOCUMENTATION
A record of field activities will be maintained. Documentation will include:
• Recordkeeping by field personnel of primary field activities
• Records of all samples collected for analysis via sample collection forms
• Use of sample labels and chain-of-custody tracking forms for all samples collected for analysis.
Field logbooks will be used to document descriptions of sampling activities, conferences
associated with field sampling activities, sampling personnel, weather conditions, and modifications to
the procedures and plans identified in the project work plan. The field logbooks are intended to provide
sufficient data and observations to enable participants to reconstruct events that occurred during the
sampling period. In addition to logbooks, groundwater quality parameters will be recorded on a
Groundwater Sampling Form (Attachment 1), and a summary of the sampling event recorded in a Field
Report (Attachment 1).
4.2 SAMPLE CONTAINERS AND LABELS
4.2.1 CONTAINERS
Pre-cleaned sample containers will be purchased from a supplier or provided by the laboratory.
Sample containers for volatile analyses will be filled completely to minimize headspace. The types of
sample containers to be used and sample volumes for each analysis are provided in Table 4.
4.2.2 LABELS
Sample labels will be of waterproof material and self-adhering. Whenever possible, sample
labels will be pre-printed prior to field mobilization; in the field, a pen with indelible ink will be used to
complete each label. Each sample label will contain the project number, sample identification,
preservation technique, requested analyses, date and time of collection, and initials of the person(s)
preparing the sample.
Identifications for groundwater samples, soil samples and sub-slab samples collected will follow
this convention: “Location – Date”
9/08/09 I:\Projects\918\001\FileRm\R\020\RD-RA WP\Final\Appendices\AppC - SAP\RDRA_SAP_rpt_a.doc LANDAU ASSOCIATES C-4-2
Where Location refers to the well being sampled, the vapor point being sampled, or the source of the soil
sample at the site, and the date is identified in MMDDYYYY format.
4.3 SAMPLE STORAGE AND TRANSPORT
All groundwater and soil samples will be stored in picnic-style coolers filled with ice or reusable
frozen gel packs (i.e., “blue ice”) capable of sustaining the required storage/transit temperature of 4ºC
until delivery to and receipt by the laboratory. At the end of each day, samples sent to the analytical
laboratory will be inventoried. A picnic cooler will be used as a shipping container. Samples will be
picked up or delivered by hand or overnight courier to the analytical laboratory.
In preparation for shipping soil and groundwater samples, the drain plug will be taped shut. Ice
or reusable ice packs will be replenished as necessary to maintain the required storage/transit temperature
of 4ºC until delivery to and receipt by the laboratory. Samples will be packaged carefully to avoid
breakage or cross-contamination and will be shipped to the offsite analytical laboratory. The chain-of-
custody record accompanying the samples to the laboratory will be placed inside a separate plastic bag
and taped inside the cooler lid. The cooler will be taped shut and custody seals will be placed on the
cooler.
Soil, groundwater, and vapor samples will be transported to the laboratory within 72 hours of
collection (unless analyte-specific holding times require a quicker turnaround). The transportation and
handling of samples will be accomplished in a manner that not only protects the integrity of the sample
but also prevents any detrimental effects due to the possible hazardous nature of environmental samples.
Regulations for packaging, marking, labeling, and shipping hazardous materials are promulgated by the
U.S. Department of Transportation in the Code of Federal Regulations (CFR) at 49 CFR 173.6 and
173.24.
Vapor samples will be stored in the box the Summa canisters arrived in. Extra packing material
may be added to the box prior to sending samples to the laboratory. There are no temperature
requirements for air samples.
Sample custody tracking (Section 7.0) will be in effect during storage and transport activities.
Sample custody tracking will be used so that an accurate, written record exists that can be used to trace
the possession and handling of samples so that their quality and integrity can be maintained from
collection until completion of all required analyses. Adequate sample custody will be achieved by
maintaining approved field and analytical documentation. Such documentation includes the chain-of-
custody record, which is initially completed by the sampler and is thereafter signed by those individuals
who accept custody of the sample. A sample will be considered to be in custody if it is:
• In someone’s physical possession;
9/08/09 I:\Projects\918\001\FileRm\R\020\RD-RA WP\Final\Appendices\AppC - SAP\RDRA_SAP_rpt_a.doc LANDAU ASSOCIATES C-4-3
• In someone’s view;
• Locked up or secured in a locked container or otherwise sealed so that tampering will be evident; or
• Kept in a secured area, restricted to authorized personnel only.
In the field, sample custody tracking will be accomplished through the following:
• As few persons as possible will handle samples.
• The sample collector will be personally responsible for the completion of the chain-of-custody record, and the care and custody of collected samples until they are transferred to another person or otherwise dispatched under chain-of-custody protocols.
For sample shipment, the following custody tracking procedures will be followed:
• The coolers in which the samples are shipped will be accompanied by the chain-of-custody record identifying their contents. The original record and laboratory copy will accompany the shipment (sealed inside the shipping container). The other copy will be distributed as appropriate to Landau Associates’ QA personnel.
• Shipping containers will be sealed with custody seals for shipment to the laboratory. The method of shipment, name of courier, and other pertinent information will be entered in the “Remarks” section of the chain-of-custody record.
• If sent by mail, the package will be registered with return receipt requested. If sent by common carrier, a bill of lading will be used. Freight bills, postal services receipts, and bills of lading will be retained as part of the permanent documentation.
In the laboratory, custody tracking procedures will include the following:
• A designated sample custodian at the laboratory will accept custody of the shipped samples, verify the integrity of the custody seals, and certify that the sample identification numbers match those on the chain-of-custody record.
• The custodian will enter sample identification number data into a bound logbook, which is arranged by a project code and station number. If samples arrive with broken custody seals or broken containers, the laboratory will note this on the chain-of-custody record and will immediately notify Landau Associates.
• The laboratory will maintain sample security and custody thereafter as appropriate and as outlined in the laboratory’s QA plan and in accordance with this plan.
When samples are transferred, the individuals relinquishing and receiving the samples will sign
the chain-of-custody record and document the date and time of transfer. The sample collector will sign
the form in the first signature space. The only exception to this is the shipment of samples via
commercial carriers. Because sample containers are sealed with the chain-of-custody record inside prior
to delivery to the carrier, the custody signature will be that of the individual taking possession of the
samples from the carrier at its final destination. Each person taking custody will observe whether the
9/08/09 I:\Projects\918\001\FileRm\R\020\RD-RA WP\Final\Appendices\AppC - SAP\RDRA_SAP_rpt_a.doc LANDAU ASSOCIATES C-4-4
shipping container is correctly sealed and in the same condition as noted by the previous custodian;
deviations will be noted on the appropriate section of the chain-of-custody record.
Proper documentation of sample custody will be verified during regular review of the data
validation package.
9/08/09 I:\Projects\918\001\FileRm\R\020\RD-RA WP\Final\Appendices\AppC - SAP\RDRA_SAP_rpt_a.doc LANDAU ASSOCIATES C-5-1
5.0 EQUIPMENT DECONTAMINATION
This section describes equipment decontamination and management of decontamination
residuals.
5.1 DECONTAMINATION
Excavation and sampling equipment (such as the bucket of the excavator, stainless steel bowls,
spoons) that come directly in contact with potentially contaminated materials during the investigation will
be decontaminated prior to and in between sample collection to reduce the possibility of cross-
contamination. Groundwater samples will be collected with dedicated sample tubing and/or equipment,
so decontamination will not be required.
Decontamination of large equipment generally will consist of a high-pressure hot water or steam
wash; decontamination of smaller sampling equipment will consist of the following steps:
• Spray or scrub soiled equipment
• Wash with an Alconox soap-water solution
• Rinse with tap water
• Rinse with de-ionized or distilled water.
If heavy contamination is encountered and sampling equipment becomes coated (e.g., with solvent or oil),
the equipment may require application of a cleaning solvent (usually hexane, sprayed from a bottle) and
subsequent wipe-down or distilled water rinse as an additional decontamination step. This not anticipated
for this site.
5.2 MANAGEMENT OF DECONTAMINATION RESIDUALS
All decontamination fluids and solids that are not immediately disposed of as solid waste will be
consolidated in drums in a controlled-access area of the site. All containers will be clearly labeled with
non-weathering materials as follows:
• “Bioremediation full scale construction”
• Date and time of collection
• Source (locations) and medium (sediment, water)
• “For questions, contact J. Kruczek at Landau Associates – (503) 542-1080.”

9/08/09 I:\Projects\918\001\FileRm\R\020\RD-RA WP\Final\Appendices\AppC - SAP\RDRA_SAP_rpt_a.doc LANDAU ASSOCIATES C-5-2
Hexane is not expected to be necessary during this investigation, but, if used, hexane residuals
(including overspray and rags) will be collected separately from other decontamination residuals for
separate disposition. Unless grossly contaminated, personal protective equipment will be bagged and
disposed of as solid waste.
9/08/09 I:\Projects\918\001\FileRm\R\020\RD-RA WP\Final\Appendices\AppC - SAP\RDRA_SAP_rpt_a.doc LANDAU ASSOCIATES C-6-1
6.0 QUALITY ASSURANCE/QUALITY CONTROL
This section of the SAP establishes QA objectives for the implementation of the work plan and
QC procedures developed to meet the investigation QA objectives. The overall data quality objective
(DQO) for project implementation is to establish confidence that investigation data are of known,
appropriate, and sufficient quality to support their intended use, which is to estimate quantities and
locations of materials of environmental concern during full-scale bioremediation implementation and in
subsequent groundwater monitoring. To accomplish this goal, project data should be technically sound,
statistically valid, and properly documented, having been evaluated against established criteria for the
principal data quality indicators (DQIs) [i.e., precision, accuracy, representativeness, completeness, and
comparability (also referred to as PARCC)], as defined in U.S. Environmental Protection Agency (EPA;
1998) guidance documents. The QA procedures presented in this plan were developed in accordance with
DEQ (1990) and EPA (1994a) guidance documents and were developed to accomplish the investigation
DQO.
Laboratory analyses to be conducted during this investigation will be in accordance with standard
EPA-approved methods (EPA 1986, as currently updated) and DEQ methods (DEQ 1996). The targeted
level of data quality is comparable to that obtained from the use of Contract Laboratory Program methods
(EPA 1994b,c), with the exception of the level of documentation required with submittal of the analytical
results from the laboratory. The analytical, documentation, and validation procedures established in this
QA plan are sufficient to achieve this level of data quality and, therefore, sufficient to support the
appropriate conclusions from the data.
Current control limits established by the EPA (or DEQ) and the laboratory for the cited analytical
methods will be used for evaluating the principal DQIs. Precision will be evaluated through the
collection and analysis of field and laboratory matrix spike duplicate samples, and laboratory accuracy
will be monitored through the use of matrix spike and surrogate spike samples. In field duplicates, both
field and laboratory variability are potential sources of error; therefore, both will be considered in any
investigation of relative percent difference (RPD) values outside the target control limits. Data
acceptability will be determined on the basis of the results of a qualitative review of error sources and,
therefore, will be case-specific.
The QA objectives for representativeness, completeness, and comparability will be achieved by:
• Collecting representative samples
• Implementing standardized and uniform field and laboratory procedures
• Reporting data in conventional and standard units.
9/08/09 I:\Projects\918\001\FileRm\R\020\RD-RA WP\Final\Appendices\AppC - SAP\RDRA_SAP_rpt_a.doc LANDAU ASSOCIATES C-6-2
PARCC parameters are further defined and discussed later in this plan.
Quantitation limits will generally equal those listed in the standard EPA methods (EPA 1986, as
currently updated) or those currently achievable by the laboratory depending on effects by matrix
interferences. The project quantitation limit goals are provided in Table 5.
6.1 FIELD AND LABORATORY INSTRUMENT QUALITY ASSURANCE / QUALITY CONTROL PROCEDURES
Field and laboratory instruments will be properly operated, calibrated, and maintained by
qualified personnel according to the manufacturer’s guidelines and recommendations, as well as criteria
in the analytical method. Documentation of routine and special preventive maintenance and calibration
information will be maintained in a field or laboratory logbook or reference file. Each maintenance and
calibration logbook entry will include the date and initials of the individual performing the activity. Field
instruments requiring calibration are typically a YSI multimeter and a photoionization detector (PID).
The analytical laboratory is responsible for maintaining laboratory instruments in proper working
order, including routine maintenance and calibration, and training of personnel in maintenance and
calibration procedures. Laboratory instruments will be properly calibrated with appropriate check
standards and calibration blanks for each parameter before beginning each analysis. Instrument
performance check standards, where required, and calibration blank results will be recorded in a
laboratory logbook dedicated to each instrument. At a minimum, the preventive maintenance schedules
contained in the EPA methods and in the equipment manufacturer’s instructions will be followed.
Laboratory calibration procedures and schedules will be as described in the laboratory QA/QC plan,
which will be available for review upon request.
Multipoint initial calibration will be performed on each instrument at the start of the project, after
each major interruption to the analytical instrument, and when any ongoing calibration does not meet
control criteria. Ongoing calibration will be performed daily for metals and organic analyses, and with
every sample batch for conventional parameters (when applicable) to track instrument performance.
Laboratory instrument blanks or continuing calibration blanks provide information on the
stability of the baseline established. Continuing calibration blanks will be analyzed immediately prior to
continuing calibration verification at a frequency of one continuing calibration blank for every 10 samples
analyzed at the instrument for inorganic analyses and every 21 hours for organic analyses. If the ongoing
calibration is out of control, the analysis must come to a halt until the source of the control failure is
eliminated or reduced to meet control specifications. All project samples analyzed while instrument
calibration was out of control will be reanalyzed.
9/08/09 I:\Projects\918\001\FileRm\R\020\RD-RA WP\Final\Appendices\AppC - SAP\RDRA_SAP_rpt_a.doc LANDAU ASSOCIATES C-6-3
6.2 QUALITY ASSURANCE PROCEDURES FOR SAMPLE ANALYSES
As noted previously, the analytical methods and quantitation limit goals for this investigation are
listed in Table 5. Changes in analytical methods will not be allowed without prior written documentation
from the laboratory regarding the desired substitution and its rationale, and prior written acceptance by
Landau Associates.
The project quantitation limits are recognized to be goals, because instances may arise where high
sample concentrations, nonhomogeneity of samples, or matrix interferences preclude achieving the
desired quantitation limits and associated QC criteria. If this occurs, the laboratory will report the
reason(s) for deviations from these quantitation limits or noncompliance with QC criteria and the missed
goals will be noted during data validation. Routine poorly substantiated noncompliance with the
quantitation limit goals will not be tolerated.
6.3 QUALITY CONTROL SAMPLES
Quality control samples consist of field and laboratory quality control samples.
6.3.1 FIELD QUALITY CONTROL SAMPLES
Internal QC will be assessed through specific QC samples collected, and/or measurements taken,
in the field and laboratory. The QC samples are used to evaluate PARCC of the analytical results for this
project (see detailed discussion of these parameters in the following section). The planned analytical
methods specify routine procedures required to verify that data are within proper QC limits. Additional
internal QC includes collection and analysis of a number of field and laboratory QC samples, which are
described in this section.
Field and laboratory QC samples will be used to evaluate data validity and representativeness.
Field and laboratory QC samples will include blind field duplicates, field trip blanks, laboratory matrix or
method spikes, laboratory matrix spike duplicates, laboratory duplicates, and laboratory method blanks.
Blind field duplicates will consist of split samples collected at a single sample location. Blind
field duplicates will be collected by alternately filling sample containers for both the original and the
corresponding duplicate sample at the same location to decrease variability between the duplicates, and
submitted “blind” to the laboratory as discrete samples (i.e., given unique sample identifiers to keep the
duplicate identity unknown to the laboratory). Blind field duplicates will be collected at a frequency of
one per 20 samples, not including QC samples, but not less than one duplicate per sampling event per
matrix (a sampling event, as defined for the purpose of QC sample frequency, consists of a set of samples
of similar matrix, collected within a regularly scheduled event or within a 14-calendar-day period). Blind
9/08/09 I:\Projects\918\001\FileRm\R\020\RD-RA WP\Final\Appendices\AppC - SAP\RDRA_SAP_rpt_a.doc LANDAU ASSOCIATES C-6-4
field duplicates will be analyzed for a suite equal to the union of all analyses requested during that
sampling event, for that matrix.
One trip blank will be analyzed per cooler containing aqueous samples. Trip blanks will be
provided by the laboratory with the sample containers and cooler, and will remain in the cooler
throughout the sampling event and during sample transport to the laboratory. Trip blanks will be
analyzed for VOCs to check for sample cross-contamination during storage and transport.
6.3.2 LABORATORY QUALITY CONTROL SAMPLES
Laboratory control samples consist of matrix spike duplicates and laboratory method blanks as
described in the sections below.
6.3.2.1 Laboratory Matrix Spike and Matrix Spike Duplicates
For each aqueous sample, a minimum of one laboratory matrix spike per 20 samples (not
counting QC samples), or one matrix spike sample per sampling event, if fewer than 20 samples are
obtained, will be analyzed for VOCs. These analyses will be performed to provide information on
accuracy and to verify that extraction and concentration levels are acceptable. The laboratory spikes will
follow EPA guidance for matrix spikes.
For each sample matrix, a minimum of one laboratory matrix spike duplicate (for volatile organic
analyses) or one laboratory duplicate (for inorganic analyses) per 20 samples (not counting QC samples)
or one matrix spike duplicate sample per sampling event, if fewer than 20 samples are obtained, will be
analyzed for all constituents. These analyses will be performed to provide information on the precision of
chemical analyses. The laboratory spikes will follow EPA guidance for matrix spike duplicates.
6.3.2.2 Laboratory Method Blanks
A minimum of one laboratory method blank per 20 samples, or one every 12 hours, or one per
batch of samples analyzed (if fewer than 20 samples are analyzed) will be analyzed for all parameters
conducted using standard analytical methods to assess possible cross-contamination introduced during the
analysis. In these analyses, the laboratory source of sample dilution water will be used when possible and
appropriate. Laboratory method blanks will contain the same reagents used for the associated sample
analyses. The generation and analysis of additional method, reagent, and glassware blanks may be
necessary to verify that analysis procedures do not contaminate samples.
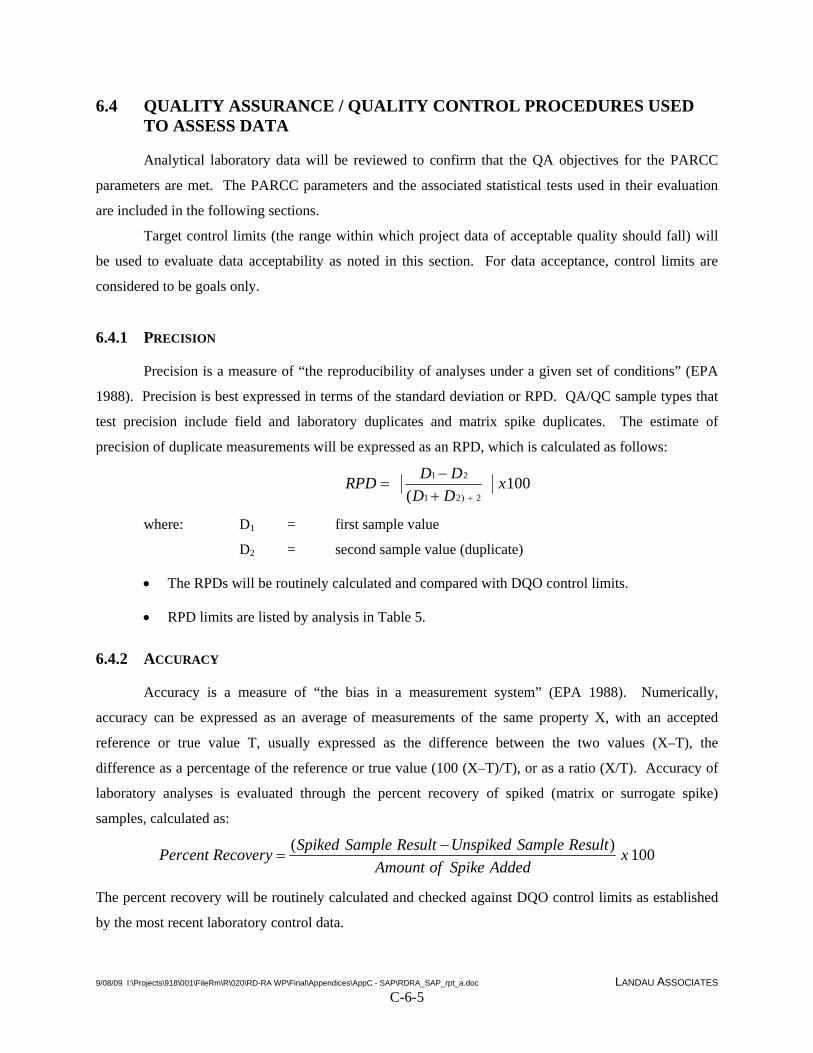
9/08/09 I:\Projects\918\001\FileRm\R\020\RD-RA WP\Final\Appendices\AppC - SAP\RDRA_SAP_rpt_a.doc LANDAU ASSOCIATES C-6-5
6.4 QUALITY ASSURANCE / QUALITY CONTROL PROCEDURES USED TO ASSESS DATA
Analytical laboratory data will be reviewed to confirm that the QA objectives for the PARCC
parameters are met. The PARCC parameters and the associated statistical tests used in their evaluation
are included in the following sections.
Target control limits (the range within which project data of acceptable quality should fall) will
be used to evaluate data acceptability as noted in this section. For data acceptance, control limits are
considered to be goals only.
6.4.1 PRECISION
Precision is a measure of “the reproducibility of analyses under a given set of conditions” (EPA
1988). Precision is best expressed in terms of the standard deviation or RPD. QA/QC sample types that
test precision include field and laboratory duplicates and matrix spike duplicates. The estimate of
precision of duplicate measurements will be expressed as an RPD, which is calculated as follows:
100( 2)21
21 xDDDDRPD
÷+−
=
where: D1 = first sample value
D2 = second sample value (duplicate)
• The RPDs will be routinely calculated and compared with DQO control limits.
• RPD limits are listed by analysis in Table 5.
6.4.2 ACCURACY
Accuracy is a measure of “the bias in a measurement system” (EPA 1988). Numerically,
accuracy can be expressed as an average of measurements of the same property X, with an accepted
reference or true value T, usually expressed as the difference between the two values (X–T), the
difference as a percentage of the reference or true value (100 (X–T)/T), or as a ratio (X/T). Accuracy of
laboratory analyses is evaluated through the percent recovery of spiked (matrix or surrogate spike)
samples, calculated as:
100)( xAddedSpikeofAmount
ultReseSamplUnspikedultResleSampSpikedRecovery Percent −=
The percent recovery will be routinely calculated and checked against DQO control limits as established
by the most recent laboratory control data.
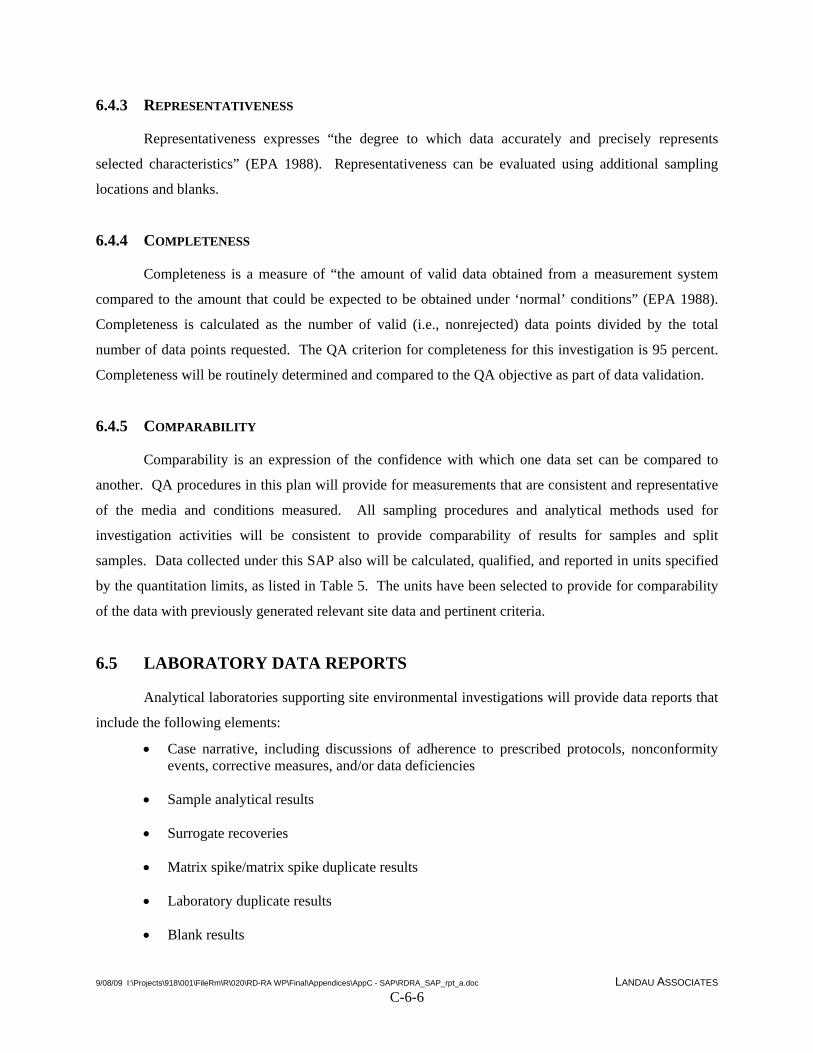
9/08/09 I:\Projects\918\001\FileRm\R\020\RD-RA WP\Final\Appendices\AppC - SAP\RDRA_SAP_rpt_a.doc LANDAU ASSOCIATES C-6-6
6.4.3 REPRESENTATIVENESS
Representativeness expresses “the degree to which data accurately and precisely represents
selected characteristics” (EPA 1988). Representativeness can be evaluated using additional sampling
locations and blanks.
6.4.4 COMPLETENESS
Completeness is a measure of “the amount of valid data obtained from a measurement system
compared to the amount that could be expected to be obtained under ‘normal’ conditions” (EPA 1988).
Completeness is calculated as the number of valid (i.e., nonrejected) data points divided by the total
number of data points requested. The QA criterion for completeness for this investigation is 95 percent.
Completeness will be routinely determined and compared to the QA objective as part of data validation.
6.4.5 COMPARABILITY
Comparability is an expression of the confidence with which one data set can be compared to
another. QA procedures in this plan will provide for measurements that are consistent and representative
of the media and conditions measured. All sampling procedures and analytical methods used for
investigation activities will be consistent to provide comparability of results for samples and split
samples. Data collected under this SAP also will be calculated, qualified, and reported in units specified
by the quantitation limits, as listed in Table 5. The units have been selected to provide for comparability
of the data with previously generated relevant site data and pertinent criteria.
6.5 LABORATORY DATA REPORTS
Analytical laboratories supporting site environmental investigations will provide data reports that
include the following elements:
• Case narrative, including discussions of adherence to prescribed protocols, nonconformity events, corrective measures, and/or data deficiencies
• Sample analytical results
• Surrogate recoveries
• Matrix spike/matrix spike duplicate results
• Laboratory duplicate results
• Blank results
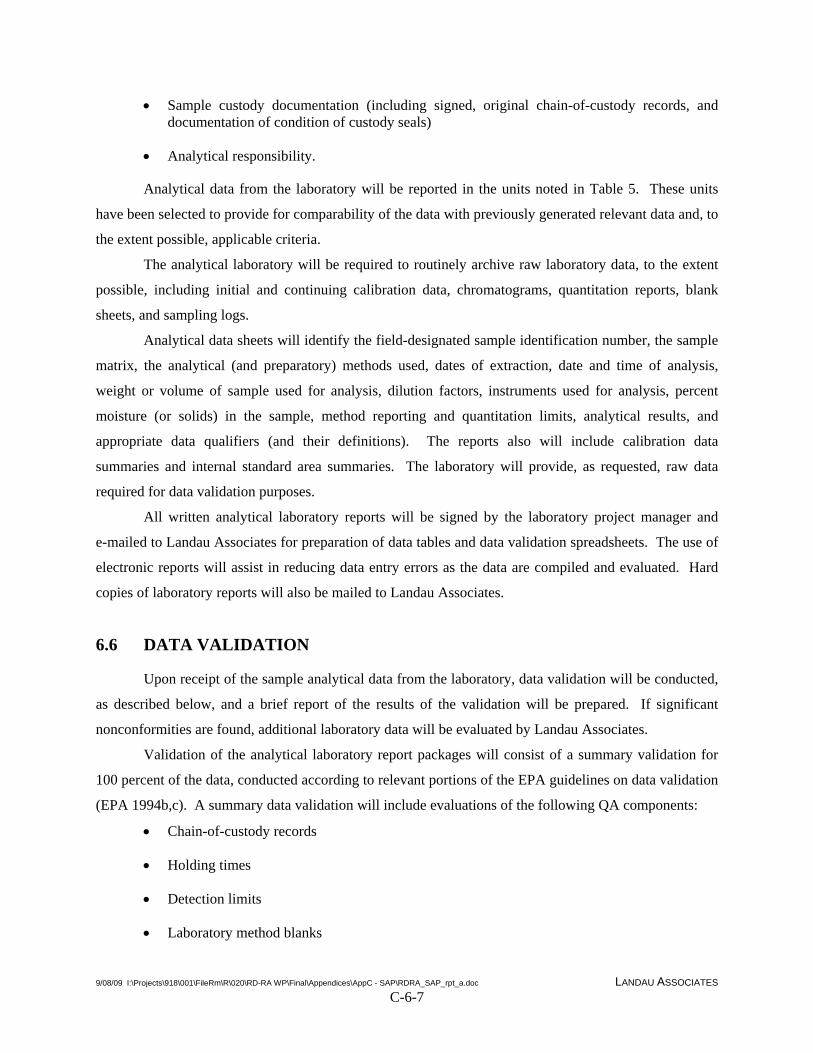
9/08/09 I:\Projects\918\001\FileRm\R\020\RD-RA WP\Final\Appendices\AppC - SAP\RDRA_SAP_rpt_a.doc LANDAU ASSOCIATES C-6-7
• Sample custody documentation (including signed, original chain-of-custody records, and documentation of condition of custody seals)
• Analytical responsibility.
Analytical data from the laboratory will be reported in the units noted in Table 5. These units
have been selected to provide for comparability of the data with previously generated relevant data and, to
the extent possible, applicable criteria.
The analytical laboratory will be required to routinely archive raw laboratory data, to the extent
possible, including initial and continuing calibration data, chromatograms, quantitation reports, blank
sheets, and sampling logs.
Analytical data sheets will identify the field-designated sample identification number, the sample
matrix, the analytical (and preparatory) methods used, dates of extraction, date and time of analysis,
weight or volume of sample used for analysis, dilution factors, instruments used for analysis, percent
moisture (or solids) in the sample, method reporting and quantitation limits, analytical results, and
appropriate data qualifiers (and their definitions). The reports also will include calibration data
summaries and internal standard area summaries. The laboratory will provide, as requested, raw data
required for data validation purposes.
All written analytical laboratory reports will be signed by the laboratory project manager and
e-mailed to Landau Associates for preparation of data tables and data validation spreadsheets. The use of
electronic reports will assist in reducing data entry errors as the data are compiled and evaluated. Hard
copies of laboratory reports will also be mailed to Landau Associates.
6.6 DATA VALIDATION
Upon receipt of the sample analytical data from the laboratory, data validation will be conducted,
as described below, and a brief report of the results of the validation will be prepared. If significant
nonconformities are found, additional laboratory data will be evaluated by Landau Associates.
Validation of the analytical laboratory report packages will consist of a summary validation for
100 percent of the data, conducted according to relevant portions of the EPA guidelines on data validation
(EPA 1994b,c). A summary data validation will include evaluations of the following QA components:
• Chain-of-custody records
• Holding times
• Detection limits
• Laboratory method blanks
9/08/09 I:\Projects\918\001\FileRm\R\020\RD-RA WP\Final\Appendices\AppC - SAP\RDRA_SAP_rpt_a.doc LANDAU ASSOCIATES C-6-8
• Surrogate recoveries
• Laboratory matrix spikes and matrix spike duplicates
• Field and laboratory duplicates
• Initial and continuing calibration summary forms
• Audit/corrective action records
• Completeness
• Overall assessment of data quality.
Section 6.4 presents statistical tests used to determine data precision, accuracy, and completeness
during data evaluation and validation. If a portion of the data is outside the limits specified in this SAP,
or if sample collection and/or documentation practices are deficient, corrective action(s) will be initiated.
Corrective action will be determined by the investigation task leader in consultation with the project
manager and may include rejection of the data and resampling, qualification of the data, or modification
of field and/or laboratory procedures. Data qualification arising from data validation findings will be
described in the data validation report, rather than in individual corrective action reports.
9/08/09 I:\Projects\918\001\FileRm\R\020\RD-RA WP\Final\Appendices\AppC - SAP\RDRA_SAP_rpt_a.doc LANDAU ASSOCIATES C-7-1
7.0 USE OF THIS REPORT
This sampling and analysis plan has been prepared for the exclusive use of Lejar Enterprises,
LLC for specific application to the remedial action implementation at the former Oregon Fir site located
in Portland, Oregon. No other party is entitled to rely on the information, conclusions, and
recommendations included in this document without the express written consent of Landau Associates.
Further, the reuse of information, conclusions, and recommendations provided herein for extensions of
the project or for any other project, without review and authorization by Landau Associates, shall be at
the user’s sole risk. Landau Associates warrants that within the limitations of scope, schedule, and
budget, our services have been provided in a manner consistent with that level of care and skill ordinarily
exercised by members of the profession currently practicing in the same locality under similar conditions
as this project. We make no other warranty, either express or implied.
This document has been prepared under the supervision and direction of the following key staff.
LANDAU ASSOCIATES, INC.
Jessica Kruczek, P.E. Senior Project Engineer
Heidi Bullock, CHMM Senior Hydrogeologist JRK/HB/ccy
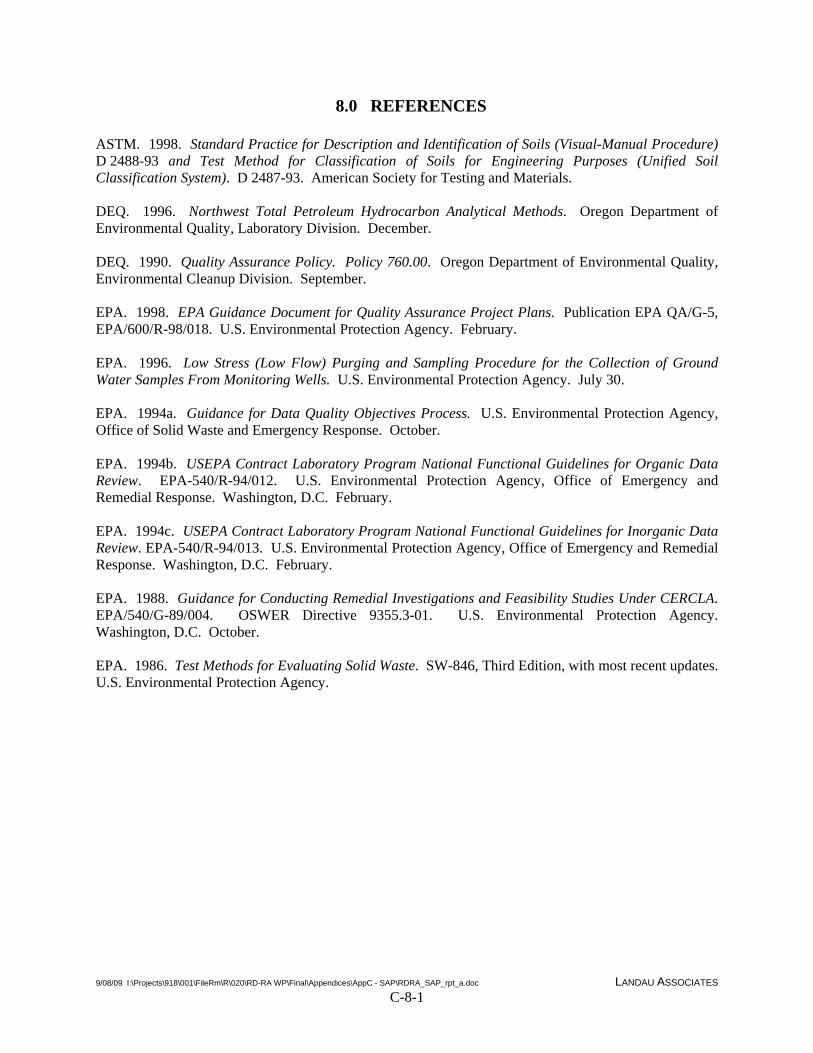
9/08/09 I:\Projects\918\001\FileRm\R\020\RD-RA WP\Final\Appendices\AppC - SAP\RDRA_SAP_rpt_a.doc LANDAU ASSOCIATES C-8-1
8.0 REFERENCES
ASTM. 1998. Standard Practice for Description and Identification of Soils (Visual-Manual Procedure) D 2488-93 and Test Method for Classification of Soils for Engineering Purposes (Unified Soil Classification System). D 2487-93. American Society for Testing and Materials. DEQ. 1996. Northwest Total Petroleum Hydrocarbon Analytical Methods. Oregon Department of Environmental Quality, Laboratory Division. December. DEQ. 1990. Quality Assurance Policy. Policy 760.00. Oregon Department of Environmental Quality, Environmental Cleanup Division. September. EPA. 1998. EPA Guidance Document for Quality Assurance Project Plans. Publication EPA QA/G-5, EPA/600/R-98/018. U.S. Environmental Protection Agency. February. EPA. 1996. Low Stress (Low Flow) Purging and Sampling Procedure for the Collection of Ground Water Samples From Monitoring Wells. U.S. Environmental Protection Agency. July 30. EPA. 1994a. Guidance for Data Quality Objectives Process. U.S. Environmental Protection Agency, Office of Solid Waste and Emergency Response. October. EPA. 1994b. USEPA Contract Laboratory Program National Functional Guidelines for Organic Data Review. EPA-540/R-94/012. U.S. Environmental Protection Agency, Office of Emergency and Remedial Response. Washington, D.C. February. EPA. 1994c. USEPA Contract Laboratory Program National Functional Guidelines for Inorganic Data Review. EPA-540/R-94/013. U.S. Environmental Protection Agency, Office of Emergency and Remedial Response. Washington, D.C. February. EPA. 1988. Guidance for Conducting Remedial Investigations and Feasibility Studies Under CERCLA. EPA/540/G-89/004. OSWER Directive 9355.3-01. U.S. Environmental Protection Agency. Washington, D.C. October. EPA. 1986. Test Methods for Evaluating Solid Waste. SW-846, Third Edition, with most recent updates. U.S. Environmental Protection Agency.
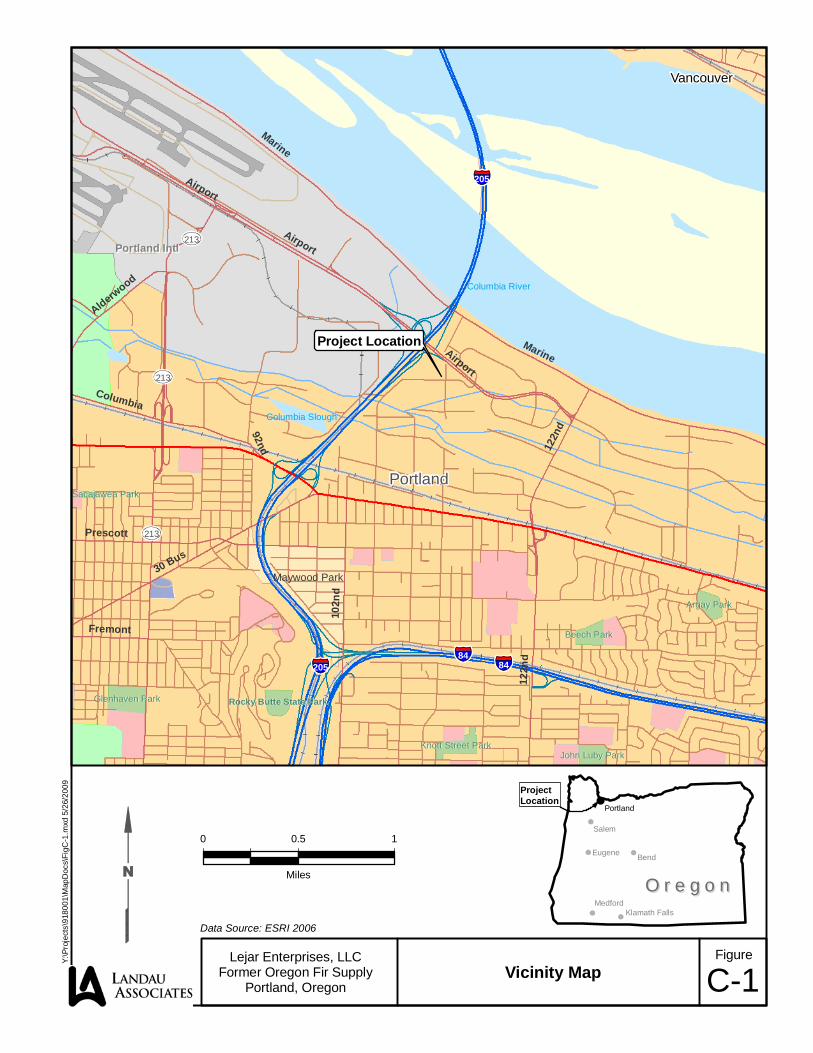
Portland
Vancouver
Maywood Park
84
205
84205
213
213
213
Marine
Airport
102n
d
30 Bus
Prescott12
2nd
Columbia
Alderwood
Fremont
92nd
Airport
122n
d
Airport
Marine
Portland IntlPortland Intl
Rocky Butte State ParkRocky Butte State ParkGlenhaven ParkGlenhaven Park
Argay ParkArgay Park
Beech ParkBeech Park
Knott Street ParkKnott Street ParkJohn Luby ParkJohn Luby Park
Sacajawea ParkSacajawea Park
Columbia RiverColumbia River
Columbia SloughColumbia Slough
Data Source: ESRI 2006
Lejar Enterprises, LLCFormer Oregon Fir Supply
Portland, OregonVicinity Map
Figure
C-1
0 0.5 1
Miles
Y:\P
roje
cts\
9180
01\M
apD
ocs\
FigC
-1.m
xd 5
/26/
2009
Portland
O r e g o nO r e g o n
Tacoma
ProjectLocation
Bend
Medford
Eugene
Klamath Falls
Salem
Project Location
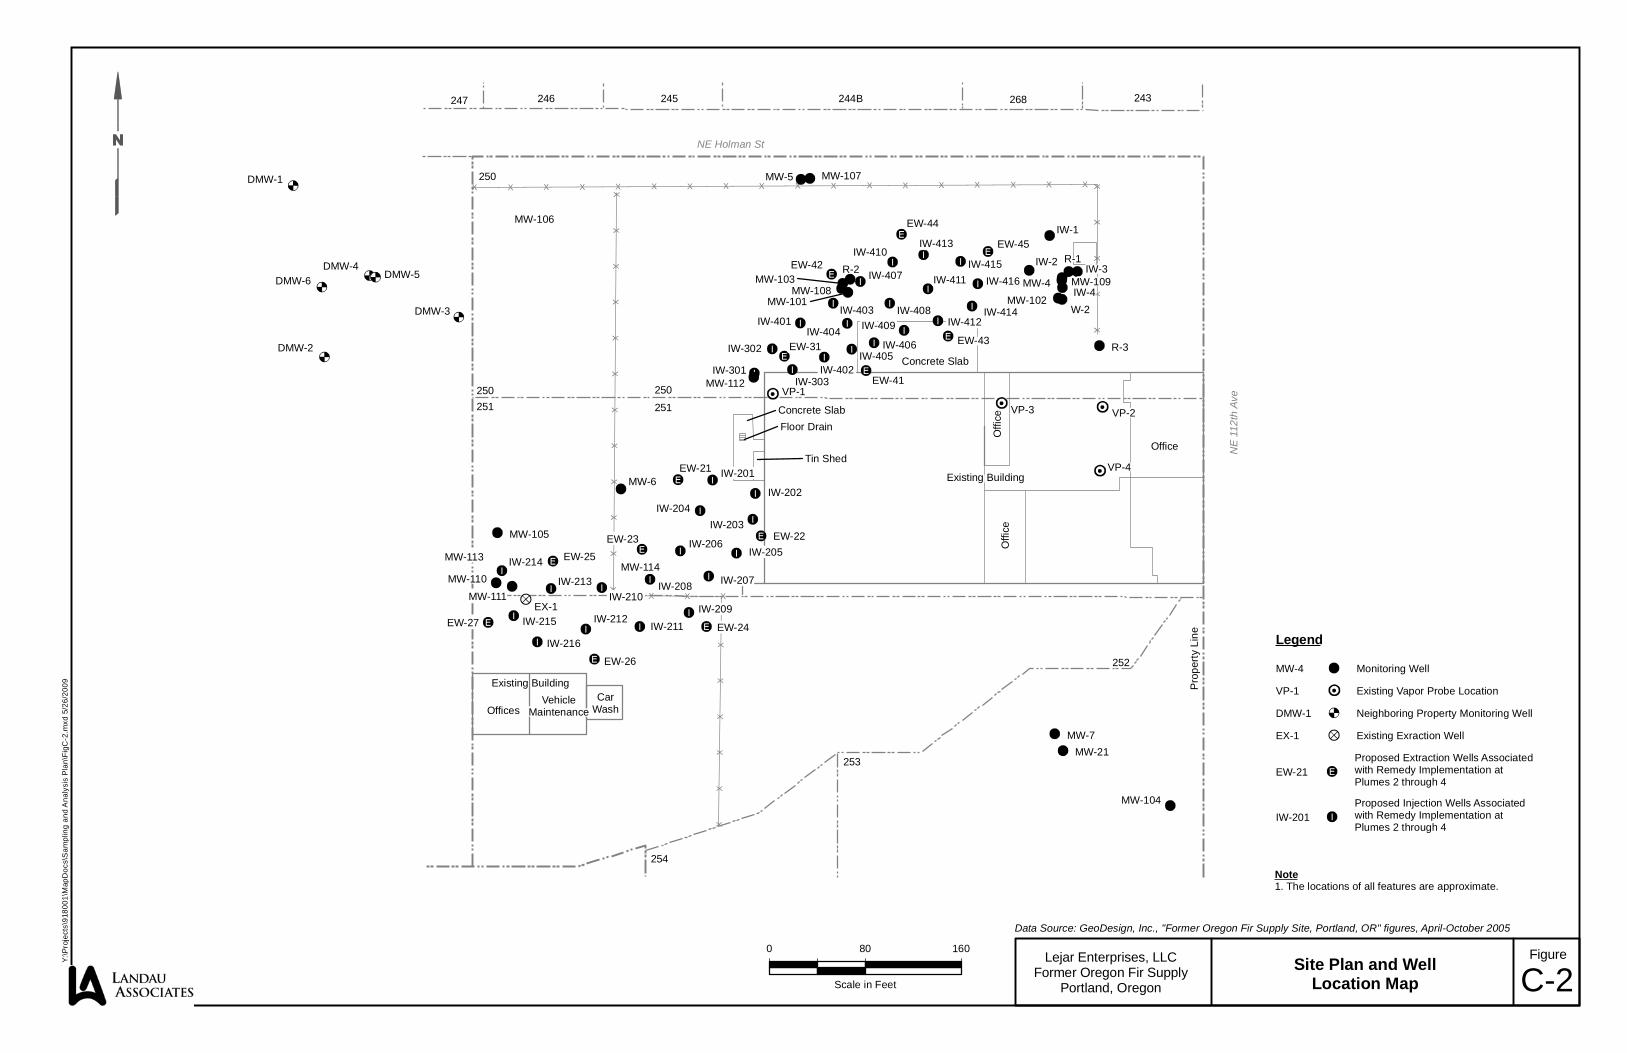
NE Holman St
NE 11
2th Av
e
Existing Building
OfficesVehicle
MaintenanceCar
Wash
Pro
perty
Lin
e
252
253
254
Existing Building
Offi
ceO
ffice
Office
Floor Drain
Tin Shed
Concrete Slab
Concrete Slab
250251
250
251
250
247 246 245 244B 268 243
IW-3IW-2
IW-1
VP-2
VP-4
VP-3
VP-1
R-3
W-2
R-2R-1
MW-7
MW-6
MW-5
EX-1
DMW-6 DMW-5
DMW-3
DMW-2
DMW-1
MW-114MW-113
MW-106
MW-112
MW-105
MW-104
IW-4MW-4
DMW-4
MW-21
MW-111
MW-110
MW-109MW-108
MW-107
MW-103
MW-102MW-101
EW-21
EW-45
EW-44
EW-42
EW-25
EW-24
EW-22EW-23
EW-26
EW-27
EW-31
EW-41
IW-202
IW-201
IW-203
IW-207
IW-204
IW-206
IW-209
IW-211IW-212
IW-208IW-210
IW-216
IW-213
IW-303
IW-408
IW-415
IW-413
IW-416
IW-414IW-412
IW-410
IW-409
IW-406
IW-407
IW-302
IW-301
IW-404IW-401
IW-402
IW-403
IW-405
IW-411
IW-214
IW-215
IW-205
EW-43
0 80 160
Scale in Feet
Data Source: GeoDesign, Inc., "Former Oregon Fir Supply Site, Portland, OR" figures, April-October 2005
Lejar Enterprises, LLCFormer Oregon Fir Supply
Portland, Oregon
Site Plan and WellLocation Map
Figure
C-2
Y:\P
roje
cts\
9180
01\M
apD
ocs\
Sam
plin
g an
d A
naly
sis
Pla
n\Fi
gC-2
.mxd
5/2
6/20
09
Legend
MW-4 Monitoring Well
VP-1 Existing Vapor Probe Location
DMW-1 Neighboring Property Monitoring Well
EX-1 Existing Exraction Well
EW-21Proposed Extraction Wells Associatedwith Remedy Implementation at Plumes 2 through 4
IW-201Proposed Injection Wells Associatedwith Remedy Implementation at Plumes 2 through 4
Note1. The locations of all features are approximate.
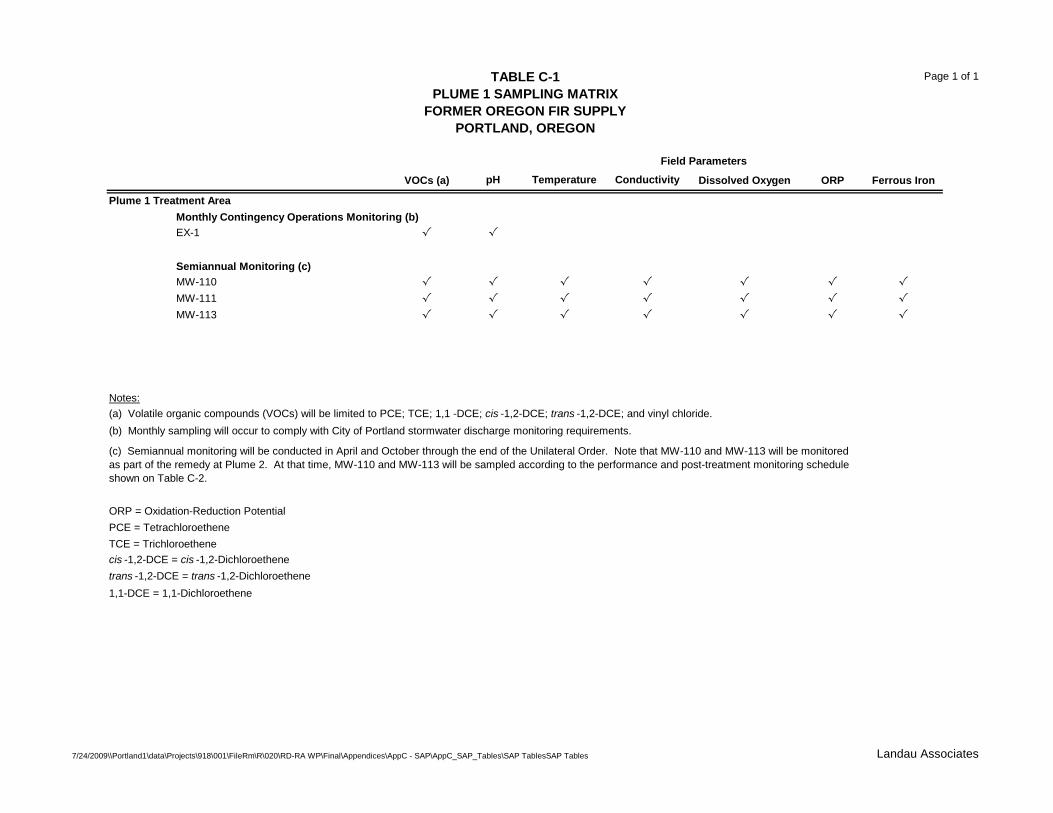
TABLE C-1PLUME 1 SAMPLING MATRIX
FORMER OREGON FIR SUPPLYPORTLAND, OREGON
Page 1 of 1
7/24/2009\\Portland1\data\Projects\918\001\FileRm\R\020\RD-RA WP\Final\Appendices\AppC - SAP\AppC_SAP_Tables\SAP TablesSAP Tables Landau Associates
VOCs (a) pH Temperature Conductivity Dissolved Oxygen ORP Ferrous Iron
Plume 1 Treatment AreaMonthly Contingency Operations Monitoring (b)EX-1 √ √
Semiannual Monitoring (c)MW-110 √ √ √ √ √ √ √MW-111 √ √ √ √ √ √ √MW-113 √ √ √ √ √ √ √
Notes:(a) Volatile organic compounds (VOCs) will be limited to PCE; TCE; 1,1 -DCE; cis -1,2-DCE; trans -1,2-DCE; and vinyl chloride.(b) Monthly sampling will occur to comply with City of Portland stormwater discharge monitoring requirements.
ORP = Oxidation-Reduction PotentialPCE = TetrachloroetheneTCE = Trichloroethenecis -1,2-DCE = cis -1,2-Dichloroethenetrans -1,2-DCE = trans -1,2-Dichloroethene1,1-DCE = 1,1-Dichloroethene
Field Parameters
(c) Semiannual monitoring will be conducted in April and October through the end of the Unilateral Order. Note that MW-110 and MW-113 will be monitored as part of the remedy at Plume 2. At that time, MW-110 and MW-113 will be sampled according to the performance and post-treatment monitoring schedule shown on Table C-2.
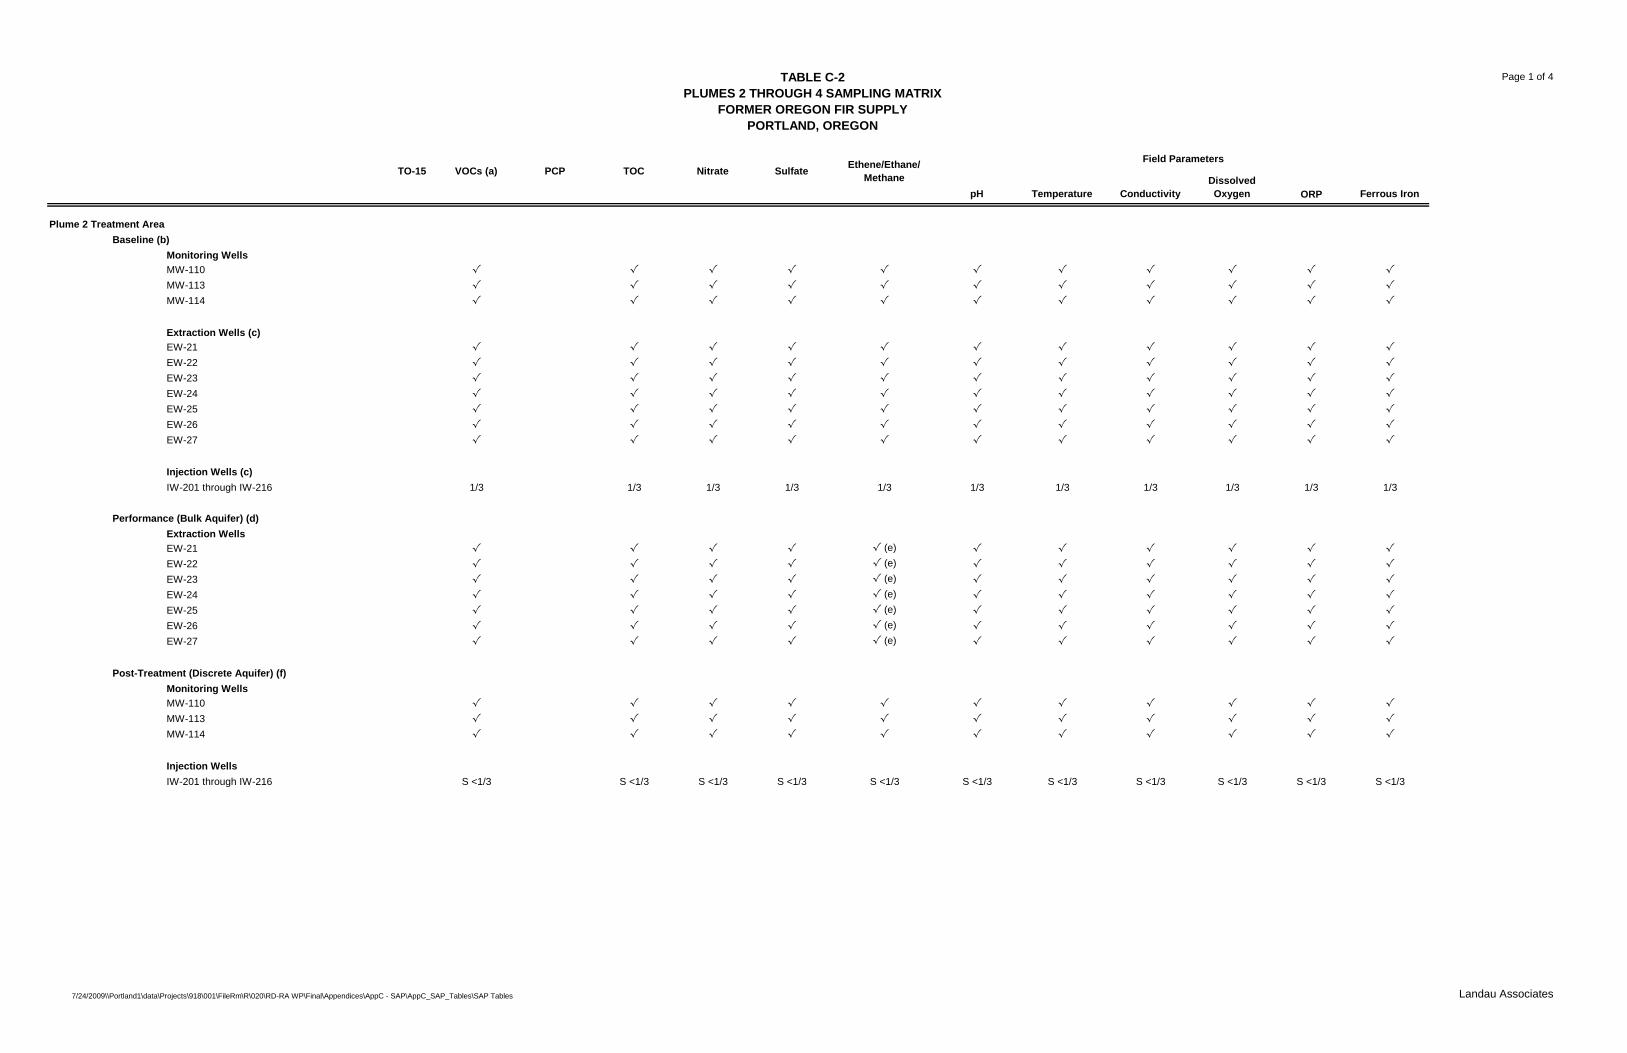
TABLE C-2PLUMES 2 THROUGH 4 SAMPLING MATRIX
FORMER OREGON FIR SUPPLYPORTLAND, OREGON
Page 1 of 4
7/24/2009\\Portland1\data\Projects\918\001\FileRm\R\020\RD-RA WP\Final\Appendices\AppC - SAP\AppC_SAP_Tables\SAP Tables Landau Associates
pH Temperature ConductivityDissolved Oxygen ORP Ferrous Iron
Plume 2 Treatment AreaBaseline (b)
Monitoring WellsMW-110 √ √ √ √ √ √ √ √ √ √ √MW-113 √ √ √ √ √ √ √ √ √ √ √MW-114 √ √ √ √ √ √ √ √ √ √ √
Extraction Wells (c)EW-21 √ √ √ √ √ √ √ √ √ √ √EW-22 √ √ √ √ √ √ √ √ √ √ √EW-23 √ √ √ √ √ √ √ √ √ √ √EW-24 √ √ √ √ √ √ √ √ √ √ √EW-25 √ √ √ √ √ √ √ √ √ √ √EW-26 √ √ √ √ √ √ √ √ √ √ √EW-27 √ √ √ √ √ √ √ √ √ √ √
Injection Wells (c)IW-201 through IW-216 1/3 1/3 1/3 1/3 1/3 1/3 1/3 1/3 1/3 1/3 1/3
Performance (Bulk Aquifer) (d)Extraction WellsEW-21 √ √ √ √ √ (e) √ √ √ √ √ √EW-22 √ √ √ √ √ (e) √ √ √ √ √ √EW-23 √ √ √ √ √ (e) √ √ √ √ √ √EW-24 √ √ √ √ √ (e) √ √ √ √ √ √EW-25 √ √ √ √ √ (e) √ √ √ √ √ √EW-26 √ √ √ √ √ (e) √ √ √ √ √ √EW-27 √ √ √ √ √ (e) √ √ √ √ √ √
Post-Treatment (Discrete Aquifer) (f)Monitoring WellsMW-110 √ √ √ √ √ √ √ √ √ √ √MW-113 √ √ √ √ √ √ √ √ √ √ √MW-114 √ √ √ √ √ √ √ √ √ √ √
Injection Wells IW-201 through IW-216 S <1/3 S <1/3 S <1/3 S <1/3 S <1/3 S <1/3 S <1/3 S <1/3 S <1/3 S <1/3 S <1/3
TOC Nitrate SulfateTO-15 Ethene/Ethane/ MethaneVOCs (a)
Field ParametersPCP
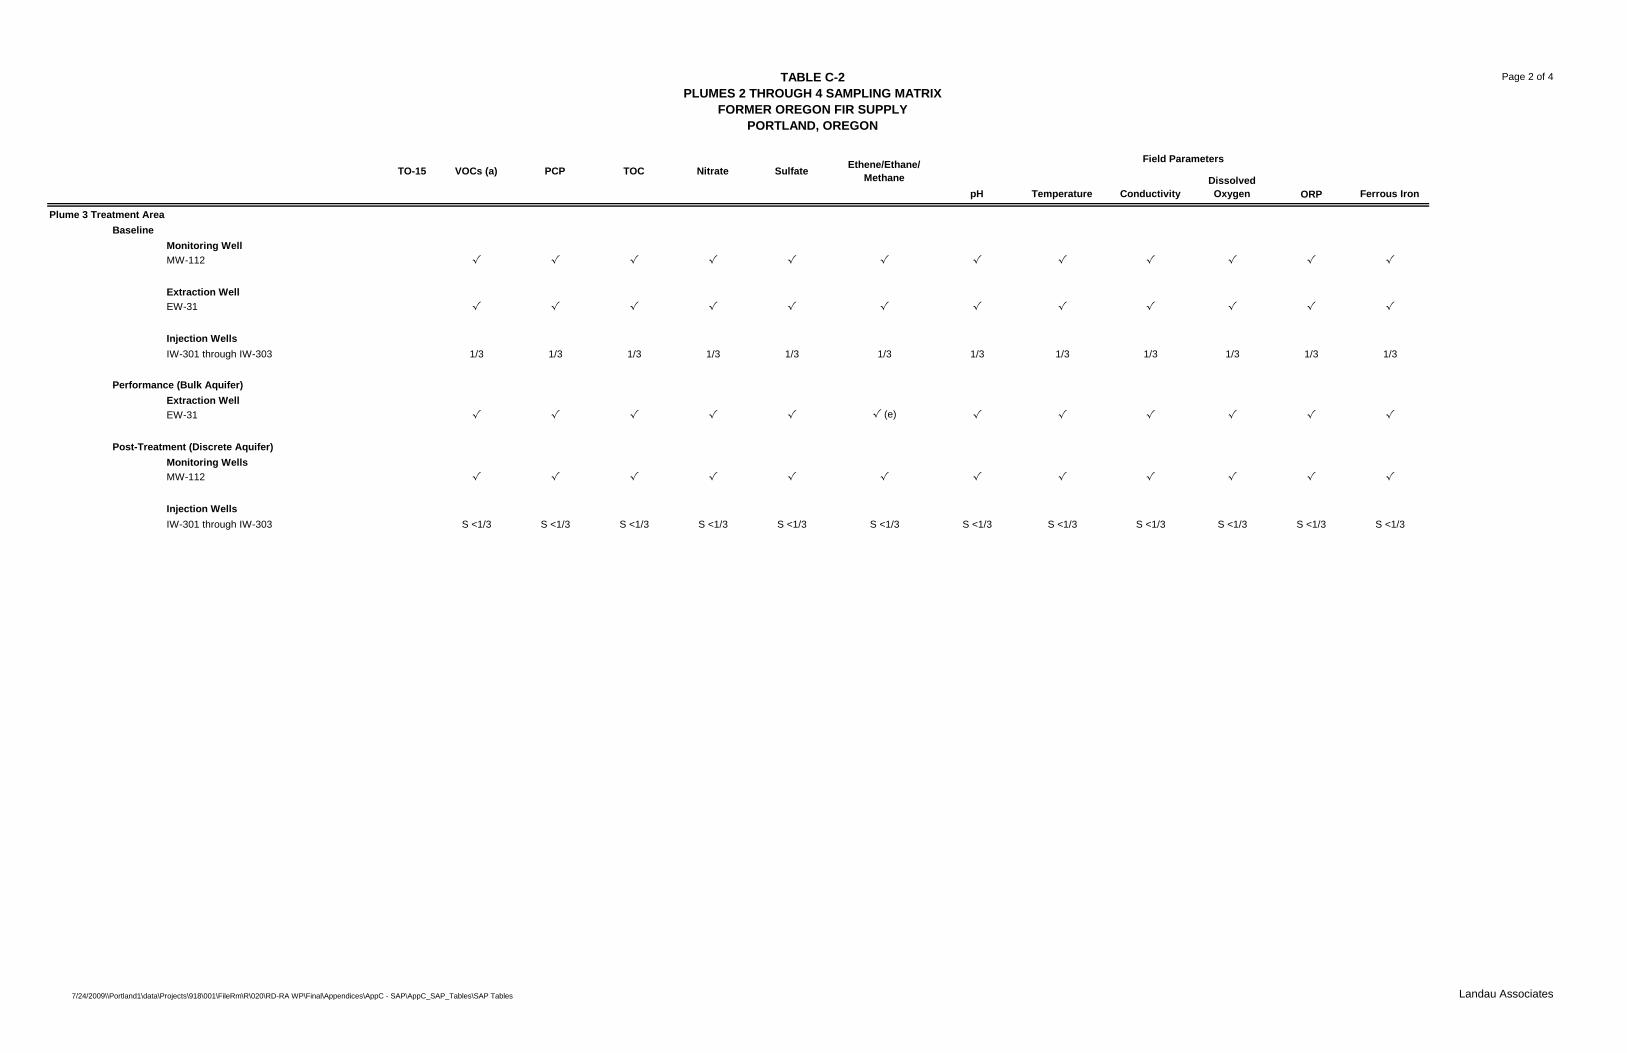
TABLE C-2PLUMES 2 THROUGH 4 SAMPLING MATRIX
FORMER OREGON FIR SUPPLYPORTLAND, OREGON
Page 2 of 4
7/24/2009\\Portland1\data\Projects\918\001\FileRm\R\020\RD-RA WP\Final\Appendices\AppC - SAP\AppC_SAP_Tables\SAP Tables Landau Associates
pH Temperature ConductivityDissolved Oxygen ORP Ferrous Iron
TOC Nitrate SulfateTO-15 Ethene/Ethane/ MethaneVOCs (a)
Field ParametersPCP
Plume 3 Treatment AreaBaseline
Monitoring WellMW-112 √ √ √ √ √ √ √ √ √ √ √ √
Extraction Well EW-31 √ √ √ √ √ √ √ √ √ √ √ √
Injection Wells IW-301 through IW-303 1/3 1/3 1/3 1/3 1/3 1/3 1/3 1/3 1/3 1/3 1/3 1/3
Performance (Bulk Aquifer)Extraction Well EW-31 √ √ √ √ √ √ (e) √ √ √ √ √ √
Post-Treatment (Discrete Aquifer) Monitoring WellsMW-112 √ √ √ √ √ √ √ √ √ √ √ √
Injection Wells IW-301 through IW-303 S <1/3 S <1/3 S <1/3 S <1/3 S <1/3 S <1/3 S <1/3 S <1/3 S <1/3 S <1/3 S <1/3 S <1/3
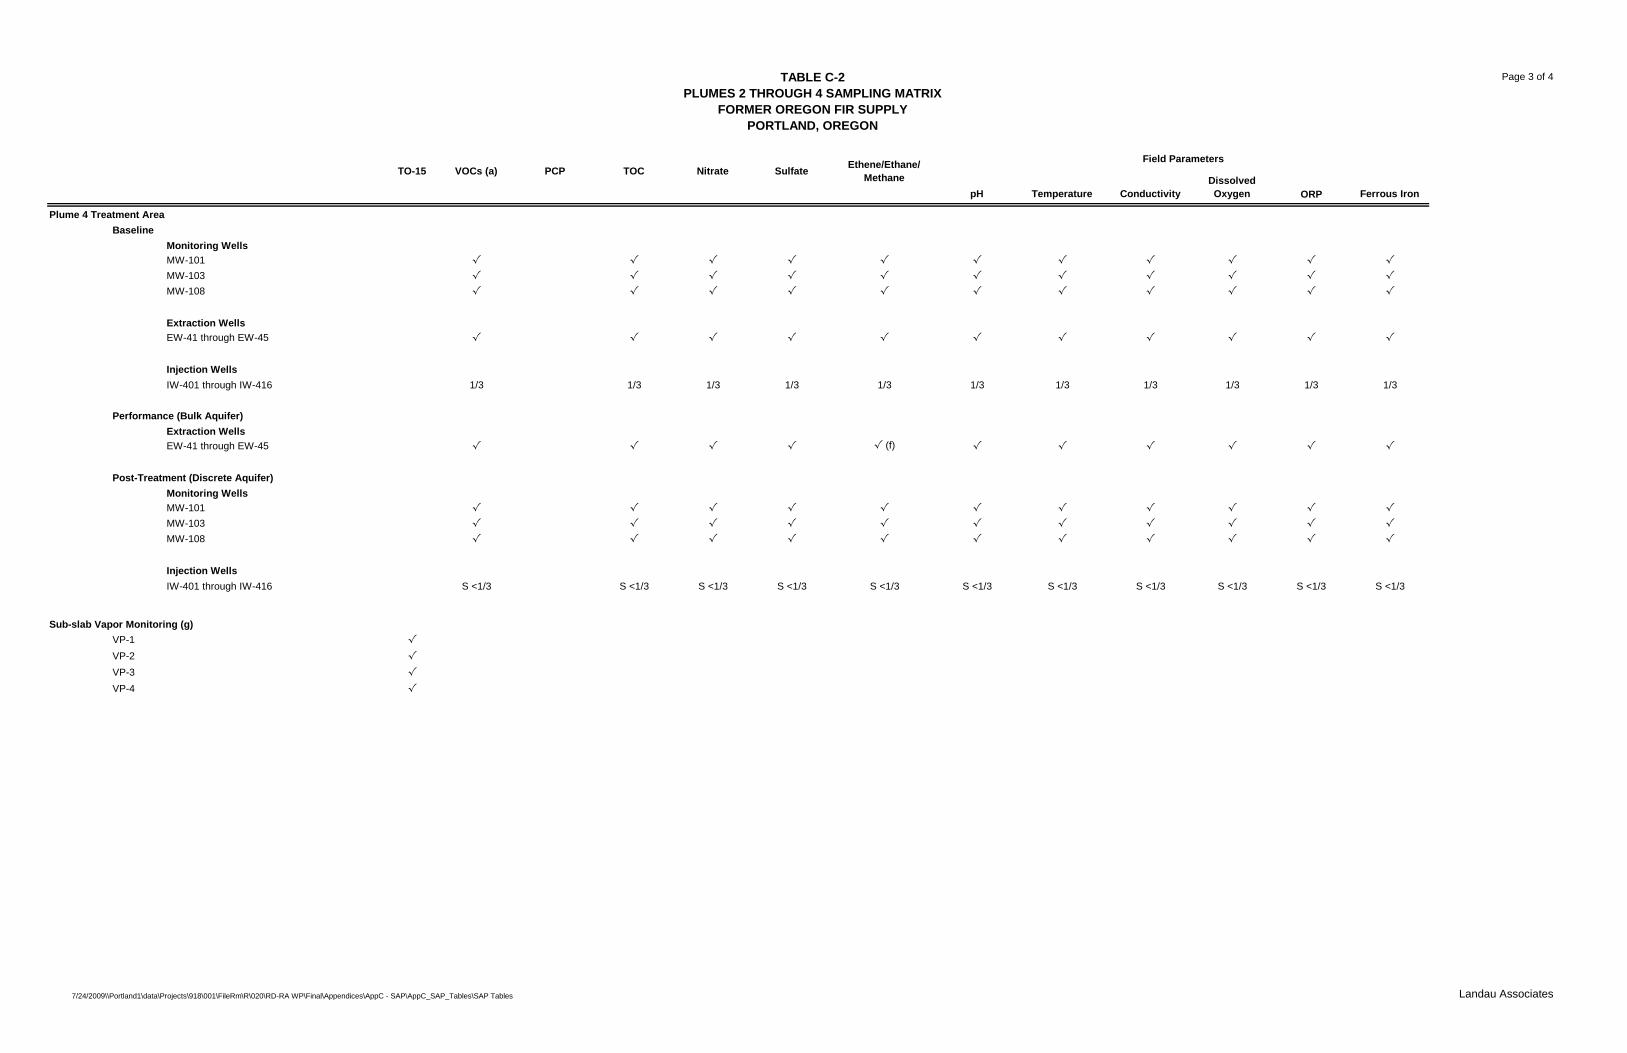
TABLE C-2PLUMES 2 THROUGH 4 SAMPLING MATRIX
FORMER OREGON FIR SUPPLYPORTLAND, OREGON
Page 3 of 4
7/24/2009\\Portland1\data\Projects\918\001\FileRm\R\020\RD-RA WP\Final\Appendices\AppC - SAP\AppC_SAP_Tables\SAP Tables Landau Associates
pH Temperature ConductivityDissolved Oxygen ORP Ferrous Iron
TOC Nitrate SulfateTO-15 Ethene/Ethane/ MethaneVOCs (a)
Field ParametersPCP
Plume 4 Treatment AreaBaseline
Monitoring WellsMW-101 √ √ √ √ √ √ √ √ √ √ √MW-103 √ √ √ √ √ √ √ √ √ √ √MW-108 √ √ √ √ √ √ √ √ √ √ √
Extraction WellsEW-41 through EW-45 √ √ √ √ √ √ √ √ √ √ √
Injection Wells IW-401 through IW-416 1/3 1/3 1/3 1/3 1/3 1/3 1/3 1/3 1/3 1/3 1/3
Performance (Bulk Aquifer) Extraction Wells EW-41 through EW-45 √ √ √ √ √ (f) √ √ √ √ √ √
Post-Treatment (Discrete Aquifer)Monitoring WellsMW-101 √ √ √ √ √ √ √ √ √ √ √MW-103 √ √ √ √ √ √ √ √ √ √ √MW-108 √ √ √ √ √ √ √ √ √ √ √
Injection WellsIW-401 through IW-416 S <1/3 S <1/3 S <1/3 S <1/3 S <1/3 S <1/3 S <1/3 S <1/3 S <1/3 S <1/3 S <1/3
Sub-slab Vapor Monitoring (g)VP-1 √VP-2 √VP-3 √VP-4 √
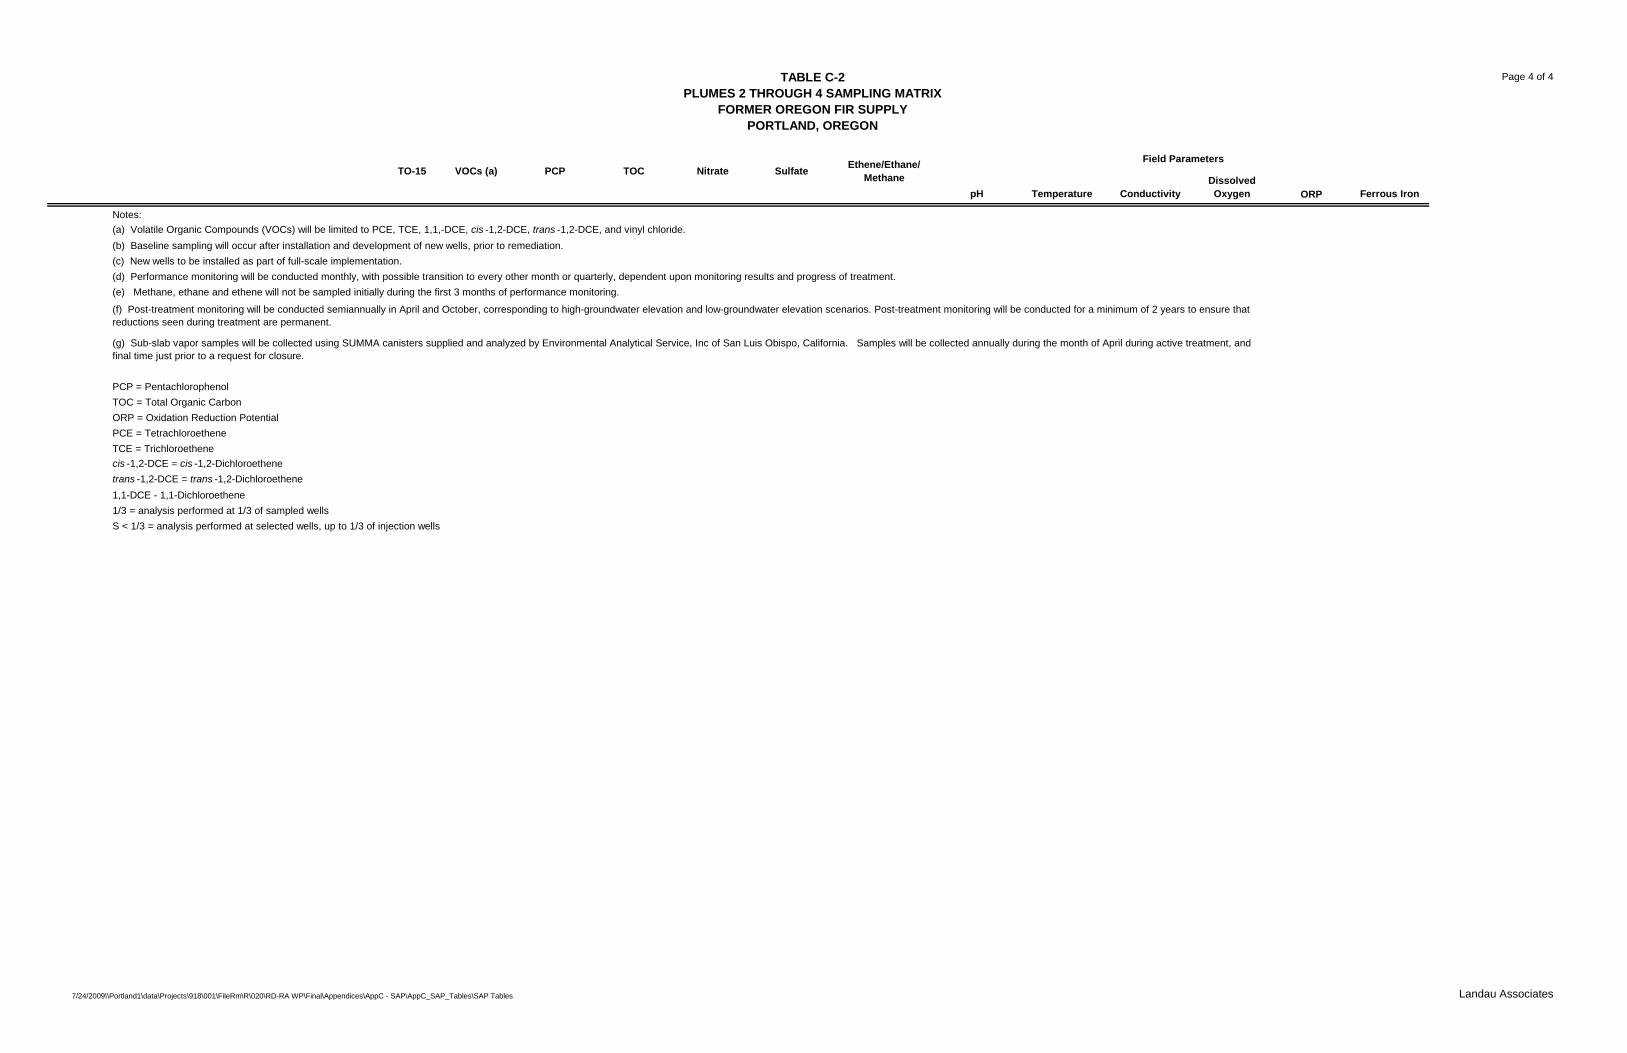
TABLE C-2PLUMES 2 THROUGH 4 SAMPLING MATRIX
FORMER OREGON FIR SUPPLYPORTLAND, OREGON
Page 4 of 4
7/24/2009\\Portland1\data\Projects\918\001\FileRm\R\020\RD-RA WP\Final\Appendices\AppC - SAP\AppC_SAP_Tables\SAP Tables Landau Associates
pH Temperature ConductivityDissolved Oxygen ORP Ferrous Iron
TOC Nitrate SulfateTO-15 Ethene/Ethane/ MethaneVOCs (a)
Field ParametersPCP
Notes:(a) Volatile Organic Compounds (VOCs) will be limited to PCE, TCE, 1,1,-DCE, cis -1,2-DCE, trans -1,2-DCE, and vinyl chloride.
(c) New wells to be installed as part of full-scale implementation.(d) Performance monitoring will be conducted monthly, with possible transition to every other month or quarterly, dependent upon monitoring results and progress of treatment. (e) Methane, ethane and ethene will not be sampled initially during the first 3 months of performance monitoring.
PCP = PentachlorophenolTOC = Total Organic CarbonORP = Oxidation Reduction PotentialPCE = TetrachloroetheneTCE = Trichloroethenecis -1,2-DCE = cis -1,2-Dichloroethenetrans -1,2-DCE = trans -1,2-Dichloroethene1,1-DCE - 1,1-Dichloroethene1/3 = analysis performed at 1/3 of sampled wellsS < 1/3 = analysis performed at selected wells, up to 1/3 of injection wells
(b) Baseline sampling will occur after installation and development of new wells, prior to remediation.
(f) Post-treatment monitoring will be conducted semiannually in April and October, corresponding to high-groundwater elevation and low-groundwater elevation scenarios. Post-treatment monitoring will be conducted for a minimum of 2 years to ensure that reductions seen during treatment are permanent.
(g) Sub-slab vapor samples will be collected using SUMMA canisters supplied and analyzed by Environmental Analytical Service, Inc of San Luis Obispo, California. Samples will be collected annually during the month of April during active treatment, and final time just prior to a request for closure.
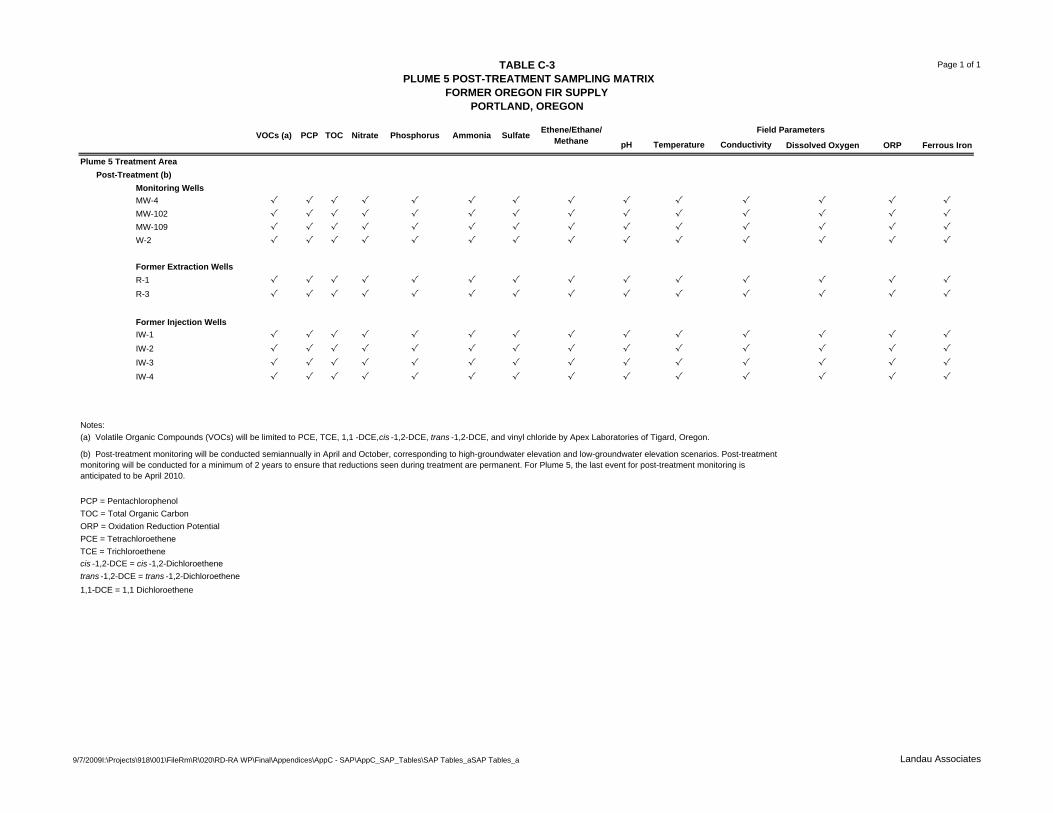
TABLE C-3 PLUME 5 POST-TREATMENT SAMPLING MATRIX
FORMER OREGON FIR SUPPLYPORTLAND, OREGON
Page 1 of 1
pH Temperature Conductivity Dissolved Oxygen ORP Ferrous Iron
Plume 5 Treatment AreaPost-Treatment (b)
Monitoring WellsMW-4 √ √ √ √ √ √ √ √ √ √ √ √ √ √MW-102 √ √ √ √ √ √ √ √ √ √ √ √ √ √MW-109 √ √ √ √ √ √ √ √ √ √ √ √ √ √W-2 √ √ √ √ √ √ √ √ √ √ √ √ √ √
Former Extraction WellsR-1 √ √ √ √ √ √ √ √ √ √ √ √ √ √R-3 √ √ √ √ √ √ √ √ √ √ √ √ √ √
Former Injection WellsIW-1 √ √ √ √ √ √ √ √ √ √ √ √ √ √IW-2 √ √ √ √ √ √ √ √ √ √ √ √ √ √IW-3 √ √ √ √ √ √ √ √ √ √ √ √ √ √IW-4 √ √ √ √ √ √ √ √ √ √ √ √ √ √
Notes:(a) Volatile Organic Compounds (VOCs) will be limited to PCE, TCE, 1,1 -DCE, cis -1,2-DCE, trans -1,2-DCE, and vinyl chloride by Apex Laboratories of Tigard, Oregon.
PCP = PentachlorophenolTOC = Total Organic CarbonORP = Oxidation Reduction PotentialPCE = TetrachloroetheneTCE = Trichloroethenecis -1,2-DCE = cis -1,2-Dichloroethenetrans -1,2-DCE = trans -1,2-Dichloroethene1,1-DCE = 1,1 Dichloroethene
(b) Post-treatment monitoring will be conducted semiannually in April and October, corresponding to high-groundwater elevation and low-groundwater elevation scenarios. Post-treatment monitoring will be conducted for a minimum of 2 years to ensure that reductions seen during treatment are permanent. For Plume 5, the last event for post-treatment monitoring is anticipated to be April 2010.
Sulfate Ethene/Ethane/ Methane
Field ParametersVOCs (a) PCP TOC Nitrate Phosphorus Ammonia
9/7/2009I:\Projects\918\001\FileRm\R\020\RD-RA WP\Final\Appendices\AppC - SAP\AppC_SAP_Tables\SAP Tables_aSAP Tables_a Landau Associates
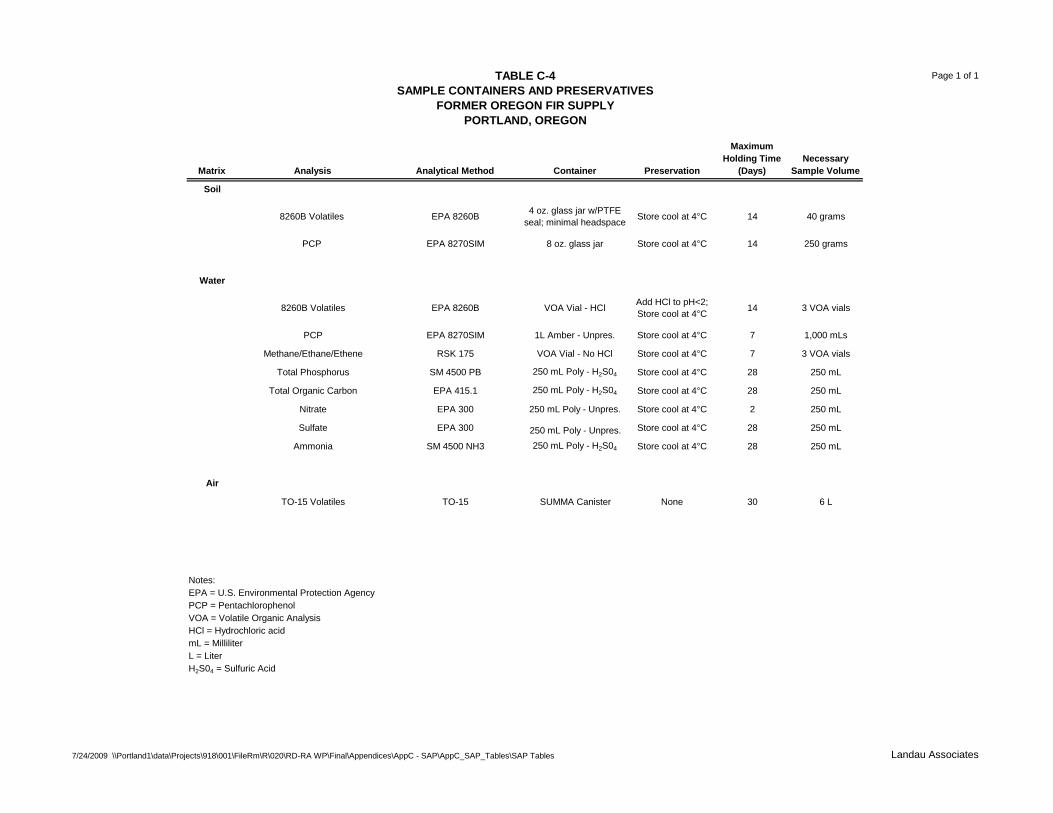
TABLE C-4SAMPLE CONTAINERS AND PRESERVATIVES
FORMER OREGON FIR SUPPLYPORTLAND, OREGON
Page 1 of 1
7/24/2009 \\Portland1\data\Projects\918\001\FileRm\R\020\RD-RA WP\Final\Appendices\AppC - SAP\AppC_SAP_Tables\SAP Tables Landau Associates
Matrix Analysis Analytical Method Container Preservation
Maximum Holding Time
(Days)Necessary
Sample Volume
Soil
8260B Volatiles EPA 8260B 4 oz. glass jar w/PTFE seal; minimal headspace Store cool at 4°C 14 40 grams
PCP EPA 8270SIM 8 oz. glass jar Store cool at 4°C 14 250 grams
Water
8260B Volatiles EPA 8260B VOA Vial - HCl Add HCl to pH<2; Store cool at 4°C 14 3 VOA vials
PCP EPA 8270SIM 1L Amber - Unpres. Store cool at 4°C 7 1,000 mLs
Methane/Ethane/Ethene RSK 175 VOA Vial - No HCl Store cool at 4°C 7 3 VOA vials
Total Phosphorus SM 4500 PB 250 mL Poly - H2S04 Store cool at 4°C 28 250 mL
Total Organic Carbon EPA 415.1 250 mL Poly - H2S04 Store cool at 4°C 28 250 mL
Nitrate EPA 300 250 mL Poly - Unpres. Store cool at 4°C 2 250 mL
Sulfate EPA 300 250 mL Poly - Unpres. Store cool at 4°C 28 250 mL
Ammonia SM 4500 NH3 250 mL Poly - H2S04 Store cool at 4°C 28 250 mL
Air
TO-15 Volatiles TO-15 SUMMA Canister None 30 6 L
Notes:EPA = U.S. Environmental Protection AgencyPCP = PentachlorophenolVOA = Volatile Organic AnalysisHCl = Hydrochloric acidmL = MilliliterL = LiterH2S04 = Sulfuric Acid
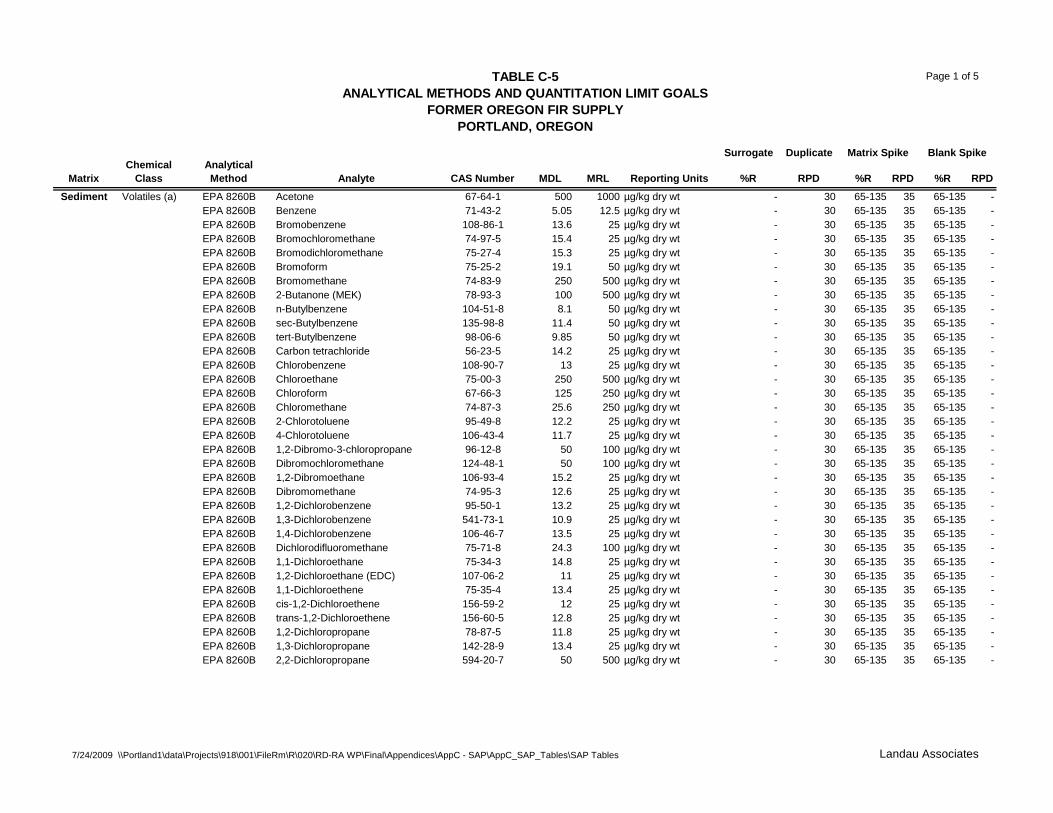
TABLE C-5ANALYTICAL METHODS AND QUANTITATION LIMIT GOALS
FORMER OREGON FIR SUPPLYPORTLAND, OREGON
Page 1 of 5
7/24/2009 \\Portland1\data\Projects\918\001\FileRm\R\020\RD-RA WP\Final\Appendices\AppC - SAP\AppC_SAP_Tables\SAP Tables Landau Associates
Surrogate Duplicate Matrix Spike Blank Spike
MatrixChemical
ClassAnalytical Method Analyte CAS Number MDL MRL Reporting Units %R RPD %R RPD %R RPD
Sediment Volatiles (a) EPA 8260B Acetone 67-64-1 500 1000 µg/kg dry wt - 30 65-135 35 65-135 -EPA 8260B Benzene 71-43-2 5.05 12.5 µg/kg dry wt - 30 65-135 35 65-135 -EPA 8260B Bromobenzene 108-86-1 13.6 25 µg/kg dry wt - 30 65-135 35 65-135 -EPA 8260B Bromochloromethane 74-97-5 15.4 25 µg/kg dry wt - 30 65-135 35 65-135 -EPA 8260B Bromodichloromethane 75-27-4 15.3 25 µg/kg dry wt - 30 65-135 35 65-135 -EPA 8260B Bromoform 75-25-2 19.1 50 µg/kg dry wt - 30 65-135 35 65-135 -EPA 8260B Bromomethane 74-83-9 250 500 µg/kg dry wt - 30 65-135 35 65-135 -EPA 8260B 2-Butanone (MEK) 78-93-3 100 500 µg/kg dry wt - 30 65-135 35 65-135 -EPA 8260B n-Butylbenzene 104-51-8 8.1 50 µg/kg dry wt - 30 65-135 35 65-135 -EPA 8260B sec-Butylbenzene 135-98-8 11.4 50 µg/kg dry wt - 30 65-135 35 65-135 -EPA 8260B tert-Butylbenzene 98-06-6 9.85 50 µg/kg dry wt - 30 65-135 35 65-135 -EPA 8260B Carbon tetrachloride 56-23-5 14.2 25 µg/kg dry wt - 30 65-135 35 65-135 -EPA 8260B Chlorobenzene 108-90-7 13 25 µg/kg dry wt - 30 65-135 35 65-135 -EPA 8260B Chloroethane 75-00-3 250 500 µg/kg dry wt - 30 65-135 35 65-135 -EPA 8260B Chloroform 67-66-3 125 250 µg/kg dry wt - 30 65-135 35 65-135 -EPA 8260B Chloromethane 74-87-3 25.6 250 µg/kg dry wt - 30 65-135 35 65-135 -EPA 8260B 2-Chlorotoluene 95-49-8 12.2 25 µg/kg dry wt - 30 65-135 35 65-135 -EPA 8260B 4-Chlorotoluene 106-43-4 11.7 25 µg/kg dry wt - 30 65-135 35 65-135 -EPA 8260B 1,2-Dibromo-3-chloropropane 96-12-8 50 100 µg/kg dry wt - 30 65-135 35 65-135 -EPA 8260B Dibromochloromethane 124-48-1 50 100 µg/kg dry wt - 30 65-135 35 65-135 -EPA 8260B 1,2-Dibromoethane 106-93-4 15.2 25 µg/kg dry wt - 30 65-135 35 65-135 -EPA 8260B Dibromomethane 74-95-3 12.6 25 µg/kg dry wt - 30 65-135 35 65-135 -EPA 8260B 1,2-Dichlorobenzene 95-50-1 13.2 25 µg/kg dry wt - 30 65-135 35 65-135 -EPA 8260B 1,3-Dichlorobenzene 541-73-1 10.9 25 µg/kg dry wt - 30 65-135 35 65-135 -EPA 8260B 1,4-Dichlorobenzene 106-46-7 13.5 25 µg/kg dry wt - 30 65-135 35 65-135 -EPA 8260B Dichlorodifluoromethane 75-71-8 24.3 100 µg/kg dry wt - 30 65-135 35 65-135 -EPA 8260B 1,1-Dichloroethane 75-34-3 14.8 25 µg/kg dry wt - 30 65-135 35 65-135 -EPA 8260B 1,2-Dichloroethane (EDC) 107-06-2 11 25 µg/kg dry wt - 30 65-135 35 65-135 -EPA 8260B 1,1-Dichloroethene 75-35-4 13.4 25 µg/kg dry wt - 30 65-135 35 65-135 -EPA 8260B cis-1,2-Dichloroethene 156-59-2 12 25 µg/kg dry wt - 30 65-135 35 65-135 -EPA 8260B trans-1,2-Dichloroethene 156-60-5 12.8 25 µg/kg dry wt - 30 65-135 35 65-135 -EPA 8260B 1,2-Dichloropropane 78-87-5 11.8 25 µg/kg dry wt - 30 65-135 35 65-135 -EPA 8260B 1,3-Dichloropropane 142-28-9 13.4 25 µg/kg dry wt - 30 65-135 35 65-135 -EPA 8260B 2,2-Dichloropropane 594-20-7 50 500 µg/kg dry wt - 30 65-135 35 65-135 -
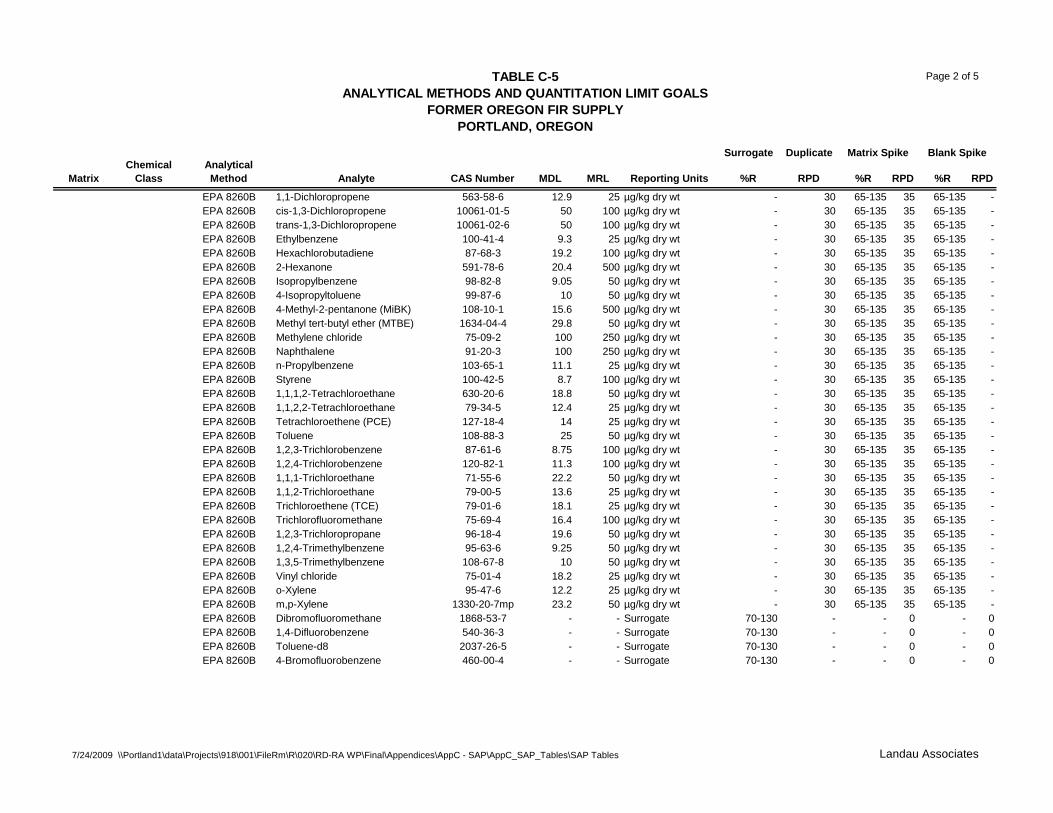
TABLE C-5ANALYTICAL METHODS AND QUANTITATION LIMIT GOALS
FORMER OREGON FIR SUPPLYPORTLAND, OREGON
Page 2 of 5
7/24/2009 \\Portland1\data\Projects\918\001\FileRm\R\020\RD-RA WP\Final\Appendices\AppC - SAP\AppC_SAP_Tables\SAP Tables Landau Associates
Surrogate Duplicate Matrix Spike Blank Spike
MatrixChemical
ClassAnalytical Method Analyte CAS Number MDL MRL Reporting Units %R RPD %R RPD %R RPD
EPA 8260B 1,1-Dichloropropene 563-58-6 12.9 25 µg/kg dry wt - 30 65-135 35 65-135 -EPA 8260B cis-1,3-Dichloropropene 10061-01-5 50 100 µg/kg dry wt - 30 65-135 35 65-135 -EPA 8260B trans-1,3-Dichloropropene 10061-02-6 50 100 µg/kg dry wt - 30 65-135 35 65-135 -EPA 8260B Ethylbenzene 100-41-4 9.3 25 µg/kg dry wt - 30 65-135 35 65-135 -EPA 8260B Hexachlorobutadiene 87-68-3 19.2 100 µg/kg dry wt - 30 65-135 35 65-135 -EPA 8260B 2-Hexanone 591-78-6 20.4 500 µg/kg dry wt - 30 65-135 35 65-135 -EPA 8260B Isopropylbenzene 98-82-8 9.05 50 µg/kg dry wt - 30 65-135 35 65-135 -EPA 8260B 4-Isopropyltoluene 99-87-6 10 50 µg/kg dry wt - 30 65-135 35 65-135 -EPA 8260B 4-Methyl-2-pentanone (MiBK) 108-10-1 15.6 500 µg/kg dry wt - 30 65-135 35 65-135 -EPA 8260B Methyl tert-butyl ether (MTBE) 1634-04-4 29.8 50 µg/kg dry wt - 30 65-135 35 65-135 -EPA 8260B Methylene chloride 75-09-2 100 250 µg/kg dry wt - 30 65-135 35 65-135 -EPA 8260B Naphthalene 91-20-3 100 250 µg/kg dry wt - 30 65-135 35 65-135 -EPA 8260B n-Propylbenzene 103-65-1 11.1 25 µg/kg dry wt - 30 65-135 35 65-135 -EPA 8260B Styrene 100-42-5 8.7 100 µg/kg dry wt - 30 65-135 35 65-135 -EPA 8260B 1,1,1,2-Tetrachloroethane 630-20-6 18.8 50 µg/kg dry wt - 30 65-135 35 65-135 -EPA 8260B 1,1,2,2-Tetrachloroethane 79-34-5 12.4 25 µg/kg dry wt - 30 65-135 35 65-135 -EPA 8260B Tetrachloroethene (PCE) 127-18-4 14 25 µg/kg dry wt - 30 65-135 35 65-135 -EPA 8260B Toluene 108-88-3 25 50 µg/kg dry wt - 30 65-135 35 65-135 -EPA 8260B 1,2,3-Trichlorobenzene 87-61-6 8.75 100 µg/kg dry wt - 30 65-135 35 65-135 -EPA 8260B 1,2,4-Trichlorobenzene 120-82-1 11.3 100 µg/kg dry wt - 30 65-135 35 65-135 -EPA 8260B 1,1,1-Trichloroethane 71-55-6 22.2 50 µg/kg dry wt - 30 65-135 35 65-135 -EPA 8260B 1,1,2-Trichloroethane 79-00-5 13.6 25 µg/kg dry wt - 30 65-135 35 65-135 -EPA 8260B Trichloroethene (TCE) 79-01-6 18.1 25 µg/kg dry wt - 30 65-135 35 65-135 -EPA 8260B Trichlorofluoromethane 75-69-4 16.4 100 µg/kg dry wt - 30 65-135 35 65-135 -EPA 8260B 1,2,3-Trichloropropane 96-18-4 19.6 50 µg/kg dry wt - 30 65-135 35 65-135 -EPA 8260B 1,2,4-Trimethylbenzene 95-63-6 9.25 50 µg/kg dry wt - 30 65-135 35 65-135 -EPA 8260B 1,3,5-Trimethylbenzene 108-67-8 10 50 µg/kg dry wt - 30 65-135 35 65-135 -EPA 8260B Vinyl chloride 75-01-4 18.2 25 µg/kg dry wt - 30 65-135 35 65-135 -EPA 8260B o-Xylene 95-47-6 12.2 25 µg/kg dry wt - 30 65-135 35 65-135 -EPA 8260B m,p-Xylene 1330-20-7mp 23.2 50 µg/kg dry wt - 30 65-135 35 65-135 -EPA 8260B Dibromofluoromethane 1868-53-7 - - Surrogate 70-130 - - 0 - 0EPA 8260B 1,4-Difluorobenzene 540-36-3 - - Surrogate 70-130 - - 0 - 0EPA 8260B Toluene-d8 2037-26-5 - - Surrogate 70-130 - - 0 - 0EPA 8260B 4-Bromofluorobenzene 460-00-4 - - Surrogate 70-130 - - 0 - 0
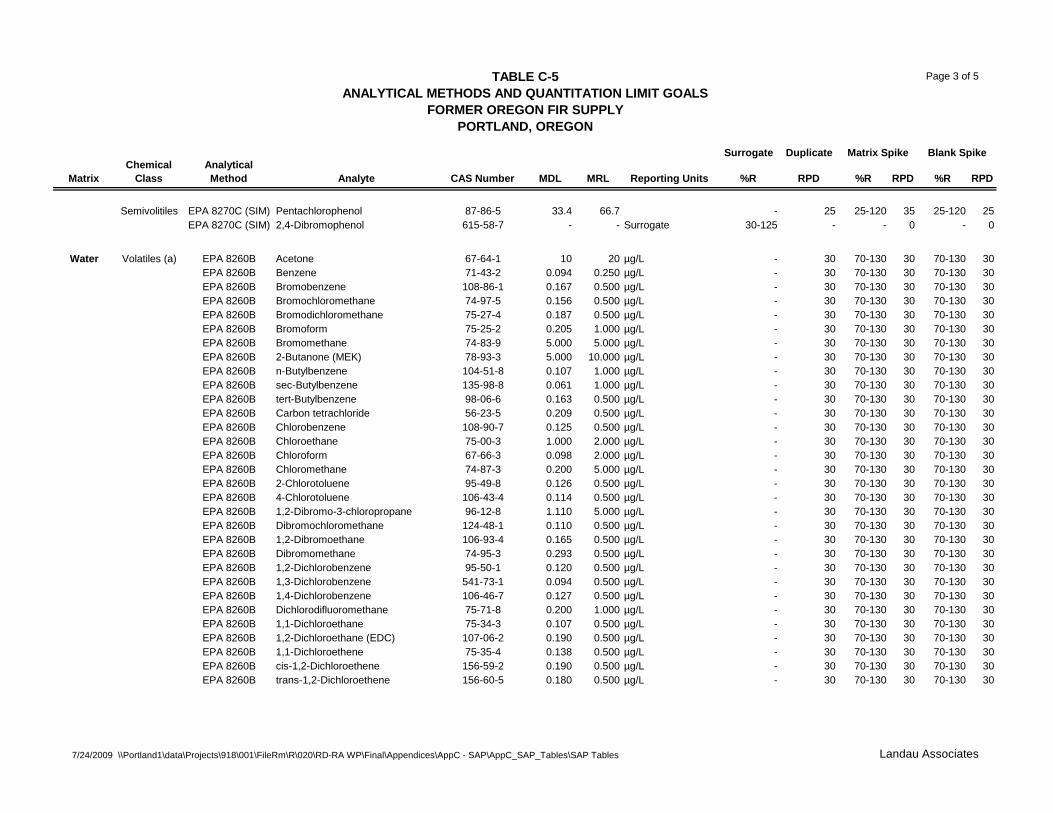
TABLE C-5ANALYTICAL METHODS AND QUANTITATION LIMIT GOALS
FORMER OREGON FIR SUPPLYPORTLAND, OREGON
Page 3 of 5
7/24/2009 \\Portland1\data\Projects\918\001\FileRm\R\020\RD-RA WP\Final\Appendices\AppC - SAP\AppC_SAP_Tables\SAP Tables Landau Associates
Surrogate Duplicate Matrix Spike Blank Spike
MatrixChemical
ClassAnalytical Method Analyte CAS Number MDL MRL Reporting Units %R RPD %R RPD %R RPD
Semivolitiles EPA 8270C (SIM) Pentachlorophenol 87-86-5 33.4 66.7 - 25 25-120 35 25-120 25EPA 8270C (SIM) 2,4-Dibromophenol 615-58-7 - - Surrogate 30-125 - - 0 - 0
Water Volatiles (a) EPA 8260B Acetone 67-64-1 10 20 µg/L - 30 70-130 30 70-130 30EPA 8260B Benzene 71-43-2 0.094 0.250 µg/L - 30 70-130 30 70-130 30EPA 8260B Bromobenzene 108-86-1 0.167 0.500 µg/L - 30 70-130 30 70-130 30EPA 8260B Bromochloromethane 74-97-5 0.156 0.500 µg/L - 30 70-130 30 70-130 30EPA 8260B Bromodichloromethane 75-27-4 0.187 0.500 µg/L - 30 70-130 30 70-130 30EPA 8260B Bromoform 75-25-2 0.205 1.000 µg/L - 30 70-130 30 70-130 30EPA 8260B Bromomethane 74-83-9 5.000 5.000 µg/L - 30 70-130 30 70-130 30EPA 8260B 2-Butanone (MEK) 78-93-3 5.000 10.000 µg/L - 30 70-130 30 70-130 30EPA 8260B n-Butylbenzene 104-51-8 0.107 1.000 µg/L - 30 70-130 30 70-130 30EPA 8260B sec-Butylbenzene 135-98-8 0.061 1.000 µg/L - 30 70-130 30 70-130 30EPA 8260B tert-Butylbenzene 98-06-6 0.163 0.500 µg/L - 30 70-130 30 70-130 30EPA 8260B Carbon tetrachloride 56-23-5 0.209 0.500 µg/L - 30 70-130 30 70-130 30EPA 8260B Chlorobenzene 108-90-7 0.125 0.500 µg/L - 30 70-130 30 70-130 30EPA 8260B Chloroethane 75-00-3 1.000 2.000 µg/L - 30 70-130 30 70-130 30EPA 8260B Chloroform 67-66-3 0.098 2.000 µg/L - 30 70-130 30 70-130 30EPA 8260B Chloromethane 74-87-3 0.200 5.000 µg/L - 30 70-130 30 70-130 30EPA 8260B 2-Chlorotoluene 95-49-8 0.126 0.500 µg/L - 30 70-130 30 70-130 30EPA 8260B 4-Chlorotoluene 106-43-4 0.114 0.500 µg/L - 30 70-130 30 70-130 30EPA 8260B 1,2-Dibromo-3-chloropropane 96-12-8 1.110 5.000 µg/L - 30 70-130 30 70-130 30EPA 8260B Dibromochloromethane 124-48-1 0.110 0.500 µg/L - 30 70-130 30 70-130 30EPA 8260B 1,2-Dibromoethane 106-93-4 0.165 0.500 µg/L - 30 70-130 30 70-130 30EPA 8260B Dibromomethane 74-95-3 0.293 0.500 µg/L - 30 70-130 30 70-130 30EPA 8260B 1,2-Dichlorobenzene 95-50-1 0.120 0.500 µg/L - 30 70-130 30 70-130 30EPA 8260B 1,3-Dichlorobenzene 541-73-1 0.094 0.500 µg/L - 30 70-130 30 70-130 30EPA 8260B 1,4-Dichlorobenzene 106-46-7 0.127 0.500 µg/L - 30 70-130 30 70-130 30EPA 8260B Dichlorodifluoromethane 75-71-8 0.200 1.000 µg/L - 30 70-130 30 70-130 30EPA 8260B 1,1-Dichloroethane 75-34-3 0.107 0.500 µg/L - 30 70-130 30 70-130 30EPA 8260B 1,2-Dichloroethane (EDC) 107-06-2 0.190 0.500 µg/L - 30 70-130 30 70-130 30EPA 8260B 1,1-Dichloroethene 75-35-4 0.138 0.500 µg/L - 30 70-130 30 70-130 30EPA 8260B cis-1,2-Dichloroethene 156-59-2 0.190 0.500 µg/L - 30 70-130 30 70-130 30EPA 8260B trans-1,2-Dichloroethene 156-60-5 0.180 0.500 µg/L - 30 70-130 30 70-130 30
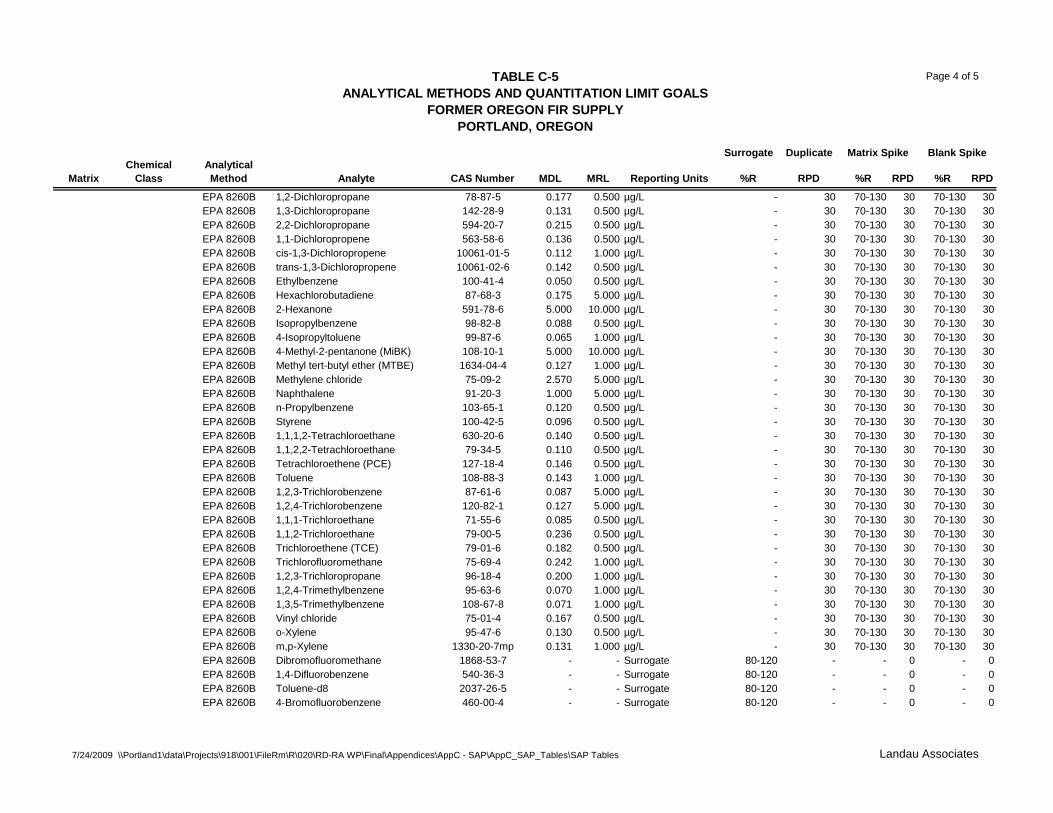
TABLE C-5ANALYTICAL METHODS AND QUANTITATION LIMIT GOALS
FORMER OREGON FIR SUPPLYPORTLAND, OREGON
Page 4 of 5
7/24/2009 \\Portland1\data\Projects\918\001\FileRm\R\020\RD-RA WP\Final\Appendices\AppC - SAP\AppC_SAP_Tables\SAP Tables Landau Associates
Surrogate Duplicate Matrix Spike Blank Spike
MatrixChemical
ClassAnalytical Method Analyte CAS Number MDL MRL Reporting Units %R RPD %R RPD %R RPD
EPA 8260B 1,2-Dichloropropane 78-87-5 0.177 0.500 µg/L - 30 70-130 30 70-130 30EPA 8260B 1,3-Dichloropropane 142-28-9 0.131 0.500 µg/L - 30 70-130 30 70-130 30EPA 8260B 2,2-Dichloropropane 594-20-7 0.215 0.500 µg/L - 30 70-130 30 70-130 30EPA 8260B 1,1-Dichloropropene 563-58-6 0.136 0.500 µg/L - 30 70-130 30 70-130 30EPA 8260B cis-1,3-Dichloropropene 10061-01-5 0.112 1.000 µg/L - 30 70-130 30 70-130 30EPA 8260B trans-1,3-Dichloropropene 10061-02-6 0.142 0.500 µg/L - 30 70-130 30 70-130 30EPA 8260B Ethylbenzene 100-41-4 0.050 0.500 µg/L - 30 70-130 30 70-130 30EPA 8260B Hexachlorobutadiene 87-68-3 0.175 5.000 µg/L - 30 70-130 30 70-130 30EPA 8260B 2-Hexanone 591-78-6 5.000 10.000 µg/L - 30 70-130 30 70-130 30EPA 8260B Isopropylbenzene 98-82-8 0.088 0.500 µg/L - 30 70-130 30 70-130 30EPA 8260B 4-Isopropyltoluene 99-87-6 0.065 1.000 µg/L - 30 70-130 30 70-130 30EPA 8260B 4-Methyl-2-pentanone (MiBK) 108-10-1 5.000 10.000 µg/L - 30 70-130 30 70-130 30EPA 8260B Methyl tert-butyl ether (MTBE) 1634-04-4 0.127 1.000 µg/L - 30 70-130 30 70-130 30EPA 8260B Methylene chloride 75-09-2 2.570 5.000 µg/L - 30 70-130 30 70-130 30EPA 8260B Naphthalene 91-20-3 1.000 5.000 µg/L - 30 70-130 30 70-130 30EPA 8260B n-Propylbenzene 103-65-1 0.120 0.500 µg/L - 30 70-130 30 70-130 30EPA 8260B Styrene 100-42-5 0.096 0.500 µg/L - 30 70-130 30 70-130 30EPA 8260B 1,1,1,2-Tetrachloroethane 630-20-6 0.140 0.500 µg/L - 30 70-130 30 70-130 30EPA 8260B 1,1,2,2-Tetrachloroethane 79-34-5 0.110 0.500 µg/L - 30 70-130 30 70-130 30EPA 8260B Tetrachloroethene (PCE) 127-18-4 0.146 0.500 µg/L - 30 70-130 30 70-130 30EPA 8260B Toluene 108-88-3 0.143 1.000 µg/L - 30 70-130 30 70-130 30EPA 8260B 1,2,3-Trichlorobenzene 87-61-6 0.087 5.000 µg/L - 30 70-130 30 70-130 30EPA 8260B 1,2,4-Trichlorobenzene 120-82-1 0.127 5.000 µg/L - 30 70-130 30 70-130 30EPA 8260B 1,1,1-Trichloroethane 71-55-6 0.085 0.500 µg/L - 30 70-130 30 70-130 30EPA 8260B 1,1,2-Trichloroethane 79-00-5 0.236 0.500 µg/L - 30 70-130 30 70-130 30EPA 8260B Trichloroethene (TCE) 79-01-6 0.182 0.500 µg/L - 30 70-130 30 70-130 30EPA 8260B Trichlorofluoromethane 75-69-4 0.242 1.000 µg/L - 30 70-130 30 70-130 30EPA 8260B 1,2,3-Trichloropropane 96-18-4 0.200 1.000 µg/L - 30 70-130 30 70-130 30EPA 8260B 1,2,4-Trimethylbenzene 95-63-6 0.070 1.000 µg/L - 30 70-130 30 70-130 30EPA 8260B 1,3,5-Trimethylbenzene 108-67-8 0.071 1.000 µg/L - 30 70-130 30 70-130 30EPA 8260B Vinyl chloride 75-01-4 0.167 0.500 µg/L - 30 70-130 30 70-130 30EPA 8260B o-Xylene 95-47-6 0.130 0.500 µg/L - 30 70-130 30 70-130 30EPA 8260B m,p-Xylene 1330-20-7mp 0.131 1.000 µg/L - 30 70-130 30 70-130 30EPA 8260B Dibromofluoromethane 1868-53-7 - - Surrogate 80-120 - - 0 - 0EPA 8260B 1,4-Difluorobenzene 540-36-3 - - Surrogate 80-120 - - 0 - 0EPA 8260B Toluene-d8 2037-26-5 - - Surrogate 80-120 - - 0 - 0EPA 8260B 4-Bromofluorobenzene 460-00-4 - - Surrogate 80-120 - - 0 - 0
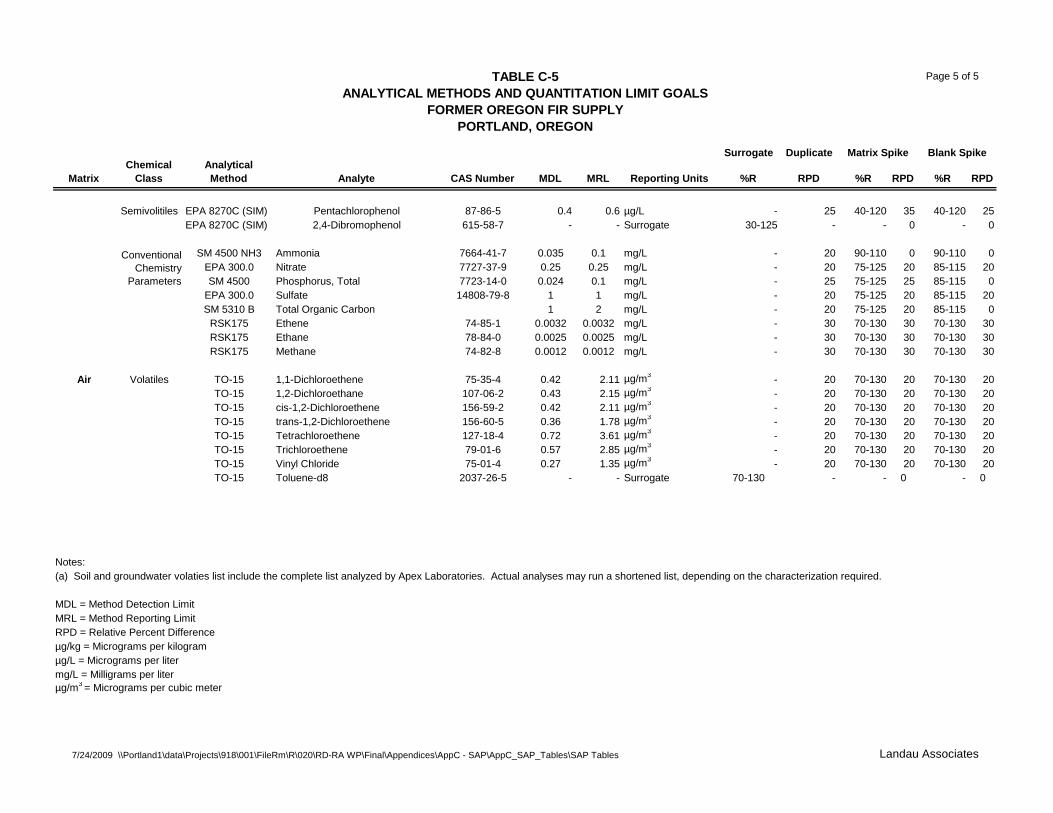
TABLE C-5ANALYTICAL METHODS AND QUANTITATION LIMIT GOALS
FORMER OREGON FIR SUPPLYPORTLAND, OREGON
Page 5 of 5
7/24/2009 \\Portland1\data\Projects\918\001\FileRm\R\020\RD-RA WP\Final\Appendices\AppC - SAP\AppC_SAP_Tables\SAP Tables Landau Associates
Surrogate Duplicate Matrix Spike Blank Spike
MatrixChemical
ClassAnalytical Method Analyte CAS Number MDL MRL Reporting Units %R RPD %R RPD %R RPD
Semivolitiles EPA 8270C (SIM) Pentachlorophenol 87-86-5 0.4 0.6 µg/L - 25 40-120 35 40-120 25EPA 8270C (SIM) 2,4-Dibromophenol 615-58-7 - - Surrogate 30-125 - - 0 - 0
SM 4500 NH3 Ammonia 7664-41-7 0.035 0.1 mg/L - 20 90-110 0 90-110 0EPA 300.0 Nitrate 7727-37-9 0.25 0.25 mg/L - 20 75-125 20 85-115 20SM 4500 Phosphorus, Total 7723-14-0 0.024 0.1 mg/L - 25 75-125 25 85-115 0
EPA 300.0 Sulfate 14808-79-8 1 1 mg/L - 20 75-125 20 85-115 20SM 5310 B Total Organic Carbon 1 2 mg/L - 20 75-125 20 85-115 0
RSK175 Ethene 74-85-1 0.0032 0.0032 mg/L - 30 70-130 30 70-130 30RSK175 Ethane 78-84-0 0.0025 0.0025 mg/L - 30 70-130 30 70-130 30RSK175 Methane 74-82-8 0.0012 0.0012 mg/L - 30 70-130 30 70-130 30
Air Volatiles TO-15 1,1-Dichloroethene 75-35-4 0.42 2.11 µg/m3 - 20 70-130 20 70-130 20TO-15 1,2-Dichloroethane 107-06-2 0.43 2.15 µg/m3 - 20 70-130 20 70-130 20TO-15 cis-1,2-Dichloroethene 156-59-2 0.42 2.11 µg/m3 - 20 70-130 20 70-130 20TO-15 trans-1,2-Dichloroethene 156-60-5 0.36 1.78 µg/m3 - 20 70-130 20 70-130 20TO-15 Tetrachloroethene 127-18-4 0.72 3.61 µg/m3 - 20 70-130 20 70-130 20TO-15 Trichloroethene 79-01-6 0.57 2.85 µg/m3 - 20 70-130 20 70-130 20TO-15 Vinyl Chloride 75-01-4 0.27 1.35 µg/m3 - 20 70-130 20 70-130 20TO-15 Toluene-d8 2037-26-5 - - Surrogate 70-130 - - 0 - 0
Notes:(a) Soil and groundwater volaties list include the complete list analyzed by Apex Laboratories. Actual analyses may run a shortened list, depending on the characterization required. MDL = Method Detection LimitMRL = Method Reporting LimitRPD = Relative Percent Differenceµg/kg = Micrograms per kilogramµg/L = Micrograms per litermg/L = Milligrams per literµg/m3 = Micrograms per cubic meter
Conventional Chemistry
Parameters
ATTACHMENT C-1
Field Forms

Exploration No. ____________________ Date __________ Hour _____________
Log of Exploration
1/22/09 \\Portland1\data\Projects\883\002\010\011\Phase I Inv. WP\Work Plan\SAP\Forms and Figures\Form 3_Log of Exploration.doc
Project Name ______________________ Project No. _______________________ Location Sketch (show dimensions to mapped features)
Client/owner _______________________ Exploration Operator _______________
Exploration Method __________________________________________________
__________________________________________________________________
Logged by ________________________ Exploration Completed ______________ (East) (North) Ground Surface Conditions ____________________________________________ Coordinates: “x” __________ “y” __________ Method __________
Weather Conditions __________________________________________________ Elevations _____________________ Datum _________________
Sam
ple
Dep
th (t
op) (
ft.)
Sam
ple
Leng
th (f
t.)
Rec
over
y Le
ngth
(ft.)
Ret
aine
d D
epth
(top
) (ft.
) R
etai
ned
Leng
th (f
t.)
Sam
ple
Num
ber
Sam
pler
/Ham
mer
Cod
es
Blo
w C
ount
s
Oth
er T
est D
ata)
___
____
__
US
CS
Sym
bol /
Uni
t Con
tact
Dep
th S
cale
(ft)
Sampler and Hammer Information
Wat
er L
evel
In
form
atio
n
Date
a = 2.42-in. I.D. Split Spoon b = 2.0-in. O.D. Split Spoon c = Shelby Tube d = ______________
1 = 300-lb. Hammer, 30-inch Drop
2 = 140-lb. Hammer, 30-inch Drop
3 = Pushed 4 = ______________
Time
Depth to Water
Hole Depth
Casing Depth
Sample Description Color, secondary soil type, PRIMARY SOIL TYPE with modifiers and
minor components (density/consistency, moisture)(geologic unit)
Comments on Heave, Water Conditions, & Drilling Action 0
1
2
3
4
5
6
7
8
9
0
1
2
3
4
5
6
7
8
9 0
Total Depth ______________ Finish Date ________________ Hour _____________ Continued
North Arrow
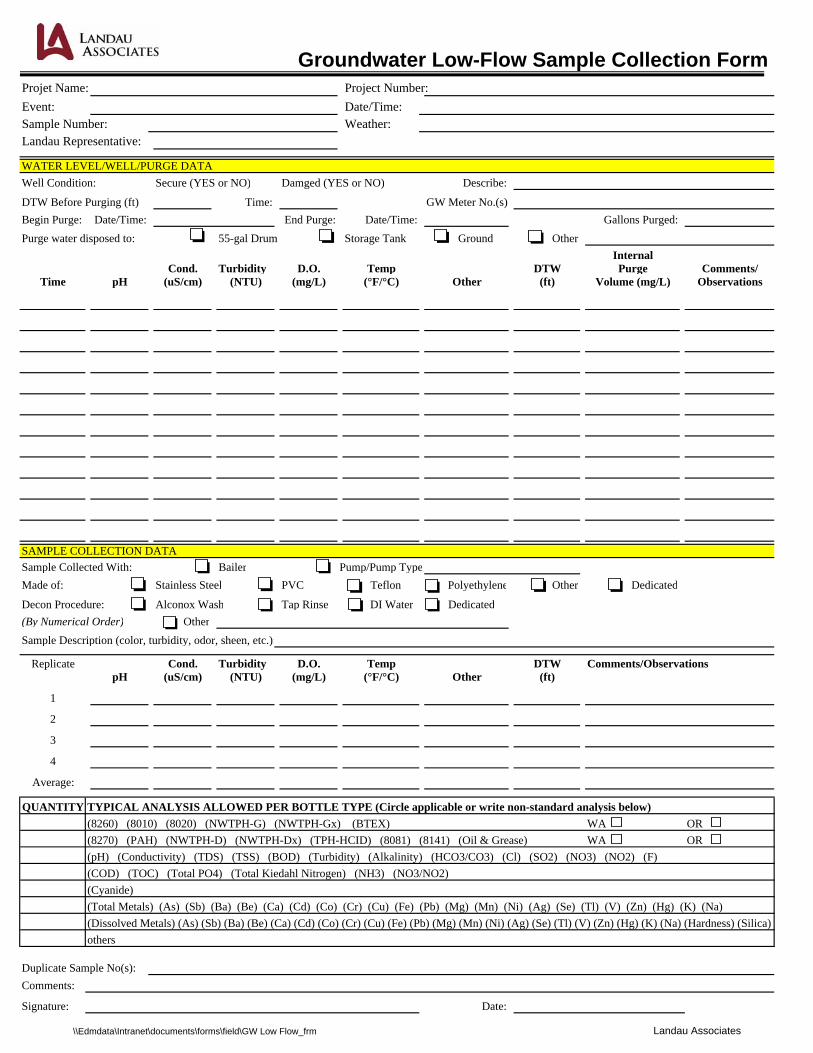
Groundwater Low-Flow Sample Collection FormProjet Name: Project Number: Event: Date/Time: Sample Number: Weather: Landau Representative:
WATER LEVEL/WELL/PURGE DATAWell Condition: Secure (YES or NO) Damged (YES or NO) Describe:
DTW Before Purging (ft) Time: GW Meter No.(s)Begin Purge: Date/Time: End Purge: Date/Time: Gallons Purged:Purge water disposed to: 55-gal Drum Storage Tank Ground Other
InternalCond. Turbidity D.O. Temp DTW Purge Comments/
Time pH (uS/cm) (NTU) (mg/L) (°F/°C) Other (ft) Volume (mg/L) Observations
SAMPLE COLLECTION DATASample Collected With: Bailer Pump/Pump TypeMade of: Stainless Steel PVC Teflon Polyethylene Other Dedicated
Decon Procedure: Alconox Wash Tap Rinse DI Water Dedicated(By Numerical Order) OtherSample Description (color, turbidity, odor, sheen, etc.):
Replicate Cond. Turbidity D.O. Temp DTW Comments/ObservationspH (uS/cm) (NTU) (mg/L) (°F/°C) Other (ft)
1
2
3
4
Average:
QUANTITY TYPICAL ANALYSIS ALLOWED PER BOTTLE TYPE (Circle applicable or write non-standard analysis below)(8260) (8010) (8020) (NWTPH-G) (NWTPH-Gx) (BTEX) WA OR(8270) (PAH) (NWTPH-D) (NWTPH-Dx) (TPH-HCID) (8081) (8141) (Oil & Grease) WA OR(pH) (Conductivity) (TDS) (TSS) (BOD) (Turbidity) (Alkalinity) (HCO3/CO3) (Cl) (SO2) (NO3) (NO2) (F)(COD) (TOC) (Total PO4) (Total Kiedahl Nitrogen) (NH3) (NO3/NO2)(Cyanide)(Total Metals) (As) (Sb) (Ba) (Be) (Ca) (Cd) (Co) (Cr) (Cu) (Fe) (Pb) (Mg) (Mn) (Ni) (Ag) (Se) (Tl) (V) (Zn) (Hg) (K) (Na)(Dissolved Metals) (As) (Sb) (Ba) (Be) (Ca) (Cd) (Co) (Cr) (Cu) (Fe) (Pb) (Mg) (Mn) (Ni) (Ag) (Se) (Tl) (V) (Zn) (Hg) (K) (Na) (Hardness) (Silica)others
Duplicate Sample No(s):Comments:
Signature: Date:
\\Edmdata\Intranet\documents\forms\field\GW Low Flow_frm Landau Associates
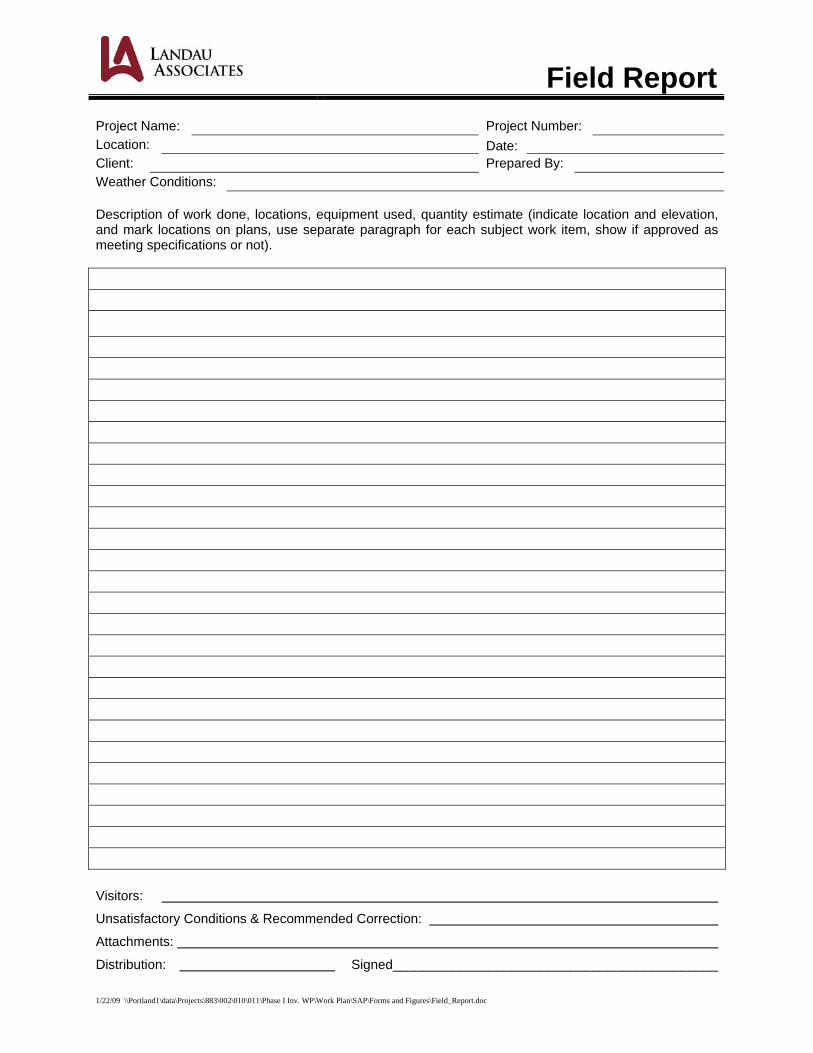
1/22/09 \\Portland1\data\Projects\883\002\010\011\Phase I Inv. WP\Work Plan\SAP\Forms and Figures\Field_Report.doc
Field Report Project Name: Project Number: Location: Date: Client: Prepared By: Weather Conditions: Description of work done, locations, equipment used, quantity estimate (indicate location and elevation, and mark locations on plans, use separate paragraph for each subject work item, show if approved as meeting specifications or not).
Visitors:
Unsatisfactory Conditions & Recommended Correction:
Attachments:
Distribution: Signed____________________________________________
ATTACHMENT C-2
EPA Low Stress (Low Flow)Sampling Procedure
U.S. ENVIRONMENTAL PROTECTION AGENCYREGION I
LOW STRESS (low flow) PURGING AND SAMPLINGPROCEDURE FOR THE COLLECTION OF
GROUND WATER SAMPLES FROM MONITORING
WELLS
July 30, 1996Revision 2
SOP #: GW 0001Region I Low Stress
(Low Flow) SOPRevision Number: 2 Date: July 30, 1996Page 1 of 13
U.S. ENVIRONMENTAL PROTECTION AGENCYREGION I
LOW STRESS (low flow) PURGING AND SAMPLING PROCEDUREFOR THE COLLECTION OF GROUND WATER SAMPLES
FROM MONITORING WELLS
I. SCOPE & APPLICATION
This standard operating procedure (SOP) provides a general frameworkfor collecting ground water samples that are indicative of mobileorganic and inorganic loads at ambient flow conditions (both thedissolved fraction and the fraction associated with mobileparticulates). The SOP emphasizes the need to minimize stress by lowwater-level drawdowns, and low pumping rates (usually less than 1liter/min) in order to collect samples with minimal alterations towater chemistry. This SOP is aimed primarily at sampling monitoringwells that can accept a submersible pump and have a screen, or openinterval length of 10 feet or less (this is the most commonsituation). However, this procedure is flexible and can be used in avariety of well construction and ground-water yield situations. Samples thus obtained are suitable for analyses of ground watercontaminants (volatile and semi-volatile organic analytes,pesticides, PCBs, metals and other inorganics), or other naturallyoccurring analytes.
This procedure does not address the collection of samples from wellscontaining light or dense non-aqueous phase liquids (LNAPLs andDNAPLs). For this the reader may wish to check: Cohen, R.M. and J.W.Mercer, 1993, DNAPL Site Evaluation; C.K. Smoley (CRC Press), BocaRaton, Florida and U.S. Environmental Protection Agency, 1992, RCRAGround-Water Monitoring: Draft Technical Guidance; Washington, DC(EPA/530-R-93-001).
The screen, or open interval of the monitoring well should beoptimally located (both laterally and vertically) to interceptexisting contaminant plume(s) or along flowpaths of potentialcontaminant releases. It is presumed that the analytes of interestmove (or potentially move) primarily through the more permeable zoneswithin the screen, or open interval.
Use of trademark names does not imply endorsement by U.S.EPA but is intended only to assist in identification of a specific type of device.
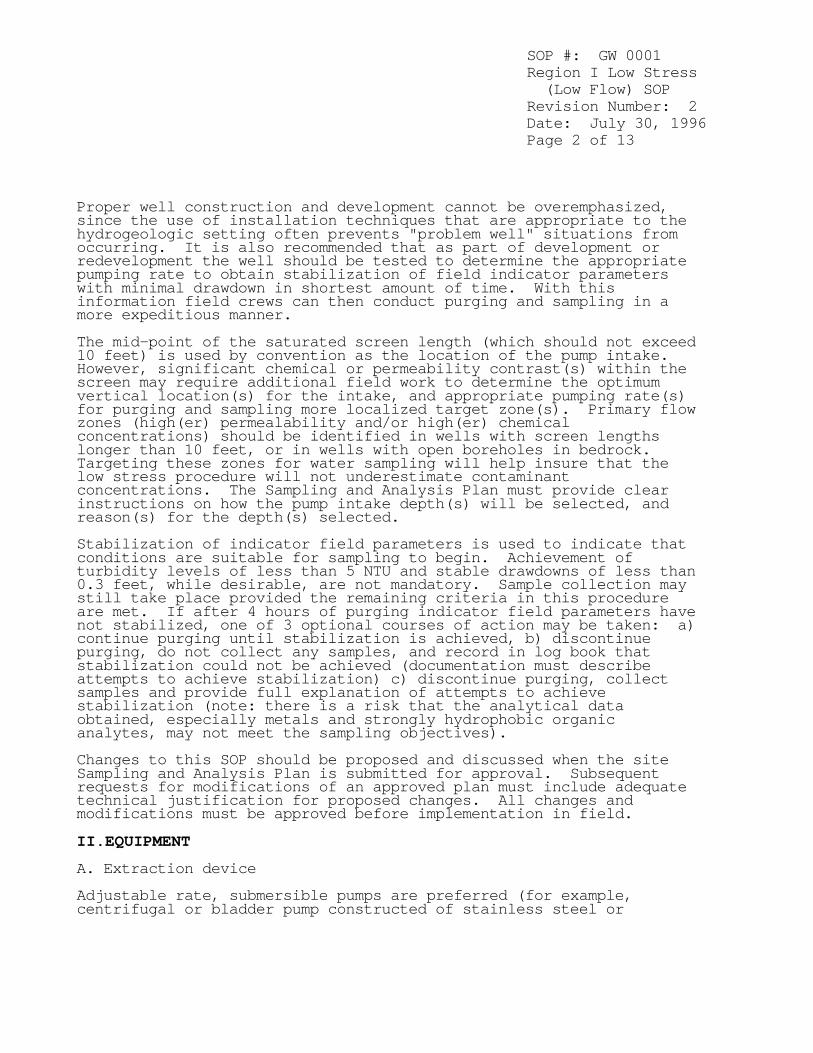
SOP #: GW 0001Region I Low Stress (Low Flow) SOPRevision Number: 2 Date: July 30, 1996Page 2 of 13
Proper well construction and development cannot be overemphasized,since the use of installation techniques that are appropriate to thehydrogeologic setting often prevents "problem well" situations fromoccurring. It is also recommended that as part of development orredevelopment the well should be tested to determine the appropriatepumping rate to obtain stabilization of field indicator parameterswith minimal drawdown in shortest amount of time. With thisinformation field crews can then conduct purging and sampling in amore expeditious manner.
The mid-point of the saturated screen length (which should not exceed10 feet) is used by convention as the location of the pump intake. However, significant chemical or permeability contrast(s) within thescreen may require additional field work to determine the optimumvertical location(s) for the intake, and appropriate pumping rate(s)for purging and sampling more localized target zone(s). Primary flowzones (high(er) permealability and/or high(er) chemicalconcentrations) should be identified in wells with screen lengthslonger than 10 feet, or in wells with open boreholes in bedrock. Targeting these zones for water sampling will help insure that thelow stress procedure will not underestimate contaminantconcentrations. The Sampling and Analysis Plan must provide clearinstructions on how the pump intake depth(s) will be selected, andreason(s) for the depth(s) selected.
Stabilization of indicator field parameters is used to indicate thatconditions are suitable for sampling to begin. Achievement ofturbidity levels of less than 5 NTU and stable drawdowns of less than0.3 feet, while desirable, are not mandatory. Sample collection maystill take place provided the remaining criteria in this procedureare met. If after 4 hours of purging indicator field parameters havenot stabilized, one of 3 optional courses of action may be taken: a)continue purging until stabilization is achieved, b) discontinuepurging, do not collect any samples, and record in log book thatstabilization could not be achieved (documentation must describeattempts to achieve stabilization) c) discontinue purging, collectsamples and provide full explanation of attempts to achievestabilization (note: there is a risk that the analytical dataobtained, especially metals and strongly hydrophobic organicanalytes, may not meet the sampling objectives).
Changes to this SOP should be proposed and discussed when the siteSampling and Analysis Plan is submitted for approval. Subsequentrequests for modifications of an approved plan must include adequatetechnical justification for proposed changes. All changes andmodifications must be approved before implementation in field.
II.EQUIPMENT
A. Extraction device
Adjustable rate, submersible pumps are preferred (for example,centrifugal or bladder pump constructed of stainless steel or
SOP #: GW 0001Region I Low Stress (Low Flow) SOPRevision Number: 2 Date: July 30, 1996Page 3 of 13
Teflon).
Adjustable rate, peristaltic pumps (suction) may be used withcaution. Note that EPA guidance states: "Suction pumps are notrecommended because they may cause degassing, pH modification, andloss of volatile compounds" (EPA/540/P-87/001, 1987, page 8.5-11).
The use of inertial pumps is discouraged. These devices frequentlycause greater disturbance during purging and sampling and are lesseasily controlled than the pumps listed above. This can lead tosampling results that are adversely affected by purging and samplingoperations, and a higher degree of data variability.
B. Tubing
Teflon or Teflon lined polyethylene tubing are preferred whensampling is to include VOCs, SVOCs, pesticides, PCBs and inorganics.
PVC, polypropylene or polyethylene tubing may be used when collectingsamples for inorganics analyses. However, these materials should beused with caution when sampling for organics. If these materials areused, the equipment blank (which includes the tubing) data must showthat these materials do not add contaminants to the sample.
Stainless steel tubing may be used when sampling for VOCs, SVOCs,pesticides, and PCBs. However, it should be used with caution whensampling for metals.
The use of 1/4 inch or 3/8 inch (inner diameter) tubing is preferred. This will help ensure the tubing remains liquid filled when operatingat very low pumping rates. Pharmaceutical grade (Pharmed) tubing should be used for the sectionaround the rotor head of a peristaltic pump, to minimize gaseousdiffusion.
C. Water level measuring device(s), capable of measuring to 0.01foot accuracy (electronic “tape”, pressure transducer). Recordingpressure transducers, mounted above the pump, are especially helpfulin tracking water levels during pumping operations, but their usemust include check measurements with a water level “tape” at thestart and end of each record.
D. Flow measurement supplies (e.g., graduated cylinder and stopwatch).
E. Interface probe, if needed.
F. Power source (generator, nitrogen tank, etc.). If a gasolinegenerator is used, it must be located downwind and at least 30 feetfrom the well so that the exhaust fumes do not contaminate thesamples.
SOP #: GW 0001Region I Low Stress (Low Flow) SOPRevision Number: 2 Date: July 30, 1996Page 4 of 13
G. Indicator field parameter monitoring instruments - pH, Eh,dissolved oxygen (DO), turbidity, specific conductance, andtemperature. Use of a flow-through-cell is required when measuringall listed parameters, except turbidity. Standards to perform fieldcalibration of instruments. Analytical methods are listed in 40 CFR136, 40 CFR 141, and SW-846. For Eh measurements, followmanufacturer's instructions.
H. Decontamination supplies (for example, non-phosphate detergent,distilled/deionized water, isopropyl alcohol, etc.).
I. Logbook(s), and other forms (for example, well purging forms).
J. Sample Bottles.
K. Sample preservation supplies (as required by the analyticalmethods).
L. Sample tags or labels.
M. Well construction data, location map, field data from lastsampling event.
N. Well keys.
O. Site specific Sample and Analysis Plan/Quality Assurance ProjectPlan.
P. PID or FID instrument (if appropriate) to detect VOCs for healthand safety purposes, and provide qualitative field evaluations.
III.PRELIMINARY SITE ACTIVITIES
Check well for security damage or evidence of tampering, recordpertinent observations.
Lay out sheet of clean polyethylene for monitoring and samplingequipment.
Remove well cap and immediately measure VOCs at the rim of the wellwith a PID or FID instrument and record the reading in the fieldlogbook.
If the well casing does not have a reference point (usually a V-cutor indelible mark in the well casing), make one. Describe itslocation and record the date of the mark in the logbook. A synoptic water level measurement round should be performed (in theshortest possible time) before any purging and sampling activitiesbegin. It is recommended that water level depth (to 0.01 ft.) and
SOP #: GW 0001Region I Low Stress (Low Flow) SOPRevision Number: 2 Date: July 30, 1996Page 5 of 13
total well depth (to 0.1 ft.) be measured the day before, in order toallow for re-settlement of any particulates in the water column. Ifmeasurement of total well depth is not made the day before, it shouldnot be measured until after sampling of the well is complete. Allmeasurements must be taken from the established referenced point. Care should be taken to minimize water column disturbance.
Check newly constructed wells for the presence of LNAPLs or DNAPLsbefore the initial sampling round. If none are encountered,subsequent check measurements with an interface probe are usually notneeded unless analytical data or field head space information signala worsening situation. Note: procedures for collection of LNAPL andDNAPL samples are not addressed in this SOP.
IV.PURGING AND SAMPLING PROCEDURE
Sampling wells in order of increasing chemical concentrations (knownor anticipated) is preferred.
1. Install Pump
Lower pump, safety cable, tubing and electrical lines slowly (tominimize disturbance) into the well to the midpoint of the zone to besampled. The Sampling and Analysis Plan should specify the samplingdepth, or provide criteria for selection of intake depth for eachwell (see Section I). If possible keep the pump intake at least twofeet above the bottom of the well, to minimize mobilization ofparticulates present in the bottom of the well. Collection of turbidfree water samples may be especially difficult if there is two feetor less of standing water in the well.
2. Measure Water Level
Before starting pump, measure water level. If recording pressuretransducer is used-initialize starting condition.
3. Purge Well
3a. Initial Low Stress Sampling Event
Start the pump at its lowest speed setting and slowly increase thespeed until discharge occurs. Check water level. Adjust pump speeduntil there is little or no water level drawdown (less than 0.3feet). If the minimal drawdown that can be achieved exceeds 0.3 feetbut remains stable, continue purging until indicator field parametersstabilize.
Monitor and record water level and pumping rate every three to fiveminutes (or as appropriate) during purging. Record any pumping rateadjustments (both time and flow rate). Pumping rates should, asneeded, be reduced to the minimum capabilities of the pump (forexample, 0.1 - 0.4 l/min) to ensure stabilization of indicator
SOP #: GW 0001Region I Low Stress (Low Flow) SOPRevision Number: 2 Date: July 30, 1996Page 6 of 13
parameters. Adjustments are best made in the first fifteen minutesof pumping in order to help minimize purging time. During pumpstart-up, drawdown may exceed the 0.3 feet target and then "recover"as pump flow adjustments are made. Purge volume calculations shouldutilize stabilized drawdown value, not the initial drawdown. Do notallow the water level to fall to the intake level (if the staticwater level is above the well screen, avoid lowering the water levelinto the screen). The final purge volume must be greater than thestabilized drawdown volume plus the extraction tubing volume.
Wells with low recharge rates may require the use of special pumpscapable of attaining very low pumping rates (bladder, peristaltic),and/or the use of dedicated equipment. If the recharge rate of thewell is lower than extraction rate capabilities of currentlymanufactured pumps and the well is essentially dewatered duringpurging, then the well should be sampled as soon as the water levelhas recovered sufficiently to collect the appropriate volume neededfor all anticipated samples (ideally the intake should not be movedduring this recovery period). Samples may then be collected eventhough the indicator field parameters have not stabilized.
3b. Subsequent Low Stress Sampling Events
After synoptic water level measurement round, check intake depth anddrawdown information from previous sampling event(s) for each well. Duplicate, to the extent practicable, the intake depth and extractionrate (use final pump dial setting information) from previousevent(s). Perform purging operations as above.
4. Monitor Indicator Field Parameters
During well purging, monitor indicator field parameters (turbidity,temperature, specific conductance, pH, Eh, DO) every three to fiveminutes (or less frequently, if appropriate). Note: during the earlyphase of purging emphasis should be put on minimizing and stabilizingpumping stress, and recording those adjustments. Purging isconsidered complete and sampling may begin when all the aboveindicator field parameters have stabilized. Stabilization isconsidered to be achieved when three consecutive readings, taken atthree (3) to five (5) minute intervals, are within the followinglimits:
turbidity (10% for values greater than 1 NTU),DO (10%),specific conductance (3%),temperature (3%), pH (± 0.1 unit),ORP/Eh (± 10 millivolts).
All measurements, except turbidity, must be obtained using a flow-through-cell. Transparent flow-through-cells are preferred, becausethey allow field personnel to watch for particulate build-up withinthe cell. This build-up may affect indicator field parameter values
SOP #: GW 0001Region I Low Stress (Low Flow) SOPRevision Number: 2 Date: July 30, 1996Page 7 of 13
measured within the cell and may also cause an underestimation ofturbidity values measured after the cell. If the cell needs to becleaned during purging operations, continue pumping and disconnectcell for cleaning, then reconnect after cleaning and continuemonitoring activities.
The flow-through-cell must be designed in a way that prevents airbubble entrapment in the cell. When the pump is turned off orcycling on/off (when using a bladder pump), water in the cell mustnot drain out. Monitoring probes must be submerged in water at alltimes. If two flow-through-cells are used in series, the onecontaining the dissolved oxygen probe should come first (thisparameter is most susceptible to error if air leaks into the system).
5. Collect Water Samples
Water samples for laboratory analyses must be collected before waterhas passed through the flow-through-cell (use a by-pass assembly ordisconnect cell to obtain sample).
VOC samples should be collected first and directly into pre-preservedsample containers. Fill all sample containers by allowing the pumpdischarge to flow gently down the inside of the container withminimal turbulence.
During purging and sampling, the tubing should remain filled withwater so as to minimize possible changes in water chemistry uponcontact with the atmosphere. It is recommended that 1/4 inch or 3/8inch (inside diameter) tubing be used to help insure that the sampletubing remains water filled. If the pump tubing is not completelyfilled to the sampling point, use one of the following procedures tocollect samples: (1) add clamp, connector (Teflon or stainlesssteel) or valve to constrict sampling end of tubing; (2) insert smalldiameter Teflon tubing into water filled portion of pump tubingallowing the end to protrude beyond the end of the pump tubing,collect sample from small diameter tubing; (3) collect non-VOCsamples first, then increase flow rate slightly until the watercompletely fills the tubing, collect sample and record new drawdown,flow rate and new indicator field parameter values.
Add preservative, as required by analytical methods, to samplesimmediately after they are collected if the sample containers are notpre-preserved. Check analytical methods (e.g. EPA SW-846, watersupply, etc.) for additional information on preservation. Check pHfor all samples requiring pH adjustment to assure proper pH value. For VOC samples, this will require that a test sample be collectedduring purging to determine the amount of preservative that needs tobe added to the sample containers prior to sampling.
If determination of filtered metal concentrations is a samplingobjective, collect filtered water samples using the same low flowprocedures. The use of an in-line filter is required, and the filter
SOP #: GW 0001Region I Low Stress (Low Flow) SOPRevision Number: 2 Date: July 30, 1996Page 8 of 13
size (0.45 um is commonly used) should be based on the samplingobjective. Pre-rinse the filter with approximately 25 - 50 ml ofground water prior to sample collection. Preserve filtered watersample immediately. Note: filtered water samples are not anacceptable substitute for unfiltered samples when the monitoringobjective is to obtain chemical concentrations of total mobilecontaminants in ground water for human health risk calculations.
Label each sample as collected. Samples requiring cooling (volatileorganics, cyanide, etc.) will be placed into a cooler with ice orrefrigerant for delivery to the laboratory. Metal samples afteracidification to a pH less than 2 do not need to be cooled.
6. Post Sampling Activities
If recording pressure transducer is used, remeasure water level withtape.
After collection of the samples, the pump tubing may either bededicated to the well for resampling (by hanging the tubing insidethe well), decontaminated, or properly discarded.
Before securing the well, measure and record the well depth (to 0.1ft.), if not measured the day before purging began. Note:measurement of total well depth is optional after the initial lowstress sampling event. However, it is recommended if the well has a“silting” problem or if confirmation of well identity is needed.
Secure the well.
V.DECONTAMINATION
Decontaminate sampling equipment prior to use in the first well andfollowing sampling of each subsequent well. Pumps will not beremoved between purging and sampling operations. The pump and tubing(including support cable and electrical wires which are in contactwith the well) will be decontaminated by one of the procedures listedbelow.
Procedure 1
The decontaminating solutions can be pumped from either buckets orshort PVC casing sections through the pump or the pump can bedisassembled and flushed with the decontaminating solutions. It isrecommended that detergent and isopropyl alcohol be used sparinglyin the decontamination process and water flushing steps be extendedto ensure that any sediment trapped in the pump is removed. Thepump exterior and electrical wires must be rinsed with thedecontaminating solutions, as well. The procedure is as follows:
Flush the equipment/pump with potable water.
SOP #: GW 0001Region I Low Stress (Low Flow) SOPRevision Number: 2 Date: July 30, 1996Page 9 of 13
Flush with non-phosphate detergent solution. If the solution isrecycled, the solution must be changed periodically.
Flush with potable or distilled/deionized water to remove all ofthe detergent solution. If the water is recycled, the water mustbe changed periodically.
Flush with isopropyl alcohol (pesticide grade). If equipmentblank data from the previous sampling event show that the level ofcontaminants is insignificant, then this step may be skipped.
Flush with distilled/deionized water. The final water rinse mustnot be recycled.
Procedure 2
Steam clean the outside of the submersible pump.
Pump hot potable water from the steam cleaner through the inside ofthe pump. This can be accomplished by placing the pump inside athree or four inch diameter PVC pipe with end cap. Hot water fromthe steam cleaner jet will be directed inside the PVC pipe and thepump exterior will be cleaned. The hot water from the steamcleaner will then be pumped from the PVC pipe through the pump andcollected into another container. Note: additives or solutionsshould not be added to the steam cleaner.
Pump non-phosphate detergent solution through the inside of thepump. If the solution is recycled, the solution must be changedperiodically.
Pump potable water through the inside of the pump to remove all ofthe detergent solution. If the solution is recycled, the solutionmust be changed periodically.
Pump distilled/deionized water through the pump. The final waterrinse must not be recycled.
VI.FIELD QUALITY CONTROL
Quality control samples are required to verify that the samplecollection and handling process has not compromised the quality ofthe ground water samples. All field quality control samples must beprepared the same as regular investigation samples with regard tosample volume, containers, and preservation. The following qualitycontrol samples shall be collected for each batch of samples (a batchmay not exceed 20 samples). Trip blanks are required for the VOCsamples at a frequency of one set per VOC sample cooler.
Field duplicate.
Matrix spike.
SOP #: GW 0001Region I Low Stress (Low Flow) SOPRevision Number: 2 Date: July 30, 1996Page 10 of 13
Matrix spike duplicate.
Equipment blank.
Trip blank (VOCs).
Temperature blank (one per sample cooler).
Equipment blank shall include the pump and the pump's tubing. Iftubing is dedicated to the well, the equipment blank will onlyinclude the pump in subsequent sampling rounds.
Collect samples in order from wells with lowest contaminantconcentration to highest concentration. Collect equipment blanksafter sampling from contaminated wells and not after backgroundwells.
Field duplicates are collected to determine precision of samplingprocedure. For this procedure, collect duplicate for each analytegroup in consecutive order (VOC original, VOC duplicate, SVOCoriginal, SVOC duplicate, etc.).
If split samples are to be collected, collect split for each analytegroup in consecutive order (VOC original, VOC split, etc.). Splitsample should be as identical as possible to original sample.
All monitoring instrumentation shall be operated in accordance withEPA analytical methods and manufacturer's operating instructions. EPA analytical methods are listed in 40 CFR 136, 40 CFR 141, and SW-846 with exception of Eh, for which the manufacturer's instructionsare to be followed. Instruments shall be calibrated at the beginningof each day. If a measurement falls outside the calibration range,the instrument should be re-calibrated so that all measurements fallwithin the calibration range. At the end of each day, checkcalibration to verify that instruments remained in calibration. Temperature measuring equipment, thermometers and thermistors, neednot be calibrated to the above frequency. They should be checked foraccuracy prior to field use according to EPA Methods and themanufacturer's instructions.
VII.FIELD LOGBOOK
A field log shall be kept to document all ground water fieldmonitoring activities (see attached example matrix), and record allof the following:
Well identification.
Well depth, and measurement technique.
Static water level depth, date, time and measurement technique.
Presence and thickness of immiscible liquid (NAPL) layers and
SOP #: GW 0001Region I Low Stress (Low Flow) SOPRevision Number: 2 Date: July 30, 1996Page 11 of 13
detection method.
Pumping rate, drawdown, indicator parameters values, and clocktime, at the appropriate time intervals; calculated or measuredtotal volume pumped.
Well sampling sequence and time of each sample collection.
Types of sample bottles used and sample identification numbers.
Preservatives used.
Parameters requested for analysis.
Field observations during sampling event.
Name of sample collector(s).
Weather conditions.
QA/QC data for field instruments.
Any problems encountered should be highlighted.
Description of all sampling equipment used, including trade names,model number, diameters, material composition, etc.
VIII. DATA REPORT
Data reports are to include laboratory analytical results, QA/QCinformation, and whatever field logbook information is needed toallow for a full evaluation of data useability.
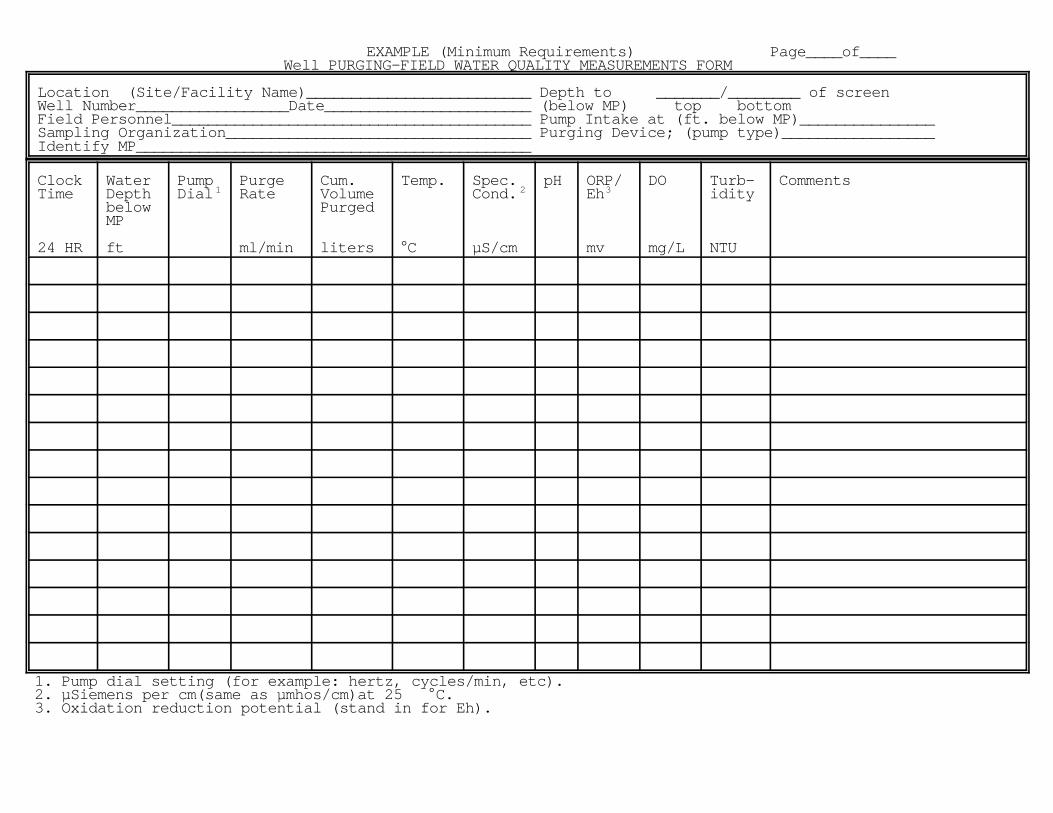
EXAMPLE (Minimum Requirements) Page____of____Well PURGING-FIELD WATER QUALITY MEASUREMENTS FORM
Location (Site/Facility Name)_________________________ Depth to _______/________ of screenWell Number_________________Date_______________________ (below MP) top bottomField Personnel________________________________________ Pump Intake at (ft. below MP)_______________Sampling Organization__________________________________ Purging Device; (pump type)_________________Identify MP____________________________________________
Clock Water Pump Purge Cum. Temp. Spec. pH ORP/ DO Turb- CommentsTime Depth Dial Rate Volume Cond. Eh idity
24 HR ft ml/min liters C µS/cm mv mg/L NTU
below Purged MP
1
2 3
1. Pump dial setting (for example: hertz, cycles/min, etc). 2. µSiemens per cm(same as µmhos/cm)at 25 C. 3. Oxidation reduction potential (stand in for Eh).

APPENDIX D
Forms

1/22/09 \\Portland1\data\Projects\883\002\010\011\Phase I Inv. WP\Work Plan\SAP\Forms and Figures\Field_Report.doc
Field Report Project Name: Project Number: Location: Date: Client: Prepared By: Weather Conditions: Description of work done, locations, equipment used, quantity estimate (indicate location and elevation, and mark locations on plans, use separate paragraph for each subject work item, show if approved as meeting specifications or not).
Visitors:
Unsatisfactory Conditions & Recommended Correction:
Attachments:
Distribution: Signed____________________________________________
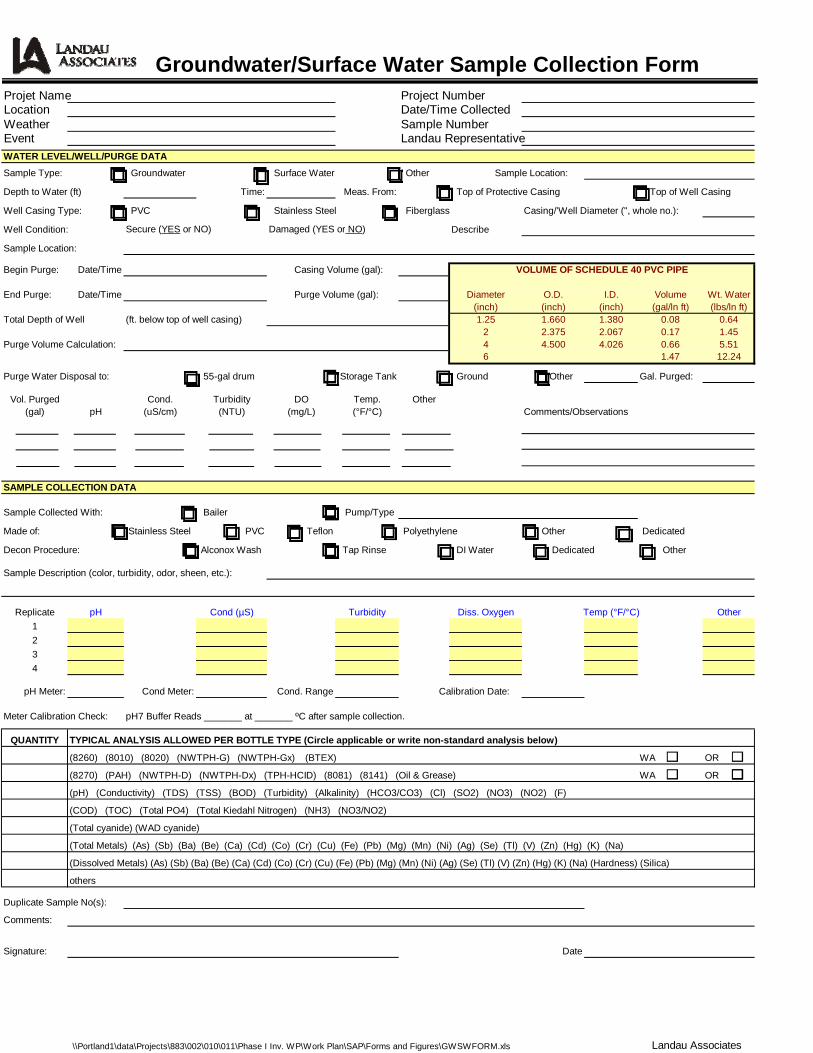
Groundwater/Surface Water Sample Collection FormProjet Name Project NumberLocation Date/Time CollectedWeather Sample NumberEvent Landau RepresentativeWATER LEVEL/WELL/PURGE DATA
Sample Type: Groundwater Surface Water Other Sample Location:
Depth to Water (ft) Time: Meas. From: Top of Protective Casing Top of Well Casing
Well Casing Type: PVC Stainless Steel Fiberglass Casing/'Well Diameter (", whole no.):
Well Condition: Secure (YES or NO) Damaged (YES or NO) Describe
Sample Location:
Begin Purge: Date/Time Casing Volume (gal): VOLUME OF SCHEDULE 40 PVC PIPE
End Purge: Date/Time Purge Volume (gal): Diameter O.D. I.D. Volume Wt. Water(inch) (inch) (inch) (gal/ln ft) (lbs/ln ft)
Total Depth of Well (ft. below top of well casing) 1.25 1.660 1.380 0.08 0.642 2.375 2.067 0.17 1.45
Purge Volume Calculation: 4 4.500 4.026 0.66 5.516 1.47 12.24
Purge Water Disposal to: 55-gal drum Storage Tank Ground Other Gal. Purged:
Vol. Purged Cond. Turbidity DO Temp. Other(gal) pH (uS/cm) (NTU) (mg/L) (°F/°C) Comments/Observations
SAMPLE COLLECTION DATA
Sample Collected With: Bailer Pump/Type
Made of: Stainless Steel PVC Teflon Polyethylene Other Dedicated
Decon Procedure: Alconox Wash Tap Rinse DI Water Dedicated Other
Sample Description (color, turbidity, odor, sheen, etc.):
Replicate pH Cond (µS) Turbidity Diss. Oxygen Temp (°F/°C) Other1234
pH Meter: Cond Meter: Cond. Range Calibration Date:
QUANTITY TYPICAL ANALYSIS ALLOWED PER BOTTLE TYPE (Circle applicable or write non-standard analysis below)
(8260) (8010) (8020) (NWTPH-G) (NWTPH-Gx) (BTEX) WA OR
(8270) (PAH) (NWTPH-D) (NWTPH-Dx) (TPH-HCID) (8081) (8141) (Oil & Grease) WA OR
(pH) (Conductivity) (TDS) (TSS) (BOD) (Turbidity) (Alkalinity) (HCO3/CO3) (Cl) (SO2) (NO3) (NO2) (F)
(COD) (TOC) (Total PO4) (Total Kiedahl Nitrogen) (NH3) (NO3/NO2)
(Total cyanide) (WAD cyanide)
(Total Metals) (As) (Sb) (Ba) (Be) (Ca) (Cd) (Co) (Cr) (Cu) (Fe) (Pb) (Mg) (Mn) (Ni) (Ag) (Se) (Tl) (V) (Zn) (Hg) (K) (Na)
(Dissolved Metals) (As) (Sb) (Ba) (Be) (Ca) (Cd) (Co) (Cr) (Cu) (Fe) (Pb) (Mg) (Mn) (Ni) (Ag) (Se) (Tl) (V) (Zn) (Hg) (K) (Na) (Hardness) (Silica)
others
Duplicate Sample No(s):
Comments:
Signature: Date
Meter Calibration Check: pH7 Buffer Reads _______ at _______ ºC after sample collection.
\\Portland1\data\Projects\883\002\010\011\Phase I Inv. WP\Work Plan\SAP\Forms and Figures\GWSWFORM.xls Landau Associates
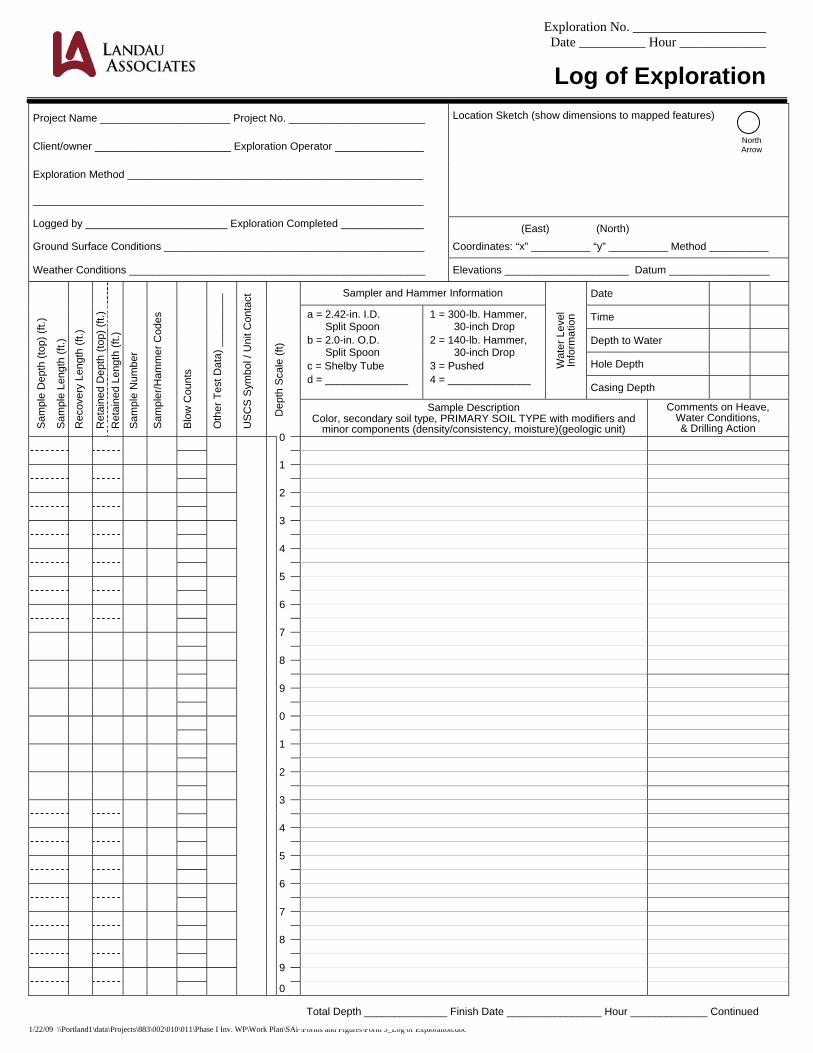
Exploration No. ____________________ Date __________ Hour _____________
Log of Exploration
1/22/09 \\Portland1\data\Projects\883\002\010\011\Phase I Inv. WP\Work Plan\SAP\Forms and Figures\Form 3_Log of Exploration.doc
Project Name ______________________ Project No. _______________________ Location Sketch (show dimensions to mapped features)
Client/owner _______________________ Exploration Operator _______________
Exploration Method __________________________________________________
__________________________________________________________________
Logged by ________________________ Exploration Completed ______________ (East) (North) Ground Surface Conditions ____________________________________________ Coordinates: “x” __________ “y” __________ Method __________
Weather Conditions __________________________________________________ Elevations _____________________ Datum _________________
Sam
ple
Dep
th (t
op) (
ft.)
Sam
ple
Leng
th (f
t.)
Rec
over
y Le
ngth
(ft.)
Ret
aine
d D
epth
(top
) (ft.
) R
etai
ned
Leng
th (f
t.)
Sam
ple
Num
ber
Sam
pler
/Ham
mer
Cod
es
Blo
w C
ount
s
Oth
er T
est D
ata)
___
____
__
US
CS
Sym
bol /
Uni
t Con
tact
Dep
th S
cale
(ft)
Sampler and Hammer Information
Wat
er L
evel
In
form
atio
n
Date
a = 2.42-in. I.D. Split Spoon b = 2.0-in. O.D. Split Spoon c = Shelby Tube d = ______________
1 = 300-lb. Hammer, 30-inch Drop
2 = 140-lb. Hammer, 30-inch Drop
3 = Pushed 4 = ______________
Time
Depth to Water
Hole Depth
Casing Depth
Sample Description Color, secondary soil type, PRIMARY SOIL TYPE with modifiers and
minor components (density/consistency, moisture)(geologic unit)
Comments on Heave, Water Conditions, & Drilling Action 0
1
2
3
4
5
6
7
8
9
0
1
2
3
4
5
6
7
8
9 0
Total Depth ______________ Finish Date ________________ Hour _____________ Continued
North Arrow
Page ___ of ___
Well Development Record
1/22/09 \\Portland1\data\Projects\883\002\010\011\Phase I Inv. WP\Work Plan\SAP\Forms and Figures\Well Development Record_frm.doc LANDAU ASSOCIATES
Project Name: Project No. Location: Date: Client: Landau Representative:
Well Number: Time:
Volume of Schedule 40 PVC Pipe
Depth to Water: Diameter
(inch) O.D. (inch)
I.D. (inch)
Volume (gal/ln ft)
Wt. Water (lbs/ln ft)
Well Depth: 1.25 1.660 1.380 0.08 0.64
Casing Diameter: 2 2.375 2.067 0.17 1.45
Casing Volume: 4 4.500 4.026 0.66 5.51 6 1.47 12.24 Est. Purge Volume:
Method of Development: Surge Block:
Yes No
Begin Development: Time: Final Volume Purged: Finish Development: Time: Water Disposal: 55-gal drum Storage Tank Ground Other _________ Initial Water Quality: (Turbidity, Color, Odor, Other) Initial Yield: pH: Temp: Conductivity: Turbidity: Notes:
Water Quality Notes:
Gallons pH Temperature Conductivity Turbidity Comments
Final Water Quality: (Turbidity, Color, Odor, Other) Final Yield: pH: Temperature: Conductivity: Turbidity:
Depth to Water After Development: Well Depth After Development:


