Embed Size (px)
Citation preview
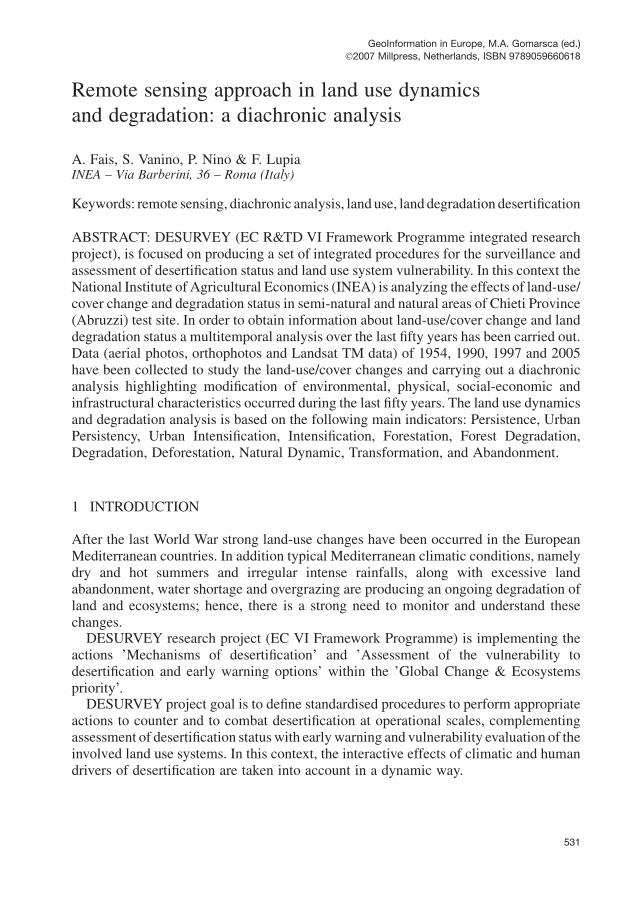
Remote sensing approach in land use dynamics
and degradation: a diachronic analysis
A. Fais, S. Vanino, P. Nino & F. LupiaINEA – Via Barberini, 36 – Roma (Italy)
Keywords: remote sensing, diachronic analysis, land use, land degradation desertification
ABSTRACT: DESURVEY (EC R&TD VI Framework Programme integrated researchproject), is focused on producing a set of integrated procedures for the surveillance andassessment of desertification status and land use system vulnerability. In this context theNational Institute of Agricultural Economics (INEA) is analyzing the effects of land-use/cover change and degradation status in semi-natural and natural areas of Chieti Province(Abruzzi) test site. In order to obtain information about land-use/cover change and landdegradation status a multitemporal analysis over the last fifty years has been carried out.Data (aerial photos, orthophotos and Landsat TM data) of 1954, 1990, 1997 and 2005have been collected to study the land-use/cover changes and carrying out a diachronicanalysis highlighting modification of environmental, physical, social-economic andinfrastructural characteristics occurred during the last fifty years. The land use dynamicsand degradation analysis is based on the following main indicators: Persistence, UrbanPersistency, Urban Intensification, Intensification, Forestation, Forest Degradation,Degradation, Deforestation, Natural Dynamic, Transformation, and Abandonment.
1 INTRODUCTION
After the last World War strong land-use changes have been occurred in the EuropeanMediterranean countries. In addition typical Mediterranean climatic conditions, namelydry and hot summers and irregular intense rainfalls, along with excessive landabandonment, water shortage and overgrazing are producing an ongoing degradation ofland and ecosystems; hence, there is a strong need to monitor and understand thesechanges.DESURVEY research project (EC VI Framework Programme) is implementing the
actions ’Mechanisms of desertification’ and ’Assessment of the vulnerability todesertification and early warning options’ within the ’Global Change & Ecosystemspriority’.DESURVEY project goal is to define standardised procedures to perform appropriate
actions to counter and to combat desertification at operational scales, complementingassessment of desertification statuswith earlywarning and vulnerability evaluation of theinvolved land use systems. In this context, the interactive effects of climatic and humandrivers of desertification are taken into account in a dynamic way.
531
GeoInformation in Europe, M.A. Gomarsca (ed.)
�2007 Millpress, Netherlands, ISBN 9789059660618
Inside DESURVEY framework INEA is involved in the analysis of spatial patterns ofland use/cover change (remote sensing based) in relation to natural and cultural landscapeattributes and in the development of a spatial statistical model in a GIS environment.INEA is also evaluating the socio-economic driving forces leading to structural changesin human-environment systems and land use transitions, defining criteria to discriminatebetween current and inherited desertification. DESURVEY Italian test site is ChietiProvince (Abruzzi).
2 STUDYAREA
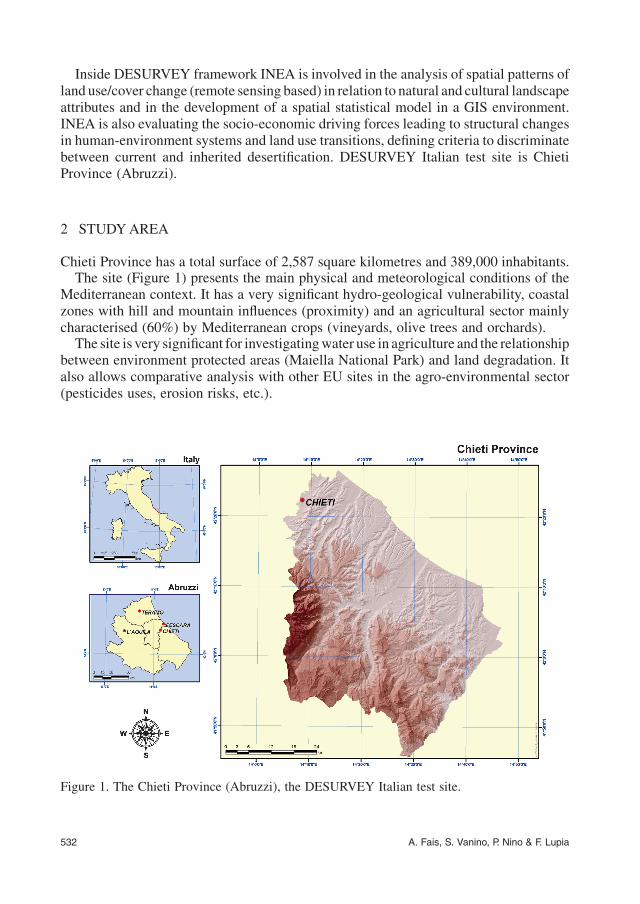
Chieti Province has a total surface of 2,587 square kilometres and 389,000 inhabitants.The site (Figure 1) presents the main physical and meteorological conditions of the
Mediterranean context. It has a very significant hydro-geological vulnerability, coastalzones with hill and mountain influences (proximity) and an agricultural sector mainlycharacterised (60%) by Mediterranean crops (vineyards, olive trees and orchards).The site is very significant for investigatingwater use in agriculture and the relationship
between environment protected areas (Maiella National Park) and land degradation. Italso allows comparative analysis with other EU sites in the agro-environmental sector(pesticides uses, erosion risks, etc.).
Figure 1. The Chieti Province (Abruzzi), the DESURVEY Italian test site.
532 A. Fais, S. Vanino, P. Nino & F. Lupia
3 DATA AND METHODS
Thework approach has been based on the integration between already existing layers andex-novo interpretation of both satellite images and ortho-photos. In particular two mapshave been directly produced by INEA (Table 3)with the samegeometric reference (ortho-photo images) and accuracy (1:25.000 scale equivalent). The other layers have beenthematically and geometrically corrected on the basis of INEA’s maps.
3.1 Data acquisition
Data of 1954, 1990, 1997 and 2005 have been used to study the land-use/cover changes.The existing data sets have been collected from several sources (Table 1).The 1954 land-use/cover map has been realised on the basis of aerial photos (1:33,000
scale). The map has a scale of 1:100,000, with a minimum mapping of 25 ha. This maphas been georeferenced to allow the overlay with the CORINE land cover map.The 1990 land-use/cover map has been produced using remote sensing techniques
integratedwith aerial photos. Themap has a scale of 1:100,000,with aminimummappingunit of 25 ha.
Table 1. Land use data collected (in digital format).
Year Source Nomenclature Scale Support of the interpretation
1954 Abruzzo Region CORINE 1:100,000 aerial photo year 19541990 CORINE ’90 CORINE 1:100,000 Landsat TM
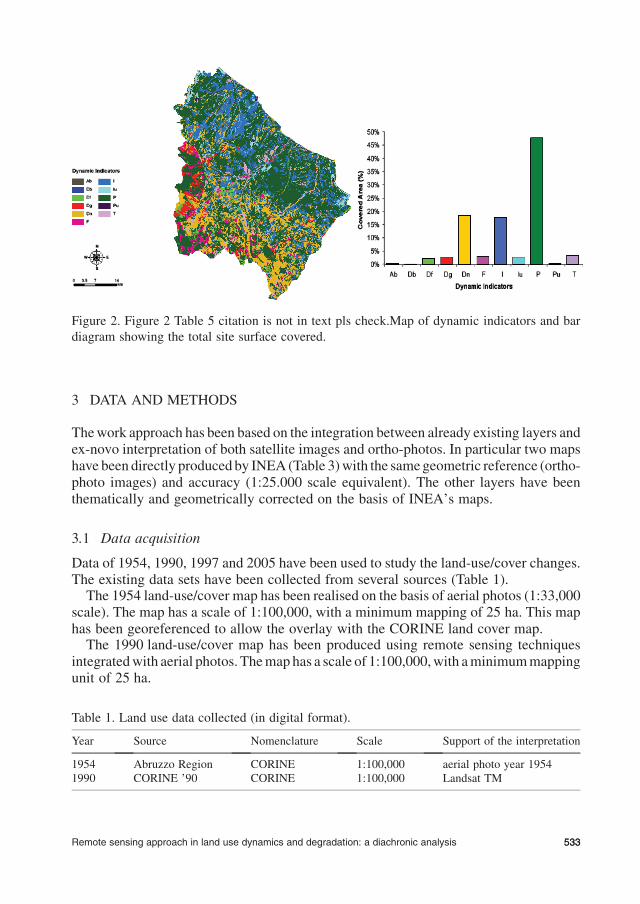
Figure 2. Figure 2 Table 5 citation is not in text pls check.Map of dynamic indicators and bar
diagram showing the total site surface covered.
533Remote sensing approach in land use dynamics and degradation: a diachronic analysis 533
3.2 Data pre-processing
Both satellite images and thematic layers have been geometrically corrected and geo-referenced in the same GRS (Geographic Reference System) European Datum ED50 –UTM33projection, using the Italian 20mDEMfor the ortho-photos, and severalGCP forsatellite images. Satellite images radiometric correction has been made directly by theimages providers (EURIMAGE and TELESPAZIO).A key point in the methodological approach has been the definition of a matching
harmonising CORINE/CASI3/DESURVEY nomenclatures (an example on Table 2).Before performing the layer intersection, controls on polygon geometry correspondencehave taken place.
3.3 Data interpretation
The 1997 land-use/cover map, CASI3 map (Fais & Nino 2001), is based on theinterpretation of spring-summer-autumn satellite images, using different false colourscomposite (RGB 432, 542, 453), and on the geometric resolution of aerial ortho-photos.Database of land-use/cover has been done at two scales: in non- irrigated areas the map is1:100,000 scale, while in the irrigated arable land the map has a scale of 1:50,000 for thethematic accuracy, and 1:25,000 for the geometric precision. Theminimummapping unitare 25 ha at 1:100,000 scale and 6.25 ha at 1:50,000 scale. The land-cover classification isbased on level 3 and 4 of CORINE nomenclature.The 2005 land-use/covermap is an up-dating of theCASI3map. The newmap has been
realized with the photo-interpretation of summer satellite images, for the thematicproperties, using aerial ortho-photos for the geometric properties. This map has a scale of1:50,000 with a minimum mapping unit of 6.25 ha.
Table 2. Example of class matching between the three different land use/cover nomenclature.
DESURVEY CORINE Land Cover 1954–1990 CASI3 Land Cover 2005
1 Cultivated and managed terrestrial areas1.1 Homogeneouscultivated land
2.1.1. Non-irrigated arable land 2.1.1. Not Irrigated arable land
2.1.2. Permanently irrigated land 2.1.2. Irrigated arable land2.2.1. Vineyards 2.1.3. Rice field2.2.2. Fruit trees and berry plantations 2.2.1. Vineyards2.2.3. Olive groves 2.2.2. Fruit trees and berry plantations
2.2.3. Olive groves
1.2 Heterogeneousagricultural areas
2.4.1. Annual crops associated withpermanent crops
2.4.1. Annual crops associatedwith permanent crops
2.4.2. Complex cultivation 2.4.2. Complex cultivation patterns2.4.3. Land principally occupiedby agriculture, with significant areasof natural vegetation
2.4.3. Land principally occupiedby agriculture, with significantareas of natural vegetation
2.4.4. Agro-forestry areas 2.4.4. Agro-forestries areas
534 A. Fais, S. Vanino, P. Nino & F. Lupia
3.4 Data processing
Themulti-temporal analysis carried out over the last fifty years has been performed usinggeo-processing functions in a GIS environment. The methodology and the resultspresented hereafter refer only to physical, environmental and infrastructural changes.The first analysis has been focussed on land use/cover polygons change detection,
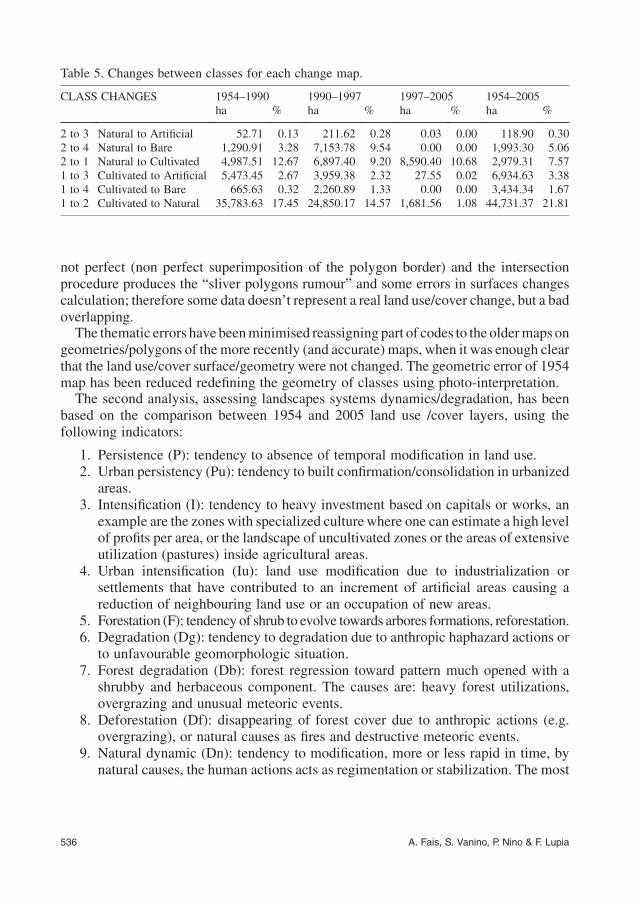
overlaying digital maps in order to generate four change maps describing the dynamicsoccurred during the following time intervals: 1954–1990, 1990–1997, 1997–2005 and1954–2005. Two different types of comparisons have been done. In the first one, the totalhectares and the relative changes per land use/cover class in the four years have beencompared (Table 4). In the second one, the shift (or persistence) of each polygons from aland use/cover class to another has been evaluated (Table 5), paying particular attention tothe following changes:
– from natural and semi natural - agricultural to artificial and other form of degradationclasses;
– from natural and semi natural to agricultural classes;– from agricultural to natural and semi natural classes.
In the first comparison, the statistical errors are not significant, because geometricstructure doesn’t influence the surface calculation per each class. In the second one, themaps geometric structures spawns several errors: in some cases the maps overlapping is
Table 4. Land use/cover classes and relative changes (values expressed in hectares and percent ofthe total site surface).
DESURVEY 1954 1990 1997 2005ha % ha % ha % ha %
1. Cultivated andmanaged areas
205,079.59 79.47 170,521.86 66.01 147,746.48 57.19 155,884.95 60.28
2. Natural andseminaturalvegetation
39,355.41 15.25 74,968.53 29.02 87,168.56 33.74 80,403.51 31.09
3. Artificial surfacesand associated areas
1,523.96 0.59 6,570.04 2.54 8,994.13 3.48 8,350.95 3.23
4. Bare areas 12,113.34 4.69 5,839.84 2.26 13,349.95 5.17 12,919.00 5.005. Wetlands 0.00 0.00 0.00 0.00 0.00 0.00 0.00 0.006. Water bodies,snow and ice
0.00 0.00 420.32 0.16 1,093.31 0.42 1,025.23 0.40
total 258,072.30 100.00 258,320.59 100.00 258,352.43 100.00 258,583.64 100.00
Table 3. Land use/cover maps produced by INEA.
Year Source Nomenclature Scale Support of the interpretation
1997 Inea 4th level CORINE(irrigated c.)
1:50,000 (irrigated c.)1:100,000 (other c.)
Landsat TM 09/08/97 þ ortho-photos
2005 Inea 4th level CORINE 1:50,000 Landsat TM þ ortho-photos
Remote sensing approach in land use dynamics and degradation: a diachronic analysis 535
not perfect (non perfect superimposition of the polygon border) and the intersectionprocedure produces the “sliver polygons rumour” and some errors in surfaces changescalculation; therefore some data doesn’t represent a real land use/cover change, but a badoverlapping.The thematic errors have beenminimised reassigning part of codes to the oldermaps on
geometries/polygons of the more recently (and accurate) maps, when it was enough clearthat the land use/cover surface/geometry were not changed. The geometric error of 1954map has been reduced redefining the geometry of classes using photo-interpretation.The second analysis, assessing landscapes systems dynamics/degradation, has been
based on the comparison between 1954 and 2005 land use /cover layers, using thefollowing indicators:
1. Persistence (P): tendency to absence of temporal modification in land use.2. Urban persistency (Pu): tendency to built confirmation/consolidation in urbanized
areas.3. Intensification (I): tendency to heavy investment based on capitals or works, an
example are the zones with specialized culturewhere one can estimate a high levelof profits per area, or the landscape of uncultivated zones or the areas of extensiveutilization (pastures) inside agricultural areas.
4. Urban intensification (Iu): land use modification due to industrialization orsettlements that have contributed to an increment of artificial areas causing areduction of neighbouring land use or an occupation of new areas.
5. Forestation (F): tendency of shrub to evolve towards arbores formations, reforestation.6. Degradation (Dg): tendency to degradation due to anthropic haphazard actions or
to unfavourable geomorphologic situation.7. Forest degradation (Db): forest regression toward pattern much opened with a
shrubby and herbaceous component. The causes are: heavy forest utilizations,overgrazing and unusual meteoric events.
8. Deforestation (Df): disappearing of forest cover due to anthropic actions (e.g.overgrazing), or natural causes as fires and destructive meteoric events.
9. Natural dynamic (Dn): tendency to modification, more or less rapid in time, bynatural causes, the human actions acts as regimentation or stabilization. The most
Table 5. Changes between classes for each change map.
CLASS CHANGES 1954–1990 1990–1997 1997–2005 1954–2005ha % ha % ha % ha %
2 to 3 Natural to Artificial 52.71 0.13 211.62 0.28 0.03 0.00 118.90 0.302 to 4 Natural to Bare 1,290.91 3.28 7,153.78 9.54 0.00 0.00 1,993.30 5.062 to 1 Natural to Cultivated 4,987.51 12.67 6,897.40 9.20 8,590.40 10.68 2,979.31 7.571 to 3 Cultivated to Artificial 5,473.45 2.67 3,959.38 2.32 27.55 0.02 6,934.63 3.381 to 4 Cultivated to Bare 665.63 0.32 2,260.89 1.33 0.00 0.00 3,434.34 1.671 to 2 Cultivated to Natural 35,783.63 17.45 24,850.17 14.57 1,681.56 1.08 44,731.37 21.81
536 A. Fais, S. Vanino, P. Nino & F. Lupia
important phenomenon is the evolution towards shrub and arboreal formations ofuncultivated and grazing areas.
10. Transformation (T): land use modification due essentially to human actions both inagricultural environment, with the transition from an arable land to a permanent orheterogeneous crops, and inside a forest formation with the modification of thespecific composition.
11. Abandonment (Ab): tendency to the lack of human presence, investments andagricultural activity.
4 RESULTS AND DISCUSSION
In the land use dynamics analysis, particularly stress has been paid on the vulnerability ofagricultural and natural land uses (losses of agricultural and natural surfaces shift toartificial areas).Inside the agricultural classes, the abandonment of agricultural surfaces has been
estimated on the basis of the passage from agricultural to natural surfaces. The passagesfrom arable lands and orchards areas to artificial and natural areas (total: 74.702 hectares)are strictly linked to the abandonment of agricultural areas.The changes from natural and semi-natural to artificial areas (8.709 hectares) can be
considered as land degradation phenomena. Particularly interesting is the path thatstarting from arable land areas (passing through pastures and natural grasslands, moorsand heath lands) arrive to transitional woodlands-scrubs, because it reveals a progressivetendency to agricultural areas abandonment, especially in marginal rural areas.The passage from natural to agricultural areas (20.475 hectares), considering that
changes of agriculture versus natural are of 62.315 hectares have to be assumed asagricultural abandonment phenomena, can be included in the normal dynamic of ruralareas surfaces rotation.In the analysis of the changes based on the landscape indicators, the main relevant
process regards the natural dynamics (Dn), both urban and agricultural intensification (Iu- I), and degradation (Dg). Some processes, such as forestation (F) and deforestation (Df),respond to time cycles dynamics, with no significant effects on the total forest surface(surface forest adjustment between F and Df). Dns are strictly linked to agricultural landabandonment phenomena, already analysed. The intensification processes aremainly dueto the urbanisation of the coastal areas (tourism development), plus the agriculturalintensification linked to the development of irrigated agriculture, and quality vineyardsdistrict developmentThe methodological approach developed in the present work allows to utilise already
existing data and cartographic layers with a very simple procedure. For data/layersintegration, it’s very important to obtain the same geometries and to harmonise thenomenclature systems. The ex-novo interpretation of the existing historical aerial photosand satellite images allows to produce land use/cover layers in a better geometric andthematic accuracies. For the successful application of this approach, it’s stronglysuggested utilising the ortho-photos geometries.
Remote sensing approach in land use dynamics and degradation: a diachronic analysis 537
REFERENCES
Annoni, A., Perdigao, W. 1997. Technical and methodological guide for updating CORINE LandCover Database. European Commission, European Environment Agency.
ARSSA 1998. Atlante del territorio rurale abruzzese – Approfondimento aggiornato al 1996.Edigrafital S.p.A., Teramo.
Di Gennaro, A., Innamorato, F. P. 2005. La grande trasformazione – Il territorio rurale dellaCampania – 1960 / 2000. CLEAN Edizioni, Napoli.
Fais, A., Nino, P., et al. 2001. CASI – Le Carte delle Aree di Studio dell’Irrigazione (Land use/cover in Irrigated Areas). Bollettini Irrigazione, INEA, Roma.
Fais, A., Nino, P. 2004. Diachronic land-use analysis for the evaluation of the impact onagriculture and natural vegetation of the high-speed railway tunnel in Central Italy.Proceedings of the International Symposium on Optical Science and Technology – SPIE 49thAnnual Meeting, Denver, Colorado USA, 2–6 August 2004-5544-42, Session 7.
Mas, J.F. 1999. Monitoring land-cover changes: a comparison of change detection techniques.International Journal of Remote Sensing 20: 139–152.
Onorati, G., et al. 2004. Analisi dei cambiamenti nella copertura delle terre in Italia nel periodo1990-2000 tramite CLC: nota preliminare.Documenti del territorio 55/2004. Centro Interreg.di Coord. e Documentazione, Roma.
www.desurvey.net.www.inea.it/pdf/irri/progettoCASI.pdf.
538 A. Fais, S. Vanino, P. Nino & F. Lupia