Embed Size (px)
Citation preview
Removing Nitrate from Drinking Water
Salah Abheiri
BSc: Environmental Science
This work is presented for the degree of
Research Master with Training, Murdoch University
School of Environmental Science
July 2010

I
I declare that this thesis is my own account of my research and
contains as its main content work which has not previously been
submitted for a degree of any tertiary educational institution.
Salah Abheiri
II
Abstract
Water resources in many parts around the world are becoming critical
because of human activity. This leads many countries around the
world to rely more on their groundwater as an essential source of
drinking water. The situation in Libya is critical because there is no
access to surface fresh water. The rainfall rate is very low, but there is
a huge quantity of ground water with good quality (average TDS
around 1030 mg/l) and this leads the country to rely on this water
source. The Great Man-Made River Authority (GMRA) was established
to produce and transfer water from the southern part of the country
(desert) where ground water is available to the northern coastal strip
where most of the population is concentrated. However, the water in
some wells in the East Japal Hassouna (EJH) well-field has a high
nitrate concentration, more than 50 mg/L as NO3-. To solve this
problem and reduce the nitrate content to less than the limits of WHO
Guidelines (50 mg/l as NO3- and10 mg/L NO3
--N), one of the available
techniques of nitrate removal has to be applied. Previous studies have
assessed techniques for nitrate removal from drinking water including
analysis of their efficiency, ease of operation, impact on the
environment and cost of production. Moreover, the characteristics of
ground water (good quality) in the EJH well-field and the potential to
use solar energy during the whole year was considered. Experimental
trial investigated the use of reverse osmosis (RO) powered by solar
III
energy to remove nitrate from synthetic water similar to water in EJH
wellfield by operating a RO unit in a closed system and using a single
solar pump to deliver feed water to the RO unit and through the unit
as well. A range of nitrate concentrations treated by applying different
pressures for each nitrate concentration. Nitrate removal percentages
ranged between 78% to 90% depending on the initial nitrate
concentration of feed water and the applied pressure. An ion exchange
experiment was also conducted to remove nitrate from synthetic water
similar to water in the EJH wellfield and from a nitrate solution by
performing column and batch test experiments. Several nitrate
concentrations and contact times were applied. Nitrate removal for the
synthetic water were excellent (100% nitrate removal) but chloride
concentration in the produced water increased over the limits of WHO
guidelines. When the same nitrate concentration (20 mg/L NO3--N) in
feed water was applied in both techniques, both of them gave a good
result in terms of nitrate removal capacity as mentioned above.
However, the produced water by ion exchange still contained chloride
concentrations over the limits of WHO guidelines in contrast to
reverse osmosis which did not produce this unintended effect.

IV
ACKNOWLEDGEMENTS
For his interest and valued guidance I wish to express my
appreciation and thanks to Prof. Goen Ho.
I would like to thank Dr. Stewart Dallas who co-supervised this work
for his valuable advice.
I am grateful to Woodside Company for their sponsorship and
Murdoch Link for their support during this work.
I would like to thank my employer (GMRA) for their support and
enabling me to finish this course.
I acknowledge Geoff and Karin from BW solar company for providing
the Lorentz PS 600 solar pump and the Dow Chemical Company for
providing me with NSR-1 Anion Exchange Resin.
I am thankful to Prof. Nick Costa for his help and support during my
study.
I would like to thank the ETC staff for their support in conducting the
RO experiment.
I would like to thank Mr. Ahmed Ammari for his support in computer
skills.
Finally, a special thanks to my family for their support in particular
my parents, and my wife who has been patient during this study.
V
Table of Contents
1 INTRODUCTION .................................................................................................................. 1
1.1 BACKGROUND ...................................................................................................................... 1
1.2 GREAT MAN-MADE RIVER PROJECT ...................................................................................... 2
1.2.1 Great Man-Made River project Systems ............................................................................ 4
1.2.2 Hasouna Jeffara System ................................................................................................... 5
1.2.3 Location........................................................................................................................... 5
1.3 HEALTH EFFECTS OF NITRATES .............................................................................................. 6
1.4 THE RELEVANCE AND NEED FOR THE PROJECT ........................................................................ 8
1.5 OUTLINE OF THESIS STRUCTURE ........................................................................................... 8
2 LITERATURE REVIEW ...................................................................................................... 9
2.1 BACKGROUND ...................................................................................................................... 9
2.2 ION EXCHANGE ................................................................................................................... 10
2.3 REVERSE OSMOSIS.............................................................................................................. 13
2.3.1 Reverse Osmosis Membrane ........................................................................................... 14
2.4 RENEWABLE ENERGY SOURCES ........................................................................................... 15
2.5 ELECTRODIALYSIS .............................................................................................................. 17
2.6 BIOLOGICAL DENITRIFICATION ........................................................................................... 18
2.7 TREATMENT ASSESSMENT ................................................................................................... 19
2.8 CONCLUSION ...................................................................................................................... 25
3 MATERIALS AND METHODS .......................................................................................... 26
3.1 NITRATE REMOVAL TECHNIQUES ......................................................................................... 26
3.2 CHEMICALS FOR EXPERIMENTS ............................................................................................ 26
3.3 REVERSE OSMOSIS TECHNIQUE ............................................................................................ 26
3.4 3.3.1 REVERSE OSMOSIS EXPERIMENT ................................................................................. 26
3.4.1 3.3.2 Typical RO experiment ..................................................................................... 27
3.4.2 3.3.3 Flow measurements .......................................................................................... 30
3.3.4 Sampling programme ..................................................................................................... 30
3.3.5 Power regeneration by PV cells ...................................................................................... 30
3.3.6 Power consumption ....................................................................................................... 31
3.5 ION EXCHANGE EXPERIMENT............................................................................................... 31
3.4.1 Regeneration of NSR1 Resin ........................................................................................... 32
3.4.2 Batch test ....................................................................................................................... 32
3.4.3 Column experiment ........................................................................................................ 34
4 RESULTS ............................................................................................................................. 39
4.1 REVERSE OSMOSIS EXPERIMENT ......................................................................................... 39
VI
4.1.1 First reverse osmosis experiment 8.3 mg/L NO3- -N concentration ............................. 39
4.1.2 Second reverse osmosis experiment 15.4 mg/L NO3- -N concentration ........................ 42
4.1.3 Third reverse osmosis experiment 27.6 mg/L NO3- -N concentration .......................... 44
4.1.4 Fourth reverse osmosis experiment 35.2 mg/L NO3- -N concentration ........................ 45
4.1.5 Fifth reverse osmosis experiment 9.6 mg/L NO3- -N concentration ............................. 46
4.1.6 Sixth reverse osmosis experiment 20.5 mg/L NO3- -N concentration ........................... 48
4.2 ION EXCHANGE EXPERIMENT .............................................................................................. 49
4.2.1 Column experiment ................................................................................................... 49
4.2.2 Batch tests ................................................................................................................ 52
5 DISCUSSION ....................................................................................................................... 55
5.1 REVERSE OSMOSIS EXPERIMENTS ....................................................................................... 55
5.1.1 Recovery Ratio .......................................................................................................... 55
5.1.2 Quality of results ....................................................................................................... 55
5.1.3 Permeation constant ................................................................................................. 56
5.2 ION EXCHANGE EXPERIMENT .............................................................................................. 56
5.2.1 Batch tests ................................................................................................................ 56
5.2.2 Column experiment ................................................................................................... 57
5.2.3 Comparision between batch test and column experimet (breakthrough point) ............. 58
5.3 DISCUSSION OF BOTH TECHNIQUES ...................................................................................... 60
5.3.1 Nitrate removal capacity ........................................................................................... 60
5.3.2 Treated water quality ................................................................................................ 60
5.3.3 Power consumption ................................................................................................... 62
5.3.4 Brine disposal ........................................................................................................... 62
5.3.5 Cost of treatment ....................................................................................................... 62
5.3.6 Sustainable Environment ........................................................................................... 63
5.3.7 Conclusion ................................................................................................................ 63
6 CONCLUSION AND RECOMMENDATIONS .................................................................. 64
6.1 CONCLUSION ...................................................................................................................... 64
6.2 RECOMMENDATIONS ........................................................................................................... 65
VII
List of Tables TABLE 1: WATER SITUATION IN LIBYA IN 1998 .............................................................................. 2
TABLE 2 : CURRENT SOURCES MUNICIPAL WATER SUPPLY IN WATER SCARCE COUNTRIES ........... 2
TABLE 3: IMPORTANT DETAILS ABOUT GMRA SYSTEMS (SAHLI, 2004) ....................................... 4
TABLE 4 : COMPARISION BETWEEN CONVENTIONAL AND ADVANCED WATER TREATMENT
METHODS TO REMOVE INORGANIC IONS.................................................................................. 9
TABLE 5: DESALINATION PRODUCTION AND PERCENTAGE OF VARIOUS PROCESSES IN 2000
(HISHAM, 2002) .................................................................................................................... 21
TABLE 6: ENERGY CONSUMPTION PER UNIT OF PRODUCT WATER FOR VARIOUS DESALINATION
TECHNIQUES .......................................................................................................................... 22
TABLE 7: NITRATE CONCENTRATION AND NITRATE REJECTION RATIO AGAINST PRESSURE ......... 39
TABLE 8 : THE RELATIONSHIP OF PRESSURE AGAINST FLOW RATES AND RECOVERY RATIO........ 40
TABLE 9: PERMEATION CONSTANTS ............................................................................................... 41
TABLE 10: THE RELATIONSHIP BETWEEN NITRATE CONCENTRATION AND PRESSURE ................. 42
TABLE 11: THE RELATION BETWEEN PRESSURE AND FLOW RATE ................................................ 43
TABLE 12: PERMEATION CONSTANT VALUES ................................................................................ 44
TABLE 13 : NITRATE CONCENTRATION AND NITRATE REJECTION RATIO AGAINST PRESSURE ..... 45
TABLE 14: FLOW RATES AND RECOVERY RATIO AGAINST PRESSURE ........................................... 45
TABLE 15: NITRATE CONCENTRATION AND REJECTION RATION AGAINST PRESSURE ................... 46
TABLE 16 : FLOWRATES AGAINST PRESSURE ................................................................................ 46
TABLE 17 : NITRATE CONCENTRATION AND NITRATE REJECTION RATIO AGIANST PRESSURE ..... 47
TABLE 18 : FLOW RATES AND PRESSURE RELATIONSHIPS............................................................ 47
TABLE 19 : NITRATE CONCENTRATION AND NITRATE REJECTION RATIO AGIANST PRESSURE ..... 48
TABLE 20 : FLOW RATES AND PRESSURE RELATIONSHIPS............................................................ 48
TABLE 21 : NITRATE REMOVAL (GR) AND FEED WATER TREATED VOLUMES (L) IN COLUMN
EXPERIMENTS......................................................................................................................... 52
TABLE 22 : BATCH TEST OF ION EXCHANGE ................................................................................. 53
TABLE 23 : BATCH TEST OF HIGH NITRATE CONCENTRATION ....................................................... 53
TABLE 24 : AMOUNT OF NITRATE REMOVED IN MG/L OF RESIN ................................................. 54
VIII
List of Figures FIGURE 1: A MAP OF LIBYA SHOWING GMRA WELLFIELDS (ABDELGADER 2009)....... 3
FIGURE 2: OSMOSIS AND REVERSE OSMOSIS (ELYANOW, 2005) ..................................13
FIGURE 3: RO EXPERIMENT ............................................................................................27
FIGURE 4: ION EXCHANGE EXPERIMENT .........................................................................34
FIGURE 5 : RELATIONSHIP BETWEEN PRESSURE AND NITRATE REJECTION RATIO ......40
FIGURE 6: RELATION OF RECOVERY RATIO WITH PRESSURE ........................................41
FIGURE 7: RELATIONSHIP BETWEEN PRESSURE AND POWER ........................................41
FIGURE 8: RELATION BETWEEN PRESSURE WITH NITRATE REJECTION RATIO .............42
FIGURE 9: THE RELATIONSHIP BETWEEN PRESSURE AND RECOVERY RATIO ...............43
FIGURE 10: THE RELATIONSHIP BETWEEN PRESSURE AND POWER ..............................44
FIGURE 11: THE RELATION BETWEEN NITRATE CONCENTRATION OF EFFLUENT AND
TIME FOR EXPERIMENTS 1&2 ..................................................................................49
FIGURE 12 : ION EXCHANGE EXPERIMENT 3 ..................................................................50
FIGURE 13 : ION EXCHANGE EXPERIMENT 4 ..................................................................51
FIGURE 14: ION EXCHANGE EXPERIMENT 5 ...................................................................51
FIGURE 15 : A REGRESSION LINEAR BETWEEN DESIRED (PREPARED) AND MEASURED
NITRATE CONCENTRATION.........................................................................................53
FIGURE 16 : THE RELATIONSHIP BETWEEN NITRATE CONCENTRATION REMAINING IN
FEED WATER ( C ) AND THE NITRATE IN RESIN (S) IN MG/L OF RESIN WHEN
SEVERAL CONTACT TIMES WERE APPLIED. ..............................................................54
IX
List of Equations
EQUATION 1: CATION EXCHANGE REACTION (1) ............................................................10
EQUATION 2: ANION EXCHANGE REACTION (2) ...............................................................10
EQUATION 3: NSR1 EXCHANGE REACTION (3) ............................................................11
EQUATION 4: REGENERATION REACTION (4) ..................................................................11
EQUATION 5: DENITRIFICATION REACTION (1) ..................................................................18
EQUATION 6: DENITRIFICATION REACTION (1) ....................................................................18
EQUATION 7: TO CALCULATE NITRATE REJECTION RATIO .............................................29
EQUATION 8: TO CALAULATE RECOVERY RATIO .............................................................29
EQUATION 9 : TO CALCULATE NITRATE BALANCE ...........................................................29
EQUATION 10: TO CALCULATE PERMEATION CONSTANT................................................29
EQUATION 11 : TO CALCULATE FLOW RATE ...................................................................36
EQUATION 12 : TO CALCULATE CONTACT TIME ..............................................................37
1
1 Introduction
1.1 Background
The availability of fresh water in arid and semi-arid countries such as
Algeria, Egypt, Morocco, Libya and Tunisia is constrained by the lack
of rainfall (Abufayed & El Ghuel, 2001). Libya as one of these
countries does not have access to surface fresh water (no rivers or
lakes), and as a part of Saharan Desert has limited rainfall. The
annual average rainfall is 200 mm per year with more than 95% of the
country receiving less than 100 mm per year. Evaporation rates are
among the highest in the world, because of the dry climate with
daytime maximum temperatures exceeding 40 deg C in some parts of
the country. The shortage of fresh water is heightened when the
demand on water was increased near the Mediterranean coast where
most of the population is concentrated (Abufayed & El Ghuel, 2001).
For the previous reasons, Libya is classified as one of 18 countries
which faces water scarcity. (Fresh water resources are under 1000
m3/cap/y) (Bremere et al., 2001). All these factors forced the country
to introduce desalination plants to produce drinking water in the
1970s. Nowadays, the country is also reliant on its relatively high
quality ground water reservoirs which were discovered in the 1960s
during oil exploration deep in the southern Libyan Desert. Even
though, ground water was considered as a good solution of water
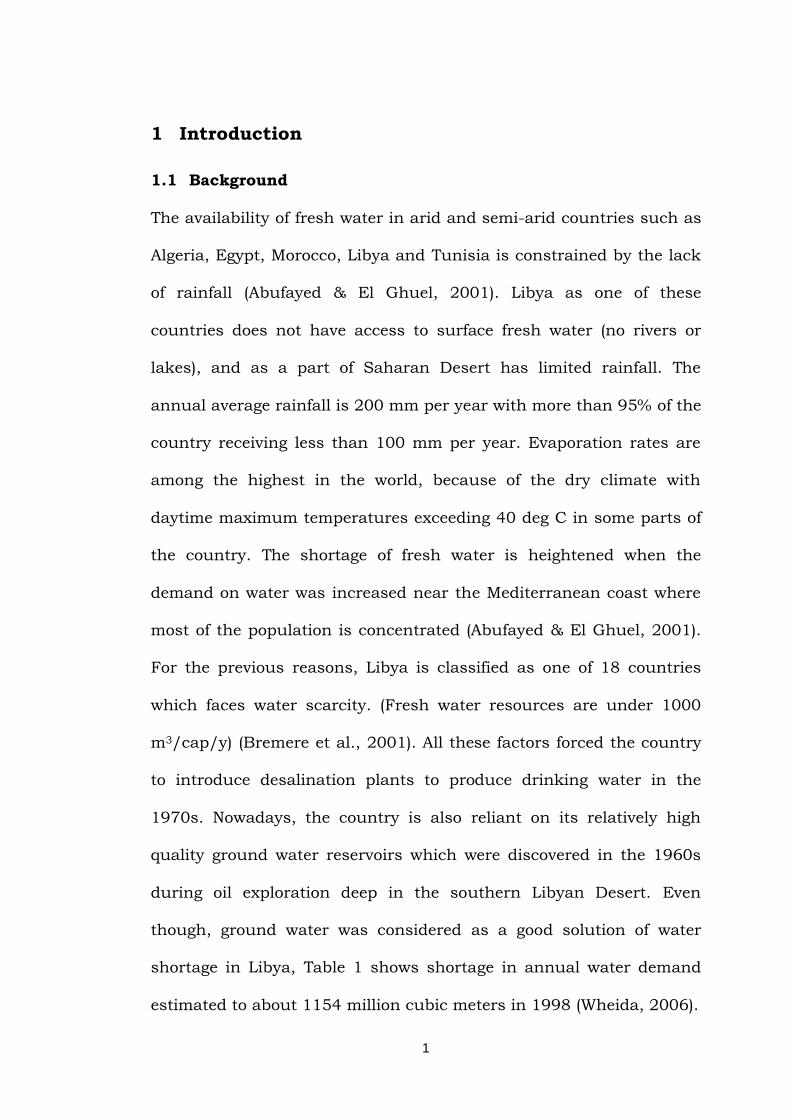
shortage in Libya, Table 1 shows shortage in annual water demand
estimated to about 1154 million cubic meters in 1998 (Wheida, 2006).
2
Table 1: Water situation in Libya in 1998
Available water
Million m3 Water
consumption Million m3
Groundwater 2557.62 Agriculture 3259.27
Surface water 61 Domestic 448.3
Desalination 47.86 Industrial 135.64
Waste water 24.16
Total 2690.64 Total 3843.21
Ground water is the main source for municipal use which represents
98% of this use compared with 2% for desalination and 0% for surface
water (Table 2) ( FAO, 1997).
Table 2 : Current sources municipal water supply in water scarce countries
Country Region Source of water for municipal use
Surface % Groundwater % Desalination %
Malta Europe 0 35 65
Barbados Caribbean 0 100 0
Singapore South-East Asia
100 0 0
Jordan Western Asia 0 100 0
Yemen 0 100 <1
Bahrain GCC states 0 60 40
Kuwait 0 For dilution ~ 100
Qatar 0 0 ~ 100
Saudi Arabia 0 50 50
Libya North Africa 0 98 2
1.2 Great Man-Made River Project
The Great Man-Made River Authority (GMRA) was established in 1984
to transfer water through closed concrete conveyance lines from
wellfields in Sahara desert (South of Libya) where the ground water
3
reserves are located to the northern coastal strip where the population
is concentrated (Abdelrhem et al., 2008). This water is used for
municipal, agricultural and industrial purposes not just for drinking
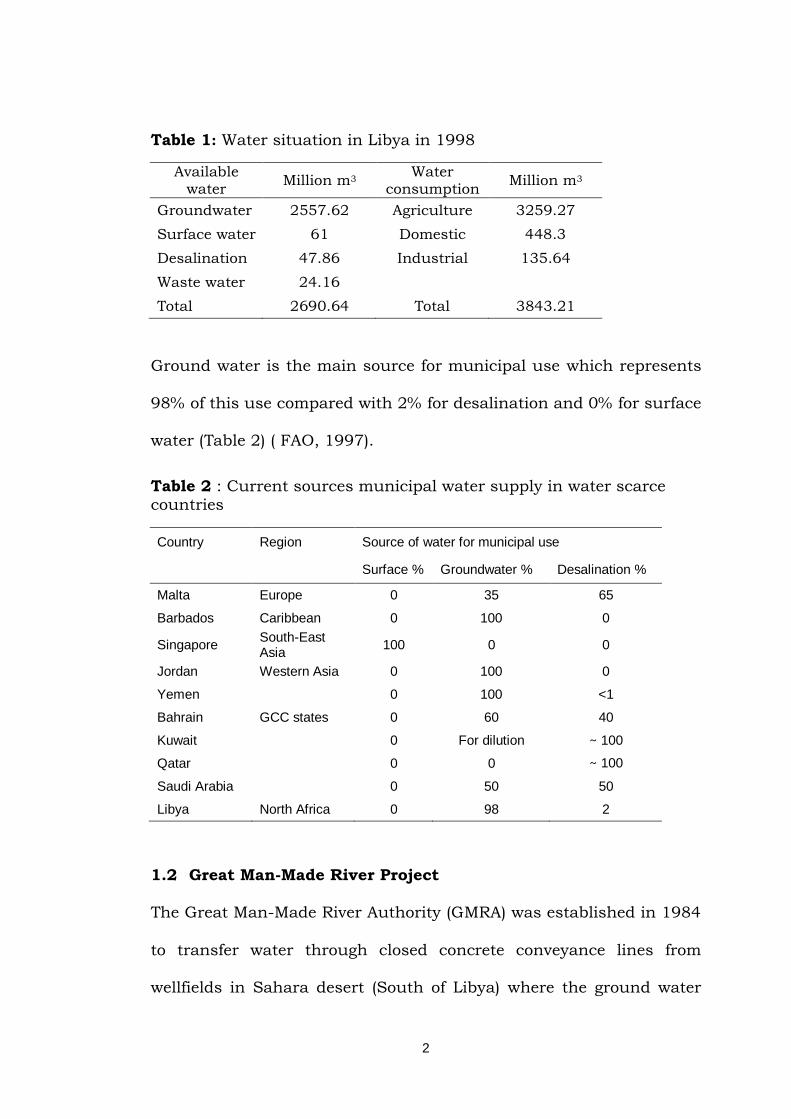
water. GMRA project consists of five phases; the first two phases are
already completed. Phase I transfers water from Sarir to Sirt and from
Tazerbo to Benghazi. Phase II involves transferring water from Jabal
Hasouna wellfield to Tripoli (Figure 1).
Figure 1: A map of Libya showing GMRA wellfields (Abdelgader 2009)
Groundwater usually contains a number of chemical compounds as
impurities. One particular ion that is sometimes found in
groundwater is nitrate. The World Health Organisation (WHO) have
set the maximum nitrate in potable water at 50 mg/L NO3-(10 mg/L
NO3- -N) (WHO, 1993a, 2004). Water is currently supplied to Tripoli
from the Jabal Hasouna wellfield. The East Jebal Hasaona EJH(S)
has a nitrate content of more than 50 mg/L NO3- in many wells and
The area of study
4
even over 100 mg/L in some wells. The average nitrate concentration
in EJH ( EJHS, EJHN and EJHW) is 53.23 mg/L NO3- ranging from
0.25 to 208 mg/L NO3- (Sahli, 2004). It is important to reduce the
nitrate content to under WHO guidelines to avoid any health problems
caused as a result of using water with high nitrate concentrations.
1.2.1 Great Man-Made River project Systems
GMRA was launched in 1984 to transfer 6.5 million cubic meters per
day from several wellfields in the southern part to the coastal zone.
These important water supply systems are listed below (Sahli, 2004):
I- Sarir/Sirt, Tazerbo/Benghazi System (SSBT)
II- Hasouna/ Jefara System
III- Sirt/ Sedada Link
IV- Jiagboub/ Tobruk System
V- Gedammes/ Zwara System
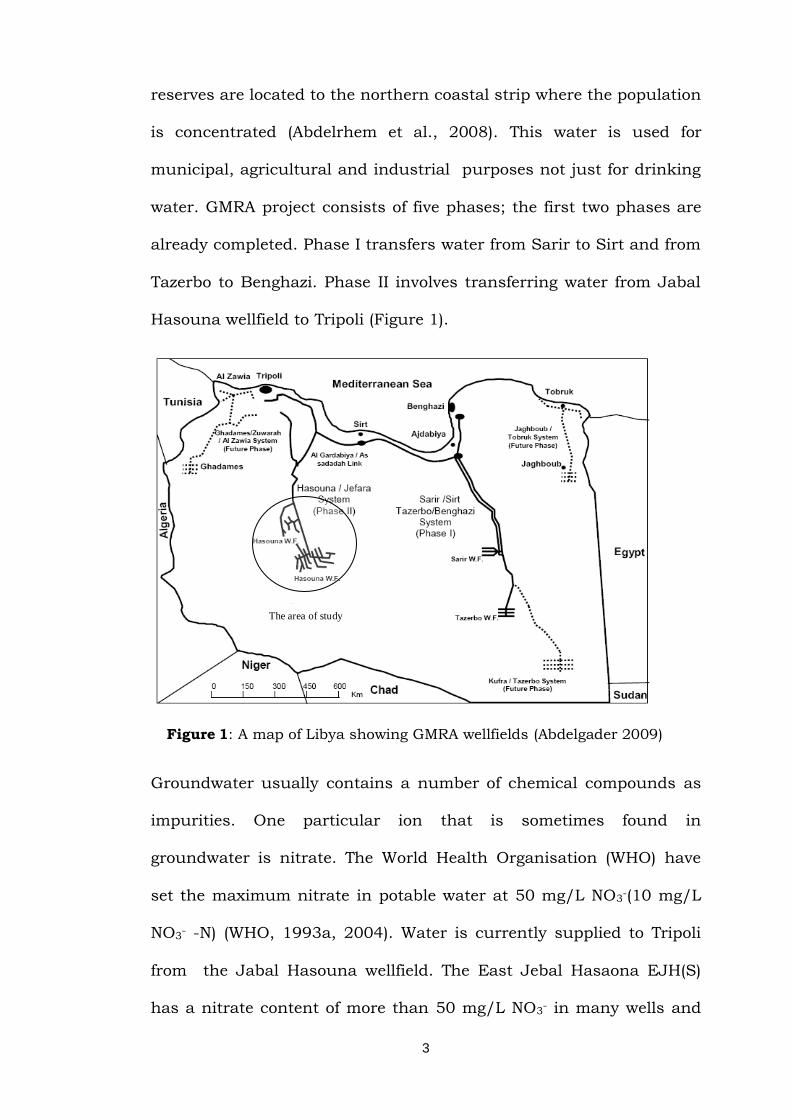
Table 3: Important details about GMRA systems (Sahli, 2004)
System Wellfields No. of wells
Design Production
MCMD
Conveyance System (km)
Phases
Sarir/Sirt Tazerbo/Benghazi (SSTB)
Sarir Tazerbo
126 108
1.0 1.0
1900 Phase 1
Kufra / Tazerbo Kufra 286 1.68 750 Phase
1(under construction)
Hasouna-Jeffara EJH NEJH
287 153
1.4 0.6
2,600 Phase 2
Sirt/Assdada Link - - - 1,900 phase 3
Jiagboub/Tobruk Jiagboub 37 50 MCMY 550 Phase
4(under construction
Ghadamis/Zwara Ghadamis 144 90 MCMY 560 Phase
5(under construction)
5
MCMD: Million m3 per day MCMY: Million m3 per year
1.2.2 Hasouna Jeffara System
The Hasouna-Jeffara system (phase 2) is part of the GMRA project
and it includes Hasouna wellfields and the conveyance line is
designed to convey two millions cubic metre of water per day to Tripoli
(capital of Libya) and the Jeffara Plain. The Hasouna wellfield is the
main subject of this study. It consists of three wellfields contains 484
production wells and the overall average of nitrate concentration is
53.2 mg/L NO3- ranging from 0.25 to 208 mg/L NO3
-. The distribution
of wells for each wellfield is as follows (Sahli, 2004):
1- East Japal Hasouna South (EJHS): this wellfield consists of 90
wells and nitrate concentration is ranged from 26 -81 mg/L NO3- with
an average 46 mg/L NO3-.
2-East Japal Hasouna North (EJHN): this wellfield consists of 78 wells
and the average of nitrate concentration is 52.3 mg/L NO3- ranging
from 2.4 to 133 mg/L NO3-.
3-East Japal Hasouna West (EJHW): this wellfield consists of 316
wells that have a variation in nitrate concentration from 0.25 to 208
mg/L NO3- with an overall average 55.3 mg/L NO3
-.
1.2.3 Location
The Hasouna wellfield is located as indicated in Figure 1, in the east
of Japal Hasouna (Hasouna Mountain) in the southwest part of Libya,
700 kilometres south of Tripoli. The Hasouna wellfield is bounded by
6
longitudes 14o13’ 00’00‖ and 14o 48 00 ― E and by latitudes 29o 42’00‖
and 29o16’00‖ N (Sahli, 2004).
1.3 Health effects of nitrates
The health problem to humans as a result of nitrates in drinking
water is due to the body's reduction of nitrate (NO3-) to nitrite (NO2
-).
The nitrite combines and oxidise haemoglobin (red blood cell oxygen-
carrying component) to form a methaemoglobin especially in bottle fed
infants. Up to 100% of nitrate is converted to nitrite in infants
compared to 10% in adults and children older than a year old.
Methaemoglobin is normally present at 1-3% in the blood. The
oxidised form of haemoglobin cannot act as an oxygen carrier in the
blood. When the quantity of methaemoglobin increases and reaches
5-10%, the ability of the red blood cells to carry oxygen is reduced.
This condition is called methemoglobinemia. The symptoms can
include lethargy and shortness of breath and the victim becomes blue
coloured (Schmoll et al., 2006). Anoxia and death can occur at very
high uptakes of nitrite and nitrate from drinking water when 45-65%
of the haemoglobin has been converted (Schmoll et al, 2006).
Methaemoglobinaemia is observed in populations where the food for
infants is prepared with water containing nitrate more than 50 mg/l,
but other factors are also involved in the disease. Based on
methaemoglobinaemia in infants, the WHO has established a
guideline value of nitrate ion of 50 mg/l as NO3- and guideline value
for nitrite of 3 mg/l as NO2- (Schmoll et al, 2006). Very high nitrate
concentrations in water (> 100mg/l) must be considered as potentially
7
hazardous especially to young children, children with gastroenteritis
and pregnant women. Most nitrates in the body are excreted in the
urine largely unchanged, while some nitrate is converted by bacteria
to nitrite in the stomach. Up to 25% of nitrate is recirculated in saliva
and most is converted to nitrite by bacteria. Nitrite reacts in an acidic
environment to form N-nitroso compounds with amines and amides in
the intestines, which may be associated with gastric and bladder
cancer (ECETOC, 1988). N-nitroso compounds are closely related to
animal carcinogens associated with cancer of the oesophagus,
stomach, colon bladder and haematopoietic system. However, there is
a little epidemiological evidence to link nitrate directly to cancer in
humans (Cantor, 1997; Ward et al., 2005). Nitrate concentrations
above 100mg/L can affect pregnant women and adults with a rare
metabolic condition called congenital glucose-6-phosphate
dehydrogenase deficiency (an inability to metabolise sugar)
(Department Health WA, 2008). Some studies found an increased risk
of spontaneous abortion and birth defects when mothers drank water
with high nitrate concentration. Pregnant women or the women who
are trying to be pregnant should not drink water with more than 50
mg/L as NO3- (Health Department Washington, 2007). The potential
health problems which may arise from nitrate contamination obligate
the removal of nitrate in the EJH wellfield water supply to levels
within WHO guidelines.
8
1.4 The relevance and need for the project
The major concern regarding the use of ground water with an
excessive nitrate concentration is related to health effects. Therefore,
the main aim of this study was to identify what is the most suitable
technique for nitrate removal according to the characteristics of the
GMRA water. The specific objectives of this study were as follow:
1. Compare and contrast the effectiveness and efficiency of a
commercial Reverse Osmosis (RO) unit and an Ion-Exchange
resin unit to remove nitrate from GMRA water in keeping with
WHO Guidelines capable of achieving the designed demand of
Jabal Hasouna wellfield.
2. Investigate the option of using solar energy to operate the most
effective and efficient method of nitrate removal at Jabal Hasouna
wellfield.
1.5 Outline of Thesis Structure
Chapter 1 presents background information that includes water
situation in Libya and the health effects of nitrate on human.
Chapter 2 gives a literature review on removing nitrate from drinking
water, and the techniques which are used to achieve the desired
results.
Chapter 3 provides the methodology of the research and includes the
proposed design for both RO and Ion exchange units.
Chapter 4 presents the results of the experiments.
Chapter 5 presents analysis of the results and discussion.
9
In chapter 6 conclusions and recommendations for further research
are presented.
2 Literature review
2.1 Background
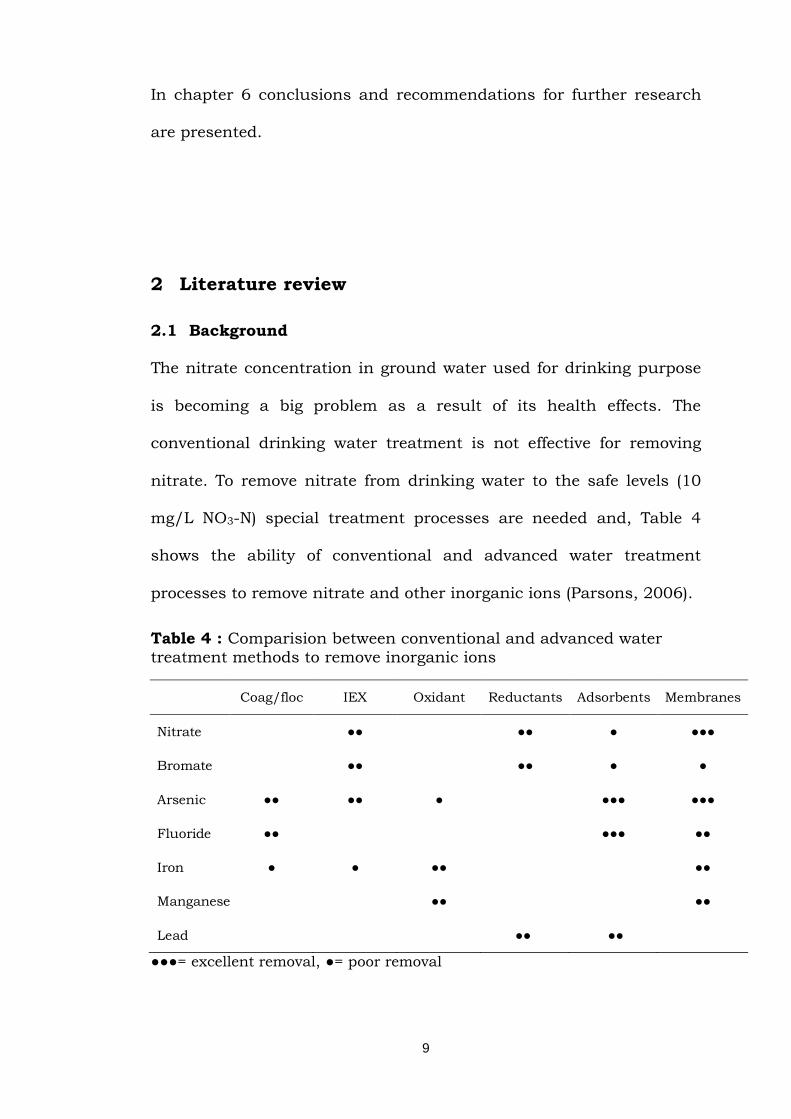
The nitrate concentration in ground water used for drinking purpose
is becoming a big problem as a result of its health effects. The
conventional drinking water treatment is not effective for removing
nitrate. To remove nitrate from drinking water to the safe levels (10
mg/L NO3-N) special treatment processes are needed and, Table 4
shows the ability of conventional and advanced water treatment
processes to remove nitrate and other inorganic ions (Parsons, 2006).
Table 4 : Comparision between conventional and advanced water
treatment methods to remove inorganic ions
Coag/floc IEX Oxidant Reductants Adsorbents Membranes
Nitrate ●● ●● ● ●●●
Bromate ●● ●● ● ●
Arsenic ●● ●● ● ●●● ●●●
Fluoride ●● ●●● ●●
Iron ● ● ●● ●●
Manganese ●● ●●
Lead ●● ●●
●●●= excellent removal, ●= poor removal
10
Moreover, the easiest option is to blend high nitrate concentration
water with low nitrate water but this is not always feasible either
because the low nitrate water is not available or transferring this
water is very expensive. Nitrate removal is therefore required. A
number of techniques have been developed such as ion exchange (IX),
reverse osmosis(RO), electrodialysis (ED) and biological denitrification
(Parsons,2006; Bae et al., 2002).
2.2 Ion exchange
IX is a reversible interchange of undesirable ions in water by other
ions from exchange resin (ion exchanger), and this leads to release of
ions such as hydroxide (OH-), chloride (Cl-), and sodium (Na+) ions to
the product water (CGER, 1997). Ion exchangers are classified into
anion and cation exchangers. Anion exchangers are used to remove
anions such as sulphate(SO4-2), nitrate(NO3
-) and carbonate(HCO3-)
and cation exchangers remove cations like calcium and magnesium.
The ions in the resin A+ are replaced by undesirable ions in untreated
water B+ and an ion exchange reaction takes place that may be
represented by the following equation (Harland, 1994):
R- A+ + B+ → R- B+ + A+ Equation 1: Cation exchange reaction (1)
Solid solution solid solution
This equation is an example of cation exchange and anions in solution
are not removed in the exchange. Anions can be removed by applying
anion exchanger and the anion exchange reaction is similar to the
previous equation and can be written (Harland, 1994):
R+ A- + B- → R+ B- + A- Equation 2: Anion exchange reaction (2)
11
For nitrate removal a strong base resin is used and this resin uses a
functional exchange group that holds, for example, chloride. When
nitrate flows over the resin beads, chloride is exchanged with nitrate
and the chloride flows out with the treated water. This process
continues until all the resin's functional groups are saturated with
contaminated ions ( Parsons and Jefferson, 2006).
R+ Cl- + NO3- → R+ NO3
- + Cl- Equation 3: NSR1 exchange reaction (3)
The resin needs to be regenerated with 2-3 volumes of a saturated
brine solution and the exchange reaction is as follows ( Parsons and
Jefferson, 2006):
R+ NO3- + Na+ Cl- → R+ Cl-+ Na+ NO3
- Equation 4:Regeneration reaction (4)
During the treatment the resin also removes similar anions such as
bicarbonate and sulphate. Since conventional ion exchange resins
have a general selectivity sequences of SO4-2, NO3
-, Cl- and HCO3- ,
sulfate ions in feed water interfere with nitrate removal and lead to
short service runs. This problem has been solved by developing a
nitrate selective resin and successfully has been used to remove
nitrate from ground water with high sulphate concentration (Guter,
1997). The nitrate selective resin prefers to exchange its chloride for
nitrate over sulphate at normal drinking water concentration. These
resins contain triethylammonium instead of trimethylammonium
which is found in the conventional resins. The ion exchange capacity
in conventional resin is greater than the selective resin. Using
conventional resins can be more economic where sulphate
concentration is low. In waters with high sulphate concentration the
12
nitrate selective resins are more economic to use (Croll, 1992). The ion
exchange seems to be the preferred technique to remove nitrate from
small water supplies because of its ease of operation, effectiveness
and low cost of operation (Bae et al., 2002). However a serious
problem arises when just one IX vessel is used to remove nitrate,
because of variation of chloride and alkalinity. In particular, chloride
variations are undesirable for some industrial customers. Moreover,
high chloride and low alkalinity waters able to dissolve zinc from
brass fitting in pipe systems. However, water with pH of more than
8.3 can form corrosion products and may block pipes (Croll, 1992).
This problem should be solved before the product water reaches the
customers and solving the problem can be done by blending the
product water with untreated water to meet the nitrate removal target.
Another option is to follow brine regeneration with a suitable rinse of
sodium bicarbonate. This will replace part of chloride by bicarbonate
ion so, during the treatment process some of nitrate will replace
bicarbonate and lead to reduce chloride concentration and increase
alkalinity. Improving water quality can be done using a plant
containing three vessels, with two vessels operating and the third
under regeneration processes (Croll, 1992). However, the most
unresolved problem that faces ion exchange is the disposal of spent
brine which is produced from regeneration of exhausted resin and
contains high concentration of nitrate, sodium, chloride, sulphate and
other ions (Parsons and Jefferson, 2006). To solve this problem many
regeneration procedures have been developed to recycle the spent
13
brine. One such procedure is ion exchange combined with
denitrification processes (Bae et al., 2002). Recently, there are more
interest to use electrochemical cells to treat waste brine and reduce
nitrate to nitrogen gas ( Parson and Jefferson, 2006)
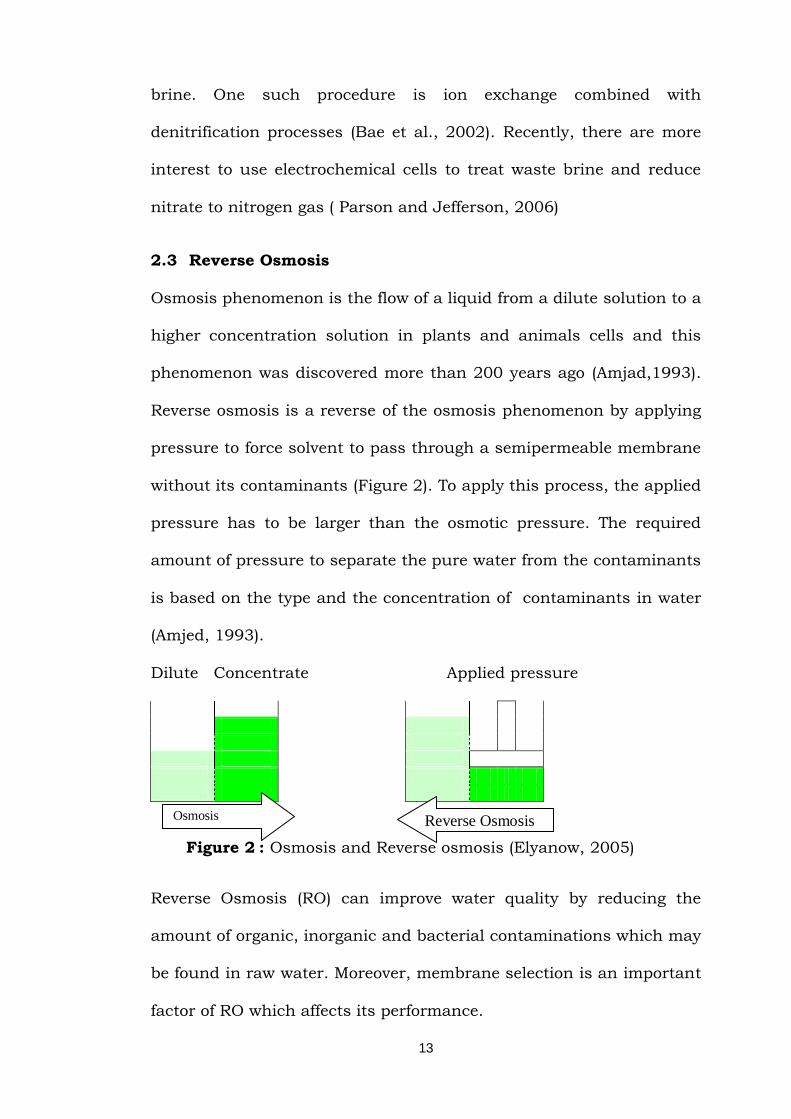
2.3 Reverse Osmosis
Osmosis phenomenon is the flow of a liquid from a dilute solution to a
higher concentration solution in plants and animals cells and this
phenomenon was discovered more than 200 years ago (Amjad,1993).
Reverse osmosis is a reverse of the osmosis phenomenon by applying
pressure to force solvent to pass through a semipermeable membrane
without its contaminants (Figure 2). To apply this process, the applied
pressure has to be larger than the osmotic pressure. The required
amount of pressure to separate the pure water from the contaminants
is based on the type and the concentration of contaminants in water
(Amjed, 1993).
Dilute Concentrate Applied pressure
: Osmosis and Reverse osmosis (Elyanow, 2005) Figure 2
Reverse Osmosis (RO) can improve water quality by reducing the
amount of organic, inorganic and bacterial contaminations which may
be found in raw water. Moreover, membrane selection is an important
factor of RO which affects its performance.
Osmosis Reverse Osmosis
14
2.3.1 Reverse Osmosis Membrane
The RO membrane is the most important part in any RO unit. The
membrane technology has been widely developed since 1950s when
the first membrane was produced. The cost of membranes can take
up to 15-40 % of the total cost of reverse osmosis desalination plant
and must be replaced periodically (Zaho, 2006). The main types of
membrane are thin film (TF) and cellulose triacetate (CTA) membranes
(Remco Engineering, 2006). Moreover, commercially, there are three
types of RO membranes available: plate-and-frame, hollow fiber, and
spiral wound. Spiral wound membranes are the most popular because
of their widespread utilization, low cost and easy availability from
manufacturers (Zaho, 2006).
Membrane selection is based on the characteristics of the raw water
such as, hardness, acidity, total dissolved solids and chlorine content.
Every membrane has a different permeation constant that depends on
operating and design parameters. For example a membrane with high
salt rejection requires a high pressure difference to produce a
determined flow rate of permeate.
RO can produce high quality water, but it does not mean it can
remove all contaminants. The RO efficiency for removing nitrate is
between 83-92% (Karmin et al.,1990). Recovery ratio is defined as the
ratio of permeate flow to feed flow. The recovery for RO unit varies and
for brackish water is in the range of 50-80 % of feed water (Tannehill
et al., 1997). Recovery can be increased by using RO membranes in
series to as high as 92% ( Remco Engineering, 1998).
15
One of the most common problems of RO techniques is the disposal of
the brine. The amount of brine from brackish water is ranged from 20
- 50 % (Tannehill et al., 1997)
2.4 Renewable energy sources
Using renewable energy source with RO desalination plants has
increased interest and development. The plants in operation are small
scale (<10m3/day) and represent only 0.02% of the total world
desalination capacity (Mathioulakis et al., 2007). These plants are
largely demonstration or research plants and often operate non
continuously; in addition, renewable energy still frequently used is
more expensive than traditional sources (Helal et al., 2008; Lami et
al., 2008). Therefore, the unit cost of operation for RO coupled with
renewable energy is higher than for typical RO plants. Communities
that would typically benefit from coupled renewable energy with RO
are located in rural areas (Mathioulakis et al., 2007) . Renewable
energy sources have been coupled with brackish water RO
desalination. In Australia, small scale (0.4-1 m3/day) RO desalination
system powered by solar energy have been tested (Harison, 2003;
Masson et al., 2005; Richard and Schaefer, 2002; Werner and
Schaefer, 2007). These systems were used in remote areas in central
Australia, where communities are small and fresh water is limited.
While large RO plants play an important role in larger coastal cities,
small RO units with simple design and renewable energy can
successfully provide water to rural communities (Werner and
Schaefer, 2007).
16
The three main renewable energy sources available are solar
(photovoltaic and thermal), wind and geothermal energy. The thermal
energy source is normally used with distillation desalination, while
wind and photovoltaic solar energy are commonly paired with RO
desalination. The RO systems can use seawater or brackish water as
the feed source and are typically small to medium plants. Overall, the
energy source most often used has been solar energy ( 70% of
market), and RO has the majority (62%) of the renewable energy
desalination market (Mathioulakis et al., 2007). Brackish water
systems using photovoltaic energy have a range of production from
0.1 to 60 m3/day (Garcia-Rodriguez, 2003). Solar powered
desalination is possibly the most promising alternative energy choice,
and both distillation and membrane plants have been designed and
operated. In particular, countries already advanced in conventional
RO desalination, such as Spain, Italy, and Saudi Arabia, have
successfully implemented solar photovoltaic energy and seawater RO
plants (Garcia-Rodriguez, 2003; Herold et al., 1998; Tzen et al.,1998).
Other countries, with arid and sunny climates, and rural
communities that have limited access to electrical power grids or
central water distribution network, have also investigated similar
renewable energy –RO systems for both seawater and brackish water
sources (Bouguescha et al., 2005; Garcia-Rodriguez, 2003; Herold et
al.,1998; Tzen et al., 1998; Weiner et al., 2001).
17
2.5 Electrodialysis
Electrodialysis (ED) is an electrical driven unit operation in which
ions are transported through semi-permeable membranes from one
solution to another under the influence of a direct current (DC)
electrical field. Electrodialysis membranes are typically used in cell
pairs. The pairs are placed alternately as cation and anion transfer
membranes. When a DC potential is passed through the membrane
array, ions are selectively transferred through the membrane. As a
result alternate compartments are formed in which the ionic content
is greater or less than the concentration in the original water. By
manifolding the appropriate compartments, treated water (low
electrolyte concentration) and brine (high electrolyte concentration)
can be collected (Zaho,2006).
Electrodialysis has a good track record on the GMRA and has been
used on both the Sarir and Brega pipe plants (which are used to
produce concrete pipes for GMRA conveyances lines), at the
construction camps to produce water for industrial purposes. These
units are used to treat raw water different from GMRA wellfields
water. Electrodialysis is very expensive in energy cost, and the
process is more effective in removing divalent ions, e.g. sulphate,
calcium and magnesium, than monovalent ions such as nitrate and
chloride.
18
2.6 Biological Denitrification
In biological denitrification certain micro-organisms are introduced to
the nitrate contaminated water and carbon source is added as a food
supply. Nitrate is converted to harmless nitrogen gas through two-
step reactions. Most of bacteria that are used in this process are
hetrophic which can use a wide range of carbon compounds. The
most used carbon sources are methanol and ethanol. The two step
reactions are: (Dahab, 1991)
6NO3- + 2CH3OH → 6NO2
- + 2CO2 + 4H2O Equation 5
6NO2- + 3CH3OH → 3N2 + 3CO2 + 3H2O + 6OH- Equation 6
Denitrification can occur naturally in a groundwater environment.
Studies have shown this process happens in both shallow and deep
aquifer systems (Dahab, 1991). For treatment the biological
denitrification can be conducted in either suspended or attached
growth system. In the suspended growth system the bacterial biomass
is suspended in the reactor unit and in the attached growth system a
solid matrix is used to support the bacterial biomass in the reactor
unit (Hiscock, 1991). This technique has proven its effectiveness in
the removal of nitrate in several pilot plants and in full scale
demonstration plants in both Germany and France. However,
biological dinitrification is not currently used to treat drinking water
in United States (Dahab, 1991). During this treatment a small
amount of biological sludge has to be disposed of. Moreover, this
19
process can be more expensive than the traditional treatments
because of its complexity that include adding carbon sources in the
appropriate stoichiometric amount and post-treatments that have to
be applied to remove micro-organisms, excess carbon and turbidity.
The post-treatments generally include aerated sand or activated
carbon filtration and ozonation or chlorination (Clifford, 1993).
Therefore, biological denitrification is widely used in the treatment of
waste water before discharging to water bodies (Schoeman, 2002).
2.7 Treatment assessment
Several water treatment methods are available for nitrate removal,
and the challenge or selection between these techniques depends on
desired water quality, plant capacity, skilled staff to operate the unit
and the cost of treatment including unit operation and maintenance.
Nitrate removal by biological denitrification is usually the preferred
solution for nitrate removal because nitrate is transformed into
gaseous nitrogen with a very high yield. Biological denitrification,
however, shows some drawback in process control and output water
quality. Nitrates are formed if insufficient carbon or energy is
available and substrate is in excess. This problem, especially when
random changes in the feed composition occur, can also be
complicated by the presence of excess biomass in the final water.
Therefore, post-treatment, disinfection and oxidation are normally
required. Biological treatment is preferred for large plants.
20
Processes based on IX, RO, ED are preferred for medium and small
applications (Schoeman, 2002). These techniques are more
economics, lower level in feed, process parameters control and
does not require an extensive post treatment. A comparison made
between IX and RO states RO is more expensive, but the data refer to
traditional membranes for desalination with low nitrate rejection
about 70%. New membranes with high nitrate rejection can improve
RO costs (Schoeman,2002). Additionally, IX is a form of ion removal
but is commonly used for removing scale forming ions such as
calcium and magnesium from hard water (water softening) as
compared to desalting. Ion exchange as mentioned before is the use of
ion exchange deionisers using synthetic resins to remove practically
all ionic material, however it generally cannot remove organics and
can become a breeding ground for bacteria. Regular generation of the
resin is required if an increase in salt concentration is to be avoided.
RO is more efficient than deionisation (IX) due to the used of
chemicals required to regenerate the resin for that process (Osmonics,
1997). Zhao in his Masters degree thesis (2006) compared RO with
other desalination techniques such as solar distillation, multistage
flash distillation (MSF), multi effect distillation (MED), vapour
compression (VC), freeze separation methods and ED. However, this
assessment was based on the use of RO in desalination, and was not
applicable to nitrate removal. In fact RO has become a major
technique in most large desalination production techniques. The main
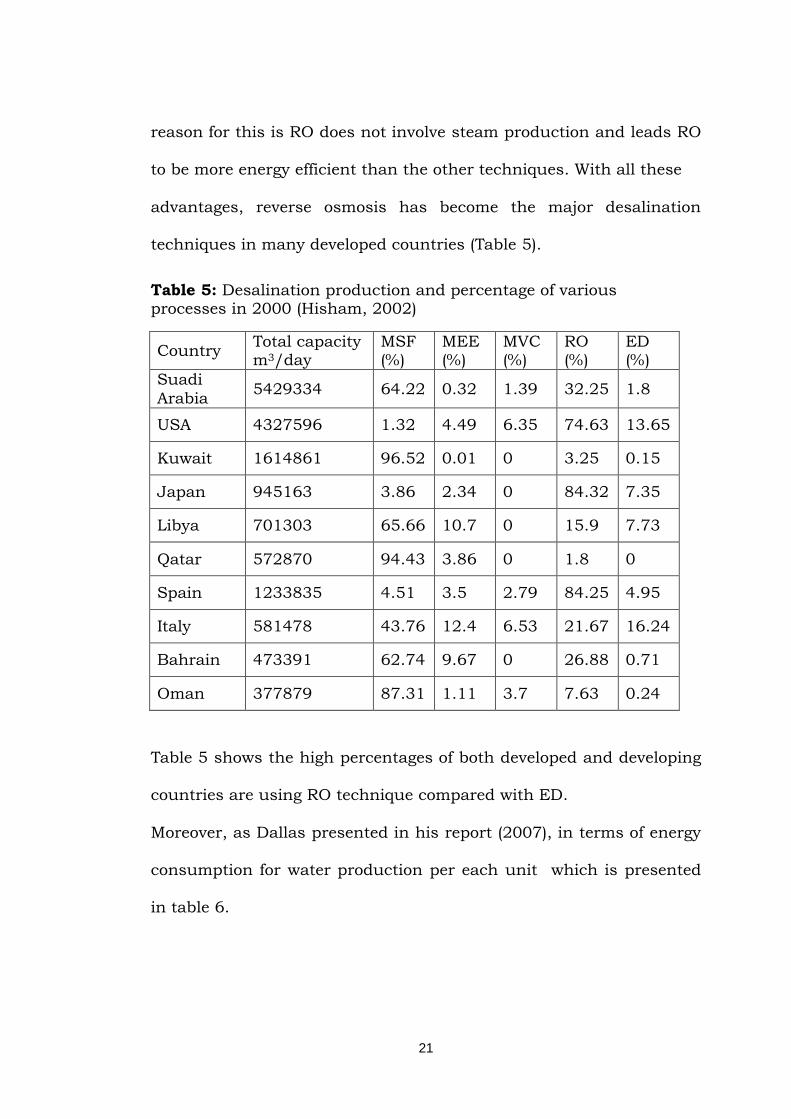
21
reason for this is RO does not involve steam production and leads RO
to be more energy efficient than the other techniques. With all these
advantages, reverse osmosis has become the major desalination
techniques in many developed countries (Table 5).
Table 5: Desalination production and percentage of various processes in 2000 (Hisham, 2002)
Country Total capacity m3/day
MSF (%)
MEE (%)
MVC (%)
RO (%)
ED (%)
Suadi
Arabia 5429334 64.22 0.32 1.39 32.25 1.8
USA 4327596 1.32 4.49 6.35 74.63 13.65
Kuwait 1614861 96.52 0.01 0 3.25 0.15
Japan 945163 3.86 2.34 0 84.32 7.35
Libya 701303 65.66 10.7 0 15.9 7.73
Qatar 572870 94.43 3.86 0 1.8 0
Spain 1233835 4.51 3.5 2.79 84.25 4.95
Italy 581478 43.76 12.4 6.53 21.67 16.24
Bahrain 473391 62.74 9.67 0 26.88 0.71
Oman 377879 87.31 1.11 3.7 7.63 0.24
Table 5 shows the high percentages of both developed and developing
countries are using RO technique compared with ED.
Moreover, as Dallas presented in his report (2007), in terms of energy
consumption for water production per each unit which is presented
in table 6.
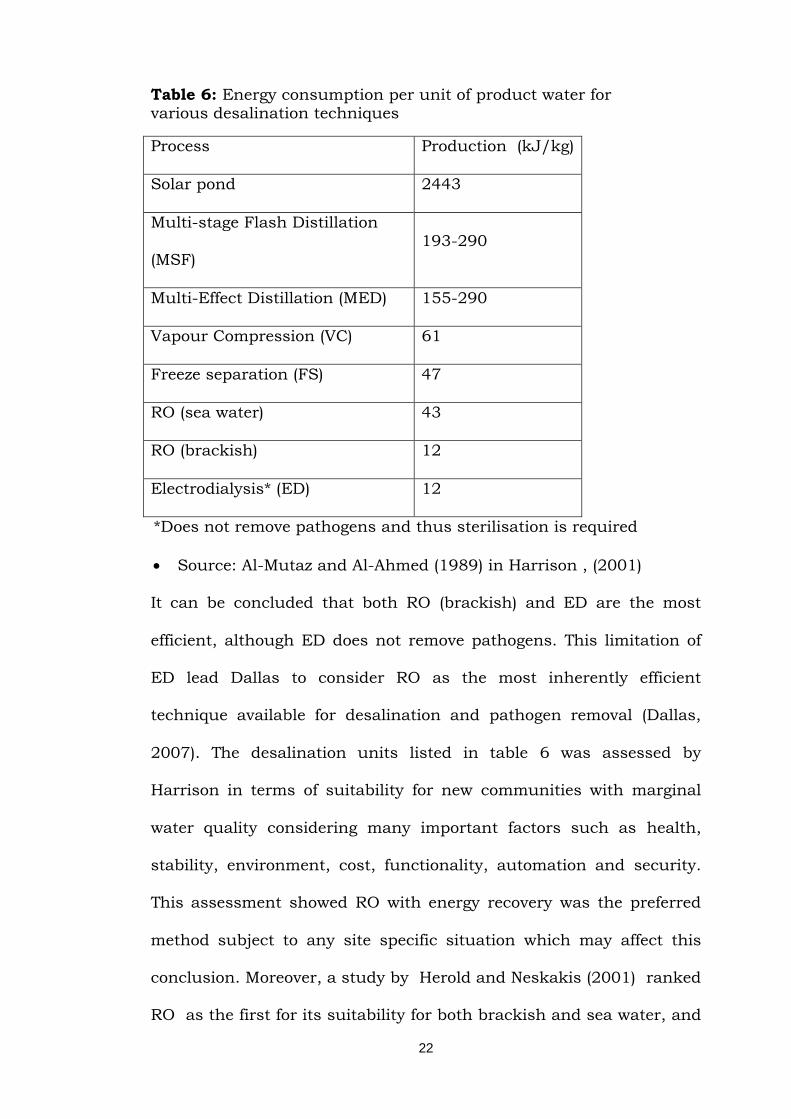
22
Table 6: Energy consumption per unit of product water for various desalination techniques
Process Production (kJ/kg)
Solar pond 2443
Multi-stage Flash Distillation
(MSF)
193-290
Multi-Effect Distillation (MED) 155-290
Vapour Compression (VC) 61
Freeze separation (FS) 47
RO (sea water) 43
RO (brackish) 12
Electrodialysis* (ED) 12
*Does not remove pathogens and thus sterilisation is required
Source: Al-Mutaz and Al-Ahmed (1989) in Harrison , (2001)
It can be concluded that both RO (brackish) and ED are the most
efficient, although ED does not remove pathogens. This limitation of
ED lead Dallas to consider RO as the most inherently efficient
technique available for desalination and pathogen removal (Dallas,
2007). The desalination units listed in table 6 was assessed by
Harrison in terms of suitability for new communities with marginal
water quality considering many important factors such as health,
stability, environment, cost, functionality, automation and security.
This assessment showed RO with energy recovery was the preferred
method subject to any site specific situation which may affect this
conclusion. Moreover, a study by Herold and Neskakis (2001) ranked
RO as the first for its suitability for both brackish and sea water, and
23
low power requirement compared to ED, MED and VC; more suitable
in arid middle east regions; flexibility in water quality, quantity, site
location, unit operation. Brine disposal produced from the
desalination process is always problematic. Brine can comprise
between 20-50% of the treated water volume, depending on the
quality of raw water. Brine is usually disposed in evaporation ponds.
And this is very expensive (Schoeman & Steyn,2002).
A study included six different methods to remove nitrate and
hardness includes: ion exchange, reverse osmosis and electrodialysis
and combinations of lime softening with ion exchange, ion exchange
softening with ion exchange for nitrate removal and membrane
softening with ion exchange nitrate removal. This study was based on
treatment cost as an important factor which was evaluated in relation
to water quality production. Even this review included blending
treated water with raw water to provide water within the drinking
water regulations. It was clear; ion exchange technique was shown to
be the most economic process for nitrate removal but it did not solve
the high hardness of the water and did not provide water with as good
quality as the other processes. Additionally, the high cost of waste
disposal ponds made IX nitrate removal more expensive on a capital
basis even than brackish water RO. When the cost of brine disposal
was included RO became just slightly more expensive than IX by 12%.
Considering the overall and especially producing a better water
quality RO becomes an attractive alternative. It is expected that a city
24
would choose this technique for construction (Christopher et al.,
1995).
Good quality water is available in GMRA in Libya in East Jebal
Hasaona (EJH) wellfield (approximately 1030 mg/l). However nitrate
concentration is more than 50 mg/l in many wells and even over 100
mg/l in some wells. Furthermore, it can be concluded from the
previous discussion that RO could be an appropriate technology to
remove nitrate from drinking water in GMRA in EJH well-field. In
addition, low dissolved solids require less pressure and of course less
energy so decrease the cost of water production. Phase 2 is already
established to provide Tripoli (the capital city of Libya) and the other
cities located along side the conveyance line with 2 million cubic
meter per day for domestic, agriculture and industrial use. There are
two choices to remove the nitrate, the first one is just to treat the
quantity of water that will be used for drinking purpose . The second
choice is to install the most suitable technique for nitrate removal
such as RO system on the highest nitrate concentration wells, and
manage water production by blending the produced water from RO
units with the water from the other wells to produce water with
acceptable nitrate concentration under WHO standards.
Because the raw water in EJH well-field is good quality (less salts)
which can increase the RO recovery ratio, so the rejected water can be
less than the normal rate. Moreover, there are many options for brine
disposal: discharging into sewage treatment plant, field irrigation or
mixed with raw water to produce water suitable for other domestic
25
purpose except for drinking, for example washing cars, cleaning
streets, flushing toilets or any other purpose appropriate for this type
of water.
Even Libya, which is considered a rich country that has access to
natural gas and diesel (fuels to generate electricity), friendly
environmental solutions should be applied to reduce the impact on
the environment and to use the available resources in a sustainable
way. Using renewable energy to run the RO units must be considered
and the best source that is available in the Libyan desert (where the
EJH well-field is located) is solar power, so a combination of RO with
the renewable energy is considered as a good sustainable solution for
removing nitrate from drinking water in GMRA in EJH well-field.
Furthermore, ion exchange is considered as the best technique in
removing nitrate from ground water in terms of cost of treatment.
2.8 Conclusion
In brief, removing nitrate from drinking water in GMRA in Libya under
the standards of WHO is an important issue to avoid health effects
particularly with respect to bottle fed infants under the age of 3
months. In addition, as it has been discussed in this chapter RO and
IX are the suitable techniques of removing nitrate from drinking
water. Thus the aim of this study is to investigate both of them to
choose the most suitable one for nitrate removal, considering the
existing characteristics and water quality in EJH well-field which may
affect the ability of these techniques.
26
3 Materials and Methods
3.1 Nitrate removal techniques
There are many methods available for the removal of nitrate from
water, such as reverse osmosis, ion exchange, electrodialysis and
denitrification (Byung, 2001). This study will focus on Reverse
Osmosis and Ion Exchange Techniques. Experimental trials were
conducted for both techniques to assess which is the most
appropriate technique according to the characteristics of water in
Jabal Hasouna wells in Libya and the other relevant factors
(availability of sunshine and using solar energy to power the RO unit).
3.2 Chemicals for experiments
Nitrate solutions for all experiments were prepared from potassium
nitrate (KNO3) and nitrate measurements were done using a HACH
spectrophotometer DR 2800 and applying Nitrate, HR (0 to 30 mg/L
NO3- -N) (cadmium reduction method) number 8039 .
3.3 Reverse osmosis technique
Reverse osmosis can improve water quality by reducing total dissolved
solids and is also able to reduce bacteria which may be found in raw
water. The ability of RO to remove nitrate from drinking water is
between 83 and 92% (Karmin et al., 1990).
3.4 3.3.1 Reverse Osmosis Experiment
Reverse osmosis experiments were conducted by using an existing RO
unit in Environmental Technology Centre in Murdoch University. This
unit was modified to work in a closed system. The experiments were
27
carried out in a closed system to avoid having to prepare fresh nitrate
solution for each pressure level. Moreover, a solar submersible pump
(Lorentz PS600 HR-04H) was used to discharge raw water from the
feed tank and through the RO unit as well, which is not the same as
the normal system which normally uses a high pressure pump after
pretreatment to discharge raw water through the RO membrane. The
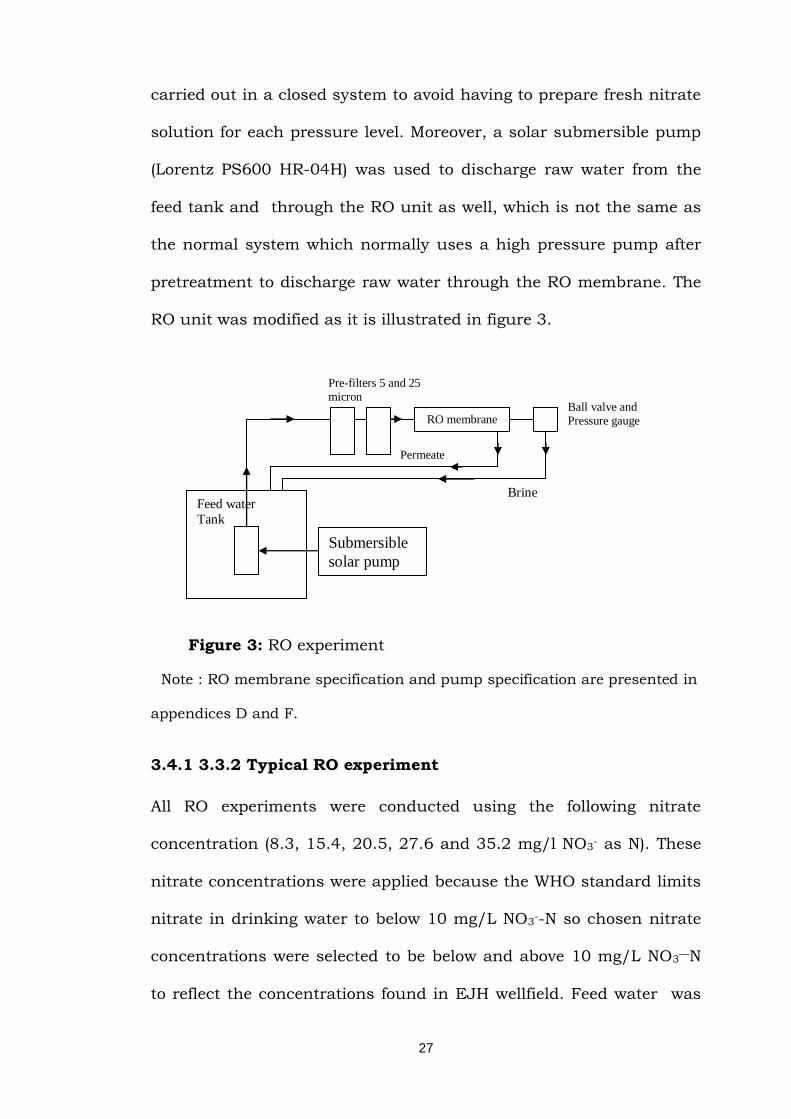
RO unit was modified as it is illustrated in figure 3.
Note : RO membrane specification and pump specification are presented in
appendices D and F.
3.4.1 3.3.2 Typical RO experiment
All RO experiments were conducted using the following nitrate
concentration (8.3, 15.4, 20.5, 27.6 and 35.2 mg/l NO3- as N). These
nitrate concentrations were applied because the WHO standard limits
nitrate in drinking water to below 10 mg/L NO3--N so chosen nitrate
concentrations were selected to be below and above 10 mg/L NO3—N
to reflect the concentrations found in EJH wellfield. Feed water was
Feed water
Tank
Pre-filters 5 and 25 micron
Brine
RO membrane
Permeate
Ball valve and Pressure gauge
Figure 3: RO experiment
Submersible
solar pump
28
prepared by adding a potassium nitrate solution to scheme water in
storage tank to prepare the desired nitrate concentration and was left
for two days before running the experiment to make sure the chlorine
in scheme water was released from raw water to protect RO
membrane. Chlorine in feed water can cause damage to the
membrane. Then the RO unit was turned on and the pressure was
adjusted to start the experiment with 50 psi. Feed water was pumped
directly to the pre-filtration unit of 5 and 20 micron to remove the
suspended solids or any substances that may affect the membrane.
Then the feed water passed through the RO membrane and using a
gate valve and pressure gauge to apply a variable pressure to force
water to pass through the membrane to produce permeate and reject
brine. Both permeate and brine were returned to the tank, because
the experiments were run in a closed system. During an experiment
samples from feed water, permeate and brine were taken every half an
hour and nitrate concentration was analysed and when the steady
conditions were reached the pressure was changed to 70 psi and the
same procedure was repeated.
The experimental conditions were varied to a pressure of 90 and 110
psi. Flow rate was measured for inlet and outlet during the
experiment and for each different pressure. Under each nitrate
concentration and applied pressure, nitrate concentration of permeate
and brine was measured.
29
Moreover, nitrate rejection ratio, recovery ratio, nitrate balance and
membrane permeation constant were calculated through the following
equations.
SRR= (( Cf – Cp )/Cf )* 100 (Harrison, 2001) Equation 7: To
calculate nitrate rejection ratio
Where
SRR Nitrate rejection ratio %
Cf Nitrate concentration of feed water (mg/L NO3- as N)
Cp Nitrate concentration of Permeate (mg/L NO3- as N)
Y = (Qp/Qf) * 100 (Harrison, 2001) Equation 8: To
calaulate Recovery ratio
Where
Y = Recovery ratio (%)
Qp =Permeate stream flow rate (L/sec)
Qf = Feed stream flow rate (L/sec)
Nitrate balance of influent have to be the same as effluent
Qf * Cf = (Qp * Cp) + (Qb * Cb) Equation 9 : To calculate
nitrate balance
Qb= Brine stream flow (L/sec)
Cb = Brine nitrate concentration (mg/L NO3- -N)
K = Qp/ (P-л) (Harrison, 2001) Equation 10: To calculate
permeation constant
Where
K = Permeation constant (L.sec-1/kPa)
P = Pressure (kPa)
Л = Osmotic pressure = (Conductivity in ppm * 0.07)
30
3.4.2 3.3.3 Flow measurements
Flow rate was measured by taking the first flow meter reading then
after five minutes taking the second reading. The flow rate (L/min)
was calculated by subtracting the second reading from the first
reading then the result was divided by five.
3.3.4 Sampling programme
After running the RO unit and adjusting the pressure on 50 psi,
water samples were collected from raw water, permeate and brine
every half an hour and analysed until the steady condition was
reached (when nitrate concentration in the permeate and brine
remained constant). Then two samples from each stream were
collected and analysed. After that the pressure value (70, 90 and110),
was changed and the same procedure was followed for each pressure
value.
3.3.5 Power regeneration by PV cells
The RO experiments were conducted during full sunshine days
between 9:00 am to 4:00 pm. Moreover, the power was generated
using six solar panels and the solar radiation during the mentioned
period on 3/12/2009 was between 623-1113 Watt/m2 and the
average was 965 Watt/m2 (weather station). Furthermore, the power
peak production of each PV cell is 140 Watt. In this case the
efficiency of solar panels is 15% of the availble 965 Watt/m2 and this
percentage is matching the normal solar power efficiency of 10-15%.
This low efficiency could be as a result of some photon energy
31
transformed to heat instead of electrical energy. Anything can lead to
reflection of the incoming rays on the cell surface and electrical
resistance losses in the connecting cables and the semiconductors.
However, the measured power using a multi meter was different for
each applied pressure and was between 203 and 283 watt and these
readings were compatible for pressures between 50-110 psi. In
addition the calculated power (consumed power by pump) was
calculated by multiplying pressure N/m2 (Pa) and flow rate m3/s
ranged from 69 – 150 Watt.
3.3.6 Power consumption
Power generation was calculated by measuring voltage and current
from control box in solar panel using a multimeter (P (Watt) = V (Volt)
* I (Ampere)). This value represents the power which was produced by
solar panels. The actual consumed power was calculated using the
following equations:
The consumed power was related to the applied pressure and the flow
rate of the pump
1- Power W = J/s so = Nm/s because J= Nm
2- Pressure Pa = N/m2
3- Flow m3/s
Pressure multiplied by flow calculates power in Nm/s (Watt).
3.5 Ion Exchange experiment
Ion exchange experiments were conducted using nitrate selective
resin (Dowex NSR1) to remove nitrate from prepared solutions. Firstly,
32
batch tests were run to calculate nitrate removal capacity of the resin
and compared with specification of the resin. Then column
experiments were carried out using nitrate solutions and a synthetic
water similar to water quality in Great Man-made River Project. The
specification of this water is given in appendix C, to investigate the
effect of nitrate concentration, presence of other anions (sulphate,
chloride and bicarbonate) and contact time on nitrate removal
capacity of the resin.
3.4.1 Regeneration of NSR1 Resin
The specification of NSR1 indicates that the Brine NaCl (3-10%) is
used to regenerate the resin at nearly 50 °C. Regeneration was
conducted after each experiment using the following procedure:
1- 3.5 % of brine were prepared by dissolving 70 gram on NaCl in two
litres of deionised water. Two litres was prepared to match the resin
specification ( 2-3 volume of the resin).
2- Drain the brine into the column for one hour by adjusting the flow
rate using Huffman valve.
3- drain the brine to the top level of the bead and close the valve and
keep it for one hour.
4- Drain the brine and wash the resin using 3-6 volumes of deionised
water.
3.4.2 Batch test
In this test three experiments were carried out with different contact
times (1, 2 and 4 minutes) for each one. All of them had the same
33
range of nitrate concentration (10, 20, 40, 60, 80, 100 mg/L NO3–N).
Moreover, two experiments were conducted with two minutes contact
time and the nitrate concentrations were different to the previous
three tests (150, 200, 250, 300, 350 mg/L NO3-N). High nitrate
concentrations were used to investigate nitrate removal capacity of
the resin. The nitrate concentration solution for the batch test was
prepared as follows:
I- Potassium nitrate was dried in oven for 24 hours.
II- 3.62 g of KNO3 was dissolved in 1 L of deionized water to
prepare 500 mg/L NO3 as N.
III- A pipette was used to transfer 2 mL of 500 mg/L NO3 to a 100
mL flask and fill with deionized water up to the mark to prepare
10 mg/L NO3 as N.
IV- Transfer 4, 8, 12, 16 and 20 mL of stock solution to prepare 20,
40, 60, 80 and 100 mg/L NO3 as N.
Batch test was conducted by transferring 50 mL from prepared nitrate
solutions 10 mg/L NO3 as N in a conical flask containing stirring
magnet and placing it on a magnetic stirrer. Then one mL of nitrate
selective resin was added and the magnetic stirrer was turned on for
one minute. After one minute the magnetic stirrer was turned off and
10 ml of a solution was taken to measure the remaining concentration
of nitrate. The same procedure was applied with other nitrate
solutions 20, 40, 60, 80 and 100 mg/L NO3 as N. The same batch test
was repeated but with different contact times of 2 and 4 minutes.
34
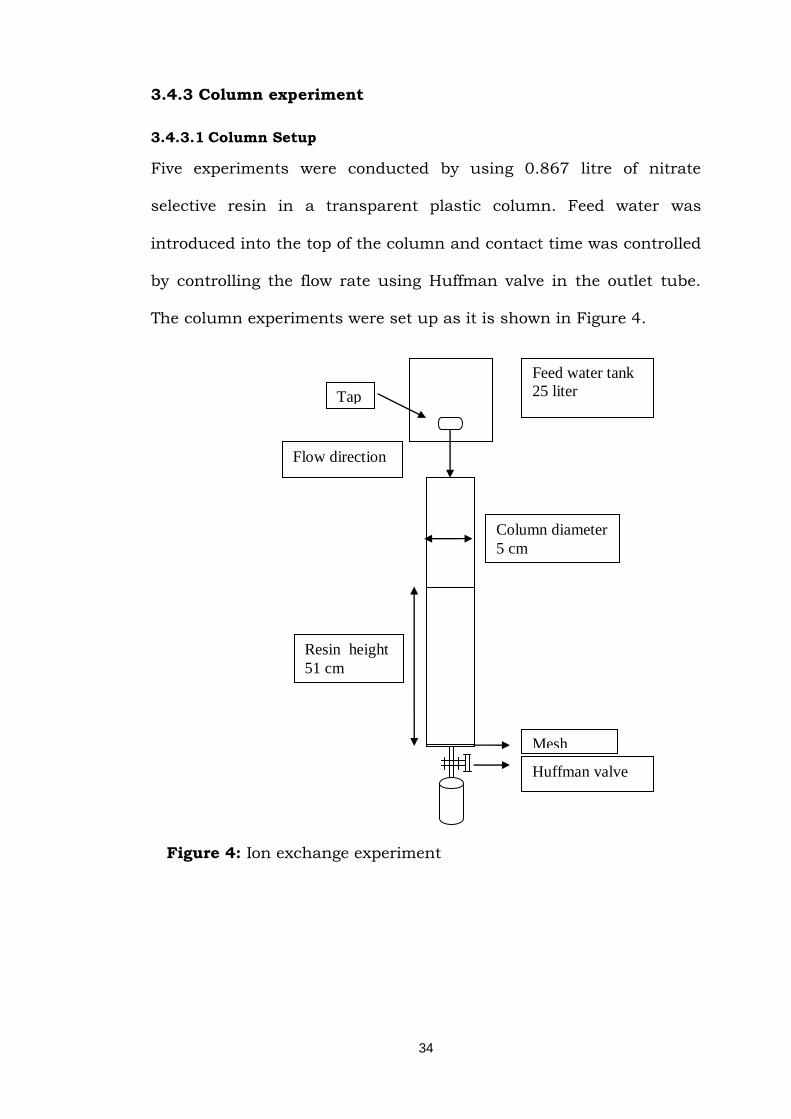
3.4.3 Column experiment
3.4.3.1 Column Setup
Five experiments were conducted by using 0.867 litre of nitrate
selective resin in a transparent plastic column. Feed water was
introduced into the top of the column and contact time was controlled
by controlling the flow rate using Huffman valve in the outlet tube.
The column experiments were set up as it is shown in Figure 4.
Figure 4: Ion exchange experiment
Resin height
51 cm
Column diameter
5 cm
Huffman valve
Mesh
Feed water tank
25 liter
Flow direction
Tap
35
3.4.3.2 Feed Solution Preparation
Feed water was prepared as follows:
A- Nitrate solution
I- Potassium nitrate was dried and 43.28 gram of it dissolved in
deionized water and then poured into a 50 litre container diluted to
50 litre to prepare 120 mg/L NO3 as N.
B- Nitrate solution and other anions
I- The step as the first step in A.
II- 22.4 gram of calcium chloride was dissolved in a litre of
deionized water and added to the 50-litre tank.
III- 17 gram of sodium sulphate was dissolved in a litre of deionized
water and added to the 50 L container.
IV- 12.31 gram of sodium bicarbonate was dissolved in one litre of
deionized water and added to the same tank.
V- The prepared solution was diluted up to 50 litre to prepare the
desired salts concentration (178 mg/L HCO3-, 284 mg/L Cl-,
230 mg/L So4-2 and 120 mg/L No3- as N).
C- Synthetic water
This water was prepared to be similar to the water quality in EJH
well-field as it is illustrated in appendix C.
3.4.3.3 Experimental runs
1- First experiment was conducted by using just nitrate solution
with one-minute contact time to investigate nitrate removal
capacity of the resin.
36
2- The second one was run for reproducibility by using the same
feed water and the same contact time.
3- The third experiment was done by using prepared water
containing other salts beside nitrate to investigate the effect of
the presence of these anions on nitrate removal using the same
nitrate selective resin and contact time was the same as the
first one.
4- The fourth experiment was carried out by using synthetic water
similar to water in EJH wellfield and on minute contact time to
investigate the efficiency of ion exchange technique of nitrate
removal from water, whose quality was the same as the average
of water parameters in EJH wellfield.
5- The fifth one was run using the same synthetic water like the
previous one but the contact time was 2 min to investigate the
effect of contact time on nitrate removal.
3.4.3.4 Flow rate and contact time calculations
Flow rate for the column experiments was calculated by this equation:
V = Q/A Equation 11 : To Calculate flow rate
Where
V = Velocity (h/m)
Q = Flow rate (m3/h)
A = Area (m2)
The resin manufacturer recommended that the velocity for NSR1 resin
is between 5-60 m/h (Darcy velocity). Firstly 7.65 m/h was used
Area = 3.14 * (0.025 m*0.025 m) = 0.00196 m2
37
Q= A * V = 0.00196 * 7.65 = 0.015 m3/h = 15.0 L/h = 0.250 L/min
From the calculated flow rate contact time can be calculated by the
following equation:
Flow rate = Volume (ml) / contact time (min) Equation 12 : To
calculate contact time
Volume was calculated by using the clear column filled with IX resin.
The column was filled with water to just over the resin bed volume.
The water was drained using Huffman valve until the water level was
exactly at the bottom level of the bed volume. This volume represented
the resin pore space volume and was equal 250 mL.
T = V/Q
Where T = Contact time (min)
V = volume (L)
Q= Flow rate L/min
So the contact time equals:
= 0.25 (L)/0.25 (L/min)= 1 min
Secondly 3.825 m/h velocity was used following the same calculation
as above.
Area = 3.14 * (0.025 m*0.025 m) = 0.00196 m2
Q= A * V = 0.00196 * 3.825 = 0.0075 m3/h = 7.5 L/h = 0.125 L/min
Then contact time was calculated using 0.125 L/min flow rate
T = V/Q
= 0.25 (L)/0.125 (L/min)= 2 min
Volumes of treated water calculations:
38
In the experiments 1, 2, 3, and 4 were conducted using one minute
contact time (0.250 L/min flow rate) so, every four minutes were
treated 0.25 L/min * 4 min = 1 L
Volume of treated water can be calculated by divded the accumulative
time by 4 when one minute contact time was used and diveded by 8
when two minutes contact time was used ( experiment 5).
39
4 Results
This chapter summarizes the key results from the experiments carried
out for both reverse osmosis and ion exchange techniques. Details of
the result are in Appendix A and B.
4.1 Reverse Osmosis Experiment
The results presented in this section include nitrate concentrations
and flow rates for all streams and their relationship with the applied
pressure besides recovery ratio, nitrate rejection ratio and permeation
constant of the membrane.
4.1.1 First reverse osmosis experiment 8.3 mg/L NO3- -N
concentration
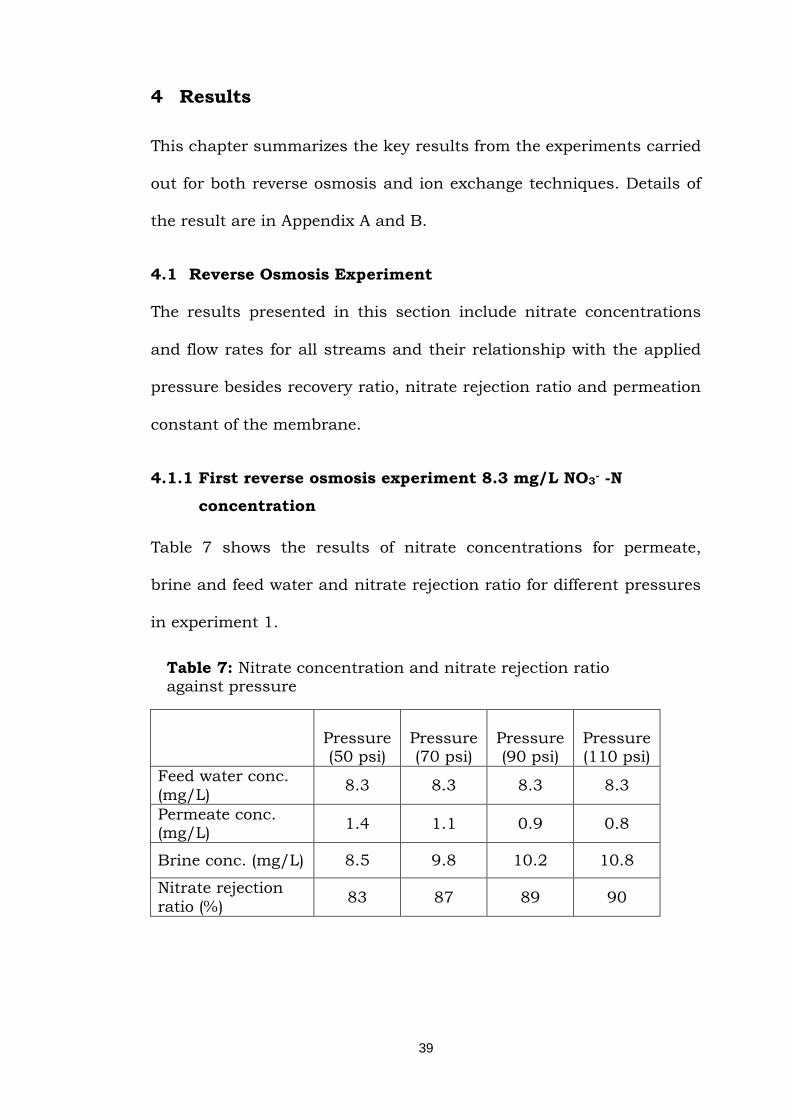
Table 7 shows the results of nitrate concentrations for permeate,
brine and feed water and nitrate rejection ratio for different pressures
in experiment 1.
Table 7: Nitrate concentration and nitrate rejection ratio against pressure
Pressure (50 psi)
Pressure (70 psi)
Pressure (90 psi)
Pressure (110 psi)
Feed water conc.
(mg/L) 8.3 8.3 8.3 8.3
Permeate conc. (mg/L)
1.4 1.1 0.9 0.8
Brine conc. (mg/L) 8.5 9.8 10.2 10.8
Nitrate rejection
ratio (%) 83 87 89 90
40
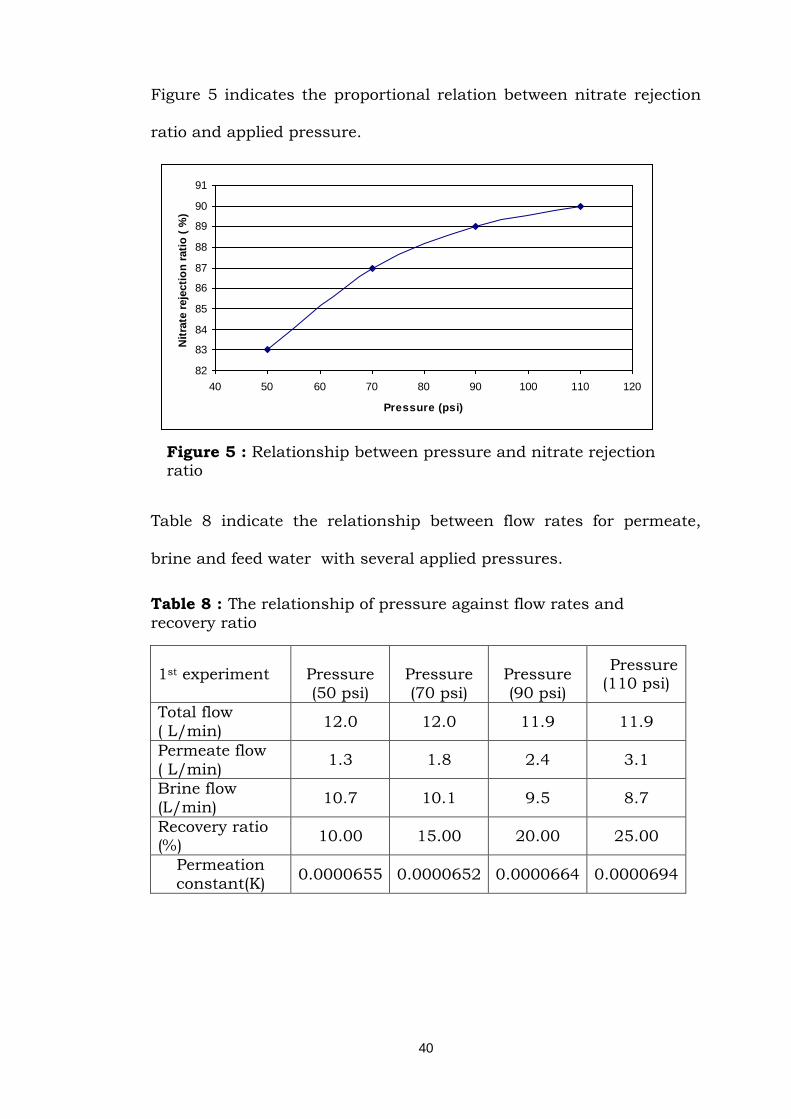
Figure 5 indicates the proportional relation between nitrate rejection
ratio and applied pressure.
82
83
84
85
86
87
88
89
90
91
40 50 60 70 80 90 100 110 120
Pressure (psi)
Nit
rate
reje
cti
on
rati
o (
%)
Figure 5 : Relationship between pressure and nitrate rejection ratio
Table 8 indicate the relationship between flow rates for permeate,
brine and feed water with several applied pressures.
Table 8 : The relationship of pressure against flow rates and
recovery ratio
1st experiment
Pressure
(50 psi)
Pressure
(70 psi)
Pressure
(90 psi)
Pressure (110 psi)
Total flow
( L/min) 12.0 12.0 11.9 11.9
Permeate flow
( L/min) 1.3 1.8 2.4 3.1
Brine flow
(L/min) 10.7 10.1 9.5 8.7
Recovery ratio (%)
10.00 15.00 20.00 25.00
Permeation
constant(K) 0.0000655 0.0000652 0.0000664 0.0000694
41
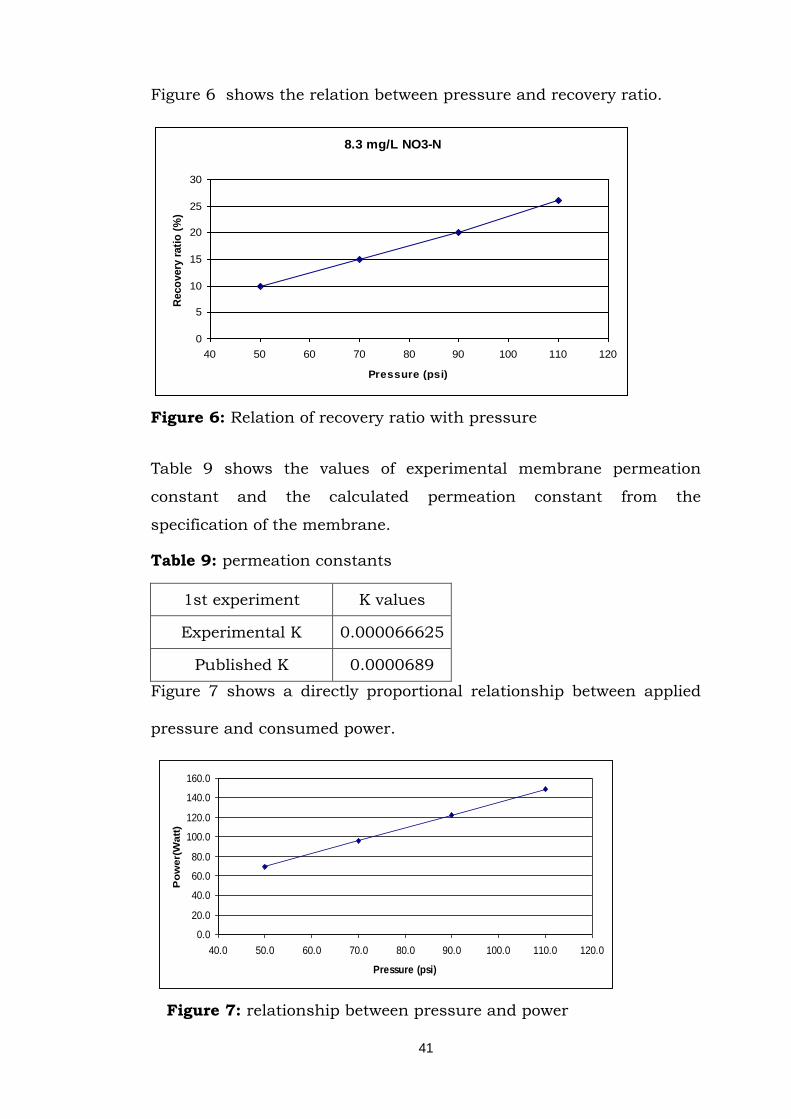
Figure 6 shows the relation between pressure and recovery ratio.
8.3 mg/L NO3-N
0
5
10
15
20
25
30
40 50 60 70 80 90 100 110 120
Pressure (psi)
Reco
very
rati
o (
%)
Figure 6: Relation of recovery ratio with pressure
Table 9 shows the values of experimental membrane permeation
constant and the calculated permeation constant from the
specification of the membrane.
Table 9: permeation constants
1st experiment K values
Experimental K 0.000066625
Published K 0.0000689
Figure 7 shows a directly proportional relationship between applied
pressure and consumed power.
0.0
20.0
40.0
60.0
80.0
100.0
120.0
140.0
160.0
40.0 50.0 60.0 70.0 80.0 90.0 100.0 110.0 120.0
Pressure (psi)
Po
wer(
Watt
)
Figure 7: relationship between pressure and power
42
4.1.2 Second reverse osmosis experiment 15.4 mg/L NO3- -N
concentration
Second experiment results are presented in appendix A. Table 10
shows nitrate concentration of all streams besides nitrate rejection
ratio in the applied pressures of this experiment.
Table 10: The relationship between nitrate concentration and pressure
Pressure
(50 psi)
Pressure
(70 psi)
Pressure
(90 psi)
Pressure
(110 psi)
Feed water conc.
(mg/L) 15.4 15.4 15.4 15.4
Permeate conc.
(mg/L) 2.4 2.1 1.9 1.5
Brine conc. (mg/L) 16.4 17.1 18.5 20.4
Nitrate rejection
ratio (%) 84 86 88 90
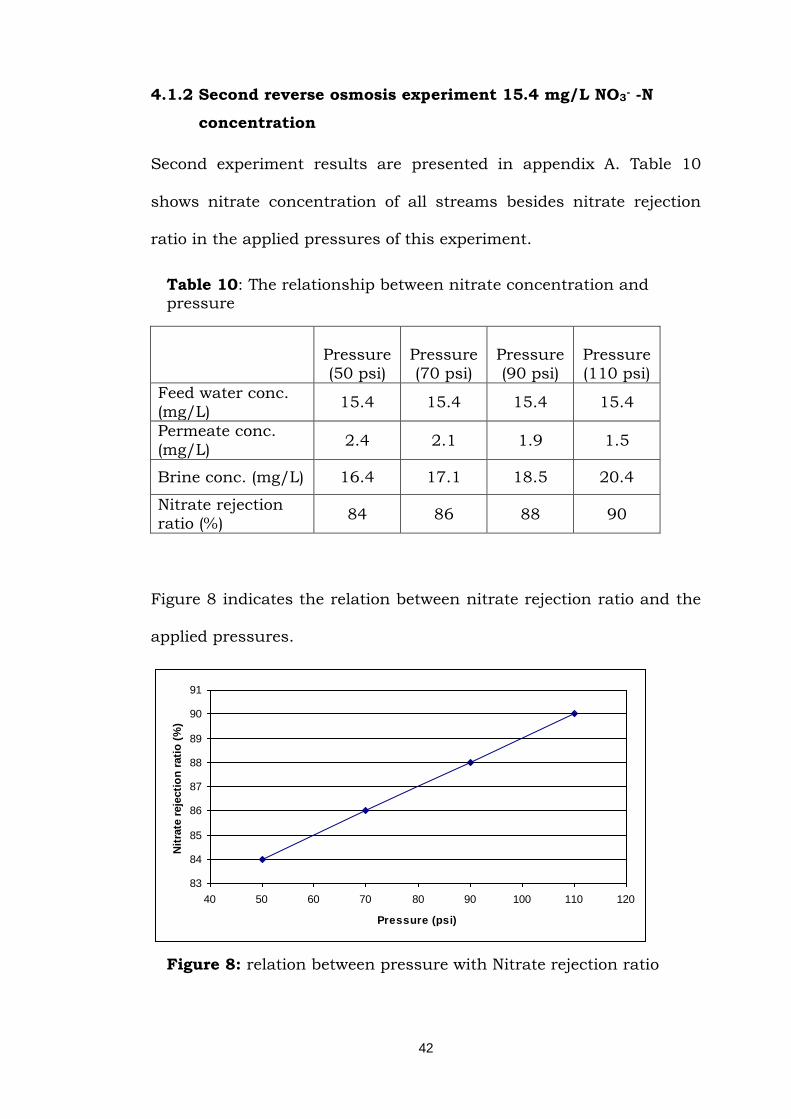
Figure 8 indicates the relation between nitrate rejection ratio and the
applied pressures.
83
84
85
86
87
88
89
90
91
40 50 60 70 80 90 100 110 120
Pressure (psi)
Nit
rate
reje
cti
on
rati
o (
%)
Figure 8: relation between pressure with Nitrate rejection ratio
43
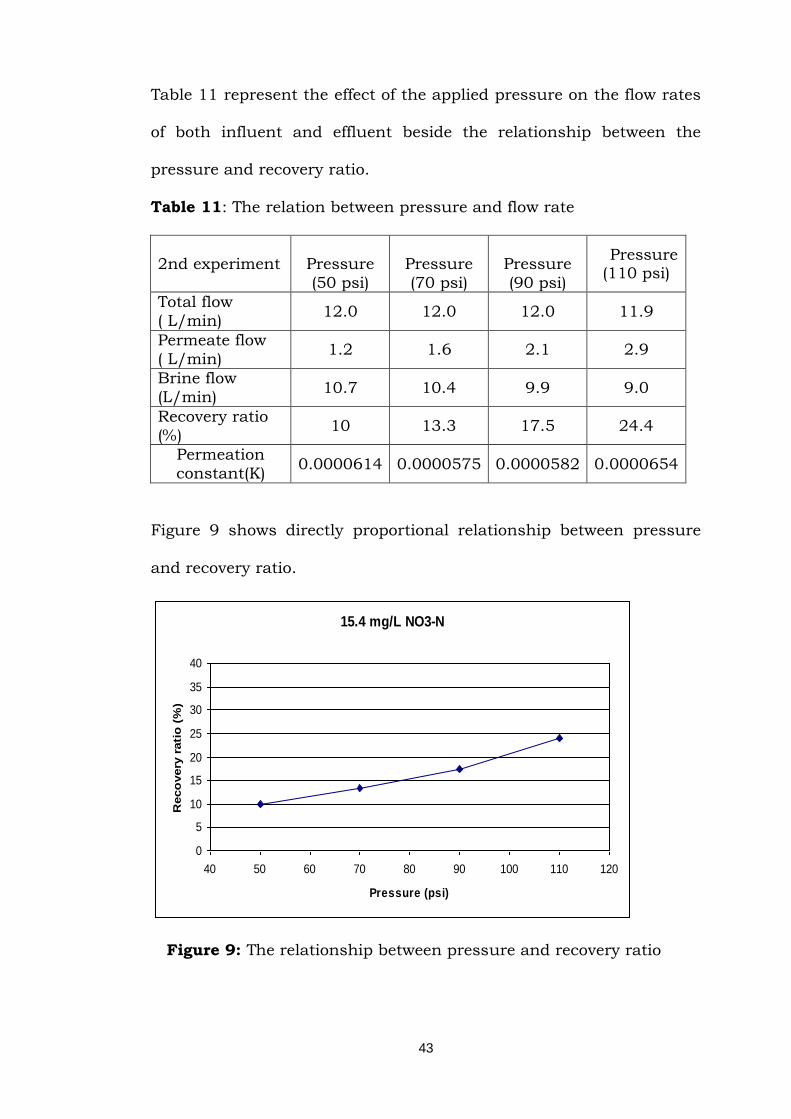
Table 11 represent the effect of the applied pressure on the flow rates
of both influent and effluent beside the relationship between the
pressure and recovery ratio.
Table 11: The relation between pressure and flow rate
2nd experiment
Pressure
(50 psi)
Pressure
(70 psi)
Pressure
(90 psi)
Pressure (110 psi)
Total flow
( L/min) 12.0 12.0 12.0 11.9
Permeate flow
( L/min) 1.2 1.6 2.1 2.9
Brine flow
(L/min) 10.7 10.4 9.9 9.0
Recovery ratio
(%) 10 13.3 17.5 24.4
Permeation
constant(K) 0.0000614 0.0000575 0.0000582 0.0000654
Figure 9 shows directly proportional relationship between pressure
and recovery ratio.
15.4 mg/L NO3-N
0
5
10
15
20
25
30
35
40
40 50 60 70 80 90 100 110 120
Pressure (psi)
Reco
very
rati
o (
%)
Figure 9: The relationship between pressure and recovery ratio
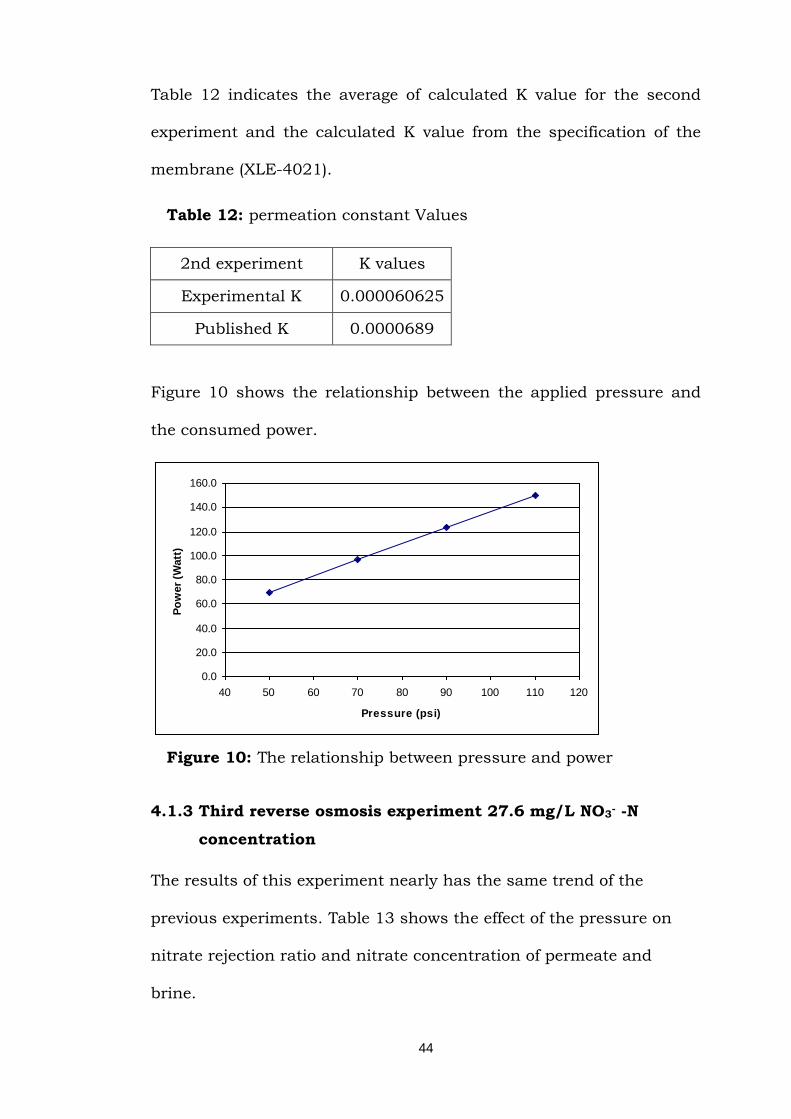
44
Table 12 indicates the average of calculated K value for the second
experiment and the calculated K value from the specification of the
membrane (XLE-4021).
Table 12: permeation constant Values
2nd experiment K values
Experimental K 0.000060625
Published K 0.0000689
Figure 10 shows the relationship between the applied pressure and
the consumed power.
0.0
20.0
40.0
60.0
80.0
100.0
120.0
140.0
160.0
40 50 60 70 80 90 100 110 120
Pressure (psi)
Po
wer
(Watt
)
Figure 10: The relationship between pressure and power
4.1.3 Third reverse osmosis experiment 27.6 mg/L NO3- -N
concentration
The results of this experiment nearly has the same trend of the
previous experiments. Table 13 shows the effect of the pressure on
nitrate rejection ratio and nitrate concentration of permeate and
brine.
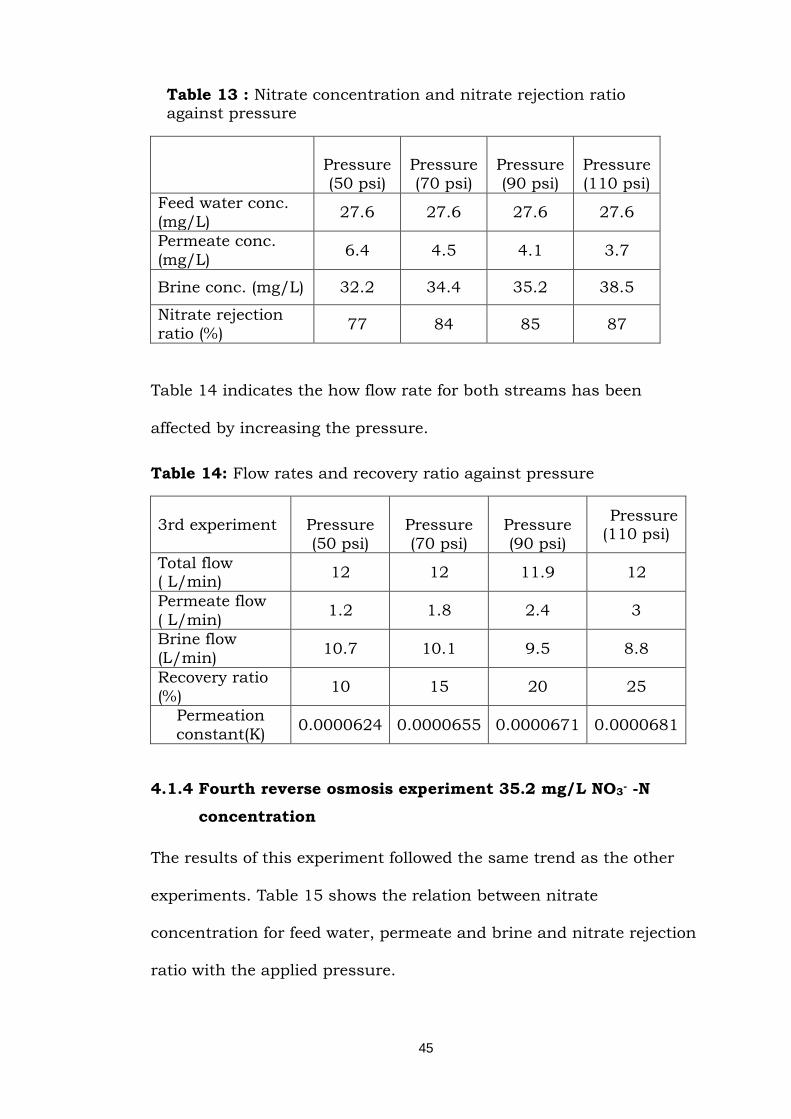
45
Table 13 : Nitrate concentration and nitrate rejection ratio against pressure
Pressure
(50 psi)
Pressure
(70 psi)
Pressure
(90 psi)
Pressure
(110 psi)
Feed water conc.
(mg/L) 27.6 27.6 27.6 27.6
Permeate conc.
(mg/L) 6.4 4.5 4.1 3.7
Brine conc. (mg/L) 32.2 34.4 35.2 38.5
Nitrate rejection
ratio (%) 77 84 85 87
Table 14 indicates the how flow rate for both streams has been
affected by increasing the pressure.
Table 14: Flow rates and recovery ratio against pressure
3rd experiment
Pressure
(50 psi)
Pressure
(70 psi)
Pressure
(90 psi)
Pressure (110 psi)
Total flow ( L/min)
12 12 11.9 12
Permeate flow
( L/min) 1.2 1.8 2.4 3
Brine flow
(L/min) 10.7 10.1 9.5 8.8
Recovery ratio
(%) 10 15 20 25
Permeation
constant(K) 0.0000624 0.0000655 0.0000671 0.0000681
4.1.4 Fourth reverse osmosis experiment 35.2 mg/L NO3- -N
concentration
The results of this experiment followed the same trend as the other
experiments. Table 15 shows the relation between nitrate
concentration for feed water, permeate and brine and nitrate rejection
ratio with the applied pressure.
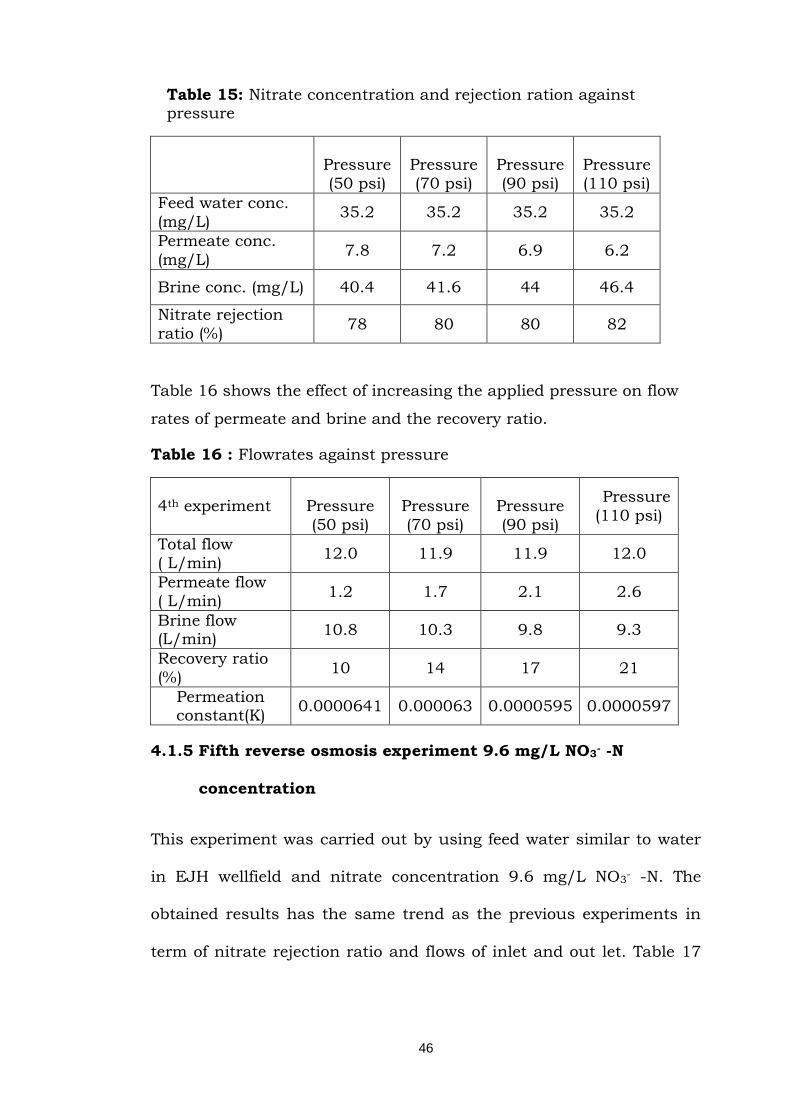
46
Table 15: Nitrate concentration and rejection ration against pressure
Pressure
(50 psi)
Pressure
(70 psi)
Pressure
(90 psi)
Pressure
(110 psi)
Feed water conc.
(mg/L) 35.2 35.2 35.2 35.2
Permeate conc.
(mg/L) 7.8 7.2 6.9 6.2
Brine conc. (mg/L) 40.4 41.6 44 46.4
Nitrate rejection
ratio (%) 78 80 80 82
Table 16 shows the effect of increasing the applied pressure on flow
rates of permeate and brine and the recovery ratio.
Table 16 : Flowrates against pressure
4th experiment
Pressure
(50 psi)
Pressure
(70 psi)
Pressure
(90 psi)
Pressure
(110 psi)
Total flow
( L/min) 12.0 11.9 11.9 12.0
Permeate flow
( L/min) 1.2 1.7 2.1 2.6
Brine flow (L/min)
10.8 10.3 9.8 9.3
Recovery ratio
(%) 10 14 17 21
Permeation constant(K)
0.0000641 0.000063 0.0000595 0.0000597
4.1.5 Fifth reverse osmosis experiment 9.6 mg/L NO3- -N
concentration
This experiment was carried out by using feed water similar to water
in EJH wellfield and nitrate concentration 9.6 mg/L NO3- -N. The
obtained results has the same trend as the previous experiments in
term of nitrate rejection ratio and flows of inlet and out let. Table 17
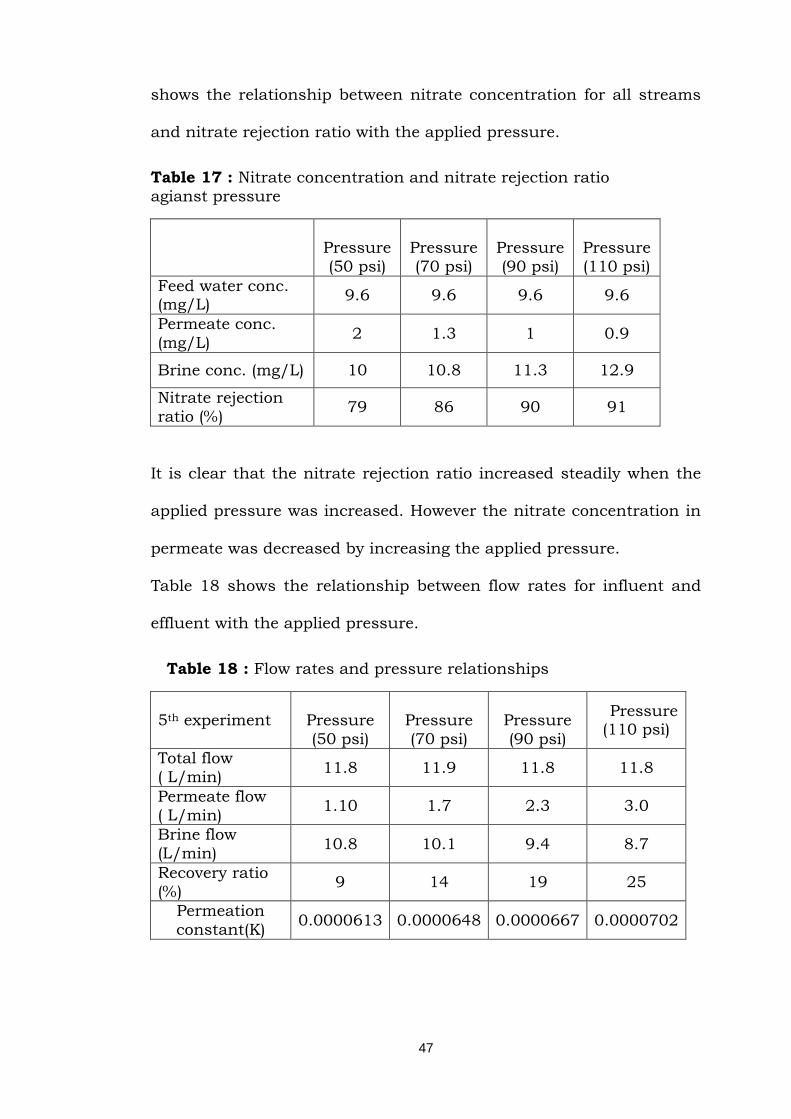
47
shows the relationship between nitrate concentration for all streams
and nitrate rejection ratio with the applied pressure.
Table 17 : Nitrate concentration and nitrate rejection ratio
agianst pressure
Pressure
(50 psi)
Pressure
(70 psi)
Pressure
(90 psi)
Pressure
(110 psi)
Feed water conc. (mg/L)
9.6 9.6 9.6 9.6
Permeate conc.
(mg/L) 2 1.3 1 0.9
Brine conc. (mg/L) 10 10.8 11.3 12.9
Nitrate rejection
ratio (%) 79 86 90 91
It is clear that the nitrate rejection ratio increased steadily when the
applied pressure was increased. However the nitrate concentration in
permeate was decreased by increasing the applied pressure.
Table 18 shows the relationship between flow rates for influent and
effluent with the applied pressure.
Table 18 : Flow rates and pressure relationships
5th experiment
Pressure
(50 psi)
Pressure
(70 psi)
Pressure
(90 psi)
Pressure (110 psi)
Total flow
( L/min) 11.8 11.9 11.8 11.8
Permeate flow
( L/min) 1.10 1.7 2.3 3.0
Brine flow
(L/min) 10.8 10.1 9.4 8.7
Recovery ratio
(%) 9 14 19 25
Permeation
constant(K) 0.0000613 0.0000648 0.0000667 0.0000702
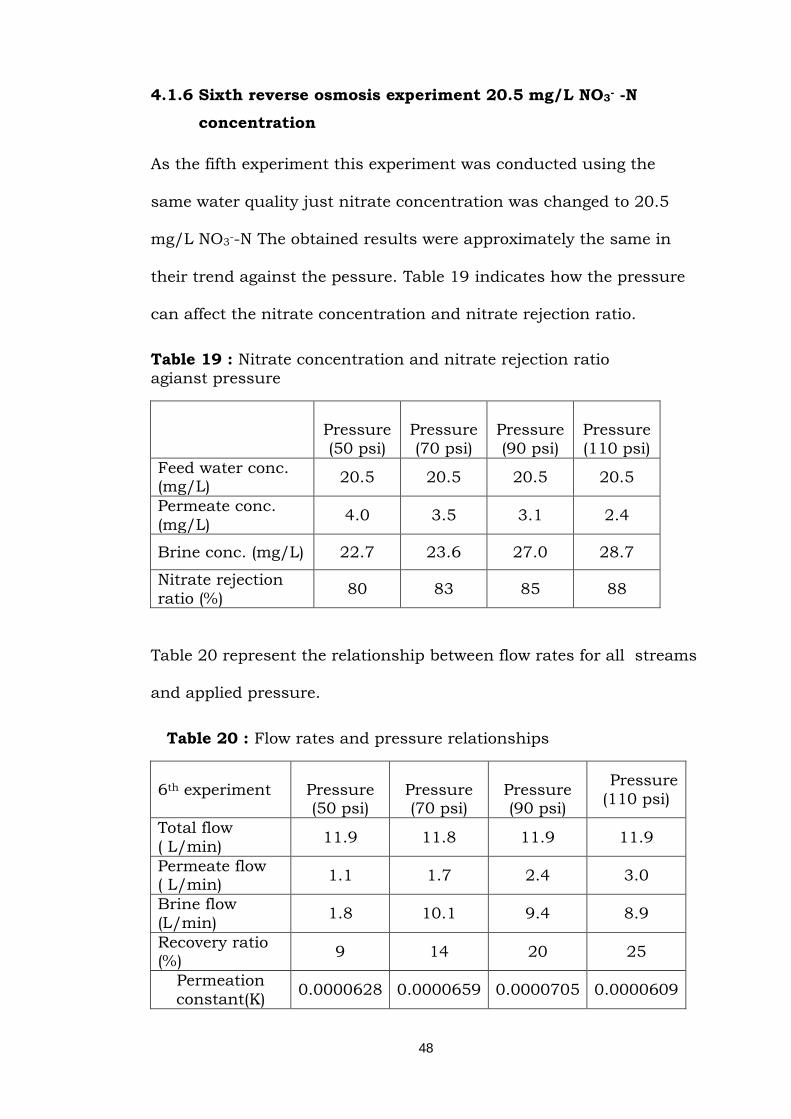
48
4.1.6 Sixth reverse osmosis experiment 20.5 mg/L NO3- -N
concentration
As the fifth experiment this experiment was conducted using the
same water quality just nitrate concentration was changed to 20.5
mg/L NO3--N The obtained results were approximately the same in
their trend against the pessure. Table 19 indicates how the pressure
can affect the nitrate concentration and nitrate rejection ratio.
Table 19 : Nitrate concentration and nitrate rejection ratio
agianst pressure
Pressure
(50 psi)
Pressure
(70 psi)
Pressure
(90 psi)
Pressure
(110 psi)
Feed water conc. (mg/L)
20.5 20.5 20.5 20.5
Permeate conc.
(mg/L) 4.0 3.5 3.1 2.4
Brine conc. (mg/L) 22.7 23.6 27.0 28.7
Nitrate rejection
ratio (%) 80 83 85 88
Table 20 represent the relationship between flow rates for all streams
and applied pressure.
Table 20 : Flow rates and pressure relationships
6th experiment
Pressure (50 psi)
Pressure (70 psi)
Pressure (90 psi)
Pressure
(110 psi)
Total flow
( L/min) 11.9 11.8 11.9 11.9
Permeate flow ( L/min)
1.1 1.7 2.4 3.0
Brine flow
(L/min) 1.8 10.1 9.4 8.9
Recovery ratio (%)
9 14 20 25
Permeation
constant(K) 0.0000628 0.0000659 0.0000705 0.0000609
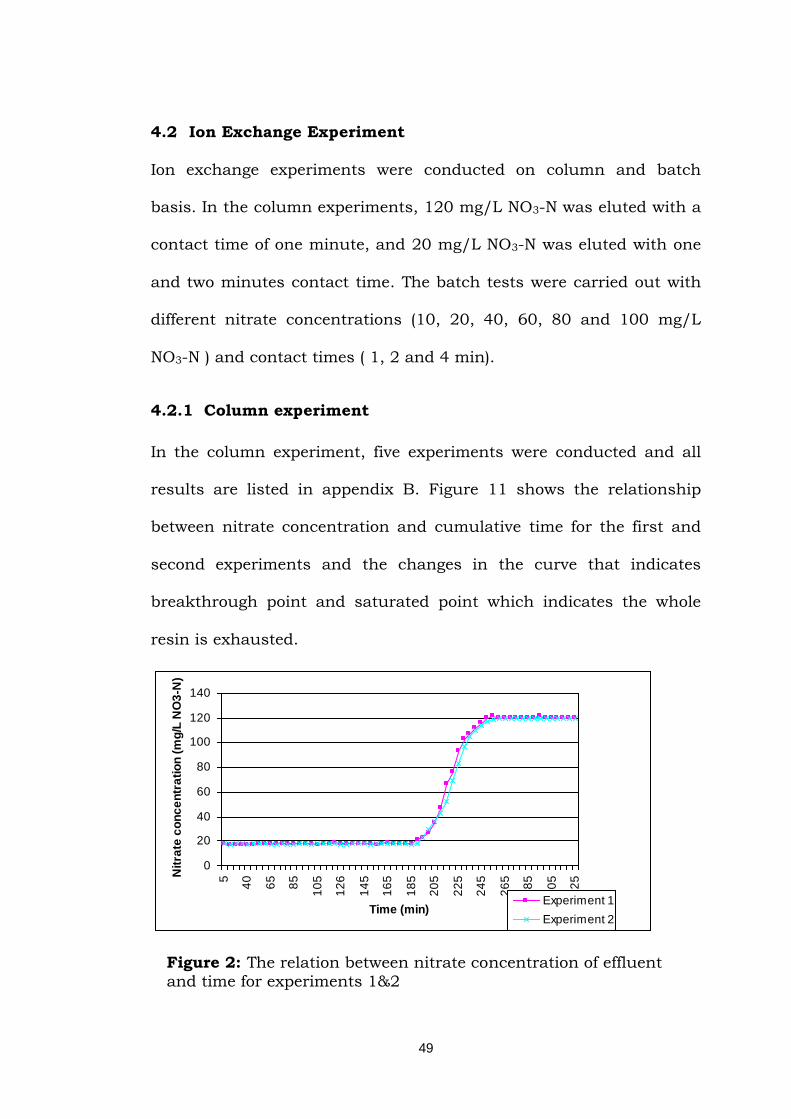
49
4.2 Ion Exchange Experiment
Ion exchange experiments were conducted on column and batch
basis. In the column experiments, 120 mg/L NO3-N was eluted with a
contact time of one minute, and 20 mg/L NO3-N was eluted with one
and two minutes contact time. The batch tests were carried out with
different nitrate concentrations (10, 20, 40, 60, 80 and 100 mg/L
NO3-N ) and contact times ( 1, 2 and 4 min).
4.2.1 Column experiment
In the column experiment, five experiments were conducted and all
results are listed in appendix B. Figure 11 shows the relationship
between nitrate concentration and cumulative time for the first and
second experiments and the changes in the curve that indicates
breakthrough point and saturated point which indicates the whole
resin is exhausted.
0
20
40
60
80
100
120
140
5
40
65
85
10
5
12
6
14
5
16
5
18
5
20
5
22
5
24
5
26
5
28
5
30
5
32
5
Time (min)
Nit
rate
co
nc
en
tra
tio
n (
mg
/L N
O3
-N)
Experiment 1
Experiment 2
Figure 2: The relation between nitrate concentration of effluent
and time for experiments 1&2
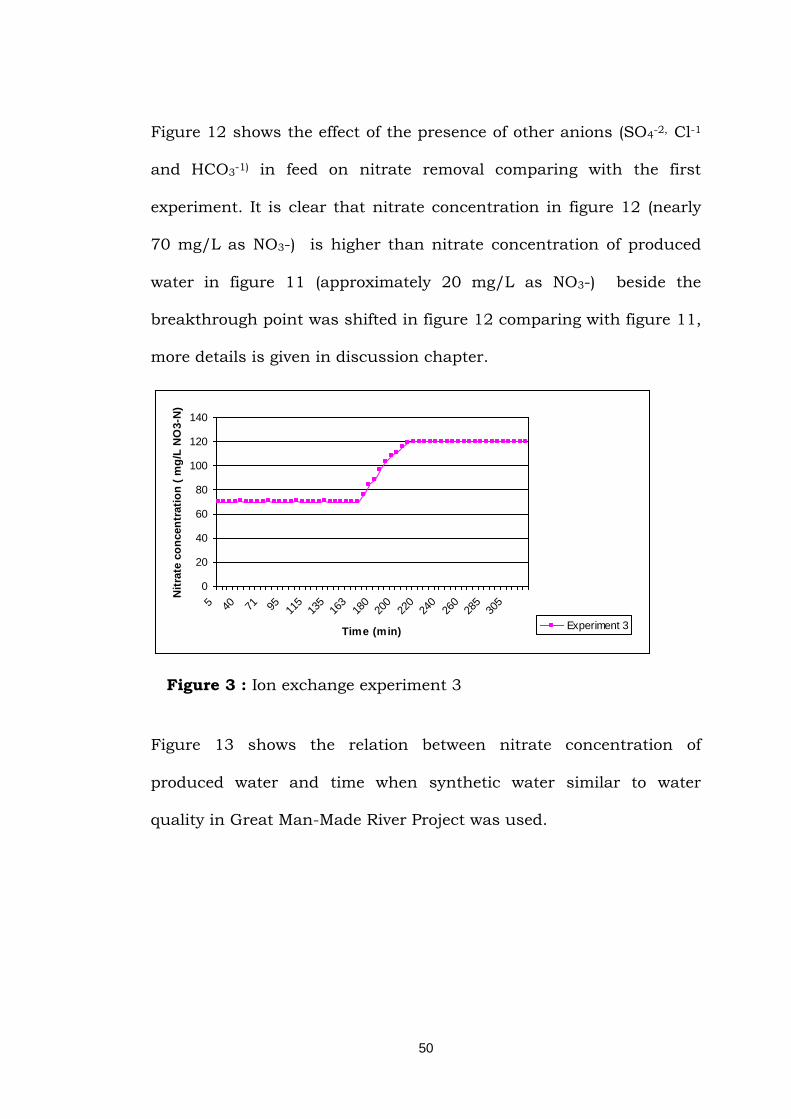
50
Figure 12 shows the effect of the presence of other anions (SO4-2, Cl-1
and HCO3-1) in feed on nitrate removal comparing with the first
experiment. It is clear that nitrate concentration in figure 12 (nearly
70 mg/L as NO3-) is higher than nitrate concentration of produced
water in figure 11 (approximately 20 mg/L as NO3-) beside the
breakthrough point was shifted in figure 12 comparing with figure 11,
more details is given in discussion chapter.
0
20
40
60
80
100
120
140
5 40 71 95 115
135
163
180
200
220
240
260
285
305
Time (min)
Nit
rate
co
ncen
trati
on
( m
g/L
NO
3-N
)
Experiment 3
Figure 3 : Ion exchange experiment 3
Figure 13 shows the relation between nitrate concentration of
produced water and time when synthetic water similar to water
quality in Great Man-Made River Project was used.
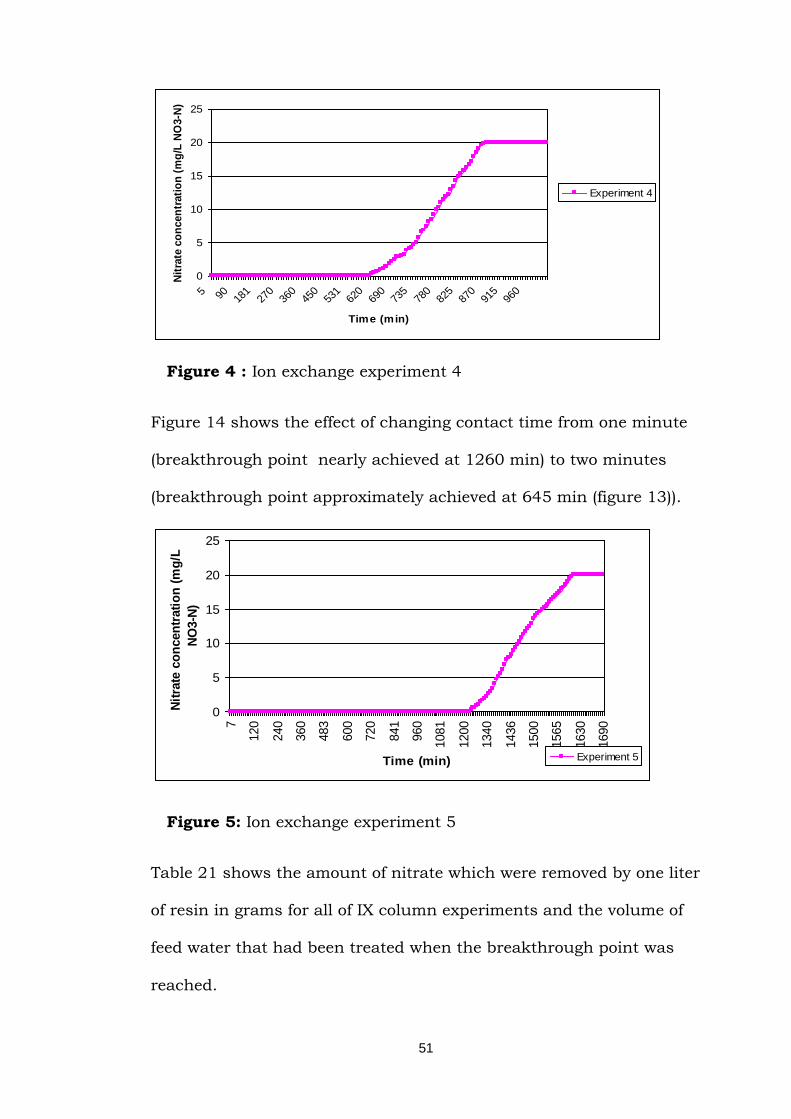
51
0
5
10
15
20
25
5 90 181
270
360
450
531
620
690
735
780
825
870
915
960
Time (min)
Nit
rate
co
ncen
trati
on
(m
g/L
NO
3-N
)
Experiment 4
Figure 4 : Ion exchange experiment 4
Figure 14 shows the effect of changing contact time from one minute
(breakthrough point nearly achieved at 1260 min) to two minutes
(breakthrough point approximately achieved at 645 min (figure 13)).
0
5
10
15
20
25
7
120
240
360
483
600
720
841
960
1081
1200
1340
1436
1500
1565
1630
1690
Time (min)
Nit
rate
co
ncen
trati
on
(m
g/L
NO
3-N
)
Experiment 5
Figure 5: Ion exchange experiment 5
Table 21 shows the amount of nitrate which were removed by one liter
of resin in grams for all of IX column experiments and the volume of
feed water that had been treated when the breakthrough point was
reached.
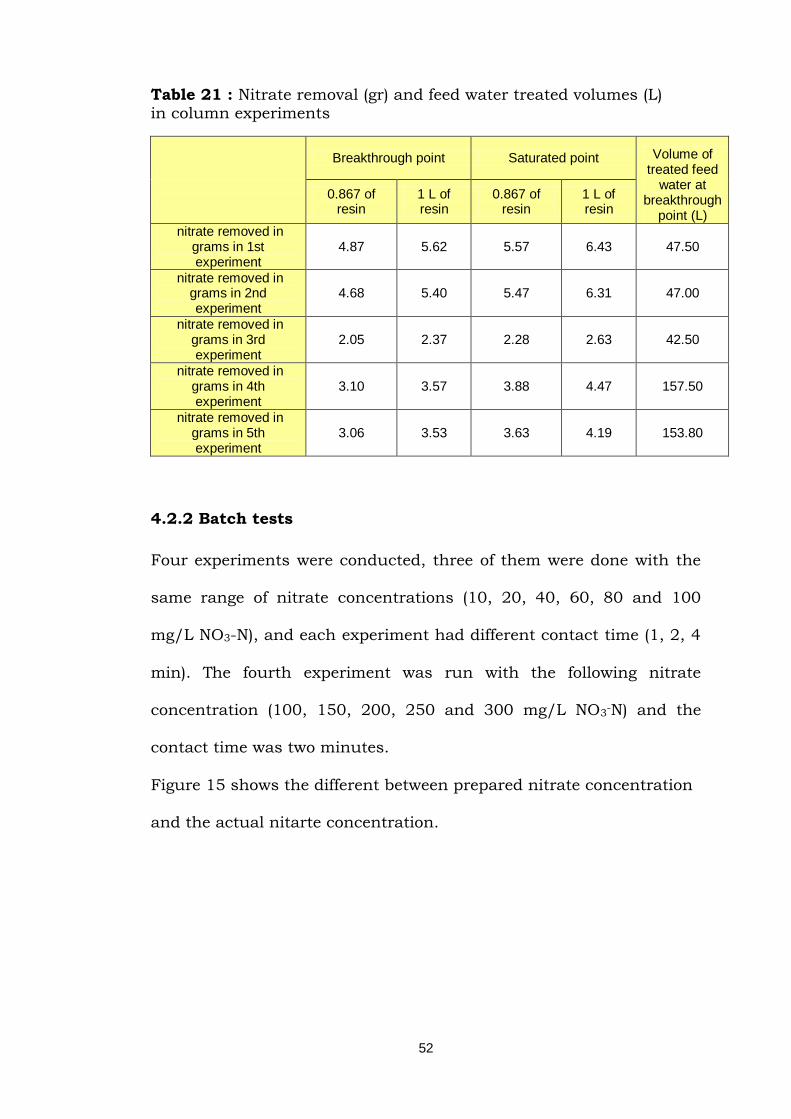
52
Table 21 : Nitrate removal (gr) and feed water treated volumes (L) in column experiments
Breakthrough point Saturated point Volume of
treated feed water at
breakthrough point (L)
0.867 of
resin 1 L of resin
0.867 of resin
1 L of resin
nitrate removed in grams in 1st experiment
4.87 5.62 5.57 6.43 47.50
nitrate removed in grams in 2nd experiment
4.68 5.40 5.47 6.31 47.00
nitrate removed in grams in 3rd experiment
2.05 2.37 2.28 2.63 42.50
nitrate removed in grams in 4th experiment
3.10 3.57 3.88 4.47 157.50
nitrate removed in grams in 5th experiment
3.06 3.53 3.63 4.19 153.80
4.2.2 Batch tests
Four experiments were conducted, three of them were done with the
same range of nitrate concentrations (10, 20, 40, 60, 80 and 100
mg/L NO3-N), and each experiment had different contact time (1, 2, 4
min). The fourth experiment was run with the following nitrate
concentration (100, 150, 200, 250 and 300 mg/L NO3-N) and the
contact time was two minutes.
Figure 15 shows the different between prepared nitrate concentration
and the actual nitarte concentration.
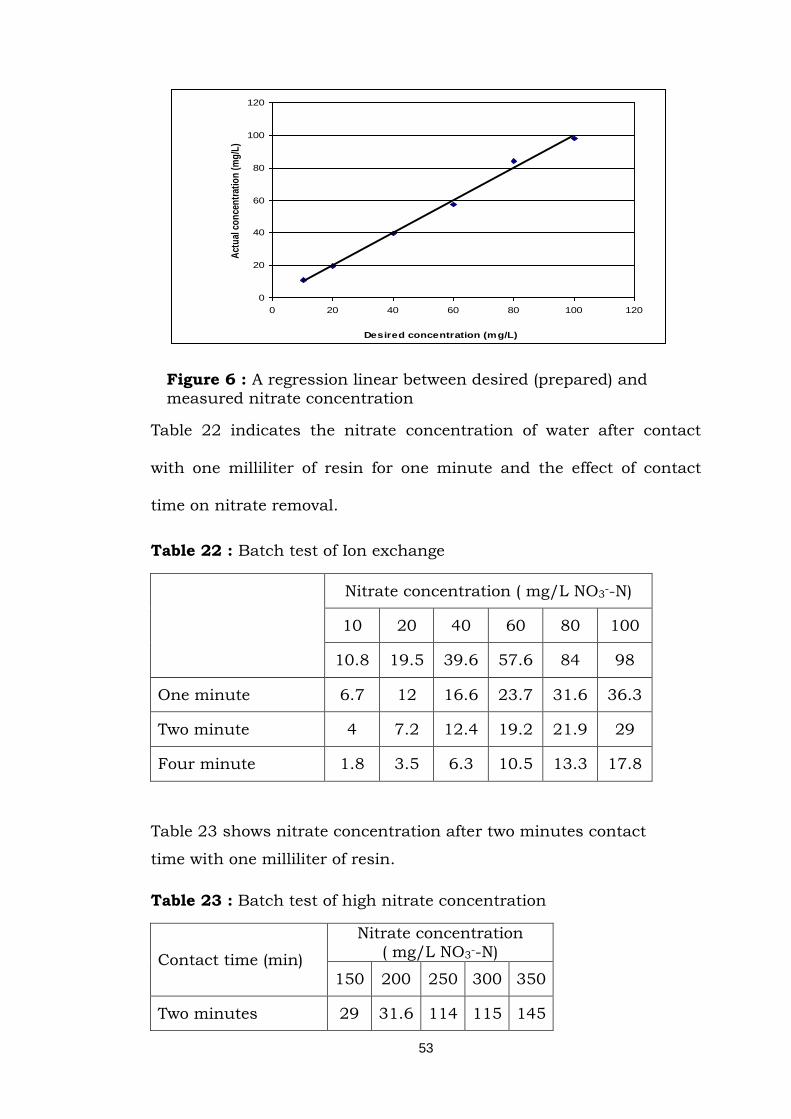
53
0
20
40
60
80
100
120
0 20 40 60 80 100 120
Desired concentration (mg/L)
Act
ual
co
nce
ntr
atio
n (
mg
/L)
Figure 6 : A regression linear between desired (prepared) and
measured nitrate concentration
Table 22 indicates the nitrate concentration of water after contact
with one milliliter of resin for one minute and the effect of contact
time on nitrate removal.
Table 22 : Batch test of Ion exchange
Nitrate concentration ( mg/L NO3--N)
10 20 40 60 80 100
10.8 19.5 39.6 57.6 84 98
One minute 6.7 12 16.6 23.7 31.6 36.3
Two minute 4 7.2 12.4 19.2 21.9 29
Four minute 1.8 3.5 6.3 10.5 13.3 17.8
Table 23 shows nitrate concentration after two minutes contact
time with one milliliter of resin.
Table 23 : Batch test of high nitrate concentration
Contact time (min)
Nitrate concentration
( mg/L NO3--N)
150 200 250 300 350
Two minutes 29 31.6 114 115 145
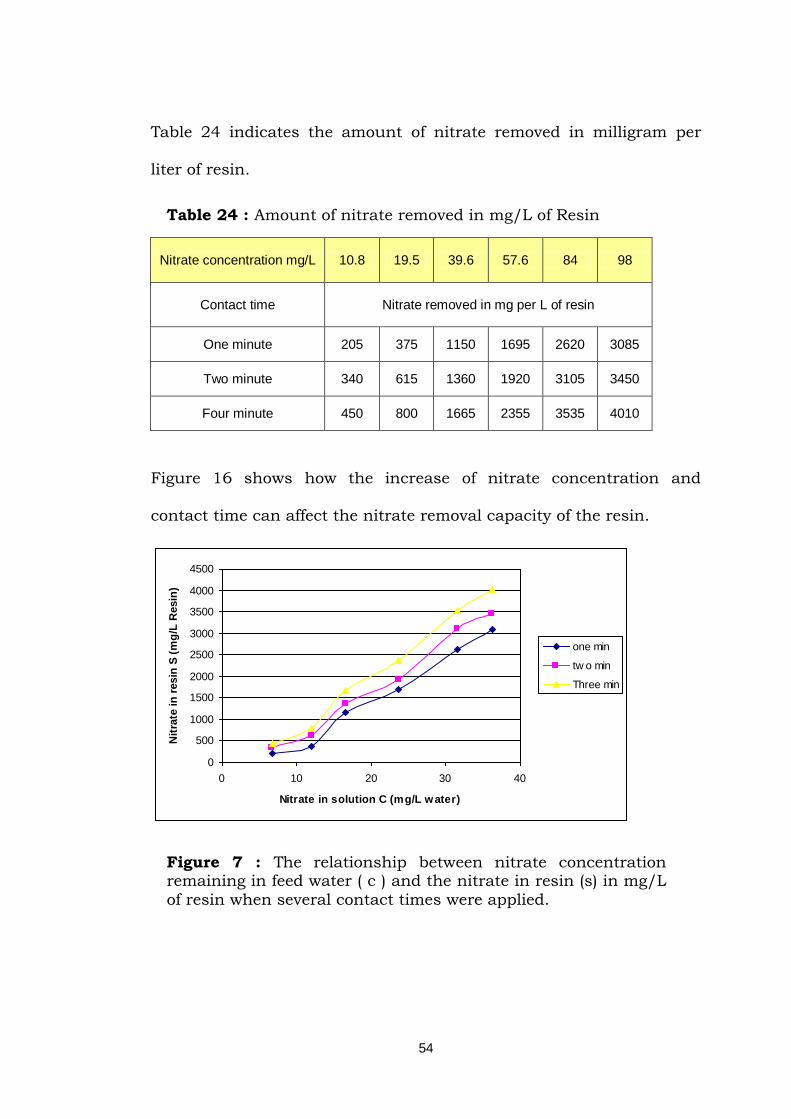
54
Table 24 indicates the amount of nitrate removed in milligram per
liter of resin.
Table 24 : Amount of nitrate removed in mg/L of Resin
Nitrate concentration mg/L 10.8 19.5 39.6 57.6 84 98
Contact time Nitrate removed in mg per L of resin
One minute 205 375 1150 1695 2620 3085
Two minute 340 615 1360 1920 3105 3450
Four minute 450 800 1665 2355 3535 4010
Figure 16 shows how the increase of nitrate concentration and
contact time can affect the nitrate removal capacity of the resin.
0
500
1000
1500
2000
2500
3000
3500
4000
4500
0 10 20 30 40
Nitrate in solution C (mg/L water)
Nit
rate
in
resin
S (
mg
/L R
esin
)
one min
tw o min
Three min
Figure 7 : The relationship between nitrate concentration remaining in feed water ( c ) and the nitrate in resin (s) in mg/L
of resin when several contact times were applied.
55
5 Discussion
In this chapter, the results will be analysed and discussed for both
techniques in terms of their efficiency of nitrate removal and the
quality of the produced water.
5.1 Reverse Osmosis Experiments
In RO technique pressure played the most important role. So it is
important to discuss the relationship between pressure and other
parameters in this section.
5.1.1 Recovery Ratio
Recovery ratio for all experiments ranged between 9 to 26 % and were
increased by increasing the applied pressure (Tables 8, 11, 14, 16, 18,
and 20). This ratio is low because the RO unit included just a single
membrane unit. This was expected because this recovery ratio is
compatible with the typical recovery for RO units (10-25%) powered
by solar energy ( Richards& Schafer, 2003). Moreover, recovery ratios
can be increased up to 92% by applying many membranes in series
(Remco Engineering, 1998).
5.1.2 Quality of results
Results assessment was done by comparing results obtained with the
specification of RO membrane. The recovery ratio ranged from 9% to
26% which is nearly the same as the membrane manufacturer's
specification and match the typical recovery ratio for RO units
powered by solar energy between 10 - 25 % (Richards & Schafer,
56
2003). Flow rate balance of inlet and outlet streams were
approximately the same (11.9 L/min ± 1) for all RO experiments
(Appendix A). Nitrate balance shows that nitrate in the influent (
amount of nitrate in feed water) was nearly the same as in the effluent
(amount in permeate + amount in brine) for all experiments as
indicated in Appendix A. The difference between nitrate balance in the
inlet and outlet streams was ± 7% (Appendix A). In addition nitrate
rejection ratio was calculated as well and these ratio were ranged
between (82-91%) when the applied pressure was 110 psi (Tables 7,
10, 13, 15, 17, and 19). These values nearly match the RO efficiency
for removing nitrate 83-92% (Karmin,1990).
5.1.3 Permeation constant
Permeation constant (K) of the RO membrane was calculated from the
details given in the membrane manufacturer's specification (published
K = 6.8 X 10⁻⁵)(Table 9). Permeation constant (K) for each experiment
(experimental K) and for every singal applied pressure was calculated
as well. The average of K for each experiment was 6.5 X 10 -5 ± (0.4).
5.2 Ion Exchange Experiment
The results obtained from both column experiment and batch test will
be discussed in this section.
5.2.1 Batch tests
Nitrate removal capacity of one liter of the resin with one minute
contact time was nearly 3.1 gram of nitrate (Table 24) and this
amount was increased to 3.45 gram of nitrate (Table 24) by
57
increasing the contact time for 2 minutes and 4.0 grams for four
minutes when nitrate concentration was 100 mg/L NO3--N. Based on
the manufacturer's specification one liter of resin can remove 12.6
gram of nitrate. However, feed water volume in the batch test was 50
milliliter and this volume contains just 5 gram of nitrate when the
concentration is 100 mg/L NO3- -N. Four grams of nitrate removed
when 4 minutes contact time was applied and 100 mg/L NO3- -N of
feed water was used and this amount of nitrate represent 80 % of 5
gram of nitrate (the maximum amount of nitrate can be removed
when using 50 milliliter of 100 NO3--N). For this reason high nitrate
concentrations were used in the batch test and the resin specification
of nitrate removal capacity (12.6 gram of nitrate) was nearly achieved
(10.25 gram of nitrate was removed) when the batch test was
conducted using high nitrate concentration (350 mg/L NO3- -N) with
two minutes contact time. The amount of nitrate removed was 10.25
gram of nitrate, nearly 81% of nitrate removal capacity according to
manufacturer's specification. From batch test results, it can be
noticed that the nitrate removal capacity is increased by increasing
nitrate concentration in feed water and contact time.
5.2.2 Column experiment
The calculated flow rate was based on manrufacturer's
recommendation (5 – 60 m/h velocity) 250 ml/min when 7.65 m/h
velocity was used. Contact time (one minute) was calculated when
flow rate and pore space volume of the resin were known, the
calculation was mentioned in material and methods chapter. The
58
column experiments were conducted using one minute contact time
(7.6 h/m velocity) except experiment three that was conducted using
two minutes contact time to investigate the effect of contact time for
nitrate removal.
5.2.3 Comparision between batch test and column experimet
(breakthrough point)
Figures 11, 12, 13 and 14 shows the breakthrough points of all IX
experiments. In experiment one nitrate solution 120 mg/L NO3- -N
was used as a feed water and the breakthrough point was reached
after treating 47.5 liter (190 min Figure 11) of nitrate solution and,
5.6 gram of nitrate was removed. The amount of nitrate removed (5.6
gram of nitrate /L) by column experiment was larger than the amount
removed in batch test (3.1 gram of nitrate /L) when the same contact
time (one minute) was used. This difference in nitrate removal
capacity between the column experiment and batch test may result
because the nitrate concentration in feed water in column experiment
(120 mg/L NO3- -N) was higher than the nitrate concentration in
batch test (100 mg/L NO3- -N). The nitrate removal capacity in batch
test increased by increasing the nitrate concentration in feed water.
This increase percentage of nitrate removal in batch test one were
calculated and ranged from 64% to 84% when 20 mg/L NO3- -N was
added ( 20, 40 ,60, 80, and 100 mg/L NO3—N). The average was 74%,
so these calculation was used to assume that 4.2 gram of nitrate can
be removed if 120 mg/L NO3—N was used in batch test compared with
5.6 gram of nitrate in column experiment. In the second experiment
59
nitrate solution was used as well with the same nitrate concentration
to investigate the result accuracy the nitrate removal was
approximately the same and this goal was achieved ( 5.4 gram of
nitrate was removed) when 47 liter of nitrate solution were treated
(188 min in Figure 11). In the third experiment Nitrate solution ( 120
mg/L NO3- -N) with other anions that is found in EJH wellfield (
sulphate, chloride and bicarbonate) was used as a feed water. The
results were completely different and the amount of nitrate removed
was 2.37 gram on nitrate per liter of resin compared with 5.6 gram of
nitrate removed in the first experiment and this change showed the
effect of the presence of the other salts on nitrate removal even
though the resin was a nitrate selective resin. The result of third
experiment was compatable with a study done by Samatya that
shown the exchange between nitrate ions and ion exchange resin are
impeded in the presence of chloride and sulphate. The nitrate
breakthrough point shifted more which shows a remarkable influence
of both chloride and sulphate on nitrate removal by a nitrate selective
resin (Samatya, 2006).
The fourth and fifth experiments were carried out using a synthetic
water similar to water quality in EJH wellfield (the same parameters
as the average of EJH parameters in appendix C) with contact time of
one and two minutes in sequence. In experiments 4 and 5, the
amount of nitrate removed when the breakthrough point were reached
was 3.57 and 3.53 gram respectively (Table 21) after treating with
157.5 and 153.7L (Figures 13 and 14). The only difference was
60
experiment 5 took (1230 min) to reach the breakthrough point and
this period was nearly as two times as in experiment 4 (630 min). In
the fourth experiment the amount of nitrate removed was 3.57 gram
of nitrate approximately close to the capacity of nitrate removal in
batch test when one minute contact time was applied. Fifth
experiment gave a better result 3.53 gram of nitrate removed was
nearly match 3.4 gram of nitrate removed in batch test when two
minutes contact time was conducted. In ion exchange techniques the
resin capacity for removing salts reduced when many regeneration
processes were applied many times.
5.3 Discussion of both techniques
5.3.1 Nitrate removal capacity
The results obtained from both techniques were acceptable in terms of
nitrate removal to under WHO limits 10 mg/L NO3- -N. When the
same feed water was applied for both methods (20 mg/L NO3-N), ion
exchange technique gave a better result of producing water (0 mg/L
NO3 as N) compared with RO technique (4.4 mg/L NO3 as N).
5.3.2 Treated water quality
Although the nitrate removal capacity were satisfied for both
techniques, the quality of product water is another factor which can
affect both of them. For example chloride concentration in product
water in ion exchange experiment was higher than WHO Guidelines
for drinking water (250 mg/L Cl-). Even though, there is no health-
based limits for chloride concentration in drinking water. However,
61
chloride concentraion more than 250 mg/L Cl- can give raise to
detectable taste in water (WHO, 2003). Chloride concentration was
increased because the working mechanism of the nitrate selective
resin is to substitute chloride by nitrate, so the chloride flows out in
produced water. The nitrate removal process reduced sulphate and
bicarbonate which are replaced with chloride and led to add more
cholride in product water. (Christopher et al., 1995). This problem can
be solved by using NaOH or NaHCO3 to regenerate the resin, so OH-
or HCO3- replaces nitrate during the regeneration process and when
ion exchanger used the exchange will be between nitrate and
hydroxide (or bicarbonate). Consequently, this will lead to an increase
in the pH of produced water (alkalinity) and introduce the problems of
high alkalinity in product water. This also increases the cost of
treatment because sodium hydroxide is more expensive compared
with sodium chloride. The chloride problem for RO technique is
already solved because in this technique the pressure play an
important role to force water to pass through the membrane without
its contaminated salts, whether these salts are anion or cation,
monovalent or divalent. This capacity for removing anions and cations
will increase the chances to choose RO instead of IX if the raw water
contains a high concentration of anions and cations. Anion exchanger
do not reduce cations to acceptable levels unless using a combination
of anion vessel and cation vessel which lead to increase the cost of
treatment.
62
5.3.3 Power consumption
Ion exchange does not use as much power as RO and this affects the
cost of treatment comparing with RO which requires a pressure to
force water to pass through the membrane. Applying more pressure
leads to more power consumption and more cost. The cost of
treatment may be increased by using renewable energy to operate the
RO unit.
5.3.4 Brine disposal
Both techniques face the same problem with (brine). RO discharged a
high rejected concentration and IX discharge brine during
regeneration process. Ion exchange's brine has higher TDS than RO
wastes (Christopher et al., 1995). The idea of using brine from RO for
irrigation agriculture may introduce other problems because it has a
high nitrate concentration which may lead to damage of the lands
(high salinity) when a high salt water is used. The more suitable
solution nowadays could be an evaporation pond or a combination of
two techniques such as RO and denitrification.
5.3.5 Cost of treatment
The economic issue was not investigated for both techniques in this
study. It is still considered as an important factor and many previous
studies have already compared RO and IX in terms of the cost of
production. These studies proved IX is more economical than RO. A
study by Christopher, Kartinen and condon in 1995 shown RO is 12%
higher cost than IX. However, blending the produced water by RO that
63
has low TDS with raw water to produce water with nitrate
concentration within limits of drinking water can be used to increase
the recovery ratio and reduce the consumed energy and eventually
lead to decrease the cost of production.
5.3.6 Sustainable Environment
Using clean energy (solar power) to operate RO units is considered as
a promising technology and this combination can be used in EJH
wellfiled because in that area of Libya it is sunny nearly during the
whole year. Furthermore, low salt water that is available in GMRA in
Libya in EJH well-field (1030 ppm). The nitrate problem can be
considered as an advantage for RO because low dissolved solids
require less pressure and of course less energy, so decrease the cost
of water production. On the other hand, nitrate will be replaced by
chloride in product water in IX technique and introduce another
problem.
5.3.7 Conclusion
It can be concluded from the previous discussion that RO is the more
suitable than IX as a process to remove nitrate from drinking water in
GMRA in EJH wellfield within the limits of WHO for drinking water.
64
6 Conclusion and recommendations
6.1 Conclusion
In brief, removing nitrate from drinking water in EJH well-field in
Libya to below the standards of WHO is an important issue to avoid
deleterious health effects particularly with respect to bottle fed infants
under the age of 3 months. The results from both techniques were
good in term of nitrate removal because both processes reduced
nitrate to below WHO limits. In RO experiments, nitrate was reduced
to under the WHO standards (10 mg/L NO3- -N) even while applying
low pressure rate 50 psi to treat 35.2 mg/L NO3- as N ( over the
average of nitrate concentration in EJH wellfield). This fact shows the
efficiency of the RO unit in removing nitrate from drinking water. Ion
exchange technique achieved the same objective by reducing nitrate
to below WHO standards of nitrate in drinking water. In fact the
nitrate removal capacity was 100% of nitrate removal when synthetic
water similar to EJH wellfeild water was treated. RO experiment has
advantage in this case because water in EJH wellfield has a high
chloride concentration and this can be removed at the same time of
removing nitrate because RO unit can remove both the anions and
cations found in drinking water. This problem clearly appears in IX
technique because nitrate replaces chloride in the resin and releases
chloride into the produced water. This results in increased chloride
concentrations which are already in high concentration. The chloride
65
problem can be solved by regenerating the resin using sodium
hydroxide, sodium bromide or sodium bicabonate. However this
alternative introduces another problem by increasing pH level in
drinking water if sodium hydroxide or sodium bicarbonate was used
or increasing the bromine concentration. Both will increase the cost of
treatment because both compounds are more expensive than sodium
chloride.
6.2 Recommendations
1- A real pilot process plant has to be constructed to treat water from
EJH wellfield for trail to investigate both reverse osmosis and ion
exchange techniques under the real environmental conditions.
2- Apply the ―SHTEFIE‖ criteria (Social, Health, Technological,
Economic, Financial, Institutional and Environmental) which was
developed by Franceys and Ince from Loughborough University (Parr
& Shaw, 1999) to assess the appropriate water supply technologies to
remove nitrate from drinking water with the surrounding
circumstances of EJH wellfield.
3-Combine more than one nitrate removal technique to overcome the
disadvantage of each process.
66
References Abufayed, A., M. K. A.Elghuei, M. Rashed. 2002. Desalination: a viable
supplemental source of water for arid states of North Africa. Desalination 152: 75-81
Abdelgader, A. 2009. Water Quality Management in Great Man-Made River
Authority. MSc diss., Loughborough University. Abdelrhem, Esam, Khalim Rashid, Amiruddin Ismail. 2008. Integrated
Groundwater Management for Great Man-Made River Project in Libya. European Journal of Scientific Research 22 (4): 562-569.
Afonso, M.D., J. O. Jaber, and M. S. Mohsen. 2003. Brackish ground water treatment by reverse osmosis in Jordan. Desalination 164: 157-1.
Amjad, Z. 1993. Reverse Osmosis: Membrane Technology, Water chemistry,
and Idustrial Applications. New York, Chapman & Hall.
Bae Byung-Uk, Yoo-Hoon Jung, Woon-Woo Han, Hang-Sik Shin. 2001. Improved brine recycling during nitrate removal using ion exchange. Water Research 36: 3330-3340.
Binnie, C. and M. Kimber. 2009. Basic Water Treatment. Fourth Edition. London UK: Thomas Telford Limited.
Bremere, I., M. Kennedy, A. Stikker and J. Schippers. 2001. How Water
Scarcity Will Effect the Growth in the Desalination Market in the Coming 25 Years. Desalination 138: 7-15.
Bouguecha, S., B. Hamrouni, and M. Dhahbi. 2005. Small scale
desalination pilots powered by renewable energy sources: case study. Desalination 183, 151-165.
Cantor, K. P. 1997. Drinking water and cancer. Cancer Causes and Control 8: 292-308. Christopher J. Martin , O. Ernest, Jr. Kartinen and Gordon, J. 1995. Examination of processes for multipli contaminant removal from groundwater. Desalination 102: 35-45. Clifford, D., and X. Liu. 1993. Biological Denitrification of Spent Regenerant
Brine Using a Sequencing Batch Reactor. Water Resources . 27(9): 1477-1484
Clifford, DA., and X. Liu. 1993. Ion Exchange for Nitrate Removal. AWWA 85
(4):135-43.
67
Croll B. T. 1993. The Proceeding of the Ion Exchange Processes conference, April 4-7, 1993: The Removal of Nitrate from Water Using Ion Exchange edited by A. Dyer, M. J. Hudson and Williams P. A. North East Wales Institute, Wrexham UK The Royal Society of Chemistry.
Dahab, M. F. 1991. Nitrate treatment methods: An Overview. In Nitrate
contamination: Exposure, Consequences, and Control Bogardi, I., R. Kuzelka and W. Ennenga. Springer-Verlag New York. 349-368.
Dallas, S. 2007. Solco Technology Assessment comparison project (part1). Remote area potable water supply technology market research.Perth, Murdoch University. Department Of Health, Government of Western Australia. 2008. Nitrate in
drinking water (online) http://www.health.wa.gov.au/envirohealth/ water/ docs/nitrate_in_drinkingwater.pdf (March, 2008).
Dow Chemical company. 2003. Basic of RO and NF: Principle of Reverse Osmosis and Nano filtration (Online). Available:http://www.dow.com (November 15, 2008). Dowex NSR-1, Nitrate selective resin.2009. Dow company
http://www.dow.com/PublishedLiterature/dh_0200/0901b80380200a94.pdf?filepath=liquidseps/pdfs/noreg/177-02035.pdf&fromPage=GetDoc (September, 2009)
ECETOC. 1988. Nitrate and drinking water, ECETOC Technical Report 27,
European
Chemical Industry Ecology and Toxicology Centre, Brussels.
Filmtec membranes, XLE-21 specification. (2008) DOW Company. http://www.dowwaterandprocess.com/products/membranes/xle_4021.htm (October, 2008)
Garcia-Rodriguez, L. 2003. Renewable energy application in desalination: state
of art. Solar energy: 75, 381-393.
Gary, N. F. 2008. Drinking Water Quality Problems and Solutions.
Cambridge: Cambridge University Press. GMRA.1995. Operation and Maintenance Manual. Great Man-Made River
Project.
Guter GA.1997. Ion Exchange Technologt: Nitrtae Removal from Contaminated Ground Water by Anion Exchange. Lancaster: Technomic Publishing Co. Inc.
Harland, C. E. 1994. Ion Exchange Theory and Practice. Cambridge UK: The Royal Society of Chemistry.
Harrison, D. (2001). Solar Powered Reverse Osmosis Desalination Technology
for Remote Communities. PhD diss., Perth, Murdoch University.
68
Helal, A. M., S.A. Al-Malek, E.S. Al-Kateeri. 2008. Economic feasibility of
alternative designs of a PV-RO desalination unit for remote areas in the United Arab Emirates. Desalination: 221 (1-3), 1-16.
Herold, D., and A. Neskakis. 2006. Desalination and Water Reuse. 15(4): 17-21. Herold, D., V. Horstmann, A. Neskakis, J. Plettner-Marliani, G. Peirnavieja,
and R. Carlo. 1998. Small scale photovoltaic desalination for rural water supply- demonstration plant in Gran Canaria. Renewable
energy: 14(1-4): 293-298.
Hiscock, K.M. J. W. Lloyd, and D. N. Lerner. 1991. Review of Natural and Artificial Denitrification of Groundwater. Water Resources 25(9):1099- 1111.
Hisham, T. 2002. Fundamentals of Salt Water Desalination. Elsevier Science Idris, A., A. F. Ismail, et al. 2002. Optimization of cellulose acetate hollow
fiber reverse osmosis membrane production using Taguchi method. Journal of Membrane Science 205(1-2): 223-237.
John C. Kotz, P. M. T., Gabriela C. Weaver (2006). Chemistry & Chemical
Reactivity. Canda, Thomson Learning, Inc. Karmin, M., B. Christain and N. Hayden. 1990. Reverse Osmosis for Home
Treatment of Drinking Water. Centre for Environmental Toxicology .
Komp, R. J. 2003. Practical photovoltaic: electricity from solar cells. Ann Arbor, Michigan, aatec publications.
Lami, A., P. van der Zaag, and E. von Munch. 2008. Impact of solar energy
cost on water production cost of desalination plant in Eygpt Energy Policy 36(5): 1748-1756.
Lorentz solar pump, PS600 HR/C. 2009. http://www.lorentz.de/offgrid/en/products/ps/600 (May, 2009) Masson, L., B. S. Richards, A. I.Schaefer. 2005. System design and
preformance testing of a hybrid membrane-photovolatic desalination system. Desalination: 179, 51-59.
Mathioulakis, E., V. Belessiotis, E. Delyannis. 2007. Desalination by using
alternative energy: review and state of art. desalination: 203, 346-365. Osmonics. 1997. Pure water Handbook. Second Edition. Minnetonka, USA. Parekh, B. S. 1988. Reverse Osmosis Technology: Application for High-
Purity-Water Production. New York: Marcel Dekker, Inc.
69
Parsons, S. A., and B. Jefferson. 2006. Potable Water Treatment Processes. Oxford UK: Blackwell Publishing Ltd.
Remco Engineering. 2008. Questions about Reverse Osmosis. (Online)
Available: http://www.remco.com/ro_quest.htm (September 16, 2008). Richards, B. S., and A.I. Schaefer. 2002. Design considerations for a solar-
powered desalination system for remote communities in Australia Desalination: 144, 193-199.
Sahli, N. 2004. Water Quality in The Hasouna Wellfields. PhD diss.,
Sydney University. Samatya, S., N. Kabay, U. Yuksel, M. Arda and M. Yuksel. 2006. Removal of
Nitrate from Aqueous Solution by Nitrate Selective Ion Exchange Resins. Reactive & Functional Ploymers 66: 1206-14.
Schmoll, O., G. Howard, J. Chilton, and I. Chorus. Protecting Ground Water
for Health: World Health Organization. London, UK: Alliance House. Schoeman, J. J. and A. Steyn 2003. Nitrate removal with reverse osmosis
in a rural area in South Africa. Desalination 155(1): 15-26. Shrimali, M., and K. P. Singh. 2001. New Methods of Nitrate Removal from
Water. Environmental Pollution 112: 351-59. Sumiyoshi, N. 2007. Water Purification in Developing Countries : Reverse
osmosis technology. MCs diss., Perth, Mordoch University. Tannehill, C.C., M. F. Dahab, W. E. W Woldt, I. Bogardi. 1996. Evaluation of
Nitrate Treatment Methods Under Uncertainty. Environmental Systems
25(4): 421-444.
The state of world Population. 1999. UNFPA, New Your. ISBN 0-89714-563-
1 Tzen, E., K. Perrakis, and P. Baltas. 1998. Design of a stand alone PV-
desalination system for rural areas. Desalination 119, 327-334.
Ward, M. H., T. M. Dekok, and P. Levallois et al. 2005. Workshop report: drinking-water nitrate and health- recent finding and research needs. Environmental Health Persoectives 113 (11): 1607-14.
Weiner, D., D. Fisher, E.J. Moses, B. Katz, and G., Meron. 2001. Operation
experience of a solar- and wind-powered desalination demonstration
plant. Desalination 137: 7-13.
70
Werner, M., and A. I. Schaefer. 2007. Social aspects of a solar-powered desalination unit for remote Australian communities. Desalination
203:375-393.
Wheida E., and R. Verhoeven 2007. An alternative solution of the water shortage problem. Water Resour Manage 21: 961-982.
WHO. 2003. Chlordane in drinking water. Guidelines for Drinking Water Quality. Geneva, World Health Organization.
WHO. 2004 and 1993. Guidelines for Drinking Water Quality. Geneva, World
Health Organization. Wolf, T. 2003. Solar powered 1500 L/day Reverse Osmosis-Unit, to purify
Ground water in remote areas of Western Australia. Murdoch University.
Zhao, Y. 2006. Reverse Osmosis Desalination in a Mini Renewable Energy
Power Supply System. MCs diss., Curtin University of Technology.
71
Appendices List
Appendix A: Reverse Osmosis results.......................................72
Appendix B: Ion exchange results.............................................78
Appendix C: GMRA water parameters.......................................94
Appendix D: RO membrane specification.................................103
Appendix E: Ion exchange resin specification..........................105
Appendix E: PS600 HR/C solar pump specification.................107
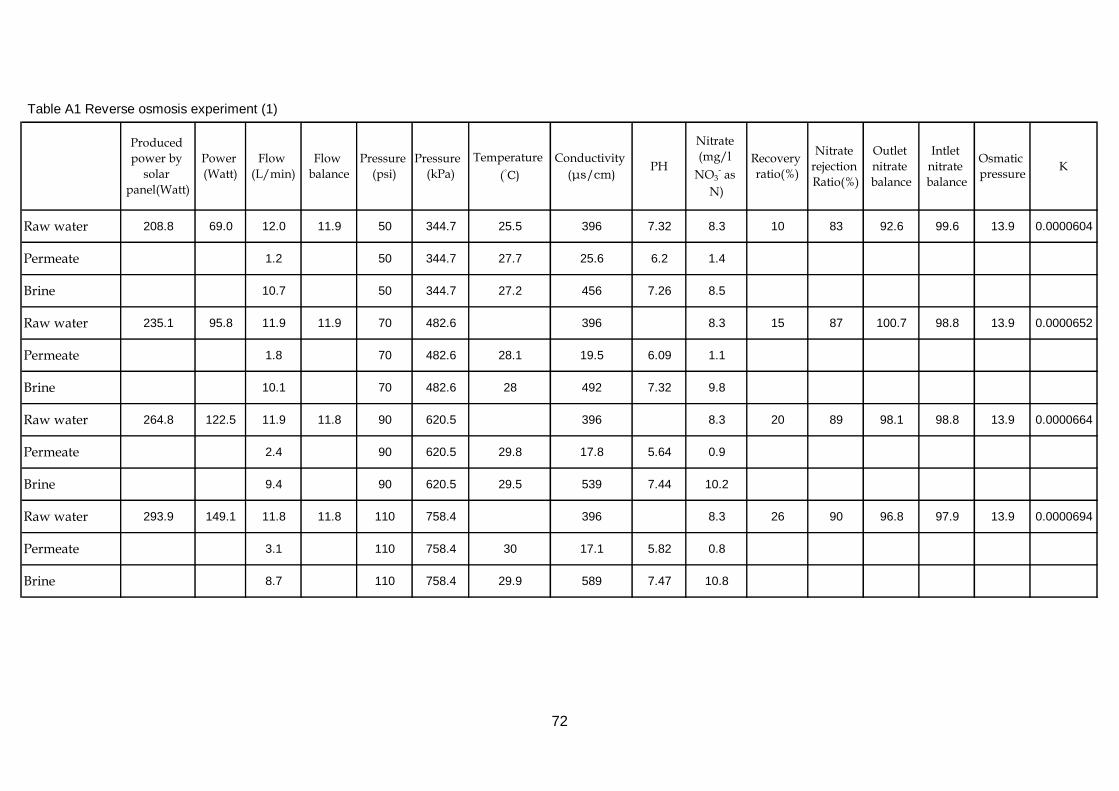
Table A1 Reverse osmosis experiment (1)
Produced
power by
solar
panel(Watt)
Power
(Watt)
Flow
(L/min)
Flow
balance
Pressure
(psi)
Pressure
(kPa)
Temperature
(◦C)
Conductivity
(μs/cm)PH
Nitrate
(mg/l
NO3- as
N)
Recovery
ratio(%)
Nitrate
rejection
Ratio(%)
Outlet
nitrate
balance
Intlet
nitrate
balance
Osmatic
pressureK
Raw water 208.8 69.0 12.0 11.9 50 344.7 25.5 396 7.32 8.3 10 83 92.6 99.6 13.9 0.0000604
Permeate 1.2 50 344.7 27.7 25.6 6.2 1.4
Brine 10.7 50 344.7 27.2 456 7.26 8.5
Raw water 235.1 95.8 11.9 11.9 70 482.6 396 8.3 15 87 100.7 98.8 13.9 0.0000652
Permeate 1.8 70 482.6 28.1 19.5 6.09 1.1
Brine 10.1 70 482.6 28 492 7.32 9.8
Raw water 264.8 122.5 11.9 11.8 90 620.5 396 8.3 20 89 98.1 98.8 13.9 0.0000664
Permeate 2.4 90 620.5 29.8 17.8 5.64 0.9
Brine 9.4 90 620.5 29.5 539 7.44 10.2
Raw water 293.9 149.1 11.8 11.8 110 758.4 396 8.3 26 90 96.8 97.9 13.9 0.0000694
Permeate 3.1 110 758.4 30 17.1 5.82 0.8
Brine 8.7 110 758.4 29.9 589 7.47 10.8
72
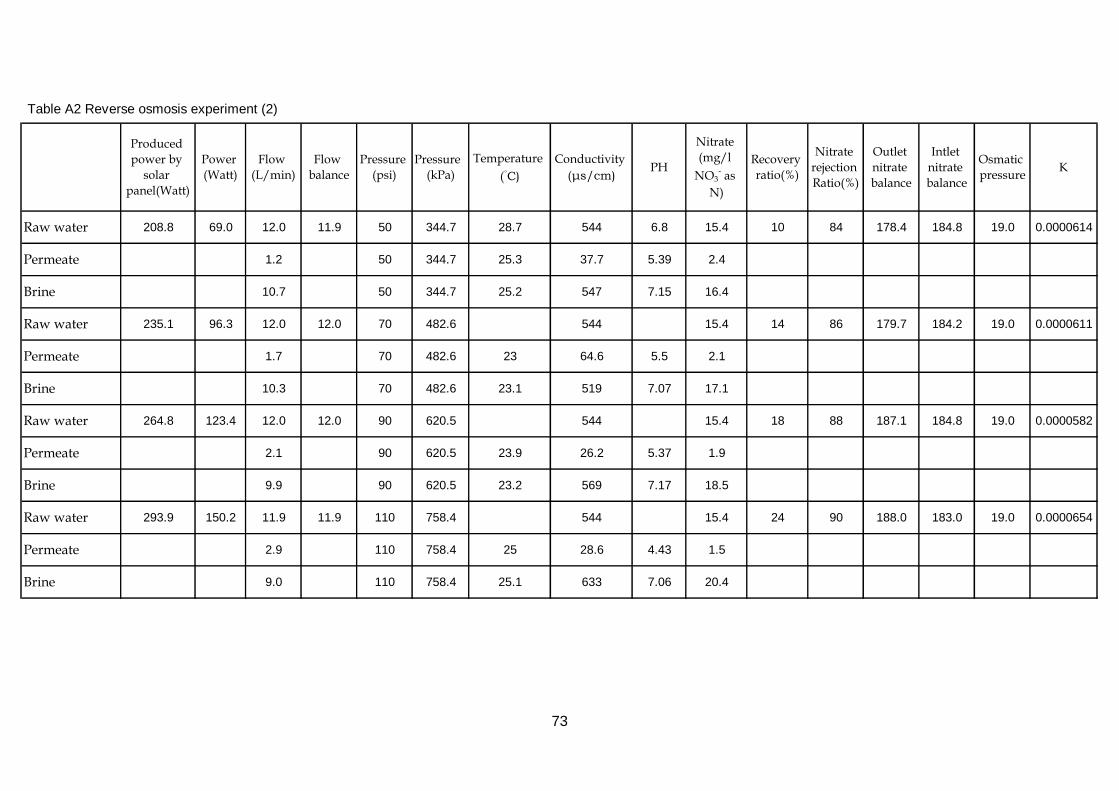
Table A2 Reverse osmosis experiment (2)
Produced
power by
solar
panel(Watt)
Power
(Watt)
Flow
(L/min)
Flow
balance
Pressure
(psi)
Pressure
(kPa)
Temperature
(◦C)
Conductivity
(μs/cm)PH
Nitrate
(mg/l
NO3- as
N)
Recovery
ratio(%)
Nitrate
rejection
Ratio(%)
Outlet
nitrate
balance
Intlet
nitrate
balance
Osmatic
pressureK
Raw water 208.8 69.0 12.0 11.9 50 344.7 28.7 544 6.8 15.4 10 84 178.4 184.8 19.0 0.0000614
Permeate 1.2 50 344.7 25.3 37.7 5.39 2.4
Brine 10.7 50 344.7 25.2 547 7.15 16.4
Raw water 235.1 96.3 12.0 12.0 70 482.6 544 15.4 14 86 179.7 184.2 19.0 0.0000611
Permeate 1.7 70 482.6 23 64.6 5.5 2.1
Brine 10.3 70 482.6 23.1 519 7.07 17.1
Raw water 264.8 123.4 12.0 12.0 90 620.5 544 15.4 18 88 187.1 184.8 19.0 0.0000582
Permeate 2.1 90 620.5 23.9 26.2 5.37 1.9
Brine 9.9 90 620.5 23.2 569 7.17 18.5
Raw water 293.9 150.2 11.9 11.9 110 758.4 544 15.4 24 90 188.0 183.0 19.0 0.0000654
Permeate 2.9 110 758.4 25 28.6 4.43 1.5
Brine 9.0 110 758.4 25.1 633 7.06 20.4
73
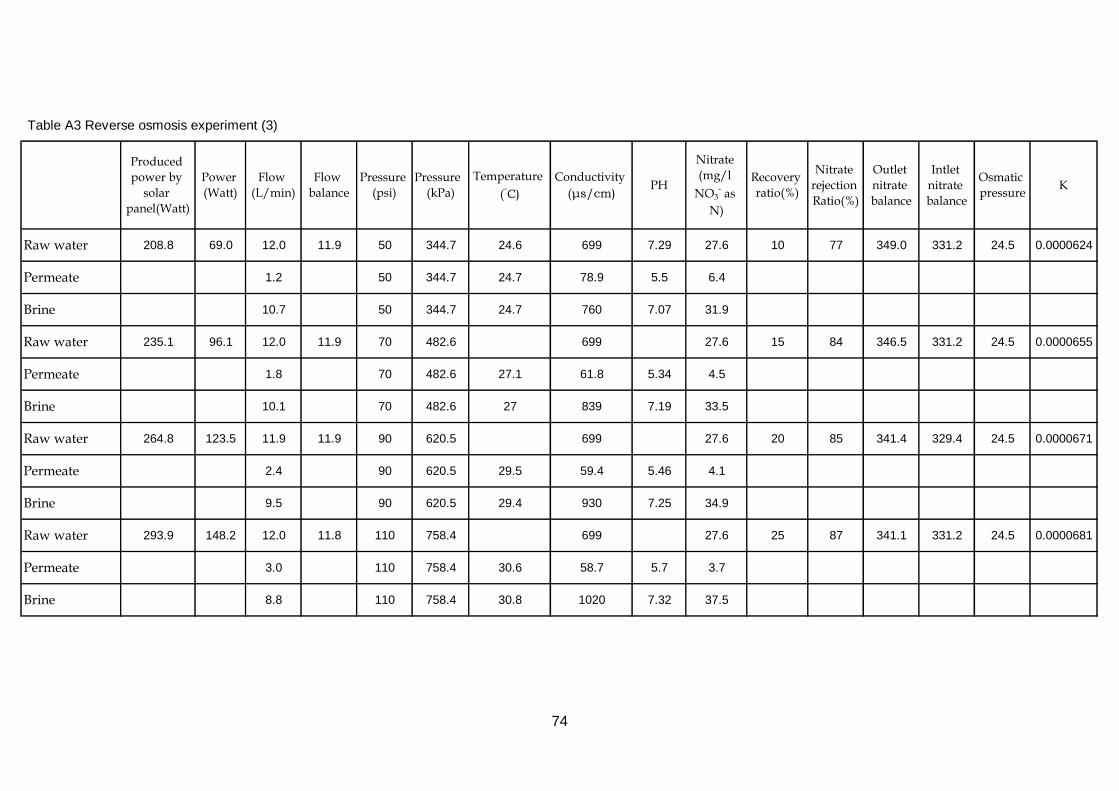
Table A3 Reverse osmosis experiment (3)
Produced
power by
solar
panel(Watt)
Power
(Watt)
Flow
(L/min)
Flow
balance
Pressure
(psi)
Pressure
(kPa)
Temperature
(◦C)
Conductivity
(μs/cm)PH
Nitrate
(mg/l
NO3- as
N)
Recovery
ratio(%)
Nitrate
rejection
Ratio(%)
Outlet
nitrate
balance
Intlet
nitrate
balance
Osmatic
pressureK
Raw water 208.8 69.0 12.0 11.9 50 344.7 24.6 699 7.29 27.6 10 77 349.0 331.2 24.5 0.0000624
Permeate 1.2 50 344.7 24.7 78.9 5.5 6.4
Brine 10.7 50 344.7 24.7 760 7.07 31.9
Raw water 235.1 96.1 12.0 11.9 70 482.6 699 27.6 15 84 346.5 331.2 24.5 0.0000655
Permeate 1.8 70 482.6 27.1 61.8 5.34 4.5
Brine 10.1 70 482.6 27 839 7.19 33.5
Raw water 264.8 123.5 11.9 11.9 90 620.5 699 27.6 20 85 341.4 329.4 24.5 0.0000671
Permeate 2.4 90 620.5 29.5 59.4 5.46 4.1
Brine 9.5 90 620.5 29.4 930 7.25 34.9
Raw water 293.9 148.2 12.0 11.8 110 758.4 699 27.6 25 87 341.1 331.2 24.5 0.0000681
Permeate 3.0 110 758.4 30.6 58.7 5.7 3.7
Brine 8.8 110 758.4 30.8 1020 7.32 37.5
74
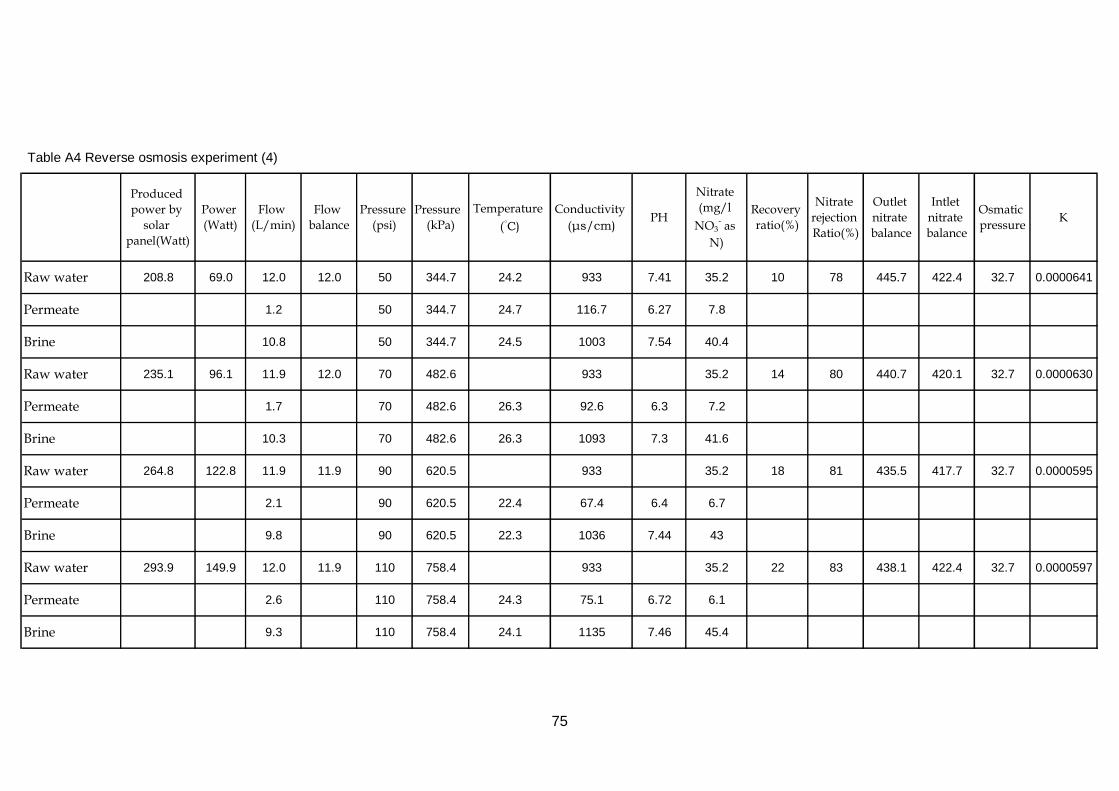
Table A4 Reverse osmosis experiment (4)
Produced
power by
solar
panel(Watt)
Power
(Watt)
Flow
(L/min)
Flow
balance
Pressure
(psi)
Pressure
(kPa)
Temperature
(◦C)
Conductivity
(μs/cm)PH
Nitrate
(mg/l
NO3- as
N)
Recovery
ratio(%)
Nitrate
rejection
Ratio(%)
Outlet
nitrate
balance
Intlet
nitrate
balance
Osmatic
pressureK
Raw water 208.8 69.0 12.0 12.0 50 344.7 24.2 933 7.41 35.2 10 78 445.7 422.4 32.7 0.0000641
Permeate 1.2 50 344.7 24.7 116.7 6.27 7.8
Brine 10.8 50 344.7 24.5 1003 7.54 40.4
Raw water 235.1 96.1 11.9 12.0 70 482.6 933 35.2 14 80 440.7 420.1 32.7 0.0000630
Permeate 1.7 70 482.6 26.3 92.6 6.3 7.2
Brine 10.3 70 482.6 26.3 1093 7.3 41.6
Raw water 264.8 122.8 11.9 11.9 90 620.5 933 35.2 18 81 435.5 417.7 32.7 0.0000595
Permeate 2.1 90 620.5 22.4 67.4 6.4 6.7
Brine 9.8 90 620.5 22.3 1036 7.44 43
Raw water 293.9 149.9 12.0 11.9 110 758.4 933 35.2 22 83 438.1 422.4 32.7 0.0000597
Permeate 2.6 110 758.4 24.3 75.1 6.72 6.1
Brine 9.3 110 758.4 24.1 1135 7.46 45.4
75
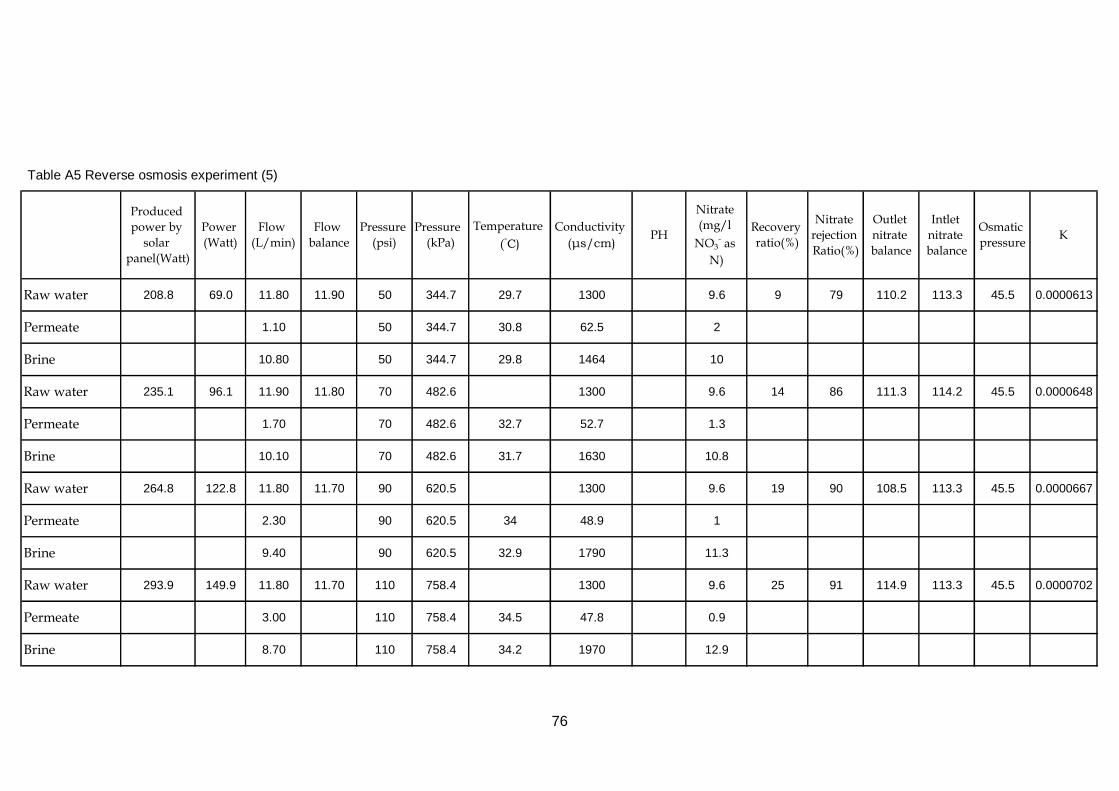
Table A5 Reverse osmosis experiment (5)
Produced
power by
solar
panel(Watt)
Power
(Watt)
Flow
(L/min)
Flow
balance
Pressure
(psi)
Pressure
(kPa)
Temperature
(◦C)
Conductivity
(μs/cm)PH
Nitrate
(mg/l
NO3- as
N)
Recovery
ratio(%)
Nitrate
rejection
Ratio(%)
Outlet
nitrate
balance
Intlet
nitrate
balance
Osmatic
pressureK
Raw water 208.8 69.0 11.80 11.90 50 344.7 29.7 1300 9.6 9 79 110.2 113.3 45.5 0.0000613
Permeate 1.10 50 344.7 30.8 62.5 2
Brine 10.80 50 344.7 29.8 1464 10
Raw water 235.1 96.1 11.90 11.80 70 482.6 1300 9.6 14 86 111.3 114.2 45.5 0.0000648
Permeate 1.70 70 482.6 32.7 52.7 1.3
Brine 10.10 70 482.6 31.7 1630 10.8
Raw water 264.8 122.8 11.80 11.70 90 620.5 1300 9.6 19 90 108.5 113.3 45.5 0.0000667
Permeate 2.30 90 620.5 34 48.9 1
Brine 9.40 90 620.5 32.9 1790 11.3
Raw water 293.9 149.9 11.80 11.70 110 758.4 1300 9.6 25 91 114.9 113.3 45.5 0.0000702
Permeate 3.00 110 758.4 34.5 47.8 0.9
Brine 8.70 110 758.4 34.2 1970 12.9
76
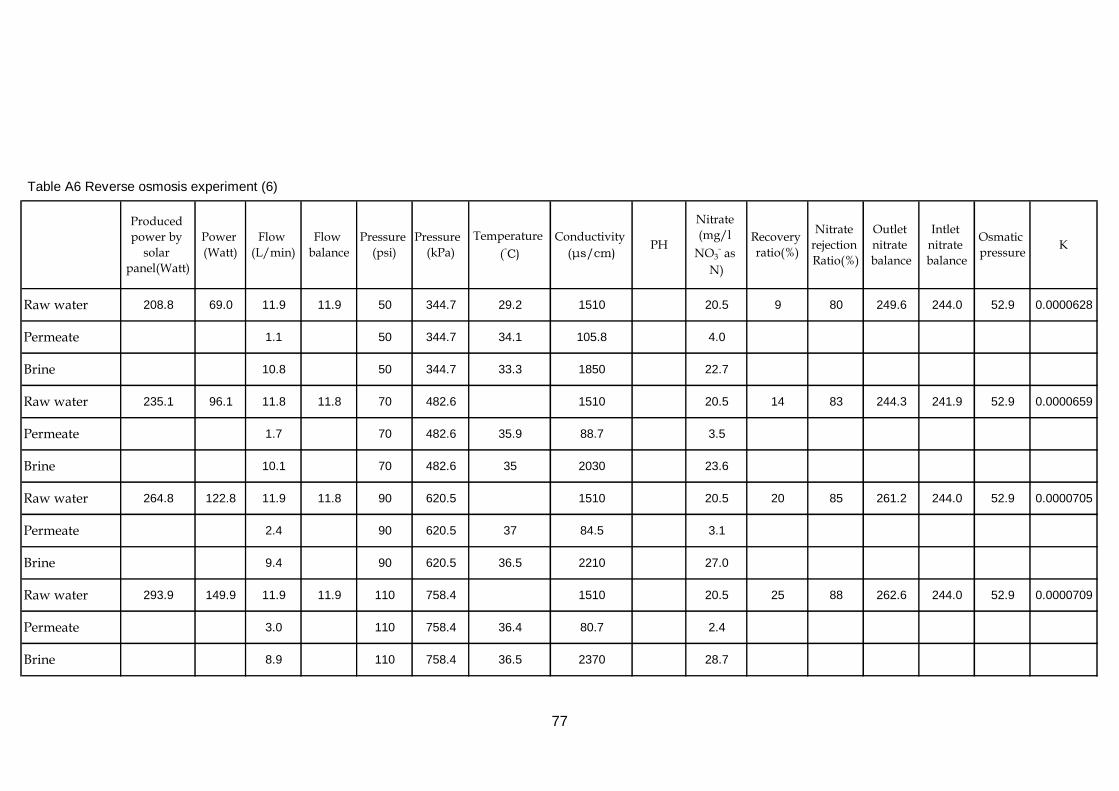
Table A6 Reverse osmosis experiment (6)
Produced
power by
solar
panel(Watt)
Power
(Watt)
Flow
(L/min)
Flow
balance
Pressure
(psi)
Pressure
(kPa)
Temperature
(◦C)
Conductivity
(μs/cm)PH
Nitrate
(mg/l
NO3- as
N)
Recovery
ratio(%)
Nitrate
rejection
Ratio(%)
Outlet
nitrate
balance
Intlet
nitrate
balance
Osmatic
pressureK
Raw water 208.8 69.0 11.9 11.9 50 344.7 29.2 1510 20.5 9 80 249.6 244.0 52.9 0.0000628
Permeate 1.1 50 344.7 34.1 105.8 4.0
Brine 10.8 50 344.7 33.3 1850 22.7
Raw water 235.1 96.1 11.8 11.8 70 482.6 1510 20.5 14 83 244.3 241.9 52.9 0.0000659
Permeate 1.7 70 482.6 35.9 88.7 3.5
Brine 10.1 70 482.6 35 2030 23.6
Raw water 264.8 122.8 11.9 11.8 90 620.5 1510 20.5 20 85 261.2 244.0 52.9 0.0000705
Permeate 2.4 90 620.5 37 84.5 3.1
Brine 9.4 90 620.5 36.5 2210 27.0
Raw water 293.9 149.9 11.9 11.9 110 758.4 1510 20.5 25 88 262.6 244.0 52.9 0.0000709
Permeate 3.0 110 758.4 36.4 80.7 2.4
Brine 8.9 110 758.4 36.5 2370 28.7
77
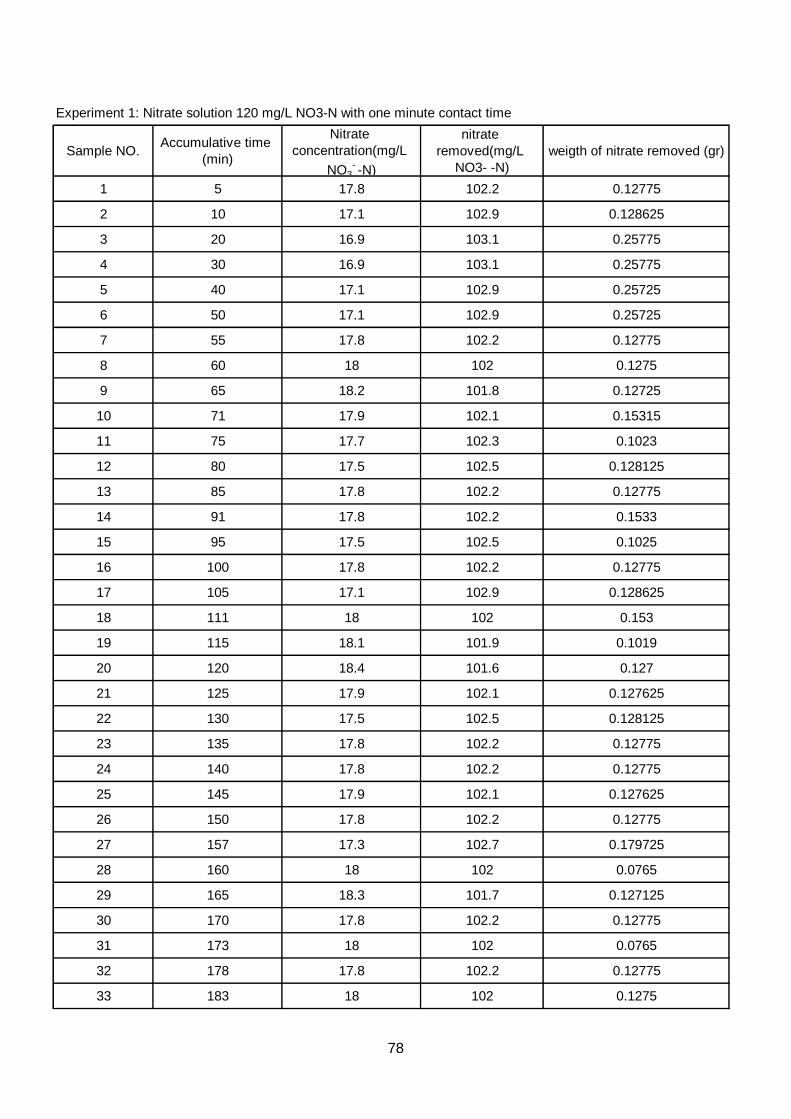
Experiment 1: Nitrate solution 120 mg/L NO3-N with one minute contact time
Sample NO.Accumulative time
(min)
Nitrate
concentration(mg/L
NO3- -N)
nitrate
removed(mg/L
NO3- -N)
weigth of nitrate removed (gr)
1 5 17.8 102.2 0.12775
2 10 17.1 102.9 0.128625
3 20 16.9 103.1 0.25775
4 30 16.9 103.1 0.25775
5 40 17.1 102.9 0.25725
6 50 17.1 102.9 0.25725
7 55 17.8 102.2 0.12775
8 60 18 102 0.1275
9 65 18.2 101.8 0.12725
10 71 17.9 102.1 0.15315
11 75 17.7 102.3 0.1023
12 80 17.5 102.5 0.128125
13 85 17.8 102.2 0.12775
14 91 17.8 102.2 0.1533
15 95 17.5 102.5 0.1025
16 100 17.8 102.2 0.12775
17 105 17.1 102.9 0.128625
18 111 18 102 0.153
19 115 18.1 101.9 0.1019
20 120 18.4 101.6 0.127
21 125 17.9 102.1 0.127625
22 130 17.5 102.5 0.128125
23 135 17.8 102.2 0.12775
24 140 17.8 102.2 0.12775
25 145 17.9 102.1 0.127625
26 150 17.8 102.2 0.12775
27 157 17.3 102.7 0.179725
28 160 18 102 0.0765
29 165 18.3 101.7 0.127125
30 170 17.8 102.2 0.12775
31 173 18 102 0.0765
32 178 17.8 102.2 0.12775
33 183 18 102 0.1275
78
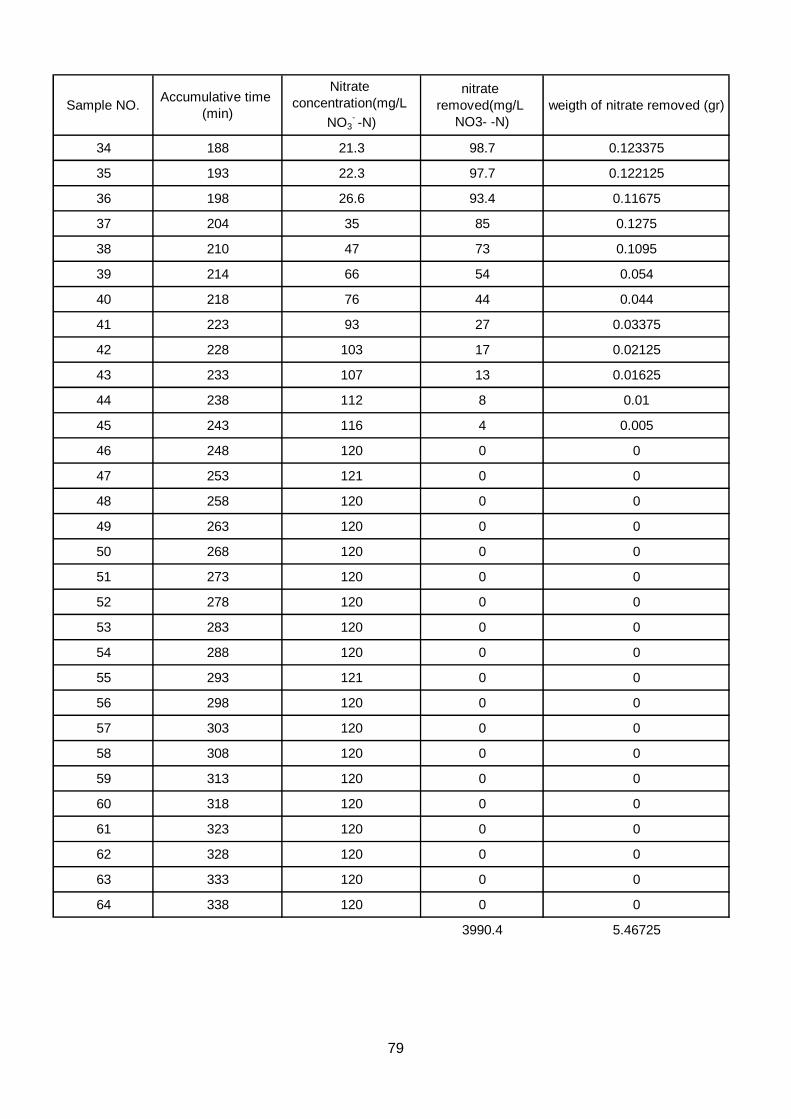
Sample NO.Accumulative time
(min)
Nitrate
concentration(mg/L
NO3- -N)
nitrate
removed(mg/L
NO3- -N)
weigth of nitrate removed (gr)
34 188 21.3 98.7 0.123375
35 193 22.3 97.7 0.122125
36 198 26.6 93.4 0.11675
37 204 35 85 0.1275
38 210 47 73 0.1095
39 214 66 54 0.054
40 218 76 44 0.044
41 223 93 27 0.03375
42 228 103 17 0.02125
43 233 107 13 0.01625
44 238 112 8 0.01
45 243 116 4 0.005
46 248 120 0 0
47 253 121 0 0
48 258 120 0 0
49 263 120 0 0
50 268 120 0 0
51 273 120 0 0
52 278 120 0 0
53 283 120 0 0
54 288 120 0 0
55 293 121 0 0
56 298 120 0 0
57 303 120 0 0
58 308 120 0 0
59 313 120 0 0
60 318 120 0 0
61 323 120 0 0
62 328 120 0 0
63 333 120 0 0
64 338 120 0 0
3990.4 5.46725
79
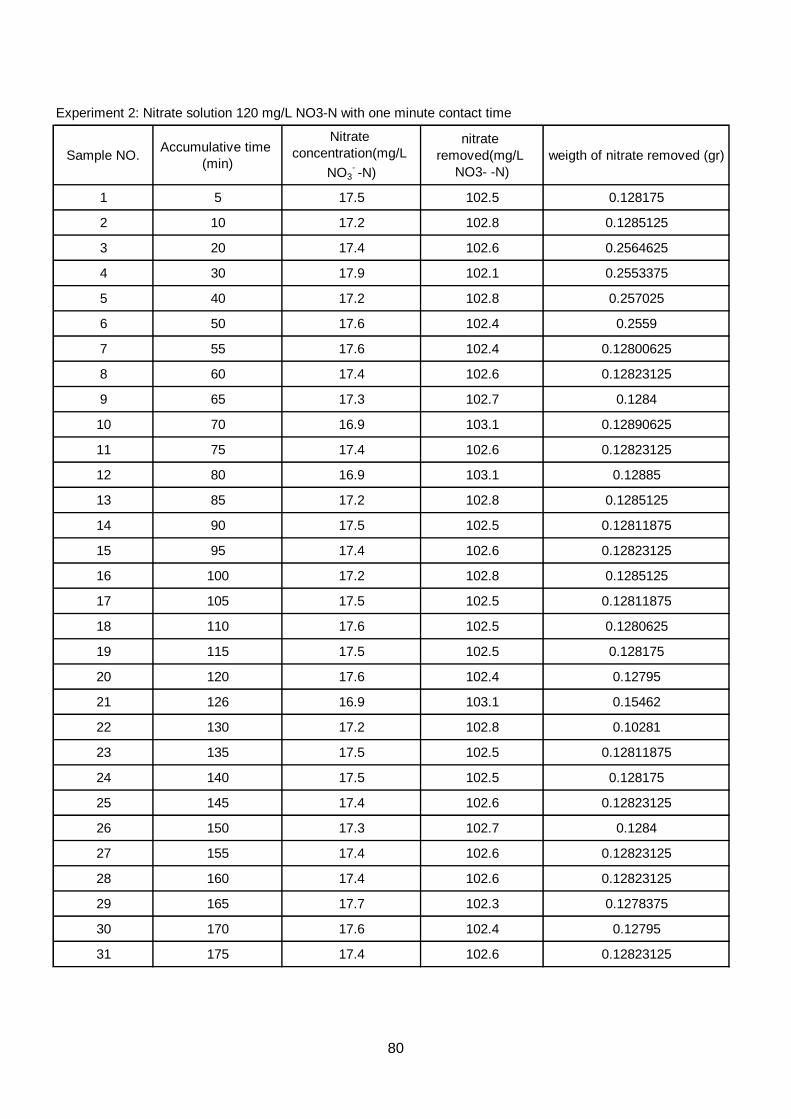
Experiment 2: Nitrate solution 120 mg/L NO3-N with one minute contact time
Sample NO.Accumulative time
(min)
Nitrate
concentration(mg/L
NO3- -N)
nitrate
removed(mg/L
NO3- -N)
weigth of nitrate removed (gr)
1 5 17.5 102.5 0.128175
2 10 17.2 102.8 0.1285125
3 20 17.4 102.6 0.2564625
4 30 17.9 102.1 0.2553375
5 40 17.2 102.8 0.257025
6 50 17.6 102.4 0.2559
7 55 17.6 102.4 0.12800625
8 60 17.4 102.6 0.12823125
9 65 17.3 102.7 0.1284
10 70 16.9 103.1 0.12890625
11 75 17.4 102.6 0.12823125
12 80 16.9 103.1 0.12885
13 85 17.2 102.8 0.1285125
14 90 17.5 102.5 0.12811875
15 95 17.4 102.6 0.12823125
16 100 17.2 102.8 0.1285125
17 105 17.5 102.5 0.12811875
18 110 17.6 102.5 0.1280625
19 115 17.5 102.5 0.128175
20 120 17.6 102.4 0.12795
21 126 16.9 103.1 0.15462
22 130 17.2 102.8 0.10281
23 135 17.5 102.5 0.12811875
24 140 17.5 102.5 0.128175
25 145 17.4 102.6 0.12823125
26 150 17.3 102.7 0.1284
27 155 17.4 102.6 0.12823125
28 160 17.4 102.6 0.12823125
29 165 17.7 102.3 0.1278375
30 170 17.6 102.4 0.12795
31 175 17.4 102.6 0.12823125
80
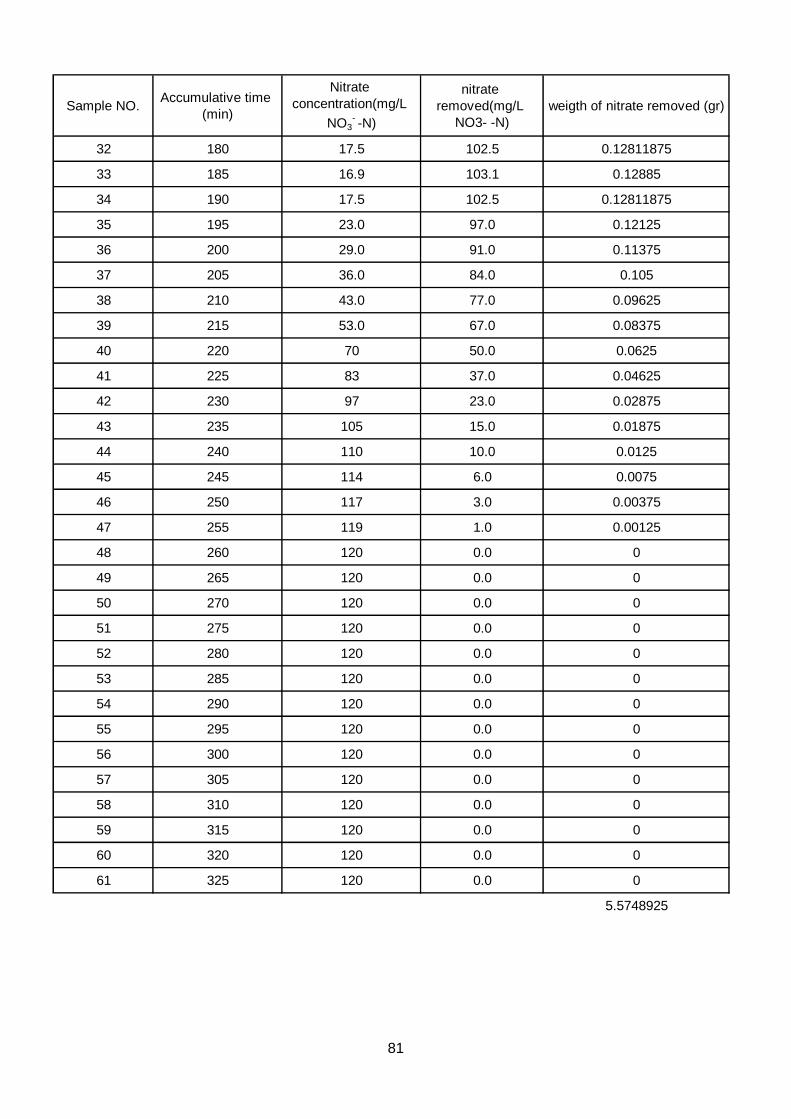
Sample NO.Accumulative time
(min)
Nitrate
concentration(mg/L
NO3- -N)
nitrate
removed(mg/L
NO3- -N)
weigth of nitrate removed (gr)
32 180 17.5 102.5 0.12811875
33 185 16.9 103.1 0.12885
34 190 17.5 102.5 0.12811875
35 195 23.0 97.0 0.12125
36 200 29.0 91.0 0.11375
37 205 36.0 84.0 0.105
38 210 43.0 77.0 0.09625
39 215 53.0 67.0 0.08375
40 220 70 50.0 0.0625
41 225 83 37.0 0.04625
42 230 97 23.0 0.02875
43 235 105 15.0 0.01875
44 240 110 10.0 0.0125
45 245 114 6.0 0.0075
46 250 117 3.0 0.00375
47 255 119 1.0 0.00125
48 260 120 0.0 0
49 265 120 0.0 0
50 270 120 0.0 0
51 275 120 0.0 0
52 280 120 0.0 0
53 285 120 0.0 0
54 290 120 0.0 0
55 295 120 0.0 0
56 300 120 0.0 0
57 305 120 0.0 0
58 310 120 0.0 0
59 315 120 0.0 0
60 320 120 0.0 0
61 325 120 0.0 0
5.5748925
81
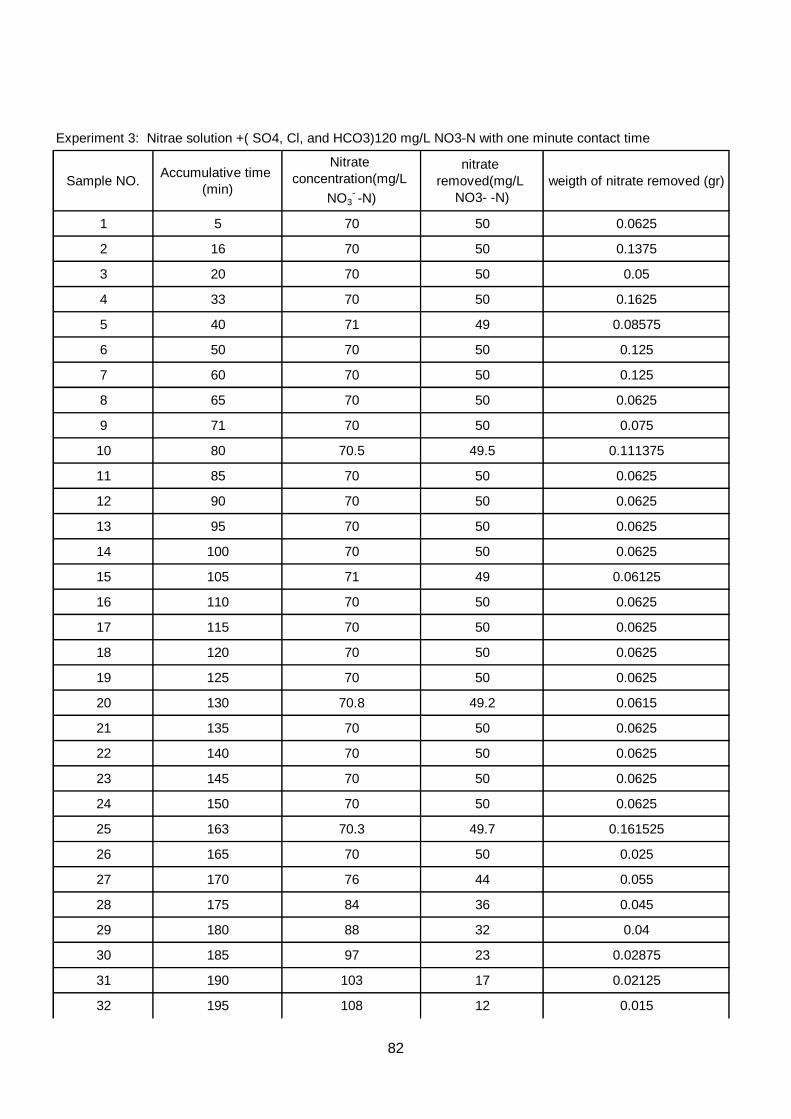
Experiment 3: Nitrae solution +( SO4, Cl, and HCO3)120 mg/L NO3-N with one minute contact time
Sample NO.Accumulative time
(min)
Nitrate
concentration(mg/L
NO3- -N)
nitrate
removed(mg/L
NO3- -N)
weigth of nitrate removed (gr)
1 5 70 50 0.0625
2 16 70 50 0.1375
3 20 70 50 0.05
4 33 70 50 0.1625
5 40 71 49 0.08575
6 50 70 50 0.125
7 60 70 50 0.125
8 65 70 50 0.0625
9 71 70 50 0.075
10 80 70.5 49.5 0.111375
11 85 70 50 0.0625
12 90 70 50 0.0625
13 95 70 50 0.0625
14 100 70 50 0.0625
15 105 71 49 0.06125
16 110 70 50 0.0625
17 115 70 50 0.0625
18 120 70 50 0.0625
19 125 70 50 0.0625
20 130 70.8 49.2 0.0615
21 135 70 50 0.0625
22 140 70 50 0.0625
23 145 70 50 0.0625
24 150 70 50 0.0625
25 163 70.3 49.7 0.161525
26 165 70 50 0.025
27 170 76 44 0.055
28 175 84 36 0.045
29 180 88 32 0.04
30 185 97 23 0.02875
31 190 103 17 0.02125
32 195 108 12 0.015
82
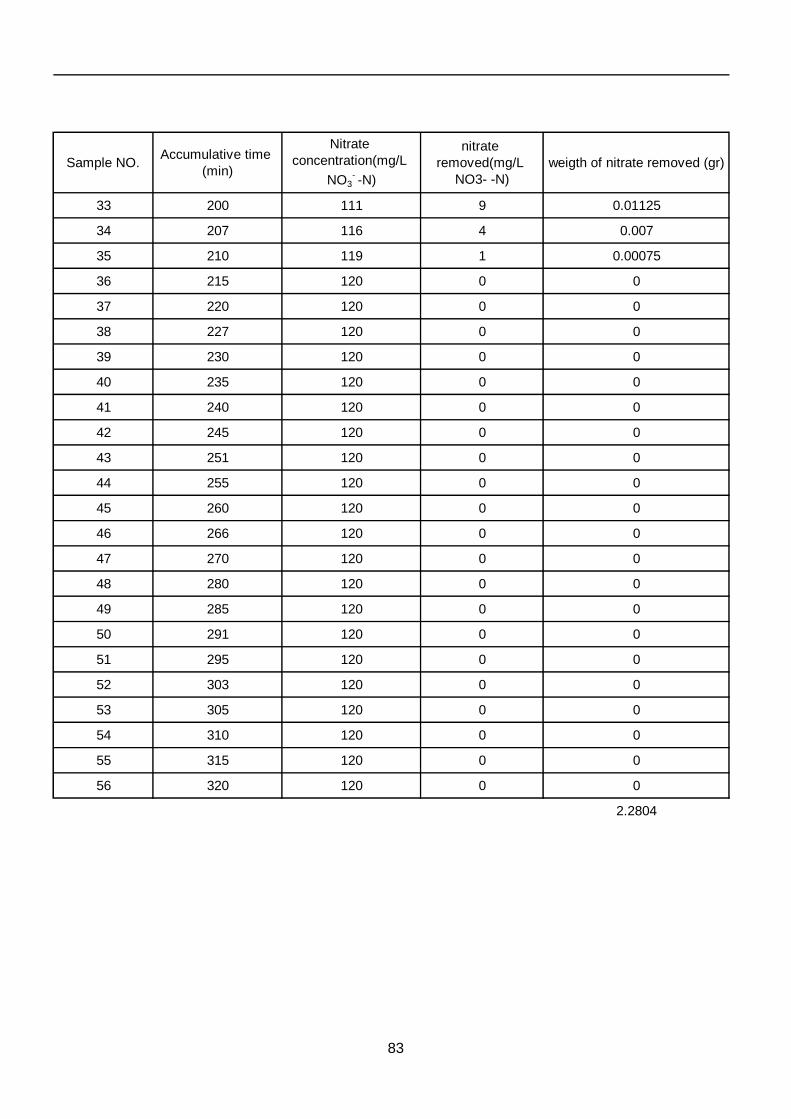
Sample NO.Accumulative time
(min)
Nitrate
concentration(mg/L
NO3- -N)
nitrate
removed(mg/L
NO3- -N)
weigth of nitrate removed (gr)
33 200 111 9 0.01125
34 207 116 4 0.007
35 210 119 1 0.00075
36 215 120 0 0
37 220 120 0 0
38 227 120 0 0
39 230 120 0 0
40 235 120 0 0
41 240 120 0 0
42 245 120 0 0
43 251 120 0 0
44 255 120 0 0
45 260 120 0 0
46 266 120 0 0
47 270 120 0 0
48 280 120 0 0
49 285 120 0 0
50 291 120 0 0
51 295 120 0 0
52 303 120 0 0
53 305 120 0 0
54 310 120 0 0
55 315 120 0 0
56 320 120 0 0
2.2804
83
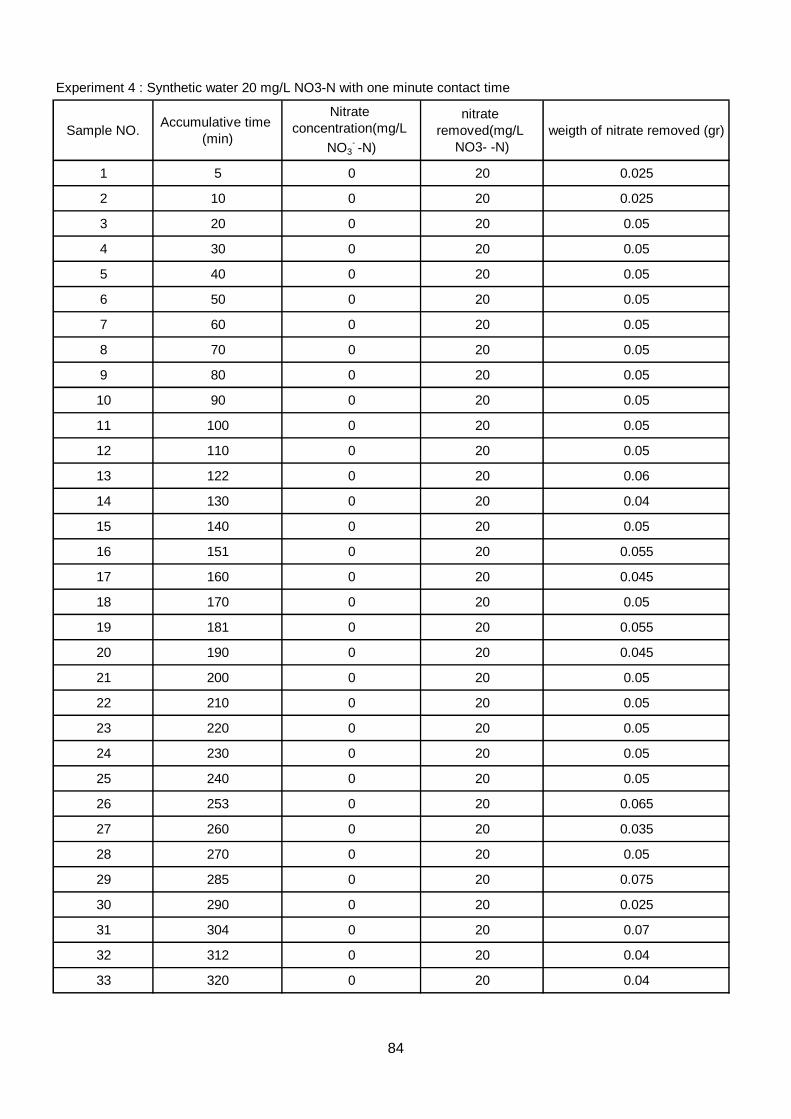
Experiment 4 : Synthetic water 20 mg/L NO3-N with one minute contact time
Sample NO.Accumulative time
(min)
Nitrate
concentration(mg/L
NO3- -N)
nitrate
removed(mg/L
NO3- -N)
weigth of nitrate removed (gr)
1 5 0 20 0.025
2 10 0 20 0.025
3 20 0 20 0.05
4 30 0 20 0.05
5 40 0 20 0.05
6 50 0 20 0.05
7 60 0 20 0.05
8 70 0 20 0.05
9 80 0 20 0.05
10 90 0 20 0.05
11 100 0 20 0.05
12 110 0 20 0.05
13 122 0 20 0.06
14 130 0 20 0.04
15 140 0 20 0.05
16 151 0 20 0.055
17 160 0 20 0.045
18 170 0 20 0.05
19 181 0 20 0.055
20 190 0 20 0.045
21 200 0 20 0.05
22 210 0 20 0.05
23 220 0 20 0.05
24 230 0 20 0.05
25 240 0 20 0.05
26 253 0 20 0.065
27 260 0 20 0.035
28 270 0 20 0.05
29 285 0 20 0.075
30 290 0 20 0.025
31 304 0 20 0.07
32 312 0 20 0.04
33 320 0 20 0.04
84
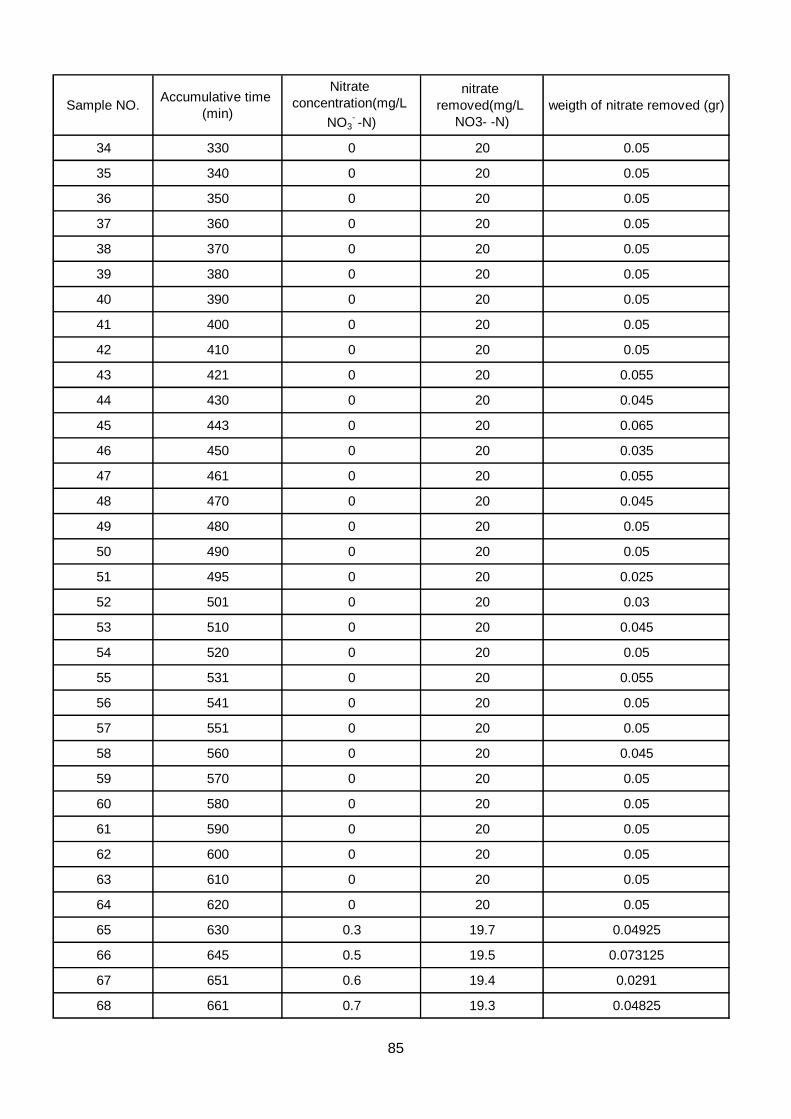
Sample NO.Accumulative time
(min)
Nitrate
concentration(mg/L
NO3- -N)
nitrate
removed(mg/L
NO3- -N)
weigth of nitrate removed (gr)
34 330 0 20 0.05
35 340 0 20 0.05
36 350 0 20 0.05
37 360 0 20 0.05
38 370 0 20 0.05
39 380 0 20 0.05
40 390 0 20 0.05
41 400 0 20 0.05
42 410 0 20 0.05
43 421 0 20 0.055
44 430 0 20 0.045
45 443 0 20 0.065
46 450 0 20 0.035
47 461 0 20 0.055
48 470 0 20 0.045
49 480 0 20 0.05
50 490 0 20 0.05
51 495 0 20 0.025
52 501 0 20 0.03
53 510 0 20 0.045
54 520 0 20 0.05
55 531 0 20 0.055
56 541 0 20 0.05
57 551 0 20 0.05
58 560 0 20 0.045
59 570 0 20 0.05
60 580 0 20 0.05
61 590 0 20 0.05
62 600 0 20 0.05
63 610 0 20 0.05
64 620 0 20 0.05
65 630 0.3 19.7 0.04925
66 645 0.5 19.5 0.073125
67 651 0.6 19.4 0.0291
68 661 0.7 19.3 0.04825
85
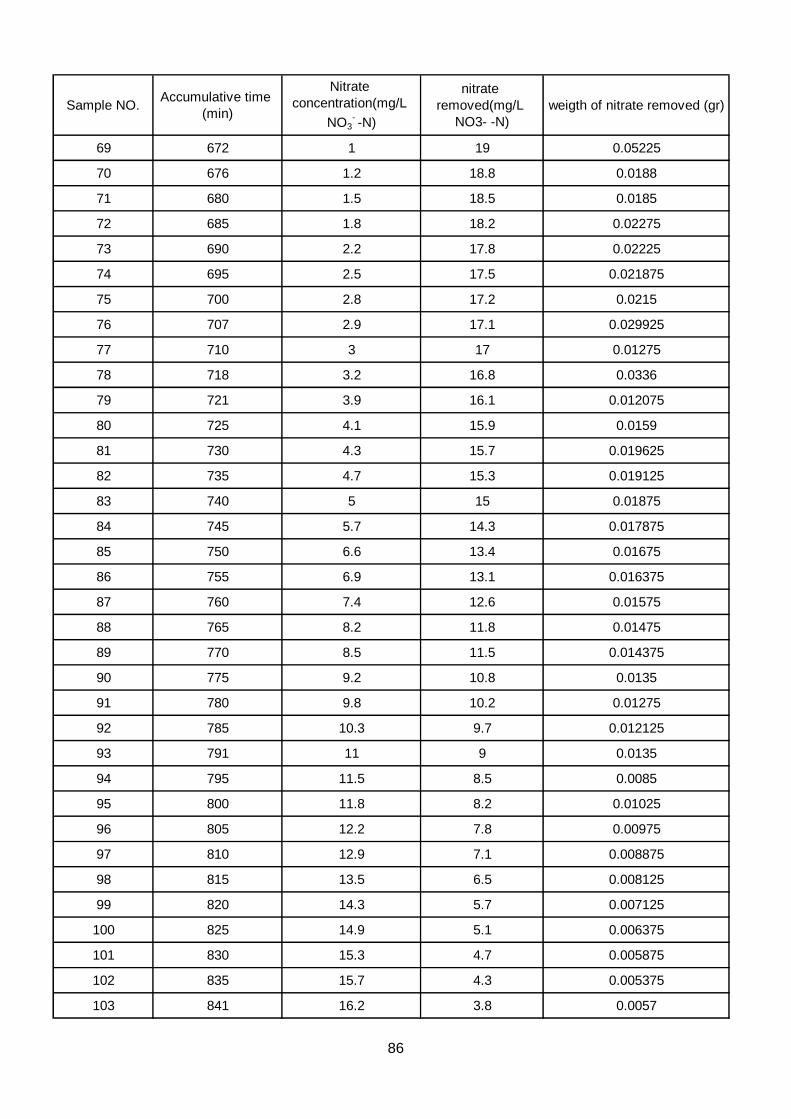
Sample NO.Accumulative time
(min)
Nitrate
concentration(mg/L
NO3- -N)
nitrate
removed(mg/L
NO3- -N)
weigth of nitrate removed (gr)
69 672 1 19 0.05225
70 676 1.2 18.8 0.0188
71 680 1.5 18.5 0.0185
72 685 1.8 18.2 0.02275
73 690 2.2 17.8 0.02225
74 695 2.5 17.5 0.021875
75 700 2.8 17.2 0.0215
76 707 2.9 17.1 0.029925
77 710 3 17 0.01275
78 718 3.2 16.8 0.0336
79 721 3.9 16.1 0.012075
80 725 4.1 15.9 0.0159
81 730 4.3 15.7 0.019625
82 735 4.7 15.3 0.019125
83 740 5 15 0.01875
84 745 5.7 14.3 0.017875
85 750 6.6 13.4 0.01675
86 755 6.9 13.1 0.016375
87 760 7.4 12.6 0.01575
88 765 8.2 11.8 0.01475
89 770 8.5 11.5 0.014375
90 775 9.2 10.8 0.0135
91 780 9.8 10.2 0.01275
92 785 10.3 9.7 0.012125
93 791 11 9 0.0135
94 795 11.5 8.5 0.0085
95 800 11.8 8.2 0.01025
96 805 12.2 7.8 0.00975
97 810 12.9 7.1 0.008875
98 815 13.5 6.5 0.008125
99 820 14.3 5.7 0.007125
100 825 14.9 5.1 0.006375
101 830 15.3 4.7 0.005875
102 835 15.7 4.3 0.005375
103 841 16.2 3.8 0.0057
86
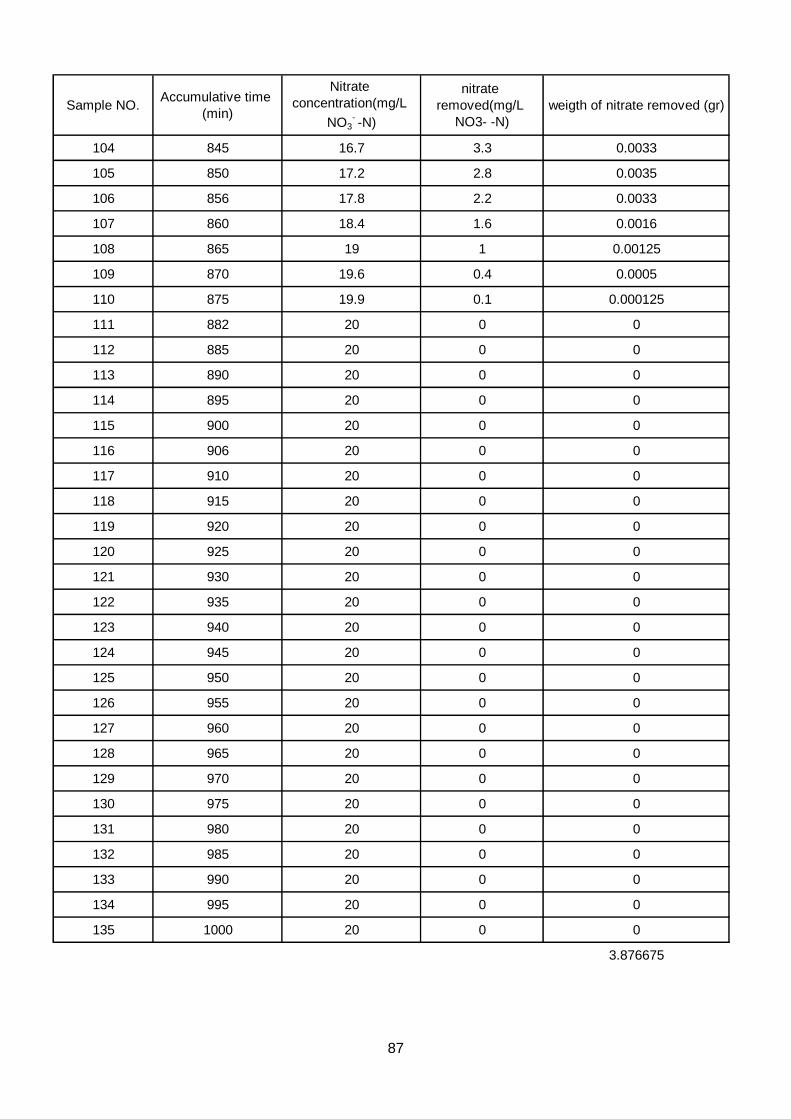
Sample NO.Accumulative time
(min)
Nitrate
concentration(mg/L
NO3- -N)
nitrate
removed(mg/L
NO3- -N)
weigth of nitrate removed (gr)
104 845 16.7 3.3 0.0033
105 850 17.2 2.8 0.0035
106 856 17.8 2.2 0.0033
107 860 18.4 1.6 0.0016
108 865 19 1 0.00125
109 870 19.6 0.4 0.0005
110 875 19.9 0.1 0.000125
111 882 20 0 0
112 885 20 0 0
113 890 20 0 0
114 895 20 0 0
115 900 20 0 0
116 906 20 0 0
117 910 20 0 0
118 915 20 0 0
119 920 20 0 0
120 925 20 0 0
121 930 20 0 0
122 935 20 0 0
123 940 20 0 0
124 945 20 0 0
125 950 20 0 0
126 955 20 0 0
127 960 20 0 0
128 965 20 0 0
129 970 20 0 0
130 975 20 0 0
131 980 20 0 0
132 985 20 0 0
133 990 20 0 0
134 995 20 0 0
135 1000 20 0 0
3.876675
87
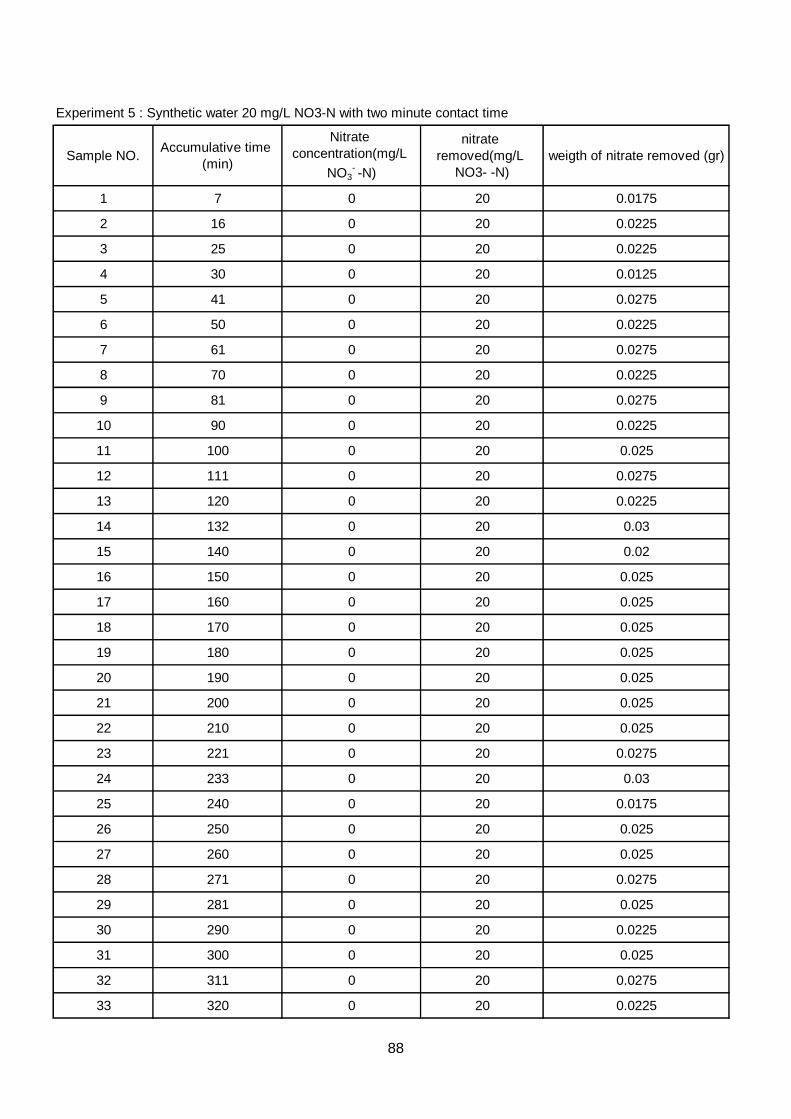
Experiment 5 : Synthetic water 20 mg/L NO3-N with two minute contact time
Sample NO.Accumulative time
(min)
Nitrate
concentration(mg/L
NO3- -N)
nitrate
removed(mg/L
NO3- -N)
weigth of nitrate removed (gr)
1 7 0 20 0.0175
2 16 0 20 0.0225
3 25 0 20 0.0225
4 30 0 20 0.0125
5 41 0 20 0.0275
6 50 0 20 0.0225
7 61 0 20 0.0275
8 70 0 20 0.0225
9 81 0 20 0.0275
10 90 0 20 0.0225
11 100 0 20 0.025
12 111 0 20 0.0275
13 120 0 20 0.0225
14 132 0 20 0.03
15 140 0 20 0.02
16 150 0 20 0.025
17 160 0 20 0.025
18 170 0 20 0.025
19 180 0 20 0.025
20 190 0 20 0.025
21 200 0 20 0.025
22 210 0 20 0.025
23 221 0 20 0.0275
24 233 0 20 0.03
25 240 0 20 0.0175
26 250 0 20 0.025
27 260 0 20 0.025
28 271 0 20 0.0275
29 281 0 20 0.025
30 290 0 20 0.0225
31 300 0 20 0.025
32 311 0 20 0.0275
33 320 0 20 0.0225
88
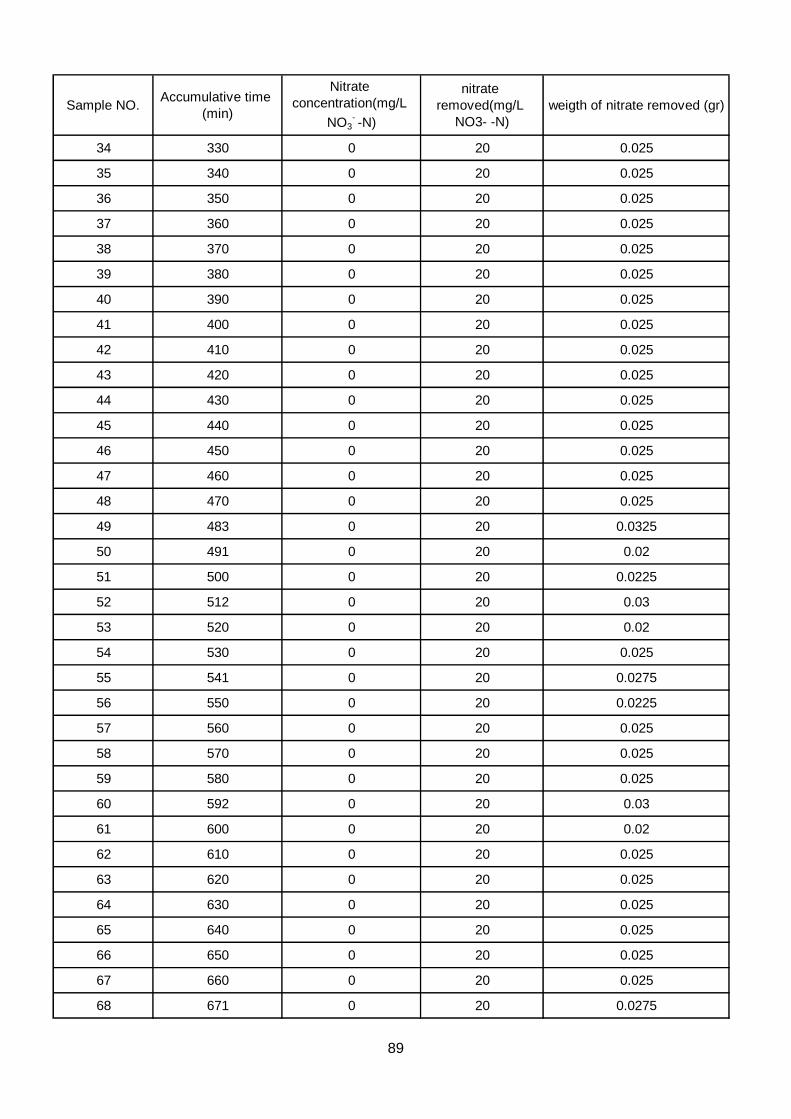
Sample NO.Accumulative time
(min)
Nitrate
concentration(mg/L
NO3- -N)
nitrate
removed(mg/L
NO3- -N)
weigth of nitrate removed (gr)
34 330 0 20 0.025
35 340 0 20 0.025
36 350 0 20 0.025
37 360 0 20 0.025
38 370 0 20 0.025
39 380 0 20 0.025
40 390 0 20 0.025
41 400 0 20 0.025
42 410 0 20 0.025
43 420 0 20 0.025
44 430 0 20 0.025
45 440 0 20 0.025
46 450 0 20 0.025
47 460 0 20 0.025
48 470 0 20 0.025
49 483 0 20 0.0325
50 491 0 20 0.02
51 500 0 20 0.0225
52 512 0 20 0.03
53 520 0 20 0.02
54 530 0 20 0.025
55 541 0 20 0.0275
56 550 0 20 0.0225
57 560 0 20 0.025
58 570 0 20 0.025
59 580 0 20 0.025
60 592 0 20 0.03
61 600 0 20 0.02
62 610 0 20 0.025
63 620 0 20 0.025
64 630 0 20 0.025
65 640 0 20 0.025
66 650 0 20 0.025
67 660 0 20 0.025
68 671 0 20 0.0275
89
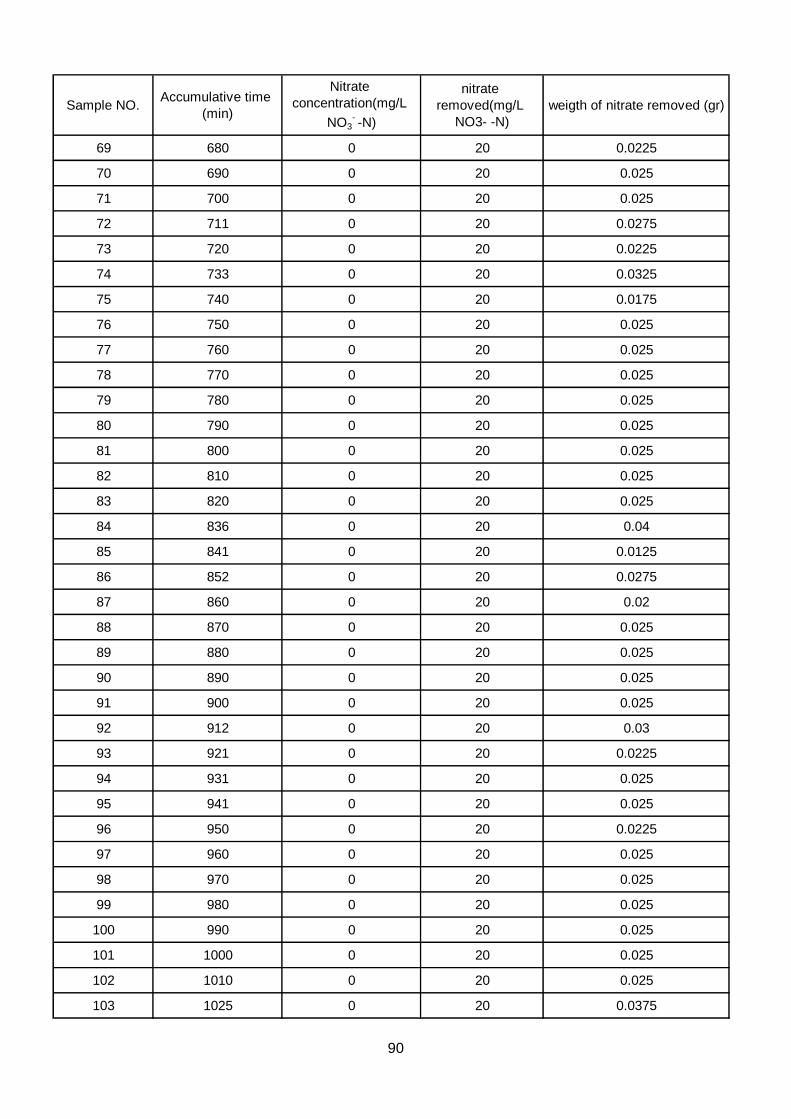
Sample NO.Accumulative time
(min)
Nitrate
concentration(mg/L
NO3- -N)
nitrate
removed(mg/L
NO3- -N)
weigth of nitrate removed (gr)
69 680 0 20 0.0225
70 690 0 20 0.025
71 700 0 20 0.025
72 711 0 20 0.0275
73 720 0 20 0.0225
74 733 0 20 0.0325
75 740 0 20 0.0175
76 750 0 20 0.025
77 760 0 20 0.025
78 770 0 20 0.025
79 780 0 20 0.025
80 790 0 20 0.025
81 800 0 20 0.025
82 810 0 20 0.025
83 820 0 20 0.025
84 836 0 20 0.04
85 841 0 20 0.0125
86 852 0 20 0.0275
87 860 0 20 0.02
88 870 0 20 0.025
89 880 0 20 0.025
90 890 0 20 0.025
91 900 0 20 0.025
92 912 0 20 0.03
93 921 0 20 0.0225
94 931 0 20 0.025
95 941 0 20 0.025
96 950 0 20 0.0225
97 960 0 20 0.025
98 970 0 20 0.025
99 980 0 20 0.025
100 990 0 20 0.025
101 1000 0 20 0.025
102 1010 0 20 0.025
103 1025 0 20 0.0375
90
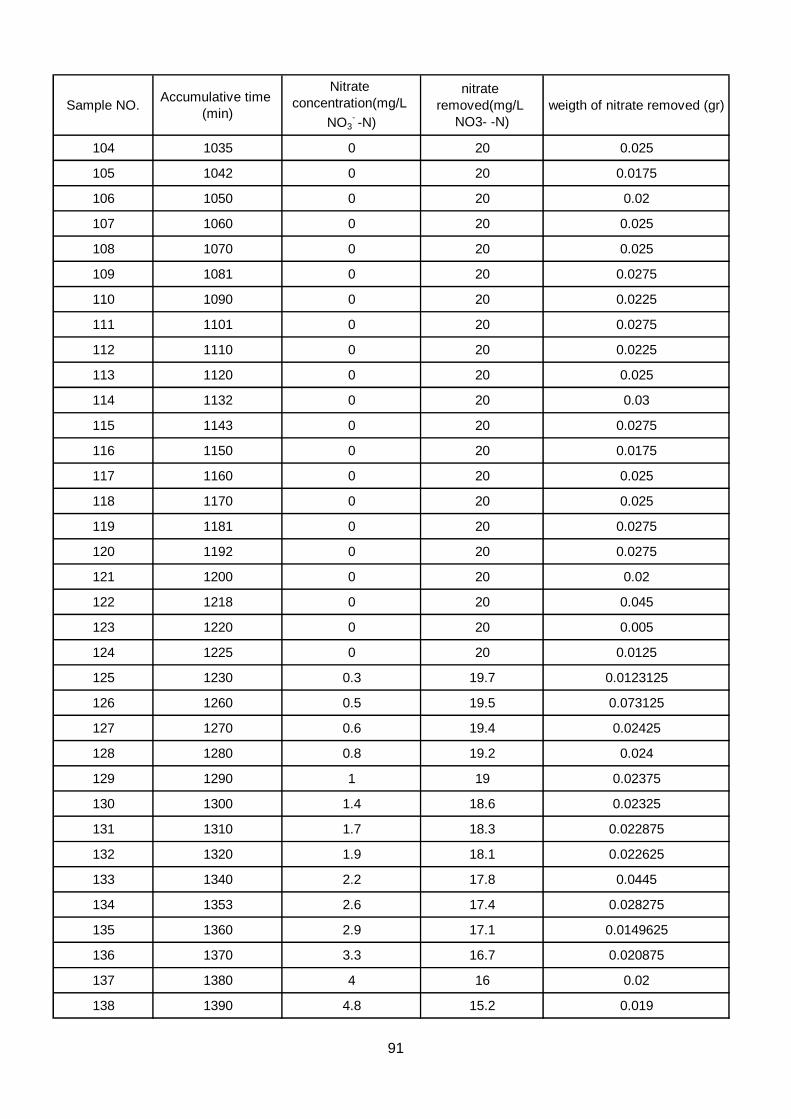
Sample NO.Accumulative time
(min)
Nitrate
concentration(mg/L
NO3- -N)
nitrate
removed(mg/L
NO3- -N)
weigth of nitrate removed (gr)
104 1035 0 20 0.025
105 1042 0 20 0.0175
106 1050 0 20 0.02
107 1060 0 20 0.025
108 1070 0 20 0.025
109 1081 0 20 0.0275
110 1090 0 20 0.0225
111 1101 0 20 0.0275
112 1110 0 20 0.0225
113 1120 0 20 0.025
114 1132 0 20 0.03
115 1143 0 20 0.0275
116 1150 0 20 0.0175
117 1160 0 20 0.025
118 1170 0 20 0.025
119 1181 0 20 0.0275
120 1192 0 20 0.0275
121 1200 0 20 0.02
122 1218 0 20 0.045
123 1220 0 20 0.005
124 1225 0 20 0.0125
125 1230 0.3 19.7 0.0123125
126 1260 0.5 19.5 0.073125
127 1270 0.6 19.4 0.02425
128 1280 0.8 19.2 0.024
129 1290 1 19 0.02375
130 1300 1.4 18.6 0.02325
131 1310 1.7 18.3 0.022875
132 1320 1.9 18.1 0.022625
133 1340 2.2 17.8 0.0445
134 1353 2.6 17.4 0.028275
135 1360 2.9 17.1 0.0149625
136 1370 3.3 16.7 0.020875
137 1380 4 16 0.02
138 1390 4.8 15.2 0.019
91
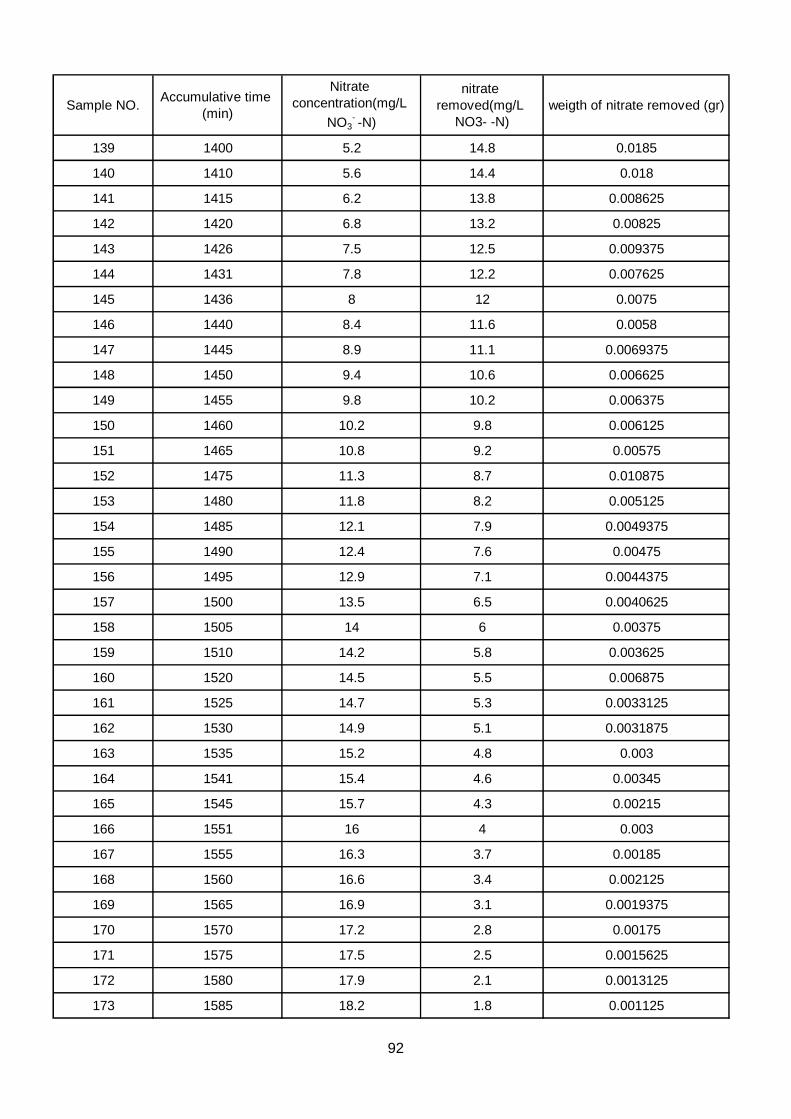
Sample NO.Accumulative time
(min)
Nitrate
concentration(mg/L
NO3- -N)
nitrate
removed(mg/L
NO3- -N)
weigth of nitrate removed (gr)
139 1400 5.2 14.8 0.0185
140 1410 5.6 14.4 0.018
141 1415 6.2 13.8 0.008625
142 1420 6.8 13.2 0.00825
143 1426 7.5 12.5 0.009375
144 1431 7.8 12.2 0.007625
145 1436 8 12 0.0075
146 1440 8.4 11.6 0.0058
147 1445 8.9 11.1 0.0069375
148 1450 9.4 10.6 0.006625
149 1455 9.8 10.2 0.006375
150 1460 10.2 9.8 0.006125
151 1465 10.8 9.2 0.00575
152 1475 11.3 8.7 0.010875
153 1480 11.8 8.2 0.005125
154 1485 12.1 7.9 0.0049375
155 1490 12.4 7.6 0.00475
156 1495 12.9 7.1 0.0044375
157 1500 13.5 6.5 0.0040625
158 1505 14 6 0.00375
159 1510 14.2 5.8 0.003625
160 1520 14.5 5.5 0.006875
161 1525 14.7 5.3 0.0033125
162 1530 14.9 5.1 0.0031875
163 1535 15.2 4.8 0.003
164 1541 15.4 4.6 0.00345
165 1545 15.7 4.3 0.00215
166 1551 16 4 0.003
167 1555 16.3 3.7 0.00185
168 1560 16.6 3.4 0.002125
169 1565 16.9 3.1 0.0019375
170 1570 17.2 2.8 0.00175
171 1575 17.5 2.5 0.0015625
172 1580 17.9 2.1 0.0013125
173 1585 18.2 1.8 0.001125
92
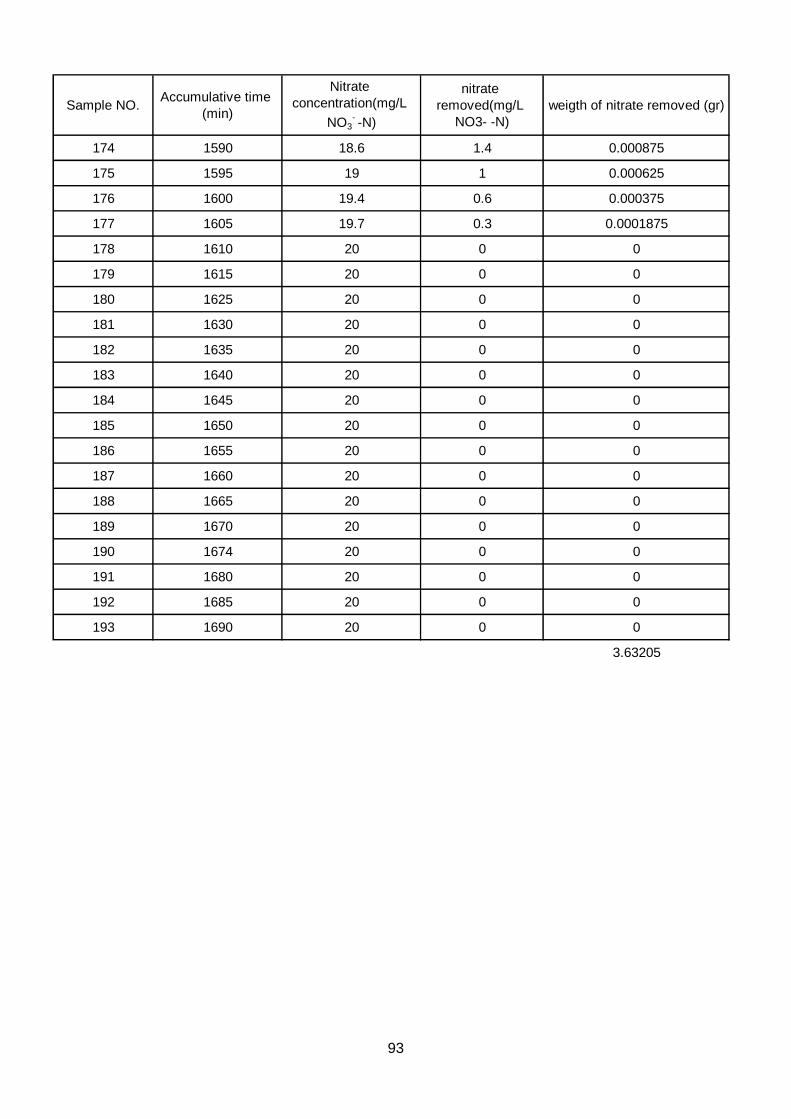
Sample NO.Accumulative time
(min)
Nitrate
concentration(mg/L
NO3- -N)
nitrate
removed(mg/L
NO3- -N)
weigth of nitrate removed (gr)
174 1590 18.6 1.4 0.000875
175 1595 19 1 0.000625
176 1600 19.4 0.6 0.000375
177 1605 19.7 0.3 0.0001875
178 1610 20 0 0
179 1615 20 0 0
180 1625 20 0 0
181 1630 20 0 0
182 1635 20 0 0
183 1640 20 0 0
184 1645 20 0 0
185 1650 20 0 0
186 1655 20 0 0
187 1660 20 0 0
188 1665 20 0 0
189 1670 20 0 0
190 1674 20 0 0
191 1680 20 0 0
192 1685 20 0 0
193 1690 20 0 0
3.63205
93
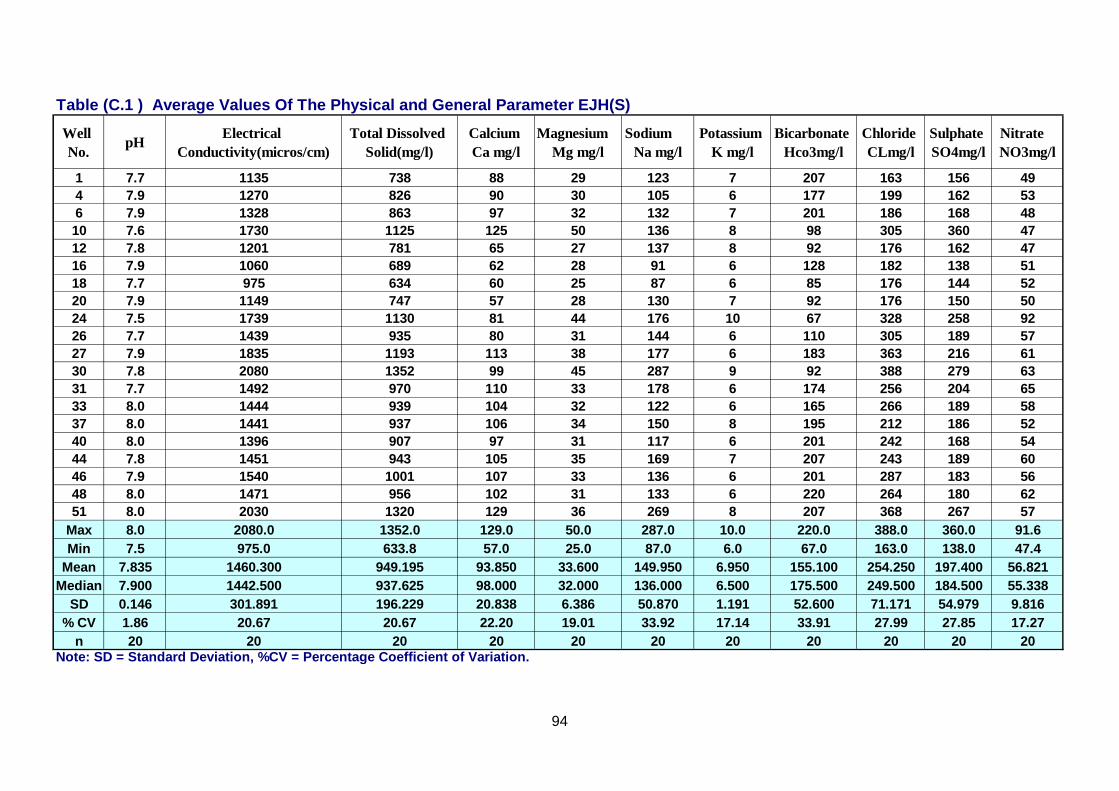
Table (C.1 ) Average Values Of The Physical and General Parameter EJH(S)
Well
No.pH
Electrical
Conductivity(micros/cm)
Total Dissolved
Solid(mg/l)
Calcium
Ca mg/l
Magnesium
Mg mg/l
Sodium
Na mg/l
Potassium
K mg/l
Bicarbonate
Hco3mg/l
Chloride
CLmg/l
Sulphate
SO4mg/l
Nitrate
NO3mg/l
1 7.7 1135 738 88 29 123 7 207 163 156 49
4 7.9 1270 826 90 30 105 6 177 199 162 53
6 7.9 1328 863 97 32 132 7 201 186 168 48
10 7.6 1730 1125 125 50 136 8 98 305 360 47
12 7.8 1201 781 65 27 137 8 92 176 162 47
16 7.9 1060 689 62 28 91 6 128 182 138 51
18 7.7 975 634 60 25 87 6 85 176 144 52
20 7.9 1149 747 57 28 130 7 92 176 150 50
24 7.5 1739 1130 81 44 176 10 67 328 258 92
26 7.7 1439 935 80 31 144 6 110 305 189 57
27 7.9 1835 1193 113 38 177 6 183 363 216 61
30 7.8 2080 1352 99 45 287 9 92 388 279 63
31 7.7 1492 970 110 33 178 6 174 256 204 65
33 8.0 1444 939 104 32 122 6 165 266 189 58
37 8.0 1441 937 106 34 150 8 195 212 186 52
40 8.0 1396 907 97 31 117 6 201 242 168 54
44 7.8 1451 943 105 35 169 7 207 243 189 60
46 7.9 1540 1001 107 33 136 6 201 287 183 56
48 8.0 1471 956 102 31 133 6 220 264 180 62
51 8.0 2030 1320 129 36 269 8 207 368 267 57
Max 8.0 2080.0 1352.0 129.0 50.0 287.0 10.0 220.0 388.0 360.0 91.6
Min 7.5 975.0 633.8 57.0 25.0 87.0 6.0 67.0 163.0 138.0 47.4
Mean 7.835 1460.300 949.195 93.850 33.600 149.950 6.950 155.100 254.250 197.400 56.821
Median 7.900 1442.500 937.625 98.000 32.000 136.000 6.500 175.500 249.500 184.500 55.338
SD 0.146 301.891 196.229 20.838 6.386 50.870 1.191 52.600 71.171 54.979 9.816
% CV 1.86 20.67 20.67 22.20 19.01 33.92 17.14 33.91 27.99 27.85 17.27
n 20 20 20 20 20 20 20 20 20 20 20Note: SD = Standard Deviation, %CV = Percentage Coefficient of Variation.
94
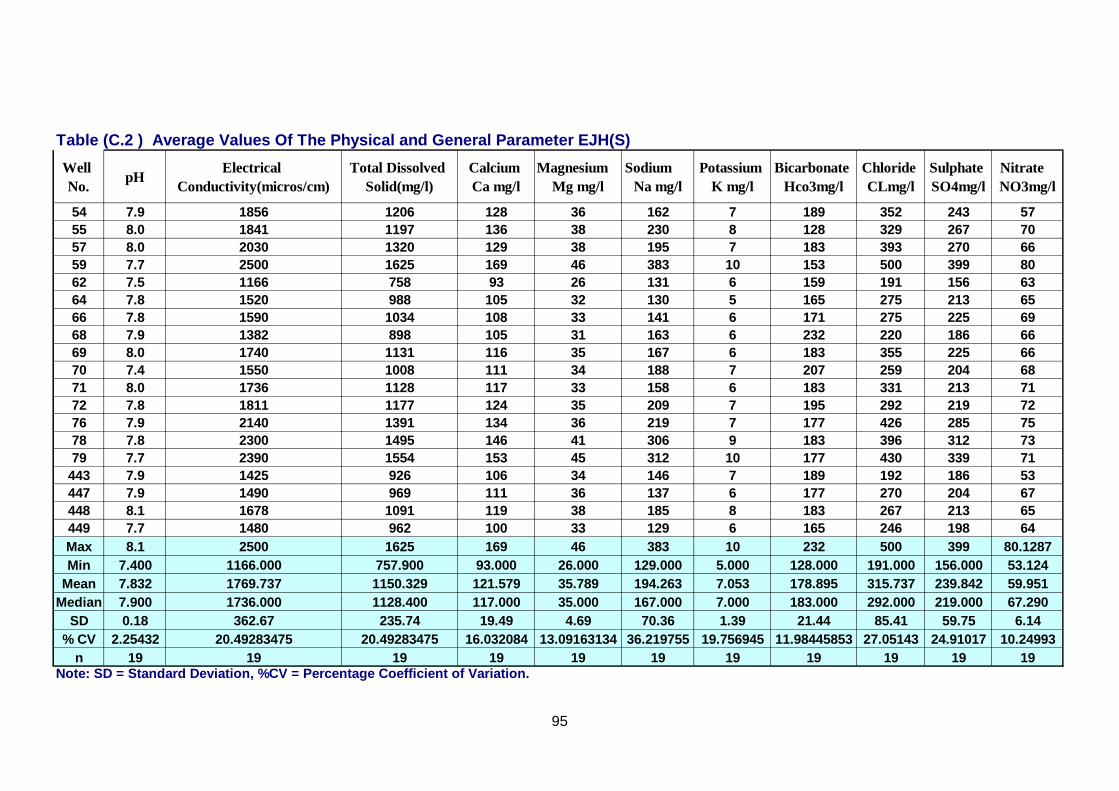
Table (C.2 ) Average Values Of The Physical and General Parameter EJH(S)
Well
No.pH
Electrical
Conductivity(micros/cm)
Total Dissolved
Solid(mg/l)
Calcium
Ca mg/l
Magnesium
Mg mg/l
Sodium
Na mg/l
Potassium
K mg/l
Bicarbonate
Hco3mg/l
Chloride
CLmg/l
Sulphate
SO4mg/l
Nitrate
NO3mg/l
54 7.9 1856 1206 128 36 162 7 189 352 243 57
55 8.0 1841 1197 136 38 230 8 128 329 267 70
57 8.0 2030 1320 129 38 195 7 183 393 270 66
59 7.7 2500 1625 169 46 383 10 153 500 399 80
62 7.5 1166 758 93 26 131 6 159 191 156 63
64 7.8 1520 988 105 32 130 5 165 275 213 65
66 7.8 1590 1034 108 33 141 6 171 275 225 69
68 7.9 1382 898 105 31 163 6 232 220 186 66
69 8.0 1740 1131 116 35 167 6 183 355 225 66
70 7.4 1550 1008 111 34 188 7 207 259 204 68
71 8.0 1736 1128 117 33 158 6 183 331 213 71
72 7.8 1811 1177 124 35 209 7 195 292 219 72
76 7.9 2140 1391 134 36 219 7 177 426 285 75
78 7.8 2300 1495 146 41 306 9 183 396 312 73
79 7.7 2390 1554 153 45 312 10 177 430 339 71
443 7.9 1425 926 106 34 146 7 189 192 186 53
447 7.9 1490 969 111 36 137 6 177 270 204 67
448 8.1 1678 1091 119 38 185 8 183 267 213 65
449 7.7 1480 962 100 33 129 6 165 246 198 64
Max 8.1 2500 1625 169 46 383 10 232 500 399 80.1287
Min 7.400 1166.000 757.900 93.000 26.000 129.000 5.000 128.000 191.000 156.000 53.124
Mean 7.832 1769.737 1150.329 121.579 35.789 194.263 7.053 178.895 315.737 239.842 59.951
Median 7.900 1736.000 1128.400 117.000 35.000 167.000 7.000 183.000 292.000 219.000 67.290
SD 0.18 362.67 235.74 19.49 4.69 70.36 1.39 21.44 85.41 59.75 6.14
% CV 2.25432 20.49283475 20.49283475 16.032084 13.09163134 36.219755 19.756945 11.98445853 27.05143 24.91017 10.24993
n 19 19 19 19 19 19 19 19 19 19 19Note: SD = Standard Deviation, %CV = Percentage Coefficient of Variation.
95
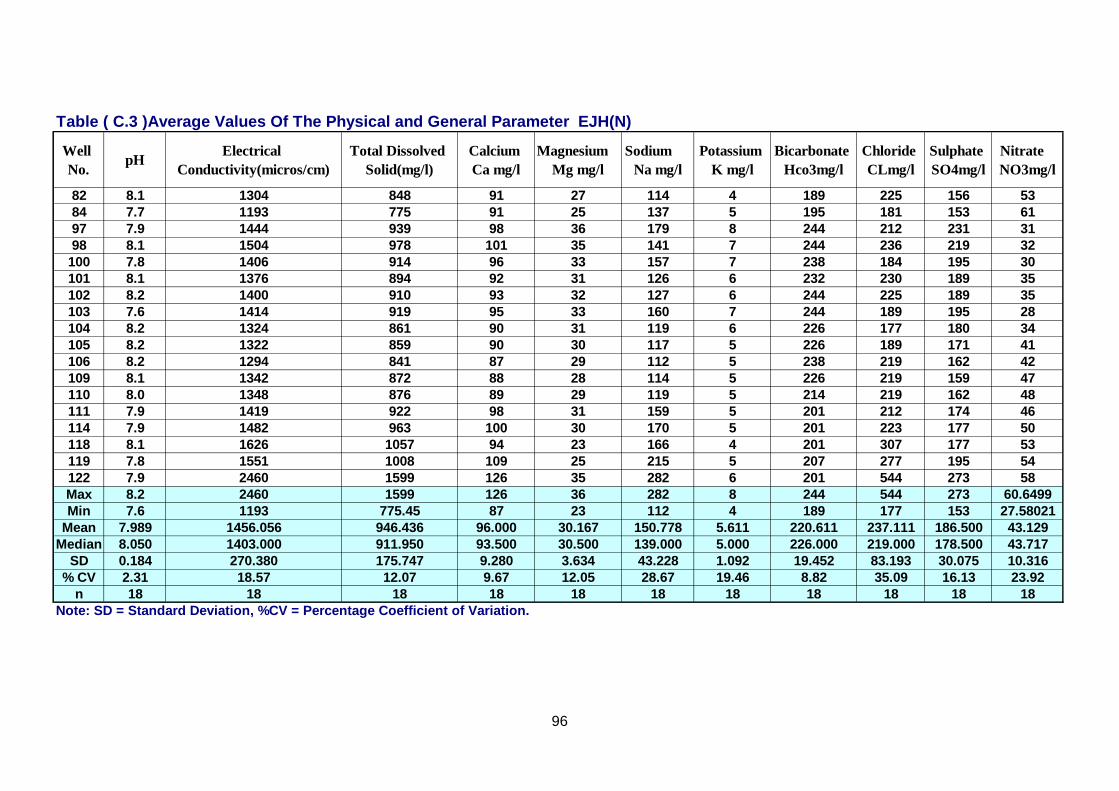
Table ( C.3 )Average Values Of The Physical and General Parameter EJH(N)
Well
No.pH
Electrical
Conductivity(micros/cm)
Total Dissolved
Solid(mg/l)
Calcium
Ca mg/l
Magnesium
Mg mg/l
Sodium
Na mg/l
Potassium
K mg/l
Bicarbonate
Hco3mg/l
Chloride
CLmg/l
Sulphate
SO4mg/l
Nitrate
NO3mg/l
82 8.1 1304 848 91 27 114 4 189 225 156 53
84 7.7 1193 775 91 25 137 5 195 181 153 61
97 7.9 1444 939 98 36 179 8 244 212 231 31
98 8.1 1504 978 101 35 141 7 244 236 219 32
100 7.8 1406 914 96 33 157 7 238 184 195 30
101 8.1 1376 894 92 31 126 6 232 230 189 35
102 8.2 1400 910 93 32 127 6 244 225 189 35
103 7.6 1414 919 95 33 160 7 244 189 195 28
104 8.2 1324 861 90 31 119 6 226 177 180 34
105 8.2 1322 859 90 30 117 5 226 189 171 41
106 8.2 1294 841 87 29 112 5 238 219 162 42
109 8.1 1342 872 88 28 114 5 226 219 159 47
110 8.0 1348 876 89 29 119 5 214 219 162 48
111 7.9 1419 922 98 31 159 5 201 212 174 46
114 7.9 1482 963 100 30 170 5 201 223 177 50
118 8.1 1626 1057 94 23 166 4 201 307 177 53
119 7.8 1551 1008 109 25 215 5 207 277 195 54
122 7.9 2460 1599 126 35 282 6 201 544 273 58
Max 8.2 2460 1599 126 36 282 8 244 544 273 60.6499
Min 7.6 1193 775.45 87 23 112 4 189 177 153 27.58021
Mean 7.989 1456.056 946.436 96.000 30.167 150.778 5.611 220.611 237.111 186.500 43.129
Median 8.050 1403.000 911.950 93.500 30.500 139.000 5.000 226.000 219.000 178.500 43.717
SD 0.184 270.380 175.747 9.280 3.634 43.228 1.092 19.452 83.193 30.075 10.316
% CV 2.31 18.57 12.07 9.67 12.05 28.67 19.46 8.82 35.09 16.13 23.92
n 18 18 18 18 18 18 18 18 18 18 18
Note: SD = Standard Deviation, %CV = Percentage Coefficient of Variation.
96
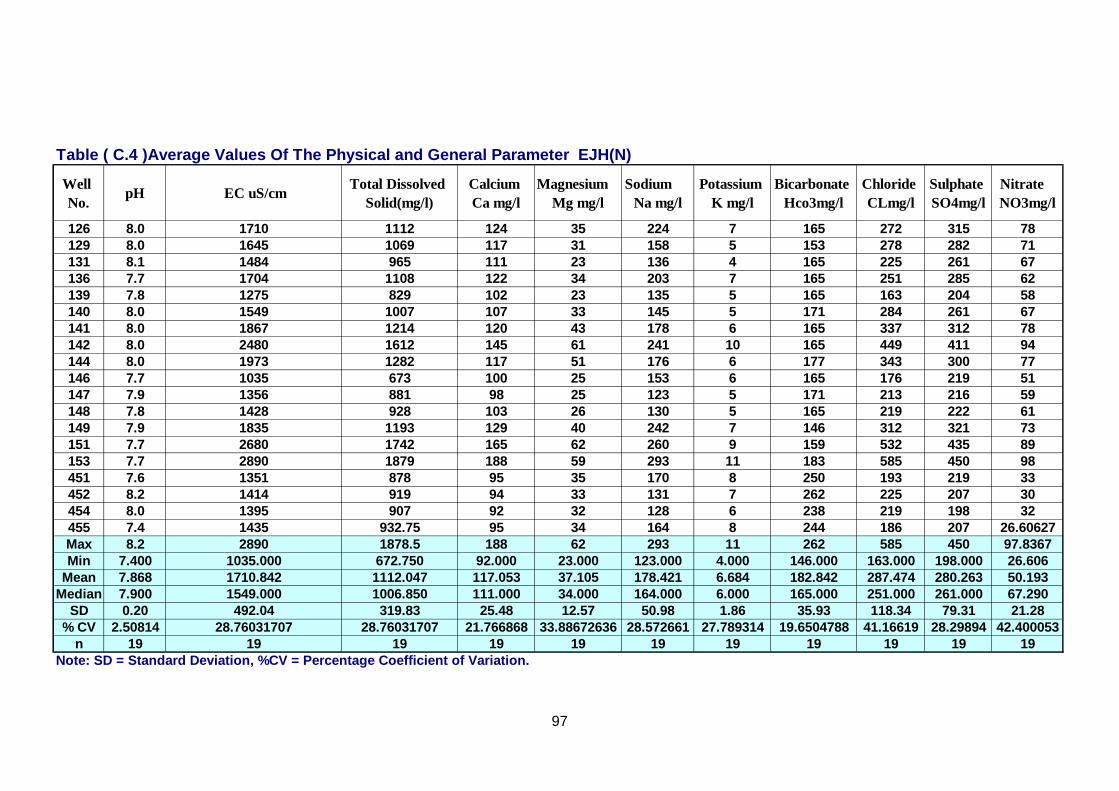
Table ( C.4 )Average Values Of The Physical and General Parameter EJH(N)
Well
No.pH EC uS/cm
Total Dissolved
Solid(mg/l)
Calcium
Ca mg/l
Magnesium
Mg mg/l
Sodium
Na mg/l
Potassium
K mg/l
Bicarbonate
Hco3mg/l
Chloride
CLmg/l
Sulphate
SO4mg/l
Nitrate
NO3mg/l
126 8.0 1710 1112 124 35 224 7 165 272 315 78
129 8.0 1645 1069 117 31 158 5 153 278 282 71
131 8.1 1484 965 111 23 136 4 165 225 261 67
136 7.7 1704 1108 122 34 203 7 165 251 285 62
139 7.8 1275 829 102 23 135 5 165 163 204 58
140 8.0 1549 1007 107 33 145 5 171 284 261 67
141 8.0 1867 1214 120 43 178 6 165 337 312 78
142 8.0 2480 1612 145 61 241 10 165 449 411 94
144 8.0 1973 1282 117 51 176 6 177 343 300 77
146 7.7 1035 673 100 25 153 6 165 176 219 51
147 7.9 1356 881 98 25 123 5 171 213 216 59
148 7.8 1428 928 103 26 130 5 165 219 222 61
149 7.9 1835 1193 129 40 242 7 146 312 321 73
151 7.7 2680 1742 165 62 260 9 159 532 435 89
153 7.7 2890 1879 188 59 293 11 183 585 450 98
451 7.6 1351 878 95 35 170 8 250 193 219 33
452 8.2 1414 919 94 33 131 7 262 225 207 30
454 8.0 1395 907 92 32 128 6 238 219 198 32
455 7.4 1435 932.75 95 34 164 8 244 186 207 26.60627
Max 8.2 2890 1878.5 188 62 293 11 262 585 450 97.8367
Min 7.400 1035.000 672.750 92.000 23.000 123.000 4.000 146.000 163.000 198.000 26.606
Mean 7.868 1710.842 1112.047 117.053 37.105 178.421 6.684 182.842 287.474 280.263 50.193
Median 7.900 1549.000 1006.850 111.000 34.000 164.000 6.000 165.000 251.000 261.000 67.290
SD 0.20 492.04 319.83 25.48 12.57 50.98 1.86 35.93 118.34 79.31 21.28
% CV 2.50814 28.76031707 28.76031707 21.766868 33.88672636 28.572661 27.789314 19.6504788 41.16619 28.29894 42.400053
n 19 19 19 19 19 19 19 19 19 19 19
Note: SD = Standard Deviation, %CV = Percentage Coefficient of Variation.
97
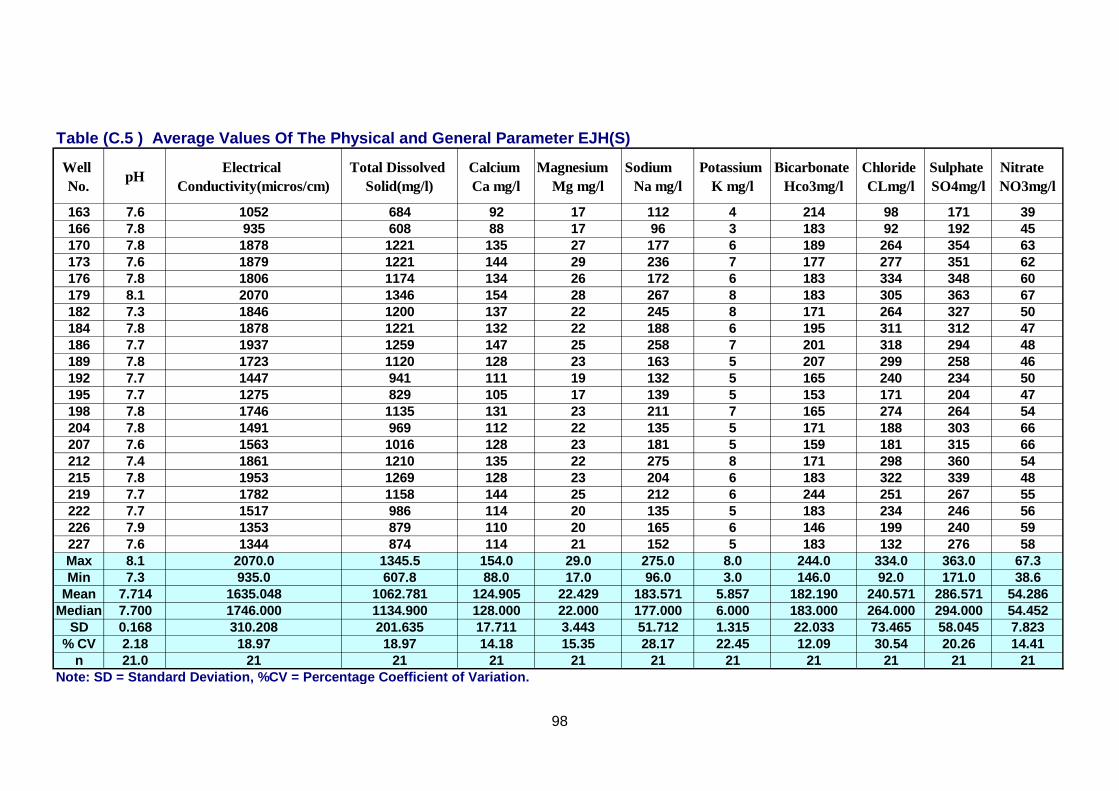
Table (C.5 ) Average Values Of The Physical and General Parameter EJH(S)
Well
No.pH
Electrical
Conductivity(micros/cm)
Total Dissolved
Solid(mg/l)
Calcium
Ca mg/l
Magnesium
Mg mg/l
Sodium
Na mg/l
Potassium
K mg/l
Bicarbonate
Hco3mg/l
Chloride
CLmg/l
Sulphate
SO4mg/l
Nitrate
NO3mg/l
163 7.6 1052 684 92 17 112 4 214 98 171 39
166 7.8 935 608 88 17 96 3 183 92 192 45
170 7.8 1878 1221 135 27 177 6 189 264 354 63
173 7.6 1879 1221 144 29 236 7 177 277 351 62
176 7.8 1806 1174 134 26 172 6 183 334 348 60
179 8.1 2070 1346 154 28 267 8 183 305 363 67
182 7.3 1846 1200 137 22 245 8 171 264 327 50
184 7.8 1878 1221 132 22 188 6 195 311 312 47
186 7.7 1937 1259 147 25 258 7 201 318 294 48
189 7.8 1723 1120 128 23 163 5 207 299 258 46
192 7.7 1447 941 111 19 132 5 165 240 234 50
195 7.7 1275 829 105 17 139 5 153 171 204 47
198 7.8 1746 1135 131 23 211 7 165 274 264 54
204 7.8 1491 969 112 22 135 5 171 188 303 66
207 7.6 1563 1016 128 23 181 5 159 181 315 66
212 7.4 1861 1210 135 22 275 8 171 298 360 54
215 7.8 1953 1269 128 23 204 6 183 322 339 48
219 7.7 1782 1158 144 25 212 6 244 251 267 55
222 7.7 1517 986 114 20 135 5 183 234 246 56
226 7.9 1353 879 110 20 165 6 146 199 240 59
227 7.6 1344 874 114 21 152 5 183 132 276 58
Max 8.1 2070.0 1345.5 154.0 29.0 275.0 8.0 244.0 334.0 363.0 67.3
Min 7.3 935.0 607.8 88.0 17.0 96.0 3.0 146.0 92.0 171.0 38.6
Mean 7.714 1635.048 1062.781 124.905 22.429 183.571 5.857 182.190 240.571 286.571 54.286
Median 7.700 1746.000 1134.900 128.000 22.000 177.000 6.000 183.000 264.000 294.000 54.452
SD 0.168 310.208 201.635 17.711 3.443 51.712 1.315 22.033 73.465 58.045 7.823
% CV 2.18 18.97 18.97 14.18 15.35 28.17 22.45 12.09 30.54 20.26 14.41
n 21.0 21 21 21 21 21 21 21 21 21 21
Note: SD = Standard Deviation, %CV = Percentage Coefficient of Variation.
98
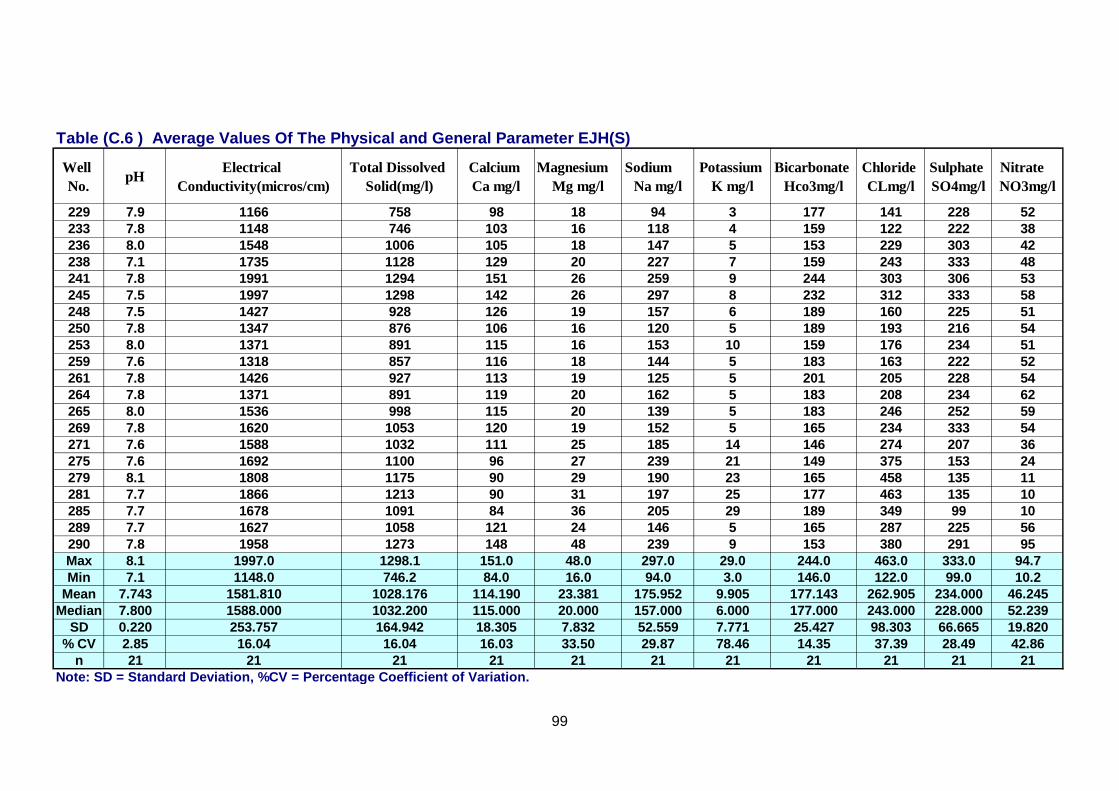
Table (C.6 ) Average Values Of The Physical and General Parameter EJH(S)
Well
No.pH
Electrical
Conductivity(micros/cm)
Total Dissolved
Solid(mg/l)
Calcium
Ca mg/l
Magnesium
Mg mg/l
Sodium
Na mg/l
Potassium
K mg/l
Bicarbonate
Hco3mg/l
Chloride
CLmg/l
Sulphate
SO4mg/l
Nitrate
NO3mg/l
229 7.9 1166 758 98 18 94 3 177 141 228 52
233 7.8 1148 746 103 16 118 4 159 122 222 38
236 8.0 1548 1006 105 18 147 5 153 229 303 42
238 7.1 1735 1128 129 20 227 7 159 243 333 48
241 7.8 1991 1294 151 26 259 9 244 303 306 53
245 7.5 1997 1298 142 26 297 8 232 312 333 58
248 7.5 1427 928 126 19 157 6 189 160 225 51
250 7.8 1347 876 106 16 120 5 189 193 216 54
253 8.0 1371 891 115 16 153 10 159 176 234 51
259 7.6 1318 857 116 18 144 5 183 163 222 52
261 7.8 1426 927 113 19 125 5 201 205 228 54
264 7.8 1371 891 119 20 162 5 183 208 234 62
265 8.0 1536 998 115 20 139 5 183 246 252 59
269 7.8 1620 1053 120 19 152 5 165 234 333 54
271 7.6 1588 1032 111 25 185 14 146 274 207 36
275 7.6 1692 1100 96 27 239 21 149 375 153 24
279 8.1 1808 1175 90 29 190 23 165 458 135 11
281 7.7 1866 1213 90 31 197 25 177 463 135 10
285 7.7 1678 1091 84 36 205 29 189 349 99 10
289 7.7 1627 1058 121 24 146 5 165 287 225 56
290 7.8 1958 1273 148 48 239 9 153 380 291 95
Max 8.1 1997.0 1298.1 151.0 48.0 297.0 29.0 244.0 463.0 333.0 94.7
Min 7.1 1148.0 746.2 84.0 16.0 94.0 3.0 146.0 122.0 99.0 10.2
Mean 7.743 1581.810 1028.176 114.190 23.381 175.952 9.905 177.143 262.905 234.000 46.245
Median 7.800 1588.000 1032.200 115.000 20.000 157.000 6.000 177.000 243.000 228.000 52.239
SD 0.220 253.757 164.942 18.305 7.832 52.559 7.771 25.427 98.303 66.665 19.820
% CV 2.85 16.04 16.04 16.03 33.50 29.87 78.46 14.35 37.39 28.49 42.86
n 21 21 21 21 21 21 21 21 21 21 21
Note: SD = Standard Deviation, %CV = Percentage Coefficient of Variation.
99
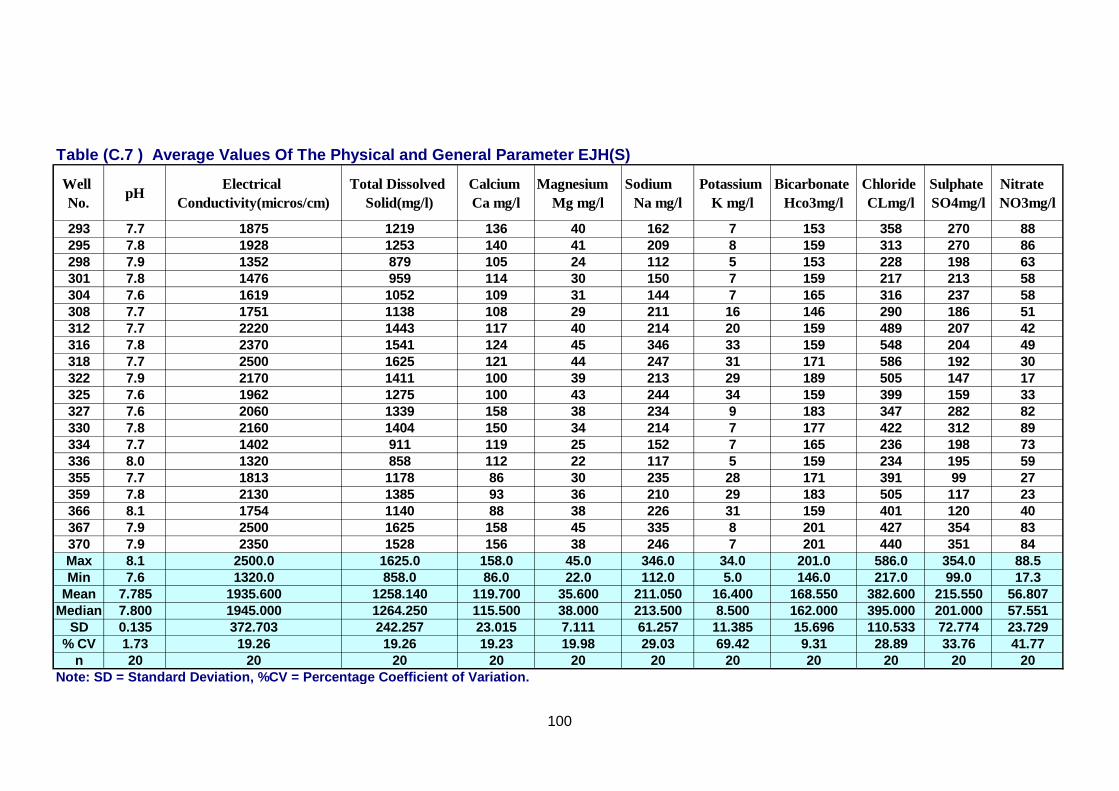
Table (C.7 ) Average Values Of The Physical and General Parameter EJH(S)
Well
No.pH
Electrical
Conductivity(micros/cm)
Total Dissolved
Solid(mg/l)
Calcium
Ca mg/l
Magnesium
Mg mg/l
Sodium
Na mg/l
Potassium
K mg/l
Bicarbonate
Hco3mg/l
Chloride
CLmg/l
Sulphate
SO4mg/l
Nitrate
NO3mg/l
293 7.7 1875 1219 136 40 162 7 153 358 270 88
295 7.8 1928 1253 140 41 209 8 159 313 270 86
298 7.9 1352 879 105 24 112 5 153 228 198 63
301 7.8 1476 959 114 30 150 7 159 217 213 58
304 7.6 1619 1052 109 31 144 7 165 316 237 58
308 7.7 1751 1138 108 29 211 16 146 290 186 51
312 7.7 2220 1443 117 40 214 20 159 489 207 42
316 7.8 2370 1541 124 45 346 33 159 548 204 49
318 7.7 2500 1625 121 44 247 31 171 586 192 30
322 7.9 2170 1411 100 39 213 29 189 505 147 17
325 7.6 1962 1275 100 43 244 34 159 399 159 33
327 7.6 2060 1339 158 38 234 9 183 347 282 82
330 7.8 2160 1404 150 34 214 7 177 422 312 89
334 7.7 1402 911 119 25 152 7 165 236 198 73
336 8.0 1320 858 112 22 117 5 159 234 195 59
355 7.7 1813 1178 86 30 235 28 171 391 99 27
359 7.8 2130 1385 93 36 210 29 183 505 117 23
366 8.1 1754 1140 88 38 226 31 159 401 120 40
367 7.9 2500 1625 158 45 335 8 201 427 354 83
370 7.9 2350 1528 156 38 246 7 201 440 351 84
Max 8.1 2500.0 1625.0 158.0 45.0 346.0 34.0 201.0 586.0 354.0 88.5
Min 7.6 1320.0 858.0 86.0 22.0 112.0 5.0 146.0 217.0 99.0 17.3
Mean 7.785 1935.600 1258.140 119.700 35.600 211.050 16.400 168.550 382.600 215.550 56.807
Median 7.800 1945.000 1264.250 115.500 38.000 213.500 8.500 162.000 395.000 201.000 57.551
SD 0.135 372.703 242.257 23.015 7.111 61.257 11.385 15.696 110.533 72.774 23.729
% CV 1.73 19.26 19.26 19.23 19.98 29.03 69.42 9.31 28.89 33.76 41.77
n 20 20 20 20 20 20 20 20 20 20 20
Note: SD = Standard Deviation, %CV = Percentage Coefficient of Variation.
100
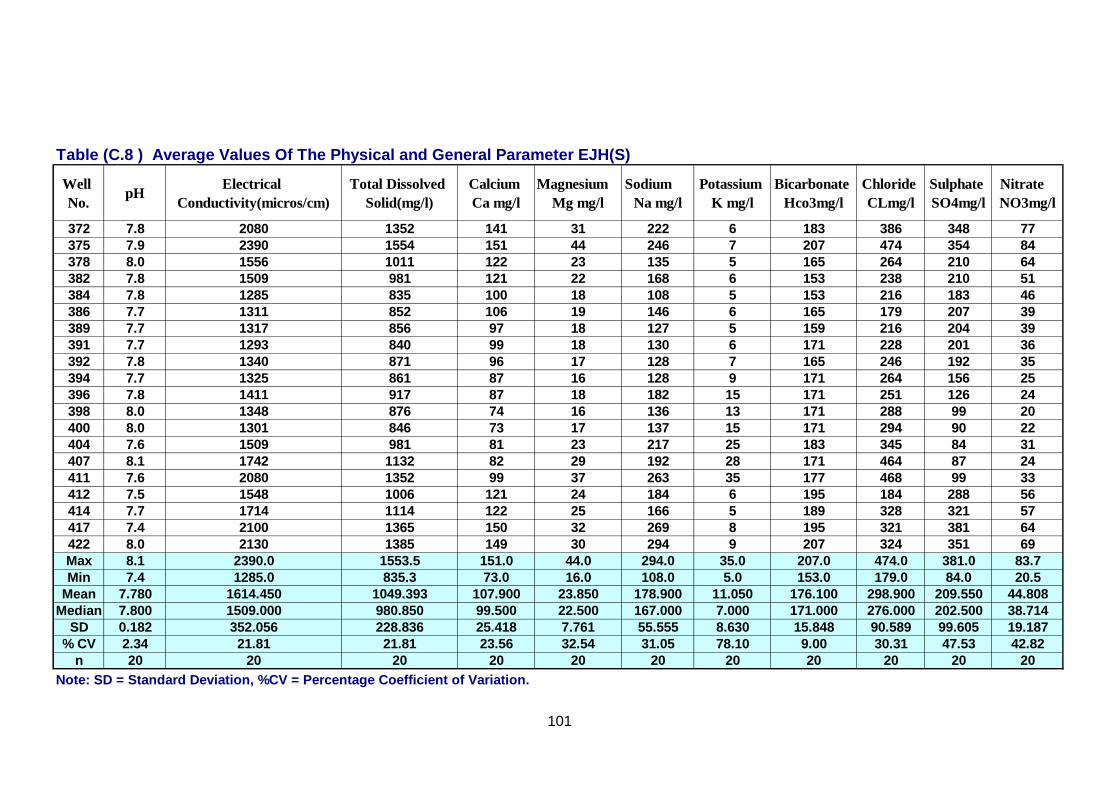
Table (C.8 ) Average Values Of The Physical and General Parameter EJH(S)
Well
No.pH
Electrical
Conductivity(micros/cm)
Total Dissolved
Solid(mg/l)
Calcium
Ca mg/l
Magnesium
Mg mg/l
Sodium
Na mg/l
Potassium
K mg/l
Bicarbonate
Hco3mg/l
Chloride
CLmg/l
Sulphate
SO4mg/l
Nitrate
NO3mg/l
372 7.8 2080 1352 141 31 222 6 183 386 348 77
375 7.9 2390 1554 151 44 246 7 207 474 354 84
378 8.0 1556 1011 122 23 135 5 165 264 210 64
382 7.8 1509 981 121 22 168 6 153 238 210 51
384 7.8 1285 835 100 18 108 5 153 216 183 46
386 7.7 1311 852 106 19 146 6 165 179 207 39
389 7.7 1317 856 97 18 127 5 159 216 204 39
391 7.7 1293 840 99 18 130 6 171 228 201 36
392 7.8 1340 871 96 17 128 7 165 246 192 35
394 7.7 1325 861 87 16 128 9 171 264 156 25
396 7.8 1411 917 87 18 182 15 171 251 126 24
398 8.0 1348 876 74 16 136 13 171 288 99 20
400 8.0 1301 846 73 17 137 15 171 294 90 22
404 7.6 1509 981 81 23 217 25 183 345 84 31
407 8.1 1742 1132 82 29 192 28 171 464 87 24
411 7.6 2080 1352 99 37 263 35 177 468 99 33
412 7.5 1548 1006 121 24 184 6 195 184 288 56
414 7.7 1714 1114 122 25 166 5 189 328 321 57
417 7.4 2100 1365 150 32 269 8 195 321 381 64
422 8.0 2130 1385 149 30 294 9 207 324 351 69
Max 8.1 2390.0 1553.5 151.0 44.0 294.0 35.0 207.0 474.0 381.0 83.7
Min 7.4 1285.0 835.3 73.0 16.0 108.0 5.0 153.0 179.0 84.0 20.5
Mean 7.780 1614.450 1049.393 107.900 23.850 178.900 11.050 176.100 298.900 209.550 44.808
Median 7.800 1509.000 980.850 99.500 22.500 167.000 7.000 171.000 276.000 202.500 38.714
SD 0.182 352.056 228.836 25.418 7.761 55.555 8.630 15.848 90.589 99.605 19.187
% CV 2.34 21.81 21.81 23.56 32.54 31.05 78.10 9.00 30.31 47.53 42.82
n 20 20 20 20 20 20 20 20 20 20 20
Note: SD = Standard Deviation, %CV = Percentage Coefficient of Variation.
101
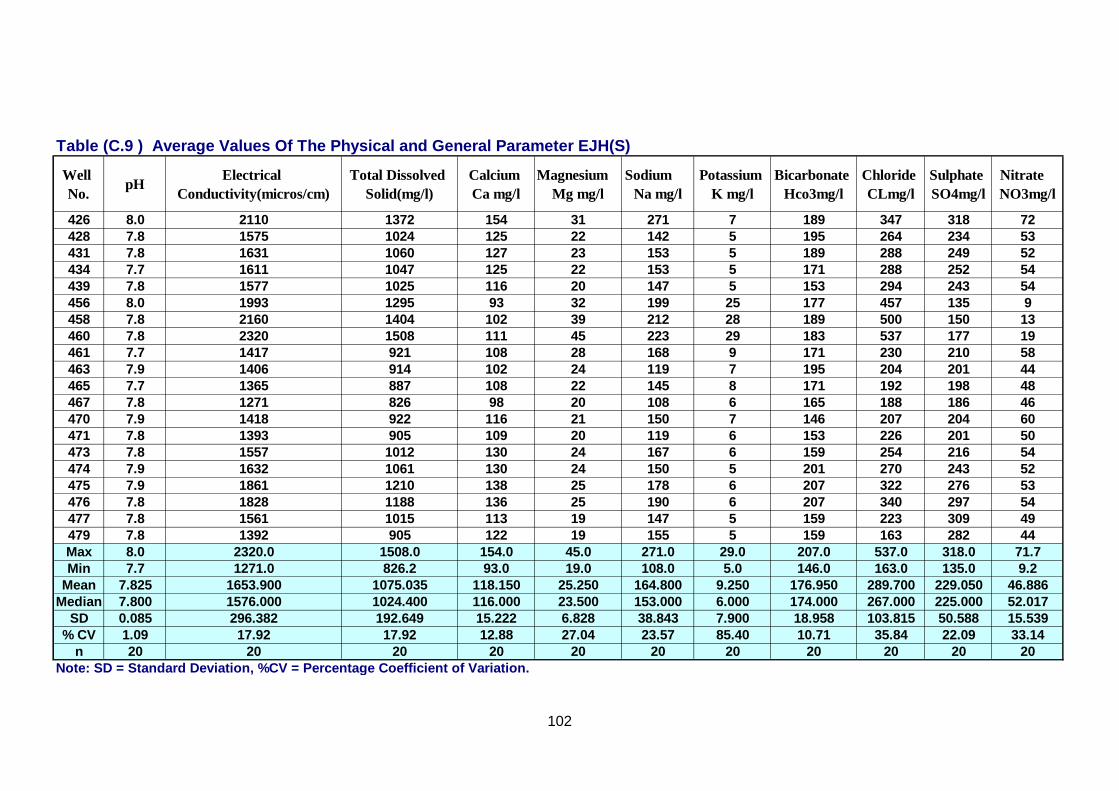
Table (C.9 ) Average Values Of The Physical and General Parameter EJH(S)
Well
No.pH
Electrical
Conductivity(micros/cm)
Total Dissolved
Solid(mg/l)
Calcium
Ca mg/l
Magnesium
Mg mg/l
Sodium
Na mg/l
Potassium
K mg/l
Bicarbonate
Hco3mg/l
Chloride
CLmg/l
Sulphate
SO4mg/l
Nitrate
NO3mg/l
426 8.0 2110 1372 154 31 271 7 189 347 318 72
428 7.8 1575 1024 125 22 142 5 195 264 234 53
431 7.8 1631 1060 127 23 153 5 189 288 249 52
434 7.7 1611 1047 125 22 153 5 171 288 252 54
439 7.8 1577 1025 116 20 147 5 153 294 243 54
456 8.0 1993 1295 93 32 199 25 177 457 135 9
458 7.8 2160 1404 102 39 212 28 189 500 150 13
460 7.8 2320 1508 111 45 223 29 183 537 177 19
461 7.7 1417 921 108 28 168 9 171 230 210 58
463 7.9 1406 914 102 24 119 7 195 204 201 44
465 7.7 1365 887 108 22 145 8 171 192 198 48
467 7.8 1271 826 98 20 108 6 165 188 186 46
470 7.9 1418 922 116 21 150 7 146 207 204 60
471 7.8 1393 905 109 20 119 6 153 226 201 50
473 7.8 1557 1012 130 24 167 6 159 254 216 54
474 7.9 1632 1061 130 24 150 5 201 270 243 52
475 7.9 1861 1210 138 25 178 6 207 322 276 53
476 7.8 1828 1188 136 25 190 6 207 340 297 54
477 7.8 1561 1015 113 19 147 5 159 223 309 49
479 7.8 1392 905 122 19 155 5 159 163 282 44
Max 8.0 2320.0 1508.0 154.0 45.0 271.0 29.0 207.0 537.0 318.0 71.7
Min 7.7 1271.0 826.2 93.0 19.0 108.0 5.0 146.0 163.0 135.0 9.2
Mean 7.825 1653.900 1075.035 118.150 25.250 164.800 9.250 176.950 289.700 229.050 46.886
Median 7.800 1576.000 1024.400 116.000 23.500 153.000 6.000 174.000 267.000 225.000 52.017
SD 0.085 296.382 192.649 15.222 6.828 38.843 7.900 18.958 103.815 50.588 15.539
% CV 1.09 17.92 17.92 12.88 27.04 23.57 85.40 10.71 35.84 22.09 33.14
n 20 20 20 20 20 20 20 20 20 20 20
Note: SD = Standard Deviation, %CV = Percentage Coefficient of Variation.
102
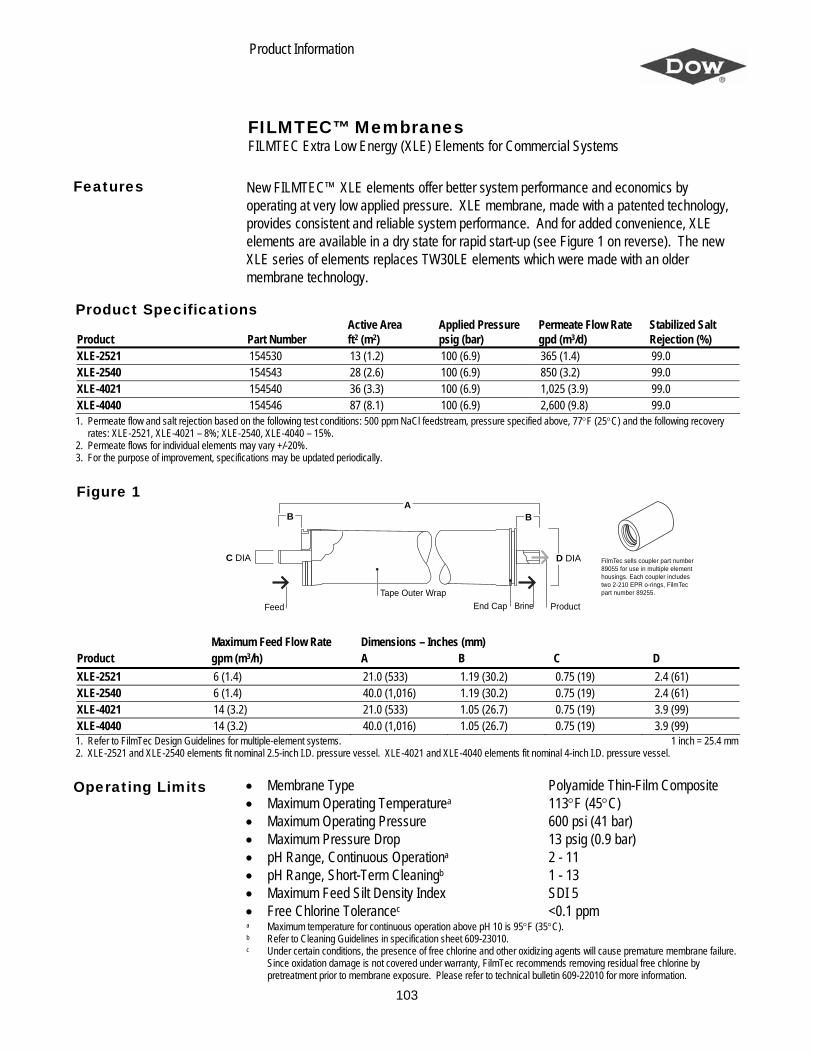
Product Information
FILMTEC™ Membranes FILMTEC Extra Low Energy (XLE) Elements for Commercial Systems
Features
New FILMTEC™ XLE elements offer better system performance and economics by operating at very low applied pressure. XLE membrane, made with a patented technology, provides consistent and reliable system performance. And for added convenience, XLE elements are available in a dry state for rapid start-up (see Figure 1 on reverse). The new XLE series of elements replaces TW30LE elements which were made with an older membrane technology.
Product Specifications Product
Part Number
Active Area ft2 (m2)
Applied Pressure psig (bar)
Permeate Flow Rate gpd (m3/d)
Stabilized Salt Rejection (%)
XLE-2521 154530 13 (1.2) 100 (6.9) 365 (1.4) 99.0 XLE-2540 154543 28 (2.6) 100 (6.9) 850 (3.2) 99.0 XLE-4021 154540 36 (3.3) 100 (6.9) 1,025 (3.9) 99.0 XLE-4040 154546 87 (8.1) 100 (6.9) 2,600 (9.8) 99.0 1. Permeate flow and salt rejection based on the following test conditions: 500 ppm NaCl feedstream, pressure specified above, 77°F (25°C) and the following recovery
rates: XLE-2521, XLE-4021 – 8%; XLE-2540, XLE-4040 – 15%. 2. Permeate flows for individual elements may vary +/-20%. 3. For the purpose of improvement, specifications may be updated periodically.
Figure 1 A
B B
D DIAC DIA
Feed
Tape Outer WrapEnd Cap ProductBrine
FilmTec sells coupler part number89055 for use in multiple elementhousings. Each coupler includestwo 2-210 EPR o-rings, FilmTecpart number 89255.
Maximum Feed Flow Rate Dimensions – Inches (mm) Product gpm (m3/h) A B C D XLE-2521 6 (1.4) 21.0 (533) 1.19 (30.2) 0.75 (19) 2.4 (61) XLE-2540 6 (1.4) 40.0 (1,016) 1.19 (30.2) 0.75 (19) 2.4 (61) XLE-4021 14 (3.2) 21.0 (533) 1.05 (26.7) 0.75 (19) 3.9 (99) XLE-4040 14 (3.2) 40.0 (1,016) 1.05 (26.7) 0.75 (19) 3.9 (99) 1. Refer to FilmTec Design Guidelines for multiple-element systems. 1 inch = 25.4 mm 2. XLE-2521 and XLE-2540 elements fit nominal 2.5-inch I.D. pressure vessel. XLE-4021 and XLE-4040 elements fit nominal 4-inch I.D. pressure vessel.
• • • • • • • •
Membrane Type Polyamide Thin-Film Composite Maximum Operating Temperaturea 113°F (45°C) Maximum Operating Pressure 600 psi (41 bar) Maximum Pressure Drop 13 psig (0.9 bar) pH Range, Continuous Operationa 2 - 11 pH Range, Short-Term Cleaningb 1 - 13 Maximum Feed Silt Density Index SDI 5 Free Chlorine Tolerancec <0.1 ppm
a Maximum temperature for continuous operation above pH 10 is 95°F (35°C). b Refer to Cleaning Guidelines in specification sheet 609-23010. c Under certain conditions, the presence of free chlorine and other oxidizing agents will cause premature membrane failure.
Since oxidation damage is not covered under warranty, FilmTec recommends removing residual free chlorine by pretreatment prior to membrane exposure. Please refer to technical bulletin 609-22010 for more information.
Operating Limits
103
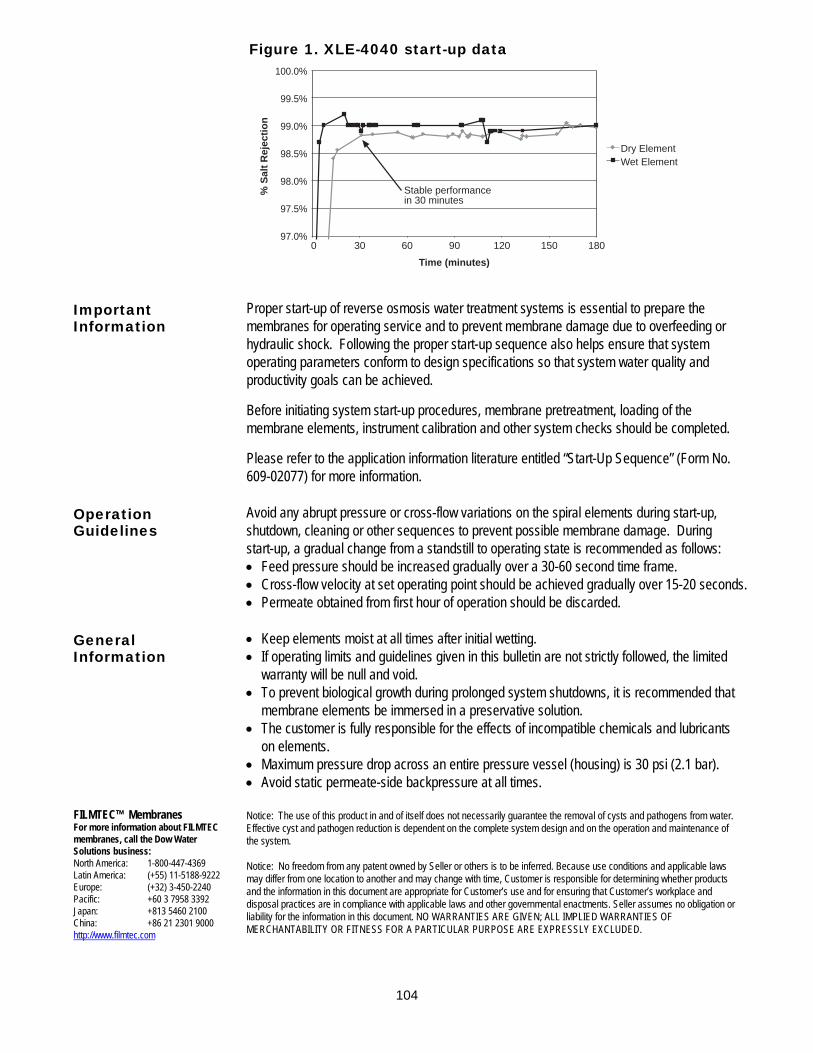
Figure 1. XLE-4040 start-up data
Time (minutes)%
Sal
t R
ejec
tio
n
100.0%
99.5%
99.0%
98.5%
98.0%
97.5%
97.0%0 30 60 90 120 150 180
Dry ElementWet Element
Stable performancein 30 minutes
Important Information
Proper start-up of reverse osmosis water treatment systems is essential to prepare the membranes for operating service and to prevent membrane damage due to overfeeding or hydraulic shock. Following the proper start-up sequence also helps ensure that system operating parameters conform to design specifications so that system water quality and productivity goals can be achieved. Before initiating system start-up procedures, membrane pretreatment, loading of the membrane elements, instrument calibration and other system checks should be completed. Please refer to the application information literature entitled “Start-Up Sequence” (Form No. 609-02077) for more information.
Operation Guidelines
Avoid any abrupt pressure or cross-flow variations on the spiral elements during start-up, shutdown, cleaning or other sequences to prevent possible membrane damage. During start-up, a gradual change from a standstill to operating state is recommended as follows: • •
Feed pressure should be increased gradually over a 30-60 second time frame. Cross-flow velocity at set operating point should be achieved gradually over 15-20 seconds.
•
• •
•
•
• •
Permeate obtained from first hour of operation should be discarded.
General Information
Keep elements moist at all times after initial wetting. If operating limits and guidelines given in this bulletin are not strictly followed, the limited warranty will be null and void. To prevent biological growth during prolonged system shutdowns, it is recommended that membrane elements be immersed in a preservative solution. The customer is fully responsible for the effects of incompatible chemicals and lubricants on elements. Maximum pressure drop across an entire pressure vessel (housing) is 30 psi (2.1 bar). Avoid static permeate-side backpressure at all times.
FILMTEC™ Membranes For more information about FILMTEC membranes, call the Dow Water Solutions business: North America: 1-800-447-4369 Latin America: (+55) 11-5188-9222 Europe: (+32) 3-450-2240 Pacific: +60 3 7958 3392 Japan: +813 5460 2100 China: +86 21 2301 9000 http://www.filmtec.com
Notice: The use of this product in and of itself does not necessarily guarantee the removal of cysts and pathogens from water. Effective cyst and pathogen reduction is dependent on the complete system design and on the operation and maintenance of the system. Notice: No freedom from any patent owned by Seller or others is to be inferred. Because use conditions and applicable laws may differ from one location to another and may change with time, Customer is responsible for determining whether products and the information in this document are appropriate for Customer’s use and for ensuring that Customer’s workplace and disposal practices are in compliance with applicable laws and other governmental enactments. Seller assumes no obligation or liability for the information in this document. NO WARRANTIES ARE GIVEN; ALL IMPLIED WARRANTIES OF MERCHANTABILITY OR FITNESS FOR A PARTICULAR PURPOSE ARE EXPRESSLY EXCLUDED.
104
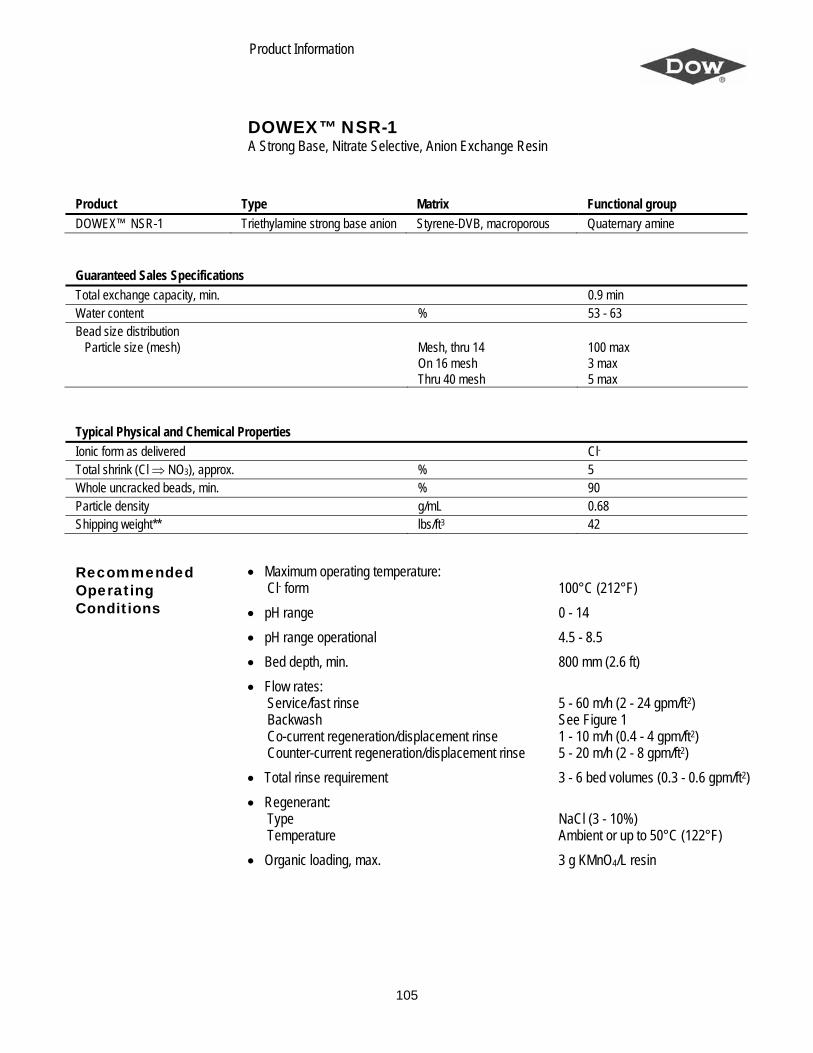
Product Information
DOWEX™ NSR-1 A Strong Base, Nitrate Selective, Anion Exchange Resin
Product Type Matrix Functional group DOWEX™ NSR-1 Triethylamine strong base anion Styrene-DVB, macroporous Quaternary amine Guaranteed Sales Specifications Total exchange capacity, min. 0.9 min Water content % 53 - 63 Bead size distribution Particle size (mesh)
Mesh, thru 14 On 16 mesh Thru 40 mesh
100 max 3 max 5 max
Typical Physical and Chemical Properties Ionic form as delivered Cl- Total shrink (Cl ⇒ NO3), approx. % 5 Whole uncracked beads, min. % 90 Particle density g/mL 0.68 Shipping weight** lbs/ft3 42 Recommended Operating Conditions
• Maximum operating temperature: Cl- form
• pH range • pH range operational • Bed depth, min. • Flow rates:
Service/fast rinse Backwash Co-current regeneration/displacement rinse Counter-current regeneration/displacement rinse
• Total rinse requirement • Regenerant:
Type Temperature
• Organic loading, max.
1 00°C (212°F) 0 - 14 4 .5 - 8.5 8 00 mm (2.6 ft) 5 - 60 m/h (2 - 24 gpm/ft2) See Figure 1 1 - 10 m/h (0.4 - 4 gpm/ft2) 5 - 20 m/h (2 - 8 gpm/ft2) 3 - 6 bed volumes (0.3 - 0.6 gpm/ft2) NaCl (3 - 10%) A mbient or up to 50°C (122°F) 3 g KMnO4/L resin
105
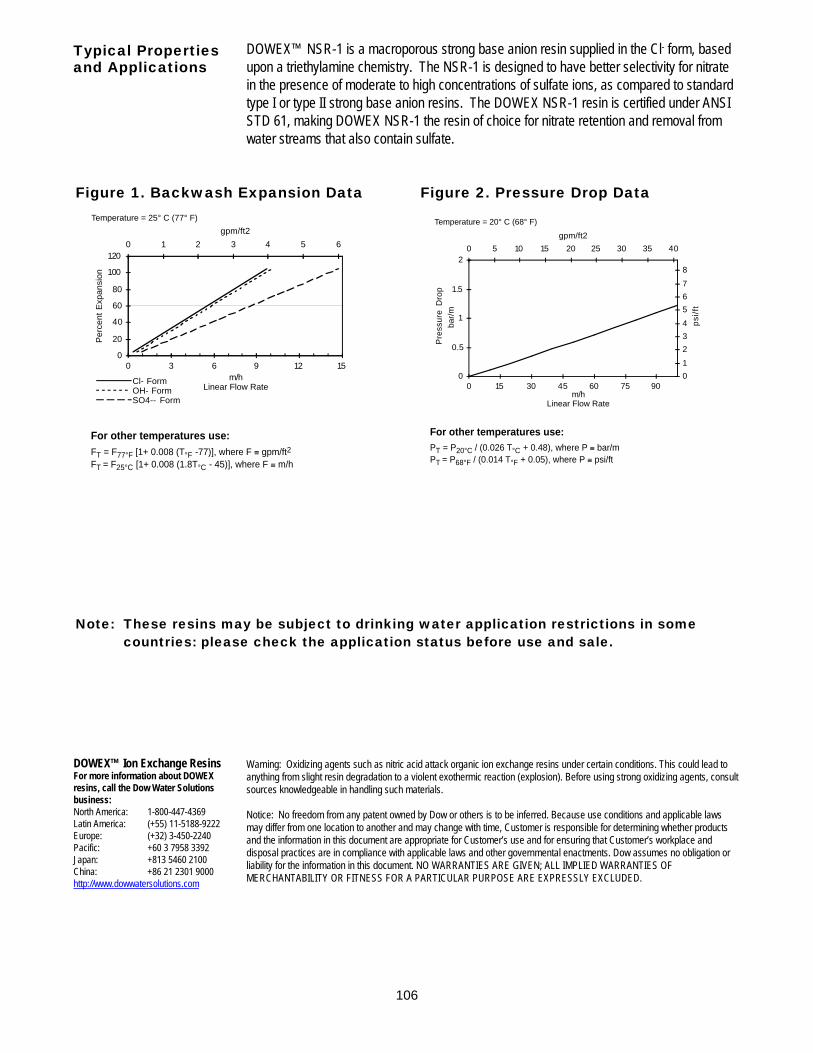
Typical Properties and Applications
DOWEX™ NSR-1 is a macroporous strong base anion resin supplied in the Cl- form, based upon a triethylamine chemistry. The NSR-1 is designed to have better selectivity for nitrate in the presence of moderate to high concentrations of sulfate ions, as compared to standard type I or type II strong base anion resins. The DOWEX NSR-1 resin is certified under ANSI STD 61, making DOWEX NSR-1 the resin of choice for nitrate retention and removal from water streams that also contain sulfate.
Figure 1. Backwash Expansion Data Figure 2. Pressure Drop Data
0
20
40
60
80
100
120
0 3 6 9 12 15m/h
Linear Flow Rate
Per
cent
Exp
ansi
on
0 1 2 3 4 5 6
gpm/ft2
Cl- FormOH- FormSO4-- Form
For other temperatures use:FT = F77°F [1+ 0.008 (T°F -77)], where F ≡ gpm/ft2
FT = F25°C [1+ 0.008 (1.8T°C - 45)], where F ≡ m/h
Temperature = 25° C (77° F)
0
0.5
1
1.5
2
0 15 30 45 60 75 90m/h
Linear Flow Rate
bar/
m
0
1
2
3
4
5
6
7
8
0 5 10 15 20 25 30 35 40
gpm/ft2
psi
/ft
Pre
ssur
e D
rop
For other temperatures use:PT = P20°C / (0.026 T°C + 0.48), where P ≡ bar/mPT = P68°F / (0.014 T°F + 0.05), where P ≡ psi/ft
Temperature = 20° C (68° F)
Note: These resins may be subject to drinking water application restrictions in some
countries: please check the application status before use and sale. DOWEX™ Ion Exchange Resins For more information about DOWEX resins, call the Dow Water Solutions business: North America: 1-800-447-4369 Latin America: (+55) 11-5188-9222 Europe: (+32) 3-450-2240 Pacific: +60 3 7958 3392 Japan: +813 5460 2100 China: +86 21 2301 9000 http://www.dowwatersolutions.com
Warning: Oxidizing agents such as nitric acid attack organic ion exchange resins under certain conditions. This could lead to anything from slight resin degradation to a violent exothermic reaction (explosion). Before using strong oxidizing agents, consult sources knowledgeable in handling such materials. Notice: No freedom from any patent owned by Dow or others is to be inferred. Because use conditions and applicable laws may differ from one location to another and may change with time, Customer is responsible for determining whether products and the information in this document are appropriate for Customer’s use and for ensuring that Customer’s workplace and disposal practices are in compliance with applicable laws and other governmental enactments. Dow assumes no obligation or liability for the information in this document. NO WARRANTIES ARE GIVEN; ALL IMPLIED WARRANTIES OF MERCHANTABILITY OR FITNESS FOR A PARTICULAR PURPOSE ARE EXPRESSLY EXCLUDED.
106
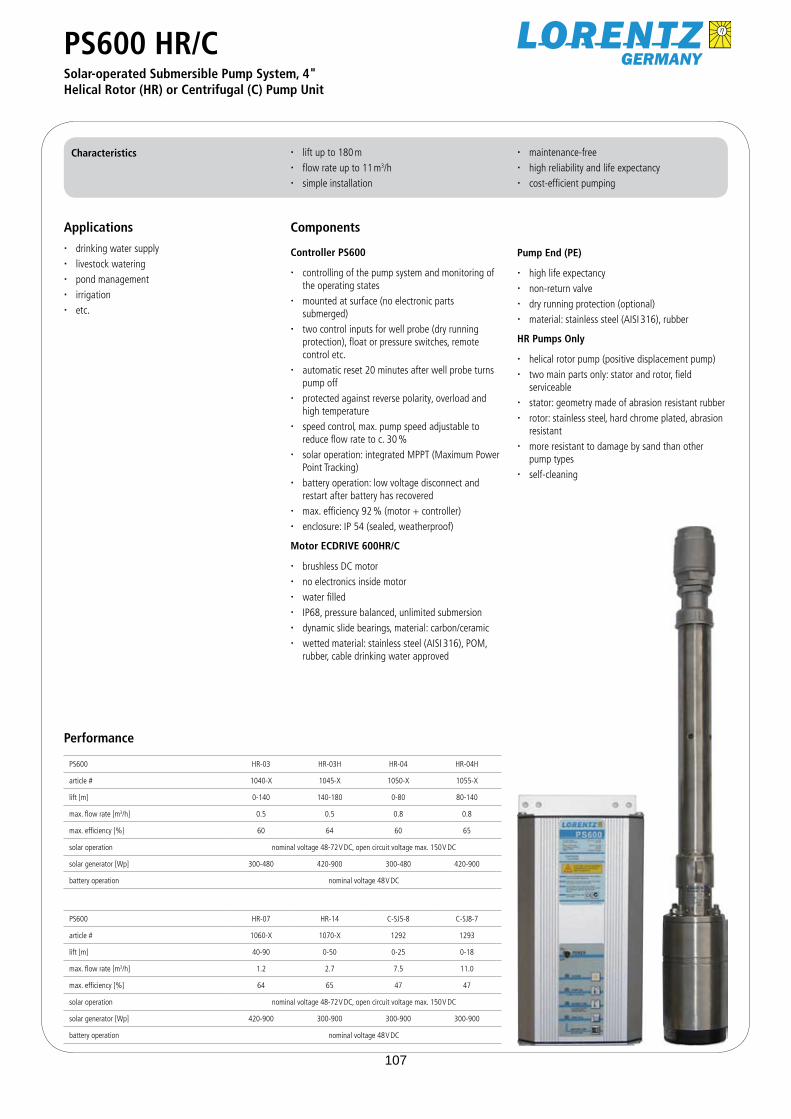
PS600 HR/CSolar-operated Submersible Pump System, 4" Helical Rotor (HR) or Centrifugal (C) Pump Unit
Characteristics lift up to 180 m �flow rate up to 11 m � 3/hsimple installation �
maintenance-free �high reliability and life expectancy �cost-efficient pumping �
Applications
drinking water supply �livestock watering �pond management �irrigation �etc. �
Performance
PS600 HR-03 HR-03H HR-04 HR-04H
article # 1040-X 1045-X 1050-X 1055-X
lift [m] 0-140 140-180 0-80 80-140
max. flow rate [m3/h] 0.5 0.5 0.8 0.8
max. efficiency [%] 60 64 60 65
solar operation nominal voltage 48-72 V DC, open circuit voltage max. 150 V DC
solar generator [Wp] 300-480 420-900 300-480 420-900
battery operation nominal voltage 48 V DC
PS600 HR-07 HR-14 C-SJ5-8 C-SJ8-7
article # 1060-X 1070-X 1292 1293
lift [m] 40-90 0-50 0-25 0-18
max. flow rate [m3/h] 1.2 2.7 7.5 11.0
max. efficiency [%] 64 65 47 47
solar operation nominal voltage 48-72 V DC, open circuit voltage max. 150 V DC
solar generator [Wp] 420-900 300-900 300-900 300-900
battery operation nominal voltage 48 V DC
Components
Controller PS600
controlling of the pump system and monitoring of �the operating statesmounted at surface (no electronic parts �submerged)two control inputs for well probe (dry running �protection), float or pressure switches, remote control etc.automatic reset 20 minutes after well probe turns �pump offprotected against reverse polarity, overload and �high temperaturespeed control, max. pump speed adjustable to �reduce flow rate to c. 30 %solar operation: integrated MPPT (Maximum Power �Point Tracking)battery operation: low voltage disconnect and �restart after battery has recoveredmax. efficiency 92 % (motor + controller) �enclosure: IP 54 (sealed, weatherproof) �
Motor ECDRIVE 600HR/C
brushless DC motor �no electronics inside motor �water filled �IP68, pressure balanced, unlimited submersion �dynamic slide bearings, material: carbon/ceramic �wetted material: stainless steel (AISI 316), POM, �rubber, cable drinking water approved
Pump End (PE)
high life expectancy �non-return valve �dry running protection (optional) �material: stainless steel (AISI 316), rubber �
HR Pumps Only
helical rotor pump (positive displacement pump) �two main parts only: stator and rotor, field �serviceablestator: geometry made of abrasion resistant rubber �rotor: stainless steel, hard chrome plated, abrasion �resistantmore resistant to damage by sand than other �pump typesself-cleaning �
107
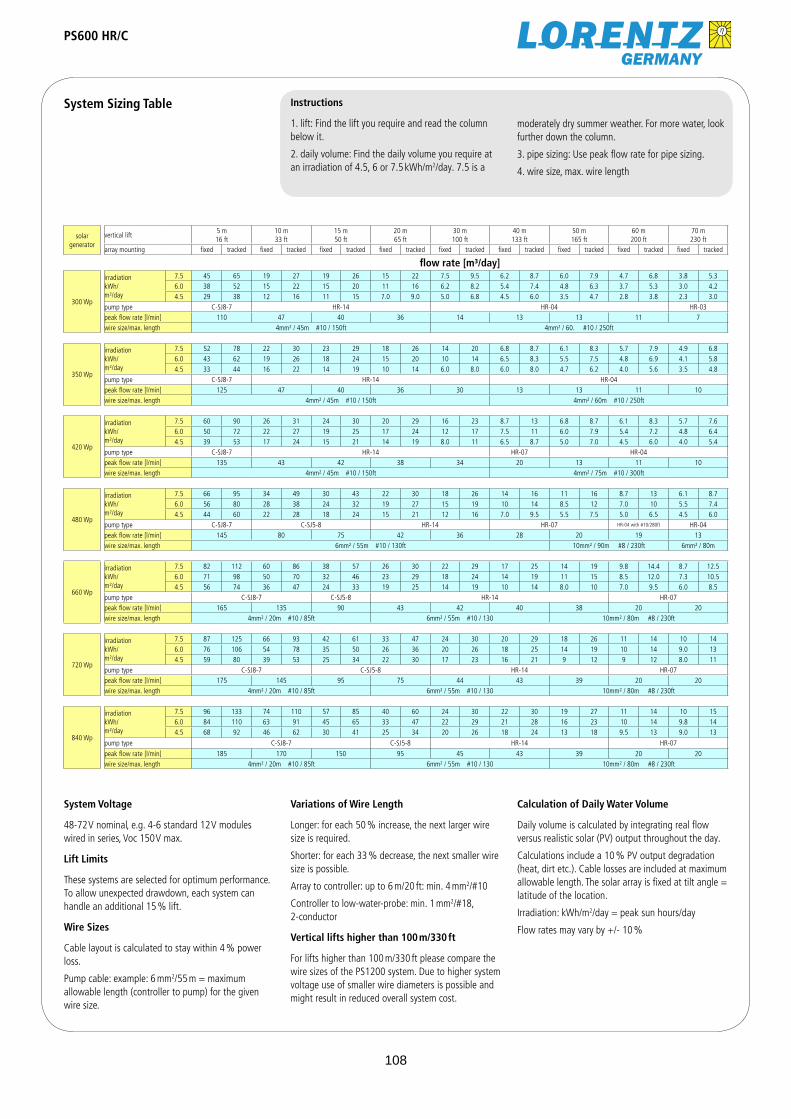
PS600 HR/C
System Sizing Table Instructions
1. lift: Find the lift you require and read the column below it.
2. daily volume: Find the daily volume you require at an irradiation of 4.5, 6 or 7.5 kWh/m2/day. 7.5 is a
System Voltage
48-72 V nominal, e.g. 4-6 standard 12 V modules wired in series, Voc 150 V max.
Lift Limits
These systems are selected for optimum performance. To allow unexpected drawdown, each system can handle an additional 15 % lift.
Wire Sizes
Cable layout is calculated to stay within 4 % power loss.
Pump cable: example: 6 mm2/55 m = maximum allowable length (controller to pump) for the given wire size.
Calculation of Daily Water Volume
Daily volume is calculated by integrating real flow versus realistic solar (PV) output throughout the day.
Calculations include a 10 % PV output degradation (heat, dirt etc.). Cable losses are included at maximum allowable length. The solar array is fixed at tilt angle = latitude of the location.
Irradiation: kWh/m2/day = peak sun hours/day
Flow rates may vary by +/- 10 %
moderately dry summer weather. For more water, look further down the column.
3. pipe sizing: Use peak flow rate for pipe sizing.
4. wire size, max. wire length
solar generator
vertical lift5 m16 ft
10 m33 ft
15 m50 ft
20 m65 ft
30 m100 ft
40 m133 ft
50 m165 ft
60 m200 ft
70 m230 ft
array mounting fixed tracked fixed tracked fixed tracked fixed tracked fixed tracked fixed tracked fixed tracked fixed tracked fixed tracked
flow rate [m³/day]
300 Wp
irradiationkWh/m²/day
7.5 45 65 19 27 19 26 15 22 7.5 9.5 6.2 8.7 6.0 7.9 4.7 6.8 3.8 5.36.0 38 52 15 22 15 20 11 16 6.2 8.2 5.4 7.4 4.8 6.3 3.7 5.3 3.0 4.24.5 29 38 12 16 11 15 7.0 9.0 5.0 6.8 4.5 6.0 3.5 4.7 2.8 3.8 2.3 3.0
pump type C-SJ8-7 HR-14 HR-04 HR-03peak flow rate [l/min] 110 47 40 36 14 13 13 11 7wire size/max. length 4mm² / 45m #10 / 150ft 4mm² / 60. #10 / 250ft
350 Wp
irradiationkWh/m²/day
7.5 52 78 22 30 23 29 18 26 14 20 6.8 8.7 6.1 8.3 5.7 7.9 4.9 6.86.0 43 62 19 26 18 24 15 20 10 14 6.5 8.3 5.5 7.5 4.8 6.9 4.1 5.84.5 33 44 16 22 14 19 10 14 6.0 8.0 6.0 8.0 4.7 6.2 4.0 5.6 3.5 4.8
pump type C-SJ8-7 HR-14 HR-04peak flow rate [l/min] 125 47 40 36 30 13 13 11 10wire size/max. length 4mm² / 45m #10 / 150ft 4mm² / 60m #10 / 250ft
420 Wp
irradiationkWh/m²/day
7.5 60 90 26 31 24 30 20 29 16 23 8.7 13 6.8 8.7 6.1 8.3 5.7 7.66.0 50 72 22 27 19 25 17 24 12 17 7.5 11 6.0 7.9 5.4 7.2 4.8 6.44.5 39 53 17 24 15 21 14 19 8.0 11 6.5 8.7 5.0 7.0 4.5 6.0 4.0 5.4
pump type C-SJ8-7 HR-14 HR-07 HR-04peak flow rate [l/min] 135 43 42 38 34 20 13 11 10wire size/max. length 4mm² / 45m #10 / 150ft 4mm² / 75m #10 / 300ft
480 Wp
irradiationkWh/m²/day
7.5 66 95 34 49 30 43 22 30 18 26 14 16 11 16 8.7 13 6.1 8.76.0 56 80 28 38 24 32 19 27 15 19 10 14 8.5 12 7.0 10 5.5 7.44.5 44 60 22 28 18 24 15 21 12 16 7.0 9.5 5.5 7.5 5.0 6.5 4.5 6.0
pump type C-SJ8-7 C-SJ5-8 HR-14 HR-07 HR-04 with #10/280ft HR-04peak flow rate [l/min] 145 80 75 42 36 28 20 19 13wire size/max. length 6mm² / 55m #10 / 130ft 10mm² / 90m #8 / 230ft 6mm² / 80m
660 Wp
irradiationkWh/m²/day
7.5 82 112 60 86 38 57 26 30 22 29 17 25 14 19 9.8 14.4 8.7 12.56.0 71 98 50 70 32 46 23 29 18 24 14 19 11 15 8.5 12.0 7.3 10.54.5 56 74 36 47 24 33 19 25 14 19 10 14 8.0 10 7.0 9.5 6.0 8.5
pump type C-SJ8-7 C-SJ5-8 HR-14 HR-07peak flow rate [l/min] 165 135 90 43 42 40 38 20 20wire size/max. length 4mm² / 20m #10 / 85ft 6mm² / 55m #10 / 130 10mm² / 80m #8 / 230ft
720 Wp
irradiationkWh/m²/day
7.5 87 125 66 93 42 61 33 47 24 30 20 29 18 26 11 14 10 146.0 76 106 54 78 35 50 26 36 20 26 18 25 14 19 10 14 9.0 134.5 59 80 39 53 25 34 22 30 17 23 16 21 9 12 9 12 8.0 11
pump type C-SJ8-7 C-SJ5-8 HR-14 HR-07peak flow rate [l/min] 175 145 95 75 44 43 39 20 20wire size/max. length 4mm² / 20m #10 / 85ft 6mm² / 55m #10 / 130 10mm² / 80m #8 / 230ft
840 Wp
irradiationkWh/m²/day
7.5 96 133 74 110 57 85 40 60 24 30 22 30 19 27 11 14 10 156.0 84 110 63 91 45 65 33 47 22 29 21 28 16 23 10 14 9.8 144.5 68 92 46 62 30 41 25 34 20 26 18 24 13 18 9.5 13 9.0 13
pump type C-SJ8-7 C-SJ5-8 HR-14 HR-07peak flow rate [l/min] 185 170 150 95 45 43 39 20 20wire size/max. length 4mm² / 20m #10 / 85ft 6mm² / 55m #10 / 130 10mm² / 80m #8 / 230ft
Variations of Wire Length
Longer: for each 50 % increase, the next larger wire size is required.
Shorter: for each 33 % decrease, the next smaller wire size is possible.
Array to controller: up to 6 m/20 ft: min. 4 mm2/#10
Controller to low-water-probe: min. 1 mm2/#18, 2-conductor
Vertical lifts higher than 100 m/330 ft
For lifts higher than 100 m/330 ft please compare the wire sizes of the PS1200 system. Due to higher system voltage use of smaller wire diameters is possible and might result in reduced overall system cost.
108
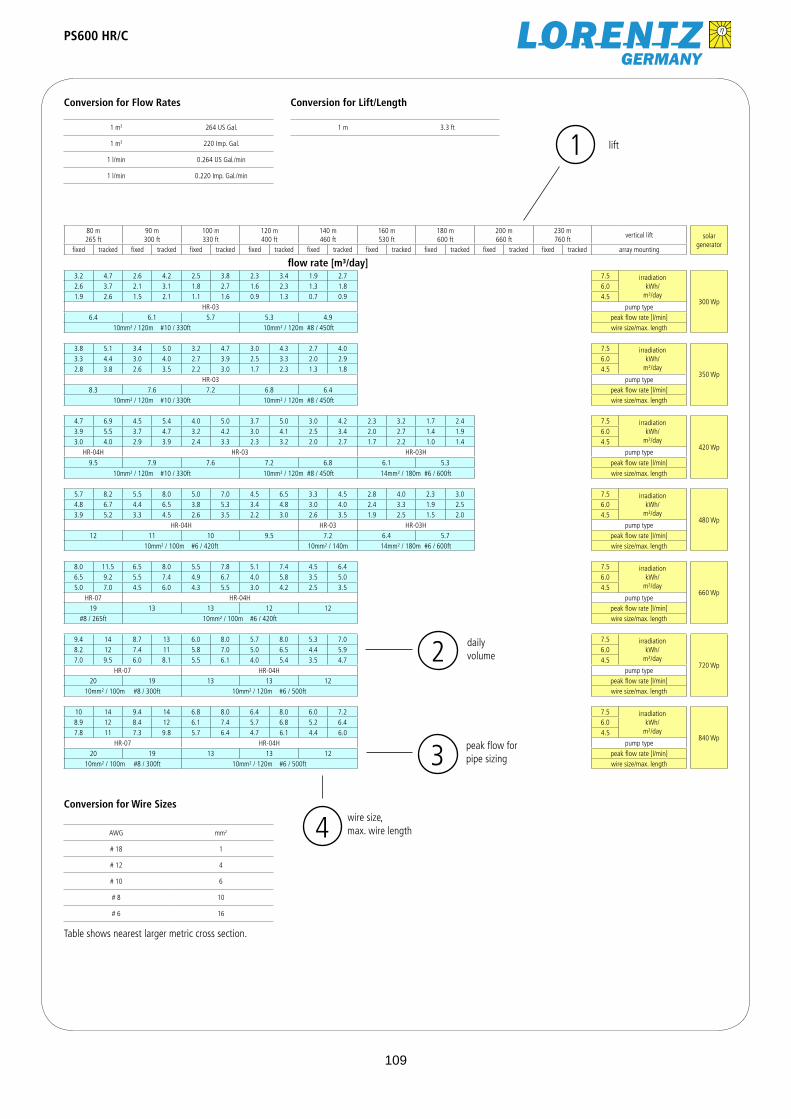
80 m 265 ft
90 m 300 ft
100 m330 ft
120 m400 ft
140 m460 ft
160 m530 ft
180 m600 ft
200 m660 ft
230 m760 ft
vertical lift solar generator
fixed tracked fixed tracked fixed tracked fixed tracked fixed tracked fixed tracked fixed tracked fixed tracked fixed tracked array mounting
flow rate [m³/day]3.2 4.7 2.6 4.2 2.5 3.8 2.3 3.4 1.9 2.7 7.5 irradiation
kWh/m²/day
300 Wp
2.6 3.7 2.1 3.1 1.8 2.7 1.6 2.3 1.3 1.8 6.01.9 2.6 1.5 2.1 1.1 1.6 0.9 1.3 0.7 0.9 4.5
HR-03 pump type6.4 6.1 5.7 5.3 4.9 peak flow rate [l/min]
10mm² / 120m #10 / 330ft 10mm² / 120m #8 / 450ft wire size/max. length
3.8 5.1 3.4 5.0 3.2 4.7 3.0 4.3 2.7 4.0 7.5 irradiationkWh/
m²/day350 Wp
3.3 4.4 3.0 4.0 2.7 3.9 2.5 3.3 2.0 2.9 6.02.8 3.8 2.6 3.5 2.2 3.0 1.7 2.3 1.3 1.8 4.5
HR-03 pump type8.3 7.6 7.2 6.8 6.4 peak flow rate [l/min]
10mm² / 120m #10 / 330ft 10mm² / 120m #8 / 450ft wire size/max. length
4.7 6.9 4.5 5.4 4.0 5.0 3.7 5.0 3.0 4.2 2.3 3.2 1.7 2.4 7.5 irradiationkWh/
m²/day420 Wp
3.9 5.5 3.7 4.7 3.2 4.2 3.0 4.1 2.5 3.4 2.0 2.7 1.4 1.9 6.03.0 4.0 2.9 3.9 2.4 3.3 2.3 3.2 2.0 2.7 1.7 2.2 1.0 1.4 4.5
HR-04H HR-03 HR-03H pump type9.5 7.9 7.6 7.2 6.8 6.1 5.3 peak flow rate [l/min]
10mm² / 120m #10 / 330ft 10mm² / 120m #8 / 450ft 14mm² / 180m #6 / 600ft wire size/max. length
5.7 8.2 5.5 8.0 5.0 7.0 4.5 6.5 3.3 4.5 2.8 4.0 2.3 3.0 7.5 irradiationkWh/
m²/day480 Wp
4.8 6.7 4.4 6.5 3.8 5.3 3.4 4.8 3.0 4.0 2.4 3.3 1.9 2.5 6.03.9 5.2 3.3 4.5 2.6 3.5 2.2 3.0 2.6 3.5 1.9 2.5 1.5 2.0 4.5
HR-04H HR-03 HR-03H pump type12 11 10 9.5 7.2 6.4 5.7 peak flow rate [l/min]
10mm² / 100m #6 / 420ft 10mm² / 140m 14mm² / 180m #6 / 600ft wire size/max. length
8.0 11.5 6.5 8.0 5.5 7.8 5.1 7.4 4.5 6.4 7.5 irradiationkWh/
m²/day660 Wp
6.5 9.2 5.5 7.4 4.9 6.7 4.0 5.8 3.5 5.0 6.05.0 7.0 4.5 6.0 4.3 5.5 3.0 4.2 2.5 3.5 4.5
HR-07 HR-04H pump type19 13 13 12 12 peak flow rate [l/min]
#8 / 265ft 10mm² / 100m #6 / 420ft wire size/max. length
9.4 14 8.7 13 6.0 8.0 5.7 8.0 5.3 7.0 7.5 irradiationkWh/
m²/day720 Wp
8.2 12 7.4 11 5.8 7.0 5.0 6.5 4.4 5.9 6.07.0 9.5 6.0 8.1 5.5 6.1 4.0 5.4 3.5 4.7 4.5
HR-07 HR-04H pump type20 19 13 13 12 peak flow rate [l/min]
10mm² / 100m #8 / 300ft 10mm² / 120m #6 / 500ft wire size/max. length
10 14 9.4 14 6.8 8.0 6.4 8.0 6.0 7.2 7.5 irradiationkWh/
m²/day840 Wp
8.9 12 8.4 12 6.1 7.4 5.7 6.8 5.2 6.4 6.07.8 11 7.3 9.8 5.7 6.4 4.7 6.1 4.4 6.0 4.5
HR-07 HR-04H pump type20 19 13 13 12 peak flow rate [l/min]
10mm² / 100m #8 / 300ft 10mm² / 120m #6 / 500ft wire size/max. length
lift
PS600 HR/C
Conversion for Flow Rates
1 m3 264 US Gal.
1 m3 220 Imp. Gal.
1 l/min 0.264 US Gal./min
1 l/min 0.220 Imp. Gal./min
Conversion for Lift/Length
1 m 3.3 ft
Conversion for Wire Sizes
AWG mm2
# 18 1
# 12 4
# 10 6
# 8 10
# 6 16
Table shows nearest larger metric cross section.
peak flow for pipe sizing
wire size, max. wire length
daily volume
4
3
2
1
109
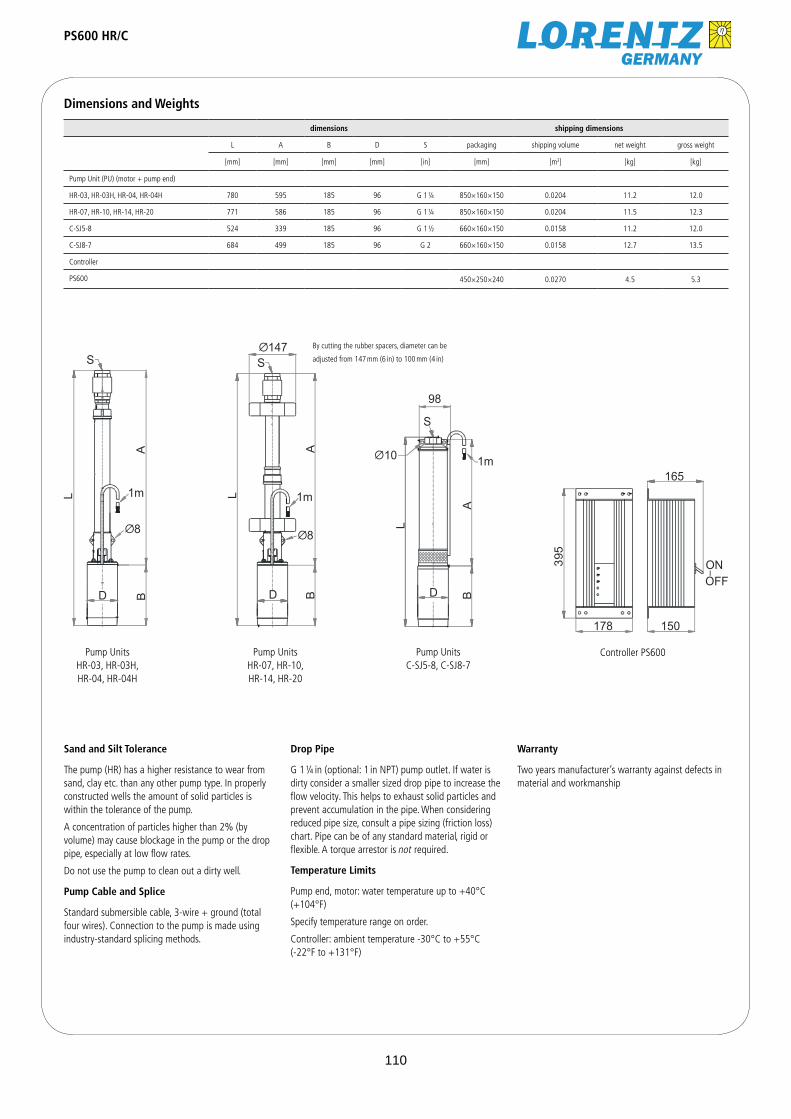
PS600 HR/C
Dimensions and Weights
Sand and Silt Tolerance
The pump (HR) has a higher resistance to wear from sand, clay etc. than any other pump type. In properly constructed wells the amount of solid particles is within the tolerance of the pump.
A concentration of particles higher than 2% (by volume) may cause blockage in the pump or the drop pipe, especially at low flow rates.
Do not use the pump to clean out a dirty well.
Pump Cable and Splice
Standard submersible cable, 3-wire + ground (total four wires). Connection to the pump is made using industry-standard splicing methods.
dimensions shipping dimensions
L A B D S packaging shipping volume net weight gross weight
[mm] [mm] [mm] [mm] [in] [mm] [m3] [kg] [kg]
Pump Unit (PU) (motor + pump end)
HR-03, HR-03H, HR-04, HR-04H 780 595 185 96 G 1 ¼ 850×160×150 0.0204 11.2 12.0
HR-07, HR-10, HR-14, HR-20 771 586 185 96 G 1 ¼ 850×160×150 0.0204 11.5 12.3
C-SJ5-8 524 339 185 96 G 1 ½ 660×160×150 0.0158 11.2 12.0
C-SJ8-7 684 499 185 96 G 2 660×160×150 0.0158 12.7 13.5
Controller
PS600 450×250×240 0.0270 4.5 5.3
395
165
150178
ONOFF
S
1m
A
L
BD
O8
S
1m
A
L
BD
O8
O147
S
1mA
L
BD
O10
98
By cutting the rubber spacers, diameter can be
adjusted from 147 mm (6 in) to 100 mm (4 in)
Pump Units HR-03, HR-03H, HR-04, HR-04H
Pump Units HR-07, HR-10, HR-14, HR-20
Pump Units C-SJ5-8, C-SJ8-7
Controller PS600
Drop Pipe
G 1 ¼ in (optional: 1 in NPT) pump outlet. If water is dirty consider a smaller sized drop pipe to increase the flow velocity. This helps to exhaust solid particles and prevent accumulation in the pipe. When considering reduced pipe size, consult a pipe sizing (friction loss) chart. Pipe can be of any standard material, rigid or flexible. A torque arrestor is not required.
Temperature Limits
Pump end, motor: water temperature up to +40°C (+104°F)
Specify temperature range on order.
Controller: ambient temperature -30°C to +55°C (-22°F to +131°F)
Warranty
Two years manufacturer’s warranty against defects in material and workmanship
110