Embed Size (px)
Citation preview
Kidney International, Vol. 57 (2000), pp. 203–214
Renal afferent signaling diuretic response is impairedin streptozotocin-induced diabetic rats
CHIANG-TING CHIEN, HSIUNG-FEI CHIEN, YA-JONG CHENG, CHAU-FONG CHEN,and SU-MING HSU
Departments of Clinical Research, Surgery, Physiology, and Pathology, National Taiwan University College of Medicine,Taipei, Taiwan
was not restored by acute correction of hyperglycemia inRenal afferent signaling diuretic response is impaired in strep-DMAI rats. However, antihistamine treatment or chronic insu-tozotocin-induced diabetic rats.lin treatment recovered the MRu response to mechanical stim-Background. Renal insufficiency develops in diabetes anduli in DM rats. Because of the desensitized CR2 and MRushows structural and functional abnormalities. Renal afferents,activity, renorenal reflexes elicited by backflow of urine andincluding chemoreceptors and mechanoreceptors located inincreasing UP were depressed in DM rats.the vascular and ureteropelvic portions of the kidney, may
Conclusion. Despite a lack of structural changes, the op-reflect changes in the environment and trigger an afferenterating system, signaling ability, and renorenal reflex regulatorynerve-mediated regulatory function that is known as the reno-function of two renal afferent nerve receptors, CR2 and MRu,renal reflex. In this study, the involvement of these renal sen-are altered in the early diabetic state.sory receptors during the early diabetic state is defined.
Methods. Diabetes was induced in rats after a tail vein injec-tion of streptozotocin (STZ; 60 mg/kg intravenously). Fourgroups of rats, control (C), diabetic (DM), diabetic with acute Like other visceral organs, the kidneys have a profuseinsulin treatment (DMAI, 9 U/rat, subcutaneously, on the ex-
sensory innervation. Electrophysiologic studies in theperimental day), and chronic insulin treatment (DMCI, 9 U/mammalian kidney have identified two major classes ofrat, subcutaneously, daily) were studied. Spontaneous firing
type 2-renal chemoreceptor (CR2), arterial mechanoreceptor sensory receptors of the renal afferent nerves, chemore-(MRa), ureteropelvic mechanoreceptor (MRu), and venous ceptors (CRs), and mechanoreceptors (MRs). Renalmechanoreceptor (MRv) were identified by single-unit analysis CRs are of two types, CR1 and CR2. Both respond toof renal afferent nervous activity. The receptor activities were
renal ischemia, but only CR2 reacts to alterations in theconfirmed by their response patterns to stimuli elicited by renalelectrolyte composition of the renal pelvis [1–3]. MRsarterial occlusion (RAO), backflow of urine, increasing arterial
pressure, increasing ureteropelvic pressure (UP), or renal ve- are of three types, each sensitive to arterial perfusionnous occlusion (RVO). The response of these afferent recep- pressure (MRa), venous pressure (MRv), and uretero-tors to a challenge of volume expansion and their functional pelvic pressure (MRu) [3–9]. These sensory receptorsactivities on renorenal reflexes were also examined. Immuno-
with their specific activities can reflect the physical andstaining with PGP 9.5 was applied for examination of the nervechemical states of the kidney in diuretic and antidiureticdistribution in the diabetic kidney. The tissue level of histaminestates [2, 3, 9], as well as in pathologic conditions such asin the renal pelvis was determined. We explored the effect of
histamine on renal receptor activity in these animals to address chronic hypoxia [3], hypertension [10–12], and ischemicthe possible role of histamine in MRu receptor activity. renal failure [13]. Activation of these renal sensory re-
Results. In early diabetics, signaling activities in MRa and ceptors [that is, renal afferent nerve activity (RANA)]MRv were maintained; however, activity in CR2 and MRucould initiate renorenal reflexes through the efferent in-was depressed. For CR2, the reduced basal discharge and thenervation or through circulatory changes [10, 12] or couldrepressed responses to RAO, backflow of urine, and volume
expansion found in DM rats were recovered by acute insulin initiate a direct effect on the function of the visceraltreatment to restore glucose levels to near normal. For MRu, organs by releasing neuropeptides [14]. Therefore, thesethe depressed response to increasing UP and volume expansion renal sensory receptors respond to specific messages
from different areas of the intrarenal vascular and inter-stitial beds, and they play an important role in the regula-Key words: diabetes, renal chemoreceptor, mechanoreceptor, volume
expansion, renorenal reflex. tion of body fluid homeostasis [10, 12].Human beings or animals that have diabetes developReceived for publication February 15, 1999
functional and structural abnormalities in various organs.and in revised form July 20, 1999Accepted for publication September 20, 1999 The altered body fluid homeostasis is evidenced by hy-
perglycemia/hyperosmolarity and increases in extracel- 2000 by the International Society of Nephrology
203

Chien et al: Renal sensory receptors in diabetes204
lular fluid, blood volume, glomerular filtration rate, and control rats. For daily collection of urine samples, eachrat was placed in an individual metabolic cage.urinary protein excretion [15, 16]. Other biochemical
changes also involve an increase in the synthesis of hista-Surgical preparationmine and/or its level in tissues [17]. Histamine has been
known to affect afferent nerve activity via its receptor Two weeks after STZ injection, the rats were anesthe-tized with sodium pentobarbital (40 mg/kg, intraperito-on nerve fibers [18] or nerve terminals [19]. Structural
alterations in the kidney include an increase in renal mass neally). The body temperature was kept at 36.58C to378C by an infrared light and was monitored with a rectalinvolving glomeruli, tubules, and blood vessels [20, 21],
progressive tubulointerstitial changes, and collagen de- thermometer. The trachea was exposed via a midlinecervical incision and was then intubated. Catheters wereposition [22, 23]. Thus, the characteristics and functions
of these renal sensory receptors may be affected as a placed in the left femoral artery for continuous bloodpressure recordings with a pressure transducer (Gouldresult of altered homeostasis, renal structural changes,
and/or neuropathy [24] associated with diabetes. In this P23-ID; Gould Inc., Cleveland, OH, USA) and in theright femoral vein for infusion of anesthetic and saline.study, we used the technique of single-unit recordings
of nerve fibers to compare each receptor responding to The heart rate was determined with a tachograph trig-gered by arterial pulsations. All hemodynamic responsesspecific stimuli (described in the Methods section) and
volume expansion (VE) in diabetic and control rats. We were recorded by a polygraph (RS-3400; Gould Inc.).The rat was placed on its right side, and the left kidneylooked for the mechanisms responsible for the alter-
ations in these sensory receptor activities, if present, was exposed via a flank incision. The kidney surface wascontinuously bathed with paraffin oil warmed to 388Cduring the early diabetic state in streptozotocin (STZ)-
treated rats. and illuminated with a fiber optic light source. With thehelp of a stereoscopic dissecting microscope (Olympus,SZ-STU2), the left renal nerves at the angle between
METHODSthe aorta and the left renal artery were carefully isolated
Induction of diabetes from the surrounding tissues on each side of the leftrenal artery for recording of the renal nerve activity.Female Wistar rats weighing 200 to 230 g were fed rat
chow and water ad libitum and were housed in standardRenal nerve activity recordingcare facilities. All studies and care of animals adhered
to the National Research Council guide for the care and The recording technique has been reported previously[3, 13]. Briefly, recordings from the multifiber prepara-use of laboratory animals. Experiments were performed
one week after rats were acclimatized to their environ- tions, which contain renal sympathetic efferent (RENA)and renal visceral afferent fibers (RANA), were madement. The rats were assigned to one of four groups: a
control (C) group, a diabetes group (DM), a diabetes 1 by placement of the intact nerve fiber in one pair of thin,bipolar stainless steel electrodes. The renal nerves andacute (single) insulin-treatment group (DMAI), and a
diabetes 1 chronic (daily) insulin treatment (DMCI) electrodes were continuously bathed in a pool of warmparaffin oil (388C) to prevent the tissue from drying. Thegroup. In total, 67 controls, 63 DM, 24 DMAI, and 24
DMCI rats were used in this study. electrical signals were amplified 20,000-fold and filtered(high-frequency cutoff 3000 Hz, low-frequency cutoff 30In the DM, DMAI, and DMCI groups, diabetes was
induced by a single intravenous injection of streptozo- Hz) by a Grass model P511 AC preamplifier and werecontinuously displayed on a Gould oscilloscope (1604;tocin (STZ) via the tail vein (60 mg/kg; Sigma Chemical
Co., St. Louis, MO, USA) in a 2% solution of cold 0.1 mol Gould Inc.). The amplified signals were recorded onmagnetic tape and fed into a window discriminator (WPIcitrate buffer (pH 4.5). The onset of diabetes occurred
rapidly and was identified by polydipsia, polyuria, and 121) and a Gould integrator amplifier (13-4615-70; GouldInc.). Renal nerve activity was analyzed with an impulsea glucose concentration .250 mg/dL of blood (One
Touch II; LIFESCAN, Milpitas, CA, USA) withdrawn counter designed and built in our laboratories, whichwas set to accumulate and display the number of nervefrom the tail vein. Control rats received a similar volume
of vehicle alone. DMAI rats were injected with a single impulses per unit time. The background activity, whichcould be caused by the precision of the nerve dissectiondose of long-acting insulin (NPH Iletin, U-100; 9 U/rat,
subcutaneously; Eli Lilly, Indianapolis, IN, USA) [25, 26] from surrounding tissue, nerve damage during handling,and the equipment itself [13], was excluded from theon the day of the experiment (2 weeks after receiving
the STZ injection), which reduced blood glucose levels window discriminator by adjustment of the thresholdvoltage [3, 13]. After this adjustment, a standard pulsefrom 394 6 32 to 168 6 21 mg/dL. DMCI rats received
chronic insulin (9 U/rat, subcutaneously, daily), with was generated for every spike that exceeded the thresh-old level. The neural activity was transformed into ablood glucose levels hovering around 147 6 19 mg/dL.
The blood glucose concentration was 109 6 7 mg/dL for spike number. We selectively recorded activity from af-

Chien et al: Renal sensory receptors in diabetes 205
Table 1. Characteristics and methods for identification of renal sensory receptors located in the mammalian kidney
Receptor types Excitation/characteristics Methods for identification References
ChemoreceptorCR1 1) Silent type at rest Activated by RAO only (not studied in this [2]
2) Excitation by renal ischemia, severe hypotension, experiment)or hemorrhage
CR2 1) Spontaneous firing at rest Spontaneous type, activated by both RAO for 1–2 [1–3]2) Activation by renal ischemia, severe hypotension, min and backflow of non-diuretic urine into the renal
hemorrhage and backflow of non-diuretic urine, pelvis0.9 mol NaCl, 0.15 mol KCl
3) Inhibition by backflow of salineMechanoreceptor
MRa 1) Silent or spontaneous firing at rest Spontaneous type, activated by increasing arterial [3–6]2) Activation by hypertension blood pressure by injection of norepinephrine (1 mg/3) Inhibition by hypotension, RAO 100 g body weight iv), and inhibition by RAO
MRu 1) Silent or spontaneous firing at rest Spontaneous type, activated by elevating UP to 40 61 [3,8–10]2) Activation by elevating UP mm Hg, and unresponsive to RAO
MRv 1) Silent or spontaneous firing at rest Activated by RVO [3,7]2) Activation by elevating renal venous pressure or
RVO
Abbreviations are: CR1, chemoreceptor type 1; CR2, chemoreceptor type 2; MRa, arterial mechanoreceptor; MRu, ureteropelvic mechanoreceptor; MRv, venousmechanoreceptor; UP, ureteropelvic pressure; RVO, renal venous occlusion; RAO, renal arterial occlusion.
ferent or efferent fibers on bipolar hook electrodes by first severed so that the left kidney was isolated fromcutting the nerve and recording at the distal or proximal any efferent neural influence [1]. Multifiber RANA wasend for RANA or RENA, respectively. verified from the peripheral end of the cut nerve filament.
The afferent nerve bundle was then repeatedly split withRenal receptor identification fine forceps until a single-unit impulse from a dissected
nerve filament was apparent on the oscilloscope trace [3].After surgery and nerve isolation, a short section ofThe characteristics and detailed methods of identifi-the renal artery was carefully cleared of connective tissue
cation of renal sensory receptors of CR2 and MRs into allow complete occlusion by clamping with forcepsthe kidney are presented in Table 1. Only spontaneouslyduring the experiment. A three-way adapter constructedfiring units were selected in this experiment. We identi-of PE-90 tubing was first connected to three saline-filledfied CR2 with the enhanced activity in RAO (that is,pieces of PE-50 tubing, which had previously been in-ischemia) and backflow of urine and identified MRa withserted into the left upper ureter and tied at the uretero-enhanced activity by an acute rise in blood pressurepelvic junction. One branch of the T-tube connector was(BP) and with depressed activity by RAO. MRu wasconnected to a Gould pressure transducer (P23-ID) forspecifically activated by elevated UP (backflow of urine)measurement of ureteropelvic pressure (UP), and thebut was not altered by RAO. MRv was specifically acti-other was left open to allow urine to flow out freely.vated and identified by RVO.This setup allowed continuous measurement of UP and
Upon stimulation, an increase in activity of at leastcollection of urine during normal flow or backflow of100% above basal levels was considered to be a prerequi-urine, as previously described by Recordati et al [2].site for verification of a specific type of receptor. If aRenal venous pressure was measured from another cath-nerve fiber did not meet this requirement, dissection ofeter (PE-10), which was put into the renal vein from thethe nerve bundle was continued until a single fiber metovarian vein.the criterion. Nerve activity and hemodynamic variablesIdentification and verification of the renal sensory re-were stored on a neuro-corder (DR-890; Neuro Data Inc.,ceptor were done by renal arterial occlusion (RAO),New York, NY, USA). All hemodynamic and single-elevated blood pressure by intravenous injection of nor-unit responses were displayed on a polygraph (RS3400;epinephrine (NE; 1 mg/100 g body weight), elevated UPGould Inc.). The single-unit impulses of renal afferentsto 40 mm Hg by elevating the ureteropelvic catheter,reflect the real-time chemical or physical changes in thebackflow of urine or chemical solutions (saline, 0.9 molmicroenvironment.NaCl or 0.15 mol KCl) and renal venous occlusion
(RVO; Table 1).Volume expansion
Single renal afferent nerve activity Acute VE with isotonic saline is a method for detec-tion of the volume-reflex arc and renal regulation of fluidFor the study of RANA, the greater splanchnic and
all other visible nerves joining the coeliac plexus were excretion [3, 13, 25, 26]. After identification of a single
Chien et al: Renal sensory receptors in diabetes206
nerve unit, the resting activity of the sensory receptor electrodes. Assessments of RENA were performed bythe use of an intravenous injection of NE (1 mg/100 gwas determined during four to five minutes to serve asbody weight) for reflexive depression of RENA [13].the baseline. Intravenous infusion of isotonic saline of
Cortical microvascular blood flow was measured with5% of body weight over a 10-minute period was thena Perimed PF3 and a PF303 probe of 1 mm diameterbegun. After saline loading, we determined the singleplaced over the left kidney surface as described pre-RANA during a 10-minute recovery period. BP and UPviously [27]. The laser-Doppler flowmeter (PeriFlux;were recorded simultaneously throughout the experi-PERIMED, Stockholm, Sweden) was calibrated suchment. Urine samples were collected for every two-that one perfusion unit was equivalent to 10 mV. Corticalminute interval from the left ureter during the resting,microvascular blood flow measured in this way repre-saline loading, and recovery periods. The percentagesents the product of the velocity of moving blood cells(%) of accumulated water excretion and sodium excre-and the concentration of moving blood cells in the vol-tion were calculated as follows:ume of tissue under the probe. Thus, the velocity is
Percentage (%) of accumulated water excretion 5 measured as the magnitude of the frequency shift,whereas the intensity of the signal is proportional to thenumber of erythrocytes moving within the volume of
the amount of urine excretion during a 10-minutesaline load and 10-minute recovery periods
the water amount in 5% ofbody weight of saline infused
tissue being illuminated. The PF3 flowmeter allows theconcentration of the moving blood cell component to beextracted from the perfusion and is continuously re-
Percentage (%) of accumulated sodium excretion 5 corded on a polygraph (Grass 79D; Gould Inc.).Approximately one hour was allowed to elapse be-
tween the end of surgery and the start of experiments;the amount of sodium excretion during a 10-minute
saline load and 10-minute recovery periodsthe sodium amount in 5% ofbody weight of saline infused
three consecutive 20-minute periods, control, stimula-tion, and recovery periods were used. We evaluated BP,RENA, cortical microvascular blood flow, urinary flowrate, and urinary sodium excretion from the left kidneyRenorenal reflexesduring these three periods in each control and DM rat.
Renorenal reflexes are characterized as responses oc- Urine samples were collected in each 20-minute period.curring in one kidney as a result of interventions on thesame (ipsilateral) or the opposite (contralateral) kidney Histology and immunostainingmediated by neurohumoral mechanisms [10, 12]. To ex- Histology. After anesthesia, kidneys (N 5 6 each inplore whether this regulatory function by the renorenal C and DM groups) were removed and fixed in 10%reflex was altered during the diabetic state, we examined neutral-buffered formalin solution, dehydrated in gradedthe contralateral renorenal reflex by MR stimulation (by ethanols, and embedded in paraffin. Five micrometerelevating UP) or CR stimulation (by retrograde uretero- sections were stained with Masson’s trichrome and eosin/pelvic perfusion with 0.9 mol NaCl) in the right renal hematoxylin. A matrix deposition score from 0 to 3 waspelvis of control (N 5 7) and DM (N 5 7) rats. based on the intensity and distribution of collagen in the
After anesthesia and surgery, the right kidney was renal pelvis: 0 for no change, 1 for mild change, 2 forexposed through a small midline abdominal incision. For moderate change, and 3 for severe change. The matrixMR stimulation, a saline-filled, 50 cm long catheter (PE- score was counted randomly in each section for more60) was inserted into the right ureter, and the UP was than 100 fields under high power (3400). Observers didincreased to 40 6 1 mm Hg by elevation of the ureteral not know the source of the histologic sections beingcatheter above the level of the kidney. For CR stimula- examined.tion, CR2 was stimulated by retrograde ureteropelvic Immunostaining. We performed immunostaining byperfusion with 0.9 mol NaCl into the right pelvis. A PE- using an antiubiquitin carboxyl terminal hydrolase anti-60 catheter was inserted into the right ureter with its tip body, PGP 9.5 [28], to evaluate the nerve distribution inending at the renal pelvis. A PE-10 catheter was placed C and DM (N 5 6 each) rats. The kidney was perfusedinside the PE-60 catheter and advanced into the renal with Tris-buffered saline (TBS) and fixed with a coldpelvis with its tip ending 1 to 2 mm beyond the tip of mixture of 2% paraformaldehyde, lysine, and sodiumthe PE-60 catheter. This technique allowed complete periodate [29] for two hours. Tissues were OCT embed-drainage of the effluent. The right renal pelvis was per- ded, and frozen sections were obtained.fused at 25 mL/min; the infusion rate did not change the After drying for two hours, sections were rehydratedUP. For examining multifiber RENA in the contralateral and washed with TBS, treated with 3% hydrogen perox-renorenal reflex experiment, the central end of one sec- ide in TBS for 30 minutes, and then incubated for 30
minutes in 10% normal goat serum and 0.1% Triton-tioned left renal nerve branch was placed on the pair of

Chien et al: Renal sensory receptors in diabetes 207
X100 (Sigma) in TBS. The slides were then incubated described previously [3]. The transformed spikes wereovernight at 48C with antiubiquitin carboxyl terminal counted with a Gould integrator. Quantitative data werehydrolase antibody (1:1000). Next, the reaction was visu- expressed as mean 6 sem. Data were subjected to analy-alized by the avidin-biotin-peroxidase complex method, sis of variance followed by Duncan’s multiple range testas previously described [30]. A method-specific test was for assessment of the differences among the control, DM,done by replacement of the primary antibody with non- DMAI, and DMCI groups. Student’s paired t-test wasimmune rabbit IgG at the same working concentration used for detecting differences between the control andas the primary antibody. DM groups in the renorenal reflex experiment. P , 0.05
was considered to indicate statistical significance.Histamine assayThe histamine content in the renal pelvic wall was
measured in four groups of rats (N 5 6 each). At the RESULTSend of the two-week treatment period, the rats were General observationsexsanguinated under anesthetized with sodium pento-
Kidney weight. The initial body weights of selectedbarbital (60 mg/kg, intraperitoneally). The kidney wasrats were similar in the four groups before STZ or vehicleremoved, and the renal pelvic wall was dissected. Theinjection. Two weeks after STZ treatment, there was atissues were homogenized at 48C with a Polytron homoge-lesser increase in body weight in the DM and DMAInizer in 3 mL aliquots of phosphate-buffered saline (PBS),rats as compared with C and DMCI rats (Table 2). Inand the protein concentrations in the supernatant were
determined by Lowry’s method [31]. The histamine lev- terms of kidney weight per 100 g body weight, there wasels in the supernatant were determined by ELISA accord- a significant increase in the DM and DMAI groups whening to the manufacturer’s instructions (IBL, Hamburg, compared with the control group.Germany). The lowest detectable level is 0.25 ng/mL. Mean systemic blood pressure and blood glucose. The
mean arterial blood pressure was not significantly differ-Histamine responses
ent among the four groups of rats. Mean blood glucoseThe following experiment was used for exploring levels exceeded 400 mg/dL in DM rats, but acute or
whether a change in the histamine level in the renal pelvis chronic insulin treatment effectively lowered them tomay affect MRu activity because increased numbers of within the control level (Table 2).mast cells and increased ureteropelvic level of histamine
Sodium and potassium excretion, urine flow, and urinewere found in DM rats. Three groups of rats were used,
osmolarity. As shown in Table 2, diuresis, a decrease inincluding nondiabetic normal rats (N 5 6) and normalurinary electrolyte concentration of sodium and potas-rats pretreated with a small amount of antihistaminesium, and an increment of total urinary osmoles were(Venan; Y.F. Chemical Corp., Taipei Hsin-Chiang, Tai-apparent in DM rats, but insulin treatment led to re-wan; 0.3 mg per rat, intraperitoneally, N 5 5) and acovery.larger amount of antihistamine (1 mg per rat, intraperito-
neally, N 5 5). The MRu response to increased UP (40Single renal afferent nerve activitymm Hg) by elevation of a ureteral catheter containing
CR2. In C rats, CR2 was activated during RAO (Fig.histamine solution (0.3 to 3.0 mg/mL) was evaluated. Inthe antihistamine pretreated groups, antihistamine was 1A and Table 3). Backflow of nondiuretic urine or hyper-administered 10 minutes before the histamine effect was tonic solutions (for example, 0.9 mol NaCl or 0.15 moldetermined. After this determination, we treated DM rats KCl solution) activated the CR2 activity to a similarwith antihistamine (4 mg/kg body weight, intraperitone- degree. The CR2 activity was decreased during backflowally, daily) for two weeks to examine whether the re- of normal saline (Table 3).pressed MRu activity could be restored. The CR2 activity was depressed in the DM group, as
were the CR2 responses to different stimuli (Fig. 1A andUrine chemical analysisTable 3). The basal discharge of CR2 and its activity in
Urine was collected in preweighed tubes, and the urineDM rats during RAO and infusion of hypertonic solu-
volume was measured gravimetrically. Urinary sodiumtions were approximately 40% and 45% to 56% of thoseand potassium concentrations were measured by flamein C rats, respectively. Restoration of blood glucose tophotometry (Eppendorf MFM 6350). The urinary osmo-near normal in DMAI and DMCI rats restored the basallarity was determined with an osmometer (5100 Vaporactivity of CR2 and the magnitude of the response topressure osmometer; Wescor, Stoneham, MA, USA).various stimuli (Table 3).
Statistical analysis MRa. In C rats, MRa was activated by an acute risein BP. The discharge rate in MRa was increased 12-foldThe recording of a single unit of RANA, BP, UP,
and transformed spikes in each rat was performed as at the hypertensive stage (BP range from 175 to 185

Chien et al: Renal sensory receptors in diabetes208
Table 2. Basic physiologic parameters in control, DM, DMAI, and DMCI rats
Control DM DMAI DMCI(N 5 10) (N 5 10) (N 5 10) (N 5 9)
Initial body weight g 210610 215 69 208 69 214 611Final body weight g 248614 213 612a 220615a 239610Blood pressure mm Hg 10565 109 65 110 66 108 65Blood glucose mg/dL 10967 410 628a 168621 147 619Kidney weight mg/100 g body wt
Left 41169 512 615a 520618a 436614Right 40869 516 616a 517615a 430613
Basic urinary componentsUrinary [Na1] mmol/L 108621 40 65a 93618 114619Urinary [K1] mmol/L 137617 55 67a 115619 133 614Urinary osmolarity mOsm/L 11466148 1040 666 1098 6101 1231 6166Urinary volume mL/day 2362 69 64a 3567 27 64Total urinary osmoles 24,592 6526 70,578 63045a 33,79065310 29,980 6487
Values are means 6 se. Abbreviations are: DM, diabetic rats; DMAI, diabetic rats with acute insulin treatment; DMCI, diabetic rats with chronic insulin treatment.a P , 0.05 vs. control group
Fig. 1. Representative responses of renal type 2 chemoreceptor (CR2) to backflow of nondiuretic urine (BFU; A, upper panel) and to renalarterial occlusion (RAO; A, lower panel) are displayed in one control (A, left panel) and one DM rat (A, right panel). Note the repressed CR2activity in DM rats. (B) Representative response patterns of renal ureteropelvic mechanoreceptor (MRu) to elevated ureteral pressure (UP; upto 40 mm Hg) are displayed in one control (B, left panel) and one DM rat (B, right panel). Note the repressed MRu response in the DM rat.
mm Hg) after intravenous NE infusion (1 mg/100 g body MRu discharge in response to elevated UP was less inDM rats than in C rats (Fig. 1B and Table 3). Dailyweight). MRa was depressed by RAO (that is, decreased
renal perfusion pressure; Table 3). insulin treatment in the DMCI rats restored the sup-pressed response of MRu to an elevated UP, but theThe basal MRa activity was unaltered in DM, DMAI,
and DMCI rats. The magnitude of the MRa response to blunt response was not recovered upon a single insulininjection in the DMAI group (Table 3).changes in renal perfusion pressure was also about the
same in the DM, DMAI, and DMCI groups (Table 3). MRv. In C rats, MRv was activated by RVO, and thedischarge rate increased approximately 13-fold. WhenMRu. In C rats, MRu was activated by stepped in-
creases in UP to 40 6 1 mm Hg. The discharge rate compared with the C group, the basal MRv activity wasabout the same in the DM, DMAI, and DMCI rats, asincreased 17-fold after UP elevation. MRu activities
were not altered by RAO. was the excited level of MRv in response to RVO (Table3). RAO and increasing BP or UP had no effect on theThe basal MRu activity was unaffected in the DM,
DMAI, and DMCI rats. However, the magnitude of the activity of MRv.

Chien et al: Renal sensory receptors in diabetes 209
Table 3. Responses of four types of renal sensory receptors to specific stimuli in control, DM, DMAI, and DMCI rats
Activities (spikes/10 s) during
Basal activities Backflow of Back flow of Backflow of Backflow ofReceptor Group N spikes/10 s RAO ↑RPP urine (↑UP) saline 0.9 mol NaCl 0.15 mol KCl RVO
CR2 C 7 6.960.7 70 65.9a 6.761.0 50 64.5a 3.660.6a 5469a 63610a 6.561.0DM 7 2.660.5b 3163.6ab 2.360.6b 1862.8a,b 2.560.4 29 66ab 3566ab 2.961.0b
DMAI 6 5.560.7 59 69.1a 5.660.6 47 65.5a 3.060.4a 41610a 5569a 5.661.2DMCI 6 5.960.8 65 67.3a 5.260.7 53 65.9a 3.560.5a 4569a 61611a 6.260.9
MRa C 6 4.460.6 1.6 60.6a 5267.4a 4.260.8 ND ND ND 4.260.7DM 7 3.960.7 1.7 60.5a 4867.3a 3.761.0 ND ND ND 3.660.5DMAI 6 5.160.7 0.8 60.7a 5769.0a 4.760.7 ND ND ND 4.860.8DMCI 6 4.760.6 1.4 60.6a 6068.8a 4.660.6 ND ND ND 4.460.6
MRu C 6 3.160.5 3.0 60.6 3.3 60.5 50 67.1a ND ND ND 2.960.5DM 6 2.660.5 2.2 60.4 2.5 60.5 24 63.6a,b ND ND ND 2.960.6DMAI 6 3.460.7 3.6 60.7 3.8 60.6 31 65.0a,b ND ND ND 3.360.7DMCI 6 3.760.6 3.1 60.6 3.6 60.6 45 65.9a ND ND ND 3.660.6
MRv C 7 5.460.8 5.6 60.7 5.2 60.7 5.6 60.8 ND ND ND 70611a
DM 8 4.560.6 4.7 60.5 5.1 60.5 4.9 60.5 ND ND ND 63610a
DMAI 6 4.961.0 5.1 60.9 5.0 60.9 5.5 61.0 ND ND ND 75614a
DMCI 6 5.061.1 4.8 61.0 4.9 61.0 5.0 61.0 ND ND ND 66612a
Data are means 6 se. Abbreviations are: s, seconds; RAO, renal artery occlusion; ↑RPP, increasing renal perfusion pressure by NE (1 mg/100 g body weight iv);↑UP, increasing ureteropelvic pressure by elevating ureteral catheter; RVO, renal venous occlusion; CR2, chemoreceptor type 2; MRa, renal arterial mechanoreceptor;MRu, renal ureteropelvic mechanoreceptor; MRv, renal venous mechanoreceptor; C, control rats; DM, diabetic rats; DMAI, diabetic 1 acute, insulin-treated rats;DMCI, diabetic 1 chronic insulin-treated rats; ND, not detected.
a P , 0.05 vs. basal activityb P , 0.05 vs. control
Fig. 2. Mean changes in CR2, MRa, MRu,and MRv in response to volume expansion inC (s; N 5 7), DM (d; N 5 6), DMAI (,;N 5 6) and DMCI (.; N 5 6) rats. In DM rats,the activity of CR2 was significantly depressedand remained suppressed during the salineloading and recovery period (A), whereas theactivity of MRa and MRv to volume expan-sion was unaltered (B and D). The peak valueof MRu in response to volume expansion wasdecreased significantly in DM rats as com-pared with that in C rats (N 5 6; C). Restoringof blood glucose to normal in DMAI (N 5 6)and DMCI rats (N 5 6) recovered the basaldischarge rate of CR2 and its response to vol-ume expansion (A). However, acute restora-tion of blood glucose to normal did not leadto recovery of the response of MRu to volumeexpansion in DMAI rats (N 5 6, C). Six toeight rats for each receptor were used for test-ing. *P , 0.05, DM vs. C group; #P , 0.05,DMAI vs. C group.
Volume expansion on renal sensory receptors loading/VE were enhanced to a similar degree in all fourgroups of rats. The peak activity of MRu in response toGroup data for responses of the CR2, MRa, MRu,saline loading, however, was less in DM rats than in Cand MRv to saline loading (VE) are shown in Figurerats (21 6 3 spikes/10 seconds in DM rats vs. 40 6 52. During the saline loading and recovery periods, thespikes/10 seconds in C rats, P , 0.05). Restoration ofactivity of CR2 was significantly decreased, and the re-blood glucose to normal in DMAI rats did not recoversponses were similar in C, DMAI, and DMCI rats. Inthe response of MRu to saline loading/VE (Table 3 andDM rats, the activity of CR2 was consistently depressedFig. 2); however, recovered MRu activity upon salineduring the resting, saline loading, and recovery periods.
The activities of MRa and MRv in response to saline loading could be observed in DMCI rats (Fig. 2).

Chien et al: Renal sensory receptors in diabetes210
The responses of BP to VE were similar in all fourgroups. During the control and saline-loading periods,the magnitude of the BP was not altered significantly(from 112 6 6 to 117 6 7 mm Hg in C rats, from 109 65 to 114 6 6 mm Hg in DM rats, from 110 6 7 to 114 66 mm Hg in DMAI rats, and from 107 6 6 to 112 6 7mm Hg in DMCI rats).
Volume expansion elicited significant diuresis and na-triuresis in C and, to a lesser degree, in DM rats. De-creased urinary flow was noted in DM rats during theVE period (28 6 4 mL/min/g kidney weight in DM ratsvs. 70 6 12 mL/min g kidney weight in C rats). Thedecreased urinary flow rate was accompanied by de-creases in the peak value of UP (5.6 6 0.9 mm Hg inDM rats vs. 9.0 6 1.1 mm Hg in C rats) and urinarysodium excretion rate (5.1 6 0.9 m/min/g kidney weightin DM rats vs. 15 6 4 mL/min/g kidney in C rats) in DMrats. In C rats, the left kidney excreted 21 6 3% ofinfused water during the 20-minute VE and recoveryperiod, whereas in DM rats, the percentage of accumu-lated water excretion was 10 6 2% (P , 0.05). Thepercentage of accumulated sodium excretion was 9 62% in DM rats vs. 19 6 3% in C rats (P , 0.05). Acutereduction of hyperglycemia (6 hours before VE chal-lenge) only partly recovered the percentage accumulatedwater excretion (13 6 3%) and sodium excretion (12 63%) in the DMAI rats. However, chronic insulin treat-ment recovered the percentage accumulated water ex-cretion (19 6 4%) and sodium excretion (18 6 4%) inthe DMCI rats.
Renorenal reflexesFig. 3. MRu and CR2 stimulation elicited changes in renorenal reflex
MRu stimulation. In C rats, an increased UP to 40 parameters in C (s) and DM (d) rats. In C rats (N 5 7), MRu stimula-tion in the right kidney resulted in decreased renal efferent nervousmm Hg in the right kidney resulted in a decreased RENAactivity (RENA) in the left kidney. The decrease in RENA resulted in(65 6 7% of resting value, P , 0.05) in the left kidney.an increase in cortical microvascular blood flow (CMVBF), urine flow
The decrease in RENA resulted in an increase in renal (UF), and urinary sodium excretion (UNaV) in the contralateral kidneysof C rats. Such a contralateral inhibition of renorenal reflexes was notcirculation and urine (water and sodium) excretion [5,evident in DM rats (N 5 7). All parameters remained unaffected in17, 21]. We noted increases in cortical microvascularPENA, MAP, CMVBF, UF, and UNaV. CR stimulation by backflow of
blood flow (129 6 8% of control value, P , 0.05), urine 0.9 mol NaCl into the right pelvis resulted in an excitatory renorenalreflex in the left kidney in C rats. The excitatory renorenal reflex wasflow (from 3.6 6 0.6 to 6.6 6 0.7 mL/min/g kidney weight,not evident in DM rats. Abbreviations are: kw, kidney weight; C, restingP , 0.05), and urinary sodium excretion (from 0.17 6stage; S, stimulation; R, recovery phase. *P , 0.05, DM vs. C group.
0.03 to 0.3 6 0.04 mL/min/g kidney weight, P , 0.05) inthe contralateral kidneys of C rats. Such a contralateralinhibition of renorenal reflexes was not evident in DMrats (Fig. 3A). P , 0.05). The excitatory renorenal reflex was not evi-
dent in DM rats (Fig. 3B).CR2 stimulation. Backflow of 0.9 mmol NaCl into theright pelvis resulted in an excitatory renorenal reflex in
Increased mast cells and collagenous tissue in thethe left kidney in C rats (Fig. 3B). The excitatory renore-renal pelvis in diabetic ratsnal reflex responses resulted in an increase in BP (from
104 6 4 to 114 6 5 mm Hg, P , 0.05) and contralateral To address whether changes in renal sensory receptorsduring early diabetes result from the alteration of neuralRENA (135 6 9% of control value, P , 0.05), as also
shown by decreases in cortical microvascular blood flow constructs, we used antibody PGP 9.5 to stain nervefibers. Noted that the majority of stained fibers were(from 100 6 0% to 76 6 8%, P , 0.05), urine flow (from
3.6 6 0.4 to 2.1 6 0.2 mL/min/g kidney weight, P , 0.05), found in the wall of the ureter and in the subepithelialregion of the renal pelvis (Fig. 4 A and B). Minor stainingand sodium excretion from 0.17 6 0.03 to 0.09 6 0.02,

Chien et al: Renal sensory receptors in diabetes 211
Fig. 4. PGP 9.5 positively stained fibers (N,arrows) are oriented circumferentially in thewall of the ureter and the subepithelial regionof the renal pelvis (A and B). There were nosignificant differences in their numbers anddistribution between C (B) and DM (A) rats.High magnification of these stained fibers areshown in (C and D). The number of mast cellswas increased in the interstitium or aroundthe blood vessels in the renal pelvis of DMrats (A), but rarely in C rats. (E) These mastcells in high magnification.
Table 4. Number of mast cells, collagen deposition, and histamine content of renal pelvis from control, DM, DMAI, and DMCI rats
Control DM DMAI DMCI(N 5 6) (N 5 6) (N 5 6) (N 5 6)
Number of mast cells in renal pelvis per visual field (4003) 2.0 60.1 5.8 61.0a 4.861.2a 1.760.2Matrix deposition score of collagen in renal pelvis (4003) 1.2 60.3 2.4 60.5a 2.360.5a 1.460.4Renal pelvic histamine ng/mg protein 4.161.2 11.763.3a 9.162.1a 5.661.6
Values are means 6 se. Abbreviations are: DM, diabetic rats; DMAI, diabetic rats with acute insulin treatment; DMCI, diabetic rats with chronic insulin treatment.a P , 0.05 vs. control group
was seen in the surroundings of blood vessels and tu- level in the renal pelvic wall similar to that of normalrats (Table 4).bules, and in the glomeruli of the renal cortex. Fibers in
the renal pelvis were oriented in a circumferential fash-Ureteropelvic mechanoreceptor activityion (Fig. 4 A–C). The morphologic appearance and dis-altered by histaminetribution of PGP 9.5-labeled fibers in the renal pelvis
were not different between C and DM rats during early In nondiabetic normal rats, histamine administered viaa ureteropelvic catheter depressed the enhanced MRudiabetes. A few mast cells located in the interstitium or
around the blood vessels and increased collagenous tis- response to elevated UP. The mean resting MRu activityin normal rats was 3.1 6 0.6 spikes/10 seconds and wassue were found in the renal pelvis in DM rats (Fig. 4E),
but not in C rats (Fig. 4D and Table 4). Otherwise, the increased to 59 6 8 spikes/10 seconds after MRu stimula-tion by elevated UP. Histamine treatment depressed thekidneys did not differ microscopically between C and
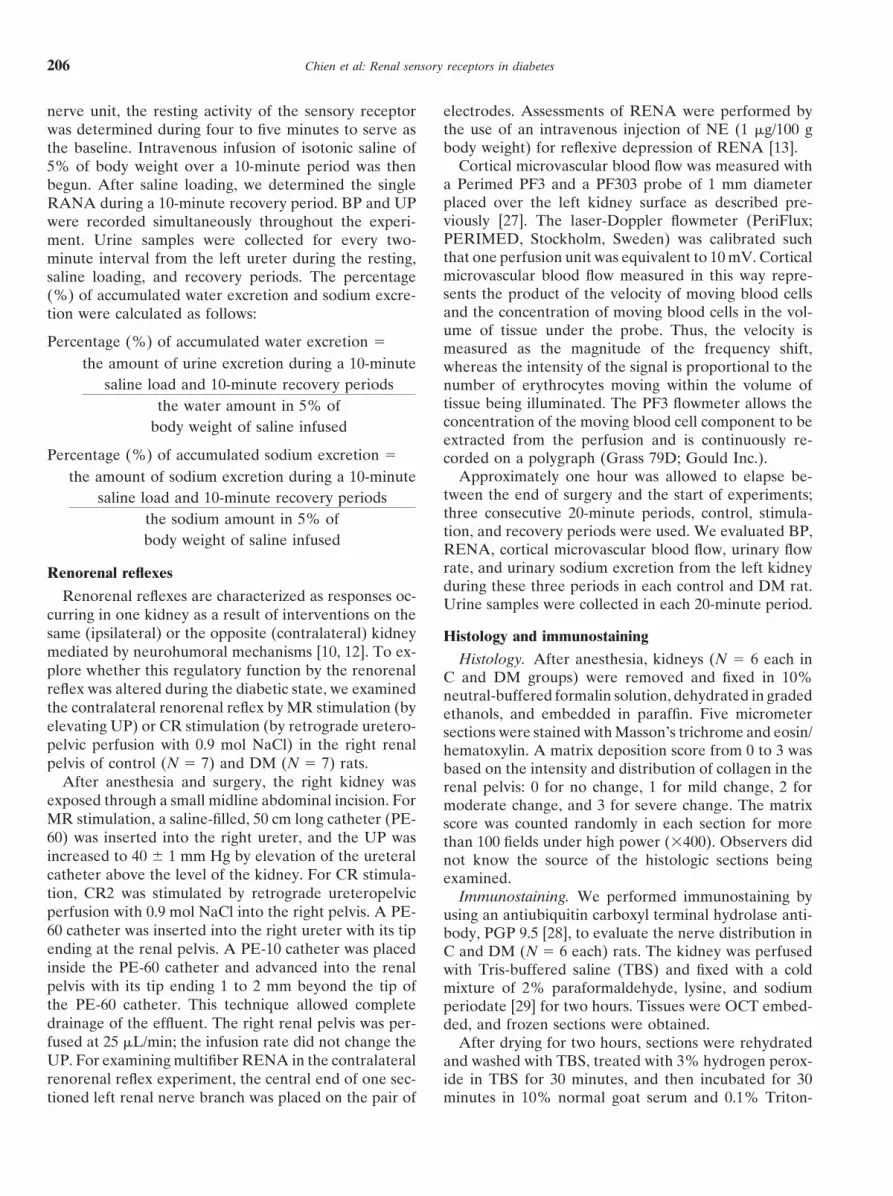
DM rats. MRu response (mean 49 6 10, 32 6 9, 10 6 4 spikes/10 seconds at doses of 0.3, 1, and 3 mg/ml of histamine)
Increased histamine in diabetic renal pelvis to elevated UP in a dose-dependent manner. The hista-mine-depressed MRu response was partly blocked byAfter two weeks of STZ, the histamine content in the
renal pelvic wall was significantly increased in the DM intravenous pretreatment with antihistamine (Fig. 5A).In separate experiments, antihistamine treatment ingroup when compared with that in C rats. The DMCI
rats with repeated insulin treatment had a histamine the DM rats restored the depressed response of MRu
Chien et al: Renal sensory receptors in diabetes212
state. (c) MRa and MRv receptors were not altered inthe early diabetic state.
Changes in CR2 activity are related to the hydrationstate of the animal (abstract; Wu et al, Neurosci Lett 229:101, 1997). In the diabetic state, sodium and potassiumions as well as other chemicals, such as endogenous aden-osine and bradykinin, were diluted as the water contentin the extracellular fluid or urine increased. Thus, thedecreased urinary chemical contents in DM rats coulddepress the CR2 activity [3, 8]. It is noteworthy that asimilar degree of response to RAO and to backflow ofnondiuretic urine or to hypertonic solutions was notedin both C and DM rats when percentage changes wereconsidered (Table 3). Furthermore, the recovery of thebasal discharge after insulin treatment indicates that thefunction of renal CR CR2 does not appear compromised,and its activity mirrors the physiologic reaction in dia-betic rats.
In the early diabetic state, the renal blood flow andarterial blood pressure remained unchanged, and thus,the basal activity of MRa and MRv was unaltered. Inresponse to specific mechanical stimulus and acute VE,the activity in MRa and MRv was excited to a similarlevel between control and DM rats. The mechanisms forenhancing MRa activity during VE might be attributedto an increase in interstitial (hydrostatic) pressure, bloodvolume (via volume stretch), and/or blood flow (via shearFig. 5. (A) In normal rats (j; N 5 6), the administration of histaminestress) [3]. Similarly, the MRv is activated because of an(0.3 to 3 mg/mL) via a ureteropelvic catheter repressed the MRu activity
elicited by increased ureteropelvic pressure ( ; UP) in a dose-depen- increase in renal venous pressure during VE [3]. It seemsdent manner. Antihistamine pretreatment effectively prevented the that arterial or venous hemodynamics is maintainedMRu activity from being repressed by histamine. *P , 0.05, vs. control
within the physiologic range during early diabetes.value; #P , 0.05, vs. histamine (3 mg/mL) treatment. (B) In DM ratswith daily antihistamine treatment (DMCA), MRu responses to the Unlike MRa and MRv, MRu is activated by an in-stimuli of increased UP and volume expansion (VE) could be restored. crease in the urine flow rate and UP [3, 9]. In theory,Symbols are: (j) DM, N 5 6; ( ) DM 1 antihistamine, N 5 5; ( )
MRu activity could be increased because of diabetes-control, N 5 6. *P , 0.05, vs. normal group; #P , 0.05, vs. DM group.associated diuresis. However, our study showed that noenhanced MRu activity was obtained in DM rats. Asuboptimal (desensitized) response of MRu to increasing
to elevated UP. The desensitized response of MRu to UP and VE was also noted. More importantly, the desen-VE was also partly recovered in DM rats receiving anti- sitization of MRu could not be reversed to a normalhistamine treatment (Fig. 5B). level in acutely insulin-treated DM rats. Whether the
desensitization of MRu can be attributed to a selectedneuropathy associated with DM has yet to be clearly
DISCUSSION defined.Our findings can be summarized as follows: (a) In DM In this study, we did not find morphologic differences
rats, the basal discharge of CR2 and its response to in the renal nerve fiber distribution in the renal pelvisspecific stimuli were repressed because of a decreased between control and DM rats; however, an increased ex-urinary electrolyte concentration. The correction of blood pression of mast cells and collagen deposition, as well assugar and urinary electrolyte concentration by insulin increased histamine contents, was found around the renalrestored the CR2 activity. (b) For MRu, the basal dis- pelvis. Mast cells are rarely identified in the normal kid-charge remained unchanged, but the enhanced response ney [28], but these cells are increasingly present in dia-to mechanical stimuli was blunted in early diabetics. betic kidneys [22, 23]. Mast cells, by producing a basement-Daily insulin or antihistamine treatments were required membrane component and type VIII collagen [22, 23],to restore the MRu activity. Increases in collagen deposi- may contribute in part to the increased collagen deposi-tion and histamine content in the renal pelvis contributed tion and irreversible fibrosis in the renal pelvis [32, 33].
The increased collagen deposition in the pelvis may ren-to desensitization of the MRu during the early diabetic

Chien et al: Renal sensory receptors in diabetes 213
der the MRu response ineffective (that is, desensitiza- cluding an increased histamine level) in the renal pelvisin the early DM state. The alteration of MRu activity intion) to pressure or stretch stimuli in DM rats.
The increasing tissue level of histamine in the renal the early diabetic state is particularly significant despitethe lack of any significant structural derangement in thepelvis may also play a role in desensitization of MRu
activity in DM rats. Histamine, a putative neurotransmit- renal pelvis. A disturbance in these two receptors affectsthe volume and fluid homeostasis, via an abnormal reno-ter in the mammalian nervous system [34], is elevated
significantly in kidneys of rats with experimental diabetes renal volume reflex, in DM.[17]. Histamine is known to affect afferent nerve activityvia its receptors on nerve fibers [18] or nerve terminals ACKNOWLEDGMENTS[19]. Our study in nondiabetic normal rats indicated that This research was supported by grants NTUH 88S2003, NTUMC
CMB87-08, NSC89-2320-B-002-119, NSC89-2314-B-002-089, and NHRI-histamine depressed the MRu response to an increasedGT-EX89S704L.UP in a dose-dependent manner and that pretreatment
with antihistamine partially restored the desensitization Reprint requests to Dr. Su-Ming Hsu, Department of Pathology,National Taiwan University College of Medicine, 1-1 Jen-Ai Road,of MRu activity by histamine. More importantly, in DMTaipei, Taiwan.rats, daily antihistamine treatment alone without insulinE-mail: [email protected]
treatment was sufficient in restoring MRu activity. Itseems that the increased histamine plays an importantrole in desensitization of MRu. The increased mast cells APPENDIXin STZ rats may participate in collagen deposition and/ Abbreviations used in this article are: C, control; CR, chemorecep-
tor; DM, diabetic; DMAI, diabetic with acute insulin treatment; DMCI,or histamine release.diabetic with chronic insulin treatment; MRa, arterial mechanorecep-The renal sensory receptor activity reflects the hydro-tor; MRu, ureteropelvic mechanoreceptor; MRv, venous mechanore-
static or chemical environment in the kidney, and its ceptor; RANA, renal afferent nerve activity; RAO, renal arterial occlu-sion; RENA, renal efferent nerve activity; RVO, renal venouspotential function also lies in the initiation of reflex ef-occlusion; STZ, streptozotocin; UP, ureteropelvic pressure; VE, vol-fects that may affect the kidney directly through its effer-ume expansion.
ent innervation or indirectly through circulatory changes[10, 12]. In normal rats, as shown in this study, CR2
REFERENCESactivation increases contralateral efferent renal nerve
1. Recordati GM, Moss NG, Waselkov L: Renal chemoreceptorsactivity via an excitatory renorenal reflex and leads toin the rat. Circ Res 43:534–543, 1978
compensatory antidiuresis and antinatriuresis in the con- 2. Recordati GM, Moss NG, Genovesi S, Rogens PR: Renal recep-tors in the rat sensitive to chemical alterations of their environment.tralateral kidney. On the other hand, MRu activationCirc Res 46:395–405, 1980reduces contralateral efferent renal nerve activity via an
3. Chien CT, Fu TC, Wu MS, Chen CF: Attenuated response of renalinhibitory renorenal reflex. This leads to a compensatory mechanoreceptors to volume expansion in chronically hypoxic rats.diuresis and natriuresis in the contralateral kidney. Fur- Am J Physiol 273:F712–F717, 1997
4. Gilmore JP, Tomomatsu E: Renal mechanoreceptors in nonhumanthermore, renal afferent information originating in renalprimates. Am J Physiol 248:R202–R207, 1985receptors can be conveyed to a number of central areas 5. Kneupfer MM, Schramn LP: Properties of renobulbar afferent
known to be involved in the regulation of body fluid fibers in rats. Am J Physiol 248:R113–R119, 19856. Niijima A: Afferent discharges from arterial mechanoreceptors inbalance and arterial blood pressure [35]. In this study,
the kidney of the rabbit. J Physiol 219:477–485, 1971we noted that both excitatory and inhibitory renorenal 7. Astrom A, Crafoord J: Afferent activity recorded in the kidneyreflexes induced by CR2 or MRu stimulation in the renal nerves of rats. Acta Physiol Scand 70:10–15, 1967
8. Becham WS, Kunze DL: Renal receptors evoking a spinal vasomo-pelvis were impaired in DM rats. The possible mecha-tor reflex. J Physiol 201:73–85, 1969nism of the abnormal volume reflex can be ascribed, in 9. Genovesi S, Pieruzzi F, Wijnmaalen P, Centonza L, Golin R,
part, to the blunted renal sympathoinhibition in response Zanchetti A, Stella A: Renal afferents signaling diuretic activityin the cat. Circ Res 73:906–913, 1993to acute VE, as described by Patel and Zhang [25, 26].
10. Moss NG: Renal function and renal afferent and efferent nerveThey stressed that the altered neural efferent component activity. Am J Physiol 243:F425–F433, 1982of the volume reflex is partly responsible for the impaired 11. Moss NG: Electrophysiological characteristics of renal sensory
receptors and afferent renal nerves. Miner Electrolyte Metab 15:diuretic and natriuretic responses to acute VE in DM.59–75, 1989However, our study indicates that the abnormal renore-
12. Stella A, Zanchetti A: Functional role of renal afferents. Physiolnal reflex in DM may also be attributable to desensitiza- Rev 71:659–682, 1991
13. Chien CT, Fu TC, Lai YL, Chang YC, Chen CF: Renal neuraltion of renal afferent activity.response to ischemic renal failure in chronic hypoxic rats. J AutonIn conclusion, among four renal sensory receptors, theNerv Syst 58:11–17, 1996
activity in CR2 and MRu is altered, whereas the activity 14. Maggi CA, Meli A: The sensory-efferent functions of capsaicin-sensitive sensory neurons. Gen Pharmacol 19:1–43, 1988in MRa and MRv is maintained during early diabetes.
15. Ilstrup KM, Keane WF, Michels LD: Intravascular and extracel-CR2 activity is depressed because of a decreased urinarylular volumes in the diabetic rat. Life Sci 29:717–724, 1981
electrolyte concentration; however, MRu activity is de- 16. Mogensen CE: Renal function changes in diabetes. Diabetes25(Suppl):872–875, 1976sensitized because of an altered microenvironment (in-

Chien et al: Renal sensory receptors in diabetes214
17. Gill DS, Thompson CS, Dandona P: Increased histamine in 27. Huang C, Davis G, Johns EJ: Study of the actions of humanrecombinant erythropoietin on rat renal haemodynamics. Clin Sciplasma and tissues in diabetic rats. Diabetes Res 7:31–34, 198883:453–459, 199218. Sekizawa S, Tsubone H, Kuwahara M, Sugano S: Does histamine
28. Wilkinson KD, Lee K, Deshpande S, Duerksen-Hughes P, Bossstimulate trigeminal nasal afferents? Respir Physiol 112:13–22,JM, Pohl J: The neuron-specific protein PGP9.5 is a ubiquitin1998carboxyl-terminal hydrolase. Science 246:670–67319. Yoshitomi T, Ishikawa H, Haruno I, Ishikawa S: Effect of hista-
29. McLean I, Nakane PK: Periodate-lysine-paraformaldehyde fixa-mine and substance P on the rabbit and human iris sphinctertive: A new fixative for immunoelectron microscopy. J Histochemmuscle. Graefes Arch Clin Exp Ophthalamol 233:181–185, 1995Cytochem 22:1077–1083, 197420. Ross J, Goldman JK: Effect of streptozotocin-induced diabetes
30. Hsu SM, Raine L, Fanger H: Use of avidin-biotin-peroxidaseon kidney weight and compensatory hypertrophy in the rat. Endo-complex (ABC) in immunoperoxidase techniques: A comparisoncrinology 88:1079–1086, 1971between ABC and unlabeled antibody (PAP) procedures. J Histo-21. Seyer-Hansen K: Renal hypertrophy in streptozotocin diabeticchem Cytochem 29:577–580, 1981rats. Clin Sci Mol Med 51:551–555, 1976
31. Lowry OH, Rosebrough NJ, Farr AL, Randal RJ: Protein mea-22. Ruger BM, Dunbar PR, Hasen Q: Human mast cells producesurement with the Folin phenol reagent. J Biol Chem 193:265–275,type VIII collagen in vivo. Int Exp Pathol 75:397–404, 1994195123. Ruger BM, Hasan Q, Greenhill NS, Davis PE, Dunbar PR, 32. Colvin RB, Dvorak AM, Dvorak HF: Mast cells in the cortical
Neale TJ: Mast cells and type VIII collagen in human diabetic tubular epithelium and interstitium in human renal disease. Humnephropathy. Diabetologia 39:1215–1222, 1996 Pathol 5:315–326, 1974
24. Aronin N, Leeman SE, Clements RS: Diminished flare response 33. Thompson HL, Burbelo PD, Gabriel G, Yamada Y, Metcalfein neuropathic diabetic patients: Comparison of effects of sub- DD: Murine mast cells synthesize basement membrane compo-stance P, histamine, and capsaicin. Diabetes 36:1139–1143, 1987 nents. A potential role in early fibrosis. J Clin Invest 87:619–623,
25. Patel KP, Zhang PL: Reduced renal responses to volume expan- 1991sion in streptozotocin-induced diabetic rats. Am J Physiol 34. Ishikawa S, Sperelakis N: A novel class (H3) of histamine recep-257:R672–R679, 1989 tors on perivascular nerve terminals. Nature 327:158–169, 1987
26. Patel KP, Zhang PL: Reduced renal sympathoinhibition in re- 35. Ferguson M, Bell C: Ultrastructural localization and character-sponse to acute expansion in diabetic rats. Am J Physiol 267:R372– ization of sensory nerves in the rat kidney. J Comp Neurol 274:9–16,
1988R379, 1994


