Embed Size (px)
Citation preview
of January 4, 2011This information is current as
2005;174;3580-3589J Immunol Steven D. LondonCandace Enocksen, Richard Peppler, Lucille London and Mantej S. Bharhani, Jasvir S. Grewal, Mark J. Pilgrim, MechanismsSites: Activation Status and Cytotoxic in Peyer’s Patches and Distal Gut-MucosalActivation of Antigen-Specific T Lymphocytes Reovirus Serotype 1/Strain Lang-Stimulated
References
rlshttp://www.jimmunol.org/content/174/6/3580.full.html#related-uArticle cited in:
http://www.jimmunol.org/content/174/6/3580.full.html#ref-list-1, 16 of which can be accessed free at:cites 30 articlesThis article
Subscriptionshttp://www.jimmunol.org/subscriptionsonline at
isThe Journal of ImmunologyInformation about subscribing to
Permissions http://www.aai.org/ji/copyright.html
Submit copyright permission requests at
Email Alerts http://www.jimmunol.org/etoc/subscriptions.shtml/at
Receive free email-alerts when new articles cite this article. Sign up
Print ISSN: 0022-1767 Online ISSN: 1550-6606.Immunologists, Inc. All rights reserved.
by The American Association ofCopyright ©2005 9650 Rockville Pike, Bethesda, MD 20814-3994.The American Association of Immunologists, Inc.,
is published twice each month byThe Journal of Immunology
on January 4, 2011w
ww
.jimm
unol.orgD
ownloaded from
Reovirus Serotype 1/Strain Lang-Stimulated Activation ofAntigen-Specific T Lymphocytes in Peyer’s Patches andDistal Gut-Mucosal Sites: Activation Status andCytotoxic Mechanisms1
Mantej S. Bharhani,2 Jasvir S. Grewal,2 Mark J. Pilgrim, Candace Enocksen, Richard Peppler,Lucille London, and Steven D. London3
Intraduodenal priming of mice with reovirus serotype 1/strain Lang (reovirus 1/L) stimulates gut lymphocytes and generatesprecursor and effector CTLs. Our earlier studies demonstrated that germinal center and T cell Ag (GCT) is a marker whichidentifies reovirus 1/L-specific precursor CTL and effector CTL in Peyer’s patches (PP) of reovirus 1/L-inoculated mice. In thisstudy, we characterized the expression of the activation markers, GCT and CD11c, on reovirus 1/L-stimulated gut lymphocytesand the effector mechanisms involved in reovirus 1/L-specific cytotoxicity. We found that intraduodenal reovirus 1/L inoculationof mice induced the expression of both GCT and CD11c on PP lymphocytes (PPL), intraepithelial lymphocytes (IEL), and laminapropria lymphocytes (LPL), and these activated cells expressed Fas ligand (FasL). The majority of the GCT�CD11c� IEL andLPL expressed a phenotype, TCR���Thy-1�CD8� similar to that expressed on reovirus 1/L-stimulated PPL. However, spleniclymphocytes expressed GCT but not CD11c after stimulation with reovirus 1/L. Perforin, Fas-FasL, and TRAIL pathways werefound to be involved in PPL, IEL, and LPL cytotoxic activity against reovirus 1/L-infected targets. In PPL, perforin and Fas-FasLpathways were more effective than TRAIL. In IEL, all three cytotoxic mechanisms were equally as effective. However, LPL preferFas-FasL and TRAIL over perforin. Further, we demonstrated the preferential migration of GCT� PPL to the intraepithelialcompartment and the lamina propria. These results suggest that GCT and CD11c can be used as activation markers for gutlymphocytes and CD11c can also be used to differentiate between activated gut and systemic lymphocytes. The Journal ofImmunology, 2005, 174: 3580–3589.
T he gut mucosal immune system consists of two function-ally distinct types of tissue: 1) inductive sites, consistingprimarily of Peyer’s patches (PP)4 and mesenteric lymph
nodes; and, 2) effector sites, comprising two major sites, the lam-ina propria (LP) and the epithelium-associated cells, intraepitheliallymphocytes (IEL) (1, 2). Unlike the majority of nonintestinallymphocytes, many LP lymphocytes (LPL) and IEL exhibit phe-notypic and functional characteristics of activated cells (3, 4). TheLP lymphocyte population is comprised of CD4 and CD8 T cellsand of B cells and plasma cells secreting primarily IgA (5). How-ever, lymphocytes in the intraepithelial compartment are pheno-typically diverse and are comprised of two major CD8� subsets
based on TCR expression: �� or �� (3). Although it was believedthat the development of CD8 �� (TCR-�� IEL) was thymus-de-pendent and that the development of CD8�� IEL (TCR-�� and-��) was thymus-independent, it is now clear that most IEL re-quire some form of thymic influence for complete maturation andexpression of their surface molecules (6, 7). Thus, it is importantto determine the mechanisms by which IEL are selected and sub-sequently respond to Ag. However, the activated nature of residentintestinal T cells makes it difficult to study primary T cell activa-tion in the mucosa.
Intraduodenal (i.d.) inoculation of reovirus serotype 1/strainLang (reovirus 1/L) has proven to be an effective model for study-ing mucosal T cells and their properties. Our previous studies us-ing this model have demonstrated that i.d. inoculation of reovirus1/L leads to the generation of MHC-restricted reovirus 1/L-specificprecursor (p) CTL in PP and the intraepithelial compartment aswell as IgA memory B cells in PP (8, 9). We also have reportedthat both reovirus 1/L-specific pCTL and effector (e) CTL, gener-ated by in vitro restimulation of PP lymphocytes (PPL) with reo-virus 1/L, express the germinal center and T cell Ag (GCT) (10).This Ag is characterized by a mAb that was originally found tobind to germinal center (GC) B cells present in the spleens ofAg-stimulated mice and also a subpopulation of CD8� cells (11).The expression of GCT on eCTL and pCTL indicates that GCTmay provide a means to detect pCTL or eCTL in all gut mucosaltissues after their stimulation in the PP (10). CD11c has also beendemonstrated to be a hallmark of T cell activation in vivo and anindicator of ongoing Ag-specific T cell activation in the intestinalepithelium (3). Therefore, CD11c may prove to be a useful marker
Department of Microbiology and Immunology, Medical University of South Carolina,Charleston, SC 29425
Received for publication August 3, 2004. Accepted for publication December28, 2004.
The costs of publication of this article were defrayed in part by the payment of pagecharges. This article must therefore be hereby marked advertisement in accordancewith 18 U.S.C. Section 1734 solely to indicate this fact.1 This work was supported by National Institutes of Health/National Institute of Den-tal and Craniofacial Research Grant Number 5R01 DE12781 (to S.D.L.).2 M.S.B. and J.S.G. contributed equally to this work.3 Address correspondence and reprint requests to Dr. Steven D. London, Department ofMicrobiology and Immunology, Medical University of South Carolina, P.O. Box 250504,173 Ashley Avenue, Charleston, SC 29425. E-mail address: [email protected] Abbreviations used in this paper: PP, Peyer’s patch; LP, lamina propria; IEL, in-traepithelial lymphocyte; LPL, LP lymphocyte; PPL, PP lymphocyte; i.d., intraduo-denal; reovirus 1/L, reovirus serotype 1/strain Lang; pCTL, precursor CTL; eCTL,effector CTL; GC, germinal center; GCT, GC and T cell Ag; FasL, Fas ligand; CMF,Ca2�, Mg2�-free HBSS; PEC, peritoneal exudate stimulator cell; MOI, multiplicityof infection; LDH, lactate dehydrogenase; CMA, Concanamycin A.
The Journal of Immunology
Copyright © 2005 by The American Association of Immunologists, Inc. 0022-1767/05/$02.00
on January 4, 2011w
ww
.jimm
unol.orgD
ownloaded from
for identifying activated gut mucosal lymphocytes in our model ofgut mucosal reovirus 1/L infection. It has been known for sometime that activated T cells traffic to the intestine, although the pre-cise subsets and molecular mechanisms involved in this processare not fully understood (12). Although reovirus 1/L infectionleads to the generation of MHC-restricted virus-specific TCR��IEL (9), and this response parallels the induction of a response inPP, it is unclear whether IEL are primed in PP, in situ, or elsewhere(13). In addition, whether IELs can be activated in situ via Agpresentation by intestinal epithelial cells or whether IELs are ac-tivated outside of the epithelium followed by migration into themucosa is unknown.
Virus-specific pCTL have been isolated from PP and IEL afteri.d. priming with reovirus 1/L (8, 9). However, the mechanisms bywhich these cells mediate the killing of virally infected target cellsare still poorly understood. Recent studies of CTLs have definedtwo major pathways of contact-dependent cytotoxicity in vitro (14,15). The first pathway involves granule exocytosis and pore for-mation in the target cell membrane through extracellular Ca2�-dependent polymerization of perforin. The perforin/granzymepathway of cytotoxicity is the principal modus operandi for CD8�
T cells. The second pathway is mediated by T cell Fas ligand(FasL) engagement of Fas expressed by target cells. Use of theFas-FasL pathway of target cell lysis is thought to be favored byCD4� T cells (16). However, human virus-specific CD4� T cellscan also use the perforin/granzyme pathway of cytotoxicity (17).Recent work has revealed that T cell induction of target cell apo-ptosis may involve other receptor-mediated pathways, the mostnotable of which is TRAIL (18).
The objective of this work is to gain further understanding of thecellular and molecular interactions, which occur within the gut,that result in protective mucosal immunity. In this report, we dem-onstrate that GCT and CD11c are expressed by recently activatedgut lymphocytes. We characterized the pathways of cytotoxicityused by PPL, LPL, and IEL and found the involvement of perforin,Fas-FasL, and TRAIL, although to a different extent in each ofthese populations. We also provide evidence that it is the recentlystimulated (GCT�) PPL population which preferentially migratesto the intraepithelial compartment and LP following enteric virusinfection.
Materials and MethodsAnimals and virus
Four-week-old female BALB/cJ mice were purchased from The JacksonLaboratory. Six- to 8-wk-old mice were used in all experiments. Mice weremaintained under specific pathogen-free conditions and provided sterilefood and water ad libitum. All animal manipulations were performed inclass II biological safety cabinets. Virally primed mice were kept physi-cally isolated from all other experimental and stock mice.
Reovirus 1/L was originally obtained from Dr. W. Joklik (Duke Uni-versity School of Medicine, Durham, NC). Third passage, gradient-purifiedstocks were titered by limiting dilution on L cell monolayers (19).
Antibodies
The following mAbs were used in this study: anti-TCR-�� (clone H57-597), anti-TCR-�� (clone GL3), and anti-CD4 (clone CT-CD4) were pur-chased from Caltag Laboratories. Anti-Thy-1.2 (clone 53-2.1), anti-CD8�(clone 53-6.7), anti-CD8� (clone 53.5.8), anti-B220 (clone RA3-6B2), anti-CD16/CD32 (Fc block, clone 2.4G2), anti-CD11c (clone HL3), anti-FasL(clone MFL3), and anti-hamster IgG mixture (clones G70-204 and G94-56)were purchased from BD Pharmingen. Anti-GCT (clone 1024CD3.5) wasa gift from Dr. F. M. Platt (Oxford University, Oxford, U.K.). Abs wereconjugated with FITC, PE, allophycocyanin, PerCP, or biotin. Streptavi-din-conjugated PE, allophycocyanin, and PerCP (BD Pharmingen) wereused as second-step reagents to identify biotinylated primary Abs. Each Abwas titrated to determine the optimal staining concentration for maximumsignal.
Immunization
Mice were anesthetized with a 0.15 cc i.p. dose of 20% ketamine (Vetalar100 mg/cc; Fort Dodge Laboratories) and 2.0% acepromazine maleate(PromAce 10 mg/cc; Ayerest Laboratories) and then inoculated i.d. with3 � 107 PFU of reovirus 1/L in 50 �l of 0.9% NaCl (8). Control mice wereinoculated as above with the same volume of 0.9% NaCl.
Isolation of lymphocyte populations
IEL and LPL were isolated from mice with some modifications of a pro-tocol described previously (20). In brief, the intestines from the duodenumto the ileocecal junction were removed and flushed with Ca2�, Mg2�-freeHBSS (CMF). PPs and mesentery were removed and the intestines wereopened longitudinally and cut into small pieces. The pieces were stirredthree times for 30 min in CMF containing 10 mM HEPES, 25 mMNaHCO3, 2% FBS, 1 mM EDTA, and 1 mM DTT at 37°C. The eluted cellsfrom the first two incubations were collected, passed through 74 �m nylonmesh to partially purify the IEL and kept at 37°C in CO2 incubator for45–60 min. IEL were subsequently separated from epithelial cells by cen-trifugation through 44/67.5% Percoll (Pharmacia) gradient at 600 � g for20 min. IEL were harvested from the interface between the 44% and 67.5%Percoll layers. For the isolation of LPL, the EDTA-treated intestinal pieceswere washed and then digested for 90 min with RPMI 1640 containing 5%FBS, 10 mM HEPES, 25 mM NaHCO3, 100 U/ml Collagenase type II(Sigma-Aldrich), 0.5 mg/ml Dispase II (Boehringer Mannheim), and 100U/ml DNase I (Boehringer Mannheim) at 37°C. LPL were then purifiedthrough a 40/67.5% Percoll gradient centrifuged at 600 � g for 20 min. PPswere isolated and digested with collagenase and dispase, as describedabove. Splenocytes were isolated by pressing the spleen between the twofrosted slides. RBCs were removed by lysis with 0.84% ammoniumchloride.
Multicolor immunofluorescence staining for surface markers
Single cell suspensions (0.5–1 � 106/sample) in HBSS-5% FBS containing0.02% sodium azide were preincubated for 20 min with anti-CD16/32 toblock FcRs (Fc�III A/B) to prevent nonspecific binding. The cells werethen incubated with the relevant appropriately titered mAbs for 30 min onice. These Abs were either directly labeled with FITC, allophycocyanin,PE, and PerCP, or were biotinylated. In the case of biotinylated Abs,streptavidin-conjugated PE, allophycocyanin, or PerCP were used as sec-ond step reagents. After washing with HBSS without phenol red and FBS,the cells were fixed in 2% paraformaldehyde for 20 min at room temper-ature and analyzed for cell surface marker expression using a FACSCaliburflow cytometer (BD Biosciences). Data were analyzed using CellQuestsoftware (BD Biosciences).
RT-PCR
PPL, IEL, and LPL were harvested and RNA was extracted by the chlo-roform/isopropanol method using TRI-reagent (Sigma-Aldrich). Using aone-step RT-PCR kit (Qiagen), RNA (500 ng) was first reverse-tran-scribed, and then PCR-amplified. Amplification was performed in a DNAthermal cycler (PerkinElmer/Cetus) set at 1 min each at 94°C, 58°C and72°C for 30 cycles for FasL, perforin, and �-actin followed by an extensionat 72°C for 10 min. Amplification for TRAIL was for 28 cycles at 92°C (30s), 57°C (30 s), and 72°C (2 min). After amplification, the PCR productwas electrophoresed on a 1.5% agarose gel and visualized by ethidiumbromide staining under UV illumination. The specific primers for FasL(sense 5�-CTG GAA TGG GAA GAC ACA TA-3� and antisense 5�-AAAGGT CTT AGA TTC CTC AA-3�), perforin (sense 5�-CAC AAG TTCGTG CCA GGT GTA-3� and antisense 5�-GCA TGC TCT GTG GAGCTG TTA-3�), TRAIL (sense 5�-TCA CCA ACG AGA TGA AGCAGC-3� and antisense 5�-CTC ACC TTG TCC TTT GAG ACC-3), and�-actin (sense 5�-TTG TAA CCA ACT GGG ACG ATA TGG-3� andantisense 5�-GAT CTT GAT CTT CAT GGT GCT AGG-3�) were pur-chased from Integrated DNA Technologies. Amplified products for �-ac-tin, TRAIL, perforin, and FasL were 760, 513, 491, and 214 bp, respec-tively. For semiquantitative RT-PCR analysis, band intensities on scannedgels were analyzed using specific bands of the housekeeping gene �-actintranscripts as a reference using the public domain NIH Image programdeveloped at the National Institutes of Health.
Generation of Ag-specific CTL effector cells
To generate Ag-specific CTL effector cells, gut lymphocytes (PPL, LPL,and IEL) isolated as described above from enterically primed mice werecultured with some modifications (8). In brief, lymphocytes were culturedin 96-well microtiter plates at a density of 1 � 106 cells/ml in 200 �l ofRPMI 1640 medium supplemented with 5 � 10�5 M 2-ME, 2 mM L-
3581The Journal of Immunology
on January 4, 2011w
ww
.jimm
unol.orgD
ownloaded from
glutamine, 10% FCS, gentamicin, penicillin, streptomycin, and nystatin.Thioglycolate-elicited peritoneal exudate stimulator cells (PEC) pulsedwith reovirus 1/L at a multiplicity of infection (MOI) of 2 for 1 h were usedas a source of APCs. PEC (5 � 104) were added to each well containinglymphocytes. For PPL and LPL, cultures were harvested on day 5. In thecase of IEL, cultures were supplemented with rIL-2 (100 pg/ml) and IL-15(10 ng/ml) (BioSource International) on day 1 and harvested the followingday. For all populations, live cells were enriched at the interface of a44/67.5% Percoll gradient before analyzing their cytotoxic activity.
Cytotoxicity assay
Cytolytic activity was measured by a lactate dehydrogenase (LDH) releaseassay (Cytotoxicity Detection kit; Roche Diagnostics) from PPL, IEL, andLPL isolated on day 10 post-reovirus 1/L inoculation (peak time point forFasL expression, see Fig. 7). Effector cells, as prepared above, were addedin triplicate to U-bottom wells of 96-well microtiter plate and serial dilu-tions were made at the indicated E:T ratios. Reovirus 1/L-infected (MOI �10) or noninfected KD2SV target cells were then added to each well. Theplates were then incubated at 37°C. After 4 h of incubation, the plates werecentrifuged at 250 � g for 10 min. Cell-free supernatants (50 �l) from eachwell were collected and transferred to a 96-well flat-bottom microtiterplate. Fifty microliters of freshly prepared reaction mixture was added toeach well and incubated at room temperature for 10–30 min in the dark.The released LDH activity was measured at OD490 with a reference wave-length of 650 nm. Maximum LDH release was determined by incubation oftarget cells in 100 �l of 2% Triton X-100 and spontaneous LDH releasewas determined by addition of medium only. The percentage of specificLDH released was calculated as percent-specific cytotoxicity � (experi-mental release � effector spontaneous release � target spontaneous re-lease)/(maximum target release � spontaneous target release). Results areexpressed as the mean percent-specific cytotoxicity � SD.
To evaluate the role of perforin in CTL-mediated cytolysis, effector cellswere pretreated with Concanamycin A (CMA; Sigma-Aldrich) for 2 h at afinal concentration of 100 nM to inactivate perforin. Similarly, anti-FasLmAb (10 �g/ml; BD Pharmingen) was used to inhibit Fas-FasL mediatedlysis and anti-TRAIL mAb (10 �g/ml; R & D Systems) was used to inhibitTRAIL-mediated cytotoxicity. Appropriate isotype matched control mAbswere used in all experiments and no significant effect on the cytotoxicactivity was observed (data not shown).
Adoptive transfer
BALB/cJ mice were inoculated i.d. with reovirus 1/L as described, andPPLs were isolated after 3 days. Cells were labeled with the fluorescentdye, CFSE (Molecular Probes). Briefly, cells were suspended in HBSSwithout serum containing 5 �M CFSE for 30 min at 37°C for staining andfor an additional 20 min in HBSS containing 10% FBS to stop the reaction.The labeled cells were washed twice with HBSS before transfer via tailvein injection into recipient mice. One day after cell transfer (1 � 107
cells/mouse), the recipient mice were inoculated i.d. with 3 � 107 PFU ofreovirus 1/L (infected group) or saline (control group) and sacrificed 3 daysafter cell transfer. The IEL, LPL, and PPL were isolated, stained for GCT,and analyzed for CFSE� and GCT� cells as described above.
Statistical analysis
The ANOVA method was used to analyze the data. A p value of �0.05 wasconsidered to indicate significance.
ResultsGCT is induced on lymphocytes in the PP, intraepithelialcompartment, and LP following reovirus 1/L infection
To determine whether a GCT� lymphocyte population developedin gut mucosal inductive and effector sites following reovirus 1/Linoculation, BALB/cJ mice were inoculated i.d. with 3 � 107 PFUof reovirus 1/L. PPL, IEL, and LPL were obtained and analyzedfor the expression of the GCT Ag by flow cytometry on days 3, 7,and 10 postinoculation. In these studies, B cells in the PPL andLPL were identified by expression of the cell surface molecule,B220. We verified that 100% of the B220� LPL and PPL alsoexpressed the CD19 B cell marker, thus demonstrating the pheno-type of the B cell populations in the these gut-mucosal compart-ments (data not shown). We found that in control, saline-inocu-lated mice, a very small population of PPL, IEL, and LPL express
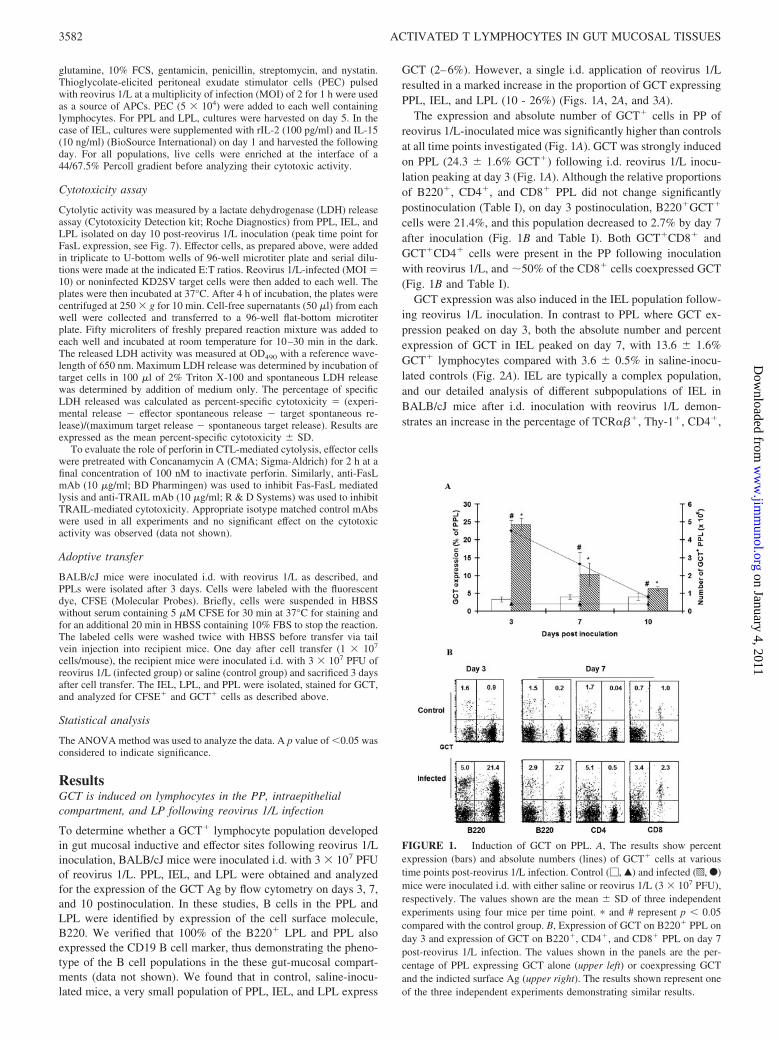
GCT (2–6%). However, a single i.d. application of reovirus 1/Lresulted in a marked increase in the proportion of GCT expressingPPL, IEL, and LPL (10 - 26%) (Figs. 1A, 2A, and 3A).
The expression and absolute number of GCT� cells in PP ofreovirus 1/L-inoculated mice was significantly higher than controlsat all time points investigated (Fig. 1A). GCT was strongly inducedon PPL (24.3 � 1.6% GCT�) following i.d. reovirus 1/L inocu-lation peaking at day 3 (Fig. 1A). Although the relative proportionsof B220�, CD4�, and CD8� PPL did not change significantlypostinoculation (Table I), on day 3 postinoculation, B220�GCT�
cells were 21.4%, and this population decreased to 2.7% by day 7after inoculation (Fig. 1B and Table I). Both GCT�CD8� andGCT�CD4� cells were present in the PP following inoculationwith reovirus 1/L, and �50% of the CD8� cells coexpressed GCT(Fig. 1B and Table I).
GCT expression was also induced in the IEL population follow-ing reovirus 1/L inoculation. In contrast to PPL where GCT ex-pression peaked on day 3, both the absolute number and percentexpression of GCT in IEL peaked on day 7, with 13.6 � 1.6%GCT� lymphocytes compared with 3.6 � 0.5% in saline-inocu-lated controls (Fig. 2A). IEL are typically a complex population,and our detailed analysis of different subpopulations of IEL inBALB/cJ mice after i.d. inoculation with reovirus 1/L demon-strates an increase in the percentage of TCR���, Thy-1�, CD4�,
FIGURE 1. Induction of GCT on PPL. A, The results show percentexpression (bars) and absolute numbers (lines) of GCT� cells at varioustime points post-reovirus 1/L infection. Control (�, Œ) and infected (p, F)mice were inoculated i.d. with either saline or reovirus 1/L (3 � 107 PFU),respectively. The values shown are the mean � SD of three independentexperiments using four mice per time point. � and # represent p � 0.05compared with the control group. B, Expression of GCT on B220� PPL onday 3 and expression of GCT on B220�, CD4�, and CD8� PPL on day 7post-reovirus 1/L infection. The values shown in the panels are the per-centage of PPL expressing GCT alone (upper left) or coexpressing GCTand the indicted surface Ag (upper right). The results shown represent oneof the three independent experiments demonstrating similar results.
3582 ACTIVATED T LYMPHOCYTES IN GUT MUCOSAL TISSUES
on January 4, 2011w
ww
.jimm
unol.orgD
ownloaded from
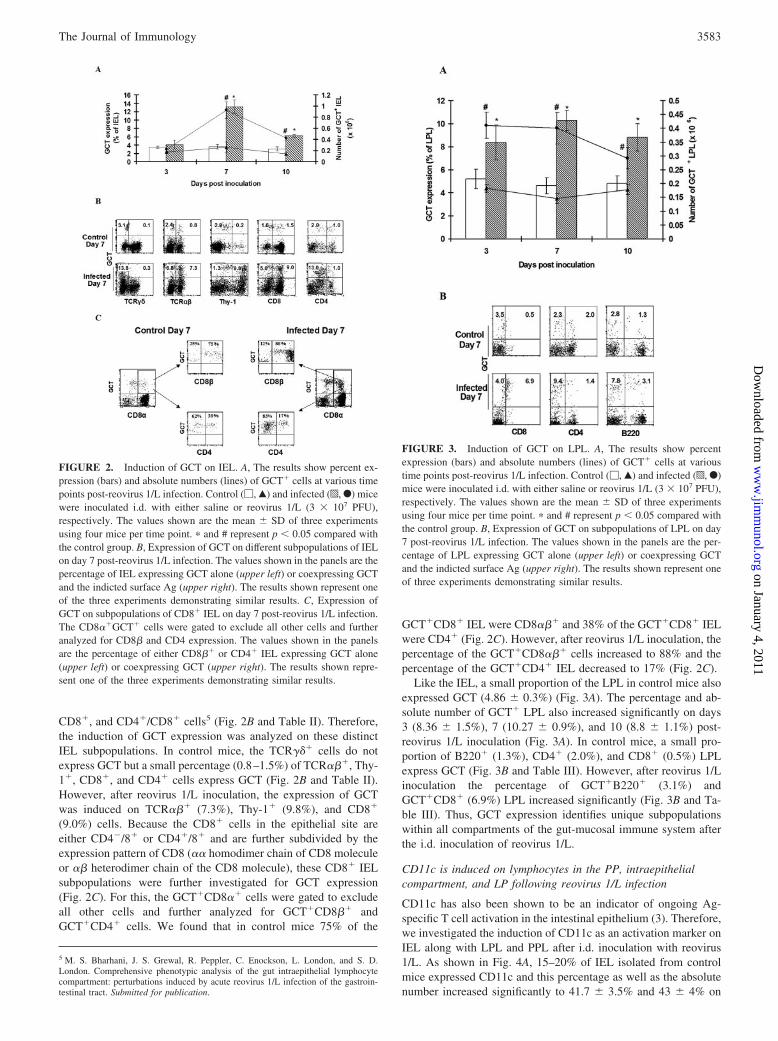
CD8�, and CD4�/CD8� cells5 (Fig. 2B and Table II). Therefore,the induction of GCT expression was analyzed on these distinctIEL subpopulations. In control mice, the TCR��� cells do notexpress GCT but a small percentage (0.8–1.5%) of TCR���, Thy-1�, CD8�, and CD4� cells express GCT (Fig. 2B and Table II).However, after reovirus 1/L inoculation, the expression of GCTwas induced on TCR��� (7.3%), Thy-1� (9.8%), and CD8�
(9.0%) cells. Because the CD8� cells in the epithelial site areeither CD4�/8� or CD4�/8� and are further subdivided by theexpression pattern of CD8 (�� homodimer chain of CD8 moleculeor �� heterodimer chain of the CD8 molecule), these CD8� IELsubpopulations were further investigated for GCT expression(Fig. 2C). For this, the GCT�CD8�� cells were gated to excludeall other cells and further analyzed for GCT�CD8�� andGCT�CD4� cells. We found that in control mice 75% of the
GCT�CD8� IEL were CD8��� and 38% of the GCT�CD8� IELwere CD4� (Fig. 2C). However, after reovirus 1/L inoculation, thepercentage of the GCT�CD8��� cells increased to 88% and thepercentage of the GCT�CD4� IEL decreased to 17% (Fig. 2C).
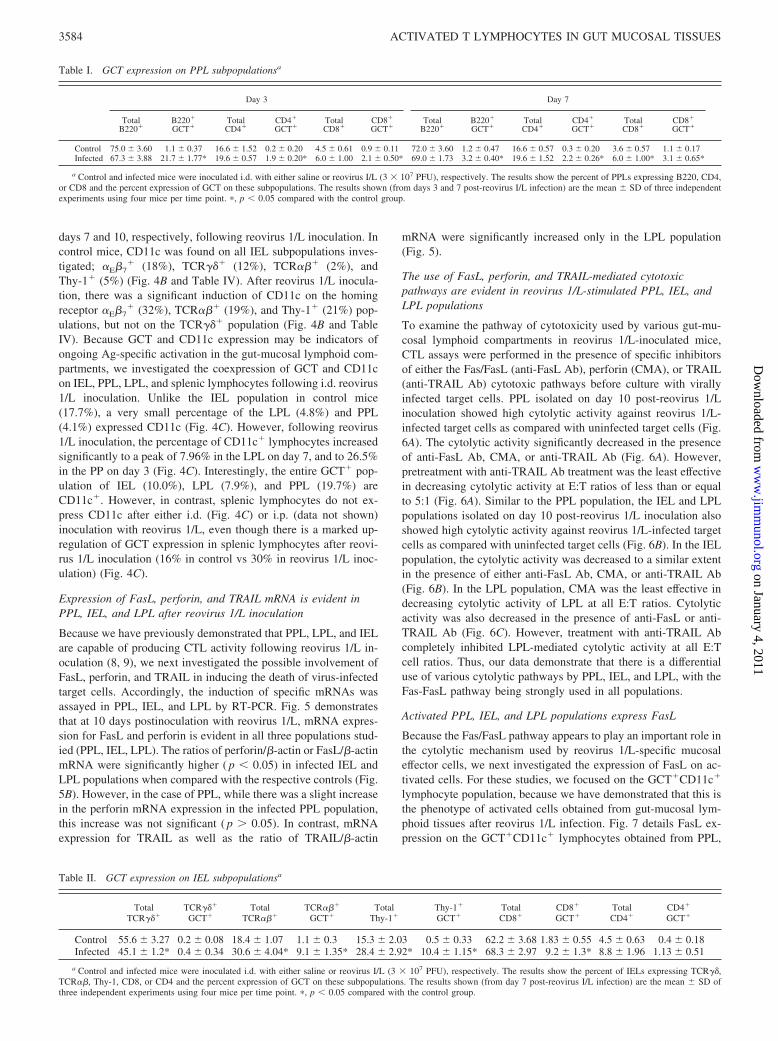
Like the IEL, a small proportion of the LPL in control mice alsoexpressed GCT (4.86 � 0.3%) (Fig. 3A). The percentage and ab-solute number of GCT� LPL also increased significantly on days3 (8.36 � 1.5%), 7 (10.27 � 0.9%), and 10 (8.8 � 1.1%) post-reovirus 1/L inoculation (Fig. 3A). In control mice, a small pro-portion of B220� (1.3%), CD4� (2.0%), and CD8� (0.5%) LPLexpress GCT (Fig. 3B and Table III). However, after reovirus 1/Linoculation the percentage of GCT�B220� (3.1%) andGCT�CD8� (6.9%) LPL increased significantly (Fig. 3B and Ta-ble III). Thus, GCT expression identifies unique subpopulationswithin all compartments of the gut-mucosal immune system afterthe i.d. inoculation of reovirus 1/L.
CD11c is induced on lymphocytes in the PP, intraepithelialcompartment, and LP following reovirus 1/L infection
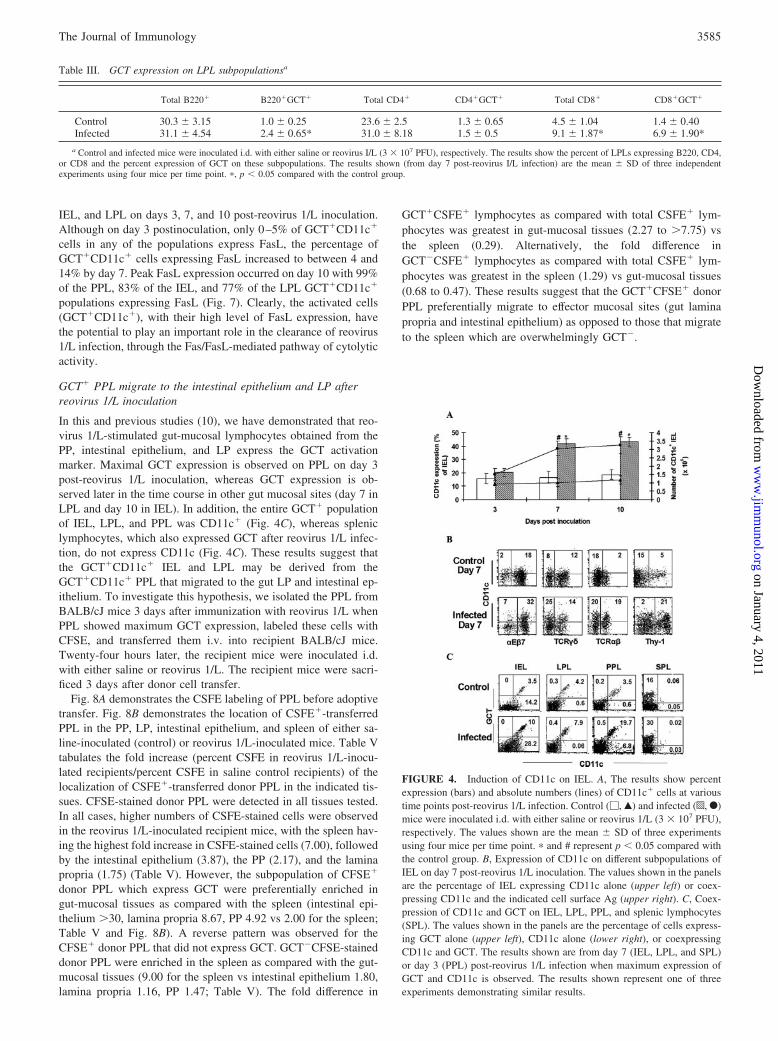
CD11c has also been shown to be an indicator of ongoing Ag-specific T cell activation in the intestinal epithelium (3). Therefore,we investigated the induction of CD11c as an activation marker onIEL along with LPL and PPL after i.d. inoculation with reovirus1/L. As shown in Fig. 4A, 15–20% of IEL isolated from controlmice expressed CD11c and this percentage as well as the absolutenumber increased significantly to 41.7 � 3.5% and 43 � 4% on
5 M. S. Bharhani, J. S. Grewal, R. Peppler, C. Enockson, L. London, and S. D.London. Comprehensive phenotypic analysis of the gut intraepithelial lymphocytecompartment: perturbations induced by acute reovirus 1/L infection of the gastroin-testinal tract. Submitted for publication.
FIGURE 2. Induction of GCT on IEL. A, The results show percent ex-pression (bars) and absolute numbers (lines) of GCT� cells at various timepoints post-reovirus 1/L infection. Control (�, Œ) and infected (p, F) micewere inoculated i.d. with either saline or reovirus 1/L (3 � 107 PFU),respectively. The values shown are the mean � SD of three experimentsusing four mice per time point. � and # represent p � 0.05 compared withthe control group. B, Expression of GCT on different subpopulations of IELon day 7 post-reovirus 1/L infection. The values shown in the panels are thepercentage of IEL expressing GCT alone (upper left) or coexpressing GCTand the indicted surface Ag (upper right). The results shown represent oneof the three experiments demonstrating similar results. C, Expression ofGCT on subpopulations of CD8� IEL on day 7 post-reovirus 1/L infection.The CD8��GCT� cells were gated to exclude all other cells and furtheranalyzed for CD8� and CD4 expression. The values shown in the panelsare the percentage of either CD8�� or CD4� IEL expressing GCT alone(upper left) or coexpressing GCT (upper right). The results shown repre-sent one of the three experiments demonstrating similar results.
FIGURE 3. Induction of GCT on LPL. A, The results show percentexpression (bars) and absolute numbers (lines) of GCT� cells at varioustime points post-reovirus 1/L infection. Control (�, Œ) and infected (p, F)mice were inoculated i.d. with either saline or reovirus 1/L (3 � 107 PFU),respectively. The values shown are the mean � SD of three experimentsusing four mice per time point. � and # represent p � 0.05 compared withthe control group. B, Expression of GCT on subpopulations of LPL on day7 post-reovirus 1/L infection. The values shown in the panels are the per-centage of LPL expressing GCT alone (upper left) or coexpressing GCTand the indicted surface Ag (upper right). The results shown represent oneof three experiments demonstrating similar results.
3583The Journal of Immunology
on January 4, 2011w
ww
.jimm
unol.orgD
ownloaded from
days 7 and 10, respectively, following reovirus 1/L inoculation. Incontrol mice, CD11c was found on all IEL subpopulations inves-tigated; �E�7
� (18%), TCR��� (12%), TCR��� (2%), andThy-1� (5%) (Fig. 4B and Table IV). After reovirus 1/L inocula-tion, there was a significant induction of CD11c on the homingreceptor �E�7
� (32%), TCR��� (19%), and Thy-1� (21%) pop-ulations, but not on the TCR��� population (Fig. 4B and TableIV). Because GCT and CD11c expression may be indicators ofongoing Ag-specific activation in the gut-mucosal lymphoid com-partments, we investigated the coexpression of GCT and CD11con IEL, PPL, LPL, and splenic lymphocytes following i.d. reovirus1/L inoculation. Unlike the IEL population in control mice(17.7%), a very small percentage of the LPL (4.8%) and PPL(4.1%) expressed CD11c (Fig. 4C). However, following reovirus1/L inoculation, the percentage of CD11c� lymphocytes increasedsignificantly to a peak of 7.96% in the LPL on day 7, and to 26.5%in the PP on day 3 (Fig. 4C). Interestingly, the entire GCT� pop-ulation of IEL (10.0%), LPL (7.9%), and PPL (19.7%) areCD11c�. However, in contrast, splenic lymphocytes do not ex-press CD11c after either i.d. (Fig. 4C) or i.p. (data not shown)inoculation with reovirus 1/L, even though there is a marked up-regulation of GCT expression in splenic lymphocytes after reovi-rus 1/L inoculation (16% in control vs 30% in reovirus 1/L inoc-ulation) (Fig. 4C).
Expression of FasL, perforin, and TRAIL mRNA is evident inPPL, IEL, and LPL after reovirus 1/L inoculation
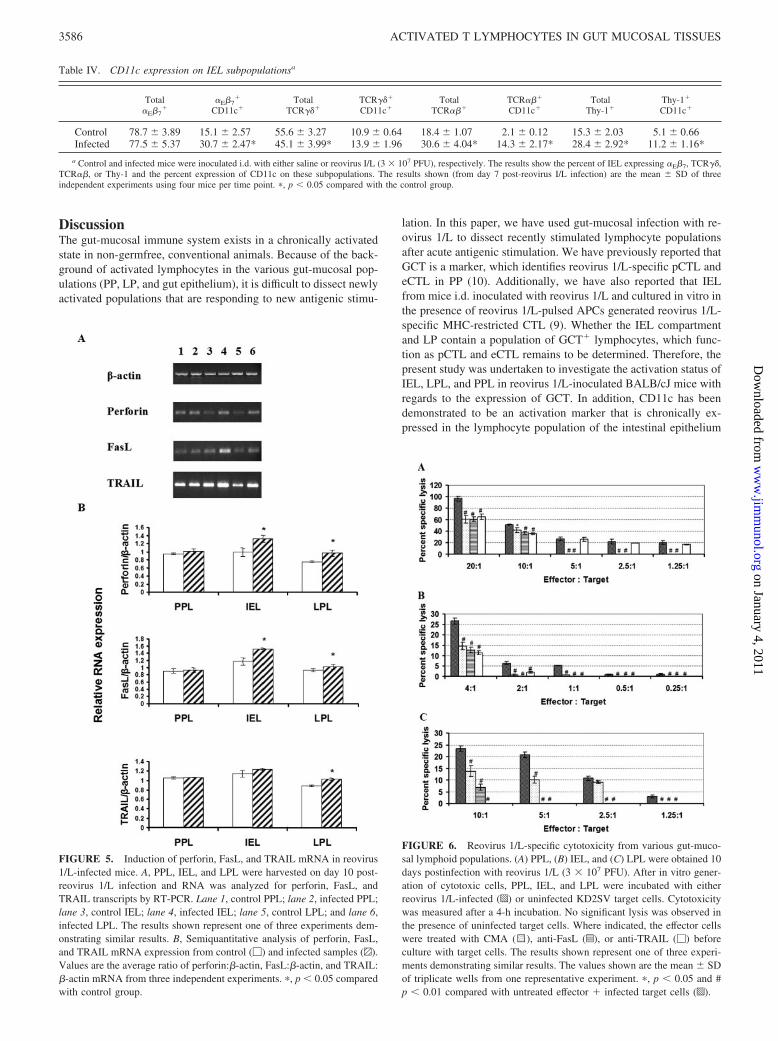
Because we have previously demonstrated that PPL, LPL, and IELare capable of producing CTL activity following reovirus 1/L in-oculation (8, 9), we next investigated the possible involvement ofFasL, perforin, and TRAIL in inducing the death of virus-infectedtarget cells. Accordingly, the induction of specific mRNAs wasassayed in PPL, IEL, and LPL by RT-PCR. Fig. 5 demonstratesthat at 10 days postinoculation with reovirus 1/L, mRNA expres-sion for FasL and perforin is evident in all three populations stud-ied (PPL, IEL, LPL). The ratios of perforin/�-actin or FasL/�-actinmRNA were significantly higher ( p � 0.05) in infected IEL andLPL populations when compared with the respective controls (Fig.5B). However, in the case of PPL, while there was a slight increasein the perforin mRNA expression in the infected PPL population,this increase was not significant ( p 0.05). In contrast, mRNAexpression for TRAIL as well as the ratio of TRAIL/�-actin
mRNA were significantly increased only in the LPL population(Fig. 5).
The use of FasL, perforin, and TRAIL-mediated cytotoxicpathways are evident in reovirus 1/L-stimulated PPL, IEL, andLPL populations
To examine the pathway of cytotoxicity used by various gut-mu-cosal lymphoid compartments in reovirus 1/L-inoculated mice,CTL assays were performed in the presence of specific inhibitorsof either the Fas/FasL (anti-FasL Ab), perforin (CMA), or TRAIL(anti-TRAIL Ab) cytotoxic pathways before culture with virallyinfected target cells. PPL isolated on day 10 post-reovirus 1/Linoculation showed high cytolytic activity against reovirus 1/L-infected target cells as compared with uninfected target cells (Fig.6A). The cytolytic activity significantly decreased in the presenceof anti-FasL Ab, CMA, or anti-TRAIL Ab (Fig. 6A). However,pretreatment with anti-TRAIL Ab treatment was the least effectivein decreasing cytolytic activity at E:T ratios of less than or equalto 5:1 (Fig. 6A). Similar to the PPL population, the IEL and LPLpopulations isolated on day 10 post-reovirus 1/L inoculation alsoshowed high cytolytic activity against reovirus 1/L-infected targetcells as compared with uninfected target cells (Fig. 6B). In the IELpopulation, the cytolytic activity was decreased to a similar extentin the presence of either anti-FasL Ab, CMA, or anti-TRAIL Ab(Fig. 6B). In the LPL population, CMA was the least effective indecreasing cytolytic activity of LPL at all E:T ratios. Cytolyticactivity was also decreased in the presence of anti-FasL or anti-TRAIL Ab (Fig. 6C). However, treatment with anti-TRAIL Abcompletely inhibited LPL-mediated cytolytic activity at all E:Tcell ratios. Thus, our data demonstrate that there is a differentialuse of various cytolytic pathways by PPL, IEL, and LPL, with theFas-FasL pathway being strongly used in all populations.
Activated PPL, IEL, and LPL populations express FasL
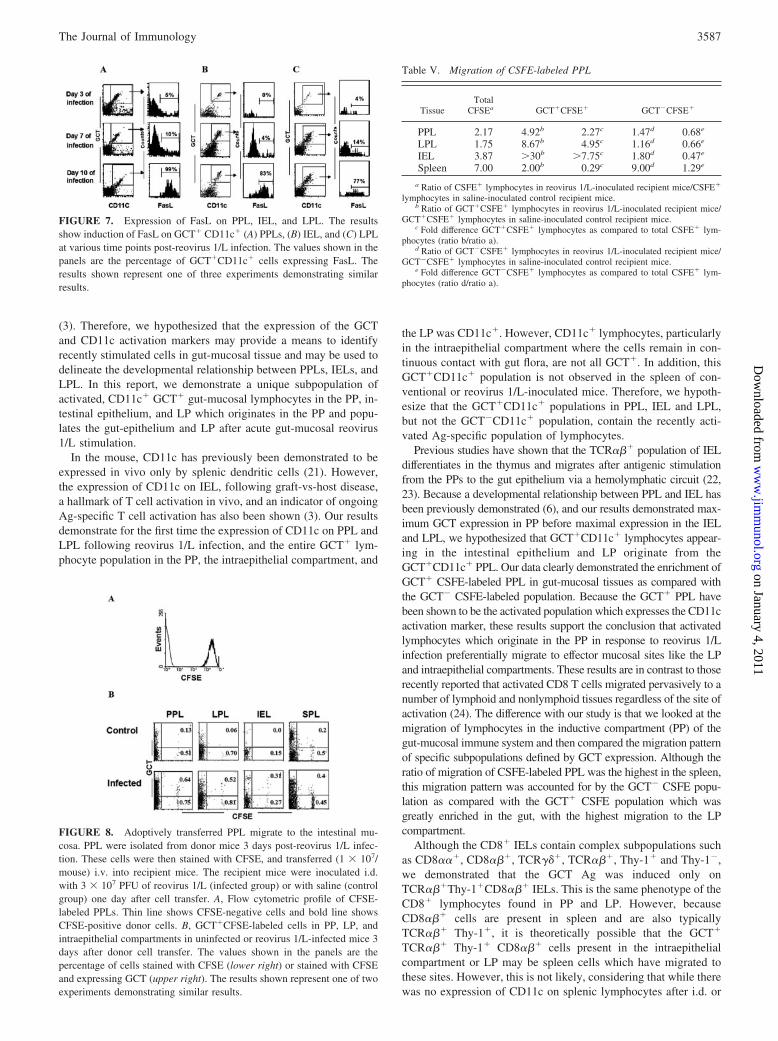
Because the Fas/FasL pathway appears to play an important role inthe cytolytic mechanism used by reovirus 1/L-specific mucosaleffector cells, we next investigated the expression of FasL on ac-tivated cells. For these studies, we focused on the GCT�CD11c�
lymphocyte population, because we have demonstrated that this isthe phenotype of activated cells obtained from gut-mucosal lym-phoid tissues after reovirus 1/L infection. Fig. 7 details FasL ex-pression on the GCT�CD11c� lymphocytes obtained from PPL,
Table II. GCT expression on IEL subpopulationsa
TotalTCR���
TCR���
GCT�Total
TCR���TCR���
GCT�Total
Thy-1�Thy-1�
GCT�TotalCD8�
CD8�
GCT�TotalCD4�
CD4�
GCT�
Control 55.6 � 3.27 0.2 � 0.08 18.4 � 1.07 1.1 � 0.3 15.3 � 2.03 0.5 � 0.33 62.2 � 3.68 1.83 � 0.55 4.5 � 0.63 0.4 � 0.18Infected 45.1 � 1.2* 0.4 � 0.34 30.6 � 4.04* 9.1 � 1.35* 28.4 � 2.92* 10.4 � 1.15* 68.3 � 2.97 9.2 � 1.3* 8.8 � 1.96 1.13 � 0.51
a Control and infected mice were inoculated i.d. with either saline or reovirus I/L (3 � 107 PFU), respectively. The results show the percent of IELs expressing TCR��,TCR��, Thy-1, CD8, or CD4 and the percent expression of GCT on these subpopulations. The results shown (from day 7 post-reovirus I/L infection) are the mean � SD ofthree independent experiments using four mice per time point. �, p � 0.05 compared with the control group.
Table I. GCT expression on PPL subpopulationsa
Day 3 Day 7
TotalB220�
B220�
GCT�TotalCD4�
CD4�
GCT�TotalCD8�
CD8�
GCT�Total
B220�B220�
GCT�TotalCD4�
CD4�
GCT�TotalCD8�
CD8�
GCT�
Control 75.0 � 3.60 1.1 � 0.37 16.6 � 1.52 0.2 � 0.20 4.5 � 0.61 0.9 � 0.11 72.0 � 3.60 1.2 � 0.47 16.6 � 0.57 0.3 � 0.20 3.6 � 0.57 1.1 � 0.17Infected 67.3 � 3.88 21.7 � 1.77* 19.6 � 0.57 1.9 � 0.20* 6.0 � 1.00 2.1 � 0.50* 69.0 � 1.73 3.2 � 0.40* 19.6 � 1.52 2.2 � 0.26* 6.0 � 1.00* 3.1 � 0.65*
a Control and infected mice were inoculated i.d. with either saline or reovirus I/L (3 � 107 PFU), respectively. The results show the percent of PPLs expressing B220, CD4,or CD8 and the percent expression of GCT on these subpopulations. The results shown (from days 3 and 7 post-reovirus I/L infection) are the mean � SD of three independentexperiments using four mice per time point. �, p � 0.05 compared with the control group.
3584 ACTIVATED T LYMPHOCYTES IN GUT MUCOSAL TISSUES
on January 4, 2011w
ww
.jimm
unol.orgD
ownloaded from
IEL, and LPL on days 3, 7, and 10 post-reovirus 1/L inoculation.Although on day 3 postinoculation, only 0–5% of GCT�CD11c�
cells in any of the populations express FasL, the percentage ofGCT�CD11c� cells expressing FasL increased to between 4 and14% by day 7. Peak FasL expression occurred on day 10 with 99%of the PPL, 83% of the IEL, and 77% of the LPL GCT�CD11c�
populations expressing FasL (Fig. 7). Clearly, the activated cells(GCT�CD11c�), with their high level of FasL expression, havethe potential to play an important role in the clearance of reovirus1/L infection, through the Fas/FasL-mediated pathway of cytolyticactivity.
GCT� PPL migrate to the intestinal epithelium and LP afterreovirus 1/L inoculation
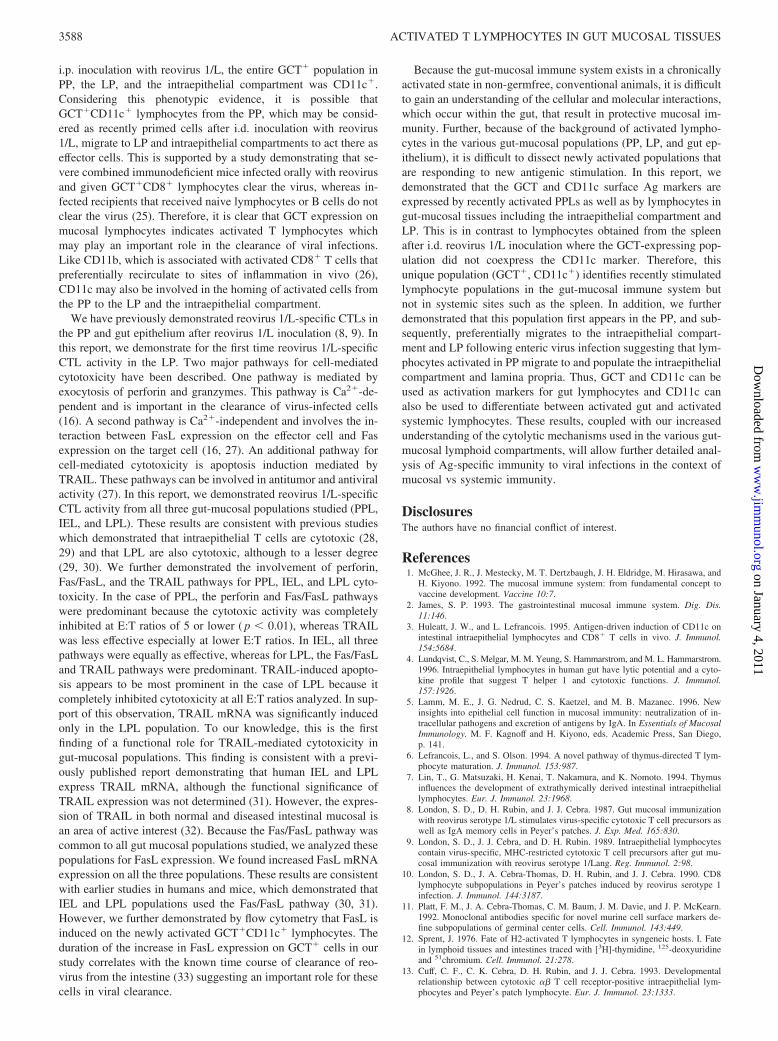
In this and previous studies (10), we have demonstrated that reo-virus 1/L-stimulated gut-mucosal lymphocytes obtained from thePP, intestinal epithelium, and LP express the GCT activationmarker. Maximal GCT expression is observed on PPL on day 3post-reovirus 1/L inoculation, whereas GCT expression is ob-served later in the time course in other gut mucosal sites (day 7 inLPL and day 10 in IEL). In addition, the entire GCT� populationof IEL, LPL, and PPL was CD11c� (Fig. 4C), whereas spleniclymphocytes, which also expressed GCT after reovirus 1/L infec-tion, do not express CD11c (Fig. 4C). These results suggest thatthe GCT�CD11c� IEL and LPL may be derived from theGCT�CD11c� PPL that migrated to the gut LP and intestinal ep-ithelium. To investigate this hypothesis, we isolated the PPL fromBALB/cJ mice 3 days after immunization with reovirus 1/L whenPPL showed maximum GCT expression, labeled these cells withCFSE, and transferred them i.v. into recipient BALB/cJ mice.Twenty-four hours later, the recipient mice were inoculated i.d.with either saline or reovirus 1/L. The recipient mice were sacri-ficed 3 days after donor cell transfer.
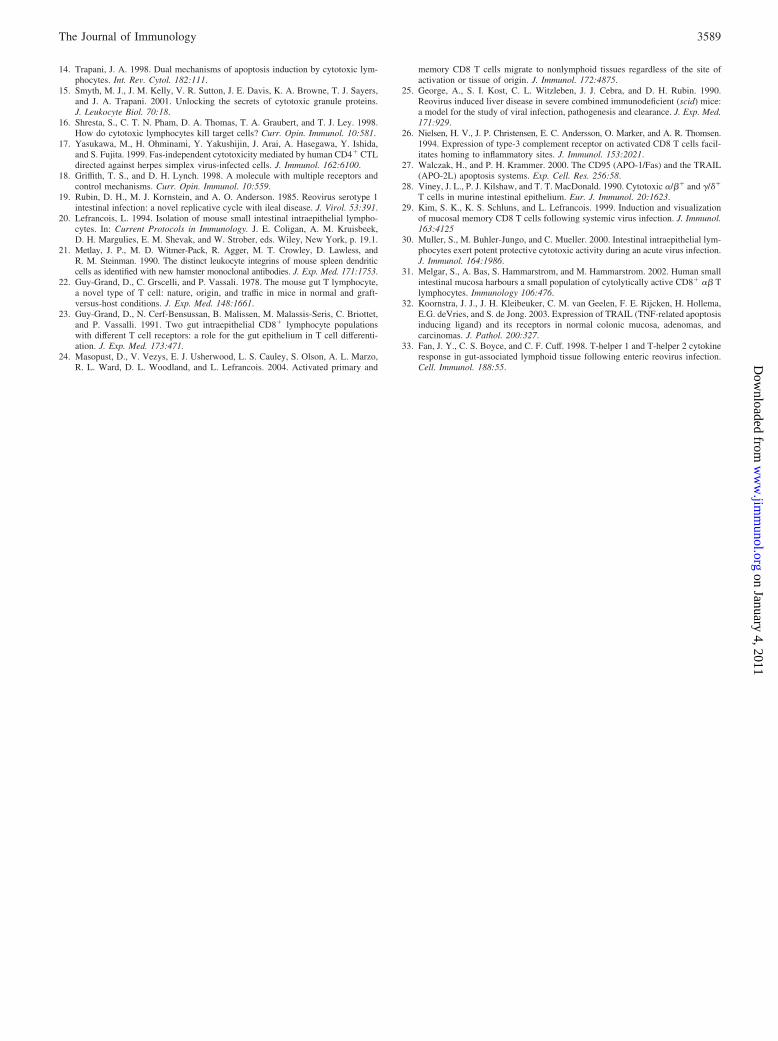
Fig. 8A demonstrates the CSFE labeling of PPL before adoptivetransfer. Fig. 8B demonstrates the location of CSFE�-transferredPPL in the PP, LP, intestinal epithelium, and spleen of either sa-line-inoculated (control) or reovirus 1/L-inoculated mice. Table Vtabulates the fold increase (percent CSFE in reovirus 1/L-inocu-lated recipients/percent CSFE in saline control recipients) of thelocalization of CSFE�-transferred donor PPL in the indicated tis-sues. CFSE-stained donor PPL were detected in all tissues tested.In all cases, higher numbers of CSFE-stained cells were observedin the reovirus 1/L-inoculated recipient mice, with the spleen hav-ing the highest fold increase in CSFE-stained cells (7.00), followedby the intestinal epithelium (3.87), the PP (2.17), and the laminapropria (1.75) (Table V). However, the subpopulation of CFSE�
donor PPL which express GCT were preferentially enriched ingut-mucosal tissues as compared with the spleen (intestinal epi-thelium 30, lamina propria 8.67, PP 4.92 vs 2.00 for the spleen;Table V and Fig. 8B). A reverse pattern was observed for theCFSE� donor PPL that did not express GCT. GCT�CFSE-staineddonor PPL were enriched in the spleen as compared with the gut-mucosal tissues (9.00 for the spleen vs intestinal epithelium 1.80,lamina propria 1.16, PP 1.47; Table V). The fold difference in
GCT�CSFE� lymphocytes as compared with total CSFE� lym-phocytes was greatest in gut-mucosal tissues (2.27 to 7.75) vsthe spleen (0.29). Alternatively, the fold difference inGCT�CSFE� lymphocytes as compared with total CSFE� lym-phocytes was greatest in the spleen (1.29) vs gut-mucosal tissues(0.68 to 0.47). These results suggest that the GCT�CFSE� donorPPL preferentially migrate to effector mucosal sites (gut laminapropria and intestinal epithelium) as opposed to those that migrateto the spleen which are overwhelmingly GCT�.
FIGURE 4. Induction of CD11c on IEL. A, The results show percentexpression (bars) and absolute numbers (lines) of CD11c� cells at varioustime points post-reovirus 1/L infection. Control (�, Œ) and infected (p, F)mice were inoculated i.d. with either saline or reovirus 1/L (3 � 107 PFU),respectively. The values shown are the mean � SD of three experimentsusing four mice per time point. � and # represent p � 0.05 compared withthe control group. B, Expression of CD11c on different subpopulations ofIEL on day 7 post-reovirus 1/L inoculation. The values shown in the panelsare the percentage of IEL expressing CD11c alone (upper left) or coex-pressing CD11c and the indicated cell surface Ag (upper right). C, Coex-pression of CD11c and GCT on IEL, LPL, PPL, and splenic lymphocytes(SPL). The values shown in the panels are the percentage of cells express-ing GCT alone (upper left), CD11c alone (lower right), or coexpressingCD11c and GCT. The results shown are from day 7 (IEL, LPL, and SPL)or day 3 (PPL) post-reovirus 1/L infection when maximum expression ofGCT and CD11c is observed. The results shown represent one of threeexperiments demonstrating similar results.
Table III. GCT expression on LPL subpopulationsa
Total B220� B220�GCT� Total CD4� CD4�GCT� Total CD8� CD8�GCT�
Control 30.3 � 3.15 1.0 � 0.25 23.6 � 2.5 1.3 � 0.65 4.5 � 1.04 1.4 � 0.40Infected 31.1 � 4.54 2.4 � 0.65* 31.0 � 8.18 1.5 � 0.5 9.1 � 1.87* 6.9 � 1.90*
a Control and infected mice were inoculated i.d. with either saline or reovirus I/L (3 � 107 PFU), respectively. The results show the percent of LPLs expressing B220, CD4,or CD8 and the percent expression of GCT on these subpopulations. The results shown (from day 7 post-reovirus I/L infection) are the mean � SD of three independentexperiments using four mice per time point. �, p � 0.05 compared with the control group.
3585The Journal of Immunology
on January 4, 2011w
ww
.jimm
unol.orgD
ownloaded from
DiscussionThe gut-mucosal immune system exists in a chronically activatedstate in non-germfree, conventional animals. Because of the back-ground of activated lymphocytes in the various gut-mucosal pop-ulations (PP, LP, and gut epithelium), it is difficult to dissect newlyactivated populations that are responding to new antigenic stimu-
lation. In this paper, we have used gut-mucosal infection with re-ovirus 1/L to dissect recently stimulated lymphocyte populationsafter acute antigenic stimulation. We have previously reported thatGCT is a marker, which identifies reovirus 1/L-specific pCTL andeCTL in PP (10). Additionally, we have also reported that IELfrom mice i.d. inoculated with reovirus 1/L and cultured in vitro inthe presence of reovirus 1/L-pulsed APCs generated reovirus 1/L-specific MHC-restricted CTL (9). Whether the IEL compartmentand LP contain a population of GCT� lymphocytes, which func-tion as pCTL and eCTL remains to be determined. Therefore, thepresent study was undertaken to investigate the activation status ofIEL, LPL, and PPL in reovirus 1/L-inoculated BALB/cJ mice withregards to the expression of GCT. In addition, CD11c has beendemonstrated to be an activation marker that is chronically ex-pressed in the lymphocyte population of the intestinal epithelium
FIGURE 5. Induction of perforin, FasL, and TRAIL mRNA in reovirus1/L-infected mice. A, PPL, IEL, and LPL were harvested on day 10 post-reovirus 1/L infection and RNA was analyzed for perforin, FasL, andTRAIL transcripts by RT-PCR. Lane 1, control PPL; lane 2, infected PPL;lane 3, control IEL; lane 4, infected IEL; lane 5, control LPL; and lane 6,infected LPL. The results shown represent one of three experiments dem-onstrating similar results. B, Semiquantitative analysis of perforin, FasL,and TRAIL mRNA expression from control (�) and infected samples (^).Values are the average ratio of perforin:�-actin, FasL:�-actin, and TRAIL:�-actin mRNA from three independent experiments. �, p � 0.05 comparedwith control group.
FIGURE 6. Reovirus 1/L-specific cytotoxicity from various gut-muco-sal lymphoid populations. (A) PPL, (B) IEL, and (C) LPL were obtained 10days postinfection with reovirus 1/L (3 � 107 PFU). After in vitro gener-ation of cytotoxic cells, PPL, IEL, and LPL were incubated with eitherreovirus 1/L-infected (p) or uninfected KD2SV target cells. Cytotoxicitywas measured after a 4-h incubation. No significant lysis was observed inthe presence of uninfected target cells. Where indicated, the effector cellswere treated with CMA (1), anti-FasL (z), or anti-TRAIL (�) beforeculture with target cells. The results shown represent one of three experi-ments demonstrating similar results. The values shown are the mean � SDof triplicate wells from one representative experiment. �, p � 0.05 and #p � 0.01 compared with untreated effector � infected target cells (p).
Table IV. CD11c expression on IEL subpopulationsa
Total�E�7
��E�7
�
CD11c�Total
TCR���TCR���
CD11c�Total
TCR���TCR���
CD11c�Total
Thy-1�Thy-1�
CD11c�
Control 78.7 � 3.89 15.1 � 2.57 55.6 � 3.27 10.9 � 0.64 18.4 � 1.07 2.1 � 0.12 15.3 � 2.03 5.1 � 0.66Infected 77.5 � 5.37 30.7 � 2.47* 45.1 � 3.99* 13.9 � 1.96 30.6 � 4.04* 14.3 � 2.17* 28.4 � 2.92* 11.2 � 1.16*
a Control and infected mice were inoculated i.d. with either saline or reovirus I/L (3 � 107 PFU), respectively. The results show the percent of IEL expressing �E�7, TCR��,TCR��, or Thy-1 and the percent expression of CD11c on these subpopulations. The results shown (from day 7 post-reovirus I/L infection) are the mean � SD of threeindependent experiments using four mice per time point. �, p � 0.05 compared with the control group.
3586 ACTIVATED T LYMPHOCYTES IN GUT MUCOSAL TISSUES
on January 4, 2011w
ww
.jimm
unol.orgD
ownloaded from
(3). Therefore, we hypothesized that the expression of the GCTand CD11c activation markers may provide a means to identifyrecently stimulated cells in gut-mucosal tissue and may be used todelineate the developmental relationship between PPLs, IELs, andLPL. In this report, we demonstrate a unique subpopulation ofactivated, CD11c� GCT� gut-mucosal lymphocytes in the PP, in-testinal epithelium, and LP which originates in the PP and popu-lates the gut-epithelium and LP after acute gut-mucosal reovirus1/L stimulation.
In the mouse, CD11c has previously been demonstrated to beexpressed in vivo only by splenic dendritic cells (21). However,the expression of CD11c on IEL, following graft-vs-host disease,a hallmark of T cell activation in vivo, and an indicator of ongoingAg-specific T cell activation has also been shown (3). Our resultsdemonstrate for the first time the expression of CD11c on PPL andLPL following reovirus 1/L infection, and the entire GCT� lym-phocyte population in the PP, the intraepithelial compartment, and
the LP was CD11c�. However, CD11c� lymphocytes, particularlyin the intraepithelial compartment where the cells remain in con-tinuous contact with gut flora, are not all GCT�. In addition, thisGCT�CD11c� population is not observed in the spleen of con-ventional or reovirus 1/L-inoculated mice. Therefore, we hypoth-esize that the GCT�CD11c� populations in PPL, IEL and LPL,but not the GCT�CD11c� population, contain the recently acti-vated Ag-specific population of lymphocytes.
Previous studies have shown that the TCR��� population of IELdifferentiates in the thymus and migrates after antigenic stimulationfrom the PPs to the gut epithelium via a hemolymphatic circuit (22,23). Because a developmental relationship between PPL and IEL hasbeen previously demonstrated (6), and our results demonstrated max-imum GCT expression in PP before maximal expression in the IELand LPL, we hypothesized that GCT�CD11c� lymphocytes appear-ing in the intestinal epithelium and LP originate from theGCT�CD11c� PPL. Our data clearly demonstrated the enrichment ofGCT� CSFE-labeled PPL in gut-mucosal tissues as compared withthe GCT� CSFE-labeled population. Because the GCT� PPL havebeen shown to be the activated population which expresses the CD11cactivation marker, these results support the conclusion that activatedlymphocytes which originate in the PP in response to reovirus 1/Linfection preferentially migrate to effector mucosal sites like the LPand intraepithelial compartments. These results are in contrast to thoserecently reported that activated CD8 T cells migrated pervasively to anumber of lymphoid and nonlymphoid tissues regardless of the site ofactivation (24). The difference with our study is that we looked at themigration of lymphocytes in the inductive compartment (PP) of thegut-mucosal immune system and then compared the migration patternof specific subpopulations defined by GCT expression. Although theratio of migration of CSFE-labeled PPL was the highest in the spleen,this migration pattern was accounted for by the GCT� CSFE popu-lation as compared with the GCT� CSFE population which wasgreatly enriched in the gut, with the highest migration to the LPcompartment.
Although the CD8� IELs contain complex subpopulations suchas CD8���, CD8���, TCR���, TCR���, Thy-1� and Thy-1�,we demonstrated that the GCT Ag was induced only onTCR���Thy-1�CD8��� IELs. This is the same phenotype of theCD8� lymphocytes found in PP and LP. However, becauseCD8��� cells are present in spleen and are also typicallyTCR��� Thy-1�, it is theoretically possible that the GCT�
TCR��� Thy-1� CD8��� cells present in the intraepithelialcompartment or LP may be spleen cells which have migrated tothese sites. However, this is not likely, considering that while therewas no expression of CD11c on splenic lymphocytes after i.d. or
FIGURE 8. Adoptively transferred PPL migrate to the intestinal mu-cosa. PPL were isolated from donor mice 3 days post-reovirus 1/L infec-tion. These cells were then stained with CFSE, and transferred (1 � 107/mouse) i.v. into recipient mice. The recipient mice were inoculated i.d.with 3 � 107 PFU of reovirus 1/L (infected group) or with saline (controlgroup) one day after cell transfer. A, Flow cytometric profile of CFSE-labeled PPLs. Thin line shows CFSE-negative cells and bold line showsCFSE-positive donor cells. B, GCT�CFSE-labeled cells in PP, LP, andintraepithelial compartments in uninfected or reovirus 1/L-infected mice 3days after donor cell transfer. The values shown in the panels are thepercentage of cells stained with CFSE (lower right) or stained with CFSEand expressing GCT (upper right). The results shown represent one of twoexperiments demonstrating similar results.
FIGURE 7. Expression of FasL on PPL, IEL, and LPL. The resultsshow induction of FasL on GCT� CD11c� (A) PPLs, (B) IEL, and (C) LPLat various time points post-reovirus 1/L infection. The values shown in thepanels are the percentage of GCT�CD11c� cells expressing FasL. Theresults shown represent one of three experiments demonstrating similarresults.
Table V. Migration of CSFE-labeled PPL
TissueTotal
CFSEa GCT�CFSE� GCT�CFSE�
PPL 2.17 4.92b 2.27c 1.47d 0.68e
LPL 1.75 8.67b 4.95c 1.16d 0.66e
IEL 3.87 30b 7.75c 1.80d 0.47e
Spleen 7.00 2.00b 0.29c 9.00d 1.29e
a Ratio of CSFE� lymphocytes in reovirus 1/L-inoculated recipient mice/CSFE�
lymphocytes in saline-inoculated control recipient mice.b Ratio of GCT�CSFE� lymphocytes in reovirus 1/L-inoculated recipient mice/
GCT�CSFE� lymphocytes in saline-inoculated control recipient mice.c Fold difference GCT�CSFE� lymphocytes as compared to total CSFE� lym-
phocytes (ratio b/ratio a).d Ratio of GCT�CSFE� lymphocytes in reovirus 1/L-inoculated recipient mice/
GCT�CSFE� lymphocytes in saline-inoculated control recipient mice.e Fold difference GCT�CSFE� lymphocytes as compared to total CSFE� lym-
phocytes (ratio d/ratio a).
3587The Journal of Immunology
on January 4, 2011w
ww
.jimm
unol.orgD
ownloaded from
i.p. inoculation with reovirus 1/L, the entire GCT� population inPP, the LP, and the intraepithelial compartment was CD11c�.Considering this phenotypic evidence, it is possible thatGCT�CD11c� lymphocytes from the PP, which may be consid-ered as recently primed cells after i.d. inoculation with reovirus1/L, migrate to LP and intraepithelial compartments to act there aseffector cells. This is supported by a study demonstrating that se-vere combined immunodeficient mice infected orally with reovirusand given GCT�CD8� lymphocytes clear the virus, whereas in-fected recipients that received naive lymphocytes or B cells do notclear the virus (25). Therefore, it is clear that GCT expression onmucosal lymphocytes indicates activated T lymphocytes whichmay play an important role in the clearance of viral infections.Like CD11b, which is associated with activated CD8� T cells thatpreferentially recirculate to sites of inflammation in vivo (26),CD11c may also be involved in the homing of activated cells fromthe PP to the LP and the intraepithelial compartment.
We have previously demonstrated reovirus 1/L-specific CTLs inthe PP and gut epithelium after reovirus 1/L inoculation (8, 9). Inthis report, we demonstrate for the first time reovirus 1/L-specificCTL activity in the LP. Two major pathways for cell-mediatedcytotoxicity have been described. One pathway is mediated byexocytosis of perforin and granzymes. This pathway is Ca2�-de-pendent and is important in the clearance of virus-infected cells(16). A second pathway is Ca2�-independent and involves the in-teraction between FasL expression on the effector cell and Fasexpression on the target cell (16, 27). An additional pathway forcell-mediated cytotoxicity is apoptosis induction mediated byTRAIL. These pathways can be involved in antitumor and antiviralactivity (27). In this report, we demonstrated reovirus 1/L-specificCTL activity from all three gut-mucosal populations studied (PPL,IEL, and LPL). These results are consistent with previous studieswhich demonstrated that intraepithelial T cells are cytotoxic (28,29) and that LPL are also cytotoxic, although to a lesser degree(29, 30). We further demonstrated the involvement of perforin,Fas/FasL, and the TRAIL pathways for PPL, IEL, and LPL cyto-toxicity. In the case of PPL, the perforin and Fas/FasL pathwayswere predominant because the cytotoxic activity was completelyinhibited at E:T ratios of 5 or lower ( p � 0.01), whereas TRAILwas less effective especially at lower E:T ratios. In IEL, all threepathways were equally as effective, whereas for LPL, the Fas/FasLand TRAIL pathways were predominant. TRAIL-induced apopto-sis appears to be most prominent in the case of LPL because itcompletely inhibited cytotoxicity at all E:T ratios analyzed. In sup-port of this observation, TRAIL mRNA was significantly inducedonly in the LPL population. To our knowledge, this is the firstfinding of a functional role for TRAIL-mediated cytotoxicity ingut-mucosal populations. This finding is consistent with a previ-ously published report demonstrating that human IEL and LPLexpress TRAIL mRNA, although the functional significance ofTRAIL expression was not determined (31). However, the expres-sion of TRAIL in both normal and diseased intestinal mucosal isan area of active interest (32). Because the Fas/FasL pathway wascommon to all gut mucosal populations studied, we analyzed thesepopulations for FasL expression. We found increased FasL mRNAexpression on all the three populations. These results are consistentwith earlier studies in humans and mice, which demonstrated thatIEL and LPL populations used the Fas/FasL pathway (30, 31).However, we further demonstrated by flow cytometry that FasL isinduced on the newly activated GCT�CD11c� lymphocytes. Theduration of the increase in FasL expression on GCT� cells in ourstudy correlates with the known time course of clearance of reo-virus from the intestine (33) suggesting an important role for thesecells in viral clearance.
Because the gut-mucosal immune system exists in a chronicallyactivated state in non-germfree, conventional animals, it is difficultto gain an understanding of the cellular and molecular interactions,which occur within the gut, that result in protective mucosal im-munity. Further, because of the background of activated lympho-cytes in the various gut-mucosal populations (PP, LP, and gut ep-ithelium), it is difficult to dissect newly activated populations thatare responding to new antigenic stimulation. In this report, wedemonstrated that the GCT and CD11c surface Ag markers areexpressed by recently activated PPLs as well as by lymphocytes ingut-mucosal tissues including the intraepithelial compartment andLP. This is in contrast to lymphocytes obtained from the spleenafter i.d. reovirus 1/L inoculation where the GCT-expressing pop-ulation did not coexpress the CD11c marker. Therefore, thisunique population (GCT�, CD11c�) identifies recently stimulatedlymphocyte populations in the gut-mucosal immune system butnot in systemic sites such as the spleen. In addition, we furtherdemonstrated that this population first appears in the PP, and sub-sequently, preferentially migrates to the intraepithelial compart-ment and LP following enteric virus infection suggesting that lym-phocytes activated in PP migrate to and populate the intraepithelialcompartment and lamina propria. Thus, GCT and CD11c can beused as activation markers for gut lymphocytes and CD11c canalso be used to differentiate between activated gut and activatedsystemic lymphocytes. These results, coupled with our increasedunderstanding of the cytolytic mechanisms used in the various gut-mucosal lymphoid compartments, will allow further detailed anal-ysis of Ag-specific immunity to viral infections in the context ofmucosal vs systemic immunity.
DisclosuresThe authors have no financial conflict of interest.
References1. McGhee, J. R., J. Mestecky, M. T. Dertzbaugh, J. H. Eldridge, M. Hirasawa, and
H. Kiyono. 1992. The mucosal immune system: from fundamental concept tovaccine development. Vaccine 10:7.
2. James, S. P. 1993. The gastrointestinal mucosal immune system. Dig. Dis.11:146.
3. Huleatt, J. W., and L. Lefrancois. 1995. Antigen-driven induction of CD11c onintestinal intraepithelial lymphocytes and CD8� T cells in vivo. J. Immunol.154:5684.
4. Lundqvist, C., S. Melgar, M. M. Yeung, S. Hammarstrom, and M. L. Hammarstrom.1996. Intraepithelial lymphocytes in human gut have lytic potential and a cyto-kine profile that suggest T helper 1 and cytotoxic functions. J. Immunol.157:1926.
5. Lamm, M. E., J. G. Nedrud, C. S. Kaetzel, and M. B. Mazanec. 1996. Newinsights into epithelial cell function in mucosal immunity: neutralization of in-tracellular pathogens and excretion of antigens by IgA. In Essentials of MucosalImmunology. M. F. Kagnoff and H. Kiyono, eds. Academic Press, San Diego,p. 141.
6. Lefrancois, L., and S. Olson. 1994. A novel pathway of thymus-directed T lym-phocyte maturation. J. Immunol. 153:987.
7. Lin, T., G. Matsuzaki, H. Kenai, T. Nakamura, and K. Nomoto. 1994. Thymusinfluences the development of extrathymically derived intestinal intraepitheliallymphocytes. Eur. J. Immunol. 23:1968.
8. London, S. D., D. H. Rubin, and J. J. Cebra. 1987. Gut mucosal immunizationwith reovirus serotype 1/L stimulates virus-specific cytotoxic T cell precursors aswell as IgA memory cells in Peyer’s patches. J. Exp. Med. 165:830.
9. London, S. D., J. J. Cebra, and D. H. Rubin. 1989. Intraepithelial lymphocytescontain virus-specific, MHC-restricted cytotoxic T cell precursors after gut mu-cosal immunization with reovirus serotype 1/Lang. Reg. Immunol. 2:98.
10. London, S. D., J. A. Cebra-Thomas, D. H. Rubin, and J. J. Cebra. 1990. CD8lymphocyte subpopulations in Peyer’s patches induced by reovirus serotype 1infection. J. Immunol. 144:3187.
11. Platt, F. M., J. A. Cebra-Thomas, C. M. Baum, J. M. Davie, and J. P. McKearn.1992. Monoclonal antibodies specific for novel murine cell surface markers de-fine subpopulations of germinal center cells. Cell. Immunol. 143:449.
12. Sprent, J. 1976. Fate of H2-activated T lymphocytes in syngeneic hosts. I. Fatein lymphoid tissues and intestines traced with [3H]-thymidine, 125-deoxyuridineand 51chromium. Cell. Immunol. 21:278.
13. Cuff, C. F., C. K. Cebra, D. H. Rubin, and J. J. Cebra. 1993. Developmentalrelationship between cytotoxic �� T cell receptor-positive intraepithelial lym-phocytes and Peyer’s patch lymphocyte. Eur. J. Immunol. 23:1333.
3588 ACTIVATED T LYMPHOCYTES IN GUT MUCOSAL TISSUES
on January 4, 2011w
ww
.jimm
unol.orgD
ownloaded from
14. Trapani, J. A. 1998. Dual mechanisms of apoptosis induction by cytotoxic lym-phocytes. Int. Rev. Cytol. 182:111.
15. Smyth, M. J., J. M. Kelly, V. R. Sutton, J. E. Davis, K. A. Browne, T. J. Sayers,and J. A. Trapani. 2001. Unlocking the secrets of cytotoxic granule proteins.J. Leukocyte Biol. 70:18.
16. Shresta, S., C. T. N. Pham, D. A. Thomas, T. A. Graubert, and T. J. Ley. 1998.How do cytotoxic lymphocytes kill target cells? Curr. Opin. Immunol. 10:581.
17. Yasukawa, M., H. Ohminami, Y. Yakushijin, J. Arai, A. Hasegawa, Y. Ishida,and S. Fujita. 1999. Fas-independent cytotoxicity mediated by human CD4� CTLdirected against herpes simplex virus-infected cells. J. Immunol. 162:6100.
18. Griffith, T. S., and D. H. Lynch. 1998. A molecule with multiple receptors andcontrol mechanisms. Curr. Opin. Immunol. 10:559.
19. Rubin, D. H., M. J. Kornstein, and A. O. Anderson. 1985. Reovirus serotype 1intestinal infection: a novel replicative cycle with ileal disease. J. Virol. 53:391.
20. Lefrancois, L. 1994. Isolation of mouse small intestinal intraepithelial lympho-cytes. In: Current Protocols in Immunology. J. E. Coligan, A. M. Kruisbeek,D. H. Margulies, E. M. Shevak, and W. Strober, eds. Wiley, New York, p. 19.1.
21. Metlay, J. P., M. D. Witmer-Pack, R. Agger, M. T. Crowley, D. Lawless, andR. M. Steinman. 1990. The distinct leukocyte integrins of mouse spleen dendriticcells as identified with new hamster monoclonal antibodies. J. Exp. Med. 171:1753.
22. Guy-Grand, D., C. Grscelli, and P. Vassali. 1978. The mouse gut T lymphocyte,a novel type of T cell: nature, origin, and traffic in mice in normal and graft-versus-host conditions. J. Exp. Med. 148:1661.
23. Guy-Grand, D., N. Cerf-Bensussan, B. Malissen, M. Malassis-Seris, C. Briottet,and P. Vassalli. 1991. Two gut intraepithelial CD8� lymphocyte populationswith different T cell receptors: a role for the gut epithelium in T cell differenti-ation. J. Exp. Med. 173:471.
24. Masopust, D., V. Vezys, E. J. Usherwood, L. S. Cauley, S. Olson, A. L. Marzo,R. L. Ward, D. L. Woodland, and L. Lefrancois. 2004. Activated primary and
memory CD8 T cells migrate to nonlymphoid tissues regardless of the site ofactivation or tissue of origin. J. Immunol. 172:4875.
25. George, A., S. I. Kost, C. L. Witzleben, J. J. Cebra, and D. H. Rubin. 1990.Reovirus induced liver disease in severe combined immunodeficient (scid) mice:a model for the study of viral infection, pathogenesis and clearance. J. Exp. Med.171:929.
26. Nielsen, H. V., J. P. Christensen, E. C. Andersson, O. Marker, and A. R. Thomsen.1994. Expression of type-3 complement receptor on activated CD8 T cells facil-itates homing to inflammatory sites. J. Immunol. 153:2021.
27. Walczak, H., and P. H. Krammer. 2000. The CD95 (APO-1/Fas) and the TRAIL(APO-2L) apoptosis systems. Exp. Cell. Res. 256:58.
28. Viney, J. L., P. J. Kilshaw, and T. T. MacDonald. 1990. Cytotoxic �/�� and �/��
T cells in murine intestinal epithelium. Eur. J. Immunol. 20:1623.29. Kim, S. K., K. S. Schluns, and L. Lefrancois. 1999. Induction and visualization
of mucosal memory CD8 T cells following systemic virus infection. J. Immunol.163:4125
30. Muller, S., M. Buhler-Jungo, and C. Mueller. 2000. Intestinal intraepithelial lym-phocytes exert potent protective cytotoxic activity during an acute virus infection.J. Immunol. 164:1986.
31. Melgar, S., A. Bas, S. Hammarstrom, and M. Hammarstrom. 2002. Human smallintestinal mucosa harbours a small population of cytolytically active CD8� �� Tlymphocytes. Immunology 106:476.
32. Koornstra, J. J., J. H. Kleibeuker, C. M. van Geelen, F. E. Rijcken, H. Hollema,E.G. deVries, and S. de Jong. 2003. Expression of TRAIL (TNF-related apoptosisinducing ligand) and its receptors in normal colonic mucosa, adenomas, andcarcinomas. J. Pathol. 200:327.
33. Fan, J. Y., C. S. Boyce, and C. F. Cuff. 1998. T-helper 1 and T-helper 2 cytokineresponse in gut-associated lymphoid tissue following enteric reovirus infection.Cell. Immunol. 188:55.
3589The Journal of Immunology
on January 4, 2011w
ww
.jimm
unol.orgD
ownloaded from


