Embed Size (px)
Citation preview

REPORT TO ANDREW W. MELLON FOUNDATION
The Economic Environment of American Symphony Orchestras
Robert J. FlanaganGraduate School of BusinessStanford UniversityStanford, CA 94305
March 2008
© Robert J. Flanagan

ii
Table of Contents
Acknowledgements iv
Executive Summary v
I. Historical Perspective on Symphony Economics 3
II. Symphony Orchestra Finances 5
Exhibit 1. Model of orchestra revenues and expenses 7
III. Overview of Recent Developments 8
Graph 1. Attendance per concert 11Graph 2. Performance income gap 13Graph 3. Symphony expenses and the producer prices 14Graph 4. Private contributions 16Graph 5. Government support 17Graph 6. Distribution of symphony revenues, 1987 and 2000 18Graph 7. Distribution of total expenses, 1987 and 2000 20Graph 8. Overall financial balance 21
IV. Trends and Cycles in Orchestra Finances 23
V. Concert Attendance 31
Exhibit 2. Public participation in the arts 34Exhibit 3. Consumption of broadcasts and recordings of performing arts 49
VI. Artistic costs 51
Graph 9. Musicians’ salaries and consumer prices 53
VII. Private and public support for symphony orchestras 55
VIII. Endowment 66
Exhibit 4. Returns and Draws on Endowment 68Exhibit 5. Endowment Required to Offset Performance Income Gap 70
IX. Conclusions 71
References 78

iii
Appendix A. The sample of symphony orchestras 80
Table A1. Sample orchestras and data availability 81
Appendix B. Data from other performing arts 84
Appendix C. Cycle and trend analyses of symphony finances 85
Table C1. Effects of Cycle and Trend on Symphony Orchestra Finances 88
Appendix D. Statistical analyses of concert attendance and external support 89
Table D1. Regression analysis of regular season concert attendance 91Table D2. Regression analysis of pops concert attendance 92Table D3 Regression analysis of external support 96Table D4 Regression analysis of competition from opera companies 97

iv
ACKNOWLEDGEMENTS
I must thank several organizations and individuals for facilitating the researchdiscussed in this report. Foremost among these is the Andrew W. Mellon Foundation,which has pursued a long-term program of activities designed to discover ways toimprove the economic health and viability of performing arts organizations. I amparticularly grateful to Susan Feder, Diane Ragsdale, and (at early stages of the project)Cathy Maciariello of the Foundation’s Performing Arts Program for their commitment toan independent study of economic issues facing the symphony orchestra industry andtheir support throughout the project. The study itself would not have been possiblewithout the raw material provided by several performing arts organizations. The Leagueof American Orchestras provided me with data on finances and operations of U.S.symphony orchestras and patiently responded to my questions about the definitions andinterpretations of some variables. Opera America and Dance/USA also generouslyprovided similar information on their member organizations. These organizationsrequested only that I not identify information for individual performing artsorganizations, and I have acceded to their request.
I have also benefited from the comments and criticisms of a remarkable group ofsymphony musicians, managers and board members now known collectively as theElephant Task Force. Members of this group, constituted by the Mellon Foundation in2003 to seek joint solutions to the challenges faced by symphony orchestras, read throughtwo early drafts of the report and provided numerous insights and suggestions on how thefinal report might be improved. Professor Paul DiMaggio and Mr. Greg Sandow alsoprovided helpful comments on an early draft.
Needless to say, none of these individuals or organizations is responsible for thecontents of the final report. From the project’s inception I was left free to develop my own analyses and conclusions, and while I have benefited immensely from the commentsof these parties, I have not always accepted their suggestions.

v
EXECUTIVE SUMMARY
1. What issues does the report address? The Mellon foundation requested a fact-finding study of (1) cyclical and trend developments in the economic health of thesymphony orchestra industry and (2) influences on performance and nonperformancerevenues and expenses of orchestras. The hope is that analyses of these influences willclarify decisions facing symphony orchestras and help individual symphonies to assessand project their own economic health.
2. Which symphony orchestras are included in the analyses? The main sampleincludes every symphony orchestra that was one of the largest 50 symphonies in theUnited States (based on budget size) for at least two years during the 1987/88 through the2003/04 concert seasons (the period covered by the data). Each symphony that meets thisrequirement remains in the sample throughout the 17-year period, irrespective of its rankin other years. This approach produced a sample of 63 symphony orchestras (listed inTable A1) that includes some orchestras whose “economic health” either declined or improved over the period along with orchestras whose economic health was stable. Thesample represents over 70 percent of orchestra revenues and expenditures in the UnitedStates and provides the raw material for most of the analyses in this report.
Some descriptions of basic industry trends use data from the 32 symphony orchestras thatreported information in every year during 1987-2003 seasons (Sections III and VI).
3. Where do the data come from? The League of American Orchestras (formerly theAmerican Symphony Orchestra League) provided data on the financial and operatingcharacteristics of symphony orchestras. (Individual orchestras submit these datafollowing a template established by the League.) Information on local marketcharacteristics, such as population and per capita income, come from publicly availableU.S. government data. Opera America provided data on the financial and operatingcharacteristics of their members. In presenting the results of statistical analyses of largenumbers of arts organizations, the report preserves the confidentiality of the dataprovided by individual organizations.
4. How is the report structured? Section II (particularly Exhibit I) explains the modelof orchestra finances underlying the analyses. The economic challenges faced bysymphony orchestras begin with the fact that their performance revenues from concerts,broadcasts and recordings do not cover their performance expenses for artistic personnel,concert production, marketing, and general administration. The resulting performanceincome gap has worsened over time and will worsen in the future.
Symphonies try to offset the performance income gap with nonperformance income,including contributions (from individuals, businesses, and foundations), governmentsupport, and investment income. The annual financial balance of a symphony indicatesthe extent to which nonperformance income has offset the performance income gap.

vi
This report seeks to describe how the various elements of performance revenues,performance expenses, and nonperformance income and expenses are linked to three setsof potential influences: (1) Policy decisions of symphony orchestras, (2) characteristics ofthe local market, and (3) competition from other performing arts organizations.
5. Broad developments. The graphs in Section III show the main trends based on the 32continuously reporting orchestras, whose presence throughout the period signals theirsuperior economic health. Even this group of comparatively healthy orchestras hasencountered significant economic challenges, including a worsening of the performanceincome gap (Graph 2), declining attendance per concert (for virtually all types ofconcerts) that limits performance revenue growth (Graph 1), and a tendency ofperformance expenses to grow more rapidly than other costs in the economy (Graph 3).This group of larger orchestras has also experienced changes in the distribution ofperformance revenues (Graph 6), performance expenses (Graph 7), growth of privatecontributed support (Graph 4), and a decline of government support (Graph 5).
The remaining sections of the report explore linkages between these economicdevelopments and orchestra policies, market characteristics, and competition forattendance and contributed support from other performing arts organizations using thecomplete sample of 63 symphonies. The analytical results therefore reflect the experienceof orchestras at varying degrees of economic health.
6. Cycles and trends in revenues, expenses and contributions (Section IV).The financial health of symphony orchestras is sensitive to the general state of theeconomy. The burden of recessions on orchestras results as much from the decline incontributed support—particularly private contributions—as from cyclical change in theperformance income gap. Recessions worsened the overall surplus/deficit position of theaverage symphony in this sample, while business expansions improve the overallfinancial balance.
Holding the influence of general economic conditions on symphony finances constant,upward trends in private contributed support and investment income offset both a longterm decline in government support and the long-term deterioration in the performanceincome gap. As a result, there was a modest trend improvement in the overallsurplus/deficit position of orchestras in the late 20th century.
7. Concert attendance (Section V). Annual concert attendance declines sharply inrecessions and increases during economic expansions. After holding general economicconditions constant, annual attendance has increased as orchestras have added concerts totheir schedules, but adding concerts yields smaller and smaller attendance gains. In fact,attendance per concert declined throughout 1990s and into the new century. Even ifevery concert were sold out, however, the vast majority of U.S. orchestras would not earnsufficient income to cover all performance expenses.
Once the number of concerts has been set, an orchestra’s ticket pricing and marketing policies influence attendance per concert. Higher ticket prices discourage some

vii
attendance but raise performance revenues. Higher marketing expenditures increaseattendance at regular season concerts. Only expenditures on mail and phone campaignsare significantly related to pops concert attendance. Incremental expenditures on all typesof marketing activities are subject to diminishing returns—successively smaller gains inattendance per concert.
Location also influences attendance, which is positively related to an area’s population (but is not significantly related to either the real per capita income or unemployment ratein an area). To a small degree, symphony and opera performances may compete forattendees: An increase in opera ticket prices raises symphony attendance (andconversely), with other influences held constant. This competitive effect is quantitativelysmall, however.
8. Artistic Costs (Section VI). Artistic costs constitute the major expense category ofexpense for orchestras but have declined as a percent of total costs. Most symphonymusicians are unionized, and their salaries are set in collective bargaining agreementssigned by both labor and management representatives. Between the 1987 and 2003concert seasons, the minimum and average effective salaries of regular orchestramusicians increased more rapidly than consumer prices, the average wages and salariesof other unionized workers in the United States, and the average wages and salaries ofnonunion workers. Payments to guest soloists and guest conductors have increased atabout the same rate as the salaries of orchestra musicians.
9. Public and Private Support (Section VII). All symphony orchestras must rely onprivate philanthropy and government support to offset their performance income gap, butorchestras differ widely in the extent to which they rely on private contributions byindividuals, businesses and foundations. Government support is invariably a lessimportant source of funding than private philanthropy. The highly varied structure ofnonperformance income for orchestras indicates that they do not follow a common modelfor achieving financial balance.
Philanthropic contributions to orchestras depend on the characteristics of their marketareas, the development activities of the orchestras, and (to a small extent) thedevelopment activities of competing performing arts organizations. Orchestras in areaswith higher per capita income receive more private contributions.
Orchestra ticket-pricing, concert programming, and fundraising policies also mayinfluence the level of contributed support. Once the effects of an area’s economic capacity are held constant, the effect of fundraising activities on contributed supportappears more modest than sometimes claimed. For larger orchestras, there are indicationsthat annual fundraising expenditures do not immediately pay for themselves.
There is some evidence of competition between different performing arts organizationsfor contributed support. Although the evidence is not ironclad, it appears that a smallproportion of increased private contributions to operas comes at the expense of symphonyorchestras in the same area, and vice versa. While, this competitive effect is small in the

viii
data for the late 20th century, it could lead to a mutual and mutually unproductiveescalation of development and fundraising expenditures by all competing artsorganizations.
10. Endowment (Section VIII). The returns on endowment experienced by individualsymphony orchestras are highly dispersed even though they all have access to the samecapital markets when they invest their endowments. Returns to endowment investmentsare cyclically sensitive (Exhibit 4). In the early 21st century, the endowment policies ofmost symphony orchestras permit annual draws from the endowment of 5-7 percent innominal terms. The actual draws of some symphony orchestras appear to exceed thispolicy. Actual symphony orchestra endowments are not sufficiently large to coverperformance deficits at prudent endowment draw rates (Exhibit 5). Endowment drawrates that would offset performance deficits in the short run are so high that they wouldcannibalize endowments to a point where it could sustain only smaller draws in thefuture.

1
THE ECONOMIC ENVIRONMENT OF AMERICAN SYMPHONY ORCHESTRAS
Robert J. FlanaganGraduate School of BusinessStanford UniversityStanford, CA 94305
© Robert J. Flanagan
The genesis of this project could have been the following quote:
“In spite of their vitality, growth in numbers, and the volume of their attendance,
all symphony orchestras are facing serious financial problems and their future rests on an
unstable basis. Receipts from tickets have never been enough to balance the costs…. All,
therefore, have had to resort to various kinds of deficit financing…. Endowments are
becoming more difficult to build up and the income therefrom has been found uncertain
when most needed in depressions. Annual maintenance fund drives are finding fewer
large donors and are reaching out for more contributors of small sums. Subsidies have
been little tried in this country and involve many problems.”
As it happens, the quote is from a book published in 1940—America’s Symphony
Orchestras by Margaret Grant and Herman S. Hettinger (pp. 21-22). Sixty-eight years
later, the durability of the economic problems of symphony orchestras worries pessimists,
while the continued survival of most major symphonies may encourage complacency
among optimists, who conclude that solutions to chronic operating deficits will always
emerge. In fact, the proportion of orchestra expenses covered by performance revenues
has continued to decline. Grant and Hettinger report that by the late 1930s the three most
successful major symphony orchestras earned “only [!!] an average of 85 percent of their
2
total budgets, while … the whole group averages about 60 per cent.” (p. 21) By the 21st
century, these results would be viewed with envy.
It would be another 26 years before William Baumol and William Bowen (1966)
identified the economic roots of the financial problems facing symphonies (as well as
other performing arts and many other not-for-profit and service organizations). Variously
referenced as “Baumol’s curse” or “Bowen’s disease,” the crucial facts are that labor
productivity advances more rapidly in the goods-producing sector than in the performing
arts (and in many other service industries), but broadly speaking, both sectors compete in
the same labor markets. People with a given level of skill expect to receive similar
compensation no matter where they work. Increases in output per hour in the goods-
producing sector limit increases in labor costs per unit of output. (Indeed, if hourly
productivity increases more rapidly than hourly labor costs, labor costs per unit of output
will actually decline.) As long as pay increases parallel productivity increases, pay
increases do not necessitate price increases. In performing arts and other activities with
low productivity growth, the situation is quite different. Artists and other employees
expect their pay to keep pace with pay elsewhere in the economy, but with only small
productivity gains, labor costs per concert or other unit of output increase. One way to
cover increasing costs per unit of output is to raise prices, and a major conclusion of
Baumol and Bowen’s analysis was that prices of arts performances would continue to rise
relative to prices in the goods-producing industries. Unless they find alternative sources
of funding their expenses, the arts and other low-productivity-growth industries face the
“curse” or “disease” of increasing relative prices, a development that tends to discourage
patronage (Section V).

3
Of course, other methods of addressing the cost disease, including private
philanthropy and government support, can mitigate the need for price increases.
Moreover, whether or not the increasing relative price of the symphonies and other
performing artsdiscourages attendance depends on how the population’s taste for
symphony music changes as incomes increase. After all, the productivity increases that
support higher wages produce higher incomes and changing expenditure patterns. If
tastes for classical music increase sufficiently rapidly with real income growth, the
effects of higher prices might be countered.
The simple arithmetic reviewed above indicates why the 68-year-old quote from
Grant and Henninger remains apt. It also raises two kinds of questions. How have
symphony orchestras survived in the face of the unpromising arithmetic highlighted by
Baumol and Bowen? How effective are the alternative strategies for creating financial
balance in symphony orchestras? This fact-finding report addresses these questions
drawing on an extensive analysis of data for over 60 large U.S. symphony orchestras
from 1987 to 2004. To set the context for that analysis, however, the report begins with a
brief historical review of the economic environment of U.S. symphony orchestras.
I. Historical Perspective on Symphony Economics
The earliest classical music organizations in the United States existed mainly to
accompany operas or choruses, rather than to perform concerts on their own. By the
middle of the 19th century this situation began to change. The oldest symphony orchestra
in the United States, the New York Philharmonic Society, was established in 1842. Like
the New York Philharmonic, many early orchestras were organized as musicians’
cooperatives. After acceptance into an orchestra, players paid an initiation fee and an
4
annual charge, chose their conductor, hired rehearsal and performance venues, and
accepted a share of the net proceeds as their compensation. As the residual claimants,
they bore most of the economic risk of early musical ventures and had to divide their time
between artistic and management activities. Some musicians mitigated the risk by giving
preference to outside paid performances over symphony rehearsals. The cooperative
structure of some early symphonies gave musicians a property right in their positions,
which proved a barrier to personnel changes needed to upgrade orchestra quality (Caves
2000). By the 20th century, the unpromising arithmetic caught up with symphony
orchestras, and they no longer earned a surplus. Indeed, operating deficits became a way
of life (Grant and Henninger 1940). Moreover, orchestras required a different
organizational form if they were to improve performance quality.
Several major orchestras thenacquired individual “angels” or groups of
committed wealthy citizens, who pledged funds to cover the ubiquitous operating
deficits. With this support, major symphonies were able to expand in size from around
four-dozen to almost 100 musicians, to lengthen seasons, and to guarantee musicians a
weekly salary for the duration of the season. Those who pledged the funds also took over
or arranged for the management of symphony activities, and musicians were able to focus
on their art.1
By 1900, only 13 symphony orchestras of consequence existed in the United
States, and further growth was slow until the 1920s. Writing in 1940, Grant and
Henninger noted that over 80 percent of the existing orchestras at that time “have been
1 There have been two comparatively recent reversions to musician ownership of an orchestra. The DenverSymphony Orchestra failed in 1989 and reformed the following year as the Colorado Symphony, which isowned by its musicians. The New Orleans symphony ceased operations in 1990 and reformed for the 1991-92 season as the Louisiana Symphony. Looking abroad, four symphony orchestras in London are organizedas musicians’ cooperatives.

5
established since the close of the World War, over half since 1929. Paradoxical as it
seems, the greatest growth occurred during the most severe years of the depression.” (p.
21) The authors also note that all symphony orchestras faced “serious financial problems”
as of the late 1930s. However satisfying earning 60 percent of an orchestra’s performing
expenses may seem from the perspective of today’s symphonies, it was a decided decline
from the surpluses that permitted some early orchestras to be run as musicians’
cooperatives. Subsequent studies have documented increasing financial pressures on the
nation’ssymphony orchestras (Wolf Organization, 1992).
This fact-finding report provides a diagnosis of several key economic issues
facing symphony orchestras at the turn of the new century. The objective of the diagnosis
is to clarify both symphony orchestra policies that might mitigate some adverse economic
trends documented in the report and the extent to which such trends are influenced by
factors that are beyond the control of symphony organizations. The following section
outlines the simple model of symphony finances that guides the organization of this
report.
II. Symphony Orchestra Finances
This fact-finding report analyzes trends in the finances of symphony orchestras
between the 1987/88 and 2003/04 concert seasons. A straightforward model of symphony
revenues and expenditures informs the organization of the analysis. Read from left to
right, Exhibit 1 illustrates the main elements of the model. Orchestras earn performance
revenues from their concerts, broadcasts, and sales of recordings. Their revenues
invariably fall short of their performance expenses for artistic personnel, concert
production, marketing, general administration, and education, yielding a significant

6
performance income gap–a deficit on current operations. The next section will describe
trends in the performance income gap at the end of the 20th century and explain how
changes in various revenues and expenses determined the evolution of the gap.
The performance income gap may be offset in whole or in part by
nonperformance income received by the orchestra. There are three principle sources of
nonperformance income: private philanthropy, government support, and investment
income. As not-for-profit organizations, symphonies may receive tax-deductible private
contributions from individuals, businesses, and foundations as well as grants from all
levels of government. To obtain these contributions, however, orchestras must incur
fundraising costs that could be avoided if performance revenues exceeded operating
expenditures. Investment income mainly consists of income from an orchestra’s
endowment.
If philanthropy, government support, and investment income more than offset the
performance income gap, the orchestra has an overall financial surplus for the year; if
nonperformance income falls short of the gap, there is an overall financial deficit. (Note
in Exhibit 1 that the model already accounts for any extraordinary fundraising efforts or
draw from the endowment to address a projected annual orchestra deficit.)
The model outlined in Exhibit 1 permits one to “account” for changes in the
performance income gap or the annual surplus or deficit. It provides a guide to organizing
information on how these financial outcomes changed without providing insights on why
the changes occurred. This behavioral question—why the changes occurred—can be

7
Exhibit 1. Symphony Orchestra Finances
PerformanceRevenuesTicket salesBroadcast feesRecording royalties
Performance ExpensesArtisticConcert productionGeneral administrationMarketingEducation
PerformanceIncomeGap
ContributionsIndividualsBusinessesFoundationsGovernment
InvestmentIncome
AnnualFinancialBalance(Surplus or Deficit)
FundraisingExpenses

8
raised with regard to each element of revenue and expense and provides the most helpful
information for understanding financial outcomes.
Three types of influence on symphony finances receive attention throughout the
report: policy variables controlled by symphony organizations, characteristics of the local
market area, and competition with other performing arts organizations. In exploring the
role of symphony orchestra policy variables, the findings may assist orchestras in relating
their policy choices to financial outcomes. Tracing the role of market characteristics may
help orchestras understand the opportunities and constraints offered by the economic
capacity and social characteristics of their local market area. Previous discussions of the
“Why” questions omit a potentially important element of the market for symphony
orchestra concerts—the fact that orchestras may compete with other performing arts
organizations (and more broadly, with other uses of leisure time) for patronage and
philanthropic support. The current report recognizes that major symphony orchestras are
one element of a much broader market for performing arts and examines how
competition among some performing arts influences their performance revenues and
expenses and the philanthropic contributions that they receive.
III. Overview of Recent Developments
This section provides a snapshot of the economic fortunes of U. S. symphony
orchestras at the end of the 20th century, using data from 32 orchestras that submitted
detailed reports on their finances and operations to the League of American Orchestras
(“the League”) for each concert season between 1987/88 and 2003/04.2 Although this
sample includes most of the largest U.S. orchestras, there is considerable variation in
2 Appendix A provides a list of these orchestras. Although 33 orchestras reported some data each year, oneorchestra did not report sufficient data to be included in these exhibits.

9
their size and range of activities. The number of concerts, total attendance, and
attendance per concert for the largest orchestra in the sample are 14-15 times larger than
for the smallest orchestra, for example. Data from these orchestras provide an aggregate
summary description of economic developments for a consistent group of symphonies,
highlighting many issues to be analyzed later in the report using information from a much
larger sample of orchestras.
Concerts and attendance. In 1987 the median number of concerts per season by
orchestras in this group was 175. This number includes regular season, pops, educational,
chamber, summer, and choral, ballet or opera concerts. For some orchestras the total also
includes concerts performed during domestic and foreign tours. Subsequently, most
orchestras added more concerts to their schedules, with larger symphonies expanding
their concert schedules the most. Between the 1987 and 2003 concert seasons, the median
number of concerts of all types rose about 11 percent to 195 per year. The mix of
concerts played by U.S. symphony orchestras changed modestly as the total increased,
with the share of regular season, summer and on-tour concerts declining and the share of
pops and educational concerts increasing.
Median total attendance at concerts by these orchestras peaked in 2000 and then
declined in the recession that began the new century. By 2003, the median annual concert
attendance for these symphonies was only 91 percent of its 1987 level. Despite the
increasing number of concerts, total attendance declined.3 The combination of increasing
concerts and declining total attendance produced a precipitous decline in attendance per
3 For the 1991-1997 concert seasons, the League data permit a comparison of attendance at regular seasonand pops concerts with ticket sales for those concerts. For most of those years, attendance is a fewpercentage points higher than ticket sales for regular concerts and a few percentage points lower than ticketsales for pops concerts. There is no significant trend in the difference between attendance and ticket salesfor either of these types of concerts during this seven-year period.

10
concert at the end of the 20th century (Graph 1). The decline is broad-based, ranging from
the regular season concerts that historically have attracted the most dedicated patrons to
concert halls to the educational concerts designed to build future audiences. No type of
concert experienced a trend increase in attendance per concert.4 Since the broad decline
in attendance per concert constitutes the major limitation on performance revenues,
Section V of this report analyzes influences on this development.
A decline in the ratio of subscription to single tickets accompanied the drop in
attendance per concert. Averaged over 1991 to 1997 (the only years for which these data
are available), the median symphony orchestra sold four times as many subscription
tickets as single tickets for both regular season and pops concerts. This average masks a
significant trend decline in the ratio of subscription to single tickets, however. In 1991 the
median orchestra sold five subscription tickets for every single ticket for both regular and
pops concerts. By 1997 it sold only three subscription tickets for every single ticket sold
for regular concerts. For pops concerts, the ratio declined to 3.5 subscription tickets per
single ticket. Not only has attendance per concert dropped, but the loss is particularly
large among the subscription patrons who are likely to have a long-term commitment to
symphony orchestras. If it is more costly to sell single than subscription tickets, this
development will add to the cost pressures on orchestras.
Performance income gap. What has been the effect of the twin forces of
increasing numbers of concerts but declining attendance per concert on the balance
between performance revenues and expenses? The median performance income gap for
the 32 symphony orchestras continued to deteriorate in the last years of the 20th century,
4 Statistical analyses confirmed that these conclusions also apply to the full sample of 63 symphonyorchestras.

11

12
widening from 49 percent of performance expenditures in 1987 to 55 percent in 2000
(Graph 2). By 2000, the performance income earned by these orchestras covered only 45
percent of their performance expenses. The gap ranged from 23 percent to 77 percent of
the performance expenses of symphonies in the sample. (That is, the performance income
earned by individual symphonies in the sample covered from 77 to 23 percent of their
performance expenses in 2000.) None of the 32 symphonies incurred even one year in
which performance income exceeded performance expenses, although eight orchestras
managed to reduce the gap as a percent of performance expenditures.
Notwithstanding efforts by symphonies to raise performance revenues by
expanding their portfolio of concerts and to limit performance expenses, revenues failed
to grow as rapidly as performance costs. Despite declining attendance per concert,
median performance revenues per concert (adjusted for inflation) increased by 33 percent
(2.2 percent per year), but real performance expenditures per concert increased even more
rapidly—by 54 percent (3.4 percent per year).5 Had a rise in expenses of this magnitude
occurred in the goods-producing sector, it would have been offset by the productivity
increases that occurred in the late 20th century. In a sector without such productivity
increases, however, the result is increased pressure on prices and the overall financial
balance.
A comparison of the evolution of performance expenses for these 32 orchestras
with the producer price index for finished goods illustrates this point (Graph 3). The latter
index reflects the prices of finished goods as they leave the factory. The index changes as
production expenses change in goods-producing industries. With both measures indexed
5 Revenues and expenditures are expressed in constant year 2000 dollars by deflating the nominal figuresreported to the League of American Orchestras by the GDP deflator.

13

14

15
to equal 1 in 1987, we see how much more rapidly performance expenses evolve in the
symphony sector, where only modest productivity gains are possible, relative to the
goods-producing sector. To summarize, the historical growth of the performance income
gap continued into the early years of the 21st century.
Nonperformance income and expenses. Symphony orchestras have had to counter
the performance income gap by attracting support from private and public sources and
from investment income. Fundraising activities carry with them an expense that is
unrelated to concert performance, and the fundraising and development expenses of these
symphonies increased from the mid-1990s. During the same period, private contributed
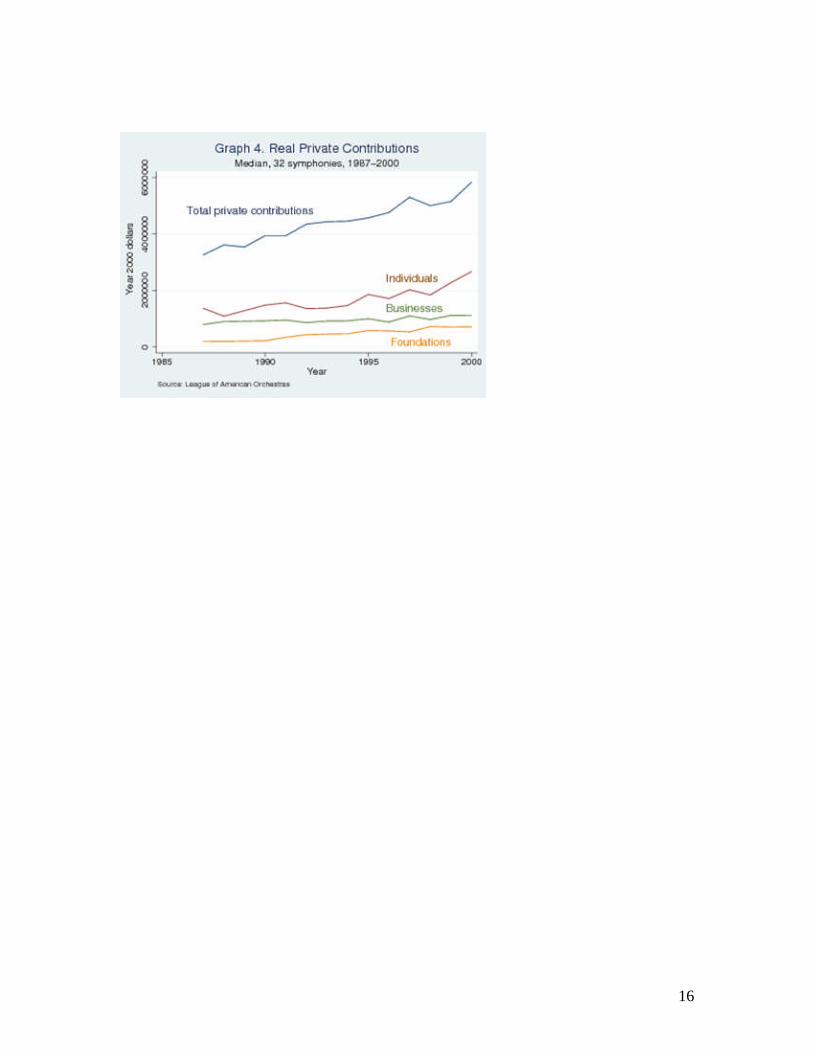
support also increased particularly rapidly (Graph 4). The evolution of private support
was driven by the growth of giving by individuals—particularly during the late 1990s.
Support from foundations and businesses increased at a more modest rate. In contrast,
government support declined steadily after 1989. Nominal increases in government
support to the median symphony orchestra in the sample did not even keep up with
inflation (Graph 5).
Distribution of revenues and expenses. During the last years of the 20th century,
performance revenues constituted a minority and declining share of the income received
by this sample of symphony orchestras. Between 1987 and 2000, the median share of
performance revenues dropped from 42 to 38 percent of the total revenues (Graph 6).
Indeed, by 2000, performance revenues and private philanthropy accounted for almost
identical shares of median symphony revenues.6 The rising share of investment income in
6 Rulings by the Financial Accounting Standards Board significantly altered the conventions for reportingsome financial variables by symphony orchestras and other not-for-profit organizations. As a result, data oncontributions, investment income, and endowment are comparable only through the year 2000, limitinganalyses of these variables to the 1987-2000 concert seasons throughout this report.
16

17

18

19
total orchestra revenue constituted another notable development (Graph 6). Clearly, the
management of orchestra endowments and other investment decisions has become
increasingly important for the financial balance of symphony orchestras.
The structure of expenses in these 32 symphony orchestras changed little between
1987 and 2000. The most notable change is a continuing decline in the share of artistic
and non-artistic costs in total orchestra expenses. A decline in the median share of artistic
costs from 62 percent to 55 percent of total expenses was accompanied by modest
increases in the median shares of other expenses (Graph 7).
Overall financial balance. Changes in the balance between total revenues and
total expenditures—the overall surplus or deficit of an orchestra—indicate the
organization’s degree of success in offsetting the performance income gap through
contributions and investment income. Averaged over the 1987 through 2000 seasons, the
median financial balance of the 32 orchestras was slightly negative. As a percent of total
expenses (performance expenses plus fundraising expenses), the average balance moved
from negative numbers in the late 1980s and early 1990s to positive results with the
growth of private contributions during the strong economy of the late 1990s (Graph 8).
Whether negative or positive, the average annual balance is much smaller as a percent of
total expenses than the performance income gaps discussed earlier. Contributions and
investment income have permitted some symphony orchestras to narrow persistent
performance income gaps. There is little evidence that individual orchestras persist in
either a surplus or deficit position over time. In each year, some orchestras ran significant
surpluses, while others ran significant deficits, but none of the 32 orchestras had
surpluses (or deficits) throughout the entire period.

20

21

22
Similar patterns emerge in the full sample of 63 orchestras that is analyzed in the
rest of the report. Between 1987 and 2000, forty-six orchestras ran deficits on average,
while seventeen orchestras ran surpluses on average. The average financial balance for all
the symphonies over the 14 year period was negative (deficit), but the experience of
individual orchestras was widely dispersed. In year 2000 dollars, the overall financial
balance for the median orchestra in this sample changed from a deficit of almost $49,000
in 1987 to approximate balance in 2000. Most orchestras achieved their strongest
financial position during 1997-99, when very favorable general economic conditions
prevailed. (This fact signals the importance of controlling for the effects of general
economic conditions, as is done in the next section, before drawing conclusions on trends
in the financial health of orchestras.)
This section has provided a snapshot of key developments in the economic
environment of U.S. symphony orchestras at the turn of the new century. The
continuation of the historical worsening in the performance income gap provides the
point of departure. Developments on both the revenue and expense side of the balance
sheet drive the continued deterioration. Declining total concert attendance and attendance
per concert have limited the growth of performance revenues. For this group of
orchestras, expanding the number and variety of concerts performed did not typically
increase total concert attendance. At the same time, the costs incurred by symphony
orchestras grew more rapidly than costs in the rest of the economy. Limited opportunities
for productivity growth play an important role in the costs pressures.
With performance revenues covering increasingly smaller fractions of
performance expenses, the ability of orchestras to grow nonperformance income has

23
become all important. Increases in private philanthropic support (particularly from
individual contributors) and investment income played an important role in countering
the performance income gap. Direct support received from all levels of government was
quite limited and did not keep up with inflation. Net increases in nonperformance income
approximately offset the performance income gap, producing a fragile financial balance
for the median orchestra in the last years of the 20th century.
This snapshot describes but does not explain the main developments influencing
the economic health of U.S. symphony orchestras in the late 20th century. Subsequent
sections report on efforts to identify key factors that have influenced these developments.
One open question is whether the developments reported in this section reflect genuine
industry trends or simply short-term response to general business conditions. The next
section examines the respective roles of cycle (variations in general business conditions)
and trend factors. Sections V through VII examine the roles of symphony policies, local
market characteristics, and competition between performing arts organizations on
symphony revenues and expenses. A discussion of endowment policies (Section VIII)
concludes the report.
IV. Trends and Cycles in Orchestra Finances
Changes in the financial balances of symphony orchestras can reflect the
influence of both general economic conditions(“business conditions”) and trend factors,
such as the “unpromising arithmetic” stressed by Baumol and Bowen and/or changing
consumer preferences for live performance of symphonic music. Changing business
conditions may influence revenues, since concert ticket sales and purchases of recorded
music should increase in good times and decrease or grow less rapidly when business

24
conditions are poor. Orchestra expenses also may respond to general economic
conditions. Salary and wage growth tends to accelerate when demand is strong and to
decelerate in weak labor markets. Orchestras may adjust to weaker consumer demand by
reducing the number or scale of concert performances. In contrast,trend or “structural”
influences on the economic health of symphony orchestras do not vary with general
economic conditions. They reflect the consequences of low productivity growth and long-
term changes in how the population uses leisure time.
Discriminating carefully between the influence of cycles and trends on orchestra
finances facilitates diagnoses of the long-term health of the symphony industry. This
discrimination is crucial, because cyclical variations in general economic conditions can
obscure underlying trends in revenues and expenses, leading to misinterpretations of
current financial developments. Isolating the separate effects of cycle and trend on
symphony finances reduces the risk of developing overly pessimistic views of industry
trends during cyclical downturns and overly optimistic views of trends during improving
economic conditions, for example.
Methods and Data
General economic conditions in the United States improved in the late 1980s,
weakened in the early 1990s, and then began a long period of improvement from 1992
through 2000, which saw the beginning of another recession. The objective of this section
is to separate the influence of these transitory, cyclical variations in economic conditions
from long-term (trend) determinants of the financial wellbeing of symphony orchestras.
When multiple factors (such as cycle and trend in the present case) simultaneously
influence particular outcomes (such as measures of the financial health of orchestras), the

25
challenge is to determine the distinctive influence of each factor. Multiple regression
analysis provides a statistical technique for meeting that challenge. Regression analysis
isolates the distinctive influence of each factor on a measure of financial health after first
holding constant the influence of all other factors included in the analysis. The analysis
expresses the average correlation between the influences and financial health for the
sample of orchestras and years for which data are available. In this section, regression
analyses of the experience of 63 symphony orchestras will provide information on the
extent to which the changing financial fortunes of the symphony orchestras reflect the
influence of (1) changes in general economic conditions (i.e., the cycle) and (2) trend
factors that are unrelated to changing economic conditions. The sample of symphony
orchestras used in the regression analyses is much larger than the sample used in section
III. The difference occurs because the snapshots in section III were for a common set of
32 orchestras that reported sufficient information in every year. For a variety of reasons,
the other symphonies in the sample did not report data in every year.7 The statistical
analysis procedure simply skips years in which data are missing, enabling the analysis of
a larger number of orchestras and wider range of experience.
This study analyzes data provided by symphony orchestras to the League of
American Orchestras and by opera companies to Opera America. Concerns have been
expressed that different orchestras (or operas) may use different definitions for some of
the information that they report. If that occurs, can analyses of the combined data for
several organizations yield trustworthy results? There are two ways in which the impact
of this concern is reduced in the current study. First, the League and Opera America each
7 See Appendix A for information about why information may be missing for some orchestras in someyears.

26
provide member organizations with a questionnaire template, in an effort to have all
members adhere to common definition for each variable. Nevertheless, variations in
reporting may still occur. Second, and more importantly, this study mainly examines the
correlations between measures of the financial health of symphony orchestras and factors
that may influence that health by analyzing their interaction over time. For this analysis, it
is important that the year-to-year variation recorded in the data be accurate. A reporting
difference between two orchestras that does not change from year to year will not
influence these correlations.8
Cycle and Trend in Revenues and Expenses
The net cyclical impact on the performance income gap of symphony orchestras
depends on whether the effect of changing business conditions is stronger on
performance-related revenues or expenses. If revenues are more sensitive to economic
conditions than expenses, the performance income gap of symphonies should improve
with good business conditions and deteriorate with poor conditions. Alternatively, if
performance expenses are more sensitive to business conditions than revenues, the
performance income gap will improve in recessions (because the growth of expenses
slows more rapidly than the growth of revenues) and deteriorate in business expansions.
Real (adjusted for inflation) performance revenues were cyclically sensitive
between 1987 and 2003, declining in recessions and increasing in economic expansions.
In contrast, real performance expenses were not reliably correlated with variations in
8 More technically, much of the analysis of the experience of the panel of 63 orchestras between the 1987and 2003 concert seasons uses a statistical technique (known as fixed effects analysis) that ignores ongoingdifferences in the ways that different orchestras report their data. Fixed effects analysis considers only howvariables change over time for each orchestra and ignores differences in the level of variables in differentorchestras. Random effects estimation uses both the “across orchestra” and the “over time” variation in the data.

27
business conditions. The difference in the cyclical sensitivity of revenues and expenses
results in a worsening of the performance income gap in recessions and an improvement
in the gap during business expansions.9
If only economic conditions mattered, the performance revenues and expenses of
symphony orchestras would be in balance over the business cycle—the deterioration of
the performance income gap that occurs in recessions would be offset when business
conditions improved. In a sense, the financial problems that developed in a recession
would tend to cure themselves when overall economic conditions improved. However,
the regression analysis also finds significant trend increases in both real income and real
expenses after controlling for the effects of business conditions. Between the 1987 and
2003 concert seasons, the trend increase in real performance expenses for this group of
symphonies was three times larger than the trend increase in real performance income.
For the average symphony in this sample, the performance income gap grew at about $
370,000 per year after controlling for the effects of economic conditions. Clearly, factors
influencing the long-term growth of performance income and expenses dominated the
evolution of the real performance income gap over this period. To put this point
differently, each time economic conditions return to full employment (removing the
cyclical effect), the industry confronts a worse performance income gap because of the
influence of trend factors.
There is considerable variation in the cyclical sensitivity of the revenues and
expenses of individual orchestras. For most orchestras the trend increase in real
performance expenses is two to four times as large as the trend increase in real
performance income. There are a few dramatic extremes where the expense trend is over
9 Appendix C provides details of the statistical analysis underlying this discussion.

28
eight times as large as the revenue trend, however. At the other extreme, there are a very
few orchestras where the trends are approximately in balance. In short, the majority of
orchestras have continued to experience a long-term worsening of the performance
income gap, even after controlling for the perturbations introduced by changes in general
economic conditions that are beyond the control of the symphony community. Even if
orchestras adjust successfully to the cyclical “weather,”the long-run economic“climate”
of the industry produces ever-increasing performance deficits.
How successfully have symphony orchestras countered the long-term
deterioration in the performance income gap? Symphonies cannot survive without
significant nonperformance income from private philanthropy, government support, and
investment income. Understanding how such support changes over time is crucial to
understanding the financial issues currently facing symphony orchestras in the United
States. Private philanthropic support may depend on personal incomes, corporate profits,
and asset values—all of which are likely to vary with general business conditions.
Investment income may also vary cyclically.
The cycle and trend analysis of inflation-adjusted private philanthropy and
government support for 63 symphony orchestras in the United States covers the concert
seasons 1987-2000. The total external support received by orchestras in this sample was
significantly related to the general state of the economy, decreasing in recessions and
increasing in economic expansions. Private philanthropy, government support, and
investment income all varied with economic conditions, although private philanthropy
was most responsive to changes in the state of the economy. Cyclical variations in private
philanthropy mainly reflected the influence of economic conditions on individual giving.

29
Business and foundation support was not reliably related general economic conditions.
Efforts to detect the role of stock prices on private support for symphonies were not
successful.10
Symphony orchestras cannot by themselves reverse economic cycles, but with
sufficient advance warning they can take actions to mitigate the impact of cyclical
changes. How can symphony orchestras obtain an early warning of cyclical changes? The
local unemployment rate used as the key indicator of changing business conditions in the
statistical analyses tends to rise after a recession begins and to fall after a recovery has
started. In contrast, there are leading indicators of economic activity that provide
advance warning of changes in business conditions. For example, each month The
Conference Board publishes an “index of leading indicators.”11 For almost 50 years, the
index has on average predicted the onset of recessions about 11 months in advance and
the onset of recoveries about 7 months in advance. That is, the index provides longer
advance warning of the onset of a recession than of recovery from a recession. Leading
indicators can provide all parties in the orchestra industry with information that assists
forward planning to address the variations in the performance income gap and
contributed support that accompany cyclical fluctuations. In particular, mitigating the
impact of cyclical factors on orchestras may require allocating some of the gains in good
times to reserves to be used in bad times.
10 Stock price indices tended to be highly correlated with the unemployment rate (which represents thegeneral state of business conditions in this analysis), and it was not easy to detect the separate influence ofeach variable in this small sample.11 http://www.conference-board.org/economics/. The Conference Board also publishes monthly updates tothe index in Business Cycle Indicators. The leading indicators used to construct the overall index includethe average workweek in manufacturing (because most employers alter the weekly work hours of currentemployees before laying off workers (in a recession) or hiring new employees (in an expansion)), neworders for consumer and capital goods (because changes in orders precede changes in production), an indexof consumer expectations (which predicts future consumption expenditures), and new claims forunemployment insurance. Data for most leading indicators are only available for the national economy.

30
While private philanthropy and government support followed similar cyclical
patterns, the trends in these two sources of support for symphony orchestras diverged
sharply over the period analyzed. For the average symphony in this sample, government
support diminished by about $30,000 per year, after controlling for the effects of
economic conditions. More than counterbalancing this decline were trend increases in
private support (about $189,000 per year) and investment income (about $65,000 per
year) after holding the effects of business conditions constant. On balance, the trend in
nonperformance income was therefore significantly positive. About half of the trend
increase in private support for symphony orchestras came from individuals. Of the
remainder, the trend increase in foundation support was about twice as large as the trend
increase in business support.
This brings us to the bottom line—the role of cyclical and trend factors in the
evolution of the overall financial balance of symphony orchestras in the United States.
The analysis of the full sample of orchestras showed some cyclical variation in the
performance income gap. But contributed support is more sensitive to general economic
conditions than development and fundraising expenses, with the result that recessions
worsened the overall surplus/deficit position of the average symphony in this sample,
while economic expansions improved the overall financial balance. It may be worth
emphasizing that the financial burdens that recessions place on orchestras reflect their
impact on both performance and nonperformance revenues and expenses. Recessions
aggravate the financial balance of symphony orchestras to an important extent by
depressing private contributions and investment income when they are needed most to
offset growing performance deficits.

31
Each year, the trend increase in total revenue modestly exceeds the trend increase
in total expenses. As a result, there is a small but statistically significant trend
improvement in the overall financial balance of the average symphony in the sample. In
interpreting this gentle trend toward surplus between the 1987 and 2000 concert seasons,
however, consider the following factors: (1) A trend toward surplus is different from a
surplus. Most of the 63 orchestras continued to run an overall deficit at the end of the
sample period. (2) To the extent that the trend toward surplus reflects excessive draws of
investment income from endowments, it masks a serious long run financial challenge to
orchestras (see Section VIII). (3) The effects of small adverse cyclical changes can
overwhelm the positive trend. The statistical results indicate that the financial
consequences of a one-half of a percentage point increase in the unemployment rate
would completely counter the trend toward surplus in any year.
To summarize, the analysis of cycle and trend effects identified an ongoing and
widely-shared trend deterioration in the performance income gap as well as a tendency
for the gap to worsen in recessions and improve in good times. The burden of recessions
on orchestras is increased by a cyclical decline in contributed support—particularly
private contributions—but a trend increase in private support countered much of the trend
decline in both the performance income gap and government support. The data
underlying these findings reflect the symphony orchestra policies, market characteristics,
and policies of other performing arts organizations in effect during that period. Financial
outcomes and trends may change, for better or for worse, as any of these conditioning
factors change. The remaining sections of this report explore the role of these factors to
obtain guidance about how the trends that have been described might be altered.

32
V. Concert Attendance
The performance income of symphony orchestras flows mainly from concert
attendance. Attending symphony concerts requires significant expenditures of both time
and money—expenditures that could be allocated instead to other performing arts or
many activities outside of the arts. This section examines symphony attendance in the
context of general developments in how Americans use their time away from work.
Trends in Leisure Time
There were significant changes in how adult Americans allocated their time in the
last decades of the 20th century. Data from time diary surveys in which respondents
record the amount of time spent in various activities throughout the day reveal that while
the weekly hours of market work (roughly, work for pay) remained steady between 1965
and 2003, hours of unpaid work in the home declined. (In these surveys, work in the
home includes food preparation, other household chores, shopping, and obtaining goods
and services.) The time diaries also record the time that respondents spend in various
categories of leisure activities, although they do not define activities as narrowly as
“attending a symphony orchestra concert” or “patronizing the performing arts.”
Nevertheless, time spent in the broader categories of leisure activities that would include
concert attendance (along with many other entertainment and social activities) has
increased by over 5 hours per week since 1965 for the average adult, according to a
recent study (Aguiar and Hurst 2006). In short, the time available for patronizing
symphonies and other performing arts increased in the last decades of the 20th century.
The study also finds, however, that more educated people—the traditional supporters of
the arts—experienced smaller increases in leisure than less educated people. Another

33
study of these data noted that “attendance at museums, concerts and other cultural
events….translates to an average of 5 minutes a week or just over 4 hours a year of arts
participation per capita”(Robinson and Godbey 1997, p. 174).
Against this background of increasing leisure time, surveys by the National
Endowment for the Arts (NEA) record how public participation in symphony orchestra
concerts and other performing arts has changed since 1982. Unlike the time use surveys
used to establish the broad trends in hours of work and leisure, surveys sponsored by the
NEA in 1982, 1992, and 2002 focus on public participation in specific performing arts
(NEA 2004). (“Participation” is defined as attending at least one performance.)
Notwithstanding the increase in leisure time, the NEA surveys indicate little
change in public participation in the performing arts. The proportion of the adult
population reporting that they attended at least one performance of various arts remained
quite stable between 1982 and 2002 (Exhibit 2). That is, the number of attendees has at
most kept pace with population increases; increased leisure time has not significantly
broadened the audiences attending performances. This finding is as true for individual
performing arts as it is for the arts in general. In the NEA surveys of the U.S. population,
the percent of adults who say they attended at least one classical music performance
remained roughly constant (at about 12-13 percent) between 1982 and 2002 (Exhibit 2).
Interestingly, this stability in patronage emerges for the other performing arts as well,
irrespective of their general popularity with the public. Despite changes in the income,
education, and age distribution of the American population, the proportion of Americans
patronizing each of these arts remained stable during the last two decades of the 20th

34
century.12 This is a remarkable finding to which we shall return below: The various
marketing strategies developed and implemented by symphony orchestras and other
performing arts organizations are not associated with any proportionate increase in
participation, despite the growth of leisure time. Moreover, no performance art appears to
be growing at the expense of others.
The NEA also gathered information on the frequency of attendance at arts
performances. While the proportion of the population attending performances has been
stable, the frequency of attendance by each patron declined for theater and dance but
grew for classical and other types of music. The number of classical concerts per year
attended by the average concert patron increased from 2.6 to 3.1 between 1992 and 2002.
In each survey year, both the likelihood and frequency of attending a concert (or another
arts performance) increase with income and particularly education. It is therefore
puzzling that the proportion of the population attending symphony concerts has been so
stable during a period in which both real income and the proportion of the population
with at least a college education increased.
12 While there may be no significant shift in the patronage patterns of Americans among the variousperforming arts, many other activities also compete for leisure time. The NEA survey also explored thepublic’s participation in several alternative uses of leisure time, including movies, sporting events, outdoor activities, visiting museums, exercise and gardening. Interestingly, none of these activities shows asignificant increase in the percent of adult participation since 1992, and some show significant declines(NEA (2004)). If anything, a smaller proportion of Americans appear to be allocating time away from workto some of the activities that might compete with attending symphonies or other arts performances.

35
Exhibit 2. Performing Arts Attendance (Percent of U.S. Adults)
1982 1992 2002
Classical music 13 13 12
Opera 3 3 3
Jazz 10 11 11
Musical theater 19 17 17
Non-Musical theater 12 14 12
Ballet 4 5 4
Source: National Endowment for the Arts (2004)
Clearly, the proportion of highly educated Americans attending classical music
concerts must have declined in the late 20th century. In fact, analyses of the NEA surveys
reveal that the participation of college-educated people in classical concerts declined by
30 percent between 1982 and 2002. Participation in opera, ballet, and theater also
declined, although by smaller proportions. The only increases in participation noted for
college graduates were in jazz concerts (13%) and art museums (5%) (DiMaggio and
Mukhtar 2004). In order to better understand these patterns of participation in live
symphony orchestra performances and to determine strategies for increasing attendance,
this section explores the importance of several influences on concert attendance.
Attendance and the Number of Concerts
The overview provided in section III noted that between the 1987 and 2003
concert seasons, total concert attendance had declined for the group of 32 symphony
orchestras that reported data in each year of the period. For the larger sample of

36
orchestras analyzed in this section, the median annual attendance also declined over the
period. Median annual attendance was about 218,000 in 1987. After declining during the
first half of the 1990s, median annual attendance recovered to a new peak of about
215,000 in 2000, before declining to almost 199,000 in the 2003, a recession year.13
Changing business conditions exert a powerful influence on concert attendance; a one
percentage point increase in the local unemployment rate (say, from five to six percent) is
associated with a loss of eleven thousand patrons annually for the average orchestra. The
fact that concert attendance generally rises in good times and falls in bad times is the
major source of the cyclical sensitivity of performance revenues discussed in the previous
section. After holding the impact of unemployment constant, the statistical analysis
shows a trend increase in average annual attendance, which must be interpreted carefully.
An increasing number of concerts per year (about five concerts per year for the
average orchestra) was the main factor behind rising attendance. Regression analysis
clarified that while total concert attendance increases with the number of concerts
performed, the effect of adding concerts to an orchestra’s schedule has diminishing
effects on attendance. Each additional concert yields a smaller increase in attendance.
Adding a concert to the schedule of an orchestra performing the median number of
concerts raises annual attendance by about 555 patrons, while adding a concert to the
schedule of orchestras performing a much larger number of concerts would increase
annual attendance by less than 450 patrons. Even though many costs incurred by
symphony orchestras are fixed annually, the incremental costs of adding another concert
are not zero. The evidence that additional concerts have diminishing effects on
13 The average experience should not obscure the variation in the experience of individual orchestras. Ofthe orchestras reporting sufficient data for analysis, 17 experienced a general increase in attendance overthe period, while 38 experienced declining attendance.

37
attendance implies that there are limits on the extent to which a concert schedule can
productively be expanded.
Once the influence of business conditions and the number of concerts performed
is held constant, there is a trend decline in total attendance. (This statistical result
confirms the decline in attendance per concert that appears earlier in Graph 1 for a
smaller group of orchestras.) Perhaps the most interesting result of this analysis is that the
positive effect of another concert on attendance is small relative to the negative effect of
another year on attendance. The average orchestra would have to add six concerts per
year to its schedule to counter the effects of one year’s decline in attendance.Because of
the diminishing effects of concerts on attendance, orchestras with the largest concert
schedules would have to add even more concerts annually to overcome the trend decline
in attendance.
Attendance and Seating Capacity
For most U.S. symphony orchestras, attendance at regular season concerts was
well below the seating capacity of their performance venues. Attendance at regular
season concerts averaged between 65 and 76 percent of seating capacity during the 1987-
2003 seasons for these orchestras. These averages conceal considerable variation among
individual orchestras, with a few averaging over 95 percent of seating capacity, while
others barely filled half of their seats. Regression analysis confirmed that the percent of
available seats filled by orchestras varies with business conditions, which partially
explains the fact that these orchestras filled a smaller fraction of their seats during the
recession at the beginning of the new century. But the regression analysis also uncovered
a small but statistically significant downward trend in the fraction of seats that are filled.

38
After holding the effects of business conditions constant, the proportion of available seats
filled by concert patrons declined by about .4 percentage points per year. If the trend
continues, the percentage of regular season seats sold will decline by about four
percentage points (e.g., from 70 percent to 66 percent) every ten years for the average
orchestra.14
How much better off would orchestras have been at the end of the 20th century if
they had been able to fill every seat at every regular-season concert? On average, the
orchestras in this sample filled about 71 percent of their regular-season seats between the
1987 and 2003 concert seasons, although the fraction filled was lower at the end of the
period than at the beginning. Under rather strong assumptions, the actual concert revenue
from regular season concerts therefore averaged 71 percent of potential concert revenue.
Assuming that vacant seats can be filled for the same prices charged for occupied seats,
one can estimate each orchestra’s potential concert income from a full house for every
performance. The procedure undoubtedly produces an overestimate of the revenues from
a full house, because it is unlikely that a full house would be achieved without altering
ticket pricing policies. Lower ticket prices would most likely be necessary to fill empty
seats.
The performance income gaps of symphony orchestras can be recomputed using
the estimate of hypothetical concert income with a full house. While higher concert
income will reduce the performance income gap, this procedure will overestimate the
14 Regression analyses also turned up evidence that actual seating capacity declined during this period forthe average orchestra in this sample. Seating capacity, which is linked to the size of concert venues and thenumber of regular season concerts performed during a year, exhibits no cyclical sensitivity (in contrast tothe percent of seats sold). The regression analyses confirm the positive relationship between the number ofconcerts and seating capacity, but also reveal a negative time trend in capacity after controlling for thenumber of concerts performed. The sources of this trend could not be determined with the data available forthis study.
39
extent of the reduction because it ignores possible additional costs incurred to fill the
vacant seats as well as the overestimate of concert revenue. Applying these very
optimistic assumptions about ticket pricing and costs, selling out each concert
performance would eliminate about 45 percent of the performance income gap on
average, with considerable variation among individual symphonies. Only a few
orchestras might completely eliminate the performance income gap by filling every seat,
even under these assumptions. In short, even if every seat were filled, U.S. symphony
orchestras still would face a significant financial challenge that would have to be met by
actions to reduce the performance income gap or raise nonperformance revenues. The
remainder of this report provides information that may help guide those actions.
Influences on Attendance per Concert
The analysis of attendance per concert follows a simple economic model of the
supply of and demand for symphony concerts. Symphony orchestras supply concerts (or
rather a block of seats for a concert performance). The number of seats is set by the
capacity of the hall, but the capacity is rarely reached by most of orchestras.
Ticket pricing. Symphony orchestras also set ticket prices for admission to a
concert, and their ticket price policies influence attendance. Ticket prices rarely vary over
the season for a given category of concert (e.g., regular season concerts). Two questions
arise in setting ticket prices: (1) how sensitive is concert attendance to the average ticket
price? (2) What is the structure or menu of ticket prices for different customers that will
maximize symphony revenues?
Virtually all products and services face a tradeoff between the price charged and
the quantity sold. Raising prices invariably reduces sales. Nevertheless, if a ticket price

40
increase is proportionately greater than the reduction in tickets sold, symphony revenues
will increase. The key empirical question is whether ticket sales are sufficiently
“inelastic” in response to ticket price increases to produce a revenue increase. In general,
the sales response will be least sensitive to price changes when there are fewer substitutes
(related products or services) that the consumer can shift to in the face of a price increase.
In the case of symphony orchestra performances, a perfect substitute would be the same
program performed by another orchestra of comparable quality on the same night in a
nearby venue—an unlikely event. However, other cultural experiences can provide near
substitutes. In cities with a relatively large number of alternative cultural experiences,
ticket sales may be more sensitive to ticket pricing than in cities with few cultural
alternatives.
Orchestra revenues may also be enhanced by carefully designed ticket-price
structures. The key idea is to charge higher prices to groups who have the strongest
inclination to attend a concert and lower prices to groups who are less inclined to
attend.15 At first glance, it may seem that some symphony-pricing policies violate this
basic principle of revenue maximization. Subscribers—arguably the patrons with the
strongest demand for symphony concerts—generally pay a lower price per concert than
purchasers of single concert tickets. (Of course, principles of revenue maximizing pricing
are applied to the extent that ticket prices vary with the desirability of different seats in a
concert hall.) However, symphony orchestras and other cultural organizations often
encourage “voluntary” annual, lump-sum donations by subscribers in order to maintain or
improve the quality of their seat. This practice, which cannot be applied to sales of single
15 This principle is not applied uniformly. At major rock concerts, for example, a single price often appliesto all seats (Connolly and Krueger (2005)).

41
tickets, moves in the direction of optimal price discrimination principles (Caves 2000).
The data available for this report permit limited exploration of links between the structure
of ticket prices and performance revenues. The data submitted to the League of American
Orchestras permit one to estimate subscription and single ticket prices for regular-season
and pops concerts. Reporting orchestras do not submit information on the structure of
ticket prices by location of seating or day of the week, however.
Symphony orchestras do not report exact ticket price data to the League. Instead,
they report data on revenues and attendance for some types of concerts. Average ticket
price data were constructed for this study by dividing concert revenues by attendance for
each orchestra in each season. Separate ticket price data were constructed for regular
season concerts and pops concerts. The ticket price estimates have two limitations. As
constructed averages they may not be a price that any individual concert patron faces,
even though they provide an indication of an orchestra’s general ticket price level.
Moreover, ticket price estimates do not bundle in “voluntary” contributions that may be
expected of subscribers, thus understating the effective price that they pay.
A statistical analysis of variations in attendance per concert confirmed the
importance of the ticket pricing policies of symphony orchestras.16 Attendance at both
regular season and pops concerts is inversely related to the ticket prices charged for those
events, for example. Higher ticket prices are associated with lower attendance and
conversely. However, the relationship between ticket prices and attendance is “inelastic”
so that the loss in revenues from diminished attendance does not completely offset the
gain in revenues from charging a higher price to the people who do attend. Not
surprisingly, symphony patrons can turn to alternative uses of their leisure time as the
16 Appendix D includes the technical details of the statistical analysis underlying this discussion.

42
price of symphony tickets rises, but those alternatives are imperfect substitutes for a
concert. For regular season concerts, for example, a 10 percent increase in the average
ticket price is associated with a five percent decline in attendance per concert.17
Attendance at pops concerts is somewhat less responsive to differences in price: a 10
percent increase in the average price of a pops concert ticket is associated with a two and
one half to three percent decline in attendance. These results are in line with estimates of
the price sensitivity of concert attendance in earlier studies (Seaman 2005).
Marketing activities. Attendance per concert may also be influenced by the
marketing activities of a symphony orchestra. Indeed, the very success of marketing
expenditures may be assessed by their influence on attendance. Orchestras may develop
and implement a variety of marketing activities to increase the number of patrons per
concert at the selected ticket price. Telephone and mail campaigns tend to be used to
acquire and retain season subscribers. (As noted in Section III, subscribers still account
for a majority of ticket sales, although the ratio of subscription to single tickets declined
during the 1990s.) In contrast, media advertising tends to be used to stimulate sales of
single concert tickets.
We have seen that marketing expenses not only increased but accounted for an
increasing share of symphony budgets between the 1987 and 2003 concert seasons
(Graph 7), a period in which attendance per concert generally declined (Graph 1). These
twin developments raise questions about how marketing expenditures are linked to
concert attendance. Without further analysis, one might conclude that marketing
17 Data that symphony orchestras provided to the League included breakdowns of income and attendanceby single concerts and season subscribers for some types of concerts only until 1998. With more extensivedata on ticket prices for subscribers and single ticket purchasers, the price sensitivity of different groups ofsymphony patrons could be explored.

43
expenditures by orchestras were unproductive, but this conclusion would ignore the fact
that many other factors also influence concert attendance. The key question is whether
marketing activities and attendance are linked, after holding the effects of other
influences on attendance constant. If marketing activities and attendance per concert are
correlated, orchestras may also benefit from knowing whether the effects of marketing
activities change with the level of marketing expenditures. If the best marketing
opportunities are exploited first, incremental marketing expenditures may be subject to
diminishing returns, yielding smaller and smaller increases in attendance per concert. On
the other hand, if there are economies of scale in marketing activities, large expenditures
may produce successively larger attendance gains. Data on annual marketing
expenditures reported to the League permit analyses of the nature of the links between
marketing activities and attendance per concert.
Regression analysis confirms that attendance per regular season concert increases
with marketing expenditures by symphony orchestras, but also indicates that marketing
activities encounter diminishing returns. That is, incremental increases in marketing
expenditures produce smaller and smaller gains in attendance per concert. For regular
season concerts, expenditures for phone and mail campaigns and for media advertising
are significantly correlated with attendance. As noted above, these marketing activities
tend to be directed at separate populations—subscription and single ticket patrons
respectively. The analysis indicates that the phone/mail expense per additional attendee is
lower than the media advertising expense per attendee. Combined with the declining ratio
of subscription to single ticket sales, this finding implies increasingly higher overall
marketing expenses for a given level of attendance. The statistical analyses also indicate

44
that both phone/mail campaigns and media advertising are subject to diminishing returns
in raising attendance at regular season concerts. Past marketing results tend to provide an
overly optimistic prediction of the effects of incremental marketing expenditures.
Characteristics of market area. The pricing, programming, and marketing policies
of symphony orchestras are not the only influence on attendance per concert. The
potential audience for symphony concerts also may vary with the economic and
demographic characteristics of the markets in which orchestras operate. Some
symphonies exist in the country’s largest metropolitan areas, while others are based in
cities of modest size. Other studies have shown that concert attendance is strongly
correlated with per capita income and education, which play an important role in defining
tastes for cultural experiences.18 In our analysis of how concert attendance varies between
symphonies and over time for individual symphonies, we include variables for
population, real per capita income, and the unemployment rate in each area in which a
sample symphony orchestra is located. Population captures the potential size of an
audience, while real income and unemployment signal the economic capacity of the
population to attend concerts and support a local orchestra.
The key local area characteristic that emerges from the statistical analysis is
population size. Orchestras in areas with larger populations experience higher attendance
per concert; within an area, attendance per concert rises as population increases. In
contrast, attendance per concert is not significantly related to either the real per capita
income or the unemployment rate of an area.
18 The NEA surveys discussed earlier find that education is the most powerful determinant of attendance ofany performing art (NEA (2004)).There is some controversy about the respective roles of income andeducation, however, since the latter is an important determinant of the former (Seaman 2005). Limitationsin government reporting of educational attainment (the percent of the population with at least a collegedegree) by local area prevented its use as an explanatory variable in this study.
45
Competition from other performing arts. Finally, attendance at symphony
concerts may be influenced by the presence of other performing arts organizations
operating in the same market area. A salient characteristic of performing arts
performances is that they require significant time as well as income from attendees.
While income increases over time for most people, time constraints are less elastic. Time
constraints force patrons of the arts to choose among arts performances, and performing
arts organizations may compete with each other for the scarce time of arts patrons. How
performing arts organizations compete and the consequences of such competition for the
financial balance of arts organizations has received little study in the past.
Ticket pricing policies and marketing activities that attract new patrons to an
opera, dance, or theater performance may do so at the expense of attendance at a concert
by the local symphony orchestra. And conversely: pricing and marketing activities by
orchestras may cut into attendance at other performing arts. This kind of competition can
have very serious implications for the financial balance of all performing arts
organizations. Higher marketing expenses by arts organizations seeking to increase
attendance may be countered by other arts organizations in order to prevent a loss of
attendance. If an opera increases its marketing effort to fill its hall, a nearby symphony
orchestra may have to increase advertising and marketing expenditures to prevent an
erosion of patronage. The outcome could be an escalating war of marketing expenditures
whose only purpose is to prevent a loss of market share. The escalating expenditures may
produce no net gain in attendance for either organization. Attendance and related
revenues may remain roughly flat while expenses escalate.

46
One cannot rule out a more appealing alternative hypothesis, however: self-
interested pricing and marketing activities by any arts organization will raise general
interest in and attendance at all performing arts. Ultimately, the nature and effects of
competition between different performing arts organizations must be settled by an
analysis of actual experience. An analysis of competitive interactions between symphony
orchestras and opera companies is feasible thanks to extensive financial and operational
data for U.S. opera companies made available for this study by Opera America. These
data make it possible to analyze the effects of the presence of competing opera
companies, the ticket prices charged by those companies, and their level of advertising
and marketing expenditures on attendance per symphony concert.
The statistical analysis tested for several potential competitive interactions
between symphony orchestras and local opera companies. There is evidence of a
statistically significant but quantitatively small relationship between opera ticket prices
and regular season symphony attendance (and conversely) in some analyses. Higher
season ticket prices charged by a local opera are associated with higher symphony
attendance. Alternatively, if the price of a season ticket for a local opera falls relative to
the price of symphony tickets, symphony attendance per concert will decline. Note that
the relative price of an opera could fall either because the opera reduces its price relative
to the symphony ticket price or because the symphony raises its ticket price relative to the
price of opera tickets. (No statistically significant relationship between the price of single
opera tickets and regular season symphony attendance, and no relationship between the
price of any opera tickets and pops concert attendance emerges in the statistical analysis.)

47
The direct relationship between opera ticket prices and regular season symphony
concert attendance in some analyses confirms the intuition that these two performing arts
are to some degree substitutes: When the relative price of opera tickets increases, some
opera patrons reduce their opera attendance and increase their symphony attendance (and
conversely). Nevertheless, this effect is quantitatively small and not always reliable: if an
opera doubled its ticket price (relative to symphony ticket prices) attendance per concert
at the local symphony would at most increase by three percent. Scheduling can influence
the strength of competition between performing arts. In some communities, the
symphony and opera performances occur at different times of year, an arrangement that
not only reduces direct competition for patrons between the two performing arts, but also
permits musicians to play in both orchestras.
The statistical analysis did not reveal further significant impacts of opera
companies on attendance at a symphony’s regular season concerts in the same market
area. In particular, neither the presence of an opera company in the market area nor the
level of marketing expenditures by that opera company had a reliable impact on
attendance at those concerts duringthe time period studied. No aspect of a local opera’s
operations, including its ticket pricing, had a significant impact on attendance at pops
concerts.
Broadcasts and recordings. We should not leave the topic of arts competition
without raising the intriguing question of whether some symphony orchestras effectively
compete with themselves when they broadcast their concerts or make and sell sound
recordings. These activities raise all of the issues posed by the presence of competing

48
performing arts organizations. Do live broadcasts and recordings of the symphony
repertoire substitute for live performances or raise the demand for them?
The availability of high quality broadcasts and sound recordings of classical
music could raise attendance at symphony concerts. Throughout most of the history of
classical music in the United States, symphony orchestras appear to have assumed that
broadcasts and recordings stimulate the demand for live performances. From the vantage
point of the early 20th century, Grant andHenninger (1940, p. 21) comment that “…there
is considerable evidence that these media have created wider interest in symphonic music
and have contributed to the growth in the number of symphony orchestras and the size of
their audiences.” Early sound reproduction was mediocre, and exposure to symphonic
music on radio and, later, television may have built demand for superior quality of live
performances.
Over the decades, the quality of sound recordings increased immensely, however,
raising the possibility that recordings no longer raise the demand for and may even
substitute for concert attendance. NEA surveys again provide some evidence on the use
of potential substitutes for live performances in the late 20th century. While a larger
proportion of the population listens to broadcast and recorded classical music than attends
concerts, the use of these alternatives has declined since 1992 (Exhibit 3). This decline
coincides with the rise of the internet as a source of recorded and broadcast music—an
option not anticipated in the design of these surveys. Notwithstanding the dramatic
improvements in the quality of broadcast and recorded sound since the early 1980s, the
survey data do not support the hypothesis that performing arts attendance stabilized
because people allocated more time to broadcast and recorded performances.

49
Programming choices. Once the ticket price has been set, attendance per concert
generally varies with shifts in demand for particular concerts. Shifts in demand from
concert to concert may reflect variations in programming and the appeal of guest soloists
and guest conductors. For symphonies that provide multiple performances of a program
each week, these demand-shift factors will mainly determine weekly variations in
attendance per concert. Symphony orchestras do not report data on individual concerts to
the League, so it was not possible to explore the interesting question of how
programming choices influence attendance with the data available for this study.
Exhibit 3. Performing Arts Broadcasting and Recording (Percent of U.S. Adults)
1982 1992 2002
Watch on TV, Video or DVDClassical music 25 26 18Opera 12 12 6Jazz 18 22 16Musical theater 21 17 12Non-Musical theater 26 18 9Dance 20 13Museums 23 34 25
Listen to on the radioClassical music 20 31 24Opera 7 9 6Jazz 18 28 24Musical theater 4 4 2Non-Musical theater 4 3 2
Listen to RecordingsClassical music 22 24 19Opera 8 7 6Jazz 20 21 17Musical theater 9 6 4
Source: NEA (2004), p. 55 - 58.

50
Conclusions Regarding Concert Attendance
Concert performance is the central objective of symphony orchestras. Addressing
the relentless deficits—performance income gaps—that accompany this central activity
requires attention to enhancing performance revenues and controlling performance costs.
Concert attendance produces the major flow of performance revenue for orchestras and
hence has been isolated for analysis in this section. These are the main conclusions of that
analysis. (1) The vast majority of symphony orchestras would fail to cover performance
expenses with performance revenues, even if they were able to fill every available seat
for every concert. (2) Adding concerts to an orchestra’s schedule produces smaller and
smaller attendance gains on average. Attendance per concert has declined. (3) Ticket
pricing policies have an important influence on performance revenues. Because the
demand for symphony performances is only moderately sensitive to ticket price, higher
ticket prices will raise performance revenues, even though they discourage some
attendance. A full evaluation of the effect of higher ticket prices should consider the
following complication, however: To the extent that private philanthropic contributions
to orchestras flow from concert patrons, the gains in performance revenue from higher
ticket prices may be offset to an unknown extent by reductions in nonperformance
income from fewer attendees. (4) Marketing activities are associated with higher
attendance per concert, after holding the effects of ticket prices and other influences on
attendance constant. However, the declining ratio of subscription to single ticket sales
experienced on average by this group of orchestras implies an increase in marketing costs
per ticket sold. Even more important is the fact that marketing expenditures are subject to
diminishing returns. Past performance is an overly optimistic guide to the yield of

51
incremental marketing expenditures, and beyond some point, marketing expenditures
may not pay for themselves. (5) In some analyses, there is a statistically significant but
quantitatively small competitive interaction between symphony orchestras and operas. In
these analyses, changes in the relative price of symphony and opera tickets in the same
area are associated with small changes in relative attendance. Whether such competitive
interactions occur between symphony orchestras and other performing arts remains an
important topic for future research. (6) Some influences on attendance, like the
population of a local market area, are beyond the influence of specific symphony
orchestra policies.
VI. Artistic Costs
If concert attendance constitutes the major source of performance revenue for
symphony orchestras, artistic costs—mainly the compensation of regular and substitute
orchestra musicians, regular and guest conductors, and guest soloists—comprise the
major category of expense. Because they average over half of the total annual expenses
(Graph 7), even small changes in artistic costs can have a notable impact on the overall
financial balance of orchestras. Between the 1987 and 2003 concert seasons, for example,
the total artistic costs of the orchestras in this study increased less rapidly (about 2.1
percent per year) than total marketing expenses (4.3 percent per year) and total
fundraising and development expenses (3.9 percent per year) but nonetheless had two to
five times more impact on total costs because of their large share of total expenses. The
share of artistic costs in total orchestra expenses varies quite widely among the orchestras

52
in our sample—from about 37 to 65 percent in a typical year. This section describes the
recent evolution of artistic costs within the symphony industry.19
Salary payments to regular orchestra musicians averaged 57 percent of total
artistic costs. Guest soloists and guest conductors accounted for the next largest share of
artistic expense—15 percent of artistic costs. The salary of an orchestra’s regular
conductor averaged five percent of the artistic budget, as did the share of salary payments
to substitute musicians. Various payroll taxes and benefits account for the remaining
artistic costs.
Virtually all salaries for symphony orchestra musicians are determined in local
collective bargaining negotiations between symphony management and symphony
musicians or their union representatives. Since 1987, the minimum weekly salary for
orchestra musicians established in collective bargaining agreements signed by
management and labor at the 63 orchestras in our sample increased at about 4.0 percent
per year. Average weeklymusicians’ salaries, which include seniority payments and
“over scale” payments to musicians who play a prominent musical role (e.g., first-chair)
in the orchestra, increased at slightly over 3.8 percent per year. Along with the wages of
most other workers in society,musicians’ salaries increased more rapidly than the cost of
living, as captured by the evolution of the Consumer Price Index (CPI). (See Graph 9, in
which both measures of musician salaries and the CPI have been indexed to equal 1 in
1987.) Between the 1987 and 2003 seasons, the weekly salaries of symphony orchestra
musicians also increased more rapidly than the average wages and salaries of other
unionized workers in the United States, of nonunion workers, and of other professional
19 Because information on some dimensions of artistic costs were not reported in all years, the period ofanalysis is sometimes shorter than in earlier sections of this report.

53

54
service workers. Some of these groups, notably employees in the education sector, also
work in industries with very low productivity gains.
Annual musicians’ salaries also reflect the number of weeks worked. Forty-five
years ago, very few orchestras provided 52-week guarantees to musicians. Over
subsequent decades, many orchestras raised the number of guaranteed weeks per concert
season, but increases in guaranteed weeks appear to have stopped by the mid-1980s. No
trend in the paid weeks per year emerges in the sample orchestras between the 1987 and
2003 concert seasons. In short, the growth of weekly salaries alone accounts for virtually
all of the increase in musicians’ annual salaries since 1987.
Employment arrangements in symphony orchestras appear to limit the adjustment
of artistic costs to changes in business conditions. The discussion in section IV noted that
performance expenses were much less sensitive to changes in business conditions than
performance revenues, resulting in a significant increase in the performance income gap
during recessions. The fact that artistic costs do not vary significantly with business
conditions is an important source of this outcome. In an effort to stabilize the annual
incomes of symphony musicians, collective bargaining agreements in the industry now
typically specify the number of regular musicians in an orchestra, a guaranteed number of
annual weeks of employment for musicians, and a maximum number of services per
week, as well as the minimum weekly salary and salary supplements discussed earlier.
Collective agreements or other employment arrangements that set both salary and
employment levels limit the ability of organizations to adjust their operations to changes
in business conditions and exacerbate the size of the performance income gaps of
symphony orchestras in recessions. In contrast, most collective bargaining agreements in

55
private sector industries in the United States establish a wage or salary level and leave
decisions regarding employment levels to the employer.
Payments to soloists, which include the combined effect of individual fees and the
number of soloists engaged by orchestras, increased about 2.8 percent per year. There
was no significant trend in payments to conductors in the full sample of orchestras,
although payments to regular conductors in larger orchestras did appear to increase more
rapidly than the pay of musicians in those orchestras.
In summary, the pay of symphony orchestra musicians increased more rapidly
than the pay of most other groups of workers in the United States in the late 20th century.
Collective bargaining agreements signed by representatives of both management and
labor have also limited the ability to adjust labor costs during cyclical or other sources of
economic adversity. These limitations contribute to the worsening of the performance
income gap during periods of poor economic conditions.
VII. Private and Public Support for Orchestras
With their persistent gaps between earned income and performance expenses,
symphony orchestras and other performing arts organizations must rely on private
philanthropy, government grants, and investment income in trying to achieve financial
balance. More than half of the budget of many orchestras must be financed from these
sources of nonperformance income. Section IV of this report examined the cyclical and
trend behavior of private support from individuals, businesses, and foundations and
public support from all levels of government. This section extends that discussion to
consider the role of several other influences on private and public support for orchestras.

56
There was remarkable variation among orchestras in the amount and composition
of external support received in the late 20th century. Philanthropic contributions by
individuals ranged between six and 60 percent of the private support received by
individual orchestras in the sample. Support from businesses ranged between 5 and 53
percent of private support; for independent foundations the range was 2 to 35 percent.
Shares also ranged widely over time for individual orchestras. Clearly, the composition of
external support for U.S. symphonies varies widely across orchestras and over time.
Government support was invariably a less important source of funding than private
philanthropy. Neglecting two outliers, support from all levels of government ranged
between one and 25 percent of the total income received by orchestras in the sample. The
highly varied structure of nonperformance income for these orchestras undermines any
notion that they followed a common model of external financial support in the late 20th
century. This section examines influences on these variations in contributed support, both
across symphonies and across time.
Private Support
This analysis of private contributed support between the 1987 and 2000 concert
seasons considers the role of three potential influences—the financial capacity of a local
market area to support orchestras and other performing arts, symphony orchestra policies,
and competition with other performing arts. The underlying statistical analysis of data for
62 symphony orchestras examines the relationship between each of these potential
influences policies, and the amount of private support for symphony orchestras.20
20 Appendix D reports technical details of the statistical analyses discussed in this section. One of theoriginal 63 orchestras lacked sufficient data to be included in these analyses.

57
The capacity of parties with a taste for symphonic music to provide financial
support to a local orchestra should depend on the size of the local area population and its
financial capacity as indicated by its real per capita income. The local area
unemployment rate may provide further information on capacity for private philanthropic
support. Since changes in the value of assets may account for changes in support from
both individuals and foundations, changes in stock market prices, a major influence on
asset values, also may influence private contributions. Furthermore, since philanthropic
contributions may be used to reduce taxable income in the United States, the incentive to
contribute to philanthropic and charitable organizations increases with the marginal
income taxes paid by individuals. This familiar fact motivates a test for the effect of
marginal income tax rates on contributed support.21
Analyses of variations in support between orchestras and within orchestras over
timeconfirm the influence of an area’s population size and real per capita income on real
private contributions to the area’s symphonyorchestra. Orchestras in areas with more
people and higher per capita income receive more private support. Once the effects of
population and income are held constant, the unemployment rate has no significant
impact on private contributions, however. Broad stock price indices also are not
significantly related to overall private support. (Stock market indices are so closely
correlated with the unemployment rate and other measures of general economic
conditions in annual data that it is difficult to disentangle the unique influence of stock
21 The NEA surveys discussed in Section V find that concert attendance increases with education. Tastesfor symphonic music apparently increase with schooling. This finding suggests that other factors equal,areas with a more highly educated population will provide more philanthropic support to orchestras. Thehypothesis must be examined with care, since there is a strong correlation between education and realincome. A more basic difficulty confronted efforts to address the hypothesis in this study: Data oneducational attainment are only available for a limited number of years and for only some areas.

58
prices in statistical analyses.) The limited variation in federal personal income tax rates
over this 14 year period provides little traction for a statistical analysis, and no
statistically significant relationship between marginal federal income tax rates and
contributions by individuals emerge from the analysis. (Progress in detecting linkages
between tax policies and private support for orchestras must await data providing greater
variation in tax rates.22) Similar patterns emerge from analyses that focus only on changes
within orchestras over time. Increases in local population and per capita income raise
private contributions.
Symphony orchestra policies constitute a second influence on the level of
contributed support. The earlier discussion of ticket pricing noted that some orchestras
may expect “voluntary” donations from patrons who wish to preserve their seating
assignments, for example. Concert programming choices may also influence the level of
support that an orchestra receives.
Orchestras also initiate a variety of fundraising activities to increase contributed
support from private and public sources. This report noted earlier that the share of
fundraising in total orchestra expenses increased in the late 20th century (Graph 7).
Assessing the links between fundraising activities and contributed support requires care,
however, because an area’s economic capacity and other orchestra policies also influence
an orchestra’s nonperformance income.The statistical procedures used to assess these
links account for other influences on nonperformance income before estimating the
independent contribution of fundraising activities. These procedures are designed to
22 A useful extension of this analysis would be to combine information on federal and state income taxrates—a strategy that would introduce more variation in tax rates over time as well as between areas.Because corporate income tax rates changed only once over the period, no attempt was made to relatebusiness contributions to tax rates.

59
address the following policy questions faced by symphony orchestras: What is the return
on another dollar of fundraising expenditure, given other influences on an orchestra’s
nonperformance income? Do further expenditures pay for themselves? To address these
questions the statistical analysis examines how development and fundraising expenses are
related to philanthropic contributions over time within symphony orchestras. These “fixed
effects” analyses show the effect of an average symphony spending one more dollar on
fundraising activities on private support.
Preliminary analyses of the data indicated that the relationship between
fundraising expenditures and private contributions was different for large and small
orchestras. When the orchestras are split into a group of “small” symphonies (with total
budgets under $9 million in the late 1990s) and “large” symphonies (with budgets over
$9 million in the late 1990s), an additional dollar of fundraising expense is associated
with increased private contributions of $1.96 for small orchestras and 51 cents for large
orchestras. Taken at face value, this finding implies that from the first dollar spent,
fundraising does not pay for itself in large orchestras.
This provocative finding emerges from statistical analyses that assume that the
returns to fundraising activity do not vary with the level of fundraising expense. It does
not allow for the possibility that fundraising may become more or less productive with
the level of fundraising expenditure by an orchestra. If fundraising departments pursue
their best opportunities first, for example, fundraising expenditures may eventually be
subject to diminishing returns. On the other hand, if there are economies of scale in
fundraising activities, large expenditures may yield disproportionately larger
contributions than small expenditures. By a small margin, regression analyses that

60
checked these possibilities by permitting the effects of fundraising expenditures to
change as the level of expenditure changes did not describe the data as well as the
analyses that assumed that fundraising expenditures yield constant returns for both
smaller and larger orchestras. Yet, the “constant returns” results imply that fundraising
expenditures by large orchestras fail to pay for themselves, a result that many readers
may find implausible.
A key reason for the statistical finding is that factors other than fundraising
activities typically account for some of the philanthropic contributions to symphony
orchestras. In particular, per capita real income in an orchestra’s market area is strongly
correlated with private contributions, independently of what the orchestra spends on
fundraising. To make this point differently, simple ratios of total contributions to
fundraising expense grossly overstate the return on fundraising activities, because they
effectively credit fundraising activities with many contributions that an orchestra would
have received anyway, including the economic capacity of an area, a desire to maintain
seating preferences, and appreciation for the musical director’s programming choices.
Readers of preliminary drafts of this report suggested other factors that might
account for the low (and even negative) returns to fundraising and development activities
found in the statistical analysis of the orchestra data. Current development and
fundraising expenses may be incurred to lay the groundwork for significant contributions
in future years. There are expenses associated with the stewardship of past donors that are
intended in part to encourage additional giving in the future, for example. Planned giving
commitments also require significant current costs to generate future nonperformance
income. The interval between incurring costs and receiving returns may lengthen to the

61
extent that orchestras turn their attention to commitments from younger patrons. These
are very sensible and well-informed observations about the nature of some development
activities. It is also true, however, that over the fourteen-year period covered by the
statistical analysis, the promise of an eventual positive return on fundraising investments
is not reflected in the data for larger orchestras.
The return to fundraising activities by symphony orchestras may also be
challenged by increasing competition for philanthropic contributions. In principle, such
competition can be quite broad and changing tastes about the direction of philanthropy
can influence the return on an orchestra’s efforts. The following paragraphs focus more
narrowly on competition for contributions between performing arts organizations.
Competition from other local performing arts organizations for philanthropic
donations may not be as sharp as the competition for patronage discussed in section V,
because the time constraint that may influence current attendance choices is not relevant
for philanthropic support. Assuming that the philanthropic budgets of individuals and
organizations are limited, however, competition for private support (like competition for
patronage) may mean that gains in nonperformance income by one organization come at
the expense of another performing arts organization. Efforts by each arts organization in
turn to preserve or increase donations may produce escalating fundraising expenses. With
this possibility in mind, this section explores the sensitivity of orchestra philanthropy to
the presence of opera companies in the same market and the scale of their competing
fundraising activities.
This report extends the analysis of philanthropic support for symphony orchestras
to include variables indicating the presence of competing opera companies in a market,
62
the amount of private and government support received by operas, and the level of
development and fundraising expenditures by local operas.23 The presence of at least one
opera company in a symphony orchestra’s market area is associated with a decline in
total private contributions to symphony orchestras. On average, the decline is equal to
$364,000 or about seven percent of total private support. Government support for
symphony orchestras is also lower (by $ 145,000 on average) in markets in which there is
also an opera company. While the statistical foundation for this finding is quite strong for
total private contributions, it weakens when the three main sources of private support—
individual, business, and independent foundation support—are analyzed separately. The
finding is strongest for individual support (where it is marginally significant on statistical
grounds) and weakest for support from private foundations.
How does the decline in revenue associated with the presence of a competing
opera company occur? Answering these questions require a very cautious interpretation
of the data and careful consideration of different lines of causation. If we identify a
positive correlation between philanthropic support for symphony orchestras and support
for nearby opera companies, for example, does it mean that the support generated by the
opera has spilled over into support for the local symphony, or does it mean that higher
support for a local symphony induces extra (costly) development efforts by the
competing opera company. One approach to addressing this puzzle is to test for a
sequence of reactions by lagging key explanatory variables.
After holding the effects of an area’s economic capacity and an orchestra’s
development/fundraising expenditures constant, the data reveal a small but statistically
significant inverse correlation between support for an opera company in one year and
23 Appendix D contains details on the underlying statistical analysis.

63
support for a nearby symphony in the subsequent year. In fact, the data reveal a broader
story: There is also an inverse relationship between an opera’s fundraising expenditures
in one year and the level of external support for a nearby symphony the following year.
These results are consistent with a scenario in which higher development expenditures by
an opera company raise support for the opera at the partial expense of the nearby
symphony orchestra a year later. This pattern appears for total private support, for its
three main components (support from individuals, businesses, and independent
foundations), and for public sources. (Some public funding comes from state and local
governments, which may have to respond to many or all arts organizations of
consequence in an area.) The effect is very small, however. Each additional dollar of
private contributions to an opera company in one year is associated with a decline of
three cents in contributions to a nearby symphony orchestra in the following year.24
Public Support
Direct government support of symphony orchestras in the United States is quite
limited in comparison with other industrialized countries.25 Earlier in this report, Graph 5
described the decline in real government support received by major orchestras at the end
of the 20th century. Government support for performing arts in dollars increased during
the 1990s, but public support as a fraction of income dropped from 9 % to 6 % as “larger
appropriations are being divided among more and more constituencies through the very
politicized process of public arts funding.” (Dempster 2002, p. 14). Indirectly, the federal
24 This finding requires cautious interpretation, for when the level of support received by a neighboringopera company is not lagged, the support received by operas and orchestras are positively correlated—theopposite of what is observed when opera support is lagged. The sequence of actions that emerges with theuse of the lagged support for operas would seem to clarify the causality. But they do not constitute absoluteproof.25 A study of data for the 1970s documented how public support for the arts in the United States laggedbehind Europe (Montias 1986).

64
government supports symphony orchestras (and other not-for-profit organizations)
through the tax deductibility of philanthropic donations. We now move to an analysis of
factors determining variations in the level of support from all levels of government
between orchestras and over time.
The analysis can address questions about how the underlying political processes
allocate support for the arts. To what extent is government support allocated on the basis
of an area’s ability to pay?In particular, do funding allocations compensate for area
differences in ability to pay? Do an orchestra’s fundraising activities influence the
amount of government support that it receives? If so, is the effect of fundraising
sufficiently large that marginal fundraising expenditures pay for themselves when both
private and public returns to fundraising are considered?
The results of the statistical analysis provide mixed signals regarding the political
values underlying the allocation of government support to symphony orchestras.
Symphonies in high income areas receive less support than orchestras in low income
areas. In this sense public support tends to offset private support and equalize performing
arts activities geographically. However, areas with high unemployment receive less
government support than areas with low unemployment, an outcome that reinforces
geographical differences in economic capacity. Fixed effects estimates indicate that over
time, government support flows toward areas experiencing the largest gains in real per
capita income and the largest reductions in unemployment. The regression analyses also
find that fundraising expenditures produce diminishing amounts of government support, a
result that is driven mainly by the relationship in small orchestras.

65
Conclusions about Contributed Support
To some extent the private philanthropy and government support that a symphony
orchestra may receive to help defray the performance income gap depend on ability-to-
pay factors that characterize the market in which it is located. By combining the financial
data reported to the League of American Orchestras with government data on the
economic characteristics of these markets, the regression analyses discussed in this
section provided information on how sensitive government support and the major
varieties of private philanthropy are to the ability to pay characteristics. For better and for
worse, these characteristics change slowly and cannot by influenced quickly by private or
public policy actions.
External support also depends on the development and fundraising activities of
orchestras, and this section has provided the most detailed analysis to date of the
relationship between development/fundraising expenditures and contributions to
symphony orchestras. A key point is that simple comparisons of levels of contributed
support and levels of fundraising expense can provide a seriously misleading picture of
the results of incremental expenditures on fundraising, because such comparisons err in
attributing all contributed support to fundraising activities. In fact, an area’s economic
capacity for philanthropy and other orchestra policies constitute important independent
influences on contributions. The findings in this section therefore caution against
expanding fundraising budgets on the basis of simple comparisons of contributions and
fundraising expenses. Indeed, they raise the possibility that fundraising expenditures in
some orchestras may not pay for themselves.

66
Symphony orchestras face sharp competition in the market for philanthropic
contributions. For a given ability to pay and a given level of fundraising expense,
contributions to orchestras decline with the presence of opera companies in the same
market. Competition with other performing arts organizations may be a part of the
diminishing returns to fundraising expense found in the statistical analysis. To the extent
that ability to pay limits total contributions to the performing arts, development activities
by different performing arts organizations may be little more than a battle to maintain
each organization’s share of a more or less fixed contributions pie. In this situation, the
financial balance of all organizations could be improved by a mutual de-escalation of the
battle over market share.
Perhaps the evidence questioning the efficacy of some orchestra fundraising
activities will eventually be mitigated by future returns that are not yet reflected in the
orchestra data. It may also be the case that the findings in this section reflect a broader
bias in the way that orchestras address deficits—a preference for searching for new
revenues over controlling the costs of running a symphony orchestra.
VIII. Endowment
Symphony orchestras may also draw income from their endowments in order to
achieve financial balance. The size of an orchestra’s endowment depends on (1) current
and past contributions to endowment, (2) the market returns on the investments that
comprise the endowment, and (3) withdrawals from endowment. Market returns on
stocks, bonds and other investments vary from year to year. While positive in most years,
negative returns can and do occur in some years, an outcome that reduces the value of an

67
endowment. Market returns tend to be lowest in cyclical downturns, when orchestras are
most likely to need additional nonperformance income.
Data reported to the League permit an overview of endowment policies since the
1998-99 concert season. This period includes the last two years of an economic boom,
followed by a significant recession beginning in 2000 and the beginnings of an economic
recovery at the end of the period. The cyclical impact on investment returns is clearly
visible in column (1) of Exhibit 4 for two groups of orchestras. Respectable positive rates
of return on endowment investments at the beginning of the period gave way to losses
(negative returns) as economic conditions deteriorated at the beginning of the new
century, followed by a return to positive returns with the partial recovery. Returns on
investment experienced by individual orchestras also became more dispersed (column
(2)). Since all orchestras have access to the same national and international capital
markets, the highly dispersed returns on investment indicate that individual orchestras
follow very different investment strategies.
Endowment draws (as a percent of the market value of endowments) increased for
the largest orchestras (column (3)). In any given year, endowment draw rates vary
substantially across orchestras (column (4)). During the early years of the new century,
the number of orchestras for which endowment draws exceeded market returns increased
notably, but this tendency began to reverse in the 2002/03 season (column (5)). Continual
endowment draws in excess of market returns leaves orchestras with fewer resources to
offset the ongoing performance deficits. Beginning with the 2002-03 season, data
reported to the League includes a statement of each orchestra’s endowment policy. Most

68
(5)(1) (2) (3) (4) Number of Orchestras
Year Median Range Median Range Where (3) > (1)
1998-1999 14.0% 4.9 to 27.9% 5.0% 3.13 to 8.0% 2
1999-2000 9.7% 4.3 to 30.1 5.0% 2.7 to 14.0 2
2000-2001 -9.7% - 26.0 to 15.7 5.1% 0 to 10.5 17
2001-2002 -7.4% - 15.0 to 13.0 6.2% 3.7 to 16 20
2002-2003 6.5% - 9.4 to 22.3 5.9% 1.7 to 12.2 8
1998-1999 9.7% 4.4 to 23.2% 5.0% 2.9 to 8.0% 2
1999-2000 7.0% 4.7 to 12.0 4.5% 0 to 7.5 0
2000-2001 -5.4% - 24.0 to 12.5 3.8% 0 to 8.4 11
2001-2002 -5.9% - 14.0 to 5.0 4.1% 2.6 to 8.1 13
2002-2003 5.2% - 3.5 to 12.0 4.7% 0.6 to 11.1 6
Source: League of American Orchestras
25 Largest Orchestras
Next 25 Largest Orchestras
Exhibit 4. Returns and Draws on EndowmentEndowment Draw
As Percent of Market ValueReturn on Investment
69
symphonies now have policies that permit annual draws in the range of 5 to 7 percent of
the market value of their endowment, but some have clearly exceeded this range.
How large would endowments have to be for prudent annual endowment draws to
offset the performance income gaps of symphony orchestras? Exhibit 5 provides the
estimates of the required endowment for the median orchestra and orchestras at the 25th
and 75th percentile of performance income gaps.26 Estimates of required endowment are
provided for three endowment draw rates (four, five, and six percent) along with the
actual endowment of orchestras at those three positions in the distribution. The main
point that emerges from Exhibit 5 is that actual endowments are not sufficiently large to
cover performance deficits at these endowment draw rates. To make the same point a
different way: with endowment levels that existed at the beginning of the 21st century, it
would take an endowment draw rate of at least 20 percent to fully offset the performance
income gap of the median orchestra. This point applies more broadly. None of the
orchestras in the sample have endowments large enough to offset performance deficits at
prudent endowment draw rates. Endowment draw rates that would offset performance
deficits in the short run are so high that they would cannibalize endowment to a point
where it could sustain only smaller draws in the future.
The incapacity of current symphony orchestra endowments to offset performance
deficits is in fact larger than the presentation in Exhibit 5 indicates. As indicated in
section IV of this report, the performance income gap tends to get worse over time, even
after controlling for its cyclical fluctuations. As a result, estimates of required endowment
26 The estimates in Exhibit 5 use the average of the performance income gaps for 1998, 1999 and 2000—years which capture the end of an economic boom and the beginning of a recession. The averageperformance income gaps are divided by the alternative endowment draw rates to obtain the estimates ofthe required endowments. The actual endowment figures are also averages of 1998, 1999, and 2000.

70
Exhibit 5. Endowment Required to Offset Performance Income Gap, 2000(millions of dollars)
Orchestra at: Endowment Draw Rate Actual4 % 5 % 6% Endowment
25th Percentile $ 70.7 $ 56.6 $ 47.1 $ 7.4
Median $ 129.6 $ 103.7 $ 86.4 $ 24.4
75th Percentile $ 295.0 $ 236.0 $ 196.7 $ 62.2
Source: Orchestra reports to League of American Orchestras

71
at any point in time—such as year 2000 in Exhibit 5—ignore the endowment growth that
would be needed to offset increases in performance deficits over time.
To summarize, symphony orchestras that pursue financial stability solely through
endowment policies face three challenges. First, they require extremely large increases in
current endowments to offset current performance deficits using prudent endowment
draw rates. Second, endowments must continue to grow at rates sufficient to offset the
trend increase in performance deficits with prudent draw rates. Third, the dispersed
returns indicate that many orchestras could gain by improving the management of
endowment investments.
IX. Conclusions
This fact finding report first documented several trends in the economic health of
symphony orchestras in the United States. As orchestras have increased the number and
variety of concerts that they provide, total annual concert attendance increased somewhat,
but attendance per concert has declined sharply. Moreover, those who attend concerts are
increasingly likely to purchase single tickets rather than season subscriptions. At the
same time, limited opportunities for productivity gains guarantee that the costs of running
a symphony orchestra increase more rapidly than costs in the private sector. With
performance-related expenses increasing more rapidly than performance revenues,
revenues cover a diminishing fraction of expenses. As symphony orchestras try to
address growing performance income gaps by attracting more patrons and donors,
expenditures for marketing and fundraising comprise an increasing—although still
small—share of total costs. Artistic expenses, which constitute over half of the average
orchestra’s costs, increased less rapidly even though musicians’ salaries have increased

72
more rapidly than the average wages of other union and nonunion workers in the United
States.
Increased contributed support from private sources (mainly individuals) has
helped orchestras meet their ubiquitous performance income gaps, but this support is
sensitive to general economic conditions. Once the effects of business conditions are held
constant, there is a trend increase in private support that more than offsets a trend decline
in public support. The overall financial balance between the performance and
nonperformance revenues and expenses of orchestras are thus sensitive to general
economic conditions, deteriorating when conditions are poor and improving when
conditions are good. During the boom of the late 1990s, for example, overall financial
balance was achieved on average for the larger orchestras. After holding the effects of
business conditions constant, there is a small trend improvement in the overall financial
balance.
These developments will not surprise most students of symphony orchestras.
Most are not new, although the remarkable database assembled for this project enabled a
more thorough documentation of the changing economics of symphony orchestras than
has been possible in past studies.
This report then examined the importance of three categories of influence on these
trends: the policies of symphony orchestras, characteristics of an orchestra’s market area,
and competition with other performing arts. The statistical analyses discussed in the
report document the importance of economic characteristics of a market area, such as the
size and real income of the area population, on an orchestra’s performance revenues and
contributed support. The impact of these characteristics is often significant, but they are

73
the factors that are least likely to change rapidly and they are unlikely to be changed by
the policies of symphony organizations. To some degree, symphonies must live with the
luck of where they are located.
In contrast, many policy decisions made by orchestra organizations influence their
economic balance. Decisions on ticket pricing and the budgets for marketing activities
influence performance revenues by altering concert attendance. Decisions on the scale of
development and fundraising activities influence the level of contributed support. The
statistical analyses discussed in this report confirm a tradeoff between ticket prices and
attendance that may influence pricing decisions by orchestras. Higher prices reduce
attendance, although not by enough to reduce revenues. Marketing activities raise
attendance but are subject to distinct diminishing returns. That is, incremental marketing
expenditures yield smaller and smaller gains in concert attendance.
Turning to nonperformance revenues and costs, higher fundraising expenditures
are associated with larger donations, but the returns to fundraising activities seem largerst
for smaller orchestras. Some of the statistical results imply that fundraising expenditures
may not pay for themselves in larger orchestras. Even when fundraising activities
produce a net gain, the size of that gain is smaller than is often claimed in casual
discussions of fundraising impact. Development and fundraising activities may be given
credit for private support that orchestras would receive anyway, given the economic
capacity of their area market.
Finally, symphony orchestras (a) vary widely in the rate of returns that they
receive on their endowment investments, (b) vary widely in the extent to which they draw
on their endowments to achieve financial balance, and (c) often exceed their stated

74
endowment policies. No symphony orchestra has sufficient endowment to offset
performance income gaps at prudent rates of endowment draw. Higher rates of
endowment draw would diminish the endowment resources available for achieving long-
term financial balance.
The question of how competition between different performing arts organizations
might influence patterns of attendance and philanthropic support has been all but ignored
in past studies. This report examined how the presence of one or more opera companies
might influence the economic fortunes of symphony orchestras in the same market area.
Broadly speaking, the analyses identified statistically significant but quantitatively small
interactions between these two performing arts. Attendance at symphony orchestra
concerts is slightly but inversely related to relative price of tickets to local opera
performances. On the other hand, the analysis detected no significant relationship
between the marketing expenditures of opera companies and attendance at symphony
orchestras. There is also evidence that a small fraction of the private philanthropic
support received by opera companies consists of a diversion from support for the local
symphony orchestra.
An objective of this fact-finding project is to provide information that will prove
useful for decision making by the various parties that have a stake in the wellbeing of
symphony orchestras in the United States. Several provocative facts that emerge from the
report raise issues that can be evaluated by individual symphony organizations as they
develop their policies for the future. The first provocative fact is the sheer variety of
policies currently practiced by individual orchestras. The structures of revenues and
expenses, patterns of contributed support, returns on investments, and endowment draw

75
practices all vary widely. Whatdoes this imply about the concept of “best practice” for
each of these issues? While no single model may fit all organizations and while this is not
an industry in which competitive forces may provoke an aggressive search for better
practices, the variance in actual practice at least raises the question of how much
symphony orchestras try to learn from each other’s policies and experience.
A second set of provocative facts are the findings that marketing activities (and
their associated expenses) are subject to diminishing returns and that in some cases
fundraising expenditures may not pay for themselves. These findings signal the
importance of evaluating the efficacy of incremental expenditures on these activities and
to be wary of assigning benefits to these activities that might have been received anyway.
A third provocative fact is the relative increase in musicians’ pay. These pay
increases, which are jointly agreed to by symphony artists and management, influence the
largest component of every orchestra’s expenses. As with expenditures for marketing and
fundraising, the consistency of current policies with long-run financial and artistic
stability merits assessment. The same may be said of symphony endowments: The
current endowment-draw policies of some orchestras may not be consistent with the use
of endowment to achieve long-term financial stability.
A review of these “provocative facts” and the report that generated them is likely
to frustrate anyone searching for a single solution to the economic challenges faced by
symphony orchestras. Taken as a whole, the report documents the futility of single
solutions. Most orchestras cannot achieve economic stability by selling out their concert
halls, or by ever-increasing marketing expenditures, or by drawing prudent amounts from
their endowments, or by relying on direct government support. The prospects for filling

76
the gap through private philanthropy are more ambiguous. Federal tax policies continue
to provide incentives for philanthropic donations. On the other hand, (1) the number of
organizations competing for such donations continues to increase, (2) the ratio of
subscribers, who are more likely to donate, to single-ticket purchasers has declined, and
(3) this report finds mixed evidence on the returns to fundraising. Note that each of these
strategies seeks economic balance through revenue enhancement. The evidence implies
that orchestras that are limited to revenue enhancement must adopt a portfolio of
strategies, since no single strategy will achieve economic balance for an orchestra.
Greater emphasis on cost control provides a clear alternative approach, and an implicit
theme of this report has been that an evaluation of what an orchestra gets for the costs
that it incurs should guide a cost control strategy.
These final paragraphs are perhaps the place to note a few potentially important
issues that could not be fully explored with the data available for this project. This report
does not fully explain why successive cohorts of an increasingly educated population are
less likely to attend symphony concerts. In particular, the report does not address the
formation of tastes for symphonic music—the financial reports of arts organizations do
not provide the requisite raw material. A full analysis of this phenomenon should
consider the match between current symphonic concert programming and listening tastes
of an increasingly heterogeneous U.S. population.
The range of activities that compete for the time and money of symphony patrons
is potentially quite large. In exploring competitive interactions between symphony
orchestras and opera companies, this study assumed that other performing arts with rich
symphonic musical traditions would offer the strongest competition. This assumption

77
may not be correct. The extent and nature of competition between performing arts and
even other potentially important uses of nonmarket time is poorly understood and merits
much more investigation in the future.

78
References
Aguiar, Mark and Erik Hurst.2006. “Measuring trends in leisure: The allocation of timeover five decades,” National Bureau of Economic Research Working Paper No. 12082. Cambridge, Mass. March.
Baumol, William J. and William G. Bowen. 1966., The performing arts, the economicdilemma; a study of problems common to theater, opera, music, and dance. New York:Twentieth Century Fund.
Caves, Richard E. 2000. Creative Industries: Contracts between Art and Commerce.Cambridge, Mass.: Harvard University Press.
Connolly, Marie and Alan Krueger. 2005. “Rockonomics: The Economics of PopularMusic.” Cambridge, Mass.: National Bureau of Economic Research Working Paper No. 11282. April.
Dempster, Douglas J. 2002. “The Wolf Report and Baumol’s Curse: The Economic Health of American Symphony Orchestras in the 1990s and Beyond,” Harmony. No. 15.October.
DiMaggio, Paul J. and Toqir Muchtar. 2004. “Arts Participation as Cultural Capital in the United States,” Poetics 32, pp. 169-94.
Grant, Margaret and Herman S. Hettinger. 1940.America’s Symphony Orchestras: AndHow They Are Supported. New York: W.W. Norton.
Montias, John Michael. 1986. “Public Support for the Performing Arts in Europe and the United States.” In P. J. DiMaggio (ed.) Nonprofit Enterprise in the Arts. New York:Oxford University Press.
National Endowment for the Arts. 2004. 2002 Survey of Public Participation in the Arts.Research Division Report No. 45. Washington, D.C.: NEA
Robinson, John P. and Geoffrey Godbey. 1997. Time for Life: The Surprising WasAmericans Use their Time. University Park, Pa: Pennsylvania State University Press.
Sagoo, Sumeet, ed. 2005. Facts and Figures on Government Finance. 38th edition.Washington, D.C.: National Tax Foundation.
Seaman, Bruce A. 2005. Attendance and Public Participation in the PerformingArts: A Review of the Empirical Literature. Working Paper 06-25, Andrew Young Schoolof Policy Studies, Georgia State University, August 2005
U.S. Bureau of Economic Analysis. 2006. http://www.bea.gov/bea/regional/reis/(Website for data on area population and per capita income.)

79
U.S. Bureau of Labor Statistics. 2006a. http://data.bls.gov/cgi-bin/surveymost?la(Website for data on area unemployment rates.)
U.S. Bureau of Labor Statistics. 2007b. http://www.bls.gov/web/echistry.pdf(Website for Employment Cost Index.)
U.S. President. 2005. Economic Report of the President. Washington.

80
APPENDIX A
THE SAMPLE OF SYMPHONY ORCHESTRAS
The League of American Orchestras provided the annual financial and operating
reports for over 180 symphony orchestras for the period from the 1983/84 season to the
2003/04 season. The fact that some of the variables of greatest analytical interest do not
appear in the reports before 1987/88 determined the 17 year time period of the analysis—
the 1987/88 through 2003/04 concert seasons.
Three considerations influenced the selection of orchestras for the analytical
sample. First, it seemed desirable to analyze data from select a sample large enough to
account for most symphonic activity in the United States. Selecting a group of symphony
orchestra representing a variety of economic circumstances was equally important: A
statistical analysis would add little to a case study if each orchestra faced identical
circumstances. Finally, in addition to being representative of the industry, the sample had
to consist of orchestras that reported to the League for at least some years during the
sample period. As a practical matter, many of the League’s members are sufficiently
small that they report irregularly and provide incomplete data when they do report.
To be included in the analysis, a symphony orchestra had to have been ranked as
one of the top 50 symphonies (based on budget size) in at least two years during the 17-
year sample period. Each symphony that met this requirement for inclusion remained in
the sample throughout the 17 year period of the analysis, irrespective of its rank in other
years. This approach produced a sample of 63 symphony orchestras, which are listed in
Table A1, along with a record of the years for which data are available for each

81
87/88 88/89 89/90 90/91 91/92 92/93 93/94 94/95 95/96 96/97 97/98 98/99 99/00 00/01 01/02 02/03 03/04 YEARSSymphony
1 Alabama X X X X X X X X X X X X 122 Atlanta X X X X X X X X X X X X X X X X X 173 Baltimore X X X X X X X X X X X X X X X X X 174 Boston X X X X X X X X X X X X X X X X X 175 Buffalo X X X X X X X X X X X X X X X X 166 Charlotte X X X X X X X X X X X X X X 147 Chicago X X X X X X X X X X X X X X X X X 178 Cincinnati X X X X X X X X X X X X X X X X X 179 Cleveland X X X X X X X X X X X X X X X X X 17
10 Columbus X X X X X X X X X X X X X X 1411 Dallas X X X X X X X X X X X X X X X X X 1712 Denver X X X X X X X X X X X X X X X 1513 Dayton X X X X X X X X X X X X X X X X 1614 Detroit X X X X X X X X X X X X X X X X X 1715 Florida Orchestra X X X X X X X X X X X X X X X X 1616 Florida Philharmonic X X X X X X X X X X X X X X X 1517 Florida Symphony X X X X 418 Fort Wayne X X X X X X X X X X X X X X X X X 1719 Fort Worth X X X X X X X X X X X X X X X X X 1720 Grand Rapids X X X X X X X X X X X X X X X X X 1721 Grant Park X X X X X X X X X X 1022 Hartford X X X X X X X X X X X X X X X X 1723 Honolulu X X X X X X X X X X X 1124 Houston X X X X X X X X X X X X X X X X 1625 Indianapolis X X X X X X X X X X X X X X X X X 1726 Jacksonville X X X X X X X X X X X X X X X X X 1727 Kansas City X X X X X X X X X X X X X X X X X 1728 Knoxville X X X X X X X X X X X X X X X X X 1729 LA Chamber X X X X X X X X X X X X X 1330 Los Angeles X X X X X X X X X X X X X X X X X 1731 Louisville X X X X X X X X X X X X X X 1432 Memphis X X X X X X X X X X X X X X X X 1633 Milwaukee X X X X X X X X X X X X X X X X X 1734 Minnesota X X X X X X X X X X X X X X X X X 1735 N Carolina X X X X X X X X X X X X X X X 1536 Naples X X X X X X X X X X X X 1237 Nashville X X X X X X X X X X X X X X X X 1638 National X X X X X X X X X X X X X X X X X 1739 New Jersey X X X X X X X X X X X X X X X X X 1740 New Mexico X X X X X X X X X X X X X 1341 New World X X X X X X X X X X X X 1242 New York X X X X X X X X X X X X X X X X X 1743 Omaha X X X X X X X X X X X X X X X X X 1744 Oregon X X X X X X X X X X X X X X X X X 1745 Pacific X X X X X X X X X X X X X X X X X 1746 Philadelphia X X X X X X X X X X X X X X X X X 1747 Phoenix X X X X X X X X X X X X X X X X X 1748 Pittsburgh X X X X X X X X X X X X X X X X X 1749 Richmond X X X X X X X X X X X X X X X X X 1750 Rochester X X X X X X X X X X X X X X X X 1651 Sacramento X X X X X X 652 Saint Louis X X X X X X X X X X X X X X 1453 Saint Paul X X X X X X X X X X X X X X X X X 1754 San Antonio X X X X X X X X X X X X X X X X 1655 San Diego X X X X X X X X X X X X 1256 San Francisco X X X X X X X X X X X X X X X X X 1757 San Jose X X X X X X X X X X X X 1258 Seattle X X X X X X X X X X X X X X X X X 1759 Syracuse X X X X X X X X X X X X X X X 1560 Toledo X X X X X X X X X X X X 1261 Tulsa X X X X X X X X X X 1062 Utah X X X X X X X X X X X X X X X X X 1763 Virginia X X X X X X X X X X X X 12
Total Symphonies 59 60 60 61 55 56 57 56 52 55 52 53 57 55 57 55 55
3384427
Appendix Table A1. Sample Symphonies
Number represented 17 years:Number represented 16 yearsNumber represented 15 years:Number represented 14 years:Number represented 13 years:Number represented 12 years:

82
symphony. The sample represents over 70 percent of orchestra revenues and expenditures
in the United States.
Stable, ongoing organizations dominate the sample; the majority of the orchestras
reported data for 16 or 17 years during the period. One can learn much from the
experience of declining or expanding organizations, however, and the selection procedure
was designed to avoid biases that might exclude such orchestras. (A sample consisting
only of the largest orchestras at the end of the sample period would have been biased
toward survivors, losing potentially valuable information about the experience of
orchestras that had failed. Similarly, a sample consisting only of the largest orchestras at
the beginning of the period would have been biased against rapidly growing orchestras,
whose experience is also potentially valuable.)
The gaps in data availability observed in Table A1 occur for two reasons: Some
orchestras cease to exist; some surviving orchestras may fail to report for various
extraordinary circumstances (including strikes or recent changes in management) or
because they no longer affiliate with the League. Since symphonies that have
encountered extraordinary economic difficulties may be of particular interest, a list of
orchestra closures during 1987-2004 follows. The fact that 17 percent of the orchestras in
the sample encountered temporary or permanent closures over this period signals the
fragile economic circumstances of many leading symphonies.

83
Symphony Orchestra Closures, 1987-2003
Orchestra Time Period Event
Alabama 1992-93 through 1996-97 Formerly the Birmingham Symphony,which declared bankruptcy in 1993. Rebornas the Alabama Symphony Orchestra in1994-96.
Denver 1989-90 Denver orchestra went bankrupt in 1989 andlater reformed as the Colorado SymphonyOrchestra
FloridaPhilharmonic2002-2004 Closed in 2002 (strike in 2000)
FloridaSymphony 1991-92 through 2003-04 Closed in 1991. Succeeded in 1995 by the
(smaller) Orlando Philharmonic Orchestra
Honolulu 1993-95 Hiatus as they shifted from HawaiiSymphony to Honolulu Symphony
Louisville 1995-96 through 97-98 Filed for bankruptcy. Now functioningwithout an executive director.
Sacramento 1996-2004 Closed in 1996
San Antonio 2003-2004 Work hiatus
San Diego 1996 through 1998-99 Spring 1996 bankruptcy. Reorganized andreopened 1998.
San Jose 2002 Closed. Filed for chapter 7 in 2002.
Tulsa 1998-2004 Closed 98-04. Efforts to restart the orchestrabegan in 2005 but failed as of 2006.

84
APPENDIX B
DATA FOR OTHER PERFORMING ARTS
One objective of this study is to examine how the financial performance of
symphony orchestras is linked to the presence and policies of other performing arts
organizations in the same market areas. Data provided by Opera America are used to test
for potential economic interactions between symphony orchestras and opera companies.
Opera America was able to provide extensive financial and operating data on opera
companies around the United States. These data indicate the presence or absence of opera
companies in the market areas of the sample symphonies along with information on their
income and expenses, private and government support, and attendance and ticket prices.
In market areas in which there were multiple opera companies, the information on
income, expenses, outside support and attendance were summed over all the opera
companies in order to represent the uses of resources that might otherwise be available
for symphony orchestras. The minimum single and season ticket prices of the largest
opera company in an area were used as an indication of price of alternative performing
arts opportunities available to potential symphony patrons.
Dance/USA provided similar information on dance companies, but the time span
of the financial information was too short to be incorporated in the analysis. An attempt
was made to use measures of the presence of dance companies in the market areas of the
sample symphony orchestras, but with dance companies in each market area throughout
the sample period, the data lacked the variation needed to produce statistical estimates.

85
APPENDIX C: Cycle and Trend Analyses of Symphony Finances
This appendix presents the results of the statistical analysis underlying the
discussion in Section IV of cycle and trend behavior of the revenues and expenses of the
63 symphony orchestras in the sample. The analysis first explores the extent to which
variations in performance income and expenses reflect cyclical and trend factors. Cyclical
factors stem from changes in overall business conditions, while trend factors reflect the
operation of structural factors that are not correlated with the overall state of the
economy. The primary “structural” factors are very slow productivity growth in
symphony orchestras (and other performing arts) and changes in the use of leisure time.
The statistical analysis is conducted on an unbalanced panel of annual data for 63
orchestras over 17 concert seasons (1987-2003). Table C1 reports the results of fixed
effects regression analyses of real earned income, real performance expenses, the
performance income gap (the difference between real earned income and expenses),
measures of nonperformance income and overall financial balance. The table reports the
regression coefficients expressing the sensitivity of each of these variables (in year 2000
dollars) to the local unemployment rate (the indicator of cyclical conditions) and a linear
time trend. The numbers in parentheses are robust standard errors. The table also reports
the level of statistical significance and the R2 (proportion of variance in the dependent
variable that is accounted for by the cycle and trend variables). Results with no asterisk
do not reach conventional levels of statistical significance.
Each regression coefficient in the Unemployment Rate column indicates the
response of the associated dependent variable to a one percentage point change in the
unemployment rate for each symphony’s local area, holding the effects of the time trend

86
constant. Each coefficient in the Time Trend column indicates the response of the
dependent variable to a one year change, holding the effects of the local unemployment
rate constant. The statistical results in Table C1 show that each percentage point increase
in the unemployment rate significantly reduces real earned income of the average
orchestra in the sample by about $186,000. Real performance expenditures are not
reliably correlated with the unemployment rate, however. (The negative coefficient on
unemployment in the performance expense regression (regression 2) is not statistically
significant.) With performance revenues more responsive to general economic conditions
than performance expenses, the performance income gap gets worse (becomes more
negative) in recessions and improves when unemployment declines during economic
expansions (regression 3).
The time trend in real performance expenses is about three times as large as the
trend in real earned income, so over time the performance income gap is growing at a
statistically significant $370,000 per year for the average symphony. Private
philanthropic contributions, government support, and investment income may be used to
address the growing deficits. The trend in total outside support is positive, but smaller
than the annual deterioration in the performance income gap (regression 4). The increase
in total support obscures the very different trends for private and government support.
Real government support declined by almost $30,000 per year for the average symphony
in the sample (regression 5). Increases in individual, foundation and business support
more than countered the declining government support (regressions 6a, 6b, and 6c). An
upward trend in real investment income of about $80,000 per year (after holding constant
the effects of unemployment) also helps to offset the trend deterioration in the
87
performance income gap (regression 7). Cyclical changes in investment income
contribute to the decline in orchestra revenues when unemployment increases, however.
Combining both performance and nonperformance sources of income and
expenses, the analysis shows that both total symphony revenue (including contributed
support and investment income) and total expenses (including fundraising expenses) vary
with overall economic conditions, but total revenue is more sensitive to the cycle than
total expenses (regressions 8 and 9). As a result, the overall financial balance of
symphony orchestras is cyclically sensitive–moving further into deficit when
unemployment rises and toward surpluses when unemployment declines.
The trend in total performance plus nonperformance revenue (regression 8) is
modestly higher than the trend in total expenses (regression 9), so the overall financial
balance improves slightly over time, after controlling for the effect of general economic
conditions.

88
Table C1. Effects of Cycle and Trend, 1987-2003
Dependent Unemployment TimeVariable Rate Trend R2 Time Period
1. Earned Income -186,008 121,529 0.16 1987 - 2003(47,735)* (11,410)*
2. Performance expense -118,130 374,725 0.35 1987 - 2003(76480) (18,288)*
3. Performance income gap -102,563 -370,290 0.45 1987 - 2003(59,312)*** (14,240)*
4. Total support -166,745 157,929 0.28 1987 - 2000(43,623)* (12,972)*
5. Government support -37,516 -30,548 0.07 1987 - 2000(14,086)* (4,188)*
6. Private contributions -124,656 188,681 0.35 1987 - 2000(41,257)* (12,302)*
6a. Individual -44,059 84,018 0.25 1987 - 2000(24,042)*** (7,372)*
6b. Business -16,212 14,866 0.03 1987 - 2000(14,807) (4,541)*
6c. Foundation 7,305 42,531 0.14 1987 - 2000(16,278) (4,991)*
7. Investment Income -60,843 65,042 0.19 1987-2000(22,136)* (6,597)*
8. Total Revenue -433,076 341,312 0.35 1987 - 2000(81,449)* (24,272)*
9. Total Expense -261,980 329,247 0.33 1987 - 2000(76,677)* (22,850)*
10. Overall surplus -52,563 22,455 0.03 1987 - 2000or deficit (31,855)*** (9,431)**
* p-value < .01 ** p-value < .05 *** p-value < .10Note: Fixed effects estimates. All monetary variables adjusted forinflation.

89
APPENDIX D: Analysis of Attendance and External Support
This appendix provides details of statistical analyses underlying discussions in
Sections V and VII of the report.
Concert Attendance Analysis
Section V of the report discusses the influences on attendance per concert in an
effort to understand more fully the decisions that influence a major part of the
performance revenues of U.S. symphony orchestras. The statistical analyses reported in
that section test for the influence of symphony orchestra policy variables, economic
characteristics of the local market area, and competition from opera companies on
symphony orchestra attendance. The key orchestra policy variables are average ticket
prices for regular-season and pops concerts and measures of expenditures on various
marketing activities (in thousands of dollars) by each orchestra. The average ticket price
data were constructed by dividing concert revenue by concert attendance (separately for
regular and pops concerts). The financial and operating data were provided by the League
of American Orchestras. Information on the characteristics of each orchestra’s market
area was obtained from government sources. The statistical analysis examines the role of
an area’s population size (U.S. Bureau of Economic Analysis, 2006), per capita income
(U.S. Bureau of Economic Analysis, 2006), and unemployment rate (U.S. Bureau of
Labor Statistics, 2006). The ticket price and marketing expenditures of opera companies
in the same market area were used to test for possible interactions between orchestras and
other performing arts. These data were provided by Opera America.
The regression analysis was conducted on a panel data set consisting of 62
symphonies for which annual financial data are available for some or all of the concert

90
seasons between 1987 and 2003. Most estimates are obtained from samples of between
511 to 765 orchestra years, depending on the availability of data for competing opera
companies. Both random effects and fixed effects models were estimated. The discussion
emphasizes fixed effects estimates, since the effects of changes in the independent
variables over time are most relevant for policymaking in most symphony orchestras.
Fixed effects estimates also remove ongoing differences in reporting practices between
orchestras. Separate regression analyses were conducted for regular season (Table D1)
and pops concerts (Table D2). The dependent variable is the natural logarithm of
attendance per concert. Independent variables include the natural log of the constructed
ticket price, several specifications of marketing expenditures on media advertising and on
phone and mail campaigns, and the natural logs of the area population, the area real
income, price of local opera tickets, local opera marketing expenditures, and attendance
at local operas.
The results of the regression analyses confirm the statistical and economic
significance of the orchestra policy variables. The price elasticity of demand for seats is
about -.5 for regular season concerts and -.3 for pops concerts. Both media advertising
and telephone/mail campaigns have a significant positive influence on attendance per
regular season concert, and each activity is subject to diminishing returns. (The nonlinear
specifications of marketing activities (regressions 3 and 4), which support this
conclusion, fit the data better than the linear specification (regressions 1 and 2) in Tables
D1 and D2.) Only expenditures on telephone and mail campaigns are significantly
correlated with attendance per pops concert, but they also yield diminishing returns. In

91
Regession number: 1 2 3 4 5 6 7
Ticket price -.525 -.549 -.554 -.571 -.632 -.520 -.633(.039) * (.042) * (.038) * (.042) * (.045) * (.039) * -0.047 *
Media ads .00013 .00012 .00300 .00033 .00190 .00020(.00004) * (.00004) * (.00008) * (.00008) * (.00008) * -0.00009 *
(Media ads)2 -1.37E-07 -1.33E-07 -7.22E-08 -7.28E-08(4.39E-08) * (4.42E-08) * (4.20E-08) *** (4.35E-08) ***
Phone/mail .00016 .00014 .00040 .00350 .00034 .00035(0.00003) * (0.00003) * (0.00006) * (0.00006) * (0.00006) * (0.00007) *
(phone/mail)2 -7.09E-08 -6.13E-08 -6.02E-08 -6.20E-08(1.71E-08) * (1.77E-08) * (1.66E-08) * (1.71E-08) *
Marketing exp. .00028
Population .105 .280 .068 .205 .315 .196 .390(.036) * (.176) (.037) *** (.175) (.193) (.150) (.206) ***
Real Income .277 .191 .128 .037 .109 -.006 .137(.132) ** (.170) (.133) (.171) (.182) (.125) (.198)
Opera Ticket price 0.025 0.018(.015) *** (.016)
Opera Marketing expense .028(.017) ***
(Marketing exp)2 -3.90E-08(6.67E-09) *
R2 .194 .295 .253 .322 .402 .261 .404Number of concert years 591 591 591 591 421 511 379Estimation method RE FE RE FE FE FE FEDependent variable: Logarithm of attendance per regular season concert* p-value < .01, ** p-value <.05, *** p-value < .10
(Regression coefficients and standard errors)Table D1. Analysis of Attendance per Regular Season Concert, 1987-2003

92
Regression number: 1 2 3 4 5 6
Ticket price -.263 -.330 -.278 -.344 -.286 -.340(.046) (.053) * (.047) * (.052) * (.050) * (.055) *
Media ads -6.99E-06 -.00004 .00022 .00020 -.00020 -.00029(.00007) (.00007) (.00015) (.00016) (.00018) (.00018)
(Media ads)2 -2.07E-07 -2.16E-07 7.27E-08 1.10E-07(1.31E-07) (1.33E-07) (1.34E-07) (1.37E-07)
Phone/mail .00013 .00011 .00035 .00035 .00048 .00051(.00005) * (.00006) ** (.00013) * (.00014) * (.00013) * (.00014) *
(phone/mail)2 -9.49E-08 -9.76E-08 -1.45E-07 -1.59E-07(5.20E-08) *** (5.40E-08) *** (5.20E-08) * (5.48E08) ***
Population .019 .756 -.025 .715 -.101 .338(.058) (.268) * (.061) (.267) * (.085) (.303)
Real Income -.063 -.268 -.123 -.366 -.085 -.046(.193) (.276) (.196) (.278) (.231) (.309)
Opera Marketing expense .053 .040(.024) ** (.027)
R2 .067 .124 .075 .136 .094 .211Number of concert years 487 487 487 487 326 326Estimation method RE FE RE FE RE FE
Table D2. Analysis of Attendance per Pops Concert, 1987-2003(Regression coefficients and standard errors)
Dependent variable: Logarithm of attendance per pops concert* p-value < .01, ** p-value <.05, *** p-value < .10

93
short, incremental marketing expenditures yield successively smaller gains in attendance
for both regular season and pops concerts.
Of the market area variables, the area population and real income were
occasionally significantly correlated with attendance. (Always insignificant in trial
regressions, the area unemployment rate was dropped from the reported regressions. A
variable for the proportion of the population with at least a college degree, potentially an
important indicator of tastes for symphony music, was available for too few years to be
used in the analysis.)
Turning to competition from other performing arts, neither the presence of an
opera company or attendance at local opera performances are significantly correlated
with regular season symphony attendance. Marketing expenditures by a local opera have
a small, marginally significant but positive correlation with symphony attendance at
regular season concerts (regression 5 in Table D1). No significant correlation with a local
opera’s marketing expenditures emerges in the analysis of attendance at pops concerts.
The effects of ticket pricing by local opera companies on attendance at regular season
symphony concerts is sensitive to how an orchestra’s marketing expenditures enter the
analysis, however. When the analysis controls for total marketing expenditures
(regression 6), an increase in the relative price of opera season tickets (effectively, a
decrease in the relative price of symphony tickets) is associated with higher symphony
attendance—presumably because some arts patrons who would have attended the opera
go instead to a symphony concert. This statistically significant effect is quantitatively
very small. When the analysis enters expenditures on media and phone/mail campaigns

94
separately, however, the price of opera tickets is not a statistically significant determinant
of attendance at symphony concerts (regression 7). Opera ticket prices are not
significantly correlated with attendance at pops concerts. The price of single tickets to
local opera performances was never statistically significant in the regression analyses.
Overall, the analysis does not uncover evidence of strong competition between these
performing arts organizations.
External Support Analysis
Section VII of the report discusses the determinants of private philanthropic
contributions and public support for symphony orchestras in the United States. The
underlying statistical analyses again examine the respective roles of the policies of
orchestras, an area’s economiccapacity for supporting an orchestra, and competition
from other performing arts on external support for symphonies. Measures of private
philanthropy (including contributions from individuals, businesses, and independent
foundations) and support from all levels of government, expressed in year 2000 dollars,
constitute the dependent variables in the analyses. Development and fundraising
expenditures constitute the key orchestra policy variable in seeking contributions.
Measures of an area’seconomic capacity for philanthropy include population, per capita
income, and the local unemployment rate. Measures of stock prices (U.S. President 2005,
statistical appendix) and federal income tax rates (Sagoo 2005) were added to capture
national influences on the capacity and incentive to support performing arts. Data on the
presence, fundraising efforts, and fundraising success of opera companies in the same
market area provide an indication of competition from other performing arts
organizations.

95
The analysis was conducted on the same panel data set used in the analysis of
attendance per concert. Most estimates are obtained from a sample of 759 orchestra
years. The text discussion again emphasizes the results of fixed effects estimates. The
analyses test for both linear and nonlinear relationships between development
expenditures and private contributions. The nonlinear specifications test for the
possibility that the influence of incremental fundraising expenditures on contributions
depends on the overall level of fundraising expenditures. If fundraising activities are
subject to diminishing returns, the impact of a marginal dollar spent on fundraising will
diminish with the size of the fundraising budget. (In the quadratic specification used in
the analyses, the linear fundraising expenses (FE) term will be positive and the squared
term (FE2) will be negative.) If fundraising expenditures exhibit economies of scale, the
impact of a marginal dollar spent will increase with the size of the budget. (The linear
term in the regression will be negative and the squared term will be positive.) Table D3
reports the results of the fixed effects regression analyses discussed in Section VII.
Establishing the nature of the relationship between contributions and fundraising
expenditures was somewhat complicated (Tables D3 and D4). The results of an initial,
exploratory fixed effects analysis of the full sample of orchestras were consistent with
diminishing returns to fundraising expenditures: In a comparison of linear and nonlinear
specifications of fundraising expense, the latter provided a superior fit of the data and
indicated that increasing fundraising expenses yielded successively smaller incremental
contributions (regressions 1 and 2 in Table D3). However, this pattern in the data could
also emerge if larger-budget orchestras receive smaller returns to fundraising than

96
Table D3. Analysis of External Support for U.S. Symphony Orchestras, 1987 - 2000
(Regression coefficients and standard errors)
Type of Estimation AreaReal per
Capita Unemployment Fund raising
Support-Sample Method Population Income Rate Expense (FX) FX2 Time R2
1. Private - All FE 1.45 269.1 4,962 1.33 -1.54E-07 -35,570 .46
(.29)* (37.3)* (41,018) (.36)* (7.02E-08)** (23,025)
2. Private - All FE 1.527 303.2 10,964 .63 -34,061 .44
(.291)* (37.3)* (41,039) (.17)* (23,078)
3. Private-Small FE -.41 75.72 -17,314 -.10 3.17E-06 46,021 .44
(.26) (29.90)** (28,800) (.98) (1.29E-06)** (15,981)*
4. Private-Small FE -.32 74.2 -14,458 1.96 42869 .45
(.26) (30.10)** (28,982) (.27)* (16,044)*
5. Private-Large FE 1.13 293.2 -49,978 .84 -6.75E-08 45,814 .53
(.48)** (62.4)* (72,545) (.56) (1.05E-07) (46,599)
6. Private-Large FE 1.16 294.5 -44,017 .51 49,227 .53
(.48) (62.3)* (71,891) (.22)** (46,257)
7. Government-All orchestras FE -.10 25.9 -35,382 .33 -7.30E-08 -50,471 .13
(.11) (13.4)*** (14811)** (.13)** (2.54E-08)* (8297)*
Notes: All monetary variables are in year 2000 dollars.
FE = Fixed effects estimation
* p-value < .01 ** p-value < .05 *** p-value < .10

97
smaller-budget orchestras, even though neither group is experiencing diminishing returns
to their fundraising efforts. To test for this possibility, the sample of orchestras was
divided roughly in half based on total budget size, and each group was analyzed
separately. For each group of orchestras, F-tests indicated that a linear (constant)
relationship between fundraising expenses and private contributions provided a slightly
superior fit of the data (regressions 3 and 4 in Table D3 for smaller orchestras;
regressions 5 and 6 for larger orchestras). The returns for smaller orchestras ($1.96 in
private contributions per dollar of fundraising expense) exceeded the returns obtained by
larger orchestras ($ .51 per fundraising dollar). Not only are the returns for large
orchestras smaller than the returns for small orchestras, but taken at face value,
fundraising expenditures by larger orchestras do not pay for themselves. Some possible
rationales for this result are discussed in the main text, but the finding remains puzzling
and worthy of further consideration. These estimates also confirm the influence of two
economic capacity variables (area population and per capita income) on private
contributions, but find that the area unemployment rate is not significantly related to
private contributions.
Another point of interest is the absence of a statistically significant time trend in
regressions 1 and 2 in Table D3. The apparent trend in private support visible in Graph 5
is “explained” by the economic capacity and development expense variables. That is,
once the effects of these variables are held constant in the regression analysis, there is no
significant time trend in private support over time. On this dimension, the disaggregated
results differ. While the statistical model fully explains the growth of private
contributions to larger orchestras, some unexplained trend remains for smaller orchestras.

98
The analysis of real government support for symphony orchestras confirms the
negative trend in public support apparent in Graph 6 (regression 7 in Table D3).
However, the analysis also reveals that government support favors orchestras in high
income areas with low unemployment rates. That is public support tends to reinforce the
geographical inequalities in economic capacity to support symphony orchestras rather
equalize the resources available to different areas. In interpreting this result, recall that
the government support data pertain to all levels of government support combined. The
results also indicate that increased fundraising expenditures are associated with
diminishing increments of government support.
Section VII also discusses the role of competition from other performance arts
organizations on the external support received by a symphony orchestra. A key point of
that discussion is that there is a statistically significant (but quantitatively small) inverse
correlation between support received by an orchestra and the level of support received by
an opera company in the same market area one year earlier, but the correlation is
significant and positive when support for the opera is not lagged. (There is also a
discussion of the causality issues that may account for these strikingly different results.)
The discussion is based on a statistical analysis of real private (including
individual, business and foundation) and public support for opera companies and
symphony orchestras for 1987-2000 reported in Table D4. The regression model is
identical to the model generating the results in Table D3, except for the addition of
variables representing competition from opera companies. For each symphony orchestra
in the sample, the database records whether there is an opera company present, the annual

99
Table D4. Opera Companies and Contributed Support, 1987 - 2000(Regression coefficients and
standard errors)Type ofOrchestra Estimation Opera Support for Opera Opera fundraising expenseSupport Method Presence Lagged Current Lagged Current
Private FE -363,926 -0.03 .16 -.18 .56(177934)** (.01)** (.03)* (.06)* (.08)*
Private RE -115,133 -0.03 .09 -.20 .48(173,009) (.01)* (.03)* (.06)* (.07)*
Individual FE -141,735 -0.02 .10 -.07 .28(112,368) (.01)** (.01)* (.03)** (.04)*
Individual RE 1,365 -0.014 .08 -.08 .26(100,234) (.077)** (.01)* (.03)** (.04)*
Business FE -84,023 0.1 -.15 .005 .03(72,892) (.04)** (.07)** (0.025) (0.03)
Business RE 9,248 0.12 -.04 .02 -.02(69,327) (.04)* -0.07 (0.020) (0.030)
Foundation FE -60,373 -0.01 .002 -.06 .10(80,622) (.006)*** -0.004 (.03)** (.04)**
Foundation RE 39,657 -0.01 .008 -0.04 0.15(69,218) (.006) (.004)*** (0.025) (.03)*
Government FE -144,580(65,625)**
Notes: Each coefficient is from a separate regression that also includes as independentvariables the area population, real per capita income and unemployment rate as well as theorchestra's development/fundraising expenditures specified as a quadratic. All monetaryvariables are in year 2000 dollars.
RE = random effects estimationFE = fixed efforts estimation* p-value < .01 ** p-value < .05 *** p-value < .10

100
development and fundraising expenditures by that opera, and the annual levels of private
and public support received by that opera. As with the orchestra data, the data on private
support includes separate information on support from individuals, businesses, and
foundations.
The addition of different variables representing the presence, fundraising
expenditures, and external support of opera companies did not change any of the
qualitative findings in Table D3. The relationships between explanatory and dependent
variables describing an area’s economic capacity and an orchestra’s fundraising
expenditures remained the same, with some modest changes in the exact value of the
coefficients. As a result, Table D4 reports only the regression coefficients and standard
errors for the opera variables that were added to the analysis to test for possible effects of
competition between the performing arts.


