Embed Size (px)
Citation preview
Technology in Cancer Research and Treatment
ISSN 1533-0346
2012 March 15 [Epub ahead of print]
© Adenine Press (2012)
1
Reproducibility and Comparison of DCE-MRI and DCE-CT Perfusion Parameters in a
Rat Tumor Model
www.tcrt.org
Dynamic contrast-enhanced magnetic resonance imaging (DCE-MRI) and computed tomography (DCE-CT) provide independent measures of biomarkers related to tumor per-fusion. We compared the reproducibilities and absolute values of DCE-MRI and DCE-CT biomarkers in the same tumors in an animal model, to investigate the physiologic validity of both approaches. DCE-MRI and DCE-CT were each performed sequentially on three consecutive days in each of twelve rats bearing C6 glioma xenografts. DCE-MRI yielded endothelial transfer constant (Ktrans), extracellular, extravascular space volume fraction (ve), and contrast agent reflux rate constant (kep); and DCE-CT, blood flow (BF), blood volume (BV), mean transit time (MTT), and permeability-surface area product (PS) using Tofts and deconvolution physiological models, with 6.6 and 0.4 seconds temporal resolu-tions, respectively. Variability in DCE-CT and DCE-MRI were evaluated by variance com-ponents analysis. Intra-rat coefficients of variation for DCE-CT parameters BF, BV, MTT and PS were 25%, 22%, 18% and 23%; and for DCE-MRI parameters Ktrans, kep and ve were 23%, 16% and 20%, respectively. Mean (6SD) BF, BV, MTT and PS were: 44.6 (613.7) ml min21 100 g21, 5.7 (61.5) ml 100 g21, 10.8 (62.3) seconds, and 14.6 (64.7) ml min21 100 g21, respectively. Mean (6SD) Ktrans, kep and ve were: 0.21 (60.05) min21, 0.68 (60.14) min21, and 0.29 (60.06), respectively. Permeability estimates from DCE-MRI (Ktrans) were 44% higher than from DCE-CT (PS), despite application of appropriate correc-tions. DCE-MRI and DCE-CT biomarkers of tumor perfusion have similar reproducibilities suggesting that they may have comparable utility, but their derived parameter values are not equivalent.
Key words: Perfusion MRI; Perfusion CT; Reproducibility; Tumor.
Introduction
Imaging biomarkers from dynamic contrast-enhanced magnetic resonance imag-ing (DCE-MRI) (1), and to a lesser extent, dynamic contrast-enhanced computed tomography (DCE-CT) (2), have shown utility in anti-cancer drug development. Many clinical studies have been reported in Phase I/II clinical trials and in other settings (3-7). Before drugs are first trialed in humans, animal studies are often
*Corresponding author:Chaan S. Ng, M.D.Phone: 713-792-6759E-mail: [email protected]
Chaan S. Ng, M.D.1*John C. Waterton, Ph.D.2
Vikas Kundra, M.D., Ph.D.1
David Brammer, D.V.M.3
Murali Ravoori, Ph.D.1
Lin Han, Ph.D.1
Wei Wei, M.S.4
Sherry Klumpp, D.V.M.3
Valen E. Johnson, Ph.D.4
Edward F. Jackson, Ph.D.5
1Departments of Radiology, The
University of Texas MD Anderson
Cancer Center, 1515 Holcombe
Boulevard, Houston, Texas, 77030, USA2Translational Sciences, AstraZeneca,
Alderley Park, Macclesfield, Cheshire,
UK3Veterinary Medicine and Surgery,
The University of Texas MD Anderson
Cancer Center, 1515 Holcombe
Boulevard, Houston, Texas, 77030, USA4Biostatistics, The University of Texas
MD Anderson Cancer Center, 1515
Holcombe Boulevard, Houston, Texas,
77030, USA5Imaging Physics, The University of
Texas MD Anderson Cancer Center,
1515 Holcombe Boulevard, Houston,
Texas, 77030, USA
Abbreviations: MRI: Magnetic Resonance Imaging; CT: Computed Tomography; DCE-MRI: Dynamic Contrast Enhanced Magnetic Resonance Imaging; DCE-CT: Dynamic Contrast Enhanced Computed Tomography; BF: Blood Flow; BV: Blood Volume; MTT: Mean Transit Time; PS: Permeability-Surface Area Product; IAUC: Initial Area Under the Curve; ROI: Region of Interest; TR: Repetition Time; TE: Echo Time; IV: Intravenous; wCV: Within-Subject Coefficient of Variation.
2 Ng et al.
Technology in Cancer Research & Treatment 2012 March 15 [Epub ahead of print]
essential in defining the effect size, duration, and histopatho-logic consequences of novel therapeutic interventions.
Commonly, the biomarker Ktrans (transfer constant, min21) is derived using, for example, the Tofts model (8) from gado-linium chelate DCE-MRI studies. In principle, Ktrans is an absolute parameter characterizing the gadolinium chelate pharmacokinetics, independent of the particular method of measurement (i.e., magnetic resonance). However, practical implementations in MRI have several well-known vulner-abilities and confounding factors, including uncertainties over the time-dependent plasma gadolinium concentration, not only in the arterial system but also in the tortuous tumor microvasculature; errors in T1 measurement; tissue-depen-dent relaxivities; incomplete mixing of the extravascular compartment; water proton exchange; and inadequacies in time-resolution for properly characterizing the first-pass (9, 10).
In DCE-CT, the biomarkers tumor blood flow (BF) (ml min21 100 g21), blood volume (BV) (ml 100 g21), and permeabil-ity surface area product (PS) (ml min21 100 g21) are com-monly derived using the deconvolution (Lee) model (11) from organoiodine DCE-CT studies. While DCE-CT is also, in principle, subject to some of the same confounding fac-tors as DCE-MRI, the direct link between iodine concentra-tion and Hounsfield unit increment may make the CT method somewhat more robust than the MRI method with the latter’s dependence on native tissue T1, contrast agent relaxivity, and water exchange.
Although there are some published reports of the reproducibili-ties of the biomarkers derived individually from DCE-MRI (12-15) and DCE-CT (16-19), there are very few published reports on the accuracy of DCE-MRI biomarkers or, indeed, DCE-CT biomarkers, and their comparability (20, 21). We sought to assess the reproducibility of imaging biomark-ers derived from DCE-MRI and DCE-CT acquisitions in an animal model using a well-characterized xenograft and closely matched tumor volumes. Such studies comparing DCE-MRI and DCE-CT in a back-to-back fashion are lack-ing. We hypothesized that if the respective methods and mod-els indeed yield reliable descriptions of gadolinium-chelate and organoiodine pharmacokinetics, then, in the same tumor, appropriately chosen measurements should be quantitatively comparable.
In this study, we measured DCE-MRI and DCE-CT biomark-ers on three successive days in each of twelve rat xenografts. Absolute parameter values and reproducibility were com-pared. Imaging methods were chosen to parallel those com-monly used in the clinic to maximize the translational value of the study. The tumor chosen was the well-vascularized C6 glioma model in nude rats (22).
Materials and Methods
The study was approved by the Institutional Animal Care and Use Committee. C6 rat glioma cells were obtained from the American Type Culture Collection (Manassas, VA, USA). Five thousand C6 cells were injected subcutaneously per nude rat (n 5 14, Charles River, Wilmington, MA). Cells were injected in the flank region, at the approximate axial level of the inferior aspect of the kidneys and distal aorta. Tumor measurements were undertaken using calipers, and tumors allowed to grow until they reached a nominal size of approximately 1 cm diameter. Each rat then underwent DCE-CT and DCE-MRI on three consecutive days, with CT and MRI undertaken in a sequential (back-to-back) fashion on each of the three days. As gadolinium-based MR contrast agents are known to attenuate x-rays, CT studies were under-taken before MRI studies to prevent any possible impact on the DCE-CT measures due to residual MR contrast agent present during the CT scans (22). Animals were scanned in batches of 2 to 4 animals per cohort.
Animals were placed in a CT- and MRI-compatible cradle in which a 5-cm hole had been cut in its dependent portion, into which the subcutaneous tumor could be located. Hair from around the tumor was shaved, and the region of the tumor was placed in a “bath” of ultrasound gel to minimize air/tumor susceptibility effects in the MRI imaging studies. A temperature controlled pad was placed underneath the ani-mals, and the animals were gently immobilized with tape. On each day of imaging, animals were kept under inhalational anesthesia (the average duration of anesthesia was 2.4 hours), and all imaging for the day was undertaken with the animal in the same position on the cradle throughout. Animals were anesthetized with 1-2% isoflurane in a 1 l min21 O2 flow, and imaging was undertaken in free respiration throughout. For both CT and MRI, the imaging volume was targeted on the central portion of the tumor.
Before the first day of scanning, an in-dwelling 3F central venous catheter was placed in an internal jugular vein by a Veterinary Surgeon, for the purposes of IV administration of CT and MRI contrast agents. The catheter was maintained for the duration of the study with a dextrose/heparin solution.
DCE-CT Technique and Perfusion Analysis
CT was undertaken on a clinical 4-row multidetector CT (LightSpeed, GE Healthcare, Waukesha, WI). Scanning was undertaken through the central portion of the tumor in cine mode (the parameters were 4 3 2.5 mm collimation, 80 kV, 60 mA, and 0.8 s rotation speed), for a duration of 50 sec-onds, following administration through the in-dwelling cen-tral venous catheter, of iodinated contrast (ioversol, 320 mg iodine/ml (Optiray 320), Mallinckrodt, St Louis, MO),
Technology in Cancer Research & Treatment 2012 March 15 [Epub ahead of print]
Reproducibility and Cross-Validation of DCE-CT and DCE-MRI 3
1.5 ml/kg body weight, via pump injection at 5 ml min21 (KD Scientific infusion pump, Holliston, MA). For a 200 g ani-mal, this was 300 µl of contrast medium, injected over 3.6 seconds. Reconstruction of the images was undertaken at 0.4 s segmentation. This resulted in four 2.5-mm contigu-ous CT slices, each with 125 images, and an in-plane spatial resolution of 0.5 mm 3 0.5 mm.
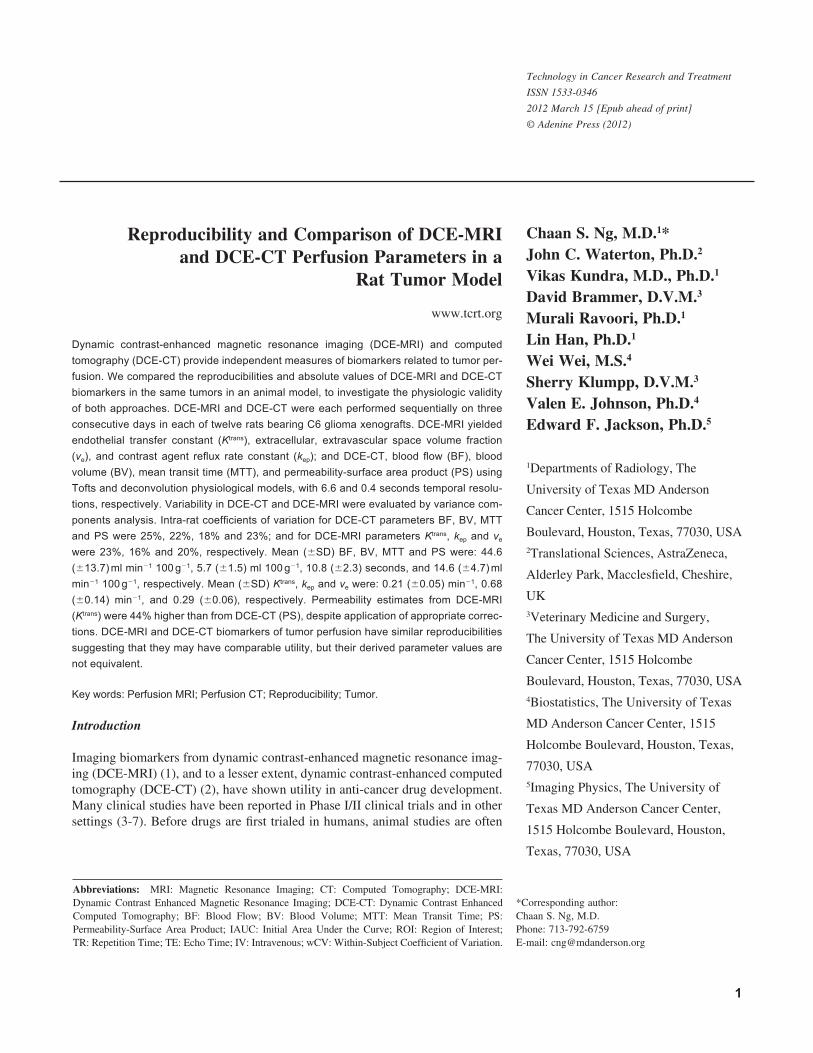
DCE-CT data were analyzed using commercially available software, which is based on a deconvolution model (11). An arterial ROI was positioned over the largest available artery (typically the descending aorta, but if not available in the field of view, then the common iliac artery). Using the Body Tumor protocol on a GE Advantage Windows worksta-tion (CT Perfusion 3 module, GE Healthcare, Waukesha, WI), parametric maps of blood volume (BV), blood flow (BF), mean transit time (MTT), and permeability-surface area product (PS) were then obtained. Free-hand regions of interest were drawn around the perimeter of the tumor on axial sections. The mean of the values for each tumor ROI were obtained, and the results from the two larg-est contiguous axial sections were averaged (Figure 1). An estimate of tumor volume (cm3) was obtained from the formula for an oblate spheroid, πXY2/6000, where X and Y (mm) were orthogonal measurements of the tumor from CT.
DCE-MRI Technique and Perfusion Analysis
MRI was undertaken in a dedicated animal 7.0 Tesla/ 30 cm bore MRI scanner (Bruker BioSpin, Billerica, MA). The MR scanning protocol consisted of the acquisition of sagittal and axial T2-weighted images, axial T1-weighted images, single section (maximum cross sectional area) variable repetition time (TR) images for native tissue (pre-contrast agent administration) T1 estimates, axial DCE images, and post-Gd axial T1-weighted images. For the DCE-MR acquisition, a 3D fast spoiled gradient echo sequence was used with TE 5 1.8 ms, TR 5 5.3 ms, 108 flip angle, 24-mm z-axis coverage (twelve 2-mm sec-tions), 128 3 96 matrix, 60-mm FOV, temporal resolution of 6.6 sec, and a total scan time of 6.5 min. Contrast agent was administered after 10 baseline scans were acquired. The in-plane spatial resolution of the DCE-MRI images was 0.5 mm 3 0.6 mm.
The MRI contrast agent was delivered through the same in-dwelling central venous catheter as used for the pre-ceding CT, as follows: 0.1 mmol/kg dose of gadopentetate dimeglumine (Magnevist, Bayer Healthcare Pharmaceuti-cals, Wayne, NJ), via an MR-compatible injection system (Harvard Apparatus, PHD 2000 Programmable, Plymouth Meeting, PA). For a 200 g rat, 200 µl of contrast media at 1:5 dilution of Magnevist: saline was administered, over
a period of 10 seconds. This was followed by a saline flush of the same volume and injection rate.
DCE-MRI data were analyzed using a two compartment pharmacokinetic model,
C t K C t e dtp
tk t tep( ) ( )
( )5 trans
0∫ ′ ′− − ′
where C(t) is the concentration of the contrast agent in the region of interest, Cp(t) is the concentration of the agent in
Figure 1: Axial DCE-CT parametric maps for (A) BF, (B) BV, (C) MTT and (D) PS. Units for color bars, ml min21 100 g21, ml 100 g21, seconds, and ml min21 100 g21, respectively (E) Corresponding dynamic curves for the tumor (green line) and arterial input function (blue line). Y-axis in Hounsfield CT density; X-axis in milliseconds. Note: The software generates maps for the whole field of view. Purple outline delineates the tumor ROI.
4 Ng et al.
Technology in Cancer Research & Treatment 2012 March 15 [Epub ahead of print]
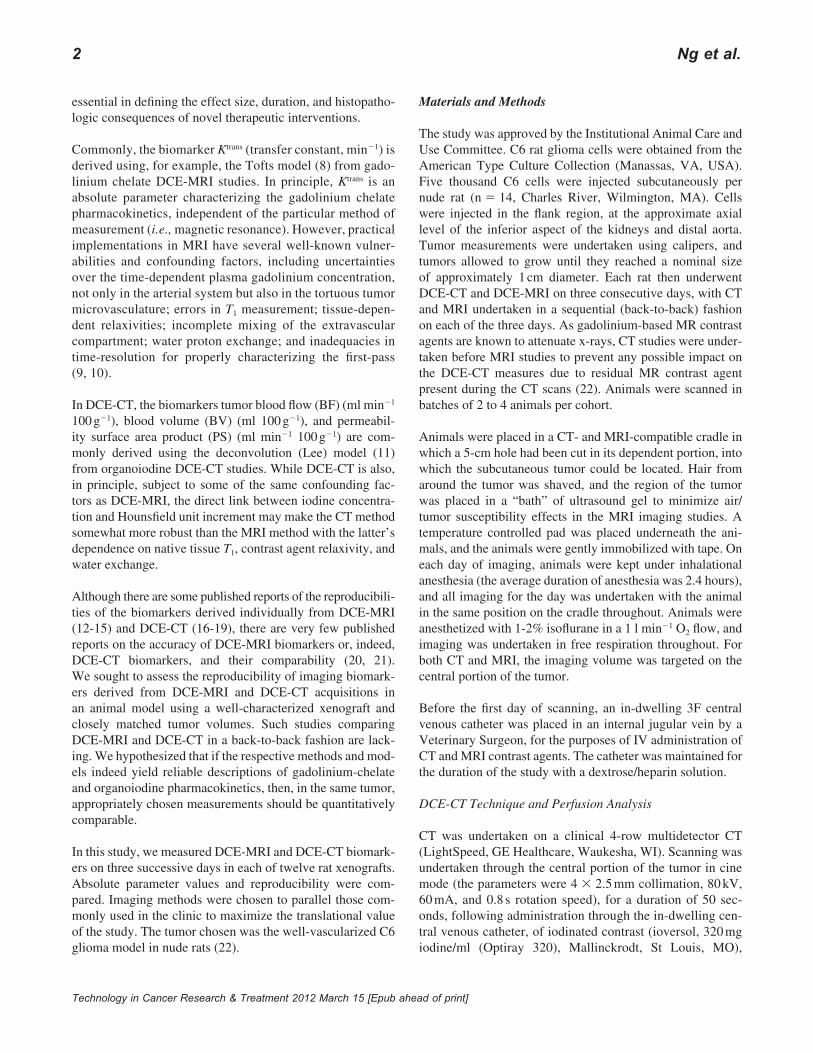
the vascular space (vascular input function), Ktrans is the endothelial transfer constant (min21), and kep is the reflux rate (min21). Change in signal intensity vs. time data were used for the analyses, which were performed using the Kinmod module within the CineTool environment (GE Healthcare, Waukesha, WI). Parametric maps of Ktrans, kep, and extra-cellular, extravascular space volume fraction (ve 5 Ktrans/kep,
unitless) were generated for each animal at each time point (Figure 2). A model contrast agent uptake and clearance curve was used in the analyses, with the model contrast agent curve obtained from a cohort of seven rats imaged at three time points each using the same 3D fast gradient echo sequence but with spatial saturation bands proximal to the imaging volume to minimize flow related enhancement effects. The
Figure 2: (A) Axial dynamic MRI and DCE-MRI parametric maps for (B) Ktrans, (C) kep and (D) ve from the same animal and day as in Figure 1. Units for color bars, min21, min21, and dimensionless, respectively. (E) Corresponding dynamic curves for the tumor (blue dots) and model plasma concentration curve (red line). Note: The software generates maps for the defined region of interest only.
Technology in Cancer Research & Treatment 2012 March 15 [Epub ahead of print]
Reproducibility and Cross-Validation of DCE-CT and DCE-MRI 5
vascular signal intensity uptake curves were averaged over all animals and time points and the washout component fit by a biexponential function, y(t) 5 A [a1 exp(2m1 t) + a2 exp(2m2 t)], yielding short and long component amplitude and clearance rate values of a1 5 0.56, m1 5 0.0333 s21, a2 5 0.36, m2 5 0.0010 s21, respectively, in good agreement with previously published data (22, 24).
As for the DCE-CT data, the results from the ROIs in the two imaging sections representing the largest cross-section of tumor were averaged.
The acquisition protocols and modeling techniques utilized in the above DCE-MRI and DCE-CT evaluations closely reflect those commonly used in clinical settings.
Histopathology
Animals were euthanized after the third day of imaging. Tumors were harvested and fixed in formalin. Tumor sections were subsequently stained with hematoxylin and eosin. The degree of necrosis, estimated as the percent cross-sectional area of necrosis compared to that of the tumor on midline section, was assessed by a Veterinary Pathologist.
Statistics
Summary statistics of DCE-CT parameters (BF, BV, MTT, and PS) and DCE-MRI parameters (Ktrans, kep, and ve) were provided in the form of mean, standard deviation, and range. For MRI parameters, the mean of square root transformed voxel values was calculated, and then back transformed to the raw scale (squared) for subsequent statistical analyses.
A variance components analysis was used to estimate the inter- and intra-rat variances (23). The intra-rat coefficient of variation (wCV) was calculated using the Bland-Altman
method (13), as follows: logarithms of the data were taken and within-rat standard deviations estimated; the results were back-transformed to the raw scale (anti-log) and one was sub-tracted from them to obtain the wCVs.
A linear mixed model was used to test the effect of time on each DCE-CT and DCE-MRI parameter for the three days of repeat scans, and to assess the association between PS and Ktrans. The linear mixed model took into account the correla-tion between measurements of the same rat.
All statistical analyses were two-sided and p-values of 0.05 or less were considered statistically significant. Statistical analysis was carried out using SAS version 9 (SAS Institute, Cary, NC). Plotting was performed using S-Plus 7 (Insightful Inc., Seattle, WA).
Results
A total of 14 rats were scanned, providing 42 data points for DCE-CT and 42 for DCE-MRI. We were able to undertake DCE-CT analyses on all data; however, 10/42 DCE-MRI datasets were excluded due to sub-optimal injection tech-nique, which resulted in 12 rats with evaluable DCE-MRIs. Thus we have 14 DCE-CT reproducibility, 12 DCE-MRI reproducibility, and 12 paired animal DCE-CT and DCE-MRI comparison studies.
The median (range) tumor size was 0.2 (0.1-2.6) cm3. On his-tology, the tumors were found to be markedly vascularized with vascular structures ranging from thick-walled vessels to capillaries. In larger neoplasms, necrosis was common and was characterized by a serpentine pattern with a dense border of small dark neoplastic nuclei (pseudopalisading) around the edges of the necrotic areas (data not shown). The median extent of tumor necrosis on histopathology was 3.8% (range, 0 to 29%).
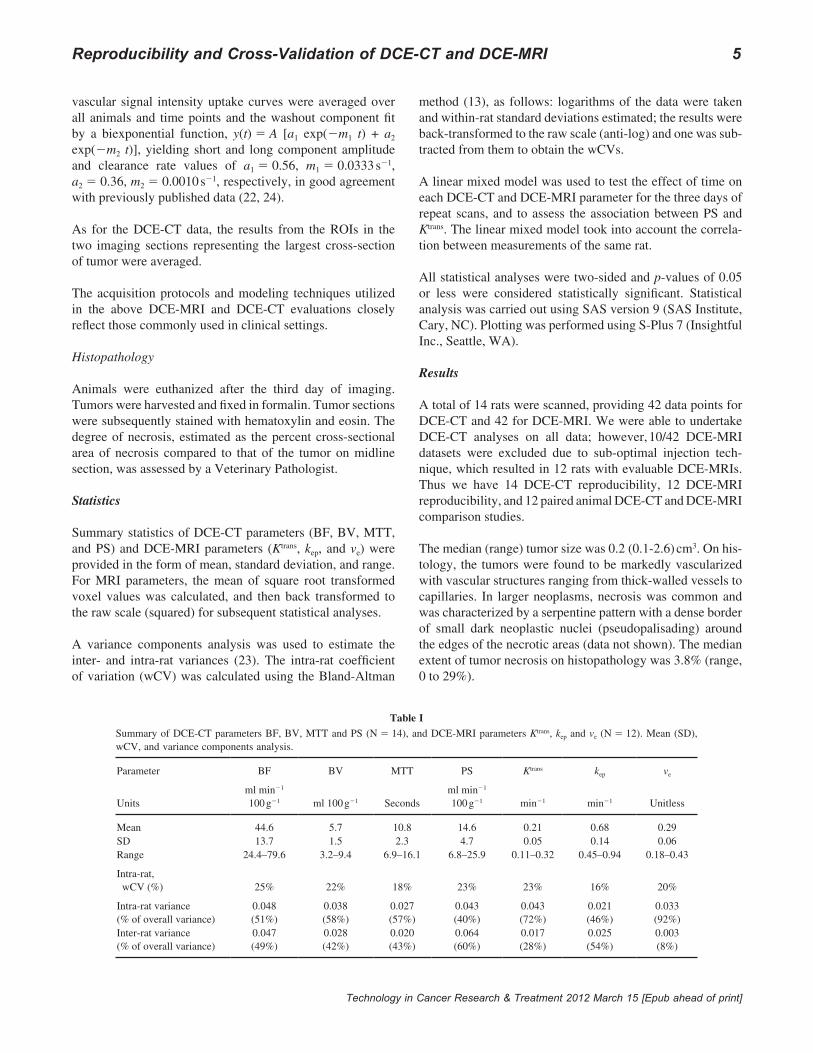
Table ISummary of DCE-CT parameters BF, BV, MTT and PS (N 5 14), and DCE-MRI parameters Ktrans, kep and ve (N 5 12). Mean (SD), wCV, and variance components analysis.
Parameter BF BV MTT PS Ktrans kep ve
Unitsml min21 100 g21 ml 100 g21 Seconds
ml min21 100 g21 min21 min21 Unitless
Mean 44.6 5.7 10.8 14.6 0.21 0.68 0.29SD 13.7 1.5 2.3 4.7 0.05 0.14 0.06Range 24.4–79.6 3.2–9.4 6.9–16.1 6.8–25.9 0.11–0.32 0.45–0.94 0.18–0.43
Intra-rat, wCV (%) 25% 22% 18% 23% 23% 16% 20%
Intra-rat variance(% of overall variance)
0.048(51%)
0.038(58%)
0.027(57%)
0.043(40%)
0.043(72%)
0.021(46%)
0.033(92%)
Inter-rat variance(% of overall variance)
0.047(49%)
0.028(42%)
0.020(43%)
0.064(60%)
0.017(28%)
0.025(54%)
0.003(8%)
6 Ng et al.
Technology in Cancer Research & Treatment 2012 March 15 [Epub ahead of print]
Reproducibility of DCE-CT and DCE-MRI
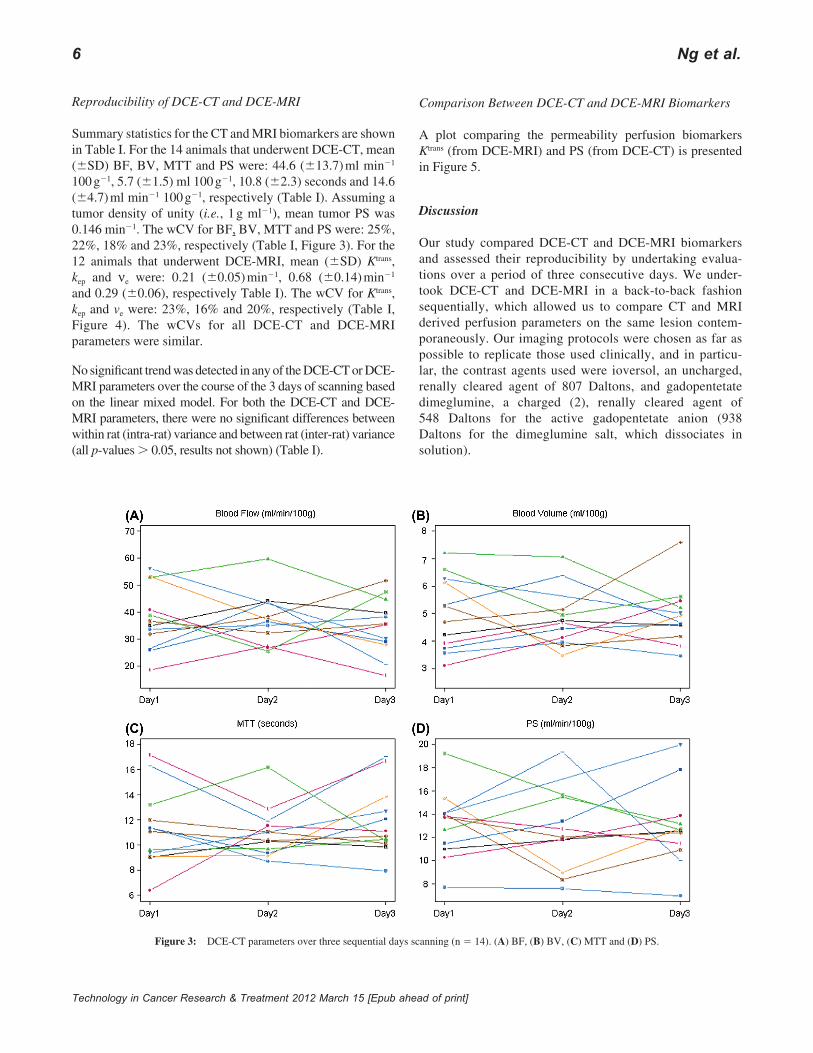
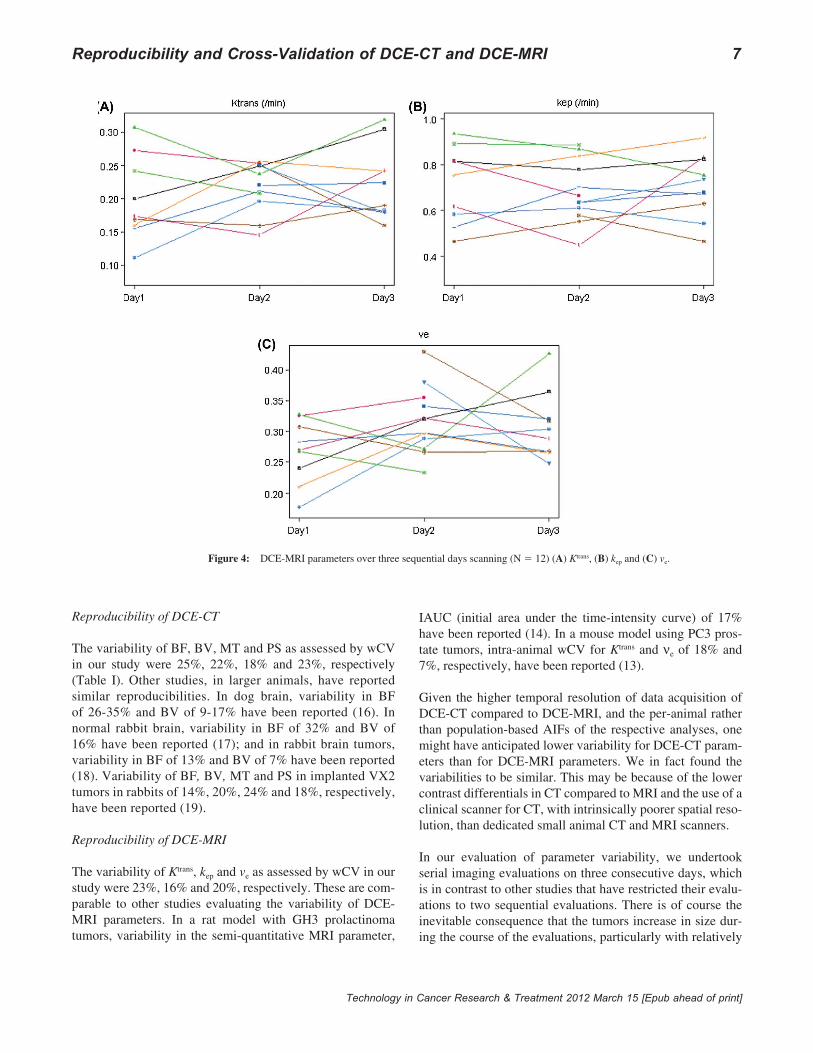
Summary statistics for the CT and MRI biomarkers are shown in Table I. For the 14 animals that underwent DCE-CT, mean (6SD) BF, BV, MTT and PS were: 44.6 (613.7) ml min21 100 g21, 5.7 (61.5) ml 100 g21, 10.8 (62.3) seconds and 14.6 (64.7) ml min21 100 g21, respectively (Table I). Assuming a tumor density of unity (i.e., 1 g ml21), mean tumor PS was 0.146 min21. The wCV for BF, BV, MTT and PS were: 25%, 22%, 18% and 23%, respectively (Table I, Figure 3). For the 12 animals that underwent DCE-MRI, mean (6SD) Ktrans, kep and νe were: 0.21 (60.05) min21, 0.68 (60.14) min21 and 0.29 (60.06), respectively Table I). The wCV for Ktrans, kep and ve were: 23%, 16% and 20%, respectively (Table I, Figure 4). The wCVs for all DCE-CT and DCE-MRI parameters were similar.
No significant trend was detected in any of the DCE-CT or DCE-MRI parameters over the course of the 3 days of scanning based on the linear mixed model. For both the DCE-CT and DCE-MRI parameters, there were no significant differences between within rat (intra-rat) variance and between rat (inter-rat) variance (all p-values . 0.05, results not shown) (Table I).
Comparison Between DCE-CT and DCE-MRI Biomarkers
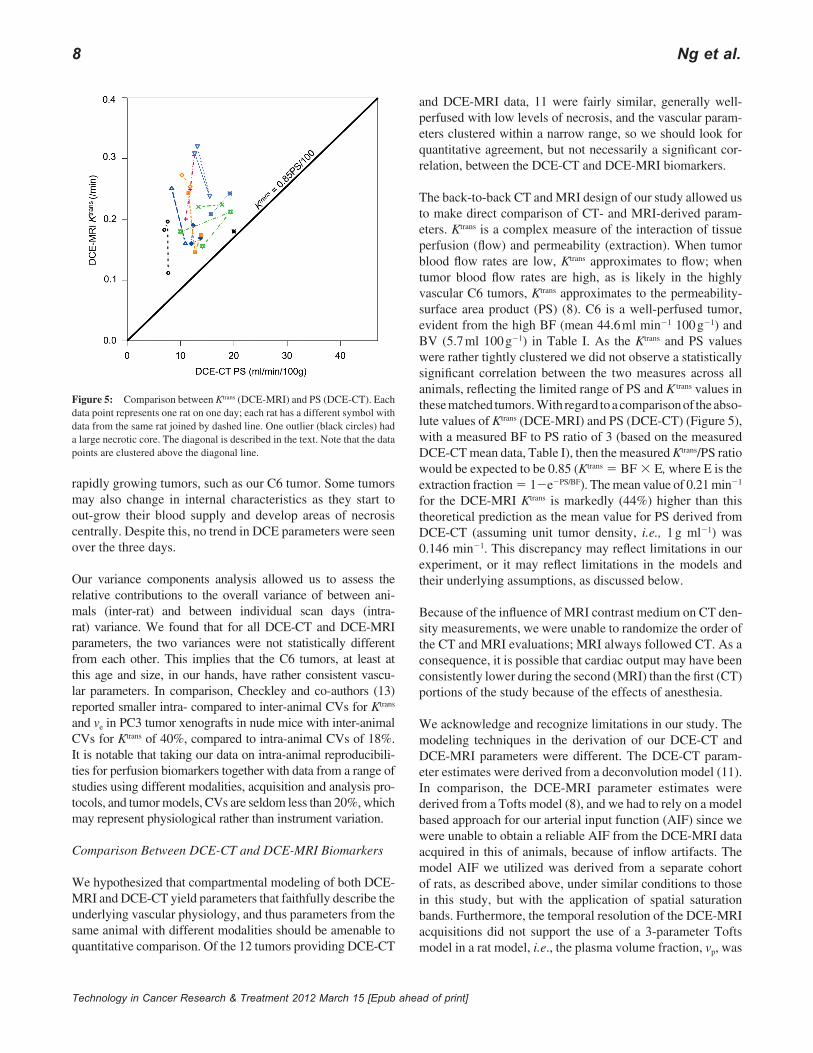
A plot comparing the permeability perfusion biomarkers Ktrans (from DCE-MRI) and PS (from DCE-CT) is presented in Figure 5.
Discussion
Our study compared DCE-CT and DCE-MRI biomarkers and assessed their reproducibility by undertaking evalua-tions over a period of three consecutive days. We under-took DCE-CT and DCE-MRI in a back-to-back fashion sequentially, which allowed us to compare CT and MRI derived perfusion parameters on the same lesion contem-poraneously. Our imaging protocols were chosen as far as possible to replicate those used clinically, and in particu-lar, the contrast agents used were ioversol, an uncharged, renally cleared agent of 807 Daltons, and gadopentetate dimeglumine, a charged (2), renally cleared agent of 548 Daltons for the active gadopentetate anion (938 Daltons for the dimeglumine salt, which dissociates in solution).
Figure 3: DCE-CT parameters over three sequential days scanning (n 5 14). (A) BF, (B) BV, (C) MTT and (D) PS.
Technology in Cancer Research & Treatment 2012 March 15 [Epub ahead of print]
Reproducibility and Cross-Validation of DCE-CT and DCE-MRI 7
Reproducibility of DCE-CT
The variability of BF, BV, MT and PS as assessed by wCV in our study were 25%, 22%, 18% and 23%, respectively (Table I). Other studies, in larger animals, have reported similar reproducibilities. In dog brain, variability in BF of 26-35% and BV of 9-17% have been reported (16). In normal rabbit brain, variability in BF of 32% and BV of 16% have been reported (17); and in rabbit brain tumors, variability in BF of 13% and BV of 7% have been reported (18). Variability of BF, BV, MT and PS in implanted VX2 tumors in rabbits of 14%, 20%, 24% and 18%, respectively, have been reported (19).
Reproducibility of DCE-MRI
The variability of Ktrans, kep and ve as assessed by wCV in our study were 23%, 16% and 20%, respectively. These are com-parable to other studies evaluating the variability of DCE-MRI parameters. In a rat model with GH3 prolactinoma tumors, variability in the semi-quantitative MRI parameter,
IAUC (initial area under the time-intensity curve) of 17% have been reported (14). In a mouse model using PC3 pros-tate tumors, intra-animal wCV for Ktrans and νe of 18% and 7%, respectively, have been reported (13).
Given the higher temporal resolution of data acquisition of DCE-CT compared to DCE-MRI, and the per-animal rather than population-based AIFs of the respective analyses, one might have anticipated lower variability for DCE-CT param-eters than for DCE-MRI parameters. We in fact found the variabilities to be similar. This may be because of the lower contrast differentials in CT compared to MRI and the use of a clinical scanner for CT, with intrinsically poorer spatial reso-lution, than dedicated small animal CT and MRI scanners.
In our evaluation of parameter variability, we undertook serial imaging evaluations on three consecutive days, which is in contrast to other studies that have restricted their evalu-ations to two sequential evaluations. There is of course the inevitable consequence that the tumors increase in size dur-ing the course of the evaluations, particularly with relatively
Figure 4: DCE-MRI parameters over three sequential days scanning (N 5 12) (A) Ktrans, (B) kep and (C) ve.
8 Ng et al.
Technology in Cancer Research & Treatment 2012 March 15 [Epub ahead of print]
rapidly growing tumors, such as our C6 tumor. Some tumors may also change in internal characteristics as they start to out-grow their blood supply and develop areas of necrosis centrally. Despite this, no trend in DCE parameters were seen over the three days.
Our variance components analysis allowed us to assess the relative contributions to the overall variance of between ani-mals (inter-rat) and between individual scan days (intra-rat) variance. We found that for all DCE-CT and DCE-MRI parameters, the two variances were not statistically different from each other. This implies that the C6 tumors, at least at this age and size, in our hands, have rather consistent vascu-lar parameters. In comparison, Checkley and co-authors (13) reported smaller intra- compared to inter-animal CVs for Ktrans and ve in PC3 tumor xenografts in nude mice with inter-animal CVs for Ktrans of 40%, compared to intra-animal CVs of 18%. It is notable that taking our data on intra-animal reproducibili-ties for perfusion biomarkers together with data from a range of studies using different modalities, acquisition and analysis pro-tocols, and tumor models, CVs are seldom less than 20%, which may represent physiological rather than instrument variation.
Comparison Between DCE-CT and DCE-MRI Biomarkers
We hypothesized that compartmental modeling of both DCE-MRI and DCE-CT yield parameters that faithfully describe the underlying vascular physiology, and thus parameters from the same animal with different modalities should be amenable to quantitative comparison. Of the 12 tumors providing DCE-CT
and DCE-MRI data, 11 were fairly similar, generally well-perfused with low levels of necrosis, and the vascular param-eters clustered within a narrow range, so we should look for quantitative agreement, but not necessarily a significant cor-relation, between the DCE-CT and DCE-MRI biomarkers.
The back-to-back CT and MRI design of our study allowed us to make direct comparison of CT- and MRI-derived param-eters. Ktrans is a complex measure of the interaction of tissue perfusion (flow) and permeability (extraction). When tumor blood flow rates are low, Ktrans approximates to flow; when tumor blood flow rates are high, as is likely in the highly vascular C6 tumors, Ktrans approximates to the permeability-surface area product (PS) (8). C6 is a well-perfused tumor, evident from the high BF (mean 44.6 ml min21 100 g21) and BV (5.7 ml 100 g21) in Table I. As the Ktrans and PS values were rather tightly clustered we did not observe a statistically significant correlation between the two measures across all animals, reflecting the limited range of PS and K trans values in these matched tumors. With regard to a comparison of the abso-lute values of Ktrans (DCE-MRI) and PS (DCE-CT) (Figure 5), with a measured BF to PS ratio of 3 (based on the measured DCE-CT mean data, Table I), then the measured Ktrans/PS ratio would be expected to be 0.85 (Ktrans 5 BF 3 E, where E is the extraction fraction 5 12e2PS/BF). The mean value of 0.21 min21 for the DCE-MRI Ktrans is markedly (44%) higher than this theoretical prediction as the mean value for PS derived from DCE-CT (assuming unit tumor density, i.e., 1 g ml21) was 0.146 min21. This discrepancy may reflect limitations in our experiment, or it may reflect limitations in the models and their underlying assumptions, as discussed below.
Because of the influence of MRI contrast medium on CT den-sity measurements, we were unable to randomize the order of the CT and MRI evaluations; MRI always followed CT. As a consequence, it is possible that cardiac output may have been consistently lower during the second (MRI) than the first (CT) portions of the study because of the effects of anesthesia.
We acknowledge and recognize limitations in our study. The modeling techniques in the derivation of our DCE-CT and DCE-MRI parameters were different. The DCE-CT param-eter estimates were derived from a deconvolution model (11). In comparison, the DCE-MRI parameter estimates were derived from a Tofts model (8), and we had to rely on a model based approach for our arterial input function (AIF) since we were unable to obtain a reliable AIF from the DCE-MRI data acquired in this of animals, because of inflow artifacts. The model AIF we utilized was derived from a separate cohort of rats, as described above, under similar conditions to those in this study, but with the application of spatial saturation bands. Furthermore, the temporal resolution of the DCE-MRI acquisitions did not support the use of a 3-parameter Tofts model in a rat model, i.e., the plasma volume fraction, vp, was
Figure 5: Comparison between Ktrans (DCE-MRI) and PS (DCE-CT). Each data point represents one rat on one day; each rat has a different symbol with data from the same rat joined by dashed line. One outlier (black circles) had a large necrotic core. The diagonal is described in the text. Note that the data points are clustered above the diagonal line.
Technology in Cancer Research & Treatment 2012 March 15 [Epub ahead of print]
Reproducibility and Cross-Validation of DCE-CT and DCE-MRI 9
ignored. This can lead to an overestimation of Ktrans values. In addition, the contrast media used differ in charge and molec-ular weight, so identical permeability-surface area product measures would not be expected. Our comparisons were not based on a perfusion of the entire volume of tumor, which has challenges beyond the scope of this work. Instead, our comparisons were based on two contiguous maximal axial sections, which can be reliably determined.
Our tumors were all from the same cell type and of similar sizes at the time of imaging. As a consequence, our param-eter values were in a relatively narrow range; this limited out ability to evaluate associations between parameter values. Evaluation of different cell lines, with different perfusion characteristics would be helpful in future work.
The temporal resolution for our CT data (0.4 s) was 10-fold higher than that for our MRI data (6.6 s), which enabled esti-mation of BF from the initial uptake curve in CT, but not from MRI. Although our MRI scanner was a dedicated small-bore animal scanner, our CT scanner was a clinical (human) and not a dedicated animal unit. It is possible that a dedicated small animal CT scanner may yield smaller variability in DCE-CT parameters than that derived from the clinical unit on which our study was undertaken. Nevertheless, the spatial resolu-tions of the CT (0.5 3 0.5 mm) and MRI (0.5 3 0.6 mm) scanners were comparable, and the wCVs for the DCE-CT and DCE-MRI were very similar. The DCE-MRI and DCE-CT acquisition protocols and modeling techniques utilized in our study closely reflect those commonly used in clinical settings, thereby enhancing the potential translatability of this work.
In summary, the variability in DCE-CT and DCE-MRI biomark-ers was similar. This suggests that both techniques may have comparable utility in pre-clinical and clinical studies. However, permeability estimates derived from DCE-MRI (K trans) and DCE-CT (PS) yielded systematically different absolute values, suggesting that they are not entirely equivalent or interchange-able. Knowledge of the variability of the DCE parameters is important to guide appropriate experimental design and statisti-cal consideration in future experimental studies.
Conflict of Interest
We certify that regarding this paper, no actual or potential conflicts of interests exist; the work is original, has not been accepted for publication nor is concurrently under consider-ation elsewhere, and will not be published elsewhere without the permission of the Editor and that all the authors have con-tributed directly to the planning, execution or analysis of the work reported or to the writing of the paper.
Research Funding: MDACC – AstraZeneca Research Collaboration Alliance, Contract #LS2006-00016301.
References
Jackson, A., O’Connor, J. P., Parker, G. J., Jayson, G. C. Imaging 1. tumor vascular heterogeneity and angiogenesis using dynamic con-trast-enhanced magnetic resonance imaging. Clin Cancer Res 13, 3449-3459 (2007).Xiong, H. Q., Herbst, R., Faria, S. C., Scholz, C., Davis, D., Jackson, 2. E. F., Madden, T., McConkey, D., Hicks, M., Hess, K., Charnsan-gavej, C. A., Abbruzzese, J. L. A phase I surrogate endpoint study of SU6668 in patients with solid tumors. Invest New Drugs 22, 459-466 (2004).Morgan, B., Thomas, A. L., Drevs, J., Hennig, J., Buchert, M., Jivan, 3. A., Horsfield, M. A., Mross, K., Ball, H. A., Lee, L., Mietlowski, W., Fuxuis, S., Unger, C., O’Byrne, K., Henry, A., Cherryman, G. R., Laurent, D., Dugan, M., Marme, D., Steward, W. P. Dynamic contrast-enhanced magnetic resonance imaging as a biomarker for the pharmacological response of PTK787/ZK 222584, an inhibitor of the vascular endothelial growth factor receptor tyrosine kinases, in patients with advanced colorectal cancer and liver metasta-ses: results from two phase I studies. J Clin Oncol 21, 3955-3964 (2003).Stevenson, J. P., Rosen, M., Sun, W., Gallagher, M., Haller, D. G., 4. Vaughn, D., Giantonio, B., Zimmer, R., Petros, W. P., Stratford, M., Chaplin, D., Young, S. L., Schnall, M., O’Dwyer, P. J. Phase I trial of the antivascular agent combretastatin A4 phosphate on a 5-day sched-ule to patients with cancer: magnetic resonance imaging evidence for altered tumor blood flow. J Clin Oncol 21, 4428-4438 (2003).Evelhoch, J. L., LoRusso, P. M., He, Z., DelProposto, Z., Polin, L., 5. Corbett, T. H., Langmuir, P., Wheeler, C., Stone, A., Leadbetter, J., Ryan, A. J., Blakey, D. C., Waterton, J. C. Magnetic resonance imag-ing measurements of the response of murine and human tumors to the vascular-targeting agent ZD6126. Clin Cancer Res 10, 3650-3657 (2004).Willett, C. G., Boucher, Y., di Tomaso, E., Duda, D. G., Munn, L. L., 6. Tong, R. T., Chung, D. C., Sahani, D. V., Kalva, S. P., Kozin, S. V., Mino, M., Cohen, K. S., Scadden, D. T., Hartford, A. C., Fischman, A. J., Clark, J. W., Ryan, D. P., Zhu, A. X., Blaszkowsky, L. S., Chen, H. X., Shellito, P. C., Lauwers, G. Y., Jain, R. K. Direct evidence that the VEGF-specific antibody bevacizumab has antivascular effects in human rectal cancer. Nat Med 10, 145-147 (2004).Liu, G., Rugo, H. S., Wilding, G., McShane, T. M., Evelhoch, J. L., 7. Ng, C., Jackson, E., Kelcz, F., Yeh, B. M., Lee, F. T., Jr., Charnsan-gavej, C., Park, J. W., Ashton, E. A., Steinfeldt, H. M., Pithavala, Y. K., Reich, S. D., Herbst, R. S. Dynamic contrast-enhanced mag-netic resonance imaging as a pharmacodynamic measure of response after acute dosing of AG-013736, an oral angiogenesis inhibitor, in patients with advanced solid tumors: results from a phase I study. J Clin Oncol 23, 5464-5473 (2005).Tofts, P. S., Brix, G., Buckley, D. L., Evelhoch, J. L., Henderson, E., 8. Knopp, M. V., Larsson, H. B., Lee, T. Y., Mayr, N. A., Parker, G. J., Port, R. E., Taylor, J., Weisskoff, R. M. Estimating kinetic param-eters from dynamic contrast-enhanced T(1)-weighted MRI of a dif-fusable tracer: standardized quantities and symbols. J Magn Reson Imaging 10, 223-232 (1999).Leach, M. O., Brindle, K. M., Evelhoch, J. L., Griffiths, J. R., Horsman, 9. M. R., Jackson, A., Jayson, G. C., Judson, I. R., Knopp, M. V., Maxwell, R. J., McIntyre, D., Padhani, A. R., Price, P., Rathbone, R., Rustin, G. J., Tofts, P. S., Tozer, G. M., Vennart, W., Waterton, J. C., Williams, S. R., Workman, P. The assessment of antiangiogenic and antivascular therapies in early-stage clinical trials using magnetic resonance imaging: issues and recommendations. Br J Cancer 92, 1599-1610 (2005).Jayson, G. C., Waterton, J. C. in 10. Dynamic Contrast-Enhanced Mag-netic Resonance Imaging in Oncology (Eds. A. Jackson, D. L. Buckley, G. J. Parker) (Springer, 2005).
10 Ng et al.
Technology in Cancer Research & Treatment 2012 March 15 [Epub ahead of print]
Lee, T.-Y. Functional CT: physiological models. 11. Trends Biotechnol 20, S3-S10 (2002).Ng, C. S., Raunig, D. L., Jackson, E. F., Ashton, E. A., Kelcz, F., 12. Kim, K. B., Kurzrock, R., McShane, T. M. Reproducibility of perfu-sion parameters in dynamic contrast-enhanced MRI of lung and liver tumors: effect on estimates of patient sample size in clinical trials and on individual patient responses. AJR Am J Roentgenol 194, W134-140 (2010).Checkley, D., Tessier, J. J., Kendrew, J., Waterton, J. C., Wedge, S. R. 13. Use of dynamic contrast-enhanced MRI to evaluate acute treatment with ZD6474, a VEGF signalling inhibitor, in PC-3 prostate tumours. Br J Cancer 89, 1889-1895 (2003).Robinson, S. P., McIntyre, D. J., Checkley, D., Tessier, J. J., Howe, 14. F. A., Griffiths, J. R., Ashton, S. E., Ryan, A. J., Blakey, D. C., Waterton, J. C. Tumour dose response to the antivascular agent ZD6126 assessed by magnetic resonance imaging. Br J Cancer 88, 1592-1597 (2003).Galbraith, S. M., Lodge, M. A., Taylor, N. J., Rustin, G. J., Bentzen, S., 15. Stirling, J. J., Padhani, A. R. Reproducibility of dynamic contrast-en-hanced MRI in human muscle and tumours: comparison of quantitative and semi-quantitative analysis. NMR Biomed 15, 132-142 (2002).Nabavi, D. G., Cenic, A., Dool, J., Smith, R. M., Espinosa, F., Craen, 16. R. A., Gelb, A. W., Lee, T. Y. Quantitative assessment of cerebral hemodynamics using CT: stability, accuracy, and precision studies in dogs. J Comput Assist Tomogr 23, 506-515 (1999).Cenic, A., Nabavi, D. G., Craen, R. A., Gelb, A. W., Lee, T. Y. 17. Dynamic CT measurement of cerebral blood flow: a validation study. AJNR Am J Neuroradiol 20, 63-73 (1999).
Cenic, A., Nabavi, D. G., Craen, R. A., Gelb, A. W., Lee, T. Y. 18. A CT method to measure hemodynamics in brain tumors: validation and application of cerebral blood flow maps. AJNR Am J Neuroradiol 21, 462-470 (2000).Purdie, T. G., Henderson, E., Lee, T. Y. Functional CT imaging of 19. angiogenesis in rabbit VX2 soft-tissue tumour. Phys Med Biol 46, 3161-3175 (2001).Berkowitz, B. A., Tofts, P. S., Sen, H. A., Ando, N., de Juan, E., Jr. 20. Accurate and precise measurement of blood-retinal barrier break-down using dynamic Gd-DTPA MRI. Invest Ophthalmol Vis Sci 33, 3500-3506 (1992).Ng, C. S., Kodama, Y., Mullani, N. A., Barron, B. J., Herbst, R. S., 21. Abbruzzese, J. L., Charnsangavej, C. Tumor blood flow measured by perfusion CT and 15O-labeled water PET: a comparison study. JCcomput Assist Tomogr 33, 460-465 (2009).Bradley, D. P., Tessier, J. J., Lacey, T., Scott, M., Jurgensmeier, J. M., 22. Odedra, R., Mills, J., Kilburn, L., Wedge, S. R. Examining the acute effects of cediranib (RECENTIN, AZD2171) treatment in tumor models: a dynamic contrast-enhanced MRI study using gadopentate. Magn Reson Imaging 27, 377-384 (2009).Lumbroso, P., Dick, C. E. X-ray attenuation properties of radio-23. graphic contrast media. Med Phys 14, 752-758 (1987).Bradley, D. P., Tessier, J. L., Checkley, D., Kuribayashi, H., Waterton, 24. J. C., Kendrew, J., Wedge, S. R. Effects of AZD2171 and vandetanib (ZD6474, Zactima) on haemodynamic variables in an SW620 human colon tumour model: an investigation using dynamic contrast-en-hanced MRI and the rapid clearance blood pool contrast agent, P792 (gadomelitol). NMR Biomed 21, 42-52 (2008).
Received: July 25, 2011; Revised: September 19, 2011; Accepted: October 24, 2011


