Embed Size (px)
Citation preview
1
Report No: AUS0001645 (CBA)
.(CB
Congo, Republic of
Republic of Congo HRBF Impact Evaluation Cost Benefit Analysis
. August 8, 2019
. HNP
.
Pub
lic D
iscl
osur
e A
utho
rized
Pub
lic D
iscl
osur
e A
utho
rized
Pub
lic D
iscl
osur
e A
utho
rized
Pub
lic D
iscl
osur
e A
utho
rized

2
.
.
© 2017 The World Bank 1818 H Street NW, Washington DC 20433 Telephone: 202-473-1000; Internet: www.worldbank.org Some rights reserved
This work is a product of the staff of The World Bank. The findings, interpretations, and conclusions expressed in this work do not necessarily reflect the views of the Executive Directors of The World Bank or the governments they represent. The World Bank does not guarantee the accuracy of the data included in this work. The boundaries, colors, denominations, and other information shown on any map in this work do not imply any judgment on the part of The World Bank concerning the legal status of any territory or the endorsement or acceptance of such boundaries. Rights and Permissions The material in this work is subject to copyright. Because The World Bank encourages dissemination of its knowledge, this work may be reproduced, in whole or in part, for noncommercial purposes as long as full attribution to this work is given. Attribution—Please cite the work as follows: “World Bank. 2019. Republic of Congo HRBF Impact Evaluation, Cost-Benefit Analysis. © World Bank.”
All queries on rights and licenses, including subsidiary rights, should be addressed to World Bank Publications, The World Bank Group, 1818 H Street NW, Washington, DC 20433, USA; fax: 202-522-2625; e-mail: [email protected].

3

4
Acknowledgements Avril Kaplan, HAFH2
György Bèla Fritsche, HAFH2

5
Republic of Congo Second Health System Strengthening Project (PDSS-II) (P143849)
Cost Benefit Analysis
August 2019
Executive Summary
The project development outcome of the Republic of Congo Health System Strengthening
Project II is to increase utilization and quality of maternal and child health services in targeted
areas. The purpose of this analysis is to assess whether the dollar benefit of performance-based
financing (PBF) implemented in Congo outweigh its dollar costs. To do so, this analysis
monetizes the major benefits and costs associated with the project, and reports on three
measures: the benefit to cost ratio, the net present value and the internal rate of return.
When considering just the PBF intervention zones, the Benefit-Cost Ratio (BCR) is 2.60
for the verified PBF data. This suggests that every dollar invested in PBF in Congo yields an
economic return of 2.60 dollars. The investment in PBF of US$28.9 million generated economic
benefits with a net present value of US$44.4 million. The internal rate of return was 6 percent.
When considering the entire project cost, which also includes PBF control costs and all other non-
PBF related program components, the project is still economically beneficial.
Background to the Republic of Congo – PDSSII project.
The Republic of Congo has a population of about 4.5 million people and a 2015 GDP of
US$ 1,851 per capita, which dropped from US$ 3,200 per capita per year in 2013. Its 2015 human
development index is 136/187. A US$ 120 million five-year health system development project
was conceived in 2013, based on a successful pilot experience implemented from 2012-14 using
Performance-Based Financing (PBF) in three departments1,2 to extend this approach to cover 86
percent of the population. A cloud-based database with a public frontend with data upload through
tablets and smart phones has been introduced (http://www.fbp-msp.org/#/).
Other complementary interventions implemented through the project included a demand-
generating project called the ‘Rainbow Program’ in which color-coded vouchers are used to
identify those in need of key basic health services and to educate and persuade them to use
services. In addition, in close collaboration with LISUNGI, a social protection program, 25 percent
of the poorest households were identified and were issued ID cards to access services free of
1 Zeng, W., et al., Evaluation of results-based financing in the Republic of the Congo: a comparison group pre-post
study. Health Policy and Planning, 2018: p. 9.
2 Fritsche, G., et al., Performance-Based Financing Toolkit. 2014, © World Bank.
https://openknowledge.worldbank.org/handle/10986/17194 License: CC BY 3.0 IGO: Washington DC.

6
charge. Both programs intended to boost health service utilization among the poorest households.
Unfortunately, after investments in training and preparation, neither program had the opportunity
to mature before the project stopped due to lack of government funding. Identification of the
poorest was successful, but the quantity of services received by this group was minimal.
The Purpose of the Cost Benefit Analysis.
The project development outcome of the Republic of Congo Health System Strengthening
Project II is to increase utilization and quality of maternal and child health services in targeted
areas. The purpose of this analysis is to assess whether the dollar benefit of PBF implemented in
Congo outweighs its dollar costs. To do so, this analysis monetizes the major benefits and costs
associated with the project, and reports on three measures:
1. Benefit to cost ratio (BCR): the ratio between the benefits and costs of performance-
based financing, expressed in monetary units at discounted present values. A ratio greater
than one indicates that project benefits outweigh its costs.
2. Net present value (NPV): the sum of the present values of a cash flow stream. An NPV
above zero indicates that PBF was profitable.
3. Internal rate of return (IRR): the discount rate that equates the present value of the
project’s cash inflow to the present value of its outflow. While the NPV measures the
project’s dollar profitability, the IRR measures its percentage profitability.
Beneficiaries
The project implemented PBF in 195 health facilities that covered 7 departments. PBF
reached a target population of 2,410,178 people, or 48% of the total population of the Republic of
Congo (2016 population estimate). PBF facilities were selected using systematic random
sampling. The basic package of health services at health center and community levels covered
20 services, which aimed to primarily reduce maternal and child mortality, yet likely had positive
implications for the entire population served by the contracted health facilities. A complementary
package of health services contracted to 17 district hospitals covered 16 services. The
subnational health administration in the targeted districts and departments were under
performance contracts, also select central ministry of health departments were contracted.3 4
3 Fritsche, G., et al. (2014). Performance-Based Financing Toolkit. Washington DC, © World Bank.
https://openknowledge.worldbank.org/handle/10986/17194 License: CC BY 3.0 IGO. 4 Fritsche, G. and J. Peabody (2018). "Methods to Improve Quality Performance at Scale in Lower -, and Middle-
Income Countries." Journal of Global Health 8(2).

7
Project Benefits
The project conducted a baseline health survey in 2015, which was intended to assess
changes in health outcomes in project areas. However, due to funding constraints, the end line
survey was not completed. Also, the project had to be halted prematurely, due to funding
constraints; from the total project cost of US$ 120 million, US$ 100 million was counterpart funding
of which only US$ 20 million became available. The project therefore had only 2 years and 4
months of ‘full functional mode’: phasing in of contracting started as of July 2015 with three
departments (the old pilot departments), while others were added by the end of December 2015.
As of January 2016, all planned contracts had been issued. The project closed prematurely in
April 2018.
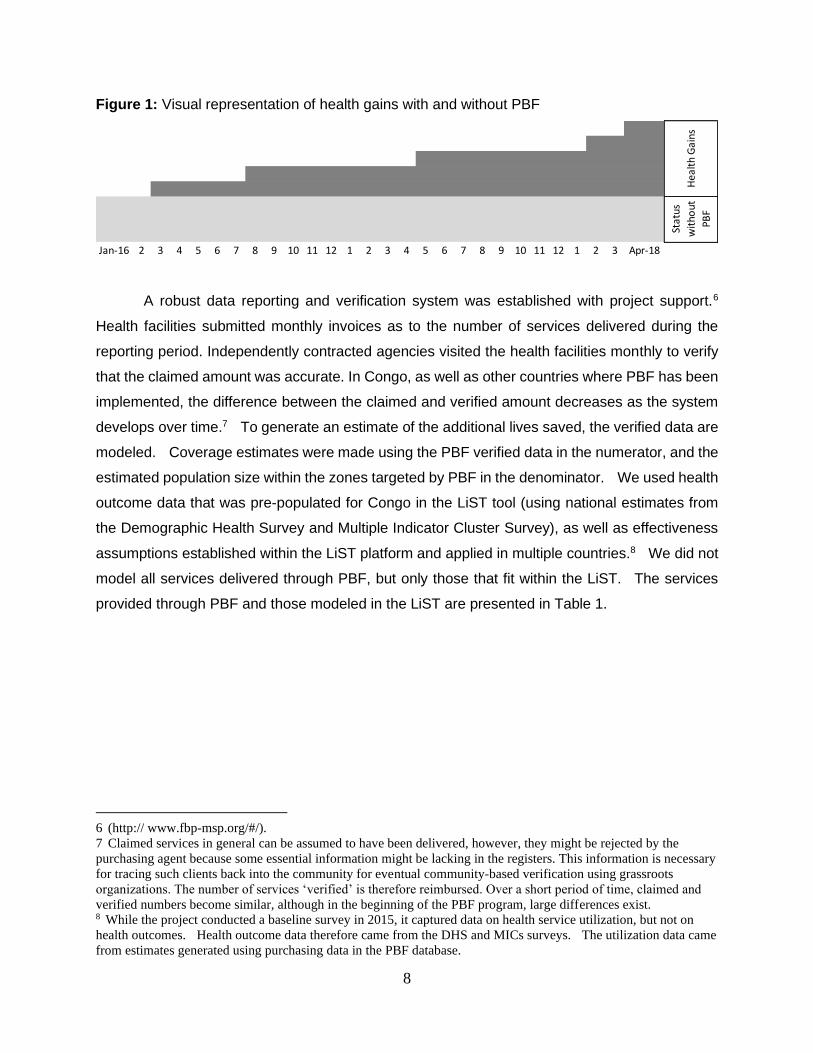
To assess the impact of PBF in the population served by the contracted health facilities,
changes in health service utilization, as reported in quarter 1 of 2016, 2017 and 2018, were used
to estimate the number of additional child and maternal lives saved, as well as the number of
stillbirths prevented. The methodology used by the Lives Saved Tool to attribute additional lives
saved to changes in service utilization is described elsewhere.5 We propose that January 2016
be considered as the baseline quarter, and then assume that service increases in the project
areas were due to the project intervention. During project implementation, services in non-project
areas likely declined due to decreased public financing for health. Yet, no data exist for non-PBF
project areas, and this is a limitation of the current analysis. The situation is presented
schematically below – all dark colored health gains are assumed to be due to PBF.
5 Winfrey, W., McKinnon, R., Stover, J. (2011). Methods used in the Lives Saved Tool (LiST). BMC Public Health,
11(Suppl 3): S32.
8
Figure 1: Visual representation of health gains with and without PBF
A robust data reporting and verification system was established with project support.6
Health facilities submitted monthly invoices as to the number of services delivered during the
reporting period. Independently contracted agencies visited the health facilities monthly to verify
that the claimed amount was accurate. In Congo, as well as other countries where PBF has been
implemented, the difference between the claimed and verified amount decreases as the system
develops over time.7 To generate an estimate of the additional lives saved, the verified data are
modeled. Coverage estimates were made using the PBF verified data in the numerator, and the
estimated population size within the zones targeted by PBF in the denominator. We used health
outcome data that was pre-populated for Congo in the LiST tool (using national estimates from
the Demographic Health Survey and Multiple Indicator Cluster Survey), as well as effectiveness
assumptions established within the LiST platform and applied in multiple countries.8 We did not
model all services delivered through PBF, but only those that fit within the LiST. The services
provided through PBF and those modeled in the LiST are presented in Table 1.
6 (http:// www.fbp-msp.org/#/).
7 Claimed services in general can be assumed to have been delivered, however, they might be rejected by the
purchasing agent because some essential information might be lacking in the registers. This information is necessary
for tracing such clients back into the community for eventual community-based verification using grassroots
organizations. The number of services ‘verified’ is therefore reimbursed. Over a short period of time, claimed and
verified numbers become similar, although in the beginning of the PBF program, large differences exist. 8 While the project conducted a baseline survey in 2015, it captured data on health service utilization, but not on
health outcomes. Health outcome data therefore came from the DHS and MICs surveys. The utilization data came
from estimates generated using purchasing data in the PBF database.
Jan-16 2 3 4 5 6 7 8 9 10 11 12 1 2 3 4 5 6 7 8 9 10 11 12 1 2 3 Apr-18
Hea
lth
Gai
ns
Stat
us
wit
hout
PBF

9
Table 1: Summary of services delivered at health facilities and hospitals under PBF contracts
Health Centers District Hospitals
1. External Consultation (new cases) 2. Admission day for observation 3. Small surgery 4. Child fully vaccinated 5. Well Child Visit 6-23 months 6. Well Child Visit 24-59 months 7. PEC Children 0-59 months moderate
acute malnutrition (MAM) 8. Prenatal consultation (new registered
and standard) - target 3 visits 9. Voluntary HIV/AIDS testing for pregnant
women 10. Pregnant woman VAT 2 and over 11. Pregnant woman TPI-2 12. Postnatal Consultation - 1st week and
6th week 13. Assisted birth by qualified staff 14. Family planning: New and renewal
(oral & injections) 15. Severe case evacuated and arrived at the
hospital 16. HIV + client under profylaxis co-
trimoxazol 17. Voluntary HIV/AIDS testing (excluded
pregnant women) 18. Screening of positive TBC-BK cases 19. TBC - BK positive case treated and cured 20. Home visit
1. External consultation - doctor or health assistant
2. Day of hospitalization 3. Patient arrived in the hospital and given
feedback 4. Major surgery - hernia, peritonitis,
hydrocele, occlusion, USG 5. Eutocic delivery 6. Cesarean section 7. Dystocic assisted childbirth 8. Number of ARV clients followed one
semester 9. Voluntary HIV/AIDS Screening 10. HIV + pregnant client, put under
protocol ARV 11. New born HIV + mother put under
protocol ARV 12. Family planning: New and renewal
(oral & injection) 13. Family planning: New user (IUD and
implant) 14. Family planning: Ligatures and
vasectomies 15. Screening of positive TBC-BK cases 16. TBC - BK positive case treated and cured
*Services in bold were modeled within LiST
Table 2 presents the estimated additional lives saved due to greater health service
coverage within the catchment area of health centers and hospitals with PBF contracts. In 2017,
an estimated 352 lives were saved due to increased service coverage, and in 2017, an estimated
759 additional lives were saved.
To generate an estimate of lives saved due to improved service quality, a baseline
estimate was modeled in LiST where all services provided in health centers and hospitals were
multiplied by their respective baseline quality score (0.42 and 0.39). The quality score is based
on a series of indicators that measure both the structural quality of health facilities and the quality
of clinical practice as measured through patient vignettes (the vignettes were introduced in
October 2017). The same multiplier was then applied to the 2017 and 2018 coverage estimates
to generate the number of additional lives saved if quality remained the same while service
coverage increased. A second model was run where the coverage estimates were multiplied by

10
the improved quality scores for 2017 (0.61 for health centers and 0.52 for hospitals) and 2018
(0.70 for health centers and 0.51 for hospitals).9 The number of lives saved from the baseline
model were then subtracted from the second model to generate an estimate of the number of
lives saved due to improved quality. As Table 1 illustrates, this approach estimates that 127
additional lives were saved in 2017 due to improvements in service quality, and 240 lives were
saved in 2018.
Table 1: Estimate of additional lives saved due to increased service coverage and quality in
Republic of Congo
Additional lives saved* Increased Quantity Improved Quality
2017 2018 2017 2018
Stillbirths prevented 65 135 26 50
Children (0-59 months) 251 547 88 163
<1 month 164 340 68 115
1-59 months 87 208 20 48
Maternal 36 77 13 27
Total 352 759 127 240
To assign a monetary value to the additional lives saved, we multiplied the number of
productive years saved by Gross Domestic Product (GDP) per capita. We used GDP per capita
in 2017 at current US$ 1,658. We assumed that GDP would grow at a rate of 3.5 percent, which
is the estimated economic growth rate in Congo between 2017 and 2035.10 We applied a discount
rate of 3 percent per year. We assumed that individuals would contribute to the economy from
the time they were 18 years old until their time of death, which we took as the life expectancy at
birth in Congo (66.8 years for children and stillbirths, and 68.4 years for mothers). We took the
median age between 12 and 59 months to calculate the average age of child death. We added
half the total fertility rate (of 4.56 births per women) to the average age at first birth in Congo (19.5
years) to calculate the average age of maternal death. Table 2 summarizes the benefits,
expressed in monetary terms, for the additional lives saved through PBF. To avoid double
counting of additional lives saved through PBF (i.e. the same person being saved in 2017 and
9 The quality score in hospitals remained constant between 2017 and 2018. This is because the rigor of the quality
verifications improved over the course of the project, particularly after sanctions from the third-party counter
verifications were applied. 10 Republic of Congo Systematic Country Diagnostic, 2018. This growth rate assumes that the non-oil sector grows
at an average of 5 percent per year (it has grown at 7 percent between 2005 and 2015).

11
2018), we only consider the monetary value of additional lives saved in 2018, the final year of
PBF.
Table 2: Monetary value of additional lives saved, modeled using verified and quality adjusted coverage
Verified Verified – Quality adjusted
Benefit of PBF program (USD 2018)
$71,479,697 $94,112,294
Project Costs
Table 3 summarizes the project costs from 2015 to 2018. A more detailed breakdown of
project costs is provided in Annex 1. Two scenarios are considered. The first is the cost of
implementing PBF in the intervention zones only, which includes the cost of subsidies, the cost
of verification, salary and technical assistance for consultants, supervision, PBF training, vehicles
and motorcycles, and other operating costs only in intervention zones.11 The second scenario is
the entire cost of the program, which includes intervention and non-intervention zones, the various
health financing studies and policy dialogue, the rainbow program and the indigent targeting and
the cost to purchase of a six-month nationwide supply of vaccines in December 2017.
Table 3: Project costs of PBF and of the Health System Strengthening Project II
2015 2016 2017 2018 Total
PBF intervention
zones
$3,638,438
$8,543,859
$10,128,536
$6,563,193
$28,874,026
Entire project
cost
$3,811,476
$11,606,270
$11,995,329
$9,379,604
$36,792,679
*Central African Franc (XAF) was converted to USD using average annual exchange rates
11 Only half of the expenditures on salaries and TA costs, as well as supervision and other operating costs were
considered in 2016. This is because the remaining half was used in the control districts.

12
Results Table 4 presents the results of the analysis when considering the cost of implementing
PBF in intervention zones only, and for the entire project. When considering just the PBF
intervention zones, the Benefit-Cost Ratio (BCR) is 2.60 for the verified PBF data, and 3.42
when it is adjusted for improved quality. This suggests that every dollar invested in PBF in
Congo yields an economic return ranging from 2.60 to 3.42 dollars. The investment in PBF of
US$28.9 million generated economic benefits with a net present value of ranging from US$ 44.4
million to US$67.2 million. The internal rate of return ranged from 5.5 to 6.3 percent. When
considering the entire project cost, which also includes PBF control costs and all other non-PBF
related program components, the project is still economically beneficial.
Table 4: Project results, considering cost of PBF
Cost Scenario 1: PBF cost only
Cost Scenario 2: Entire Project cost
Verified Verified plus quality
adjustment
Verified Verified plus quality
adjustment
Benefit Cost Ratio 2.60 3.42 2.04 2.69
Net Present Value $44,438,219 $67,173,586 $36,954,920 $59,690,287
Internal Rate of Return 5.5% 6.3% 4.9% 5.6%
Sensitivity Analysis
PBF payments were made to contracted facilities based on the both the quantity and
quality of health services they delivered. Quality was measured through a quantified checklist,
a separate one for health centers and hospitals, applied each quarter by health administrators.
The quality score for health centers (hospitals) increased from an average of 42 (39) percent in
2016, to 61 (52) percent in 2017, and to 70 (51) percent in 2018. Hence, PBF influenced the
number of lives saved by increasing service utilization and improving the quality of services.
This analysis is based on a series of assumptions. A sensitivity analysis was therefore
conducted to alter key assumptions to assess the impact on results. The baseline case
presented uses the cost of PBF in intervention zones only and assumes a 3 percent discount rate
and economic growth of 3.5 percent per year. Both the verified and quality adjusted results are
considered. When the discount rate increases from three to five percent, the project is still

13
economically viable. If the assumption of a lower long-term economic growth rate is used (of 2.8
percent12), the project is also economically viable. If the project only considers the PBF subsidies
paid out for the services included in the LiST model, then the project is more economically viable
than baseline.
Adjusting for quality in this analysis has several limitations. The team used the quality
index as a multiplier for service coverage: the quality score (between 0 and 1) was multiplied by
the coverage and then the quality adjusted coverage rates was entered in the LiST. The number
of lives saved was then added to the number of lives saved when only quantity increases were
considered. This approach translates an increased quality index score into increased service
coverage. An alternative approach is to assume that anything less than perfect quality care
translates into decreased service coverage. The team therefore ran a scenario where service
coverage was deflated each year by multiplying coverage by the quality index. In this scenario
of “quality deflated coverage “, the project is still economically viable.
Table 5: Sensitivity analysis
Verified Verified – Quality adjusted
BCR NPV IRR BCR NPV IRR
Baseline case 2.60 $44,438,219 5.5% 3.42 $67,173,586 6.3%
Discount rate 5 percent 1.20 $5,542,625 5.5% 1.58 $15,720,707 6.3%
Economic growth 2.8% 1.97 $26,859,317 4.8% 2.88 $44,039,861 5.6%
Removal of PPF subsidies of services not included in LiST model
3.03 $48,327,275 6.0% 3.99 $71,062,642 6.8%
Quality deflated
coverage 2.04 $28,973,567 4.9%
Limitations
This analysis has limitations. First, the population that received the intervention was not
compared with a control population. Therefore, this analysis assumes that any increase in
coverage is attributed to the intervention, but this may not be the case. Some data suggest that
the economic conditions across Congo deteriorated over the study period (GDP per capita
12 Republic of Congo Systematic Country Diagnostic, 2018. This growth rate assumes that the non-oil sector grows
at an average of 4 percent per year (it has grown at 7 percent between 2005 and 2015).

14
decreased and GDP growth was negative in 2016 and 2017). If general health system functioning
deteriorated in non-PBF districts, the relative impact of PBF could be larger than presented in this
CBA.
Second, coverage was calculated using the number of services delivered each quarter as
reported in the PBF database as the numerator, and an estimate of the target population served
in the denominator. This approach to estimate service coverage provides a rough estimate but
may not be accurate.
Third, we are assuming that any increase in utilization is due to new patients being drawn
into the health system. In other countries, like Nigeria for example, people who had been using
private sector services were returning to the PBF facilities. Data is not available to test this trend
in ROC. However, we expect that this issue is less common because the PBF in ROC includes
contracts to the private sector. In Brazzaville and Point Noire for example, over 75 percent of
contracts were with the private sector.
Fourth, the LiST does not model all services provided through the PBF package and it
only measures lives saved for mothers and children under 5 (see Table 1). The interventions
provided through PBF do target women and children, but also have had benefits for men and
people of all ages. The number of lives saved generated from the model is likely underestimated.
Furthermore, the model only considers the financial benefits of saving lives, and not of other
program benefits like decreasing the length of illness or improving wellbeing.
Finally, to obtain quality adjusted coverage, coverage estimates were multiplied by the
average quality index score (between 0 and 1) at hospitals and health centers and entered this
data into the LiST. This approach is limited because the exact relationship between a unit
increase on the quality index score, effective coverage and the number of lives saved is
unknown.13
13 Oher studies in Nigeria and Zambia have taken a different approach to adjust for quality improvements. Studies
led by Zeng et al. have convened expert panels to develop a health-effect index for quality of care. The health-effect
index is country specific. It was then multiplied by service coverage. The results, treated as quality-adjusted
coverage, are then entered in LiST.

Document of the World Bank
Annex 1: Project Costs
2014-15 2016 2017 2018 Total % of Funds
Project PBF Costs
Payment of subsidies to PBF 464,275,000 2,634,312,181 3,667,553,474 2,414,191,223 9,180,331,878 43%
Investment unit 426,000,000 1,083,000,000 - - 1,509,000,000 7%
PBF subsidies to health facilities - 1,105,000,530 3,270,008,961 2,179,003,063 6,554,012,554 30% Investment unit to health regulatory entities 38,275,000 113,945,000 - - 152,220,000 1% Incentives to health regulatory entities Control and evaluation - 291,027,477 335,554,313 192,449,680 819,031,470 4%
Incentives to central - 41,339,174 61,990,200 42,738,480 146,067,854 1%
Verification (ACV, ACVE, ASLO) 462,842,724 1,217,845,935 1,284,058,570 470,385,810 3,435,133,039 16%
Salary and TA costs 320,989,012 190,330,161 403,605,668 360,188,680 1,275,113,521 6%
Supervision 320,989,012 49,152,403 403,605,668 360,188,680 1,133,935,763 5%
Training 454,334,892 148,975,964 - - 603,310,856 3%
Vehicles and motorcycles - 790,735,955 - - 790,735,955 4%
Operating costs (office furniture, materials) 138,704,225 98,062,064 213,545,203 91,937,794 542,249,286 3%
Total PBF cost 2,162,134,865 5,129,414,662 5,972,368,583 3,696,892,187 16,960,810,297 79%
Project Non-PBF costs
Payment of subsidies to control zones - 1,004,129,460 - - 1,004,129,460 5%
Salary and TA costs for control zones - 190,330,161 - - 190,330,161 1%
Supervision in control zones - 49,152,403 - - 49,152,403 0% Operating costs in control zones (office furniture, supplies and smail material) - 98,062,064 - - 98,062,064 0%
Cost of other training 3,566,000 85,982,132 20,052,455 132,115,150 241,715,737 1%
Indigent targeting program 6,240,995 203,159,764 364,507,921 5,748,000 579,656,680 3%
VAD - 156,340,066 79,212,601 - 235,552,667 1%
Drugs and vaccines - - 252,393,409 1,380,990,733 1,633,384,142 8% Institutional support ( studies, policies and strategic plans etc) 93,020,876 51,401,149 384,602,036 67,564,315 596,588,376 3%
Total Non-PBF cost 102,827,871 1,838,557,198 1,100,768,422 1,586,418,198 4,628,571,689 21%
Total Project Cost 2,264,962,736 6,967,971,860 7,073,137,005 5,283,310,385 21,589,381,986 100%


