Embed Size (px)
Citation preview

THE WORLD BANK
RESEARCHGB SERVER
Government Wage Policy in Africa: Some Findings and Policy IssuesDavid L. Lindauer, Oey Astra Meesook, and Parita Suebsaeng
Export-Promoting Trade Strategy: Issues and EvidenceJagdish N. Bhagwati
The State and the Invisible HandStanislaw Wellisz and Ronald Findlay
Technological Priorities for Farming in Sub-Saharan AfricaHans Binswanger and Prabhu Pingali
Education and Development: A ReviewGeorge Psacharopoulos
Pub
lic D
iscl
osur
e A
utho
rized
Pub
lic D
iscl
osur
e A
utho
rized
Pub
lic D
iscl
osur
e A
utho
rized
Pub
lic D
iscl
osur
e A
utho
rized

THE WORLD BANK
RESEARCHOBSERVER
EDITOR Richard Ff. SnapeCOEDITORS Vittorio Corbo, David TurnhamASSISTANT EDITOR Clara L. ElseMEMBERS OF THE EDITORIAL BOARD Domingo Cavallo (Fundaci6nMediterranea, Argentina), Juergen Donges (Kiel Institute of WorldEconomics, Federal Republic of Germany), Mark Gersovitz (PrincetonUniversity, United States), Vittorio Corbo, Dennis N. de Tray, EnzoGrilli, Peter Muncie, George Psacharopoulos, Richard H. Snape, DavidTurnham, William Tyler
The World Bank Research Observer is published twice a year, inJanuary and July, by the International Bank for Reconstruction andDevelopment (the World Bank). It is managed in the office of the SeniorVice President, Policy, Planning, and Research, and the Editorial Boardis drawn from across the Bank and the international community ofeconomists. It seeks to inform nonspecialist readers about economicresearch currently being undertaken within the Bank and areas ofeconomics relevant for development policy.
The World Bank does not accept responsibility for the views expressedherein, which are those of the authors and should not be attributed tothe World Bank or its affiliated organizations. Some of the findings,interpretations, and conclusions are the results of research supportedby the Bank; they do not necessarily represent official policy of theBank. The designations employed are solely for the convenience of thereader and do not imply the expression of any opinion whatsoever onthe part of the World Bank or its affiliates concerning the legal statusof any country, territory, city, area, or of its authorities, or concerningthe delimitation of its boundaries or national affiliation.
The World Bank Research Observer welcomes inquiries, comments,and editorial responses. Please direct correspondence to:
The World Bank Research ObserverEditor, Room S-13-131
The World Bank1818 H Street, N.W.
Washington, D.C. 20433, U.S.A.
The World Bank Research Observer is available on subscription at $20a year for readers with mailing addresses in countries that are membersof the Organisation for Economic Co-operation and Development.Readers with addresses in non-OECD countries are eligible to receivecomplimentary subscriptions on request.
The most recent World Bank publications are described in the annualspring and fall catalogs, which are available free of charge from thePublications Sales Unit, The World Bank, 1818 H Street, N.W.,Washington, D.C. 20433, U.S.A., or from the World Bank EuropeanOffice, 66, avenue d'lena, 75116 Paris, France.
C 1988 by the international Bankfor Reconstruction and Development/ The World Bank
All rights reservedManufactured in the United States of America
ISSN 0257-3032
Material in this journal is copyrighted. Requests for permission toreproduce articles should be addressed to the Director of Publications,The World Bank, 1818 H Street, N.W., Washington, D.C. 20433, U.S.A.The World Bank encourages dissemination of its work and will normallygive permission promptly and, when the intended reproduction is fornoncommerical purposes, without asking a fee. Permission is notrequired to make photocopies for classroom and similar immediate use.

Imp~~ortantSubscrip lon NOice$20; A~~~~~~~~~~~~~~~~JO;
is pkzbim he_ tw' ta,cots$I~
- g ImporSntSubsinnph'-OECt; e
Detach card here and mail--------------
Yes, I wish to receive The World Bank Research Observer.
Name Title
Address
City State Postal Code CountryI Subscribers in OECD countries:
I El Enclosed is my check for US$20, payable to World Bank Publications.I E Charge my El VISA El MasterCard El American Express
I Credit Card Number Expiration Date
I SignatureEl Please bill me. (Institutional orders only.)
I Purchase Order Number
Subscribers in non-OECD countries:El I am eligible to receive a complimentary subscription to The World Bank Research
Observer according to the terms listed above. Please enroll me as a complimentarysubscriber.
If paying by check, detach this card and return it with your payment in an envelopeaddressed to World Bank Publications, Dept. 0552, Washington, D.C. 20073-0552, U.S.A.Otherwise, detach this card, affix postage to the preaddressed side, and drop it in the
I mail.

_~~~_ ___ ~ 1
Affix lPostageHere l
'I
.1l
World Bank Publications1818 H Street, N.W., Room jl-085IWashington, D.C. 20433, U.S.A. .

TIE WORLD BANK
RESEARCHOBSERVER
VOLUME 3 NUMBER 1 JANUARY 1988
Government Wage Policy in Africa: Some Findingsand Policy Issues
David L. Lindauer, Oey Astra Meesook,and Parita Suebsaeng 1
Export-Promoting Trade Strategy: Issues and EvidenceJagdish N. Bhagwati 27
The State and the Invisible HandStanislaw Wellisz and Ronald Findlay 59
Technological Priorities for Farming in Sub-Saharan AfricaHans Binswanger and Prabhu Pingali 81
Education and Development: A ReviewGeorge Psacharopoulos 99

Correction
Some parts of a sentence were inadvertently dropped from the article"Land Rights Systems and Agricultural Development in Sub-SaharanAfrica" by Feder and Noronha, which appeared in the July 1987 issueof the Observer. The statement referring to Tanzania in the firstparagraph of p. 150 should read:
In Tanzania, after attempts to reintroduce the golden era of com-munal tenure, the government then began experimenting with long-term leases to individual farmers (for thirty years, which could beextended to ninety-nine years).
We regret any inconvenience this may have caused.

GOVERNMENT WAGE POLICYIN AFRICASome Findings and Policy Issues
David L. LindauerOey Astra MeesookParita Suebsaeng
y the late 1970s and early 1980s two problems related togovernment wage and employment policies had become acutein many African countries: the government's fiscal perfor-
mance and its ability to provide real goods and services to the popula-tion. Considerable research and policy dialogue have been devoted tothe problem of growing government expenditures in the face of de-clining public resources, and less to the real performance of the gov-ernment, in particular the role played by its own pay and employmentpolicies.
The government's fiscal and real performances are not independent.Under growing macroeconomic constraints, the size of the govern-ment and the level of wages and salaries of public workers have comeunder scrutiny as factors contributing to the overall problem of con-taining government budgets. Indeed, freezes or ceilings on governmentemployment and wages have frequently figured in discussions betweencountries and the International Monetary Fund in the context ofstand-by arrangements. Such agreements, often targeted at the aggre-gate level of government wage expenditures, have rarely consideredthe microeconomic implications of government wage and employmentdecisions on the actual provision of public goods and services.
In the meantime, African governments have become increasinglyunable to finance and manage the public sector. Visible signs includedeclining morale and work effort on the part of government workers,problems in staffing large numbers of skilled positions, paucity ofcomplementary inputs in producing government services, and increas-
Cn 1988 The International Bank for Reconstruction and Development/The XWorld Bank

Table 1. Growth of Public Employment in Selected African Countries, 1970-83Public sector as % Annual growthofformalsector Number of public employees rate, 1975-83
Country and coverage wage employment, 1981 1970 1975 1980 1983 (percent)
GhanaCivil service' - _ 75,000 - 20 0, 00Ob 15.oc
[100] [267]
LiberiaGovernment public service 16 - - - 3 3,600 b -Public corporations 5b - - 1 0 ,0 0 0 b -
MalawiCivil service established posts - - 31,840d 39,824 50,368 7.9e
[100] [125] [158]
MaliCivil servicef 339 26,637 31,783 45,733 49,116 5.6
[84] [100] [144] [155]Fonctionnaires 21 13,425 18,078 30,598 35,193 8.7Conventionnaires 10 13,212 13,705 15,135 13,923 0.2
Municipal and district employees 1 - - 950 - -Parastatalsh 329 - - 45,401 - -
NigeriaFederal civil service employeesi 43i 89,813k 144,8171 231,802 279,665 8.6
[62] [100] [160] [193]State and local governments - - 338,524" - 822,113 15.9e
> Parastatalsn 22 - 256,014" - 621,741 15.9eC) Total public sector _ - 716,421W - 1,723,519 15.8'Io [100] [241]
SenegalW Civil service and noncommercial public enterprises 459 61,836 71,7420 88,390 - 5.4PZ, [86] [100] [123]p
SudanC_, Budgeted positions for classified employees in central andz regional governmentsq - 131,612' 135,8915 161,893Y 2.6
[100] [103] [123] [123]Budgeted positions for unclassified employees in central and
0° regional governments - - 173,866 -

C ZambiaT Zambian employees in central and local governments
(including classified daily employees) 379 127,170" 124,760 135,750 131,646 0.7[100] [109] [106]
Parastatals 389 - 116,090 136,420 - 3.3'[100] [118]
-Not available.a,. Note: Figures in square brackets are index values.o a. Excludes educational service, police, and military. b. Data are for 1982. c. Data are for 1975-82.
d. Data are for 1977-78, when nearly 10,000 teachers were brought under the civil service established list for the first time. Thus comparable figures are not available for
earlier years.e. Data are for 1977-83.f. Data include both fonctionnaires who are governed by civil service regulations and conventionnaires who are governed by a colleCtive agreement. Municipal and district
employees are not included.g. Data are for 1980.h. Data include employees of companies under the Ministere de Tutelle des Societes d'Etat, employees working for the Operations de Developpenient Agricoles, and
employees working for other public and parapublic agencies.i. Data include both established and nonestablished staff. Established staff includes both permanent and temporary employees.
j. Public sector here includes federal civil service and state and local governments; however, data on trends in employment are available for the federal civil service only.
k. Data are for 1971. 1. Excludes Ministries of Information, Mines, and Power. m. Data are for 1977.n. Data include federal and state corporations. o. Data are for 1976. p. Data are for 1976-80.
q. Public sector includes classified and unclassified employees of the government; however, data on trends in employment are available for classified employees only.Although the number of unclassified workers is significant, data to show trends in their employment are not available. (In 1983 unclassified workers accounted for 52
percent of total budgeted positions. In 1977-78 a number of unclassified employees were transferred to the classified category.)r, Data are for 1975-76. s. Data are for 1979-80. t. Data are for 1983-84.u. Data include parastatal employment. v. Data are for 1975-80.Source: Ghana: Data from the Office of the Civil Service, Central Bureau of Statistics, as reported in Fox 1985, table 2. 1975 data are from the Report of the Commission
of Inquiry, Civil Service Structure, and Procedures. Liberia: Ministry of Planning and Economic Affairs, as reported in Khan 1983. Malawi: Government of Malawi,
Estimates of Expenditure on Revenue Accountfor the Financial Year 1983/84 as lJaid Before Parliament on 18th March, 1983, Budget Document 1 and earlier volumes.
Mali: 1970, 1975, and 1980 data based on Commission Nationale de la Reforme Administrative, Review of Trends in Civil Service Staff, 1975-80. 1983 data based on
Direction Nationale du Travail et des Lois Sociales, Office Nationale de la Main d'Oeuvre, National Conference on Employment-Employment Policy in Mali, (BilanEconomique et Financier de la Republique du Mali, 1981). These are reported in Lardeau and others 1985, tables A-1 and B-1. Nigeria: Federal Civil Service Manpower
Statistics, 1976, 1979, and 1981 (table 1.4). Reference date is September 30 until 1977 and December 31 thereafter. National Manpower Board, Federal Ministry of
National Planning, Study of Nigeria's Manpower Requirements, 1981 (Lagos, June 1983). Senegal: Direction de la Statistique, Situation Economique 1959-1979, as
reported in Bloch 1985, table 1. Sudan: Data provided by the Civil Service Department, as reported in Lindauer and Meesook 1984b. Zambia: Central Statistical Office,
Lusaka. 1970 data from Report on Employment and Earnings, 1969-71, tables 3.1 and 3.2. 1975 data from Monthly Digest of Statistics, January-March 1980
supplement, tables 2, 3, and 4. 1980 data from Report on Employment and Earnings, 1980, table 3.0; Employment and Earnings Survey, tables 1, 2, and 3 for the quarter
ending December 1980; Monthly Digest of Statistics, April-September 1983 supplement. 1983 data are from the unpublished Manpower Survey, 1983.

ing imbalance between the demand for government services and theprovision of public goods.
For a number of reasons the longer-term issues of pay and employ-ment practices and the government's real performance have not re-ceived as much attention as the shorter-term issues of fiscal manage-ment. The macroeconomic imbalance in many African economies,brought on by adverse changes in the external terms of trade, mis-guided economic policies, political instability, and other factors, hasindeed created a fiscal crisis. A contributing factor has been the con-ventional wisdom among external advisers that African governmentsare "too big" and wages are "too high," in part because of excessivegovernment pay levels which set wage standards throughout the mod-ern sector. According to this view, African countries inherited high-wage economies from the colonial period, and both the level andstructure of real wages have remained out of line ever since. Forexample, the following views were expressed in 1981: African wagesare high compared with those of Asia . . Higher African wages re-flect ... government wage policy, which in many countries sets indus-trial wages above the level they would otherwise be.' With this viewof the African situation, it is not surprising that policy advice hasconstantly called for a reduction in pay levels.
Whatever the merits of the conventional wisdom, the lack of evi-dence substantiating it is disturbing. A primary objective of this articleis, therefore, to assess the conventional wisdom by documenting re-cent trends in government wages and employment.' This task is com-plicated by the scarcity of data on wages and employment in Africancountries, particularly information disaggregated according to skilllevel and sector. The evidence presented here documents the signifi-cant real wage adjustments experienced by most government workersin the countries in our sample. A seconcl objective is to provide amore microeconomic focus on the relation between government payand employment policies and on the real consequences of such poli-cies on government performance. This focus may suggest some usefuldirections for policy reform.
Findings In our sample of African countries, public employment (includingparastatal companies) accounts for between one-fifth and four-fifths ofwage employment in the formal sector (see table 1).3 African wageemployees are typically only a small fraction of the working-age popu-lation, but the dominance of the public sector in the formal economyimplies that most wages will be influenced by government pay andemployment decisions.4 This is in contrast to advanced market econo-mies where government pay and employment policies are often thoughtto be constrained by wage levels prevailing in the private sector.'
4 Research Observer 3, no. 1 (January 1988)

Government wage and employment experiences and policies differconsiderably among African countries. Table 2 presents evidence onrelative government wage and employment levels across our sample.Note that some variance in relative wage and employment structuresis not conclusive proof of different policy approaches; it could alsoreflect underlying economic conditions. The extent of variation, how-ever, suggests that policy differences are likely to be significant. Forexample, salary differentials between senior government officials andunskilled civil servants (column 2) are roughly 25:1 in Malawi, butonly 7:1 in Zambia. And unskilled government workers in Liberiaearn more than four times the per capita income, while in Sudansimilar workers receive only three-fifths of per capita income (column4). The crude data on government employment per capita (columns 5and 6) also suggest differences in the relative size of governmentbetween countries with similar levels of per capita income.
Since significant differences in government pay and employmentpolicies exist across African economies, sensitivity to specific nationalcircumstances should be a prerequisite for policy formulation. How-ever, enough basic similarities characterize recent government wageand employment trends to suggest common areas of needed policyreform. We document these trends here, paying attention to move-ments in real government wages, the evolution of the government paystructure, the role of fringe benefits in total compensation, and gov-ernment wages and employment in relation to the government wagebill.
Wage Levels
The economic difficulties of most African countries have been asso-ciated with a general decline in real incomes. The public sector hasnot been spared. In every country in our sample and for virtually alllevels of civil servants, basic starting salaries have declined in realterms from the early or mid-1970s to around 1983 (see table 3)-oftenby significantly more than the average fall in real per capita income.The most extreme cases are in Uganda and Ghana, where real basicstarting salaries had virtually disappeared by 1983 compared with1976, and in Sudan, where by 1983 real basic starting salaries hadfallen to around one-third of their 1975 level and one-fifth of their1970 level.
Without implying that the earlier salary levels of any country werein any way correct, it is worth emphasizing that, with few exceptions,significant adjustments in real government salaries have taken place inresponse to economic downturns. In Sudan real wages fell 11-15percent annually between 1975 and 1983. In Uganda they fell by one-fifth to one-third each year over this period. Far from being rigid, real
David L. Lindauer and others 5

aN
Table 2. Government Pay and Employment Policy Outcomes in Selected African Countries, 1980-84GNP per capita, 1983 Government salary structure, Government employment per 1, 000 inhabitants
(U.S. dollars) SsI/sU.sk SUnivISU-k Sln,k/GNP per capita Established postsb Total budgeted positions'Country (1) (2) (3) (4) (5) (6)
Liberia 480 - 2.8d 4.2 d 19.1' 19.8'
Malawi 210 24.9f 9.2f 1.2g 6.8d
Nigeria 770 9.29 2.69 2.6g 10.81
Senegal 440 - 3.1 2.4g 7.0f 9.5f
Sierra Leone 330 11.3h - 1 .8 h
Sudan 400 9.3f 2.6f 0.6d 7.8d 13.6d
Zambia 580 6.9d 2"7d 2.0 13.2d 21.2d
a. Government salary structure is defined as follows: SsI/Svn,k is the ratio of starting basic salaries of senior government officials to the starting basic salaries of the lowest-paid regular government employees. Given different bureaucratic organizational forms, these occupational categories are not identical across countries, although an attemptwas made to keep categories as uniform as was possible. Senior officials referred to the following: Malawi-undersecretary; Nigeria-permanent secretary; Sierra Leone-deputy secretary; Sudan-deputy undersecretary; Zambia-undersecretary. Unskilled categories referred to the lowest-paid regular government employee, usually amessenger. SV,iISI,,k is the ratio of starting basic salaries of university graduates to the starting basic salaries of the lowest-paid regular government employees. For Malawi,Nigeria, Sudan, and Zambia the entry position for university graduates refers to administrative positions; for Liberia it refers to starting salaries for those with a bachelor'sdegree in education; for Senegal it refers to the lowest salary a university graduate receives upon entering government service.
b. Unless otherwise noted, data refer to budgeted posts for regular civilian employees. Note that this is a crude index of actual employment since budgeted positions oftena remain unfilled. For Liberia, Nigeria, and Senegal, however, the numbers refer to actual, not budgeted, positions. In Nigeria employment includes all levels of government.
c. Data differ from those for established posts in that nonregular, usually casual, employees are also included. Casual employees are included as full-time equivalents. For>- Liberia and Senegal data refer to actual employment; for other countries they refer to budgeted positions. In Sudan the distinction between established posts and totalG budgeted positions is more complex, involving distinct treatment of casual labor and of regional as opposed to central government employees. (See Lindauer and Meesookce 1984b for details.)
d. Data are for 1983.e. Data are for 1981.f. Data are for 1984.
P g. Data are for 1982.- h. Data are for 1980.
Source: GNP per capita: World Development Report 1985, table 1. In order to compute the ratio in column 4, GNP per capita figures expressed in U.S. dollars were: converted to local currencies using the annual average official market rate as reported in International Financial Statistics, various years. Population: World Development5'< Report, various years. Government salary and employment data: for Sierra Leone, Sierra Leone Government, Estimates of Revenue and Expenditure, 1979-80; for all other
countries, see tables 1 and 3.00

salaries have been eroded by inflation in the face of infrequent salaryadjustments that have not kept up with price increases. Large nominalincreases were granted to Ugandan civil servants in 1981: 30 percent,50 percent, and 300 percent more than the 1976 levels for departmentheads, university graduates, and group employees, respectively. Theseincreases were made meaningless, however, by a seventeenfold in-crease in prices.
A direct comparison between the trends in real wages of workers inthe government and private sectors is not possible because data thatcontrol for the different skill compositions of the two sectors areunavailable. Instead, a simple comparison is made between thegrowth rates of real per capita GDP and real government startingsalaries (see last two columns of table 3). In many countries govern-ment workers have borne a larger than average share of the adjust-ment to deteriorating macroeconomic conditions.
It could be argued that basic starting salaries are a poor index oftotal compensation for government workers since the time path oftotal compensation would look different if official, as well as unof-ficial, perquisites are added to basic earnings. There are a number ofresponses to this argument.
Even with a more complete accounting of official total compensa-tion, including basic wages and fringe benefits, the results of decliningreal salaries seem to be robust with respect to a number of adjust-ments that can be made to basic starting salaries. The major fringebenefit, housing (which can be in the form of actual housing or ahousing allowance) helps to cushion part, but not all, of the decline inreal salaries. If, as is often assumed, households spend about 25-35percent of their income on housing, then, for those who receivehousing, 65-75 percent of total compensation is still subject to beingeroded by rising consumer prices. In the face of the price inflationsexperienced in our sample of countries, housing benefits may onlymarginally slow the trend in declining real pay of government of-ficials. Furthermore, many government workers, although nominallyentitled to government housing, receive no housing benefit at all andare thus exposed to the full brunt of escalating urban prices.
Other official benefits-for example, transport, health, and familyallowances-are all difficult to quantify. Impressionistic evidence sug-gests that they do not cover the majority of government workers, areusually small relative to basic wages, and have generally not beenincreased in response to falling real wages. There is little evidence thatnonwage benefits have significantly altered the trends in real payreported here.
As for unofficial perquisites of office, there is no denying that somegovernment jobs provide access to scarce commodities, valuable con-tacts, and the opportunity for illicit incomes through bribes and kick-
David L. Lindauer and others 7

Table 3. Trends in Real Basic Starting Salaries in the Public Sector in SelectedAfrican Countries, 1975-83(1975 = 100)
Annual growth, 1975-83 (percent)
Country and grade 1970 1975 1980 1983 Salary Real GDP per capita
Ghana -4.82-Principal secretary/chief/director/deputy engineer in chief - 100' 41.4 11.0 -30.8b5-Officer/administrative III/senior works superintendent - 100 49.5 15.3 -26.9b10-Messenger/watchman/laborer - 100' 94.8 39.7 -14.3bMalawi 1.2SS-Undersecretary - 100 84.0 64.5 -5.3A3-University graduate - 100 96.2 73.9 -3.7D6-Messenger - 100 92.2 85.2 -2.0Nigeria -2.117-Permanent secretary 85.9' 100 47.0 30.1 -13.98-University graduate 82.1c 100 50.1 38.1 -11.41-Unskilled laborer 69.2c 100 76.5 63.8 -5.5Senegal -2.6
PO A-With university degree - lood 106.5' 73.8f -3.79B-With secondary school diploma _ 100" 114.3' 84.7f -2.15E-No diploma - lOOd 128.5S 112.7f i1S9Sierra Leone 0.2
Z Deputy secretary 122.0 100 62.2 - -9.1'Technical officer 119.0 100 70.2 -- 6.8hMessenger 111.1 100 103.3 - 0.71
W' Sudan - 5.2iz 4-Deputy undersecretary 151.8 100 59.6 28.7 -14.4
9-University graduate 177.7 100 64.9 31.2 -13.514-Secondary school graduate 167.1 100 66.5 32.0 -13.318-Unskilled worker 153.3 100 72.7 35.0 -12.3Uganda -3.2U1-Permanentsecretary/undersecretary -lood 7.7e 5.0i 34.8k
0 US-Entering university graduate lood 9,1e 5.9i _33 koo? Group employee - lood 2371 154i -23.5k

D) Zambia -2.4g> S3-Undersecretary 131.61 100 68.2 44.9 -9.5
512-Entering university graduate 105.71 100 63.0 40.9 -10.6S21-Lowest salaried employee 98.51 100 88.7 83.0 -2.3Laborer 95.81 100 85.2 87.7 -1.6
- Not available.a. Data are for 1977. d. Data are for 1976. g. Data are for 1976-84. j. Data are for August 1983.
b. Data are for 1977-83. e. Data are for 1981. h. Data are for 1975-80. k. Data are for 1976-83.a c. Data are for 1972. f. Data are for 1984. i. Data are for 1975-82. 1. Data are for 1971.
Source: Real basic starting salaries: Gbana: Office of the Civil Service, Central Bureau of Statistics. Basic starting salaries are deflated by the consumer price index (cpi) forAccra City. Malawi: Official salary scales of the governmiient of Malawi. Starting salaries are deflated by the low-income cni for Blantyre, excluding rent, as reported in the
International Monetary Fund, International Financial Statistics, 37, no. 3 (March 1984). For 198.3, the deflator refers to November 1983 and is not the annual average as it
is for all other years. Nigeria: 1972, 1975, and 1979: 0. Fajana and A. Aderinto, Factors Affecting Public Sector Salaries Policy in an Open Economy: Nigeria (Ottavwa:International Development Research Center, 1981), tables 2.4 and 2.5. 1981 and 1982: Preliminary table on trends of pay in civil service since Udoji from Public Service PayResearch Unit, Establishments Department, Office of the Head of the Civil Service of the Federation. Figures for 1979 and 1981 are the same; these are assumed to be the
1980 figures. Figures for 1982 remained ulnchanged through 1984. Nominial starting salaries are deflated by (a) cpi for Lagos (1965-77) and (b) cpi for all urban areas(1975-83). These are two distinct cpi series which cannot be linked. The latter series is also available separately for low-, middle-, and high-income groups. Because the
consumer price trends for these groups are not very different, the all-tirban cpi is used. Consunier price indexes are from Annual Abstract of Statistics, 1975, table 10.7(Lagos series), Digest of Statistics (June 1981), table 6.2, and The Consumer Price Index Report, April-June 1982, table 2 (all-urban series). Senegal: Figures refer to
average pay for the hierarchy, not startinig salary. Data for 1976 are fromii Ministere du Plan et de la Cooperation, Division des Ressources Humaines, "L'emploi dans IC
ecteur Public: Evolution et perspectives,' 1978; data for 1981 and 1984 are from Direction de Trailement Automzatique de l'lnform7ation, the Ministry of Finance computer
enter, as reported in Bloch 1985, table 8. Nominal figtires are deflated by CPI-A, the African Consumer Price Index, Direction de la Statistique, Situation Economique,
Ministere des Finances. Sierra Leone: Salary scale for civil servants is from Estimates of Revenue and Expenditures. Nominal salaries are deflated by Freetown cpi. SudHan:
Salary scales provided by the Civil Service Department. All figures refer to June. Higher-Salaries Consumer Price Indices for 1970-8.3 and preliminary figures for Junc,
November, and December 1983 are provided by the Department of Statistics. Uganda: Basic starting salaries for 1976 and 1981 are taken from appendix 1, "The RevisedSalaries in Shillings per Anllnm-Effective on 1st July, 1981:' attached to memorandum EC 9442, Amendments to Circular Standing Instruction No. 2 of 1976-Increasesin Salaries/Wages, from the Permanent Secretary of the Ministry of Public Service and Cabinet Affairs. Between 1981 and 1983, salary scales remained unchanged. Norninal
salaries are deflated by the Kampala cost-of-living index (low-income groLip), Statistics Department, Ministry of P'larning and Economic Development. Zambia: 1971:"Report of the Commission Appointed to Review Salaries, Salary Structures and Conditions of Service of the Zambian Public Service and the Defense Forcc," Government
Paper 1, May 1971, appendix A and conversion table 48 of the main report. 1975:"Summary of the Main Recommendations of the Commission of Inquiry into the Salaries,Salary Structures and Conditions of Service, Together with the Party and Governrnent Reactions to the Recommendations,' Government Paper 1, 1975, appendixes B and
C. 1980: "Sumnmary of the Main Recommendations of the Administrative Commnittee of Inquiry into the Salaries, Salary Structures and Conditions of Service, 'Together with
the Party and its Government's Reactions to the Recommendations," Government Paper 3, 1980, appendixes B and K. Also reported in Personnel Circular B9, Personnel
Division, appendixes B and D. 1983: Personnel Circular B3 of 1984, Personnel Division, appendixes BI and B3. Figures refer to November 1983. S3 salaries are deflated byhigh-income urban cPI, the others by low-income urban cPi. In 1975, low-income included houscholds with gross monthly incornes less than K100, and high-income
included households with gross monthly incomes of K300 or more. cPi data are from Monthly Digest of Statistics, May 1973, September 1974, January-February 1976,
November-December 1977, andJuly-September 1982; and Consumer Price Statistics, May 1982, April 1984, andJuly 1984.Real GDP per capita: International Monetary Fund, International Financial Statistics, various years. GD)P in constant prices divided by midyear estimates of population.

backs. Measuring these forms of income is clearly beyond the scope ofthis (and probably any) study. However, it should be emphasized thatmost civil servants-teachers, health workers, typists, secretaries, andmessengers-are not likely to be in a position to take advantage ofsuch income sources. For those officials who can gain financially fromthe abuse of their offices, it is difficult to determine how far decliningreal salaries may be a contributing cause to any increases in illicitgains.
Determining trends in total compensation is obviously difficult, butin the case of Zambia it has been possible to estimate other com-ponents of remuneration besides basic wages. The addition of housingbenefits does not significantly alter the trend suggested by real basicsalaries (see table 4). Similarly, adjustments for income taxes, while in
Table 4. Trends in Real Basic Starting Salariesfor Government Workers after Various Adjustments,Zambia, 1975-83(1975= 100)
Type of adjustment and grade 1975 1980 1983
Basic starting salaryS3-Undersecretary 100 68 45SI12-Entering university graduate 100 63 41S21-Lowest-paid salaried employee 100 89 83
Basic starting salary plus value of imputed rentS3-Undersecretary 100 75 56S12-Entering university graduate 100 73 59S21-Lowest-paid salaried employee 100 96 92
Basic starting salary plus housing allowanceS3-Undersecretary 100 70 46S12-Entering university graduate 100 66 42S21-Lowest-paid salaried employee 100 96 82
Net-of-tax basic starting salary-single individualS3-Undersecretary 100 62 47S 12-Entering university graduate 100 62 41S21-Lowest-paid salaried employee 100 87 81
Net-of-tax basic starting salary-married individual with fourchildren
S3-Undersecretary 100 63 47S12-Entering university graduate 100 63 42S21-Lowest-paid salaried employee 100 89 83
Basic salary allowing for annual progression and salary awardsS3-Undersecretary 100 92 69S12-Entering university graduate 100 77 54S21-Lowest-paid salaried employee 100 105 98
Source: Meesook and others 1986, table 4.2.
10 Research Observer 3, no. 1 (January 1988)

the expected direction, are of little significance. Finally, when allow-ances are made for progression of Zambian civil servants up thesalary scale, it is still the case that real salaries have fallen consider-ably for all but the lowest-paid government workers.
For our sample as a whole, official nonwage benefits do not appearto have grown in response to declining real salaries. If anything, manyof them, including the provision of housing and petroleum, havedecreased since the mid-1970s, owing to increasingly severe fiscalconstraints. Thus we conclude that real starting salaries can be con-sidered a robust indicator of the real compensation of governmentworkers over time.
It must be noted that declines in real wages have not been confinedto civil servants; similar results are obtained for parastatal and privatecompany employees.6 Government workers, however, appear to havefared less well than other workers in the formal sector. These resultsare particularly important when assessing the relative attractiveness ofgovernment jobs and the impact of relative wages among differentemployers in allocating labor throughout the wage economy.
Wage Structure
Some African governments have pursued pay policies that favorlower-skilled workers, who have therefore experienced a smaller de-cline in real earnings than the higher-skilled (table 3). This is especial-ly true for government workers in Nigeria, Senegal, and Zambia. InZambia the starting salaries of unskilled workers in 1983 adjusted forinflation were 88 percent of what they had been in 1975; for undersec-retaries, however, the share was only 43 percent. One way that gov-ernments have favored the unskilled has been by granting the sameabsolute increases to all groups. As a consequence, there has been ageneral compression of the wage scales of civil servants whereby theratio of the highest to lowest salaries has been reduced over time(table 5). In Zambia, where there was a conscious government policyto narrow the gap between the higher and lower skill categories,undersecretaries are paid seven times as much as the lowest-salariedemployee, compared with twenty times as much in 1971 and fifteentimes as much in 1975. Although complete data are not available,differentials between higher- and lower-skill workers in the parastataland private sectors also seem to have shrunk.
Within the government sector, the policy of compressing the wagestructure over time has exacerbated the overall problem of decliningreal wages. Policies to reduce pay differentials between higher- andlower-level staff have been implemented without sufficient regard tostaffing needs, vacancy, and turnover rates. Moreover, governmentpolicy has sometimes been directed at the parastatal and private sec-
David L. Lindauer and others 11

Table 5. Salary Compression in Selected AfricanCountries, 1970-83
Total percentagechange in salary
compression,Country and comparison 1970 1975 1980 1983 1975-83
MalawiCivil serviceUndersecretary/unskilled - 33.0 30.0 29.8 -9.7
NigeriaCivil servicePermanent secretary/
unskilled 21.9a 17.6 15.4 9.2 -47.7Private sectorbChief executive/unskilled - 47.3C 25.1 1 7 .6d -62.8'
SudanCivil serviceDeputy undersecretary/
unskilled 13.0 13.1 10.8 9.3f -29.0
ZambiaCivil serviceUndersecretary/ lowest salaried
employee 19.29 14.5 10.3 6 .9 h -52.4Parastatal
ZIMCO managing director/securityguard - 12.6 - 12.8 1.6
zccM supervisor/unskilled 4.7 5.4 4.8 4.4 -18.5Private
Constructionworker-skilled/unskilled - 1.6 1.3 1.2 -25.0
-Not available.Note: Salary compression is measured as the ratio of basic starting salaries of the highest to
lowest skill categories for which data are available.a. Data are for 1972. e. Data are for 1976-82.b. Median salaries. f. Data are for December 1983.c. Data are for 1976. g. Data are for 1971.d. Data are for 1982. h. Data are For November 1983.Source: Civil service salaries: See table 3 for sources.Parastatal and private sector salaries: Nigeria: 1976-80: Pay Comparability Survey Report,
Pay Research Unit, Establishments Department, August 1980; checked against preliminarytable on trends of pay in civil service since Udoji, 1982, from Public Service Pay Research Unit.1982: Preliminary Table on Rates of Wages and Regular l-ringe Benefits, 1982, from Wagesand Productivity Unit. Zambia: zIMCO: Data supplied by ziMco and contained in appendix B1,Actual Salary Notches on ziMco Corporate Salary Structure, of 1984. zccM: Data provided bythe Copper Industry Service Bureau, Pay Research Unit, Kitwe. Construction: Data collectedfrom collective agreements between the Employers Association of the Building and Civil Engi-neering Industry and the Union of Building, Engineering and General Workers. See Meesookand others 1986, appendix tables 11, 12, and 16.
12 Research Observer 3, no. 1 (January 1988)

tors as well, so that real wage rates for the unskilled have been keptup relative to those for higher-skilled groups.
At the higher end of the scale, relatively low salaries have resultedin difficulties for the government in attracting and retaining qualifiedstaff, many of whom leave for other sectors or other countries. Theloss of skilled manpower and the decline in productivity of the re-maining higher-level staff together are also likely to have adverseeffects on the productivity of the rest of the staff who are managed bythem. The compression in the wage structure over time also appearsto have reduced the incentives of workers to acquire skills, as hasbeen reported for the construction industry in Zambia. This trendshould be a source for concern for the long run.
Policies of "narrowing the gap" beyond relative wage adjustmentsdictated by market forces have had several motivations. They havebeen supported by trade union movements, especially in Zambia.They are consistent with elements of African socialism, the politicalideology expounded by many leaders. They are defended on the basisof equity objectives. Although there may have been grounds for somenarrowing of wage differentials in postindependence Africa, we do notbelieve that recent wage compression in the public sector has neces-sarily improved income equity within each nation as a whole. In fact,if such pay policies compromise the performance of the public sector,a general decline in national income, not an improvement in incomeequality, may be the main consequence.
In general, policies that lead to compression in salary structuresmay be politically more acceptable than alternative measures duringperiods of economic downturns and declining national income. Fur-thermore, market forces, especially the rapid expansion since the1960s of schooling opportunities and hence of educated manpower,have probably warranted a narrowing in various dimensions of thewage structure over time. In some African economies, however, thedegree to which the government has compressed the salary structuremay have created significant problems of labor allocation whose nega-tive consequences may persist for a substantial period of time.
Another related consequence of government pay policies is theresulting relationship between the salary levels and structures in thegovernment and those in the parastatal and private sectors.7 Althoughthe data are poor, they suggest that salaries in parastatals are general-ly higher than those in the civil service for all grades and that privatecompanies pay skilled workers more, and unskilled workers less, thandoes the government (see table 6).
In Zambia the parastatal premium over government pay for com-parable jobs ranged from 13 to 48 percent for unskilled workers. Asurvey in Mali showed that salaries in the civil service were generallylower than those in state companies and private enterprises. Indepen-
David L. Lindauer and others 13

Table 6. Salaries in the Government, Parastatal, and Private Sectors in Selected Countries, 1980-84(government = 100)
Type of enterprise
Country and grade Government Public Private
Liberia, 1983 Government Rubber concessionsUnskilled worker 100 52Mali, 1984 (basic salary) Civil service State enterprisesHigher-level staff (category B7) 100 103Lower-level staff (category B1) 100 131Nigeria, 1982 (median salary) Public sector Private sectorPermanent secretary/chief executive (grade 17) 100 202University graduate (grade 8-9) 100 176Unskilled (grade 1) 100 Public corporations 105
Central and regional Public corporations National ElectricitySudan, 1983 (starting basic salary) government under 1976 act Corporation Sudan RailwaysDeputy undersecretary (grade 4) 100 121 125 104University graduate entry (grade 9) 100 125 125 108Secondary graduate entry (grade 14) 100 112 122 110Unskilled worker (grade 18) 100 104 113 110Uganda, 1983 (starting basic salary) Public service Parastatals Private companiesHigh level (Ul) 100 146 116University graduate 100 146 187Lowest level 100 129 109
t Zambia, 1980 (starting basic salary) Civil service Parastatals Private companiesc, Supervisor 100 106 1328 Clerk typist 100 93 112
O Gen.eral laborer 100 148 84> Zambia, 1983 (average earnings per bour)Q Professional 100 131 144e Clerical 100 125 144
> Laborer 100 113 79
° Source: Liberia: Khan 1983, p. 20. The author reports that "the results are at best crude approximations and they conceal a good deal of variation within each sector."Nevertheless, he concludes that "the wage rate in the Government sector is completely out of line with that in the other parts of the economy" and that the differential has
'p' been widening. Mali: Lardeau and others 1985, table B-5. Nigeria: "Preliminary Table on Rates of Wages and Regular Fringe Benefits, 1982" from the Wages and; Productivity Unit, as reported in Suebsaeng 1984, table 7. Sudan: Lindauer and Meesook 1984b, table 4.2. Uganda: Meesook 1983, table 1. The figures reported are based.< on average basic salaries for comparable employees in five parastatal and two private companies obtained from salary scales and information provided by the companies.
Zambia: Meesook and others 1986, tables 4.8 and 4.7.co

dent studies of Tanzania reveal that in both 1971 and 1980 parastatalemployees received wages significantly different from those of workersin the private sector, and in both cases more than those of governmentworkers. By comparison, in Kenya occupational wage differentials byemployer generally seem to be less significant.8
In evaluating pay differentials for workers of comparable skills andqualifications across the government, parastatal, and private wagesectors it is important to compare not only basic salaries but alsofringe benefits, allowances, and other job characteristics (see table 7).Given differing degrees of job security across employer groups, com-plete wage parity for even similar categories of workers should neitherbe expected nor desired. Moreover, wage parity, which is consistentwith the efficient allocation of labor under perfect competition, maynot be consistent with efficiency under alternative market structures.9
Thus, although the difference between private and government wagesmay signal the direction in which the government may wish to adjustits wage, the private wage is not necessarily the one that should beoffered by the government, since government wage and employmentactions will in turn affect the private wage. However, in some settingsthe existence and persistence of public wages higher than comparableprivate ones, or of parastatal wages higher than comparable govern-ment ones, may constitute a monopoly rent that is both costly andinequitable to the extent that it accrues only to those workers fortu-nate enough to secure the better-paying positions.
Few parastatal enterprises have complete autonomy over their ownpay scales. Governments play a big role and ought to permit stateenterprises to attract and maintain qualified staff. However, sinceparastatals are often operated without strict regard to commercialprinciples, the government also ought to be concerned to preventgenerous salaries from translating simply into losses absorbed by thegovernment treasury. In most African countries parastatals have beenable to obtain finance from the government when they have run at aloss or lacked the resources for investment. This ease of financing hasreduced management incentives to operate efficiently and control thewage bill. Higher pay in parastatals may also lure qualified civilservants out of their ministries. Thus the public enterprise sector maybenefit from the government in two ways: from receiving transfers offinancial resources and from being able to use these resources toattract skilled workers away from the government.
As a result, some governments have tried to force parastatal pay toconform to government levels. The Udoji pay reforms instituted suchan alignment in Nigeria in the mid-1970s. In Sudan many parastatalscome under the 1976 Public Corporations Act and are governed by acommon salary scale. In Zambia the authorities unified the salaryscales for the government and parastatal companies in 1975.
David L. Lindauer and others 15

Table 7. Fringe Benefits in Selected African CountriesCountry Benefit
Liberia 1981: Commission to look into public corporation salaries found thatnonsalary benefits in the public corporations for higher- and lower-levelemployees were substantially better than those provided in the government.The lower-skilled categories in the government do not receive any fringebenefits except for some transportation allowances.
Mali 1984: Civil servants received on average allowances and benefits equaling 27.5percent of total compensation, or 37.9 percent of basic salary.
Allowances and benefits differ between. the government and parapublicorganizations:Benefit Civil service ParapublicFamily allowance CFAF 1,000 per child CFAF 500 per child
per month per monthMedical Basic plan Slightly betterWorkman's compensation Basic plan Slightly betterRetirement Better Basic planHousing Provision fcor some None, but long-term,
(< 1 percent in low-interest loans areBamako area). 20 available for purchasepercent of estimated of housing.market rent isdeducted from salary.
Malawi Government, 1983: All government employees are eligible for housing.Approximately 85 percent are housed ancl pay 10-121/2 percent of basic salaryin rent. Those waiting for housing do not receive any allowance or benefit; 77percent of them are eligible for the lowest type of housing (class F).
Public enterprises, 1983: Housing benefits system parallel with government.Employees pay 5-71/2 percent of basic salary in rent.
Nigeria 1982: All fringe benefits taken together can constitute 35-100 percent of basicsalary. Civil servants receive either government quarters accommodations or ahousing allowance. Private employees receive free furnished housing or anallowance.
Housing allowances as a percentage of median salaries:Level Public PrivatePermanent secretary (level 17) 5 9-31University graduate (level 8-9) 11 7-17Unskilled (level 1) 8 7-22
For both public and private sectors, transportation is an equally importantallowance; sometimes transport allowances exceed housing allowance benefits.The leave allowance is also significant for employees in both sectors.
Senegal Government, 1984: Budget figures show that on average civil servants' fringebenefits account for 64 percent of base pay; for public enterprises, theyconstitute 53 percent of base pay. Very few government officials have the rightto be housed-only the top grades and regional governors. They either gethousing for which they pay 35 percent of base salary in rent or an allowance of100,000-250,000 francs per month. Most: prefer to be housed. In 1984, theaverage salaries of top officials ranged frorn 150,000-203,000 francs permonth; thus, housing allowance as a percentage of average salary ranged from67 to 123 percent. If, however, persons in the highest hierarchies do gethousing, it is estimated that an average leased property is worth 415,000 francs
(continued)
16 Research Observer 3, no. 1 (January 1988)

Table 7 (continued)Country Benefit
per month, the average mean income of hierarchies A & B equals 160,000francs per month; 40,000 francs of rent must be paid per month. Thus theestimated value of getting housing equals 47 percent of base pay. Manyteachers who used to be eligible for housing have lost their rights to be housed,but instead receive 25,000 francs per month allowance. The government alsoprovides indemnities for doing unpleasant work. There are also productivitybonuses and numerous other benefits.
Parastatals, 1984: Provisions are similar to the government. Modest housingallowances are provided to a small number of employees.
Sudan Government: Fringe benefits and allowances are relatively unimportant. Freeor heavily subsidized housing is not generally provided by the government.
Public corporations: In general offer better benefits and allowances com-pared with the government. Sudan Railways (with allowances estimated at 25percent of basic salaries) also provides housing at nominal rent to some staff.
Uganda Government, 1983: Fringe benefits and allowances are unequally distributedacross grades. With regard to housing, there are only 4,000 government poolhousing units; those in grades U5 and above are eligible but only the very topofficials are likely to get housing and they pay a nominal rent. The rest of thosewho are eligible for housing but do not get it, as well as those who are noteligible, do not get an allowance to compensate.
Estimated value of housing benefits as a percentage of basic salaries:Level Public Parastatal PrivateHigh 102-358 45-275 16-17Middle (university graduate) 40 50-235 16-63Low None 30-85 24
It must be noted that transportation allowances are large in the parastatalsector for middle- and high-level employees, in some cases amounting to morethan housing allowances. They are also important for high officials in thegovernment.
Zambia Government, 1983: Approximately 62 percent of eligible civil servants arehoused; 35 percent are on waiting lists and receive an allowance; 3 percentown their own homes and receive an allowance.
Parastatals, 1983: Approximately 74 percent of all employees are providedwith housing. Others receive an allowance.
Private companies, 1983: Do not generally provide housing except for veryhigh executives. Employees receive an allowance.
Housing benefits as a percentage of basic salaries:Estimated value Those Those receiving
for those provided receiving homeownersLevel with housing allowance allowanceS3 43 8 35S7 63 11 43S12 90 12 54S21 90 25 57
Source: Liberia: Khan 1983, pp. 13-14. Mali: Lardeau and others 1985. See, in particular,table B-7. Malawi: Lindauer and Meesook 1984a. Nigeria: Suebsaeng 1984, table 7. Senegal:Bloch 1985. Sudan: Lindauer and Meesook 1984b, pp. 11, 33. Uganda: Meesook 1983,pp. 4-5 and table 1. Zambia: Meesook and others 1986, p. 84, p. 90, and table A.2.2.
David L. Lindauer and others 17

Under such arrangements parastatal companies usually find ways tocircumvent specified salary scales and so maintain a premium overgovernment pay. In Zambia, for example, an extended scale for pro-fessional and technical workers was instituted in the parastatals, al-lowing salaries to be increased by as much as 40 percent of their basiclevels. Where parastatals are unable to add a premium to their basicpay, they often lose (or fail to recruit) slcilled technicians and seniormanagers, because of competition from private employers, bothdomestic and foreign. Thus, attempts to control parastatal pay bylegislating uniform salary scales have a tendency to fail eventually.Giving public enterprises the incentive to operate on commercial prin-ciples is likely to be the best strategy for minimizing the problemsassociated with the determination of pay in the public sectors.
Forms of Compensation
As already noted, fringe benefits are widespread in Africa, thoughthey vary greatly among countries, sectors, and grade levels.'0 Hous-ing, for example, is often provided by African employers, especiallyby the public sector-but it is not a customary fringe benefit inSudan.
Nonwage benefits affect compensation in a variety of ways, beyondthe trends that have already been discussed in the real value of wages.First, fringe benefits and allowances often constitute a significant frac-tion of total compensation and of the government's wage bill. Second,in virtually all countries, fringe benefits and allowances are unequallydistributed across grades, with senior officials typically receiving rela-tively more generous benefits. For instance, in Malawi, most of thosewaiting for housing are the lowest paid, who do not receive anyallowance or benefit to compensate. In Uganda only top officials arelikely to be housed; the rest of those who are eligible for housing buthave not received it, as well as the majority of employees who are noteligible at all, do not get any allowance to help meet housing costs.Third, housing is usually considered by government employees to betheir most valuable fringe benefit and those who have the choicewould always prefer to get housed rather than to receive an allow-ance. Housing is generally inelastic in supply and expensive. Employ-ees who manage to get government quarters pay a nominal rent(usually not exceeding 10 percent of basic salary) and thus end up in abetter position relative to their counterparts who have to pay higherrents at market prices. Fourth, the quality of government-providedhousing often bears little relation to the income of the recipient.Government workers may receive housing built according to stan-dards dating back to the colonial period, with a market rental valuewhich may equal or surpass the recipients' basic wages. Such a system
18 Research. Observer 3, no. 1 (January 1988)

clearly wastes scarce resources, since it imposes an overconsumptionof housing on civil servants. Fifth, transportation allowances are sig-nificant for some senior officials in certain countries. Finally, there areindications that fringe benefits are more generous in the parastatalsector than in the government. Indeed, increasing the provision offringe benefits is one way to evade governmental attempts to holddown wages in parastatal companies.
In many African countries civil servants have come to expect cer-tain fringe benefits more or less as a right. Governments, however, arefinding it increasingly difficult to maintain their provision, especiallyof housing. Thus, the system often results in cases where individualsin the same grade have very different levels of total compensation,depending on whether or not they have government housing. Such asystem produces obvious inequities as well as inefficiencies. Whenevercompensation becomes separated from performance and remunerationis tied to connections or the "luck of the draw," the payment systembecomes less effective as an incentive for performance and more opento the possibilities for corruption.
Many African economies now face the task of financing their com-pensation systems under severe budgetary difficulties. Throughout Af-rica government workers are experiencing frequent arrears in theirwages. In addition, benefits to which they are entitled, either by law orcustom, are often not provided. Housing is the most obvious examplebut health benefits, pensions, and other payments are also often notreceived. As part of the overall solution to budget deficits, a broadrestructuring of compensation packages would be desirable. A growingawareness of the need for reform is evident in several countries."
Government Employment
After independence, public employment in many African countriesgrew in response to increased demand for public services, especially ineducation and health care. Although data are poor, especially thoseon parastatal employment, it is clear that government employmenthas been growing, often rapidly, in all countries in our sample (seetable 1). In Sudan the creation of stronger regional governments dur-ing the mid-1970s resulted in the total number of budgeted positionsexpanding by 2.6 percent a year-even though regionalization wassupposed only to transfer staff from the central to regional bureau-cracies. In Nigeria public employment increased partly as a result ofthe creation of administrative units in newly formed states. At thesame time federal civil service employment tripled between 1971 and1983. The government of Senegal has apparently felt obliged to hireworkers to reduce unemployment, particularly of secondary and uni-versity graduates. Shortly after the change in regimes in Liberia in
David L. Lindauer and others 19

1980, government employment expanded rapidly, apparently far inexcess of any reasonable projection of the demand for public services.By comparison, Zambia seems to have been more restrained in itsexpansion of government employment-although government em-ployment per capita started at a much higher level (see table 2).
Many explanations are offered for growing government employ-ment. General economic contraction and stagnating agriculture seemto have limited the job opportunities in the private sector. The pres-sures of rising urban unemployment may have influenced many gov-ernments to expand public employment beyond what their fiscal re-sources could comfortably bear.
Lack of the appropriate data makes it difficult to assess the relativechanges in employment of different groups of government employees.Nonetheless, the numbers of lower-skilled employees seem to havegrown relatively faster. For example, in Zambia between 1978 and1983 the number of classified daily employees grew at an annual rateof 4.2 percent compared with 1.3 percent for civil servants. In manycountries (such as Nigeria, Sudan, Uganda, and Zambia) daily em-ployees form a group separate from other civil service grades. Accur-ate records of their numbers are not kept, so when a freeze or ceilingon increases in government employment has been imposed, hiringextra daily workers becomes a way of evading the regulation. Further-more, they are paid from a budget separate from other civil servants.Although the daily-paid are considered to be temporary workers, inZambia many of them have been at their jobs for years. Their averagewage is comparable to the average salary of the lowest-paid civilservant.
While the public sector expands its payroll, it is often also plaguedby skill shortages. For example, in Zambia job vacancies in the gov-ernment for doctors, technicians, engineers, and accountants cannotbe filled. Uganda, too, has shortages, especially of accountants. Somecountries have been affected by labor demands from abroad. Higherwages in the Gulf states have drawn experienced labor out of Sudan.In Mali teachers have migrated to neighiboring countries in responseto better pay.
The growth in government employnient in many countries hastended to exacerbate the difficulties of administering wage policy inthe public sector. Employment growth has not necessarily occurredfor skill categories in short supply, such as doctors, accountants, andskilled administrators. This leads to a changing input mix of laborskills in the government. Efficiency problems in the government maybe in part a consequence of the failure to maintain appropriate laborskill complementarities. The greater numbers of government employ-ees at lower skill levels also diminish the government's ability to makepay levels more attractive for the skilled personnel it needs.
20 Research Observer 3, no. 1 (January 1988)

Government Wage Bill
Despite the fall in real wages in the public sector, the governmentwage bill has been widely seen as a source of economic difficulty. Asignificant share of total government expenditures goes to pay govern-ment employees. This share has been growing. In Zambia it increasedfrom 18 percent in 1970 to 28 percent in 1983; the wage bill rose at anannual rate of 12.8 percent, compared with 8.9 percent for totalgovernment expenditure. In Senegal the average rate of growth of thegovernment wage bill since 1978-79 has been 14 percent, representingan increase in real terms over this period. In one extreme case, wagesand salaries as a proportion of total public revenue in Liberia jumpedfrom 36 percent in 1977-78 to 66 percent in 1981-82.
Both increases in employment and in nominal wages and salarieshave contributed to the rise in the share of the wage bill over time.For Zambia the increase in the wage bill between 1978 and 1983 canbe divided as follows: 84 percent from nominal salary increases toexisting staff, and the remaining 16 percent from increases in staffnumbers. Since the number of classified daily employees grew fasterthan that of established staff, and their salary increases were alsorelatively greater, their share of wages increased over this period.
The increase in the share of the wage bill in total governmentspending has put a squeeze on other types of expenditures. Theseinclude complementary inputs, needed in the production of govern-ment services (such as paper, typewriters, cars, and gasoline in thecase of Uganda). Such changes in the input mix signal potentialinefficiencies in the use of government resources. Furthermore, in-creases in wage expenditures, other things being equal, imply a de-crease in capital expenditures, which are urgently needed in thesecountries for their long-term development.
The consequences of falling real wages in the public sector have in Policy Issuesextreme cases (such as Ghana, Sudan, and Uganda) been a demorali-zation of the civil service and a deterioration in government perfor-mance. In Uganda in 1982 the Public Service Salaries Review Commis-sion found that "the civil servant had either to survive by lowering hisstandards of ethics, performance and dutifulness or remain uprightand perish. He chose to survive.""12 Of course, the ongoing politicaltension in Uganda has also significantly contributed to the fallingproductivity of government employees. However, along some margin,declining real wages must be expected to affect work performance.
In Uganda it has been estimated that government employees spendonly one-third to one-half of their normal working hours on govern-ment work; the rest of the time is devoted to other jobs that they take
David L. Lindauer and others 21

in order to survive, such as farming or trading. The deterioration incivil service performance has occurred at a time when, more thanever, governments require an efficient administration to help bringrapid economic recovery.
Declining real pay and deteriorating jcb performance are not inde-pendent of each other; civil servants' work effort is not wage inelastic.The response of workers to declining real compensation is complex.Workers may seek other opportunities vvhere the relative returns totheir effort are higher. They may do so by leaving or simply notjoining the public service. They may also moonlight, either on or offthe job. Another alternative is for workers to increase their leisuretime by decreasing their work effort.
What compounds the problem is that, once such responses becomewidespread, discipline breaks down in government offices. Supervisorslose the ability to reprimand their subordinates for not spending theright time and effort on the job because they are themselves guiltyof the same transgressions. Moreover, the most productive workers,especially among the highly skilled, are the ones most likely to beoffered jobs outside the government. This lowers overall productivityin the civil service, both because of the workers' own departure andthrough their effect on the performance of those who stay behind.
There are no simple solutions to the problem of declining productivityamong civil servants. The policy recommendations summarized here canonly provide some guidelines and suggest feasible action that govern-ments might wish to adopt. Yet it is clear that some pieces of conven-tional wisdom have been unhelpful: that "African wages are too high"and that inappropriate real wage levels and structures in African coun-tries have been maintained over time. In some instances, especially wherethere exists an excess demand for government jobs-often for the least-skilled positions-further downward adjustment in real wages may becalled for. But, in other cases, government wage offers should be mademore competitive with the opportunity cost of scarce labor skills.
One remedy to improve upon current imbalances would be forgovernments to stop trading off higher wages for employment expan-sion. There is a great deal of pressure for governments to hire moreworkers when the private sector is depressed. A government could,however, provide more and better services with a streamlined civilservice rather than a larger one that has serious problems with pro-ductivity and discipline. Thus, a first option for governments is toconsider reducing the civil service to an affordable and maintainablesize. This option is particularly important in countries where recentgrowth in government employment has been especially rapid.
One practical action that can be taken is to audit existing posts andpersonnel, so as to determine which posts are essential for the func-tioning of the civil service and which are redundant. At a minimum
22 Research Observer 3, no. 1 (January 1988)

such an audit would provide the information necessary for the elimi-nation of "ghost" employees, a phrase used in Liberia to describe thecollection of salaries by employees who appear in name only.
Additional finance can be freed for increasing the relative wages ofsome remaining workers by freezing or reducing the number of publicemployees. This can be done by decree, attrition, or special schemessuch as early retirement programs. Whichever strategy is chosen, theobjective should be to achieve more manageable levels of adequatelypaid public employment over the medium term.
A second tradeoff that governments might consider is between wageincreases for the highly skilled and the unskilled. The policy of com-pressing differentials may have adversely affected both efficiency andequity. Policies of narrowing the gap within the public sector havelimited the government's ability to compete for highly skilled staff andmay have significantly impaired the performance of the governmentsector. To alleviate resulting shortages of skilled workers will usuallymean allowing for a widening, not a narrowing, in wage differentials.
There is also a need for firmer financial controls over the provisionof fringe benefits. Similarly, the system of who is entitled to whatneeds to be defined more clearly. Because governments are unable toprovide benefits such as housing uniformly to all workers at the samelevel, the pay of similar workers tends to vary widely-an inefficientand inequitable outcome. Moreover, the associated system of ration-ing permits corruption and wastes the time and effort workers spendtrying to get housing. Since the provision of fringe benefits, especiallyhousing, has become such a financial and administrative burden, gov-ernments may wish to move toward a more cash-oriented compensa-tion system. In a perfectly competitive world, a cash-based system,because it increases the choices consumers can make, would be prefer-able to one involving payments in kind. However, it will not bepossible to transform the compensation system overnight given theexisting stock of government housing. In the meantime, housing canstill serve to widen wage differentials where this is desirable.
Public enterprises, which are often covered by government paypolicies, tend to have more flexibility than the government itself inwage-setting practices. Government policy toward the parastatalsshould be directed at preventing them from exploiting any monopolis-tic advantages they might have. Forcing parastatals to follow a gov-ernment salary scale is likely to create other management problems,especially in staffing and performance. A long-run policy of makingparastatals commercially accountable may be a better approach.
This article documents recent trends in government wage and employment levels for Abstracta number of African countries and challenges the conventional wisdom that public
David L. Lindauer and others 23

wages are too high in Africa. Although most countries have significantly adjusted thereal wages of government workers over the past decade, considerable variance incross-country experience with regard to government wage levels, wage structures, andemployment growth is evident. On the basis of the observed trends, the article calls fora more microeconomic focus on the relationship between government pay and employ-ment policies and on the real consequences of such policies on the government's abilityto provide goods and services.
Notes 1. From World Bank (1981). This view is repeated and elaborated upon in WorldBank (1986): "Personnel policies in the public sector [in African economies] must alsochange: they influence urban earnings because the government and public enterprisesare the largest employers in most countries. Public sector hiring and wage policies haveinflated wages in many cases and left them out of line with productivity and labor costsin other developing countries. Although earnings data are poor and difficult to comparebetween countries, indicators for selected African and Asian countries reveal thatgovernment and urban wages in low-income Africa are relatively high. This salarystructure was adopted at the time of independence a nd then maintained in many Africancountries through most of the 1970s; it must be adjusted to reflect current budgetaryrealities." Further arguments for institutional interventions as sources of wage distor-tions in developing economies appear in Kannappan (1983).
2. Previous empirical work in this area includes Abdin and others (1983) and Hellerand Tait (1983).
3. A precise definition of public employment cannot be given because the publicsector is rarely a single homogeneous unit. In different countries it might include federalor national civil services, state and local governments, military services, parastatalcompanies, and joint ventures. We have tried to maintain a consistent definition thatincludes all levels of governments and wholly state-owned public enterprises. Notes tothe various tables provide further details with regard to specific countries.
4. Wages and employment in the private sector are also influenced by other govern-ment actions, including minimum wage orders, wage guidelines, and legislation overcollective agreements. In this article, our primary focus is on public sector pay andemployment decisions.
S. Analyses of government pay policy in an advanced economy, that is, the UnitedStates, are presented in Fogel and Lewin (1974) and Smith (1977).
6. See Meesook and others (1986), table 4.1, for the Zambian experience.
7. Issues relating to the parastatal sector are explored more fully in Lindauer (1986).
8. See Lindauer and Sabot (1983) and Knight and Sabot (forthcoming).
9. This has been explored in Lindauer (1987).
10. For a description of fringe benefits in a selected number of African countries seeLindauer and others (1986), table 7.
11. In Malawi, for example, there is some sentiment toward eliminating housing aspart of the compensation of civil servants and moving to a more cash-oriented systemof pay.
12. The problem is extensively discussed in Republic of Uganda (1982). See, forexample, chapter 6.
References Abdin, Ragia, and others. 1983. A World of Differentials. Sevenoaks, U.K.: Hodder andStoughton.
Bloch, Peter C. 1985. "Wage Policy, Wage Structure and Employment in the Public Sectorof Senegal." CPD Discussion Paper 1985-41. World Bank, Country Policy Department,Washington, D.C.
24 Research Observer 3, no. 1 (January 1988)

Fogel, W., and D. Lewin. 1974. "Wage Determination in the Public Sector." Industrialand Labor Relations Revieuw 27, no. 3.
Fox, Louise. 1985. "Incomes and Employment Policy in Ghana." World Bank, CountryPolicy Department, Washington, D.C.
Heller, Peter, and Alan Tait. 1983. Government Employment and Pay: Some Interna-tional Comparisons. International Monetary Fund Occasional Paper 24. Washington,D.C.
Kannappan, Subbiah. 1983. Emplovment Problems and the Urban Labor Market inDeveloping Nations. Ann Arbor, Michigan: University of Michigan, Graduate Schoolof Business Administration, Division of Research.
Khan, Aziz. 1983. "Employment and Wages in Liberia: Some Preliminary Notes vw'ithSpecial Reference to the Public Sector." World Bank, Country Policy Department,Washington, D.C.
. 1985. "Wages and Employment in Nigeria: A Discussion of Issues with SpecialReference to the Public Sector." World Bank, Country Policy Department, Wash-ington, D.C.
Knight, J. B., and R. H. Sabot. Forthcoming. "Educational Expansion, GovernmentPolicy and Wage Compression." Journal of Development Economics.
Lardeau, J., and others. 1985. "Mali: Employment and Salaries in the Civil Service."World Bank, Western Africa Regional Office, Washington, D.C.
Lindauer, David L. 1986. "Parastatal Pay Policy in Africa." CPD Discussion Paper1986-31. World Bank, Country Policy Department, Washington, D.C.
. 1987. "Government Wage and Employment Policy: An Analytical Treatmentwith Special Reference to Africa." cr'o Discussion Paper 1987-3. World Bank,Country Policy Department, Washington, D.C.
Lindauer, David L., and Ocy Astra Meesook. 1984a. "Housing as a Form of Compen-sation for Civil Servants in Malawi." World Bank, Country Policy Department,Washington, D.C.
.1984b. "Public Sector Pav and Employment Policy in the Sudan." CPD DiscussionPaper 1984-33. World Bank, Country Policy Department, Washington, D.C.
Lindauer, David L., and others. 1986. "Government Wage Policy in Africa: Summary ofFindings and Policy Issues." CPD Discussion Paper 1986-24. World Bank, CountryPolicy Department, Washington, i).C.
Lindauer, David L., and R. H. Sabot. 1983. "The Public/Private Wage Differential in aPoor Urban Economy." Journal of Development Economics 12 (February/April):137-52.
Meesook, Oey Astra. 1983. "Public Sector Pay in Uganda." World Bank, Country PolicyDepartment, Washington, D.C.
Meesook, Oey Astra, and others. 1986. "Wage Policy and the Structure of Wages andEmployment in Zambia." CPD Discussion Paper 1986-1. World Bank, Country PolicyDepartment, Washington, D.C.
Republic of Uganda. 1982. Report of the Public Service Salaries Review Commission1980-82. Kampala.
Smith, Sharon. 1977. "Government Wage Differentials." Journal of Urban Economics4, no. 3.
Suebsaeng, Parita. 1984. "Employment and Salaries in the Nigerian Civil Service: SomePreliminary Notes." World Bank, Country Policy Department, Washington, D.C.
World Bank. 1981. Accelerated Development in Sub-Saharan Africa. Washington, D.C.
. 1986. Financing Adjustment with Growth in Sub-Saharan Africa, 1986-90.Washington, D.C.
David L. Lindauer and others 25


EXPORT-PROMOTINGTRADE STRATEGYIssues and Evidence
Jagdish N. Bhagwati
he question of the wisdom of adopting an export-promotingT trade strategy has recurred in the history of the developingcountries. Development economics was born in an atmosphere
of export pessimism at the end of the World War II. By the late 1960s,however, the remarkable success of the few economies that pursued"export-promoting" (EP) rather than "import-substituting" (Is) policiesswung the weight of academic opinion behind the EP strategy. Aidingthis process were numerous academic findings from research projectsaround the world, which investigated both these EP successes and thefailures of the is countries.1
The debt crisis of the 1980s, the sluggish world economy, and thecontinuing depression of primary product prices have revived exportpessimism afresh. It is time again, therefore, to examine the old andnew arguments that question the wisdom of the EP strategy.
The early postwar arguments in support of export pessimism arebriefly reviewed below, before the precise content of an EP strategy isstated. The article then considers a few salient lessons that haveemerged in the studies on the advantages of the EP strategy andexamines several new sources of skepticism concerning export-prom-oting trade policies. The contrasts between the old (postwar) pessi-mism and the new pessimism prevalent today are then exploitedbriefly to draw a central policy lesson for the developing countries,especially in regard to the multilateral trade negotiations (MTN).2
It is well known that export pessimism characterized the thinking The Firstof most influential development economists and policymakers in the Exportdeveloping countries after World War II. The most articulate pro- Pessimism
, 1988 The International Bank for Reconstruction and Development/The World Bank 27

ponents of the pessimist school of thought were the two greatpioneers of development economics: Raul Prebisch (see Prebisch 1952and 1984) and Ragnar Nurkse (see Nurkse 1959). Their diagnoses,however, had significant differences.
Prebisch considered the terms of trade of primary products, thenthe chief exports of developing countries, to be declining regardless ofthe policies of the developing countries. L eft to themselves, producersin the developing countries would have responded to this secular priceshift by industrializing, which would make (trade tariff) protection or(domestic subsidy) promotion unnecessary and unjustified.' By con-trast, Nurkse's export pessimism arose from the notion that foreignmarkets simply could not accommodate imports on a sufficient scaleas developing countries accelerated their development. Therefore, ex-port pessimism explicitly meant "elasticity" pessimism, and the casefor government intervention then follows.4 Nurkse, therefore, advo-cated what he called a policy of "balanced growth."
Paradoxically, however, Nurkse was nnindful of the costs of indis-criminate protectionism, as he had also written about the collapse ofthe world trading system during the 1930s (Nurkse 1953). "Balancedgrowth" could only mean government incentives to assist industriali-zation, a prescription that appears to have combined uneasily with thecaveats that Nurkse expressed about protection. By contrast, Pre-bisch's brand of pessimism did not justify protectionism but wasnevertheless widely used by his followers to do so in Latin America.
The export pessimism of these influen-tial economists was cast inthe mold of natural forces and phenomena that the developing coun-tries faced. Nurkse, for instance, wrote about increasing economy inthe use of raw materials and a shift further from natural to syntheticmaterials, both dampening the demand for developing countries' ex-ports over time. Developing countries could do nothing to changethese conditions at the source, just as one cannot do anything aboutbad weather. But their policies had to acljust to these conditions, justas one can buy an umbrella against the rain. (By contrast, as I notebelow, the second export pessimism of the 1980s is rooted in protec-tionist threats, which can be addressed at the source and hence havecritically different implications for developing country policies.)
The export pessimism following World War II was to prove unjusti-fied by the unfolding reality. World trade did not merely grow rapidlyduring the 1950s and 1960s, it grew even faster than world income.The growth rates in both output and trade were unprecedented forsuch sustained periods (see table 1). Furthermore, the economies thatshifted quickly to an EP strategy experienced substantial improvementsin their export performance. This was particularly the case for fourFar Eastern economies-Hong Kong, Singapore, the Republic of Ko-rea, and Taiwan-but it was by no means confined to them. The
28 Research Observer 3, no. 1 (January 1988)

Table 1. Postwar Growth Rates of World Outputand Trade(average annual percentage change)
Period World output World trade
1953-63 4.3 6.11963-73 5.1 8.91973-83 2.5 2.8
Source: Hufbauer and Schott 1985, table A-1, p. 97.
dramatic rise in these economies' share of trade in GDP over thisperiod placed them well above the regression lines for trade-GDP ratiosand per capita incomes. These regressions would suggest that trade-GDP ratios fall as per capita income rises, whereas these successfulexporters showed a spectacular rise in their trade shares as their percapita incomes grew rapidly. 5 Clearly, history has sided with econo-mists such as Cairncross (1962) and Krueger (1961) who had beenamong the foremost critics of export pessimism.
Although the evidence of successful trade expansion decisively re-futed the validity of export pessimism, the economic analysis in sup-port of such pessimism was also to prove enlightening and has abearing on the dissection of the resurgent, second export pessimismprevalent today. Nurkse, for instance, had embraced Robertson's clas-sic phrase: trade as "an engine of growth," which established a ratherstrong and direct link in the export pessimists' minds between exter-nal conditions and internal expansion. In a classic throwback to thisform of argumentation, Lewis (1980) argued more recently in a much-quoted passage: 6
The growth rate of world trade in primary products over the periodof 1873 to 1913 was 0.87 times the growth rate of industrialproduction in the developed countries; and just about the samerelationship, about 0.87, also ruled in the two decades to 1973...We need no elaborate statistical proof that trade depends onprosperity in the industrial countries (p. 556).
But, it is evident from several analyses, 7 the latest being by Riedel(1984), that such stable relationships (which suggest the exclusivedominance of demand in determining trade performance) simply can-not be extracted from the export experience of developing countriesin the postwar period. The export performance of these and othercountries must be explained by domestic incentives (or supply) morethan by external (or demand) conditions. It is worth restating the twomain arguments supporting this conclusion.
First, although Lewis addresses the linkage between industrial coun-try incomes and developing country exports of primary products,
jagdish N. Bhagwati 29

Riedel (1984, table 4) shows that even this aggregate developing coun-try relationship is not stable. The stability, in turn, obviously cannotbe maintained for individual developing countries.
Second, it is important to note again t:hat the postwar period hasseen a dramatic shift in the export composition of developing coun-tries toward manufactures. Developing c0untry exports of manufac-tures grew threefold in the 1955-78 periocl and represented one-fourthof overall exports. Manufactures are now close in magnitude to theother nonfuel exports such as food, minerals, and agricultural rawmaterials. Of course, the successful exporters of the postwar perioddominate this shift. But their experience, based on domestic policies,proves that one cannot assess trade potential through mechanicallinkages to industrial country income expansion.
The most compelling aggregate statistics show that during the pros-perous 1960s, developing countries' exports of manufactures grewnearly twice as fast as the industrial countries' incomes. The expan-sion of developing countries' trade over the 1950s and 1960s occurredas protection in the industrial countries was diminishing sharply as aconsequence of first the elimination of quotas and then the reductionin tariffs. Even during the troubled 1970s, developing countries' ex-ports of manufactures grew more than four times as rapidly as theindustrial countries' income.8
The only key question that has remained at issue, therefore, is whathas been called the "fallacy of composition": can all, or most, devel-oping countries become successful exporters simultaneously? Or, fo-cusing on the successful Asian exporters, the question may be put: canthe Asian export model be successfully exported to all? The suspicionstill lingers that the success of a few was built on the failure of themany and that, if all had shifted to the EP strategy, none would havefared well.
There are two distinct sources of this worry. The first presumes thatmarkets would not be able to absorb all of the exports that wouldmaterialize if developing countries shifted. to an EP strategy. The sec-ond argues that while the markets could be found, they would beclosed by protectionist measures, provoked by the import penetrationand outcries of market disruption. The second source is the majorcause of export pessimism today, while the first source was the onethat afflicted the earlier wave of export pessimism. I now examine theformer argument and defer discussion of the latter.
First, as I shall argue more fully belovv, the fear that world tradewould have to grow by leaps and bounds if most developing countriespursued an EP strategy is unwarranted. This fear follows from tryingto put all countries on the curve estimated in Cline (1982) for theAsian exporters with very high ratios o:f trade to national income.The pursuit of an EP strategy simply amounts to the adoption of a
30 Research Observer 3, no. 1 (January 1988)

structure of incentives which does not discriminate against exports infavor of the home market. This does not imply that the resultingincreases in trade-income ratios will be necessarily as dramatic as inthe Far Eastern case.
Second, the share of developing countries in the markets for manu-factures in most industrial countries has been, and continues to be,relatively small. In the aggregate, the share of manufactured exportsfrom developing countries in the consumption of manufactures in theindustrial countries runs at a little over 2 percent. "Absorptive capaci-ty" purely in the market sense, therefore, is not prima facie a plausi-ble source of worry.
Third, a chief lesson of the postwar experience is that policymakerswho seek to forecast exports typically understate export potential byunderstating the absorptive capacity of import markets. This comeslargely from having to focus on known exports and partly fromdownward estimation biases when price elasticities for such exportsare econometrically measured. Experience underlines the enormouscapacity of wholly unforeseen markets to develop when incentivesexist to make profits; "miscellaneous exports" often represent thesource of spectacular gains when the bias against exports, typical of isregimes, is removed.
Fourth, trade economists have increasingly appreciated the potentialfor intraindustry specialization as trade opportunities open. The pro-gressive dismantling of trade barriers within the European Communi-ties (EC), for instance, led to increased mutual trade in similar prod-ucts rather than to massive reductions in the scale of output in indus-try groups within industrial member states.9 There is no reason todoubt that such intraindustry trade in manufactures among develop-ing countries and between them and the industrial countries can alsodevelop significantly.
Finally, if we reckon with the potential for trade between develop-ing countries where policies can change to permit its increase, and thepossibility of opening new sectors such as agriculture and services tofreer trade, then the export possibilities are even more abundant thanthe preceding arguments indicate.' 0
Therefore, although the postwar export pessimism was unjustified,it provided a rationale for the adoption of inward-looking trade poli-cies in many developing countries. In addition, trade restrictions wereadopted to protect the industries that had grown up fortuitously inLatin America because World War II had provided artificial induce-ment to set up domestic capacities to produce int'errupted suppliesfrom traditional, competitive suppliers abroad.' 1 Often, chiefly inLatin America, there was also a reluctance to devalue. Combined withhigh rates of inflation, this caused continuously overvalued exchangerates that amounted to a de facto is trade policy (see the appendix)."
Jagdish N. Bhagwati 31
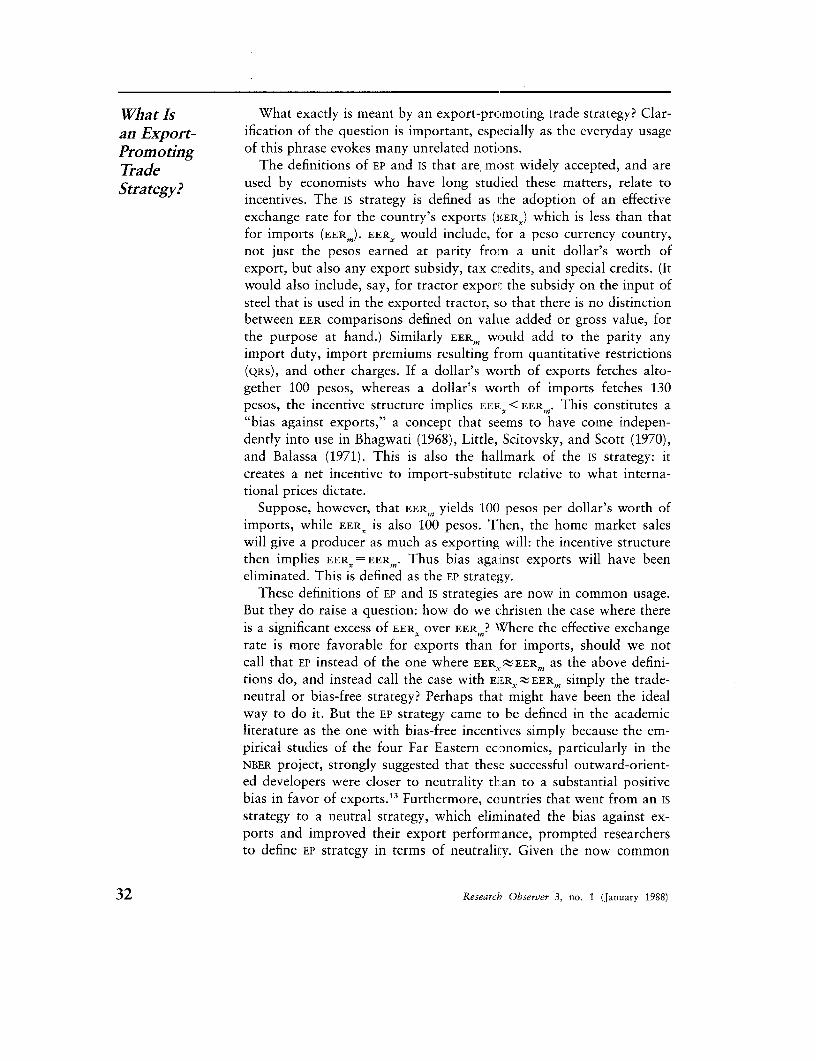
What Is What exactly is meant by an export-promoting trade strategy? Clar-an Export- ification of the question is important, especially as the everyday usagePromoting of this phrase evokes many unrelated notions.Trade The definitions of EP and is that are most widely accepted, and areStrategy? used by economists who have long studied these matters, relate to
incentives. The is strategy is defined as t-he adoption of an effectiveexchange rate for the country's exports (ESERx) which is less than thatfor imports (EERm). EER, would include, for a peso currency country,not just the pesos earned at parity from a unit dollar's worth ofexport, but also any export subsidy, tax credits, and special credits. (Itwould also include, say, for tractor exporn the subsidy on the input ofsteel that is used in the exported tractor, so that there is no distinctionbetween EER comparisons defined on value added or gross value, forthe purpose at hand.) Similarly EERm would add to the parity anyimport duty, import premiums resulting from quantitative restrictions(QRS), and other charges. If a dollar's worth of exports fetches alto-gether 100 pesos, whereas a dollar's worth of imports fetches 130pesos, the incentive structure implies EERX<EERm. This constitutes a"bias against exports," a concept that seems to have come indepen-dently into use in Bhagwati (1968), Little, Scitovsky, and Scott (1970),and Balassa (1971). This is also the hallmark of the is strategy: itcreates a net incentive to import-substitute relative to what interna-tional prices dictate.
Suppose, however, that EERm yields 100 pesos per dollar's worth ofimports, while EERx is also 100 pesos. Then, the home market saleswill give a producer as much as exporting will: the incentive structurethen implies EERX=EERm. Thus bias against exports will have beeneliminated. This is defined as the EP strategy.
These definitions of EP and is strategies are now in common usage.But they do raise a question: how do we christen the case where thereis a significant excess of EERx over EERm? Where the effective exchangerate is more favorable for exports than for imports, should we notcall that EP instead of the one where EERX EERm as the above defini-tions do, and instead call the case with EER,;:EER. simply the trade-neutral or bias-free strategy? Perhaps that might have been the idealway to do it. But the EP strategy came to be defined in the academicliterature as the one with bias-free incentives simply because the em-pirical studies of the four Far Eastern economies, particularly in theNBER project, strongly suggested that these successful outward-orient-ed developers were closer to neutrality than to a substantial positivebias in favor of exports."3 Furthermore, countries that went from an isstrategy to a neutral strategy, which eliminated the bias against ex-ports and improved their export performance, prompted researchersto define EP strategy in terms of neutrality. Given the now common
32 Research Observer 3, no. 1 (January 1988)

usage of these terms, therefore, I have suggested recently the followingterminology that does least violence to what has been the practice todate:"4
IS strategy: EER < EER
EP strategy: EERX Z EER,
Ultra-EP strategy: EERX > EER '
Nonetheless, it is not uncommon, especially among policymakers, tofind references to EP (or outward-oriented) trade strategy as includingboth the neutral and the pro-export bias strategies."5 The reader mustbe alert to see what exactly is the implicit definition being used in aparticular context.
These definitions clearly relate to average incentives. Nonetheless, itis obvious that, within EP for instance, some activities may be import-substituting in the sense that their EERm exceeds the average EERX.
Thus, the pursuit of either the EP or the ultra-EP strategy does notpreclude import-substituting in selected sectors. This is true for mostof the successful Far Eastern developers. Nor does this fact rendermeaningless the distinction among the different trade strategies, as issometimes contended. As I have argued elsewhere (Bhagwati 1986c):
We also need to remember always that the average EERX and EERm
can and do conceal very substantial variations among differentexports and among different imports. In view of this fact, I havelong emphasized the need to distinguish between the questions ofthe degree of import substitution and the pattern of import substi-tution. Thus, within the broad aggregates of an EP country case,there may well be activities that are being import-substituted (i.e.,their EER m exceeds the average EERx ). Indeed there often are. Butone should not jump to the erroneous conclusion that there istherefore no way to think of EP versus is and that the distinction isan artificial one any more than one would refuse to acknowledgethat the Sahara is a desert, whereas Sri Lanka is not, simply becausethere are some oases (p. 93).
Nor should one equate the EP strategy with the absence of govern-ment intervention, as is often done by proponents of the Is strategyand sometimes by advocates of the EP strategy as well. It is true that alaissez-faire policy would satisfy the requirement that EERX = EER .
This is not a necessary condition for this outcome, however. The FarEastern economies (with the exception of Hong Kong) and others thathave come close to the EP strategy have been characterized by con-siderable government activity in the economic system. In my judg-ment, such intervention can be of great value, and almost certainlyhas been so, in making the EP strategy work successfully. By publiclysupporting the outward-oriented strategy, by even bending in somecases toward ultra-export promotion, and by gearing the credit insti-
Jagdish N. Bhagwati 33

tutions to supporting export activities in an overt fashion, govern-ments in these countries appear to have established the necessaryconfidence that their commitment to the EP strategy is serious, thusinducing firms to undertake costly investments and programs to takeadvantage of the EP strategy.
The laissez-faire model does not quite capture this aspect of theproblem since governments, except in the models of Friedman andBakunin, fail to abstain or self-destruct; they will invariably findsomething, indeed much, to do. Therefore, explicit commitment to anactivist, supportive role in pursuit of the EP strategy, providing theassurance that it will be protected from inroads in pursuit of numer-ous other objectives in the near future, would appear to constitute adefinite advantage in reaping the benefits of this strategy.
Some other caveats are also in order.Development economists such as Chenery and his many associates
have used the terminology of is and EP in a wholly different fashion.They have typically used identities to decompose observed growth ofoutput in an industry or the economy into components attributable toexport promotion, import substitution, and other categories." Quiteaside from the fact that such decompositions are, except under singu-lar circumstances, statistical descriptions without analytical signific-ance, they also have no relationship to the incentives-related defini-tions of trade strategy that have been set out here. Unfortunately, thisdistinction occasionally gets confused in popular discussions, especial-ly as economists sometimes deploy both usages simultaneously (thatis, using the incentives-based definition to group countries into alter-native categories and the Chenery-type terminology to explain theireconomic performance, as in Balassa 1983).
The incentives-defined EP strategy also has to be distinguished fromthe traditional concept of "export-led" growth, in which a country'sexports generate income expansion attributable to direct gains fromtrade and indirect beneficial effects. The notion of export-led growthis closer to Nurkse's and Lewis's export pessimism that was dissectedearlier. The incentives-related EP definition has literally nothing to dowith such beneficial external phenomena. Whether the success of anEP strategy, defined in terms of freedom from bias against exports,requires the presence of a beneficial external environment is a separateissue that will be treated again in a later section that focuses on therevived export pessimism.
Finally, it is worth stressing that the concept of EP or outwardorientation relates to trade incentives (direct trade policies or domes-tic or exchange rate policies that affect trade) but does not imply thatthe EP strategy countries must be equally outward-oriented in regardto their policies concerning foreign investment. Hong Kong and Singa-pore have been more favorable in their treatment of foreign investors
34 Research Observer 3, no. 1 (January 1988)

than the great majority of the is countries, but the historic growth ofJapan, presumably as an EP country, was characterized by extremelyselective control on the entry of foreign investment. Logically andempirically, the two types of outward orientation, in trade and inforeign investment, are distinct phenomena, though whether one canexist efficiently without the other is an important question that hasbeen raised in the literature and is surrounded by far more controver-sy than the question of the desirability of an EP strategy in trade.
With the EP strategy defined in terms of the incentive structure, the Why Doessubstantive conclusion that has emerged from the major research an Export-projects listed earlier is that the economic performance of the EP Promotingcountries has been remarkably strong, although they had no one Strategy Aidrooting for their success when development efforts were being initiat- Development?ed in the early 1950s. Here, as elsewhere, history has turned upsurprises.
In evaluating this outcome, we have to distinguish between twoquestions: (a) why should the EP strategy have been helpful in acceler-ating economic development, and (b) could the acceleration have beencaused by factors other than the EP strategy?
The Evidence
The serious evidence on the successful impact of the EP strategy oneconomic performance, as measured by an improved growth rate, hasto be found in the country studies of the research projects on tradeand development (listed earlier). Among these, the most compellingevidence is in the analyses in the NBER project where the EP strategywas carefully defined and transitions to it from an is strategy byvarious phases were systematically investigated."'
There is also much cited evidence that relates largely to associationsbetween growth rates of exports and growth rates of income, as in thework of Michaely (1977) who used data for 1950-73 for forty-onecountries, and the further extension of this type of work by Balassa(1978) and Feder (1983).1S Complementing this approach is the al-together different statistical formulation in Michalopoulos and Jay(1973). This study takes a very different approach to the problem byusing exports as an argument in estimating an economywide produc-tion function from aggregate output and factor use data. Using datafor thirty-nine countries this study argued that exports are an inde-pendent input into national income.19
Neither the Michaely-Balassa-Feder nor the Michalopoulos-Jayfindings, however, bear directly on the question whether the EP strate-gy is productive of more growth, because the incentive-related EP
Jagdish N. Bhagwati 35

strategy is not the one used to examine the question of income orgrowth performance. It is necessary to identify whether the superiorexport growth rates (or higher export magnitudes) belong to the EP
countries.This is particularly worrisome since hvigh growth rates of exports
may have been caused by high growth rat:es of output (which, in turn,may have resulted from other exogenous factors such as a highersavings effort), rather than the other way around. Thus, if is does notparametrically reduce trade greatly, it is conceivable that this reversecausation could lead the rapidly expanding countries, whether EP orIs, to show higher export growth rates than less rapidly expandingeconomies.
Hence, while these cross-country regressions are certainly interest-ing, valuable and suggestive, they cannot be considered compelling onthe issue in question, especially as they (and conclusions based onthem) are likely to be critically dependent on the period, sample ofcountries, and variables chosen. By contrast, the detailed countrystudies are methodologically superior and more persuasive. And, asnoted already, they do indicate the superiority of the EP strategy.
The Reasons
Economists have been preoccupied with the reasons why the isstrategy has been generally dominated by the EP strategy, and why thecountries that rapidly made the transition from the former to thelatter have done better. The following hypotheses have been ad-vanced, based on the usual mix of analytical insights, casual empiri-cism, and econometric evidence.20
Resource Allocation Efficiency. The first set of reasons for thesuccess of the EP strategy relies on the fact that it brings incentives fordomestic resource allocation closer to int:ernational opportunity costsand hence closer to what will generally produce efficient outcomes.This is true, not merely in the sense that there is no bias againstexports and in favor of the home market: (that is, EERX;: EERm) underthe EP strategy, but also in the sense that the is countries seem to havegenerally had a chaotic dispersion of EERS among the different activi-ties within export and import-competing activities as well. That is,the degree of is goes far and the pattern of is reflects widely divergentincentives. By contrast, the EP strategy does better both on degree(since EERX ; EER.) and on pattern.
Why is the degree of bias so large and the pattern wrong under is?The answer seems to lie in the way in which is is often practiced andin the constraints that surround EP. Thus is could, in principle, becontained to modest excess of EERm over EERX. But typically Is arisesin the context of overvalued exchange rates and associated exchange
36 Research Observer 3, no. 1 (January 1988)

controls. So there is no way in which the excess of domestic overforeign prices is being tracked by government agencies in most cases,and the excesses of EERm over EERX simply go unnoticed. The non-transparency is fatal. By contrast, EP typically tends to constrain itselfto rough equality, and ultra-EP also seems to be moderate in practice,because policy-induced excesses of EERX over EERm often require subsi-dization that is constrained by budgetary problems.
In the same way, the pattern of EER. can be terribly chaotic be-cause exchange controls and QRS on trade will typically generatedifferential premiums and hence differential degrees of implied protec-tion of thousands of import-competing activities. By contrast, the EP
strategy will typically unify exchange rates, which avoids these prob-lems and, when it relies on export subsidization, will be handledboth with necessary transparency and with budgetary constraints thatwould then prevent wide dispersions in EERS.
The chaotic nature of differential incentives among diverse activitiesin is regimes has been documented by estimates of effective rates ofprotection (ERPS) (though these estimates can be misleading in quanti-tative restrictions regimes where the import premiums may reflecteffects of investment controls, indicating therefore resource denialrather than resource attraction to the high-premium and therefore,other things being equal, the high-ERP activities. The estimates ofcross-sectional domestic resource costs (DRCS), which provide insteada guide to differential social returns to different activities, have alsounderlined these lessons. The conceptual and measurement analysesof several distinguished economists, including Michael Bruno, MaxCorden, Harry Johnson, and Anne Krueger, have contributed greatlyto this literature.
Directly Unproductive Profit-Seeking and Rent-Seeking Activities.Yet another important aspect of the difference between EP and Isstrategies is that is regimes are more likely to trigger what economictheorists now call directly unproductive profit-seeking (DuP) activities(Bhagwati 1982b). These activities divert resources from productiveuse into unproductive but profitable lobbying to change policies or toevade them or to seek the revenue and rents they generate."' Rent-seeking activities (Krueger 1974), where lobbies chase rents attachedto import licenses and other quantitative restrictions, are an importantsubset of such DuP activities. The diversion of entrepreneurial energiesand real resources into such DUP activities tends to add to the conven-tionally measured losses from the high degree and chaotic pattern ofis.
2 2
It must be admitted that, although economists have now begun tomake attempts at estimating these costs, they are nowhere near arriv-ing at plausible estimates simply because it is not yet possible toestimate realistically the production functions for returns to different
Jagdish N. Bhaguati 37

kinds of lobbying. But, as Harrod once remarked, arguments thatcannot be quantified are not necessarily unimportant in economics,and the losses arising from DUP and rent-seeking activities seem pre-sently to illustrate his observation. 23
Foreign Investment. If is regimes have tended to use domestic re-sources inefficiently in the ways that were just outlined, the sameapplies to the use of foreign resources. This is perhaps self-evident,but substantial theoretical work by Bhagwati (1973), Brecher andDiaz-Alejandro (1977), Uzawa (1969), Hamada (1974), and others hasestablished that foreign investment that comes in over QRs and tar-iffs-the so-called tariff-jumping investment-is capable of immiseriz-ing the recipient country under conditions that seem uncannily closeto the conditions in the is countries in the postwar decades. Theseconditions require capital flows into capital-intensive sectors in theprotected activities. It is thus plausible that, if these inflows were notactually harmful, the social returns on them were at least low com-pared with what they would be in the EP countries where the inflowswere not tariff-jumping but rather aimed at world markets, in linewith the EP strategy of the recipient countries.
In addition, I have hypothesized (Bhagwati 1978 and 1986a) that,other things being equal, foreign investments into is countries will beself-limiting in the long run because they are aimed at the homemarket and therefore constrained by it. If so, and there seems to besome preliminary evidence in support of this hypothesis in ongo-ing econometric analysis," 4 then is countries would have been han-dicapped also by the lower amount of foreign investment flows andnot just by their lower social productivity compared with the EP
countries.Gray Area Dynamic Effects. Although the arguments so far provide
ample satisfaction to those who seek to understand why the EP strate-gy does so well, dissatisfaction has continued to be expressed thatthese are arguments of static efficiency and that dynamic factors suchas savings and innovations may well be favorable under an import-substituting trade strategy.
Of course, if what we are seeking to explain is the relative successof the EP countries with growth, this counterargumentation makeslittle sense since, even if it were true, the favorable effects fromthese "gray area" sources of dynamic efficiency would have beenoutweighed in practice by the static efficiency aspects. But the coun-terargumentation is not compelling anyway. Overall, it is not possibleto claim that is regimes enable a country to save more or less than EP
regimes: the evidence in the NBER project, for instance, went bothways. Nor does it seem possible to maintain that EP or IS regimes arenecessarily more innovative. It is possible to argue that EP regimesmay lead to more competition and less-sheltered markets and hence
38 Research Observer 3, no. 1 (January 1988)

more innovation. But equally, Schumpeterian arguments suggest thatthe opposite might also be true.25
The few recent studies that have appeared do suggest that theEP strategy may encourage greater innovation. Krueger and Tuncer(1980) examined eighteen Turkish manufacturing industries during the1963-76 period. They found that periods of low productivity growthroughly occurred during periods when foreign exchange controls wereparticularly restrictive and hence the is strategy was being accentuat-ed. The overall rate of productivity growth was also low throughoutthe period during which Turkey pursued an is strategy. In an analy-sis of productivity change in Japan, Korea, Turkey, and Yugoslavia,Nishimizu and Robinson (1984) argue that if growth is decomposedinto that due to "domestic demand expansion," "export expansion,"and "import substitution," the interindustrial variation in factor pro-ductivity growth reflects (except for Japan) the relative roles of exportexpansion and import substitution, the former causing a positive im-pact and the latter a negative one. However, as the authors recognize,export expansion may have been caused by productivity change rath-er than the other way around, the regressions begging the issue ofcausality.
What is the influence of economies of scale in EP and is regimes?Theoretically, the EP success should be increased because world mar-kets are certainly larger than home markets. But, systematic evidenceis not yet available on this question. For instance, evidence is lackingto indicate whether firms that turn to export markets are character-ized by greater scale of output than those firms that do not. Experi-ence in the case of the EC suggests that trade may lead not to changesin the level of output so much as to product specialization.
Suppose however that we do assume that economies of scale will beexploited when trade expands. The cost of protection, or the gainsfrom trade, will then rise significantly. Harris (1986) has calculated forCanada that a 3.6 percent rise in GNP could follow from the unilateralelimination of Canadian tariffs, if the economies of scale are fullyexploited.
Finally, in the matter of X-efficiency, it is again plausible that firmsunder Is regimes should find themselves more frequently in shelteredand monopolistic environments than those under EP regimes; a greatdeal of such evidence is available from the country studies in theseveral research projects discussed. X-efficiency therefore ought to begreater under the EP regime. However, as is well known, this is anotoriously gray area where measurement has often turned out to beelusive.
Although the arguments for the success of the EP strategy based oneconomies of scale and X-efficiency are plausible, empirical supportfor them is not available. The arguments on savings and innovation
Jagdish N. Bhagwati 39

provide a less than compelling case for showing that EP is necessarilybetter on their account than is.
Growth and Other Objectives
A final word is necessary on the superior economic performance ofthe EP strategy. Much like the die-hard monetarists who keep shiftingtheir definitions of money as necessary in order to keep their faith, theproponents of is have tended to shift their objections as required bythe state of the art.
When it became evident that the EP strategy yielded higher growthand that the static versus dynamic efficiency arguments were notpersuasive and probably went in favor of the EP strategy, the is
proponents shifted ground. They took to arguing that the objective ofdevelopment was not growth but the alleviation of poverty or unem-ployment and that EP might be better for growth but was worse forthese other objectives. This was part of a larger argument that be-came fashionable during the 1970s in certain development circles: thatgrowth had been the objective of development to date; that the objec-tive was wrong; that the true objective of poverty amelioration was illserved by development efforts directed at growth; and that growtheven harmed (in certain formulations of such critics) the poor.
The evidence does not support the views that growth was desired initself, that poverty elimination was not a stated objective which waspursued by the acceleration of growth rates to "pulk up" the poor intogainful employment, and that growth on a sustained basis has nothelped the poor. These orthodoxies are no longer regarded as plausi-ble., as I have argued at length elsewhere.26
In regard to the narrower question at hand, that is, whether the EP
strategy procures efficiency and growth but adversely affects povertyand employment, evidence has now been gathered extensively in asequel NBER project, directed by Krueger (1982). Essentially, she andher associates document how investment allocation under EP requiresthe expansion of labor-intensive activities, because developing countryexports are typically labor-intensive. Therefore, EP strategies tend toencourage the use of labor and hence the growth of employment andthe alleviation of poverty in countries that typically have underem-ployed labor.
Moreover, after more than two decades of successful growth in theEP regimes, especially in the four Far Eastern economies, it has be-come easier for economists to contemplate and comprehend the effectsof compound rates and the advantages of being on rapid escalators.Even if it had been true that the EP strategy yielded currently loweremployment or lower real wages, the rapid growth rates would over-whelm these disadvantages in the time of simply one generation. It
40 Research Observer 3, no. 1 (January 1988)

would appear therefore that both the employment-intensive nature ofEP growth in developing countries and the higher growth rates in theEP countries have provided a substantial antidote to the poverty andunderemployment that afflicted these countries at the start of theirdevelopment process.
These lessons were important. Many developing countries learned The Secondthem the hard way: by following is policies too long and seeing the Exportfortunate few pursuing the EP strategy do much better. Perhaps learn- Pessimisming by others' doing and one's own undoing is the most commonform of education!
But just as these lessons were widely accepted, and a "new ortho-doxy" in their favor was established, a new wave of export pessimismarrived on the scene. This second export pessimism, which is paradoxi-cally both more serious and more tractable in principle, tends to under-mine the desired shift to the EP strategy in the developing countries.
There are two sets of factors generating this pessimism: (a) objec-tive events such as the slowing down of the world economy since the1970s and the resurgence of powerful protectionist sentiments in theindustrial countries, and (b) new intellectual and academic argumentsin support of inward-looking trade policies in the developing coun-tries. The two are not entirely unrelated since theory, especially inter-national trade theory, does not grow in a vacuum. But they can bedealt with sequentially nonetheless.
In essence, the second export pessimism rests on the view that,whatever the market-defined absorptive capacity for the exports of thedeveloping countries, the politics of protectionism in the industrialcountries (which still constitute the chief markets of developing coun-try exports) is such that the exports from developing countries faceserious and crippling constraints that make the pursuit of an EP strate-gy (with EERX,-EERm) inefficient, if not positively foolish.
If this assessment is correct, then the EP strategy's premise thatforeign markets are available at prices largely independent of one'sown exports is certainly not valid. But this must be correctly under-stood. If Brazil successfully exports footwear, for example, and theimporting countries invoke market-disruption-related QRs, or frivolouscountervailing duty (CVD) retaliation, then Brazil faces a less thanperfectly elastic market for footwear, and an optimal tariff (that is, ashift to is strategy) in this sector is called for. This should justify onlyselective protection, carefully devised and administered, not a generalis strategy. If, however, this response is feared no matter what isexported, that is, the fear of protectionism is nearly universal inscope, a generalized shift to Is strategy unfortunately would be appro-priate.
Jagdish N. Bhagwati 41

The second pessimism, like the first, takes the latter, vastly morefearsome form, extending to exports generally. The resulting case fora general shift to the is strategy then collapses only if the protectionistthreat can be shown to be less serious than- it appears or if the threat,even though serious, can be contained by multilateral efforts or otherpolicy options that ought to be undertaken along with the EP strategy.As it happens, a case can be made in support of both these responses.
How Serious Is In assessing the extent to which the protectionist threat must bethe Protectionist taken seriously, one may first make the prudential statement that itThreat? should never be regarded lightly. Sectional interests have always pro-
vided the political momentum through congresses and parliaments toprotectionist responses to import competition. The postwar history oftrade barriers also shows, however, the important role that execu-tive branches have played in upholding the national interest, broad-ly served by freer trade and specialization. The real question is: hasthe threat become sufficiently more serious so that the developingcountries ought to turn away from embracing the EP strategy?
First, a few facts need to be noted. As table 1 briefly indicates,trade expansion has certainly slowed considerably since the 1970s. Buteven so, world trade has grown faster than world income during the1970-83 period. More compelling is the fact that the developing coun-tries' exports of manufactures to the industrial countries have grownalmost twice as fast as the exports of these countries to one another,showing even during the 1970s a growth rate of more than 8 percentannually. This has happened during a period when nontariff barriers(NTBS), such as voluntary export restraints (VERS), began to proliferateand when the OECD countries showed sluggish growth rates and in-creased unemployment.
That exports from the developing countries continued to grow inthis fashion was first highlighted by Hughes and Krueger (1984) whothought that it was a puzzle since a large amount of actual protectionseemed to have already been adopted. This puzzle has stimulatedBaldwin (1982 and 1985) into developing an interesting thesis: thatprotection is far less effective than one thinks simply because there aremany ways in which exporting countries can get around it in continu-ing to increase their export earnings. Thus, Baldwin has written:
Consider the response of exporting firms to the imposition of tighterforeign restrictions on imports of a particular product. One immediateresponse will be to try to ship the product in a form which is notcovered by the restriction... One case involves coats with removablesleeves. By importing sleeves unattached, the rest of the coat comes inas a vest, thereby qualifying for more favorable tariff treatment...
42 Researcb Observer 3, no. 1 (January 1988)

The use of substitute components is another common way ofgetting around import restrictions. The quotas on imports of sugarinto the United States only apply to pure sugar, defined as 100percent sucrose. Foreign exporters are avoiding the quotas byshipping sugar products consisting mainly of sucrose, but alsocontaining a sugar substitute, for example, dextrose ... At one time,exporters of running shoes to the United States avoided the hightariff on rubber footwear by using leather for most of the upperportion of the shoes, thereby qualifying for duty treatment asleather shoes" (1985, p. 110).
Yoffie (1983) has also recently examined the VERS on footwear andtextiles from a political scientist's perspective and found that thedynamic exporting economies such as Korea and Taiwan have em-braced them with considerable ingenuity, much like what Baldwin hasdocumented, to continue expanding their exports significantly.
There is also a more subtle factor at play here which relates towhy VERS may have provided the mechanism by which the executivebranches of government interested in maintaining freer trade mayhave succeeded in keeping trade expanding. VERs are, in that view, a"porous" form of protection that is deliberately preferred becauseof this nontransparent porousness. I have argued recently (Bhagwati1986b) that in industries such as footwear, two characteristics seem tohold that lend support to this porous protection model as an explana-tion for why protection is ineffective: (a) undifferentiated products(that is, cheaper varieties of garments and footwear) make it easy to"transship," that is, to cheat on rules of origin, passing off products ofa country restricted by VERs as products of countries not covered byVERs; and (b) low start-up costs and therefore small recoupment hori-zons apply in shifting investment and hence products to adjacent thirdcountries that are not covered by VERs, so that an exporting countrycan get around (admittedly at some cost) the VERs by "investment-shunting" to sources unafflicted by VERs. This strategy allows theexporter to recover his investment costs, since it is usually some timebefore the VERS get around to covering these alternative sources, orVERs are eliminated as the political pressure subsides (as was the casewith U.S. footwear). 27
In both ways, therefore, VERS in these types of industries can yield a"close-to-free-trade" solution for the exporting countries. These coun-tries can continue to profit from their comparative advantage byeffectively exploiting, legally (through investment-shunting) and ille-gally (through transshipments), the fact that VERs leave third countriesout whereas importing country tariffs and quotas do not."8
But the question then arises: why would the protecting importingcountries prefer this porous protection? Does it not imply that the
Jagdish N. Bhagwati 43

market-disrupted industry fails to be protected as it would under acorresponding import trade restraint? Indeed it does. But that is pre-cisely its attractiveness.
If executive branches want free trade in the national interestwhereas legislatures respond to the sectoral interests-definitely thestylized description of the "two-headed" democracies in the UnitedStates and the United Kingdom-then it can be argued that executiveswill prefer to use a porous form of protection which, while ensuringfreer market access, will nonetheless manage to appear as a conces-sion to the political demands for protection from the legislature orfrom their constituencies. Undoubtedly, these protectionist groups andtheir congressional spokesmen will eventually complain about con-tinuing imports. But then the executive branch can always cite its VER
actions, promise to look into complaints and perhaps bring othercountries into the VER net, and continue to obfuscate and buy timewithout effectively protecting.29
If the foregoing arguments suggest that executives have been cleverenough, both in exporting and importing countries, in keeping marketsmuch more open than the casual reading of the newspapers wouldsuggest, there are also additional forces in favor of freer trade that havenow emerged in the world economy which need to be considered inmaking a reasonable assessment of the prospects for increased protec-tionist measures. I believe that the international political economy haschanged dramatically in the last two decades to generate new andinfluential actors that are supportive of freer world trade.
A fairly common complaint on the part of analysts of the politicaleconomy has been the asymmetry of pressure groups in the tariff-making process. The beneficiaries of protection are often concentrat-ed, whereas its victims tend to be either diffused (as is the case withfinal consumers) or unable to recognize the losses they incur (as whenprotection indirectly affects exports and hence hurts those engaged inproducing exportables).30
Direct foreign investment (DFI) and the growing maze of globalizedproduction have changed this equation perceptibly. When DFI iS un-dertaken, not for tariff-jumping in locally sheltered markets, but forexports to the home country or to third markets, as is increasingly thecase, protectionism threatens the investments so made and tends togalvanize these influential multinationals into lobbying to keep mar-kets open. For example, it was noticeable that when the U.S. semicon-ductor suppliers recently gathered to discuss antidumping legal actionagainst Japanese producers of memory microchips known as EPROMs
(or erasable programmable read-only memories), noticeably absentwere Motorola Inc. and Texas Instruments Inc. who produce semicon-ductors in Japan and expect to be shipping some back to the UnitedStates. 3 "
44 Research Observer 3, no. 1 (January 1988)
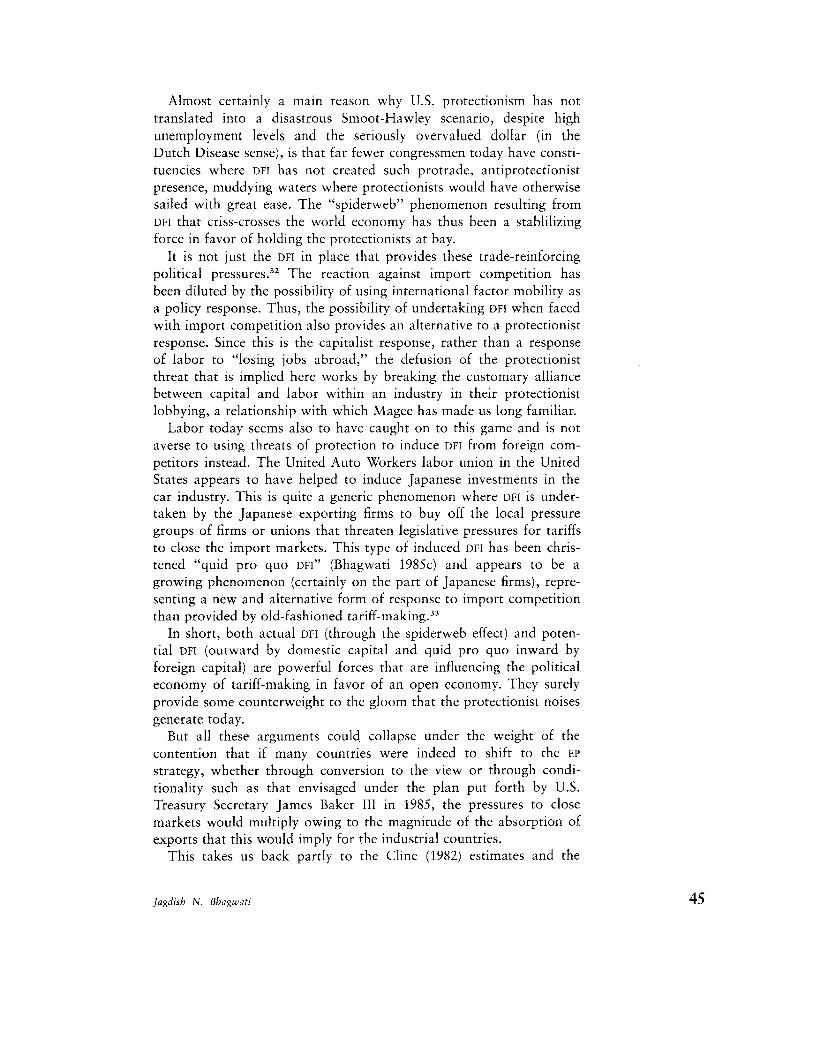
Almost certainly a main reason why U.S. protectionism has nottranslated into a disastrous Smoot-Hawley scenario, despite highunemployment levels and the seriously overvalued dollar (in theDutch Disease sense), is that far fewer congressmen today have consti-tuencies where DFI has not created such protrade, antiprotectionistpresence, muddying waters where protectionists would have otherwisesailed with great ease. The "spiderweb" phenomenon resulting fromDFI that criss-crosses the world economy has thus been a stablilizingforce in favor of holding the protectionists at bay.
It is not just the DFI in place that provides these trade-reinforcingpolitical pressures.3 The reaction against import competition hasbeen diluted by the possibility of using international factor mobility asa policy response. Thus, the possibility of undertaking DFI when facedwith import competition also provides an alternative to a protectionistresponse. Since this is the capitalist response, rather than a responseof labor to "losing jobs abroad," the defusion of the protectionistthreat that is implied here works by breaking the customary alliancebetween capital and labor within an industry in their protectionistlobbying, a relationship with which Magee has made us long familiar.
Labor today seems also to have caught on to this game and is notaverse to using threats of protection to induce DFI from foreign com-petitors instead. The United Auto Workers labor union in the UnitedStates appears to have helped to induce Japanese investments in thecar industry. This is quite a generic phenomenon where DFI is under-taken by the Japanese exporting firms to buy off the local pressuregroups of firms or unions that threaten legislative pressures for tariffsto close the import markets. This type of induced DFI has been chris-tened "quid pro quo DFI" (Bhagwati 1985c) and appears to be agrowing phenomenon (certainly on the part of Japanese firms), repre-senting a new and alternative form of response to import competitionthan provided by old-fashioned tariff-making.33
In short, both actual DFI (through the spiderweb effect) and poten-tial DFI (outward by domestic capital and quid pro quo inward byforeign capital) are powerful forces that are influencing the politicaleconomy of tariff-making in favor of an open economy. They surelyprovide some counterweight to the gloom that the protectionist noisesgenerate today.
But all these arguments could collapse under the weight of thecontention that if many countries were indeed to shift to the EP
strategy, whether through conversion to the view or through condi-tionality such as that envisaged under the plan put forth by U.S.Treasury Secretary James Baker III in 1985, the pressures to closemarkets would multiply owing to the magnitude of the absorption ofexports that this would imply for the industrial countries.
This takes us back partly to the Cline (1982) estimates and the
jagdish N. Bhagwati 45

several refutations of the pessimism engenclered by them that were setout earlier.34 But it remains true that, even if the estimates in Cline arenot to be taken seriously, the addition of any kind of trade pressure ina significant degree could touch off a wider range of sectoral, safe-guard moves in the industrial countries in the present climate. It isindeed possible to argue that (a) Cline-type estimates are not plausibleand exaggerate what would happen; (b) there is a great deal ofabsorptive capacity in the market sense in the world economy whichcan readily handle improved export performance resulting from theshift of many developing countries to the EP mode of organizing trade;and (c) there are powerful new forces in the international politicaleconomy that may make the protectionist bark worse than the protec-tionist bite. Nonetheless, the danger of protectionism does remainacute, especially in the present macroeconomic situation of sluggishgrowth and the continuing trade deficit in the United States. Thecapacity of the U.S. executive branch to hold the line against protec-tionism has been significantly eroded by the neglect of fiscal deficitsand the upsurge in congressional support for protection and fairtrade. The fragility of the situation requires serious attention to otherpolicy instruments such as the multinational trade negotiations (MTN),
as discussed below.An important consequence of the second wave of export pessimism,
which is based on this protectionist threat rather than on the belief inmarket-determined forces that limit export prospects, is that develop-ing countries can join in the process of trying to contain this threatand thereby change the very prospects for their trade. This suggeststhat they join hands with the industrial countries in efforts such as theMTN to contain the threat to the world trading system and to keepmarkets open to expanding trade levels. Shifting to the is strategy,therefore, based on export pessimism reflecting protectionist senti-ments simply makes no sense from an economic viewpoint unless thedeveloping countries are convinced that protectionism is here to stayand will be translated into actuality no matter what is done-anassumption that seems to be wholly unwarranted in light of thediscussion earlier in this section; A far more sensible policy approachseems rather to be to join with the executives of countries that sup-port freer trade initiatives, among them certainly the United States, incontaining the protectionist sentiments through strategies such as en-tering into trade negotiations.
New Arguments It may be useful to address some new intellectual defenses of the isfor the is strategy that have recently emerged in the academic literature.35
Strategy Labor Market Imperfections. In recent: articles, especially Fields(1984), it has been argued that the EP strategy is not appropriate when
46 Research Observer 3, no. 1 (January 1988)

there are excessively high wages in the economy and that EP countriessuch as Jamaica have done badly by ignoring this caveat. Now, thetheoretical literature on market imperfections and optimal policy thatemerged in the postwar period, with the independent contributions byMeade (1951) and Bhagwati and Ramaswami (1963) setting off thespectacular growth of the subject during the 1960s, has shown thatfactor market imperfections are best addressed by domestic, rather thantrade, taxes and subsidies.36 It is true, however, that the second-bestpolicy measures in such a case could be trade tariffs and subsidies.
There are two other problems with Fields's argument. First, he doesnot establish that countries such as Jamaica have been following the EP
strategy in the incentive-related sense that is relevant. As it happens,Jamaica certainly has not and has for long periods been in the is modeinstead. This confusion of concepts and hence conclusions is not con-fined to Fields's analysis, but afflicts even the proponents of EP strategyin some cases. Second, it is not at all clear from Fields that the highwages constitute a market imperfection in the sense required for depar-ture from unified exchange rates in the form of the is strategy.
In my view, wages are relevant in a different sense that is macro-theoretic, rather than microtheoretic as Fields suggests. If overallwages are "too high," that can only mean that somehow they, andtherefore the price level as well, are out of line with the exchangerate. That is, the country is suffering from overvaluation. In short, ifthat is so, we have already seen that the country is pursuing an Isstrategy, whether it intends to or not. Therefore, a country simplycannot hold on to any EP strategy if it continues to experience exces-sive wages. The sustained pursuit of EP, so that investors respond tothe incentives that EP defines, thus requires a sound macro policy asits foundation. Sound macro policies may then also bring, in turn,their own other rewards that supplement those that follow from theexport-promoting strategy.
Satisficing Theory of IS. An interesting thesis has been proposed bythe political scientist Ruggie (1983), which seems to argue that theadvantage of an EP strategy cannot be enjoyed by many developingcountries because they simply do not possess the flexibility of resourcemovements and the necessary political capacities to manage suchflexibility that the pursuit of EP requires. I would call this therefore the"satisficing" theory of the is strategy: developing countries in thispredicament must make do without the gains from trade and efficien-cy improvements that EP strategy brings.
This is a difficult argument to judge since, even if it were validwithin its premises, I do not find it compelling if such political con-straints are equated with the fact of being less developed economi-cally. In fact, given the lack of democratic structures with pressuregroup politics and attendant constraints on economic action by the
Jagdish N. Bhagwati 47

government, it is doubtful whether developing countries are not theones at advantage in this matter!
Again, is it clear that tensions and distributional conflicts are neces-sarily more difficult under an EP strategy? An is strategy, while insulat-ing the economy relatively from external disturbances, may create yetmore tensions and conflicts if the resulting stultification of incomeexpansion accentuates the zero-sum nature of other policy options inthe system. The correct statement of the Ruggie thesis would thenseem to be that, in the pursuit of any development strategy, thecompatibility of it with the political structure and resilience of thecountry needs to be considered. And this caveat needs to be addressednot only to the EP proponents.
Coping with External Instability. A similar economic concern hasbeen that, while EP may be better under steady-state conditions, itexposes the economy to the downside in the world economy andmakes it more vulnerable to instability.
Of course, the downside effects have to be set off against the upsideeffects. When this is done, it is not evident that countries pursuing EP
strategies are necessarily worse off. As it happens, even the downsideexperience of EP strategy countries during t:he years after the oil shockseems to have been more favorable than the experience of the Isstrategy countries, according to statistical. analysis by Balassa (1983and 1984). The reason seems to have been their greater capacity todeal with external adversity by using export expansion more success-fully to adapt to the world slowdown and thus avoiding importcontraction.
Conclusion Export promotion policies emerge withi success from the detailedscrutiny offered in this article. Equally important is the fact that theirsuccessful adoption will require collaborative and intense efforts toensure that the protectionist threat, recently escalating, is not allowedto break out into actual protection on a massive scale.
The multilateral trade negotiations offer the only reasonable pros-pect for maintaining a momentum in favor of a freer world tradingsystem. Failure to pursue them successfully, in a spirit of accommoda-tion and mutual understanding of constraints and needs, will onlyundermine what seems like the best mechanism for containing theprotectionist threat.
Appendix: Definitions
Theoretical Figure 1 illustrates, in the two-good model, the definitions of the-Clarification Of export-promoting (EP), import-substituting (Is), and ultra-export-pro-Key Concepts moting (ultra-EP) trade strategies.
48 Research Observer 3, no. 1 (January 1988)

AB is the country's production possibility curve. With given inter-national prices P''S, equilibrium production would be reached at P*under unified exchange rates which ensure that the relative goodsprices domestically are equal to P0S. Therefore, at P-, we haveEERX=EERm, where EER refers to the effective exchange rate. This isdefined as the EP strategy.
When the incentive to produce the import-competing good exceeds that to produce the ex- Figure 1
portable good, because of a tariff or overvalued Importable
exchange rates, for example (as shown below), good
production shifts to Pm. Here, EERX< EERm. Thisis the is strategy.
If the biased incentive goes in the other direc-tion, the relative incentives imply EERX>EERm A EER<EER7, (S)
and production shifts to the right of P", to say EER EER, (EP)
Pm. This is defined as the ultra-EP strategy.
S
Overvalued Exchange Rates and IS Strategy EER,> EER, (Ultra-EP)
0 B Exportable
An overvalued exchange rate will imply the good
pursuit of the is strategy. Figure 2 demonstratesthis with the standard supply and demand dia-gram for foreign exchange. Figure 2
If the exchange rate is adjusted to clear themarket, at S, then EERX = EERm because an ident- y=Rate of exchange
ical parity applies to both export and import , 'transactions. But consider now an overvalued ex- D /change rate with exchange controls in place. Un-der these circumstances the overvalued exchange Y,EER_
rate Ym leads to OW foreign exchange beingearned, corresponding to R on the SS curve. This i sforeign exchange will then be rationed to users,fetching a market-determined price which ex- (= EER, R
ceeds yr. That price is determined by Q on the sD
DD curve, with Ym representing then the pricecorresponding to quantity OW. Evidently then, 0 w Foreign('y,-yx)'yx represents the rate of premium that exchange
scarce foreign exchange commands in this over-valued exchange rate system.
It is also evident that 7. = EERX and 7m = EERm and thereforeEERX < EER. by the magnitude of the premium on rationed foreign
exchange. The overvalued exchange rate therefore implies the pursuitof an is strategy, whether it is intended or not.
Jagdish N. Bhagwati 49

The Cost of Protection with Tariff-Seeking
The new theory of directly unproductive profit-seeking (DUP)
and rent-seeking activities, which incorporates lobbying and relatedpolicy-triggered and policy-influencing activities into formal economic
theorizing, is illustrated in figure 3 by referenceFigure 3 to the phenomenon of tariff-seeking lobbying.
Importable good AB is the production possibility curve if thereis no tariff-seeking activity. If, as in conventionalanalysis, we assume an exogenously specified tar-
A iff, equilibrium production shifts to P (where, ofTariff-inclusive course, EER x< EERm)*
A, p s price ratio Suppose now that this very tariff is insteadA, _ World price ratio arrived at by lobbying which uses up real re-
\< wiPw sources, diverting these resources from being pro-ductively employed in producing the two goods.Then, the resources that are available to produce
0 0 B,R B S the two goods in this endogenous tariff, or equiv-Exportable
good alently tariff-seeking, equilibrium can be hypoth-etically seen to result in a "net-of-tariff-seeking"
production possibility curve A,B, at P.The total cost of protection is QS, measured in the conventional
equivalent variation fashion. By putting the given world price ratiotangent to AB at P*, we can then decompose this total cost of protec-tion as follows: QS = QR + RS where QR. is the conventional cost ofprotection (but measured along the net curve AB) and RS is theadditional cost of tariff-seeking (representing the cost of divertingresources from productive use to tariff-seeking lobbying).3"
Abstract This article evaluates recent arguments against the adoption of an export-promoting(EP) trade strategy. It reviews past experience with trade strategies, and distinguishesbetween the old and new export pessimism. The forrner was based on an (unwarranted)assessment of "natural" or market forces. The latter, by contrast, reflects "man-made"protectionism. This review finds that an EP policy remains the preferred option provideddeveloping countries forcefully join with the industrial countries in strategies to containprotectionist threats and to preserve and expand an open trading system.
Thanks are due to Armeane Choksi, Martin Wolf, Constantine Michalopoulos, SarathNotes Rajapatirana, Swaminathan Aiyar, Mohsin Khan, Vittorio Corbo, Adrian Wood, and
Bela Balassa for helpful comments and to Sunil Gulati, Susan Hume, Douglas Irwin,and David Laster for research assistance.
1. The chief studies were directed by Little, Scitovsky, and Scott (1970) at theOrganisation for Economic Co-operation and Development (OECD), Balassa (1971) atthe World Bank, Bhagwati (1978) and Krueger (1978) at the National Bureau ofEconomic Research (NBER) in the United States, and Donges (1976) at the Kiel Institutein Germany. Complementing and overlapping each other, these studies represent a
50 Research Observer 3, no. 1 (January 1988)

comprehensive analysis of the central question that has preoccupied developmenteconomists from the very beginning of the discipline.
2. Among other reviews that complement this article, the reader may consultBehrman 1984, Bhagwati and Srinivasan 1979, Findlay 1984, and Srinivasan 1986a and1986b.
3. Prebisch may have subsequently embraced the Nurkse view that primary productmarkets were also price inelastic, according to Balassa. I refer here to the main Prebischthesis as originally propounded and widely attributed to him.
4. In technical jargon, we have here the classic case for an optimal tariff since theterms of trade vary with the level of trade.
S. This is an example of the dangers of using such regressions, with little underlyingrationale, for predictive purposes. I have considered this issue at great length (Bhagwati1985a, p. 2).
6. Compare Goldstein and Khan (1982) and Riedel (1984), who analyze this argumentfully in two splendid and independent articles. Also of importance is the classicexamination of the issue by Kravis (1970).
7. See again the results cited in the synthesis volumes of the research projects listedin note 1. The Goldstein-Khan (1982) analysis also bears directly on this issue.
8. Compare Riedel's (1984) discussion of this finding in table 4.
9. There is a substantial empirical literature on this subject, with important contri-butions by Balassa, Grubel, and Lloyd. In addition, recent theoretical work by Dixit,Lancaster, Krugman, Helpman, and others has provided the analytical explanation forsuch intraindustry trade.
10. All these arguments are effectively a rebuttal of Dornbusch's (1986) restatementof the limited absorptive capacity thesis for developing country exports, which assertsthat substantial terms of trade losses would follow from the simultaneous resort to EP
strategy by many developing countries.
11. I am indebted to Vittorio Corbo for pointing this out to me.
12. Compare the comment on Prebisch in Bhagwati (1985a).
13. The estimated excess of EER, over EER, appeared to be below 10 percent atmaximum in the few careful cross-section estimates we had. This is reconfirmed forKorea in a more recent analysis by Nam (1986).
14. The strategies have been illustrated in the simplified two-goods model of tradi-tional trade theory in figure 1 in the appendix.
15. See also Krueger's (1980) informal usage of the phrase in this fashion.
t6. Compare Chenery, Shishido, and Watanabe (1962) for one such decomposition.For an analytical synthesis and evaluation of alternative measures of import substitution,see Desai (1979).
17. See, in particular, the synthesis volumes by Bhagwati (1978) and Krueger (1978).
18. Krueger's (1978) synthesis volume also contains similar cross-country regressionsfor the ten semi-industrialized countries in the NBER project. See the extensive review inLal and Rajapatirana (1987).
19. Balassa's (1978) reestimation of Michaely-type regressions also incorporates theMichalopoulos-Jay approach, thus combining the two different methodologies underone rubric.
20. It is well known, of course, that factors that lead to improved efficiency and henceto income improvement need not necessarily lead to sustained higher growth rates.Thus, in the Harrod-Domar model, where labor supply is slack, a once-for-all improve-ment in efficiency will indeed translate into a permanent higher growth rate of income,but not so in the steady state in the Solow model, where the growth rate is determined
jagdish N. Bhagwati 51

by the growth rate of labor and the rate of technicail change. In the text, however, weare explaining growth rates over a period of two or three decades, which makes thesesubtleties not particularly relevant, in my judgment. Moreover, it is important to notethat, for any given growth rate, a more efficient economic regime will require less savings(and hence less blood, sweat, and tears) to sustain it than a less efficient economicregime.
21. See Bhagwati and Srinivasan (1983, p. 30) for a taxonomy of such lobbyingactivities.
22. The appendix to this article explains the manner in which the conventional costof distorted production decisions resulting from protection is augmented by the cost oftariff-seeking lobbying when the protective tariff is the result of such lobbying. Costs ofother kinds of lobbying, including the effects of DUP activities such as illegal trade (thatis, tariff evasion), can be similarly illustrated. If the EP strategy relies not on exchangerate flexibility but simply on selective export subsidies to eliminate the bias againstexports (as in Phase II, delineated in the Bhagwati-Krueger NBER project), the DUP
activities can be expected to arise extensively in that regime as well.
23. Krueger's (1974) classic article contains estimates of rent-seeking costs, that is,resources spent in chasing premiums or rents on quantitative restrictions. These highestimates, up to 15 percent of GNP, are based on the assumption that rents result in anequivalent loss of resources in equilibrium (the so-called one-on-one postulate in rent-seeking theory). Recently, computable general equilibrium models have begun toincorporate such DUP and rent-seeking activities, so that progress can be expected inassessing the magnitude of such costs. Compare Dervis, de Melo, and Robinson (1981)and Grais, de Melo, and Urata (1986).
24. See the discussion in Balasubramanian (1984) and in Bhagwati (1986a). In privatecommunication, Balasubramanian has provided further results in support of thishypothesis.
25. See Bhagwati (1978), where some chapters summarize and evaluate these argu-ments with evidence from the ten country studies.
26. See Bhagwati (1985d) where I review the arguments and the evidence on theseissues, drawing also on the valuable contributions of Surjit Bhalla, Pranab Bardhan, PaulIsenman, Ian Little, Irma Adelman, Montek Ahluwalia, Keith Griffen, Paul Streeten,and T. N. Srinivasan, among others.
27. The investment shunting need occur only insofar as it is necessary to meet value-added rules of origin, of course, making the cost of profiting from this porousness evenless than otherwise.
28. Of course, the VERs in this instance represent only a partial and suboptimalapproximation to the free trade solution, which remains the desirable but infeasiblealternative. Moreover, not all exporting countries are capable of the flexible and shrewdresponse that underlies the model of porous protection sketched above.
29. This "two-headed" version of governments is what underlies the Feenstra-Bhagwati (1982) model of the efficient tariff. There, the model postulates that one branchof the government (pursuing special interests) interacts with a protectionist lobby toenact a political economy tariff. Then, another branch of the government (pursuing thenational interest) uses the revenue generated by this tariff to bribe the lobby intoaccepting a less harmful tariff that nonetheless leaves it as well off as under the politicaleconomy tariff. When this model was presented to a scientific conference in 1978, thegeneral reaction was that the model had a "schizophrenic" two-headed government!Traditional trade theory is so often modelled in terms of a monolithic government thatwhat was obviously a realistic innovation was regardecl as a bizarre feature of the model.
30. See, for example, Olson (1971), Finger (1982), and Mayer (1984).
31. See the report by Miller (1985).
32. Helleiner (1977) and most recently Lavergne and Helleiner (1985) have argued
52 Research Observer 3, no. 1 (January 1988)

that multinationals have become active agents exercising political pressure in favor offree trade. The structure of trade barriers has been related to patterns of DFI by Helleinerbut the later work by Lavergne finds this relationship to be fairly weak. This hypothesisand research do not extend to the potential DFi effects in favor of freer trade (whichwould occur if DFI becomes an alternative response to import competition), which isdiscussed in Bhagwati (1982b and 1986a) and in the text.
33. In fact, the Ministry of International Trade and Industry of Japan has recentlycompleted a survey of Japanese DFI abroad and found that a large fraction of therespondents cited reasons of the quid pro quo variety to explain their investmentdecisions. I am indebted to Professor Shishido of the International University of Japanfor this reference. See also the theoretical modeling of such quid pro quo DFI in Bhagwati,Brecher, Dinopoulos, and Srinivasan (1987) and in Bhagwati and Dinopoulos (1986), theformer using perfectly competitive structure and the latter using monopoly and duopolystructures instead.
34. See also the critique offered by Ranis (1985). Cline (1985) basically defends hisposition by arguing that the high ratios of trade to GNP typical of Far Eastern economiesare likely to trigger difficulties and that he should not have been read to mean that theEP strategy would necessarily lead to such phenomenally high trade growth rates andtrade ratios.
35. In the following, I select for treatment only the most important such arguments,given the central theme of this paper. For a more comprehensive review of recentarguments for protection, including those applying to industrial countries-as inKaldor's (1966) argument for protection to prevent British deindustrialization orSeabury's (1983) advocacy of protection to prevent American deindustrialization fordefense reasons-see my analyses in Bhagwati (1985c, 1985e, and 1986c). For a differentemphasis, more skeptical of antiprotectist arguments and EP strategy, see Streeten (1982).
36. The theory has been synthesized in Bhagwati (1971), and there is also a splendidshort treatment by Srinivasan (1987) in his entry on distortions for The New Palgrave.
37. For the original analysis of this problem, see Bhagwati (1980). Further discussionof the question can be found in Bhagwati, Brecher, and Srinivasan (1984).
Balassa, Bela. 1971. The Structure of Protection in Developing Countries. Baltimore, ReferencesMd.: Johns Hopkins University Press.
. 1978. "Exports and Economic Growth: Further Evidence." Journal of Develop-ment Economics (June): 181-89.
. 1983. "External Shocks and Adjustment Policies in Twelve Less-DevelopedCountries: 1974-76 and 1979-81." Paper presented to the annual meeting of theAmerican Economic Association, San Francisco, December.
-____ 1984. Adjustment to External Shocks in Developing Economies. World BankStaff Working Paper 472. Washington, D.C.
Balassa, Bela, and Carol Balassa. 1984. "Industrial Protection in the Developed Coun-tries." World Economy (June): 179-96.
Balasubramanian, V. N. 1984. "Incentives and Disincentives for Foreign Direct Invest-ment in Less Developed Countries." Weltwintschaftliches Archiv 720-35.
Baldwin, Robert. 1982. The Inefficacy of Trade Policy. Frank D. Graham MemorialLecture, Essays in International Finance 150. Princeton, N.J.: Princeton University,Department of Economics.
. 1985. "Ineffectiveness of Protection in Promoting Social Goals." World Econo-my (June): 109-18.
Behrman, Jere. 1984. "Rethinking Global Negotiations: Trade." In J. Bhagwati and J.Ruggie, eds. Power, Passions, and Purpose. Cambridge, Mass.: MIT Press.
Jagdish N. Bhagwati 53
Bhagwati, Jagdish. 1968. The Theory and Practice of Commercial Policy. Frank D.Graham Memorial Lecture, Essays in International Finance 8. Princeton, N.J.:Princeton University, Department of Economics.
. 1971. "The Generalized Theory of Distortions and Welfare." In J. Bhagwatiand others, eds. Trade, Balance of Payments and Growth: Essays in Honor of C. P.Kindleberger. Amsterdam: North Holland.
. 1973. "The Theory of Immiserizing Growth: Further Applications." In M.Connolly and A. Swoboda, eds. International Trade and Money. Toronto: Universityof Toronto Press.
. 1978. Anatomy and Consequences of Exchange Control Regimes. Cambridge,Mass.: Ballinger Publishing Company for National Bureau of Economic Research.
. 1980. "Lobbying and Welfare." Journal of Public Economics (December):355-63.
. 1982a. "Shifting Comparative Advantage, P'rotectionist Demands, and PolicyResponse." In J. Bhagwati, ed. Import Competition and Response. Chicago, Ill.:Chicago University Press.
. 1982b. "Directly-unproductive, Profit-seeking (DuP) Activities." Journal ofPolitical Economy (October): 988-1002.
. 1985a. Wealth and Poverty: Essays in Development Economics, vol. 1. Ed. byGene Grossman. Cambridge, Mass.: MIT Press.
. 1985b. Dependence and Interdependence: Essays in Development Economics,vol. 2. Ed. by Gene Grossman. Cambridge, Mass.: MIT Press.
. 1985c. "Protectionism: Old Wine in New Bottles." Journal of Policy Modeling(Spring): 23-33.
. 1985d. Growth and Poverty. Michigan State University Center for AdvancedStudy of International Development Occasional Paper 5. East Lansing.
. 1985e. "Export Promotion as a Development Strategy." In T. Shishido and R.Sato, eds. Essays in Honor of Saburo Okita. Boston, Mass.: Auburn House.
. 1986a. Investing Abroad. Esmee Fairbairn Lecture. Lancaster, England: Univer-sity of Lancaster.
-_____ 1986b. "VERs, Trade and Foreign Investment." Paper presented to the WesternEconomic Association Conference, San Francisco, July.
. 1986c. "Rethinking Trade Strategy." In J. Lewis and V. Kallab, eds. Develop-ment Strategies Reconsidered. Washington, D.C.: Overseas Development Council.
Bhagwati, Jagdish, R. Brecher, and T. N. Srinivasan. 1984. "DuP Activities and EconomicTheory." European Economic Review (April): 291-307.
Bhagwati, Jagdish, R. Brecher, E. Dinopoulos, and T. N. Srinivasan. 1987. "Quid ProQuo Investment and Policy Intervention: A Political-Economy-Theoretic Analysis."Journal of Development Economics, forthcoming.
Bhagwati, Jagdish, and E. Dinopoulos. 1986. "Quid Pro Quo Investment and MarketStructure." Paper presented to the Western Economic Association Conference, SanFrancisco, July.
Bhagwati, Jagdish, and V. K. Ramaswami. 1963. "Domestic Distortions, Tariffs and theTheory of Optimum Subsidy." Journal of Political Economy (February): 44-50.
Bhagwati, Jagdish, and T. N. Srinivasan. 1979. "Trade Policy and Development." In R.Dornbusch and J. Frenkel, eds. International Economic Policy: Theory and Evidence.Baltimore, Md.: Johns Hopkins University Press.
. 1983. Lectures on International Trade. Cambridge, Mass.: MIT Press.
Brecher, R., and C. Diaz-Alejandro. 1977. "Tariffs, Foreign Capital and ImmiserizingGrowth." Journal of International Economics (November): 317-22.
54 Research Observer 3, no. 1 (January 1988)
Cairncross, A. 1962. Factors in Economic Development. London: Allen and Unwin.
Chenery, H., S. Shishido, and T. Watanabe. 1962. "The Pattern of Japanese Growth,1914-1954." Econometrica (January): 98-139.
Cline, W. 1982. "Can the East Asian Model of Development be Generalized?" WorldDevelopment (February): 81-90.
. 1985. "Reply." World Development (April).
Dervis, K., J. de Melo, and S. Robinson. 1981. "A General Equilibrium Analysis ofForeign Exchange Shortages in a Developing Economy." Economic Journal (De-cember): 891-906.
Desai, P. 1979. "Alternative Measures of Import Substitution." Oxford Economic Papers(November): 312-24.
Donges, J. 1976. "A Comparative Study of Industrialization Policies in Fifteen Semi-Industrial Countries." Weltwirtschaftliches Archiv, 626-59.
Dornbusch, R. 1986. "Impacts on Debtor Countries of World Economic Conditions."Paper presented at a Seminar on External Debt, Saving and Growth in Latin America,International Monetary Fund, Washington, D.C., October 13-16.
Feder, G. 1983. "On Exports and Economic Growth." Journal of Development Eco-nomics (April): 59-73.
Feenstra, R., and J. Bhagwati. "Tariff Seeking and the Efficient Tariff." In J. Bhagwati,ed. Import Competition and Response. Chicago, Ill.: Chicago University Press.
Fields, G. 1984. "Employment, Income Distribution and Economic Growth in SevenSmall Open Economies." Economic Journal (March): 74-83.
Findlay, R. 1984. "Trade and Development: Theory and Asian Experience." AsianDevelopment Review, 23-42.
Finger, J. M. 1982. "Incorporating the Gains from Trade into Policy." World Economy(December): 367-77.
Goldstein, M., and M. S. Khan. 1982. Effects of Slowdown in Industrial Countries onGrowth in Non-oil Developing Countries. International Monetary Fund OccasionalPaper 12. Washington, D.C.
Grais, W., J. de Melo, and S. Urata. 1986. "A General Equilibrium Estimate of the Effectsof Reductions in Tariffs and Quantitative Restrictions in Turkey in 1978." In T. N.Srinivasan and J. Whalley, eds. General Equilibrium Trade Policy Modelling. Cam-bridge, Mass.: MIT Press.
Hamada, K. 1974. "An Economic Analysis of the Duty-Free Zone." Journal of Interna-tional Economics (August): 225-41.
Harris, R. 1986. "Market Structure and Trade Liberalization: A General EquilibriumAssessment." In T. N. Srinivasan and J. Whalley, eds. General Equilibrium TradePolicy Modelling. Cambridge, Mass.: MIT Press.
Harrod, R. 1951. The Life of John Maynard Keynes. New York: Harcourt and Brace.
Helleiner, G. K. 1977. "Transnational Enterprises and the New Political Economy ofUnited States Trade Policy." Oxford Economic Papers (March): 102-16.
Hufbauer, G., and J. Schott. 1985. Trading for Growth: The Next Round of TradeNegotiations. Washington, D.C.: Institute for International Economics.
Hughes, H., and A. Krueger. 1984. "Effects of Protection in Developed Countries onDeveloping Countries." In R. Baldwin and A. Krueger, eds. The Structure andEvolution of Recent U.S. Trade Policy. Chicago, Ill.: Chicago University Press forNational Bureau of Economic Research.
Kaldor, N. 1966. Causes of the Slow Economic Growth of the United Kingdom.Cambridge, England: Cambridge University Press.
Jagdish N. Bhagwati 55

Kravis, 1. 1970. "Trade as a Handmaiden of Growth: Similarities between the Nine-teenth and Twentieth Centuries." Economic Journal (December): 850 72.
Krueger, Anne. 1961. "Export Prospects and Economic Growth: India: A Comment."Economic Journal (June): 436-42.
_____. 1974. "The Political Economy of the Rent-Seeking Society." American Eco-nomic Review (June): 291-303.
-_____ 1978. Foreign Trade Regimes and Economic Development: LiberalizationAttempts and Consequences. Cambridge, Mass.: Ballinger Publishing Company forNational Bureau of Economic Research.
. 1980. "Trade Policy as an Input to Development." American Economic Review(May): 288-92.
. 1982. Trade and Employment in Developing Countries: Synthesis and Conclu-sions. Chicago, Ill.: University of Chicago Press.
Krueger, Anne, and B. Tuncer. 1980. Estimating Total Factor Productivity Growth in aDeveloping Country. World Bank Staff Working Paper 422. Washington, D.C.
Lal, D., and S. Rajapatirana. 1987. "Trade Regimes and Economic Growth in Develop-ing Countries." World Bank Research Observer 2, no. 2 (July): 189-217.
Lavergne, R., and G. K. Helleiner. 1985. "'United States Transnational Corporations andthe Structure of United States Trade Barriers: An Empirical Investigation." UnitedNations, New York.
Lewis, W. A. 1980. "The Slowing Down of the Engine of Growth." American EconomicReview (September): 555-64.
Little, I., T. Scitovsky, and M. Scott. 1970. Industry and Trade in Some DevelopingCountries. London: Oxford University Press.
Mayer, W. 1984. "Endogenous Tariff Formation." American Economic Review 74, no.5 (December): 970-85.
Meade, J. 1951. Trade and Welfare: The Theory of International Economic Policy, vol.2. London: Oxford University Press.
Michaely, M. 1977. "Exports and Growth: An Empirical Investigation." Journal ofDevelopment Economics (March): 49-53.
Michalopoulos, C., and K. Jay. 1973. Growth of Exports and Income in the DevelopingWorld: A Neoclassical View. Agency for International Development Discussion Paper28. Washington, D.C.
Miller, M. 1985. "Big U.S. Semiconductor Makers Expected to Sue Over 'Dumping' ofJapanese Chips." Wall Street Journal, October 1.
Nam, Chong-Hyun. 1986. "Trade Policy and Economic Development in Korea."International Economics Research Division, Development Research Department,World Bank.
Nishimizu, M., and S. Robinson. 1984. "Trade Policies and Productivity Change in Semi-Industrialized Countries." Journal of Development Economics (October): 177-206.
Nurkse, R. 1953. Problems of Capital Formation in Underdeveloped Countries. Oxford,England: Basil Blackwell.
-_____ 1959. Patterns of Trade and Development. Wicksell Lectures. Stockholm:Almquist and Wicksell.
Olson, M. 1971. The Logic of Collective Action: Public Goods and the Theory ofGroups. Cambridge, Mass.: Harvard University Press.
Prebisch, R. 1952. "Problemas Teoricos y Practicos del Crecimiento Economico." UnitedNations, Economic Commission for Latin America.
56 Research Observer 3, no. 1 (January 1988)

. 1984. "Five Stages in My Thinking about Development." In P. Bauer, G. Meier,and D. Seers, eds. Pioneers in Development. New York: Oxford University Press.
Ranis, G. 1985. "Can the East Asian Model of Development be Generalized?" WorldDevelopment (April): 543-45.
Riedel, J. 1984. "Trade as the Engine of Growth in Developing Countries, Revisited."Economic Journal (March): 56-73.
Ruggie, J., ed. 1983. The Antinomies of Interdependence: National Welfare and theInternational Division of Labor. New York: Columbia University Press.
Seabury, P. 1983. "Industrial Policy and National Defense." Journal of ContemporaryStudies 5-15.
Srinivasan, T. N. 1986a. "Development Strategy: Is the Success of Outward Orientationat an End?" In S. Guhan and M. Shroff, eds. Essays on Economic Progress andWelfare. New Delhi: Oxford University Press.
-_____ 1986b. "International Trade for Developing Countries in the Nineteen Eighties:Problems and Prospects." In J. Dunning and M. Usui, eds. Economic Independence.London: Macmillan.
. 1987. "Distortions." In The New Palgrave. London: Macmillan, forthcoming.
Streeten, P. 1982. "A Cool Look at 'Outward-looking' Strategies for Development."World Economy (September): 159-69.
Uzawa, H. 1969. "Shihon Jiyuka to Kokumin Keizai" (Liberalization of ForeignInvestments and the National Economy). Economisuto, pp. 106-22 (in Japanese).
Yoffie, D. 1983. Power and Protectionism. New York: Columbia University Press.
jagdish N. Bbagwati 57


THE STATEAND THE INVISIBLE HAND
Stanislaw WelliszRonald Findlay
conomic analysis has always been based on the postulate thatpeople act in their own self interest. Yet, as economists proudlydemonstrate, the interaction of selfish individuals in perfectly
competitive markets leads, "as if guided by an invisible hand," tosocially beneficial outcomes. Of course, economists recognize thatcompetitive markets cannot solve the problems associated with exter-nalities in production and consumption and with the provision ofpublic goods. This creates a role for the state, which appears as adeus ex machina to eliminate whatever deviations from Pareto opti-mality result from failures of competitive markets. In addition thestate may be regarded as also having the duty of redistributing in-comes to achieve the targets specified by some social welfare function.In all cases, however, the state is portrayed simply as an instrument toachieve abstract objectives of national welfare.
This standard approach to economic behavior in both its privateand public aspects makes two crucial assumptions that have onlyrecently begun to be questioned. First, even though the behavior ofprivate agents is assumed to be selfish, it is taken for granted that theonly way they can achieve their aims is to satisfy directly their ownwants for goods and services or to satisfy those of others throughvoluntary exchange. Thus all economic behavior is "useful" or "pro-ductive," in the sense of providing goods and services that enter theutility function of someone in society.
Much economic behavior, however, does not fit into this conven-tional framework. In the case of theft or robbery, the criminals devotetheir time and energy, as well as material inputs, to depriving othermembers of society of their incomes by means of coercion or fraud.
(C 1988 The International Bank for Reconstruction and Development/The World Bank 59

Not all illegal behavior is of this type, of course. Smuggling or blackmarketeering are examples of illegal behavior that provides goods andservices to other members of society. Of course, many perfectly legaleconomic activities are not directed at producing goods and services.The example we shall explore extensively in this article is lobbying-the use of resources to obtain government regulations that boost theincomes of a particular group by raising the prices of what its mem-bers sell or by lowering the prices of what they buy.
Second, it is usually assumed that the state seeks to maximize anobjective function of social welfare. This assumption is appropriatefor normative analysis, but it either leaves open the question of apositive theory of government behavior or makes the fatal mistake ofsupposing that governments always do only what they should do.
An alternative approach, which we shall adopt here, is to assumethat the government maximizes some objective function of its owninterest. But what should that function be? Is it rational for thegovernment to maximize public revenue, or public expenditure, or thedifference between the two? By analogy with the theory of the firm itis appealing to begin by thinking of the state as a natural monopoly,the "monopoly of the legal use of force," in Max Weber's famousdefinition, and to conceive of the state as maximizing monopoly profitor "surplus." Such an objective function seems appropriate for anabsolute monarch in early modern Europe or for some of today'sThird World dictators. But in a modern state the power of the ruler(president, prime minister, or junta) is greatly circumscribed and isusually filtered through a bureaucracy that pursues goals of its own.The monopoly model, with its simplc beauty, no longer appliesdirectly.
In the case of modern "democratic pluralist" societies the state isbetter portrayed not as an autonomous decisionmaker, but as a bro-ker or mediator between interest groups, with economic policy result-ing from the pushes and pulls of these factions. People with similarinterests lobby to obtain favorable legislation, while the governmentresponds by working out compromises acceptable to the various pow-er groups.
This article is concerned with "income appropriation," that is, withthe use of private or state resources to acquire, rather than to gener-ate, income. The traditional term "production" is reserved for activi-ties that generate income. Both appropriation and production can beeither legal or illegal, though the bulk of economic literature is con-cerned only with legal production. Examples of the treatment ofillegal production would be the analysis of smuggling by Bhagwatiand Hansen (1973) and of the "second economy" in Soviet-type sys-tems by Wellisz and Findlay (1986). The case of legal appropriation isconsidered in Krueger (1974), where individuals use resources to ac-
60 Research Observer 3, no. 1 (January 1988)

quire licenses for quota-restricted imports, and in Bhagwati and Srini-vasan (1980), where people strive to divert revenue from the publicpurse to themselves. Illegal production has been studied by Becker(1968), in his well-known analysis of crime and punishment, and byTullock (1967) who considers theft as an analogy to lobbying.
Of all the aspects of legal appropriation, rent-seeking has recentlyattracted the most attention. The term was coined by Krueger to referto the behavior of people or companies who expend resources toacquire import licenses that command a scarcity premium or "rent" inthe form of the excess of domestic over world (tariff-inclusive) prices.The term has subsequently been applied to all types of behavior thatwe have classified as "appropriation." Bhagwati (1982) proposed thephrase "directly unproductive profit-seeking" activities for the generalcategory, while restricting rent seeking (as we do in this article) toKrueger's original usage.
The economic role of the state can be described in different ways, The Economydepending on one's view of the state itself and the motives of the and the Statepeople who exercise sovereign power. Certain extreme cases illustratethe nature of the issues involved. At one extreme there could be agovernment of Platonic Guardians, who selflessly bring about what-ever levels of public expenditure and taxation best serve the collectiveinterests of the citizens. At the other, there is the Hobbesian Levi-athan, in which case the government serves the absolute ruler's ownends, subject only to his providing the citizens with the minimalframework of law and order that makes his rule preferable to thestate of nature. To isolate the role of the different objectives of thetwo types of government, we assume the same underlying factorendowments and technology for the public and private sectors of theeconomy in both cases.'
In the private sector of the economy final goods and services areproduced under competitive conditions by applying labor to capitalavailable in fixed supply. We shall make the usual neoclassical as-sumptions concerning the production function, that marginal productsof both factors are positive and diminishing. For the time being, weshall treat the final output as a single composite commodity.
The government sector provides an intermediate, collective good,"law and order," which is factor-augmenting in the private sector or"Hicks neutral" in the sense that it augments the productivity of bothfactors in the private sector equally. To simplify the analytics weassume that the public good is made by labor alone, though all thequalitative conclusions hold if we make the reasonable assumptionthat the government sector is less capital-intensive than the privatesector. There are diminishing returns at the margin to increased gov-
Stanislaw Wellisz and Ronald Findlay 61

ernment expenditure. The total supply of labor in the economy isfixed, and workers are free to choose employment in either sector,which means that the government must pay a wage equal to the netprivate sector wage.
The government has the power to tax. We shall assume for nowthat a tax t is proportional to the excess of income of each factor inthe private sector above a basic level. In the absence of the publicgood (in the Hobbesian "state of nature") each factor earns its basic
Figure 1 income, and, of course, pays no tax. Given theOutput fixity of factor supply the tax is nondistortionary.
c We thus leave aside the familiar problems of thes / > "incentive" and "efficiency" aspects of the tax
structure to concentrate exclusively on the "politi-cal economy" features of the problem.
The economy described above is represented inE / \ figure 1. The total labor supply is shown by 00',
/ G / \ with public sector employment measured to theA / ( \ right from O and private sector employment to theF X T left from O'. If all labor is employed in the private
sector, no public good is supplied and private out-
0 B . put is OA. As labor is transferred to public employ-) R ment, total output of the final good increases as
Public Privateemployment proyme shown by the rising portion of the ACO' curve.
With successive labor transfers fewer workers areleft in production. Furthermore, successive additions to public em-ployment have a diminishing effect on private sector productivity.
Output reaches a maximum at BC (equal to OS) when OB workersare in the public, and O'B in the private sector. If public employmentincreases beyond this point, output declines; output is zero if there areno workers in the private sector.
Government by Platonic Guardians
If the country were guided by selfless Platonic Guardians whosesole aim is to maximize output, the government would impose a taxt0 , yielding just enough revenue to pay the optimal number of publicsector workers at the prevailing net-of-tax competitive wage. In figure1 the curve OGR shows government revenues as a function of em-ployment in the public sector. Since the tax rate is fixed, the taxrevenue is directly related to private sector production, upon whichthe tax is levied. As public employment rises from zero to OB, privateincome increases, and so does tax revenu.e. With further increases ingovernment employment, however, incom.e and the tax revenue bothdecline. The curve FE represents the cost of providing the public goodas a function of public employment. When there are no public em-
62 Researcb Observer 3, no. 1 (January 1988)

ployees-and hence no public good-the private sector wage is OF.As the number of public employees rises, so does the wage. This isbecause of (a) the increasing private sector capital-labor ratio, and (b)the productivity-augmenting effect of public sector employment. Thusthe FE curve rises throughout its range. The two curves intersect at G.At this point the budget is balanced, and the public good is providedat the socially optimal level.
The Leviathan
The Guardians' polar opposite is Hobbes's Leviathan, which isentirely selfish but a necessary evil. It alone can provide law andorder, without which life is "solitary, poor, nasty, brutish, and short."As payment for this essential public good, the Leviathan extractsincome from its subjects, which it puts to its own uses. But theLeviathan, no matter how selfish, does not make its subjects worse offthan they would be in the state of nature (hence our assumption thatbasic income is free of tax).
Unlike the Guardians, whose aim is to maximize income accruingto society, the Leviathan's goal is to maximize the difference betweenthe tax take and the public sector wage bill. ALeviathan with unconstrained ability to tax will, fOguret2however, provide the same volume of the publicgood as the Guardians-because the higher the finalproduction, the greater the surplus it can extract.
In figure 1, the Leviathan would tax the private /sector to keep wages and capital rental down to the /
level of the state of nature. The wage would remain K
at OF and capital rental at FA. Income accruing to / Iboth factors would remain at OA, as shown by the I G EL horizontal line through point A, while all the bene- A
fits of increased production would accrue to the F
Leviathan. The surplus reaches a maximum ASwhen OB workers are in the public sector. Thus the 0 L M B N R O'
structure of employment and the volume of produc- Public Private
tion would be the same under the rule of a perfectly
benevolent dictator as under that of an utterly ruthless satrap, thoughof course income distribution is very different in the two cases.
Historically, the taxing power of the executive branch of the gov-ernment (monarch, president, or dictator) has been circumscribed byfigure 2 tradition or by parliamentary rule. This produces a paradox:if the taxes that the Leviathan is permitted to levy are subject to alimit, the structure of production is less efficient, though the public isbetter off. To demonstrate this proposition, let us assume that thesovereign is not allowed to tax at more than t', the rate just sufficient
Stanislaw Wellisz and Ronald Findlay 63
to pay for the optimal level of public employment, OB (figure 2).Clearly, a constrained Leviathan would have no interest employingOB people, for it can generate a surplus only if public employment islower. The surplus is shown as the vertical distance between the taxrevenue curve, OGR, and the cost-of-public-employment curve, FE.From the Leviathan's point of view OL represents the best level ofpublic employment. At this point the slopes of the FE and OGRcurves are equal, which means that the marginal cost of public em-ployment equals the marginal tax yield from public employment, sothe surplus is maximized.
No matter how high the tax rate, the Leviathan will supply asuboptimal amount of the public good as long as the tax limit isbinding. Suppose that the tax limit is raised from t* to t+. Since t+ ishigher than V-, the new tax revenue carve, OHR, lies above theOGR curve, but both curves reach a maximum at B, at which pointthe marginal tax revenue is zero for any tax rate (figure 2). By thesame token, net-of-tax private sector wages are lower under the t+than under the t* regime. The curve representing public expendi-ture on wages, FK, lies below, and is flatter than, FE, but bothcurves have a positive slope throughout the range. The level ofpublic employment that maximizes the surplus, OM, will thereforebe higher than OL, but since the slope of FK is positive, point Mwill lie to the left of B. Points M and B would coincide only if thetax rate is high enough to make the FIK curve horizontal, that is,high enough to keep the population at the state-of-nature incomelevel after tax.
It is easy to find cases in which the tax-constrained Leviathansupplies too little of the public good and extracts a surplus for its ownpurposes. Well into the eighteenth century European kings maintainedgreat palaces, but did not adequately provide for the safety of thehighways. Recent events in the Philippines and elsewhere providecontemporary examples. The prevalent complaint, however, is notthat governments are venal, but that they are too big and thus threa-ten to cramp, rather than assist, private production. How can theexcessive size of government be accounted for in our model?
The answer is that the assumption of "one man government" isinapplicable to the modern world. Alfred Jarry's Ubu Roi personallyextracted taxes from his subjects by beating them with his financestick. A real life sovereign, whatever his title and whatever his power,has a vast hierarchy of tax collectors and other bureaucrats.
One of the few legitimate ways in which a bureaucrat can enrichhimself is by expanding his bureau. To organize large teams efficient-ly, supervisory hierarchies are needed. For them to be efficient, super-visors must be paid more than those supervised (see, for instance,Calvo and Wellisz 1979). A larger bureau therefore means higher pay.
64 Researcb Observer 3, no. 1 (January 1988)

It also brings more power and prestige, an important consideration tomany people, as emphasized by Niskanen (1971) and before him, ofcourse, Parkinson. But the need for staff can be justified only in termsof the bureau's service to the community, as measured by the outputof the public good. So bureau heads have an incentive to maximizeoutput subject to the budgetary constraint.
Let us assume again that t- is the historically given tax. If theGuardians were running the government, they would employ OBworkers at the competitive wage and return to the public the excess oftax revenue over expenditure. The Leviathan would collect the taxand spend a suboptimal fraction of it on the public good. The bu-reaucracy would spend the full amount to employ ON workers.
The bureaucratic monster, unlike the Leviathan, can be made toserve the public interest if an appropriate limit is put on the govern-ment's power to tax. If the tax rate were tc' and the government wererequired to balance its budget, it would hire exactly the same numberof public sector employees and provide the same volume of publicgoods as one directed by the Guardians.
We have been using the term "social optimum" to refer to themaximum output of the final, private good. Labor, however, wouldwish to maximize wages, and capital to maximize profits. Under ourassumption that the intermediate public good is relatively labor-inten-sive, labor would favor an extension of the public sector and capital acontraction, relative to the social optimum.
The production of public goods benefits society by raising privatesector productivity. At the social optimum the marginal gain in pro-ductivity just equals the marginal product of a private sector worker.If the public sector expands any more, the production loss caused bywithdrawing workers from the private sector would outweigh theproductivity gain from the corresponding increase in public employ-ment, so that final output would decline. However, the withdrawal oflabor from private production increases the capital-labor ratio andraises wages independently of the productivity effect. It follows thatlabor benefits if private sector employment is reduced by raising pub-lic employment above the socially optimal level. By the same token,capitalists would favor a socially suboptimal level of public goods.These results are in line with the tendency of labor-oriented politicalparties to favor extensions of government activity and for capitalisti-cally oriented ones to resist them.
Revenue and Protection: A Government-Capitalist Alliance
In many developing countries governments rely heavily on importduties as a source of finance. These duties favor import-substitutingindustries. The state's desire for revenue, and local industry's desire
Stanislaw Wellisz and Ronald Findlay 65

for protection, can result in a mutually beneficial regime of hightariffs, even though it is obviously inimical to economic efficiency. Wedemonstrate the possibility of this outcome, under plausible condi-tions, in the context of a simple model.2
Since we are considering international trade, it will be convenientto assume that the private sector produces two goods, the relativeprices of which are fixed on the world market, a labor-intensiveexport and a capital-intensive import substitute, as in the familiarHeckscher-Ohlin model.3 Both sectors of private industry draw on thesame pool of capital, in fixed supply, which is freely transferable andmalleable, so that all capitalists form a single interest group. There isalso a fixed labor pool, which can be competitively hired by privateemployers or by the government. For the sake of simplicity, we shallignore, in this section, the effect of government output in enhancingthe productivity of factors hired by the private sector.
We assume that the objective of the government is the "bureau-cratic" one of maximizing public employment, according to theParkinson-Niskanen "law" of the previous section, subject to therequirement that the budget be balanced, with tariff proceeds beingthe sole source of revenue. A tariff, in conjunction with the givenrelative price of the two goods on the world market, would determinethe real wage by the familiar Stolper-Samuelson theorem, as well asthe level of imports and government revenue, assuming initially thatthe entire labor force is employed in the private sector. The govern-ment now uses the revenue to hire workers at the tariff-determinedwage until expenditure is equal to revenue. Note that as labor iswithdrawn from the private sector total revenue will fall, since pro-duction of the capital-intensive import substitute will rise according tothe Rybczynski theorem, which thus implies a reduction in the volumeof imports and hence in the tariff proceeds.
If the initial tariff is sufficiently small, an increase in the tariff level,at constant public employment, would raise total revenue and alsoreduce total expenditure, since the higher tariff would lower the realwage, by the Stolper-Samuelson theorem. Thus if the tariff rate isbelow the maximum revenue level, it vwould be to the government'sadvantage to raise the tariff still further since doing so would bothincrease revenue and reduce the cost of public employment. At themaximum revenue point itself a further small increase in the tariffwould leave revenue unchanged, by the definition of a maximum,while it would still lower the real wage so that public employmentcould be increased further. Thus the optimum for the bureaucraticgovernment must be at a tariff level tlhat is beyond the maximumrevenue point or to the right of the peak of the Laffer curve.
In order to determine the tariff that maximizes public employmentsubject to a balanced budget, we first observe that maximizing public
66 Resea:rch Observer 3, no. 1 (January 1988)

employment subject to a balanced budget is logically equivalent tomaximizing the budget surplus (or minimizing the budget deficit) for agiven level of public employment. The premise is that maximizing thesurplus for given public employment makes possible the biggest incre-ment in public employment and so best contributes to the sole objec-tive of government policy in the model. At the optimum any changein the tariff level will result in a deficit, while any higher level ofpublic employment must result in a deficit even if the tariff rate isadjusted in such a way as to minimize it.
In figure 3 we depict government revenue R and expenditure E asfunctions of the level of public employment Lg. For each value of Lg,such as LgO, the tariff to is chosen in such a way as to maximize thesurplus So, equal to the difference between reve-nue R° and expenditure Eo. Revenue and expendi- Figure 3
ture each depend on the tariff rate and level of Government
public employment since these variables deter- revenue
mine the wage rate and the level of imports. As Lg
is increased the tariff is altered appropriately ateach value of Lg to maximize the vertical distancebetween the R and E curves, thus maximizing the E
budget surplus. At the intersection point corres- ponding to the optimal level L of public em- PW=E' …
ployment the budget is exactly balanced and so E°
the corresponding tariff rate t*- is the optimal one Rfor the government's objective. Employment lev- I
els to the right of Lg:- correspond to deficits and lhence are not feasible. The R function slopes ± !
downward since higher public employment re- L , Public
duces the volume of imports, as explained ear- employment
lier, and hence of tariff proceeds. The E functionslopes upward since the greater volume of public employment resultsin a higher level of government expenditure.
Since the return on capital is an increasing function of the tariff,capitalists would ideally desire the tariff to be prohibitive. Thus capi-talists, who would already be benefiting from the tariff set above themaximum revenLe level, might even be able to persuade the govern-ment to raise it still higher than t0 . Labor would, of course, exertpressure in the opposite direction and attempt to move the economytoward free trade. If labor and other interests are weak, the result willbe a high protective wall for import substitution in industry, sustainedby the implicit alliance of private capitalists and the bureaucraticstate. Thus what appears to be irrational from the politically naiveperspective of neoclassical trade theory is perfectly explicable fromthe perspective of "political economy." It should be said, however,that in this case to understand is not necessarily to forgive.
Stanislaw Wellisz and Ronald Findlay 67

Pressure Group Thus far the analysis has paid little attention to the influence ofPolicymaking conflicting pressure groups on policy formulation. This section con-and centrates on this issue, without forgetting that, powerful as suchTrade Barriers groups may be, the will of the governrnent also matters. The state
may be regarded as an autonomous decisionmaker, or as an arbitratoramong opposing interest groups. The latter role is especially impor-tant in modern democracies, where, typically, economic groups andfactions strive to obtain legislation favoring their particular interests.
James Madison held economic factionalism to be inherent in plural-istic, democratic societies; thus the role of the government is to findcompromises acceptable to the divergent economic interests. Thisview has found wide acceptance among political scientists, such asBentley (1908) and Truman (1951). In their studies of the determinantsof political action, economists initially did not consider the role ofpressure groups. Instead, they concentrated on the analysis of elec-tions and on the role of politicians and parties (see Schumpeter 1947,Downs 1956, Buchanan and Tullock 1962, and Riker 1962). By the1970s, however, the pressure group approach to policymaking, stimu-lated by Olson's Logic of Collective Action (1965), gained wide cur-rency (see also Posner 1974, Stigler 1975, and Brock and Magee 1978).Other analyses taking this approach included Becker's formalizationof pressure group theory (1983), Brock and Magee (1978) and Findlayand Wellisz's (1982) general equilibrium politicoeconomic models withendogenous trade barriers, and Bhagwati's (1980) and Bhagwati andSrinivasan's (1980 and 1982) analyses of lobbying costs.
The idea behind the pressure group approach to policymaking issimple. People or enterprises with similar economic interests realizethat, by organizing, they can exert greater pressure on the governmentthan they can individually. These organizations must persuade thepotential beneficiaries to share in the cost of lobbying: the politicaleffectiveness of interest groups depends, in part, on how effectively the"free rider" problem is solved. The lobbies incur expenditures tofurther their cause; the government responds to pressures and counter-pressures and designs compromise policies. Such policies may not beto the advantage of the nation as a whole, so neoclassical analysiswould term them irrational from a social point of view. Yet thepolicies are rational in the sense that they serve the interests of therelevant groups that lobby for them.
The pressure group approach is consistent with, but broader than,the analysis of preferences expressed through votes. The latter cannotbe used to analyze policymaking in pluralistic societies that lack effec-tive formal mechanisms for the expression of public opinion. Andeven where voting is the decisive factor, organized lobbies make theirinfluence felt through propaganda, campaign contributions, and other
68 Research Observer 3, no. 1 (January 1988)

means. Many election results are incomprehensible unless one isaware of the influence of groups. 4 Thus, if policies reflected only theself-interest of the majority of voters or their view of the good society,special interest legislation would not exist. It does exist, for example,when a few producers are protected at the expense of many consum-ers. The phenomenon can readily be explained in terms of the dispro-portionately large influence exerted on policymakers by small, concen-trated interest groups (for a proof of this proposition, see Wellisz andWilson 1986).
Factions and Tariff Policy
The essential features of the endogenous determination of tariffsmay be seen in a simple Madisonian model with two politically activefactions: landowners and capitalists. Farm goods are produced byapplying labor to land, and manufactures by applying labor to capi-tal.' Capitalists and landlords hire workers from a common pool. Partof the farm production is consumed domestically, and the rest isexported at fixed terms of trade in exchange for manufactured goodsthat compete with those produced domestically.
We assume that production is carried on under competitive condi-tions, but that, for political purposes, individuals organize lobbies tofoster their common interests. The capitalists, whose manufacturedgoods compete with imports, form a protectionist faction. Since lan-dlords would be hurt by a tariff on manufactures, their faction favorsfree trade. Where the interests of labor lie is less clear. A tariff onmanufactured goods lowers the wage in terms of such goods, butraises the wage in terms of the exportable farm product. Dependingon the proportion in which workers consume agricultural and indus-trial goods, a tariff may therefore raise or lower real wages. We shallassume for now that workers remain politically neutral.
In choosing its policy the government takes into account the pres-sure exerted by the opposing lobbies. How much weight is attached toeach depends, of course, on the government's ideology, as well asinternal and international obligations. The government's preferencesand constraints determine the "tariff formation function," which has,as its arguments, the pressures exercised by the opposing lobbies. Thestrength of a lobby's pressures may be measured by how much itspends. The tariff rate is thus an increasing function of the politicalexpenditure of the manufacturers and a decreasing function of that ofthe landlords.
To promote rationally the aims of its faction, each lobby spendsresources on the basis of its perception of the actions of its opponent.The political struggle to determine the tariff level can be thought of asa Cournot-Nash process in which each faction, taking the actions of
Stanislaw Wellisz and Ronald Findlay 69

the other side as given, calculates the optimal level of its own spend-ing in the light of the tariff formation function and of the structure ofthe economy. In figure 4, the capitalists' and landlords' lobbying
expenditures are indicated, respectively, along the
Figure 4 horizontal and the vertical axes. The reaction func-Landlords' tions KK' and AA' represent the optimal behaviorlobbying of each of the two lobbies, given the other one'sexpenditures expenditure. For instance, if the capitalists' lobby
spends OH to promote tariffs, the landlords' lobbyK' will react by spending OM to fight them. The capi-
talists will then react by raising their spending toOH', and so on. The dotted lines show equal tariff
M. C -contours, with T1T1 indicating a lower tariff levelM / than T-'T-, which, in turn, is lower than T2T2 .
AT When capitalists increase their spending on tariffT', e promotion, it is likely that landlords will respond
KZ by spending enough to lower the tariff from thelevel that would obtain if they had done nothing,
0 H X ' W Capitalists' but not enough to return it to its initial level. Forlobbying the capitalists, symmetric behavior is assumed. Itexpenditures follows that the tariff rises as one moves from left
to right along AA', the landlords' reaction function,and falls as one moves from left to right along KK', the manufactur-ers' reaction function. It also follows that KK' is steeper than AA',which is a sufficient condition for the stability of the equilibrium tarifft* (corresponding to the line T*T* in figure 4) endogenously deter-mined by the intersection of KK' and AA', yielding OH" and OM* asthe optimal levels of political expenditure by capitalists and landlords,respectively.6 At the equilibrium point for each faction, the marginalcost of political expenditure equals marginal revenue, which is thebenefit that would be derived from the change in the tariff resultingfrom the marginal increase in political spending.
In real life, of course, political behavior is more complicated. Butthe simple model brings out the essential features of policymaking.Lobbying determines the tariff rate. The tariff influences the returns tothe productive factors, hence income distribution.
If lobbies simply bribe decisionmakers, then from a social point ofview lobbying constitutes an income transfer. Government officials getricher at the expense of the lobbying interests, but except for transac-tion costs no real resources are used up in the process. In the past,societies took a permissive attitude toward influence-buying. Manygovernment posts could be bought (in Europe the practice of buyingmilitary commissions persisted until well into the nineteenth century),and their occupants were expected to further their own interests orthose of their backers. Today, it is more expensive for interest groups
70 Research Observer 3, no. I (January 1988)
to influence policymakers. As a result, total spending on lobbyingis reduced (see Becker 1983). Paradoxically, however, rules limitinginfluence-buying raise the resource cost of lobbying, though only upto a point. 7 Legitimate lobbying activities, such as publicity campaignsand election contributions, do use economic resources. In the limitingcase there is no transfer element, so the social and private costs oflobbying are equal.8
Insofar as lobbying uses real resources, these are withdrawn fromproduction. Conventional economic analysis does not consider thepolicy formation process, hence it fails to take into account that overand above the costs of tariff distortions, there are the real resourcecosts of lobbying for and against tariffs. Conventional analysis alsoholds that a lowering of trade barriers always increases welfare. Thereis the possibility, however, that the costs of a struggle for tradeliberalization might outweigh the benefits of the more liberal policies. 9
As in war some victories might be Pyrrhic ones.
Quotas, Domestic Content Rules, and Voluntary Restraints
National interest arguments can be made for the imposition ofmoderate tariffs to protect infant industries, to exploit a country'smonopoly power, and (especially in the case of developing countries)to raise fiscal revenue. Standard economic analysis fails, however, toexplain the proliferation of quantitative trade restrictions that createmore distortion (or bring in less fiscal revenue) than do equivalenttariffs that give the same degree of protection.
To be sure, there are pragmatic reasons why governments mayresort to quantitative restrictions. The freedom to manipulate tariffs islimited by international treaties; these typically permit quotas forspecific purposes-for example, to correct a temporary trade imbal-ance. The use of quotas also gives power to government officials byenabling them to reward friends through generous allocations and topunish enemies. But to reach a fuller understanding of the selectionand use of quantitative restrictions one must turn, once again, tointerest group considerations." 0
The introduction of import quotas, as compared with a regime ofpure tariffs, strengthens protectionist forces. To understand this ten-dency, let us begin from the tariff equilibrium of the previous section.Consider the introduction of an import quota that would furtherreduce the import volume. This quota would raise the domestic priceof the imported commodity and would provide further protection fordomestic manufactures. If the tariff rate were held constant a rentwould emerge to the holders of the import licenses equal to thedifference between the domestic price and the world price plus tariff.The potential holders of these licenses, let us call them "traders,"
Stanislaw Wellisz and Ronald Findlav 71

would therefore be willing to join the protectionist group. Govern-ment revenue would fall if tariff rates remained unchanged. If, howev-er, the initial tariff were set at less than the maximum revenue level,the tariff rate could be raised to restore the initial revenue while stillleaving a margin for rent.
In figure 4 the protectionist reaction function KK' would shift tothe right, since the traders would be willing to contribute to the warchest of the lobby in the expectation of obtaining rents. The antipro-tectionist landlord faction would have the same reaction function asbefore. The new equilibrium would therefore be to the right alongAA', implying a higher degree of trade restriction and greater expen-diture of resources on lobbying by both factions. We have thereforeshown that the possibility of using import quotas in addition to tariffsmakes for an unambiguously more restrictive and wasteful trade re-gime than one limited purely to tariffs.
Domestic content rules lay down a specified proportion of a prod-uct (by quantity or value) that must be produced with domestic inputsin order to be sold on the domestic market. They are a way ofshielding domestic producers from foreign competition without arous-ing the wrath of powerful antiprotectionist groups."1 A domestic firm
that does not meet the rules has to pay a higherFigure 5 duty on the imported content or obtains lower pro-Price of o I1the importable tection on the final product or both."
This type of protection is popular in industriesD s where the final product is assembled from different
parts, which may be imported or manufactured do-mestically. It has been used in Australia for auto-mobiles, tractors, industrial machinery, petrochemi-cals, and various consumer nondurables (see Lloyd
B / \ _ 1973). In many developing countries domestic con-H____CN tent rules are weak for 1ewly established industries,A < then gradually tightened so as to promote local
GiU\ F production of parts and components.I , D The essential aspects of domestic content rules
0 ~L W K X Volumeof the can be seen in the following example. Consider aimportable commodity such as milk, which can be produced by
domestic dairy farmers or imported at a fixed worldprice. In figure 5 demand and supply curves DD and SS are depicted,with OA indicating the world price. If a tariff of AB is imposed, thedomestic price will be OB, the quantity demanded will be OK, domes-tic production will be OL, and imports will be LK. Tariff revenue ofGCEF accrues to the government.
If the regime is changed to a domestic content rule in place of thetariff, how can the same import-production ratio be preserved? Thesolution is indicated in figure 5 by the dotted line through point C.
72 Research Observer 3, no. 1 (January 1988)

We shall now assess the repercussions of this change on domesticprices, output, and imports.
If the domestic price remained unchanged at OB, importers, whosecost under the new regime would be only OA, would receive rentsequal to GCEF, the tariff revenue previously accruing to the govern-ment. As a result, importers would try to increase the supply of milkto domestic consumers. The imported component is available freely atthe world price, but importers must increase their purchases fromdomestic producers in the same proportion. This process will lowerthe price paid by domestic consumers below OB but raise the pricereceived by domestic producers above OB. Equilibrium will beachieved when all the rents have been competed away.
At equilibrium the price paid by domestic consumers is OH. Thetotal quantity demanded is OX, with OW supplied domestically andWX imported. The price received by domestic producers is OJ, thelevel necessary to induce them to supply OW. The area HJMN, thepremium to domestic producers, is equal to UNRV, the rents on theimported component, so that sales to domestic consumers break even.
Compared with the tariff regime both consumers and producersappear to be better off. Consumers pay a lower price and consume agreater quantity. Producers benefit from the rise in domestic supplyprice. However, the additional production of LW increases the domes-tic resource cost to society by GCMV, the excess of domestic opportu-nity cost of the resources involved over the cost LW at the worldprice. The government, of course, loses the entire tariff revenue.
As can be seen from figure 5, the more inelastic is the supply, thegreater is the gain to domestic producers. In the limiting case of zeroelasticity the replacement of a tariff by an equivalent domestic contentscheme would transfer the entire tariff revenue to the domestic pro-ducers, while consumers would suffer equally in either situation.
It is therefore not surprising that pressure for domestic contentprotection frequently arises in industries where there are either naturalor artificially created barriers to the expansion of output. Exampleswould be industries where there are extensive economies of scale,government licensing of entry, or "closed shop" labor unions.
Analytically identical to domestic content rules for commodity im-ports are schemes that specify numerical ratios between domestic andforeign workers in employment, either explicitly or implicitly throughmanipulation of job specifications, seniority rules, and so forth. Find-lay and Lundahl (1987) develop a model along these lines to apply toracial discrimination between white and black labor in contexts suchas South Africa.
Of all the trade restrictions, voluntary export restraints (VERS) ap-pear to be the most irrational. The imposition of VERs raises prices tothe consumers, without yielding any revenue either to the government
Stanislaw Wellisz and Ronald Findlay 73

or to the importers. Yet in advanced industrial countries VERs arerapidly becoming the favorite form of trade restraint. They are some-times imposed in circumstances where international treaties, such asthe General Agreement on Tariffs and Trade, prohibit the tighteningof mandatory import restrictions. VERS may also be represented as amild measure, to be followed by compuilsory import barriers in caseof noncompliance (see Jones 1984).
To understand VERs we must take into account the interactionbetween domestic and foreign interest groups. Consider the relationsbetween two countries, which we shall call "United States" and "Ja-pan," with goods manufactured in the latter being exported to theformer, while agricultural products move in the opposite direction.The U.S. manufacturers would want to erect trade barriers to protecttheir interests, while Japanese manufacturers would favor free trade.So would U.S. farmers, but, for the sake of simplicity we shall assumethat they remain politically passive.
In this model, the terms of trade are determined by the generalequilibrium of the world economy. The tariff level that emerges frominternational negotiations reflects the r elative amount of resourcescommitted by both sides to further their respective causes, as in theMadisonian model presented earlier.
Suppose that, under the resulting tariff treaty, total imports aregreater than the level that would prevail under an optimum tariffregime. A further restriction of U.S. imports would give increasedprotection to the import-competing industry and would also increasegovernment revenues. An equivalent reduction of Japanese exportswould have the same protective effect on U.S. industry. In this case,however, the revenue would accrue to the Japanese exporters, whowould sell less, but who could, therefore, charge a higher price. ThusVERS work in favor of both parties: U.S. manufacturers receive moreprotection, while Japanese exporters are able to charge higher prices.Domestic consumers lose; so do the specific factors in the domesticexport sector; but they are also passive actors in the game."3
Lobbying and Democracy
In a struggle among interest groups, who is likely to win, and whoto lose? Concentrated interest groups seem to carry more weight thandiffuse ones. The latter do not have much incentive to form a lobby.Collectively, the millions of shirt-wearers in the United States losemore through restraints on shirt imports than is gained by U.S. shirt-makers. Individually, however, each of the consumers has little atstake, but for each of the producers the matter is of crucial impor-tance. It is therefore easier to organize the few makers into a lobbythan the many wearers. There is also a question of group discipline.
74 Research Observer 3, no. 1 (January 1988)

Small groups are virtually self-policing; the larger the group, the moresevere the problem of free riders.
As a second generalization, reallocative rules usually favor smallgroups over large ones (size being measured by income rather thanmembership). Distortions that reallocate income impose a deadweightloss on society-that is, they reduce the total availability of goods andservices. A large group carries a larger part of the burden than a smallgroup does.
The advantages of smallness and of concentration are reflected inthe prevailing pattern of distortion. Industrial countries subsidize andprotect agriculture, whereas many developing countries favor theirrelatively small industrial sectors. Within each group there are smallbut highly organized special interests receiving privileged treatment.
The results of group action thus run counter to the principles ofmajority rule and social justice. The minority often wins, and incomeis not necessarily redistributed from rich to poor. But group actionalso has positive effects. Like advertising, lobbying spreads misinfor-mation, but it also provides information that would otherwise not beavailable. Lobbies make people more aware of the issues and presum-ably increase the rationality of choices made by the voters. Mostimportant of all, group action protects minority interests against thepotential dictatorship of the majority. Defeat at the polls does not putminorities completely at the mercy of those who win. The politicalstrength of small groups gives them a countervailing power essentialfor the existence of a democratic society.
The distortions caused by the lobbying of interest groups may have Rent-Seekinga potentially valuable by-product that each group does not initiallyappropriate for itself. For instance, import quotas may be imposed toprotect local manufacturers, or to defend the currency, without therebeing an advance plan on how to allocate the consequent rents. Thissituation promotes rent-seeking-activities intended to capture therents (see Krueger 1974). A similar phenomenon, called revenue-seek-ing by Bhagwati and Srinivasan (1980), may occur if the governmentfails to allocate in advance the fiscal revenues generated by a tariff.
In contrast to political lobbying, which is inherently a group activi-ty, rent-seeking may take the form of individuals competing againsteach other. For example, import license petitioners may have to queueup, with rewards going to those who do not get discouraged or whofill out the numerous documents needed to get a license. Individualsengaged in rent-seeking cannot also do productive work at the sametime, so rent-seeking, like lobbying, shrinks the production possibilityfrontier of the economy.
To explain the reasoning underlying the rent-seeking analysis con-
Stanislaw Wellisz and Ronald Findlay 75

sider a country that completely specialized in the production of asingle good, wheat, which can be export:ed in exchange for cloth atfixed terms of trade of a bushel of wheat for a yard of cloth. Thereare 12 million workers engaged in wheat production, in which theyhave a constant average (and marginal) product of one bushel perworker, so that labor is the only scarce factor of production. Weassume that under initial free trade conditions the country consumes 6million bushels of wheat and exports the remaining 6 million inexchange for 6 million yards of cloth.
Suppose now that an import quota of 4 million yards of cloth isimposed. The terms of trade are still one for one, so exports of wheatwill decline to 4 million bushels. With all workers continuing toproduce wheat the domestic market will now have to absorb 8 millionbushels of wheat and 4 million yards of cloth. With more wheat andless cloth available the domestic relative price of cloth in terms ofwheat will rise, say, to two bushels per yard. Importers will reap a"scarcity rent" of a bushel of wheat per yard of cloth imported, intotal equal to 4 million bushels of wheat, This rent is a pure transfer,the gain to the importers coming directly at the expense of consumers.By forcing consumers to buy less cloth and more wheat than theywould like, at world prices, the quota also imposes an additionalwelfare loss.
All this is standard analysis. Krueger's innovation was to observethat import quotas would be sought after: a production worker couldquit his job and spend his time writing petitions to get an importlicense entitling him to buy the foreign good and sell it at the higherhome price. The quota thus imposes an extra cost: the output lostwhen people devote themselves to rent-seeking rather than production.
Consider an eminently "fair" system of license allocation: the quotawill be divided equally among all applicants. How many will apply?Quite obviously, as the number of applications grows, the quantity ofcloth for each license decreases. Furthermore, as workers withdrawfrom production to become rent-seekers, less and less wheat is pro-duced, so the domestic price of cloth falls relative to the price ofwheat. At some point rent-seeking and wheat production will beequally profitable, and labor transfers will cease. For example, equili-brium may be reached when the domestic price of cloth is 1.5 bushelsof wheat, so that the scarcity rent on cloth imports equals 2 millionbushels of wheat. At equilibrium the rent to each rent-seeking individ-ual equals the wage that the same person could earn in production-that is, one bushel of wheat a year. It follows that at equilibrium theremust be 2 million rent-seekers, so that the country produces 2 millionbushels of wheat less than before the imposition of the quota. Theeconomic cost of rent-seeking, as measured by the loss of production,is equal to the value of the rent created by the quota.
76 Research Observer 3, no. 1 (January 1988)

How important are such rents in a developing country? Krueger(1974) estimated that they amounted to 7 percent of India's income in1964 and to 15 percent of Turkey's in 1968. By including financialmarket distortions (which were ignored by Krueger), Mohammad andWhalley (1984) raised the estimate of rents in India to between 30percent and 45 percent of the gross national product.
These figures suggest that the social cost of rent seeking is stagger-ing. But is it conceivable that a third (or more) of a country's popula-tion is engaged in rent-seeking? True, in India and other developingcountries there are endless lines of petitioners at every office, butvirtually all villagers, who make up 80 percent of the population, andmost urban dwellers perform their usual productive tasks.
A closer look at the analysis reveals that the cost of rent-seekingcannot be higher than the value of the rents, but it can be lower. InKrueger's words, the estimates of rents "may be interpreted as thedeadweight costs from quantitative restrictions in addition to thewelfare costs of their associated tariff equivalents if one believes thatthere is competition on rents" (1974, p. 301).
The qualifying clause is extremely important: rent-seeking is elimi-nated, or at least greatly reduced, if the division of the spoils isdecided upon in advance. For instance, it is common practice toallocate quotas as a function of imports in a base year. Rent-seekersmay try to change the allocation, but there is no presumption that theentire rent will be competed away. Barriers to entry are likely to beparticularly severe in the market for influence.
Even if competitive rent-seeking does occur, the cost to society islikely to be much smaller than the size of the rents. The Kruegerhypothesis is that competition means standing in line or filling informs. But competition can also mean bribing officials, a sociallyreprehensible act but one that in economic terms represents a puretransfer. We have here yet another example of the difference betweenprivate and public virtues. A fair system of free competition for rents,administered by incorruptible public servants, paradoxically imposesthe greatest social cost.
It remains true, nevertheless, that, by ignoring rent-seeking, conven-tional measures of welfare underestimate the cost of quotas. More-over, unlike lobbying, which in a pluralistic society may play a posi-tive role, rent-seeking has no redeeming social virtues: it is sheerwaste. Thus the rent-seeking analysis carries an important policymessage: avoid, if you can, the imposition of quantitative restrictions;if you cannot, make sure that the rents will not be competed away.
This article's objective has been to bring out the implications for Conclusioneconomic analysis of two crucial departures from traditional assump-
Stanislaw Wellisz and Ronald Findlay 77

tions. One is that self-interested individual behavior in the economy isnot confined to the provision of directly useful goods and services foroneself or others through exchange. Such behavior can also be intend-ed, through group action, to influence government rules and policy tofavor the group at the expense of the rest of society. The other is thatthe government cannot always be regarded as either a selfless guardi-an of the public interest or as an impartial mediator between differentparts of society.
Once this perspective is adopted, many aspects of economic lifethat are deemed irrational by traditional neoclassical analysis-suchas high tariffs in small open economies or heavy public expendi-ture-become explicable as expressions of the interests of the rele-vant groups. In a world of oligopolistic group interests in the privatesector and an autonomous state in the public sector, the "invisiblehand" is not always benign: self-seeking does not necessarily promotethe common good.
Abstract This article discusses the consequences for resource allocation of the behavior of self-interested groups within and outside the government. The power groups that areconsidered are the state as a surplus-maximizing monopoly, the self-aggrandizingbureaucracy, and private lobbies with divergent interests. The article uses the analytictools of neoclassical political economy and discusses recent writings in the field.
Among the problems dealt with are the supply of public goods, the severity of tradebarriers, and the choice of tariffs, quotas, domestic content rules, and voluntary exportrestraints as instruments of commercial policy. The discussion takes into account thecost of lobbying and rent-seeking, the competition for spoils resulting from government-imposed restrictions on the free allocation of resources. The article shows that forsociety as a whole the outcome of group rivalries is, in general, less favorable thanoutcomes based on atomistic individual behavior and benign government, which is theframework adopted in most standard economic analysis.
Notes 1. The analysis in this and the next two sections draws on the model developed inFindlay and Wilson (1987).
2. For further details on the material in this section, see Findlay and Wellisz (1983).
3. This case applies to a developing country that both exports and imports manufac-tured goods. We later discuss a specific factors model, more appropriate for the casewhere primary commodities are exported and manufactures imported.
4. Mayer (1984) elegantly integrates the pressure group and voting approaches.
5. We assume, for simplicity, that agriculture does not require capital and thatmanufacturing does not require land. Our results could be generalized by assuming thatthat ratio of capital to land were lower in agriculture than in industry.
6. Multiple equilibria are, of course, possible, but we shall assume that the equili-brium is unique.
7. It is clear that a Draconian law prohibiting all forms of lobbying would eliminateall lobbying expenditure, so there could be no resource cost.
8. The relation between private and social cost of lobbying is discussed at greaterlength in Wellisz and Findlay (1984).
78 Research Observer 3, no. 1 (January 1988)

9. Bhagwati (1980) and Bhagwati and Srinivasan (1980) point out that an evaluationof the economic costs of lobbying must take into account the distortion of the economycaused by existing trade barriers. The greater the degree of distortion the lower theopportunity cost (at world prices) of the factor favored by the distortion. In an economyso grossly distorted that the accumulation of the protected factor is "immiserizing,"lobbying can increase welfare by absorbing enough of the factor that has a negativeshadow price as a result of the distortion.
10. This section summarizes Findlay and Wellisz (1986).
11. For a discussion of the effect of domestic content rules on resource allocation, seeCorden (1971, pp. 45-50), and Grossman (1981), as well as Findlay and Wellisz (1986).
12. Domestic content requirements may also be imposed by the importing countrywishing to limit preferential treatment granted to specific countries, as in the case of theEuropean Community's imports of textiles from developing countries under the LomeConvention.
13. See Feenstra (1984) for an analysis and measurement of the welfare costs of VERS
to the U.S. market for automobiles.
Becker, Gary S. 1968. "Crime and Punishment: An Economic Approach." Journal of ReferencesPolitical Economy, vol. 76, no. 2.
. 1983. "A Theory of Competition among Pressure Groups for Political Influ-ence." Quarterly Journal of Economics 98, no. 3: 371-400.
Bentley, Arthur F. 1908. The Process of Government. Chicago: University of ChicagoPress.
Bhagwati, Jagdish N. 1980. "Lobbying and Welfare." Journal of Public Economics 14,no. 3: 355-63.
. 1982. "Directly Unproductive, Profit-Seeking (DuP) Activities." Journal ofPolitical Economy 90, no. 5: 988-1002.
Bhagwati, Jagdish N., and Bent Hansen. 1973. "A Theoretical Analysis of Smuggling."Quarterly Journal of Economics 87, no. 2: 172-87.
Bhagwati, Jagdish N., and T. N. Srinivasan. 1980. "Revenue Seeking: A Generalizationof the Theory of Tariffs." Journal of Political Economy 88, no. 6: 1069-87.
. 1982. "The Welfare Consequence of Directly-Unproductive Profit-Seeking (DUP)
Lobbying Activities." Journal of International Economics, 13, no. 1: 33-44.
Brock, William A., and Stephen P. Magee. 1979. "The Economics of Special InterestPolitics: The Case of the Tariff." American Economic Review 68, no. 2: 246-50.
Buchanan, James M., and Gordon Tullock. 1962. The Calculus of Consent. Universityof Michigan Press.
Calvo, Guillermo A., and Stanislaw Wellisz. 1979. "Hierarchy, Ability, and IncomeDistribution." Journal of Political Economy 87, no. 5: 991-1010.
Corden, William M. 1971. The Theory of Protection. Oxford: Oxford University Press.
Downs, Anthony. 1975. An Economic Theory of Protection. Oxford: Oxford UniversityPress.
Feenstra, Robert C. 1984. "Voluntary Export Restraints in U.S. Autos, 1980-81; Quality,Employment and Welfare Effects." In Robert E. Baldwin and Anne 0. Krueger, eds.The Structure and Evolution of Recent U.S. Trade Policy. Chicago: University ofChicago Press.
Findlay, Ronald, and John D. Wilson. 1987. "The Political Economy of Leviathan." InA. Razin and E. Sadka, eds. Economic Policy in Theory and Practice. Macmillan.
Stanislaw Wellisz and Ronald Findlay 79

Findlay, Ronald, and Mats Lundahl. 1987. "Racial Discrimination, Dualistic LaborMarkets and Foreign Investment." Journal of De;velopment Economics, forthcoming.
Findlay, Ronald, and Stanislaw Wellisz. 1982. "Endogenous Tariffs, the Political Econ-omy of Trade Restrictions, and Welfare." In Jagdish N. Bhagwati, ed. ImportCompetition and Response. Chicago: University of Chicago Press.
. 1983. "Some Aspects of the Political Economy of Trade Restrictions." Kyklos36, no. 3: 469-81.
. 1984. "Toward a Model of Endogenous Rent-Seeking." In David C. Collander,ed. Neoclassical Political Economy. Cambridge, Mass.: Ballinger.
. 1986. "Tariffs, Quotas and Domestic Content Protection." Public Choice 50,no. 1-3: 221-242.
Grossman, Gene M. 1981. "The Theory of Domestic Content Protection and ContentPreference." Quarterly Journal of Economics 96, no. 4: 583-604.
Jones, Kent. 1984. "The Political Economy of Voluntary Export Restraints." Kyklos 37,no. 1: 82-101.
Krueger, Anne 0. 1974. "The Political Economy of the Rent-Seeking Society." AmericanEconomic Review 64, no. 3: 481-87.
Lloyd, P. J. 1973. Non-Tariff Distortions in Australian Trade. Canberra: AustralianNational University Press.
Mayer, Wolfgang. 1984. "Endogenous Tariff Formation." American Economic Review74, no. 5: 970-85.
Mohammad, Sharif, and John Whalley. 1984. "Rent-Seeking in India: Its Cost and PolicySignificance." Kyklos 37, no. 3: 367-413.
Niskanen, William. 1971. Bureaucracy and Representative Government. Chicago:Aldine.
Olson, Mancur. 1965. The Logic of Collective Action. Cambridge, Mass.: HarvardUniversity Press.
Posner, Richard A. 1974. "Theories of Economic Regulation." Bell Journal of Economics4, no. 2: 335-58.
Riker, William H. 1962. The Theory of Political Coalitions. New Haven, Conn.: YaleUniversity Press.
Schumpeter, Joseph A. 1947. Capitalism, Socialism, and Democracy. 2d ed. New York:Harper and Row.
Stigler, George J. 1975. The Citizen and the State. Chicago: University of Chicago Press.
Truman, David B. 1951. The Government Process. 2d ed. New York: Knopf.
Tullock, Gordon. 1967. "The Welfare Costs of Tariffs, Monopolies, and Theft." WesternEconomic Journal 5, no. 3: 224-32.
Wellisz, Stanislaw, and Ronald Findlay. 1984. "Protection and Rent-Seeking in Devel-oping Countries." In David C. Colander, ed. Neoclassical Political Economy. Cam-bridge, Mass.: Ballinger.
. 1986. "Central Planning and the Second ]'conomy in Soviet-Type Systems."Economic Journal 96, no. 383: 646-58.
Wellisz, Stanislaw, and John Wilson. 1986. "Lobbying and Tariff Formation: A Dead-weight Loss Consideration." Journal of International Economics 20, no. 1: 367-75.
80 Research Observer 3, no. 1 (January 1988)

TECHNOLOGICAL PRIORITIESFOR FARMINGIN SUB-SAHARAN AFRICA
Hans BinswangerPrabbu Pingali
A dvanced agricultural technologies have not achieved muchsuccess in Sub-Saharan Africa. Attempts to match Asia'sGreen Revolution in food grains have often failed. The use of
tractors has produced disappointing results and has been abandonedin many areas. Many irrigation projects have yielded low or negativereturns.
One reason for this unsatisfactory record is that the wrong technol-ogy priorities have been followed in several countries. Other reasonsinclude faulty pricing policies, inadequate infrastructure, and poorinstitutional development. This article focuses on technology priori-ties and is intended to provide an analytical framework for makingchoices about technology.
Sub-Saharan Africa has a wide range of climates, soils, and labor,which leads to a variety of farming systems. Technology strategieshave often failed to take proper account of these local differences, sohave not been cost-effective.
Farmers change their techniques in two ways: (a) they may decide toincrease the use of an input with which they are already familiar (factorsubstitution), as when they decide to weed more intensively, to applyorganic fertilizer, or to make simple improvements to their land, or (b)they may adopt techniques that are new to them, in which case theyhave to go through a learning process. In either case farmers will makeonly those changes that they think will reduce unit costs of production(including the implicit cost of family labor and the opportunity cost ofland). That a technique is highly advanced does not necessarily meanthat it will reduce production costs in African conditions.
t, 1988 The International Bank for Reconstruction and Development/The World Bankn1

Techniques that are new to local farmers may have been usedelsewhere and can be applied virtually unchanged: one example is theadoption of machinery. However, the technology often needs to bechanged, which requires some research and development to adapt itto local conditions.
It takes a long time for agricultural research to bear fruit in in-creased production. The research and technology strategies adoptedtoday will have their full impact in the first quarter of the nextcentury, which is the planning horizon we employ in this article. Inmost cases, the chosen techniques and therefore the technology priori-ties will have to be tailored to local conditions. In a few cases,however, local conditions can be changed by investing in infrastruc-ture and encouraging migration, making it cost-effective to use moreadvanced techniques.
The Evolution Large parts of Africa are still farmed by traditional methods ofof Farming shifting cultivation. Farmers slash and burn patches of forest, farmingSystems the land for a few years until its fertility diminishes. The farmers then
move on to another forest patch, leaving ithe land for twenty years orso to recover its natural fertility. Little tillage is necessary, and diggingsticks are enough for the purpose. Draft animals are not needed (andin any case cannot survive in African forests, because tsetse fliesspread trypanosomiasis). This phase of forest fallow farming lies at oneend of a spectrum of agricultural techniques, with multiple cropping atthe other end (see table 1). The evolution from shifting cultivation tomultiple cropping is driven by population growth and by the higherreturns to farming which arise when market infrastructure improvesand farmgate prices increase (Boserup 1965, Ruthenberg 1980, andPingali, Bigot, and Binswanger 1987). Fa.rmers first move to a bushfallow system: they cultivate their patches for longer periods (six toeight years) and leave them fallow for a similar period. Because theyhave to weed and till the land, they start making regular use of hoes.
As population density grows, bush gives way to grass cover. Thefallow period is reduced, perhaps to no more than a year. Plowingand intensive weeding are needed, so the use of draft animals becomeseconomic (and possible, since the disappearance of forests reduces thetsetse fly menace). Animal manure helps to fertilize the soil. Sincethere is abundant grazing on pastures and grass fallows, the cost ofkeeping cattle is low.
As population density increases still further, annual cropping andlater multiple cropping become the rule. This stage has been reachedin much of Asia, but is still uncommon in large parts of Africa. Landis now scarce, and its value rises. Farmers find it cost-effective to shiftfrom manual techniques to labor-saving devices such as milling ma-
82 Research Observer 3, no. 1 (January 1988)

Table 1. Farming Operations in Different Farming Systems'° Operation or Forestfallow Bushfallow Shortfallow Annual cultivation Multiple croppingsi situation system system system system system
Land clearing Fire Fire None None None
; .Land preparation No land preparation; Use of hoe and dig- Plow Animal-drawni plow Animal-drawn plow-, and planting use of digging stick ging stick to loosen and tractor and tractor
to plant roots and soilsow seeds
Fertilization Ash, perhaps house- Ash, sometimes chiti- Manure, sometimes Manure, sometimes Manure, sometimeshold refuse for mene techniques,, human waste, sometimes human waste, compost- human waste, compost-garden plots household refuse for composting ing, cultivation of ing, cultivation of
garden plots green manure crops, green manure crops,chemical fertilizers chemical fertilizers
Weeding Minimal Required as the Intensive weeding Intensive weeding Intensive weedinglength of fallow required required requireddecreases
Use of animals None Animal-drawn plow Plowing, transport Plowing, transport Plowing, transportbegins to appear as interculture interculture, post- interculture, post-length of fallow harvest tasks, and harvest tasks, anddecreases irrigation irrigation
Seasonality of Minimal Weeding Land preparation, Land preparation, Acute peak in demanddemand for labor weeding, and weeding, and around land prepar-
harvesting harvesting ation, harvest, andpostharvest tasks
Supply of fodder None Emergence of grazing Abundant open grazing Open grazing re- Intensive fodderland stricted to marginal management and pro-
lands and stubble duction of foddergrazing crops
a. To augment the ashes from the bush cover, branches are cut from surrounding trees, carried to the plot of land to be cultivated, and burned to provide extra nutrientsfor the soil.
X0

chines, mechanical pumps, and tractors. They have to use manure orchemical fertilizers to maintain soil fertility. Low-cost irrigation canbecome economic. The transition to these new technologies dependson many factors-the relative cost of labor, capital, and fertilizers; thecost and availability of credit; the reliability of markets for inputs andoutput; the access to spare parts and repair facilities; and the adequa-cy of information and training systems.
Population growth is only one influence on farming systems. Otherpowerful forces include access to urban or foreign markets, whichdepends on improvements in transport infrastructure and marketingfacilities. When farmers are able to sell a surplus, they want to growmore by using more lands-so farming becomes more intensive assurely as it does when populations grow. However, the pattern isoften fairly patchy, because good market access may be confined tosmall areas, and farmers may migrate to areas with high-quality soilsand infrastructure.
Classifying The conventional way of measuring the abundance of land in aCountries particular country is arable land per capita. This measure is unsatis-
factory, since it does not take account of differences in soil qualityand climate. The Food and Agriculture Organization (FAo) has comeup with a new measure that does so. Its project on Land Resourcesfor Populations of the Future (Higgins and others 1982) estimated, formost developing countries, the physical potential for food productionat different levels of technology.
Each country was divided into a number of agroecological cells. Foreach cell, the FAO estimated the maximum number of calories of foodproduction that could be sustained at three levels of technology-lowinput, intermediate input, and high input. It then added up these cellfigures to give total potential calorie production for each country.Although this physical approach is no guide to future agriculturalproduction, it does provide a standardized measure of a country'sland endowments.
For all countries in Sub-Saharan Africa and for selected ones inAsia and Latin America, we look first at the population projections ofthe World Bank for the years 2000 and 2025. We divide the countrypopulations by the FAO's estimates of potential calorie production-atintermediate input technology, as this is the level most African coun-tries should reach between 2000 and 2025. The result is a standard-ized population density: the number of people per million kilocaloriesof production potential. We call this the agroclimatic population den-sity. Even given the uncertainties and margins of error inherent insuch an exercise, the picture that emerges is striking and useful.
When countries are ranked conventionally by population per square
84 Research Observer 3, no. 1 (January 1988)

kilometer of agricultural land, Bangladesh comes first, India comesseventh, Kenya falls somewhere in the middle, and Niger is near thebottom. When ranked by agroclimatic population density, the rank-ings change dramatically: Niger and Kenya are more densely popula-ted than Bangladesh is today, and India ranks only twenty-ninth onthe list. Kenya and Niger have large, semiarid areas of low caloriepotential, where extensive livestock production is the only profitableform of farming. Bangladesh and India, in contrast, have invested inirrigation and have considerably increased their scope for multiplecropping. (The FAO's estimates for potential calorie production includethe impact of irrigation investments already made or planned up tothe year 2000.)
An alternative measure of the balance between land and laborendowments is the agroclimatic labor density, defined as the numberof agricultural workers per million calories of production potential.Recent projections (Zachariah 1986) imply that the agricultural laborforce in Sub-Saharan Africa will rise rapidly in future decades. Sincethe proportion of the labor force in agriculture is still very high andoverall population growth is expected to be very rapid, pressure onland will grow even if the rest of the economy provides buoyant jobopportunities. Figure 1 gives a picture of the likely outcome. The leftpanel shows that the proportion of the labor force in agriculturewill decline in Sub-Saharan Africa, as in Asia and Latin America.Nonetheless, as the right panel shows, the agroclimatic labor densitywill shoot up in almost all African countries, at a much faster ratethan in India or Brazil.
Population growth in Sub-Saharan Africa will average 3.2 percent ayear in the 1980s, the fastest in recorded history. Even under favorableassumptions it will slow only marginally in the 1990s, to 3.1 percent.In the medium run the trend is not reversible, even if fertility fallssharply. Entrants to the labor market for the next fifteen years havealready been born, and mortality is still falling steeply.
The rest of this article uses agroclimatic population density ratherthan agroclimatic labor density as a measure of land abundance. Theformer shows pressures on the demand side, as well as on the rurallabor market, and is therefore a better indicator of the farming sys-tems that will emerge in the years ahead. For African countries thetwo measures are, in any case, highly correlated.
Table 2 divides countries in Sub-Saharan Africa (and a few others)into three groups which will have low, medium, and high density in2025. Low density is defined as fewer than 100 people per millionkilocalories of potential production (and is roughly a quarter less thanthe density of 127 reached by Thailand in 1980). High density isdefined as more than 250 people per million kilocalories of potentialproduction, slightly below the density reached by India or Egypt in
Hans Binswanger and Prabhu Pingali 85

Figure 1
A. Share of Labor in Agriculture B. Agroclimatic Agricultural Labor Density
Actual Projected 1,000 Projected Niger
Kenya
80500
EthiopiaOther Sub-Saharancountries60-
Sub- MaliSaharan NigeriaAirica 100 India
a)
reorganization wastakingTanzania
China~ South W0 50 Zimdbabwe
a6 A esia Ghanaa a Philippines
40~~~~~~~~~~~~~~040 ~~~~~~~~~~c C6te dOlvoire0
a ~~~~~Guinea
Cameroon
10 Zaire
20-LatinAmnerica
5-
Brazil
0l 21960 1960 2000 2020 1980 2000 2025
a. China's labor force data are anomalous for the period 1957-63, when major economicreorganization was taking place.
Source: World Bank data.
86 Research Observer 3, no. 1 (January 1988)

Table 2. Population Density by Climate, Selected Countries, 1987-2025Climatic category Low density, Medium densityb High density,
Humid lowlandsCountry Guinea Bissau (2028) Sao Tome and Principe (2041) Bangladesh
Malaysia (2091) Sierra Leone (2054) MairitiusLiberia (2051)Equatorial Guinea (2088)Zaire (2080)Congo (2109)
Share of Sub-Saharancountries in totalSub-Saharan population 8.7 percent 0.9 percent 0.3 percent
Mixed climatesd
Country C6te d'Ivoire (2038) Gambia (2031) KenyaChad(2041) Zimbabwe (2032) RwandaBahamas (2086) Togo (2033) BarbadosMadagascar (2041) Ghana (2036) BurundiArgentina (2123) Tanzania (2033) ComorosCameroon (2045) Benin (2040) MauritaniaBrazil (2119) Costa Rica (2097) EthiopiaZambia (2066) Guinea (2072) IndiaAngola (2071) Sudan(2065) NepalCentral African Republic (2114) Mozambique (2062) NigeriaGabon (2147) Uganda
MalawiShare of Sub-Saharan
countries in totalSub-Saharan population 12.8 percent 22.1 percent 46.3 percent
Arid or semiarid climatesCountry None Mali (2027) Niger
Somalia
LesothoAfghanistanPakistanEgyptNamibia (1988)Senegal (2006)Mexico (2019)Botswana (2023)Burkina Faso (2024)Swaziland (2024)
Share of Sub-Saharancountries in totalSub-Saharan population 0 percent 1.8 percent 7.1 percent
Note: In each climatic category, countries are ranked by projected population density in 2000. Data are unavailable forthe Sub-Saharan countries of Cape Verde, Djibouti, and Seychelles. Countries not in Sub-Saharan Africa are in italics.
a. Having less than 100 people per million kilocalories of potential production by 2025. Figures in parentheses denotethe year a country is expected to reach a density of 100.
b. Having 100 people per million kilocalories of potential production currently or by 2025. Figures in parenthesesdenote the year a country is expected to reach a density of 250.
c. Having 250 people per million kilocalories of potential production currently or by 2025. Figures in parenthesesdenote the year a country that has not yet reached a density of 250 is expected to do so.
d. Includes climates with mostly intermediate rainfall and countries with both high- and low-rainfall zones.Source: Binswanger and Pingali 1987.
Hans Binswanger and Prabhu Pingali 87

1980. Medium density is the range 100 to 250 people per millionkilocalories of potential production. In each group, countries are thensubdivided into three climatic categories.
M Mainly humid lowlands. These countries range from Zaire in thelow-density group to Bangladesh in the high-density group.
a Countries with mixed climates or intermediate rainfall. The bulk ofSub-Saharan African countries belong to this category. The coun-tries are equally divided between low, medium, and high density.The medium-density countries have substantial pockets of infra-marginally scarce land.
* Arid and semiarid countries. In our planning horizon, all but oneof these countries will have high density or be on the way todoing so.
This methodology highlights the fact that semiarid zones are undermuch greater population pressure relative to their land endowmentsthan are the humid areas. Migration from arid to wetter areas there-fore makes sense, and is already happening on a substantial scale(sometimes across international borders).
The table shows that one-third of all Sub-Saharan countries-thir-teen out of thirty-nine-will still have a low density in 2025, despiterapid population growth: Africa is a huge continent. Shifting cultiva-tion will still be the most common systetn of farming in low-densityAfrican countries, particularly those with humid lowlands (the Re-public of the Congo, Equatorial Guinea, Guinea Bissau, Liberia, andZaire). However, in highlands with more moderate and healthy cli-mates, population density will be greater. The highlands of Madagas-car and Kivu province in Zaire are already densely populated, andannual cropping is the norm.
The medium-density group contains twelve countries. Of these,Sierra Leone is the only one dominated by humid lowlands, and Malithe only one in the semiarid tropics. In our planning horizon, shiftingcultivation will gradually be phased out from this group, though itwill still occur in regions with low population density.
Some twenty-one Sub-Saharan countries already have high densityor will reach it by 2025. Eleven of them are in the semiarid zone. Ninehave mixed climates and areas with good soil and intermediate rain-fall. By 2025, the majority of Africans will live in high-density coun-tries. Shifting cultivation will disappear completely. These are thecountries where intensive agricultural techniques will have the greatestchance of success.
Agriculture We will consider six kinds of agricultural techniques and see howTechnologies useful they are in different regions and farming systems.
88 Research Observer 3, no. 1 (January 1988)

Input-Intensive Techniques
In sparsely populated areas of Sub-Saharan Africa, cultivationrights can usually be obtained free or for token payment. Land andlabor are the only two inputs used in production. Such regions aredominated by subsistence farming, partly because market access ispoor. In these areas, input-intensive techniques (such as the use ofchemical fertilizers, pesticides, and high-yielding varieties) are notattractive to farmers. The cost of buying inputs is greater than anysaving in labor costs that may result, and the farmer has no incentiveto save on land costs.
Input-intensive techniques become cost-effective as populationgrows. Initially it becomes cost-effective to fertilize the soil with man-ure. Market access also tends to improve, especially if the transportsystem is developed; it becomes feasible for farmers to specialize insome crops and sell their surpluses. Land becomes relatively scarce, soland-saving technologies become more attractive.
New Crops and Higher-Quality Varieties
History shows that African farmers are willing to switch fromsubsistence crops to cash crops when marketing outlets are available.Even in thinly populated areas, farmers have often found it economicto shift to tree crops such as cocoa and oil palm. In many other areasthey have diversified into cotton and groundnuts. They are also will-ing to move to new subsistence crops that expand their dietary choiceor reduce the labor needed for subsistence production.
In areas dominated by shifting cultivation, the introduction of treecrops is attractive. When land is abundant it is cost-effective to plantmore trees badly rather than improve the quality of trees alreadyplanted. As population density increases and infrastructure improves,land becomes more valuable, so it becomes economic for farmers toupgrade the quality of their plantations.
For existing crops, farmers are willing to adopt higher-quality vari-eties. For instance, they will switch from short-staple to long-staplecotton wherever the higher price of the latter compensates for thehigher labor and other input costs. In the short run, such a shift isindependent of land value. However, if the better crops turn out to bevery profitable they will draw in immigrants, so land prices will rise.Cultivation techniques will then shift from extensive to intensive.
Stress-Resistant Varieties
The benefit of seeds that are resistant to drought, disease, and pestsis independent of land and labor costs, so farmers are eager to adopt
Hans Binswanger and Prabhn Pingali 89

them whether land is scarce or abundant. And they can benefit fromsuch varieties even if it is not profitable to use fertilizers and pesti-cides. Resistant varieties do not require any extra labor. The only costinvolved is for new seeds, and even that iis often a one-shot cost whenfarmers can multiply the seeds locally. The importance of resistance topests and disease is increasing in areas of high-yielding monoculture,as such areas are the most prone to attacks.
Research to improve stress resistance can have a high payoff. Butthe appropriate kind of stress-resistant varieties will depend on theagroclimate and ecology of each area. Drought tolerance may beimportant in semiarid areas but will be pointless for crops grownunder irrigation. Pests and diseases vary from one area to the next, soresearch has to be carefully focused.
Labor-Saving Techniques
Generally speaking, tractors have been cost-effective where land isabundant and labor scarce (as in North America). Following thatlogic, many agricultural experts once thought tractors would be ap-propriate for Africa, too. But many tractorization projects failed, andAfrica today is less mechanized than even the land-scarce, labor-abundant countries of South Asia.
The reason is that different farming systems require very differentamounts of labor. There is no point in trying to introduce a labor-saving tractor in a system needing little labor. In shifting cultivation,tree cover is removed by cutting and burning; the tree stumps aresimply left in the ground. The soil is soft and can be prepared withhoes or digging sticks. Since land is abundant, farmers can chooseonly the light, easy-to-work soils. Such realities help to explain why alabor-saving device like the plow is not used in labor-scarce forests,yet starts to be adopted in grass fallows where labor is more abun-dant. The number and intensity of operations are too low in forestfallow systems to justify plows. In addition, a plow can be usedeffectively only when farmers have removed some or all of the treestumps on their plots. This arduous task is not worthwhile if plots areabandoned after a few seasons.
When infrastructure develops and farming becomes more intensive,mechanization starts to be cost-effective. Typically, the most power-intensive activities (like milling and water pumping) will be mechan-ized first. Then may come a shift from draft animals to tractors,provided various questions can be answered satisfactorily: (a) Will thesavings in wages compensate for the high cost of a tractor? (b) Iscredit available at an economic rate of interest? (c) What are therelative costs of fodder and diesel? (d) Is there reliable access to spareparts and servicing facilities?
90 Research Observer 3, no. 1 (January 1988)

In much of Sub-Saharan Africa, the answers to these questions leadfarmers to prefer animals to tractors. Of seventeen projects attemptingto leapfrog from hoes to tractors without the intermediate stage ofdraft animals, all but three failed (Pingali, Bigot, and Binswanger1987). Most of the failures were in bush and semibush country, wherethe land is full of tree stumps and damages tractor-drawn implements.A jump from hoes to tractors has worked only in depression andvalley bottoms that are periodically innundated with water, and ingrassy savannas. Under these conditions there are no tree stumps.Soils in valley bottoms are often heavy, making them suitable forgrowing rice, provided plenty of power is available to prepare theland. If, in addition, labor is scarce and the infrastructure well devel-oped, tractors can be a success. This has happened in Sudan andZimbabwe and in pockets in other countries, but has usually beenaided by heavy subsidies for mechanization. Whatever the conditions,tractors do little to boost yields. One study found that tractors failedto increase yields in ten out of fourteen cases of tractorization in Sub-Saharan Africa (Pingali, Bigot, and Binswanger 1987). Farmers whodo mechanize do so mainly to save labor and extend their land, not toraise yields.
The use of other labor-saving devices such as herbicides will beeconomic only if the saving in labor outweighs their cost. Such inno-vations will succeed where wages are high and the cost of herbicidesis low-neither of which applies in most of Africa.
Crop-Husbanding Techniques
Weeding is a simple technology that boosts yields and saves land. Inforest and bush fallow systems, however, weeding is not needed in thefirst year of cultivation; once weeds start to proliferate, the plot isabandoned for a new one.
As farming systems develop into short fallows and permanent culti-vation, weed problems increase sharply. Weeding becomes necessary,especially where organic fertilizers are used. It is most profitablewhere chemical fertilizers are involved, as it ensures that expensivenutrients are not wasted on fertilizing weeds. A similar pattern occurswith other types of husbandry, such as incorporating crop residues inthe soil. As long as yields can be maintained simply by moving toanother plot, farmers will not be interested in these techniques. But asland becomes scarce and valuable such techniques become important.
The cost-effectiveness of fodder management depends on the valuesof fodder, land, and labor. Where land is abundant, fodder has littlevalue. Farmers will leave their harvested fields to be grazed by anyanimals, as it is not worth their while to harvest the residue for theirown livestock. Where land values have risen and grazing land is
Hans Binswanger and Prabbu Pingali 91

scarcer, farmers may allow in only their own animals and those ofpeople who pay for grazing rights. As lan(d and fodder values rise stillmore, farmers may find it cost-effective tc store their residue and useit over the year for stall feeding. When fodder values rise even higher,farmers often find it cost-effective to grow fodder crops.
Land Improvements
Land improvements affect crop yields in. three ways: (a) directly, asin the case of irrigation, drainage, and the application of lime; (b) asan essential component to fertilizers and high-yielding varieties; and(c) over the long term, by controlling erosion.
As with other yield-raising techniques, land improvements becomeeconomic only when land becomes relatively scarce. In forest andearly bush fallows, farmers invest virtually nothing in land. Whenthey use land more intensively, their first investments are to removetree stumps and build well-defined boundaries. This generally happensin early grass fallows.
Where farmers can choose among different soils, they first cultivatethe light, easy-to-work soils of the midslopes. As cultivation growsmore intensive, farmers expand uphill to rnarginal lands, which theyprotect against erosion by ridging, tied ridging, and terracing. In themore densely populated parts of Sub-Saharan Africa such protectivestructures existed in precolonial times: examples include the Jos Pla-teau in Nigeria, the Mandara Mountains of Cameroon, the KikuyuHighlands of Kenya, Mt. Kilimanjaro in Tanzania, Kigezi District inUganda, Rwanda, and Burundi (Okigbo 1977, Morgan 1969, andGleave and White 1969).
Antierosion investments are becoming increasingly common in in-tensively farmed areas of Africa. Machakos District of Kenya, forexample, attracted many immigrants from the highlands between 1955and 1965, and the farmers readily adopted bench terracing (Ahn1977). However, where the easily cultivable soils of the midslopes areabundant, farmers are not interested in preventing erosion. And evenwhen land is very scarce they fail to protect very marginal soils,where returns to antierosion investments are low, and widespreaderosion damage occurs.
As population densities increase, farmers also move to the hard-to-work soils of the lower slopes and depressions. The heavy, water-logged soils of valley bottoms and depressions often cannot be farmeduntil they have been drained and flooding has been controlled orirrigation has been provided. Thus, while land is lost in the marginalareas, high-qualilty land is being formed in previously unused areas.These heavier soils are particularly suitable for irrigated rice, whichhas become a major crop in Asia but not yet in Africa.
92 Research Observer 3, no. 1 (January 1988)

In Asia, small-scale irrigation and water control techniques arecommon. In large parts of semiarid India, gently rolling uplands areused intensively for rainfed crops. The runoff is stored in tanks andused for wet rice cultivation in the valleys and depressions. Althoughsome of the tank systems have been in operation for hundreds ofyears, most were built in the late nineteenth and early twentiethcenturies. In addition, many wells have been sunk, and the waterpumped up to irrigate a second crop on the middle and lower slopes(Englehardt 1984). The ultimate form of water control is to be foundon the meticulously terraced hillsides of Java and the Philippines,where in each rice field the required depth of water is stored and theexcess drained into the field immediately below (Ruthenberg 1980).Sub-Saharan Africa is a long way from this, but parts of it are ripe fortanks and wells.
Beyond a point, the small irrigation schemes developed by farmershave to be complemented by state-supported, large-scale systems forexpanding acreage and allowing land to be farmed more intensively.Such systems are worthwhile only where population is dense, sinceirrigated farming is labor-intensive. The frequent failure of large irri-gation systems in Sub-Saharan Africa can be attributed partly to thereluctance of farmers to engage in labor-intensive production whenthey have other alternatives.
The Office du Niger scheme in Mali is a case in point. Coercivemethods had to be used to bring in settlers. The 50,000 hectares thatwere developed by 1964 fell far short of the initial target of severalhundred thousand hectares. Even in this limited area, the land wasnot farmed intensively enough to yield an output that would meet thecosts of both settlers and the management of the scheme, providefarmers with a decent livelihood, and earn a return on the heavycapital investment (de Wilde 1967). Now that population density isincreasing, the prospects are better.
The previous section showed tnat Green Revolution techniques that Implications forhave succeeded in the densely populated regions of Asia are unlikely Research andto be adopted by farmers in large parts of Africa, where land is still Technologyabundant and market access poor. No matter how good research and Transferextension is in such places, farmers will not be interested in fertilizers,irrigation, fertilizer-responsive seeds, elaborate crop husbanding, orland improvement and conservation. In such conditions, asking re-search and extension workers to propagate high yields is a recipe fordemoralizing them.
Instead, farmers are moire likely to be attracted by stress-avoidingtechnologies, new crops, and higher-quality varieties. These are theareas on which research should focus. Scientists should also try to
Hans Binswanger and Prabhu Pingali 93

develop varieties that will boost yields without requiring fertilizers orirrigation. Such varieties will not produce dramatic breakthroughs,but are more likely to be adopted by farmers.
Past research efforts for land-abundant: areas have often failed be-cause the researchers did not understand shifting cultivation systems.Rather than trying to focus on a few specific issues such as productquality, and stress resistance, they often aimed at making the leap tohigh-yield, high-input farming long before such a system was cost-competitive with shifting cultivation.
These failures are well demonstrated by what happened to Ugan-da's research and extension efforts from 1910 to the mid-1960s (Carr1984). The program was intended to clevelop and promote high-yielding varieties in conjunction with fertilizers, new techniques ofcrop husbandry, and better land management. Yet not one of thecrops achieved any significant increase in yield at the farm level.Farmers simply did not adopt most of the proposed innovations.Nonetheless, they readily adopted new crops and a sequence of newvarieties that improved and later maintained the quality of the cotton.
In the next century, Uganda's growing population will ensure thatland becomes scarce and valuable. Then it will make sense to focuson yield-raising, land-saving strategies. Much of the research effortbetween 1910 and 1960 was almost a century too early. Such mistakesmust be avoided elsewhere.
Another (though less serious) example of misdirected research camemore recently, from the International Crop Research Institute for theSemi-Arid Tropics (ICRISAT) in West Africa. Its work on varieties ofsorghum and millet initially emphasized the adaptation of fertilizer-responsive cultivars from India and did not focus on stress resistance.However, the Indian varieties did not have the resistance qualities oflocal varieties. Moreover, they were unable to outperform the tradi-tional varieties with the small amounts of fertilizer that farmers werewilling to use in dryland agriculture. ICRISAT's research strategy hasnow been changed toward stress resistance.
It is also important to curtail work on labor-intensive husbandrytechniques for land-abundant farming. Decades of effort to introducemanures and crop residues have met with very limited success. More-over, researchers must take into account the fact that the demand forlabor is highly seasonal. The worst kind of husbandry techniques arethose that increase labor demand in peak seasons (Ouedraogo, New-man, and Norman 1982).
The Strategy Long before population growth makes land scarce throughout aEvolves country, some areas do become densely populated. They may be close
to transport and marketing facilities, or have pockets of exceptional
94 Research Observer 3, no. 1 (January 1988)

soil or climatic advantages. For them, high-yielding research strategiesare more appropriate. It is not surprising, therefore, that the bigsuccess stories of agricultural research come primarily from denselypopulated East African countries such as Kenya, or from tree cropareas where land is inframarginally scarce.
By concentrating research on such environments, several advantagesare gained. The relevance of research is maximized. Limited researchstaff and resources are focused on a limited range of issues, and henceare more effective. Researchers have to solve some basic problems inadapting genetic material to local conditions, which will benefit moreregions as land grows scarcer.
Just as Asia's Green Revolution has been most successful in irrigat-ed areas or where rainfall is reliable, so irrigation will be necessary inmuch of Africa too if that continent is to have its own Green Revolu-tion. However, irrigation projects in Sub-Saharan Africa are noto-riously expensive (see below).
By contrast, areas with reliable rain and good soil are well placedto absorb high-yielding technologies without irrigation: many parts ofRwanda, Burundi, Kenya, and Nigeria fit this description. If agricul-tural prices are remunerative and not depressed by discriminatorygovernment policies, farmers will be interested in buying inputs anddeveloping their crop husbandry. Many will spontaneously improvetheir land and dig wells. The process can be accelerated by providingextension services and credit.
Another case for regional targeting involves the humid lowlands,which often have chemically and structurally fragile soils. If such soilsare cultivated intensively, the results can be rapid leaching, soil acidi-fication, and erosion. Large amounts of fertilizer and lime are neededto maintain soil structure and fertility, while large amounts of laboror machinery are needed for weeding and other husbandry (Ruthen-berg 1980, Lal 1983, Kang and Juo 1981). Since all these activities areexpensive, it is hard for those farming these poor soils to producegoods at competitive prices. Subsistence cultivation is therefore therule, except where infrastructure makes tree crops economic.
The big challenge for researchers is to devise systems that canproduce crops at a price competitive with other agroclimatic zones.The paucity of past successes suggests that this may not be possiblefor some of the soils in Africa, so it is essential to concentrate re-search on the more promising environments. Other areas can still behelped, but not necessarily by research. In several low- and medium-density countries, for example, the provision of infrastructure canhelp expand acreage and facilitate a switch to tree crops.
In high-density countries labor-saving innovations are much lessrelevant than yield-raising ones. Mechanization will generally be cost-effective for such power-intensive operations as milling and pumping.
Hans Binswanger and Prabhu Pingali 95

For control-intensive operations (such as harvesting), however, mech-anization will be economic only when wages rise substantially (Bins-wanger 1986). Until then, it will often be appropriate for farmers to usetractors for tillage, animals for weeding, and labor for harvesting. Man,animal, and machine will be complements, not substitutes.
The policy message from this analysis is clear. Governments shouldtry to create a distortion-free environment that allows farmers tochoose the most cost-effective combinations. Governments should re-frain from subsidizing or otherwise pushing any particular form ofmechanization.
Implications for The same logic that governs the relevance of research also appliesProjects and to infrastructure projects. Where land is abundant and cultivationInfrastructure shifting, it is a mistake to invest heavily in projects attempting to raise
the productivity of land. Even if irrigation is provided cheaply, farm-ers will make little use of it, as irrigation involves a lot of labor. Forlow-density areas with good land, roads are by far the most relevantform of infrastructure. They provide access to markets and allowpeople to migrate to places where farming is most remunerative.
However, infrastructure does not always lead to a greater concen-tration of population. Farmers may prefer to move from denselypopulated to thinly populated areas, to overcome local shortages ofland. It is a mistake to try to force people to congregate in certainareas and take up intensive farming (as was attempted in the Ujaamaexperiment in Tanzania). Where land is abundant, it can be morecost-effective to undertake extensive cultivation.
Given the high cost of irrigation and land improvement in Sub-Saharan Africa, such projects should be undertaken only where landis scarce, population densities are relatively high, and good infrastruc-ture and marketing facilities exist. The obsession with high yields thatmany specialists from industrial countries and Asia bring to Africacan be as counterproductive in projects as in research.
Large-scale irrigation projects in Africa typically cost several timesmore than their equivalents in Asia. One reason is that Sub-SaharanAfrica lacks the ample, skilled labor and low-cost technical and mana-gerial staff of Asia, which means that cheap, labor-intensive con-struction is not feasible. Expensive labor-saving equipment has to bebrought all the way from Europe, North America, or East Asia. Theprojects are usually staffed by expensive expatriate managers andtechnicians. Until project costs are reduced dramatically, irrigation inSub-Saharan Africa will be cost-effective only for private wells, liftirrigation, and minor impoundment and diversion schemes.
One factor that could be favorable to irrigation (though not tohuman welfare) is that labor costs are unlikely to rise much and may
96 Research Observer 3, no. I (January 1988)

even decline in many parts of Africa in the coming decades. A rapidlygrowing population means that farmers become willing to engage inlabor-intensive irrigated agriculture. If education and training alsoexpand to create skills in construction, engineering, and manage-ment, African countries can adopt cheap Asian construction tech-niques. Meanwhile, other engineering solutions must be explored tobring costs down. The technical potential for irrigation in Sub-Saha-ran Africa is large. Even the Sahel has large river systems, such as theSenegal and Niger, which can be used to irrigate substantial areas.
In flood plains and valleys in humid areas where the soil is good,drainage can be cost-effective. Such areas are often suitable for grow-ing rice, which has already begun in Guinea, Sierra Leone, Senegal,the Niger valley, and the basin of Lake Victoria. In Sukumaland,Tanzania, the flood plain was used only for grazing forty years ago(Rounce 1949); today it is sown completely with rice. Investment indrainage increases the amount of land available for cultivation, and sobecomes cost-effective when land values rise. It also reduces healthhazards and attracts labor-essential, in large numbers, for rice farm-ing.
Investments in infrastructure are vital. But they must be selective, tomake the best use of limited funds and staff. It is tempting for Africangovernments to try to spread infrastructure uniformly over every dis-trict. However, building roads in areas with poor soil does little tohelp agriculture: farmers in such areas cannot grow cash crops or treecrops at competitive prices and will tend to continue with subsistencecultivation. By contrast, the areas with the best land and climate offerthe quickest returns on infrastructure. They are the places wherefarming will be most profitable, immigration will take place mostrapidly, advanced agricultural technologies will most readily beadopted, and where the linkages between farming, services, and indus-try will develop best. In such areas, agricultural research and infra-structural investment will reinforce each other, and the results will be
.k.stri ing.
The article examines the suitability of different agricultural research strategies in AbstractAfrican countries with varying endowments of land, labor, and climate. Differences insuch endowments lead to a wide spectrum of farming systems. Agricultural technologiesthat are cost-effective in some farming systems are not in others. Many past failures aredue to a mismatch between technological strategies and farming systems. The articleclassifies countries of Sub-Saharan Africa on the basis of agroclimatic density andsuggests appropriate technological strategies for each class of countries.
Ahn, P. 1977. "Erosion Hazard and Farming Systems in East Africa." In D. J. Greenland Referencesand R. Lal, eds. Soil Conservation and Management in the Humid Tropics. Chiches-ter: John Wiley.
Hans Binswanger and Prabhu Pingali 97

Binswanger, Hans P. 1986. "Evaluating Research System Performance and TargetingResearch in Land-Abundant Areas of Sub-Saharan Africa." World Development 14,no. 4.
Boserup, Ester. 1965. The Conditions of Agricultural Growth. Chicago: Aldine.
Carr, Stephen. 1984. "The Impact of Government Intervention on Smallholder Devel-opment in North and East Uganda." Occasional Paper 5. Wye College, AgrarianDevelopment Unit, London.
de Wilde, John C. 1967. Experiences with Agricultural Development in Tropical Africa.vol. 2. Baltimore, Md.: Johns Hopkins University Press.
Engelhardt, T. 1984. "Economics of Traditional Smallholder Irrigation Systems in Semi-Arid Tropics of South India." Ph. D. dissertation. Universitat Hohenheim, Stuttgart.
Gleave, M. B., and H. P. White. 1969. "Population Density and Agricultural Systems inWest Africa." In M. F. Thomas and G. W. Whittington, eds. Environment andLand-Use in Africa. London: Methuen.
Higgins, G. M., and others. 1982. Potential Population Supporting Capacities of Landsin the Developing World. Technical Report of Project INT/75/P13. Rome: Food andAgriculture Organization, United Nations Fund for Population Activities, and Inter-national Institute for Applied Systems Analysis.
Kang, B. T., and A. S. R. Juo. 1981. "Management: of Low-Activity Soils in TropicalAfrica for Food Crop Production." Paper presented at the Fourth International SoilClassification Workshop, Kigali, Rwanda, June 2--12.
Lal, R. 1983. No-Till Farming: Soil and Water Conservation and Management in theHumid and Sub-Humid Tropics. Monograph 2. Ibadan, Nigeria: International Insti-tute for Tropical Agriculture.
Morgan, W. B. 1969. "Peasant Agriculture in Tropical Africa." In M. F. Thomas andG. W. Whittington, eds. Environment and Land-tUse in Africa. London: Methuen.
Okigbo, B. N. 1977. "Farming Systems and Soil Erosion in West Africa." In D. J.Greenland and R. Lal, eds. Soil Conservation and Management in the Humid Tropics.Chichester: John Wiley.
Ouedraogo, I., M. D. Newman, and D. W. Norman. 1982. The Farmer in the Semi-AridTropics of West Africa: A Partially Annotated Bibliography. ICRISAT Research Bulletin4. Patancheru, India: International Center for Research in the Semi-Arid Tropics.
Pingali, Prabhu, Yves Bigot, and Hans P. Binswanger. 1987. Agricultural Mechanizationand the Evolution of Farming Systems in Sub-Saharan Africa. Baltimore, Md.: JohnsHopkins University Press.
Ruthenberg, Hans P. 1980. Farming Systems in the jTropics. Oxford: Clarendon.
Ruttan, Vernon. 1982. Agricultural Research Policy. Minneapolis: University of Minne-sota Press.
Rounce, N. V. 1949. The Agriculture of the Cultivation Steppe. Capetown: Longmans,Green.
Zachariah, K. C. 1986. "Use of Population Projections for Analyzing the Implicationsof Population Growth in Agricultural Labor Force with Applications to Sub-SaharanAfrican Countries." World Bank, Population, Health and Nutrition Department,Washington, D.C.
98 Research Observer 3, no. I (January 1988)

EDUCATIONAND DEVELOPMENTA Review
George Psacharopoulos
hat education is a form of investment that can contribute toindividual and social development is not a novel idea. Overtwo centuries ago Adam Smith wrote:
A man educated at the expense of much labor and time. . . may becompared to one.. . expensive machine. . . The work which helearns to perform. . . over and above the usual wages of commonlabor will replace the whole expense of his education (1776, p. 101).
Articles on education as investment appeared sporadically in thefirst half of this century (for example, Strumilin1929, Walsh 1935). But it was not until the late Figure 1
1950s that the subject became a separate field ofstudy-the economics of education. The spur was Csthe realization that not all the increases in na- Gr
tional output could be accounted for by the tta n nent , n
growth of conventional inputs: physical capital, attainrentlabor, and land. The "residual" puzzle in growth Fami y arnis
accounting was solved by Schultz (1961a) and Abi tv J- ngothers, who introduced human capital into the 3 otcome
aggregate production function. Co nitive
One way of analyzing the complex links be-tween education and development is illustrated infigure 1. The direct relationship depicted by arrow 4-from schoolto the labor market-is known as the "external efficiency of edu-cation" and has received most attention in the literature, mainly fromeconomists. The triangular path (arrows 1, 3, and 6) from familybackground to schooling and learning outcomes is known as the
Co 1988 The International Bank for Reconstruction and Development/The World Bank 99

"internal efficiency of education" and has been studied mainly bysociologists and psychologists. In recent years, the availability of lon-gitudinal data sets has permitted some attempts to estimate the fullmodel.
The first section in this article presents some of the principal find-ings on the role of education in development that have been generatedin the past twenty years. The following section deals with a series ofdebates that have appeared in the literature. The final section at-tempts to draw some policy implications for educational priorities indeveloping countries.
The Evidence This review is restricted to the effects of education most directlyrelated to a common notion of economic development. One is efficien-cy in resource utilization, leading to higher income; another is moreequitable distribution of such income.
Labor Market Outcomes
There is widespread evidence that an individual's earnings increasewith each extra year of schooling. The explanation of human capitaltheory is that education makes the individual more productive, not
only in the market place but also in the household.Figure 2 As Welch (1970) and Schultz (1975) have put it,Earnings/productivity education has a beneficial allocative effect or helps
the individual to deal with disequilibrium situa-tions.
Moreeducation+ + The empirical core of the human capital school/ . + + lies in the crossover shown in figure 2-the tra-
Less education deoff between a low level of education and earn-Lesseducatin mings today versus more education and earnings to-
morrow. Such a relationship has been documentedin practically every country that has data on age-
Age/experience earning profiles by education. (See the appendixfor examples from the latest Brazilian census.)
Proper discounting of the costs and benefits associated with educa-tional investment (the minus and plus areas in figure 2) leads toestimates of its profitability from both the private and social point ofview. Like the rate of return to any other project, the return toeducational investment is the discount rate that sets the net presentvalue of the net stream of benefits equal to zero. In a state subsidizedsystem the cost of education to the individual is the earnings forgonewhile in school. From a social viewpoint, however, the cost of educa-tion must include all resources used to provide education (for exam-ple, teachers' salaries and the use of classrooms).
100 Research Observer 3, no. 1 (January 1988)

Estimates of the returns to education are now available for oversixty countries. Table 1 gives a regional summary and raises severalnoteworthy points.
* The social returns to education in developing countries are at leastas high as any reasonable measure of the opportunity cost of capitalor a social discount rate. In other words, investment in people may bemore conducive to economic growth than investment in machines.
* Rates of return are highest in primary education, followed bysecondary and then university levels. For primary education, unitcosts are small relative to the extra lifetime income or productivityassociated with literacy. For university education, the opposite istrue.
* The same diminishing returns apply across countries: the moredeveloped the country, the lower the returns to education at alllevels. The high returns to education in low-income countries mustbe attributed to their relative scarcity of human capital.
* Private returns are higher than social returns at all levels-a resultof the public subsidization of education in most countries. Thediscrepancy between private and social returns is greatest at univer-sity level-which raises issues of equity as well as of how educa-tional expansion should be financed.
Other studies have estimated rates of return by field of study andby sex. Table 2 shows that technical education and agronomy areassociated with lower returns than the more general subjects-a coun-terintuitive result that is again due to the relatively high unit cost oftechnical education (Psacharopoulos 1987a). And table 3 shows thatthe rate of return is higher on women's education than on men's.Although in all societies the absolute earnings of men are higher, theopportunity cost of study for women is often lower than for men, and
Table 1. The Returns to Investment in Educationby Country Group and Level of Schooling(percent)
Social return Private return
Country group Primary Secondary Higher Primary Secondary Higher
Africa 26 17 13 45 26 32Asia 27 15 13 31 15 18Latin America 26 18 16 32 23 23Intermediate' 13 10 8 17 13 13Industrial - 11 9 - 12 12
-Not available because of lack of a control group of illiterates.a. Refers to South European and Middle East countries. Figures are averages for fifty-eight
countries and mainly refer to the late 1970s.Source: Psacharopoulos 1985, p. 586.
George Psacharopoulos 101

furthermore women's education allows them to participate in thelabor force in the first place.
Growth Accounting
If expenditure on education produces a high social rate of return,macroeconomic analyses should pick up on the link between the expan-sion of education and economic growth. This issue has been extensivelystudied, following the pioneer work of Schultz (1961b) and Denison(1967). Their approach, called "growth accounting," breaks down acountry's economic growth into various contributory factors, such asinvestment in physical capital, growth in the workforce, and invest-ments in human capital. (The growth in agricultural land has not beenfound to be a major source of growth.) As table 4 shows, such macroevidence bears out the microeconomic links between education andearnings. The same relationships have been studied by economic histo-rians, who relate the literacy level of a country to cycles of growth. Forexample, Saxonhouse (1977), in a study of the Japanese cotton spinning
Table 2. The Social Returns to Education by Leveland Field of Study(percent)
Educational level Field of study Rate of return
Secondary school General, academic 16curriculum Technical, vocational 12
University faculty Law, economics, social sciences 12Engineering 12Agronomy 8
Note: Rate of return figures are averages for seven countries and are based on data mainlyfrom 1980.
Source: Based on Psacharopoulos 1985, tables 6 and 7.
Table 3. The Returns to Education by Sex(percent)
Sex Rate of return
Males 11Females 15
Note: Figures are mainly private rates and refer to the coefficient of the average year ofschooling estimated by means of Mincer's (1974) semilogarithmic earnings function in sixteencountries during the late 1970s.
Source: Based on Psacharopoulos 1985, p. 588.
102 Research Observer 3, no. 1 (January 1988)

Table 4. The Contribution of Education to EconomicGrowth by Region
Percentage of growth rateRegion explained by education
Africa 17.2Asia 11.1Latin America 5.1North America
and Europe 8.6
Note: Figures are simple country averages within regions and mostly refer to economicgrowth in the 1950s and 1960s.
Source: Based on Psacharopoulos 1984b, table 8-2.
industry from 1891 to 1935, found that education, among other factors,had a large and significant impact on productivity growth. Easterlin(1981) examined data for twenty-five of the world's largest countriesand concluded that the spread of technology depended on the learningpotentials and motivation that were linked to the development of for-mal schooling: in other words, that the most likely causal link is fromeducation to economic growth, not the other way around.
Income Distribution
Since education has such a strong bearing on individual earnings, itmust also affect the way income is distributed. The net effect of theexpansion of schooling has been a reduction in the dispersion of earn-ings and hence a more equal income distribution. (The appendix givesan exemplary income distribution by education in Brazil.)
This equitable effect, however, strongly depends on which level ofschooling is expanded. The equity impact is highest for basic education,since the low earnings of otherwise illiterate workers are raised nearerto the overall mean. But if university education is expanded (andespecially postgraduate education), the equity effect may be negative, inthe sense that a group of workers with earnings above the mean areraised even further away from it. Taking Mexico as an example, Marinand Psacharopoulos (1976) report that providing primary education to10 percent of those without it would make income distribution moreequal by nearly 5 percent compared with the present level of an in-equality index. Giving higher education to 5 percent of those withsecondary education, however, would worsen the inequality index by 2percent. Since most university students come from the higher-incomegroups in any society, state subsidies for their education will boost theirfuture earnings at the expense of the general taxpayers, who are less
George Psacharopoulos 103

likely to enroll their children in higher education. Table S shows that infour countries the children of the upper-income groups received thebulk of the higher education subsidy.
The Debates The views of the human capital school have long been the subjectof considerable controversy in the literature. The same positive correla-tion between education and earnings coulcl also be predicted by severalother theories, which, if valid, would weaken the "education-for-devel-opment" proposition. Especially vulnerable in this respect has been thelink between earnings and productivity. Fcr if the higher earnings asso-ciated with more schooling do not have a productivity counterpart, thesocial payoff of investment in schooling would vanish.
Screening
Among the many arguments that earnings may not reflect produc-tivity, perhaps the most elaborate is the cne known as the "screeninghypothesis" (Arrow 1973). Employers prefer, and pay higher salariesto, the more educated because the employers use schooling as a proxyfor various unobserved characteristics that such employees will in factbe more productive. To the extent that those with greater naturalability receive more years of schooling, the higher earnings of themore educated are due to their greater genetic ability rather than totheir education. According to some estimates, the social rate of returnto investment in schooling should be halved when screening is takeninto account (Taubman and Wales 1973).
Although this theory sounds plausible, many attempts to test ithave failed to produce any support for it. Early evidence by Griliches(1970) has shown that the inclusion of measured ability in an earningsfunction does not diminish the importance of schooling in determin-ing earnings (see also Layard and Psacharopoulos 1974). The same
Table 5. The Share of Higher Education Subsidiesto Different Income Groups in Selected Countries(percent)
Survey Income groupCountry year Lower Middle Upper
Chile 1983 15 24 61Colombia 1974 6 35 60Indonesia 1978 7 10 83Malaysia 1974 10 38 51
Source: World Bank 1986, p. 61.
104 Research Observer 3, no. 1 (January 1988)

result was repeated in two recent studies of Kenya and Tanzania(Boissiere, Knight, and Sabot 1985). And where the outcome of educa-tion is measured directly by the value of extra output (by means of anagricultural production function) rather than by extra earnings, it hasbeen found that the effect of schooling is substantial. According to areview by Jamison and Lau (1982), four years of education raisesagricultural productivity by 9 percent over what it would be with noeducation. Such a benefit, when it is combined with the low cost ofproviding primary education, confirms the relatively high rate of re-turn to primary education.
Public versus Private Sector
Another way of shadow pricing education is by observing the earn-ings of those employed in the competitive parts of the economy (forexample, the private sector or self-employment). Private employerscannot keep on paying a wage much higher or lower than what aparticular employee contributes to production: if they do, they willeither incur unsustainable losses or the employee will leave. Table 6shows that the returns to investment in education, as estimated forthose employed in the competitive sectors, are higher than those forthe economy as a whole. The reason for such finding is that civilservice pay scales have a tendency to narrow the earnings dispersion,especially by paying above their marginal product those with thelowest level of schooling (Psacharopoulos 1983). Furthermore, in self-employment, where no screening takes place, standardized labor earn-ings for other inputs used by enterprises in the informal sector mustreflect the value of education in production.
Segmentation
Another popular debate in the economics of education comes underthe heading of labor market segmentation, or duality (Gordon 1972).
Table 6. The Private Returns to Education by Sectorof Economic Activity(percent)
Economic sector Rate of return
Private 13Public 10
Note: The figures are averages for eleven countries, estimated by the Mincerian earningsfunction and refer mainly to the late 1970s.
Source: Based on Psacharopoulos 1985, table 4.
George Psacharoponlos 105

The starting point is the proposition that: there are good jobs and badjobs. Whereas education helps those in good jobs to achieve high pay,it does not do so for those who are locked in bad jobs with fewpromotion prospects.
Empirical tests of this descriptive proposition have suffered from astatistical artifact most lucidly expressed by Cain (1976). By fittingearnings functions within low-pay bad jobs and high-pay good jobs,one necessarily truncates the income-dependent variable of the lattergroup and finds a lower effect of education on earnings.
In fact, the labor market is a continuum, with no clear line separat-ing the alleged segments. In addition, many workers, by acquiringmore education, have been able to cross over to the higher segment-something they could not otherwise have achieved. The issue is mobil-ity, which can be examined only with longitudinal data-whereasmost attempts to test for labor market duality have been based oncross-sectional data. But Chau tests on the difference between two setsof coefficients on an earnings function fitted to a split cross-sectionalsample (usually by occupation) say nothing about how education mayassist an otherwise low-paid worker to move up to the other group(Psacharopoulos 1978; Corbo and Stelcner 1983).
Declining Returns over Time
In the mid-1970s, some people expressed fears that the world maybe overeducated, in the sense that schooling had expanded beyond anormative optimum (Freeman 1976, Dore 1976). Such fears continueto be voiced today regarding educational expansion in developingcountries. Whereas education was a socially profitable investment inthe 1960s, it might not be in the 1990s.
This issue is settled rather easily by looking at the rare instanceswhere the returns to education have been estimated within a countryfor more than one year. As shown in table 7, the profitability ofinvestment in education, like that for any other type of investment,declines over time as educational expansion takes place. However, thedecline is far from drastic. It took ten years for the rate of return inBrazil to drop from 16.5 percent to 14.5 percent. During the sameperiod the mean years of schooling completed was raised from 3.9years to 5.7 years. Building the stock of human capital by means ofannual flows of graduates is a very slow process (Psacharopoulos andArriagada 1986).
The interaction between shifts in the supply and demand for edu-cated labor is what Tinbergen (1975) described as the race betweeneducation and technology. Whereas school expansion increases thesupply of graduates and thus tends to lower the rate of return, techno-logical demand for more sophisticated skills keeps pace with the
106 Research Observer 3, no. 1 (January 1988)

Table 7. The Private Returns to Education at Two Pointsin Time in Selected Countries(percent)
Country Survey year Rate of return
Brazil 1970 16.51980 14.5
Colombia 1965 17.31978 14.4
Source: Brazil, from Psacharopoulos 1985, table 4; Colombia, from Mohan 1981, p. 40.
Table 8. The Changing Composition of the Labor Forcein Selected Countries
Percentage of the labor force Mean
With no With higher years ofCountry Year education education schooling
Brazil 1960 48.2 0.5 2.41980 24.7 5.9 5.6
Chile 1969 18.6 2.3 5.91981 4.1 8.3 8.1
Source: Psacharopoulos and Arriagada 1986, p. 572.
increased supply. The net result of such a race is an elastic "reducedform" set of intersections of the supply and demand for educatedlabor.
Supply shifts of educated labor have been impressive in the yearssince World War II, and especially during the 1960s in developingcountries. Table 8 shows, as an example, the changing composition ofthe labor force in two Latin American countries.
Educated Unemployment
Fears are often expressed that the expansion of education producesunemployed graduates. It is true that the transition from school towork has been exacerbated in recent years, mainly because of sluggisheconomic growth. Nonetheless, the "product" of education will lastfifty years-the working time of the individual concerned. There is noevidence that any person who is willing to work remains idle for fifty,forty, or even five years. The incidence of unemployment is a sharplydeclining function of age or time since graduation; virtually everyonefinds a niche within a matter of weeks or months (Psacharopoulosand Sanyal 1981). In one branch of economics, at least, the period
George Psacharopoulos 107

between graduation and landing a job is interpreted as waiting time,in the sense that an "unemployed" person makes a voluntary decisionto remain out of work so that he or she can search for a better job orsalary rather than accept the first available (Stigler 1962). In Indone-sia, for example, it was found that job search among secondaryschool graduates yields a 21 percent rate of return (Clark 1983).
Radical Interpretations
The Marxist school of radical economics puts a completely differ-ent interpretation on the education-earnings relationship. It sees edu-cation as a means by which the dominant social class perpetuates thestatus quo from generation to generation (Bowles 1972). By providingschooling to its offspring, the income earning power and economicdominance of that class will be sustained. Schools also enhance cer-tain qualities of docility that are rewarded by employers; they do notimpart productivity-boosting skills (Bowles and Gintis 1975).
Of course, more educated parents will seek to give their children atleast as much education as they themselves have received. This is aglobal phenomenon, widely studied by sociologists (for example, seeJencks and others 1972). But this does not necessarily deny the pro-ductivity value of education-it is more an issue of how educationwas acquired in the first place and by whom. Research on socialmobility has demonstrated that education helps many children ofmodest social origins to reach the highest occupational classes andincome groups (Anderson 1987).
Quality versus Quantity
Most of the evidence on the developmental effects of educationrefers to the extensive margin, that is, to the number of years ofschooling of the labor force. Evidence on the intensive margin-thequality of education provided-is scarce. (For one attempt, see Behr-man and Birdsall 1983). The reason is that, in developing countries,longitudinal data sets that follow the student from school to adult lifeand measure economic performance are rare. Furthermore educationalquality means different things to different people. First, there is thetraditional input definition, by which higher expenditure per pupil ora lower repetition rate are indicators of good quality. But throwingmoney at schools does not necessarily mean that such money will beused efficiently, and automatically promoting everyone in a class doesnot mean that graduates will (at least) have been made literate. Sec-ond, there is the output definition of educational quality, based on thestudents' learning achievement. But because so many factors otherthan schooling (for example, prior cognitive knowledge and family
108 Research Observer 3, no. 1 (January 1988)

background) correlate with cognitive achievement in a cross section, itis difficult to isolate the particular effects of education. However,extensive work with the so-called educational production functionshas resulted in the conclusion that, although family factors are asso-ciated with achievement, specific educational inputs, like the availabil-ity of textbooks, do have a net effect in raising achievement (Heyne-man and Loxley 1983).
In education, as in any other field, universal policy prescriptions Educationalsimply do not exist. The strategy and tactics of education depend Strategiesupon the initial conditions in a particular country, which means thatwhereas policy A is suitable for country X, policy B may be moresuitable for country Y. Given this qualification, the accumulated evi-dence in the economics of education in the past thirty years permitssome broad policy generalizations. The list which follows is conserva-tive, in the sense that, unless the initial conditions in a given countrydictate otherwise, the propositions may be applicable to a large num-ber of countries.
Emphasis on Primary Education
For the poorest countries, perhaps the safest strategy is to increaseprimary education coverage for children age six to fourteen. Suchinvestment has the highest social rate of return, and unless a popula-tion is literate, other (physical) investment projects may fail (Mingatand Tan 1987). In addition to direct economic returns, primary educa-tion is associated with larger externalities than any other social invest-ment: suffice it to mention the creation of a more informed electorate.Haveman and Wolfe (1984) have identified many nonmarket benefitsof education, including better decisions around the home, better sani-tation, more leisure time, more efficient consumption, and even betterchoice of a marital partner. When such effects are priced, the standardestimates may capture only half of the total value of schooling.
Emphasis on General Skills at the Secondary Level
As development takes place and primary education becomes al-most universal, the next frontier for educational policy is secondaryschools. Although some countries were tempted to vocationalize suchschools in order to make them relevant to the world of work, theresults have not always matched expectations. For example, in arecent evaluation of two systems of diversified secondary education(Colombia and Tanzania), most of those who studied agricultural orindustrial subjects were found, one to three years after leaving school,
George Psacharopoulos 109

in jobs such as office clerk, which were unrelated to their training.Their activities did not differ from those of a control group of generaleducation graduates (Psacharopoulos and Loxley 1985).
Such evidence, coupled with the high unit cost of vocationalizingthe curriculum, favors the more conservative policy of emphasizinggeneral skills-like science and mathematics-in secondary education.The unit cost of teaching such subjects is relatively low, and thegraduates are flexible enough to fit into a variety of occupations or goon to study in a variety of fields.
Emphasis on Employment-Based Vocational Training
The urge to modernize and industrialize has led many countries toemphasize the creation of technical and vocational skills in the laborforce. Such emphasis is fine, although it raises the question of wherevocational training should take place. The evidence suggests thatemployment-based training has an advantage over the same type oftraining done in formal schools. Latin American countries have reliedextensively on employer-financed training in institutions like SENA inColombia, SENATI in Peru, and SENAI in Brazil. A recent evaluation inColombia has revealed that the social rate of return to investment inSENA courses is 14 percent, well above tlhat from investment in for-mal secondary technical education. And the profitability of on-the-job training was found to increase with the years of general educationa worker has (Jimenez, Kugler, and Horn 1986).
Employers know more about the demand for labor than the formalschool system does, and they are better placed to follow technologicaldevelopments in a variety of occupations. And the costs of on-the-jobtraining are usually shared between the employer and the employee,whereas school-based training is typically financed by the taxpayer.
Of course, this does not mean that all vocational institutions woulddisappear. Proprietary schools offering commercial or industrial sub-jects would certainly remain; people enroll in them voluntarily, arewilling to pay for their courses, and thereby help to ensure the rele-vance of what they offer. These qualities give them a considerableedge over public vocational schools, which are usually regarded as aninadequate alternative to academic institutions.
Emphasis on Cost Recovery in Higher Education
At the highest level of education, cost recovery is the most promis-ing policy for both efficiency and equity reasons. Too much of atypical education budget is devoted to the university level, which hasthe lowest rate of return, and a disproportionate number of studentscome from the more affluent parts of society (World Bank 1986).
110 Research Observer 3, no. 1 (January 1988)

Some sons and daughters of poor farmers make it to the university,but they are the exceptions that prove the rule. Yet attendance at theuniversity is typically free, and students may even receive a cashallowance. If students pay at least part of the cost of their education,they are more likely to make better choices on whether to enroll andwhat to study. For the talented poor, selective scholarships or loanscan be provided (Mingat and Tan 1986).
Along with cost recovery, universities could adopt more traditionalefficiency measures, such as the consolidation of dispersed campusesinto larger units. Economies of scale apply as much to universitycampuses as to industrial plants. The average cost per student declinessharply once enrollment exceeds 500 (Psacharopoulos 1982).
Emphasis on School Quality
There is no point in enrolling every six- to fourteen-year-old inschool if many who leave school at fifteen do not know how to readand write. International comparisons of reading, mathematics, andscience show that students in developing countries achieve only afraction of what their peers manage in industrial countries (Heynemanand Loxley 1983).
Money alone does not improve the quality of education (Hanushek1986). It needs to be concentrated on buying those inputs that arecost-effective in raising the level of student achievement. One suchquality booster is the availability of textbooks, along, of course, withteachers qualified to use them (Lockheed, Vail, and Fuller 1987). Inparallel, a system of examinations will allow the authorities to moni-tor who learns what and to take corrective measures if, say, elemen-tary reading and arithmetic standards are dropping.
Deemphasis on Planning Models
Since the early days of educational policy, it has been popular forcountries to attempt to plan their educational systems by means offormal models. The most widely used model has been the one knownas manpower forecasting, based on a set of fixed relations betweenthe anticipated growth in output and the educational or skill require-ments to produce such output (Harbison and Myers 1964). For exam-ple, if the historical elasticity of the growth in higher education enroll-ment and GDP growth is equal to 1, and a country's twenty-year plananticipated GDP growth of 7 percent a year, then university enroll-ments should also grow by 7 percent a year. The epitome of suchmodels is found in the Mediterranean Regional Project of the Organi-sation for Economic Co-operation and Development (OECD), whichwas also extended to Latin America (see Parnes 1962 and OECD 1967).
George Psacharopoulos 1l1

In practice, forecasts and outcomes have differed enormously. Thisis not surprising: technological change and its implications for thedemand for skills have been too elusive to predict, and the absence ofprice and, especially, wage elasticities in the model reduced it to amechanical application with no practical interest. (For a critique seePsacharopoulos 1984a.) The trend is therefore away from such formalmodels. They are being replaced by a recognition that what matters isthe individual demand for education by students and their familiesresponding to wages and other market signals.
Emphasis on Analytical Work Specific to Countries
Universal policy prescriptions do not exist, but the general princi-ples outlined in this article can be fine-tuned to the conditions in eachcountry. It may be that, although in most developing countries pri-mary education should receive priority, in country X it is the second-ary level that offers a higher rate of return. Or it may be in country Ythat university faculty should be expanded.
Once a country has decided that, for example, primary education isa priority, it faces a series of options on how to go about increasingits supply. First, how much primary education to provide: four years,five years or perhaps, nine years? The answer will depend on howlong is needed to instill literacy in the students. Four years combinedwith the provision of a qualified teacher and a textbook for eachstudent may achieve more than eight years of education with anuntrained teacher and only one textbook to a class. Then there is thequestion on how to attract students. It is well known that simplybuilding schools in a rural area does not ensure that children willenroll in them. Perhaps a subsidy, say in the form of free lunches,would offset some of the opportunity cost of child labor and thusmake parents willing to release them from agricultural activities.
Such issues need to be studied carefully, which in turn requires acritical mass of social scientists to document and monitor relation-ships in the system, so that the most appropriate educational policy isadopted. However, few Ministries of Education have analytical unitslinked to the decisionmaking process. Efforts to develop them may beone of the best preliminary investments available.
Concluding There are many strategies for development, each surrounded withComment controversy. On the issue of human versus physical capital invest-
ment, the classic examples in the early literature were India and Japan(Schultz 1961b). The crash investment in steel mills in India was notaccompanied by sustained growth, whereas Japan's emphasis on edu-cation since the Meiji set the foundation for its economic miracle.
112 Research Observer 3, no. I (January 1988)

Of course, it is not easy to establish cause and effect in develop-ment economies-too many factors change at the same time. Yet thisreview of the evidence provides grounds for confidence that invest-ment in education is a major contributor to development.
Month y earnings Appendix:(thousands of cruzeros) Education
and Incomein Brazil
80
60 University education
A~~~~~~g
Secondary education
40 -~~~~~~
/A\
20 Primars educatn eri Freqenc
m um Noschooing (0 415 25 35 45 55 65
Age
Earnings categoryin multiples of Mean years Mean earnings Frequencyminimum wage ofrschooling (cruzeros a month) (percent)
Below 1/4 2.8 828 0.81/4..3/4 3.1 2,401 7.43/4-1 3.6 3,848 10.41-2 4.1 6,143 32.82-3 4.9 10,326 17.03-5 6.1 16,518 15.55-10 8.7 29,870 9.910-15 10.9 51,543 3.215-20 12.2 73,595 1.220 and above 13.0 149,785 1.8All earnings categories 4.3 15,105 100.0
Note: Data for the table and figure are based on the public use tapes of the 1980 BrazilianCensus. Distribution refers to urban males.
Source: Psacharopoulos 1987b.
George Psacharopoulos 113

Abstract The article reviews the evidence on the role of education in economic development,with emphasis on issues that have appeared in the literature in the past two decades:the contribution of education to economic growth, the screening hypothesis, thesegmentation of the labor market, the return to investment in schooling, and the effectsof education on unemployment and income distribution. It concludes with an optimisticassessment of the contribution of educational investment to the development process,especially when such investment is targeted to primary schooling, general education,and improvements in the quality of instruction and when it is accompanied by cost-recovery at the higher levels of education.
References Anderson, C. Arnold 1986. "Social Selection in Education and Economic Development."EDT Series 82. World Bank, Education and Training Department, Washington, D.C.
Arrow, Kenneth. 1973. "Higher Education as a Filter." Journal of Public Economics 2,no. 3: 193-216.
Behrman, J. R., and Nancy Birdsall. 1983. "The Quality of Schooling: Quantity Aloneis Misleading." American Economic Review 73, no. 5: 928-46.
Boissiere, M., J. Knight, and R. Sabot. 1985. "Earnings, Schooling, Ability and CognitiveSkills." American Economic Review 75, no. 5: 1016-30.
Bowles, Samuel. 1972. "Schooling and Inequality from Generation to Generation."Journal of Political Economy 80, no. 3 (part 2): 219-51.
Bowles, Samuel, and Herbert Gintis. 1975. "The Plroblem with Human Capital Theo-ry-A Marxian Critique." American Economic Review 65, no. 2: 74-82.
Cain, Glen C. 1976. "The Challenge of Segmented Labor Market Theories to OrthodoxTheory: A Survey." Journal of Economic Literature 14, no. 4: 1215-57.
Clark, David H. 1983. How Secondary School Graduates Perform in the Labor Market:A Study of Indonesia. World Bank Staff Working Paper 615. Washington, D.C.
Corbo, Vittorio, and M. Stelcner. 1983. "Earnings Determination and Labor Markets:Gran Santiago, Chile 1978." Journal of Development Economics 12, no. 1-2:215-66.
Denison, Edward F. 1967. Why Growth Rates Differ?. Washington, D.C.: BrookingsInstitution.
Dore, R. P. 1976. The Diploma Disease. New York: Allen and Unwin.
Easterlin, R. 1981. "Why Isn't the Whole World Developed?" Journal of EconomicHistory 41, no. 1: 1-19.
Freeman, Richard. 1976. The Overeducated American. New York: Academic Press.
Gordon, David. 1972. Theories of Poverty and Unemployment. New York: Lexington.
Griliches, Zvi. 1970. "Notes on the Role of Education in Production Functions andGrowth Accounting." In W. Lee Hansen, ed. Education, Income, and Human Capital.New York: Columbia University Press for National Bureau of Economic Research.
Hanushek, Eric. 1986. "The Economics of Schooling: Production and Efficiency in PublicSchools." Journal of Economic Literature 24, no. 3: 1141-77.
Harbison, Frederick, and C. A. Myers. 1964. Education, Manpower and EconomicGrowth. New York: McGraw-Hill.
Haveman, Robert H., and Barbara L. Wolfe. 1984. "Schooling and Economic Well-Being: The Role of Nonmarket Effects." Journal of Human Resources 19, no. 3(summer): 377-407.
Heyneman, Stephen, and William A. Loxley. 1983. "The Effect of Primary-School
114 Research Observer 3, no. 1 (January 1988)

Quality on Academic Achievement across Twenty-Nine High and Low IncomeCountries." American Journal of Sociology 88, no. 6: 11-61.
Jamison, Dean, and Lawrence J. Lau. 1982. Farmer Education and Farm Efficiency.Baltimore, Md.: Johns Hopkins University Press.
Jencks, Christopher, and others. 1972. Inequality: A Re-Assessment of the Effect ofFamily and Schooling in America. New York: Basic Books.
Jimenez, Emmanuel, and B. Kugler, with R. Horn. 1986. "An Economic Evaluation ofa National Training System: Colombia's Servicio Nacional de Aprendizaje (SENA)."
EDT Series 24. World Bank, Education and Training Department, Washington, D.C.
Layard, Richard, and George Psacharopoulos. 1974. "The Screening Hypothesis and theReturns to Education." Journal of Political Economy 82, no. 5: 985-98.
Lockheed, Marlaine E., S. Vail, and B. Fuller. 1987. "Why Textbooks Affect Achievementin Developing Countries: Evidence from Thailand." EDT Series 53. World Bank,Education and Training Department, Washington, D.C.
Marin, Alan, and George Psacharopoulos. 1976. "Schooling and Income Distribution."Review of Economics and Statistics 58, no. 3: 332-38.
Mincer, Jacob. 1974. Schooling Experience and Earnings. Cambridge, Mass.: NationalBureau of Economic Research.
Mingat, Alain, and J. P. Tan. 1986. "Financing Public Higher Education in DevelopingCountries: The Potential Role of Loan Schemes." Higher Education 15, no. 3: 283-97.
-_____ 1987. "Measuring the Economic Efficiency of Project Related Training: SomeEvidence from World Bank Projects." EDT Series 89. World Bank, Education andTraining Department, Washington, D.C.
Mohan, Rakesh. 1981. The Determinants of Labor Earnings in Developing Metropolis:Estimates for Bogota and Cali, Colombia. World Bank Staff Working Paper 498.Washington, D.C.
Organisation for Economic Co-operation and Development (OECD). 1967. Problems ofHuman Resources Planning in Latin America and the Mediterranean Regional ProjectCountries. Paris.
Parnes, Herbert. 1962. Forecasting Educational Needs for Economic and Social Devel-opment. Paris, OECD.
Psacharopoulos, George. 1978. "Labor Mlarket and Income Distribution: The Case ofthe U.K." In W. Krelle and A. Shorrocks, eds. Personal Income Distribution.Amsterdam: North-Holland.
. 1982. "The Economics of Higher Education in Developing Countries." Com-parative Education Review 26, no. 2: 139-59.
. 1983. "Education and Private versus Public Sector Pay." Labour and Society 8,no. 2: 123-34.
. 1984a. "Assessing Training Priorities in Developing Countries: Current Practiceand Possible Alternatives." International Labour Review 123, no. 5: 569-83.
. 1984b. "The Contribution of Education to Economic Growth: InternationalComparisons." In John W. Kendrick, ed. International Comparisons of Productivityand Causes of the Slowdown. Cambridge, Mass.: Ballinger.
-____ 1985. "Returns to Education: A Further Internal Update and Implications."Journal of Human Resources 20, no. 4: 584-604.
. 1987a. "To Vocationalize or Not to Vocationalize? That Is the CurriculumQuestion." International Review of Education 33, no. 2: 187-211.
. 1987b. "Earnings and Education in Brazil: Evidence from the 1980 Census." EDT
Series 90. World Bank, Education and Training Department, Washington, D.C.
George Psacharopoulos 115

Psacharopoulos, George, and A. M. Arriagada. 1986. "The International Compositionof the Labor Force: An International Comparison." International Labor Review 125,no. 5: 561-74.
Psacharopoulos, George, and William A. Loxley. 1985. Diversified Secondary Educationand Development: Evidence from Colombia and Tanzania. Baltimore, Md.: JohnsHopkins University Press.
Psacharopoulos, George, and B. Sanyal. 1981. Higher Education and Employment: TheIIEP Experience in Five Less Developed Countries. Paris: Unesco, InternationalInstitute for Educational Planning.
Saxonhouse, Gary R. 1977. "Productivity Change and Labor Absorption in JapaneseCotton Spinning, 1891-1935." Quarterly Journal of Economics 91, no. 2: 195-200.
Schultz, T. W. 1961a. "Education and Economic Growth." In N. B. Henry, ed. SocialForces Influencing American Education. Chicago., Ill.: University of Chicago Press forthe National Society for the Study of Education.
. 1961b. "Investment in Human Capital." American Economic Review 51, no. 1:1-17.
. 1975. "The Value of the Ability to Deal with Disequilibria." Journal ofEconomic Literature 13, no. 3: 827-46.
Smith, Adam. 1776. The Wealth of Nations. 1937 edition. New York: Random House.
Stigler, George. 1962. "Information in the Labor Market." Journal of Political Economy70 (5), no. 2 (supplement): 94-105.
Strumilin, S. G. 1929. "The Economic Significance of National Education, The PlannedEconomy." Reprinted in: Unesco. Readings in the Economics of Education. Paris,1968.
Taubman, P. F., and T. Wales. 1973. "Higher Education, Mental Ability and Screening."Journal of Political Economy 81, no. 1: 28-55.
Tinbergen, Jan. 1975. Income Distribution: Analysis and Policies. Amsterdam: North-Holland.
Walsh, J. R. 1935. "Capital Concept Applied to Man." Quarterly Journal of Economics49, no. 1 (February): 255-85.
Welch, Finis. 1970. "Education in Production." Journal of Political Economy 78, no. 1:35-59
World Bank. 1986. The Financing of Education in Developing Countries: An Explora-tion of Policy Options. Washington, D.C.
116 Research Observer 3, no. 1 (January 1988)
"The pimary source for medium- and long-term external debt of manydeveloping countries." - Suhas Ketkar. Latin American Economist,
Vice-President, Marine Midland Bank, North America
World Debt Tables, 1987-88 EditionThe World Bank's invaluable annual reference guide to theexternal debt of developing countries . . .
* Provides data on the external debt of 109 developingcountries.
* Shows statistical tables by country.Gives aggregate position of all countries, major borrowers,and 1 7 higly indebted borrowers.
* Outdines characteristics of the debt situation for aU countries.* Presents a set of four charts for each country depicting debt
stocks and associated indicators, as well as flows of debtservice and associated debt-service ratios.
World Debt Tables is published in two volumes. The firstvolume contains analysis of the world debt situation andsummary tables. The second volume contains the completetables for all 109 countries. Order either Volume I orVolumes I and II together.
Volume 1. Analysis and Summary TablesAbout 96 pages/8Y2 x 11 ISBN 0-8213-0984-6Order Stock #BK0984iUSS 16.95 /Price Code 022Volumne 11. Country lhblesAbout 448 pages/ 832 x I ISet of Volumes I and IIOrderStock #BK0985/US$125.00/Price Code S06/ ISBN 0-8213-0985-4Special note: Persons who order the set automatically receive periodicsupplements as new data become available.
Order Form Please send me the following publications:I Title Stock * Price*
I TOTAL
I W Enclosed is mv check for USS I
El Charge my G VISA W MasterCard G American NameExpress G Eurocard (American Express accepted Address
I only for orders to Washington, D.C. Eurocard accepted I
| onilv for orders to Paris) CSty state
Postal Code CountryCredit Card Number Expiration Date Return coupon to: or:
World Bank Publications World Bank Publications || PO Box 0552 66, avenue dlena
s eWashington D.C. U.S.A. 75116 Paris, FranceI Signature )007i-0552
E l Please bill me (Institutional customers only I *Prices varv from country to country. To order fromI other countries, request a list of local World Bank Pub-
| __________________________________________________ lications Distributors. Coupon orders accepted onlvyPurchase order aunuber from the U.S.A. and France. -
L- ----------------------------------

World Bank titles on education
-- ~-- -- -----------
1 Order Form Please send me the following publications: fl Title St o Price* o
| ~~~~ ~~ ~~~~~~~~~~~TOTAL | Enclosed is mycheck for US$
[1 Charge my C VISA C MasterCard Ne | 1 American'Express -6 Eurocard (Amierican Address
Express accepted only for orders to Washington, D.C.IEurocard accepted,only for orders to Paris) City State|
PACe Cod~ ~ -- - - --- ~Postal Code Country !Credit Card Number Expiration Date Return coupon to: or:
World Bank Publications World Bank Publications IX~ ~PO Box 0552 66, avenue d'ena|
SIgnaur Washington, D.C. U.'i.A. 75116 Paris, FranceSlgnature ~~~~~~~~20073-0552
11I Please biDl me (Institutional customers only) *Prices vary from country to country. To corder fromaother countries, request a list of local World Bak Pub-
X ~~~~~~~~~~~~~~~~~lications Distributors. Coupon orders accepted only|Purchase order nuF ber from the U.S.AP and France.
___ ________________ - -___ _______ -

Contributors
Jagdish N. Bhagwati is Arthur Lehman Professor of Economics andprofessor of political science, Columbia University.
Hans Binswanger is chief of the Agricultural Operations Division,Central America and Mexico Region, World Bank. In his previousassignment as chief of the Agricultural Research Unit, Agriculture andRural Development Department, World Bank, he led two researchprojects on Sub-Saharan Africa.
Ronald Findlay is a professor in the Department of Economics,Columbia University.
David L. Lindauer is associate professor of economics, WellesleyCollege.
Oev Astra Meesook is senior economist, Country Operations Divi-sion, Eastern Africa Department, World Bank.
Prabhu Pingali is an economist for the International Rice ResearchInstitute, Manila, Philippines. While working on this article Mr. Pin-gali was a long-term consultant involved in several research projectson African agriculture.
George Psacharopoulos is chief of the Human Resources Division,Technical Department, Latin America and Caribbean Region, WorldBank, and former editor of this journal.
Parita Suebsaeng is research analyst, Economic Advisory Staff,World Bank.
Stanislau' Wellisz is a professor in the Department of Economics,Columbia University.


