Embed Size (px)
Citation preview

http://researchspace.auckland.ac.nz
ResearchSpace@Auckland
Copyright Statement The digital copy of this thesis is protected by the Copyright Act 1994 (New Zealand). This thesis may be consulted by you, provided you comply with the provisions of the Act and the following conditions of use:
• Any use you make of these documents or images must be for research or private study purposes only, and you may not make them available to any other person.
• Authors control the copyright of their thesis. You will recognise the author's right to be identified as the author of this thesis, and due acknowledgement will be made to the author where appropriate.
• You will obtain the author's permission before publishing any material from their thesis.
To request permissions please use the Feedback form on our webpage. http://researchspace.auckland.ac.nz/feedback
General copyright and disclaimer In addition to the above conditions, authors give their consent for the digital copy of their work to be used subject to the conditions specified on the Library Thesis Consent Form and Deposit Licence.

Reducing Screen Occlusions on Small
Displays
Paul Schmieder
30 June 2014
A thesis submitted in fulfilment
of the requirements for the degree of
Doctor of Philosophy,
The University of Auckland, 2014.

ii

iii
ABSTRACT
Information occlusion on small displays is a familiar problem affecting interaction on
multiple levels. This research investigates solutions to two causes of screen occlusion: first,
temporal and spatial occlusion caused by magnification strategies such as zooming and
overview + detail interfaces and, second, the physical occlusion caused by fingers interacting
with the display. The findings from each area considerably reduce screen occlusion on small
displays.
To overcome occlusions caused by magnification interfaces, distortion-based strategies are
used and applied to the sketching domain for rapid content creation and editing. The use of
distortion-based magnification strategies has been limited to viewing and selecting
information; usability problems, such as the comprehension difficulties caused by the visual
transformations employed, have not been solved. A novel combination of sketching is used as
the context to investigate information creation and editing using distortion techniques.
Sketching allows to identify the requirements for content creation and editing, and also
addresses problems shared with content viewing and selecting. To investigate the
requirements for magnified sketching, first the problems existing distortion interfaces have
when used for sketching are identified. Next, solutions to address the identified problems are
developed and tested iteratively before concluding with a comparison of the improved
distortion interface and other magnification strategies. The results of this final comparison of
the distortion, zooming and overview + detail interfaces demonstrate the improved distortion
interface’s efficacy and that it is the participants’ preferred interface for magnified content
editing and creation.
To overcome finger-based occlusion, the use of 3D gestures captured by a camera is
investigated, thus moving the interaction space away from the display. When entering data on
a touchscreen using the fingers, the information below the finger is covered and thus hidden
from the user. An input mechanism is developed and evaluated which uses 3D gestures
captured by the front-facing camera. As this input metaphor is novel, the first step was to
investigate the requirements of such an interaction on the device as well as on the user. To
this end, a set of gestures of varying demands on the user was devised and recognition
algorithms for these gestures developed. The resultant gesture interface was tested on users.
The results show the potential of the new interaction mechanism and provide further insight
into successful and robust recognition strategies.

iv

v
ACKNOWLEDGEMENTS
This is to thank all the people I was honored to meet over the past 7 years at university and in
New Zealand. This time was truly a life-enriching, invaluable life experience!!!
Figure of Owls: A bunch of smart and accomplished HCI people who shared their knowledge,
passion, problems and spare time with me.
Danke to my brilliant supervisors Beryl, John and Andrew! A super-special thanks to Beryl
who had already supervised me for my Masters. I learned a lot from you guys about research,
writing and life. For that I am very grateful.
Danke for an awesome research group! Rachel, thanks for your valuable input and
accompanying me throughout that whole time - it helped tremendously to have someone
slightly older and somehow considerably wiser than me by my side the whole time. Adam,
Jamie, Safurah and Jacky; thanks for sharing your special powers with me and I’m hopeful
our paths will cross again.
Danke to all the non-HCI people whom I met along the way and who shared their time with
me: Stefan, Clemens, Sebastian, Christian, Sheri, (s)Ali, (t)Ali, Glen, Val, Mozghan, Moiz,
Katie, Sonja and whoever else I may have forgotten.
Danke to my family who always supported me even when I told them that I’ll move to the
other side of the world.
Danke to Denise for your love, support and understanding.
Danke New Zealand! What a beautiful country with its amazing nature and people. We’ll be
back for sure!

vi

vii
Contents
1. Introduction ........................................................................................................................ 1
1.1. Occlusion-Free Magnification Strategies .................................................................... 1
1.2. Gesture Input ............................................................................................................... 4
1.3. Motivation ................................................................................................................... 5
1.4. Research Questions ..................................................................................................... 8
1.5. Research Contributions ............................................................................................. 10
1.6. Thesis Outline ........................................................................................................... 11
1.7. Definition of Terms ................................................................................................... 15
2. Related Work ................................................................................................................... 17
2.1. Screen Occlusion ....................................................................................................... 17
2.2. Magnification Interfaces ........................................................................................... 18
2.2.1. Occluding Magnification Interfaces .................................................................. 19
2.2.2. Non-Occluding Magnification Techniques........................................................ 23
2.2.3. Applications and Evaluations of Magnification Interfaces ................................ 29
2.2.4. Focus + Context Interfaces for Sketching .......................................................... 32
2.3. Gesture Input using Cameras .................................................................................... 34
2.3.1. Interaction Techniques for Mobile Devices ....................................................... 35
2.3.2. Camera-Based Interaction on Mobile Devices .................................................. 35
2.3.3. Gesture Input ...................................................................................................... 37
2.3.4. Computer Vision Based Input ............................................................................ 39
2.4. Summary ................................................................................................................... 43

viii
3. Methodology .................................................................................................................... 45
3.1. Existing Focus + Context Interfaces for Magnified Sketching ................................. 45
3.2. Iterative Improvements of Focus + Context Interfaces ............................................. 47
3.2.1. Technical Framework ........................................................................................ 47
3.2.2. Evaluation Study Settings .................................................................................. 50
3.3. Efficacy of Improved Focus + Context Interfaces .................................................... 51
3.4. Above Camera Gesture and Recognizer Design ....................................................... 51
3.5. Gesture and Recognizer Evaluation .......................................................................... 52
3.6. Summary ................................................................................................................... 53
4. Magnified Occlusion-Free Sketching .............................................................................. 55
4.1. Study I - Basic Lens Configuration ........................................................................... 55
4.1.1. Selection of Distortion Interfaces ...................................................................... 56
4.1.2. Evaluation of Existing Distortion Interfaces for Magnified Sketching ............. 57
4.1.3. Results ................................................................................................................ 65
4.1.4. Summary ............................................................................................................ 72
5. Development of Intelligent Distortion Strategies ............................................................ 75
5.1. Study 2 - Evaluation of Intelligent Distortion Interfaces for Magnified Sketching .. 75
5.1.1. Distortion Interfaces........................................................................................... 76
5.1.2. Procedure, Tasks, Method, Apparatus and Data Captured ................................ 79
5.1.3. Participants ......................................................................................................... 80
5.1.4. Results ................................................................................................................ 80
5.2. Study 3 - Comprehending Distortions ....................................................................... 90
5.2.1. Visual Guides ..................................................................................................... 91

ix
5.2.2. Method ............................................................................................................... 93
5.2.3. Participants ......................................................................................................... 94
5.2.4. Tasks .................................................................................................................. 94
5.2.5. Procedure ........................................................................................................... 96
5.2.6. Data Captured .................................................................................................... 97
5.2.7. Results ................................................................................................................ 97
5.2.8. Summary .......................................................................................................... 106
6. Comparing Strategies for Magnified Sketching ............................................................ 109
6.1. Study 4 - Comparing Strategies for Magnified Sketching on Small Displays ........ 109
6.1.1. Magnification Interfaces .................................................................................. 109
6.1.2. Tasks ................................................................................................................ 114
6.1.3. Method ............................................................................................................. 116
6.1.4. Participants ....................................................................................................... 117
6.1.5. Procedure ......................................................................................................... 117
6.1.6. Data Captured .................................................................................................. 118
6.1.7. Results .............................................................................................................. 119
6.1.8. Summary .......................................................................................................... 130
6.2. Summary of Magnified Sketching .......................................................................... 131
7. Gesture Input on Mobile Phones.................................................................................... 135
7.1. Gestures ................................................................................................................... 136
7.1.1. Design .............................................................................................................. 137
7.1.2. Performance & Robustness .............................................................................. 143
7.2. Evaluation................................................................................................................ 144

x
7.2.1. Participants ....................................................................................................... 144
7.3. Apparatus ................................................................................................................ 145
7.3.1. Tasks ................................................................................................................ 145
7.3.2. Procedure ......................................................................................................... 148
7.4. Results ..................................................................................................................... 149
7.4.1. Interaction ........................................................................................................ 149
7.4.2. Phone Performance and Recognition Accuracy .............................................. 151
7.5. Summary ................................................................................................................. 153
8. Discussion ...................................................................................................................... 155
8.1. Distortion Interfaces for Magnified Sketching........................................................ 155
8.1.1. Magnification Strategies and the Importance of Having an Overview............ 157
8.1.2. Distortion Interface Improvements .................................................................. 158
8.2. 3D Gesture Input ..................................................................................................... 164
8.2.1. Capturing and Recognizing Gestures............................................................... 164
8.2.2. Designing Gestures .......................................................................................... 167
8.2.3. Designing the Device ....................................................................................... 168
8.3. Combining the Findings & Summary ..................................................................... 169
9. Conclusion & Future Work ............................................................................................ 171
9.1. Conclusions ............................................................................................................. 171
9.2. Future Work ............................................................................................................ 175
Appendix A: Ethics Application Documents ......................................................................... 177
Appendix B: Questionnaires .................................................................................................. 185
Appendix C: Co-Authorship Forms ....................................................................................... 199

xi
Appendix D: Image Permissions ........................................................................................... 203
References .............................................................................................................................. 207

xii

xiii
List of Figures
FIGURE 1. THE FIRST ADDRESSED SOURCE OF SCREEN OCCLUSION NAMELY MAGNIFICATION STRATEGIES. THE
SAME SKETCH IS SHOWN WITH (A) NO MAGNIFICATION, (B) ZOOMING INTERFACE AND SCROLLBARS FOR
NAVIGATION, (C) OVERVIEW + DETAIL INTERFACE AND (D) A MAGNIFYING LENS. INTERFACES (B) – (D)
OCCLUDE INFORMATION AND REQUIRE ADDITIONAL NAVIGATIONAL STEPS TO DISPLAY ALL INFORMATION.1
FIGURE 2. THE SAME SKETCH IS SHOWN WITH (A) A FISHEYE LENS AND (B) A SIGMA LENS. BOTH LENSES
DISPLAY PARTS OF THE INFORMATION DISTORTED TO GENERATE THE SPACE REQUIRED FOR THE
MAGNIFIED PARTS. ........................................................................................................................................ 2
FIGURE 3. THE MOVING CANVAS PROBLEM. THE CURSOR IS ALWAYS THE LENS CENTRE. AS THE CURSOR MOVES
TOWARDS THE LINE (A-C), THE MAGNIFIED PART OF THE LINE MOVES TOWARDS THE CURSOR. BOTH
MEET AT THE LINE’S ORIGINAL POSITION (D). ............................................................................................... 3
FIGURE 4. A RECTANGLE SURROUNDING A CIRCLE AND 4 LINES (A) COVERED BY A FISHEYE LENS (B + C).THE
LENS BORDERS ARE COLOURED BLUE AND THE TRANSITION REGION GREY. ............................................... 4
FIGURE 5. PROCESS DIAGRAM OF THE RESEARCH PRESENTED IN THIS THESIS. ................................................... 12
FIGURE 6. AN EXAMPLE OF A ZOOMING INTERFACE. GOOGLE MAPS SHOWING AUCKLAND, NEW ZEALAND IN THE
MAIN VIEW. IN THE TOP LEFT CORNER A SLIDER IS OFFERED TO CHANGE THE ZOOM LEVEL. NOTE THE
ABSENCE OF VISUAL CUES INDICATING, FOR EXAMPLE, THE RELATIVE POSITION OF AUCKLAND WITHIN
THE COMPLETE CONTEXT (I.E. THE WORLD). .............................................................................................. 18
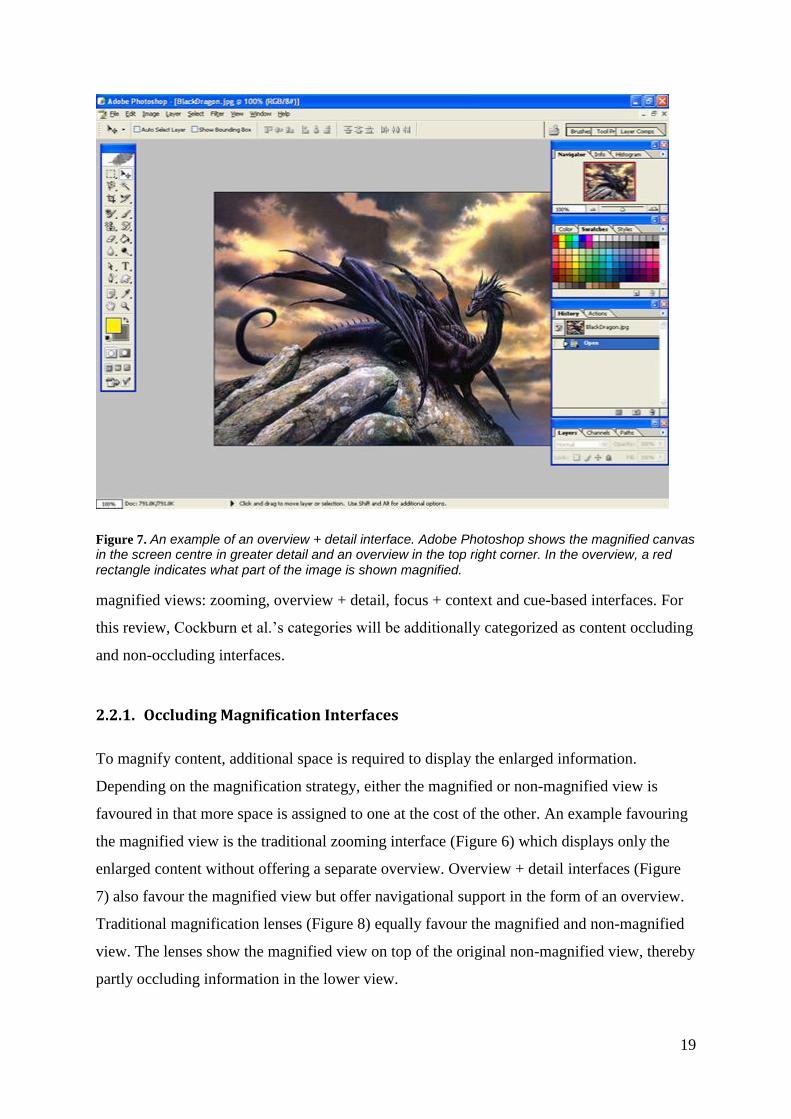
FIGURE 7. AN EXAMPLE OF AN OVERVIEW + DETAIL INTERFACE. ADOBE PHOTOSHOP SHOWS THE MAGNIFIED
CANVAS IN THE SCREEN CENTRE IN GREATER DETAIL AND AN OVERVIEW IN THE TOP RIGHT CORNER. IN
THE OVERVIEW, A RED RECTANGLE INDICATES WHAT PART OF THE IMAGE IS SHOWN MAGNIFIED............ 19
FIGURE 8. A MAGNIFICATION LENS (LEFT) AND A FISHEYE LENS (RIGHT) ARE USED TO DETERMINE WHETHER THE
BALL IS TOUCHING THE GROUND DURING THE 2011 WORLD CUP GAME BETWEEN NEW ZEALAND AND
ARGENTINA. WHILE THE MAGNIFIER OCCLUDES CONTENT DIRECTLY SURROUNDING THE LENS, THE
FISHEYE LENS SHOWS THAT HIDDEN CONTENT VISUALLY DISTORTED. ...................................................... 20
FIGURE 9. SIGMA LENSES WHICH USE TRANSLUCENCY TO TRANSITION BETWEEN MAGNIFIED AND CONTEXT VIEW.
TAKEN FROM (PIETRIGA AND APPERT 2008). ............................................................................................ 25
FIGURE 10. THE SAME SKETCH IS SHOWN WITH (A) NO MAGNIFICATION, (B) ZOOMING INTERFACE AND
SCROLLBARS FOR NAVIGATION, (C) OVERVIEW + DETAIL INTERFACE WITH THE OVERVIEW OVERLAPPING
THE DETAILED VIEW IN THE LOWER RIGHT CORNER,(D) A MAGNIFYING LENS OCCLUDING ITS IMMEDIATE
SURROUNDINGS AND (E) A FISHEYE LENS WHICH DISTORTS THE CONTENT SURROUNDING THE FOCUS
AREA. ........................................................................................................................................................... 29
FIGURE 11. (A) THE PDA WITH THE FISHEYE LENS USED IN LANK AND PHAN’S (2004) EVALUATION STUDY. (B)
THEIR SKETCHING APPLICATION’S INTERFACE WHILE DRAWING. THE OVERVIEW IN THE TOP RIGHT
CORNER SHOWS THE UNDISTORTED SKETCH BUT IS NOT PART OF THE ACTUAL INTERFACE. IMAGE TAKEN
FROM (LANK AND PHAN 2004). .................................................................................................................. 33

xiv
FIGURE 12. THE LUCIDTOUCH SYSTEM BY WIGDOR, FORLINES ET AL. (2007). (A) THE SCHEMATIC VIEW OF THE
HARDWARE COMPONENTS. (B) THE PROTOTYPE. TAKEN FROM (WIGDOR, FORLINES ET AL. 2007). ...... 35
FIGURE 13. THE TANGIBLE CONTROLLER DEVELOPED BY KATO AND KATO (2009). A SPRING IS ATTACHED TO
THE BACK OF THE DEVICE ABOVE THE CAMERA. THE SPRING MOVEMENT IS USED TO PROVIDE INPUT AND
IS TRACKED BY THE PHONE’S REAR-FACING CAMERA BELOW THE SPRING. IMAGE TAKEN FROM (KATO
AND KATO 2009)......................................................................................................................................... 36
FIGURE 14. SIMPLEINK’S MAIN INTERFACE AND GENERAL AS WELL AS DISTORTION LENS OPTIONS. .................... 48
FIGURE 15. FISHEYE LENS: THE LEFT SKETCH SHOWS THE SKETCH UNCHANGED. THE RIGHT SIDE SHOWS THE
FISHEYE LENS WHICH CONSISTS OF TWO REGIONS: THE INNER REGION ENCASED BY THE INNER BLUE
BORDER SHOWS THE INFORMATION AT A CONSTANT MAGNIFICATION. THE OUTER REGION OR TRANSITION
REGION SHOWS THE INFORMATION VISUALLY TRANSFORMED. OUTSIDE THE LENS THE INFORMATION
REMAINS UNCHANGED................................................................................................................................. 58
FIGURE 16. BLENDING LENS: THE UPPER LAYER SHOWS THE INK FULLY OPAQUE IN THE CENTER AND LINEARLY
FADES OUT IN THE OUTER LENS. THE LOWER LAYER SHOWS THE UNMAGNIFIED CONTENT WHICH FADES
OUT TOWARDS THE LENS CENTER. ............................................................................................................. 59
FIGURE 17. THE FIXED LENS: THE RED BORDER INDICATES THAT THE LENS IS CURRENTLY PINNED DOWN. ........ 60
FIGURE 18. TEST ENVIRONMENT SHOWING EMPTY ((A)-(D) AND COMPLETED ((E) – (H)) EXAMPLES OF THE
TASKS. THE UPPER ROW SHOWS THE DRAWING TASKS ((A & E) FLOOR PLAN, (B & F) MAZE) AND THE
LOWER ROW THE WRITING TASKS ((C & G) UML CLASS DIAGRAM, (D & H) FAVOURITES LIST). ................ 61
FIGURE 19. THE USE STRATEGIES FOR THE FIXED LENS WHEN DRAWING. THE ORIGINAL SHAPE IS SHOWN IN (A).
(B) SHOWS THE FL FIXED IN THE CENTRE OF THE SHAPE. ONE STRATEGY IS TO DRAW ONLY IN THE
MAGNIFIED REGION ONCE THE LENS IS FIXED (C). ANOTHER STRATEGY IS TO DRAW IN THE DISTORTED
AREA PROBABLY RESULTING IN A DRAWN SHAPE WHICH DOES NOT LOOK AS INTENDED (D). ................... 66
FIGURE 20. A COMPLETED UML DIAGRAM FROM TASK ONE USING (A) THE FISHEYE LENS, (B) THE BLENDING
LENS AND (C) THE FIXED LENS. ................................................................................................................... 67
FIGURE 21. RATINGS ON A 7 POINT LIKERT SCALE CENTRED ON NEUTRAL. THE SCALE CATEGORIES ARE:
STRONGLY DISAGREE (SD), DISAGREE (D), DISAGREE SOMEWHAT (DS), NEUTRAL (N), AGREE
SOMEWHAT (AS), AGREE (A) AND STRONGLY AGREE (SA). ...................................................................... 70
FIGURE 22. BEHAVIOUR OF THE FISHEYE LENS BASED (A) AUTO ZOOM LENS, (B) SEMANTIC LENS AND (C) SNAP
LENS. THE AUTO ZOOM LENS APPROACHES THE SKETCH (T1). WHEN PINNED DOWN (T2 & T4) THE LENS
ANALYSES THE COVERED INK AND AUTOMATICALLY INCREASES IN SIZE TO COVER ALL INK OF INTEREST.
COLOURING THE LENS BORDERS RED INDICATES ITS PINNED STATE. WHEN THE LENS IS UNPINNED IT
ASSUMES ITS ORIGINAL SIZE AND BORDER COLOUR (T3). THE SEMANTIC LENS MOVES CONTINUOUSLY
HORIZONTALLY (T1-T4). WHEN DRAWING (T2 & T4) THE CURSOR MOVES FREELY VERTICALLY WITHOUT
THE LENS FOLLOWING. THE SEMANTIC LENS HIGHLIGHTS THE STROKES BELONGING TO THE SAME GROUP
(T2). AS THE LENS IS NAVIGATED TO THE RIGHT (T3) THE GROUP CHANGES (T4). AS THE SNAP LENS
APPROACHES THE SKETCH (T1) IT SNAPS ONTO THE FIRST GROUP AND THE CURSOR CAN BE MOVED
FREELY (T2). AS THE CURSOR CONTINUES MOVING TO THE RIGHT THE LENS REMAINS ON ITS INITIAL

xv
POSITION (T3) UNTIL THE CURSOR LEAVES THE INNER LENS AND IT SNAPS ONTO THE NEXT GROUP IN
REACH (T4).................................................................................................................................................. 77
FIGURE 23. RATINGS ON A 7 POINT LIKERT SCALE CENTRED ON NEUTRAL. THE SCALE CATEGORIES ARE:
STRONGLY DISAGREE (SD), DISAGREE (D), DISAGREE SOMEWHAT (DS), NEUTRAL (N), AGREE
SOMEWHAT (AS), AGREE (A) AND STRONGLY AGREE (SA). ...................................................................... 86
FIGURE 24. THE DISTORTION GUIDES’ BEHAVIOURS WHEN FREELY MOVING (T1-T3) AND PINNED (T4). (A) THE
GRID LINES AND CONTENT COVERED BY THE LENS. (B) THE FOREGROUND GUIDE DISPLAYS THE STAR
MAGNIFIED AND UNDISTORTED ON THE RIGHT SIDE AS THE STAR ENTERS THE TRANSITION REGION UNTIL
THE DISTORTED AND MAGNIFIED VIEWS MERGE AS THE STAR ENTERS THE MAGNIFIED REGION (T3 & T4).
(C) WHEN THE STAR ENTERS THE TRANSITION REGION WITH THE BACKGROUND GUIDE (T1) THE
UNDISTORTED, UNMAGNIFIED VIEW IS SHOWN UNDER THE LENS AREA WITH THE DISTORTED VIEW
OVERLAID. THE TEMPLATE USED FOR THESE SCENARIOS IS SHOWN IN FIGURE 25 (A). ........................... 91
FIGURE 25. (A) THE BACKGROUND USED FOR ALL THE TASKS WITH THE TEMPLATE USED FOR TASK 1 (SEE (B)).
(B) THE FIRST TASK TESTING ALIGNMENT, SCALE, DIRECTION AND DISTANCE WITH THE CONTROL
CONDITION. (C) TASK 2 TESTING ALIGNMENT WITH THE BACKGROUND GUIDE. (D) TASK 3 TESTING SCALE
WITH THE CONTROL CONDITION. (E) TASK 4 TESTING DIRECTION WITH THE FOREGROUND GUIDE. (F)
TASK 5 TESTING DISTANCE WITH THE GRID. ............................................................................................... 94
FIGURE 26. THE COMPLETION TIME MEANS FOR THE 5 TASKS AND THE VISUAL SUPPORT: NONE, GRID,
FOREGROUND (FG) AND BACKGROUND (BG). ........................................................................................... 98
FIGURE 27. THE ERROR RATE MEANS FOR THE 5 TASKS AND THE VISUAL SUPPORT: NONE, GRID, FOREGROUND
AND BACKGROUND. ..................................................................................................................................... 99
FIGURE 28. MEAN AND DEVIATION VALUES FOR THE RANKINGS FOR EACH TASK (1 IS HIGHEST, 4 LOWEST). THE
DEVIATION INDICATES THE MAXIMUM AND MINIMUM RANK RECEIVED BY EACH LENS. ............................. 104
FIGURE 29. THE SIMPLEINK INTERFACE USED TO COMPARE THE DIFFERENT MAGNIFICATION INTERFACES. ON
THE LEFT SIDE THE DRAWING TASK IN FORM OF A MEMORY GAME IS SHOWN WITHOUT MAGNIFICATION.
THE INSTRUCTION WINDOW ON THE RIGHT SHOWS DETAILED TASK DESCRIPTIONS FOR THE
PARTICIPANTS. .......................................................................................................................................... 110
FIGURE 30. THE ZOOMING INTERFACE SHOWING THE DRAWING TASK AT 2 TIMES MAGNIFICATION. THE USER CAN
SKETCH ANYWHERE ON THE CANVAS. THE SCROLLBARS ARE USED TO DISPLAY ANOTHER PART OF THE
CANVAS. .................................................................................................................................................... 111
FIGURE 31. THE OVERVIEW + DETAIL INTERFACE SHOWING THE ANNOTATION TASK AT 2 TIMES MAGNIFICATION.
THE INK COVERED BY THE GREEN INSET IS SHOWN MAGNIFIED AT THE BOTTOM. THE USER CAN ONLY
SKETCH IN THE BOTTOM WINDOW. ............................................................................................................ 112
FIGURE 32. THE FISHEYE LENS SHOWING THE DRAWING TASK AT 4 TIMES MAGNIFICATION. THE USER CAN ONLY
SKETCH IN THE LENS’ INNER REGION SHOWING THE INK AT CONSTANT MAGNIFICATION. ........................ 113
FIGURE 33. COMPLETION TIME IN SECONDS FOR THE DRAWING AND ANNOTATING TASKS AT TWO MAGNIFICATION
LEVELS FOR FISHEYE LENS, ZOOM AND RADAR INTERFACES. .................................................................. 120
FIGURE 34. NUMBER OF ERRORS FOR THE DRAWING AND ANNOTATING TASKS AT TWO MAGNIFICATION LEVELS
FOR FISHEYE LENS, ZOOMING AND RADAR INTERFACES. ......................................................................... 121

xvi
FIGURE 35. RANKINGS (1 IS THE HIGHEST RANKED AND 3 THE LOWEST) FOR THE THREE INTERFACES FOR
CATEGORIES: DRAWING, ANNOTATING AND OVERALL. ............................................................................. 123
FIGURE 36. QUESTIONNAIRE RATINGS FOR THE FISHEYE LENS’ FEATURES FROM DRAWING AND ANNOTATING. 125
FIGURE 37. A SMARTPHONE WITH A FRONT-FACING CAMERA AND A THUMB PERFORMING A GESTURE ABOVE IT
ON THE RIGHT. ........................................................................................................................................... 136
FIGURE 38. THE TILT GESTURE: TILTING THE FINGER TO EITHER SIDE DETERMINES THE DIRECTION OF INPUT AND
THE AMOUNT OF TILT DETERMINES THE LEVEL OF ACCELERATION. ......................................................... 138
FIGURE 39. THE TILT GESTURE: THE CAPTURED IMAGES USED TO COMPUTE THE TILT. (A) A SLIGHT TILT TO THE
RIGHT. (B) THE THUMB COMPLETELY COVERING THE CAMERA IN NEUTRAL POSITION. (C) A STRONG TILT
TO THE LEFT. ............................................................................................................................................. 139
FIGURE 40. THE DISTANCE GESTURE: THE INPUT DEPENDS ON THE DISTANCE BETWEEN CAMERA AND THUMB. A
PREDEFINED DISTANCE IS THE NEUTRAL INPUT WHERE NO CHANGES ARE INVOKED. ............................. 139
FIGURE 41. THE DISTANCE GESTURE: THE IMAGES AFTER THE SOBEL OPERATOR HAS BEEN APPLIED WITH THE
THUMB (A) CLOSE, (B) FURTHER AWAY AND (C) FAR AWAY FROM THE CAMERA. THE BLUE LINE INDICATES
THE THUMB’S WIDTH USED TO CALCULATE ITS DISTANCE FROM THE CAMERA. ....................................... 140
FIGURE 42. THE CIRCULAR GESTURE: THE DIRECTION OF THE CIRCULAR MOTION DETERMINES THE INPUT
DIRECTION AND THE SPEED OF THE MOTION DETERMINES THE LEVEL OF ACCELERATION. HOLDING THE
FINGER AT A POSITION INVOKES NO CHANGE (I.E. NEUTRAL INPUT). ....................................................... 141
FIGURE 43. THE CIRCLE GESTURE: THE IMAGES WITH THE THUMB IN BLACK AFTER THE FLOOD-FILL ALGORITHM.
THE WHITE DOT IN THE BLACK BLOB INDICATES THE CENTER OF MASS. (A) THE CAPTURED IMAGE WITH
THE THUMB NOT MOVING THUS WITHOUT BLUR AS THE CAMERA HAD TIME TO ADJUST. (B-D) THE
CAPTURED IMAGES WITH THE THUMB MOVING FAST THUS WITH THE BACKGROUND HIGHER ILLUMINATION
AS THE CAMERA HAS NOT ENOUGH TIME TO FOCUS. ................................................................................ 142
FIGURE 44. THE TEST PROGRAM SHOWING THE CONTACT MINI APP. IN THE TOP RIGHT CORNER A NAME IS
SHOWN WHICH THE PARTICIPANT HAS TO SELECT NEXT. ON THE RIGHT SIDE TOP THE INDICATOR SHOWS
A CURRENT (NEUTRAL) INPUT OF 0. .......................................................................................................... 146
FIGURE 45. THE TEST PROGRAM SHOWING THE ZOOMING MINI-APP. CONTROLLING THE SIZE OF THE GREEN
SQUARE, THE PARTICIPANTS HAS TO MATCH THE SQUARE’S SIZE WITH THE RED FRAME. ...................... 147
FIGURE 46. THE TEST PROGRAM SHOWING THE BREAKOUT MINI-APP. THE USER CONTROLS THE PADDLE WITH
THE TILT GESTURE TO SEND THE BALL BACK UPWARDS UNTIL ALL BRICKS ARE DESTROYED. ................ 147
FIGURE 47. THE QUESTIONNAIRE RATINGS FOR THE THREE GESTURES ON A 5 POINT LIKERT SCALE CENTRED ON
NEUTRAL. THE RATINGS ARE: 1= STRONGLY DISAGREE, 2 = DISAGREE, 3 = NEUTRAL, 4 = AGREE, 5 =
STRONGLY AGREE. .................................................................................................................................... 150
FIGURE 48. THE FISHEYE LENS WITH THE BACKGROUND GUIDE AND GRID COMBINED. ....................................... 162

xvii
List of Tables
TABLE 1. A TAXONOMY FOR MOBILE INTERACTION USING MOTION GESTURES BY RUIZ, LI ET AL. (2011). THIS
TABLE IS ADOPTED FROM RUIZ, LI ET AL.(2011). ....................................................................................... 38
TABLE 2. ASSUMPTIONS OF MOTION CAPTURE SYSTEMS LISTED ACCORDING TO FREQUENCY STARTING WITH THE
MOST COMMON ASSUMPTION. THIS TABLE IS ADOPTED FROM MOESLUND AND GRANUM (2001). ........... 40
TABLE 3. THE PROPERTIES OF THE DISTORTION INTERFACES. EACH LENS IS 1/3 OF THE DISPLAY HEIGHT,
MAGNIFIES THE INFORMATION BY FACTOR 3 AND USES A LINEAR DISTORTION FUNCTION. ....................... 60
TABLE 4. THE TASKS IN THE THREE SERIES FOR STUDY 1. .................................................................................... 63
TABLE 5. THE SIX CONDITIONS USED TO EVALUATE THE CHOSEN EXISTING DISTORTION INTERFACES FOR
MAGNIFIED SKETCHING: THE FISHEYE LENS, THE BLENDING LENS AND THE FIXED LENS. ......................... 64
TABLE 6. DESCRIPTIVE STATISTICS FOR THE ERROR RATE FOR THE FOUR TASKS AND THE WITHIN-SUBJECTS
EFFECTS’ P-VALUES. ................................................................................................................................... 67
TABLE 7. THE SIX CONDITIONS FOR THE EVALUATION OF THE INTELLIGENT DISTORTION LENSES: THE AUTO ZOOM
LENS, SEMANTIC LENS AND THE SNAP LENS. .............................................................................................. 80
TABLE 8. DESCRIPTIVE STATISTICS FOR THE ERROR RATE FOR THE FOUR TASKS. THE SEMANTIC LENS ALWAYS
RESULTED IN SIGNIFICANTLY MORE ERRORS THAN THE AUTO ZOOM AND SNAP LENSES. ......................... 81
TABLE 9. DESCRIPTIVES AND SIGNIFICANT DIFFERENCES FOR QUESTIONNAIRE RATINGS FOR THE AUTO ZOOM
(AZ), SEMANTIC (SE) AND SNAP (SN) LENS. TO INDICATE THE RANKING RELATIONSHIP FOR A
COMPARISON “<” AND “>” ARE USED. ......................................................................................................... 83
TABLE 10. THE POST HOC TEST STATISTICS FOR THE KRUSKAL-WALLIS TEST ANALYSING THE ERROR RATE
ACROSS TWO STUDIES. NINE MANN-WHITNEY TESTS ARE USED TO INVESTIGATE THE STATISTICAL
DIFFERENCES OF THE SIX INTERFACES. BECAUSE OF THE NINE COMPARISONS, THE BONFERRONI
CORRECTED P VALUE’S LEVEL OF SIGNIFICANCE IS 0.05/ 9 = 0.005. IN THE BRACKETS, THE MEAN
VALUES ARE REPORTED INCLUDING THE STANDARD DEVIATION. ............................................................... 85
TABLE 11. THE TASKS (FIGURE 25), THE DISTORTION PROPERTY THEY ARE DESIGNED TO TEST. ....................... 95
TABLE 12. THE P-VALUE (P) FOR FINAL RANKING AND FINAL RATING USING A BONFERRONI-CORRECTED
WILCOXON SIGNED-RANK TEST. TESTED ARE CONTROL CONDITION, GRID, FOREGROUND (FG) AND
BACKGROUND (BG) GUIDE. TO INDICATE THE RANKING RELATIONSHIP FOR A COMPARISON “<”, “>” AND
“=”ARE USED. ............................................................................................................................................ 102
TABLE 13. THE NUMBER OF RELOCATIONS REQUIRED FOR THE SCROLL BARS (ZOOMING INTERFACE), INSET
(OVERVIEW + DETAIL) AND FISHEYE LENS TO VIEW THE COMPLETE CANVAS MAGNIFIED. FOR THE FISHEYE
LENS, THE NUMBER OF RELOCATIONS TO VIEW THE COMPLETE TEMPLATE IN THE INNER LENS AREA AND
COMPLETE LENS (IN BRACKETS) ARE REPORTED. .................................................................................... 115
TABLE 14. QUESTIONNAIRE QUESTIONS FROM EVALUATING MAGNIFICATION STRATEGIES. ............................... 119
TABLE 15. THE MEAN AND STANDARD DEVIATION FOR ERROR RATE ACROSS ZOOM LEVELS AND TASK TYPES. 120
TABLE 16. MEAN VALUES AND STANDARD DEVIATION FOR NAVIGATION TIME AND NUMBER OF RELOCATIONS FOR
THE ZOOM AND OVERVIEW + DETAIL INTERFACES AT TWO MAGNIFICATION LEVELS. ............................... 123

xviii
TABLE 17. RESULTS OF RANKING DATA ANALYSIS SHOWING THE SIGNIFICANT DIFFERENCES BETWEEN THE
INTERFACES. ............................................................................................................................................. 124
TABLE 18. TEST STATISTICS COMPARING THE INTERFACES REGARDING THE EASE WITH WHICH SMALL OBJECTS
ARE SKETCHED COMPARED TO BIG OBJECTS. .......................................................................................... 124
TABLE 19. PERFORMANCE MEASUREMENTS IN MILLISECONDS USING A SAMSUNG OMNIA W PHONE. .............. 143
TABLE 20. DISCUSSION TOPICS AND LOCATIONS IN THIS THESIS. ........................................................................ 155
1
1. Introduction
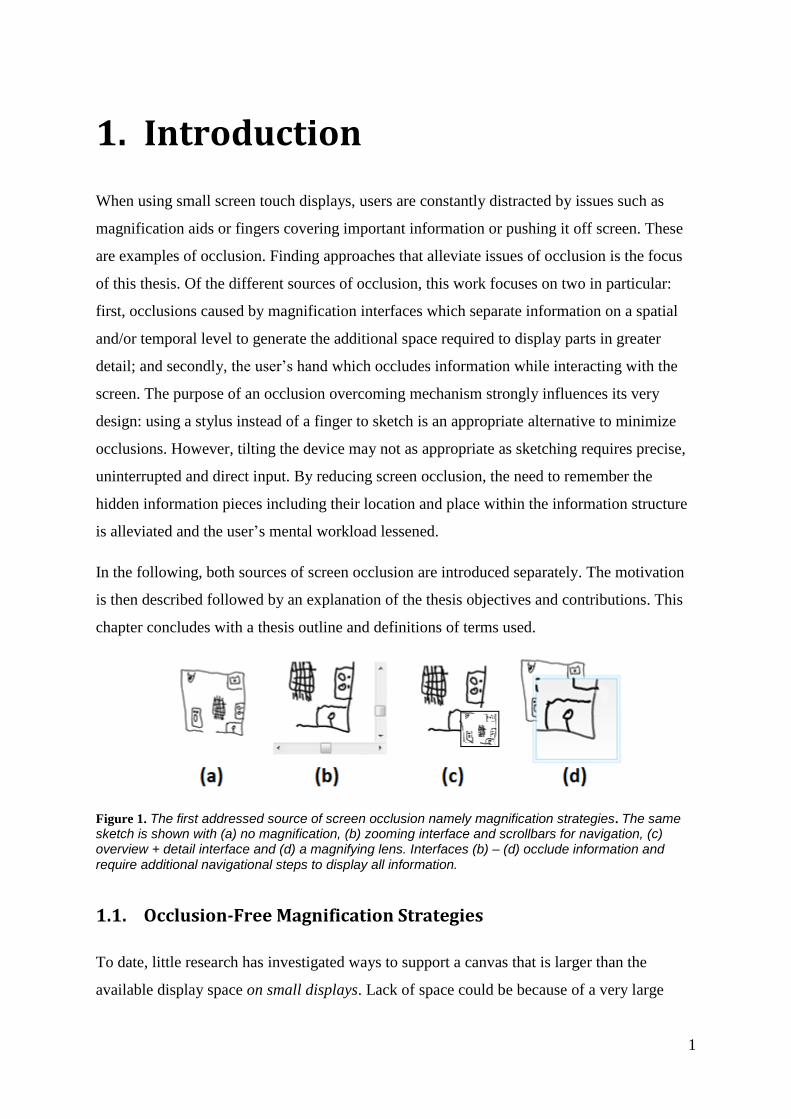
When using small screen touch displays, users are constantly distracted by issues such as
magnification aids or fingers covering important information or pushing it off screen. These
are examples of occlusion. Finding approaches that alleviate issues of occlusion is the focus
of this thesis. Of the different sources of occlusion, this work focuses on two in particular:
first, occlusions caused by magnification interfaces which separate information on a spatial
and/or temporal level to generate the additional space required to display parts in greater
detail; and secondly, the user’s hand which occludes information while interacting with the
screen. The purpose of an occlusion overcoming mechanism strongly influences its very
design: using a stylus instead of a finger to sketch is an appropriate alternative to minimize
occlusions. However, tilting the device may not as appropriate as sketching requires precise,
uninterrupted and direct input. By reducing screen occlusion, the need to remember the
hidden information pieces including their location and place within the information structure
is alleviated and the user’s mental workload lessened.
In the following, both sources of screen occlusion are introduced separately. The motivation
is then described followed by an explanation of the thesis objectives and contributions. This
chapter concludes with a thesis outline and definitions of terms used.
Figure 1. The first addressed source of screen occlusion namely magnification strategies. The same sketch is shown with (a) no magnification, (b) zooming interface and scrollbars for navigation, (c) overview + detail interface and (d) a magnifying lens. Interfaces (b) – (d) occlude information and require additional navigational steps to display all information.
1.1. Occlusion-Free Magnification Strategies
To date, little research has investigated ways to support a canvas that is larger than the
available display space on small displays. Lack of space could be because of a very large

2
canvas or because of a requirement for highly detailed information on a small display. What
is required is a way to view information at a higher resolution than the base resolution.
To fully comprehend information, all its pieces have to be understood and their places within
the information structure have to be known. Magnification strategies which separate
information by, for example, spreading it over multiple views require additional manual
navigation to view the occluded information (Figure 1 (b) – (d)). The extra steps needed for
navigation can be frustrating and also increase mental workload (Grudin 2001). In addition, if
only a small part of the information is visible, the user has to mentally visualize the
information structure based on his/her working memory (Wickens and Hollands 2000) which
also increases mental workload. To fully comprehend information, the complete content has
to be available at all times.
Figure 2. The same sketch is shown with (a) a fisheye lens and (b) a Sigma lens. Both lenses display parts of the information distorted to generate the space required for the magnified parts.
Occlusion-free magnification can be achieved by using a single display that accommodates
all information. Focus + context views (Figure 2) embed the detailed view into the context
and show all parts simultaneously. There are different strategies to transition between the
focused view and its context using different dimensions such as space (Furnas 1986) (Figure
2 (a)), time (Gutwin 2002) and translucency (Pietriga and Appert 2008) ( Figure 2 (b)). By
displaying all information in a single display, the short term memory workload is potentially
decreased as it alleviates the need to assimilate and remember the different views used by
content-occluding interfaces.
Focus + context views visually transform the information between the focus and its context to
generate the additional space required. The visual transformation profile depends on the
dimension and the transition functions (Carpendale, Cowperthwaite et al. 1997) used to

3
embed focus into the context. Because of the intentional transformations, focus + context
views are often referred to as "distortion interfaces".
Until now, distortion techniques have been evaluated for passive tasks, where content is
viewed and selected, but not for active tasks of creation and editing. Sketching is a powerful
domain to rapidly create and edit content with high precision. Digital sketching is potentially
more powerful than pen-and-paper sketching as it provides the means to manipulate content.
Zooming, rotating, scaling, relocating and erasing provide only a fraction of the possible
basic editing features a digital environment has to offer. More advanced editing techniques
include beautification (Plimmer, Purchase et al. 2010), recognition and various
transformations to other representations (Plimmer and Freeman 2007). However, limited
display size reduces interaction capabilities (Gatward 2008).
The practical advantages and effectiveness of applying zooming techniques to sketching have
been shown by Agrawala and Shilman (2005). In their interface, a region of the document is
magnified to allow annotations to be written in the same font size as the document’s content.
While Agrawala and Shilman (2005) used a zooming interface (Figure 1 (d)) which occludes
parts of the content, Lank and Phan (2004) employed a fisheye lens on a small screen to
avoid hiding context.
Figure 3. The moving canvas problem. The cursor is always the lens centre. As the cursor moves towards the line (a-c), the magnified part of the line moves towards the cursor. Both meet at the line’s original position (d).
Distortion techniques offer promise for small displays, although the techniques have several
problems. The moving canvas is one of the problems and is caused by scale differences
between visual and motor space in the magnified region (Gutwin 2002). This is where objects
on the magnified canvas move in the opposite direction to the stylus (Figure 3).

4
Figure 4. A rectangle surrounding a circle and 4 lines (a) covered by a fisheye lens (b + c).The lens borders are coloured blue and the transition region grey.
Another problem is the additional mental workload required by the user to understand and
interact with the distorted objects (Grudin 2001); e.g. understanding spatial relationships
between distorted objects can be difficult (Figure 4) (Carpendale, Cowperthwaite et al. 1997).
To recognize objects, distorted or not, their basic visual properties such as length, direction,
angle and scale have to be correctly assessed (Cleveland and McGill 1984). As distortions
change the visual appearance of objects, the assessment of visual properties becomes more
difficult. While there are approaches that help to better identify and understand distortions
overall (Zanella, Carpendale et al. 2002, Brosz, Carpendale et al. 2011) it is unclear how well
they support the different aspects of orientation and if other approaches may be more
suitable.
1.2. Gesture Input
Communicating with mobile devices relies on the available input channels such as
microphones, buttons, sensors and the keyboard. For example, to provide continuous input,
the swipe keyboard relies on gestures captured by the touchscreen (Kushler 2003). To
perform the required gestures, the finger slides over the touchscreen thereby occluding the
information directly below. To overcome screen occlusion, gestures can be captured by the
phone’s sensors such as the gyroscope and accelerometer. However, these gestures require
the device to be moved in 3D space which is potentially distracting (Hinckley and Song
2011).
Using gesture input is a common strategy for a variety of devices and can be performed in
different dimensions. For mobile devices, 2D gestures are common on the touchscreen

5
(Bragdon, Nelson et al. 2011) including pinch and zoom, and swipe. 2D touch gestures can
also be combined with 3D motion gestures (Hinckley and Song 2011).
A continuous input mechanism is desirable as it provides affordances suited for controlling
continuous variables, such as volume. Ideally, a continuous input mechanism is application-
independent, allowing fast and precise manipulation in both directions (e.g. volume up and
down; fast for big changes or slow for precise adjustments) such as with the scroll wheels on
MP3-Players like Apple’s IPod Classic or Microsoft’s Zune. However, most portable devices,
including smartphones, use buttons to adjust volume. Alternatively, continuous input can be
captured by the touchscreen but this means displaying appropriate interface elements
requiring extra screen space. Sensors in smart phones are also able to provide continuous
input but usually require distracting and disruptive device movements.
Gesture recognition is typically a computationally intensive process. Performing such
recognition on mobile devices with limited processing power is challenging, particularly
when it involves capturing and processing images (Wang, Zhai et al. 2006, Gu, Mukundan et
al. 2008, Chun and Hoellerer 2013).
Cameras in mobile devices have been widely used in research systems. They have focused on
cameras on the back of a device tracking that device's position (Boring, Baur et al. 2010) or
hand movements (Wang, Zhai et al. 2006, Wigdor, Forlines et al. 2007, Chun and Hoellerer
2013). Kato and Kato (2009) attached a spring with a marker at its end above the back-facing
camera, allowing continuous input by tracking the marker in three dimensions. However, due
to the camera position and the attached spring, operating the marker was rather constrained.
Because of the yet unknown nature of the novel interaction, the aim of this work is to
investigate the potential of using 3D finger gestures as input.
1.3. Motivation
The motivation for this research is to reduce information occlusion to allow for better
interaction.
Occluded information causes problems during interaction. Depending on the type of
occlusion, interaction is made more difficult. If important information is off-screen or hidden
behind a physical object in the line of sight such as a finger, users have to rely on their

6
memory to recall the desired information, increasing mental workload (Grudin 2001). For a
human to process as much information as possible in the shortest time possible, the
information has to be within the person’s attention span. This follows the principle of
reducing the cost structure of information (Card, Mackinlay et al. 1999) and is
predominantly concerned with increasing the cognitive processing capacity. To view the
currently hidden information, additional steps by the user are required. These steps again
cause problems: firstly, it costs time and distracts from the actual task and, secondly,
knowledge regarding the exact location of the desired information is required.
In the context of magnified sketching, there are different ways to provide an overview and
thus eliminate occlusion while showing parts in greater detail. Having all information
constantly visible solves the problems associated with off-screen information. Grudin (2001)
spread information over several screens, some showing a detailed view and others an
overview. He found that changing focus between monitors nevertheless distracts from the
actual task and can lead to frustration. Such overview + detail views (Figure 1 (c)) integrate
the detailed and overview views into one interface displayed on one or more monitors
requiring the user to change focus between both views.
Distortion-based focus + context views such as the fisheye lens (Figure 2) directly integrate
the detailed view into its context not requiring changes of focus. This strategy of embedding
detailed information while providing an overview has been proven successful for certain task
types (Gutwin and Skopik 2003) but not others (Donskoy and Kaptelinin 1997). For all task
types, distortion-based techniques have been applied to concern viewing and selecting data
but not creating them.
The potential of focus + context views for sketching is indicated by other research. Lank and
Phan (2004) and Agrawala and Shilman (2005) demonstrated how magnified sketching can
be successful: their qualitative data showed that participants used the lenses while achieving
an improved performance. Gutwin and Skopic (2003) used steering, a domain similar to
sketching, to research magnified content creation and editing. Instead of following a visible
line (as is done in steering) sketching relies on following a mental path to create objects.
Gutwin and Skopic (2003) showed that fisheye lenses performed better than non-focus +
context views regardless of the amount of distortion. Another study by Gutwin (2002)
explored how to increase target acquisition with fisheye lenses. Obtaining the right starting

7
point for a gesture is equally important, especially when objects are added to complement
existing sketches or edit sketches.
In summary, there is quantitative and qualitative proof indicating the potential for magnified
sketching using focus + context views. This proven potential, together with the importance of
having access to all the information without changing focus, has motivated this research in
the area of magnified sketching.
While a stylus is used in this work to sketch on a magnified canvas, the question arises as to
whether it can also be used to control the magnification interface. The stylus is the preferred
input device when precision and direct input (e.g. the ink is generated where the input device
is located) is important. However, there might be more suitable mechanisms to manipulate
the magnification interface itself when, for example, one wants to change the magnification
level. Because the stylus is already used to sketch, performing additional stylus actions may
be distracting and unintuitive. Moreover, to control the magnification interface an input
mechanism with more distinctive states could handle more interface properties.
Using the other hand which does not control the stylus to provide input on the touchscreen is
an option but causes occlusion as information is hidden under the hand and fingers. There are
approaches moving the interaction space away from the information of interest by, for
example, projecting the input area on another plane (Karlson and Bederson 2007),
automatically displaying the content hidden under the hand elsewhere (Vogel and
Balakrishnan 2010) or capturing the touch on the back of the device (Wigdor, Forlines et al.
2007). However, these alternatives either hide some of the displayed information or require
specialised devices. What is needed is a way to provide input away from the screen (to avoid
occlusions) which has sufficiently distinctive states to control a variety of interface
properties, does not require special devices and allows users to manipulate the interface in an
intuitive and comfortable manner.
There are various input channels available on small screen devices each with its advantages
and disadvantages. One solution is to use motion sensors, but they require potentially
distracting device movements. Another option satisfying all aforementioned criteria is to use
the front-facing camera to capture gestures controlling the magnification interface: By
offering an interaction space away from the display, screen occlusion is reduced. The
required hardware, camera and finger are already there. No potentially distracting device
movements are required. The input is independent of application (except for those directly

8
using the front-facing camera) and is therefore always accessible. Using the camera can be
combined with other sensors to further enrich interaction. These advantages strongly
emphasise the advantages of gesture-based interaction using the front-facing camera and have
motivated the research in this area.
1.4. Research Questions
The two main research questions in this research can be framed as follows.
I. “Can focus + context views be effectively used to achieve occlusion free magnification
for content creation and editing?”
II. “Can 3D gestures captured by a mobile device’s front-facing camera be effectively
used to provide precise input away from the screen?”
To answer the two questions, they are broken down into smaller questions. Questions (1) to
(3) address the first main research question and questions (4) to (6) the second main research
question. Answering the small questions allows to identify potential solutions.
(1) Can existing focus + context techniques be used to achieve occlusion-free
magnification for content creation and editing? Answering this question leads to
understanding the requirements for focus + context views when used to create and
edit information. In addition, understanding how key features of existing focus +
context views perform when applied to the untested domain enables to single out
potentially beneficial features and/or identify strategies how to improve them. To
answer this first question, related work is reviewed to identify existing focus +
context views and types of tasks typically involved in content creation and editing. A
test environment for sketching is implemented in which magnification strategies can
be easily integrated. The identified techniques are implemented and evaluated using
the identified task types and their performances analysed. This question is addressed
in Chapter 4.
(2) What are the shortcomings (if any) of existing focus + context views for magnified
content creation and editing and how can they be overcome? To answer this question,
the data from question (1) is analysed and the major problems are identified. Solutions
inspired by an analysis of related work are implemented and evaluated with the focus
9
on overcoming the identified shortcomings. This question is addressed in Chapters 4
and 5.
(3) Are the improved focus + context techniques suitable for content creation and editing
and how do they perform compared with other magnification strategies? To answer
these questions, the features responsible for good performances of focus + context
views found in the answers to questions (1) and (2) are integrated into one interface.
Using content creation and editing tasks, the improved interface is compared with
other common magnification techniques. The results of the evaluation are used to
gauge the efficacy of the improvements and to determine how the improved focus +
context view compares with other magnification techniques. Chapter 6 addresses this
question.
(4) Do current mobile devices have sufficient performance capabilities to allow for
camera-based gesture recognition in real-time?
(5) Can 3D gestures be accurately recognized by mobile devices?
(6) What are the requirements for 3D gestures captured by a mobile device’s front-facing
camera in regard to recognition and usability? This and the previous two questions
are solved by implementing a test framework and designing 3D gestures including
associated recognition algorithms. An evaluation study asked participants to perform
tasks using the gestures. These tasks required accurate gesture recognition for precise
input manipulation (Question (5)) and in real-time (Question (4)). Based on the
results, requirements for the gestures can be identified so that future gestures can be
accurately recognized and are easy to perform (Question (6)). Chapter 7 addresses
these three questions.
In sum, to answer these questions two test frameworks were developed. The first framework
was used to test magnification techniques for content creation and editing. It enabled me to
implement and evaluate existing focus + context techniques, identify their shortcomings
when used for content creation and editing, develop solutions and gauge the solutions’
efficacy. The second framework enabled me to develop and test recognizers for 3D gestures
captured by a mobile device’s front-facing camera and explore the gesture space.

10
1.5. Research Contributions
The research presented in this thesis contributes to the field of Human Computer Interaction,
particularly the areas of visualisations and input strategies for user interfaces. This research
yielded the following contributions.
1. This research provides the basic requirements for focus + context views when used
for content creation and editing. An analysis of the performance of focus + context
views designed for viewing and selecting content showed their unsuitability for
content creation and editing. The analysis identified three core areas requiring
improvements. First, a mode in which the stylus can be moved freely without
changing what is magnified. Second, reducing the distraction caused by the focus +
context view’s visual distortions and making these distortions easier to comprehend.
Third, easy and accessible ways to manipulate a view’s parameters such as lens size.
Papers resulting from this work include:
Schmieder, P. Distortion Techniques for Sketching. INTERACT 2011,
Springer Berlin / Heidelberg 386-389; and
Schmieder, P., B. Plimmer and J. Hosking (2012). Non-Occluding Intelligent
Magnifiers for Sketching on Small Displays. HCI. Birmingham, England 195-
204.
2. As part of this research, techniques were developed to overcome the shortcomings of
existing focus + context views when used for content creation and editing. To switch
between modes, automatic snapping was tested as an alternative to manual mode
changes which have a significant effect on completion time and effort. To make the
visual transformations more appealing, automatic resizing of the magnified areas was
tested as well as a mechanism to optimally position the magnified area over the
content of interest. Additionally, this research developed visual guides to support the
comprehension of visually distorted content. The novel guides are compared to an
existing guide and a control condition used to gauge their impact on comprehension.
The evaluation focuses on understanding how well the guides support comprehension
of four object properties crucial for recognizing objects: scale, alignment, distance
and direction. Based on the results, guidelines for designers are developed to
guarantee the best interaction when designing distortion based focus + context
techniques. Papers resulting from this work include:

11
Schmieder, P., B. Plimmer and J. Hosking (2012). Non-Occluding Intelligent
Magnifiers for Sketching on Small Displays. HCI. Birmingham, England 195-
204.
Schmieder, P., A. Luxton-Reilly, B. Plimmer and J. Hosking (2013). Visual
Guides for Comprehending Digital Ink in Distortion Lenses. Proceedings of
the 27th International BCS Human Computer Interaction Conference. London,
United Kingdom, BCS L&D Ltd.
3. My research resulted in the design of 3D gestures and development of associated
recognizers to enable capturing input away from the screen. This contribution is
threefold. First, device performance was tested to investigate whether it supported
accurate real-time gesture recognition. Second, different gestures were designed to
explore the gesture space in which future gestures are comfortably performed and can
be accurately recognized. Third, future gestures were elicited from users after they
completed a study familiarising them with the new interaction paradigm, thus making
a normal user expert. This work has resulted in the following publication:
Schmieder, P., A. Luxton-Reilly, B. Plimmer and J. Hosking (2013). Thumbs
Up: 3D Gesture Input on Mobile Phones Using the Front-Facing Camera.
INTERACT 2013. Cape Town, SA, Springer.
Content from these publications also appears in this thesis.
1.6. Thesis Outline
The remainder of this thesis is organised as follows (Figure 5):

12
Figure 5. Process diagram of the research presented in this thesis.
Chapter 1: Introduction
The first chapter provides an overview of the thesis. It starts with a description of existing
occlusion free magnification strategies followed by an overview of gesture input research.
This is followed by a description of the motivation and the research questions and
contributions.
Chapter 2: Related Work
There are two main areas of research described in Chapter 2 namely magnification strategies
and camera-based gesture input. The chapter starts with an overview of the related research
into screen occlusion. It continues with a discussion of the impact of occlusions followed by
an overview of magnification strategies. Afterwards, an overview of gesture input is then
provided, including related research into interaction techniques and camera-based input on
mobile devices, gestures and computer vision.

13
Chapter 3: Methodology
Chapter 3 describes the approach to reduce screen occlusions caused by magnification
interfaces and physical objects in the user’s line-of-sight. This chapter also contains an
overview of the software framework developed to investigate magnification interfaces.
Chapter 4: Magnified Occlusion-Free Sketching
This chapter describes the investigation of existing occlusion-free magnification interfaces. It
starts with an explanation of how and why certain focus + context interfaces were chosen for
further and more detailed testing. Following this is a description of the evaluation study
comparing existing focus + context interfaces for magnified sketching and, finally, an
analysis of the study’s results.
Chapter 5: Development of Intelligent Distortion Strategies
There are two studies presented in Chapter 5 both aiming at making focus + context suitable
for content creation and editing. The first study trials new features aiming to overcome two of
the usability problems identified in the study presented in Chapter 4. The second study in this
chapter focuses on finding a solution for the comprehension difficulties associated with the
visually transformed information.
Chapter 6: Comparing Strategies for Magnified Sketching
Chapter 6 describes the last evaluation study into magnified sketching. This study compares
the improved focus + context views with other magnification strategies. The aim is to gauge
the impact of the new features as well as to determine the strength and weaknesses of all
tested interfaces for magnified sketching.
Chapter 7: Gesture Input on Mobile Phones
Chapter 7 investigates the use of gestures performed above a mobile device’s front-facing
camera with the focus on device performance and human-device interaction. The aim of this
work is to investigate an alternative and expressive mechanism to control the magnification
interface without causing additional occlusion. The design of the gestures and their associated

14
recognizers and the test framework is described. Then the study investigating the use of the
gestures is described and its results analysed and put into context.
Chapter 8: Discussion
This chapter discusses the implications of this work for magnified sketching and gesture
input. The focus of the magnified sketching discussion is on the chosen methodology and on
the requirements of focus + context techniques when used for sketching. The discussion
about gesture input focuses on the new interaction including the lessons learned about how to
recognize the gestures and the gesture constraints important for recognition accuracy and
usability.
Chapter 9: Conclusion and Future Work
The last chapter contains a conclusion of the work presented in this thesis. This chapter also
identifies gaps in the research and directions for future work.
15
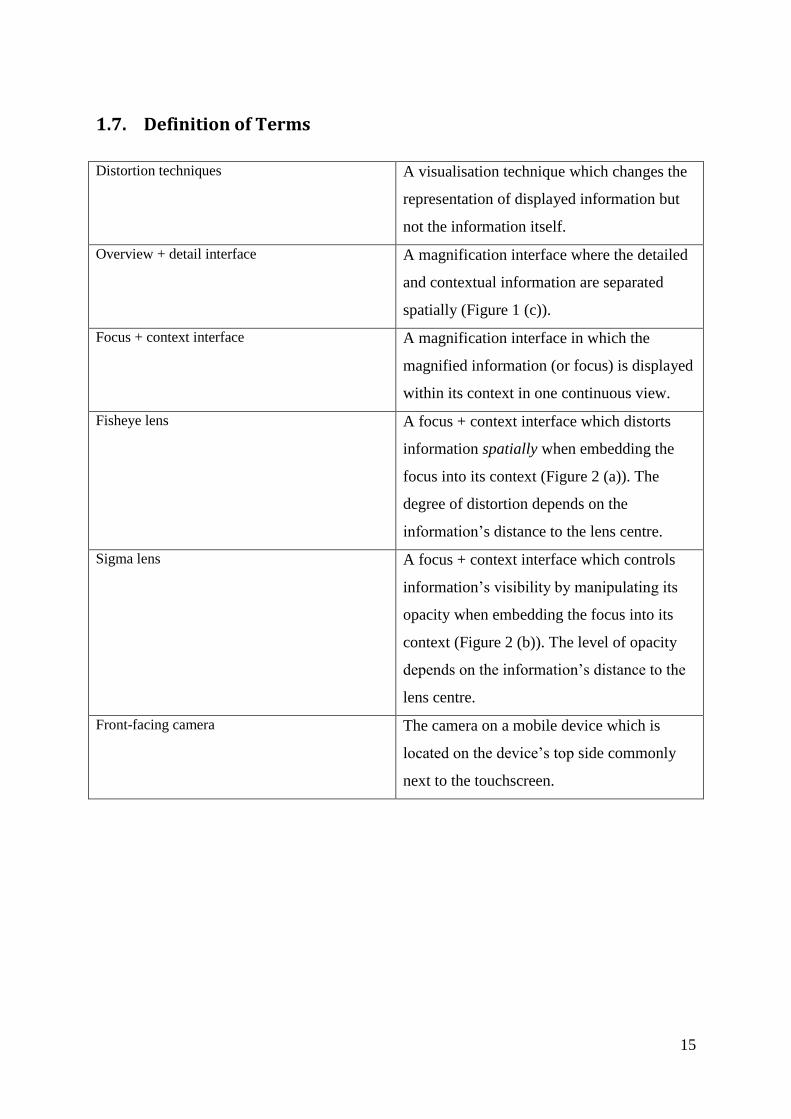
1.7. Definition of Terms
Distortion techniques A visualisation technique which changes the
representation of displayed information but
not the information itself.
Overview + detail interface A magnification interface where the detailed
and contextual information are separated
spatially (Figure 1 (c)).
Focus + context interface A magnification interface in which the
magnified information (or focus) is displayed
within its context in one continuous view.
Fisheye lens A focus + context interface which distorts
information spatially when embedding the
focus into its context (Figure 2 (a)). The
degree of distortion depends on the
information’s distance to the lens centre.
Sigma lens A focus + context interface which controls
information’s visibility by manipulating its
opacity when embedding the focus into its
context (Figure 2 (b)). The level of opacity
depends on the information’s distance to the
lens centre.
Front-facing camera The camera on a mobile device which is
located on the device’s top side commonly
next to the touchscreen.

16

17
2. Related Work
This chapter presents a review of screen occlusion research on small displays. First, two
common categories of screen occlusion are introduced. Next, magnification strategies as one
source of screen occlusion are reviewed as well as how information occlusion affects
working with interfaces. The focus is on distortion-based techniques found in focus + context
views and how these techniques achieve magnification without occluding information.
Following this, physical sources of screen occlusion are summarized; for example finger
input on a touchscreen. Section 2.3 reviews related work regarding gesture-based input
captured by the camera to provide input away from the touchscreen. The chapter concludes
with a summary of current research and open questions on occlusion-free interaction on small
screens.
2.1. Screen Occlusion
There are two main sources of information occlusions on screens: physical and software-
originated occlusion. Software-originated occlusions are caused by the method used to
display information. For example, layering information leads to occlusion of lower layers.
One solution is to make the overlaid information transparent, to preserve the readability of
the information below (Bier, Stone et al. 1993, Baudisch and Gutwin 2004). Another
approach is to split the information over multiple analogue and/or digital media: one medium
shows the detailed information which depends on its relative location to the other medium
(Mackay, Pothier et al. 2002). Another example of software-sided occlusions, and the focus
of Section 2.2, is magnification interfaces: to display part of the information in greater detail,
the additional space required is taken from the other displayed parts and thus occluding them
(Cockburn, Karlson et al. 2009).
Physical occlusions are caused by objects in the line-of-sight between the user’s eyes and the
screen. These objects are commonly used to provide input. For example, using a finger on a
touchscreen device to select links in a web browser is one source of occlusion whereby the
finger hides the information below, thus impeding precise target selections (Potter, Weldon et
al. 1988). This problem is increased on small displays with small targets (Sears and
Shneiderman 1991) as, in addition to the finger, the hand also covers parts of the display.

18
Additionally, the proportion of information hidden behind the finger is much larger on small
displays. There are software- and hardware-based solutions to overcome physical occlusions:
Software solutions include magnifying the target area to increase the target size (Albinsson
and Zhai 2003), mapping multiple inputs to one (Benko, Wilson et al. 2006), scaling the
display space (Olwal and Feiner 2003) or analysing what content is occluded and adjusting
the displayed information accordingly (Vogel and Balakrishnan 2010). Hardware solutions
include moving the input area to the back side of the screen (Wigdor, Forlines et al. 2007) or
using a pen, an input device usually smaller than a finger, to minimize screen occlusion (Ren
and Moriya 2000). Yet another hardware solution and the focus of Section 2.3 is to capture
input away from the screen using an integrated camera (Chun and Hoellerer 2013).
Figure 6. An example of a zooming interface. Google maps showing Auckland, New Zealand in the main view. In the top left corner a slider is offered to change the zoom level. Note the absence of visual cues indicating, for example, the relative position of Auckland within the complete context (i.e. the world).
2.2. Magnification Interfaces
Magnification interfaces have different strategies to display the magnified content while also
showing the non-magnified content. Cockburn et al. (2009) divided magnification strategies
into four groups according the dimensions they use to combine the magnified and non-
19
Figure 7. An example of an overview + detail interface. Adobe Photoshop shows the magnified canvas in the screen centre in greater detail and an overview in the top right corner. In the overview, a red rectangle indicates what part of the image is shown magnified.
magnified views: zooming, overview + detail, focus + context and cue-based interfaces. For
this review, Cockburn et al.’s categories will be additionally categorized as content occluding
and non-occluding interfaces.
2.2.1. Occluding Magnification Interfaces
To magnify content, additional space is required to display the enlarged information.
Depending on the magnification strategy, either the magnified or non-magnified view is
favoured in that more space is assigned to one at the cost of the other. An example favouring
the magnified view is the traditional zooming interface (Figure 6) which displays only the
enlarged content without offering a separate overview. Overview + detail interfaces (Figure
7) also favour the magnified view but offer navigational support in the form of an overview.
Traditional magnification lenses (Figure 8) equally favour the magnified and non-magnified
view. The lenses show the magnified view on top of the original non-magnified view, thereby
partly occluding information in the lower view.

20
Figure 8. A magnification lens (left) and a fisheye lens (right) are used to determine whether the ball is touching the ground during the 2011 World Cup game between New Zealand and Argentina. While the magnifier occludes content directly surrounding the lens, the fisheye lens shows that hidden content visually distorted.
Different magnification strategies use either time or space to accommodate magnified and
non-magnified views on the screen. The zooming interfaces use a temporal separation as
there is exactly one view only showing the magnified content. Overview + detail interfaces
use space to separate both views.
The separation of views introduces a discontinuity that Grudin (2001) suggested increases the
cognitive workload. To fully comprehend information, all its pieces have to be understood
and their place within the information structure has to be known. Thus, if only a part of the
information is visible, manual navigation is required to display the rest of the information.
The extra steps needed for navigation can be frustrating and increase mental workload
(Grudin 2001). In addition, if only a small part of the information is visible, the user has to
mentally visualize the information structure based on his/her working memory (Wickens and
Hollands 2000) which again increases mental workload. Optimal comprehension requires all
pertinent information to be visible all the time.
In the following zoom, overview + detail and magnification lenses are briefly presented with
the emphasis on how they occlude content. More detailed surveys of these magnification
strategies are found in Cockburn, Karlson et al. (2009), Hornbæk and Hertzum (2011) and
Burigat and Chittaro (2013).
Zooming Interfaces
A zooming interface features one view to display the content (Figure 6). When zoomed, parts
of the content are outside the viewable area and therefore hidden from the user. This

21
magnification strategy separates magnified and non-magnified content on a temporal level
(Perlin and Fox 1993, Bederson and Hollan 1994).
There are various strategies to change the content currently displayed. One method is to zoom
out until the new location is displayed and zoom in again on the location of interest. Another
approach is panning. This requires knowledge about the relative position of the new location
to the current position. None of these approaches are ideal as they are time-consuming and
may require spatial knowledge about the content.
There are various research systems investigating zooming interfaces. The first application to
apply zooming in a desktop environment was the Pad system (Perlin and Fox 1993).
Subsequently, zooming interfaces have been applied to various domains including drawing
tools (Druin, Stewart et al. 1997) and software visualizations (Summers, Goldsmith et al.
2003).
Keeping the detailed information mentally aligned with the context when temporally
separated can be difficult (Card, Mackinlay et al. 1999, Hornbaek, Bederson et al. 2002). To
aid navigation, Baudisch and Rosenholtz (2003) use visual rings surrounding off-screen
objects. The portion of the ring visible on screen gives an indication of the off-screen object’s
location and distance. Another approach to aid navigation is semantic zooming where objects
change appearance or shape as they change size (Perlin and Fox 1993). For example, Jul and
Furnas (1998) used landmarks to indicate the existence of object groups which would
otherwise not be visible at low magnification. When zooming in, the landmarks are replaced
by the actual objects. Yet another example is to highlight objects of interest in the overview
(Burigat and Chittaro 2013).
Overview + Detail Interfaces
In an overview + detail interface, a detailed view typically dominates the screen space and is
supplemented by other views providing an overview of the information (Plaisant, Carr et al.
2002). There are different approaches to offer an overview. A one-dimensional approach is
scrollbars and a two dimensional approach is a smaller view showing the complete content
(Figure 7). While usually one overview window is used, the use of multiple overview
windows at higher magnification levels is recommended (Plaisant, Carr et al. 2002,
Shneiderman and Plaisant 2005). The small nature of the overview potentially leads to

22
information occlusion as content might not be displayed due to the limited resolution of the
overview window.
The detailed and overview views are independent of each other in that users can interact with
them individually. However, changes in one view are often echoed in the other. An example
is Adobe’s PhotoshopTM
(Adobe 2013) which shows the complete canvas in one view and the
magnified part in another view. The latter’s position is reflected by a rectangle ("viewfinder")
displayed on top of the overview. The focus in the magnified view and viewfinder’s position
in the overview change accordingly; i.e. if one is moved manually, the other’s position is
adjusted automatically. There is no consistency in terms of size ratio between overview and
detailed view but the overview is commonly smaller.
The small nature of overview results in the information being shown at a coarse level and
commonly leads to navigational problems. These problems exist as orientation clues are
missing in small visualizations. Jul and Furnas (1998) analysed the information to form
groups of objects. Object groups which would not be visible at a given magnification level
are replaced by landmarks creating visual awareness of their existence. Another common
approach to aid navigation is to embed visual cues into the interface. For example, Google’s
Chrome browser (Google 2013) uses yellow lines in the vertical scrollbar to indicate the
positions that match a search term.
The efficacy of overview + detail interfaces on small screens can partially be deduced from
studies examining overview + detail interfaces on desktop computers (Burigat and Chittaro
2013). For example, the positive effect of displaying an overview in addition to the magnified
information should aid navigation.
Magnification Lens Interfaces
Magnification lenses separate both views in the third dimension (on the z-axis): one view is
on top of the other. The advantage is that the magnified view is shown on top of its context.
The space necessary to display parts of the content enlarged is taken from the immediate
surroundings of the lens. In Figure 8 (left) the magnification lens is centred on the ball
showing everything within a predefined radius enlarged. However, it is not possible to tell
which players are standing around the pack on the ground as they are partly occluded by the
lens.

23
Cockburn, Karlson et al. (2009) group lenses as an overview + detail interface as they
separate the magnified and non-magnified view but show both simultaneously. While this is
true, lenses actively occlude information. In contrast, the existence of occlusions in overview
+ detail interfaces depends on the resolution of the overview window. Hence lenses are
regarded as a separate group in this thesis.
2.2.2. Non-Occluding Magnification Techniques
To generate the space required to display parts enlarged, non-occluding techniques use
different strategies. A technique called focus + context views uses distortion techniques and a
lens metaphor. The space is generated by visually transforming parts of the content using
various dimensions such as space (Furnas 1986), time (Gutwin 2002) and translucency
(Pietriga and Appert 2008). Another technique called cue-based views supports the user by
visually emphasizing objects of interest without scaling them - thus not requiring extra space.
Both strategies are presented in this section with the emphasis on focus + context views.
Focus + Context Interfaces
Focus + context interfaces embed the detailed view into its context using space, time and/or
translucency (Figure 8). Similar to magnification lenses, focus + context views separate the
detailed and context views in the third dimension. The difference between magnification
lenses and focus + context is that focus + context views do not occlude content.
The first conceptual distortion technique, called the bifocal display by Spence and Apperley
(1982), is best described by the analogy of using four rollers over which paper was folded.
The paper between the two foreground rollers formed the focal region while the remaining
paper was aligned at an angle over the background rollers. It took nine years before this
conceptual technique was realized.
Mackinlay, Robertson et al. (1991) implemented the perspective wall based on the bifocal
display. They transformed 2D layouts into 3D ones which permitted a smooth integration
detail and context. It was possible to adjust the view and the ratio of detail and context.
Furnas (1986) was the first to apply fisheye concepts to computer interfaces. He defined the
theoretical foundations for fisheye lenses to balance the detailed and context views. Each
point in a structure has a Degree of Interest (DOI) which determines whether a point is

24
displayed. Furnas proposed a DOI function based on the distance between a point and the
focal centre; i.e. the closer the point the more interesting. The distance can be spatial or
semantic. Furnas described a variety of application areas for fisheye views, ranging from
structured programming languages over management structures to hierarchically organized
texts.
Sarkar and Brown (1992) applied Furnas’ (1986) theoretical framework to graphical
transformations in general and exploring graphs in particular. They presented a graphical
framework which is used to compute an object’s size, position and level of detail. An object’s
distorted properties completely depend on its distance to the focal centre. Sarkar and Brown
used the Euclidian distance to compute a DOI. They applied their graphical fisheye to graphs
and maps. Their algorithm has been frequently used in later work for fisheye visualizations
(Gutwin 2002, Gutwin and Fedak 2004, Jakobsen and Hornbæk 2011).
Carpendale and Montagnese (2001) presented the elastic presentation framework. It provides
a mathematical framework which allows the exploration of various visualization schemes.
Their approach takes a 2D plane and projects it in a 3D space. The framework uses a single
viewpoint as from of a viewing window or lens. Changing the viewpoint, and therefore the
lens’ position, transforms the points on the 2D plane. The transformation depends on the
distortion function, the distance function, lens size, the distortion region’s size, the distance
between lens and 2D plane and each point’s distance to the focal centre.
All points in the lens centre are equally magnified and undistorted, identical to a standard
magnifying glass. The distance of the lens to the 2D plane determines the magnification
level; i.e. the greater the distance the higher the magnification. The distance can be computed
in various ways. Carpendale and Montagnese’s (2001) framework allows the use of different
LP metrics which among other things determines the lens shape. For example, a L(2) metric,
or Euclidian distance, results in a round lens shape whereas a L(∞) metric results in a squared
lens shape.
Surrounding the lens is the distortion region that is characterized by its size and distortion
function. To generate the additional space required by the lens, the distortion region
transforms the information surrounding the lens. The distortion function determines how a
point is displaced, resulting in a distinct distortion profile. Carpendale and Montagnese’s
(2001) framework includes several functions including a linear, Gaussian, cosine,
hemispheric and Manhattan function. The distortion profile is influenced by the

25
magnification level and distortion region size. The higher the magnification, the more space
needs to be generated by the distortion region resulting in stronger distortions. Additionally,
the smaller the distortion region’s size, the stronger is the distortion.
Combining both dimensions of speed and time, Gutwin (2002) presented speed-coupled
flattening lenses. A speed-coupled lens’ magnification level depends on the lens’
acceleration. The faster the lens is moved, the lower the magnification level until it
completely vanishes.
Figure 9. Sigma lenses which use translucency to transition between magnified and context view. Taken from (Pietriga and Appert 2008)
1.
While the fisheye lens uses space to transition between magnified and context regions,
Pietriga and Appert’s (2008) Sigma lens uses translucency (Figure 9). A Sigma lens consists
of two layers. The lower layer shows the content at normal size and the upper layer shows the
magnified part of the content. The magnified content is fully opaque within a predefined
distance of the centre: outside this area the opacity decreases linearly until it vanishes. The
lower layer is designed the opposite way; the content is fully opaque on the outside of the
lens and decreases linearly till it is completely vanished at the lens' centre. As a result, no
additional space is required to show parts of the content enlarged. Pietriga and Appert
combined their Sigma lens with Gutwin’s (2002) speed-coupled lenses in that a lens’
acceleration determines the level of magnification and thus the lens’ visibility.
1 Image obtained from Pietriga, E. and C. Appert (2008). Sigma Lenses: Focus-Context Transitions Combining
Space, Time and Translucence. Proceeding of the Twenty-sixth Annual SIGCHI Conference on Human Factors
in Computing Systems, Florence, Italy, ACM. Reproduced with permission from the author.

26
COMPREHENDING DISTORTIONS
The visually transformed content generated by focus + context interfaces means that
additional mental workload is required to comprehend and interact with distorted
information. The distorted objects and their relationships with other distorted objects,
magnified or non-magnified, can be difficult to judge (Carpendale, Cowperthwaite et al.
1997). To recognize objects, distorted or not, their basic visual properties such as length,
direction, angle and scale have to be correctly assessed (Cleveland and McGill 1984). As
distortions change the visual appearance of objects, the assessment of orientation properties
becomes more difficult.
The general perception of a visual object’s properties in relation to their actual properties is
the discipline of psychophysics (Wagner 2006). Bertin (1977) and Cleveland and McGill
(1984) believed that visual variables (Bertin) or elementary perceptual tasks (Cleveland and
McGill) are used to extract information from visual data. Cleveland and McGill extended
Bertin’s original seven visual variables (i.e. position, size, shape, value, colour, orientation
and texture) into ten elementary perceptual tasks (i.e. position common scale, position non-
aligned scale, length, direction, angle, area, volume, curvature, shading, and colour
saturation) as they believed that some of Bertin’s categories were too broad. Wigdor, Shen et
al. (2007) and Bezerianos and Isenberg (2012) use a subset of Cleveland and McGill’s
elementary perceptual tasks to inform their work on visual distortions. They provide
guidelines to overcome such distortions in the context of varying distances and viewing
angles in tabletop and multi-surface environments.
Visual guides can help navigation and understanding of distorted and non-distorted content.
Prior work to aid user comprehension of distortions includes: use of a grid and/or shading
(Zanella, Carpendale et al. 2002) and allowing users to define distorted regions to be
displayed undistorted on an inset (Brosz, Carpendale et al. 2011). Zanella, Carpendale et al.’s
(2002) goal was to determine if people can: first, see if a distortion is present and, if so, locate
it and, second, accurately gauge the level of distortion. The latter was a relative measure:
participants ranked the distortions present starting with the strongest. Zanella, Carpendale et
al. found the grid to be the most useful visual guide. Grid and shading together and shading
individually were worse for judging the level of distortions. Zanella, Carpendale et al.’s goal
was to help people to identify distorted regions and make basic judgments but not to
understand the distorted content. To aid comprehension of distorted information, Carpendale,

27
Cowperthwaite et al. (1997) proposed the use of structural changes to the distortions such as
limiting the distortion, smoothly integrate distortions into context and magnification to scale
to address to support recognition.
The Undistort Lens (Brosz, Carpendale et al. 2011) supports distortion comprehension by
reversing the distortions. The Undistort Lens allows users to specify an area in the distorted
region to be displayed undistorted in an inset. Brosz, Carpendale et al. demonstrated various
scenarios in which this lens helps to better understand the distorted content. In that respect,
the Undistort Lens is an alternative approach to visual guides more akin to radar views
requiring user input to define its region of effect. While these approaches help one to better
understand distortions overall, it is unclear how well they support the different aspects of
orientation and if other approaches may be more suitable.
TARGET ACQUISITION
A problem all lenses, distortion based or not, face is that objects move when magnified by a
lens, making it particularly difficult to acquire targets. Because the space under the lens is
magnified but the pointer movement/step width is not, objects move towards the pointer to
compensate for the difference in movement. The higher the magnification, the higher is the
difference between magnified space and pointer movement, thus the objects move faster.
Target acquisition such as trying to click on an icon using the mouse is one of the problems
caused by scale differences between motor and visual space in the magnified region (Gutwin
2002). Motor space refers to the physical space in which people interact to communicate with
the computer by, for example, pushing a mouse. Strategies to overcome this problem include
pinning the lens (Appert, Chapuis et al. 2010) and lens flattening (Gutwin 2002). Pinning a
lens means to decouple lens and cursor movement and so avoid movement, entirely allowing
for pixel precise pointing. However, this makes exploring content more cumbersome as users
have to pin/unpin the cursor frequently. Automatically snapping the lens overcomes the
additional manual step of decoupling lens and cursor (Baudisch, Cutrell et al. 2005,
Fernquist, Shoemaker et al. 2011). Gutwin (2002) developed speed-coupled lenses which
change the magnification level depending on acceleration. When the fisheye lens moves
above a predefined speed, the magnification is decreased. Using speed-coupled lenses result
in faster completion times and lower error rates compared to non-flattening fisheye lenses.

28
WHAT TO MAGNIFY
Another problem fisheye lenses face is the problem what to magnify. This problem is
different to the two previously-presented problems as it deals with content selection rather
than content representation. Furnas (2006) focused on this problem when revisiting his
originally proposed theoretical framework (Furnas 1986) to determine an object’s degree of
interest which usually relied on distance alone (e.g. (Sarkar and Brown 1992)). For overview
+ detail interfaces, Burigat and Chittaro (2013) highlight objects of interest in the overview
supporting navigation. In cue-based interfaces (next section) Kosara, Miksch et al. (2001)
used semantic knowledge to determine what to visually emphasize.
Cue-Based Interfaces
Instead of scaling objects to emphasize their presence, a cue-based interface changes the way
objects are rendered, so no transitioning between magnified and context view is necessary.
An object may be visually highlighted by either changing its presentation or by changing all
the other, less important objects’ representations. Kosara, Miksch et al. (2001) used blurring
to deemphasize unimportant objects. As an example, Kosara, Miksch et al. used a chess game
tutoring system that blurred figures of the opposing party which had no influence on the
move of the currently-selected active party’s piece. They used semantic knowledge in the
form of chess rules to determine each figure's degree of interest.
Cue-based techniques can be combined with the previously-explained techniques. As
mentioned before, Google Chrome (Google 2013) indicates the locations of search term
matches by displaying yellow lines on the horizontal scrollbar. Additionally, Chrome uses
text highlighting to emphasize a match’s position on the screen. By combining scrollbar and
highlighting, Google Chrome merges elements of overview + detail and cue-based interfaces.

29
2.2.3. Applications and Evaluations of Magnification Interfaces
Figure 10. The same sketch is shown with (a) no magnification, (b) zooming interface and scrollbars for navigation, (c) overview + detail interface with the overview overlapping the detailed view in the lower right corner,(d) a magnifying lens occluding its immediate surroundings and (e) a fisheye lens
which distorts the content surrounding the focus area.
There are numerous evaluation studies examining the individual challenges of magnification
interfaces as well as comparing the performance of magnification interfaces in different
domains. Figure 10 shows a sketch and what it might look like if displayed with various
magnification interfaces. A third category of evaluation studies examines the scalability of
such interfaces. Moreover, there are two comprehensive literature reviews of magnification
interfaces (Leung and Apperley 1994, Cockburn, Karlson et al. 2009).
The severity of a problem's magnification interfaces face depends on the application area.
Distortion-based lenses have been applied to a variety of domains and tasks with different
success. Domains vary from map (Pattath, Ebert et al. 2009), document (Cockburn, Savage et
al. 2005) and tree navigation (Baudisch, Good et al. 2002) over-reading comprehension
(Hornbaek and Frokjaer 2003) and graph editing (Schaffer, Zuo et al. 1996) to chart
representation (Isenberg, Bezerianos et al. 2011).
A standard approach to evaluate a magnification technique is to define a series of tasks and
evaluate the technique in question together with other existing magnification interfaces
(Baudisch, Good et al. 2002, Gutwin 2002, Nekrasovski, Bodnar et al. 2006). Performance
criteria are usually task-completion time and error rate. Task examples are steering (Gutwin
2002), target acquisition (Ramos, Cockburn et al. 2007) and menu selection (Bederson 2000).
While distortion lenses increase performance on tasks such as large steering tasks (Gutwin
and Skopik 2003) and target acquisition (Gutwin 2002), they have a negative performance
impact on menu selection tasks (Bederson 2000). In the following, a typical evaluation is
presented in greater detail to provide an insight into high quality evaluation of magnification
interfaces.

30
Investigating the performance of distortion techniques for interactive tasks, Gutwin and
Skopik (2003) evaluated fisheye lenses and non-distortion magnification interfaces. The
authors chose a steering task where participants had to follow a line with the pointer. Three
fisheye lenses, a panning view including a small overview window and radar view were
evaluated. Twenty participants volunteered to complete steering tasks involving different
shapes (horizontal, diagonal, step and curve) at three different magnification levels (1x, 2x
and 4x). Performance was measured as the time required following the path including
potential navigational actions such as panning.
The first and second fisheye lenses used Sarkar and Brown’s (1992) algorithm. While the
first lens had a pyramid shape, the second had a round shape. The difference between the first
two lenses and the third was that the third had a flat top whereas the first two had an apex.
The main difference between the two non-distortion techniques was how the content was
navigated. In the panning interface, participants dragged the mouse on the detailed view
whereas in the radar interface, participants had to use the viewfinder in the radar to navigate
the content. Thus, for the latter interface, steering was done by moving the viewfinder in the
radar view so that the centre of the detailed view followed the path.
The fisheye lenses resulted in the fastest completion times, followed by the panning view and
the radar view, especially at higher magnification levels. The main reason for the fisheye’s
better performance was that the path was completely visible, but for the non-distortion
reorientation in the detailed window was necessary. The radar view resulted in significantly
more errors than the other tested interfaced: i.e. participants made approximately one error
per run when using the radar view as opposed to one error per five runs using any of the other
four techniques. Looking at fisheye lenses separately showed a performance increase with
increasing magnification level with no effect on the error rate. Participants overall preferred
the fisheye lenses but felt that the panning view was better to avoid errors. Of the three
fisheye lenses, the flat top lens was the most preferred, followed by the round lens and
pyramidal lens. In terms of accuracy, participants preferred the pyramidal lens over the round
and the flat top lenses.
Besides being domain and task dependent, the performance of magnification interfaces is
influenced by the experiment’s setup. One factor is screen size. Aiming to study basic
perceptions on differently sized screens, Ball and North (2005) asked 36 participants to
complete a navigation and a comparison task using a zoom + pan interface. Three monitor

31
configurations (one, four and nine) and three target sizes (small, medium and large) were
used for both tasks. The first task was to find a red dot among grey dots. The second task was
firstly to find red targets and then to match identical targets. Based on the results, the authors
concluded two major findings. First, although none of the monitor configurations resulted in
a better performance, large configurations were never disadvantageous regarding
performance. Second, given finer details (or small targets) larger configurations produce
better performance.
Ball and North (2005) noticed that when completing the second task, participants
occasionally reported target pairs more than ones with medium and small display settings.
They hypothesized that because the targets were moving when zooming and/or panning,
participants did not always maintain a mental image of the target's original position. The
authors noticed that participants tended to squint at small targets rather than zoom in. They
suggested this was to avoid loss of context information, as participants felt frustrated and
complained about missing overview in the one and four monitor configurations.
While Ball and North (2005) concentrated exclusively on basic perception issues using a
zoom + pan interface, Jakobsen and Hornbæk (2011) studied the impact of different screen
sizes on zooming, overview + detail and focus + context interfaces. They asked 19
participants to complete navigation, comparison and tracing tasks on three display sizes: large
(5760 x 2400), medium (1920 x 800) and small (640 x 267). A fisheye lens (focus + context),
an interface with fixed zoom plus a small inset showing the entire content (overview + detail)
and a zoom-able interface (zooming) were used to complete the tasks. The results showed
that the fisheye lens was significantly slower on small displays than the other two interfaces.
The authors suggested that this may be due to the 27x magnification compressed into a
fisheye lens: this is one-third of the display size and thus particularly small. The authors
found that using medium displays resulted in faster completion times than large screens. One
of the reasons was that participants required more time to locate the target on a large display
when using the zooming and focus + context interfaces. Participants found using the fisheye
significantly harder than the other two interfaces. Interestingly, the fisheye lens was found to
be easier to use on the large display suggesting that the bigger the display, the easier is its
use.
In a follow up study, Jakobsen and Hornbæk (2013) further investigated the impact of
information space and scale when using differently sized displays for magnification

32
techniques. Previous studies investigating the impact of different display sizes on
magnification techniques used either a fixed or a variable information space. The information
space refers to the amount of information displayed: in a constant space, the information is
the same across display sizes and the scale varies, whereas in a variable information space,
the amount differs and the scale is constant. For example, Ball and North (2005) used a fixed
information space as they used the same map for all display setups. Jakobsen and Hornbæk’s
results showed that the choice of information space affects performance. Focus + context
interfaces perform better on large displays when a variable information space is used. With a
fixed information space however, focus + context interfaces are only worse on small displays.
The authors also found that if targets are visible at all magnification levels, larger displays
have no positive effect on performance.
In summary, these studies suggest that there is a number of general rules which apply to
every interface technique. First, the smaller the display, the harder it is to maintain a mental
overview. Second, very small targets are hard to deal with. Third, high magnification levels
require a sufficiently large display space assigned to them.
Magnification interfaces have been applied to various domains and tasks with different
success rates. The tasks were predominantly navigating and viewing content. Different tasks
within these domains were used to evaluate the different interface types. In general, none of
the techniques is perfect for all domains and each comes with its unique usability advantages
and disadvantages. Usually, overview + detail interfaces are preferred over zooming
interfaces as they better support content overview and navigation. Focus + context interfaces
such as the fisheye lens performed best for large steering tasks and when distant targets have
to be acquired. The biggest advantage of focus + context techniques is that it displays the
complete content at all times, requiring no navigating as did the other magnification
interfaces.
2.2.4. Focus + Context Interfaces for Sketching
Research concentrated on applying focus + context interfaces to tasks where the interaction
was limited to viewing and navigating content as opposed to content creation and editing. As
Sarkar and Brown (1992) put it: “The fisheye view is a promising technique for viewing and
browsing structures.” To my knowledge, the only exception is work done by Lank and Phan
(2004) who used a fisheye lens for sketching to create and edit information. However, due to

33
hardware constraints, they had to use a stationary fisheye lens that did not address problems
such as target acquisition. Of the viewing and navigation tasks focus + context interfaces
have been applied to, steering (Gutwin and Skopik 2003) is arguably the closest match to
content creation and editing. Steering involves moving the cursor along a predefined line
similar to drawing where one sketches on “mental” lines to create visible shapes. Both these
studies show positive results for focus + context interfaces when compared to other
magnification strategies (Gutwin and Skopik 2003, Lank and Phan 2004).
In the next paragraphs, work by Agrawala and Shilman (2005) and Lank and Phan (2004) is
presented in greater detail.
Agrawala and Shilman (2005) used a digital magnifying glass to annotate documents. They
classified their tool as a focus + context interface although information is occluded. In this
work, this work is instead classified as a content-occluding interface as the information
directly surrounding the magnifying glass is hidden.
With the goal to determine the magnification lens’ effect on the annotation process, Agrawala
and Shilman (2005) evaluated DIZI using six members of their lab as participants. To create
the lens, move it and change the magnification level gestures are used. The task was to
annotate conference papers with or without zooming. Participants liked the zooming function
for writing and editing where space was limited. However, annotations involving long,
figural gestures were preferably drawn without zoom as less precision was required.
Figure 11. (a) The PDA with the fisheye lens used in Lank and Phan’s (2004) evaluation study. (b) Their sketching application’s interface while drawing. The overview in the top right corner shows the undistorted sketch but is not part of the actual interface. Image taken from (Lank and Phan 2004)
2.
2 Image obtained from Lank, E. and S. Phan (2004). Focus + Context Sketching on a Pocket PC. CHI '04
Extended Abstracts on Human Factors in Computing Systems, Vienna, Austria, ACM. Reproduced with
permission from the author.

34
While Agrawala and Shilman (2005) used a zoom region which occludes parts of the content,
Lank and Phan (2004) employed a fisheye lens to avoid hiding information. They
implemented their interface on a PDA and used its keys to switch between modes; e.g.
drawing, viewing and erasing mode (Figure 11). Due to limited hardware performance, Lank
and Phan’s lens remains at the position where it is activated rather than following the stylus.
Their use of a static lens helped them avoid the problems faced by movable lenses such as
target acquisition. 17 participants completed writing and drawing tasks using a stationary
fisheye lens and a scrollable overview + detail interface. The lens was, overall, perceived
positively and, despite its stationary nature, participants preferred the fisheye lens over
having to scroll the canvas for their drawing tasks.
Although Lank and Phan (2004)'s work is a first step toward the successful utilization of
distortion techniques for creating and editing content, the static lens was found to be very
constraining. Their evaluation study identified this as the prototype’s major drawback by a
number of the participants.
In summary, focus + context interfaces have not been applied to their full capacity to content
creation and editing. However, work by Gutwin and Skopik (2003), Agrawala and Shilman
(2005) and Lank and Phan (2004) has shown the potential of magnification interfaces in
general and focus + context interfaces in particular. Further research is required to investigate
the suitability of focus + context interfaces for creation and editing information.
2.3. Gesture Input using Cameras
Information occlusion can be caused by objects situated between the user’s eyes and the
screen. In contemporary mobile devices, the screen is commonly used to provide input in the
form of touch gestures (Brewster and Hughes 2009, Bragdon, Nelson et al. 2011, Holz and
Baudisch 2011). This can lead to occlusions caused by fingers and hands used to provide
input and impedes tasks such as target selection (Potter, Weldon et al. 1988). In addition to
the screen, other means to provide input include buttons, integrated sensors (e.g.
accelerometer and gyroscope) (Hinckley and Song 2011) and cameras (Vardy, Robinson et
al. 1999, Wang, Zhai et al. 2006). In the following, these alternative input metaphors are
presented with a focus on 3D gesture input captured by the mobile phone’s camera.

35
2.3.1. Interaction Techniques for Mobile Devices
To investigate interaction techniques for mobile phones, research commonly focuses on
facilitating mode manipulations based on the input channels available in mobile devices. One
input channel (Brewster and Hughes 2009) can be used individually or a combination of
channels (Du, Ren et al. 2011, Hinckley and Song 2011). Brewster and Hughes (2009)
investigated the use of pressure on touchscreens to differentiate between small and capital
letters entered on the phone’s keyboard. Hinckley and Song (2011) explored gestures
combining touch and motion using gyroscope, accelerometer and touchscreen. They propose
motions for continuous input such as tilt-to-zoom and discrete input such as hard-tap. The
camera is also frequently the focus of research into interaction techniques as it can capture a
variety of information and thus be used for different purposes (Vardy, Robinson et al. 1999,
Wang, Zhai et al. 2006). This is further explained in the next section.
Figure 12. The LucidTouch system by Wigdor, Forlines et al. (2007). (a) The schematic view of the hardware components. (b) The prototype. Taken from (Wigdor, Forlines et al. 2007)
3.
2.3.2. Camera-Based Interaction on Mobile Devices
Cameras on mobile devices can be differentiated by their location: integrated in the device or
external. Vardy, Robinson et al. (1999)'s system uses a camera attached to the wrist to
capture finger movements. LucidTouch (Wigdor, Forlines et al. 2007) uses a camera attached
to a fixed boom on the backside of a touchscreen to capture the fingers (Figure 12). The
device allows users to provide input from the backside of the device to reduce occlusion. The
3 Image obtained from Wigdor, D., C. Forlines, P. Baudisch, J. Barnwell and C. Shen (2007). LucidTouch: a
see-through mobile device. Proceedings of the 20th Annual ACM Symposium on User Interface Software and
Technology, Newport, Rhode Island, USA, ACM. Reproduced with permission from the author.

36
screen displays the information plus a rendered version of the fingers indicating their
position. This pseudo-transparent device allows precise target selection with all 10 fingers. In
Wigdor, Forlines et al. (2007)’s study, participants had mixed feelings towards the pseudo-
transparency wanting to see the rendered fingers for some tasks and not see them for others.
In more common use are device-integrated cameras which are predominantly on the rear.
TinyMotion (Wang, Zhai et al. 2006) uses a rear-facing camera to measure cell phone
movements. It computes phone tilts to control games such as Tetris and text input.
TinyMotion requires a button press combined with a phone tilt to input a character (Wang,
Zhai et al. 2006). An evaluation study showed that amongst other things, TinyMotion can be
successfully used to detect camera movement and that users are able to input text faster than
with other trialled input methods. Another application is a see-through tool for applications
such as maps (Bier, Stone et al. 1993). The device’s position over a surface is recognized and
augmented with information.
Figure 13. The tangible controller developed by Kato and Kato (2009). A spring is attached to the back of the device above the camera. The spring movement is used to provide input and is tracked by the phone’s rear-facing camera below the spring. Image taken from (Kato and Kato 2009)
4.
Kato and Kato (2009) developed a tangible controller for continuous analogue input. They
attached a spring to the top of the rear-facing camera with a marker attached to its end
(Figure 13). The user provides input by moving the marker in any direction. Kato and Kato
4 Image obtained from Kato, H. and Kato, T. (2009). A camera-based tangible controller for cellular phones.
Proceedings of the 11th International Conference on Human-Computer Interaction with Mobile Devices and
Services, Bonn, Germany, ACM. Reproduced with permission from the author.

37
compared their novel input metaphor to a keypad and found their method to be significantly
faster.
Chun and Hoellerer (2013) explored hand and finger gestures to manipulate virtual objects
shown on the phone screen. Using simple and computationally cheap recognition algorithms,
the gestures allow users to move, scale and change the virtual object’s translucency. To
interact with the virtual object, users hold the phone with their non-dominant hand pointing
the camera at the dominant hand. The users perform the gestures with the dominant hand
while observing the screen.
Bragdon, Nelson et al. (2011) investigated the impact of distractions on touch interaction.
Comparing gestures and their soft button equivalent, they found gestures are less affected by
distractions and perform as well as soft buttons without distractions. Negulescu, Ruiz et al.
(2012) investigated the cognitive demands of motion gestures, screen tapping and swiping on
users when they are distracted. In the author’s study, participants used the three input
metaphors to trigger up, down, left and right input commands while either walking or not
looking at the phone. The results show that motion gestures’ cognitive costs are statistically
indistinguishable from tapping and swiping. Gestures, as explained in more detail in the next
section, including touch and motion gestures, are commonly used for mobile device
interaction.
2.3.3. Gesture Input
The design of the gestures used to provide input predominantly depends on how the input is
captured and the gesture mapping. Gestures for mobile phones are captured in two and/or
three dimensions. 2D gestural input is commonly used on the touchscreen (Morris, Wobbrock
et al. 2010, Bragdon, Nelson et al. 2011). Popular gestures are pinch and zoom, and swipe.
2D touch gestures can be combined with 3D motion gestures (Hinckley and Song 2011).
These latter gestures make use of a variety of sensors such as the gyroscope (Ruiz and Li
2011), accelerometer (Iwasaki, Miyaki et al. 2009) and cameras (Wigdor, Forlines et al.
2007).
To provide input, individual fingers are used as well as multiple fingers and/or the complete
hand. Karlson, Bederson et al. (2008) looked at the interaction between hands and mobile
devices including user preferences and mechanical limitations. The WristCam by Vardy,
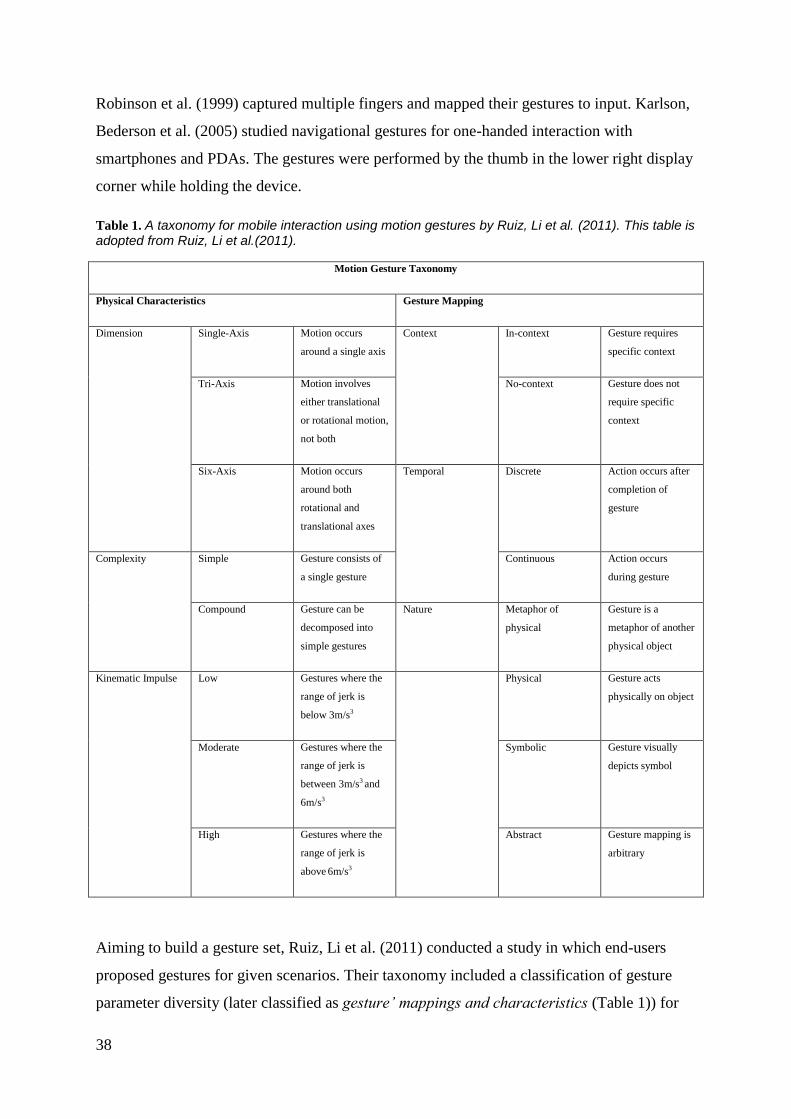
38
Robinson et al. (1999) captured multiple fingers and mapped their gestures to input. Karlson,
Bederson et al. (2005) studied navigational gestures for one-handed interaction with
smartphones and PDAs. The gestures were performed by the thumb in the lower right display
corner while holding the device.
Table 1. A taxonomy for mobile interaction using motion gestures by Ruiz, Li et al. (2011). This table is adopted from Ruiz, Li et al.(2011).
Motion Gesture Taxonomy
Physical Characteristics Gesture Mapping
Dimension Single-Axis Motion occurs
around a single axis
Context In-context Gesture requires
specific context
Tri-Axis Motion involves
either translational
or rotational motion,
not both
No-context Gesture does not
require specific
context
Six-Axis Motion occurs
around both
rotational and
translational axes
Temporal Discrete Action occurs after
completion of
gesture
Complexity Simple Gesture consists of
a single gesture
Continuous Action occurs
during gesture
Compound Gesture can be
decomposed into
simple gestures
Nature Metaphor of
physical
Gesture is a
metaphor of another
physical object
Kinematic Impulse Low Gestures where the
range of jerk is
below 3m/s3
Physical Gesture acts
physically on object
Moderate Gestures where the
range of jerk is
between 3m/s3 and
6m/s3
Symbolic Gesture visually
depicts symbol
High Gestures where the
range of jerk is
above 6m/s3
Abstract Gesture mapping is
arbitrary
Aiming to build a gesture set, Ruiz, Li et al. (2011) conducted a study in which end-users
proposed gestures for given scenarios. Their taxonomy included a classification of gesture
parameter diversity (later classified as gesture’ mappings and characteristics (Table 1)) for

39
smartphones. They elicited gesture sets from 20 participants by presenting them with action
and navigation-based tasks such as ‘answer a phone call’. Upon a presented task, each
participant had to: first, verbally design a gesture; second, perform the gesture and, third, rate
their gesture against a predefined set of questions such as “The gesture I picked is easy to
perform” (Ruiz, Li et al. 2011). Based on the collected gestures, they found consensus among
study participants regarding movement parameters and gesture-to-command mappings. The
resulting taxonomy differentiates between how a gesture is mapped to a command and a
gesture’s physical characteristics.
Another taxonomy was developed by Wobbrock, Morris et al. (2009) who grouped gestures
into four dimensions for surface computing: binding, flow, nature and form. They collected
gestures from non-technical participants and formed a gesture set based on the participants’
consensus over the gestures for each command: a gesture used by the majority of the
participants for the same command was highly likely to be included in the final gesture set.
Based on the collected gestures, Wobbrock, Morris et al. (2009) developed their taxonomy
for analysing and characterizing gestures. The authors argue that while it is appropriate to
use gestures developed by system designers for early investigations, those gestures are not
necessarily what users would want. In later work, the authors support this hypothesis that
user-designed gestures are preferred by the ultimate users compared to those defined by
designers (Morris, Wobbrock et al. 2010).
To explore the tracking of fingers on mobile phones, Chun and Hoellerer (2013) chose three
commonly-used gestures; swiping, scaling and value adjustment. The gestures were designed
similar to existing gestures. Their results suggest that simple and computationally
inexpensive approaches for finger tracking can be accurately used while maintaining
acceptable frame rates.
2.3.4. Computer Vision Based Input
Computer vision systems are widely used to collect visual information for gesture-based
input (Freeman, Anderson et al. 1998). The choice of technique depends on factors such as
desired information, environmental circumstances and available computational power.
Commonly-sought information is recognition of objects and/or gestures (Mitra and Acharya
2007) and object tracking (Yilmaz, Javed et al. 2006). To gain this information,

40
environmental factors such as lighting, motion speed and blur as well as occlusions must be
considered (Moeslund and Granum 2001).
Several extensive overviews of computer vision-based motion capture are available
(Freeman, Anderson et al. 1998, Azuma, Baillot et al. 2001, Moeslund and Granum 2001,
Ballagas, Borchers et al. 2006, Zhou, Duh et al. 2008). Here, the focus is on robust vision
systems requiring little computational power and working reliably under varying
environmental factors.
Table 2. Assumptions of motion capture systems listed according to frequency starting with the most common assumption. This table is adopted from Moeslund and Granum (2001).
Assumptions related to appearance Assumptions related to movements
Subject 1. The subject remains inside the workspace
2. None or constant camera movement
3. Only one person in the workspace at a
time
4. The subject faces the camera at all times
5. Movement parallel to the camera-plane
6. No occlusion
7. Slow and continuous movements
8. Only move one or a few limbs
9. The motion pattern of the subject is
known
10. Subject moves on flat ground plane
1. Known start pose
2. Known subject
3. Markers placed on the subject
4. Special coloured clothes
5. Tight-fitting clothes
Environment
1. Constant lighting
2. Static background
3. Uniform background
4. Know camera parameters
5. Special hardware
The robustness and complexity of a vision system partly depends on the assumptions it makes
regarding the tracked object’s movements, the tracking environment and the tracked subject
(Table 2) (Moeslund and Granum 2001). Depending on their precise purpose, systems make
use of a number of these assumptions (Table 2) thus reducing the variable factors the systems
have to deal with for accurate tracking. The more assumptions made, the lower the
complexity due to the fewer tracking difficulties.
While none of the “Environment” assumptions hold when tracking objects using the mobile
phone, assumptions regarding the tracked subject are regularly made by these vision systems

41
(Table 2). For example, the TinyMotion system (Wang, Zhai et al. 2006) is independent of
environmental factors as it works reliably under different illumination conditions and
changing backgrounds, as do other mobile phone based systems (Vardy, Robinson et al.
1999, Kato and Kato 2009). As for successfully making assumptions regarding the tracked
subject, Vardy, Robinson et al. (1999) used a start pose by turning the wrist inwards before
the tracking is started. That way the camera is blackened, which starts tracking. Another
approach in mobile systems to aid robustness and reduce complexity is to add markers to the
tracked object (Kato and Kato 2009, Chun and Hoellerer 2013).
To successfully track an object, the desired object must first be segmented (identified) in the
image and, secondly, the desired information such as object movement over frames must be
extracted. Identifying or segmenting the object can be done by extracting spatial and/or
temporal information from the captured image. One simple and commonly-used approach
based on temporal analysis subtracts an image from a second image pixel by pixel (Polana
and Nelson 1994, Chun and Hoellerer 2013). Another temporal approach is to use the
coherent motion of object features such as the object’s edges or intensity between frames
(Freeman, Anderson et al. 1998, Boring, Baur et al. 2010). All the temporal approaches
require the tracked object to be the only one moving in the scene. In this research the question
whether this assumption can hold under certain circumstances for mobile phone-based
tracking is explored; e.g. when the tracked object is dominating the scene and moving at a
speed where the camera cannot focus on the background. Chapter 7 describes how this can be
successfully achieved.
When using spatial data to segment an image, either thresholding or statistical approaches
can be used. One of the simplest thresholding approaches is to use unique object features
such as colour (Darrell, Maes et al. 1994, Kovac, Peer et al. 2003) and shape (Potamias and
Athitsos 2008). If an object has no such unique features, markers can be attached to the
tracked object (Buchmann, Violich et al. 2004, Kato and Kato 2009). Rather than using
markers attached to the moving object, Chun and Hoellerer (2013) use a marker as a world
reference frame. Statistical approaches also rely on object characteristics such as colour or
edges. Multiple images are analysed and the statistical features such as intensity or colour are
extracted for each pixel. Afterwards, the current image’s values are compared to the statistics
to separate object from background (Yamada, Ebihara et al. 1998).

42
After being identified in the image, the object’s motion over several frames is determined.
The specific technique depends on the purpose of tracking. In the mobile phone environment
commonly sought information is the object’s distance (Chun and Hoellerer 2013), its
movement direction (Chun and Hoellerer 2013) and/or path (Wang, Zhai et al. 2006).
Object tracking and gesture recognition is typically a computationally intensive process.
Performing such recognition on mobile devices with limited processing power is challenging,
particularly when it involves image capture. Wang, Zhai et al. (2006) used a Motorola v710
to capture gesture input and reported a maximum rate of 15.2 frames per second (fps). When
image processing algorithms were applied to the input, the capture rate dropped to 12fps. Gu,
Mukundan et al. (2008) showed that many image-processing algorithms reduced frame rates
below one fps when implemented on a variety of different phones. Chun and Hoellerer
(2013) trialled a Lucas-Kanade optical flow algorithm (Lucas and Kanade 1981) to track the
hand on a Nokia N900 phone running Maemo 5. Using the optical flow method slowed the
mobile down to 1 – 5 fps. By replacing the slow method with a combination of background
subtraction and motion segmentation algorithms they increased the speed to 18 – 20 fps.
Common strategies to reduce computational requirements are to reduce the captured image’s
size, its colour scheme, to skip frames for analysis and grid sampling. TinyMotion (Wang,
Zhai et al. 2006) converts a 24 bit RGB colour image to an 8-bit image using bit shifting. To
additionally reduce computational complexity for the following computations, TinyMotion
uses grid sampling (Kuhn 2010). While rendering a 640 x 480 resolution video stream on the
display, Chun and Hoellerer (2013)'s system internally uses a 320 x 240 resolution for
computations. To further reduce complexity, some of the vision-based tasks are only
executed every 5 frames.
Tracking a large fast-moving object dominating a scene is challenging. Fast optical flow
algorithms and graph-cut approaches are viable but computationally expensive (Barron, Fleet
et al. 1994). With limited computer power, temporal difference images have been used
successfully to detect coarse-scale motion (Freeman, Anderson et al. 1998). To further deal
with changing lighting and blur, other properties of the tracked object are used, such as
object, shape and colour (Yilmaz, Xin et al. 2004).

43
2.4. Summary
A review of related work into two causes of screen occlusion has been presented. The
importance of the complete information being visible has also been shown in related work.
The first cause of occlusions considered is that produced by magnification strategies. There
has been much attention on the different magnification techniques in research, especially on
the desktop PC domain but less attention on magnification on small displays. Of the
magnification techniques which do not occlude information, most attention is on distortion-
based strategies such as fisheye lenses. With one exception, these distortion techniques have
been used to view and select information but not to create and edit it (Lank and Phan 2004).
However, some of the work for viewing information hints at the suitability of distortion
techniques to be used for information creation. This thesis explores the use of distortion-
based magnification techniques for creating and editing information.
The second cause for occlusion is caused by physical objects in the user’s line of sight and
has been subject to much research. Most commonly, those objects are fingers and hands used
to provide input on the mobile devices’ touchscreens. Methods to solve this problem use
different input channels already integrated in the phone sensors and the camera. Cameras
have been widely researched for different scenarios such as to determine the phone’s position
and to augment reality. However, little research has been done to track gestures captured
close to the camera while considering the phone’s limited performance compared to desktop
computers. This thesis explores the use of a mobile phone’s front-facing camera to capture
gesture input performed by the user’s thumb.
Regarding the first research question as to whether focus + context interfaces can be used to
achieve occlusion free magnification for content creation and editing, the review of related
work has shown the potential of existing focus + context interfaces but also hinted at
potential usability problems such as the moving canvas. As for the second research question
regarding the use of 3D gestures to provide precise input away from the screen, an analysis of
related work has indicated how this can be achieved potentially, and what interaction aspects
have to be considered.

44

45
3. Methodology
This chapter describes how ways to reduce information occlusion on small displays are
explored. The focus is on occlusions caused by magnification strategies and by fingers when
used to provide input on touch screens. For the first of the two, a review of related work
showed that focus + context interfaces which do not occlude content have been almost
exclusively used for information viewing and selection. To explore whether focus + context
interfaces are suitable to create and edit information, existing interfaces are tested for creating
and editing tasks which is described in the next section (Section 4.1). The results were used
as a foundation to identify potential usability challenges and develop, implement and test
solutions iteratively (Robey, Welke et al. 2001). These steps are described in Chapter 5.
Lastly, the study methods gauging the effects of the new features and evaluating the
improved focus + context interface with other common magnification interfaces are described
in Chapter 6.
Following a review of related work investigating ways to reduce information occlusion
caused by fingers, the focus is on gestures performed above the phone’s front-facing camera
to provide input away from the screen. To research unknown affordances and challenges of
this input metaphor, gestures and associated recognizers were designed. This is described in
Section 7.1. The next and final section (Section 7.2) outlines the evaluation methods to test
gestures and recognizers.
3.1. Existing Focus + Context Interfaces for Magnified Sketching
Different distortion interfaces have proved useful for a variety of tasks but their suitability for
content creation and editing has, to my knowledge, not been tested. To obtain usability and
performance baseline data for the new task domain, existing focus + context interfaces were
evaluated. To be able to compare the results, the same kind of data as other researchers
investigating magnification interfaces were collected: performance was defined by
completion time and error rate (Gutwin 2002, Ramos, Cockburn et al. 2007). Observations
and a questionnaire were also used to identify usability issues. The questionnaire was used to
ask questions precisely aiming at known usability issues from other domains as well as to
capture unanticipated matters. The aim was to identify interface features responsible for bad

46
and good performances. Positive features could be further exploited and bad ones either
improved or rejected for future interfaces.
To investigate the suitability of distortion interfaces for content creation, the first step was to
decide which interfaces to evaluate. As there are numerous existing focus + context
interfaces, each containing interdependent features, it was not feasible time-wise to test them
all. To determine which interfaces to test in greater detail, available interfaces were
informally tested against predefined criteria. To test the interfaces they were implemented in
the evaluation platform SimpleInk, described in Section 3.2.1. Once the candidate interfaces
were found, values for their specific features were determined.
To decide which focus + context interfaces to include in a more detailed study, existing ones
were filtered, implemented and tested. With many other promising distortion interfaces,
filtering helped to eliminate candidates whose restrictions were too limiting at this
exploratory stage of research. An interface passed the filter if, first, it allowed the user to
choose what part of the information to magnify; second, if the interface did not require
additional semantic knowledge to decide what to magnify, and third, if the interface’s
magnification was independent of user actions such as lens acceleration.
There are several features of a lens which contribute to its performance, such as distortion
dimension & function and lens size, most of which are continuous. Therefore, there are an
infinite number of lens variations. The issue of how many distortion interfaces to evaluate
included several considerations such as feasibility in terms of study duration. Too few
interfaces mean that insufficient distortion techniques are tested. Too many interfaces lead to
evaluation sessions that take too long for participants to complete, or require too many
participants to make statistical sense. Since the study attempts to distinguish between a small
number of key lens features, a small number of participants using a within-subject study
design suffices. Using fewer participants means that each participant needs to complete the
same tasks with all interfaces. This also means that the number of interfaces has to be kept
small to ensure a suitable study duration time for each participant.
Each interface has a different combination of features; some unique to a particular lens and
others identical across several lenses. Features include distortion dimension (e.g. space, time
and translucency) and magnification lens shape, size and distortion function (e.g. linear,
exponential and logarithmic). To investigate the impact of a feature on interface usability,
each tested interface uses a different combination of features. For example, one tested

47
interface may use a lens metaphor to show content enlarged. Other characteristics of this lens
may be that it uses space to embed the magnified information into its context, has a round
shape and uses a linear distortion function. Because features are interdependent, each
interface contains a limited number of unique features, making it easier to attribute a
particular usability aspect to a tested feature. Because of the number of features, not all
feature combinations can be tested. Hence those features likely to have a bigger impact on
usability such as distortion dimension are varied. Other features such as the lens metaphor
and magnification factor are kept identical across all interfaces.
3.2. Iterative Improvements of Focus + Context Interfaces
To improve existing focus + context interfaces so they can be used for information creation
and editing, identified usability issues (Section 4.1.3) had to be addressed. For each usability
problem, a number of interface features were iteratively developed (Robey, Welke et al.
2001), tested and their efficacy gauged. This included using and modifying existing features
found in related work such as a grid to help people comprehend distortions (Carpendale,
Cowperthwaite et al. 1997).
In each evaluation study, multiple interface features addressing different usability problems
were tested. As it was too time-expensive to test each feature in isolation, a number of
usability problems were targeted in each evaluation study and hence a number of features
trialled. When required, a particular usability problem has been addressed in multiple studies,
using what has been learned in the one study to inform the next study.
To reduce the number of confounding factors across evaluations, as many evaluation settings
as possible were identical. Therefore, a test framework called SimpleInk was developed in
which all magnification interfaces were implemented and tested. Additionally, the studies’
setups were kept identical. The evaluations settings and SimpleInk are explained in greater
detail in the following two sections.
3.2.1. Technical Framework
To investigate magnification interfaces for sketching, the test environment SimpleInk was
developed. The design of SimpleInk was driven by three central requirements. Firstly, the
main screen has to feature a drawing canvas for sketching and basic editing operations.
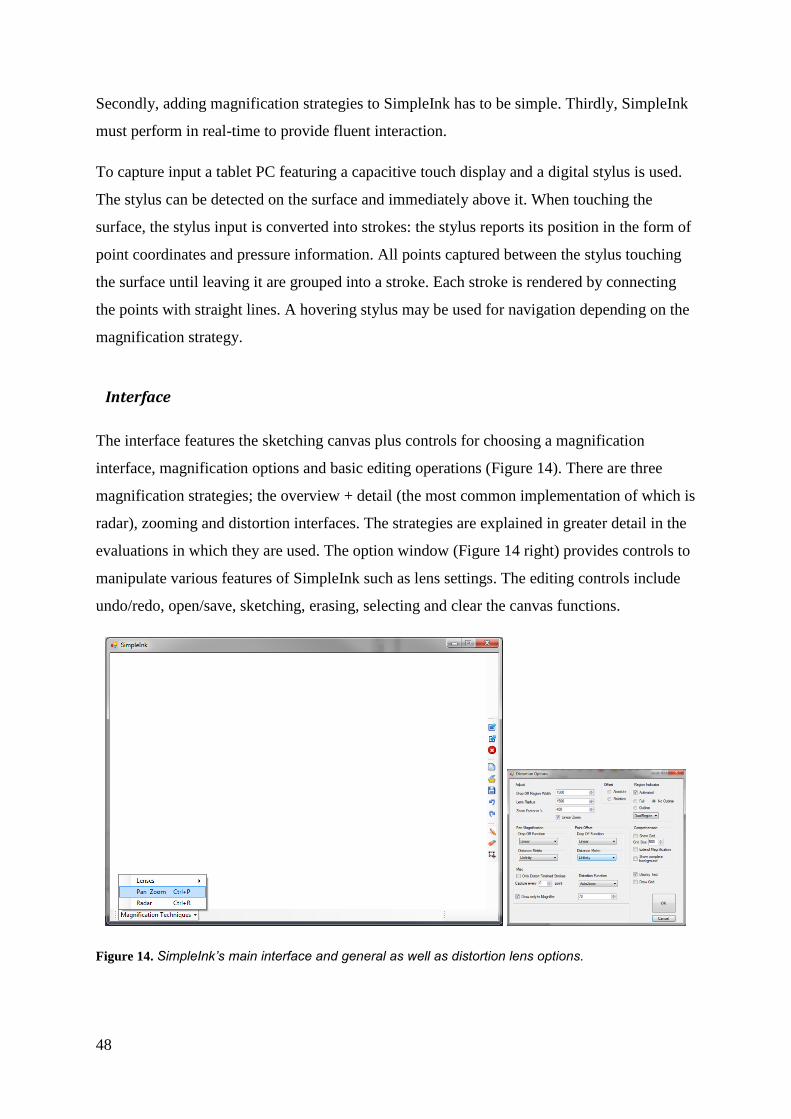
48
Secondly, adding magnification strategies to SimpleInk has to be simple. Thirdly, SimpleInk
must perform in real-time to provide fluent interaction.
To capture input a tablet PC featuring a capacitive touch display and a digital stylus is used.
The stylus can be detected on the surface and immediately above it. When touching the
surface, the stylus input is converted into strokes: the stylus reports its position in the form of
point coordinates and pressure information. All points captured between the stylus touching
the surface until leaving it are grouped into a stroke. Each stroke is rendered by connecting
the points with straight lines. A hovering stylus may be used for navigation depending on the
magnification strategy.
Interface
The interface features the sketching canvas plus controls for choosing a magnification
interface, magnification options and basic editing operations (Figure 14). There are three
magnification strategies; the overview + detail (the most common implementation of which is
radar), zooming and distortion interfaces. The strategies are explained in greater detail in the
evaluations in which they are used. The option window (Figure 14 right) provides controls to
manipulate various features of SimpleInk such as lens settings. The editing controls include
undo/redo, open/save, sketching, erasing, selecting and clear the canvas functions.
Figure 14. SimpleInk’s main interface and general as well as distortion lens options.

49
There are a variety of interface characteristics which can be manipulated. Most options
manipulate the distortion-based lenses. Basic options include the size of the inner and outer
lens regions, the magnification level and the lens indicators used to visually differentiate the
lens from the canvas. More advanced options allow the distortion strategy to be changed.
Implemented lenses include a standard magnifier, the document lens (Robertson and
Mackinlay 1993), the Sigma lens (Pietriga and Appert 2008) and variations of the fisheye
lens (Furnas 1986, Sarkar and Brown 1992). The different implementations of the lenses are
explained in the evaluation studies of the chapter where they are first used.
There are also a number of functions to control other aspects of a lens.
Two functions to manipulate the information in a lens’ distortion region; a linear and
a Gaussian function (Carpendale and Montagnese 2001) are provided.
Two distance metrics are available to determine a lens’ shape in two dimensional
space (Carpendale and Montagnese 2001): the L(2) and L(∞) metrics result in a round
and a square shape respectively.
(De)Activate of visual comprehension guides including a grid.
Background text to be displayed on the canvas. To improve letter smoothness when
distorted, a vector-based alphabet has been devised as part of SimpleInk that enables
each point of a letter to be manipulated and therefore distorted individually.
Software Architecture
SimpleInk allows magnification strategies to be easily added and modified by decoupling the
stroke processing from the rendering functionality. Stroke processing includes capturing the
sketched information, managing it and providing the information to the magnification
strategies. Each magnification strategy defines how the strokes are rendered. Encapsulating
the magnification strategies makes it easy to add and modify strategies without dealing with
stroke management.
Performance
SimpleInk is written in C# using the Microsoft Windows Real-Time Stylus interface, with
rendering partly done on the GPU using Direct2D (Microsoft 2010) to ensure real-time
performance. The Real-Time Stylus interface (Microsoft 2012) allows the program to react to

50
input as required as it notifies events but does not trigger other actions such as rendering. An
analysis showed that the drawing operations are the most computationally expensive ones. To
further optimize the rendering, drawing methods provided by the Direct2D API are
implemented in addition to the Graphics class’ (Microsoft 2013) drawing methods. This way,
rendering can be done on the GPU rather than the CPU increasing performance. Additionally,
the canvas uses double buffering to prevent screen flickering.
There are different Tablet PC programming interfaces for .NET Framework of which the
Real-Time Stylus is the fastest and most flexible. InkOverlay (Microsoft 2013) is a
commonly-used, comprehensive yet simple API which provides a variety of structures to
capture the ink and basic ink operations such as select, erase, move and copy. However, the
captured information is restricted to basic information about the pen’s current state.
Compared to the Real-Time stylus interface, the InkOverlay is also slower. The Real-Time
stylus interface is a performance-oriented, flexible and sparse API as it only provides basic
information about the pen’s state.
To further increase performance, only parts of the canvas are redrawn between screen
refreshes. In the overview + detail interface, the overview area is updated when the user has
finished sketching a stroke in the detail area. For the distortion interface, if not stated
otherwise, only the area covered by the lens is updated. The zooming interface does not use
any optimized sketching strategy as it is fast enough.
3.2.2. Evaluation Study Settings
All evaluation studies were conducted in a closed room on the University of Auckland
campus. The tablet PC was placed on a table and the user was seated next to it. Each of the
four studies used SimpleInk running on a HP EliteBook 2740p tablet PC featuring a 13”
capacitive display with a resolution of 1280 x 800. The tablet has an Intel® core ™ i7 CPU
with 2.67GHz and 4GB RAM. As an input device, the original HP digital stylus which came
with the tablet is used. The stylus has a barrel button close to the tip.
All studies have a within-subject design and in order to participate in the study, volunteers
were required to have normal or corrected-to-normal eyesight.
For all studies in this research, approvals from the University of Auckland Human
Participants Ethics Committee were obtained.

51
There are two general drawing rules for all following evaluation studies: first, sketching
outlines of the objects is sufficient and, second, if an object is sketched it should not intersect
with existing objects.
3.3. Efficacy of Improved Focus + Context Interfaces
To gauge the effect of the new features, the improved focus + context interface was compared
with other magnification strategies. Based on the literature review, common magnification
strategies and tasks were chosen to investigate the strengths and weaknesses of the tested
interfaces. An overview + detail and a zooming interface were compared to the improved
focus + context interface. The specific design of each interface was based on related work.
For example, the overview + detail interface features a bigger overview area and a small
detail area as this is a common approach for sketching. The same performance criteria as
those of the previous studies were chosen for this study: completion time, error rate and user
ratings and ranking were captured with a questionnaire and interviews.
3.4. Above Camera Gesture and Recognizer Design
In Chapter 2 the literature was reviewed regarding four different topics important for 3D
gesture interaction capture by mobile device cameras. Interaction techniques are studied for
mobile phones to investigate how to input data without occluding the screen. Next, camera-
based input interaction was investigated to identify how the camera could be used to trigger
input. The third topic of interest was gesture input. It provided insights into commonly-used
gestures, their applications and their strength and limitations. Lastly, algorithms to track the
finger used to input data were researched. The aim was to identify potential computationally
low-cost tracking algorithms to recognize the gestures using the camera. The purpose of this
investigation is to find an alternative way to manipulate the magnification interface without
involving the stylus (as it is already used to sketch) and without additionally occluding
information.
Mobile devices have various input channels facilitated by different technological device
features. As it was the goal to reduce screen occlusion, the input has to be captured away
from the screen. Another criterion was that the input method should not distract the user by,
for example, requiring device and thus screen movements by gyroscope and accelerometer.

52
Yet another criterion was that no additional hardware be needed. The front- facing camera
was chosen because of the convenient location next to the screen, the power to capture a
variety of gestures and hence the camera’s potential to enrich the interaction experience.
When choosing what gestures should be used for input, decisions have to be made
considering the limitations of the capturing method and the gesture affordances. Using the
camera meant that gestures have to be performed in the camera’s viewing field. In terms of
affordances, the gestures have to be distinguishable, memorable and easy to perform. The
difficulty of a gesture is influenced by the dimension it is performed in and the space
boundaries in which the gesture is performed. 2D gestures are generally easier to perform
than are 3D gestures as they only require movements on one plane. The motions involved in a
gesture also impact usability. For example, if a gesture requires the thumb to move away
from the phone which is held with the same hand, distance can become strenuous. Since the
exact requirements for gestures were not known, the aim was to seek out the boundaries for
the new interaction affordances. Thus, a set of gestures was designed, each having different
requirements with varying demands on the user and camera.
The gesture recognizers test different algorithms with varying computational demands to
explore the limitations of current mobile devices. The simplest recognizer analyses the light
distribution over the captured image and a step function to determine the input. The more
computationally expensive algorithms use multiple steps to recognize the gesture, each
employing different algorithms such as Sobel operators and flood fill algorithms. The choice
of recognition strategies also helped to explore robustness issues associated with the chosen
algorithms, such as requirements of lighting conditions.
3.5. Gesture and Recognizer Evaluation
To investigate 3D gesture input on mobile devices, a study trialling the designed gestures and
their recognizers was conducted. Tasks resembling typical activities were chosen to gauge the
recognizers’ accuracy and gesture usability. Based on the results, guidelines for gesture,
phone and gesture recognizer designers were formulated.
The aim of the study into gesture input was to engage the participants in performing the
gestures and thus testing the recognizers. To get the participants to use each gesture in all its
facets with as few constraints as possible, games were used. Each game ensured that

53
participants used all gesture motions and at different speeds. Another advantage of using a
game was that participants concentrated on the task rather than the gesture. Thus the gesture
became the intended means to an end and not the focus of the interaction. Because
participants would concentrate on the game, the weaknesses of the gestures and its recognizer
were more visible. For example, while concentrating on the game, a user may slowly drift
away from the camera’s viewing field, something which may not happen if the user mainly
focuses on the correct execution of the gesture.
Using a different application to test each gesture allows tailoring gestures to control familiar
scenarios. For example, using a circular gesture where the user has to make a circular motion
to increase or decrease the volume is a familiar combination often done with portable music
players such as the Apple IPod. Because of the familiar match, participants do not have to get
accustomed to how the gesture manipulates the application but can concentrate on completing
their tasks.
The aim was to use techniques to accurately recognize the gestures which run in real-time on
contemporary mobile phones. There is a broad variety of devices with small screens and a
front-facing camera available with different computational capabilities. Using cheap
performance recognition techniques ensures that the recognizers will run on most of the
phones available now and in future. To test whether the developed recognizers run in real-
time, a mobile phone with average computational power was used for the evaluation.
3.6. Summary
This chapter has provided an overview of the chosen methodology to achieve the goal to
reduce information occlusion. The artefacts produced by the steps of the methodology
include the novel focus + context techniques and new gestures and associated recognizers for
3D camera-based input. The following chapters describe the approaches to reduce screen
occlusion on small displays.

54

55
4. Magnified Occlusion-Free
Sketching
The goal of the research presented in this chapter is to explore occlusion-free magnification
strategies for sketching with the focus on distortion based techniques. These techniques show
all the information, thus overcoming the problem of spatial and/or temporal occlusion. In
contrast with earlier work which has been applied to information viewing and selection, the
goal is to suggest suitable techniques for creating and editing information. The sketching
domain offers an environment for rapid and unconstrained creation of information and thus is
ideal for exploring the requirements of distortion-based techniques.
In this chapter, the first of four incremental evaluation studies is described. Each iteration
includes the identification of requirements, the development of solutions and their evaluation.
The first study determines the efficacy of existing magnification interfaces when used for
sketching. The results provide a detailed insight into the interfaces’ strength and weaknesses
for content creation. From the results, general requirements of distortion lenses for magnified
sketching are identified and used as base-line data for the second study presented in the next
chapter (Section 5.1).
Portions of the chapters have been published elsewhere (Schmieder 2011, Schmieder,
Plimmer et al. 2012).
This chapter begins with a detailed description of the first study (Study I). Next the study’s
results are presented before the chapter concludes with a summary of the findings and a
discussion.
4.1. Study I - Basic Lens Configuration
Different visualizations for distortion techniques have been widely researched over the past
30 years. The tasks such techniques have been tested on almost exclusively concern viewing
and selecting information. Here, however, distortion lenses are used in the sketching domain.
This new combination magnifies information and allows users to rapidly create and edit

56
content with high precision. The versatile nature of sketching means that both known
difficulties and possible emerging ones may pose challenges. To understand these challenges
better and thus to make distortion lenses and sketching a successful combination, a user study
evaluating existing distortion-based magnification lenses was conducted.
The goals of this study are:
to investigate how people use the lenses;
to look into what people like and dislike about the lenses in general;
to identify the specific lens properties which prove beneficial for the interaction, and
to test whether different lenses and/or lens properties are preferred for the task types
drawing and writing.
To meet these goals, several lenses incorporating a variety of different lens properties are
tested.
4.1.1. Selection of Distortion Interfaces
Several distortion-based interfaces were implemented and informally tested to select those for
further, more rigorous testing: the document lens (Robertson and Mackinlay 1993), Sarkar
and Brown’s fisheye lens (Sarkar and Brown 1992) and the Sigma lens (Pietriga and Appert
2008). Three interfaces were ignored: the perspective wall (Mackinlay, Robertson et al.
1991), blurring lenses (Kosara, Miksch et al. 2001) and speed-coupled lenses (Gutwin 2002)
as they did not make the filter described in Section 3.1.
Informal testing of the implemented distortion interfaces was done by five Human Computer
Interaction researchers who provided formative feedback. Each participant completed a series
of drawing tasks with all implemented interfaces. Based on the results, the document lens
(Robertson and Mackinlay 1993) was excluded because of the strong distortions in the
interface and their frequent changes. When using the perspective wall in SimpleInk,
participants complained about the omnipresent distortion and its frequent changes.
Sarkar and Brown’s fisheye lens (Sarkar and Brown 1992) and the Sigma lens (Pietriga and
Appert 2008) were the most promising candidates for further testing. Both interfaces showed
promising results in the preliminary tests. Also, the analysis of related work has shown that

57
both lenses have been proven efficient for a variety of tasks similar to drawing and writing
(Cockburn, Karlson et al. 2009) such as steering tasks (Gutwin and Skopik 2003).
4.1.2. Evaluation of Existing Distortion Interfaces for Magnified Sketching
The goal of this evaluation is to investigate how existing distortion lenses perform in the
sketching domain. The results will show that they are not usable for sketching. However, this
study provides insights into the problem and provides baseline performance data.
An experiment was conducted asking participants to complete four tasks using three different
distortion lenses integrated into SimpleInk: fisheye (Furnas 1986, Sarkar and Brown 1992),
blending (Pietriga and Appert 2008) and fixed fisheye lens (Furnas 1986, Sarkar and Brown
1992). If the stylus is hovering over the surface, the distortion lens is shown relative to the
stylus tip’s position. This is used to navigate the canvas and inspect the sketched objects.
When in contact with the surface, digital ink is generated at the stylus’s position. Lens and
stylus are coupled, so when the stylus is moved, the lens moves as well.
For the remainder of this thesis, this evaluation is referred to as Study 1.
Distortion Interfaces
The three interfaces have different features, some unique to a particular interface and others
identical across interfaces for which values had to be determined. Fixed features are features
that all interfaces share while variable features are those specific to a particular interface.
The distortion function is a fixed feature and determines how the information is visually
transformed. There is no perfect candidate and multiple functions have been looked at
(Carpendale and Montagnese 2001). A linear function was chosen because it is arguably the
easiest to understand in terms of the visual distortions it causes.
Another fixed feature all interfaces share is the lens metaphor. The lenses consist of an inner
and an outer region. The inner region displays the information at constant magnification. The
outer region shows a visual transition between the magnified information in the inner lens
region and the information outside the lens.
The remaining fixed features are the size, indicators and the magnification factor. All lenses
are one-third of the display height. For interaction support, each lens’ region is shaded grey

58
with blue borders to indicate the lens’ shape and size. The magnification factor for all lenses
is three.
Variable lens features include the distortion strategy and lens shape. The distortion strategy
determines how information is visually connected between the magnified and non-magnified
interface regions. One strategy is to use space to visualize the transition between detailed and
context view but has the disadvantage of additional space being required (Furnas 1986). Its
advantage is a direct visual connection between the two regions (Figure 15). Sigma lenses
(Pietriga and Appert 2008) use translucency which does not require extra space for
transitioning as the magnified ink is drawn on top of the original-sized ink in the same area.
However, by stacking both views there is no direct visual connection between information
parts spanning over the magnified and context regions (Figure 16).
The lens shape depends on the distance concept used to compute the visual distortions. One
often-used concept is the Lp-metric (Carpendale and Montagnese 2001) which allows
different shapes by adjusting its dependent variable. If set to L(∞) it is squared (Figure 15)
while for L(2) (called Euclidian distance in two-dimensional space) the distortion shape is
round (Figure 17).
The three chosen magnification interfaces are introduced next and their individual features
explained. The features include the distortion strategy and lens shape.
Figure 15. Fisheye lens: The left sketch shows the sketch unchanged. The right side shows the fisheye lens which consists of two regions: the inner region encased by the inner blue border shows the information at a constant magnification. The outer region or transition region shows the information visually transformed. Outside the lens the information remains unchanged.
FISHEYE LENS
The fisheye lens is based on Furnas (1986), Sarkar and Brown (1992) and Carpendale and
Montagnese (2001). It is divided into focus and transition regions (Figure 15). The focus
region is flat and shows the ink at constant magnification and undistorted. A flat focus region

59
provides a sketching area with consistent characteristics. The transition region which
immediately surrounds the focus region uses a linear drop-off function to distort the ink. The
distance between the original point’s location (P) and its distorted location (P’) is calculated
as follows:
C is the lens center, z the zoom factor, r1 the radius of the focus region, r2 the radius of the
transition region and d(C,P) the distance between lens center and P.
The lens’ diameter is one-third of the display height, a value commonly found in related work
(Jakobsen and Hornbæk 2011). The focus and transition region have the same width. The lens
shape is rectangular using a L(∞) metric (Carpendale and Montagnese 2001).
Figure 16. Blending lens: The upper layer shows the ink fully opaque in the center and linearly fades out in the outer lens. The lower layer shows the unmagnified content which fades out towards the lens center.
BLENDING LENS
The blending lens is based on Sigma lens (Pietriga and Appert 2008) and consists of one
region. The blending lens uses different levels of opaqueness to transition between focus and
context regions (Figure 16). The lens consist of two layers: the lower layer shows the original
ink while the upper layer shows the magnified ink. The magnified ink is fully opaque within
a predefined (1/3 of the lens size) distance of the center: outside this area the opacity
decreases linearly until it vanishes. The lower layer is designed in the opposite way; the ink is
fully opaque on the outside of the lens and decreases linearly until it completely vanishes at
the lens center. The upper and lower layers use the same linear function to compute each
pixel’s opacity as the fisheye lens uses to calculate each pixel’s offset. The lens shape is
rectangular using a L(∞) metric.

60
Figure 17. The fixed lens: the red border indicates that the lens is currently pinned down.
FIXED LENS
The fixed lens is a fisheye lens (Furnas 1986, Sarkar and Brown 1992) that can be pinned to a
location using the stylus button. Thus it avoids the known problems of a moving canvas
(Gutwin 2002). Pinning the lens decouples stylus and lens movement and allows users to
draw freely without the lens moving, a technique previously used by Appert, Chapuis et al.
(2010). When finished, a user unpins the lens using the stylus button and moves it to the next
location. This lens is circular using a L(2) metric (Carpendale and Montagnese 2001). The
fixed lens’ implementation is identical to the fisheye except for the circular shape and ability
to be pinned down. For the evaluation, participants were told that the lens has to be pinned to
sketch.
For a detailed overview of the different lens properties and their respective values please refer
to Table 3.
Table 3. The properties of the distortion interfaces. Each lens is 1/3 of the display height, magnifies the information by factor 3 and uses a linear distortion function.
Property Fisheye Blending Fixed
Transition dimension Space Translucency Space
Distance metric L(∞) L(∞) L(2)
Lens freezes No No Yes
Procedure
Participants were placed at a desk on which the tablet PC lay. The tablet screen was folded
over the keyboard so that the screen was flat on the table facing the participant. At the start of
the study, each participant was given a tutorial. Participants were advised that it is sufficient

61
to sketch an object by indicating its outline. After they had read the general instructions, they
had to complete the first part of the questionnaire.
The next steps were repeated for all three lenses. At first, the study facilitator activated the
distortion lens and demonstrated the lens’ characteristics. Afterwards, the participants
familiarized themselves with the lens by playing a game of noughts and crosses against the
facilitator. Before and after each task the facilitator loaded the template and saved the final
sketch.
Each participant started with the first task of the respective task series. After completing both
drawing tasks, the participants rated their experience using the questionnaire. Then the two
writing tasks were completed before finishing the rating section of the questionnaire. After
completing all 12 sketching tasks, the participants used the third section of the questionnaire
to rank the lenses and answered questions regarding preferred and non-preferred lens
features.
Figure 18. Test environment showing empty ((a)-(d) and completed ((e) – (h)) examples of the tasks. The upper row shows the drawing tasks ((a & e) floor plan, (b & f) maze) and the lower row the writing tasks ((c & g) UML class diagram, (d & h) favourites list).
Tasks
Each participant completed a task series (two drawing and two writing tasks) with each of the
three distortion lenses. Tasks were divided into drawing and writing to investigate whether
these activities have different requirements and thus require different lenses; drawing

62
typically involves slower and longer stylus movements; writing usually consists of faster,
curvy stylus motions.
To compel the participants to use the lenses, they were given a template for each task (Figure
18), to which they had to add objects. Participants were asked not to let added components
touch their containing objects. For example, when adding a TV to a TV cabinet, the TV
boundaries should not intersect with the cabinet.
For the first task in each task series, a floor plan had to be completed by adding seven new
objects to the floor plan. The challenge for this task was to add small objects to a given
scenario. Additionally, the lens had to be moved over at least half the canvas between each
addition operation.
The second task in each task series asked the participants to complete a maze. The template
showed the outer border of the maze with two openings. To complete the tasks, further walls
had to be progressively added within the inner region, forcing the participant to draw smaller
and smaller elements each time. Finally, a line indicating a path from outside the maze to the
smallest, innermost shape was drawn. The design of this drawing task forced longer lines to
be drawn; the distortion lens was not always big enough to cover the ink of interest.
The first writing task contained a skeleton of a UML class diagram to which five method
names had to be added. The challenge was navigation as the participants had to ensure that
each method name neither touched the name in the next line nor the class box. Additionally,
space awareness was necessary so that the class box would fit all five methods.
The template for the final writing task contained five textboxes to which words had to be
added. This task design helped participants with navigation but forced them to move more
into writing operations. Additionally, the lens had to be repositioned every time. For an
overview of the tasks and their variations across the three task series refer to Table 4.

63
Table 4. The tasks in the three series for Study 1.
Task Series 1 Series 2 Series 3
Drawing 1: Completing a
floor layout
Living room
Bathroom Garage
Drawing 2: Draw a maze Rectangular maze Triangular maze Diamond-shaped maze
Writing 1: Complete a
UML diagram
Methods around office
activities; e.g. “Print()”
Methods indicating
colours; e.g. “Yellow()”
Methods around sport
activities; e.g.
“Running()”
Writing 2: Complete a list
of text boxes
List of Favourites; e.g.
“Porsche” for the car
category
List of cities in the world;
e.g. “Berlin”
List of famous titles; e.g.
“The Jungle Book” for
the book category
Method
The study had a within-subject design and tested two variable factors: distortion lens (fisheye,
blending, fixed lens) and task type (drawing, writing). Participants completed three task
series, each comprising two drawing and two writing tasks. The order of tasks series was
identical for each participant; i.e. each participant started with Series One and finished with
Series Three. To reduce the learning effect but to ensure that the task order had no influence
on the outcome, the tasks had a similar design across the three series; e.g. the first task in
each series was to complete a different floor plan.
While the tasks series order was kept constant, the order of lenses was varied, forming six
conditions (Table 5). This allowed to account for the possible effect of lens order.
Participants
Twelve participants volunteered for the study (10 male and 2 female), ranging in age from 20
to 32 years. None had used digital distortion lenses before. Two of the participants were left-
handed. Recruitment took place on the university campus, resulting in participants from four
faculties.
Pilot Studies
To validate the test protocol and to determine whether the instructions were appropriate to the
tasks, two pilot studies were conducted. Based on the first pilot study participants' comments,

64
the questionnaire was updated. In its initial version, participants were asked to state their
preferred lens. This was replaced by a lens ranking to additionally learn about the least
preferred lens. In SimpleInk, the pen button has been deactivated for the fisheye and blending
lenses as it was unintentionally activated by the pilot participants numerous times.
Table 5. The six conditions used to evaluate the chosen existing distortion interfaces for magnified sketching: the fisheye lens, the blending lens and the fixed lens.
Condition Lens I Lens II Lens III
1 FishEye Blending Fixed
2 Blending FishEye Fixed
3 Fixed FishEye Blending
4 FishEye Fixed Blending
5 Blending Fixed FishEye
6 Fixed Blending FishEye
Apparatus
The test application, SimpleInk, was run in full-screen mode on a 1200 x 800 pixel display.
The zoom was set to 3 for all distortion lenses and could not be adjusted by the participants.
The distortion lens was activated at all times. The sessions were recorded using screen
capture, video and sound.
Data Captured
For each task, completion time and number of errors were measured. The completion time
was defined as the period between when the stylus was first in display range until the last
object of the task was completely drawn. A shape irregularly intersecting with another shape
was counted as an error.
A questionnaire that contained three sections was completed by all participants. The first
section enquired about their general familiarity with digital sketching and distortion lenses on
a 5-point Likert scale. The second section asked the participants nine questions in which they
had to rate different lens characteristics on a 7-point Likert scale for drawing and writing
respectively. The last section asked the participants to rank the three lenses according to
preference. Additionally, three open questions requested further explanations as to what they
liked and disliked about the lenses, including their features of choice for the perfect distortion

65
lens. This often evolved into a discussion between the researcher and participant about the
effect of the different features.
4.1.3. Results
The results presented in this section are based on the data captured using the participants’
drawings, screen capture using Morae (TechSmith 2005) and the questionnaire. It took the
participants approximately an hour to complete the study. Here, the mean scores for each
specific task are reported followed by a summary of task results and participants' ratings of
the interfaces. Participants’ comments and the study facilitator’s observations are also
reported.
The completion time had a normal distribution. Error rates were transformed using the natural
logarithm to overcome their non-normal distribution. The data was analysed using a one-way
repeated measures ANOVA for factor distortion interface (fisheye, translucency or fixed
lens). Significant differences between groups were examined using Bonferroni-corrected
pairwise comparisons. If sphericity was violated, Greenhouse-Geisser estimates were used for
correction. To analyse the questionnaire data, Friedman’s ANOVA (nonparametric) tests
were used. For further analysis investigating the differences between variables, Bonferroni-
corrected Wilcoxon signed-rank tests were used.
Task Completion Times
A significant difference was found for the total completion time, F(2,22) = 6.338, p = 0.007.
Pairwise comparisons showed that the fixed lens (463s±136) was significantly slower than
the blending lens (350s±78), p = 0.014. There were no significant differences between fixed
lens and fisheye lenses (380s±94) or between fisheye and blending lenses. The fixed lens
(175s±43) was significantly slower than fisheye (134s±40, p = 0.02) and the blending lenses
(136s±28, p = 0.007) when completing the first drawing task which involved on average eight
repositioning actions. For Tasks Two to Four, no significant differences were found.
Two of the lenses (fisheye and blending lens) were coupled with the pen so participants could
only draw in the lens' centre. However, participants using the fixed lens could draw anywhere
and they used one of three different sketching strategies with different impact on completion
time and error rate. Strategy One was to pin the lens at the desired location and exclusively

66
sketch in the magnified inner region of the lens. The lens was later repositioned to the next
location. Strategy Two extended Strategy One with participants sketching in the magnified
and distorted regions of the lens. This approach resulted in a lower completion time but more
errors as the content sketched in the transition region did not always look as expected (Figure
19). Strategy Three was to pin the lens at a location and sketch inside and outside the lens.
This resulted in the lowest completion time of the three strategies but also in the highest error
rate.
Figure 19. The use strategies for the fixed lens when drawing. The original shape is shown in (a). (b) shows the FL fixed in the centre of the shape. One strategy is to draw only in the magnified region once the lens is fixed (c). Another strategy is to draw in the distorted area probably resulting in a drawn shape which does not look as intended (d).
Error Rate
A statistically significant difference was found for the error rate: F(2,22) = 63.186, p < 0.001.
Pairwise comparisons show that using the fixed lens (2.2±2.37) resulted in significantly fewer
errors than the fisheye (8.42±4.52, p < 0.001) and blending lenses (8.12±3.71, p < 0.001).
Looking at the tasks individually, the fixed lens is shown as always resulting in significantly
fewer errors (Table 6) except for the maze drawing task.
The second drawing task involved drawing bigger shapes. In this case there are no
disadvantages for lenses without the ability to decouple lens and pen movement regarding
precision. This is because participants were only asked to draw a shape within another shape
but not as close as possible to another shape. For the fixed lens, the previously explained
drawing strategies Two and Three were mainly used for the second drawing task, resulting in
more errors than the other two lenses (fisheye:11, blending: 15, fixed:19).

67
Table 6. Descriptive statistics for the error rate for the four tasks and the Within-Subjects Effects’ p-values.
Tasks FishEye Blending Fixed p-value
1 (drawing - floor plan) 3.17±2.12 3.67±2.1 1.25±1.01 0.002
2 (drawing - maze) 1.56±1.38 1.25±1.22 0.92±1.44 0.213
3 (writing – class diagram) 1.67±1.56 0.83±1.03 0±0 0.038
4 (writing – list) 2±1.48 2.42±1.31 0±0 0.000
For Drawing Task 1 and the writing tasks, the fixed lens allowed for a considerably greater
precision (Table 6). Figure 20 shows an example of the same class diagram completed by
different participants using the three different lenses. As can be seen, the fixed lens (Figure
20 (c)) looks smaller, requiring a lot less space than the same UML diagram drawn with the
other two lenses. Another advantage of the fixed lens over the fisheye and blending lenses is
that the overall space available can be better estimated regarding how big a word can be so
that all words fit. The words in (a) and (b) became smaller the further down the list they were
with the last word being almost squeezed in, but in (c) they appear of equal size.
In summary, using the fixed lens results in a statistically significant lower error rate for tasks
where space is limited. There is no statistically significant difference between fisheye and
blending lenses.
Figure 20. A completed UML diagram from Task One using (a) the fisheye lens, (b) the blending lens and (c) the fixed lens.
Participant Interface Preferences
An analysis of the ranking data shows no significant difference for drawing (χ2(2) = 3.17, p =
0.205) but one for writing (χ2(2) = 14, p = 0.001). Pairwise comparisons for the drawing
rankings shows that the fixed lens (1.17±0.39) is ranked significantly higher than the fisheye
(2.67±0.49, T = 0, p = 0.002) and blending lenses (2.17±0.72, T = 9, p = 0.015).

68
Comparing the ratings from the questionnaire for drawing, the questions regarding the ease of
using the distortion lens (χ2(2) =12.47, p = 0.002) and whether one would like to reuse the
lens (χ2(2) = 8.58, p = 0.014) show significant differences. The blending lens (4.33±1.92) is
rated by participants as being significantly easier to use than the fisheye lens (3.25±1.66, T =
0, p = 0.01). Furthermore, participants reported that they were less willing to reuse fisheye
lens (3±1.54) compared to the fixed lens (4.58±1.31, T = 3, p = 0.011).
For writing, there are significant differences for three questions - namely, the ease of using
the distortion lens (χ2(2) = 8.45, p = 0.015), the impact of the negative effects caused by the
distorted ink (χ2(2) =7.95, p = 0.019) and the willingness to reuse the lens (χ
2(2) =10.42, p =
0.005). The fixed lens (5.42±1.44) is ranked significantly higher regarding its ease than the
fisheye lens (3.5±1.57, T = 2.5, p = 0.01). Furthermore, the negative impact of the distortion
is ranked significantly higher for the fisheye lens (2.75±1.29) compared to the fixed
(4.83±1.8, T = 4, p = 0.016) and blending lenses (4.17±2.04, T = 0, p = 0.011). Note that the
question was asked in a negative fashion; that the lower the rating the worse the impact of the
distortions on sketching. Finally, the fisheye lens (2.83±1.47) is ranked significantly lower
regarding the participants willingness to reuse the lens compared to the fixed lens (5±1.04, T
= 0, p = 0.007).
There is a negative correlation between the participants’ choices to use the lens again and the
error rate (r2
=- 0.422, p < 0.01). There is no correlation between completion time and the
participants’ choices to reuse the lens. Thus participants tend to prefer lenses with which
fewer errors are produced but do not care very much about the time.
Differences between Drawing and Writing
To analyse the differences between drawing and writing, completion time and error rate,
dependent t-tests were used comparing the drawing and writing times and error rates for each
lens separately. On average, the writing tasks were completed significantly faster than the
drawing tasks for each lens. There were no significant differences for error rate for the
fisheye and blending lenses. However, there is a significant difference between drawing
(1.08±1.25) and writing (0±0) with the fixed lens, t(23)=2.249, p = 0.34. While participants
made no error with the fixed lens when writing, both drawing tasks resulted in a similar
number of errors (task 1:15, task 2:11). A comparison of the participants’ interface ratings for

69
drawing and writing from Questions Four to Eight about lens usability characteristics (Figure
21) from the questionnaire showed no significant differences.
The writing and drawing tasks were not designed to take an equal amount of time nor were
the number of objects which had to be drawn. The participants’ ratings and their comments
suggest that there is no difference between drawing and writing but more tests are required
for a substantiated assessment.
Participants’ Comments
Participants said that the perfect distortion lens should have the ability to be pinned down.
Ten participants said pinning down the lens enabled them to draw more space efficiently and
neatly as the canvas was stationary. They described the feeling of sketching on a moveable
canvas as unnatural, undesirable and extremely uncomfortable. The lens preferences and
willingness to use a lens again were congruent.
Five participants suggested that the lens was always a bit too small so they were looking for
an easy way to manipulate the lens size. The different lens shapes were not noticed by ten of
the participants. When specifically asked, nine said they did not care and three stated a slight
preference for the rectangular shape.
The fixed lens was preferred by 83.3% of the participants for writing. When asked why they
preferred the lens, eleven of twelve participants specifically stated that the stationary mode
was their main reason. This made drawing larger shapes more cumbersome as they frequently
had to reposition the lens. The missing ability of the fixed lens to move freely led to the lower
ranking for drawing.
The blending and fisheye lens were coupled with the pen and so the lenses moved whenever
the pen moved. A typical comment when using one of the two lenses with a moving canvas
was: “It feels like writing in a moving bus.” Additionally, participants stated that the
fisheye’s distorted ink and the blending lens’ unmagnified ink were difficult to comprehend.
Comparing the lenses with a moving canvas, the fisheye lens was observed to be better
received than the blending lens. The participants said that they did not understand the
blending lens as they could not relate the magnified and non-magnified ink. They stated that
the lower layer was a smaller duplication of the upper magnified layer. Participant 7 said,

70
Figure 21. Ratings on a 7 point Likert scale centred on neutral. The scale categories are: strongly disagree (SD), disagree (D), disagree somewhat (DS), neutral (N), agree somewhat (AS), agree (A) and strongly agree (SA).
“There wasn’t any further information coming from the blending lens compared to the other
two lenses.” This was a common opinion.
Furthermore, participants rated the use of the fixed lens’ transition region higher than the
blending lens’s non-magnified lower layer (Figure 21). Participants said that they mainly
used the fixed lens’ distorted ink in the transition region for navigation and drawing.
Suggestions for features for distortion lenses apart from those evaluated included a variety of
proposals. One suggested feature to increase comprehension of the visual distortions was a
grid. Another proposal was a lens that only shows distortions when stopped, which is similar
to speed-flattening lenses (Gutwin 2002). The latter decreases the degree of magnification at
higher movement speeds and therefore distortion, depending on the lens’ acceleration. Yet
another proposal was a semantic lens. The idea is that a lens could emphasize objects similar
to those in the lens area and de-emphasize other objects. A similar method has been used by
Kosara, Miksch et al. (2001) who blurred chess pieces which were not important for a current
situation in a chess game.
In sum, the ability to decouple lens and pen movement as done in the fixed lens resulted in
significantly fewer errors at the cost of a higher completion time. Additionally, the fixed lens
was generally preferred by participants, especially when fewer lens repositionings were

71
required. However, the more repositionings were required, the less participants liked the
fixed lens.
Discussion
This discussion informs and confers about the learned information. The discussions form the
basis for the decisions made regarding the following studies.
Distortion lenses contain many features which are interdependent. Furthermore, most features
have continuous values. It is not feasible to test each feature independently so certain factors
were fixed, such as the magnification degree. Two distortion techniques were used (fisheye
and blending) which made it difficult to identify the individual sub-features and their effects
on performance and preference. This discussion is mainly based on written comments in the
questionnaire and discussion.
Transitioning using space between the magnified content and its non-magnified context was
preferred by participants over using translucency. While the results suggest that the way the
fisheye technique integrates the magnified view into its context, it remains unclear whether
different parameters of the blending lens would have yielded different results; choosing a
different level of opacity might have had a more positive effect or a larger and differently-
shaped opaque areas may have also increased understanding.
The primary usability problem was the moving canvas under the lens; participants preferred
the fixed lens. By fixing the lens, the error rate was reduced but at the cost of time taken to
position the lens. The main reason for the difference is most likely due to the frequent
repositioning of the fixed lens when completing the tasks. This becomes obvious when
comparing tasks involving many or only a few repositioning steps. A possible solution is to
decouple lens and pen movement automatically using context information.
The next issue most evident was that distorted ink in the transition region was hard to
understand. It has been shown that the process of mentally translating an object’s distorted
representation into its original shape increases mental workload (Carpendale, Cowperthwaite
et al. 1997). Some participants’ solution was to position the lens so shapes of interest are in
the magnified region. Others took the additional time to understand the distorted ink. Two
possible solutions are to dynamically adjust the size of the lens so that it covers all shapes of
interest, or to visually connect related ink in the magnified and distorted regions.

72
The inability of the fixed lens to sketch freely led to lower ranking for drawing compared to
writing tasks. As participants were asked to only sketch with the fixed lens pinned down,
drawing bigger shapes meant needing to frequently reposition the lens. This involved
pressing the pen button to unfreeze the lens, reposition it so that it aligns with the previously
added content and press the button again. For the writing task, repositionings were rarely
required for individual words as most words fit into the magnified region of the lens.
However, the ratings for the drawing tasks suggest that if the words were longer (thus
requiring frequently repositionings) the fixed lens would have received lower rankings for the
writing tasks too.
None of the lenses were suitable for sketching: the overall acceptance of the lenses and the
participants’ willingness to use any of them again averaged a neutral rating at best. However,
although none of the existing lenses proved suitable for sketching, this evaluation study
provided an insight into the usefulness of their individual features.
In sum, comments such as, “The winning lens wasn’t really good by itself but was the best
one of the three.” suggests that further research needs to be done before distortion lenses can
be used to successfully support magnified sketching. Additionally, I believe that, specifically
in combination with the ability to be pinned down, the fisheye technique is more suited as it
better visually integrates the magnified ink into the non-magnified sketch.
4.1.4. Summary
Based on the evaluation’s results, the main challenges for the use of distortion techniques are:
1. the moving canvas;
2. the distortions are distracting and difficult to comprehend
The quantitative and qualitative results from the evaluation have shown that the fixed lens
partly overcomes those problems resulting in a lower error rate but requiring more time. As a
result, the participants preferred the fixed lens and rated it the least distracting regarding its
distortion (Figure 21). While the fixed lens was clearly rated the most suitable lens for
writing, the blending lens was rated slightly higher for drawing. The fisheye lens was found
to be the most distracting lens with the lowest appeal for potential users.

73
Regarding the several lens features used, qualitative results show a demand for
comprehension support of the distorted information became obvious, as well as the ability to
freeze the lens specifically for writing. Also, a linear and non-skewed distortion function is
the most suitable as anything else hinders users from estimating distances between shapes
correctly. No significant differences between drawing and writing were found suggesting that
both task types have the same requirements on distortion interfaces. Finally, despite the non-
linear transformation of the squared lens caused by the L(∞) distance metric, participants
slightly preferred it over the circular lens as it made aligning on the horizontal and vertical
axes easier.
The analysis of results suggested further research needs to be done before distortion lenses
can be used to successfully support magnified sketching. Although none of the existing lenses
proved suitable, using them provided insight into the usefulness of their individual features.
To overcome the main problems, a lens (see listing above) has to have a feature to decouple
lens and pen movement, a rectangular shape and use a linear and non-skewed distortion
function. Additionally, the results suggest that the fisheye technique has the most potential as
it better visually integrates the magnified ink into the non-magnified sketch. In the next
chapter, the second and third studies exploring and evaluating potential solutions to overcome
the moving canvas and distortion comprehension problems are presented.

74

75
5. Development of Intelligent
Distortion Strategies
Building on the results from the first evaluation study (Study 1), two novel distortion lenses
were implemented. In the previous study evaluating the use of existing focus + context
techniques/views for content creation and editing, two usability problems were identified.
These problems mean that existing focus + context techniques are not suitable for content
creation and editing tasks. Hence, the focus of the two studies presented in this chapter is to
find solutions for three of the problems identified in Study 1: first, the moving canvas when
sketching and, second, to make the distorted content easier to comprehend.
The study reported in this chapter (Study 2) addresses both identified problems; the moving
canvas and comprehension difficulties of distorted objects. Three solutions are tested for each
of the two problems. A further study (Study 3) focuses exclusively on the comprehension
problems caused by visual distortions and is discussed later in this chapter in which two
novel visual guides are developed and compared with a grid and a control condition to gauge
each guides’ effectiveness to support comprehension.
Portions of this chapter have been published elsewhere (Schmieder 2011, Schmieder,
Plimmer et al. 2012, Schmieder, Luxton-Reilly et al. 2013).
This chapter considers the conduct and conclusions of Study 2, including a detailed
description of the tested interfaces, the study setup and results. Afterwards, Study 3 is
presented in depth. This includes a description of the evaluated visual guides, the evaluation
itself and a discussion and summary of the results.
5.1. Study 2 - Evaluation of Intelligent Distortion Interfaces for
Magnified Sketching
To be able to compare the evaluation results from the new lenses with the previous ones
(Study 1 in Section 4.1), the new lenses were evaluated using the same evaluation methods,
procedure, measured variables and tasks.

76
For the remainder of this thesis, this evaluation is referred to as Study 2.
5.1.1. Distortion Interfaces
The design of the three new lenses concentrates on specifically addressing two major
usability issues identified in Chapter 4. First, to solve the problem of the moving canvas,
three different strategies to optimize stylus and lens coupling are implemented. Second, to
minimize the impact of distortion the new lenses use context information from the sketch to
regulate what is distorted and emphasize shapes of importance. Additionally, to explore ways
into facilitating lens size manipulations, an automatic resize mechanism is tested as well as an
optimized positioning technique in order to optimally cover information of interest with the
lens. Since the fisheye lens showed the most potential, it is used for all conditions to make it
easier to gauge the effect of other features. To test the solutions, three different coupling,
context highlighting and coverage strategies are combined in each lens in different ways and
are explained in the next section.
Auto Zoom Lens
The auto zoom lens (Figure 22 (a)) can be manually pinned to a spot; it remains there until
unpinned thus avoiding the moving canvas problem. Identical to the fixed lens from Study 1,
pinning the auto zoom lens decouples stylus and pen, enabling the pen to move without the
lens following. It remains at the location until it is unpinned. The pinned state is visualized by
the magnifier’s border being red instead of blue.

77
Figure 22. Behaviour of the fisheye lens based (a) auto zoom lens, (b) semantic lens and (c) snap lens. The auto zoom lens approaches the sketch (t1). When pinned down (t2 & t4) the lens analyses the covered ink and automatically increases in size to cover all ink of interest. Colouring the lens borders red indicates its pinned state. When the lens is unpinned it assumes its original size and border colour (t3). The semantic lens moves continuously horizontally (t1-t4). When drawing (t2 & t4) the cursor moves freely vertically without the lens following. The semantic lens highlights the strokes belonging to the same group (t2). As the lens is navigated to the right (t3) the group changes (t4). As the snap lens approaches the sketch (t1) it snaps onto the first group and the cursor can be moved freely (t2). As the cursor continues moving to the right the lens remains on its initial position (t3) until the cursor leaves the inner lens and it snaps onto the next group in reach (t4).
To address the context issue, the lens adjusts its size based on the underlying ink to avoid
content of interest being distorted. When the auto zoom lens is pinned, the ink in the
magnified area is analysed. If the lens covers most of an underlying shape, the lens’ size is
automatically adjusted to cover it completely. Intelligently increasing the lens size avoids ink
of interest being in the transition region, thus alleviating the mental mappings between a
shape’s distorted and magnified view. The auto zoom lens resumes to its original size after
unpinning.
A busy canvas may lead to difficulties for the algorithm to find a clear size boundary. To
solve this, the lens can grow at most up to one quarter of the window size. This may lead to
shapes of interest being in the transition region.

78
Semantic Lens
The semantic lens addresses the moving canvas problem by partially decoupling the lens and
stylus when sketching: the lens only follows the stylus on the horizontal axis when sketching
(Figure 22 b). As the stylus vertical position changes, the lens’ vertical position remains the
same so no canvas movement on the vertical axis occurs. If the stylus is above the canvas the
lens moves freely in all directions.
To support context understanding, this lens highlights ink belonging to a group. The semantic
lens (Figure 22 (b.1 & b.2)) uses semantic rules and recognition algorithms to analyse the ink
and identify groups of related strokes. Ink belonging to the group is highlighted to support
content understanding. An example of a semantic group is a text box including its containing
text or a table plus its surrounding chairs.
The semantic rules are based on stroke type and spatial layout. There are two types of
strokes: drawing and writing. A recognition algorithm from Patel, Plimmer et al. (2007) is
used to determine a stroke’s type. This algorithm was chosen based on accuracy and
classification time. The algorithm was originally used to classify strokes after they had been
completely drawn. To adapt the algorithm to recognize unfinished strokes, tests using the
datasets from Blagojevic, Plimmer et al. (2011) were conducted. The aim was to empirically
determine the minimum number of stroke points the recognition algorithms needs for
classification. After seven points, the recognition algorithm correctly classified the strokes in
88% of all cases. It is noted that only cases where the complete stroke was correctly classified
are considered.
The stroke types, together with the distances between strokes, were used to determine
whether a currently drawn stroke belongs to an existing semantic group. If a stroke is within a
calculated distance from the previously drawn stroke it belongs to the same semantic group as
the previous one. The distance is based on the average length of the strokes already in the
semantic group. If the distance is smaller than 1/5 of the average length then the currently
sketched stroke is automatically in the group. If it is smaller than 1/3 of the average length
and the previously stroke is of type writing, the stroke is also part of the semantic group. The
latter is necessary as text consists of smaller strokes than shape strokes. If the currently
sketched stroke does not belong to an existing group it forms its own group.
79
Snap Lens
To overcome the moving canvas problem, the snap lens analyses the underlying ink to
automatically pin itself to a location (Figure 22 (c)). Gravity fields are used to decide when
and where the lens snaps. The snapping algorithm calculates an invisible gravity field for
each stroke based on the stroke’s size and its spatial environment. Whenever the lens enters a
gravity field, it automatically positions itself in the field’s centre. The size of the gravity field
is determined by a shape’s size and the free space around it.
There are two snapping strategies, depending on the lens’s spatial environment. If the lens is
snapped over a cluster of stroke(s) with no other strokes nearby, the cluster’s gravity field’s
size is the sum of its bounding box and the lens’ radius. If there are other strokes in a stroke
cluster’s environment, their gravity fields are merged. If a gravity field is too big to be
covered completely by a lens, it is divided into smaller, non-overlapping, rectangular fields.
Each field has the size of the magnified lens region. The merged gravity field is divided in a
left to right, top to bottom manner.
To release the snap, the pen has to be moved outside the magnified region. However, a snap
is only released if the user is not sketching. This strategy of snap and release favours fewer
but more distant lens repositionings over more frequent, smaller ones. In an initial test, this
behaviour was preferred by participants as more frequent repositionings interrupted thought
and sketch processes. When no existing ink is within a predefined lens radius, the lens is
moved freely. If the lens snaps to an undesired location, the pen button can be used to
overrule the snap. To support context understanding, the snap lens assumes an optimized
position over the shapes. The aim is to maximize shape coverage and minimize the ink in the
transition region, similar to the auto zoom lens.
5.1.2. Procedure, Tasks, Method, Apparatus and Data Captured
To evaluate the intelligent distortion interfaces for magnified sketching, the same procedure,
tasks, method, apparatus and data captured are used as in Study 1 (Section 4.1). This allowed
comparing the results from both studies.

80
5.1.3. Participants
Twelve participants volunteered to complete the four tasks using the three new lenses. None
of the participants for this study took part in Study 1. Their age range was between 22 and 34
years. Two participants were female and three were left-handed.
No pilot studies were required as the same protocol as in Study 1 was used. Thus, the test
protocol was already validated and the instructions were appropriate to the tasks.
Table 7. The six conditions for the evaluation of the intelligent distortion lenses: the auto zoom lens, semantic lens and the snap lens.
Condition Lens I Lens II Lens III
1 Auto zoom snap semantic
2 Snap Auto zoom Semantic
3 Semantic Auto zoom Snap
4 Auto zoom Semantic Snap
5 Snap Semantic Auto zoom
6 Semantic Snap Auto zoom
5.1.4. Results
The results presented in this section are based on the data captured using the participants’
drawings, screen capture using Morae (TechSmith 2005) and the questionnaire. It took the
participants approximately an hour to complete the study. Here the mean scores for each
specific task are reported followed by a summary of task results and participants’ ratings of
the interfaces. Participants’ comments and the study facilitator’s observations are also
reported.
To analyse the completion time which has a normal distribution, a one-way repeated
measures ANOVA is used. To further examine significant differences between groups,
Bonferroni-corrected pairwise comparisons are used. Greenhouse-Geisser estimates are used
for correction if sphericity is violated. To analyse the error rate and (questionnaire data),
Friedman’s ANOVA (nonparametric) tests are used. For further analysis investigating the
differences between groups, Bonferroni-corrected Wilcoxon signed-rank tests are used and
the results corrected for the number of tests.

81
Task Completion Time
There was no main effect found when looking at completion times of the new lenses, F(2,22)
= 1.927, p = 0.169. Nor were significant differences found when looking at drawing (F(2,22)
= 1.06, p = 0.363) and writing ( F(2,22) = 3.1, p = 0.065) separately.
Error Rate
The number of errors is significantly different depending on what interface is used, χ2(2) =
16.270, p = 0.000. Pairwise comparisons of the total errors over all four tasks showed that
using the auto zoom (1.17±1.19, p = 0.005) and snap lens (1.08±1.08, p = 0.005) resulted in
significantly fewer errors than the semantic lens (5.33±4.03). Looking at drawing and writing
tasks separately, a significant difference can be found for drawing (χ2(2) = 12.01, p = 0.002)
and writing (χ2(2) = 15.5, p = 0.000). Pairwise comparisons show that the semantic lens
results in significantly more errors than the auto zoom snapping lens for drawing (p = 0.007)
and writing (p = 0.007) and in significantly more errors than the snap lens for writing (p =
0.011) (Table 8).
Table 8. Descriptive statistics for the error rate for the four tasks. The semantic lens always resulted in significantly more errors than the auto zoom and snap lenses.
Task type Auto zoom Semantic Snap
Drawing 1.08±1 2.92±2.19 1±1.01
Writing 0.08±0.29 2.412±2.35 0.8±0.29
Participant Interface Preferences
An analysis of the ranking data showed significant differences for drawing (χ2(2) = 17.17, p =
0.000) and writing (χ2(2) = 16.21, p = 0.000). Pairwise comparisons for the drawing rankings
showed that the semantic lens (2.92±0.29) is ranked significantly lower than the auto zoom
(1.25±0.45, T = 0, p = 0.001) and snap lenses (1.83±0.58, T = 5, p = 0.005). For writing, the
semantic lens (2.83±0.39) is ranked significantly lower than the auto zoom lens (1.17±0.39, T
= 0, p = 0.001).

82
The questionnaire’s ratings for drawing showed the semantic lens being ranked significantly
lower in regard to the ease of use (χ2(2) = 10.86, p = 0.004), the distraction caused by the
distortions (χ2(2) = 10.88, p = 0.004) and the participants’ willingness to reuse the lens (χ
2(2)
= 8.76, p = 0.013). For these three questions, the semantic lens was always ranked
significantly lower than the auto zoom lens (Table 9).
Similar trends are found when analysing the data for the ratings in regard to writing:
Significant differences are found for the interfaces’ ease of use (χ2(2) = 10.61, p = 0.005), the
distraction caused by the distortions (χ2(2) = 10.87, p = 0.004), the willingness to reuse the
interface (χ2(2) =7.58, p = 0.023) and the use of the distorted information (χ
2(2) = 6.91, p =
0.032). The semantic lens was always ranked significantly lower for these four questions
compared to the auto zoom lens (Table 9). The semantic lens (4.58±1.83) was also ranked
significantly lower than the snap lens (3.92±1.93) regarding the distraction caused by the
distorted ink (T = 2.5, p = 0.016).
Participants’ Comments
When asked which features to include into a perfect lens, seven participants chose the snap
function over the pin one which received only two votes; the remaining three did not
comment on this. The auto zoom was liked by eight participants.

83
Table 9. Descriptives and significant differences for questionnaire ratings for the auto zoom (AZ), semantic (Se) and snap (Sn) lens. To indicate the ranking relationship for a comparison “<” and “>” are used.
Drawing Writing
Question Means + std
devs.
Significant
differences
Means + std
devs.
Significant
differences
Lens was easy
to use
Az(6±0.85)
Sn(4.83±1.53)
Se(3.67±1.72)
Semantic lens <
auto zoom lens:
T = 0, p = 0.005
Az(6.58±0.52)
Sn(5.58±1.17)
Se(3.58±2.07)
Semantic lens <
auto zoom lens:
T = 1.5, p = 0.005
Distortions
hindered
sketching
Az(3.08±1.24)
Sn(4.75±1.81)
Se(4.92±1.62)
Semantic lens <
auto zoom lens:
T = 0, p = 0.007
Az(2.5±1.51)
Sn(3.92±1.93)
Se(4.58±1.83)
Semantic lens <
snap lens:
T = 2.5, p= 0.016;
Semantic lens –
auto zoom lens:
T = 0, p= 0.007
Use lens again Az(6±0.85)
Sn(4.33±1.78)
Se(4.17±1.7)
Semantic lens <
auto zoom lens:
T = 0, p= 0.005
Az(6.08±0.79)
Sn(5.25±1.36)
Se(4.17±2.08)
Semantic lens <
auto zoom lens:
T = 0, p = 0.007
Used the
distorted ink
Az(3.5±1.93)
Sn(5.33±1.67)
Se(4.5±1.83)
Semantic lens <
auto zoom lens:
T = 2, p = 0.014
Comparing Studies 1 and 2
To compare the results across the six lenses from this study and Study 1 (Section 4.1),
between subjects tests were used as different participants completed the four tasks in both
studies. The completion time has a normal distribution and is analysed using a one way

84
Anova and corrected using a Tukey HSD correction. As the homogeneity of variance
assumption is broken, Welch’s F ratio is used. To compare the error rate across all six lenses,
a Kruskal-Wallis test was used as the error rate has a non-normal distribution. Mann-Whitney
tests were used to follow up the findings and a Bonferroni correction used.
There was no significant effect of the chosen lens on the overall completion time, F(5, 66) =
2.276, p = 0.161. Looking at the tasks separately, a significant effect of interface on
completion time can be found for task 3, F(5,66)=3.567, p = 0.004. A post hoc test showed
that the fixed lens (52.33±16.59) is significantly slower than the auto zoom lens (31.83±7.76,
p = 0.005) and snap lens (35.33±11.37, p = 0.032). To complete Task 3, participants had to
add four method names to a UML class skeleton/container. When pinned over the skeleton,
the auto zoom lens covered most of the container. This required fewer repositionings and
reduced time. When adding the names to the container, the snap lens snapped to a position in
the middle of the container. This allowed the names to be added with few lens repositionings,
again saving time.
The error rate was significantly affected by the choice of interface, H(5) = 44.204, p = 000.
To reduce the number of comparisons in order to reduce the factor for the Bonferroni
correction, only nine comparisons were made (Table 10). Excluded comparisons are those
already done within each of the two studies; e.g. the fisheye lens as already compared with
the blending and fixed lens and these comparisons are omitted. The remaining nine
comparisons compare all lens pairs across the two evaluations (Table 10). All lenses with a
stationary mode (i.e. fixed, auto zoom and snap) result in significantly fewer errors compared
to all lenses which move completely freely when sketching (fisheye and blending) (Table 10).
There are no significant differences within these two groups (i.e. stationary mode and free
moving).

85
Table 10. The post hoc test statistics for the Kruskal-Wallis test analysing the error rate across two studies. Nine Mann-Whitney tests are used to investigate the statistical differences of the six interfaces. Because of the nine comparisons, the Bonferroni corrected p value’s level of significance is 0.05/ 9 = 0.005. In the brackets, the mean values are reported including the standard deviation.
Comparison Test statistics
Study 1 Study 2 U p
Fisheye (8.42±4.52) Auto zoom (1.17±1.19) 2.5 000
Fisheye Semantic (5.33±4.03) 34 .027
Fisheye Snap (1.08±1.08) 3 000
Blending (8.17±3.71) Auto zoom 1 000
Blending Semantic 33 0.023
Blending Snap 0 000
Fixed (2.17±2.37) Auto zoom 48.5 0.156
Fixed Semantic 32.5 0.021
Fixed Snap 50 0.187
The questionnaire ratings from Study 1 (Section 4.1) and Study 2 (Figure 23) show that the
lenses with a stationary mode are preferred over the lenses with a moving canvas. While none
of the lenses in Study 1 was completely positively rated regarding its ease and the
participants’ willingness for reuse, the new, intelligent auto zoom lens scored exclusively
positive ratings in both of these categories. The use and comprehension of the distorted
content in the lens’ transition region did not improve. Furthermore, there is no considerable
difference in the dislike for a lens which moves completely freely while sketching (fisheye
and semantic) and the semantic lens which reduces the movement to the horizontal axis.

86
Figure 23. Ratings on a 7 point Likert scale centred on neutral. The scale categories are: strongly disagree (SD), disagree (D), disagree somewhat (DS), neutral (N), agree somewhat (AS), agree (A) and strongly agree (SA).
Discussion
There are two findings from Study 2: the success of intelligent distortion lenses, and that
drawing and writing are similar and do not require different lenses. Based on these findings,
new design guidelines were developed.
This study investigated four features of lenses: canvas movement, transition region, lens
shape and distortion technique. Both studies highlighted two features of existing lenses which
need to be addressed for the lenses to be successful in creating content: the moving canvas
problem and the choice of what to magnify and how to emphasize shapes of interest.
A completely free-moving lens caused significantly more errors than stationary lenses.
Significant differences were found for the error rate across all six lenses from both
evaluations.
One approach to overcome the moving canvas problem was to decouple the lens and stylus
movement. When done manually (fixed lens) more time was required to complete the tasks.

87
A lens which automatically snaps onto shapes and therefore saves time was evaluated and
was received positively: the majority of participants selected the snap feature as being part of
their perfect lens. However, when asked which lens the participants would most like to use
again, the snap lens came second behind the auto zoom lens. They gave two main reasons:
the automatic resize of the auto zoom lens helped them a lot, and the snap function did not
always work as expected.
The challenge when designing such a snap function is to find the optimal offset between the
distances determining when to enter and release a snap. If the release distance is too small,
the user has only a little space to sketch without the lens moving. If too large, sketched
objects close to the current snap location cannot be snapped without leaving the area first.
The snap function uses only distance. This problem could be solved by considering distance
and stylus speed, together with automatic lens sizing.
Transition regions are an undoubted benefit of distortion lenses (Gutwin and Skopik 2003,
Cockburn, Karlson et al. 2009). However, they do increase cognitive load. This is particularly
a problem when the item of interest spans the magnified and transition regions. The ability to
intelligently increase the magnification region size is one approach to tackle this problem. By
covering the ink of interest in the magnified region, users do not need to spend time to
comprehend the distorted ink in the transition region. This is evident when comparing the
completion time of auto zoom lens (98s) and the fixed lens (143s) for writing tasks. By
successfully reducing the need to use the content in the lens’ transition region, understanding
why the visual distortions are difficult to comprehend and overcoming these difficulties is not
helped and needs further work.
The other trialled approach to the transition region issue was to highlight shapes of interest in
the semantic lens. The idea was to highlight these groups to further support content
understanding when sketching. Coping with the movement of the lens overwhelmed the other
features of the semantic lens. When asked whether the highlighted ink helped them to
understand the context, most participants said that they did not pay much attention to the
groups. One participant commented that colouring the groups was perceived insufficiently
different from the other ink so that “it did not really stand out”.
Highlighting had a possibly unfair trial because it was a part of a moving lens. A more
aggressive solution could be to magnify only ink of interest. This could be done using the
blending lens distortion techniques which are based on translucency. The semantic group

88
would be shown on the upper layer magnified while the rest is shown with increasing levels
of translucency at normal size in the background.
The new lenses were perceived as more satisfying than existing lenses. Comparing the first
two questions in Figure 21 and Figure 23, it is evident that the new lenses were easier to use,
more likely to be reused and their distorted ink was perceived as more helpful. In Study 1
(Section 4.1) each lens roughly received equally negative and positive ratings. The new
lenses (Figure 23, Section 5.1) scored much more positively. The auto zoom lens had all
positive scores, while the snap lens was mainly positive. The semantic lens, with its moving
canvas rated worst of the new lenses, reinforcing the problem of a moving canvas: while
limiting the canvas movement to one direction as done with the semantic lens did not result in
significantly more errors, it was disliked by almost as many participants as the lenses with a
completely freely moving canvas.
The last key finding is that no large differences in requirements for drawing and writing were
found. Lank and Phan (2004) used both writing and drawing tasks in an evaluation study,
acknowledging that the two tasks are different and so may require different lenses. In Study
2, participants were asked to rate the lenses for drawing and writing individually. Despite
participants choosing different lenses as their favourites for drawing and writing, no great
differences were found between the questionnaire ratings for the activities.
Summary
The results of Study 1 (Section 4.1) show that current distortion lenses are not suitable for
sketching. The evaluation of the three intelligent magnification lenses demonstrated that
intelligent distortion lenses can successfully support magnified sketching. Of the three
intelligent lenses, the auto zoom lens was preferred by three quarters of the participants
followed by the snap lens. The semantic lens was the least preferred lens. This trend is also
reflected in the completion time and error rate where the semantic lens performed
significantly worse.
The intelligent lenses’ novel techniques solve the moving canvas problem by pinning the
lens. Automatic pinning has a higher user acceptance as it relieved the tedium of manual
pinning. This and the lenses’ use of context information to automatically increase lens size
and optimize lens snapping resulted in higher user acceptance and an easier use. The new

89
lenses that have a stationary mode also resulted in a lower error rate while not affecting the
task completion times compared to the lenses without stationary modes used in the two
previous evaluations.
The evaluations showed the problems participants had with comprehending the distortions.
Visual guides have been researched (Carpendale, Cowperthwaite et al. 1997, Zanella,
Carpendale et al. 2002) but it remains unclear to what extent the navigation support helps
comprehension in general and how it supports comprehension of specific properties of
distorted objects such as scale, alignment, distance and direction. To answer these questions
and develop helpful visual guides, the next evaluation investigates visual guides to support
comprehension. This includes developing novel guides and comparing them to existing ones
regarding their comprehension support in general as well as for their support to comprehend
individual distorted objects’ properties crucial for recognition.

90
5.2. Study 3 - Comprehending Distortions
The following study investigates visual guides and whether they can improve comprehension
of visually transformed information in distortion-based magnification interfaces. The
previously presented studies (Chapter 4 and Chapter 5- Section 5.1) confirmed what has been
established for distortion interfaces used to view and select information (Carpendale,
Cowperthwaite et al. 1997): comprehending visually distorted information is difficult. To
overcome this problem, two novel visual guides have been developed, implemented and,
together with a grid, evaluated. The focus of this study is on understanding whether the new
guides aid comprehension, and if so how and to what extent.
An experiment was conducted using the three visual guides and a control condition. The aim
was to gauge the level of support the guides provide, and to compare the techniques against
each other and against lenses without additional guidance. The main focus was on the general
performance of the guides and also their effect on comprehension of scale, alignment,
direction and distance. These orientation properties are based on the four elementary
perceptual tasks of Cleveland and McGill’s (1984) work namely; area (scale), angle
(alignment), direction and length (distance). Those four were chosen for two reasons: first,
Cleveland and McGill’s ranking (1984) lists them among the best elementary perceptual tasks
for accurate judgments and, second, because I hypothesize they are influenced by the visual
distortions.
This study was conducted using a distortion lens based on the fisheye technique (Furnas
1986, Sarkar and Brown 1992) as it is commonly used, so the knowledge gained will be
readily applicable to existing work in distortion-based interfaces. The lens regions were
shaded light grey with blue borders (Figure 24: t1-t3) to outline the focus region as well as
the complete lens. When pinned, the blue lens borders were replaced by red ones (Figure 24:
t4).

91
Figure 24. The distortion guides’ behaviours when freely moving (t1-t3) and pinned (t4). (a) The grid lines and content covered by the lens. (b) The foreground guide displays the star magnified and undistorted on the right side as the star enters the transition region until the distorted and magnified views merge as the star enters the magnified region (t3 & t4). (c) When the star enters the transition region with the background guide (t1) the undistorted, unmagnified view is shown under the lens area with the distorted view overlaid. The template used for these scenarios is shown in Figure 25 (a).
5.2.1. Visual Guides
To evaluate the new visual guides, they were implemented into SimpleInk to be used in
combination with a fisheye lens. Figure 24 shows a time sequence of each guide on a fisheye
lens, a small star appears at the outer border of the lens in t1 (below the ‘r’) and moves
through the transition region to the center of the lens in t4. The three visual guides are
explained in the following sections.
Grid
The idea of a grid is to provide participants with a frame of reference. By analysing how the
gridlines behave, one may deduce a distorted shape’s original representation. The grid is a
grating of equally spaced crossed bars in the background (Figure 24 a). It is semi-opaque to
differentiate it from the canvas content. The same distortion is applied to the grid lines and
content. Different grid sizes were tested to determine a sufficiently fine-grained grid while
minimizing distraction. One grid cell fitting well inside the focus region gave the best trade-
off between detail and distraction.

92
Foreground
The motivation for the foreground technique is to show an additional view of distorted
objects: each distorted object is shown magnified and undistorted in the foreground. The
foreground guide displays all content covered by the fisheye lens’s transition region
magnified and undistorted. In Figure 24 (b) above its non-magnified representation, the lower
part of the text which is covered by the lens is shown magnified. Hence, the lens (without the
guide) shows the distorted content in the transition region and magnified content in the focus
region while the foreground guide displays an additional, magnified version of the transition
region content. When a shape is in the transition region it is duplicated: its distorted version is
shown semi- opaque in the transition region and its magnified version shown fully opaque
(Figure 24 b: t3-4). The content in the foreground guide is spread beyond the borders of the
lens. The design is similar to Pietriga and Appert’s Sigma lens (Pietriga and Appert 2008)
with two differences: there is no fading of ink based on the inks distance to the lens centre,
and the ink in the foreground is not limited to the lens region.
The visual guide’s design is motivated by the Undistort Lens (Brosz, Carpendale et al. 2011)
which allows users to define a subset of the distorted area to be shown undistorted.
Background
The motivation for the background lens is to show distorted content undistorted under the
lens. Thus users have both views in the same location so that they do not have to change
perspective as with the foreground lens. The background guide shows the distorted view plus
the shapes in their original position and size in the background of both the magnified and
transition regions of the lens (Figure 24 c). When a shape is in the lens’s midpoint (Figure 24
c: t4) both its views are on top of each other. If a user adds an object to the magnification
region it is instantly duplicated in the background.
As for the foreground guide, the Undistort Lens (Brosz, Carpendale et al. 2011) was the
motivation for the background guide. While the visual support of the foreground guide can
extend beyond the lens boundaries, the background guide confines the visual help to the
boundaries of the lens on the cost of size as the content is shown in its original position and
size.

93
5.2.2. Method
Study 3 had a within-subject design that tested one factor: visual guide (Control, Grid,
Foreground and Background). Participants completed five tasks using all three guides for
each task. They completed one task with all three guides and without any visual help (control
condition) before commencing the next task. The task order was identical: every participant
started with Task 1 and finished with Task 5 but to reduce the learning effect, the order of
guides within tasks was counter-balanced. Furthermore there were four versions of each task;
e.g. the four clocks in Task 2 showed different times in each task version.
The task order was kept identical because the first three tasks were completed with a static
lens accustoming the participants to visual distortion. Further the order of guides may have a
bigger impact on the learning effect.
Depending on the orientation property of interest, a task may be completed on a static image
or in the test environment. To test all four orientation properties together (Task 1), alignment
(Task 2) and scale (Task 3) the lens’ position was required to be identical to ensure the same
distortion effects for the same objects across all participants: working with static images
guaranteed these positioning requirements. As the primary goal of this study is to gauge the
effects of visual guides on distortions and not the guides’ usability, static images were
favoured over using the test environment for Tasks 1-3. The interactive test environment was
used for Tasks 4-5.
The distortion lens used to evaluate the comprehension guides is based on the fixed lens from
Study 1 (Section 4.1) which in turn is based on fisheye lens (Furnas 1986, Sarkar and Brown
1992). The participants can only sketch in the lens’ inner focus region. The lens’ flat focus
region was set to two-thirds of the lens diameter and the transition region took the balance of
the space. Identical to the fixed lens, the content in the transition region is visually
transformed using a linear function (Carpendale, Cowperthwaite et al. 1997). The lens is
round using a L(2) metric (Carpendale and Montagnese 2001). The zoom level is set to four.

94
Figure 25. (a) The background used for all the tasks with the template used for task 1 (see (b)). (b) The first task testing alignment, scale, direction and distance with the control condition. (c) Task 2 testing alignment with the background guide. (d) Task 3 testing scale with the control condition. (e) Task 4 testing direction with the foreground guide. (f) Task 5 testing distance with the grid.
5.2.3. Participants
There were 24 participants: 10 females and 14 males, ranging in age from 19 to 32 years.
Four participants were left-handed. 20 participants were students from different majors and
the remaining 4 worked full time. Most had no experience of distortion effects but 3 had used
them in other contexts such as photography.
5.2.4. Tasks
A lens covered the area of interest on the template image shown in Figure 25 a. For Tasks 1-3
the participants were presented with a static image and the stylus was used for recording
answers. For Tasks 4 & 5 participants used the test environment and stylus. Sessions were
recorded using screen capture and sound.
Participants completed each task using the three guides and the control condition: grid,
foreground and background. Each task used a different template but all had text in the
background to simulate a busy canvas. The templates for each task were hand drawn by the
researcher. For the first three tasks involving static images and showing a scenario,
participants wrote the solution on the image. For the remaining two tasks, a template was

95
provided which had to be completed and participants could only sketch in the focus region.
The lens was pinned while drawing so the situation was the same as when using the
screenshots.
The tasks were designed with the aim of specifically testing the impact of distortions on
scale, alignment, direction and distance (Table 11). While it is hard if not impossible to test
any of the four elements in isolation, Tasks 2 - 5 each focus on one element. Task 1 targets all
four properties at once.
Table 11. The tasks (Figure 25), the distortion property they are designed to test.
Task Property
1 - Identify the Shape Alignment, Scale, Direction, Distance
2 - What’s the time Alignment
3 - What’s the size Scale
4 - Draw straight lines Direction
5 - Fill the gaps Distance
The first general task asked participants to identify objects in the lens’ transition region. For
example, clockwise from 12 o’clock, Figure 25 (b) has a diamond, rectangle, star, and ellipse.
All four task versions included four out of twelve basic shapes or words that had to be
identified. Participants were advised that there were no identical shapes; e.g. only one of the
four could be a circle. To complete the task, participants had to write the shape type or the
word next to its distorted representation on the screenshot. This task tests all four orientation
properties. For example, when identifying a distorted square it is important to recognize that
the opposite edges are equally long (scale), all edges form right angles (alignment) and
opposite edges are parallel (direction). Finally to determine it is a square as opposed to a
rectangle, each side has equal length (distance).
The second task tested alignment (Figure 25 (c)). Participants had to read the time on the four
analog clocks in the transition region. While this is an unlikely scenario, reading distorted
clocks allowed me to specifically measure the distortions’ impact on alignment. Participants
were advised that the times would be in multiples of five; e.g. the clock may show 4:15 or
4:20 but not 4:18. To ensure equality between the task versions while varying the difficulty,

96
each clock showed a different time: one of the clocks was on the hour, one on the 15, 30 or
45 minute mark and the remaining two on other times.
The third task tested relative and absolute scale judgments (Figure 25 (d)). The participants
were asked to judge shape sizes. The image had five identical shapes (e.g. diamonds): four in
the transition region and one in the focus region. The task was to order the shapes in the
transition region according to size starting with the smallest. Participants also had to identify
the shape in the transition region that was of the same size as the shape shown in the lens’
focus region.
The fourth and fifth tasks were completed in the test environment on the tablet PC. The
fourth was designed to test the impact of distortion on direction (Figure 25 (e)). Participants
had to connect four crosses with straight lines. The template showed four numbered crosses
which had to be connected in ascending order. To connect crosses, the lens had to be pinned
over the starting cross. The distances between the lines required participants to reposition
their lens as the pairs were too far away to be in the focus region at the same time. A line was
sufficiently straight if the direction from the start cross pointed at the target cross.
The last task primarily required judgment of distance (Figure 25 (f)). Participants had to add
two shapes to a line of existing shapes. The goal was to add shapes of the same size
equidistant from two existing shapes. The size instruction was to ensure that the added shapes
were of similar size for all the participants. This was necessary as drawing differently sized
shapes across participants would have resulted in an unfair comparison, especially for
completion time. Participants had to position the lens between existing shapes and pin it
before starting to draw. If the center point of the participants shapes was within 5% of the
exact midpoint between the two surrounding shapes and within 5% of their size, the task was
regarded as correct. Otherwise errors for distance and/or scale were recorded.
5.2.5. Procedure
Participants were seated at a table with the tablet (that was folded over the keyboard)
immediately in front of them. A tutorial was given to inform them about the study setup (e.g.
lens configurations, zoom level etc.) and to guide them through the experiment. After reading
the general instruction the participants completed the first section of the questionnaire

97
enquiring about their background. Afterwards, the study facilitator explained the fisheye lens
as well as all three visual guides.
Before each task the participants read a task description in the tutorial advising them what to
do. Each task consisted of four subtasks each with a different visual guide. The order of the
guides depended on the participant’s assigned condition. Once a task was completed, the
participant completed the corresponding part of the questionnaire. These steps were repeated
for each of the five tasks.
After all tasks, a final section of the questionnaire was completed. This included an overall
visual guide ranking and rating. The experiment concluded with a (recorded) discussion
between participant and facilitator about each guide’s pros and cons. It took the participants
on average 36 minutes to complete the study.
5.2.6. Data Captured
Completion time and error rate were measured for each task. Completion time is defined as
the time span between a participant being shown a screenshot and completing the task (Tasks
1-3) and between a participant starting to draw until finishing (Tasks 4-5).
A questionnaire comprising three parts was used to capture different aspects of the
participants’ interactions. The first part gauged participants’ familiarity with digital sketching
and distortion techniques. The second part asked participants to rate the visual guides
according to their helpfulness and distraction on a 5-point Likert scale. It also asked the
participants to rank the lenses according to preference. The last part asked the participants to
provide an aggregate ranking and to rate the guides on a 10-point scale. The rating was done
to further indicate how far away each guide is from being perfect and how big the differences
are between the guides.
5.2.7. Results
Here, the mean scores for each specific task are reported followed by a summary of task
results, participant’s rankings and ratings of the guides. Participants’ comments and the study
facilitator’s observations are also reported.

98
Figure 26. The completion time means for the 5 tasks and the visual support: none, grid, foreground (FG) and background (BG).
Completion time is normally distributed while error rate and questionnaire data are not. To
analyse the completion time, a one-way repeated measures ANOVA was used. To further
examine significant differences between the variables, Bonferroni-corrected pairwise
comparisons are used. Greenhouse-Geisser estimates are used for correction if sphericity is
violated. To analyse the error rate and questionnaire data, Friedman’s ANOVA
(nonparametric) tests are used. For further analysis investigating the differences between
variables, Bonferroni-corrected Wilcoxon signed-rank tests are used and the results corrected
for the number of tests. All effects are reported with adjusted p-values (p = 0.05 divided by
the number of tests). The number of tests is six for the error rate, ranking and rating and three
for helpfulness and distraction. No learning effects in the form of statistically significant
differences were found between the tasks and error rate and/or completion time.
Scale, Alignment, Direction and Distance
The tasks are designed to address four shape properties which distortions disrupt: scale,
alignment, direction and distance. The following statistical analysis looks at each of them in
turn in terms of time (Figure 26), error rate (Figure 27), preference (Figure 28), distraction
and helpfulness.
The first task testing all four orientation properties shows a significant difference for
completion time (F(3,69)=7.622; p=0.01). Pairwise comparisons show the mean grid time
(27.08s±10.9) is significantly slower than the foreground (18.29s±4.9; p=0.013) and
background guides (18.29s±5.8; p=0.014).

99
Figure 27. The error rate means for the 5 tasks and the visual support: none, grid, foreground and background.
The error rate shows a significant difference (χ2(3)=39.431; p<0.001) where the control
condition (1.54±1.1) results in significantly more errors than any guide; i.e. grid (0.79±0.78,
T = 13.5, p=0.013), foreground guide (0.08±0.28, T = 0, p<0.001), background guide
(0.21±0.41, T = 0, p<0.001). Additionally, using the grid produces significantly more errors
than foreground (T = 0, p=0.001) and background guides (T = 0, p=0.002).
The analysis also shows a significant difference for helpfulness (χ2(2)=27.31; p<0.001) and
distraction (χ2(2)=11.914; p=0.003). Compared to the grid (2.21±1.48) the foreground
(4.71±0.46, T = 4, p<0.001) and the background guides (4.38±0.71, T = 7.5, p<0.001) are, on
average, significantly more helpful. However, the comparisons also shows that the grid
(1.63±0.82) is significantly less distracting than the foreground guide (2.67±1.34, T = 24,
p=0.004) but is not significantly different to the background guide (2.29±1.12). In summary,
the background and foreground guides resulted in significantly fewer errors and were rated as
more helpful than grid and control conditions. However the grid was less distracting than the
foreground guide.
Alignment
Task 2 tested alignment. The results show significant differences for time (F(3,69)=4.651;
p=0.005) and error rate (χ2(3)=33.721; p<0.001). Pairwise comparisons show the grid
(34.26s±11.4) as being significantly slower than the foreground guide (27.92s±7; p=0.015).
The comparisons also shows that, first, having no visual guide (1.46±0.88) resulted in
significantly more errors than foreground (0.38±0.58, T = 5.5, p<0.001) and background

100
guides (0.33±0.48, T = 0, p<0.001) and, second, the grid (1.33±0.87) also results in
significantly more errors than foreground (T = 15, p<0.001) and background guides (T = 13,
p=0.001).
There is a significant difference for helpfulness (χ2(2)=39.747; p<0.001) and none for
distraction. Pairwise comparisons show that the grid (2.04±1.16) is significantly less helpful
than foreground (4.88±0.34, T = 0, p<0.001) and background guides (4.17±0.76, T = 0,
p<0.001). The background guide is also significantly less helpful than foreground guide (T =
17, p=0.001). In summary the grid and control condition resulted in more errors while
background and foreground performed equally but the foreground was perceived as more
helpful.
Scale
Task 3 tested scale. The results show no significant differences for time but one for error rate
(χ2(3)=27.39; p<0.001). Pairwise comparisons show that the control condition (0.79±0.59)
results in significantly more errors than foreground (0.13±0.34, T = 0, p<0.001) and
background guides (0.21±0.41, T = 7.5, p=0.001). The grid (0.67±0.48) also results in
significantly more errors than foreground (T = 18, p=0.002) and background guides (T = 0,
p=0.001). Looking only at the errors made during sorting the shapes according to size no
significant difference can be found.
When matching the shape in the magnified region to its equal in the transition region, a
significant difference can be found (χ2(3)=26.753; p<0.001). Pairwise comparisons show the
same pattern as with the total errors made for Task 3: first, the control condition (0.71±0.46)
results in significantly more errors than foreground (0.08±0.28, T = 0, p<0.001) and
background guides (0.21±0.41, T = 7.5, p=0.001) and, second, grid (0.63±0.49) results in
significantly more errors than foreground (T = 18, p=0.002) and background guides (T = 0,
p=0.002).
There is a significant difference for helpfulness (χ2(2)=23.4; p<0.001) and none for
distraction. Pairwise comparisons show that the grid (3.21±1.14) is significantly less helpful
than foreground (4.58±0.5, T = 0, p<0.001) and background guides (4.58±0.5, T = 0,
p=0.001). In summary, foreground and background guides produce the best results for scale
as they result in significantly fewer errors and are the most helpful.

101
Direction
Task 4 tested direction. The results significant differences for time (F(3,69)=11.763;
p<0.001) and error rate (χ2(3)=22.66, p<0.001). Pairwise comparisons show the background
guide (68.38s±22.3) being significantly slower than the control condition (55.5s±15.31;
p=0.001) and grid (56.79s±16.83; p=0.004). The control condition (2.04±0.75) results in
significantly more errors than using the grid (1.04±1.04, T = 7, p<0.001), foreground
(1.13±0.74, T = 14, p=0.001) and background guides (1.46±0.78, T = 11, p=0.006).
While no significant effect for helpfulness could be found, one for distraction is found
(χ2(2)=16.029; p<0.001). Pairwise comparisons show the grid (1.71±0.86) is significantly less
distracting than the foreground guide (3.08±1.1, T = 2.5, p=0.001). The background guide
(2.33±0.87) is also significantly less distracting than the foreground guide (T = 22, p=0.008).
In summary, the grid is the most effective guide for direction due to its lower completion
time and lowest distraction.
Distance
Task 5 tested distance. The results show a significant difference for time (F(3,69)=7.644;
p=0.005) but none for error rate (χ2(3)=2.973; p=0.396). Pairwise comparisons show that the
control condition (21.71s±5.52) results in a significantly lower completion time than grid
(30.63s±10.19; p<0.001) and background guide (30.58s±11.9; p=0.006). Similar to the
control condition, the foreground guide (23.17s±6.36) is also significantly faster than grid
(p=0.008) and background guide (p=0.01).
There is no significant difference for helpfulness but one for distraction (χ2(2)=9.387;
p=0.009). Pairwise comparisons show that the grid (1.42±0.58) is significantly less
distracting than the foreground guide (2.33±1.2, T = 8, p=0.003). In summary, the grid is the
most effective guide for distance as it is the least distracting.

102
Table 12. The p-value (p) for final ranking and final rating using a Bonferroni-corrected Wilcoxon signed-rank test. Tested are control condition, grid, foreground (FG) and background (BG) guide. To indicate the ranking relationship for a comparison “<”, “>” and “=”are used.
None<Grid None<FG None<BG Grid<FG Grid<BG FG=BG
Ranking
T = 8.5
p<0.001
T = 0
p<0.001
T = 0
p<0.001
T = 80
p=0.038
T = 39.5
p =0.001
T = 92
p=0.078
Rating
T = 6.5
p<0.001
T = 0
p<0.001
T = 0
p<0.001
T = 53
p=0.005
T = 19.5
p<0.001
T = 89
p=0.217
The participants’ final ranking of performance conducted at Study 3’s conclusion shows a
significant difference, χ2(3)=49.35; p<0.001. Pairwise comparisons show that no help
(3.96±0.2) is ranked significantly lower than the visual guides (Table 12). The grid
(2.58±0.78) is also ranked significantly lower than foreground (1.96±0.75) and background
guides (1.5±0.66), which are equally ranked. For the individual ranking, Tasks 1, 2 and 3
show the same pattern where the control condition is significantly lower than all the others
and the grid is ranked significantly lower than the grid and foreground. However, for Tasks 4
and 5 there is no significant difference between grid (Task 4: 2±0.76; Task 5: 1.83±0.75),
foreground (Task 4:2.71±1.21; Task 5: 2.21±1.04) and background (Task 4: 1.88±1.01; Task
5: 2.25±0.97) with the grid being ranked higher than the foreground guide.
The final rating of the guides over all the tasks shows a significant difference, χ2(3)=46.89;
p<0.001. Pairwise comparisons show a similar distribution as the results of the ranking
(Table 12); i.e. the control is the lowest rated (2.1±1.83), followed by the grid (5.48±1.5).
There is no significant difference between foreground (6.83±1.19) and background guides
(7.48±1.03).
Participants’ Comments & Observations
At the conclusion of each task the participants were asked to comment on what they liked and
disliked about the three visual guides. The grid was described by eight participants as a frame
of reference where the vertical and horizontal lines allow for precise judgments of direction
and distance. Eleven participants also pointed out the advantages of the grid to gauge the size
of objects. However, six participants said they had difficulty identifying a shape with the help

103
of a grid. They commented on how they would try to reverse engineer the visual distortion
but would eventually give up. This is consistent with the facilitator’s observations and the
completion time, which was always higher than the other guides except for Task 4. Four
participants suggested that having more gridlines would help. In contrast, four participants
commented on the grid being distracting and partly occluding content.
Five participants pointed out the foreground guide made comprehending content easy. They
stated that identifying shapes was particularly easy due to the preserved shape and the
magnified size of the objects. However, seven participants found the foreground distracting.
In addition, more than half (54%) of the participants asserted their dislike for the foreground
with the shapes being “always out of focus and literally all over the place” (P4). Interestingly
the two negative comments about the guide’s information being out of focus and its
distraction were so overwhelming that participants did not comment on any other negative
aspects. With the other guides there were, on average, five negative comments stated by at
most six participants. This emphasizes the severity of the foreground guide distraction.
The background guide’s most commented feature was seeing the shapes in both views as they
are drawn (10) – the ink is simultaneously displayed in the magnified region and in the lens
background. Eight participants also commented positively on the ease of comprehension of
the guide due to the original view being retained under the lens. However, four participants
stated their dislike for the clutter and three that the original view was sometimes occluded by
the lens’ content. Additionally, three found the background information too small at times.
Discussion
The background and grid guides are better than the foreground guide and no guide. If all four
identifying properties (scale, alignment, direction and distance) have to be equally supported
the background guide is most suited as it delivers consistently positive results. However, the
grid allows for better comprehension when direction and distance are most important. The
foreground, while competitive on the quantitative measures, was disliked by users. Any of the
visual guides is preferable in quantitative and qualitative measures compared with no guide.

104
Figure 28. Mean and deviation values for the rankings for each task (1 is highest, 4 lowest). The deviation indicates the maximum and minimum rank received by each lens.
Comparing the background and foreground guides, there are few differences in the
quantitative measures (completion time, error rate) and helpfulness. However, users strongly
preferred the background guide, noting two major issues with the foreground guide during the
active canvas tasks 4 & 5: changing focus was reported as being difficult, and the perceived
movement of the background was reported to be distracting.
The foreground guide displays the undistorted view away from the lens and thus the center of
focus. This required the participants to change their focus between the lens and guide content
and thus resulted in a higher mental workload (Grudin 2001). More than half of the
participants made this complaint about the foreground guide. Having to change focus like this
is similar to using a radar window where one also has to switch between views, but the
foreground guide has the advantage of both views being integrated, thus making better use of
the total space available. The distraction factor was the other complaint of the foreground
guide. This is caused by the movement of the foreground over the canvas as the lens moves.
Since this additional information is outside the lens, it seems as if everything is moving.
In contrast, the background guide allowed the user to fully concentrate on the lens by
displaying the additional undistorted view of the distorted shapes in the lens’ background at
its original size and location. Additionally, with the background guide, participants took
advantage of shapes appearing in the background at their original size and position as they
105
were drawing: this information is solely provided by the background guide and positively
commented on by 10 participants.
Quantitative results suggest judgments of alignment and scale are best supported by the
foreground and background guides. This includes the identification of distorted shapes. Both
guides display the visually transformed objects undistorted but use different scales and
locations for the additional information. However, the foreground guide has the distraction
problems discussed above, making the background guide the better guide for alignment and
scale.
The grid was best for judging direction and distance. Participants used the grid lines as a
frame of reference, allowing them to accurately estimate direction and distance by following
the lines. Supporting the results, other researchers have successfully used grids in distorted
visualizations for tasks where judging direction and distance is most important such as
geographic maps (Zanella, Carpendale et al. 2002). Interestingly, using the grid as a frame of
reference is unsuitable for judging alignment and scale for visual distortions. Grid structures
are a common addition in various digital and non-digital interfaces such as MS WordTM
(Microsoft 2013) and Adobe PhotoshopTM
(Adobe 2013) and cartographical maps
respectively. This widespread familiarity made participants believe the grid would be
particularly helpful. However, in non-distortion-based environments the conditions are
different, in that no mental reverse engineering of the distorted content, including the
distorted gridlines, is required. The participants’ disappointment was reflected in the grid’s
overall rating and ranking: it ranked third. Participant 23 stated she “was the most
disappointed with the grid” as it did not live up to the expected standards.
The control condition was consistently perceived as the least-preferred condition across all
measurements. The lack of distraction and shorter completion time are the only advantages of
having no visual support. As there is no additional information displayed, the participants had
no extra information to incorporate in their decision. Hence none of the guides was ever
significantly faster than the control condition. However, the results also showed that, except
for judging direction, having no help always resulted in significantly higher error rates. It was
always the least helpful and least preferred condition and was consistently rated and ranked
the lowest.
The ordering of the orientating properties is different from studies by Cleveland and McGill
(Cleveland and McGill 1984), Wigdor, Shen at al. (Wigdor, Shen et al. 2007) and Bezerianos

106
and Isenberg (Bezerianos and Isenberg 2012) in that scale (or area) judgments produced the
least errors followed by distance, angle and direction. A reason could be that participants in
Study 3 were required to order them relative to their size and not apply absolute sizes as done
by the other authors. If only the errors are considered when people had to match the
magnified but undistorted object with its distorted version of equal size then the order of
properties is identical to Cleveland and McGill’s results with scale being the least accurate.
The interactive sketching context was used to gauge the effects of distortions on information
and evaluate two novel visual guides because it is an easy and familiar metaphor to create and
edit content. Editing is important to target the individual orientation properties, especially
distance and direction. To apply the proposed guides to other domains (e.g. map navigation
(Pattath, Ebert et al. 2009) and graph diagram analysis (Schaffer, Zuo et al. 1996))
adjustments may be required. Rather than using one translucent layer, Lieberman (1994) used
several translucent layers to accommodate information layers for browsing an image or a
map. Similarly, Pietriga and Appert (2008) used one translucent layer but with varying levels
of translucency to transition between focus and context areas in distortion lenses. Exploring
other contexts is a subject for future work.
5.2.8. Summary
Displaying visually distorted information has a number of disadvantages such as higher
mental workload and comprehension difficulties, but has the advantage of non-occluding
magnification. Two novel visual guides were developed, implemented and evaluated. The
focus was on the four disrupted orientation properties important for identifying distorted
information: scale, alignment, distance and direction.
Our introductory research questions were: (a) What is the effect of distortions on
comprehension? and (b) To what degree can visual guides aid comprehension? Based on the
results, visual changes in the distortion region made information comprehension considerably
more difficult as the control condition had a higher error rate and lower user preference
compared to the tested guides. The grid and background guide both aided comprehension
without distracting the user.
The following guidelines are proposed for the best interaction when designing distortion-
based magnification lenses:

107
Any visual support is better than none.
Overall, the background lens is most suitable.
However, the grid is more appropriate when precise judgments are required involving
only direction and distance.
While no guide outperforms the other guides for all identifying properties, a combination of
the background and grid may be more suitable than either individually. There is a danger of
such a combination being too distracting; this combination requires more research in future
work. The final ratings show that while none of the guides are yet perfect, the novel
background guide is overall best.
Of the identified problems existing distortion-based interfaces encounter when used for
content creation and editing, possible solutions were investigated in this and the previous
study (Section 5.2). However, the extent to which the solutions alleviate the problems with
the moving canvas and comprehension difficulties is unclear and is the focus of the next and
final study researching magnification techniques for magnified sketching.

108

109
6. Comparing Strategies for
Magnified Sketching
The study presented in this chapter builds on the results from the previous two chapters
which presented three studies analysing and improving the usability of focus + context
techniques for content creation and editing. New lens features addressing three usability
problems faced by existing focus + context techniques when used for magnified sketching
have been developed, implemented, tested and their performances discussed. The final study
(Study 4) presented in this chapter gauges the efficacy of the best of the novel lenses. The
aim of this study is to compare a distortion lens developed and refined over the previous
studies with two common magnification strategies, overview + detail and a zooming
interface.
At the beginning of this chapter, the magnification interfaces are described with the focus on
the specific configuration of each interface. The study setup and results are then presented
before summarizing Study 4. Finally, all four studies are summarized with the focus on what
has been learned and accomplished.
6.1. Study 4 - Comparing Strategies for Magnified Sketching on Small
Displays
To gauge the impact of the new features (Studies 2 & 3) addressing the identified usability
problems of existing distortion interfaces (Study 1), this study compares the improved
distortion interface with other common magnification strategies.
6.1.1. Magnification Interfaces
The zooming, overview + detail and distortion interfaces are implemented in SimpleInk
(Figure 29). The standard controls on the right side of the interface are hidden for this
evaluation. Among the standard controls on the bottom tool strip, the currently selected
interface is shown as well as a button to load the next task. Instructions are displayed in a
separate window situated to the right of the main window.

110
Figure 29. The SimpleInk interface used to compare the different magnification interfaces. On the left side the drawing task in form of a memory game is shown without magnification. The instruction window on the right shows detailed task descriptions for the participants.
Due to the different magnification strategies the amount of information visible at any one
time differs. While the zooming interface (Figure 30) displays only the magnified part of the
information, the overview region in the overview + detail interface (Figure 31) shows
everything in two separate views. One view shows the information in greater detail and the
other view provides a coarse overview. The distortion interface (Figure 32) shows the
information in its original size apart from the content covered by the fisheye lens. In the
following sections the three magnification interfaces are introduced and the decisions behind
their specific design explained.

111
Figure 30. The zooming interface showing the drawing task at 2 times magnification. The user can sketch anywhere on the canvas. The scrollbars are used to display another part of the canvas.
Zooming Interface
The zooming interface consists of one canvas spread over the visible area of the screen with
the basic controls on the left and bottom sides. With zooming activated, two scrollbars on the
left and bottom side allow the user to change the currently visible area of the canvas. To view
the complete canvas, the scrollbars have to be repositioned several times depending on the
magnification level. For example, a magnification level of two fragments the canvas into four
parts requiring at least three scrollbar adjustments to view the complete canvas. Sketching is
possible on the entire visible canvas.

112
Figure 31. The overview + detail interface showing the annotation task at 2 times magnification. The ink covered by the green inset is shown magnified at the bottom. The user can only sketch in the
bottom window.
Overview + Detail Interface
The overview + detail interface is comprised of two sections: the overview region starts at the
top of the display while the sketching region covers the remaining space. There are no rules
how much space has to be allocated to either region. Google MapsTM
(Google 2013) and
Adobe PhotoshopTM
(Adobe 2013) allocate most space to the interaction region and only a
small percentage to the overview window. However, the shrunk information does not provide
all the details of the original information. The aim of this study is to provide an overview of
the information which still allows users to read text and recognize coarse details in sketches.
Initial trials showed that an overview window smaller than 70% of the display height makes
it impossible to recognize details and 80% was perceived as the most comfortable. As a
result, the overview window used for this study is considerably larger than the sketching area
which covers the remaining 20% of display height. A similar space distribution is used by a
variety of note taking apps which allow zooming on tablet computers such as Noteshelf
TM(PTE 2012).

113
To choose part of information shown in the sketching region, an adjustable inset is shown in
the overview region. The inset outlined by a green border encases the area shown in the
sketching area, so moving the inset changes the content shown in the sketching region.
Editing the information is only possible in the sketching region which shows the magnified
information.
Figure 32. The fisheye lens showing the drawing task at 4 times magnification. The user can only sketch in the lens’ inner region showing the ink at constant magnification.
Distortion Interface
As in the previous two evaluations, a fisheye lens is used. The flat focus region shows the ink
at constant magnification while the distortion region uses a linear drop-off function to
transition between focus and context. The lens has a diameter size of 30% of the display
height with the focus region covering two-thirds of that space. The lens shape is rectangular
using a L(∞) metric (Carpendale and Montagnese 2001) as the previous evaluation (Section
5.2) showed a preference for the rectangular lens shape. To support comprehension, the
background guide is used which displays the ink covered by the lens in undistorted form and
in its original position. The background guide is used as it best supports comprehension of
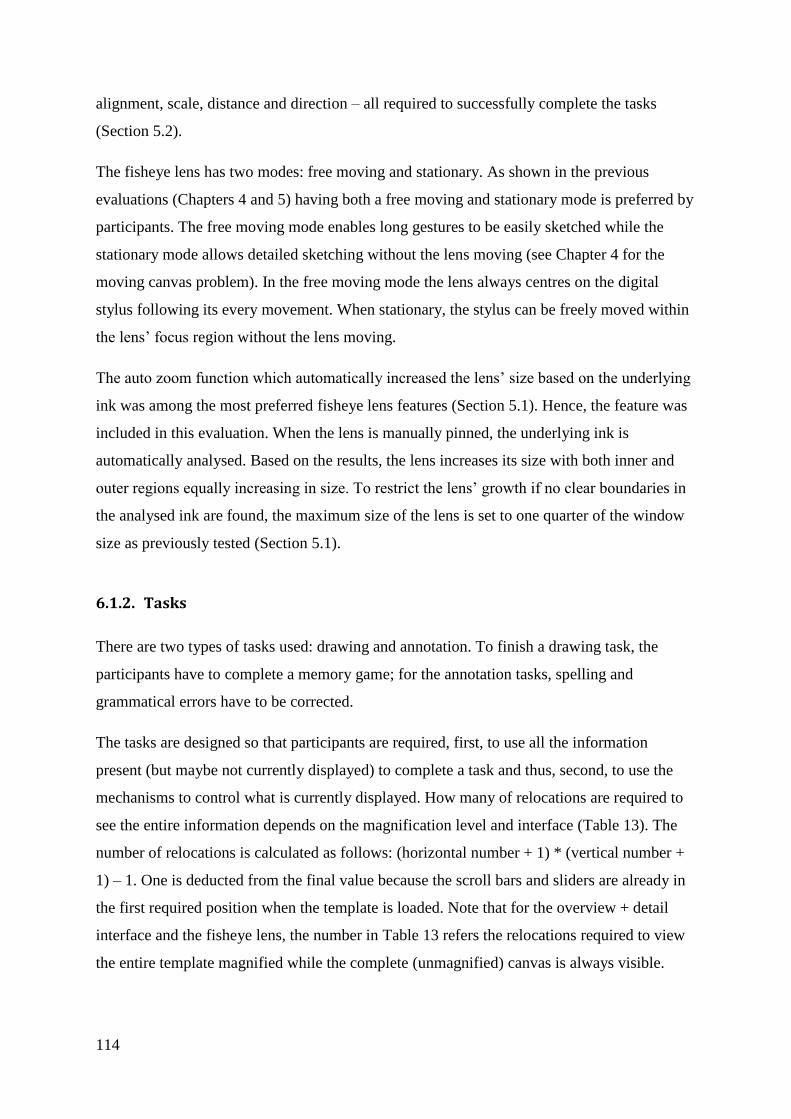
114
alignment, scale, distance and direction – all required to successfully complete the tasks
(Section 5.2).
The fisheye lens has two modes: free moving and stationary. As shown in the previous
evaluations (Chapters 4 and 5) having both a free moving and stationary mode is preferred by
participants. The free moving mode enables long gestures to be easily sketched while the
stationary mode allows detailed sketching without the lens moving (see Chapter 4 for the
moving canvas problem). In the free moving mode the lens always centres on the digital
stylus following its every movement. When stationary, the stylus can be freely moved within
the lens’ focus region without the lens moving.
The auto zoom function which automatically increased the lens’ size based on the underlying
ink was among the most preferred fisheye lens features (Section 5.1). Hence, the feature was
included in this evaluation. When the lens is manually pinned, the underlying ink is
automatically analysed. Based on the results, the lens increases its size with both inner and
outer regions equally increasing in size. To restrict the lens’ growth if no clear boundaries in
the analysed ink are found, the maximum size of the lens is set to one quarter of the window
size as previously tested (Section 5.1).
6.1.2. Tasks
There are two types of tasks used: drawing and annotation. To finish a drawing task, the
participants have to complete a memory game; for the annotation tasks, spelling and
grammatical errors have to be corrected.
The tasks are designed so that participants are required, first, to use all the information
present (but maybe not currently displayed) to complete a task and thus, second, to use the
mechanisms to control what is currently displayed. How many of relocations are required to
see the entire information depends on the magnification level and interface (Table 13). The
number of relocations is calculated as follows: (horizontal number + 1) * (vertical number +
1) – 1. One is deducted from the final value because the scroll bars and sliders are already in
the first required position when the template is loaded. Note that for the overview + detail
interface and the fisheye lens, the number in Table 13 refers the relocations required to view
the entire template magnified while the complete (unmagnified) canvas is always visible.
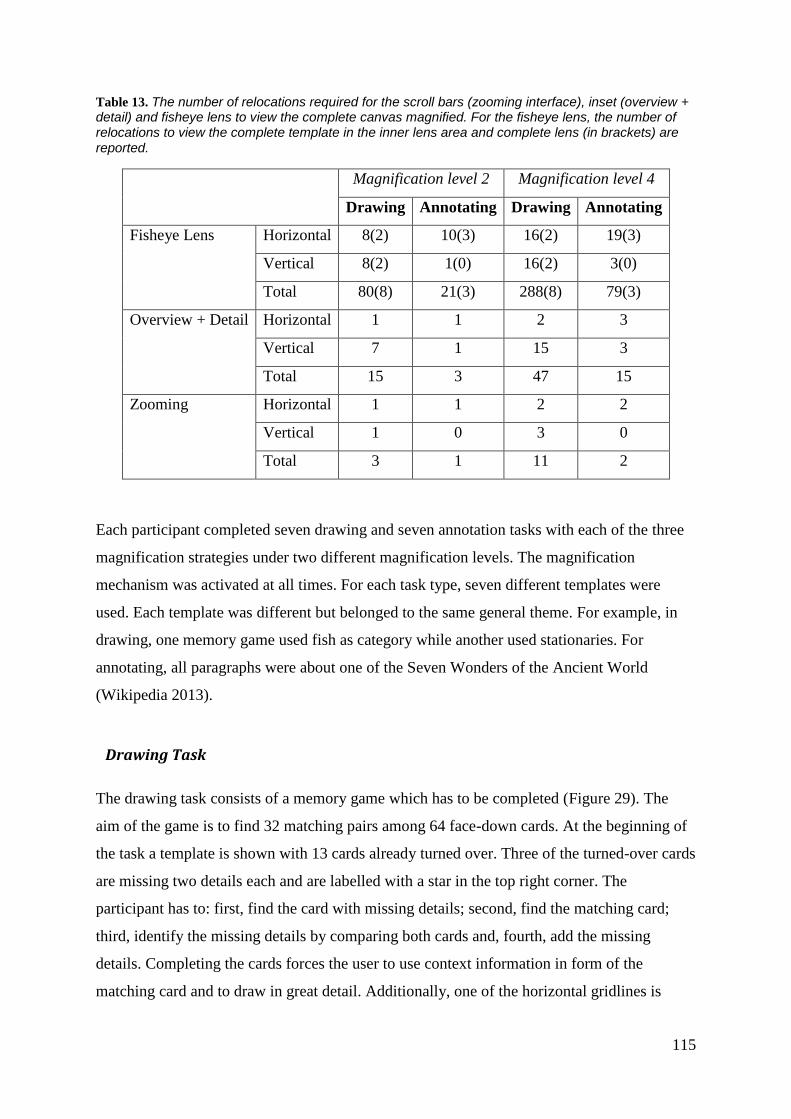
115
Table 13. The number of relocations required for the scroll bars (zooming interface), inset (overview + detail) and fisheye lens to view the complete canvas magnified. For the fisheye lens, the number of relocations to view the complete template in the inner lens area and complete lens (in brackets) are reported.
Magnification level 2 Magnification level 4
Drawing Annotating Drawing Annotating
Fisheye Lens Horizontal 8(2) 10(3) 16(2) 19(3)
Vertical 8(2) 1(0) 16(2) 3(0)
Total 80(8) 21(3) 288(8) 79(3)
Overview + Detail Horizontal 1 1 2 3
Vertical 7 1 15 3
Total 15 3 47 15
Zooming Horizontal 1 1 2 2
Vertical 1 0 3 0
Total 3 1 11 2
Each participant completed seven drawing and seven annotation tasks with each of the three
magnification strategies under two different magnification levels. The magnification
mechanism was activated at all times. For each task type, seven different templates were
used. Each template was different but belonged to the same general theme. For example, in
drawing, one memory game used fish as category while another used stationaries. For
annotating, all paragraphs were about one of the Seven Wonders of the Ancient World
(Wikipedia 2013).
Drawing Task
The drawing task consists of a memory game which has to be completed (Figure 29). The
aim of the game is to find 32 matching pairs among 64 face-down cards. At the beginning of
the task a template is shown with 13 cards already turned over. Three of the turned-over cards
are missing two details each and are labelled with a star in the top right corner. The
participant has to: first, find the card with missing details; second, find the matching card;
third, identify the missing details by comparing both cards and, fourth, add the missing
details. Completing the cards forces the user to use context information in form of the
matching card and to draw in great detail. Additionally, one of the horizontal gridlines is

116
missing and has to be added, forcing the user to sketch long figural lines. The fisheye lens is
too small to cover a complete grid cell at either magnification level. The template is 10cm by
10cm.
It is emphasised to the participants that an added object should not intersect with an existing
object as this would count as an error.
Annotating Task
In the annotation task, a paragraph consisting of three sentences over four lines is shown
(Figure 31). To complete the task, one sentence has to be struck out - requiring a long figural
gesture. Another sentence contains two spelling mistakes and a third sentence has two
grammatical errors. The errors are emphasized by the words appearing in capital letters. To
correct a word it has to be first underlined and then the correct version written above the
error. This forces small detailed sketching. As with the drawing tasks, the added objects
should not intersect with pre-existing ones which is otherwise counted as an error. The
template is 10cm by 5cm.
While the spelling errors can be corrected without knowing the content of the sentence, the
grammatical errors require the participant to use the context information. This information is
in close proximity of the incorrect word thus shown in the distortion region of the fisheye
lens.
6.1.3. Method
The study had a within-subject design and tests two factors: magnification strategy (zooming,
overview + detail and distortion) and magnification level (two and four). Participants
completed one training task for each task type followed by the six drawing and annotation
tasks. Half the participants started with the drawing tasks, the other half with the annotation
tasks. The order of tasks within a task type was identical for all participants; e.g. each
participant started with the building category and finished with the fish category for the
drawing tasks. While the task order was kept constant, the order of interfaces and
magnification levels was systematically varied among participants, using a Greco-Latin
square to reduce the influence of learning effects.

117
For the analysis of the completion time and error rate, the collected sketching and annotating
data was separated; thus two separate analyses investigated the effects for sketching and
annotating in terms of completion time and error rate. The task types were separated because
the tasks for each type are too different for a fair comparison. However, for the subjective
ratings it is more valuable having participants do both task types as they can directly compare
the interfaces’ performances for drawing and annotating. To reduce the learning effect, the
order whether a participant started with drawing or annotating was counterbalanced: eight
participants started with sketching and eight started with annotating.
6.1.4. Participants
Four pilot studies were conducted to validate the test protocol as well as to ensure that the
instructions were appropriate to the tasks. Based on the results from the pilot participants, the
fisheye lens’ snapping feature was deactivated. Invoking the stationary with a snapping
mechanism as evaluated in Section 5.1 showed promising results in terms of completion time,
error rate and user satisfaction. The pilot participants in this study had problems with the
snapping as it was difficult to precisely position the lens at a specific location. For example,
when writing between existing lines, the lens would snap to the closest ink object, in this case
either of the lines. As a result, the lens would barely cover the space between the lines where
people tried to write. The pilot participants ended up keeping the manual overwrite button
pressed while sketching - effectively deactivating the snap function. To make the snapping
mechanism more applicable for magnified sketching, more research is required.
16 participants volunteered for the study (ten male and six female) and had an average age of
28.69±4.85 years. Recruitment took place on the university campus. Two participants were
left-handed.
6.1.5. Procedure
At the start of the study, each participant was given a tutorial. After the participants had read
the general instructions, they had to complete the first part of the questionnaire. The tablet PC
placed in front of the participants was running SimpleInk on full screen mode. First, the
participants were shown an unmagnified template of each task type. Afterwards participants
completed three tasks, one drawing and two annotation tasks, using all magnification

118
interfaces and magnification levels to familiarise themselves with the test environment and
tasks. The magnification was activated at all times for the remainder of the study.
Each participant started with the first of six tasks of the assigned task type. Once finished, the
participant pressed the forward button which automatically saved the current sketch and
loaded the next task template. After all six tasks were finished the participants rated their
experiences for that specific task type using the questionnaire. Next, the remaining six tasks
of the remaining task type were completed including the rating on the questionnaire. At the
conclusion of the study, the participants finished the final part of the questionnaire regarding
preferred and non-preferred interface characteristics.
6.1.6. Data Captured
For each task, completion time and error rate were measured. The completion time was
defined as the period between when the stylus was first in range of the tablet PC until the last
object of the task was completely drawn. The navigation time (i.e. scrolling and panning) it
took a participant to display the desired canvas part was also measured, including the number
of scrolls (zooming interface) and pans (overview + detail). The distortion interface was
excluded from the navigation time measurement because the lens could be directly pointed at
the desired location requiring no separate navigation control. The sessions were recorded
using Morae (TechSmith 2005).
An added object overlapping with a pre-existing shape counted as an error. Regardless of the
number of intersections, one added object can at most be awarded one error.
The questionnaire had three sections. The first enquired about the general familiarity of
participants with magnification interfaces and digital sketching on a 5-point Likert scale. The
second section asked the participants to rate nine questions regarding different characteristics
of the interfaces in terms of ease and helpfulness for both task types on a 5-point Likert scale
(Table 14). The last section asked the participants to rank the magnification interfaces for
each task type individually and overall. Additionally, three open questions requested further
explanations as to what they liked and disliked about the interfaces and whether the different
magnification levels had any influence on interaction. This often evolved into a discussion
between the researcher and participant.

119
Table 14. Questionnaire questions from evaluating magnification strategies.
1 How helpful was the interface?
2 How easy was [drawing | annotating] using the interface?
3 How easy was it to [drawing | annotating] detailed/small objects?
4 How easy was it to [drawing | annotating] bigger/long objects?
5 How easy was navigating the canvas?
6 FishEye lens – Did you pay attention to the ink in the distortion region?
7 FishEye lens – Did you understand the ink in the distortion region?
8 FishEye lens – Did you pay attention/use the ink in the lens background showing the ink in original size?
9 FishEye lens – How helpful was the automatic lens-resize mechanism?
6.1.7. Results
The participants averaged 36 minutes to complete all tasks, including the questionnaire.
The results presented in this section are based on the data captured using the participants’
sketches, Morae recordings, the questionnaire and the facilitator’s observations. Mean scores
for each specific task are reported followed by a summary of task results, participants’
rankings, and ratings of the guides. Participants’ comments are also reported.
Completion time and number of errors have normal distributions. Each is analysed using a
two-way repeated measures Anova for factors interface (fisheye, zoom and radar) and zoom
level (2, 4). To further examine significant differences between the variables, Bonferroni-
corrected pairwise comparisons are used. Greenhouse-Geisser estimates are used for
correction if sphericity is violated.
To analyse the questionnaire data, Friedman’s ANOVA (nonparametric) tests are used. For
further analysis investigating the differences between variables, Bonferroni-corrected
Wilcoxon signed-rank tests are used and the results corrected for the number of tests.

120
Figure 33. Completion time in seconds for the drawing and annotating tasks at two magnification levels for fisheye lens, zoom and radar interfaces.
Completion Time
There is a significant main effect of interface on completion time for drawing (F(2,30)=13.75,
p = 0.000) and annotating (F(2,30) = 4.93, p = 0.014). For drawing, the zooming interface
(125.75s ±7.43) was significantly slower than the fisheye lens (94.72s±4.18, p = 0.000) and
the overview + detail interface (99.34s±5.45, p=0.014). Contrary to drawing, for annotating
the zooming interface (85.81s±3.07) was significantly faster than the fisheye lens
(95.38s±3.51, p = 0.019).
There was also a significant main effect of the zoom level on completion time for drawing
(F(1,15) = 35.44, p = 0.000) and annotating (F(1,15) = 42.23, p = 0.000). For both task types,
the higher zoom level resulted in a significantly higher completion time (p Drawing = 0.000, p
Annotating = 0.000) (Table 15) (Figure 33).
Table 15. The mean and standard deviation for error rate across zoom levels and task types.
Task Type Zoom level two Zoom level four
Drawing 87.31±3.61 125.92±7
Annotating 75.98±2.7 103.65±4.06
There was no significant interaction effect between interface and zoom level on completion
time for drawing (F(2,30) = 3.22, p = 0.054) and annotating (F(2,30) = 0.98, p = 0.387).

121
Figure 34. Number of errors for the drawing and annotating tasks at two magnification levels for fisheye lens, zooming and radar interfaces.
Error Rate
There is no significant effect of the interface on the number of errors made for drawing
(F(2,30) = 1.01, p = 0.352) and annotating (F(2,30) = .039, p = 0.681). There was a
significant effect of the zoom level on errors made for drawing (F(1,15) = 5.71, p = 0.03) but
not for annotating (F(1,15) = 1.58, p = 0.227). Pairwise comparisons showed that for drawing
a zoom level of two (1.17±0.015) resulted in significantly more errors than a level of four
(0.83±0.11).
There was no significant interaction effect between interface and zoom level on the error rate
for drawing (F(2,30) = 1.4, p = 0.262) and annotating (F(2,30) = 0.06, p = 0.945) (Figure 34).
Navigation Time and Effort
To investigate the additional affordances the zooming and overview + detail interfaces had on
the participants in terms of navigation time, the time spent on navigating was measured and
the number of navigation steps counted. The term navigation refers to the steps necessary to
change what is currently shown on the canvas by operating the scrollbars (zooming interface)
and to select what part of the canvas is shown magnified by repositioning the inset (overview
+ detail interface). The navigation steps denote how often the scrollbars were used and how
often the inset was moved. These additional steps to navigate the canvas were not required

122
for the fisheye lens as the magnified view is integrated into the context and can be reached by
direct pointing at the area of interest.
Comparing the completion times of two different magnification levels within the same
interface shows how different magnification levels affect each interface. Additionally, the
same magnification level across the two interfaces are compared to investigate how the
interface impacts navigation time. Time spent on navigating and the number of navigational
steps were corrected using a natural logarithm to overcome the abnormal distribution. Both
are analysed using dependent t-tests.
Using the lower zoom level of two always results in significantly lower navigation time
compared to the higher magnification level of four for drawing (zoom: t(15) = 7.13, p =
0.000; overview + detail: t(15) = 5.29, p = 0.000) and annotating (zoom: t(15) = 4.93, p =
0.000; overview + detail: t(15) = 3.41, p = 0.004) (Table 16). The same applies to the number
of relocations; the lower magnification required significantly fewer relocations for drawing
(zoom: t(15) = 7.78, p = 0.000; overview + detail: t(15) = 8.18, p = 0.000) and annotating
(zoom: t(15) = 7.02, p = 0.000; overview + detail: t(15) = 10.32, p = 0.000).
Using the zooming interface resulted in a significantly higher navigation time compared to
the overview + detail interface for drawing (zoom level 2: t(15) = 5.01, p = 0.000; zoom level
4:t(15) = 6.93, p = 0.000) and annotating (zoom level 2: t(15) = 4.11,p = 0.001; zoom level 4:
t(15) = 9.71, p = 0.000). The same applies to the number of relocations for drawing (zoom
level 2: t(15) = 7.75, p = 0.000; zoom level 4: t(15) = 8.03, p = 0.000). For annotating there is
no significant difference (Table 16).

123
Table 16. Mean values and standard deviation for navigation time and number of relocations for the zoom and overview + detail interfaces at two magnification levels.
Zoom level Zooming interface Overview + detail interface
Time Drawing
2 36.13±13.69 19.69±5.44
4 82.25±29.68 32.13±9.98
Time Annotating
2 25.13±5.04 19±4.46
4 39±10.76 24.38±4.76
Number of Relocations Drawing
2 11.94±2.62 6.69±1.25
4 26.19±9.89 10.75±2.05
Number of Relocations Annotating
2 7.63±0.81 7.44±0.96
4 11.19±1.56 11.13±1.02
Participants Rankings, Ratings and Comments
An analysis of the ranking data shows significant differences in all three categories: drawing
(χ2(2) =15.88 , p = 0.000), annotating (χ
2(2) = 13.63, p = 0.001) and overall (χ
2(2) = 18.86, p
= 0.000). Pairwise comparisons showed the zooming interface is ranked significantly lower
than the fisheye lens and the overview + detail interface in the three categories (Table 17,
Figure 35). The final rating of the lenses where participants assigned a number between 1
(not helpful at all) and 10 (the perfect help) showed no significant difference.
Figure 35. Rankings (1 is the highest ranked and 3 the lowest) for the three interfaces for categories: drawing, annotating and overall.
124
Table 17. Results of ranking data analysis showing the significant differences between the interfaces.
Task Type Fisheye – Zoom Overview + detail -
Zoom
Drawing T = 9, p = 0.002 T = 6, p = 0.001
Annotating T = 16, p = 0.006 T = 12, p = 0.003
Overall T = 11, p = 0.002 T = 6, p = 0.001
For drawing, there are significant differences between the interfaces for their helpfulness
(χ2(2) = 18.78, p = 0.000) and how easy it was to navigate the canvas (χ
2(2) = 19.61, p =
0.000). In terms of helpfulness, the zooming interface (2.31±1.26) ranked significantly lower
than the fisheye lens (4.06±0.57, T = 3, p = 0.001) and overview + detail interface
(3.94±0.77, T = 3, p = 0.001). The same trend is found regarding the ease of canvas
navigation: the zooming interface (1.88±1.09) is ranked significantly lower than fisheye lens
(4.56±0.81, T=1.5, p= 0.001) and overview + detail interface (4.31±0.6, T = 5, p = 0.001).
For annotation, significant differences between interfaces on the ratings are found for the
interface helpfulness (χ2(2) = 13.04, p = 0.001), the ease of sketching using the interface
(χ2(2) = 8.13, p = 0.017) and the ease to navigate the canvas (χ
2(2) = 16.34, p = 0.000). In
terms of helpfulness, the overview + detail interface (4.19±0.54) rated significantly higher
than the zooming interface (2.81±0.91, T = 0, p = 0.002). Sketching was significantly easier
using the overview + detail interface (3.88±0.806) compared to the zooming interface
(3.13±0.806, T = 9, p = 0.015). Finally, navigating using the zooming interface (2.56±1.15)
rated significantly lower than the fisheye lens (4.31±0.95, T=0, p=0.003) and the overview +
detail interface (4.25±0.58, T=3.5, p= 0.001).
Table 18. Test statistics comparing the interfaces regarding the ease with which small objects are sketched compared to big objects.
Task Type Fisheye Zooming Overview + Detail
Drawing T = 10.5, p = 0.15 T = 2.5, p = 0.006 T = 0, p = 0.001
Annotating T = 29, p = 0.42 T = 5.5, p = 0.008 T = 0, p = 0.003

125
Figure 36. Questionnaire ratings for the fisheye lens’ features from drawing and annotating.
Using Wilcoxon signed-rank tests to compare the ratings regarding the ease with which small
figures are sketched in comparison to long figures showed significant differences for the
zooming (3.75±1.24Small Figures; 2.63±1.31Long Figures) and overview + detail (4.5±0.52 Small Figures;
2.94±1 Long Figures) interfaces for drawing and significant differences for the zooming
(4±0.89Small Figures; 2.63±1.14Long Figures) and overview + detail (4.5±0.63 Small Figures; 2.88±1.26
Long Figures) interfaces for annotating. With both interfaces sketching longer figures compared
to small objects rated significantly lower (Table 18). There were no significant differences for
the fisheye lens.
Comparing the ratings for the fisheye specific features for drawing and annotating (Figure
36) a Wilcoxon signed rank test shows no statistically significant differences. While 75% of
the participants understood the distorted ink, only 37.5% for drawing and 25% for annotating
used the ink. Instead, the participants used a combination of the comprehension guide and
automatic resize mechanism.

126
Summary
The zooming interface was ranked significantly lower by the participants compared to the
overview + detail interface and the fisheye lens for drawing and annotating. Participants also
rated the zooming interface significantly lower in terms of helpfulness and ease of navigation
for both task types. For annotating, there was also a significant difference in terms of ease of
sketching: the zooming interface rated significantly lower than the overview + detail
interface. While there are no statistically significant differences between overview + detail
interface and fisheye lens, the latter was more often rated as the participants’ top choice
(Figure 35) for drawing, annotating and overall.
While the choice of interface had no significant effect on the error rate, the magnification
level of two resulted in significantly more errors than the higher magnification level of four.
The higher magnification level also resulted in a significantly higher completion time. The
choice of interface showed a significant impact on completion time. It took participants
significantly more time to complete the tasks using the zooming interface for drawing. For
annotation, the zooming interface was significantly faster than the fisheye lens.
The analysis of navigation times for the zooming and overview + detail interfaces showed
two patterns. First, regardless of the interface, using the lower magnification level resulted in
a significantly lower completion time and significantly fewer scrolls (zooming interface) and
inset relocations (overview + detail interface). Second, using the zooming interface resulted
in a significantly higher completion time regardless of zoom level compared to the overview
+ detail interface.
Comparing drawing and annotating, significant differences were found for helpfulness, ease
of sketching and completion time. The fisheye was rated significantly more helpful for
drawing but not for annotating. Additionally, the fisheye lens was significantly slower than
the zooming interface when annotating but significantly faster for drawing. While the
overview + detail interface was rated significantly higher for ease of use than the zooming
interface for annotation, there was no difference between the two for drawing.
Discussion
The zooming interface’s lower ranking and ratings are predominantly due to: 1) the extra
navigation required and 2) only part of the canvas being visible. 15 participants commented

127
that not having all information visible is problematic and all participants commented
negatively on the uninformed navigation; uninformed because participants had no clue as to
where the missing information was located and thus where to navigate to. This was especially
apparent in the drawing task where these problems resulted in significantly higher completion
times for the zooming interface as participants had to search for the desired card pairs. This
was also reflected in the significantly greater number of navigational steps participants
completed with the zooming interface compared to the overview + detail interface. As a
result, the zooming interface ranked significantly lower for ease of navigation under all
conditions.
Navigating the zooming interface using only scrollbars may have contributed to the lower
ranking for ease of navigation. Besides using scrollbars, existing zooming interfaces such as
Google Maps (Google 2013) use panning as an alternative method for navigation. In the
presented studies into magnified sketching, the stylus was the only input device. Panning
would have required a participant to somehow select a point on the canvas and communicate
a movement trajectory indicating the panning direction and distance. In SimpleInk, whenever
the stylus touched the canvas ink was generated. One option would have been to press the
stylus button while panning to differentiate between panning and sketching. While it is
unclear to what extent the missing option of panning influenced usability, a study by Gutwin
and Fedak (2004) suggested that, in terms of completion time and ease of navigation, a
panning option would have made no considerable difference. Similar to Study 4, Gutwin and
Fedak compared a fisheye lens, a zooming interface and a panning interface, asking
participants to complete tasks on a small display. Their results show that panning was
significantly slower than the other two interfaces. The authors named four reasons for the
higher completion time of which two involved task specific aspects (monitor off-screen
events and combining scrollbars and panning) which are different from Study 4’s tasks and
thus do not apply here. The first reason given by Gutwin and Fedak was that, as opposed to
navigating at the normal non-magnified view, panning was the only tested interface where
navigation happened in the magnified view, thus requiring considerably more mouse
movement. The second reason is that participants could not see the target and sometimes
navigated/panned in the wrong direction. Both reasons also apply to Study 4’s content
creation and editing tasks and thus suggest that even if panning the zooming interface had
been possible, using the zooming interface would still have resulted in a higher completion
time and uninformed navigation.

128
While the zoom level was fixed for this evaluation, an adjustable zoom level would have
allowed participants to zoom out for overview and zoom into the desired location once it was
found. Pietriga, Appert et al. (2007) investigated multi-scaled interfaces and how to optimize
searching tasks and developed a framework for further investigations of the design space.
Possible solutions include using visual cues indicating the locations of off-screen objects
(Baudisch and Rosenholtz 2003). However, this would require knowledge concerning which
objects are of interest.
The direct integration of the focus view into the context makes sketching both small figures
and large figures easier. Because the zooming interface separates the information temporally
and the overview + detail interface spatial, navigational steps interrupting the sketching
process are required if a figure continues into an off-screen canvas area. This is not required
with the fisheye lens. The lens follows the stylus which in turn generates ink resulting in
small and long figures being equally easily drawn in contrast to the other two interfaces.
Some participants said that when sketching long lines, the distortions distracted them. If no
detailed view is required for sketching such long figures, the distortions could be reduced
based on the stylus acceleration: the faster the stylus moves, the lower the magnification and
thus fewer distortions. This approach was successfully used by Gutwin (2002) to improve
target acquisition in distortion interfaces. The overview + detail interface used by Gutwin and
Skopik (2003) automatically generated ink at the center of the detailed area. To change what
is displayed in the detailed area and thus to generate ink, participants moved the inset in the
overview area. While this design did not require participants to lift the pen to sketch long
figures, it resulted in a significantly higher error rate compared to the fisheye lens and
zooming interface. Gutwin and Skopik’s approach also introduced an indirection as ink is not
generated at the pen’s tip, which they used to navigate the inset.
The lack of an overview and the inability to completely zoom out with the zooming interface
may have affected task completion. Since participants did not have the opportunity to see the
sketch in its entirety, they never had a chance to initially build a memory map. After
observing the pilot participants, a conscious decision was made not to provide such an initial
overview for two reasons. First, all pilot participants and almost all participants of the main
study, when presented with the task would navigate over the entire sketch template,
absorbing the information and building a memory map. Considering that 11 scrolling actions
were required, navigating over the complete canvas was comparatively cheap time-wise
compared to, for example, the overview +detail interface which required 47 repositionings

129
(Table 13). After examining the complete canvas, participants still had problems
remembering where objects of interest were located. This is supported by the significantly
higher completion time for the drawing tasks and the observations from the facilitator. He
described the participants’ navigational behaviour as a searching task rather than conscious
navigation to a known location. The second reason not to provide an overview for the
zooming interface was that the participants wanted to see the overview multiple times. When
tested with the first two pilot participants, they wanted to have another look at the overview
during the study. This would have introduced an overview function to the zooming interface.
An adjustable zoom level allows participants to gain an overview when required. Since the
other magnification strategies had fixed magnification levels, making it adjustable for the
zooming interface would have resulted in an unfair comparison.
The amount of navigational effort is directly related to the completion time. The annotation
task required considerably fewer navigational adjustments (Table 13) than the drawing task.
For example, annotating the zooming interface was significantly faster than the fisheye lens.
It only required horizontal scrolling whereas for drawing, horizontal and vertical scrolling
was required.
One of the advantages often found with distortion-based interfaces compared to other
magnification strategies is a lower task completion time (Schaffer, Zuo et al. 1996, Hornbaek
and Frokjaer 2003, Gutwin and Fedak 2004, Shoemaker and Gutwin 2007). While this is true
for the drawing task, the same does not apply for the annotation tasks for two reasons. First,
the navigational effort is directly related to completion time and considerably fewer scrolls
were required for the annotation task (Table 13). Second, having an overview as provided by
the fisheye lens was not as important to complete the annotation task: even at four times
magnification one-third of the text was always visible compared to one-twelfth for the
drawing task.
There was no significant effect of interface on error rate. This is partly supported by Gutwin
and Skopik’s results (2003) who tested the effect of different magnification levels (1x, 2x,4x)
on fisheye lenses, overview + detail and zooming interfaces for steering tasks. Gutwin and
Skopik found a significantly higher error rate for the overview + detail interface. However,
while their fisheye lens was configured similar to the fisheye evaluated in this study, the
overview + detail interface was considerably different. Following the path with the overview

130
+ detail interface was achieved by moving the small inset which automatically moved the
detailed area and drew a line in the overview area’s center.
For drawing, a lower magnification level resulted in significantly more errors. The drawing
task required more precise sketching as missing details needed to be added to existing small
objects. For the annotation task, it was up to the user where to write provided it was between
the lines. The significantly lower completion time for both task types when using the smaller
magnification level supports this finding: as it is possible to draw more precisely if more
space is available, participants will make use of that space, resulting in fewer errors and a
higher completion time. While five participants commented that the magnification level did
not have an effect on sketching with overview + detail interface and fisheye lens, four stated
that all interfaces were worse at higher magnification.
The fisheye lens was preferred for drawing but not for annotating. The fisheye lens’
advantages are that it integrates the focus into the context and also provides an overview.
However, the inner lens area where people sketch is the smallest of the trialled interfaces’
sketching areas. This is particularly a problem for annotating where added words may not
always fit into the inner lens area. Thus, when using the stationary lens mode, the lens has to
be manually repositioned right next to its previous position: an action which is usually not
required for drawing as objects fit into the inner lens area. Additionally, having an overview
is not as important for the annotating tasks as most of the text is visible and the content
structure clear, so navigation is informed; i.e. a word is followed by a word and a sentence
continues on the next line. Four participants stated that reading distorted words was harder
than recognizing distorted objects. This is supported by Hornbaek and Frokjaer (2003) who
found text to be more comprehensible using an overview + detail interface compared to a
fisheye lens. To make words more readable, other distortion schemes for writing can be used,
such as only distorting text vertically (Baudisch, Lee et al. 2004) or scaling words as a whole
(Guimbretiere, Stone et al. 2001).
6.1.8. Summary
Comparing the improved fisheye lens with overview + detail and zooming interfaces for
magnified sketching allowed detailed insights into the interfaces’ performances for content
creation and editing. Of the three tested interfaces, the zooming interface was ranked the
lowest, least preferred, hardest to navigate and least helpful. No significant differences were

131
found between the overview + detail interface and the distortion-based fisheye lens. This is
an improvement, especially in terms of error rate where problems with the original fisheye
lens configurations such as the moving canvas hindered precise targeting. In the participants’
rankings the fisheye lens was most often ranked as the top choice for drawing, annotating and
overall.
Having an overview of the information proved important for task completion. Both interfaces
offering an overview, fisheye lens and overview + context interface, were preferred and
resulted in faster completion times. This was demonstrated in the drawing task where,
specifically at high magnification, task completion heavily depended on information which
was spread across the sketching template with no apparent ordering rule.
6.2. Summary of Magnified Sketching
The research presented in this and the previous two chapters identified the challenges faced
when using distortion-based magnification interfaces for the creation and editing of content.
By using existing distortion-based interfaces for sketching, the main challenges for this novel
combination of interface and domain were identified (Chapter 4): the moving canvas and the
distracting distortions. In the following two studies, solutions for the two challenges were
developed, implemented and evaluated (Chapter 5). Finally, the improved fisheye lens was
evaluated against other common magnification interfaces, namely zooming and overview +
detail (Chapter 6). The results showed improved performances of the developed fisheye lens
compared to the original fisheye lens (Furnas 1986, Sarkar and Brown 1992) regarding the
identified challenges.
To address the moving canvas challenge, which causes problems with target acquisition, an
additional stationary mode for the fisheye lens was investigated. Using this mode, in which
lens and stylus movement are decoupled, sketching smaller gestures potentially requiring
more precise control becomes easier. The original fisheye lens where the lens always follows
the pen (Furnas 1986, Sarkar and Brown 1992) results in significantly more errors compared
to fisheye lenses with a stationary mode (Chapters 4 and 5). Introducing a second mode
requires a mechanism to switch between the modes. Using the button on the stylus was tested
first and resulted in significantly slower completion times as the lens was often repositioned
(Section 4.1.3). Snapping was tested as a technique and successfully overcame the time
disadvantages (Section 5.1.4). However, using the snapping technique for dense sketches

132
requires further research as it occasionally leads to unintended snaps (Section 5.1.4). In
conclusion, the final experiment showed that using the pen button, although not ideal, does
not result in significantly higher completion times than the other tested interfaces.
To manipulate the lens size, an automatic lens resize mechanism was designed, implemented
and tested. The auto resize technique was triggered when the lens changed into the stationary
mode and increased its sized based on the content covered by the lens. Participants preferred
the auto resize function when initially tested (5.1) and when compared to other magnification
interfaces (Chapter 6). The snap technique was also trialled to manipulate the lens size so that
it perfectly positioned the lens. The aim was to cover as much of the important information as
possible with the fisheye lens’ inner region which equally magnifies the content. While
snapping does not resize the lens, perfectly positioning it received positive comments
(Section 5.1.4). Manually changing the lens size was outside the scope of this work but
potential solutions include the use of the non-dominant hand (Matsushita, Ayatsuka et al.
2000) or pressure (Ramos and Balakrishnan 2005) to adjust the lens size.
The visually-distorted information in the fisheye lens’ transition region is difficult to
comprehend (Carpendale, Cowperthwaite et al. 1997), increases mental workload and can be
distracting (Grudin 2001). To address this problem, the movement of one of the fisheye
lenses in the second evaluation (Section 5.1.1) was restricted to the horizontal. The results
showed that such restrictions did not improve comprehension and/or proved distracting.
Participants still ranked and rated the lens significantly lower and made significantly more
errors compared to the completely stationary lenses. The third evaluation (Section 5.2)
exclusively designed, implement and evaluated visual guides to support comprehension. Two
novel guides, the background and foreground guides, were added to the test framework for
use in combination with fisheye lenses. A grid was also added as it is a visual aid commonly
used in combination with distortions (Zanella, Carpendale et al. 2002). The three visual
guides together with the control conditions (i.e. no visual guide) were evaluated with a focus
on how well they support the comprehension of scale, alignment, distance and direction in
distorted information. These four visual properties are crucial for comprehension (Bertin
1977, Wigdor, Shen et al. 2007). The results showed that, while there is no perfect support,
the background guide best supported all four visual properties. However, the grid was better
when only direction and distance are important.

133
The final study compared the improved fisheye lens with other common magnification
strategies and demonstrated the success of the new fisheye lens features. The results showed
how the new features considerably improve the usability of fisheye lenses when used for
magnified creation and editing. The improved fisheye lens was most frequently rated top
choice and was at least equally good if not better than the other tested interfaces. The results
also showed the importance of occlusion-free magnification for a better interaction when
having an overview is important.
This chapter presented a series of incremental studies to overcome one of the software-sided
causes for information occlusions namely magnification interfaces. While previous studies
focused on occlusions caused by how information is displayed, the work presented in the next
chapter focuses on physical sources of occlusion happening when interacting with the
information: using fingers to interact with the information on small screens leads to the
fingers being in the line-of-sight when hovering and/or touching the screen. The rational for
the following investigation is to find a suitable mechanism to manipulate the magnification
interface (e.g. adjusting the magnification factor) without involving the already busy stylus.

134

135
7. Gesture Input on Mobile Phones
The previous three chapters reported on work to reduce screen occlusions caused by how
information is displayed on a small screen. Choosing a distortion-based strategy to show
information magnified, this research concentrated on how information is presented but not
how the presentation and/or magnification interface can be manipulated without causing
occlusions. A method is required to provide input without physically obstructing the user’s
line-of-sight which, for example, occurs when using the finger on touch screens. To address
this problem of physical occlusions, this chapter investigates 3D gestures performed away
from the screen in order to provide input and thus controlling the magnification lenses.
This chapter explores how 3D gestures can be used to provide continuous input captured by
the front-facing camera, thus potentially reducing screen occlusion. Information occlusion
can be caused by software and/or by physical objects in the line-of-sight between user and
screen. Typical mobile devices have limited input modalities available: touch screen, two or
three buttons, sensors, cameras and microphones. Gesture input has the advantage of
supporting continuous input thus reducing the demand for input actions – one successful
example of gesture input is the swipe keyboard (Kushler 2003). However, the disadvantage
of most continuous input modalities is that they use the touch screen which obstructs the
information on the display, or the gyroscope or accelerometer that require distracting device
movements (Holz and Baudisch 2011). Recent smart phones include front-facing cameras.
Their location means that such cameras are easily accessible away from the screen while their
field of view is visible to the user and moving a thumb in this field does not require
distracting device movements (Figure 37).
In this chapter, the use of a front-facing camera on a mobile device for continuous gesture
based input is investigated, a combination I believe is novel. Using a front-facing camera has
multiple potential advantages. First, the required hardware, camera and finger are already
present. Second, the input is independent of application (except for those directly using the
front-facing camera) and therefore always available. Third, no distracting device movements
are required. Fourth, by offering an interaction space away from the display, screen occlusion
is reduced. Fifth, the camera can be combined with other sensors to enrich interaction.

136
There are three components required to support this interaction modality – the gesture
capture, the gesture recognition, and the gesture design – all of which contribute to the user
experience. To test the feasibility of this approach, three gestures were defined and
appropriate recognizers with varying demands on usability and hardware developed. In the
second phase, the gestures were evaluated using a smart phone in different scenarios. In
addition to the gesture recognizer performance, the focus was also on the demands on
participants in terms of interaction space and the comfort of thumb movements.
The work presented in this paper has been published at an international conference
(Schmieder, Luxton-Reilly et al. 2013).
Figure 37. A smartphone with a front-facing camera and a thumb performing a gesture above it on the right.
7.1. Gestures
The novelty of using front-facing cameras for gesture input on a mobile device means the
feasibility of such a system is unknown. To address this, a user study was conducted, testing
three gestures of varying demands on hardware performance and user input capability. This
study addresses three questions. 1) Are current mobile devices powerful enough for camera-
based gesture recognition in real-time? 2) Are 3D gestures performed above the camera an
easy and precise way to capture input? 3) What is the interaction space above the camera
where gestures can be comfortably performed? For the development and testing, a Samsung
Omnia W was used, featuring a single core 1.4 GHz Scorpion processor and Windows Phone

137
7. As results will show, camera-based gestural input can be successfully used in mobile
devices for enriched natural interaction.
7.1.1. Design
Three gestures and an accompanying recognition algorithm to accurately identify each
gesture were designed. To allow for continuous input, each gesture can be performed such
that it differentiates between two motion directions: for example, to increase and decrease the
volume, to zoom in and out of an image or to scroll a list up and down.
As the motion direction depends on the phone’s orientation, the orientation was used by the
recognizers to decide what motion direction maps in to what input direction. Additionally,
each gesture has different levels of acceleration. For example, one level may increase the
volume by one each step, another by three and another by five. Each gesture has a neutral
state where no changes occur.
Before the gestures are recognized, each captured image is pre-processed. The first step
scales the image to 40 x 30. Different resolutions for the gesture recognizers were tested and
40 x 30 was found to be the best trade-off between performance and accuracy. Additionally,
the image is converted from 32 bit RGB to 8 bit grayscale.
The thresholds used for the algorithms were obtained by testing the algorithms under
different lighting conditions: bright- outside during a sunny day; neutral daylight - in the
office with open blinds; artificial light - in the office with blinds down and light on, half dark
- in the office with blinds down. Completely dark was not trialled as the algorithms require
some light to track the thumb.

138
Tilt Gesture
Figure 38. The tilt gesture: Tilting the finger to either side determines the direction of input and the amount of tilt determines the level of acceleration.
The thumb is lying on the camera and its tilt determines the input (Figure 38). The tilt
direction and intensity determines the direction and acceleration of change in input. Tilting
the thumb to the right maps to an increase in input and tilting to the left a decrease. The
higher the tilt is the higher the level of acceleration. If no tilt is applied to the thumb covering
the camera, no changes in input are invoked.
The recognition algorithm analyses the light captured by the camera to calculate the input
(Figure 39). The first step is to split the captured image in half depending on the phone
orientation: the split divides the image so that each half is covered by half of the thumb.
Second, the average brightness value is computed over the pixels in each half. The image half
with the lower brightness is the side the thumb is tilted towards. Similar low brightness
values mean that the thumb evenly covers both image halves so no input changes are
triggered. Finally, based on the brightness values and thus the amount of tilt, a step function
is used to determine the level of input acceleration: the brighter the image half the higher the
acceleration.

139
Figure 39. The tilt gesture: The captured images used to compute the tilt. (a) a slight tilt to the right. (b) the thumb completely covering the camera in neutral position. (c) A strong tilt to the left.
A brightness threshold determines if the tilt gesture is currently being applied. The gesture
recognizer is only used if the average brightness over the complete image is below a
predefined threshold. This threshold is set to 55% of an image brightness value taken when
nothing covers the camera (e.g. when the application is started). This threshold provides the
best offset between brightness ranges to determine the level of acceleration and
activate/deactivate the gesture recognizer.
The tilt gesture’s performance requirements are the lowest of those developed. To compute a
new input value, one loop is required to iterate over all pixels to calculate the required
average brightness values, one condition is required to test whether the gesture is activated,
one to test tilt direction and one for each level of acceleration.
Distance Gesture
Figure 40. The distance gesture: the input depends on the distance between camera and thumb. A
predefined distance is the neutral input where no changes are invoked.

140
The distance between thumb and front-facing camera is used to adjust the input (Figure 40).
A predefined distance marks a neutral point where no input manipulation happens. A smaller
thumb-to-camera distance triggers a decreased input and a larger one an increase. The
distance determines the level of acceleration.
Input is based on the thumb’s diameter in the captured image: the larger the diameter, the
closer the thumb. To calculate the distance, the thumb’s position in the captured image is
determined. Then, brightness values are computed over the image. Finally, the input value is
determined using the thumb’s distance and brightness.
Figure 41. The distance gesture: The images after the Sobel operator has been applied with the thumb (a) close, (b) further away and (c) far away from the camera. The blue line indicates the thumb’s width used to calculate its distance from the camera.
To detect the thumb in the image a Sobel edge detector with a 3x3 kernel is applied. The
resulting Sobel image (Figure 41) contains objects defined by their borders. To identify the
thumb, three assumptions are made. 1) The thumb partly covers the center row of the Sobel
image. 2) In the center row the thumb is the biggest object. 3) The thumb forms an
uninterrupted blob starting at the image. Hence the recognition algorithm analyses the center
row of the image looking for the biggest group of dark pixels bounded by white pixels. If the
biggest section is above half the image’s width, the algorithm further tests whether the
section is part of a blob connected to at least one image edge. If no object satisfies all three
criteria, the algorithm discards the image and no input is invoked, presuming the gesture is
not currently being performed.
The size of the range between minimum and maximum thumb distance is divided into smaller
spans, each accommodating a different input value. A span has to be sufficiently large to be
easily found by the user in terms of distance of his/her thumb to the camera. For example, in
a 40 pixels-wide image, the total range is 20 as the thumb must be at least half the image
width. This leaves 20 pixels to be split into smaller spans. Spans of one-eighth of the image

141
width were found to work best. Brightness values determine if a thumb is covering the
camera completely. This allows further differentiations when the thumb covers the image
width completely but does not yet physically cover the camera.
The biggest challenge for the distance gesture is for users to keep the thumb in the camera’s
viewing field. As the thumb moves away, it does so on an angle so it continuously moves
away from the camera’s visible area.
The distance gesture’s performance requirements are low. To compute the Sobel image, two
loops iterating over the image are required. Another loop is used to compute the brightness
values. A set of conditions is required for the step function to determine the final input value.
Circular Gesture
Figure 42. The circular gesture: The direction of the circular motion determines the input direction and the speed of the motion determines the level of acceleration. Holding the finger at a position invokes no change (i.e. neutral input).
A circular motion is performed close above the camera to adjust the input (Figure 42).
Depending on the motion direction (clockwise or counter-clockwise) input is either increased
or decreased. The speed of the gesture determines the level of acceleration.
The circle gesture recognizer first detects the thumb. The thumb’s center of mass is then used
to calculate the motion direction. Motion speed is based on the thumb’s overlap between two
consecutive images.

142
Figure 43. The circle gesture: The images with the thumb in black after the flood-fill algorithm. The white dot in the black blob indicates the center of mass. (a) The captured image with the thumb not moving thus without blur as the camera had time to adjust. (b-d) The captured images with the thumb moving fast thus with the background higher illumination as the camera has not enough time to focus.
To detect the thumb, a flood-fill algorithm is used based on the captured image’s greyscale
values (Figure 43). The thumb appears darker than the rest due to the movement close to the
camera: cameras found in smart phones are not fast enough to adjust their blending settings to
evenly illuminate the image. As the thumb changes illumination conditions quickly, the
camera makes the background behind the thumb appear much brighter than normal (Figure
43). The flood-fill algorithm finds the biggest connected thumb blob composed of pixels with
an 8-bit greyscale value below 90. If the biggest blob covers more than 21% of the captured
image it is presumed to be the thumb. Otherwise the thumb is presumed not to be in the
image. If no thumb is detected in more than four successive images further computational
steps are stopped and only resumed when a thumb is found in at least four successive images.
Motion direction is calculated using the cross-products of three successive images. The
weighted average location for each thumb blob is calculated to determine its center of mass
(Figure 43): the center of mass’ x-coordinate is the average value over all the blob pixels x-
values. The same applies to the y-coordinate. Afterwards, the cross-products between the four
most recent thumb centres of mass are computed. Using more than two consecutive images
increases recognition accuracy as it overrules individual false recognitions (Kameda and
Minoh 1996). If the sum of the three resulting vector magnitudes is positive, the gesture
motion is clockwise and otherwise counter-clockwise.
Motion speed depends on movement and on the number of intersection points between two
successive thumb blobs. To detect a stationary thumb, the image is divided into four even
quadrants. If the thumb remains in the same quadrant over four successive images, the motion
counts as stopped. If not, the thumb is moving and the overlap of two thumbs in successive
images is computed. A step function based on the overlap percentages is used to define
thresholds for the different levels of acceleration depending on the number of acceleration

143
levels. For example, given two acceleration levels, empirical tests showed a threshold of 42%
to be optimal: a higher overlap than 42% means a slower acceleration and a smaller overlap a
higher acceleration. Using quadrants to detect a stationary thumb rather than overlaps is
better as it compensates for small or unintentional thumb movements.
7.1.2. Performance & Robustness
The computation of a new input value consists of multiple steps of which capturing the image
is the most computationally expensive (Table 19). If no other computations are performed,
the Samsung Omnia W captures up to 16 images per second. In the following, comments on
the robustness and accuracy of the recognizers in general and under different lighting
conditions are presented.
The tilt and circle gestures are both unaffected by different lighting conditions and fast
lighting changes. Only when it was completely dark did both recognizers stop working. The
main reason for the robustness is that in both cases the thumb dominates the captured images,
making the background appear bright and unfocused (Figure 43).
The distance gesture worked perfectly under the tested lighting conditions except in the half
dark condition. In this condition if there were multiple dark objects in the image background
they were occasionally merged with the thumb: because of the insufficient lighting the Sobel
operator did not detect all the edges. Fast lighting changes did not affect the algorithm.
Table 19. Performance measurements in milliseconds using a Samsung Omnia W phone.
Tilt
Gesture
Distance
Gesture
Circular Gesture
Pre-process Image image captured (66.75msec)
scaled & converted to greyscale (1.9msec)
Process Image - 4.93 (Sobel)
Detect Thumb - 1.12 2.88 (Flood Fill & mass
center)
Compute Direction &
Acceleration
0.97 0.51 1.76
Total 69.62 75.21 73.29

144
7.2. Evaluation
A user study was conducted to explore the interaction with a smartphone using those
developed camera gestures. This study focused on the requirements of suitable 3D gestures
and the space they are performed in with the aim of informing further research regarding the
basic requirements of this novel and yet unexplored interaction. Four pilot participants were
used to determine algorithm parameters such as the number of acceleration levels and the rate
at which changes were applied. Only one of the recognizers was activated at one time,
requiring a button press to change between them. This study focuses on (or “aims to answer”)
the following research questions.
What defines the interaction space in which gestures can be comfortably performed above
the camera?
Are the evaluated gestures easy and intuitive, and are their associated apps an appropriate
match?
Is the phone’s hardware sufficiently powerful for real-time performance?
Are the gestures recognized accurately in terms of direction and acceleration changes and
reactiveness?
7.2.1. Participants
Participants each had to have a smartphone as their mobile device to ensure device
familiarity. 24 participants were recruited, 8 females and 16 males, ranging in age from 19 to
41 (mean: 25.63 years, SD = 5.17). Five were left-handed. There was no compensation for
participation. Since accurately tracking objects may depend on the visual properties of the
tracked object, the selection of participants tried to ensure a variety in thumb size, shape and
colour in the evaluation. To test the robustness of the algorithms, participants from different
ethnic groups were intentionally recruited (10 Caucasians, 6 Indians, 5 Asians and 3 from the
Middle East) and of different height as an approximation of thumb size (mean: 171cm, SD =
8.62).
145
7.3. Apparatus
To test the gestures, participants used a Samsung Omnia W I8350 featuring a single core 1.4
GHz Scorpion processor and Windows Phone 7. The front-facing camera was located on the
shorter side’s corner (Figure 37). The capture rate of the front-facing camera is on average
between 8-10 images per second on the Windows Phone with a gesture recognizer and test
application running.
The gesture recognizers were integrated in a program running on the phone. Each recognizer
was configured to support two directions and to differentiate between two acceleration levels:
one and three. The choice to use two acceleration levels was based on the results from the
four pilot study participants. While the tilt and circle gestures would have worked intuitively
enough with three acceleration levels, the distance gesture did not. When the thumb was
moved with the lower acceleration, changes were applied every 500ms to allow for accurate
input. This low change rate was chosen as the pilot study participants frequently overshot the
target with a faster change rate. For the faster acceleration level, changes were applied after
each image was analysed and the new value computed (i.e. on average below 100 msec).
Sessions were recorded using a video camera mounted above the participants.
7.3.1. Tasks
Each of the three designed tasks was dedicated to a particular gesture. An additional task was
developed for training in all three gestures. Each task required participants to use all facets of
the gesture so that the invoked input direction and level of acceleration were frequently
changed. The choice of task for a particular gesture was based on similar mappings found in
current environments as explained in the following. The order of gestures was varied among
the participants, forming six conditions.

146
Contact List – Circle Gesture
Figure 44. The test program showing the contact mini app. In the top right corner a name is shown which the participant has to select next. On the right side top the indicator shows a current (neutral) input of 0.
To scroll a list using a circular motion is familiar practice. MP3 players such as Apple’s iPod
Classic use a circular motion to browse their content. Scrolling a list requires participants to
bridge bigger distances faster as well as precise manipulations to jump between neighbouring
list entries.
The scrolling mini app displayed a list of 78 contacts to simulate a standard smartphone
Contact list (Figure 44). To scroll down/up, participants performed a clockwise/anti-
clockwise motion. If the acceleration level was one the selector, indicated by a blue colour,
jumped from the currently selected contact to the next neighbour. An acceleration level of
three jumped three contacts at once.
In the top right corner a name was displayed which was also in the contact list. Participants
were asked to scroll to that name in the list as fast as possible. The correct name had to be
selected for two seconds, requiring participants to provide neutral input. After two seconds,
the name in the top right corner was replaced by another name from the contact list. In total,
participants had to scroll to 10 different names. The choice of names made participants
perform precise selections (e.g. to go from one name to a neighbour) and to bridge larger
gaps (e.g. Paul to Billie).

147
Figure 45. The test program showing the zooming mini-app. Controlling the size of the green square, the participants has to match the square’s size with the red frame.
Zooming – Distance Gesture
Participants controlled the size of a green square on the screen (Figure 45). To zoom in,
participants moved their thumb close to the camera and to zoom out the thumb was moved
further away. This gesture is familiar for zooming as going closer to an object makes it
naturally appear bigger and going further away makes it smaller.
An acceleration level of one increased or decreased the square’s size by 10 pixels and a level
three by 30 pixels. The square can have any width between 0 and 300 pixels resulting in 30
distinct zoom-able sizes.
The participants’ aim was to match their square’s size with a red frame shown on the display.
To indicate equal sizes, the red frame turned white. Participants had to keep the size constant
for two seconds, requiring them to adjust the thumb camera position to neutral, before the
frame changed size and turned red again. In total the red frame changed size 10 times.
Figure 46. The test program showing the BreakOut mini-app. The user controls the paddle with the tilt gesture to send the ball back upwards until all bricks are destroyed.

148
BreakOut - Tilting Gesture
Participants controlled the paddle in BreakOut (Figure 46) to bounce the ball upwards. The
aim was to destroy all ten bricks lined in the top of the game area by hitting each with the
ball. After a brick was hit, the ball was deflected down towards the paddle. The angle of
deflection when the ball hit the paddle depended on where the ball hit the paddle. To destroy
the bricks, the user needed both small and large paddle position adjustments forcing them to
use all facets of the tilt gesture. The game area was 300 pixels wide. An acceleration level of
one meant a paddle move of 4 pixels while a level of three meant a 12 pixel move. In total the
paddle had 75 distinct positions. Each destroyed brick scored 10 points, making 100 points
the highest score. The game was also used in previous research to study camera-based input
techniques (Hansen, Eriksson et al. 2006).
7.3.2. Procedure
Participants were seated at a table with the smartphone lying immediately in front of them.
They were given a tutorial guiding them through the study. The participants completed the
study individually. The participants’ first task was to complete the first section of the
questionnaire. The questionnaire is available in Appendix B.
To familiarize themselves with the Windows Phone, participants were asked to pick it up and
the facilitator explained the main elements on the screen. Once familiar, the participants
started the test application. During this, the phone was held in portrait orientation before
changing to landscape to interact with the test application.
At the beginning of each gesture, the facilitator explained the gesture to the participant. The
participant was then told to navigate to the volume mini app which was used for training and
trial the gesture. Then the participant completed both a gesture-specific task and the
questionnaire for this gesture. This was repeated for each gesture. The order of the tasks was
counterbalanced.
After all tasks were finished, the final section of the questionnaire was completed. The
experiment concluded with a discussion of other possible gestures allowing continuous input.
It took the participants on average 29 minutes to complete the study.

149
7.4. Results
The collected data includes the questionnaires, session video recordings and transcripts of the
final discussion. The questionnaire comprised three sections. The first gauged participants’
familiarity with gesture input. The second asked participants to rate each gesture regarding its
ease and recognition accuracy using a five-point Likert scale. The last contained a ranking of
the gestures as well as questions gauging the interaction space above the camera including
camera location.
7.4.1. Interaction
All 24 participants held the smartphone in landscape orientation with the camera on the right.
Regardless of their handedness, all participants chose to use their right thumb to perform the
gestures. The matches between gesture and associated mini apps were never rated as
negative, thus confirming the design choices (Figure 47).
Ideal Camera Position
The camera should ideally be centred on the horizontal axis in landscape orientation on the
phone’s right side. When asked in the questionnaire to indicate the optimal camera position
on the phone, all participants chose the right side of the screen. Six participants chose the top
corner, eight the center and nine the lower corner. Ten participants noted that the camera on
the horizontal axis should be centred between screen and phone edge. The camera on the test
phone was closer to the edge than to the screen which sometimes created problems with the
tilt and circle gesture: a tilt to the right (of a big thumb) meant a tilt slightly over the phone’s
edge. While performing the circle gesture, some participants drifted away from the camera’s
center. They stated that they used the space between screen and phone edge as a frame of
reference with their circle motion touching both sides.
Keeping the Thumb in the Camera’s Viewing Field
Each gesture used a different interaction space above the camera with different demands on
the user. The tilt gesture was the easiest one to keep in the camera’s viewing field as it
essentially was performed as a two-dimensional gesture with the thumb lying flat on the
camera (Figure 47). It received ratings above neutral with 83% of the participants strongly

150
agreeing to the ease and 17% agreeing. In contrast, the ease of keeping the distance and circle
gestures in the camera’s viewing field was rated lower.
The dominant usability problem with the distance gesture was to keep it in the viewing field.
To measure the distance between camera and phone, the recognition algorithm calculates the
thumb’s diameter. If the thumb is close but not centred above the camera, it is only partially
visible so its measured diameter is smaller than it actually is and the calculated distance is
incorrect. As the thumb moves away from the camera it does so in an arc. Its tip moves
towards the bottom of the phone as it moves up, leaving the camera’s viewing field on the
lower edge. However, this usually occurs after the thumb position starts feeling
uncomfortable due to the high finger stretch. In the questionnaire, participants were asked
what the maximum distance between thumb and camera was before holding the thumb
became uncomfortable. Measured with a ruler, the average distance stated was 4.75±1.12 cm
(Min = 2 cm, Max = 6 cm). Most participants stated that it became uncomfortable just before
thumb and thumb socket formed a straight line.
Figure 47. The questionnaire ratings for the three gestures on a 5 point Likert scale centred on neutral. The ratings are: 1= strongly disagree, 2 = disagree, 3 = neutral, 4 = agree, 5 = strongly agree.
For correct recognition, the circle gesture had to be performed at a certain height above the
camera and the motion had to circle the camera. The gesture did not require participants to
draw a perfectly round circle nor one perfectly centred above the camera. However, moving
outside the camera’s viewing field, as some participants did, made it impossible to track the

151
thumb resulting in incorrect recognition. On occasion the thumb was too close to the camera
so the image was almost totally dark, again leading to incorrect recognition. Participants on
average found it harder to keep the thumb in the right area for the circle compared to the
distance gesture, with the distance gesture having 17% of the participants rating it below
average and the circle gesture 29%. This was also reflected in the questionnaire where eight
participants said it was difficult to keep the circular movement above the camera. There were
no complaints about the distance gesture.
In summary, the tilt gesture is the easiest, with only positive ratings. The distance gesture is
rated second, followed by the circle.
Ease of Gesture Motions
The thumb movements for the distance and circle gestures were perceived as physically
uncomfortable at times. Having to hold the thumb still at changing positions over an extended
duration (Zooming task: Ave = 141±36s) was perceived as uncomfortable by 12.5% of the
participants. For the circle gesture, 29% of the participants experienced discomfort when
performing the gesture: three stated their thumb movement was restricted as they were
holding the phone with the same hand. This was particularly evident when the thumb tip
moved close to the thumb base forming a right angle between the thumb’s first and second
phalanges.
7.4.2. Phone Performance and Recognition Accuracy
All gesture recognizers and mini applications ran in real-time on the phone. In the
questionnaire participants rated the overall accuracy of the gesture recognizer as well as the
recognizers’ reactiveness and the ease and correctness of changing the acceleration level and
direction (Figure 47).
The gestures and their associated mini applications ran smoothly apart from two occurrences
when the camera froze for two seconds during interaction. This occurred randomly for
different recognizers and appeared to be an artefact of the phone’s API to the camera buffer.
The recognizers’ reactiveness was rated neutral and above for the tilt gesture and neutral and
above by 21 participants for the distance gesture and by 23 for the circle gesture (Figure 47).

152
To allow for precise adjustments, changes were applied every 500ms, which some
participants perceived as too slow. For the distance gesture, changes were invoked instantly
when the thumb distance entered a new range. For example, to zoom in with an acceleration
level of one, the thumb (depending on its size) had to be roughly between 3 and 4 cm away.
Any other distance range was mapped to another input. If the thumb position was changed
but not enough to change ranges, participants perceived this as slow to react. For the circle
gesture, the thumb had to rotate half a circle to trigger any change in input. A lower threshold
meant that sometimes unintended changes were invoked as the circular motion was not
performed.
Changing the level of acceleration was rated below neutral for the distance and circle gesture
by two and five participants respectively (Figure 47). For the distance gesture, to change the
level of acceleration, the finger has to be in the distance range associated with the desired
acceleration. To find the correct range, one either recalls it from practice/experience or moves
towards the desired range until the input value changes to the desired outcome. As
participants had had little training, not all remembered the positions perfectly so had to use
the second strategy which some perceived as suboptimal. For the circle gestures, correctly
recognizing the acceleration required the circle to be performed above the center of the
camera. If this condition was violated the recognizer could not accurately differentiate
between the acceleration levels of one and three. Due to the problems of keeping the thumb
in the required space, the acceleration levels were occasionally recognized incorrectly (Figure
47).
Changing the input direction was always rated as neutral or higher for all gestures (Figure
47). Differentiating between directions was easier than changing the acceleration levels
because the motions were more different and thus easier to remember and recognize. For
example, for the circle gesture, one had to change the motion direction regardless of
acceleration. Additionally, to accurately recognize the correct direction it was sufficient for
the camera to capture part of the circular motion, thus not requiring a centred motion above
the camera.
When asked for other gestures, participants proposed one of three gestures. The first,
proposed by four participants, is a circular motion but on the z-axis above the camera. Thus
staying inside the camera’s viewing field would become easier. Circle direction and speed
determine acceleration level and direction. The second and third are variants of swipe

153
motions. The second, proposed by four, consists of a horizontal swipe motion with the swipe
direction determining the input direction. Once the swipe in a direction reached the outer
border the finger is either lifted high above the camera or besides it to return to the other side
and continue the gesture. The third variation, proposed by seven participants, has an
additional horizontal swipe that makes the extra motion to return to the start position
redundant.
To sum-up, this evaluation shows that users can operate well-designed gesture recognition
algorithms which can run in real-time on current generation smartphones. The gestures allow
for accurate adjustments of acceleration and directions if the gesture requirements such as
motion path and accuracy are satisfied.
7.5. Summary
Three gestures and associated recognizers were developed, implemented and evaluated to
allow for continuous input on portable devices. To capture input the front-facing camera is
used as its location offers an easily reachable input channel away from the screen. Using
camera-based gestures avoids the need to move the device, which would potentially interrupt
the interaction and does not occupy valuable screen space.
The presented work shows how 3D gestures are successfully captured and recognized.
Different low-cost recognition strategies are implemented and trialled. The evaluation
demonstrates the robustness of the recognition algorithms under different conditions; e.g.
different lighting conditions and different colours and sizes of the tracked thumbs. The
evaluation also provides insights into the design of gestures and their requirements and also
the interaction space above front-facing cameras where gestures are comfortably performed.
While the work presented in this chapter successfully investigates the use of 3D gestures to
provide input, how this novel input metaphor can be used to control the magnification lenses
developed in this research has not been addressed yet. The next chapter discusses ways of
combining both lines of research as well as discussing each line individually.

154

155
8. Discussion
The previous part of this thesis (Chapters 4-7) has described the details of the investigation
into ways to reduce screen occlusion on small displays. This chapter discusses what was
learnt and suggests how it can be applied. The chapter is split into two sections. First, the
studies presented in Chapter 4-6 and the implications for magnified sketching are discussed.
Second, 3D gesture input from Chapter 7 as an alternative way to provide input is discussed.
Both sections center around the research approach and what has been learnt. A brief
discussion concludes this chapter: it looks into ways to combine both approaches to reduce
screen occlusions.
8.1. Distortion Interfaces for Magnified Sketching
The discussion presented in this section focuses on the approach taken to identify
requirements for magnified sketching using distortion-based interfaces. Furthermore, the
overall impact of the new distortion features compared to other magnification strategies are
discussed as well as the development of the features throughout the studies. Please refer to
the individual study sections in Chapters 4 and 5 for the discussions about specific results of
the study (Table 20).
Table 20. Discussion topics and locations in this thesis.
page
Study 1
Interdependent lens features 69
Space versus translucency to transition between magnified content and its context 69
Moving canvas problem 69
Comprehension of distorted information is difficult 69
Sketching with stationary lens mode 70
Study 2
Restricting lens movement while sketching 84
Ways to help comprehension of distorted information 84
Snap function design 85
Transition region of fisheye lens 85

156
Highlighting shapes of interest 85
Success of new intelligent lenses 86
Differences between drawing and writing 86
Study 3
Success of visual guides in terms of helpfulness and preference 102
Displaying help outside lens 102
Displaying help inside lens 103
What visual property is best for what content 103
Any guide better than none 103
Ordering of visual properties 104
Applicability of guides to domains other than sketching 104
Study 4
Navigation is hard without overview 124
Design of zooming interface 125
Sketching small and long figures with the interfaces 126
Navigational effort in relation to completion time 127
Completion time for fisheye lens when compared to other magnification interfaces 127
Error rate for the interfaces 127
Effect of different magnification levels 127
Success of fisheye lens 128
Discussion Chapter
Magnification strategy performance is strongly domain-dependent
Content structure and its impact on magnification interfaces
The impact of the overview’s design on usability
The unsuitability of existing distortion-based interfaces for sketching
Different fisheye lens modes and how to invoke them
The importance of visual guides to support comprehension
Combining visual guides
The impact of display size on magnified sketching
The improved fisheye lens
Impact of stationary mode on target acquisition
Ability to draw long and small figures is important
How well results will scale on different display sizes

157
8.1.1. Magnification Strategies and the Importance of Having an Overview
The performance of a magnification strategy is strongly domain-dependent. Having a content
overview is one factor influencing a strategy’s performance. Depending on the content’s
structure, providing an overview can make the difference in efficacy and thus acceptance.
The lack of an overview when working with content which has no inherent structure means
that the magnification strategy is less helpful due to the harder, uninformed navigation. This
was shown when completing the drawings in Study 4: using the zooming interface, the only
tested interface that does not provide an overview, resulted in a significantly higher
completion time compared to the other two interfaces. The greater completion time was the
result of people manually searching for their next target with no visual indication where this
target is located, based on the currently displayed content. These results demonstrate the
value of having an overview when working on unstructured content. Hence, I firmly believe
that the following statement applies as a general rule for all magnification strategies:
Whenever content which has no inherent structure is magnified, an overview has to be
provided to facilitate informed navigation of the entire content.
Magnified structured content does not necessarily benefit from having an overview. When
working on a block of text such as during the annotation task in Study 4, an overview has no
positive impact on completion time. In contrast, the zooming interface was significantly
faster than the fisheye lens. In a block of text, the information is visually presented in a linear
fashion where one word follows another and a sentence is followed by another sentence.
Thus, to navigate to a target word or phrase which is currently off-screen, one can follow the
text flow. However, if there are multiple blocks of text spread over multiple pages, having an
overview helps, as shown by Hornbaek and Frokjaer (2003). These authors researched
reading comprehension and compared a linear interface (no overview), a distortion-based
interface and an overview + detail interface. Participants preferred having an overview and
they particularly liked the overview + detail interface which had the fastest completion time.
The effect of overviews on other kinds of structured content was not directly addressed in this
research. For example, diagrams, graphs and charts such as family trees have a structure to
visually describe the connected elements. While the structure depicts relationships between
the elements, it is not explicit where off-screen elements are located. Hence, where the

158
content’s structure does not explicitly show the relative locations of elements and/or where
content is spread over a big canvas, users would also benefit from an overview.
It is important to note that an overview’s design can considerably affect the interface’s
efficacy. In Study 4, the overview pane in the trialled overview + detail interface covered
80% of the space. The chosen size meant that most of the details are visible and the text
remained readable. While Hornbaek and Frokjaer’s (2003) overview pane only covers about
20% of the screen real estate, their use of bigger fonts for section and subsection headings
made these headings readable in the overview. Without manipulating the headings’ font size,
the headings would not have been readable and thus the overview + detail interface may not
have been as successful.
8.1.2. Distortion Interface Improvements
In Study 1 existing distortion interfaces were trialled to determine the requirements for
distortion-based interfaces when used for content creation and editing. Following the
literature review (Chapter 2), the most promising interfaces were chosen for further testing.
As there are numerous existing distortion-based interfaces, each containing interdependent
features (Furnas 1986, Mackinlay, Robertson et al. 1991, Robertson and Mackinlay 1993,
Pietriga and Appert 2008) rigorously testing all interfaces with all parameter combinations
would require more time and test participants than available for the duration of research for a
Ph.D. Instead, existing interfaces were identified in the literature, implemented and
informally tested. If the performance of an interface showed promising results in the informal
study, then it was included in Study 1.
The interfaces which passed the predefined inclusion criteria were tested further to fine tune
their parameters. To be able to better relate features to performances, a feature was integrated
into more than one interface if possible. Additionally, the number of total features in each
lens was kept low because one feature may shadow the performance of another. For example,
in Study 2 (Section 5.1) the semantic lens tested restricting the lens movement to the
horizontal axis while sketching to reduce the distraction caused by the distorted content. As
the results showed, restricting the lens movement was not sufficient. In fact, sketching with
the lens remained so distracting that most participants did not notice the additional
highlighting feature.

159
The results of this study lead me to believe that existing distortion interfaces are unsuitable
for content creation and editing. This assessment is based on the results of Study 1 where
participants completed drawing and writing tasks using three existing distortion interfaces.
The comment, “The winning lens wasn’t really good by itself but was the best one of the
three.” by a study participant best sums up the interfaces’ performance. An analysis of the
results identified two main usability problems which rendered the lenses unusable: the
moving canvas problem prohibiting precise pointing and difficulties in comprehending the
distortions. These two problems are also known when distortion-based interfaces are used to
view and select content. By addressing these two usability problems for content creation and
editing, I expect the solutions will also apply to content viewing and selection.
Research suggests that the moving canvas problem (Section 4.1.2) negatively affects precise
target acquisition (Gutwin 2002). As the canvas is moving when the pen moves, it is more
difficult to precisely select a target. In Studies 1 (Chapter 4) and 2 (Section 5.1) a stationary
lens mode for sketching was developed and tested, including different ways of invoking it. In
the stationary mode inspired by Appert, Chapuis et al. (2010), stylus and lens movements are
decoupled, allowing the user to sketch without the lens moving. Both studies showed the
success of the fully stationary mode as it results in significantly fewer errors compared to
lenses without a stationary mode. Fully stationary refers to the fact that only partly
decoupling lens and cursor movement is not sufficient as demonstrated by the semantic lens
in Study 2. These observations are supported by related work where the lens was always
stationary (Lank and Phan 2004) and where lens and stylus movement were decoupled
(Appert, Chapuis et al. 2010).
Invoking the lens manually can have a significant impact on completion time (Study 1).
Using snapping as an alternative resulted in faster completion times but decoupled lens and
cursor at times at the wrong location. To support the snapping mechanism, additional
knowledge about the content could help to determine each element’s degree of interest and
therefore the likelihood of the intended element being the target of a snap. Kosara, Miksch et
al. (2001) used chess rules as a knowledge foundation to deduct which pieces of the chess
game are important in any given situation. If the domain had no such implicit information
such as the sketching domain, recognition techniques can help: similar to the semantic lens
(Study 2) where a recognizer was used to differentiate between drawing and writing, a
recognizer could be used to gain content knowledge.

160
While the stationary mode allows precise interaction, a free-moving lens mode is still
required to allow people to sketch bigger figures. The evaluations have shown the need for a
free-moving mode additional to a stationary one. For example, participants in Study 1
(Section 4.1) sketched only in stationary mode. This led to frequent manual lens
repositionings which cost extra time, especially when they tried to perfectly align objects
after a repositioning. Because of frustration, a few of those participants started sketching in
the lens’ transition area, increasing the risk of errors. In Study 4, participants had to sketch
long figures when adding lines to the memory game and striking out sentences in the
annotation task. Only with the fisheye lens figures which span the entire canvas can be
sketched without lifting the stylus as there is no temporal (zooming interface) or spatial
separation (overview + detail interface). As a result, the fisheye lens was the only one of the
three interfaces for which sketching small figures was rated equally easy to sketching long
figures. To sketch longer figures with the other two interfaces without lifting the stylus could
be achieved only by deactivating the magnification, with the loss of the detailed view.
To invoke the decoupling of lens and cursor, the stylus’ button was used with mixed success.
Using the stylus button to switch between free-moving and stationary lens mode resulted in
unintentional button presses and led to user frustration. The button position at the lower end
of the stylus in combination with the non-intuitive button’s pressure point triggered several
unintentional mode changes during the evaluations (Sections 4.1 and 5.1). Users also voiced
their frustration with the poor stylus design. Because of this dissatisfaction and the extra time
manual button presses require, the snapping technique to automatically switch modes was
evaluated (Section 5.1). Although the snapping mechanism was not featured in the fisheye
lens when evaluated against other magnification interfaces (Section 6.1), the manual mode
changes did not result in significant time differences; Study 1 (Section 4.1) showed how
frequent manual mode changes can lead to significantly greater completion times. One reason
could be that the fisheye lens was faster than the other interfaces as suggested by related work
(Gutwin and Skopik 2003, Shoemaker and Gutwin 2007). If so, the manual mode changes
would not have made a significant difference. Alternatively, instead of using the stylus which
came with the used HP tablet, other styluses could have been used, potentially overcoming
the handling problem.
In sum, to address the moving canvas problem, I believe each distortion-based interface
should have a combination of two modes: one mode in which lens and cursor movement are
coupled to draw longer figures and another mode where lens and cursor movement are fully

161
decoupled to enable a precise interaction. To switch between modes, an automatic
mechanism such as snapping can be used and its precision further supported by using content
domain knowledge.
Comprehending the transformed content is difficult without additional visual support. This
assessment is based on the results of Study 1 where participants tried to avoid using the
distorted content due to comprehension difficulties. While increasing the lens size and thus
covering content which would otherwise be distorted was well received (Study 2), it does not
help in comprehending distortions. Inspired by Zanella, Carpendale et al. (2002), the tested
visual guides significantly helped people to better comprehend distorted content (Study 3).
The results suggested that any of the tested visual guides is significantly better than no help.
By additionally showing the distorted content undistorted, participants had significantly
fewer difficulties recognizing content, specifically the elements’ scale and alignment. To
assess direction and distance, a grid acting as a frame of reference was the preferred guide.
These results are similar to Zanella, Carpendale et al. and Baudisch, Lee et al. (2004)’s work.
Zanella, Carpendale et al. found a grid to be the most successful guide to locate and estimate
the level of distortions on a map, a task not requiring the recognition of each distorted
element. Baudisch, Lee et al. suggested that only partially distorting text by compressing it
exclusively on the vertical axis yields several advantages including improved readability and
preserved alignment. While partial distortions have not been trialled, Study 3’s results
suggest that preserving alignment is important to recognition, especially text: alignment was
one of the visual properties only supported effectively by visual guides showing the distorted
content undistorted (Study 3) and hence allowed people to recognize the letters and read text
easily.

162
Figure 48. The fisheye lens with the background guide and grid combined.
Although combining visual guides has not been tested, combining grid and background guide
may further increase usability. There is no overall best-suited visual guide as each has its
strength and weaknesses. However, a combination of grid and background guide may
outperform each single guide. One of the problems arising is that both guides work on
different scales: the background guide shows the distorted content undistorted under the lens
in its original size and position. In contrast, the part of the grid covered by the lens is shown
magnified. To effectively combine both guides they have to work to the same scale. This can
be achieved by showing the gridlines covered by the lens additionally in the background
unaffected by the distortions (Figure 48). One has to carefully choose the grid size: showing
too much information in the background can clutter the area and distract and interfere with
the magnified content in the foreground.
In sum, the results from Study 3 and related work suggest that if it is sufficient to gauge
distance and direction of distorted elements, additionally displaying a frame of reference is
sufficient. However, if the individual elements have to be recognized, showing the distorted
content undistorted is required. Depending on the task domain, an additional visual guide
may not be required if it is sufficient to preserve certain visual properties by only partially
distorting the content.
While the results presented underline the strength of fisheye lenses for magnified sketching
on small displays, it is unclear how their performance scales with smaller displays. The
chosen 13 inch display on the HP Tablet PC is considered small but still large compared to
mobile phone screens which typically measure around 4 inches. Jakobsen and Hornbaek

163
(2011) compared zooming, overview +detail and focus + context interfaces for navigation.
Their results show an effect of display size on usability especially for the focus + detail
interface: their smallest display (640 x 267) resulted in higher completion times (compared to
the bigger displays) with the fisheye lens being the least preferred interface. However, to fit
the information in the fisheye lens’ transition area, the information was highly compressed
(up to 27 map pixels were compressed to one display pixel) making recognizing and targeting
information extremely difficult. Gutwin and Fedak (2004) compared a standard zooming
interface, overview + detail interface and fisheye lens on small displays. Similar to Jakobsen
and Hornbaek, their results showed that magnification on small displays results in greater
task completion times. These results indicate that additional problems will arise if fisheye
lenses are used on displays smaller than 13 inch.
The improved fisheye lens’ usability for content creation and editing is at least as good as the
other two tested interfaces, namely zooming and overview + detail (Study 4). The results
strongly suggest that the new distortion interface features significantly improve usability:
precise selection has been a problem encountered by distortion-based interfaces and so were
hard to comprehend visual distortions (Carpendale, Cowperthwaite et al. 1997, Gutwin
2002). The results of Study 4 suggest the ability to draw longer figures as well as to sketch
precisely without having to manually change what is currently shown magnified are among
the fisheye lens’ biggest advantages. Additionally, by embedding the detail into its context,
the fisheye lens always shows the entire content overview which considerably improves the
interaction (Gutwin and Skopik 2003, Cockburn, Karlson et al. 2009). Overall, the fisheye
lens offers unique characteristics for magnified content creation and editing on small
displays. By adding a stationary mode and visual comprehension support, the work presented
in this thesis has significantly improved the fisheye lenses’ usability and make them a viable
option for magnified sketching.

164
8.2. 3D Gesture Input
The aim of investigating 3D gesture input on mobile phones was to explore an alternative to
the stylus to, additionally to sketching, also manipulate the magnification interface itself. 3D
gestures captured by the front-facing camera have potential but are a yet untested method of
interaction. Hence, this work is the first step towards determining the requirements of the new
interaction metaphor on hardware, people and gesture designers.
Studies comparing the proposed techniques with state-of-the-art interaction methods (e.g.
touch screen-based input) and/or eliciting gestures from users are not useful at this stage of
development. At the beginning of this research, the affordances and challenges when using
the thumb for gesture input were unknown. If the aim is to create new gesture sets, letting
non-technical users design gestures commonly yields better results. However, if the
affordances are unknown it is more appropriate for designers to create the gestures
(Wobbrock, Morris et al. 2009, Morris, Wobbrock et al. 2010). The exploration of 3D gesture
input resulted in data which provides insights into the novel interaction including the
proposal for new gestures on which future research can build. Building on the results,
possible next steps are studies looking at creating user-defined gesture sets similar to
Wobbrock, Morris et al. (2009) and Ruiz, Li et al. (2011).
Capturing input away from the screen reduces occlusion. While the presented study did not
investigate to what extent screen occlusion is reduced, I strongly believe that occlusions are
reduced if users do not need to touch the display thus always having a completely visible
screen.
All results reported in this section are from Chapter 7.
8.2.1. Capturing and Recognizing Gestures
Gesture recognition using front-facing cameras has to run in real-time despite a mobile
devices’ limited hardware performance. To track objects like a thumb, a number of tracking
approaches may be unsuitable due to high performance requirements (Wang, Zhai et al. 2006,
Gu, Mukundan et al. 2008, Chun and Hoellerer 2013). The following methods provide
sufficient information while allowing for real-time interaction: working with the image’s

165
brightness, edge detection and differential images; the last is unsuitable if fast movements are
involved due to fast lighting changes.
A captured image’s brightness (or its excess) can be used to track moving objects near the
camera. If a tracked object moves fast and covers at least quarter of the image, the
background is overexposed, making it too bright with almost no contours. Using a threshold
to extract the close darker object from the background is easy and has low performance cost
as shown by the circle recognizer.
The distance gesture demonstrates how to track an object at any distance that is not moving.
Using computationally fast edge detectors allowed the gesture recognizer to identify the
object based on its edges and additional information about the thumb’s size and origin: the
thumb always originates from at least one corner and covers at least a certain proportion of
the image. These findings are supported by Hogg (1984) who used edge detectors to estimate
human poses.
Capturing the gestures with the camera using these algorithms also has disadvantages.
Constant capture of images consumes power, draining the battery and requires some light.
One concern when constantly running the gesture recognizers is battery life. While it was not
the focus of this work to gauge the impact on battery life but to concentrate on the interaction
parameters, an evaluation similar to Wang, Zhai et al. (2006) can help to better understand
the impact of the gesture recognizers: Wang, Zhai et al. measured the battery life of their
camera-based system running on a Motorola v710 mobile and found that under load the
phone lasts on average 215 minutes and with moderate use 487 minutes. Whether these
results are transferable to a smartphone, such as the Samsung Omnia W used in this study, is
doubtful. Nonetheless, the trend that a more moderate phone use prolongs battery life is most
likely the same.
While it does not matter whether the light is natural or artificial, sufficient lighting is
required: tests showed that except for the Sobel operator which detects edges, the algorithms
worked in all conditions except for complete darkness. In the latter case, the light emitted by
the screen is not sufficient for accurate recognition. To use gestures for input when it is
completely dark, an artificial light source is required. One solution would be to perform the
gestures above the back-facing camera which commonly has a LED light installed next to it
to act as a flashlight for taking pictures. This would, however, change the requirements for
the gestures. Another solution is to have an LED next to the front-facing camera such as in
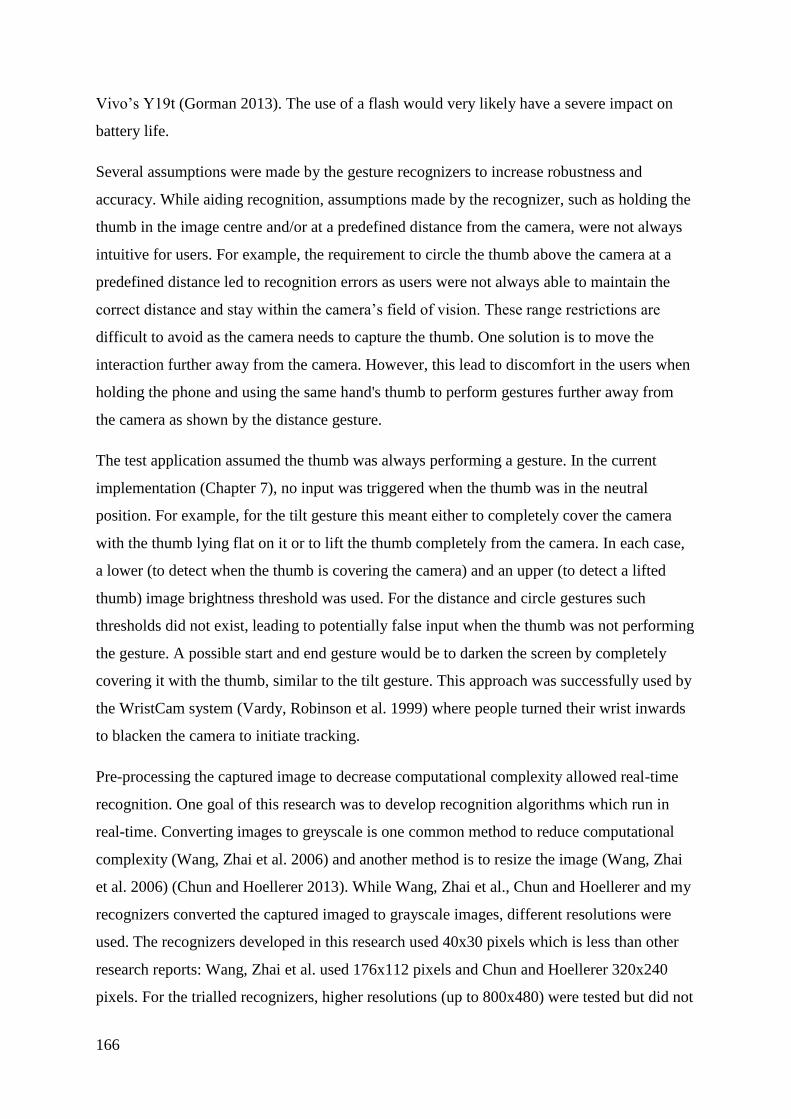
166
Vivo’s Y19t (Gorman 2013). The use of a flash would very likely have a severe impact on
battery life.
Several assumptions were made by the gesture recognizers to increase robustness and
accuracy. While aiding recognition, assumptions made by the recognizer, such as holding the
thumb in the image centre and/or at a predefined distance from the camera, were not always
intuitive for users. For example, the requirement to circle the thumb above the camera at a
predefined distance led to recognition errors as users were not always able to maintain the
correct distance and stay within the camera’s field of vision. These range restrictions are
difficult to avoid as the camera needs to capture the thumb. One solution is to move the
interaction further away from the camera. However, this lead to discomfort in the users when
holding the phone and using the same hand's thumb to perform gestures further away from
the camera as shown by the distance gesture.
The test application assumed the thumb was always performing a gesture. In the current
implementation (Chapter 7), no input was triggered when the thumb was in the neutral
position. For example, for the tilt gesture this meant either to completely cover the camera
with the thumb lying flat on it or to lift the thumb completely from the camera. In each case,
a lower (to detect when the thumb is covering the camera) and an upper (to detect a lifted
thumb) image brightness threshold was used. For the distance and circle gestures such
thresholds did not exist, leading to potentially false input when the thumb was not performing
the gesture. A possible start and end gesture would be to darken the screen by completely
covering it with the thumb, similar to the tilt gesture. This approach was successfully used by
the WristCam system (Vardy, Robinson et al. 1999) where people turned their wrist inwards
to blacken the camera to initiate tracking.
Pre-processing the captured image to decrease computational complexity allowed real-time
recognition. One goal of this research was to develop recognition algorithms which run in
real-time. Converting images to greyscale is one common method to reduce computational
complexity (Wang, Zhai et al. 2006) and another method is to resize the image (Wang, Zhai
et al. 2006) (Chun and Hoellerer 2013). While Wang, Zhai et al., Chun and Hoellerer and my
recognizers converted the captured imaged to grayscale images, different resolutions were
used. The recognizers developed in this research used 40x30 pixels which is less than other
research reports: Wang, Zhai et al. used 176x112 pixels and Chun and Hoellerer 320x240
pixels. For the trialled recognizers, higher resolutions (up to 800x480) were tested but did not

167
significantly improve recognition and interfered with real-time performance. It is unclear
whether the other two aforementioned systems tested other resolutions.
8.2.2. Designing Gestures
Designing successful motion gestures means creating intuitive gestures without constraints.
As the camera has a limited field of view, gestures have to be fitted to this area: gestures
close to the camera have to be directly above it while those further away can be further away
from the camera’s center as well. However, gestures cannot be too far away as this becomes
uncomfortable to the point where holding the device with both hands becomes impossible.
Each state in a gesture motion must be easily identifiable and performable. If it is unclear
what motion to perform to effect change or if the motion requires physically uncomfortable
moves, the gesture may be unsuitable for continuous input. The distance gesture showed that
having no explicit knowledge of the required motion to change to a given acceleration level
may dissatisfy users.
The number of acceleration levels depends on the differentiability of the gesture motions. For
example, with the distance gesture there was a total range of 6 cm available. This had to be
divided in sub-ranges each dedicated to a unique input value. Trying to divide this range into
more than five ranges (two directions with two acceleration levels each plus a neutral range)
would be unrealistic as users’ ability to discriminate those ranges is too difficult, as shown in
the evaluation.
User feedback is important: a change in gesture must immediately cause a change of input
while providing sufficient control for small changes. Allowing for subtle input changes
requires sensitive recognizers. Recognizers that are too sensitive may result in unwanted
movements being treated as input. The results of Study 5 indicate that differentiating between
small and big changes based on finger movement and/or hand distance was not a good fit for
small value adjustments. This is consistent with findings by Chun and Hoellerer (2013) in the
domain of hand gestures. They suggested the use of physical input sources such as keyboard
and buttons as a better alternative. Another solution may be to use different gestures for
differently sized input changes. However, different gestures mean there is more for the user
to learn and more complex recognizers.

168
Triggering small changes in input requires a reasonable rate at which those changes are
invoked. While the tested recognizers determined the current gesture input on average under
100msecs, this speed made exact value adjustments difficult. In the first configuration of the
presented recognizers where each change was applied at under 100msecs, the pilot
participants often overshot their target. They stated that applying change at such high
frequency makes it hard to estimate when to start performing the neutral gesture: 500ms were
found to be the best offset.
8.2.3. Designing the Device
The camera position preference, regardless of the user's handedness, is on the right side of the
phone. When asked for their preferred camera position, the participants’ answers did not
show any strong preference between the vertical position (top, centre or bottom). However,
there was a preference for the camera to be centred on the phone border.
Regardless of the camera position, the gestures did not impair screen visibility. When asked,
participants stated that they were able to see the entire screen during the interaction. An
analysis of the video recording showed that items of importance such as the next name for the
scrolling tasks situated on the screen’s right border next to the camera were not covered by
any gesture.
Independent of the gesture design, the aim of this research was to develop gesture recognizers
which run fluently on existing middle class phones. Real-time camera-based gesture
recognition has been researched on phones which are less computational powerful than the
used Samsung Omnia W (Wang, Zhai et al. 2006, Gu, Mukundan et al. 2008, Kato and Kato
2009). The goal was not to recreate or confirm these results, but rather develop algorithms
which are guaranteed to run on contemporary phones and those future phones which are
likely to be even more computationally powerful. Chun and Hoellerer (2013) ran a Lucas-
Kanade optical flow algorithm (Lucas and Kanade 1981) on a Nokia N900 (Nokia 2011)
featuring a 600MHz ARM Cortex-A8 CPU. While using this algorithm-phone combination
resulted in 1-5 frames per second, using a more powerful phone such as the Samsung Galaxy
series (Samsung 2013) with dual and quad core CPUs may have yielded real-time
performance. Algorithms such as the above Lucas-Kanade optical flow algorithm may also
allow for more accurate recognition with potentially fewer requirements on environment (e.g.
light) and tracked object (e.g. know size and origin). In sum, the algorithms developed in this

169
research allow reliable recognition with low requirements for computational resources
measured by today’s standards of mobile phones. I believe that now that the results have
established baseline data for recognizer performance, future developments should make use
of more computationally powerful devices, allowing one to run more sophisticated algorithms
for potentially more accurate and less restrictive recognition.
8.3. Combining the Findings & Summary
The work on two sources of screen occlusion presented in this research has been discussed in
this chapter. The importance of having all information visible has been shown, especially in
the first part (Section 8.1) where the occluding magnification interfaces have been rated less
helpful (zooming interface) and harder to sketch - especially bigger figures (zooming and
overview + detail interface). The potential for using 3D gestures to reduce screen occlusion
was demonstrated in the preceding chapter.
Previous research indicates how focus + context techniques and gesture input can be
combined to create and edit content on mobile devices with small displays. While the
research presented in this thesis investigated both sources of screen occlusion in isolation,
other work indicates how it can be combined. A general overview of combining mobile
devices featuring a smaller screen than that tested in the presented research and distortion
interfaces is provided by Burigat and Chittaro (2013). Adding gesture input, Karlson,
Bederson et al. (2005) used thumb gestures captured by the PDA’s touch screen rather than
the camera. They used eight thumb gestures to control and navigate a tabular fisheye
interface: four directional commands (up, down, left and right), two to go back and forward
and two gestures to trigger activate and cancel functions. The gestures are performed in the
lower right screen corner. Rather than using the touch screen, a camera-based approach could
be used. Also, instead of navigating the fisheye interface which is already done with the
stylus in this research, the gestures could be used to manipulate the interface settings such as
magnification factor. There, the dominant hand could be used to sketch while the non-
dominant hand performs the gestures and vice versa. This is a promising alternative as, first,
the location of the thumb gestures have to be slightly altered and, second, a combination of
the three already-trialled gestures offer sufficiently distinctive states to control various
interface settings such as fisheye lens size and magnification level.

170
Gestures can potentially also be used for sketching itself. Sketching on the touch screen using
the finger results in the fat finger problem where the finger occludes the content directly
below (Vogel and Baudisch 2007). One way previously explored to overcome the problem is
to use the backside of the device (Wigdor, Forlines et al. 2007). Another approach is to use
gestures to sketch. In their overview + detail interface, Gutwin and Skopik (2003) used the
inset in the overview window to steer the detailed window along a predefined path. Instead of
using a mouse to control the inset and thus the path in the detailed window, gestures captured
by the front-facing camera can be used to control the distortion lens.

171
9. Conclusion & Future Work
In this work two causes of information occlusion were investigated, namely magnification
interfaces and finger input, and developed techniques to eradicate the occlusions on small
screens. To overcome occlusions caused by magnification interfaces the use of focus +
context techniques were explored as they always show all information. The focus was on
improving existing focus + context techniques to be used for information creation and editing
in the form of sketching on small screens. Until now, they have been almost exclusively
designed for viewing and selecting information. The new techniques primarily target
problems shared by existing focus + context techniques and those developed as part of this
research for information creation and editing. Thus the presented solutions can be applied to
existing focus + context in specific cases and magnification techniques in general. To explore
an alternative way to control the magnification interface’s settings without involving stylus or
touchscreen, the focus was on capturing input using the camera and so moving the interaction
away from the small screen. This chapter provides an overview of the conducted research
including its contributions. Finally, proposals for future work are provided.
9.1. Conclusions
The objective of this research to reduce screen occlusions on small displays was successfully
achieved. Focus + context views can be effectively used to achieve occlusion-free
magnification for content creation and editing. This first of two main research questions was
answered by reviewing related work to learn about existing focus + context techniques
including their strength and weaknesses (Chapter 2). Next, the fact was established that
existing focus + context techniques are unsuitable for content creation and editing (Chapter
4). Subsequently, features addressing the usability problems existing focus + context
techniques face were developed, implemented and tested (Chapter 5). Finally, the improved
focus + context techniques were compared with other magnification techniques and their
performance was equally good if not better than the zooming and overview + detail
techniques (Chapter 6). The presented research also shows that 3D gestures can be captured
by a mobile device’s front-facing camera, thus positively answering the second main research
question. Chapter 7 describes in detail how screen occlusion can be reduced by capturing the

172
thumb's movement above the mobile phone, thus providing precise input away from the
screen.
The review of related work showed that focus + context techniques allow magnifying parts of
the information without occluding others. However, with one exception (Lank and Phan
2004), occlusion-free strategies have been solely used for information viewing and selecting.
Furthermore, the usability problems of focus + context techniques when used for viewing and
selecting were identified. Features were found that address these problems but it remains
unclear how suitable they are for content creation and editing. What’s more, problems such as
difficulties in acquiring targets and comprehending the visually transformed content may
intensify when content is created and edited. While there are numerous studies comparing
focus + context techniques with other magnification strategies for various tasks, none directly
involved the task of content creation and editing.
The investigation of 3D gesture input captured by a mobile device’s camera showed that
while using the camera is a well-researched area (Wang, Zhai et al. 2006, Chun and Hoellerer
2013), capturing continuous finger gestures close to the camera is not. In terms of
computational requirements on mobile devices to run recognition in real-time, the literature
review identified potential candidates in the form of accurate and computationally low-cost
recognition algorithms but it remains unclear if and how these algorithms can track moving
fingers close above the device. The requirements of gesture design were also unclear in that
the spatial requirements allowing gestures to be comfortably performed and accurately
recognized are not addressed by other research.
The first step in order to use focus + context techniques for information creation and editing
was to test the existing techniques identified in the related work review. To investigate
magnification strategies for sketching, a test framework was developed and the identified
focus + context techniques integrated and evaluated. The results show that current focus
+context techniques are unsuitable for sketching. Two main problems were identified. First,
because the canvas in the magnified area moves while sketching, precise sketching/targeting
becomes difficult. Second, the visual distortions caused by focus + context techniques are
difficult to comprehend and potentially distracting. A potential solution to overcome the
moving canvas problems trialled in the study is to decouple stylus and lens movement while
sketching. However, the studies have shown that having a “coupled” or free-moving lens
mode is as important as a “decoupled” or stationary lens mode.

173
The second study addressed the two identified problems and trialled solutions implemented
across three fisheye lenses. The results of the study testing the intelligent lenses showed that
restricting lens movement while sketching is not sufficient: only a completely stationary
mode helps to overcome the targeting problems and also reduces the distractions caused by
the visual distortions. To support comprehension, highlighting ink of interest seemed to be
ineffective. However, the lens-highlighting feature did not have a fair trial as the associated
lens was the same which restricted lens movement to the horizontal axis; a feature severely
impacting lens usability in a negative way. The features to optimize the lens coverage of
information of interest in the form of snapping and automatic resizing were highly rated and
most participants said they would like to have these features in their ideal lens.
To further investigate comprehension support and to understand how the support specifically
helps to recognize distorted information, a third evaluation study was conducted. Besides
gauging the overall impact of the tested visual guides on comprehension, the specific interest
was on how well the guides support the comprehension of four object properties crucial for
recognition (Bertin 1977, Cleveland and McGill 1984): scale, alignment, direction and
distance. The result yielded three findings. First, any visual guide is better than none. Second,
while none of the tested guides outperforms the others for all four properties, the background
guide is most suited if recognizing all properties is important. Third, if precise judgements of
only direction and distance are required, the grid is more appropriate. Overall, participants
preferred to have the visual guide’s information shown at the area of interest rather than, for
example, offset to the side of the interface. Combining visual guides may improve
comprehension even further.
The fourth evaluation in Chapter 6 gauges the impact of the improved focus + context
techniques and compares them with other common magnification strategies - namely, a
zooming and an overview + detail interface. The zooming interface ranked the lowest, the
least helpful and the hardest to navigate of the three interfaces. Having a free-moving and a
stationary mode in the focus + context interface makes sketching precise details as well as
longer figures equally easy. This is not the case for the other two interfaces as both require
navigational actions interrupting the sketching process when sketching longer figures which
continue into an off-screen canvas area. If having an overview was important, the focus +
context interface performed at least as well if not better than the other interfaces. The lack of
an overview is especially detrimental for navigation: when completing the drawing task with
the zooming interface, participants had to search the desired information rather than directly

174
navigating to it. There were no significant differences of interface on error rate, suggesting
that the new focus + context features support precise targeting and comprehension.
The fifth and last evaluation study tested 3D gestures captured by a mobile device’s camera
away from the screen and thus potentially reducing screen occlusion and offering an
alternative way to control magnification interfaces. While work presented in Chapters 4-6
concentrated on how information is visualized to avoid occlusion, this study focused on how
the visualisation can be manipulated without causing occlusions. Before the study, it was
unclear whether the mobile device was powerful enough to guarantee accurate real-time
gesture recognition and whether gestures could be comfortably performed while still being
recognizable.
The results show that the devices are powerful enough and accurate and robust recognition is
possible. Different low-cost recognition techniques such as Sobel operator were used and
yielded accurate and robust recognition of 3D gestures under different environmental
conditions. When designing the gestures, the camera’s limited field and the fingers’ motor
limitations have to be considered. It was particularly difficult for the participants to keep the
thumb in the camera’s viewing field if rotating the thumb closely above the camera, as done
for the circle gesture. The study results also yielded new gestures proposed by the
participants which mostly used swipe motions on one or more axis.
In summary, the key contributions of this research are as follows.
A rigorous investigation was conducted of existing focus + context techniques. This
includes the identification of usability problems these techniques face when used for
information creation and editing.
Techniques to overcome the problems of existing focus + context techniques when
used for content creation and editing were developed. The first of these addressed
problems was the moving canvas problem which makes target acquisition more
difficult. The second problem was how to easily manipulate the focus + context
interface settings such as size. The third problem was the comprehension problems
caused by the visual distortions in focus + context interfaces.
A detailed comparison of the improved focus + context techniques with other
common magnification techniques namely zooming and overview + detail when used
for content creation and editing.

175
This research designed 3D gestures and developed associated recognizers to enable
capturing input away from the screen. This contribution is threefold. First, device
performance was tested to investigate whether it supported accurate real-time gesture
recognition. Second, different gestures were designed to explore the gesture space in
which future gestures are comfortably performed and can be accurately recognized.
Third, future gestures were elicited from users after they completed a study
familiarising them with the new interaction paradigm, thus making this normal user
an expert.
9.2. Future Work
The presented exploration of ways to reduce screen occlusion made several contributions to
the field of magnification techniques and 3D gesture input on mobile devices.
To improve focus + context techniques to be used for magnified sketching, features to
overcome identified problems were developed and tested. While some of the tested features
showed positive results, there are many open questions left. For example, to change between
lens modes, the snapping mechanism was well-received by the participants but was difficult
for annotating text. The lens snapped on the text's centre. While this is the desired behaviour
for drawing, for annotating the lens should snap between the lines so that users can annotate
the text. One solution would be to devise recognition algorithms which automatically
differentiate between text and drawing and adjust the snapping behaviour accordingly. A
similar approach was trialled with the semantic lens (Section 5.1.1) that used recognition to
group-related strokes.
Other focus + context features did not have a fair trial as they were tested in combination
with features which severely impacted usability. As a result, such features should be re-
evaluated. For example, visually highlighting related strokes as done by the semantic lens
(Section 5.1.1) was often overlooked as participants were overwhelmed with the lens’
distracting movement.
To improve comprehension of distorted information, visual guides were used to help users
recognize properties crucial for identifying distorted objects. While there is no guide
outperforming the other guides for all identifying properties, a combination of the
background guide and grid may be more suitable than either individually. However, there is a

176
danger that such a combination will be too distracting. More work is needed to answer this
question.
While the improved focus + context techniques performed well compared to the other
magnification techniques, it remains unclear under what circumstances which technique
should be used. Generalising the results from this research and other related work should
ideally result in guidelines advising designers under what circumstances to use which
magnification technique. However, work in this area fails to provide clear guidelines. One
reason is that the magnification techniques’ performances strongly depend on the domain
(Cockburn, Karlson et al. 2009). In the presented research, focus + context techniques
performed better for drawing, especially when having an information overview was
important. For annotating, where having an overview did not add much value, overview +
detail techniques were preferred. To conclusively answer the question of when to use what,
more empirical analyses of the different magnification techniques are required.
While this work has shown the potential of using camera-based gesture input for mobile
device interaction, the presented research leaves many questions unanswered. The purpose of
this research into 3D gesture input was to gauge the potential of the novel interaction method
with the aim to reduce information occlusion on the screen. As this potential was successfully
demonstrated, a variety of questions are raised. To what extent do the gestures captured away
from the screen reduce screen occlusion? What are suitable gestures for the novel interaction
in terms of interaction and recognition accuracy? Can the camera-based interaction be made
accessible for one-handed interaction? What are the environmental impacts on (for example)
battery life and privacy? Further research is required to answer these and other questions.

177
Appendix A: Ethics Application
Documents
There are two ethics applications resulting from this research.
Department of Computer Science,
Level 3, Science Center, Building 303
38 Princes Street, Auckland.
Phone: 3737599, ext: 82128
PARTICIPANT INFORMATION SHEET
Title: Examining different distortion techniques for the creation and editing of content.
To participants:
My name is Paul Schmieder, I am a PhD student in the Department of Computer Science at
the University of Auckland under the supervision of Dr Beryl Plimmer. I am conducting
research into digital pen input computing.
I am investigating the use of distortion techniques for the creating and editing of content in
form of drawing and writing tasks using different distortion lenses. A part of that research is
involving potent ‘ordinary’ users to identify the different requirements for distortion lenses to
be used for drawing and writing on a Tablet PC. This particular project aims to [identify the

178
specific requirements of distortion techniques | test a range of distortion lenses] when used
for drawing and writing on a Tablet PC.
In this study we are testing the sketching behaviours of participants when using a range of
different distortion lenses in comparison with drawing and writing tasks.
You are invited to participate in our research and we would appreciate any assistance you can
offer us, although you are under no obligation to do so.
Participation involves one visit to our laboratory at The University of Auckland, for
approximately 45 min. Participation requires that your eyesight is normal or corrected-to-
normal by spectacles or contact lenses. If you agree to participate, you may be asked to
sketch using a computer and digital pen. You will be asked to complete a series of drawing
and writing tasks and full instructions will be given to you before the tasks.
You will be asked to interact with a simple computer sketching tool. You will be asked to fill
in a short questionnaire to note your existing experience with the tasks and technology and
complete a short questionnaire on your experience. Audio and video recordings will be made
recording your participation for later analysis. You can ask the facilitator to turn off the
video/audio recording instrument at any time during the activity. This is necessary to study
your sketching behaviour afterwards and to compare it with other participants’ behaviours to
possibly identify common patterns. To guarantee confidentiality your faces will be blurred in
the recordings.
All the questionnaire information you provide will remain confidential; i.e. after you finished
the questionnaire it will not be possible to associate it with you anymore. The digital
recordings are used in research reports on this project and other subsequent projects on
sketching interaction. You choose whether your recordings are available or not on the consent
form. Your consent form will be held in a secure file for 6 years, at the end of this time it will
be properly disposed of. Your name will not be used in any reports arising from this study.
The information collected during this study may be used in future analysis and publications
and will be kept indefinitely. At the conclusion of the study, a summary of the findings will
be available from the researchers upon request.
If you don’t want to participate, you don’t have to give any reason for your decision. If you
do participate, you may withdraw at any time during the session and you can also ask for the
information you have provided to be withdrawn at any time until one week after the

179
conclusion of your session, without explanation, by contacting me (details below). If you
agree to participate in this study, please first complete the consent form attached to this
information sheet. Your consent form will be kept separately from your questionnaire data so
that no-one will be able to identify your answers from the information you provide.
Thank you very much for your time and help in making this study possible. If you have any
questions at any time you can phone me (3737599 ext 89357), my supervisor Beryl Plimmer
(3737599 ext 82285) or the Head of Department, Professor Gill Dobbie (3737599 ext 83949),
or you can write to us at:
Department of Computer Science,
The University of Auckland
Private Bag 92019
Auckland.
For any queries regarding ethical concerns, please contact The Chair, The University of
Auckland Human Participants Ethics Committee, The University of Auckland, Private Bag
92019, Auckland. Tel. 3737599 ext 83711.
APPROVED BY THE UNIVERSITY OF AUCKLAND HUMAN PARTICIPANTS
ETHICS COMMITTEE on 12/05/2011 for a period of 3 years from 12/05/2011. Reference
2011/186.

180
Department of Computer Science,
Level 3, Science Center, Building 303
38 Princes Street, Auckland.
Phone: 3737599, ext: 82128
CONSENT FORM
This consent form will be held for a period of at least six years
Title: Examining different distortion techniques for the creation and editing of content
Researcher: Paul Schmieder and Beryl Plimmer
I have been given and understood an explanation of this research project. I have had an
opportunity to ask questions and have them answered.
I understand that at the conclusion of the study, a summary of the findings will be available
from the researchers upon request.
I understand that the data collected from the study will be held indefinitely and may be used
in future analysis.
I understand that I may withdraw myself and any information traceable to me at any time up
to one week after the completion of this session without giving a reason.
I understand that I may withdraw my participation during the laboratory session at any time.
I understand that I may ask the facilitator to turn off for the video/audio recording instrument
at any time during the activity.
I agree to take part in this research by completing the laboratory session which can take up to
45 minutes.
I agree/do not agree digital and video recordings taken during the session being used
research reports on this project.
Signed: Name:
Date: APPROVED BY THE UNIVERSITY OF AUCKLAND HUMAN PARTICIPANTS
ETHICS COMMITTEE on 12/05/2011 for a period of 3 years from 12/05/2011. Reference
2011/186.

181
Department of Computer Science,
Level 3, Science Center, Building 303
38 Princes Street, Auckland.
Phone: 3737599, ext: 82128
PARTICIPANT INFORMATION SHEET
Title: Examining the interaction between people and front facing cameras on mobile
devices
To participants:
My name is Paul Schmieder, I am a PhD student in the Department of Computer Science at
the University of Auckland under the supervision of Dr Beryl Plimmer. I am conducting
research into mobile interaction. I am investigating the use of the front facing camera for
gestural input on mobile devices such as smartphones using the fingers. A part of this
research is involving potent ‘ordinary’ users to identify the different requirements for
gestures to be used for interacting with the mobile device. This particular project aims to
[identify the specific requirements for gestural interaction| test a range of gesture recognition
algorithms] when used for input.
In this study we are gauging the interaction space above the camera and potential gestures to
interact with the device.
You are invited to participate in our research and we would appreciate any assistance you can
offer us, although you are under no obligation to do so.
Participation involves one visit to our laboratory at The University of Auckland, for
approximately 30 min. Participation requires that your eyesight is normal or corrected-to-

182
normal by spectacles or contact lenses. If you agree to participate, you may be asked to
complete a series of tasks using a smartphone. Full instructions will be given to you before
the tasks.
You will be asked to interact with a simple application running on the mobile device. You
will be asked to fill in a short questionnaire to note your existing experience with the tasks
and technology and complete a short questionnaire on your experience. Audio and video
recordings will be made recording your participation for later analysis. You can ask the
facilitator to turn off the video/audio recording instrument at any time during the activity.
This is necessary to study your sketching behaviour afterwards and to compare it with other
participants’ behaviours to possibly identify common patterns. To guarantee confidentiality
your faces will be blurred in the recordings.
All the questionnaire information you provide will remain confidential; i.e. after you finished
the questionnaire it will not be possible to associate it with you anymore. The digital
recordings are used in research reports on this project and other subsequent projects on
mobile device interaction. You choose whether your recordings are available or not on the
consent form. Your consent form will be held in a secure file for 6 years, at the end of this
time it will be properly disposed of. Your name will not be used in any reports arising from
this study. The information collected during this study may be used in future analysis and
publications and will be kept indefinitely. At the conclusion of the study, a summary of the
findings will be available from the researchers upon request.
If you don’t want to participate, you don’t have to give any reason for your decision. If you
do participate, you may withdraw at any time during the session and you can also ask for the
information you have provided to be withdrawn at any time until one week after the
conclusion of your session, without explanation, by contacting me (details below). If you
agree to participate in this study, please first complete the consent form attached to this
information sheet. Your consent form will be kept separately from your questionnaire data so
that no-one will be able to identify your answers from the information you provide.
Thank you very much for your time and help in making this study possible. If you have any
questions at any time you can phone me (3737599 ext 89357), my supervisor Beryl Plimmer
(3737599 ext 82285) or the Head of Department, Professor Gill Dobbie (3737599 ext 83949),
or you can write to us at:

183
Department of Computer Science,
The University of Auckland
Private Bag 92019
Auckland.
For any queries regarding ethical concerns, please contact The Chair, The University of
Auckland Human Participants Ethics Committee, The University of Auckland, Private Bag
92019, Auckland. Tel. 3737599 ext 83711.
APPROVED BY THE UNIVERSITY OF AUCKLAND HUMAN PARTICIPANTS
ETHICS COMMITTEE on 15/06/2012 for a period of 3 years from 15/06/2012. Reference
8237.

184
Department of Computer Science,
Level 3, Science Center, Building 303
38 Princes Street, Auckland.
Phone: 3737599, ext: 82128
CONSENT FORM
This consent form will be held for a period of at least six years
Title: Examining the interaction between people and front facing cameras on mobile
devices
Researcher: Paul Schmieder and Beryl Plimmer
I have been given and understood an explanation of this research project. I have had an
opportunity to ask questions and have them answered.
I understand that at the conclusion of the study, a summary of the findings will be available
from the researchers upon request.
I understand that the data collected from the study will be held indefinitely and may be used
in future analysis.
I understand that I may withdraw myself and any information traceable to me at any time up
to one week after the completion of this session without giving a reason.
I understand that I may withdraw my participation during the laboratory session at any time.
I understand that I may ask the facilitator to turn off for the video/audio recording instrument
at any time during the activity.
I agree to take part in this research by completing the laboratory session which can take up to
30 minutes.
I agree/do not agree digital and video recordings taken during the session being used
research reports on this project.
Signed: Name: Date:
APPROVED BY THE UNIVERSITY OF AUCKLAND HUMAN PARTICIPANTS
ETHICS COMMITTEE on 15/06/2012 for a period of 3 years from 15/06/2012. Reference
8237.

185
Appendix B: Questionnaires
There are four questionnaires resulting from the five studies presented in this research. The
first two studies used the same questionnaire.
Questionnaire for Study 1 & Study 2

186
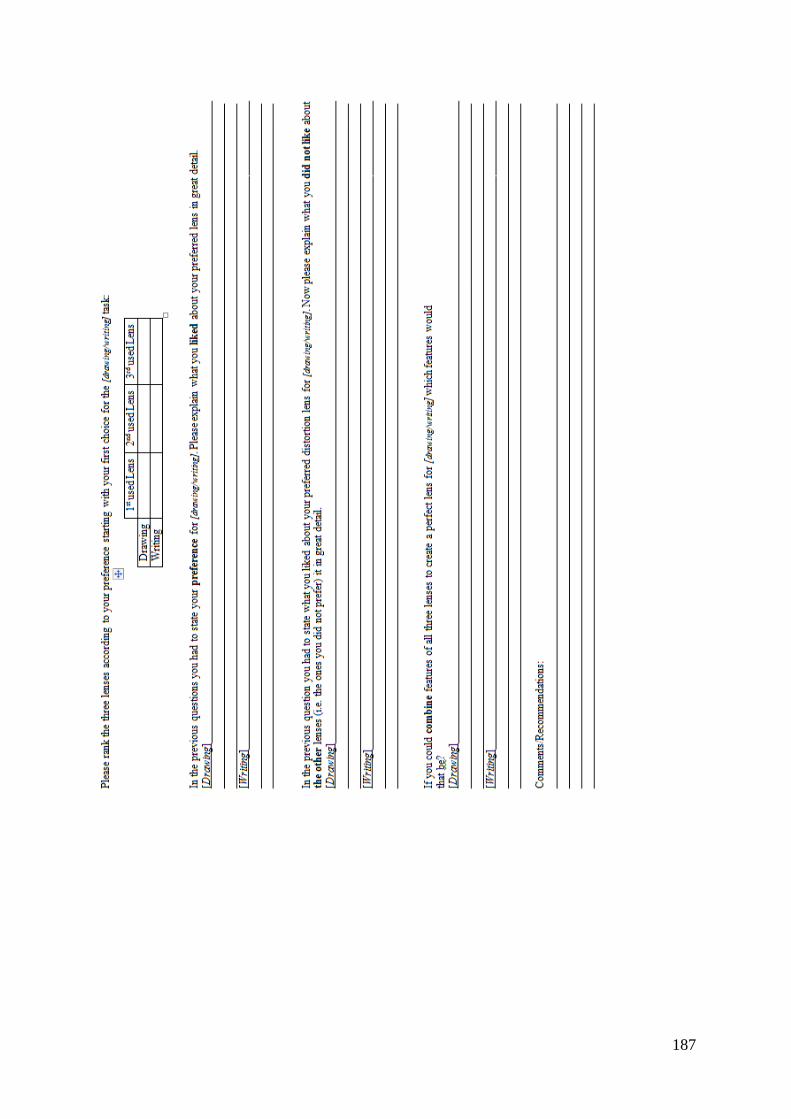
187

188
Questionnaire for Study 3
A Complete only this Section before the
Session
I have used real pen and paper to draw and write Frequently Occasionally A couple of
times
Once Never
I have used distortion techniques Frequently Occasionally A couple of
times
Once Never
I have used digital pen input on a computer Frequently Occasionally A couple of
times
Once Never
I have used distortion techniques to draw and
write using a tablet PC
Frequently Occasionally A couple of
times
Once Never
B
Please rate and rank the four visual aids for each task. Rating is done by circling your answer on a 5 point
scale: 1 = Not at all, 2 = not really, 3 =undecided, 4 = somewhat, 5 = very much. (You can use the following abbreviations: None: N; Background: B; Foreground: F; Grid: G)
B.1 Identify the Shape
Ratings: Grid Foreground Background
No
t at
all
No
t re
ally
Un
dec
ided
So
mew
hat
Ver
y m
uch
No
t at
all
No
t re
ally
Un
dec
ided
So
mew
hat
Ver
y m
uch
No
t at
all
No
t re
ally
Un
dec
ided
So
mew
hat
Ver
y m
uch
How helpful was
the aid?
How distracting
was the aid?
Preference:
1st 2
nd 3
rd 4
th
Identify the Shape
B.2 Tell the Time
Ratings:
Grid Foreground Background
No
t at
all
No
t re
ally
Un
dec
ided
So
mew
hat
Ver
y m
uch
No
t at
all
No
t re
ally
Un
dec
ided
So
mew
hat
Ver
y m
uch
No
t at
all
No
t re
ally
Un
dec
ided
So
mew
hat
Ver
y m
uch

189
How helpful was
the aid?
How distracting
was the aid?
Preference:
1st 2
nd 3
rd 4
th
Tell the Time
B.3 Estimate the Sizes
Ratings:
Grid Foreground Background
No
t at
all
No
t re
ally
Un
dec
ided
So
mew
hat
Ver
y m
uch
No
t at
all
No
t re
ally
Un
dec
ided
So
mew
hat
Ver
y m
uch
No
t at
all
No
t re
ally
Un
dec
ided
So
mew
hat
Ver
y m
uch
How helpful was
the aid?
How distracting
was the aid?
Preference:
1st 2
nd 3
rd 4
th
Estimate the Sizes
B.4 Connect the Dots
Ratings:
Grid Foreground Background
No
t at
all
No
t re
ally
Un
dec
ided
So
mew
hat
Ver
y m
uch
No
t at
all
No
t re
ally
Un
dec
ided
So
mew
hat
Ver
y m
uch
No
t at
all
No
t re
ally
Un
dec
ided
So
mew
hat
Ver
y m
uch
How helpful was
the aid?

190
How distracting
was the aid?
Preference:
1st 2
nd 3
rd 4
th
Connect the dots
B.5 Complete the Row
Ratings:
Grid Foreground Background
No
t at
all
No
t re
ally
Un
dec
ided
So
mew
hat
Ver
y m
uch
No
t at
all
No
t re
ally
Un
dec
ided
So
mew
hat
Ver
y m
uch
No
t at
all
No
t re
ally
Un
dec
ided
So
mew
hat
Ver
y m
uch
How helpful was
the aid?
How distracting
was the aid?
Preference:
1st 2
nd 3
rd 4
th
Complete the Row
C
Please rank the four visual aids overall according to your preference. Please also score the helpfulness of the aid
on a scale from 1 to 10 (1 means totally useless and 10 the perfect help). This is to further indicate the
differences between the visual aids; e.g. the first ranked aid may have a score of 8 meaning that while it was
good it was still not the perfect help.
1st 2
nd 3
rd 4
th
Rank
Helpfulness

191
Comments/Recommendations:
__________________________________________________________________________________________
__________________________________________________________________________________________
__________________________________________________________________________________________
__________________________________________________________________________________________
__________________________________________________________________________________________
__________________________________________________________________________________________

192
Questionnaire for Study 4
A Complete only this Section before the
Session – Please circle your answers
Gender: male/female Age: _____ Handedness: left/right/both
I have used distortion techniques Frequently Occasionally A couple of
times
Once Never
I have used digital pen input on a computer Frequently Occasionally A couple of
times
Once Never
I have used zooming interfaces on a computer Frequently Occasionally A couple of
times
Once Never
I have used detail + overview interfaces on a
computer
Frequently Occasionally A couple of
times
Once Never
I have used distortion techniques to draw and
write using a tablet PC
Frequently Occasionally A couple of
times
Once Never
B
Please rate and rank the three magnification interfaces for both task types (annotating and drawing). Rating is
done by circling your answer on a 5 point scale: 1 = Not at all, 2 = not really, 3 =undecided, 4 = somewhat, 5 =
very much.
B.1 Drawing & Annotating
Ratings: 1 = Not at all 2 = not really 3 = undecided 4 = somewhat 5 = very much
Ratings: Drawing Annotating
FishEye Zoom Radar FishEye Zoom Radar
How helpful was the interface?
How easy was [drawing | annotating] using the
interface?
How easy was it to [drawing | annotating]
detailed/small objects?
How easy was it to [drawing | annotating]
bigger/long objects?
How easy was navigating the canvas?

193
FishEye lens – Did you pay attention to the ink in
the distortion region?
FishEye lens – Did you understand the ink in the
distortion region?
FishEye lens – Did you pay attention/use the ink
in the lens background showing the ink in original
size?
FishEye lens – How helpful was the automatic
lens-resize mechanism?
(You can use the following abbreviations: Fisheye: F; Zoom: Z; Radar: R)
Preference:
1st 2
nd 3
rd
Ranking for Drawing
Ranking for Annotating
C
Please rank the three magnification interfaces overall according to your preference. Please also score the
helpfulness of the strategy on a scale from 1 to 10 (1 means totally useless and 10 the perfect help). This is to
further indicate the differences between the interfaces; e.g. the first ranked aid may have a score of 8 meaning
that while it was good it was still not the perfect help.
1st 2
nd 3
rd
Overall Rank
Helpfulness
What was the best thing about your preferred interface?
__________________________________________________________________________________________
__________________________________________________________________________________________
__________________________________________________________________________________________
__________________________________________________________________________________________

194
__________________________________________________________________________________________
__________________________________________________________________________________________
What was the worst thing about your least preferred interface?
__________________________________________________________________________________________
__________________________________________________________________________________________
__________________________________________________________________________________________
__________________________________________________________________________________________
__________________________________________________________________________________________
__________________________________________________________________________________________
Did the two different magnification levels have any influence on the interaction with the interfaces? If so, how?
__________________________________________________________________________________________
__________________________________________________________________________________________
__________________________________________________________________________________________
__________________________________________________________________________________________
__________________________________________________________________________________________
__________________________________________________________________________________________
Comments/Recommendations:
__________________________________________________________________________________________
__________________________________________________________________________________________
__________________________________________________________________________________________
__________________________________________________________________________________________
__________________________________________________________________________________________
__________________________________________________________________________________________

195
Questionnaire for Study 5
Questionnaire
A Complete only this Section before the Session
Age: _______ Height: _______ Gender: male/female Right-handed:
yes/no
Please circle your answer.
Ethnicity Asian Caucasian Maori or
Pacific
Islander
Indian Other (please
write what it
is):
I have used mobile
devices such as smart
phones, IPad …
Frequently Occasionall
y
A couple
of times
Once Never
I have used the front
facing camera on
mobile devices for e.g.
video conferencing
Frequently Occasionall
y
A couple
of times
Once Never
I have used gestural
input to interact with an
electronic device such
as Nintendo WII, Xbox
…
Frequently Occasionall
y
A couple
of times
Once Never
B Complete after each gesture-application turn. Please use numbers from 1 to 5 indicating
whether you (1) strongly disagree, (2) disagree, (3) neutral, (4) agree and (5) strongly agree.

196
Left-Right Up-Down Circle
General Experience
I understood the gesture
I enjoyed the gesture
Gesture Specific
The gesture was intuitive/felt
right
The thumb movement to
perform the gesture was
easy/not awkward
The gesture input was accurate
A change in gesture was
immediately reflected in a
change in input
Controlling the LEVEL OF
CHANGE IN
ACCELARATION was easy
Controlling/changing the
MOTION DIRECTION was
easy
Keeping the thumb in the
camera viewing field was easy
C Complete at the Conclusion of the Study
Where in your opinion is the best location on the mobile device to put the camera above which the gestures are
performed? Please indicate the position in the rectangle on the right.

197
Did performing the gestures involve awkward and/or uncomfortable hand/finger movements and/or positions?
If so please describe it in details.
------------------------------------------------------------------------------------------------
------------------------------------------------------------------------------------------------
------------------------------------------------------------------------------------------------ What space to interact with your thumb above the device feels comfortable in terms of distance to the device?
------------------------------------------------------------------------------------------------
------------------------------------------------------------------------------------------------
------------------------------------------------------------------------------------------------ Can you think of any other gestures allowing two-directional input with different accelerations and an
application?
------------------------------------------------------------------------------------------------
------------------------------------------------------------------------------------------------
------------------------------------------------------------------------------------------------
Please rank the gestures. Write the rank (1-3) next to the gesture. ___ Circle ___ Up-Down ___ Left-
Right
Comments/Suggestions
------------------------------------------------------------------------------------------------
------------------------------------------------------------------------------------------------
------------------------------------------------------------------------------------------------
------------------------------------------------------------------------------------------------

198

199
Appendix C: Co-Authorship Forms

200

201

202

207
References
Adobe, S. (2013). "Adobe Photoshop family." Retrieved 14.10.2013, 2013, from
http://www.adobe.com/products/photoshopfamily.html.
Agrawala, M. and M. Shilman (2005). DIZI: A Digital Ink Zooming Interface for Document
Annotation. INTERACT
Albinsson, P.-A. and S. Zhai (2003). High Precision Touch Screen Interaction. Proceedings
of the SIGCHI Conference on Human Factors in Computing Systems. Ft. Lauderdale,
Florida, USA, ACM: 105-112.
Appert, C., O. Chapuis and E. Pietriga (2010). High-Precision Magnification Lenses.
Proceedings of the 28th International Conference on Human Factors in Computing Systems.
Atlanta, USA, ACM: 273-282.
Azuma, R., Y. Baillot, R. Behringer, S. Feiner, S. Julier and B. MacIntyre (2001). "Recent
Advances in Augmented Reality." Computer Graphics and Applications, IEEE 21(6): 34-47.
Ball, R. and C. North (2005). Effects of Tiled High-Resolution Display on Basic
Visualization and Navigation Tasks. CHI '05 extended abstracts on Human factors in
computing systems. Portland, OR, USA, ACM: 1196-1199.
Ballagas, R., J. Borchers, M. Rohs and J. G. Sheridan (2006). "The Smart Phone: A
Ubiquitous Input Device." Pervasive Computing, IEEE 5(1): 70-77.
Barron, J. L., D. J. Fleet and S. S. Beauchemin (1994). "Performance of Optical Flow
Techniques." International Journal of Computer Vision 12(1): 43-77.
Baudisch, P., E. Cutrell, K. Hinckley and A. Eversole (2005). Snap-and-Go: Helping Users
Align Objects Without the Modality of Traditional Snapping. Proceedings of the SIGCHI
Conference on Human Factors in Computing Systems. Portland, Oregon, USA, ACM: 301-
310.
Baudisch, P., N. Good, V. Bellotti and P. Schraedley (2002). Keeping Things in Context: A
Comparative Evaluation of Focus Plus Context Screens, Overviews, and Zooming.
Proceedings of the SIGCHI conference on Human factors in computing systems.
Minneapolis, Minnesota, USA, ACM: 259-266.
Baudisch, P. and C. Gutwin (2004). Multiblending: Displaying Overlapping Windows
Simultaneously Without the Drawbacks of Alpha Blending. Proceedings of the SIGCHI
Conference on Human Factors in Computing Systems. Vienna, Austria, ACM: 367-374.
Baudisch, P., B. Lee and L. Hanna (2004). Fishnet, A Fisheye Web Browser with Search
Term Popouts: A Comparative Evaluation with Overview and Linear View. Proceedings of
the working conference on Advanced visual interfaces. Gallipoli, Italy, ACM: 133-140.
Baudisch, P. and R. Rosenholtz (2003). Halo: A Technique for Visualizing Off-Screen
Objects. Proceedings of the SIGCHI Conference on Human Factors in Computing Systems.
Ft. Lauderdale, Florida, USA, ACM: 481-488.
Bederson, B. B. (2000). Fisheye Menus. Proceedings of the 13th annual ACM symposium on
User interface software and technology. San Diego, California, United States, ACM: 217-
225.
Bederson, B. B. and J. D. Hollan (1994). Pad++: A Zooming Graphical Interface for
Exploring Alternate Interface Physics. Proceedings of the 7th annual ACM Symposium on
User Interface Software and Technology. Marina del Rey, California, USA, ACM: 17-26.

208
Benko, H., A. D. Wilson and P. Baudisch (2006). Precise Selection Techniques for Multi-
Touch Screens. Proceedings of the SIGCHI Conference on Human Factors in Computing
Systems. Montreal, Quebec, Canada, ACM: 1263-1272.
Bertin, J. (1977). La Graphique et le Traitement Graphique de l'Information, Flammarion
Paris.
Bezerianos, A. and P. Isenberg (2012). "Perception of Visual Variables on Tiled Wall-Sized
Displays for Information Visualization Applications." IEEE Transactions on Visualization
and Computer Graphics 18(12).
Bier, E. A., M. C. Stone, K. Pier, W. Buxton and T. D. DeRose (1993). Toolglass and Magic
Lenses: The See-Through Interface. Proceedings of the 20th annual Conference on Computer
Graphics and Interactive Techniques. Anaheim, CA, ACM: 73-80.
Blagojevic, R., B. Plimmer, J. Grundy and Y. Wang (2011). "Using Data Mining for Digital
Ink Recognition: Dividing Text and Shapes in Sketched Diagrams." Computers & Graphics
35(5): 976–991.
Boring, S., D. Baur, A. Butz, S. Gustafson and P. Baudisch (2010). Touch Projector: Mobile
Interaction Through Video. Proceedings of the 28th international conference on Human
factors in computing systems. Atlanta, Georgia, USA, ACM: 2287-2296.
Bragdon, A., E. Nelson, Y. Li and K. Hinckley (2011). Experimental Analysis of Touch-
Screen Gesture Designs in Mobile Environments. Proceedings of the 2011 annual conference
on Human Factors in Computing Systems. Vancouver, BC, Canada, ACM: 403-412.
Brewster, S. A. and M. Hughes (2009). Pressure-Based Text Entry for Mobile Devices.
Proceedings of the 11th International Conference on Human-Computer Interaction with
Mobile Devices and Services. Bonn, Germany, ACM: 1-4.
Brosz, J., S. Carpendale and M. A. Nacenta (2011). "The Undistort Lens." Computer
Graphics Forum 30(3): 881-890.
Buchmann, V., S. Violich, M. Billinghurst and A. Cockburn (2004). FingARtips: Gesture
Based Direct Manipulation in Augmented Reality. Proceedings of the 2nd international
conference on Computer Graphics and Interactive Techniques in Australasia and South East
Asia. Singapore, ACM: 212-221.
Burigat, S. and L. Chittaro (2013). "On the Effectiveness of Overview+Detail Visualization
on Mobile Devices." Personal Ubiquitous Computing 17(2): 371-385.
Card, S. K., J. D. Mackinlay and B. Shneiderman (1999). Readings in Information
Visualization: Using Vision to Think, Morgan Kaufmann Pub.
Carpendale, M. S. T., D. J. Cowperthwaite and F. D. Fracchia (1997). Making Distortions
Comprehensible. Visual Languages, 1997. Proceedings. 1997 IEEE Symposium on, Capri,
Italy, IEEE Computer Society.
Carpendale, M. S. T. and C. Montagnese (2001). A Framework for Unifying Presentation
Space. Proceedings of the 14th annual ACM symposium on User Interface Software and
Technology. Orlando, Florida, ACM: 61-70.
Chun, W. H. and T. Hoellerer (2013). Real-time Hand Interaction for Augmented Reality on
Mobile Phones. IUI. Santa Monica, USA, ACM.
Cleveland, W. S. and R. McGill (1984). "Graphical Perception: Theory, Experimentation,
and Application to the Development of Graphical Methods." Journal of the American
Statistical Association 79(387): 531-554.
Cockburn, A., A. Karlson and B. B. Bederson (2009). "A Review of Overview+Detail,
Zooming, and Focus+Context Interfaces." ACM Comput. Surv. 41(1): 1-31.
Cockburn, A., J. Savage and A. Wallace (2005). Tuning and Testing Scrolling Interfaces that
Automatically Zoom. Proceedings of the SIGCHI conference on Human Factors in
Computing Systems. Portland, Oregon, USA, ACM: 71-80.

209
Darrell, T., P. Maes, B. Blumberg and A. Pentland (1994). A Novel Environment for Situated
Vision and Behavior, Vision and Modeling Group, Media Laboratory, Massachusetts
Institute of Technology.
Donskoy, M. and V. Kaptelinin (1997). Window Navigation With and Without Animation: A
Comparison of Scroll Bars, Zoom, and Fisheye View. CHI '97 Extended Abstracts on Human
Factors in Computing Systems. Atlanta, Georgia, ACM: 279-280.
Druin, A., J. Stewart, D. Proft, B. Bederson and J. Hollan (1997). KidPad: A Design
Collaboration Between Children, Technologists, and Educators. CHI 97. Atlanta, ACM: 463-
470.
Du, Y., H. Ren, G. Pan and S. Li (2011). Tilt & Touch: Mobile Phone for 3D Interaction.
Proceedings of the 13th international conference on Ubiquitous Computing. Beijing, China,
ACM: 485-486.
Fernquist, J., G. Shoemaker and K. S. Booth (2011). "Oh Snap" - Helping Users Align
Digital Objects on Touch Interfaces INTERACT. Lisbon, Portugal, Springer.
Freeman, W. T., D. B. Anderson, P. Beardsley, C. N. Dodge, M. Roth, C. D. Weissman, W.
S. Yerazunis, H. Kage, I. Kyuma, Y. Miyake and K. Tanaka (1998). "Computer Vision for
Interactive Computer Graphics." Computer Graphics and Applications, IEEE 18(3): 42-53.
Furnas, G. (1986). Generalized Fisheye Views. Proceedings of the SIGCHI conference on
Human Factors in Computing Systems. Boston, USA, ACM: 16-23.
Furnas, G. W. (2006). A Fisheye Follow-Up: Further Reflections on Focus + Context.
Proceedings of the SIGCHI conference on Human Factors in Computing Systems. Montreal,
Canada, ACM: 999-1008.
Gatward, K. (2008). Effects of Canvas Size on Sketching: Implications for Creativity Support
Tools, The University of Bath.
Google. (2013). "Chrome Browser." Retrieved 01/10/2013, 2013, from
https://www.google.com/intl/en/chrome/browser/.
Google. (2013). "Google Maps." Retrieved 14.10.2013, 2013, from
https://maps.google.com/.
Gorman, M. (2013). "Vivo's Y19t is a phone built for China and aimed at ladies, has front-
mounted flash for well-lit selfies." Retrieved 01.07.2013, 2013, from
http://www.engadget.com/2013/07/01/vivo-y19t-front-facing-camera-flash/.
Grudin, J. (2001). Partitioning Digital Worlds: Focal and Peripheral Awareness in Multiple
Monitor Use. Proceedings of the SIGCHI conference on Human factors in computing
systems. Seattle, Washington, United States, ACM: 458-465.
Gu, J., R. Mukundan and M. Billinghurst (2008). Developing Mobile Phone AR Applications
using J2ME. Image and Vision Computing New Zealand, 2008. IVCNZ 2008. 23rd
International Conference, IEEE: 1-6.
Guimbretiere, F., M. Stone and T. Winograd (2001). Fluid Interaction with High-Resolution
Wall-Size Displays. Proceedings of the 14th annual ACM symposium on User Interface
Software and Technology. Orlando, Florida, ACM: 21-30.
Gutwin, C. (2002). Improving Focus Targeting in Interactive Fisheye Views. Proceedings of
the SIGCHI conference on Human Factors in Computing Systems: Changing our world,
changing ourselves. Minneapolis, Minnesota, USA, ACM: 267-274.
Gutwin, C. and C. Fedak (2004). Interacting with Big Interfaces on Small Screens: A
Comparison of Fisheye, Zoom, and Panning Techniques. Proceedings of Graphics Interface
2004. London, Ontario, Canada, Canadian Human-Computer Communications Society: 145-
152.
Gutwin, C. and A. Skopik (2003). Fisheyes are Good for Large Steering Tasks. Proceedings
of the SIGCHI conference on Human factors in computing systems. Ft. Lauderdale, Florida,
USA, ACM: 201-208.
210
Hansen, T. R., E. Eriksson and A. Lykke-Olesen (2006). Use Your Head: Exploring Face
Tracking for Mobile Interaction. CHI '06 Extended Abstracts on Human Factors in
Computing Systems. Montral, Quebec, Canada, ACM: 845-850.
Hinckley, K. and H. Song (2011). Sensor Synaesthesia: Touch in Motion, and Motion in
Touch. Proceedings of the 2011 annual conference on Human Factors in Computing Systems.
Vancouver, BC, Canada, ACM: 801-810.
Hogg, D. C. (1984). Interpreting Images of a Known Moving Object, University of Sussex.
Holz, C. and P. Baudisch (2011). Understanding Touch. Proceedings of the SIGCHI
Conference on Human Factors in Computing Systems. Vancouver, BC, Canada, ACM: 2501-
2510.
Hornbaek, K., B. B. Bederson and C. Plaisant (2002). "Navigation Patterns and Usability of
Zoomable User Interfaces With and Without an Overview." ACM Trans. Comput.-Hum.
Interact. 9(4): 362-389.
Hornbaek, K. and E. Frokjaer (2003). "Reading Patterns and Usability in Visualizations of
Electronic Documents." ACM Trans. Comput.-Hum. Interact. 10(2): 119-149.
Hornbæk, K. and M. Hertzum (2011). "The Notion of Overview in Information
Visualization." International Journal of Human-Computer Studies 69(7–8): 509-525.
Isenberg, P., A. Bezerianos, P. Dragicevic and J. D. Fekete (2011). "A Study on Dual-Scale
Data Charts." IEEE Transactions on Visualization and Computer Graphics 17(12): 2469-
2478.
Iwasaki, K., T. Miyaki and J. Rekimoto (2009). Expressive Typing: A New Way to Sense
Typing Pressure and its Applications. Proceedings of the 27th international conference
extended abstracts on Human Factors in Computing Systems. Boston, MA, USA, ACM:
4369-4374.
Jakobsen, M. R. and K. Hornbæk (2011). Sizing Up Visualizations: Effects of Display Size in
Focus+Context, Overview+Detail, and Zooming Interfaces. Proceedings of the 2011 annual
conference on Human factors in computing systems. Vancouver, BC, Canada, ACM: 1451-
1460.
Jakobsen, M. R. and K. Hornbæk (2013). "Interactive Visualizations on Large and Small
Displays: The Interrelation of Display Size, Information Space, and Scale." Visualization and
Computer Graphics, IEEE Transactions on 19(12): 2336-2345.
Jul, S. and G. W. Furnas (1998). Critical Zones in Desert Fog: Aids to Multiscale Navigation.
Proceedings of the 11th annual ACM symposium on User interface software and technology.
San Francisco, California, United States, ACM: 97-106.
Kameda, Y. and M. Minoh (1996). A Human Motion Estimation Method Using 3-Successive
Video Frames. International conference on Virtual Systems and Multimedia: 135-140.
Karlson, A. K. and B. B. Bederson (2007). ThumbSpace: Generalized One-Handed Input for
Touchscreen-Based Mobile Devices, Springer Berlin Heidelberg.
Karlson, A. K., B. B. Bederson and J. Contreras-Vidal (2008). "Understanding One Handed
Use of Mobile Devices." Handbook of research on User Interface Design and Evaluation for
Mobile Technology.
Karlson, A. K., B. B. Bederson and J. SanGiovanni (2005). AppLens and LaunchTile: Two
Designs for One-Handed Thumb Use on Small Devices. Proceedings of the SIGCHI
Conference on Human Factors in Computing Systems. Portland, Oregon, USA, ACM: 201-
210.
Kato, H. and T. Kato (2009). A Camera-Based Tangible Controller for Cellular Phones.
Proceedings of the 11th International Conference on Human-Computer Interaction with
Mobile Devices and Services. Bonn, Germany, ACM: 1-2.

211
Kosara, R., S. Miksch and H. Hauser (2001). Semantic Depth of Field. Proceedings of the
IEEE Symposium on Information Visualization 2001 (INFOVIS'01). San Diego, USA, IEEE
Computer Society: 97.
Kovac, J., P. Peer and F. Solina (2003). Human Skin Color Clustering for Face Detection.
EUROCON 2003. Computer as a Tool. The IEEE Region 8. 2: 144-148 vol.142.
Kuhn, P. M. (2010). Algorithms, Complexity Analysis and VLSI Architectures for MPEG-4
Motion Estimation, Springer Publishing Company, Incorporated.
Kushler, C. A., Marsden, Randal J. (2003). System and Method for Continuous Stroke Word-
Based Text Input USA, ForWord Input Inc. 7,098,896.
Lank, E. and S. Phan (2004). Focus+Context Sketching on a Pocket PC. CHI '04 extended
abstracts on Human Factors in Computing Systems. Vienna, Austria, ACM: 1275-1278.
Leung, Y. and M. Apperley (1994). "A Review and Taxonomy of Distortion-Oriented
Presentation Techniques." ACM Transactions on Computer-Human Interaction (TOCHI)
1(2): 126-160.
Lieberman, H. (1994). Powers of Ten Thousand: Navigating in Large Information Spaces.
Proceedings of the 7th annual ACM symposium on User interface software and technology.
Marina del Rey, California, United States, ACM: 15-16.
Lucas, B. D. and T. Kanade (1981). An Iterative Image Registration Technique with an
Application to Stereo Vision. Proceedings of the 7th international joint conference on
Artificial intelligence.
Mackay, W. E., G. Pothier, C. Letondal, K. Begh and H. E. Sorensen (2002). The Missing
Link: Augmenting Biology Laboratory Notebooks. Proceedings of the 15th annual ACM
symposium on User Interface Software and Technology. Paris, France, ACM: 41-50.
Mackinlay, J. D., G. G. Robertson and S. K. Card (1991). The Perspective Wall: Detail and
Context Smoothly Integrated. Proceedings of the SIGCHI conference on Human Factors in
Computing Systems: Reaching through technology. New Orleans, Louisiana, United States,
ACM: 173-176.
Matsushita, N., Y. Ayatsuka and J. Rekimoto (2000). Dual Touch: A Two-Handed Interface
for Pen-Based PDAs. Proceedings of the 13th annual ACM symposium on User Interface
Software and Technology. San Diego, California, USA, ACM: 211-212.
Microsoft. (2010). "Direct2D." Retrieved 13.10.2013, 2013, from
http://msdn.microsoft.com/en-us/library/windows/desktop/dd370990(v=vs.85).aspx.
Microsoft. (2012). "RealTimeStylus Reference." Retrieved 13.10.2013, 2013, from
http://msdn.microsoft.com/en-us/library/windows/desktop/ms701683(v=vs.85).aspx.
Microsoft. (2013). "Graphics Class." Retrieved 13.10.2013, 2013, from
http://msdn.microsoft.com/en-us/library/system.drawing.graphics.aspx.
Microsoft. (2013). "InkOverlay Class." Retrieved 13.10.2013, 2013, from
http://msdn.microsoft.com/en-us/library/microsoft.ink.inkoverlay(v=vs.90).aspx.
Microsoft. (2013). "Word." Retrieved 14.10.2013, 2013, from
http://office.microsoft.com/en-us/word/.
Mitra, S. and T. Acharya (2007). "Gesture Recognition: A Survey." Systems, Man, and
Cybernetics, Part C: Applications and Reviews, IEEE Transactions on 37(3): 311-324.
Moeslund, T. B. and E. Granum (2001). "A Survey of Computer Vision-Based Human
Motion Capture." Computer Vision and Image Understanding 81(3): 231-268.
Morris, M. R., J. O. Wobbrock and A. D. Wilson (2010). Understanding Users' Preferences
for Surface Gestures. Proceedings of Graphics Interface. Ottawa, Ontario, Canada, Canadian
Information Processing Society: 261-268.
Negulescu, M., J. Ruiz, Y. Li and E. Lank (2012). Tap, Swipe, or Move: Attentional
Demands for Distracted Smartphone Input. Proceedings of the International Working
Conference on Advanced Visual Interfaces. Capri Island, Italy, ACM: 173-180.

212
Nekrasovski, D., A. Bodnar, J. McGrenere, F. Guimbretiere and T. Munzner (2006). An
Evaluation of Pan & Zoom and Rubber Sheet Navigation With and Without an Overview.
Proceedings of the SIGCHI conference on Human Factors in computing systems. Montreal,
Quebec, Canada, ACM: 11-20.
Nokia. (2011). "Nokia N900 support." Retrieved 01.11.2013, 2013, from
http://www.nokia.com/gb-en/support/product/n900/.
Olwal, A. and S. Feiner (2003). Rubbing the Fisheye: Precise Touch-Screen Interaction with
Gestures and Fisheye Views. UIST'03, Citeseer.
Patel, R., B. Plimmer, J. Grundy and R. Ihaka (2007). Ink Features for Diagram Recognition.
4th Eurographics Workshop on Sketch-Based Interfaces and Modeling Riverside, California,
ACM: 131-138.
Pattath, A., D. S. Ebert, W. Pike and R. A. May (2009). Contextual Interaction for Geospatial
Visual Analytics on Mobile Devices.
Perlin, K. and D. Fox (1993). Pad: An Alternative Approach to the Computer Interface.
Proceedings of the 20th annual conference on Computer Graphics and Interactive
Techniques. Anaheim, CA, ACM: 57-64.
Pietriga, E. and C. Appert (2008). Sigma Lenses: Focus-Context Transitions Combining
Space, Time and Translucence. Proceeding of the twenty-sixth annual SIGCHI conference on
Human Factors in Computing Systems. Florence, Italy, ACM: 1343-1352.
Pietriga, E., C. Appert and M. Beaudouin-Lafon (2007). Pointing and Beyond: An
Operationalization and Preliminary Evaluation of Multi-Scale Searching. Proceedings of the
SIGCHI Conference on Human Factors in Computing Systems. San Jose, California, USA,
ACM: 1215-1224.
Plaisant, C., D. Carr and B. Shneiderman (2002). "Image-Bowser Taxonomy and Guidelines
for Designers." Software, IEEE 12(2): 21-32.
Plimmer, B. and I. Freeman (2007). A Toolkit Approach to Sketched Diagram Recognition.
HCI. Lancaster, UK, eWiC. 1: 205-213.
Plimmer, B., H. C. Purchase and H. Y. Yang (2010). SketchNode: Intelligent sketching
support and formal diagramming. OZCHI Brisbane, Australia, ACM.
Polana, R. and R. Nelson (1994). Low Level Recognition of Human Motion (or How to Get
Your Man Without Finding His Body Parts). Motion of Non-Rigid and Articulated Objects,
1994., Proceedings of the 1994 IEEE Workshop on: 77-82.
Potamias, M. and V. Athitsos (2008). Nearest Neighbor Search Methods for Handshape
Recognition. Proceedings of the 1st international conference on Pervasive Technologies
Related to Assistive Environments. Athens, Greece, ACM: 1-8.
Potter, R. L., L. J. Weldon and B. Shneiderman (1988). Improving the Accuracy of Touch
Screens: An Experimental Evaluation of Three Strategies. Proceedings of the SIGCHI
Conference on Human Factors in Computing Systems. Washington, D.C., USA, ACM: 27-
32.
PTE, F. T. (2012). "Noteshelf." Retrieved 14.10.2013, 2013, from
http://www.fluidtouch.biz/noteshelf/.
Ramos, G. and R. Balakrishnan (2005). Zliding: Fluid Zooming and Sliding for High
Precision Parameter Manipulation. Proceedings of the 18th annual ACM symposium on User
interface Software and Technology. Seattle, WA, USA, ACM: 143-152.
Ramos, G., A. Cockburn, R. Balakrishnan and M. Beaudouin-Lafon (2007). Pointing Lenses:
Facilitating Stylus Input Through Visual-and Motor-Space Magnification. Proceedings of the
SIGCHI conference on Human Factors in Computing Systems. San Jose, California, USA,
ACM: 757-766.

213
Ren, X. and S. Moriya (2000). "Improving Selection Performance on Pen-Based Systems: A
Study of Pen-Based Interaction for Selection Tasks." ACM Trans. Comput.-Hum. Interact.
7(3): 384-416.
Robertson, G. G. and J. D. Mackinlay (1993). The Document Lens. Proceedings of the 6th
annual ACM symposium on User Interface Software and Technology. Atlanta, Georgia,
United States, ACM: 101-108.
Robey, D., R. Welke and D. Turk (2001). "Traditional, Iterative, and Component-Based
Development: A Social Analysis of Software Development Paradigms." Information
Technology and Management 2(1): 53-70.
Ruiz, J. and Y. Li (2011). DoubleFlip: A Motion Gesture Delimiter for Mobile Interaction.
Proceedings of the SIGCHI Conference on Human Factors in Computing Systems, ACM:
2717-2720.
Ruiz, J., Y. Li and E. Lank (2011). User-Defined Motion Gestures for Mobile Interaction.
Proceedings of the 2011 annual conference on Human Factors in Computing Systems.
Vancouver, BC, Canada, ACM: 197-206.
Samsung. (2013). "Our Galaxy Smartphones." Retrieved 15.10.2013, 2013, from
http://www.samsung.com/us/topic/our-galaxy-smartphones.
Sarkar, M. and M. Brown (1992). Graphical Fisheye Views of Graphs, ACM.
Schaffer, D., Z. Zuo, S. Greenberg, L. Bartram, J. Dill, S. Dubs and M. Roseman (1996).
"Navigating Hierarchically Clustered Networks through Fisheye and Full-Zoom Methods."
ACM Trans. Comput.-Hum. Interact. 3(2): 162-188.
Schmieder, P. (2011). Distortion Techniques for Sketching INTERACT. P. Campos, N.
Graham, J. Jorge et al. Lisbon, Portugal, Springer Berlin / Heidelberg. 6949: 386-389.
Schmieder, P., A. Luxton-Reilly, B. Plimmer and J. Hosking (2013). Thumbs Up: 3D Gesture
Input on Mobile Phones Using the Front Facing Camera. INTERACT 2013. Cape Town, SA,
Springer.
Schmieder, P., A. Luxton-Reilly, B. Plimmer and J. Hosking (2013). Visual Guides for
Comprehending Digital Ink in Distortion Lenses. Proceedings of the 27th International BCS
Human Computer Interaction Conference. London, United Kingdom, BCS L&D Ltd.
Schmieder, P., B. Plimmer and J. Hosking (2012). Non-Occluding Intelligent Magnifiers for
Sketching on Small Displays. BCS-HCI '12. Birmingham, United Kingdom, British
Computer Society: 195-204.
Sears, A. and B. Shneiderman (1991). "High Precision Touchscreens: Design Strategies and
Comparisons with a Mouse." International Journal of Man-Machine Studies 34(4): 593-613.
Shneiderman, B. and C. Plaisant (2005). Designing the User Interface. Boston, Pearson
Addison Welsey.
Shoemaker, G. and C. Gutwin (2007). Supporting Multi-Point Interaction in Visual
Workspaces. Proceedings of the SIGCHI Conference on Human Factors in Computing
Systems. San Jose, California, USA, ACM: 999-1008.
Spence, R. and M. Apperley (1982). "Data Base Navigation: An Office Environment for the
Professional." Behaviour & Information Technology 1(1): 43-54.
Summers, K. L., T. E. Goldsmith, S. Kuhica and T. P. Caudell (2003). An Experimental
Evaluation of Continuous Semantic Zooming in Program Visualization. Proceedings of the
Ninth annual IEEE conference on Information Visualization. Seattle, Washington, IEEE
Computer Society: 155-162.
TechSmith. (2005). "Morae." 2004, from
http://www.techsmith.com/products/morae/default.asp.
Vardy, A., J. Robinson and C. Li-Te (1999). The WristCam as Input Device. Wearable
Computers, 1999. Digest of Papers. The Third International Symposium on: 199-202.

214
Vogel, D. and R. Balakrishnan (2010). Occlusion-aware interfaces. Proceedings of the
SIGCHI Conference on Human Factors in Computing Systems, Atlanta, Georgia, USA,
ACM.
Vogel, D. and P. Baudisch (2007). Shift: A Technique for Operating Pen-Based Interfaces
Using Touch. Proceedings of the SIGCHI Conference on Human Factors in Computing
Systems. San Jose, California, USA, ACM: 657-666.
Wagner, M. (2006). The Geometries of Visual Space. Mahwah, NJ, USA, Lawrence Erlbaum
Associates.
Wang, J., S. Zhai and J. Canny (2006). Camera Phone Based Motion Sensing: Interaction
Techniques, Applications and Performance Study. Proceedings of the 19th annual ACM
symposium on User Interface Software and Technology. Montreux, Switzerland, ACM: 101-
110.
Wickens, C. D. and J. G. Hollands (2000). Decision Making. Engineering Psychology and
Human Performance. Upper Saddle River, NJ, USA, Prentice Hall.
Wigdor, D., C. Forlines, P. Baudisch, J. Barnwell and C. Shen (2007). Lucid Touch: A See-
Through Mobile Device. Proceedings of the 20th annual ACM symposium on User interface
software and technology. Newport, Rhode Island, USA, ACM: 269-278.
Wigdor, D., C. Shen, C. Forlines and R. Balakrishnan (2007). Perception of Elementary
Graphical Elements in Tabletop and Multi-Surface Environments. Proceedings of the
SIGCHI Conference on Human Factors in Computing Systems. San Jose, California, USA,
ACM: 473-482.
Wikipedia. (2013). "Seven Wonders of the Ancient World." Retrieved 14.10.2013, 2013,
from http://en.wikipedia.org/wiki/Seven_Wonders_of_the_Ancient_World.
Wobbrock, J. O., M. R. Morris and A. D. Wilson (2009). User-Defined Gestures for Surface
Computing. Proceedings of the SIGCHI Conference on Human Factors in Computing
Systems. Boston, MA, USA, ACM: 1083-1092.
Yamada, M., K. Ebihara and O. Jun (1998). A New Robust Real-Time Method for Extracting
Human Silhouettes from Color Images. Automatic Face and Gesture Recognition, 1998.
Proceedings. Third IEEE International Conference on: 528-533.
Yilmaz, A., O. Javed and M. Shah (2006). "Object Tracking: A Survey." ACM Comput.
Surv. 38(4): 13.
Yilmaz, A., L. Xin and M. Shah (2004). "Contour-Based Object Tracking with Occlusion
Handling in Video Acquired Using Mobile Cameras." Pattern Analysis and Machine
Intelligence, IEEE Transactions on 26(11): 1531-1536.
Zanella, A., M. S. T. Carpendale and M. Rounding (2002). On the Effects of Viewing Cues in
Comprehending Distortions. Proceedings of the second Nordic conference on Human-
computer interaction. Aarhus, Denmark, ACM: 119-128.
Zhou, F., H. B.-L. Duh and M. Billinghurst (2008). Trends in Augmented Reality Tracking,
Interaction and Display: A Review of Ten Years of ISMAR. Proceedings of the 7th
IEEE/ACM International Symposium on Mixed and Augmented Reality, IEEE Computer
Society: 193-202.


