Embed Size (px)
Citation preview

1
Authors: Guido Schryen ([email protected]), Gerhard Rauchecker, Martina Comes
Title Resource Planning in Disaster Response – Decision Support Models and Methodologies
Subtitle None
Abstract
Managing the response to natural, man-made and technical disasters becomes increasingly important in the light of climate change, globalization, urbanization and growing conflicts. Sudden onset disasters are typically characterized by high stakes, time pressure and uncertain, conflicting or lacking information. Since the planning and management of response is a complex task, decision makers of aid organizations can thus benefit from decision support methods and tools. A key task is the joint allocation of rescue units and the scheduling of incidents under different conditions of collaboration. We present an approach to support decision makers, who coordinate response units, by (a) suggesting mathematical formulations of decision models, (b) providing heuristic solution procedures and (c) evaluating the heuristics against both current best practice behavior and optimal solutions. Our computational experiments show that, for the generated problem instances, (1) current best practice behavior can be improved substantially by our heuristics, (2) the gap between heuristic and optimal solutions is very low for instances without collaboration and (3) our heuristics are capable of providing solutions for all generated instances in less than a second on a state-of-the-art PC.
Keywords Disaster response, Decision support, Optimization, Resource allocation, Scheduling, Collaboration

2
1 Introduction
Managing risks in today’s societies has become increasingly important in the light of climate change, globalization, urbanization and growing conflicts. Beyond rising pressure on the environment, critical infrastructures, and production systems, these trends result in a growing number of shocks: natural and man-made emergencies have more severe consequences than ever before (IDDRI and IOM 2012, p. 7) due to cascading effects through more interlaced systems, and concentration of population and industry. Natural disasters, including earthquakes, tsunamis and hurricanes, have caused many casualties and tremendous economic harm – and are predicted to cause even more in the future. It is estimated that, between 2000 and 2009, about 1 million people lost their lives and economic damage of about 1,000 billion USD occurred due to natural disasters. According to a recent report of the UN (UN-OCHA 2013, p. 2), “[i]nter-agency appeals typically target 60-70 million people each year, compared with 30-40 million ten years ago.” Regarding the economic impact for the most prominent recent example, the Fukushima Daichi incident, assessments of direct damages reach about 211 billion USD, turning it into the most costly natural disaster ever (Kajitani et al. 2013).
To understand how systems and societies prepare for and respond to disasters, the disaster management cycle is frequently used (French and Geldermann 2005). A disaster event triggers the response phase, which comprises actions immediately following a disaster event such as search and rescue, setting up field hospitals, or providing food, to longer-term processes, such as education or recovery. As communities rebuild in the aftermath of the disaster, the cycle moves from the recovery phase again to the preparedness and mitigation phase where reconstruction is undertaken in ways that aim to reduce vulnerability and develop more resilient infrastructures and organizations (Comes et al. 2013a). Planning and preparedness are crucial steps in the process as (1) most models and decision support tools need to be set up a priori and (2) collaboration and cooperation require trust and stable structures, which can only be acquired over time and with frequent practice (Banuls and Turoff 2011).
In this paper, we focus on the response phase in sudden onset disasters. This phase is typically characterized by a large set of tasks with different resource requirements and time pressure. Therefore, information and decision support systems that facilitate communication and transparent and easily understandable decision support tools are crucial (Comfort 2007). During the disaster response, the use of information systems and decision support tools is the basis for the execution of response plans (Mendonça et al. 2007). The execution of plans is typically managed by a command and control center. A commander at the scene coordinates the activities of the units responding to the disaster. The on-scene commander and support staff collect and analyze data, make decisions, and monitor their implementation and consequences. In these situations, allocating scarce resources to specific tasks is particularly challenging since complex decisions need to be made within minutes.

3
Based on the need for decision support systems in the phase of disaster response, our paper addresses the following research questions:
1. How can disaster response situations be formally modeled by means of optimization models?
2. How can optimization models be solved efficiently? 3. To what extent can solutions obtained by proposed methods improve current best
practice behavior?
In this paper, we consider two types of disaster response situations: a) those where each task can be processed by a single rescue unit and b) those where the collaboration of rescue units to process particular tasks might become necessary. As being unfolded later in this paper, these situations require different solving approaches.
The remainder of this paper is structured as follows. In Section 2, we frame the discussion by providing an introduction into the disaster response domain and conceptualizing our decision support problems. Section 3 suggests mathematical formulations of the decision support problems. In Section 4, we present heuristics to solve the proposed models. The fifth section shows our computational experiments and results, which are discussed in Section 6. Finally, we provide a summary and an outlook on future research.
2 Framing the discussion
In this section, we provide the foundations of the disaster response domain and the decision support problems under consideration: rescue unit assignment and scheduling problems.
2.1 Disaster response
Events that have a massive negative large-scale impact on people have been inconsistently named “emergency”, “hazard”, “catastrophe”, “incident”, “disaster”, and “crisis” in the literature. We follow the terminology of “The International Federation of Red Cross and Red Crescent Societies” (IFRC n.d.), which defines “disaster” as follows: “A disaster is a sudden,
calamitous event that seriously disrupts the functioning of a community or society and causes human, material, and economic or environmental losses that exceed the community’s or society’s ability to cope using its own resources.” The types of disaster events that are covered by the above definition are broad and include natural, man-made, and technological disasters. Based on the understanding of the IFRC, we define the management of disasters as
“[t]he organization and management of resources and responsibilities for dealing with all aspects of […] disasters, in particular preparedness, response and recovery in order to lessen the impact of disasters”.
The disaster management literature shows large consensus that challenges and activities can be classified into the preparedness phase, the response phase and the recovery phase (Ajami & Fattahi, 2009; Altay & Green III, 2006, French and Geldermann 2005, Wex et al. 2014).
In the preparedness phase, tasks are related to training, early warning, and the planning and establishment of necessary emergency services (UN/ISDR, 2005; Gasparini et al., 2007; Svensson et al., 1996; Pollak et al., 2004; F. Nisha de Silva, 2001).

4
In the response phase, rescue from immediate danger and stabilization of the condition of survivors are essential. Tasks include relief, emergency shelter and settlement, emergency telecommunication, emergency health, water and sanitation, tracing and restoring family links, and logistics (IFRC, 2012, Kovacs & Spens, 2011). Various decision support approaches in the literature focus on the orchestration of these efforts: First, both competitive and cooperative mechanisms are developed (e.g., Fiedrich et al. (2000)). Second, computational intelligence research is applied to bridge the gap between information system design principles and decision support process architectures (Leifler, 2008; van de Walle & Turoff, 2008). Third, empirical investigations of past decision-making conclusions are used to establish innovative courses of action (Faraj & Xiao, 2006). Fourth, research considers decision-making based on either decentralized agents (Airy et al., 2009; Falasca et al., 2009) or a centralized authority. With regard to the former, researchers argue that distributed coordination (i. e. assignments and schedules) remains independent of failures of a single emergency operations center and communication bottlenecks evolve more seldom. Regarding the latter, mathematical programming models are proposed by Rolland et al. (2010) and Wex et al. (2011, 2012, 2013,2014)
In the recovery phase, person finding, data analysis, infrastructure repair and the provision of emergency services are key tasks (GAO, 2006; Saleem et al., 2008; Sherali et al., 1991).
2.2 Conceptualizing the decision support problems
We conceptualize two types of (deterministic) disaster response situations as illustrated in Figure 1. A set of incidents, such as collapsed buildings, fires and buried people, requires attention by rescue units, each of which represents a “standardised package of trained personnel and modules of equipment, ready to be deployed at short notice.” (IFRC n.d.). We further conceptualize different types of rescue units and incidents by providing for
capabilities. In our models, an incident can be processed by a rescue unit if and only if the
capabilities required to respond to are features of unit .
The coordination of efforts of different teams and the question of which tasks to assign to which team at what time remains an obstacle to efficient and effective disaster response (Zook et al., 2010). We study the problems of optimally scheduling rescue units and assigning them to incidents in the immediate response to a sudden onset disaster. We distinguish situations without and with collaboration, and we refer to these problems as the Rescue Unit Assignment and Scheduling Problem without Collaboration (RUASP) and Rescue Unit Assignment and Scheduling Problem with Collaboration (RUASP/C). Our understanding of RUASP and RUASP/C is based on our interviews with associates from the German Federal Agency for Technical Relief (THW).

5
a) Exemplary visualization of RUASP
b) Exemplary visualization of RUASP/C
Fig. 1 Disaster response situations a) without and b) with collaboration
We consider situations characterized by scarce resources, i.e., in which the number of available rescue units is lower than or equal to the number of incidents that need to be processed. As stated above, we account for specific requirements of incidents and different capabilities of rescue units since not every rescue unit is able to process each incident (property 1). Next, we account for the facts that processing times are both incident- and unit-specific (property 2) and that different rescue units need different travel times between the locations of incidents (property 3). We assume that the processing of an incident must not be interrupted (non-preemption) (property 4) and that a unit can handle only one incident at a time (property 5). As proxy of overall harm, we use the sum of weighted completion times regarding the processing of incidents (property 6). The weighting factor represents the factor of destruction, also referred to as severity level, which accounts for both casualties and damage induced over time. The completion time of an incident is the time until which all trapped and injured persons are rescued, fires extinguished, or other consequences defused.

6
We show sample solutions of both RUASP and RUASP/C in Figure 2, with the number of rescue units being 3, the number of incidents being 7 and 5, respectively, and the level of severity (factor of destruction) of incidents varying between 1 and 5.
a) Sample solution for RUASP
b) Sample solution for RUASP/C
Fig. 2 Sample solution of an RUASP instance and an RUASP/C instance
The RUASP is related to a problem in the scheduling literature. Wex et al. (2012, p. 19) show that the RUASP is a generalization of the “parallel-machine scheduling problem with unrelated machines, non-batch sequence-dependent setup times and a weighted sum of
completion times as objective”. This problem is classified as / /∑ in the scheduling
literature (Allahverdi et al. 2008, pp. 987ff).
2.3 Discussion of assumptions
The conceptualization of both decision support problems proposed in the previous subsection is based on some assumptions. We briefly discuss these:
Weighting factors
The use of a weighting factor for each incident allows distinguishing incidents in terms of severity. This distinction is common practice; for example, the U.S. Department of Homeland Security uses five levels of severity: low (1), guarded (2), elevated (3), high (4), and severe (5) (Wex et al., 2014, p. 704). In our model, we follow the suggestion to

7
use five levels. However, it should be noticed that, in practice, such a classification is applied at the ordinal scale level. In our models, we use these at cardinal scale level as approximation in order to perform arithmetics.
Objective function
Our objective function draws on completion times, which, we believe, are a key indicator for the overall resulting harm. This is in line with literature on recovery and resilience, that describes the ultimate aim of disaster response as a “bounce back” to a new steady state (Manyena 2006). We thereby avoid comparing damages and harm to people. We compute a linear aggregation of the harm of single incidents using their weighting factors. Linear aggregation has been advocated for being understandable and easy to communicate (Geldermann et al. 2009). We also agree that in practice more than one criterion may be relevant and should be applied, resulting in a multi-objective decision model (MODM). However, before analyzing a more complex MODM in future work, we aim at first achieving an understanding of the single-criterion decision (model).
Certainty of data
In real cases, most information is likely to be uncertain. For example, travel times may be approximations due to unclear infrastructure conditions, processing times may be approximations as the exact nature of the incident and the requirements to process it are not known, or the classification of the severity of an incident may depend on subjective assessments and linguistic uncertainty. For the sake of simplicity and in order to develop an initial understanding of how quantitative models can support decision making during disaster response situations, we do not consider any kind of uncertainty in our models. We discuss future work concerning uncertainty in the final section of this paper.
3 Decision support models
In this section, we propose mathematical formulations of the decision support problems RUASP and RUASP/C.1 Both models are presented in the form of a mixed integer quadratic problem (MIQP). Our models use the following notation:
Real incidents 1,… , and ficticious incidents 0 and 1,
rescue units 1,… , ,
unit capabilities / incident requirements 1,… , ,
1 The situations are based on the description in earlier works but our approaches in this work go be-
yond as follows: (1) Wex et al. (2011) model the situation without collaboration by means of a recursive optimization model. As recursion is difficult to solve using optimizers, we suggest here a non-recursive model. (2) A basic and fuzzy version of our (non-recursive, crisp) model has been suggested in Wex et al. (2012); however, we improve this model by modifying constraints and removing redundant constraints. (3) Wex et al. (2013) model the situation with collaboration. Again, we improve this model by modifying and removing redundant constraints. (4) Wex et al. (2014) draw on Wex et al. (2012) and compare solutions obtained from applying heuristics for the model without collaboration with lower bounds of optimal solutions. We would like to stress that, beyond model improvements, our paper goes beyond the cited works not only with regard to model discussion but also with regard to computing optimal solutions.

8
capabilities ∈ 0,1 for all 1,… , and 1,… , , where 1 if and
only if rescue unit is capable of processing incident ,
processing times 0 for all 1,… , and 1,… , , where 0 if and
only if 1,
traveling times 0 for all 0,… , , 1,… , and 1,… , and
severity levels 0 for all 1,… , .
Furthermore, we define the following decision variables:
∈ 0,1 for all 0,… , , 1,… , 1 and 1,… , , where 1 if and
only if incident is processed by rescue unit immediately before incident .
∈ 0,1 for all 0, … , , 1,… , 1 and 1, … , , where 1 if and
only if incident is processed by rescue unit before incident .
3.1 Rescue Unit Assignment and Scheduling Problem without Collaboration (RUASP)
With the notations presented above, the objective function (O) represents the total weighted
completion times over all real incidents. The fictitious incidents 0 and 1 represent the
starting depot and the end depot, respectively, of a rescue unit. The mathematical model for RUASP can be written as shown below.
min∑ ∑ ∑ ∑ ∑ (O)
s.t.∑ ∑ 1, 1, … , (C1)
∑ ∑ 1 , 1, … , (C2)
∑ 1 , 1, … , (C3)
∑ , 1, 1, … , (C4)
∑ ∑ , 1, …,n;k=1,…,m (C5)
0, 1, … , n; k 1, … ,m C6
1, 0, … , ; 1, … , ; 1, … , 1; 1, … C7
, 0, … , ; 1, … , 1; 1, … C8
∑ , 0, … , ; 1, … , 1; 1, … C9
∑ , 0, … , ; 1, … , 1; 1, … C10
∑ , 1, … , ; 1, … , C11
, ∈ 0,1 , 0,… , ; 1, … , 1; 1, …
The constraints (C1) and (C2) ensure that each real incident has exactly one immediate predecessor and one immediate successor. (C3) and (C4) guarantee that each tour begins and ends at a depot. Because of constraint (C5) a unit which arrives at a real incident also has to depart from there. Condition (C6) prohibits cycles. The transitivity constraint (C7) means that
a rescue unit , which processes incident before incident and incident before incident ,
9
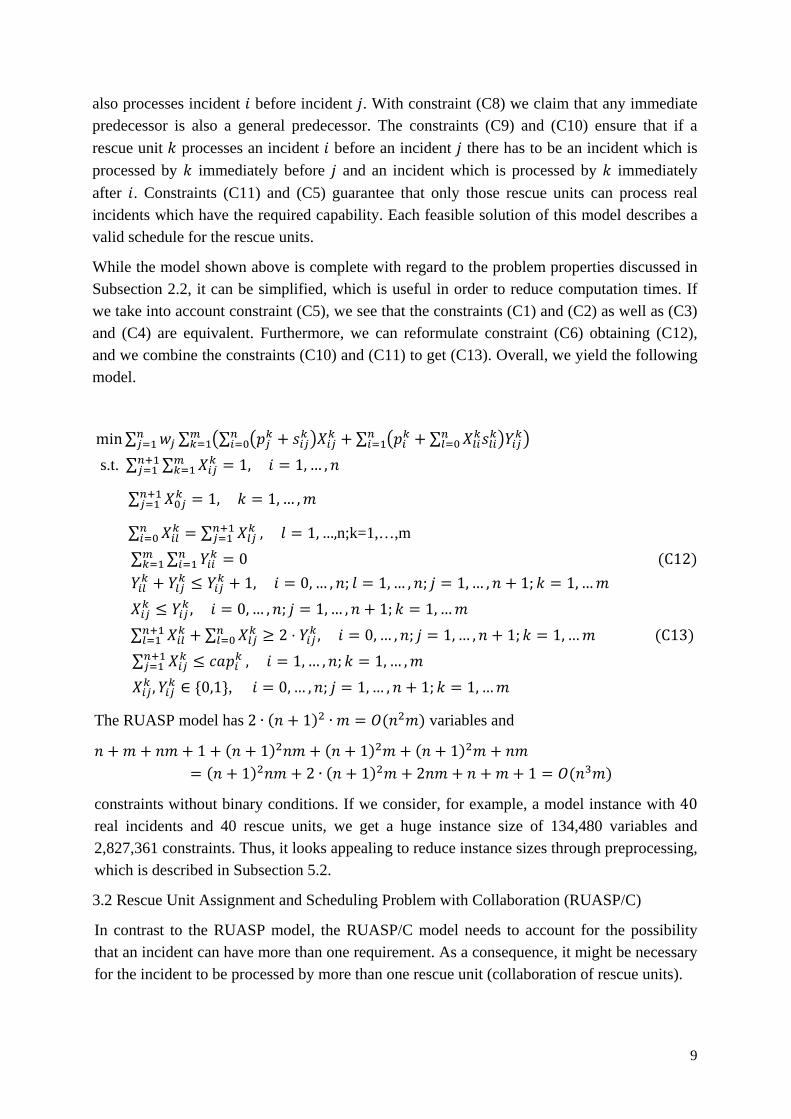
also processes incident before incident . With constraint (C8) we claim that any immediate predecessor is also a general predecessor. The constraints (C9) and (C10) ensure that if a
rescue unit processes an incident before an incident there has to be an incident which is
processed by immediately before and an incident which is processed by immediately
after . Constraints (C11) and (C5) guarantee that only those rescue units can process real incidents which have the required capability. Each feasible solution of this model describes a valid schedule for the rescue units.
While the model shown above is complete with regard to the problem properties discussed in Subsection 2.2, it can be simplified, which is useful in order to reduce computation times. If we take into account constraint (C5), we see that the constraints (C1) and (C2) as well as (C3) and (C4) are equivalent. Furthermore, we can reformulate constraint (C6) obtaining (C12), and we combine the constraints (C10) and (C11) to get (C13). Overall, we yield the following model.
min∑ ∑ ∑ ∑ ∑
s.t.∑ ∑ 1, 1, … ,
∑ 1, 1, … ,
∑ ∑ , 1, …,n;k=1,…,m
∑ ∑ 0 C12
1, 0, … , ; 1, … , ; 1, … , 1; 1, …
, 0, … , ; 1, … , 1; 1, …
∑ ∑ 2 ⋅ , 0, … , ; 1, … , 1; 1, … C13
∑ , 1, … , ; 1, … ,
, ∈ 0,1 , 0,… , ; 1, … , 1; 1, …
The RUASP model has 2 ∙ 1 ∙ variables and
1 1 1 11 2 ∙ 1 2 1
constraints without binary conditions. If we consider, for example, a model instance with 40 real incidents and 40 rescue units, we get a huge instance size of 134,480 variables and 2,827,361 constraints. Thus, it looks appealing to reduce instance sizes through preprocessing, which is described in Subsection 5.2.
3.2 Rescue Unit Assignment and Scheduling Problem with Collaboration (RUASP/C)
In contrast to the RUASP model, the RUASP/C model needs to account for the possibility that an incident can have more than one requirement. As a consequence, it might be necessary for the incident to be processed by more than one rescue unit (collaboration of rescue units).

10
The RUASP/C model is an extension of the RUASP model, i.e., each RUASP instance is an RUASP/C instance at the same time, but not vice versa. We sketch the proof as follows: Take any RUASP instance. Then each incident has exactly one requirement and therefore is an instance of RUASP/C. However, take an RUASP/C instance where an incident has more than one requirement and where this incident cannot be processed by one single unit. In this case, the respective incident needs to be processed by more than one rescue unit, which cannot be modeled as an RUASP instance.
In order to model this new situation, we extend the above notation by the following elements:
Capability indicators ∈ 0,1 for all 1,… , and 1,… , , where
1 if and only if unit has the capability and
requirement indicators ∈ 0,1 for all 1,… , and 1,… , , where
1 if and only if incident has the requirement .
Based on the RUASP model and these definitions, we suggest the following collaboration model:
min∑ ∑ ∑ ∑ ∑
s.t.∑ 1, 1, … ,
∑ ∑ ⋅ , 1 , 1, … , ; 1, … , C1c
∑ ∑ , 1, …,n;k=1,…,m
∑ ∑ 0
1, 0, … , ; 1, … , ; 1, … , 1; 1, …
, 0, … , ; 1, … , 1; 1, …
∑ ∑ 2 ⋅ , 0, … , ; 1, … , 1; 1, …
∑ ∑ , 1, … , ; 1, … (C2c)
, ∈ 0,1 , 0,… , ; 1, … , 1; 1, …
Constraint (C2) no longer holds as an incident can now be processed by more than one unit.
(C1c) assures that (1) for every real incident and every rescue unit there can be at most
one incident that is processed by immediately after and (2) a rescue unit can only process real incidents which it is capable of. Therefore, (C1c) replaced the constraints (C2) and (C11). The new constraint (C2c) guarantees that each requirement of every real incident gets covered.
The RUASP/C model has 2 ∙ 1 ∙ variables as in the case of the RUASP
model. The number of constraints amounts to 1 11 1 1 2 ∙ 1 2 1
without the binary conditions. Interestingly, compared to the RUASP model,
we get only additional constraints when considering collaboration. If we regard, for
example, model instances with 40 real incidents and 40 rescue units and 8 types of

11
capabilities, we get an instance size of 134,480 variables and 2,827,641 constraints. As in the case of RUASP, we analyze options of preprocessing in Subsection 5.2
4 Heuristics
With regard to computational complexity, Wex et al. (2012) show that RUASP is computationally intractable and NP-hard. As RUASP/C is a generalization of RUASP, the RUASP/C is even harder to solve and also NP-hard. Our computational results presented in the succeeding section even show that many instances of sizes up to 40 incidents and 40 rescue units cannot be solved optimally in less than ten hours using an Intel Core i7-2600 CPU. However, in practice, decision makers need to get solutions after just minutes. Therefore, we develop heuristics in order to solve large instances within minutes. For both of our problems we suggest a greedy heuristic and a heuristic adapted from the scheduling literature.
The greedy heuristics implement the current best practice behavior as we identified it in our interviews with representatives of the German THW. Applying these heuristics has two benefits: First, when compared with optimal solution values, the quality of best practice solutions can be measured. Second, when compared with other heuristics, the improvement of heuristics over current best practice behavior can be measured. With regard to our second heuristic, we draw on the literature. Wex et al. (2014) develop and test many heuristics for RUASP, including a GRASP metaheuristic. We decided to use that algorithm which performed best among all construction heuristics and which could hardly be improved by improving heuristics and the GRASP metaheuristic. With regard to RUASP/C, we adapted the scheduling heuristic to make it applicable to RUASP/C.
We provide Pseudo codes of our heuristics, which draw on the mathematical notations used
above. In addition, we introduce the notations ≔ 1,… , and ≔ 1,… , .
4.1 Heuristics for RUASP
The greedy heuristic, referred to as GREEDY, follows the idea that incidents are assigned to
rescue units in descending order of their factor of destruction. Here, each incident is
assigned to the rescue unit that is capable of starting to process incident earliest, with assignment history being considered. The implementation of the GREEDY algorithm is described below.
1 Sort incidents in decreasing order of severity, i.e. ⋯ .
2 Initialize the current completion time ≔ 0, the current incident ≔ 0 and the
current schedule ≔ ∅ for every unit ∈ .
3 for 1,… , do
4 ≔ ∈ | 1
5 if ∅ then
6 choose the unit with the lowest starting time ≔ ∈
7 else
8 return infeasible

12
9 endif
10 update ≔ , ≔ and ≔ ∪
11 endfor
12 return , … , as the list of schedules
The scheduling algorithm, which we refer to as SCHED in the following, is more sophisticated and considers in each step contemporaneously the factors of destruction, assignment history, processing times and travel times. The implementation of the SCHED is given below.
1 Initialize the current completion time ≔ 0, the current incident ≔ 0 and the
current schedule ≔ ∅ for every unit ∈ . Initialize the incidents ≔ 1,… , .
2 while ∅ do
3 set : , ∈ | 1
4 if ∅ then
5 choose the next incident ∗ and its processing unit ∗ by setting
∗, ∗ ≔ , ∈
6 update ∗ ≔ ∗ ∗ ∗∗
∗∗, ∗ ≔ ∗, ∗ ≔ ∗ ∪ ∗ and ≔ \ ∗
7 else
8 return infeasible
9 endif
10 endwhile
11 return , … , as the list of schedules
4.2 Heuristics for RUASP/C
The two heuristics for RUASP/C are adaptations of the RUASP heuristics. In the GREEDY heuristic, we again draw on the idea that incidents are assigned to rescue units in decreasing order of their severity levels and that an incident is assigned to a rescue unit which can begin to process the incident earliest. As incidents may demand multiple requirements, we need to track those capabilities, which have already been covered.
1 Sort the incidents in decreasing order of severity, i.e. ⋯ .
2 Initialize the current completion time ≔ 0, the current incident ≔ 0 and the
current schedule ≔ ∅ for every unit ∈ .

13
3 for 1,… , do
4 set ≔ ∈ | 1
5 while ∅do
6 set ≔ ∈ |∃ ∈ : 1
7 if ∅ then
8 choose the unit with the lowest starting time ≔ ∈
9 set ≔ ∈ | , 1 and apply these capabilities by
≔ \
10 update ≔ , ≔ and ≔ ∪
11 else
12 return infeasible
13 endif
14 endwhile
15 endfor
16 return , … , as the list of schedules
In order to adapt SCHED to RUASP/C, we again draw on the idea of SCHED, i.e., the next incident to process is the one with the lowest ratio of the (shortest) completion time to the severity level.
1 Initialize the current completion time ≔ 0, the current incident ≔ 0 and the
current schedule ≔ ∅ for every unit ∈ . Initialize the incidents ≔ 1,… , .
2 while 0 for some , ∈ do
3 : , ∈ |∃ ∈ : 1
4 if ∅ then
5 choose the next incident ∗ and its processing unit ∗ by setting
6 ∗, ∗ ≔ , ∈
7 apply the capabilities of ∗ by setting ∗ ≔ 0 for all ∈ with
∗ 1
8 update ∗ ≔ ∗ ∗ ∗∗
∗∗, ∗ ≔ ∗ and ∗ ≔ ∗ ∪ ∗
9 else
10 return infeasible
11 endif
12 endwhile
13 return , … , as the list of schedules
5 Computational Experiments
The goal of our computational experiments is to evaluate the GREEDY heuristic and the SCHED heuristic for both problems RUASP and RUASP/C against optimal solutions. Thereby, we can also compare the quality of GREEDY solutions (best practice) with SCHED

14
solutions. Where computationally feasible (in terms of available computing resources), we determine optimal solutions; in all other cases, we use lower bounds of optimal solutions, which are reported by the Gurobi optimizer based on the Branch & Cut procedure the solver applies.
In the subsequent subsections, we describe how we generated RUASP and RUASP/C instances, how we reduced the sizes of model instances through preprocessing, which computing environment we used, and what our results are.
5.1 Data generation
For our computational evaluation, we draw on artificially generated data as real data is not available. We analyze RUASP and RUASP/C instances of different sizes, with the maximum number of incidents and rescue units being 40 for the following reason: Our interviews at the THW provided this figure as a realistic size of an assignment and scheduling problem. Due to the dynamics of a disaster, new instances (and solutions) need to be generated in an iterative manner, cf. Subsection 6.2. Our data generation is based on the following assumptions:
1. The number of instances is not smaller than the number of rescue units because of the large-scale effects of disasters.
2. Travel times between incident locations are low compared to processing times as most incidents during disasters occur in urban areas. For example, it takes much more time to extinguish a house on fire or to stabilize a collapsed building than it takes a rescue unit to travel there. We account for this relationship by different normal distributions for generating processing times, and travel and setup times. In order to check the robustness of our results, we vary the standard deviations of both normal distributions as shown in Table 1.
3. The factor of destruction of an incident indicates the level of severity: low (1), guarded (2), elevated (3), high (4), and severe (5) harm. We select a discrete uniform distribution for severity levels.
4. We provide for the following eight capabilities of rescue units: policemen, fire brigades, paramedics, locating/rescuing, debris removal, infrastructure preservation, logistics teams, and special casualty access teams (THW n.d.). Table 1 summarizes the details of data generation. For each scenario size (e.g., 40 incidents and 20 rescue units), we generate and solve ten instances for each of the distribution sets 1 and 2.
Table 1. Details of data generation
Input parameter Value, range, distribution
Number of rescue units ∈ 10,20,30,40
Number of real incidents ∈ 10,20,30,40 ,
Number of unit capabilities 8
Number of instances per scenario 10
Factors of destruction ~ 1,5,1 , 1,… ,
Incident requirements (RUASP) ∼ 1,8,1 , 1,… ,

15
Unit capabilities (RUASP) ∼ 0,1,0.25 , 1,… , , 1,… ,
Capabilities (RUASP) : , ∈ 0,1 , 1,… , , 1, … ,
Incident requirements (RUASP/C) ~ 0,1,0.25 , 1,… , , 1,… ,
Unit capabilities (RUASP/C) ∼ 0,1,0.25 , 1,… , , 1, … ,
Distribution set 1
Process times ~ 20,10 , 1,… , , 1,… ,
Travel times ∼ 1,0.3 , 0,… , , 1,… , , 1, … ,
Distribution set 2
Process times ~ 20,6 , 1, … , , 1, … ,
Travel times ∼ 1,0.5 , 0,… , , 1,… , , 1, … ,
5.2 Preprocessing
As discussed in Subsections 3.1 and 3.2, instance sizes of both RUASP and RUASP/C
become extremely large even for moderate sizes of and . A substantial reduction of sizes of model instances is necessary to compute optimal solutions (as benchmark for our heuristics). It is not necessary in order to apply the heuristics themselves.
We apply a preprocessing procedure to each of the generated instances in terms of reducing the number of variables and constraints. The reduction of both the number of variables and the number of constraints is essentially based on the fact that each of the rescue units is usually not capable of processing all incidents.
In the RUASP model, constraint (C11) allows for size reduction in terms of both variables
and constraints. We assign 1, 1, … , , i.e., each rescue unit is capable
of processing both virtual incidents 0 and 1 . If 0, i=1,…,n, i.e., rescue unit is
not capable of processing incident , all variables , 1, … , 1 , can be set to zero and
thus be removed from the model due to constraint (C11). If we additionally apply (C5), we
can also set all variables , 0, … , , to zero. This holds for , 1, … , 1 and
, 0, … , likewise due to constraint (C13). Constraint (C11) can also be removed from
the model: if 0, all variables occurring on the left side are set to zero and were
removed; if 1, the constraint is redundant with (C2). Furthermore, using constraint
(C12), we can also set all , 1, … , , 1, … , , to zero; this, in turn, allows us to
remove all , 1, … , , 1, … , , due to constraint (C8). Finally, constraint (C12) can
also be removed. For our RUASP instances, the expected number of variables that are removed in the preprocessing procedure is about 93%.
Next, we expose how the variable reduction affects the expected number of removable constraints. As explained above, some of the constraints of (C11) and the constraints (C12)

16
can be removed. Additionally, from (C5), (C7), (C8) and (C13) we can remove constraints. For our RUASP instances, the expected number of constraints that are removed in the preprocessing procedure is about 97%.
Similar to the preprocessing procedure described above, we can remove both variables and constraints from instances of the RUASP/C model. Constraint (C1c) allows for size reduction in terms of variables and constraints; in addition, many of the constraints (C2c), (C8) and (C12) can be removed. For our RUASP/C instances, the expected number of variables and constraints that are removed in the preprocessing procedure is about 88% and 95%, respectively.
5.3 Computational environment
For modeling purposes, we use the system AIMMS 3.13 and apply the Gurobi optimizer (version 5.5) to solve instances optimally or to obtain lower bounds of optimal solutions. When solving instances optimally, we abort the solution process after three hours because pre studies show that further improvements are only marginal. All heuristics are implemented in the programming language of AIMMS.
For our computations we used an Intel Core i7-2600 CPU with 3.40 GHz and 8GiB RAM.
5.4 Results
We first present the results for RUASP. For each of the instance sizes, we evaluate the performance of both heuristics GREEDY and SCHED against optimal solutions. For each
instance size, we average the ten ratios _ / and _ / and
_ / _ of all instances 1,… ,10 , with _ and
_ being the solution values of the greedy and the scheduling heuristic,
respectively, and being the optimal solution value of instance z. For every problem size,
this leads to those values / , / and / , respectively, which are shown in Table 2. Only the instances with 40 incidents and 10 rescue units could not be solved optimally within three hours and therefore we used lower bounds provided by the solver in this case.
Table 2 provides the averaged ratios for RUASP, with the coefficients of variation (ratio of the standard deviation to the mean) as robustness measure given in parentheses.
Tab. 2 Averaged ratios for RUASP
#Incidents / #units
10/10 20/10 20/20 30/10 30/20 30/30 40/10* 40/20 40/30 40/40
Distribution set 1
GREEDY/ OPT
1.33
(0.16)
1.29
(0.12)
1.65
(0.1)
1.29
(0.1)
1.76
(0.11)
2.17
(0.1)
2.07
(0.11)
1.73
(0.12)
1.96
(0.09)
2.37
(0.13)
SCHED/ 1.02 1.04 1.06 1.03 1.03 1.02 1.48 1.03 1.04 1.03

17
The average times required to find optimal solutions of RUASP instances are presented in Table 3, which also includes the coefficients of variation. We do not provide the average times of the heuristics as all of these were below one second.
Tab. 3 Average runtimes for RUASP in seconds
#Incidents / #units
10/10 20/10 20/20 30/10 30/20 30/30 40/10* 40/20 40/30 40/40
Distribution set 1 Average runtime
0.1 (1.08)
92.8 (1.74)
1.0 (0.79)
2349.0 (0.64)
243.8 (2.62)
7.5 (0.51)
- 766.6 (0.84)
162.9 (1.75)
34.0 (1.53)
Distribution set 2 Average runtime
0.6 (0.30)
112.9 (2.15)
1.3 (0.56)
3789.2 (0.74)
57.4 (1.22)
4.4 (0.41)
- 2484.1 (0.86)
337.4 (2.20)
14.3 (0.62)
* We terminated the computation after three hours. (•) Coefficient of variation
Analogous to the presentation of the RUASP results, Table 4 provides our results for RUASP/C. As, in contrast to RUASP, our computing resources were not able to find optimal solutions within three hours - with the exception of 10/10 instances -, we used lower bounds (LB) as determined by our solver. Again, we also do not provide the average times of the heuristics as all of these were below one second.
Tab. 4 Averaged ratios for RUASP/C
#Incidents / #units
10/10* 20/10 20/20 30/10 30/20 30/30 40/10 40/20 40/30 40/40
Distribution set 1 GREEDY/ LB
1.49 (0.15)
2.03 (0.2)
1.81 (0.17)
2.67 (0.22)
2.53 (0.13)
2.56 (0.14)
3.39 (0.13)
3.04 (0.13)
2.82 (0.1)
3.0 (0.11)
SCHED/ LB
1.1 (0.07)
1.51 (0.19)
1.22 (0.09)
1.95 (0.19)
1.44 (0.09)
1.28 (0.08)
2.49 (0.1)
1.82 (0.15)
1,37 (0.08)
1.25 (0.04)
OPT (0.02) (0.03) (0.05) (0.02) (0.02) (0.01) (0.16) (0.02) (0.02) (0.01)
SCHED/ GREEDY
0.78 (0.13)
0.81 (0.13)
0.65 (0.14)
0.8 (0.1)
0.59 (0.12)
0.47 (0.11)
0.72 (0.11)
0.61 (0.14)
0.54 (0.09)
0.44 (0.12)
Distribution set 2
GREEDY/ OPT
1.09 (0.08)
1.15 (0.06)
1.32 (0.05)
1.15 (0.05)
1.30 (0.08)
1.43 (0.05)
1.76 (0.10)
1.37 (0.08)
1.45 (0.06)
1.55 (0.07)
SCHED/ OPT
1.03 (0.05)
1.04 (0.03)
1.04 (0.02)
1.03 (0.02)
1.07 (0.04)
1.05 (0.02)
1.55 (0.12)
1.03 (0.01)
1.04 (0.01)
1.04 (0.02)
SCHED/ GREEDY
0.95 (0.10)
0.90 (0.05)
0.79 (0.05)
0.89 (0.05)
0.83 (0.09)
0.73 (0.06)
0.88 (0.05)
0.75 (0.08)
0.72 (0.07)
0.67 (0.08)
* Optimal solutions could not be found; lower bounds are used as substitutes.
(•) Coefficient of variation

18
SCHED/ GREEDY
0.75 (0.13)
0.75 (0.12)
0.69 (0.12)
0.74 (0.12)
0.58 (0.17)
0.51 (0.11)
0.74 (0.09)
0.6 (0.08)
0.49 (0.11)
0.42 (0.12)
Distribution set 2 GREEDY/ LB
1.25 (0.10)
1.79 (0.23)
1.65 (0.21)
2.44 (0.14)
2.12 (0.13)
1.98 (0.10)
2.95 (0.10)
2.37 (0.11)
2.34 (0.09)
1.95 (0.07)
SCHED/ LB
1.09 (0.07)
1.57 (0.18)
1.23 (0.12)
2.13 (0.13)
1.57 (0.14)
1.40 (0.13)
2.46 (0.08)
1.79 (0.09)
1.52 (0.08)
1.36 (0.07)
SCHED/ GREEDY
0.87 (0.09)
0.90 (0.13)
0.77 (0.17)
0.88 (0.08)
0.74 (0.05)
0.71 (0.07)
0.84 (0.06)
0.76 (0.08)
0.65 (0.04)
0.70 (0.08)
* Optimal solutions could be found.
(•) Coefficient of variation
6 Discussion
6.1 Results
We first discuss our results on RUASP before we proceed analogously with RUASP/C. Analyzing the computational results, we get the following findings:
(1) The current best practice behavior (modeled as GREEDY heuristic) provides schedules which lead to an overall harm (achieved solution value) that is 29% up to 137% worse compared to the minimum harm (optimal solution value) in distribution set 1, and 9% up to 76% worse compared to the minimum harm in distribution set 2. Apparently, the performance of the Greedy heuristic does not only depend of the instance size but also of the distributions used.
(2) Our proposed heuristic SCHED provides an overall harm which is only 2% up to 6% above the minimum harm in distribution set 1 – we exclude the case 40/10 as we did not get optimal solutions – and only 3% up to 7% above the minimum harm in distribution set 2, with the case 40/10 being excluded again. The performance of the heuristic is robust against changes in the distributions.
(3) The heuristic SCHED improves current best practice behavior by 19% up to 56% in distribution set 1 – the case 40/10 is excluded from this consideration again – and 5% up to 33% in distribution set 2, with the case 40/10 being excluded again. For the distributions used, the extent with which SCHED improves the current best practice behavior only depends on the performance of the latter.
(4) The robustness (in terms of coefficients of variation) is much higher for SCHED/OPT compared to GREEDY/OPT. For both ratios, we did not find substantial differences between the coefficients of variation in distribution set 1 and distribution set 2.
To sum up, in the tested cases, the proposed SCHED heuristic comes close the optimum and improves the current best practice behavior substantially. The case 40/10, which shows an averaged SCHED/OPT ratio of 48% in distribution set 1 and 55% in distribution set 2, is more difficult to interpret. We see two possible explanations for the substantially higher figure compared to other ratios: First, it could be that the gaps between the computed lower

19
bounds and the optimal solution values are high so that the averaged ratio of 48% in distribution set 1 (55% in distribution set 2) are due to this gap and consequently does not indicate the quality of the heuristic. Second, it could be that the aforementioned gap is low, which would indicate a poor performance of the scheduling heuristic in the case 40/10. Although we do not know which of the two explanations is true, we assume that explanation no. 1 is more likely because even in the case 30/10, which is the closest to the case 40/10 in terms of the ratio of number of incidents to the number of units, the averaged SCHED/OPT ratio is as low as 3% in both distribution sets, which shows a good performance of the scheduling heuristic.
Runtimes show that the SCHED heuristic needs only less than a second in all tested cases and is thus very applicable in practice. In contrast, as our simulations show the time required to find optimal solutions averages to 39 minutes (63 minutes) with a high coefficient of variation of 64% (74%) in case 30/10 with distribution set 1 (distribution set 2). Over all simulation instances, it amounts to more than 167 minutes2 in the worst case (case 30/10, distribution set 2). Furthermore, computation times vary substantially between the two distribution sets, which increases the difficulty of predicting computing time. These figures show the infeasibility of determining optimal solutions in real-case situations. Even worse, the computing times for getting optimal solutions are likely to increase substantially with instances that are larger than the tested ones, especially when the ratio of incidents to rescue units increases.
With regard to RUASP/C, we have only lower bounds available. As a consequence, the calculated ratios are upper bounds for the ratios of heuristic solution values to optimal solution values. Based on the computational results, we get the following findings:
(1) The GREEDY heuristic provides solutions which are 49% up to 239% above the lower bounds in distribution set 1 and 25% up to 195% above the lower bounds in distribution set 2. As in the case of RUASP, the performance of the Greedy heuristic does not only depend of the instance size but also of the distributions used.
(2) The SCHED heuristic shows values of 10% up to 149% in distribution set 1 and 9% up to 146% in distribution set 2. In some cases, for example in the cases (10/10), (20/20), (30/30) and (40/40), the solutions provided by SCHED are at most 10% (9%), 22% (23%), 28% (40%) and 25% (36%) above the optimal solutions, with the first value referring to distribution set 1 and the second one referring to distribution set 2. In contrast to RUASP, these figures are high but they provide at least “acceptable” upper bounds of solution quality. For most of the instance sizes, we observe a robustness of results with regard to the distribution set used.
2 The average runtime for the instance size 30/10 is about 39 minutes with distribution set 1 and about 63
minutes with distribution set 2. Three out of ten instances even required more than 90 minutes in distribution set 1, and four out of ten instances required more than 85 minutes in distribution set 2.

20
(3) While the ratio of heuristic solutions and optimal solutions cannot be precisely determined, the ratios of solutions provided by the suggested heuristic SCHED and the GREEDY heuristic do not depend on the gaps between optimal solution values and lower bounds. These ratios show that the SCHED heuristic improves the quality of GREEDY solutions by 25% up to 58% in distribution set 1 and by 10% up to 35% in distribution set 2, resulting in a substantial improvement of current best practice behavior. Similarly to the case of RUASP, for the distributions used, the extent with which SCHED improves the current best practice behavior largely depends on the performance of the latter.
(4) As in the case of RUASP, the SCHED heuristic shows a higher robustness (in terms of coefficients of variation) than the GREEDY heuristic. However, the extent of the difference depends on the distribution set used.
(5) As the SCHED heuristic can be executed in less than a second, it is very applicable in practice. In contrast, yielding optimal solutions was not possible within three hours (with the exception of the case (10/10)). This time period is far too long for being acceptable in practice.
Our computational results show that the application of the suggested SCHED heuristics substantially improves current best practice behavior for both distribution sets used while providing solutions close to the optimum in RUASP instances regardless of the used distribution (high robustness). In addition, as for each instance the SCHED heuristic requires an execution time of less than a second, we recommend that they are included in decision support systems of Emergency Operations Centers. We deliberately argue that the heuristics be applied as a tool of decision support rather than one of decision making for two reasons: First, it must not be excluded that the scheduling and rescue plan is not recommendable or even infeasible for unforeseeable circumstances, which are known to human decision makers but not to the algorithms applied. Second, we assume that the chance of adoption is higher when decisions of experts are supported rather than substituted.
6.2 Static models in a dynamic decision environment
The suggested decision support models RUASP and RUASP/C consider static situations, in which we assume that the incidents, available rescue units and their characteristics are known. However, in practice, the decision situation is dynamic as, for example, new incidents occur, the relative severity level or the processing times of incidents may change, rescue units and their capabilities may change, and travel times may vary due to changing infrastructure conditions. These dynamics can be considered through the generation and solving of a sequence of (static) RUASP or RUASP/C instances: at some point of time, a rescue organization needs to make a first decision on the allocation and scheduling of rescue units based on the current status quo of information, although knowing that conditions are likely to change in the near future. At some future points of time, the organization needs to update their previously made decisions based on new information (re-scheduling).

21
From a conceptual perspective, this update is implemented through the generation of a new instance of RUASP or RUASP/C. This instance includes new information and has to account for the fact that some of the known incidents have already been or are being processed. Accordingly, rescue units may have been already assigned and sent to incidents once information changes. When this is the case, the model prohibits assigning busy rescue units until they have finished their jobs (non-preemption). Non-preemption seems to be realistic under different practical and ethical considerations. Regarding future work, it may be interesting to relax the non-preemption assumption depending on the level of severity of incidents. To sum up, a sequence of dependent instances and solutions is iteratively generated during the disaster response phase. The frequency with which the rescue organization wishes to generate and solve new instances depends on the frequency with which new information occurs.
7 Summary and Outlook
In this paper, we address the operational task of Emergency Operation Centers to assign rescue units to incidents during the response phase of a disaster. We suggest optimization models for two situations, with and without collaboration of rescue units. As both problems are proven to be NP-hard and solutions of problem instances need to be available in practice within minutes, we suggest heuristics. Our computational validation of these heuristics shows that (1) current best practice behavior can be improved substantially by drawing on our heuristics, (2) the gap between heuristic solutions and optimal solutions is very low for instances without collaboration and (3) our heuristics are capable of providing solutions for all generated instances of all problem sizes in less than a second on a state-of-the-art PC.
While our findings contribute to advances in both the academic literature and practical applications, we admit that there are some limitations, which at the same time provide avenues for further research.
First, our models are based on the assumption that the processing of an incident must not be interrupted (non-preemption). However, in chaotic situations, such as disaster response situations, the level of severity of incidents can be estimated only vaguely and they can change over time, also new incidents may occur. Under these conditions it may seem desirable to interrupt the processing of incidents in favor of addressing more severe incidents. For example, it seems reasonable to interrupt the process of extinguishing a fire in favor of rescuing injured people. It might also become necessary to add time window constraints to the model, which can be done straightforward.
Second, our current objective function models the sum of completion times of incidents weighted by their severity levels. This implies that the quality of a decision is judged exclusively on the basis of temporal aspects. Cost, quality of resolving tasks, success rates etc. are neglected. Thus, other objective functions might apply. If they are considered simultaneously, this will lead to a multi-criteria decision making problem. This is particularly useful when a consensus must be built and conflicts between different value judgments need to be resolved (Comes et al. 2013b).

22
Third, our computational validation is based on instances that have been generated artificially due to the unavailability of empirical data. A key task in future research is the acquisition of real data and the re-evaluation of our heuristics. This task also includes the validation of the appropriateness of our test bed in terms of used probability distributions and parameter values.
Fourth, our computing resources are limited. We analyzed the robustness of our simulation results with regard to distributions and parameter values only for those shown in Table 1. Similarly, having more computing resources available would enable researchers to simulate more than ten instances per instance size and to subsequently conduct a statistical analysis of the results. Finally, more computing power could help to solve RUASP/C instances optimally rather than drawing on lower bounds of optimal solutions.
Fifth, data is prone to uncertainty. For example, processing times and travel times may not be precisely available and the availability and the applicability of rescue units may change over time. As a consequence, uncertainty modeling applies. From our perspective, this task is particularly challenging as addressing it requires selecting appropriate uncertainty theories, such as one of several probability theories or fuzzy set theory. It also requires appropriate parameterization, i.e., probability functions in the case of probability theory and membership functions in the case of fuzzy set theory. This, in turn, requires having empirical data available. The application of uncertainty modeling would also alter the solution procedures to be applied.
Sixth, the applicability of the proposed methodologies in real-world situations would need to be discussed with rescue organizations, such as the German THW.
Finally, when multiple organizations are involved, centralized planning may need to be substituted or complemented by means (e.g., models, information flows) of inter-organizational coordination. We do not follow this approach as the occurrence of multiple autonomous parties requires decision support models which vary substantially from the proposed centralized models.
References Airy G, Mullen T, Yen J (2009) Market based adaptive resource allocation for distributed rescue teams. In: Landgren J, Jul S (eds) 6th International ISCRAM Conference, Gothenburg
Ajami S, Fattahi M (2009) The role of earthquake information management systems (EIMSs) in reducing destruction: A comparative study of Japan, Turkey and Iran. Disaster Prevention and Management 18 (2): 150-161
Allahverdi A, Ng CT, Cheng TCE, Kovalyov MY (2008) A survey of scheduling problems with setup times or costs. Eur J Oper Res 187(3):985-1032
Altay N, Green III WG (2006) OR/MS research in disaster operations management. Eur J Oper Res 175 (1): 475-493
Bañuls VA, Turoff M (2011) Scenario construction via Delphi and cross-impact analysis. Technol Forecast Soc Change 78(9):1579–1602

23
Comes T, Bertsch V, French S (2013a) Designing dynamic stress tests for improved critical infrastructure resilience. In: Comes T, Fiedrich F, Fortier S, Geldermann J, Mueller T (eds) Proc 10th International ISCRAM Conference, Baden-Baden
Comes T, Hiete M, Schultmann F (2013b) An approach to multi-criteria decision problems under severe uncertainty. Journal of MCDA 20(1):29-48
Comfort LK (2007) Crisis management in hindsight: cognition, communication, coordination, and control. Publ Admin Rev 67(s1):189-197
de Silva FN (2001) Providing spatial decision support for evacuation planning: a challenge in integrating technologies. Disaster Prevention and Management 10 (1): 11-20
Falasca M, Zobel CW, Fetter GM (2009) An optimization model for humanitarian relief volunteer management. In: Landgren J, Jul S (eds) Proc 6th International ISCRAM Conference, Gothenburg
Faraj S, Xiao Y (2006) Coordination in fast-response organizations. Management Science 52 (8): 1155-1169
Fiedrich F, Gehbauer F, Rickers U (2000) Optimized resource allocation for emergency response after earthquake disasters. Saf Sci 35(1-3):41-57
French S, Geldermann J (2005) The varied contexts of environmental decision problems and their implications for decision support. Environ Sci Pol 8(4):378-391
GAO (2006) Disaster Relief: Governmentwide Framework Needed to Collect and Consolidate Information to Report on Billions in Federal Funding for the 2005 Gulf Coast Hurricanes: GAO-06-834
Gasparini P, Manfredi G, Zschau J (Eds.) (2007) Earthquake Early Warning Systems. Springer, Berlin, Heidelberg
Geldermann, J., Bertsch, V., Treitz, M., French, S., Papamichail, K. N., & Hämäläinen, R. P. (2009) Multi-criteria decision support and evaluation of strategies for nuclear remediation management. Omega 37(1): 238-251
IDDRI, IOM (2012) The state of environmental migration 2011. http://publications.iom.int/bookstore/free/State_Environmental_Migration_2011.pdf. Accessed on 2014-09-06
IFRC (n.d.) Disaster management. http://www.ifrc.org/en/what-we-do/disaster-management/. Accessed on 2014-09-05
Kajitani Y, Chang SE, Tatano H (2013) Economic impacts of the 2011 Tohoku-Oki earthquake and tsunami. Earthquake Spectra 29(S1):457-478
Kovács, G., & Spens, K. (2011) Trends and developments in humanitarian logistics – a gap analysis. International Journal of Physical Distribution & Logistics Management, 41(1):32-45
Leifler O (2008) Combining Technical and Human-Centered Strategies for Decision Support in Command and Control: The ComPlan Approach. In Fiedrich F, van de Walle B (Eds.), Proceedings of the 5th Conference on Information Systems for Crisis Response and Management (ISCRAM 2008): 504-515
Manyena, S. (2006) The concept of resilience revisited. Disasters, 30(4):434-450
Mendonça D, Jefferson T, Harrald J (2007) Collaborative adhocracies and mix-and-match technologies in emergency management. Comm ACM 50(3):44-49

24
Pollak E, Falash M, Ingraham L, Gottesman V (2004) Operational analysis framework for emergency operations center preparedness training. In Ingalls RG, Rossetti MD (Eds.), Proceedings of the 36th Conference on Winter Simulation (WSC): 839-848
Rolland E, Patterson RA, Ward K, Dodin B (2010) Decision support for disaster management. Oper Manag Res 3(1):68-79
Saleem K, Luis S, Deng Y, Chen S-C, Hristidis V, Li T (2008). Towards a business continuity information network for rapid disaster recovery. In Chun, SA, Janssen M, Gil-Garcia JR (Eds.), Proceedings of the 2008 International Conference on Digital Government Research ACM International Conference Proceeding Series: 107-116.
Sherali HD, Carter TB, Hobeika AG (1991). A location-allocation model and algorithm for evacuation planning under hurricane/flood conditions. Transportation Research Part B: Methodological 25(6):439-452
Svensson A, Holst J, Lindquist R., Lindgren G. (1996). Optimal Prediction of Catastrophes in autoregressive moving-average processes. Journal of Time Series Analysis 17(5): 511-531
THW (n.d.) Einheiten & Fachgruppen. http://www.thw.de/DE/Einheiten-Technik/Fachgruppen/fachgruppen_node.html. Accessed on 2014-09-06
UN/ISDR (2005). Hyogo Framework for Action 2005-2015: Building the Resilience of Nations and Communities to Disasters (Hyogo Framework), http://www.unisdr.org/we/coordinate/hfa. Accessed on 2014-09-06
UN-OCHA (2013) World Humanitarian. Data and Trends 2013. United Nations publishing, New York.
van de Walle B, Turoff M (2008). Decision Support for Emergency Situations. In Burstein F, Holsapple C (Eds.). Handbook on Decision Support Systems 2, International Handbooks on Information Systems, Springer, Berlin, Heidelberg: 39-63
Weng MX, Lu J, Ren H (2001) Unrelated parallel machine scheduling with setup consideration and a total weighted completion time objective. Int J Prod Econ 70(3):215-226
Wex F, Schryen G, Neumann D (2011) Intelligent decision support for centralized coordination during emergency response. In: Mendonca D, Dugdale J (eds) Proc 8th International ISCRAM Conference, Lisbon
Wex, F, Schryen G, Neumann D (2012) Operational emergency response under informational uncertainty: A fuzzy optimization model for scheduling and allocating rescue units. Int J Inform Syst Crisis Response Manag 4(3):23-41
Wex F, Schryen G, Neumann D (2013) Decision modeling for assignments of collaborative rescue units during emergency response. In: Sprague RH (ed) Proc 46th HICSS. IEEE Computer Society, Washington, DC, pp 166-175
Wex, F, Schryen G, Feuerriegel, S., Neumann D (2014) Emergency response in natural disaster management: Allocation and scheduling of rescue units. Eur J Oper Res 235: 697-708
Zook, M, Graham, M, Shelton, T, & Gorman, S (2010) Volunteered geographic information and crowdsourcing disaster relief: a case study of the Haitian earthquake. World Medical & Health Policy, 2(2):7-33


