Embed Size (px)
Citation preview

Annals of Agric. Sci., Moshtohor, Vol. 39(1): 197-209 (2001).
ISSN 1110-0419
RESPONSE OF WHEAT PLANTS GROWN IN NEWLY RECLAIMED SALINE CALCAREOUS SOIL AS AFFECTED BY SOIL CONDITIONERS
AND BIOFERTILIZERS BY
Bouthaina F. Abd EI-Ghany* and Tewfike, T.A. ** * Desert Res. Center, Mataria, Cairo, Egypt. ** Agric. Botany Dept. (Agric. Microbiology), Faculty of Agriculture,
Moshtohor, Benha Branch, Zagazig University, Egypt.
ABSTRACT
A field experiment was carried out in Wadi Sudr, South Sinai on wheat crop, (cultivar Giza 8) to study the effect of three soil conditioners i.e. composted garbage (CG), sheep dung (SH) in the rates 10, 15, 20 ton/fed and Evergreen 500 (EG) in the rates 0.1, 0.2, 0.3 ton/fed, two biofertilizers, i.e. Azotobacter chroococcum or Azospiri/lum /ipoferum on soil microbiological parameters and wheat yield.
Data revealed that application of 20 ton/fed of either SH or CG and 0.3 ton/fed EG soil conditioners increased the counts of total microbes, azospirilla, azotobacters and aerobic cellulose decomposers.
Both of SH and CG soil conditioners were found to be more effective than EG during different plant growth stages.
Association ofbiofertilizers with soil conditioners resulted in increasing soil organic matter, total nitrogen, protein content and total carbohydrates in grains compared to control treatment.
Grain, straw and biological yields were increased as a response to biofertilizers particularly, Az.chroococcum and soil conditioners application (20 ton/fed).
INTRODUCTION
Wheat is considered as one of the most important cereal crops in the world. In Egypt, wheat production represents only 5.7 million tons which account for 55% of the total consumption (Shabana et at., 1998). Moreover, it is considered one of the moderately salt tolerant crops which is suitable to be cultivated under saline calcareous new reclaimed soils.
198 Annals Of Agric. Sc., Moshtohor, Vol39{1), 2001
Wadi Sudr soil is cvnsidered as one of the newly reclaimed soils at South Sinai, Egypt. In several locations, salinity reached hazardeous levels besides its poor fertility and weak structure. The need to unique treatment to solve soil problems is nowadays attended many studies (Khalil eta/., 1996).
Several investigators found that using of soil conditioners engaged with biofertilizers for soil or seeds increased the yield and soil fertility (Wassif et a/., 1995).
This investigation was directed to raise the productivity of Wadi Sudr soil and wheat crop as strategic crop. The use of soil conditioners and biofertilizers aimed to stress on the sustainable development of such soil by means of considering all soil productivity parameters and to evaluate the interacting effect of biofertilization and soil conditioners on wheat production. Finally, the investment ratio has been estimated as a real benefit to the farmers through several options of the most successful treatments.
MATERIALS AND METHODS
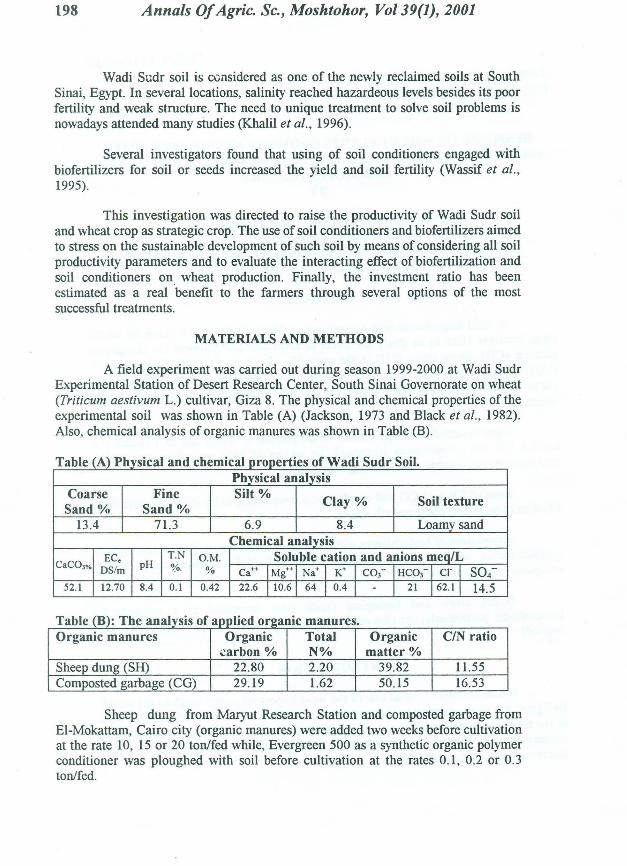
A field experiment was carried out during season 1999-2000 at Wadi Sudr Experimental Station of Desert Research Center, South Sinai Governorate on wheat (Triticum aestivum L.) cultivar, Giza 8. The physical and chemical properties of the experimental soil was shown in Table (A) (Jackson, 1973 and Black eta/., 1982). Also, chemical analysis of organic manures was shown in Table (B).
Table (A) Ph . ays1cal and chem1cal properties of Wadi Sudr s . Oil.
Physical analysis Coarse Fine Silt%
Clay% Soil texture Sand% Sand%
13 .4 71.3 6.9 8.4 Loamy sand Chemical analysis
EC. T.N O.M. Soluble cation and anions meq/L CaC03" DS!m
pH "/o. % Ca .... I Mg .... Na+ I K+ I col- Hcol- 1 cr I so4 52.1 12.70 8.4 0.1 0.42 22.6 110.6 64 1 o.4 1 - 21 162.1 1 14.5
T bl (B) Th a e : I . f e ana1ys1s o r d appue or2amc manures. Organic manures Organic Total Organic C/N ratio
carbon °/o N% matter% Sheep dung (SH) 22.80 2.20 39.82 11.55 Composted garbage (CG) 29.19 1.62 50.15 16.53
Sheep dung from Maryut Research Station and composted garbage from El-Mokattam, Cairo city (organic manures) were added two weeks before cultivation at the rate 10, 15 or 20 ton/fed while, Evergreen 500 as a synthetic organic polymer conditioner was ploughed with soil before cultivation at the rates 0.1, 0.2 or 0.3 ton/fed.

Response Of Wheat Plants Grown In Newly Reclaimed... ... .... 199 '
Superphosphate (15.5% P20 5) was applied at the rate 60 kg/fed in two equal doses, the first one was before cultivation and the second was after 45 days of sowing. Also, ammonium sulphate (20.5% N) and potassium sulphate (50o/oK20) were added at the rates of 50 and 75 kg/fed, respectively after 30, 45 and 60 days of sowing.
Preparation of biofertilizers: A fresh liquid culture medium of pure strains of Azotobacter chroococcum
and Azospirillum /ipoferum (isolated from rhizosphere of wheat plants grown in Wadi Sudr location and identified according to Bergey's Mannual, 1984) were used as seed biofertilizer. Ashby's medium (Abdel-Malek and Ishac, 1968), was used for preparation of Azotobacter chroococcum. Dobereiner's medium (Dobereiner, 1978), was used for Azospirillum lipoferum preparation. Both strains were grown separately at 28°C for 7 and 5 days, respectively till the number of bacteria reached about 108 cfulml. .
Seeds of wheat were damped in the inoculum for 3 hr and treated with 16% gum arabic as an adhesive agent before sowing. The control treatment was treated with the respective uninoculated media and gum arabic.
Treatments: Treatments of this study were as follows :
1. Control (without biofertilization). 2. Azotobacter chroococcum. 3. Azospirillum /ipoferum.
The experiment was carried out in a completely randomized block design including three treatments with four replicates.
Samples: Rhizosphere soil samples were collected at tillering, heading and harvesting
stages of plant growth for microbiological determinations. Also, wheat grains at harvesting were taken for chemical analysis.
Microbiological and chemical determinations: Rhizosphere soil samples were obtained at tillering, heading and harvesting
and analyzed for total microbial plate counts on Bunt and Rovira medium (1955). Azotobacters densities were determined on nitrogen deficient medium (Abdel-Malek and Ishac, 1968) a.nd azospiri!la on Dobereiner's medium (Dobereiner, 1978) by the most probable number technique. Aerobic cellulose decomposers on Dubos medium (Allen, 1961). For estimating chemical constituents of wheat grains, the samples were dried at 70°C for 24 hr and total N was determined using micro-kjeldahl method, as described was calculated by Page et a/. (1982). Protein content by multiplying total N by 6.25. Also, total soluble carbohydrates was estimated according to Dubois eta/. (1956).
Wheat yield: At harvesting, the grains, straw and biological yields were determined.

200 Annals Of Agric. Sc., Moshtohor, Vol 39(1), 2001
Statistical analysis: Data of grains, straw and biological yield were assessed by analysis of
variance (ANOV A) to detennine the significant differences between treatments by L.S.D. according to Snedecor and Cochran (1989). In addition, the investment ratio (IR) were calculated for the applied treatments to recognize the most efficient and economical ones.
RESULTS AND DISCUSSION
1. Soil microbiological parameters: A- Total microbial counts.
Initial total microbial counts in Wadi Sudr soil before cultivation was found to be 25 x 106 cfulg soil. Data in Table (1) show the changes in the counts which tended to increase in all treatments reaching maximum level at heading stage of plant growth. The counts declined towards harvesting stage.
The biofertilization along with soil conditioners gave higher counts than control. The maximum counts were recorded with SH, particularly with the rate of20 ton/fed followed by CG then EG soil conditioners.
Data also revealed that SH and CG (organic matter) gave higher count values than EG (synthetic organic polymer) with all treatments. Alexander (1977) reported that the organic matter have positive influence on solubilizing certain soil minerals making them more readily available for growing plants and soil microorganisms. Also, biofertilization and soil conditioners enhanced the microbial activity, improved soil fertility and increased the number and biological activity of desired microorganisms iu the root environment. This result is also in agreement with Subba Roa (1988) and EI-Kased eta/. (1996). Obtained results also revealed that using of 20 ton/fed of SH and CG organic soil conditioners and using of 0.3 ton/fed of EG synthetic organic polymer conditioner gave the highest counts of microorganisms at heading stage of plant growth than other levels of soil conditioners.
B- Azospirilla. Initial counts of azospirilla were 35 x 104 cfu!g soil. Data in Table (2) show
that the azospirilla densities in rhizosphere soil of wheat plants increased in all soil treatments compared to control. The highest counts were associated with heading stage.
Addition of different types of soil conditioners increased the counts of azospirilla in comparison to control. The highest values were obtained in the presence of CG organic soil conditioner (20 ton/fed) in all plant growth stages. The biofertilization by either A. lipoferum or Az. chroococcum in the presence of soil conditioners increased azospirilla counts. This result may be due to the production of plant growth promoting substances by asymbiotic Nr fixing bacteria ( Vlassak and Reynders, 1980). These results are in agreement with those obtained by Abd ElGhany eta/. (1997)

Response Of Wheat Plants Grown In Newly Reclaimed.......... 201
Table (1): Total microbial count in rhizosphere of wheat plants grown in saline calcareous soil as affected by soil conditioners and biofertilizers.
(C t 106 fu/ "I) oun s x C t_g_ SOl
Ton/fed. SH EG Treatments 10 15 20 0.1 0.2
Tille ring Control 54 98 109 27 41
Vt. 150 197 220 44 55 lipoferum Az. 191 280 259 98 116 chroococcum
Heading Control 113 189 209 59 87 lA. lipoferum 254 290 297 49 99 IAz. 293 508 580 204 230 chroococcum
Harvesting Control 73 120 139 40 lA. 190 220 259 68 lipoferum IAz. 213 308 330 132 chroococcum
. . '\0 Irutial rrucrobtal counts 25 x 10 cfu I g soil . Control = without biofertilizition. A. lipoferum = Azospiri/lum lipoferum. Az. chroococcum = Azotobacter chroococum SH = Sheep dung
57 80
200
EG = Evergreen 500 (synthetic organic polymer) CG = Composted garbage .
C- Azotobacters:
CG 0.3 10 15 20
52 30 64 101 63 148 187 182
200 186 270 300
98 77 113 189 115 238 260 284 284 270 470 552
61 47 82 119 101 174 201 229
219 201 290 315
Data presented in Table (3) show Azotobacter densities at different stages of plant growth in the presence of soil congitioners and biofert1izers. It is obvious from data that azotobacters count reached its maximum values at heading stage of plant growth. The highest counts were recorded with Az. chroococcum received 20 ton/fed CG as an organic conditioner. Considering the effect of type of soil conditioners on Azotobacter counts, the treatments could be arranged generally in the descending order; (20 ton/fed CG) > (20 ton/fed SH) > (0.3 ton/fed EG) > the others, i.e. the effect of CG soil conditioner in increasing Azotobacter counts was more than that of other soil conditioners. The increasing of Azotobacter densities in the case of biofertlization by Az. chroococcum compared to other treatments may be attributed not only to N2-fixition process, but also to the production of growth promoting substances and successful competition against antagonists of plant growth (Gowily et a/., 1993). Also, application ofCG manure as soil conditioner stimulated the growth and activity of microorganisms as previously found by Ishac eta/. (1986b) and Faid (1994).

202 Annals OfAgric. Sc., Moshtohor, Vol 39(1), 2001
Table (2): Azospirillum densities in saline calcareous soil as affected by soil conditioners and biofertilizers.
(C 106 fu/ 'l) ounts x c rg sot .
~· SH EG
s 10 15 20 0.1 0.2
Tillering Control 0.061 0.074 0.082 0.04 0.045 A. lipoferum 0.081 0.083 0.10 0.074 0.08 Az. chroococcum 0.13 0.15 0.17 0.13 0.15
Heading Control 0.12 0.15 0.16 0.095 0.092 A. /ipoferum 0.14 0.16 0.21 0.11 0.15 Az. chroococcum 0.22 0.24 0.28 0.21 0.22
Harvestin2 Control 0.09 0.11 0.12 0.056 0.078 A. lipoferum 0.11 0.13 0.15 0.093 0.11 Az. chroococcum 0.14 0.16 0.19 0.13 0.14
0 0 0 0 \4 lrutlal azospmlla count 35 x 10 cfu/g so1l. Refer to foot notes of Table (1).
CG
0.3 10 15 20
0.068 0.061 0.068 0.080 0.082 0.083 0.083 0.11 0.15 0.14 0.15 0.2
0.11 0.12 0.12 0.14 0.15 0.16 0.17 0.26 0.22 0.26 0.28 0.33
0.091 0.08 0.093 0.11 0.13 0.13 0.14 0.17 0.17 0.15 0.17 0.26
Table (3): Azotobacter densities in saline calcareous soil as affected by soil conditioners and biofertilizers. ·
(C 106 fu/ '1) ounts x c rg SOl
~ SH EG
Treatments 10 15 20 0.1 0.2 0.3
Tille rim Control 0.045 0.061 0.078 0.02 0.037 0.04 A. lipoferum 0.061 0.0.61 0.037 0.037 0.06 0.068 Az. 0.068 0.11 0.15 0.06 0.068 0.078 chroococcum
Headin~ Control 0.068 0.092 0.11 0.061 0.068 0.068 A. lipoferum 0.068 0.092 0.14 0.092 0.093 0.093 A.z 0.17 0.26 0 .39 0.14 0.15 0.15 chroococcum
Harvestin2 Control 0.045 0.061 0.078 0.04 A . lipoferum 0.061 0.078 0.093 0.045 !A .z 0.11 0.13 0.17 0.093 chroococcum
0 0 \4 lrutlal Azotobacter counts 40 x 10 cfu/g soil. Refer to footnotes of Tables (1).
0.045 0.061 0.061 0.068 0.12 0.11
10
0.037 0.061 0.091
0.04 0.093 0.17
0.036 0.078 0.14
CG
15 20
0.04 0.045 0.068 0.078 0.12 0.15
0.061 0.083 0.11 0.15 0.39 0.45
0.045 0.068 0.092 0.11 0.17 0.21

Response Of Wheat Plants Grown In Newly Reclaimed... ....... 203
D. Aerobic cellulose decomposers: Data presented in Table ( 4) show that counts of aerobic cellulose
decomposers considerably increased at heading stage of growth compared to other growth stages. The highes~ counts were recorded with A. lipoferum in the presence of different soil conditioners at heading stage. Soil conditioner CG was more effective followed by SH, than EG (soil synthetic organic polymer). The highest values were recorded with 20 ton/fed of both CG and SH soil conditioners and 0.3 ton/fed with EG soil conditioner. These results are in agreement with those obtained by Abd ElGhany eta/. (1997).
E. Organic carbon: Results in Table (5) show that addition of soil conditioners in combination
of biofertilizers gave the highest figures of soil organic matter. Increasing rate of soil conditioners increased the soil carbon content correspondingly.
Table (4): Aerobic cellulose decomposer counts in saline calcareous soil as affected by soil conditioners and biofertilizers.
(C 105 fu/ ·1 ounts x c rg sm ).
~· SH EG
Treatments 10 15 20 0.1 0.2 0.3 10
Tillerin~ -·-··
Control 0.02 0.04 0.061 0.11 0.02 0.02 0.068 lA. lipoferum 0.04 0.045 0.093 0.15 0.11 0.061 0.14 !Az. 0.045 0.078 0.1 0.17 0.13 0.04 0.068 chroococcum
Headin1! Control 0.04 0.045 0.068 0.33 0.12 0.045 0.095 lA. lipoferum 0.13 0.17 0.24 0.54 0.39 0.39 0.28 !Az. 0.074 0.093 0.11 0.26 0.26 0.078 0.17 chroococcum
Harvesting Control 0.02 0.045 0.045 0.2 0.091 0.02 0.068 A. lipoferum 0.045 0.061 0.078 0.33 0.2 0.17 0.14 Az. 0.11 0.14 0.17 0.26 0.17 0.061 0.11 chroococcum .. Iruttal counts ofaerobtc cellulose decomposers 10 x 10 cfu/g sotl. Refer to footnotes of Table (1).
CG
15 20
0.085 0.14 0.15 0.20 0.11 0.17
0.17 0.28 0.39 0.54 0.26 0.39
0.11 0.14 0.23 0.33 0.17 0.26
Data also indicate increases in organic carbon along with plant growth. This could be related to the development of root system which in turn, added to the soil organic materials (Abd El-Ghany, 1982; Khalil eta/., 1991 and El-Sersawy eta/., 1997). Generally, results were in harmony with those of microbial counts receiving soil conditioners in combination with biofertlizaton.

204 Annals Of Agric. Sc., Moshtohor, Vol39{1), 2001
2. Plant parameters: A- Wheat grain constituents:
Total nitrogen and protein content. It can be noticed from data presented in Table (6) that total N and
percentage of protein increased as a result of adding soil conditioners and biofertilizers. The highest values of both N and protein percentage were recorded with SH soil conditioner at a level of 20 .tonlfed.combined with Az. chroococcum. This result may be due to higher initial content of N in SH soil conditioner (Shabana eta/., 1998), and also to lhe beneficial effects ofAz. chroococcum on increasing plant growth which reflected on increasing total Nand protein content. Data in Table (6) revealed that the highest values of total N and protein percentage were obtained with the level of 20 ton/fed SH soil conditioner followed by 20 ton/fed CG, then 0.3 ton/fed EG soil conditioners.
Table (5): Percentage of organic carbon in saline calcareous soil as affected by soil conditioners and biofertilizers.
~ SH EG CG
Treatments r--IO 15 20 0.1 0.2 0.3 10 15 30
Tillerin Initial 0.05 0.05 0.05 0.05 0.05 0.05 0.05 0.05 0.05 Control 0.17 0.32 0.56 0.13 0.2 0.28 0.25 0.37 0.71
lA- lipoferum O.i7 0.32 0.56 0.13 0.2 0.28 0.25 0.37 0.71 IAz. 0.17 0.32 0.56 0.13 0.2 0.28 0.25 0.37 0.71 Chroococcum
Han'esting Control 0.29 0.33 0.42 0.20 0.28 0.37 0.33 0.39 0.48 lA. /ipoferum 0.32 0.42 0.75 0.24 0.40 0.44 0.41 0.61 0.82 IAz. 0.38 0.5 0.8 0.26 0.45 0.49 0.49 0.68 0.95 Chroococcum Refer to footnotes of Table (1).
Total carbohydrates (T.C): Data presented in Table (6) showed that the percentages ofT.C. increased
as a result of using biofertilization and adding soil conditioners compared to control. The positive effect of soil conditioners and bacterial inoculation on increasing T.C. may be resulted from its role on increasing leaf area, C02 fixation and chlorophyll content, which led to improving plant photosynthesis (Mehta and Singh, 1979). The highest values of T.C. percentages were observed with SH soil conditioner received 20 ton/fed combined with Az. chroococcum followed by CG and (20 ton/fed) and then 0.3 ton/fed ofEG soil conditioner.
B. Wheat yield: It is obvious from data presented in Table (7) that biofertilization and soil
conditioners wheat yield. It is evident that, all of biofertilizers positively influenced and soil conditioners uset.l significantly increased the grain, straw and biological

Response Of Wheat Plants Grown In Newly Reclaimed.......... 205
yields of wheat crop as compared with the control treatment. This result is in harmony with those obtained by Wassif eta/. (1995).
Table (6): Effect of adding soil conditioners and biofertlizers on chemical constituents o f h w eat grams.
Ton/fed. SH EG CG
Treatments 10 15 20 0.1 0.2 0.3 10 15 20
N% Control 1.60 1.64 1.68 1.56 1.58 1.62 1.62 1.65 1.69 A. /ipoferum 1.80 1.88 1.93 1.68 1.73 1.77 1.75 1.78 1.82 Az. 1.84 1.92 1.96 1.73 1.76 1.80 1.80 1.87 1.90 Chroococcum
Protein% Control 10.00 10.25 10.50 9.75 9.88 10.13 10.13 10.31 10.56 lA. lipoferum 11.25 11.75 12.06 10.50 10.81 11.06 10.90 11.13 11.38 IAz. 11.50 12.00 12.25 10.81 11.00 11.25 11.25 11.69 11.88 Chroococcum
Total carbohydrates % Control 70.00 73.0 75.6 68.4 71.0 73.3 68.5 70.2 74.5
14- lip~ferum 73.7 76.6 77.9 68.9 73.6 74.2 72.6 73.3 76.5 IAz. 75.6 77.4 78.8 72.3 73 .9 74.8 75.7 76.2 77.3 chroococcum Refer to footnotes of Table (1).
The grain yield significantly increased particularly, with Az. chroococcum combined with soil conditioners. Also, the soil conditioners CG and SH at 20 ton/fed significantly increased grain yield compared to 0.3 ton/fed EG and control treatments.
The straw yield significantly increased with Az. chroococcum combined with all soil conditioners levels compared to control treatment. The effect of CG soil conditioner was more significant than SH particularly at the rate of 20 ton/fed. compared to control.
The highest value of biological yield was recorded in the case of using Az. chroococcum partiuclarly with the application of CG soil conditioner. Biological yield significantly increased with all soil conditioners associated with Az. chroococcum. The levels 20 ton/fed of CG and SH and 0.3 ton/fed of EG soil conditioner were the most effective on the biological yield of wheat crop more than other levels of soil conditioners.
3. Economic evaluation: To detect the investment ratio (IR), the following data presented in Tables
(8 and 9) show a calculation for this value to all studied treatments considering the appraisal of all costs and gains of cultivation process.
206 Annals Of Agric. Sc., Moshtohor, Vol 39(1), 2001
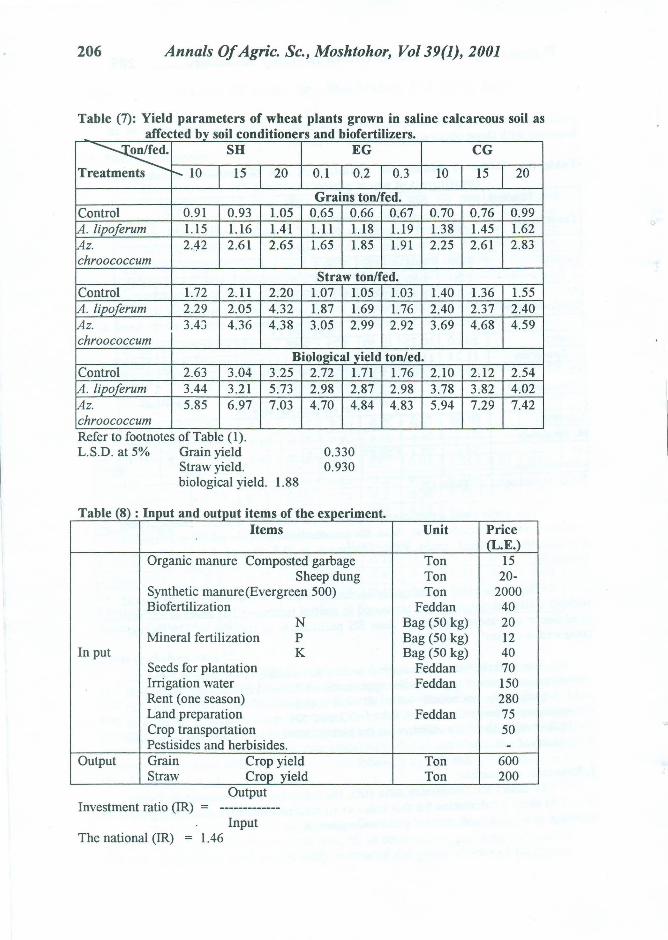
Table (7): Yield parameters of wheat plants grown in saline calcareous soil as n t db ·1 d"f db" r, rtT a ec e 1y soa con 1 roners an ro e 1 rzers.
~ SH EG
Treatments r--- 10 15 20 0.1 0.2 0.3 10
Grains ton/fed. Control 0.91 0.93 1.05 0.65 0.66 0.67 0.70
[A . lipoferum 1.15 1.16 1.41 1.11 1.18 1.19 1.38 [Az. 2.42 2.61 2.65 1.65 1.85 1.91 2.25 chroococcum
Straw ton/fed. Control 1.72 2.11 2.20 1.07 1.05 1.03 1.40 lA. lipoferum 2.29 2.05 4.32 1.87 1.69 1.76 2.40 IAz. 3.4J 4.36 4.38 3.05 2.99 2.92 3.69 chroococcum
Biological yield tonled. Control 2.63 3.04 3.25 2.72 1.71
[A . lipoferum 3.44 3.21 5.73 2.98 2.87 [Az. 5.85 6.97 7.03 4.70 4.84 chroococcum Refer to footnotes of Table (1). L.S.D. at 5% Grain yield 0.330
Straw yield. 0.930 biological yield. 1.88
T bl (8) In t d a e : IPU an output rtems o f h t e expenment. Items
Organic manure Composted garbage Sheep dung
Synthetic manure(Evergreen 500) Biofertilization
N Mineral fertilization p
In put K Seeds for plantation Irrigation water Rent (one season) Land preparation Crop transportation Pestisides and herbisides.
Output Grain Crop yield Straw Crop yield
Output Investment ratio (IR) = ------------
Input The national (IR) = 1.46
1.76 2.10 2.98 3.78 4.83 5.94
Unit
Ton Ton Ton
Feddan Bag (50 kg) Bag (50 kg) Bag (50 kg)
Feddan Feddan
Feddan
Ton Ton
CG
15 20
0.76 0.99 1.45 1.62 2.61 2.83
1.36 1.55 2.37 2.40 4.68 4.59
2.12 2.54 3.82 4.02 7.29 7.42
Price (L.E.)
15 20-
2000 40 20 12 40 70 150 280 75 50 -
600 200

Response Of Wheat Plants Grown In Newly Reclaimed... .. ..... 207
T bl (9) E a e : . (L E) t d"fl t CODOIDIC eva uatiOD ID . or I erent treatmen s un d er s tud ~ Az. Azosp. SH EG
10 15 20 0.1 0.2 - - - - - - -- - - - - - EG - - - - - EG -- - - - - - -- - - - - - -- - - - - - -- Azosp. - - - - -- - - - - - -- Azosp - - - - -- - - - SH - -- - - SH - - -- - SH - - - -- Azosp - - - - EG - Azosp - SH - - -- Azosp - - - EG -- Azosp SH - - - -
Az. - - - - - -- Azosp - - - - -- Azosp - - - - -- Azosp - - SH - -
Az. - - - - - -Az. - - - - - EG Az. - - - - EG -Az. - - SH - -Az. - SH - - - -Az. - - SH - - -Az. - - - - - -Az. - - - - - -
Az. - Azotobacter chroococcum Azosp.= Azospirillum lipoferum IR = Investment ratio
0.3 EG -------
EG -----------
EG -------
CG Gains
10 15 20 Grain Straw
- - - 402 206 - - - 396 210 - - - 390 214 - - - 348 180 - CG - 456 272
CG - - 420 280 CG - - 828 480 - - CG 594 310 - - - 714 352 - - - 630 440 - - - 558 422 - - - 546 344 - - - 708 338 - - - 696 410 - - - 666 374 - - - 590 458
CG - - 1350 738 - CG - 070 474 - - CG 972 480 - - - 846 864 - - - 1146 584 - - - 1110 598 - - - 990 610 - - - 1590 876 - - - 1452 686 - - - 1566 872 - - CG 1698 918 - CG - 1566 936
SH = Sheep manure EG = Evergreen
Total
608 606 604 528 728 700 1308 904 1066 1070 980 890 1041 1106 1040 1148 2088 1344 1452 1710 1730 1708 1600 2466 2138 2438 2616 2502
CG = Composted garbage.
Cost IR L.E.
1097 0.55 977 0.61 897 0.67 697 0.75 922 0.79 847 9.83 1584 0.83 997 0.91 1137 0.94 1077 0.98 997 0.98 897 0.99 1037 1.0 1037 1.07 937 1.1 937 1.23 1584 1.32 962 1.39 1037 1.4 1137 1.5 1137 1.5 1037 1.6 937 1.7 1137 2.17 937 2.28 1037 2.35 1037 2.52 962 2.59
Data presented in Table (9) show that the lowest value of (IR) resulted under the condition of synthetic manuring > control. Bio-soil conditioners improved the yield either grain or straw and also increased the (IR) Azotobacter chroococcum + CG or SH increased grain and straw as much as 5 folds and (IR) ~ 3 folds if compared with control treatment. All these treatments improve both short or long term production parameters.
REFERENCES
Abd EI-Ghany, Bouthaina F. (1982): The effect of root exudates of some medical plants on rhizosphere rnicroflora, M.Sc. Thesis, Fac. Agric., Ain Shams Univ., Egypt.
Abd EI-Ghany, Boutaina, F. ; Khalil, K.W.; EI-Sersawy, M.M. and Awadalla, S.Y. (1997): Improvement of Wadi Sudr soil properties using modern bioorganic techniques and their effects on desertification combat and barley production. Desert Inst. Bull., Egypt. 47 (1) : 69-100.

208 Annals Of Agric. Sc., Moshtohor, Vol 39(1), 2001
Abdel-Malek, Y. and Ishac, Y.Z. (1968): Evaluation of methods used in counting azotobacters, J. Appl. Bact., 31:267-275.
Alexander, M. (1977): Introduction to soil microbiology, 2nd Ed., pp. 143, 44, 148-162, 423-437, John Willey and Sons. Inc., New York.
Allen, O.N. (1961): Experimens in soil bacteriology, Burgess Publishing Co., USA. Bergy's Manual of Systematic Bacteriology (1984): 9th Ed. Vol. I. In Holt., J.G. and
Krieg, N.R. (eds.). Williams and Wilkins, Baltimore. Black, C.a.; Evans, D.O.; Ensminger, L.E.; White, J.L.; Clark, F.E. and Dinauer, RC.
(1982): Methods of Soil analysis. Part 2. Chemical and microbiological properties. 2nd Ed. Soil Sci. of Am. Inc. Publ., Madison, Wisconsin, U.S.
Bunt, J.S. and Rovira, A.D. (1955) : Microbiological studies of some sub-antoretic soils. Soil Sci., 6:119-128.
Dobereiner, J. (1978): Influence of environmental factors on the occurrence of Spirillum lipOform in soil and roots. Ecol. Bull. (Stockholm) 26, 343-352.
Dubois, M.; Gilles, K.A.; Hamilton, J.K.; Robers, P.A. and Smith, F. (1956): Colorimetric method for determination of sugars and related substances. Anal. Chern., 28 (3): 350-356.
El-Kased, F.A.; Kamh, R.N. and Abd El-Ghany Bouthaina F. (1996): Wheat rsponse to bio and mineral nitrogen fertigated in newly reclaimed sandy soil. Desert lnst. Bull. Egypt. 46, No. 2, pp. 373-386.
El-Sersawy, M.M.; Abd El-Ghany, Bouthaina F.; Khalil, K.W. and Awadalla, S.Y. (1997) : Interaction between organic manure mixtures, applied N-levels and biofertilizaton on calcareous soil properties and wheat production in Wadi Sudr. Egypt. J. Soil Sci. 37 (3): (In Press).
Faid, E.M.Y. (1994): Studies on biofertilization on desert soils. M.Sc. Thesis, Fac. Agric., Ain Shams Univ., Cairo, Egypt.
Gowily, Ahlam, E.; Abd El-Ghany, Bouthaina, F. and Omar, S.A. (1993): Effect of biofertilizer application on controlling soybean root-rot disease. Egypt. J. Appl. Sci. 8(9): 20-31.
lshac, Y.Z.; El-Haddad, M.; El-Borollosy,M.a.; Eweda, E. Wedad and Girgis, M.G.Z. (1986b): Studies on Azospirillum in Egypt. !-Densities as affected by some ecological factors. 2nd Conf. Of the AABNF, Cairo, Egypt, 450-458.
Jackson, M.L. (1973): Soil chemical analysis, Prentice-Hall of Indian private, New Delhi.
Khalil, K.W. ; El-Sersawy, M.M.; Abd El-Ghany, Bouthaina, F. and Hashem, F.a. (1991): Profitability of using some organic wastes with P fertilization on wheat production under saline irrigation water and Wadi Sudr conditions, Egypt. J. Appl. Sci. 6(7): 267-281.
Khalil, K.w.; El-Sersawy, M.M.; Abd El-Ghany, bouthaina, F. and Awadalla, S.Y. (1996): Sustainable improvement of slaine calcareous soil by bio-organic technique and impact on wheat crop. 5th Nat. Congress of Egypt. Soil Sci. Soc. Nov. 20 & 21.
Mehta, U.r. and Singh, H.B. (1979): Response of greenroom to sulphur on calcareous soils. Indian J. of Agric. Sci., 49(9) :703-706.
Page, A.L., Miller, R.H. and Keeney, D.R. (1982): Methods of soil analysis. Part 2, No. 9, in the series Agronomy. Amer. Soc. Of Agron. Madison, Wis., USDA.

Response Of Wheat Plants Grown In Newly Reclaimed......... . 209
Shabana, M.K.; Wassif, M.M.; Saad, S.M. and Ashour, I.A. (1998): Effect of some soil amendments on the quantity and some chemical properties of wheat yield under irrigation with saline water conditions. Desert Inst. Bull., Egypt. 48 (1); 197-207.
Snedecor, G.W. and Cochran, W.G. (1989): Statistical methods. 8th Ed. Lowa State Univ., Press, Iowa, USA.
Subba Roa, N.S. (1988): Biofertilizers in Agriculture. Oxford and TBH pub. Co. Ltd., New Delhi, Bombay Calcutta, 134-141.
Vlassak, K. and Reynders, L. (1980): Azospirillum rhizocoenoes in agricultural practice. IV. Int. Syrup. On N2-fixation. Camberra. December, 1980.
Wassif, M.M.; Shabana, M.K.; Saad, S.M.; El-Maghraby, S.E. and Ashour, I.A. (1995): Influence of some soil amendments on calcareous soil propertis and its productivity of wheat under high saline irrigation water. Egypt. J. Soil. Sci. 35(4): 438-451.
~I J~ ~ ~~ ~~ .).l... L>.li.J ~ .) ~ ~~ ~~~ 1"'\..le. ~q ~ .J.J.J u.l...ll A..;l.ii : r..sA .J ~jill w~ 0.o ~:::c .Y.:J't:. ~~ .J.l.! A o ~ ~ o.ll... ~.ls;.J, ul.l! J lib Y • .J 'o .J '. wy~ ~j.J ~ L>~ .J' . ..,.s • , .,.. .J • , Y .J • , ' wy~ ~j .J cr-u......:. L> y:...c. _;J .>! uc- o ).~ r..sA .J o • • 0:!..» .)! ) Az. chroococcum 41!\.S.:i 'i ~.JJUll w1i:~·! L>~l ~I .l_y;..J C" <.JI.L..! J lL...b .li.J ~ ~""4ill wL..YiJI.J ~_,l.J:Hfi=.JI ~jill wL.....4! ~ (o.l_fo.-....) A .lipoferum
:~tl.illw~i flib . , .,.. 1"'1~1 .J 1"'\..le. '.II ~ .J.) .Ji 0 .1.J1 ~w 0.o 01-l! 1 lib " • ~"'~~~ 01 , 'i ~ .JJ'il , ~I w~.Jfi.::...JI .lbc 1 o.lyj -.)! lS .li ~jlll w~ o • • 0:!..» .)! ul.l!
.Ljl .&. · .I . .1 .II ~I w .~CII .~<w ~ ·'JI ~ .r- .)y~ ~~ .J ~ . .J'.J.)
uc 1_;;1u ys\ w.i\.S 1"'\..le. '11 ~ .J.J.J u.l...ll A..;l.ii ~jill w~ ,) ~\:l.i\1 w ~~ w .J
. ~~ w\...:.lll _,..u ~ly ~\.til o •• 0:!..»~'11
o.lyj -.)! L>.l>.! ~jill w~ c- (.5~1 ~~ ~1y.:;;1 ul ~~ ~.J L....S
AJ .Jt.i.. wl .J~ .>!fill .J ~ .J...r:ll .J ~ .JJUll 0.o ~~I lS _jl::..... .J ~jill .) ~_,..;:...jl o.lWI .~).WI~~
~ ~ J~I.J u4JI J~I.J ~~I J~ L.;.o JS .llj .L..!.J Y • J.la.AJ :i.. ·~ 1 1 w~ 1~1 .~<w ~ ·''I ~b .. 11 ~ -.;;II :i..b..:i....." . .? I"' .J ~ . .J'.J.):i C" lS~ ~ c..- . . ;&
.<.JI.l! I lib


