Embed Size (px)
Citation preview

Restoration ofspecies-rich Nardus grasslandsvia phosphorus-mining
Stephanie Schelfhout

ir.StephanieSCHELFHOUT
Restorationofspecies-richNardusgrasslandsviaphosphorus-mining
Thesissubmittedinfulfillmentoftherequirementsforthedegreeof
Doctor(PhD)inAppliedBiologicalSciences:ForestandNatureManagement
February2019

Dutchtranslationofthetitle:Herstelvansoortenrijkeheischralegraslandenviauitmijnen
Illustrationonthecover:Succisapratensis–Blauweknoop(front);Mowingmanagementinapost-fertilizationfieldinVrieselhof,Ranst,Belgium(back)
Citationofthisthesis:SchelfhoutS(2019)Restorationofspecies-richNardusgrasslandsviaphosphorus-mining.Doctoraldissertation.GhentUniversity,Ghent,Belgium.
ISBN-number:978-946357174-6
Promotors: Prof.Dr.ir.JanMERTENSForNaLab,Dpt.ofEnvironment,Fac.BioscienceEngineering,GhentUniversity
Dr.ir.AnDESCHRIJVER,ForNaLab,Dpt.ofEnvironment,Fac.BioscienceEngineering,GhentUniversityFac.ScienceandTechnology,UniversityCollegeGhent
Prof.Dr.ir.KrisVERHEYENForNaLab,Dpt.ofEnvironment,Fac.BioscienceEngineering,GhentUniversity
Prof.Dr.ir.GeertHAESAERTDpt.ofPlantsandCrops,Fac.BioscienceEngineering,GhentUniversity
Boardofexaminers:
Prof.Dr.ir.JoDEWULF(Chairman)EnVOC-STEN,Dpt.ofGreenChemistryandTechnology,Fac.BioscienceEngineering,GhentUniversity
Prof.Dr.ir.LanderBAETENForNaLab,Dpt.ofEnvironment,Fac.BioscienceEngineering,GhentUniversity
Dr.ir.FrankNEVENSDpt.ofPlantsandCrops,Fac.BioscienceEngineering,GhentUniversity
Dr.TobiasCEULEMANSUnitEcology,EvolutionandBiodiversityconservation,Dpt.ofBiology,UniversityofLeuven
Prof.Dr.RobMARRSDpt.ofEarth,OceanandEcologicalSciences,SchoolofEnvironmentalSciences,UniversityofLiverpool
Dean: Prof.Dr.ir.MarcVANMEIRVENNEFac.BioscienceEngineering,GhentUniversity
Rector: Prof.Dr.ir.RikVANDEWALLEGhentUniversity
Theauthorand thesupervisorsgive theauthorization toconsultand tocopypartsof thisworkforpersonaluseonly.Everyotheruse issubjecttothecopyright laws.Permissiontoreproduceanymaterialcontainedinthisworkshouldbeobtainedfromtheauthor.PhotosbyStephanieSchelfhoutunlessindicatedotherwise.

CONTENTS
DANKWOORD...........................................................................................................................................iSUMMARY..............................................................................................................................................ivSAMENVATTING.....................................................................................................................................viLISTOFABBREVIATIONS,SYMBOLSANDDEFINITIONS.......................................................................viiiCHAPTER1Ecologicalrestorationandtheroleofphosphorus..............................................................11.1Theageofecologicalrestoration..................................................................................................31.2Semi-naturalgrasslands:threatenedhotspotsofbiodiversity......................................................41.3Land-useintensification:fromoligotrophictoeutrophicecosystems..........................................81.4Restorationofoligotrophicgrasslands........................................................................................211.5Aim,researchquestionsandthesisoutline.................................................................................27
CHAPTER 2 P-removal for restoration of Nardus grasslands on former agricultural land: cuttingtraditions...............................................................................................................................................29CHAPTER 3 Phytomining to re-establish phosphorus-poor soil conditions for nature restoration onformeragriculturalland........................................................................................................................41CHAPTER4Phosphorus-miningforecologicalrestorationonformeragriculturalland.......................59CHAPTER 5 Phosphorusmining efficiency declineswith decreasing soil P concentration and variesacrosscropspecies...............................................................................................................................75CHAPTER6EffectsofbioavailablephosphorusandsoilbiotaontypicalNardusgrasslandspecies incompetitionwithfast-growingplantspecies........................................................................................89CHAPTER7Generaloverviewofresults,decisiontreeforpractitionersandfutureperspectives.....105Abstract...........................................................................................................................................1067.1RQ1:CantraditionalmanagementbymowingrestoreNardusgrasslandonformeragriculturalland?................................................................................................................................................1087.2RQ2:Isitpossibletophytominephosphorusmoreefficiently?...............................................110Box2.Estimatingthetimetophytominephosphorusalongasoilphosphorusgradient...............1117.3RQ3:DoNardusgrasslandspeciesbenefitfrominoculationwithsoilbiota?...........................1177.4Decisiontree..............................................................................................................................118Box3.Screeningfieldsforrestorationofoligotrophicgrasslands..................................................1227.5Implicationsforpracticeandpolicy...........................................................................................1237.6Knowledgegapsandfutureresearchopportunities.................................................................127
APPENDICES........................................................................................................................................129CITEDLITERATURE..............................................................................................................................169AFFILIATIONSOFCO-AUTHORS...........................................................................................................185CURRICULUMVITAE............................................................................................................................186

i
The ideal scientist thinks like a poet and only later works like a bookkeeper
E. O. Wilson in Letters to a young scientist (2013)
DANKWOORD
“Maghetietsmeerzijn?”Ditonderzoekheeftietslangermogendurenengelukkigmaar.Hetspeeltzich af op het spanningsveld tussen landbouw en natuur en deze complexiteit met al zijnstakeholdershad iknietopvier jaar tijdkunnenbegrijpen (nietdat ikditnuvolledigbegrijpmaartocheenbeetje).Ditonderzoekwaseenbijzondereuitdagingwaar ikacht jaar langerggraagaanwerkte inhet inspirerendeGontrodeenhet gezellige Schoonmeersen, samenmet gepassioneerdepromotoren en collega’s, samen met de mensen die midden in de praktijk staan, nl. denatuurbeheerders en landbouwers die openstaan voor nieuwigheden, en samen met al diestudentjesdieikmochtontmoeten.Bedankt,hetwasleerrijk!Zoalsjeinditdoctoraatzalzienopdemaking-of-actie-foto’s,kreegikergveelhulp.Eenwoordvandankishierbijopzijnplaats.
Fenomenaal,dát isdekrachttermdiepastbijdecoachingenondersteuningdie ikmochtgenietentijdensditdoctoraat.Promotoren-team, ikapprecieer jullieenormvoor jullieopenheid,bereidheidomteluisteren,tehelpen,temotiveren,opterreintegaanenmetmijnwildegedachtenoverwegtekunnen. Jan, zonder jouwcoachingwasditwerknietgelukt. Jij kanopeenmanier ronduit“trektopnix”zeggendiehelemaalnietzoergklinktomdat jetegelijkookheldereoplossingenaanreiktdiemehelpendeechteessentieteontdekken.Bedanktommederuimteenvrijheidtegevenvoorditdoctoraatmaar ook inmijn andere dagelijkse taken. Het is een plezier om nog eens twee jaar jeassistenttekunnenzijn.Toegegeven, ikvondheteenbeetje frustrerenddat jemehet laatste jaar(bewust)buitenmasterthesissenetc.hieldmaarikzieookindathetcruciaalwasomditdoctoraattekunnenafronden.Dekomende twee jaar zal ikmeopnieuwmoeien ;-).An, samenoppierenjachttijdensExpeditionLumbricusnaarDenemarkenwasonvergetelijkeninspirerend.Zonderdezeeerstestappenindeonderzoekswereldstondiknooitwaariknuben,ophetpuntomeendoctoraatafteronden,steljevoor.Doorjouwerdhetmeduidelijkdatalsikmaargenoeggepassioneerdwasdoorhetonderwerp,dathetdanpaséchtinteressantzouworden.Bedanktommetemotiverenomvoordiebeursaanvragen tegaan,me te troostenbijontgoochelingenenmeopnieuwversemoed in tespreken. Ben ik – achteraf gezien -maar wat blij dat ik die IWT-beurs niet haalde en dat het ditassistentschapwerd.Ikapprecieerjecan-domentaliteitenjeimmensegoestingombijtedragenaanonze Vlaamse natuur. Kris, ik voel me bevoorrecht om reeds zo lang met jou te mogensamenwerken.Alvantoenikeenbachelorstudentjewas inhetderdejaar,droomdeikstiekemomaan “het LaBo” tewerken.De lessenbosbeheer, vegetatiekundeen,misschiennogwelhetmeestvanal,dejaarlijksemeerdaagseexcursiesdedenmealsstudentproevenvanwaarhetéchtboeiendwordt, de praktijk, het veld in, maar ook gaven ze me een eerste beeld van de sfeer in datGontroodseecosysteemdatzich laterherbenoemdeals“ForNaLab”.Endatzatdaarvolmet JNM-ers!Bedanktvoorjesteun,motiverendvermogenenpassie.Geert,bedanktvoordesamenwerkingen ondersteuning. Jouw landbouw-expertise is voor dit doctoraatsonderwerp, dat zich afspeelttussenlandbouwennatuur,eentroefdiegoedvanpaskwam.
I am truly honored thatmy PhDwas critically evaluated byRobMarrs,Tobias Ceulemans, FrankNevens, Lander Baeten and Jo Dewulf. Thank you very much for the interesting and relevantdiscussionduringthepredefence.Iamgratefulforyourwillingnesstohelpmeenhancethiswork.
Natuurbeheerders, planners en landbouwers die aan natuurherstel doen, jullie experimenterendagdagelijks met traditionele en nieuwe technieken om de natuur te beheren, te herstellen, teversterken.DeVlaamsenatuurheeftjullieenjullieexperimentennodig.Meernog,denieuwekennisdie jullie dagelijks in het veld opdoen moet meer gedeeld worden. Ik hoop dat ik hieraan magbijdragen.Bedanktvoordetallozediscussies,zeopendenmijnogenvoordewerkelijkesituatieinhetveld.Bedanktaandedeelnemersvandestuurgroepuitmijnen:VLM,Natuurpunt,Boerenbond,ANB,

ii
landbouwers en Regionale Landschappen waren goed vertegenwoordigd tijdens dezeoverlegmomenten.Mario De Block, je was er bij vanaf het eerste uur met je interesse in hetuitmijnonderzoek.Bedanktomcontactenaantereikennaarbeheerdersdieervooropenstondenenom terreinen te vindenwaarwe konden testen en bodem verzamelen. In het bijzonderwil ik demensenvanNatuurpuntenhetANBbedankenomonsdetoelatingtegevenomtegaanuitmijnenindenatuurgebiedenLandschapDeLieremanenhetVloethemveld(opdeForbio-site).Bemestenomdenatuurteherstellen?Geweldigdatjulliehiervooropenstondenendatjullieditonderzoekwildenondersteunen:KrisVanderSteen,JanVandenBergheenLucDeCat.NaastDeLieremanwasookhet natuurgebied Turnhouts Vennengebied niet veilig voor ons onderzoek en onze ‘drang’ ombodemstalentenemen,MarcSmets,bedankt!BedanktookaandebeheerdersvanDenTeut,waarwe zo maar even gigantisch veel fosforarme bodem mochten gaan halen voor onze mesocosm.DieterDijckmans,jijbentéénvandielandbouwersdiederuimtemaaktomteexperimenterenentevernieuwen.Bedanktvooraljehulpopterrein,hetwasuiterstleerrijkommetjousamentewerkenengesprekkentevoerendiesomsookwelletterlijkoverkoetjesenkalfjesgingen.
Dit doctoraat is beraamd, bewerkt en volbracht in twee bijzondere ecosystemen. Het eerste, hetForNaLab in Gontrode, is een uniekewerkomgevingwaar teamwork de standaard is enwaar hetnatuurenthousiasme erg hoog is. PhD-godmotherMargot, hoe kan ik jou ooit genoeg bedanken?Dankzij jouzijndie laatste loodjeswatmindergaanwegen. Ikkijkaluitnaarhetrealiserenvandegekkigheden (en serieuzigheden, uiteraard) uit onze hersenspinsels, post-25 feb! Together withMechiandNuri in the intercontinentalofficewasanunforgettableexperience,girls, thankyou forouryears together, Imiss you,next timewe’llhaveadrink to celebrate!Collega-AAP-jesLotte enSanne,het isreuzefijnomsamenmet jullietewerken.Lotte,metaanstekelijke lachenkundeomfotogenieke beelden te schieten, toen ik je studentjewas begeesterde jeme bij de practica (metbijenvriendelijke bomen en struiken) en de (meerdaagse) excursies, bedankt! Sanne, jouwaanstekelijkepassieenaansterkendinlevingsvermogenheeftmevaakgeholpen.LucenGreet,sorrydatikjullieplanningmeerdaneensindewarbrachtmet“dringendestalen”ofeen“reeksje”datdanplotswat langerwas dan eerder ingeschat… Zonder jullie nauwgezetwerk en enthousiasmemaarookdeeigenschapom“matige”dagenopte“monsteren”washetonmogelijkomditdoctoraatrondtekrijgen,bedankt!VeldwerksamenmetLuc,deCeunenbrothers(KrisenFilip)enRobbeisdemax!Bedankt voor jullie energie en vernuft!Pieter VGB, klasgenootje en collega, bedankt om ook eengraslander te worden, diep vanbinnen moet je toegeven dat graslanden interessanter zijn danbossen. Of misschien is het zoals Mike zei, “Grasslands are small forests”.Mike, thank you forbringingyourBritishwittiness tothe lab, I trulyenjoyyourbanterandwordplay.Christel,bedanktvoor alle administratieve ondersteuning, ondanks mijn kunde om de dingen administratiefingewikkeldtemaken.Andreas,ikherinnermenogdetijdvan“GorikenAndreas”endaarnadetijdinde“Fondatie”,twee legendarischeForNaLabperiodesdie ikmis!Jegafdeaanzetzoalsalleen jijdat kan voor demegalomane potproef, demesocosm, bedankt! Safaa, thank you for leading themesocosm experiment and for your pleasant company in office 0.18. Graslandertjes, Iris, Eva, enMargot, het is reuzefijn samenwerken met jullie, de Hongarije SER Summerschool was eenonvergetelijkfleurigeweek.MaarookHaben,SanneR,Pallieter,Shiyu,Sumi,…enikvergeetnunogtalvannamendiehetGontrode-ecosysteemzobijzondermaken,dankjullieallemaal!
HetecosysteemingebouwCvandecampusSchoonmeersenenhetdaarmeeverbondenBottelare,wasde tweedewerkplekwaarditdoctoraatplaatsvond.WashetnuHoGent,UGent,BIOT,GTBofBW15?Wemaaktensamenwatidentiteitscrisissenmeemaarsteedswaserruimtevoorcollegialiteiten vriendschap. Legendarische BIOT-weekends en quizjes georganiseerd door een fantastisch FC(Hans, Jolien V, Jolien M,Maarten,Michiel,Danny, Kris, Boris,… MERCI!), een heerlijk gezelligebureausamenmetJan,Filip,Hans,GeertB,JonasenMarie-Christine,maarookgoestingommeeopterreintegaanvooruitmijnveldwerk,DannyenJelleMerci!BedanktookaandeBottelare-crewvoorde (teelt)informatie en praktische hulp, Veerle, Kevin en Etienne. Verder wil ik ook hetsecretariaatsteam,Marijke,EllenenGriet,bedankenvoorhetontwarrenvanmijnadminkluwens!

iii
Danmag ik ook de stage- en vakantiewerkstudenten niet vergeten: Predrag Miljkovic, TomohiroNagata,JelleVandenBerghe,FrancescoCalabrese,GabrieleMidolobedankt!Endevelebachelorenmasterthesisstudentendiehunsteentjebijdroegenaanditonderzoek…merci!TimMorald,thankyou for helping with harvesting. Ellemie Comeyne, bedankt om als vrijwilliger mee op terrein tegaan,datjarenheelgezelligebodemstalen.
Aanvriendenenfamilie,julliezagenmehetlaatstejaarwatminder,waarvoormijnexcuses,ikhebwatintehalen.Aanmijnouders,bedanktomjulliegroenedochterdekansenenruimtetegevenomtestuderenenommijnkeuzeste(onder)steunen.BedanktpapaomtonnengrondtetransporterenvanuitOud-Turnhout.Bedanktmamaomteduimenvoordebeursaanvragen, te troostenwanneerdiemisluktenentesupporterenbijmijnlaatsteloodjes.Aanmijnschoonouders,bedanktvoorjullieinteresse, Hugo’s vraag “levert dit doctoraat nu opwat je verwacht had?” deedme in de laatstemaandenwelwatverdernadenken.Bedankt!
Mijnliefstelief,Fre,zonderjouwasditdoctoraatonmogelijk.Jijwashetdiemedooraanmoedigingenrustkonactiverenomervoorteblijvengaan.Het laatste jaarwaszwaarwegensdecombinatievanhetafrondenvanditdoctoraatmetdetijdelijkewoonst,het(zelf)bouwenvanonshuis,jeeigenversopgestartebedrijfendanzwijgiknogoveronzeserreenBiekes&Bezekesprojecten.Metjouisdat allemaal behapbaar! Je gaf me de structuur die ik nodig had om dit doctoraat te kunnenafwerken,vanmewekkenoponaardsvroegetijdstippen(ok,toegegeven6u30à7u00valtwelmee,gegevendeversekoffievanversgemalenkoffieboontjes)totmeopeen‘normaal’uurdedagtelatenafsluiten. Het is ongelooflijk hoe nauw je me hebt bijgestaan en hoe betrokken je bent bij mijndoctoraat. Je kan mijn onderzoek in twee zinnen in eenvoudige mensentaal uitleggen, integenstellingtotikzelfdiemealsnelverliesinpietluttigefosfordetails.Ikbenjedankbaarenkijkuitnaaronzepost-25febperiode.
18Februari2019
Stephanie

iv
SUMMARY
Grassland ecosystems can be extremely species-rich and harbor a large proportion ofEuropeanwildlife.Duetoagriculturalintensificationinthe20thcentury,species-richNardusgrasslands (a European priority habitat type) are nowadays largely confined to naturereserves,wheretheyarefurtherthreatenedbye.g.atmosphericnitrogendeposition.TypicalplantspeciesofNardusgrasslandsareadaptedtonutrient-poorsoilconditionsthroughtheirconservativeresourceusestrategy.Land-useintensificationcausestheplantcommunitytoshift from the slow-growth strategy species inNardus grasslands to fast-growth strategyspecies in eutrophic grasslandswherenutrient cycling is fast andplant species richness islow. The soil biota community also changes, i.e. from fungi-dominated with omnivorousnematodes to bacteria-dominated microbial with herbivorous nematodes. Biodiversityconservation will benefit from better protection of (remnant, i.e. degraded) Nardusgrasslands, reducing pressures on degraded grasslands and restoration of degradedgrasslands.
The restoration of Nardus grasslands on former agricultural land is impeded by thephosphorus that has accumulated in the soil due to repeated fertilization. Bioavailableconcentrations of phosphorusmay be tenfold higher in former agricultural fields than inremnantNardusgrasslands.Nitrogenandpotassium levels, incontrast,generallydecreaseagainthroughmowingmanagementwhenfertilizationceases.Hence,phosphorusisthekeynutrientforevaluatingtherestorationpotentialofformeragriculturalgrasslands.
InremnantNardusgrasslandsandinamesocosmexperiment,wefoundasoilphosphorusthresholdof12mgPOlsenkg-1.Athigherbioavailablesoilphosphorusconcentrations,typicalNardus grassland species disappeared, probably due to being shaded out by fast-growingplant species (and inoculation with soil biota did not increase their performance). Forecological restoration, phosphorus can be extracted with plant biomass, i.e. throughphytomining (by mowing or P-mining). We compared the potential and optimizationopportunitiesoftraditionalmowingmanagement,i.e.unfertilizedcuttingandremovinghaytwoor three timesayear,andP-mining, i.e.yieldmaximizationbyaddinggrowth-limitingnutrientsother thanphosphorus (i.e. nitrogenandpotassium).Mowing for16-25years inpost-fertilizationgrasslandsdidnotyieldthefloristicandphosphorus-poortargetsofNardusgrassland. The biomass production was relatively low due to nitrogen and potassiumlimitation.Another40 to114yearsofphosphorus removalwouldbeneededto reach thesoilphosphorusthresholdofNardusgrasslands.WithP-mining,therestorationtimewouldbeconsideratelyshorter.Thepotential tophytominephosphoruswithP-miningdependedon the soil phosphorus concentration: high phosphorus removal on phosphorus-rich soils,decreasing removal potential with decreasing soil phosphorus concentration. Addingbiostimulants, i.e. phosphorus-solubilizing bacteria, humic substances or arbuscularmycorrhizalfungi,didnotresult inhigherphosphorusremovalwithP-mining.Cropspeciessuch as buckwheat, sunflower and maize were considerably more effective at removing

v
phosphorus through P-mining than triticale or flax, at phosphorus-rich soils (all speciesperformedsimilarlyinsoilswithlowerphosphorusconcentrations).
Optimizationopportunities forphytominingofphosphorusappear tobe limited.Restoringphosphorus-poor soil conditions on former agricultural land will remain a challenge.Phytominingphosphoruswillalwaysbealong-termcommitment,whichcanbemademoreefficientbyliftingthelimitationofnutrientsotherthanphosphorus(P-mining)orselectingcropspeciesthattakeupmorephosphorus.Oligotrophichabitattypesdeservehigh-priorityconservationbecauseitisnearlyimpossibletorestoreoligotrophicfieldsoneutrophicfields,unless a drastic technique is used such as topsoil removal. Ecological restoration of semi-natural grasslands on former agricultural land involves a large investment of time and/ormoney (i.e. decades of mowing or P-mining management or ten thousands of euros perhectare for topsoil removal). Therefore, it is necessary for practitioners in ecologicalrestorationtofocustheireffortsandcarefullyselecttheirgoals,fieldsandtechniques.
To aid practitioners, we developed a decision tree.We advise that the abiotic and bioticconditionsbeexaminedcarefullyandcomparedtothetargetedhabitattype,i.e.measuringthe distance to target. We highlight the importance of restoring the abiotic conditionsbeforestartingbioticrestorationandinitiatingsuitablemanagement.TheabioticdistancetotargetforNardusgrasslandrestorationistheamountofphosphorustoberemoved,whichwilldeterminethetimeneededforphytomining(mowingorP-mining).Evaluatingthecostoftherestorationtechnique,thetimeneededtoreachthetargetandthepotentialvalueofthe site in the landscape, can help in prioritizing restoration efforts. Restoring Nardusgrasslandoneutrophic soils requires topsoil removal, a costlymeasure, and ishenceonlylikely with financial support of e.g. European Life funding or large national naturedevelopment projects. Low-budget projects can probably better focus on restoration onfieldswithahistoryoflessintensivefertilizationwherephytominingbymowingorP-miningis attainable. It might be most efficient to invest some money (a small fraction whencompared to the purchasing price) in the abiotic screening of parcels before purchasingthemorbeforeselectingatargethabitattype,i.e.ahabitattypewithlessstringentabioticrequirementsoneutrophicfields(withhighphosphoruslevels).Forinstance,grasslandsrichincommonnativeherbspeciesareeasiertocreate,canbebeneficialfore.g.pollinatorsandcan be used strategically as corridors between oligotrophic habitats or as buffer zones toprevent inflow of fertilization from nearby agricultural fields. These novel ecosystems,however, can probably never fully replace highly specialized ecosystems such as Nardusgrasslands.

vi
SAMENVATTING
Graslanden kunnen enorm soortenrijk zijn. Een groot deel van de Europese plant- endiersoorten is gebonden aan deze soortenrijke graslanden. De intensivering van delandbouwtijdensde20steeeuwheeftervoorgezorgddatsoortenrijkeheischralegraslanden(eenprioritairEuropeeshabitattype)nuenkelnogvoorkomen innatuurgebieden,waarzeverder bedreigd worden door o.a. atmosferische stikstofdepositie. Plantensoorten vanheischralegraslandenzijnaangepastaannutriëntenarmebodem; ze zijngekenmerktdooreen conservatief gebruik van nutriënten. Landgebruiksintensivering veroorzaakt eenverschuiving in de soortensamenstelling van de plantengemeenschap, van de veletraaggroeiende soorten van heischrale graslanden naar een klein aantal snelgroeiendesoorten in eutrofe graslanden. Ook de gemeenschap van bodembiota verandert, van eensysteem gedomineerd door fungi en met omnivore nematoden naar een bacterie-gedomineerd systeemmet herbivore nematoden. Biodiversiteitsbehoud is gebaat bij eenbetere bescherming van de resterende heischrale graslanden en bij het herstel vangedegradeerdegraslanden.
Hetherstelvanheischralegraslandenopvoormaligelandbouwgrondismoeilijk.Jarenlangebemesting heeft gezorgd voor accumulatie van fosfor in de bodem. De concentratie vanbiobeschikbaar fosfor kan tot tien keer hoger zijn in voormalige landbouwgrond dan inheischrale graslanden. Ook stikstof en kalium zijn in hoge concentraties aanwezig nabemesting, maar deze elementen verdwijnen relatief snel uit de bodem door eenverschralend maaibeheer zonder bemesting. Om de potentie voor herstel van heischraalgraslandopvoormaligelandbouwgrondteevalueren,moetenweduskijkennaarfosfor.
Inheischralegraslandenenineenmesocosm-experimentvondenweeengrenswaardevoorbodemfosfor van 12 mg POlsen kg-1. Bij hogere concentraties biobeschikbaar fosforverdwenen de plantensoorten typisch voor heischraal grasland, waarschijnlijk doorcompetitie voor licht met snelgroeiende plantensoorten, en inoculatie met bodembiotahielp hen niet om te overleven bij hoge fosforconcentraties. Bij natuurherstel kunnenweproberen om bodemfosfor te verwijderen via fytoextractie: fosfor wordt opgenomen inplantenenafgevoerdmetdeplantenbiomassabijdeoogst.Wevergelekenfytoextractievanfosforbij tweehersteltechnieken: traditioneelmaaibeheer (geenbemesting, twee totdriekeerper jaarmaaienmetafvoervanhooi)enuitmijnen(bemestingmetstikstofenkaliumom de biomassaproductie te maximaliseren). Na 16-25 jaar maaien in graslanden opvoormaligelandbouwgrondwasernoggeenheischralevegetatieenfosfor-armebodem.Debiomassaproductie van de bestudeerde graslanden was relatief laag, door stikstof- enkaliumlimitatie.Omdegrenswaardevoorfosfor-armeheischralegraslandentebereikenzounog40tot114jaarmaaibeheernodigzijn.Deduurvanhetbeheerkaneenflinkstukkortermet uitmijnen. De potentie voor fosforafvoer via uitmijnen hangt weliswaar af van deconcentratie fosfor in de bodem: hoge fosforafvoer uit fosforrijke bodems, dalendefosforafvoer met dalende concentratie bodemfosfor. Uitmijnen met toevoeging vanbiostimulanten (fosforsolubiliserende bacteriën, humuszuren of arbusculaire mycorrhiza)

vii
zorgdenietvooreenhogerefosforafvoer.Boekweit,zonnebloemenmaiswarenaanzienlijkeffectiever in het afvoeren van fosfor via uitmijnbeheer dan triticale of vlas, in fosforrijkebodems;erwasgeenverschilinfosforafvoertussendegewasseninfosforarmebodems.Hetblijkt moeilijk om fosforafvoer via uitmijnbeheer te optimaliseren. Het zal steeds eenuitdagingblijvenomfosfor-limiterendebodemomstandighedenteherstellenopvoormaligelandbouwgrond. Fytoextractie van fosfor is een langetermijnengagement, dat beperktefficiëntergemaaktkanwordendoornutriëntenlimitatiedoorandereelementendanfosforop te heffen via uitmijnen of door gewassen te gebruiken diemeer fosfor opnemen.Hetbeschermenvanbestaandeoligotrofehabitatszoueenhogeprioriteitmoetenkrijgengezienhetbijnaonmogelijkisomvaneutrofebodemsopnieuwoligotrofebodemstemaken,tenzijerontgrondtwordt.Voorherstelvansoortenrijkgraslandopvoormaligelandbouwgrondiseengroteinvesteringnodig,vantijdéngeld.Daaromishetbelangrijkdatterreinbeheerdersactief in natuurherstel kiezen voor een haalbaar doel gekoppeld aan een weloverwogenkeuzevanterreinenenhersteltechnieken.
Omterreinbeheerderstehelpenbijhetnemenvandenodigekeuzes,ontwikkeldenweeenbeslissingsboom.Weadviserenomdeabiotischeenbiotischeterreinconditiestemetenentevergelijkenmetdeterreinconditiesvanhetdoelhabitattypeomdeafstandtothetdoeltebepalen.Webenadrukkenhetbelangvanhetherstellenvandeabiotischeterreinconditiesvóór er gewerkt wordt aan biotisch herstel. De afstand tot het doel voor heischralegraslanden isdehoeveelheid fosfordieverwijderdmoetworden.Ditbepaaltdetijdnodigvoor fytoextractieviamaaienofuitmijnen.Doorteevaluerenhoeveel tijdnodig isomhetdoeltebereiken,watdekostvanhetbeheerzalzijnenhoegrootdepotentiëlewaardevanhetterrein inhet landschapis,kunnenprioriteitengesteldwordenvoorhetnatuurherstel.Omopeutrofebodemssoortenrijkeheischralegraslandenteherstellenisontgrondennodig,een duremaatregel die enkelmogelijk ismet financiële steun van bijvoorbeeld EuropeseLife-projecten of nationale natuurherstelprojecten. Projectenmet een klein budget kiezenbeter voor natuurherstel op terreinen met een geschiedenis van minder intensieflandgebruik waar via fytoextractie verschraald kan worden of voor een natuurdoeltypewaarvoor geen fosfor-limiterende bodemomstandigheden nodig zijn zoals bijvoorbeeldkruidenrijke graslanden onder stikstof- of kalium-limitatie. Kruidenrijke graslanden metalgemene inheemse kruidachtigen zijn ook waardevol voor o.a. pollinatoren. Ze kunnenbovendien corridors vormen voor soorten van oligotrofe habitats of als bufferzone hetinstromen van meststoffen uit nabijgelegen landbouwterreinen opvangen. Deze nieuweecosystemen zijn vermoedelijk geen volwaardige vervanging voor hoog-gespecialiseerdeecosystemen zoals heischrale graslanden, maar ze kunnen de lokale biodiversiteit welhelpenopkrikken.

viii
LISTOFABBREVIATIONS,SYMBOLSANDDEFINITIONS
oligotrophicsoil nutrient-poorsoil;e.g.withNardusgrasslandvegetationmesotrophicsoil inbetweenoligotrophicandeutrophicsoilconditions;e.g.withgrass-herbmixtureeutrophicsoil nutrient-richsoil;e.g.withfast-growinggrassspecies6230* EuropeanNatura2000priorityhabitattypeofspecies-richNardusgrasslands6230_hn subtypeofdryNardusgrasslandsspecifiedfornorthernBelgium(DeSaegerandWouters,2017;
seeAppendix1.Aforaspecieslist)Nardusgrassland intactNardusgrasslandaccordingtothecriteria(see§1.4)remnant Nardusgrassland
Nardusgrasslandthathasbeendegradedsomehowandlostspecies,forexamplebyatmosphericnitrogendepositionoracidification
phytomining phosphorusextractionbybiomassproduction,throughmowingorP-miningmowing cuttingofgrasslandswardstoremovenutrientswithhay
P-mining mowing+fertilizationwithgrowth-limitingnutrients(e.g.NandK);othercropsarepossibleCSR plantstrategiesaccordingtoGrime2001;Competitor,Stress-tolerator,RuderalSLA SpecificLeafAreaP PhosphorusPCaCl2 calciumchloride-extractablesoilphosphorus;immediatelyavailablephosphorusPOlsen sodiumbicarbonate-extractablesoilphosphorus;bioavailablephosphorusPAL ammonium-lactate-extractablesoilphosphorus;bioavailablephosphorusbut>POlsenPOxalate ammonium-oxalate-oxalicacid-extractablesoilphosphorus;slowlycyclingphosphorusPTotal totalsoilPΔPOlsen changeinPOlsenovertime
ΔPOxalate changeinPOxalateovertime
PExcessive excessphosphorusstockinsoil(versustargetslowlycyclingphosphorusstock)
PSD PhosphateSaturationDegree
pH,pHH2O,pHKCl measureofacidity,measurementofpHbyextractioninH2OorKCl
N NitrogenK Potassium
PNI PhosphorusNutritionIndex
NNI NitrogenNutritionIndex
KNI PotassiumNutritionIndex
DM DrybioMass
PDM,NDM,KDM nutrientcontentindrybiomassofresp.phosphorus,nitrogenandpotassium
AM ArbuscularMycorrhizalfungiPSB Phosphate-SolubilizingBacteria
HS HumicSubstances;humicandfulvicacids
SD StandardDeviationofthemeanSE StandardErrorofthemean
NMDS Non-metricMulti-DimensionalScalinganalysis
LME LinearMixedEffectsmodels
(Δ)AICc (changein)correctedAkaikeInformationCriteria;correctionforsmallsamplesize
R2 coefficientofdetermination
R2m marginalR2;proportionofvarianceexplainedbyfixedfactorsalone
R2c conditionalR2;proportionofvarianceexplainedbybothfixedandrandomfactors
ANOVA ANalysisOfVAriance
p significanceofstatisticaltest
F statisticaltest;ratiobetweenvariationbetweensamplemeansandvariationwithinthesamples
χ2 statisticaltest;Pearson’schi-squaredtest
DF DegreesofFreedom
TITAN ThresholdIndicatorTaxaAnalysis

ix
“To our shame, we are careless with our language. We say that ‘we’ve lost 97% of our flower rich meadows since the 1930s’ or that ‘we’ve lost 86% of the Corn Bunting population’. We speak of ‘a loss of 97% of our Hedgehogs’. Loss, lost... as if this habitat and these species have mysteriously disappeared into the ether, as if they’ve accidentally vanished. But they haven’t – they’ve been destroyed.”
Chris Packham (2018) in A Peoples Manifesto for Wildlife

1
CHAPTER1Ecologicalrestorationandtheroleofphosphorus
CHAPTER1Ecologicalrestorationandtheroleofphosphorus
Past,presentandfutureofEuropeanNature©JeroenHelmer,ARKNatuurontwikkeling
“Nature is not a ‘nice to have’ – it is our life-support system”
Mike Barrett (Executive director of science and conservation at WWF)
2
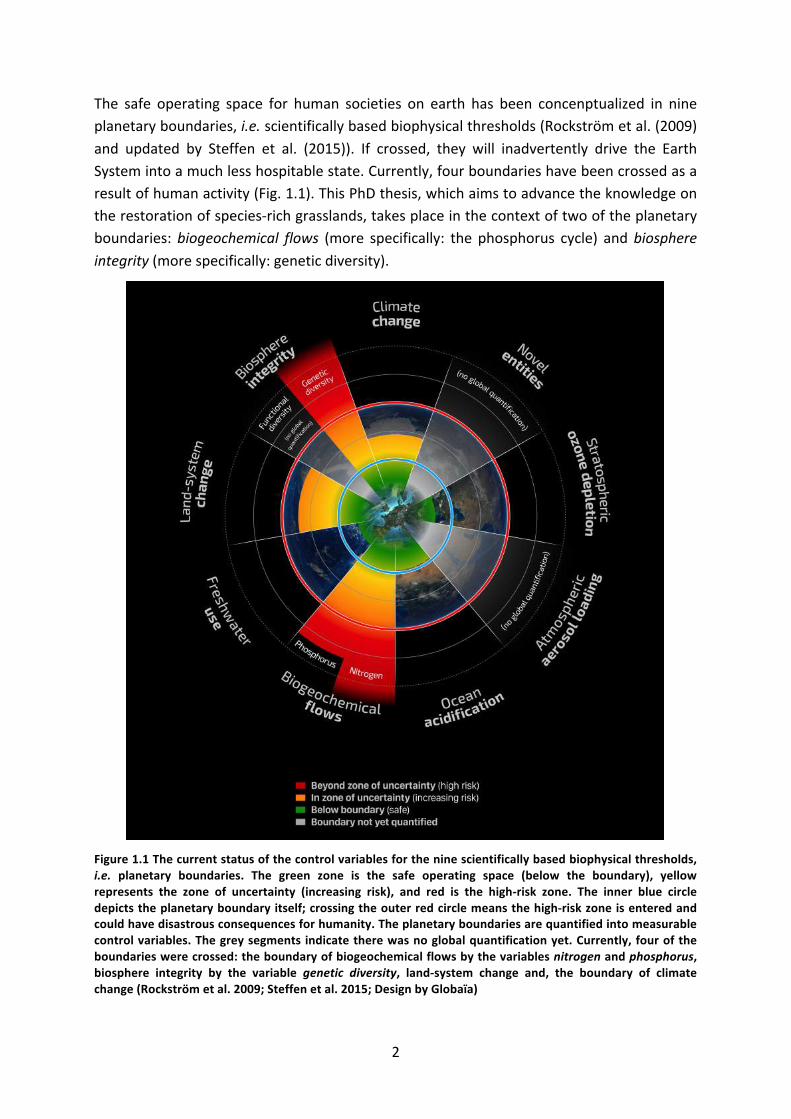
The safe operating space for human societies on earth has been concenptualized in nineplanetaryboundaries,i.e.scientificallybasedbiophysicalthresholds(Rockströmetal.(2009)and updated by Steffen et al. (2015)). If crossed, they will inadvertently drive the EarthSystemintoamuchlesshospitablestate.Currently,fourboundarieshavebeencrossedasaresultofhumanactivity(Fig.1.1).ThisPhDthesis,whichaimstoadvancetheknowledgeontherestorationofspecies-richgrasslands,takesplaceinthecontextoftwooftheplanetaryboundaries:biogeochemical flows (more specifically: the phosphorus cycle) andbiosphereintegrity(morespecifically:geneticdiversity).
Figure1.1Thecurrentstatusofthecontrolvariablesfortheninescientificallybasedbiophysicalthresholds,i.e. planetary boundaries. The green zone is the safe operating space (below the boundary), yellowrepresents the zone of uncertainty (increasing risk), and red is the high-risk zone. The inner blue circledepictstheplanetaryboundaryitself;crossingtheouterredcirclemeansthehigh-riskzoneisenteredandcouldhavedisastrousconsequencesforhumanity.Theplanetaryboundariesarequantifiedintomeasurablecontrolvariables.Thegreysegments indicatetherewasnoglobalquantificationyet.Currently, fouroftheboundarieswerecrossed:theboundaryofbiogeochemicalflowsbythevariablesnitrogenandphosphorus,biosphere integrity by the variable genetic diversity, land-system change and, the boundary of climatechange(Rockströmetal.2009;Steffenetal.2015;DesignbyGlobaïa)

3
1.1Theageofecologicalrestoration
Motivating people and policy makers to care for and restore natural habitats and theirspecieshasbecomeapressingmatter (Barnoskyetal.2012;Ceballosetal.2015)becausethe time windowwe have to halt further biodiversity loss is probably only two or threedecades(Ceballosetal.2017).WearethusindireneedforaconcreteactionplantobeabletoreachtheambitioustargetoftheConventiononBiologicalDiversity(CBD;SecretariatoftheConventiononBiologicalDiversity2014):
“…by 2050, biodiversity is valued, conserved, restored and wisely used, maintaining ecosystem services, sustaining a healthy planet and delivering benefits essential for all people”
TheglobalbiodiversitycommitmentisoneoftheseventeenSustainableDevelopmentGoalsof theUnitedNations (UnitedNations2015). Itsaim is toconservebiodiversityworldwideandtorestoredegradednaturalhabitatsandtheirbiodiversityby2030.Wearenotontracktoreachthisaimandneedmeasurablegoalsandindicatorstomonitorourprogress(Maceetal.2018).TheEuropeanUnion incorporatedthebiodiversitycommitment intopolicy, intheHabitatsDirective(92/43/EEC)andBirdsDirective(79/409/EEC-2009/147/EC).Hereaswell,targetsarefarfromreached.Accordingtothe2007-2012StateofNatureReport,60%of the non-bird species andmore than three quarters of the European habitats are in anunfavourable or bad status, while only 4% of the non-bird species and habitats show animprovingtrend(EuropeanCommission2015).
Preventingfurtherhabitatlossshouldbeprioritized(MilleniumEcosystemAssessment2005;Morris et al. 2006; Sutcliffe et al. 2014). It is far easier and cheaper to conserve naturalsystemsthantorestorethem(Balmfordetal.2002).Involvingalllocalstakeholdersenablessustainable conservation that is also socially justifiable (Vucetich et al. 2018). Next toconservation as such, enlarging habitats of adequate environmental quality by restoringdeteriorated habitats is necessary to halt biodiversity loss (Aronson andAlexander 2013).Perringetal.(2018)definedecologicalrestorationas:
“The process of assisting the recovery of damaged, degraded or destroyed socio-ecological systems in changing environments, for the benefit of people and nature across scales.”
This definition also takes account of the importance of the socio-ecological entanglement(restoration does not take place in a vacuum but are interconnectied with various socialaspects),aswellasofthevariousscalesofneeds(localtoglobal)ofrestorationeffortsandscales of whom to involve in restoration (from governments to local actors). Effectiverestoration requires identification of threats, understanding the underlying ecologicalmechanisms that can influence successful restoration, and recognition of appropriateinterventions for a given context (Perring et al. 2015). Restoration efforts have to becarefullymonitored,andsuccessmademeasurablebydefiningrestorationtargetsthatarebothambitiousandrealistic.Theeraofecologicalrestoration(sensuE.O.Wilson)isaroundthecorner,andevidence-basedassessmentsareneededforverifyingsuccessfulrestorationtechniques(Suding2011).

4
1.2Semi-naturalgrasslands:threatenedhotspotsofbiodiversity
In2013,semi-naturalgrasslandscovered28%oftheEuropeangrasslandarea(197,400km2;dataforEU28;EurostatFSS).Incontrasttoprimarygrasslands,semi-naturalgrasslandsarenotclimaxvegetationandareman-made.Theyexistthroughcontinuousmanagement, i.e.mowing (bi-)annually or grazing, to halt the succession towards forest (Hansson andFogelfors2000).Becauseofthelinkwithtraditionalhay-makingandpasturing,semi-naturalgrasslands are considered Biological Cultural Heritage, with high historical, cultural andesthetic values (Eriksson 2018). In their review on Palaearctic grasslands, Dengler et al.(2014)write:
“Semi-natural grasslands are an essential part of the cultural landscape of Europe and resulted from centuries or millennia of low-intensity land use since the beginning of the Neolithic period […] Such grasslands are mainly used for grazing by livestock (pastures) or hay-making (meadows), but might also be a successional stage of abandoned arable fields.”
Semi-natural grasslands can be extremely species-rich and break global records acrossbiomes for vascular species density at survey areas below 100 m2. For example, in aTransylvanianmeadow in Romania, 98 plant specieswere found per 10m2 (Wilson et al.2012). This highbiodiversity is not limited to vascularplantsbut extends toother taxa aswell,e.g. bryophytes (Virtanenetal.2000), fungi (Griffithetal.2012;Ozingaetal.2013),butterflies(vanSwaayetal.2006;seeFig1.3h),moths(Fox2013),bumblebees(Goulsonetal.2005;Carvelletal.2006)andoligolecticsolitarybees(Woodetal.2016;seeFig.1.3i).Forexample, out of 436 well-studied butterfly species in Europe, 57% need semi-naturalgrasslandsastheirmainhabitatforfeedingandcompletingtheirlife-cycle(vanSwaayetal.2006).
Europeangrasslandsarerecognizedashotspotsofbiodiversity,becausetheyharboralargeproportionoftheEuropeanbiodiversity,buttheyarealsothreatened(Dengleretal.2014;Habeletal.2013)andamongthemostaffectedhabitatsinEuropeandCentralAsia(IPBES,2018): abouthalfof thegrasslandhabitat typesprotectedby theNatura2000 framework(n=53) are threatened to some degree according to the European Red List of Habitats(Janssenetal.2016).Amongthedeterioratinggrasslandhabitat typesare thespecies-richNardusgrasslands,Europeanhabitattype6230*andapriorityhabitattypeintheHabitatsDirective (Annex I), i.e. a habitat type in danger of disappearance with its natural rangemainlywithintheterritoryoftheEuropeanUnion(95%insidetheEU28territory;Giganteetal. 2015).Nardusgrasslands are listed on the European Red List of Habitats despite theirlarge natural range (Fig. 1.2; Gigante et al. 2015). The conservation status “U2”, i.e.“unfavourable–bad”,intheAlpine,Atlantic,BorealandContinentalbiogeographicregionsiscausedbythestrongdecreaseinareaaswellashabitatqualityduringthesecondhalfofthe20thcentury. In theAtlanticbiogeographic region (Belgium, theNetherlands,NorthernGermanyandSouthernDenmark),Nardusgrasslandswerepartofheathlandsystemswithtraditional pasturalism. Nowadays, they are almost completely converted into intensivelyusedgrasslands for forageproduction,arable land for intensivecropcultivation, forest,or

5
urban land: in theNetherlands95%of theheathlandvegetation typeswere lostbetween1850and2000withsimilardeclinesinnorthernBelgium(Odéetal.2001)andstillcontinuestodeteriorate:over the last20years, thequalityofmanyof theNardus grasslands in theNetherlands has decreased further; and, in 2016 the area of well-developed Nardusgrassland was estimated at only 30-40 ha (van der Zee et al. 2017). Remnant Nardusgrasslandsarelargelyconfinedtonaturereserves,oftenrestrictedtosmallareas(Giganteetal. 2015), and under pressure of acidification and eutrophication due to atmosphericnitrogen deposition (Stevens et al. 2011a), invasion by non-native species and alteredprecipitationduetoclimatechange(Giganteetal.2015).
Figure 1.2DistributionmapofHabitat type E1.7 Lowland to submontane, dry tomesicNardus grasslands(Giganteetal.2015)
Survey/Expert input
Legend

6
The6230*habitattypeincludesalargevarietyofplantcommunities(i.e.associations),withvaryingecologicalsituations(hydrology,acidity,soiltype),however,theyarealltypifiedbynutrient-poor (i.e. oligotrophic) soil conditions. In the Atlantic biogeographic region, asubtype of the 6230* habitat type according to the EuropeanNature Information SystemEUNIS classification is categorized as “E1.7 Lowland to submontane, dry to mesic Nardus
grasslands”.InnorthernBelgium,Nardusgrasslandoccursonawidevarietyofsoiltypes:onsand, loamandpeat soilsbutmostlyon loamysandor sandy loamsoils (ZwaenepoelandStieperaere, 2002). Three associations are distinguished by Zwaenepoel and Stieperaere(2002):(i)Festucorubrae-Genistelletumsagittalis,themostcalcareoustype(pHH2O4.5-7.5),occurringongraveldepositisontopofcalcareoussubstrate;(ii)Galiohercynici-Festucetum
ovinae,occurringonsandyloamthathas lostbasiccationsduetoleaching(pHH2O4.3-6.0);and, (iii)Gentiano pneumonanthes-Nardetum, occurring on soils containing more organicmaterialandtypicallyacidtoneutral(pHH2O4.0-6.4).Morerecently,DeSaegerandWouters(2017)definedfoursubtypeswithinthe6230-grasslands:(i)6230_hn:dryNardusgrasslands;(ii) 6230_hmo:moistNardus grasslands; (iii) 6230_hnk: dry, calcareousNardus grassland;and,(iv)6230_ha:species-richgrasslandsoftheAgrostiscapillaristype(seeAppendix1.Aforan identification key). This PhD thesis handles the restoration of the 6230_hn subtype, aspecies-richgrassland type (inChapter2,we reporta species-richnessofup to49speciesper 9 m2) with typical species such as Succisa pratensis,Nardus stricta, Potentilla erecta(complete species list in Appendix-Table 1.A) and will be further simply called “Nardusgrassland”.
Figure 1.3 on the next page: Species ofNardus grasslands. From left to right, top to bottom: Potentillaerectaa, Succisa pratensisa,Gentiana pneumonantheb,Brizamediab,Pedicularis sylvaticab(Photo©DannyLaps), Polygala serpyllifoliab, Hygrocybe conicac, Pyrgus malvaed (Photo ©Vilda/Lars Soerink), Andrenamarginatae(Photo©GBIF,Norway,2017).Theplantspeciesareanearthreatenedorbvulnerableaccordingto the Belgian Red List. cH. conica is among the most common waxcap species associated with Nardusgrasslands,mostotherwaxcapspeciesarevery rare (Ozingaetal.2013). dP.malvae isassociatedwithP.erecta(MaesandVanDyck1996)andiscriticallyendangeredinFlanders(Maesetal.2012a).eA.marginataisassociatedwithS.pratensis,buthasgoneextinct fromtheNetherlandssince1962 (Peetersetal.2012;Reemer2018)andprobablyfromFlanders(personalcommunicationJensD’Haeseleer)

(a) (b) (c)
(f)(e)(d)
(g) (h) (i)

8
1.3Land-useintensification:fromoligotrophictoeutrophicecosystems
1.3.1Changesinhistoricalandcurrentland-useintensity
The intensification of grasslandmanagement is a global trend caused by economic-drivenagricultural systems (Oenema et al. 2014). Farmers that aim tomaximize their return oninvestmentscaleuptheirfoodandfeedproductionandintensifytheirland-use;small,moretraditionalfarmersgenerallyquitfarming.Theenvironmentalimpactsofintensifiedfarmingpractices,suchasspecies-loss(Stoateetal.2009),haveindirectanddirecteffectsonNardusgrasslands. Indirectly, neighbouring Nardus grasslands to intensively used farmland aremainly affected by atmospheric nitrogen deposition, an important indirect side-effect ofintensificationwhichleadstospecies-loss(Dupréetal.2010,DeSchrijveretal.2011)andashifttograss-dominatedvegetation(Bobbinketal.1998;Stevensetal.2011a;see§1.3.3).Directly,Nardusgrasslandsareaffectedevenmoreseverelywhentheyareconverted intointensivelyusedgrasslandsforforageproduction,suchashasoccurredtolargeproportionsofNardus grasslands in western Europe (Gigante et al. 2015). The level and period overwhichland-usehasbeenintensified,resultsinagradientofhistoricalland-useintensification(sensuWasof et al. 2019).We distinguish three types of grassland systems, according tohistorical and currentmanagement, soil chemistry, plant and soil biota communities (Fig.1.5):
Oligotrophic grasslands such as Nardus grasslands on acid sandy soils that have beenmanagedtraditionallyuptonow:nofertilizationandmowingonceannuallywithoccasionalaftermath grazing. Net nutrient removal occurs annually throughmowing combined withremovinghay(Tilley2014);autumngrazingleadstomorepatchynessinnutrientavailabilityratherthantonutrientdepletion(Mikolaetal.2009).Thesoilisnutrient-poor(see§1.3.2).Vegetation growth is limited by nutrients, limitation by phosphorus or co-limitation bynitrogen and phosphorus, which allows for species-rich vegetation with red-listed plantspecies(see§1.3.3).
Mesotrophicgrasslandsaregrasslandsforwhichland-usemanagementhasbeenintensified(see Eutrophic grasslands) and again turned into traditional management (withoutfertilization). If nutrient input by fertilization stops, after some years, biomass productionwillagainbelimitedbynutrients,thistimenotbyphosphorusbutratherbynitrogenand/orpotassium(Pegteletal.1996;see§1.3.2).Theaccumulatedphosphorusisstillpresentinthesoil, though, and soil phosphorus levels are still high. The land-use history of thesegrasslands can differwidely. The species-richness varies from species-rich to species-poor(see§1.3.3).
Eutrophic grasslands are formerly oligotrophic grasslands transformed by land-useintensification: long-term intensive management, including practices to increase biomassproduction and feed quality such as fertilization, cultivation, tillage, altering hydrology,intensive grazing, herbicide use against dicotyledons and seeding with fast-growing plantspecies suchasLoliumperenne,Dactylis glomerataandPhleumpratense. In Flanders, the

9
recommendation for annual fertilization of intensively used grasslands on sandy soil,allowingfourtosixannualbiomassharvestsforforageproduction,is354kgnitrogen,25kgphosphorusand292kgpotassiumperhectare(Romboutsetal.2015).Theaddednitrogenandpotassiumcanbecompletelytakenupandremovedagain ingrasslands(Schellbergetal.1999)whenbestpracticeprinciplesfornutrientmanagementareapplied(Gouldingetal.2008).Nitrogenandpotassiumoccur inhighlymobilemoleculesprone touptakebyplantroots or leaching from the soil over time (Stevenson and Cole 1999). Phosphorus, on theother hand, rapidly becomes less available for plant uptake in the soil (Stevenson& Cole1999), isoversuppliedandaccumulates inthesoilthroughtheyearsofhighnutrient input(Box 1; see §1.3.2). For example, from 1970 to 2000, western European agricultural soilswerefertilizedannuallywithonaverageabout20to30kgPha-1whilstonly10kgPha-1wasremovedwiththecrops(Sattarietal.2012).Legislationtoregulatethemaximalphosphorusinput is very different between the European countries, with the highest maximumphosphorus applications standards in Flanders, Brittany and the Netherlands (Amery andSchoumans2014),n.b. regionstypifiedby intensive livestockproductionandconsequentlythe largest phosphorus surpluses (Fig. 1.4; De Smet et al. 1996; Bomans et al. 2005);although, these legislations are becomingmore strict, e.g. in Flanders theManure Action
Plan 5 (MAP5) for the period 2015-2018 restricted for the first time the overuse ofphosphorus. These regulations may have come too late for acid, sandy soils in Flanderswhereaccumulationofphosphorusinthetopsoillayer(0-30cm)hasleachedtodeepersoillayers(30-90cm)inamajorityoffields(DeBolleetal.2013a).Thehighnutrientavailabilitydue to fertilization causes the vegetation to shift from biomass production limited bynutrients to limitationby lightas thevegetation isdominatedbya few fast-growingplantspecies(Hautieretal.2009;see§1.3.3).
Figure 1.4 European map of the phosphorus balance (kg P ha-1), i.e. the difference between input byfertilizationandremovalbycropsderivedfromdatabetween1990and2003.Thisfiguredoesnottakeintoaccount manure transfers between regions or withdrawal of phosphorus from the phosphorus-cycle(Bomansetal.2005)
Bom
ansetal2005
Addressingphosphorus
relatedproblemsinfarm
practiceP-balance (kg P ha-1)

10
Figure 1.5RemnantoligotrophicNardusgrasslandsdiffer frommesotrophic andeutrophic grasslands thatoriginated through increasing (historical) land-use intensity of formerNardus grasslands (see §1.3.1). Thethreegrasslandtypesoccuralongagradientof(historicalandcurrent)land-useintensity(sensuWasofetal.2019).Soilchemistryvariables,bioavailablephosphorusconcentrationsandpH,differaccordingtoWasofetal. (2019)andtheothersources in§1.3.2.Thetypeofnutrient limitationshifts fromnutrient limitation inoligotrophicandmesotrophicgrasslandstolightlimitation(Hautieretal.2009).Oligotrophicgrasslandsarelimited by phosphorus (see §1.3.3).Mesotrophic grasslands are, due to historical land-use intensification,not limited by phosphorus but by nitrogen and/or potassium (Pegtel et al. 1996). The vegetation differsaccordingtoVanDaeleetal.(2017)andWasofetal.(2019):fromslow-growingstress-tolerantcommunitiesinoligotrophicgrasslandstofast-growingcompetitivecommunitiesineutrophicgrasslands.Species-richnessis high in oligotrophic grasslands, with a high number of rare species (see Chapter 2). Slight fertilizationcausesaturnoverinthespeciesassemblyandspecies-richnessmayevenincrease(Bobbinketal.1998;andother sources in §1.3.3); however, species-richnessdecreaseswith furthernutrient-input (see§1.3.3). SoilmicrobiotaandnematodesarerepresentedaccordingtothefindingsofWasofetal.(2019)

11
Table1.1Characteristicsofthemanagement,soilandvegetationofoligo-,meso-andeutrophicgrasslands(seeFig.1.5)
aNardusgrassland=6230*grasslandsofthelowlandsandsubmontaneousregion(EUNISE1.7;Giganteetal.2015); grass-herb mix grasslands on acid, sandy soils in dry to moist conditions resemble either the basalcommunity of Anthoxantum odoratum (syntaxon code: 16RG24 sensu Schaminée et al. 2015) or Holcuslanatus-Silene flos-cuculi (syntaxoncode:16RG7sensuSchaminéeetal.2015);Loliumperennegrasslandsonacid,sandysoilsindrytomoistconditionsresemblethebasalcommunityHolcuslanatus-L.perenne(syntaxoncode: 16RG23 sensu Schaminée et al. 2015) b sensu Wasof et al. 2019 c Source of data: Oligotrophicgrasslands:theremnantNardusgrasslandsinchapter2(n=34);Meso-(n=17)andeutrophic(n=9)grasslands:Wasof et al. 2019 (pHH2O converted from pHKCl following Van Lierop 1981)
d Assumption: see §1.3.3 eAssumption:Nardus grasslands according to (Bakker et al. 2002; Hejcman et al. 2010a; Bedia and Busqué2013); grass-herbmix according to phase 3 grasslands in Schippers et al. (2012); Lolium perenne grasslandsaccordingtophase0and1grasslandsinSchippersetal.(2012)fNo.per9m2;Nardusgrasslandsbasedon34Nardus grasslands (Chapter 2); grass-herb mix based on 7 post-fertilization grasslands (Chapter 2) and 16experimentalplotswithmowingmanagementforfiveyears(Chapter3);Loliumperennegrasslandsbasedon8experimentalplotswithP-miningmanagement,i.e.fertilizedwithnitrogenandpotassium,onphosphorus-richsoilconditions(>80mgPOlsenkg
-1)(Chapter3)gCharacteristicsfortheoligotrophic(n=19),mesotrophic(n=43) and eutrophic (n = 10) grassland species following the species selection of Van Daele et al. 2017). Thespecies list is shown inAppendix-Table1.B;Traitswerederived fromtheLEDATraitbase (Kleyeretal.2008)with the function tr8of theRpackageTR8 (Bocci 2015); CSR-valueswerederived fromPierceet al. (2017);AnalysesofvariancetestingbetweenthegrasslandgroupswiththefunctionslmandanovaoftheRpackagestats.Significantdifferencesbetweengrasslandgroupsareindicatedbythep-value:***p<0.001;**p<0.01;NS=notsignificant
Oligotrophicgrassland
Mesotrophicgrassland
Eutrophicgrassland
p-value
Floristicassociationa Nardus grass-herbmix Loliumperenne Management Historicalland-useintensityb low medium-high high Currentland-useintensity low low-medium high Soil bioavailablephosphorusc
[min-max](mgPOlsenkg-1)
low2-14
mid-high27-128
high73-170
pHH2O[min-max]c 4.2-6.8 4.7-5.8 4.7-5.8 Limitationd (nitrogen)
phosphorusnitrogenpotassium
light
Vegetation Productivitye(tdrybiomassha-1y-1)
1-3 3-6 >8
No.plantspeciesf(No.per9m2)
22 8-13 8
No.red-listedspeciesf(No.per9m2)
4 0 0
Speciescharacteristicsg Ellenberg-N 1.4�±0.6A 3.5�±1.3B 4.8�±1.2C ***SLA(cm2g-1) 18.4±8.9A 27.4±9.5B 27.5±9.8AB **C 20±21 27±19 37±13 NSS 50±30B 27±22A 18±18A ***R 30±14A 47±19AB 45±21B **

12
1.3.2Changesinsoilchemistry
Repeated fertilization, particularly in areas with a surplus of animal manure, leads tonutrientaccumulationinagriculturalsoils(Bouwmanetal.2012;Ringevaletal.2017).Thenitrogenandpotassiumlevelsgenerallydecreaseagainthroughmowingmanagement(upto>200kgNha-1y-1,Jonesetal.2017)andleaching(onaverage50kgNha-1y-1inintensivelyused arable land, Bouwman et al. 2012) after fertilization has ceased or atmosphericdepositionhasbeenreduced;phosphorusismorepersistentinthesoil(Storkeyetal.2015).Differencesinhistoricalland-useintensitycausedifferentphosphorusloadingsofgrasslandsoils: oligotrophic < mesotrophic < eutrophic (Wasof et al. 2019; Fig. 1.6). In remnant,unfertilizedNardusgrasslands,thebioavailablephosphorusconcentrationisgenerallylowerthan12mgPOlsenkg-1(Table1.1;Chapter2);fertilizationleadstoincreasedconcentrationsofbioavailable,slowly-cyclingandtotalphosphorus(Box1;Table1.1).
Figure 1.6 Soil phosphorus concentrations (mean with standard deviation) for the bioavailable (POlsen),slowly-cycling (POxalate) and total phosphorus pool (PTotal) in soil samples of the top soil layer (0-10 cm) ofoligo-,meso-andeutrophicgrasslands(datawasderivedfromthesamesetofgrasslandsshowninTable1.1;differentPpoolsaredefinedinBox1)

13
Nardus grasslands are characterized by acid to neutral soil conditions (pHH2O of 4.2-6.8;INBO).Intensifiedland-useingrasslandsonacidsoilsisaccompaniedbyincreasedsoilpHbyliming with calcium and magnesium-rich materials such as limestone till a level wherephosphorusbioavailabilityismaximal(pHH2Oof6;Gouldingetal.2008;Box-Fig.1.3).ThepHofmesotrophic and eutrophic grasslands was found to be increased (Wasof et al. 2019),whichisnotperseanegativeaspectofintensificationtooligotrophicgrasslandsundertheconditionlimingisnotaccompaniedbyincreasedproductivity(Hejcmanetal.2007;Hollandet al. 2018). Acidification by atmospheric nitrogen (and sulfur) deposition is one of thethreats to the vegetation of acid grasslands, such asNardus grasslands, which are moresensitive to acidification than grasslands on well-buffered soils (Stevens et al. 2011a).Sensitive plant species may disappear due to acidification below a pHH2O value of 4.6(Merunková and Chytrý 2012) or 5 (Roem and Berendse 2000), due to toxic effects byincreasedbioavailabilityofaluminiumandammonia (Routetal.2001;VanDenBergetal.2005;Kleijnetal.2008;DeGraafetal.2009).Theoccurrenceofsomeacid-tolerantspeciessuch asCalluna vulgaris andGentiana pneumonanthemay be decreasedby liming (RoemandBerendse2000).However, inour study, the increasedsoilpH in themesotrophicandeutrophic grasslandswas accompanied by an increased availability of nutrients,which doposeaseverebottleneckforNardusgrasslandspecies(see§1.3.3).
Box1.Soilphosphorus
Understandingandpredictingchangesinsoilphosphorusavailabilityiscomplicatedbecauseofthevariousinorganicandorganictypesofphosphorusoccurringinthesoil(DeSchrijveretal.2012;Kruseetal.2015)andthenumerouschemicalmethodsforphosphorusextraction(overview of current methods in Wuenscher et al. 2015). It is important to choose theappropriate extraction method for each research question. For instance, the totalphosphorusconcentrationmaygiveaquickviewonthehistoricalphosphorusfertilizedtoafield. Characterizing soil phosphorus concentrations into different pools or fractions mayprovideamoredetailedinsight,e.g.historicalfertilizationanddepletionprocesses(NegassaandLeinweber2009).
Various conceptual soil phosphorus models have been developed (Alvarez and Steinbach2017), among which the Phosphorus Pool Model of Roberts and Johnston (2015), whichconsiders inorganicsoilphosphorustoreside in four inter-relatedpools thatdiffer in theiravailabilityforplant-uptake(Box-Fig.1.1).
The bioavailable phosphorus pool (first and second pools in Box-Fig. 1.1) containsphosphorusinthesoilsolutionandphosphorusthatissurface-adsorbedtosoilcomponentssuch as iron and aluminium (hydr)oxides, organic material and clay particles. Thisbioavailablephosphoruspoolisimmediatelyorwithinagrowingseasonavailabletoplantsandcanbedeterminedthroughextractioninsodiumbicarbonate(NaHCO3;POlsen),amethoddevelopedforcalcareoussoils(Olsenetal.1954)thatgivessatisfactoryresultsalsoinacidsoils (Renneson et al. 2016). In calcareous soils, the NaHCO3 solution lowers theconcentration of Ca2+ in solution as CaCO3 precipitates, and therefore promotes

14
calciumphosphatedissolution. In neutral or acid soils, the solubility of aluminumand ironphosphatesincreasesastheOH-ionsintheOlsenextractlowertheconcentrationsofAl3+byaluminate complex formationandof Fe3+ byprecipitation as ironoxide (Wuenscher et al.2015).TheconcentrationofPOlseninthesoilcorrelateswellwithphosphorusuptakeinplantsinspecies-richgrasslands(Gilbertetal.2009)andisusedfrequentlyforecologicalresearchforquiteawidepH-range(Loebetal.2009;Ceulemansetal.2014;Johnstonetal.2016).
For theobjectiveof re-establishingphosphorus-poor soil conditions, it is important tonotonly get insight into the bioavailable phosphorus pool, but also into the slowly cyclingphosphoruspoolthatcanfeedthebioavailablepoolonatimescaleofmanyyears(Syersetal.2008;DeSchrijveretal.2012;Johnstonetal.2014).Thesethirdandfourthpoolsconsistof phosphorus that is more strongly bound onto and contained in soil components.Extraction with ammonium oxalate (POxalate; Schwertmann 1964) gives a measure of thisslowlycyclingphosphoruspool(vanRotterdametal.2012).
Box-Figure1.1Thefourpoolsof inorganicphosphorus insoils thatcanbecomebioavailableoverdifferenttimescales, categorized in termsofbioavailabilityandextractability (Robertsand Johnston2015).Pools1and2(i.e.bioavailableP)canbeassessedbytheOlsen-method(POlsen);pools3and4(i.e.slowlycyclingP)canprobablybemeasuredbytheoxalate-method(POxalate),but itshouldbeassessedwhethertheoxalate-methodgivesacompletepictureofthesepools
This model is a simplified, though understandable, interpretation of the various soilphosphorus fractions. Soil phosphorus can be characterized in greater detail by thesequential fractionation procedure of Hedley et al. (1982). Phosphorus is removedprogressively fromasoilsamplebysequentiallyusingstrongerextractants inthechemicalanalysis. According to Richter et al. (2006), the nine fractions can be summarized into sixinorganicandorganicphosphorusfractionsofvariablebioavailability:bioavailableinorganicand organic phosphorus, inorganic and organic slowly cycling phosphorus associated toaluminiumandironoxides,slowclycyclinginorganicphosphorusassociatedtocalciumand,theremainingoccludedphosphorus,i.e.theresidualphosphorusthatcouldnotbeextractedbytheprevioussteps.Theoccludedfractionisassumedtobeunavailableforplant-uptake,even in the long-term, i.e. thenon-biologically cyclingphosphoruspool, and tohave littleimpactonsoilfertility(StevensonandCole1999)andcontainsphosphorusthatisassociatedto inorganic compounds that are very insoluble and to organic compounds that areconsidered resistant to mineralization. However, it was shown this pool may becomeavailableinthelong-term(Richteretal.2006).
Bio

15
Applyingthisanalysis tooligotrophicandeutrophicgrasslandsonacid,sandysoils, revealslong-termfertilizationaffectsallofthefractions,exceptthebioavailableorganicphosphorusfraction (Box-Fig. 1.2). The occluded phosphorus pool takes a small proportion of the soilphosphorus fractions. Inour furthercalculationsof thetimetophytominephosphoruswedo not consider the occluded pool, hence, wemight (slightly) underestimate how long ittakes for a soil to become depleted of phosphorus after fertilization.We further do notdistinguishorganicfrominorganicfractions:thebioavailablephosphoruspoolmeasuredbyextractioninsodiumcarbonate(POlsen)alsocontainsorganicphosphorusassociatedwithsoilorganic surfaces and humic and fulvic acids (Blake et al. 2003; Alt et al. 2011); and, theslowly cycling phosphorus pool measured by extraction in ammonium oxalate contains asmallamountoforganicphosphorus(Koopmansetal.2004).
Box-Figure1.2Casestudyoftheeffectsoffertilizationonsoilphosphorusfractionsinasandysoil:Inorganic(Pi) and organic (Po) phosphorus fractions in Nardus grasslands (n=18) and intensively used eutrophicgrasslands(n=12)inclosevicinitytotheNardusgrasslandsinthe0-10cmsoillayer.Thesefractionsaretheresult of Hedley fractionation (Hedley et al. 1982) and categorized according to (Richter et al. 2006). Allfractions, except the bioavailable Po-fraction were significantly higher in the eutrophic grasslands (DeSchrijveretal.unpublisheddata)
Themaximumsorptioncapacityofasoilincreaseswiththeproportionofsmall-sizeparticles(sand < loam < clay), aluminium and iron oxide minerals and, is affected by the pH(McGechan and Lewis 2002). Sorption capacity is minimal and, hence, phosphorusbioavailability ismaximal atpHH2Oaround6 (Gouldinget al. 2008;Box-Fig. 1.3).Repeatedexcessive phosphorus fertilization increases the phosphate saturation degree (!"# =[!!"#$#%& 0.5×(!"!"#$#%& + !"!"#$#%& )]×100(%)with the concentrations of phosphorus,aluminiumand iron inmmolkg-1; (VanderZeeetal.1990)).Whena threshold is reached(25%forsandysoils),soilsleachmorethan0.1mgorthophosphateperlitergroundwater,acritical eutrophication limit forwater bodies (Van der Zee et al. 1990; Rowe et al. 2016).Thesephosphorus-saturated soils are prone to leach phosphorus to deeper soil layers, as
Nardus grasslands Agricultural grasslands0
200
400
600
800
1000
1200
Phosphorus
fractions
(mgPkg
-1)
Bioavailable PiBioavailable PoSlowly cycling Fe/Al-PiSlowly cycling Ca-PiSlowly cycling PoOccluded P

16
wasfoundinthemajorityofintensivelymanagedfieldsonacid,sandysoilsandsandyloamsoils in two large screenings (De Smet et al. 1996; De Bolle et al. 2013a). Phosphorusaccumulationinthetopsoillayer(0-30cm)wasfoundtoleachtodeepersoillayers(30-90cm)(DeBolleetal.2013a)andwasalsoobservedinaeutrophicgrasslandbyincreasingthebioavailablephosphorusconcentrationstillthe50-60cmsoillayer(Box-Fig.1.4).
Box-Figure1.3Degreeof fixationofphosphorus in soils in relation to the soil acidity (pHH2O). In acid soilswithlowsoilpH,phosphorusisstronglyadsorbedtoiron(Fe)andaluminium(Al),whileinsoilswithhighpHvalues,phosphorusisabsorbedtocalcium(Ca).ThemaximalbioavailabilityofphosphorusliesaroundapHof6(StevensonandCole1999)
Box-Figure1.4Bioavailablephosphorusconcentration(mgPOlsenkg
-1)foreachofthe10cmsoillayersuntiladepthof80cminanintensivelyusedeutrophicgrasslandonanacid,sandysoilinclosevicinitytoaremnantNardus grassland (De Schrijver, unpublished results). Intensive management and fertilization caused soilphosphorus to leach from the 0-30 cm soil layer, which was tilled frequently, till deeper soil layers. Thethreshold value for the bioavailable phosphorus concentration inNardus grasslands is indicated in a greydashedline
2.5 3.5 4.5 5.5 6.5 7.5 8.5 9.5
Degreeof
fixation
pHH2O
Acid soils Basic soils
SlowlycyclingFe/Al-P
SlowlycyclingCa-P

17
1.3.3Changesinvegetation
OligotrophicNardusgrasslands have a low annual productivity, i.e. 1-3 t dry biomass ha-1(Bakkeretal.2002;Hejcmanetal.2010a;BediaandBusqué2013).Itiscommonknowledgethat fertilization increases grassland productivity (Grime 1973; Parr 1986; Marrs 1993;Goughetal.2000;HarpoleandTilman2007).Forexample,inthefieldexperimentinRengen(Germany),severalfertilizertreatmentshavebeenappliedsince1941toaNardusgrassland(Hejcman et al. 2010a) causing a range in annual productivity from on average 2.5 t drybiomass ha-1 in the unfertilized controls till 10 t dry biomass ha-1 in the plots annuallyreceiving nitrogen, phosphorus, potassium and lime. Productivity in eutrophic grasslandsmayevenreachmorethan15tdrybiomassha-1(Liebischetal.2013).
The relation between species-richness and productivity has been studied for a long time(Grime1973;Parr1986;GoughandMarrs1990;Marrs1993;Grime2001;Keddy2005)andthequestforageneral lawofnature isstillahot-topic(e.g.Fraseretal.2005;Adleretal.2011; Pierce 2014; and the discussions that followed). Grassland vegetation shifts byfertilization from nutrient-limitation to light-limitation, which is accompanied by a loss inspecies-richness(Hautieretal.2009).ThestudybyHautieretal.(2009)wasperformedwithinorganicfertilizercontainingnitrogen,phosphorus,potassiumandsomemicronutrientsatamediumrateofnitrogenandpotassiuminput(2006:40kgNha-1,35kgPha-1,60kgKha-1;2007:200kgNha-1,50kgPha-1;80kgKha-1),butwasenoughtofavortheinitiallynutrient-limitedfast-growingspeciestoshadeoutthesubordinatespecies.Addinglighttogetherwithfertilizer to thegrasslandmesocosms resulted inproductiveand species-rich communitiesbecauselight-limitationwasliftedanddidnothamperthesubordinatespecies.Thus,whennutrient-limitationisremovedfromcommunitieswithnumerousslow-growingspecies(e.g.Nardus grassland species), these communities are replacedby communitiesdominatedbyfewfast-growingspecies thatshadeout thetypicalNardusgrasslandspecies (HarpoleandTilman 2007;Hautier et al. 2009). The outcomeof fertilization depends, however, on thequantityand typeofnutrientornutrientcombinationsaddedto theecosystem. It iswell-knownthatgrasslandsloseplantspeciesduetofertilizationwithnitrogen(DeSchrijveretal.2011), phosphorus (Ceulemans et al. 2014;Hájek et al. 2017; vanDobben et al. 2017) orboth(SchellbergandHejcman2007).Ithasbeendebatedwhethernitrogenorphosphorusfertilizationwasthemostimportantdriverforthisbiodiversity-losswithevidenceinfavorofnitrogen(Soonsetal.2017)andphosphorus (SchellbergandHejcman2007;Ceulemansetal.2013;Ceulemansetal.2014;vanDobbenetal.2017).Soonsetal.(2017)andRoelingetal. (2018)argued thata shift fromphosphorus limitation intonitrogen limitationdoesnotnecessarily lead to a loss of species, rather to a species turnover, i.e. species are beingreplacedbyotherspecies.Indeed,slightfertilizationofoligotrophicgrasslandswasshowntoresult in a status quo in species-richness and in a species turnover (Bobbink et al. 1998;Kepfer-Rojas et al. 2018). However, endangered and rare species, such as the orchidsDactylorhizamaculata,PlatantherabifoliaandListeraovata(Hejcmanetal.2010b),persistinphosphorusorphosphorus-nitrogen-co-limitedgrasslands(Wassenetal.2005;Fujitaetal.

18
2014).Theeffectofpotassiumlimitationonspecies-richnesshasbeenless-wellresearchedand are less understood (Kayser and Isselstein 2005; Sardans and Peñuelas 2015); and,similarly co-limitation between nitrogen, phosphorus and/or potassium requires moreinvestigation (Fay et al. 2015). There are, however strong indications that typicalNardusgrasslandspeciespersistbelowabioavailablephosphorusconcentrationof12mgPOlsenkg-1(see Chapters 2 and 6) and under phosphorus limitation (e.g. the Rengen experiment:Hejcmanetal.2010a;e.g.Moliniacaerulea,PotentillaerectaandSuccisapratensiswithhighN:P ratio's:Roelinget al. 2018).Butevenbelow thisbioavailablephosphorus threshold, anegativerelationbetweenbioavailablephosphorusandspecies-richnesshasbeenobservedin Nardus grasslands (Riesch et al. 2018). We may assume the shift from phosphorus-limitation intonitrogen-limitation inourdefinedmesotrophic grasslandswithan intensivefertilizationhistory,willbeaccompaniedbya lossofspecies (Table1.1).Asahypotheticalillustration,the“catastrophemodel”byParr(1986)mayexplaintheshiftfromphosphorus-limitation to nitrogen-potassium co-limitation (shift from species-rich oligotrophic tospecies-richmesotrophiccommunityinFig.1.7),followedbyasuddendroptoe.g.nitrogen-limitation(shiftfromspecies-richmesotrophictospecies-poormesotrophicinFig.1.7),againfollowedbyashifttoasystemwithlight-limitation(shiftfromspecies-poormesotrophictospecies-pooreutrophiccommunityinFig.1.7).AccordingtoParr(1986),theintroductionofadisturbance,e.g.increasedmowingfrequency,mayleadtoajumpbackfromthelowertotheupperlevelofspecies-richness.
The characteristics of theplant species typical of oligotrophic,mesotrophic and eutrophicgrasslandvaryconsiderably(Table1.1).Theplantcommunityshiftsfromplantspecieswithaslow-growth strategy in oligotrophic grasslands where nutrient cycling is slow, into acommunitywithafast-growthstrategyineutrophicgrasslandswherenutrient-cyclingisfast(sensu the fast-slowplanteconomics spectrum inReich2014). Forexample, theEllenbergnutrientindicatorvalue,whichcorrelateswellwithbiomassproduction(HillandCarey1997;Chytrýetal.2009),significantlydistinguishesthethreegrasslandtypes(Table1.1).Further,thespecificleafareaislowerandtheGrimestress-scoreishigherinoligotrophicgrasslands(Fig. 1.8; Table 1.1).Oligotrophic plant communities consists of slow-growing species,e.g.Nardus stricta, Potentilla erecta, Danthonia decumbens, Veronica officinalis and Luzulamultiflora (De Saeger andWouters, 2017; Appendix 1.A), which have a conservative andstress-tolerant resource use strategy (Fig. 1.8; Pierce et al. 2017). These traits typicallyincludeslowgrowth rate, lowspecific leafarea,high leaf longevity,high recalcitrance (i.e.with a low decomposition rate) and high resorption of nutrients from senescing leaves(Table1.1;Wrightetal.2004).Mesotrophicgrasslandcommunitiesaretypifiedbyspecieswithintermediatetofast-growingtraits,e.g.Anthoxanthumodoratum,Centaureajaceaandplantago lanceolata. Fast-growing species are adapted to copingwith light-limitedgrowthconditionsbyfast-growthtraits,suchashighbiomassproduction, lowtissue lifespan,highrateofresourceacquisition,lowrecalcitranceandhighbiogeochemicalcycling(Wrightetal.2004). Eutrophic grassland communities are typified by such species are dominated bytypically tall, long-lived and strongly competitive (high C-value on the CSR-scale; Fig. 1.8)

19
specieswhichrequirehighnitrogeninput(highEllenbergnitrogenindicatorvalue).Wescheetal.(2012)showedanincreasedaverageEllenbergnitrogenindicatorvalueisaccompaniedbya lossofnectar-producinggrasslandherbs, likelynegativelyaffecting theabundanceofpollinatinginsects.
Figure 1.7 Theoretical effects of intensified land-use and nutrient enrichment on species-richness and thepositionof the threegrasslandcategoriesdefined in this thesis (oligotrophic,mesotrophicandeutrophic).Mesotrophicgrasslands canbe species-poorbutalsohave thepotential toharborahigh species-richness.Schemeofadiscontinuous response inspecies-richnessafter the“catastrophemodel”byParr (1986).Theredarrowshowschangesinspecies-richnessasitrespondstosmallchangesinnutrientstatus:startingwithhigh species-richness in oligotrophic grasslands, species-composition alters when moving towardsmesotrophic grasslands with initially no loss in species-richness. Suddenly, a jump occurs towards thespecies-poormesotrophicgrasslands(i.e.acatastropheevent)beforecontinuingtobecomeaspecies-pooreutrophicgrassland.Itisunclearwhethertheshiftfromspecies-pooreutrophicgrasslandscanbemadebacktospecies-richoligotrophicgrasslands(greenarrow)
Figure1.8CSR-strategyofoligotrophic(green),mesotrophic(blue)andeutrophic(purple)grasslandspecies(n = 72) in Van Daele et al. (2017). CSR-values as defined by Pierce et al. (2017); names shown for thenineteenspeciesstudiedinChapter6;all72specieslistedinAppendix1.B

20
1.3.4Changesinsoilbiotacommunities
Below-groundbiotaareecologicallylinkedwithabove-groundbiota(Wardleetal.2004)andhence with the spectrum of slow to fast resource economics the plant communityrepresents(sensuReich2014).Inoligotrophichabitats,theslow-cyclingnutrientturnoverinthe soil food web is fed by nutrient-poor plant material and typically consists of fungi,enchytraeid worms and macro- and micro-arthropods. In eutrophic conditions, the fast-cyclingnutrient turnover in the soil foodweb is fedbynutrient-richplantmaterial and ismade up of bacteria, earthworms and microfauna (i.e. nematodes). Through plant-soilfeedbacks,soilbiotacommunitiescaninteractwithandshapetheplantcommunity(ThakurandWright2017).Negativeplant-soilfeedbacks,e.g.throughsoilpathogens,werefoundtooccurmore in fast-growing plant species; positive plant-soil feedbacks, e.g. bymutualistssuchasmycorrhizathathelpwithnutrientacquisition,weremorecommoninslow-growingplant species (Lekberg et al. 2018). Whether plant-soil feedbacks affect plant-plantcompetitiondependsonsoilfertility:ineutrophicsoils,negativeplant-soilfeedbackeffectsaregenerallyoutweighedbyplant-plantcompetition;and, inoligotrophicsoils,mutualisticplant-soil feedbackscanpreventcompetitiveexclusionandthusfavourslow-growingplantspecies(Lekbergetal.2018).
Land-useintensificationcandecreasethediversityandalterthecommunityassemblyofsoilbacteria, fungi, collembola and nematodes (Wood et al. 2017). Fertilization, increasedmowing frequency, liming, soil tillage and altered vegetation composition will each haveeitherpositiveornegativeeffectsoncertainspeciesgroups.Inalargegrasslandfertilizationexperiment, for instance, fertilization with nitrogen and phosphorus caused only slightchanges to the diversity of the microbial community, but lead to a consistent shift incommunity composition (Leff et al. 2015). In the fertilized plots, microbial species witheutrophictraitswererelativelymoreabundantwhileoligotrophicmicrobialspecies,suchasarbuscularmycorrhiza, declined. Contrastingly,Wasof et al (2019) found a higher relativeabundanceofarbuscularmycorrhizaineutrophicgrasslandsthaninoligotrophicgrasslands,whichisprobablyexplainedbypracticeofliminginthoseintensivelyusedgrasslands.Whiletheseacid,sandysoilsinunlimedconditionswithpossiblyhighbioavailabilityinaluminiumcanhavenegativeeffectsonarbuscularmycorrhiza(Segueletal.2013),limingmighthaveapositiveeffect.Forarbuscularmycorrhiza,theabioticsoilconditionsseemmoreimportantthantheidentityofthehostplantspecies(VanGeeletal.2017).Nematodes,ontheotherhand,doshowaplantspecieseffect(Viketoftetal.2005).InWasofetal(2019),fast-growingplant species (Lolium perenne, Holcus lanatus and Taraxacum officinale) were associatedwithherbivorousnematodes,whichfeedontheplantroots,andslow-growingplantspecies(MoliniacaeruleaandPotentillaerecta)wereassociatedwithfungivorousandbacterivorousnematodes.Muchisstillunknownaboutplant-soilfeedbackeffects,butthefieldisrapidlydevelopingthrough,e.g.moreaffordablemolecularanalysistechniques.

21
1.4Restorationofoligotrophicgrasslands
Ecological restoration involves decisionmaking onmany levels (local towhole landscape)and by multiple actors (restoration practitioner to legislators on international level) andbegins with identifying the goal and assessing the starting situation by an ecosystemassessment to determine the bottlenecks to recovery (Fig 1.9; Hulvey et al. 2013). Arestorationpractitionermightnothavetheknowledge (i.e. scientificbottleneck)ormeans(i.e. financial bottleneck) to restore communities that went locally extinct (i.e. bioticbottleneck)onafieldwithalteredsoilconditions(i.e.abioticbottleneck).Inaddition,notallmanagementmeasuresmaybefeasibleattheparticularfield.
Figure 1.9 Framework to guide decisions for restoring ecosystems as an illustration for the multitude ofoptionsandconstraintsinrestorationecologicalprojects(Hulveyetal.2013)
SEE FIGURE 18.3
Identify goal(s)Is there a problem?Continue to
maintain/manageas historicalsystem
No
No
No
Yes/maybe
Yes
Yes
YesProceed
Goal:Manage fornovel speciescomposition
and/orfunctionservice
Goal:Protectspecies/
biodiversity
Goal:Recover
or maintainfunction/services
Partly/maybe
Can barriers beremoved/altered?
Manage ashybrid
Manage aspossiblenovel
ecosystem
Change scope/scale
No
Is cost/riskacceptable?
Consider feasibility ofremoving barriers
Hybrid Novel
Historical
Maintain as-is Restore
Passiverecovery
Conduct an ecosystem assessment
What is management goal?
Do components differ from those prevailinghistorically?Determine sources of changeDetermine if ecosystem will recover passivelyDetermine barriers to recovery
Consider costs/risks ofmanagement options
Re-visit management goal andassess feasibility
Ecological barriers only/Socialbarriers only/BothWhat are costs and likelihoodof success?
SEE FIGURE 18.2
Are the ecosystemchanges reversible?

22
Anunambiguousandmeasurablegoalshouldbeputforwardtobeabletoverifyrestorationsuccess,adjustrestorationeffortsifnecessaryorevenchangethegoaltoanecologicallyandeconomicallymore realistic target (Rohr et al. 2018).Anexampleof aneasilymeasurablegoalisarea,asinthe2014decreeoftheFlemishgovernmentwhichaimstokeepthe377haremnantNardusgrasslandsinanoptimalconditionandrestoreanadditional637haNardusgrasslands(Appendix1.C).Therestorationsuccessofspecies-richNardusgrasslandscanbealsoevaluatedbasedonthefollowingcriteria:
- re-establishmentofnutrient-limitingsoilconditions(Marrs1993;Roelingetal.2018),low phosphorus concentrations in particular (cf. the 12mgPOlsen kg-1 threshold inTable1.1,§1.3.2),
- atmospheric nitrogen deposition below the threshold of 12 kg N ha-1 y-1 (vanDobbenetal.2012),
- presence of minimally four typical Nardus grassland species, such as Succisapratensis,Nardus stricta, Potentilla erecta (complete species list in Appendix 1.A),that together cover more than 10% (target for 6230_hn class of dry Nardusgrasslands;DeSaegerandWouters2017;keyinAppendix1.A),
- presenceoftypicalfaunaspecies,e.g.butterflies(Pyrgusmalvae,Maculinaealcon),crickets(Grylluscampestris),reptiles(Coronellaaustriaca),
For evaluating restoration success, also a measure for the ‘benefit of people’ should beincluded, which leads to the disciplines of multifunctionality and ecosystem services.However,thevariousfunctionsandecosystemservicesofgrasslandshavebeen,apartfromthe relationship biodiversity-biomass production, hardly quantified and require furtherresearch(Bengtssonetal.2019),e.g.Lindemann-Matthiesetal.(2010),whichquantifiedtheaesthethicappreciationofgrasslandsalongagradientofvaryingspecies-richness.
In approved projects in Natura 2000 areas in Flanders, the target of restoring Nardusgrasslandswasalmostalwaysselectedbeforeassessingthe(a)bioticfieldcharacteristicsofthefieldswhererestorationwilltakeplace(Appendix1.C). It ishenceunclearwhethertheproposedandbudgetedmanagementmeasureswillenabletoattaintheambitiousgoalofrestoring637haofadditionalNardusgrassland.InFlanders,alargepartofplannedhabitatrestorationwillprobably takeplaceon formeragricultural land (Gobinetal.2009),wherethe soil conditions and vegetation are in generally eutrophic (see §1.3.2). Restoration ofNardusgrasslandsonsucheutrophicfieldsinspecies-poor,fragmentedandintensivelyusedlandscapesrequiresrestorationofboththeabioticandbioticsiteconditions.Restorationofotherspecies-richgrasslandtypessuchas lowlandhaymeadows(Natura2000habitattype6510)andcalcareousgrasslands(Natura2000habitattype6210)requiresimilarattentiontoreinstallingabioticandbioticsiteconditions(see§7.5).
Eutrophic soil conditions are an abiotic bottleneck with long-lasting negative effects onbiodiversity(seeChapter1.3).Elevatedsoilphosphorusconcentrationsinparticularpersistforalongtimeinthesoil,i.e.decadestomillennia(Dupoueyetal.2002;McLauchlanetal.2006; Kepfer-Rojas et al. 2018). Hence, restoration efforts of this abiotic bottleneck are

23
aimed at reducing the soil fertility, in particular soil phosphorus concentrations.Here,weintroduce commonly used and novel techniques to reduce bioavailable soil phosphorusconcentrations:
- The removalof theentirephosphorus-enriched soil layer, i.e. topsoil removal, is aquickandeffectiverestorationtechnique(Verhagenetal.2001;Smoldersetal.2008;Frouzetal.2009;Töröketal.2011;Emsensetal.2015).Afterintensiveagriculture,phosphorus concentrations are high in the tillage layer (generally 0-30 cm), butphosphorus may have leached to deeper soil layers as well (Box-Fig. 1.4). It istherefore,importanttobeforehandaccuratelydeterminethedepthofthesoillayerthat needs to be removed (Hölzel and Otte 2003). The large soil volumes to beremoved and transported (e.g. 6000 m3 per hectare for the top 0-60 cm) rendertopsoilremovalexpensive(Table1.2).Thishighone-timecostcouldbereducedifthetopsoil can be re-used, for construction of dikes, or to introduce topographic andplant compositional heterogeneity on site, as being demonstrated in Australiangrasslands(Gibson-RoyandMcdonald2014).Nearcompleterestorationoffloraandfauna ofNardus grassland on formerly eutrophic soil has been reported only forrestorationprojectsinwhichthenutrient-enrichedsoillayeristakenawaybytopsoilremovalandtargetspecieshavebeenre-introduced(e.g.Loebetal.2018).However,in some cases,e.g. if thewater table is near the surfaceor due to project budgetrestrainments,topsoilremovalisnotpossible.
- Full-inversion tillage, i.e. the insituburialof thephosphorus-enrichedtopsoil layer(Glenetal.2016),islikelyacheaper(Table1.2)alternativetotopsoilremovalthoughthetechniqueisnotcommonlyusednorwell-researched.Tillagemaybeperformeduntilaboutonemetersoildepth,butthistechniquerequiresthedeepersoil layers(60-100cm)tobephosphorus-poor(Milliganetal.2017).
- In situ fixation of phosphorusbyaddingchemicalamendments (e.g. ironchloride,aluminium sulphate, calcium carbonate, elemental sulphur and iron-richmaterials)hasshownvariablesuccesstodecreasethebioavailableconcentrationofphosphorus(Annetal.2000;Grootjansetal.2002;Gilbertetal.2003;Stuckeyetal.2007;Geurtsetal.2011).Toreducethebioavailabilityofphosphorussignificantly,largeamountsarenecessary(i.e.4–63tha-1),whichmayhavenegativeside-effectssuchastoxicitytothetargetspecies(Marrs1993;Annetal.2000).
- Grazing leads to patchiness in nutrient availability rather than nutrient depletionfromthesoil(Mikolaetal.2009).Marrs(1993)reportedthatsheepgrazingannualyremovedonly 5 kgPha-1. Jewell et al. (2007) found cattle grazing locally removedlessthan20kgPha-1y-1and,elsewherewithinthesamefield,addedmorethan50kgP ha-1 y-1, which renders this technique useless to restore phosphorus-poor soilconditionsoneutrophicsoils.
- Soilphosphorusconcentrationsmaybereducedbyphytoextractionorphytomining,i.e.phosphorusextractionbybiomassproduction,throughmowingorP-mining.

24
o Mowing isthepracticeofcuttinggrasslandswardstoremovenutrientswithhay.Nofertilizersareused.Grasslandsthatwere intensivelyfertilizedmightannuallyproducemorethan15tdrybiomassha-1(Pegteletal.1996).Afterseveralyearsofmowingwithoutfertilization,biomassproductionsignificantlydecreases due to limitation of nutrients other than phosphorus, namelynitrogen (Van Der Woude et al. 1994; Smits et al. 2008) and potassium(Oelmann et al. 2009). The annual biomass production generally falls backfrom15to5tdrybiomassha-1,orevenless(Berendseetal.1992;Pegteletal. 1996; Pavlu et al. 2011). With lower biomass production, phosphorusremoval rates decline from about 45 to 6 kg P ha-1 (Pegtel et al. 1996).Therefore,thisrestorationmethodmighttakeseveraldecadesandduetothecumulativecostovertheyears(Table1.2),itmaybemoreexpensivethantheone-timecostoftopsoilremoval.Mowingisaneffectivetechniquetoreducethebioavailabilityofnitrogenandpotassium,butnotofphosphorus.
o P-mining combines mowing management with fertilization of nitrogen andpotassium (growth-limiting nutrients other than phosphorus) to maximizebiomass production and thus phosphorus removal. The techniquehas beensuggestedbyMarrs (1993)andCrawleyetal. (2005)andcanbeusedasanadjustedagriculturaltechniquethatmaybeusedasaguidedtransitionfromagriculture to nature. P-mining can be done with the existing grasslandvegetation or with arable crop that efficiently take up phosphorus andproduce high quantities of biomass. Harvesting hay or other crops maydeplete the soil of phosphorus. However, little long-term field evidence isavailableonhowfastphosphoruscanberemovedbyP-mining(MacDonaldetal. 2012). Johnston et al. (2016) recently compiled several long-termphosphorus depletion experiments and found bioavailable phosphorus todecline exponentially, with the rate of decline depending on the soil’sphosphorus-buffering capacity, actual phosphorus saturation and ability torestore the equilibrium between the different phosphorus pools. ModelingalsosuggestedlimitedphosphorusremovalovertimewithP-mining(Perringetal.2009).InthefirstphaseofP-mining,thebioavailablephosphoruspoolisconstantly and sufficiently replenished from the slowly cycling phosphoruspool (Vanden Nest et al. 2015). Later in the P-mining process, phosphorususually becomes depleted in the rhizosphere, limiting plant-growth and,consequently,phosphorusremoval(Koopmansetal.2004).Thiscomplicatesestimationsofphosphorusremovalalongtherestorationprocess.ThecostofP-miningdependsuponthequantityandqualityofthebiomassanditsvalueforfarmers;long-termP-miningmaybeexpensiveincasewhenthebiomasshas a low value (Table 1.2) ormay be disadvantageous because during theperiod of P-mining little nature values are present due to intensivemanagement.

25
Marrs(1993)statedthatthesuccessofreducingsoil fertilitydependsuponhowmuchthesoilfertilitywasincreasedandhowfastsoilfertilitycanbereduced.Betterpredictionsoftheoutcomes of measures to reduce soil phosphorus concentrations will lead to bettermanagement decisions (Brudvig 2017). In this PhD, we aim to provide additional data tobettersupportdecisionsintheecologicalrestorationprocess.
Eutrophication and acidification causedbyatmospheric nitrogen deposition are a secondabioticbottleneck,nexttotheeutrophicsoilconditionsresultingfromformerfertilization.Apotentialeffectisincreasedgrasscoverattheexpenseofforbspecies(Stevensetal.2006).Ashort-termsolutionisinsitumitigationbymeasuressuchaslimingorincreasedmowingtoovercometheacidifyingandeutrophyingeffects(Stevensetal.2011b;Jonesetal.2017).Amore sustainable long-termstrategy is tobringdownatmosphericnitrogendepositions inNatura2000 sites tonon-detrimental levels (Soonset al. 2017),which cannotbedonebylocal field managers but involves national and international legislation, e.g. theprogrammaticapproachtonitrogen(ProgrammatischeAanpakStikstof,PAS)inFlandersandtheNetherlands.Whenlong-termnitrogeninput isceased,mowingandremovingbiomasstwiceayeareffectivelyleadstoadecreaseinsoilnitrogenconcentrationsandplantdiversityrecoveryingrasslands(Storkeyetal.2015).
Overcomingabioticbottleneckshasrarelyledtothetargetedhabitatrecovery(Verhagenetal.2001;Bischoff2002;PoschlodandBiewer2005).Biotic bottlenecksmustbetackledaswell. Seeds of target plant species (Ozinga et al. 2009) and the typical community of soilorganisms(vanderHeijdenetal.2008)maybeabsentorhinderedbyhabitatfragmentationandlowdispersalcapacityofNardusgrasslandspecies(Verhagenetal.2001;Piessensetal.2005).Thesoilseedbankofeutrophicgrasslandsdoesnotcontainspeciesofsemi-naturalgrasslandtypes(Bekkeretal.1997).Spontaneousrecolonizationoftargetspeciesmayoccurafter the abiotic conditions are restored if the surrounding landscape is species-rich andlandscapeconnectivityishigh(Mitchleyetal.2012;Michalcováetal.2013)andthesource-communitiesarecloseby(e.g.withinafewmeters,Berendseetal.1992).InwesternEurope,however, oligotrophic grasslands are nutrient-poor habitat islands in a species-pooreutrophic landscape (Fibich et al. 2018).Hence, active re-introductions bye.g. transfer offreshseed-containinghayorseedingofmissingspeciesarecrucialforrestoringthetargetedspecies-richcommunitiesintheshortterm(Kiehletal.2010).Inthelongterm,connectingthe oligotrophic habitats by strategic ecological restoration is amore sustainable solution(ecologicalintensificationofthelandscapesensuKovács-Hostyánszkietal.(2017)).

26
Table 1.2 Costs, advantages and disadvantages of several ecological restoration techniques for restoringphosphorus-poorsoilconditionsoneutrophicsoils.TheunderlinedtechniquesarestudiedinthisPhDTechnique Cost
(euroha-1)Advantages Disadvantages
Topsoilremoval 15500–20200–25000a175000a2
Onetimeintervention P-limitationinshort-term
ExpensiveDeepexcavationnecessaryifsoil-PhasleachedtodeepersoillayersDeepexcavationnotalwayspossibleRemovestheseedbank,soillayerrichinorganicmatterandcationsabletobufferagainstacidification
Full-inversiontillage
2170b OnetimeinterventionP-limitationinshort-term
NotsuitableforsoilswithdeepleachingofP
Grazing 284–600c ClosetotraditionalmanagementofNardusgrasslandIncreasedheterogeneityandpatchiness
LimitedP-removal
Mowing 580–1872d ClosetotraditionalmanagementofNardusgrasslandNonutrientorpesticideinputNK-limitationwithinafewyears
LimitedP-removalUncertaintlyoftimeneededHayqualitydecreasessocostincreasesHighcumulativecosts
P-mining 0–540e IncreasedP-removal UncertaintlyoftimeneededUncertaintyofproductivityandeconomicalattainabilityRequiresfertilizersandintensiveagriculturalmanagementHighcumulativecosts
a1 removalof0-50cm including transportationcost for respectively1km,2kmand3km(Oosterbaanetal.2008);a2averagecostforremovalof0-50cmincludingtransportationcost(Anonymous2012);costsmaybeloweriftopsoilremovaliscombinedwithe.g.constructionofdikes.bconversionfromPoundsterlingtoEuro(Luscombeetal.2008)cexcludingplacingoffences,includingreparationcoststofences(Anonymous2012)dpricedifferencedependsupondifficultytomowonterrain(Anonymous2012)anduponthegainor losstodisposeofthehay, inFlandersandtheNetherlandstheprocessingofhaycosts50europertondrybiomass(CompeerandMattheij2017)eCostmayvaryfrombreak-even(orevenprofitable)till540europerhectare(Oosterbaanetal.2008)

27
1.5Aim,researchquestionsandthesisoutline
InthisPhDthesis,weaimtostudyhowNardusgrasslandcommunitiescanberestoredafterintensiveland-use.Ourthreemainresearchquestions(RQ)are:
RQ1: Can traditionalmanagement bymowing restoreNardus grassland on formeragriculturalland?RQ2:Isitpossibletomakephytominingofphosphorusmoreefficientandeffective?RQ3:DoNardusgrasslandspeciesbenefitfrominoculationwithsoilbiotaalongasoilphosphorusgradient?
In Chapter 2, we evaluate the effects of traditional mowing management on formeragricultural land and compare the vegetation composition and soil phosphorusconcentrationsofformerlyintensifiedgrasslandswithremnantNardusgrasslands(RQ1;Fig.1.10). Based on fieldmeasurements of phosphorus removal bymowing,we estimate thetimeneeded to reach thephosphorus threshold found in remnantNardus grasslands.Wefurther model the restoration time needed with P-mining and compare and discuss theattainabilityofthetargetwithbothmanagementmeasures.
InChapters3-5,weusesoilphosphorusgradientsinonefieldandthreepotexperimentstostudy the optimization of phosphorus removal by P-mining (RQ2). We used the soilphosphorus gradient approach to simulate the chronosequence of soil phosphorusconcentrationsduringrestoration.
- Chapter 3 handles a five-year field experiment situated in the nature reserves ofLandschap de Liereman and Vloethemveld wherein the effects of mowing and P-mining management are compared with regard to phosphorus removal and soilphosphorusconcentrations.
- Chapter 4 reports the resultsof apot experiment inwhichweaimed to speedupphosphorus removal by P-mining by adding either humic substances or arbuscularmycorrhiza.
- InChapter5,wecomparephosphorusremovalbyphosphorusminingwithfivecropspeciesinanotherpotexperiment.
InChapter6,thefirstresultsofamulti-yearmesocosmexperimentarepresented,inwhichwealsouseasoilphosphorusgradienttostudytheinteractiveeffectsofsoilbiotaandsoilphosphorus availabilityon targetplant species abundance (RQ3). The slow-growing targetspecies were planted in communities with fast-growing meso- and eutrophic speciesallowingforcompetitionbetweentheplantspecies.
InChapter7,wesynthesizethenewinsightsacquiredduringthisPhDthesistoanswerthethreeresearchquestionsanddevelopadecisionschemetoguidepractitionersinevaluatingtheattainabilityoftheirtargetsandinselectingthemostappropriaterestorationtechnique.Finally, we discuss the implications for practice and policy, recommend opportunities forfurtherresearchandsummarizethekeyfindings.

28
Figure 1.10 Thesis outline. In Chapter 2, we explored the effects of reinstating traditional mowingmanagementafteraperiodofintensiveland-useanddescribethedistancetotargetforNardusgrasslands(Natura2000habitattypeH6230*)invegetationcompositionandsoilphosphorusconcentrations(ResearchQuestion1).InChapters3-5,weexperimentallyexplorepossibilitiestomakephytominingofphosphorus(bymowingorP-mining)moreefficientandeffective(ResearchQuestion2).Chapter6containsthefirstresultsofanexperimenttoallowNardusgrasslandspeciestogrowabovetheirsoilphosphorusthresholdbyaddingsoil biota (Research Question 3). In Chapter 7, the results of this thesis are discussed, a decision tree ispresented to aid practitioners to select themost appropriate restoration technique; and,we explore theimplications forpractice,opportunities for further researchandwegivea conciseanswer to the researchquestions

29
CHAPTER 2 P-removal for restoration of Nardus grasslands on former agricultural land: cu�ing
CHAPTER 2P-removal for restoration of Nardus grasslands on
former agricultural land: cut�ng tradi�ons
Mowing of mesotrophic grasslands on previously intensively managed fields in nature reserve Vlijmens Venin ‘s-Hertogenbosch (NL) in June 2018
A�er: Schelfhout S, Mertens J, Perring MP, Raman M, Baeten L, Demey A, Reubens B, Oosterlynck S, Gibson-Roy P, Verheyen K, De Schrijver A. 2017. P-removal for restoration of Nardus grasslands on former agriculturalland: cutting traditions. Restoration Ecology 25:S178–S187. Doi: 10.1111/rec.12531

30
Abstract
Past intensive land-use complicates the successful restoration of oligotrophic species-richgrassland types. One of the major bottlenecks are the elevated nutrient levels due tofertilization,especiallyresidualphosphorus(P).Aimingtodepletenutrients,managersoftenreintroduce traditional haymakingmanagement, sometimes combinedwith grazing. Here,weevaluatewhetherthistechniquerestorestheabioticandbioticboundaryconditionsforrestorationofNardusgrassland.SevengrasslandswereselectedinFlanders,Belgium,whichhadelevatednutrientlevelsafterthecessationof intensiveagriculture16to24yearsago,andwhich have beenmown and grazed since.We compared soil and vegetation data ofthese post-fertilization grasslands with 34 well-developed oligotrophicNardus grasslands.Mowing and grazing did not cause community composition to resemble that of Nardusgrassland.Furthermore,bioavailableP-concentrationsweresignificantlyhigherinthepost-fertilization grasslands andP-limitationwasnotobtained.RestoringP-poor soil conditionsthrough continued mowing and grazing management would take at least decades.Phosphorus-miningcanshortentherestorationtimebyincreasedP-removal.
2.1Introduction
Thesoilphosphoruscontentcanbedecreasedbyremovingphosphorustakenupbyplants,i.e. phytomining which includes mowing and P-mining management (see §1.4). Thephosphorus removal rate depends upon the amount of harvested biomass and upon itsphosphorusconcentration.Incaseofgrasslandrestorationonfertilizedland,thepracticeofmowing with hay removal after the cessation of fertilization is often used, sometimescombinedwithgrazing.Mowingremovesnitrogeneffectivelybecausenitrateismobileandhighlysusceptibleforleachingorplant-uptake(Storkeyetal.2015).However,mowingdoesnot sufficientlydecrease thesoilphosphoruscontentonheavily fertilizedagricultural land(Smits et al. 2008). The reason for low annual phosphorus removal with mowing is thedecliningbiomassproductionduetolimitationofothernutrientsthanphosphorus,namelynitrogen(VanDerWoudeetal.1994;Smitsetal.2008)and/orpotassium(Oelmannetal.2009).Restoringphosphorus-poorsoilconditionsthroughmowingmayconsequentlytakealongtimeandmowingcan,therefore, fail–asasinglemeasure–torestorebiodiversityonheavilyfertilizedland(Smitsetal.2008).
Here,westudytherestorationsuccessofsevenpost-fertilizationgrasslandsthathavebeenmownfollowedbygrazingformorethan15yearsinordertorestoreNardusgrasslands.Toget insight inthe‘distancetotarget’,ofthepost-fertilizationgrasslands,wecomparetheirvegetation composition and soil phosphorus concentrationswithwell-developed remnantNardusgrasslands.Wemeasuredhowmuchphosphorushasbeenremovedbythepracticeof mowing and calculated the phosphorus stock that would have been removed by amanagementofP-mining.TheeffectivenessofbothmowingandP-mining techniqueswasassessedbycalculatingthetimeneededforrestoration.

31
2.2Methods
2.2.1FieldmeasurementsinNardusgrasslandsandpost-fertilizationgrasslands
To assess vegetation composition and soil data of remnantNardus grasslands,we used adatabasecontainingdataof34parcelsspreadover11locationsinnorthernBelgium(INBO2015).Mostofthesegrasslandsweredegradedtosomedegreeby(i)atmosphericnitrogendepositioninthepast(criticalloadwasexceededinmorethan70%oftheareaofspecies-richgrasslandsin2008innorthernBelgium)orpresent(criticalloadwasexceededinmorethan47%oftheareaofspecies-richgrasslandsin2017;VlaamseMilieumaatschappij2018),and by (ii) habitat fragmentation. However, we can assume that the soil phosphorusconcentrationswereunchangedandcanberegardedasreferencevaluestocomparewith.Theplantspeciescoverwasmeasuredina9m2quadratperparcelinJuly-September2012– 2014. In eachNardus grassland, one representativequadratwas selectedwithout usingthe presence or absence of target plant species as a selection criterion. Subsequently tothese vegetation surveys, nine soil cores (0-10 cm) were collected in each quadrat andcombinedintoonesample(0.5l).Thesesamplesweredried(40°Cfor48h),sieved(2mmsievesize)andchemically-analysed(seefurtherchemicalanalyses).
We selected seven post-fertilization grasslands, all with comparable hydrology and soiltextureastheNardusgrasslands.Thesegrasslandswerelocatedonrelativelydry,sandysoils(Podzol in WRB classification) in two neighbouring nature reserves in northern Belgium:TurnhoutsVennengebiedandLandschapdeLiereman(Appendix2.B).Thesevengrasslandswereinintensiveagriculturaluse,andhence,fertilizeduntil16–24yearsago.Sincethen,althoughstillexposedtoatmosphericN-deposition (28-31kgNha-1y-1;Coolsetal.2015),activefertilizationhasceased.ThemanagementconsistedofmowingwithhayremovalonceayearinJulyandgrazinginlatesummerwithponiesorcows.
VegetationmeasurementswereperformedinJuly2014in4m²plotsperparcel,thenumberofplotsperparcel(twotosix)dependedonthesizeandtheheterogeneityofthegrassland.Foursoilcores(0-10cm)werecollectedfromeachquadratandcombinedintoonesample(0.3 l). The sampleswere dried, sieved and analysed for bioavailable and slowly cycling P(seefurtherchemicalanalyses).
Inthepost-fertilizationgrasslands,P-removalbythecurrentmowingpracticewasassessedbymeasuringbiomassproductionandbiomassP-concentration(PDM)inone0.25m2subplotwithineachofthequadrats.Theswardwascuttwocmabovethesoillevelonthesamedayasthevegetationsurvey.Vegetationsamplesweredried(70°Cfor48h),weighedtoobtainthetotaldrybiomass(DM)andgroundbeforechemicalanalysis(seefurther).
2.2.2Chemicalanalyses
Asameasureforthebioavailablephosphoruspool(Gilbertetal.2009),soilswereextractedinNaHCO3(POlsen) following ISO11263:1994(E). Inordertoget insight intheslowlycyclingphosphoruspool,weextractedsoils inammonium-oxalate-oxalicacid (POxalateaccording to

32
NEN 5776:2006; van Rotterdam et al. 2012). Extracted phosphorus was measuredcolorimetrically according to the malachite green procedure (Lajtha et al. 1999). POxalateconcentrationswerenotavailableinthedatabaseofNardusgrasslandsandwerethereforecalculatedbasedonthePOlsenconcentrations.WeassessedtherelationbetweenPOlsenandPOxalate in120soil samples taken inclosevicinity to thepost-fertilizationgrasslands.LinearregressionanalysesrevealedastrongrelationbetweenPOlsenandPOxalate:POxalate=0.67+3.03*POlsen;R2=0.93andp<0.001(lmfunctionintheRpackagestats;Fig.2.1).Additionally,soil-pHH2Ointhepost-fertilizationgrasslandsispresentedinAppendix-Table2.B.
Figure2.1 Linear regressionbetween concentrationsofbioavailableP (POlsen) and slowly cyclingP (POxalate)from 120 soil samples. The bioavailable P-threshold forNardus grasslands, namely, 12mg POlsen kg
-1 (seeMethodssection),correspondstoaslowlycyclingP-concentrationof37mgPOxalatekg
-1andisindicatedwithgreydashedlines.Theblackfulllinedepictsthelinearmodel;theshadedareaillustratesthestandarderror;and,inthetopleft,thelinearmodelandfitareshown
Plantbiomasswasanalysedfortotalphosphorusconcentration(PDM)bydigesting100mgofsamplewith0.4mlHClO4(65%)and2mlHNO3(70%) inTeflonbombsfor4hat140°C.Pwas measured colorimetrically according to the malachite green procedure (Lajtha et al.1999), and total potassium concentration (KDM) by atomic absorption spectrophotometry(AA240FS,FastSequentialAAS).Totalnitrogenconcentration(NDM)wasmeasuredbyhigh-temperaturecombustionat1,150°Cusinganelementalanalyzer (VarioMACROcubeCNS,Elementar,Hanau,Germany).
POxalate= 0.67 + 3.03 * POlsen
p-value < 0.001
R2 = 0.93
12
37

33
2.2.3Calculationsandstatisticalanalyses
Wecombinedtwodatasetsofvegetationsurveysdifferinginplotsize(Nardusgrasslandsof9 m2 and post-fertilization grasslands of 4 m2size). To be able to compare plant speciesrichness and vegetation composition inNardus and post-fertilization grasslands, we usedrarefactioncurvestoconvertthe4m2quadratsinpost-fertilizationgrasslandsintoone9m2quadrat per grassland, a procedure made possible by the multiple quadrats per post-fertilizationgrassland(Appendix2.C,andseeGotelliandColwell2001).
Wetestedfordifferencesinthenumberofplantspeciesandtypicalspecies(Appendix2.A)betweenremnantNardusgrasslands(n=34)andpost-fertilizationgrasslands(n=7)witht.testin the R-package stats without equal variances (p<0.05; R Core Team 2015). To explorepotential differences in plant community composition, we performed a non-metricmulti-dimensional scaling analysis (NMDS) withmetaMDS from R-package vegan.We used theLennon dissimilarity index to quantify between-plot compositional differences with theoriginal quadrat data. Since this index is derived from species turnover only, it excludesnestedness patterns derived from richness differences (Baselga 2010). Convex hulls wereaddedwithordihull fromR-packagevegan (Fig.2.2;Oksanenetal.2017).Weperformedapermutationalanalysisofvarianceonthesamedissimilaritymatrix,withgrasslandtypeaspredictor and a significance based on 999 permutations (Anderson 2001). Plant speciessignificantly indicative for eitherNardus or post-fertilization grasslands from the quadratsrecorded here were obtained by indicator value analysis withmultipatt in the R-packageindicspecies(DeCáceresetal.2010).
Wetestedfordifferences insoilPOlsenandPOxalateconcentrationsbetweenremnantNardusgrasslands(n=34)andpost-fertilizationgrasslands(n=7)byusingt.testintheR-packagestatswithout equal variances. To get insight in the abiotic ‘distance to target’ of the post-fertilization grasslands, we used a threshold value for bioavailable phosphorus of 12 mgPOlsenkg-1soil,whichwascalculatedasthe95percentileofthedatasetgatheredinRamanetal. (Instituut voor Natuur- en Bosonderzoek, Brussel, unpublished data). This valuecorrespondswith a slowly cycling phosphorus pool of 37mg POxalate kg-1 when convertedwiththelinearregressionasdiscussedpreviously.
POxalatestocksinthe0-10cmsoillayerwerecalculatedbyassumingsoilbulkdensityof1.4gcm-3 for sandy soils. For Nardus grasslands, a threshold value of 51.8 kg POxalate ha-1 washerewithcalculated.SubtractingthisthresholdvaluefromtheP-oxalatestocksofeachpost-fertilizationgrasslandgaveinsightinthe‘distancetotarget’,i.e.theexcessofslowlycyclingphosphorus(PExcessive).
The annual P-removal by mowing the post-fertilization quadrats was calculated bymultiplying DM with PDM. For each post-fertilization grassland, we estimated how manyyears itwouldtaketoreachthethresholdofNardusgrasslandbydividingPExcessivewith itscurrentannualP-removal.

34
How long it takes to reach the threshold value depends both on the phosphorusconcentrations in the soil and the soil depth inwhich concentrations are elevated.Whenparcelsareregularlyploughed,itislikelythatP-concentrationsareelevatedinthecompletefurrow,orevendeeperwhensoilswereP-saturatedandP-leachingoccurred. Ifnoregularploughing has occurred, sometimes only the topsoil has elevated P-concentrations. Weillustratedthisissuebyperformingourcalculationsfortwocases:i)caseinwhichonlythe0-10 cm topsoil and ii) case in which the furrow (0-30 cm soil) contains elevated P-concentrations.TheP-concentrationforthe0-30cmsoilwasassumedtobethesameasinthe0-10cmsoil.Weherewanttostressthatthesecalculationsareonlyestimations,aswehereassumeP-removalbymowingtostayconstantintime.Itmight,however,bepossiblethatannualP-removalwould furtherdecreaseasaconsequenceofP-depletion in thesoil(Chapter4).
To verifywhether the target of P-limitation orNP-co-limitationwas obtained in the post-fertilization grasslands (see Introduction), we compared PDM and NDM to the ecologicalcriticalthresholdsofP-andN-limitationingrasslands(PDM<0.7gPkg-1andNDM<14gNkg-1according toWassen et al. 1995 and Güsewell 2004). To verify which nutrient(s) limitedbiomass production for P-mining purposes, we compared P-, N- and K-concentrations inplantbiomasstoagriculturalstandards(PDM<2.6gPkg-1,NDM<20gNkg-1,KDM<20gKkg-1;Baileyetal.1997).
For each post-fertilization grassland, we calculated potential P-extraction by P-mining. P-mining results in lifting N- and K-limitation through fertilization, andwe assume biomassproductionwill increasecomparedtothemowingmanagement.DuetoNK-fertilization,P-removalwill increasewithbiomassproduction,whilePDMwillprobablynotchange,as it ismainlyinfluencedbybioavailablesoil-P-concentrations(Gilbertetal.2009).WefurthermoremodelledhowmuchtimeitwilltaketodepletePExcessivebyP-mining.Alsoherewewanttostress that our calculations are only rough estimations because little experimentalknowledge is available on how effective P-mining is in the long-term (MacDonald et al.2012).DuringP-miningmanagement,annualP-removaldeclinesovertimewithdecreasingsoilphosphorusbioavailability(Chapter4).Therefore,weassumethatinitially,inasoilwithhigh bioavailable phosphorus concentration (>65mg POlsen kg-1), annual P-removal is high(i.e.45kgPha-1accordingtounpublishedresultsonP-miningfields inclosevicinitytothepost-fertilizationgrasslands).Further,weassumedP-miningtoslowdownuntil20mgPOlsenkg-1isreachedinstepsaccordingtoChapter4:65-55mgPOlsenkg-1,33.5kgPha-1;55-36mgPOlsenkg-1,22kgPha-1;36-25mgPOlsenkg-1,14kgPha-1;25-20mgPOlsenkg-1,10kgPha-1.Whenbioavailablephosphoruspoolsaredepletedany further,P-removalbyP-miningwilllikely approach phosphorus removal by mowing. Therefore, we suggest changing themanagement from P-mining to mowing without NK-fertilization when a bioavailable P-concentration of 20 mg POlsen kg-1 is achieved. In this last step, we use the measured P-removalbymowingfromeachpost-fertilizationquadratuntilthetargetof12mgPOlsenkg-1isreached.Alsothesecalculationswereperformedfortwosoildepths,0-10cmand0-30cm.
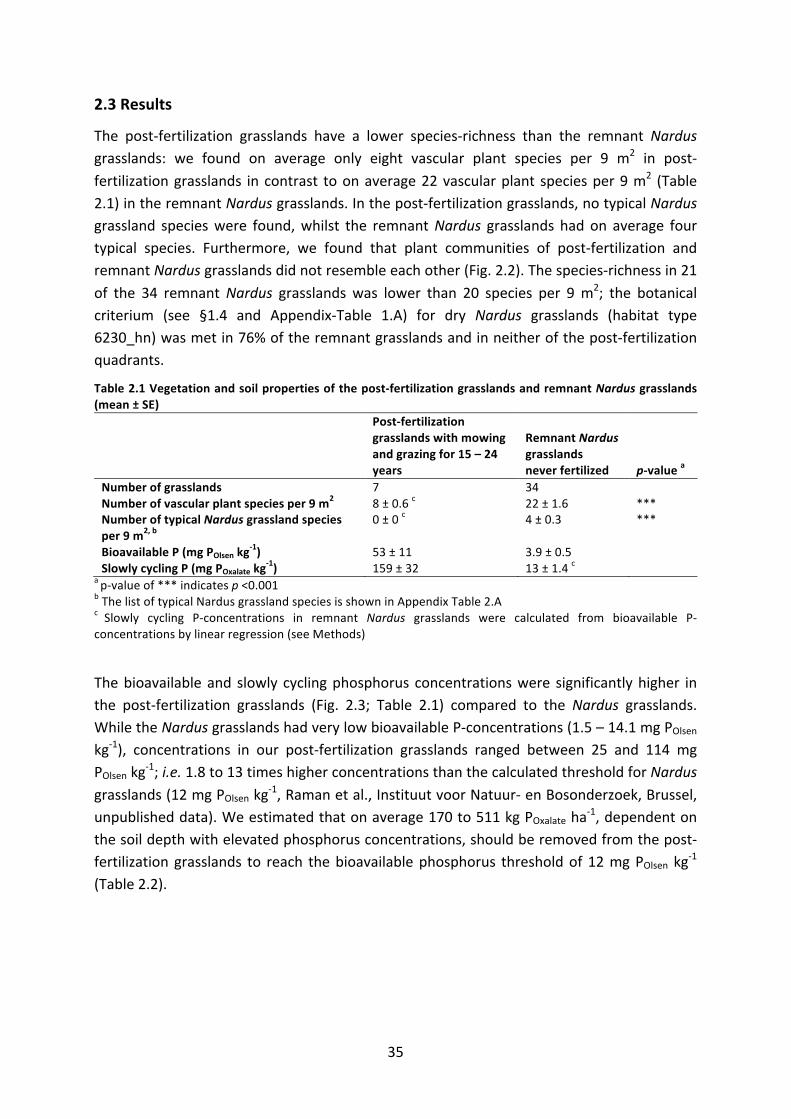
35
2.3Results
The post-fertilization grasslands have a lower species-richness than the remnant Nardusgrasslands: we found on average only eight vascular plant species per 9 m2 in post-fertilizationgrasslands incontrast toonaverage22vascularplant speciesper9m2 (Table2.1)intheremnantNardusgrasslands.Inthepost-fertilizationgrasslands,notypicalNardusgrassland specieswere found,whilst the remnantNardusgrasslands had on average fourtypical species. Furthermore, we found that plant communities of post-fertilization andremnantNardusgrasslandsdidnotresembleeachother(Fig.2.2).Thespecies-richnessin21of the 34 remnantNardus grasslands was lower than 20 species per 9m2; the botanicalcriterium (see §1.4 and Appendix-Table 1.A) for dry Nardus grasslands (habitat type6230_hn)wasmetin76%oftheremnantgrasslandsandinneitherofthepost-fertilizationquadrants.
Table2.1Vegetationandsoilpropertiesofthepost-fertilizationgrasslandsandremnantNardusgrasslands(mean±SE) Post-fertilization
grasslandswithmowingandgrazingfor15–24years
RemnantNardusgrasslandsneverfertilized p-valuea
Numberofgrasslands 7 34 Numberofvascularplantspeciesper9m2 8±0.6c 22±1.6 ***NumberoftypicalNardusgrasslandspeciesper9m2,b
0±0c 4±0.3 ***
BioavailableP(mgPOlsenkg-1) 53±11 3.9±0.5
SlowlycyclingP(mgPOxalatekg-1) 159±32 13±1.4c
ap-valueof***indicatesp<0.001bThelistoftypicalNardusgrasslandspeciesisshowninAppendixTable2.Ac Slowly cycling P-concentrations in remnant Nardus grasslands were calculated from bioavailable P-concentrationsbylinearregression(seeMethods)
Thebioavailableand slowly cyclingphosphorus concentrationswere significantlyhigher inthe post-fertilization grasslands (Fig. 2.3; Table 2.1) compared to the Nardus grasslands.WhiletheNardusgrasslandshadverylowbioavailableP-concentrations(1.5–14.1mgPOlsenkg-1), concentrations in our post-fertilization grasslands ranged between 25 and 114 mgPOlsenkg-1;i.e.1.8to13timeshigherconcentrationsthanthecalculatedthresholdforNardusgrasslands(12mgPOlsenkg-1,Ramanetal.,InstituutvoorNatuur-enBosonderzoek,Brussel,unpublisheddata).Weestimatedthatonaverage170to511kgPOxalateha-1,dependentonthesoildepthwithelevatedphosphorusconcentrations,shouldberemovedfromthepost-fertilizationgrasslands to reach thebioavailablephosphorus thresholdof12mgPOlsen kg-1(Table2.2).

36
Figure2.2Resultsofanon-metricmulti-dimentionalscaling(NMDS)ordinationoftheplantcommunitiesinthe 34 remnant Nardus grasslands and the seven post-fertilization grasslands (29 quadrats are shown).Distancesbetweenpointsrepresentdifferencesinthecompositionofvegetationplotsthatarederivedfromturnover (Lennon dissimilarity; F=44.2; p<0.001) and are independent from variation in species richness.Indicative species significantly associated with our remnant Nardus grasslands and post-fertilizationgrasslandsrespectively,wereshownrespectivelyintherightandleftcornersingray(p=0.001)
Figure2.3Numberofvascularplant species found in9m2quadrats for remnantNardus grasslands (n=34)andpost-fertilizationgrasslands(n=7)versusbioavailableP-concentration(mgPOlsenkg
-1).Numberofplantspeciesinpost-fertilizationgrasslandswasestimatedfromrarefactioncurves(Appendix2.C).Thereddottedlineindicates12mgPOlsenkg
-1
0.2
0.4
0.6
0.0
-0.2
-0.4
-0.6
Remnant Nardus grassland
identity

37
Figure2.4NDM-andPDM-concentrationinthevegetationofpost-fertilizationquadrats(n=29)areshownwithdifferentshapesaccordingtosevengrasslandstheyweresurveyedin.ThecoloredpolygonsindicateN-,P-orNP-co-limitation in an ecological context (Wassen et al. 1995). The red dashed lines indicate N- and P-limitationinanagriculturalcontext(Baileyetal.1997).TheredopencircleshowstheonequadratwhereKwasnotlimitingaccordingtotheagriculturalstandardofBaileyetal.(1997)
We compared N, K and P concentrations in the plant biomass of the post-fertilizationgrasslandstoagriculturalstandardvalues(growthlimitationwhenNDM<20gNkg-1,KDM<20gKkg-1,PDM<2.6gPkg-1,Baileyetal.1997).Infiveofthesevenpost-fertilizationgrasslands,wefoundalimitationofNandP,whileKwaslimitinginallseven(seeFig.2.4).Areviewonnutrient limitationbyGüsewell (2004) revealed thatanN:P ratioof less than10 indicatesthatbiomassproductionwill be stimulatedbyN-fertilization.We found that theN:P ratiowas less than10 in all post-fertilization grasslands, and in noneof them the ecological P-limitationwasreached(PDM<0.7gPkg-1,Wassenetal.1995).
The currentmowingmanagement in thepost-fertilizationgrasslands annually removesonaverage1.9tdrybiomassha-1and5.3kgPha-1.Weestimatedthatitwouldtakeabout40to118yearstoreachthesoilPthresholdwiththisP-removalrate,therangedependentofthesoil depthwith elevated P-concentrations (Table 2.2). Our calculations show that with P-mining,thetimeneededtoreachtherestorationtargetislessthanhalfofthetimeneededwithmowingmanagement(onaverage14to46years,dependingonthedepthofsoilwithelevatedP-concentrations,seeTable2.2).
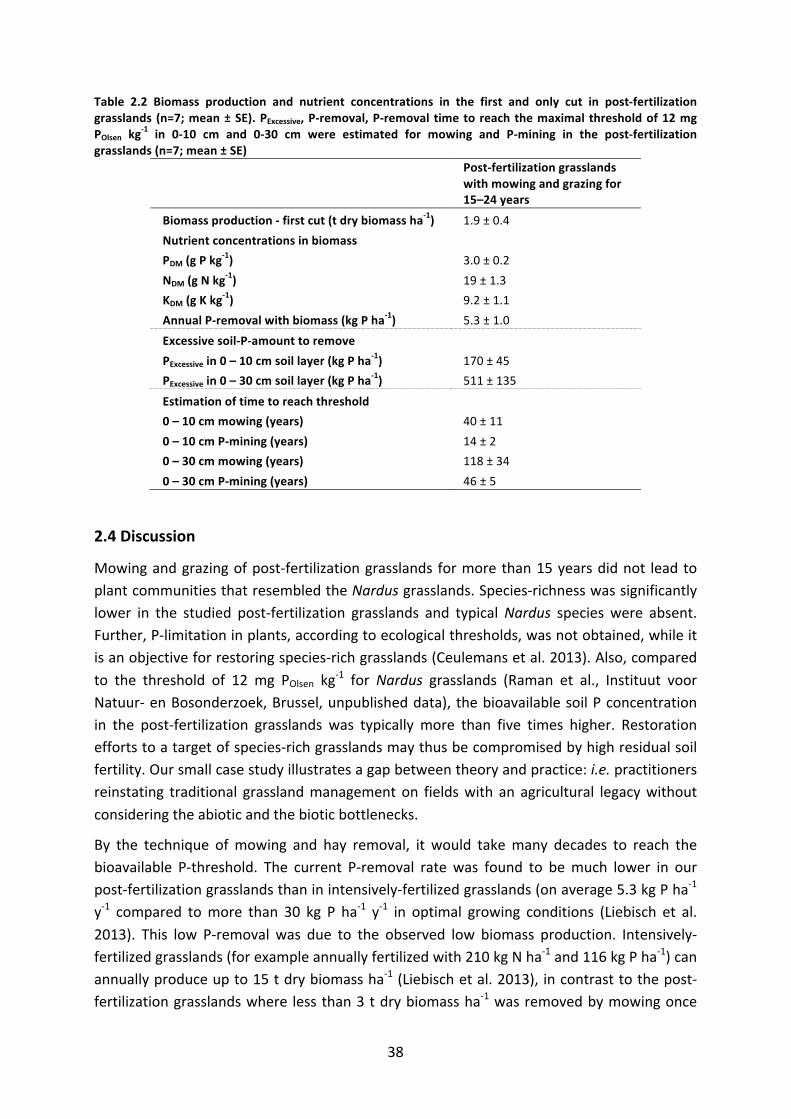
38
Table 2.2 Biomass production and nutrient concentrations in the first and only cut in post-fertilizationgrasslands (n=7;mean±SE).PExcessive,P-removal,P-removal timetoreachthemaximal thresholdof12mgPOlsen kg
-1 in 0-10 cm and 0-30 cm were estimated for mowing and P-mining in the post-fertilizationgrasslands(n=7;mean±SE)
Post-fertilizationgrasslandswithmowingandgrazingfor15–24years
Biomassproduction-firstcut(tdrybiomassha-1) 1.9±0.4Nutrientconcentrationsinbiomass PDM(gPkg
-1) 3.0±0.2NDM(gNkg
-1) 19±1.3KDM(gKkg
-1) 9.2±1.1AnnualP-removalwithbiomass(kgPha-1) 5.3±1.0Excessivesoil-P-amounttoremove PExcessivein0–10cmsoillayer(kgPha-1) 170±45PExcessivein0–30cmsoillayer(kgPha-1) 511±135Estimationoftimetoreachthreshold 0–10cmmowing(years) 40±110–10cmP-mining(years) 14±20–30cmmowing(years) 118±340–30cmP-mining(years) 46±5
2.4Discussion
Mowingandgrazingofpost-fertilizationgrasslands formorethan15yearsdidnot leadtoplantcommunitiesthatresembledtheNardusgrasslands.Species-richnesswassignificantlylower in the studied post-fertilization grasslands and typicalNardus species were absent.Further,P-limitationinplants,accordingtoecologicalthresholds,wasnotobtained,whileitisanobjectiveforrestoringspecies-richgrasslands(Ceulemansetal.2013).Also,comparedto the threshold of 12 mg POlsen kg-1 forNardus grasslands (Raman et al., Instituut voorNatuur-enBosonderzoek,Brussel,unpublisheddata), thebioavailablesoilPconcentrationin the post-fertilization grasslands was typically more than five times higher. Restorationeffortstoatargetofspecies-richgrasslandsmaythusbecompromisedbyhighresidualsoilfertility.Oursmallcasestudyillustratesagapbetweentheoryandpractice:i.e.practitionersreinstating traditional grasslandmanagementon fieldswith an agricultural legacywithoutconsideringtheabioticandthebioticbottlenecks.
By the technique ofmowing and hay removal, it would takemany decades to reach thebioavailable P-threshold. The current P-removal ratewas found to bemuch lower in ourpost-fertilizationgrasslandsthaninintensively-fertilizedgrasslands(onaverage5.3kgPha-1y-1 compared tomore than 30 kg P ha-1 y-1 in optimal growing conditions (Liebisch et al.2013). This low P-removal was due to the observed low biomass production. Intensively-fertilizedgrasslands(forexampleannuallyfertilizedwith210kgNha-1and116kgPha-1)canannuallyproduceupto15tdrybiomassha-1(Liebischetal.2013), incontrasttothepost-fertilizationgrasslandswhere lessthan3tdrybiomassha-1wasremovedbymowingonce

39
per year (at least in all quadrats but one,where 5 t dry biomass ha-1was removed). ThisfindingwassimilartoobservationsbyBakkeretal.(2002)ingrasslandsmownfor25yearswithout fertilization. While we can assume that our post-fertilization grasslands werepreviously intensively-fertilized and were, hence, very productive, the low biomassproductioncanbeexplainedbynutrientlimitationofN-and/orK,insomecasesalsoofP,atleastaccordingtoagriculturalstandardvalues.
P-miningaimsatmaximizingP-removalbyNK-fertilization,andourcalculationsshowedthatthis technique might halve the time needed to restore the necessary P-concentrations.AlthoughsomestudiesareinvestigatingP-mininginthefield(Doddetal.2012;Postmaetal.2015),morelong-termfieldexperimentsareneededtogetbetterinsightinwhichcropsaremostoptimaltoreachrestorationtargets.Managerscanchoosetomineasquickaspossibleby means of an intensive agricultural practice, using crops that are not interesting forbiodiversity(e.g.maize)andcropprotectionproducts,orundertakeamoreextensivewayofmining, with crops beingmore interesting for biodiversity (e.g. grass-clover) and no cropprotection(Carvelletal.2006;Goulsonetal.2011).
Little field data is available on the costs/gains of P-mining. Tomake the technique of P-mining economically feasible for farmers, it is important that the crop or hay quality isguaranteed.InfieldswithlowsoilP-concentrationsinanagriculturalcontext,Pinforagewillalsolikelybesuboptimalandthiscanbethecauseofalowernutritionalvalue.Forforagetoserve as the only feed component of the diet of high yielding dairy cows, it should notcontain less than3gP kg-1ofdrybiomass (Valket al. 1999). Possiblyother less commonusedcropswillbemoreoptimalinthelaterstagesofP-mining(e.g.buckwheat;Simpsonetal.2011).
2.5Conclusion
The post-fertilization grasslands under study clearly show that the target of species-richNardus grasslands is far from reached after at least 15 years of traditional grasslandmanagement (mowingwithhay removalandgrazing).Weestimatedthat restoringP-poorsoil conditions through continued traditional mowing and grazingmanagementmay takemany decades. P-mining might halve the time needed to restore the P-poor targetconcentration.
2.6Acknowledgements
WethankthepeoplefromNatuurpuntTurnhoutsVennengebiedandLandschapdeLiereman.Also,we thank L.Willems andG. De bruyn for assistingwith the chemical analysis of soil and biomasssamples. We also thank coordinating editor K. Hulvey and the anonymous reviewers for theirvaluablecommentsonthismanuscript.A.D.S.heldagrant fromtheResearchFoundationFlanders(FWO)andfurthersupportwasprovidedbyFWOprojectG050215N.
Illustrations from Chapter 3 on the next page (from left to right, top to bottom): Jelle Van den Bergheharvesting in Liereman-1;DannyVereeckeharvesting in Liereman-2; amowingplot at Liereman-1 in June2016;KrisandFilipCeunenandJelleVandenBergherakingthecutgrassinLiereman-2;thefinger-bar;soilprofileinLiereman-1;RobbeDeBeeldeinapackedcarwiththemowermachineandfreshbiomasssamples


41
CHAPTER 3 Phytomining to re-establish phosphorus-poor soil conditions for nature restoration on formeragricultural land
CHAPTER 3Phytomining to re-establish phosphorus-poor soil
condi�ons for nature restora�on on formeragricultural land
Mowing of the field experiment in Oud-Turnhout required a lot of (wo)man power
After: Schelfhout S, Schrijver A, Vanhellemont M, Vangansbeke P, Wasof S, Perring MP, Haesaert G, VerheyenK, Mertens J. Phytomining to re-establish phosphorus-poor soil conditions for nature restoration on formeragricultural land. Accepted pending minor revisions at Plant and Soil

42
Abstract
Torestorespecies-richgrasslandsonformeragriculturalland,typicallyphosphorus-poorsoilconditionsneedtobere-established.Hereweassessthepotentialofphosphorusextractionby biomass production, i.e. phytomining. We compare two techniques: (i) mowing, i.e.cuttingandremovinghaytwoorthreetimesayear,and(ii)P-mining,i.e.mowingwithyieldmaximizationbyaddinggrowth-limitingnutrientsotherthanphosphorus(i.e.nitrogenandpotassium).
Inafive-yearfieldexperimentatthreefieldssituatedalongasoilphosphorusgradient,westudied phosphorus removal through both biomass assessment and changes in two soilphosphoruspools:bioavailablephosphorus(POlsen)andslowlycyclingphosphorus(POxalate).
Phosphorus-mining doubled the phosphorus removalwith biomass compared tomowing,and phosphorus removal with biomass was lower at fields with an initially lowerconcentrationofPOlseninthesoil.ThePOlsenconcentrationsdecreasedsignificantlyduringtheexperimentwith the largest decreases in phosphorus-rich plots. Changes in the POlsen andPOxalatestockswerecorrelatedwiththeamountofphosphorusremovedwithbiomass.
Phosphorus-mining effectively increases phosphorus removal compared to mowing, butbecomes less efficient with decreasing soil phosphorus concentrations. Restoringphosphorus-poor soil conditions on formerly fertilized land remains a challenge:phytominingmostoftenneedsalong-termcommitment.
3.1Introduction
Inafield-basedexperiment,weinvestigatedtheeffectivenessoftworestorationtechniquesfor phosphorus removal and their effect on the concentrations and stocks of bioavailableand slowly cycling phosphorus in the soil.We compared (i)mowing, i.e. cutting grasslandswardstoremovenutrientswithhay,and(ii)P-mining,i.e.mowingmanagementcombinedwith fertilization of nitrogen and potassium (growth-limiting nutrients other thanphosphorus) to maximize biomass production and thus phosphorus removal (see §1.4).Mowingiswidelyusedasarestorationtechniqueonformeragriculturalland(e.g.Bakkeretal.2002;Töröketal.2011;Chapter2).Afterseveralyearsofmowing,however,thebiomassproduction generally decreases due to limitation by nitrogen and potassium (Van DerWoudeet al. 1994;Oelmannet al. 2009), and therefore lessphosphoruswill be removedwithhay.P-miningcouldbemoreeffectiveatreducingsoilphosphorusconcentrations.Yet,only little field evidence on the effects of long-term P-mining is available, especially incomparisonwithmowingmanagement. Recently, Johnston et al. (2016) compiled severallong-termphosphorusdepletionexperimentsandfoundbioavailablephosphorustodeclineexponentially, with the rate of decline depending on the soil’s phosphorus-bufferingcapacity, actual phosphorus saturation and ability to restore the equilibriumbetween thedifferent phosphorus pools.We performed our experiment from 2011-2016 (i.e. during 5years) in three fields differing in historical land-use intensity and thus representing a soilphosphorus gradient. For each studied field and restoration technique, we assessed the

43
annual biomass yield and phosphorus removedwith biomass.We expected (i) to removemorephosphorusbyP-miningthanbymowing;(ii)todepletethestocksofbioavailableandslowlycyclingphosphoruswithamagnitudesimilartotheamountofphosphorusremovedwithbiomass;and (iii) significanteffectsof the initial soilphosphorus concentrationon (i)and(ii).Wediscusstheimplicationofourresultsinanecologicalrestorationcontext.
3.2Methods
3.2.1Studysitesandexperimentalsetup
We selected three fields with comparable soil conditions but different soil phosphorusconcentrations to trade space for time, and hence allow for investigating phosphorusremovalwith biomasswhile soils becomedepleted of phosphorus. The study fields lay inLandschap de Liereman, a nature reserve in northern Belgium (Fig. 3.1). The fields weresimilar with regard to climate, hydrology and soil texture (Table 3.1), but differed in soilphosphorusconcentrationsbecauseofdifferencesinhistoricalland-useintensity.Thefieldswere previously managed as fertilized grasslands mown for hay production; fertilizationceasedin1990forLiereman-1andin2005forLiereman-2andLiereman-3.Theaimofthefieldowner(non-profitorganizationNatuurpunt)istorestorespecies-richNardusgrasslands(Europeanhabitattype6230*),whichlocallyremaininsmallpatchesandroadverges.
InApril2011, theexperimentwassetupbysowing thesamespecies-mixtureatall fields.First,theexistingvegetationwasremovedbyglyphosateapplicationandploughingthe0-30cmsoillayer.Second,thesoilswerelimedwith1424kgCCE(CalciumCarbonateEquivalent)ha-1(2687kggranularDolokornha-1containing:>920g[CaCO3+MgCO3]kg-1,fromwhichatleast530gCaOkg-1and300gMgCO3kg-1; followingrecommendationsbytheBelgianSoilService) and harrowed. Third, we sowed the commercial Herbagreen plus mixture fromPhilipseedsataseedingrateof40kgha-1withaseeddrill:LoliumperenneL.cultivarsPlenty(32%), Roy (20%), Milca (15%) and Alcancia (10%); Phleum pratense L. subsp. pratensecultivarLirocco(10%);FestucapratensisHuds.cultivarPreval(5%);PoapratensisL.cultivarBalin(3%);andtheherbspeciesTrifoliumrepensL.(5%).Thisseedmixturecontainsspeciesthatcanbeusedforforageproduction(i.e.theproducedhayhasaneconomicalvaluetothefarmer)onsandysoils.Limingwasrepeatedeverytwoyearswith1200kgCCEha-1(3000kggranularDolokornha-1containing:>600gCaCO3kg-1and>300gMgCO3kg-1,fromwhichatleast400gCaOkg-1and150gMgO;followingrecommendationsbytheBelgianSoilService).InMay2012,weappliedherbicidestofavourthesowngrassspecies(Bofix:40g[(4-Amino-3,5-dichloro-6-fluoro-2-pyridinyl)oxy]acetic acid L-1, 20 g 3,6-Dichloropyridine-2-carboxylicacidL-1and200g(4-Chloro-2-methylphenoxy)aceticacidL-1atarateof5Lha-1).In2013and2014,thiswasrepeatedinthepartsofthefieldsmanagedbyP-mining.
Ateachfield,wemarkedeightplotsof4.5mby7m,whichwethenfurthermanaged(from2011-2016) by one of the two studied restoration techniques: mowing in four plots, P-mining intheotherfourplots,accordingtoarandomizedblockdesign(Fig.3.2).Thetotalnumber of plots was 24 (8 plots x 3 fields). The mowing plots were managed without

44
fertilization; the P-mining plots with annual fertilization of nitrogen (130 kg N ha-1 asNH4NO3)andpotassium(225kgKha-1asK2SO4.MgSO4, i.e. followingrecommendationsbythe Belgian Soil Service). All plotsweremown twice a year, except for 2011, i.e. the firstyear, when the vegetation was not fully developed and was mown only once, and 2013when we mowed three times because of high standing crop biomass in August (seeAppendix-Table 3.A). Each year, two thirds of the total annual amount of fertilizer wereappliedinMarchandonethirdafterthefirstcut.WedescribedthevegetationcompositioninJune2017(seeAppendix-Table3.B).
3.2.2Biomasssamplingandchemicalanalyses
Wesampledeachplottwotimesperyear,rightbeforethefieldsweremown.Allplotsofafield were sampled (and mown) at the same time (see Appendix-Table 3.A for samplingdates).Weharvestedthebiomass inthecentralpartofeachplotwithamowerequippedwith a finger-bar of 1.1 m width along a length of 2 to 4 m, which was measuredimmediatelyafter cutting.Weweighed the freshbiomasswithhanging scales in the field,andtookasub-sampleformeasuringthedrymattercontentofthebiomass(afterdryingthesampletoconstantweightat65°Cforatleast48h).
The dry sub-samples were ground and digestedwith 0.4ml HClO4 (65%) and 2ml HNO3(70%)inTeflonbombsat140°Cfor4h.Intheseextracts,thephosphorusconcentrationwasmeasuredcolorimetrically according to themalachitegreenprocedure (Lajthaetal. 1999)and the potassium concentrationwasmeasured by atomic absorption spectrophotometry(AA240FS,FastSequentialAAS,Agilent,SantaClara,UnitedStatesofAmerica).Thenitrogenconcentrationwasmeasuredbyhigh-temperaturecombustionat1150°Cusinganelementalanalyzer(VarioMACROcubeCNS,Elementar,Hanau,Germany).
3.3.3Soilsamplingandchemicalanalyses
InApril2011andJanuary2017,wecollectedsoilsampleswithanaugerof3cmdiameterattwodepths(0-15and15-30cm)atthreelocationsequallyspreadinthecentreofeachplot.Wecombinedthethreesamplesintoamixedsampleperplotandpersamplingdepth,driedthemat40°Cfor48handpassedthemthrougha2mmsieve.Thebioavailableandslowlycycling phosphorus concentrations were measured by the following two methods: (i)extraction in sodium bicarbonate (NaHCO3; according to ISO 11263:1994(E)) to measurebioavailable phosphorus (POlsen), which is available for plants within one growing season(Gilbert et al. 2009), and (ii) extraction in ammoniumoxalate-oxalic acid ((NH4)2C2O4accordingtoNEN5776:2006)tomeasureslowlycyclingphosphorus(POxalate),whichincludesphosphorus thatcanbecomeavailableon the longer term (vanRotterdametal.2012). Inthe 2011 samples, also the total phosphorus concentration (PTotal) was measured aftercomplete destruction with perchloric acid (HClO4; 65%), nitric acid (HNO3; 70%) andsulphuricacid(H2SO4;98%)inTeflonbombsat150°Cfor4h.Intheextracts,thephosphorusconcentrationwasmeasured colorimetrically according to themalachite green procedure(Lajthaetal.1999).

45
To measure soil bulk density at the two sampling depths, we collected undisturbed soilsampleswith standard sharpened steel 100 cm3Kopecky rings (diameter5.1 cm,height5cm). We sampled at four locations in the centre of each field (5 sampling locations inLiereman-1tocoverthepotentialheterogeneityinthisfield).Ateachsamplinglocation,weremovedthetopsoilcontainingmostoftheplantrootswithashovelanddrovetworingsinthe7-12cmsoil layer.Wecarefullyexposedthe15-30cmsoil layerandcollectedanothertwo rings from the 18-23 cm soil layer. The sampleswere dried until constant weight at105°Cfor48handweighed.
3.2.4Calculations
Wecalculatedthebulkdensityofthesoilbydividingthedryweightofthesoilsamplebythevolumeof theKopecky ring.StocksofPOlsenandPOxalatewerecalculatedbymultiplying thebulkdensitywiththephosphorusconcentrationanddepthoftheconcernedsoil layer.WecalculatedthechangesinthePOlsenandPOxalateconcentrationsandstocksovertime(ΔPOlsen,ΔPOxalate)bysubtractingthe2011fromthe2017values.
We calculated phosphorus removal with biomass by multiplying the biomass with itsphosphorusconcentrationforeachsamplingtime,andsummedthemperyeartocalculateannual biomass and phosphorus removal.We then calculated mean annual biomass andphosphorusremovalfortheyears2012until2016,leavingout2011becausethevegetationwas not yet fully developed then. The mean annual phosphorus concentration in drybiomass was calculated by dividing mean annual phosphorus removal by mean annualbiomass.
Wederivedagronomicnutrientindicesforphosphorus,nitrogenandpotassiumtodescribethenutrientlimitationforbiomassgrowthaccordingtoDuruandThélier-Huché(1995)andDuruandDucrocq(1997).Wecalculatedthephosphorus,nitrogenandpotassiumnutritionindices(PNI,NNI,KNI)as
!"# = 100 × !% (0.065 × !%+ 0.15),!!" = 100 × !% 4.8 × !"#$%&&!!.!" ,!"# = 100 × !% (1.6+ 0.525 × !%),
withP%,N%andK%thepercentageofphosphorus,nitrogenandpotassiuminthebiomassof the first cut (May-June). Values of 100% indicate there is no limitation by phosphorus,nitrogen or potassium; values above 100% indicate there is luxury consumption of thisnutrient;and,valuesbelow100% indicatedeficiency inproportion to the index (DuruandDucrocq 1997). For instance, values below 60% indicate severe limitation by this nutrient(Mládkováetal.2015).

46
Figure3.1MapofEuropeandnorthernBelgium(magnificationinsquare)withthenaturereserve(townshipbetweenbrackets)wheretheexperimenttookplace.SoilclassificationaccordingtotheBelgianSoilService
(a)
(b)
Figure3.2(a)Exampleoftheexperimentalsetupateachfield.Wesampledbiomassandsoil inthecentralzone within each of the mowing (green) and P-mining (grey) plots. Bulk density measurements wereperformedonfoursamplesateachfield.(b)IllustrationoftheeffectsoftherestorationtechniquesmowingandP-mininginMay2016inLiereman-1
FIELD
7 m
4.5
m
1.1 m x 2-4 m
5 m
mowing
P-mining
bulk density sampling
biomass sampling
soil sampling
PLOT

Table3.1Initialsoilpropertiesofthethreefields(2011).Samplesfromthe0-30cmsoillayerconsistedofsixsoilcoresbulkedtogethertoonesampleperfield.Samplesfromthe0-15and15-30cmsoillayersareshownbymean±standarddeviationwitheightsamplesperfield(i.e.onebulkedsampleforeachplot);eachofthesamplesconsistedofthreesoilcores.Bulkdensityisshownbymean±standarddeviationwitheightsamplesatfourlocationsperfield
Depth(cm) Liereman-1 Liereman-2 Liereman-3Coordinates 51°20’0.1”N5°1’1.7”E 51°19’58.4”N5°0’57.4”E 51°20’50.5”N5°1’11.2”E
Township Oud-Turnhout Oud-Turnhout Oud-Turnhout
Naturereserve LandschapDeLiereman LandschapDeLiereman LandschapDeLiereman
Meanannnualprecipitationa(mm) 870 870 870
Meanannualtemperaturea(°C) 10.5 10.5 10.5
BEMEXbclassification 0-30 Coarsesand Coarsesand CoarsesandWRBcclassification 0-30 GleyicPodzol(Arenic) AlbicPodzol(Arenic) GleyicPodzol(Arenic)
OrganicC(weight%)d 0-30 4.3 1.5 1.4
pHKCld 0-30 4.1 4.8 4.6
PAL(mgkg-1)d 0-30 30 130 300
KAL(mgkg-1)d 0-30 30 <20 40
CaAL(mgkg-1)d 0-30 380 290 300
MgAL(mgkg-1)d 0-30 40 40 50
POlsen(mgkg-1) 0-15 29±17 71±16 112±16
15-30 27±21 70±15 108±21POxalate(mgkg-1) 0-15 66±32 220±84 422±34
e
15-30 71±47 225±94 417±52e
PTotal(mgkg-1) 0-15 196±62 366±118 605±113
15-30 245±115 372±116 565±119
Bulkdensity(gcm-3) 0-15 1.5±0.2 1.6±0.1 1.5±0.1
15-30 1.5±0.2 1.6±0.1 1.5±0.1
aDatabetween1981and2010bytheRoyalMeteorologicalInstituteofBelgiumforOud-Turnhout;
bSoilclassificationaccordingtoBelgianSoilService:“Coarsesand”:sandyfraction[50μm-2mm]>90%andmedianofsandyfraction>200μmandclayfraction[<2
μm]<8%;cSoilclassificationaccordingtotheWorldReferenceBaseforSoilResourcesclassification(WRB);dTocharacterizethesefields,onebulkedsample(regulargrid,augerdiameter=3cm,6soilcoresperfield)ofthe0-30cmsoillayerperfieldwasanalysedbythelab
oftheSoilServiceofBelgium:soiltexturebymanualcharacterization;organiccarbonaccordingtoanSSB-adjustedWalkleyandBlackmethod(WalkleyandBlack1934);P,K,MgandCaextractedinacidammonium-lactate(resp.PAL,KAL,MgALandCaAL;Egnéretal.1960)measuredwithInductivelyCoupledPlasma(ICP);eInsteadofeightsamples,onlysixsampleswereanalysedforPOxalatein2011
47

48
3.3.5Statisticalanalyses
First, to investigate the effects of restoration technique (mowing vs. P-mining) and POlsenconcentration in 2011 (POlsen-2011) on annual biomass properties for theperiod 2012-2016,wefittedlinearmixedeffectsmodelswiththefunctionlmeofthe“nlme”packageusingtherestrictedestimatesmaximumlikelihoodmethod(REML)(Pinheiroetal.2017).Thedifferentannualresponsevariablesweconsideredwere:phosphorusremovalwithbiomass,biomassyield (square root transformed), phosphorus concentration in biomass (log transformed),PNI(logtransformed),NNIandKNI.TheresponsevariablesweretransformedifnecessarytoensurenormalityoftheresidualsandhomogeneityofvariancefollowingZuuretal.(2009).Thefullmodelshadthefollowingform:responsevariable~restorationtechniquexPOlsen-2011+restorationtechniquexPOlsen-20112.Weusedplotnestedwithinfieldnestedwithinyearasarandomfactortoaccount forthenestedstructureof thedataandtherepeatedmeasures(yearlyobservations)inaplot.Wecomparedthenullmodelincludingrandomeffectsonly,theintermediateincludingallintermediatecombinationsofthemodeltermsandfullmodelsbased on the correctedAkaike Information Criteria (AICc) andAkaikeweights (Zuur et al.2009)withtheAICctabfunctionofthe“bbmle”package(BolkerandTeam2016).Incaseofcompetitivemodels, i.e.multiplemodelswithadifference inAICc (ΔAICc)of less than two(Goodenough et al. 2012), we used ANOVA tests to select the optimal model with thefunctionanovaofthe“stats”package(R-Core-Team2016).Fortheselectedfinalmodels,weobtainedchi-square (χ2) valuesand significanceof the fixed termsusingType IIWald chi-squaretestswiththeanovafunctionofthe“stats”package.WeassessedthegoodnessoffitoftheoptimalmodelsbycalculatingthemarginalandconditionalR2(R2mandR2c)withther.squaredGLMMfunctionofthe“MuMIn”package(Bartoń2018),withR2mrepresentingthevarianceexplainedbyfixedfactorsandR2cthevarianceexplainedbybothfixedandrandomfactors.
Second, to investigate whether the soil phosphorus concentrations (POlsen and POxalate)decreasedoverthecourseoftheexperiment,andwhetherthisdecreasewasaffectedbytherestorationtechnique,wefittedlinearmixedeffectsmodelsofthefollowingform:POlsenorPOxalate~restorationtechniquexYear,withfieldasrandomfactor.Wefittedlinearmodelsaswe expected the decline in phosphorus concentrations to be linear during the relativelyshorttimeofourexperiments(i.e.5years).
Third,weinvestigatedtheeffectsofrestorationtechniqueandPOlsen-2011onthechanges inPOlsenandPOxalateconcentrations(ΔPOlsen,ΔPOxalate)at0-15cmand15-30cmdepthwithlinearmixedeffectsmodelsoftheform:ΔPOlsenorΔPOxalate~restorationtechniquexPOlsen-2011.Wealso evaluated the relation between the ΔPOxalate and ΔPOlsen concentrations with a linearmixedeffectsmodeloftheform:ΔPOxalateconcentration~ΔPOlsenconcentration.Finally,theΔPOxalateandΔPOlsenstockswerecomparedwiththecumulativephosphorusremovalwitha

49
modeloftheform:ΔPOlsenorΔPOxalatestock~restorationtechniquexcumulativephosphorusremoval,random=~1|Field.
In themixedeffectsmodelswithheterogeneousvariancesamong fields,weallowed foradifferent variance per field using weights varIdent (Pinheiro et al. 2017). Results wereconsidered significantwhen thep-valuewas less than0.05unless indicatedotherwise.AllstatisticalanalyseswereperformedwithR(R-Core-Team2016);graphsweremadewiththe“ggplot”package(Wickham2009).
3.3Results
3.3.1Phosphorusremovalwithbiomass
The biomass yield, the phosphorus concentration in the biomass and consequently theannual phosphorus removal were all significantly affected by the applied restorationtechnique(Fig.3.3;Fig.3.4;Appendix-Tables3.C.1and3.C.2).Between2012and2016,weannuallyremovedsignificantlymorebiomassandmorephosphorusfromtheP-miningplotsthanfromthemowingplots(biomass:7±2vs.3±1tdrybiomassha-1;phosphorus:18±7vs.8±5kgPha-1;p<0.001).Theconcentrationofphosphorusinthebiomass,however,waslowerintheP-miningplotsthaninthemowingplots(2.5±0.7vs.2.9±0.7gPkg-1;p<0.001Thebiomassyield,thephosphorusconcentrationinthebiomassandtheannualphosphorusremovalweresignificantlyaffectedbytheconcentrationofPOlseninthesoilatthebeginningoftheexperiment(POlsen-2011)and,exceptforthebiomassyield,bytheinteractionsbetweenPOlsen-2011 and the applied restoration technique (Appendix-Table 3.C.2). The appliedrestoration technique and POlsen-2011 explained 67% of the variation (R2m) in phosphorusremoval with biomass. The interannual variation explained a large proportion of theremainingvariation(51%):e.g.summerdroughts,suchasin2014and2015,probablycauseda drop in the biomass production during the drymonths and consequently a drop in thephosphorusremovalwithbiomass.
The agronomic phosphorus nutrient index (PNI) of the biomass in 2012-2016 differedsignificantlybetweenthetworestorationtechniquesandtheinteractionsbetweenPOlsen-2011andrestorationtechnique(p<0.001forrestorationtechnique;p<0.01forPOlsen-2011andtheinteractions; Appendix-Tables 3.C.3 and 3.C.4; Appendix-Fig. 3.C.1a). Phosphorus was notlimitinginanyofthemowingplots(meanPNI=98±21%),butappearedtobelimitinginthemining plots of the field with the lowest soil phosphorus concentrations (mean PNI inLiereman-1 = 55 ± 13%). The biomass production in the mowing plots was limited bypotassium (mean KNI 36 ± 15%; Appendix-Fig. 3.C.1c) and nitrogen (meanNNI 41 ± 13%;Appendix-Fig. 3.C.1b), with especially severe potassium limitation in the field Liereman-1(mean KNI 24 ± 6%). The applied fertilizers in the mining plots resulted in only limitedpotassiumlimitation(meanKNI82±19%)butcouldnotpreventnitrogenlimitation(meanNNI67±19%),whichwas,however,lessseverethaninthemowingplots(p<0.001).

50
Figure 3.3 Themean and standard deviation of annual removal of phosphorus with biomass (kg ha-1 y-1)plotted versus POlsen-2011 (mg kg-1) for the 24 plotswithmowing and P-mining treatment in the four studyfields.Theregressionlinesshowtheoptimallinearmixedeffectmodelfittedtothe120datapointsforthe2012-2016period
Figure3.4Themeanandstandarddeviationofannualbiomass(a;tdrybiomassha-1)andannualphosphorusconcentration inbiomass (b;gPkg-1)plottedversusPOlsen-2011 (mgPOlsenkg
-1) for the24plotswithmowingandP-mining treatment in the four study fields. The regression lines show themostoptimal linearmixedeffectsmodelfittedtothe120datapointsforthe2012-2016period

51
3.3.2Changesinsoilphosphorusconcentrations
The POlsen concentration in the 0-15 cm soil layer decreased significantly during the fieldexperimentwithonaverage14mgPOlsen kg-1 (p<0.001;Appendix-Fig. 3.C.2a). The2011-2017 absolute decrease in POlsen concentration was larger in the soils with a high initialconcentrationof POlsen and larger in theP-miningplotsof the Liereman-3 field (Appendix-Tables3.C.5and3.C.6;Fig.3.5a).ThePOlsenconcentrationin2017wasonaverage25%lowerthanin2011andthisratiowasapparentlylowerforthehighestinitialPOlsenconcentrations,however,thiseffectwasnotsignificant(datanotshown).WefoundnosignificantchangeinPOlsen concentration in the 15-30 cm soil layer (Appendix-Fig. 3.C.2c). There was a strongpositive correlation between the change in POlsen concentration and the change in POxalateconcentration(p<0.001;R2m=76%;Fig.3.6;Appendix-Table3.C.7).However,thechangeinthePOxalateconcentrationvariedwidelyinthe0-15cmsoillayer,andwefoundnosignificantchange in POxalate concentrations for either soil layer (Appendix-Table 3.C.5; Appendix-Fig.3.C.2band3.C.2d;Fig.3.5b).Between2011and2017,thestockinthePOlsendecreasedinthe0-15and0-30cmsoillayers,whilethestockinPOxalateremainedthesame(Fig.3.7).
Figure3.5ChangesinPOlsen(a;mgkg-1;n=24)andPOxalate(b;mgkg-1;n=22becauseoftwomissingsamples)inthe0-15cmsoillayerbetween2011and2017plottedversusPOlsen-2011(mgkg-1).Negativevaluesrepresentdecreasesinphosphorusconcentrations;positivevaluesshowincreasesinphosphorusconcentrations.Theline was fitted according to the optimal linear mixed effects model for a transformed change in POlsenconcentrationasresponsevariable

52
Figure3.6ChangesinPOlsenversusPOxalateconcentrations(mgkg-1)inthe0-15cmsoillayerbetween2011and2017 (n = 22). Negative values represent decreases in phosphorus concentrations; positive values showincreasesinphosphorusconcentrations.ThefullblacklinewasfittedaccordingtotheoptimallinearmixedeffectsmodelforchangeinPOxalateconcentrationasresponsevariable
Figure3.7ThestockofPOlsen(a,b;inkgPha
-1;n=24)andPOxalate(c,d;inkgPha-1;n=22)inthe0-15cm(a,c)
and 0-30 cm (b, d) soil layers of themowing and P-mining plots before and after the experiment (2011,2017). Significance of effects is indicated by *** p < 0.001; * p < 0.05; nsmeans the differencewas notsignificant

53
3.3.3Phosphorusremovalwithbiomassversuschangeinsoilphosphorusstock
Therewasaweaknegativerelationshipbetweenthe2011-2017changeinthestockofPOlseninthe0-15cmsoil layerontheonehandandtheremovalofphosphoruswithbiomassonthe other hand (p < 0.1, R2m = 15%; Appendix-Tables 3.C.8 and 3.C.9; Fig. 3.8a). Therelationship between the change in stock of POlsen in the 0-15 cm soil layer and therestoration technique was also weak (p < 0.1, R2m = 13%; Supplementary Table S7). Ingeneral,thecumulativephosphorusremovalwithbiomasswaslargerthanthechangeinthestocksofPOlseninthesoil(datapointsabovethe1:1lineinFig.3.8a).ThechangesofPOxalatestocks in the 0-15 cm soil layer variedwidely andwere significantly negatively correlatedwith thecumulative removalofphosphoruswithbiomass (p<0.05;R2m=28%;Appendix-Tables3.C.8and3.C.9;Fig.3.8b).
Figure3.8Change inPOlsenstock(a;kgha
-1;n=24)andPOxalatestock(b;kgha-1;n=22) inthe0-15cmsoil
layerbetween2011and2017plottedversusthecumulativePremovalwithbiomass(kgha-1)between2011and 2016. Negative values represent decreases in phosphorus stocks; positive values show increases inphosphorusstocks.Thedottedlineisthe1:1line.Accordingtothelinearmixedeffectsmodels,thedashedblack line indicates amarginally significant relation (p < 0.1) and the full black line indicates a significantrelation

54
3.4Discussion
3.4.1PhosphorusremovalhigherwithP-miningandonphosphorus-richsoils
TheremovalofphosphoruswithbiomassintheP-miningplotswastwiceaslargeasinthemowingplots,anddecreasedwiththeinitialconcentrationofPOlsen inthesoil.Johnstonetal.(2016)alsoreportedhighphosphorusremovalonphosphorus-richsoils(20-25kgPha-1,similar toourresults)andfoundphosphorusremoval toberelatedtothesoilphosphorusconcentration on soils with less phosphorus. The lower phosphorus removal in the plotscontaining less POlsen in our space-for-time field experiment indicates that the extraphosphorusremovalgainedbyP-miningwilllikelydiminishovertimeduringrestoration.Inour experiment, the phosphorus removal dropped linearly with decreasing POlsenconcentration; in contrast, in the long-term Exhaustion Land experiment (Johnston et al.2016),phosphorusremovalwasstableuntilthesoilPOlsenthresholddecreasedbelow20mgPOlsen kg-1, afterwhich the relationshipbecame linearaswell.Hence,whenestimating thetimeneeded to restorephosphorus-poor soil conditions throughmowingorP-mining, thedecrease in annual phosphorus removal after a certain soil phosphorus level has beenreachedshouldbetakenintoaccount.
The difference in phosphorus removal between P-mining and mowing plots was mainlydriven by the higher biomass yield in the P-mining plots, seeing that the phosphorusconcentration in thebiomasswas lower in theP-miningplots.Theswards in theP-miningplots yielded,onaverage, two timesmorebiomass than in themowingplots.Ourminingswardsannuallyyielded7±2tdrybiomassha-1,inlinewithotherfertilizedgrasslands(onaverage 6 t dry biomass ha-1 y-1 in Duffková et al. 2015) but lower than the intensivelyfertilizedgrasslands thatproducedupto14 tdrybiomassha-1y-1 inLiebischetal. (2013).Theyieldsinourmowingplots,i.e.3±1tdrybiomassha-1y-1,weresimilartotheyieldsingrasslands under nature management mown for 15 to 25 years in Belgium and theNetherlands (Bakker et al. 2002; Chapter 2). In the swards under mowing regime, thebiomass production was severely limited by nitrogen and potassium from the secondgrowingseasononwards, in linewiththewell-describednitrogenandpotassiumdepletionof soils through leaching or plant uptake (Van DerWoude et al. 1994; Smits et al. 2008;Oelmann et al. 2009; Storkey et al. 2015). The restraint on biomass production due tonitrogenandpotassium limitation in themowingplotsprobablyexplains that thebiomassyield in theseplotsonlyweakly increasedwith soil phosphorus concentrations (Appendix-Table3.C.1).SoilphosphorusappearedtobelimitingonlyintheP-miningplotsofthefieldwith the lowest soil phosphorus concentration (Liereman-1; indicated by PNI < 60% cf.Mládkováetal.2015;Appendix-Fig.3.C.1a).
The phosphorus concentration in the harvested biomass was affected by both the initialconcentration of POlsen in the soil and the applied restoration technique. The plantphosphorusconcentrationswerepositivelycorrelatedwith thePOlsen concentrations in the

55
soil,e.g.intheP-miningplotswesawatwofoldincreasefromonaverage1.8±0.3mgPg-1in the phosphorus-poor field (Liereman-1) to on average 3.0 ± 0.1 mg P g-1 in thephosphorus-rich field (Liereman-3;Fig.3.4b). In theLiereman-3mowingplots, theaveragePNIforJunewasequaltoorgreaterthan100%,whichindicatesnolimitationbyphosphorusor even luxury consumption of this nutrient (Duru and Ducrocq 1997), i.e. an increase inphosphorus uptake with soil phosphorus concentration that does not result in additionalbiomass(AertsandChapin1999).Interestingly,thisluxuryconsumptionofphosphorusalsooccurredinotherP-miningstudies:twopotexperiments(Chapters4and5)andalong-termfieldstudy(Baukeetal.2018).Thephosphorusconcentration inthebiomasswas lower inthe P-mining plots than in the mowing plots, which may be caused by: (i) dilution, i.e.concentrations of nutrients in plants tend to decrease - become diluted - as the plantsproducemorebiomass(Hejcmanetal.2010),or(ii)(temporary)phosphoruslimitationintherhizosphere (Hinsinger 2001) as a result of a lag in the replenishment of the pools ofbioavailable phosphorus in the soil, formerly described as transactional phosphoruslimitationinVitouseketal.(2010).
3.4.2DecreasingPOlsenovertime
Onaverage,theconcentrationofPOlseninthe0-15cmsoillayerwas25%lowerattheendofthe experiment than before the experiment started. In absolute numbers, the dropappearedtobelargerinphosphorus-richplots.Wefoundacleardistinctioninphosphorusremovalwithbiomassbetweenthetwoappliedrestorationtechniquesandtheoverall2011-2016phosphorusremovalwithbiomasswasrelatedtothechangeinPOlsenandPOxalatestocksin the 0-15 cm soil layer. Changes in bioavailable soil phosphorus concentrations can becausedbyplantphosphorusuptakethroughroots,translocationtoshootsandsubsequentremoval with hay, but can also happen through phosphorus fixation in roots, uptake bymicrobial biomass or accumulation in soil organic matter. These organic pools of soilphosphoruscanbeasink (e.g. incorporationofphosphorus into livingmicrobialbiomass),butcan(later)alsobecomeasourceofbioavailablephosphorusthroughmineralizationandrelease of microbial phosphorus after cell death (von Lützow et al. 2006). Inorganicphosphorus can also be fixed by migration into organic phosphorus pools and occludedmineralpools(vanderSalmetal.2017),butphosphoruscanalsobereleasedfromorganicorinorganicrecalcitrantphosphoruspools.Togainfullinsightintothecomplexphosphoruscycle,athoroughfractionationprocedureshouldbeexecuted(cfr.DeSchrijveretal.2012),whichwasfarbeyondthescopeofourstudy.
Wewanttonotethatourresultsareonlyvalid forsoilswithacomparablesandytexture,soilacidityandorganicmattercontent.ThePOlsentoPOxalateratioandthechangesinthisratioafterphytoextractionofphosphoruscandifferacrosssoiltypes(CrossandSchlesinger1995;Johnstonetal.2016;Baukeetal.2018)..
56
3.4.3Limitationsofspace-for-timesubstitution
Achronosequence,oraspace-for-timeexperimentalsetup,isasubstitutionforwhenlong-termtime-seriesarenotavailable.Ourobservationscoverfiveyears,whichisshorterthantheperiodoverwhichwewanttomakepredictions(severaldecades).AccordingtoJohnsonandMijanishi(2008),aspace-for-timesubstitutionis:
“… a time sequence of development from a series of plots differing in age since some initial condition, i.e. time since the site became available for occupation or colonization or the time since last disturbance. It makes the critical assumption that each site in the sequence differs only in age and that each site has traced the same history in both its abiotic and biotic components. If these assumptions are correct, then each site will have repeated the successional sequence of every other older site up to its present age.”
Inourfieldexperiment,despitesimilaritiesbetweenthefields(soiltexture,landscape,land-use as a grassland), each of the three fields were managed and fertilized in a differentmanneraffectingnotonlysoilphosphorusconcentrationsbutalsoine.g.pH(slightlymoreacidicinLiereman-1)andorganiccarboncontent(higherinLiereman-1;Table3.1).Anotherlimitationofaspace-for-timesubstitutionistheenvironmentalfluctuationcausedbytime,whichcouldmaskresults(FosterandTilman2000).Inourexperimentatmosphericnitrogendepositionwashigherinthe90’s(onaverage45kgNha-1y-1in1990innorthernBelgium;Coolsetal.2015)thanatthetimeoftheexperiment(onaveragebetween26and24kgNha-1 y-1 between2011and2016 innorthernBelgium;VlaamseMilieumaatschappij, 2018).ThedifferenceinbiomassproductionandphosphorusremovalbetweenthemowingandP-miningtreatmentsiscurrentlyprobablylargerthaninthe90’sbecauseahigheratmosphericnitrogen input would have made the mowing plots more productive. Despite theselimitations, such a space-for-time substitution remains valuable to get insight into theinteractive effects of initial soil phosphorus concentrations andmanagement on biomassproduction and phosphorus removal. However, supplementing the current time-for-spaceexperimentwith repeatedmeasurements in a long-termexperiment could help validatingthe resultsandgetting insight into theeffectsofenvironmental fluctuations (JohnsonandMiyanishi2008;Raczetal2013).
3.4.4Implicationsforecologicalrestoration
Phytomining is an effective technique for removing phosphorus from soils: it has a largecapabilityforphosphorusremoval,i.e.upto34kgPha-1y-1atphosphorus-richsoils.Whenconsideringphytomining to re-establishphosphorus-poor soil conditions,managers shouldhoweverbeawareoffourdrawbacks.
First,onphosphorus-richfields,largeamountsofphosphorusneedtoberemovedtorestorephosphorus-poor soil conditions, and this can take several decades (Chapter 2). For thedepletionofbioavailablephosphoruspools,itisnecessarytoalsoreducetheslowlycyclingphosphorus pools that replenish the bioavailable pools. To estimate the restoration

57
potentialofspecificfieldsforre-establishingphosphorus-poorsoilconditions,practitionersthereforeneedtoassessboththebioavailableandslowlycyclingphosphoruspools.
Secondly, the available time and financial budget should match with the choice for arestorationtechniquedespitethelawofdiminishingreturns(seeKubanek2017onoptimaldecision making). The law of diminishing returns impedes the use of phytomining forrestoration (Marrs 1993): phosphorus removal with biomass declines with decreasingbioavailablephosphorusconcentrationsinthesoildespiteconstantrestorationefforts.Thisdecreaseinphosphorusremovalefficiencyhastobetakenintoaccountwhenestimatingtherestoration time neededwith phytomining. As we showed here, the potential to removephosphoruswithbiomassbyeithermowingorP-miningdiddifferdependingonthe initialsoil phosphorus concentration. The advantage of P-mining over mowing (i.e. morephosphorusremovalthroughmining)wassmallerwhenthesoilscontainedlessbioavailable(<50mgPOlsenkg-1)andslowlycyclingphosphorus.Thechoiceforarestorationtechniqueisalsoaneconomicalquestion(Rohretal.2018)becauseduringrestorationviaphytomining,hayyieldswill likelydecrease,aswellas thequalityof theproducedhay.Feedcontaininglessthan3gPkg-1drybiomassisinadequateforhighyieldingdairycowsaccordingtoValketal.(1999).Theproducedhaymaythuschangeovertimefromavaluableproduct(feed)intoawasteproduct(butseethesolutionsproposedbytheinterregionalGrasGoedproject:www.grasgoed.eu). It is advisable to account for this potential cost at the start of therestorationproject;governmentscouldencouragetheperseveranceofrestorationeffortstoachievephosphorus-poorsoilconditionsviaphytominingbysubsidizing.
A third drawback to consider is that neither the bioavailable nor the slowly cyclingphosphorusconcentrationsinthedeepersoillayer(15-30cm)hadbeendecreasedafterfiveyears of phytomining (contrary to the significant decline in the bioavailable phosphorusconcentrationsintheupper0-15cmsoil layer).Yet,thephosphoruspoolsinthe15-30cmsoillayerandeventhesubsoillayer(>30cmdeep)arelikelytobeaccessiblebyplantrootsormycorrhiza in symbiosiswith theseplants, especiallywith P-mining (Bauke et al 2018).Thephosphoruspools in thesedeeper soil layers should thusbe taken into considerationwhenestimatingtherestorationpotentialofafield.
The fourth drawback specifically for P-mining is that fertilization with nitrogen can havenegativeeffectsonthesurroundingenvironmentifthefertilizerisadministeredincorrectly.Whentheappliednitrogendosesareexcessive, residualsoilmineralnitrogencan leachtothe ground water (D’Haene et al. 2014). The risks of using nitrogen fertilizers can beminimized by following fertilizer recommendations to limit off-site loss. Reducing thetemporarily high soil nitrogen and potassium concentrations after P-mining is possible bymowingwithoutfertilizerinputforafewyears(Smitsetal.2008).
Restoringphosphorus-poorsoilconditions(e.g.<12mgPOlsenkg-1forrestorationofNardusgrasslands;Chapter2)onphosphorus-richsoils,suchastheLiereman-3fieldinourstudy,via
58
P-mining or mowing is a time-consuming approach that will take many decades (seeestimationofthedurationinChapter2andBox2).Fortheseparcels,moredrasticmeasuressuchasmechanicallyremoval(i.e.topsoilremoval;cf.Töröketal.2011)orinsituburial(i.e.full-inversion tillage;cf.Milliganetal.2016)of thephosphorus-enrichedsoil layer canbeconsidered. When reducing the bioavailable and slowly cycling phosphorus pools is notfeasible, it might be more appropriate to aim for floristically diverse mesotrophic plantcommunitiesthatrequirelessphosphorus-poorsoilconditions,andcertainlyareinterestingfordiverse insectcommunities thatbenefite.g.pollinationandnaturalpestcontrol in thesurrounding(Woodcocketal.2014).Toworktowardsthisaim,mowingtoobtainnitrogen-,potassium-orco-limitationofthesenutrientswithinafewyearscanbecombinedwiththeactive introduction of common non-endangered legume and forb species following swarddisturbancetoenhancetheirgermination(Klausetal.2018).
3.5Conclusions
Thepotential tophytominephosphorus (witheitherP-miningormowing)dependson thephosphorus concentration in the soil, with high phosphorus removal possible onphosphorus-rich soils and the removal potential becoming lower on soils with lowerphosphorus concentrations. Phosphorus mining led to larger phosphorus removal withbiomass compared to conventional mowing management. It is clear that restoringphosphorus-poorsoilconditionsonformerlyfertilizedlandwillremainachallengeandthatphytomining phosphorus is always a long-term commitment. For initially phosphorus-richparcels, turning thenature restoration goal towards communitiesofmesotrophichabitatsmight bemore realisticwhen drastic measures such as removal of the phosphorus-richtopsoilarenotanoption.
3.6Acknowledgements
WearegratefulfortheadmissiontoconductourfieldexperimentinLandschapDeLiereman(Natuurpunt);thecooperationwiththepeopleofNatuurpunt,AgencyofForestandNature(ANB)and local farmerswasgreatlyappreciated.Special thanks toKrisVanderSteen, JanVandenBerghe andDieterDijckmans. Further,we thank our lab technicians LucWillemsandGreetdeBruynforprocessingandanalysingoursamples.KrisCeunen,FilipCeunen,LucWillems,RobbeDeBeelde,JelleVandenBerghe,DannyVereeckeandTomohiroNagataarethanked for helping with fieldwork. Lander Baeten and Haben Blondeel are thanked forhelping out with the statistics. We thank three anonymous reviewers for their helpfulcomments.

59
CHAPTER 4 Phosphorus-mining for ecological restoration on former agricultural land
CHAPTER 4Phosphorus-mining for ecological restora�on on
former agricultural land
Second harvest in the pot experiment
After: Schelfhout S, De Schrijver A, De Bolle S, De Gelder L, Demey A, Du Pré T, De Neve S, Haesaert G,Verheyen K, Mertens J. 2015. Phosphorus mining for ecological restora�on on former agricultural land.Restoration Ecology. 23:842–851. Doi: 10.1111/rec.12264
60
Abstract
To restore species-rich terrestrial ecosystemson ex-agricultural land, establishing nutrientlimitationfordominantplantgrowthisessential,becauseinnutrient-richsoils,fast-growingspecies often exclude target species. However N-limitation is easier to achieve than P-limitation (because of a difference in biogeochemical behavior), biodiversity is generallyhighest under P-limitation. Commonly-used restoration methods to achieve low soil P-concentrationsareeitherveryexpensiveor takeavery longtime.ApromisingrestorationtechniqueisP-mining,anadjustedagriculturaltechniquethataimsatdepletingsoil-P.HighbiomassproductionandhencehighP-removalwithbiomass isobtainedby fertilizingwithnutrientsotherthanP.ApotexperimentwassetuptostudyP-miningwithLoliumperenne
L.onsandysoilswithvaryingP-concentrations:fromanintensively-usedagriculturalsoiltoasoilnearthesoilP-targetforNardusgrassland.AllpotsreceivedN-andK-fertilization.Theeffects of biostimulants on P-uptake were also assessed by the addition of arbuscularmycorrhiza(Glomusspp.),humicsubstancesorphosphate-solubilizingbacteria(Bacillussp.andPseudomonasspp.). InourP-richsoil (111mgPOlsenkg-1),P-removalratewashighbutbioavailablesoil-Pdidnotdecrease.AtlowersoilP-concentrations(64and36mgPOlsenkg-1),bioavailablesoil-PhaddecreasedbuttheP-removalratehadbythendropped60%despiteN-andK-fertilizationanddespitethatthetarget(<12mgPOlsenkg-1)wasstillfaraway.Noneof the biostimulants altered this trajectory. Therefore, restoration will still take decadeswhen startingwith ex-agricultural soils unless P-fertilization historywasmuch lower thanaverage.
4.1Introduction
Possibly,P-miningmightbeoptimizedby increasingtheP-uptakethroughtheuseofplantbiostimulants (Calvo et al. 2014): e.g. the addition of arbuscular mycorrhiza, humicsubstances or phosphate-solubilizing bacteria. Mycorrhiza can provide P to the plant byovercoming the P-depletion zone in the rhizosphere with an extensive hyphal network(SmithandRead2008).Humicsubstancesarehumicandfulvicacidsthatcanmobilizeandsolubilize P by (i) blocking P-adsorption-sites (ligand exchange), (ii) oxide dissolution bycomplexingaluminum(Al)oriron(Fe)heldinminerals,(iii)mobilizationofPheldinmetal-humicsubstancesor(iv)viaalterationofthesoilpH(Gyaneshwaretal.2002;DrouillonandMerckx2003;Jonesetal.2003).Applicationofhumicsubstancesresultedinhigheryieldandconsequently higher P-uptake for several crops (Verlinden et al. 2009; Daur andBakhashwain2013).Phosphate-solubilizingbacteriaarefree-living,plant-growth-promotingrhizobacteriamainly fromthegeneraPseudomonasandBacillus thatcansolubilizeP fromcalcium(Ca)orAlphosphatesources(RodriguezandFraga1999;Rosasetal.2006;Trivediand Sa 2008). Recently, a pot experiment showed the positive effect of Bacillus brevis,PseudomonasputidaandP.corrugataontheavailablePconditionsinacid,sandysoilswithhightotalP-contents(DeBolleetal.2013b).

61
HerewepresenttheresultsofapotexperimentwhereP-miningwithN-andK-fertilization,was tested incombinationwithseveralbiostimulantsatvaryingsoilP-concentrationswithLoliumperenneL.ThedifferentP-concentrationsrepresentthreephasesinthedevelopmentfromagriculturalsoilstowardssoilswithlowbioavailableP-pools,asoilP-chronosequence.We hypothesized that P-removal through P-mining will become less effective withdecreasingsoilP-concentrationdespiteN-andK-fertilizationandthatbiostimulantsenhanceP-miningespeciallyatthelowestsoilP-concentrations.
4.2Methods
A pot experimentwas conducted to test the effect of (i) the soil P-concentration and (ii)additions of mycorrhiza, humic substances and P-solubilizing bacteria on biomassproduction,P-concentrations,P-removalandfinalplantavailableP-concentrations.
4.2.1Set-upoftheexperiment
ThesoiloriginatedfromthreesiteslocatedwithinafivehundredmeterradiusinLandschapDeLiereman(Oud-Turnhout)naturereserveintheBelgianCampineregion.Onthesesites,the ultimate target was the restoration of European Natura 2000 priority habitat 6230*,species-rich semi-natural Nardus grassland (Galvánek and Janák 2008). Non-degradedNardus grasslands are closed dry ormesophilic, perennial grasslands on oligotrophic soilsthat have a bioavailable P-concentration of less than 12 mg POlsen kg-1 (Raman et al.unpublishedresults;Chapters2and6),thiswillbeconsideredasthetargetinthispaper.ThethreesandysoilswereselectedbasedontheirbioavailableP-concentrations:111mgPOlsenkg-1 furtherreferredtoasHigh-P,64mgPOlsenkg-1 furtherreferredtoasMid-Pand36mgPOlsen kg-1 further referred to as Low-P (Table 4.1), and represented three phases in thedevelopmenttowardsP-poorsoilconditions(12mgPOlsenkg-1),i.e.asoilP-chronosequence.The three sites are currentlymanaged as haymeadows and cropped annually since theywere taken out of agriculture. In the Low-P site, fertilization stopped about twenty yearsago. The Mid-P and High-P sites were taken out of agriculture five years ago but P-concentrationsdifferedduetodifferentfertilizationhistories.Whenthethreeparcelswerestill inagriculturaluse,theywereplowedregularlyandtherefore,thetopsoilofatleast20cm was quite homogenous in nutrient concentrations. In August 2011, soil of the threeparcelswascollectedfromthe5–15cmsoillayertoavoidtheplantrootsfromthetop0–5 cm layer.We sieved (25mmmesh), thoroughlyhomogenized, sampledandanalyzed toassesstheinitialhumidityandchemicalsoilconditions.Afterwards,eachsoilwashydratedupto20%(V%).ForeachsoilP-concentrationandtreatmentwithbiostimulantsorcontrol,sevenpotsof15cmdiameterand12cmdepthwerefilledwith1.4kgsoil.PotswerelinedwithapolyethylenebaginordertoavoidsoilandPfromleachingduringwatering.Ineachpot, 1 g ryegrass seed (LoliumperenneL., varietyPlenty)was sownon the18th ofAugust2011 (day1).Potswereplacedrandomly inagrowthchamberwithaday/night regimeof16/8h, temperatureof18°Canda relativehumiditymaintainedat75% for123days.Thehumidityofthesoilwaskeptaround20%(V%)withpurifiedwater.

62
Table4.1Characterizationoftheinitialsoilpropertiesforthe5-15cmsoillayeroftheselectedsites.Soilproperties High-P Mid-P Low-PCoordinates 51°20’50.5”N
5°1’11.2”E51°19’58.4”N5°0’57.4”E
51°20’0.1”N5°1’1.7”E
PCaCl2(mgkg-1) 7.00 0.93 0.23POlsen(mgkg-1) 111 64 36POxalate(mgkg-1) 414 196 59.4AlOxalate(mgkg-1) 619 543 380FeOxalate(mgkg-1) 349 246 175PSD(%) 46 26 11PTotal(mgkg-1) 656 329 171AgriculturalvalueP-concentrationa Ratherhigh Ratherlow VerylowpH(KCl) 4.64 4.39 3.94CTotal(%)
1.60 1.00 0.99NTotal(%)
0.11 0.06 0.05C:N 14.5 16.7 19.8KBaCl2(mgkg-1) 16.2 10.2 14.7CaBaCl2(mgkg-1) 741 355 128MgBaCl2(mgkg-1) 62.4 30.2 9.85NaBaCl2(mgkg-1) 2.49 2.49 4.00AlBaCl2(mgkg-1) 30.0 52.0 136CEC(meqkg-1) 4.60 2.63 2.29BS(%) 93 78 34
aRatingoftheP-concentrationfollowingadvicebytheSoilServiceofBelgium(Bodemkundigedienst)

63
BasedonrecommendationsbytheSoilServiceofBelgiumandtoavoidlimitationeffectsbynutrientsother thanPduring theexperiment,we fertilizedall pots three timeswithNasNH4NO3andKasKNO3onday0,44and95(fordetailsseeAppendix-Table4.A).Intotal,351mgNand468mgKwereaddedperpot,correspondingwith198kgNha-1and319kgK2Oha-1inthefield.SoilswerelimedaccordingtotheirinitialsoilpH(thelimeconsistedof60%CaCO3and30%MgCO3;High-Preceived336mgpot-1,Mid-P434mgpot-1andLow-P602mgpot-1).
Next to the control that only received N- and K-fertilization, four treatment levels ofbiostimulants were applied on day 1 of the experiment: (i) the application of arbuscularmycorrhiza, (ii and iii) addition of humic substances at two levels (HS1 andHS2), and (iv)application of phosphate-solubilizing bacteria. For the mycorrhiza treatment, thecommercially-availableproductINOQAgriwasused(fromINOQGmbH,Schnega,Germany).ThiscontainedthreespeciesofthegenusGlomuscoatedonvermiculiteascarriermaterial:Glomus etunicatum Becker andGerd.,G. intraradices Schenck and Sm. andG. claroideumSchenckandSm..Aftersowing,mycorrhizawereappliedontopofthesoilatadoseof1.5gperpot.Thehumicsubstancesusedinthisexperimentwerealiquidmixtureofhumic(12%w/w)andfulvicacids(3%w/w)fromthecommercially-availableproductHumifirst®.Humicsubstanceswereappliedintwoconcentrationlevels;HS1with0.05mlHumifirstperpot(50liter ha-1, the recommended dose by the producer) and HS2with 7ml Humifirst per pot(7,000 liter ha-1, a similar dose as used in experiments to fixate P with various chemicalamendments (Ann et al. 2000; Diaz et al. 2008)). The addition of Phosphate-solubilizingbacteriawasdoneasdescribedbyDeBolle et al. (2013) and consistedof amixtureofB.brevis (ATCC8246),P.putida (ATCC12633) andP. corrugata (ATCC29736)obtained fromDSMZ (Braunschweig, Germany). The bacterial inoculum consisted of 2.2×10⁸ colony-forming units (CFU) g−1 of dry soil, basedon the population size of phosphate-solubilizingbacteriainsoilsasfoundbyHuetal.(2009).
GerminationratesofL.perennewerelowintwopotsoftheLow-Psoilwiththephosphate-solubilizingbacteria treatment, thereforebiomassproductionwasmuch lower than in theotherfivepots.Thesetwopotswereremovedfromthedataset.
Toverifymycorrhizalsurvivalattheendoftheexperiment,rootsofL.perennewereclearedand stained using to the ink and vinegarmethod (Vierheilig et al. 1998). Colonization bymycorrhizawas affirmedbymicroscopy in the treatmentswheremycorrhizawere added.Therootsinpotswithoutadditionofmycorrhizawerenotinfected.
Todeterminetheprevalenceofthephosphate-solubilizingbacterialinoculations,wetriedtoassessthethreespeciesaddedtothepotsinanextraexperiment.Thewildtypestrainwasfirstmade rifampicin (Rif) resistant,we only succeeded to do thiswithP. corrugata. Thisresistantstrainwastheninoculatedandafter30daysmonitoredthroughplatingonLBagarsupplementedwithrifampicinandkanamycin(fordetailedinformationonthemethod,seeAppendix4.B).Overall,theamountofcolonyformingunitspergramofsoildecreasedfromcirca3x107to2x105after30days(datanotshown)indicatingthatthoughthebacteriawere
64
present at a lower concentration than initially, they could have an effect in the potexperiment(seealsoCanbolatetal.2006andYuetal.2011).
4.2.2Samplingandchemicalanalysis
To get an insight in how the three soils differ in chemical composition, initial soilcharacteristicswere assessed on sub-samples of the three collected soils aftermixing thebulksamples thoroughlyandbefore fertilization.Samplesweredriedat40°C for48handthenpassed througha1-mmsieve.SoilpH (withKClasextractant)wasmeasuredusingaglass electrode (Orion, Orion Europe, Cambridge, England, model 920A) following theprocedure described in ISO 10390:1994(E). Exchangeable K+, Ca2+, Mg2+, Na+ and Al3+concentrations were measured by atomic absorption spectrophotometry (AA240FS, FastSequentialAAS)afterextractioninBaCl2(NEN5738:1996).Forcalculationofeffectivecationexchangecapacity(CEC)ofthesoils,allextractedexchangeablecations(K+,Ca2+,Mg2+,Na+and Al3+ inmeq kg-1) were summed. Effective base saturation (BS)was calculated by theratioofthesumofK+,Ca2+,Mg2+andNa+overthesumofK+,Ca2+,Mg2+,Na+andAl3+.Totalcarbon (C) and total N content were measured by dry combustion at 850°C using anelemental analyzer (Vario MAX CNS, Elementar, Germany). Further, we quantified theoriginalsoilP-concentrationsbyanalyzingbulksampleson:
i.SolubleandreadilysolublePextractedinCaCl2(PCaCl2;Simonis&Setatou1996)andmeasured by ICP (CAP 6000 series, Thermo Fisher-scientific Inc., Waltham,Massachusetts,USA);
ii.BioavailablePwhichisavailableforplantswithinonegrowingseason(Gilbertetal.2009) by extraction in NaHCO3 (POlsen; according to ISO 11263:1994(E)) andcolorimetricmeasurement according to themalachite greenprocedure (Lajthaet al.1999);
iii.SlowlycyclingP,whichalsoincludesPthatcanbecomeavailableonthelongertermandisadsorbedbyAlandFe.ThisP-fractionwasextractedinammoniumoxalate-oxalicacid(POxalate,AlOxalateandFeOxalate;accordingtoNEN5776:2006).P-concentrationsweremeasuredaccordingtothemalachitegreenprocedure.AlandFeconcentrationsweremeasured by atomic absorption spectrophotometry (AA240FS, Fast Sequential AAS)and
iv. Total Pmeasured after complete destructionwith HClO4 (65%), HNO3(70%) andH2SO4(98%)inTeflonbombsfor4hat150°C(PTotal).P-concentrationsweremeasuredaccordingtothemalachitegreenprocedure.

65
The soil P-concentrations at the end of the experiment (day 123) were also analyzed onbioavailableP(POlsen,asdescribedaboveinii).Grasswascuttwocmabovethesoillevel,atfourtimes(day29,60,95and123).Foreachgrasscutting,grasssampleswereweighed(drymass, DM) after drying to constant weight at 70°C for 48 h and P-concentration wasobtainedafterdigesting100mgofthesamplewith0.4mlHClO4(65%)and2mlHNO3(70%)inTeflonbombs for4hat140°C.Phosphoruswasmeasuredcolorimetricallyaccording tothemalachitegreenprocedure(Lajthaetal.1999).PlantKandNweremeasuredinasubsetofthesamplestogetanestimationofhowmuchK-andN-fertilizerwasrecoveredwiththebiomass cuttings and whether these elements were limiting plant growth. The subsetconsisted of six samples: two biomass samples from each soil-P level in the controltreatment at day 95. Plant K-concentrations were obtained also after digestion in Teflonbombs as described previously and measured by atomic absorption spectrophotometry(AA240FS,FastSequentialAAS).PlantN-concentrationsweremeasuredbyhightemperaturecombustion at 1150°C using an elemental analyzer (Vario MACRO cube CNS, Elementar,Germany).Atday95,noneofthesamples indicatedtohaveK-orN-deficienciesbasedonoptimalconcentrationsandtheaveragePnutritionindex(seeAppendix4.C).
4.2.3Calculations
Per harvest time, P-removal was calculated by multiplying biomass production and P-concentrationinbiomass.TotalbiomassproductionandtotalP-removalarethesumsoverthe four harvest times. Themeanbiomass P-concentrationwas calculatedbydividing thetotalP-removalbythetotalbiomassremoval.Thephosphatesaturationdegree(PSD)oftheinitial soil samples estimates P losses to the groundwater and also the potential P to bedesorbed and thus supplied to the bioavailable pool. We calculated PSD by!"# =[!!"#$#%& 0.5×(!"!"#$#%& + !!!"#$#%& )]×100(%) with POxalate, AlOxalate and FeOxalaterepresenting the numbers of moles of P, Al and Fe per kg of soil extracted withammoniumoxalate-oxalicacid(seeSamplingandChemicalAnalysis).ThedenominatorisanestimationofthetotalPsorptioncapacityofthesoil.Soilsarerankedas‘P-critical’ataPSDof higher than 24%, which corresponds with more than 0.1 mg orthophosphate/litergroundwater.Thismeansthesesoilscanleadtoeutrophicationofsurfacewaters.SoilswithPSD-valueshigher than35%are regardedas ‘P-saturated’ and result inmore than0.3mgorthophosphate/litergroundwater (VanMeirvenneetal.2007).We further calculated thedifference in bioavailable P-stocks at the beginning and the end of the pot experiment.BioavailableP-stock(inmgPpot-1)atday0andday123werecalculatedbymultiplyingthebioavailableP-concentration(inmgPOlsenkg-1)atthattimewiththeamountofsoilperpot(1.4kg).

66
4.2.4Statisticalanalyses
Homogeneity of varianceswas tested using Bartlett tests, heterogenic response variables(POlsen) were transformed (square root) to achieve the homogeneity assumption.Comparisons of means (total biomass production, mean P-concentration, total P-removaland finalbioavailableP-concentration)weredoneusing two-wayANOVAtestswithsoilP-concentration and treatment and their interaction as factors. Residuals from these testswere examined for normal distribution with quantile-quantile plots. If the interactionbetweensoilP-concentrationand treatmentwasnot significant, this interaction termwasomitted from themodel and the additivemodel was used for further comparison of themeans.Multiple comparisons of treatments, soil P-concentrations and their interaction ifsignificant were performed by means of Tukey using the HSD.test from R-package“agricolae”. A one-way student’s t-test was used to find differences between thebioavailable P-concentration at the end of the experiment and at the beginning. AllstatisticaltestswerecomputedwithR2.14.0(RCoreTeam2013)andstatisticalsignificancewassetatplessthan0.05.
4.3Results
4.3.1EffectsofsoilP-concentrationsonP-removal
ThemaindeterminantoftheamountofPextractedinbiomasswasthesoilP-concentration(Table 4.2). Both biomass production and biomass P-concentration decreased significantlywhen going from High-P toMid-P (resp. 23% and 45% lower) and from High-P to Low-P(resp.36%and53%lower)(Tables4.2and4.3).ThefurtherdecreaseinP-removalfromMid-PtoLow-Pwasnotsignificant(Fig.4.1).
4.3.2ChangesinbioavailableP-concentration
BioavailableP-concentrations(POlsen)seemedtoincrease5%betweenday0andday123forHigh-P (student’s t-test,p<0.05), despitehighP-removalwithbiomass (Fig. 4.1). InMid-P,bioavailablesoilP-stocksdecreased9%(p<0.001)andthisseemedequaltotheamountofPremoved with biomass. In contrast, in Low-P, bioavailable soil P-stocks decreased 29%(p<0.001),morethantheamountofPremovedwithbiomass.

67
Figure4.1 InHigh-P,P-removaldidnot result inadeclineofbioavailablesoil-P,while inMid-P,P-removalwasequaltothedecreaseinbioavailablesoil-P.InLow-P,bioavailablesoilP-stocksdecreasedmorethantheamountofPthatwasremovedwithbiomass.Mean±SE(n=7)ofchangeinbioavailablesoilP-stocks(initial−finalbioavailablesoilP-stock)andtotalP-removalwithL.perenneover123days(mgPpot-1).Upper-andlowercaseletters,respectively,indicatesignificantdifferencesbetweenmeanchangesinbioavailablesoil-PstocksandmeanP-removalwithbiomass(Table4.2)

Table4.2EffectsofsoilP-concentration,theadditionofbiostimulantsandtheirinteractionontotalbiomassproduction,meanP-concentration,totalP-removal,Initial–finalbioavailableP-stock
SoilP-concentration
Biostimulantaddition Interaction
F-value p-value F-value p-value F-value p-value ErrorTotalbiomassproduction
144.8 *** 21.7 *** 11.2 ***
MeanP-concentration 450.8 *** 18.7 *** 1.3 NS
TotalP-removal
1675.5 *** 5.0 ** 21.9 ***
FinalbioavailableP-concentration 4284.9 *** 5.4 *** 1.5 NS
Initial–finalbioavailableP-stock 65.7 *** 5.9 *** 1.9 NS
Degreesoffreedom 2
4
8 88
Resultsoftwo-wayANOVA(f-valuesandsignificancelevels)areshown(n=7).Significancelevelsare***p<0.001;**p<0.01;*p<0.05;NS=notsignificant
Table 4.3Mean ± SD (n=7, except for Low-Pwith P solubilizing bacteriawhere n=5) for each soil P-concentration and treatmentwith biostimulants of totalbiomassproduction,meanP-concentrationinbiomassandfinalbioavailableP-concentration
SoilP-concentration
P-mining
P-mining+arbuscularmycorrhiza
P-mining+humicsubstances(50literha-1)
P-mining+humicsubstances(7000literha-1)
P-mining+phosphate-solubilizingbacteria
B B AB A C
Totalbiomassproduction(gdrybiomasspot-1)
High-P A 4.80±0.65
5.04±0.49
5.37±0.21
4.65±0.66
5.00±0.69
Mid-P B 3.69±0.66 a 3.89±0.53 a 3.86±0.53 a 4.16±0.59 a 1.70±0.43 b
Low-P C 3.09±0.48 b 2.64±0.44 bc 2.76±0.30 bc 4.11±0.37 a 1.88±0.27 c
BC BC C B A
MeanbiomassP-concentration(mgPg-1drybiomass)
High-P A 4.30±0.44 4.09±0.22 3.72±0.24 4.05±0.48 4.69±0.46
Mid-P B 2.22±0.19 2.12±0.19 2.10±0.15 2.29±0.23 2.92±0.33
Low-P C 2.01±0.42 1.98±0.23 1.97±0.11 2.28±0.33 2.54±0.31
B C C C A FinalbioavailableP-concentration(mgPOlsenkg
-1)at123days
High-P A 116.29±3.9 108.46±2.4 107.57±7.5 107.40±5.5 112.59±4.4
Mid-P B 57.90±2.4 57.31±4.1 55.84±2.5 56.40±2.5 58.74±2.9
Low-P C 25.46±3.1 23.11±3.6 23.64±1.2 25.67±2.4 28.20±4.0
AllpotsreceivedN-andK-fertilization,moreadditionswereasfollows:arbuscularmycorrhiza;humicsubstancesat50literha-1;humicsubstancesat7,000literha
-1;
andphosphate-solubilizingbacteria.
Lowercase letters show the significant differences within one soil P-level if the interaction was significant (two-way ANOVA and Tukey HSD post hoc tests).
UppercaselettersshowthemaineffectsofsoilP-concentrationandbiostimulantaddition.Thetargetforspecies-richNardusgrasslandsis<10mgPOlsenkg-1(Raman
etal.2014)
68

69
4.3.3EffectsofbiostimulantsonP-removal
WhilebiostimulantshadlittleoveralleffectsonP-removalinbiomass(Fig.4.2),thereweresome interesting effects of biostimulants at specific soil P-concentrations. In High-P, theadditionofphosphate-solubilizingbacteriaresultedinthehighestP-removalcomparedtoallothertreatments.InMid-P,however,thisadditioncausedasignificantdeclineinPremoval(40%).IntheLow-Psoil,thehumicsubstancestreatmentwithhighdosage(HS2)significantlyimproved the total P-removal by 52% because of a significant 33% increase in biomassproduction.OverallsoilP-concentrations, theP-concentration inbiomasswassignificantlyincreasedwithadditionofphosphate-solubilizingbacteria.
Figure 4.2Mean + SE (n = 7) of the total P-removal with L. perenne over 123 days (mg P pot-1). High-Pcontains 111mg POlsen kg-1,Mid-P 64mg POlsen kg-1 and Low-P 36mg POlsen kg-1. Letters indicate significantdifferencesbetweenallmeans(p<0.05)basedonaTukeyHSDposthoctestfollowingatwo-wayANOVA(Table4.2)
4.3.4EffectsofbiostimulantsonbioavailablePinsoil
FinalbioavailableP-concentrationsonday123weresignificantlyaffectedbytheadditionofbiostimulants(Tables4.2and4.3).OverallsoilP-levels,additionwithphosphate-solubilizingbacteria resulted in higher bioavailable P-concentrations than the control.With the otherbiostimulants,finalbioavailableP-concentrationswerelower.

70
4.4Discussion
4.4.1P-removaldecreasesovertimeduetoP-limitation
Ourresults,acrosssandysoilswithdifferentinitialconcentrationsofbioavailableP,showedreducedP-removalfromthosesoilswithlowerbioavailablePdespiteN-andK-fertilization.Thismeans that P-mining will slow down over time, as bioavailable soil P-concentrationsdecrease.P-miningwill,therefore,takelongerthanwouldbeassumedfrominitialP-uptakerateson recently-abandonedagricultural land.Themaincause for thedeclineofP-uptakewith decreasing soil P-bioavailabilitywas the increasing P-limitation as indicated by the PnutritionindexandplantP-concentrations(Appendix4.C).N-andK-availabilitydidnotlimitP-mining.Werecoveredinallpots50–70%oftheaddedNand50–65%oftheaddedKwith the harvested grass. This indicates an overfertilization, more so in the Low-P pots.Duringrestorationinpractice,N-andK-fertilizationshouldbeadjustedtotheneedsofthecropand lowered iftheproductiondecreasesovertime. Itmighthowevertakesometimebefore P-removal will decline. In a long-term field experiment with several soil P-concentrations on a sandy texture,McCollum (1991) saw that in the beginning of the P-mining-process a plateau phase occurred, during which production would be constantlyhigh. This was followed by a phase in which yields dropped significantly with furtherdecreasingsoilP-concentration.Theplateauphasecanlastquitelong:Obersonetal.(2010)showedinapotexperimentthatP-removalwithL.multiflorumwasstillatthesameamountofourHigh-Psoil,althoughthesoilusedwasnotfertilizedwithPfor22years.Nevertheless,itseemslikethedecreaseinP-uptakeisnotasteadydecreaseasuptakeinLow-Pwasnotsignificantly lowerthanMid-P.P-removalremainsmoreeffectivethanwouldbeexpected.Thisis,however,difficulttoexplain.
4.4.2ChangeofbioavailablesoilP-stockisnotonlydrivenbyremovalofPwithbiomass
In our High-P, despite the high P-removal with biomass, we did not see a decline inbioavailable P. Bioavailable soil-P even increased.We can assume that in P-rich soils, thetransferofP fromthe slowly cyclingpool to thebioavailablepoolwasas fastasor fasterthan P-removalwith biomass.During the P-mining process,when the easily extractable Phasbeentakenupbyplants,Pwillbecomedepletedintherhizosphereandwillstarttolimitplant growthand consequently P-removal.We could confirm this inourMid-P soilwherefinalbioavailableP-concentrationswere9%lowerthanatthebeginningoftheexperiment.Here, the decrease in bioavailable Pwas roughly equivalent to the amount of P thatwasremovedwithbiomassduringthe123daysof theexperiment.Availabilitydecreasedevenmore inourLow-PsoilwherebioavailablePdecreased29%,which ismuchmorethantheamountofPremovedwithbiomass.ThispatternmaybeduetotheformationofanorganicstableP-pool through rootsandmicrobial immobilisationofP (DeSchrijveretal.2012).Ptaken up by plants can be removed with shoots when mown, be fixed in roots oraccumulated inotherorganicsoilpoolssuchasmicrobialbiomassandsoilorganicmatter.The latter can become both a source of bioavailable P (remineralisation, release of

71
microbial-P after cell death) or an important sink (immobilisation, incorporation of P intolivingmicrobialbiomass)(vonLützowetal.2006).AlthoughtheaccumulationofanorganicstableP-poolishappeninginallthreesoilP-concentrations, it isprobablyrelativelyhighintheLow-Psoil.
4.4.3Effectsofbiostimulants
The second aim of our experiment was to test whether additions of biostimulants couldsignificantlyincreasethephytoextractionofPfromthesoil.AtthreesoilP-levelswetestedarbuscularmycorrhiza,humicsubstancesat twoconcentrationsandphosphate-solubilizingbacteria.Thebiostimulantssignificantly increasedP-removal inonlytwocases:phosphate-solubilizing bacteria at High-P and a high concentration of humic substances at Low-P.NeitheroftheothertreatmentsincreasedP-removal.Andcontrarytowhatweexpected,P-removaldecreasedsignificantlybythephosphate-solubilizingbacteriaadditioninLow-P.
Overall, we did not find significant improvements by the addition of mycorrhiza despiteaffirmed colonization in the roots. We acknowledge that crop responses to addedmycorrhiza have proven to be often unpredictable (Ryan and Graham 2002) and thatinoculation is not always successful. Therefore, the experiment was repeated using adifferentapplicationmethodformycorrhizaandphosphate-solubilizingbacteria.Theyweremixedwiththesoil insteadofappliedontopof thesoil.ThisdidnothaveaneffectonP-removal and does not have an impact on the results of the main pot experiment (seeAppendix4.D). In contrast toour results,a sterile Low-Psoil (37mgPOlsen kg-1) inoculatedwithG.intraradicesandsownwithL.perenneresultedinsignificantlypositiveeffectsfrommycorrhiza (Lee et al. 2012). These positive effects on biomass production and P-concentrationweresimilartotheeffectsofPfertilization.Leeetal.(2012)didnotfertilizetheir soil with Nwhilewe did fertilize N and K in all of our pots according to agronomicstandards. It is likely thatN fertilization inourexperiment reducedpossibleeffectsof theadded mycorrhiza (Johnson et al. 2003). Also, Azcón et al. (2003) observed that thebeneficialeffectsofG.mosseae ina soilverypoor inP (4.5mgPOlsenkg-1)wereabsentathigh N- and P-fertilization regimes. P-mining will, due to N- and K-fertilization, be atechniquethatisincompatiblewithpotentiallybeneficialarbuscularmycorrhiza.
Wealsotestedtheeffectsofhumicsubstancesinthisexperiment.Theseorganicacidscan,depending on soil properties,mobilize and solubilize P from the slowly cycling soil P-pool(JonesandDarrah1994;Gangetal.2012).Inourtreatmentwithahighdose(HS2),humicsubstancescausedasignificantincreaseinbiomassproductionandP-removalintheLow-Pconcentration.Thisdosewashoweverunreasonablylarge.HS2wasappliedat7,000literha-1,muchhigher than the standarddose (HS1: 50 liter ha-1), and therefore, very expensive.This low dose did not improve biomass production nor P-removal in any of the soil P-concentrations.ThisisinaccordancewiththegreenhousestudiesofJonesetal.(2007)withwheat and of Pilanalı & Kaplan (2003) with strawberries, but in contrast with fieldexperimentswherepositiveeffectsof lowHSdosageon (root)biomassproductionandP-uptakewereobserved (Sharif2002;Verlindenetal.2009;Verlindenetal.2010;Daurand

72
Bakhashwain 2013). The effects of humic substances in concentrations in between ourtested doses should be tested experimentally. It is possible that in a mid-rangeconcentration,humicsubstancesarestilleffectiveforenhancingP-uptakeinP-poorsoils.
Thirdly, we included phosphate-solubilizing bacteria in our experiment. Recently, a potexperimentgaveinsightinthepositiveeffectsofaddingB.brevis,P.putidaandP.corrugataontheavailablePconditions inacid,sandysoilswithhightotalP-contents (DeBolleetal.2013b). However, we should be cautious with concluding that phosphate-solubilizingbacteriaadditioncanhavebeneficialeffectsoncropgrowth,sinceresultsfrompotandfieldexperimentsareoftenconflicting.For instance,Malboobietal. (2009) foundthatbiomassproductionofpotatoes ina fieldexperimentwas reducedby severalPSBstrains.While inthesamepaper,apositiveinfluenceonbiomassproductionofpotatoesinapotexperimentwas reported. In our experiment, we have found for the High-P concentration that P-removalwasenhancedwith14%(from20.4gPpot-1 to23.2gPpot-1)by theadditionofphosphate-solubilizingbacteria.IntheMid-Pconcentration,onthecontrary,thistreatmentcausedasignificantdropinP-removal,whichwasmainlycausedbylowbiomassproduction.Despite higher P-concentrations in biomass, P-removal in Low-P and Mid-P was notimproved by the phosphate-solubilizing bacteria addition. But these organisms may be auseful tool at soils with high P-concentrations. However, the addition of phosphate-solubilizingbacteriato fieldsmaystillbeunrealisticsincetheeffectsoncropgrowthwerenotconsistent,andproductionoftheseorganismsforsoilapplicationsonalargescalemightnotyetbeeconomicallyattainable.
Calculationsof the timeneeded to reach low soil P-concentrationswithP-miningneed tointoaccountthatP-removalwilldecreaseintime(seeAppendix4.E).Wedonotknowhowlongexactlyhow long itwould take to restore low-PconcentrationswithP-mining, togetbetter insight in this, field data at different P-mining phases is needed. From our potexperiment, italsoseemsthat inthe laterstagesof theP-miningprocess, thedecreaseofbioavailable soil-Pmight actually go faster than assumed from the amount of P removedwithbiomass.Wethinkaconsiderablefractionofbioavailablesoil-Pwillbefixedtemporarilyinplantroots.Therefore, intheendofP-mining, itmightbebettertoalsousecropsfromwhich also roots are harvested or a transition fromhigh-productive crops to crops betteradjusted to low soil P-concentrations are worth considering (Delorme et al. 2000). Also,duringrestorationinpractice,fertilizationofNandKshouldbeadjustedtotheneedsofthecropandlowerediftheproductiondecreasesovertime.
4.5Conclusion
WehaveshownP-removalratewas60%higherinourP-richsoilthanintheP-poorestsoil.This finding implies P-removalwill likely slow downwhen soil P concentrations decrease,andhence,withtime.Noneofthebiostimulantsalteredthistrajectory.CalculationsoftherestorationtimeneededtoreachlowsoilP-concentrationswithP-miningneedtotakethis

73
delayintoaccount.RestorationofNardusgrasslandsonex-agriculturalsoilsbyP-miningwillprobablytakedecadesunlessP-fertilizationhistorywasmuchlowerthanaverage.
4.6Acknowledgements
WethankLucWillems,GreetDebruynandPredragMiljkovićforassistingwiththecollectionand chemical analysis of soil and biomass samples. Also, wewould like to thankMichaelPerring, Rob HMarrs,Margot Vanhellemont, theManaging Editor Valter Amaral and theCoordinating Editor Valerie Eviner, for their valuable comments on this manuscript. Thisresearch was funded by a Ph.D. grant from the Research Fund of the University CollegeGhenttoSSandADSheldapostdoctoralfellowshipfromtheResearchFoundation-Flanders(FWO).SDBheldaPhD.fellowshipfromtheSpecialResearchFund(BOF)ofGhentUniversity
MasterthesisstudentTomDuPréand internshipstudentPredragMiljkovicperformingthesecondharvestandNK-fertilizationinthepotexperiment

74
Colorimetricdeterminationofphosphorusinextractionsfrombiomassorsoilsamples
MeasurementofsoilaciditywithanelectrodeaftershakingdrysoilindemineralizedwaterorKClsolution

75
CHAPTER 5 Phosphorus mining efficiency declines with decreasing soil P concentration and varies across cropspecies CHAPTER 5Phosphorus mining efficiency declines with decreasing
soil P concentra�on and varies across crop species
The pot experiment at 88 days
After: Schelfhout S, De Schrijver A, Verheyen K, De Beelde R, Haesaert G, Mertens J. 2018. Phosphorus miningefficiency declines with decreasing soil P concentration and varies across crop species. International Journal ofPhytoremedia�on. 20:9. 939-946. DOI: 10.1080/15226514.2018.1448363
76
Abstract
HighsoilPconcentrationshinderecologicalrestorationofbiologicalcommunitiestypicalfornutrient-poor soils. Phosphorusmining, i.e. growing crops with fertilization other than P,might reduce soil P concentrationsmore quickly. However, crop species have different P-uptakerates,whichmayalsovarywithsoilPconcentration.Inapotexperimentwiththreesoil-P-levels(High-P:125-155mgPOlsenkg-1;Mid-P:51-70mgPOlsenkg-1;Low-P:6-21mgPOlsenkg-1),wemeasuredhowmuchPwasremovedbyfivecropspecies:buckwheat(Fagopyrum
esculetum Moench), maize (Zea mays L.), sunflower (Helianthus annuus L.), flax (Linum
usitatissimum L.) and triticale (X TriticosecaleWittmack). Total P removal decreasedwithsoil-P-levelanddependeduponcrop identity.BuckwheatandmaizeremovedmostPfromHigh-PandMid-PsoilsandtriticaleremovedlessPthanbuckwheat,maizeandsunflowerateverysoil-P-level.ThedifferenceinPremovalbetweencropswas,however,almostabsentinLow-Psoils.AbsoluteandrelativePremovalwithseedsdependeduponcropspeciesand,formaize and triticale, also upon soil-P-level. None of the previously-grown crop speciessignificantly affectedP removal by the follow-up crop, perennial ryegrass (Loliumperenne
L.).WecanconcludethatformaximizingPremoval,buckwheatormaizecouldbegrown.
5.1Introduction
Currently, the sustainableuseof P is also ahot topic in anagronomic context; consensusexiststokeepsoilPwithinanagronomicoptimumwherePconcentrationsarenotlimitingcropyieldsandthereisnoriskforPlosses(Withersetal.2017).ThisPoptimumdependsonvarioussoilfactors,rainfallandthecropspecies(Tangetal.2009;Baietal.2013;Johnstonetal.2014;Sánchez-Alcaláetal.2015),butcanbegeneralizedtorangebetween15and25mgPOlsenkg-1(Syersetal.2008;Poultonetal.2013).
ApotentialsolutionforreducingsoilPconcentrationsfromP-saturatedsoils(>85mgPOlsenkg-1)maybe to growcropswith zero-P fertilization, and,hence,using legacy soil P stocks(Jordan-Meilleetal.2012;Sharpleyetal.2013;Roweetal.2016).ThispracticeofdepletingsoilsofPbycultivatingcropsorgrasswherebybiomassproduction,andhencetheremovalrate of P, is optimized by fertilizationwith growth-limiting nutrients, other than P, is alsonamed P-mining or phytoextraction of P. Initially, P depletion over time follows a linearcurvewhichbecomescurvilinear lateron,andthus,slowsdownovertime(Johnstonetal.2016).ThetrajectoryofP-richtowardsP-poorsoilsdepends,amongotherthings,uponthePbufferingcapacityof thesoiland itsability to restore theequilibriumbetweendifferentPpools(seeBox1).InorganicPinsoilcanbeconsideredinfourpoolsofvaryingavailabilityforplantuptake:whenimmediatelyaccessibleP,oralso,Pinthesoilsolution(pool1),becomesdepleted in the rhizosphere, further P uptake depends upon how fast readily extractable(pool 2) and low extractable P-pools (pools 3 and 4) can resupply the soil solution pool(Johnstonetal.2014).
TheP-miningtrajectorywill furtherbeaffectedbythegrowingcropspecies.Sharmaetal.(2007)foundlargevariationsinPuptakeamongdifferentcropspeciesandspecifiedthata

77
potentialcandidateforP-miningshouldhavehighbiomassproduction,highP-concentrationandarelevanteconomicvalue.SomeplantspeciesareabletoincreasePuptakebecauseofspecificPacquisitionstrategies,andcanevenuseorganicP(Turner2008),forexampleviarootexcretionofprotonsandorganicanionstomobilizePfromlessbioavailablePfractions(Horst et al. 2001; Simpson et al. 2011). Phosphorus-miningmight be optimized by usingthose crop species in crop rotationwhere specific P acquisition strategies can increase Puptakeforthemselvesorforthefollow-upcropand,thereby,improvingPacquisitionbythewhole system (Horst et al. 2001; Rowe et al. 2016). Specific crop rotations have beendeveloped for a multitude of purposes, e.g. using N-fixing crops for managing N-fertility(Crews and Peoples 2004) or using nematode antagonistic crop species (Barker andKoenning 1998). However, only a limited number of long-term field experiments forselecting crop rotations with the purpose of maximizing P extraction exist (described byKratochviletal.2006andFiorellinoetal.2017).Inthesetwostudies,itwasconcludedthatrotations for silage removedmore P than grain rotations. These rotationswere tested atdifferent initial soil P concentrations, ranging from roughly 20 to 140 mg POlsen kg-1(conversionfromMehlich-3extractionsbasedonWolfandBaker1985)and illustratedaPremoval rate dependent on the initial soil P concentration. The investigated rotations forsilagecontainedrye(SecalecerealeL.),maize(ZeamaysL.),alfalfa(MedicagosativaL.)andryegrass (Lolium perenne L.) but this list could be further extended with, e.g. buckwheat(Fagopyrum esculetum Moench) able to mobilize P under zero-P-fertilization due to rootexcretionoforganicacids(Possingeretal.2013).
Toaidwiththiscropselectionwehavesetupapotexperimentcontainingfivecropspeciesand a follow-up crop along a series of soilswith differing P concentrations. Our researchquestionsare:(i)HowlargeisthedifferenceinPremovalbetweenthestudiedcropspecies?(ii)DotheinitialsoilPconcentrationsaffectthisdifferenceinPremoval?(iii)IsPremovalofthefollow-upcropaffectedbythepreviouscropspecies?
5.2Methods
5.2.1Soilcollection
Basedonanunpublishedextensivescreening,ninefieldswereselectedwithin1kmradiusin“LandschapDeLiereman”naturereserve(Oud-Turnhout,Belgium;Table5.1).Fieldsdifferedin soil P concentrations, and had comparable sandy textures, hydrological conditions andacidity.Wegrouped the fieldsaccording to theirbioavailable soil-P-concentration in threesoil-P-levels:125-155mgPOlsenkg-1furtherreferredtoasHigh-P,51-70mgPOlsenkg-1furtherreferredtoasMid-P,and,6-21mgPOlsenkg-1furtherreferredtoasLow-P.Perfield,150kgsoilwascollectedfromthe5-20cmsoil layerbetweenJulyandSeptember2012(Fig.5.1).The collected soil was sieved (1 cm mesh), homogenized with a cement mixer andconsequentlysampledtodeterminethesoilmoisturecontentgravimetrically.Soilmoisturecontentwasbroughtuptoavolumetriclevelof20%withdeionizedwater.

78
Figure5.1SoilcollectioninnaturereserveLandschapDeLieremanin2012
Table5.1Characterizationoftheinitialsoilpropertiesforthesoilsusedinthepotexperiment(n=5)Soil-ID Soil-P-
levelCoordinates POlsen
(mgkg-1)PTotal(mgkg-1)
POxalate(mgkg-1)
FeOxalate(mgkg-1)
AlOxalate(mgkg-1)
PSD(%)
pHKCl
P-9 High-P 51°19'46.3"N5°01'58.9"E
155±6 693±20 494±28 419±18 1284±75 33±1.0 4.2±0.0
P-8 High-P 51°19'52.1"N5°00'56.9"E
131±11 517±26 332±10 466±21 949±33 28±0.4 4.3±0.1
P-7 High-P 51°19'58.1"N5°00'58.0"E
125±7 675±45 453±17 369±12 925±16 41±1.0 4.6±0.0
P-6 Mid-P 51°20'08.2"N5°01'12.0"E
70±3 364±21 207±4 265±12 423±14 37±0.8 4.5±0.0
P-5 Mid-P 51°20'00.1"N5°01'01.3"E
51±1 274±7 132±3 213±5 357±11 29±0.4 4.5±0.0
P-4 Mid-P 51°20'23.5"N5°00'53.2"E
51±2 388±9 162±6 567±23 1353±36 10±0.2 4.5±0.0
P-3 Low-P 51°20'50.4"N5°01'11.6"E
21±2 217±95 42±5 456±57 563±45 5±0.2 4.3±0.0
P-2 Low-P 51°20'21.5"N5°01'14.6"E
19±1 113±10 61±6 280±23 430±14 11±1.0 4.3±0.0
P-1 Low-P 51°20'03.6"N5°01'12.9"E
6±1 78±5 12±1 155±18 878±37 1±0.1 3.8±0.0

79
5.2.2Chemicalsoilanalyses
Toverify initialchemicalsoilconditions,wesampledthebulksoilofeachselectedfieldbytakingfivesamplesafterthehomogenizationprocedure.Soilsamplesweredriedat40°Cfor48 h and then passed through a 2 mm sieve. Soil pH (with 1 M KCl as extractant) wasmeasuredusinga glass electrode (Orion,OrionEurope,Cambridge, England,model 920A)following the procedure described in ISO 10390:1994(E). Further, we analyzed soil Pconcentrationsbyfollowingextractionmethods:
i.BioavailableP,whichisavailableforplantswithinonegrowingseason(Gilbertetal.2009)byextractioninNaHCO3(POlsen;accordingtoISO11263:1994(E));and
ii.SlowlycyclingP,whichalsoincludesPthatcanbecomeavailableonthelongertermandisadsorbedbyAlandFe.ThisP-fractionwasextractedinammoniumoxalate-oxalic acid (POxalate; according to NEN 5776:2006). Al and Feconcentrations were alsomeasured in these extracts (AlOxalate and FeOxalate) byatomicabsorptionspectrophotometry(AA240FS,FastSequentialAAS);and
iii. TotalPmeasuredafter completedestructionwithHClO4 (65%),HNO3(70%)andH2SO4(98%)inTeflonbombsfor4hat150°C(PTotal).
Intheextracts,Pwasmeasuredcolorimetricallyaccordingtothemalachitegreenprocedure(Lajthaetal.1999).Wecalculatedthephosphatesaturationdegree(PSD),whichestimatesthe potential P to be desorbed and thus supplied from the slowly cycling pool to thebioavailable pool by!"# = [!!"#$#%& 0.5×(!"!"#$#%& + !"!"#$#%&)]×100(%)with the P,AlandFecontents(inmmolkg-1)extractedwithammoniumoxalate-oxalicacid.SoilPSDof25% is seen as the critical limit above which the potential leaching of P to groundwaterbecomeslargerthan0.1mgorthophosphateliter-1groundwater(VanderZeeetal.1990).
5.2.3Setupofthepotexperiment
ForoptimalP-availability, soilpHH2O shouldbebetween5.5and7.0 (Gouldingetal.2008;whichrelatestoapH-KClrangeof4.8to6.4;VanLierop1981).Hence,beforefillingpots,thesoilswere limedwith chalkpowder (Dolokorn: 60%CaCO3and30%MgCO3): according totheir differing soil pH, 9.4 gDolokornpot-1was added to soils P-1, P-2 andP-3 and 5.1 gDolokorn pot-1 was added to soils P-4, P-5, P-6, P-7, P-8 and P-9. For each soil and cropcombination,threepotsof26cmdiameterwerefilledwith7kgsoil.FivecropspecieswereselectedbasedontraitsthatcouldbenefitPextractionalongdifferentsoilPconcentrations:high yield potential in maize (Zea mays L.; Ehlert et al. 2009) and sunflower (Helianthusannuus L.; Sharma et al. 2007); specific P acquiring strategy in buckwheat (Fagopyrum
esculetumMoench;Possingeretal.2013)andflax(LinumusitatissimumL.;KranzandJacob1977 in Hakala et al. 2009); and, tolerance for low soil P concentrations in triticale (XTriticosecaleWittmack;vanDijkandvanGeel2012;seeAppendix5.A forvarieties).Seedswere sownatdepthsanddensitiesaccording to field recommendationson24-26October2012 (Anonymous 2003; Pannecoucque et al. 2012; see also Appendix-Table 5.A.1). Next,
80
potswereplacedrandomlyinagreenhousewithday/nightregimeof14/10h,temperatureof19°C,andarelativehumiditymaintainedat75%from24October2012until15Mai2013.Thepotswerewateredtokeepthesoilhumidityaroundavolumetriclevelof20%.Allpotswere fertilizedwithnutrientsother thanP tomakesure limitationby thesenutrientswasminimal. All fertilizationswere donewith nutrient solutions containingNH4NO3 and KNO3followingfieldrecommendations(Debaekeetal.1998;Björkman2010;Maesetal.2012b;vanDijkandvanGeel2012;seealsoAppendix-Table5.A.2),exceptforday30wheneachpotwasfertilizedwithmacro-andmicronutrients:76.6mgNasNH4NO3andCa(NO3)2·H2O,50mgKasK2SO4,100mgMgasMgSO4·7H2O,1.2mgBasH3BO3,2mgMnasMnCl2·4H2O,3.7mgZnasZnSO4·7H2O,11.1mgCuasCuCl2·2H2Oand13.9mgMoasNa2MoO4·2H2O.
5.2.4Plantsamplingandchemicalanalyses
Dependingonthecropspecies,cropsweregrownfor105-202days, i.e.untilseedsstartedtoripenbutbefore leaveswilted(seeTableS1).Wecutcrops2cmabovethesoilsurfaceand kept the above-ground vegetative parts and seeds separately. These samples wereweighed (dry mass, DM) and ground after drying to constant weight at 70°C for 48 h.Phosphorus concentration in biomasswas obtained after digesting 100mg of the samplewith0.4mlHClO4(65%)and2mlHNO3(70%)inTeflonbombsfor4hat140°Cand,then,colorimetricallymeasuringaccordingtothemalachitegreenprocedure(Lajthaetal.1999).Totalabove-groundbiomasswascalculatedbysummingseedandabove-groundvegetativebiomass.Phosphorusremovalwithseedsandvegetativepartswascalculatedbymultiplyingtotalabove-groundbiomassandPconcentration.TotalPremovalwascalculatedasthesumofPremovalwithseedsandPremovalwithvegetativeparts.
5.2.5Thefollow-upcrop:perennialryegrass
To evaluate the effects of the different crops on P-removal with a next crop, we grewperennial ryegrass in each pot as a phytometer. After the final crop harvest, on 13September 2013, the soil in all pots was harrowed superficially with a hand cultivator tocreateoptimalseedingconditionsandsownwith2gramsofLoliumperennevariety‘Plenty’.ToexcludelimitationbyothernutrientsthanP,wefertilizedallpotswith250mgNand350mg K as NH4NO3 and KNO3 on day 0. Ryegrass was grown for 52 days at the samegreenhouseconditions,harvestedandchemically-analyzedasdescribedabove.
5.2.6Statisticalanalyses
AllstatisticalanalyseswereperformedwithR(RCoreTeam2016)andstatisticalsignificancewassetatp lessthan0.05.Weclusteredtheninesoilsintothreesoil-P-levelsaccordingtotheirsoilPconcentrationtoallowtestingtheeffectofsoil-P-levelontheresponsevariableswith analysis of variance (ANOVA). We used two-way ANOVA (the aov function from R-package“stats”) to test theeffectsofcrop identity, soil-P-levelandtheir interactionon (i)totalabove-groundbiomass,meanPconcentrationandtotalPremovalofthefivecropsandthe follow-up crop and (ii) P removal with seeds and vegetative parts. To achieve the

81
homogeneityassumption, thecropresponsevariables totalabove-groundbiomass, totalPremoval and P removal with seeds were square root-transformed; P concentration inbiomass, P removal with vegetative parts, P concentration in the follow-up crop and Premovalwith the follow-up cropwere log10-transformed.Residuals from theANOVA testswereexaminedfornormaldistributionwithquantile-quantileplots.Multiplecomparisonsofcropidentityandsoil-P-levelwereperformedbymeansofTukeyusingtheHSD.testfunctionfromR-package“agricolae” (deMendiburu2016).Finally, foreachcropspeciesexcept fortriticale,weperformedsecondorder linear regressions for totalP removal versusOlsenPconcentrationusing the lm function from theR-package “stats”. For triticale, a first orderlinearregressiongaveabetterfitbasedontheadjustedR2.AccordingtoANOVAtestingandthe adjusted R2, the second order linear regressions fitted the data significantly better,exceptfortriticalewhereafirstorderlinearregressionwasmoreappropriate.
5.3Results
TheremovalofPwithabove-groundbiomasswassignificantlyinfluencedbythesoil-P-level(High-P>Mid-P>Low-P;F2,120=155.5,p<0.001)andcropidentity(buckwheat>maize=sunflower > flax > triticale; F4, 120 = 97.6, p < 0.001; see Tables 5.2 and 5.3). Interactionsbetweensoil-P-levelandcropidentitywerealsosignificant(F8,120=7.3,p<0.001).MaximalPremovalwasobtainedbybuckwheatandmaizeatHigh-P(onaverage232mgPpot-1)andminimalP removalby triticaleat Low-P (onaverage10mgPpot-1). P removalby triticalereachedonly14–20%ofPremovalwithbuckwheatacrossall soil-P-levels.WeobservedthatthemagnitudeofthedeclineinPremovalwithsoil-P-leveldependeduponcropidentitywiththesteepestdeclineinbuckwheatand(nearly)nodeclineinflaxandtriticale(Fig.5.2and Appendix-Table 5.B). For buckwheat, maize and sunflower, P removal decreasedrespectively 31 – 37%when soil-P-level decreased fromHigh-P toMid-P and, 60 – 68%when soil-P-level decreased from Mid-P to Low-P. And further, while P content inbuckwheat, sunflower and flax seeds remained the same with increasing soil-P-level, Premovalwithseedsbecamerelativelymoreimportantformaizeandtriticale(Figure5.3).
Totalabove-groundbiomasswasmostlyaffectedbycropidentity(F4,120=164.8,p<0.001;Table5.2).Formaize,totalabove-groundbiomasswasalsosignificantlyaffectedbythesoil-P-level (High-P>Mid-P> Low-P). Theeffectof soil-P-levelon total above-groundbiomasswaslessclearintheothercropsandcompletelyabsentinflax.
Premovalwiththefollow-upcrop,perennialryegrass,wasaffectedsignificantlyonlybythesoil-P-level and not by the identity of the previous crop species (Tables 5.2 and 5.4).Meanwhile, biomass P concentration was affected by both soil-P-level (High-P >Mid-P >Low-P;F2,120=123.5,p <0.001)andby theprevious crop (F4,120 =4.9,p <0.001): inpotswhere flax was grown previously, P-concentration in the follow-up crop was significantlyhigherthanwheretriticale,buckwheatormaizewasgrown(Tables5.2and5.4).

82
Figure5.2TotalPremovalwithbiomassversusbioavailablePconcentrationinthepotexperiment(n=135).Colors indicatecrop identity;curvesrepresent first (triticale)andsecondorder linear regressions (the fourothercropspecies;forcoefficientsandstatisticsseeAppendix-Table5.B);shadesshowthestandarderrorofthemean
Figure5.3Effectsof soil-P-level and crop identityonP removalwith seedsandvegetativeparts. Eachbarrepresents the mean of three replicates minus one standard deviation of the mean. Letters indicatesignificantdifferencesbetweenallmeansofseedPremoval(lowercase)andnon-seedPremoval(uppercase)basedonaTukeyHSDposthoctestfollow-upatwo-wayANOVA(p<0.05;Table2)
●
●
●
●
●
●
●
●
●
●
●
●
●
●
●
●
●
●
●●
●
●
●
●
●
●
●
●●
●
●
●
●
●
●
●
●●●
●
●
●
●●
●
●●
●
●
●●
●
●
●
●●●
●
●
●
●
●●
●●
●
●●
●
●
●●
●●
●
●
●●●
●
●●●●
●
●
●
●
●
●
●
●●●●
●
●
●
●
●●
●
●●●
●●●
●
●
●
●
●
●
●●
●
●●
●●●
●
●
●●
●●●
●
●
●
●
●
●
●
●
●
●
●
●
●
●
●
●
●
●
●
●
●
●
●
●
●●
●
●
●
●
●
●
●
●●
●
●
●
●
●
●
●
●●●
●
●
●
●●
●
●●
●
●
●●
●
●
●
●●●
●
●
●
●
●●
●●
●
●●
●
●
●●
●●
●
●
●●●
●
●●●
●
●
●
●
●
●
●
●
●●●●
●
●
●
●
●●
●
●●●
●●
●
●
●
●
●
●
●
●●
●
●●
●●●
●
●
●●
●●●
●
●
●
●
●
●
0
100
200
300
0 50 100 150
POlsen (mg kg−1)
Tota
l P re
mov
al w
ith b
iom
ass
(mg
P po
t−1)
plant●●
●●
●●
●●
●●
Buckwheat
Corn
Sunflower
Flax
Triticale

Table5.2Effectsofcropidentity,soil-P-levelandtheirinteractionontotalabove-groundbiomass,P-concentrationinbiomassandP-removalwithbiomassoftheusedcropandofthefollow-upcrop.TheeffectonP-removalwithseedsandnon-seedsisalsoshownExperiment Responsevariable CropID Soil-P-level CropIDxsoil-P-level
F-value p-value F-value p-value F-value p-value
Fivecrops Totalabove-groundbiomass 164.8 *** 41.1 *** 3.7 ***
Pconcentrationinbiomass 46.7 *** 95.9 *** 2.1 *
Premovalwithbiomass 97.6 *** 155.5 *** 7.3 ***
Premovalwithseeds 45.0 *** 28.5 *** 11.3 ***
Premovalwithvegetativeparts 143.2 *** 111.4 *** 4.1 ***
Follow-upcrop Totalabove-groundbiomass 1.3 ns 17.5 *** 0.3 ns
Pconcentrationinbiomass 4.9 ** 123.5 *** 0.3 ns
Premovalwithbiomass 0.7 ns 76.9 *** 0.3 ns
Degreesoffreedom 4
2
8
Resultsoftwo-wayANOVA;Significancelevelsare***p<0.001;**p<0.01;*p<0.05;ns,notsignificant
Table5.3Mean±SD(n=9)foreachcultivatedcropspeciesandsoilP-concentrationoftotalabove-groundbiomass,meanP-concentrationandtotalP-removal
Totalabove-groundbiomass(gdrybiomasspot-1)
Pconcentrationinbiomass(mgPg-1drybiomass)
TotalPremoval(mgPpot-1)
High-P Mid-P Low-P High-P Mid-P Low-P High-P Mid-P Low-P
A B C
A B C
A B C
Buckwheat B 43±10 cde 49±18 cd 28±8 efgh A 6.5±1.4 a 4.0±1.6 b 2.0±0.8 def A 269±31 a 186±67 bc 59±33 e
Maize A 111±15 a 84±22 b 59±16 c D 1.8±0.6 def 1.5±0.5 ef 0.8±0.2 g B 195±39 ab 123±35 cd 50±23 ef
Sunflower C 40±10 cdef 35±12 defg 22±5 ghi B 3.9±0.5 b 3.1±0.8 bc 1.7±0.5 ef B 156±37 bcd 105±35 d 39±17 ef
Flax C 26±3 fgh 28±7 efgh 23±3 gh C 2.2±0.5 cde 2.0±0.7 cde 1.4±0.4 ef C 57±11 e 54±13 ef 32±8 ef
Triticale D 19±5 hi 12±7 ij 7±5 j C 2.8±0.4 bcd 2.1±0.5 cde 1.2±0.4 fg D 54±16 ef 26±17 fg 10±10 g
Results from two-way ANOVA and Tukey post hoc tests are indicated with uppercase letters (main effects of crop ID and soil-P-level) and lowercase letters
(interactioneffectofcropIDxsoil-P-level) 8
3

Table 5.4Mean ± SD (n=9) for each cultivated pre-crop species and soil P-concentration of total above-ground biomass,mean P-concentration and total P-removalwiththefollow-upcrop
Above-groundbiomassfollow-upcrop(gDMpot-1)
P-concentrationfollow-upcrop(mgPg-1drybiomass)
P-removalfollow-upcrop(mgPpot-1)
High-P Mid-P Low-P High-P Mid-P Low-P High-P Mid-P Low-P
A A B
A B C
A B C
Buckwheat 11±4 10±3 7±4 ABC 3.6±0.6 2.7±1.0 1.4±0.3 41±16 26±11 9±6
Maize 9±4 9±3 7±4 BC 3.4±1.1 2.4±0.6 1.5±0.5 32±19 21±5 10±6
Sunflower 10±3 11±5 6±3 AB 4.2±0.8 3.1±0.8 1.7±0.5 42±12 33±18 10±5
Flax 9±4 8±5 5±3 A 4.5±0.5 3.4±0.9 1.6±0.5 41±19 29±18 8±4
Triticale 11±3 9±2 7±2 C 3.2±0.7 2.6±0.6 1.3±0.5 35±12 23±4 10±5
Resultsfromtwo-wayANOVAandTukeyposthoctestsareindicatedwithuppercaseletters(maineffectsofcropIDandsoil-P-level);TheinteractionofcropIDx
soil-P-levelwasnotsignificant
84
85
5.4Discussion
5.4.1Premovaldecreaseswithsoil-P-levelandvariesacrosscropspecies
We investigatedP removalwith five cropsacross various soil-P-levels inapotexperimentduringonegrowingseason.Phosphorusremovalwasmainlyaffectedbysoil-P-level;acrossall crop species, it decreasedwith soil P concentration despiteN- and K-fertilization. Thisfinding is similar to the results of Chapter 4, a pot experimenton similar sandy soilswithryegrass, andalso inaccordancewith long-term fertilization studies (Johnstonet al. 2014;Fiorellino et al. 2017). In the context of ecological restoration, when estimating the timeneededforP-miningtowardsP-poorsoils(Chapter2andBox2),itisrelevanttoaccountforthe decline in P removal because thiswill likely cause a lengthening of the duration.WefoundthatespeciallyatHigh-PandMid-Psoils,thecropspeciesusedforP-miningmattered:buckwheat,maize and sunflowerwere cropswith relatively large P removal compared toflaxandtriticale.Acrossallsoil-P-levels,buckwheatandsunflowerbothhadrelativelyhighyieldsandPconcentrationsinbiomasswhilemaizeonlyhadrelativelyhighyields.SimilarlytoSchiemenzandEichler-Löbermann(2010),buckwheatstoodoutasasuitablecropforP-miningatHigh-andMid-Plevels.IncontrasttoPossingeretal.(2013),thiswasnotthecaseataLow-Plevel.Infact,inourLow-PsoilsthedifferenceinPremovalbetweencropspecieswasalmostabsent,exceptfortriticaleremovingsignificantlythreetofivetimeslessPthantheothercrops.Thiscorrespondstoliteraturewheregenerally,smallgraincerealsarenotP-efficientinzeroPsystems,e.g.Colombetal.(2007)showedwithalong-termfieldstudythatwheatismoresensitivethanmaizeandsunflowertotheabsenceofPfertilization.Triticale,a hybrid betweenwheat and rye, seems to have inherited its P-efficiency traits from thelesser P-efficient wheat rather than from rye according to experiments with the triticalevarietyDT-46 (Pandeyetal.2005).The lessercapabilityof smallgraincereals toextractPunder zero-P fertilizationwasalso confirmed in the long-termP-mining study reportedbyKratochviletal. (2006)andFiorellinoetal. (2017).Phosphorusremovalpotentialof flax isinconsistentinliterature:flaxwasreportedinaP-fertilizedpotexperimenttoaccumulateP(Hakalaetal.2009),whileitwasalsoapoorP-miningcropwhencomparedwithbuckwheat,sunflowerandmaize(Kalra1971).
WefurtherfoundthatabsoluteandrelativePremovalwithseedsdependeduponthecropspecies (in accordance with Hakala et al. (2009)) and soil-P-level. In buckwheat andsunflower,P-removalwithseedsvariedfrom2to23%oftotalPremovalandtheabsolutePremovalwithseedswasnotaffectedbysoil-P-level.Incontrast,maizeseedscontained43-55% of the above-ground P and this value significantly increased with soil-P-level. Thisobservation may have implications for practice, for example, for maximizing P removal,buckwheat or sunflower could be grown as silage crops where the whole above-groundplant is harvested, i.e. no leaves are allowed towilt.While formaize, bothharvesting forsilage and harvesting for grains are suitable options when maximizing P removal is theobjective.

86
For buckwheat, sunflower and triticale, total above-groundbiomass resided on a ‘plateauphase’atHigh-PandMid-Psoilsand,then,decreasessuddenlyinLow-Psoils.Accordingtoliterature, this is defined as the critical soil P concentration where yield responds to Pfertilization and lies, depending on various soil factors and the crop species, betweenbioavailableP concentrationsof 8 and35mgPOlsen kg-1 (Tanget al. 2009;Bai et al. 2013;Poultonetal.2013;Johnstonetal.2014;Sánchez-Alcaláetal.2015).
Further,our results showadifference in luxuryP consumptionbetween the crop species.LuxuryP consumption,definedas increasingplantPacquisitionwith soilP concentrationsnotresulting inadditionalbiomassproduction(AertsandChapin1999),wasclearlyshownforbuckwheatand,slightlylessapparent,forsunflower.ThecontinueduseofcropspecieswiththistraitinazeroPsupplysystemwould,withtime,depletesoilPstocks.Cropspeciessuchasbuckwheat, sunflowerandalso thehighyieldingmaize, arepreferablyusedwhenthe objective is to reduce soil P concentrations from High-P to Mid-P concentrations.However, in the context of ecological restoration it is preferable to sustain the highestpossible P-removal rates also towards or below Low-P soil levels.Wehave shown that atthese levels, the crop species is less important; P-removal becomes very low in these soilconditions anyway. This implies that the last stretch of P-mining at Low-P soil-P-levels torestoreP-poorreferenceconditions(<12mgPOlsenkg-1)willbetime-consuming.
Contrastingly, for sustainablePuse in anagricultural context, it isdesirable toavoidbotheutrophication and yield losses by staying within optimal bioavailable P concentrations(Syers et al. 2008). Temporarily P-mining management may be used in fields where thephosphatesaturationdegree(PSD)hasexceeded25%,i.e.thethresholdforsandysoilsfromwheneutrophicationbecomescriticalforwaterbodies(VanderZeeetal.1990;Roweetal.2016;seeBox1inChapter1).ThePSDmaybedecreasedtosafelevelsbyminingthesoil-boundP-stockwithcrops takingupa lotofphosphorus suchasbuckwheatandmaize.Tocontinuecropproductionwithoutyield losses foras longaspossible ina zero-P fertilizingsystem,itseemsadvisabletousecropspeciesthatdonotoverlyusesoilP,e.g.smallcerealgraincropssuchastriticaleasthiscropseemedtotakeuponlysmallamountsP.
5.4.2P-removalofthefollow-upcropwasnotaffectedbythepreviouscropspecies
Despitetheverydifferentcharacteristicsofeachofthecropsinourexperiment,noneofthecropspecieshadasignificanteffectonP-removalbythefollow-upcrop,perennialryegrass.OnlythePconcentrationinthetissueofthefollow-upcropwassignificantlyaffectedbytheidentityofthepreviously-growncrop:itwassignificantlyhigherwhenitwasgrownafterflaxor sunflower thanwhen it was grown after triticale. The positive effect of flaxmay be areversedexampleofthe‘dilutioneffect’,whenconcentrationsofnutrientsinplantstendtodecreaseandhencebecome ‘diluted’as theplantproducesmorebiomass (Hejcmanetal.2010).Incontrasttotheeffectsofcropspecies,thefollow-upcropwassignificantlyaffectedbythesoil-P-level.
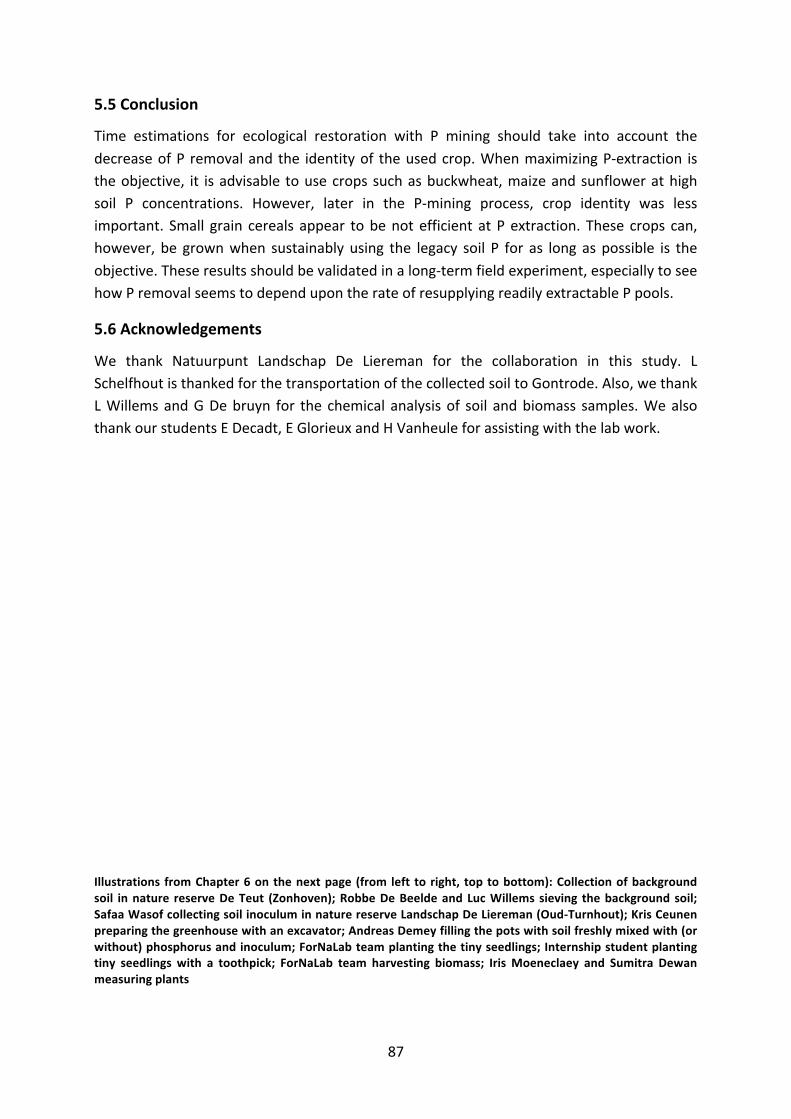
87
5.5Conclusion
Time estimations for ecological restoration with P mining should take into account thedecreaseofP removaland the identityof theusedcrop.WhenmaximizingP-extraction istheobjective, it isadvisable tousecropssuchasbuckwheat,maizeandsunflowerathighsoil P concentrations. However, later in the P-mining process, crop identity was lessimportant. Small grain cereals appear tobenotefficient atPextraction. These crops can,however, be grownwhen sustainablyusing the legacy soil P for as long aspossible is theobjective.Theseresultsshouldbevalidatedinalong-termfieldexperiment,especiallytoseehowPremovalseemstodependupontherateofresupplyingreadilyextractablePpools.
5.6Acknowledgements
We thank Natuurpunt Landschap De Liereman for the collaboration in this study. LSchelfhoutisthankedforthetransportationofthecollectedsoiltoGontrode.Also,wethankLWillemsandGDebruyn for the chemical analysisof soil andbiomass samples.WealsothankourstudentsEDecadt,EGlorieuxandHVanheuleforassistingwiththelabwork.
Illustrations fromChapter6onthenextpage (from left toright, toptobottom):Collectionofbackgroundsoil innature reserveDeTeut (Zonhoven);RobbeDeBeeldeandLucWillems sieving thebackgroundsoil;SafaaWasofcollectingsoilinoculuminnaturereserveLandschapDeLiereman(Oud-Turnhout);KrisCeunenpreparingthegreenhousewithanexcavator;AndreasDemeyfillingthepotswithsoilfreshlymixedwith(orwithout)phosphorusandinoculum;ForNaLabteamplantingthetinyseedlings;Internshipstudentplantingtiny seedlings with a toothpick; ForNaLab team harvesting biomass; IrisMoeneclaey and Sumitra Dewanmeasuringplants


89
CHAPTER 6 Effects of bioavailable phosphorus and soil biota on typical Nardus grassland species incompetition with fast-growing plant species
CHAPTER 6Effects of bioavailable phosphorus and soil biota ontypical Nardus grassland species in compe�tion with
fast-growing plant species
The mesocosm experiment on 25/06/2018 with flowering Centaurea jacea visited by Bombus lapidarius(photo: Iris Moeneclaey)
After: Schelfhout S, Wasof S, Mertens, Vanhellemont M, Demey A, Haegeman A, Vangansbeke P, Viaene N,Baeyen S, De Su�er N, Maes M, van der Pu�en W, Verheyen K, De Schrijver A. Effects of bioavailablephosphorus and soil biota on typical Nardus grassland species in competition with fast-growing plant species.Submitted to Ecological Indicators

90
Abstract
The restoration of Nardus grasslands is often hampered by high bioavailability of soilphosphorus and disturbed biotic soil communities. In order to better understand thesebottlenecks,westudiedNardusgrasslandspeciesplantedtogetherwithfast-growingspeciesin50-literpotsalongagradientofbioavailablephosphoruswithorwithout inoculationofsoilbiotafromoligo-,meso-oreutrophicgrasslands.
In thismesocosmexperiment, thethreshold inbioavailablephosphorus forchanges in theplant community was 11.5 mg POlsen kg-1 (Threshold Indicator Taxa Analysis). Above thethreshold, a small increase in phosphorus resulted in a disproportionally large drop inabundance of the indicator species, among which four of the typical Nardus grasslandspecies,whose low performancewas independent of the soil biota treatment. Below thethreshold,thetypicalNardusgrasslandspeciesflourished,mostclearlysointhemesocosmsinwhichnobiotawereadded.Thebiomassof typicalNardus grasslandspeciesdecreasedwiththetotalbiomassoftheplantcommunityineachmesocosm.
Interestingly,thephosphorusthresholdinourmesocosmexperimentwasclosetotheupperbioavailablephosphorusconcentrationsinremnantNardusgrasslandsinnorthernBelgium.For the restoration of Nardus grasslands, phosphorus-poor soil conditions are essential.Nardusgrasslandspeciesareabletohandlenutrient limitationbutnot light limitation.Werecommendfurtherresearchtounderstandhowsoilbiotainoculationaltersthecompetitiveabilityofplantspeciesinrelationtosoilphosphorusavailability.
Themesocosmexperimenton20/05/2016

91
6.1Introduction
Species-richNardusgrasslands(EuropeanhabitattypeH6230*)aretypifiedbynutrient-poorsoils with very low bioavailable phosphorus concentrations (Chapter 2). Fertilization, i.e.lifting nutrient-limitation, causes the vegetation to shift from nutrient-limitation to light-limitation and a reduction in species-richness (Hautier et al. 2009; DeMalach et al. 2017;Hautieretal.2018). Infertilesoilconditions,specieswithasmall initialadvantagesuchasfastgerminationandgrowthratetointerceptlight(i.e.specieswithfastearly-growth:fast-growingspeciesorgrass-herbmixgrasslandspeciesandLoliumperennegrasslandspeciesinVanDaeleetal.2017)asymmetricallyoutcompetespecieswithoutthistrait(i.e.specieswithslow early-growth: slow-growing species orNardus grassland species in Van Daele et al.2017; see §1.3.3). Reinstating phosphorus-limiting soil conditions in particular (SchellbergandHejcman2007;Ceulemansetal.2014;vanDobbenetal.2017)allowsrareplantspeciestothrive(Wassenetal.2005).Bioavailablephosphorusconcentrations insoilsofremnant,unfertilizedNardusgrasslandswerefoundtobebelowathresholdof12mgPOlsenkg-1(the95th percentile in the database of the Flemish Research Institute for Nature and Forest,reported in Chapter 2). Such a threshold value can, for instance, be used to directrestoration efforts towards candidate fields with a small abiotic ‘distance to target’ (cf.Chapter2).
Plant communities are not only shaped by environmental filters, which affect plant-plantcompetition,butalsobyplant-soilfeedbackeffects, i.e. interactionsbetweenplantspeciesand their (micro)biotic environment (Thakur andWright 2017). For ecological restoration,the development of a plant community may be directed towards a specific target byinoculationwithsoilbiotasourcedfromreferencefields(Wubsetal.2016;vanderBijetal.2018). Fast-growing plant species appear to be more susceptible to pathogens (negativeplant-soil feedback); slow-growing plant species appear to benefit more from mutualistssuchasmycorrhizathathelpwithnutrientacquisition(positiveplant-soilfeedback;Lekberget al. 2018). The abiotic context, i.e. resource availability, influences how plant-soilfeedbacksaffectplant-plantcompetition (Lekbergetal.2018). In resource-richconditions,plant-plant competition for light generally outweighs negative plant-soil feedback effects(e.g. root-feeding nematodes feeding on roots of fast-growing species); in resource-poorconditions, mutualistic plant-soil feedbacks can prevent competitive exclusion and favourslow-growingplant species (e.g. enhancedgerminationandgrowthofoligotrophic speciesby mycorhizzal associations). The restoration ofNardus grasslands may therefore benefitfrom tweaking the soil biota community in order to favour the growth and competitiveabilityoftargetplantspecies(Kardoletal.2006;Brinkmanetal.2012;Torrezetal.2016).
Soil biota inoculation, as a grassland restoration measure, may differentially affect slow-growingandfast-growingplantspeciesinthecommunity,withtheoutcomedependingonresource availability, e.g. soil nutrient concentrations. Here, we study the interactionbetweensoilbiotaandphosphorusavailabilityoncommunitiesconsistingofbothfast-andslow-growingplantspeciesinamesocosmexperimentallowingforthecompetitionforlight

92
andnutrientsbetween these species.Our firstobjectivewas toassess the changes in theplant community along the bioavailable phosphorus gradient. We expected to find a‘community change point’ in bioavailable phosphorus concentration, or an environmentalthreshold,where thecommunity composition shifts.Our secondobjectivewas to test theinteractiveeffectofbioavailablephosphorusconcentrationsandsoilbiotainoculationonthetypicalNardus grassland species.Weexpected that theadditionof soilbiota fromNardusgrasslandshasapositiveeffectontheplantspeciestypicalforNardusgrasslands,allowingthemtogrowathighersoilphosphorusconcentrations.
6.2Methods
In 110 mesocosms, i.e. medium-sized plant communities, we manipulated soil biotapresence and bioavailable soil phosphorus concentrations and (unsuccessfully) simulateddifferentlevelsofatmosphericnitrogendeposition(fulldesigninAppendix6.A;Fig.6.1).
InMarch-April2016,we filled50-literpotswith36kgγ-irradiated (25KGray)phosphorus-poorsandysoilmixedwithanextra4kgofsandysoilforthesoilbiotatreatmentwithfourlevels: “No biota” (using the same γ-irradiated soil), “Oligotrophic”, “Mesotrophic” and“Eutrophic” using freshly sampled soil from oligotrophic, mesotrophic and eutrophicgrasslands (see Appendix 6.A.1 for information on the soil collection and processing;Appendix 6.A.2 and6.A.3 for informationon the abiotic characteristics of thebackgroundandinoculumsoil).Werepeatedthesoilbiotainoculationtreatmentbycollectingthethreetypesof living soil in three regions innorthernBelgium.Wasofet al. (2019)describes thevegetation, abiotic soil conditions, nematode and microbiotic communities of the donorgrasslands.
To create a phosphorus gradient across the mesocosms with bioavailable phosphorusconcentrationsof<10,15,20,25and60mgPOlsen kg-1,wemixedeither0,3,5,6or16gNaH2PO4 in the 40 kg of soil, these quantitieswere derived from a small fertilization potexperimentprecedingthemesocosmexperiment.Wedidnotsucceed increatingthe<10mgPOlsenkg-1xEutrophicsoilbiotatreatmentcombination inoneof thereplications (withinoculum from the Gulke Putten fields) due to the unavoidable addition of nutrientstogetherwiththe4kgofsoilinoculum(theN,PandKadditionswithinoculumareshowninAppendix-Table6.A.5).InthesoilmeasurementofJune2018,whencomparingwiththe“Nobiota” treatment, thebioavailablephosphorus concentrationsappeared tohave increasedslightlybyaddingeutrophicsoilinoculumthoughnotsignificantly(seeAppendix-Fig.6.A.5).The intended soil phosphorus levels (n=5) resulted in a smooth phosphorus gradient byaddingthe inoculums(seeAppendix-Fig.6.A.5).Therefore, thesoilofeachmesocosmwassampledeveryyeartomeasuretheconcentrationofbioavailablephosphorusatthetimeofthe summerbiomassharvest. In the analyses,weused themost recentmeasurements inbioavailablephosphorusconcentrations (seeAppendix-Fig.6.A.5)asacontinuousvariable,insteadofthecategoricalphosphoruslevels.

93
The (failed) nitrogen treatment was aimed at simulating realistic atmospheric nitrogendeposition rates, i.e. <5, 20 or 60 kgN ha-1 y-1.We spread 0, 90 or 270mgNH4NO3 in ademineralizedwatersolutionevenlyoneachmesocosm,monthlyfromMarchuntilOctober.Despite these additions, in the plant tissue of mesocosms in the 20 or 60 kg N ha-1 y-1treatments, we did not find increased nitrogen concentrations or increased nitrogen tophosphorus ratio; in the soil of thesemesocosms, we did not find increased bioavailableNH4
+orNO3-concentrations.Probably, thehigh irrigationrate tocompensate for thehigh
greenhouse temperatures (summermeanof20.4°C±6.4 SDandmaximal temperatureof42.1°C in contrast to a summer mean of 17.5°C in Belgium according to the RoyalMeteorologic Institute,KMI)causedtheaddednitrogento leachfromthemesocosms.WeincludedthenitrogentreatmentasanexplanatoryfactorinthefullGLMmodels.Innoneofourfinalmodels,thenitrogentreatmentwasretainedasasignificantexplanatoryfactor(seeAppendixC).
Figure 6.1 Design of themesocosm experiment. Nineteen grass, herb or shrub species – typical of oligo-,meso-,eutrophicnutrientstatus–wereplantedtogetherinpots.Soilnutrientavailabilitywasmanipulatedbyaddingnitrogenandphosphorusindifferentlevels.Thenitrogentreatmentfailedduetoleachingeffectsfollowingthehighirrigationrateinthegreenhousetocompensateforhighsummertemperatures.Thesoilbiotacommunitydifferedamongpotsaslivingsoilfromoligo-,meso-,andeutrophicgrasslands(fromeachofthreeregionsinnorthernBelgium)wasaddedtopartofthepots
InApril2016,weplantednineteenspecies ineachmesocosm.WechosespeciestypicalofNardusgrasslands(oligotrophicspecies),grass-herbmixedgrasslands(mesotrophicspecies)orgrass-dominatedLoliumperennegrasslands(eutrophicspecies)(cf.VanDaeleetal.2017;Fig.6.2).Themesocosmsweregrowninagreenhouse,withanaveragetemperatureof15°C

94
± 7 SD, a relative air humidity of 71% ± 14 SD and natural light conditions.We cut andremovedallabove-groundbiomassthreetimesperyear(March,June,September).
InJune2018, ineachmesocosm,wemeasuredthetotaldrybiomassandtheseparatedrybiomasses of the threemost abundant species of the oligo-,meso- and eutrophic speciesweplanted(afterdryingfor48hat70°C).Fortheothertenspecies,weestimatedtheircoverineach mesocosm and used this cover and the total mesocosm biomass to estimate thespecies’ biomass (Appendix 6.A.8). Permesocosm, three samples of the 0-5 cm soil layerwere taken with a 1 cm diameter auger, combined, dried (48h, 40°C) and analyzed forbioavailable phosphorus (extraction with sodium bicarbonate according to Olsen et al.(1954), colorimetric measurement with the malachite green procedure of Lajtha et al.(1999)).
Figure6.2Thebiomassoftheoligotrophic,mesotrophicandeutrophicplantspeciesrelativetothebiomassoftheentirecommunityinthe110mesocosmsinthethirdyearoftheexperiment(June2018)
Using the species’ biomass data, we looked for ‘change points’ along the phosphorusgradientusingThresholdIndicatorTaxaAnalysis(TITAN,BakerandKing2010;functiontitan,TITAN2 package, Baker et al. 2015). A change point, or ecological threshold, is a point atwhich a small increase in an environmental variable results in a disproportionally largechangeincommunitycomposition(BakerandKing2010).Ifalongthephosphorusgradient,

95
asynchronouschangeoccursintheabundanceofasubsetofspecies,thisparticularlevelofthe phosphorus gradient is identified as a community change point. TITAN fits theabundance of individual species along the studied gradient and combines the abruptchanges of ‘pure’ and ‘reliable’ species (i.e. species that consistently show a significantchangefor>95%ofthe999bootstrappedruns) intoapositiveandanegativecommunitythreshold(Appendix6.B).
ForthetypicalNardusgrasslandspecies(oligotrophicspecies) identifiedassensitivetosoilphosphorusbyTITAN(i.e.indicatorspecies),wesummedthedrybiomassineachmesocosm(‘absolute biomass’) and divided it by the total dry biomass of the mesocosm (‘relativebiomass’). We fitted generalized linear models to study the effects of the bioavailablephosphorus concentration, the soil biota treatment, and their interaction on the absoluteandrelativebiomassofthetypicalNardusgrasslandspecies(functionglm,quasifamilywithidentity linkandconstantvariance,statspackage;modelselectionprocedures inAppendix6.C). To investigate the impactof plant-plant competitionon the typicalNardus grasslandspecies,we looked for a relationship between thebiomass of these species and the totalbiomass of the mesocosms (function glm). Finally, we fitted generalized least squaresmodelstostudytheeffectsoftheexperimentaltreatmentsonthetotalbiomass(functiongls,weights=varIdent(form=~1|biota)toallowforadifferentvarianceperbiotalevel,statspackage). We performed post-hoc pairwise comparisons to compare the differencesbetween the soil biota levels (function lsmeans with tukey adjustment, package lsmeans,Lenth2016).AllanalyseswereperformedinR(R-Core-Team,2016);non-TITANgraphsweremadewithggplot2(Wickham,2009).
6.3Results
A negative environmental threshold of 11.5 mg POlsen kg-1 (i.e. the negative communitychangepoint;redlineinFig.6.3)andapositiveenvironmentalthresholdof8.3mgPOlsenkg-1(i.e.thepositivecommunitychangepoint;greylineinFig6.3)wereidentifiedbythechangesinthemesocosmcommunities.Asthebioavailablephosphorusconcentrationsincrease,thesum(z) scores will climb as the community-level response increases in magnitude:consequently, thenegative threshold reveals a greater change in the community than thepositivethreshold.Thepeakinthenegativesum(z)scoresissharp(filledpointsinFig.6.3),whichprovidesstrongevidenceforasharp,synchronouschangeinthecommunity(KingandBaker,2014).Incontrast,thepeakinthepositivesum(z)scoresisbroad(emptypointsinFig.6.3),whichimpliesamoregradualchangeinthespecies’distributionsalongthephosphorusgradient.Aroundthisthreshold,sixsignificantindicatorspecieswereobservedwithsharplydeclining responses to higher bioavailable phosphorus concentrations in the soil (Fig. 6.4;Table 6.1; p < 0.05). The narrower the uncertainty around the individual species’ changepoint,thegreaterthesupportforathreshold-typeresponseforasinglespecies.Thewiderthis uncertainty is, theweaker is the evidence for a sharp change in the distribution of a

96
speciesalong thegradient (KingandBaker,2014).Fourof thesignificant indicator speciesweretypicalNardusgrasslandspecies(oligotrophicspecies:L.multiflora,N.stricta,Molinia
caerulea and P. erecta); two were typical for grass-herb mixed grasslands (mesotrophicspecies: Anthoxanthum odoratum and Rumex acetosa). The three other typical Nardusgrasslandspeciesplantedinthemesocosmswerenotconsidered‘reliable’species(Succisapratensis, reliability score 0.94) or had too few occurrences in 2018 due to low survival(CallunavulgarisandCarexechinata;Table6.1),andwereexcludedfromfurtherstatisticalanalyses. One eutrophic species, Dactylis glomerata, responded significantly positivelytowardsincreasingsoilphosphorusconcentrations(Table6.1).TheresponseofeachofthenineteenspeciestothebioavailablephosphorusconcentrationsisshowninAppendix6.B.
The relative cumulative biomass of the typicalNardus grassland species was significantlyaffectedbythebioavailablephosphorusconcentration(p<0.001),thesoilbiotatreatment(p<0.001)andtheirinteraction(p<0.05;D2=28%;Fig.6.5a;Appendix6.C.1).Theabsolutecumulative biomass of these species was only affected significantly by the bioavailablephosphorus concentration (p < 0.001) and not by the soil biota treatment (D2 = 11%;Appendix6.C.1).Belowthenegativeenvironmentalthresholdof11.5mgPOlsenkg-1,the“Nobiota”mesocosmshadasignificantlyhigherrelativebiomassofthetypicalNardusgrasslandspeciesthanthemesocosmsinwhichsoilbiotahadbeenadded(average“Nobiota”2.97%±1.10 SD, average mesocosms with biota 1.10% ± 0.92 SD; p < 0.05). In the “No biota”mesocosms, the relative biomass of the typicalNardusgrassland species dropped steeplywithincreasingbioavailablephosphorusconcentration.
Aboveaconcentrationof17.1mgPOlsenkg-1,therewerenosignificantdifferencesinrelativebiomassbetweenthebiotatreatmentlevels(resultspost-hoctesting).Therelativebiomasswasalmostfivetimeslessthantheaveragebiomassofall“Nobiota”treatmentmesocosmsbelow the 11.5 mg POlsen kg-1 threshold (0.61% ± 0.65 SD). The typicalNardus grasslandspecies were absent in 16 out of the 63 mesocosms with bioavailable phosphorusconcentrationsabove the11.5mgPOlsenkg-1thresholdand in3of the47mesocosmswithphosphorusconcentrationbelowthethreshold(2mesocosmswitholigotrophicbiotaadded,1witheutrophicsoilbiota).
The relative biomass of the typical Nardus grassland species was significantly negativelycorrelatedwiththetotalplantbiomasspermesocosm(p<0.001;D2=42%;Fig.6.5b).Thetotalbiomasswas significantlyaffectedby thebioavailablephosphorusconcentration (p <0.01), the soil biota treatment (p < 0.001), and their interaction (p < 0.05), but the finalmodelexplainedonlylittlevariation(R2=12%;Fig.6.5c).Below22.9mgPOlsenkg-1,thetotalbiomass was significantly lower in the “No biota”mesocosms (p < 0.05; results post-hoctesting). The mesocosms inoculated with soil biota and below the 11.5 mg POlsen kg-1
threshold were dominated by Centaurea jacea and by Plantago lanceolata (below thethresholdandwithbiota:onaverage63%±28SDcomparedto“Nobiota”:3%±5SD;abovethethreshold:onaverage67%±28SD).

97
Figure6.3Thenegative(redline,5thand95thpercentilesasdashedredlines)andthepositive(greyline,5thand 95th percentiles as dashed grey lines) change points of the community composition in the 110mesocosms. Each point represents the sum of the negative (filled) and positive (empty) z scores at acandidatecommunity-levelchangepointofbioavailablephosphorusconcentration;thegreatestsumzpointindicates the most abrupt change in community composition along the phosphorus gradient. The linesrepresentcumulativefrequencydistributionofchangepointsamongthe999bootstrapreplicates(full line:negative;dashedline:positive)
Figure 6.4 The negative community threshold (red line; 5th and 95th percentiles as dotted lines) and thenegative species-specific thresholds for the significant indicator species along the studied gradient inbioavailable phosphorus (TITAN: purity ≥ 0.95; reliability ≥ 0.95. p < 0.05). Symbol size represents themagnitudeof the response (z scores); blackdotted lines represent the5th and95th percentiles among thebootstrap replicates. Thepositive community threshold andpositive indicator species are not shown (seeTable6.1)
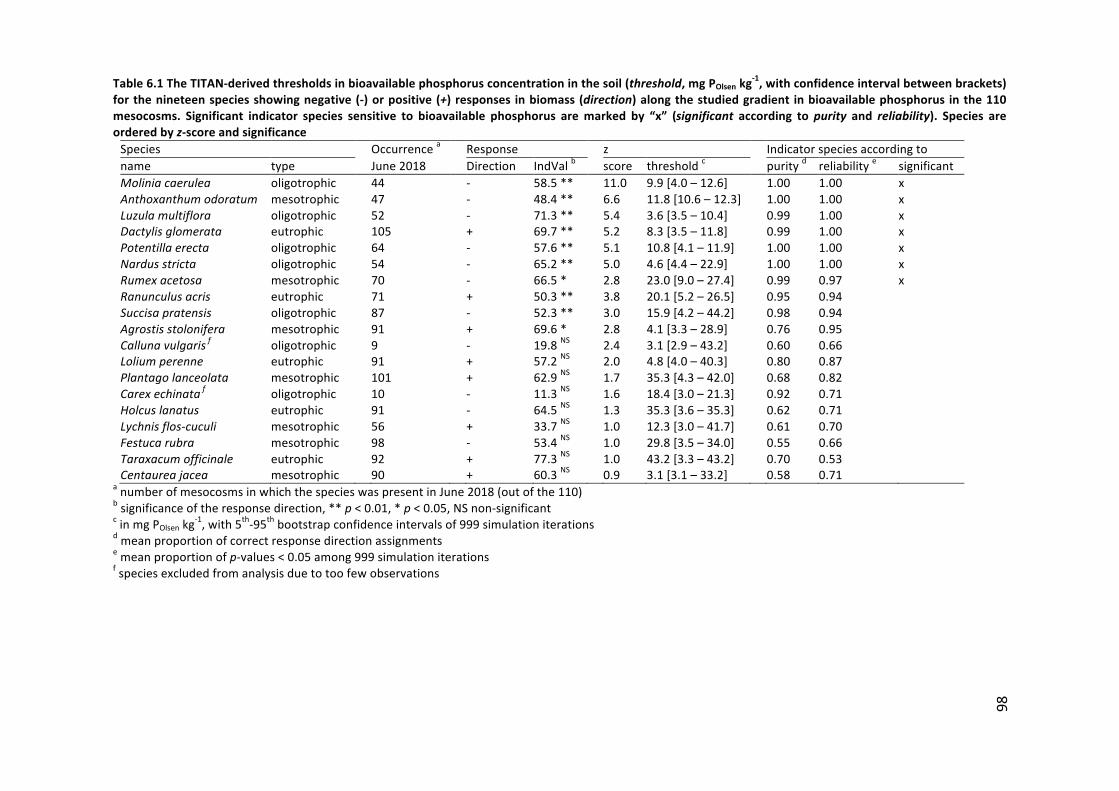
Table6.1TheTITAN-derivedthresholdsinbioavailablephosphorusconcentrationinthesoil(threshold,mgPOlsenkg-1,withconfidenceintervalbetweenbrackets)
forthenineteenspeciesshowingnegative(-)orpositive(+)responses inbiomass(direction)alongthestudiedgradient inbioavailablephosphorus inthe110mesocosms. Significant indicator species sensitive to bioavailable phosphorus aremarked by “x” (significant according topurity and reliability). Species areorderedbyz-scoreandsignificanceSpecies Occurrence
a Response z Indicatorspeciesaccordingto
name type June2018 Direction IndValb score threshold
c purity
d reliability
e significant
Moliniacaerulea oligotrophic 44 - 58.5** 11.0 9.9[4.0–12.6] 1.00 1.00 x
Anthoxanthumodoratum mesotrophic 47 - 48.4** 6.6 11.8[10.6–12.3] 1.00 1.00 x
Luzulamultiflora oligotrophic 52 - 71.3** 5.4 3.6[3.5–10.4] 0.99 1.00 xDactylisglomerata eutrophic 105 + 69.7** 5.2 8.3[3.5–11.8] 0.99 1.00 x
Potentillaerecta oligotrophic 64 - 57.6** 5.1 10.8[4.1–11.9] 1.00 1.00 x
Nardusstricta oligotrophic 54 - 65.2** 5.0 4.6[4.4–22.9] 1.00 1.00 x
Rumexacetosa mesotrophic 70 - 66.5* 2.8 23.0[9.0–27.4] 0.99 0.97 x
Ranunculusacris eutrophic 71 + 50.3** 3.8 20.1[5.2–26.5] 0.95 0.94
Succisapratensis oligotrophic 87 - 52.3** 3.0 15.9[4.2–44.2] 0.98 0.94
Agrostisstolonifera mesotrophic 91 + 69.6* 2.8 4.1[3.3–28.9] 0.76 0.95
Callunavulgarisf oligotrophic 9 - 19.8NS 2.4 3.1[2.9–43.2] 0.60 0.66
Loliumperenne eutrophic 91 + 57.2NS
2.0 4.8[4.0–40.3] 0.80 0.87
Plantagolanceolata mesotrophic 101 +
62.9NS
1.7 35.3[4.3–42.0]
0.68 0.82
Carexechinataf oligotrophic 10 - 11.3NS 1.6 18.4[3.0–21.3] 0.92 0.71
Holcuslanatus eutrophic 91 - 64.5NS 1.3 35.3[3.6–35.3] 0.62 0.71
Lychnisflos-cuculi mesotrophic 56 + 33.7NS 1.0 12.3[3.0–41.7] 0.61 0.70
Festucarubra mesotrophic 98 - 53.4NS 1.0 29.8[3.5–34.0] 0.55 0.66
Taraxacumofficinale eutrophic 92 + 77.3NS 1.0 43.2[3.3–43.2] 0.70 0.53
Centaureajacea mesotrophic 90 + 60.3NS 0.9 3.1[3.1–33.2] 0.58 0.71
anumberofmesocosmsinwhichthespecieswaspresentinJune2018(outofthe110)
bsignificanceoftheresponsedirection,**p<0.01,*p<0.05,NSnon-significant
cinmgPOlsenkg
-1,with5
th-95
thbootstrapconfidenceintervalsof999simulationiterations
dmeanproportionofcorrectresponsedirectionassignments
emeanproportionofp-values<0.05among999simulationiterationsfspeciesexcludedfromanalysisduetotoofewobservations
98
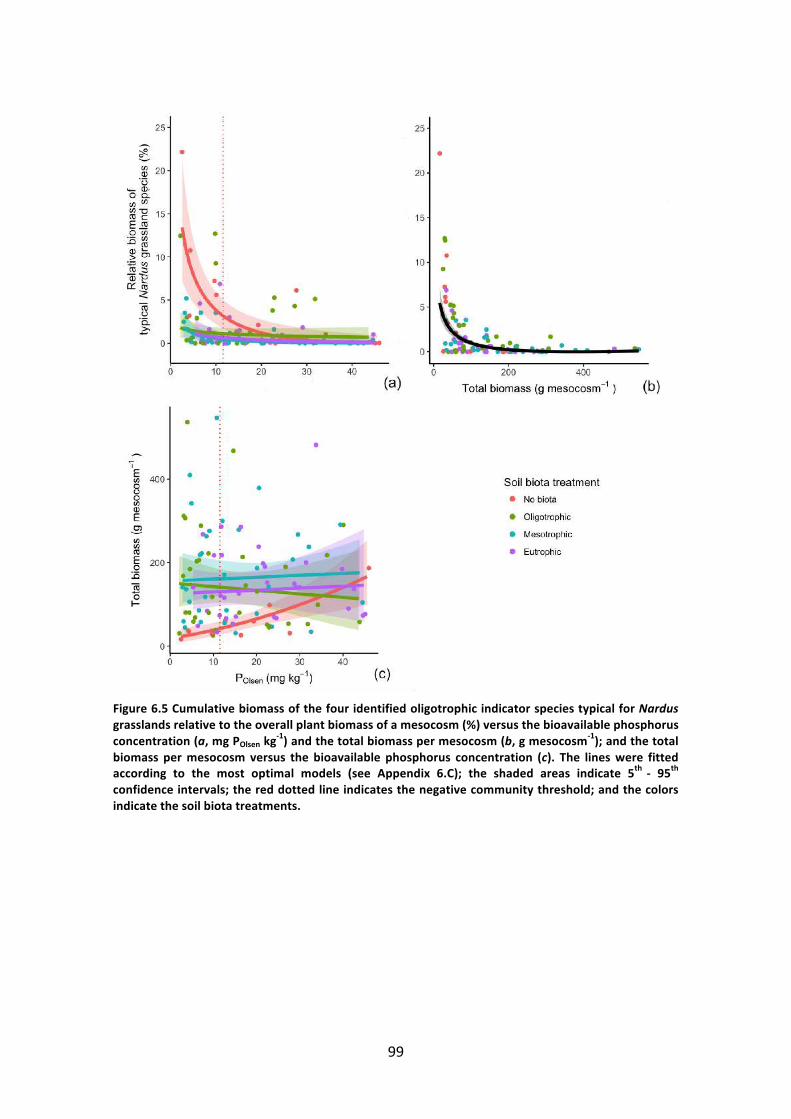
99
Figure6.5CumulativebiomassofthefouridentifiedoligotrophicindicatorspeciestypicalforNardusgrasslandsrelativetotheoverallplantbiomassofamesocosm(%)versusthebioavailablephosphorusconcentration(a,mgPOlsenkg
-1)andthetotalbiomasspermesocosm(b,gmesocosm-1);andthetotalbiomass permesocosm versus the bioavailable phosphorus concentration (c). The lineswere fittedaccording to the most optimal models (see Appendix 6.C); the shaded areas indicate 5th - 95thconfidenceintervals;thereddottedlineindicatesthenegativecommunitythreshold;andthecolorsindicatethesoilbiotatreatments.

100
6.4Discussion
After three growing seasons in our mesocosm experiment, we evaluated theperformance of typicalNardus grassland species planted togetherwith fast-growingspecies (in total nineteen species typical of oligo- to eutrophic growing conditions)across a gradient in bioavailable phosphorus concentrations, and with or withoutinoculationofsoilbiotaofdifferentprovenances(oligo-toeutrophicgrasslandsvs.a“No biota” treatment). The controlled nature of our greenhouse mesocosmexperiment enabled us to investigate how the interaction of soil phosphorusconcentrations and soil biota affect the competitive exclusion of typical Nardusgrassland species, which are slow-growing oligotrophic plant species. Experimentsrarely investigatedsuchcontextdependencyofplantcommunitiestothe inoculationof soil biota, i.e. dependency to bioavailable phosphorus concentration in the soil(Hoeksemaetal.2010;butseeDeDeynetal.2004).
We found a negative community threshold for bioavailable phosphorus of 11.5 mgPOlsenkg-1.Thisnegativecommunitythresholdrepresentsthebioavailablephosphorusconcentrationabovewhichasmall increase inphosphorusconcentrationresults inadisproportionally largenegativeresponseof the four identifiedoligotrophic indicatorspecies typical forNardus grasslands. Thebiomassof these species (L.multiflora,N.stricta,M. caerulea and P. erecta) dropped sharply inmesocosms in which the soilphosphorus concentrations exceeded the threshold. The threshold in our artificialmesocosms was surprisingly similar to the threshold found in remnant Nardusgrasslands(<12mgPOlsenkg-1,Chapter2).Thenegativespecies-specificthresholdsforthe typicalNardus grassland species in ourmesocosms ranged from3.6 and4.6mgPOlsenkg-1 forL.multifloraandN.stricta to9.9and10.8mgPOlsenkg-1 forM.caeruleaandP. erecta,which suggests that a community-basedecological threshold (e.g. thethresholdof11.5or12mgPOlsenkg-1here)maynotbesufficientwhenmanagersaimtorestore specific species (cf. 'ecological threshold' vs 'management threshold' in Jax2016).
ApartfromA.odoratumandR.acetosa(thresholds11.8and23mgPOlsenkg-1),neitherof the other mesotrophic species nor any eutrophic species were identified assignificant negative indicator species for increasing bioavailable phosphorusconcentrations. Field experiments showed similar negative responses to phosphorusfertilizationforA.odoratum(Hejcmanetal.2007;Hejcmanetal.2014;Duffkováetal.2015); a contrastingpositive (Duffkováet al., 2015;Hejcmanet al., 2007)orneutral(Hejcman et al., 2014) response for R. acetosa; and a negative response for P.lanceolata (Duffková et al., 2015; Hejcman et al., 2007), for which we found nosignificantresponseinourmesocosms.AlsointhefieldstudyofHejcmanetal.(2007),oligotrophicspecies(includingourstudyspeciesS.pratensis,N.stricta,P.erectaandL.

101
multiflora) responded negatively to phosphorus fertilization and mesotrophic plantspecies showed variable responses (including P. lanceolata, R. acetosa and A.odoratum). Eutrophic plant species responded positively (including Holcus lanatus,TaraxacumofficinaleandD.glomerata).Inourexperiment,D.glomeratawastheonlyspecies with a significant positive response to increasing soil phosphorusconcentrations.
In the mesocosms with soil phosphorus concentrations well above the communitythreshold, the typicalNardus grassland species were frequently absent or had lowbiomass, independentof the soilbiota treatment. Lekbergetal. (2018)also showedthatnegativeplant-soilfeedbackeffectsareoutweighedbyabove-groundplant-plantcompetition, i.e. light-limitation, in resource-rich conditions. In the phosphorus-richmesocosms,thefast-growingmeso-andeutrophicspeciesoutcompetedandovergrewthe slow-growing typical Nardus grassland species. This was indicated by a strongnegative relationship between the relative biomass of the typicalNardus grasslandspeciesandthetotalbiomassoftheplantcommunities.Inthemesocosmscontainingless phosphorus than the threshold, the relative biomass of the typical Nardusgrasslandspecieswastwice(soilbiotaadded)orevenfivetimes(nosoilbiota)ashighas in the mescosms with high phosphorus availability. In the phosphorus-poormesocosms, plant-plant competition was probably lower, which enabled the typicalNardus grassland species to survive and flourish,most clearly so in themesocosmswithoutsoilbiota inwhichthetotalbiomasswas lowerthan in themesocosmswithaddedsoilbiota.Thehighertotalbiomassinmesocosmswithaddedsoilbiotamaybethe result of a positive plant-soil interaction that enabled certain plant species toacquire more nutrients in the phosphorus-poor soil conditions (cf. Lekberg et al.,2018). Twomesotrophic plant species,C. jacea andP. lanceolata, appeared to havebenefitedmorefromthesoilbiotathanthetypicalNardusgrasslandspecies,whichiscontrary towhatweexpected (Lekberget al. 2018). These two fast-growing speciesproduced clearly more biomass in the phosphorus-poormesocosms with soil biota.Interestingly, according to the MaarjAM database, these two species appear moresusceptibletocolonizationbyarbuscularmycorrhizathanthetypicalNardusgrasslandspecies in our experiment; 107 and 366 arbuscular mycorrhiza taxa are known tocolonizeC. jacea andP. lanceolata,whereas only 33 arbuscularmycorrhiza taxa areknown to colonize L. multiflora and zero arbuscular mycorrhiza taxa are known tocolonizeM. caerulea, N. stricta and P. erecta (Öpik et al. 2010). Although not allmycorrhizal interactions are beneficial for plants (Hoeksema et al., 2010), this factmightbeanexplanationforourfinding,however,requiresfurtherverificationby,e.g.quantifyingrootcolonizationbyarbuscularmycorrhizaspeciesonthenineteenplantspecies used in the experiment. Alternatively, without the “No biota” treatment, itappears inoculation with soil biota ‘masks’ soil phosphorus effects on the typical

102
Nardusgrasslandspecies,similarlytothefindingsofDeDeynetal.(2004).However,athreshold analysis on the dataset whereas from the “No biota” treatment wasexcluded,confirmedtheinitialfindingsofsignificantsensitivityoftheNardusgrasslandspeciestowardsincreasingsoilphosphorusbioavailability(datanotshown).Westressfurther investigation isneededby,e.g.comparingthesoilbiotacommunities ineachmesocosmwith the plant communities and by field experiments. For example, in afieldandmesocosmexperiment,Wubsetal.(2016)foundthevegetationofanarablefield,where the topsoilwas removed and then inoculatedwith soil biota ofNardusgrasslands, to shift towards thecompositionof the remnantNardusgrasslandwhichwas used as a donor site. Further, adding sods from heathlands shifted the plantcommunitytowardsthecompositionoftheheathlanddonorsite.Similarlythebelow-ground soil community also shifted towards the donor sites. Also van der Bij et al.(2018) showed in a field experiment that adding soil biota, by spreading out sodscontaining both seeds and soil biota, enhanced the re-establishment of Nardusgrasslandandheathlandspeciesaftertopsoil removal.Thesefieldexperiments,afterfiveandthreeyears,providestrongevidencethattheinoculationwithsoilbiota,e.g.byspreadingoutsods,maydrivetheplantcommunitydevelopmentinthedirectionoftargethabitattypes.
Thephosphorus-poor soil conditions typicalof remnantNardusgrasslandswerealsoessential for the survival of the typical Nardus grassland species amongst morecompetitive species in our mesocosms. However, restoring phosphorus-poor soilconditions and (re-)introducing target species will likely not warrant successfulrestorationof typicalNardus plant communities. In contrast to fast-growing species,slow-growingtypicalNardusgrasslandspeciesareknowntobeunabletoswitchfroma growth strategy aimed at acquiring enough nutrients to a growth strategy ofproducingmorebiomass(VanDaeleetal.,2017).Smallchangesinnutrientavailabilityinnutrient-poorsoilscan,hence,leadtothelossofslow-growingspeciesspecializedatsurvivingunderseverephosphorus-limitation(Roelingetal.2018).Suchchangesmaybe induced by specific interactions with soil biota but still needs to be revealed byfurtherresearch.
6.5Conclusions
Phosphorus-poor soil conditions were essential for most typical Nardus grasslandspecies inourmesocosmexperiment.Thenegativecommunity thresholdof11.5mgPOlsen kg-1 in the mesocosms corresponds to the upper limits of bioavailable soilphosphorus concentrations in remnantNardus grasslands. Above the threshold, thesoilbiotatreatmentdidnotaffectthebiomassofthetypicalNardusgrasslandspecies.Belowthe threshold, the typicalNardus grasslandspeciescouldsurviveand flourish,most clearly so in the mesocosms of the “No biota” treatment. Increasing total

103
biomass per mesocosm, due to fast-growing species, negatively affected the slow-growingNardusgrasslandspeciesindicatingcompetitionforlight.
6.6Acknowledgements
This project was funded by Research Foundation Flanders (project G050215N) andhostedatFlandersResearchInstituteforAgriculture,FisheriesandFood.Wethankthenaturereservemanagersforpermittingsoilcollectionandhelpingwithfieldselection,our ForNaLab colleagues andmany students from theUniversity College andGhentUniversity for theirhelp in installingandmanaging theexperimentand for samplingandsampleprocessing.
Themesocosmexperimenton07/09/2016(photo:SafaaWasof)

104
FreshlycutmeadowinainlavalléedelaMeuseinnorthernFrance
DiscussinggrasslandrestorationmeasuresinthefieldwithstakeholdersinnaturereserveLandschapDeLiereman(Oud-Turnhout)

105
CHAPTER 7 General overview of results, decision tree for practitioners and future perspectives
CHAPTER 7General overview of results, decision tree for
practi�oners and future perspec�ves
Taking soil samples in a grassland in Landschap De Liereman to assess the depth of phosphorusleaching
“Not investing [in nature] is irreversible” (Fisher and Krutilla 1974)
Decision tree a�er: Schelfhout S, Mertens J, Perring MP, Raman M, Baeten L, Demey A, Reubens B,Oosterlynck S, Gibson-Roy P, Verheyen K, De Schrijver A. 2017. P-removal for restoration of Nardusgrasslands on former agricultural land: cutting traditions. Restoration Ecology. 25:S178–S187. Doi:10.1111/rec.12531
0 cm10 cm20 cm30 cm40 cm50 cm

106
Abstract
Inthischapter,wediscussthethreeoverarchingresearchquestionsofthisPhDthesis(cf.§1.5),usingtheresultsanddataofourstudiesdescribedinChapters2-6.
ThisthesishandlestherestorationofNardusgrasslands,oneoftheEuropeanpriorityhabitat types. Grassland ecosystems are important for a manifold of species fromvarious taxa;however, largeareashavebeendestroyedby land-use changeorhavedeteriorated due to land-use intensification and atmospheric nitrogen deposition.TypicalplantspeciesofNardusgrasslandsareadaptedtonutrient-poorsoilconditionsby their conservative resourceusestrategy,e.g. slow-growth. Incaseof fertilization,theyare likely tobecomeshadedoutby fast-growingplant species.Phosphorus is akeynutrientforevaluatingtherestorationpotentialofpreviously-fertilizedgrasslands,wherebioavailablephosphorusconcentrationsarehigh.
We have shown that restoringNardus grasslands on former agricultural land is notstraightforward.Reinstatingtraditionalmanagement,suchasmowingfor16-25years(Chapter2),didnotrestoreplantcommunitiesofNardusgrasslands(cf.answertoRQ1in §7.1; Fig. 7.1). The studied post-fertilization grasslands were mesotrophic toeutrophic, i.e.withfast-growingplantspeciesandhighconcentrationsofbioavailablephosphorusinthesoil.Thetimeneededtolowerthesoilphosphorusconcentrationsbytraditionalmowingmanagementappearedtobeverylong(40to118years).
Ina five-year fieldexperiment (Chapter3),P-mining(i.e. liftingnutrient limitationbynitrogenandpotassium)removedtwotimesmorephosphorusthanmowing,wherebythe period for abiotic restoration is halved. Optimization opportunities forphytominingphosphoruswerelimited(cf.answertoRQ2in§7.2).Addingmycorrhizaor humic substances did not increase phosphorus removal with P-mining in a potexperiment (Chapter 4). However, certain crop species were more effective atremovingphosphorusthanothers(potexperimentChapter5).
Theefficiencyofremovingphosphorusfromthesoildroppedsteeplywithdecreasingsoilphosphorusconcentrationsinthethreeexperiments(Chapters3-5).Thisdecreaseinannualphosphorusremovalshouldbetakenintoaccountwhenestimatingthetimeneededtorestorephosphorus-poorsoilconditionsthroughmowingorP-mining.
Soil biota inoculation did not help Nardus grassland species to withstand soilphosphorus concentrations above the threshold of 12mg POlsenkg-1 we observed inremnantNardusgrasslands(cf.Chapter2)andourmesocosmexperiment(Chapter6,answer toRQ3 in§7.3). The slow-growingplant species typicalofNardusgrasslandspersisted in extremely phosphorus-poor environments and performed better if theywerenotshadedoutbyfast-growingspecies.

107
We developed a decision model to aid planners and managers in their choice ofrealistic restoration targets and interventions (§7.4).Wehighlight the importanceofrestoringabioticconditionsbeforestartingbioticrestorationandinitiatingtraditionalgrasslandmanagement.Cost-effectiveeffortsforrestorationshouldbewell-preparedandbasedonmeasurementsof relevant initial soil characteristics.Thisallows foranevaluation of the distance to target and the selection of an effective restorationtechnique.ThesetechniquesmayinvolvecuttingwithmowingandutilizingalternativetechniquesasP-miningortopsoilremoval.
Figure7.1Thesisoutlineandsummaryofthekeyfindingsperchapter

108
7.1RQ1:CantraditionalmanagementbymowingrestoreNardusgrasslandonformeragriculturalland?
Traditional management, i.e. unfertilized mowing with hay removal and autumngrazing,ofpost-fertilizationgrasslands forat least15yearsdidnotyield the floristicand phosphorus-poor targets ofNardus grassland (Chapter 2). The remnantNardusgrasslandsweretypifiedbyslow-growingspeciessuchasMoliniacaerulea,PotentillaerectaandVeronicaofficinalis,ofwhichsomewereRedListspeciessuchasPolygalavulgaris. The post-fertilization grasslands contained fewer species, only fast-growingcommonspeciesandnoRedListspecies.
Phosphorus-poor soil conditions are essential for the restoration of species-richNardus grasslands of the type 6230_hn (see Appendix 1.A). More specifically, abioavailablephosphorusconcentrationof12mgPOlsenkg-1appearstobeanupperlimitfor thishabitat type.Weobservedthissoilphosphorusthreshold inremnantNardusgrasslands (95th percentile for 34 grasslands; Chapter 2) and in a mesocosmexperimentinwhichwegrewNardusspeciestogetherwithfast-growingspeciesalonga gradient of bioavailable phosphorus (Threshold Indicator Taxa Analysis TITAN,Chapter6).AsmallincreaseinphosphorusavailabilityabovethephosphorusthresholdresultedinadisproportionallylargedropinabundanceofthetypicalNardusspeciesinthemesocosmcommunities(Chapter6).However,inthepost-fertilizationgrasslands,the bioavailable soil phosphorus concentrations were two to thirteen times higherthanthephosphorus thresholdof12mgPOlsenkg-1.Yet, thebiomassproductionwasrelativelylow(3tdrybiomassha-1y-1)duetonitrogenandpotassiumlimitation.Withthecurrentmowingmanagement,another40yearsofphosphorusremovalwouldbeneededtoreachthephosphorusthresholdinthe0-10cmsoillayer,andanother118years for the 0-30 cm soil layers. Enhancing the species-richness of grasslands withhigher phosphorus concentrations than the threshold may be possible by choosinganothertargethabitattypeand(experimentingwith) introducingthemissingspecies(biotic restoration). For example, on acid, sandy soilswhere the threshold of 12mgPOlsen kg-1 is not realistic, the 6230_ha type (species-rich grasslands of the Agrostiscapillaris group with someNardus grassland species; Appendix 1.A; De Saeger andWouters 2017) or the rbbha type (species-rich grasslands of the Agrostis capillarisgroupwithlessNardusgrasslandspecies;Appendix1.A;DeSaegerandWouters2017)maybebettertargets.
Using traditional mowing management as a restoration technique is probably onlyeffective inspecificconditions, i.e. in fieldswhere theabioticconditionsareclose tothetargetandwherethesurrounding landscapematrix isspecies-richand landscapeconnectivityishigh(Winsaetal.2015),e.g.intheWhiteCarpathianMountainsoftheCzechRepublic(Michalcováetal.2013).Thegrasslandswestudiedlay,however,ina

109
species-poor, fragmented landscape. In addition, the remnantNardus grasslands aresmall (<0.5 ha; larger areas usually contain more species (Keddy 2005)) andsurrounded by eutrophic intensively used fields unhospitable for Nardus grasslandspecies.
RestorationofNardusgrasslandsoneutrophicfieldsinspecies-poor,fragmentedandintensivelyused landscapes requiresactive restorationofboth theabioticandbioticsiteconditions.
The feasibility of restoring Nardus grasslands on previously-intensified grasslandsdepends on the (a) biotic starting point of the restoration trajectory, i.e. on thedistance to target. The distance to this target is the amount of phosphorus to beremovedandwilldeterminethetimeneededforP-miningbyphytomining(mowingorP-mining;Box2);theextentofthephosphorusenrichment,i.e.thedepthuptowhichsoilphosphorus iselevated(Box-Fig.1.4),willdeterminethecostof topsoil removal.Thecostoftherestorationtechniqueandthetimeneededtoreachthetargetmaybeweighedwith thepotential valueof the site in the landscape that isbeing restored.Becauseofthehighcost(e.g.€25000ha-1inTable1.2),topsoilremovalismorelikelyto be used in large restoration projects, funded by e.g. European Life+ projects orwithin the framework of nature development projects of the Flemish Land Agency(VLM).
Biotic restoration should follow abiotic restoration and involves the activereintroductionoftargetplantspecies(Piessensetal.2005;Helsenetal.2013),e.g.viaseed or hay transfer (Edwards et al. 2007; Hedberg and Kotowski 2010) or plug-planting(Walkeretal.2004)aftersoildisturbance(Kiehletal.2010).Bioticrestorationalso involves aiding the below- and above-ground fauna communities, e.g. byspreadingoutsodsfromdonorNardusgrasslandstorestorethebelow-groundmicro-andmesofauna communities (Wubs et al. 2016; Loeb et al. 2018; van der Bij et al.2018).

110
7.2RQ2:Isitpossibletophytominephosphorusmoreefficiently?
Traditionalmowingmanagementremovedonlylittlephosphoruswithbiomass(i.e.5.3±1.0kgPha-1,Chapter2)duetolimitationbynitrogenandpotassium.Therestorationtime needed for reaching phosphorus-poor soil conditions would therefore be long(i.e.40to114years).WithP-mining,i.e.mowingwithyieldmaximizationbyaddingthegrowth-limiting nutrients nitrogen and potassium, the restoration time would beconsideratelyshorter(i.e.14to46years).
Inour fieldexperiment (Chapter3), P-mining led to largerphosphorus removalwithbiomass compared to conventional mowing management, but the potential tophytominephosphorus(withP-miningandmowing)dependedonthesoilphosphorusconcentration:highphosphorusremovalonphosphorus-richsoils,decreasingremovalpotentialwith decreasing soil phosphorus concentration. The resultswere similar inour pot experiments (Chapters 4-5). The phosphorus removal rate was 37 to 91%lower in the phosphorus-poor soil conditions than in the phosphorus-rich soilconditions (Table 7.1). The decrease in phosphorus removal with decreasing soilphosphorus concentrations implies a slowing down of phosphorus removal withbiomass over time. A delay that should be taken into account in calculations of therestoration timeneeded to reach lowsoilphosphorus concentrationswithP-mining.Assuch,restorationofNardusgrasslandsonintensivelyfertilizedsoilsbyP-miningwillprobablytakedecades.
Theuseof specific cropspecies forP-miningmay increasephosphorus removaland,thus,shortenthetimeneededforrestoringphosphorus-poorsoilconditions(Chapter5). At high soil phosphorus concentrations, phosphorus removal with biomass washigher with buckwheat, maize and sunflower than with flax and triticale; at lowerphosphorusconcentrations,thedifferenceinphosphorusremovalwasalmostabsentbetween crop species, except for triticale which consistently performed worst atremoving phosphorus (Table 7.1). Before formulating recommendations on thepossibilities of P-mining with crops, the results of our pot experiment need to bevalidated in a long-term field experiment. Adding biostimulants, i.e. phosphorussolubilizing bacteria (PSB), humic substances or arbuscular mycorrhizal fungi (AM)(Chapter4),didnotincreasephosphorusremovalwithP-mining(Table7.1).
Restoring phosphorus-poor soil conditions on post-agricultural land will remain achallenge.Phytominingphosphoruswill alwaysbea long-termcommitmentand canbe made slightly more efficient by lifting the limitation of nutrients other thanphosphorus(P-mining)orselectingcropspeciesthattakeupmorephosphorus.
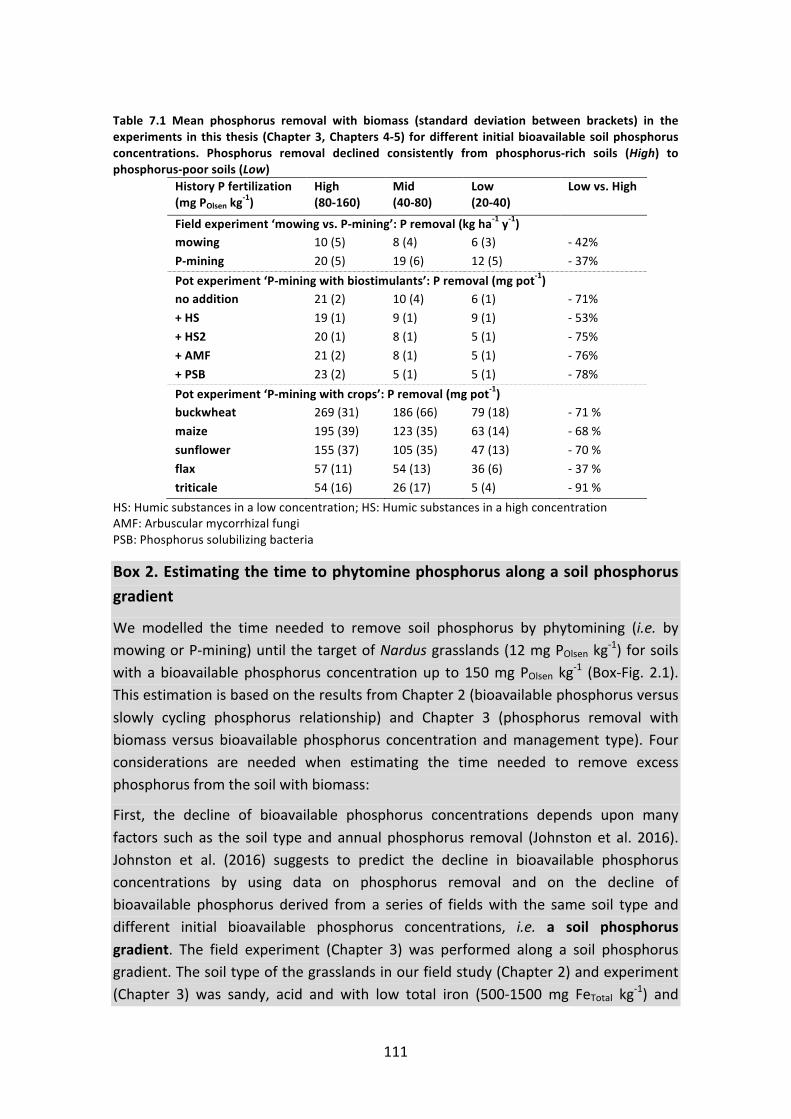
111
Table 7.1 Mean phosphorus removal with biomass (standard deviation between brackets) in theexperiments in this thesis (Chapter3,Chapters4-5) fordifferent initialbioavailablesoilphosphorusconcentrations. Phosphorus removal declined consistently from phosphorus-rich soils (High) tophosphorus-poorsoils(Low)
HistoryPfertilization(mgPOlsenkg
-1)High(80-160)
Mid(40-80)
Low(20-40)
Lowvs.High
Fieldexperiment‘mowingvs.P-mining’:Premoval(kgha-1y-1)mowing 10(5) 8(4) 6(3) -42%P-mining 20(5) 19(6) 12(5) -37%Potexperiment‘P-miningwithbiostimulants’:Premoval(mgpot-1)noaddition 21(2) 10(4) 6(1) -71%+HS 19(1) 9(1) 9(1) -53%+HS2 20(1) 8(1) 5(1) -75%+AMF 21(2) 8(1) 5(1) -76%+PSB 23(2) 5(1) 5(1) -78%Potexperiment‘P-miningwithcrops’:Premoval(mgpot-1)buckwheat 269(31) 186(66) 79(18) -71%maize 195(39) 123(35) 63(14) -68%sunflower 155(37) 105(35) 47(13) -70%flax 57(11) 54(13) 36(6) -37%triticale 54(16) 26(17) 5(4) -91%
HS:Humicsubstancesinalowconcentration;HS:HumicsubstancesinahighconcentrationAMF:ArbuscularmycorrhizalfungiPSB:Phosphorussolubilizingbacteria
Box2.Estimatingthetimetophytominephosphorusalongasoilphosphorusgradient
We modelled the time needed to remove soil phosphorus by phytomining (i.e. bymowingorP-mining)untilthetargetofNardusgrasslands(12mgPOlsenkg-1) forsoilswith abioavailablephosphorus concentrationup to150mgPOlsen kg-1 (Box-Fig. 2.1).ThisestimationisbasedontheresultsfromChapter2(bioavailablephosphorusversusslowly cycling phosphorus relationship) and Chapter 3 (phosphorus removal withbiomass versus bioavailable phosphorus concentration andmanagement type). Fourconsiderations are needed when estimating the time needed to remove excessphosphorusfromthesoilwithbiomass:
First, the decline of bioavailable phosphorus concentrations depends upon manyfactors suchas the soil typeandannual phosphorus removal (Johnstonet al. 2016).Johnston et al. (2016) suggests to predict the decline in bioavailable phosphorusconcentrations by using data on phosphorus removal and on the decline ofbioavailable phosphorus derived from a series of fieldswith the same soil type anddifferent initial bioavailable phosphorus concentrations, i.e. a soil phosphorusgradient. The field experiment (Chapter 3) was performed along a soil phosphorusgradient.Thesoiltypeofthegrasslandsinourfieldstudy(Chapter2)andexperiment(Chapter 3) was sandy, acid and with low total iron (500-1500 mg FeTotal kg-1) and

112
medium total aluminium concentrations (2200-4500 mg AlTotal kg-1). This modelingexerciseisvalidonlyforsuchsoils.
Second, the yearly amount of phosphorus removed by biomass decreases withdecreasing bioavailability of phosphorus in the soil (see answer to RQ2) and hasprobablyalargeimpactonthetimeneededtoremovephosphorus(seeAppendix4.E).Hereweassumegrasslandmanagement,however,higherphosphorusremovalmaybepossible by using arable crops such as maize or buckwheat (see Chapter 5). In ourmodel we used the relation between phosphorus removal and bioavailablephosphorusforgrasslandmanagement(P-miningormowing)foundinChapter3(seeFig.3.3;Equations1and2).Belowabioavailablephosphorusconcentrationof25mgPOlsen kg-1, the advantage of P-mining over mowing (i.e. more phosphorus removalthrough mining) was small (Chapter 3). Therefore, at a bioavailable phosphorusconcentrationof25mgPOlsenkg-1,weassumedtoswitchmanagementfromP-miningtomowinginourtimeestimations.Withphosphorusremovalwithbiomass(inkgPha-1y-1)asPremovalandbioavailablephosphorusconcentrationasPOlsen(inmgPOlsenkg-1),weassumed:
Annualphosphorusremovalwithmowingmanagement:
!!"#$%&' = 4.8 (±3.2)+ 0.05(±0.03)×!!"#$%(Equation1;Chapter3)AnnualphosphorusremovalwithP-miningmanagement:
Aslongasbioavailablephosphorusconcentrationwashigherthan25mgPOlsenkg-1:
!!"#$%&' = 9.8(±5.5)+ 0.11(±0.07)×!!"#$%(Equation2;Chapter3)For bioavailable phosphorus concentration lower than 25 mg POlsen kg-1, we
used(Equation1).
Third, it isnecessary to take intoaccount the slowly cyclingphosphoruspools thatreplenish the bioavailable pools (see Box 1 and Chapter 3).We, therefore, use therelationbetweenbioavailableandslowlycyclingphosphorus (Fig.2.1;Equation3) topredict the decline in bioavailable phosphorus concentrations when slowly cyclingphosphorus stocks (in kg ha-1) are depleted with phosphorus. With slowly cyclingphosphorus concentration as POxalate (inmgPOxalate kg-1) andbioavailable phosphorusconcentrationasPOlsen(inmgPOlsenkg-1),weassumed:
!!"#$#%& = 0.67+ 3.03×!!"#$%(Equation3;Chapter2)Fourth, in intensivelyusedgrasslands, it isvery likelyphosphorusconcentrationsareincreasedoverthedepthof30cmorevendeeperby(thecombinationof)ploughingand leaching of phosphorus (Box-Fig. 1.4). In our field experiment, neither thebioavailablenortheslowlycyclingphosphorusconcentrationsinthedeepersoillayer

113
(15-30cm)weredecreasedafterfiveyearsofphytomining(contrarytothesignificantdeclineinthebioavailablephosphorusconcentrationsintheupper0-15cmsoillayer;Chapter3).Yet,thephosphoruspoolsinthe15-30cmsoillayerandeveninthesubsoillayer (> 30 cm deep) are likely to be accessible by plant roots or mycorrhiza insymbiosis with these plants, especially with P-mining (Bauke et al 2018). It is stillunclearwhetherthephosphoruspoolsinthesedeepersoillayersshouldbetakenintoconsideration when estimating the potential of a field for restoring an oligotrophichabitattype.Wethereforeperformedthismodellingexerciseforboth0-10cmand0-30cmsoillayers.
Thetimeneededtoreachthephosphorus-poorthresholdofNardusgrasslands(12mgPOlsen kg-1) had a wide range depending upon the soil depth and method tophytominephosphorus (Box-Fig.2.1).Largeexcessivephosphorusstocks(>500kgPha-1 in Box-Fig. 2.1b) are accompanied by a long time estimation of the abioticrestoration(>50years).Theamountofexcessphosphorustoremove isaboutthreetimeshigherforthe0-30cmsoil(upto3000kgPha-1)layerthanforthe0-10cmsoillayer(upto1000kgPha-1).ThetimeneededtoremovephosphorusismarkedlyhigherformowingthanforP-mining(Box-Fig.2.1a).Thelongesttimeestimationswerefoundforfieldswithhighbioavailablephosphorusconcentrations(Box-Fig.2.1a).
It appears unrealistic to phytomine phosphorus (mowing or P-mining) from fieldswith very high soil phosphorus concentrations (> 60 mg POlsen kg-1) to reach theNardus grassland threshold because this would take more than 50 years (Box-Fig.2.1a). For this soil type, it may be more realistic to only consider fields with abioavailable phosphorus concentration less than 60mg POlsen kg-1 for restoration byphytomining(Box-Fig.2.1candd).Ifitsufficestophytominethe0-10cmsoillayer,thetimeneededrangesupto39yearsformowingmanagementandupto23yearsforP-miningmanagement depending upon the initial soil phosphorus bioavailability (Box-Fig.2.1c).However,phytominingthe0-30cmsoillayerrequiresmoretime:upto131years for mowing management and up to 78 years for P-mining managementdependingupontheinitialsoilphosphorusbioavailability(Box-Fig.2.1c).
In fields containing less than 25 mg POlsen kg-1, it is better to use mowing as arestoration technique because there appears no gain in efficiency of P-mining overmowingmanagement(seealsoChapter3).

114
Box-Figure2.1 Estimation of time needed to phytomine phosphorus versus the initial bioavailablephosphorusconcentration(mgPOlsenkg
-1;aandc)andversustheamountofsoilphosphorusinexcessto the thresholdofNardus grasslands (kgPha-1;bandd).Panelscanddshowamagnifiedpartofpanels a and b (0-60mg POlsen kg
-1 in c and the corresponding excess P stock in d). The timewasestimated for phytomining by mowing (green dotted line and blue dot-dashed line) and P-mining(brown full line and yellow dashed line) management and of the 0-10 cm (green dotted line andbrownfullline)andthe0-30cm(bluedot-dashedlineandyellowdashedline)soillayers.Estimationsarebasedontherelationbetweenbioavailableandslowlycyclingphosphorus(Chapter2)andonthemodel forphosphorus removalwithbiomass (Chapter3).Shadesshowthe95%confidence intervalderived from the phosphorus removalmodel (Chapter 3). Estimates are only valid for similar fieldconditions (sandy,acid,500-1500mgFeTotalkg
-1and2200-4500mgAlTotalkg-1)andmanagement (bi-
annualmowingwithoutfertilizationandP-miningbybi-annualmowingwithNandKfertilization)

115
Duringthefive-yearfieldexperimentofChapter3,fourofthegrasslandplotsreachedtheabioticphosphorus-poorthresholdof12mgPOlsenkg-1inthetopsoillayer(Box-Fig.2.2). In these plots, biotic restoration by introducing the missing target species byseeding or hay transfermay increase the species richness and shift the communitycomposition towards the target of Nardus grasslands, though this remains to betested. The other species-poor grasslands below the phosphorus threshold wereremnantNardusgrasslandswherespecies-richnessmaybeincreasedaswellbybioticrestoration(Chapter2).Theacceptabletimelimitforabioticrestorationdependsupontheprojectcontext.Grasslandswithveryhighsoilphosphorusconcentrations(>60mgPOlsen kg-1) and low species numbers (10 species per 9m2) fall out of the scope forabioticrestorationbyphytominingbecauseitwouldprobablytaketoolong(upto350years).However,itseemsreasonabletoassumephytominingisarealisticrestorationtechnique in the grassland plots with intermediate bioavailable phosphorusconcentrations (15 to 60 mg POlsen kg-1): phosphorus removal bymowing for fieldsbelow25mgPOlsenkg-1andbyP-miningforfieldsbetween25and60mgPOlsenkg-1.P-mining immediately after intensive land-use does not imply a big change in themanagement and nature values (which are probably low). However, when using P-miningonmesotrophicgrasslandsthatweremanagedbytraditionalmowingforalongtime and species-rich, the nature values are decreased by the increased land-useintensity.Itisworthalsoconsideringthisloss

116
Box-Figure 2.2 The number of species per 9m2 versus bioavailable phosphorus concentrations (mgPOlsen kg
-1) for each of the grasslands in Chapters 2 and 3. The green oval shape indicates remnantNardus grasslands in no apparant need of restoration measures. The orange oval shape indicatesremnantgrasslandsandabioticallyrestoredpost-fertilizationgrasslandsinneedofbioticrestoration.Theblueoval shape indicates post-fertilization grasslands in needof abiotic andbiotic restoration;light blue fields (below 25 mg POlsen kg
-1) are probably suitable for restoration by mowingmanagement;darkbluefields(between25and60mgPOlsenkg
-1)areprobablysuitableforrestorationbyP-mining.Theredovalshapeindicatesgrasslandsforwhichphosphorusremovalbyphytominingwouldbetooslow

117
7.3RQ3:DoNardusgrasslandspeciesbenefitfrominoculationwithsoilbiota?
In mesocosms with bioavailable soil phosphorus concentrations higher than 12 mgPOlsenkg-1,thebiomassoftypicalNardusgrasslandspecieswasextremelylowandnotaffected by the type of soil biota added (Chapter 6). In mesocosms with lowerbioavailable soil phosphorus concentrations, the abundance of typical Nardusgrassland species was impeded by the presence of soil biota from oligo-, meso- oreutrophic grasslands. Inoculation with soil biota did not enable typical Nardusgrasslandspecies to flourishatphosphorusconcentrationshigher thanthethresholdof 11.5mg POlsen kg-1. Yet, themesocosm experiment is ongoing andmore in-depthanalysis of the plant-soil biota interactions might shed new light on this topic. Incontrast to our preliminary results, other studies have shown inoculation of soilcommunities from target habitat types can help speed up the biotic restoration ofoligotrophic grasslandsandheathlands. Inoculationwith soil biota,e.g. by spreadingout sods, may drive the plant community development in the direction of targethabitattypes.

118
7.4Decisiontree
Basedonour results,wepresentadecision tree toaidpractitioners in selecting theappropriaterestorationtechniquegiventheabioticandbioticbottlenecks(Fig.7.2).Toobtain effective restoration management of Nardus grasslands after land-useintensification (cf. §1.3), we propose to focus on fields where phosphorus-poor soilconditionscanbereachedwithinareasonabletimespanandwithareasonablecost.Whatisreasonablemaybedifferentforprojects.Asanexample,theoutcomeofthedecisionmodelispresentedforarestorationproject(Box3).
Figure 7.2Decision tree for practitioners restoring species-rich semi-natural grasslands on fertilizedland.ThisdecisionmodelwasinspiredbyKemmersandvanDelft(2010)butwithaparticularfocusonabiotic and biotic restoration. In caseswhere P-depletion is needed, the choice for an appropriaterestorationtechniqueisbaseduponthetimeandcostneededforrestoration.ThetimeneededwithmowingorP-miningdependsuponPExcessivewhilethecostfortopsoilremovalisdependentonthesoildepthwithelevatedP-concentrations
Thefirststepistoassesstheneedforabioticrestorationbydeterminingthedistanceto target, i.e.bymeasuringrelevantabioticvariables(see§1.4)andcomparingthesevalueswiththeircorrespondingthresholdsofthetargetedhabitattype(seeBox2).Ifthe abiotic threshold is not met, abiotic restoration is needed before bioticrestoration can happen. Which abiotic restoration technique is most appropriatedependsonthedistancetotargetandontherestorationprojectconstraintssuchasbudgetandtiming.OneofthesetargetsfortherestorationofNardusgrasslands,isthe

119
phosphorus-poortargetof12mgPOlsenkg-1(see§1.4,Chapters2and6).Thefeasibilityof restoring Nardus grassland on phosphorus-rich soils seems thus questionablewithout financial support ofe.g. European Life+ fundingorwithin the frameworkofnature development projects of the Flemish Land Agency (VLM). Topsoil removal isgenerallycostly(seeTable1.2inchapter1).Low-budgetprojectscanprobablybetterfocus on restoration on fields with a history of less intensive fertilization wherephytominingbymowingorP-miningisattainable.Itmightbemostefficienttoinvestsome money in the abiotic screening of parcels before purchasing them or beforeselectingatargethabitattype.
The second step is, if no substantial amountofphosphorushas tobe removedor ifabioticrestorationhasbeensuccesful, toassess theneed forbiotic restoration (see§1.4). We only found examples of successful restoration of Nardus grasslands oneutrophic land where the topsoil was removed followed by the reintroduction oftargetspecies(Berendseetal.1992;Loebetal.2018);and,asimilarfindingforothergrasslandtypes:Moliniagrassland(Natura2000habitattype6410;TallowinandSmith2001; Hölzel and Otte 2003; Walker et al. 2004; Klimkowska et al. 2007; Fig. 7.3),alluvial Cnidion grassland (Natura2000 habitat type 6440; Hölzel & Otte 2003),calcareous grasslands (Natura2000 habitat type 6210;Walker et al. 2004; Kiehl andPfadenhauer2007), lowlandhaymeadows(Natura2000habitattype6510;Walkeretal. 2004), but also for various species-rich grasslands in Australia (Gibson-Roy et al.2010).
Third, for conserving these ecosystems, the appropriate traditional grasslandmanagement(mowingand/orgrazing)canbeintroducedandmaintained(see§1.3.1).
As a final step, if the changes to the ecosystem are irreversible and restoration ofoligotrophicNardusgrasslandsisunrealisticbecauseoftimeormoneyconstraints,onecould decide to focus the restoration efforts on other sites, or one could chooseanother habitat type as a target for which the phosphorus concentrations may behigher;thismayevenbeanovelecosystemorahybridecosystembetweenanovelandhistoricalecosystem(sensuHobbsetal.2006;Hobbsetal.2009),whichcanresult incertainecologicalfunctionsaswell.Inthiscase,species-richhabitattypesthatarelessdemandingwithregardtosoilphosphoruslevelsmaybetargeted,suchasspecies-richmesotrophicgrass-herbmixturegrasslandswithcommon,floweringplantspeciessuchasLeucanthemumvulgare,Centaureajacea,LotuscorniculatusandTrifoliumpratense.Associationsaimedataidingpollinators,e.g.BumblebeeConservationTrust(UK),arepioneers in this topic and have developed species lists of native pollinator-friendlyplant species that tolerate growing in mesotrophic soil conditions (Appendix 7.A).Mesotrophicspecies-richgrasslandsmaybecreatedbythecombinationofafewyearsoftraditionalmowingmanagementtoobtainnitrogenand/orpotassiumlimitationand

120
low biomass production (cf. 3 t DM ha-1 in Chapters 2 and 3) and the activeintroductionofcommonnativelegumeandforbspecieson(patchesof)nakedsoilviaseeding or hay transfer (Klaus et al. 2017). Creating such species-rich grasslands onformerlyintensivelyusedlandcanupgradebiodiversity(Woodcocketal.2014),e.g.bytheprovisionoffoodandnestingplacestoamultitudeofpollinatorsandotherinsects(Wrattenetal.2012;e.g.Fig.7.4). Importantly,suchnovelgrasslandecosystemscanprobably not replace highly specialized systems such as oligotrophic habitat types,whichtypicallyharboralotofRedListspecies.Whenlocatedadjacenttositesofhighecological value, e.g. well-developed Nardus grasslands, such restored novelmesotrophic grasslands may be used as corridors by, e.g. butterflies, betweenoligotrophichabitatsorasbufferzonestoprevent inflowoffertilizationfromnearbyagricultural fields. The continued (mowing) management of these mesotrophicgrasslandsmay,however,becomecostlyover time,especially if theproducedhay isnotvalorized(seeTable1.2inchapter1).Themanagementofarablelandsownwith(rare) annual wildflowers may be easier (superficial cultivation every three years;personalcommunicationMarkMartens)andmayalsoresult inhighdiversityofflora(Albrecht et al. 2016; Lang et al. 2018) and fauna species, i.e. pollination reservoirs(sensuVenturinietal.2017).

121
Figure7.3Successful floristicrestorationofoligotrophicMoliniongrasslandsoneutrophic landaftertopsoilremovalandhaytransferin2012innaturereserveHonderdMorgenin‘sHertogenbosch(theNetherlands)duringLifeprojectBluesinthemarshes.PhototakeninJune2018
Figure7.4Resultofintroducingcommonherbspeciesinthesecondyearafterintroductiontoafieldwithextremelyhighbioavailablephosphorusconcentration(>150mgPOlsenkg
-1)duetohighhistoricalland-useintensity(greenhousewithhorticulturalproductionoflandscapeplants)(a)inMay2018withabundant Leucanthemum vulgare and and Lychnis flos-cuculi; and, (b) in June 2018with abundantCentaurea jacea,Achilleamillefolium,TrifoliumpratenseandLotuscorniculatus inRuiter (Belgium).Pollinatorsightings in2018includecommonspecies(Ariciaagestis,Lycaenaphlaeas,Coliascroceus,Smerinthusocellata,Dasypodahirtipes)aswellasrarespecies(Argynnispaphia,Cupidoargiades)
(a) (b)
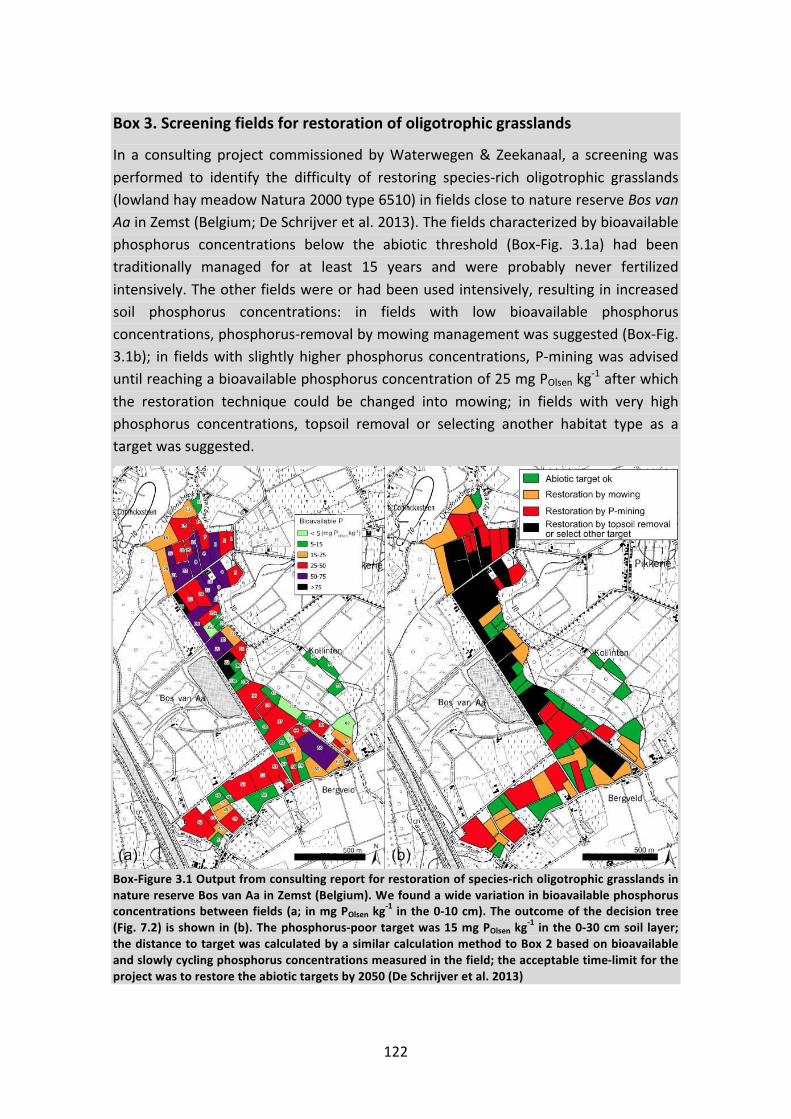
122
Box3.Screeningfieldsforrestorationofoligotrophicgrasslands
In a consulting project commissioned byWaterwegen& Zeekanaal, a screeningwasperformed to identify the difficulty of restoring species-rich oligotrophic grasslands(lowlandhaymeadowNatura2000type6510)infieldsclosetonaturereserveBosvanAainZemst(Belgium;DeSchrijveretal.2013).Thefieldscharacterizedbybioavailablephosphorus concentrations below the abiotic threshold (Box-Fig. 3.1a) had beentraditionally managed for at least 15 years and were probably never fertilizedintensively.Theotherfieldswereorhadbeenusedintensively,resultinginincreasedsoil phosphorus concentrations: in fields with low bioavailable phosphorusconcentrations,phosphorus-removalbymowingmanagementwassuggested(Box-Fig.3.1b); in fieldswith slightlyhigherphosphorus concentrations,P-miningwasadviseduntilreachingabioavailablephosphorusconcentrationof25mgPOlsenkg-1afterwhichthe restoration technique could be changed into mowing; in fields with very highphosphorus concentrations, topsoil removal or selecting another habitat type as atargetwassuggested.
Box-Figure3.1Outputfromconsultingreportforrestorationofspecies-richoligotrophicgrasslandsinnaturereserveBosvanAainZemst(Belgium).Wefoundawidevariationinbioavailablephosphorusconcentrationsbetweenfields(a; inmgPOlsenkg
-1 inthe0-10cm).Theoutcomeofthedecisiontree(Fig.7.2) isshownin(b).Thephosphorus-poortargetwas15mgPOlsenkg
-1 inthe0-30cmsoil layer;thedistancetotargetwascalculatedbyasimilarcalculationmethodtoBox2basedonbioavailableandslowlycyclingphosphorusconcentrationsmeasuredinthefield;theacceptabletime-limitfortheprojectwastorestoretheabiotictargetsby2050(DeSchrijveretal.2013)
(mg POlsen kg-1)
Bioavailable P
500 m(a) (b)

123
7.5Implicationsforpracticeandpolicy
To protect and restore European habitat types, cooperation between the variousstakeholders of different levels, from local to regional, is required (cf. EuropeanParliamentresolutionon25/10/2018forCOP14;seeexamplesinTable7.2).BasedontheinsightsacquiredduringthisPhD,weformulateimplicationsforpracticeandpolicyforsomeofthestakeholders.
In 2007, Flanders had 36.150 ha grasslands of (high) nature value (BiologischeWaarderingskaart; Danckaert et al. 2008). However, only 16% (5806 ha, 0.4% ofFlanders)weremanagedwith a focus to conserve biodiversity; 19% (6988 ha)werelegallyunprotectedasgrassland;and,62%werelegallyunprotectedasgrasslandwithecological value and were allocated inadequately on the Flemish land-use map(translation: zonevreemd; Vlaamse Overheid 2000), i.e. as agricultural land which isprobably intensivelymanaged(e.g.withfertilizerandherbicide input). Incontrast, inthesemi-naturalgrasslandsthatcoveronly0.4%oftheland,39%oftheplantspeciesofFlandersarefound(over600species,ofwhich130ontheRedList,Dumortieretal.2003) together with many other species (see §1.2). Hence, upgrading the speciesrichness of Flanders involves a better legal protection of the grasslands of highnaturevalueandrestoringbiodiversityondegradedgrasslands.
Residual soil phosphorus, as a legacy effect of intensification, impedes ecologicalrestoration of several terrestrial ecosystems: several species-rich grassland types(Janssensetal.1998;MerunkováandChytrý2012;Ceulemansetal.2014),calcareousgrasslands (Niinemets and Kull 2005), lowland hay meadows (Gilbert et al. 2009),heathlands (Aerts et al. 1995; Kooijman et al. 2016), forests (Verheyen and Hermy2004; Baeten et al. 2010; Blondeel et al. 2018) andwetlands (Olde Venterink et al.2001;Wassenetal. 2005).Weare obliged to treat oligotrophic habitat typeswithhigh-priorityconservation(cf.Mooreetal.1989foroligotrophicwetlands)becauseitisnearly impossible to turneutrophic fields intooligotrophic fieldswithoutdrasticandexpensivemeasuressuchastopsoilremoval.
We advise to carefully examine the abiotic and biotic conditions of a field beforeplanningrestoration.Thisimpliesfreeingupbudgetforchemicalanalysesandexpertadvice(seeBox3).Thefeasibilityofparticulartargetscanthenbecomparedbasedonthedistancetotarget, incombinationwiththeattainablerestorationtechniques,theprojectbudgetavailableandtheacceptabletimelimitwithintheprojectcontext.Thedistance to the target of Nardus grasslands is the amount of phosphorus to beremoved, which will determine the time needed for phytomining (mowing or P-mining).Foracid,sandysoilssimilartoourstudy,itseemsreasonabletoassumefieldswith very high soil phosphorus concentrations (> 60mg POlsen kg-1) fall out of thescopeforabioticrestorationbyphytominingbecauseitwouldprobablytaketoolong

124
(hundreds of years). Restoring high-level targets such as Nardus grasslands oneutrophiclandmaybelimitedtoprojectswithlargebudgets,i.e.whereitispossibletousetopsoilremovalasarestorationtechnique.Weadviseprojectsandorganizationswithsmallbudgetstofocustheirrestorationeffortsofoligotrophichabitattypesonoligo-ormesotrophicfieldsorworktowardshabitattypeswithlessstringentabioticrequirements on eutrophic fields (e.g. nitrogen-limited flower-rich grasslands withcommon species) that may benefit the local biodiversity more than unsuccessfulattemptsatreachinghigh-levelunattainabletargets.
For acid, sandy soils similar to our study, we can further assume phytomining is arealistic restoration technique in the grassland plots with intermediate bioavailablephosphorusconcentrations(15to60mgPOlsenkg-1):phosphorusremovalbyP-miningforfieldsbetween25and60mgPOlsenkg-1andbymowingforfieldsbelow25mgPOlsenkg-1.P-miningimmediatelyafterintensiveland-usedoesnotimplyabigchangeinthemanagement and nature values (which are probably low). However, P-miningmesotrophicspecies-richgrasslandswillcauseadropinbiodiversity,henceitisworthconsidering this loss before selecting a target or restoration technique. PractitionersmayuseP-miningwithexistinggrasslandvegetation,withgrass-clover (TimmermansandvanEekeren2016)orwithspecificcrops(seeChapter5).Managerscanchoosetomineasquicklyaspossiblebymeansofanintensiveagriculturalpractice,usingcropsthatarenot interesting forbiodiversity (e.g.maize)andcropprotectionproducts,orundertake a more extensive way of mining, with crops being more interesting forbiodiversity(e.g.grass-clover,seeFig7.5)andnocropprotection(Carvelletal.2006;Goulsonetal.2011).During the restoration trajectory towardsphosphorus-poor soilconditions,itisprobablybettertoswitchP-miningintomowingmanagementinfieldscontaininglessthan25mgPOlsenkg-1,becausethereappearsnogaininefficiencyofP-miningovermowingmanagement(seealsoChapter3)anditalsotakesafewyearstodecreasethenitrogenandpotassiumconcentrationsinthesoil.
When the abiotic target is (almost) reached, restoration can be assisted byreintroducingthemissingspecies.Countingonspontaneousrecolonizationwillhighlylikelynotsufficeinfragmentedspecies-poorlandscapesasFlanders.
Perhapsmost importantly,weurgepractitioners to try out (new) abiotic and bioticrestoration techniques in the field and to share the resultswith other practitionersand researchers, e.g. Conservation Evidence or the interregional GrasGoed project(seeFig.7.6andTable7.2).

125
Figure 7.5 Grass-clover with P-mining management to phytomine phosphorus on former agricultalfields(inLifeprojectBluesintheMarshesin‘sHertogenbosch,theNetherlands)isanattractivecropforbumblebees(Goulsonetal.2005)
Figure 7.6 Practitioners in ecological restoration of species-rich grasslands exchanging theirexperiencesduringtheInterregionalGrasGoedprojectbyInverde(seeTable7.2)
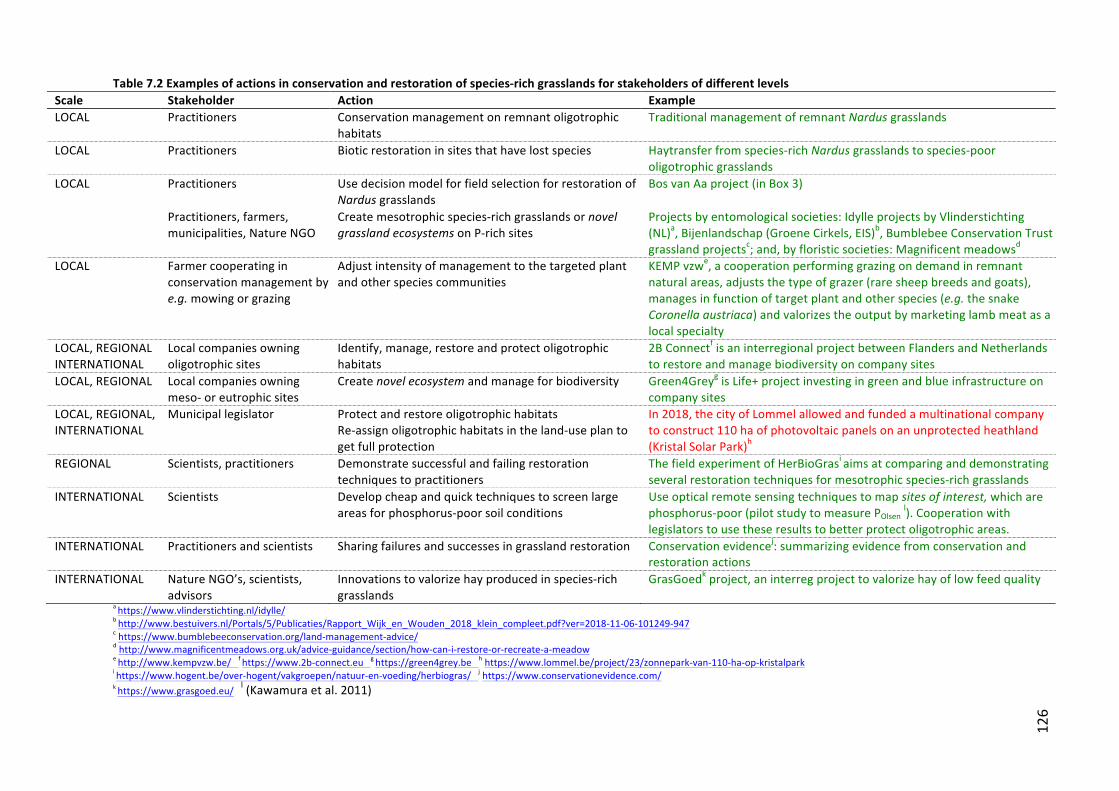
Table7.2Examplesofactionsinconservationandrestorationofspecies-richgrasslandsforstakeholdersofdifferentlevelsScale Stakeholder Action ExampleLOCAL Practitioners Conservationmanagementonremnantoligotrophic
habitats
TraditionalmanagementofremnantNardusgrasslands
LOCAL Practitioners Bioticrestorationinsitesthathavelostspecies Haytransferfromspecies-richNardusgrasslandstospecies-pooroligotrophicgrasslands
LOCAL Practitioners Usedecisionmodelforfieldselectionforrestorationof
NardusgrasslandsBosvanAaproject(inBox3)
Practitioners,farmers,
municipalities,NatureNGO
Createmesotrophicspecies-richgrasslandsornovelgrasslandecosystemsonP-richsites
Projectsbyentomologicalsocieties:IdylleprojectsbyVlinderstichting
(NL)a,Bijenlandschap(GroeneCirkels,EIS)
b,BumblebeeConservationTrust
grasslandprojectsc;and,byfloristicsocieties:Magnificentmeadows
d
LOCAL Farmercooperatingin
conservationmanagementby
e.g.mowingorgrazing
Adjustintensityofmanagementtothetargetedplant
andotherspeciescommunities
KEMPvzwe,acooperationperforminggrazingondemandinremnant
naturalareas,adjuststhetypeofgrazer(raresheepbreedsandgoats),
managesinfunctionoftargetplantandotherspecies(e.g.thesnakeCoronellaaustriaca)andvalorizestheoutputbymarketinglambmeatasa
localspecialty
LOCAL,REGIONAL
INTERNATIONAL
Localcompaniesowning
oligotrophicsites
Identify,manage,restoreandprotectoligotrophic
habitats
2BConnectfisaninterregionalprojectbetweenFlandersandNetherlands
torestoreandmanagebiodiversityoncompanysites
LOCAL,REGIONAL Localcompaniesowning
meso-oreutrophicsites
Createnovelecosystemandmanageforbiodiversity Green4GreygisLife+projectinvestingingreenandblueinfrastructureon
companysites
LOCAL,REGIONAL,
INTERNATIONAL
Municipallegislator Protectandrestoreoligotrophichabitats
Re-assignoligotrophichabitatsintheland-useplanto
getfullprotection
In2018,thecityofLommelallowedandfundedamultinationalcompany
toconstruct110haofphotovoltaicpanelsonanunprotectedheathland
(KristalSolarPark)h
REGIONAL Scientists,practitioners Demonstratesuccessfulandfailingrestoration
techniquestopractitioners
ThefieldexperimentofHerBioGrasiaimsatcomparinganddemonstrating
severalrestorationtechniquesformesotrophicspecies-richgrasslands
INTERNATIONAL Scientists Developcheapandquicktechniquestoscreenlarge
areasforphosphorus-poorsoilconditions
Useopticalremotesensingtechniquestomapsitesofinterest,whicharephosphorus-poor(pilotstudytomeasurePOlsen
l).Cooperationwith
legislatorstousetheseresultstobetterprotectoligotrophicareas.
INTERNATIONAL Practitionersandscientists Sharingfailuresandsuccessesingrasslandrestoration Conservationevidencej:summarizingevidencefromconservationand
restorationactions
INTERNATIONAL NatureNGO’s,scientists,
advisors
Innovationstovalorizehayproducedinspecies-rich
grasslands
GrasGoedkproject,aninterregprojecttovalorizehayoflowfeedquality
ahttps://www.vlinderstichting.nl/idylle/
bhttp://www.bestuivers.nl/Portals/5/Publicaties/Rapport_Wijk_en_Wouden_2018_klein_compleet.pdf?ver=2018-11-06-101249-947
chttps://www.bumblebeeconservation.org/land-management-advice/dhttp://www.magnificentmeadows.org.uk/advice-guidance/section/how-can-i-restore-or-recreate-a-meadow
ehttp://www.kempvzw.be/
fhttps://www.2b-connect.eu
ghttps://green4grey.be
hhttps://www.lommel.be/project/23/zonnepark-van-110-ha-op-kristalpark
ihttps://www.hogent.be/over-hogent/vakgroepen/natuur-en-voeding/herbiogras/
jhttps://www.conservationevidence.com/
khttps://www.grasgoed.eu/
l(Kawamuraetal.2011)
126
127
7.6Knowledgegapsandfutureresearchopportunities
Although other studies have investigated P-mining in the field (Dodd et al. 2012;Postma et al. 2015), more long-term field experiments on various soil types (seeJohnston et al. 2016; Bauke et al. 2018) are needed to get better insight in: e.g.phosphorusremovalrate,whichcropsaremostoptimaltoreachrestorationtargets,whichsoiltexturesaremorerelevanttouseP-miningasarestorationtechnique.Also,littlefielddataisavailableonthecostsandgainsofP-mining.Tomakethetechniqueof P-mining economically feasible for farmers, it is important that the crop or hayqualityisguaranteed.InfieldswithlowsoilP-concentrationsinanagriculturalcontext,P in forage will also likely be suboptimal and this can be the cause of a lowernutritionalvalue.For foragetoserveas theonly feedcomponentof thedietofhighyieldingdairycows,itshouldnotcontainlessthan3mgPg-1ofdrybiomass(Valketal.1999).
Little information is found for the last phaseof phytomining inparticular,whenthephosphorusremovalratecanbecomeverylowdespitesoilphosphorusconcentrationsabovethetargetof12mgPOlsenkg-1(seeChapter3).Phosphoruscanalsobereleasedfromorganicorinorganicrecalcitrantphosphoruspools(RobertsandJohnston2015).To get complete insight in the complexity of phosphorus cycling, a thoroughfractionation procedure should be executed at different points in time duringphytomining(cfr.DeSchrijveretal.2012).
Athirdgapinknowledgeaboutphytominingforecologicalrestorationisthequestionof which soil depth to remove phosphorus from. We showed that neither thebioavailablenortheslowlycyclingphosphorusconcentrationsinthedeepersoillayer(15-30cm)weredecreasedafterfiveyearsofphytomining(contrarytothesignificantdeclineinthebioavailablephosphorusconcentrationsintheupper0-15cmsoillayer).Yet,thephosphoruspoolsinthe15-30cmsoillayerandeveninthesubsoillayer(>30cm deep) are likely to be accessible by plant roots ormycorrhiza in symbiosis withtheseplants(Baukeetal2018).It isunclearwhetherthephosphoruspools inthesedeeper soil layers should be taken into consideration when estimating therestoration potential of a field. Phosphorus uptake from deeper soil layers can beassessedby,e.g.tracerexperimentswithlabelledphosphorus(33Pisotophicexchange;Kruseetal.2015).
Testing and finetuning novel restoration techniques such as full-inversion tillagedeserves more attention, as well as further research may focus on the ecologicalfunctionscarriedbynovelgrasslandecosystems.
The development of cheap and quick techniques to screen large areas forphosphorus-poor soil conditions can enhance the identification, restoration andconservationofoligotrophichabitats,but requires further research. It isquickerand

128
may be cheaper to measure the canopy reflectance in situ to deduce bioavailablephosphorus concentrations (Kawamura et al 2011). Another option may be to useopticalremotesensingtoscanlargeareas(KerrandOstrovsky2003).
Wefoundthevegetationof thepost-fertilizationgrasslands inChapters2and3was(severely) limited by potassium. However, the effect of potassium limitation onspecies-richnesshasbeenless-wellresearchedandarelessunderstoodthannitrogenand phosphorus limitation (Kayser and Isselstein 2005; Sardans and Peñuelas 2015);and,similarlyco-limitationbetweennitrogen,phosphorusand/orpotassiumrequiresmoreinvestigation(Fayetal.2015).Experimentationinthefieldorinmorecontrolledenvironments(greenhouse)maybesuitedtoinvestigatethisfurther.
Inthecontextofclimatechange,summerdroughtsaremorelikelytooccurinEurope(Kovatsetal.2014).Targetoligotrophicplantspeciesmaybeabletowithstandhighersoil phosphorus concentrations in combinationwith a yearly drought period due tolimited biomass production. Such complex interactions between soil fertility and(summer)droughtperiodsmayberesearchedby,e.g.addingadroughttreatmenttothemesocosmexperimentpresentedinChapter6.
Basedonthefirstresultsfromthemesocosm,westress further investigationof theplant-soilinteractionsisneededby,e.g.comparingthesoilbiotacommunitiesineachmesocosm with the plant communities. Small changes in nutrient availability innutrient-poorsoilsappearedtoleadtothelossofslow-growingspeciesspecializedinsurvivingunderseverephosphorus-limitation(Roelingetal.,2018).Suchchangesmaybe induced by specific interactions with soil biota but still needs to be revealed byfurtherresearch,suchasadetailedinvestigationoftheinteractionsinthemesocosmexperiment.
Another much-needed innovation is the economic valorization of the hay fromspecies-rich grasslands or grasslands in restoration management. Before theagricultural revolution, grasslands were much-needed for farmers and weretraditionallymanagedforhaytooverwintercattle,horsesandsheep.Nowadays,thehayqualitydoesnotsufficeanymorenordospecies-richgrasslandsfitinthemodernfarming systems. The incentive to restore and continue management of theseecosystemsneedstobefoundelsewherebecausetraditionalmowingmanagementisexpensive(seeTable1.2)aswellasthecostishightodisposeofthecuthay(50eurot-1drybiomass;CompeerandMattheij2017).Annually,about40000tdrybiomass isproducedinFlanders(CompeerandMattheij2017).Examplesofsuchinnovationsareusing the fibres for production of paper or insulation material (e.g. the GrassGoedproject).

129
APPENDICES
APPENDICESAppendicesChapter1
Appendix1.AKeyforidentifying6230Nardusgrasslands(withsubtypes)
The identification key by De Saeger andWouters (2017) distinguishes four subtypes of thespecies-richNardusgrasslands(Natura20006230*):
• 6230_hn:droog,heischraalgrasland;translatedasdryNardusgrassland
• 6230_hmo:vochtig,heischraalgrasland;translatedasmoistNardusgrassland
• 6230_hnk:droog,kalkrijkerheischraalgrasland(Betonico-Brachypodietum);translatedasdry,calcareousNardusgrassland
• 6230_ha:soortenrijkegraslandenvanhetstruisgrasverbond;translatedasspecies-richgrasslandsoftheAgrostiscapillaristype
In this PhD, we focus on 6230_hn (dry Nardus grasslands; see Appendix-Table 1.A for theidentificationofthishabitat).
Appendix-Table 1.ATranslationof the key for identifyingNardusgrassland typesbyDe Saeger andWouters(2017)
Stepa Question ifYES ifNO1. Isitanopenbiotopewithgrassyvegetation(Poaceaeorother)
andherbspeciesmorethan50%ofthecover?(itisagrassland)2. othertype
2. Isthecoverbytreesandshrubs(crownarea)lessthan10% 3. othertype3. Isthegrasslandissituatedinthepolderarea(andatleast2
halophytespeciesarepresent)orinthecoastalanddunearea?othertype 4.
4. CoverwithlargeCarexspecies,Glyceriamaxima,Irispseudacorus,Equisetumfluviatile,Thyphasp.,Schoenoplectuslacustris,Schoenoplectustabernaemontaniand/orSparganiumsp.isequaltoorhigherthan70%ORthecoverwithspeciesfromthewetlandgroupb(excludingJuncuseffusus,Phragmitesaustralis,CarexacutaenCarexacutiformis)ishigherthanthecoverwithotherspecies
othertype 5.
5. WasgrasslandmanagementabandonedANDarepeatyspeciescabundantlypresent?
othertype 6.
6. Arelargesedgespeciesdcodominantlypresent? othertype 7.7. Isthevegetationpartoftheforestedgeorpartoftheedgeofa
watercourse,andaretypicalspeciesoftheGalio-Alliarionvegetationtypedominant?
othertype 8.
8. Arenitrophilousspeciesetogether(co-)dominant? othertype 9.9. Wasgrasslandmanagementbymowingorgrazingabandoned
ANDatleasttworuderalspeciesfareabundantlypresent.ORitisaruderalhabitatwithatleast30%ofthecoveroccupiedbyruderalspecies.
othertype 10.
10. Isthecoverofspeciestypicalforwetruderalsiteconditionsghigherthan30%?
othertype 11.

130
11. Areatleast3calcareousspecieshoccasionallypresent?ORis1calcareousspecieshfrequentlypresent?
Calcareoustypesincluding6230_hnk
12.
12. IsthecoverwithNardusstrictaequaltoorhigherthan30%? 6230,moveto14.
13.
13. IsthesoiloligotrophicandmostlyacidANDareatleastthreespeciespresentfromtheNardusgroupiANDareheathlandspeciesjpresent?
6230,moveto14.
othertype
14. Aremultiplespeciesindicatingmoistsoilconditionskpresentinhighfrequency?
6230_hmo,seehmo-groupl
6230_hn,see15.
15. AreatleastfourspeciesfromtheNardusorha*groupmpresentANDtogethercovermorethan10%?
6230_hn 6230_hno
NA Atleastonespeciesfromtheha*groupmfrequentlypresentORatleastthreespeciesfromthe(ha*andNardus)-groupsm,ieachoccasionallypresent
6230_ha rbbha
NA Atleastfourspecies,eachfrequentlypresent,fromtheha-groupnandorheathlandspeciesj
rbbha othertype
aWefilteredouttherelevantstepsfortheidentificationofNardusgrasslands,consequently,thestepnumbersaredifferentthaninDeSaegerandWouters(2017)b Marsh species: Cardamine amara, Carex vesicaria, Juncus filiformis, Carex lasiocarpa, Cladium mariscus, Irispseudacorus,Rorippaamphibia,Calamagrostiscanescens,Carexpseudocyperus,Equisetumfluviatile,Peucedanumpalustre,Epilobiumpalustre,Agrostiscanina,Violapalustris,Galiumpalustre,Methaaquatica,Carexnigra,Carexcurta,Eriophorumangustifolium…c Peat species: Achillea ptarmica, Lysimachia vulgaris, Peucedanum palustre, Calamagrostis canescens, Galiumuliginosum,Comarumpalustre,Eriophorumangustifolium,Sphagnumsp.and/orCarexnigradLargesedgespecies:Juncuseffusus,Juncusconglomeratus,Juncusacutiflorus,Juncussubnodulosus,Juncusinflexus eNitrophilous species:Urticadiocia,Galiumaparine,Rumexobtusifolius,Cirsiumarvense,Cirsiumvulgare,Rubussp.,Arctiumsp.,Jacobeavulgarissubsp.vulgaris,Dactylisglomerataf Ruderal species: Cirsium arvense, Convolvulus arvensis, Artemisia vulgaris, Tanacetum vulgare, Solidagocanadensis,Calamagrostisepigeos,Conyzasp.,Dipsacusfullonum,Equisetumarvensis,…g Species of wet ruderal soil conditions: Persicaria bistorta, Valeriana officinalis, Angelica sylvestris, Lythrumsalicaria…h Calcareous species: Lathyrus tuberosus, Briza media, Cirsium acaule, Ophrys apifera, Silene vulgaris,Himantoglossum hircinum, Cinopodium vulgare, Helianthemum nummularium, Tragopogon pratensis subsp.pratensis, Brachypodium pinnatum, Agrimonia eupatoria, Trisetum flavescens, Centaurea scabiosa, Gymnadeniaconopsea,Sanguisorbaofficinalis,Primulaveris,Anacamptismorio,Pulicariadysenterica,Origanumvulgare…i Nardus species: Succisa pratensis, Carex panicea, Viola riviniana, Carex pallescens, Nardus stricta, Hieraciumvulgatum, Solidago virgaurea, Festuca filiformis, Hypericum pulchrum, Ulex europaeus, Botrychium lunaria,Dactylorhiza maculata subsp. maculata, Pedicularis sylvatica, Viola canina, Thymus serpyllum, Gentianapneumonanthe, Lathyrus linifolius, Potentilla anglica, Galium saxatile, Polygala serpyllifolia, Veronica officinalis,Hieracium lactucella, Genista anglica, Hieracium laevigatum, Euphrasia stricta, Danthonia decumbens, Potentillaerecta,Juncussquarrosus,Carexbinervis,Luzulamultiflora,Serratulatinctoria,PlatantherabifoliajHeathlandspecies:Callunavulgaris,Ericacinerea,Ericatetralix,Juncussquarrosus,Carexpilulifera,Carexarenaria,Agrostis vinealis, Genista anglica, Genista pilosa, Cytisus scoparius, Vaccinium vitis-idaea, Vaccinium myrtillus,Trichophorumcespitosumsubsp.germanicum,Deschampsiaflexuosa,Ulexeuropaeusk Species of moist soil conditions: Erica tetralix, Pedicularis sylvatica, Dactylorhiza maculata subsp. maculata,Gentianapneumonanthe,Carexnigra,Carexpanicea,Carexoederisubsp.oedocarpa,Agrostiscanina,Hydrocotylevulgaris,Juncusacutiflorus,…l hmo species: Succisa pratensis, Carex panicea, Carex pallescens,Nardus stricta, Carex oederi subsp. oedocarpa,Dactylorhiza maculata subsp. maculata, Pedicularis sylvatica, Gentiana pneumonanthe, Danthonia decumbens,Juncussquarrosus,Carexbinervis,Luzulamultiflora,Platantherabifolia,Serratulatinctoriam ha* species: Gnaphalium sylvaticum, Hieracium vulgatum, Filago minima, Vulpia bromoides, Galium verum,Campanularotundifolia,Thymusserpyllum,Dianthusdeltoides,Potentillaargentea,JasoineMontanan ha species:Cerastiumarvense,Achilleamillefolium, Luzula campestris,Hypochaeris radicata,Agrostis capillaris,Trifolium arvense, Ornithopus perpusillus, Trifolium dubium, Leontodon saxatilis, Ranunculus bulbosus, Hieraciumpilosella,Rumexacetosella,Plantagolanceolata,Airapraecox,Airacaryphylleaoindicatesthehabitathasdeterioratedorisweaklydeveloped
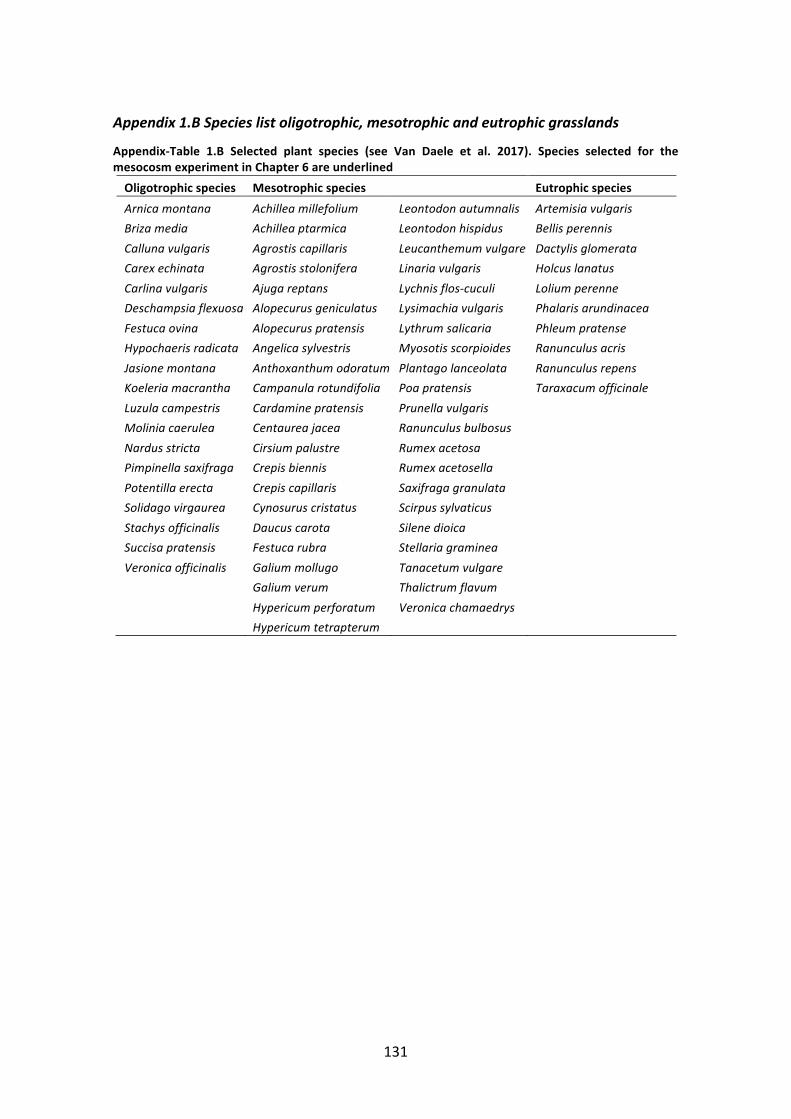
131
Appendix1.BSpecieslistoligotrophic,mesotrophicandeutrophicgrasslands
Appendix-Table 1.B Selected plant species (see Van Daele et al. 2017). Species selected for themesocosmexperimentinChapter6areunderlinedOligotrophicspecies Mesotrophicspecies EutrophicspeciesArnicamontana Achilleamillefolium Leontodonautumnalis Artemisiavulgaris
Brizamedia Achilleaptarmica Leontodonhispidus Bellisperennis
Callunavulgaris Agrostiscapillaris Leucanthemumvulgare Dactylisglomerata
Carexechinata Agrostisstolonifera Linariavulgaris Holcuslanatus
Carlinavulgaris Ajugareptans Lychnisflos-cuculi Loliumperenne
Deschampsiaflexuosa Alopecurusgeniculatus Lysimachiavulgaris Phalarisarundinacea
Festucaovina Alopecuruspratensis Lythrumsalicaria Phleumpratense
Hypochaerisradicata Angelicasylvestris Myosotisscorpioides Ranunculusacris
Jasionemontana Anthoxanthumodoratum Plantagolanceolata Ranunculusrepens
Koeleriamacrantha Campanularotundifolia Poapratensis Taraxacumofficinale
Luzulacampestris Cardaminepratensis PrunellavulgarisMoliniacaerulea Centaureajacea RanunculusbulbosusNardusstricta Cirsiumpalustre RumexacetosaPimpinellasaxifraga Crepisbiennis RumexacetosellaPotentillaerecta Crepiscapillaris SaxifragagranulataSolidagovirgaurea Cynosuruscristatus ScirpussylvaticusStachysofficinalis Daucuscarota SilenedioicaSuccisapratensis Festucarubra StellariagramineaVeronicaofficinalis Galiummollugo Tanacetumvulgare
Galiumverum Thalictrumflavum
Hypericumperforatum Veronicachamaedrys
Hypericumtetrapterum

132
Appendix1.CListofspecificNaturetargetsforNardusgrasslandsinFlanders
In2007,250–350haofFlanderswere reportedasNardusgrasslands (Natura2000type 6230*) and it was targeted to restore another 600 ha of Nardus grasslands(Appendix-Fig. 1.C; Paelinckx et al. 2009). Within the European Natura 2000framework, the aimwas formulated to keep the protected habitats (including theirtypicalspecies)inanoptimalstateandtorestorethemifnecessary.
In2014,theFlemishgovernmentapprovedadecreewithtwogoals:(i)tokeep377haofremnantNardusgrasslandsinanoptimalconditionbyinsituimprovingthequalityof these grasslands, and (ii) to restore an additional 637 ha of Nardus grasslands(Appendix-Table 1.C). However, only vague descriptions were given of how thisambitiousgoalshouldbereached.Therestorationofprobablyonlyaminorityoftheseadditional grasslands to restore will take place on phosphorus-poor soils: onabandoned Nardus grassland that became forest (1 ha) and on forests on non-agricultural land (121ha).More thanaquarter (174ha) isplanned to takeplaceonsiteswith a fertilization history: on arable land and post-fertilization grasslands. Forhalf of the additional grasslands to restore (334 ha), there is no clear indication ofwherethisrestorationwilltakeplace.Onlyforfiveofthe43projectsitismentionedtoworktowardsabioticsoiltargets;mowingandgrazingismentionedinthreeoftheseprojects;and,topsoilremovalismentionedinoneproject.Severalprojects(7)statetowork on the biotic bottleneck. And for some projects (4), other target species thanplantspecieswerelisted,e.g.butterflies,reptiles,crickets,birds,bats.
Appendix-Figure 1.C Distribution of remnant Nardus grasslands (Natura2000 habitat type 6230*)basedontheoccurrenceoftypicalspeciesinFlanders(Paelinckxetal.2009)

Appendix-Table1.CSpecificnaturetargetsforspecies-richNardusgrasslands(Natura20006230*)inFlanders(VlaamseOverheid,n.d.)
ArearemnantNardusgrasslands
Qualitytargetremnant
AreaNardusgrasslandstorestore
Previouslanduseorhabitattypenotspecified
FromabandonedNardusgrassland
Fromforest
Fromheathland
Fromarablefield
Frompost-fertilizationgrassland
Region Code (ha)
(ha)
(ha)
(ha)(ha)
(ha)
(ha)
(ha)
BosenHei(Malle) 638 22 equal 15
0
8
0
8
0Caestert 406 2 enhance 10
0
0
0
0
10
DeMaten 908 5 enhance 23
0
12
0
0
12Demervallei 745 8 enhance 82
82
0
0
0
0
Dijlevallei 724 3 enhance 10
10
0
0
0
0GroteNete 657 8 enhance 23
0
23
0
0
0
HallerbosBrabantseheide 901 6 enhance 18
18
0
0
0
0
Haspengouw 416 2 enhance 7
7
3
0
0
0Haspengouw(Vinne,
Zoutleeuw) 417 5 enhance 6
6
0
0
0
0
Jekervallei 452 <0.5 enhance 1
1
0
0
0
0
Jekervallei2 453 <0.5 enhance 1
1
0
0
0
0
KleineNete 828 1 enhance 6
6
0
0
0
0
KleineNete 851 2 enhance 6
0
3
3
0
0
Mangelbeek 687 2 enhance 5
5
0
0
0
0
Mangelbeek 688 20 enhance 7
0 7
0
0
0
7
MechelseHeide 952 1 enhance 1
1
0
0
0
0
MechelseHeide 953 10 enhance 6
0
3
0
0
3
Noord-OostLimburg 672 9 enhance 16
0
0
0
0
16
OvergangKempen
Haspengouw 478 <0.5 enhance 2
0
2
0
0
0
OvergangKempen
Haspengouw 479 0 enhance 4
0
0
0
0
4
OvergangKempen
Haspengouw 480 <0.5 enhance 0
0
0
0
0
0OvergangKempen
Haspengouw 481 <0.5 enhance 1
1
0
0
0
0
133

Schietvelden 624 13 enhance 9
0
0
0
0
9
TurnhoutsVennengebied 803 53 enhance 99
0
33
0
33
33
ValleigebiedKampenhout 531 <0.5 enhance 0
0
0
0
0
0
VijvergebiedMidden-
Limburg 708 <0.5 enhance 13
13
0
0
0
0VijvergebiedMidden-
Limburg 709 1 enhance 15
0
0
0
0
15
VlaamseArdennen 545 <0.5 enhance 3
3
0
0
0
0
Voerstreek 439 2 enhance 15
15
0
0
0
0
Wingevallei
499-
500 11 enhance 54
0
27
0
0
27
ZandigVlaandereOost 603 8 enhance 70
70
0
0
0
0ZandigVlaandereWest 588 55 enhance 40
40
0
0
0
0
Zandleemstreek 560 1 enhance 0
0
0
0
0
0Zeeschelde(sigma) 938 1 equal 0
0
0
0
0
0
Zonienwoud 512 8 enhance 29
29
0
0
0
0Zonienwoud 519 1 enhance 9
0
9
0
0
0
Zwartebeek 855 25 enhance 15
15
0
0
0
0Zwartebeek 856 24 enhance 0
0
0
0
0
0
Zwartebeek 871 1 enhance 5
5
0
0
0
0Zwartebeek 874 66 enhance 6
0
0
0
0
0
Zwartebeek 888 0 enhance 7
7
0
0
0
0TOTAL(ha)
377
637
334
121
3
40
135
134

135
AppendicesChapter2
Appendix2.A:TypicalNardusgrasslandspecies
Appendix-Table2.A Listwith typical species indryacidophilous lowlandAtlanticNardus grasslandswithinEuropeanhabitattype6230(T’Jollynetal.2009)
ScientificnameAgrostisvinealis
Botrychiumlunaria
Carexpilulifera
Danthoniadecumbens
Euphrasiastricta
Festucaovina
Galiumsaxatile
Genistaanglica
Gnaphaliumsylvaticum
Hieraciumlactucella
Hieraciumlaevigatum
Lathyruslinifolius
Luzulamultiflora
Nardusstricta
Polygalavulgaris
Potentillaerecta
Veronicaofficinalis
Violacanina
Appendix2.B:Summaryofthesevenpost-agriculturalgrasslands
Appendix-Table 2.B Location and soil characteristics of the seven post-fertilization grasslands (mean(minimum–maximum))
Grasslandidentity
Naturereserve Coordinates
Timesincefertilization(year)
Numberofplotspergrassland
BioavailableP(mgPOlsenkg-1)
SlowlycyclingP(mgPOxalatekg
-1) pHH2O
PF1LandschapdeLiereman
51°20'24.1''N5°1'14.8''E 21 5 25* 70*
5.5(5.5–5.5)
PF2LandschapdeLiereman
51°20'7.6''N5°1'2.3''E 24 4
54(41-82)
166(119-194)
5.5(5.3–5.9)
PF3LandschapdeLiereman
51°20'4.9''N5°1'13.0''E 25 2
43(22-64)
111(50-172)
4.8(4.6–5.0)
PF4LandschapdeLiereman
51°19'46.2''N5°2'0.2''E 16 4
114(94-157)
334(238-410)
5.6(5.2–5.8)
PF5TurnhoutsVennengebied
51°21'48.1''N4°57'1.4''E 23 5
56(41-87)
178(146-240)
5.8(5.5–6.1)
PF6TurnhoutsVennengebied
51°21'39.7''N4°55'25.4''E 17 3
35(27-44)
132(90-162)
5.9(5.8–6.0)
PF7TurnhoutsVennengebied
51°22'3.6''N4°57'44.9''E 23 6
46(32-58)
120(78-180)
5.7(5.2–6.4)
*In one grassland (PF1), the soil sampling strategywas different: a composited samplewas taken over thewholegrassland(n=4)insteadofonesampleineachplot

136
Appendix 2.C: Rarefaction of the number of vascular plant species in post-fertilizationgrasslands
Wearecombiningtwodatasets,oneincludingtheremnantNardusgrasslandsandoneincludingthepost-fertilizationgrasslands.Themethodologyinthesevegetationsurveyswasdifferent:thesizeofthe remnantNardus grasslandquadratswas9m2 (3mx3m) andonequadratwaspositioned ineachof34grasslands;while,thesizeofthequadratsinthepost-fertilizationgrasslandswas4m2(2mx2m)butforeachofsevengrasslands,twotosixquadratswereinventoried,dependingonthesizeofthegrassland.
Constructingsample-basedrarefactioncurvesallowsforcomparingthenumberofspeciesbetweenthe remnant grasslands and post-fertilization grasslands despite the difference in quadrat sizes(Gotelli and Colwell 2001). Therefore, we constructed these curves for the post-fertilizationgrasslands,plottedasfunctionofsamplesize(Appendix-Fig.2.C).Allpossiblecombinationsbetweenquadrats,withineachofthesevengrasslands,weremadetocalculatethemeanspeciesnumberfor8m2,12m2,16m2,20m2and24m2plots.Then,wefittedsecondorderlinearmodelsandcalculatedthenumberofspeciesin9m2quadratsfromthesecurves(Appendix-Table2.C).
Appendix-Figure2.CRarefactioncurvesforthesevenpost-fertilizationgrasslands.Thefilledcirclesshowthemean number of species and the flags show the standard error obtained by combining the vegetationsurveys fromtwo to sixquadrats ineachof thegrasslands.Thecurveswere fittedby secondorder linearmodels(seeAppendix-Table2.C)
Appendix-Table2.CFittedrarefactioncurves,andtheiradjustedR-squaredandp-values,forthesevenpost-fertilizationgrasslandsaccordingtosecondorderlinearmodels(! = ! + !" + !!!)Grasslandidentity
Fittedvaluefora
Fittedvalueforb
Fittedvalueforc AdjustedR2 p-value
Estimatednumberofspeciesfor9m2
PF1 2.920 0.525 -0.011 0.997 0.001 6.7PF2 3.438 0.639 -0.014 0.999 0.018 8.0PF3 3.000 0.375 0 * * 6.4PF4 3.313 0.916 -0.027 0.993 0.049 9.3PF5 4.120 0.986 -0.022 0.994 0.003 11.2PF6 2.000 0.958 -0.031 * * 8.1PF7 4.696 0.364 -0.004 0.996 0.0001 7.6
Inthelastcolumn,theestimatesforthenumberofvascularplantspeciesaregivenforanareaof9m2
*The R2 and p-values for PF3 and PF6 were not calculated because there were too few quadrats in thesegrasslands
●
●
●
●
●
●
●
●
●
●
●
●
●
●
●
●
●
●
●
●
●
●
●
●
●
●
●
●
●
●
●
●
●●
●
●
●
●
●
●●
●
●
●
●
●
●
●
●
●
●
●
●
●
●
●
●
●
0
5
10
15
0 5 10 15 20 25Area ( m2 )
Num
ber o
f spe
cies
Post−fertilizationgrassland ID
●●
●●
●●
●●
●●
●●
●●
PF1PF2PF3PF4PF5PF6PF7

137
AppendicesChapter3
Appendix3.A:Biomasssamplingdates
Appendix-Table3.ABiomasssamplingdates forthethreefields inLandschapDeLieremanandthefield inVloethemveld
Year Harvest Liereman2011 1 02/082012 1 15/05 2 21/092013 1 25/05 2 13/08 3 23/092014 1 12/06 2 10/102015 1 21/05 2 22/102016 1 29/06 2 21/10

138
Appendix3.B:Speciescompositionin2011and2017
Appendix-Table3.BVegetation composition in July 2017 inmowingandP-miningplots:mean cover in%;minimalandmaximalvaluesareshownbetweenbrackets.Coverbygrassspeciesisindicatedby“G”;coverbyforbspeciesby“F”andcoverbymossspecies“M” Species Type Occurrencein
Seedmix(%)Mowing(%)
P-mining(%)
Sownspecies-mixin2011
Festucapratensis G 5 0.4(0-5) 0.4(0-5)Loliumperenne G 77 0.2(0-1) 9(0-80)
Phleumpratensis G 10 16(0-40) 51(5-90) Poapratensis G 3 0 0 Trifoliumrepens F 5 2(0-10) 4(0-25)Spontaneousspeciesfoundin2017
Achilleamillefolium F 2(0-25) 0Agrostiscapillaris G 36(0-50) 18(0-55)Agrostisstolonifera G 9(0-50) 9(0-35)Anthoxanthumodoratum G 10(0-40) 3(0-25)
Arrhenatherumelatius G 0 1(0-15) Betulapendula F 0.2(0-1) 0 Bromushordeaceus G 0.1(0-1) 0 Cardaminepratensis F 0.1(0-1) 0.4(0-5) Carexovalis G 0.9(0-5) 0.7(0-7) Cerastiumfontanum F 7(1-25) 3(0-20) Cirsiumarvense F 0.5(0-5) 11(0-55) Cirsiumpalustre F 0.7(0-7) 1(0-10) Conyzacanadensis F 0 0.1(0-1) Crepiscapillaris F 2(0-7) 0.5(0-5) Dactylisglomerata G 0 4(0-30) Holcuslanatus G 28(10-60) 35(10-60) Jacobaeavulgaris F 5(0-40) 3(0-20) Juncusbufonius G 0.8(0-10) 0 Juncuseffusus G 2(0-10) 0.1(0-1) Leontodonautumnalis F 7(0-20) 2(0-15) Lotuspedunculatus F 4(0-25) 1(0-7) Luzulacampestris F 3(0-25) 0.1(0-1) Pinussylvestris F 0.1(0-1) 0 Plantagolanceolata F 0 0.1(0-1) Plantagomajor F 0.1(0-1) 0 Quercusrobur F 0.1(0-1) 0 Ranunculusrepens F 21(0-50) 8(0-20) Rhytidiadelphussquarrosus M 19(0-90) 0 Rumexacetosa F 0 0.3(0-1) Rumexacetosella F 7(0-30) 0.2(0-1) Rumexobtusifolius F 0 1(0-7) Salixcaprea F 0.2(0-1) 0 Sonchusoleraceus F 1(0-7) 0 Taraxacumofficinale F 5(0-25) 7(0-20) Trifoliumdubium F 0.1(0-1) 0 Urticadioica F 0.1(0-1) 2(0-25) Veronicaarvensis F 0.1(0-1) 0.2(0-1)

139
Appendix3.C:Modelselectionandoptimalmodels
Appendix-Table3.C.1Modelselectionoftherelationshipsbetweenannualbiomasspropertiesin2012-2016andtherestorationtechniqueandsoilphosphorusconcentrationatthestartoftheexperiment(POlsen-2011)
a.OnlycompetitivemodelswithΔAICcof lessthantwoareshown(BurnhamandAnderson,2002). IncaseofmultiplesuitablemodelsaccordingtoΔAICc,modelswerecomparedwithANOVAtests.Theselectedoptimalmodelsareshowninbold
ResponseVariable
PredictorVariablesinModel df AICc ΔAICc wb p-valuec
Phosphorusremovalwithbiomass
Restorationtechnique+POlsen-2011+Restorationtechnique:POlsen-2011+POlsen-2011
2+Restorationtechnique:POlsen-2011
2
12 687 0 0.40 ns
Restorationtechnique+POlsen-2011+Restorationtechnique:POlsen-2011+POlsen-2011
2
11 688 0.3 0.34
Restorationtechnique+POlsen-2011+Restorationtechnique:POlsen-2011
10 688 1.0 0.24
Biomassd Restorationtechnique+POlsen-2011 9 96 0 0.48 * Restorationtechnique 8 98 1.7 0.21 Phosphorusconcentrationinbiomasse
Restorationtechnique+POlsen-2011+Restorationtechnique:POlsen-2011+POlsen-2011
2
11 -94 0 0.59 ns
Restorationtechnique+POlsen-2011+Restorationtechnique:POlsen-2011+POlsen-2011
2+Restorationtechnique:POlsen-2011
2
12 -93 1.4 0.29
aThe fullmodelshad the following form: responsevariable~ restoration technique xPOlsen-2011 + restorationtechniquexPOlsen-2011
2.Weusedplotnestedwithinfieldnestedwithinyearasrandomfactorsbw:theAkaikeweightindicatestheprobabilitythatthemodelisthebestmodelofthesetofmodelstestedc*indicatesasignificantdifferencewithp<0.05;nsindicatesnosignificantdifferencebetweenthemodelsdBiomasswassquareroottransformedePhosphorusconcentrationinbiomasswaslogtransformed

140
Appendix-Table3.C.2Theoptimalmodelsforannualbiomassyield(tha-1),meanphosphorusconcentrationin the biomass (mg kg-1) and phosphorus removal with biomass (kg ha-1), for 2012-2016, including therestorationtechniquetreatmentandthesoilphosphorusconcentrationatthestartoftheexperiment(POlsen-
2011)a
Model Estimate
Standarderror
χ2 df p-valueb R2m
c R2c
cBiomassd 1,10
3 67% 97
% Intercept 1.5 0.1 403
*** Restorationtechnique 1.0 0.06 34
0 ***
POlsen-2011 0.002 0.001 5 * Pconcentrationinbiomasse 1,10
1 46% 80
% Intercept 0.6 0.09 291
*** Restorationtechnique -0.3 0.06 33 *** POlsen-2011 0.01 0.002 80 *** POlsen-2011
2 -0.00005
0.00001 23 *** Restorationtechnique:
POlsen-20110.002 0.0007 6 *
Phosphorusremovalwithbiomass
1,102
66% 96% Intercept 4.8 1.6 81 ***
Restorationtechnique 5.0 1.2 193
*** POlsen-2011 0.05 0.01 61 *** Restorationtechnique:
POlsen-20110.06 0.02 11 **
aThe fullmodelshad the following form: responsevariable~ restoration technique xPOlsen-2011 + restorationtechnique x POlsen-2011
2. We used plot nested within field nested within year as random factors (seeSupplementaryTableS3andFig.S4)bSignificanceofeffectsisindicatedby***p<0.001;**p<0.01;*p<0.05cThe percentage of variance explained by the fixed effects (R²m) and the full model, including the randomeffectsyear,fieldandplot(R²c)areshownforeachmodeldBiomasswassquareroottransformedePhosphorusconcentrationinbiomasswaslogtransformed
Appendix-Table 3.C.3 Model selection of the relationships between the nutrient indices for phosphorus(PNI), nitrogen (NNI) and potassium (KNI), including the restoration technique treatment and the soilphosphorusconcentrationatthestartoftheexperiment(POlsen-2011)
a.OnlycompetitivemodelswithΔAICcofless than twoare shown (BurnhamandAnderson,2002). In caseofmultiple suitablemodelsaccording toΔAICc,modelswerecomparedwithANOVAtests.Theselectedoptimalmodelsareshowninbold
ResponseVariable
PredictorVariablesinModel df AICc
ΔAICc
wb p-valuec
PNId Restorationtechnique+POlsen-2011+
Restorationtechnique:POlsen-2011+POlsen-2011
2+Restorationtechnique:POlsen-2011
2
12 -123
0 0.87
NNI Restorationtechnique+POlsen-2011 9 842 0 0.35 ns Restorationtechnique 8 842 0.7 0.26KNI Restorationtechnique+POlsen-2011+
Restorationtechnique:POlsen-2011+POlsen-2011
2
11 884 0 0.74
aThe fullmodelshad the following form: responsevariable~ restoration techniquexPOlsen-2011+ restorationtechniquexPOlsen-2011
2.Weusedplotnestedwithinfieldnestedwithinyearasrandomfactorsbw:theAkaikeweightindicatestheprobabilitythatthemodelisthebestmodelofthesetofmodelstestedcnsindicatesnosignificantdifferencebetweenthemodelsdPNIwaslogtransformed

141
Appendix-Table 3.C.4 The optimal models for nutrient indices for phosphorus (PNI), nitrogen (NNI) andpotassium (KNI) in May-June for 2012-2016, including the restoration technique treatment and the soilphosphorusconcentrationatthestartoftheexperiment(POlsen-2011)
a
Model Estimate Standarderror
χ2 df p-valueb R2m
c R2cc
PNId 1,87 63% 75% Intercept 4 0.09 16809 *** Restorationtechnique -0.6 0.1 62 *** POlsen-2011 0.006 0.002 105 *** POlsen-2011
2 -0.00002 0.00001 16 *** Restorationtechnique:
POlsen-20110.009 0.003 16 ***
Restorationtechnique:POlsen-2011
2-0.00005 0.00002 7 **
NNI 1,91 47% 96% Intercept 41 5 131 *** Restorationtechnique 25 2 171 *** KNI 1,88 83% 99% Intercept 9 5 258 *** Restorationtechnique 71 4 600 *** POlsen-2011 0.7 0.1 3 . POlsen-2011
2 -0.004 0.0009 17 *** Restorationtechnique:
POlsen-2011-0.3 0.06 24 ***
aThe fullmodelshad the following form: responsevariable~ restoration techniquexPOlsen-2011+ restorationtechniquexPOlsen-2011
2.WeusedplotnestedwithinfieldnestedwithinyearasrandomfactorsbSignificanceofeffectsisindicatedby***p<0.001;**p<0.01;.p<0.1.c The percentage of variance explained by the fixed effects (R²m) and the fullmodel, including the randomeffectsyear,fieldandplot(R²c)areshownforeachmodeldPNIwaslogtransformed
Appendix-Figure3.C.1Thenutrientinducesforphosphorus(PNI;a),nitrogen(NNI;b)andpotassium(KNI;c)inbiomassharvestedinMayorJuneplottedversusPOlsen-2011(mgkg-1)forthe24plots.Meanandstandarddeviationfor2012-2016areshown.Theregressionlinesshowtheoptimallinearmixedeffectsmodelfittedtothe120datapoints

142
Appendix-Fig.3.C.2TheconcentrationofPOlsen(a,c;n=24)andPOxalate(b,d;n=22)inthe0-15cm(a,b)and15-30cm(c,d)soil layersofthemowingandP-miningplotsbeforeandaftertheexperiment(2011,2017).Significanceofeffectsisindicatedby***p<0.001;nsmeansthedifferencewasnotsignificant

143
Appendix-Table 3.C.5 Model selection of the relationships between the change in POlsen and POxalateconcentrationsbetween2011and2017 in the0-15 cmand15-30 cm soil layers, including the restorationtechniquetreatmentandthesoilphosphorusconcentrationatthestartoftheexperiment(POlsen-2011)
a.Onlycompetitive models with ΔAICc of less than two are shown (Burnham and Anderson, 2002). In case ofmultiplesuitablemodelsaccordingtoΔAICc,modelswerecomparedwithANOVAtests.Theselectedoptimalmodelsareshowninbold
ResponseVariable
PredictorVariablesinModel df AICc ΔAICc wb
Changein0-15cmPOlsenconcentration
Restorationtechnique+POlsen-2011+Restorationtechnique:POlsen-2011
8 198 0 0.83
Changein0-15cmPOxalateconcentration
nullmodel 5 250 0 0.51
Changein15-30cmPOlsenconcentration
POlsen-2011 6 203 0 0.75
Changein15-30cmPOxalateconcentration
POlsen-2011 6 243 0 0.69
aThemodelshadthefollowingform:ΔPOlsenorΔPOxalate~restorationtechniquexPOlsen-2011.Weusedfieldasarandomfactorbw:theAkaikeweightindicatestheprobabilitythatthemodelisthebestmodelofthesetofmodelstested
Appendix-Table 3.C.6 The optimal models for the change in POlsen and POxalate concentrations (mg kg-1)between2011and2017inthe0-15cmsoillayer,includingtherestorationtechniquetreatmentandthesoilphosphorusconcentrationatthestartoftheexperiment(POlsen-2011)
a
Model Estimate Standarderror
χ2 df p-valueb R2m
c R2cc
ChangeinPOlsenconcentration 1,18 40% 88%
Intercept -28 18 1 ns Restorationtechnique 0.5 0.09 68 *** POlsen-2011 -10 8 44 *** Restorationtechnique:
POlsen-20110.3 0.08 10 **
ChangeinPOxalateconcentration 1,19 0% 0% Intercept 7 10 0.4 ns
aThemodelshadthefollowingform:ΔPOlsenorΔPOxalate~restorationtechniquexPOlsen-2011.Weusedfieldasarandomfactor(seeSupplementaryTableS6)bSignificanceofeffectsisindicatedby***p<0.001;**p<0.01;ns,notsignificantcThe percentage of variance explained by the fixed effects (R²m) and the full model, including the randomeffectsfieldandplot(R²c)areshownforeachmodel
Appendix-Table3.C.7ThemodelforthechangeinPOlsenversusPOxconcentration(mgkg-1)inthe0-15cmsoillayerbetween2011and2017(n=22)a
Model Estimate Standarderror χ2 df p-valueb R2m
c R2cc
ChangeinPOxalateconcentration 1,18 76% 76% Intercept -39 9 3 ns
ChangeinPOlsenconcentration
3 0.4 66 ***
aThemodelhadthefollowingform:ΔPOxalate~ΔPOlsen.WeusedfieldasarandomfactorbSignificanteffectsareindicatedby***p<0.001.nsindicatesnosignificantdifferencebetweenthemodelscThe percentage of variance explained by the fixed effects (R²m) and the full model, including the randomeffectsfieldandplot(R²c)areshownforeachmodel

144
Appendix-Table 3.C.8 Model selection of the relationships between the change in POlsen and POxalateconcentrations between 2011 and 2017 in the 0-15 cm soil layer, including the restoration techniquetreatmentand the cumulativephosphorus removalwithbiomassa.Only competitivemodelswithΔAICcofless than twoare shown (BurnhamandAnderson2002). In caseofmultiple suitablemodels according toΔAICc,modelswerecomparedwithANOVAtests.Theselectedoptimalmodelsareshowninbold
ResponseVariable
PredictorVariablesinModel df AICc ΔAICc wb p-valuec
ChangeinPOlsenstock
Restorationtechnique 4 245 0 0.37 ns .CumulativePremoval 4 245 0.4 0.29 .
nullmodel 3 246 0.8 0.24 ChangeinPOxalatestock
CumulativePremoval 4 282 0 0.54
aThemodelshad the following form:ΔPOlsenorΔPOxalate ~ restoration techniquex cumulativeP removal.Weusedfieldasarandomfactorbw:theAkaikeweightindicatestheprobabilitythatthemodelisthebestmodelofthesetofmodelstestedcSignificanteffectsareindicatedby.p<0.1.nsindicatesnosignificantdifferencebetweenthemodels
Appendix-Table3.C.9TheoptimalmodelsforthechangeinPOlsenandPOxalatestocks(kgha-1)between2011
and2017inthe0-15cmsoillayer,includingtherestorationtechniquetreatmentandcumulativephosphorusremovalwithbiomassa
Model Estimate Standarderror χ2 df p-valueb R2m
c R2cc
ChangeinPOlsenstock 1,20 15% 24% Intercept -1.2 19 12 ** cumulativePremoval 0.44 0.2 4 . ChangeinPOlsenstock 1,20 13% 15% Intercept 19 10 20 *** Restoration
technique26 14 4 .
ChangeinPOxalatestock 1,18 28% 33% Intercept -155 71 0.6 ns cumulativePremoval 2.5 0.9 8 *
aThemodelshad the following form:ΔPOlsenorΔPOxalate ~ restoration techniquex cumulativeP removal.WeusedfieldasarandomfactorbSignificant effects are indicated by ** p < 0.01; * p < 0.05; p < 0.1. ns indicates no significant differencebetweenthemodelscThe percentage of variance explained by the fixed effects (R²m) and the full model, including the randomeffectsfieldandplot(R²c)areshownforeachmodel

145
AppendicesChapter4
Appendix4.ANitrogenandpotassiumfertilization
ToavoidlimitationeffectsbynutrientsotherthanPonplantgrowth,soilswerefertilizedthreetimesduring the pot experiment (Appendix-Table 4.A). We followed the recommendations by the SoilServiceofBelgium(BodemkundigeDienst).Duringthepotexperimentwerecoveredabout50–70%oftheaddedNand50–65%oftheaddedKwithfourgrassclippings.
Appendix-Table4.AFertilizationrateduringthemainpotexperiment(totalduration123days) Doseperpot
(1.4kgsoil,15cmdiameter)Convertedtodoseperha
Firstfertilization:priortofillingthepots,NasNH4NO3andKasK2O
76mgNpot-155mgKpot-1
43kgNha-137kgK2Oha
-1Secondfertilization:day44,NandKasNH4NO3andKNO3
210mgNpot-1315mgKpot-1
119kgNha-1215kgK2Oha
-1Thirdfertilization:day95,NandKasNH4NO3andKNO3
65mgNpot-198mgKpot-1
37kgNha-167kgK2Oha
-1TOTALfertilization(inthreedoses) 351mgNpot-1
468mgKpot-1198kgNha-1319kgK2Oha
-1
Appendix 4.B Additional pot experiment for testing the survival of added phosphate-solubilizingbacteria(PSB)inthethreesoilP-concentrations
Todeterminetheprevalenceofthephosphate-solubilizingbacterialinoculations,wetriedtoassessthe three species (Bacillus brevis, Pseudomonas putida and P. corrugata) added to the pots in anextraexperiment.Thewildtypestrainwasfirstmaderifampicin(Rif)resistant,weonlysucceededtodo this with P. corrugata: a spontaneousmutant resistant of P. corrugata to rifampicin (Rif) wasobtained by transferring an aliquot of a LBbroth culture into LBbroth with 100 mg liter-1 Rif,incubatingthecultureat30°Cand isolatingaRifRcloneaftergrowth.Subsequently, thisclonewasmarked with the rfp-gene. The insertion of the mini-Tn5- PA1-04/03::rfp-cassette into pB10 wasperformed througha triparentalmating, inwhich thehelperplasmidpRK600 (Kessleretal. 1992),presentinEscherichiacoliHB101(BoyerandRoulland-Dussoix1969),mobilizedthedeliveryplasmidpSM1833 (Haagensen et al. 2002) from the donor E. coli MV1190 (Herrero et al. 1990) into therecipientP.corrugata(ATCC29736).SelectioninLBbrothwithrifampicin(50mg/ml)andkanamycin(100 mg/ml) resulted in P. corrugata (ATCC 29736) derivative with the PA1-04/03::rfp-cassetteinserted in the chromosome. The survival of this strainP. corrugate rfp in the three different soiltypeswasmonitoredthroughplatingonLBagarsupplementedwithrifampicinandkanamycin(bothwith a concentration of 100mg/ml). Soil samples from bulk soil and rhizosphere combined weretakenonday4,day14andday30.Inextrapots,wealsoinoculatedthewildtypetoseetheeffectonthebiomassproductionofL.perenne.
Overall,theamountofCFU’spergramofsoildecreasedfromcirca3x107to2x105after30days(datanotshown)indicatingthatthoughthebacteriawerepresentatalowerconcentrationthaninitially,they could have an effect in the pot experiment. The production of grass biomass grown on soilsupplementedwithP. corrugate rfpwas foundnot todiffer significantly fromthecontrolwith thewildtypeP.corrugate,suchthattheinsertionoftherfp-cassettedidnotseemtohavehamperedtheeffectsofthestrain.

146
Appendix4.CNutrientlimitationsinthemainpotexperiment
P-miningisanadjustedagriculturaltechniquethataimsatdepletingsoil-P.HighbiomassproductionandhencehighP-removalwithbiomassareobtainedbyfertilizingwithnutrientsotherthanP. It isimportanttoknow,whethertheN-andK-fertilizationperformedinourexperimentwassufficienttorelieve the plants from N- or K-limitation. Therefore, we need to compare our plant N- and K-concentrations to agronomic thresholds from literature created for evaluating nutrients limitingoptimal crop production. Table 4.C shows that, at day 95 of the main experiment, none of thesamples indicated tohaveN- (45 to67mgNg-1DM)orK-deficiencies (47 to87mgKg-1DM) foroptimal biomass production following agronomic concentration thresholds. In agricultural cropproduction,optimalconcentrationsare20mgNg-1DMand20.3mgKg-1DM(Baileyetal.1997).
According to Liebisch et al. (2013), P-limitation in an agricultural context is indicated by P-concentrationslessthan2.1mgPg-1DM.Baileyetal.(1997)ismorestrictanddescribeslimitationfor crop growth at concentrations less than 2.6 mg P g-1 DM. It is also possible to describe P-limitation for crop growth by the calculation of the P nutrition index (PNI):!"# = (100×!!"#$%&&) (0.065×!!"#$%&& + 0.15)inwhichPbiomassandNbiomassare themeasuredPandN concentrations in%weight (DuruandThélier-Huché1997).WithPNI-valuesof less than80,cropsarelimitedbyP(Liebischetal.2013).AccordingtothePNI,ourplantswerelimitedbyPintheMid-PandLow-Psoils.
However, in an ecological context, nutrient limitation should bemore severe to limit fast-growingspeciesfromoutcompetingsub-ordinatetargetspecies.Forexample,atplantconcentrationsoflessthan 1 mg P g-1 DM, P can still not be the limiting nutrient for plant growth (Koerselman andMeuleman1996). Inthiscase,biomassproductionwillstillbetoohighforestablishingspecies-richgrasslands.
Appendix-Table4.CMean±SDofnutrientconcentrations(n=7forP,n=2forNandK)andPnutritionindex(PNI)inabove-groundbiomassforthreesoilP-concentrations(High-P,Mid-PandLow-P)inthecontrolpots.P-limitationinanagriculturalcontextisindicatedbyPNI<80(Liebischetal.2013),P-concentration<2.1mgPg-1(Liebischetal.2013)orP-concentration<2.6gPkg-1(Baileyetal.1997)
SoilP-concentration
P-concentrationinbiomass(mgPg-1DM)
N-concentrationinbiomass(mgNg-1DM)
K-concentrationinbiomass(mgKg-1DM)
PNI
High-P 4.30±0.44 49.70±3.39 62.51±7.35 90.9Mid-P 2.22±0.19 51.82±2.55 71.01±5.09 45.6Low-P 2.01±0.42 55.92±7.32 78.58±5.39 39.1
Appendix4.DAdditionalpotexperimentdesignedforinoculationtesting
A second pot experiment was executed to test whether the inoculation method of arbuscularmycorrhiza (AM) or phosphorus-solubilizing bacteria (PSB) affected the proportions between thetreatments. The experimentwas a repetition of themain pot experimentwithout the two humicsubstancestreatments,exceptfortheduration(60dinsteadof123d),thenumberofreplicates(fiveinsteadofseven),thenumberofgrasscuttings(twoinsteadoffour)andthewayAMandPSBwereappliedtothesoil.TheAMwerenotappliedontopofthesoilbutmixedwiththegrassseedsbeforesowing.ThemodificationinthePSBapplicationwasthatthePSBsolutionwasequallymixedinthesoilbyrepeatedlylayeringonecmofsoiland5mlofthePSBinsolution.Thisexperimenttookplaceafterthemainpotexperimentatasimilargrowthenvironment.Thepotswerefertilizedwith94.25mgNand97.5mgKeach,correspondingwith53kgNha-1and66kgK2Oha-1.Thegrasswascuttwotimesatday29andday60andsoilwascollectedatday60.Initialandfinalsoilcharacteristicswereassessedaccordingtothesamemethodsasusedinthemainpotexperiment.

147
Similarlytothemainpotexperiment,theresponsesintheAMtreatmentdidnotsignificantlydifferfromthecontrol(Appendix-Tables4.D.1and4.D.2).Alsosimilarly,asignificantlylowertotalbiomassproductionwasfoundontheLowandMid-PlevelwhenNK+PSBwereadded.MeanP-concentrationwassignificantlyhigher inallNK+PSBtreatments thantheother treatments inExp2. Incontrast tothemainpotexperiment,wedidmeasureasignificantlylowerPOlsenconcentrationofHigh-Pafter60daysintheNK+PSBtreatmentwhencomparedtotheNKtreatment.
Appendix-Table 4.D.1 Effects of soil P-level, treatment with biostimulants and their interaction on totalbiomass production, mean P-concentration, total P-removal and final bioavailable soil-P in the potexperimentofAppendix2
SoilP-concentration
Biostimulantaddition Interaction
F-value p-value F-value p-value F-value p-value ErrorTotalbiomassproduction
7.1 *** 23.8 *** 4.7 **
MeanP-concentration22.8 *** 22.8 *** 0.5 NS
TotalP-removal55.6 *** 4.9 * 5.4 **
FinalbioavailableP-concentration
2063.0 *** 12.0 *** 14.2 ***
DF 2
2
4
36Resultsoftwo-wayANOVA(f-valuesandsignificancelevels)areshown(n=5).Significancelevelsare***p<0.001;**p<0.01;*p<0.05;NS=notsignificantAppendix-Table 4.D.2Mean ± SD (n=5) for each soil P-concentration and treatmentwith biostimulants oftotal biomass production,mean P-concentration, total P-removal and bioavailable P-concentration by theendof 60days thepotexperiment inAppendix2.All pots receivedN- andK-fertilization,moreadditionswereasfollows:arbuscularmycorrhizaandphosphate-solubilizingbacteria
SoilP-concentration
P-mining
P-mining+arbuscularmycorrhiza
P-mining+phosphate-solubilizingbacteria
A A B
Totalbiomassproduction(gDMpot-1)
High-P A 2.97±0.18
3.31±0.13
2.97±0.75Mid-P B 2.65±0.13 a 3.28±0.36 a 1.70±0.49 b
Low-P B 3.11±0.12 a 2.98±0.22 a 1.79±0.75 b B B A
MeanP-concentration(gPkg-1DM)
High-P A 3.10±0.23
2.94±0.13
3.61±0.32Mid-P B 2.19±0.10
2.26±0.12
3.05±0.67
Low-P B 2.40±0.22
2.43±0.17
3.01±0.39 AB A B
TotalP-removal(mgPpot-1)
High-P A 9.22±1.10
9.73±0.67
10.55±1.71Mid-P B 5.79±0.30 ab 7.39±0.73 a 4.95±1.04 b
Low-PB
7.47±0.87 a 7.22±0.62ab 5.22±1.63 b
A A B FinalbioavailableP-concentration(mgPOlsenkg
-1)at60days
High-P A 96.98±3.44 a 99.29±3.15 a 84.29±2.85 bMid-P B 56.97±2.85
53.89±4.69
54.88±1.98
Low-P C 25.59±2.18
24.94±1.45
26.25±2.27LowercaselettersshowthesignificantdifferenceswithinonesoilP-leveliftheinteractionwassignificant(two-
wayANOVAandTukeyHSDposthoc tests).Uppercase letters showthemaineffectsof soilP-concentrationandbiostimulantaddition

148
Appendix4.E Estimationof timeneeded to restore theP-poor conditionsonaP-rich ex-agriculturalfield
To restore species-rich grasslands such as Nardus grassland on ex-agricultural fields, severe P-depletion is essential because due to fertilization history soil P-concentrations are enrichedsignificantly.We give here a rough estimation of the time needed for this restoration (Appendix-Table 4.E.1). The bioavailable and slowly cycling P-concentrations come from field data (naturereserveLandschapDeLieremanandsurroundingsinOud-turnhout,Belgium).
Assuming theoriginalP-poorconditions forNardus grassland (<10mgPOlseng-1) shouldbe reachedduringrestoration,forexampleonaP-richsoil,1500kgPha-1shouldberemovedfromthe0-30cmsoillayer.Whenmowingwithoutanyfertilizationasanutrientdepletingtechniqueisused,150yearsareneeded ifweestimateanannualP-removalof10kgPha-1 (Oelmannetal.2009). In contrast,withP-miningwithouttakingintoaccountthatP-removalslowsdownovertimeandremainashighaswhenstillfertilizedwithP(P-removalof45kgPha-1y-1,Galletetal.2003)itwouldrequireonly33years.However,fromourresultsitisclearthattheactualP-removaltimewillbemuchlonger(>50years) because, initially, bioavailability of soil-P can remainhigh for a long timedespite significantamounts of P removedwith biomass and, because, P-removal slows downwith decreasing soil P-concentration.
Appendix-Table 4.E.1 Estimation of time needed to restore abiotic conditions on a previously intensively-usedagriculturalfield.
HypotheticalP-richsoil
Hypotheticaltarget
BioavailableP-concentration(mgPOlsenkg-1):availableforplants
withinonegrowingseason 125 10SlowlycyclingP-concentration(mgPOxalatekg
-1):canbecomeavailableforplantsinthelongterm,inequilibriumwithbioavailableP-pool
400 50
SlowlycyclingP-stockintop0–30cm(kgPOxalateha-1) 1700 200
P-stocktoremovefrom0–30cm(kgPha-1) 1500
Timetoreachtarget(year)
Mowingwithoutanyfertilization:annuallyremoving10akgPha-1 150P-miningwithoutslowingdown:annuallyremoving45bkgPha-1 33P-miningwithslowingdownaccordingtotheresultsofourpotexperiment:annuallyremoving45bkgPha-1until65mgPOlsenkg
-1isreached,thenannuallyremoving22ckgPha-1until36mgPOlsenkg
-1isreachedandthenannuallyremoving14dkgPha-1
60
a(Oelmannetal.2009)b(Galletetal.2003)cdecreasingtheinitial45kgPha-1with61%,followingtheresultsfromthepotexperimentinChapter4ddecreasingtheinitial45kgPha-1with70%,followingtheresultsfromthepotexperimentinChapter4

149
AppendicesChapter5
Appendix5.AAdditionalinformationforthepotexperiment
Appendix-Table5.A.1Informationontheusedcropvarieties,sowingdensityandnumberofgrowingdaysCropspecies Scientificnameandvariety Sowingdensity
(#seedspot-1)Harvestatdaynr
Buckwheata,c FagopyrymesculentumMOENCHvarietyunknown
20 117
Maizeb Zeamayssubsp.maysL.variety‘P8000’
8 139
Flaxa,c LinumusitatissimumL.varietyunknown
20 202
Sunflowerb,c HelianthusannuusL.variety‘Uniflorusgiganteus’
8 105
Triticaleb xTriticosecaleWittmackvariety‘Orval’
20 202
a(Anonymous2003)b(Pannecoucqueetal.2012)cseedswereobtainedat“HetVlaamsZaadhuis”
Onthevernalizationoftriticale:
Weusedawintervariety,sowhen4to5leafswereunfolded,thesepotsweremovedoutdoorsforvernalizationfromday41until97atabout-5°Cto5°Cfollowingrecommendationsby(FAO2004).
Appendix-Table5.A.2InformationonthefertilizationofthecropsinthepotexperimentCropspecies
Recommendationsoffertilizationinthefield
TotallyaddedNandKperpotasNH4NO3andKNO3
TotallyaddedNandKperpotconvertedtodoseperhawithpotsurface
Timesfertilized;atdaynr
Buckwheat 30-35kgNha-128-33kgKha-1a
204mgNpot-1104mgKpot-1
51kgNha-126kgKha-1
5dosages:ondays13,30,55,67and88
Maize 110-190kgNha-174-173kgKha-1b
421mgNpot-1312mgKpot-1
106kgNha-179kgKha-1
8dosages:ondays13,30,55,67,78,85,88and105
Flax 70kgNha-142-100kgKha-1c
279mgNpot-1179mgKpot-1
70kgNha-145kgKha-1
6dosages:ondays13,30,55,67,78and88
Sunflower 30-80kgNha-150-100kgKha-1d
346mgNpot-1237mgKpot-1
87kgNha-160kgKha-1
7dosages:ondays13,30,55,67,78,85and88
Triticale 50-127kgNha-124-90kgKha-1b
354mgNpot-1295mgKpot-1
89kgNha-174kgKha-1
5dosages:ondays13,30,99,124and139
Follow-upcrop:Ryegrass
89-139kgNha-159-141kgKha-1b
250mgNpot-1350mgKpot-1
63kgNha-188kgKha-1
1dosageonday0
a(Björkman2010)b(Maesetal.2012)c(vanDijkandvanGeel2012)d(Debaekeetal.1998)

150
Appendix5.BLinearregressions
Appendix-Table5.BCoefficientswithstandarderror,adjustedR2,f-valuesandp-valuesforlinearregressionsbetweensoil-P-levelsandP-removalforeachofthefivecropspecies a b c adjustedR2 F-value p-valuea
Buckwheat 3.6±22 4.0±0.74-0.015±0.004 0.80 54 ***
Maize 7.9±14 2.7±0.48-0.009±0.003 0.83 64 ***
Sunflower -3.4±14 2.7±0.47-0.012±0.003 0.76 42 ***
Flax19.1±4.6 0.89±0.16
-0.004±0.001 0.63 23 ***
Triticale 4.1±4.5 0.36±0.05 - 0.66 52 ***aSignificance:***p<0.001

151
AppendicesChapter6
Appendix6.ASet-upmesocosmexperiment
In March-April 2016, we set up a mesocosm experiment to unravel the effects of nitrogen andphosphorusavailabilityininteractionwithsoilbiotaonplantcommunities(Fig.6.1)inthecontextofecologicalrestorationofspecies-richNardusgrasslandsonformeragriculturalland.Theexperimentconsistsof110mesocosmsandissupposedtorunformultipleyears.
6.A.1.Soilcollectionandprocessing
Ineachpot(Fig.6.1),wecombinedthreedifferentsubstrates:
1. sterilizednutrient-poormineralsand,acquiredatahorticulturalcenter
2. sterilizednutrient-poorbackgroundsoil,collectedwithasmallexcavatorfromthetop5to15cmfromgrasslandsinnaturereserveDeTeut(Zonhoven)inthesandyregionofnorthernBelgium inearly2016(Appendix-Table6.A.1).Thesourcesiteshadphosphorus-poorsandysoilwithpHKClabove3.8toavoidtoxicityofaluminium(pHKClvalueconvertedfrompHH2OinthescreeningofDeGraafetal.2009;conversionfactorbyVanLierop,1981;seeAppendix6.A.2).Wesievedthecollectedsoilovera1cmmeshandhomogenizedit.
3. freshlysampledsoilinoculumfromthreetypesofsites(Fig.6.1)-oligotrophic,mesotrophicand eutrophic (based on differences in vegetation, abiotic soil conditions, nematode andmicrobioticcommunities;screeningofsitesdescribedinWasofetal.2019).Wecollectedsoilfromatleastfourlocationspersite(oneortwofields;Appendix-Table6.A.1)inapooledsoilsampletoincorporatewithin-sitevariation.Wesievedthesoilovera1cmmeshandapplieditfreshtothemesocosmswithintwoweeksaftersampling.
The nutrient-poor mineral sand and the background soil were wrapped in 50 kg packages andsterilized by γ-irradiation of 25 KGray (Synergy Health Ede B.V., Etten Leur, the Netherlands) toeliminatethemajorityofthemicrobialandmesofaunacommunities(Zhangetal.2016).
Appendix-Table 6.A.1 The source siteswherewe collected the background soil and soil inoculum for themesocosmexperiment;classificationinto“nutrientstatus”basedonWasofetal.(2019)
Soil No.fields Nutrientstatus Region Naturereserve Coordinates
Background 1 Oligotrophic Zonhoven DeTeut 51°00’37.4”N05°23’59.9”E
Soilinoculum
Oligo-GP 1 Oligotrophic Wingene GulkePutten 51°04’42.1”N03°20’18.2”E
Meso-GP 1 Mesotrophic Wingene GulkePutten 51°04’39.4”N03°20’05.1”E
Eutro-GP 2 Eutrophic Wingene GulkePutten 51°04’37.9”N03°19’44.6”E51°04’41.9”N03°19’39.7”E
Oligo-L 2 Oligotrophic Oud-Turnhout
LandschapdeLiereman
51°20’23.1”N05°00’05.0”E51°20’01.8”N05°00’39.7”E
Meso-L 2 Mesotrophic Oud-Turnhout
LandschapdeLiereman
51°20’00.1”N05°01’01.7”E51°20’24.1”N05°01’15.0”E
Eutro-L 2 Eutrophic Oud-Turnhout
LandschapdeLiereman
51°20’20.9”N05°00’12.8”E51°19’53.2”N05°00’59.7”E
Oligo-TV 1 Oligotrophic Turnhout Hooiput 51°18’53.0”N05°07’34.0”E
Meso-TV 2 Mesotrophic Turnhout TurnhoutsVennengebied
51°21’42.7”N04°56’48.6”E51°22’17.7”N04°55’40.8”E
Eutro-TV 2 Eutrophic Turnhout TurnhoutsVennengebied
51°22’23.0”N04°55’31.8”E51°21’40.0”N04°55’25.4”E

152
6.A.2Abioticcharacteristicsofbackgroundandsoilinoculum
Tocharacterizetheinitialabioticsoilconditions,wetooksamplesofthebackgroundandsoilinocula.Thesamplesweredriedat40°C for48handpassed througha2mmsieve.Soil pHKCl (withKClasextractant)wasmeasuredusingaglasselectrode(Orion,OrionEurope,Cambridge,England,model920A) following the procedure described in ISO 10390:1994(E). The bioavailable phosphorusconcentration was measured by extraction in sodium bicarbonate (NaHCO3; Olsen et al. (1954);according to ISO11263:1994(E)) tomeasurebioavailablephosphorus (POlsen),which isavailable forplantswithinonegrowingseason(Gilbertetal.,2009).
Thetotalconcentrationofphosphorus,potassium,calcium,magnesium,sodiumandaluminumwasassessed after complete destruction of the samples with perchloric acid (HClO4; 65%), nitric acid(HNO3; 70%) and sulphuric acid (H2SO4; 98%) in Teflon bombs at 150°C for 4 h. The phosphorusconcentration was measured colorimetrically according to the malachite green procedure (PTotal;Lajthaetal.,1999).Theconcentrationofpotassium(KTotal),calcium(CaTotal),magnesium(MgTotal),sodium (NaTotal) and aluminum (AlTotal) in the acid-destructed samplesweremeasuredby atomicabsorptionspectrophotometry (AA240FS,FastSequentialAAS).Total carbonandnitrogen content(CTotal, NTotal)weremeasured by dry combustion at 850°C using an elemental analyzer (VarioMAXCNS,Elementar,Germany).
The chemical soil characteristics of the background soil resembled the characteristics of theoligotrophicsoilinoculum(Appendix-Table6.A.2).Thebioavailablephosphorusconcentrationintheoligotrophic soil samples was below the threshold of 12mg POlsen kg-1 found in soils of remnant,unfertilizedNardusgrasslands(the95thpercentileinthedatabaseoftheFlemishResearchInstitutefor Nature and Forest, reported in Schelfhout et al. (2017)). The bioavailable phosphorusconcentrations of the Mesotrophic and Eutrophc soil inocula could be clustered as another twogroupsofnutrientstatus:Mesotrophic(13–28mgPOlsenkg-1)andEutrophic(67–107mgPOlsenkg-1)soilinocula.AccordingtotheclassificationsystemoftheBelgianSoilService(BEMEX),thesoiltypeofallsoilexcepttheGulkePuttensoilwasCourseSand,which iscomparabletotheWorldReferenceBase(WRB)soiltypeGleyicPodzol(Arenic).ThesoiltypeoftheGulkePuttensoilwasLoamySand,whichiscomparabletotheWRBsoiltypeGleyicCambisol(Loamic).
Appendix-Table6.A.2Characteristicsofthecollectedbackgroundandinoculumsoilsin2016Soil pHKCl POlsen
(mgkg-1)PTotal(mgkg-1)
NTotal
(gkg-1)KTotal
(mgkg-1)CaTotal(mgkg-1)
MgTotal(mgkg-1)
NaTotal(mgkg-1)
AlTotal(mgkg-1)
FeTotal(mgkg-1)
CTotal(gkg-1)
Background 3.7 7.2 48 780 398 409 184 < 1628 2838 10
Inoculum
Oligo-GP 3.6 4.6 67 1470 1315 254 396 18 4445 6187 20Meso-GP 4.2 28.3 316 2270 1199 1050 494 19 5828 5959 26Eutro-GP 4.5 106.7 1067 3530 2129 1578 977 33 8159 12413 37Oligo-L 3.7 5.8 95 1220 328 349 139 < 3941 1476 15Meso-L 4.0 13.2 287 2080 574 758 177 16 5791 1757 24Eutro-L 4.1 67.2 419 1600 179 730 134 < 2186 1454 21Oligo-TV 3.5 5.6 71 1590 754 423 194 35 4084 1848 21Meso-TV 4.2 12.2 197 1950 583 670 202 4 4482 1541 22Eutro-TV 4.5 67.2 661 2340 539 1178 211 11 4623 2313 31

153
6.A.3.Bioticcharacteristicsofthesoilinocula
We took samples of the fresh soil inocula to assess the nematode communities by microscopicobservation and the microbial communities by Next Generation Sequencing (NGS) followed bymetabarcoding.
6.A.3.1.Microscopyandcountingofnematodes
Wemeasuredtheabundanceanddiversityofnematodesbyextractingallnematodesfrom100cm3of soil by zonal centrifugation (Hendrickx 1995) as described inWasof et al. (2019). The first 200nematodes encountered in each samplewere identified to genus level following the identificationkeysofBongers(1988)andBrzeski(1998).Thetotalnumberofnematodespergenusineachsamplewasthenextrapolatedbasedonthissub-sampleof200nematodes.
6.A.3.2.Molecularcharacterizationofbacteriaandfungi
WeextractedDNA from250mg soil using the PowerSoil® kit (MOBIO Laboratories Inc.,QIAGEN,Venlo, theNetherlands) and ran two Polymerase Chain Reactions (PCRs) including purifications toamplifythemolecularbarcodeandtoaddIlluminaadapterstothefragments.Forbacteria,theV3-V4 regionof the16S rDNA,which varies in lengthbetween250-400basepairs,wasusedwith anadapted version of primer fITS7(GTGAATCATCRAATYTTTG) and for fungi, the primer ITS4NGSr(Ihrmarket al. 2012; Tedersooet al. 2014); bothprimershad Illumina-specific adapterextensions.The first PCR consisted of an initial denaturation at 95°C for 3 min, followed by 25 cycles ofdenaturation (95°C for30s),annealing (55°C for30s)andextension (72°C for30min),anda finalextensionstepat72°Cfor5min.FortheITS2fragment,30cycleswereusedinsteadof25.AsecondPCR of 8 cycles was done to attach indices and sequencing adaptors to the amplicons using theNexteraXTindexkit(Illumina,SanDiego,CA,USA).ThePCRmixeswerepreparedusingtheKapaHiFiHotstart ReadyMix (Kapabiosystems, Wilmington, MA, USA) according to the manufacturer’sinstructions. PCR products were cleaned after each step using the HighPrep PCR reagent kit(MAGBIO,Gaithersburg,MD).ThelibrarieswerequantifiedusingtheQuantusdouble-strandedDNAassay (Promega, Madison, WI, USA), diluted to 10 nM and pooled in equal amounts. Paired-endsequencing(2x300bp)wasdoneusingtheIlluminaMiSeqv3platform(Illumina,SanDiego,California,USA)atMacrogen (SouthKorea).Thedemultiplexeddatawere furtherprocessedby removing theprimers using Trimmomatic v0.32 (Bolger et al. 2014) andmerging the forward and reverse readsusing PEAR v.0.9.8 (Zhang et al. 2014). Length cut-off values for themerged sequences were setbetween 400 and 450 bp for the V3-V4 and between 200 and 480 bp for the ITS2 region and aminimumoverlapsizeof120bpandqualityscorethresholdof30wereused.ITSxv.1.0.11wasusedto extract the ITS2 fragments from the amplicons (Bengtsson-Palme et al. 2013). Next, sequenceswere quality filtered (maxEE=3), deduplicated and clustered into Operational Taxonomical Units(OTUs;clusteringat97%forbacteriaand98.5%for fungi)usingUparsesoftware(Edgar2013).FortheV3-V4sequences,chimeraswereremovedwiththeRDPGolddatabaseasareference(Edgaretal. 2011). On average, 84,384 sequences per sample were retained for the V3-V4 fragment, and148,081 for the ITS2 fragment. Rarefaction analyses confirmed that we covered the sample’smicrobial diversity by running enough sequences for both bacterial OTUs (Appendix-Fig. 6.A.3.2a)andfungalOTUs(Appendix-Fig.6.A.3.2b).
For each soil sample, the number of occurrences of each OTU was counted. The OTUs weretaxonomicallyassignedwiththeuclustmethod,consideringmaximumthreedatabasehitswiththeQIIMEsoftware(version1.9.0standardsettings;Caporasoetal.2010)againsttheSILVAdatabaseforbacteria(version119;Yilmazetal.2013)andtheUnitedatabaseforfungi(version7.0;Kõljalgetal.2013) and using a minimum identity match of 90%. For each OTU, the highest taxonomic levelpresent inmore than50%of thedatabasehitswas retained. The setof identifiedOTUswas thenusedtoconstructabacterialandafungalabundancematrixofOTUsacrossthesoilinocula.

154
Figure6.A.3.2Therarefactioncurvesofthenumberofbacterial(a)andfungal(b)OTUsversusthenumberofsequencesinthesamplesreachaplateau,whichindicatesthatthenumberofsequenceswashighenough.Figuresmadewiththefunctionrarecurveoftheveganpackage(Oksanenetal.,2017)
6.A.3.3Thenematode,bacteriaandfungicommunities
Thesoilbiotacommunitiesoriginatingfromtheoligotrophic,mesotrophicandeutrophicsoilinocula,i.e. the nutrient status levels, showed clear differences (Appendix-Fig. 6.A.3.3, Appendix-Table6.A.3.3). Further in-depth analyses of the realized soil biota communities in the mesocosmexperimentwillbedoneinafuturepaper(Wasofetal.,unpublished).
We plotted alpha diversity using the original, unfiltered nematode and OTU matrices (functionplot_richness withmeasureObserved of the package phyloseq;McMurdie and Holmes 2013) andcomparedalphadiversityamongthenutrientstatuslevelsbyanalysisofvariancewiththefunctionaovofthepackagestats(R-Core-Team,2016).Incaseofsignificantdifferencesbetweenthenutrientstatuslevels(p<0.05),weperformedpost-hocpairwisecomparisonsofleast-squaresmeansbythefunction lsmeans with tukey adjustment of the package lsmeans (Lenth, 2016). In total, the soilsamplescontained46nematodegenera,6122OTUsforthebacterial16Sprimersand4602OTUsforthe fungal ITS primers. The oligotrophic soils contained a significantly lower number of nematodegenera than the mesotrophic soils (Appendix-Fig. 6.A.3.3a) and a significantly smaller number ofbacterial OTUs than the eutrophic soils (Appendix-Fig. 6.A.3.3c). Fungal diversity did not differsignificantlybetweenthenutrientstatuslevels(Appendix-Fig.6.A.3.3e).
WestudieddifferencesincommunityassemblyamongthenutrientstatuslevelsusingConstrainedAnalysisofPrincipalCoordinates(CAP)ordinations,constrainingforthenutrientstatus,forthefull,unfilterednematodematrixandthefilteredbacterialandfungalOTUmatrices,i.e.forthesubsetsofOTUsthatoccurred20timesormoreacrossthesamples(functionordinatewithBray-CurtisdistancewiththephyloseqpackageinR;McMurdieandHolmes(2013)).Wetestedfordifferencesbetweenthenutrient status levels using the functionanova of the stats package.Ordinationswereplottedwith the function plot_ordination of the phyloseq package. The community assembly differedsignificantly among the nutrient status levels for nematodes (Appendix-Fig. 6.A.3.3b, constrainedproportion 44%), bacteria (Appendix-Fig. 6.A.3.3d, constrained proportion 54%, 1952 OTUs afterfiltering)andfungi(Appendix-Fig.6.A.3.3f,constrainedproportion39%,1719OTUsafterfiltering).

155
Appendix-Figure6.A.3.3AlphadiversityandCAPordination(withconstrainedgroupingfornutrientstatus)fornematode,bacteriaand fungi communities in thesoil inocula.Significantdifferences inalphadiversitybetweentheoligotrophic,mesotrophicandeutrophicnutrientstatusareindicatedbythecapitallettersA,BandAB;NSindicatesnosignificantdifference

156
Appendix-Table 6.A.3.3 Comparison of the species richness and community composition of nematodes,bacteriaandfungiinthesoilinoculabetweenoligotrophic,mesotrophicoreutrophicnutrientstatusgroups(ANOVA)
Alphadiversitya Communitycompositionb
soilbiota df F-value p-valuec df F-value p-valuecNematodes 2,6 7.4 * 2,6 2.4 *Bacteria 2,6 9.6 * 2,6 3.6 **Fungi 2,6 3.1 NS 2,6 2.0 *
anumberofgenera(nematodes)orOTUs(bacteria,fungi)bMultivariateanalysisontheabundancematricesbyCAPconstrainingfor“nutrientstatus”cThep-valueindicatesasignificantdifferencebetweenthethreenutrientstatusgroups:**p<0.01;*p<0.05;NSnotsignificant.
6.A.4Fillingthepots
Weplaced theempty50-literpots (withperforatedbottomtoallowdrainage)on topof10cmofmineralsand,toallowdrainage,inthreetrenchesdugintothesoilofthegreenhouse(Appendix-Fig.6.A.4).Wefilledthepotswiththethreesubstrates(seeAppendix6.A.2)indifferentlayers.First,weadded 8 kg γ-irradiatedmineral sand on the bottom of each pot, covered it with root cloth, andaddedanother8kgγ-irradiatedmineralsandontop.Next,weusedacementmixertohomogenize36kgγ-irradiatedbackgroundsoilwith4kgfreshsoilinoculum.Inthemesocosmswithoutsoilbiota,weused40kgγ-irradiatedbackgroundsoil,whichwasalsoprocessed inthecementmixer.Duringmixing,wealsoaddedthedifferentphosphorus levels tothesoils (seeAppendix6.A.5).Weaddedthesesoil-phosphorusmixturesontopofthemineralsandinthepots.
Appendix-Figure6.A.4Thepotswereplacedinthegreenhouseinthreeblocksfollowingarandomizedblockdesign

157
6.A.5Nutrienttreatments
Thenutrient treatments consistedofamonthlynitrogenaddition (3 levels)during theexperimentandaone-timephosphorusaddition(3or5levels)atthebeginningoftheexperiment.
1. Thenitrogen treatmentwas aimed at simulating realistic atmospheric nitrogen depositionrates, i.e.<5,20or60kgNha-1y-1.Wespread0,90or270mgNH4NO3inademineralizedwater solution evenly on eachmesocosm,monthly fromMarchuntilOctober.Wedid nottest the effect of nitrogen in our study, but we included the nitrogen treatment as anexplanatoryfactorinouranalysesforacompleterepresentationoftheexperimentaldesign.Innoneofourfinalmodels,thenitrogentreatmentwasretainedasasignificantexplanatoryfactor(seeAppendixC).
2. Thephosphorus addition consisted of five dosage levels for constructingmesocosmswithbioavailable soilphosphorus justbelow, justaboveandwellabove the thresholdof12mgPOlsen kg-1 described for remnantNardus grasslands (Schelfhout et al. 2017). The targetedphosphorusconcentrationswere<10,20and60mgPOlsenkg-1.Forthemiddlenitrogenlevel,we added twomore phosphorus levels (targets 15 and 25mg POlsen kg-1) to investigate indetail the possible change point in plant community composition in the phosphorusconcentration range of 15-25 mg POlsen kg-1. We added 0, 3, 5, 6 or 16 g NaH2PO4 in ademineralizedwatersolutiontothe40kgofsoilusedtofilleachpot.Withtheadditionof4kgof soil inoculumto the36kgsterilizedbackgroundsoil foreachmesocosm(seesectionA4),extranutrientswere imported inthemesocosms(Appendix-Table6.A.5),anundesiredbutunavoidable sideeffect inourexperiment.Therefore,wesampled thesoilofeachpoteveryyear tomeasure theconcentrationofbioavailablephosphorusandused the realizedgradientinphosphorusconcentration(seeAppendix-Fig.6.A.5)measuredatthetimeofthebiomassharvestasacontinuousvariable,insteadofthecategoricalphosphoruslevels,asanexplanatoryvariableinourmodels.InthemeasurementofJune2018,whencomparingwiththe “No biota” treatment, the bioavailable phosphorus concentrations appeared to haveincreasedslightlybyaddingsoil inoculumthoughnotsignificantly(seeAppendix-Fig.6.A.5),mostclearlyinthepotsinwhicheutrophicsoilinoculumwasadded.
Appendix-Table6.A.5Stocksofthemacronutrientsphosphorus,nitrogenandpotassiuminthesoilsusedinthisexperiment
Name Phosphorus(gPmesocosm-1)
Nitrogen(gNmesocosm-1)
Potassium(gKmesocosm-1)
Background(36kg)a 1.7 28.1 14.3
inoculum
Nobiota(4kg)b 0.2 3.1 1.6
Oligotrophic(4kg)c 0.3(0.06) 5.7(0.8) 3.2(2.0)
Mesotrophic(4kg)c 1.1(0.3) 8.4(0.6) 3.1(1.4)
Eutrophic(4kg)c 2.9(1.3) 10.0(3.9) 3.8(4.2)a36kgofbackgroundsoilwasusedineachpotb4kgofbackgroundsoilwasaddedtopotswiththe“Nobiota”treatmentc4 kg of inoculum soil was added to potswith the oligotrophic,mesotrophic or eutrophic treatment;meanvaluewithstandarderrorofthemeanbetweenbrackets(n=3,asinthreesitesperinoculum)

158
Appendix-Figure6.A.5Thebioavailablephosphorusconcentration(mgPOlsenkg
-1)inthemesocosms(n=110)didnotdiffersignificantly(NS)betweenthefourlevelsofthesoilbiotatreatment,accordingtoanANOVAtest(anovafunctionofthestatspackagewithp<0.05)followedbypost-hoctesting(functionlsmeansofthelsmeanspackage,Lenth2016)
6.A.6Plantspecies
Wechosenineteenplantspeciestypicalofgrasslands (seeFig.6.1)basedonthescreeningbyVanDaele et al. (2017), excluding Leguminosae, hemiparasitic and annual plant species, and speciestypicalofcalcareous,wetorverydrysoilconditions.Thenineteenspecies’CSR-strategiesareevenlyspreadalong theCSR-triangle (FigA6a)and they fall into threegroups that canbe linked to threedifferentgrasslandcommunitiesalongahistoricalland-usegradient(cf.Wasofetal.,2019).Thefiveeutrophicplantspeciesaretypicallyfoundingrass-dominatedLoliumperennegrasslands,thesevenmesotrophic species in grass-herb mixed grasslands, the seven oligotrophic species in Nardusgrasslands.
We obtained seeds of the nineteen species at Rieger-Hofmann® GmbH (Germany), a commercialnurseryofplantseedssourcedinnaturereserves.Wesurface-sterilizedtheseedsbysoakingin0.5%household bleach for 30 to 60 seconds to prevent fungal infection and rinsed them withdemineralizedwater.Then,afterstratificationifnecessary(followingVanDaeleetal.,2017),weputthe seeds on heat-sterilized glass beads moistened with demineralized water in a germinationcabinet (light regime 16h light, 8h dark; temperature 22°C when light, 18°C when dark) until asufficientnumberofseedlingswasobtained.Aftergermination,whichtookonetothreeweeks,wetransferredtheseedlingstoanacclimatizedroom(lightregime16hlight,8hdark;temperature4°C)to keep all seedlings in a similar post-germination stage until planting. In April 2016,we carefullyplantedseedlingsinthepotsinthegreenhouseusingtoothpicks.Eachpot(45cmdiameter)received114 seedlings, planted in 38 groups of three (Fig. 6.1; Appendix-Fig. 6.A.6b). The nineteen centerpositionsweretakenbyeachofthenineteenselectedspeciesatrandompositions.Duetothesizeof

159
the pots, there were eighteen edge positions, which were planted at random with each of theoligotrophic and eutrophic species and with six of the seven mesotrophic species (the missingmesotrophic species was randomly assigned per pot). Two months after the transplantation, werecorded and replaced all dead seedlings; plants that died afterwardswere not replaced. Aroundeachmesocosm,weinstalledwirefencingtomakesurethattheabove-groundplantbiomassdidnotfallopenintheopenspacebetweenthemesocosmsandtoallowforlightlimitationwithintheplantcommunities(Cover-Fig.Chapter6).
Appendix-Figure 6.A.6 (a)Overview of CSR-scores of the nineteen species after Pierce et al. (2017); (b) AplantedpotwiththenineteenspeciesinApril2016
6.A.7Growingconditionsinthegreenhouse
The mesocosms were grown in a non-heated greenhouse at Flanders Research Institute forAgriculture,FisheriesandFood(ILVO) inMerelbeke.Theaverageair temperaturewas17.4°C±7.3SD,therelativeairhumiditywas71%±14SD,andtherewerenaturallightconditions.Irrigationwasperformedwithanautomatedsprinklewateringsystemusingtapwater(Appendix-Table6.A.7),uptotwotimesperdaydependingontheclimaticconditionsinthegreenhouse(hotweatherrequiredahigher irrigation frequencyanddosage).The irrigationcausedanestimatedannual inputof3kgnitrogen ha-1 (below the threshold for atmospheric nitrogen deposition of 12 kg nitrogen ha-1 y-1;(vanDobbenetal.2012)and282kgcalciumha-1 (wellbelow liming recommendations to increasethepHaccordingtotheBelgianSoilService).
Appendix-Table6.A.7Chemicalcharacteristicsofthetapwaterusedforirrigationinthegreenhouse Concentration(mgl-1)pH NH4
a NO3a PO4
a Kb SO4a Nab Cab Clc
6.9 0.5 <0.04d <0.04d 1.4 23.7 3.1 35.2 10.1ameasuredwithanUVphotometricmethodatk=210nm(NO3),640nm(SO4),660nm(NH4),830nm(PO4)bmeasuredbyatomicabsorptionspectrophotometerAA240FS,FastSequentialAAScmeasuredwithanionspecificelectrodedbelowthedetectionlimit
Calluna vulgarisLuzula multiflora
Nardus stricta
Molinia caeruleaPotentilla erecta
Succisa pratensis
Plantago lanceolata
Lychnis flos-cuculi
Lolium perenne
Taraxacum officinale
Ranunculus acris
Dactylis glomerata
Holcus lanatus
Centaurea jacea
Festuca rubra
Agrostis stolonifera
Anthoxanthum odoratum
Rumex acetosa
Carex echinata
Species group
(a) (b)
160
6.A.8BiomassharvestJune2018
We harvested the above-ground biomass in eachmesocosm by cutting the vegetationwith grassscissors4cmabovesoillevel.First,weseparatelyharvestedeachoftheninemostabundantspecies(Agrostis stolonifera,Centaurea jacea,Dactylis glomerata,Holcus lanatus,Nardus stricta, Plantagolanceolata, Potentilla erecta, Rumex acetosa, Taraxacum officinale). Second, we estimated thepercentagecoverforeachoftheothertenspecies(Anthoxanthumodoratum,Callunavulgaris,Carexechinata, Festuca rubra, Lolium perenne, Luzula multiflora, Lychnis flos-cuculi, Molinia caerulea,Ranunculusacris,Succisapratensis).Third,wejointlyharvestedtheremainingabove-groundbiomass(ofthetenspeciestogether)ineachmesocosm.Allbiomasssamplesweredriedfor48hat70°Candweighed. We then used the dry weights to calculate the total dry biomass per mesocosm andestimatethedrybiomassforthetennon-abundantspeciesbasedontheirspecies-specificcoverandthetotaldrybiomassineachmesocosm.
Appendix6.BSupplementaryinformationabouttheTITANanalysis
Of the five eutrophic species (Appendix-Fig. 6.B.1), one species, i.e.Dactylis glomerata, showed apositiveresponsetowards increasingbioavailablephosphorusconcentrations, i.e.apositivechangepoint. Of the seven mesotrophic species (Appendix-Fig. 6.B.2), the two indicator species, i.e.Anthoxanthum odoratum and Rumex acetosa, showed a negative change point. Of the sevenoligotrophicspecies(Appendix-Fig.6.B.3),fourweresignificantindicatorspeciesshowinganegativechangepoint,i.e.Luzulamultiflora,Moliniacaerulea,NardusstrictaandPotentillaerecta.
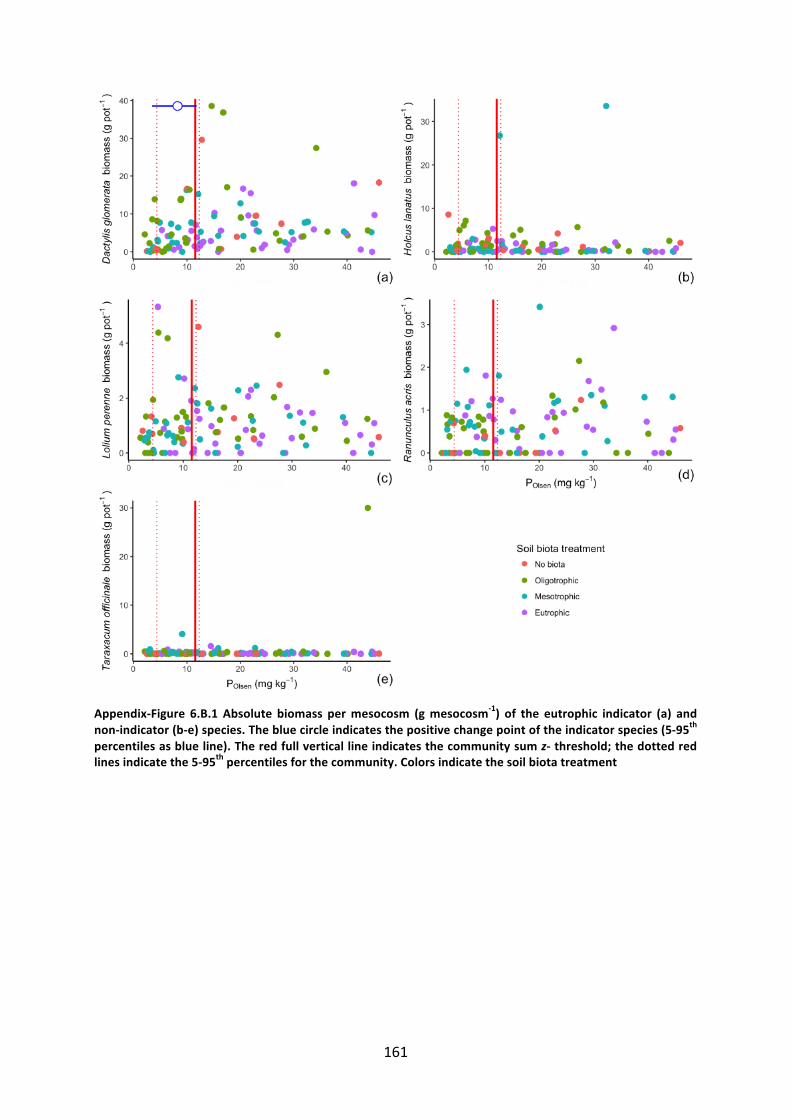
161
Appendix-Figure 6.B.1 Absolute biomass permesocosm (gmesocosm-1) of the eutrophic indicator (a) andnon-indicator(b-e)species.Thebluecircleindicatesthepositivechangepointoftheindicatorspecies(5-95thpercentilesasblueline).Theredfullverticallineindicatesthecommunitysumz-threshold;thedottedredlinesindicatethe5-95thpercentilesforthecommunity.Colorsindicatethesoilbiotatreatment

162
Appendix-Figure6.B.2Absolutebiomasspermesocosm(gmesocosm-1)ofthemesotrophicindicator(bandg) and non-indicator (a, c-f) species. The red circles indicate the negative change point of the indicatorspecies (with5-95thpercentilesasa redhorizontal line).The red full vertical line indicates thecommunitysumz-threshold;thedottedredlinesindicatethe5-95thpercentilesforthecommunity.Colorsindicatethesoilbiotatreatment
40 ~ 60 ~ • a. a. -9 -9 (/)
(/)
(/) 30 "' (/) :e E "' 0 40 E • :.ë 0 •• :.ë
20 • E • • .:= ~ ~ ~ • I 0 <:: •• • • • -o 20
~ 0
10 1 • • E (/)
~ .. : :::>
~ • • ~ • <:: (/) . ,.. .... , <1> e 0 .. ... )( 0 ... ...,~ ... ... ~
Ol 0 <(
0 10 20 30 40 :S 0 10 20 30 40 <::
(a) <( (b)
!,... • • 0 ' 4 • a. • ë -9 a.
(/) 400
' • -9 • (/) (/)
"' • (/) • • E "' e :e 0 • E •: ~ • • :.ë e: • 0 • .: .. • • ' :.ë • ' <1> : J-.. . <I> 200 • • ~ • (,) • <1> ••• • • .0 • ' • • • • . ...., • 2 ,. • • <1> • '· • • ~ ..... • • <1> 1 • • • . , (,) • --..:· '· • :::> : e •• • ~ • • .!!! :" • • <:: A • • • .. Q) • • • <I> 0 ·-• • • IJ.. 0 .. ' ... • ü
0 10 20 30 40 0 10 20 30 40 (d) (c)
!,... • • !,... • 0 0 a. a. • 150 • -9 -9 3 (/)
(/) (/) (/)
"' "' • E E • 0 • 0 :.ë 100 • • :.ë 2 ' ""' •• • .!!! • :::> .!!1 (,) :::> • : ' • 0 •• (,) • • Q)
,;, 1 • (,) 50 •• • <:: 0 •• .!!1 • • • <;::: • • • -~ :e • ••• • 0
A Ï. ' • ~ • • • • Ol <:: .!!! , .. .<::: --·-~ 0 .... • .... <:: 0 .. .. • .!!! -J u. 0 10 20 30 40 0 10 20 30 40
(e) Polsen (mg kg" 1) (f)
60
~ a. -9 • Soil biota treatment (/)
40 (/)
"' • No biota E 0 • Oligotrophic :.ë • <tl (/) • • Mesotrophic 0 20 • Q; • Eulrophic (,)
· = • • <tl )( <I> • E :::>
0
.._ _____ ... _ Q:
0 10 20 30 40
Polsen (mg kg" 1) (g)

163
Appendix-Figure6.B.3Absolutebiomasspermesocosm(gmesocosm-1)oftheindicatoroligotrophicspecies(c-f) and non-indicator oligotrophic species (a, b and g) according to TITAN. The red circles indicate thenegativechangepointoftheindicatorspecies(with5-95thpercentilesasaredhorizontalline).Theredfullverticallineindicatesthecommunitysumz-threshold;thedottedredlinesindicatethe5-95thpercentilesforthecommunity.Colorsindicatethesoilbiotatreatment
' • • ' 0 0 1.5 a. a. .2! 0.9 .2! (/) (/) (/) (/)
"' "' E E 1.0 • 0 0.6 0 e : :ë :ë (/)
.'!! • •t:: • <1l <1l .2>
0.3 ~ 0.5 ~ (.) • <1l
Q)
t:: • )(
" ~ ::: <1l • <1l 0.0 _ ...... ....... ... --. (.) 0.0 -- ---· ... _ (.)
0 10 20 30 40 0 10 20 30 40
(a) (b)
!,... 0
!,... 0 a. a.
.2! • .2! (/)
2 (/) • :
(/) (/) .:. "' • • "' E E • 0 • • 0 :ë · = • • • :ë
I • ~ . ~, • <1l 0 1 • ~ \ • · • <;:::: "· • • 2 • ~ Q) ·~ • •: . • • <1l .~ . • •• E :. • (.) :• • e: • ' • .!!! .. ••• • • • • .!!! • " :8 • N • • " 0 ---- .... • ... _
~ 0 -- ... ··· ... _ -J
0 10 20 30 40 0 10 20 30 40 (d) (c)
' !,... 0 0 a. a.
.2! .2! 2 • (/) (/) (/) (/)
I "' "' E E 0 • • 0 :ë :ë .'!! • .'!! • • (.)
:S ~ •: • Q) •• (/) • .!!! (/) • • ~ • ~ • • t::
A. · · ' ·..~~ • <1l .r .-.. .:..~ •• ... ~ ~ ~ 0 & 0 -·· .. . ......
0 10 20 30 40 0 10 20 30 40
(e) Polsen (mg kg-1) (f)
~ • a. 4 .2! (/) • Soil biota treatment (/)
"' E 3 • No biota . Q • : • • .c • • • Oligotrophic
-~ 2 ,
• Mesotrophic t:: • ~ •• • • • Eutrophic ~ • • • Q. • <1l '-' . • •• • • • (/) • ·n • (.) • " 0 • -- • • • • • (/)
0 10 20 30 40
Polsen (mg kg-1) (g)

164
Appendix6.CModelselectionandoptimalmodels
6.C.1BiomassoftypicalNardusgrasslandspecies~experimentaltreatments
For the typical Nardus grassland species identified as sensitive to increasing soil phosphorusconcentrations by TITAN (see Fig. 6.2; Luzula multiflora, Molinia caerulea, Nardus stricta andPotentillaerecta),we investigatedtheabsolutebiomass (sumof thebiomassesof the fourspeciespermesocosm) and the relative biomass (i.e. summedbiomass of the four species relative to thetotalbiomassofthemesocosm).Theabsolutebiomassresponsevariablewasnottransformed.Therelative biomass response variable was square root transformed. Both variables contained asignificantproportionofzeros(17%),whichweretruezeroobservations.Wevisually inspectedtheresiduals as described in Zuur et al. (2009); generalized linear models with the quasi family withidentity link and constant variance were suitable for the two response variables. We used thefunctionglmofthestatspackage(R-Core-Team2016).Thefullmodelscontainedtheconcentrationofbioavailablesoilphosphorus(logtransformed),thesoilbiotatreatment(4levels)andthenitrogentreatment(3levels)asexplanatoryvariables.
Wesystematicallydeletedmodeltermsfromthefullmodelsuntilminimumadequatemodelswerereached(Manningetal.,2004)byusingthedrop1functionofthestatspackageasrecommendedbyZuuretal.(2009)withthelikelihoodratiotestLRT.Theaimofourmodelselectionwastominimizethe residual deviance with the constraint of all explanatory variables being statistically significant(TableC1).Weassessedthegoodnessoffitofthemodelsbycalculatingthedeviancereduction(D2;GuisanandZimmermann2000),whichisagoodness-of-fitstatisticsimilartotheR2measure,by
!! = (!"## !"#$%&'" − !"!"#$%& !"#$%&'") !"## !"#$%n!"For the final, selectedmodels (Appendix-Table6.C.1.2,Appendix-Fig.6.C.1.2, Fig.3a),weobtainedlikelihood ratio chi-square values and significance of the fixed terms using Type IIWald likelihoodtestswiththeAnova functionofthecarpackage(test=LR;FoxandWeisberg,2011).Thenitrogentreatmentwasneverretainedasasignificantexplanatoryfactor.
Appendix-Table6.C.1.1Modelselectionbysingletermdeletionstartingwithfullmodelsfortheabsoluteandrelativebiomassof thetypicalNardusgrasslandspecies in themesocosms (n=110).Theobjectivewastomaximizethedevianceexplainedbythemodelwithallexplanatoryvariablesbeingsignificant.Atermwasdeletedwhenomittingthetermfromthemodelcausedthesmallestchangeindeviance
Absolutebiomass(gmesocosm-1)
Relativebiomassb(%mesocosm-1)
Explanatoryvariablesinthemodela
Explaineddeviance
Alltermssignificant?c
Explaineddeviance
Alltermssignificant?c
log(Olsen-P)*Soilbiota*Nlevel
29% no 43% nolog(Olsen-P)*Soilbiota+Nlevel
19% no 29% nolog(Olsen-P)+Soilbiota*Nlevel
23% no 29% nolog(Olsen-P)*Nlevel+Soilbiota
18% no 26% nolog(Olsen-P)*Soilbiota 20% no 28% yeslog(Olsen-P)+Soilbiota 17% no log(Olsen-P) 11% yes
a Generalized linear models with quasi family error distribution. The fit of the models is characterized byexplaineddevianceanddeletionofsingletermsistestedbylikelihoodratiotestsbsquareroottransformedcp<0.05isconsideredsignificant

165
Appendix-Table6.C.1.2OptimalmodelsoftheabsoluteandrelativebiomassofthetypicalNardusgrasslandspeciesinthemesocosms(n=110).Thefitofthemodelsischaracterizedbythedeviance(D2)
aGeneralizedlinearmodelswithquasifamilyerrordistribution.SBstandsfor‘SoilBiotatreatment’.bwithstandarderrorbetweenbracketsc***p<0.001,**p<0.01,*p<0.05dwithdegreesoffreedom(df)betweenbracketse The response variable was square root transformed, the coefficients and standard errors were backtransformedinthistable
Appendix-Figure 6.C.1 Absolute biomass of the typical Nardus grassland species in function of thebioavailablephosphorusconcentration.Theblacklineillustratesthesignificantrelationshipaccordingtotheglm fittedmodel.Theshadedarea indicatesthe5th-95thconfidence intervals.Thedottedred line indicatesthenegativecommunitychangepointidentifiedbyTITAN(seeAppendix6.B)
Modela Parameterestimateb
LikelihoodratioChisquare
p-valuec df Nulldevianced
Residualdevianced
D2
Absolutebiomass(gmesocosm-1) 137(109) 104(108) 11% Intercept 2.8(0.3) logPOlsen -0.7(0.1) 34.2 *** 1 Relativebiomass(%mesocosm-1)e 94.7(109) 63.5(102) 28% Intercept 22.1(7.0) logPOlsen -1.5(0.7) 18.3 *** 1 SBOligotrophic -11.1(5.6) SBMesotrophic -8.9(5.1) 16.4 *** 3 SBEutrophic -9.9(6.4) logPOlsen:SBOligotrophic 1.1(0.7) logPOlsen:SBMesotrophic 0.6(0.5) 11.1 * 3 logPOlsen:SBEutrophic 0.8(0.7)

166
6.C.2BiomassoftypicalNardusgrasslandspecies~totalbiomassofthemesocosms
WemodelledtheabsoluteandrelativebiomassofthetypicalNardusgrasslandspeciesasafunctionofthetotalbiomasspermesocosm(Appendix-Table6.C.2,Appendix-Fig.6.C.2,Fig.3b),withglmmodels, as described in section C1. The fullmodel containedonly the totalbiomasspermesocosm.
Appendix-Table6.C.2OptimalmodelsoftheabsoluteandrelativebiomassofthetypicalNardusgrasslandspeciesinthemesocosms(n=110).Thefitofthemodelsischaracterizedbythedeviance(D2).
aGeneralizedlinearmodelswithquasifamilyerrordistributionbwithstandarderrorbetweenbracketsc***p<0.001,**p<0.01,*p<0.05dwithdegreesoffreedom(df)betweenbracketse The response variable was square root transformed, the coefficients and standard errors were backtransformedinthistable
Appendix-Figure 6.C.2 Absolute biomass of the typical Nardus grassland species in function of the totalbiomass per mesocosm. The black line illustrates the significant relationship according to the glm fittedmodel.Theshadedareaindicatesthe5th-95thconfidenceintervals
Modela Parameterestimateb
LikelihoodratioChisquare
p-valuec df Nulldevianced
Residualdevianced
D2
Absolutebiomass(gmesocosm-1) 137.3(109) 125.8(108) 42% Intercept 2.9(0.6) Totalbiomass -0.4(0.1) 9.9 ** 1 Relativebiomass(%mesocosm-1)e 94.7(109) 55.7(108) 42% Intercept 19.2(3.6) Totalbiomass -0.5(0.1) 75.7 *** 1

167
6.C.3Totalmesocosmbiomass~experimentaltreatments
We investigated the effects of the experimental treatments on the total above-ground biomassharvestedineachmesocosm(Appendix-Table6.C.3,Fig.3c).Thetotalbiomassresponsevariablewassquareroottransformed.Wevisually inspectedtheresidualsasdescribed inZuuretal. (2009)andusedgeneralizedleast-squaremodelswiththefunctiongls,allowingfordifferentvarianceperBiotalevel using varIdent(form=~1|Biota) as weights, with restricted estimates maximum likelihood(REML) as method from the stats package (R-Core-Team 2016). The full models contained theconcentrationofbioavailable soil phosphorus (log transformed), the soilbiota treatment (4 levels)andthenitrogentreatment(3levels)asexplanatoryvariables.
Wecomparedthenullmodel,intermediatemodelsandthefullmodelbasedonthecorrectedAkaikeInformation Criteria (AICc) andAkaikeweights (Zuur et al., 2009)with the functionAICctab of thebblmepackage(BolkerandR-Core-Team2016).Weaimedtoselect‘competitive’models,i.e.modelswithadifference inAICc (ΔAICc)of less thantwo(Goodenoughetal.,2012).Weretainedonlyonemodel: the Soil biota*POlsen model (df 12,AICc 636,ΔAIC 0,weight 0.67).We obtained chisquarevaluesandsignificancesoftheexplanatorytermsusingTypeIIWaldchisquaretestswiththeAnovafunctionofthecarpackage(TableC4;FoxandWeisberg2011).
Appendix-Table6.C.3Optimalmodeldescribingtherelationshipbetweenthetotalabove-groundbiomassineachmesocosm(n=110)andtheexperimentaltreatments.Soilbiotaisabbreviatedas‘SB’
aGeneralizedleasedsquaremodelswithquasifamilyerrordistribution.SBstandsfor‘SoilBiotatreatment’.bwithstandarderrorbetweenbracketsc***p<0.001,**p<0.01,*p<0.05d The response variable was square root transformed, the coefficients and standard errors were backtransformedinthistable
Modela Parameterestimateb
LikelihoodratioChisquare
p-valuec
df R2
Totalbiomass(gmesocosm-1)d 15% Intercept 17.8(6.7)
POlsen 0.03(0.01) 8.9 ** 1 SBOligotrophic 64.3(25.0) SBMesotrophic 67.3(26.8) 54.2 *** 3 SBEutrophic 49.6(22.0) POlsen:SBOligotrophic -0.05(0.04) POlsen:SBMesotrophic -0.03(0.03) 11.0 * 3 POlsen:SBEutrophic -0.03(0.02)

168
AppendicesChapter7
Appendix7.ASpecies-listofcommonherbspeciesthattoleratemesotrophicsoilconditions
Appendix-Table7.APlantspeciestolerantofgrowinginmesotrophicsoilconditionsSpeciesmixbyMagnificentMeadowsa Speciesmixbybumblebeeconservationtrustb
Achilleamillefolium Agrimoniaeupatoria
Ajugareptans Scorzoneroidesautumnalis
Cardaminepratensis Stachysofficinalis
Centaureanigra Lotuscorniculatus
Knautiaarvensis Pimpinellasaxifraga
Lathyruspratensis Hypochaerisradicata
Leontodonautumnalis Centaureanigra
Leucanthemumvulgare Rumexacetosa
Sileneflos-cuculi Viciasativa
Prunellavulgaris Primulaveris
Ranunculusacris Succisapratensis
Ranunculusbulbosus Knautiaarvensis
Rhinanthusminor Galiumverum
Trifoliumpretense Ranunculusacris
Viciacracca Lathyruspratensis
Viciasativa Leucanthemumvulgare
Plantagolanceolata
Leontodonhispidus
Prunellavulgaris
Trifoliumpratense
Achilleamillefolium
RhinanthusminoraSource:http://www.magnificentmeadows.org.uk/assets/pdfs/Wildflowers_tolerant_of_soil_fertility.pdfbbbct:https://www.bumblebeeconservation.org/wp-content/uploads/2017/08/Bumblebee_seed_mix_for_neutral_soils.pdf

169
CITEDLITERATURE
CITEDLITERATUREAdler PB, Seabloom EW, Borer ET, et al. (2011) Productivity is a poor predictor of plant species richness.
Science333:1750–3.doi:10.1126/science.1204498Aerts R, Chapin FS (1999) TheMineral Nutrition ofWild Plants Revisited: A Re-evaluation of Processes and
Patterns.Adv.Ecol.Res.pp1–67Aerts R, Huiszoon A, Oostrum JHA Van, et al. (1995) The Potential for Heathland Restoration on Formerly
ArableLandataSiteinDrenthe,TheNetherlands.JApplEcol32:827.doi:10.2307/2404822AlbrechtH,CambecèdesJ,LangM,WagnerM(2016)Managementoptionsfortheconservationofrarearable
plantsinEurope.BotLett163:389–415.doi:10.1080/23818107.2016.1237886AltF,OelmannY,HeroldN,etal. (2011)Phosphoruspartitioning ingrasslandandforestsoilsofGermanyas
relatedtoland-usetype,managementintensity,andlanduse-relatedpH.JPlantNutrSoilSci174:195–209.doi:10.1002/jpln.201000142
Alvarez R, Steinbach HS (2017) Modeling soil test phosphorus changes under fertilized and unfertilizedmanagements using artificial neural networks. Agron J 109:2278–2290. doi:10.2134/agronj2017.01.0014
AmeryF,SchoumansOF(2014)AgriculturalphosphoruslegislationinEurope.doi:10.1111/nyas.12540AndersonMJ(2001)Anewmethodfornon-parametricmultivariateanalysisofvariance.AustralEcol26:32–46.
doi:10.1111/j.1442-9993.2001.01070.pp.xAnnY,ReddyKR,Delfino JJ (2000) Influenceofchemicalamendmentsonphosphorus immobilization insoils
fromaconstructedwetland.EcolEng14:157–167.Anonymous(2003)Kennisakker.nl.In:Prod.Akkerb.http://www.kennisakker.nl/kenniscentrum/goedepraktijk.
Accessed1Sep2012Anonymous (2012) Opmaak van een model voor de technische kosten van inrichtings- en beheerwerken,
EindrapportBE0112000229.BerchemAronsonJ,AlexanderS(2013)Ecosystemrestorationisnowaglobalpriority:Timetorollupoursleeves.Restor
Ecol21:293–296.doi:10.1111/rec.12011Azcón R, Ambrosano E, Charest C (2003) Nutrient acquisition in mycorrhizal lettuce plants under different
phosphorusandnitrogenconcentration.PlantSci165:1137–1145.doi:10.1016/S0168-9452(03)00322-4Baeten L, Verstraeten G, Frenne P, et al. (2010) Former land use affects the nitrogen and phosphorus
concentrationsandbiomassofforestherbs.PlantEcol212:901–909.doi:10.1007/s11258-010-9876-9BaiZ,LiH,YangX,etal.(2013)ThecriticalsoilPlevelsforcropyield,soilfertilityandenvironmentalsafetyin
differentsoiltypes.PlantSoil372:27–37.doi:10.1007/s11104-013-1696-yBaileyJS,BeattieJAM,KilpatrickDJ,CushnahanA(1997)Thediagnosisandrecommendationintegratedsystem
(DRIS)fordiagnosingthenutrientstatusofgrasslandswards:II.Modelcalibrationandvalidation.PlantSoil197:137–147.doi:10.1023/A:1004288505814
BakerME,KingRS(2010)Anewmethodfordetectingandinterpretingbiodiversityandecologicalcommunitythresholds.MethodsEcolEvol1:25–37.doi:10.1111/j.2041-210X.2009.00007.x
BakerME,KingRS,KahleD(2015)TITAN2:ThresholdIndicatorTaxaAnalysis.Bakker JP, Elzinga JA, de Vries Y (2002) Effects of long-term cutting in a grassland system: perspectives for
restoration of plant communities on nutrient-poor soils. Appl Veg Sci 5:107–120. doi: doi:10.1111/j.1654-109X.2002.tb00540.x
BalmfordA,BrunerA,CooperP,etal.(2002)Economicreasonsforconservingwildnature.Science297:950–3.doi:10.1126/science.1073947
Barker KR, Koenning SR (1998) Developing sustainable systems for nematode management. Annu RevPhytopathol36:165–205.doi:doi:10.1146/annurev.phyto.36.1.165
Barnosky AD, Hadly EA, Bascompte J, et al. (2012) Approaching a state shift in Earth’s biosphere. Nature486:52–58.doi:10.1038/nature11018
Bartoń K (2018) MuMIn: Multi-Model Inference. R package version 1.42.1 https://CRAN.R-project.org/package=MuMIn

170
BaselgaA (2010)Partitioning the turnoverandnestednesscomponentsofbetadiversity.GlobEcolBiogeogr19:134–143.doi:10.1111/j.1466-8238.2009.00490.x
Bauke SL, von Sperber C, Tamburini F, et al. (2018) Subsoil phosphorus is affected by fertilization regime inlong-termagriculturalexperimentaltrials.EurJSoilSci69:103–112.doi:10.1111/ejss.12516
Bedia J, Busqué J (2013) Productivity, grazing utilization, forage quality and primary production controls ofspecies-richalpinegrasslandswithNardusstricta innorthernSpain.GrassForageSci68:297–312.doi:10.1111/j.1365-2494.2012.00903.x
BekkerRM,VerweijGL,SmithREN,etal.(1997)SoilseedbanksinEuropeangrasslands:doeslanduseaffectregenerationperspectives?JApplEcol34:1293–1310.
Bengtsson J, Bullock JM, Egoh B, et al. (2019) Grasslands-more important for ecosystem services than youmightthink.Ecosphere10:e02582.doi:10.1002/ecs2.2582
Bengtsson-PalmeJ,RybergM,HartmannM,etal.(2013)ImprovedsoftwaredetectionandextractionofITS1and ITS2 from ribosomal ITS sequences of fungi and other eukaryotes for analysis of environmentalsequencingdata.MethodsEcolEvol4:914–919.doi:10.1111/2041-210X.12073
Berendse F, Oomes MJM, Altena HJ, Elberse WT (1992) Experiments on the restoration of species-richmeadowsinTheNetherlands.BiolConserv62:59–65.
BischoffA(2002)Dispersalandestablishmentoffloodplaingrasslandspeciesaslimitingfactorsinrestoration.BiolConserv104:25–33.doi:10.1016/S0006-3207(01)00151-3
BjörkmanT(2010)BuckwheatProduction:Planting.AgronFactSheetSer2.BlakeL,JohnstonAE,PoultonPR,GouldingKWT(2003)Changesinsoilphosphorusfractionsfollowingpositive
andnegativephosphorusbalancesforlongperiods.PlantSoil254:245–261.Blondeel H, Perring MP, Bergès L, et al. (2018) Context-Dependency of Agricultural Legacies in Temperate
ForestSoils.Ecosystems.doi:10.1007/s10021-018-0302-9BobbinkR,HornungM,RoelofsJGM(1998)Theeffectsofair-bornenitrogenpollutantsonspeciesdiversityin
naturalandsemi-naturalEuropeanvegetation.J.Ecol.BocciG(2015)TR8:AnRpackageforeasilyretrievingplantspeciestraits.MethodsEcolEvol6:347–350.doi:
10.1111/2041-210X.12327Bolger AM, Lohse M, Usadel B (2014) Trimmomatic: A flexible trimmer for Illumina sequence data.
Bioinformatics30:2114–2120.doi:10.1093/bioinformatics/btu170BolkerB,TeamRDC(2016)bbmle:ToolsforGeneralMaximumLikelihoodEstimation.Rpackageversion1.0.20
https://CRAN.R-project.org/package=bbmleBomansE,FransenK,GobinA,etal.(2005)Addressingphosphorusrelatedproblemsinfarmpractice.BongersT(1988)DeNematodenvanNederland.KNNV,Zeist,theNetherlandsBouwmanL,GoldewijkKK,VanDerHoekKW,etal.(2012)Exploringglobalchangesinnitrogenandphosphorus
cyclesinagricultureinducedbylivestockproductionoverthe1900-2050period.ProcNatlAcadSciUSA110:20882–20887.doi:10.1073/pnas.1012878108
BoyerHW,Roulland-DussoixD(1969)AcomplementationanalysisoftherestrictionandmodificationofDNAinEscherichiacoli.JMolBiol41:459–472.
BrinkmanEP,RaaijmakersCE,Bakx-SchotmanJMT,etal.(2012)Matgrassswardplantspeciesbenefitfromsoilorganisms.ApplSoilEcol62:61–70.doi:10.1016/j.apsoil.2012.07.012
Brudvig LA (2017) Toward prediction in the restoration of biodiversity. J Appl Ecol 54:1013–1017. doi:10.1111/1365-2664.12940
BrzeskiMW (1998) Nematodes of Tylenchina in Poland and Temperate Europe.Muzeum i Instytut ZoologiiPAN,Warsaw,Poland
BurnhamK,AndersonD(2002)ModelSelectionandMultimodel Inference:APractical Information-TheoreticApproach,Secondedi.Springer-Verlag,NewYork(USA)
Calvo P, Nelson L, Kloepper JW (2014) Agricultural uses of plant biostimulants. Plant Soil 383:3–41. doi:10.1007/s11104-014-2131-8
CanbolatMY,BilenS,ÇakmakçıR,etal.(2006)Effectofplantgrowth-promotingbacteriaandsoilcompactiononbarleyseedlinggrowth,nutrientuptake,soilpropertiesandrhizospheremicroflora.BiolFertilSoils42:350–357.doi:10.1007/s00374-005-0034-9
Caporaso JG, Kuczynski J, Stombaugh J, et al. (2010) QIIME allows analysis of high-throughput communitysequencingdata.NatMethods7:335.
CarvellC,RoyDB,SmartSM,etal.(2006)Declinesinforageavailabilityforbumblebeesatanationalscale.BiolConserv132:481–489.doi:10.1016/j.biocon.2006.05.008
CeballosG,EhrlichPR,BarnoskyAD,etal.(2015)Acceleratedmodernhuman-inducedspecieslosses:Enteringthesixthmassextinction.SciAdv1:e1400253–e1400253.doi:10.1126/sciadv.1400253
171
CeballosG,EhrlichPR,DirzoR(2017)Biologicalannihilationviatheongoingsixthmassextinctionsignaledbyvertebrate population losses and declines. Proc Natl Acad Sci 201704949. doi:10.1073/pnas.1704949114
CeulemansT,MerckxR,HensM,HonnayO (2013)Plantspecies loss fromEuropeansemi-naturalgrasslandsfollowing nutrient enrichment - is it nitrogen or is it phosphorus? Glob Ecol Biogeogr 22:73–82. doi:10.1111/j.1466-8238.2012.00771.x
CeulemansT, StevensCJ,DuchateauL,etal. (2014)Soilphosphorus constrainsbiodiversityacrossEuropeangrasslands.GlobChangBiol20:3814–3822.doi:10.1111/gcb.12650
ChytrýM,HejcmanM,HennekensSM,SchellbergJ(2009)ChangesinvegetationtypesandEllenbergindicatorvaluesafter65yearsoffertilizerapplicationintheRengenGrasslandexperiment,Germany.ApplVegSci12:167–176.doi:10.1111/j.1654-109X.2009.01011.x
Colomb B, Debaeke P, Jouany C, Nolot JM (2007) Phosphorusmanagement in low input stockless croppingsystems:CropandsoilresponsestocontrastingPregimesina36-yearexperimentinsouthernFrance.EurJAgron26:154–165.doi:10.1016/j.eja.2006.09.004
Compeer A, Mattheij S (2017) Inventarisatie biomassastromen Vlaanderen en Noord-Brabant. Mechelen,Belgium
Cools N, Wils C, Hens M, et al. (2015) Atmosferische stikstofdepositie en Natura 2000instandhoudingsdoelstellingen in Vlaanderen. Verkennende gewestelijke ruimtelijke analyse van deecologischeimpact,vansectorbijdragenenvandebijdrage.Brussel
Crawley MJ, Johnston AE, Silvertown J, et al. (2005) Determinants of species richness in the Park GrassExperiment.AmNat165:179–92.doi:10.1086/427270
Crews TE, PeoplesMB (2004) Legume versus fertilizer sources of nitrogen: ecological tradeoffs and humanneeds.AgricEcosystEnviron102:279–297.doi:10.1016/j.agee.2003.09.018
CrossAF,SchlesingerWH(1995)AliteraturereviewandevaluationoftheHedleyfractionation:Applicationstothe biogeochemical cycle of soil phosphorus in natural ecosystems. Geoderma 64:197–214. doi:10.1016/0016-7061(94)00023-4
D’HaeneK,SalomezJ,DeNeveS,etal.(2014)EnvironmentalperformanceofnitrogenfertiliserlimitsimposedbytheEUNitratesDirective.AgricEcosystEnviron192:67–79.doi:10.1016/j.agee.2014.03.049
DanckaertS,CarelsK,VanGijseghemD (2008) Juridisch-wetenschappelijke toestandvanblijvendgrasland inVlaandereninhetkadervanderandvoorwaardenregeling.doi:10.2118/159154-MS
DaurI,BakhashwainAA(2013)Effectofhumicacidongrowthandqualityofmaizefodderproduction.PakistanJBot45:21–25.
DeBolle S,DeNeve S,HofmanG (2013a) Rapid redistributionof P to deeper soil layers in P saturated acidsandysoils.SoilUseManag29:76–82.doi:10.1111/j.1475-2743.2012.00426.x
DeBolleS,GebremikaelMT,MaervoetV,DeNeveS(2013b)Performanceofphosphate-solubilizingbacteriainsoilunderhighphosphorusconditions.BiolFertilSoils49:705–714.doi:10.1007/s00374-012-0759-1
DeCáceresM,LegendreP,MorettiM(2010)Improvingindicatorspeciesanalysisbycombininggroupsofsites.Oikos119:1674–1684.doi:10.1111/j.1600-0706.2010.18334.x
DeDeynGB,RaaijmakersCE,VanderPuttenWH(2004)Plantcommunitydevelopmentisaffectedbynutrientsandsoilbiota.JEcol92:824–834.
DeGraafMCC,BobbinkR,SmitsNAC,etal.(2009)Biodiversity,vegetationgradientsandkeybiogeochemicalprocessesintheheathlandlandscape.BiolConserv142:2191–2201.
deMendiburuF(2016)agricolae:StatisticalProceduresforAgriculturalResearch.DeSaegerS,WoutersJ(2017)BWKenHabitatkartering,eenpraktischehandleiding.Deel5:degraslandsleutel.
doi:doi.org/10.21436/inbor.13847497De Schrijver A, De Frenne P, Ampoorter E, et al. (2011) Cumulative nitrogen input drives species loss in
terrestrialecosystems.GlobEcolBiogeogr20:803–816.doi:10.1111/j.1466-8238.2011.00652.xDe Schrijver A, Schelfhout S, Verheyen K (2013) Bodemonderzoek naar de potenties voor herstel en
ontwikkelingvansoortenrijkgraslandBosvanAa.Gontrode,BelgiumDeSchrijverA,VesterdalL,HansenK,etal.(2012)Fourdecadesofpost-agriculturalforestdevelopmenthave
causedmajorredistributionsofsoilphosphorusfractions.Oecologia169:221–34.doi:10.1007/s00442-011-2185-8
DeSmet J,HofmanG,Vanderdeelen J, et al. (1996)Phosphateenrichment in the sandy loamsoilsofWest-Flanders,Belgium.FertilRes43:209–215.
DebaekeP,CabelguenneM,HilaireA,RaffaillacD(1998)Cropmanagementsystemsforrainfedandirrigatedsunflower (Helianthus annuus) in south-western France. J Agric Sci 131:S0021859698005747. doi:10.1017/S0021859698005747

172
Delorme TA, Angle JS, Coale FJ, Chaney RL (2000) Phytoremediation of Phosphorus-Enriched Soils. Int JPhytoremediation2:173–181.doi:10.1080/15226510008500038
DeMalach N, Zaady E, Kadmon R (2017) Light asymmetry explains the effect of nutrient enrichment ongrasslanddiversity.EcolLett20:60–69.doi:10.1111/ele.12706
Dengler J, JanišovácM, Török P,Wellstein C (2014) Biodiversity of Palaearctic grasslands: a synthesis. AgricEcosystEnviron182:1–14.
DiazA,Green I, TibbettM (2008)Re-creationof heathlandon improvedpastureusing top soil removal andsulphuramendments:Edaphicdriversandimpactsonericoidmycorrhizas.BiolConserv141:1628–1635.doi:10.1016/j.biocon.2008.04.006
DoddRJ,Mcdowell RW,Condron LM (2012)Usingnitrogen fertiliser todecreasephosphorus loss fromhighphosphorussoils.ProcNewZealGrasslAssoc74:121–126.
DrouillonM,MerckxR(2003)TheroleofcitricacidasaphosphorusmobilizationmechanisminhighlyP-fixingsoils.GayanaBot60:55–62.doi:10.4067/S0717-66432003000100009
Duffková R, HejcmanM, Libichová H (2015) Effect of cattle slurry on soil and herbage chemical properties,yield,nutrientbalanceandplantspeciescompositionofmoderatelydryArrhenatheriongrassland.AgricEcosystEnviron213:281–289.doi:10.1016/j.agee.2015.07.018
DumortierM,DeBruynL,PeymenJ,etal.(2003)Natuurrapport2003.Natuurrapport21:Dupouey JL,DambrineE, Laffite JD,MoaresC (2002) Irreversible impactofpast landuseon forest soilsand
biodiversity.Ecology83:2978–2984.doi:10.1890/0012-9658(2002)083[2978:IIOPLU]2.0.CO;2Dupré C, Stevens CJ, Ranke T, et al. (2010) Changes in species richness and composition in European acidic
grasslandsoverthepast70years:thecontributionofcumulativeatmosphericnitrogendeposition.GlobChangBiol16:344–357.doi:10.1111/j.1365-2486.2009.01982.x
DuruM,DucrocqH(1997)AnitrogenandphosphorusherbagenutrientindexasatoolforassessingtheeffectofNandPsupplyonthedrymatteryieldofpermanentpastures.NutrCyclAgroecosystems47:59–69.
Duru M, Thélier-Huché L (1995) N and P–K status of herbages: use for diagnosis of grasslands. DiagnosticProcedCropNManag125–138.
EdgarRC(2013)UPARSE:highlyaccurateOTUsequencesfrommicrobialampliconreads.NatMethods10:996.Edgar RC,Haas BJ, Clemente JC, et al. (2011)UCHIME improves sensitivity and speed of chimera detection.
Bioinformatics27:2194–2200.doi:10.1093/bioinformatics/btr381EdwardsAR,MortimerSR,LawsonCS,etal.(2007)Haystrewing,brushharvestingofseedandsoildisturbance
astoolsfortheenhancementofbotanicaldiversityingrasslands.BiolConserv134:372–382.EgnérH,RiehmH,DomingoW(1960)UntersuchungüberdiechemischeBodenanalysealsGrundlage fürdie
BeurteilungdesNährstoffzustandesderBöden. II. Chemische Extraktionsmethoden zur Phosphor undKaliumbestimmung.KLantbrukshogskolansAnn26:199–215.
Ehlert PAI, Dekker PHM, van der Schoot JR, et al. (2009) Fosforgehalten en fosfaatafvoercijfers vanlandbouwgewassen.Eindrapportage.WageningenUR,Wageningen
EmsensWJ,AggenbachCJS,SmoldersAJP,vanDiggelenR(2015)Topsoilremovalindegradedrichfens:Canweforceanecosystemreset?EcolEng77:225–232.doi:10.1016/j.ecoleng.2015.01.029
Eriksson O (2018)What is biological cultural heritage and why should we care about it? An example fromSwedishrurallandscapesandforests.NatConserv28:1–32.doi:10.3897/natureconservation.28.25067
EuropeanCommission(2015)ReportfromthecommissiontothecouncilandEuropeanparliament.TheStateof Nature in the European Union. Report on the status of and trends for habitat types and speciescoveredbytheBirdsandHabitatsDirectivesforthe2007-2012periodasrequire.Brussels,Belgium
FAO(2004)Triticaleimprovementandproduction.FAOPlantproductionandprotectionpaper,Rome,ItalyFayPa.,ProberSM,HarpoleWS,etal.(2015)Grasslandproductivitylimitedbymultiplenutrients.NatPlants
1:15080.doi:10.1038/nplants.2015.80FibichP,VítováA,LepšJ(2018)Interactionbetweenhabitatlimitationanddispersallimitationismodulatedby
specieslifehistoryandexternalconditions:Astochasticmatrixmodelapproach.CommunityEcol19:9–20.doi:10.1556/168.2018.19.1.2
FiorellinoN, Kratochvil R, Coale F (2017) Long-termagronomicdrawdownof soil phosphorus inmid-atlanticcoastalplainsoils.AgronJ109:455–461.doi:10.2134/agronj2016.07.0409
Fisher AC, Krutilla J V (1974) Valuing Long Run Ecological Consequences and Irreversibilities. J Environ EconManage1:96–108.
FosterBL,TilmanD,EcologySP(2011)DynamicandStaticViewsofSuccession :TestingtheDescriptivePowerof the Chronosequence Approach Dynamic and static views of succession : Testing approach thedescriptivepowerofthechronosequence.146:1–10.
FoxJ,WeisbergS(2011)AnRCompaniontoAppliedRegression.

173
FoxR(2013)ThedeclineofmothsinGreatBritain:Areviewofpossiblecauses.InsectConservDivers6:5–19.doi:10.1111/j.1752-4598.2012.00186.x
FraserMD,FychanR,JonesR(2005)Theeffectofharvestdateandinoculationontheyieldandfermentationcharacteristicsoftwovarietiesofwhitelupin(Lupinusalbus)whenensiledasawhole-crop.AnimFeedSciTechnol119:307–322.doi:DOI10.1016/j.anifeedsci.2004.12.015
FrouzJ,DiggelenR,PižlV,etal.(2009)Theeffectoftopsoilremovalinrestoredheathlandonsoilfauna,topsoilmicrostructure,andcellulosedecomposition:implicationsforecosystemrestoration.BiodiversConserv18:3963–3978.
FujitaY,OldeVenterinkH, vanBodegomPM,etal. (2014) Low investment in sexual reproduction threatensplantsadaptedtophosphoruslimitation.Nature505:82–86.doi:10.1038/nature12733
GalletA, FlischR, Ryser J-P, et al. (2003) Effect of phosphate fertilizationon crop yield and soil phosphorusstatus.JPlantNutrSoilSci166:568–578.doi:10.1002/jpln.200321081
GalvánekD,JanákM(2008)ManagementofNatura2000habitats.6230*Species-richNardusgrasslands.GangX,HongboS,RongfuX, et al. (2012) The roleof root-releasedorganic acids andanions inphosphorus
transformations in a sandy loam soil from. African J Microbiol Res 6:674–679. doi:10.5897/AJMR11.1296
GeurtsJJM,vandeWouwPAG,SmoldersAJP,etal.(2011)Ecologicalrestorationonformeragriculturalsoils:Feasibilityofinsituphosphatefixationasanalternativetotopsoilremoval.EcolEng37:1620–1629.
Gibson-RoyP,McdonaldT(2014)Reconstructinggrassyunderstoriesinsouth-easternAustralia:InterviewwithPaulGibson-Roy.EcolManagRestor15:111–122.doi:10.1111/emr.12116
Gigante D, Biurrun I, Capelo J, et al. (2015) European Red List of Habitats - Grasslands Habitat Group: E1.7Lowlandtosubmontane,drytomesicNardusgrassland.
GilbertJ,GowingD,LovelandP(2003)Chemicalameliorationofhighphosphorusavailabilityinsoiltoaidtherestorationofspecies-richgrassland.EcolEng19:297–304.
Gilbert J, Gowing D, Wallace H (2009) Available soil phosphorus in semi-natural grasslands: Assessmentmethodsandcommunitytolerances.BiolConserv142:1074–1083.doi:10.1016/j.biocon.2009.01.018
Glen E, Price EAC, Caporn SJM, et al. (2016) Evaluation of topsoil inversion in U.K. habitat creation andrestorationschemes.RestorEcol25:72–81.doi:10.1111/rec.12403
Gobin A, Uljee I, Van Esch L, et al. (2009) Landgebruik in Vlaanderen.Wet. Rapp.MIRA 2009, NARA 2009,VMM/INBO,INBO.R.2009.20
GoodenoughAE,HartAG,StaffordR(2012)Regressionwithempiricalvariableselection:Descriptionofanewmethodandapplicationtoecologicaldatasets.PLoSOne7:1–10.doi:10.1371/journal.pone.0034338
Gotelli NJ, Colwell RK (2001) Quantifying biodiversity: procedures and pitfalls in the measurement andcomparisonofspeciesrichness.EcolLett4:379–391.doi:10.1046/j.1461-0248.2001.00230.x
Gough L, Osenberg CW, Gross KL, Collins SL (2000) Fertilization effects on species density and primaryproductivityinherbaceousplantcommunities.Oikos89:428–439.
Gough MW, Marrs RH (1990) A Comparison of Soil Fertility between Semi-Natural and Agricultural Plant-Communities-ImplicationsfortheCreationofSpecies-RichGrasslandonAbandonedAgriculturalLand.BiolConserv51:83–96.
GouldingK,JarvisS,WhitmoreA(2008)Optimizingnutrientmanagementforfarmsystems.PhilosTransRSocBBiolSci363:667–680.doi:10.1098/rstb.2007.2177
Goulson D, Hanley ME, Darvill B, et al. (2005) Causes of rarity in bumblebees. Biol Conserv 122:1–8. doi:10.1016/j.biocon.2004.06.017
GoulsonD,RaynerP,DawsonB,DarvillB(2011)Translatingresearchintoaction;bumblebeeconservationasacasestudy.JApplEcol48:3–8.doi:10.1111/j.1365-2664.2010.01929.x
Griffith GW, Roderick K, Graham A, Causton DR (2012) Swardmanagement influences fruiting of grasslandbasidiomycetefungi.BiolConserv145:234–240.doi:10.1016/j.biocon.2011.11.010
Grime JP (2001)Plant strategies, vegetationprocesses andecosystemproperties, 2ndedition. JohnWiley&Sons,Chichester,UK
GrimeJP(1973)Controlofspeciesdensityinherbaceousvegetation.JEnvironManage1:151–167.Grootjans AP, Bakker JP, Jansen AJM, Kemmers RH (2002) Restoration of brook valley meadows in the
Netherlands.Hydrobiologia478:149–170.GuisanA,ZimmermannNE(2000)Predictivehabitatdistributionmodelsinecology.EcolModell135:147–186.
doi:10.1016/S0304-3800(00)00354-9GüsewellS(2004)N :Pratiosinterrestrialplants:variationandfunctionalsignificance.NewPhytol164:243–
266.

174
GyaneshwarP,KumarGN,ParekhLJ,PoolePS(2002)Roleofsoilmicroorganisms in improvingPnutritionofplants.PlantSoil245:83–93.doi:10.1023/A:1020663916259
HaagensenJAJ,HansenSK,JohansenT,MolinS(2002)Insitudetectionofhorizontaltransferofmobilegeneticelements.FEMSMicrobiolEcol42:261–268.doi:10.1111/j.1574-6941.2002.tb01016.x
Habel JC, Dengler J, Janišová M, et al. (2013) European grassland ecosystems: Threatened hotspots ofbiodiversity.BiodiversConserv22:2131–2138.doi:10.1007/s10531-013-0537-x
HájekM,DreslerP,HájkováP,etal.(2017)Long-lastingImprintofFormerGlassworksonVegetationPatterninan Extremely Species-rich Grassland: A Battle of Species Pools onMesic Soils. Ecosystems 20:1233–1249.doi:10.1007/s10021-017-0107-2
Hakala K, KeskitaloM, Eriksson C, Pitkanen T (2009) Nutrient uptake and biomass accumulation for elevendifferentfieldcrops.AgricFoodSci18:366–387.
HanssonM,FogelforsH(2000)Managementofasemi-naturalgrassland;resultsfroma15-year-oldexperimentinsouthernSweden.JVegSci11:31–38.doi:10.2307/3236772
HarpoleWS,TilmanD(2007)Grasslandspecieslossresultingfromreducednichedimension.Nature446:791–3.doi:10.1038/nature05684
Hautier Y, Niklaus PA, Hector A (2009) Competition for Light Causes Plant Biodiversity Loss AfterEutrophication.Science324:636–638.doi:10.1126/science.1169640
Hautier Y, Vojtech E, Hector A (2018) The importance of competition for light depends on productivity anddisturbance.EcolEvol1–7.doi:10.1002/ece3.4403
HedbergP,KotowskiW(2010)Newnaturebysowing?Thecurrentstateofspecies introduction ingrasslandrestoration,andtheroadahead.JNatConserv18:304–308.
Hedley MJ, Stewart JWB, Chauchan BS (1982) Changes in Inorganic and Organic Soil Phosphorus FractionsInducedbyCultivationPracticesandbyLaboratoryIncubations.SoilSciSocAmJ46:970–976.
Hejcman M, Češková M, Schellberg J, Pätzold S (2010a) The Rengen Grassland Experiment: Effect of SoilChemical Properties on Biomass Production, Plant Species Composition and Species Richness. FoliaGeobot45:125–142.doi:https://www.jstor.org/stable/23064952
HejcmanM, KlaudisovaM, Schellberg J, HonsovaD (2007) The RengenGrassland Experiment: Plant speciescomposition after 64 years of fertilizer application. Agric Ecosyst Environ 122:259–266. doi:10.1016/j.agee.2006.12.036
HejcmanM,SchellbergJ,PavlůV(2010b)Dactylorhizamaculata,PlatantherabifoliaandListeraovatasurviveNapplicationunderPlimitation.ActaOecologica36:684–688.doi:10.1016/j.actao.2010.09.001
HejcmanM,SochorováL,PavlůV,etal. (2014)The steinachgrasslandexperiment: Soil chemicalproperties,swardheight andplant species composition in three cut alluvialmeadowafterdecades-long fertilizerapplication.AgricEcosystEnviron184:76–87.doi:10.1016/j.agee.2013.11.021
HelsenK,HermyM,HonnayO(2013)Spatialisolationslowsdowndirectionalplantfunctionalgroupassemblyinrestoredsemi-naturalgrasslands.JApplEcol50:404–413.doi:10.1111/1365-2664.12037
HendrickxG(1995)Anautomaticapparatusforextractingfree-livingnematodestagesfromsoil.Nematologica41:308.
HerreroM,deLorenzoV,TimmisKN(1990)Transposonvectorscontainingnon-antibioticresistanceselectionmarkers for cloning and stable chromosomal insertion of foreign genes in Gramnegative bacteria. JBacteriol172:6557–6567.
HillMO,CareyPD(1997)PredictionofYieldintheRothamstedParkGrassExperimentbyEllenbergIndicator.JVegSci8:579–586.
HinsingerP (2001)Bioavailability of soil inorganic P in the rhizosphere as affectedby root-induced chemcialchanges:areview.PlantSoil237:173–195.
HobbsRJ,AricoS,AronsonJ,etal.(2006)Novelecosystems:Theoreticalandmanagementaspectsofthenewecologicalworldorder.GlobEcolBiogeogr15:1–7.doi:10.1111/j.1466-822X.2006.00212.x
Hobbs RJ, Higgs E,Harris JA (2009)Novel ecosystems: implications for conservation and restoration. TrendsEcolEvol24:599–605.doi:10.1016/j.tree.2009.05.012
Hoeksema JD, Chaudhary VB, Gehring CA, et al. (2010) A meta-analysis of context-dependency in plantresponse to inoculation with mycorrhizal fungi. Ecol Lett 13:394–407. doi: 10.1111/j.1461-0248.2009.01430.x
HollandJE,BennettAE,NewtonAC,etal. (2018)Liming impactsonsoils,cropsandbiodiversity intheUK:Areview.SciTotalEnviron610–611:316–332.doi:10.1016/j.scitotenv.2017.08.020
HölzelN,OtteA(2003)Restorationofaspecies-richfloodmeadowbytopsoil removalanddiasporetransferwithplantmaterial.ApplVegSci6:131–140.doi:10.1111/j.1654-109X.2003.tb00573.x
175
HorstWJ,KamhM,JibrinJM,ChudeVO(2001)AgronomicmeasuresforincreasingPavailabilitytocrops.PlantSoil237:211–223.doi:10.1023/A:1013353610570
Hu J, Lin X, Wang J, et al. (2009) Population size and specific potential of P-mineralizing and -solubilizingbacteriaunder long-termP-deficiency fertilization ina sandy loamsoil. Pedobiologia (Jena)53:49–58.doi:10.1016/j.pedobi.2009.02.002
Hulvey KB, Standish RJ, Hallett LM, et al. (2013) Incorporating Novel Ecosystems into ManagementFrameworks.Nov.Ecosyst.Interv.NewEcol.WorldOrder.pp157–171
Ihrmark K, Bödeker ITM, Cruz-Martinez K, et al. (2012) New primers to amplify the fungal ITS2 region –evaluationby454-sequencingof artificial andnatural communities. FEMSMicrobiol Ecol 82:666–677.doi:10.1111/j.1574-6941.2012.01437.x
IPBES (2018) The IPBES regional assessment report on biodiversity and ecosystem services for Europe andCentral Asia. Rounsevell M, Fischer M, Torre-Marin Rando A, Mader A (eds.). Secretariat of theIntergovernmentalScience-PolicyPlatformonBiodiversityandEcosystemServices,Bonn,Germany.892pages.
ISO10390,1994.Soilquality–DeterminationofpHISO 11263, 1994. Soil quality – Determination of phosphorus – Spectrometric determination of phosphorus
solubleinsodiumhydrogencarbonatesolutionJanssen J, Rodwell JS, García Criado M, et al. (2016) European Red List of Habitats Part 2. Terrestrial and
freshwaterhabitats.doi:10.2779/091372Janssens F, Peeters A, Tallowin JRB, et al. (1998) Relationship between soil chemical factors and grassland
diversity.PlantSoil202:69–78.doi:10.1023/A:1004389614865Jax K (2016) Thresholds, tipping points and limits. In: PotschinM, Jax K (eds) OpenNESS Ecosyst. Serv. Ref.
Book.ECFP7GrantAgreem.no.308428.pp1–4JewellPL,KäuferleD,GüsewellS,etal.(2007)Redistributionofphosphorusbycattleonatraditionalmountain
pastureintheAlps.AgricEcosystEnviron122:377–386.doi:10.1016/j.agee.2007.02.012JohnsonEA,MiyanishiK(2008)Testingtheassumptionsofchronosequences insuccession.EcolLett11:419–
431.doi:10.1111/j.1461-0248.2008.01173.xJohnsonNC,RowlandDL,CorkidiL,etal.(2003)Nitrogenenrichmentaltersmycorrhizalallocationatfivemesic
to semiarid grasslands. Ecology 84:1895–1908. doi: 10.1890/0012-9658(2003)084[1895:NEAMAA]2.0.CO;2
JohnstonAE, PoultonPR, Fixen PE, CurtinD (2014) Phosphorus. Its EfficientUse inAgriculture., 1st ed. AdvAgron.doi:10.1016/B978-0-12-420225-2.00005-4
Johnston AE, Poulton PR, White RP, Macdonald AJ (2016) Determining the longer term decline in plant-available soil phosphorus from short-term measured values. Soil Use Manag 32:151–161. doi:10.1111/sum.12253
JonesCA,JacobsenJS,MugaasA(2007)EffectofLow-RateCommercialHumicAcidonPhosphorusAvailability,Micronutrient Uptake, and Spring Wheat Yield. Commun Soil Sci Plant Anal 38:921–933. doi:10.1080/00103620701277817
Jones DL, Darrah PR (1994) Role of root derived organic acids in the mobilization of nutrients from therhizosphere.PlantSoil166:247–257.doi:10.1007/BF00008338
Jones DL, Dennis PG, Owen AG, van Hees PAW (2003) Organic acid behavior in soils - misconceptions andknowledgegaps.PlantSoil248:31–41.doi:10.1023/A:1022304332313
Jones L, Stevens C, Rowe EC, et al. (2017) Canon-sitemanagementmitigate nitrogendeposition impacts innon-woodedhabitats?BiolConserv212:464–475.doi:10.1016/j.biocon.2016.06.012
Jordan-Meille L,RubækGH,EhlertPAI, et al. (2012)Anoverviewof fertilizer-P recommendations inEurope:Soil testing, calibration and fertilizer recommendations. Soil Use Manag 28:419–435. doi:10.1111/j.1475-2743.2012.00453.x
KalraYP(1971)Differentbehaviourofcropspeciesinphosphateabsorption.PlantSoil34:535–539.KardolP,BezemerTM,vanderPuttenWH(2006)Temporalvariationinplant-soilfeedbackcontrolssuccession.
EcolLett9:1080–8.doi:10.1111/j.1461-0248.2006.00953.xKawamuraK,MackayAD,TuohyMP,etal.(2011)Potentialforspectralindicestoremotelysensephosphorus
andpotassiumcontentoflegume-basedpastureasameansofassessingsoilphosphorusandpotassiumfertilitystatus.IntJRemoteSens32:103–124.doi:10.1080/01431160903439908
KayserM, Isselstein J (2005) Potassium cycling and losses in grassland systems: A review. Grass Forage Sci60:213–224.doi:10.1111/j.1365-2494.2005.00478.x
Keddy P (2005) Putting the plants back into plant ecology: Six pragmatic models for understanding andconservingplantdiversity.AnnBot96:177–189.doi:10.1093/aob/mci166

176
Kemmers R, van Delft B (2010) Kanttekeningen bij ontgronden voor natuur. Vakbl Nat Bos Landschnovember:30–33.
Kepfer-Rojas S, Verheyen K, De Schrijver A, et al. (2018) Persistent land-use legacies increase small-scalediversityandstrengthenvegetation-soilrelationshipsonanunmanagedheathland.BasicApplEcol.doi:10.1016/j.baae.2018.10.004
KerrJT,OstrovskyM(2003)Fromspacetospecies:Ecologicalapplicationsforremotesensing.TrendsEcolEvol18:299–305.doi:10.1016/S0169-5347(03)00071-5
KesslerB,deLorenzoV,TimmisKN(1992)AgeneralsystemtointegratelacZfusionsintothechromosomesofGram-negativeeubacteria:regulationofthePm-promotoroftheTol-plasmidstudiedwithallcontrollingelementsinmonocopy.MolGenGenet233:293–301.doi:10.1007/BF00587591
KiehlK,KirmerA,DonathTW,etal.(2010)Speciesintroductioninrestorationprojects-Evaluationofdifferenttechniquesfortheestablishmentofsemi-naturalgrasslandsinCentralandNorthwesternEurope.BasicApplEcol11:285–299.
Kiehl K, Pfadenhauer J (2007) Establishment and persistence of target species in newly created calcareousgrasslandsonformerarablefields.PlantEcol189:31–48.
KingRS,BakerME(2014)Use,Misuse,andLimitationsofThresholdIndicatorTaxaAnalysis(TITAN)forNaturalResourceManagement.Appl.ThresholdConceptsNat.Resour.Decis.Mak.pp1–324
KlausVH,HoeverCJ,FischerM,etal.(2018)Contributionofthesoilseedbanktotherestorationoftemperategrasslandsbymechanicalswarddisturbance.RestorEcol26:114–122.doi:10.1111/rec.12626
Klaus VH, Schäfer D, Kleinebecker T, et al. (2017) Enriching plant diversity in grasslands by large-scaleexperimental sward disturbance and seed addition along gradients of land-use intensity. J Plant Ecol10:581–591.doi:10.1093/jpe/rtw062
KleijnD,BekkerRM,BobbinkR,etal. (2008) Insearchforkeybiogeochemical factorsaffectingplantspeciespersistenceinheathlandandacidicgrasslands:Acomparisonofcommonandrarespecies.JApplEcol45:680–687.doi:10.1111/j.1365-2664.2007.01444.x
Kleyer M, Bekker RM, Knevel IC, et al. (2008) The LEDA Traitbase: a database of life-history traits of theNorthwestEuropeanflora.JEcol96:1266–1274.
KlimkowskaA,VanDiggelenR,BakkerJP,GrootjansAP(2007)WetmeadowrestorationinWesternEurope:Aquantitative assessment of the effectiveness of several techniques. Biol Conserv 140:318–328. doi:10.1016/j.biocon.2007.08.024
KoerselmanW,MeulemanAFM(1996)ThevegetationN:Pratio:Anewtooltodetectthenatureofnutrientlimitation.JApplEcol33:1441–1450.
KõljalgU,NilssonRH,AbarenkovK,etal.(2013)Towardsaunifiedparadigmforsequence-basedidentificationoffungi.MolEcol22:5271–5277.doi:10.1111/mec.12481
KooijmanAM,CusellC,vanMourikJ,ReijmanT(2016)Restorationofformeragriculturalfieldsonacidsandysoils: Conversion to heathland, rangeland or forest? Ecol Eng 93:55–65. doi:10.1016/j.ecoleng.2016.05.005
KoopmansGF,ChardonWJ,EhlertPAI,etal.(2004)Phosphorusavailabilityforplantuptakeinaphosphorus-enrichednoncalcareoussandysoil.JEnvironQual33:965–975.
Kovács-HostyánszkiA,EspíndolaA,VanbergenAJ,etal.(2017)Ecologicalintensificationtomitigateimpactsofconventional intensive land use on pollinators and pollination. Ecol Lett 20:673–689. doi:10.1111/ele.12762
KovatsRS,ValentiniR,BouwerLM,etal. (2014)Europe. In:BarrosVR,FieldCB,DokkenDJ,etal. (eds)Clim.Chang. 2014 Impacts, Adapt. Vulnerability Part B Reg. Asp.Work.Gr. II Contrib. to Fifth Assess. Rep.Intergov.PanelClim.Chang.CambridgeUniversityPress,Cambridge(UK)andNewYork(USA),pp1267–1326
KranzE,JacobF(1977)CompetitionformineralsbetweenLinumandCamelina.2.Uptakeof32P-phosphateand86Rb.Flora166:505–516.
KratochvilRJ,CoaleFJ,MomenB,etal.(2006)CroppingSystemsforPhytoremediationofPhosphorus-EnrichedSoils.IntJPhytoremediation8:117–130.doi:10.1080/15226510600678456
Kruse J,AbrahamM,AmelungW,et al. (2015) Innovativemethods in soil phosphorus research :A review. JPlantNutrSoilSci178:43–88.doi:10.1002/jpln.201400327
KubanekJ(2017)Optimaldecisionmakingandmatchingaretiedthroughdiminishingreturns.ProcNatlAcadSci114:8499–8504.doi:10.1073/pnas.1703440114
KuoS(1996)Phosphorus.In:SparksDL(ed)MethodsSoilAnal.Part3,SSSAB.Ser.No.5,SSSAASA.Madison,USA,pp869–919

177
LajthaK,DriscollCT,JarrellWM,ElliottET(1999)SoilPhosphorus:CharacterizationandTotalElementAnalysis.In: Robertson GP, Coleman DC, Bledsoe CS, Sollins P (eds) Stand. SoilMethods Long-Term Ecol. Res.OxfordUniversityPress,NewYork,pp115–142
LangM,PresteleJ,WiesingerK,etal. (2018)Reintroductionofrarearableplants:seedproduction,soilseedbanks,anddispersal3yearsaftersowing.RestorEcol26:S170–S178.doi:10.1111/rec.12696
LeeB-R,MuneerS,AviceJ-C,etal.(2012)MycorrhizalcolonisationandP-supplementeffectsonNuptakeandN assimilation in perennial ryegrass underwell-watered and drought-stressed conditions.Mycorrhiza22:525–34.doi:10.1007/s00572-012-0430-6
Leff JW, Jones SE, Prober SM, et al. (2015) Consistent responses of soil microbial communities to elevatednutrient inputs in grasslands across the globe. Proc Natl Acad Sci 112:10967–10972. doi:10.1073/pnas.1508382112
LekbergY,BeverJD,BunnRA,etal.(2018)Relativeimportanceofcompetitionandplant–soilfeedback,theirsynergy, context dependency and implications for coexistence. Ecol Lett 21:1268–1281. doi:10.1111/ele.13093
Lenth R V. (2016) Least-Squares Means: the R Package lsmeans. J Stat Softw 69:1–33. doi:10.18637/jss.v069.i01
Liebisch F, Bünemann EK, Huguenin-elie O, et al. (2013) Plant phosphorus nutrition indicators evaluated inagricultural grasslands managed at different intensities. Eur J Agron 44:67–77. doi:10.1016/j.eja.2012.08.004
Lindemann-MatthiesP,JungeX,MatthiesD(2010)Theinfluenceofplantdiversityonpeople’sperceptionandaesthetic appreciation of grassland vegetation. Biol Conserv 143:195–202. doi:10.1016/j.biocon.2009.10.003
LoebR, Kuijpers L, PetersRCJH, et al. (2009)Nutrient limitation along eutrophic rivers?Roles ofN, P andKinput in a species-rich floodplain hay meadow. Appl Veg Sci 12:362–375. doi: 10.1111/j.1654-109X.2009.01034.x
Loeb R, van der Bij A, Bobbink R, et al. (2018) Hoe ontwikkel je droog heischraal grasland op voormaligelandbouwgrond?LevendeNat119:24–29.
Luscombe G, Scott R, Young D (2008) Soil InversionWorks. Breaking new ground in creative conservation.Liverpool,UK
MacDonaldGK,BennettEM,TaranuZE(2012)Theinfluenceoftime,soilcharacteristics,andland-usehistoryonsoilphosphoruslegacies:aglobalmeta-analysis.GlobChangBiol18:1904–1917.doi:10.1111/j.1365-2486.2012.02653.x
Mace GM, BarrettM, Burgess ND, et al. (2018) Aiming higher - bending the curve of biodiversity loss. NatSustain1:448–451.doi:10.1038/s41893-018-0130-0
MaesD,VanDyckH (1996) EengedocumenteerdeRode lijst vandagvlinders vanVlaanderen. Instituut voorNatuurbehoud,Brussels,Belgium
MaesD,VanreuselW,Jacobs I,etal. (2012a)De IUCNRodeLijstvandedagvlinders inVlaanderen.Brussels,Belgium
MaesS,ElsenA,TitsM,etal. (2012b)Wegwijs indeBodemvruchtbaarheidvandeBelgischeAkkerbouw-enWeilandpercelen(2008–2011).Heverlee,Belgium
MalboobiMA,BehbahaniM,MadaniH,etal.(2009)Performanceevaluationofpotentphosphatesolubilizingbacteria inpotatorhizosphere.WorldJMicrobiolBiotechnol25:1479–1484.doi:10.1007/s11274-009-0038-y
Marrs RH (1993) Soil Fertility and Nature Conservation in Europe: Theoretical Considerations and PracticalManagementSolutions.AdvEcolRes24:241–300.doi:10.1016/S0065-2504(08)60044-6
Marrs RH, Snow CSR, Owen KM, Evans CE (1998) Heathland and acid grassland creation on arable soils atMinsmere:identificationofpotentialproblemsandatestofcroppingtoimpoverishsoils.BiolConserv85:69–82.doi:10.1016/S0006-3207(97)00139-0
McCollumRE(1991)BuildupandDecline inSoilPhosphorus:30-YearTrendsonaTypicUmprabuult.AgronJ83:77–85.
McGechan MB, Lewis DR (2002) Sorption of phosphorus by soil, part 1: Principles, equations and models.BiosystEng82:1–24.
McLauchlanKK,HobbieSE,PostWM(2006)Conversionfromagriculturetograsslandbuildssoilorganicmatterondecadaltimescales.EcolAppl16:143–53.
McMurdie PJ,Holmes S (2013) phyloseq:AnRpackage for reproducible interactive analysis and graphics ofmicrobiomecensusdata.e61217.

178
MerunkováK,ChytrýM(2012)EnvironmentalcontrolofspeciesrichnessandcompositioninuplandgrasslandsofthesouthernCzechRepublic.PlantEcol213:591–602.doi:10.1007/s11258-012-0024-6
MichalcováD,ChytrýM,PechanecV,etal.(2013)HighPlantDiversityofGrasslandsinaLandscapeContext:AComparisonofContrastingRegions inCentralEurope.FoliaGeobot49:117–135.doi:10.1007/s12224-013-9173-1
Mikola J, Setälä H, Virkajärvi P, et al. (2009) Defoliation and patchy nutrient return drive grazing effects onplantandsoilpropertiesinadairycowpasture.EcolMonogr79:221–244.doi:10.1890/08-1846.1
Millenium Ecosystem Assessment (2005) Ecosystems and Human Well-being: Biodiversity Synthesis.WashingtonD.C.,USA
MilliganG,ScottR,YoungD,etal.(2017)Reducingsoilfertilitytoenableecologicalrestoration:AnewmethodtotesttheefficacyofFull-InversionTillage.EcolEng98:257–263.doi:10.1016/j.ecoleng.2016.11.003
MitchleyJ,JongepierováI,FajmonK(2012)Regionalseedmixturesforthere-creationofspecies-richmeadowsin the White Carpathian Mountains: results of a 10-yr experiment. Appl Veg Sci 15:253–263. doi:10.1111/j.1654-109X.2012.01183.x
Mládková P,Mládek J, Hejduk S, et al. (2015) High-nature-value grasslands have the capacity to copewithnutrient impoverishment induced by mowing and livestock grazing. J Appl Ecol 52:1073–1081. doi:10.1111/1365-2664.12464
MooreDRJ,KeddyPa.,GaudetCL,WisheuIC(1989)Conservationofwetlands:Doinfertilewetlandsdeserveahigherpriority?BiolConserv47:203–217.doi:10.1016/0006-3207(89)90065-7
Morris RK a., Alonso I, Jefferson RG, Kirby KJ (2006) The creation of compensatory habitat—Can it securesustainabledevelopment?JNatConserv14:106–116.doi:10.1016/j.jnc.2006.01.003
NegassaW,LeinweberP (2009)HowdoestheHedleysequentialphosphorus fractionationreflect impactsofland use and management on soil phosphorus: A review. J Plant Nutr Soil Sci 172:305–325. doi:10.1002/jpln.200800223
NEN 5776, 2006. Soil quality – Determination of phosphorus – Spectrometric determination of phosphorussolubleinsodiumhydrogencarbonatesolution
NiinemetsÜ,KullK(2005)Co-limitationofplantprimaryproductivitybynitrogenandphosphorusinaspecies-rich wooded meadow on calcareous soils. Acta Oecologica 28:345–356. doi:10.1016/j.actao.2005.06.003
ObersonA,TagmannHU,LangmeierM,etal. (2010)Freshandresidualphosphorusuptakebyryegrassfromsoilswithdifferentfertilizationhistories.PlantSoil334:391–407.doi:10.1007/s11104-010-0390-6
OdéB,GroenK,DeBlustG(2001)HetNederlandseenVlaamseheidelandschap.LevendeNat4:145–149.Oelmann Y, Broll G, Holzel N, et al. (2009) Nutrient impoverishment and limitation of productivity after 20
years of conservation management in wet grasslands of north-western Germany. Biol Conserv142:2941–2948.doi:10.1016/j.biocon.2009.07.021
Oenema O, De Klein C, Alfaro M (2014) Intensification of grassland and forage use: Driving forces andconstraints.CropPastureSci65:524–537.doi:10.1071/CP14001
OksanenJ,GuillaumeBlanchetF,FriendlyM,etal.(2017)vegan:CommunityEcologyPackage.OldeVenterinkH,vanderVlietRE,WassenMJ(2001)Nutrientlimitationalongaproductivitygradientinwet
meadows.PlantSoil234:171–179.doi:10.1023/A:1017922715903OlsenSR,ColeCV,WatanabeFS,DeanLA(1954)Estimationofavailablephosphorusinsoilsbyextractionwith
sodiumbicarbonate.USDACirc939:OosterbaanA,deJongJI,KuitersAT(2008)Vernieuwingeninontwikkelingenbeheervannatuurgraslandenop
voormaligelandbouwgrondopdrogezandgronden.WageningenUR,WageningenÖpikM, Vanatoa A, Vanatoa E, et al. (2010) The online databaseMaarjAM reveals global and ecosystemic
distributionpatterns in arbuscularmycorrhizal fungi (Glomeromycota).NewPhytol 188:223–241. doi:10.1111/j.1469-8137.2010.03334.x
OzingaWa,ArnoldsE,KeizerP-J,KuyperTW(2013)Paddenstoeleninhetnatuurbeheer-Deel2:Mycoflorapernatuurtype.KNNVPublishing,Driebergen,theNetherlands
OzingaWa,RömermannC,BekkerRM,etal.(2009)DispersalfailurecontributestoplantlossesinNWEurope.EcolLett12:66–74.
PaelinckxD,SannenK,GoethalsV,etal.(2009)GewestelijkedoelstellingenvoordehabitatsensoortenvandeEuropeseHabitat-enVogelrichtlijnvoorVlaanderen,INBO.M.200.MededelingenvanhetInstituutvoorNatuur-enBosonderzoek,Brussel
PandeyR,SinghB,NairTVR(2005)ImpactofArbuscular-MycorrhizalFungionPhosphorusEfficiencyofWheat,Rye,andTriticale.JPlantNutr28:1867–1876.doi:10.1080/01904160500251381

179
Pannecoucque J,VanWaes J,DeVliegherA (2012)Belgischebeschrijvendeenaanbevelenderassenlijstvoorvoedergewassenengroenbedekkers2012.Merelbeke,Belgium
Parr TW (1986) Mathematical models of grasslands. Internal report to the Institute of Terrestrial Ecology.Lancaster,UK.51pages.
PavluV,SchellbergJ,HejcmanM(2011)Cuttingfrequencyvs.Napplication:effectofa20-yearmanagementinLolio-Cynosuretumgrassland.GrassForageSci66:501–515.
PeetersTMJ,NieuwenhuijsenH,SmitJ,etal.(2012)DeNederlandseBijen(Hymenoptera:Apidaes.l.),Natuurvan.NaturalisBiodiversityCenter,Leiden,theNetherlands
PegtelDM,BakkerJP,VerweijGL,FrescoLFM(1996)N,KandPdeficiencyinchronosequentialcutsummer-drygrasslandsongleypodzolafterthecessationoffertilizerapplication.PlantSoil178:121–131.
Perring M., Erickson T., Brancalion PH. (2018) Rocketing restoration: Enabling the upscaling of ecologicalrestorationintheAnthropocene.RestorEcol1–7.doi:10.1111/rec.12871
PerringMP, Edwards G, deMazancourt C (2009) Removing Phosphorus from Ecosystems ThroughNitrogenFertilizationandCuttingwithRemovalofBiomass.Ecosystems12:1130–1144.doi:10.1007/s10021-009-9279-8
PerringMP,StandishRJ,PriceJN,etal.(2015)Advancesinrestorationecology:risingtothechallengesofthecomingdecades.Ecosphere6:1–25.doi:10.1890/ES15-00121.1
PierceS(2014)Implicationsforbiodiversityconservationofthelackofconsensusregardingthehumped-backmodel of species richness and biomass production. Funct Ecol 28:253–257. doi: 10.1111/1365-2435.12147
Pierce S, Negreiros D, Cerabolini BEL, et al. (2017) A global method for calculating plant CSR ecologicalstrategiesappliedacrossbiomesworld-wide.FunctEcol31:444–457.doi:10.1111/1365-2435.12722
Piessens K, Honnay O, Hermy M (2005) The role of fragment area and isolation in the conservation ofheathlandspecies.BiolConserv122:61–69.doi:10.1016/j.biocon.2004.05.023
PilanalıN,KaplanM(2003)InvestigationofEffectsonNutrientUptakeofHumicAcidApplicationsofDifferentFormstoStrawberryPlant.JPlantNutr26:835–843.doi:10.1081/PLN-120018568
PinheiroJ,BatesD,DebroyS,etal.(2017)nlme:LinearandNonlinearMixedEffectsModels.Rpackageversion3.1-131https://CRAN.R-project.org/package=nlme
PoschlodP,BiewerH(2005)Diasporeandgapavailabilityarelimitingspeciesrichnessinwetmeadows.FoliaGeobot40:13–34.
Possinger AR, Byrne LB, Breen NE (2013) Effect of buckwheat (Fagopyrum esculentum) on soil-phosphorusavailabilityandorganicacids.JPlantNutrSoilSci176:16–18.doi:10.1002/jpln.201200337
Postma R, van Rotterdam D, Hut H, et al. (2015) Fosfaatuitmijning voor natuurontwikkeling op voormaligelandbouwgrondinDrenthe;Eindrapport2010-2014Deelresultaat6&7.Wageningen
PoultonPR,JohnstonAE,WhiteRP(2013)Plant-availablesoilphosphorus.PartI:theresponseofwinterwheatand spring barley to Olsen P on a silty clay loam. Soil Use Manag 29:4–11. doi: 10.1111/j.1475-2743.2012.00450.x
R-Core-Team (2016) R: A Language and Environment for Statistical Computing. R Foundation for StatisticalComputing,Vienna,Austria
RáczIA,DériE,KisfaliM,etal.(2013)Earlychangesoforthopteranassemblagesaftergrasslandrestoration:Acomparison of space-for-time substitution versus repeated measures monitoring. Biodivers Conserv22:2321–2335.doi:10.1007/s10531-013-0466-8
Reemer(2018)BasisrapportvoordeRodeLijstBijen.Leiden,theNetherlandsReichPB(2014)Theworld-wide“fast-slow”planteconomicsspectrum:Atraitsmanifesto.JEcol102:275–301.
doi:10.1111/1365-2745.12211RennesonM,BarbieuxS,ColinetG(2016) Indicatorsofphosphorusstatus insoils:significanceandrelevance
forcropsoilsinsouthernBelgium.Areview.BiotechnolAgronSocEnviron20:257–272.RichterDD,AllenHL,LiJW,etal.(2006)Bioavailabilityofslowlycyclingsoilphosphorus:majorrestructuringof
soilPfractionsoverfourdecadesinanaggradingforest.Oecologia150:259–271.RieschF,StrohHG,TonnB,IsselsteinJ(2018)SoilpHandphosphorusdrivespeciescompositionandrichnessin
semi-natural heathlands and grasslands unaffected by twentieth-century agricultural intensification.PlantEcolDivers11:239–253.doi:10.1080/17550874.2018.1471627
RingevalB,AugustoL,MonodH,etal.(2017)Phosphorusinagriculturalsoils:driversofitsdistributionattheglobalscale.GlobChangBiol23:3418–3432.doi:10.1111/gcb.13618
Roberts TL, Johnston AE (2015) Phosphorus use efficiency andmanagement in agriculture. Resour ConservRecycl105:275–281.doi:10.1016/j.resconrec.2015.09.013

180
Rockström J, Steffen W, Noone K, et al. (2009) A safe operating environment for humanity. Nature461|24:472–475.doi:10.5751/ES-03180-140232
Rodriguez H, Fraga R (1999) Phosphate solubilizing bacteria and their role in plant growth promotion.BiotechnolAdv17:319–339.doi:10.1016/S0734-9750(99)00014-2
RoelingIS,OzingaWA,vanDijkJ,etal.(2018)PlantspeciesoccurrencepatternsinEurasiangrasslandsreflectadaptationtonutrientratios.Oecologia186:1055–1067.doi:10.1007/s00442-018-4086-6
RoemWJ,BerendseF(2000)Soilacidityandnutrientsupplyratioaspossiblefactorsdeterminingchanges inplant species diversity in grassland and heathland communities. Biol Conserv 92:151–161. doi:10.1016/S0006-3207(99)00049-X
Rohr JR,BernhardtES,CadotteMW,ClementsWH(2018)Theecologyandeconomicsof restoration:When,what,where,andhowtorestoreecosystems.EcolSoc.doi:10.5751/ES-09876-230215
Rombouts G, Abts M, Anthonissen A, et al. (2015) Praktijkgids bemesting - Grasland en voedergewassen.Brussel.Depotnummer:D/2015/3241/239
RosasSB,AndrésJA,RoveraM,CorreaNS(2006)Phosphate-solubilizingPseudomonasputidacaninfluencetherhizobia–legumesymbiosis.SoilBiolBiochem38:3502–3505.doi:10.1016/j.soilbio.2006.05.008
RoutG,SamantarayS,DasP(2001)Aluminiumtoxicityinplants :areview.AgronEDPSci21:3–21.Rowe H, Withers PJA, Baas P, et al. (2016) Integrating legacy soil phosphorus into sustainable nutrient
management strategies for future food, bioenergy and water security. Nutr Cycl Agroecosystems104:393–412.doi:10.1007/s10705-015-9726-1
RyanMH,GrahamJH(2002)Istherearoleforarbuscularmycorrhizalfungiinproductionagriculture?PlantSoil244:263–271.doi:10.1023/A:1020207631893
Sánchez-Alcalá I, del Campillo MC, Torrent J (2015) Critical Olsen P and CaCl2 -P levels as related to soilproperties:resultsfrommicropotexperiments.SoilUseManag31:233–240.doi:10.1111/sum.12184
SardansJ,PeñuelasJ(2015)Potassium:aneglectednutrientinglobalchange.GlobEcolBiogeogr24:261–275.doi:10.1111/geb.12259
SattariSZ,BouwmanAF,GillerKE,vanIttersumMK(2012)Residualsoilphosphorusasthemissingpieceintheglobalphosphoruscrisispuzzle.PNAS109:6348–6353.doi:10.1073/pnas.1113675109
Schaminée JHJ, Janssen J, Weeda EJ, et al. (2015) Veldgids Rompgemeenschappen. KNNV Publishing,Wageningen,TheNetherlands
Schellberg J, Hejcman M (2007) The Rengen Grassland Experiment (1941 - 2006) and its contribution tograsslandecology.GrasslSciEur12:512–515.
Schellberg J,MöselerBM,KühbauchW,Rademacher IF (1999)Long-termeffectsof fertilizeronsoilnutrientconcentration,yield, foragequalityand floristic compositionofahaymeadow in theEifelmountains,Germany.GrassForageSci54:195–207.
Schiemenz K, Eichler-LöbermannB (2010) Biomass ashes and their phosphorus fertilizing effect on differentcrops.NutrCyclAgroecosystems87:471–482.doi:10.1007/s10705-010-9353-9
SchippersW,BaxI,GardenierM(2012)OntwikkelenvanKruidenrijkGrasland.AardewerkAdvies,UtrechtSchwertmann U (1964) Differenzierung der Eisenoxide des Bodens durch Extraktion mit Ammoniumoxalat-
Lösung.JPlantNutrSoilSci105:194–202.Secretariat of the Convention on Biological Diversity (2014) Global Biodiversity Outlook 4. A mid-term
assessmentof progress towards the implementationof the Strategic Plan for Biodiversity 2011-2020.doi:10.2143/KAR.25.0.504988
Seguel A, Cumming JR, Klugh-Stewart K, et al. (2013) The role of arbuscular mycorrhizas in decreasingaluminium phytotoxicity in acidic soils: A review. Mycorrhiza 23:167–183. doi: 10.1007/s00572-013-0479-x
SharifM(2002)Effectof ligniticcoalderivedhumicacidongrowthandyieldofwheatandmaize inalkalinesoil.NWFPAgriculturalUniversityPeshawar
SharmaNC,StarnesDL,SahiSV(2007)Phytoextractionofexcesssoilphosphorus.EnvironPollut146:120–127.doi:10.1016/j.envpol.2006.06.006
SharpleyA, JarvieHP,BudaA,etal. (2013)PhosphorusLegacy:OvercomingtheEffectsofPastManagementPractices to Mitigate Future Water Quality Impairment. J Environ Qual 42:1308. doi:10.2134/jeq2013.03.0098
Simonis AD, Setatou HB (1996) Assessment of available phosphorus and potassium in soils by the calciumchlorideextractionmethod.CommunSoilSciPlantAnal27:685–694.doi:10.1080/00103629609369587
Simpson RJ, Oberson A, Culvenor RA, et al. (2011) Strategies and agronomic interventions to improve thephosphorus-useefficiencyoffarmingsystems.PlantSoil349:89–120.doi:10.1007/s11104-011-0880-1
SmithSE,ReadDJ(2008)Mycorrhizalsymbiosis,Third.AcademicPressLtd,London

181
Smits N a. C, Willems JH, Bobbink R (2008) Long-term after-effects of fertilisation on the restoration ofcalcareousgrasslands.ApplVegSci11:279–286.doi:10.3170/2008-7-18417
SmoldersAJP,LucassenECHET,vanderAalstM,etal. (2008)DecreasingtheabundanceofJuncuseffususonformer agricultural lands with noncalcareous sandy soils: Possible effects of liming and soil removal.RestorEcol16:240–248.
Soons MB, Hefting MM, Dorland E, et al. (2017) Nitrogen effects on plant species richness in herbaceouscommunitiesaremorewidespreadandstrongerthanthoseofphosphorus.BiolConserv212:390–397.doi:10.1016/j.biocon.2016.12.006
SteffenW,RichardsonK,Rockström J,etal. (2015)Planetaryboundaries:Guidinghumandevelopmentonachangingplanet.Science348:1217.doi:10.1126/science.aaa9629
StevensCJ,DiseNB,GowingDJG,MountfordJO(2006)LossofforbdiversityinrelationtonitrogendepositionintheUK:Regionaltrendsandpotentialcontrols.GlobChangBiol12:1823–1833.doi:10.1111/j.1365-2486.2006.01217.x
Stevens CJ, Duprè C, Dorland E, et al. (2011a) The impact of nitrogen deposition on acid grasslands in theAtlanticregionofEurope.EnvironPollut159:2243–50.doi:10.1016/j.envpol.2010.11.026
Stevens CJ, Gowing DJG, Wotherspoon K a, et al. (2011b) Addressing the Impact of Atmospheric NitrogenDeposition on Western European Grasslands. Environ Manage 48:885–94. doi: 10.1007/s00267-011-9745-x
Stevenson FJ, Cole MA (1999) Cycles of soils: Carbon, Nitrogen, Phosphorus, Sulfur, Micronutrients, 2ndedition.Wiley,NewYork(USA)
StoateC,BáldiA,BejaP,etal.(2009)Ecologicalimpactsofearly21stcenturyagriculturalchangeinEurope-Areview.JEnvironManage91:22–46.doi:10.1016/j.jenvman.2009.07.005
StorkeyJ,MacdonaldAJ,PoultonPR,etal.(2015)Grasslandbiodiversitybouncesbackfromlong-termnitrogenaddition.Nature528:401–404.doi:10.1038/nature16444
StuckeyCC,MarrsRH,PywellRF(2007)Theuseofchemicalameliorantstorestoreheathlandandspecies-richgrassland.AspApplBiol(VegetationManagement)82:49–56.
SudingKN(2011)TowardanEraofRestorationinEcology:Successes,Failures,andOpportunitiesAhead.AnnuRevEcolEvolSyst42:465–487.doi:10.1146/annurev-ecolsys-102710-145115
Sutcliffe LME, Batáry P, Kormann U, et al. (2014) Harnessing the biodiversity value of Central and EasternEuropeanfarmland.DiversDistrib722–730.doi:10.1111/ddi.12288
Syers JK, JohnstonAE,CurtinD (2008) Efficiencyof Soil andFertilizerPhosphorusUse:ReconcilingChangingConcepts of Soil Phosphorus Behaviour with Agronomic Information. FAO Fertil Plant Nutr Bull. doi:10.1017/S0014479708007138
T’JollynF,BoschH,DemolderH,etal.(2009)OntwikkelingvancriteriavoordebeoordelingvandelokalestaatvaninstandhoudingvandeNatura2000habitatypen.Brussel
TallowinJRB,SmithREN(2001)RestorationofaCirsio-MolinietumFenMeadowonanAgriculturallyImprovedPasture.RestorEcol9:167–178.doi:10.1046/j.1526-100x.2001.009002167.x
TangX,MaY,HaoX,etal.(2009)DeterminingcriticalvaluesofsoilOlsen-Pformaizeandwinterwheatfromlong-termexperimentsinChina.PlantSoil323:143–151.doi:10.1007/s11104-009-9919-y
Tedersoo L, Bahram M, Põlme S, et al. (2014) Global diversity and geography of soil fungi. Science. 346:1256688.doi:10.1126/science.1256688
ThakurMP,Wright AJ (2017) Environmental Filtering, Niche Construction, and Trait Variability: TheMissingDiscussion.TrendsEcolEvol32:884–886.doi:10.1016/j.tree.2017.09.014
Tilley M (2014) Karakterisatie van de nutriëntentoestand en de impact van maaibeheer in halfnatuurlijkegraslanden.doi:https://lib.ugent.be/nl/catalog/rug01:002166405
TilmanD,PascalaS(1993)TheMaintenanceofSpeciesRichnessinPlantCommunities.In:RicklefsR,SchluterD(eds)SpeciesDivers.Ecol.Communities.UniversityofChicagoPress,Chicago,USA,pp13–25
Timmermans BGH, van Eekeren N (2016) Phytoextraction of Soil Phosphorus by Potassium-Fertilized Grass-CloverSwards.JEnvironQual45:701–708.doi:10.2134/jeq2015.08.0422
TörökP,VidaE,DeákB,etal.(2011)GrasslandrestorationonformercroplandsinEurope:Anassessmentofapplicabilityoftechniquesandcosts.BiodiversConserv20:2311–2332.doi:10.1007/s10531-011-9992-4
TorrezV,CeulemansT,MergeayJ,etal.(2016)Effectsofaddinganarbuscularmycorrhizalfungiinoculumandofdistancetodonorsitesonplantspeciesrecolonizationfollowingtopsoilremoval.ApplVegSci19:7–19.doi:10.1111/avsc.12193
Trivedi P, Sa T (2008) Pseudomonas corrugata (NRRL B-30409)Mutants Increased Phosphate Solubilization,Organic Acid Production, and Plant Growth at Lower Temperatures. Curr Microbiol 56:140–4. doi:10.1007/s00284-007-9058-8
182
Turner BL (2008) Resource partitioning for soil phosphorus: a hypothesis. J Ecol 96:698–702. doi:10.1111/j.1365-2745.2008.01384.x
UnitedNations (2015) Transforming ourworld: The 2030 agenda for sustainable development. A/RES/70/1.doi:10.1007/s13398-014-0173-7.2
ValkH, SebekBJ,Van’tKloosterAT, JongbloedAW (1999)Clinical effectsof feeding lowdietaryphosphoruslevelstohighyieldingdairycows.VetRec145:673–674.doi:10.1136/vr.145.23.673
Van Daele F, Wasof S, Demey A, et al. (2017) Quantifying establishment limitations during the ecologicalrestorationofspecies-richNardusgrassland.ApplVegSci20:594–607.doi:10.1111/avsc.12330
VanDenBergLJL,DorlandE,VergeerP,etal.(2005)Declineofacid-sensitiveplantspeciesinheathlandcanbeattributed to ammonium toxicity in combination with low pH. New Phytol 166:551–564. doi:10.1111/j.1469-8137.2005.01338.x
vanderBijAU,WeijtersMJ,BobbinkR,etal.(2018)Facilitatingecosystemassembly:Plant-soilinteractionsasarestorationtool.BiolConserv220:272–279.doi:10.1016/j.biocon.2018.02.010
vanderHeijdenMGA,BardgettRD,vanStraalenNM(2008)Theunseenmajority:soilmicrobesasdriversofplantdiversityandproductivityinterrestrialecosystems.EcolLett11:296–310.
vanderSalmC,vanMiddelkoopJC,EhlertPAI(2017)Changesinsoilphosphoruspoolsofgrasslandsfollowing17yrs of balanced application of manure and fertilizer. Soil Use Manag 33:2–12. doi:10.1111/sum.12333
Van Der Woude BJ, Pegtel DM, Bakker JP (1994) Nutrient Limitation After Long-Term Nitrogen FertilizerApplicationinCutGrasslands.JApplEcol31:405–412.
VanderZeeSEATM,vanRiemsdijkWH,deHaanFAM(1990)Hetprotokolfosfaatverzadigdegrondendeel II:Technischeuitwerking.Wageningen,TheNetherlands
vanderZeeF,BobbinkR, LoebR,etal. (2017)NaareenActieplanHeischralegraslanden:hoebehoudenenherstellenweheischralegraslandeninNederland?Wageningen,TheNetherlands
van Dijk W, van Geel W (2012) Adviesbasis voor de bemesting van akkerbouw- envollegrondsgroentengewassen.Wageningen,TheNetherlands
vanDobbenH,BobbinkR,BalD,vanHinsbergA(2012)Overzichtvankritischedepositiewaardenvoorstikstof,toegepast op habitattypen en leefgebieden van Natura 2000. Alterra-rapport 2397. doi:10.1029/2004JB003221
vanDobbenHF,WamelinkGWW,SlimPA,etal.(2017)Species-richgrasslandcanpersistundernitrogen-richbutphosphorus-limitedconditions.PlantSoil411:451–466.doi:10.1007/s11104-016-3021-z
Van Geel M, Jacquemyn H, Plue J, et al. (2017) Abiotic rather than biotic filtering shapes the arbuscularmycorrhizal fungal communities of European seminatural grasslands. New Phytol. doi:10.1111/nph.14947
VanLieropW(1981)ConversionoforganicsoilpHvaluesmeasuredinwater,0.01MCaCl2or1NKCl.CanJSoilSci577579:577–579.
Van Meirvenne M, Tariku M, De Neve S, et al. (2007) Afbakening van de fosfaatverzadigde gebieden inVlaanderenopbasisvaneenkritischefosfaatverzadigingsgraadvan35%.Ghent
vanRotterdam a.MD,BussinkDW,TemminghoffEJM,vanRiemsdijkWH (2012)Predicting thepotentialofsoils to supply phosphorus by integrating soil chemical processes and standard soil tests. Geoderma189–190:617–626.doi:10.1016/j.geoderma.2012.07.003
vanSwaayC,WarrenM,LoïsG(2006)BiotopeuseandtrendsofEuropeanbutterflies.JInsectConserv10:189–209.doi:10.1007/s10841-006-6293-4
VandenNestT,RuysschaertG,VandecasteeleB,etal. (2015)PavailabilityandP leachingafter reducing themineralPfertilizationandtheuseofdigestateproductsasneworganicfertilizersina4-yearfieldtrialwithhighPstatus.AgricEcosystEnviron202:56–67.doi:10.1016/j.agee.2014.12.012
VenturiniEM,DrummondFA,HoshideAK,etal.(2017)Pollinationreservoirsforwildbeehabitatenhancementin cropping systems: a review. Agroecol Sustain Food Syst 41:101–142. doi:10.1080/21683565.2016.1258377
Verhagen R, Klooker J, Bakker JP, van Diggelen R (2001) Restoration succes of low-production plantcommunitiesonformeragriculturalsoilsaftertop-soilremoval.ApplVegSci4:75–82.
VerheyenK,HermyM(2004)Recruitmentandgrowthofherb-layerspecieswithdifferentcolonizingcapacitiesinancientandrecentforests.JVegSci15:125–134.doi:10.1111/j.1654-1103.2004.tb02245.x
VerlindenG,CoussensT,DeVlieghera.,etal.(2010)Effectofhumicsubstancesonnutrientuptakebyherbageandonproductionandnutritivevalueofherbagefromsowngrasspastures.GrassForageSci65:133–144.doi:10.1111/j.1365-2494.2009.00726.x

183
VerlindenG,PyckeB,MertensJ,etal.(2009)Applicationofhumicsubstancesresultsinconsistentincreasesincropyieldandnutrientuptake.JPlantNutr32:1407–1426.doi:10.1080/01904160903092630
VierheiligH,CoughlanA,WyssU,PicheY (1998) Inkandvinegar,asimplestainingtechnique forarbuscular-mycorrhizalfungi.ApplEnvironMicrobiol64:5004–7.
Viketoft M, Palmborg C, Sohlenius B, et al. (2005) Plant species effects on soil nematode communities inexperimentalgrasslands.ApplSoilEcol30:90–103.doi:10.1016/j.apsoil.2005.02.007
VirtanenR,JohnstonAE,CrawleyMJ,EdwardsGR(2000)Bryophytebiomassandspeciesrichnessontheparkgrassexperiment,Rothamsted,UK.PlantEcol151:129–141.doi:10.1023/A:1026533418357
Vlaamse Milieumaatschappij (2018) Jaarrapport Lucht. Emissies 2000-2016 en luchtkwaliteit 2017.D/2018/6871/015
Vlaamse Overheid (2000) Gewestplan.https://www.ruimtelijkeordening.be/NL/Beleid/Planning/Plannen/Bestemmingsplan/Gewestplan.
VlaamseOverheidNatura2000Vlaanderen.von LützowM,Kögel-Knabner I, EkschmittK, et al. (2006) Stabilizationoforganicmatter in temperate soils:
mechanismsandtheirrelevanceunderdifferentsoilconditions-areview.EurJSoilSci57:426–445.doi:10.1111/j.1365-2389.2006.00809.x
VucetichJA,BurnhamD,MacdonaldEA,etal.(2018)Justconservation:Whatisitandshouldwepursueit?BiolConserv221:23–33.doi:10.1016/j.biocon.2018.02.022
Walker KJ, Stevens P a, Stevens DP, et al. (2004) The restoration and re-creation of species-rich lowlandgrassland on land formerlymanaged for intensive agriculture in the UK. Biol Conserv 119:1–18. doi:10.1016/j.biocon.2003.10.020
WalkleyA,BlackIA(1934)AnexaminationoftheDjegtareffmethodfordeterminingsoilorganicmatterandaproposedmodificationofthechromicacidtitrationmethod.SoilSci37:29–38.
Wardle D a, Bardgett RD, Klironomos JN, et al. (2004) Ecological linkages between aboveground andbelowgroundbiota.Science304:1629–1633.doi:10.1126/science.1094875
Wasof S, De Schrijver A, Schelfhout S, et al. (2019) Linkages between aboveground and belowgroundcommunitycompositionsingrasslandsalongahistoricalland-useintensitygradient.PlantSoil434:289.doi:10.1007/s11104-018-3855-7
WassenMJ,OldeVenterinkHGM,SwartEOAM(1995)Nutrientconcentrationsinmirevegetationasameasureofnutrientlimitationinmireecosystems.JVegSci6:5–16.doi:10.2307/3236250
WassenMJ, VenterinkHO, Lapshina ED, Tanneberger F (2005) Endangered plants persist under phosphoruslimitation.Nature437:547–550.doi:10.1038/nature03950
Wesche K, Krause B, Culmsee H, Leuschner C (2012) Fifty years of change in Central European grasslandvegetation:Large losses inspecies richnessandanimal-pollinatedplants.BiolConserv150:76–85.doi:10.1016/j.biocon.2012.02.015
WickhamH(2009)ggplot2:ElegantGraphicsforDataAnalysis.Springer-VerlagNewYorkWilsonJB,PeetRK,DenglerJ,PärtelM(2012)Plantspeciesrichness:theworldrecords.JVegSci23:796–802.
doi:10.1111/j.1654-1103.2012.01400.xWinsaM,BommarcoR,LindborgR,etal.(2015)Recoveryofplantdiversityinrestoredsemi-naturalpastures
dependsonadjacentlanduse.ApplVegSci18:413–422.doi:10.1111/avsc.12157Withers PJA,HodgkinsonRA,RollettA, et al. (2017)Reducing soil phosphorus fertility bringspotential long-
termenvironmentalgains:AUKanalysis.EnvironResLett12:063001.doi:10.1088/1748-9326/aa69fcWolfAM,BakerDE (1985)Comparisonsof soil testphosphorusbyOlsen,BrayP1,Mehlich I andMehlich III
methods.CommunSoilSciPlantAnal16:467–484.doi:10.1080/00103628509367620WoodJR,HoldawayRJ,OrwinKH,etal.(2017)Nosingledriverofbiodiversity:Divergentresponsesofmultiple
taxaacrosslandusetypes.Ecosphere.doi:10.1002/ecs2.1997Wood TJ, Holland JM, Goulson D (2016) Diet characterisation of solitary bees on farmland: dietary
specialisationpredictsrarity.BiodiversConserv25:1–17.doi:10.1007/s10531-016-1191-xWoodcock BA, Savage J, Bullock JM, et al. (2014) Enhancing floral resources for pollinators in productive
agriculturalgrasslands.BiolConserv171:44–51.doi:10.1016/j.biocon.2014.01.023Wratten SD, Gillespie M, Decourtye A, et al. (2012) Pollinator habitat enhancement: Benefits to other
ecosystemservices.AgricEcosystEnviron159:112–122.doi:10.1016/j.agee.2012.06.020Wright IJ,ReichPB,WestobyM,etal. (2004)Theworldwide leafeconomicsspectrum.Nature428:821–827.
doi:10.1038/nature02403WubsERJ,vanderPuttenWH,BoschM,BezemerTM(2016)Soil inoculationsteersrestorationof terrestrial
ecosystems.NatPlants2:16107.doi:10.1038/nplants.2016.107

184
WuenscherR,UnterfraunerH, PeticzkaR, Zehetner F (2015)A comparisonof 14 soil phosphorus extractionmethods applied to 50 agricultural soils from Central Europe. Plant Soil Environ 61:86–96. doi:10.17221/932/2014-PSE
Yilmaz P, Wegener Parfrey L, Yarza P, et al. (2013) The SILVA and “All-species living tree project (LTP)”taxonomicframeworks.NucleicAcidsRes.doi:10.1093/nar/gkt1209
YuX,LiuX,ZhuTH,etal.(2011)Isolationandcharacterizationofphosphate-solubilizingbacteriafromwalnutand their effect on growth and phosphorus mobilization. Biol Fertil Soils 47:437–446. doi:10.1007/s00374-011-0548-2
ZhangJ,KobertK,FlouriT,StamatakisA (2014)PEAR:A fastandaccurate IlluminaPaired-EndreAdmergeR.Bioinformatics30:614–620.doi:10.1093/bioinformatics/btt593
ZhangS,CuiS,GongX,etal. (2016)EffectsofgammairradiationonsoilbiologicalcommunitiesandCandNpoolsinaclayloamsoil.ApplSoilEcol108:352–360.doi:10.1016/j.apsoil.2016.09.007
ZuurA,IenoE,WalkerN,etal.(2009)MixedeffectsmodelsandextensionsinecologywithR.Springer,NewYork
Zwaenepoel A, Stieperaere H (2002) Hoofdstuk 16: Heischraal grasland (Nardo-Galion). In: Zwaenepoel A,T’Jollyn F, Vandenbussche V, Hoffmann M (eds) Systematiek van natuurtypen voor Vlaanderen:Graslanden.AMINAL,afdelingNatuur,p55

185
AFFILIATIONSOFCO-AUTHORSLander Baeten Forest & Nature Lab, Department of Environment, Faculty of Bioscience Engineering, Ghent
University,Geraardsbergsesteenweg267,9090Gontrode(Melle),BelgiumSteveBaeyenResearchInstituteforAgriculture,FisheriesandFood(ILVO),BurgemeesterVanGansberghelaan
96,9820Merelbeke,BelgiumRobbeDeBeeldeForest&NatureLab,DepartmentofEnvironment,FacultyofBioscienceEngineering,Ghent
University,Geraardsbergsesteenweg267,9090Gontrode(Melle),BelgiumSaraDeBolleResearchgroupsoilfertilityandnutrientmanagement,DepartmentofEnvironment,Facultyof
BioscienceEngineering,GhentUniversity,CoupureLinks653,9000Ghent,BelgiumLeen De GelderDepartmentof Biotechnology, Faculty of Bioscience Engineering,GhentUniversity, Valentin
Vaerwyckweg1,9000Ghent,BelgiumAndreasDemey Forest&NatureLab,DepartmentofEnvironment,FacultyofBioscienceEngineering,Ghent
University,Geraardsbergsesteenweg267,9090Gontrode(Melle),BelgiumStefaanDeNeveResearchgroupsoilfertilityandnutrientmanagement,DepartmentofEnvironment,Faculty
ofBioscienceEngineering,GhentUniversity,CoupureLinks653,9000Ghent,BelgiumAnDe Schrijver Forest&Nature Lab,Departmentof Environment, FacultyofBioscienceEngineering,Ghent
University, Geraardsbergsesteenweg 267, 9090 Gontrode (Melle), Belgium; Faculty of Science andTechnology,UniversityCollegeGhent,Brusselsesteenweg161,9090Melle,Belgium
Nancy De Sutter Research Institute for Agriculture, Fisheries and Food (ILVO), Burgemeester VanGansberghelaan96,9820Merelbeke,Belgium
TomDuPréGraduatedMSc.StudentatFacultyofBioscienceEngineering,GhentUniversityPaul Gibson-Roy School of Geography and ResourceManagement. The University of Melbourne. Parkville
3052, Victoria, Australia; Greening Australia. 1 Smail St, Ultimo, Sydney 2007,New South Wales.Australia
Annelies Haegeman Research Institute for Agriculture, Fisheries and Food (ILVO), Burgemeester VanGansberghelaan96,9820Merelbeke,Belgium
GeertHaesaertDepartmentofPlantsandCrops,FacultyofBioscienceEngineering,GhentUniversity,ValentinVaerwyckweg1,9000Ghent,Belgium
MartineMaesResearchInstituteforAgriculture,FisheriesandFood(ILVO),BurgemeesterVanGansberghelaan96,9820Merelbeke,Belgium
Jan Mertens Forest & Nature Lab, Department of Environment, Faculty of Bioscience Engineering, GhentUniversity,Geraardsbergsesteenweg267,9090Gontrode(Melle),Belgium
SimonOosterlynckGraduatedMSc.StudentatFacultyofBioscienceEngineering,GhentUniversityMichaelPPerringForest&NatureLab,DepartmentofEnvironment,FacultyofBioscienceEngineering,Ghent
University,Geraardsbergsesteenweg267,9090Gontrode(Melle),Belgium;EcosystemRestorationandIntervention Ecology (ERIE) Research Group, School of Plant Biology, The University of WesternAustralia,35StirlingHighway,CrawleyWA6009Australia
MaudRamanResearchInstituteforNatureandForest,Kliniekstraat25,1070Brussels,Belgium
Bert Reubens Research Institute for Agriculture, Fisheries and Food (ILVO), Burg. Van Gansberghelaan 109,9820Merelbeke,Belgium
Wim H. van der PuttenNetherlands Institute of Ecology, Department of Terrestrial Ecology (NIOO-KNAW),Droevendaalsesteeg 10, 6708 PB, Wageningen, the Netherlands; Laboratory of Nematology,Department Plant Sciences,Wageningen University (WUR), PO Box 8123, 6700 ES,Wageningen, theNetherlands.
Pieter Vangansbeke Forest & Nature Lab, Department of Environment, Faculty of Bioscience Engineering,GhentUniversity,Geraardsbergsesteenweg267,9090Gontrode(Melle),Belgium
Margot Vanhellemont Forest&Nature Lab,Department of Environment, Faculty of Bioscience Engineering,GhentUniversity,Geraardsbergsesteenweg267,9090Gontrode(Melle),BelgiumFacultyofScienceandTechnology,UniversityCollegeGhent,Brusselsesteenweg161,9090Melle,Belgium
Kris Verheyen Forest & Nature Lab, Department of Environment, Faculty of Bioscience Engineering, GhentUniversity,Geraardsbergsesteenweg267,9090Gontrode(Melle),Belgium
Safaa Wasof Forest & Nature Lab, Department of Environment, Faculty of Bioscience Engineering, GhentUniversity,Geraardsbergsesteenweg267,9090Gontrode(Melle),Belgium

186
CURRICULUMVITAEPersonaldata
Name StephanieSchelfhoutAddress Oudeheerweg-Ruiter205
9250WaasmunsterNationality BelgianEmail [email protected]
[email protected] orcid.org/0000-0003-4642-352X
Professionalexperience
2012-Present PhDresearcheratForNaLab,GhentUniversity2014-Present TeachingassistantatForNaLab,GhentUniversity2012-2014 TeachingassistantatUniversityCollegeGhent2011-2012 ScientificpersonnelatUniversityCollegeGhent
Education
2012-2018 PhDandDoctoralSchoolsprogrammeGhentUniversityTitlePhDThesis:Roleofphosphorusintherestorationofspecies-richNardusgrasslandsviaphosphorus-mining(promotors:JanMertens,AnDeSchrijver,KrisVerheyen,GeertHaesaert)
2008-2010 MSc.inBioscienceEngineering,ForestandNatureManagement,GhentUniversity.MSc.Thesis:TreespecieseffectonearthwormcommunitiesinDanishandFlemishforests(promotor:AnDeSchrijver)
2ndsemester2009 ErasmusexchangeinattheUniversitätfürBodenkultur(BOKU)inVienna2004-2008 BSc.inBioscienceEngineering:LandandForestManagement,Ghent
UniversityBSc.Thesis:BestrijdingvanAmerikaansevogelkersinhetVlaamsebos:waarstaanweanno2007?(promotor:MargotVanhellemont)
1998-2004 SecondarySchool,ModerneTalen-Wiskunde,CampusLyceum,Wachtebeke

187
Scientificpublications
PeerreviewedpublicationsincludedintheWebofScience
WasofS,DeSchrijverA,Schelfhout S,PerringMP,RemyE,Mertens J,de laPeñaE,DeSutterN,Viaene N, Verheyen K. 2019 Linkages between aboveground and belowground communitycompositionsingrasslandsalongahistoricalland-useintensitygradient.PlantandSoil.434:289.(IF2017:3.306)DOI:https://doi.org/10.1007/s11104-018-3855-7
Schelfhout S, De Schrijver A, Verheyen K, De Beelde R, Haesaert G,Mertens J. 2018. Phosphorusmining efficiency declines with decreasing soil P concentration and varies across crop species.International Journal of Phytoremediation 20, 939–946. (IF 2017: 1.886) DOI:https://doi.org/10.1080/15226514.2018.1448363
VerstraetenG,VancampenhoutK,DesieE,DeSchrijverA,HlavaJ,SchelfhoutS,VerheyenK,MuysB.2018.Treespecieseffectsareamplifiedbyclaycontentinacidicsoils.SoilBiologyandBiochemistry.121:43–49.(IF2017:4.926)DOI:https://doi.org/10.1016/j.soilbio.2018.02.021
SchelfhoutS,JanMertensJ,PerringMP,RamanM,BaetenL,DemeyA,ReubensB,OosterlynckS,Gibson-RoyP,VerheyenK,DeSchrijverA.2017.P-removalforRestorationofNardusGrasslandsonFormer Agricultural Land: Cutting Traditions. Restoration Ecology 25: S178–S187. (IF 2017: 2.544)DOI:https://doi.org/10.1111/rec.12531
Schelfhout S, Mertens J, Verheyen K, Vesterdal L, Baeten L, Muys B, De Schrijver A. 2017. TreeSpecies Identity Shapes Earthworm Communities. Forests 8 (3). (IF 2017: 1.956) DOI:https://doi.org/10.3390/f8030085
VanDaele F,Wasof S, DemeyA,Schelfhout S, De Schrijver A, Baeten L, vanRuijven J,Mertens J,Verheyen K. 2017. Quantifying Establishment Limitations During the Ecological Restoration ofSpecies-richNardus Grassland. Applied Vegetation Science 20 (4): 594–607. (IF 2017: 2.331) DOI:https://doi.org/10.1111/avsc.12330
SetiawanNN,VanhellemontM,De SchrijverA,Schelfhout S, Baeten L, VerheyenK. 2016.MixingEffectsonLitterDecompositionRatesinaYoungTreeDiversityExperiment.ActaOecologica70:79–86.(IF2017:1.615)DOI:https://doi.org/10.1016/j.actao.2015.12.003
Schelfhout S,De SchrijverA,DeBolle S,DeGelder L,DemeyA,DuPréT,DeNeveS,HaesaertG,VerheyenK,Mertens J.2015.PhosphorusMining forEcologicalRestorationonFormerAgriculturalLand.RestorationEcology23(6):842–851.(IF2017:2.544)DOI:https://doi.org/10.1111/rec.12264
DeSchrijverA,DeFrenneP,Staelens J,VerstraetenG,MuysB,VesterdalL,WuytsK,VanNevelL,SchelfhoutS,DeNeveS,VerheyenK.2012.TreeSpeciesTraitsCauseDivergenceinSoilAcidificationDuring FourDecadesof Postagricultural ForestDevelopment.Global ChangeBiology18 (3): 1127–1140.(IF2017:8.997)DOI:http://doi.wiley.com/10.1111/j.1365-2486.2011.02572.x
Underreview
SchelfhoutS,WasofS,MertensJ,VanhellemontM,DemeyA,HaegemanA,VangansbekeP,BaeyenS, De Sutter N, Maes M, Viaene N, van der Putten W H, Verheyen K, De Schrijver A. Effects ofbioavailablephosphorusandsoilbiotaontypicalNardusgrasslandspeciesincompetitionwithfast-growingplantspecies.UnderreviewinEcologicalIndicators(IF2017:3.983)
Schelfhout S,De SchrijverA,VanhellemontM,VangansbekeP,Wasof S, PerringMP,HaesaertG,Verheyen K, Mertens J. Phytomining to re-establish phosphorus-poor soil conditions for naturerestorationonformeragriculturalland.AcceptedpendingminorrevisionsinPlantandSoil(IF2017:3.306)
188
Articlesinotherjournals
VanhellemontM,Schelfhout S,Mertens J,VerheyenK.2014.Bos inDeValleiVanDeGondebeek:1775-2013.Bosrevue(50):1–4
Schelfhout S, De Schrijver A, Mertens J, De Block M, Herr C, De Smedt P, Verheyen K. 2014.NatuurontwikkelingOpLandbouwgrond :Herstelmaatregelen.Natuur.focus13(1):31–39
De SchrijverA,Schelfhout S, DemeyA, RamanM, Baeten L,DeGroote S,Mertens J, VerheyenK.2013.Natuurhersteloplandbouwgrond:Fosforalsbottleneck.Natuur.focus12(4):145–153
Schelfhout S, De Schrijver A, Vesterdal L, Mertens J, Verheyen K. 2013. Over De Intieme RelatieTussenBoomsoortenEnRegenwormen.DeLevendeNatuur114(5):191–193
De Schrijver A,DemeyA,De Frenne P,Schelfhout S, Vergeynst J, De Smedt P, Verheyen K. 2013.StikstofEnBiodiversiteit:EenOnverzoenbaarDuo.Natuur.focus12(3):92–102
DeSchrijverA,WuytsK,Schelfhout S, Staelens J,VerstraetenG,VerheyenK.2012.VerzuringVanTerrestrische Ecosystemen: Oorzaken, Remedies En Gevolgen Voor De Biodiversiteit. Natuur.focus11:136–143
De Schrijver A, Van Uytvanck J, Thomaes A, Schelfhout S, Mertens J. 2011. EcologischeBosontwikkelingOpVoormaligeLandbouwgrondeninDePraktijk:KeuzesVoorBeheerders.Bosrevue(37):7–11
VanhellemontM,CalleB,Eliat-EliatO,SchelfhoutS,VanDeVijverE,VerheyenK.2008.BestrijdingVanAmerikaanseVogelkersinVlaanderen:StandVanZaken.Bosrevue(25):1–5
Bookchapter
DeSchrijverA,AmpoorterE,vanderBurgR,DemeyA,SchelfhoutS,OlsthoornA,DeSmedtP,Van-gansbeke P, Van Nevel L, Hommel P, De Frenne P, Mertens J, Verheyen K. 2018.Groeiplaatsverbetering.In:JansenP,BoostenM,CornelisJ,ThomassenE,WinnockM.PraktijkboekBosbeheer.StichtingProbos,Wageningen
Scientificactivities
Participationinsymposiawithoralpresentation
SchelfhoutS.2018.Kleinelandschapselementenkiezen:debijenweideupgradeninagrarischgebied.InKoplopersbijeenkomst:DemeerwaardevanBestuivers&agrobiodiversiteit.Ghent,Belgium
Schelfhout S, Raman M, De Schrijver A. 2016. Restoration of Species-rich Nardus Grasslands onFormer Fertilized Land by ReinitiatingMowing and Grazing Is Inadequate. In SER conference BestPractice in Ecological Restoration: 10th European Conference on Ecological Restoration. Freising,Germany
Schelfhout S. 2015. Restoration of Species-rich Grasslands on Former Agricultural Land via P--mining?InInterlife.Natuurpunt.Kasterlee,Belgium
Schelfhout S,DeSchrijverA,VerheyenK,HaesaertG,Mertens J.2013.RestorationofSpecies-richNardus Grasslands: Exploring the Technique of PhosphorusMining. In Open Landscapes : Ecology,ManagementandNatureConservation.Hildesheim,Germany
MertensJ,SchelfhoutS.2014.NatuurrestoratieOpVoormaligeLandbouwgrondenviaUitmijnenVanFosfor: Eerste Resultaten in Natuurgebieden ‘Landschap De Liereman’ (Oud-Turnhout) En Het‘Vrieselhof’ (Oelegem). In “(A)biotisch” En Toch Actief!: Ontmoetingsdag Ankona. Antwerpen,Belgium

189
Schelfhout S.2013.Afgraven,maaienenuitmijnen. InStudiedagFosfaatEnGraslandbiodiversiteit.Brussels,Belgium
SchelfhoutS.2011.Devoorbereidendefase:fosforuitmijnenofniet?InEcologischebosuitbreidingopsterkbemestegronden:vanwetenschapnaarpraktijk.Gontrode,Belgium
Schelfhout S, De Schrijver A, Mertens J, Vesterdal L, Verheyen K. 2011. Het boomsoorteffect opregenwormpopulatiesinDeenseenVlaamsebossen.InStartersdaginhetBos-enNatuuronderzoek.Brussels,Belgium
Participationinsymposiawithposterpresentation
DemeyA,SchelfhoutS,DeSchrijverA,MertensJ,delaPenaE,ViaeneN,DeSutterN,VerheyenK.2015. Impact of Bioavailable Phosphorus on Plant and Soil Microbial Communities in GrasslandUnderRestorationManagement.InEcologyofSoilMicroorganisms(ESM).Prague,CzechRepublic
Heyman T, Schelfhout S. 2016. Fosforuitmijning: Gewasselectie ter verschraling van voormaliglandbouwgebiedvoornatuurontwikkeling. InStartersdag inhetbos-ennatuuronderzoek.Brussels,Belgium
Bracke J, Schelfhout S, Debersaques F, Baert G, Mertens J. 2015. Verkennende studie van deregenworm als bodemingenieur in private moestuinen. In Startersdag in het bos- ennatuuronderzoek.Brussels,Belgium
DeBeeldeR,SchelfhoutS,DeSchrijverA,VerheyenK,HaesaertG,MertensJ.2013.Uitmijnenvanfosfor in functie van natuurontwikkeling op voormalige landbouwgronden: Potexperiment mettwaalfgewassenopeenbodem-P-chronosequentie. InStartersdaginhetbos-ennatuuronderzoek.Brussels,Belgium
Schelfhout S, Du Pré T, De Schrijver A, Verheyen K, Haesaert G, De Bolle S, Mertens J. 2012.Phytoextraction of Phosphorus for Ecological Restoration: Application of Soil Additives. In 4thInternationalEcoSummit.Ohio,USA
SchelfhoutS,DuPréT,DeSchrijverA,VerheyenK,DeBolleS,MertensJ.2012.Uitmijnenvanfosfor:een haalbare maatregel voor natuurontwikkeling op voormalige landbouwgronden? Optimalisatiemet chemische en biologische bodemaddities. In Startersdag in het Bos- en Natuuronderzoek.Brussels,Belgium
Participationinsymposiaorspecialisttrainingswithoutpresentation
20/08-24/08/2018 BestPracticeinmanagementandrestorationofEuropeandrygrasslands.SEREuropeSummerSchoolonEcologicalRestoration2018.Hungary.ByMelindaHalassy,KatalinTörök(SER,MTACentreforEcologicalResearch)
15/05/2018;21,28-29/06/2018
GrasGoed–graslandbeheer.InterregprojectGrasGoed,Natuurlijkgroenalsgrondstof.Zwartebeek,Koersel,BelgiumandBluesintheMarshes,Cromvoirt,TheNetherlands.ByWillyVerbeke(Inverde)
13/02/2018 Hetnieuwenatuurbeheerplan.ByLiselotLedene(Inverde)26-27/08/2016 Theroleofsoilseedbanksinrestoration.SEREuropestudent
course.Freising,Germany.ByPeterTörök(UniversityofDebrecen),HaraldAlbrecht(TUMFreising)
20/04/2016 AnintroductiontodplyrforRusers.Flamesworkshop.Ghent,Belgium.

190
16/09/2015 Heideontwikkelingopvoormaligelandbouwgrond.NationaalParkDwingelderveld,Dwingeloo,Nederland.
20/11/2014 NetherlandsAnnualEcologyMeeting(NERN).Wageningen,theNetherlands.
07/11/2014 Demonstratie:grasmaaienvoorvergisting?Deinze,Belgium.ByInverde.
05-06/06/2014 GraslandenindeFranseMaasvallei.Stenay,France.ByWillyVerbeke(Inverde)
25/02-1/03/2013 Workshopontaxonomyandsystematicofarbuscularmycorrhizalfungi.Ghent,Belgium.ByChrisWalker
Participationtoothertrainings
2ndsemester2018 AdvancedAcademicEnglish:Writingskills–(Bioscience)Engineering.Ghent,Belgium.ByTomDeMoor
2ndsemester2018 GrowYourFutureCareer.Ghent,Belgium.ByRobinLefebvre26/03/2014 Doeltreffendpresenteren.Leuven,Belgium.ByJean-LucDoumont04/02/2015 Basisassistententraining.Ghent,Belgium.12/02/2015 Practicumtraining.GhentBelgium.14,28/11/2014 Schrijvenvoorniet-vakgenotenenpers.Ghent,Belgium.ByAnnDeRon11-15/02/2013 Whatyouneedtoknowtobeeffectiveinwritingandpublishingyour
work.Louvain-La-Neuve,Belgium.MichaelHochberg(MonpellierUniversity)
Otheractivitiesandrelevantmemberships
ManuscriptreviewerforPlantEcologyandDiversity(1),Plantandsoil(1)
MemberofNatuurpunt
MemberofvzwDurme
MemberoftheSocietyforEcologicalRestoration
Consultingexperience
ProvoostS,VangansbekeP,RamanM,D’HulsterF,SchelfhoutS,VerheyenK,DeSchrijverA.2018.Referentieonderzoek nutriënten voor bepalen van de kwaliteit van Europees beschermdeduinhabitats.Hoeproblematischzijnfosfatenaandekust?Opdrachtgever:ANB
Mertens J, Schelfhout S, De Schrijver A.Maart 2018. Advisering over natuurherstel in hetmilitairdomeinTielenkamp.Opdrachtgever:ANB
Schelfhout S, Vangansbeke P, De Schrijver A, Mertens J. 2017. Bondige rapportage: Herstel vanheischralegraslandenendrogeheideviauitmijneninMaasmechelen.Opdrachtgever:ABOgroup
Schelfhout S, Vangansbeke P, De Schrijver A, Mertens J. 2017. Advisering over Het Herstel VanSoortenrijkeGraslandenviaMaaienEnUitmijneninDeOudeKaleVallei.Opdrachtgever:NatuurpuntLovendegem
Schelfhout S, Vangansbeke P, De Schrijver A, Mertens J. 2017. Advisering over Het Herstel VanSoortenrijkeGraslandenviaMaaienEnUitmijnen inDe LangeVeldenEnDrongen.Opdrachtgever:StadGent

191
Vangansbeke P, De Schrijver A, Schelfhout S, Verheyen K. 2017. Onderzoek NaarMethodes VoorAbiotischHerstelVanSoortenrijkeGraslanden inHetLIFE-projectPaysMosan.Opdrachtgever: LifePaysMosan
DemeyA,De SchrijverA,Schelfhout S, VerheyenK. 2014.NIP Fondatie-Heernisse: ExpertenadviesVegetatieontwikkeling.Opdrachtgever:ANB
DeSchrijverA,Schelfhout,VerheyenK.2013.OnderzoekNaarMogelijkhedenVoorCreatieVanOpenWater in De Depressie Van DeMoervaart (zoneWulfsdonk) in Relatie Tot Fosfor. Opdrachtgever:ANB
DeSchrijverA,SchelfhoutS,VerheyenK.2013.BodemonderzoeknaardepotentiesvoorherstelenontwikkelingvansoortenrijkgraslandBosvanAa.Opdrachtgever:Waterwegen&Zeekanaal
De Schrijver A, Schelfhout S, Verheyen K. 2013. Onderzoek Naar De Potenties Voor Herstel EnOntwikkeling VanGlanshavergraslandMetGrote Pimpernel inDeGebieden Pikhaken–Hollaken EnDorent.Opdrachtgever:ANB
De Schrijver A, Schelfhout S, Verheyen K. 2012. Onderzoek Naar Mogelijkheden VoorNatuurontwikkelinginDeDepressieVanDeMoervaartinRelatieTotFosfor.Opdrachtgever:ANB
Teachingexperience
ExcursionsandpracticaasTeachingAssistant
Master InMasterofScienceindeBiowetenschappen:land-entuinbouwkundeoptielandschaps-engroenbeheer
2012-Present NatuurontwikkelingbyJanMertens GroenbeheerbyJanMertens BosbeheerbyJanMertens BodemecologiebyJanMertens2012,2014,2015
Organisationofinternationalstudentexcursions
Bachelor InBachelorofScienceindebiowetenschappen(2ndyear)2012-Present EcologiebyJanMertens
Tutorofmasterdissertations
2018 LarsAllein:Natuurhersteltechniekenopvoormaligelandbouwgrond2016 FrederikVanDaele:Below-groundeffectsonplanttraits,competitionandcommunity
compositionintherestorationofNardeteagrasslands(guidancepracticalwork)2016 ThierryHeyman:Optimalegewaskeuzeen–rotatievoorhetuitmijnenvanfosfor2015 JolienBracke:Verkennendestudievanderegenwormalsbodemingenieurinprivate
moestuinen2014 KjellBastiaenssens:Optimalisatievaneenmesocosmnaareffectenvanfosforen
bodemlevenopplantengemeenschappen2014 PieterJoos:Ontwikkelingvanblauwgrasland:heteffectvanstikstofbemestingopde
fosforafvoer2013 ChristopheCousaert:VerhoogdevatbaarheidvanPleiocheitasetosabijlupinestijdens
hetuitmijnen?2013 RobbeDeBeelde:Uitmijnenvanfosforinfunctievannatuurontwikkelingop
voormaligelandbouwgronden:gewasselectie2013 TomDuPré:Natuurherstelviafosfor-uitmijnen:effectvanbodemadditiesovereen
bodem-fosfor-chronosequentie

192
Tutorofbachelordissertations
2017 SanderBombeke,SofieDejaegher.HerintroductievaneendotterbloemgraslandinhetbuitenlaboOvermeersen
2017 TomasBoone,EmmaDuthoo,BerdienVanDeVelde.Nutriëntenstromenin(moes)tuinen
2015 BertThienpondt,CorneelMartens,JoachimVanDeSteen:Opnaareengroenestadmetleefstraten:potproef
2014 NinaSarens,AnthonyDenayerandWietseBas:Kiemingenoverlevingvanflorauitheischralegraslanden
2014 ElineGlorieux,EmmyDecadtandHerlindeVanheule:Uitmijnenvanfosforuitdebodem:effectvan12gewassenopdedrogestofproductieenfosforafvoervanEngelsraaigras
2014 EvelienStautemans.Deoverlevingvanfosfaatsolubiliserendebacteriëninbodemsmetverschillendfosfaatgehalte
2012 ChristopheCousaert,RobbeDeBeelde,KorneelNeysens.Uitmijnenvanfosforinfunctievannatuurontwikkelingopvoormaligelandbouwgronden:effectvanAMFenPSB’s
Miscellaneous
Teaching course forbeekeepers:DeBijenweide (translated:Flora forbees). InDeinze (2015),Gent(2014,2015,2016,2017and2018),Laarne(2018).


