Embed Size (px)
Citation preview

Review of EU airport energy interests and priorities with respect to ICT, energy efficiency and enhanced building operation
Andrea Costa1, Luis M. Blanes1, Ciara Donnelly1 and Marcus M. Keane1
1 National University of Ireland, Galway, Civil Engineering Department, Informatics Research Unit for Sustainable Engineering (IRUSE)
University road, Galway, Ireland
Email: [email protected]
Abstract: This paper gives an overview on EU airport energy interests and priorities with respect to ICT, energy efficiency and enhanced building operation. To achieve this objective the paper begins with an overview on airports role on energy consumption, then novel review of airport energy consumption figures and energy efficiency actions at the EU level is presented. The research covers also interest and requirements of two Italian airports (MXP and FCO) in relation to enhanced operation which include: sub-metering and visualisation needed to better understand the end energy use, data analysis for benchmarking and correlation with operational and weather data, action management for maintenance operation support.
Keywords: Airport, Energy Consumption, Operation and Maintenance,
1. Introduction
Airports are actually small cities. They serve as critical nodes in the global, national and local transportation infrastructure connecting people, facilitating business, and enabling commerce. ACI EUROPE member airports (400+) welcome more than 1.5 billion passengers and handle over 17 million metric tonnes of cargo and 20 million aircraft movements (ACI-Europe, 2012).With respect to economic impact, Europe’s airports employ over 1.2 million people. These jobs alone with the amount up to a €59 billion have the impact on EU GDP and every on-site airport job indirectly creates another 2.1 jobs offsite (ACI-Europe, 2010). Correspondingly, airports are massive energy consumers and emission producers, being de-facto comparable to small cities. As one thinks of airports, they must be considered as open spaces containing many and various functional areas which include an “air side” (runway operations) and “land side” (terminal operations). These consist of runway spaces, runway lighting, hangers, maintenance bays, parking areas, outdoor lighting, terminal areas with their office spaces, check in areas, security areas, gates, restaurants, and shops amongst others. Therefore, due to the economic impact, their role as the critical transportation infrastructure nodes, and due to their energy consumption magnitude, the airports are excellent candidates for the energy efficiency research. Aviation’s overall contribution to the global GHG emissions inventory is dominated by aircraft in flight and these emissions are beyond the control and influence of airports. On the other hand, it is also true that still room is available to make advancements in decreasing GHG originated by airport buildings and services both in airside and landside facilities (Baumert, Herzog and Pershing, 2005). Socially and in the terms of the scale magnitude, the energy efficiency improvements in this space are meaningful and support Europe towards its 20-20-20 and 50-50-50 policy targets. Airports are also adequate because they display an open and positive attitude about the efficiency

measures arose from need, culture, and good business sense. In response to the arguably most difficult decade which the air industry has ever faced, airports and airlines are aggressively seeking for every possible cost savings measure. They also face pressure to “green” their image and politically there is the direct challenge from the government for transportation to be less dependent on the imported oil for security reasons. Thus the airport operators search for solutions (ACI-Europe, 2009).
CASCADE is an European FP7 research project which is developing facility-specific measurement-based energy action plans for the airport energy managers that are underpinned by Fault Detection Diagnosis (FDD) methods (PSE.AG, 2012). A framework and methodology for building customized ICT solutions is under development in order to integrate with and on the basis of the existing ICT infrastructure and operational procedures. A measurement framework and minimal data set will be established to control and benchmark the equipment performance, to optimize user behaviour, and to match client specifications. FDD enables the state-of-the-art energy management because it can be used to suggest problems in system design, equipment efficiency, and operational settings. CASCADE is aiming also at turning FDD into the actionable information by developing an energy action plan that links Actions-Actors-ISO Standards (ISO, 2011) through a web-based management portal. The developed ICT solutions will be able to integrate with existing systems and will target a 3-year return on investment and 20% reduction of energy consumption and 20% reduction of CO2 emissions. CASCADE will achieve these objectives in time by:
1. Engaging the client, determining their needs, and encouraging organisational change 2. Integrating new ICT technologies with the systems present at client facilities 3. Collecting data on user operation and equipment performance 4. Applying fault detection methods across operational scenarios and equipment
performance benchmarks 5. Making an Energy Action Plan that links actors, actions, and ISO standards based on
facility specific data and providing cost/benefit (kWh, CO2, Euros).
CASCADE approach focuses to the actions which airports can take in order to address GHG sources within their control and influence, fully in the line with ACI guidelines and recommendations for the future strategic airport planning and management (ACI, 2009). Energy management actions in large organizations, such as airports, span across different levels from the top level with the overall energy policy and planning to the bottom with scheduled and emergency based operation and maintenance. In order to support top level energy management it is important to better understand the starting point of an airport in relation to its energy consumption and set reasonable targets. The work presented in Section 2 shows an analysis of energy trends and energy efficiency interests of EU airports in broad terms are very relevant. This analysis is unique and novel by itself since it is the first airport specific study done in this direction. The paper documents also the study of two important European airports Roma Fiumicino (FCO) and SEA Malpensa (MXP) describing their current requirements in terms of enhanced airport operation which were identified in close collaboration with airport staff to answer their expectation in terms of energy savings, plant operation optimization and organizational questions towards an ISO based Energy Management (Section 3).

2. Review of airport energy consumption figures and energy efficiency actions at the EU level
2.1. Methodology
This study is based on the collection and comparison of both energy figures along with energy action measures of airports with the European area. In terms of population and sampling, as can be seen in Fig. 1 below, airports were gathered from the ACI – Europe monthly passenger traffic report 2010 (ACI-Europe, 2010b) specifically from the list shown for the accumulated passenger traffic (January-December 2010) which comprised of 93 airports (this is the total number of airports that was provided with yearly traffic data form ACI Europe in the annual report). Secondly, the airports which have become Airport Carbon Accredited (ACA) were considered which accounted for 57 airports. Some of these were already included in the previous 93, giving us a total of 113 airports for analysis. Fig. 1 shows the geographical extent of the sample taken. It must be noted that airports like Moscow and Istanbul-Ataturk have been included in this study, since they were included in the ACI Europe annual report. The two airports are in the geographical and economic influence of the European aviation community.
Fig. 1. Population definition and location
The collection of information took place during the period of October 2011 and May 2012. The sourcing of this information was done through the official websites of the airports themselves on the internet and in some cases through the websites of concessionaires or airport operators, thus all used figures are publicly available. The percentage of available data from the global sample of 113 airports can be seen in Fig. 2 below. Almost half of the airports did not disclose any energy figures for 2010 (55 out of 113). It must be noted that some airports have been included in aggregated figures making it impossible to gather specific information about one single airport, i.e. Swedavia for Swedish airports. Considering only ACA accredited airports the availability of energy figures for was higher and equal to 65% (37 airports out of 57 accredited).

Fig. 2. Energy figures – data availability for 2010
An interesting finding was that a number of smaller airports which are included in bigger organisations with larger groups of airports (e.g.TAV Airports Holding - the leading airport operator in Turkey) benefit from the general policies and environmental action plans which exist at the large organisation level but wouldn’t likely exist for a same size airport only locally managed. For example, Flores airport (FLW) with only 42,446 passengers in 2010 publicises good quality information. Portuguese airports (Aeroportos de Portugal, ANA) are a great example of one of the common cases throughout this investigation. This is the inclusion of a number of different airports in one single report under a common management. This can vary from state run companies to big contractors, e.g. British Airport Authority (BAA). The difficulty with this is that the figures are reflecting the environmental performance of the company’s activities making it difficult to get individual performance data for one single facility. This sort of reporting has minimised the total number of data which could have been used during the study to enrich the sample. It also highlights the need for a consistent and standardised format for accountancy and reporting of energy consumption figures.
Different components for energy consumption (end use) exist within the airport environment. The reporting of these sources varies greatly from total energy demand figures which have been clearly broken down into further categories of energy consumption (e.g. by facility, by end use) with other reports including only one energy consumption figure with no clarification of what is included.
Taking into account all airports in the sample with energy consumption (energy end use) figures, the analysis has considered only the total energy consumption given by the formula Equation 1. Note that fuel does not include back up units and/or ground transportation.
Equation 1: Energy Consumption Calculation
2.2. Energy figures
Among the considered 113 airports set, only 58 had figures for their total energy consumption (energy end use) available for either 2009 or 2010.As described in section above all data sources are publicly available. As we can see in Fig. 3, Fig. 4 and Fig. 5, a correlation exists between the airport energy consumption and both the number of passengers and the traffic unit. To account for the passenger number, we have used the ACI definition of “PAX” described as follows:
Equation 2: Definition of PAX

International and domestic passengers take into account both enplaned deplaned passengers. Direct transit passengers (who arrive at and depart from the airport on a flight bearing the same number) are counted only once. American Aviation industry uses the number of enplanements as a consistent indicator in relation to passenger numbers. This would make it easier to aggregate airport passenger numbers and to work out individual airport contributions and weighting factors which could be used as a basis for more in depth analysis. For our analysis, we have used the “traffic unit” as a comparable metric. The “traffic unit” (tu) is used internationally and is suitable for assessing airports based on both the number of passengers and the amount of freight (1 tu = 1PAX or 100kg Cargo (incl. mail) (Both enplaned and deplaned).
Additionally there are a number of different factors which surely impact on airport energy consumption and could subsequently result in further interesting studies, for which more data would be needed. These include factors such as:
1. Airport size (area and volume of conditioned spaces, area of externally exposed building envelope)
2. Shape factors:
a. Compact (One main Building with bus transportation)
b. Pier finger terminals
c. Pier satellite terminals
d. Remote satellite terminals
3. Location-Climate (Hot and cold degree days – HDD and CDD, solar radiation, humidity levels)
4. Hours of Operation
5. Building envelope
6. HVAC Systems and Controls
7. Level of maintenance at the facility
8. Occupant / User behaviour and energy management
It was not possible to incorporate these parameters into our analysis due to time constraints and other limitations such as consistent availability of data for the whole sample.
In Fig. 6 below, the normalised energy consumption has been plotted against the Total energy consumption, where the size of the circles represents the number of PAX. As this is the case that the circle size is the PAX, it gives you an idea of how busy is an airport is and their impact with regards to energy and normalized energy consumption.
London Heathrow (LHR), Paris Charles de Gaulle (CDG) and Frankfurt (FRA) are clearly ahead of the rest in relation to their overall energy usage, but with 13.57, 17.93 and 15.69 normalised energy consumption respectively, they are almost one and a half times the average of 9.29 kWh/PAX.year.
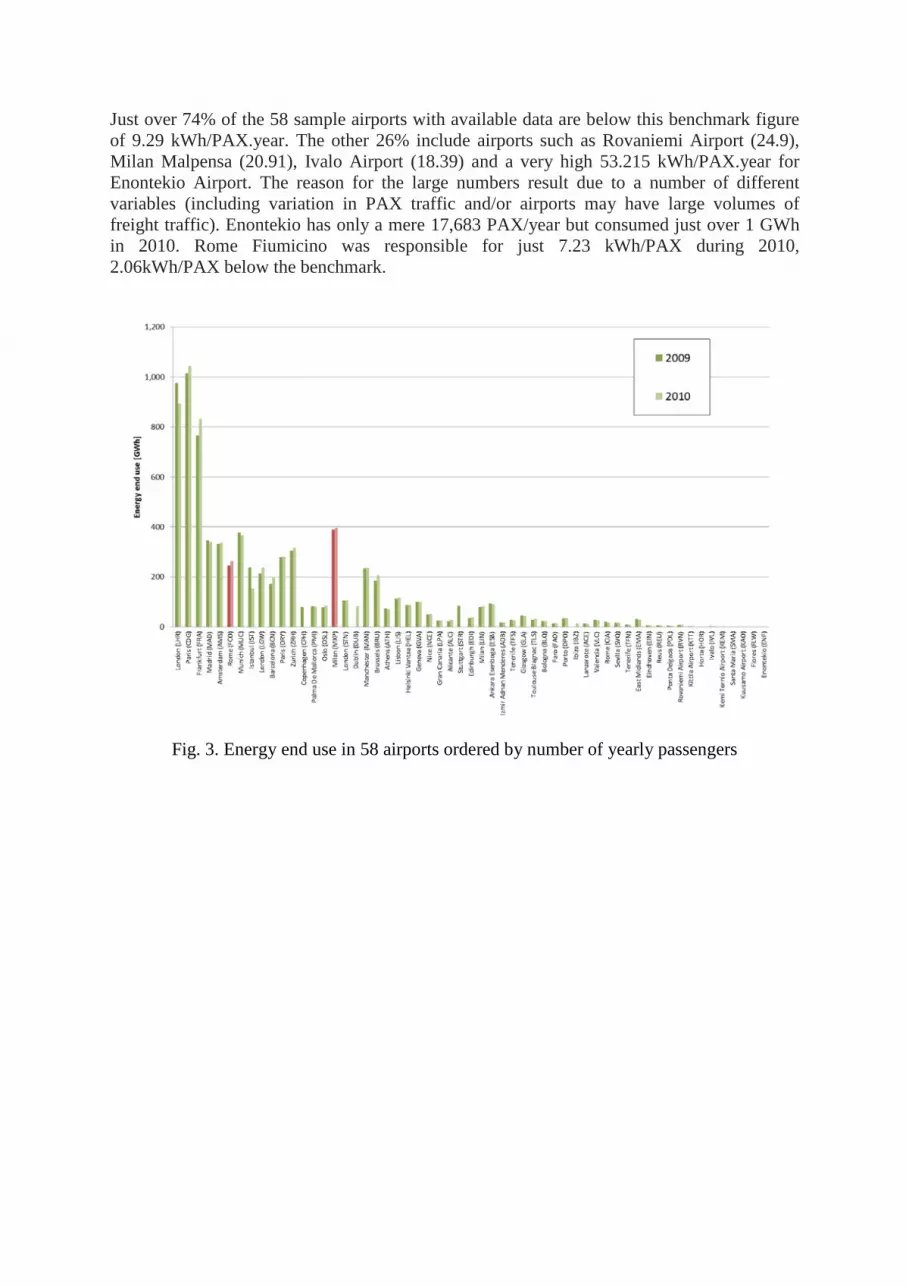
Just over 74% of the 58 sample airports with available data are below this benchmark figure of 9.29 kWh/PAX.year. The other 26% include airports such as Rovaniemi Airport (24.9), Milan Malpensa (20.91), Ivalo Airport (18.39) and a very high 53.215 kWh/PAX.year for Enontekio Airport. The reason for the large numbers result due to a number of different variables (including variation in PAX traffic and/or airports may have large volumes of freight traffic). Enontekio has only a mere 17,683 PAX/year but consumed just over 1 GWh in 2010. Rome Fiumicino was responsible for just 7.23 kWh/PAX during 2010, 2.06kWh/PAX below the benchmark.
Fig. 3. Energy end use in 58 airports ordered by number of yearly passengers

Fig. 4. Normalised Energy Consumption by Passengers figures
Fig. 5. Normalised Energy Consumption by Traffic unit [TU]

Fig. 6. Total Energy Consumption [GWh] vs. [kWh/PAX] (where size of bubble represents PAX)
Fig. 7. Total Energy Consumption vs. Energy Consumption per TU (where size of bubble represents PAX)

2.3. Energy actions and interests
All related actions reported in our 113 Sample airports during the period of 2009-2010 have been gathered and analysed. A number of airports do not have any significant action in 2009-10 because they were built or refurbished just before the considered period. The total number of energy related actions that it was possible to identify from the available information across 113 was 302. The actions were grouped in 5 different categories: energy management, HVAC, lighting, Renewable Energy Technologies (RET) and operational procedures. The following sections give a description of each category with some example for different airports.
Fig. 8. Energy actions per category
Energy management and operational procedures
The most popular category was “Energy Management and operational procedures with 106 out of 302 actions. When it comes to energy saving, energy management is a sustainable way to achieve goals set out by an organisation, not only for achieving cost savings but also other rewards such as a productive and enthusiastic workforce, (as encouraged in ISO 50001). Until recently, many organisations did not place a big focus on having an energy management program implemented at their facility. This trend is changing rapidly, and energy management is becoming a necessity for cost efficient operations. The integration of sustainability into daily operations and decision making processes needs to be strongly emphasised (ISO, 2011).
• Expansion of systems for central operations monitoring of boiler and power controls • Environmental training • Installation of additional metering for controlling major consumption points • Integration of additional metering with existing Building Management Systems • Replacing all oil vehicles with electric Powered vehicles • Lower aircraft average taxiing time by 10% by 2015 • Power sources provided at Gate as opposed to using APU • Shutdown of Baggage handling systems when not in use

Lighting
As shown in Figure 28, lighting actions made up 28% of the total energy related actions gathered throughout the study. With potential electricity savings of 85%, LED lighting refurbishments presented themselves as the most a common energy saving measure with examples including replacement of runway fixtures to LED, motion sensors for automated control of lighting areas which may not be used very frequently. Passive Infrared sensors (PIR sensors) were used in many cases. These are electronic devices that measure infrared (IR) light radiating from objects which come into its area of detection. Motion is detected when an infrared source with one temperature, a human, passes in front of an infrared source with another temperature, such as a wall.
• Motion detection for lighting • LED Replacements • Intelligent Lighting controls for areas of low occupancy EG. Passive Infrared Sensors
(PIR) • Retrofit of 65000 light fittings with Retrolux system (reduction of approx 20W per
fitting) • Roof glazing replacements • Passive Lighting
HVAC
Heating Ventilation and Air Conditioning (HVAC) can be responsible for up to 80% (SEAI,2008) of a facilities energy bill, due to poor design, operation and management. The most frequent measure taken in relation to HVAC was the installation or improvement of BMS and BAS systems. BMS and BAS schedules were also manually optimised according to effective user profiles.
• Regulation of ventilation on new generator at arrival • Installation of air curtains in boarding bridges • BMS/BAS system improvement • Optimisation of setpoints, eg. Setting AC systems to OFF on weekends or Off peak • Installed frequency converters on two ventilation systems • Cold and Heat Storage (CHS) • Combined Heat and Power (CHP), Tri Generation Plants
Renewable energy technologies
Only 17% of all actions came under the category of renewable energy. The most adopted RET system were:
• Photovoltaic panels • Biomass fuel production • Geothermal • Wind power

3. Airports requirements for enhanced operation, the specific case of MXP and FCO airports
This section shows both the core airport needs in relation to enhanced airport operation with a specific focus on energy action management and HVAC systems. This work is the result of many iterations with airport stakeholders of both Milan Malpensa airport (managed by SEA Spa) and Rome Fiumicino airport (managed by ADR Spa) to determine their interests and priorities with respect to energy efficiency and with CASCADE consortium partners (technology providers) to determine high impact strategies that must be targeted to work within the limited resources and time of the project. The aim of this section is to give an overview of gaps for improvement identified within current airports energy and maintenance operation. The main needs identified on the airport side were the following:
1. Energy savings and CO2 emission reduction 2. Hardware and software for sub-metering at every level and location within the whole
airport 3. Identification and advanced visualisation of Key Performance Indicators (KPIs) 4. ISO 50001 certification 5. Correlation studies between measured parameters (operational & weather data vs
KPIs) 6. Maintenance activities support (performance assessment, costs impact, workflow and
action management, predictive maintenance, etc… )
We will focus now on the two main areas in which we identified room for improvement: performance monitoring and energy and maintenance action management:
3.1. Performance data monitoring
Both airports do not have a detailed energy end use monitoring system. Available measurements data on the thermal side are only at the overall airport level (utility bills) whereas on the electrical side they are only at the main switchboard level by which is possible to identify energy consumption of different macro areas (like terminals or buildings) or main systems (like BHS) of the airport. This resolution doesn’t allow for end use energy monitoring and performance assessment. The first airport requirement is therefore sub-monitoring at a higher resolution and deeper level of detail, closer to end use energy consumption (e.g. HVAC air handling units and components, lighting for specific indoor or outdoor spaces or other equipment electrical/thermal consumption). Once more data is available also advanced visualisation is required. Another requirement is to identify representative KPIs at both facility and system/subsystem level. Correlation studies need also to be carried out between KPIs and relevant parameters available such as weather conditions (outdoor air temperature, relative humidity, solar radiation wind speed, etc…) and operational data (flight numbers, passengers, baggage and freight movements, etc…). Correlation studies are very useful for performance assessment, benchmarking and facility level fault detection. Currently at MXP a daily energy consumption monitoring review is carried out to compare available electrical energy consumption with the consumption of the day before of the same day in the previous year. At FCO this is done only on monthly basis. CASCADE has the potential to offer to both airports a significant opportunity of improvement through advanced visualization techniques and correlation between energy use and the parameters with major influence on energy consumption.

Fig. 9. Screenshot of automatically generated energy consumption daily report at MXP.
3.2. Energy and maintenance action management
Both airports use SAP software platform for enterprise management. This platform also allows for energy and maintenance action management, Fig. 10. shows the current actions work flow at FCO: if a fault or an operation problem is detected by either a room occupant or the control room (though the BMS supervisory interface), a corrective action is assigned to the external maintenance company though the SAP call centre (outsourced service) or though directly into the SAP system (by the control room). The only difference with MXP is that in the Milan airport case there is not call centre and all the corrective actions (and user complaints) pass through the control room and form there they are directly entered into SAP. Once the corrective action is entered in the system, the outsourced maintenance company automatically receives a printout with the corrective action request. This action is then carried out by the maintenance company and once it is completed, it is closed on the SAP platform. However, the current version of SAP at both airports doesn’t allow the airports to formally validate the closure request coming from the maintenance company. This leads to possible issues like: the maintenance company doesn’t close the action as expected by the airport or doesn’t really specify all the details of the work carried tout to fix the issue. This feature could be automated in the CASCADE solution platform in relation to the actions triggered by the FDD providers. Airports would like to have a platform that allows a systematic way to plan maintenance related actions including basic finicalities like task and responsibilities assignation to people and time planning but also advanced functionalities like considerations on actions related energy savings, implementation costs and payback period calculation. Another aspect is that there is a lot of paper work involved once the fix is carried out by the maintenance company and this is all paper based, this is also something that the airports would like to automate and systematise possibly within the CASCADE. Lastly, in the airports wishes list there is also a tool feature to support the negotiation process between airport maintenance administration office and the outsourced maintenance company which initiates whenever actions involving additional costs need to be carried out.

Fig. 10. Energy and maintenance action management workflow
4. Conclusion
This paper gives an overview of airports role on energy consumption at the EU level and the importance of research in this field. An overview of the FP7 CASCADE project is also given in the introduction. The the issue of ehnaced airport operation is tackeld at both top and bottom level. In rlation to the top level analysis a novel and detailed research of available airport energy consumption figures, energy actions and interest of the top 113 EU airports. In relation to the bottom level, the case of two airports is presented. This section reviews FCO and MXP operation and describes current requirements in terms of enhanced airport operation which were identified in close collaboration with the airports to answer their expectation in terms of energy savings, plant operation optimization and organizational questions towards an ISO based Energy Management. The identified airport requirements for enhanced operation include: sub-metering and visualisation needed to better understand the end energy use, data analysis for benchmarking and correlation with operational and weather data, action management for maintenance operation support.

Acknowledgements
This research was funded by the Irish Research Council for Science, Engineering & Technology (IRCSET), D'Appolonia s.p.a. and the European Community's Seventh Framework Programme (FP7/2007-2013) under grant agreement No. 284920.
References: ACI. 2009. Policies and Reccomended Practices Handbook, Geneve: Airports Council International ACI-Europe. 2009. Airport Business Communique Magazine. Autum Quarterly 2009. [Online]. Available from: http://www.airport-business.com/ [Accessed 1 May 2012] ACI-Europe. 2010. An Outlook for Europe’s Airports, Facing the Challenges of the 21st Century. [Online]. Available from: http://www.aci-europe.org/policy/position-papers.html [Accessed 7 November 2011] ACI-Europe. 2010b. Monthly traffic report. [Online] Available from: http://www.vnukovo.ru/eng/for-specialist/aci_trffc_rpts/#.UCfivaMeONg [Accessed 1 May 2012] ACI-Europe. 2012. ACI-Europe Statistics. [Online]. Available from: http://www.aci-europe.org [Accessed 2 May 2012] Baumert, K.A., Herzog, T. and Pershing, J. (2005). Navigating the Numbers. Greenhouse gas data and international policy. Washington: World Resources Institute ISO. 2011. ISO 50001 – Energy management systems. Requirements with guidance for use. Geneve: International Standards Association PSE.AG. 2012. CASCADE ICT for Energy Efficient Airports.[Online] Available from: http://www.cascade-eu.org [Accessed 1 May 2012]


