Embed Size (px)
Citation preview
Table of Contents Tables
General Information on the Russian Banking Sector 1-11
Banking sector in the economy of Russia 1-3
Institutional features of the banking sector 4-11
Activities of Credit Institutions 12-39.2
Main trends 12-29
Financial condition 30-31
Regional breakdown 32.1-39.2
Macroprudential Indicators of the Banking Sector 40-66
Some indicators of the banking sector financial soundness 40
Capital adequacy 41-46
Credit risk 47-56
Market risk 57-62
Liquidity of credit institutions 63-66
The Summary Methodology to "Review of the Banking Sector
of the Russian Federation"67
ANALYTICAL DATA
№ 136 February 2014
THE CENTRAL BANK OF THE RUSSIAN FEDERATION
BANKING SUPERVISION DEPARTMENT
REVIEW
OF THE BANKING SECTOR
OF THE RUSSIAN FEDERATION(INTERNET-VERSION)
General Information on the Russian Banking Sector
Banking sector in the economy of Russia
Table 1
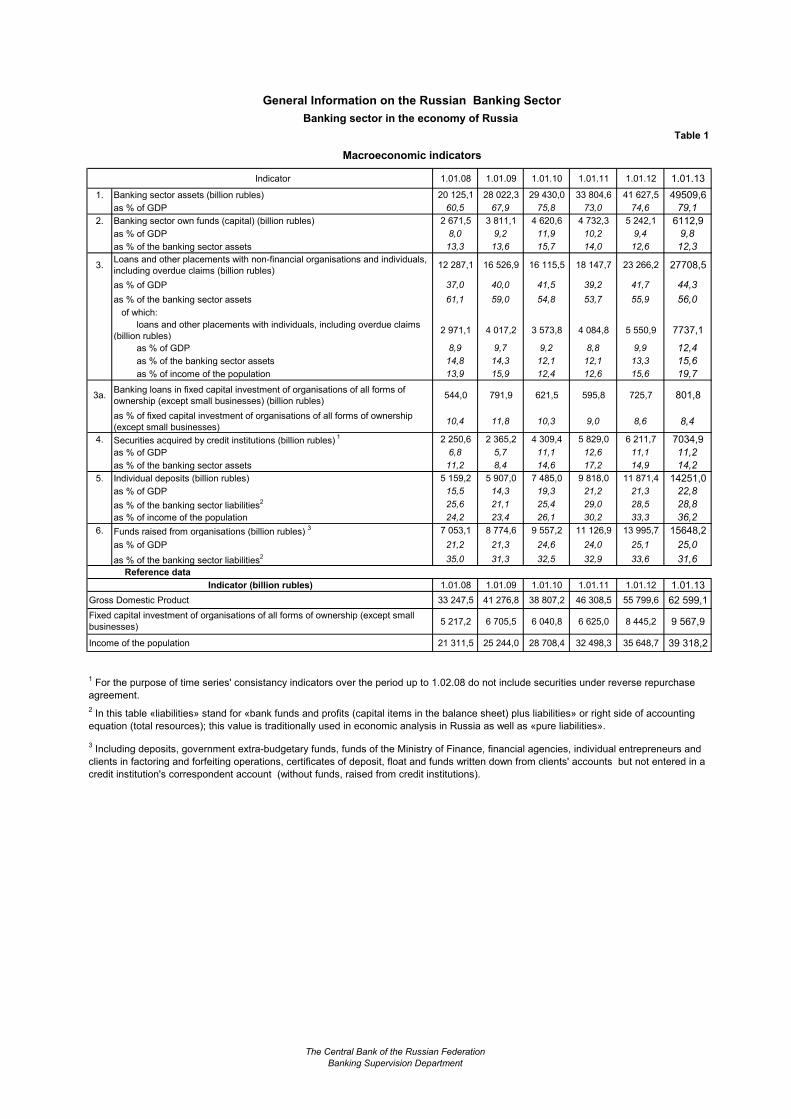
Macroeconomic indicators
Indicator 1.01.08 1.01.09 1.01.10 1.01.11 1.01.12 1.01.13
1. Banking sector assets (billion rubles) 20 125,1 28 022,3 29 430,0 33 804,6 41 627,5 49509,6
as % of GDP 60,5 67,9 75,8 73,0 74,6 79,1
2. Banking sector own funds (capital) (billion rubles) 2 671,5 3 811,1 4 620,6 4 732,3 5 242,1 6112,9
as % of GDP 8,0 9,2 11,9 10,2 9,4 9,8
as % of the banking sector assets 13,3 13,6 15,7 14,0 12,6 12,3
3.Loans and other placements with non-financial organisations and individuals,
including overdue claims (billion rubles)12 287,1 16 526,9 16 115,5 18 147,7 23 266,2 27708,5
as % of GDP 37,0 40,0 41,5 39,2 41,7 44,3
as % of the banking sector assets 61,1 59,0 54,8 53,7 55,9 56,0
of which:
loans and other placements with individuals, including overdue claims
(billion rubles)2 971,1 4 017,2 3 573,8 4 084,8 5 550,9 7737,1
as % of GDP 8,9 9,7 9,2 8,8 9,9 12,4
as % of the banking sector assets 14,8 14,3 12,1 12,1 13,3 15,6
as % of income of the population 13,9 15,9 12,4 12,6 15,6 19,7
3а.Banking loans in fixed capital investment of organisations of all forms of
ownership (except small businesses) (billion rubles) 544,0 791,9 621,5 595,8 725,7 801,8
as % of fixed capital investment of organisations of all forms of ownership
(except small businesses) 10,4 11,8 10,3 9,0 8,6 8,4
4. Securities acquired by credit institutions (billion rubles) 1 2 250,6 2 365,2 4 309,4 5 829,0 6 211,7 7034,9
as % of GDP 6,8 5,7 11,1 12,6 11,1 11,2
as % of the banking sector assets 11,2 8,4 14,6 17,2 14,9 14,2
5. Individual deposits (billion rubles) 5 159,2 5 907,0 7 485,0 9 818,0 11 871,4 14251,0
as % of GDP 15,5 14,3 19,3 21,2 21,3 22,8
as % of the banking sector liabilities2 25,6 21,1 25,4 29,0 28,5 28,8
as % of income of the population 24,2 23,4 26,1 30,2 33,3 36,2
6. Funds raised from organisations (billion rubles) 3 7 053,1 8 774,6 9 557,2 11 126,9 13 995,7 15648,2
as % of GDP 21,2 21,3 24,6 24,0 25,1 25,0
as % of the banking sector liabilities2 35,0 31,3 32,5 32,9 33,6 31,6
Reference data
Indicator (billion rubles) 1.01.08 1.01.09 1.01.10 1.01.11 1.01.12 1.01.13
Gross Domestic Product 33 247,5 41 276,8 38 807,2 46 308,5 55 799,6 62 599,1
5 217,2 6 705,5 6 040,8 6 625,0 8 445,2 9 567,9
Income of the population 21 311,5 25 244,0 28 708,4 32 498,3 35 648,7 39 318,2
Fixed capital investment of organisations of all forms of ownership (except small
businesses)
2 In this table «liabilities» stand for «bank funds and profits (capital items in the balance sheet) plus liabilities» or right side of accounting
equation (total resources); this value is traditionally used in economic analysis in Russia as well as «pure liabilities».
3 Including deposits, government extra-budgetary funds, funds of the Ministry of Finance, financial agencies, individual entrepreneurs and
clients in factoring and forfeiting operations, certificates of deposit, float and funds written down from clients' accounts but not entered in a
credit institution's correspondent account (without funds, raised from credit institutions).
1 For the purpose of time series' consistancy indicators over the period up to 1.02.08 do not include securities under reverse repurchase
agreement.
The Central Bank of the Russian Federation
Banking Supervision Department
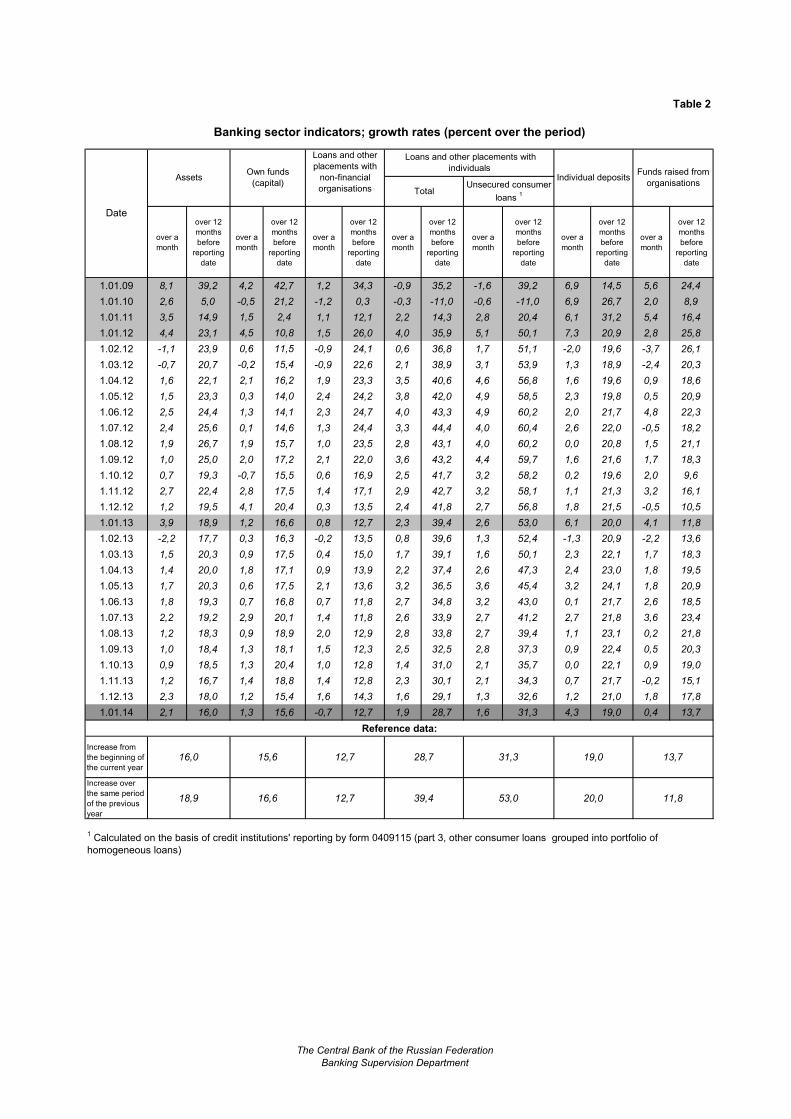
Table 2
Banking sector indicators; growth rates (percent over the period)
over a
month
over 12
months
before
reporting
date
over a
month
over 12
months
before
reporting
date
over a
month
over 12
months
before
reporting
date
over a
month
over 12
months
before
reporting
date
over a
month
over 12
months
before
reporting
date
over a
month
over 12
months
before
reporting
date
over a
month
over 12
months
before
reporting
date
1.01.09 8,1 39,2 4,2 42,7 1,2 34,3 -0,9 35,2 -1,6 39,2 6,9 14,5 5,6 24,4
1.01.10 2,6 5,0 -0,5 21,2 -1,2 0,3 -0,3 -11,0 -0,6 -11,0 6,9 26,7 2,0 8,9
1.01.11 3,5 14,9 1,5 2,4 1,1 12,1 2,2 14,3 2,8 20,4 6,1 31,2 5,4 16,4
1.01.12 4,4 23,1 4,5 10,8 1,5 26,0 4,0 35,9 5,1 50,1 7,3 20,9 2,8 25,8
1.02.12 -1,1 23,9 0,6 11,5 -0,9 24,1 0,6 36,8 1,7 51,1 -2,0 19,6 -3,7 26,1
1.03.12 -0,7 20,7 -0,2 15,4 -0,9 22,6 2,1 38,9 3,1 53,9 1,3 18,9 -2,4 20,3
1.04.12 1,6 22,1 2,1 16,2 1,9 23,3 3,5 40,6 4,6 56,8 1,6 19,6 0,9 18,6
1.05.12 1,5 23,3 0,3 14,0 2,4 24,2 3,8 42,0 4,9 58,5 2,3 19,8 0,5 20,9
1.06.12 2,5 24,4 1,3 14,1 2,3 24,7 4,0 43,3 4,9 60,2 2,0 21,7 4,8 22,3
1.07.12 2,4 25,6 0,1 14,6 1,3 24,4 3,3 44,4 4,0 60,4 2,6 22,0 -0,5 18,2
1.08.12 1,9 26,7 1,9 15,7 1,0 23,5 2,8 43,1 4,0 60,2 0,0 20,8 1,5 21,1
1.09.12 1,0 25,0 2,0 17,2 2,1 22,0 3,6 43,2 4,4 59,7 1,6 21,6 1,7 18,3
1.10.12 0,7 19,3 -0,7 15,5 0,6 16,9 2,5 41,7 3,2 58,2 0,2 19,6 2,0 9,6
1.11.12 2,7 22,4 2,8 17,5 1,4 17,1 2,9 42,7 3,2 58,1 1,1 21,3 3,2 16,1
1.12.12 1,2 19,5 4,1 20,4 0,3 13,5 2,4 41,8 2,7 56,8 1,8 21,5 -0,5 10,5
1.01.13 3,9 18,9 1,2 16,6 0,8 12,7 2,3 39,4 2,6 53,0 6,1 20,0 4,1 11,8
1.02.13 -2,2 17,7 0,3 16,3 -0,2 13,5 0,8 39,6 1,3 52,4 -1,3 20,9 -2,2 13,6
1.03.13 1,5 20,3 0,9 17,5 0,4 15,0 1,7 39,1 1,6 50,1 2,3 22,1 1,7 18,3
1.04.13 1,4 20,0 1,8 17,1 0,9 13,9 2,2 37,4 2,6 47,3 2,4 23,0 1,8 19,5
1.05.13 1,7 20,3 0,6 17,5 2,1 13,6 3,2 36,5 3,6 45,4 3,2 24,1 1,8 20,9
1.06.13 1,8 19,3 0,7 16,8 0,7 11,8 2,7 34,8 3,2 43,0 0,1 21,7 2,6 18,5
1.07.13 2,2 19,2 2,9 20,1 1,4 11,8 2,6 33,9 2,7 41,2 2,7 21,8 3,6 23,4
1.08.13 1,2 18,3 0,9 18,9 2,0 12,9 2,8 33,8 2,7 39,4 1,1 23,1 0,2 21,8
1.09.13 1,0 18,4 1,3 18,1 1,5 12,3 2,5 32,5 2,8 37,3 0,9 22,4 0,5 20,3
1.10.13 0,9 18,5 1,3 20,4 1,0 12,8 1,4 31,0 2,1 35,7 0,0 22,1 0,9 19,0
1.11.13 1,2 16,7 1,4 18,8 1,4 12,8 2,3 30,1 2,1 34,3 0,7 21,7 -0,2 15,1
1.12.13 2,3 18,0 1,2 15,4 1,6 14,3 1,6 29,1 1,3 32,6 1,2 21,0 1,8 17,8
1.01.14 2,1 16,0 1,3 15,6 -0,7 12,7 1,9 28,7 1,6 31,3 4,3 19,0 0,4 13,7
Reference data:
Increase from
the beginning of
the current year
16,0 15,6 12,7 28,7 31,3 19,0 13,7
Increase over
the same period
of the previous
year
18,9 16,6 12,7 39,4 53,0 20,0 11,8
1 Calculated on the basis of credit institutions' reporting by form 0409115 (part 3, other consumer loans grouped into portfolio of
homogeneous loans)
AssetsOwn funds
(capital)
Loans and other
placements with
non-financial
organisations Unsecured consumer
loans 1
Loans and other placements with
individualsIndividual deposits
Funds raised from
organisationsTotal
Date
The Central Bank of the Russian Federation
Banking Supervision Department
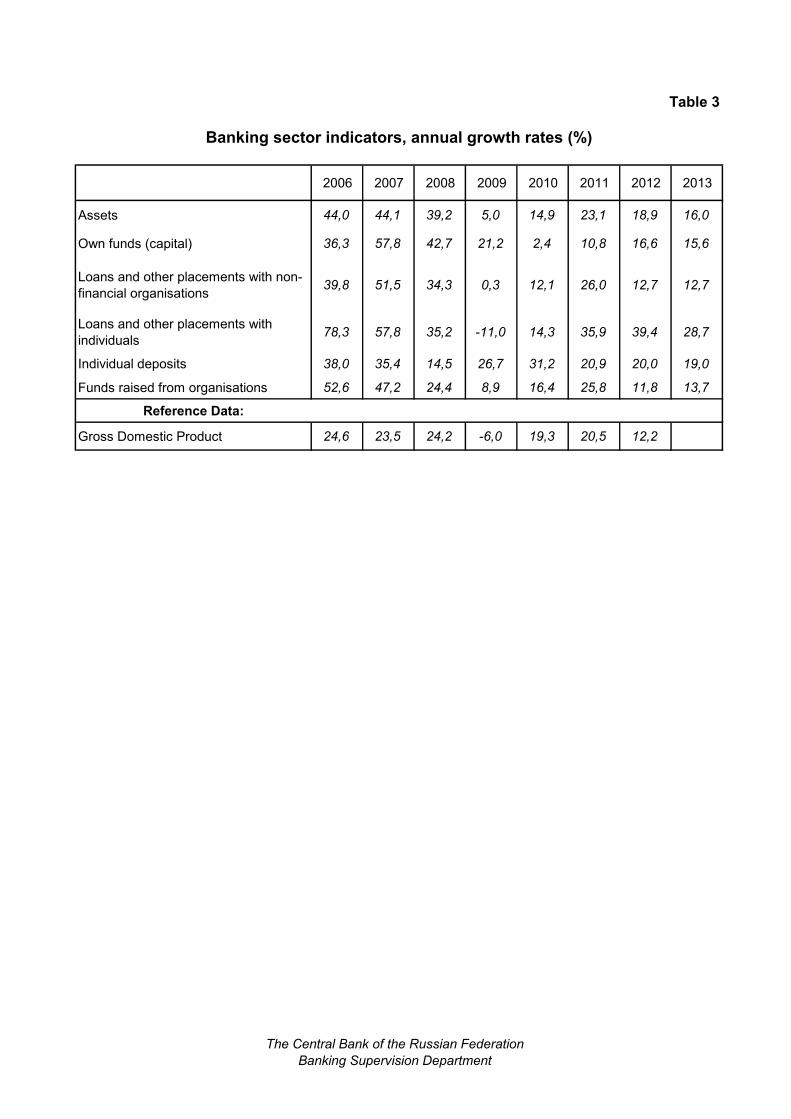
Table 3
2006 2007 2008 2009 2010 2011 2012 2013
Assets 44,0 44,1 39,2 5,0 14,9 23,1 18,9 16,0
Own funds (capital) 36,3 57,8 42,7 21,2 2,4 10,8 16,6 15,6
Loans and other placements with non-
financial organisations39,8 51,5 34,3 0,3 12,1 26,0 12,7 12,7
Loans and other placements with
individuals78,3 57,8 35,2 -11,0 14,3 35,9 39,4 28,7
Individual deposits 38,0 35,4 14,5 26,7 31,2 20,9 20,0 19,0
Funds raised from organisations 52,6 47,2 24,4 8,9 16,4 25,8 11,8 13,7
Reference Data:
Gross Domestic Product 24,6 23,5 24,2 -6,0 19,3 20,5 12,2
Banking sector indicators, annual growth rates (%)
The Central Bank of the Russian Federation
Banking Supervision Department
Institutional features of the banking sector
Table 4
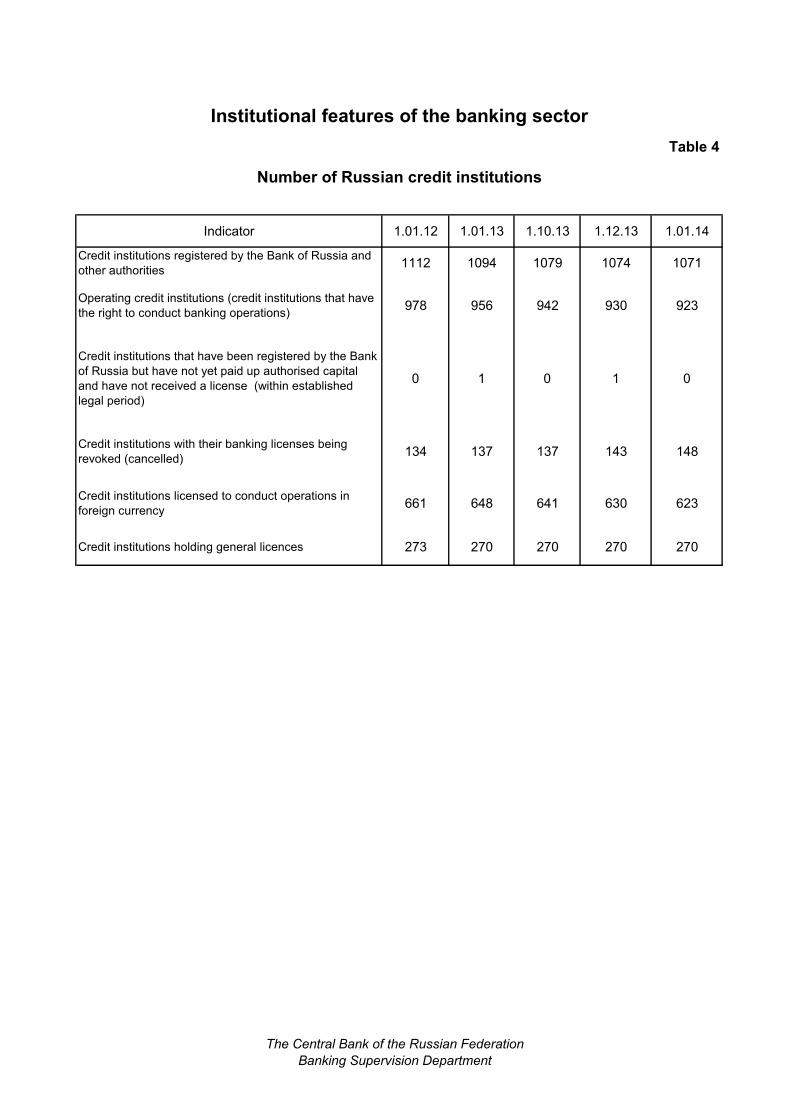
Number of Russian credit institutions
Indicator 1.01.12 1.01.13 1.10.13 1.12.13 1.01.14
Credit institutions registered by the Bank of Russia and
other authorities1112 1094 1079 1074 1071
Operating credit institutions (credit institutions that have
the right to conduct banking operations)978 956 942 930 923
Credit institutions that have been registered by the Bank
of Russia but have not yet paid up authorised capital
and have not received a license (within established
legal period)
0 1 0 1 0
Credit institutions with their banking licenses being
revoked (cancelled) 134 137 137 143 148
Credit institutions licensed to conduct operations in
foreign currency661 648 641 630 623
Credit institutions holding general licences 273 270 270 270 270
The Central Bank of the Russian Federation
Banking Supervision Department
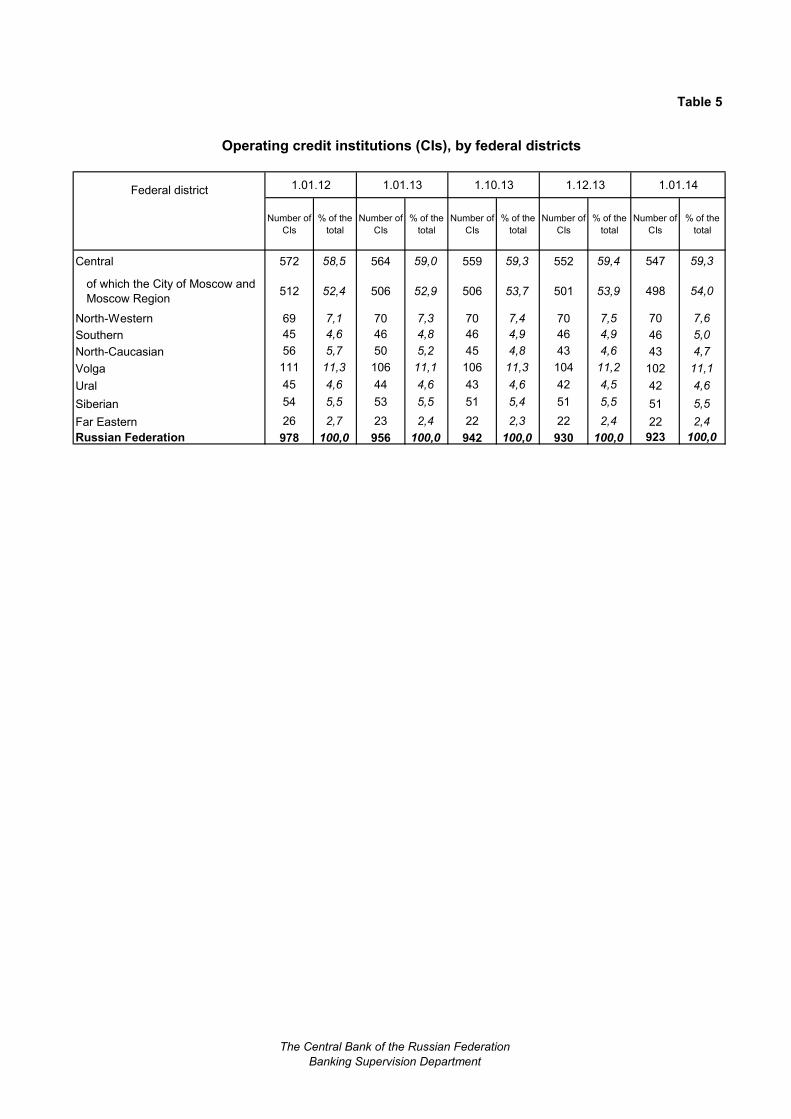
Table 5
Operating credit institutions (CIs), by federal districts
Federal district 1.01.12 1.01.13 1.10.13 1.12.13 1.01.14
Number of
CIs
% of the
total
Number of
CIs
% of the
total
Number of
CIs
% of the
total
Number of
CIs
% of the
total
Number of
CIs
% of the
total
Central 572 58,5 564 59,0 559 59,3 552 59,4 547 59,3
of which the City of Moscow and
Moscow Region512 52,4 506 52,9 506 53,7 501 53,9 498 54,0
North-Western 69 7,1 70 7,3 70 7,4 70 7,5 70 7,6
Southern 45 4,6 46 4,8 46 4,9 46 4,9 46 5,0
North-Caucasian 56 5,7 50 5,2 45 4,8 43 4,6 43 4,7
Volga 111 11,3 106 11,1 106 11,3 104 11,2 102 11,1
Ural 45 4,6 44 4,6 43 4,6 42 4,5 42 4,6
Siberian 54 5,5 53 5,5 51 5,4 51 5,5 51 5,5
Far Eastern 26 2,7 23 2,4 22 2,3 22 2,4 22 2,4
Russian Federation 978 100,0 956 100,0 942 100,0 930 100,0 923 100,0
The Central Bank of the Russian Federation
Banking Supervision Department
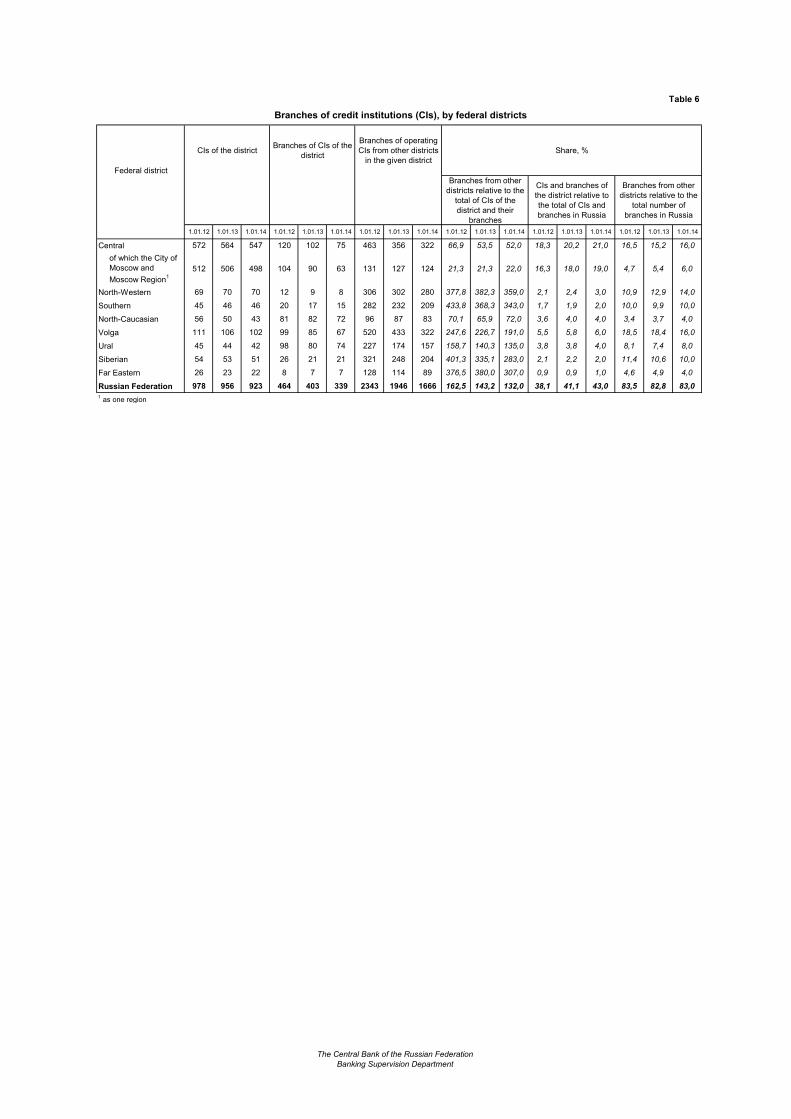
Table 6
Branches of credit institutions (CIs), by federal districts
Federal district
CIs of the districtBranches of CIs of the
district
Branches of operating
CIs from other districts
in the given district
Share, %
Branches from other
districts relative to the
total of CIs of the
district and their
branches
CIs and branches of
the district relative to
the total of CIs and
branches in Russia
Branches from other
districts relative to the
total number of
branches in Russia
1.01.12 1.01.13 1.01.14 1.01.12 1.01.13 1.01.14 1.01.12 1.01.13 1.01.14 1.01.12 1.01.13 1.01.14 1.01.12 1.01.13 1.01.14 1.01.12 1.01.13 1.01.14
Central 572 564 547 120 102 75 463 356 322 66,9 53,5 52,0 18,3 20,2 21,0 16,5 15,2 16,0
of which the City of
Moscow and
Moscow Region1
512 506 498 104 90 63 131 127 124 21,3 21,3 22,0 16,3 18,0 19,0 4,7 5,4 6,0
North-Western 69 70 70 12 9 8 306 302 280 377,8 382,3 359,0 2,1 2,4 3,0 10,9 12,9 14,0
Southern 45 46 46 20 17 15 282 232 209 433,8 368,3 343,0 1,7 1,9 2,0 10,0 9,9 10,0
North-Caucasian 56 50 43 81 82 72 96 87 83 70,1 65,9 72,0 3,6 4,0 4,0 3,4 3,7 4,0
Volga 111 106 102 99 85 67 520 433 322 247,6 226,7 191,0 5,5 5,8 6,0 18,5 18,4 16,0
Ural 45 44 42 98 80 74 227 174 157 158,7 140,3 135,0 3,8 3,8 4,0 8,1 7,4 8,0
Siberian 54 53 51 26 21 21 321 248 204 401,3 335,1 283,0 2,1 2,2 2,0 11,4 10,6 10,0
Far Eastern 26 23 22 8 7 7 128 114 89 376,5 380,0 307,0 0,9 0,9 1,0 4,6 4,9 4,0
Russian Federation 978 956 923 464 403 339 2343 1946 1666 162,5 143,2 132,0 38,1 41,1 43,0 83,5 82,8 83,0
1 as one region
The Central Bank of the Russian Federation
Banking Supervision Department
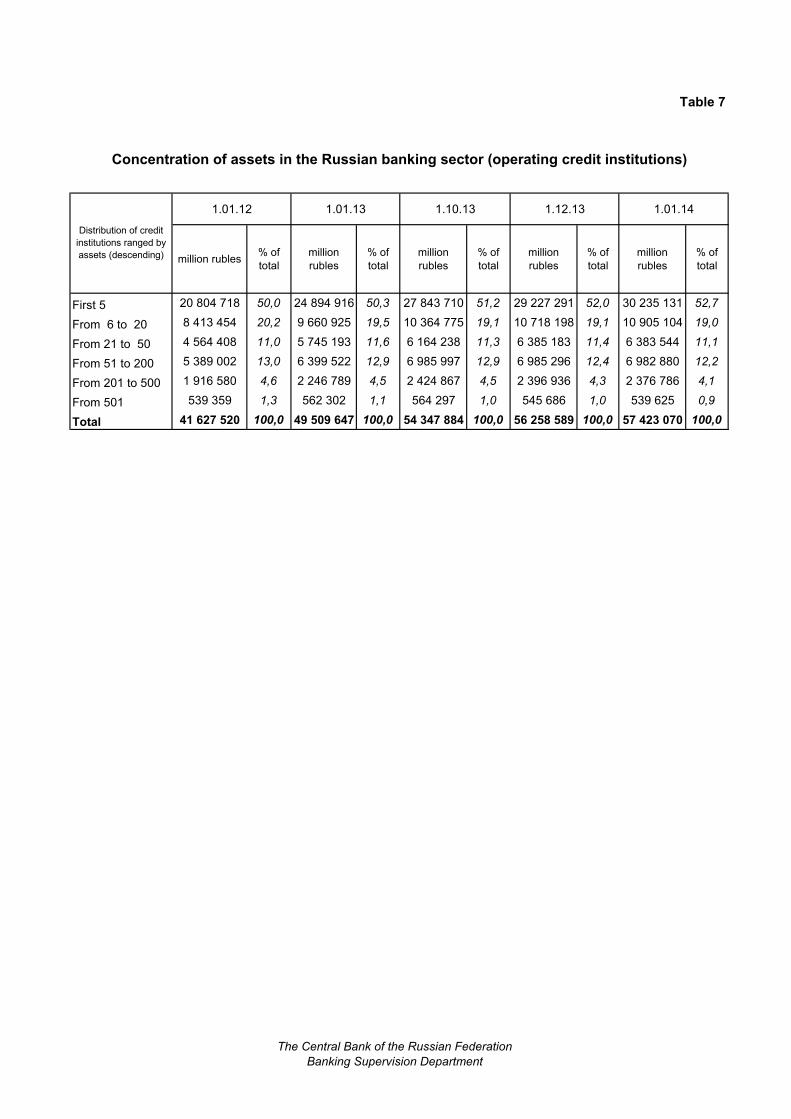
Table 7
Concentration of assets in the Russian banking sector (operating credit institutions)
1.01.12 1.01.13 1.10.13 1.12.13 1.01.14
million rubles% of
total
million
rubles
% of
total
million
rubles
% of
total
million
rubles
% of
total
million
rubles
% of
total
First 5 20 804 718 50,0 24 894 916 50,3 27 843 710 51,2 29 227 291 52,0 30 235 131 52,7
From 6 to 20 8 413 454 20,2 9 660 925 19,5 10 364 775 19,1 10 718 198 19,1 10 905 104 19,0
From 21 to 50 4 564 408 11,0 5 745 193 11,6 6 164 238 11,3 6 385 183 11,4 6 383 544 11,1
From 51 to 200 5 389 002 13,0 6 399 522 12,9 6 985 997 12,9 6 985 296 12,4 6 982 880 12,2
From 201 to 500 1 916 580 4,6 2 246 789 4,5 2 424 867 4,5 2 396 936 4,3 2 376 786 4,1
From 501 539 359 1,3 562 302 1,1 564 297 1,0 545 686 1,0 539 625 0,9
Total 41 627 520 100,0 49 509 647 100,0 54 347 884 100,0 56 258 589 100,0 57 423 070 100,0
Distribution of credit
institutions ranged by
assets (descending)
The Central Bank of the Russian Federation
Banking Supervision Department
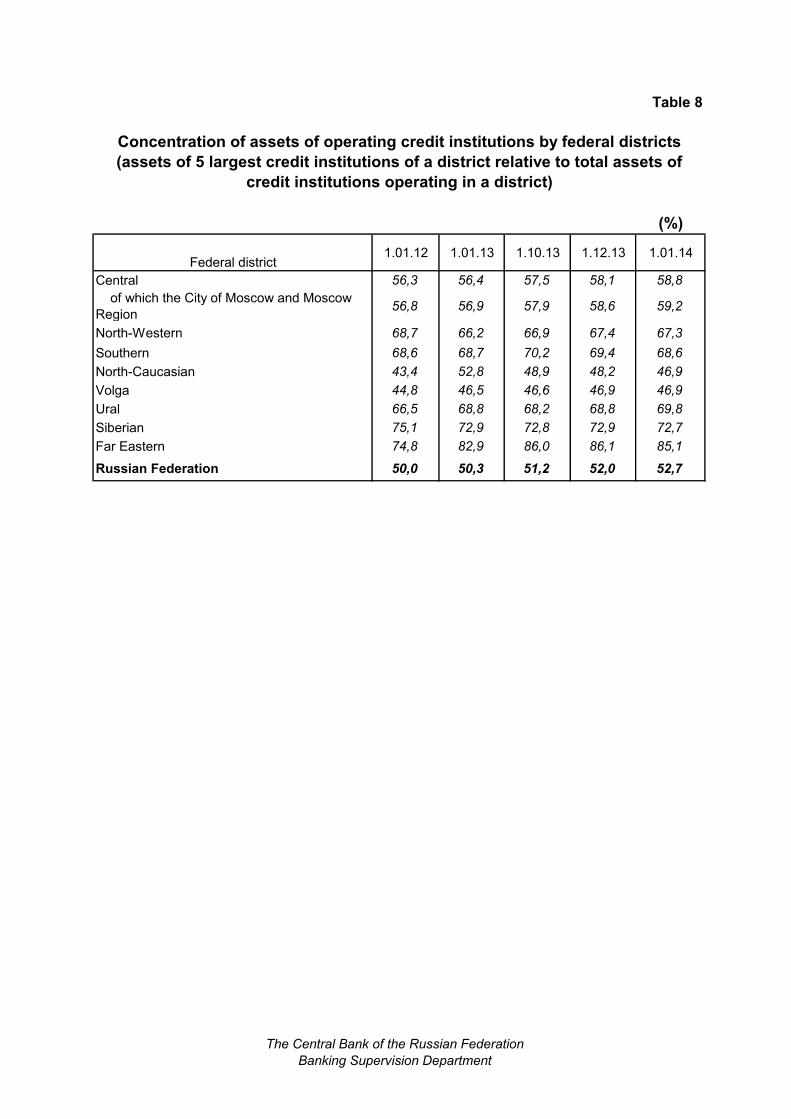
Concentration of assets of operating credit institutions by federal districts
(assets of 5 largest credit institutions of a district relative to total assets of
credit institutions operating in a district)
(%)
Federal district1.01.12 1.01.13 1.10.13 1.12.13 1.01.14
Central 56,3 56,4 57,5 58,1 58,8
of which the City of Moscow and Moscow
Region56,8 56,9 57,9 58,6 59,2
North-Western 68,7 66,2 66,9 67,4 67,3
Southern 68,6 68,7 70,2 69,4 68,6
North-Caucasian 43,4 52,8 48,9 48,2 46,9
Volga 44,8 46,5 46,6 46,9 46,9
Ural 66,5 68,8 68,2 68,8 69,8
Siberian 75,1 72,9 72,8 72,9 72,7
Far Eastern 74,8 82,9 86,0 86,1 85,1
Russian Federation 50,0 50,3 51,2 52,0 52,7
Table 8
The Central Bank of the Russian Federation
Banking Supervision Department
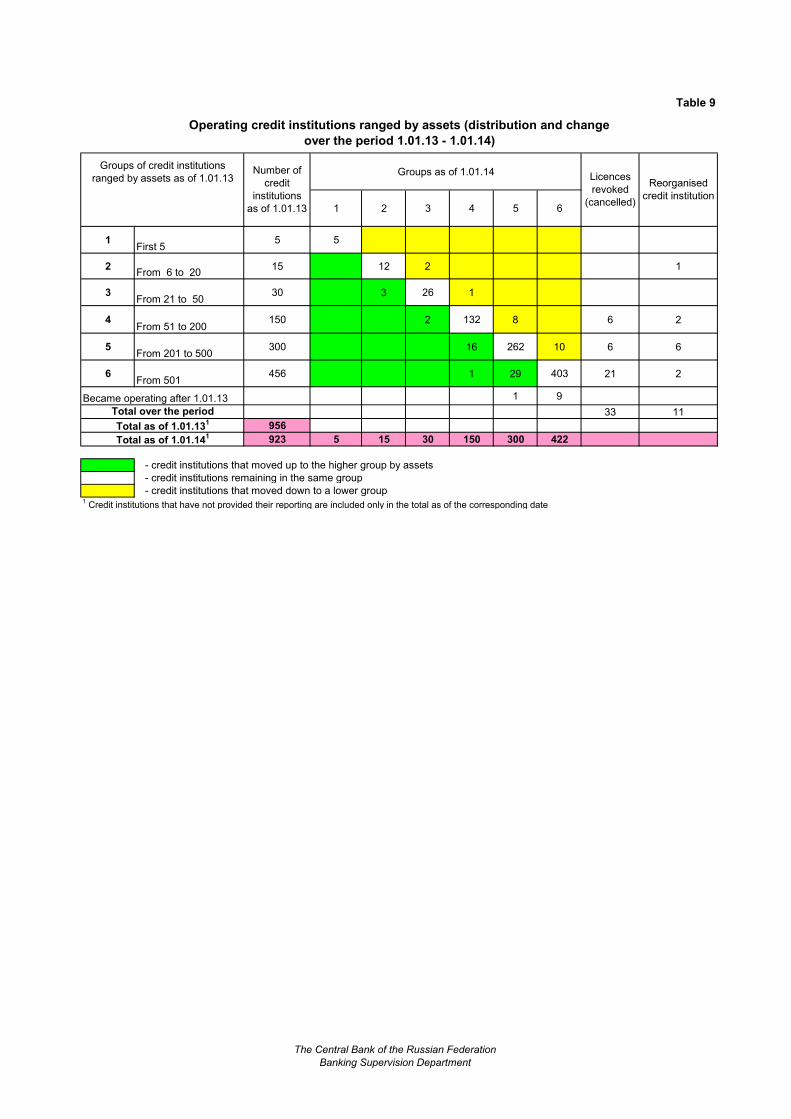
Table 9
Operating credit institutions ranged by assets (distribution and change
over the period 1.01.13 - 1.01.14)
Groups of credit institutions
ranged by assets as of 1.01.13Groups as of 1.01.14
1 2 3 4 5 6
1First 5
5 5
2From 6 to 20
15 12 2 1
3From 21 to 50
30 3 26 1
4From 51 to 200
150 2 132 8 6 2
5From 201 to 500
300 16 262 10 6 6
6From 501
456 1 29 403 21 2
Became operating after 1.01.13 1 9
33 11
956
923 5 15 30 150 300 422
- credit institutions that moved up to the higher group by assets
- credit institutions remaining in the same group
- credit institutions that moved down to a lower group 1 Credit institutions that have not provided their reporting are included only in the total as of the corresponding date
Total as of 1.01.141
Number of
credit
institutions
as of 1.01.13
Licences
revoked
(cancelled)
Reorganised
credit institution
Total over the period
Total as of 1.01.131
The Central Bank of the Russian Federation
Banking Supervision Department
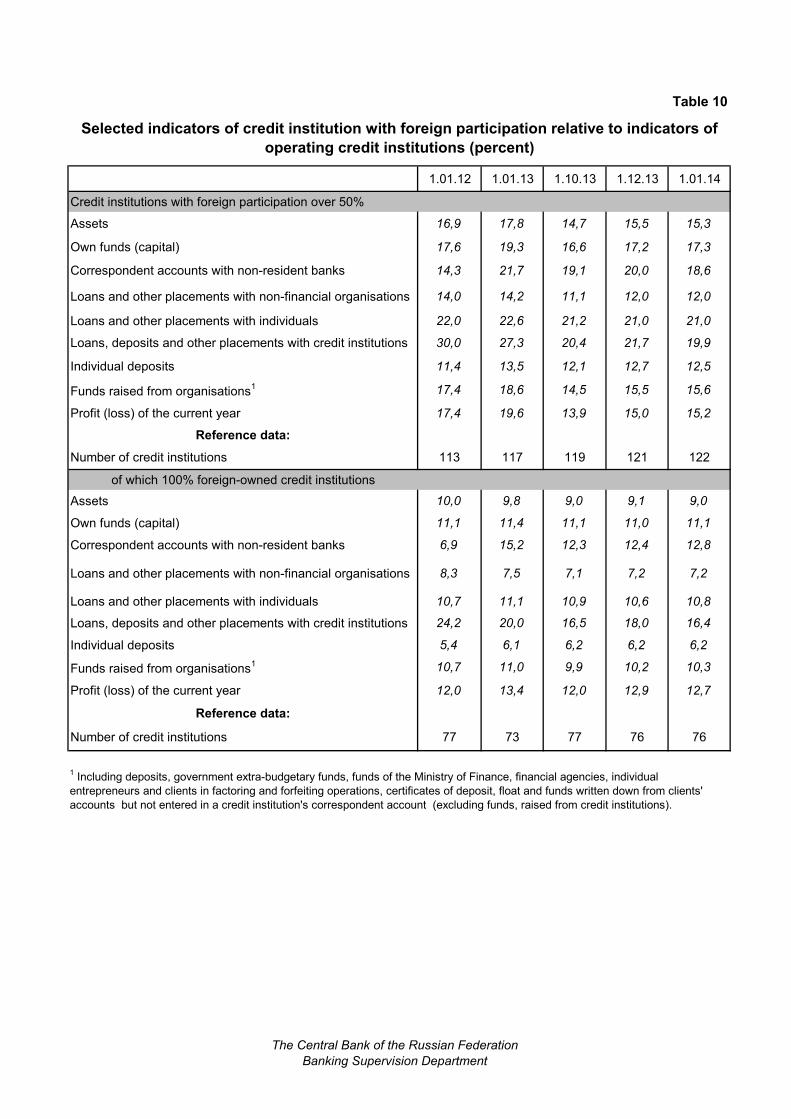
Table 10
Selected indicators of credit institution with foreign participation relative to indicators of
operating credit institutions (percent)
1.01.12 1.01.13 1.10.13 1.12.13 1.01.14
Credit institutions with foreign participation over 50%
Assets 16,9 17,8 14,7 15,5 15,3
Own funds (capital) 17,6 19,3 16,6 17,2 17,3
Correspondent accounts with non-resident banks 14,3 21,7 19,1 20,0 18,6
Loans and other placements with non-financial organisations 14,0 14,2 11,1 12,0 12,0
Loans and other placements with individuals 22,0 22,6 21,2 21,0 21,0
Loans, deposits and other placements with credit institutions 30,0 27,3 20,4 21,7 19,9
Individual deposits 11,4 13,5 12,1 12,7 12,5
Funds raised from organisations1 17,4 18,6 14,5 15,5 15,6
Profit (loss) of the current year 17,4 19,6 13,9 15,0 15,2
Reference data:
Number of credit institutions 113 117 119 121 122
of which 100% foreign-owned credit institutions
Assets 10,0 9,8 9,0 9,1 9,0
Own funds (capital) 11,1 11,4 11,1 11,0 11,1
Correspondent accounts with non-resident banks 6,9 15,2 12,3 12,4 12,8
Loans and other placements with non-financial organisations 8,3 7,5 7,1 7,2 7,2
Loans and other placements with individuals 10,7 11,1 10,9 10,6 10,8
Loans, deposits and other placements with credit institutions 24,2 20,0 16,5 18,0 16,4
Individual deposits 5,4 6,1 6,2 6,2 6,2
Funds raised from organisations1 10,7 11,0 9,9 10,2 10,3
Profit (loss) of the current year 12,0 13,4 12,0 12,9 12,7
Reference data:
Number of credit institutions 77 73 77 76 76
1 Including deposits, government extra-budgetary funds, funds of the Ministry of Finance, financial agencies, individual
entrepreneurs and clients in factoring and forfeiting operations, certificates of deposit, float and funds written down from clients'
accounts but not entered in a credit institution's correspondent account (excluding funds, raised from credit institutions).
The Central Bank of the Russian Federation
Banking Supervision Department
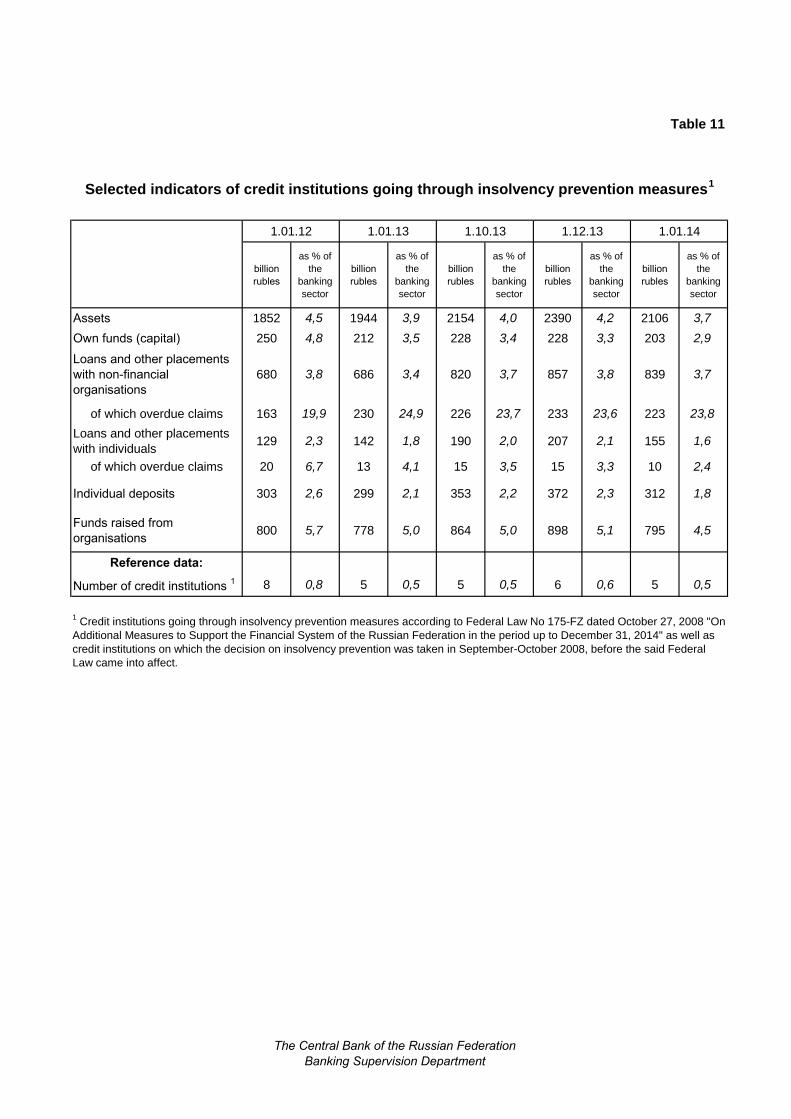
Table 11
Selected indicators of credit institutions going through insolvency prevention measures1
1.01.12 1.01.13 1.10.13 1.12.13 1.01.14
billion
rubles
as % of
the
banking
sector
billion
rubles
as % of
the
banking
sector
billion
rubles
as % of
the
banking
sector
billion
rubles
as % of
the
banking
sector
billion
rubles
as % of
the
banking
sector
Assets 1852 4,5 1944 3,9 2154 4,0 2390 4,2 2106 3,7
Own funds (capital) 250 4,8 212 3,5 228 3,4 228 3,3 203 2,9
Loans and other placements
with non-financial
organisations
680 3,8 686 3,4 820 3,7 857 3,8 839 3,7
of which overdue claims 163 19,9 230 24,9 226 23,7 233 23,6 223 23,8
Loans and other placements
with individuals129 2,3 142 1,8 190 2,0 207 2,1 155 1,6
of which overdue claims 20 6,7 13 4,1 15 3,5 15 3,3 10 2,4
Individual deposits 303 2,6 299 2,1 353 2,2 372 2,3 312 1,8
Funds raised from
organisations 800 5,7 778 5,0 864 5,0 898 5,1 795 4,5
Reference data:
Number of credit institutions 1 8 0,8 5 0,5 5 0,5 6 0,6 5 0,5
1 Credit institutions going through insolvency prevention measures according to Federal Law No 175-FZ dated October 27, 2008 "On
Additional Measures to Support the Financial System of the Russian Federation in the period up to December 31, 2014" as well as
credit institutions on which the decision on insolvency prevention was taken in September-October 2008, before the said Federal
Law came into affect.
The Central Bank of the Russian Federation
Banking Supervision Department
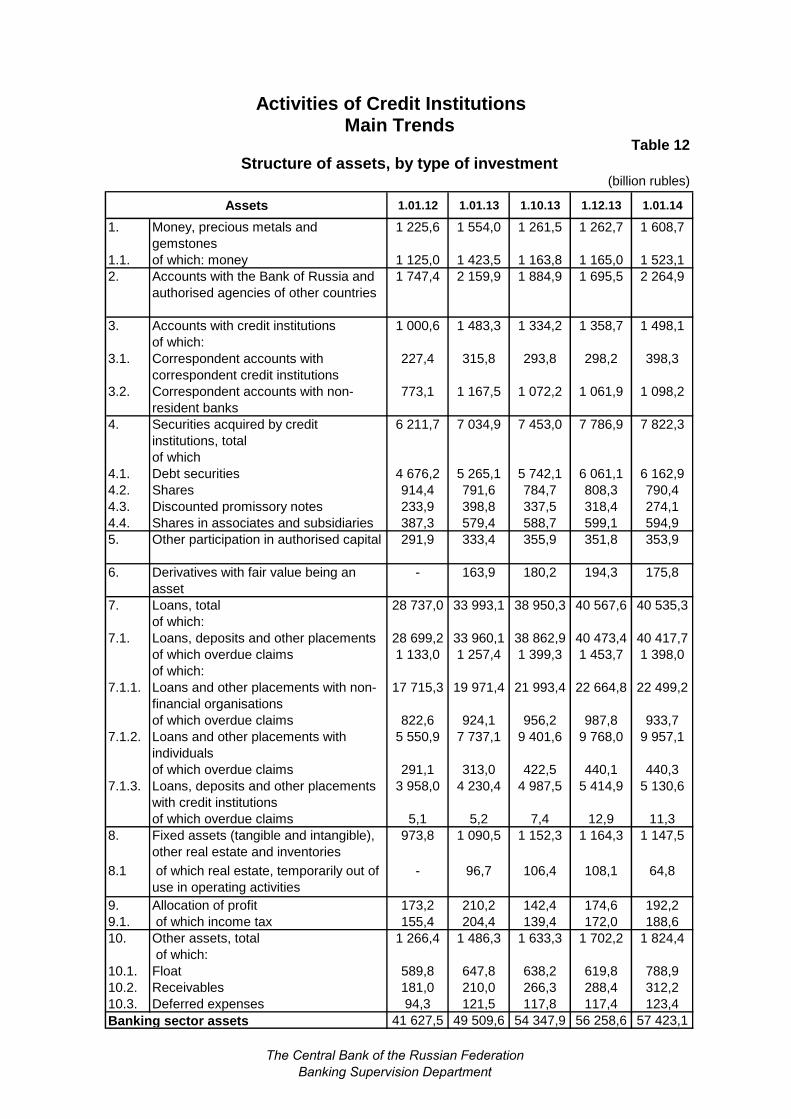
Table 12
Structure of assets, by type of investment (billion rubles)
Assets 1.01.12 1.01.13 1.10.13 1.12.13 1.01.14
1. Money, precious metals and
gemstones
1 225,6 1 554,0 1 261,5 1 262,7 1 608,7
1.1. of which: money 1 125,0 1 423,5 1 163,8 1 165,0 1 523,1
2. Accounts with the Bank of Russia and
authorised agencies of other countries
1 747,4 2 159,9 1 884,9 1 695,5 2 264,9
3. Accounts with credit institutions 1 000,6 1 483,3 1 334,2 1 358,7 1 498,1
of which:
3.1. Correspondent accounts with
correspondent credit institutions
227,4 315,8 293,8 298,2 398,3
3.2. Correspondent accounts with non-
resident banks
773,1 1 167,5 1 072,2 1 061,9 1 098,2
4. Securities acquired by credit
institutions, total
6 211,7 7 034,9 7 453,0 7 786,9 7 822,3
of which
4.1. Debt securities 4 676,2 5 265,1 5 742,1 6 061,1 6 162,9
4.2. Shares 914,4 791,6 784,7 808,3 790,4
4.3. Discounted promissory notes 233,9 398,8 337,5 318,4 274,1
4.4. Shares in associates and subsidiaries 387,3 579,4 588,7 599,1 594,9
5. Other participation in authorised capital 291,9 333,4 355,9 351,8 353,9
6. Derivatives with fair value being an
asset
- 163,9 180,2 194,3 175,8
7. Loans, total 28 737,0 33 993,1 38 950,3 40 567,6 40 535,3
of which:
7.1. Loans, deposits and other placements 28 699,2 33 960,1 38 862,9 40 473,4 40 417,7
of which overdue claims 1 133,0 1 257,4 1 399,3 1 453,7 1 398,0
of which:
7.1.1. Loans and other placements with non-
financial organisations
17 715,3 19 971,4 21 993,4 22 664,8 22 499,2
of which overdue claims 822,6 924,1 956,2 987,8 933,7
7.1.2. Loans and other placements with
individuals
5 550,9 7 737,1 9 401,6 9 768,0 9 957,1
of which overdue claims 291,1 313,0 422,5 440,1 440,3
7.1.3. Loans, deposits and other placements
with credit institutions
3 958,0 4 230,4 4 987,5 5 414,9 5 130,6
of which overdue claims 5,1 5,2 7,4 12,9 11,3
8. Fixed assets (tangible and intangible),
other real estate and inventories
973,8 1 090,5 1 152,3 1 164,3 1 147,5
8.1 of which real estate, temporarily out of
use in operating activities
- 96,7 106,4 108,1 64,8
9. Allocation of profit 173,2 210,2 142,4 174,6 192,2
9.1. of which income tax 155,4 204,4 139,4 172,0 188,6
10. Other assets, total 1 266,4 1 486,3 1 633,3 1 702,2 1 824,4
of which:
10.1. Float 589,8 647,8 638,2 619,8 788,9
10.2. Receivables 181,0 210,0 266,3 288,4 312,2
10.3. Deferred expenses 94,3 121,5 117,8 117,4 123,4
Banking sector assets 41 627,5 49 509,6 54 347,9 56 258,6 57 423,1
Main TrendsActivities of Credit Institutions
The Central Bank of the Russian Federation
Banking Supervision Department
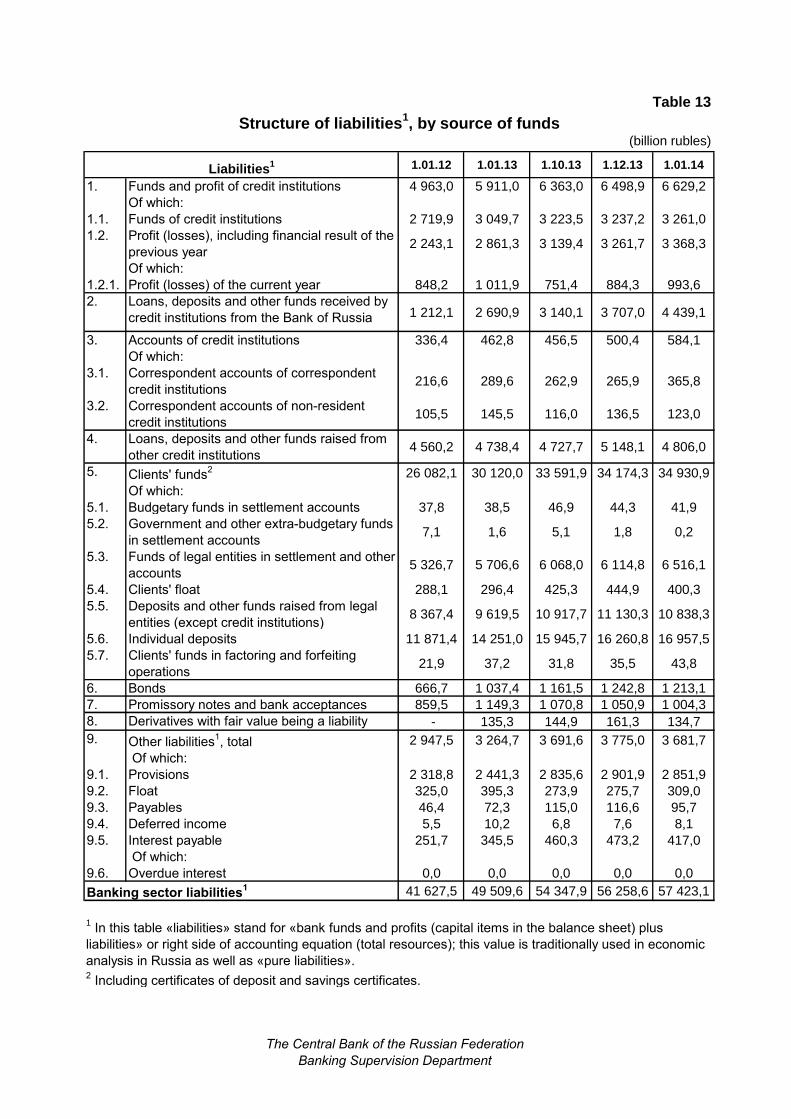
Table 13
Structure of liabilities1, by source of funds
(billion rubles)
Liabilities1 1.01.12 1.01.13 1.10.13 1.12.13 1.01.14
1. Funds and profit of credit institutions 4 963,0 5 911,0 6 363,0 6 498,9 6 629,2
Of which:
1.1. Funds of credit institutions 2 719,9 3 049,7 3 223,5 3 237,2 3 261,0
1.2. Profit (losses), including financial result of the
previous year2 243,1 2 861,3 3 139,4 3 261,7 3 368,3
Of which:
1.2.1. Profit (losses) of the current year 848,2 1 011,9 751,4 884,3 993,6
2. Loans, deposits and other funds received by
credit institutions from the Bank of Russia 1 212,1 2 690,9 3 140,1 3 707,0 4 439,1
3. Accounts of credit institutions 336,4 462,8 456,5 500,4 584,1
Of which:
3.1. Correspondent accounts of correspondent
credit institutions216,6 289,6 262,9 265,9 365,8
3.2. Correspondent accounts of non-resident
credit institutions 105,5 145,5 116,0 136,5 123,0
4. Loans, deposits and other funds raised from
other credit institutions4 560,2 4 738,4 4 727,7 5 148,1 4 806,0
5. Clients' funds2 26 082,1 30 120,0 33 591,9 34 174,3 34 930,9
Of which:
5.1. Budgetary funds in settlement accounts 37,8 38,5 46,9 44,3 41,9
5.2. Government and other extra-budgetary funds
in settlement accounts 7,1 1,6 5,1 1,8 0,2
5.3. Funds of legal entities in settlement and other
accounts5 326,7 5 706,6 6 068,0 6 114,8 6 516,1
5.4. Clients' float 288,1 296,4 425,3 444,9 400,3
5.5. Deposits and other funds raised from legal
entities (except credit institutions) 8 367,4 9 619,5 10 917,7 11 130,3 10 838,3
5.6. Individual deposits 11 871,4 14 251,0 15 945,7 16 260,8 16 957,5
5.7. Clients' funds in factoring and forfeiting
operations 21,9 37,2 31,8 35,5 43,8
6. Bonds 666,7 1 037,4 1 161,5 1 242,8 1 213,1
7. Promissory notes and bank acceptances 859,5 1 149,3 1 070,8 1 050,9 1 004,3
8. Derivatives with fair value being a liability - 135,3 144,9 161,3 134,7
9. Other liabilities1, total 2 947,5 3 264,7 3 691,6 3 775,0 3 681,7
Of which:
9.1. Provisions 2 318,8 2 441,3 2 835,6 2 901,9 2 851,9
9.2. Float 325,0 395,3 273,9 275,7 309,0
9.3. Payables 46,4 72,3 115,0 116,6 95,7
9.4. Deferred income 5,5 10,2 6,8 7,6 8,1
9.5. Interest payable 251,7 345,5 460,3 473,2 417,0
Of which:
9.6. Overdue interest 0,0 0,0 0,0 0,0 0,0
Banking sector liabilities1 41 627,5 49 509,6 54 347,9 56 258,6 57 423,1
2 Including certificates of deposit and savings certificates.
1 In this table «liabilities» stand for «bank funds and profits (capital items in the balance sheet) plus
liabilities» or right side of accounting equation (total resources); this value is traditionally used in economic
analysis in Russia as well as «pure liabilities».
The Central Bank of the Russian Federation
Banking Supervision Department
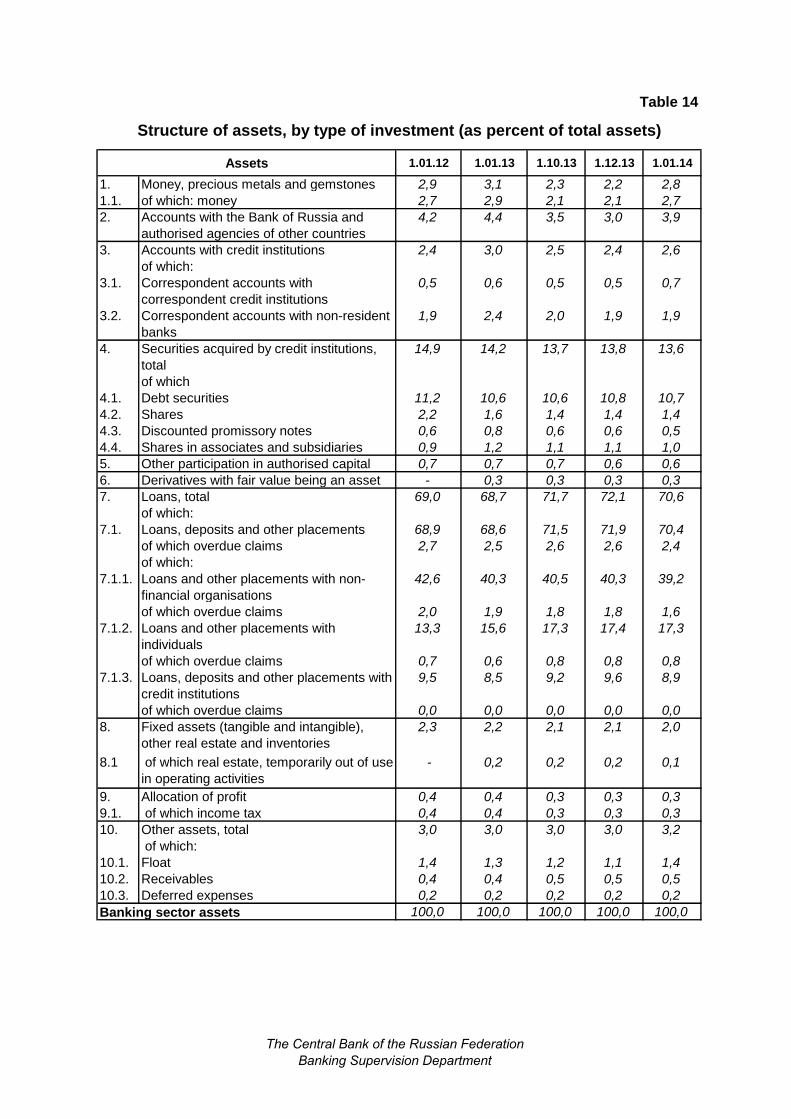
Table 14
Structure of assets, by type of investment (as percent of total assets)
Assets 1.01.12 1.01.13 1.10.13 1.12.13 1.01.14
1. Money, precious metals and gemstones 2,9 3,1 2,3 2,2 2,8
1.1. of which: money 2,7 2,9 2,1 2,1 2,7
2. Accounts with the Bank of Russia and
authorised agencies of other countries
4,2 4,4 3,5 3,0 3,9
3. Accounts with credit institutions 2,4 3,0 2,5 2,4 2,6
of which:
3.1. Correspondent accounts with
correspondent credit institutions
0,5 0,6 0,5 0,5 0,7
3.2. Correspondent accounts with non-resident
banks
1,9 2,4 2,0 1,9 1,9
4. Securities acquired by credit institutions,
total
14,9 14,2 13,7 13,8 13,6
of which
4.1. Debt securities 11,2 10,6 10,6 10,8 10,7
4.2. Shares 2,2 1,6 1,4 1,4 1,4
4.3. Discounted promissory notes 0,6 0,8 0,6 0,6 0,5
4.4. Shares in associates and subsidiaries 0,9 1,2 1,1 1,1 1,0
5. Other participation in authorised capital 0,7 0,7 0,7 0,6 0,6
6. Derivatives with fair value being an asset - 0,3 0,3 0,3 0,3
7. Loans, total 69,0 68,7 71,7 72,1 70,6
of which:
7.1. Loans, deposits and other placements 68,9 68,6 71,5 71,9 70,4
of which overdue claims 2,7 2,5 2,6 2,6 2,4
of which:
7.1.1. Loans and other placements with non-
financial organisations
42,6 40,3 40,5 40,3 39,2
of which overdue claims 2,0 1,9 1,8 1,8 1,6
7.1.2. Loans and other placements with
individuals
13,3 15,6 17,3 17,4 17,3
of which overdue claims 0,7 0,6 0,8 0,8 0,8
7.1.3. Loans, deposits and other placements with
credit institutions
9,5 8,5 9,2 9,6 8,9
of which overdue claims 0,0 0,0 0,0 0,0 0,0
8. Fixed assets (tangible and intangible),
other real estate and inventories
2,3 2,2 2,1 2,1 2,0
8.1 of which real estate, temporarily out of use
in operating activities
- 0,2 0,2 0,2 0,1
9. Allocation of profit 0,4 0,4 0,3 0,3 0,3
9.1. of which income tax 0,4 0,4 0,3 0,3 0,3
10. Other assets, total 3,0 3,0 3,0 3,0 3,2
of which:
10.1. Float 1,4 1,3 1,2 1,1 1,4
10.2. Receivables 0,4 0,4 0,5 0,5 0,5
10.3. Deferred expenses 0,2 0,2 0,2 0,2 0,2
Banking sector assets 100,0 100,0 100,0 100,0 100,0
The Central Bank of the Russian Federation
Banking Supervision Department
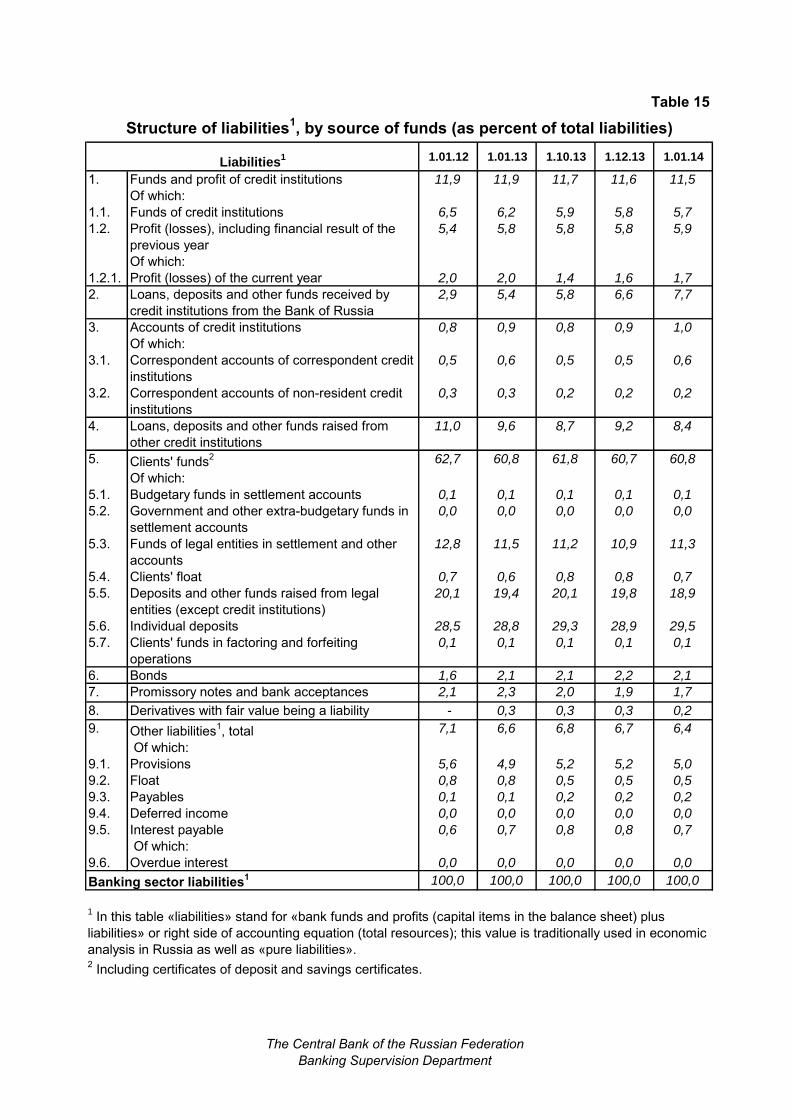
Table 15
Structure of liabilities1, by source of funds (as percent of total liabilities)
Liabilities1 1.01.12 1.01.13 1.10.13 1.12.13 1.01.14
1. Funds and profit of credit institutions 11,9 11,9 11,7 11,6 11,5
Of which:
1.1. Funds of credit institutions 6,5 6,2 5,9 5,8 5,7
1.2. Profit (losses), including financial result of the
previous year
5,4 5,8 5,8 5,8 5,9
Of which:
1.2.1. Profit (losses) of the current year 2,0 2,0 1,4 1,6 1,7
2. Loans, deposits and other funds received by
credit institutions from the Bank of Russia
2,9 5,4 5,8 6,6 7,7
3. Accounts of credit institutions 0,8 0,9 0,8 0,9 1,0
Of which:
3.1. Correspondent accounts of correspondent credit
institutions
0,5 0,6 0,5 0,5 0,6
3.2. Correspondent accounts of non-resident credit
institutions
0,3 0,3 0,2 0,2 0,2
4. Loans, deposits and other funds raised from
other credit institutions
11,0 9,6 8,7 9,2 8,4
5. Clients' funds2 62,7 60,8 61,8 60,7 60,8
Of which:
5.1. Budgetary funds in settlement accounts 0,1 0,1 0,1 0,1 0,1
5.2. Government and other extra-budgetary funds in
settlement accounts
0,0 0,0 0,0 0,0 0,0
5.3. Funds of legal entities in settlement and other
accounts
12,8 11,5 11,2 10,9 11,3
5.4. Clients' float 0,7 0,6 0,8 0,8 0,7
5.5. Deposits and other funds raised from legal
entities (except credit institutions)
20,1 19,4 20,1 19,8 18,9
5.6. Individual deposits 28,5 28,8 29,3 28,9 29,5
5.7. Clients' funds in factoring and forfeiting
operations
0,1 0,1 0,1 0,1 0,1
6. Bonds 1,6 2,1 2,1 2,2 2,1
7. Promissory notes and bank acceptances 2,1 2,3 2,0 1,9 1,7
8. Derivatives with fair value being a liability - 0,3 0,3 0,3 0,2
9. Other liabilities1, total 7,1 6,6 6,8 6,7 6,4
Of which:
9.1. Provisions 5,6 4,9 5,2 5,2 5,0
9.2. Float 0,8 0,8 0,5 0,5 0,5
9.3. Payables 0,1 0,1 0,2 0,2 0,2
9.4. Deferred income 0,0 0,0 0,0 0,0 0,0
9.5. Interest payable 0,6 0,7 0,8 0,8 0,7
Of which:
9.6. Overdue interest 0,0 0,0 0,0 0,0 0,0
Banking sector liabilities1 100,0 100,0 100,0 100,0 100,0
2 Including certificates of deposit and savings certificates.
1 In this table «liabilities» stand for «bank funds and profits (capital items in the balance sheet) plus
liabilities» or right side of accounting equation (total resources); this value is traditionally used in economic
analysis in Russia as well as «pure liabilities».
The Central Bank of the Russian Federation
Banking Supervision Department
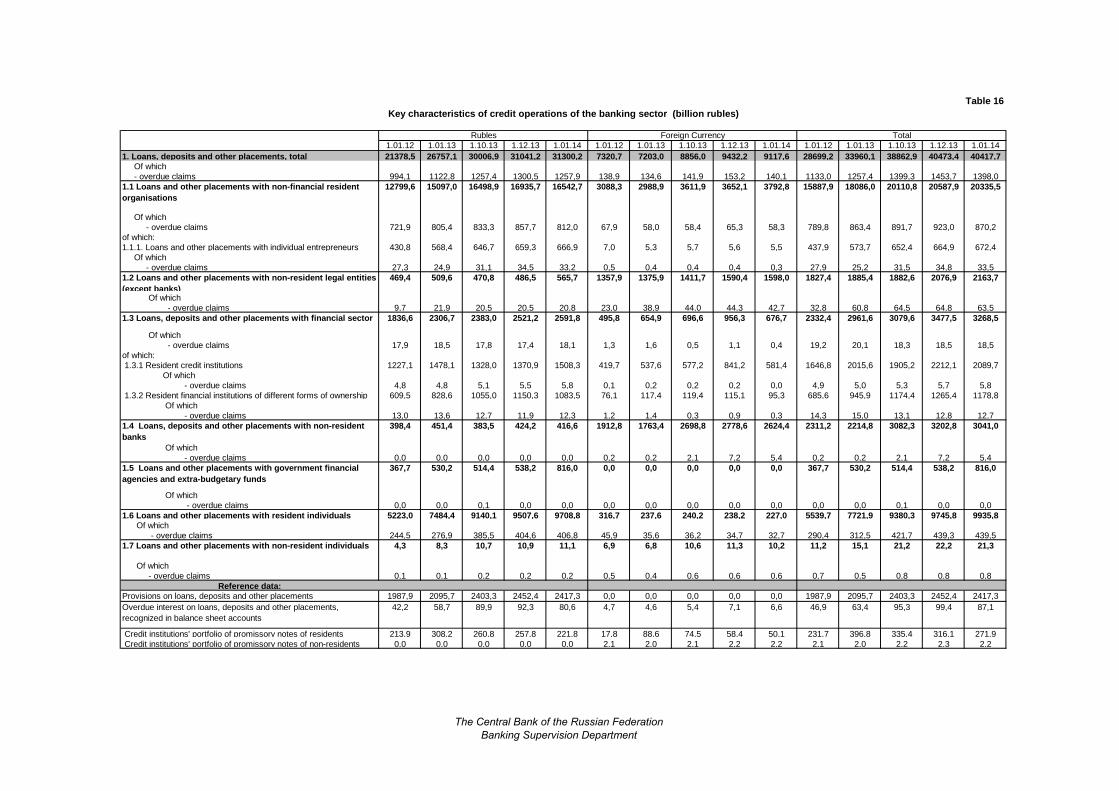
Table 16
Key characteristics of credit operations of the banking sector (billion rubles)
1.01.12 1.01.13 1.10.13 1.12.13 1.01.14 1.01.12 1.01.13 1.10.13 1.12.13 1.01.14 1.01.12 1.01.13 1.10.13 1.12.13 1.01.14
1. Loans, deposits and other placements, total 21378,5 26757,1 30006,9 31041,2 31300,2 7320,7 7203,0 8856,0 9432,2 9117,6 28699,2 33960,1 38862,9 40473,4 40417,7 Of which
- overdue claims 994,1 1122,8 1257,4 1300,5 1257,9 138,9 134,6 141,9 153,2 140,1 1133,0 1257,4 1399,3 1453,7 1398,0
1.1 Loans and other placements with non-financial resident
organisations
12799,6 15097,0 16498,9 16935,7 16542,7 3088,3 2988,9 3611,9 3652,1 3792,8 15887,9 18086,0 20110,8 20587,9 20335,5
Of which
- overdue claims 721,9 805,4 833,3 857,7 812,0 67,9 58,0 58,4 65,3 58,3 789,8 863,4 891,7 923,0 870,2
of which:
1.1.1. Loans and other placements with individual entrepreneurs 430,8 568,4 646,7 659,3 666,9 7,0 5,3 5,7 5,6 5,5 437,9 573,7 652,4 664,9 672,4
Of which
- overdue claims 27,3 24,9 31,1 34,5 33,2 0,5 0,4 0,4 0,4 0,3 27,9 25,2 31,5 34,8 33,5
1.2 Loans and other placements with non-resident legal entities
(except banks)
469,4 509,6 470,8 486,5 565,7 1357,9 1375,9 1411,7 1590,4 1598,0 1827,4 1885,4 1882,6 2076,9 2163,7
Of which
- overdue claims 9,7 21,9 20,5 20,5 20,8 23,0 38,9 44,0 44,3 42,7 32,8 60,8 64,5 64,8 63,5
1.3 Loans, deposits and other placements with financial sector 1836,6 2306,7 2383,0 2521,2 2591,8 495,8 654,9 696,6 956,3 676,7 2332,4 2961,6 3079,6 3477,5 3268,5
Of which
- overdue claims 17,9 18,5 17,8 17,4 18,1 1,3 1,6 0,5 1,1 0,4 19,2 20,1 18,3 18,5 18,5
of which:
1.3.1 Resident credit institutions 1227,1 1478,1 1328,0 1370,9 1508,3 419,7 537,6 577,2 841,2 581,4 1646,8 2015,6 1905,2 2212,1 2089,7
Of which
- overdue claims 4,8 4,8 5,1 5,5 5,8 0,1 0,2 0,2 0,2 0,0 4,9 5,0 5,3 5,7 5,8
1.3.2 Resident financial institutions of different forms of ownership 609,5 828,6 1055,0 1150,3 1083,5 76,1 117,4 119,4 115,1 95,3 685,6 945,9 1174,4 1265,4 1178,8
Of which
- overdue claims 13,0 13,6 12,7 11,9 12,3 1,2 1,4 0,3 0,9 0,3 14,3 15,0 13,1 12,8 12,7
1.4 Loans, deposits and other placements with non-resident
banks
398,4 451,4 383,5 424,2 416,6 1912,8 1763,4 2698,8 2778,6 2624,4 2311,2 2214,8 3082,3 3202,8 3041,0
Of which
- overdue claims 0,0 0,0 0,0 0,0 0,0 0,2 0,2 2,1 7,2 5,4 0,2 0,2 2,1 7,2 5,4
1.5 Loans and other placements with government financial
agencies and extra-budgetary funds
367,7 530,2 514,4 538,2 816,0 0,0 0,0 0,0 0,0 0,0 367,7 530,2 514,4 538,2 816,0
Of which
- overdue claims 0,0 0,0 0,1 0,0 0,0 0,0 0,0 0,0 0,0 0,0 0,0 0,0 0,1 0,0 0,0
1.6 Loans and other placements with resident individuals 5223,0 7484,4 9140,1 9507,6 9708,8 316,7 237,6 240,2 238,2 227,0 5539,7 7721,9 9380,3 9745,8 9935,8 Of which
- overdue claims 244,5 276,9 385,5 404,6 406,8 45,9 35,6 36,2 34,7 32,7 290,4 312,5 421,7 439,3 439,5
1.7 Loans and other placements with non-resident individuals 4,3 8,3 10,7 10,9 11,1 6,9 6,8 10,6 11,3 10,2 11,2 15,1 21,2 22,2 21,3
Of which
- overdue claims 0,1 0,1 0,2 0,2 0,2 0,5 0,4 0,6 0,6 0,6 0,7 0,5 0,8 0,8 0,8
Reference data:Provisions on loans, deposits and other placements 1987,9 2095,7 2403,3 2452,4 2417,3 0,0 0,0 0,0 0,0 0,0 1987,9 2095,7 2403,3 2452,4 2417,3
Overdue interest on loans, deposits and other placements,
recognized in balance sheet accounts
42,2 58,7 89,9 92,3 80,6 4,7 4,6 5,4 7,1 6,6 46,9 63,4 95,3 99,4 87,1
Credit institutions' portfolio of promissory notes of residents 213,9 308,2 260,8 257,8 221,8 17,8 88,6 74,5 58,4 50,1 231,7 396,8 335,4 316,1 271,9
Credit institutions' portfolio of promissory notes of non-residents 0,0 0,0 0,0 0,0 0,0 2,1 2,0 2,1 2,2 2,2 2,1 2,0 2,2 2,3 2,2
Rubles Foreign Currency Total
The Central Bank of the Russian Federation
Banking Supervision Department
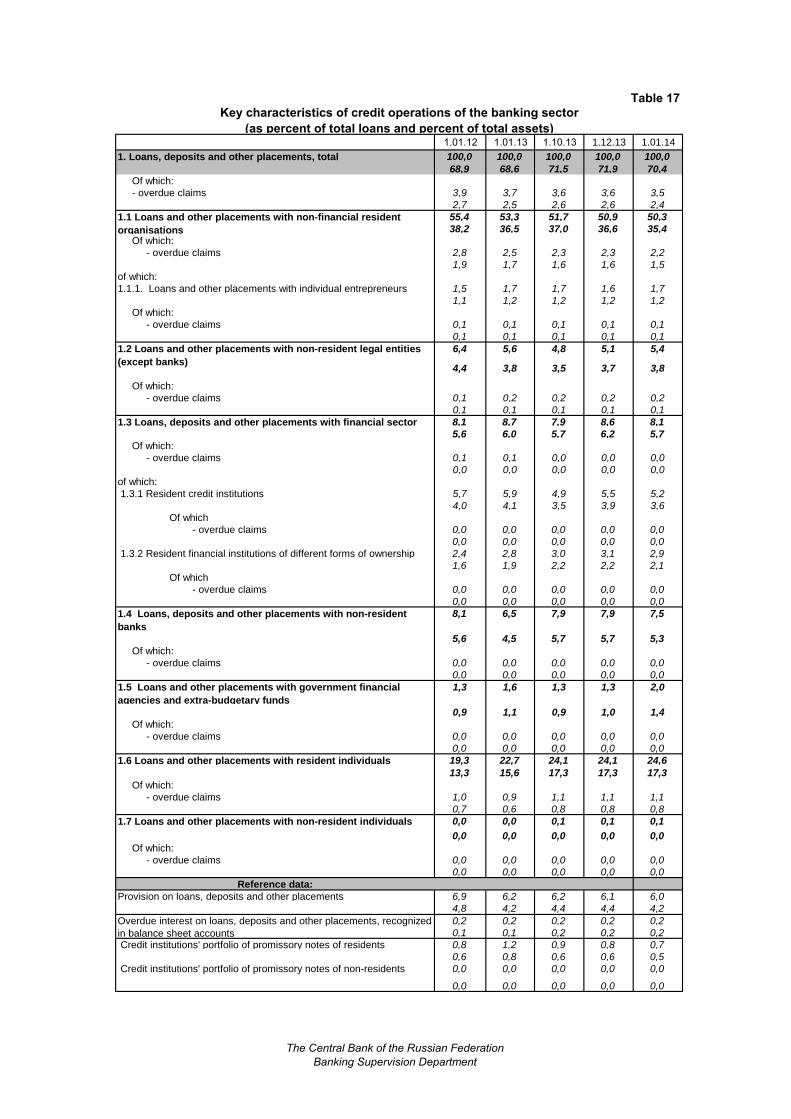
Table 17
Key characteristics of credit operations of the banking sector
(as percent of total loans and percent of total assets)1.01.12 1.01.13 1.10.13 1.12.13 1.01.14
100,0 100,0 100,0 100,0 100,0
68,9 68,6 71,5 71,9 70,4
Of which:
- overdue claims 3,9 3,7 3,6 3,6 3,5
2,7 2,5 2,6 2,6 2,4
55,4 53,3 51,7 50,9 50,3
38,2 36,5 37,0 36,6 35,4
Of which:
- overdue claims 2,8 2,5 2,3 2,3 2,2
1,9 1,7 1,6 1,6 1,5
of which:
1.1.1. Loans and other placements with individual entrepreneurs 1,5 1,7 1,7 1,6 1,7
1,1 1,2 1,2 1,2 1,2
Of which:
- overdue claims 0,1 0,1 0,1 0,1 0,1
0,1 0,1 0,1 0,1 0,1
6,4 5,6 4,8 5,1 5,4
4,4 3,8 3,5 3,7 3,8
Of which:
- overdue claims 0,1 0,2 0,2 0,2 0,2
0,1 0,1 0,1 0,1 0,1
8,1 8,7 7,9 8,6 8,1
5,6 6,0 5,7 6,2 5,7
Of which:
- overdue claims 0,1 0,1 0,0 0,0 0,0
0,0 0,0 0,0 0,0 0,0
of which:
1.3.1 Resident credit institutions 5,7 5,9 4,9 5,5 5,2
4,0 4,1 3,5 3,9 3,6
Of which
- overdue claims 0,0 0,0 0,0 0,0 0,0
0,0 0,0 0,0 0,0 0,0
1.3.2 Resident financial institutions of different forms of ownership 2,4 2,8 3,0 3,1 2,9
1,6 1,9 2,2 2,2 2,1
Of which
- overdue claims 0,0 0,0 0,0 0,0 0,0
0,0 0,0 0,0 0,0 0,0
1.4 Loans, deposits and other placements with non-resident
banks
8,1 6,5 7,9 7,9 7,5
5,6 4,5 5,7 5,7 5,3
Of which:
- overdue claims 0,0 0,0 0,0 0,0 0,0
0,0 0,0 0,0 0,0 0,0
1.5 Loans and other placements with government financial
agencies and extra-budgetary funds
1,3 1,6 1,3 1,3 2,0
0,9 1,1 0,9 1,0 1,4
Of which:
- overdue claims 0,0 0,0 0,0 0,0 0,0
0,0 0,0 0,0 0,0 0,0
1.6 Loans and other placements with resident individuals 19,3 22,7 24,1 24,1 24,6
13,3 15,6 17,3 17,3 17,3
Of which:
- overdue claims 1,0 0,9 1,1 1,1 1,1
0,7 0,6 0,8 0,8 0,8
1.7 Loans and other placements with non-resident individuals 0,0 0,0 0,1 0,1 0,1
0,0 0,0 0,0 0,0 0,0
Of which:
- overdue claims 0,0 0,0 0,0 0,0 0,0
0,0 0,0 0,0 0,0 0,0
Reference data:
Provision on loans, deposits and other placements 6,9 6,2 6,2 6,1 6,0
4,8 4,2 4,4 4,4 4,2
0,2 0,2 0,2 0,2 0,2
0,1 0,1 0,2 0,2 0,2
Credit institutions' portfolio of promissory notes of residents 0,8 1,2 0,9 0,8 0,7
0,6 0,8 0,6 0,6 0,5
Credit institutions' portfolio of promissory notes of non-residents 0,0 0,0 0,0 0,0 0,0
0,0 0,0 0,0 0,0 0,0
Overdue interest on loans, deposits and other placements, recognized
in balance sheet accounts
1. Loans, deposits and other placements, total
1.1 Loans and other placements with non-financial resident
organisations
1.2 Loans and other placements with non-resident legal entities
(except banks)
1.3 Loans, deposits and other placements with financial sector
The Central Bank of the Russian Federation
Banking Supervision Department
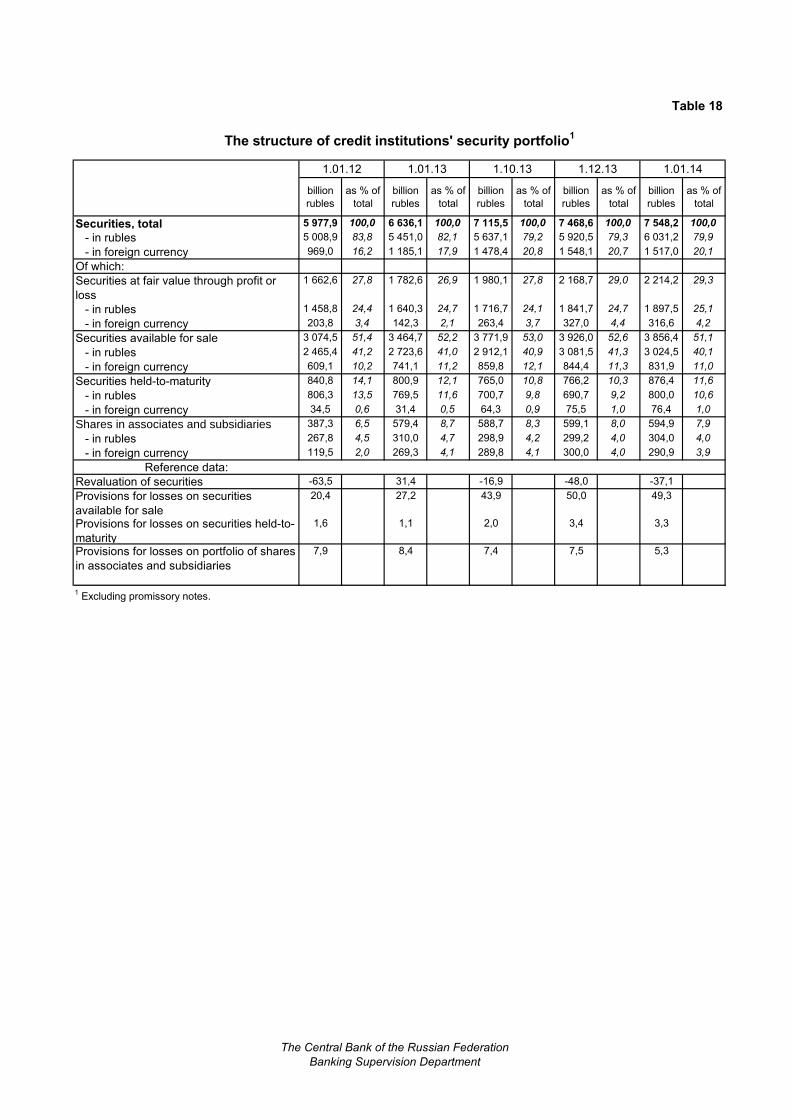
Table 18
The structure of credit institutions' security portfolio1
1.01.12 1.01.13 1.10.13 1.12.13 1.01.14
billion
rubles
as % of
total
billion
rubles
as % of
total
billion
rubles
as % of
total
billion
rubles
as % of
total
billion
rubles
as % of
total
Securities, total 5 977,9 100,0 6 636,1 100,0 7 115,5 100,0 7 468,6 100,0 7 548,2 100,0
- in rubles 5 008,9 83,8 5 451,0 82,1 5 637,1 79,2 5 920,5 79,3 6 031,2 79,9
- in foreign currency 969,0 16,2 1 185,1 17,9 1 478,4 20,8 1 548,1 20,7 1 517,0 20,1
Of which:
Securities at fair value through profit or
loss
1 662,6 27,8 1 782,6 26,9 1 980,1 27,8 2 168,7 29,0 2 214,2 29,3
- in rubles 1 458,8 24,4 1 640,3 24,7 1 716,7 24,1 1 841,7 24,7 1 897,5 25,1
- in foreign currency 203,8 3,4 142,3 2,1 263,4 3,7 327,0 4,4 316,6 4,2
Securities available for sale 3 074,5 51,4 3 464,7 52,2 3 771,9 53,0 3 926,0 52,6 3 856,4 51,1
- in rubles 2 465,4 41,2 2 723,6 41,0 2 912,1 40,9 3 081,5 41,3 3 024,5 40,1
- in foreign currency 609,1 10,2 741,1 11,2 859,8 12,1 844,4 11,3 831,9 11,0
Securities held-to-maturity 840,8 14,1 800,9 12,1 765,0 10,8 766,2 10,3 876,4 11,6
- in rubles 806,3 13,5 769,5 11,6 700,7 9,8 690,7 9,2 800,0 10,6
- in foreign currency 34,5 0,6 31,4 0,5 64,3 0,9 75,5 1,0 76,4 1,0
Shares in associates and subsidiaries 387,3 6,5 579,4 8,7 588,7 8,3 599,1 8,0 594,9 7,9
- in rubles 267,8 4,5 310,0 4,7 298,9 4,2 299,2 4,0 304,0 4,0
- in foreign currency 119,5 2,0 269,3 4,1 289,8 4,1 300,0 4,0 290,9 3,9
Reference data:
Revaluation of securities -63,5 31,4 -16,9 -48,0 -37,1
Provisions for losses on securities
available for sale
20,4 27,2 43,9 50,0 49,3
Provisions for losses on securities held-to-
maturity
1,6 1,1 2,0 3,4 3,3
Provisions for losses on portfolio of shares
in associates and subsidiaries
7,9 8,4 7,4 7,5 5,3
1 Excluding promissory notes.
The Central Bank of the Russian Federation
Banking Supervision Department
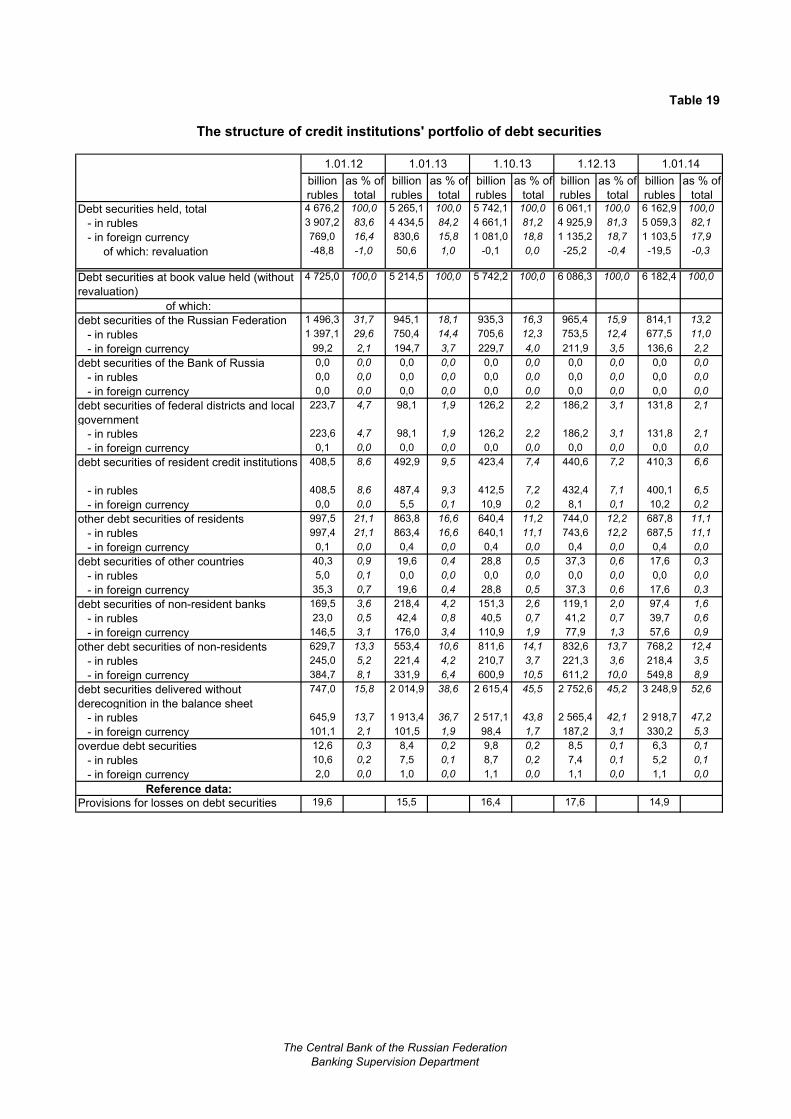
Table 19
The structure of credit institutions' portfolio of debt securities
1.01.12 1.01.13 1.10.13 1.12.13 1.01.14
billion
rubles
as % of
total
billion
rubles
as % of
total
billion
rubles
as % of
total
billion
rubles
as % of
total
billion
rubles
as % of
total
Debt securities held, total 4 676,2 100,0 5 265,1 100,0 5 742,1 100,0 6 061,1 100,0 6 162,9 100,0
- in rubles 3 907,2 83,6 4 434,5 84,2 4 661,1 81,2 4 925,9 81,3 5 059,3 82,1
- in foreign currency 769,0 16,4 830,6 15,8 1 081,0 18,8 1 135,2 18,7 1 103,5 17,9
of which: revaluation -48,8 -1,0 50,6 1,0 -0,1 0,0 -25,2 -0,4 -19,5 -0,3
Debt securities at book value held (without
revaluation)
4 725,0 100,0 5 214,5 100,0 5 742,2 100,0 6 086,3 100,0 6 182,4 100,0
of which:
debt securities of the Russian Federation 1 496,3 31,7 945,1 18,1 935,3 16,3 965,4 15,9 814,1 13,2
- in rubles 1 397,1 29,6 750,4 14,4 705,6 12,3 753,5 12,4 677,5 11,0
- in foreign currency 99,2 2,1 194,7 3,7 229,7 4,0 211,9 3,5 136,6 2,2
debt securities of the Bank of Russia 0,0 0,0 0,0 0,0 0,0 0,0 0,0 0,0 0,0 0,0
- in rubles 0,0 0,0 0,0 0,0 0,0 0,0 0,0 0,0 0,0 0,0
- in foreign currency 0,0 0,0 0,0 0,0 0,0 0,0 0,0 0,0 0,0 0,0
debt securities of federal districts and local
government
223,7 4,7 98,1 1,9 126,2 2,2 186,2 3,1 131,8 2,1
- in rubles 223,6 4,7 98,1 1,9 126,2 2,2 186,2 3,1 131,8 2,1
- in foreign currency 0,1 0,0 0,0 0,0 0,0 0,0 0,0 0,0 0,0 0,0
debt securities of resident credit institutions 408,5 8,6 492,9 9,5 423,4 7,4 440,6 7,2 410,3 6,6
- in rubles 408,5 8,6 487,4 9,3 412,5 7,2 432,4 7,1 400,1 6,5
- in foreign currency 0,0 0,0 5,5 0,1 10,9 0,2 8,1 0,1 10,2 0,2
other debt securities of residents 997,5 21,1 863,8 16,6 640,4 11,2 744,0 12,2 687,8 11,1
- in rubles 997,4 21,1 863,4 16,6 640,1 11,1 743,6 12,2 687,5 11,1
- in foreign currency 0,1 0,0 0,4 0,0 0,4 0,0 0,4 0,0 0,4 0,0
debt securities of other countries 40,3 0,9 19,6 0,4 28,8 0,5 37,3 0,6 17,6 0,3
- in rubles 5,0 0,1 0,0 0,0 0,0 0,0 0,0 0,0 0,0 0,0
- in foreign currency 35,3 0,7 19,6 0,4 28,8 0,5 37,3 0,6 17,6 0,3
debt securities of non-resident banks 169,5 3,6 218,4 4,2 151,3 2,6 119,1 2,0 97,4 1,6
- in rubles 23,0 0,5 42,4 0,8 40,5 0,7 41,2 0,7 39,7 0,6
- in foreign currency 146,5 3,1 176,0 3,4 110,9 1,9 77,9 1,3 57,6 0,9
other debt securities of non-residents 629,7 13,3 553,4 10,6 811,6 14,1 832,6 13,7 768,2 12,4
- in rubles 245,0 5,2 221,4 4,2 210,7 3,7 221,3 3,6 218,4 3,5
- in foreign currency 384,7 8,1 331,9 6,4 600,9 10,5 611,2 10,0 549,8 8,9
debt securities delivered without
derecognition in the balance sheet
747,0 15,8 2 014,9 38,6 2 615,4 45,5 2 752,6 45,2 3 248,9 52,6
- in rubles 645,9 13,7 1 913,4 36,7 2 517,1 43,8 2 565,4 42,1 2 918,7 47,2
- in foreign currency 101,1 2,1 101,5 1,9 98,4 1,7 187,2 3,1 330,2 5,3
overdue debt securities 12,6 0,3 8,4 0,2 9,8 0,2 8,5 0,1 6,3 0,1
- in rubles 10,6 0,2 7,5 0,1 8,7 0,2 7,4 0,1 5,2 0,1
- in foreign currency 2,0 0,0 1,0 0,0 1,1 0,0 1,1 0,0 1,1 0,0
Reference data:
Provisions for losses on debt securities 19,6 15,5 16,4 17,6 14,9
The Central Bank of the Russian Federation
Banking Supervision Department
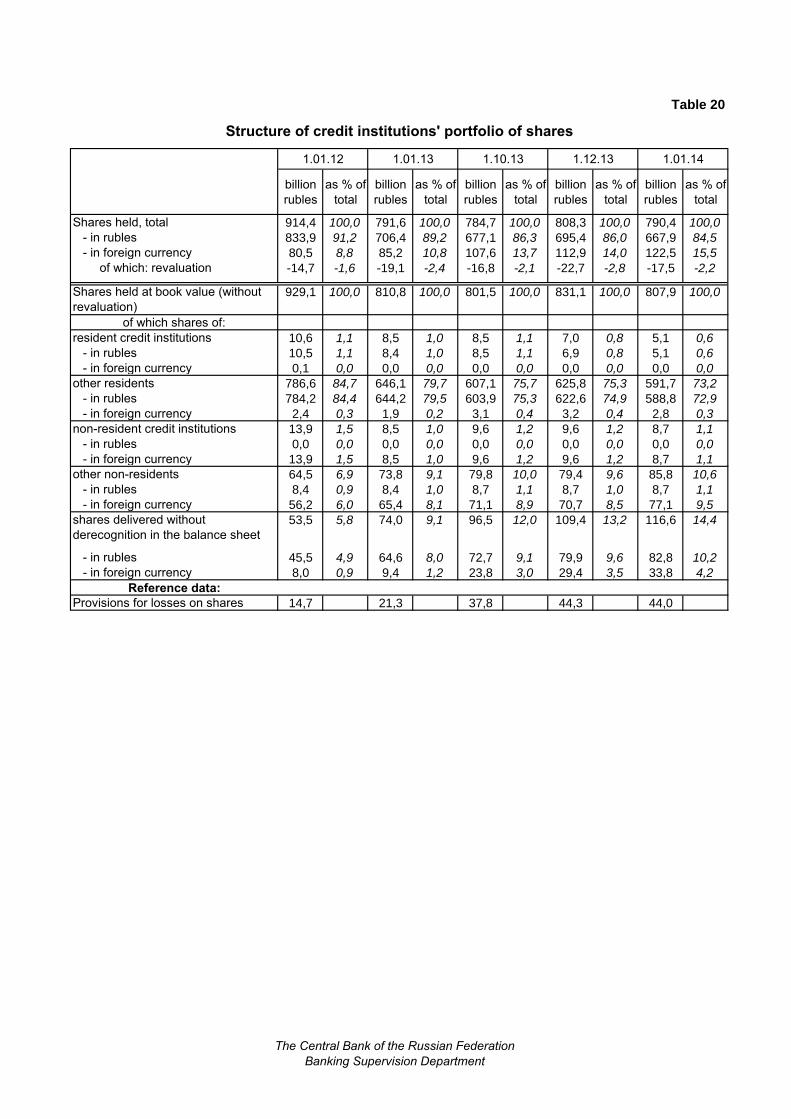
Table 20
Structure of credit institutions' portfolio of shares
1.01.12 1.01.13 1.10.13 1.12.13 1.01.14
billion
rubles
as % of
total
billion
rubles
as % of
total
billion
rubles
as % of
total
billion
rubles
as % of
total
billion
rubles
as % of
total
Shares held, total 914,4 100,0 791,6 100,0 784,7 100,0 808,3 100,0 790,4 100,0
- in rubles 833,9 91,2 706,4 89,2 677,1 86,3 695,4 86,0 667,9 84,5
- in foreign currency 80,5 8,8 85,2 10,8 107,6 13,7 112,9 14,0 122,5 15,5
of which: revaluation -14,7 -1,6 -19,1 -2,4 -16,8 -2,1 -22,7 -2,8 -17,5 -2,2
Shares held at book value (without
revaluation)
929,1 100,0 810,8 100,0 801,5 100,0 831,1 100,0 807,9 100,0
of which shares of:
resident credit institutions 10,6 1,1 8,5 1,0 8,5 1,1 7,0 0,8 5,1 0,6
- in rubles 10,5 1,1 8,4 1,0 8,5 1,1 6,9 0,8 5,1 0,6
- in foreign currency 0,1 0,0 0,0 0,0 0,0 0,0 0,0 0,0 0,0 0,0
other residents 786,6 84,7 646,1 79,7 607,1 75,7 625,8 75,3 591,7 73,2
- in rubles 784,2 84,4 644,2 79,5 603,9 75,3 622,6 74,9 588,8 72,9
- in foreign currency 2,4 0,3 1,9 0,2 3,1 0,4 3,2 0,4 2,8 0,3
non-resident credit institutions 13,9 1,5 8,5 1,0 9,6 1,2 9,6 1,2 8,7 1,1
- in rubles 0,0 0,0 0,0 0,0 0,0 0,0 0,0 0,0 0,0 0,0
- in foreign currency 13,9 1,5 8,5 1,0 9,6 1,2 9,6 1,2 8,7 1,1
other non-residents 64,5 6,9 73,8 9,1 79,8 10,0 79,4 9,6 85,8 10,6
- in rubles 8,4 0,9 8,4 1,0 8,7 1,1 8,7 1,0 8,7 1,1
- in foreign currency 56,2 6,0 65,4 8,1 71,1 8,9 70,7 8,5 77,1 9,5
shares delivered without
derecognition in the balance sheet
53,5 5,8 74,0 9,1 96,5 12,0 109,4 13,2 116,6 14,4
- in rubles 45,5 4,9 64,6 8,0 72,7 9,1 79,9 9,6 82,8 10,2
- in foreign currency 8,0 0,9 9,4 1,2 23,8 3,0 29,4 3,5 33,8 4,2
Reference data:
Provisions for losses on shares 14,7 21,3 37,8 44,3 44,0
The Central Bank of the Russian Federation
Banking Supervision Department
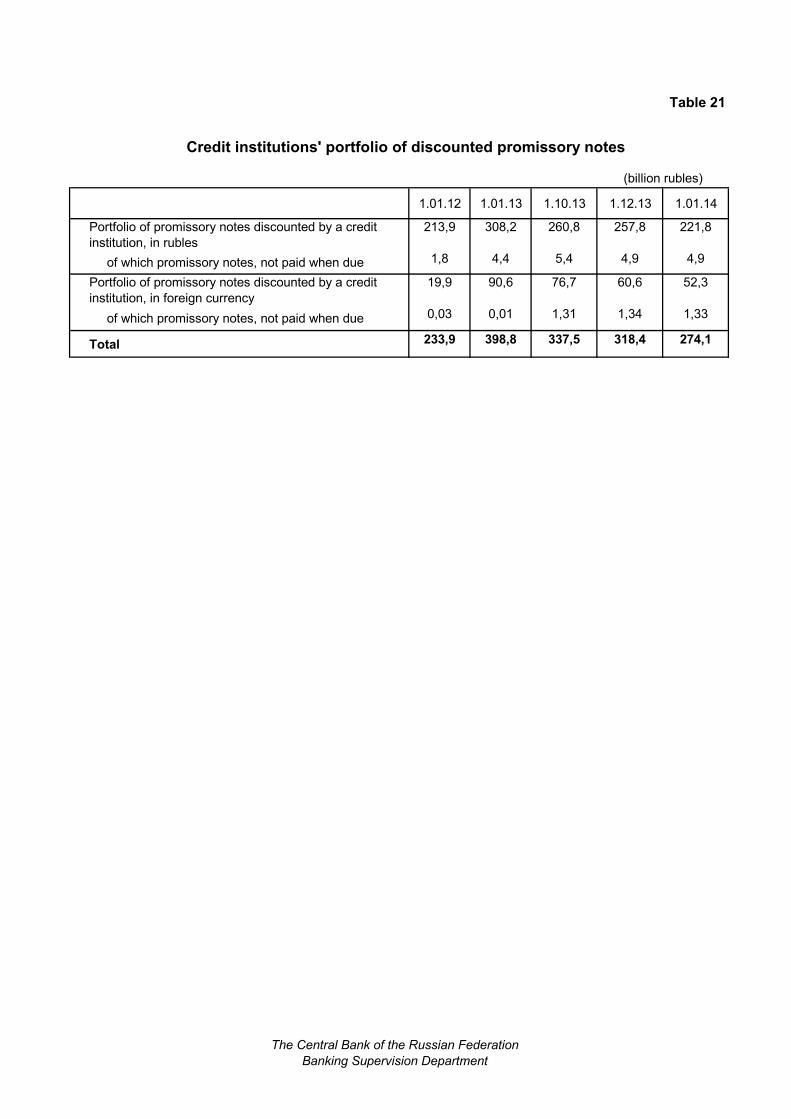
Table 21
Credit institutions' portfolio of discounted promissory notes
1.01.12 1.01.13 1.10.13 1.12.13 1.01.14
Portfolio of promissory notes discounted by a credit
institution, in rubles
213,9 308,2 260,8 257,8 221,8
of which promissory notes, not paid when due 1,8 4,4 5,4 4,9 4,9
Portfolio of promissory notes discounted by a credit
institution, in foreign currency
19,9 90,6 76,7 60,6 52,3
of which promissory notes, not paid when due 0,03 0,01 1,31 1,34 1,33
Total 233,9 398,8 337,5 318,4 274,1
(billion rubles)
The Central Bank of the Russian Federation
Banking Supervision Department
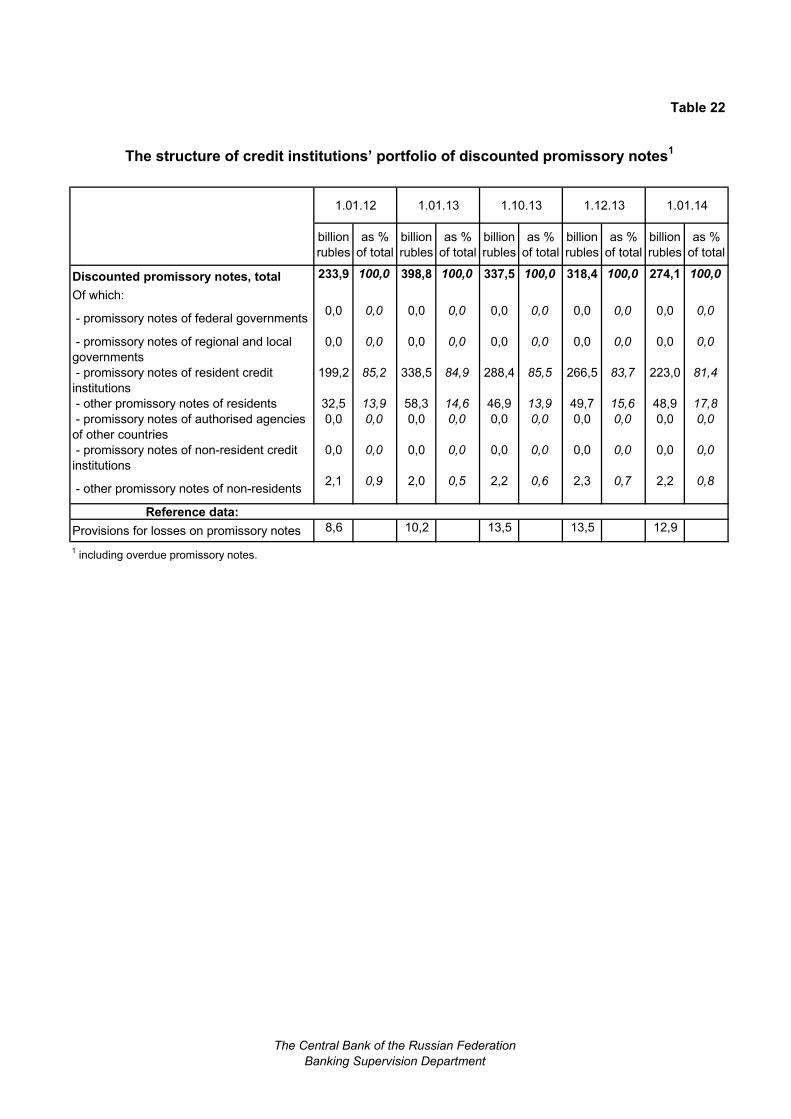
Table 22
The structure of credit institutions’ portfolio of discounted promissory notes1
1.01.12 1.01.13 1.10.13 1.12.13 1.01.14
billion
rubles
as %
of total
billion
rubles
as %
of total
billion
rubles
as %
of total
billion
rubles
as %
of total
billion
rubles
as %
of total
Discounted promissory notes, total 233,9 100,0 398,8 100,0 337,5 100,0 318,4 100,0 274,1 100,0
Of which:
- promissory notes of federal governments0,0 0,0 0,0 0,0 0,0 0,0 0,0 0,0 0,0 0,0
- promissory notes of regional and local
governments
0,0 0,0 0,0 0,0 0,0 0,0 0,0 0,0 0,0 0,0
- promissory notes of resident credit
institutions
199,2 85,2 338,5 84,9 288,4 85,5 266,5 83,7 223,0 81,4
- other promissory notes of residents 32,5 13,9 58,3 14,6 46,9 13,9 49,7 15,6 48,9 17,8
- promissory notes of authorised agencies
of other countries
0,0 0,0 0,0 0,0 0,0 0,0 0,0 0,0 0,0 0,0
- promissory notes of non-resident credit
institutions
0,0 0,0 0,0 0,0 0,0 0,0 0,0 0,0 0,0 0,0
- other promissory notes of non-residents2,1 0,9 2,0 0,5 2,2 0,6 2,3 0,7 2,2 0,8
Reference data:
Provisions for losses on promissory notes 8,6 10,2 13,5 13,5 12,9
1 including overdue promissory notes.
The Central Bank of the Russian Federation
Banking Supervision Department
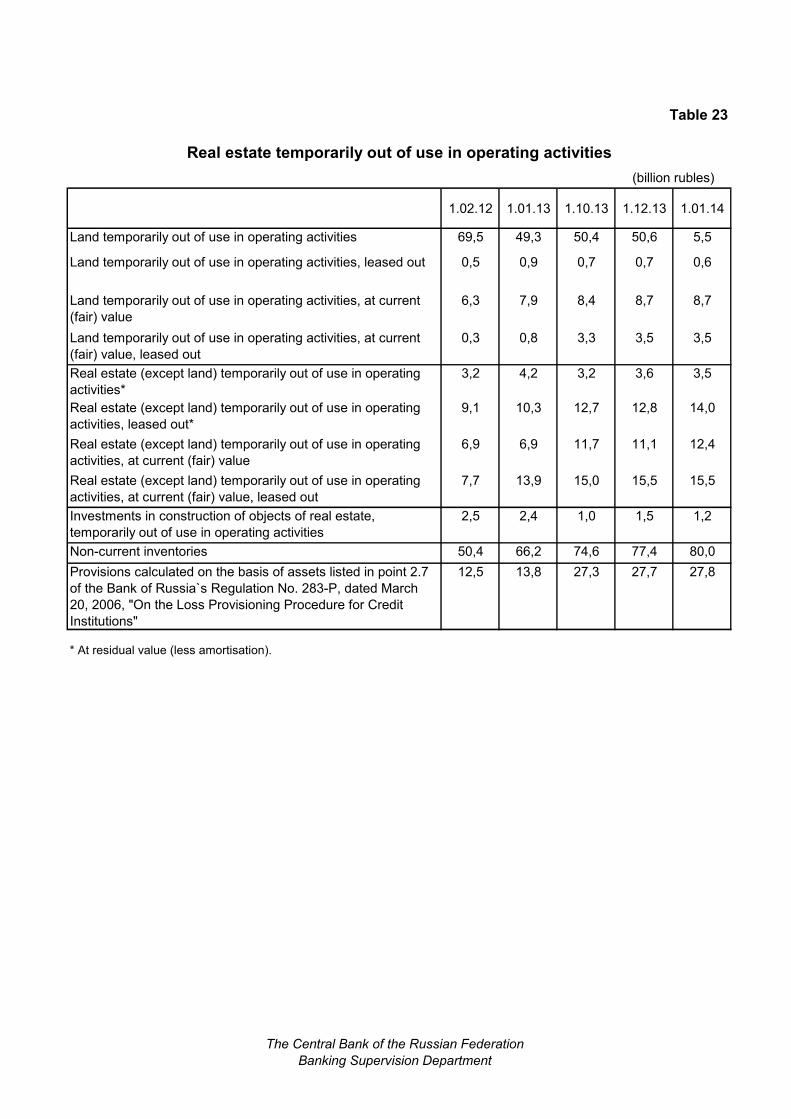
Table 23
Real estate temporarily out of use in operating activities
1.02.12 1.01.13 1.10.13 1.12.13 1.01.14
Land temporarily out of use in operating activities 69,5 49,3 50,4 50,6 5,5
Land temporarily out of use in operating activities, leased out 0,5 0,9 0,7 0,7 0,6
Land temporarily out of use in operating activities, at current
(fair) value
6,3 7,9 8,4 8,7 8,7
Land temporarily out of use in operating activities, at current
(fair) value, leased out
0,3 0,8 3,3 3,5 3,5
Real estate (except land) temporarily out of use in operating
activities*
3,2 4,2 3,2 3,6 3,5
Real estate (except land) temporarily out of use in operating
activities, leased out*
9,1 10,3 12,7 12,8 14,0
Real estate (except land) temporarily out of use in operating
activities, at current (fair) value
6,9 6,9 11,7 11,1 12,4
Real estate (except land) temporarily out of use in operating
activities, at current (fair) value, leased out
7,7 13,9 15,0 15,5 15,5
Investments in construction of objects of real estate,
temporarily out of use in operating activities
2,5 2,4 1,0 1,5 1,2
Non-current inventories 50,4 66,2 74,6 77,4 80,0
Provisions calculated on the basis of assets listed in point 2.7
of the Bank of Russia`s Regulation No. 283-P, dated March
20, 2006, "On the Loss Provisioning Procedure for Credit
Institutions"
12,5 13,8 27,3 27,7 27,8
* At residual value (less amortisation).
(billion rubles)
The Central Bank of the Russian Federation
Banking Supervision Department
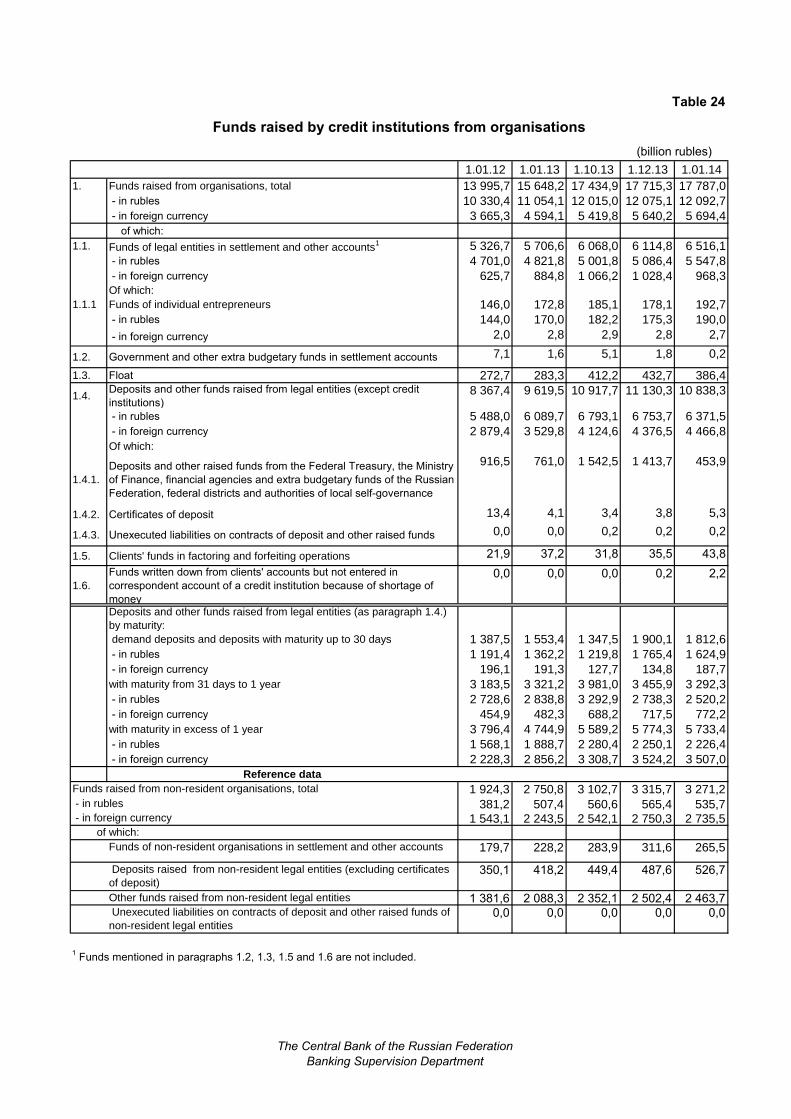
Table 24
Funds raised by credit institutions from organisations
1.01.12 1.01.13 1.10.13 1.12.13 1.01.14
1. Funds raised from organisations, total 13 995,7 15 648,2 17 434,9 17 715,3 17 787,0
- in rubles 10 330,4 11 054,1 12 015,0 12 075,1 12 092,7
- in foreign currency 3 665,3 4 594,1 5 419,8 5 640,2 5 694,4
of which:
1.1. Funds of legal entities in settlement and other accounts1 5 326,7 5 706,6 6 068,0 6 114,8 6 516,1
- in rubles 4 701,0 4 821,8 5 001,8 5 086,4 5 547,8
- in foreign currency 625,7 884,8 1 066,2 1 028,4 968,3Of which:
1.1.1 Funds of individual entrepreneurs 146,0 172,8 185,1 178,1 192,7
- in rubles 144,0 170,0 182,2 175,3 190,0
- in foreign currency 2,0 2,8 2,9 2,8 2,7
1.2. Government and other extra budgetary funds in settlement accounts 7,1 1,6 5,1 1,8 0,2
1.3. Float 272,7 283,3 412,2 432,7 386,4
1.4.Deposits and other funds raised from legal entities (except credit
institutions) 8 367,4 9 619,5 10 917,7 11 130,3 10 838,3
- in rubles 5 488,0 6 089,7 6 793,1 6 753,7 6 371,5
- in foreign currency 2 879,4 3 529,8 4 124,6 4 376,5 4 466,8
Of which:
1.4.1.
Deposits and other raised funds from the Federal Treasury, the Ministry
of Finance, financial agencies and extra budgetary funds of the Russian
Federation, federal districts and authorities of local self-governance
916,5 761,0 1 542,5 1 413,7 453,9
1.4.2. Certificates of deposit 13,4 4,1 3,4 3,8 5,3
1.4.3. Unexecuted liabilities on contracts of deposit and other raised funds 0,0 0,0 0,2 0,2 0,2
1.5. Clients' funds in factoring and forfeiting operations 21,9 37,2 31,8 35,5 43,8
1.6.
Funds written down from clients' accounts but not entered in
correspondent account of a credit institution because of shortage of
money
0,0 0,0 0,0 0,2 2,2
Deposits and other funds raised from legal entities (as paragraph 1.4.)
by maturity:
demand deposits and deposits with maturity up to 30 days 1 387,5 1 553,4 1 347,5 1 900,1 1 812,6
- in rubles 1 191,4 1 362,2 1 219,8 1 765,4 1 624,9
- in foreign currency 196,1 191,3 127,7 134,8 187,7
with maturity from 31 days to 1 year 3 183,5 3 321,2 3 981,0 3 455,9 3 292,3
- in rubles 2 728,6 2 838,8 3 292,9 2 738,3 2 520,2
- in foreign currency 454,9 482,3 688,2 717,5 772,2
with maturity in excess of 1 year 3 796,4 4 744,9 5 589,2 5 774,3 5 733,4
- in rubles 1 568,1 1 888,7 2 280,4 2 250,1 2 226,4
- in foreign currency 2 228,3 2 856,2 3 308,7 3 524,2 3 507,0
Reference data
1 924,3 2 750,8 3 102,7 3 315,7 3 271,2
381,2 507,4 560,6 565,4 535,7
1 543,1 2 243,5 2 542,1 2 750,3 2 735,5
Funds of non-resident organisations in settlement and other accounts 179,7 228,2 283,9 311,6 265,5
Deposits raised from non-resident legal entities (excluding certificates
of deposit)350,1 418,2 449,4 487,6 526,7
Other funds raised from non-resident legal entities 1 381,6 2 088,3 2 352,1 2 502,4 2 463,7 Unexecuted liabilities on contracts of deposit and other raised funds of
non-resident legal entities0,0 0,0 0,0 0,0 0,0
1 Funds mentioned in paragraphs 1.2, 1.3, 1.5 and 1.6 are not included.
of which:
(billion rubles)
Funds raised from non-resident organisations, total
- in rubles
- in foreign currency
The Central Bank of the Russian Federation
Banking Supervision Department
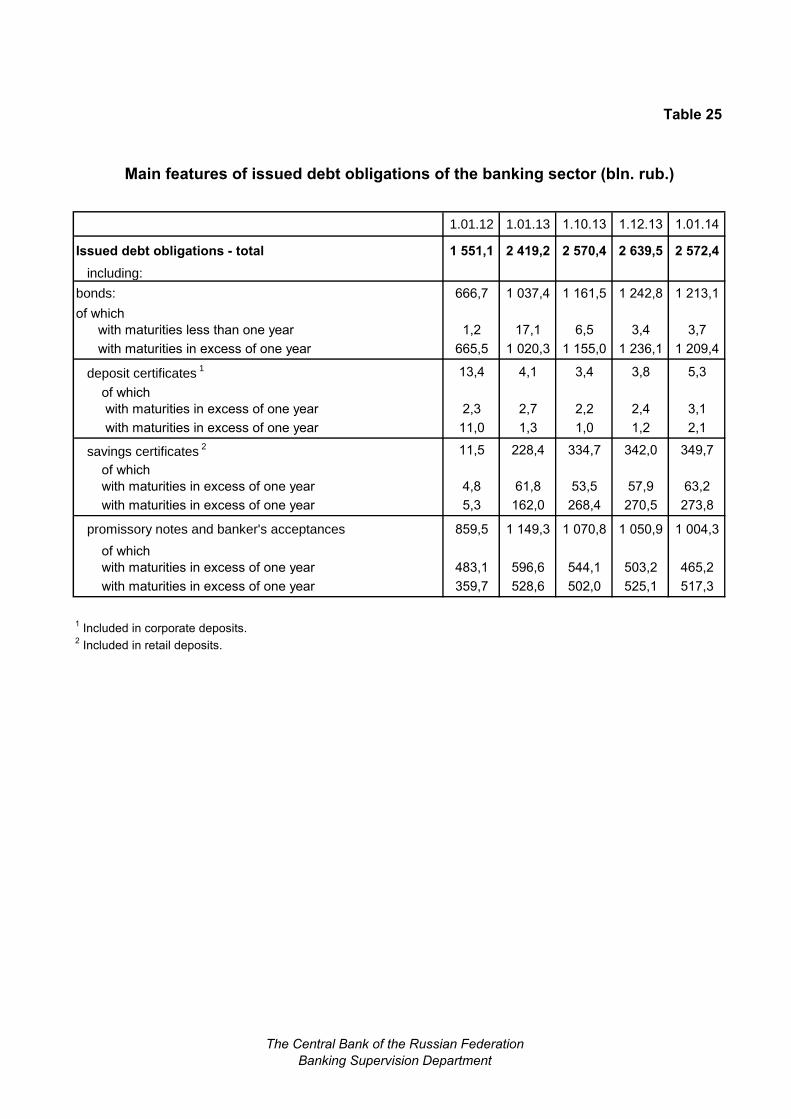
Table 25
Main features of issued debt obligations of the banking sector (bln. rub.)
1.01.12 1.01.13 1.10.13 1.12.13 1.01.14
Issued debt obligations - total 1 551,1 2 419,2 2 570,4 2 639,5 2 572,4
including:
bonds: 666,7 1 037,4 1 161,5 1 242,8 1 213,1
of which
with maturities less than one year 1,2 17,1 6,5 3,4 3,7
with maturities in excess of one year 665,5 1 020,3 1 155,0 1 236,1 1 209,4
deposit certificates 1 13,4 4,1 3,4 3,8 5,3
of which
with maturities in excess of one year 2,3 2,7 2,2 2,4 3,1
with maturities in excess of one year 11,0 1,3 1,0 1,2 2,1
savings certificates 2 11,5 228,4 334,7 342,0 349,7
of which
with maturities in excess of one year 4,8 61,8 53,5 57,9 63,2
with maturities in excess of one year 5,3 162,0 268,4 270,5 273,8
promissory notes and banker's acceptances 859,5 1 149,3 1 070,8 1 050,9 1 004,3
of which
with maturities in excess of one year 483,1 596,6 544,1 503,2 465,2
with maturities in excess of one year 359,7 528,6 502,0 525,1 517,3
1 Included in corporate deposits.
2 Included in retail deposits.
The Central Bank of the Russian Federation
Banking Supervision Department
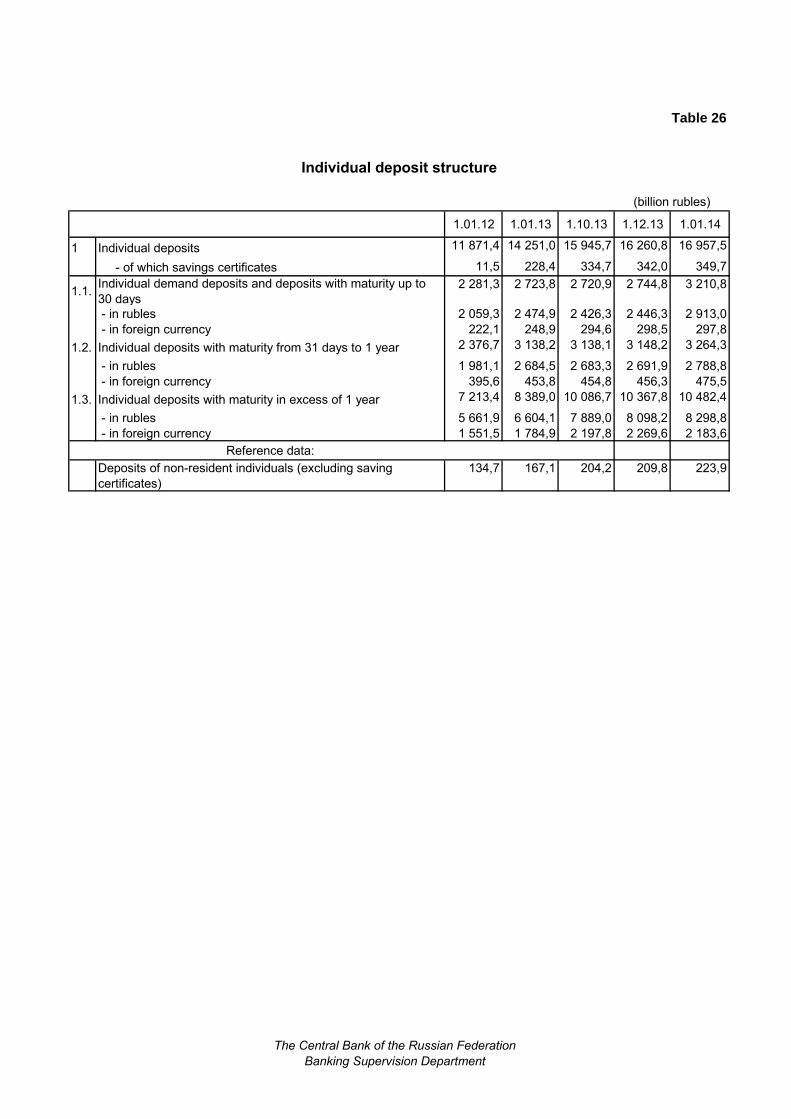
Table 26
1.01.12 1.01.13 1.10.13 1.12.13 1.01.14
1 Individual deposits 11 871,4 14 251,0 15 945,7 16 260,8 16 957,5
- of which savings certificates 11,5 228,4 334,7 342,0 349,7
1.1.Individual demand deposits and deposits with maturity up to
30 days
2 281,3 2 723,8 2 720,9 2 744,8 3 210,8
- in rubles 2 059,3 2 474,9 2 426,3 2 446,3 2 913,0
- in foreign currency 222,1 248,9 294,6 298,5 297,8
1.2. Individual deposits with maturity from 31 days to 1 year 2 376,7 3 138,2 3 138,1 3 148,2 3 264,3
- in rubles 1 981,1 2 684,5 2 683,3 2 691,9 2 788,8
- in foreign currency 395,6 453,8 454,8 456,3 475,5
1.3. Individual deposits with maturity in excess of 1 year 7 213,4 8 389,0 10 086,7 10 367,8 10 482,4
- in rubles 5 661,9 6 604,1 7 889,0 8 098,2 8 298,8
- in foreign currency 1 551,5 1 784,9 2 197,8 2 269,6 2 183,6
Reference data:
Deposits of non-resident individuals (excluding saving
certificates)
134,7 167,1 204,2 209,8 223,9
Individual deposit structure
(billion rubles)
The Central Bank of the Russian Federation
Banking Supervision Department
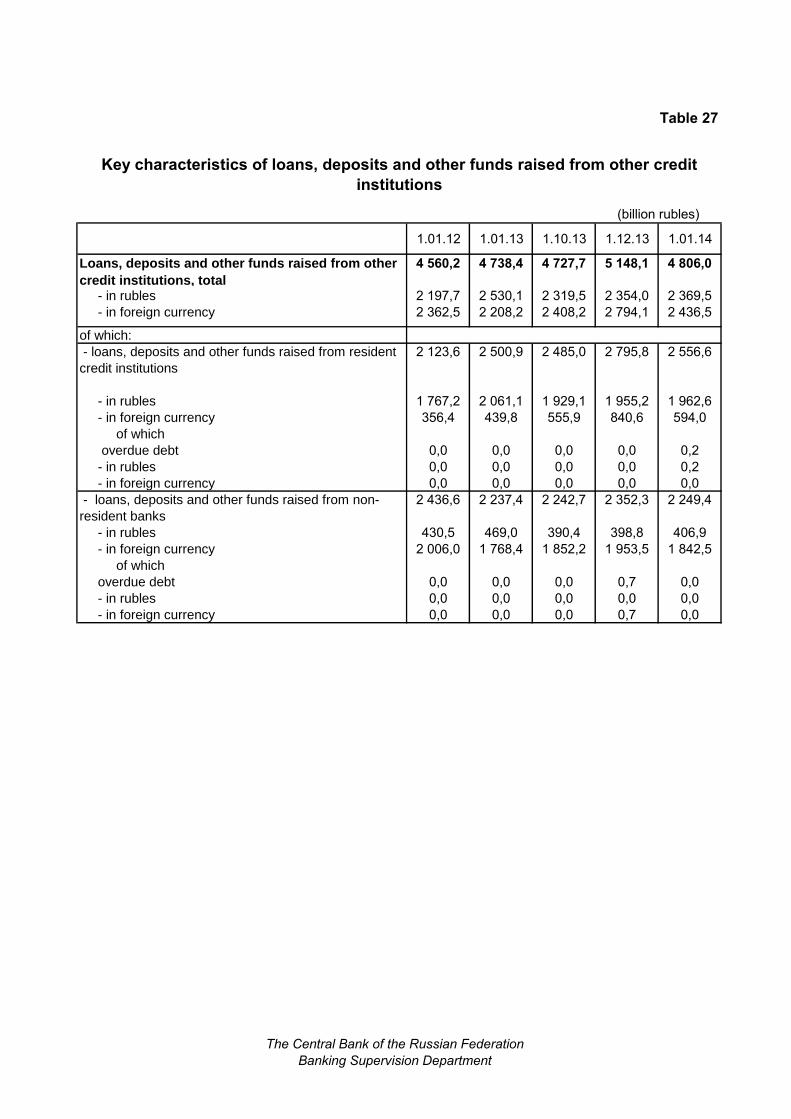
Table 27
Key characteristics of loans, deposits and other funds raised from other credit
institutions
1.01.12 1.01.13 1.10.13 1.12.13 1.01.14
Loans, deposits and other funds raised from other
credit institutions, total
4 560,2 4 738,4 4 727,7 5 148,1 4 806,0
- in rubles 2 197,7 2 530,1 2 319,5 2 354,0 2 369,5
- in foreign currency 2 362,5 2 208,2 2 408,2 2 794,1 2 436,5
of which:
- loans, deposits and other funds raised from resident
credit institutions
2 123,6 2 500,9 2 485,0 2 795,8 2 556,6
- in rubles 1 767,2 2 061,1 1 929,1 1 955,2 1 962,6
- in foreign currency 356,4 439,8 555,9 840,6 594,0
of which
overdue debt 0,0 0,0 0,0 0,0 0,2
- in rubles 0,0 0,0 0,0 0,0 0,2
- in foreign currency 0,0 0,0 0,0 0,0 0,0
- loans, deposits and other funds raised from non-
resident banks
2 436,6 2 237,4 2 242,7 2 352,3 2 249,4
- in rubles 430,5 469,0 390,4 398,8 406,9
- in foreign currency 2 006,0 1 768,4 1 852,2 1 953,5 1 842,5
of which
overdue debt 0,0 0,0 0,0 0,7 0,0
- in rubles 0,0 0,0 0,0 0,0 0,0
- in foreign currency 0,0 0,0 0,0 0,7 0,0
(billion rubles)
The Central Bank of the Russian Federation
Banking Supervision Department
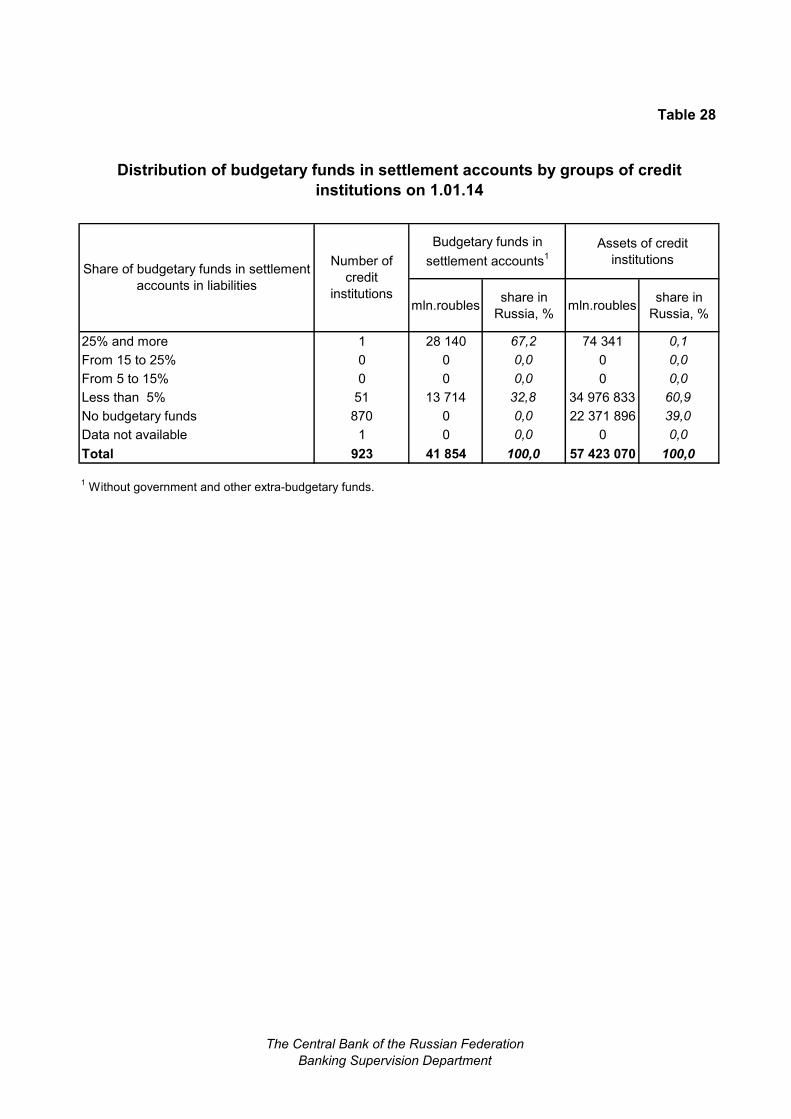
Table 28
Distribution of budgetary funds in settlement accounts by groups of credit
institutions on 1.01.14
Budgetary funds in
settlement accounts1
Assets of credit
institutions
mln.roublesshare in
Russia, %mln.roubles
share in
Russia, %
25% and more 1 28 140 67,2 74 341 0,1
From 15 to 25% 0 0 0,0 0 0,0
From 5 to 15% 0 0 0,0 0 0,0
Less than 5% 51 13 714 32,8 34 976 833 60,9
No budgetary funds 870 0 0,0 22 371 896 39,0
Data not available 1 0 0,0 0 0,0
Total 923 41 854 100,0 57 423 070 100,0
1 Without government and other extra-budgetary funds.
Number of
credit
institutions
Share of budgetary funds in settlement
accounts in liabilities
The Central Bank of the Russian Federation
Banking Supervision Department
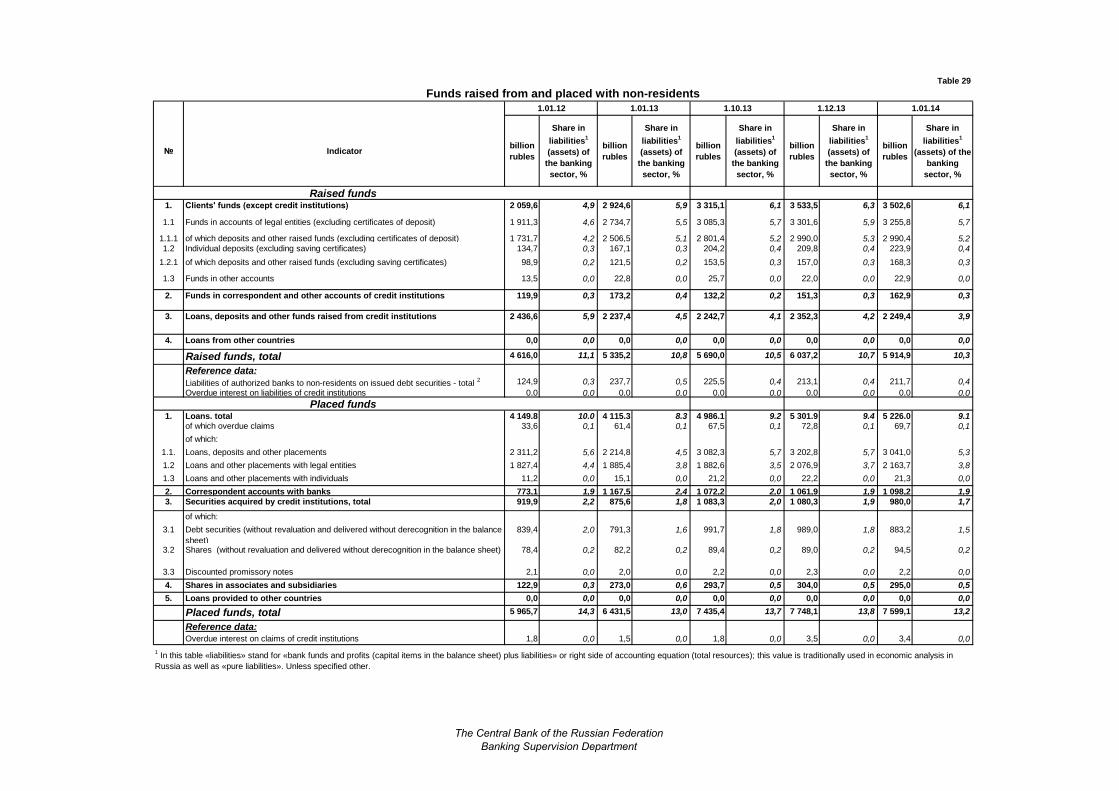
Table 29
1.01.12 1.01.13 1.10.13 1.12.13 1.01.14
№ Indicatorbillion
rubles
Share in
liabilities1
(assets) of
the banking
sector, %
billion
rubles
Share in
liabilities1
(assets) of
the banking
sector, %
billion
rubles
Share in
liabilities1
(assets) of
the banking
sector, %
billion
rubles
Share in
liabilities1
(assets) of
the banking
sector, %
billion
rubles
Share in
liabilities1
(assets) of the
banking
sector, %
Raised funds1. Clients' funds (except credit institutions) 2 059,6 4,9 2 924,6 5,9 3 315,1 6,1 3 533,5 6,3 3 502,6 6,1
1.1 Funds in accounts of legal entities (excluding certificates of deposit) 1 911,3 4,6 2 734,7 5,5 3 085,3 5,7 3 301,6 5,9 3 255,8 5,7
1.1.1 of which deposits and other raised funds (excluding certificates of deposit) 1 731,7 4,2 2 506,5 5,1 2 801,4 5,2 2 990,0 5,3 2 990,4 5,21.2 Individual deposits (excluding saving certificates) 134,7 0,3 167,1 0,3 204,2 0,4 209,8 0,4 223,9 0,4
1.2.1 of which deposits and other raised funds (excluding saving certificates) 98,9 0,2 121,5 0,2 153,5 0,3 157,0 0,3 168,3 0,3
1.3 Funds in other accounts 13,5 0,0 22,8 0,0 25,7 0,0 22,0 0,0 22,9 0,0
2. Funds in correspondent and other accounts of credit institutions 119,9 0,3 173,2 0,4 132,2 0,2 151,3 0,3 162,9 0,3
3. Loans, deposits and other funds raised from credit institutions 2 436,6 5,9 2 237,4 4,5 2 242,7 4,1 2 352,3 4,2 2 249,4 3,9
4. Loans from other countries 0,0 0,0 0,0 0,0 0,0 0,0 0,0 0,0 0,0 0,0
Raised funds, total 4 616,0 11,1 5 335,2 10,8 5 690,0 10,5 6 037,2 10,7 5 914,9 10,3
Reference data:
Liabilities of authorized banks to non-residents on issued debt securities - total 2 124,9 0,3 237,7 0,5 225,5 0,4 213,1 0,4 211,7 0,4
Overdue interest on liabilities of credit institutions 0,0 0,0 0,0 0,0 0,0 0,0 0,0 0,0 0,0 0,0
Placed funds 1. Loans, total 4 149,8 10,0 4 115,3 8,3 4 986,1 9,2 5 301,9 9,4 5 226,0 9,1
of which overdue claims 33,6 0,1 61,4 0,1 67,5 0,1 72,8 0,1 69,7 0,1
of which:
1.1. Loans, deposits and other placements 2 311,2 5,6 2 214,8 4,5 3 082,3 5,7 3 202,8 5,7 3 041,0 5,3
1.2 Loans and other placements with legal entities 1 827,4 4,4 1 885,4 3,8 1 882,6 3,5 2 076,9 3,7 2 163,7 3,8
1.3 Loans and other placements with individuals 11,2 0,0 15,1 0,0 21,2 0,0 22,2 0,0 21,3 0,0
2. Correspondent accounts with banks 773,1 1,9 1 167,5 2,4 1 072,2 2,0 1 061,9 1,9 1 098,2 1,9
3. Securities acquired by credit institutions, total 919,9 2,2 875,6 1,8 1 083,3 2,0 1 080,3 1,9 980,0 1,7
of which:
3.1 Debt securities (without revaluation and delivered without derecognition in the balance
sheet)
839,4 2,0 791,3 1,6 991,7 1,8 989,0 1,8 883,2 1,5
3.2 Shares (without revaluation and delivered without derecognition in the balance sheet) 78,4 0,2 82,2 0,2 89,4 0,2 89,0 0,2 94,5 0,2
3.3 Discounted promissory notes 2,1 0,0 2,0 0,0 2,2 0,0 2,3 0,0 2,2 0,0
4. Shares in associates and subsidiaries 122,9 0,3 273,0 0,6 293,7 0,5 304,0 0,5 295,0 0,5
5. Loans provided to other countries 0,0 0,0 0,0 0,0 0,0 0,0 0,0 0,0 0,0 0,0
Placed funds, total 5 965,7 14,3 6 431,5 13,0 7 435,4 13,7 7 748,1 13,8 7 599,1 13,2
Reference data:
Overdue interest on claims of credit institutions 1,8 0,0 1,5 0,0 1,8 0,0 3,5 0,0 3,4 0,0
Funds raised from and placed with non-residents
1 In this table «liabilities» stand for «bank funds and profits (capital items in the balance sheet) plus liabilities» or right side of accounting equation (total resources); this value is traditionally used in economic analysis in
Russia as well as «pure liabilities». Unless specified other.
The Central Bank of the Russian Federation
Banking Supervision Department
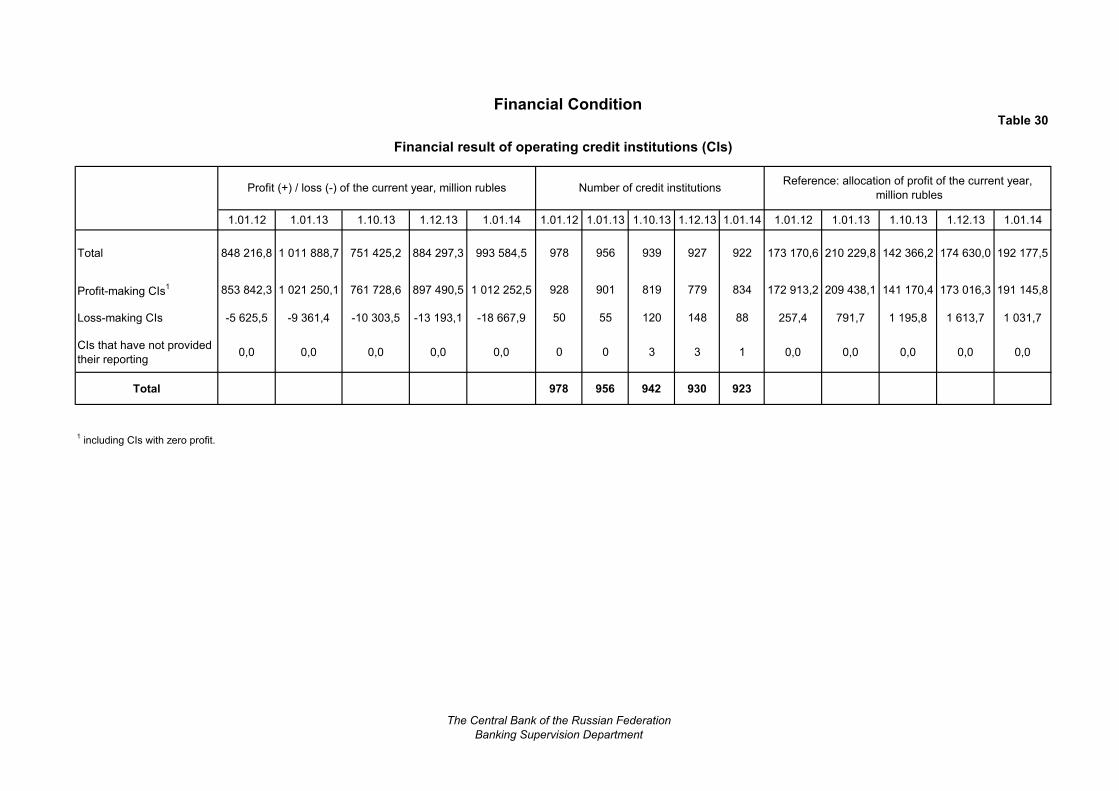
Financial ConditionTable 30
Financial result of operating credit institutions (CIs)
1.01.12 1.01.13 1.10.13 1.12.13 1.01.14 1.01.12 1.01.13 1.10.13 1.12.13 1.01.14 1.01.12 1.01.13 1.10.13 1.12.13 1.01.14
Total 848 216,8 1 011 888,7 751 425,2 884 297,3 993 584,5 978 956 939 927 922 173 170,6 210 229,8 142 366,2 174 630,0 192 177,5
Profit-making CIs1 853 842,3 1 021 250,1 761 728,6 897 490,5 1 012 252,5 928 901 819 779 834 172 913,2 209 438,1 141 170,4 173 016,3 191 145,8
Loss-making CIs -5 625,5 -9 361,4 -10 303,5 -13 193,1 -18 667,9 50 55 120 148 88 257,4 791,7 1 195,8 1 613,7 1 031,7
CIs that have not provided
their reporting0,0 0,0 0,0 0,0 0,0 0 0 3 3 1 0,0 0,0 0,0 0,0 0,0
Total 978 956 942 930 923
Reference: allocation of profit of the current year,
million rublesProfit (+) / loss (-) of the current year, million rubles Number of credit institutions
1 including CIs with zero profit.
The Central Bank of the Russian Federation
Banking Supervision Department
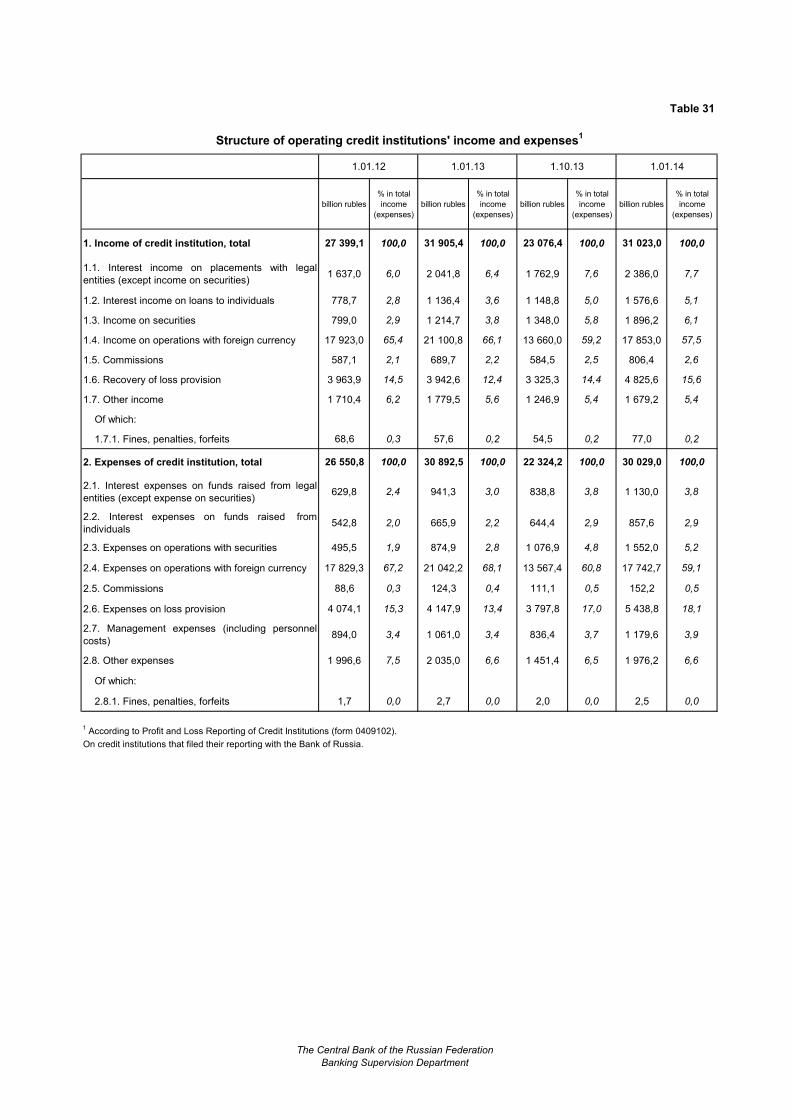
Table 31
Structure of operating credit institutions' income and expenses1
1.01.12 1.01.13 1.10.13 1.01.14
billion rubles
% in total
income
(expenses)
billion rubles
% in total
income
(expenses)
billion rubles
% in total
income
(expenses)
billion rubles
% in total
income
(expenses)
1. Income of credit institution, total 27 399,1 100,0 31 905,4 100,0 23 076,4 100,0 31 023,0 100,0
1.1. Interest income on placements with legal
entities (except income on securities)1 637,0 6,0 2 041,8 6,4 1 762,9 7,6 2 386,0 7,7
1.2. Interest income on loans to individuals 778,7 2,8 1 136,4 3,6 1 148,8 5,0 1 576,6 5,1
1.3. Income on securities 799,0 2,9 1 214,7 3,8 1 348,0 5,8 1 896,2 6,1
1.4. Income on operations with foreign currency 17 923,0 65,4 21 100,8 66,1 13 660,0 59,2 17 853,0 57,5
1.5. Commissions 587,1 2,1 689,7 2,2 584,5 2,5 806,4 2,6
1.6. Recovery of loss provision 3 963,9 14,5 3 942,6 12,4 3 325,3 14,4 4 825,6 15,6
1.7. Other income 1 710,4 6,2 1 779,5 5,6 1 246,9 5,4 1 679,2 5,4
Of which:
1.7.1. Fines, penalties, forfeits 68,6 0,3 57,6 0,2 54,5 0,2 77,0 0,2
2. Expenses of credit institution, total 26 550,8 100,0 30 892,5 100,0 22 324,2 100,0 30 029,0 100,0
2.1. Interest expenses on funds raised from legal
entities (except expense on securities)629,8 2,4 941,3 3,0 838,8 3,8 1 130,0 3,8
2.2. Interest expenses on funds raised from
individuals542,8 2,0 665,9 2,2 644,4 2,9 857,6 2,9
2.3. Expenses on operations with securities 495,5 1,9 874,9 2,8 1 076,9 4,8 1 552,0 5,2
2.4. Expenses on operations with foreign currency 17 829,3 67,2 21 042,2 68,1 13 567,4 60,8 17 742,7 59,1
2.5. Commissions 88,6 0,3 124,3 0,4 111,1 0,5 152,2 0,5
2.6. Expenses on loss provision 4 074,1 15,3 4 147,9 13,4 3 797,8 17,0 5 438,8 18,1
2.7. Management expenses (including personnel
costs) 894,0 3,4 1 061,0 3,4 836,4 3,7 1 179,6 3,9
2.8. Other expenses 1 996,6 7,5 2 035,0 6,6 1 451,4 6,5 1 976,2 6,6
Of which:
2.8.1. Fines, penalties, forfeits 1,7 0,0 2,7 0,0 2,0 0,0 2,5 0,0
1 According to Profit and Loss Reporting of Credit Institutions (form 0409102).
On credit institutions that filed their reporting with the Bank of Russia.
The Central Bank of the Russian Federation
Banking Supervision Department
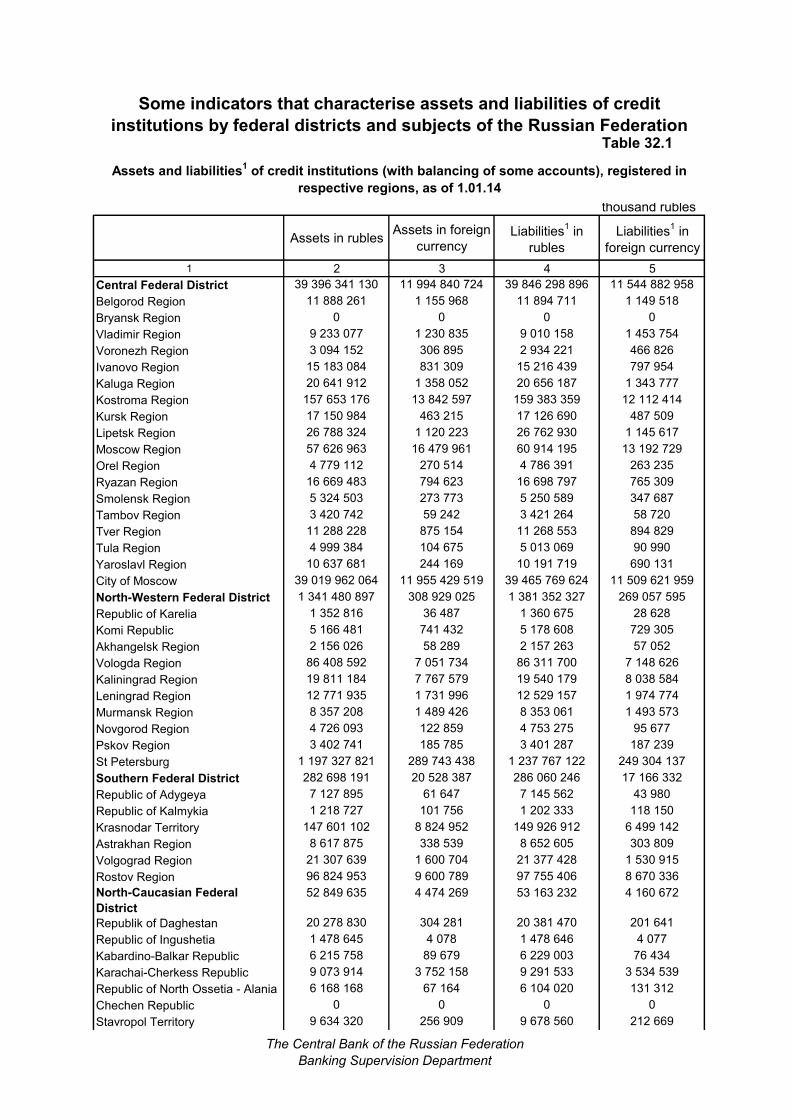
Some indicators that characterise assets and liabilities of credit
institutions by federal districts and subjects of the Russian FederationTable 32.1
Assets and liabilities1 of credit institutions (with balancing of some accounts), registered in
respective regions, as of 1.01.14
thousand rubles
Assets in rublesAssets in foreign
currencyLiabilities
1 in
rubles
Liabilities1 in
foreign currency
1 2 3 4 5
Central Federal District 39 396 341 130 11 994 840 724 39 846 298 896 11 544 882 958
Belgorod Region 11 888 261 1 155 968 11 894 711 1 149 518
Bryansk Region 0 0 0 0
Vladimir Region 9 233 077 1 230 835 9 010 158 1 453 754
Voronezh Region 3 094 152 306 895 2 934 221 466 826
Ivanovo Region 15 183 084 831 309 15 216 439 797 954
Kaluga Region 20 641 912 1 358 052 20 656 187 1 343 777
Kostroma Region 157 653 176 13 842 597 159 383 359 12 112 414
Kursk Region 17 150 984 463 215 17 126 690 487 509
Lipetsk Region 26 788 324 1 120 223 26 762 930 1 145 617
Moscow Region 57 626 963 16 479 961 60 914 195 13 192 729
Orel Region 4 779 112 270 514 4 786 391 263 235
Ryazan Region 16 669 483 794 623 16 698 797 765 309
Smolensk Region 5 324 503 273 773 5 250 589 347 687
Tambov Region 3 420 742 59 242 3 421 264 58 720
Tver Region 11 288 228 875 154 11 268 553 894 829
Tula Region 4 999 384 104 675 5 013 069 90 990
Yaroslavl Region 10 637 681 244 169 10 191 719 690 131
City of Moscow 39 019 962 064 11 955 429 519 39 465 769 624 11 509 621 959
North-Western Federal District 1 341 480 897 308 929 025 1 381 352 327 269 057 595
Republic of Karelia 1 352 816 36 487 1 360 675 28 628
Komi Republic 5 166 481 741 432 5 178 608 729 305
Akhangelsk Region 2 156 026 58 289 2 157 263 57 052
Vologda Region 86 408 592 7 051 734 86 311 700 7 148 626
Kaliningrad Region 19 811 184 7 767 579 19 540 179 8 038 584
Leningrad Region 12 771 935 1 731 996 12 529 157 1 974 774
Murmansk Region 8 357 208 1 489 426 8 353 061 1 493 573
Novgorod Region 4 726 093 122 859 4 753 275 95 677
Pskov Region 3 402 741 185 785 3 401 287 187 239
St Petersburg 1 197 327 821 289 743 438 1 237 767 122 249 304 137
Southern Federal District 282 698 191 20 528 387 286 060 246 17 166 332
Republic of Adygeya 7 127 895 61 647 7 145 562 43 980
Republic of Kalmykia 1 218 727 101 756 1 202 333 118 150
Krasnodar Territory 147 601 102 8 824 952 149 926 912 6 499 142
Astrakhan Region 8 617 875 338 539 8 652 605 303 809
Volgograd Region 21 307 639 1 600 704 21 377 428 1 530 915
Rostov Region 96 824 953 9 600 789 97 755 406 8 670 336
North-Caucasian Federal
District
52 849 635 4 474 269 53 163 232 4 160 672
Republik of Daghestan 20 278 830 304 281 20 381 470 201 641
Republic of Ingushetia 1 478 645 4 078 1 478 646 4 077
Kabardino-Balkar Republic 6 215 758 89 679 6 229 003 76 434
Karachai-Cherkess Republic 9 073 914 3 752 158 9 291 533 3 534 539
Republic of North Ossetia - Alania 6 168 168 67 164 6 104 020 131 312
Chechen Republic 0 0 0 0
Stavropol Territory 9 634 320 256 909 9 678 560 212 669
The Central Bank of the Russian Federation
Banking Supervision Department
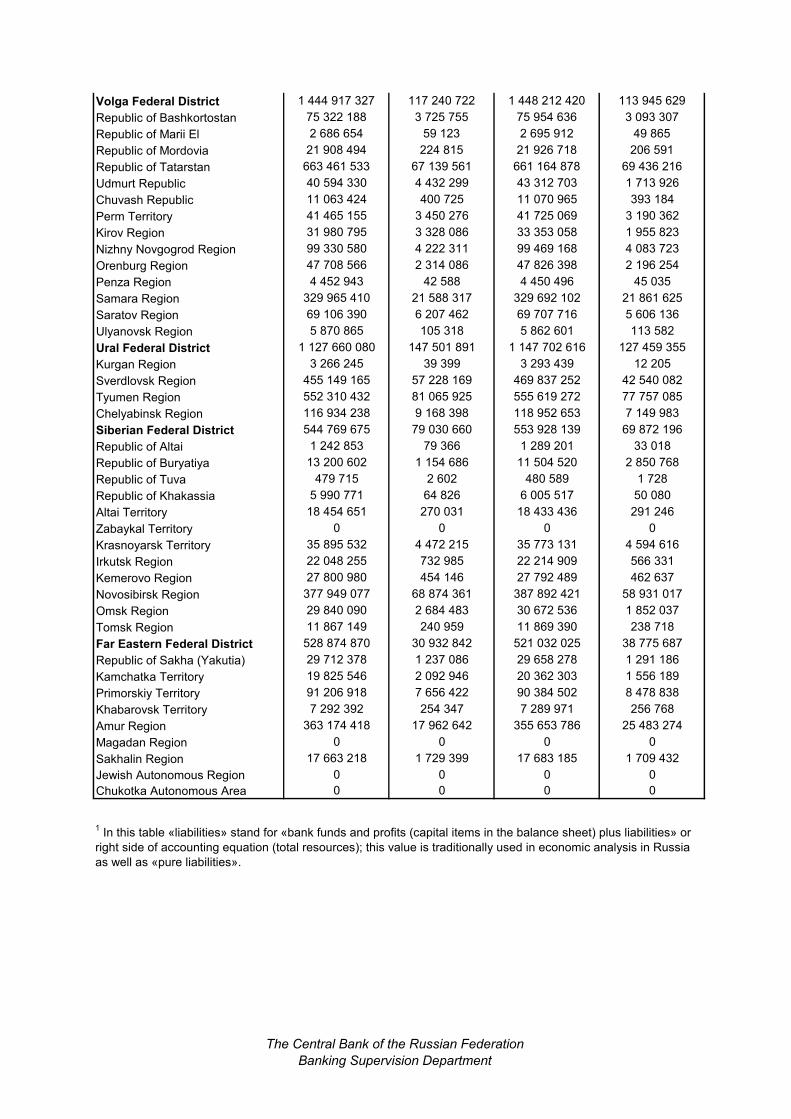
Volga Federal District 1 444 917 327 117 240 722 1 448 212 420 113 945 629
Republic of Bashkortostan 75 322 188 3 725 755 75 954 636 3 093 307
Republic of Marii El 2 686 654 59 123 2 695 912 49 865
Republic of Mordovia 21 908 494 224 815 21 926 718 206 591
Republic of Tatarstan 663 461 533 67 139 561 661 164 878 69 436 216
Udmurt Republic 40 594 330 4 432 299 43 312 703 1 713 926
Chuvash Republic 11 063 424 400 725 11 070 965 393 184
Perm Territory 41 465 155 3 450 276 41 725 069 3 190 362
Kirov Region 31 980 795 3 328 086 33 353 058 1 955 823
Nizhny Novgogrod Region 99 330 580 4 222 311 99 469 168 4 083 723
Orenburg Region 47 708 566 2 314 086 47 826 398 2 196 254
Penza Region 4 452 943 42 588 4 450 496 45 035
Samara Region 329 965 410 21 588 317 329 692 102 21 861 625
Saratov Region 69 106 390 6 207 462 69 707 716 5 606 136
Ulyanovsk Region 5 870 865 105 318 5 862 601 113 582
Ural Federal District 1 127 660 080 147 501 891 1 147 702 616 127 459 355
Kurgan Region 3 266 245 39 399 3 293 439 12 205
Sverdlovsk Region 455 149 165 57 228 169 469 837 252 42 540 082
Tyumen Region 552 310 432 81 065 925 555 619 272 77 757 085
Chelyabinsk Region 116 934 238 9 168 398 118 952 653 7 149 983
Siberian Federal District 544 769 675 79 030 660 553 928 139 69 872 196
Republic of Altai 1 242 853 79 366 1 289 201 33 018
Republic of Buryatiya 13 200 602 1 154 686 11 504 520 2 850 768
Republic of Tuva 479 715 2 602 480 589 1 728
Republic of Khakassia 5 990 771 64 826 6 005 517 50 080
Altai Territory 18 454 651 270 031 18 433 436 291 246
Zabaykal Territory 0 0 0 0
Krasnoyarsk Territory 35 895 532 4 472 215 35 773 131 4 594 616
Irkutsk Region 22 048 255 732 985 22 214 909 566 331
Kemerovo Region 27 800 980 454 146 27 792 489 462 637
Novosibirsk Region 377 949 077 68 874 361 387 892 421 58 931 017
Omsk Region 29 840 090 2 684 483 30 672 536 1 852 037
Tomsk Region 11 867 149 240 959 11 869 390 238 718
Far Eastern Federal District 528 874 870 30 932 842 521 032 025 38 775 687
Republic of Sakha (Yakutia) 29 712 378 1 237 086 29 658 278 1 291 186
Kamchatka Territory 19 825 546 2 092 946 20 362 303 1 556 189
Primorskiy Territory 91 206 918 7 656 422 90 384 502 8 478 838
Khabarovsk Territory 7 292 392 254 347 7 289 971 256 768
Amur Region 363 174 418 17 962 642 355 653 786 25 483 274
Magadan Region 0 0 0 0
Sakhalin Region 17 663 218 1 729 399 17 683 185 1 709 432
Jewish Autonomous Region 0 0 0 0
Chukotka Autonomous Area 0 0 0 0
1 In this table «liabilities» stand for «bank funds and profits (capital items in the balance sheet) plus liabilities» or
right side of accounting equation (total resources); this value is traditionally used in economic analysis in Russia
as well as «pure liabilities».
The Central Bank of the Russian Federation
Banking Supervision Department
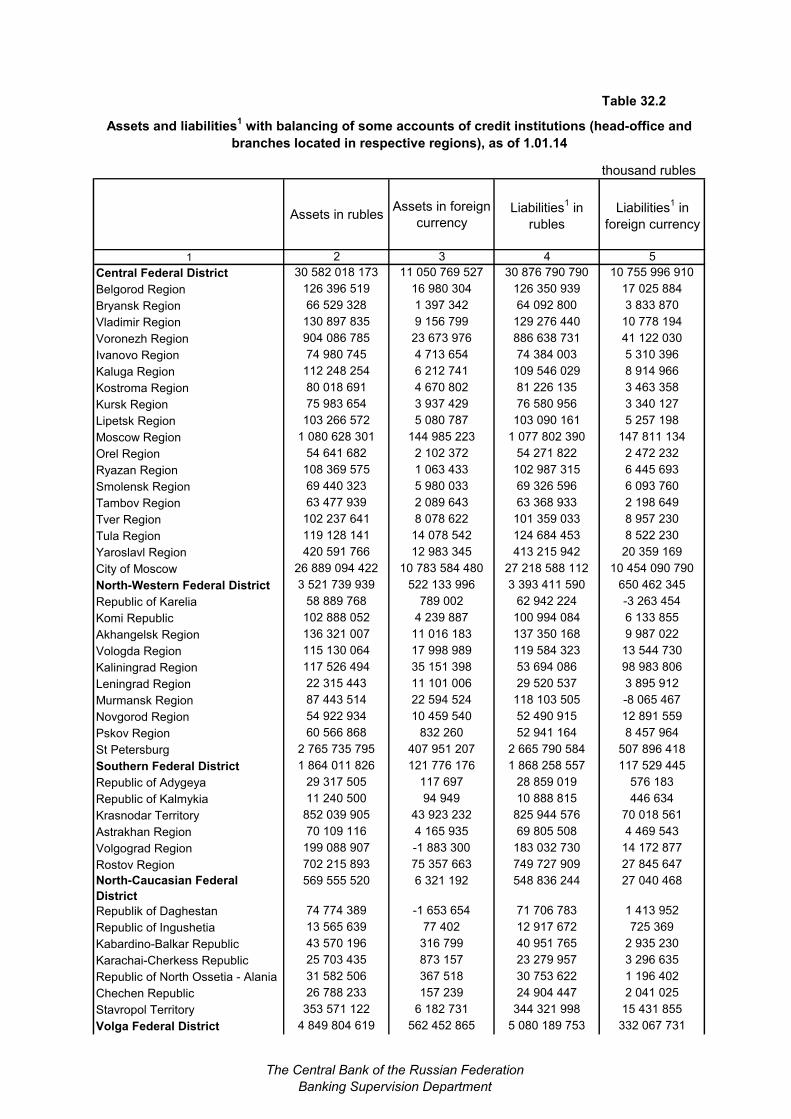
Table 32.2
Assets and liabilities1 with balancing of some accounts of credit institutions (head-office and
branches located in respective regions), as of 1.01.14
thousand rubles
Assets in rublesAssets in foreign
currencyLiabilities
1 in
rubles
Liabilities1 in
foreign currency
1 2 3 4 5
Central Federal District 30 582 018 173 11 050 769 527 30 876 790 790 10 755 996 910
Belgorod Region 126 396 519 16 980 304 126 350 939 17 025 884
Bryansk Region 66 529 328 1 397 342 64 092 800 3 833 870
Vladimir Region 130 897 835 9 156 799 129 276 440 10 778 194
Voronezh Region 904 086 785 23 673 976 886 638 731 41 122 030
Ivanovo Region 74 980 745 4 713 654 74 384 003 5 310 396
Kaluga Region 112 248 254 6 212 741 109 546 029 8 914 966
Kostroma Region 80 018 691 4 670 802 81 226 135 3 463 358
Kursk Region 75 983 654 3 937 429 76 580 956 3 340 127
Lipetsk Region 103 266 572 5 080 787 103 090 161 5 257 198
Moscow Region 1 080 628 301 144 985 223 1 077 802 390 147 811 134
Orel Region 54 641 682 2 102 372 54 271 822 2 472 232
Ryazan Region 108 369 575 1 063 433 102 987 315 6 445 693
Smolensk Region 69 440 323 5 980 033 69 326 596 6 093 760
Tambov Region 63 477 939 2 089 643 63 368 933 2 198 649
Tver Region 102 237 641 8 078 622 101 359 033 8 957 230
Tula Region 119 128 141 14 078 542 124 684 453 8 522 230
Yaroslavl Region 420 591 766 12 983 345 413 215 942 20 359 169
City of Moscow 26 889 094 422 10 783 584 480 27 218 588 112 10 454 090 790
North-Western Federal District 3 521 739 939 522 133 996 3 393 411 590 650 462 345
Republic of Karelia 58 889 768 789 002 62 942 224 -3 263 454
Komi Republic 102 888 052 4 239 887 100 994 084 6 133 855
Akhangelsk Region 136 321 007 11 016 183 137 350 168 9 987 022
Vologda Region 115 130 064 17 998 989 119 584 323 13 544 730
Kaliningrad Region 117 526 494 35 151 398 53 694 086 98 983 806
Leningrad Region 22 315 443 11 101 006 29 520 537 3 895 912
Murmansk Region 87 443 514 22 594 524 118 103 505 -8 065 467
Novgorod Region 54 922 934 10 459 540 52 490 915 12 891 559
Pskov Region 60 566 868 832 260 52 941 164 8 457 964
St Petersburg 2 765 735 795 407 951 207 2 665 790 584 507 896 418
Southern Federal District 1 864 011 826 121 776 176 1 868 258 557 117 529 445
Republic of Adygeya 29 317 505 117 697 28 859 019 576 183
Republic of Kalmykia 11 240 500 94 949 10 888 815 446 634
Krasnodar Territory 852 039 905 43 923 232 825 944 576 70 018 561
Astrakhan Region 70 109 116 4 165 935 69 805 508 4 469 543
Volgograd Region 199 088 907 -1 883 300 183 032 730 14 172 877
Rostov Region 702 215 893 75 357 663 749 727 909 27 845 647
North-Caucasian Federal
District
569 555 520 6 321 192 548 836 244 27 040 468
Republik of Daghestan 74 774 389 -1 653 654 71 706 783 1 413 952
Republic of Ingushetia 13 565 639 77 402 12 917 672 725 369
Kabardino-Balkar Republic 43 570 196 316 799 40 951 765 2 935 230
Karachai-Cherkess Republic 25 703 435 873 157 23 279 957 3 296 635
Republic of North Ossetia - Alania 31 582 506 367 518 30 753 622 1 196 402
Chechen Republic 26 788 233 157 239 24 904 447 2 041 025
Stavropol Territory 353 571 122 6 182 731 344 321 998 15 431 855
Volga Federal District 4 849 804 619 562 452 865 5 080 189 753 332 067 731
The Central Bank of the Russian Federation
Banking Supervision Department
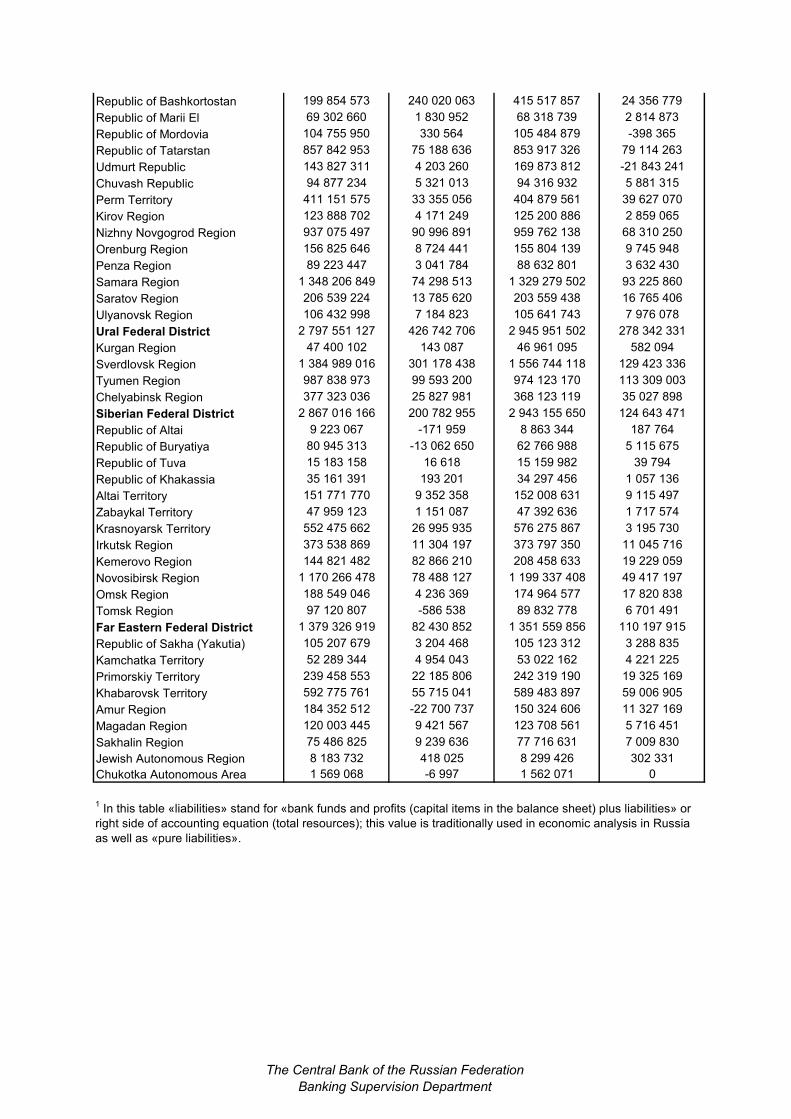
Republic of Bashkortostan 199 854 573 240 020 063 415 517 857 24 356 779
Republic of Marii El 69 302 660 1 830 952 68 318 739 2 814 873
Republic of Mordovia 104 755 950 330 564 105 484 879 -398 365
Republic of Tatarstan 857 842 953 75 188 636 853 917 326 79 114 263
Udmurt Republic 143 827 311 4 203 260 169 873 812 -21 843 241
Chuvash Republic 94 877 234 5 321 013 94 316 932 5 881 315
Perm Territory 411 151 575 33 355 056 404 879 561 39 627 070
Kirov Region 123 888 702 4 171 249 125 200 886 2 859 065
Nizhny Novgogrod Region 937 075 497 90 996 891 959 762 138 68 310 250
Orenburg Region 156 825 646 8 724 441 155 804 139 9 745 948
Penza Region 89 223 447 3 041 784 88 632 801 3 632 430
Samara Region 1 348 206 849 74 298 513 1 329 279 502 93 225 860
Saratov Region 206 539 224 13 785 620 203 559 438 16 765 406
Ulyanovsk Region 106 432 998 7 184 823 105 641 743 7 976 078
Ural Federal District 2 797 551 127 426 742 706 2 945 951 502 278 342 331
Kurgan Region 47 400 102 143 087 46 961 095 582 094
Sverdlovsk Region 1 384 989 016 301 178 438 1 556 744 118 129 423 336
Tyumen Region 987 838 973 99 593 200 974 123 170 113 309 003
Chelyabinsk Region 377 323 036 25 827 981 368 123 119 35 027 898
Siberian Federal District 2 867 016 166 200 782 955 2 943 155 650 124 643 471
Republic of Altai 9 223 067 -171 959 8 863 344 187 764
Republic of Buryatiya 80 945 313 -13 062 650 62 766 988 5 115 675
Republic of Tuva 15 183 158 16 618 15 159 982 39 794
Republic of Khakassia 35 161 391 193 201 34 297 456 1 057 136
Altai Territory 151 771 770 9 352 358 152 008 631 9 115 497
Zabaykal Territory 47 959 123 1 151 087 47 392 636 1 717 574
Krasnoyarsk Territory 552 475 662 26 995 935 576 275 867 3 195 730
Irkutsk Region 373 538 869 11 304 197 373 797 350 11 045 716
Kemerovo Region 144 821 482 82 866 210 208 458 633 19 229 059
Novosibirsk Region 1 170 266 478 78 488 127 1 199 337 408 49 417 197
Omsk Region 188 549 046 4 236 369 174 964 577 17 820 838
Tomsk Region 97 120 807 -586 538 89 832 778 6 701 491
Far Eastern Federal District 1 379 326 919 82 430 852 1 351 559 856 110 197 915
Republic of Sakha (Yakutia) 105 207 679 3 204 468 105 123 312 3 288 835
Kamchatka Territory 52 289 344 4 954 043 53 022 162 4 221 225
Primorskiy Territory 239 458 553 22 185 806 242 319 190 19 325 169
Khabarovsk Territory 592 775 761 55 715 041 589 483 897 59 006 905
Amur Region 184 352 512 -22 700 737 150 324 606 11 327 169
Magadan Region 120 003 445 9 421 567 123 708 561 5 716 451
Sakhalin Region 75 486 825 9 239 636 77 716 631 7 009 830
Jewish Autonomous Region 8 183 732 418 025 8 299 426 302 331
Chukotka Autonomous Area 1 569 068 -6 997 1 562 071 0
1 In this table «liabilities» stand for «bank funds and profits (capital items in the balance sheet) plus liabilities» or
right side of accounting equation (total resources); this value is traditionally used in economic analysis in Russia
as well as «pure liabilities».
The Central Bank of the Russian Federation
Banking Supervision Department
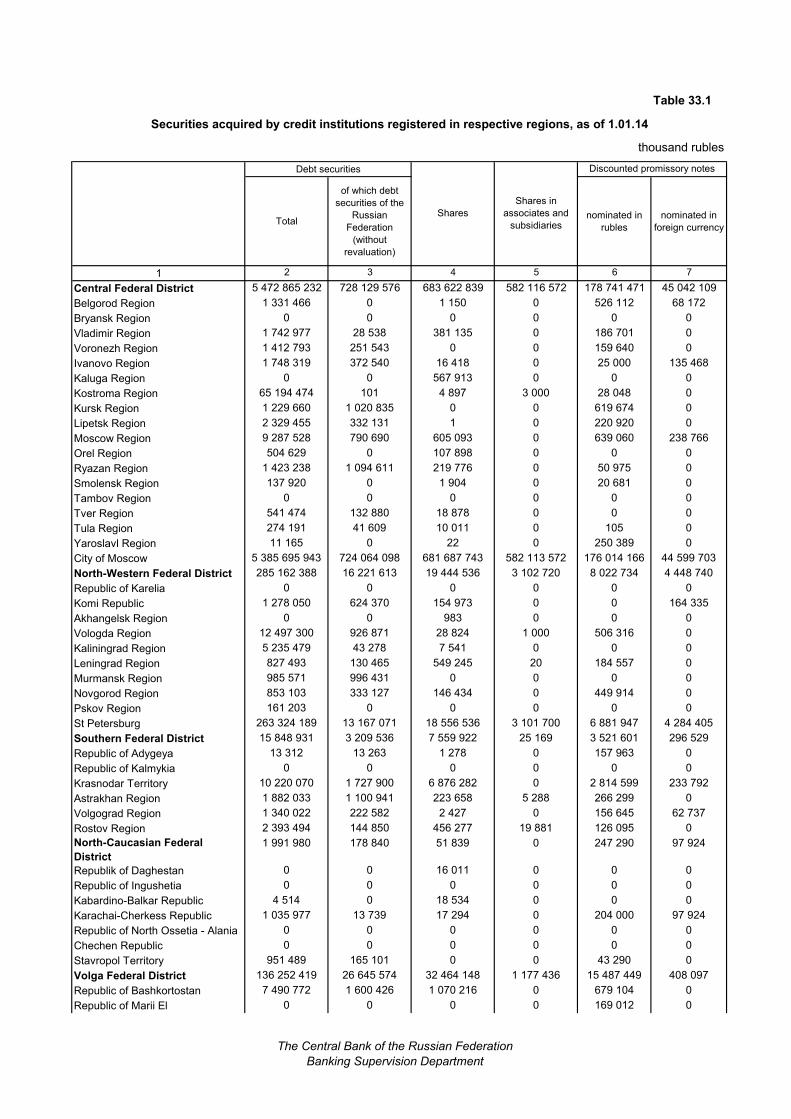
Table 33.1
Securities acquired by credit institutions registered in respective regions, as of 1.01.14
thousand rubles
Debt securities
Total
of which debt
securities of the
Russian
Federation
(without
revaluation)
nominated in
rubles
nominated in
foreign currency
1 2 3 4 5 6 7
Central Federal District 5 472 865 232 728 129 576 683 622 839 582 116 572 178 741 471 45 042 109
Belgorod Region 1 331 466 0 1 150 0 526 112 68 172
Bryansk Region 0 0 0 0 0 0
Vladimir Region 1 742 977 28 538 381 135 0 186 701 0
Voronezh Region 1 412 793 251 543 0 0 159 640 0
Ivanovo Region 1 748 319 372 540 16 418 0 25 000 135 468
Kaluga Region 0 0 567 913 0 0 0
Kostroma Region 65 194 474 101 4 897 3 000 28 048 0
Kursk Region 1 229 660 1 020 835 0 0 619 674 0
Lipetsk Region 2 329 455 332 131 1 0 220 920 0
Moscow Region 9 287 528 790 690 605 093 0 639 060 238 766
Orel Region 504 629 0 107 898 0 0 0
Ryazan Region 1 423 238 1 094 611 219 776 0 50 975 0
Smolensk Region 137 920 0 1 904 0 20 681 0
Tambov Region 0 0 0 0 0 0
Tver Region 541 474 132 880 18 878 0 0 0
Tula Region 274 191 41 609 10 011 0 105 0
Yaroslavl Region 11 165 0 22 0 250 389 0
City of Moscow 5 385 695 943 724 064 098 681 687 743 582 113 572 176 014 166 44 599 703
North-Western Federal District 285 162 388 16 221 613 19 444 536 3 102 720 8 022 734 4 448 740
Republic of Karelia 0 0 0 0 0 0
Komi Republic 1 278 050 624 370 154 973 0 0 164 335
Akhangelsk Region 0 0 983 0 0 0
Vologda Region 12 497 300 926 871 28 824 1 000 506 316 0
Kaliningrad Region 5 235 479 43 278 7 541 0 0 0
Leningrad Region 827 493 130 465 549 245 20 184 557 0
Murmansk Region 985 571 996 431 0 0 0 0
Novgorod Region 853 103 333 127 146 434 0 449 914 0
Pskov Region 161 203 0 0 0 0 0
St Petersburg 263 324 189 13 167 071 18 556 536 3 101 700 6 881 947 4 284 405
Southern Federal District 15 848 931 3 209 536 7 559 922 25 169 3 521 601 296 529
Republic of Adygeya 13 312 13 263 1 278 0 157 963 0
Republic of Kalmykia 0 0 0 0 0 0
Krasnodar Territory 10 220 070 1 727 900 6 876 282 0 2 814 599 233 792
Astrakhan Region 1 882 033 1 100 941 223 658 5 288 266 299 0
Volgograd Region 1 340 022 222 582 2 427 0 156 645 62 737
Rostov Region 2 393 494 144 850 456 277 19 881 126 095 0
North-Caucasian Federal
District
1 991 980 178 840 51 839 0 247 290 97 924
Republik of Daghestan 0 0 16 011 0 0 0
Republic of Ingushetia 0 0 0 0 0 0
Kabardino-Balkar Republic 4 514 0 18 534 0 0 0
Karachai-Cherkess Republic 1 035 977 13 739 17 294 0 204 000 97 924
Republic of North Ossetia - Alania 0 0 0 0 0 0
Chechen Republic 0 0 0 0 0 0
Stavropol Territory 951 489 165 101 0 0 43 290 0
Volga Federal District 136 252 419 26 645 574 32 464 148 1 177 436 15 487 449 408 097
Republic of Bashkortostan 7 490 772 1 600 426 1 070 216 0 679 104 0
Republic of Marii El 0 0 0 0 169 012 0
Discounted promissory notes
Shares in
associates and
subsidiaries
Shares
The Central Bank of the Russian Federation
Banking Supervision Department
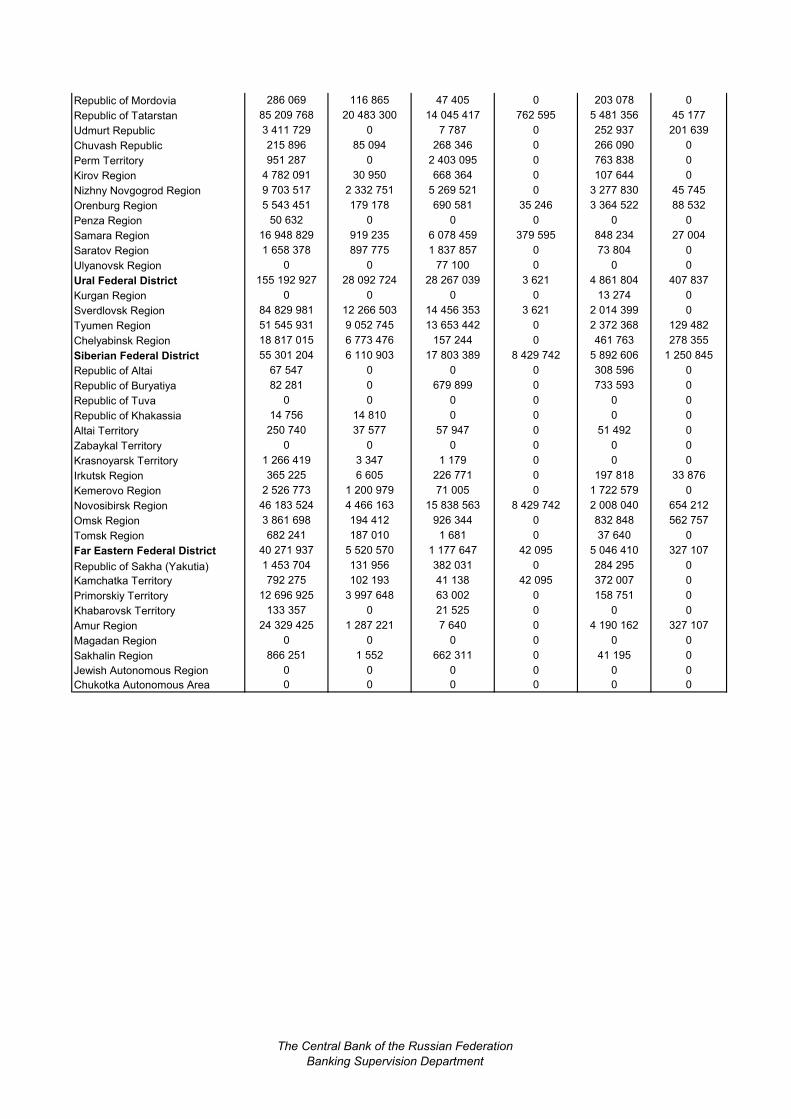
Republic of Mordovia 286 069 116 865 47 405 0 203 078 0
Republic of Tatarstan 85 209 768 20 483 300 14 045 417 762 595 5 481 356 45 177
Udmurt Republic 3 411 729 0 7 787 0 252 937 201 639
Chuvash Republic 215 896 85 094 268 346 0 266 090 0
Perm Territory 951 287 0 2 403 095 0 763 838 0
Kirov Region 4 782 091 30 950 668 364 0 107 644 0
Nizhny Novgogrod Region 9 703 517 2 332 751 5 269 521 0 3 277 830 45 745
Orenburg Region 5 543 451 179 178 690 581 35 246 3 364 522 88 532
Penza Region 50 632 0 0 0 0 0
Samara Region 16 948 829 919 235 6 078 459 379 595 848 234 27 004
Saratov Region 1 658 378 897 775 1 837 857 0 73 804 0
Ulyanovsk Region 0 0 77 100 0 0 0
Ural Federal District 155 192 927 28 092 724 28 267 039 3 621 4 861 804 407 837
Kurgan Region 0 0 0 0 13 274 0
Sverdlovsk Region 84 829 981 12 266 503 14 456 353 3 621 2 014 399 0
Tyumen Region 51 545 931 9 052 745 13 653 442 0 2 372 368 129 482
Chelyabinsk Region 18 817 015 6 773 476 157 244 0 461 763 278 355
Siberian Federal District 55 301 204 6 110 903 17 803 389 8 429 742 5 892 606 1 250 845
Republic of Altai 67 547 0 0 0 308 596 0
Republic of Buryatiya 82 281 0 679 899 0 733 593 0
Republic of Tuva 0 0 0 0 0 0
Republic of Khakassia 14 756 14 810 0 0 0 0
Altai Territory 250 740 37 577 57 947 0 51 492 0
Zabaykal Territory 0 0 0 0 0 0
Krasnoyarsk Territory 1 266 419 3 347 1 179 0 0 0
Irkutsk Region 365 225 6 605 226 771 0 197 818 33 876
Kemerovo Region 2 526 773 1 200 979 71 005 0 1 722 579 0
Novosibirsk Region 46 183 524 4 466 163 15 838 563 8 429 742 2 008 040 654 212
Omsk Region 3 861 698 194 412 926 344 0 832 848 562 757
Tomsk Region 682 241 187 010 1 681 0 37 640 0
Far Eastern Federal District 40 271 937 5 520 570 1 177 647 42 095 5 046 410 327 107
Republic of Sakha (Yakutia) 1 453 704 131 956 382 031 0 284 295 0
Kamchatka Territory 792 275 102 193 41 138 42 095 372 007 0
Primorskiy Territory 12 696 925 3 997 648 63 002 0 158 751 0
Khabarovsk Territory 133 357 0 21 525 0 0 0
Amur Region 24 329 425 1 287 221 7 640 0 4 190 162 327 107
Magadan Region 0 0 0 0 0 0
Sakhalin Region 866 251 1 552 662 311 0 41 195 0
Jewish Autonomous Region 0 0 0 0 0 0
Chukotka Autonomous Area 0 0 0 0 0 0
The Central Bank of the Russian Federation
Banking Supervision Department
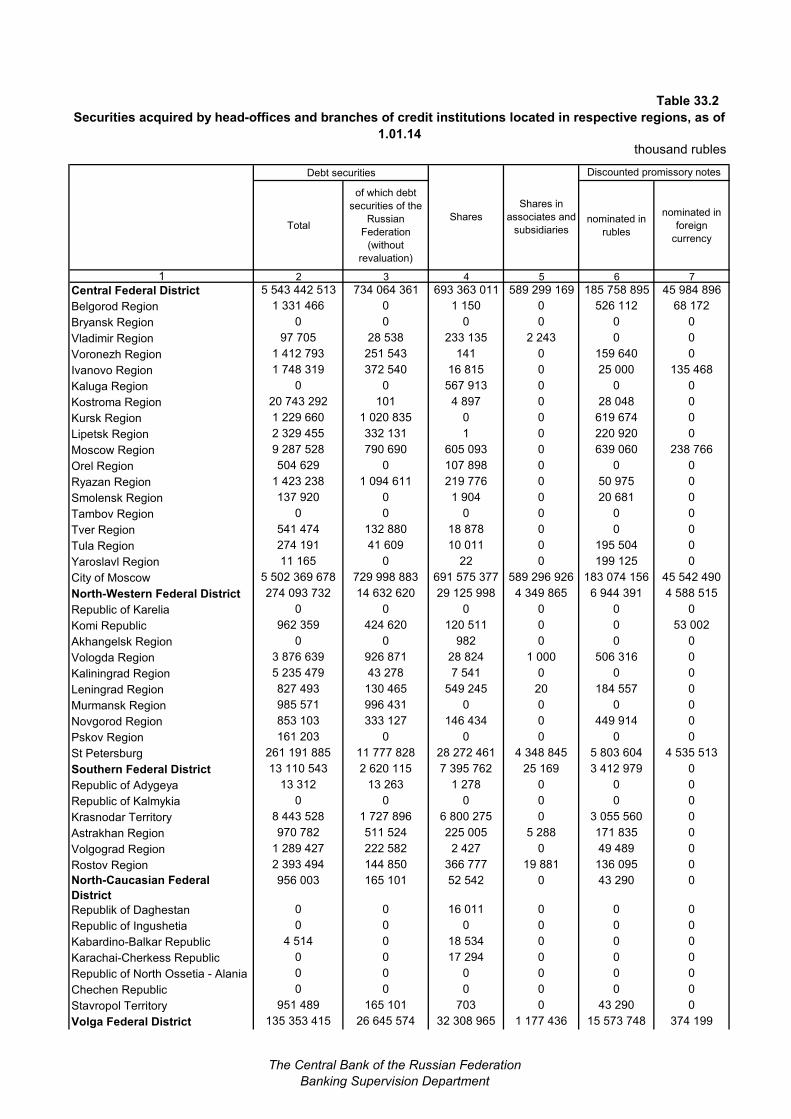
Table 33.2
Securities acquired by head-offices and branches of credit institutions located in respective regions, as of
1.01.14
thousand rubles
Debt securities
Total
of which debt
securities of the
Russian
Federation
(without
revaluation)
nominated in
rubles
nominated in
foreign
currency
1 2 3 4 5 6 7
Central Federal District 5 543 442 513 734 064 361 693 363 011 589 299 169 185 758 895 45 984 896
Belgorod Region 1 331 466 0 1 150 0 526 112 68 172
Bryansk Region 0 0 0 0 0 0
Vladimir Region 97 705 28 538 233 135 2 243 0 0
Voronezh Region 1 412 793 251 543 141 0 159 640 0
Ivanovo Region 1 748 319 372 540 16 815 0 25 000 135 468
Kaluga Region 0 0 567 913 0 0 0
Kostroma Region 20 743 292 101 4 897 0 28 048 0
Kursk Region 1 229 660 1 020 835 0 0 619 674 0
Lipetsk Region 2 329 455 332 131 1 0 220 920 0
Moscow Region 9 287 528 790 690 605 093 0 639 060 238 766
Orel Region 504 629 0 107 898 0 0 0
Ryazan Region 1 423 238 1 094 611 219 776 0 50 975 0
Smolensk Region 137 920 0 1 904 0 20 681 0
Tambov Region 0 0 0 0 0 0
Tver Region 541 474 132 880 18 878 0 0 0
Tula Region 274 191 41 609 10 011 0 195 504 0
Yaroslavl Region 11 165 0 22 0 199 125 0
City of Moscow 5 502 369 678 729 998 883 691 575 377 589 296 926 183 074 156 45 542 490
North-Western Federal District 274 093 732 14 632 620 29 125 998 4 349 865 6 944 391 4 588 515
Republic of Karelia 0 0 0 0 0 0
Komi Republic 962 359 424 620 120 511 0 0 53 002
Akhangelsk Region 0 0 982 0 0 0
Vologda Region 3 876 639 926 871 28 824 1 000 506 316 0
Kaliningrad Region 5 235 479 43 278 7 541 0 0 0
Leningrad Region 827 493 130 465 549 245 20 184 557 0
Murmansk Region 985 571 996 431 0 0 0 0
Novgorod Region 853 103 333 127 146 434 0 449 914 0
Pskov Region 161 203 0 0 0 0 0
St Petersburg 261 191 885 11 777 828 28 272 461 4 348 845 5 803 604 4 535 513
Southern Federal District 13 110 543 2 620 115 7 395 762 25 169 3 412 979 0
Republic of Adygeya 13 312 13 263 1 278 0 0 0
Republic of Kalmykia 0 0 0 0 0 0
Krasnodar Territory 8 443 528 1 727 896 6 800 275 0 3 055 560 0
Astrakhan Region 970 782 511 524 225 005 5 288 171 835 0
Volgograd Region 1 289 427 222 582 2 427 0 49 489 0
Rostov Region 2 393 494 144 850 366 777 19 881 136 095 0
North-Caucasian Federal
District
956 003 165 101 52 542 0 43 290 0
Republik of Daghestan 0 0 16 011 0 0 0
Republic of Ingushetia 0 0 0 0 0 0
Kabardino-Balkar Republic 4 514 0 18 534 0 0 0
Karachai-Cherkess Republic 0 0 17 294 0 0 0
Republic of North Ossetia - Alania 0 0 0 0 0 0
Chechen Republic 0 0 0 0 0 0
Stavropol Territory 951 489 165 101 703 0 43 290 0
Volga Federal District 135 353 415 26 645 574 32 308 965 1 177 436 15 573 748 374 199
Discounted promissory notes
Shares in
associates and
subsidiaries
Shares
The Central Bank of the Russian Federation
Banking Supervision Department
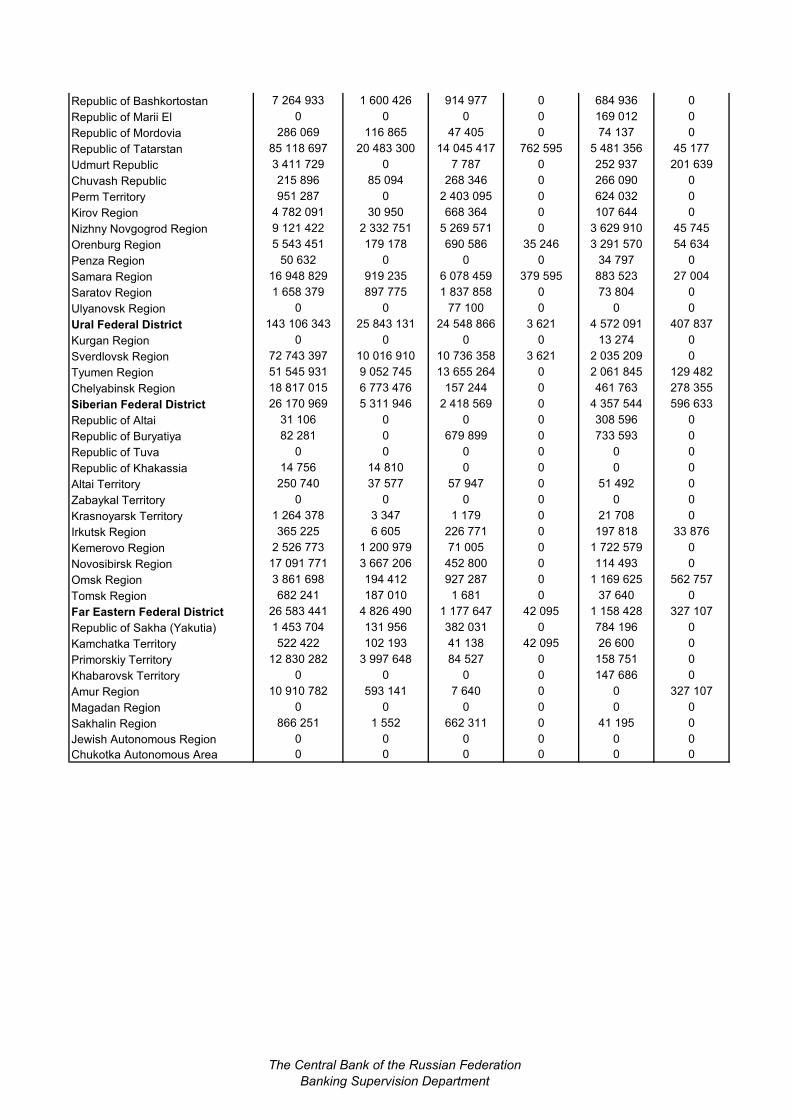
Republic of Bashkortostan 7 264 933 1 600 426 914 977 0 684 936 0
Republic of Marii El 0 0 0 0 169 012 0
Republic of Mordovia 286 069 116 865 47 405 0 74 137 0
Republic of Tatarstan 85 118 697 20 483 300 14 045 417 762 595 5 481 356 45 177
Udmurt Republic 3 411 729 0 7 787 0 252 937 201 639
Chuvash Republic 215 896 85 094 268 346 0 266 090 0
Perm Territory 951 287 0 2 403 095 0 624 032 0
Kirov Region 4 782 091 30 950 668 364 0 107 644 0
Nizhny Novgogrod Region 9 121 422 2 332 751 5 269 571 0 3 629 910 45 745
Orenburg Region 5 543 451 179 178 690 586 35 246 3 291 570 54 634
Penza Region 50 632 0 0 0 34 797 0
Samara Region 16 948 829 919 235 6 078 459 379 595 883 523 27 004
Saratov Region 1 658 379 897 775 1 837 858 0 73 804 0
Ulyanovsk Region 0 0 77 100 0 0 0
Ural Federal District 143 106 343 25 843 131 24 548 866 3 621 4 572 091 407 837
Kurgan Region 0 0 0 0 13 274 0
Sverdlovsk Region 72 743 397 10 016 910 10 736 358 3 621 2 035 209 0
Tyumen Region 51 545 931 9 052 745 13 655 264 0 2 061 845 129 482
Chelyabinsk Region 18 817 015 6 773 476 157 244 0 461 763 278 355
Siberian Federal District 26 170 969 5 311 946 2 418 569 0 4 357 544 596 633
Republic of Altai 31 106 0 0 0 308 596 0
Republic of Buryatiya 82 281 0 679 899 0 733 593 0
Republic of Tuva 0 0 0 0 0 0
Republic of Khakassia 14 756 14 810 0 0 0 0
Altai Territory 250 740 37 577 57 947 0 51 492 0
Zabaykal Territory 0 0 0 0 0 0
Krasnoyarsk Territory 1 264 378 3 347 1 179 0 21 708 0
Irkutsk Region 365 225 6 605 226 771 0 197 818 33 876
Kemerovo Region 2 526 773 1 200 979 71 005 0 1 722 579 0
Novosibirsk Region 17 091 771 3 667 206 452 800 0 114 493 0
Omsk Region 3 861 698 194 412 927 287 0 1 169 625 562 757
Tomsk Region 682 241 187 010 1 681 0 37 640 0
Far Eastern Federal District 26 583 441 4 826 490 1 177 647 42 095 1 158 428 327 107
Republic of Sakha (Yakutia) 1 453 704 131 956 382 031 0 784 196 0
Kamchatka Territory 522 422 102 193 41 138 42 095 26 600 0
Primorskiy Territory 12 830 282 3 997 648 84 527 0 158 751 0
Khabarovsk Territory 0 0 0 0 147 686 0
Amur Region 10 910 782 593 141 7 640 0 0 327 107
Magadan Region 0 0 0 0 0 0
Sakhalin Region 866 251 1 552 662 311 0 41 195 0
Jewish Autonomous Region 0 0 0 0 0 0
Chukotka Autonomous Area 0 0 0 0 0 0
The Central Bank of the Russian Federation
Banking Supervision Department
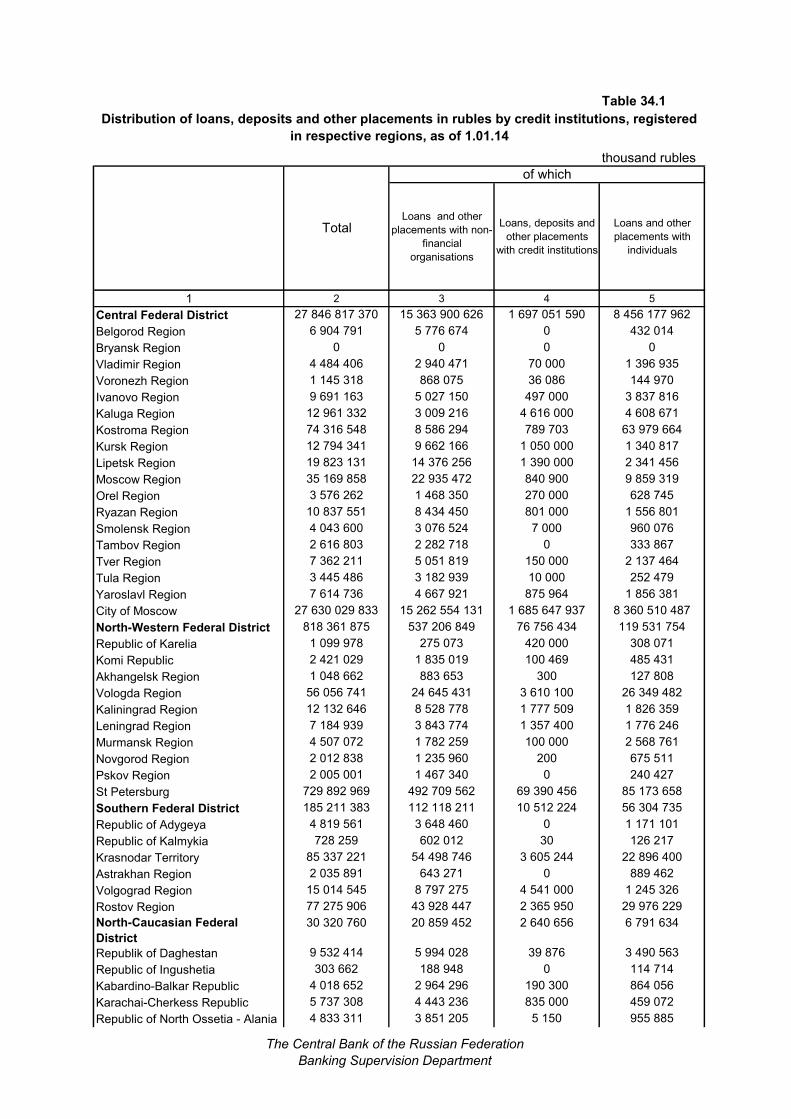
Table 34.1
Distribution of loans, deposits and other placements in rubles by credit institutions, registered
in respective regions, as of 1.01.14
thousand rubles
of which
Loans and other
placements with non-
financial
organisations
Loans, deposits and
other placements
with credit institutions
Loans and other
placements with
individuals
1 2 3 4 5
Central Federal District 27 846 817 370 15 363 900 626 1 697 051 590 8 456 177 962
Belgorod Region 6 904 791 5 776 674 0 432 014
Bryansk Region 0 0 0 0
Vladimir Region 4 484 406 2 940 471 70 000 1 396 935
Voronezh Region 1 145 318 868 075 36 086 144 970
Ivanovo Region 9 691 163 5 027 150 497 000 3 837 816
Kaluga Region 12 961 332 3 009 216 4 616 000 4 608 671
Kostroma Region 74 316 548 8 586 294 789 703 63 979 664
Kursk Region 12 794 341 9 662 166 1 050 000 1 340 817
Lipetsk Region 19 823 131 14 376 256 1 390 000 2 341 456
Moscow Region 35 169 858 22 935 472 840 900 9 859 319
Orel Region 3 576 262 1 468 350 270 000 628 745
Ryazan Region 10 837 551 8 434 450 801 000 1 556 801
Smolensk Region 4 043 600 3 076 524 7 000 960 076
Tambov Region 2 616 803 2 282 718 0 333 867
Tver Region 7 362 211 5 051 819 150 000 2 137 464
Tula Region 3 445 486 3 182 939 10 000 252 479
Yaroslavl Region 7 614 736 4 667 921 875 964 1 856 381
City of Moscow 27 630 029 833 15 262 554 131 1 685 647 937 8 360 510 487
North-Western Federal District 818 361 875 537 206 849 76 756 434 119 531 754
Republic of Karelia 1 099 978 275 073 420 000 308 071
Komi Republic 2 421 029 1 835 019 100 469 485 431
Akhangelsk Region 1 048 662 883 653 300 127 808
Vologda Region 56 056 741 24 645 431 3 610 100 26 349 482
Kaliningrad Region 12 132 646 8 528 778 1 777 509 1 826 359
Leningrad Region 7 184 939 3 843 774 1 357 400 1 776 246
Murmansk Region 4 507 072 1 782 259 100 000 2 568 761
Novgorod Region 2 012 838 1 235 960 200 675 511
Pskov Region 2 005 001 1 467 340 0 240 427
St Petersburg 729 892 969 492 709 562 69 390 456 85 173 658
Southern Federal District 185 211 383 112 118 211 10 512 224 56 304 735
Republic of Adygeya 4 819 561 3 648 460 0 1 171 101
Republic of Kalmykia 728 259 602 012 30 126 217
Krasnodar Territory 85 337 221 54 498 746 3 605 244 22 896 400
Astrakhan Region 2 035 891 643 271 0 889 462
Volgograd Region 15 014 545 8 797 275 4 541 000 1 245 326
Rostov Region 77 275 906 43 928 447 2 365 950 29 976 229
North-Caucasian Federal
District
30 320 760 20 859 452 2 640 656 6 791 634
Republik of Daghestan 9 532 414 5 994 028 39 876 3 490 563
Republic of Ingushetia 303 662 188 948 0 114 714
Kabardino-Balkar Republic 4 018 652 2 964 296 190 300 864 056
Karachai-Cherkess Republic 5 737 308 4 443 236 835 000 459 072
Republic of North Ossetia - Alania 4 833 311 3 851 205 5 150 955 885
Total
The Central Bank of the Russian Federation
Banking Supervision Department
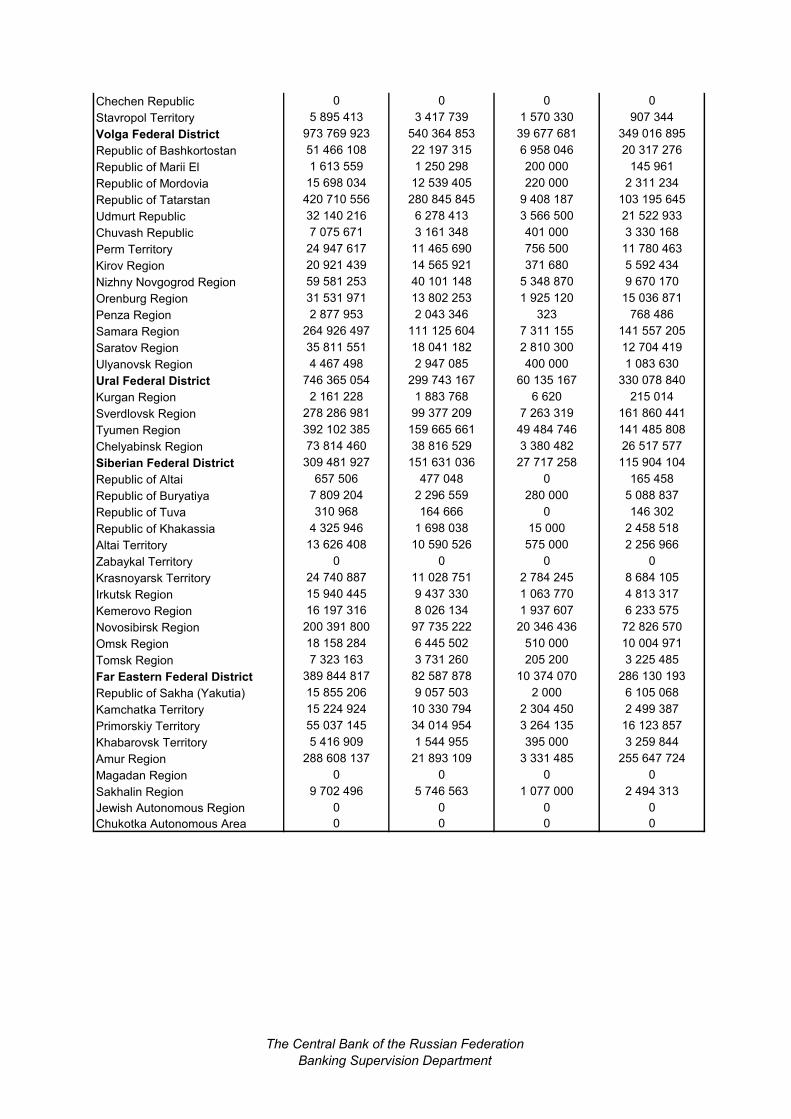
Chechen Republic 0 0 0 0
Stavropol Territory 5 895 413 3 417 739 1 570 330 907 344
Volga Federal District 973 769 923 540 364 853 39 677 681 349 016 895
Republic of Bashkortostan 51 466 108 22 197 315 6 958 046 20 317 276
Republic of Marii El 1 613 559 1 250 298 200 000 145 961
Republic of Mordovia 15 698 034 12 539 405 220 000 2 311 234
Republic of Tatarstan 420 710 556 280 845 845 9 408 187 103 195 645
Udmurt Republic 32 140 216 6 278 413 3 566 500 21 522 933
Chuvash Republic 7 075 671 3 161 348 401 000 3 330 168
Perm Territory 24 947 617 11 465 690 756 500 11 780 463
Kirov Region 20 921 439 14 565 921 371 680 5 592 434
Nizhny Novgogrod Region 59 581 253 40 101 148 5 348 870 9 670 170
Orenburg Region 31 531 971 13 802 253 1 925 120 15 036 871
Penza Region 2 877 953 2 043 346 323 768 486
Samara Region 264 926 497 111 125 604 7 311 155 141 557 205
Saratov Region 35 811 551 18 041 182 2 810 300 12 704 419
Ulyanovsk Region 4 467 498 2 947 085 400 000 1 083 630
Ural Federal District 746 365 054 299 743 167 60 135 167 330 078 840
Kurgan Region 2 161 228 1 883 768 6 620 215 014
Sverdlovsk Region 278 286 981 99 377 209 7 263 319 161 860 441
Tyumen Region 392 102 385 159 665 661 49 484 746 141 485 808
Chelyabinsk Region 73 814 460 38 816 529 3 380 482 26 517 577
Siberian Federal District 309 481 927 151 631 036 27 717 258 115 904 104
Republic of Altai 657 506 477 048 0 165 458
Republic of Buryatiya 7 809 204 2 296 559 280 000 5 088 837
Republic of Tuva 310 968 164 666 0 146 302
Republic of Khakassia 4 325 946 1 698 038 15 000 2 458 518
Altai Territory 13 626 408 10 590 526 575 000 2 256 966
Zabaykal Territory 0 0 0 0
Krasnoyarsk Territory 24 740 887 11 028 751 2 784 245 8 684 105
Irkutsk Region 15 940 445 9 437 330 1 063 770 4 813 317
Kemerovo Region 16 197 316 8 026 134 1 937 607 6 233 575
Novosibirsk Region 200 391 800 97 735 222 20 346 436 72 826 570
Omsk Region 18 158 284 6 445 502 510 000 10 004 971
Tomsk Region 7 323 163 3 731 260 205 200 3 225 485
Far Eastern Federal District 389 844 817 82 587 878 10 374 070 286 130 193
Republic of Sakha (Yakutia) 15 855 206 9 057 503 2 000 6 105 068
Kamchatka Territory 15 224 924 10 330 794 2 304 450 2 499 387
Primorskiy Territory 55 037 145 34 014 954 3 264 135 16 123 857
Khabarovsk Territory 5 416 909 1 544 955 395 000 3 259 844
Amur Region 288 608 137 21 893 109 3 331 485 255 647 724
Magadan Region 0 0 0 0
Sakhalin Region 9 702 496 5 746 563 1 077 000 2 494 313
Jewish Autonomous Region 0 0 0 0
Chukotka Autonomous Area 0 0 0 0
The Central Bank of the Russian Federation
Banking Supervision Department
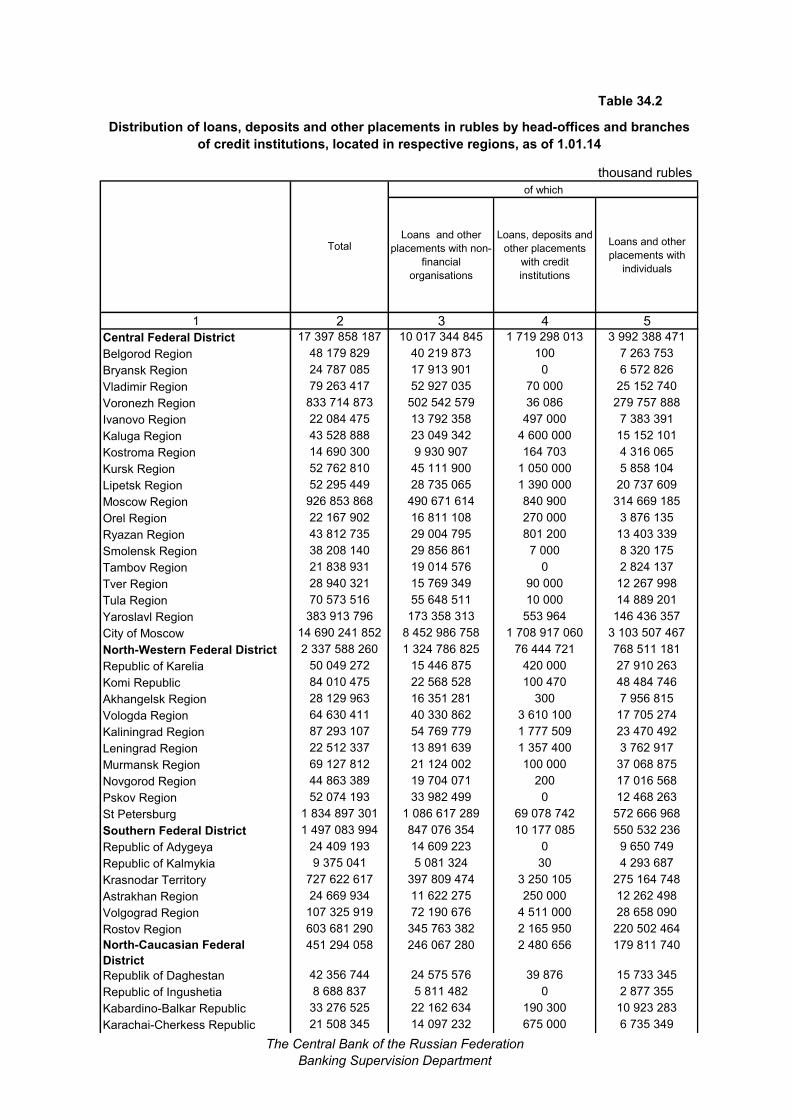
Table 34.2
Distribution of loans, deposits and other placements in rubles by head-offices and branches
of credit institutions, located in respective regions, as of 1.01.14
thousand rubles
Loans and other
placements with non-
financial
organisations
Loans, deposits and
other placements
with credit
institutions
Loans and other
placements with
individuals
1 2 3 4 5
Central Federal District 17 397 858 187 10 017 344 845 1 719 298 013 3 992 388 471
Belgorod Region 48 179 829 40 219 873 100 7 263 753
Bryansk Region 24 787 085 17 913 901 0 6 572 826
Vladimir Region 79 263 417 52 927 035 70 000 25 152 740
Voronezh Region 833 714 873 502 542 579 36 086 279 757 888
Ivanovo Region 22 084 475 13 792 358 497 000 7 383 391
Kaluga Region 43 528 888 23 049 342 4 600 000 15 152 101
Kostroma Region 14 690 300 9 930 907 164 703 4 316 065
Kursk Region 52 762 810 45 111 900 1 050 000 5 858 104
Lipetsk Region 52 295 449 28 735 065 1 390 000 20 737 609
Moscow Region 926 853 868 490 671 614 840 900 314 669 185
Orel Region 22 167 902 16 811 108 270 000 3 876 135
Ryazan Region 43 812 735 29 004 795 801 200 13 403 339
Smolensk Region 38 208 140 29 856 861 7 000 8 320 175
Tambov Region 21 838 931 19 014 576 0 2 824 137
Tver Region 28 940 321 15 769 349 90 000 12 267 998
Tula Region 70 573 516 55 648 511 10 000 14 889 201
Yaroslavl Region 383 913 796 173 358 313 553 964 146 436 357
City of Moscow 14 690 241 852 8 452 986 758 1 708 917 060 3 103 507 467
North-Western Federal District 2 337 588 260 1 324 786 825 76 444 721 768 511 181
Republic of Karelia 50 049 272 15 446 875 420 000 27 910 263
Komi Republic 84 010 475 22 568 528 100 470 48 484 746
Akhangelsk Region 28 129 963 16 351 281 300 7 956 815
Vologda Region 64 630 411 40 330 862 3 610 100 17 705 274
Kaliningrad Region 87 293 107 54 769 779 1 777 509 23 470 492
Leningrad Region 22 512 337 13 891 639 1 357 400 3 762 917
Murmansk Region 69 127 812 21 124 002 100 000 37 068 875
Novgorod Region 44 863 389 19 704 071 200 17 016 568
Pskov Region 52 074 193 33 982 499 0 12 468 263
St Petersburg 1 834 897 301 1 086 617 289 69 078 742 572 666 968
Southern Federal District 1 497 083 994 847 076 354 10 177 085 550 532 236
Republic of Adygeya 24 409 193 14 609 223 0 9 650 749
Republic of Kalmykia 9 375 041 5 081 324 30 4 293 687
Krasnodar Territory 727 622 617 397 809 474 3 250 105 275 164 748
Astrakhan Region 24 669 934 11 622 275 250 000 12 262 498
Volgograd Region 107 325 919 72 190 676 4 511 000 28 658 090
Rostov Region 603 681 290 345 763 382 2 165 950 220 502 464
North-Caucasian Federal
District
451 294 058 246 067 280 2 480 656 179 811 740
Republik of Daghestan 42 356 744 24 575 576 39 876 15 733 345
Republic of Ingushetia 8 688 837 5 811 482 0 2 877 355
Kabardino-Balkar Republic 33 276 525 22 162 634 190 300 10 923 283
Karachai-Cherkess Republic 21 508 345 14 097 232 675 000 6 735 349
Total
of which
The Central Bank of the Russian Federation
Banking Supervision Department
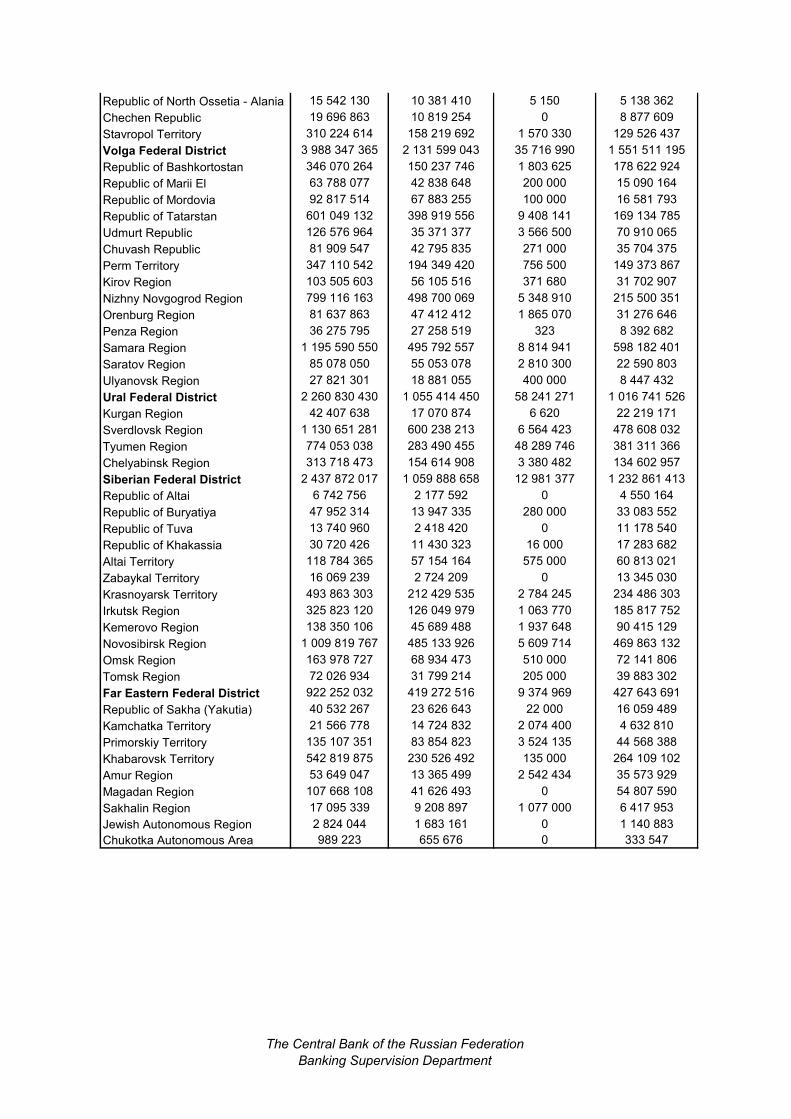
Republic of North Ossetia - Alania 15 542 130 10 381 410 5 150 5 138 362
Chechen Republic 19 696 863 10 819 254 0 8 877 609
Stavropol Territory 310 224 614 158 219 692 1 570 330 129 526 437
Volga Federal District 3 988 347 365 2 131 599 043 35 716 990 1 551 511 195
Republic of Bashkortostan 346 070 264 150 237 746 1 803 625 178 622 924
Republic of Marii El 63 788 077 42 838 648 200 000 15 090 164
Republic of Mordovia 92 817 514 67 883 255 100 000 16 581 793
Republic of Tatarstan 601 049 132 398 919 556 9 408 141 169 134 785
Udmurt Republic 126 576 964 35 371 377 3 566 500 70 910 065
Chuvash Republic 81 909 547 42 795 835 271 000 35 704 375
Perm Territory 347 110 542 194 349 420 756 500 149 373 867
Kirov Region 103 505 603 56 105 516 371 680 31 702 907
Nizhny Novgogrod Region 799 116 163 498 700 069 5 348 910 215 500 351
Orenburg Region 81 637 863 47 412 412 1 865 070 31 276 646
Penza Region 36 275 795 27 258 519 323 8 392 682
Samara Region 1 195 590 550 495 792 557 8 814 941 598 182 401
Saratov Region 85 078 050 55 053 078 2 810 300 22 590 803
Ulyanovsk Region 27 821 301 18 881 055 400 000 8 447 432
Ural Federal District 2 260 830 430 1 055 414 450 58 241 271 1 016 741 526
Kurgan Region 42 407 638 17 070 874 6 620 22 219 171
Sverdlovsk Region 1 130 651 281 600 238 213 6 564 423 478 608 032
Tyumen Region 774 053 038 283 490 455 48 289 746 381 311 366
Chelyabinsk Region 313 718 473 154 614 908 3 380 482 134 602 957
Siberian Federal District 2 437 872 017 1 059 888 658 12 981 377 1 232 861 413
Republic of Altai 6 742 756 2 177 592 0 4 550 164
Republic of Buryatiya 47 952 314 13 947 335 280 000 33 083 552
Republic of Tuva 13 740 960 2 418 420 0 11 178 540
Republic of Khakassia 30 720 426 11 430 323 16 000 17 283 682
Altai Territory 118 784 365 57 154 164 575 000 60 813 021
Zabaykal Territory 16 069 239 2 724 209 0 13 345 030
Krasnoyarsk Territory 493 863 303 212 429 535 2 784 245 234 486 303
Irkutsk Region 325 823 120 126 049 979 1 063 770 185 817 752
Kemerovo Region 138 350 106 45 689 488 1 937 648 90 415 129
Novosibirsk Region 1 009 819 767 485 133 926 5 609 714 469 863 132
Omsk Region 163 978 727 68 934 473 510 000 72 141 806
Tomsk Region 72 026 934 31 799 214 205 000 39 883 302
Far Eastern Federal District 922 252 032 419 272 516 9 374 969 427 643 691
Republic of Sakha (Yakutia) 40 532 267 23 626 643 22 000 16 059 489
Kamchatka Territory 21 566 778 14 724 832 2 074 400 4 632 810
Primorskiy Territory 135 107 351 83 854 823 3 524 135 44 568 388
Khabarovsk Territory 542 819 875 230 526 492 135 000 264 109 102
Amur Region 53 649 047 13 365 499 2 542 434 35 573 929
Magadan Region 107 668 108 41 626 493 0 54 807 590
Sakhalin Region 17 095 339 9 208 897 1 077 000 6 417 953
Jewish Autonomous Region 2 824 044 1 683 161 0 1 140 883
Chukotka Autonomous Area 989 223 655 676 0 333 547
The Central Bank of the Russian Federation
Banking Supervision Department
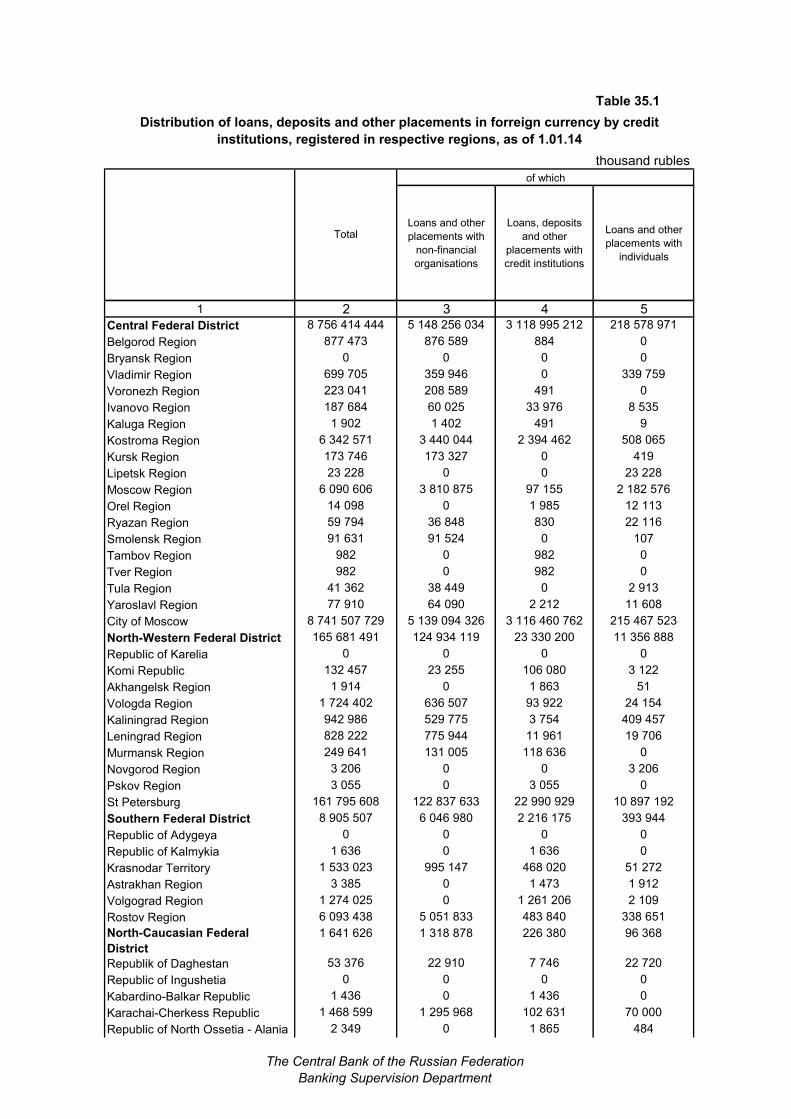
Table 35.1
Distribution of loans, deposits and other placements in forreign currency by credit
institutions, registered in respective regions, as of 1.01.14
thousand rubles
Loans and other
placements with
non-financial
organisations
Loans, deposits
and other
placements with
credit institutions
Loans and other
placements with
individuals
1 2 3 4 5
Central Federal District 8 756 414 444 5 148 256 034 3 118 995 212 218 578 971
Belgorod Region 877 473 876 589 884 0
Bryansk Region 0 0 0 0
Vladimir Region 699 705 359 946 0 339 759
Voronezh Region 223 041 208 589 491 0
Ivanovo Region 187 684 60 025 33 976 8 535
Kaluga Region 1 902 1 402 491 9
Kostroma Region 6 342 571 3 440 044 2 394 462 508 065
Kursk Region 173 746 173 327 0 419
Lipetsk Region 23 228 0 0 23 228
Moscow Region 6 090 606 3 810 875 97 155 2 182 576
Orel Region 14 098 0 1 985 12 113
Ryazan Region 59 794 36 848 830 22 116
Smolensk Region 91 631 91 524 0 107
Tambov Region 982 0 982 0
Tver Region 982 0 982 0
Tula Region 41 362 38 449 0 2 913
Yaroslavl Region 77 910 64 090 2 212 11 608
City of Moscow 8 741 507 729 5 139 094 326 3 116 460 762 215 467 523
North-Western Federal District 165 681 491 124 934 119 23 330 200 11 356 888
Republic of Karelia 0 0 0 0
Komi Republic 132 457 23 255 106 080 3 122
Akhangelsk Region 1 914 0 1 863 51
Vologda Region 1 724 402 636 507 93 922 24 154
Kaliningrad Region 942 986 529 775 3 754 409 457
Leningrad Region 828 222 775 944 11 961 19 706
Murmansk Region 249 641 131 005 118 636 0
Novgorod Region 3 206 0 0 3 206
Pskov Region 3 055 0 3 055 0
St Petersburg 161 795 608 122 837 633 22 990 929 10 897 192
Southern Federal District 8 905 507 6 046 980 2 216 175 393 944
Republic of Adygeya 0 0 0 0
Republic of Kalmykia 1 636 0 1 636 0
Krasnodar Territory 1 533 023 995 147 468 020 51 272
Astrakhan Region 3 385 0 1 473 1 912
Volgograd Region 1 274 025 0 1 261 206 2 109
Rostov Region 6 093 438 5 051 833 483 840 338 651
North-Caucasian Federal
District
1 641 626 1 318 878 226 380 96 368
Republik of Daghestan 53 376 22 910 7 746 22 720
Republic of Ingushetia 0 0 0 0
Kabardino-Balkar Republic 1 436 0 1 436 0
Karachai-Cherkess Republic 1 468 599 1 295 968 102 631 70 000
Republic of North Ossetia - Alania 2 349 0 1 865 484
Total
of which
The Central Bank of the Russian Federation
Banking Supervision Department
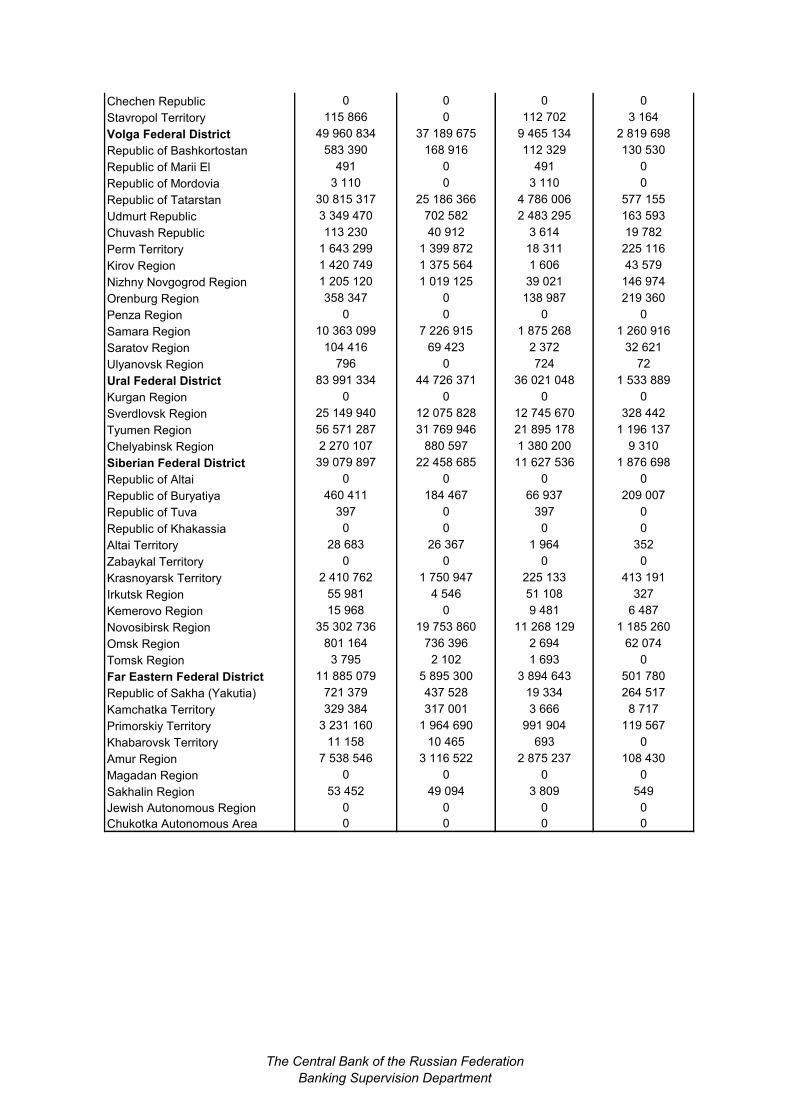
Chechen Republic 0 0 0 0
Stavropol Territory 115 866 0 112 702 3 164
Volga Federal District 49 960 834 37 189 675 9 465 134 2 819 698
Republic of Bashkortostan 583 390 168 916 112 329 130 530
Republic of Marii El 491 0 491 0
Republic of Mordovia 3 110 0 3 110 0
Republic of Tatarstan 30 815 317 25 186 366 4 786 006 577 155
Udmurt Republic 3 349 470 702 582 2 483 295 163 593
Chuvash Republic 113 230 40 912 3 614 19 782
Perm Territory 1 643 299 1 399 872 18 311 225 116
Kirov Region 1 420 749 1 375 564 1 606 43 579
Nizhny Novgogrod Region 1 205 120 1 019 125 39 021 146 974
Orenburg Region 358 347 0 138 987 219 360
Penza Region 0 0 0 0
Samara Region 10 363 099 7 226 915 1 875 268 1 260 916
Saratov Region 104 416 69 423 2 372 32 621
Ulyanovsk Region 796 0 724 72
Ural Federal District 83 991 334 44 726 371 36 021 048 1 533 889
Kurgan Region 0 0 0 0
Sverdlovsk Region 25 149 940 12 075 828 12 745 670 328 442
Tyumen Region 56 571 287 31 769 946 21 895 178 1 196 137
Chelyabinsk Region 2 270 107 880 597 1 380 200 9 310
Siberian Federal District 39 079 897 22 458 685 11 627 536 1 876 698
Republic of Altai 0 0 0 0
Republic of Buryatiya 460 411 184 467 66 937 209 007
Republic of Tuva 397 0 397 0
Republic of Khakassia 0 0 0 0
Altai Territory 28 683 26 367 1 964 352
Zabaykal Territory 0 0 0 0
Krasnoyarsk Territory 2 410 762 1 750 947 225 133 413 191
Irkutsk Region 55 981 4 546 51 108 327
Kemerovo Region 15 968 0 9 481 6 487
Novosibirsk Region 35 302 736 19 753 860 11 268 129 1 185 260
Omsk Region 801 164 736 396 2 694 62 074
Tomsk Region 3 795 2 102 1 693 0
Far Eastern Federal District 11 885 079 5 895 300 3 894 643 501 780
Republic of Sakha (Yakutia) 721 379 437 528 19 334 264 517
Kamchatka Territory 329 384 317 001 3 666 8 717
Primorskiy Territory 3 231 160 1 964 690 991 904 119 567
Khabarovsk Territory 11 158 10 465 693 0
Amur Region 7 538 546 3 116 522 2 875 237 108 430
Magadan Region 0 0 0 0
Sakhalin Region 53 452 49 094 3 809 549
Jewish Autonomous Region 0 0 0 0
Chukotka Autonomous Area 0 0 0 0
The Central Bank of the Russian Federation
Banking Supervision Department
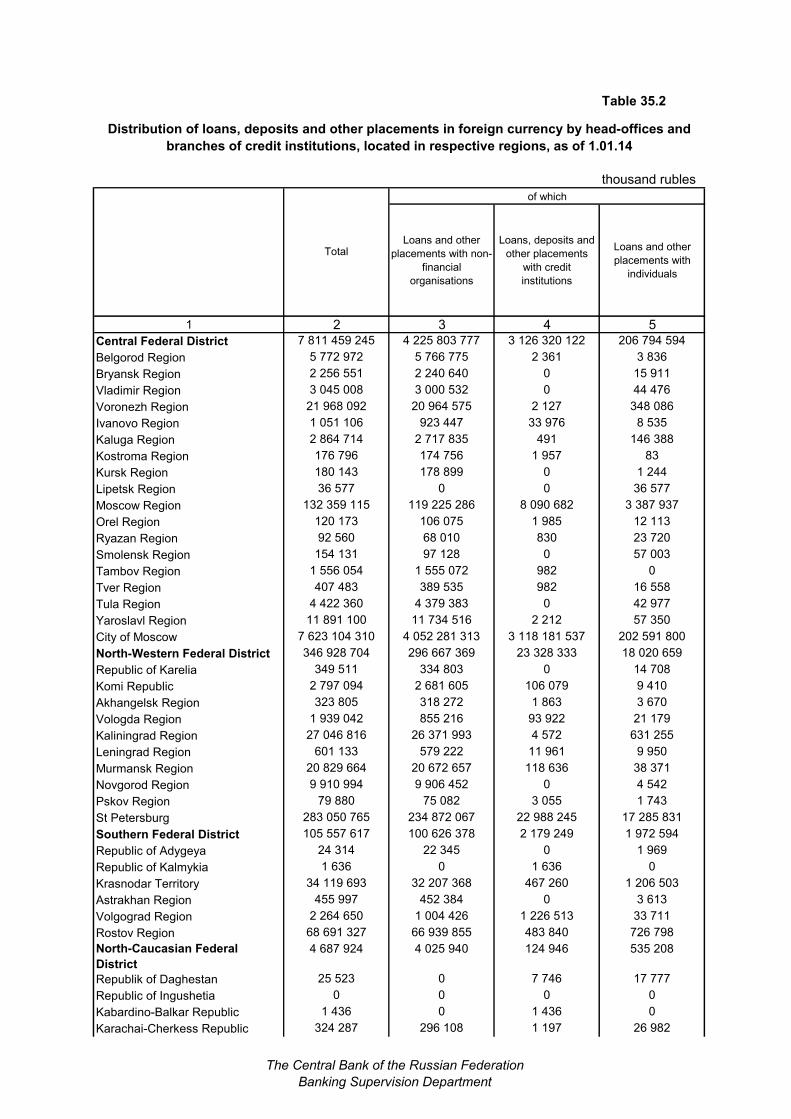
Table 35.2
Distribution of loans, deposits and other placements in foreign currency by head-offices and
branches of credit institutions, located in respective regions, as of 1.01.14
thousand rubles
Loans and other
placements with non-
financial
organisations
Loans, deposits and
other placements
with credit
institutions
Loans and other
placements with
individuals
1 2 3 4 5
Central Federal District 7 811 459 245 4 225 803 777 3 126 320 122 206 794 594
Belgorod Region 5 772 972 5 766 775 2 361 3 836
Bryansk Region 2 256 551 2 240 640 0 15 911
Vladimir Region 3 045 008 3 000 532 0 44 476
Voronezh Region 21 968 092 20 964 575 2 127 348 086
Ivanovo Region 1 051 106 923 447 33 976 8 535
Kaluga Region 2 864 714 2 717 835 491 146 388
Kostroma Region 176 796 174 756 1 957 83
Kursk Region 180 143 178 899 0 1 244
Lipetsk Region 36 577 0 0 36 577
Moscow Region 132 359 115 119 225 286 8 090 682 3 387 937
Orel Region 120 173 106 075 1 985 12 113
Ryazan Region 92 560 68 010 830 23 720
Smolensk Region 154 131 97 128 0 57 003
Tambov Region 1 556 054 1 555 072 982 0
Tver Region 407 483 389 535 982 16 558
Tula Region 4 422 360 4 379 383 0 42 977
Yaroslavl Region 11 891 100 11 734 516 2 212 57 350
City of Moscow 7 623 104 310 4 052 281 313 3 118 181 537 202 591 800
North-Western Federal District 346 928 704 296 667 369 23 328 333 18 020 659
Republic of Karelia 349 511 334 803 0 14 708
Komi Republic 2 797 094 2 681 605 106 079 9 410
Akhangelsk Region 323 805 318 272 1 863 3 670
Vologda Region 1 939 042 855 216 93 922 21 179
Kaliningrad Region 27 046 816 26 371 993 4 572 631 255
Leningrad Region 601 133 579 222 11 961 9 950
Murmansk Region 20 829 664 20 672 657 118 636 38 371
Novgorod Region 9 910 994 9 906 452 0 4 542
Pskov Region 79 880 75 082 3 055 1 743
St Petersburg 283 050 765 234 872 067 22 988 245 17 285 831
Southern Federal District 105 557 617 100 626 378 2 179 249 1 972 594
Republic of Adygeya 24 314 22 345 0 1 969
Republic of Kalmykia 1 636 0 1 636 0
Krasnodar Territory 34 119 693 32 207 368 467 260 1 206 503
Astrakhan Region 455 997 452 384 0 3 613
Volgograd Region 2 264 650 1 004 426 1 226 513 33 711
Rostov Region 68 691 327 66 939 855 483 840 726 798
North-Caucasian Federal
District
4 687 924 4 025 940 124 946 535 208
Republik of Daghestan 25 523 0 7 746 17 777
Republic of Ingushetia 0 0 0 0
Kabardino-Balkar Republic 1 436 0 1 436 0
Karachai-Cherkess Republic 324 287 296 108 1 197 26 982
Total
of which
The Central Bank of the Russian Federation
Banking Supervision Department
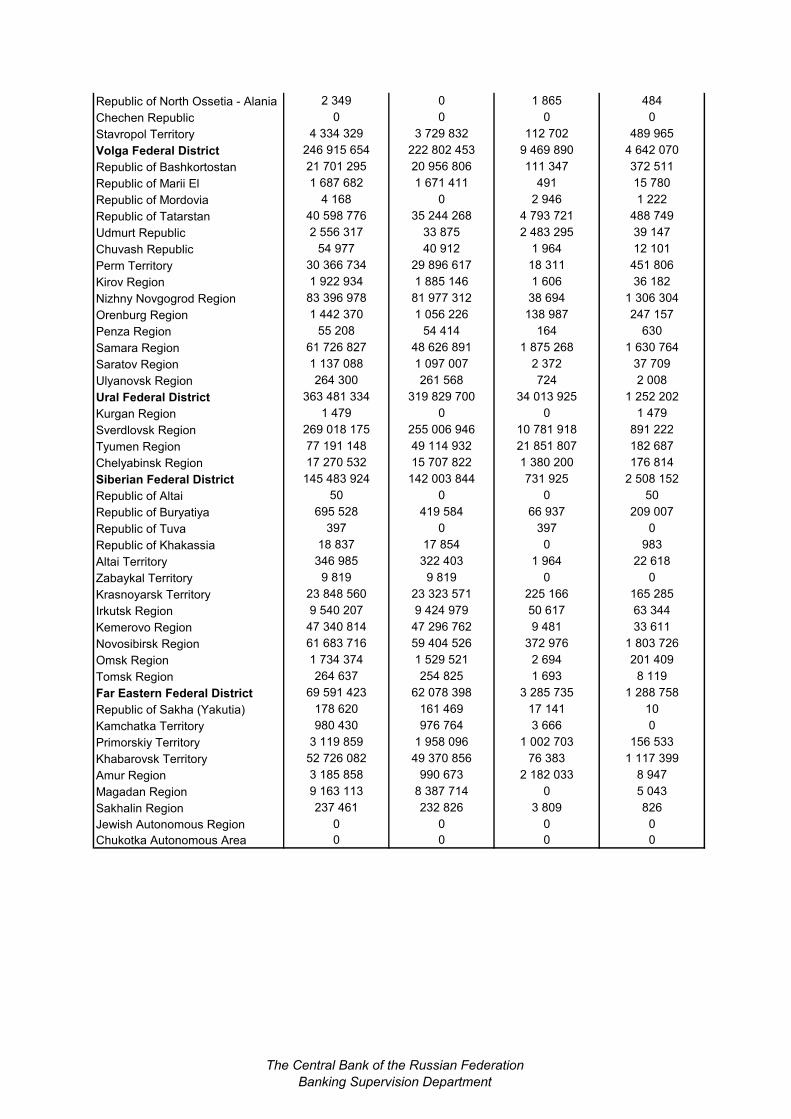
Republic of North Ossetia - Alania 2 349 0 1 865 484
Chechen Republic 0 0 0 0
Stavropol Territory 4 334 329 3 729 832 112 702 489 965
Volga Federal District 246 915 654 222 802 453 9 469 890 4 642 070
Republic of Bashkortostan 21 701 295 20 956 806 111 347 372 511
Republic of Marii El 1 687 682 1 671 411 491 15 780
Republic of Mordovia 4 168 0 2 946 1 222
Republic of Tatarstan 40 598 776 35 244 268 4 793 721 488 749
Udmurt Republic 2 556 317 33 875 2 483 295 39 147
Chuvash Republic 54 977 40 912 1 964 12 101
Perm Territory 30 366 734 29 896 617 18 311 451 806
Kirov Region 1 922 934 1 885 146 1 606 36 182
Nizhny Novgogrod Region 83 396 978 81 977 312 38 694 1 306 304
Orenburg Region 1 442 370 1 056 226 138 987 247 157
Penza Region 55 208 54 414 164 630
Samara Region 61 726 827 48 626 891 1 875 268 1 630 764
Saratov Region 1 137 088 1 097 007 2 372 37 709
Ulyanovsk Region 264 300 261 568 724 2 008
Ural Federal District 363 481 334 319 829 700 34 013 925 1 252 202
Kurgan Region 1 479 0 0 1 479
Sverdlovsk Region 269 018 175 255 006 946 10 781 918 891 222
Tyumen Region 77 191 148 49 114 932 21 851 807 182 687
Chelyabinsk Region 17 270 532 15 707 822 1 380 200 176 814
Siberian Federal District 145 483 924 142 003 844 731 925 2 508 152
Republic of Altai 50 0 0 50
Republic of Buryatiya 695 528 419 584 66 937 209 007
Republic of Tuva 397 0 397 0
Republic of Khakassia 18 837 17 854 0 983
Altai Territory 346 985 322 403 1 964 22 618
Zabaykal Territory 9 819 9 819 0 0
Krasnoyarsk Territory 23 848 560 23 323 571 225 166 165 285
Irkutsk Region 9 540 207 9 424 979 50 617 63 344
Kemerovo Region 47 340 814 47 296 762 9 481 33 611
Novosibirsk Region 61 683 716 59 404 526 372 976 1 803 726
Omsk Region 1 734 374 1 529 521 2 694 201 409
Tomsk Region 264 637 254 825 1 693 8 119
Far Eastern Federal District 69 591 423 62 078 398 3 285 735 1 288 758
Republic of Sakha (Yakutia) 178 620 161 469 17 141 10
Kamchatka Territory 980 430 976 764 3 666 0
Primorskiy Territory 3 119 859 1 958 096 1 002 703 156 533
Khabarovsk Territory 52 726 082 49 370 856 76 383 1 117 399
Amur Region 3 185 858 990 673 2 182 033 8 947
Magadan Region 9 163 113 8 387 714 0 5 043
Sakhalin Region 237 461 232 826 3 809 826
Jewish Autonomous Region 0 0 0 0
Chukotka Autonomous Area 0 0 0 0
The Central Bank of the Russian Federation
Banking Supervision Department
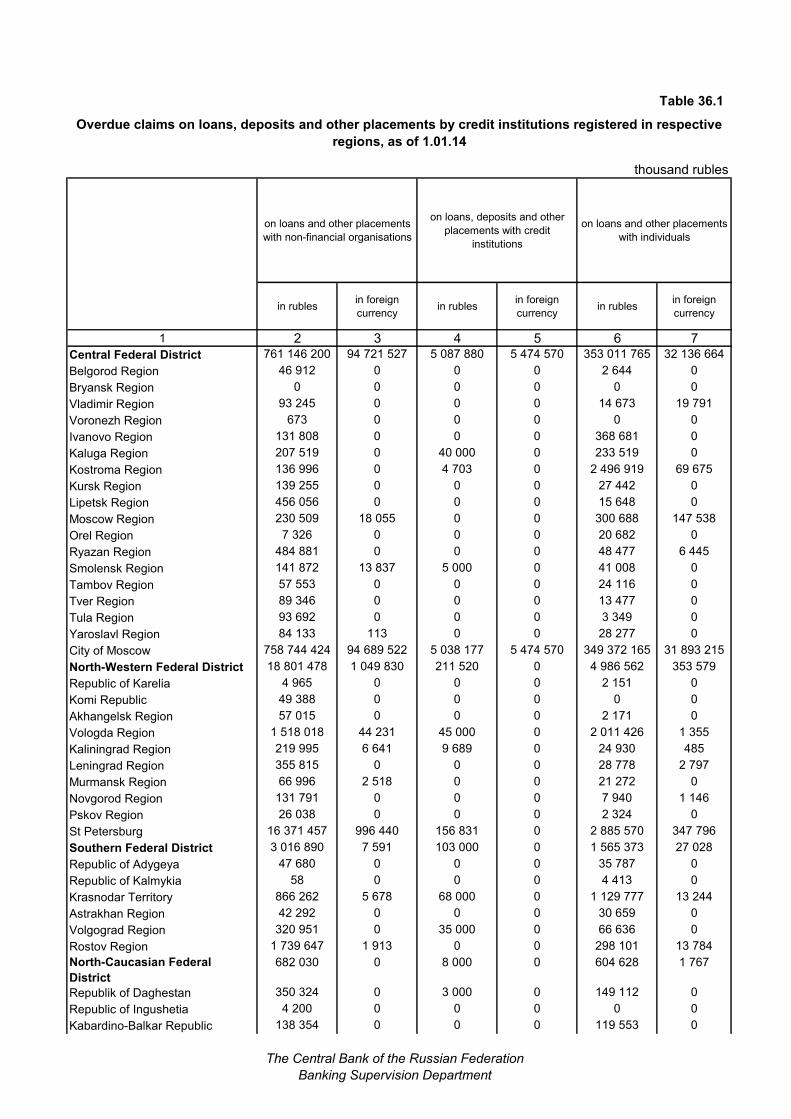
Table 36.1
Overdue claims on loans, deposits and other placements by credit institutions registered in respective
regions, as of 1.01.14
thousand rubles
on loans and other placements
with non-financial organisations
on loans, deposits and other
placements with credit
institutions
on loans and other placements
with individuals
in rublesin foreign
currencyin rubles
in foreign
currencyin rubles
in foreign
currency
1 2 3 4 5 6 7
Central Federal District 761 146 200 94 721 527 5 087 880 5 474 570 353 011 765 32 136 664
Belgorod Region 46 912 0 0 0 2 644 0
Bryansk Region 0 0 0 0 0 0
Vladimir Region 93 245 0 0 0 14 673 19 791
Voronezh Region 673 0 0 0 0 0
Ivanovo Region 131 808 0 0 0 368 681 0
Kaluga Region 207 519 0 40 000 0 233 519 0
Kostroma Region 136 996 0 4 703 0 2 496 919 69 675
Kursk Region 139 255 0 0 0 27 442 0
Lipetsk Region 456 056 0 0 0 15 648 0
Moscow Region 230 509 18 055 0 0 300 688 147 538
Orel Region 7 326 0 0 0 20 682 0
Ryazan Region 484 881 0 0 0 48 477 6 445
Smolensk Region 141 872 13 837 5 000 0 41 008 0
Tambov Region 57 553 0 0 0 24 116 0
Tver Region 89 346 0 0 0 13 477 0
Tula Region 93 692 0 0 0 3 349 0
Yaroslavl Region 84 133 113 0 0 28 277 0
City of Moscow 758 744 424 94 689 522 5 038 177 5 474 570 349 372 165 31 893 215
North-Western Federal District 18 801 478 1 049 830 211 520 0 4 986 562 353 579
Republic of Karelia 4 965 0 0 0 2 151 0
Komi Republic 49 388 0 0 0 0 0
Akhangelsk Region 57 015 0 0 0 2 171 0
Vologda Region 1 518 018 44 231 45 000 0 2 011 426 1 355
Kaliningrad Region 219 995 6 641 9 689 0 24 930 485
Leningrad Region 355 815 0 0 0 28 778 2 797
Murmansk Region 66 996 2 518 0 0 21 272 0
Novgorod Region 131 791 0 0 0 7 940 1 146
Pskov Region 26 038 0 0 0 2 324 0
St Petersburg 16 371 457 996 440 156 831 0 2 885 570 347 796
Southern Federal District 3 016 890 7 591 103 000 0 1 565 373 27 028
Republic of Adygeya 47 680 0 0 0 35 787 0
Republic of Kalmykia 58 0 0 0 4 413 0
Krasnodar Territory 866 262 5 678 68 000 0 1 129 777 13 244
Astrakhan Region 42 292 0 0 0 30 659 0
Volgograd Region 320 951 0 35 000 0 66 636 0
Rostov Region 1 739 647 1 913 0 0 298 101 13 784
North-Caucasian Federal
District
682 030 0 8 000 0 604 628 1 767
Republik of Daghestan 350 324 0 3 000 0 149 112 0
Republic of Ingushetia 4 200 0 0 0 0 0
Kabardino-Balkar Republic 138 354 0 0 0 119 553 0
The Central Bank of the Russian Federation
Banking Supervision Department
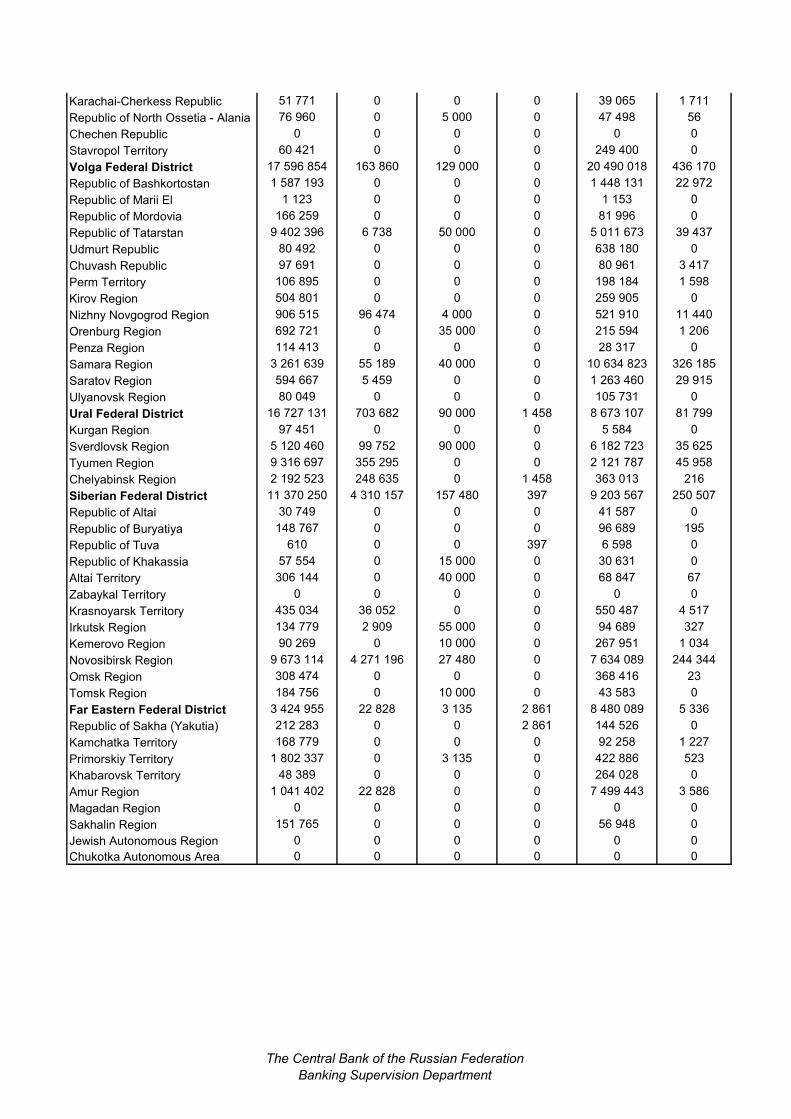
Karachai-Cherkess Republic 51 771 0 0 0 39 065 1 711
Republic of North Ossetia - Alania 76 960 0 5 000 0 47 498 56
Chechen Republic 0 0 0 0 0 0
Stavropol Territory 60 421 0 0 0 249 400 0
Volga Federal District 17 596 854 163 860 129 000 0 20 490 018 436 170
Republic of Bashkortostan 1 587 193 0 0 0 1 448 131 22 972
Republic of Marii El 1 123 0 0 0 1 153 0
Republic of Mordovia 166 259 0 0 0 81 996 0
Republic of Tatarstan 9 402 396 6 738 50 000 0 5 011 673 39 437
Udmurt Republic 80 492 0 0 0 638 180 0
Chuvash Republic 97 691 0 0 0 80 961 3 417
Perm Territory 106 895 0 0 0 198 184 1 598
Kirov Region 504 801 0 0 0 259 905 0
Nizhny Novgogrod Region 906 515 96 474 4 000 0 521 910 11 440
Orenburg Region 692 721 0 35 000 0 215 594 1 206
Penza Region 114 413 0 0 0 28 317 0
Samara Region 3 261 639 55 189 40 000 0 10 634 823 326 185
Saratov Region 594 667 5 459 0 0 1 263 460 29 915
Ulyanovsk Region 80 049 0 0 0 105 731 0
Ural Federal District 16 727 131 703 682 90 000 1 458 8 673 107 81 799
Kurgan Region 97 451 0 0 0 5 584 0
Sverdlovsk Region 5 120 460 99 752 90 000 0 6 182 723 35 625
Tyumen Region 9 316 697 355 295 0 0 2 121 787 45 958
Chelyabinsk Region 2 192 523 248 635 0 1 458 363 013 216
Siberian Federal District 11 370 250 4 310 157 157 480 397 9 203 567 250 507
Republic of Altai 30 749 0 0 0 41 587 0
Republic of Buryatiya 148 767 0 0 0 96 689 195
Republic of Tuva 610 0 0 397 6 598 0
Republic of Khakassia 57 554 0 15 000 0 30 631 0
Altai Territory 306 144 0 40 000 0 68 847 67
Zabaykal Territory 0 0 0 0 0 0
Krasnoyarsk Territory 435 034 36 052 0 0 550 487 4 517
Irkutsk Region 134 779 2 909 55 000 0 94 689 327
Kemerovo Region 90 269 0 10 000 0 267 951 1 034
Novosibirsk Region 9 673 114 4 271 196 27 480 0 7 634 089 244 344
Omsk Region 308 474 0 0 0 368 416 23
Tomsk Region 184 756 0 10 000 0 43 583 0
Far Eastern Federal District 3 424 955 22 828 3 135 2 861 8 480 089 5 336
Republic of Sakha (Yakutia) 212 283 0 0 2 861 144 526 0
Kamchatka Territory 168 779 0 0 0 92 258 1 227
Primorskiy Territory 1 802 337 0 3 135 0 422 886 523
Khabarovsk Territory 48 389 0 0 0 264 028 0
Amur Region 1 041 402 22 828 0 0 7 499 443 3 586
Magadan Region 0 0 0 0 0 0
Sakhalin Region 151 765 0 0 0 56 948 0
Jewish Autonomous Region 0 0 0 0 0 0
Chukotka Autonomous Area 0 0 0 0 0 0
The Central Bank of the Russian Federation
Banking Supervision Department
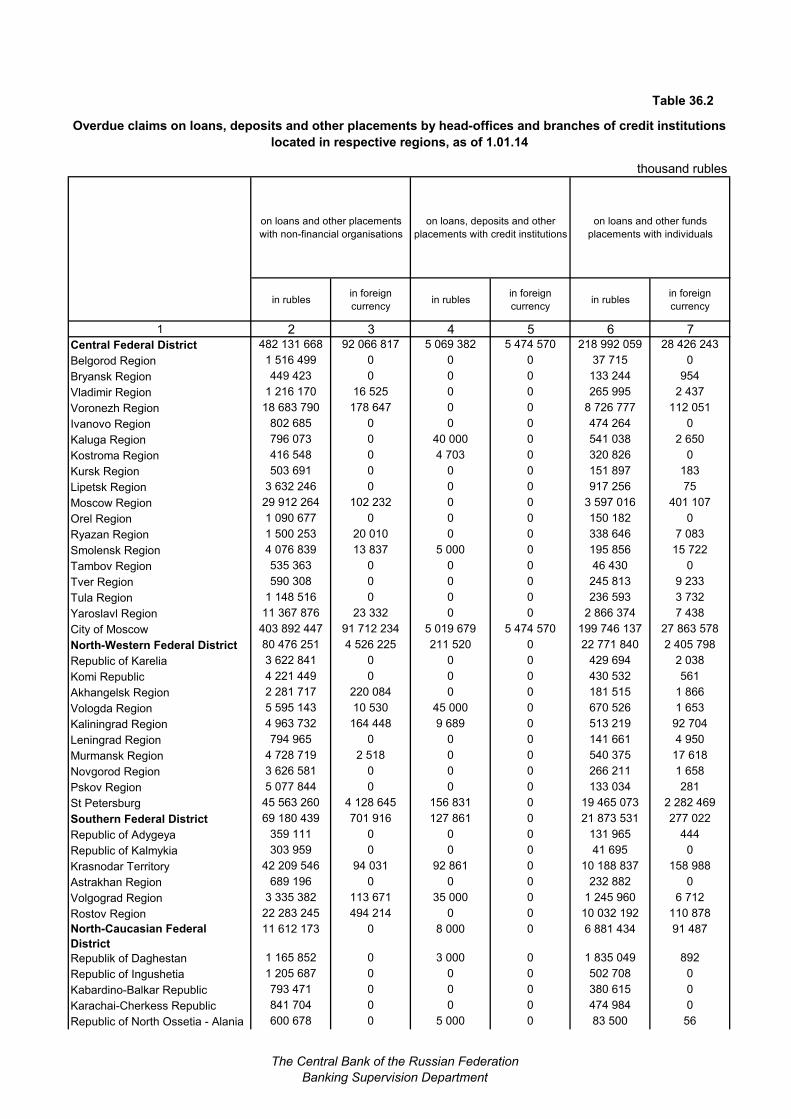
Table 36.2
Overdue claims on loans, deposits and other placements by head-offices and branches of credit institutions
located in respective regions, as of 1.01.14
thousand rubles
on loans and other placements
with non-financial organisations
on loans, deposits and other
placements with credit institutions
on loans and other funds
placements with individuals
in rublesin foreign
currencyin rubles
in foreign
currencyin rubles
in foreign
currency
1 2 3 4 5 6 7
Central Federal District 482 131 668 92 066 817 5 069 382 5 474 570 218 992 059 28 426 243
Belgorod Region 1 516 499 0 0 0 37 715 0
Bryansk Region 449 423 0 0 0 133 244 954
Vladimir Region 1 216 170 16 525 0 0 265 995 2 437
Voronezh Region 18 683 790 178 647 0 0 8 726 777 112 051
Ivanovo Region 802 685 0 0 0 474 264 0
Kaluga Region 796 073 0 40 000 0 541 038 2 650
Kostroma Region 416 548 0 4 703 0 320 826 0
Kursk Region 503 691 0 0 0 151 897 183
Lipetsk Region 3 632 246 0 0 0 917 256 75
Moscow Region 29 912 264 102 232 0 0 3 597 016 401 107
Orel Region 1 090 677 0 0 0 150 182 0
Ryazan Region 1 500 253 20 010 0 0 338 646 7 083
Smolensk Region 4 076 839 13 837 5 000 0 195 856 15 722
Tambov Region 535 363 0 0 0 46 430 0
Tver Region 590 308 0 0 0 245 813 9 233
Tula Region 1 148 516 0 0 0 236 593 3 732
Yaroslavl Region 11 367 876 23 332 0 0 2 866 374 7 438
City of Moscow 403 892 447 91 712 234 5 019 679 5 474 570 199 746 137 27 863 578
North-Western Federal District 80 476 251 4 526 225 211 520 0 22 771 840 2 405 798
Republic of Karelia 3 622 841 0 0 0 429 694 2 038
Komi Republic 4 221 449 0 0 0 430 532 561
Akhangelsk Region 2 281 717 220 084 0 0 181 515 1 866
Vologda Region 5 595 143 10 530 45 000 0 670 526 1 653
Kaliningrad Region 4 963 732 164 448 9 689 0 513 219 92 704
Leningrad Region 794 965 0 0 0 141 661 4 950
Murmansk Region 4 728 719 2 518 0 0 540 375 17 618
Novgorod Region 3 626 581 0 0 0 266 211 1 658
Pskov Region 5 077 844 0 0 0 133 034 281
St Petersburg 45 563 260 4 128 645 156 831 0 19 465 073 2 282 469
Southern Federal District 69 180 439 701 916 127 861 0 21 873 531 277 022
Republic of Adygeya 359 111 0 0 0 131 965 444
Republic of Kalmykia 303 959 0 0 0 41 695 0
Krasnodar Territory 42 209 546 94 031 92 861 0 10 188 837 158 988
Astrakhan Region 689 196 0 0 0 232 882 0
Volgograd Region 3 335 382 113 671 35 000 0 1 245 960 6 712
Rostov Region 22 283 245 494 214 0 0 10 032 192 110 878
North-Caucasian Federal
District
11 612 173 0 8 000 0 6 881 434 91 487
Republik of Daghestan 1 165 852 0 3 000 0 1 835 049 892
Republic of Ingushetia 1 205 687 0 0 0 502 708 0
Kabardino-Balkar Republic 793 471 0 0 0 380 615 0
Karachai-Cherkess Republic 841 704 0 0 0 474 984 0
Republic of North Ossetia - Alania 600 678 0 5 000 0 83 500 56
The Central Bank of the Russian Federation
Banking Supervision Department
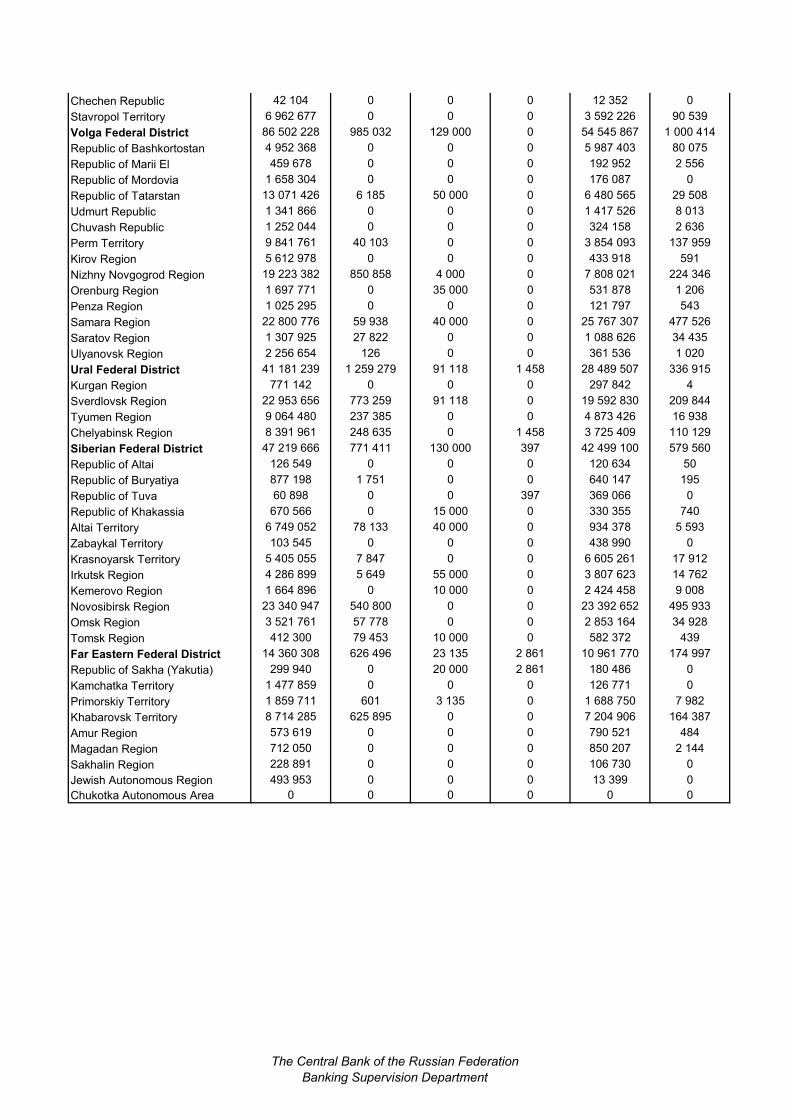
Chechen Republic 42 104 0 0 0 12 352 0
Stavropol Territory 6 962 677 0 0 0 3 592 226 90 539
Volga Federal District 86 502 228 985 032 129 000 0 54 545 867 1 000 414
Republic of Bashkortostan 4 952 368 0 0 0 5 987 403 80 075
Republic of Marii El 459 678 0 0 0 192 952 2 556
Republic of Mordovia 1 658 304 0 0 0 176 087 0
Republic of Tatarstan 13 071 426 6 185 50 000 0 6 480 565 29 508
Udmurt Republic 1 341 866 0 0 0 1 417 526 8 013
Chuvash Republic 1 252 044 0 0 0 324 158 2 636
Perm Territory 9 841 761 40 103 0 0 3 854 093 137 959
Kirov Region 5 612 978 0 0 0 433 918 591
Nizhny Novgogrod Region 19 223 382 850 858 4 000 0 7 808 021 224 346
Orenburg Region 1 697 771 0 35 000 0 531 878 1 206
Penza Region 1 025 295 0 0 0 121 797 543
Samara Region 22 800 776 59 938 40 000 0 25 767 307 477 526
Saratov Region 1 307 925 27 822 0 0 1 088 626 34 435
Ulyanovsk Region 2 256 654 126 0 0 361 536 1 020
Ural Federal District 41 181 239 1 259 279 91 118 1 458 28 489 507 336 915
Kurgan Region 771 142 0 0 0 297 842 4
Sverdlovsk Region 22 953 656 773 259 91 118 0 19 592 830 209 844
Tyumen Region 9 064 480 237 385 0 0 4 873 426 16 938
Chelyabinsk Region 8 391 961 248 635 0 1 458 3 725 409 110 129
Siberian Federal District 47 219 666 771 411 130 000 397 42 499 100 579 560
Republic of Altai 126 549 0 0 0 120 634 50
Republic of Buryatiya 877 198 1 751 0 0 640 147 195
Republic of Tuva 60 898 0 0 397 369 066 0
Republic of Khakassia 670 566 0 15 000 0 330 355 740
Altai Territory 6 749 052 78 133 40 000 0 934 378 5 593
Zabaykal Territory 103 545 0 0 0 438 990 0
Krasnoyarsk Territory 5 405 055 7 847 0 0 6 605 261 17 912
Irkutsk Region 4 286 899 5 649 55 000 0 3 807 623 14 762
Kemerovo Region 1 664 896 0 10 000 0 2 424 458 9 008
Novosibirsk Region 23 340 947 540 800 0 0 23 392 652 495 933
Omsk Region 3 521 761 57 778 0 0 2 853 164 34 928
Tomsk Region 412 300 79 453 10 000 0 582 372 439
Far Eastern Federal District 14 360 308 626 496 23 135 2 861 10 961 770 174 997
Republic of Sakha (Yakutia) 299 940 0 20 000 2 861 180 486 0
Kamchatka Territory 1 477 859 0 0 0 126 771 0
Primorskiy Territory 1 859 711 601 3 135 0 1 688 750 7 982
Khabarovsk Territory 8 714 285 625 895 0 0 7 204 906 164 387
Amur Region 573 619 0 0 0 790 521 484
Magadan Region 712 050 0 0 0 850 207 2 144
Sakhalin Region 228 891 0 0 0 106 730 0
Jewish Autonomous Region 493 953 0 0 0 13 399 0
Chukotka Autonomous Area 0 0 0 0 0 0
The Central Bank of the Russian Federation
Banking Supervision Department

Table 37.1
Distribution of clients' funds in rubles by credit institutions registered in respective regions, as of 1.01.14
thousand rubles
of which
Budgetary
funds in
settlement
accounts
Government
and extra-
budgetary
funds in
settlement
accounts
Funds of legal
entities in
settlement and
other accounts
Deposits and other
raised funds from
legal entities
(except credit
institutions)
Individual deposits
1 2 3 4 5 6 7
Central Federal District 22 633 862 166 3 013 218 171 181 4 703 718 167 5 501 756 131 12 259 424 247
Belgorod Region 7 767 746 0 0 1 987 890 1 222 535 4 533 540
Bryansk Region 0 0 0 0 0 0
Vladimir Region 5 564 567 0 40 1 065 475 630 488 3 863 197
Voronezh Region 1 318 955 0 0 93 612 989 871 235 381
Ivanovo Region 10 754 341 0 0 2 988 749 660 672 6 952 454
Kaluga Region 16 542 872 0 0 2 907 637 2 249 272 11 380 407
Kostroma Region 85 219 804 0 0 4 390 644 4 838 895 75 973 601
Kursk Region 12 785 647 0 0 2 853 079 595 100 9 322 548
Lipetsk Region 20 141 708 0 0 3 007 354 4 508 533 12 526 479
Moscow Region 39 748 487 2 838 0 10 903 513 6 921 357 21 742 609
Orel Region 3 897 028 0 0 1 077 861 438 081 2 276 484
Ryazan Region 12 848 976 0 0 3 744 060 471 932 8 531 193
Smolensk Region 3 621 225 0 0 578 474 364 035 2 638 192
Tambov Region 2 702 599 0 0 693 372 515 718 1 483 833
Tver Region 8 497 930 0 0 3 009 771 570 752 4 909 600
Tula Region 3 069 372 0 0 620 394 539 691 1 903 264
Yaroslavl Region 6 387 319 0 0 3 457 224 367 456 2 561 785
City of Moscow 22 392 993 590 3 010 380 171 141 4 660 339 058 5 475 871 743 12 088 589 680
North-Western Federal District 881 391 605 915 514 178 330 090 311 289 818 237 250 501 011
Republic of Karelia 1 003 469 0 0 694 158 118 031 185 311
Komi Republic 4 086 429 0 0 1 620 975 664 955 1 781 319
Akhangelsk Region 1 447 636 0 0 645 589 285 059 516 977
Vologda Region 58 959 601 0 0 12 389 214 19 476 425 26 897 930
Kaliningrad Region 10 285 786 0 0 2 858 325 3 829 181 3 566 764
Leningrad Region 9 795 983 2 357 0 1 858 662 666 495 7 250 133
Murmansk Region 4 854 386 0 0 2 471 301 196 550 2 174 138
Novgorod Region 3 407 120 0 178 1 335 077 91 410 1 914 490
Pskov Region 2 251 264 0 0 639 425 2 220 1 401 874
St Petersburg 785 299 931 913 157 0 305 577 585 264 487 911 204 812 075
Southern Federal District 203 266 439 52 085 31 213 53 464 681 25 806 389 123 455 806
Republic of Adygeya 5 252 897 0 0 1 408 829 367 320 3 470 259
Republic of Kalmykia 584 492 0 0 313 892 20 000 250 544
Krasnodar Territory 111 893 748 50 816 31 213 29 100 265 14 287 562 68 155 665
Astrakhan Region 6 159 410 0 0 3 652 533 1 103 672 1 386 747
Volgograd Region 15 422 063 1 269 0 3 005 081 5 438 513 6 966 210
Rostov Region 63 953 829 0 0 15 984 081 4 589 322 43 226 381
North-Caucasian Federal District32 816 407 0 0 15 498 354 1 827 063 15 359 552
Republik of Daghestan 12 184 467 0 0 6 623 831 375 796 5 147 310
Republic of Ingushetia 560 360 0 0 477 670 0 80 119
Kabardino-Balkar Republic 3 645 980 0 0 799 011 25 164 2 821 049
Karachai-Cherkess Republic 5 811 384 0 0 3 610 101 765 398 1 417 250
Republic of North Ossetia - Alania 3 969 080 0 0 610 774 152 000 3 196 222
Chechen Republic 0 0 0 0 0 0
Stavropol Territory 6 645 136 0 0 3 376 967 508 705 2 697 602
Volga Federal District 900 636 852 8 473 222 3 327 173 411 812 218 450 027 496 950 227
Republic of Bashkortostan 58 521 865 13 161 0 9 360 687 11 620 147 37 473 573
Total
The Central Bank of the Russian Federation
Banking Supervision Department
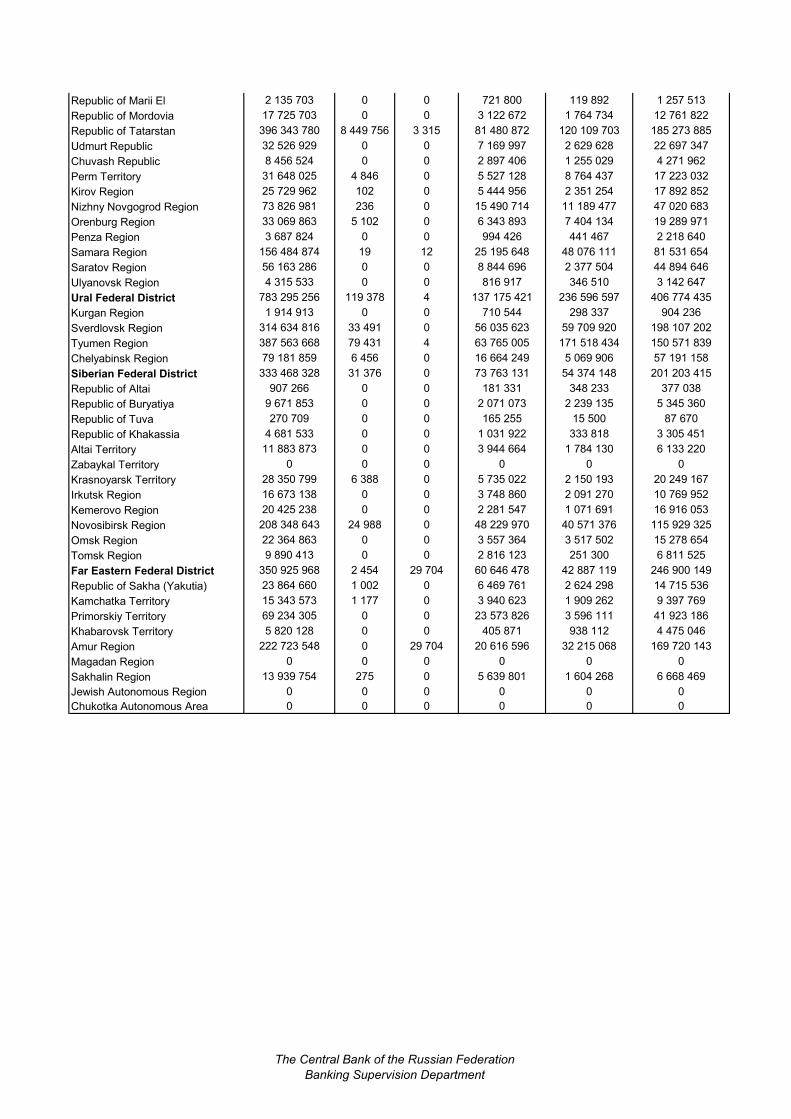
Republic of Marii El 2 135 703 0 0 721 800 119 892 1 257 513
Republic of Mordovia 17 725 703 0 0 3 122 672 1 764 734 12 761 822
Republic of Tatarstan 396 343 780 8 449 756 3 315 81 480 872 120 109 703 185 273 885
Udmurt Republic 32 526 929 0 0 7 169 997 2 629 628 22 697 347
Chuvash Republic 8 456 524 0 0 2 897 406 1 255 029 4 271 962
Perm Territory 31 648 025 4 846 0 5 527 128 8 764 437 17 223 032
Kirov Region 25 729 962 102 0 5 444 956 2 351 254 17 892 852
Nizhny Novgogrod Region 73 826 981 236 0 15 490 714 11 189 477 47 020 683
Orenburg Region 33 069 863 5 102 0 6 343 893 7 404 134 19 289 971
Penza Region 3 687 824 0 0 994 426 441 467 2 218 640
Samara Region 156 484 874 19 12 25 195 648 48 076 111 81 531 654
Saratov Region 56 163 286 0 0 8 844 696 2 377 504 44 894 646
Ulyanovsk Region 4 315 533 0 0 816 917 346 510 3 142 647
Ural Federal District 783 295 256 119 378 4 137 175 421 236 596 597 406 774 435
Kurgan Region 1 914 913 0 0 710 544 298 337 904 236
Sverdlovsk Region 314 634 816 33 491 0 56 035 623 59 709 920 198 107 202
Tyumen Region 387 563 668 79 431 4 63 765 005 171 518 434 150 571 839
Chelyabinsk Region 79 181 859 6 456 0 16 664 249 5 069 906 57 191 158
Siberian Federal District 333 468 328 31 376 0 73 763 131 54 374 148 201 203 415
Republic of Altai 907 266 0 0 181 331 348 233 377 038
Republic of Buryatiya 9 671 853 0 0 2 071 073 2 239 135 5 345 360
Republic of Tuva 270 709 0 0 165 255 15 500 87 670
Republic of Khakassia 4 681 533 0 0 1 031 922 333 818 3 305 451
Altai Territory 11 883 873 0 0 3 944 664 1 784 130 6 133 220
Zabaykal Territory 0 0 0 0 0 0
Krasnoyarsk Territory 28 350 799 6 388 0 5 735 022 2 150 193 20 249 167
Irkutsk Region 16 673 138 0 0 3 748 860 2 091 270 10 769 952
Kemerovo Region 20 425 238 0 0 2 281 547 1 071 691 16 916 053
Novosibirsk Region 208 348 643 24 988 0 48 229 970 40 571 376 115 929 325
Omsk Region 22 364 863 0 0 3 557 364 3 517 502 15 278 654
Tomsk Region 9 890 413 0 0 2 816 123 251 300 6 811 525
Far Eastern Federal District 350 925 968 2 454 29 704 60 646 478 42 887 119 246 900 149
Republic of Sakha (Yakutia) 23 864 660 1 002 0 6 469 761 2 624 298 14 715 536
Kamchatka Territory 15 343 573 1 177 0 3 940 623 1 909 262 9 397 769
Primorskiy Territory 69 234 305 0 0 23 573 826 3 596 111 41 923 186
Khabarovsk Territory 5 820 128 0 0 405 871 938 112 4 475 046
Amur Region 222 723 548 0 29 704 20 616 596 32 215 068 169 720 143
Magadan Region 0 0 0 0 0 0
Sakhalin Region 13 939 754 275 0 5 639 801 1 604 268 6 668 469
Jewish Autonomous Region 0 0 0 0 0 0
Chukotka Autonomous Area 0 0 0 0 0 0
The Central Bank of the Russian Federation
Banking Supervision Department
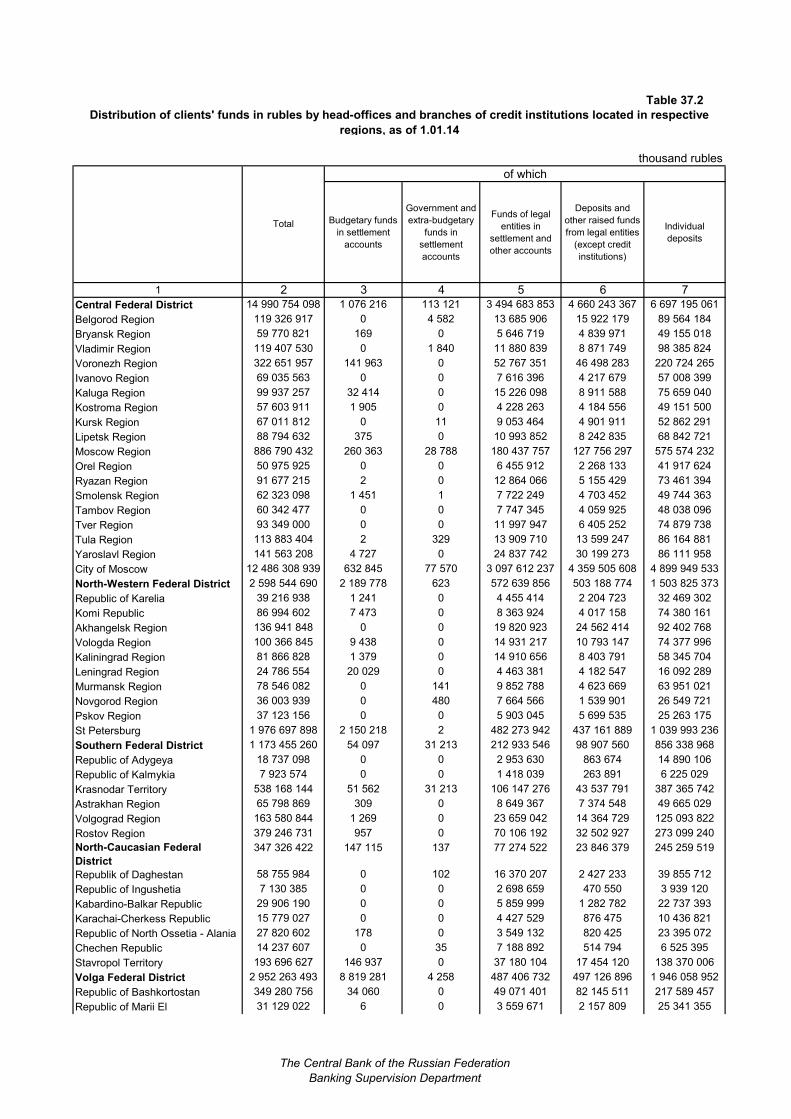
Table 37.2
Distribution of clients' funds in rubles by head-offices and branches of credit institutions located in respective
regions, as of 1.01.14
thousand rubles
of which
Budgetary funds
in settlement
accounts
Government and
extra-budgetary
funds in
settlement
accounts
Funds of legal
entities in
settlement and
other accounts
Deposits and
other raised funds
from legal entities
(except credit
institutions)
Individual
deposits
1 2 3 4 5 6 7
Central Federal District 14 990 754 098 1 076 216 113 121 3 494 683 853 4 660 243 367 6 697 195 061
Belgorod Region 119 326 917 0 4 582 13 685 906 15 922 179 89 564 184
Bryansk Region 59 770 821 169 0 5 646 719 4 839 971 49 155 018
Vladimir Region 119 407 530 0 1 840 11 880 839 8 871 749 98 385 824
Voronezh Region 322 651 957 141 963 0 52 767 351 46 498 283 220 724 265
Ivanovo Region 69 035 563 0 0 7 616 396 4 217 679 57 008 399
Kaluga Region 99 937 257 32 414 0 15 226 098 8 911 588 75 659 040
Kostroma Region 57 603 911 1 905 0 4 228 263 4 184 556 49 151 500
Kursk Region 67 011 812 0 11 9 053 464 4 901 911 52 862 291
Lipetsk Region 88 794 632 375 0 10 993 852 8 242 835 68 842 721
Moscow Region 886 790 432 260 363 28 788 180 437 757 127 756 297 575 574 232
Orel Region 50 975 925 0 0 6 455 912 2 268 133 41 917 624
Ryazan Region 91 677 215 2 0 12 864 066 5 155 429 73 461 394
Smolensk Region 62 323 098 1 451 1 7 722 249 4 703 452 49 744 363
Tambov Region 60 342 477 0 0 7 747 345 4 059 925 48 038 096
Tver Region 93 349 000 0 0 11 997 947 6 405 252 74 879 738
Tula Region 113 883 404 2 329 13 909 710 13 599 247 86 164 881
Yaroslavl Region 141 563 208 4 727 0 24 837 742 30 199 273 86 111 958
City of Moscow 12 486 308 939 632 845 77 570 3 097 612 237 4 359 505 608 4 899 949 533
North-Western Federal District 2 598 544 690 2 189 778 623 572 639 856 503 188 774 1 503 825 373
Republic of Karelia 39 216 938 1 241 0 4 455 414 2 204 723 32 469 302
Komi Republic 86 994 602 7 473 0 8 363 924 4 017 158 74 380 161
Akhangelsk Region 136 941 848 0 0 19 820 923 24 562 414 92 402 768
Vologda Region 100 366 845 9 438 0 14 931 217 10 793 147 74 377 996
Kaliningrad Region 81 866 828 1 379 0 14 910 656 8 403 791 58 345 704
Leningrad Region 24 786 554 20 029 0 4 463 381 4 182 547 16 092 289
Murmansk Region 78 546 082 0 141 9 852 788 4 623 669 63 951 021
Novgorod Region 36 003 939 0 480 7 664 566 1 539 901 26 549 721
Pskov Region 37 123 156 0 0 5 903 045 5 699 535 25 263 175
St Petersburg 1 976 697 898 2 150 218 2 482 273 942 437 161 889 1 039 993 236
Southern Federal District 1 173 455 260 54 097 31 213 212 933 546 98 907 560 856 338 968
Republic of Adygeya 18 737 098 0 0 2 953 630 863 674 14 890 106
Republic of Kalmykia 7 923 574 0 0 1 418 039 263 891 6 225 029
Krasnodar Territory 538 168 144 51 562 31 213 106 147 276 43 537 791 387 365 742
Astrakhan Region 65 798 869 309 0 8 649 367 7 374 548 49 665 029
Volgograd Region 163 580 844 1 269 0 23 659 042 14 364 729 125 093 822
Rostov Region 379 246 731 957 0 70 106 192 32 502 927 273 099 240
North-Caucasian Federal
District
347 326 422 147 115 137 77 274 522 23 846 379 245 259 519
Republik of Daghestan 58 755 984 0 102 16 370 207 2 427 233 39 855 712
Republic of Ingushetia 7 130 385 0 0 2 698 659 470 550 3 939 120
Kabardino-Balkar Republic 29 906 190 0 0 5 859 999 1 282 782 22 737 393
Karachai-Cherkess Republic 15 779 027 0 0 4 427 529 876 475 10 436 821
Republic of North Ossetia - Alania 27 820 602 178 0 3 549 132 820 425 23 395 072
Chechen Republic 14 237 607 0 35 7 188 892 514 794 6 525 395
Stavropol Territory 193 696 627 146 937 0 37 180 104 17 454 120 138 370 006
Volga Federal District 2 952 263 493 8 819 281 4 258 487 406 732 497 126 896 1 946 058 952
Republic of Bashkortostan 349 280 756 34 060 0 49 071 401 82 145 511 217 589 457
Republic of Marii El 31 129 022 6 0 3 559 671 2 157 809 25 341 355
Total
The Central Bank of the Russian Federation
Banking Supervision Department
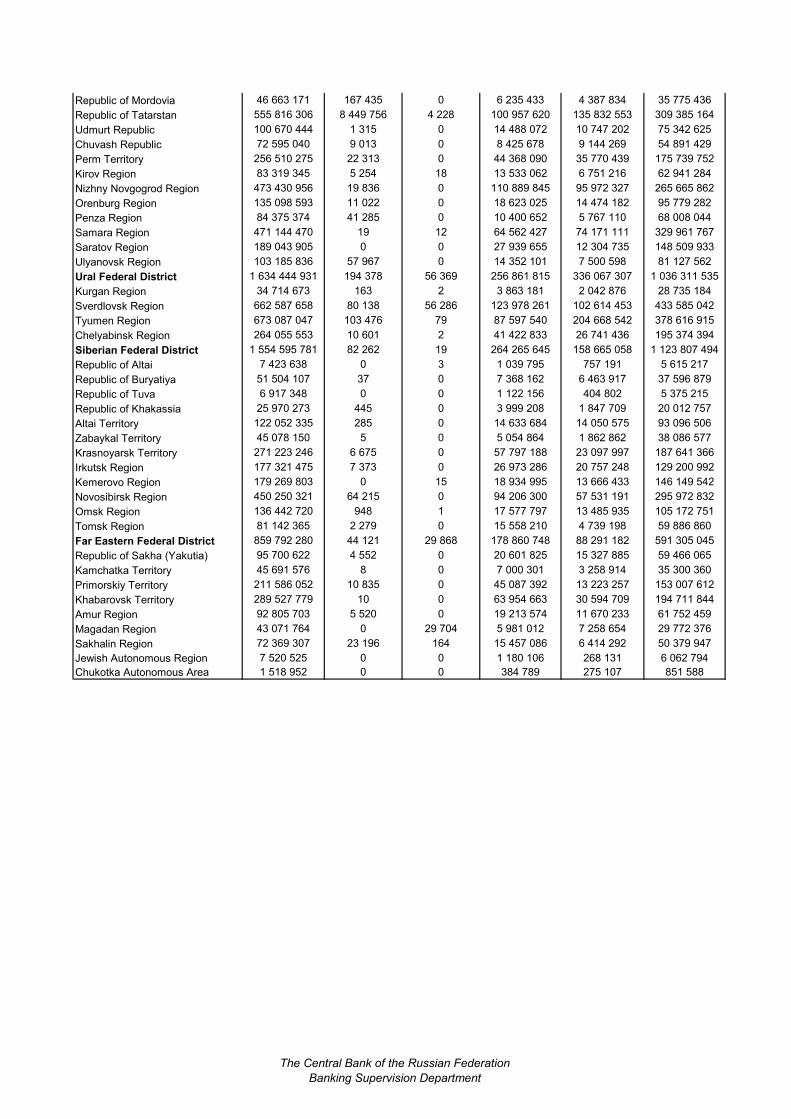
Republic of Mordovia 46 663 171 167 435 0 6 235 433 4 387 834 35 775 436
Republic of Tatarstan 555 816 306 8 449 756 4 228 100 957 620 135 832 553 309 385 164
Udmurt Republic 100 670 444 1 315 0 14 488 072 10 747 202 75 342 625
Chuvash Republic 72 595 040 9 013 0 8 425 678 9 144 269 54 891 429
Perm Territory 256 510 275 22 313 0 44 368 090 35 770 439 175 739 752
Kirov Region 83 319 345 5 254 18 13 533 062 6 751 216 62 941 284
Nizhny Novgogrod Region 473 430 956 19 836 0 110 889 845 95 972 327 265 665 862
Orenburg Region 135 098 593 11 022 0 18 623 025 14 474 182 95 779 282
Penza Region 84 375 374 41 285 0 10 400 652 5 767 110 68 008 044
Samara Region 471 144 470 19 12 64 562 427 74 171 111 329 961 767
Saratov Region 189 043 905 0 0 27 939 655 12 304 735 148 509 933
Ulyanovsk Region 103 185 836 57 967 0 14 352 101 7 500 598 81 127 562
Ural Federal District 1 634 444 931 194 378 56 369 256 861 815 336 067 307 1 036 311 535
Kurgan Region 34 714 673 163 2 3 863 181 2 042 876 28 735 184
Sverdlovsk Region 662 587 658 80 138 56 286 123 978 261 102 614 453 433 585 042
Tyumen Region 673 087 047 103 476 79 87 597 540 204 668 542 378 616 915
Chelyabinsk Region 264 055 553 10 601 2 41 422 833 26 741 436 195 374 394
Siberian Federal District 1 554 595 781 82 262 19 264 265 645 158 665 058 1 123 807 494
Republic of Altai 7 423 638 0 3 1 039 795 757 191 5 615 217
Republic of Buryatiya 51 504 107 37 0 7 368 162 6 463 917 37 596 879
Republic of Tuva 6 917 348 0 0 1 122 156 404 802 5 375 215
Republic of Khakassia 25 970 273 445 0 3 999 208 1 847 709 20 012 757
Altai Territory 122 052 335 285 0 14 633 684 14 050 575 93 096 506
Zabaykal Territory 45 078 150 5 0 5 054 864 1 862 862 38 086 577
Krasnoyarsk Territory 271 223 246 6 675 0 57 797 188 23 097 997 187 641 366
Irkutsk Region 177 321 475 7 373 0 26 973 286 20 757 248 129 200 992
Kemerovo Region 179 269 803 0 15 18 934 995 13 666 433 146 149 542
Novosibirsk Region 450 250 321 64 215 0 94 206 300 57 531 191 295 972 832
Omsk Region 136 442 720 948 1 17 577 797 13 485 935 105 172 751
Tomsk Region 81 142 365 2 279 0 15 558 210 4 739 198 59 886 860
Far Eastern Federal District 859 792 280 44 121 29 868 178 860 748 88 291 182 591 305 045
Republic of Sakha (Yakutia) 95 700 622 4 552 0 20 601 825 15 327 885 59 466 065
Kamchatka Territory 45 691 576 8 0 7 000 301 3 258 914 35 300 360
Primorskiy Territory 211 586 052 10 835 0 45 087 392 13 223 257 153 007 612
Khabarovsk Territory 289 527 779 10 0 63 954 663 30 594 709 194 711 844
Amur Region 92 805 703 5 520 0 19 213 574 11 670 233 61 752 459
Magadan Region 43 071 764 0 29 704 5 981 012 7 258 654 29 772 376
Sakhalin Region 72 369 307 23 196 164 15 457 086 6 414 292 50 379 947
Jewish Autonomous Region 7 520 525 0 0 1 180 106 268 131 6 062 794
Chukotka Autonomous Area 1 518 952 0 0 384 789 275 107 851 588
The Central Bank of the Russian Federation
Banking Supervision Department
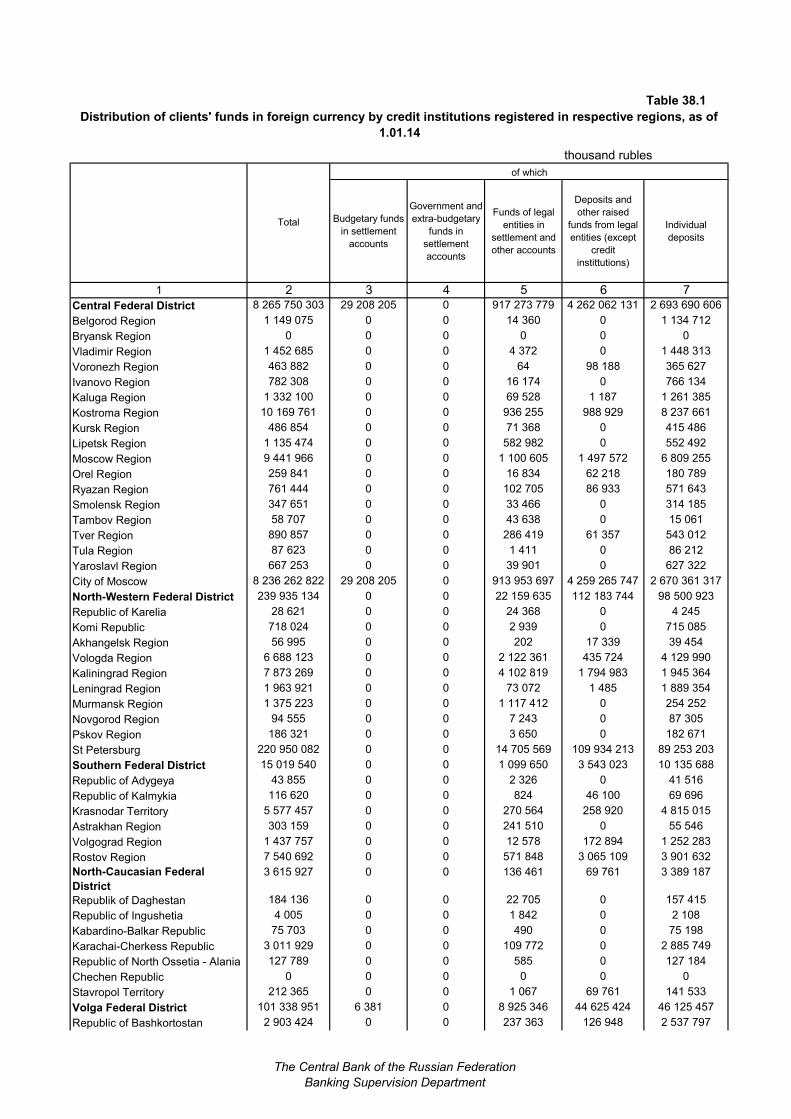
Table 38.1
Distribution of clients' funds in foreign currency by credit institutions registered in respective regions, as of
1.01.14
thousand rubles
of which
Budgetary funds
in settlement
accounts
Government and
extra-budgetary
funds in
settlement
accounts
Funds of legal
entities in
settlement and
other accounts
Deposits and
other raised
funds from legal
entities (except
credit
instittutions)
Individual
deposits
1 2 3 4 5 6 7
Central Federal District 8 265 750 303 29 208 205 0 917 273 779 4 262 062 131 2 693 690 606
Belgorod Region 1 149 075 0 0 14 360 0 1 134 712
Bryansk Region 0 0 0 0 0 0
Vladimir Region 1 452 685 0 0 4 372 0 1 448 313
Voronezh Region 463 882 0 0 64 98 188 365 627
Ivanovo Region 782 308 0 0 16 174 0 766 134
Kaluga Region 1 332 100 0 0 69 528 1 187 1 261 385
Kostroma Region 10 169 761 0 0 936 255 988 929 8 237 661
Kursk Region 486 854 0 0 71 368 0 415 486
Lipetsk Region 1 135 474 0 0 582 982 0 552 492
Moscow Region 9 441 966 0 0 1 100 605 1 497 572 6 809 255
Orel Region 259 841 0 0 16 834 62 218 180 789
Ryazan Region 761 444 0 0 102 705 86 933 571 643
Smolensk Region 347 651 0 0 33 466 0 314 185
Tambov Region 58 707 0 0 43 638 0 15 061
Tver Region 890 857 0 0 286 419 61 357 543 012
Tula Region 87 623 0 0 1 411 0 86 212
Yaroslavl Region 667 253 0 0 39 901 0 627 322
City of Moscow 8 236 262 822 29 208 205 0 913 953 697 4 259 265 747 2 670 361 317
North-Western Federal District 239 935 134 0 0 22 159 635 112 183 744 98 500 923
Republic of Karelia 28 621 0 0 24 368 0 4 245
Komi Republic 718 024 0 0 2 939 0 715 085
Akhangelsk Region 56 995 0 0 202 17 339 39 454
Vologda Region 6 688 123 0 0 2 122 361 435 724 4 129 990
Kaliningrad Region 7 873 269 0 0 4 102 819 1 794 983 1 945 364
Leningrad Region 1 963 921 0 0 73 072 1 485 1 889 354
Murmansk Region 1 375 223 0 0 1 117 412 0 254 252
Novgorod Region 94 555 0 0 7 243 0 87 305
Pskov Region 186 321 0 0 3 650 0 182 671
St Petersburg 220 950 082 0 0 14 705 569 109 934 213 89 253 203
Southern Federal District 15 019 540 0 0 1 099 650 3 543 023 10 135 688
Republic of Adygeya 43 855 0 0 2 326 0 41 516
Republic of Kalmykia 116 620 0 0 824 46 100 69 696
Krasnodar Territory 5 577 457 0 0 270 564 258 920 4 815 015
Astrakhan Region 303 159 0 0 241 510 0 55 546
Volgograd Region 1 437 757 0 0 12 578 172 894 1 252 283
Rostov Region 7 540 692 0 0 571 848 3 065 109 3 901 632
North-Caucasian Federal
District
3 615 927 0 0 136 461 69 761 3 389 187
Republik of Daghestan 184 136 0 0 22 705 0 157 415
Republic of Ingushetia 4 005 0 0 1 842 0 2 108
Kabardino-Balkar Republic 75 703 0 0 490 0 75 198
Karachai-Cherkess Republic 3 011 929 0 0 109 772 0 2 885 749
Republic of North Ossetia - Alania 127 789 0 0 585 0 127 184
Chechen Republic 0 0 0 0 0 0
Stavropol Territory 212 365 0 0 1 067 69 761 141 533
Volga Federal District 101 338 951 6 381 0 8 925 346 44 625 424 46 125 457
Republic of Bashkortostan 2 903 424 0 0 237 363 126 948 2 537 797
Total
The Central Bank of the Russian Federation
Banking Supervision Department
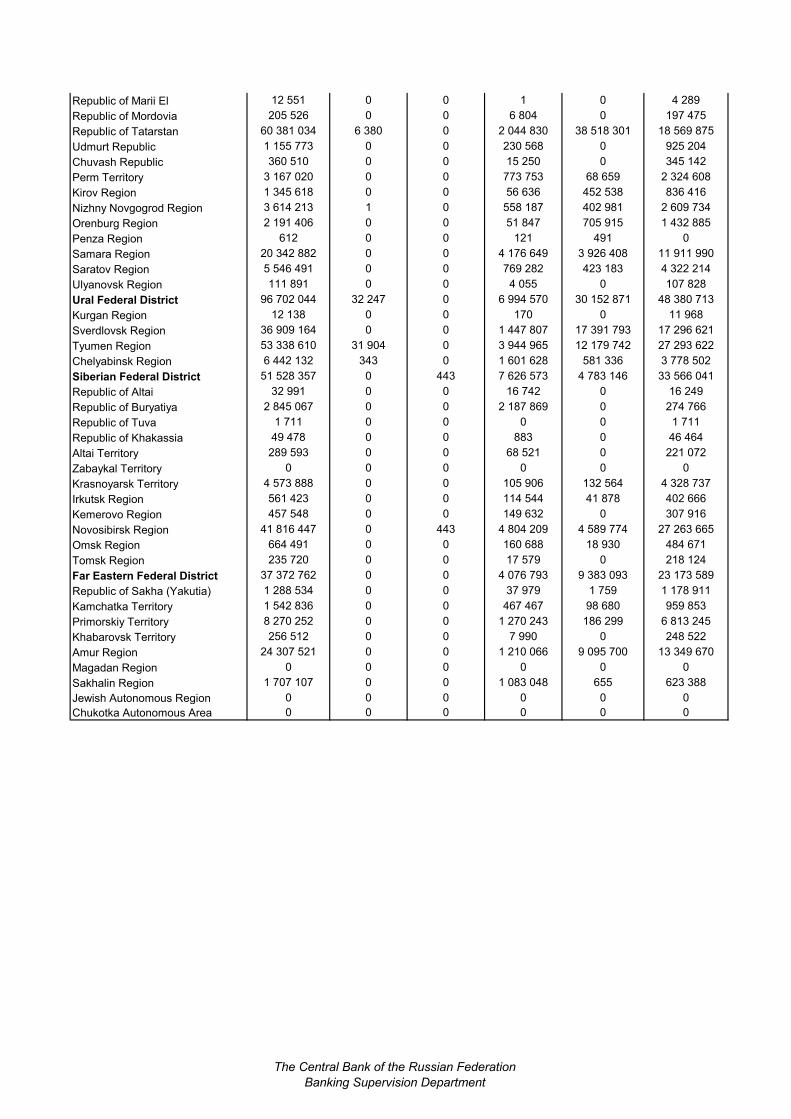
Republic of Marii El 12 551 0 0 1 0 4 289
Republic of Mordovia 205 526 0 0 6 804 0 197 475
Republic of Tatarstan 60 381 034 6 380 0 2 044 830 38 518 301 18 569 875
Udmurt Republic 1 155 773 0 0 230 568 0 925 204
Chuvash Republic 360 510 0 0 15 250 0 345 142
Perm Territory 3 167 020 0 0 773 753 68 659 2 324 608
Kirov Region 1 345 618 0 0 56 636 452 538 836 416
Nizhny Novgogrod Region 3 614 213 1 0 558 187 402 981 2 609 734
Orenburg Region 2 191 406 0 0 51 847 705 915 1 432 885
Penza Region 612 0 0 121 491 0
Samara Region 20 342 882 0 0 4 176 649 3 926 408 11 911 990
Saratov Region 5 546 491 0 0 769 282 423 183 4 322 214
Ulyanovsk Region 111 891 0 0 4 055 0 107 828
Ural Federal District 96 702 044 32 247 0 6 994 570 30 152 871 48 380 713
Kurgan Region 12 138 0 0 170 0 11 968
Sverdlovsk Region 36 909 164 0 0 1 447 807 17 391 793 17 296 621
Tyumen Region 53 338 610 31 904 0 3 944 965 12 179 742 27 293 622
Chelyabinsk Region 6 442 132 343 0 1 601 628 581 336 3 778 502
Siberian Federal District 51 528 357 0 443 7 626 573 4 783 146 33 566 041
Republic of Altai 32 991 0 0 16 742 0 16 249
Republic of Buryatiya 2 845 067 0 0 2 187 869 0 274 766
Republic of Tuva 1 711 0 0 0 0 1 711
Republic of Khakassia 49 478 0 0 883 0 46 464
Altai Territory 289 593 0 0 68 521 0 221 072
Zabaykal Territory 0 0 0 0 0 0
Krasnoyarsk Territory 4 573 888 0 0 105 906 132 564 4 328 737
Irkutsk Region 561 423 0 0 114 544 41 878 402 666
Kemerovo Region 457 548 0 0 149 632 0 307 916
Novosibirsk Region 41 816 447 0 443 4 804 209 4 589 774 27 263 665
Omsk Region 664 491 0 0 160 688 18 930 484 671
Tomsk Region 235 720 0 0 17 579 0 218 124
Far Eastern Federal District 37 372 762 0 0 4 076 793 9 383 093 23 173 589
Republic of Sakha (Yakutia) 1 288 534 0 0 37 979 1 759 1 178 911
Kamchatka Territory 1 542 836 0 0 467 467 98 680 959 853
Primorskiy Territory 8 270 252 0 0 1 270 243 186 299 6 813 245
Khabarovsk Territory 256 512 0 0 7 990 0 248 522
Amur Region 24 307 521 0 0 1 210 066 9 095 700 13 349 670
Magadan Region 0 0 0 0 0 0
Sakhalin Region 1 707 107 0 0 1 083 048 655 623 388
Jewish Autonomous Region 0 0 0 0 0 0
Chukotka Autonomous Area 0 0 0 0 0 0
The Central Bank of the Russian Federation
Banking Supervision Department
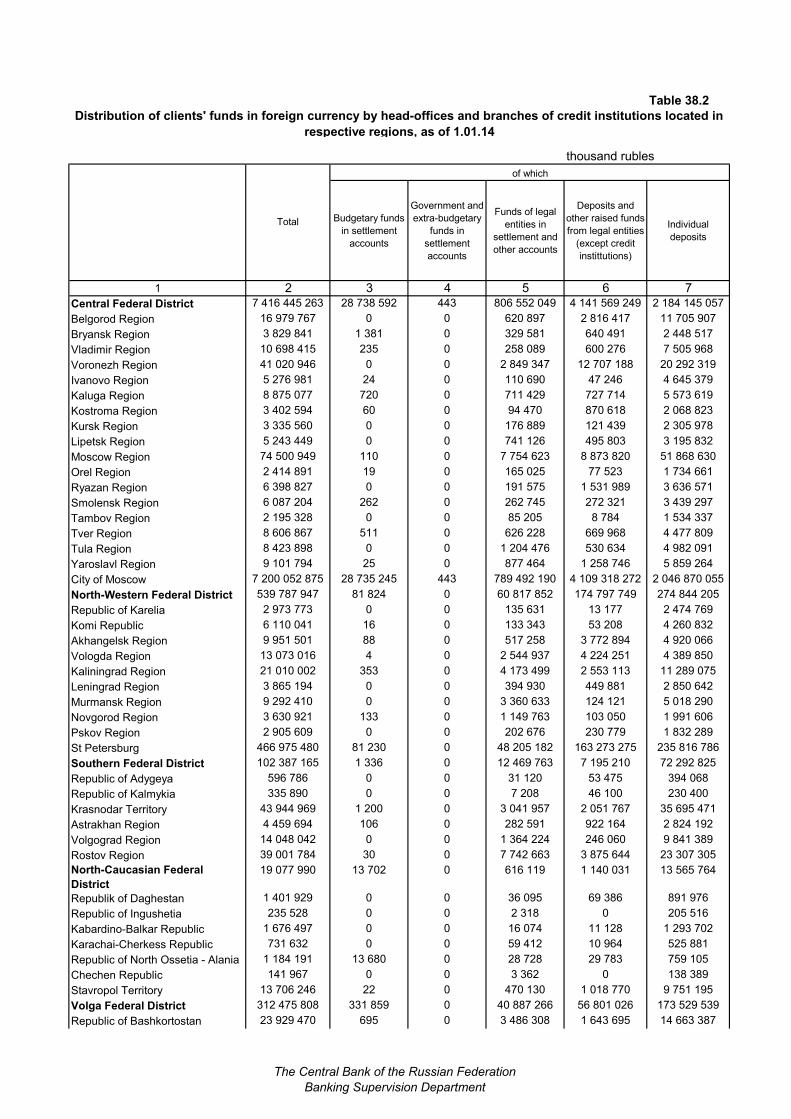
Table 38.2
Distribution of clients' funds in foreign currency by head-offices and branches of credit institutions located in
respective regions, as of 1.01.14
thousand rubles
of which
Budgetary funds
in settlement
accounts
Government and
extra-budgetary
funds in
settlement
accounts
Funds of legal
entities in
settlement and
other accounts
Deposits and
other raised funds
from legal entities
(except credit
instittutions)
Individual
deposits
1 2 3 4 5 6 7
Central Federal District 7 416 445 263 28 738 592 443 806 552 049 4 141 569 249 2 184 145 057
Belgorod Region 16 979 767 0 0 620 897 2 816 417 11 705 907
Bryansk Region 3 829 841 1 381 0 329 581 640 491 2 448 517
Vladimir Region 10 698 415 235 0 258 089 600 276 7 505 968
Voronezh Region 41 020 946 0 0 2 849 347 12 707 188 20 292 319
Ivanovo Region 5 276 981 24 0 110 690 47 246 4 645 379
Kaluga Region 8 875 077 720 0 711 429 727 714 5 573 619
Kostroma Region 3 402 594 60 0 94 470 870 618 2 068 823
Kursk Region 3 335 560 0 0 176 889 121 439 2 305 978
Lipetsk Region 5 243 449 0 0 741 126 495 803 3 195 832
Moscow Region 74 500 949 110 0 7 754 623 8 873 820 51 868 630
Orel Region 2 414 891 19 0 165 025 77 523 1 734 661
Ryazan Region 6 398 827 0 0 191 575 1 531 989 3 636 571
Smolensk Region 6 087 204 262 0 262 745 272 321 3 439 297
Tambov Region 2 195 328 0 0 85 205 8 784 1 534 337
Tver Region 8 606 867 511 0 626 228 669 968 4 477 809
Tula Region 8 423 898 0 0 1 204 476 530 634 4 982 091
Yaroslavl Region 9 101 794 25 0 877 464 1 258 746 5 859 264
City of Moscow 7 200 052 875 28 735 245 443 789 492 190 4 109 318 272 2 046 870 055
North-Western Federal District 539 787 947 81 824 0 60 817 852 174 797 749 274 844 205
Republic of Karelia 2 973 773 0 0 135 631 13 177 2 474 769
Komi Republic 6 110 041 16 0 133 343 53 208 4 260 832
Akhangelsk Region 9 951 501 88 0 517 258 3 772 894 4 920 066
Vologda Region 13 073 016 4 0 2 544 937 4 224 251 4 389 850
Kaliningrad Region 21 010 002 353 0 4 173 499 2 553 113 11 289 075
Leningrad Region 3 865 194 0 0 394 930 449 881 2 850 642
Murmansk Region 9 292 410 0 0 3 360 633 124 121 5 018 290
Novgorod Region 3 630 921 133 0 1 149 763 103 050 1 991 606
Pskov Region 2 905 609 0 0 202 676 230 779 1 832 289
St Petersburg 466 975 480 81 230 0 48 205 182 163 273 275 235 816 786
Southern Federal District 102 387 165 1 336 0 12 469 763 7 195 210 72 292 825
Republic of Adygeya 596 786 0 0 31 120 53 475 394 068
Republic of Kalmykia 335 890 0 0 7 208 46 100 230 400
Krasnodar Territory 43 944 969 1 200 0 3 041 957 2 051 767 35 695 471
Astrakhan Region 4 459 694 106 0 282 591 922 164 2 824 192
Volgograd Region 14 048 042 0 0 1 364 224 246 060 9 841 389
Rostov Region 39 001 784 30 0 7 742 663 3 875 644 23 307 305
North-Caucasian Federal
District
19 077 990 13 702 0 616 119 1 140 031 13 565 764
Republik of Daghestan 1 401 929 0 0 36 095 69 386 891 976
Republic of Ingushetia 235 528 0 0 2 318 0 205 516
Kabardino-Balkar Republic 1 676 497 0 0 16 074 11 128 1 293 702
Karachai-Cherkess Republic 731 632 0 0 59 412 10 964 525 881
Republic of North Ossetia - Alania 1 184 191 13 680 0 28 728 29 783 759 105
Chechen Republic 141 967 0 0 3 362 0 138 389
Stavropol Territory 13 706 246 22 0 470 130 1 018 770 9 751 195
Volga Federal District 312 475 808 331 859 0 40 887 266 56 801 026 173 529 539
Republic of Bashkortostan 23 929 470 695 0 3 486 308 1 643 695 14 663 387
Total
The Central Bank of the Russian Federation
Banking Supervision Department
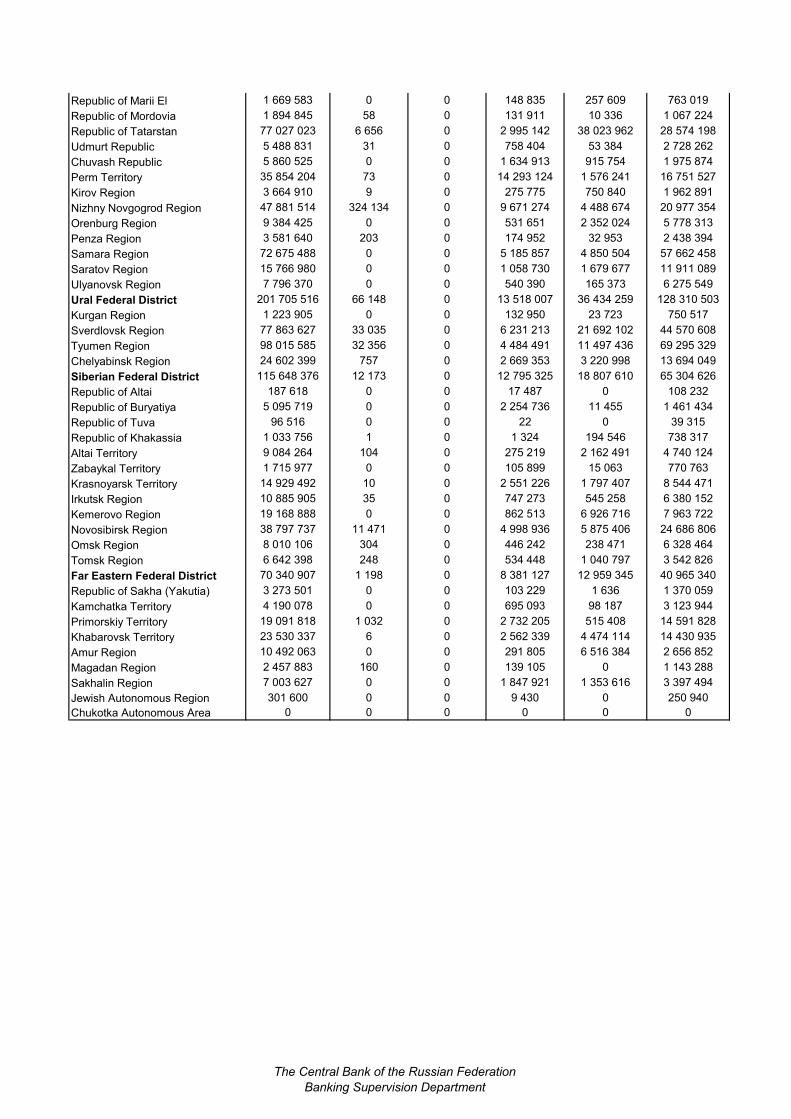
Republic of Marii El 1 669 583 0 0 148 835 257 609 763 019
Republic of Mordovia 1 894 845 58 0 131 911 10 336 1 067 224
Republic of Tatarstan 77 027 023 6 656 0 2 995 142 38 023 962 28 574 198
Udmurt Republic 5 488 831 31 0 758 404 53 384 2 728 262
Chuvash Republic 5 860 525 0 0 1 634 913 915 754 1 975 874
Perm Territory 35 854 204 73 0 14 293 124 1 576 241 16 751 527
Kirov Region 3 664 910 9 0 275 775 750 840 1 962 891
Nizhny Novgogrod Region 47 881 514 324 134 0 9 671 274 4 488 674 20 977 354
Orenburg Region 9 384 425 0 0 531 651 2 352 024 5 778 313
Penza Region 3 581 640 203 0 174 952 32 953 2 438 394
Samara Region 72 675 488 0 0 5 185 857 4 850 504 57 662 458
Saratov Region 15 766 980 0 0 1 058 730 1 679 677 11 911 089
Ulyanovsk Region 7 796 370 0 0 540 390 165 373 6 275 549
Ural Federal District 201 705 516 66 148 0 13 518 007 36 434 259 128 310 503
Kurgan Region 1 223 905 0 0 132 950 23 723 750 517
Sverdlovsk Region 77 863 627 33 035 0 6 231 213 21 692 102 44 570 608
Tyumen Region 98 015 585 32 356 0 4 484 491 11 497 436 69 295 329
Chelyabinsk Region 24 602 399 757 0 2 669 353 3 220 998 13 694 049
Siberian Federal District 115 648 376 12 173 0 12 795 325 18 807 610 65 304 626
Republic of Altai 187 618 0 0 17 487 0 108 232
Republic of Buryatiya 5 095 719 0 0 2 254 736 11 455 1 461 434
Republic of Tuva 96 516 0 0 22 0 39 315
Republic of Khakassia 1 033 756 1 0 1 324 194 546 738 317
Altai Territory 9 084 264 104 0 275 219 2 162 491 4 740 124
Zabaykal Territory 1 715 977 0 0 105 899 15 063 770 763
Krasnoyarsk Territory 14 929 492 10 0 2 551 226 1 797 407 8 544 471
Irkutsk Region 10 885 905 35 0 747 273 545 258 6 380 152
Kemerovo Region 19 168 888 0 0 862 513 6 926 716 7 963 722
Novosibirsk Region 38 797 737 11 471 0 4 998 936 5 875 406 24 686 806
Omsk Region 8 010 106 304 0 446 242 238 471 6 328 464
Tomsk Region 6 642 398 248 0 534 448 1 040 797 3 542 826
Far Eastern Federal District 70 340 907 1 198 0 8 381 127 12 959 345 40 965 340
Republic of Sakha (Yakutia) 3 273 501 0 0 103 229 1 636 1 370 059
Kamchatka Territory 4 190 078 0 0 695 093 98 187 3 123 944
Primorskiy Territory 19 091 818 1 032 0 2 732 205 515 408 14 591 828
Khabarovsk Territory 23 530 337 6 0 2 562 339 4 474 114 14 430 935
Amur Region 10 492 063 0 0 291 805 6 516 384 2 656 852
Magadan Region 2 457 883 160 0 139 105 0 1 143 288
Sakhalin Region 7 003 627 0 0 1 847 921 1 353 616 3 397 494
Jewish Autonomous Region 301 600 0 0 9 430 0 250 940
Chukotka Autonomous Area 0 0 0 0 0 0
The Central Bank of the Russian Federation
Banking Supervision Department
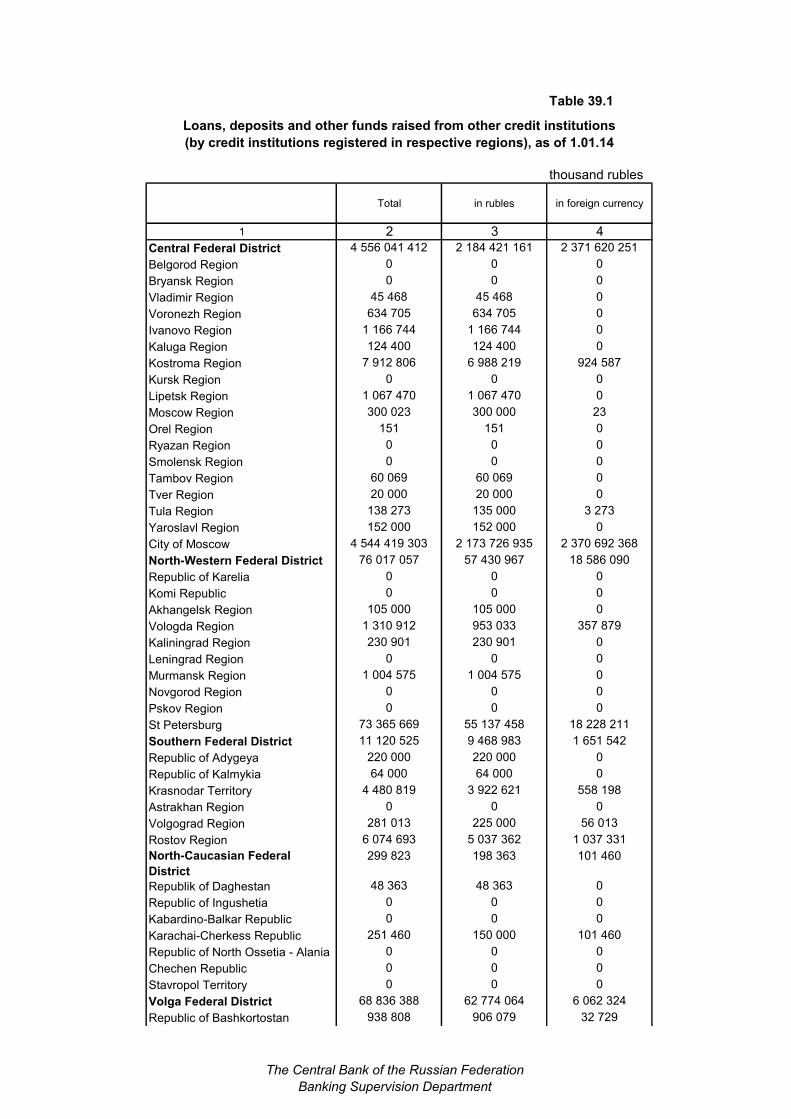
Table 39.1
Loans, deposits and other funds raised from other credit institutions
(by credit institutions registered in respective regions), as of 1.01.14
thousand rubles
Total in rubles in foreign currency
1 2 3 4
Central Federal District 4 556 041 412 2 184 421 161 2 371 620 251
Belgorod Region 0 0 0
Bryansk Region 0 0 0
Vladimir Region 45 468 45 468 0
Voronezh Region 634 705 634 705 0
Ivanovo Region 1 166 744 1 166 744 0
Kaluga Region 124 400 124 400 0
Kostroma Region 7 912 806 6 988 219 924 587
Kursk Region 0 0 0
Lipetsk Region 1 067 470 1 067 470 0
Moscow Region 300 023 300 000 23
Orel Region 151 151 0
Ryazan Region 0 0 0
Smolensk Region 0 0 0
Tambov Region 60 069 60 069 0
Tver Region 20 000 20 000 0
Tula Region 138 273 135 000 3 273
Yaroslavl Region 152 000 152 000 0
City of Moscow 4 544 419 303 2 173 726 935 2 370 692 368
North-Western Federal District 76 017 057 57 430 967 18 586 090
Republic of Karelia 0 0 0
Komi Republic 0 0 0
Akhangelsk Region 105 000 105 000 0
Vologda Region 1 310 912 953 033 357 879
Kaliningrad Region 230 901 230 901 0
Leningrad Region 0 0 0
Murmansk Region 1 004 575 1 004 575 0
Novgorod Region 0 0 0
Pskov Region 0 0 0
St Petersburg 73 365 669 55 137 458 18 228 211
Southern Federal District 11 120 525 9 468 983 1 651 542
Republic of Adygeya 220 000 220 000 0
Republic of Kalmykia 64 000 64 000 0
Krasnodar Territory 4 480 819 3 922 621 558 198
Astrakhan Region 0 0 0
Volgograd Region 281 013 225 000 56 013
Rostov Region 6 074 693 5 037 362 1 037 331
North-Caucasian Federal
District
299 823 198 363 101 460
Republik of Daghestan 48 363 48 363 0
Republic of Ingushetia 0 0 0
Kabardino-Balkar Republic 0 0 0
Karachai-Cherkess Republic 251 460 150 000 101 460
Republic of North Ossetia - Alania 0 0 0
Chechen Republic 0 0 0
Stavropol Territory 0 0 0
Volga Federal District 68 836 388 62 774 064 6 062 324
Republic of Bashkortostan 938 808 906 079 32 729
The Central Bank of the Russian Federation
Banking Supervision Department
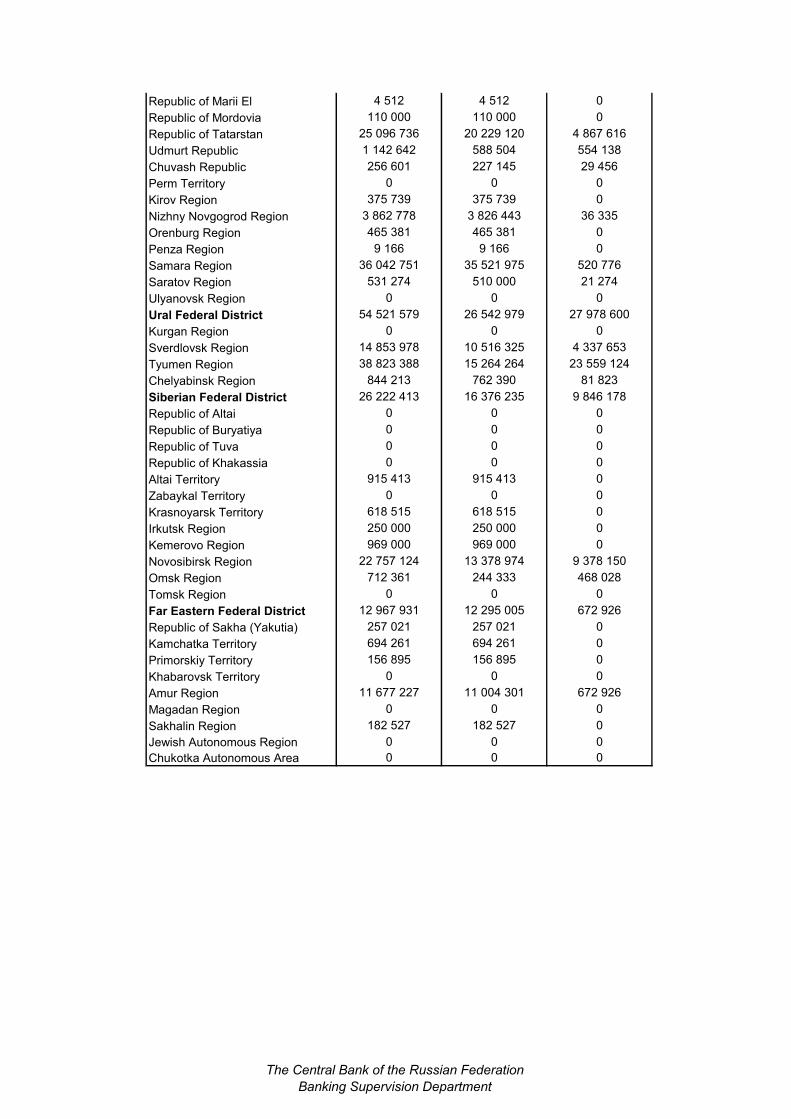
Republic of Marii El 4 512 4 512 0
Republic of Mordovia 110 000 110 000 0
Republic of Tatarstan 25 096 736 20 229 120 4 867 616
Udmurt Republic 1 142 642 588 504 554 138
Chuvash Republic 256 601 227 145 29 456
Perm Territory 0 0 0
Kirov Region 375 739 375 739 0
Nizhny Novgogrod Region 3 862 778 3 826 443 36 335
Orenburg Region 465 381 465 381 0
Penza Region 9 166 9 166 0
Samara Region 36 042 751 35 521 975 520 776
Saratov Region 531 274 510 000 21 274
Ulyanovsk Region 0 0 0
Ural Federal District 54 521 579 26 542 979 27 978 600
Kurgan Region 0 0 0
Sverdlovsk Region 14 853 978 10 516 325 4 337 653
Tyumen Region 38 823 388 15 264 264 23 559 124
Chelyabinsk Region 844 213 762 390 81 823
Siberian Federal District 26 222 413 16 376 235 9 846 178
Republic of Altai 0 0 0
Republic of Buryatiya 0 0 0
Republic of Tuva 0 0 0
Republic of Khakassia 0 0 0
Altai Territory 915 413 915 413 0
Zabaykal Territory 0 0 0
Krasnoyarsk Territory 618 515 618 515 0
Irkutsk Region 250 000 250 000 0
Kemerovo Region 969 000 969 000 0
Novosibirsk Region 22 757 124 13 378 974 9 378 150
Omsk Region 712 361 244 333 468 028
Tomsk Region 0 0 0
Far Eastern Federal District 12 967 931 12 295 005 672 926
Republic of Sakha (Yakutia) 257 021 257 021 0
Kamchatka Territory 694 261 694 261 0
Primorskiy Territory 156 895 156 895 0
Khabarovsk Territory 0 0 0
Amur Region 11 677 227 11 004 301 672 926
Magadan Region 0 0 0
Sakhalin Region 182 527 182 527 0
Jewish Autonomous Region 0 0 0
Chukotka Autonomous Area 0 0 0
The Central Bank of the Russian Federation
Banking Supervision Department
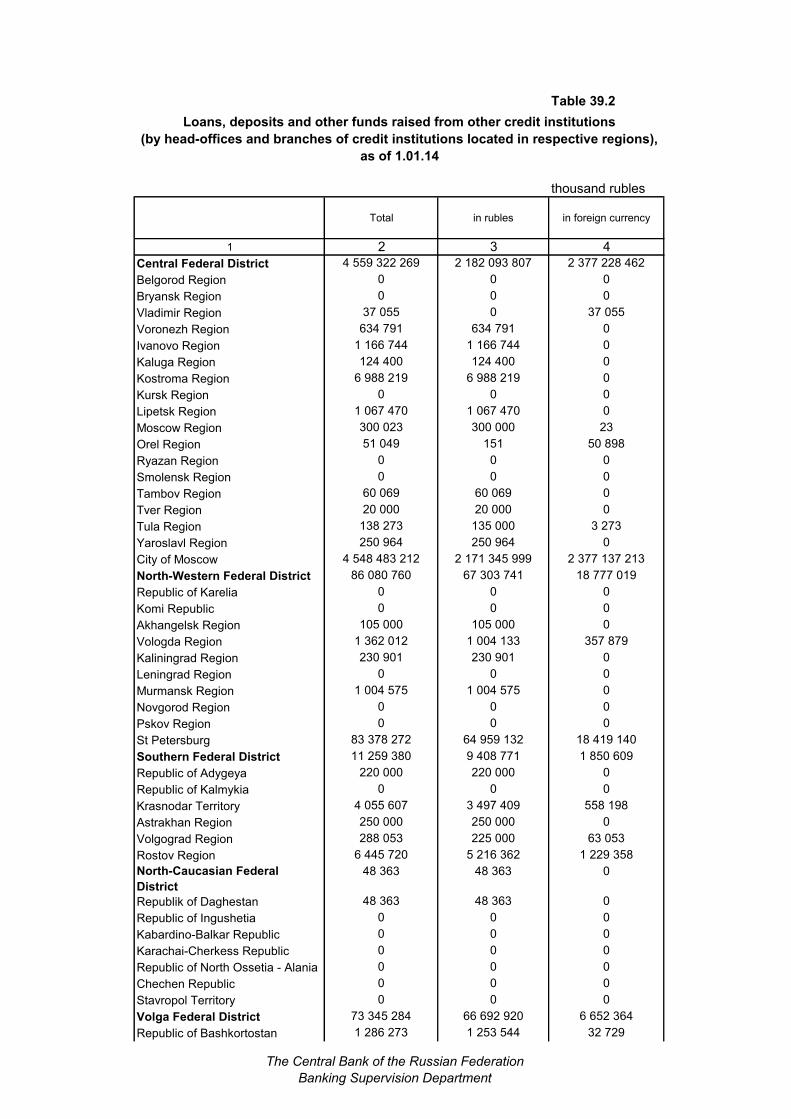
Table 39.2
Loans, deposits and other funds raised from other credit institutions
(by head-offices and branches of credit institutions located in respective regions),
as of 1.01.14
thousand rubles
Total in rubles in foreign currency
1 2 3 4
Central Federal District 4 559 322 269 2 182 093 807 2 377 228 462
Belgorod Region 0 0 0
Bryansk Region 0 0 0
Vladimir Region 37 055 0 37 055
Voronezh Region 634 791 634 791 0
Ivanovo Region 1 166 744 1 166 744 0
Kaluga Region 124 400 124 400 0
Kostroma Region 6 988 219 6 988 219 0
Kursk Region 0 0 0
Lipetsk Region 1 067 470 1 067 470 0
Moscow Region 300 023 300 000 23
Orel Region 51 049 151 50 898
Ryazan Region 0 0 0
Smolensk Region 0 0 0
Tambov Region 60 069 60 069 0
Tver Region 20 000 20 000 0
Tula Region 138 273 135 000 3 273
Yaroslavl Region 250 964 250 964 0
City of Moscow 4 548 483 212 2 171 345 999 2 377 137 213
North-Western Federal District 86 080 760 67 303 741 18 777 019
Republic of Karelia 0 0 0
Komi Republic 0 0 0
Akhangelsk Region 105 000 105 000 0
Vologda Region 1 362 012 1 004 133 357 879
Kaliningrad Region 230 901 230 901 0
Leningrad Region 0 0 0
Murmansk Region 1 004 575 1 004 575 0
Novgorod Region 0 0 0
Pskov Region 0 0 0
St Petersburg 83 378 272 64 959 132 18 419 140
Southern Federal District 11 259 380 9 408 771 1 850 609
Republic of Adygeya 220 000 220 000 0
Republic of Kalmykia 0 0 0
Krasnodar Territory 4 055 607 3 497 409 558 198
Astrakhan Region 250 000 250 000 0
Volgograd Region 288 053 225 000 63 053
Rostov Region 6 445 720 5 216 362 1 229 358
North-Caucasian Federal
District
48 363 48 363 0
Republik of Daghestan 48 363 48 363 0
Republic of Ingushetia 0 0 0
Kabardino-Balkar Republic 0 0 0
Karachai-Cherkess Republic 0 0 0
Republic of North Ossetia - Alania 0 0 0
Chechen Republic 0 0 0
Stavropol Territory 0 0 0
Volga Federal District 73 345 284 66 692 920 6 652 364
Republic of Bashkortostan 1 286 273 1 253 544 32 729
The Central Bank of the Russian Federation
Banking Supervision Department
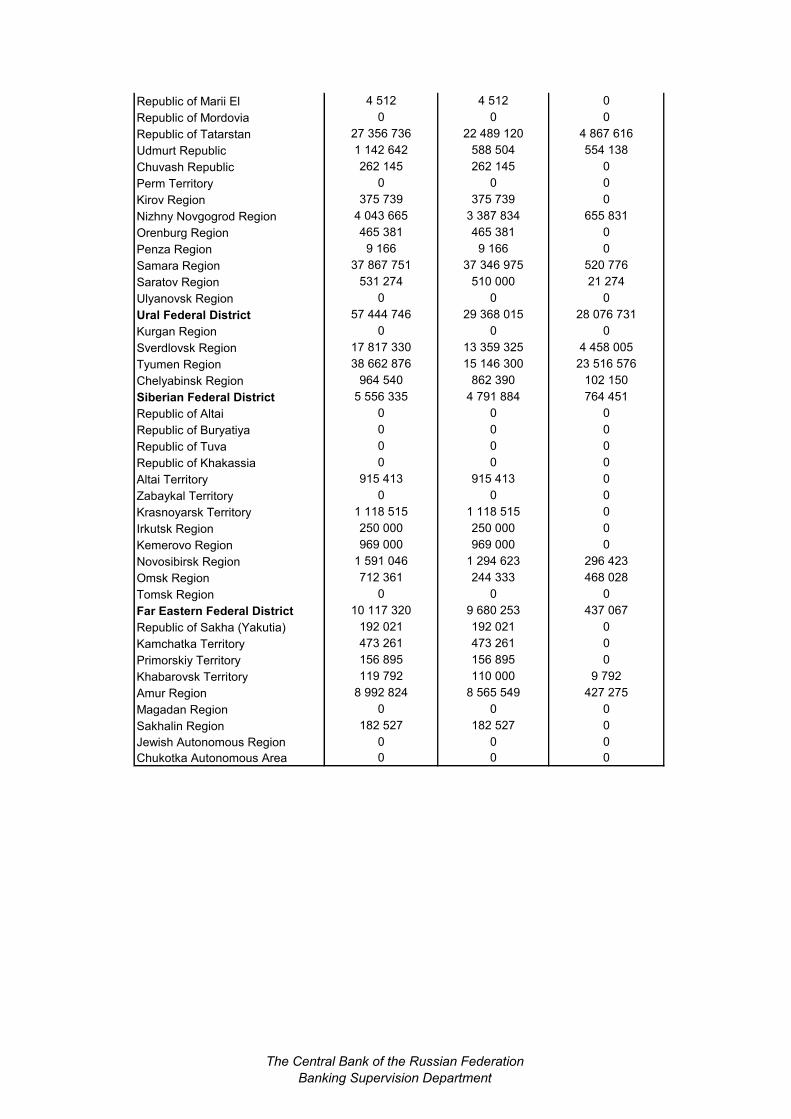
Republic of Marii El 4 512 4 512 0
Republic of Mordovia 0 0 0
Republic of Tatarstan 27 356 736 22 489 120 4 867 616
Udmurt Republic 1 142 642 588 504 554 138
Chuvash Republic 262 145 262 145 0
Perm Territory 0 0 0
Kirov Region 375 739 375 739 0
Nizhny Novgogrod Region 4 043 665 3 387 834 655 831
Orenburg Region 465 381 465 381 0
Penza Region 9 166 9 166 0
Samara Region 37 867 751 37 346 975 520 776
Saratov Region 531 274 510 000 21 274
Ulyanovsk Region 0 0 0
Ural Federal District 57 444 746 29 368 015 28 076 731
Kurgan Region 0 0 0
Sverdlovsk Region 17 817 330 13 359 325 4 458 005
Tyumen Region 38 662 876 15 146 300 23 516 576
Chelyabinsk Region 964 540 862 390 102 150
Siberian Federal District 5 556 335 4 791 884 764 451
Republic of Altai 0 0 0
Republic of Buryatiya 0 0 0
Republic of Tuva 0 0 0
Republic of Khakassia 0 0 0
Altai Territory 915 413 915 413 0
Zabaykal Territory 0 0 0
Krasnoyarsk Territory 1 118 515 1 118 515 0
Irkutsk Region 250 000 250 000 0
Kemerovo Region 969 000 969 000 0
Novosibirsk Region 1 591 046 1 294 623 296 423
Omsk Region 712 361 244 333 468 028
Tomsk Region 0 0 0
Far Eastern Federal District 10 117 320 9 680 253 437 067
Republic of Sakha (Yakutia) 192 021 192 021 0
Kamchatka Territory 473 261 473 261 0
Primorskiy Territory 156 895 156 895 0
Khabarovsk Territory 119 792 110 000 9 792
Amur Region 8 992 824 8 565 549 427 275
Magadan Region 0 0 0
Sakhalin Region 182 527 182 527 0
Jewish Autonomous Region 0 0 0
Chukotka Autonomous Area 0 0 0
The Central Bank of the Russian Federation
Banking Supervision Department
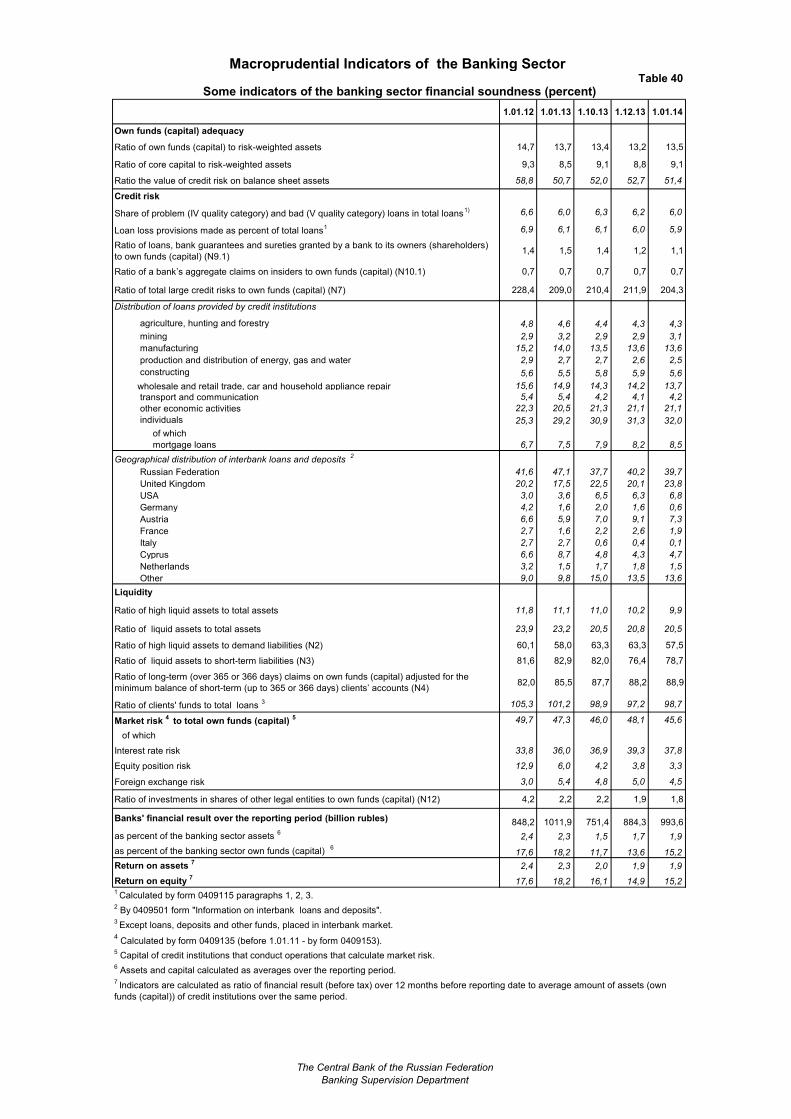
Table 40
1.01.12 1.01.13 1.10.13 1.12.13 1.01.14
Own funds (capital) adequacy
Ratio of own funds (capital) to risk-weighted assets 14,7 13,7 13,4 13,2 13,5
Ratio of core capital to risk-weighted assets 9,3 8,5 9,1 8,8 9,1
Ratio the value of credit risk on balance sheet assets 58,8 50,7 52,0 52,7 51,4
Credit risk
Share of problem (IV quality category) and bad (V quality category) loans in total loans1) 6,6 6,0 6,3 6,2 6,0
Loan loss provisions made as percent of total loans1 6,9 6,1 6,1 6,0 5,9
Ratio of loans, bank guarantees and sureties granted by a bank to its owners (shareholders)
to own funds (capital) (N9.1)1,4 1,5 1,4 1,2 1,1
Ratio of a bank’s aggregate claims on insiders to own funds (capital) (N10.1) 0,7 0,7 0,7 0,7 0,7
Ratio of total large credit risks to own funds (capital) (N7) 228,4 209,0 210,4 211,9 204,3
Distribution of loans provided by credit institutions
agriculture, hunting and forestry 4,8 4,6 4,4 4,3 4,3
mining 2,9 3,2 2,9 2,9 3,1
manufacturing 15,2 14,0 13,5 13,6 13,6
production and distribution of energy, gas and water 2,9 2,7 2,7 2,6 2,5
constructing 5,6 5,5 5,8 5,9 5,6
wholesale and retail trade, car and household appliance repair 15,6 14,9 14,3 14,2 13,7
transport and communication 5,4 5,4 4,2 4,1 4,2
other economic activities 22,3 20,5 21,3 21,1 21,1
individuals 25,3 29,2 30,9 31,3 32,0
of which
mortgage loans 6,7 7,5 7,9 8,2 8,5
Geographical distribution of interbank loans and deposits 2
Russian Federation 41,6 47,1 37,7 40,2 39,7
United Kingdom 20,2 17,5 22,5 20,1 23,8
USA 3,0 3,6 6,5 6,3 6,8
Germany 4,2 1,6 2,0 1,6 0,6
Austria 6,6 5,9 7,0 9,1 7,3
France 2,7 1,6 2,2 2,6 1,9
Italy 2,7 2,7 0,6 0,4 0,1
Cyprus 6,6 8,7 4,8 4,3 4,7
Netherlands 3,2 1,5 1,7 1,8 1,5
Other 9,0 9,8 15,0 13,5 13,6
Liquidity
Ratio of high liquid assets to total assets 11,8 11,1 11,0 10,2 9,9
Ratio of liquid assets to total assets 23,9 23,2 20,5 20,8 20,5
Ratio of high liquid assets to demand liabilities (N2) 60,1 58,0 63,3 63,3 57,5
Ratio of liquid assets to short-term liabilities (N3) 81,6 82,9 82,0 76,4 78,7
Ratio of long-term (over 365 or 366 days) claims on own funds (capital) adjusted for the
minimum balance of short-term (up to 365 or 366 days) clients’ accounts (N4) 82,0 85,5 87,7 88,2 88,9
Ratio of clients' funds to total loans 3 105,3 101,2 98,9 97,2 98,7
Market risk 4
to total own funds (capital) 5 49,7 47,3 46,0 48,1 45,6
of which
Interest rate risk 33,8 36,0 36,9 39,3 37,8
Equity position risk 12,9 6,0 4,2 3,8 3,3
Foreign exchange risk 3,0 5,4 4,8 5,0 4,5
Ratio of investments in shares of other legal entities to own funds (capital) (N12) 4,2 2,2 2,2 1,9 1,8
Banks' financial result over the reporting period (billion rubles) 848,2 1011,9 751,4 884,3 993,6
as percent of the banking sector assets 6
2,4 2,3 1,5 1,7 1,9
as percent of the banking sector own funds (capital) 6
17,6 18,2 11,7 13,6 15,2
Return on assets 7
2,4 2,3 2,0 1,9 1,9
Return on equity 7
17,6 18,2 16,1 14,9 15,2
4 Calculated by form 0409135 (before 1.01.11 - by form 0409153).
5 Capital of credit institutions that conduct operations that calculate market risk.
6 Assets and capital calculated as averages over the reporting period.
7 Indicators are calculated as ratio of financial result (before tax) over 12 months before reporting date to average amount of assets (own
funds (capital)) of credit institutions over the same period.
Macroprudential Indicators of the Banking Sector
Some indicators of the banking sector financial soundness (percent)
3 Except loans, deposits and other funds, placed in interbank market.
1 Calculated by form 0409115 paragraphs 1, 2, 3.
2 By 0409501 form "Information on interbank loans and deposits".
The Central Bank of the Russian Federation
Banking Supervision Department
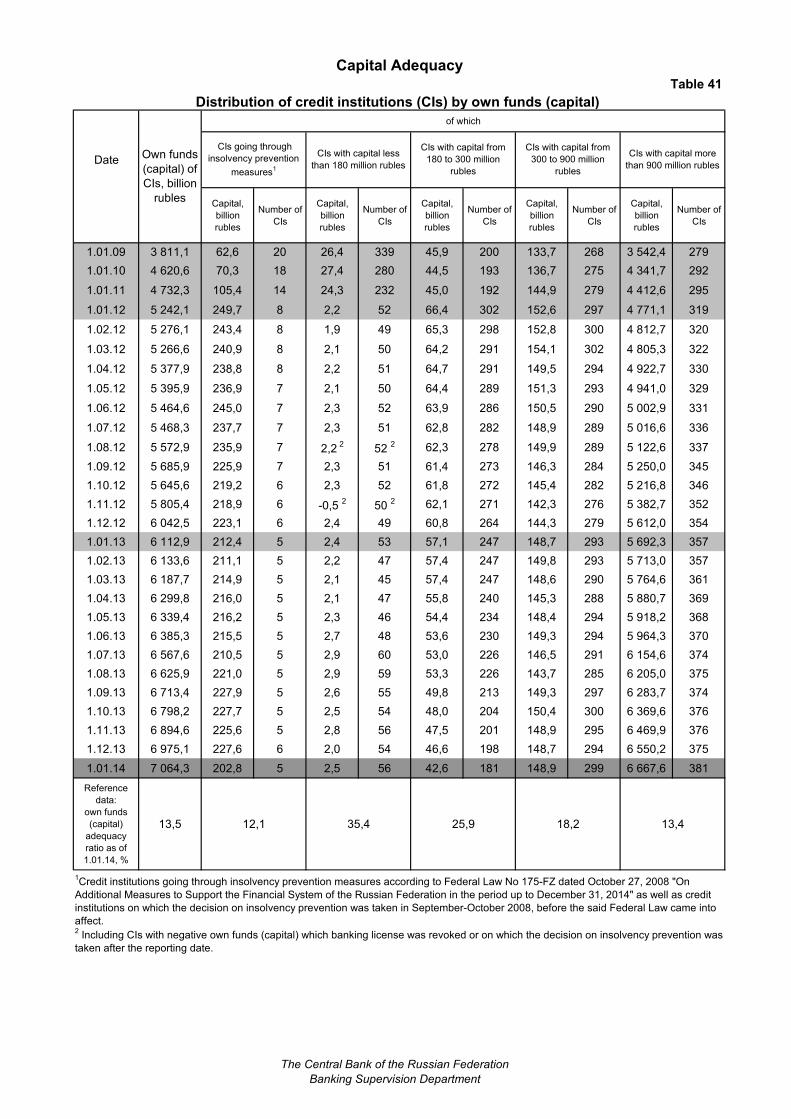
Table 41
Distribution of credit institutions (CIs) by own funds (capital)
of which
Date
Capital,
billion
rubles
Number of
CIs
Capital,
billion
rubles
Number of
CIs
Capital,
billion
rubles
Number of
CIs
Capital,
billion
rubles
Number of
CIs
Capital,
billion
rubles
Number of
CIs
1.01.09 3 811,1 62,6 20 26,4 339 45,9 200 133,7 268 3 542,4 279
1.01.10 4 620,6 70,3 18 27,4 280 44,5 193 136,7 275 4 341,7 292
1.01.11 4 732,3 105,4 14 24,3 232 45,0 192 144,9 279 4 412,6 295
1.01.12 5 242,1 249,7 8 2,2 52 66,4 302 152,6 297 4 771,1 319
1.02.12 5 276,1 243,4 8 1,9 49 65,3 298 152,8 300 4 812,7 320
1.03.12 5 266,6 240,9 8 2,1 50 64,2 291 154,1 302 4 805,3 322
1.04.12 5 377,9 238,8 8 2,2 51 64,7 291 149,5 294 4 922,7 330
1.05.12 5 395,9 236,9 7 2,1 50 64,4 289 151,3 293 4 941,0 329
1.06.12 5 464,6 245,0 7 2,3 52 63,9 286 150,5 290 5 002,9 331
1.07.12 5 468,3 237,7 7 2,3 51 62,8 282 148,9 289 5 016,6 336
1.08.12 5 572,9 235,9 7 2,2 2
52 2 62,3 278 149,9 289 5 122,6 337
1.09.12 5 685,9 225,9 7 2,3 51 61,4 273 146,3 284 5 250,0 345
1.10.12 5 645,6 219,2 6 2,3 52 61,8 272 145,4 282 5 216,8 346
1.11.12 5 805,4 218,9 6 -0,5 2
50 2 62,1 271 142,3 276 5 382,7 352
1.12.12 6 042,5 223,1 6 2,4 49 60,8 264 144,3 279 5 612,0 354
1.01.13 6 112,9 212,4 5 2,4 53 57,1 247 148,7 293 5 692,3 357
1.02.13 6 133,6 211,1 5 2,2 47 57,4 247 149,8 293 5 713,0 357
1.03.13 6 187,7 214,9 5 2,1 45 57,4 247 148,6 290 5 764,6 361
1.04.13 6 299,8 216,0 5 2,1 47 55,8 240 145,3 288 5 880,7 369
1.05.13 6 339,4 216,2 5 2,3 46 54,4 234 148,4 294 5 918,2 368
1.06.13 6 385,3 215,5 5 2,7 48 53,6 230 149,3 294 5 964,3 370
1.07.13 6 567,6 210,5 5 2,9 60 53,0 226 146,5 291 6 154,6 374
1.08.13 6 625,9 221,0 5 2,9 59 53,3 226 143,7 285 6 205,0 375
1.09.13 6 713,4 227,9 5 2,6 55 49,8 213 149,3 297 6 283,7 374
1.10.13 6 798,2 227,7 5 2,5 54 48,0 204 150,4 300 6 369,6 376
1.11.13 6 894,6 225,6 5 2,8 56 47,5 201 148,9 295 6 469,9 376
1.12.13 6 975,1 227,6 6 2,0 54 46,6 198 148,7 294 6 550,2 375
1.01.14 7 064,3 202,8 5 2,5 56 42,6 181 148,9 299 6 667,6 381
Reference
data:
own funds
(capital)
adequacy
ratio as of
1.01.14, %
13,5 12,1 35,4 25,9 18,2 13,4
CIs with capital more
than 900 million rubles
Capital Adequacy
2 Including CIs with negative own funds (capital) which banking license was revoked or on which the decision on insolvency prevention was
taken after the reporting date.
CIs going through
insolvency prevention
measures1
1Credit institutions going through insolvency prevention measures according to Federal Law No 175-FZ dated October 27, 2008 "On
Additional Measures to Support the Financial System of the Russian Federation in the period up to December 31, 2014" as well as credit
institutions on which the decision on insolvency prevention was taken in September-October 2008, before the said Federal Law came into
affect.
CIs with capital less
than 180 million rubles
CIs with capital from
180 to 300 million
rubles
CIs with capital from
300 to 900 million
rubles
Own funds
(capital) of
CIs, billion
rubles
The Central Bank of the Russian Federation
Banking Supervision Department
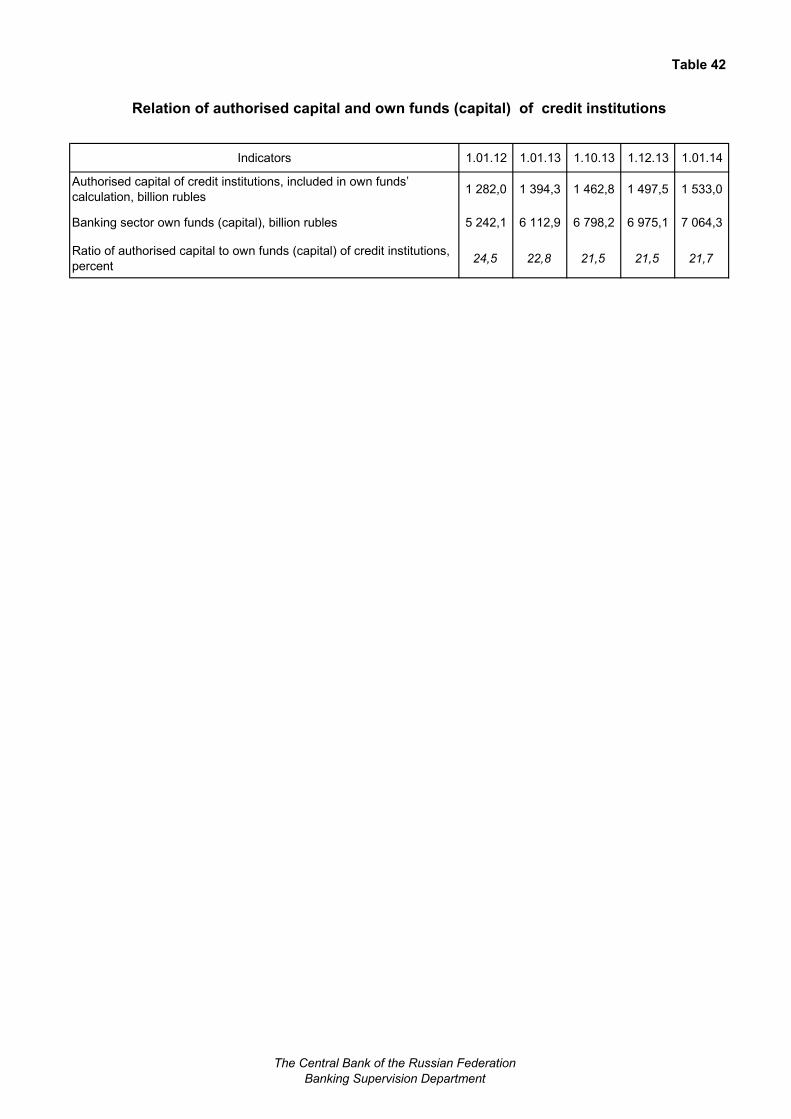
Table 42
Relation of authorised capital and own funds (capital) of credit institutions
Indicators 1.01.12 1.01.13 1.10.13 1.12.13 1.01.14
Authorised capital of credit institutions, included in own funds’
calculation, billion rubles1 282,0 1 394,3 1 462,8 1 497,5 1 533,0
Banking sector own funds (capital), billion rubles 5 242,1 6 112,9 6 798,2 6 975,1 7 064,3
Ratio of authorised capital to own funds (capital) of credit institutions,
percent24,5 22,8 21,5 21,5 21,7
The Central Bank of the Russian Federation
Banking Supervision Department
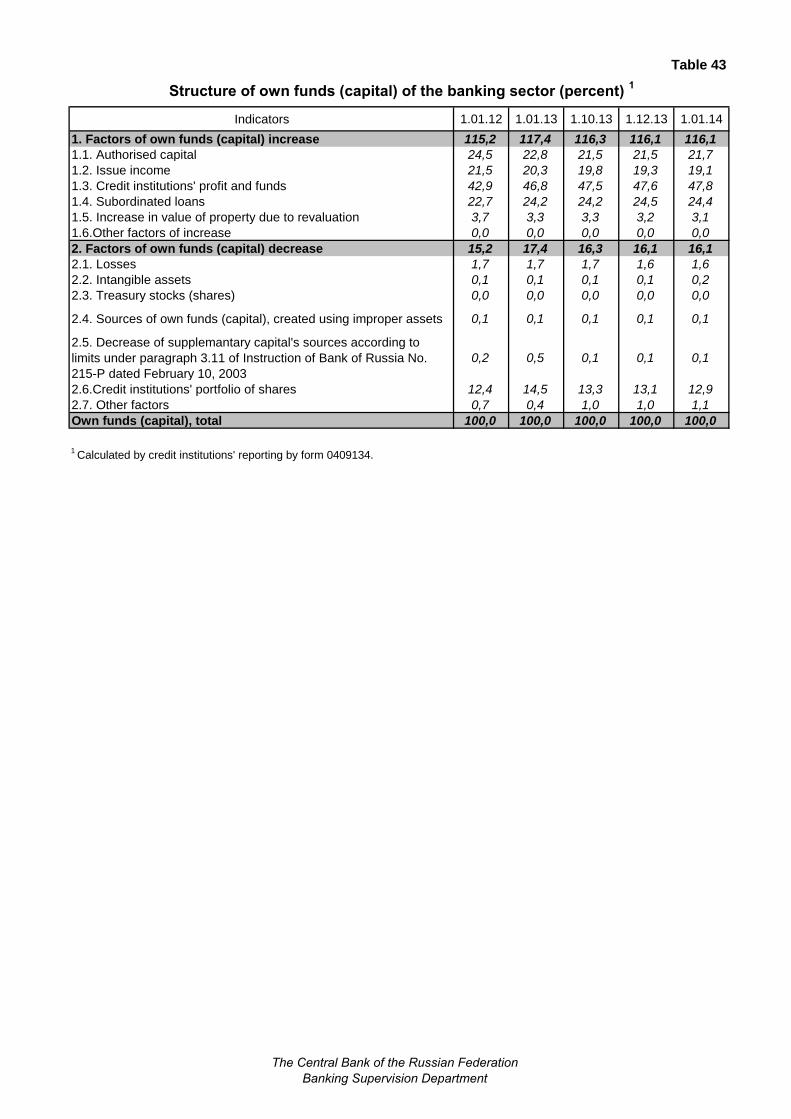
Table 43
Indicators 1.01.12 1.01.13 1.10.13 1.12.13 1.01.14
1. Factors of own funds (capital) increase 115,2 117,4 116,3 116,1 116,1
1.1. Authorised capital 24,5 22,8 21,5 21,5 21,7
1.2. Issue income 21,5 20,3 19,8 19,3 19,1
1.3. Credit institutions' profit and funds 42,9 46,8 47,5 47,6 47,8
1.4. Subordinated loans 22,7 24,2 24,2 24,5 24,4
1.5. Increase in value of property due to revaluation 3,7 3,3 3,3 3,2 3,1
1.6.Other factors of increase 0,0 0,0 0,0 0,0 0,0
2. Factors of own funds (capital) decrease 15,2 17,4 16,3 16,1 16,1
2.1. Losses 1,7 1,7 1,7 1,6 1,6
2.2. Intangible assets 0,1 0,1 0,1 0,1 0,2
2.3. Treasury stocks (shares) 0,0 0,0 0,0 0,0 0,0
2.4. Sources of own funds (capital), created using improper assets 0,1 0,1 0,1 0,1 0,1
2.5. Decrease of supplemantary capital's sources according to
limits under paragraph 3.11 of Instruction of Bank of Russia No.
215-P dated February 10, 2003
0,2 0,5 0,1 0,1 0,1
2.6.Credit institutions' portfolio of shares 12,4 14,5 13,3 13,1 12,9
2.7. Other factors 0,7 0,4 1,0 1,0 1,1
Own funds (capital), total 100,0 100,0 100,0 100,0 100,0
1 Calculated by credit institutions' reporting by form 0409134.
Structure of own funds (capital) of the banking sector (percent) 1
The Central Bank of the Russian Federation
Banking Supervision Department
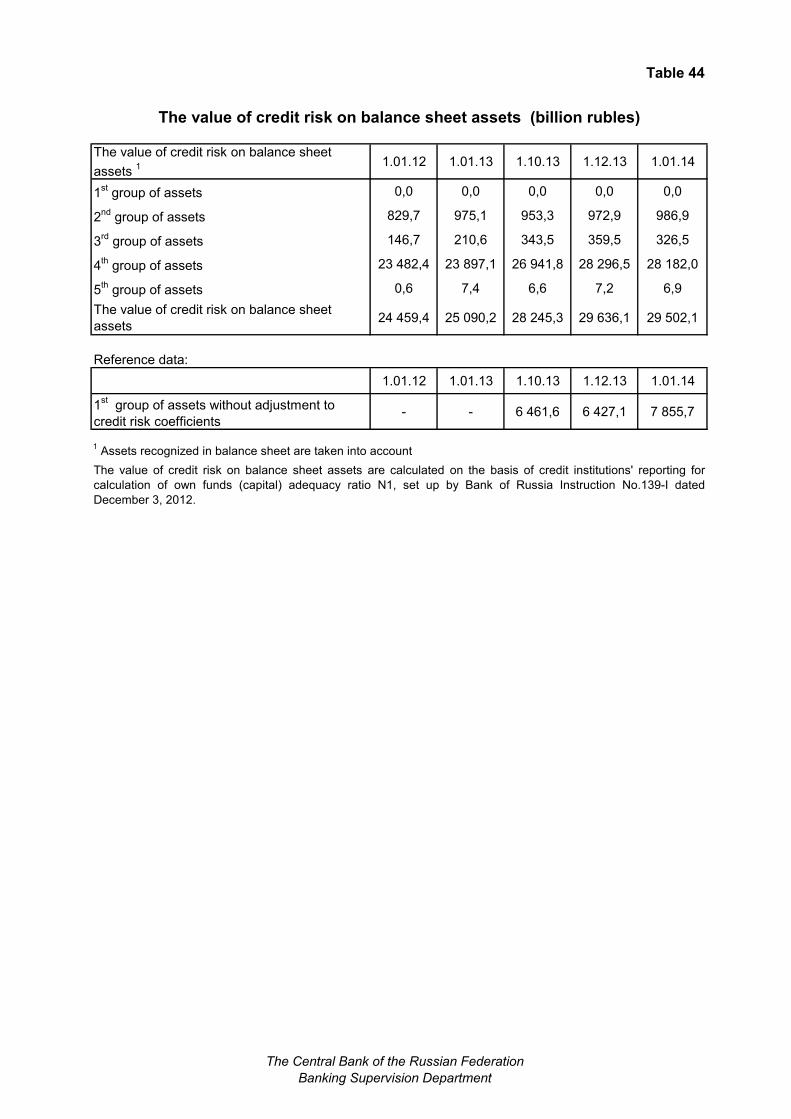
The value of credit risk on balance sheet assets (billion rubles)
The value of credit risk on balance sheet
assets 1 1.01.12 1.01.13 1.10.13 1.12.13 1.01.14
1st group of assets 0,0 0,0 0,0 0,0 0,0
2nd
group of assets 829,7 975,1 953,3 972,9 986,9
3rd
group of assets 146,7 210,6 343,5 359,5 326,5
4th group of assets 23 482,4 23 897,1 26 941,8 28 296,5 28 182,0
5th group of assets 0,6 7,4 6,6 7,2 6,9
The value of credit risk on balance sheet
assets24 459,4 25 090,2 28 245,3 29 636,1 29 502,1
Reference data:
1.01.12 1.01.13 1.10.13 1.12.13 1.01.14
1st group of assets without adjustment to
credit risk coefficients - - 6 461,6 6 427,1 7 855,7
The value of credit risk on balance sheet assets are calculated on the basis of credit institutions' reporting for
calculation of own funds (capital) adequacy ratio N1, set up by Bank of Russia Instruction No.139-I dated
December 3, 2012.
Table 44
1 Assets recognized in balance sheet are taken into account
The Central Bank of the Russian Federation
Banking Supervision Department
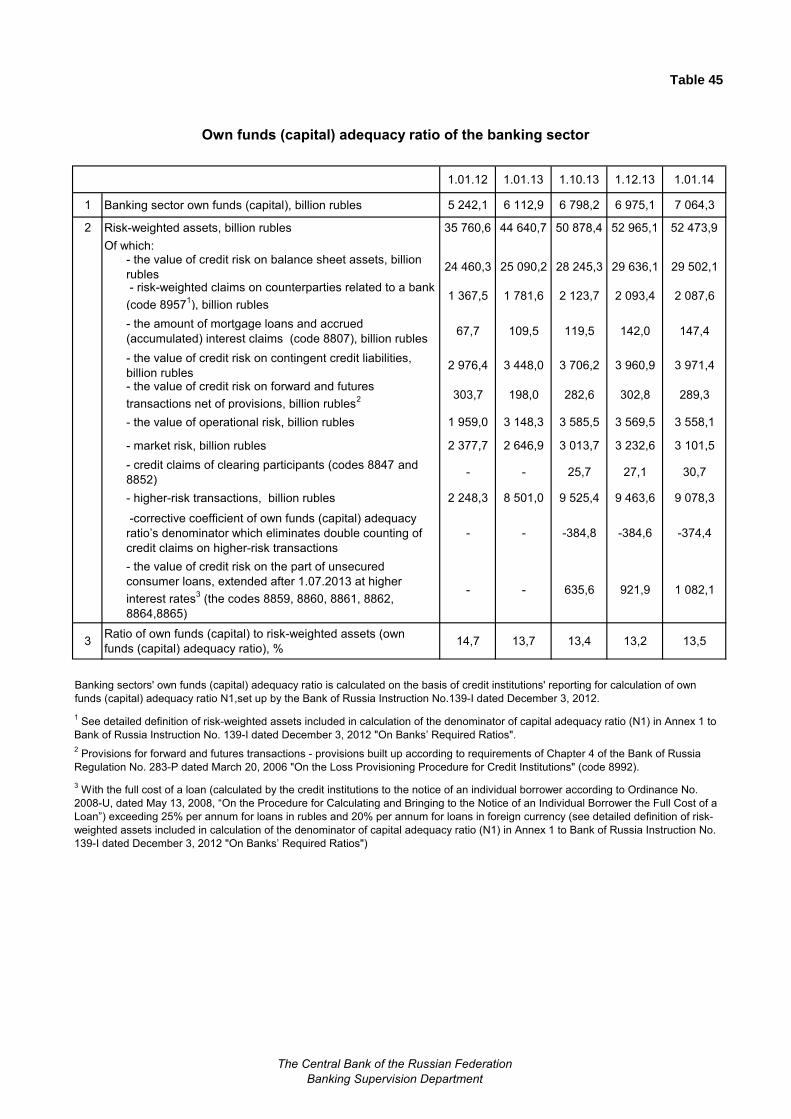
Table 45
Own funds (capital) adequacy ratio of the banking sector
1.01.12 1.01.13 1.10.13 1.12.13 1.01.14
1 Banking sector own funds (capital), billion rubles 5 242,1 6 112,9 6 798,2 6 975,1 7 064,3
2 Risk-weighted assets, billion rubles 35 760,6 44 640,7 50 878,4 52 965,1 52 473,9
Of which:- the value of credit risk on balance sheet assets, billion
rubles24 460,3 25 090,2 28 245,3 29 636,1 29 502,1
- risk-weighted claims on counterparties related to a bank
(code 89571), billion rubles
1 367,5 1 781,6 2 123,7 2 093,4 2 087,6
- the amount of mortgage loans and accrued
(accumulated) interest claims (code 8807), billion rubles67,7 109,5 119,5 142,0 147,4
- the value of credit risk on contingent credit liabilities,
billion rubles2 976,4 3 448,0 3 706,2 3 960,9 3 971,4
- the value of credit risk on forward and futures
transactions net of provisions, billion rubles2 303,7 198,0 282,6 302,8 289,3
- the value of operational risk, billion rubles 1 959,0 3 148,3 3 585,5 3 569,5 3 558,1
- market risk, billion rubles 2 377,7 2 646,9 3 013,7 3 232,6 3 101,5
- credit claims of clearing participants (codes 8847 and
8852)- - 25,7 27,1 30,7
- higher-risk transactions, billion rubles 2 248,3 8 501,0 9 525,4 9 463,6 9 078,3
-corrective coefficient of own funds (capital) adequacy
ratio’s denominator which eliminates double counting of
credit claims on higher-risk transactions
- - -384,8 -384,6 -374,4
- the value of credit risk on the part of unsecured
consumer loans, extended after 1.07.2013 at higher
interest rates3 (the codes 8859, 8860, 8861, 8862,
8864,8865)
- - 635,6 921,9 1 082,1
3Ratio of own funds (capital) to risk-weighted assets (own
funds (capital) adequacy ratio), %14,7 13,7 13,4 13,2 13,5
Banking sectors' own funds (capital) adequacy ratio is calculated on the basis of credit institutions' reporting for calculation of own
funds (capital) adequacy ratio N1,set up by the Bank of Russia Instruction No.139-I dated December 3, 2012.
1 See detailed definition of risk-weighted assets included in calculation of the denominator of capital adequacy ratio (N1) in Annex 1 to
Bank of Russia Instruction No. 139-I dated December 3, 2012 "On Banks’ Required Ratios".
3 With the full cost of a loan (calculated by the credit institutions to the notice of an individual borrower according to Ordinance No.
2008-U, dated May 13, 2008, “On the Procedure for Calculating and Bringing to the Notice of an Individual Borrower the Full Cost of a
Loan”) exceeding 25% per annum for loans in rubles and 20% per annum for loans in foreign currency (see detailed definition of risk-
weighted assets included in calculation of the denominator of capital adequacy ratio (N1) in Annex 1 to Bank of Russia Instruction No.
139-I dated December 3, 2012 "On Banks’ Required Ratios")
2 Provisions for forward and futures transactions - provisions built up according to requirements of Chapter 4 of the Bank of Russia
Regulation No. 283-P dated March 20, 2006 "On the Loss Provisioning Procedure for Credit Institutions" (code 8992).
The Central Bank of the Russian Federation
Banking Supervision Department
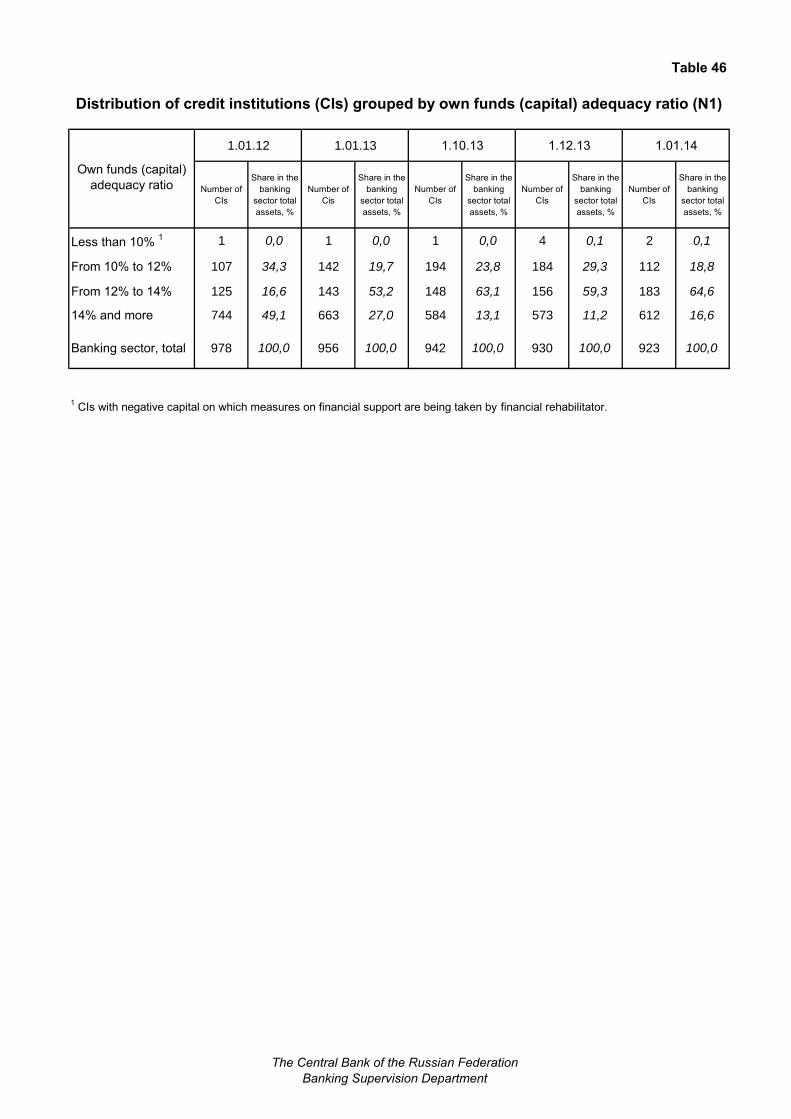
Table 46
1.01.12 1.01.13 1.10.13 1.12.13 1.01.14
Own funds (capital)
adequacy ratio Number of
CIs
Share in the
banking
sector total
assets, %
Number of
Cis
Share in the
banking
sector total
assets, %
Number of
CIs
Share in the
banking
sector total
assets, %
Number of
CIs
Share in the
banking
sector total
assets, %
Number of
CIs
Share in the
banking
sector total
assets, %
Less than 10% 1 1 0,0 1 0,0 1 0,0 4 0,1 2 0,1
From 10% to 12% 107 34,3 142 19,7 194 23,8 184 29,3 112 18,8
From 12% to 14% 125 16,6 143 53,2 148 63,1 156 59,3 183 64,6
14% and more 744 49,1 663 27,0 584 13,1 573 11,2 612 16,6
Banking sector, total 978 100,0 956 100,0 942 100,0 930 100,0 923 100,0
Distribution of credit institutions (CIs) grouped by own funds (capital) adequacy ratio (N1)
1 CIs with negative capital on which measures on financial support are being taken by financial rehabilitator.
The Central Bank of the Russian Federation
Banking Supervision Department
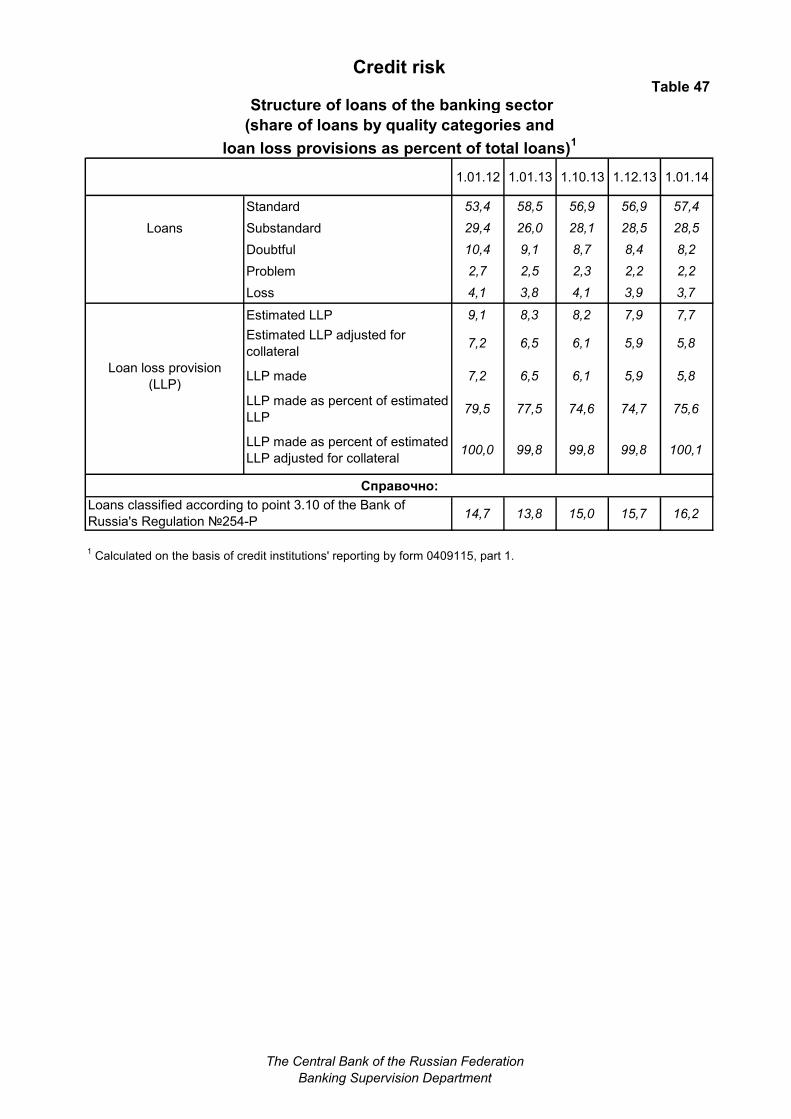
Table 47
Structure of loans of the banking sector
(share of loans by quality categories and
loan loss provisions as percent of total loans)1
1.01.12 1.01.13 1.10.13 1.12.13 1.01.14
Standard 53,4 58,5 56,9 56,9 57,4
Loans Substandard 29,4 26,0 28,1 28,5 28,5
Doubtful 10,4 9,1 8,7 8,4 8,2
Problem 2,7 2,5 2,3 2,2 2,2
Loss 4,1 3,8 4,1 3,9 3,7
Estimated LLP 9,1 8,3 8,2 7,9 7,7
Estimated LLP adjusted for
collateral7,2 6,5 6,1 5,9 5,8
Loan loss provision
(LLP)LLP made 7,2 6,5 6,1 5,9 5,8
LLP made as percent of estimated
LLP79,5 77,5 74,6 74,7 75,6
LLP made as percent of estimated
LLP adjusted for collateral100,0 99,8 99,8 99,8 100,1
Справочно:
14,7 13,8 15,0 15,7 16,2
Credit risk
1 Calculated on the basis of credit institutions' reporting by form 0409115, part 1.
Loans classified according to point 3.10 of the Bank of
Russia's Regulation №254-P
The Central Bank of the Russian Federation
Banking Supervision Department
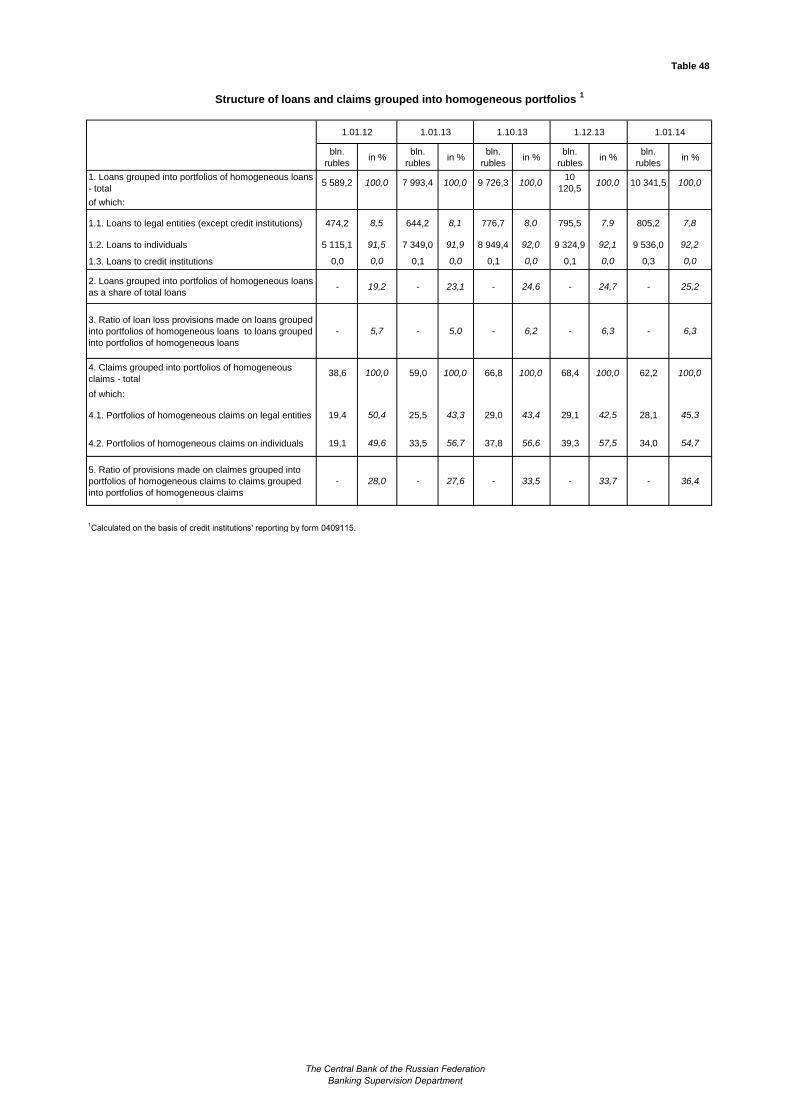
Table 48
Structure of loans and claims grouped into homogeneous portfolios 1
1.01.12 1.01.13 1.10.13 1.12.13 1.01.14
bln.
rublesin %
bln.
rublesin %
bln.
rublesin %
bln.
rublesin %
bln.
rublesin %
1. Loans grouped into portfolios of homogeneous loans
- total 5 589,2 100,0 7 993,4 100,0 9 726,3 100,0
10
120,5100,0 10 341,5 100,0
of which:
1.1. Loans to legal entities (except credit institutions) 474,2 8,5 644,2 8,1 776,7 8,0 795,5 7,9 805,2 7,8
1.2. Loans to individuals 5 115,1 91,5 7 349,0 91,9 8 949,4 92,0 9 324,9 92,1 9 536,0 92,2
1.3. Loans to credit institutions 0,0 0,0 0,1 0,0 0,1 0,0 0,1 0,0 0,3 0,0
2. Loans grouped into portfolios of homogeneous loans
as a share of total loans- 19,2 - 23,1 - 24,6 - 24,7 - 25,2
3. Ratio of loan loss provisions made on loans grouped
into portfolios of homogeneous loans to loans grouped
into portfolios of homogeneous loans
- 5,7 - 5,0 - 6,2 - 6,3 - 6,3
4. Claims grouped into portfolios of homogeneous
claims - total38,6 100,0 59,0 100,0 66,8 100,0 68,4 100,0 62,2 100,0
of which:
4.1. Portfolios of homogeneous claims on legal entities 19,4 50,4 25,5 43,3 29,0 43,4 29,1 42,5 28,1 45,3
4.2. Portfolios of homogeneous claims on individuals 19,1 49,6 33,5 56,7 37,8 56,6 39,3 57,5 34,0 54,7
5. Ratio of provisions made on claimes grouped into
portfolios of homogeneous claims to claims grouped
into portfolios of homogeneous claims
- 28,0 - 27,6 - 33,5 - 33,7 - 36,4
1Calculated on the basis of credit institutions' reporting by form 0409115.
The Central Bank of the Russian Federation
Banking Supervision Department
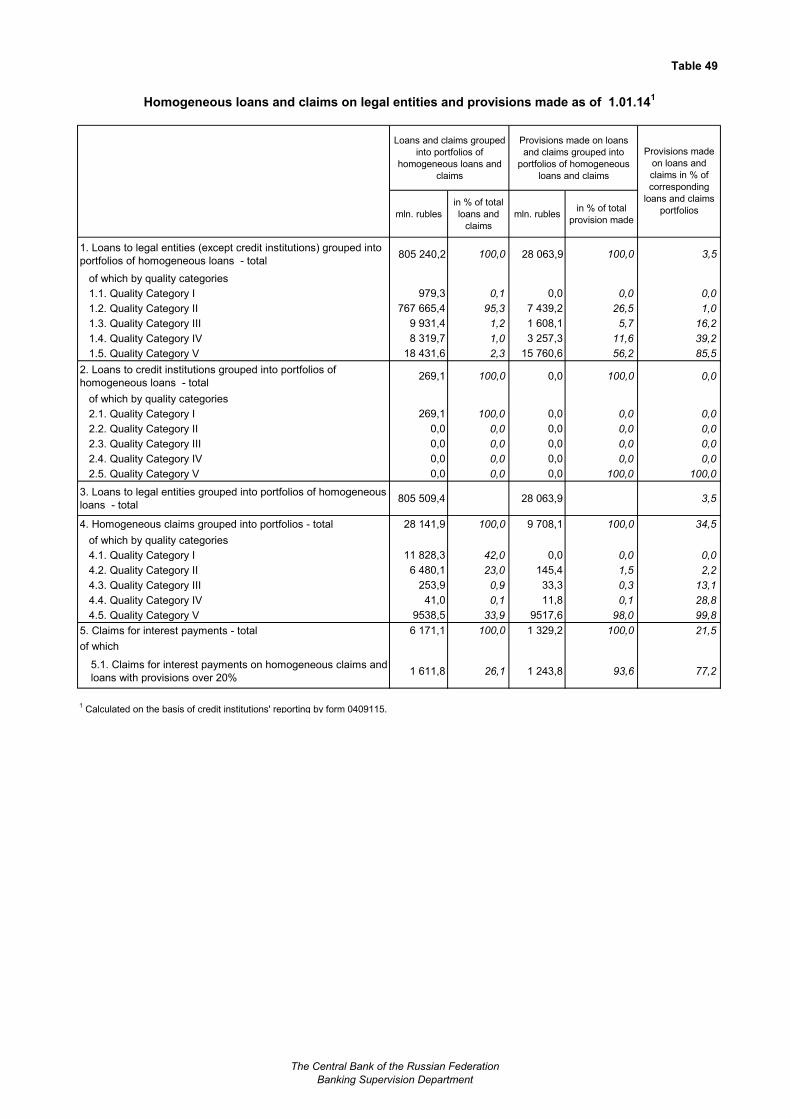
Table 49
Homogeneous loans and claims on legal entities and provisions made as of 1.01.141
Loans and claims grouped
into portfolios of
homogeneous loans and
claims
Provisions made on loans
and claims grouped into
portfolios of homogeneous
loans and claims
mln. rubles
in % of total
loans and
claims
mln. rublesin % of total
provision made
1. Loans to legal entities (except credit institutions) grouped into
portfolios of homogeneous loans - total805 240,2 100,0 28 063,9 100,0 3,5
of which by quality categories
1.1. Quality Category I 979,3 0,1 0,0 0,0 0,0
1.2. Quality Category II 767 665,4 95,3 7 439,2 26,5 1,0
1.3. Quality Category III 9 931,4 1,2 1 608,1 5,7 16,2
1.4. Quality Category IV 8 319,7 1,0 3 257,3 11,6 39,2
1.5. Quality Category V 18 431,6 2,3 15 760,6 56,2 85,5
2. Loans to credit institutions grouped into portfolios of
homogeneous loans - total269,1 100,0 0,0 100,0 0,0
of which by quality categories
2.1. Quality Category I 269,1 100,0 0,0 0,0 0,0
2.2. Quality Category II 0,0 0,0 0,0 0,0 0,0
2.3. Quality Category III 0,0 0,0 0,0 0,0 0,0
2.4. Quality Category IV 0,0 0,0 0,0 0,0 0,0
2.5. Quality Category V 0,0 0,0 0,0 100,0 100,0
3. Loans to legal entities grouped into portfolios of homogeneous
loans - total805 509,4 28 063,9 3,5
4. Homogeneous claims grouped into portfolios - total 28 141,9 100,0 9 708,1 100,0 34,5
of which by quality categories
4.1. Quality Category I 11 828,3 42,0 0,0 0,0 0,0
4.2. Quality Category II 6 480,1 23,0 145,4 1,5 2,2
4.3. Quality Category III 253,9 0,9 33,3 0,3 13,1
4.4. Quality Category IV 41,0 0,1 11,8 0,1 28,8
4.5. Quality Category V 9538,5 33,9 9517,6 98,0 99,8
5. Claims for interest payments - total 6 171,1 100,0 1 329,2 100,0 21,5
of which
5.1. Claims for interest payments on homogeneous claims and
loans with provisions over 20%1 611,8 26,1 1 243,8 93,6 77,2
1 Calculated on the basis of credit institutions' reporting by form 0409115.
Provisions made
on loans and
claims in % of
corresponding
loans and claims
portfolios
The Central Bank of the Russian Federation
Banking Supervision Department
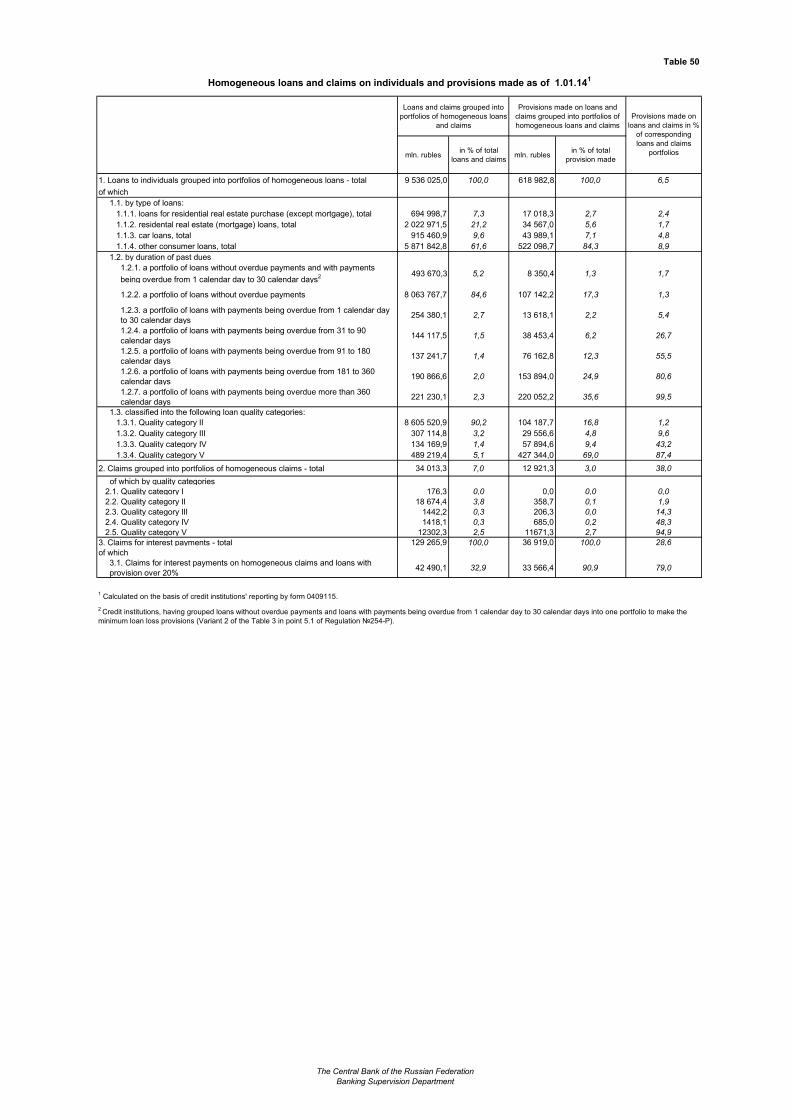
Table 50
Homogeneous loans and claims on individuals and provisions made as of 1.01.141
Loans and claims grouped into
portfolios of homogeneous loans
and claims
Provisions made on loans and
claims grouped into portfolios of
homogeneous loans and claims
mln. rublesin % of total
loans and claimsmln. rubles
in % of total
provision made
1. Loans to individuals grouped into portfolios of homogeneous loans - total 9 536 025,0 100,0 618 982,8 100,0 6,5
of which
1.1. by type of loans:
1.1.1. loans for residential real estate purchase (except mortgage), total 694 998,7 7,3 17 018,3 2,7 2,4
1.1.2. residental real estate (mortgage) loans, total 2 022 971,5 21,2 34 567,0 5,6 1,7
1.1.3. car loans, total 915 460,9 9,6 43 989,1 7,1 4,8
1.1.4. other consumer loans, total 5 871 842,8 61,6 522 098,7 84,3 8,9
1.2. by duration of past dues
1.2.1. a portfolio of loans without overdue payments and with payments
being overdue from 1 calendar day to 30 calendar days2 493 670,3 5,2 8 350,4 1,3 1,7
1.2.2. a portfolio of loans without overdue payments 8 063 767,7 84,6 107 142,2 17,3 1,3
1.2.3. a portfolio of loans with payments being overdue from 1 calendar day
to 30 calendar days254 380,1 2,7 13 618,1 2,2 5,4
1.2.4. a portfolio of loans with payments being overdue from 31 to 90
calendar days144 117,5 1,5 38 453,4 6,2 26,7
1.2.5. a portfolio of loans with payments being overdue from 91 to 180
calendar days137 241,7 1,4 76 162,8 12,3 55,5
1.2.6. a portfolio of loans with payments being overdue from 181 to 360
calendar days190 866,6 2,0 153 894,0 24,9 80,6
1.2.7. a portfolio of loans with payments being overdue more than 360
calendar days221 230,1 2,3 220 052,2 35,6 99,5
1.3. classified into the following loan quality categories:
1.3.1. Quality category II 8 605 520,9 90,2 104 187,7 16,8 1,2
1.3.2. Quality category III 307 114,8 3,2 29 556,6 4,8 9,6
1.3.3. Quality category IV 134 169,9 1,4 57 894,6 9,4 43,2
1.3.4. Quality category V 489 219,4 5,1 427 344,0 69,0 87,4
2. Claims grouped into portfolios of homogeneous claims - total 34 013,3 7,0 12 921,3 3,0 38,0
of which by quality categories
2.1. Quality category I 176,3 0,0 0,0 0,0 0,0
2.2. Quality category II 18 674,4 3,8 358,7 0,1 1,9
2.3. Quality category III 1442,2 0,3 206,3 0,0 14,3
2.4. Quality category IV 1418,1 0,3 685,0 0,2 48,3
2.5. Quality category V 12302,3 2,5 11671,3 2,7 94,9
3. Claims for interest payments - total 129 265,9 100,0 36 919,0 100,0 28,6
of which
3.1. Claims for interest payments on homogeneous claims and loans with
provision over 20%42 490,1 32,9 33 566,4 90,9 79,0
1 Calculated on the basis of credit institutions' reporting by form 0409115.
Provisions made on
loans and claims in %
of corresponding
loans and claims
portfolios
2 Credit institutions, having grouped loans without overdue payments and loans with payments being overdue from 1 calendar day to 30 calendar days into one portfolio to make the
minimum loan loss provisions (Variant 2 of the Table 3 in point 5.1 of Regulation №254-P).
The Central Bank of the Russian Federation
Banking Supervision Department
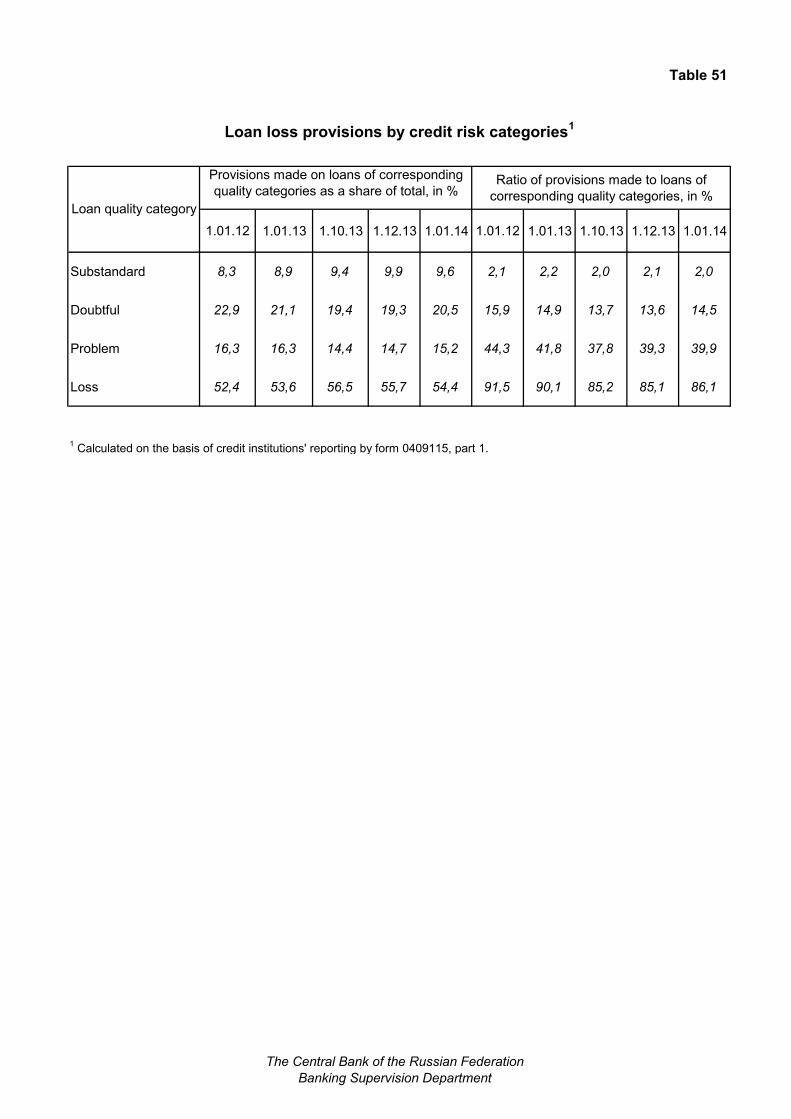
Table 51
Loan loss provisions by credit risk categories1
Provisions made on loans of corresponding
quality categories as a share of total, in %Ratio of provisions made to loans of
corresponding quality categories, in %
1.01.12 1.01.13 1.10.13 1.12.13 1.01.14 1.01.12 1.01.13 1.10.13 1.12.13 1.01.14
Substandard 8,3 8,9 9,4 9,9 9,6 2,1 2,2 2,0 2,1 2,0
Doubtful 22,9 21,1 19,4 19,3 20,5 15,9 14,9 13,7 13,6 14,5
Problem 16,3 16,3 14,4 14,7 15,2 44,3 41,8 37,8 39,3 39,9
Loss 52,4 53,6 56,5 55,7 54,4 91,5 90,1 85,2 85,1 86,1
1 Calculated on the basis of credit institutions' reporting by form 0409115, part 1.
Loan quality category
The Central Bank of the Russian Federation
Banking Supervision Department
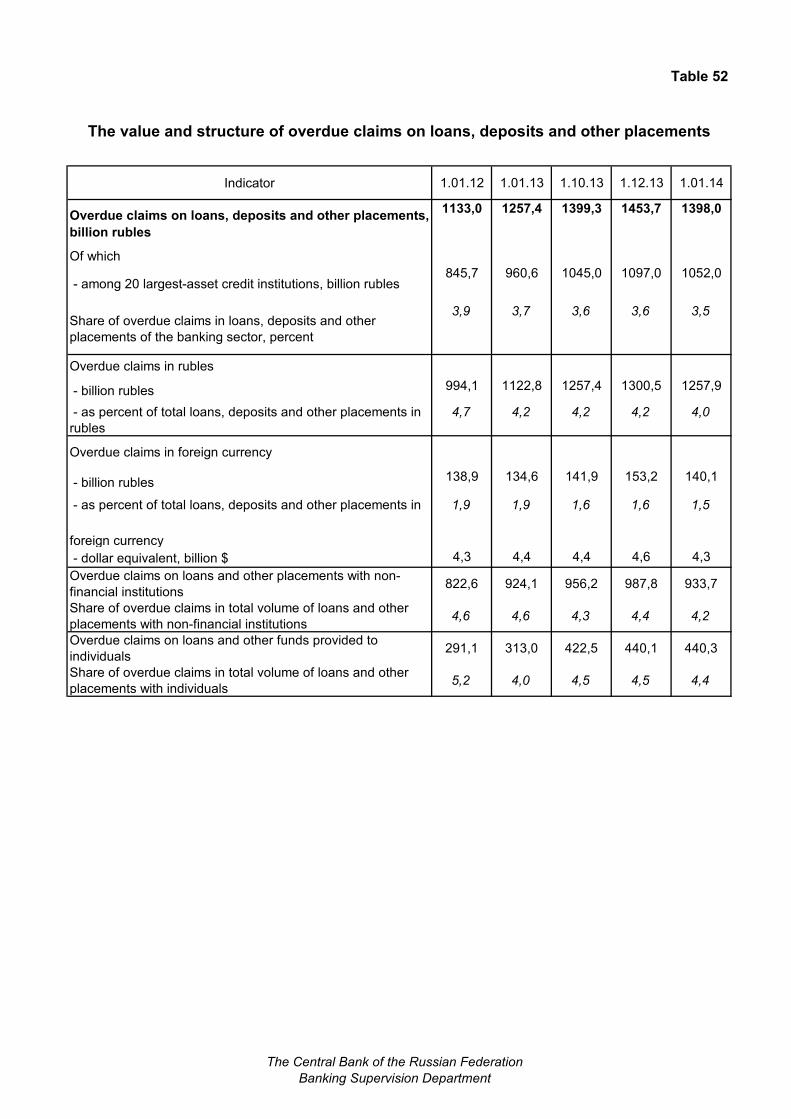
Table 52
The value and structure of overdue claims on loans, deposits and other placements
Indicator 1.01.12 1.01.13 1.10.13 1.12.13 1.01.14
Overdue claims on loans, deposits and other placements,
billion rubles
1133,0 1257,4 1399,3 1453,7 1398,0
Of which
- among 20 largest-asset credit institutions, billion rubles845,7 960,6 1045,0 1097,0 1052,0
Share of overdue claims in loans, deposits and other
placements of the banking sector, percent
3,9 3,7 3,6 3,6 3,5
Overdue claims in rubles
- billion rubles 994,1 1122,8 1257,4 1300,5 1257,9
- as percent of total loans, deposits and other placements in
rubles
4,7 4,2 4,2 4,2 4,0
Overdue claims in foreign currency
- billion rubles 138,9 134,6 141,9 153,2 140,1
- as percent of total loans, deposits and other placements in
foreign currency
1,9 1,9 1,6 1,6 1,5
- dollar equivalent, billion $ 4,3 4,4 4,4 4,6 4,3
Overdue claims on loans and other placements with non-
financial institutions822,6 924,1 956,2 987,8 933,7
Share of overdue claims in total volume of loans and other
placements with non-financial institutions4,6 4,6 4,3 4,4 4,2
Overdue claims on loans and other funds provided to
individuals291,1 313,0 422,5 440,1 440,3
Share of overdue claims in total volume of loans and other
placements with individuals5,2 4,0 4,5 4,5 4,4
The Central Bank of the Russian Federation
Banking Supervision Department
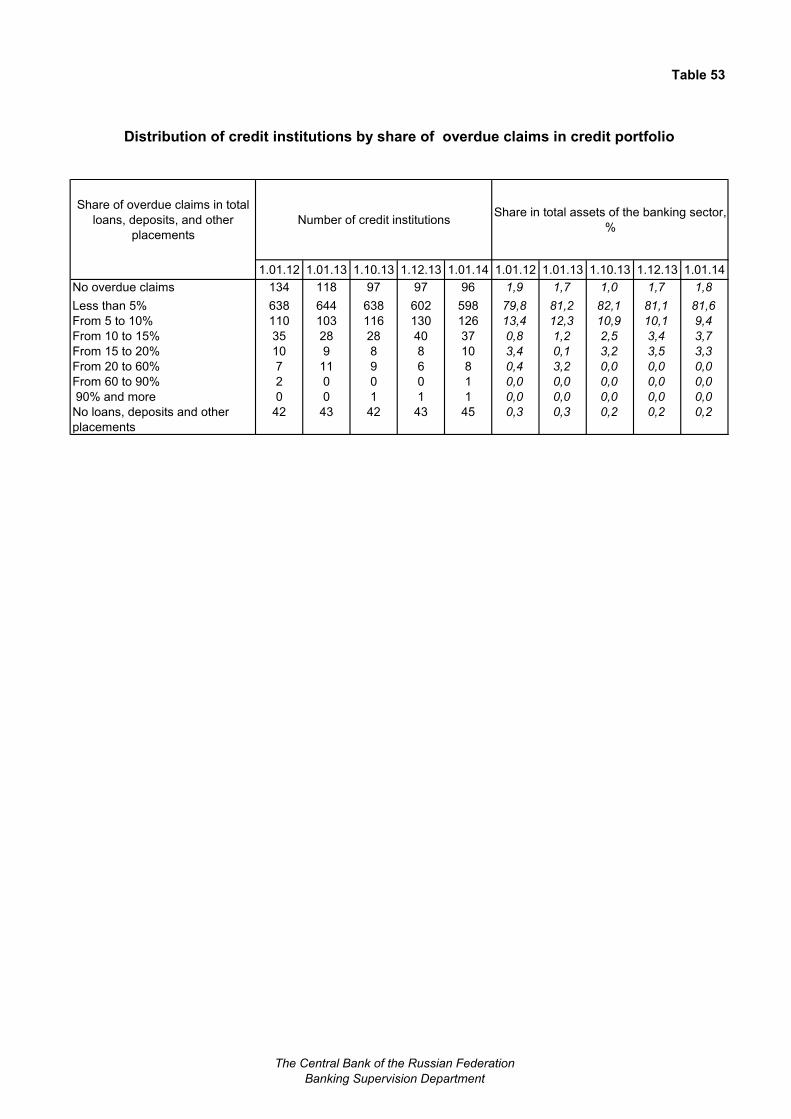
Table 53
Distribution of credit institutions by share of overdue claims in credit portfolio
Share of overdue claims in total
loans, deposits, and other
placements
Number of credit institutions Share in total assets of the banking sector,
%
1.01.12 1.01.13 1.10.13 1.12.13 1.01.14 1.01.12 1.01.13 1.10.13 1.12.13 1.01.14
No overdue claims 134 118 97 97 96 1,9 1,7 1,0 1,7 1,8
Less than 5% 638 644 638 602 598 79,8 81,2 82,1 81,1 81,6
From 5 to 10% 110 103 116 130 126 13,4 12,3 10,9 10,1 9,4
From 10 to 15% 35 28 28 40 37 0,8 1,2 2,5 3,4 3,7
From 15 to 20% 10 9 8 8 10 3,4 0,1 3,2 3,5 3,3
From 20 to 60% 7 11 9 6 8 0,4 3,2 0,0 0,0 0,0
From 60 to 90% 2 0 0 0 1 0,0 0,0 0,0 0,0 0,0
90% and more 0 0 1 1 1 0,0 0,0 0,0 0,0 0,0
No loans, deposits and other
placements
42 43 42 43 45 0,3 0,3 0,2 0,2 0,2
The Central Bank of the Russian Federation
Banking Supervision Department
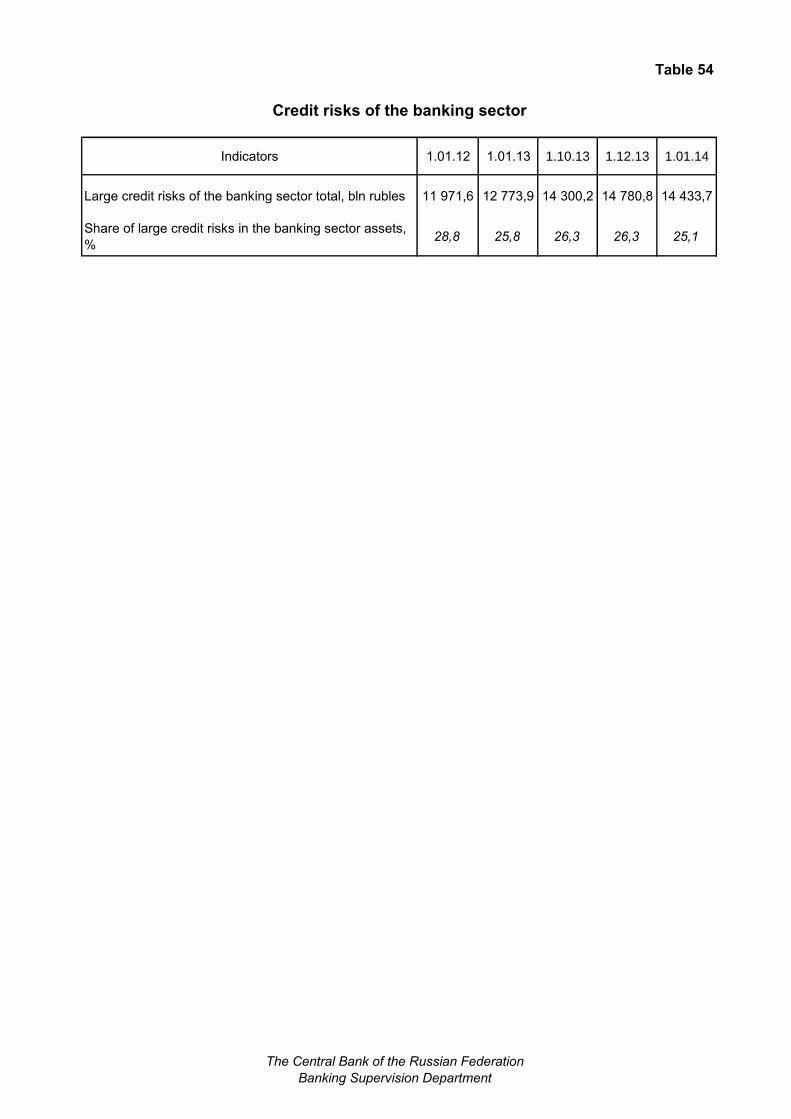
Table 54
Credit risks of the banking sector
Indicators 1.01.12 1.01.13 1.10.13 1.12.13 1.01.14
Large credit risks of the banking sector total, bln rubles 11 971,6 12 773,9 14 300,2 14 780,8 14 433,7
Share of large credit risks in the banking sector assets,
%28,8 25,8 26,3 26,3 25,1
The Central Bank of the Russian Federation
Banking Supervision Department
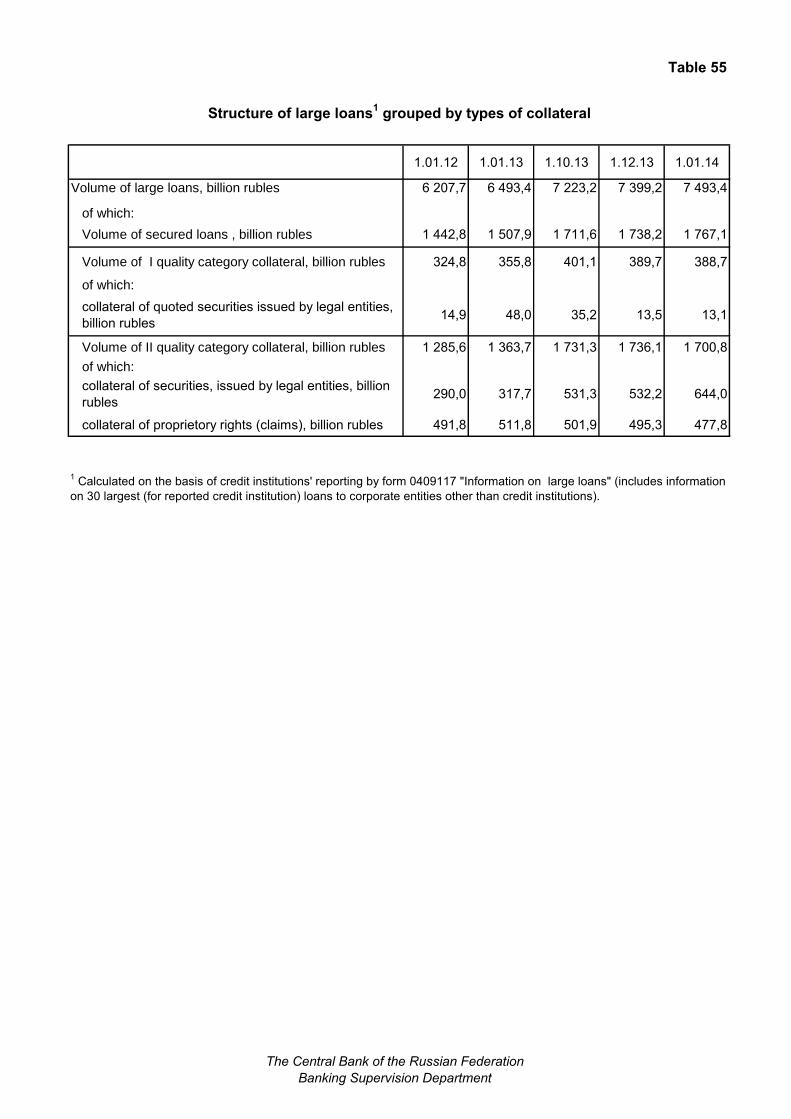
Table 55
Structure of large loans1 grouped by types of collateral
1.01.12 1.01.13 1.10.13 1.12.13 1.01.14
Volume of large loans, billion rubles 6 207,7 6 493,4 7 223,2 7 399,2 7 493,4
of which:
Volume of secured loans , billion rubles 1 442,8 1 507,9 1 711,6 1 738,2 1 767,1
Volume of I quality category collateral, billion rubles 324,8 355,8 401,1 389,7 388,7
of which:
collateral of quoted securities issued by legal entities,
billion rubles14,9 48,0 35,2 13,5 13,1
Volume of II quality category collateral, billion rubles 1 285,6 1 363,7 1 731,3 1 736,1 1 700,8
of which:
collateral of securities, issued by legal entities, billion
rubles290,0 317,7 531,3 532,2 644,0
collateral of proprietory rights (claims), billion rubles 491,8 511,8 501,9 495,3 477,8
1 Calculated on the basis of credit institutions' reporting by form 0409117 "Information on large loans" (includes information
on 30 largest (for reported credit institution) loans to corporate entities other than credit institutions).
The Central Bank of the Russian Federation
Banking Supervision Department
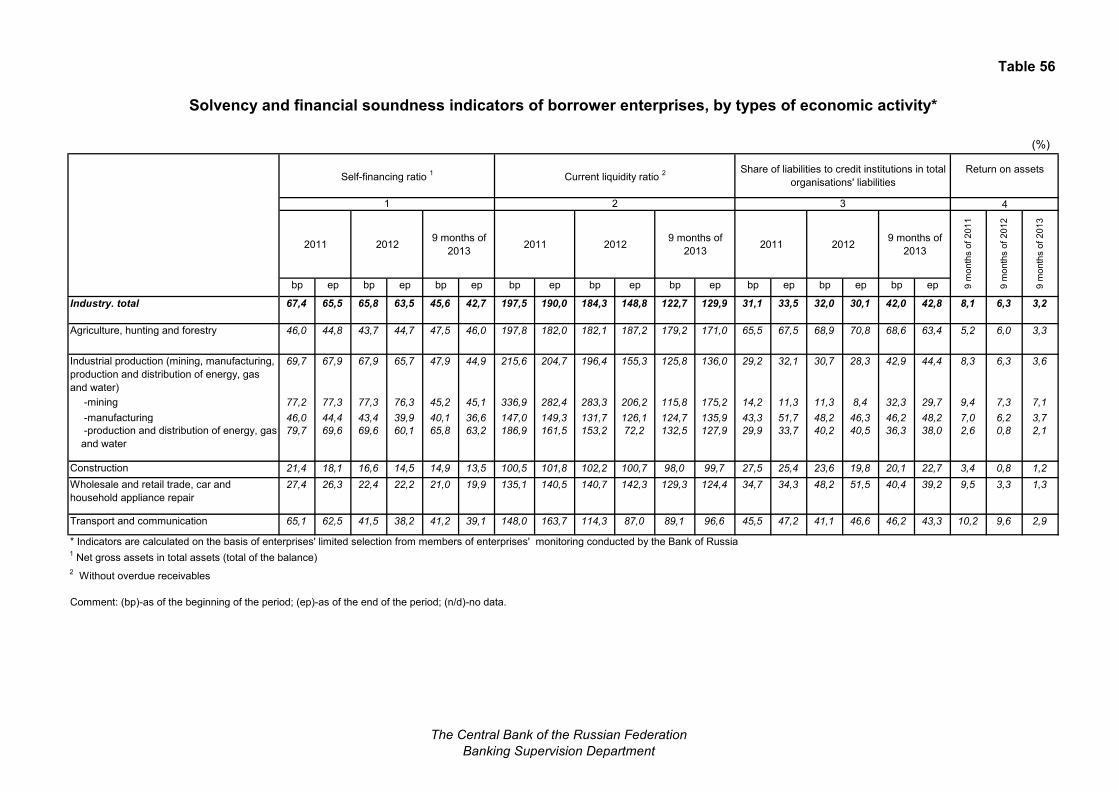
Table 56
Solvency and financial soundness indicators of borrower enterprises, by types of economic activity*
(%)
Self-financing ratio 1
Current liquidity ratio 2 Share of liabilities to credit institutions in total
organisations' liabilities
Return on assets
4
2011 20129 months of
20132011 2012
9 months of
20132011 2012
9 months of
2013
bp ep bp ep bp ep bp ep bp ep bp ep bp ep bp ep bp ep
Industry. total 67,4 65,5 65,8 63,5 45,6 42,7 197,5 190,0 184,3 148,8 122,7 129,9 31,1 33,5 32,0 30,1 42,0 42,8 8,1 6,3 3,2
Agriculture, hunting and forestry 46,0 44,8 43,7 44,7 47,5 46,0 197,8 182,0 182,1 187,2 179,2 171,0 65,5 67,5 68,9 70,8 68,6 63,4 5,2 6,0 3,3
Industrial production (mining, manufacturing,
production and distribution of energy, gas
and water)
69,7 67,9 67,9 65,7 47,9 44,9 215,6 204,7 196,4 155,3 125,8 136,0 29,2 32,1 30,7 28,3 42,9 44,4 8,3 6,3 3,6
-mining 77,2 77,3 77,3 76,3 45,2 45,1 336,9 282,4 283,3 206,2 115,8 175,2 14,2 11,3 11,3 8,4 32,3 29,7 9,4 7,3 7,1
-manufacturing 46,0 44,4 43,4 39,9 40,1 36,6 147,0 149,3 131,7 126,1 124,7 135,9 43,3 51,7 48,2 46,3 46,2 48,2 7,0 6,2 3,7
-production and distribution of energy, gas
and water
79,7 69,6 69,6 60,1 65,8 63,2 186,9 161,5 153,2 72,2 132,5 127,9 29,9 33,7 40,2 40,5 36,3 38,0 2,6 0,8 2,1
Construction 21,4 18,1 16,6 14,5 14,9 13,5 100,5 101,8 102,2 100,7 98,0 99,7 27,5 25,4 23,6 19,8 20,1 22,7 3,4 0,8 1,2
Wholesale and retail trade, car and
household appliance repair
27,4 26,3 22,4 22,2 21,0 19,9 135,1 140,5 140,7 142,3 129,3 124,4 34,7 34,3 48,2 51,5 40,4 39,2 9,5 3,3 1,3
Transport and communication 65,1 62,5 41,5 38,2 41,2 39,1 148,0 163,7 114,3 87,0 89,1 96,6 45,5 47,2 41,1 46,6 46,2 43,3 10,2 9,6 2,9
1 Net gross assets in total assets (total of the balance)
2 Without overdue receivables
Comment: (bp)-as of the beginning of the period; (ep)-as of the end of the period; (n/d)-no data.
1 2 3
* Indicators are calculated on the basis of enterprises' limited selection from members of enterprises' monitoring conducted by the Bank of Russia
9 m
on
ths o
f 2
01
1
9 m
on
ths o
f 2
01
2
9 m
on
ths o
f 2
01
3
The Central Bank of the Russian Federation
Banking Supervision Department
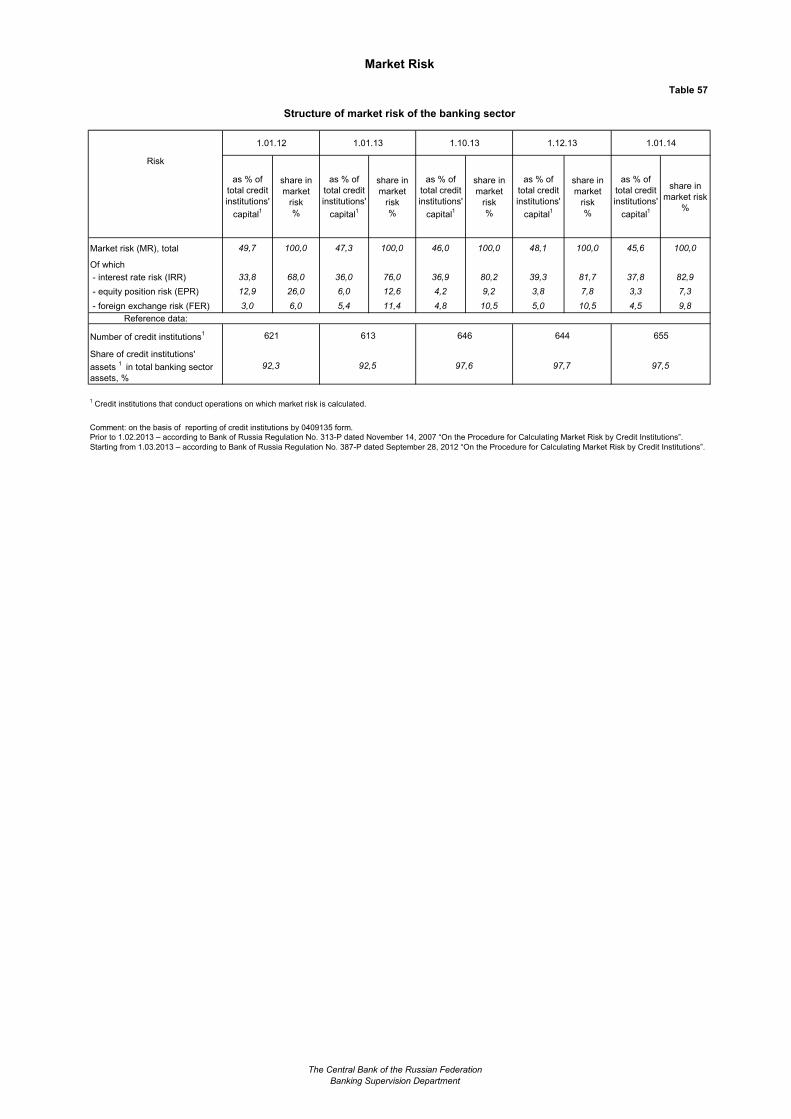
Market Risk
Table 57
Structure of market risk of the banking sector
1.01.12 1.01.13 1.10.13 1.12.13 1.01.14
Risk
as % of
total credit
institutions'
capital1
share in
market
risk
%
as % of
total credit
institutions'
capital1
share in
market
risk
%
as % of
total credit
institutions'
capital1
share in
market
risk
%
as % of
total credit
institutions'
capital1
share in
market
risk
%
as % of
total credit
institutions'
capital1
share in
market risk
%
Market risk (MR), total 49,7 100,0 47,3 100,0 46,0 100,0 48,1 100,0 45,6 100,0
Of which
- interest rate risk (IRR) 33,8 68,0 36,0 76,0 36,9 80,2 39,3 81,7 37,8 82,9
- equity position risk (EPR) 12,9 26,0 6,0 12,6 4,2 9,2 3,8 7,8 3,3 7,3
- foreign exchange risk (FER) 3,0 6,0 5,4 11,4 4,8 10,5 5,0 10,5 4,5 9,8
Reference data:
Number of credit institutions1 621 613 646 644 655
Share of credit institutions'
assets 1 in total banking sector
assets, %
92,3 92,5 97,6 97,7 97,5
1 Credit institutions that conduct operations on which market risk is calculated.
Comment: on the basis of reporting of credit institutions by 0409135 form.
Prior to 1.02.2013 – according to Bank of Russia Regulation No. 313-P dated November 14, 2007 “On the Procedure for Calculating Market Risk by Credit Institutions”.
Starting from 1.03.2013 – according to Bank of Russia Regulation No. 387-P dated September 28, 2012 “On the Procedure for Calculating Market Risk by Credit Institutions”.
The Central Bank of the Russian Federation
Banking Supervision Department
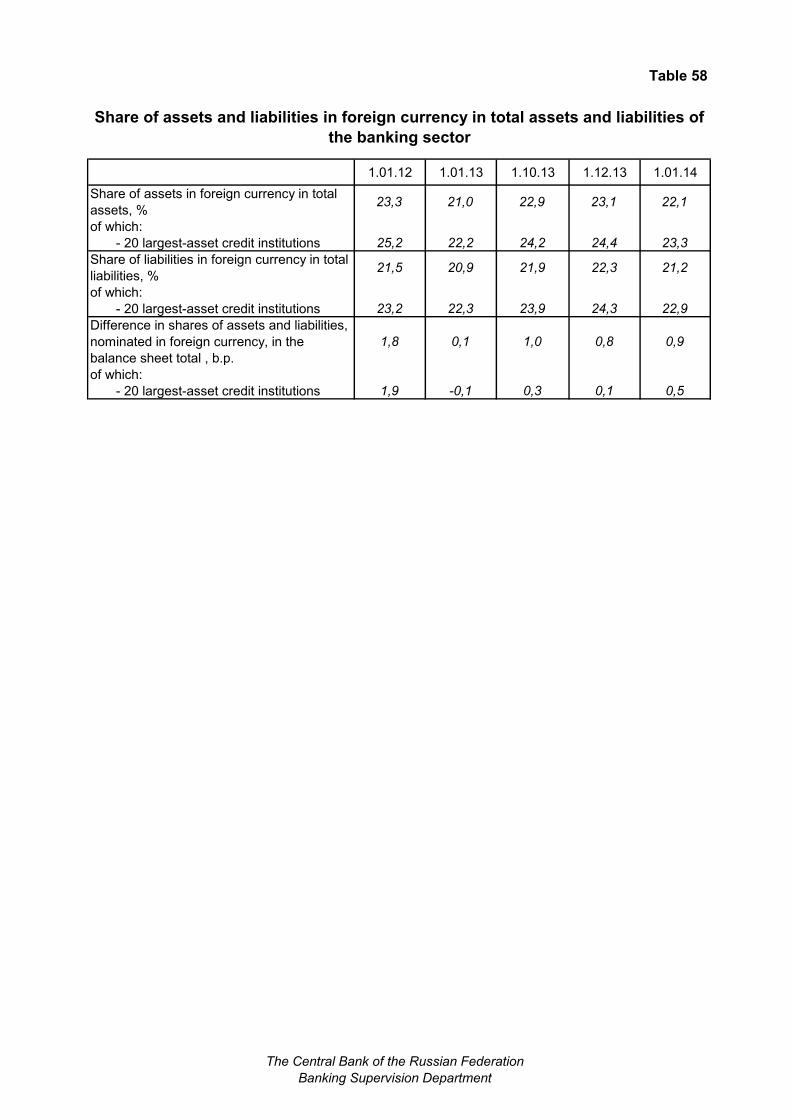
Table 58
Share of assets and liabilities in foreign currency in total assets and liabilities of
the banking sector
1.01.12 1.01.13 1.10.13 1.12.13 1.01.14
Share of assets in foreign currency in total
assets, %23,3 21,0 22,9 23,1 22,1
of which:
- 20 largest-asset credit institutions 25,2 22,2 24,2 24,4 23,3
Share of liabilities in foreign currency in total
liabilities, %21,5 20,9 21,9 22,3 21,2
of which:
- 20 largest-asset credit institutions 23,2 22,3 23,9 24,3 22,9
Difference in shares of assets and liabilities,
nominated in foreign currency, in the
balance sheet total , b.p.
1,8 0,1 1,0 0,8 0,9
of which:
- 20 largest-asset credit institutions 1,9 -0,1 0,3 0,1 0,5
The Central Bank of the Russian Federation
Banking Supervision Department
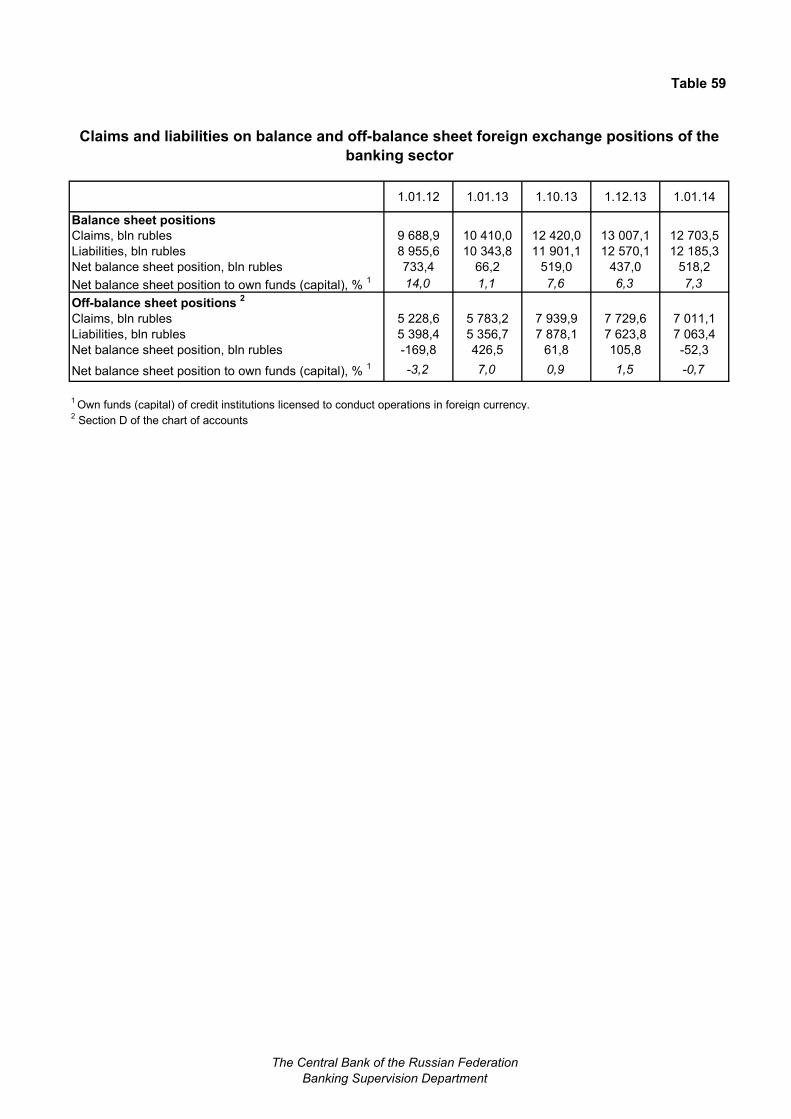
Table 59
Claims and liabilities on balance and off-balance sheet foreign exchange positions of the
banking sector
1.01.12 1.01.13 1.10.13 1.12.13 1.01.14
Balance sheet positions
Claims, bln rubles 9 688,9 10 410,0 12 420,0 13 007,1 12 703,5
Liabilities, bln rubles 8 955,6 10 343,8 11 901,1 12 570,1 12 185,3
Net balance sheet position, bln rubles 733,4 66,2 519,0 437,0 518,2
Net balance sheet position to own funds (capital), % 1 14,0 1,1 7,6 6,3 7,3
Off-balance sheet positions 2
Claims, bln rubles 5 228,6 5 783,2 7 939,9 7 729,6 7 011,1
Liabilities, bln rubles 5 398,4 5 356,7 7 878,1 7 623,8 7 063,4
Net balance sheet position, bln rubles -169,8 426,5 61,8 105,8 -52,3
Net balance sheet position to own funds (capital), % 1 -3,2 7,0 0,9 1,5 -0,7
1 Own funds (capital) of credit institutions licensed to conduct operations in foreign currency.
2 Section D of the chart of accounts
The Central Bank of the Russian Federation
Banking Supervision Department
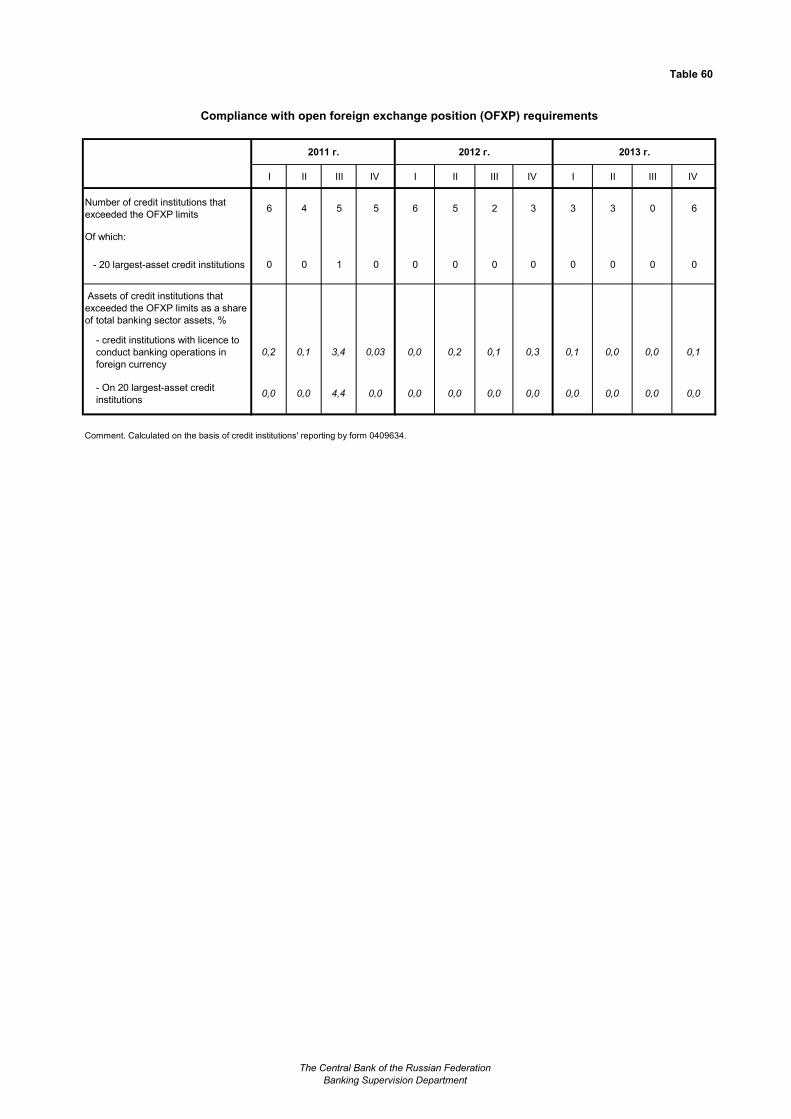
Table 60
Compliance with open foreign exchange position (OFXP) requirements
2011 г. 2012 г. 2013 г.
I II III IV I II III IV I II III IV
Number of credit institutions that
exceeded the OFXP limits 6 4 5 5 6 5 2 3 3 3 0 6
Of which:
- 20 largest-asset credit institutions 0 0 1 0 0 0 0 0 0 0 0 0
Assets of credit institutions that
exceeded the OFXP limits as a share
of total banking sector assets, %
- credit institutions with licence to
conduct banking operations in
foreign currency
0,2 0,1 3,4 0,03 0,0 0,2 0,1 0,3 0,1 0,0 0,0 0,1
- On 20 largest-asset credit
institutions0,0 0,0 4,4 0,0 0,0 0,0 0,0 0,0 0,0 0,0 0,0 0,0
Comment. Calculated on the basis of credit institutions' reporting by form 0409634.
The Central Bank of the Russian Federation
Banking Supervision Department
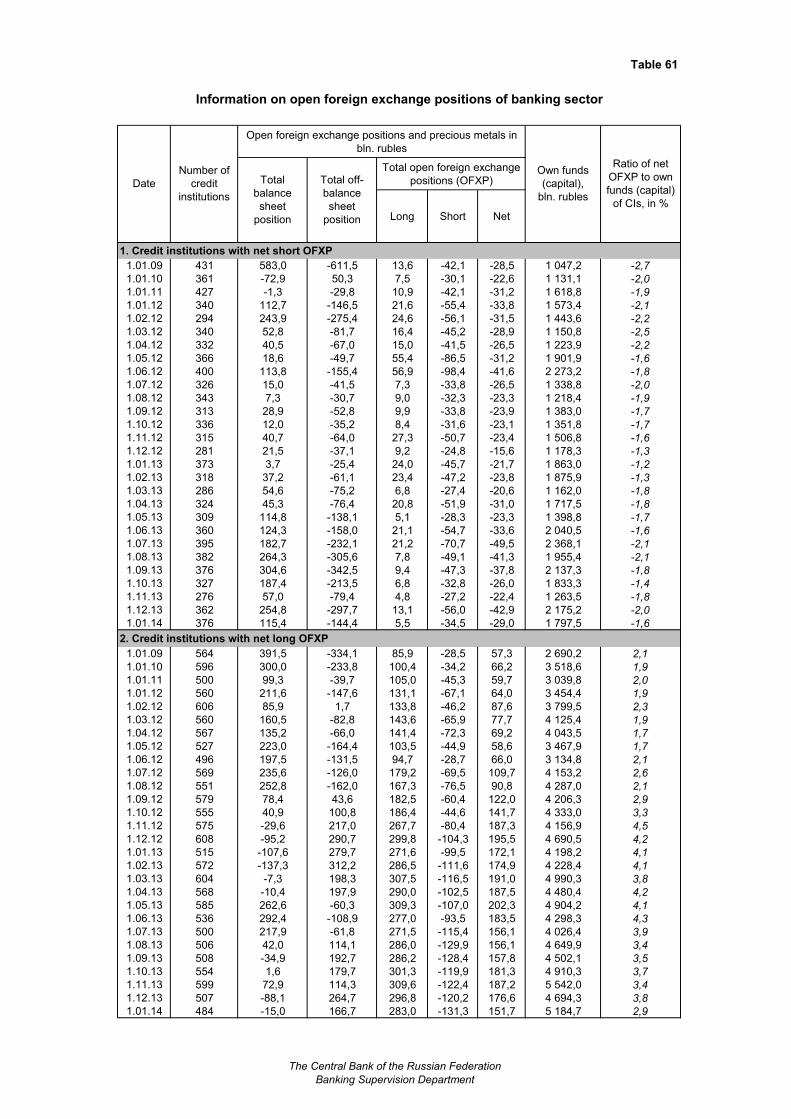
Table 61
Information on open foreign exchange positions of banking sector
Open foreign exchange positions and precious metals in
bln. rubles
Total open foreign exchange
positions (OFXP)
Long Short Net
1. Credit institutions with net short OFXP
1.01.09 431 583,0 -611,5 13,6 -42,1 -28,5 1 047,2 -2,7
1.01.10 361 -72,9 50,3 7,5 -30,1 -22,6 1 131,1 -2,0
1.01.11 427 -1,3 -29,8 10,9 -42,1 -31,2 1 618,8 -1,9
1.01.12 340 112,7 -146,5 21,6 -55,4 -33,8 1 573,4 -2,1
1.02.12 294 243,9 -275,4 24,6 -56,1 -31,5 1 443,6 -2,2
1.03.12 340 52,8 -81,7 16,4 -45,2 -28,9 1 150,8 -2,5
1.04.12 332 40,5 -67,0 15,0 -41,5 -26,5 1 223,9 -2,2
1.05.12 366 18,6 -49,7 55,4 -86,5 -31,2 1 901,9 -1,6
1.06.12 400 113,8 -155,4 56,9 -98,4 -41,6 2 273,2 -1,8
1.07.12 326 15,0 -41,5 7,3 -33,8 -26,5 1 338,8 -2,0
1.08.12 343 7,3 -30,7 9,0 -32,3 -23,3 1 218,4 -1,9
1.09.12 313 28,9 -52,8 9,9 -33,8 -23,9 1 383,0 -1,7
1.10.12 336 12,0 -35,2 8,4 -31,6 -23,1 1 351,8 -1,7
1.11.12 315 40,7 -64,0 27,3 -50,7 -23,4 1 506,8 -1,6
1.12.12 281 21,5 -37,1 9,2 -24,8 -15,6 1 178,3 -1,3
1.01.13 373 3,7 -25,4 24,0 -45,7 -21,7 1 863,0 -1,2
1.02.13 318 37,2 -61,1 23,4 -47,2 -23,8 1 875,9 -1,3
1.03.13 286 54,6 -75,2 6,8 -27,4 -20,6 1 162,0 -1,8
1.04.13 324 45,3 -76,4 20,8 -51,9 -31,0 1 717,5 -1,8
1.05.13 309 114,8 -138,1 5,1 -28,3 -23,3 1 398,8 -1,7
1.06.13 360 124,3 -158,0 21,1 -54,7 -33,6 2 040,5 -1,6
1.07.13 395 182,7 -232,1 21,2 -70,7 -49,5 2 368,1 -2,1
1.08.13 382 264,3 -305,6 7,8 -49,1 -41,3 1 955,4 -2,1
1.09.13 376 304,6 -342,5 9,4 -47,3 -37,8 2 137,3 -1,8
1.10.13 327 187,4 -213,5 6,8 -32,8 -26,0 1 833,3 -1,4
1.11.13 276 57,0 -79,4 4,8 -27,2 -22,4 1 263,5 -1,8
1.12.13 362 254,8 -297,7 13,1 -56,0 -42,9 2 175,2 -2,0
1.01.14 376 115,4 -144,4 5,5 -34,5 -29,0 1 797,5 -1,6
2. Credit institutions with net long OFXP
1.01.09 564 391,5 -334,1 85,9 -28,5 57,3 2 690,2 2,1
1.01.10 596 300,0 -233,8 100,4 -34,2 66,2 3 518,6 1,9
1.01.11 500 99,3 -39,7 105,0 -45,3 59,7 3 039,8 2,0
1.01.12 560 211,6 -147,6 131,1 -67,1 64,0 3 454,4 1,9
1.02.12 606 85,9 1,7 133,8 -46,2 87,6 3 799,5 2,3
1.03.12 560 160,5 -82,8 143,6 -65,9 77,7 4 125,4 1,9
1.04.12 567 135,2 -66,0 141,4 -72,3 69,2 4 043,5 1,7
1.05.12 527 223,0 -164,4 103,5 -44,9 58,6 3 467,9 1,7
1.06.12 496 197,5 -131,5 94,7 -28,7 66,0 3 134,8 2,1
1.07.12 569 235,6 -126,0 179,2 -69,5 109,7 4 153,2 2,6
1.08.12 551 252,8 -162,0 167,3 -76,5 90,8 4 287,0 2,1
1.09.12 579 78,4 43,6 182,5 -60,4 122,0 4 206,3 2,9
1.10.12 555 40,9 100,8 186,4 -44,6 141,7 4 333,0 3,3
1.11.12 575 -29,6 217,0 267,7 -80,4 187,3 4 156,9 4,5
1.12.12 608 -95,2 290,7 299,8 -104,3 195,5 4 690,5 4,2
1.01.13 515 -107,6 279,7 271,6 -99,5 172,1 4 198,2 4,1
1.02.13 572 -137,3 312,2 286,5 -111,6 174,9 4 228,4 4,1
1.03.13 604 -7,3 198,3 307,5 -116,5 191,0 4 990,3 3,8
1.04.13 568 -10,4 197,9 290,0 -102,5 187,5 4 480,4 4,2
1.05.13 585 262,6 -60,3 309,3 -107,0 202,3 4 904,2 4,1
1.06.13 536 292,4 -108,9 277,0 -93,5 183,5 4 298,3 4,3
1.07.13 500 217,9 -61,8 271,5 -115,4 156,1 4 026,4 3,9
1.08.13 506 42,0 114,1 286,0 -129,9 156,1 4 649,9 3,4
1.09.13 508 -34,9 192,7 286,2 -128,4 157,8 4 502,1 3,5
1.10.13 554 1,6 179,7 301,3 -119,9 181,3 4 910,3 3,7
1.11.13 599 72,9 114,3 309,6 -122,4 187,2 5 542,0 3,4
1.12.13 507 -88,1 264,7 296,8 -120,2 176,6 4 694,3 3,8
1.01.14 484 -15,0 166,7 283,0 -131,3 151,7 5 184,7 2,9
Ratio of net
OFXP to own
funds (capital)
of CIs, in %
Total
balance
sheet
position
Total off-
balance
sheet
position
Date
Number of
credit
institutions
Own funds
(capital),
bln. rubles
The Central Bank of the Russian Federation
Banking Supervision Department
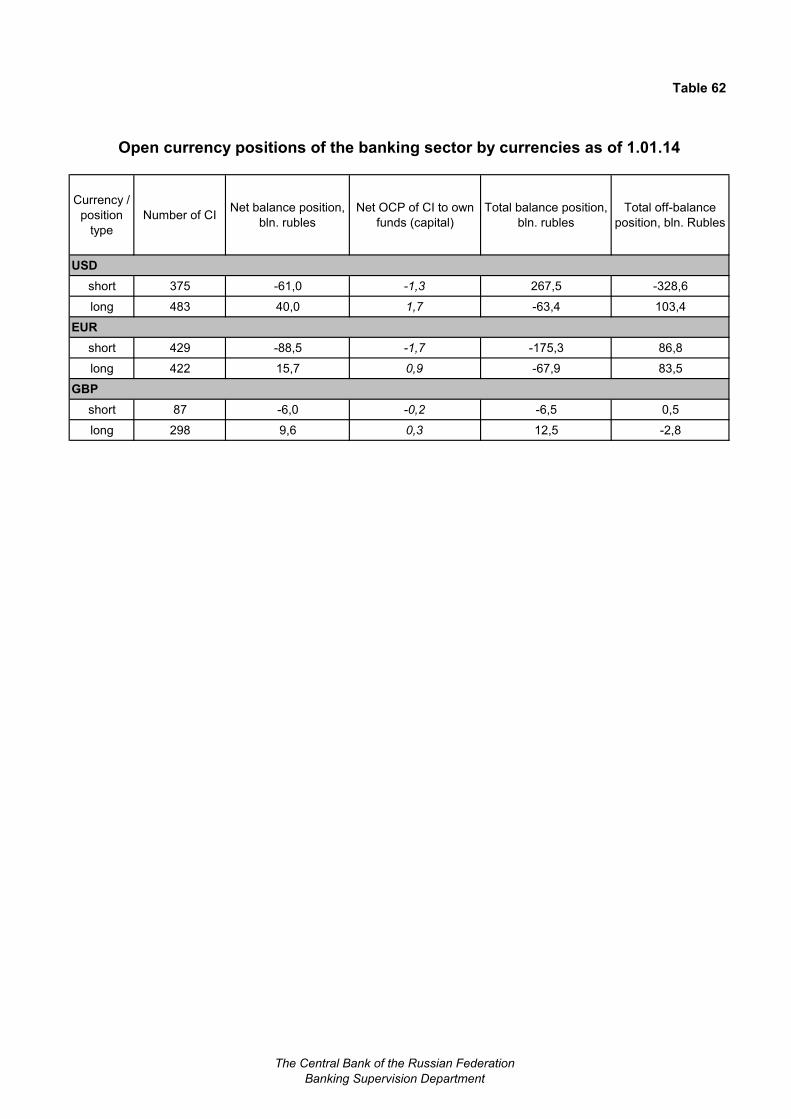
Table 62
Open currency positions of the banking sector by currencies as of 1.01.14
Currency /
position
type
Number of CINet balance position,
bln. rubles
Net OCP of CI to own
funds (capital)
Total balance position,
bln. rubles
Total off-balance
position, bln. Rubles
USD
short 375 -61,0 -1,3 267,5 -328,6
long 483 40,0 1,7 -63,4 103,4
EUR
short 429 -88,5 -1,7 -175,3 86,8
long 422 15,7 0,9 -67,9 83,5
GBP
short 87 -6,0 -0,2 -6,5 0,5
long 298 9,6 0,3 12,5 -2,8
The Central Bank of the Russian Federation
Banking Supervision Department
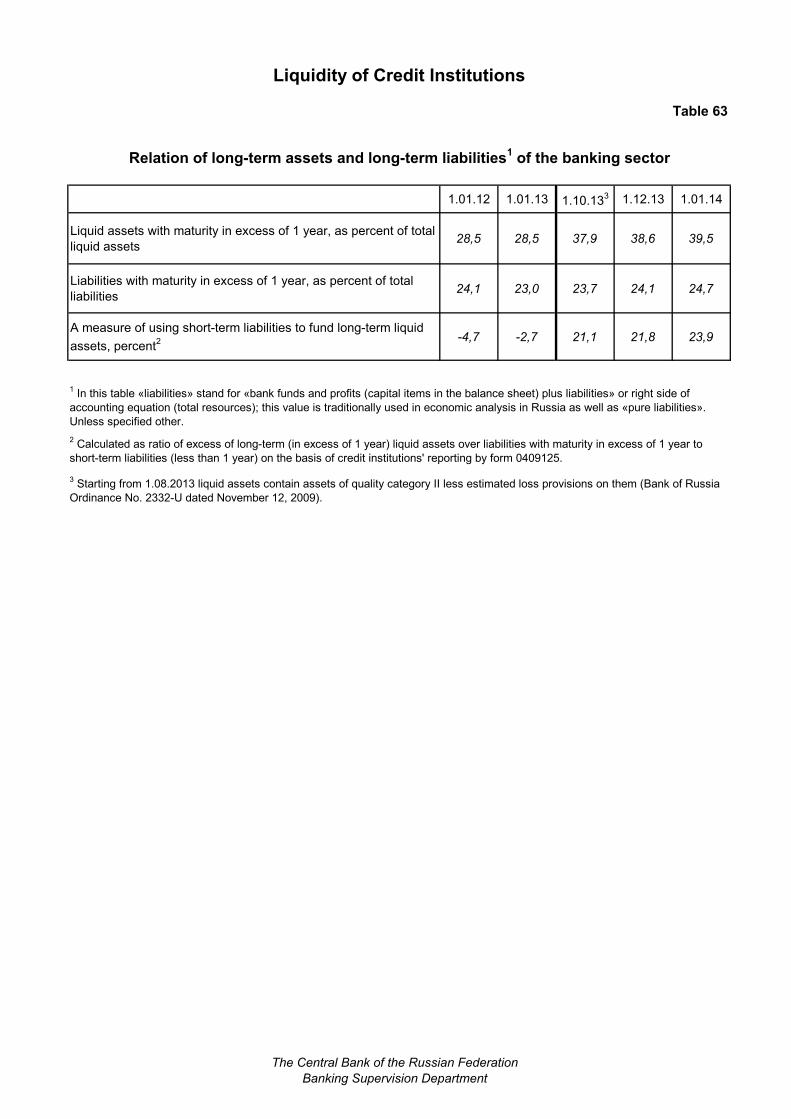
Table 63
Relation of long-term assets and long-term liabilities1 of the banking sector
1.01.12 1.01.13 1.10.133 1.12.13 1.01.14
Liquid assets with maturity in excess of 1 year, as percent of total
liquid assets28,5 28,5 37,9 38,6 39,5
Liabilities with maturity in excess of 1 year, as percent of total
liabilities 24,1 23,0 23,7 24,1 24,7
A measure of using short-term liabilities to fund long-term liquid
assets, percent2 -4,7 -2,7 21,1 21,8 23,9
2 Calculated as ratio of excess of long-term (in excess of 1 year) liquid assets over liabilities with maturity in excess of 1 year to
short-term liabilities (less than 1 year) on the basis of credit institutions' reporting by form 0409125.
3 Starting from 1.08.2013 liquid assets contain assets of quality category II less estimated loss provisions on them (Bank of Russia
Ordinance No. 2332-U dated November 12, 2009).
Liquidity of Credit Institutions
1 In this table «liabilities» stand for «bank funds and profits (capital items in the balance sheet) plus liabilities» or right side of
accounting equation (total resources); this value is traditionally used in economic analysis in Russia as well as «pure liabilities».
Unless specified other.
The Central Bank of the Russian Federation
Banking Supervision Department
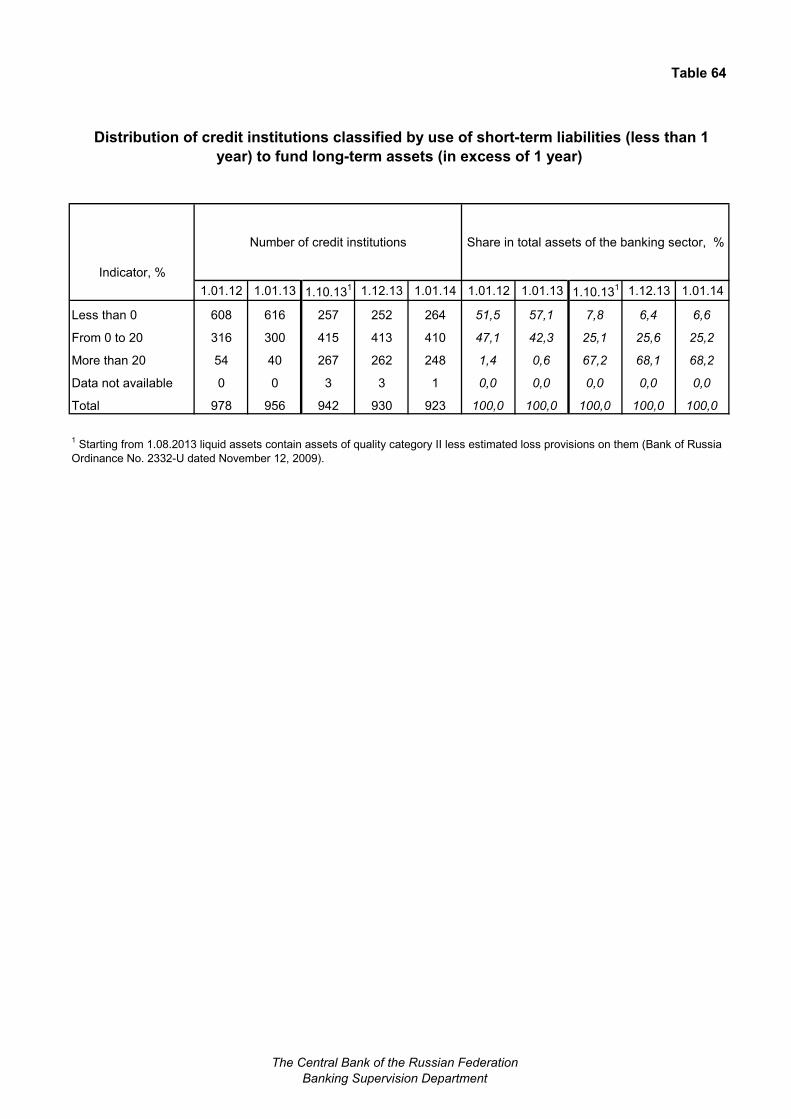
Table 64
Distribution of credit institutions classified by use of short-term liabilities (less than 1
year) to fund long-term assets (in excess of 1 year)
Indicator, %
Number of credit institutions Share in total assets of the banking sector, %
1.01.12 1.01.13 1.10.131 1.12.13 1.01.14 1.01.12 1.01.13 1.10.13
1 1.12.13 1.01.14
Less than 0 608 616 257 252 264 51,5 57,1 7,8 6,4 6,6
From 0 to 20 316 300 415 413 410 47,1 42,3 25,1 25,6 25,2
More than 20 54 40 267 262 248 1,4 0,6 67,2 68,1 68,2
Data not available 0 0 3 3 1 0,0 0,0 0,0 0,0 0,0
Total 978 956 942 930 923 100,0 100,0 100,0 100,0 100,0
1 Starting from 1.08.2013 liquid assets contain assets of quality category II less estimated loss provisions on them (Bank of Russia
Ordinance No. 2332-U dated November 12, 2009).
The Central Bank of the Russian Federation
Banking Supervision Department
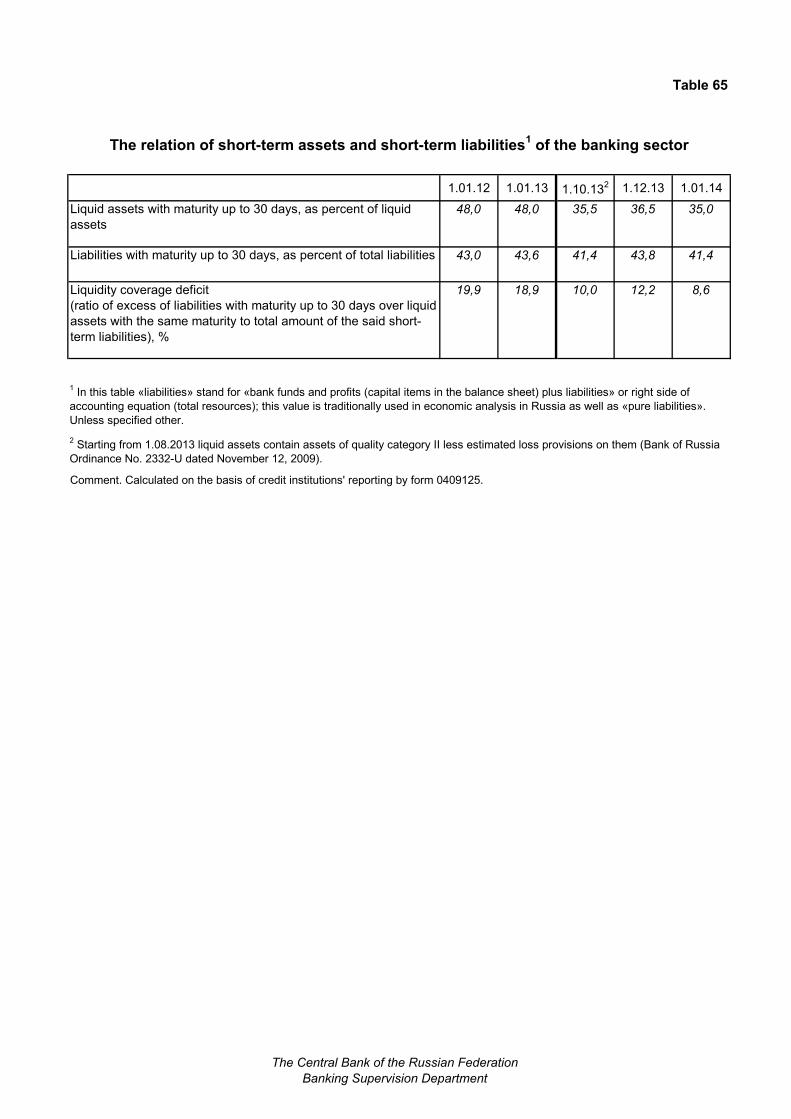
Table 65
1.01.12 1.01.13 1.10.132 1.12.13 1.01.14
Liquid assets with maturity up to 30 days, as percent of liquid
assets
48,0 48,0 35,5 36,5 35,0
Liabilities with maturity up to 30 days, as percent of total liabilities 43,0 43,6 41,4 43,8 41,4
Liquidity coverage deficit
(ratio of excess of liabilities with maturity up to 30 days over liquid
assets with the same maturity to total amount of the said short-
term liabilities), %
19,9 18,9 10,0 12,2 8,6
The relation of short-term assets and short-term liabilities1 of the banking sector
Comment. Calculated on the basis of credit institutions' reporting by form 0409125.
1 In this table «liabilities» stand for «bank funds and profits (capital items in the balance sheet) plus liabilities» or right side of
accounting equation (total resources); this value is traditionally used in economic analysis in Russia as well as «pure liabilities».
Unless specified other.
2 Starting from 1.08.2013 liquid assets contain assets of quality category II less estimated loss provisions on them (Bank of Russia
Ordinance No. 2332-U dated November 12, 2009).
The Central Bank of the Russian Federation
Banking Supervision Department
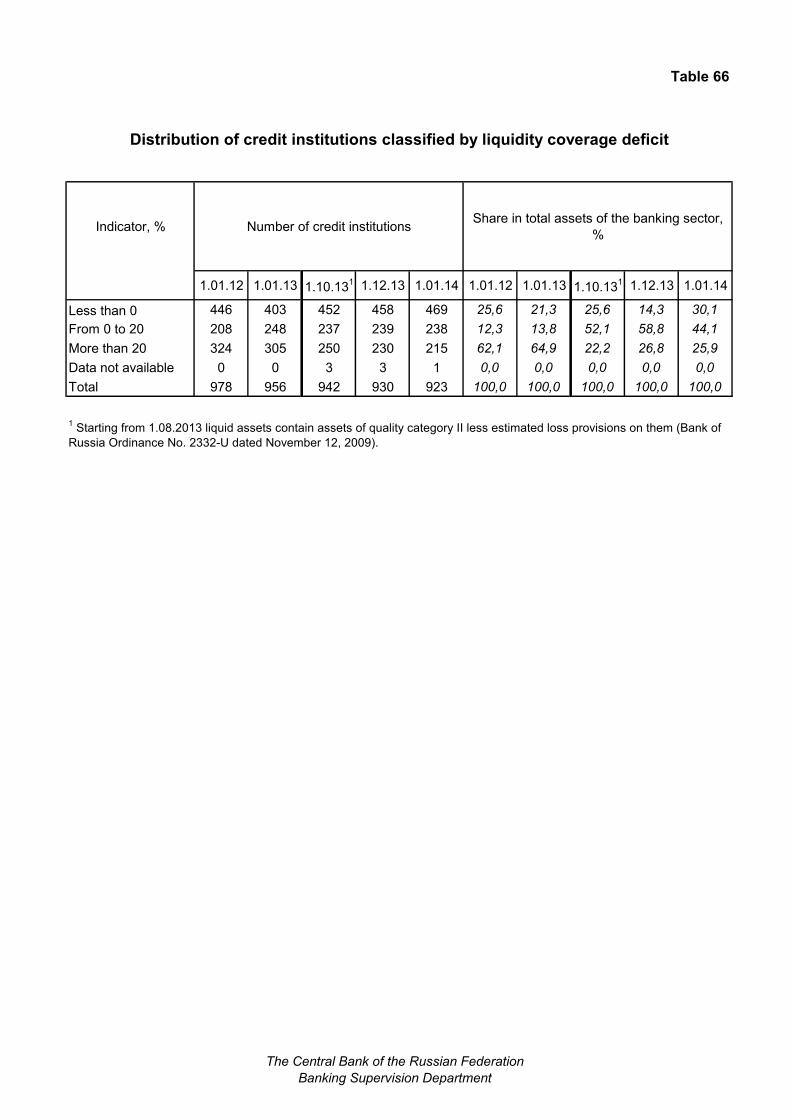
Table 66
Distribution of credit institutions classified by liquidity coverage deficit
Indicator, % Number of credit institutionsShare in total assets of the banking sector,
%
1.01.12 1.01.13 1.10.131 1.12.13 1.01.14 1.01.12 1.01.13 1.10.13
1 1.12.13 1.01.14
Less than 0 446 403 452 458 469 25,6 21,3 25,6 14,3 30,1
From 0 to 20 208 248 237 239 238 12,3 13,8 52,1 58,8 44,1
More than 20 324 305 250 230 215 62,1 64,9 22,2 26,8 25,9
Data not available 0 0 3 3 1 0,0 0,0 0,0 0,0 0,0
Total 978 956 942 930 923 100,0 100,0 100,0 100,0 100,0
1 Starting from 1.08.2013 liquid assets contain assets of quality category II less estimated loss provisions on them (Bank of
Russia Ordinance No. 2332-U dated November 12, 2009).
The Central Bank of the Russian Federation
Banking Supervision Department
67
The Summary Methodology to
"Review of the Banking Sector of
the Russian Federation"
This issue is placed as a separate material in this section of the
Bank of Russia official website.
(18th Issue )


