Embed Size (px)
Citation preview

An Allosteric Model of the Molecular
Interactions of Excitation-Contraction
Coupling in Skeletal Muscle
EDUARDO Rfos, MILOSLAV KARHANEK, JtANJIE MA, and ADOM GONZ.~LEZ
From the Department of Physiology, Rush University School of Medicine, Chicago, Illinois 60612
ABSTRACT A contact interaction is proposed to exist between the voltage sensor of the transverse tubular membrane of skeletal muscle and the calcium release channel of the sarcoplasmic reticulum. This interaction is given a quantitative formulation inspired in the Monod, Wyman, and Changeux model of allosteric transitions in hemoglobin (Monod, J., J. Wyman, and J.-P. Changeux. 1965.Journal of Molecular Biology. 12:88-118), and analogous to one proposed by Marks and Jones for voltage-dependent Ca channels (Marks, T. N., and S. W. Jones. 1992. Journal of General Physiology. 99:367-390). The allosteric protein is the calcium release channel, a homotetramer, with two accessible states, closed and open. The kinetics and equilibrium of this transition are modulated by voltage sensors (dihydropyridine receptors) pictured as four units per release channel, each undergoing independent voltage-driven transitions between two states (resting and activating). For each voltage sensor that moves to the activating state, the tendency of the channel to open increases by an equal (large) factor. The equilibrium and kinetic equations of the model are solved and shown to reproduce well a number of experimentally measured relationships including: charge movement (Q) vs. voltage, open probability of the release channel (Po) vs. voltage, the transfer function relationship Po vs. Q, and the kinetics of charge movement, release activation, and deactivation. The main consequence of the assumption of allosteric coupling is that primary effects on the release channel are transmitted backward to the voltage sensor and give secondary effects. Thus, the model reproduces well the effects of perchlorate, described in the two previous articles, under the assumption that the primary effect is to increase the intrinsic tendency of the release channel to open, with no direct effects on the voltage sensor. This modification of the open-closed equilibrium of the release channel causes a shift in the equilibrium dependency of charge movement with voltage. The paradoxical slowing of charge movement by perchlorate also results from reciprocal effects of the channel on the allosterically coupled voltage sensors. The observations of the previous articles plus the simula- tions in this article constitute functional evidence of allosteric transmission.
Address reprint requests to Dr. Eduardo Rios, Department of Physiology, Rush University School of Medicine, 1750 West Harrison St., Chicago, IL 60612.
J. GEN. PHYSIOL. © The Rockefeller University Press • 0022-1295/93/09/0449/33 $2.00 Volume 102 September 1993 449-481
449

450 T H E JOURNAL OF GENERAL PHYSIOLOGY • VOLUME 102 • 1 9 9 3
I N T R O D U C T I O N
The first suggestion of mechanical transmission in excitation-contraction (EC) coupling was the well known "plunger" hypothesis of Chandler, Rakowski, and Schneider (1976). Even though no direct biochemical proof exists of a mechanical interaction (see, for instance, Brandt, Caswell, Wen, and Talvenheimo, 1989), the hypothesis has been made more attractive by the elucidation of the structure of the foot, now known to provide a plunger-like structure that spans the triadic gap (reviewed by Fleischer and Inui, 1989, and Rios, Ma, and GonzAlez, 1991); by structural features of the triadic junction, recently discovered by Block, Imagawa, Campbell, and Franzini-Armstrong (1988); by suggestions of a fixed stoichiometry between voltage sensors and Ca release channels, derived from binding measure- ments (Anderson, Grunwald, EI-Hashem, Sealock, and Meissner, 1990); and by the functional observations of the effects of perchlorate, described in the previous two articles. In this article we propose a specific form of mechanical interaction and give it a quantitative formulation. This quantitative model makes predictions that are compared with specific experimental results obtained in situations that highly simplify the process under study.
Transmission in EC coupling is known to be complex. Indeed, in addition to what could be called the primary transmission process, through which the depolarization of the T membrane results in sarcoplasmic reticulum (SR) channel opening, there are a number of other processes that reinforce and modulate transmission. Thus, there has been evidence for some time of the coexistence of an inactivation of release, generally believed to be mediated by intracellular Ca 2+ (Schneider and Simon, 1988), which causes release to decay after a peak. Additionally, there is evidence from fractionated SR (e.g., Meissner, Darling, and Eveleth, 1986), skinned fibers (Donald- son, 1985; Volpe and Stephenson, 1986), and whole cell studies (Jacquemond, Csernoch, Klein, and Schneider, 1991; Pizarro, Csernoch, Uribe, and Rfos, 1992) that a Ca2+-induced Ca 2+ release process may amplify the voltage-controlled release, perhaps accounting for the inactivating portion (or peak) of the release waveform (but see Hollingworth, Harkins, Kurebayashi, Konishi, and Baylor, 1992). Finally, there is substantial agreement on the existence of another feedback mechanism, mediated by Ca 2+, whereby the released Ca ~+ affects the voltage sensors of the T membrane, either causing the component Qv of intramembrane charge movement (Pizarro, Csernoch, Uribe, Rodrfguez, and Rfos, 1991) or changing its kinetic properties (Pape, Jong, and Chandler, 1992).
Thus, the primary transmission mechanism coexists with three feedback processes, and this complicates the definition and quantification of the primary transmission function. Through what is known about the processes underlying the feedback mechanisms, we have designed experimental approaches or measurements that circumvent the complication and aim at quantifying the primary mechanism. In this article we describe those approaches, use them to quantify the transmission function in its simplest form, and then compare the simplified experimental results with the model. The model is an adaptation of the one developed by Monod, Wyman, and Changeux (1965) to describe allosteric transitions in hemoglobin and other multi- meric proteins. Noteworthy in this model is that the original idea of a mechanical

Rios ET AL. AUosteric Excitation-Contraction Coupling 451
interaction (Chandler et al., 1976) is kept, while the "rigid link" aspect o f it is abandoned. A similar application o f the model o f Monod et al. (1965) was introduced recently by Marks and Jones (1992) to explain gating in vol tage-dependent Ca 2+ channels.
M E T H O D S
All the results were obtained on cut frog semitendinosus muscle fibers, with the voltage clamp and Ca 2+ measurement techniques described in the first article of this series (Gonz~ilez and Rios, 1993). Specifically, all the data were obtained in a double Vaseline gap on slack fibers held at - 8 0 or - 9 0 mV, using antipyrylazo III (ApIII) for monitoring ACa2+(t), with solutions described in Table I of the first article of this series (Gonz~ilez and Rfos, 1993) and in Csernoch, Pizarro, Uribe, Rodrtguez, and Rios (1991). Intramembrane charge movement currents were measured using pulses between - 110 and -90 mV to elicit control currents, and no correction was introduced for charge in the controls (cf. Gonz~lez and Rios, 1993, for discussion of errors).
Release flux (R(t)) was derived from the calcium transients as described by Gonz~ilez and Rios (1993). A correction for depletion of calcium in the SR (Schneider, Simon, and Szucs, 1987) was applied to/~(t) records to yield corrected records, Re(t). This correction, Eq. 1 of Gonz~ilez and Rios (1993), yields an estimate of calcium content in the SR (CasR) at rest. All experiments were carried out at or near 10°C. Double pulse protocols, which simplified the release under study, are described below.
R E S U L T S
In this section we first present the set o f results that will be compared with simulations. T he simulations are then presented in a Theory section. The goal is to study the primary transmission, as obtained after reducing as much as possible the three feedback mechanisms enumera ted before: namely, Ca2+-induced Ca 2+ release, inactivation o f Ca release flux, and the feedback processes that either cause or modify Qv. Since the measured variable, Ca release flux, can be thought of as the product of a permeability (or a conductance) and a driving force, a correction for deplet ion was desirable so that the release flux would reflect only the gated variable o f interest, the permeability or openness o f the release pathway.
A Conditioning Pulse Protocol Simplifies the Study
The procedures followed to avoid the complications due to feedback and depletion are twofold. First, we concentrated on the steady (or minimum) componen t of release flux, Rm, rather than the peak or inactivating port ion, which may be due to Ca2+-induced Ca release ( J a c q u e m o n d et al., 1991; Pizarro et al., 1992; but cf. Hollingworth et al., 1992). Second, we carried out the experiments with a protocol proposed to us by Dr. Bruce Simon (used in Simon and Schneider, 1988, and Simon and Hill, 1992, and similar to protocol 1 of Csernoch et al., 1991) in which the test pulses to various voltages are preceded by a large condit ioning pulse (Fig. 1).
T he condit ioning pulse has several purposes: it reduces the peak of release in the subsequent waveform, facilitating the measurement o f the maintained flux; also, it largely eliminates the variability int roduced by the p h e n o m e n o n of deplet ion of Ca ~÷ in the SR, as it essentially equalizes the deplet ion a m o n g test pulses of different

452 THE JOURNAL OF GENERAL PHYSIOLOGY • VOLUME 102 • 1993
vol tage by in t roduc ing a similar dep le t i on before the test pulses (the magn i tude o f which is i l lustrated below).
Moreover , we have found that o the r er rors cont r ibute to differences between individual Ca 2+ t ransients and associated re lease records even if they are gene ra t ed with the same pulses. These changes can be due to an increase in dye concen t ra t ion as the dye diffuses f rom the ends o f the f iber segment , plus o the r changes in uncon t ro l l ed variables. Pe rhaps the greates t benefi t o f the cond i t ion ing pulse technique is that each cond i t ion ing pulse o f f ixed vol tage and dura t ion provides a
c o n d i t i o n i n g
20 mV
100 m s
test
i00 ms
CALCIUM
RELEASE FLUX
0.3 ~M
5 #M/ms
FIGURE 1. Ca transients and Ca release flux elicited with a double pulse protocol. (Top) Schematic of pulse pattern. The holding potential was - 8 0 inV. The test potential was vari- able and is indicated next to each release record. The sec- ond trace is the Ca transient elicited by a conditioning pulse and a test pulse to 0 inV. From this and other transients the records labeled release flux were derived, using the follow- ing removal model parame- ters: koF~ c, r, 1,200 s-l; koN ca v, 125 ~M -1 s-l; ko~, Ca ~, 1.0 S-J; koN ca p' 20 ~M -j s-l; korv ~g P, 9.0 s -l, koy Mg P, 0.03 la, M -1 s - l ;
M, 0.5 mM s-l; KD pump, 1.0 ~M; [P], 300 0.M; IT], 240 I~M; [Mg~+], 900 ~M; [EGTA], 5 raM; koN Ca EGTA, 2.0 ~ M - I s - l ;
koFF ca rGXA' 6.0 S -l. Fiber 827. External solution, Ca-Co (Gonz~i- lez and Rios, 1993); internal so- lution, 15 EGTA with calcium added for a nominal [Ca 2~] of
20 nM. Diameter, 114 ~m; linear capacitance, 16.2 nF; concentration of AplII ranged between 720 I~M at the beginning and 838 at the end of the series, which took 30 min to complete. Records are single sweeps. Temperature, 10°C.
measure o f the state o f the release system, which then can be used to normal ize the release flux measu red dur ing the test pulse.
Some o f the advantages o f this p ro toco l are exempl i f ied in the e x p e r i m e n t r e p r e s e n t e d in Figs. 1-4. Fig. 1 shows the pulse protocol , one of several records of [Ca2+]i(/) (calcium transients) , and represen ta t ive release flux records der ived f rom the calcium transients. Fig. 2 i l lustrates an addi t iona l s tage of analysis, the correct ion for dep le t i on that resu l ted in the records labe led Rc(t) (thick traces). T h e f igure i l lustrates two records ob ta ined with exactly the same pulse pro tocol (a cond i t ion ing

Rios ~T AL. Allosteric Excitation-Contraction Coupling 453
pulse followed by a test pulse to - 1 0 mV) early in the sequence (top records) and near the end of the experiment some 30 min later (middle records). The ratio of the corrected (thick) to the uncorrected (thin) flux during the test pulse gives the estimated magnitude of depletion caused by the conditioning pulse. This depletion is ~ 60% for the pulse shown early in the experiment and ~ 50% in the late record.
In this and other experiments, the release flux recorded during the conditioning pulse steadily decreased during the experiment. Additionally, the estimate of Ca content in the SR obtained from the depletion correction procedure (CasR) decreased
50 m s Rc(t) Early
~ Late
FJCURE 2. Effects of the conditioning pulse. The top and middle records in thin trace are/}(l) records obtained with a conditioning pulse (+20 mV) followed by a test pulse to -10 inV. The top record was obtained early and the middle record some 30 rain later. The middle record is the record at -10 mV in Fig. 1 after digital filtering (7 ms smoothing). The thick traces are /}c(t), obtained from the corresponding R(t) using Eq. 1 of Gonz~lez and l~os (1993). The value of CasR was 1.5 mM (early) and 1.2 mM (late). The bottom records are the corrected records scaled to match the levels of sustained release at the end of the conditioning pulse (the late record was multiplied by 1.94).
substantially. This indicates that the decay in release flux was at least in part due to depletion. Normalization or scaling of the records to equalize the amplitude of the conditioning release waveform is illustrated in the bottom pair of records in the figure. The value of/~m in the early and late test waveforms at - 10 mV was 0.53 and 0.49 of/~m in conditioning waveforms. Thus the normalization procedure reconciled the results to within a few percent. Fig. 4 plots values of/~m in the test pulse divided by/~m during the preceding conditioning pulse (so that the value at +20 mV is ~ 1). This normalization gets rid of the variability: after normalization all the values of release during the test pulses fell on the same curves,/~m(V) and/~m(Q) (Fig. 4).

454 THE JOURNAL OF GENERAL PHYSIOLOGY - VOLUME 102. 1993
Another problem in modeling transmission at the triad is posed by the existence of Qv. Even though there is universal agreement that Qv originates at EC coupling voltage sensors and participates in EC coupling, its kinetics, and for some researchers its existence, cannot be accounted for without considering processes of feedback mediated by changes in [Ca2+]i. Therefore, Qv is beyond the scope of the present model. In our view (Csernoch et al., 1991; Garcfa, Pizarro, Rfos, and Stefani, 1991; Pizarro et al., 1991; Sziics, Csernoch, Magyar, and Kovfics, 1991; Gonzfilez and Rios, 1992) Qv can be reduced or eliminated by the presence of high concentrations of calcium buffers, which have the direct effect of lowering the [Ca2+]i and a cumulative depleting effect as the fiber is pulsed repeatedly in their presence. All the experi- ments simulated here were carried out in the presence of 15 mM EGTA intracellu-
mV
~~__ -20 _ ~ . -30
~ ] ' , . . _ . -40 -60
--; i00 ms
• . . (
I
FIGURE 3. Charge movement currents during test pulses pre- ceded by conditioning. Same fi- ber and pulses as in Fig. 1. Records are the differences of a single test and the average of four control currents (obtained in positive-going pulses be- tween - 110 and -90 mV). Dif- ference records were corrected for a horizontal pedestal calcu- lated between 70 and 100 ms (except for pulses to 0 mV or greater, where the pedestal was measured at 30-40 ms).
larly; the Ca transients were small and were detectable because in all cases there were high concentrations of the calcium-sensitive dye in the cells. Charge movement currents had little kinetic evidence of Qv (Fig. 3) and Q(V) dependencies were well described by single Boltzmann distributions, an indication that Qv was small (Hui and Chandler, 1990). As described by Csernoch et al. (1991), the large conditioning pulse, which reduces the inactivating portion of release caused by a subsequent pulse, also reduces the hump component of charge movement current elicited by the subsequent pulse (or slows it, as recently argued by Hui and Chen, 1992). The conditioning pulse protocol used routinely here thus caused an added simplification, a reduction or slowing of Q~.
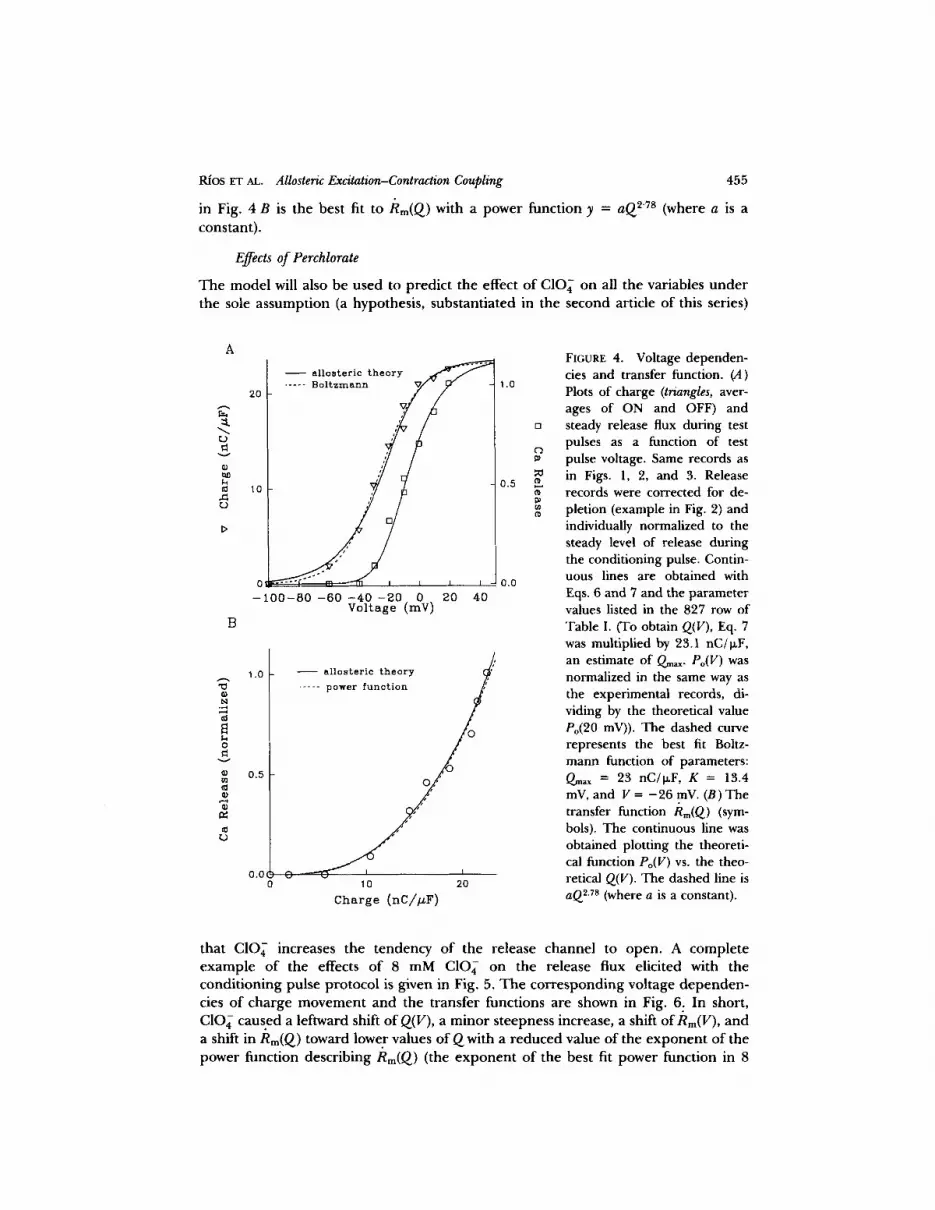
Representative equilibrium.data using the conditioning pulse protocol are shown in Fig. 4. They include Q(v), Rm(V), and the transfer function Rm(Q). The dotted line
Rios ET AL. Allosteric Excitation-Contraction Coupling 455
in Fig. 4 B is the best fit to /~m(Q) with a power funct ion y = aQ 2"7s (where a is a
constant) .
Effects of Perchlorate
T h e mode l will also be used to p red ic t the effect o f CIO 4 on all the variables u n d e r the sole a s sumpt ion (a hypothesis , subs tan t ia ted in the second art icle of this series)
2O
v
10
D
Ot
B
Q) N
O v
m
~9
- - a l los te r ie t h e o r y ~ , ' ~ ' ~ /
- - 1 0 0 - 8 0 - 6 0 - 4 0 -E0 0 B0 40 Voltage (mY)
1.o
0.5
o.o,
- ~ a11osterie t h e o r y /
C v 10 20
Charge (nC/~F)
1.0
[]
0.5
0,0
FIGURE 4. Voltage dependen- cies and transfer function. (A) Plots of charge (triangles, aver- ages of ON and OFF) and steady release flux during test pulses as a function of test pulse voltage. Same records as in Figs. 1, 2, and 3. Release records were corrected for de- pletion (example in Fig. 2) and individually normalized to the steady level of release during the conditioning pulse. Contin- uous lines are obtained with Eqs. 6 and 7 and the parameter values listed in the 827 row of Table I. (To obtain Q(V), Eq. 7 was multiplied by 23.1 nC/I~F, an estimate of Qm~x. Po(V) was normalized in the same way as the experimental records, di- viding by the theoretical value Po(20 mV)). The dashed curve represents the best fit Bohz- mann function of parameters: Q~x = 23 nC/o~F, K = 13.4 mV, and V = - 2 6 mV. (B) The transfer function Rm(Q) (sym- bols). The continuous line was obtained plotting the theoreti- cal function Po(V) vs. the theo- retical Q(v). The dashed line is aQ 2.7s (where a is a constant).
that CIO 4 increases the tendency o f the release channel to open. A comple t e e x a m p l e o f the effects o f 8 mM CIO 4 on the release flux el ici ted with the cond i t ion ing pulse p ro toco l is given in Fig. 5. T h e c o r r e spond ing vol tage d e p e n d e n - cies o f charge m o v e m e n t and the t ransfer functions are shown in Fig. 6. In short, CIO 4 caused a leftward shift o f Q(v), a m i n o r s teepness increase, a shift of/~m(V), and a shift in Rm(Q) toward lower values o f Q with a r e duc e d value of the e x p o n e n t o f the power function descr ib ing Rm(Q) (the e x p o n e n t o f the best fit power funct ion in 8

456
conditioning
THE JOURNAL OF GENERAL PHYSIOLOGY • VOLUME 102 • 1993
test
REFERENCE
25 bzM/ms
-40
PERCHLORATE
O, 10 mV
1,5 jzld/ms
- 3 o -40
-60
FIGURE 5. Effect of CIO 4 on release flux in a double pulse experiment. The release flux derived from Ca transients (not shown) and corrected for depletion in reference solution and in 8 mM CIO4- (obtained later in the experiment). Parameters of removal: koN Ca P, 100 p,M-I s-J; korr ug P, 3 s-l; M, 1.0 mM s-l; [P], 200 IxM; [EGTA], 7 mM; koN ca EC'rA, 5 o.M -l s-l; kovv ca EG'rA, 4 S -l . Other parameters were as in Fig. 1. Fiber 908; external solution, Cd-La-A9C (Csernoch et al. 1991 ); internal solution, 15 EGTA with calcium added for a nominal [Ca 2+] of 50 nM and 1.6 mM ApIII. Diameter, 115 p,m. The linear capacitance in reference varied between 21.3 and 20.8 nF; upon changing the external solution to 8 mM C10~ the linear capacitance was stable at 19.7 nF. The concentration of ApIII went from 911 ~M to 2.17 mM during the 37 min needed to complete the measurements in reference and to 2.88 after 29 min in CIO 4. Records are single sweeps. Temperature, 10°C.
m M CIO 4 in Fig. 6 is 1.70, whi le in r e f e r e n c e it is 2.88; a s imi lar r e d u c t i o n in the
e x p o n e n t was f o u n d in t he e x p e r i m e n t o f Fig. 4, a l t h o u g h da ta for CIO~- were n o t
p l o t t e d in the f igure) . A few e x p e r i m e n t s w e r e ca r r i ed ou t us ing a very h i g h c o n c e n t r a t i o n o f CIO 4. T h e
p u r p o s e was to see the e x t r e m e o f the CIO 4 effect o f l i nea r i za t ion o f t he t rans fe r

Rfos ET AL. Allosteric Excitation-Contraction Coupling 457
function. T h e study was l imi ted by increases in ionic current , which m a d e the m e a s u r e m e n t of charge m o v e m e n t quest ionable . Fig. 7 shows one in a series of calcium transients (top) and most o f the c o r r e spond ing release flux records in one o f two expe r imen t s us ing 40 mM. This high [CIO4] e x a g g e r a t e d some effects descr ibed before (Gonzfilez and Rios, 1993).
A 40 FIGURE 6. Equilibrium effects O r e f e r e n c e of CIO4: experiment and the- • perehlorate • • _ - - - allosterie m o d e ~ ory. Data are from two different
fibers. (A) Voltage dependence of charge moved in the experi-
"-. ment of Fig. 5. Represented are z0 averages of ON and OFF. Con-
tinuous lines were obtained with the allosteric model and parameters listed in Table I for fiber 908. Dashed lines are Boltzmann fits with the follow-
0 t i I ing parameters: Q~ax = 32 nC/ -90 -~o -a0 0 zo p.F, V = -37 mV, K = 14.8 mV
Voltage (mY) (reference), O.~ax = 32.8 nC/ t~F, V = - 3 7 mV, and K =
/ , ~ 12.2 mV (004 ) . (B) Transfer B 1 .0 0 r e f e r e n c e • • 8 mM perchlorate j , 6 / - • functions in reference (open cir-
0.a • 40 m~t pere des), 8 mM CIO 4 (filled circles), ~- and 40 mM CIO 4 (squares). Cir-
cles represent the same values 0.6 as in A. Squares represent the
, / g experiment (911) whose re- = ~ cords are illustrated in Figs. 7 0.4
• ~" and 8. Charges are actual vai- l ues in all cases. Release fluxes
0.2 are normalized to the steady value during the conditioning
0.0 i l pulse (for 908) or to the steady o " ~ ' ' ~ " ~ to 20 ~0 release during a single pulse to
Charge (nC/IzF) - 2 0 mV (for 911). Continuous lines were generated with the
allosteric model and parameter values listed in the corresponding rows of Table I and scaled as described in Fig. 4. The effect of 8 mM CIO~ on fiber 908 was simulated by multiplying kL and dividing k-L by 5. The effect of 40 mM CIO~ was simulated, increasing this factor to 10. Otherwise, the parameters were the same for both fibers.
In the calcium transients it could a l ready be seen that the early decay phase at the end o f the pulse was slowed and p ro longed . A slow decay of [Ca2+]i(t), early after the pulse, is an indica t ion o f slower channe l closing. Simula t ions with the Ca 2+ remova l mode l (descr ibed in Gonzfilez and Rfos, 1993) i l lustrate this point . Normal ly the removal m o d e l s imulates well the decay o f [Ca2+]i s tar t ing some 10 ms after the end

4 5 8 T H E JO U RN A L OF GENERAL PHYSIOLOGY • VOLUME 1 0 2 • 1 9 9 3
C a transient
- 5 5 m V "" . . . . . ~-~----~-'-~-'~----~.~ . . . . =::_-_..~D_.~:~_:_=~:
10 n g
- 4 o my 3 ~ M / m s
release flux 100 ms
- 4 5
- 5 0
- 5 5
- 6 0
- 8 5
FIGURE 7. Effect o f a high concentration ofCIO 4 on release flux. (Top) One of several calcium transients, elicited by a 200-ms pulse from a HP of - 9 0 to - 5 5 mV. The thick trace represents

Rios ET ~ . AUosteric Excitation-Contraction Coupling 459
of the pulse, consistent with the idea that closure of the release pathway is complete by that time. In Fig. 7 (top) we represented by a solid thicker trace the best fit simulation (to the record shown and many others). This successful simulation was, however , possible only after 52 ms in the OFF. The dashed line represents the predicted time course o f [Ca2+]i when the simulation was started 14 ms after the end of the pulse. The simulation falls unde r the measured record, suggesting that the key assumption of the model, that release has stopped, did not hold at that time. A similar result was obtained with o ther sets o f removal parameters that gave good fits o f the late port ions o f the decay. More evidence that CIO 4 slows deactivation o f release can be found in an exper iment illustrated in Fig. 12.
T he release fluxes in Fig. 7 (bottom) show in addit ion that CIO 4 caused a major reduct ion in the magni tude o f the inactivating componen t o f the release flux, again an extreme example o f an effect described earlier for lower [CIO4] (Gonz~ilez and Rios, 1993). Finally, the release flux levels were smaller than usual, perhaps due to a faster depletion.
Fig. 8 shows records o f charge movement current in the same experiment . Since slow phases o f charge movement were expected and found, longer than usual pulses were applied. Before CIO 4, a pulse to - 5 0 mV did not cause measurable release, while after C10 4 a pulse to - 7 5 mV was suprathreshold. The very slow phases seen in the charge movement records at - 7 0 and - 6 0 mV in the figure are associated with the slow increase in release flux seen in the cor responding records of Fig. 7.
The records also show a very slow componen t of charge movement in the OFF; this slow phase, however, is absent f rom the record at - 8 0 mV, which elicited no measurable release. Prolonged OFF charge movement currents in CIO 4 have been studied in detail by Huang (1987); newly shown here is the association o f these p ro longed tails with slower deactivation o f release. This, as shall be discussed, has implications for the choice a m o n g transmission models.
T he record at - 4 0 mV shows an indication of an outward current that activates dur ing the ON. This current was more obvious at higher voltages and prevented determinations o f charge movement beyond - 4 0 mV. The value of OFF charge transfer at - 4 0 mV (32 nC/p-F) was close to the largest value in reference (28 nC/p-F). The release flux at the end of the - 4 0 - m V pulse (7 p.M/ms) was similar to the value obtained earlier dur ing a 100-ms pulse to - 2 0 mV in the same solution. These observations suggest that both the charge movement and release activation at
the best fit to this and many other Ca ~÷ transients; the fit and simulation start 52 ms after the end of the pulse. Dashed curve, simulated decay of the calcium concentration, obtained with the same Ca 2+ removal model and parameters, but starting 14 ms after the end of the pulse. (Bottom) Release flux records derived from calcium transients elicited by 200- or 300-ms pulses to the potentials indicated. Parameters of removal: koN Ca p, 100 I~M -l s-l; korl~ Mg P, 3.0 S-l; M, 1.3 ~M s-l; Kb pump, 0.5 ~M; [P], 800 I~M; [EGTA], 6 mM; koN ca EGTA, 20 I~M -I S-l; kovF ca EGTA, 5 S-l; others are as in Fig. 1. Fiber 911; external solution, Cd-La-A9C with 40 mM C10 4 (substituted for methanesulfonate); internal solution, 15 EGTA with calcium added for a nominal [Ca ~+] of 50 nM and 0.8 mM ApIII. Diameter, 118 Izm. The linear capacitance varied between 15.8 and 15.5 nF and the concentration of ApIII went from 1.1 to 1.31 mM during the 18 min taken by the measurements in CIO 4. Records are derived from averages of 3 (at -45 and -45 mV), f, or 10 sweeps (at - 80 and -75 mV). Temperature, 10°C.

4 6 0 T H E JOURNAL O F G E N E R A L P H Y S I O L O G Y • V O L U M E 102 • 1 9 9 3
- 4 0 mV were close to maximal ; a Bohzmann fit, however, could not be m a d e to the Q(v) data .
T h e t ransfer funct ion (/~m(Q)) is p lo t t ed as squares in Fig. 6 B, t oge the r with da ta from ano the r e x p e r i m e n t at lower [CIO4]. T h e po in t of p lo t t ing both fibers toge the r is to stress the ex t r eme l inear izat ion caused by the h igh [C104] (the e x p o n e n t o f the best fit power funct ion was 1.03 in 40 mM CIO4).
T h e r e was some concern that this h igh [C104] would al ter the l inear electr ical p roper t ies . T h e capaci tance measu red in the control pulses is p lo t t ed in the inset o f
- 0 0 m v
- 6 0 "
~ ~ I '
1 0 v
r.)
Perchlorate 40 m M
time (min) 0 I l
1 5 0 1 8 0
1 A/F '
FIGURI~ 8. Charge movement records in high [C104]. Records are the differences between averages of all current sweeps during test pulses (numbers in previous figure legend) and double the number of intercalated controls (from -110 to - 9 0 mV), corrected by a sloping baseline fitted to the last 70 ms (for 200-ms pulses) or 100 ms (for 300-ms pulses). The ON at - 4 0 mV was corrected by subtraction of a constant, the level of the asymmetric current between 30 and 50 ms. (Inset) Evolution of the linear capacitance (calculated from integrals of the current transient during pulses from - 110 to - 9 0 mV). The abscissa is the time after exposure of the fiber to ApIII. The horizontal bar marks the time of exposure to high CIO 4.
Fig. 8 as a funct ion o f t ime dur ing the expe r imen t . It shows some decay after 160 min, but this is not unusual in our exper ience and was not cor re la ted with the
p resence o f C10 4.
Kinetic Data
T h e kinetics of charge movemen t cur ren t were also mode led . T h e s imulat ions were c o m p a r e d with expe r imen t a l records ob ta ined in fibers highly dep l e t ed by r e p e a t e d puls ing at h igh vol tage and frequency in the presence o f EGTA and BAtrI'A. For

Rios ET AL. Allosteric Excitation-Contraction Coupling 461
obvious reasons, the ex t remely d e p l e t e d condi t ion is not useful for s tudying calcium release records; therefore , the kinetic records o f charge m o v e m e n t that were c o m p a r e d with the s imulat ions were not ob ta ined in the same expe r imen t s that gene ra t ed Rm(V), Q(v), and Rm(Q) data .
A
o
-4O . = ,
••0 = =
- - r e f e r e n c e
6 ram p e r e h l o r a t e
3 A\F
13
L_ 50 ms |
- reference
" pe re h lo r a t e "
20 mV
0
-20
- 3 0
-40
-50
- 6 0
FIGURE 9. Kinetic effects of CIO4: experiment and theory. (A) Intramembrane charge movement current during 100-ms pulses from a HP of - 9 0 mV to the potentials indi- cated. These are the same re- cords in Fig. 20 of Gonzhlez and Rios (1993) (fiber 744). The internal solution is 15 EGTA, 1 BAPTA, with no added calcium. The fiber was sub- jected to a calcium depletion pulse protocol (~ 200 pulses to 20 mV at 12-s intervals). (B) Simulations (numerical solu- tions of the differential equa- tions) of charge movement transients. For description of simulations see text and next figures. Parameters are the same as those listed in Table I for fiber 827.
Fig. 9 A shows a g roup o f records of charge m o v e m e n t cur ren t f rom a d e p l e t e d f iber a l ready p r e s e n t e d as Fig. 20 in Gonzfilez and Rios (1993). CIO~- caused a substant ia l slowing of bo th ON and O F F currents , plus the appea rance , observed reproducib ly , of small hump- l ike por t ions in bo th ON and O F F revealed by a change

462 T H E JOURNAL OF GENERAL PHYSIOLOGY • VOLUME 102 • 1903
in concavity (that is, in the sign of the second derivative) rather than an actual secondary rising phase.
T H E O R Y
Glossary: Equivalence
MWC model: allosteric protein heterotropic ligand T0-T4 (tense states) R0-R4 (relaxed states) kc,k-c Kv KT --= k-c/kc kL, k-L L -- k-L/kL Ka c - Ka/K~r F (concentration of ligand) o~ --- F/KR
(function of state) YF (saturation function)
with M W C Nomenclature
Present model: Ca release channel voltage sensor molecules C0-C4 (closed states) O0-O4 (open states) kok-c (rate constants among closed states) Kc (equilibrium constant among closed states) Kc - k-c/kc = exp [ - ( V - V)/4K] kL, k-L (rate constants for opening and closing) L (equilibrium constant of closing transition) K0 (equilibrium constant among open states) f 2 = Ko/ Kc (allosteric factor) 1
f -~ exp [ - ( V - V)/4K] Po(V) (open probability) Q(V)/Qmax (fraction of charge moved)
The model specifies the formal properties of the system cartooned in Fig. 10. The unit of the model consists of one release channel, represented as a homotetramer (square blocks in the figure) and four voltage sensor molecules (the drop-like structures), each in contact with one protomer of the release channel. The bases for the structural assumptions are the recent observations of Block et al. (1988) and other evidence discussed by Rfos et al. (1991) and Rfos and Pizarro (1991).
The functional aspects of the model are closely inspired in the theory of allosteric transitions of Monod et al. (1965), henceforth termed "MWC model." The descrip- tion here will stress the parallels with that model; a list of symbols, definitions, and the equivalencies between the present model and MWC are given in the Glossary.
The allosteric protein in MWC terminology is here called the Ca 2+ release channel. It is interesting that the release channel is now believed to be a homotetramer with fourfold rotational symmetry (e.g., Wagenknecht, Grassucci, Frank, Saito, Inui, and Fleischer, 1989), thus satisfying the symmetry requirements of the MWC allosteric proteins, and in particular the fourfold repeat, to which J Monod gave so much value (the issue of symmetry is discussed by Perutz, 1990). As in the MWC model, the protein has two available states, tense and relaxed, which will here be called closed (C) and open (O). As in the original MWC model there is full cooperativity: the four protomers make a coordinated transition between open and closed, without subcon- ductance levels allowed.
The essence of the model is the manner in which the voltage sensors interact with the release channel and control its state. The interaction is assumed to be allosteric; that is, the voltage sensors act at a contact site (a binding site) on the release channel, and through this action alter the properties of the protomers, leading to their cooperative opening or closing. The implications of the term allosteric are thus
Rfos El" AL. AUosteric Excitation-Contraction Coupling 463
twofold: the act ion is by contact, and it affects o the r sites in the pro te in . Again following MWC terminology, the vol tage sensors are he te ro t rop ic l igands, and by thei r in terac t ion they modify the homot rop i c in terac t ion be tween re lease p ro t e in p ro tomers . O t h e r detai ls o f the co r r e spondence be tween the p resen t mode l and MWC will be cons ide red in the Discussion. T h e p resen t mode l is close to the mode l o f ga t ing of L-type Ca ~+ channels p r o p o s e d by Marks and Jones (1992), and thei r re la t ionships will be cons ide red in the Discussion.
Co E]E] k,.. ~ Oo BE] "k~ ~
4~01Ik~ 4k0/'lI' k~
Cl BE] k~/f E ~ O1 E3E] ~ ~ tq
O2
C3 B B ~'~ 4~. ~ o3
c 4 BEI kL/r~ ~ r~B'~;r, r ~ 04
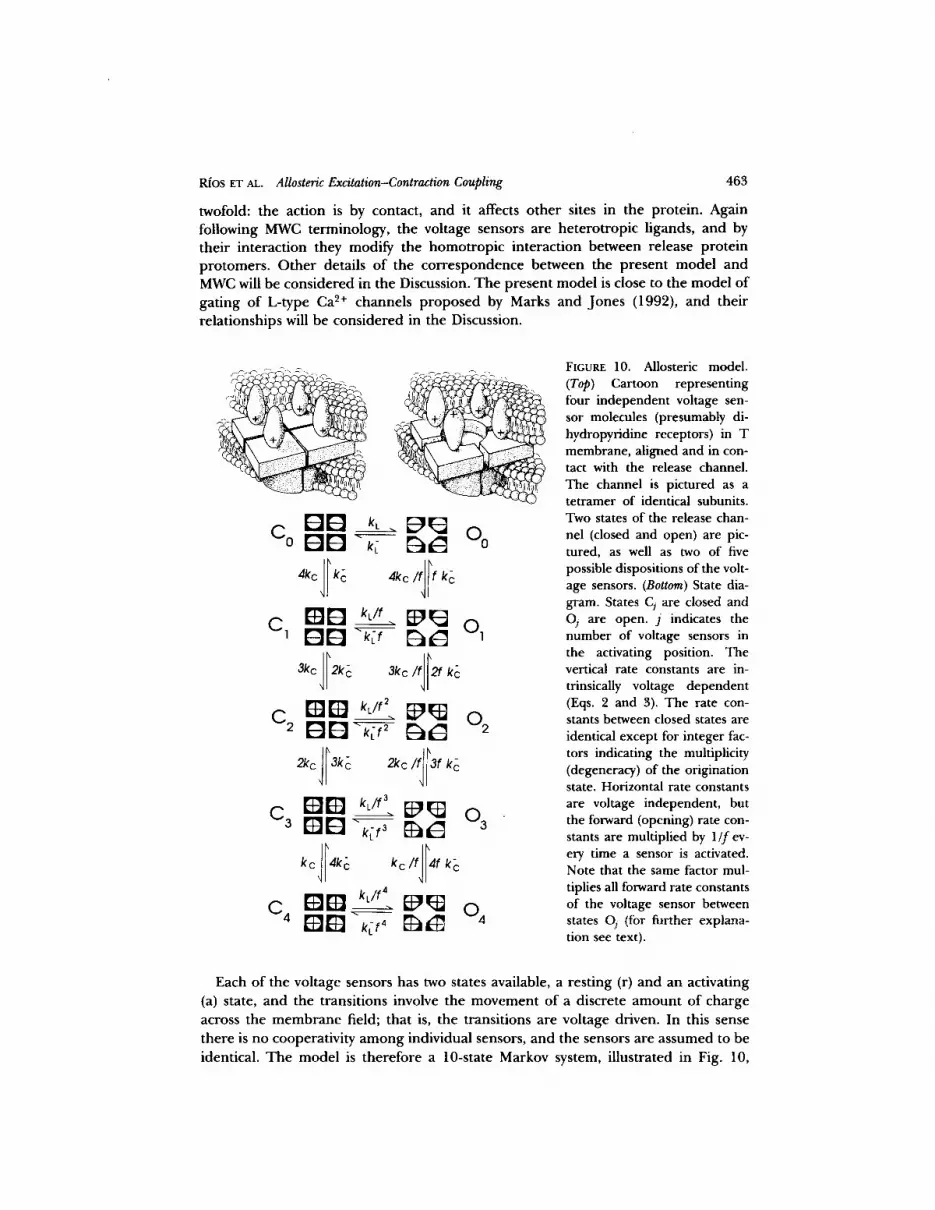
FIGURE 10. Allosteric model. (Top) Cartoon representing four independent voltage sen- sor molecules (presumably di- hydropyridine receptors) in T membrane, aligned and in con- tact with the release channel. The channel is pictured as a tetramer of identical subunits. Two states of the release chan- nel (closed and open) are pic- tured, as well as two of five possible dispositions of the volt- age sensors. (Bottom) State dia- gram. States Cj are closed and Oj are open. j indicates the number of voltage sensors in the activating position. The vertical rate constants are in- trinsically voltage dependent (Eqs. 2 and 3). The rate con- stants between closed states are identical except for integer fac- tors indicating the multiplicity (degeneracy) of the origination state. Horizontal rate constants are voltage independent, but the forward (opening) rate con- stants are multiplied by 1/f ev- ery time a sensor is activated. Note that the same factor mul- tiplies all forward rate constants of the voltage sensor between states Oj (for further explana- tion see text).
Each o f the vol tage sensors has two states available, a res t ing (r) and an activating (a) state, and the t ransi t ions involve the movemen t of a discrete a m o u n t o f charge across the m e m b r a n e field; that is, the t ransi t ions are vol tage driven. In this sense there is no cooperat ivi ty a m o n g individual sensors, and the sensors a re assumed to be
identical . T h e mode l is therefore a 10-state Markov system, i l lustrated in Fig. 10,

4 6 4 THE JOURNAL OF GENERAL PHYSIOLOGY • VOLUME 102 • 1 9 9 3
where the 10 states arise from combining five different possibilities for the sensor and two for the release channel (the individual sensor molecules are considered indistin- guishable and thus there are only five possible states for the sensor, corresponding to 0 through 4 molecules in state a). In Fig. 10 the situation represented on the left is one in which all sensors are in the r state (state Cl of the complete system). On the right, one sensor has undergone the transition and the channel is represented as open (state O1).
The parameters of the model are defined in Fig. 10. Consider first the four states at the top, Co, O0, Cx, and O1 (the others are a simple extension). The transitions between closed and open when all the sensors are in the resting state (Co and O0) are determined by the rate constants kL and k-L. Using MWC terminology, the equilib- rium constant of the closing reaction is named L -- C0/O0 (the symbols of the states are used here to represent their probabilities). The vertical transitions between the two top left states involve the change of one voltage sensor molecule. If the voltage-dependent forward rate constant is termed kc and the backward rate constant k-c, the overall forward rate constant will be 4kc due to the degeneracy of the state with one voltage sensor molecule in the a state. In MWC terminology the equilibrium constant k-c/kc is named KT, and is a dissociation constant (as the corresponding transition is a binding reaction). The binding character of the reaction is of secondary relevance to our application (cf. Discussion). In our model we use the symbol Kc instead of KT.
Consider next the effect of moving one voltage sensor; it will favor the opening of the channel tetramer. In the model this is achieved by multiplying the opening rate constant kL by a factor greater than one, which for traditional reasons is termed l / f ( f < 1) and dividing the backward rate constant k-L by the same factor. Thus, the fac tor fembodies the allosteric effect. As regards the closing equilibrium constant, the result of moving one sensor is multiplying L b y f 2 ( f2 = c in MWC terms).
Having specified these rate constants, the other two rate constants linking O0 and O1 are also specified (to satisfy microscopic reversibility) and turn out to be 4kc/fand fk-c. Thus the dissociation constant Kc becomes K0 for the open channel, and the relationship is again Ko/Kc = f2. This completes the specification of the first ring of four states; the other rings can be specified following the same rules. Only two changes merit comment. The rate constants of the vertical transitions, relating states that are both open (or closed), are similar to those in the top ring of states except for a factor that takes into account the degeneracy of states of the voltage sensor. Thus the rate constant for activation of the second sensor molecule is 3kc and for its deactivation 2k-c. Additionally, it is noted that the allosteric effect simply accumu- lates as a power of the allosteric f ac to r fas the number of activated sensors increases, until the opening rate constant becomes kL/f 4 for the transition from C4 to 04.
Voltage Dependence
Voltage drives the system by driving the two-state transitions of individual voltage sensor molecules:
kc r - ~ a (1)
k c

RiOs El" AL. Allosteric Excitation-Contraction Coupling 465
The two-state transition is governed by a Boltzmann distribution, so that Pa/Pr = exp ( [ V - V]/4K). 1 The kinetics of the transitions are described by exponential rate constants that assume a symmetric barrier
kc = 0.5ae ~v- ~)/8K (2)
k-c = 0.5ae -Iv- 7)/8K (3)
and 0t is the inverse of the time constant at V = V. Normally at rest the sensor molecules are all in state r (V is approximately - 4 0
mV) and the channel is closed. This requires ke << k-e (typical values in the simulation are 0.003 and 1,000 ms-t) . Upon depolarization, voltage sensor mole- cules make transitions individually: for every molecule in state a, the forward opening constant is multiplied by ~ 5 ( f is typically 0.2) and the backward rate constant by 0.2. As the lower states in the diagram become more populated the system shifts to the right side and the channel open probability increases. In the case when the resting tendency to open (kL/k-e - L -l) is very small, only the movement of all four sensor molecules causes the channel to open. The amount of charge moved is simply proportional to the number of sensors that undergo the transition; thus, in the case of extremely high L (low tendency to opening), the open probability (and our measure of it, the release flux, corrected for depletion and normalized) will be proportional to the fourth power of the charge moved. In general, the model predicts a dependence of a lower order.
Simulations
The simulations include steady-state dependencies of charge movement and open probability with voltage and with each other (the open probability from the model is compared with the experimentally evaluated Rm). Simulations also include kinetic solutions, time course of charge movement current, and release at various voltages. Since the model is analogous to MWC, whose steady-state solutions are analytical, it is possible to use these solutions essentially unmodified. The open channel probability is the fraction of release molecules in 0 states (the function of state R in MWC terms):
O 0 + O 1 + O z + O 3 + O 4 P o = ( o 0 + O 1 + O 2 + O 3 + O 4 ) + ( C 0 + C I + C z + C s + C 4 ) (4)
where the symbols represent the probabilities of each state. The fraction of charge moved (Q(V)/Q~a×) is the sum of the (fractional) charges in each state multiplied by the state probability (the saturation function YF in MWC):
(O1 + 202 + 305 + 404) + (C 1 + 2C 2 + 3C 3 + 4C4) QIQ~nax = 4 (5)
Po and Q/Q~x are functions of voltage only, and the expressions can be derived from the above equations and the equilibrium equations of the system. They can also
Note that the steepness factor of the Boltzmann was written as 4K (rather than simply K). This is a matter of convenience in the simulations, responding to the fact that each transition involves one-fourth of the total available charge.

4 6 6 THE JOURNAL OF GENERAL PHYSIOLOGY • VOLUME 102 . 1 9 9 3
b e t a k e n f r o m Eqs. 1 a n d 2 o f M o n o d e t al. (1965) , m a k i n g F ( the c o n c e n t r a t i o n o f
t h e l i g a n d ) e q u a l to 1:
(1 + e v- ~/4Kf-2)4
Po ( l + e V- V/4Kf-2)4 q_ L(1 + e v- V/4K)4 (6)
Q Qm~x
a n d
f -2eV- V/4K(1 + f -Ze v- "Y/4K)S + Le v- 7/4K(1 + e v- ~/4K)3 (1 + f-2eV-V/4K)4 + L(1 + eV-F/4K) 4
(7)
T A B L E I
~ra~ter~luesinSimu&tions
Fiber No. CIO~ K kL k-L f
mM* mV 1~ms 1~ms mV 827 0 4.5 0.002 900 0.175 - 2 0 827 8 4.5 0.006 300 0.175 -20
906 0 3.2 0.002 1,200 0.175 -24 906 8 3.2 0.014 200 0.175 -29
907 0 3.5 0.002 1,500 0.150 -22 907 8 3.5 0.008 375 0.150 -30
908 0 4.0 0.001 1,800 0.175 -26 908 8 4.0 0.005 360 0.175 -26
911 40 4 0.01 180 0.175 -26
Appendix: 0 7 0.001 1,500 0.3 -10 Appendix 8 7 0.003 500 0.3 -10
Parameter values used to simulate equilibrium dependencies of charge and open probability of the release channel with voltage, as well as kinetic records (charge movement currents as functions of time). One additional parameter, the kinetic constant of charge movement (e~, cf. eq. 2), was always 0.2 ms-L The optimal values of the parameters were decided by inspection of simulated curves and data. The goodness of fits is exemplified in Figs. 4 and 6. *The entries in column CIO 4 are not parameters but reminders of the [CIO4] when obtaining the experimental records that were simulated. The records in the presence of CIO 4 were simulated by multiplying the reference value OfkL and dividing k-L by the same factor, as shown in the table. In the cases of fibers 906 and 907 the fits of data in CIO~- were improved if, in addition to changing kL and k-L, ~was shifted by - 5 and - 8 mV, respectively. In the other cases, no improvement was obtained by changing ~. =The entries in the row marked Appendix correspond to the parameter values used in simulations with the generalized (eight sensor) model described in the Appendix.
T h e s e a r e t h e e q u i l i b r i u m r e l a t i o n s h i p s o f t h e sys tem. T h e y w e r e u s e d wi th su i t ab l e
va lues o f t h e p a r a m e t e r s to g e n e r a t e t h e c o n t i n u o u s l ines in Figs. 4 a n d 6. T h e va lues
o f t h e p a r a m e t e r s w e r e s e l ec t ed to b e s t d e s c r i b e t h e d a t a as j u d g e d by eye, a n d a r e
l i s t ed in T a b l e I. In a d d i t i o n to t h e g e n e r a l a d e q u a c y o f t h e s i m u l a t i o n s o f v o l t a g e
d e p e n d e n c e , it is w o r t h n o t i n g t h a t t h e Q(V) d e p e n d e n c e g e n e r a t e d wi th t h e m o d e l ,
as wel l as t h e ac tua l da t a , a r e well d e s c r i b e d by a s ing le B o l t z m a n n f u n c t i o n (Figs. 4 A
a n d 6 A ). I n Figs. 4 B a n d 6 B t h e e x p e r i m e n t a l t r a n s f e r f u n c t i o n / ~ m ( Q ) is c o m p a r e d
w i th t he c o r r e s p o n d i n g t h e o r e t i c a l f u n c t i o n , Po(Q). A g a i n t h e a g r e e m e n t is g o o d , a n d

Rfos ET AL. Allosteric Excitation-Contraction Coupling 467
as shown in Fig. 4 B, the theoretical dependence is almost identical to the best fit power function plotted as a dashed curve. This was also true in the plot of Fig. 6 B (not shown).
The Equilibrium Effects of Perchlorate
Based on the results of Ma, Anderson, Shirokov, Levis, Gonz~ilez, Karhanek, Hosey, Meissner, and Rios (1993), we applied the model to the situation in the presence of CIO 4, assuming that the only change introduced by the anion was an increase in the equilibrium constant of channel opening (a reduction in L). The lines in Fig. 6, A and B are simulations of the results of fiber 908 using the parameters listed in Table I for that fiber. In this case the simulation of the effects of CIO 4 required assuming a reduction of L by a factor of 25. Fig. 6 A shows that the shift in voltage dependence of charge movement and the small increase in the steepness of the curve are well reproduced. Fig. 6 B shows that the model simulates well the reduction in curvature of the transfer function. We included in Fig. 6 B data from Figs. 7 and 8 in the presence of 40 mM CIO 4 (squares). The model simulated well the results using the same parameters and a 100-fold decrease in the value of L. Even though the latter simulation required a normalization by maxima of release and charge that may not have actually been attained in the experiment, it does exhibit the striking lineariza- tion observed experimentally, and this feature is independent of any normalization.
It must be stressed that the changes in the distribution of Q were obtained with a change not involving any of the parameters that describe the voltage sensor. Similar parameter changes simulated the effects in the other fibers listed in Table I. In two of those, however, a visibly better simulation of the effect was achieved assuming an additional shift in V of the voltage sensors by - 5 to - 8 mV.
Simulations of Kinetics
To obtain the kinetic transients of charge movement and release channel open probability, the nine differential equations and one conservation equation of the model were solved numerically by the unmodified Euler method. Given the large magnitude of the constant k-L (typically 1,000 ms-l) , the time increment (Ate) was usually 1 Vs. A few transients were computed with ~te -- 0.2 ~s, with no detectable changes in the solutions. An increase in ~te beyond 1.5 Cs led to catastrophic results. Working with ~t~ -- 1 ~s the computer time was not trivial, ~ 1 s time per ms of computed transient on a 486 processor-based PC clone at 33 MHz.
Fig. 9 B (thin traces) shows the transients of charge movement at several voltages in reference conditions. The model parameters were the same as those used for the reference equilibrium simulations of fiber 827 (shown in Fig. 3). They should be compared with the experimental records obtained in reference conditions in a highly depleted fiber, exemplified by the thin traces of Fig. 9 A. There is general qualitative agreement, as both the experimental and the simulated transients are approximately exponential relaxations. The time constants of the simulated records are voltage dependent, increasing at intermediate voltages as do the experimental ones. The time constant of the OFF transients is approximately the same in all records in both experiment and theory.
The surprising aspect of the kinetic simulations is the fidelity with which the effects

468 T H E J O U R N A L OF GENERAL PHYSIOLOGY • VOLUME 1 0 2 . 1 9 9 3
of CIO 4 are simulated. In both experiment and theory the results in CIO~ are represented with thicker traces. The effect of CIO 4 is simulated again as a reduction of the equilibrium constant L, in this case by a factor of 9. For kinetic purposes this factor was split evenly between the opening rate constant kL, which was multiplied by 3, and the closing rate constant k-L, which was divided by the same number.
The multiple experimental effects of C10 4 on kinetics are all reproduced by the model in striking detail: (I) The ON is slower but the current intensity is initially the same. It is only after the initial peak of charge movement current that the records in CIO~ become slower. (2) The difference in kinetics is essentially lost at high voltages where the ON becomes fast regardless of CIO~. (3) The OFF is about twofold slower in CIO 4. (4) The ON current in CIO 4 loses its simple exponential character and a hump-like portion appears, which is due to a change in the sign of the curvature rather than a secondary rising phase. (5) The OFF also acquires an inflection, which in the simulation is due to the appearance of a conspicuous rising phase. In the experimental records such a rising phase is obscured by the presence of a very fast component. This fast component is the only feature of the experimental records that is not present in the simulations (but see simulations in the Appendix). Again it should be remarked that these effects on charge movement kinetics are produced in the model by changing a parameter of the release channel, not of the voltage sensor.
The same simulation also generates a Po(t) record at every voltage. These, however, do not have a suitable experimental correlate, as the conditioning pulses used reduce but do not eliminate the peak component of the release waveform. Somewhat fortuitously, the experiments in high CIO~ result in release fluxes almost devoid of inactivation, and a comparison was at tempted to see if the simulations had at least adequate qualitative features. Fig. 11 A shows Po(t) records generated with parame- ters similar to those used for Figs. 9 B and 6 (but the observations are not dependent on a particular choice of parameters). Fig. 11 (top) shows records in reference and CIO 4 (meaning that the reference hE is multiplied and k-L divided by 3) at two different voltages ( - 4 0 mV in reference, - 6 3 mV in CIO4) chosen to make the final open probability similar. It is clear that the kinetics of activation are much slower in C10 4, to the point that activation is not complete by 100 ms. This compares well with the release records at - 6 0 or - 6 5 mV in Fig. 7. Fig. 11 (bottom) shows the corresponding charge movement currents. They have a prolonged phase during the ON in CIO], which underlies the slow activation of release in the simulations and generally agrees with slow phases observed experimentally (Figs. 8 and 9). Finally, the simulations of Po(t) also exhibit slower OFF closing in CIO 4, as observed in the experiments.
The slower time course of release channel closing in CIO~- helps us understand the intriguing kinetic aspects of the simulated charge movement that so well resemble the experimentally observed effects. As we indicated, the essence of the allosteric effect (and a consequence of micro-reversibility in a closed system) is that the distribution of mobile charge shifts to more negative voltages when the channel opens. Therefore the transition to equilibrium, upon a depolarization that opens channels, occurs in two qualitatively different stages. First the closed channels activate their charge movement along the left side states of the diagram. At some point the channel opens

RfOS ET AL. Allosteric Excitation-Contraction Coupling 469
and the system moves fur ther down in the set of states a long the r ight side o f the
d iagram. When CIO 4 is p resen t the o p e n i n g is substant ial with less depolar iza t ion , and this lef t - to-r ight flow in the d i a g ra m becomes more p r o m i n e n t and p ro longed . This results in p ro longa t ion of the movemen t o f charge (and opening) .
0.5
0.4
0.3
~ 0.2
~ 0.1
0.0
-0 .1
0.1
I
~ 0.0
o
o
g
e j
-0 .1
- - -40 mV, reference -63 mY, "pe rch lo ra te"
I I I I
50 100 150 200
- - -40 mV, re fe rence -63 mV, "perchlorafie"
t t I I
50 100 150 200
t ime (ms)
FIGURE 11. How C10~- affects kinetics in the model. Simula- tions of Po(t) (top) amd charge movement current (bottom). Po(t) was computed as the sum of the occupancies of states Oj. Charge movement current as the time derivative of Q./Q, max in turn is given by Eq. 5. The parameters are similar to those used for Fig. 9 (908 entries in Table I) but K was 6 mV and was - 4 0 mV. The two voltages, - 4 0 mV in reference and - 6 3 mV in perchlorate simulations, were chosen to give approxi- mately the same Po at the end of the pulse.
Similar cons idera t ions app ly to deact ivat ion: an initial fast phase of charge movemen t co r re sponds to m o v e m e n t o f systems that were on the left set o f states (closed). This is followed by a p ro t r ac t ed phase of r e tu rn of mobi le charge, l imi ted in its rate by the v o l t a g e - i n d e p e n d e n t r ight- to- lef t (closing) transit ions. In summary, the

4 7 0 T H E JOURNAL OF GENERAL PHYSIOLOGY • VOLUME 102 • 1 9 9 3
kinetic peculiarities are explained in this coupled system because the charge movement cannot end until the gating (opening or closing) is completed.
A Failure of the Model
In the reference situation the transfer function can be described as a power function of a high order (Figs. 4 B and 6 B; see also Simon and Hill, 1992). This was explained as evidence that several sensors must move to significantly increase the open probability of the release channel (Simon and Hill, 1992). This in turn requires the system to be far from saturation; in other words, even with all four sensors activated, the open probability should be < I. This is reflected in the simulations. Thus in Fig. 3 the simulated open probability reaches a maximum of 0.72 when all voltage sensors are in the activating position (the plotted value is different because of normalization). Consequently, one of the simple predictions of the model is that CIO 4 should increase the maximum absolute value of Rm, attainable at high voltage when all the sensors move to state a.
We carried out four experiments designed specifically to test this prediction using the reversibility of the effect of CIO~. The experiments consisted in repeatedly changing the external solution back and forth from reference to CIO 4 while repeating a large pulse (to +20 or +30 mV) that moved a maximal amount of charge. One such experiment is illustrated in Fig. 12. Fig. 12 A shows four release records obtained successively in reference, CIO 4 (8 mM), a washout reference solution, and again in CIO 4. The records shown have already been corrected for depletion during the pulse (they are/~c(t) records). It can be seen that both records in CIO 4 exhibit slower deactivation than in reference.
In this experiment, as in two of the other three, the release flux was decaying in the successive pulses. The estimated CasR of SR calcium content was also decaying. Steady release after correction (circles) and CaSR are plotted in Fig. 12 B. The plot shows that both values decreased more or less in parallel, suggesting that the decay in /~c(t) may have been due to depletion. Finally, the filled circles in Fig. 12 C plot the ratio Rm/CasR, which is a measure of the permeability of the release pathway. Other symbols in the same graph represent permeability values estimated in the same way in three other experiments. On the whole, we found no evidence of increase in Rm (at high voltage) when the fibers were in CIO 4. This constitutes a major predictive failure of the model.
One intuitive explanation of this failure is that perhaps EC coupling does work close to saturation; that is, less than maximal amounts of charge movement result in full activation of the release channel. It is simple to increase the saturation of channel opening in the model by decreasing the value of L. However, this causes a decrease in the curvature of the transfer function (the exponent of the power function decreases). Thus, the model in its present form cannot both reach full saturation of channel opening and reproduce the third- or fourth-order power relationship between release and charge movement.
This failure may be due to a known oversimplification in the model, the fact that each voltage sensor molecule (of which we assume there to be four per release channel) has only two states available in the model. Since the voltage sensors presumably correspond to dihydropyridine receptors (l~os and Bruin, 1987; Tanabe,

RfOS ET AL. Allosteric Excitation-Contraction Coupling 471
Beam, Powell, and Numa, 1988) and these have multiple charged segments in their structure (Tanabe, Takeshima, Mikami, Flockerzi, Takahashi, Kanagawa, Kojima, Matsuo, Hirose, and Numa, 1987), it is likely that a description in which every sensor has more than one moving charge will be more realistic.
A B
50 m t 15
10 /~M/ms
r e f e r e n c e , w a s h o u t p e r c h l o r a t e
1
C I1
I
o
0 6 0
6 -
4
2 -
FIGURE 12.
o 1
• O e
P e r e h l o r e t e
o
t 1 80 100
3
A
0 ~20
i
0 I I I 60 BO 100 120
time (rain)
Release at high voltage. (A)/~c(t) during a pulse to +20 mV in a fiber exposed successively to external solutions reference (1), 8 mM CIO~-, reference, and C10~ again. (B) Timing of solution changes, Rm, in the successive pulses (circles), and values of the parameter CasR derived in the correction procedure (triangles). (C) Ratio of Rm/CasR (permeability) during the successive pulses in four different experiments (the abscissa, or timing of changes in CIO~, is accurate for the experiment illustrated in A and B, but only a rough approximation for the other three experiments). Circles, fiber 900, same as in A and B; diameter, 100 Izm; [ApIII], 1.7-2.1 mM. Inverted triangles, 895; diameter, 98 Ixm; [AplII], 0.72-1.1 mM. Squares, 894; diameter, 132 I~m; sarcomere length, 1.8 I~m; [ApIII] 1.5-2.1 mM. Triangles, 893; diameter, 155 Ixm; [ApIII], 1.8-2.1 mM. All fibers in external solution Cd-La-A9C and internal solution 15 EGTA with 1.6 mM ApIII at slack length. Temperature, 10-12°C.
One such description, with two independent moving charges per voltage sensor, is developed in the Appendix. It successfully predicts all the observations, including the high order power relationship Po(Q) and the failure of CIO 4 to increase the absolute maximum of release. Its better performance can be understood intuitively: it is

4 7 2 THE JOURNAL OF GENERAL PHYSIOLOGY • VOLUME 102 • 1 9 9 3
analogous to a system with more than four voltage sensors (eight in the case treated in the Appendix) and therefore it may have a high order transfer function (implying that four or five sensors have to move to substantially increase Po) and still reach maximum Po when less than the maximum number of sensors move to the a state.
D I S C U S S I O N
We have constructed a model that assumes contact interaction between voltage sensors of the T tubules and release channels of the SR. The model accounts well for several sets of observations. It describes well the voltage distribution of mobile charge, reproducing both observed Q(V) dependencies and the Boltzmann function that is generally used in their description. It reproduces well the voltage dependence of release flux, including activation at higher voltage than charge movement and the fact that release initially increases with voltage more steeply and with more curvature than charge movement. Not surprisingly, since it describes well the separate V dependencies, it reproduces well the transfer function/~m(Q). Finally, the model generates kinetic records of charge movement that are relatively uneventful mono- tonic relaxations, although on closer analysis they diverge from exponentials in interesting ways (see below).
Relationship with Previous Models
This model is directly inspired by the proposal of Chandler et al. (1976) of a mechanical link (plunger) in the T-SR junction. Two quantitative formulations have appeared that are somehow inspired by the plunger model (although they do not specifically assume or require a mechanical connection). One is by Melzer, Schneider, Simon, and Szucs (1986), in which the voltage sensor opens the channel in two stages, the first accounting for subthreshold charge and the second directly causing opening. Another is a Hodgkin-Huxley four-particle scheme recently proposed by Simon and Hill (1992). The present model has a noteworthy difference with the plunger concept and its above-mentioned formulations: it abandons the idea of a rigid link that unequivocally determines the state of the channel. The present model allows freedom in the Ca channel to be either open or closed in any of the five states of the voltage sensor. In that manner the coupling between sensor and channel becomes flexible, as reflected, for instance, in the fact that the threshold charge movement is no longer a constant (essentially arbitrary) parameter, as in Melzer et al. (1986), but a function of the rate constants of the system (which may vary under the influence of modulators).
The model of Simon and Hill (1992), in which four independent two-state voltage sensors must move to open the channel, is reached as a limiting case of the present model, when the intinsic open probability of the channel is so low that all four sensors must move before that probability becomes sizable. The present model accounts for the difference between our measurements (in which the exponent of the power describing the transfer function was less than 3) and those of Simon and Hill (in which the exponent was 4) simply as a difference in the value of L. One way of describing the present model is as a generalization of Simon and Hill's, in which the rigid link requisite that four sensors must move to open the channel has been removed.

Rfos ET AL. Allosteric Excitation-Contraction Coupling 473
Dr. Bruce Simon pointed out to us that the present model has another major difference with the Hodgkin-Huxley rn 4 formulation of Simon and Hill (1992). In that formulation the sensors are independent particles, and their rates of movement are determined by voltage only. Therefore the model of Simon and Hill predicts OFF time constants that are independent of the magnitude of the test pulse. Such prediction clearly fails in CIO 4 (as demonstrated in Figs. 8 and 9); when release activates, the OFF current becomes slower or a slower phase appears. In reference, however, it seems to hold. These features are especially well reproduced in the simulations when the generalized model of the Appendix is used (Fig. 14).
Effects of Perchlorate
A significant feature of the allosteric model is that it reproduces in intriguing detail the effects of CIO 4 on voltage distributions, transfer function, and kinetics. The most interesting aspect of the simulations of CIO 4 effects is that only a property of the release channel is assumed to be changed by CIO 4, the tendency to opening, described by the equilibrium constant L (or two kinetic constants). This single change is sufficient to reproduce in good detail equilibrium and kinetic effects on both the release function and the charge movement properties. A model-independent conclu- sion of the previous articles of this series is that CIO~- does not have its most characteristic effects on DHP receptor molecules unless they are in physiological interaction with the release channel of skeletal muscle. The simulations in this article now show that an effect on the release channel will be transmitted backward to the voltage sensor and give secondarily the effects observed, provided that an allosteric interaction links sensors and channels. Thus, the observations of the previous articles plus the simulations in this article constitute functional evidence of allosteric interaction.
A more circumspect interpretation of the simulations in this paper is that the states represented in the diagram of Fig. 10 are states of a sensor--channel complex, without a specific molecular correspondence to dihydropyride and ryanodine recep- tors. In this view, the C ~ O transitions could describe voltage-independent conformational changes in the sensor itself, which in turn determine opening of the release pathway. The effects of CIO 4 would still be ascribed to this transition, and their formalization would be identical, making this version of the model isomorphic with the one presented before. In this view, the present observations would have no bearing on the mechanism of transmission.
We have, however, shown in the previous paper that C10 4 opens the ryanodine receptor channel in bilayers and increases the binding of ryanodine and the flow of 45Ca from SR vesicles. Additionally, in the first article of this series we found that the SR lost its calcium content more rapidly in single fibers in the presence of C10~. Surprisingly, the gating currents of the L-type Ca 2+ channels in rabbit ventricle were essentially insensitive to CIO 4 (Ma et al., 1993). These observations favor the view that CIO 4 has its characteristic EC coupling effects, or some of them, through a primary effect on the release channel. The kinetics of onset and reversal of the effects (Gonz~lez and Rios, 1993), plus the observation that the effects are the same when the anion is present in the internal solution (Csernoch, Kovacs, and Szucs, 1987; Delay, Garcla, and S~nchez, 1990), are also consistent with this view.

474 T H E J O U R N A L OF GENERAL PHYSIOLOGY • V O L U M E 1 0 2 - 1 9 9 3
Since the observations in bilayer and vesicle preparations are essential justifications of the present model, one wonders to what extent effects of CIO 4 on release channels in bilayers can be extrapolated to the functioning cell. For instance, the mean open probability of a release channel in a bilayer with 20 mM CIO 4 is 5.7% (Table II of Ma et al., 1993). At first sight this seems disproportionately greater than the activation of the release channel at rest that emerges in the present simulations. Of course, the resting interaction of the release channel with the voltage sensor, and other functional interactions lost in the processes of fractionation and reconstitution may change the properties of the release channel in many ways, including altered Po and sensitivity to CIO 4 (thus Ma et al. [1993] reported that purified ryanodine receptors had a much higher affinity for [3]ryanodine than ryanodine receptors in triad- enriched vesides).
The open probability in the simulations is, however, not negligible. For instance, in Fig. 11 (top) the Po at rest, in the CIO 4 simulation, is close to 1%. Not much can be made of this number; it depends strongly, for instance, on the number of moving particles assumed in the voltage sensor (cf. Appendix; note that Po [ - 9 0 mV, in ClOg] is much less than 1%). In general, however, this model predicts finite values of Po at rest in the presence of CIO~-. The more rapid decay in calcium content in the SR, reported tentatively in Gonz~lez and Rtos (1993) as one of the effects of CIO 4, could be a simple consequence of this activation at rest. Both the experimental observations in muscle fibers and the simulations are thus generally consistent with the observations with fractionated SR.
Not all the effects of CIO 4 described by Gonz~lez and Rios (1993) are accounted for in these simulations. In particular, the simulations predict a small increase in steepness and a small leftward shift of Q(v). The large increase in steepness and the large shift observed in nondepleted fibers cannot be explained without assuming additional sites or mechanisms. It is possible that these effects involve the positive feedback processes proposed to take place between the voltage sensors and the locally increased [Ca2+]i (Csernoch et al., 1991; Pape et al., 1992) plus a negative shift in voltage dependence shared with other anions.
On the other hand, the decrease in the. proportion of inactivating release flux (relative to the noninactivating component Rm), which was shown to be a characteris- tic effect of C10 4 (Gonzfilez and Rios, 1993), could be a simple consequence of slower activation in the presence of inactivation that proceeds at a constant rate. Such an effect is d!splayed by simulations (l~os, E., manuscript in preparation) in which the decay of R(t) after the peak is modeled as a Ca2+-dependent inactivation of open channels (Simon and Schneider, 1988).
Cooperative Opening?
We gave the model a form identical to that chosen by Monod et al. (1965) to describe interactions in hemoglobin and other proteins with subunits. The MWC model is an oversimplified representation of the events in hemoglobin; Ackers, Doyle, Myers, and Daugherty (1992), for instance, have shown the existence of configurations interme- diate between all T and all R. The full cooperativity assumed by Monod et al. (1965) is, however, not essential in our simulations. This assumption was made here to simplify the model and reduce the number of adjustable parameters; even though we

Rfos ET AL. Allosteric Excitation-Contraction Coupling 475
have not used it, we feel that a more general model, like that of Koshland, Nemethy, and Filmer (1966) will simulate the results at least equally well.
There is a more interesting angle to the issue of full cooperativity. Monod (cited by Perutz, 1990) remarked that the expectation of a concerted transition in which all protomers of a protein undergo a conformational change simultaneously is strongest when there is identity of all protomers. In that case, by a simple argument of symmetry, it is difficult to imagine stable conformational changes affecting some but not all protomers. It is interesting that hemoglobin does not satisfy this full symmetry condition by not being a homotetramer. In contrast, and for all we know, the ryanodine receptor is a homotetramer and fulfills the conditions to expect a fully cooperative transition into the open state.
There have been reports of subconductance states of the release channel. Three conductances, scaled as I, 2, and 4 (Ma, Fill, Knudson, Campbell, and Coronado, 1988) or four conductances, scaled as 1, 2, 3, and 4 (Smith, Imagawa, Fill, Campbell, and Coronado, 1988; Liu, Lai, Rousseau, Jones, and Meissner, 1989) have been described for the purified ryanodine receptor reconstituted in bilayers. In principle, these substates may correspond to a piecewise opening mechanism (see Liu, et al., 1989, for a discussion of possibilities), against the hypothesis of full cooperativity. In a study of native protein from heavy SR, however, substates were observed in only 4% of the incorporations (Fill, Mejfa-Alvarez, Zorzato, Volpe, and Stefani, 1991). Thus there is no strong experimental evidence against the assumption of fully cooperative opening in native channels.
Marks and Jones's (1992) model of gating of L-type Ca channels is formally identical to the one presented here. One of the most striking aspects of their work is the simulation of several effects of the dihydropyridine agonist (+)202-791, assuming that the agonist alters the channel open-closed equilibrium without directly affecting the voltage sensors. With this assumption they account for a leftward shift of the activation curve, a small increase in steepness, and kinetic effects that include a slowing of deactivation tail currents. Obviously the effect of CIO 4 on Ca release channel gating is very similar and was modeled in this article using the same assumptions. (It was, in fact, the similarity of these effects that led us to investigate the applicability of an MWC model to our problem.) In a way, our hypothesis regarding the effect of CIO~ is that the anion is the Bay K of EC coupling! The analogy is limited, however, as CIO 4 seems to be a low affinity ligand, relatively nonspecific (in the sense that its effects are shared with other anions of rather different structure like thiocyanate, Ma et al., 1993), and with multiple binding sites (as suggested by the gradation of effects with concentration).
Hump-like Kinetics
A somewhat unexpected feature of the kinetic simulations was the appearance of hump-like components in the charge movement current, especially visible in the simulations with a generalized model (Appendix, Fig. 14). This feature of the simulated records cannot be readily equated to Qv because it does not generate real humps (secondary raising phases in the current) but regions of downward concavity during the ON transient. Also at variance with Q~, the hump-like ONs are accompa- nied by hump-like OFFs. The generation of these departures from exponential

476 THE JOURNAL OF GENERAL PHYSIOLOGY • VOLUME 102 " 1993
re laxa t ion is readi ly unde r s t andab le : the al losteric coupl ing between individual sensors and the release channel results in a coopera t ive coupl ing a m o n g the four sensors o f a channel . When a sensor moves and (especially if CIO 4 is present ) causes o p e n i n g o f the channel , the o the r sensors will be more likely to move at the same voltage. This p h e n o m e n o n , which can also be cons idered a positive feedback, under l ies the downward concave regions o f the ON simulations.
T h e p h e n o m e n o n has formal analogies with the Ca2+-media ted posit ive feedback mechan i sm used by Pizarro et al. (1991) to s imulate Q~, a l though the la t ter involves in te rchanne l feedback, whereas the allosteric mechan i sm has its self-reinforcing effects l imi ted to the sensors that ope ra t e on the same channel . It is, however, clear that a coup led system of the type p r o p o s e d here will have coopera t ive p roper t i e s that may he lp exp la in Qv. Coopera t ive mechanisms for Qv have been discussed by H u a n g (reviewed in 1989) and Hui and C h a n d l e r (1990), who specifically p r o p o s e d that Qv could reflect the m o v e m e n t o f a te t rad o f sensors. T h e p resen t mode l in fact features coopera t ive movemen t o f mul t ip le sensors m e d i a t e d by coupl ing to the release channel . It is possible that the humps and o the r features descr ibed as Qv obey a dual mechanism: a feedback m e d i a t e d by bo th local Ca 2÷ and allosteric coupl ing to the release channel .
In conclusion, the evidence p re sen ted in this series o f articles, plus the success of the mode l in r e p r o d u c i n g the observat ions, gives suppor t to the hypothesis of mechanica l t ransmission. This evidence for mechanica l t ransmission is still obviously indirect . T h e model , however, makes more testable predic t ions . For instance, o the r substances that modify the open-c losed equi l ibr ium of the release channe l should modify charge movemen t in p red ic tab le ways.
A P P E N D I X : A G E N E R A L I Z A T I O N OF T H E A L L O S T E R I C
M O D E L
As noted in the text, the model fails in the sense that it cannot have two properties simultaneously: a close approach to saturation of the open probability when movement of the voltage sensors is complete and a high order dependency between release (open probability) and charge movement at low voltage. A generalized model can generate transfer functions with both high curvature and saturation.
Based on the consensual nature of the voltage sensors and the existence of four separate transmembrane segments with highly positive charge, the generalized model assumes that each voltage sensor molecule has multiple (n) moving charges. For simplicity, the charges are described as independent. A third assumption has to do with the manner in which charges from the same sensor determine the behavior of that sensor. One possibility is to make each voltage sensor molecule independently and allosterically controlled by its n moving charges, using, for instance, the formalism of Marks and Jones (1992) to determine the state of the individual voltage sensor molecules. In turn, the state of the release channel is decided by its four voltage sensors as developed in the text. This type of generalization leads to an n-branched, two-step allosteric model.
We did something more parsimonious, simply assuming that each of the n charges in one sensor would both move independently and independently control the release channel. This assumption is equivalent to a model with 4 × n independent and indistinguishable sensors, of which the model described in the text is the simplest case (n = 1).
In Figs. 13 and 14 we present equilibrium and kinetic simulations with n = 2. The differences

RIOS ET AL. Allosteric Excitation-Contraction Coupling 477
with the simpler case are rather trivial: the model now has 18 states, Co to Cs and O0 to Os; the form of the rate constants of the voltage-dependent transitions is the same but the degeneracy factors multiplying kc and k-c are different. Thus the rate constants connecting Cj and Cj+t are now (8--j) kc and ~_c. The rate constants of the horizontal transitions are still ktf-s and k_tgO.
The model has the same number of parameters as the simpler case and the values used in the
1.0
0.8
0.6
0.4
0.2
0.0
A
o o o o . . . . . . . . . . . . . . . . . .
charge
...... f
, - - J - " : . [ . - - . - r . . . . . . I I l I
-100 -80 -60 -40 -20 0 20 40 W m (mY)
B 1.0
0.8
r
0.6 - pe rch lo ra
0.20"4 _ ~ e f e r e n e e
0.0 I I I
0.0 0.2 0.4 0.6 0.8 1.0 charge
FIGURE 13. Simulations with a generalized allosteric model. (Top) Voltage distribution of mobile charge (Q(V), continuous lines) and activation of release flux (dashed lines) with the model described in the Appen- dix, having two independent charges in each of four voltage sensor molecules. The parame- ter values are listed in the Ap- pendix line of Table I. The thick lines (labeled perchlorate) represent the corresponding functions when the rate con- stant kL is multiplied and k-i. is divided by 3. (Bottom) The cor- responding transfer functions, Po(Q).
figures are listed in Table I in the rows labeled Appendix. As always, the effect of CIO 4 was simulated by multiplying kL and dividing k-L by the same factor (3 in this case). The model performs as expected: it gives a large shift between the voltage dependencies of charge and release (Fig. 13 A ). It generates a transfer function with high curvature (Fig. 13 B) correspond- ing to the fact that several charges have to move in order to induce opening. Since there are

478 T H E J O U R N A L O F G E N E R A L P H Y S I O L O G Y • V O L U M E 102 • 1993
now eight charges per channel, the open probability saturates; that is, it reaches a maximum at voltages where charge is still moving. In other words, the increased number of mobile charges per channel is sufficient to have the high order dependence of open probability on charge movement (multiple charges required to open a channel) and for some charges to be superfluous (saturation of open probability reached with fewer than the maximum number of charges).
This phenomenon of saturation, of course, solves the problem with the effect of CIO 4 at high voltage. Fig. 13 B shows that CIO 4 linearizes the transfer function but does not significantly increase the maximum open probability.
The kinetic simulations with the generalized model keep the properties seen with the simple model, including substantial slowing of the transients, and feature new intriguing properties. There is now an initial fast component during the OFF that was not present in the previous simulations but was observed in the experimental records (Fig. 9 A). This fast component corresponds to the same saturation phenomenon indicated above (the charges that constitute the fast component move among O states without greatly changing Po).
V
- - re ference ~ p e r c h I o r a t e
/ / ~ 0 2 5 / m s
0 m s
? FIGURE 14. Kinetic simula- tions with the generalized allo- steric model. Selected records using the generalized 8 sensor model with the same parame- ters used for Fig. 13.
There are also two phases during the ON, but those had already been noted in the simulations with the simpler model. From the simulations with either model it appears that part of the nonexponential phenomena described as Q~ currents could be due to aUosteric interactions.
Note added in proof" Gyorke and Palade (1992) recently repor ted that CIO 4 has no effect on calcium release in crayfish skeletal muscle. This result does not support the
view that the primary target of CIO 4 is the release channel , suggesting instead, as the authors indicate, that skeletal muscle-style interact ion between the two proteins is essential for the CIO 4 sensitivity. This conclusion, however, is inconsistent with the observation in the second paper of this series (Ma et al., 1993) that C10 4 increases affinity for ryanodine in the same propor t ion in purified RyR protein and in triad
enr iched fractions.
We are grateful to Dr. Theodore Marks and Dr. Stephen Jones for access to their manuscript on allosteric channel gating at an early stage of the inception of this paper, which was greatly influenced by their work. We are indebted to Dr. Bruce Simon for openly and generously sharing with us his

Rfos El" AL. AUosteric Excitation-Contraction Coupling 479
many ideas on control of calcium release, even when under the influence of strong electromagnetic fields.
This work was supported by a grant from the National Institutes of Health (ARo32808). J. Ma was the recipient of a Muscular Dystrophy Association postdoctoral research fellowship.
Original version received 29July 1992 and accepted version received 20 May 1993.
R E F E R E N C E S
Ackers, G. K., M. L. Doyle, D. Myers, and M. A. Daugherty. 1992. Molecular code for cooperativity in hemoglobin. Science. 255:54-63.
Anderson, K., R. Grunwaid, A. El-Hashem, R. Sealock, and G. Meissner. 1990. High affinity
ryanodine and PN200-110 binding to rabbit skeletal muscle triads. Biophysical Journal. 57:171a. (Abstr.)
Block, B. A., T. Imagawa, K. P. Campbell, and C. Franzini-Armstrong. 1988. Structural evidence for
direct interaction between the molecular components of the transverse tubule/sarcoplasmic reticulum junction in skeletal muscle.Journal of CeU Biology. 107:2587-2600.
Brandt, N. R., A. H. Caswell, S. R. Wen, andJ . A. Talvenheimo. 1990. Molecular interactions or the
junctional foot protein and dihydropyridine receptor in skeletal muscle triads.Journal of Membrane Biology. 113:237-251.
Chandler, W. K., R. F. Rakowski, and M. F. Schneider. 1976. Effects of glycerol treatment and maintained depolarization on charge movement in skeletal muscle.Journal of Physiology. 254:285- 316.
Csernoch, L., L. Kovacs, and G. Szucs. 1987. Perchlorate and the relationship between charge movement and contractile activation in frog skeletal muscle fibres. Journal of Physiology. 390:213- 227.
Csernoch, L., G. Pizarro, I. Uribe, M. Rodriguez, and E. Rios. 1991. Interfering with calcium release
suppresses Iv, the "hump" component of intramembranous charge movement in skeletal muscle. Journal of General Physiology. 97:845-884.
Delay, M., D. E. Garcia, and J. A. S~inchez. 1990. The effects of lyotropic anions on charge movement, calcium currents and calcium signals in frog skeletal muscle fibres.Journal of Physiology. 425:449--469.
Donaldson, S. K. 1985. Peeled mammalian skeletal muscle fibers: Possible stimulation of Ca 2+ release
via a q-T-SR mechanism. Journal of General Physiology. 86:501-525.
Fill, M., R. Mejia-Alvarez, F. Zorzato, P. Volpe, and E. Stefani. 1991. Antibodies as probes for ligand gating of single sarcoplasmic reticulum Ca 2+ release channels. Biochemical Journal. 273:449-457.
Fleischer, S., and M. Inui. 1989. Biochemistry and biophysics of excitation-contraction coupling. Annual Review of Biophysics and Biophysical Chemistry. 18:333-364.
Garcia, J., G. Pizarro, E. Rios, and E. Stefani. 1991. Effect of the calcium buffer EGTA on the "hump"
component of charge movement in skeletal muscle.Journal of General Physiology. 97:885-895. Gonz~ilez A., and E. Rios. 1992. Reversible abolition of Q7 by intracellular BAPTA in frog muscle.
Biophysical Journal. 61:130a. (Abstr.)
Gonz~ilez, A., and E. Ra'os. 1993. Perchlorate improves transmission in skeletal muscle excitation- contraction coupling. Journal of General Physiology. 102:373-421.
Hollingworth, S., A. B. Harkins, N. Kurebayashi, M. Konishi, and S. M. Baylor. 1992. Excitation- contraction coupling in intact frog skeletal muscle fibers injected with mmolar concentrations of fura-2. Biophysical Journal. 63:224-234.
Huang, C. L. H. 1987. 'Off' tails of intramembrane charge movements in frog skeletal muscle in perchlorate containing solutions. Journal of Physiology. 384:491-510.

480 THE JOURNAL OF GENERAL PHYSIOLOGY • VOLUME 102 . 1993
Huang, C. L. H. 1989. Intramembrane charge movements in skeletal muscle. Physiological Reviews. 68:1197-1247.
Hui, C. S., and W. K. Chandler. 1990. Intramembranous charge movement in frog cut twitch fibers
mounted in a double Vaseline-gap chamber.Journal of General Physiology. 96:257-298.
Hui, C. S., and W. Chen. 1992. Effect of conditioning depolarization and repetitive stimulation on Q[3
and Q7 charge components in frog cut twitch fibers. Journal of General Physiology. 99:1017-1043.
Jacquemond, V., L. Csernoch, M. G. Klein, and M. F. Schneider. 1991. Voltage-gated and
calcium-gated release during depolarization of skeletal muscle fibers. Biophysical Journal. 60:867- 875.
Koshland, D. E., G. Nemethy, and D. Filmer. 1966. Comparison of experimental binding data and
theoretical models in proteins containing subunits. Biochemistry. 5:365-385.
Liu, Q. Y., A. Lai, E. Rousseau, R. V. Jones, and G. Meissner. 1989. Multiple conductance states of the purified calcium release channel complex from skeletal sarcoplasmic reticulum. Biophysical Journal. 55:415-424.
Ma, J., K. Anderson, R. Shirokov, R. Levis, A. Gonzglez, M. Karhanek, M. M. Hosey, G. Meissner,
and E. Rios. 1993. Effects of perchlorate on the molecules of excitation-contraction coupling of skeletal and cardiac muscle.Journal of General Physiology. 102:423-448.
Ma, J., M. Fill, C. M. Knudson, K. P. Campbell, and R. Coronado. 1988. Ryanodine receptor of
skeletal muscle is a gap junction-type channel. Science. 242:99-102.
Marks, T. N., and S. W. Jones. 1992. Calcium currents in the A7r5 smooth muscle-derived cell line.
An ailosteric model for calcium channel activation and dihydropyridine agonist action. Journal of. General Physiology. 99:367-390.
Meissner, G., E. Darling, and J. Eveleth. 1986. Kinetics of rapid Ca 2+ release by sarcoplasmic
reticulum: effects of Ca r+, Mg 2+ and adenine nudeotides. Biochemistry. 25:236-244.
Melzer, W., M. F. Schneider, B. Simon, and G. Szucs. 1986. Intramembrane charge movement and
Ca release in frog skeletal muscle.Journal of Physiology. 373:481-511.
Monod, J., J. Wyman, J.-P. Changeux. 1965. On the nature of allosteric transitions: a plausible model.Journal of Molecular Biology. 12:88-118.
Pape, P. C., D.-S. Jong, and W. K. Chandler. 1992. Effects of sarcoplasmic reticulum (SR) calcium loading on intramembranous charge movement in frog cut muscle fibers. Biophysical Journal. 61 :A130. (Abstr.)
Perutz, M. 1990. Mechanisms of Cooperativity and Allosteric Regulation in Proteins. Cambridge
University Press, Cambridge, UK. 101 pp.
Pizarro, G., L. Csernoch, I. Uribe, and E. Rios. 1992. Differential effects of tetracaine on two kinetic
components of calcium release in frog skeletal muscle fibres. Journal of Physiology. 457:525-538.
Pizarro, G., L. Csernoch, I. Uribe, M. Rodriguez, and E. Rios. 1991. The relationship between Q~ and Ca release from the sarcoplasmic reticulum in skeletal muscle. Journal of General Physiology. 97:913-947.
Rios, E., and G. Bruin. 1987. Involvement of dihydropyridine receptors in excitation-contraction coupling in skeletal muscle. Nature. 325:717-720.
Rfos, E., J. Ma, and A. Gonz~ilez. 1991. The mechanical model of excitation-contraction coupling in skeletal muscle.Jounal of Muscle Research and Cell Motility. 12:127-135.
Rfos, E., and G. Pizarro. 1991. The voltage sensor of excitation--contraction coupling in skeletal
muscle. Physiological Reviews. 71:849-908.
Schneider, M. F., and B. J. Simon. 1988. Inactivation of calcium release from the sarcoplasmic
reticulum in frog skeletal muscle.Journal of Physiology. 405:727-745. Schneider, M. F., B. J. Simon, and G. Szucs. 1987. Depletion of calcium from the sarcoplasmic
reticulum during calcium release in frog skeletal muscle. Journal of Physiology. 392:167-192.

Rios ET AL. Allosteric Excitation-Contraction Coupling 481
Simon, B. J., and D. A. Hill. 1992. Charge movement and SR calcium release in frog skeletal muscle can be related by a Hodgkin-Huxley model with four gating particles. Biophysical Journal. 61:1109--1116.
Simon, B. J., and M. F. Schneider. 1988. Time course of activation of calcium release from sarcoplasmic reticulum in skeletal muscle. Biophysical Journal. 54:1159-1163.
Smith, J. s., T. Imagawa, J. Ma, M. Fill, K. P. Campbell, and R. Coronado. 1988. Purified ryanodine receptor from rabbit skeletal muscle is the calcium release channel of sarcoplasmic reticulum. Journal of General Physiology. 92:1-26.
Sziics, G., L. Csernoch, J. Magyar, and L. Kov~ics. 1991. Contraction threshold and the "hump" component of charge movement in frog skeletal muscle.Journal of General Physiology. 97:897-911.
Tanabe, T., K. G. Beam, J. A. Powell, and S. Numa. 1988. Restoration of excitation-contraction coupling and slow calcium currents in dysgenic muscle by dihydropyridine receptor complemen- tary DNA. Nature. 344:134-139.
Tanabe, T., H. Takeshima, A. Mikami, V. Flockerzi, H. Takahashi, K. Kanagawa, M. Kojima, H. Matsuo, T. Hirose, and S. Numa. 1987. Primary structure of the receptor for calcium channel blockers from skeletal muscle. Nature. 328:313-318.
Volpe, P., and E. W. Stephenson. 1986. Ca ~+ dependence of transverse tubule-mediated calcium release in skinned skeletal muscle fibers.Journal of General Physiology. 87:271-288.
Wagenknecht, T., R. Grassucci, J. Frank, A. Saito, M. Inui, and S. Fleischer. 1989. Three-dimensional architecture of the calcium channel/foot structure of sarcoplasmic reticulum. Nature. 338:167-170.


