Embed Size (px)
Citation preview
Procedia Technology 10 ( 2013 ) 604 – 614
2212-0173 © 2013 The Authors. Published by Elsevier Ltd.Selection and peer-review under responsibility of the University of Kalyani, Department of Computer Science & Engineeringdoi: 10.1016/j.protcy.2013.12.401
International Conference on Computational Intelligence: Modeling Techniques and Applications (CIMTA) 2013
Risk analysis in construction sites using fuzzy reasoning and fuzzy analytic hierarchy process
Debasish Majumdera, Joy Debnathb, Animesh Biswasb* aDepartment of Mathematics, JIS College of Engineering, Kalyani -741235, India
bDepartment of Mathematics, University of Kalyani, Kalyani -741235, India
Abstract
In this paper a risk assessment process is discussed by considering all kinds of body part wise injuries which are commonly occurred in construction sites. The risk corresponding to each body part wise injuries are measured using a combination of fuzzy reasoning and fuzzy-analytic hierarchy process. In the proposed methodology, risk scores corresponding to each body part wise injuries are measured first using fuzzy reasoning. Then associated weights of each body part wise injuries are calculated on the basis of current safety situation using fuzzy-analytic hierarchy process. The overall risk score of the concerned construction sites are evaluated using sum of product method. This risk assessment system is advantageous in dealing with both qualitative and quantitative risk data due to its capability of capturing vague and possibilistic data in an effective and efficient manner and which may help safety professionals and engineers to improve their safety management system of the construction sites. A case study on risk analysis of an Indian construction company is used to illustrate the application potentiality of the proposed approach. © 2013 The Authors. Published by Elsevier Ltd. Selection and peer-review under responsibility of the University of Kalyani, Department of Computer Science & Engineering.
Keywords:Risk analysis; membership functions; fuzzy numbers; fuzzy reasoning; fuzzy-analytic hierarchy process; sum of product
1. Introduction
From the beginning of industrial revolution, risk in construction sites remains a major concern for not only a huge number of accidents occurred there but also for lethal consequences of these accidents. Thus in the present
*Corresponding author. Tel.: +91-33-25453135; fax: +91-33-25828282.
E-mail address: [email protected].
Available online at www.sciencedirect.com
© 2013 The Authors. Published by Elsevier Ltd.Selection and peer-review under responsibility of the University of Kalyani, Department of Computer Science & Engineering
ScienceDirect
605 Debasish Majumder et al. / Procedia Technology 10 ( 2013 ) 604 – 614
scenario risk analysis in constructionsites is getting more importance. Occupational health and safety is also becoming a foremost concern all over the globe due to the fact that occupational risk is a major source of hazard. So, the assessment and management of the risk is an activity that has a growing interest worldwide. Now-a-days, most of the companies consider health and safety of their employees during work as one of their schedule administration activities. Taking precautions against the risks and hazards in the workplace is one of the basic tasks of people with management responsibility.Efforts to provide safety in workplaces are not only significant for the health of workers but also inevitable managerial activities for economic and financial performance, productivity of the facility and the quality and stability of production [1].
Furthermore, risk assessment is an essential and systematic process for assessing the impact, rate and the penalty of human activities on systems with hazardous characteristics and constitutes a needful tool for the safety policy of a company. The variety in risk analysis procedures is such that there are many suitable techniques for any situation and the choice has become more a matter of taste [2].
A good number of research works have been done for assessing risk in construction industries by traditional tool like probabilistic risk analysis, fault tree analysis, etc. based on historical data. The work by Hauptmanns et al. [3], based on fault tree theory, is the systematic procedure to perform a quantitative risk assessment for occupational accidents. According to Faber and Stewart[4], risk is defined as the expected consequences associated with a given event. In occupational safety, a work accident is an event with consequences; risk is, therefore, the combination of the probability that this accident will occur and the severity of consequences arising from the accident. But the problem with these tools is that they are unable to capture the uncertainty or vagueness associated with historical data. Thus fuzzy logic approach is seemed to be very much applicable for risk analysis.
Blockley[5] made penetrate in the study of structural safety in structural engineering by introducing fuzzy concepts [6]. Blockley[7] sustained his work on this subject and introduced fuzzy set theoretic concepts for analysis of the causes of structural accidents. Cheung-Mak and Le May [8] developed a fuzzy model to recognize the damages due to one or more failures in a steam plant and piping; Christen et al. [9] have quantitatively assessed the damages to population and environment following a catastrophic accident near a plant; Ikejima et al. [10] assessed through fuzzy logic the socio-economic consequences derived from a catastrophic leakage from a gas piping; in the end, Murlidharan et al. [11]assessed risk and vulnerability in installations subjected to cyclones. Bell and Badiru[12]noted that the growth of predictive models for occupational injuries is often held back by the unpredictability associated with human abilities and performance; fuzzy set theory provides a tool to address this unpredictability.
Based on the observation of global trends, it becomes evident that industry has to adapt itself, as soon as possible, to the new requirements of business operation, in terms of organizing management activities according to the requirements of standards and regulations related to risk-based approaches. Gurcanli&Mungen [13] demonstrated a method for the assessment of the risks in construction sites using a fuzzy rule-base to deal with uncertain and inadequate data. Considering the expenses in health care, safety training, up gradation process of machines and on various safety tools, Beria et al. [14] illustrated another approach of assessing the risk in Indian industries.
In this present study all kinds of body part wise injury due to accidents which are commonly occurred in construction sites are measured. Due to the unavailability of precise and accurate data, fuzzy numbers or linguistic terms are used here as input value of each input parameters. Fuzzy reasoning approach (FRA) [15] is used to assess the risk score (RS) of each type of body part wise injuries. Since the priority to each injury is very much depends on the associated current safety situation (CSS), the weights of each body part wise injuries are evaluated by fuzzy analytic hierarchy approach(FAHP) [16], as an extension of Saaty’s widely used AHP technique [17],based on fuzzy set theory,is a systematic approach to the alternative selection and justification problem by using the concepts of and hierarchical structure analysis. The overall risk of the industry is then evaluated using sum of product (SOP) method.
2. Proposed Methodology
The process of risk analysis in this paper is performed first by assessing risk level in construction sites using FRA and FAHP; and then the way of reducingthe assessed risk level to provide better work environment for the workers associated with these sites is discussed by developing suitable maintenance and operation policies. The details of the
606 Debasish Majumder et al. / Procedia Technology 10 ( 2013 ) 604 – 614
proposed model are described in the following sub sections.
2.1. Risk assessment
Risk is generally assessed on the basis of historical data and experts judgments. So, the process of assessment frequently faces the circumstances where the data are inadequate or imprecise and sometimes uncertain also. Again, the experts involved in the process are often face difficulties to give a precise numerical value to express their judgment due to the uncertainties involved in different hazardous event or due to presence of some quantitatively immeasurable parameters in the risk assessment process. In such situation, the input values are justified to consider as a range of numerical values, fuzzy numbers or linguistic terms to expresses their judgments. In this paper, trapezoidal fuzzy numbers (TFNs), as a general form of linear type fuzzy numbers, areused to capture expert’s judgment. A TFN is expressed in the form = { , , , } with its membership function
( ) = ⎩⎪⎨⎪⎧ , ≤ ≤1, ≤ ≤, ≤ ≤0, ℎ (1)
In the current risk assessment process, the following TFNs,as described in the following Table 1, are used corresponding to different imprecise expressions to represent ambiguous data or expert’s opinion on the parameters of the proposed model.
Table 1: Linguistic terms with their associated TFNs
Inexact expressions Fuzzy Inputs Input types TFNs "…is a" Numerical value ⟨ , , , ⟩ "…between a and b" [ , ] Range of numbers ⟨ , ( + )/2, ( + )/2, ⟩ "…is between a and c and most likely to be b" ⟨ , , ⟩ Triangular fuzzy number ⟨ , , , ⟩ "…is between a and d and most likely between b and c" ⟨ , , , ⟩ Trapezoidal fuzzy number ⟨ , , , ⟩ "…is Odd" ⟨ , , , ⟩ Linguistic term Odd MF ⟨ , , , ⟩
2.1.1. Knowledge acquisition, data collection and data analysis
The collection and analysis of data helps in good understanding of different types of accidents occurred in different construction sites. The records in the archive and the experts witness are important resources for the data collection which includes preliminary official records, statements made by the injured workers and his/her relatives, statements made by site engineers, safety managers, etc. If the data seemed to be insufficient or it is involved with uncertainty, then expert’s knowledge is incorporated in the data acquisition process.
2.1.2. Input parameters selection
On the basis of collected data, three input parameters, viz., accident percentage (AP), accident severity (AS) and expenses (ES) in maintaining safety measures are identified as input parameters to assess the risk in construction sites for the proposed methodology.
2.1.3. FRA for RS assessment
In the present study, RS for each type of body part wise injuries is measured based on AP, AS and ES. Since all the accidents are not always reported in these industries, AP for each type of accidents is not exact. So, range of values is used to express the AP in order to capture the unreported accidents also. Again, it is very hard for an expert to give a precise numerical value for AS due to uncertainty associated with the consequences of different types of accidents. So, a range of numerical values or linguistic terms are considered to calculate AS on the basis of expert’s
607 Debasish Majumder et al. / Procedia Technology 10 ( 2013 ) 604 – 614
opinion. FRA is used here to capture the inexactness of available data. Thus, if , and are three TFNs corresponding to three input parameters AP, AS and ES for body
part wise accident then the corresponding membership grades are ( ), ( ) and ( ) where , and are input variables in the universe of discourse , and of AP, CS and ES, respectively. Rules are generated to determine relations between input parameters AP, AS, ES and output parameter RS; and
then they are used to find the membership grades of output parameters RS determined by FRA evaluation process on the basis of Mamdanimethod [18, 19] as follows.
The rule for body part wise accidentis : , ℎ (2)
where is a variable in the universe of discourse ofRS; and , , and are the respective qualitative descriptors of AP, AS, ES and RS for the rule, then the firing strength of the rule with fuzzy inputs ,
and for body part wise accident is calculated using fuzzy intersection operation as follows. = ( ) ∧ ( ) , ( ) ∧ ( ) , ( ) ∧ ( ) (3)
where ( ), ( ) and ( ) are respectively membership grades corresponding to fuzzy inputs , and of body part wise injuries and ( ), ( ) and ( ) are respectively membership grades
corresponding to qualitative descriptors , , of AP, AS and ES for the rule. The output of the rule is obtained as follows. ( ) = ∧ ( ) (4)
where is the firing strength of the rulecorresponding to body part wise accident, ( ) represent membership grades of fuzzy output corresponding to fuzzy inputs , and corresponding to body part wise accident for the rule in the universe of discourse of RS.
The aggregated output for body part wise injuries is calculated using fuzzy union operation as ( ) = ⋁ ( ) (5)
where ( ) are the membership grades of the fuzzy set in the universe of discourse of RS for body part wise injuries.
The aggregated output is defuzzified to a crisp number that represents the RS score corresponding to body part wise injuries using the centroid of area method as follows. = ∑ ∙∑ (6)
where ∈ , = 1,2,⋯ , are quantization of , are their membership grades corresponding to the fuzzy set in the universe of discourse of RS for body part wise accident and is the RS for body part wise injuries.
2.1.4. FAHP for weight evaluation
The contribution of each body part wise injuries to the overall risk differs due to the difference in quality of safety measures used for different body parts. To obtain the overall risk level, weight of the contribution of each
608 Debasish Majumder et al. / Procedia Technology 10 ( 2013 ) 604 – 614
body part wise accidents are evaluated on the basis of CSS of different safety measures by FAHP. Step 1: The pair wise comparison is made by using trapezoidal fuzzy comparison scale, (as described in Table 2)
from the list of all safety measures used for different body parts in construction sites on the basis of expert’s judgment. The comparison matrix thus obtained is of the following form
= = ⋯⋯⋮ ⋮ ⋱ ⋮… , , = 1,2,⋯ , (7)
where = ⟨ , , , ⟩ represents the quantified judgment on to and is more important than , = ⟨ , , , ⟩ represents the quantified judgment on to and represents the number of criterion.
Step 3: The fuzzy weights are calculated using geometric mean method [16, 18, 19]. The TFN geometric mean of the row in the comparison matrix is defined as = ⟨ , , , ⟩ = ⟨ ∏ ′ ∏ ′ ∏ ′ ∏ ⟩ (8)
= ⟨ , , , ⟩ = ⟨∑ , ∑ , ∑ , ∑ ⟩ (9)
where represents the fuzzy weight of .
Table 2. Trapezoidal fuzzy conversion scale
Linguistic scale Trapezoidal fuzzy scale Just equal ⟨1,1,1,1⟩ Equally important ⟨1,1,1,2⟩ Between equally and weakly important ⟨1,2,2,3⟩ Weakly important ⟨2,3,3,4⟩ Between weakly and strongly important ⟨3,4,4,5⟩ Strongly important ⟨4,5,5,6⟩ Between strongly and very strongly important ⟨5,6,6,7⟩ Very strongly important ⟨6,7,7,8⟩ Between very strongly and absolutely important ⟨7,8,8,9⟩ Absolutely important ⟨8,9,9,9⟩
Step 4: Fuzzy weights are converted into crisp weights using a defuzzification method [18, 19] as defined below. ∗ = ( ) (10)
where ∗denotes the crisp value of fuzzy weight of .
Step 5: Crisp weights are normalized in this step as follows. = ∗∑ ∗ (11)
where expresses the weight of after normalization process.
2.1.5. SOP method for overall RS assessment
RS for all body part wise accidents are obtained by proceeding through the above steps 1 to 5 in section 2.1.3 and then the overall RS of the construction industry has been calculated using the SOP method as
609 Debasish Majumder et al. / Procedia Technology 10 ( 2013 ) 604 – 614
= ∑ (12)
where ( = 1,2,⋯ , ) are weights corresponding to body part wise accidents and is the overall RS
of the construction industry.
2.2. Risk management
Managing risks in construction sites are recognized as a very important process in order to optimize time, cost, quality and safety. Risk management can be viewed as an immediate step after risk assessment in developing maintenance and operation policies. On the basis of estimated risk, safety personals and administrators need to identify the sources of high risk and then risk reduction method must be applied to reduce the number of accidents and to control the possible consequences.
3. Risk Assessment of Construction Sites: A Case Study
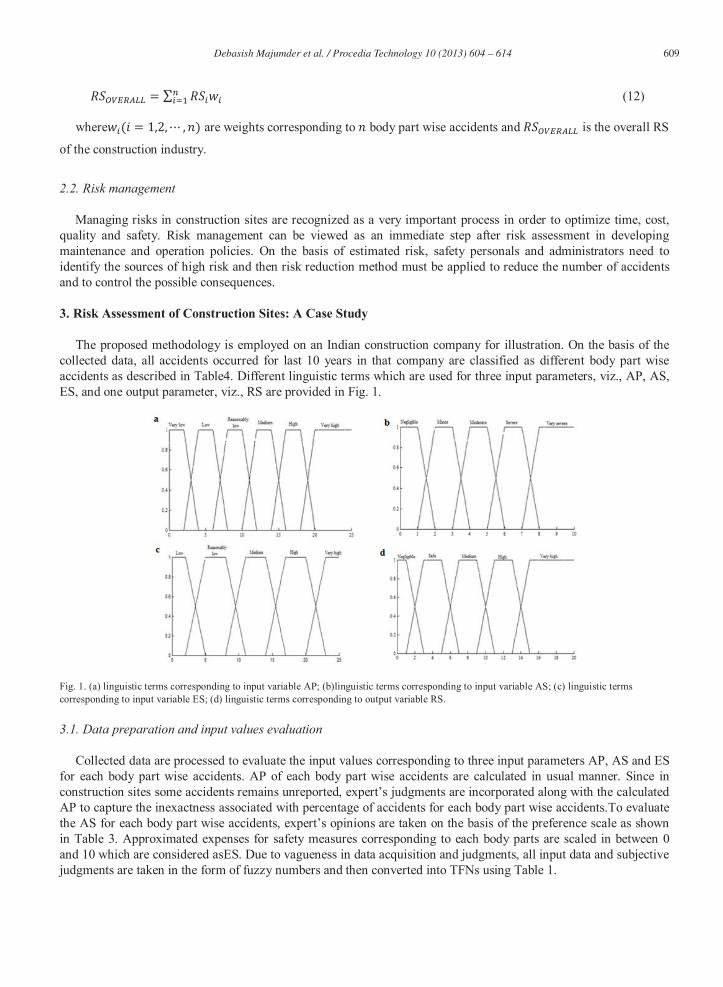
The proposed methodology is employed on an Indian construction company for illustration. On the basis of the collected data, all accidents occurred for last 10 years in that company are classified as different body part wise accidents as described in Table4. Different linguistic terms which are used for three input parameters, viz., AP, AS, ES, and one output parameter, viz., RS are provided in Fig. 1.
Fig. 1. (a) linguistic terms corresponding to input variable AP; (b)linguistic terms corresponding to input variable AS; (c) linguistic terms corresponding to input variable ES; (d) linguistic terms corresponding to output variable RS.
3.1. Data preparation and input values evaluation
Collected data are processed to evaluate the input values corresponding to three input parameters AP, AS and ES for each body part wise accidents. AP of each body part wise accidents are calculated in usual manner. Since in construction sites some accidents remains unreported, expert’s judgments are incorporated along with the calculated AP to capture the inexactness associated with percentage of accidents for each body part wise accidents.To evaluate the AS for each body part wise accidents, expert’s opinions are taken on the basis of the preference scale as shown in Table 3. Approximated expenses for safety measures corresponding to each body parts are scaled in between 0 and 10 which are considered asES. Due to vagueness in data acquisition and judgments, all input data and subjective judgments are taken in the form of fuzzy numbers and then converted into TFNs using Table 1.
610 Debasish Majumder et al. / Procedia Technology 10 ( 2013 ) 604 – 614
Table 3. Preference scale for AS
Accident severity Scale Score Negligible First aid case/ No loss time incident case (LTI)/ No medical treatment case (MTC) 1 Minor Case referred to Medical Centre/ Hospital - No LTI/No MTC 2-3 Moderate Case referred to Medical Centre/ Hospital, leading to either MTC or LTI 4-5
Severe Partial Permanent Disablement 6 Total Permanent Disablement 7
Very Severe Multiple injuries 8 Fatality 9 Multiple fatality 10
3.2. Result and discussion
The evaluation of RS for each body part wise accident and membership grades of associated risk level is done as described in section 2.1 using the softwareMATLAB(Ver. 2008b).The RS evaluation process is done by generating a Mamdani based fuzzy inference system (FIS) which consists of three inputs (AP, AS, ES), one output (RS) and 150 IF-THEN rules. The fuzzy input values, corresponding RS value (crisp) and their membership grades of associated risk level corresponding to each body part wise accidents are shown in Table 4.
Table 4. Fuzzy inputs, defuzzified RSs and membership grades of associated risk level for each body part wise accident
Body parts Accident percentage Accident severity Expenses in safety RS Membership grades Head ⟨6.5,6.75,6.75,7⟩ ⟨2,2,5,9⟩ ⟨11,11.5,11.5,12⟩ 7.4646 Medium: 1 Eye ⟨22,23,24,25⟩ ⟨2,4.5,4.5,7⟩ ⟨6,6.5,6.5,7⟩ 15.5299 Very high: 1 Ear ⟨0,0.5,0.5,1⟩ ⟨1,3,3,5⟩ ⟨9,9.5,9.5,10⟩ 3.2027 Safe: 1
Mouth ⟨0,0.5,0.5,0.851⟩ ⟨1,3,3,5⟩ ⟨4,4.25,4.25,4.5⟩ 4.8507 Safe: 1
Nose ⟨0,0.5,0.5,0.851⟩ ⟨1,3,3,5⟩ ⟨4,4.25,4.25,4.5⟩ 4.8507 Safe: 1
Face ⟨6,6.5,7,7.2⟩ ⟨1,3,3,5⟩ ⟨4.39,4.695,4.695⟩ 6.5375 Safe: 0.23 Medium: 0.77
Back ⟨1,1.5,2, 2.1⟩ ⟨1,3.5,3.5,6⟩ ⟨14.5,14.75,14.75,15⟩ 3.1409 Safe: 1
Neck ⟨0,0.5,0.5,1⟩ ⟨2,7,9,9⟩ ⟨14.5,14.75,14.75,15⟩ 5.6538 Safe: 0.67 Medium: 0.33
Chest ⟨2,2.5,2.8,3⟩ ⟨2,7,9,9⟩ ⟨24,24.5,24.5,25⟩ 3.1328 Safe: 1
Pelvis ⟨0,0.5,0.5,1⟩ ⟨2,7,9,9⟩ ⟨14.5,14.75,14.75,15⟩ 5.6634 Safe: 0.67 Medium: 0.33
Shoulder ⟨2,2.25,2.25,2.5⟩ ⟨1,3.5,3.5,6⟩ ⟨14.5,14.75,14.75,15⟩ 3.968 Safe: 1
Forearm ⟨3,3.3,3.3,3.6⟩ ⟨2,4.5,4.5,7⟩ ⟨13,13.1,13.1,13.2⟩ 5.3526 Safe: 0.82 Medium: 0.18
Hand ⟨9,9.2,9.6,10⟩ ⟨1,3.5,3.5,6⟩ ⟨11,11.5,11.5,12⟩ 6 Safe: 0.5 Medium: 0.5
Finger ⟨17,17.25,17.25,17.5⟩ ⟨1,3.5,3.5,6⟩ ⟨5,5.5,5.5,6⟩ 12.4485 High: 1
Thigh ⟨1.5,1.6,1.6,1.7⟩ ⟨1,3.5,3.5,6⟩ ⟨7.7,7.85,7.85,8⟩ 4.8745 Safe: 1
Leg ⟨13,13.25,13.25,13.5⟩ ⟨1,4,4,7⟩ ⟨18,18.5,18.5,19⟩ 6.062 Safe: 0.47 Medium: 0.53
Foot ⟨7,7.2,7.5,7.6⟩ ⟨1,3.5,3.5,6⟩ ⟨11,11.25,11.25,11.5⟩ 5.6973 Safe: 0.65 Medium: 0.35
611 D
ebasish Majum
der et al. / Procedia Technology 10 ( 2013 ) 604 – 614
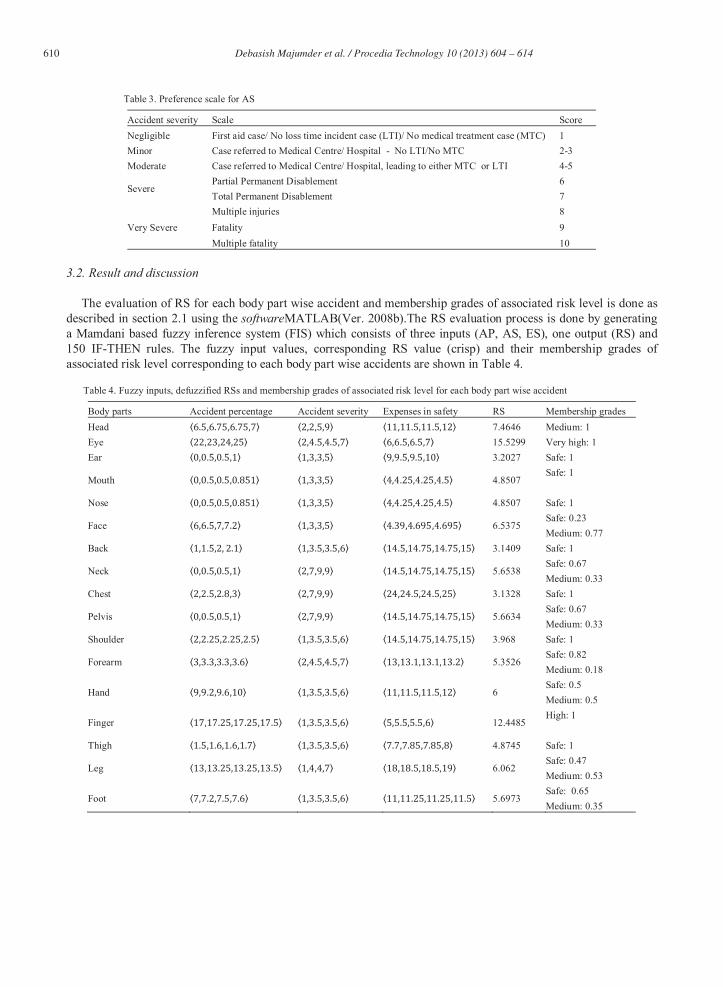
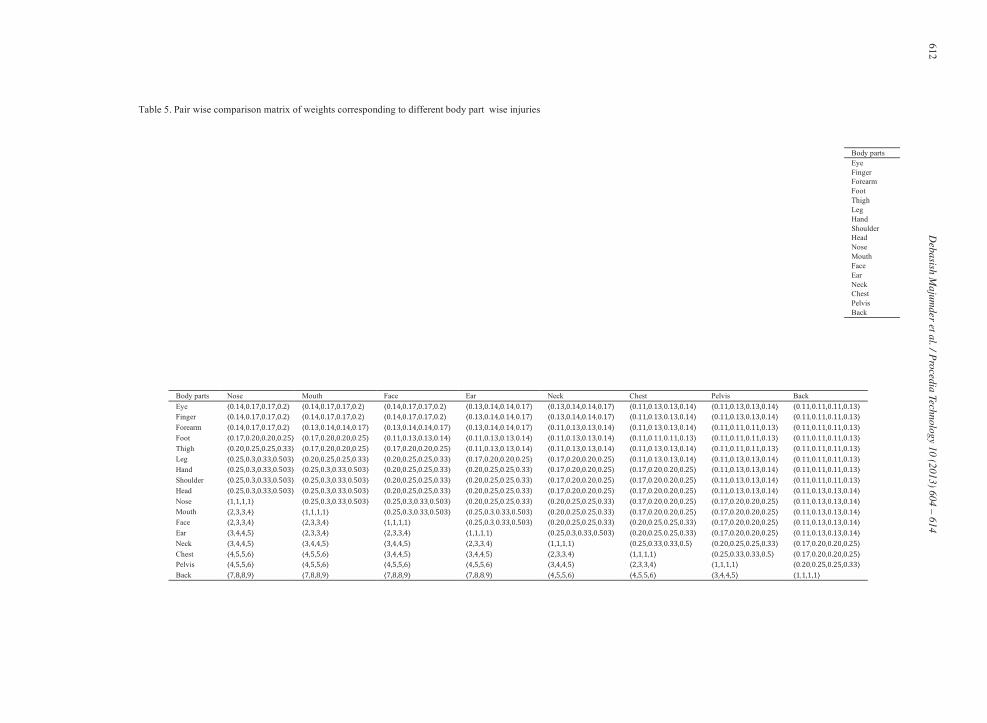
The pair wise com
parison matrix obtained in the w
eight evaluation process by using FAH
Pis shown in Table 5.
Weights corresponding to different body part w
ise injuries are obtained after FAH
P are given in Table 6.
Head ⟨0.17,0.20,0.20,0.25⟩ ⟨0.17,0.20,0.20,0.25⟩ ⟨0.14,0.17,0.17,0.2⟩ ⟨0.17,0.20,0.20,0.25⟩ ⟨0.20,0.25,0.25,0.33⟩ ⟨0.25,0.3,0.33,0.503⟩ ⟨0.25,0.3,0.33,0.503⟩ ⟨0.25,0.3,0.33,0.503⟩ ⟨1,1,1,1⟩ ⟨2,3,3,4⟩ ⟨2,3,3,4⟩ ⟨3,4,4,5⟩ ⟨3,4,4,5⟩ ⟨4,5,5,6⟩ ⟨4,5,5,6⟩ ⟨7,8,8,9⟩ ⟨7,8,8,9⟩
Shoulder ⟨0.20,0.25,0.25,0.33⟩ ⟨0.20,0.25,0.25,0.33⟩ ⟨0.17,0.20,0.20,0.25⟩ ⟨0.20,0.25,0.25,0.33⟩ ⟨0.25,0.3,0.33,0.503⟩ ⟨0.50,1,1,13⟩ ⟨0.50,1,1,13⟩ ⟨1,1,1,1⟩ ⟨2,3,3,4⟩ ⟨2,3,3,4⟩ ⟨2,3,3,4⟩ ⟨3,4,4,5⟩ ⟨3,4,4,5⟩ ⟨4,5,5,6⟩ ⟨4,5,5,6⟩ ⟨7,8,8,9⟩ ⟨8,9,9,9⟩
Hand ⟨0.20,0.25,0.25,0.33⟩ ⟨0.20,0.25,0.25,0.33⟩ ⟨0.17,0.20,0.20,0.25⟩ ⟨0.20,0.25,0.25,0.33⟩ ⟨0.25,0.3,0.33,0.503⟩ ⟨0.50,1,1,13⟩ ⟨1,1,1,1⟩ ⟨1,1,1,2⟩ ⟨2,3,3,4⟩ ⟨2,3,3,4⟩ ⟨2,3,3,4⟩ ⟨3,4,4,5⟩ ⟨3,4,4,5⟩ ⟨4,5,5,6⟩ ⟨4,5,5,6⟩ ⟨7,8,8,9⟩ ⟨8,9,9,9⟩
Leg ⟨0.20,0.25,0.25,0.33⟩ ⟨0.20,0.25,0.25,0.33⟩ ⟨0.17,0.20,0.20,0.25⟩ ⟨0.20,0.25,0.25,0.33⟩ ⟨0.25,0.3,0.33,0.503⟩ ⟨1,1,1,1⟩ ⟨1,1,1,2⟩ ⟨1,1,1,2⟩ ⟨2,3,3,4⟩ ⟨2,3,3,4⟩ ⟨3,4,4,5⟩ ⟨3,4,4,5⟩ ⟨4,5,5,6⟩ ⟨4,5,5,6⟩ ⟨7,8,8,9⟩ ⟨7,8,8,9⟩ ⟨8,9,9,9⟩
Thigh ⟨0.20,0.25,0.25,0.33⟩ ⟨0.20,0.25,0.25,0.33⟩ ⟨0.20,0.25,0.25,0.33⟩ ⟨0.25,0.33,0.33,0.5⟩ ⟨1,1,1,1⟩ ⟨2,3,3,4⟩ ⟨2,3,3,4⟩ ⟨2,3,3,4⟩ ⟨3,4,4,5⟩ ⟨3,4,4,5⟩ ⟨4,5,5,6⟩ ⟨4,5,5,6⟩ ⟨7,8,8,9⟩ ⟨7,8,8,9⟩ ⟨7,8,8,9⟩ ⟨8,9,9,9⟩ ⟨8,9,9,9⟩
Foot ⟨0.25,0.33,0.33,0.5⟩ ⟨0.25,0.33,0.33,0.5⟩ ⟨0.25,0.33,0.33,0.5⟩ ⟨1,1,1,1⟩ ⟨2,3,3,4⟩ ⟨3,4,4,5⟩ ⟨3,4,4,5⟩ ⟨3,4,4,5⟩ ⟨4,5,5,6⟩ ⟨4,5,5,6⟩ ⟨4,5,5,6⟩ ⟨7,8,8,9⟩ ⟨7,8,8,9⟩ ⟨7,8,8,9⟩ ⟨8,9,9,9⟩ ⟨8,9,9,9⟩ ⟨8,9,9,9⟩
Forearm ⟨0.25,0.33,0.33,0.5⟩ ⟨0.33,0.5,0.5,1⟩ ⟨1,1,1,1⟩ ⟨2,3,3,4⟩ ⟨3,4,4,5⟩ ⟨4,5,5,6⟩ ⟨4,5,5,6⟩ ⟨4,5,5,6⟩ ⟨5,6,6,7⟩ ⟨5,6,6,7⟩ ⟨6,7,7,8⟩ ⟨6,7,7,8⟩ ⟨6,7,7,8⟩ ⟨7,8,8,9⟩ ⟨7,8,8,9⟩ ⟨8,9,9,9⟩ ⟨8,9,9,9⟩
Finger ⟨0.33,0.50,0.50,1, ⟩ ⟨1,1,1,1⟩ ⟨1,2,2,3⟩ ⟨2,3,3,4⟩ ⟨2,3,3,4⟩ ⟨3,4,4,5⟩ ⟨3,4,4,5⟩ ⟨3,4,4,5⟩ ⟨4,5,5,6⟩ ⟨5,6,6,7⟩ ⟨5,6,6,7⟩ ⟨5,6,6,7⟩ ⟨6,7,7,8⟩ ⟨6,7,7,8⟩ ⟨7,8,8,9⟩ ⟨7,8,8,9⟩ ⟨8,9,9,9⟩
Eye ⟨1,1,1,1⟩ ⟨1,2,2,3⟩ ⟨2,3,3,4⟩ ⟨2,3,3,4⟩ ⟨3,4,4,5⟩ ⟨3,4,4,5⟩ ⟨3,4,4,5⟩ ⟨3,4,4,5⟩ ⟨4,5,5,6⟩ ⟨5,6,6,7⟩ ⟨5,6,6,7⟩ ⟨5,6,6,7⟩ ⟨6,7,7,8⟩ ⟨6,7,7,8⟩ ⟨7,8,8,9⟩ ⟨7,8,8,9⟩ ⟨8,9,9,9⟩
612 D
ebasish Majum
der et al. / Procedia Technology 10 ( 2013 ) 604 – 614
Body parts Eye Finger Forearm Foot Thigh Leg Hand Shoulder Head Nose Mouth Face Ear Neck Chest Pelvis Back
Back ⟨0.11,0.11,0.11,0.13⟩ ⟨0.11,0.11,0.11,0.13⟩ ⟨0.11,0.11,0.11,0.13⟩ ⟨0.11,0.11,0.11,0.13⟩ ⟨0.11,0.11,0.11,0.13⟩ ⟨0.11,0.11,0.11,0.13⟩ ⟨0.11,0.11,0.11,0.13⟩ ⟨0.11,0.11,0.11,0.13⟩ ⟨0.11,0.13,0.13,0.14⟩ ⟨0.11,0.13,0.13,0.14⟩ ⟨0.11,0.13,0.13,0.14⟩ ⟨0.11,0.13,0.13,0.14⟩ ⟨0.11,0.13,0.13,0.14⟩ ⟨0.17,0.20,0.20,0.25⟩ ⟨0.17,0.20,0.20,0.25⟩ ⟨0.20,0.25,0.25,0.33⟩ ⟨1,1,1,1⟩
Pelvis ⟨0.11,0.13,0.13,0.14⟩ ⟨0.11,0.13,0.13,0.14⟩ ⟨0.11,0.11,0.11,0.13⟩ ⟨0.11,0.11,0.11,0.13⟩ ⟨0.11,0.11,0.11,0.13⟩ ⟨0.11,0.13,0.13,0.14⟩ ⟨0.11,0.13,0.13,0.14⟩ ⟨0.11,0.13,0.13,0.14⟩ ⟨0.11,0.13,0.13,0.14⟩ ⟨0.17,0.20,0.20,0.25⟩ ⟨0.17,0.20,0.20,0.25⟩ ⟨0.17,0.20,0.20,0.25⟩ ⟨0.17,0.20,0.20,0.25⟩ ⟨0.20,0.25,0.25,0.33⟩ ⟨0.25,0.33,0.33,0.5⟩ ⟨1,1,1,1⟩ ⟨3,4,4,5⟩
Chest ⟨0.11,0.13,0.13,0.14⟩ ⟨0.11,0.13,0.13,0.14⟩ ⟨0.11,0.13,0.13,0.14⟩ ⟨0.11,0.11,0.11,0.13⟩ ⟨0.11,0.13,0.13,0.14⟩ ⟨0.11,0.13,0.13,0.14⟩ ⟨0.17,0.20,0.20,0.25⟩ ⟨0.17,0.20,0.20,0.25⟩ ⟨0.17,0.20,0.20,0.25⟩ ⟨0.17,0.20,0.20,0.25⟩ ⟨0.17,0.20,0.20,0.25⟩ ⟨0.20,0.25,0.25,0.33⟩ ⟨0.20,0.25,0.25,0.33⟩ ⟨0.25,0.33,0.33,0.5⟩ ⟨1,1,1,1⟩ ⟨2,3,3,4⟩ ⟨4,5,5,6⟩
Neck ⟨0.13,0.14,0.14,0.17⟩ ⟨0.13,0.14,0.14,0.17⟩ ⟨0.11,0.13,0.13,0.14⟩ ⟨0.11,0.13,0.13,0.14⟩ ⟨0.11,0.13,0.13,0.14⟩ ⟨0.17,0.20,0.20,0.25⟩ ⟨0.17,0.20,0.20,0.25⟩ ⟨0.17,0.20,0.20,0.25⟩ ⟨0.17,0.20,0.20,0.25⟩ ⟨0.20,0.25,0.25,0.33⟩ ⟨0.20,0.25,0.25,0.33⟩ ⟨0.20,0.25,0.25,0.33⟩ ⟨0.25,0.3,0.33,0.503⟩ ⟨1,1,1,1⟩ ⟨2,3,3,4⟩ ⟨3,4,4,5⟩ ⟨4,5,5,6⟩
Ear ⟨0.13,0.14,0.14,0.17⟩ ⟨0.13,0.14,0.14,0.17⟩ ⟨0.13,0.14,0.14,0.17⟩ ⟨0.11,0.13,0.13,0.14⟩ ⟨0.11,0.13,0.13,0.14⟩ ⟨0.17,0.20,0.20,0.25⟩ ⟨0.20,0.25,0.25,0.33⟩ ⟨0.20,0.25,0.25,0.33⟩ ⟨0.20,0.25,0.25,0.33⟩ ⟨0.20,0.25,0.25,0.33⟩ ⟨0.25,0.3,0.33,0.503⟩ ⟨0.25,0.3,0.33,0.503⟩ ⟨1,1,1,1⟩ ⟨2,3,3,4⟩ ⟨3,4,4,5⟩ ⟨4,5,5,6⟩ ⟨7,8,8,9⟩
Face ⟨0.14,0.17,0.17,0.2⟩ ⟨0.14,0.17,0.17,0.2⟩ ⟨0.13,0.14,0.14,0.17⟩ ⟨0.11,0.13,0.13,0.14⟩ ⟨0.17,0.20,0.20,0.25⟩ ⟨0.20,0.25,0.25,0.33⟩ ⟨0.20,0.25,0.25,0.33⟩ ⟨0.20,0.25,0.25,0.33⟩ ⟨0.20,0.25,0.25,0.33⟩ ⟨0.25,0.3,0.33,0.503⟩ ⟨0.25,0.3,0.33,0.503⟩ ⟨1,1,1,1⟩ ⟨2,3,3,4⟩ ⟨3,4,4,5⟩ ⟨3,4,4,5⟩ ⟨4,5,5,6⟩ ⟨7,8,8,9⟩
Mouth ⟨0.14,0.17,0.17,0.2⟩ ⟨0.14,0.17,0.17,0.2⟩ ⟨0.13,0.14,0.14,0.17⟩ ⟨0.17,0.20,0.20,0.25⟩ ⟨0.17,0.20,0.20,0.25⟩ ⟨0.20,0.25,0.25,0.33⟩ ⟨0.25,0.3,0.33,0.503⟩ ⟨0.25,0.3,0.33,0.503⟩ ⟨0.25,0.3,0.33,0.503⟩ ⟨0.25,0.3,0.33,0.503⟩ ⟨1,1,1,1⟩ ⟨2,3,3,4⟩ ⟨2,3,3,4⟩ ⟨3,4,4,5⟩ ⟨4,5,5,6⟩ ⟨4,5,5,6⟩ ⟨7,8,8,9⟩
Nose ⟨0.14,0.17,0.17,0.2⟩ ⟨0.14,0.17,0.17,0.2⟩ ⟨0.14,0.17,0.17,0.2⟩ ⟨0.17,0.20,0.20,0.25⟩ ⟨0.20,0.25,0.25,0.33⟩ ⟨0.25,0.3,0.33,0.503⟩ ⟨0.25,0.3,0.33,0.503⟩ ⟨0.25,0.3,0.33,0.503⟩ ⟨0.25,0.3,0.33,0.503⟩ ⟨1,1,1,1⟩ ⟨2,3,3,4⟩ ⟨2,3,3,4⟩ ⟨3,4,4,5⟩ ⟨3,4,4,5⟩ ⟨4,5,5,6⟩ ⟨4,5,5,6⟩ ⟨7,8,8,9⟩
Body parts Eye Finger Forearm Foot Thigh Leg Hand Shoulder Head Nose Mouth Face Ear Neck Chest Pelvis Back
Table 5. Pair wise comparison matrix of weights corresponding to different body part wise injuries
613 Debasish Majumder et al. / Procedia Technology 10 ( 2013 ) 604 – 614
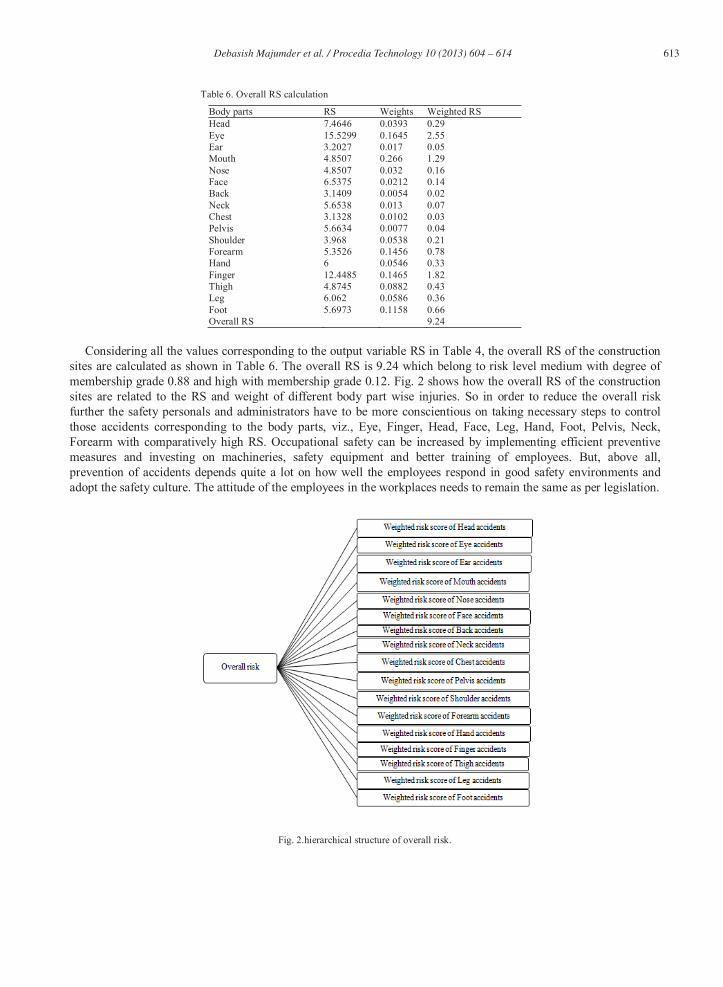
Table 6. Overall RS calculation
Body parts RS Weights Weighted RS Head 7.4646 0.0393 0.29 Eye 15.5299 0.1645 2.55 Ear 3.2027 0.017 0.05 Mouth 4.8507 0.266 1.29 Nose 4.8507 0.032 0.16 Face 6.5375 0.0212 0.14 Back 3.1409 0.0054 0.02 Neck 5.6538 0.013 0.07 Chest 3.1328 0.0102 0.03 Pelvis 5.6634 0.0077 0.04 Shoulder 3.968 0.0538 0.21 Forearm 5.3526 0.1456 0.78 Hand 6 0.0546 0.33 Finger 12.4485 0.1465 1.82 Thigh 4.8745 0.0882 0.43 Leg 6.062 0.0586 0.36 Foot 5.6973 0.1158 0.66 Overall RS 9.24
Considering all the values corresponding to the output variable RS in Table 4, the overall RS of the construction
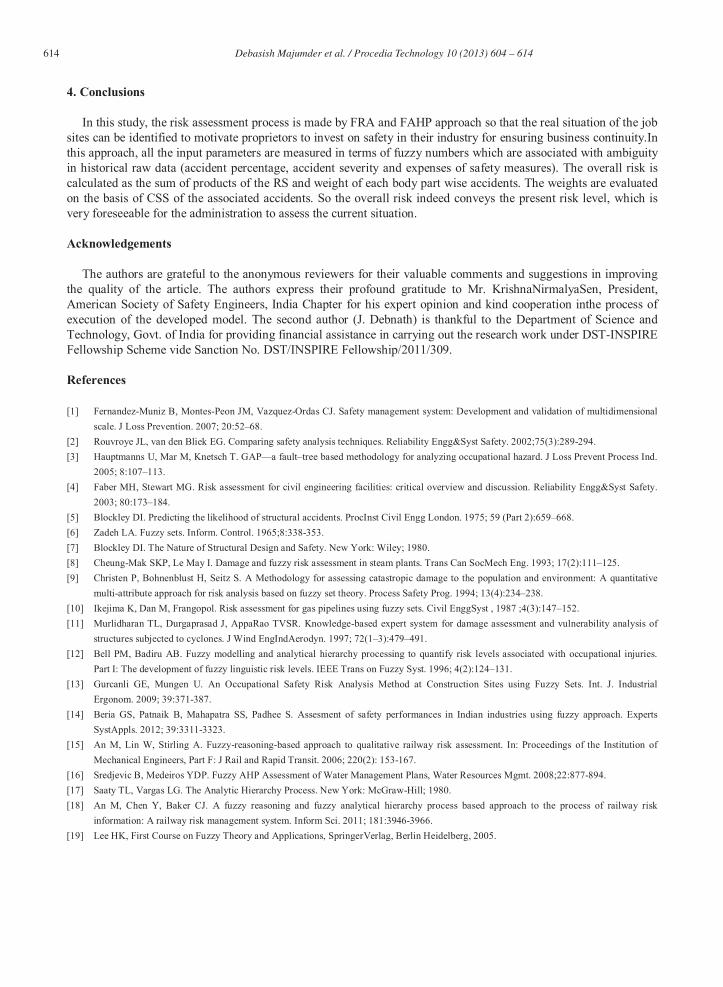
sites are calculated as shown in Table 6. The overall RS is 9.24 which belong to risk level medium with degree of membership grade 0.88 and high with membership grade 0.12. Fig. 2 shows how the overall RS of the construction sites are related to the RS and weight of different body part wise injuries. So in order to reduce the overall risk further the safety personals and administrators have to be more conscientious on taking necessary steps to control those accidents corresponding to the body parts, viz., Eye, Finger, Head, Face, Leg, Hand, Foot, Pelvis, Neck, Forearm with comparatively high RS. Occupational safety can be increased by implementing efficient preventive measures and investing on machineries, safety equipment and better training of employees. But, above all, prevention of accidents depends quite a lot on how well the employees respond in good safety environments and adopt the safety culture. The attitude of the employees in the workplaces needs to remain the same as per legislation.
Fig. 2.hierarchical structure of overall risk.
614 Debasish Majumder et al. / Procedia Technology 10 ( 2013 ) 604 – 614
4. Conclusions
In this study, the risk assessment process is made by FRA and FAHP approach so that the real situation of the job sites can be identified to motivate proprietors to invest on safety in their industry for ensuring business continuity.In this approach, all the input parameters are measured in terms of fuzzy numbers which are associated with ambiguity in historical raw data (accident percentage, accident severity and expenses of safety measures). The overall risk is calculated as the sum of products of the RS and weight of each body part wise accidents. The weights are evaluated on the basis of CSS of the associated accidents. So the overall risk indeed conveys the present risk level, which is very foreseeable for the administration to assess the current situation.
Acknowledgements
The authors are grateful to the anonymous reviewers for their valuable comments and suggestions in improving the quality of the article. The authors express their profound gratitude to Mr. KrishnaNirmalyaSen, President, American Society of Safety Engineers, India Chapter for his expert opinion and kind cooperation inthe process of execution of the developed model. The second author (J. Debnath) is thankful to the Department of Science and Technology, Govt. of India for providing financial assistance in carrying out the research work under DST-INSPIRE Fellowship Scheme vide Sanction No. DST/INSPIRE Fellowship/2011/309.
References
[1] Fernandez-Muniz B, Montes-Peon JM, Vazquez-Ordas CJ. Safety management system: Development and validation of multidimensional scale. J Loss Prevention. 2007; 20:52–68.
[2] Rouvroye JL, van den Bliek EG. Comparing safety analysis techniques. Reliability Engg&Syst Safety. 2002;75(3):289-294. [3] Hauptmanns U, Mar M, Knetsch T. GAP—a fault–tree based methodology for analyzing occupational hazard. J Loss Prevent Process Ind.
2005; 8:107–113. [4] Faber MH, Stewart MG. Risk assessment for civil engineering facilities: critical overview and discussion. Reliability Engg&Syst Safety.
2003; 80:173–184. [5] Blockley DI. Predicting the likelihood of structural accidents. ProcInst Civil Engg London. 1975; 59 (Part 2):659–668. [6] Zadeh LA. Fuzzy sets. Inform. Control. 1965;8:338-353. [7] Blockley DI. The Nature of Structural Design and Safety. New York: Wiley; 1980. [8] Cheung-Mak SKP, Le May I. Damage and fuzzy risk assessment in steam plants. Trans Can SocMech Eng. 1993; 17(2):111–125. [9] Christen P, Bohnenblust H, Seitz S. A Methodology for assessing catastropic damage to the population and environment: A quantitative
multi-attribute approach for risk analysis based on fuzzy set theory. Process Safety Prog. 1994; 13(4):234–238. [10] Ikejima K, Dan M, Frangopol. Risk assessment for gas pipelines using fuzzy sets. Civil EnggSyst , 1987 ;4(3):147–152. [11] Murlidharan TL, Durgaprasad J, AppaRao TVSR. Knowledge-based expert system for damage assessment and vulnerability analysis of
structures subjected to cyclones. J Wind EngIndAerodyn. 1997; 72(1–3):479–491. [12] Bell PM, Badiru AB. Fuzzy modelling and analytical hierarchy processing to quantify risk levels associated with occupational injuries.
Part I: The development of fuzzy linguistic risk levels. IEEE Trans on Fuzzy Syst. 1996; 4(2):124–131. [13] Gurcanli GE, Mungen U. An Occupational Safety Risk Analysis Method at Construction Sites using Fuzzy Sets. Int. J. Industrial
Ergonom. 2009; 39:371-387. [14] Beria GS, Patnaik B, Mahapatra SS, Padhee S. Assesment of safety performances in Indian industries using fuzzy approach. Experts
SystAppls. 2012; 39:3311-3323. [15] An M, Lin W, Stirling A. Fuzzy-reasoning-based approach to qualitative railway risk assessment. In: Proceedings of the Institution of
Mechanical Engineers, Part F: J Rail and Rapid Transit. 2006; 220(2): 153-167. [16] Sredjevic B, Medeiros YDP. Fuzzy AHP Assessment of Water Management Plans, Water Resources Mgmt. 2008;22:877-894. [17] Saaty TL, Vargas LG. The Analytic Hierarchy Process. New York: McGraw-Hill; 1980. [18] An M, Chen Y, Baker CJ. A fuzzy reasoning and fuzzy analytical hierarchy process based approach to the process of railway risk
information: A railway risk management system. Inform Sci. 2011; 181:3946-3966. [19] Lee HK, First Course on Fuzzy Theory and Applications, SpringerVerlag, Berlin Heidelberg, 2005.


