Embed Size (px)
Citation preview
1. Introduction
Bone is not an inert mass, but is an alive tissue: it isinfluenced by many vital processes of the body and is sensi-tive to physiological and pathological alterations. In anormal physiological situation, new bone is continuouslylaid down while old bone is subject to resorptive processes.This dynamic balance between bone formation and boneresorption is regulated by metabolic and mechanical factors[1,2].
The mechanical factors that regulate this balance are theobject of this paper, and more precisely this paper deals
with the insertion of an arthroprosthesis within theintramedullary femoral canal. This surgery results in aredistribution of the stresses acting on the bone and, corre-spondingly, in a redistribution of the bone density adjacentto the entire prosthesis [3,4]. For example, when an implanthas a distal anchorage, bone loss is experienced proximally,and this is partially compensated by hypertrophy of bonedistally [5,6].
The development of durable hip implants may dependupon devising prostheses which will minimize boneremodeling, simulating the natural loading condition asclosely as possible. In this sense a reliable measurement of
1077-2014/97/060399 + 15 $25.00/ri970074 © 1997 Academic Press Limited
Roentgenographic Features of DigitizedClinical Orthopaedic Radiographs ofFollow-up After Total Hip Arthroplasty
hen a patient undergoes an arthroprosthesis implant, the stresses acting on the bone are redistributed, and correspondingly, the bone density adjacent to the entire prosthesis W changes its pattern. In order to study these phenomena an automatic methodology has
been developed: this methodology is based on the bone density measured on X-ray. The method iscompared to other bone densitometry methods and to more recent bone remodeling pattern recog-nition methods; it turns out to be cost-effective and it has the advantage of allowing back-datedinvestigation exploiting the numerous existing radiograph records relative to arthroplastic follow-up. The results of the set-up videodensitometric analysis show the method not only has diagnosticcapability, but also can effectively support prostheses designers; moreover, the results obtainedoffer a capable support to real-time observation of remodeling processes and to the biomechanicalassessment of the behavior of bone implant systems.
For the clinical practice a risk index has been set up in order to systematize the numerous datacollected from the measuring mesh grids and to monitor dangerous situations, which can end inimplant failure.
© 1997 Academic Press Limited
A. L. Audenino, E. M. Zanetti and P. M. Calderale
Dipartimento di Meccanica, Politecnico di Torino, C.so Duca Degli Abruzzi 24, 10129, Torino, Italy
Real-Time Imaging 3, 399–413 (1997)
postoperative bone remodeling, adjacent to metal implants,is of definite value. The aim of this paper is to produce an analysis technique which, by means of regular, timely radi-ation exposure of a patient, allows the real-time assessmentand monitoring of remodeling processes; as a matter offact, the acquisition is not so critical because enough slowprocesses are being considered. By means of an appositeframe, relative to the bone, it is possible to track the move-ment of the prosthesis in the bone and to build the patternof bone density versus time. Consequently, opportuneactions can be taken by physiotherapists in order to modifythe undergoing remodeling process that is the source ofacquired data; the results of these actions will be verifiedwhen another exposure is scheduled and will inspire thenext intervention of physiotherapists. Practically a closedloop is created where the controlled event is the remodelingprocess, and the modifying action is undertaken by physio-therapists.
Clinical assessment alone is insufficient, since unstablecomponents sometimes do not produce symptoms in theshort term, and osseointegrated stems can sometimes besymptomatic. Roentgenographic assessment is able to pro-duce more useful and detailed information, and thepredictive value of certain roentgenographic signs wasproved [7]. In spite of this, it must be admitted that a com-parison of the skeletal film with vague visual recollectionof past cases is highly subjective and unscientific.
A reproducible, more objective analysis can be per-formed by the use of instruments able to quantify the graylevels of radiographic images. In fact, gray-level readingsfrom densitometers or digitized images are many timesmore accurate than the human eye for evaluating the den-sity of photographic film. The first studies on radiographicquantification of bone mineralization started a long timeago; traditional methods have primarily involved standarddensitometry. This technique compares radiographic den-sity of bone with the thickness of a reference material,having the same atomic number as the bone, exposed underthe same radiographic condition.
Ever since 1901, when the first step-wedge was used todetermine bone radiopacity [8], these techniques haveevolved and become more and more sophisticated. A tech-nique for the conversion of dental radiographs into a digitalformat was first described by Mack [9,10]. A furtherimprovement in medical imaging was warranted by theintroduction of video-cameras [11]. Many different meth-ods were employed for calibration purposes, based first onivory step-wedges [12], and later on aluminium step-wedges [9].
These techniques, applied to the evaluation of arthro-prosthesis implants, were still an object of research in spiteof the advent of new imaging techniques, such as dual-pho-ton analysis, magnetic resonance imaging (MRI), computedtomography (CT) scans, and quantitative CT scans. In fact,all the new techniques have been hampered by the inconsis-tent and irregular effects on the resulting images due to theelectron scatter effects from the metal implants. This is nottrue for the more recent technique of dual energy X-rayabsorptiometry (DEXA), whose new developments havesignificantly improved its ability to quantify regional bonemineral density in a reproducible manner, and new soft-ware allows the comparison of bone mineral densityadjacent to femoral hip implants within the femur of agiven patient and between different patients [3,4,13].
On the whole, the DEXA technique fits the aim of allow-ing comparative analyses, and its accuracy is definitelysuperior to the accuracy of an analysis based on digitizedclinical radiographs. For these reasons, traditional video-densitometry based on plain radiographs is now beinggiven very little consideration and has been practicallyabandoned as a means to evaluate the follow- up of patientswith arthroprostheses. In this sense this research is some-how singular, but it found its reasons in the observation thatthe results of use of DEXA analyses have some strong limi-tations. First of all, the quantification of the progression ofbone-remodeling processes necessitates several years ofannual measurement of the same patients [14]; only in thisway can a prospective comparison between patients withdifferent types of hip implant and a valuable early informa-tion on the design and use of femoral prostheses beprovided.
Longitudinal DEXA studies are not available at themoment, because this technique is too young. Moreover, itis difficult to provide even a future availability of thesestudies, because although DEXA has undoubted value as ascientific tool, the expense of the scan is not trivial, so it isnot possible to envision a future clinical, routine use [14].
In contrast, conventional radiographs offer a quick, noninvasive, readily available, cheap method to assess skeletaltissue. A comparison of the results of the DEXA with theappearance of the clinical radiographs provided a clearimpression of the association between the information thateach technique gives [14].
In an experimental study the volumetric densities mea-sured by videodensitometry (performed on slices of driedbone) were compared with area densities measured withDEXA; there was a strong linear correlation between the
400 A. L. AUDENINO ET AL.
two methods (r2 = 0.8) [15].The suitability of plain radi-ographs to the present study is even less demanding,because this study is restricted to the appreciation of bonedensity patterns, of its evolution with time and of its redis-tribution around the bone implant, and does not aim at theabsolute quantification of bone mineral density. For thisreason a step-wedge is not necessary (and in any case itwould not be present in all routine clinical radiographs,chosen as materials of this study); neither it is necessary toknow the exposure settings – in one word, each individualacts as his own control. The main merits of the techniqueintroduced here are its immediate applicability, its low cost,its simplicity and its accuracy, which, even if it is certainlyinferior to the one provided by DEXA, proved to be enoughfor the aim of this study. Another advantage of the tech-nique introduced here is that it allows the evaluation ofvariations in bone densitometry, these being a form ofinformation which can support a pattern recognitionapproach.
Having decided to base the analysis on plain radi-ographs, two fundamental strategies could be followed. Thefirst is to base the diagnosis on local features, and the sec-ond is to base the diagnosis on the global structures in theradiograph. Previous articles have dealt with changes invery small regions of interest [3,4]. Although quantitativemeasurement of bone-remodeling in selected regions ishelpful, such an analysis does not address the more impor-tant question about the global changes in periprostheticbone-mineral content. It is important to quantitate the resultof the overall redistribution of bone due to adaptive remod-eling [14]. That is why the study described here wasdesigned to show the feasibility of making diagnostic deci-sions on the basis of global properties.
The possibility of basing the study on trabecular patternsinstead of the only bone mineral density [16] could also beconsidered, but this would be possible only when all the radi-ographs of the follow-up were obtained using an exposuresufficient to delineate the macroscopic details of the internalarchitecture of bones [17], and this requirement was seldommatched in our experience. In any case, it must be noted thatthe results of videodensitometric analysis can be reformattedinto a sparsely or densely populated 3D data matrix to whichvarious algorithms can easily be applied in order to generatevarious systems of pattern-recognition analysis.
Materials
The X-ray images of a patient’s follow-up are acquired,digitized and stored by means of a computerized image
acquisition system. This imaging system includes a back-ground lighting system (Protek Medview A3), a CCD videocamera (Pertel CCD-501 2P, SNR: >62 dB, resolution: 5753 570, sensitivity: 0.01 lux at the sensor), a 60 mm lens(Nikkon, AF Micro Nikkor 1:2.8), a monitor to showacquired images (Panasonic WV-5410/B), a personal com-puter (Hewlett Packard Vectra PC Mod. 45945A), aframe-grabber board (Coreco Oculus 300, resolution: 5123 1024, 8-bit) and specially designed software (BorlandC++ compiler version 3.1).
Range and Offset
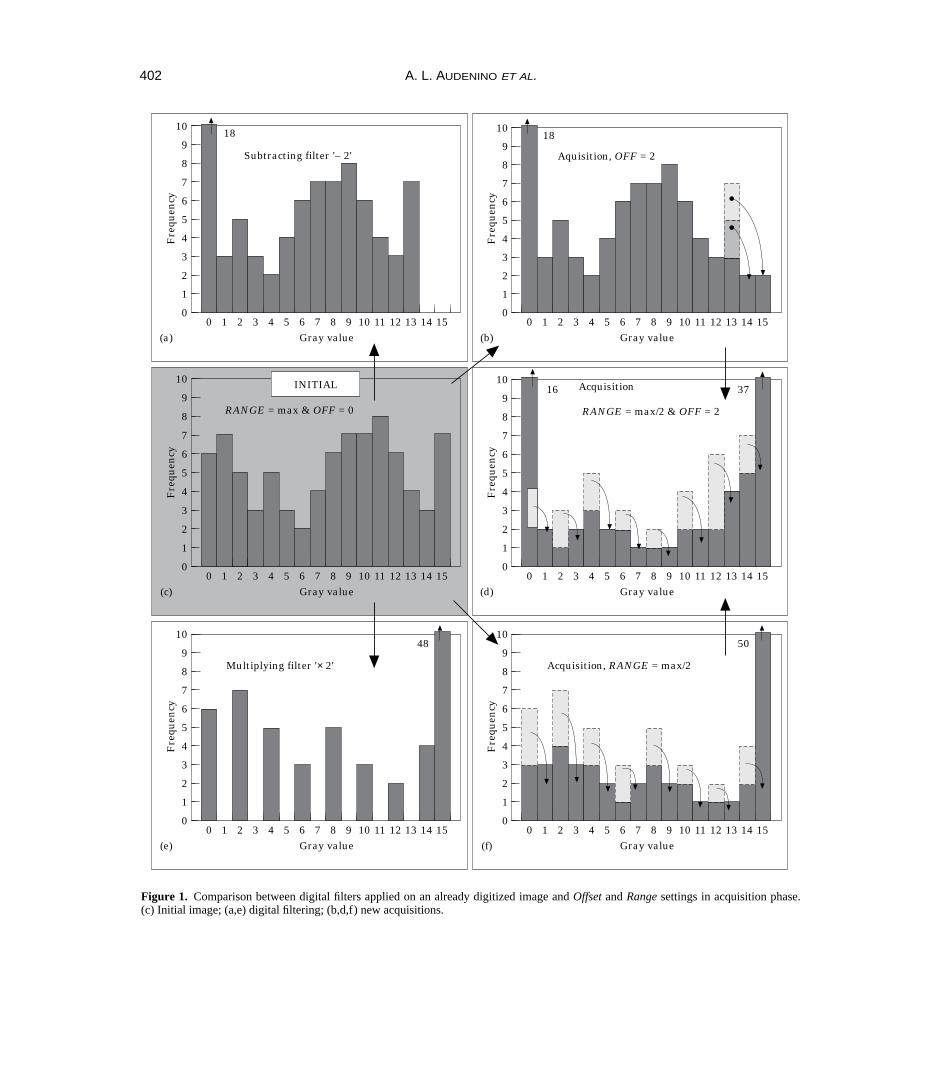
The frame-grabber board Coreco Oculus 300 permits theregulation of two important acquisition parameters (rang-ing from 0 to 255) during image capture: Offset, i.e.luminosity, and Range, i.e. contrast. Offset controls whichlight intensity is equal to the gray value zero. Range con-trols the range of the digitized signal: the lower the Rangevalue, the lower the extent of the digitised signal (maxi-mum contrasts). In other words, Range and Offsetrespectively modify the slope and the intercept of the linethat attributes a value of gray to each gray level on theradiograph.
Areas with a signal level below the lowest that can bedigitized (gray level = 0) are classified as low saturationareas (LS), and areas with a signal level above the highestthat can be digitized (grey level = 255) are classified ashigh saturation areas (HS). Where neither low nor high sat-uration is reached, the following equation applies:
(1)
where Nbit is the number of acquisition bit, GV1, GV2 arethe gray values obtained, respectively, with Range set atRng1, Rng2 and Offset set at Off1, Off2.
The effects of Range and Offset parameters on gray scalecan be effectively compared by looking at histogram dia-grams, which have gray values on the x-axis and thenumber of pixels for each gray level on the y-axis. InFigure 1 an example is shown, using only 4-bit acquisitionfor easier comprehension: Figure 1(c) shows the initialimage; (b), (d) and (f) show the effect of Range and Offseton gray scale; (a) and (e) show the effects of summing ormultiplying filters on an already acquired image. The digi-tal filters do not actually produce results equal to thoseobtained by setting Offset and Range in the capture stage[Figure 1(a)–(b) and 1(d)–(e)].
GV = GVRng
RngOff Off
Rng
Nbit
2 11
21 2
2
2 1⋅ + − ⋅ −
( )
ROENTGENOGRAPHIC FEATURES OF FOLLOW-UP RADIOGRAPHS 401
402 A. L. AUDENINO ET AL.
10
00
Gray value
Fre
quen
cy
136 10
5
9
8
7
6
4
3
2
1
1 2 3 54 7 8 9 11 12 14 15
Multiplying filter '× 2'
48
(e)
10
00
Gray value
Fre
quen
cy
136 10
5
9
8
7
6
4
3
2
1
1 2 3 54 7 8 9 11 12 14 15
Acquisition, RANGE = max/2
50
(f)
10
00
Gray value
Fre
quen
cy
136 10
5
9
8
7
6
4
3
2
1
1 2 3 54 7 8 9 11 12 14 15
RANGE = max & OFF = 0
(c)
10
00
Gray value
Fre
quen
cy
136 10
5
9
8
7
6
4
3
2
1
1 2 3 54 7 8 9 11 12 14 15
RANGE = max/2 & OFF = 2
37
(d)
10
00
Gray value
Fre
quen
cy
136 10
5
9
8
7
6
4
3
2
1
1 2 3 54 7 8 9 11 12 14 15
Subtracting filter '– 2'
18
(a)
10
00
Gray value
Fre
quen
cy
136 10
5
9
8
7
6
4
3
2
1
1 2 3 54 7 8 9 11 12 14 15
Aquisition, OFF = 2
18
(b)
16 AcquisitionINITIAL
Figure 1. Comparison between digital filters applied on an already digitized image and Offset and Range settings in acquisition phase.(c) Initial image; (a,e) digital filtering; (b,d,f) new acquisitions.
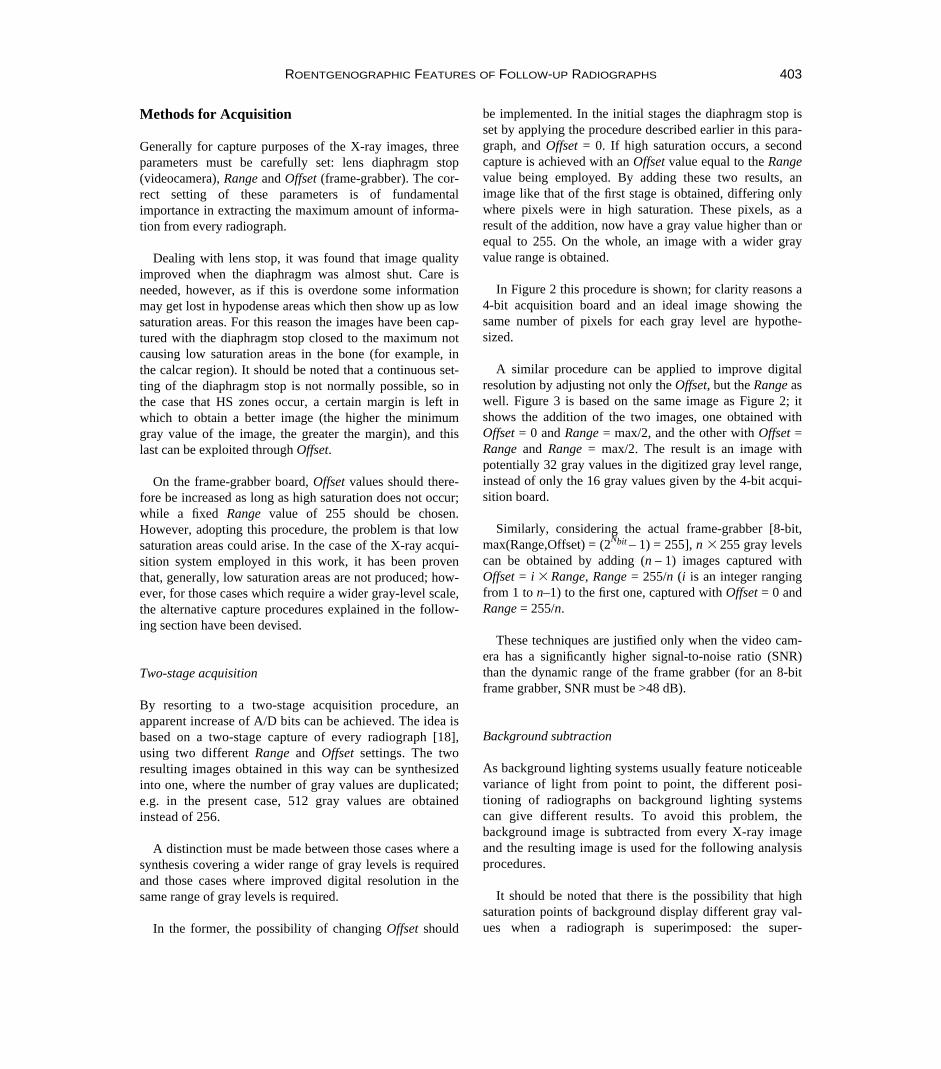
Methods for Acquisition
Generally for capture purposes of the X-ray images, threeparameters must be carefully set: lens diaphragm stop(videocamera), Range and Offset (frame-grabber). The cor-rect setting of these parameters is of fundamentalimportance in extracting the maximum amount of informa-tion from every radiograph.
Dealing with lens stop, it was found that image qualityimproved when the diaphragm was almost shut. Care isneeded, however, as if this is overdone some informationmay get lost in hypodense areas which then show up as lowsaturation areas. For this reason the images have been cap-tured with the diaphragm stop closed to the maximum notcausing low saturation areas in the bone (for example, inthe calcar region). It should be noted that a continuous set-ting of the diaphragm stop is not normally possible, so inthe case that HS zones occur, a certain margin is left inwhich to obtain a better image (the higher the minimumgray value of the image, the greater the margin), and thislast can be exploited through Offset.
On the frame-grabber board, Offset values should there-fore be increased as long as high saturation does not occur;while a fixed Range value of 255 should be chosen.However, adopting this procedure, the problem is that lowsaturation areas could arise. In the case of the X-ray acqui-sition system employed in this work, it has been proventhat, generally, low saturation areas are not produced; how-ever, for those cases which require a wider gray-level scale,the alternative capture procedures explained in the follow-ing section have been devised.
Two-stage acquisition
By resorting to a two-stage acquisition procedure, anapparent increase of A/D bits can be achieved. The idea isbased on a two-stage capture of every radiograph [18],using two different Range and Offset settings. The tworesulting images obtained in this way can be synthesizedinto one, where the number of gray values are duplicated;e.g. in the present case, 512 gray values are obtainedinstead of 256.
A distinction must be made between those cases where asynthesis covering a wider range of gray levels is requiredand those cases where improved digital resolution in thesame range of gray levels is required.
In the former, the possibility of changing Offset should
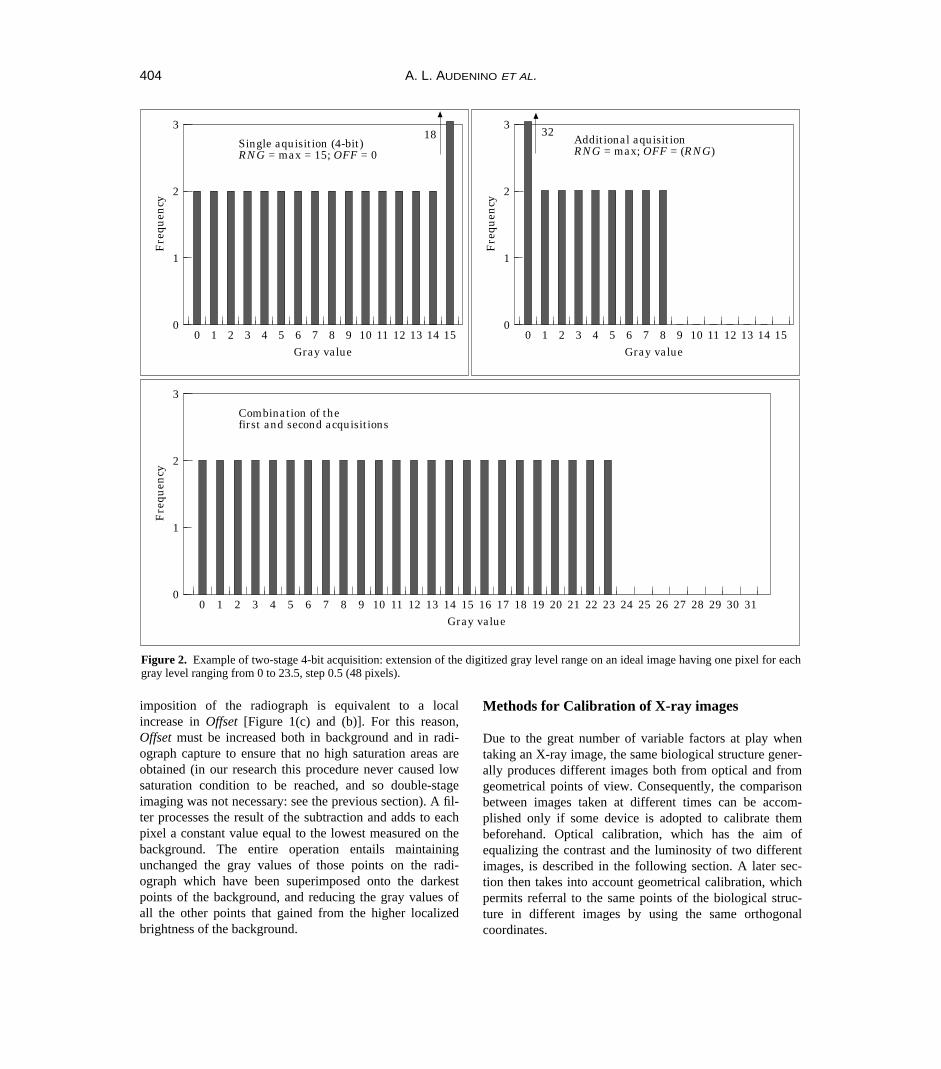
be implemented. In the initial stages the diaphragm stop isset by applying the procedure described earlier in this para-graph, and Offset = 0. If high saturation occurs, a secondcapture is achieved with an Offset value equal to the Rangevalue being employed. By adding these two results, animage like that of the first stage is obtained, differing onlywhere pixels were in high saturation. These pixels, as aresult of the addition, now have a gray value higher than orequal to 255. On the whole, an image with a wider grayvalue range is obtained.
In Figure 2 this procedure is shown; for clarity reasons a4-bit acquisition board and an ideal image showing thesame number of pixels for each gray level are hypothe-sized.
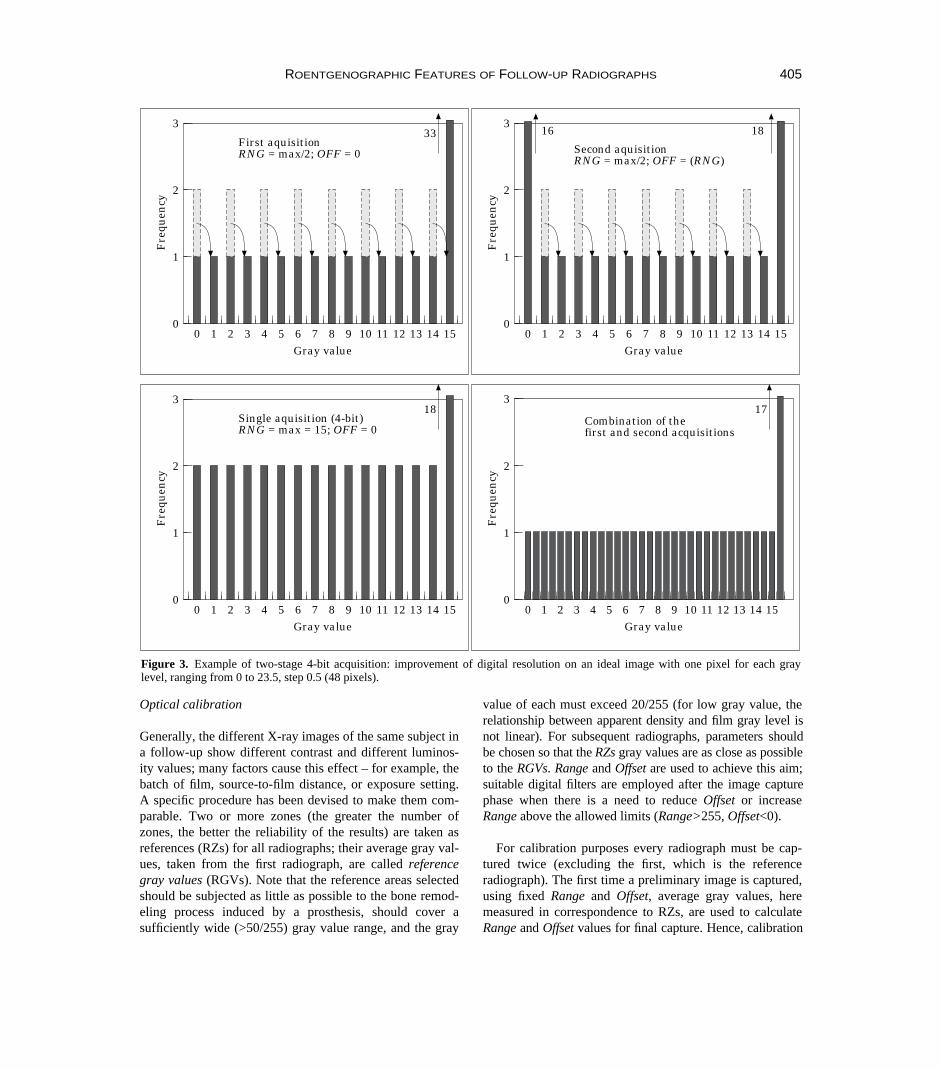
A similar procedure can be applied to improve digitalresolution by adjusting not only the Offset, but the Range aswell. Figure 3 is based on the same image as Figure 2; itshows the addition of the two images, one obtained withOffset = 0 and Range = max/2, and the other with Offset =Range and Range = max/2. The result is an image withpotentially 32 gray values in the digitized gray level range,instead of only the 16 gray values given by the 4-bit acqui-sition board.
Similarly, considering the actual frame-grabber [8-bit,max(Range,Offset) = (2Nbit – 1) = 255], n 3 255 gray levelscan be obtained by adding (n – 1) images captured withOffset = i 3 Range, Range = 255/n (i is an integer rangingfrom 1 to n–1) to the first one, captured with Offset = 0 andRange = 255/n.
These techniques are justified only when the video cam-era has a significantly higher signal-to-noise ratio (SNR)than the dynamic range of the frame grabber (for an 8-bitframe grabber, SNR must be >48 dB).
Background subtraction
As background lighting systems usually feature noticeablevariance of light from point to point, the different posi-tioning of radiographs on background lighting systemscan give different results. To avoid this problem, thebackground image is subtracted from every X-ray imageand the resulting image is used for the following analysisprocedures.
It should be noted that there is the possibility that highsaturation points of background display different gray val-ues when a radiograph is superimposed: the super-
ROENTGENOGRAPHIC FEATURES OF FOLLOW-UP RADIOGRAPHS 403
imposition of the radiograph is equivalent to a localincrease in Offset [Figure 1(c) and (b)]. For this reason,Offset must be increased both in background and in radi-ograph capture to ensure that no high saturation areas areobtained (in our research this procedure never caused lowsaturation condition to be reached, and so double-stageimaging was not necessary: see the previous section). A fil-ter processes the result of the subtraction and adds to eachpixel a constant value equal to the lowest measured on thebackground. The entire operation entails maintainingunchanged the gray values of those points on the radi-ograph which have been superimposed onto the darkestpoints of the background, and reducing the gray values ofall the other points that gained from the higher localizedbrightness of the background.
Methods for Calibration of X-ray images
Due to the great number of variable factors at play whentaking an X-ray image, the same biological structure gener-ally produces different images both from optical and fromgeometrical points of view. Consequently, the comparisonbetween images taken at different times can be accom-plished only if some device is adopted to calibrate thembeforehand. Optical calibration, which has the aim ofequalizing the contrast and the luminosity of two differentimages, is described in the following section. A later sec-tion then takes into account geometrical calibration, whichpermits referral to the same points of the biological struc-ture in different images by using the same orthogonalcoordinates.
404 A. L. AUDENINO ET AL.
3
00
Gray value
Fre
quen
cy
136 10
2
1
1 2 3 54 7 8 9 11 12 14 15
Single aquisition (4-bit)RNG = max = 15; OFF = 0
183
00
Gray value
Fre
quen
cy
136 10
2
1
1 2 3 54 7 8 9 11 12 14 15
Additional aquisitionRNG = max; OFF = (RNG)
32
3
00
Gray value
Fre
quen
cy
136 10
2
1
1 2 3 54 7 8 9 11 12 14 15
Combination of thefirst and second acquisitions
16 2922 2617 18 19 2120 23 24 25 27 28 30 31
Figure 2. Example of two-stage 4-bit acquisition: extension of the digitized gray level range on an ideal image having one pixel for eachgray level ranging from 0 to 23.5, step 0.5 (48 pixels).
Optical calibration
Generally, the different X-ray images of the same subject ina follow-up show different contrast and different luminos-ity values; many factors cause this effect – for example, thebatch of film, source-to-film distance, or exposure setting.A specific procedure has been devised to make them com-parable. Two or more zones (the greater the number ofzones, the better the reliability of the results) are taken asreferences (RZs) for all radiographs; their average gray val-ues, taken from the first radiograph, are called referencegray values (RGVs). Note that the reference areas selectedshould be subjected as little as possible to the bone remod-eling process induced by a prosthesis, should cover asufficiently wide (>50/255) gray value range, and the gray
value of each must exceed 20/255 (for low gray value, therelationship between apparent density and film gray level isnot linear). For subsequent radiographs, parameters shouldbe chosen so that the RZs gray values are as close as possibleto the RGVs. Range and Offset are used to achieve this aim;suitable digital filters are employed after the image capturephase when there is a need to reduce Offset or increaseRange above the allowed limits (Range>255, Offset<0).
For calibration purposes every radiograph must be cap-tured twice (excluding the first, which is the referenceradiograph). The first time a preliminary image is captured,using fixed Range and Offset, average gray values, heremeasured in correspondence to RZs, are used to calculateRange and Offset values for final capture. Hence, calibration
ROENTGENOGRAPHIC FEATURES OF FOLLOW-UP RADIOGRAPHS 405
3
00
Gray value
Fre
quen
cy
136 10
2
1
1 2 3 54 7 8 9 11 12 14 15
Single aquisition (4-bit)RNG = max = 15; OFF = 0
183
00
Gray value
Fre
quen
cy
136 10
2
1
1 2 3 54 7 8 9 11 12 14 15
Combination of thefirst and second acquisitions
17
3
00
Gray value
Fre
quen
cy
136 10
2
1
1 2 3 54 7 8 9 11 12 14 15
First aquisitionRNG = max/2; OFF = 0
333
00
Gray value
Fre
quen
cy
136 10
2
1
1 2 3 54 7 8 9 11 12 14 15
Second aquisitionRNG = max/2; OFF = (RNG)
1816
Figure 3. Example of two-stage 4-bit acquisition: improvement of digital resolution on an ideal image with one pixel for each graylevel, ranging from 0 to 23.5, step 0.5 (48 pixels).
procedure requires the determination of two free para-meters (Range and Offset), making at least two RZsnecessary; in other words the slope (m) and the intercept(q) of the line that attributes each radiograph gray levelwith a gray value can be independently changed. These twoparameters (m, q) are calculated by means of a linear inter-polation of the points whose first coordinate is one of theRZs’ values and whose second coordinate is the respectiveRGVs. Range and Offset for the final imaging are calculatedusing the following formula:
(2)
where: Rangep, Offsetp are the parameters chosen for pre-liminary image capture, and Rangef, Offsetf are theparameters chosen for final image capture. The resultingimage is then comparable with the first (reference) radi-ograph. Images subsequent to the reference one arecaptured by setting the diaphragm stop that makes the grayvalues in the RZs as close as possible to the RGVs. Thissetting will ensure that all radiographs have similar grayvalue ranges even before final setting of Range and Offset.This is a useful device, as diaphragm performance is notalways linear.
This calibration technique is now in use, since it furnishesgood results; other calibration techniques can be found inliterature [19]; their applicability for our purposes has beentested. As these techniques usually involve the whole image,a different location of the radiograph with respect to thebackground lighting system or of the X-ray film withrespect to the bone produces a different percentage of veryluminous pixels on the displayed image (deriving from thepoints of the background lighting system that were directlycaptured) and of very dark pixels on the radiograph (deriv-ing from the points of the X-ray film that were directlyexposed); as a consequence, falsified results are produced.Another problem is the risk that overall resorbing of thebone does not show up after calibration. For these reasons,any calibration technique should only refer to those areaswhere little or no bone remodeling occurs after implant, andwe performed an alternative calibration through the identifi-cation of as wide a reference zone as possible whichsatisfies all the requisites mentioned above for RZs. Its gray-scale histogram is then traced, and it is used for calibration.This method offers the advantage of being less conditionedby spatial positioning when compared to the RZs method.As yet, however, results have not been sufficiently satisfac-tory and it has not been possible to reproduce them,probably due to the excess sensitivity of this technique tonoise and eventual low or high saturation areas.
Geometrical calibration
The distance between the X-ray source and the biologicalstructure and their relative positioning tend to vary fromone X-ray image to another; consequently, the images ofthe same subject are not only optically but also geometri-cally different. These images, however, can generally becompared by simply applying a horizontal and a verticalscale factor. Furthermore, even if these effects were notpresent, two translations and one rotation are required tomake the main axes of the bone (both the longitudinal andtransversal axes) coincident on distinct radiographs. Forthese reasons, a specific reference frame is needed to iden-tify the same zones on the bone with the same coordinates.
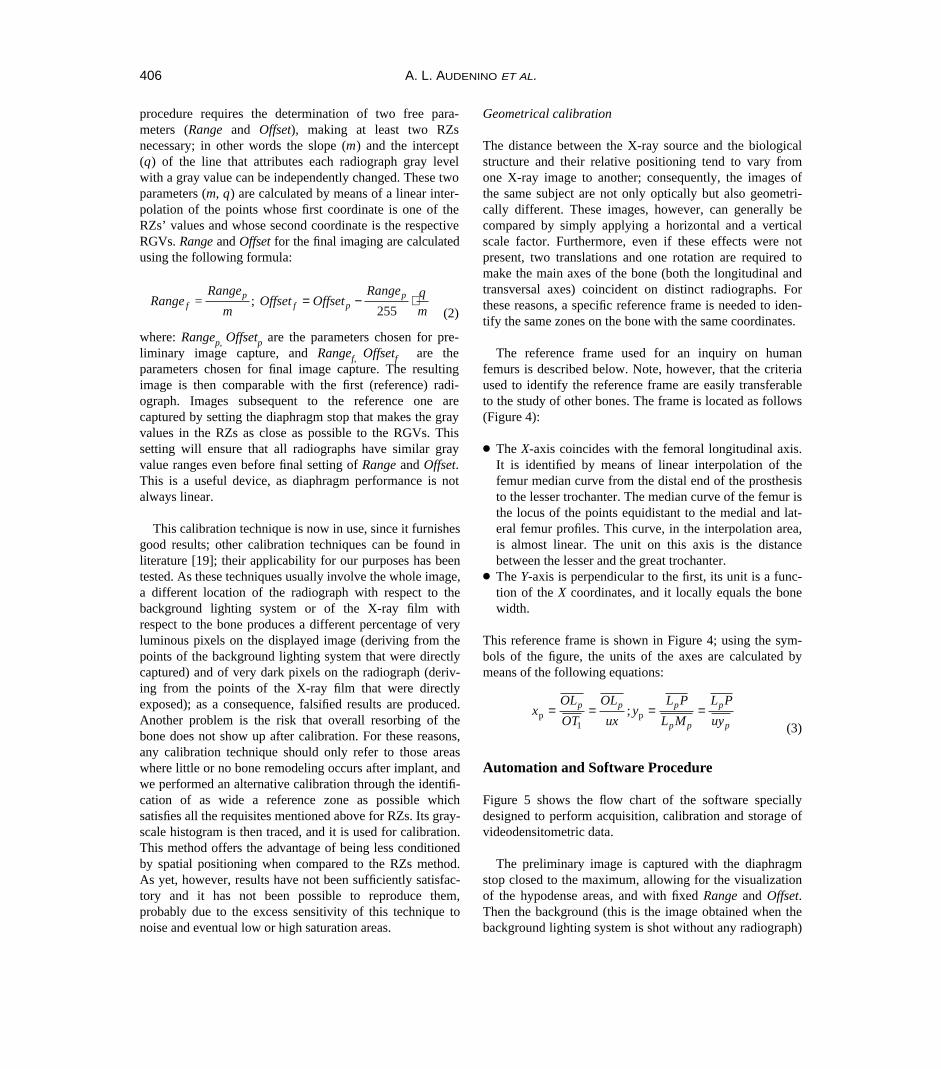
The reference frame used for an inquiry on humanfemurs is described below. Note, however, that the criteriaused to identify the reference frame are easily transferableto the study of other bones. The frame is located as follows(Figure 4):
● The X-axis coincides with the femoral longitudinal axis.It is identified by means of linear interpolation of thefemur median curve from the distal end of the prosthesisto the lesser trochanter. The median curve of the femur isthe locus of the points equidistant to the medial and lat-eral femur profiles. This curve, in the interpolation area,is almost linear. The unit on this axis is the distancebetween the lesser and the great trochanter.
● The Y-axis is perpendicular to the first, its unit is a func-tion of the X coordinates, and it locally equals the bonewidth.
This reference frame is shown in Figure 4; using the sym-bols of the figure, the units of the axes are calculated bymeans of the following equations:
(3)
Automation and Software Procedure
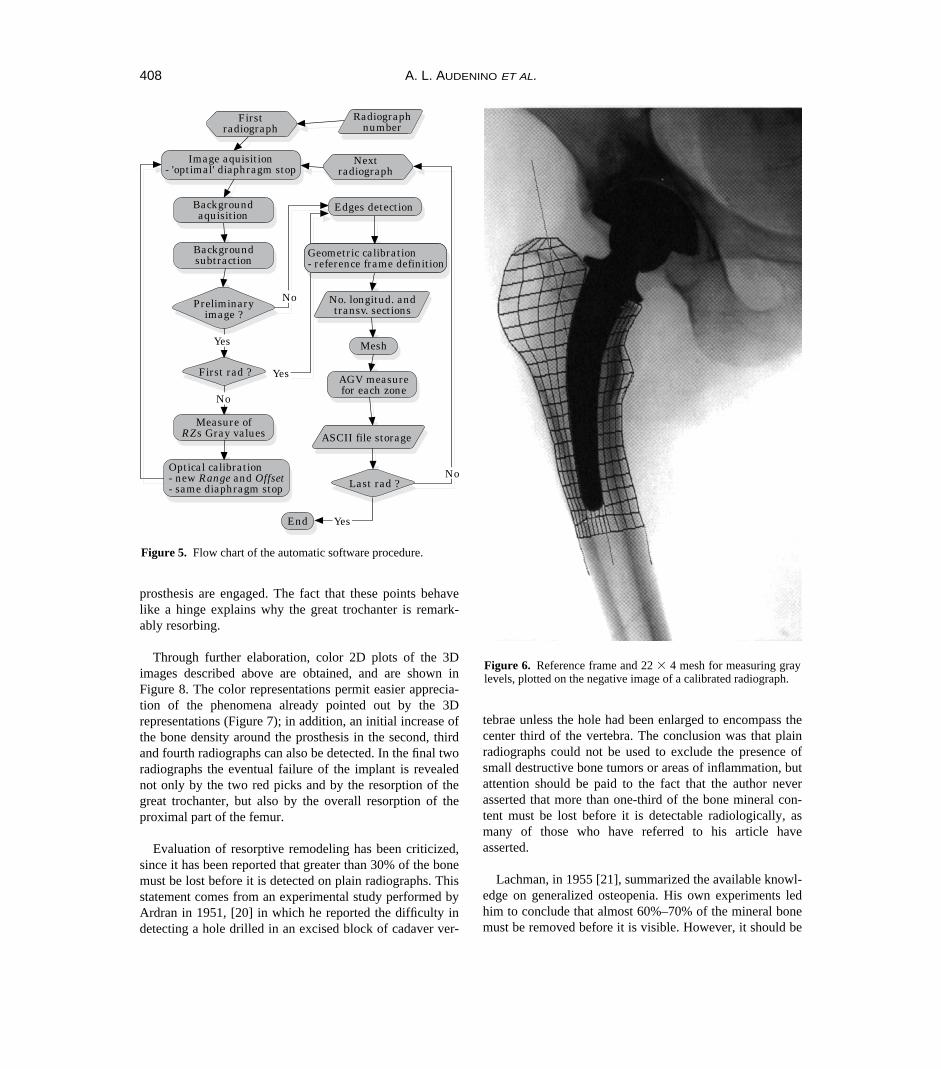
Figure 5 shows the flow chart of the software speciallydesigned to perform acquisition, calibration and storage ofvideodensitometric data.
The preliminary image is captured with the diaphragmstop closed to the maximum, allowing for the visualizationof the hypodense areas, and with fixed Range and Offset.Then the background (this is the image obtained when thebackground lighting system is shot without any radiograph)
xOL
OT
OL
uxy
L P
L M
L P
uyp p p
p p
p
pp ;= = = =
1p
Range =Range
mOffset Offset
Range q
mfp
f pp; = − ⋅
255
406 A. L. AUDENINO ET AL.
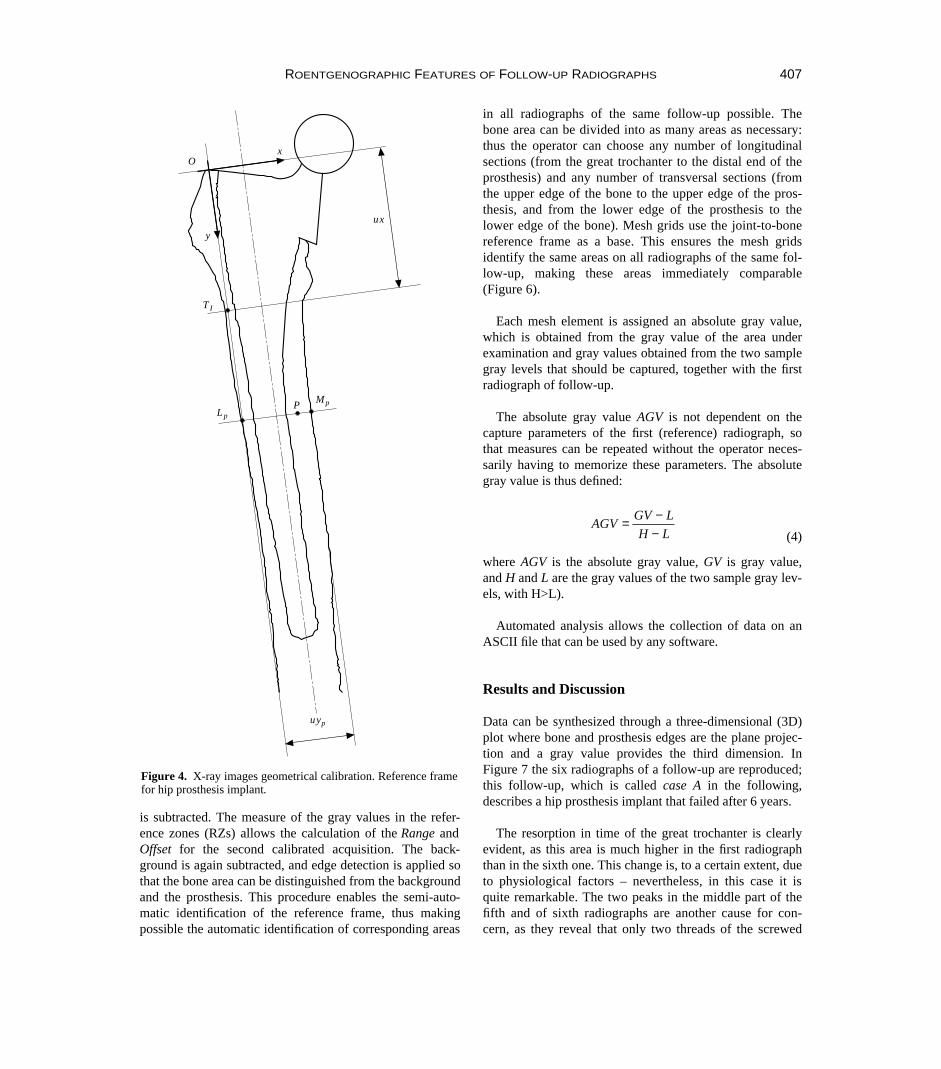
is subtracted. The measure of the gray values in the refer-ence zones (RZs) allows the calculation of the Range andOffset for the second calibrated acquisition. The back-ground is again subtracted, and edge detection is applied sothat the bone area can be distinguished from the backgroundand the prosthesis. This procedure enables the semi-auto-matic identification of the reference frame, thus makingpossible the automatic identification of corresponding areas
in all radiographs of the same follow-up possible. Thebone area can be divided into as many areas as necessary:thus the operator can choose any number of longitudinalsections (from the great trochanter to the distal end of theprosthesis) and any number of transversal sections (fromthe upper edge of the bone to the upper edge of the pros-thesis, and from the lower edge of the prosthesis to thelower edge of the bone). Mesh grids use the joint-to-bonereference frame as a base. This ensures the mesh gridsidentify the same areas on all radiographs of the same fol-low-up, making these areas immediately comparable(Figure 6).
Each mesh element is assigned an absolute gray value,which is obtained from the gray value of the area underexamination and gray values obtained from the two samplegray levels that should be captured, together with the firstradiograph of follow-up.
The absolute gray value AGV is not dependent on thecapture parameters of the first (reference) radiograph, sothat measures can be repeated without the operator neces-sarily having to memorize these parameters. The absolutegray value is thus defined:
(4)
where AGV is the absolute gray value, GV is gray value,and H and L are the gray values of the two sample gray lev-els, with H>L).
Automated analysis allows the collection of data on anASCII file that can be used by any software.
Results and Discussion
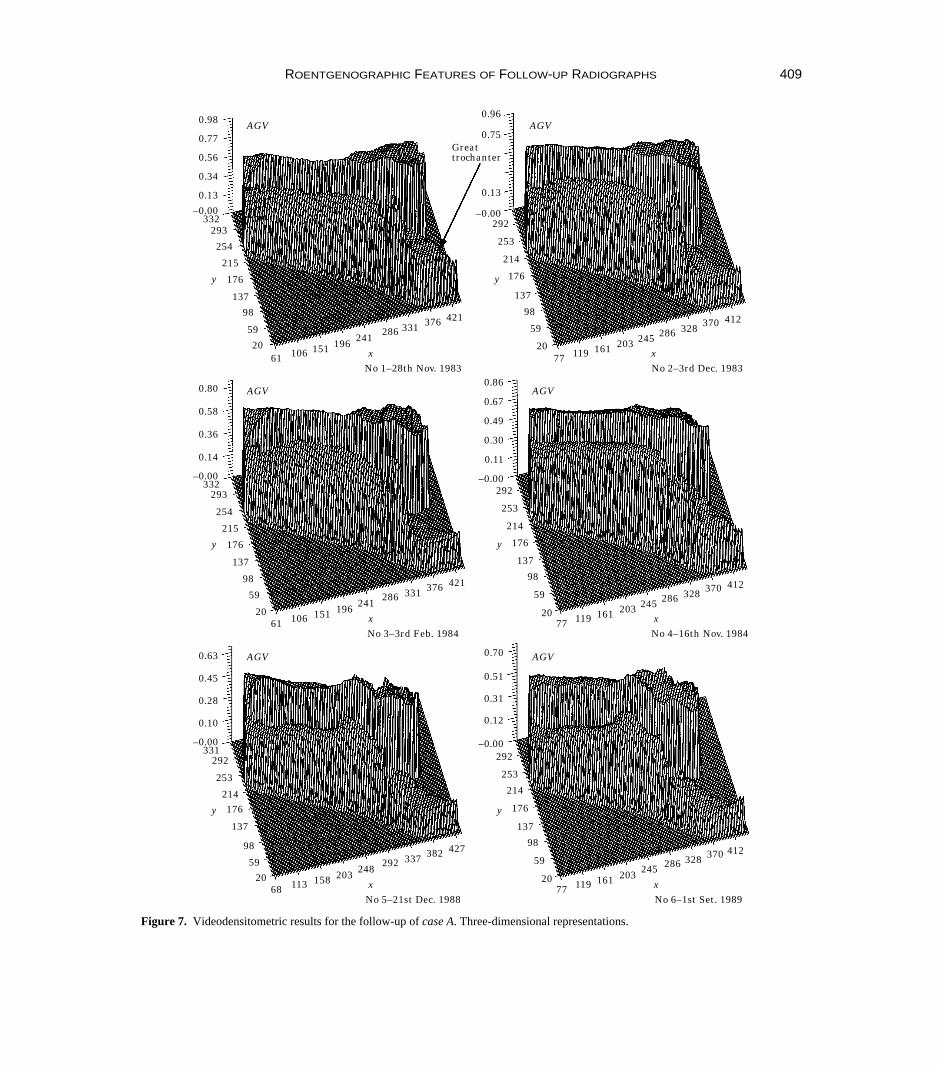
Data can be synthesized through a three-dimensional (3D)plot where bone and prosthesis edges are the plane projec-tion and a gray value provides the third dimension. InFigure 7 the six radiographs of a follow-up are reproduced;this follow-up, which is called case A in the following,describes a hip prosthesis implant that failed after 6 years.
The resorption in time of the great trochanter is clearlyevident, as this area is much higher in the first radiographthan in the sixth one. This change is, to a certain extent, dueto physiological factors – nevertheless, in this case it isquite remarkable. The two peaks in the middle part of thefifth and of sixth radiographs are another cause for con-cern, as they reveal that only two threads of the screwed
AGVGV L
H L= −
−
ROENTGENOGRAPHIC FEATURES OF FOLLOW-UP RADIOGRAPHS 407
Lp
TI
y
MpP
ux
xO
uyp
Figure 4. X-ray images geometrical calibration. Reference framefor hip prosthesis implant.
prosthesis are engaged. The fact that these points behavelike a hinge explains why the great trochanter is remark-ably resorbing.
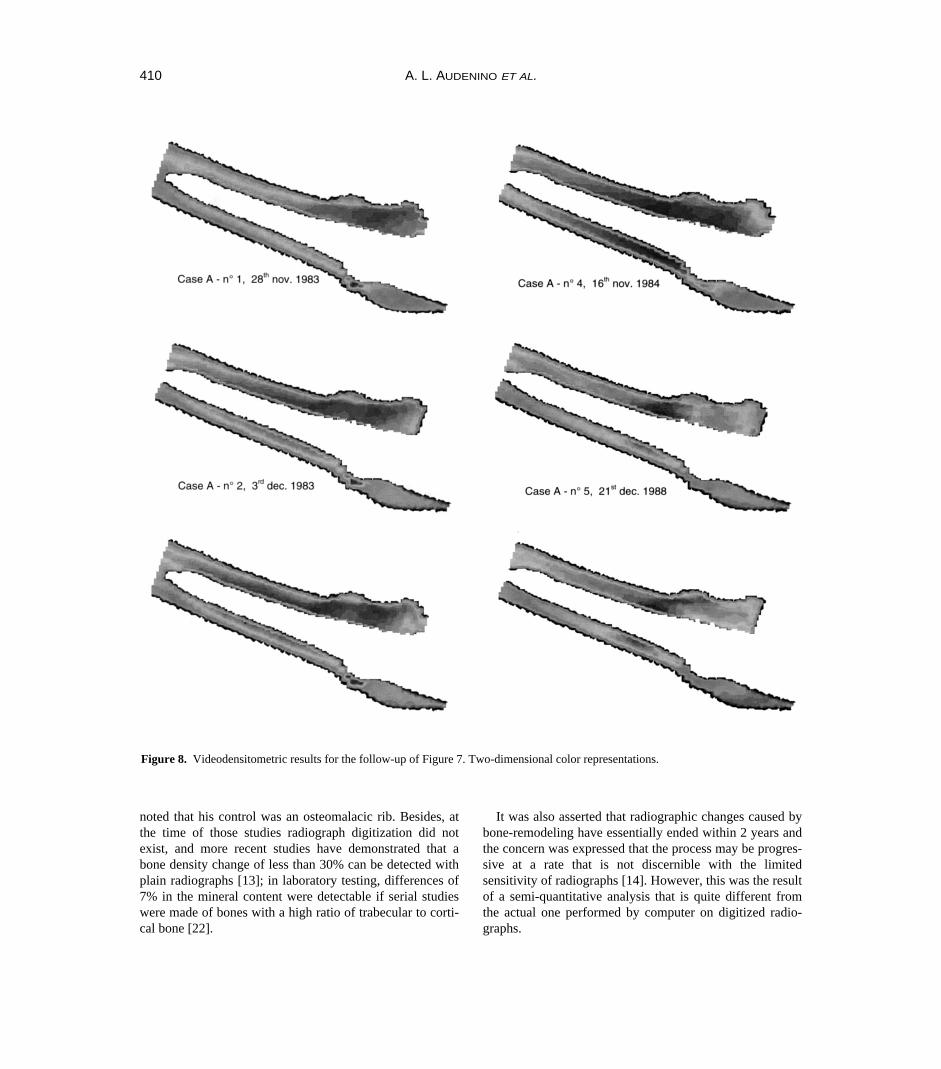
Through further elaboration, color 2D plots of the 3Dimages described above are obtained, and are shown inFigure 8. The color representations permit easier apprecia-tion of the phenomena already pointed out by the 3Drepresentations (Figure 7); in addition, an initial increase ofthe bone density around the prosthesis in the second, thirdand fourth radiographs can also be detected. In the final tworadiographs the eventual failure of the implant is revealednot only by the two red picks and by the resorption of thegreat trochanter, but also by the overall resorption of theproximal part of the femur.
Evaluation of resorptive remodeling has been criticized,since it has been reported that greater than 30% of the bonemust be lost before it is detected on plain radiographs. Thisstatement comes from an experimental study performed byArdran in 1951, [20] in which he reported the difficulty indetecting a hole drilled in an excised block of cadaver ver-
tebrae unless the hole had been enlarged to encompass thecenter third of the vertebra. The conclusion was that plainradiographs could not be used to exclude the presence ofsmall destructive bone tumors or areas of inflammation, butattention should be paid to the fact that the author neverasserted that more than one-third of the bone mineral con-tent must be lost before it is detectable radiologically, asmany of those who have referred to his article haveasserted.
Lachman, in 1955 [21], summarized the available knowl-edge on generalized osteopenia. His own experiments ledhim to conclude that almost 60%–70% of the mineral bonemust be removed before it is visible. However, it should be
408 A. L. AUDENINO ET AL.
End
Geometric calibration- reference frame definition
No
Yes
No
Yes
No
Yes
First rad ?
Last rad ?Optical calibration- new Range and Offset- same diaphragm stop
Measure ofRZs Gray values
Preliminaryimage ?
Backgroundsubtraction
Backgroundaquisition
Image aquisition- 'optimal' diaphragm stop
Edges detection
Geometric calibration- reference frame definition
No. longitud. andtransv. sections
Mesh
AGV measurefor each zone
ASCII file storage
Next radiograph
Firstradiograph
Radiographnumber
Figure 5. Flow chart of the automatic software procedure.
Figure 6. Reference frame and 22 3 4 mesh for measuring graylevels, plotted on the negative image of a calibrated radiograph.
ROENTGENOGRAPHIC FEATURES OF FOLLOW-UP RADIOGRAPHS 409
0.63
331
y
0.10
292
214176
98
137
5920
–0.00
0.28
0.45
68 113 158 203292
248337 382 427
xNo 5–21st Dec. 1988
253
AGV 0.70
y
0.12
292
214
176
98
137
59
20
–0.00
0.31
0.51
77 119 161 203286245
328 370 412
xNo 6–1st Set. 1989
253
AGV
0.80
332
y
0.14
293
215
176
98
137
59
20
–0.00
0.36
0.58
61 106 151 196286
241331 376 421
xNo 3–3rd Feb. 1984
254
AGV0.86
y
0.11
292
214
176
98
137
59
20
–0.00
0.30
0.49
77 119 161 203286245
328 370 412
xNo 4–16th Nov. 1984
253
AGV0.67
0.98
332
y
0.13
293
215
176
98
137
59
20
–0.00
0.34
0.77
61 106 151 196286
241331 376 421
xNo 1–28th Nov. 1983
254
AGV0.96
y
0.13
292
214
176
98
137
59
20
–0.00
77 119 161 203286245
328 370 412
xNo 2–3rd Dec. 1983
253
AGV0.75
0.56Greattrochanter
Figure 7. Videodensitometric results for the follow-up of case A. Three-dimensional representations.
noted that his control was an osteomalacic rib. Besides, atthe time of those studies radiograph digitization did notexist, and more recent studies have demonstrated that abone density change of less than 30% can be detected withplain radiographs [13]; in laboratory testing, differences of7% in the mineral content were detectable if serial studieswere made of bones with a high ratio of trabecular to corti-cal bone [22].
It was also asserted that radiographic changes caused bybone-remodeling have essentially ended within 2 years andthe concern was expressed that the process may be progres-sive at a rate that is not discernible with the limitedsensitivity of radiographs [14]. However, this was the resultof a semi-quantitative analysis that is quite different fromthe actual one performed by computer on digitized radio-graphs.
410 A. L. AUDENINO ET AL.
Figure 8. Videodensitometric results for the follow-up of Figure 7. Two-dimensional color representations.

Nevertheless, the authors are well aware of the manylimitations of the present method. First of all, it can onlyprovide a 2D measure of femoral density; also, someknown disturbing effects [23] were not compensated for:variations in density or thickness of soft tissues surroundinga bone to be measured are a definite source of error, even ifthe X-ray absorptive coefficient of the soft tissues is muchless than that of bone. The position of the bone cannot beassured to be exactly the same in all radiographs, and onlyrigorous standardized procedures can find a remedy for thisin the future. The calibration procedure implemented hereis not likely to compensate fully for the effects of variationsin the exposition, the developing technique, the relativeposition of the X-ray source, the patient and the X-ray film.The camera recording and digitization procedure providean unnecessary source of noise [24,25], which will beavoided in the future when a slide scanner is employed.
Some of the previously mentioned limitations soundmuch weaker if it is remembered that the study deals with acomparative analysis and no attempt is made to obtainabsolute values. Moreover, in spite of those limitations theanalysis proved effective in showing the main remodelingprocesses occurring after the implant of an arthroprosthesis.The automation of the diagnosis provides reproducible,objective results. The technique is simple, cheap and ofimmediate applicability: the analysis can be performed onroutine radiographs taken in the past, and consequently issuitable to analyse the follow-ups on disposal. There is noneed of radiographs where a step-wedge is present near thebone, no need to know the exposure setting, and no need ofextra information that may not have been recorded in thefollow-ups which are presently available.
Further study will try to integrate the analysis of bonedensity pattern with other diagnostic strategies.
The density plots presented in this study can henceforthserve as references for the evaluation of finite elementmodels simulating bone remodeling [6,26] constructedfrom these cases.
Risk index
For clinical practice we are in the process of setting up anindex to systematize all data collected, and which could beuseful in the follow-up assessment of all those cases wherean arthroprothesis has been implanted. As maturation rateat the different points in the bone varies greatly when fail-ure is about to occur and overall density is likely to be low,risk index (RI) can be defined as:
(5)
where: ∆ρ is the difference between gray values in homolo-gous areas in the current radiograph and in the firstradiograph of follow-up; and ρ is the mean gray value ofbone in the current radiograph.
When failure is about to occur, values of RI are highand continue to rise. As the automatic procedure allowsfor an increase in the number of areas into which thebone can be sectioned for analysis, a great improvementon our previous manual procedure [27–29] is obtained:in the latter, the number of areas seriously hampered thespeed of the tests. However, an increase in the number of areas carries the risk that noise may be heightened inthe measured data. To avoid this, RI was redefined asfollows:
(6)
The RI patterns, shown in Figure 9, belong to the case Afollow-up (Figures 7 and 8): the results obtained with 10zones (more or less the number used in the manual analy-sis) and those obtained using 100 zones are compared. Onlythe pattern resulting from the analysis using the highernumber of zones effectively points out a precarious situa-tion. The greater number of sections potentially providedfor the analysis procedure is highly useful not only in thediagnostic field (where 64 areas of calculation are usuallysufficient to observe localized phenomena), but also in
RI = =var( )
(var variance)∆ρ
ρ
RI = −∆ ∆ρ ρρ
max min
ROENTGENOGRAPHIC FEATURES OF FOLLOW-UP RADIOGRAPHS 411
0.8
00
Time (months)
Ris
k in
dex
(RI)
0.5
0.1
10 20 30 5040 60 70
100 measuringzones
0.2
0.3
0.4
0.6
0.7
10 measuringzones
Figure 9. Risk index patterns for the follow-up of Figure 7.
design. In fact, isodensity curves can be constructed byreading the gray value in very small areas, and they can bea support for Finite Elements Method modeling.
Conclusions
The validity of the videodensitometric analysis technique,based on radiographs, has been argued by comparing dif-ferent bone densitometry methods and also taking intoaccount more recent bone remodeling pattern recognitionmethods. The analysis has been developed and automated.The implementation of the computerized analysis of imageshas required some innovations, which have contributed tomaking videodensitometric investigation more reliable andaccurate, while also providing the possibility of immediatedata processing.
In particular, background subtraction compensates forits lack of uniformity and it removes the drawback of dif-ferent positioning of radiographs on the backgroundlighting system. A joint-to-bone reference frame is semi-automatically established to identify homologous area inall radiographs of the same follow-up. A calibration tech-nique makes radiographs comparable even when shot indifferent conditions.
To present results and to assess the follow-up, both 3Dblack and white reproductions and 2D color maps havebeen provided. A risk index RI has been defined for use inclinical practice. Videodensitometric analysis has proved auseful tool to study bone remodeling. An analysis proce-dure like the one described here enables not only aqualitative, but also quantitative, assessment; it can be auseful aid both in the diagnostics and design field, and inthe production of Finite Elements Method models.
One of the advantages of videodensitometric analysis isdue to the fact that mineral density data alone cannot bereformatted into a sparsely or densely populated 3D datamatrix to which various algorithms can easily be applied inorder to generate various systems of pattern-recognitionanalysis. As this analysis has been performed using radi-ographs, back-dated investigation is possible by takingadvantage of the vast amount of radiograph data availableon records kept in centers where arthroplastic surgery hasbeen performed for many years.
Acknowledgements
This paper was partially supported by CNR grants No.94.01908.07 and 94.00819.07
References
1. Carter, D. R., Fyhrie, D. & Orr, T. E. (1989) Relationshipsbetween loading history and femoral cancellous bone archi-tecture. J Biomech 22: 231–234.
2. Cowin S. C. Structural adaptation of bones. (1990) Appl MechRev 43(5), Part 2, S127–S133.
3. Kiratli, B. J., Heiner, J. P., McKinley, N., Wilson, M. A. &McBeath, A. A. (1991) Bone mineral density of the proxiamlfemur after total hip arthroplasty. Proc Orthop Res Soc, 16:545.
4. McCarthy, C. K., Steinberg, G. G., Agren, M., Leahey, D.,Wyman, E., Baran, D. T. (1991) Quantifying bon loss fromthe proximal femur after total hip arthroplasty. J Bone andJoint Surg, 73-B, 774–778.
5. Engh, C. A., Bobyn, J. D. & Glassman, A. H. (1987) Porous-coated hip replacement. The factors governing bone ingrowth,stress shielding, and clinical results. J Bone and Joint Surg,69-B: 45–55.
6. Huiskes, R., Weinans, H. & Dalstra, M. (1989) Adaptive boneremodeling and biomechanical design considerations for non-cemented total hip arthroplasty. Orthopedics, 12: 1255–1267.
7. Engh, C. A., Massin, P. & Suthers, K. E. (1990)Roentgenographic assessment of the biologic fixation ofpororus-surfaced femoral components. Clin Orthop Rel Res,257: 107–128.
8. Price, W. A. (1901) The science of dental radiography. DentalCosmos, 43: 483.
9. Mack, P. B., Brown, W. N. & Trapp, H. D. (1949) The quan-titative evaluation of bone density. Am J Roentgenol & RadTherapy, 61, 808–825.
10. Mack, P. B., Vose, G. P. & Nelson, J. D. (1959) New devel-opment in equipment for the roentgenographic measurementof bone density. Am J Roentgenol & Rad Therapy, 82:303–310.
11. Dickson, R. A., Paice, F. & Calnan, J. S. (1973) The quantita-tive colour television image analyser. J Bone and Joint Surg,55-B: 359–368.
12. Bywaters, E. G. L. (1948) The measurement of bone opacity.Clin Sci, 6: 281–288.
13. Kilgus, D. J., Shimaoka, E. E., Tipton, J. S. & Eberle, R. W.(1993) Dual energy X-ray absorptiometry measurement ofbone mineral density around proprous-coated cementlessfemoral implants. J Bone and Joint Surg, 75-B: 279.
14. Engh, C. A., McGovern, T. F., Bobyn, J. D. & Harris, W. H.(1992) A quantitative evaluation of periprosthetic bone-remodeling after cementless total hip arthroplasty. J Bone andJoint Surg, 74-A, 1009–1020.
15. McGovern, T. F., Engh, C. A., Zeffl-Schaffer, K. & Hooten,J. P. (1994) Cortical bone density of the proximal femur fol-lowing cementless total hip arthroplasty. Clin Orthop Rel Res,306: 145–154.
16. Farman, A. G. (1992) Diagnosing periapical bone lesions onradiographs by means of texture analysis. Oral Surg OralMed Oral Pathol, 73: 746–750.
17. Singh, M., Nagrath, A. R. & Maini, P. S. (1970) Changes intrabeular pattern of the upper end of the femur as an index ofosteoporosis. J Bone and Joint Surg, 52-A, 457–467.
18. Viceconti, M., Baruffaldi, F., Gaiba, W., Toni, A., Sudanese,A. & Giunti, A. (1995) Digital dynamic range expansionapplied to X-ray densitometric analysis of total hip replace-ment. J Biomed Eng 15: 57–59.
412 A. L. AUDENINO ET AL.
19. Rosenfeld, A. & Kak, A. C. (1982) Digital pictureprocessing, Academic Press.
20. Ardran, G. M. (1951) Bone destruction not demonstrable byradiography. Br J Radiol, 24: 107–109.
21. Lachman, E. (1955) Osteoporosis: the potentialities and limi-tations of its roentgenologic diagnosis. Am J Roentgenol, 74,712–715.
22. O’Keefe, D. (1991) Metabolic bone disease: morphometry.Radiol Clin North Am, 20, 165–174.
23. Specht, E. E. (1977) Evaluation of a computerised imageanalyser for studying alterations in radiographic bone densityin the rat. J Bone and Joint Surg 59-B, 349–351.
24. Wenzel, A. & Sewerin, I. (1991) Sources of noise in digitalsubtraction radiography. Oral Surg Oral Med Oral Pathol,71, 503–508.
25. Farman, A. G. (1990) Quantitative evaluation of digital dentalradiograph imaging systems. Oral Surg Oral Med OralPathol, 70: 661–668.
26. Weinans, H., Huiskes, R. & van Rietbergen, B. (1993)Adaptive bone remodeling around bonded noncemented totalhiparthroplasty: a comparison between animal experimentsand computer simulation. J Orthop Res, 11: 500–513.
27. Calderale, P. M., Cannas, M., Bignardi, C., Giacosa, F.,Leonardi, F., Massè, A. & Vivalda, P. (1993) Biomechanicalstudy of clinical results of orthopaedic implants by means ofX-ray image observations. Proceedings 2nd Polish–ItalianSeminar Torino, Italy, pp. 107–114.
28. Calderale, P. M., Bignardi, C., Giacosa, F. & Vivalda, P.(1993) Video-densitometric analysis of bone remodeling inretrospective follow-up of patients with prostheses.Proceedings 2nd Polish–Italian Seminar Torino, Italy, pp.115–122.
29. Calderale, P. M., Bignardi, C., Giacosa, F., Vivalda, P.,Audenino, A. L. & Zanetti, E. M. (1994) Analisi per imagingdel rimodellamento: parte I, II, III. Proc. XXIII ConvegnoNazionale AIAS Associazione Italiana per l’Analisi delleSollecitazioni, Rende (CS), pp. 579–602.
ROENTGENOGRAPHIC FEATURES OF FOLLOW-UP RADIOGRAPHS 413


