Embed Size (px)
Citation preview

PHYSICAL REVIEW B 85, 085433 (2012)
Role of applied bias and tip electronic structure in the scanning tunneling microscopy imagingof highly oriented pyrolytic graphite
G. Teobaldi,1,* E. Inami,2 J. Kanasaki,2 K. Tanimura,2,† and A. L. Shluger3,4,‡1Stephenson Institute for Renewable Energy and Surface Science Research Centre, Department of Chemistry, University of Liverpool,
L69 3BX Liverpool, United Kingdom2The Institute of Scientific and Industrial Research (ISIR), Osaka University, Mihogaoka 8-1, Ibaraki, Osaka 567-0047, Japan
3Department of Physics and Astronomy, University College London, Gower Street, WC1E 6BT London, United Kingdom4WPI-AIMR, Tohoku University, 2-1-1 Katahira, Aoba, Sendai, 980-8577, Japan
(Received 3 October 2011; revised manuscript received 6 December 2011; published 27 February 2012)
Controlled scanning tunneling microscopy (STM) experiments and first-principles simulations show thatapplied bias can significantly affect the topographic STM contrast of highly oriented pyrolytic graphite (HOPG)measured with W tips in the pure tunneling regime. Depending on the magnitude and polarity of the bias, both thehexagonal and triangular structures were imaged with the same stable tip. Statistical analysis of the experimentaldata reveals an enhancement of the corrugation amplitude for small negative biases and the occurrence of differentcontrast reversals at positive biases, whereby the relative brightness of primary and secondary image features isinverted with respect to that for negative biases. Simulations of HOPG imaging with three different W-tip modelsexplain these findings on the basis of tip-convolution effects governed by the subtle interplay of the tip electronicstates with different angular and magnetic moments and vacuum decay lengths. Finally, the calculated library ofimage contrasts and corrugation amplitudes allows us to rationalize the large variety of, sometimes contrasting,STM data on the basis of effects that different tip terminations, compositions, and sharpness have on the STMimaging of HOPG.
DOI: 10.1103/PhysRevB.85.085433 PACS number(s): 81.05.uf, 07.05.Tp, 68.37.Ef
I. INTRODUCTION
Highly ordered pyrolytic graphite (HOPG) is one ofthe most extensively used substrates in scanning tunnelingmicroscopy (STM) and is routinely used as a standard forSTM calibration.1 Carbon atoms in individual layers of HOPGare arranged into a honeycomb pattern and separated byinteratomic distances of 1.42 A. The individual layers, orgraphene sheets, are weakly bound together by van der Waals(vdW) forces and are stacked according to an ABAB sequence.The HOPG stacking sequence creates two nonequivalentatomic sites, which are usually referred to as α and β
[Fig. 1(a)]. While the α site is sandwiched between two C
atoms belonging to the adjacent layers, the β atoms face thecenter of the honeycomb structures (hollow, h site) of theneighboring layers.2
The major advantages behind HOPG popularity as asubstrate are the possibility to easily create extended (upto μm-sized) atomically flat terraces via cleavage,3 and tostraightforwardly obtain atomically resolved STM images invacuum, atmospheric, and liquid environments.4 The relativelyhigh stability of HOPG makes it an ideal substrate also for STMinvestigations of adsorbed molecules,5,6 biomolecules,7,8 andcatalytically active metal clusters.9,10 These features make ourunderstanding and controlling of STM imaging mechanismsof HOPG crucial for research of technologically relevantgraphite-11–16 and graphene-based materials17–21 as well as forinvestigations of biomaterials,7,8 novel catalysts,9,10 and otherenergy relevant materials .22
Extensive STM investigations of HOPG carried out overthe years have evidenced several anomalous features, theincomplete understanding of which has so far hampered directand straightforward interpretation of STM images of HOPG.One such feature is the giant STM contrast corrugation,
which is sometimes recorded for HOPG. This phenomenonhas been qualitatively explained in terms of tip-contaminationeffects4 and mechanical interaction between the surface atomsand the STM tip.23,24 Another peculiar feature of HOPGimaging is anomalously large-scale periodic patterns withhexagonal symmetry.25,26 These superperiodic features gen-erally occur in regions with observable boundaries, and havebeen rationalized in terms of Moire patterns originated by therotational misorientation of the top graphite layer relative tothe underlying layers.27,28
In spite of these successes, crucial features of STM imagingof HOPG are still poorly understood. In particular, almost allSTM images acquired at low sample bias show a hexagonalarrangement of bright features separated by 2.46 A (triangularpattern from now on) instead of a honeycomb pattern with1.42 A [the α-β bond length, see Fig. 1(a)] distance betweenbright features. Since the (0001) HOPG surface has twosymmetry nonequivalent types of atoms in the unit cell [α andβ atoms; Fig. 1(a)], resulting in two sublattices with the same2.46 A interatomic distance, the appearance of the triangularpattern has long been associated with selective imaging ofonly one of the two nonequivalent atoms.29,30 However, recentsimulations suggest that at short (3–4 A) tip-surface distances,and accordingly large current values, the triangular pattern ispinned on neither the α nor the β atoms, but on the hollow (h)site instead.31
Thus, despite extensive investigations, the debate on theinterpretation of HOPG images is far from being settled.The controversy spins mainly around three points: (i) theassignment of the bright (and dark) contrast features imagedin the triangular pattern to the HOPG lattice sites; (ii) thephysical mechanisms leading to imaging of only one sublatticein the triangular pattern; and (iii) the STM conditions required
085433-11098-0121/2012/85(8)/085433(15) ©2012 American Physical Society

TEOBALDI, INAMI, KANASAKI, TANIMURA, AND SHLUGER PHYSICAL REVIEW B 85, 085433 (2012)
FIG. 1. (Color online) (a) Top view of the adopted seven-layerorthorhombic HOPG slab. The topmost α and β atoms are shownas red (gray) and blue (dark gray) spheres and labeled accordingly.The hollow (h) site is also marked. Distances are in A. Top (left)and perspective (right) views of the sharp (Wsharp), blunt (Wblunt), andC-contaminated (WC) tip models are shown and labeled in panels(b)–(d). W and C atoms in (b)–(d) are displayed as orange (gray)and cyan (light gray) spheres, respectively. In all cases, a rectangleindicates the in-plane extent of the simulations cell, and arrows areused to highlight the considered high-symmetry directions.
for controllable and reversible imaging of the triangular andhoneycomb patterns.
In order to settle this controversy and gain better under-standing of the STM imaging of HOPG, many experimentalistshave sought the hidden atoms by imaging the surface using
different scan conditions and tip preparations. In some cases,it has been possible to obtain the honeycomb pattern as a resultof nonideal tip effects or mechanical interactions between thetip and the surface. Moriarty and Hughes have shown that thehoneycomb pattern can be obtained following an application ofa voltage pulse across the tunneling junction and attributed theappearance of this pattern to a tip modification induced by thepulse.32 By modeling the effect of multiple-apex terminationson the recorded STM imaging, Mizes and Harrison have shownthat the occurrence of a double-apex tip can also result in thehoneycomb pattern.33
In some cases, it has also been possible to observe atransformation between the triangular and honeycomb contrastpatterns during repeated scans. These results have beenrationalized in terms of the tip-induced sliding of the topmostHOPG layer relative to the underlying layers.34,35 On the otherhand, Wang et al. have simultaneously recorded the appearanceof both structures using the same tip.36 STM image acquisitionacross a domain boundary resulted in the triangular andhoneycomb patterns being measured simultaneously on eachside of the boundary. Also in this case, the appearance of thehoneycomb pattern has been explained in terms of translationaldisplacement of the topmost layer near the domain boundarywithout any reference to tip-induced effects.36
Recently, Cisternas et al. have succeeded in controllablyobserving both the triangular and honeycomb patterns on thesame HOPG terrace and clarifying the conditions requiredfor observing both contrasts.37 The honeycomb structurewas resolved by constant-height scanning at sample biasesover −200 mV and tunneling currents of 1.5–3 nA. For thesame applied bias, and reportedly the same tip termination,a conversion of the honeycomb contrast into the triangularone was obtained by retracting the tip by 1.0 A furtheraway from the surface. Based on these findings, the authorsargued that both the applied bias and the tip-surface distancecan have major effects on imaging of HOPG. However, themagnitude of tunneling current used in this study was muchlarger compared to that routinely used to image HOPG in thesame bias range.29,30,32,34–36,38–40 As a result, and in line withrecent suggestions,31 the mechanical tip-surface interactioncould have contributed to the imaging of the honeycombstructure. Furthermore, the conclusions in Ref. 37 are basedon images acquired in constant-height mode. Therefore, therole of applied bias and tunneling current (i.e., the baselinetip height above the surface) in the HOPG constant-currenttopographic imaging still remains to be addressed.
Apart from extensive experimental investigations, theasymmetry of HOPG contrast has also been the subject ofmany theoretical studies since the advent of STM. The firstinterpretation of the HOPG asymmetry stems from the workof Tomanek et al.41,42 This theory explains the asymmetryon the basis of the higher (lower) local density of states(LDOS) for the β (α) atoms close to the Fermi energy ofHOPG, which causes the β atoms to appear brighter thanthe α atoms at low biases. This leads to the appearance of a(β-centered) triangular structure. The theory also predicts thatthe asymmetry should be independent of the bias polarity anddisappear for large-bias voltages, leading to formation of thehoneycomb pattern. Although successful in accounting for thetriangular appearance of HOPG at low-bias voltages,29,30,38
085433-2

ROLE OF APPLIED BIAS AND TIP ELECTRONIC . . . PHYSICAL REVIEW B 85, 085433 (2012)
this theory fails to explain the experimental persistence of thetriangular pattern at higher voltages.37,39 It is also seriouslychallenged by the existence of low-bias images showing ahoneycomb pattern.32,36,37 Last but not least, this theory can behardly reconciled with the experimentally measured reversalsof STM contrast as a function of the applied bias39 and the tipheight above the surface.40 Effects related to the tip electronicstructure39 and surface deformation40 have been put forwardin order to qualitatively explain these apparently surprisingfindings.
Importantly, despite early suggestions based on simplistictip models,43–45 most of the more recent theoretical studies ofHOPG STM imaging37,38,41,42,46,47 have been carried out withinthe Tersoff-Hamann approximation,48 neglecting effects of thetip electronic structure on the STM image. One exception isthe recent work reported in Ref. 31 where more advancedcalculations were carried out for only one bias value. Thus,to the best of our knowledge, the combined effect of thetip electronic structure and applied bias on the asymmetryof HOPG images has not been addressed yet. Therefore, theexperimental and theoretical understanding of STM imaging ofone of the structurally simplest and best-characterized surfacesis still far from being complete.
Further progress in our understanding of STM imagingof HOPG at both small and large biases requires systematic,controlled, and reproducible study of the dependence ofHOPG STM contrast on the tip preparation and applied bias.Achieving such an understanding is timely in view of theincreasingly broad use of STM for characterizing the struc-ture and electronic properties of nanoengineered HOPG,11–16
multilayer graphene,17 HOPG-supported biomolecules,7,8 andcatalysts.9,10,22
Therefore, the main aim of this paper is to investigatewhether by using a stable tip one can obtain different constant-current topographic images of HOPG as a function of theapplied bias. In addressing this question, we would liketo avoid as much as possible any effects caused by shorttip-surface separation and mechanical interaction. To this end,we record and statistically analyze several HOPG topographicimages acquired between −1 and +1 V using a stable W tipat 90 K. To minimize differences in the baseline tip-surfacedistance, in each case the topographic scanning conditionswere determined on the basis of a prerecorded current-bias(I-V) calibration, which was also used as a standard for thetip control. For the sake of comparison, all the STM imagesin this study were acquired in constant-current mode as this isthe approach predominantly used in the literature for graphiteand graphene-based materials.18–21 Statistical analysis of theexperimental data reveals a profound effect of the appliedbias on the topographic contrast of HOPG. Depending on theapplied bias, we observe both the honeycomb and triangularstructures. Notably, we also observe different contrast reversalsbetween the triangular and honeycomb patterns at positivebiases.
We analyze the experimental data using first-principlessimulations accounting for the electronic structure of six dif-ferent representative tip models. In line with the experimentalfindings, we show that the effect of the electronic structureof the tip on the HOPG imaging depends on the appliedbias. Importantly, we also find that the tip-induced effects
strongly depend on the tip composition and sharpness. Asidefrom rationalization of the measured topographic images,corrugations, and I-V curves, the simulations allow us toreconcile diverse, and sometimes contrasting, results that havebeen published in the rich literature on HOPG.
The paper is organized as follows. Following the descriptionof the experimental and theoretical methods in Sec. II, wepresent the experimental results in Sec. III A. The electronicstructures of the surface and tip models are briefly presentedin Secs. III B and III C, respectively. Following considerationsof the effect of the tip-surface distance on the tip-surfaceinteractions (Sec. III D), the calculated STM appearance ofHOPG for the considered models is reported in Sec. III E.The experimental and theoretical results are compared anddiscussed in Sec. IV in relation to the previously publisheddata. Section V summarizes and concludes the paper.
II. METHODS
A. Experiments
The experiments were performed using a low-temperaturescanning tunneling microscope (LT-STM) from UNISOKUwith a base pressure of 5 × 10⁻¹¹ Torr. The HOPG samples(ZYA grade) were prepared in air by peeling of sometop graphene layers with an adhesive tape before transferinto the ultrahigh vacuum chamber. The STM and scanningtunneling spectroscopy (STS) measurements were performedat 90 K using electrochemically etched tungsten (W) tips. Widedefect-free terrace regions were fully characterized. At thebeginning of the measurements, tips were scanned over wideterraces repeatedly for days in order to get them stabilized:this procedure was crucial for obtaining atomically resolvedimages during repeated scans for hours. Using the thusprepared tips, we measured constant-height tunneling currentversus voltage (I-V) spectra by sweeping the sample biasvoltage from −1.0 to 1.0 V, with the feedback circuit opened.The measurements were carried out at the tip-surface distance,which was determined by the initial set current at 450 pA atthe sample bias voltage of −300 mV. Since the vertical driftrate in our system was less than 0.5 pm s−1, the change oftip-surface distance during the spectrum acquisition (1.1 s)was estimated to be 0.6 pm. The topographical images werethen obtained at different bias voltages in the range between−1.0 and +1.0 V. To minimize differences in the tip-surfacedistance during scans at different biases, the tunneling currentof each topographic scan was set to the same value as in thepristine I-V calibration.
To address the dependence of the measured topographiccorrugation on the applied bias, we performed statisticalanalysis of the topographic images using a procedure describedin Ref. 49.
B. Computational details
The graphite surface was modeled as a seven-layer AB-stacked 1 × 1 orthorhombic slab of 2.467 × 4.273 A2 in-planeextension [Fig. 1(a)]. Given the negligible surface relaxationmeasured by electron diffraction,50 and calculated by vdW-corrected density functional theory (DFT),51,52 the interlayerdistance was kept fixed at its experimental value (3.35 A).53
085433-3

TEOBALDI, INAMI, KANASAKI, TANIMURA, AND SHLUGER PHYSICAL REVIEW B 85, 085433 (2012)
Following Refs. 54 and 55, a sharp W tip (Wsharp) wasmodeled as a symmetric seven-layer W(110) bipyramid with a3 × 3 (13.534 × 9.57 A2) in-plane periodicity [Fig. 1(b)]. Toinvestigate possible effects due to the tip-apex sharpness, weconsidered also a complementary blunt tip (Wblunt) constitutedby three periodically repeated W(110) layers with two adatomson each side [Fig. 1(c)]. The carbon-contaminated WC tip[Fig. 1(d)] was created by substituting each of the W apexatoms of the Wsharp tip by carbon atoms. The z coordinates ofthe three (two) outermost layers of the Wsharp and WC (Wblunt)tip models were optimized until the atomic forces were smallerthan 0.02 eV A−1.
Both the graphite slab and the tip models were simulatedwithin the generalized gradient approximation Perdew-Burke-Ernzerhof (GGA-PBE) (Ref. 56) projector augmented wave(PAW) scheme as implemented in the plane-wave VASP
code.57,58 The surface Brillouin zones of the graphite slaband of the tip models were sampled with a grid of 273 and35 symmetry irreducible (SI) k points, respectively. Thesek-point grids were checked against augmented grids of 322and 48 SI k points, respectively. In both cases, we found theoriginal grids to be sufficiently dense to yield the results withinthe Tersoff-Hamann and Bardeen models (see the following)converged for all the considered energy range of ±1 eV aroundthe Fermi level. The electronic structures of both the graphiteslab and tip models were calculated using a 700-eV plane-wavecutoff.
The adsorption energy of the apex-atom (Eads) was calcu-lated as
Eads = 12 (Etip − Eblunt − 2Eapex), (1)
where Etip and Eblunt are the energies of the symmetricallyoptimized tip models with and without the (two) apex atoms,respectively. Eapex refer to the energy of one isolated apexatom in the vacuum.
The STM imaging of the graphite surface was simulatedusing both the Tersoff-Hamann48 (TH) and Bardeen59 meth-ods, as implemented in the BSKAN code.60–62 Further detailson the STM simulations can be found in Ref. 49.
III. RESULTS
A. Experimental W-tip STM imaging of HOPG
As discussed above, both the applied bias and the tip heightabove the surface can greatly affect the STM image of HOPGprobed with W tips.31,37,39,40 To consistently investigate thiseffect and address how the relative brightness of HOPG imagedwith the same stable tip is affected by the applied bias, wecarried out low-temperature (90-K) STM measurements atdifferent biases in the range between −1.0 and +1.0 V usingW tips.
Prior to the topographic imaging, and in order to as-sess the tip stability during the measurements, we recordedconstant-height current-voltage (I-V) calibration curves for thestabilized tip. I-V curves were recorded above three differentsurface sites within a wide defect-free region. The tip heightabove the surface was set at a sample bias of −0.3 V anda tunneling current of 450 pA. For each considered site, thecorresponding I-V curves were measured 10 times and for thesame tip-surface distance as determined by the initial (−0.3 V,
FIG. 2. (Color online) (a) Average I-V calibration (set-pointconditions: bias= −0.3 V, I = 0.45 nA) for negative (V< 0) andpositive (V> 0) applied biases. (b) Average topographic corrugationamplitude (and corresponding error bars) as a function of the appliedbias (see text for discussion).
450 pA) set point. This accounts for 30 I-V calibration curves,the average of which is reported in Fig. 2.
The averaged I-V curve shows a slightly asymmetricparabolic behavior with slightly larger (10%) currents (henceconductance) for positive bias. By following the same tippreparation as previously described (see Sec. II), it waspossible to reproducibly recover I-V calibration curves verysimilar to those shown in Fig. 2. Therefore, the I-V calibrationin Fig. 2 was adopted as a standard to control the tipstability, which was found to be the same before and afterthe acquisition of all the considered images. Control over thetip stability together with the I-V calibration in turn allowedus to minimize differences in tip-surface distances betweentopographic images acquired at different biases in the rangebetween −1.0 and 1.0 V.
Figure 2(b) reports the average topographic corrugationamplitude [A, see Eq. (S-7) in 49] as a function of the appliedbias. Within the experimental dispersion [Eq. (S-8) and TableS-1 in Ref. 49], we find A to depend on the applied bias. Whilerelatively constant (0.8–0.9 A) from −0.1 to 1.0 V, the average
085433-4

ROLE OF APPLIED BIAS AND TIP ELECTRONIC . . . PHYSICAL REVIEW B 85, 085433 (2012)
FIG. 3. (Color online) Selected experimental topographies of HOPG at different applied biases in the range between −1 V (a) and +1 V(i). To minimize differences in the tip-surface distance, the tunneling conditions (reported on each panel) have been set according to the I-Vcalibration standard in Fig. 2(a). The black line in (c) marks the assigned 〈1100〉 HOPG direction. Topographic maxima and minima are shownas light gray (red) and dark gray (blue) spots, respectively. In each panel, the labeled color scale reports the relative tip-surface distance (A).Note that, due to the unknown value of the absolute tip-surface distance, only a comparison between differences in relative tip-surface distances(i.e., corrugation amplitudes) between images acquired at different biases is meaningful.
corrugation increases to 1.3 and 1.1 A for biases of −0.2 and−0.5 V, respectively. Further reduction of the applied biasbelow −0.7 V leads to a decrease of the measured corrugationto 0.7–0.5 A.
Representative topographic images acquired in the consid-ered bias range are displayed in Fig. 3. Topographic imagesrecorded at bias voltage of −0.1 V show the previouslyreported29,30,37–40,66,67 triangular pattern [Fig. 3(c)]. As the biasis gradually decreased to −1.0 V, the image is also graduallychanged from a triangular into a honeycomb pattern wheretwo different atomic sites are clearly identified [Figs. 3(a) and3(b)]. Application of a small positive bias [0.1 V, Fig. 3(d)]also yields a triangular pattern, in close agreement with the−0.1 V results. Increasing the bias to the 0.4–1.0 V rangeresults in the contrast change from triangular to honeycomb[Figs. 3(e)–3(i)]. However, for biases larger than 0.7 V, anddespite the persistence of atomic resolution, we recordedan overall increase of a scratch-type noise or the changeof the corrugation magnitude. Nevertheless, even after suchrelatively noisy images, when the bias was changed to 0.1 V,it was possible to recover the expected triangular structure,which confirms the overall stability of the tip.
Despite several attempts, the W tip proved to be not stableenough to allow for multibias type39 imaging of the HOPG
surface. As a result, the experimental topographies wereobtained independently for each applied bias. Unfortunately,despite the application of drift corrections, this preventsus from unambiguous comparison of the absolute positionsof the topographic features with respect to the underlyingatomic-lattice structure for images acquired at different biases.
However, assuming that the brightest topographic featureslie along a generic 〈1100〉 direction passing through theα, β, and h sites [Fig. 1(a)], it is nevertheless possibleto identify at least the 〈1100〉 vector in the images as thedirection along which the topographic minima (or maxima) areseparated by ∼4.26 A, i.e., three times the α-β (=h-α = β-h)distance [Fig. 1(a)]. This assumption is corroborated by ourresults (see below) as well as by independent simulationsincluding the STM tip,31 and previous multibias experimentalmeasurements.39
If this assignment is correct, the only variable left uncertainis the α-β-h or h-β-α orientation of the 〈1100〉 scanline [seeFig. 1(a)]. To determine that, we used the results of oursimulations in the Bardeen approximation at −0.1 V. As shownbelow, regardless of the considered orientation of the W-tipmodel, the simulations suggest that the β atom and h site arethe brightest and darkest features of the contrast, respectively[Figs. 9(a)–9(d)]. However, the β-centered feature has an
085433-5

TEOBALDI, INAMI, KANASAKI, TANIMURA, AND SHLUGER PHYSICAL REVIEW B 85, 085433 (2012)
FIG. 4. (Color online) Experimental average relative brightness(B) profiles along the 〈1100〉 maxima-minima-maxima direction as afunction of the applied bias. For the sake of comparison, all profileshave been shifted to start with the corresponding brightness maximum(B = 1). The arrow marks the 〈1100〉 direction, as indicated inFig. 1(a). Note that, with the only exception of the −0.1 V profile,the absolute in-plane position of the topographic features along thescan lines are yet unassigned (see text for discussion).
asymmetric shoulder, which faces the α site. This asymmetry,which is present also in the experimental topographic images[Figs. 3(c) and 4], is used to identify the α → β direction andhence the α-β-h orientation. In the absence of macroscopicrotations of the sample holder, this orientation should not beinverted between the STM scans at different biases.
We stress that (i) in the absence of direct comparison be-tween the experimental and calculated asymmetries along the〈1100〉 scanline at −0.1 V, it is not possible to unambiguouslyassign α-β-h direction in the experimental topographies, and(ii) assignment of the (α,β,h) sites in one topography (at −0.1V in the present case) does not allow rigorous assignmentof the HOPG sites in topographies independently acquired atdifferent biases, unless the uncertainty due to the lateral driftbetween different images is reliably proved to be negligible(<0.1 A, see also Figs. 9 and 10). These important points havebeen previously overlooked in several STM investigations39,68
and significantly complicate comparison between differentSTM experiments available in the literature.
Once the (instantaneous) 〈1100〉 directions have beendefined, by knowing the in-plane positions of the topographicminima (m) and maxima (M),49, it is possible to calculatean average brightness profile [Eq. (S-11) in Ref. 49] foreach experimental topography. The resulting contrast map ispresented in Fig. 4. To facilitate the comparison between theaverage brightness profile (B) at different biases, the profileshave been shifted to start with the corresponding maximum(B = 1). To the best of our knowledge, this kind of analysishas not been used in previously published STM studies ofHOPG.
For the sake of discussion, we introduce the followingconvention: whenever a secondary maximum with relativebrightness (B) larger than 0.7 appears in the profile, wedefine the contrast pattern as hexagonal. Conversely, forprofiles without secondary maxima or with secondary features
darker than B = 0.7, the corresponding contrast is defined astriangular.
As shown in Fig. 4, for negative biases smaller than −0.6 V,the average contrast progressively changes from a hexagonalpattern into a triangular one (−0.5/−0.1 V). The triangularpattern is found to persist for up to small (�0.3 V) positivebiases. However, further increase of the bias above 0.3 Vleads to the reappearance of the hexagonal pattern, whichis maintained, although with some minor differences in thebrightness of primary and secondary features, up to a bias of1.0 V.
Closer inspection of Fig. 4 reveals another rather interestingpoint. While for biases between −1.0 and 0.4 V, the secondarymaxima or asymmetric shoulders are roughly 1.42 A on theleft of the principal feature (i.e., at scan length of 2.84 A), at0.5 V the secondary feature is localized roughly 1.42 A on theright of the profile maximum (i.e., at scan length of 1.42 A).Further increase of the bias in the 0.6 V/0.8 V range leadsto reappearance of a standard hexagonal pattern (secondaryfeature on the left of the primary feature), which then is againinverted at 0.9 V (secondary feature on the right of the primaryfeature), and back-converted to its standard form at 1.0 V. Inthe absence of macroscopic rotation of the sample and tipholder, these results show unambiguously that the applicationof 0.5 and 0.9 V biases changes the STM contrast, wherebythe relative position of the primary and secondary featuresalong 〈1100〉 is inverted. Thus, the tip stability during thetopographic acquisition and the results presented in Fig. 4clearly suggest that the applied bias does significantly affectthe STM contrast of HOPG. In the following, we present theresults of theoretical simulations of STM images, which shedsome light on the mechanism of this effect.
B. Calculated HOPG electronic structure
Prior to considering the effects of the tip electronic structureon the simulated STM appearance of HOPG, we present themain results for the bare surface.
The calculated density of states (DOS) for HOPG [Fig. 5(a)]shows a symmetric and nearly parabolic dispersion around theFermi energy (EF ). Consistent with the semimetallic natureof HOPG and with previous theoretical results,41,42,69,70 werecover a practically zero DOS at EF . The simulated atom-projected DOS (PDOS) for the topmost β atoms (β-PDOS) isconsistently larger than for the topmost α atoms (α-PDOS) inan energy window of 0.5 eV around EF . This difference is,however, noticeably reduced for occupied states more than 0.5eV below EF . In addition, the calculated α-PDOS is found tobe larger than β-PDOS for energies larger than EF +0.6 eV.These findings deviate from previous tight-binding resultson multilayer graphite slabs, which suggest β-PDOS to besymmetrically larger than α-PDOS to within 0.8 eV aroundEF .41,42,69,70 Our simulations with the augmented 322 k-pointgrid confirm this deviation from the tight-binding results,which we attribute to the specific parametrization adopted inRefs. 41, 42, 69, and 70.
While useful for the interpretation of the electronic structureat the HOPG surface, the PDOS analysis in Fig. 5(a) doesnot account for the vacuum decay of the electronic statesabove the considered surface.60,61,63–65 To this end, we turn
085433-6
ROLE OF APPLIED BIAS AND TIP ELECTRONIC . . . PHYSICAL REVIEW B 85, 085433 (2012)
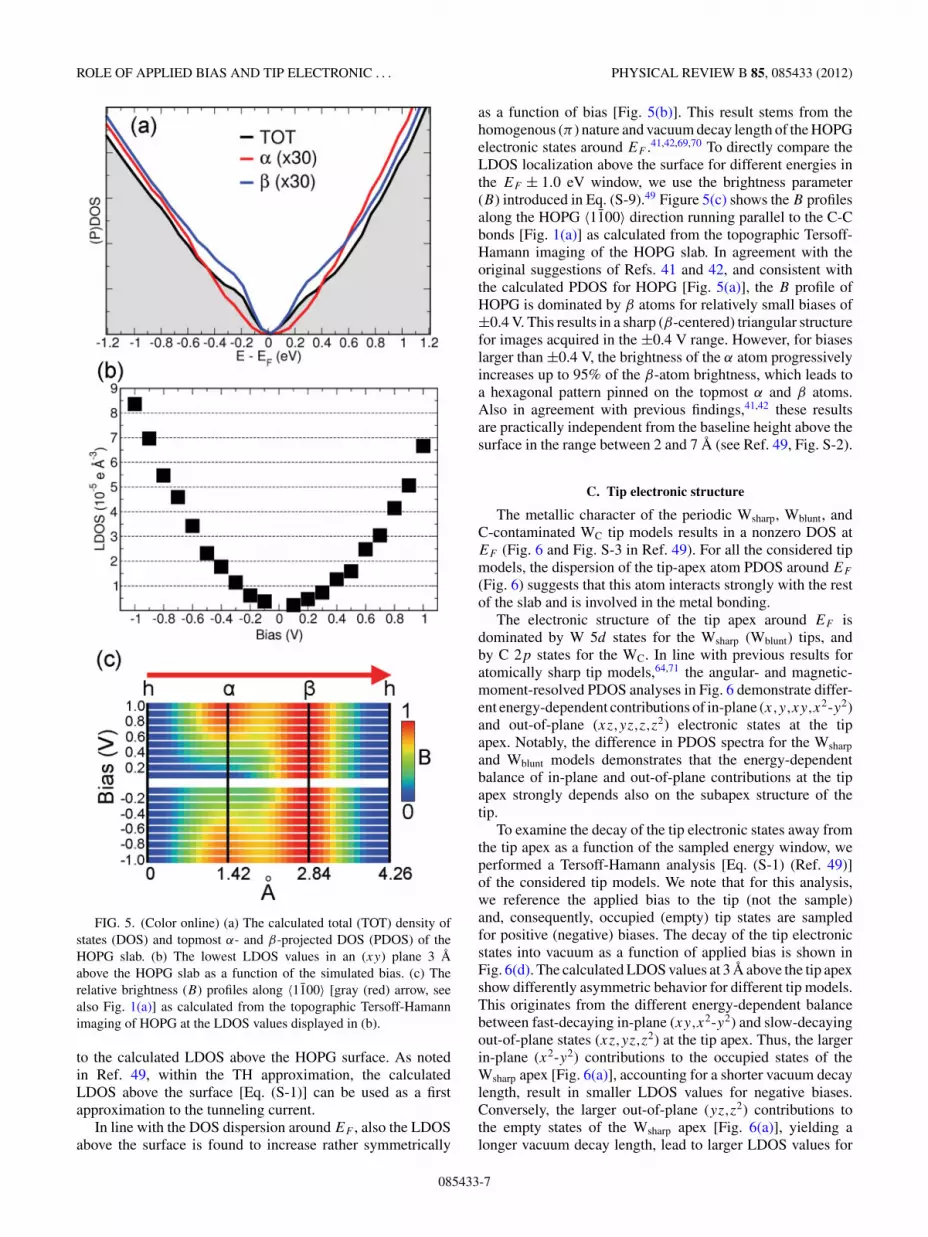
FIG. 5. (Color online) (a) The calculated total (TOT) density ofstates (DOS) and topmost α- and β-projected DOS (PDOS) of theHOPG slab. (b) The lowest LDOS values in an (xy) plane 3 Aabove the HOPG slab as a function of the simulated bias. (c) Therelative brightness (B) profiles along 〈1100〉 [gray (red) arrow, seealso Fig. 1(a)] as calculated from the topographic Tersoff-Hamannimaging of HOPG at the LDOS values displayed in (b).
to the calculated LDOS above the HOPG surface. As notedin Ref. 49, within the TH approximation, the calculatedLDOS above the surface [Eq. (S-1)] can be used as a firstapproximation to the tunneling current.
In line with the DOS dispersion around EF , also the LDOSabove the surface is found to increase rather symmetrically
as a function of bias [Fig. 5(b)]. This result stems from thehomogenous (π ) nature and vacuum decay length of the HOPGelectronic states around EF .41,42,69,70 To directly compare theLDOS localization above the surface for different energies inthe EF ± 1.0 eV window, we use the brightness parameter(B) introduced in Eq. (S-9).49 Figure 5(c) shows the B profilesalong the HOPG 〈1100〉 direction running parallel to the C-Cbonds [Fig. 1(a)] as calculated from the topographic Tersoff-Hamann imaging of the HOPG slab. In agreement with theoriginal suggestions of Refs. 41 and 42, and consistent withthe calculated PDOS for HOPG [Fig. 5(a)], the B profile ofHOPG is dominated by β atoms for relatively small biases of±0.4 V. This results in a sharp (β-centered) triangular structurefor images acquired in the ±0.4 V range. However, for biaseslarger than ±0.4 V, the brightness of the α atom progressivelyincreases up to 95% of the β-atom brightness, which leads toa hexagonal pattern pinned on the topmost α and β atoms.Also in agreement with previous findings,41,42 these resultsare practically independent from the baseline height above thesurface in the range between 2 and 7 A (see Ref. 49, Fig. S-2).
C. Tip electronic structure
The metallic character of the periodic Wsharp, Wblunt, andC-contaminated WC tip models results in a nonzero DOS atEF (Fig. 6 and Fig. S-3 in Ref. 49). For all the considered tipmodels, the dispersion of the tip-apex atom PDOS around EF
(Fig. 6) suggests that this atom interacts strongly with the restof the slab and is involved in the metal bonding.
The electronic structure of the tip apex around EF isdominated by W 5d states for the Wsharp (Wblunt) tips, andby C 2p states for the WC. In line with previous results foratomically sharp tip models,64,71 the angular- and magnetic-moment-resolved PDOS analyses in Fig. 6 demonstrate differ-ent energy-dependent contributions of in-plane (x,y,xy,x2-y2)and out-of-plane (xz,yz,z,z2) electronic states at the tipapex. Notably, the difference in PDOS spectra for the Wsharp
and Wblunt models demonstrates that the energy-dependentbalance of in-plane and out-of-plane contributions at the tipapex strongly depends also on the subapex structure of thetip.
To examine the decay of the tip electronic states away fromthe tip apex as a function of the sampled energy window, weperformed a Tersoff-Hamann analysis [Eq. (S-1) (Ref. 49)]of the considered tip models. We note that for this analysis,we reference the applied bias to the tip (not the sample)and, consequently, occupied (empty) tip states are sampledfor positive (negative) biases. The decay of the tip electronicstates into vacuum as a function of applied bias is shown inFig. 6(d). The calculated LDOS values at 3 A above the tip apexshow differently asymmetric behavior for different tip models.This originates from the different energy-dependent balancebetween fast-decaying in-plane (xy,x2-y2) and slow-decayingout-of-plane states (xz,yz,z2) at the tip apex. Thus, the largerin-plane (x2-y2) contributions to the occupied states of theWsharp apex [Fig. 6(a)], accounting for a shorter vacuum decaylength, result in smaller LDOS values for negative biases.Conversely, the larger out-of-plane (yz,z2) contributions tothe empty states of the Wsharp apex [Fig. 6(a)], yielding alonger vacuum decay length, lead to larger LDOS values for
085433-7

TEOBALDI, INAMI, KANASAKI, TANIMURA, AND SHLUGER PHYSICAL REVIEW B 85, 085433 (2012)
FIG. 6. (Color online) The angular- (s,p,d) and magnetic-moment- (x,y,z,xy,xz,yz,x2-y2,z2) resolved analysis of the atom-projecteddensity of states (PDOS) at the tip apex for the Wsharp (a), Wblunt (b), and WC tip models (c). (d) The calculated lowest LDOS values in an (xy)plane 3 A above the apex as a function of the applied bias for all the considered tip models.
positive biases. On the other hand, the predominantly in-plane(xy,x2-y2) composition of both occupied and empty states atthe Wblunt apex [Fig. 6(b)] yields a more symmetric distributionof the LDOS as a function of the applied bias.
To investigate the actual sharpness of the tip models, wenext consider the real-space distribution of the electronic statesabove the tip apex at different biases. Analysis of the tipLDOS and brightness (B) profiles (displayed in Figs. S-4,S-5, and S-6 of Ref. 49 for the interested reader) indicates arather symmetric distribution of the tip electronic states forboth the Wsharp and Wblunt models. Notably, the calculated fullwidth at half maximum (FWHM) for both Wsharp and Wblunt
tips varies within 2.4 and 2.8 A, depending on the simulatedbias. These values are close to twice the α-β (= h-α = β-h)distance [1.42 A, Fig. 1(a)]. Thus, the electronic distributionsfor the atomically sharp Wsharp and Wblunt tip models turn outto be rather wide in comparison with the HOPG lattice spacing,suggesting that convolution effects may play an important rolein determining the tunneling matrix elements and tunnelingcurrent [Eq. (S-3) in Ref. 49]. These effects are qualitativelyillustrated in Fig. 7.
In the case of the WC model, we find the correspondingLDOS distribution and B profile to be more asymmetric, broad,and structured (Fig. S-6 in Ref. 49). This results from the longervacuum decay length of W 5d subapex states with respect tothe C-apex 2p states and points toward possibly even largerconvolution effects in STM images of HOPG acquired withC-contaminated tips.
Thus, both the complicated electronic structure of the tipapex (Fig. 6) and large FWHM of the electronic states at the
tip apex with respect to the HOPG lattice spacing suggestthat bias-dependent tip-specific effects may prove importantfor evaluating the tunneling matrix elements Mτ,n [Eq. (S-4)in Ref. 49] and for the STM appearance of HOPG. In thefollowing, we present an extensive investigation of how theseeffects influence the STM imaging of the HOPG surface.
D. Tip-surface interactions and contaminations
As discussed above, the Bardeen approach can only beapplied to study tunneling junctions where the interactionbetween the STM tip and the surface does not cause significantperturbation to both surface and tip.45,59,63,64 To assess thedistance range where the method is safely applicable, wecalculated the minimum tip-surface distance to warrant negli-gible tip-surface perturbation. To this end, two representativeW- and C-terminated tip models were optimized at 5.5 Aabove the α, β, and h sites of a 7 × 5 orthorhombic graphenebilayer.49 We used a semiempirical London approximation todispersion terms,72 which proved successful in our recent studyof the interactions of metallic tips with relatively large organicmolecules with π electrons.73
Regardless of the tip-apex position above the surface (α, β,or h site), the calculated out-of-plane deformation (�z) andthe induced change from the equilibrium interlayer distance(�i) turn out to be smaller than 0.01 A for a 5.5 A initial tipheight (see Fig. S-7 and Table S-2 in Ref. 49). There is alsopractically zero electron transfer (�q) between the tip andsurface models. These results indicate negligible interactionsand deformations for tip-surface distances �5.5 A and are in
085433-8

ROLE OF APPLIED BIAS AND TIP ELECTRONIC . . . PHYSICAL REVIEW B 85, 085433 (2012)
FIG. 7. (Color online) Schematic comparison between the real-space distributions of the HOPG (p) electronic states along 〈1100〉and the different s (a), p [(b), (c)], and d [(d)–(f)] electronic states ofthe STM tip. The s, p, and d states are indicated on each panel andthe HOPG lattice sites are labeled as in Fig. 1(a). See text and Fig. 6for discussion.
line with the recent results on the interactions between a similarW-tip model and a graphene bilayer obtained with differentdispersion corrections.31 Accordingly, in the following, wewill present and discuss only the results of simulations fortip-surface distances �5.5 A. We expect these results to berepresentative of STM images acquired in pure tunnelingregime.
Finally, we note that the calculated adsorption energy [Eads,Eq. (1)] of the carbon atom at the apex of the WC tip modelis 7.1 eV, i.e., 5.75 eV larger than Eads for the lowest energyconfigurations of one carbon adatom on the HOPG surface[1.35 eV (Ref. 51)]. Therefore, one can expect contaminationof blunt W tip apexes by relatively highly mobile carbonadatoms,51 especially if the initial stages of tip stabilizationare carried out at very close tip-surface distances.
E. Simulated STM imaging of HOPG
1. Tunneling currents
Prior to considering the effects of the tip electronic structureon the constant-current topographic appearance of HOPG,we analyzed also the dependence of the tunneling currenton the applied bias for each considered tip model. Based onthe different energy-dependent angular- (s,p,d) and magnetic-moment (x,y,z,xy,xz,yz,x2 − y2,z2) contributions to the tip-apex electronic states (Fig. 6), it is reasonable to expect that thetunneling current may depend also on the relative orientation of
the tip and the surface, i.e., on the angle between the projectionof the tip apex p (x,y) and d (xy,xz,yz,x2-y2) states on thesurface plane and the high-symmetry directions of the HOPGsample (Fig. 7). To investigate the extent of such dependence,we considered two orthogonal orientations above the HOPGsurface for each tip model. In the first one, the [110] directionof the Wsharp, Wblunt, and WC tip models was oriented parallelto the HOPG 〈1100〉 direction (see Fig. 1). In the second one,the tip models were rotated by 90◦, which resulted in alignmentof the tip [001] and HOPG 〈1100〉 directions. From now on,we will refer to the rotated tip models as rWsharp, rWblunt, andrWC. For compactness of presentation, we will be using the(r)Wsharp, (r)Wblunt, and (r)WC notation when simultaneouslyreferring to both the rotated and unrotated Wsharp, Wblunt,and WC tip models. While certainly not exhaustive due tothe virtually infinite phase space of possible tip structuresand orientations, this analysis nevertheless offers qualitativeinsight into the dependence of the tunneling current and STMcontrast on the (experimentally hardly controllable) orienta-tion of the tip-apex atomic structure with respect to the HOPGlattice.
We also recall that at positive biases, electrons tunnelfrom the tip occupied states to the surface unoccupied states,whereas for negative biases, the tunneling process takes placefrom the surface occupied states to the tip empty states.63–65
Figure 8(a) reports the calculated minimum currents for theconsidered tip models and orientations at a distance of 5.5 Aabove the HOPG surface. In all cases, we calculate the currentto asymmetrically depend on the bias with larger values fornegative biases. Notably, the asymmetry of the calculated I-Vcurve is found to be larger for the sharp [(r)Wsharp] modelsthan for the blunt [(r)Wblunt] or C-contaminated [(r)WC]tips.
Given the symmetric LDOS distribution of the HOPG states[Fig. 5(b)], and the asymmetric LDOS distribution of thetip states [Fig. 6(d)], the calculated I-V behavior originatesfrom the tip electronic structure, specifically from the longervacuum decay length of the tip empty states with respect tothe occupied ones [Fig. 6(d)]. As noted above, this effect isgoverned by (i) the interplay between fast-decaying in-planeand slow-decaying out-of-plane contributions to the electronicstates at the tip apex (Fig. 6); (ii) the contributions of differentangular- and magnetic-moment components to the tunnelingmatrix element [Mτ,n in Eq. (S-4) (Ref. 49)]; and (iii) theconvolution effects originating from different in-plane andout-of-plane contributions at the tip apex (Fig. 7).
Consistent with the faster vacuum decay length of C2p electronic states with respect to W 5d electronic states(Fig. 6), the calculated currents for the carbon-contaminatedtips [(r)WC] are more than one order of magnitude smaller thanfor the W-terminated sharp [(r)Wsharp] and blunt [(r)Wblunt] tipmodels. Put together, these results clearly indicate that thecomposition, sharpness, and orientation of the tip apex cansubstantially affect the tunneling current and its dependenceon the applied bias.
2. Corrugation amplitudes
The same parameters strongly affect also the constant-current topographic imaging of HOPG. Figure 8(b) shows the
085433-9

TEOBALDI, INAMI, KANASAKI, TANIMURA, AND SHLUGER PHYSICAL REVIEW B 85, 085433 (2012)
FIG. 8. (Color online) (a) The calculated baseline tunnelingcurrents (nA) as a function of the applied bias (V) for theWsharp, rotated-Wsharp (rWsharp), Wblunt, rotated-Wblunt (rWblunt), C-contaminated (WC), and rotated-WC (rWC) tip models 5.5 A abovethe HOPG slab. (b) The calculated corrugation amplitude (A) at thetunneling I-V conditions in (a) for the considered tip models andorientations.
calculated corrugation amplitude [A, Eq. (S-7) (Ref. 49)] as afunction of the applied bias for the considered tip models andorientations at the tunneling I-V conditions of Fig. 8(a). In allcases, we find A to depend on the applied bias and to increasefor small biases. While the simulations for the (r)Wsharp tipssuggest an increase of A for negative biases in-between −0.6and −0.1 V, the A values calculated with the (r)Wblunt and(r)WC tips peak for small positive biases of 0.1–0.2 V.
Figure 8(b) demonstrates a much stronger effect of the ap-plied bias on the corrugation amplitude for the (r)Wsharp modelsthan for other tips. As for the tunneling current, this result stemsfrom the intricate energy-dependent balance between in-planeand out-of plane contributions to the electronic states at thetip apex as determined by both the apex composition and thesubapex structure (Fig. 6).
3. Topographic contrast
Simulation of the (constant-current) topographic images ofHOPG as a function of applied bias allows us to investigate
also the effects that different tip terminations can have onthe bias dependence of the HOPG contrast. As in the THcase, for compactness of presentation, we present a comparisonof the brightness profiles along the 〈1100〉 surface directionas calculated from the Bardeen topographic imaging at thetunneling (I,V) conditions reported in Fig. 8(a). The resultsare presented in Fig. 9 for all the considered tip models andorientations.
Regardless of the tip orientation, the simulations with theblunt tip models [(r)Wblunt] yield a topographic contrast inclose agreement with TH results. As shown in Figs. 9(c)and 9(d), an increase of the bias beyond ±0.6 V leads to aprogressive conversion of the β-centered triangular pattern intoa hexagonal contrast pattern pinned on the α and β atoms. Alsoin line with TH results, the simulations at biases of differentpolarity (for instance, +0.3 and −0.3 V) lead to practically thesame results. Thus, the simulations suggest negligible contrastdistortion of the HOPG imaging acquired with W tips of bluntsubapex structure.
The sharp [(r)Wsharp] tip models show a progressive changefrom a triangular β-centered structure into a (α- and β-centered) hexagonal pattern for biases more negative than−0.4 V, in qualitative agreement with the TH model fornegative biases. However, for positive biases, the resultsdeviate profoundly from the TH predictions. Considering theWsharp tip first, as the positive bias is increased, the contrastrepeatedly changes between triangular (0.1–0.2 V, 0.4–0.7 V)and hexagonal (0.3 V, 0.8–1.0 V) patterns. At the same time,the B maximum shifts from the β (α) atoms to mid α-β (h-α)sites. Positive-bias simulations with the rotated rWsharp modelgive a different deformation of the HOPG contrast with thehexagonal pattern maximum shifted toward the h-α and β-hmidpoints for biases of 0.1–0.6 V. Conversely, for biases largerthan 0.6 V, the simulated hexagonal B maximum is pinned atthe mid α-β and h sites.
Both the contrast change and the shift of the topographicfeatures from the HOPG high-symmetry sites originate fromconvolution effects (Fig. 7) between the narrowly spaced,fast-decaying 2p LDOS of HOPG (Fig. 5) and the blunt(Fig. S-4 in Ref. 49), heterogeneous LDOS at the (r)Wsharp
apex [Fig. 6(a)]. Given the same in-plane periodicity betweenthe (r)Wsharp and (r)Wblunt tip models, and the adoptionof the same k-point grid to map their electronic structure,we are to conclude that the contrast reversal modeled forthe (r)Wsharp [but not for (r)Wblunt] tip model is not asupercell-induced artifact. Various effects of different tipterminations on the topographic contrast are further illus-trated by the results for the carbon-contaminated (r)WC tipmodels.
As shown in Figs. 9(e) and 9(f), carbon contamination ofthe tip apex leads to different deformations of the contrast and,depending on the mutual orientation of the tip subapex andHOPG lattices, to the appearance of hexagonal pattern at smallbiases (WC: −0.1/+0.3 V), and to the appearance of triangularstructures for large negative biases (WC: −0.3/−1.0 V) orpositive (WC: 0.6–1.0 V, rWC: 0.9–1.0 V) biases. Similar tothe (r)Wsharp tips, also the (r)WC-tip simulations suggest thatthe tip-mediated convolution effects play an important role inshifting the B maxima away from the HOPG high-symmetrysites.
085433-10

ROLE OF APPLIED BIAS AND TIP ELECTRONIC . . . PHYSICAL REVIEW B 85, 085433 (2012)
FIG. 9. (Color online) The Bardeen brightness (B) profiles along the 〈1100〉 HOPG direction calculated with the Wsharp (a), rWsharp (b),Wblunt (c), rWblunt (d), WC (e), and rWC (f) tip models at the tunneling conditions of Fig. 8(a). The profiles in [(a), (c), and (e)] and [(b), (d),and (f)] have been calculated with the HOPG 〈1100〉 direction [red (gray) arrow, see Fig. 1(a)] aligned to the [001] (empty arrows) and [110](filled black arrows) tip directions, respectively.
To summarize, these results confirm our earlier observationthat different HOPG contrasts obtained in the pure tunnelingregime depend on the chemical composition of the tip apexand its subapex structure.
IV. DISCUSSION
In the following, we compare the presented experimentaland theoretical results and discuss them in conjunction withthe previously published data. To organize the large amount ofinformation presented above, we follow the same structureas in Sec. III by introducing sections on the tunnelingcurrents, the topographic corrugation amplitudes, the topo-graphic contrast, and possible C contamination of the Wtips.
A. Constant-height tunneling currents
We start by comparing the measured I-V calibration withprevious results acquired at room temperature with W tips. Asshown in Fig. 2(a), the experimental I-V calibration exhibits aslightly asymmetric parabolic dependence on the applied bias.This result strongly deviates from the much more asymmetricI-V behavior reported in Ref. 40, where the currents measuredfor negative biases were larger than for positive biases. Themodeled effects of the W-tip sharpness on the asymmetry ofthe I-V calibration [Fig. 8(a)] suggest that these deviationscan be due to a sharper tip termination in Ref. 40 than forthe tip adopted here. This would also be consistent with thevery long preparation procedure used in our work (see Sec. II),which may have resulted in a relatively blunt yet atomicallyterminated tip apex.
085433-11

TEOBALDI, INAMI, KANASAKI, TANIMURA, AND SHLUGER PHYSICAL REVIEW B 85, 085433 (2012)
Despite the evident overestimation of the I-V asymmetrywith the (r)Wsharp tips, the calculated current values [Fig. 8(a),10–0.01 nA] semiquantitatively match the present (Fig. 2)and other experimental values.29,30,34–40,66,67 These results areconsistent also with the recent W-tip Bardeen and multiple-scattering simulations of HOPG [∼20 nA at 5 A (Ref. 31)]performed at a single −0.3 V bias. Crucially, in the latterstudy, it was also found that multiple-scattering effects (hereneglected) do not play any significant role in the STM imagingof HOPG at tip-surface distances larger than 4 A (or currentssmaller than 100 nA). This supports the application of theBardeen approach to the study of the HOPG appearance inpure tunneling regime.
B. Topographic corrugation amplitudes
To discuss the average corrugation amplitude, we initiallynote that previous experimental39 and theoretical studies23
suggested that a corrugation amplitude (A) smaller than 1.0 Ashould be indicative of negligible tip-surface interactions.These indications, combined with the fact that the measuredaverage A values are lower than 1.0 A [Fig. 2(b)], support ourassumption that the tip-surface interaction is indeed negligiblysmall in the sampled bias range. The only exception is therelatively large 1.3-A value at −0.2 V [Fig. 2(b)]. Therefore,we attribute the measured changes in corrugation amplitude tobias-related effects.
We note that the bias-dependent A values [0.6–1.3 A, seeFig. 2(b)] measured here are significantly larger than in oneof the previous W-tip investigations of HOPG where A atdifferent biases was always less than 0.1 A.39 At the sametime, the A value at −0.1 V (0.9 A) is significantly smallerthan that acquired with another W tip (1.5 A, see Ref. 37). Thedemonstrated influence of the tip electronic structure on thetopographic corrugation amplitude [Fig. 8(b)] suggests thatthese deviations originate from the unavoidably different tipterminations in the three cases. Given the small and nearlyconstant (∼0.1 A) A value for the (r)Wblunt tips [see Fig. 8(b)],the simulations point toward a likely blunt termination for theW tip in Ref. 39. At the same time, the marked increase in A
for small negative biases with the (r)Wsharp models suggeststhat a sharper tip termination (possibly augmented by sometip-induced surface deformation23) could be the origin of thelarger (�1.3 A) A value measured in the present case (at −0.2V) and at −0.05 V and 0.4 nA in Ref. 37.
C. Topographic contrast
We start by comparing the present results with the availableexperimental data regarding the dependence of the STMtopographic contrast on the applied bias. In line with previousmultibias investigations carried out with a W tip,39 we findthat the HOPG contrast can be inverted at positive biases(Fig. 4). Statistically averaged analysis of the corrugationprofiles pins the contrast reversals at 0.5 and 0.9 V (Fig. 4).Thus, for intermediate biases in the 0.6–0.9 V range, werecover an apparently standard hexagonal pattern whereby,as for negative biases, the secondary features are alwaysdistributed on the left of the primary feature along 〈1100〉.These results markedly deviate from the findings of Ref. 39
where an inverted triangular contrast was reportedly measuredfor biases of 0.5–1.0 V.
On the basis of our simulations (Fig. 9), we attribute thisdifference to the different tip-preparation schemes (in situtip cleaning by using field emission in Ref. 39, days-longstabilization by repeated scans here), and the ensuing differenttip terminations in the two experiments. This is consistentwith the predicted strong effects of the tip termination on theHOPG imaging (Fig. 9). It also emphasizes the necessity ofhaving I-V calibrations available (Fig. 2 and Ref. 40) aheadof any meaningful comparison between experimental data setsacquired with different tips.
Prior to turning to the topographic assignment, we notethat, unlike the HOPG 〈1100〉 direction, the positions ofthe topographic features in STM images with respect to theHOPG lattice can not be rigorously defined on the basis of theexperimental topographies alone (Figs. 3 and 4). However, inanalogy with the experimental results, one can safely shiftthe calculated 〈1100〉 scan lines (Fig. 9) to start with thecorresponding brightest feature (Fig. 10). Once this is done,it is then possible to directly compare the experimental andcalculated scan lines along the (previously assigned) 〈1100〉 di-rection. Provided agreement between the experimental (Fig. 4)and calculated (Fig. 10) shifted data sets exists, this allowsassignment of the experimental topographic features to theHOPG lattice sites by reference to the absolute positions of thecalculated profiles (Fig. 9). Building on the results of this two-step procedure, we next discuss the topographic assignment ofthe present and previously published experimental results.
Given the good agreement between the experimental(Fig. 4) and the four calculated [(r)Wsharp, (r)Wblunt] profilesfor negative biases (Figs. 9 and 10), we assign the primary andsecondary topographic features to the HOPG β and α atoms,respectively. Accordingly, we conclude that β atoms should bealways visible in images acquired with pure W tips at negativebiases.
Turning to positive biases, the experimentally measuredcontrast reversal at 0.5 V is better matched by the results forthe Wsharp model. The slight underestimation of the contrast-reversal bias (0.2–0.3 V instead of 0.5 V) prevents quantitativeagreement with the experiment. However, by taking the 0.2–0.3 V simulations as representative of the experimental (0.5 V)results, it is possible to tentatively assign the bright featuresat 0.5 V to mid α-β and β-h sites, respectively. Analogously,comparison between the Wsharp results (Figs. 9 and 10) andthe experimental contrast reversal at 0.9 V (Fig. 4) assigns theexperimental hexagonal bright features to mid h-α and β-sites.
These results elucidate the experimentally measured con-trast reversal at positive biases as originating from the complexbalance between tip-induced convolution effects [Fig.7 andEq. (S-3) in Ref. 49] and the energy-dependent contribution oftip states with different vacuum decay (Fig. 6). Based on themeasurement of different contrast reversals at different biases(Fig. 4 and Ref. 39), and the strong effects of the tip subapexstructure on the ensuing HOPG STM contrast (Figs. 9 and 10),we attribute the underestimation of the contrast-bias reversalat 0.5 V (Fig. 4) to differences in experimental and theoreticalsubapex structures.
More importantly, our simulations clearly suggest that,dependent on the tip composition and structure, different
085433-12
ROLE OF APPLIED BIAS AND TIP ELECTRONIC . . . PHYSICAL REVIEW B 85, 085433 (2012)
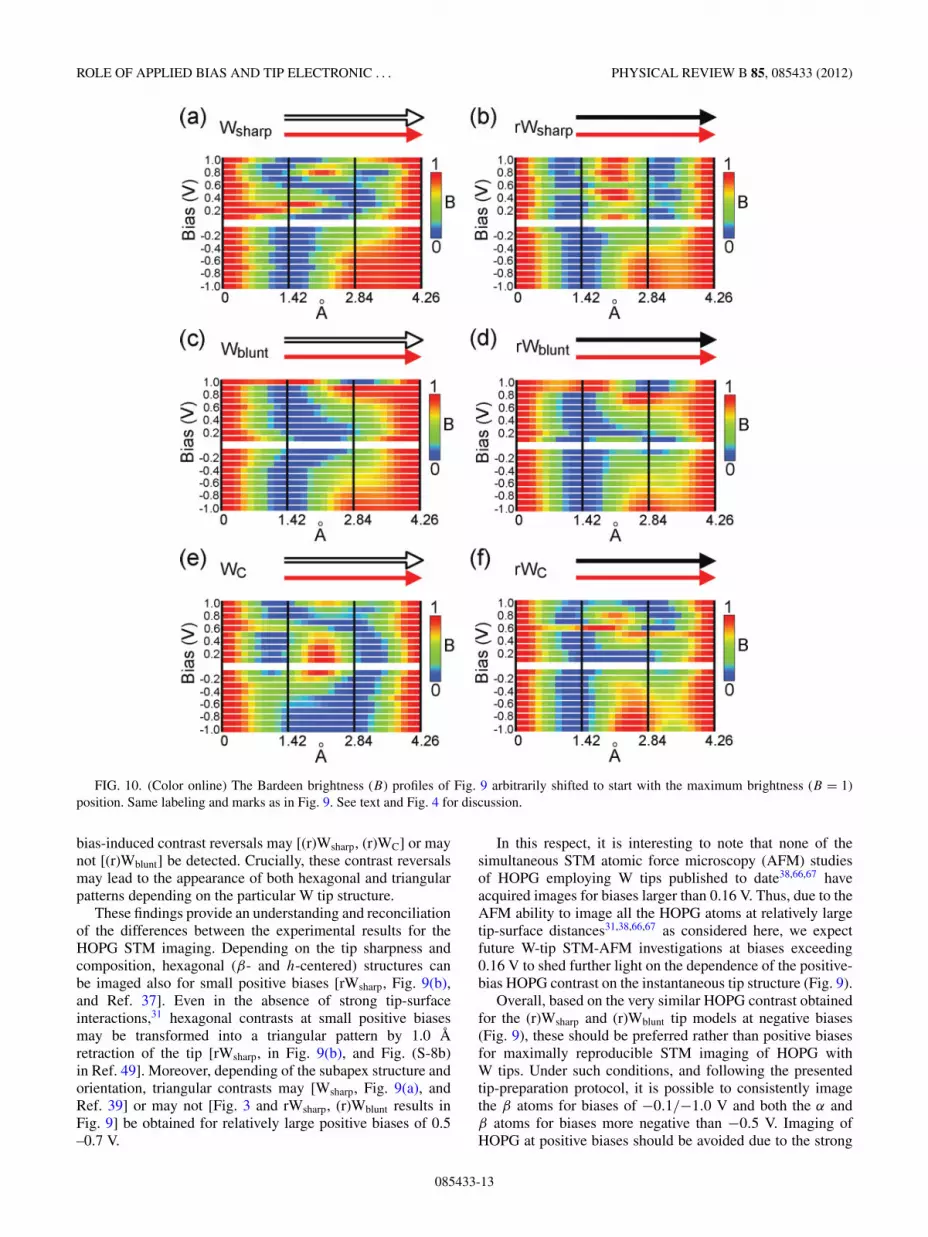
FIG. 10. (Color online) The Bardeen brightness (B) profiles of Fig. 9 arbitrarily shifted to start with the maximum brightness (B = 1)position. Same labeling and marks as in Fig. 9. See text and Fig. 4 for discussion.
bias-induced contrast reversals may [(r)Wsharp, (r)WC] or maynot [(r)Wblunt] be detected. Crucially, these contrast reversalsmay lead to the appearance of both hexagonal and triangularpatterns depending on the particular W tip structure.
These findings provide an understanding and reconciliationof the differences between the experimental results for theHOPG STM imaging. Depending on the tip sharpness andcomposition, hexagonal (β- and h-centered) structures canbe imaged also for small positive biases [rWsharp, Fig. 9(b),and Ref. 37]. Even in the absence of strong tip-surfaceinteractions,31 hexagonal contrasts at small positive biasesmay be transformed into a triangular pattern by 1.0 Aretraction of the tip [rWsharp, in Fig. 9(b), and Fig. (S-8b)in Ref. 49]. Moreover, depending of the subapex structure andorientation, triangular contrasts may [Wsharp, Fig. 9(a), andRef. 39] or may not [Fig. 3 and rWsharp, (r)Wblunt results inFig. 9] be obtained for relatively large positive biases of 0.5–0.7 V.
In this respect, it is interesting to note that none of thesimultaneous STM atomic force microscopy (AFM) studiesof HOPG employing W tips published to date38,66,67 haveacquired images for biases larger than 0.16 V. Thus, due to theAFM ability to image all the HOPG atoms at relatively largetip-surface distances31,38,66,67 as considered here, we expectfuture W-tip STM-AFM investigations at biases exceeding0.16 V to shed further light on the dependence of the positive-bias HOPG contrast on the instantaneous tip structure (Fig. 9).
Overall, based on the very similar HOPG contrast obtainedfor the (r)Wsharp and (r)Wblunt tip models at negative biases(Fig. 9), these should be preferred rather than positive biasesfor maximally reproducible STM imaging of HOPG withW tips. Under such conditions, and following the presentedtip-preparation protocol, it is possible to consistently imagethe β atoms for biases of −0.1/−1.0 V and both the α andβ atoms for biases more negative than −0.5 V. Imaging ofHOPG at positive biases should be avoided due to the strong
085433-13

TEOBALDI, INAMI, KANASAKI, TANIMURA, AND SHLUGER PHYSICAL REVIEW B 85, 085433 (2012)
dependence of the STM contrast on the hardly controllablesubapex structure and orientation of the tip. Furthermore,stability of the STM contrast for biases of different polaritiesshould be indicative of blunt tip terminations, whereas contrastmodifications point toward sharp tips.
Finally, based on the strong dependence of the HOPGpositive-bias contrast on the instantaneous tip termination, andthe high reproducibility of HOPG samples preparation,30 weargue that it should be possible to use positive-bias imaging ofHOPG and the provided library of contrasts (Figs. 9 and 10)as a standard for the elucidation of the actual tip terminationin particular experiments.
D. Identification of C contamination at the tip apex
As shown in Fig. 8, carbon contamination is found to reducethe tunneling current by more than one order of magnitudewith respect to pure W tips. Thus, C contamination duringconstant-height scans can manifest itself as a sudden drop ofthe tunneling current, or in constant-current topographic scansas a sudden drop of the baseline height.
Additionally, as shown in Figs. 9(e) and 9(f), the (r)WC
models alter the HOPG imaging also at negative biases withrespect to W-terminated tips. Thus, C contamination shouldbe also detectable at large negative biases (−0.7/−1.0 V)by the appearance of sharp triangular contrast (WC) or theimaging of hexagonal patterns with anomalously large (>2 A)separation between the primary and secondary features along〈1100〉 (rWC).
V. CONCLUSIONS
Our extensive experimental investigation accompanied bystatistical analysis of the experimental data set and by first-principles simulations with six different tip models demon-strates a marked effect of the applied bias on the topographiccontrast and corrugation amplitude of HOPG acquired with Wtips in the pure tunneling regime.
Depending on the applied bias and polarity, both thehexagonal and triangular contrast patterns can be imaged withthe same stable tip. Statistical analysis of the experimentaldata set reveals enhancement of the corrugation amplitude forsmall negative biases and the occurrence of different contrastreversals at positive biases, whereby the relative brightness ofthe primary and secondary features is inverted with respectto the negative-biases results. Simulation of HOPG imagingwith different tip models provides better understanding ofthese findings and demonstrates the profound effects of thetip electronic structure on the measured HOPG imaging.
For pure W tips, regardless of the tip structure andorientation, the negative-bias contrast is shown to progres-sively change from a β-centered triangular pattern into ahexagonal pattern pinned on α and β atoms for biases morenegative than −0.5 V. Conversely, the positive-bias contrastis found to strongly depend on the tip structure, sharpness,and orientation with respect to the HOPG lattice. Whereasblunt tip terminations yield the same contrast for both biaspolarities, sharper tips profoundly distort the HOPG imagingat positive biases. These results originate from tip-convolutioneffects, which in turn depend on the intricate balance betweenelectronic states of different angular and magnetic momentsand their different vacuum decay length outside the tip apex.
The simulations suggest that STM acquisition at negativebiases should be preferred with W tips as this leads to morereproducible imaging of HOPG. On the same grounds, andgiven the high reproducibility of HOPG sample preparation, itis argued that positive-bias imaging of HOPG could be used,together with the presented library of contrasts, as a way ofdetermining the actual tip termination. Carbon contaminationof the W tip is shown to make the HOPG contrast to stronglydepend on the tip termination also for negative biases. This,together with the corresponding reduction in the tunnelingcurrent, can be used for identifying or ruling out carboncontamination of the W tip during the STM acquisition.
Overall, these results highlight elements so far overlooked,which should be useful for the interpretation of the exceedinglylarge number of STM images of HOPG, and technologicallyrelevant related systems such as nanoengineered HOPG,multilayer graphene, graphite-supported biomolecules, andcatalysts. Finally, the introduced experimental protocol forthe tip preparation and calibration, together with the statisticalanalysis of the ensuing results, opens up for a more straightfor-ward and rigorous comparison between STM images acquiredwith different tips.
ACKNOWLEDGMENTS
This work was supported by a specially promoted Grant-in-Aid for Scientific Research (Contract No. 19001002)from the Ministry of Education, Culture, Sports, Scienceand Technology (MEXT) of Japan, and by World PremierInternational Research Center Initiative (WPI), MEXT, Japan.The authors also acknowledge the use of the UCL LegionHigh Performance Computing Facility, and associated supportservices, in the completion of this work. G.T. is currentlysupported by EPSRC-UK (EP/I004483/1). G.T. is grateful toW. A. Hofer for useful discussion.
*[email protected]†[email protected]‡[email protected]. Pong and C. Durkan, J. Phys. D: Appl. Phys. 38, R329 (2005).2R. C. Tatar and S. Rabii, Phys. Rev. B 25, 4126 (1982).3B. T. Kelly, Physics of Graphite (Applied Science, London 1981).4H. J. Mamin, E. Ganz, D. W. Abraham, R. E. Thomson, andJ. Clarke, Phys. Rev. B 34, 9015 (1986).
5H. Shinohara, Rep. Prog. Phys. 63, 843 (2000).6S. De Feyter and F. C. De Schryver, Chem. Soc. Rev. 32, 139(2003).
7C. R. Clemmer and T. P. Beebe, Scanning Microsc. 6, 319 (1992).8J. Otsuki, Coord. Chem. Rev. 254, 2311 (2010).9M. Ruben, J.-M. Lehn, and P. Muller, Chem. Soc. Rev. 35, 1056(2006).
10H. Hovel and I. Barke, Prog. Surf. Sci. 81, 53 (2006).
085433-14

ROLE OF APPLIED BIAS AND TIP ELECTRONIC . . . PHYSICAL REVIEW B 85, 085433 (2012)
11M. Lenner, A. Kaplan, and R. E. Palmer, Appl. Phys. Lett. 90,153119 (2007).
12J. Kanasaki, E. Inami, K. Tanimura, H. Ohnishi, and K. Nasu, Phys.Rev. Lett. 102, 087402 (2009).
13J. I. Paredes, A. Martinez-Alonso, and J. M. D. Tascon, Carbon 38,1183 (2000).
14J. I. Paredes, P. Solıs-Fernandez, A. Martinez-Alonso, and J. M. D.Tascon, J. Phys. Chem. C 113, 10249 (2009).
15K. H. Han, D. Spemann, P. Esquinazi, R. Hohne, V. Riede, andT. Butz, Adv. Mater. 15, 1719 (2003).
16Y. Ferro, C. Thomas, T. Angot, P. Genesio, and A. Allouche,J. Nucl. Mater. 363–365, 1206 (2007).
17M. J. Allen, V. C. Tung, and R. B. Kaner, Chem. Rev. 110, 132(2010).
18T. W. Odom, J.-L. Huang, P. Kim, and C. M. Lieber, Nature(London) 391, 62 (1998).
19J. W. G. Wilder, L. C. Venema, A. G. Rinzler, R. E. Smallery, andC. Dekker, Nature (London) 391, 59 (1998).
20Y. Z. Li, J. C. Patrin, M. Chander, J. H. Weaver, L. P. F. Chibante,and R. E. Smallery, Science 252, 447 (1991).
21P. Lauffer, K. V. Emtsev, R. Graupner, Th. Seyller, L. Ley, S. A.Reshanov, and H. B. Weber, Phys. Rev. B 77, 155426 (2008).
22R. Hiesgen, I. Wehl, E. Aleksandrova, E. Roduner, A. Bauder, andK. A. Friedrich, Int. J. Energy Res. 34, 1223 (2010).
23J. M. Soler, A. M. Baro, N. Garcia, and H. Rohrer, Phys. Rev. Lett.57, 444 (1986).
24J. B. Pethica, Phys. Rev. Lett. 57, 3235 (1986).25M. Kuwabara, D. R. Clarke, and D. A. Smith, Appl. Phys. Lett. 56,
2396 (1990).26J. Xhie, K. Sattler, M. Ge, and N. Venkateswaran, Phys. Rev. B 47,
15835 (1993).27W.-T. Pong, J. Bendall, and C. Durkam, Surf. Sci. 601, 498
(2007).28E. Cisternas, M. Flores, and P. Vargas, Phys. Rev. B 78, 125406
(2008).29S. I. Park and C. F. Quate, Appl. Phys. Lett. 48, 112 (1986).30G. Bining, H. Fuchs, Ch. Gerber, H. Rohrer, E. Stoll, and E. Tosatti,
Europhys. Lett. 1, 31 (1986).31M. Ondracek, P. Pou, V. Rozsıval, C. Gonzalez, P. Jelınek, and
R. Perez, Phys. Rev. Lett. 106, 176101 (2011).32P. Moriarty and G. Hughes, Appl. Phys. Lett. 60, 2338 (1992).33H. A. Mizes, S. I. Park, and W. A. Harrison, Phys. Rev. B 36, 4491
(1987).34P. J. Ouseph, T. Poothackanal, and G. Mathew, Phys. Lett. A 205,
65 (1995).35J. I. Paredes, A. Martınez-Alonso, and J. M. D. Tascon, Carbon 39,
476 (2001).36Y. Wang, Y. Ye, and K. Wu, Surf. Sci. 600, 729 (2006).37E. Cisternas, F. Stavale, M. Flores, C. A. Achete, and P. Vargas,
Phys. Rev. B 79, 205431 (2009).38S. Hembacher, F. J. Giessibl, J. Mannhart, and C. F. Quate, Proc.
Natl. Acad. Sci. USA 100, 12539 (2003).39S. Gwo and C. K. Shih, Phys. Rev. B 47, 13059 (1993).40G. S. Khara and J. Choi, J. Phys.: Condens. Matter 21, 195402
(2009).
41D. Tomanek, S. G. Louie, H. J. Mamin, D. W. Abraham, R. E.Thomson, E. Ganz, and J. Clarke, Phys. Rev. B 35, 7790 (1987).
42D. Tomanek and S. G. Louie, Phys. Rev. B 37, 8327 (1988).43J. Tersoff, Phys. Rev. B 41, 1235 (1990).44J. Tersoff and N. D. Lang, Phys. Rev. Lett. 65, 1132 (1990).45N. Isshiki, K. Kobayashi, and M. Tsukada, Surf. Sci. Lett. 238,
L439 (1990).46A. Selloni, P. Carnevali, E. Tosatti, and C. D. Chen, Phys. Rev. B
31, 2602 (1985).47C. D. Zeinalipour-Yazdi and D. P. Pullman, Chem. Phys. 348, 233
(2008).48J. Tersoff and D. R. Hamann, Phys. Rev. B 31, 805 (1985).49See Supplemental Material at http://link.aps.org/supplemental/
10.1103/PhysRevB.85.085433 for supplementary methods andresults.
50R. K. Raman, Y. Murooka, C. Y. Ruan, T. Yang, S. Berber, andD. Tomanek, Phys. Rev. Lett. 101, 077401 (2008).
51G. Teobaldi, K. Tanimura, and A. L. Shluger, Phys. Rev. B 82,174104 (2010).
52G. Teobaldi, H. Ohnishi, K. Tanimura, and A. L. Shluger, Carbon48, 4145 (2010).
53A. Bosak, M. Krisch, M. Mohr, J. Maultzsch, and C. Thomsen,Phys. Rev. B 75, 153408 (2007).
54G. Teobaldi, W. A. Hofer, O. Bikondoa, C. L. Pang, G. Cabailh,and G. Thornton, Chem. Phys. Lett. 437, 73 (2007).
55G. Teobaldi, M. Penalba, A. Arnau, N. Lorente, and W. A. Hofer,Phys. Rev. B 76, 235407 (2007).
56J. P. Perdew, K. Burke, and M. Ernzerhof, Phys. Rev. Lett. 77, 3865(1996).
57G. Kresse and J. Hafner, Phys. Rev. B 47, 558 (1993).58G. Kresse and J. Furthmuller, Phys. Rev. B 54, 11169 (1996).59J. Bardeen, Phys. Rev. Lett. 6, 57 (1961).60W. Hofer and J. Redinger, Surf. Sci. 447, 51 (2000).61W. A. Hofer, Prog. Surf. Sci. 71, 147 (2003).62K. Palotas and W. A. Hofer, J. Phys.: Condens. Matter 17, 2705
(2005).63W. A. Hofer, A. S. Foster, and A. L. Shluger, Rev. Mod. Phys. 75,
1287 (2003).64J. M. Blanco, C. Gonzalez, P. Jelınek, J. Ortega, F. Flores, and
R. Perez, Phys. Rev. B 70, 085405 (2004).65M. Tsukada, K. Kobayashi, N. Isshiki, and H. Kageshima, Surf.
Sci. Rep. 13, 265 (1991).66S. Hembacher, F. J. Giessibl, J. Mannhart, and C. F. Quate, Phys.
Rev. Lett. 94, 056101 (2005).67S. Kawai and H. Kawakatsu, Phys. Rev. B 79, 115440 (2009).68F. Atammy, O. Spilleche, and R. Schlogl, Phys. Chem. Chem. Phys.
1, 4113 (1999).69B. Partoens and F. M. Peeters, Phys. Rev. B 74, 075404 (2006).70P. R. Wallace, Phys. Rev. 71, 622 (1947).71W. A. Hofer, J. Redinger, and P. Varga, Solid State Commun. 113,
245 (2000).72F. Ortmann, F. Bechstedt, and W. G. Schmidt, Phys. Rev. B 73,
205101 (2006).73K. Lammle, T. Trevethan, A. Schwarz, M. Watkins, A. L. Shluger,
and R. Wiesendanger, Nano Lett. 10, 2965 (2010).
085433-15


