Embed Size (px)
Citation preview
Role of the 3-D distributions of load and lithospheric strengthin orogenic arcs:
polystage subsidence in the Carpathians foredeep
M. Taflraflpoancafl a;b, D. Garcia-Castellanos b;c, G. Bertotti b;c;�, L. Matenco b;c,S.A.P.L. Cloetingh b;c, C. Dinu d
a S.C. Prospectiuni S.A., 20 Coralilor St., Sect. 1, 78449 Bucharest, Romaniab Netherlands Research Center for Integrated Solid Earth Sciences (ISES), Amsterdam, The Netherlands
c Vrije Universiteit, Faculty of Earth and Life Sciences, De Boelelaan 1085, 1081 HV Amsterdam, The Netherlandsd Bucharest University, Faculty of Geology and Geophysics, 6 Traian Vuia Str., Sect. 1, 70139 Bucharest, Romania
Received 11 July 2003; received in revised form 16 January 2004; accepted 22 January 2004
Abstract
It has been widely documented that the depth of foredeeps does not always reflect the topography of theneighboring orogens. In many cases, the topographic load is insufficient to explain basin subsidence. Such is the caseof the SE Carpathians where an anomalously deep (almost 13 km) foreland basin has evolved since the MiddleMiocene (Badenian). A peculiar feature of this basin is its position relative to the orogen. In contrast to typicalforedeeps, which deepen towards the belt, the maximum depth of this basin is 10^20 km out of the orogen. Thesubsidence in the Carpathians Bend foreland is characterized by two stages: the first is Middle Miocene (Badenian) inage and is related to NE^SW extension when fault-bounded basins were formed. Modeling shows that the forelandunderwent small pre-orogenic uniform thinning. The modeling also predicts 6 100 m post-rift subsidence inaccordance with the regional unconformity observed at the Middle/Upper Miocene (Badenian/Sarmatian) boundary.The second subsidence stage follows rifting and is caused by flexural loading of the Carpathians nappes. According tothe planform flexural modeling results, the location of depocenter in front of the Carpathians Bend in the lattercontractional stage can be accounted for by the present topography if lateral variations in lithospheric strength aretaken into account. Since the depth of the predicted basin is half of what is actually observed, an extra-load isrequired, which is equivalent to 500^800 m in terms of extra topography. In this case, the predicted basin correspondswith the observed geometry in terms of position/shape and depth, the latter depending on the magnitude of intraplatestresses as well. The modeling also suggests that the flexural fore-bulge of the Carpathians system is represented bythe uplifted Dobrogea. Our explanation for the large subsidence recorded by the SE Carpathians foredeep highlightsthe control exerted by lateral changes in lithospheric strength on 3-D subsidence patterns in arcuate orogenic belts.> 2004 Elsevier B.V. All rights reserved.
0012-821X / 04 / $ ^ see front matter > 2004 Elsevier B.V. All rights reserved.doi:10.1016/S0012-821X(04)00068-8
* Corresponding author. Tel. : +31-20-4447288; Fax: +31-20-4449943.E-mail addresses: [email protected] (M. Taflraflpoancafl), [email protected] (D. Garcia-Castellanos),
[email protected] (G. Bertotti), [email protected] (L. Matenco), [email protected] (S.A.P.L. Cloetingh),[email protected] (C. Dinu).
EPSL 7017 25-3-04
Earth and Planetary Science Letters 221 (2004) 163^180
R
Available online at www.sciencedirect.com
www.elsevier.com/locate/epsl
Keywords: Carpathians foredeep; extension; £exural modeling; subsidence
1. Introduction
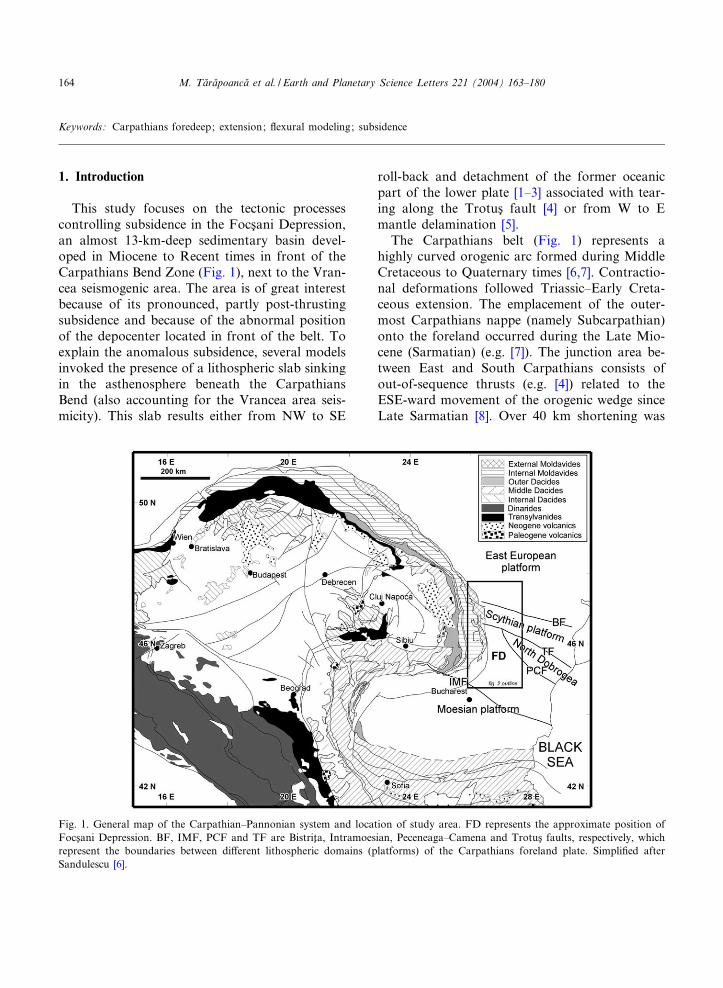
This study focuses on the tectonic processescontrolling subsidence in the FocsIani Depression,an almost 13-km-deep sedimentary basin devel-oped in Miocene to Recent times in front of theCarpathians Bend Zone (Fig. 1), next to the Vran-cea seismogenic area. The area is of great interestbecause of its pronounced, partly post-thrustingsubsidence and because of the abnormal positionof the depocenter located in front of the belt. Toexplain the anomalous subsidence, several modelsinvoked the presence of a lithospheric slab sinkingin the asthenosphere beneath the CarpathiansBend (also accounting for the Vrancea area seis-micity). This slab results either from NW to SE
roll-back and detachment of the former oceanicpart of the lower plate [1^3] associated with tear-ing along the TrotusI fault [4] or from W to Emantle delamination [5].The Carpathians belt (Fig. 1) represents a
highly curved orogenic arc formed during MiddleCretaceous to Quaternary times [6,7]. Contractio-nal deformations followed Triassic^Early Creta-ceous extension. The emplacement of the outer-most Carpathians nappe (namely Subcarpathian)onto the foreland occurred during the Late Mio-cene (Sarmatian) (e.g. [7]). The junction area be-tween East and South Carpathians consists ofout-of-sequence thrusts (e.g. [4]) related to theESE-ward movement of the orogenic wedge sinceLate Sarmatian [8]. Over 40 km shortening was
Fig. 1. General map of the Carpathian^Pannonian system and location of study area. FD represents the approximate position ofFocsIani Depression. BF, IMF, PCF and TF are BistritIa, Intramoesian, Peceneaga^Camena and TrotusI faults, respectively, whichrepresent the boundaries between di¡erent lithospheric domains (platforms) of the Carpathians foreland plate. Simpli¢ed afterSandulescu [6].
EPSL 7017 25-3-04
M. Taflraflpoancafl et al. / Earth and Planetary Science Letters 221 (2004) 163^180164
estimated for the Bend orogenic wedge. The areais also the site of the youngest Carpathians con-traction (Pliocene^Pleistocene), which was of lim-ited magnitude, in the order of several kilometers[4]. Unlike the East and South Carpathians wheremajor exhumation began at the end of the MiddleMiocene, denudation in the Bend region startedonly at the beginning of Pliocene [9].The FocsIani Depression is a V13-km-deep ba-
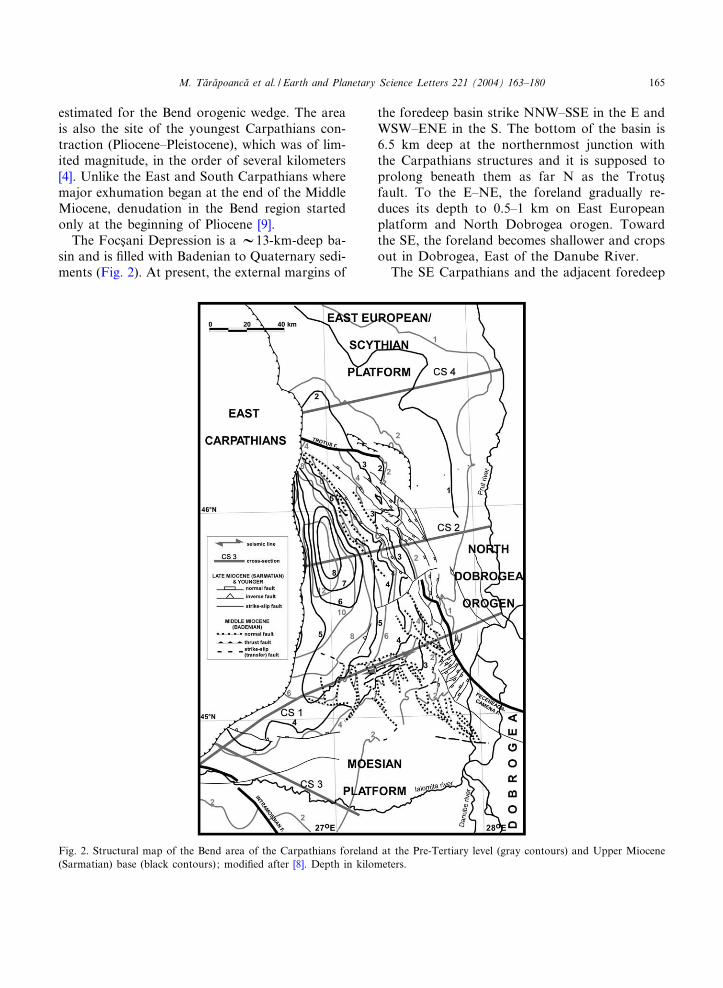
sin and is ¢lled with Badenian to Quaternary sedi-ments (Fig. 2). At present, the external margins of
the foredeep basin strike NNW^SSE in the E andWSW^ENE in the S. The bottom of the basin is6.5 km deep at the northernmost junction withthe Carpathians structures and it is supposed toprolong beneath them as far N as the TrotusIfault. To the E^NE, the foreland gradually re-duces its depth to 0.5^1 km on East Europeanplatform and North Dobrogea orogen. Towardthe SE, the foreland becomes shallower and cropsout in Dobrogea, East of the Danube River.The SE Carpathians and the adjacent foredeep
Fig. 2. Structural map of the Bend area of the Carpathians foreland at the Pre-Tertiary level (gray contours) and Upper Miocene(Sarmatian) base (black contours) ; modi¢ed after [8]. Depth in kilometers.
EPSL 7017 25-3-04
M. Taflraflpoancafl et al. / Earth and Planetary Science Letters 221 (2004) 163^180 165
have been inferred to be a¡ected by so-called hid-den loads (e.g. [1]). Modeling studies showed thatthe topographic load of the Carpathians is insuf-¢cient to ¢t the observed foredeep geometry andan extra vertical force has to be applied to thedeep end of the subducting plate [10]. These mod-els have inferred large lateral variations of litho-spheric rigidity along the Carpathians [11], possi-bly inherited from pre-compressional stages.In a previous work we documented the 3-D
architecture of the FocsIani Depression and itsevolution through time [8]. In that paper weused a large (s 1000 km) seismic survey for map-ping and several tens of well checkshots to con-vert the time structural maps in depth. Havingestablished the basin structure, we make nowthe step toward numerical modeling in order toidentify and quantify the basin forming mecha-nisms. We have demonstrated the existence oftwo quite di¡erent tectonic regimes. The ¢rstone, Middle Miocene (Badenian) in age, was char-acterized by NE^SW oriented extension and wasfollowed by regional tilting and subsidence.In this paper we will ¢rst model the subsidence
associated with the extensional deformation stage(both during and following rifting). Our goalsare: (1) to assess the amount of subsidence, whichcan be ascribed to extension, and (2) to determinethe lithospheric characteristics following the ex-tensional episode. We then model the foreland£exure due to the present topographic load usingcodes taking into account lateral changes of ge-
ometry and mechanical properties. Previous £ex-ural modeling studies along vertical sections con-cluded that the topographical load alone isinsu⁄cient to account for the subsidence in theSE Carpathians Bend foreland [1,10,11]. The ob-jective of our modelling study is to investigatewhether the observed subsidence can be explainedby 3-D loads. In doing so, we also take into ac-count the presence of areas with di¡erent litho-spheric strengths. This was not done in previousmodels.
2. Extensional modeling
2.1. The Badenian (16.5^13 Ma) extensional basin
One of the main results of the basin reconstruc-tion presented in Taflraflpoancafl et al. [8] was therecognition along the eastern margin of theFocsIani Depression of a set of NW^SE trendingnormal faults of Badenian age (Fig. 2). Badeniansediments are up to 4 km thick and mainly foundalong an area elongated in NW^SE direction. Thethickness of Badenian sediments rapidly decreasesfrom FocsIani Depression to its eastern shoulder(on the North Dobrogea orogen). The prolonga-tion of the basin to the NW and W is unclearsince it is buried beneath the Carpathians nappes.The position and structure of the former westernextensional margin of the FocsIani Depression re-main still unknown.
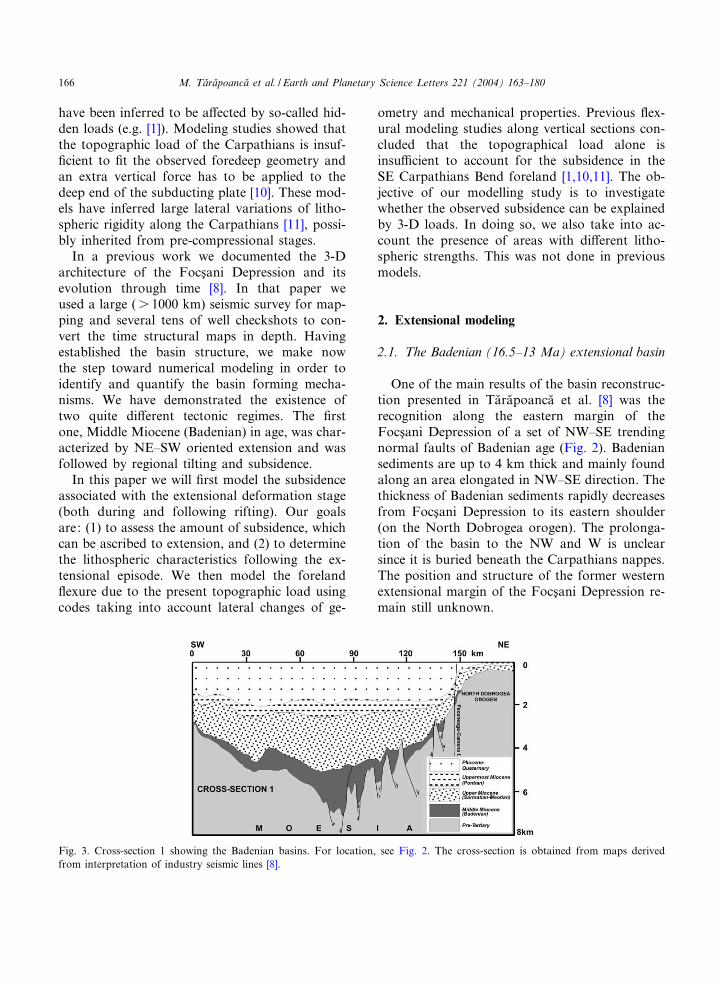
Fig. 3. Cross-section 1 showing the Badenian basins. For location, see Fig. 2. The cross-section is obtained from maps derivedfrom interpretation of industry seismic lines [8].
EPSL 7017 25-3-04
M. Taflraflpoancafl et al. / Earth and Planetary Science Letters 221 (2004) 163^180166
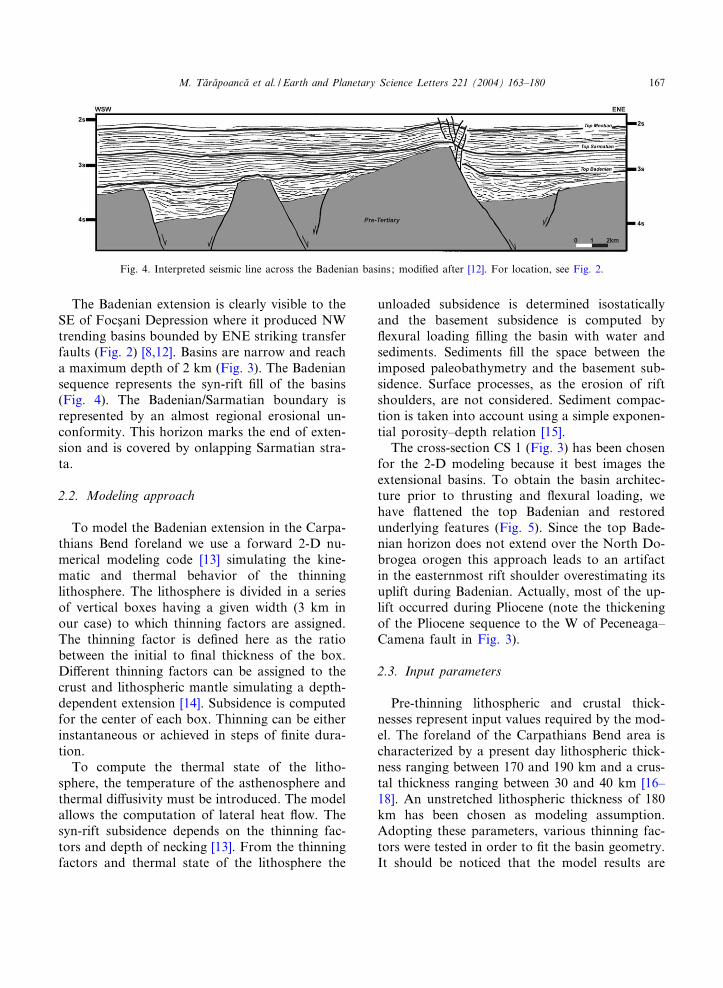
The Badenian extension is clearly visible to theSE of FocsIani Depression where it produced NWtrending basins bounded by ENE striking transferfaults (Fig. 2) [8,12]. Basins are narrow and reacha maximum depth of 2 km (Fig. 3). The Badeniansequence represents the syn-rift ¢ll of the basins(Fig. 4). The Badenian/Sarmatian boundary isrepresented by an almost regional erosional un-conformity. This horizon marks the end of exten-sion and is covered by onlapping Sarmatian stra-ta.
2.2. Modeling approach
To model the Badenian extension in the Carpa-thians Bend foreland we use a forward 2-D nu-merical modeling code [13] simulating the kine-matic and thermal behavior of the thinninglithosphere. The lithosphere is divided in a seriesof vertical boxes having a given width (3 km inour case) to which thinning factors are assigned.The thinning factor is de¢ned here as the ratiobetween the initial to ¢nal thickness of the box.Di¡erent thinning factors can be assigned to thecrust and lithospheric mantle simulating a depth-dependent extension [14]. Subsidence is computedfor the center of each box. Thinning can be eitherinstantaneous or achieved in steps of ¢nite dura-tion.To compute the thermal state of the litho-
sphere, the temperature of the asthenosphere andthermal di¡usivity must be introduced. The modelallows the computation of lateral heat £ow. Thesyn-rift subsidence depends on the thinning fac-tors and depth of necking [13]. From the thinningfactors and thermal state of the lithosphere the
unloaded subsidence is determined isostaticallyand the basement subsidence is computed by£exural loading ¢lling the basin with water andsediments. Sediments ¢ll the space between theimposed paleobathymetry and the basement sub-sidence. Surface processes, as the erosion of riftshoulders, are not considered. Sediment compac-tion is taken into account using a simple exponen-tial porosity^depth relation [15].The cross-section CS 1 (Fig. 3) has been chosen
for the 2-D modeling because it best images theextensional basins. To obtain the basin architec-ture prior to thrusting and £exural loading, wehave £attened the top Badenian and restoredunderlying features (Fig. 5). Since the top Bade-nian horizon does not extend over the North Do-brogea orogen this approach leads to an artifactin the easternmost rift shoulder overestimating itsuplift during Badenian. Actually, most of the up-lift occurred during Pliocene (note the thickeningof the Pliocene sequence to the W of Peceneaga^Camena fault in Fig. 3).
2.3. Input parameters
Pre-thinning lithospheric and crustal thick-nesses represent input values required by the mod-el. The foreland of the Carpathians Bend area ischaracterized by a present day lithospheric thick-ness ranging between 170 and 190 km and a crus-tal thickness ranging between 30 and 40 km [16^18]. An unstretched lithospheric thickness of 180km has been chosen as modeling assumption.Adopting these parameters, various thinning fac-tors were tested in order to ¢t the basin geometry.It should be noticed that the model results are
Fig. 4. Interpreted seismic line across the Badenian basins; modi¢ed after [12]. For location, see Fig. 2.
EPSL 7017 25-3-04
M. Taflraflpoancafl et al. / Earth and Planetary Science Letters 221 (2004) 163^180 167
tested only against the basin stratigraphy and notagainst features such as lithospheric thickness,which have been overprinted by subsequent tec-tonic events.Zero paleowater depths have been used. This is
consistent with the presence of evaporitic interca-lations in the Badenian deposits on the outer partof the foreland. Post-Badenian sediments aremainly shallow water (e.g. [19]). The basin is as-sumed to be ¢lled with sediments up to sea leveland their compaction is taken into account usingthe values of 0.5 and 0.8 for the surface porosity(as fraction) and characteristic depth constant(km31), respectively, corresponding roughly to asilty sand lithology.Rifting took place for a duration of 3 Ma dur-
ing Badenian times [8]. Other parameters used areshown in Table 1.The model requires the equivalent elastic thick-
ness (EET) and depth of necking as input values,the former being de¢ned either as a constant or
associated with a speci¢c isotherm. The modeledsection is longer than the width of the basin toavoid boundary e¡ects.
2.4. Results
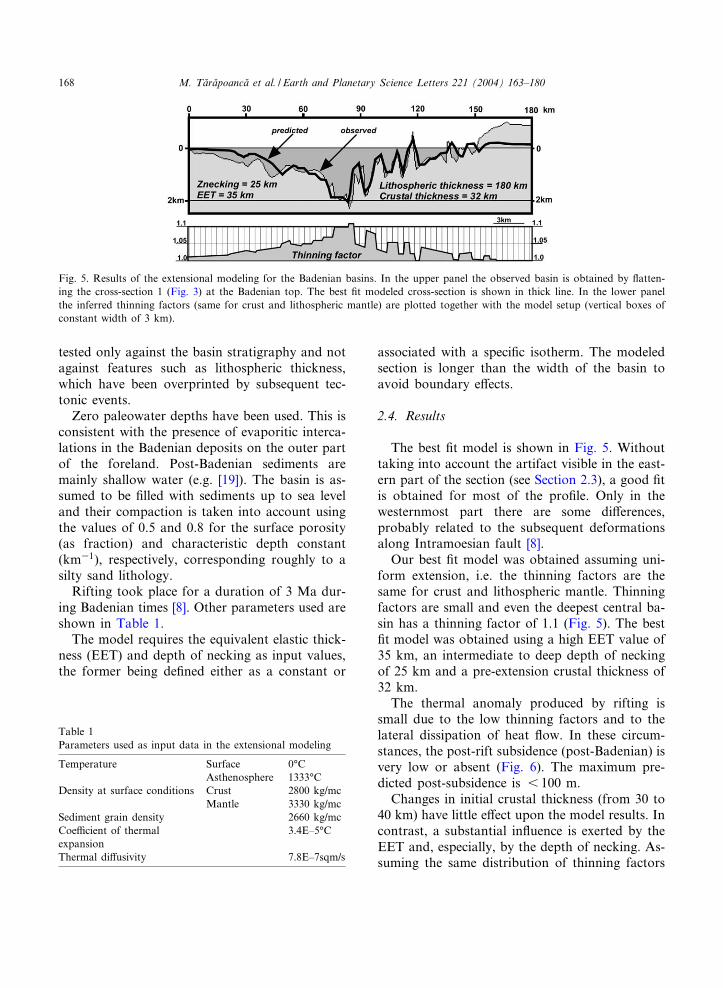
The best ¢t model is shown in Fig. 5. Withouttaking into account the artifact visible in the east-ern part of the section (see Section 2.3), a good ¢tis obtained for most of the pro¢le. Only in thewesternmost part there are some di¡erences,probably related to the subsequent deformationsalong Intramoesian fault [8].Our best ¢t model was obtained assuming uni-
form extension, i.e. the thinning factors are thesame for crust and lithospheric mantle. Thinningfactors are small and even the deepest central ba-sin has a thinning factor of 1.1 (Fig. 5). The best¢t model was obtained using a high EET value of35 km, an intermediate to deep depth of neckingof 25 km and a pre-extension crustal thickness of32 km.The thermal anomaly produced by rifting is
small due to the low thinning factors and to thelateral dissipation of heat £ow. In these circum-stances, the post-rift subsidence (post-Badenian) isvery low or absent (Fig. 6). The maximum pre-dicted post-subsidence is 6 100 m.Changes in initial crustal thickness (from 30 to
40 km) have little e¡ect upon the model results. Incontrast, a substantial in£uence is exerted by theEET and, especially, by the depth of necking. As-suming the same distribution of thinning factors
Fig. 5. Results of the extensional modeling for the Badenian basins. In the upper panel the observed basin is obtained by £atten-ing the cross-section 1 (Fig. 3) at the Badenian top. The best ¢t modeled cross-section is shown in thick line. In the lower panelthe inferred thinning factors (same for crust and lithospheric mantle) are plotted together with the model setup (vertical boxes ofconstant width of 3 km).
Table 1Parameters used as input data in the extensional modeling
Temperature Surface 0‡CAsthenosphere 1333‡C
Density at surface conditions Crust 2800 kg/mcMantle 3330 kg/mc
Sediment grain density 2660 kg/mcCoe⁄cient of thermalexpansion
3.4E^5‡C
Thermal di¡usivity 7.8E^7sqm/s
EPSL 7017 25-3-04
M. Taflraflpoancafl et al. / Earth and Planetary Science Letters 221 (2004) 163^180168
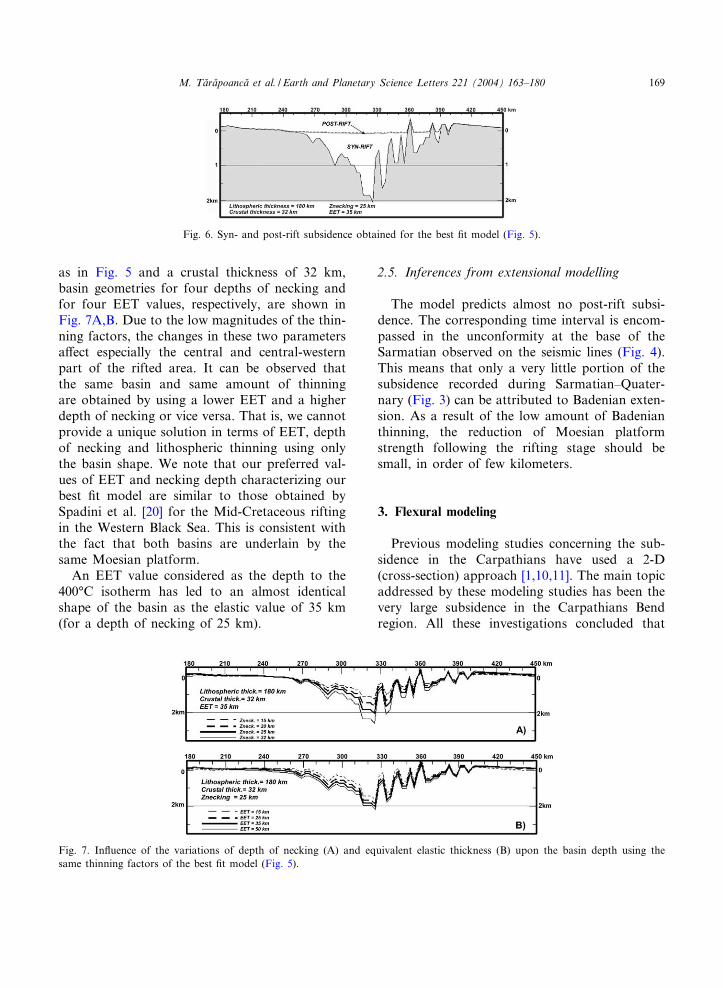
as in Fig. 5 and a crustal thickness of 32 km,basin geometries for four depths of necking andfor four EET values, respectively, are shown inFig. 7A,B. Due to the low magnitudes of the thin-ning factors, the changes in these two parametersa¡ect especially the central and central-westernpart of the rifted area. It can be observed thatthe same basin and same amount of thinningare obtained by using a lower EET and a higherdepth of necking or vice versa. That is, we cannotprovide a unique solution in terms of EET, depthof necking and lithospheric thinning using onlythe basin shape. We note that our preferred val-ues of EET and necking depth characterizing ourbest ¢t model are similar to those obtained bySpadini et al. [20] for the Mid-Cretaceous riftingin the Western Black Sea. This is consistent withthe fact that both basins are underlain by thesame Moesian platform.An EET value considered as the depth to the
400‡C isotherm has led to an almost identicalshape of the basin as the elastic value of 35 km(for a depth of necking of 25 km).
2.5. Inferences from extensional modelling
The model predicts almost no post-rift subsi-dence. The corresponding time interval is encom-passed in the unconformity at the base of theSarmatian observed on the seismic lines (Fig. 4).This means that only a very little portion of thesubsidence recorded during Sarmatian^Quater-nary (Fig. 3) can be attributed to Badenian exten-sion. As a result of the low amount of Badenianthinning, the reduction of Moesian platformstrength following the rifting stage should besmall, in order of few kilometers.
3. Flexural modeling
Previous modeling studies concerning the sub-sidence in the Carpathians have used a 2-D(cross-section) approach [1,10,11]. The main topicaddressed by these modeling studies has been thevery large subsidence in the Carpathians Bendregion. All these investigations concluded that
Fig. 6. Syn- and post-rift subsidence obtained for the best ¢t model (Fig. 5).
Fig. 7. In£uence of the variations of depth of necking (A) and equivalent elastic thickness (B) upon the basin depth using thesame thinning factors of the best ¢t model (Fig. 5).
EPSL 7017 25-3-04
M. Taflraflpoancafl et al. / Earth and Planetary Science Letters 221 (2004) 163^180 169
the load exerted by the present topography of theCarpathians is too small (accounting for maxi-mum 10% of foredeep subsidence) and that ‘hid-den loads’ must be invoked. However, none ofthem took into account the 3-D nature of theCarpathian arc and the map view variations instrength of the lithospheric domains involved.A topic that has not been addressed by these
studies is the geographic position of the depocen-ter. The Carpathians foredeep in the front of theBend Zone is peculiar because the depocenterdoes not lie under the thrust belt as predictedby simple models. A map of the foredeep base(Fig. 2) shows that it becomes shallower towardsthe belt. We investigate here the possibility thatthis feature is associated with the presence in theCarpathians domain of lithospheric blocks withsigni¢cantly di¡ering strengths.Following an initial cross-section experiment
we apply a planform modeling approach. Herebywe test : (1) the e¡ect of 3-D load distribution andlateral variations of lithospheric strengths on ba-sin position, and (2) whether the very large ob-served subsidence is the e¡ect a 3-D loading
rather than of a hidden load as shown by previous2-D experiments.
3.1. The Sarmatian^Quaternary (13^0 Ma)foredeep basin
The overall architecture of the FocsIani Depres-sion is shown in Fig. 2. Three schematic geolog-ical sections crossing the basin in various direc-tions are presented in Fig. 8A^C. The history ofthe entire East Carpathians foredeep basin beganin the Sarmatian, in association with the emplace-ment of Carpathians nappes [6,7].The northern foreland underwent important
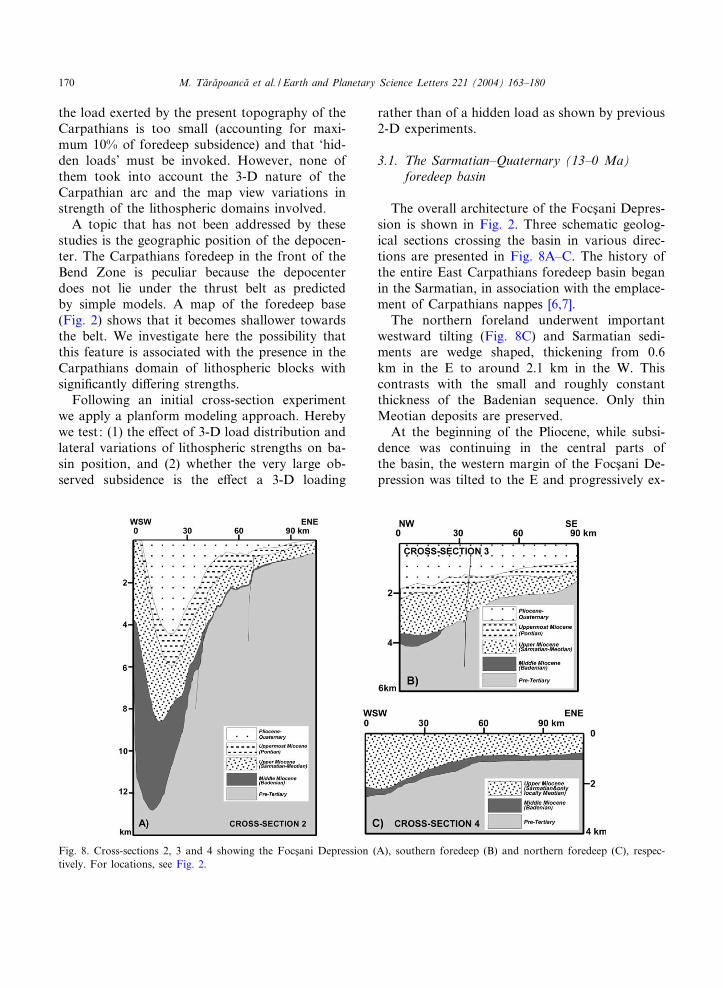
westward tilting (Fig. 8C) and Sarmatian sedi-ments are wedge shaped, thickening from 0.6km in the E to around 2.1 km in the W. Thiscontrasts with the small and roughly constantthickness of the Badenian sequence. Only thinMeotian deposits are preserved.At the beginning of the Pliocene, while subsi-
dence was continuing in the central parts ofthe basin, the western margin of the FocsIani De-pression was tilted to the E and progressively ex-
Fig. 8. Cross-sections 2, 3 and 4 showing the FocsIani Depression (A), southern foredeep (B) and northern foredeep (C), respec-tively. For locations, see Fig. 2.
EPSL 7017 25-3-04
M. Taflraflpoancafl et al. / Earth and Planetary Science Letters 221 (2004) 163^180170
humed. As a result of these events, around 8-km-thick Sarmatian^Quaternary sediments accumu-lated after the Badenian times in the FocsIani De-pression (Fig. 8A). The eastern basin margin is 1^1.6 km deep and dips gently towards the center.In contrast, the western margin is eastward dip-ping and the Upper Miocene strata crop out hav-ing roughly vertical position [21]. Removing thisyounger deformation, it can be concluded thatduring Upper Miocene time span the FocsIani De-pression was broader than at present. To the S ofthe FocsIani Depression, the Upper Miocene (Sar-matian) base reaches V3.7 km depth in front ofthe Carpathians belt and shallows southward
(Fig. 8B). The Pliocene^Quaternary sequencehas roughly the same thickness as the Upper Mio-cene one.
3.2. Lateral EET changes and the position of aforedeep depocenter: inferences from modelingalong a vertical section
Flexural modeling studies of foreland basinsshow that the width and depth of the basin aredependent on the rigidity of the lithosphere ex-pressed by its EET and on the shape and weightof the load [22,23]. A load imposed on a contin-uous plate with constant or very gradually vary-
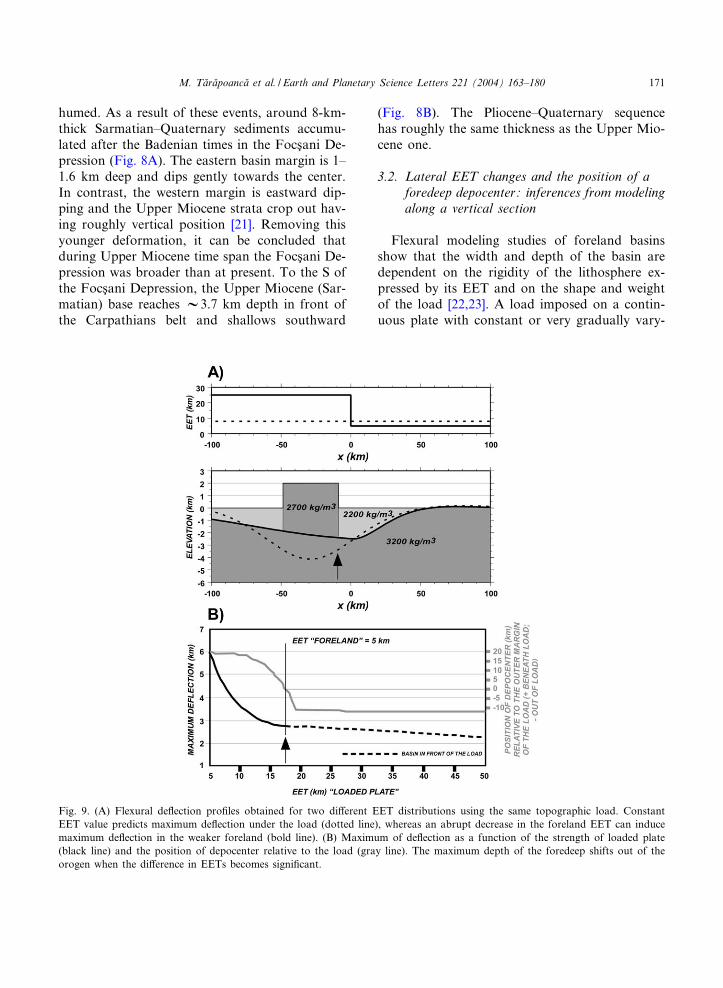
Fig. 9. (A) Flexural de£ection pro¢les obtained for two di¡erent EET distributions using the same topographic load. ConstantEET value predicts maximum de£ection under the load (dotted line), whereas an abrupt decrease in the foreland EET can inducemaximum de£ection in the weaker foreland (bold line). (B) Maximum of de£ection as a function of the strength of loaded plate(black line) and the position of depocenter relative to the load (gray line). The maximum depth of the foredeep shifts out of theorogen when the di¡erence in EETs becomes signi¢cant.
EPSL 7017 25-3-04
M. Taflraflpoancafl et al. / Earth and Planetary Science Letters 221 (2004) 163^180 171
ing EET produces a basin centered underneaththe load itself. The basin £oor gradually shallowson both sides.The predicted foredeep position and shape are,
however, signi¢cantly changed when the loadedplate is formed by two adjacent blocks with verydi¡erent strengths. The issue is relevant becausethe Carpathians fold and thrust belt overlieslithospheric blocks with very di¡erent character-istics, namely the East European and Moesian.The boundaries between these blocks are oftenformed by faults (e.g. the TrotusI fault) and arethus rapid.To illustrate the e¡ect of spatial changes in
strength of the loaded plate on basin geometry,we have calculated the de£ection of a 2-D thinelastic plate (e.g. [24]) under the weight of a rec-tangular load for di¡erent EET distributions (Fig.9A,B). In these calculations, we impose that the
topography after the lithospheric de£ection is2 km in the orogen and zero everywhere else. Inthis case, the maximum de£ection tends to moveaway from its central position and shifts towardsthe weaker plate. The trend can continue and thesite of maximum de£ection can be detached fromthe load itself. From this point, the foredeep basebecomes shallower towards the orogenic load.The shape of the basin also di¡ers from the onepredicted for a constant EET.
3.3. Planform modeling approach
To investigate the mechanism of subsidence inthe FocsIani Depression, we use a £exural modelcalculating the de£ection corresponding to a lat-erally variable load. Details on the methodologyare to be found in Garcia-Castellanos et al. [25].The load is calculated from the observed topog-
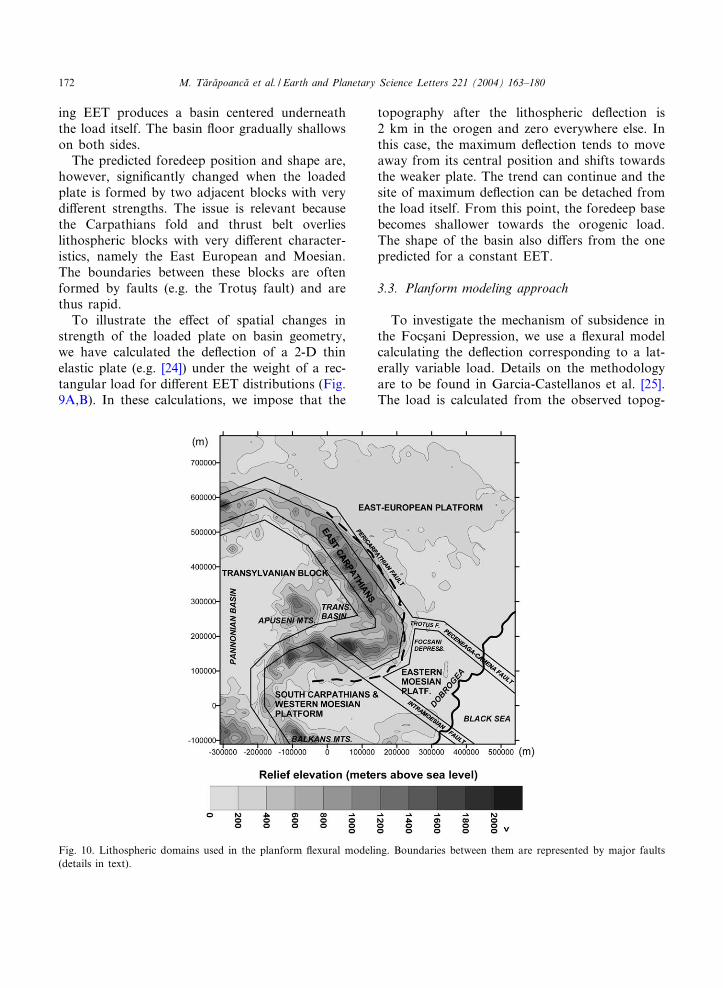
Fig. 10. Lithospheric domains used in the planform £exural modeling. Boundaries between them are represented by major faults(details in text).
EPSL 7017 25-3-04
M. Taflraflpoancafl et al. / Earth and Planetary Science Letters 221 (2004) 163^180172
raphy in the Carpathians region and the de£ec-tion is ¢lled with constant density material.The model assumes loading of an elastic thin
plate, a detailed description of the governingequations can be found e.g. in Van Wees andCloetingh [26]. The loaded plate is actuallyformed by various blocks with di¡erent constantstrength. A transition zone with variable strengthexists in each case, linearly interpolated betweenthe bounding blocks. The model geometry andstrength/load distribution controls the de£ectionpattern and the site of maximum predicted £ex-ure.
3.4. Input data for planform modeling
3.4.1. Strength of lithospheric blocksThe FocsIani Depression lies onto the northern
part of the Eastern Moesian platform which issurrounded by other lithospheric blocks withquite di¡erent tectonic histories and therefore, dif-ferent strengths. We have simpli¢ed the structureof the Carpathian domain to 5 major lithosphericdomains (Fig. 10): East European (inclusive ofScythian platform and North Dobrogea orogen),Eastern and Western Moesian platforms (the lat-ter includes the South Carpathians as well), EastCarpathians and Transylvanian (including theApuseni Mts. and the easternmost part of thePannonian basin). Major faults dividing variousplatform units represent the boundaries betweenthe foreland blocks. The Carpathians are sepa-rated from the foreland by the Pericarpathianfault, which is the most external major thrust(e.g. [7]). The boundaries between Transylvanianblock and the East and South Carpathians couldbe represented by a backthrust [9,27] and by adextral shearing zone (e.g. [2]), respectively.While the geophysical and main tectonic char-
acteristics of the de¢ned blocks are fairly wellknown (Table 2), a translation to EET values isfar from straightforward (e.g. [30]). In our model-ing strategy, we have initially used estimates fromprevious 2-D £exural studies [1,10,11] and fromrheological predictions that took into accountthe thermo-mechanical age of various blocks [28]and Tertiary deformations in the Carpathiansarea. A compilation of the EET values obtained
by previous works is given in Table 2. ExceptRoyden’s estimate [1], the EET values obtainedfrom £exural studies of the Carpathians/fore-land system are much lower (at least half) thanthose inferred from rheological studies. Subse-quently, EET values were modi¢ed to attain thebest possible ¢t. Sets of EET were varied in such away that: (1) strength distribution respects thesame initial chronology as in Table 2, and (2)the absolute values are closer to the rheologicalestimates [28] rather than the £exural ones [11].Low EET values are unrealistic for some litho-spheric domains, such as the East Europeancraton (see Table 2). On the opposite, previousEastern Moesia estimates (both £exural and rheo-logical) neglected the e¡ects induced by the Bade-nian extension, the presence of major crustalfaults (structural heterogeneities, sensu Burov etal. [31]) and the increased curvature (bendingstresses [30]) of the subducted subvertical forelandplate (e.g. [3]).
3.4.2. Initial and ¢nal topographic loadsThe numerical model we have used calculates
loads and de£ections on a grid composed of10 000 points covering the entire Carpathians re-gion.We assume the beginning of the Sarmatian as
the age for the foredeep base, with 0-m elevationover the entire model. This is justi¢ed by: (1)foreland sedimentation was either mainly evapor-itic (on East European platform), £uvial (parts ofWestern Moesian platform) or absent (parts ofWestern Moesian platform and Eastern Moesianplatform); (2) salt and shallow water deposits inTransylvanian basin; and (3) evaporitic and shal-low water deposits in the Outer Carpathians.As far as the load causing subsidence is con-
cerned we have used the present day topographyof the area (Fig. 10) with two modi¢cations. Wedo not consider the topography in the Balkansbecause the last major deformations are olderthan Sarmatian [32]. For the same reason (e.g.[6]) the topography of the Apuseni Mts. is as-sumed as the average for Transylvanian basin(400 m). The load provided by the water fromBlack Sea is also neglected.The densities of asthenosphere, load and in¢ll-
EPSL 7017 25-3-04
M. Taflraflpoancafl et al. / Earth and Planetary Science Letters 221 (2004) 163^180 173
ing material are 3200, 2700, and 2200 kg/m3, re-spectively.
3.5. Results
3.5.1. Best ¢t model using the topographic loadThe best ¢t model which we could get adopting
topography as the only e¡ective load is shown inFig. 11. This de£ection pattern is characterized bystrong East European and Western Moesian plat-forms (EETs of 37 km and 30 km, respectively),intermediate Transylvanian and East Carpathiansdomains (EETs of 26 km and 29 km, respectively)and weak Eastern Moesian block (EET=10 km).Isobaths in Fig. 11A indicate that the deepest
point of the basin is located in the inner part ofthe belt at the junction between Transylvanianblock, East and South Carpathians. In front ofthe East Carpathians the predicted foredeep hasmaximum depths between 2.3 and 2.9 km thatgradually decrease toward East to 1^1.2 km.Close to the TrotusI fault, the predicted de£ection¢ts the foredeep base to the W and underesti-mates it to the outer part (Fig. 11B), possiblydue to the in£uence of the Sarmatian and younger
tectonics of this fault. To the central-northernpart of the East European platform, the foredeepbase at the contact with the orogen has depthsranging between 1 and 3.5 km increasing fromNW toward SE along the belt [4].In front of the eastern part of the South Carpa-
thians (CS 3 in Fig. 11A), the model predicts ashape for the foredeep base similar to the ob-served one, however, with a shallower depth.Around 1.8 km depth is predicted for the SouthCarpathians foredeep close to the contact with thePericarpathian fault ; the modeled basin shallowsS-ward reaching V0.3 km. Typically, the WesternMoesian platform has a depth of 2^2.6 km infront of the Subcarpathian nappe decreasing ina S^SW direction [33,34]. A good ¢t between pre-dicted and real de£ections is obtained for most ofthis domain, taking into account that South Car-pathians/Western Moesia region had a more com-plex evolution than the simple thrust loading ob-served elsewhere: this domain su¡ered additionalEocene orogen parallel extension [35], Burdigaliandextral transtension and Late Miocene strike-slip[36].The most interesting result from this study is
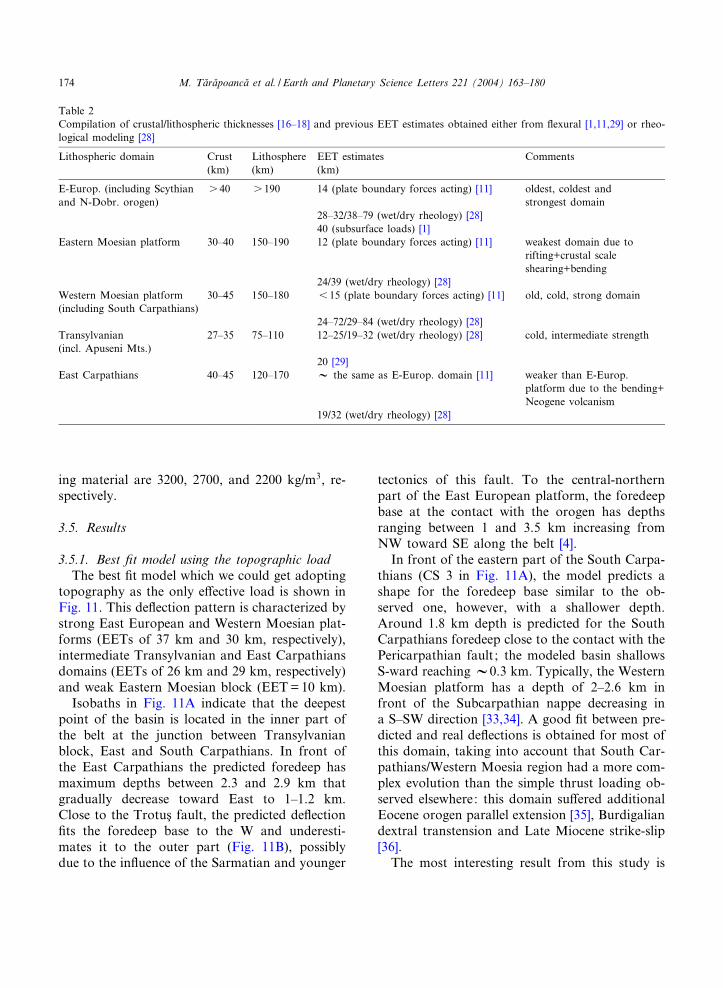
Table 2Compilation of crustal/lithospheric thicknesses [16^18] and previous EET estimates obtained either from £exural [1,11,29] or rheo-logical modeling [28]
Lithospheric domain Crust Lithosphere EET estimates Comments(km) (km) (km)
E-Europ. (including Scythianand N-Dobr. orogen)
s 40 s 190 14 (plate boundary forces acting) [11] oldest, coldest andstrongest domain
28^32/38^79 (wet/dry rheology) [28]40 (subsurface loads) [1]
Eastern Moesian platform 30^40 150^190 12 (plate boundary forces acting) [11] weakest domain due torifting+crustal scaleshearing+bending
24/39 (wet/dry rheology) [28]Western Moesian platform(including South Carpathians)
30^45 150^180 6 15 (plate boundary forces acting) [11] old, cold, strong domain
24^72/29^84 (wet/dry rheology) [28]Transylvanian(incl. Apuseni Mts.)
27^35 75^110 12^25/19^32 (wet/dry rheology) [28] cold, intermediate strength
20 [29]East Carpathians 40^45 120^170 V the same as E-Europ. domain [11] weaker than E-Europ.
platform due to the bending+Neogene volcanism
19/32 (wet/dry rheology) [28]
EPSL 7017 25-3-04
M. Taflraflpoancafl et al. / Earth and Planetary Science Letters 221 (2004) 163^180174
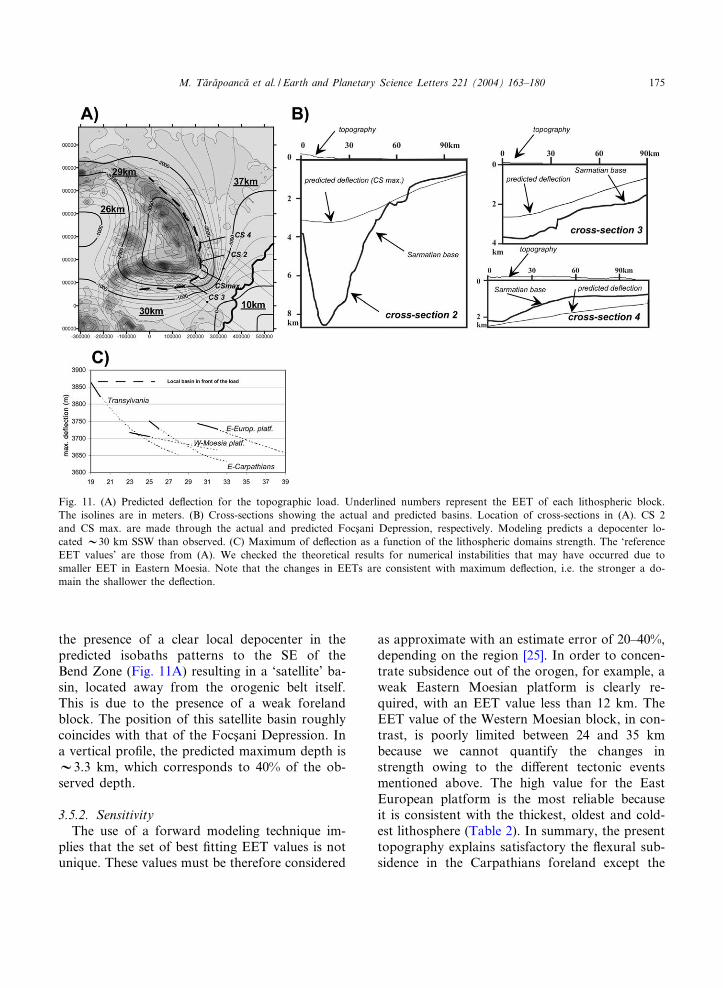
the presence of a clear local depocenter in thepredicted isobaths patterns to the SE of theBend Zone (Fig. 11A) resulting in a ‘satellite’ ba-sin, located away from the orogenic belt itself.This is due to the presence of a weak forelandblock. The position of this satellite basin roughlycoincides with that of the FocsIani Depression. Ina vertical pro¢le, the predicted maximum depth isV3.3 km, which corresponds to 40% of the ob-served depth.
3.5.2. SensitivityThe use of a forward modeling technique im-
plies that the set of best ¢tting EET values is notunique. These values must be therefore considered
as approximate with an estimate error of 20^40%,depending on the region [25]. In order to concen-trate subsidence out of the orogen, for example, aweak Eastern Moesian platform is clearly re-quired, with an EET value less than 12 km. TheEET value of the Western Moesian block, in con-trast, is poorly limited between 24 and 35 kmbecause we cannot quantify the changes instrength owing to the di¡erent tectonic eventsmentioned above. The high value for the EastEuropean platform is the most reliable becauseit is consistent with the thickest, oldest and cold-est lithosphere (Table 2). In summary, the presenttopography explains satisfactory the £exural sub-sidence in the Carpathians foreland except the
Fig. 11. (A) Predicted de£ection for the topographic load. Underlined numbers represent the EET of each lithospheric block.The isolines are in meters. (B) Cross-sections showing the actual and predicted basins. Location of cross-sections in (A). CS 2and CS max. are made through the actual and predicted FocsIani Depression, respectively. Modeling predicts a depocenter lo-cated V30 km SSW than observed. (C) Maximum of de£ection as a function of the lithospheric domains strength. The ‘referenceEET values’ are those from (A). We checked the theoretical results for numerical instabilities that may have occurred due tosmaller EET in Eastern Moesia. Note that the changes in EETs are consistent with maximum de£ection, i.e. the stronger a do-main the shallower the de£ection.
EPSL 7017 25-3-04
M. Taflraflpoancafl et al. / Earth and Planetary Science Letters 221 (2004) 163^180 175
EPSL 7017 25-3-04
M. Taflraflpoancafl et al. / Earth and Planetary Science Letters 221 (2004) 163^180176
FocsIani Depression and Eastern Moesia. Al-though the shape of the £exural basin and itsposition relative to the belt are well predicted inthe FocsIani Depression, the modeled depth is lessthan half of what is observed. Therefore, an addi-tional load should be added to the present topog-raphy.
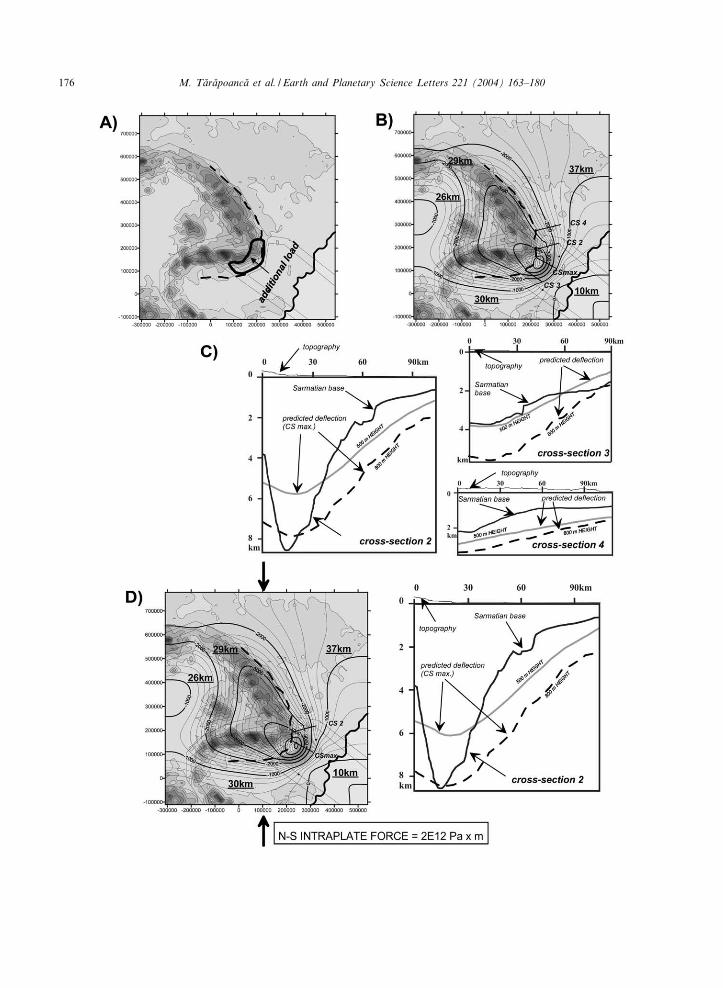
3.5.3. The e¡ect of additional vertical loadsFig. 12A shows the contour of an additional
load able to ¢t the data in the Bend zone. Thisload can be expressed in various ways, but wehave chosen to apply an additional topographicload to the Bend orogenic region, with the samedensity distribution as explained before. Two sit-uations give signi¢cant modeled results, from thevariety of loads applied. The main e¡ect for bothscenarios to increase the depth of the satellite ba-sin in front of the Carpathians Bend.The ¢rst case corresponds to 500 m extra to-
pography, the modeled de£ection pattern isshown in Fig. 12B. The satellite basin reaches adepth of V6 km which accounts for 70% of theobserved value, but the de£ection pattern repre-sents the best possible average of the basin shape(Fig. 12C), particularly south of the FocsIani De-pression (Fig. 12C, cross-section 3). The di¡erenceobserved to the SE edge of cross-section 3 is prob-ably related to the post-Badenian transtension[8,12]. At the southern edge of East Europeanplatform (Fig. 12C, cross-section 4) the di¡erencebetween predicted and real basin is roughly thesame as that obtained without an additionalload (Fig. 11B).The second case corresponds to 800 m extra
topography, the satellite basin reaching 8 km indepth, accounting for 90% of the observed value.The de£ection pattern would produce, however, abasin with a larger wavelength than observed(Fig. 12C).
3.5.4. The e¡ect of intraplate stressesIn a further series of experiments, we have
modeled the e¡ects of intraplate stresses on thegeometry of the Carpathian foredeep. The direc-tion and type of intraplate stresses approximatesthe Pliocene to recent ones (e.g. [4] and referencestherein).The results are shown in Fig. 12D. In the ¢rst
case scenario (500 m extra topographic load), as aconsequence of adding intraplate stresses the baseof the FocsIani Depression reaches V6.3 kmdepth which corresponds to 75^80% of the post-Badenian subsidence. In the second case (800 mextra load), intraplate stresses would produce adepocenter with equal depth and location asFocsIani basin. However, similarly with the no in-traplate stress scenario, the predicted wavelengthis larger than observed. Modifying the magnitudeof the intraplate stresses induced vertical varia-tions in the order of few hundreds of meters inthe depocenter area.
3.5.5. DiscussionTaking into account as novel features both the
extensional and the contractional stages of subsi-dence in the Carpathians Bend foredeep, we canexplain V60% of the basin depth using only thepresent topography as the load for the £exuralperiod. A complete incorporation of the real plan-form topography predicts larger subsidence thanthe previous computations carried out along ver-tical sections (e.g. [1]). The most important resultis that the 3-D distribution of load and lateralvariations in lithospheric strength, particularlythe presence of a weak domain in front of theBend region, determines the localization of a ba-sin out of the belt, the modeled shape being ingood agreement with the observed data.The incorporation of an additional vertical load
together with the contribution of the compressive
6
Fig. 12. (A) Location of the additional load added to the topography. Discussion in text. (B) Predicted de£ection for the actualtopographic load plus the additional 500 m load. The underlined numbers represent the EET of each lithospheric block. The iso-lines are in meters. (C) Cross-sections showing the actual and predicted basin. Solid gray line represents de£ection for the 500 madditional topographyc load, dashed line represents de£ection for the 800 m additional load. Location of cross-sections in (B).(D) Predicted de£ection (map view and cross-section) for the topographyc load plus the 500 m additional load and with the con-tribution of N^S intraplate compressive force equal with 2U1012 PaUm. Solid gray and dashed lines as in (C).
EPSL 7017 25-3-04
M. Taflraflpoancafl et al. / Earth and Planetary Science Letters 221 (2004) 163^180 177
intraplate stresses ¢t the observed FocsIani Depres-sion de£ection. The two scenarios can either aver-age the basin de£ection and shape, the obtainedvalues being still lower than the observed ones,or can entirely ¢t the maximum de£ection, butnot the wavelength. We cannot be sure on thecause of this additional load, but the extra topog-raphy might be equivalent to a sinking slab in theBend region. For instance, the 800 m extra topog-raphy corresponds to a 86-km-long oceanic slabattached at the base of the underthrusted continen-tal lithosphere with a density contrast of 25 kg/m3.The surface projection of our additional load isroughly the same as that of the invoked slab [5].Dealing with pure elastic plates loaded instan-
taneously, the modeling has considered neitherthe changes that occurred in time in the litho-spheric strength due to thermal events, faultingor bending [30,31], nor those that a¡ected topog-raphy. Since topography was diachronously cre-ated (the Bend region is V6 Ma younger than theEast and South Carpathians), although the mainthrusting event was synchronous [9], the pres-ent relief in the Bend region apparently re£ectsonly the last contractions (Pliocene^Quaternary),which are minor by comparing with the Sarma-tian ones. Therefore, a planform kinematic £exur-al modeling may better explain the subsidence inthe foredeep and also the nature of this additionalload. Further incorporation of lithospheric fold-ing mechanisms, as previously suggested [37], canexplain better the detailed pattern of the observedde£ection.
4. Conclusions
The subsidence of the unusually deep SE Car-pathians foredeep basin is mainly controlled bypre-orogenic extension followed by 3-D contrac-tional £exure.NW^SE trending extensional basins are found
to the S of FocsIani Depression whose easternmargin underwent normal faulting as well. Exten-sional modeling for these basins reveals a crust^mantle lithosphere uniform thinning of maximum1.1. The modeling also predicts 6 100 m post-riftsubsidence after Middle Miocene (Badenian) in
accordance with the regional unconformity ob-served at the Middle/Upper Miocene boundary.For the second stage of subsidence (post-Bade-
nian), a £exural model is used, taking into ac-count the plan view distribution of topographicloads and the lateral variations in the lithosphericstrength. Assigning realistic strengths to the do-mains comprising the Carpathians region, a basinis predicted in front of the Carpathians Bend be-cause the weakened foreland (due to extensionand crustal active faults) localizes the de£ection.Since the deepest modeled basin is only 3.3 km
(V40% of the observed value), an additional loadis required in the Carpathians Bend, correspond-ing to an extra topography in the order of 500^800 m. The latter is compatible with the suggestedpresence of an oceanic slab remnant at highdepths. Depending on the magnitude of intraplatestresses, a basin can develop at the position andwith the shape of the FocsIani Depression ac-counting for its entire depth.An alternative has been provided to models in-
voking a slab pull force to account for the entiresubsidence observed in the SE Carpathians fore-deep/foreland, particularly in the FocsIani Depres-sion. We demonstrated the importance of the pre-viously neglected extension in the eastern Moesianforeland and that the 3-D distributions of the to-pography and lithospheric strength plus the ac-tion of compressive intraplate stresses can leadto major subsidence in front of the topographicload. The 3-D e¡ect could be particularly impor-tant for foredeeps associated with highly arcuateorogenic belts.
Acknowledgements
This work is part of a PhD thesis of M.T. car-ried out at Vrije Universiteit Amsterdam and Bu-charest University in the framework of an ISES(Netherlands Research Centre for Integrated Sol-id Earth Sciences) project. Numerical modelingwas mostly performed in the VU facilities. Wethank E. Burov, R. Cattin and an anonymousreviewer for their comments that helped us toclarify some arguments. This is NSG publicationno. 20040203.[BARD]
EPSL 7017 25-3-04
M. Taflraflpoancafl et al. / Earth and Planetary Science Letters 221 (2004) 163^180178
References
[1] L.H. Royden, The tectonic expression of the slab pull atcontinental convergent boundaries, Tectonics 12 (1993)303^325.
[2] H.G. Linzer, Kinematics of retreating subduction alongthe Carpathian arc, Romania, Geology 24 (1996) 167^170.
[3] R. Wortel, W. Spakman, Subduction and slab detachmentin the Mediterranean^Carpathian region, Science 290(2000) 1910^1917.
[4] L. MatIenco, G. Bertotti, Tertiary tectonic evolution of theexternal East Carpathians (Romania), Tectonophysics 316(2000) 255^286.
[5] R. G|“rbacea, W. Frisch, Slab in the wrong place Lowerlithospheric mantle delamination in the last stage of theEastern Carpathian subduction retreat, Geology 26 (1998)611^614.
[6] M. Saflndulescu, Geotectonics of Romania (in Romanian),Ed. Tehnica, Bucharest, 1984.
[7] M. Saflndulescu, Cenozoic tectonic history of the Carpa-thians, in: L.H. Royden, F. Horvath (Eds.), The Panno-nian Basin, A Study in Basin Evolution, AAPG Mem. 45,1988, pp. 17^25.
[8] M. Taflraflpoancafl, G. Bertotti, L. MatIenco, C. Dinu,S.A.P.L. Cloetingh, Architecture of the Focsani Depres-sion: a 13 km deep basin in the Carpathians Bend Zone(Romania), Tectonics 22 (2003) 1074^1092.
[9] C.A.E. Sanders, P.A.M. Andriessen, S.A.P.L. Cloetingh,Life cycle of the East Carpathian orogen; erosion historyof a doubly vergent critical wedge assessed by ¢ssion-track thermochronology, J. Geophys. Res. 104 (1999)29095^29112.
[10] L.H. Royden, G.D. Karner, Flexure of the lithospherebeneath Apennine and Carpathian foredeep basins: Evi-dence for an insu⁄cient topographic load, AAPG Bull. 68(1984) 704^712.
[11] L. MatIenco, R. Zoetemeijer, S. Cloetingh, C. Dinu, Lat-eral variations in mechanical properties of the Romanianexternal Carpathians inferences of £exure and gravitymodeling, Tectonophysics 282 (1997) 147^166.
[12] M. Taflraflpoancafl, C. Dinu, D. Ciulavu, Neogene kinemat-ics of the northeastern sector of the Moesian platform(Romania), AAPG Bull. (in press).
[13] H. Kooi, Tectonic Modelling of Extensional Basins: TheRole of Lithospheric Flexure, Intraplate Stress and Rela-tive Sea-Level Change, Ph.D. Thesis, Vrije Universiteit,Amsterdam, 1991.
[14] L. Royden, C.E. Keen, Rifting process and thermal evo-lution of the continental margin of eastern Canada deter-mined from subsidence curves, Earth Planet. Sci. Lett. 51(1980) 343^361.
[15] J.G. Sclater, P.A.B. Christie, Continental stretching: Anexplanation of the post-mid-Cretaceous subsidence of theCentral North Sea basin, J. Geophys. Res. 85 (1980)3711^3739.
[16] F. Rafldulescu, Seismic models of the crustal structure in
Romania, Rev. Roum. Geol. Geophys. Geogr., Ser. Geo-phys. 32 (1988) 13^17.
[17] F. Horvath, Towards a kinematic model for the forma-tion of the Pannonian basin, Tectonophysics 226 (1993)333^357.
[18] M. Nemcok, L. Pospisil, J. Lexa, R.A. Donelick, Tertiarysubduction and slab break-o¡ model of the Carpathian^Pannonian region, Tectonophysics 295 (1998) 307^340.
[19] L. Ionesi, Geology of the Platform Units and North Do-brogea Orogen (in Romanian), Ed. Tehnica, Bucharest,1994.
[20] G. Spadini, A. Robinson, S.A.P.L. Cloetingh, Westernversus eastern Black Sea tectonic evolution; pre-rift lith-ospheric controls on basin formation, Tectonophysics 266(1996) 139^154.
[21] I. Dumitrescu, M. Saflndulescu, T. Bandrabur, Geologicalmap scale 1:200,000, Sheet 29 Covasna, Inst. Geol. Rom.,1970.
[22] T.E. Jordan, Thrusts loads and foreland basin evolution,Cretaceous, western United States, AAPG Bull. 65 (1981)2506^2520.
[23] C. Beaumont, Foreland Basins, Geophys. J. R. Astron.Soc. 65 (1981) 291^329.
[24] D.L. Turcotte, G. Schubert, Geodynamics, John Wiley,New York, 1982.
[25] D. Garcia-Castellanos, M. Ferna'ndez, M. Torne¤, Model-ling the evolution of the Guadalquivir foreland basin(South Spain), Tectonics 21 (2002).
[26] J.D. van Wees, S.A.P.L. Cloetingh, A ¢nite-di¡erencetechnique to incorporate spatial variations in rigidityand planar faults into 3-D models for lithospheric £exure,Geophys. J. Int. 117 (1994) 179^195.
[27] R. Huismans, G. Bertotti, D. Ciulavu, C.A.E. Sanders, S.Cloetingh, C. Dinu, Structural evolution of the Transyl-vanian Basin (Romania) a sedimentary basin in the bendzone of the Carpathians, Tectonophysics 272 (1997) 249^268.
[28] A. Lankreijer, V. Mocanu, S. Cloetingh, Lateral varia-tions in lithosphere strength in the Romanian Carpathiansconstraints on basin evolution, Tectonophysics 272 (1997)269^290.
[29] C.A.E. Sanders, Tectonics and Erosion, CompetitiveForces in a Compressive Orogen: A Fission Track Studyof the Romanian Carpathians, Ph.D. Thesis, Vrije Uni-versiteit, Amsterdam, 1998.
[30] E. Burov, M. Diament, The e¡ective elastic thickness (Te)of continental lithosphere; what does it really mean?,J. Geophys. Res. 100 (1995) 3905^3927.
[31] E. Burov, C. Jaupart, J.C. Mareschal, Large-scale hetero-geneities and lithospheric strength in cratons, Earth Plan-et. Sci. Lett. 164 (1998) 205^219.
[32] C. Doglioni, C. Busatta, G. Bolis, L. Marianini, M. Za-nell, Structural evolution of the eastern Balkans (Bulga-ria), Mar. Petrol. Geol. 13 (1996) 225^251.
[33] D. Paraschiv, The Moesian Platform and its Hydrocar-bons Fields (in Romanian with summary in English), Ed.Academiei, Bucharest, 1979.
EPSL 7017 25-3-04
M. Taflraflpoancafl et al. / Earth and Planetary Science Letters 221 (2004) 163^180 179

[34] L. Matenco, G. Bertotti, C. Dinu, S. Cloetingh, Tertiarytectonic evolution of the external South Carpathians andthe adjacent Moesian platform (Romania), Tectonics 16(1997) 896^911.
[35] S. Schmid, T. Berza, V. Diaconescu, N. Froitzheim, B.Fuegenschuh, Orogen-parallel extension in the SouthernCarpathians, Tectonophysics 297 (1998) 209^228.
[36] T. Raflbaflgia, L. MatIenco, Tertiary tectonic and sedimen-
tological evolution of the South Carpathians foredeep:Tectonic versus eustatic control, Mar. Petrol. Geol. 16(1999) 719^740.
[37] G. Bertotti, L. MatIenco, S. Cloetingh, Vertical move-ments in and around the SE Carpathian foredeep litho-spheric memory and stress ¢eld control, Terra Nova 15(2003) 299^305.
EPSL 7017 25-3-04
M. Taflraflpoancafl et al. / Earth and Planetary Science Letters 221 (2004) 163^180180