Embed Size (px)
Citation preview
J. GalofaroGlenn Research Center, Cleveland, Ohio
B. VaynerOhio Aerospace Institute, Brook Park, Ohio
W. DegrootSiliconlight, Inc., Sunnyvale, California
D. FergusonGlenn Research Center, Cleveland, Ohio
The Role of Water Vapor and DissociativeRecombination Processes in Solar ArrayArc Initiation
NASA/TM—2002-211328
March 2002
AIAA–2002–0938
The NASA STI Program Office . . . in Profile
Since its founding, NASA has been dedicated tothe advancement of aeronautics and spacescience. The NASA Scientific and TechnicalInformation (STI) Program Office plays a key partin helping NASA maintain this important role.
The NASA STI Program Office is operated byLangley Research Center, the Lead Center forNASA’s scientific and technical information. TheNASA STI Program Office provides access to theNASA STI Database, the largest collection ofaeronautical and space science STI in the world.The Program Office is also NASA’s institutionalmechanism for disseminating the results of itsresearch and development activities. These resultsare published by NASA in the NASA STI ReportSeries, which includes the following report types:
• TECHNICAL PUBLICATION. Reports ofcompleted research or a major significantphase of research that present the results ofNASA programs and include extensive dataor theoretical analysis. Includes compilationsof significant scientific and technical data andinformation deemed to be of continuingreference value. NASA’s counterpart of peer-reviewed formal professional papers buthas less stringent limitations on manuscriptlength and extent of graphic presentations.
• TECHNICAL MEMORANDUM. Scientificand technical findings that are preliminary orof specialized interest, e.g., quick releasereports, working papers, and bibliographiesthat contain minimal annotation. Does notcontain extensive analysis.
• CONTRACTOR REPORT. Scientific andtechnical findings by NASA-sponsoredcontractors and grantees.
• CONFERENCE PUBLICATION. Collectedpapers from scientific and technicalconferences, symposia, seminars, or othermeetings sponsored or cosponsored byNASA.
• SPECIAL PUBLICATION. Scientific,technical, or historical information fromNASA programs, projects, and missions,often concerned with subjects havingsubstantial public interest.
• TECHNICAL TRANSLATION. English-language translations of foreign scientificand technical material pertinent to NASA’smission.
Specialized services that complement the STIProgram Office’s diverse offerings includecreating custom thesauri, building customizeddata bases, organizing and publishing researchresults . . . even providing videos.
For more information about the NASA STIProgram Office, see the following:
• Access the NASA STI Program Home Pageat http://www.sti.nasa.gov
• E-mail your question via the Internet [email protected]
• Fax your question to the NASA AccessHelp Desk at 301–621–0134
• Telephone the NASA Access Help Desk at301–621–0390
• Write to: NASA Access Help Desk NASA Center for AeroSpace Information 7121 Standard Drive Hanover, MD 21076
NASA/TM—2002-211328
March 2002
National Aeronautics andSpace Administration
Glenn Research Center
Prepared for the40th Aerospace Sciences Meeting and Exhibitsponsored by the American Institute of Aeronautics and AstronauticsReno, Nevada, January 14–17, 2002
AIAA–2002–0938
The Role of Water Vapor and DissociativeRecombination Processes in Solar ArrayArc Initiation
J. GalofaroGlenn Research Center, Cleveland, Ohio
B. VaynerOhio Aerospace Institute, Brook Park, Ohio
W. DegrootSiliconlight, Inc., Sunnyvale, California
D. FergusonGlenn Research Center, Cleveland, Ohio

Available from
NASA Center for Aerospace Information7121 Standard DriveHanover, MD 21076
National Technical Information Service5285 Port Royal RoadSpringfield, VA 22100
Available electronically at http://gltrs.grc.nasa.gov/GLTRS
NASA/TM2002-211328 1
The Role of Water Vapor and Dissociative Recombination Processes in Solar Array Arc Initiation
J. Galofaro and D. Ferguson
National Aeronautics and Space Administration Glenn Research Center Cleveland, Ohio 44135
B. Vayner
Ohio Aerospace Institute Brook Park, Ohio 44142
W. Degroot
Siliconlight, Inc. Sunnyvale, California 94089
Abstract Experimental plasma arc investigations involving the onset of arc initiation for a negatively biased solar array immersed in low-density plasma have been performed. Previous studies into the arc initiation process have shown that the most probable arcing sites tend to occur at the triple junction involving the conductor, dielectric and plasma [1]. More recently our own experiments have led us to believe that water vapor is the main causal factor behind the arc initiation process. Assuming the main component of the expelled plasma cloud by weight is water, the fastest process available is dissociative recombination (H2O
+ + e- → H* + OH*). A model that agrees with the observed dependency of arc current pulse width on the square root of capacitance is presented. A 400 MHz digital storage scope and current probe was used to detect arcs at the triple junction of a solar array. Simultaneous measurements of the arc trigger pulse, the gate pulse, the arc current and the arc voltage were then obtained. Finally, a large number of
measurements of individual arc spectra were obtained in very short time intervals, ranging from 10 to 30 µs, using a ¼ meter spectrometer coupled with a gated intensified CCD. The spectrometer was systematically tuned to obtain optical arc spectra over the entire wavelength range of 260 to 680 nm. All relevant atomic lines and molecular bands were then identified. Nomenclature C = capacitance, µF I = current, A ℜ = recombination rate, #s–1 γ = recombination constant, cm3 s–1 A =molecular mass, AMU Ne, = electron density, cm–3 R = radius of sphere, cm e =electronic charge, q mp = proton mass, g Te = electron temperature, eV K =Boltzmann constant, J deg k–1 Ve = mean electron velocity, cm s–1 σ = cross section or overlap, cm2 U = scalar field potential, V t = time, s
NASA/TM2002-211328 2
Introduction The present work is aimed at understanding the underlying cause for the onset of arcing in solar arrays interacting with the space plasma environment. At present, despite the growing volume of experimental data that has been collected on conductor-dielectric initiated solar array arcs [2–8], only two theoretical models come close to describing the process of arc initiation: The first model is based on the hypothesis that a thin insulating layer on the surface of a negatively charged conductor undergoes electrostatic breakdown when the electric field strength becomes high enough [9]. The 1st model is commonly known as the Paschen Discharge Model (PDM). The second model takes into consideration the formation of a strong electric field between the metal, dielectric and plasma junctions [10, 11]. The 2nd model has been coined the Triple Junction Model (TJM). While the PDM gives good estimates for high voltage, it falls short at producing good qualitative results for solar array arcs. The TJM gives good qualitative estimates, but it does not give quantitative agreement with measurements at low voltage. The electric field strength for the case of the TJM can be 2 to 3 orders of magnitude below what is typically needed to initiate an arc [12]. More recently, a modification of the TJM attempted to explain the mechanism of arc inception for the case of low electric field strength. In this new model a field emission correction containing an artificially introduced field enhancement factor was set at approximately 1000 to 2000 [10–14]. The field enhancement factor seems unprovable. Still more recently, a new correction to the TJM has been reported in an attempt to explain the threshold behavior at the point of arc inception [13]. The current TJM predicts a proportionality between the arc rate and the ion flux to the array. However,
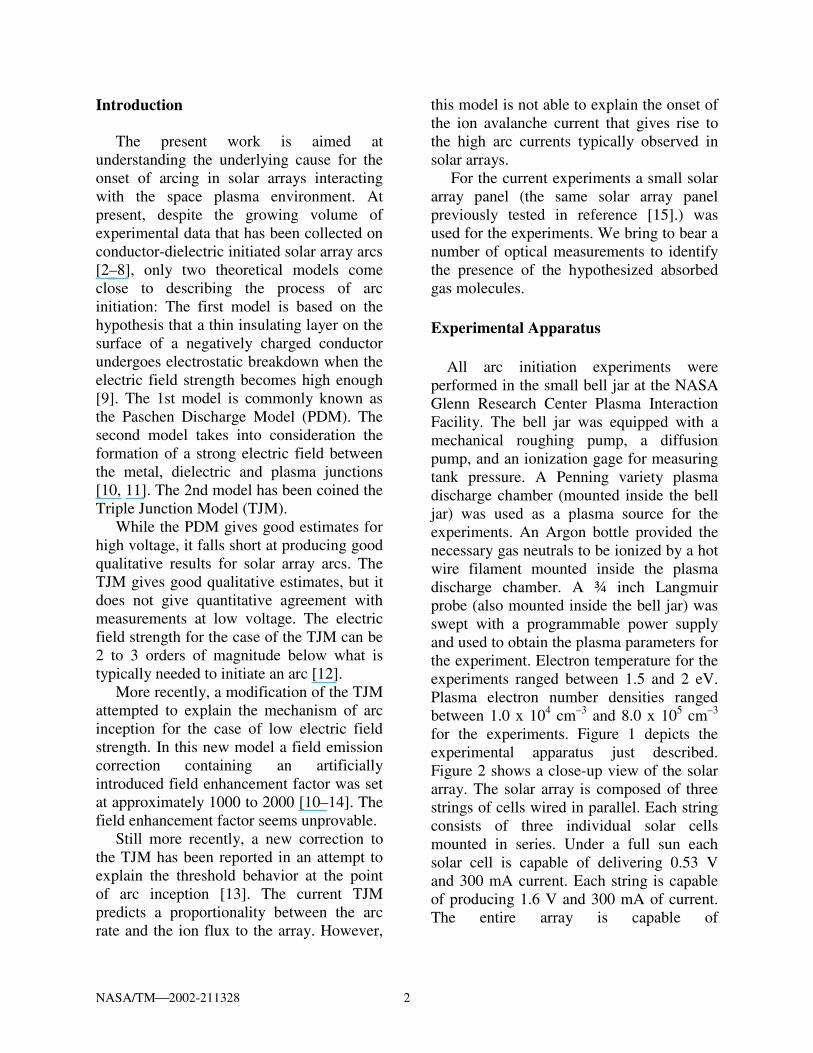
this model is not able to explain the onset of the ion avalanche current that gives rise to the high arc currents typically observed in solar arrays. For the current experiments a small solar array panel (the same solar array panel previously tested in reference [15].) was used for the experiments. We bring to bear a number of optical measurements to identify the presence of the hypothesized absorbed gas molecules. Experimental Apparatus All arc initiation experiments were performed in the small bell jar at the NASA Glenn Research Center Plasma Interaction Facility. The bell jar was equipped with a mechanical roughing pump, a diffusion pump, and an ionization gage for measuring tank pressure. A Penning variety plasma discharge chamber (mounted inside the bell jar) was used as a plasma source for the experiments. An Argon bottle provided the necessary gas neutrals to be ionized by a hot wire filament mounted inside the plasma discharge chamber. A ¾ inch Langmuir probe (also mounted inside the bell jar) was swept with a programmable power supply and used to obtain the plasma parameters for the experiment. Electron temperature for the experiments ranged between 1.5 and 2 eV. Plasma electron number densities ranged between 1.0 x 104 cm–3 and 8.0 x 105 cm–3 for the experiments. Figure 1 depicts the experimental apparatus just described. Figure 2 shows a close-up view of the solar array. The solar array is composed of three strings of cells wired in parallel. Each string consists of three individual solar cells mounted in series. Under a full sun each solar cell is capable of delivering 0.53 V and 300 mA current. Each string is capable of producing 1.6 V and 300 mA of current. The entire array is capable of
NASA/TM2002-211328 3
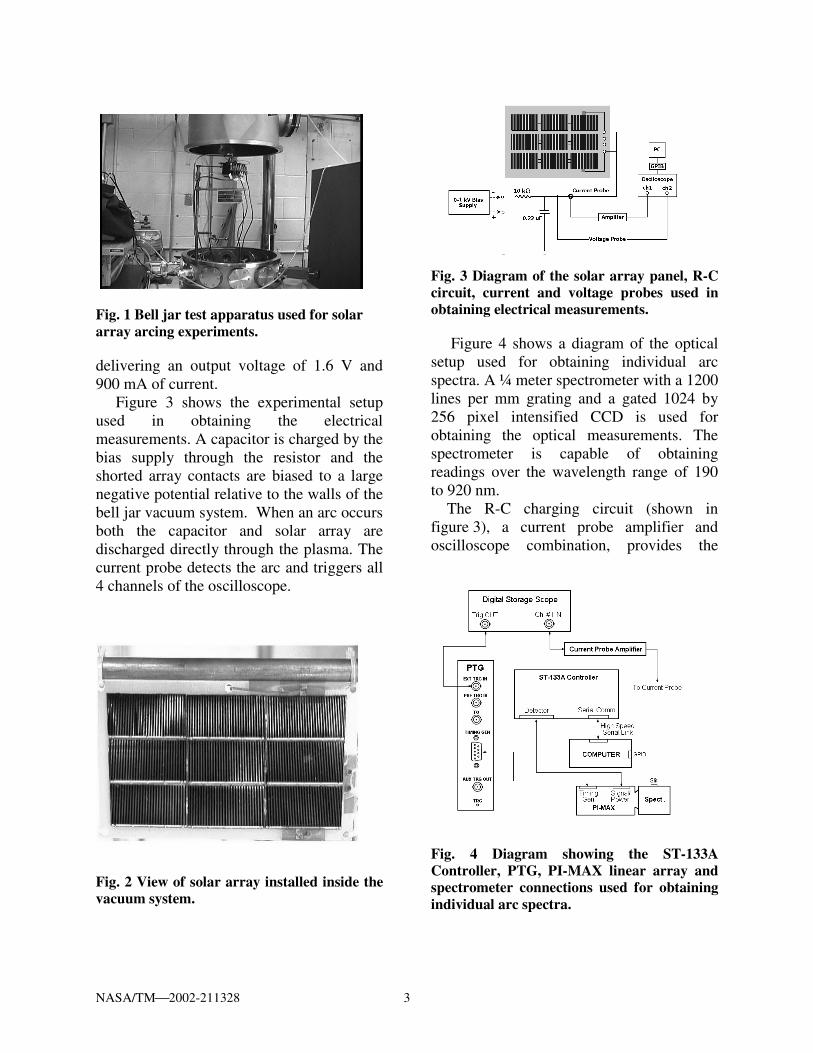
Fig. 1 Bell jar test apparatus used for solar array arcing experiments. delivering an output voltage of 1.6 V and 900 mA of current. Figure 3 shows the experimental setup used in obtaining the electrical measurements. A capacitor is charged by the bias supply through the resistor and the shorted array contacts are biased to a large negative potential relative to the walls of the bell jar vacuum system. When an arc occurs both the capacitor and solar array are discharged directly through the plasma. The current probe detects the arc and triggers all 4 channels of the oscilloscope.
Fig. 2 View of solar array installed inside the vacuum system.
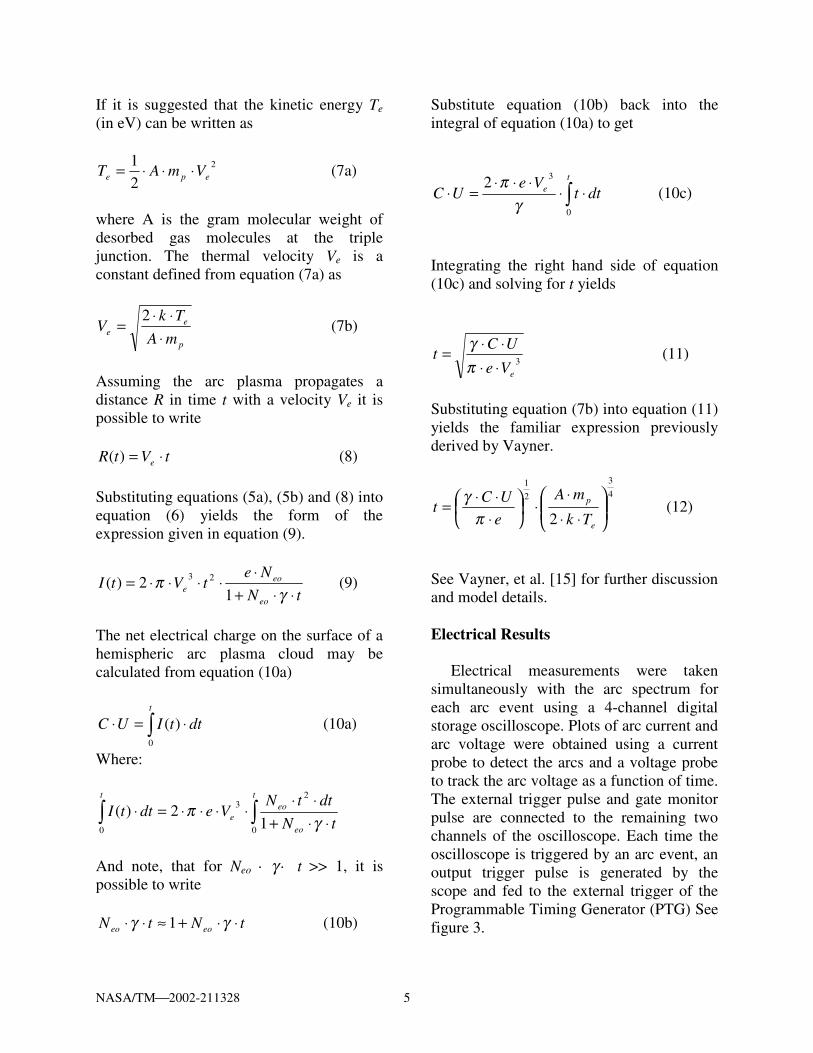
Fig. 3 Diagram of the solar array panel, R-C circuit, current and voltage probes used in obtaining electrical measurements. Figure 4 shows a diagram of the optical setup used for obtaining individual arc spectra. A ¼ meter spectrometer with a 1200 lines per mm grating and a gated 1024 by 256 pixel intensified CCD is used for obtaining the optical measurements. The spectrometer is capable of obtaining readings over the wavelength range of 190 to 920 nm. The R-C charging circuit (shown in figure 3), a current probe amplifier and oscilloscope combination, provides the
Fig. 4 Diagram showing the ST-133A Controller, PTG, PI-MAX linear array and spectrometer connections used for obtaining individual arc spectra.
NASA/TM2002-211328 4
needed output trigger for the Programmable Timing Generator (PTG) shown in figure 4. The output trigger pulse from the digital storage scope is fed directly to the external trigger input of the PTG. The received input trigger pulse causes the PTG to open the gate of the PI-MAX intensified CCD. A signal sent from the ST-133A controller causes the PI-MAX to capture a single arc spectrum for each detected arc event. Theory It has been suggested that the main causal factor behind the arc initiation process is a desorbed molecular gas ionization mechanism (specifically condensed water vapor) at the site of the triple junction. We assume the primary component of the ejected arc plasma by weight is due to H20 vapor and H20
+ ions. The fastest process available that is able to describe the arc initiation process is dissociative recombination.
∗∗−+ +⇒+ OHHeOH 2 (1) The steady state volumetric total production rate, ℜ for dissociative molecular-ion dominated recombination processes is given by
22eee NNV ⋅=>=<ℜ γσ (2)
The braces in the above equation indicate the expectation value of the product of the mean thermal velocity Ve and the overlap integral σ. (Note that ℜ has units of # s–1) It is well known that the molecular-ion recombination constant γ has a strong energy (Te) dependency [15 and 16].
e
eT
V710−
≈⟩⟨= σγ (3)
where Te (in units of eV) is the electron temperature in the arc plasma. The constant γ is in units of cm3 s–1. Setting Te = 3 eV, yields γ = 5.8·10–8 cm3 s–1 for the recombination rate constant. Assuming, Ne = 106 cm–3 and using the calculated value for γ above, the total production rate ℜ for molecular-ion dissociative recombination processes is of the order of 5.8·104 s–1. Next assume that Ne = f(t). The time dependent form for the dissociative total production rate can be written as ℜ = dNe/dt and we are able to directly obtain the following equation.
2e
e Ndt
dN⋅−= γ (4)
An argument in favor of the desorbed molecular gas ionization process comes from measurements of arc current pulse widths at different capacitances. Vayner, et al. [15] uses the equation (4) to model the square root dependency of capacitance on arc current pulse widths to within an accuracy of 10 percent. The solution to equation (4) with the appropriate boundary condition at t = 0 in equation (5b) is
tN
NtN
eo
eoe ⋅⋅+
=γ1
)( (5a)
Where: eote NN ==0| (5b)
The electric current I(t) to the surface of a hemispheric arc plasma cloud of radius R(t) ≈ (1 to 2 cm) at the dielectric-conductor junction is simply
ee VetNtRtI ⋅⋅⋅⋅⋅= )()(2)( 2π (6)
NASA/TM2002-211328 5
If it is suggested that the kinetic energy Te (in eV) can be written as
2
2
1epe VmAT ⋅⋅⋅= (7a)
where A is the gram molecular weight of desorbed gas molecules at the triple junction. The thermal velocity Ve is a constant defined from equation (7a) as
p
ee mA
TkV
⋅⋅⋅
=2
(7b)
Assuming the arc plasma propagates a distance R in time t with a velocity Ve it is possible to write
tVtR e ⋅=)( (8)
Substituting equations (5a), (5b) and (8) into equation (6) yields the form of the expression given in equation (9).
tN
NetVtI
eo
eoe ⋅⋅+
⋅⋅⋅⋅⋅=
γπ
12)( 23 (9)
The net electrical charge on the surface of a hemispheric arc plasma cloud may be calculated from equation (10a)
∫ ⋅=⋅t
dttIUC0
)( (10a)
Where:
∫ ∫ ⋅⋅+⋅⋅
⋅⋅⋅⋅=⋅t t
eo
eoe tN
dttNVedttI
0 0
23
12)(
γπ
And note, that for Neo · γ · t >> 1, it is possible to write
tNtN eoeo ⋅⋅+≈⋅⋅ γγ 1 (10b)
Substitute equation (10b) back into the integral of equation (10a) to get
∫ ⋅⋅⋅⋅⋅
=⋅t
e dttVe
UC0
32
γπ
(10c)
Integrating the right hand side of equation (10c) and solving for t yields
3eVe
UCt
⋅⋅⋅⋅=
πγ
(11)
Substituting equation (7b) into equation (11) yields the familiar expression previously derived by Vayner.
4
3
2
1
2
⋅⋅
⋅⋅
⋅⋅⋅=
e
p
Tk
mA
e
UCt
πγ
(12)
See Vayner, et al. [15] for further discussion and model details. Electrical Results Electrical measurements were taken simultaneously with the arc spectrum for each arc event using a 4-channel digital storage oscilloscope. Plots of arc current and arc voltage were obtained using a current probe to detect the arcs and a voltage probe to track the arc voltage as a function of time. The external trigger pulse and gate monitor pulse are connected to the remaining two channels of the oscilloscope. Each time the oscilloscope is triggered by an arc event, an output trigger pulse is generated by the scope and fed to the external trigger of the Programmable Timing Generator (PTG) See figure 3.
NASA/TM2002-211328 6
Fig. 5(a)
Fig. 5(b)
Figs. 5(a) and 5(b) showing synchronization of the external trigger and gate monitor pulses.
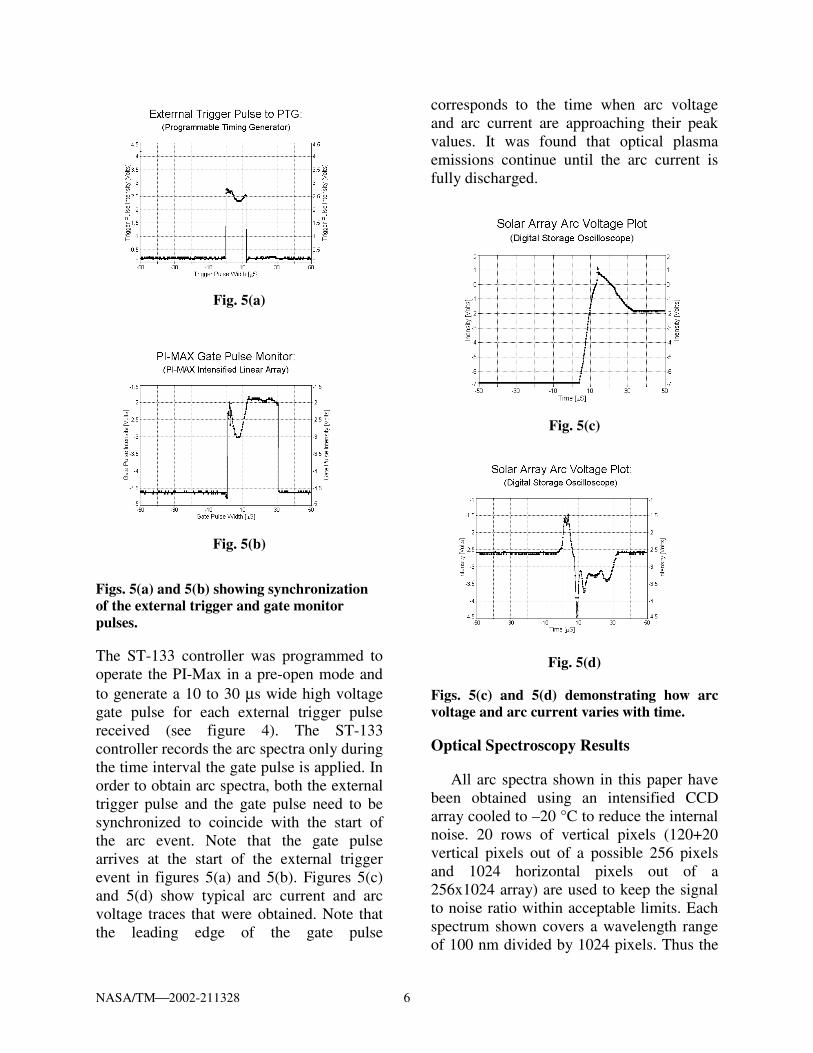
The ST-133 controller was programmed to operate the PI-Max in a pre-open mode and to generate a 10 to 30 µs wide high voltage gate pulse for each external trigger pulse received (see figure 4). The ST-133 controller records the arc spectra only during the time interval the gate pulse is applied. In order to obtain arc spectra, both the external trigger pulse and the gate pulse need to be synchronized to coincide with the start of the arc event. Note that the gate pulse arrives at the start of the external trigger event in figures 5(a) and 5(b). Figures 5(c) and 5(d) show typical arc current and arc voltage traces that were obtained. Note that the leading edge of the gate pulse
corresponds to the time when arc voltage and arc current are approaching their peak values. It was found that optical plasma emissions continue until the arc current is fully discharged.
Fig. 5(c)
Fig. 5(d)
Figs. 5(c) and 5(d) demonstrating how arc voltage and arc current varies with time.
Optical Spectroscopy Results
All arc spectra shown in this paper have been obtained using an intensified CCD array cooled to –20 °C to reduce the internal noise. 20 rows of vertical pixels (120+20 vertical pixels out of a possible 256 pixels and 1024 horizontal pixels out of a 256x1024 array) are used to keep the signal to noise ratio within acceptable limits. Each spectrum shown covers a wavelength range of 100 nm divided by 1024 pixels. Thus the
NASA/TM2002-211328 7
central wavelength set on the spectrometer corresponds to the horizontal center pixel (512) ±40 pixels. The wavelength spreads out from pixel 1 on the far left, through pixel 512, to pixel 1024 on the far right. Spectrometer calibration was then performed using a standard Oriel 6030 argon lamp source and a 50 µm slit installed on the spectrometer. Note that each pixel in the PI-MAX has a calculated resolution of 0.109 pixels per nm. A minimum of two known lines and the corresponding pixel numbers are needed to manually calibrate a given spectrum. For those instances where only one known line and the corresponding pixel number were known, equation (13) was used to convert pixels to wavelength in nanometers.
)(109.0 kckc PP −⋅±= λλ (13)
where λk and Pk are the known wavelength and known pixel number and λc and Pc are the calculated wavelength and pixel number respectively. In practice Pc is any pixel number chosen from any pixel feature on the given spectra, such that: Pc �� Pk. Four to six individual spectra are then gathered at each central wavelength setting to insure that the features present were repeatable and not merely artifacts of the measurement process. Measurements were obtained at the central wavelength starting at 260 nm. The entire optical spectra from 330 to 680 nm in wavelength were then systematically scanned in 50 nm increments. The distance between the spectrometer and the solar array was set to 16 cm. The small chamber size and random arc site locations (from one side of the array to another) caused shifts on the order of ±4 nm in measured wavelengths. In order to correct this problem the array sample was masked down to the area of one cell leaving one pair of interconnects exposed to the plasma. The reported wavelength values are averaged
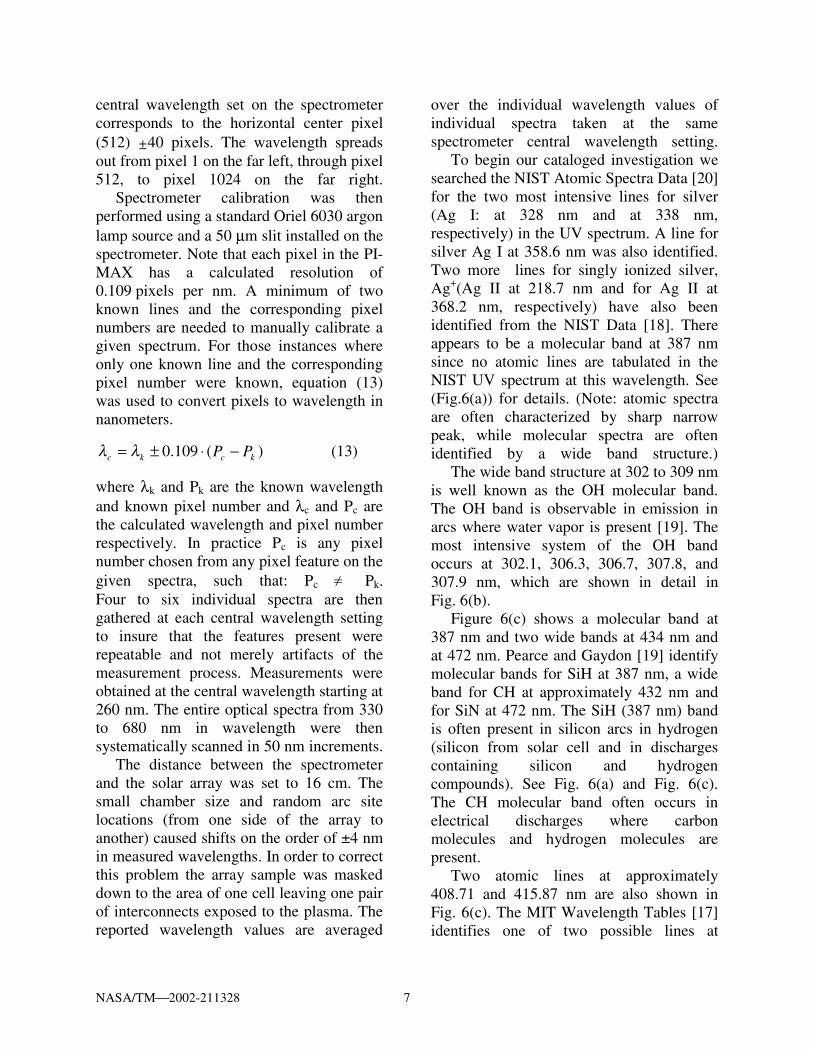
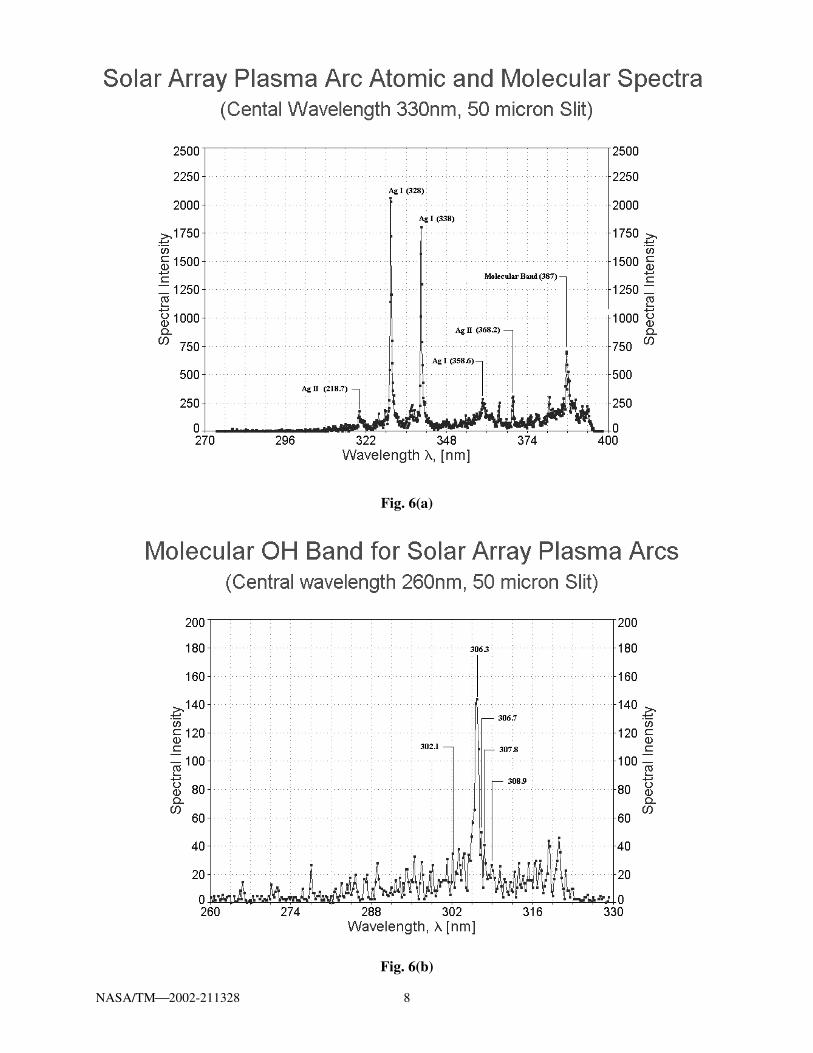
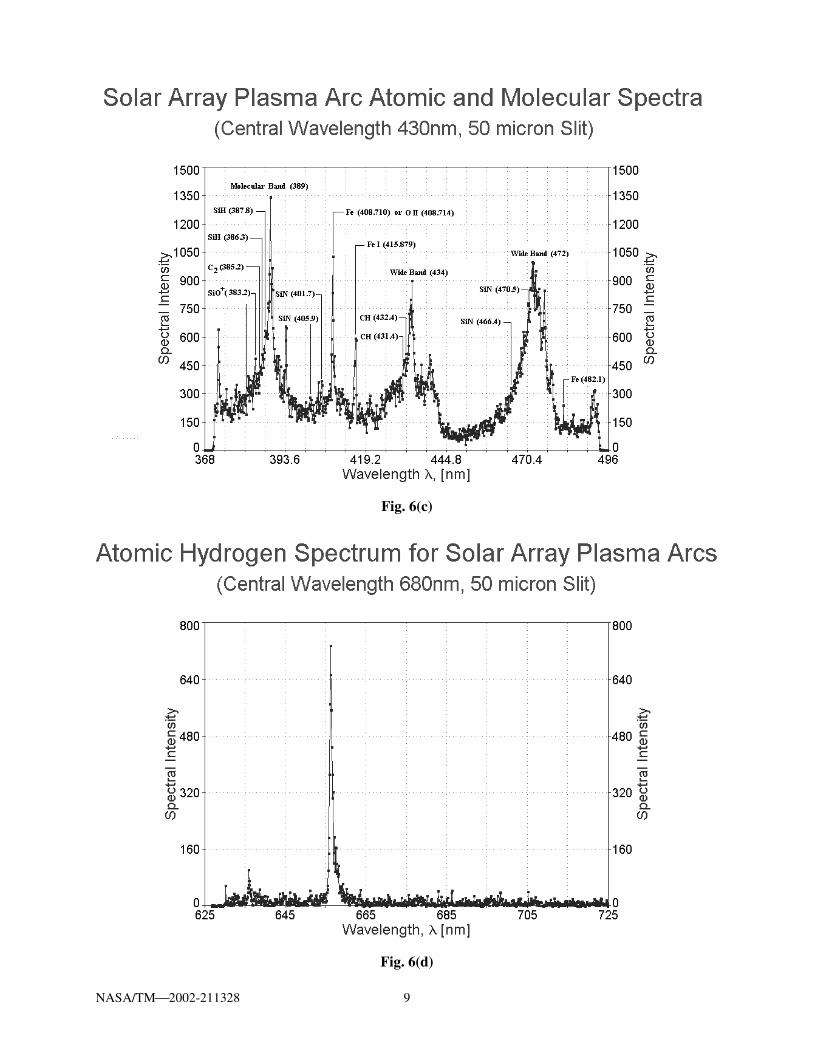
over the individual wavelength values of individual spectra taken at the same spectrometer central wavelength setting. To begin our cataloged investigation we searched the NIST Atomic Spectra Data [20] for the two most intensive lines for silver (Ag I: at 328 nm and at 338 nm, respectively) in the UV spectrum. A line for silver Ag I at 358.6 nm was also identified. Two more lines for singly ionized silver, Ag+(Ag II at 218.7 nm and for Ag II at 368.2 nm, respectively) have also been identified from the NIST Data [18]. There appears to be a molecular band at 387 nm since no atomic lines are tabulated in the NIST UV spectrum at this wavelength. See (Fig.6(a)) for details. (Note: atomic spectra are often characterized by sharp narrow peak, while molecular spectra are often identified by a wide band structure.) The wide band structure at 302 to 309 nm is well known as the OH molecular band. The OH band is observable in emission in arcs where water vapor is present [19]. The most intensive system of the OH band occurs at 302.1, 306.3, 306.7, 307.8, and 307.9 nm, which are shown in detail in Fig. 6(b). Figure 6(c) shows a molecular band at 387 nm and two wide bands at 434 nm and at 472 nm. Pearce and Gaydon [19] identify molecular bands for SiH at 387 nm, a wide band for CH at approximately 432 nm and for SiN at 472 nm. The SiH (387 nm) band is often present in silicon arcs in hydrogen (silicon from solar cell and in discharges containing silicon and hydrogen compounds). See Fig. 6(a) and Fig. 6(c). The CH molecular band often occurs in electrical discharges where carbon molecules and hydrogen molecules are present. Two atomic lines at approximately 408.71 and 415.87 nm are also shown in Fig. 6(c). The MIT Wavelength Tables [17] identifies one of two possible lines at
NASA/TM2002-211328 8
Fig. 6(a)
Fig. 6(b)
NASA/TM2002-211328 9
Fig. 6(c)
Fig. 6(d)
NASA/TM2002-211328 10
408.7 nm as either ion Fe (408.710 nm) or O+(O II at 408.714 nm). An atomic line for iron (Fe I at 415.879 nm) has also been identified in Fig. 6(c). Atomic lines for Nickel Ni at 480.7 nm (not shown) and iron Fe at 480.1 nm (not shown) were observed due to the destruction of the invar electrodes. See Fig. 6(c). A wide band (508 to 511 nm, not shown), consisting of 8 lines of Fe and Ni were also observed. A strong atomic line for H-α at (656.3 nm) corresponding to the 3d-2p transitions in the hydrogen atom was found. See Fig. 6(d) for details. Finally a strong H-β line at 486 nm (not shown) was also observed with an intensity of 500. The H 486 nm line corresponds to 4d-2p transitions of the hydrogen atom.
Summary
It has been hypothesized that a desorbed gas ionization process occurring at the triple junction of a solar array is responsible for the onset of arc initiation. A simple dissociative recombination mechanism is forwarded which theorizes that the fastest dissociative process available is due to water vapor and OH* ions. A simple semi-empirical model that favors the desorbed gas molecular ionization mechanism was then developed from measurements of the arc current pulse widths at different capacitances. The results from the described model agree with data to a factor within 10% [15] and presents another argument in favor of the desorbed gas ionization process. Our spectrometer observations give credence to the hypothesis that supports the desorbed molecular gas ionization process for water vapor at the triple junction of a solar array. We strongly believe that the onset of the arc initiation process is due to absorbed water vapor at site of a triple junction of a solar array immersed in low-density plasma.
References
1. Snyder, D.B., Ferguson, D.C.,
Vayner, B.V. and Galofaro, J.T. “New Spacecraft-Charging Solar Array Failure Mechanism,” 6th Spacecraft Charging Technology Conference, Nov. 2–6, 1998, Air Force Res. Lab, Hanscom AFB, MA, USA.
2. Galofaro, J.T., Doreswamy, C.V., Vayner, B.V. and Snyder, D.B. “Electrical Breakdown of Anodized Coatings in Low-Density Plasmas” Journal of Spacecraft and Rockets, 1999, Vol. 36, No. 2, March-April, pp. 579–585.
3. Vaughn, J.A., Carruth Jr., M.R.,
Katz, I., Mandell, M.J., and Jongeward, G.A. “Electrical Breakdown Currents on Large Spacecraft in Low Earth Orbit,” Journal of Spacecraft and Rockets, 1994, Vol. 31, No. 1, p. 54–59.
4. De la Cruz, C.P., Hastings, D.E., Ferguson, D.C., and Hillard, D.B. “Data Analysis and Model Comparison for Solar Array Module Plasma Interactions Experiment,” Journal of Spacecraft and Rockets, 1996, Vol. 33, No. 3, pp. 438–446.
5. Ferguson, D.C. “Solar Array Arcing in Plasmas,” NASA CP–3059, 1989, pp. 509.
6. Galofaro, J.T., B.V. Vayner,
Degroot, W.A., Ferguson, D.C. Thomson, C.D., Dennison, J.R., and Davies, R.E. “Inception of Snapover and Gas Induced Glow Discharges,” NASA/TM2000-209645 (AIAA Paper 2000–0245).
NASA/TM2002-211328 11
7. Vayner, B., Galofaro, J., Ferguson, D., Degroot, W., Thompson, C., Dennison, J., and Davies, R. “The Conductor-Dielectric Junctions in a Low Density Plasma,” 1999, NASA/TM–209408 (AIAA Paper 2000–0871)
8. Koons, H.C. “Summary of Environmentally Induced Discharges on the P78-2 (SCATHA) Satellite,” Journal of Spacecraft and Rockets, Vol. 22, 1983, p. 425.
9. Parks, E.D., Jongeward, G., Katz, I.,
and Davis, V.A. “Threshold Determining Mechanisms for Discharges in High Voltage Solar Arrays,” Journal of Spacecraft and Rockets, 1987, Vol. 24, No. 4, pp. 367–371.
10. Hastings, D.E., Weyl, G., and Kaufman, D. “Threshold Voltage for Arcing on Negatively Biased Solar Arrays,” Journal of Spacecraft and Rockets, 1990, Vol. 27, No. 5, pp. 539–544.
11. Cho, M., and Hasting, D.E. “Computer Simulation on High-Voltage Solar Array Arcing Onset,” Journal of Spacecraft and Rockets, 1993, Vol. 30, No. 2, pp. 189–205.
12. Vayner, B., Galofaro, J., Ferguson, D., Degroot, W., and Vayner, L. “Arcing Onset on a Solar Array Immersed in a Low Density Plasma,” AIAA Paper 2001–0400, 39th AIAA Aerospace Sciences Meeting and Exhibit, Jan. 8–11, Reno, NV.
13. Jongeward, G., and Katz, I. “Effect of Conduction and Ion Current on Solar Array Arc Thresholds,” 6th
Spacecraft Charging Technology Conf., Nov. 2–6, 1998, Air Force Res. Lab., Hanscom AFB, MA, USA, p. 42.
14. Vayner, B.V., Ferguson, D.C.
Galofaro, J.T. and Degroot, W. “Arcing Onset on a Metal-dielectric Junction Immersed in a Low Density Plasma,” XXVth International Conference On Phenomena In Ionized Gasses, No. 5, April 11–19.
15. Vayner, B.V., Galofaro, J. and Ferguson, D. “Arc Inception on a Solar Array Immersed in a Low-Density Plasma,” 7th Spacecraft Charging Technology Conference, Noordwijk, Netherlands, April 23–27, 2001.
16. Plasma Process Technology
Fundamentals, George J. Collins, Colorado State University, Fort Collins, CO ©1985, pp. 81–84.
17. Masssachusetts Institute of
Technology Wave Length Tables, George R. Harrison, M.I.T. Press, Cambridge, Massachusetts & London, England, 1960.
18. NIST Spectroscopic Properties of
Atoms and Atomic Ions, National Institute of Standards and Technology, U.S. Government Printing Office, Washington.
19. The Identification of Molecular
Spectra, Pearce, R.W.B., and Gaydon, A.G., Chapman & Hall LTD, 3rd Edition, 1963, pp. 246–247.
This publication is available from the NASA Center for AeroSpace Information, 301–621–0390.
REPORT DOCUMENTATION PAGE
2. REPORT DATE
19. SECURITY CLASSIFICATION OF ABSTRACT
18. SECURITY CLASSIFICATION OF THIS PAGE
Public reporting burden for this collection of information is estimated to average 1 hour per response, including the time for reviewing instructions, searching existing data sources,gathering and maintaining the data needed, and completing and reviewing the collection of information. Send comments regarding this burden estimate or any other aspect of thiscollection of information, including suggestions for reducing this burden, to Washington Headquarters Services, Directorate for Information Operations and Reports, 1215 JeffersonDavis Highway, Suite 1204, Arlington, VA 22202-4302, and to the Office of Management and Budget, Paperwork Reduction Project (0704-0188), Washington, DC 20503.
NSN 7540-01-280-5500 Standard Form 298 (Rev. 2-89)Prescribed by ANSI Std. Z39-18298-102
Form Approved
OMB No. 0704-0188
12b. DISTRIBUTION CODE
8. PERFORMING ORGANIZATION REPORT NUMBER
5. FUNDING NUMBERS
3. REPORT TYPE AND DATES COVERED
4. TITLE AND SUBTITLE
6. AUTHOR(S)
7. PERFORMING ORGANIZATION NAME(S) AND ADDRESS(ES)
11. SUPPLEMENTARY NOTES
12a. DISTRIBUTION/AVAILABILITY STATEMENT
13. ABSTRACT (Maximum 200 words)
14. SUBJECT TERMS
17. SECURITY CLASSIFICATION OF REPORT
16. PRICE CODE
15. NUMBER OF PAGES
20. LIMITATION OF ABSTRACT
Unclassified Unclassified
Technical Memorandum
Unclassified
National Aeronautics and Space AdministrationJohn H. Glenn Research Center at Lewis FieldCleveland, Ohio 44135–3191
1. AGENCY USE ONLY (Leave blank)
10. SPONSORING/MONITORING AGENCY REPORT NUMBER
9. SPONSORING/MONITORING AGENCY NAME(S) AND ADDRESS(ES)
National Aeronautics and Space AdministrationWashington, DC 20546–0001
Available electronically at http://gltrs.grc.nasa.gov/GLTRS
March 2002
NASA TM—2002-211328AIAA–2002–0938
E–13137
WU–744–1A–05–00
17
The Role of Water Vapor and Dissociative RecombinationProcesses in Solar Array Arc Initiation
J. Galofaro, B. Vayner, W. Degroot, and D. Ferguson
Solar array arcing; Arc initiation; Triple junction; Desorbed gas ionization mechanism;Dissociative recombination processes; Atomic spectra; Molecular spectra
Unclassified -UnlimitedSubject Category: 72 Distribution: Nonstandard
Prepared for the 40th Aerospace Sciences Meeting and Exhibit sponsored by the American Institute of Aeronautics andAstronautics, Reno, Nevada, January 14–17, 2002. J. Galofaro and D. Ferguson, NASA Glenn Research Center;B. Vayner, Ohio Aerospace Institute, 22800 Cedar Point Road, Brook Park, Ohio 44142; W. Degroot, Siliconlight, Inc., ACypress Semiconductor Company, 385 Moffett Park Drive, Suite 115, Sunnyvale, California 94089.Responsible person, Joel Galofaro, organization code 5410, 216–433–2294.
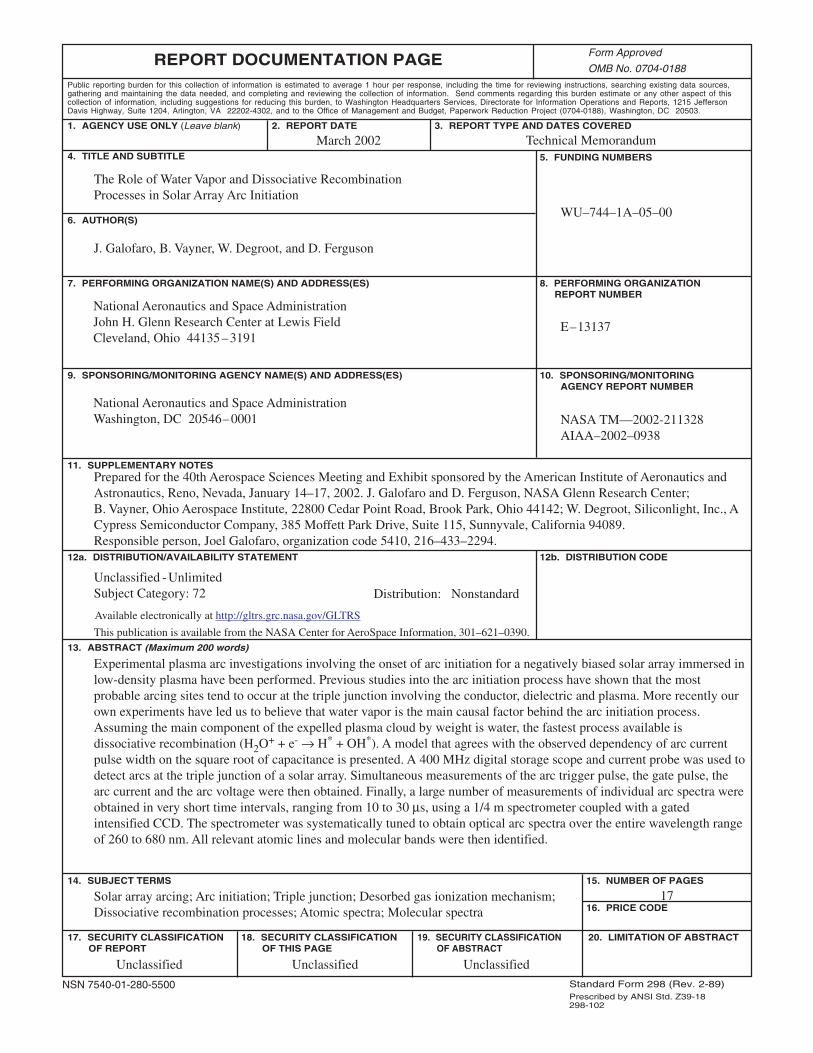
Experimental plasma arc investigations involving the onset of arc initiation for a negatively biased solar array immersed inlow-density plasma have been performed. Previous studies into the arc initiation process have shown that the mostprobable arcing sites tend to occur at the triple junction involving the conductor, dielectric and plasma. More recently ourown experiments have led us to believe that water vapor is the main causal factor behind the arc initiation process.Assuming the main component of the expelled plasma cloud by weight is water, the fastest process available isdissociative recombination (H2O+ + e- → H* + OH*). A model that agrees with the observed dependency of arc currentpulse width on the square root of capacitance is presented. A 400 MHz digital storage scope and current probe was used todetect arcs at the triple junction of a solar array. Simultaneous measurements of the arc trigger pulse, the gate pulse, thearc current and the arc voltage were then obtained. Finally, a large number of measurements of individual arc spectra wereobtained in very short time intervals, ranging from 10 to 30 µs, using a 1/4 m spectrometer coupled with a gatedintensified CCD. The spectrometer was systematically tuned to obtain optical arc spectra over the entire wavelength rangeof 260 to 680 nm. All relevant atomic lines and molecular bands were then identified.


