Embed Size (px)
Citation preview
doi:10.1016/j.jmb.2011.08.010 J. Mol. Biol. (2011) 413, 359–371
Contents lists available at www.sciencedirect.com
Journal of Molecular Biologyj ourna l homepage: ht tp : / /ees .e lsev ie r.com. jmb
Roles of Carboxyl Groups in the TransmembraneInsertion of Peptides
Francisco N. Barrera 1, Dhammika Weerakkody 2, Michael Anderson 2,Oleg A. Andreev 2, Yana K. Reshetnyak 2 and Donald M. Engelman 1⁎1Department of Molecular Biophysics and Biochemistry, Yale University, PO Box 208114, New Haven,CT 06520, USA2Physics Department, University of Rhode Island, Kingston, RI 02881, USA
Received 6 July 2011;received in revised form3 August 2011;accepted 5 August 2011Available online23 August 2011
Edited by J. Bowie
Keywords:membrane protein folding;pHLIP;pH trigger;carboxyl titration;transmembrane helix
*Corresponding author. E-mail [email protected] used: TM, transmem
POPC, 1-palmitoyl-2-oleoyl-sn-glyceOCD, oriented circular dichroism; Pglycol; pH, extracellular pH.
0022-2836/$ - see front matter © 2011 E
We have used pHLIP® [pH (low) insertion peptide] to study the roles ofcarboxyl groups in transmembrane (TM) peptide insertion. pHLIP binds tothe surface of a lipid bilayer as a disordered peptide at neutral pH; when thepH is lowered, it inserts across the membrane to form a TM helix. Peptideinsertion is reversed when the pH is raised above the characteristic pKa (6.0).A key event that facilitates membrane insertion is the protonation ofaspartic acid (Asp) and/or glutamic acid (Glu) residues, since theirnegatively charged side chains hinder membrane insertion at neutral pH.In order to gain mechanistic understanding, we studied the membraneinsertion and exit of a series of pHLIP variants where the four Asp residueswere sequentially mutated to nonacidic residues, including histidine (His).Our results show that the presence of His residues does not prevent the pH-dependent peptide membrane insertion at∼pH 4 driven by the protonationof carboxyl groups at the inserting end of the peptide. A further pH dropleads to the protonation of His residues in the TM part of the peptide, whichinduces peptide exit from the bilayer. We also find that the number ofionizable residues that undergo a change in protonation during membraneinsertion correlates with the pH-dependent insertion into the lipid bilayerand exit from the lipid bilayer, and that cooperativity increases with theirnumber. We expect that our understanding will be used to improve thetargeting of acidic diseased tissue by pHLIP.
© 2011 Elsevier Ltd. All rights reserved.
Introduction
Extracellular acidification is a hallmark of differ-ent pathologies, including cancer, inflammation,ischemic stroke, and atherosclerotic plaques. Acido-sis might be a useful biomarker for diagnosis ortreatment if means can be found to target tissue
ess:
brane; wt, wild type;ro-3-phosphocholine;EG, polyethylene
lsevier Ltd. All rights reserve
acidity. We have found that a peptide derived fromhelix C of bacteriorhodopsin,1 named pHLIP® [pH(low) insertion peptide], is capable of targetingacidic tissues and inserting into the cell plasmamembrane.2 pHLIP is able to target mouse tumorsin vivowith high specificity,2 opening the possibilityof its use for cancer imaging. Additionally, pHLIPhas a promising therapeutic potential, as it is able totranslocate cell-impermeable cargo molecules, suchas organic dyes, peptides, peptide nucleic acids, andtoxins, across the plasma membrane into thecytoplasm of tumor cells.2,3 pHLIP itself does nothave obvious acute toxicity in cells3 or in mice.2
pHLIP is monomeric at low concentrations, with amostly unstructured conformation in neutral and
d.
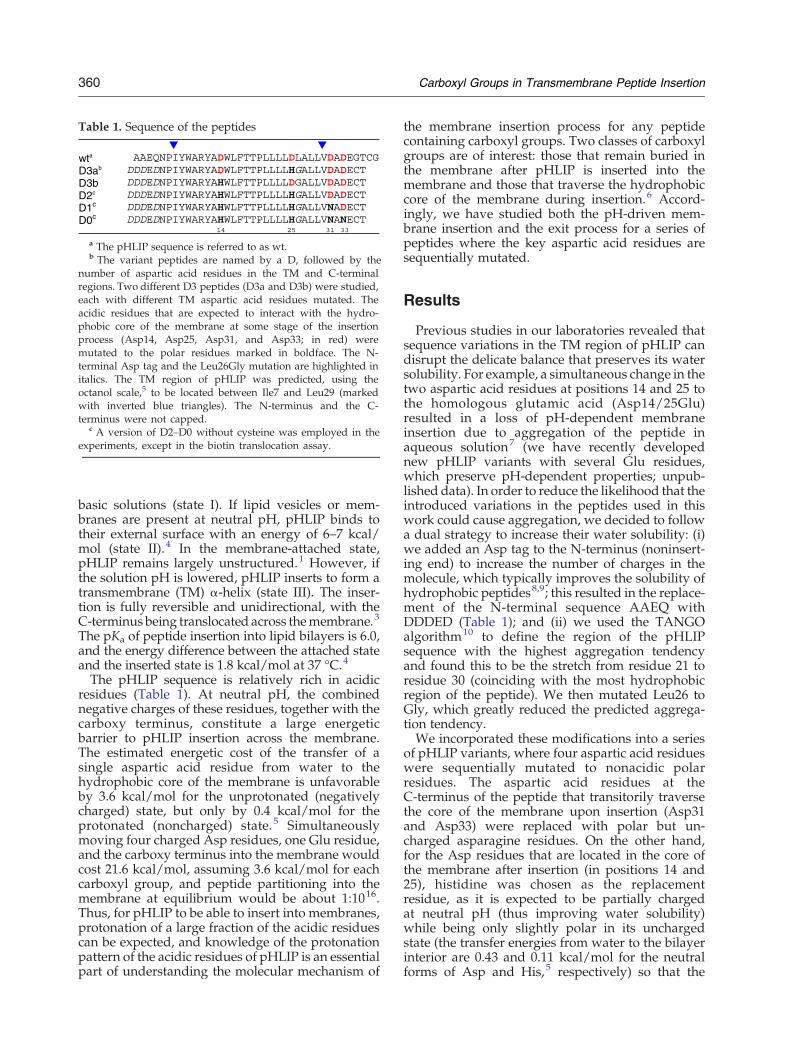
Table 1. Sequence of the peptides
wta AAEQNPIYWARYADWLFTTPLLLLDLALLVDADEGTCGD3ab DDDEDNPIYWARYADWLFTTPLLLLHGALLVDADECTD3b DDDEDNPIYWARYAHWLFTTPLLLLDGALLVDADECTD2c DDDEDNPIYWARYAHWLFTTPLLLLHGALLVDADECTD1c DDDEDNPIYWARYAHWLFTTPLLLLHGALLVNADECTD0c DDDEDNPIYWARYAHWLFTTPLLLLHGALLVNANECT
14 25 31 33
a The pHLIP sequence is referred to as wt.b The variant peptides are named by a D, followed by the
number of aspartic acid residues in the TM and C-terminalregions. Two different D3 peptides (D3a and D3b) were studied,each with different TM aspartic acid residues mutated. Theacidic residues that are expected to interact with the hydro-phobic core of the membrane at some stage of the insertionprocess (Asp14, Asp25, Asp31, and Asp33; in red) weremutated to the polar residues marked in boldface. The N-terminal Asp tag and the Leu26Gly mutation are highlighted initalics. The TM region of pHLIP was predicted, using theoctanol scale,5 to be located between Ile7 and Leu29 (markedwith inverted blue triangles). The N-terminus and the C-terminus were not capped.
c A version of D2–D0 without cysteine was employed in theexperiments, except in the biotin translocation assay.
360 Carboxyl Groups in Transmembrane Peptide Insertion
basic solutions (state I). If lipid vesicles or mem-branes are present at neutral pH, pHLIP binds totheir external surface with an energy of 6–7 kcal/mol (state II).4 In the membrane-attached state,pHLIP remains largely unstructured.1 However, ifthe solution pH is lowered, pHLIP inserts to form atransmembrane (TM) α-helix (state III). The inser-tion is fully reversible and unidirectional, with theC-terminus being translocated across themembrane.3
The pKa of peptide insertion into lipid bilayers is 6.0,and the energy difference between the attached stateand the inserted state is 1.8 kcal/mol at 37 °C.4
The pHLIP sequence is relatively rich in acidicresidues (Table 1). At neutral pH, the combinednegative charges of these residues, together with thecarboxy terminus, constitute a large energeticbarrier to pHLIP insertion across the membrane.The estimated energetic cost of the transfer of asingle aspartic acid residue from water to thehydrophobic core of the membrane is unfavorableby 3.6 kcal/mol for the unprotonated (negativelycharged) state, but only by 0.4 kcal/mol for theprotonated (noncharged) state.5 Simultaneouslymoving four charged Asp residues, one Glu residue,and the carboxy terminus into the membrane wouldcost 21.6 kcal/mol, assuming 3.6 kcal/mol for eachcarboxyl group, and peptide partitioning into themembrane at equilibrium would be about 1:1016.Thus, for pHLIP to be able to insert into membranes,protonation of a large fraction of the acidic residuescan be expected, and knowledge of the protonationpattern of the acidic residues of pHLIP is an essentialpart of understanding the molecular mechanism of
the membrane insertion process for any peptidecontaining carboxyl groups. Two classes of carboxylgroups are of interest: those that remain buried inthe membrane after pHLIP is inserted into themembrane and those that traverse the hydrophobiccore of the membrane during insertion.6 Accord-ingly, we have studied both the pH-driven mem-brane insertion and the exit process for a series ofpeptides where the key aspartic acid residues aresequentially mutated.
Results
Previous studies in our laboratories revealed thatsequence variations in the TM region of pHLIP candisrupt the delicate balance that preserves its watersolubility. For example, a simultaneous change in thetwo aspartic acid residues at positions 14 and 25 tothe homologous glutamic acid (Asp14/25Glu)resulted in a loss of pH-dependent membraneinsertion due to aggregation of the peptide inaqueous solution7 (we have recently developednew pHLIP variants with several Glu residues,which preserve pH-dependent properties; unpub-lished data). In order to reduce the likelihood that theintroduced variations in the peptides used in thiswork could cause aggregation, we decided to followa dual strategy to increase their water solubility: (i)we added an Asp tag to the N-terminus (noninsert-ing end) to increase the number of charges in themolecule, which typically improves the solubility ofhydrophobic peptides8,9; this resulted in the replace-ment of the N-terminal sequence AAEQ withDDDED (Table 1); and (ii) we used the TANGOalgorithm10 to define the region of the pHLIPsequence with the highest aggregation tendencyand found this to be the stretch from residue 21 toresidue 30 (coinciding with the most hydrophobicregion of the peptide). We then mutated Leu26 toGly, which greatly reduced the predicted aggrega-tion tendency.We incorporated these modifications into a series
of pHLIP variants, where four aspartic acid residueswere sequentially mutated to nonacidic polarresidues. The aspartic acid residues at theC-terminus of the peptide that transitorily traversethe core of the membrane upon insertion (Asp31and Asp33) were replaced with polar but un-charged asparagine residues. On the other hand,for the Asp residues that are located in the core ofthe membrane after insertion (in positions 14 and25), histidine was chosen as the replacementresidue, as it is expected to be partially chargedat neutral pH (thus improving water solubility)while being only slightly polar in its unchargedstate (the transfer energies from water to the bilayerinterior are 0.43 and 0.11 kcal/mol for the neutralforms of Asp and His,5 respectively) so that the
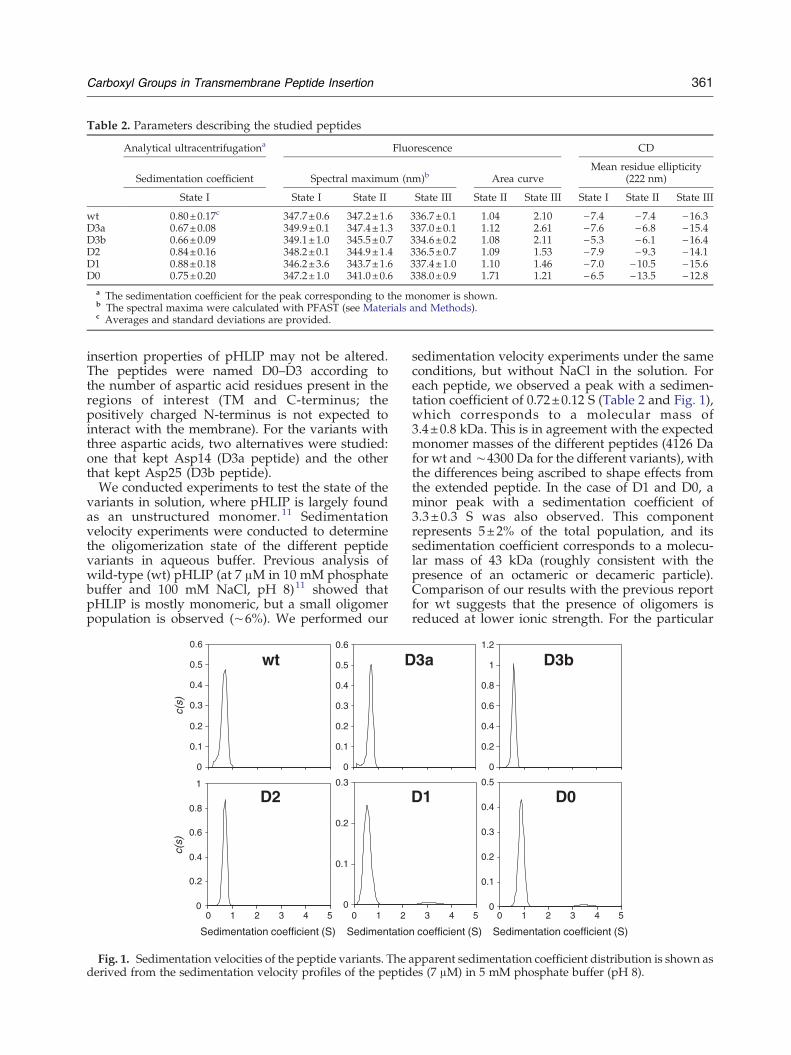
Table 2. Parameters describing the studied peptides
Analytical ultracentrifugationa Fluorescence CD
Sedimentation coefficient Spectral maximum (nm)b Area curveMean residue ellipticity
(222 nm)
State I State I State II State III State II State III State I State II State III
wt 0.80±0.17c 347.7±0.6 347.2±1.6 336.7±0.1 1.04 2.10 −7.4 −7.4 −16.3D3a 0.67±0.08 349.9±0.1 347.4±1.3 337.0±0.1 1.12 2.61 −7.6 −6.8 −15.4D3b 0.66±0.09 349.1±1.0 345.5±0.7 334.6±0.2 1.08 2.11 −5.3 −6.1 −16.4D2 0.84±0.16 348.2±0.1 344.9±1.4 336.5±0.7 1.09 1.53 −7.9 −9.3 −14.1D1 0.88±0.18 346.2±3.6 343.7±1.6 337.4±1.0 1.10 1.46 −7.0 −10.5 −15.6D0 0.75±0.20 347.2±1.0 341.0±0.6 338.0±0.9 1.71 1.21 −6.5 −13.5 −12.8
a The sedimentation coefficient for the peak corresponding to the monomer is shown.b The spectral maxima were calculated with PFAST (see Materials and Methods).c Averages and standard deviations are provided.
361Carboxyl Groups in Transmembrane Peptide Insertion
insertion properties of pHLIP may not be altered.The peptides were named D0–D3 according tothe number of aspartic acid residues present in theregions of interest (TM and C-terminus; thepositively charged N-terminus is not expected tointeract with the membrane). For the variants withthree aspartic acids, two alternatives were studied:one that kept Asp14 (D3a peptide) and the otherthat kept Asp25 (D3b peptide).We conducted experiments to test the state of the
variants in solution, where pHLIP is largely foundas an unstructured monomer. 11 Sedimentationvelocity experiments were conducted to determinethe oligomerization state of the different peptidevariants in aqueous buffer. Previous analysis ofwild-type (wt) pHLIP (at 7 μM in 10 mM phosphatebuffer and 100 mM NaCl, pH 8)11 showed thatpHLIP is mostly monomeric, but a small oligomerpopulation is observed (∼6%). We performed our
0
0.1
0.2
0.3
0.4
0.5
0.6
01 23
Sedimentatio
c(s)
0
0.1
0.2
0.3
Sedimentatio
c(s)
0
0.1
0.2
0.3
0.4
0.5
0.6
0 1 23 45
Sedimentation coefficient (S)
c(s)
0
0.2
0.4
0.6
0.8
1
0 1 2 3 4 5 0 1 2
Sedimentation coefficient (S)
c(s)
wt D
D2
Fig. 1. Sedimentation velocities of the peptide variants. Thederived from the sedimentation velocity profiles of the peptid
sedimentation velocity experiments under the sameconditions, but without NaCl in the solution. Foreach peptide, we observed a peak with a sedimen-tation coefficient of 0.72±0.12 S (Table 2 and Fig. 1),which corresponds to a molecular mass of3.4±0.8 kDa. This is in agreement with the expectedmonomer masses of the different peptides (4126 Dafor wt and ∼4300 Da for the different variants), withthe differences being ascribed to shape effects fromthe extended peptide. In the case of D1 and D0, aminor peak with a sedimentation coefficient of3.3±0.3 S was also observed. This componentrepresents 5±2% of the total population, and itssedimentation coefficient corresponds to a molecu-lar mass of 43 kDa (roughly consistent with thepresence of an octameric or decameric particle).Comparison of our results with the previous reportfor wt suggests that the presence of oligomers isreduced at lower ionic strength. For the particular
0
0.2
0.4
0.6
0.8
1
1.2
01 23 45
Sedimentation coefficient (S)
c(s)
45
n coefficient (S)
0
0.1
0.2
0.3
0.4
0.5
Sedimentation coefficient (S)
c(s)
n coefficient (S)
3 4 5 0 1 2 3 4 5
3a D3b
D1 D0
apparent sedimentation coefficient distribution is shown ases (7 μM) in 5 mM phosphate buffer (pH 8).
362 Carboxyl Groups in Transmembrane Peptide Insertion
case of the D1 and D0 peptides, they seem to have aslightly higher oligomerization tendency in solution,but they are still 95% monomeric. Thus, our resultssuggest that all the peptide variants remain solubleand are essentially monomeric. For the rest of theexperiments, we employed peptide concentrations(1.5–5 μM) lower than that used for sedimentationanalysis (7 μM); thus, the level of oligomers presentfor D1 and D0 is expected to be lower.Fluorescence spectra of the peptides in aqueous
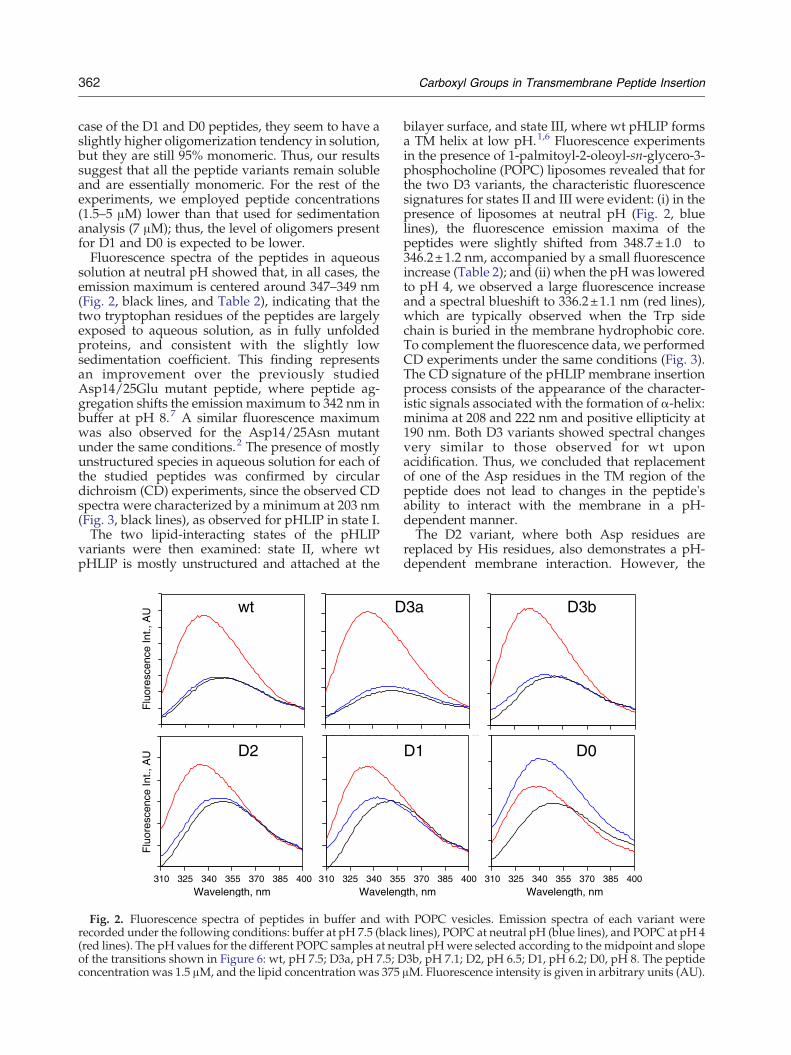
solution at neutral pH showed that, in all cases, theemission maximum is centered around 347–349 nm(Fig. 2, black lines, and Table 2), indicating that thetwo tryptophan residues of the peptides are largelyexposed to aqueous solution, as in fully unfoldedproteins, and consistent with the slightly lowsedimentation coefficient. This finding representsan improvement over the previously studiedAsp14/25Glu mutant peptide, where peptide ag-gregation shifts the emission maximum to 342 nm inbuffer at pH 8.7 A similar fluorescence maximumwas also observed for the Asp14/25Asn mutantunder the same conditions.2 The presence of mostlyunstructured species in aqueous solution for each ofthe studied peptides was confirmed by circulardichroism (CD) experiments, since the observed CDspectra were characterized by a minimum at 203 nm(Fig. 3, black lines), as observed for pHLIP in state I.The two lipid-interacting states of the pHLIP
variants were then examined: state II, where wtpHLIP is mostly unstructured and attached at the
0 325340 35Wavelen
Fluo
resc
ence
Int.,
AU
310 325
Wavelength, nm
Flu
ores
cenc
e In
t., A
U
310 325 340 355Wavelen
Flu
ores
cenc
e Int
., AU
310 325 340 355 370 385 400Wavelength, nm
Flu
ores
cenc
e In
t., A
U
wt D
D2
Fig. 2. Fluorescence spectra of peptides in buffer and witrecorded under the following conditions: buffer at pH 7.5 (black(red lines). The pH values for the different POPC samples at neuof the transitions shown in Figure 6: wt, pH 7.5; D3a, pH 7.5; Dconcentration was 1.5 μM, and the lipid concentration was 375
bilayer surface, and state III, where wt pHLIP formsa TM helix at low pH.1,6 Fluorescence experimentsin the presence of 1-palmitoyl-2-oleoyl-sn-glycero-3-phosphocholine (POPC) liposomes revealed that forthe two D3 variants, the characteristic fluorescencesignatures for states II and III were evident: (i) in thepresence of liposomes at neutral pH (Fig. 2, bluelines), the fluorescence emission maxima of thepeptides were slightly shifted from 348.7±1.0 to346.2±1.2 nm, accompanied by a small fluorescenceincrease (Table 2); and (ii) when the pHwas loweredto pH 4, we observed a large fluorescence increaseand a spectral blueshift to 336.2±1.1 nm (red lines),which are typically observed when the Trp sidechain is buried in the membrane hydrophobic core.To complement the fluorescence data, we performedCD experiments under the same conditions (Fig. 3).The CD signature of the pHLIP membrane insertionprocess consists of the appearance of the character-istic signals associated with the formation of α-helix:minima at 208 and 222 nm and positive ellipticity at190 nm. Both D3 variants showed spectral changesvery similar to those observed for wt uponacidification. Thus, we concluded that replacementof one of the Asp residues in the TM region of thepeptide does not lead to changes in the peptide'sability to interact with the membrane in a pH-dependent manner.The D2 variant, where both Asp residues are
replaced by His residues, also demonstrates a pH-dependent membrane interaction. However, the
310325340355 370385Wavelength, nm
Fluo
resce
nce
Int.,
AU
5370385400gth, nm
310 325 340 355 370 385 400Wavelength, nm
Flu
ores
cenc
e Int
., AU
370 385 400gth, nm
3a D3b
D1 D0
h POPC vesicles. Emission spectra of each variant werelines), POPC at neutral pH (blue lines), and POPC at pH 4tral pHwere selected according to the midpoint and slope3b, pH 7.1; D2, pH 6.5; D1, pH 6.2; D0, pH 8. The peptideμM. Fluorescence intensity is given in arbitrary units (AU).
-20
-15
-10
-5
0
5
195 205 215 225 235 245 255
Wavelength, nm
[ ò] (
deg
dmol
-1 c
m2 )
x10-3
-20
-15
-10
-5
0
5
10
195 205 215 225 235 245 255
Wavelength, nm
[ ò] (
deg
dmol
-1 c
m2 )
x10-3
-20
-15
-10
-5
0
5
10
195 205 215 225 235 245 255
Wavelength, nm
[Θ] (
deg
dmol
-1 c
m2 )
x10
-3
-20
-15
-10
-5
0
5
10
195 205 215 225 235 245 255
Wavelength, nm
[ ò]
(deg
dm
ol-1
cm
2 ) x1
0-3
-20
-15
-10
-5
0
5
10
205 215 225 235 245 255
Wavelength, nm
[ ò] (
deg
dmol
-1 c
m2 )
x10-3
-20
-15
-10
-5
0
5
10
195 205 215 225 235 245 255
Wavelength, nm
[Θ] (
deg
dmol
-1 c
m2 )
x10
-3
wt D3a D3b
D2 D1 D0
195
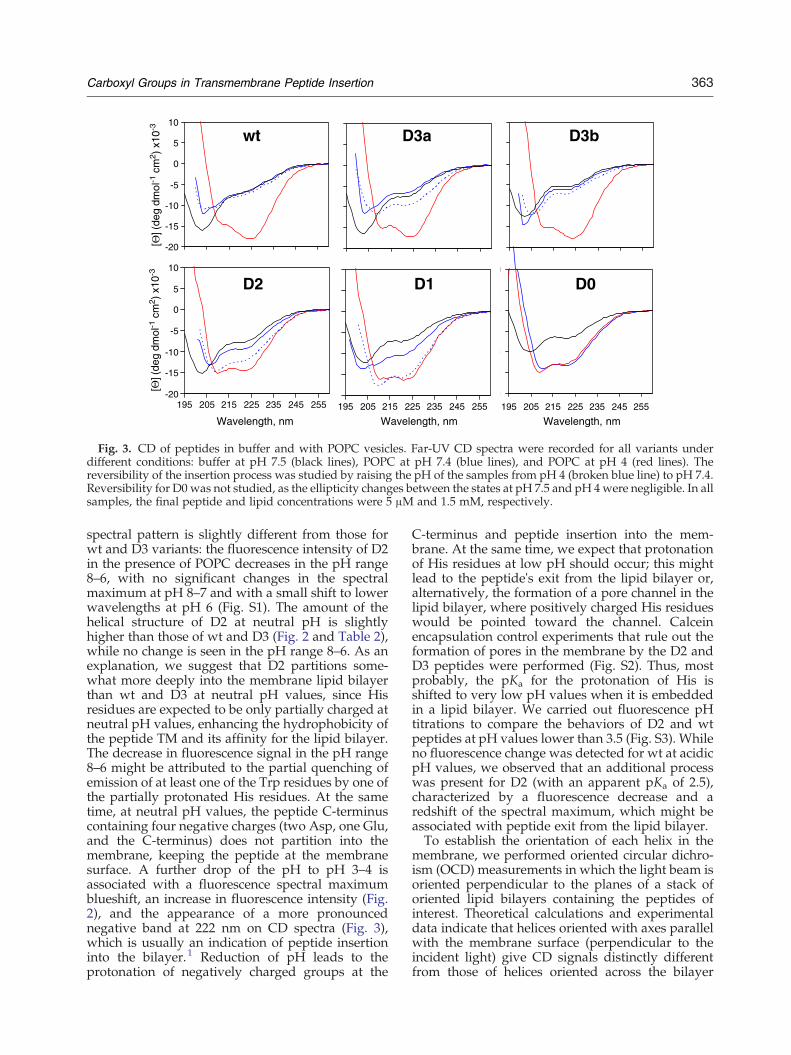
Fig. 3. CD of peptides in buffer and with POPC vesicles. Far-UV CD spectra were recorded for all variants underdifferent conditions: buffer at pH 7.5 (black lines), POPC at pH 7.4 (blue lines), and POPC at pH 4 (red lines). Thereversibility of the insertion process was studied by raising the pH of the samples from pH 4 (broken blue line) to pH 7.4.Reversibility for D0 was not studied, as the ellipticity changes between the states at pH 7.5 and pH 4were negligible. In allsamples, the final peptide and lipid concentrations were 5 μM and 1.5 mM, respectively.
363Carboxyl Groups in Transmembrane Peptide Insertion
spectral pattern is slightly different from those forwt and D3 variants: the fluorescence intensity of D2in the presence of POPC decreases in the pH range8–6, with no significant changes in the spectralmaximum at pH 8–7 and with a small shift to lowerwavelengths at pH 6 (Fig. S1). The amount of thehelical structure of D2 at neutral pH is slightlyhigher than those of wt and D3 (Fig. 2 and Table 2),while no change is seen in the pH range 8–6. As anexplanation, we suggest that D2 partitions some-what more deeply into the membrane lipid bilayerthan wt and D3 at neutral pH values, since Hisresidues are expected to be only partially charged atneutral pH values, enhancing the hydrophobicity ofthe peptide TM and its affinity for the lipid bilayer.The decrease in fluorescence signal in the pH range8–6 might be attributed to the partial quenching ofemission of at least one of the Trp residues by one ofthe partially protonated His residues. At the sametime, at neutral pH values, the peptide C-terminuscontaining four negative charges (two Asp, one Glu,and the C-terminus) does not partition into themembrane, keeping the peptide at the membranesurface. A further drop of the pH to pH 3–4 isassociated with a fluorescence spectral maximumblueshift, an increase in fluorescence intensity (Fig.2), and the appearance of a more pronouncednegative band at 222 nm on CD spectra (Fig. 3),which is usually an indication of peptide insertioninto the bilayer.1 Reduction of pH leads to theprotonation of negatively charged groups at the
C-terminus and peptide insertion into the mem-brane. At the same time, we expect that protonationof His residues at low pH should occur; this mightlead to the peptide's exit from the lipid bilayer or,alternatively, the formation of a pore channel in thelipid bilayer, where positively charged His residueswould be pointed toward the channel. Calceinencapsulation control experiments that rule out theformation of pores in the membrane by the D2 andD3 peptides were performed (Fig. S2). Thus, mostprobably, the pKa for the protonation of His isshifted to very low pH values when it is embeddedin a lipid bilayer. We carried out fluorescence pHtitrations to compare the behaviors of D2 and wtpeptides at pH values lower than 3.5 (Fig. S3). Whileno fluorescence change was detected for wt at acidicpH values, we observed that an additional processwas present for D2 (with an apparent pKa of 2.5),characterized by a fluorescence decrease and aredshift of the spectral maximum, which might beassociated with peptide exit from the lipid bilayer.To establish the orientation of each helix in the
membrane, we performed oriented circular dichro-ism (OCD) measurements in which the light beam isoriented perpendicular to the planes of a stack oforiented lipid bilayers containing the peptides ofinterest. Theoretical calculations and experimentaldata indicate that helices oriented with axes parallelwith the membrane surface (perpendicular to theincident light) give CD signals distinctly differentfrom those of helices oriented across the bilayer
364 Carboxyl Groups in Transmembrane Peptide Insertion
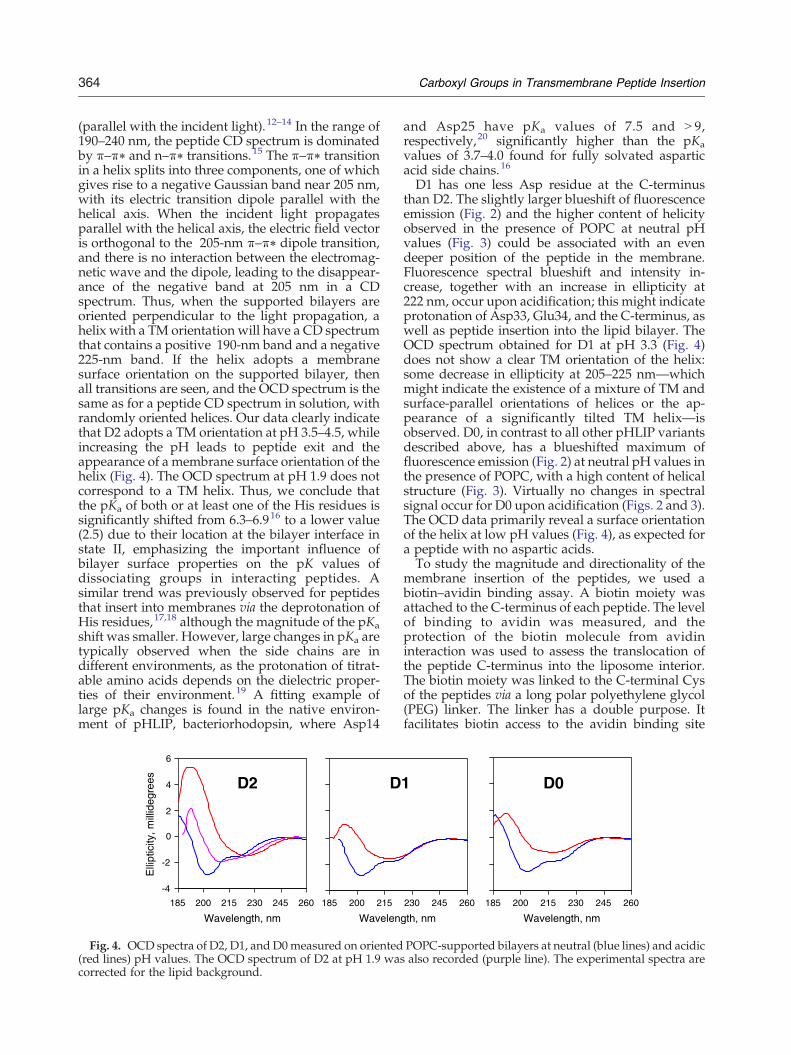
(parallel with the incident light).12–14 In the range of190–240 nm, the peptide CD spectrum is dominatedby π–π⁎ and n–π⁎ transitions.15 The π–π⁎ transitionin a helix splits into three components, one of whichgives rise to a negative Gaussian band near 205 nm,with its electric transition dipole parallel with thehelical axis. When the incident light propagatesparallel with the helical axis, the electric field vectoris orthogonal to the 205-nm π–π⁎ dipole transition,and there is no interaction between the electromag-netic wave and the dipole, leading to the disappear-ance of the negative band at 205 nm in a CDspectrum. Thus, when the supported bilayers areoriented perpendicular to the light propagation, ahelix with a TM orientation will have a CD spectrumthat contains a positive 190-nm band and a negative225-nm band. If the helix adopts a membranesurface orientation on the supported bilayer, thenall transitions are seen, and the OCD spectrum is thesame as for a peptide CD spectrum in solution, withrandomly oriented helices. Our data clearly indicatethat D2 adopts a TM orientation at pH 3.5–4.5, whileincreasing the pH leads to peptide exit and theappearance of a membrane surface orientation of thehelix (Fig. 4). The OCD spectrum at pH 1.9 does notcorrespond to a TM helix. Thus, we conclude thatthe pKa of both or at least one of the His residues issignificantly shifted from 6.3–6.916 to a lower value(2.5) due to their location at the bilayer interface instate II, emphasizing the important influence ofbilayer surface properties on the pK values ofdissociating groups in interacting peptides. Asimilar trend was previously observed for peptidesthat insert into membranes via the deprotonation ofHis residues,17,18 although the magnitude of the pKashift was smaller. However, large changes in pKa aretypically observed when the side chains are indifferent environments, as the protonation of titrat-able amino acids depends on the dielectric proper-ties of their environment.19 A fitting example oflarge pKa changes is found in the native environ-ment of pHLIP, bacteriorhodopsin, where Asp14
-4
-2
0
2
4
6
185 200 215 230 245
Wavelength, nm
Elli
ptic
ity, m
illid
egre
es
200 215
Wavelen
D2 D
185260
Fig. 4. OCD spectra of D2, D1, and D0measured on oriented(red lines) pH values. The OCD spectrum of D2 at pH 1.9 wascorrected for the lipid background.
and Asp25 have pKa values of 7.5 and N 9,respectively,20 significantly higher than the pKavalues of 3.7–4.0 found for fully solvated asparticacid side chains.16
D1 has one less Asp residue at the C-terminusthan D2. The slightly larger blueshift of fluorescenceemission (Fig. 2) and the higher content of helicityobserved in the presence of POPC at neutral pHvalues (Fig. 3) could be associated with an evendeeper position of the peptide in the membrane.Fluorescence spectral blueshift and intensity in-crease, together with an increase in ellipticity at222 nm, occur upon acidification; this might indicateprotonation of Asp33, Glu34, and the C-terminus, aswell as peptide insertion into the lipid bilayer. TheOCD spectrum obtained for D1 at pH 3.3 (Fig. 4)does not show a clear TM orientation of the helix:some decrease in ellipticity at 205–225 nm—whichmight indicate the existence of a mixture of TM andsurface-parallel orientations of helices or the ap-pearance of a significantly tilted TM helix—isobserved. D0, in contrast to all other pHLIP variantsdescribed above, has a blueshifted maximum offluorescence emission (Fig. 2) at neutral pH values inthe presence of POPC, with a high content of helicalstructure (Fig. 3). Virtually no changes in spectralsignal occur for D0 upon acidification (Figs. 2 and 3).The OCD data primarily reveal a surface orientationof the helix at low pH values (Fig. 4), as expected fora peptide with no aspartic acids.To study the magnitude and directionality of the
membrane insertion of the peptides, we used abiotin–avidin binding assay. A biotin moiety wasattached to the C-terminus of each peptide. The levelof binding to avidin was measured, and theprotection of the biotin molecule from avidininteraction was used to assess the translocation ofthe peptide C-terminus into the liposome interior.The biotin moiety was linked to the C-terminal Cysof the peptides via a long polar polyethylene glycol(PEG) linker. The linker has a double purpose. Itfacilitates biotin access to the avidin binding site
230 245
gth, nm
185 200 215 230 245 260
Wavelength, nm
1 D0
260
POPC-supported bilayers at neutral (blue lines) and acidicalso recorded (purple line). The experimental spectra are
365Carboxyl Groups in Transmembrane Peptide Insertion
and—more critically for our experiments—helps todelineate between an intraliposomal location and anextraliposomal location of the biotin, since thepolarity of the moiety makes a location inside thehydrophobic region of the bilayer unlikely. Wequantified the amount of biotin that binds to avidinmolecules present exclusively outside the liposomes(see Materials and Methods for details). We did notdetect avidin binding to biotin for the D2 peptide atlowpH (Fig. 5a) due to the biotin translocation acrossthe membrane, which complements our data (sug-gesting complete insertion of this peptide across the
0
20
40
60
80
100
120
0 1 2 3 4 5
Number of Asp
Bio
tin tr
ansl
ocat
ion,
%
0
20
40
60
80
100
120
0 1 2 3 4 5
Number of Asp
% r
ever
sibi
lity
(a)
(b)
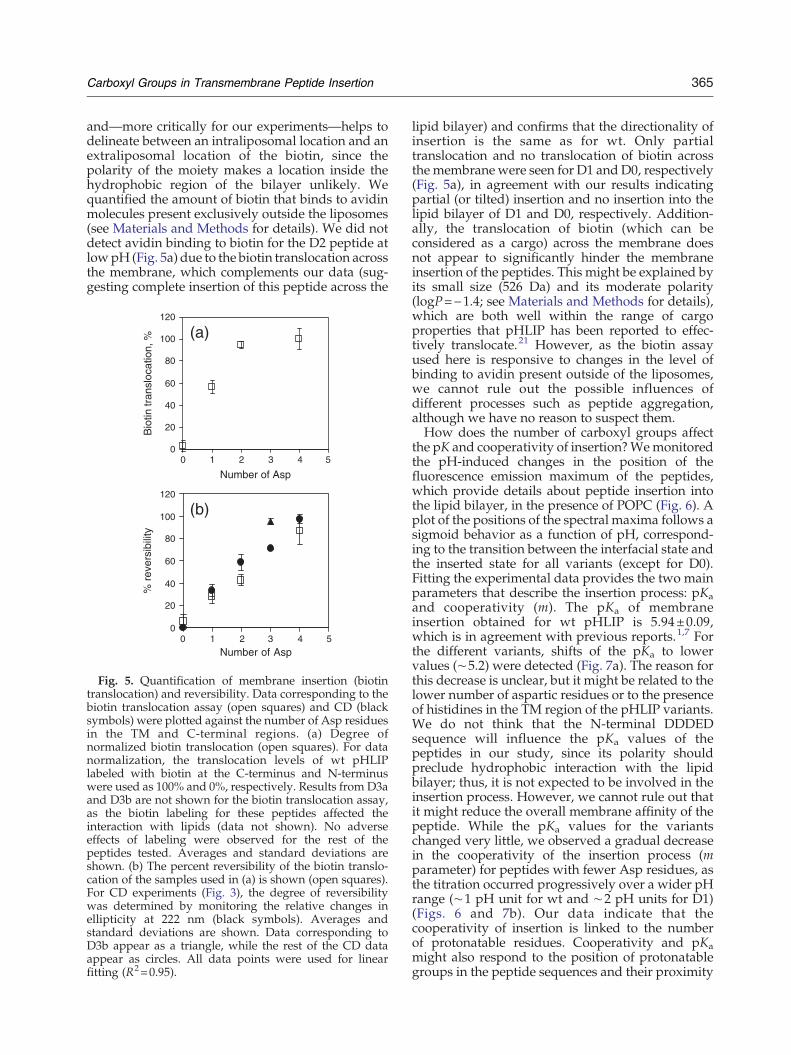
Fig. 5. Quantification of membrane insertion (biotintranslocation) and reversibility. Data corresponding to thebiotin translocation assay (open squares) and CD (blacksymbols) were plotted against the number of Asp residuesin the TM and C-terminal regions. (a) Degree ofnormalized biotin translocation (open squares). For datanormalization, the translocation levels of wt pHLIPlabeled with biotin at the C-terminus and N-terminuswere used as 100% and 0%, respectively. Results from D3aand D3b are not shown for the biotin translocation assay,as the biotin labeling for these peptides affected theinteraction with lipids (data not shown). No adverseeffects of labeling were observed for the rest of thepeptides tested. Averages and standard deviations areshown. (b) The percent reversibility of the biotin translo-cation of the samples used in (a) is shown (open squares).For CD experiments (Fig. 3), the degree of reversibilitywas determined by monitoring the relative changes inellipticity at 222 nm (black symbols). Averages andstandard deviations are shown. Data corresponding toD3b appear as a triangle, while the rest of the CD dataappear as circles. All data points were used for linearfitting (R2=0.95).
lipid bilayer) and confirms that the directionality ofinsertion is the same as for wt. Only partialtranslocation and no translocation of biotin acrossthe membrane were seen for D1 andD0, respectively(Fig. 5a), in agreement with our results indicatingpartial (or tilted) insertion and no insertion into thelipid bilayer of D1 and D0, respectively. Addition-ally, the translocation of biotin (which can beconsidered as a cargo) across the membrane doesnot appear to significantly hinder the membraneinsertion of the peptides. This might be explained byits small size (526 Da) and its moderate polarity(logP=−1.4; see Materials and Methods for details),which are both well within the range of cargoproperties that pHLIP has been reported to effec-tively translocate.21 However, as the biotin assayused here is responsive to changes in the level ofbinding to avidin present outside of the liposomes,we cannot rule out the possible influences ofdifferent processes such as peptide aggregation,although we have no reason to suspect them.How does the number of carboxyl groups affect
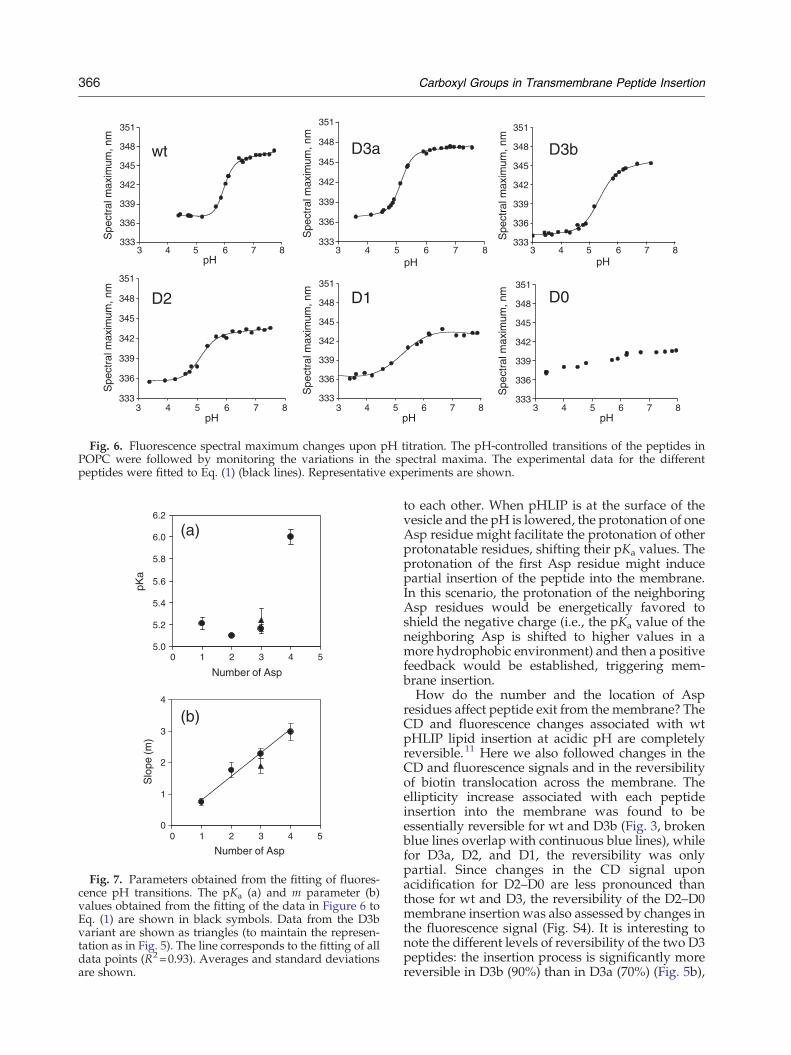
the pK and cooperativity of insertion?Wemonitoredthe pH-induced changes in the position of thefluorescence emission maximum of the peptides,which provide details about peptide insertion intothe lipid bilayer, in the presence of POPC (Fig. 6). Aplot of the positions of the spectral maxima follows asigmoid behavior as a function of pH, correspond-ing to the transition between the interfacial state andthe inserted state for all variants (except for D0).Fitting the experimental data provides the two mainparameters that describe the insertion process: pKaand cooperativity (m). The pKa of membraneinsertion obtained for wt pHLIP is 5.94±0.09,which is in agreement with previous reports.1,7 Forthe different variants, shifts of the pKa to lowervalues (∼5.2) were detected (Fig. 7a). The reason forthis decrease is unclear, but it might be related to thelower number of aspartic residues or to the presenceof histidines in the TM region of the pHLIP variants.We do not think that the N-terminal DDDEDsequence will influence the pKa values of thepeptides in our study, since its polarity shouldpreclude hydrophobic interaction with the lipidbilayer; thus, it is not expected to be involved in theinsertion process. However, we cannot rule out thatit might reduce the overall membrane affinity of thepeptide. While the pKa values for the variantschanged very little, we observed a gradual decreasein the cooperativity of the insertion process (mparameter) for peptides with fewer Asp residues, asthe titration occurred progressively over a wider pHrange (∼1 pH unit for wt and ∼2 pH units for D1)(Figs. 6 and 7b). Our data indicate that thecooperativity of insertion is linked to the numberof protonatable residues. Cooperativity and pKamight also respond to the position of protonatablegroups in the peptide sequences and their proximity
3 4 5 6 7 83 4 5 6 7 83 4 5 6 7 8
3 4 5 6 7 83 4 5 6 7 83 4 5 6 7 8
333
336
339
342
345
348
351
Spe
ctra
l max
imum
, nm
pH
333
336
339
342
345
348
351
Spe
ctra
l max
imum
, nm
pH
333
336
339
342
345
348
351
Spe
ctra
l max
imum
, nm
pH
333
336
339
342
345
348
351
Spe
ctra
l max
imum
, nm
pH
333
336
339
342
345
348
351
Spe
ctra
l max
imum
, nm
pH
333
336
339
342
345
348
351
Spe
ctra
l max
imum
, nm
pH
wt D3a D3b
D2 D1 D0
Fig. 6. Fluorescence spectral maximum changes upon pH titration. The pH-controlled transitions of the peptides inPOPC were followed by monitoring the variations in the spectral maxima. The experimental data for the differentpeptides were fitted to Eq. (1) (black lines). Representative experiments are shown.
5.0
5.2
5.4
5.6
5.8
6.0
6.2
0 1 2 3 4 5
0 1 2 3 4 5
Number of Asp
pKa
0
1
2
3
4
Number of Asp
Slo
pe (m
)
(a)
(b)
Fig. 7. Parameters obtained from the fitting of fluores-cence pH transitions. The pKa (a) and m parameter (b)values obtained from the fitting of the data in Figure 6 toEq. (1) are shown in black symbols. Data from the D3bvariant are shown as triangles (to maintain the represen-tation as in Fig. 5). The line corresponds to the fitting of alldata points (R2=0.93). Averages and standard deviationsare shown.
366 Carboxyl Groups in Transmembrane Peptide Insertion
to each other. When pHLIP is at the surface of thevesicle and the pH is lowered, the protonation of oneAsp residue might facilitate the protonation of otherprotonatable residues, shifting their pKa values. Theprotonation of the first Asp residue might inducepartial insertion of the peptide into the membrane.In this scenario, the protonation of the neighboringAsp residues would be energetically favored toshield the negative charge (i.e., the pKa value of theneighboring Asp is shifted to higher values in amore hydrophobic environment) and then a positivefeedback would be established, triggering mem-brane insertion.How do the number and the location of Asp
residues affect peptide exit from the membrane? TheCD and fluorescence changes associated with wtpHLIP lipid insertion at acidic pH are completelyreversible.11 Here we also followed changes in theCD and fluorescence signals and in the reversibilityof biotin translocation across the membrane. Theellipticity increase associated with each peptideinsertion into the membrane was found to beessentially reversible for wt and D3b (Fig. 3, brokenblue lines overlap with continuous blue lines), whilefor D3a, D2, and D1, the reversibility was onlypartial. Since changes in the CD signal uponacidification for D2–D0 are less pronounced thanthose for wt and D3, the reversibility of the D2–D0membrane insertion was also assessed by changes inthe fluorescence signal (Fig. S4). It is interesting tonote the different levels of reversibility of the two D3peptides: the insertion process is significantly morereversible in D3b (90%) than in D3a (70%) (Fig. 5b),
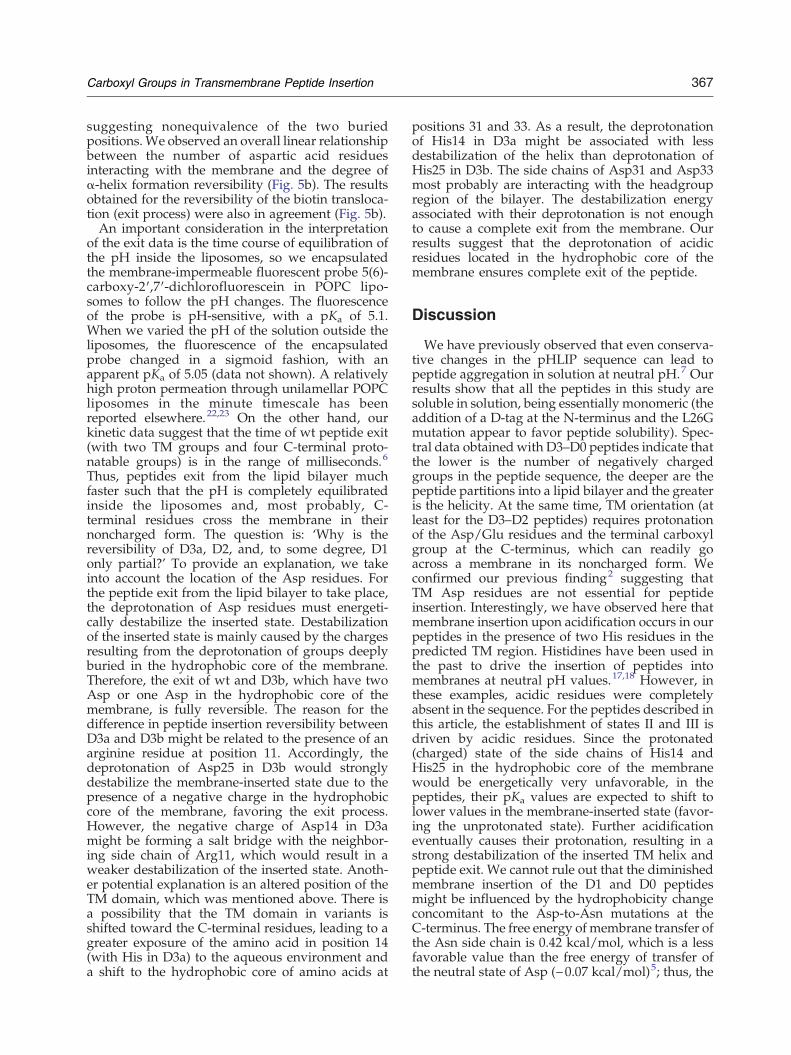
367Carboxyl Groups in Transmembrane Peptide Insertion
suggesting nonequivalence of the two buriedpositions. We observed an overall linear relationshipbetween the number of aspartic acid residuesinteracting with the membrane and the degree ofα-helix formation reversibility (Fig. 5b). The resultsobtained for the reversibility of the biotin transloca-tion (exit process) were also in agreement (Fig. 5b).An important consideration in the interpretation
of the exit data is the time course of equilibration ofthe pH inside the liposomes, so we encapsulatedthe membrane-impermeable fluorescent probe 5(6)-carboxy-2′,7′-dichlorofluorescein in POPC lipo-somes to follow the pH changes. The fluorescenceof the probe is pH-sensitive, with a pKa of 5.1.When we varied the pH of the solution outside theliposomes, the fluorescence of the encapsulatedprobe changed in a sigmoid fashion, with anapparent pKa of 5.05 (data not shown). A relativelyhigh proton permeation through unilamellar POPCliposomes in the minute timescale has beenreported elsewhere.22,23 On the other hand, ourkinetic data suggest that the time of wt peptide exit(with two TM groups and four C-terminal proto-natable groups) is in the range of milliseconds.6
Thus, peptides exit from the lipid bilayer muchfaster such that the pH is completely equilibratedinside the liposomes and, most probably, C-terminal residues cross the membrane in theirnoncharged form. The question is: ‘Why is thereversibility of D3a, D2, and, to some degree, D1only partial?’ To provide an explanation, we takeinto account the location of the Asp residues. Forthe peptide exit from the lipid bilayer to take place,the deprotonation of Asp residues must energeti-cally destabilize the inserted state. Destabilizationof the inserted state is mainly caused by the chargesresulting from the deprotonation of groups deeplyburied in the hydrophobic core of the membrane.Therefore, the exit of wt and D3b, which have twoAsp or one Asp in the hydrophobic core of themembrane, is fully reversible. The reason for thedifference in peptide insertion reversibility betweenD3a and D3b might be related to the presence of anarginine residue at position 11. Accordingly, thedeprotonation of Asp25 in D3b would stronglydestabilize the membrane-inserted state due to thepresence of a negative charge in the hydrophobiccore of the membrane, favoring the exit process.However, the negative charge of Asp14 in D3amight be forming a salt bridge with the neighbor-ing side chain of Arg11, which would result in aweaker destabilization of the inserted state. Anoth-er potential explanation is an altered position of theTM domain, which was mentioned above. There isa possibility that the TM domain in variants isshifted toward the C-terminal residues, leading to agreater exposure of the amino acid in position 14(with His in D3a) to the aqueous environment anda shift to the hydrophobic core of amino acids at
positions 31 and 33. As a result, the deprotonationof His14 in D3a might be associated with lessdestabilization of the helix than deprotonation ofHis25 in D3b. The side chains of Asp31 and Asp33most probably are interacting with the headgroupregion of the bilayer. The destabilization energyassociated with their deprotonation is not enoughto cause a complete exit from the membrane. Ourresults suggest that the deprotonation of acidicresidues located in the hydrophobic core of themembrane ensures complete exit of the peptide.
Discussion
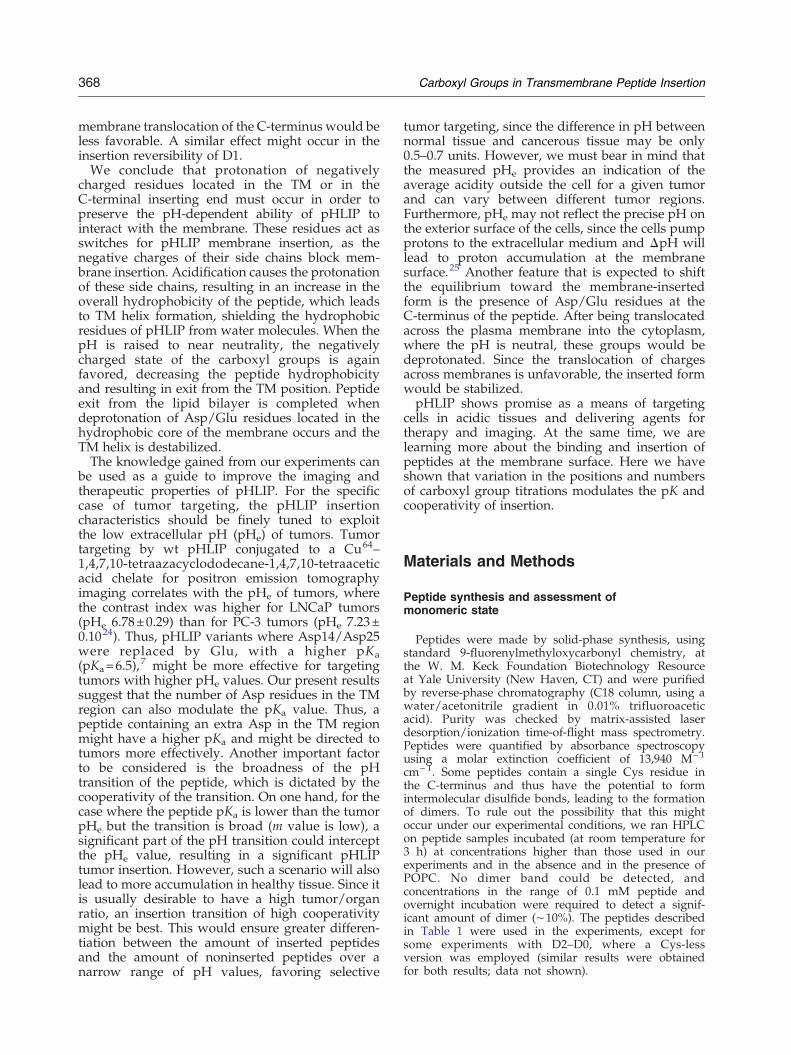
We have previously observed that even conserva-tive changes in the pHLIP sequence can lead topeptide aggregation in solution at neutral pH.7 Ourresults show that all the peptides in this study aresoluble in solution, being essentially monomeric (theaddition of a D-tag at the N-terminus and the L26Gmutation appear to favor peptide solubility). Spec-tral data obtained with D3–D0 peptides indicate thatthe lower is the number of negatively chargedgroups in the peptide sequence, the deeper are thepeptide partitions into a lipid bilayer and the greateris the helicity. At the same time, TM orientation (atleast for the D3–D2 peptides) requires protonationof the Asp/Glu residues and the terminal carboxylgroup at the C-terminus, which can readily goacross a membrane in its noncharged form. Weconfirmed our previous finding2 suggesting thatTM Asp residues are not essential for peptideinsertion. Interestingly, we have observed here thatmembrane insertion upon acidification occurs in ourpeptides in the presence of two His residues in thepredicted TM region. Histidines have been used inthe past to drive the insertion of peptides intomembranes at neutral pH values.17,18 However, inthese examples, acidic residues were completelyabsent in the sequence. For the peptides described inthis article, the establishment of states II and III isdriven by acidic residues. Since the protonated(charged) state of the side chains of His14 andHis25 in the hydrophobic core of the membranewould be energetically very unfavorable, in thepeptides, their pKa values are expected to shift tolower values in the membrane-inserted state (favor-ing the unprotonated state). Further acidificationeventually causes their protonation, resulting in astrong destabilization of the inserted TM helix andpeptide exit. We cannot rule out that the diminishedmembrane insertion of the D1 and D0 peptidesmight be influenced by the hydrophobicity changeconcomitant to the Asp-to-Asn mutations at theC-terminus. The free energy of membrane transfer ofthe Asn side chain is 0.42 kcal/mol, which is a lessfavorable value than the free energy of transfer ofthe neutral state of Asp (−0.07 kcal/mol)5; thus, the
368 Carboxyl Groups in Transmembrane Peptide Insertion
membrane translocation of the C-terminus would beless favorable. A similar effect might occur in theinsertion reversibility of D1.We conclude that protonation of negatively
charged residues located in the TM or in theC-terminal inserting end must occur in order topreserve the pH-dependent ability of pHLIP tointeract with the membrane. These residues act asswitches for pHLIP membrane insertion, as thenegative charges of their side chains block mem-brane insertion. Acidification causes the protonationof these side chains, resulting in an increase in theoverall hydrophobicity of the peptide, which leadsto TM helix formation, shielding the hydrophobicresidues of pHLIP from water molecules. When thepH is raised to near neutrality, the negativelycharged state of the carboxyl groups is againfavored, decreasing the peptide hydrophobicityand resulting in exit from the TM position. Peptideexit from the lipid bilayer is completed whendeprotonation of Asp/Glu residues located in thehydrophobic core of the membrane occurs and theTM helix is destabilized.The knowledge gained from our experiments can
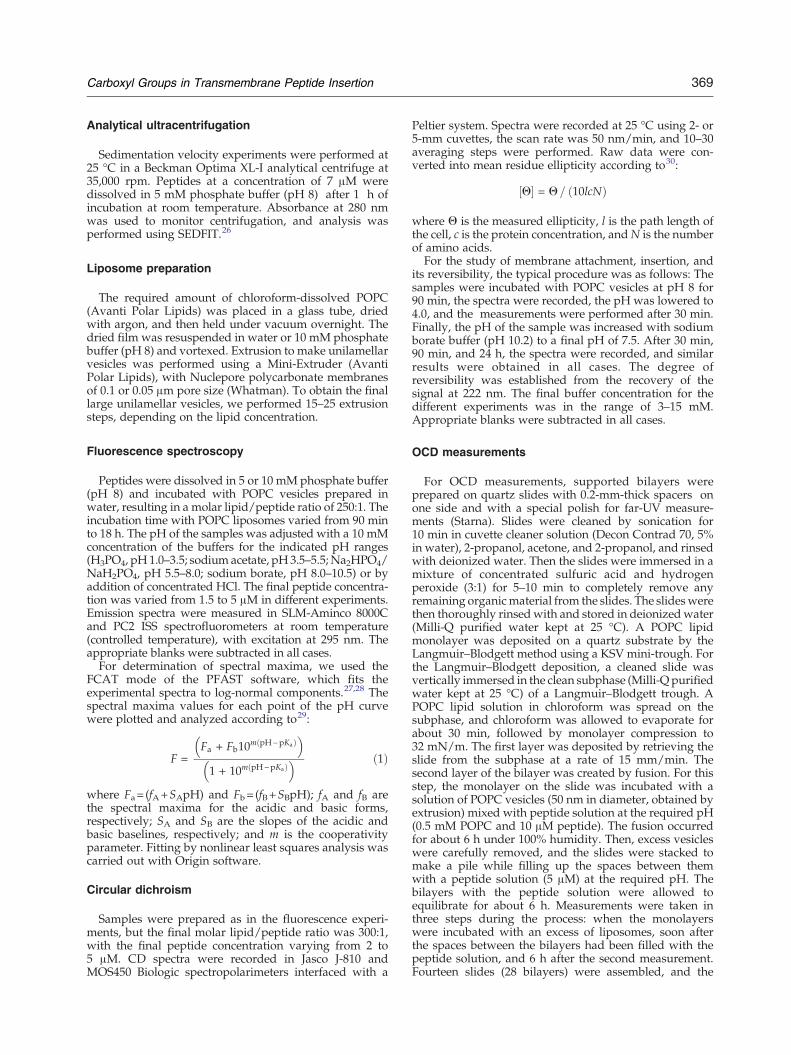
be used as a guide to improve the imaging andtherapeutic properties of pHLIP. For the specificcase of tumor targeting, the pHLIP insertioncharacteristics should be finely tuned to exploitthe low extracellular pH (pHe) of tumors. Tumortargeting by wt pHLIP conjugated to a Cu64–1,4,7,10-tetraazacyclododecane-1,4,7,10-tetraaceticacid chelate for positron emission tomographyimaging correlates with the pHe of tumors, wherethe contrast index was higher for LNCaP tumors(pHe 6.78±0.29) than for PC-3 tumors (pHe 7.23±0.1024). Thus, pHLIP variants where Asp14/Asp25were replaced by Glu, with a higher pKa(pKa=6.5),
7 might be more effective for targetingtumors with higher pHe values. Our present resultssuggest that the number of Asp residues in the TMregion can also modulate the pKa value. Thus, apeptide containing an extra Asp in the TM regionmight have a higher pKa and might be directed totumors more effectively. Another important factorto be considered is the broadness of the pHtransition of the peptide, which is dictated by thecooperativity of the transition. On one hand, for thecase where the peptide pKa is lower than the tumorpHe but the transition is broad (m value is low), asignificant part of the pH transition could interceptthe pHe value, resulting in a significant pHLIPtumor insertion. However, such a scenario will alsolead to more accumulation in healthy tissue. Since itis usually desirable to have a high tumor/organratio, an insertion transition of high cooperativitymight be best. This would ensure greater differen-tiation between the amount of inserted peptidesand the amount of noninserted peptides over anarrow range of pH values, favoring selective
tumor targeting, since the difference in pH betweennormal tissue and cancerous tissue may be only0.5–0.7 units. However, we must bear in mind thatthe measured pHe provides an indication of theaverage acidity outside the cell for a given tumorand can vary between different tumor regions.Furthermore, pHe may not reflect the precise pH onthe exterior surface of the cells, since the cells pumpprotons to the extracellular medium and ΔpH willlead to proton accumulation at the membranesurface.25 Another feature that is expected to shiftthe equilibrium toward the membrane-insertedform is the presence of Asp/Glu residues at theC-terminus of the peptide. After being translocatedacross the plasma membrane into the cytoplasm,where the pH is neutral, these groups would bedeprotonated. Since the translocation of chargesacross membranes is unfavorable, the inserted formwould be stabilized.pHLIP shows promise as a means of targeting
cells in acidic tissues and delivering agents fortherapy and imaging. At the same time, we arelearning more about the binding and insertion ofpeptides at the membrane surface. Here we haveshown that variation in the positions and numbersof carboxyl group titrations modulates the pK andcooperativity of insertion.
Materials and Methods
Peptide synthesis and assessment ofmonomeric state
Peptides were made by solid-phase synthesis, usingstandard 9-fluorenylmethyloxycarbonyl chemistry, atthe W. M. Keck Foundation Biotechnology Resourceat Yale University (New Haven, CT) and were purifiedby reverse-phase chromatography (C18 column, using awater/acetonitrile gradient in 0.01% trifluoroaceticacid). Purity was checked by matrix-assisted laserdesorption/ionization time-of-flight mass spectrometry.Peptides were quantified by absorbance spectroscopyusing a molar extinction coefficient of 13,940 M− 1
cm− 1. Some peptides contain a single Cys residue inthe C-terminus and thus have the potential to formintermolecular disulfide bonds, leading to the formationof dimers. To rule out the possibility that this mightoccur under our experimental conditions, we ran HPLCon peptide samples incubated (at room temperature for3 h) at concentrations higher than those used in ourexperiments and in the absence and in the presence ofPOPC. No dimer band could be detected, andconcentrations in the range of 0.1 mM peptide andovernight incubation were required to detect a signif-icant amount of dimer (∼10%). The peptides describedin Table 1 were used in the experiments, except forsome experiments with D2–D0, where a Cys-lessversion was employed (similar results were obtainedfor both results; data not shown).
369Carboxyl Groups in Transmembrane Peptide Insertion
Analytical ultracentrifugation
Sedimentation velocity experiments were performed at25 °C in a Beckman Optima XL-I analytical centrifuge at35,000 rpm. Peptides at a concentration of 7 μM weredissolved in 5 mM phosphate buffer (pH 8) after 1 h ofincubation at room temperature. Absorbance at 280 nmwas used to monitor centrifugation, and analysis wasperformed using SEDFIT.26
Liposome preparation
The required amount of chloroform-dissolved POPC(Avanti Polar Lipids) was placed in a glass tube, driedwith argon, and then held under vacuum overnight. Thedried film was resuspended in water or 10 mM phosphatebuffer (pH 8) and vortexed. Extrusion to make unilamellarvesicles was performed using a Mini-Extruder (AvantiPolar Lipids), with Nuclepore polycarbonate membranesof 0.1 or 0.05 μm pore size (Whatman). To obtain the finallarge unilamellar vesicles, we performed 15–25 extrusionsteps, depending on the lipid concentration.
Fluorescence spectroscopy
Peptides were dissolved in 5 or 10 mM phosphate buffer(pH 8) and incubated with POPC vesicles prepared inwater, resulting in a molar lipid/peptide ratio of 250:1. Theincubation time with POPC liposomes varied from 90 minto 18 h. The pH of the samples was adjusted with a 10 mMconcentration of the buffers for the indicated pH ranges(H3PO4, pH1.0–3.5; sodium acetate, pH 3.5–5.5;Na2HPO4/NaH2PO4, pH 5.5–8.0; sodium borate, pH 8.0–10.5) or byaddition of concentrated HCl. The final peptide concentra-tion was varied from 1.5 to 5 μM in different experiments.Emission spectra were measured in SLM-Aminco 8000Cand PC2 ISS spectrofluorometers at room temperature(controlled temperature), with excitation at 295 nm. Theappropriate blanks were subtracted in all cases.For determination of spectral maxima, we used the
FCAT mode of the PFAST software, which fits theexperimental spectra to log-normal components.27,28 Thespectral maxima values for each point of the pH curvewere plotted and analyzed according to29:
F =Fa + Fb10m pH−pKað Þ
� �
1 + 10m pH−pKað Þ� � ð1Þ
where Fa= (fA+SApH) and Fb=(fB+SBpH); fA and fB arethe spectral maxima for the acidic and basic forms,respectively; SA and SB are the slopes of the acidic andbasic baselines, respectively; and m is the cooperativityparameter. Fitting by nonlinear least squares analysis wascarried out with Origin software.
Circular dichroism
Samples were prepared as in the fluorescence experi-ments, but the final molar lipid/peptide ratio was 300:1,with the final peptide concentration varying from 2 to5 μM. CD spectra were recorded in Jasco J-810 andMOS450 Biologic spectropolarimeters interfaced with a
Peltier system. Spectra were recorded at 25 °C using 2- or5-mm cuvettes, the scan rate was 50 nm/min, and 10–30averaging steps were performed. Raw data were con-verted into mean residue ellipticity according to30:
Q½ � = Q = 10lcNð Þ
where Θ is the measured ellipticity, l is the path length ofthe cell, c is the protein concentration, andN is the numberof amino acids.For the study of membrane attachment, insertion, and
its reversibility, the typical procedure was as follows: Thesamples were incubated with POPC vesicles at pH 8 for90 min, the spectra were recorded, the pH was lowered to4.0, and the measurements were performed after 30 min.Finally, the pH of the sample was increased with sodiumborate buffer (pH 10.2) to a final pH of 7.5. After 30 min,90 min, and 24 h, the spectra were recorded, and similarresults were obtained in all cases. The degree ofreversibility was established from the recovery of thesignal at 222 nm. The final buffer concentration for thedifferent experiments was in the range of 3–15 mM.Appropriate blanks were subtracted in all cases.
OCD measurements
For OCD measurements, supported bilayers wereprepared on quartz slides with 0.2-mm-thick spacers onone side and with a special polish for far-UV measure-ments (Starna). Slides were cleaned by sonication for10 min in cuvette cleaner solution (Decon Contrad 70, 5%in water), 2-propanol, acetone, and 2-propanol, and rinsedwith deionized water. Then the slides were immersed in amixture of concentrated sulfuric acid and hydrogenperoxide (3:1) for 5–10 min to completely remove anyremaining organicmaterial from the slides. The slideswerethen thoroughly rinsedwith and stored in deionizedwater(Milli-Q purified water kept at 25 °C). A POPC lipidmonolayer was deposited on a quartz substrate by theLangmuir–Blodgett method using a KSV mini-trough. Forthe Langmuir–Blodgett deposition, a cleaned slide wasvertically immersed in the clean subphase (Milli-Q purifiedwater kept at 25 °C) of a Langmuir–Blodgett trough. APOPC lipid solution in chloroform was spread on thesubphase, and chloroform was allowed to evaporate forabout 30 min, followed by monolayer compression to32 mN/m. The first layer was deposited by retrieving theslide from the subphase at a rate of 15 mm/min. Thesecond layer of the bilayer was created by fusion. For thisstep, the monolayer on the slide was incubated with asolution of POPC vesicles (50 nm in diameter, obtained byextrusion) mixed with peptide solution at the required pH(0.5 mM POPC and 10 μM peptide). The fusion occurredfor about 6 h under 100% humidity. Then, excess vesicleswere carefully removed, and the slides were stacked tomake a pile while filling up the spaces between themwith a peptide solution (5 μM) at the required pH. Thebilayers with the peptide solution were allowed toequilibrate for about 6 h. Measurements were taken inthree steps during the process: when the monolayerswere incubated with an excess of liposomes, soon afterthe spaces between the bilayers had been filled with thepeptide solution, and 6 h after the second measurement.Fourteen slides (28 bilayers) were assembled, and the
370 Carboxyl Groups in Transmembrane Peptide Insertion
OCD spectrum was recorded on a MOS-450 spectrometerat a sampling time of 2 s.
Biotin translocation assay
HABA dye (4′-hydroxyazobenzene-2-carboxylic acid)binds to avidin at a 1:1 stoichiometry and absorbs at510 nm only in the avidin-bound state. This interaction isstrongly displaced by the binding of biotin to avidin,resulting in a quantitative reduction in HABA absorbance.This property was used to probe the location of theC-terminus of different peptides with regard to theliposome (inside or outside) (method modified fromNicol et al.31). The C-terminus of each of the peptidevariants was labeled with biotin (see the text below). Therationale for the assay is that pH-driven insertion of the C-terminus would result in biotin translocation inside theliposome, causing shielding of the biotin from the mediumoutside the liposome, where a preformed HABA/avidincomplex (Thermo Scientific) is added. If the biotin is insidethe liposome, no change in absorbance is expected. On theother hand, if pHLIP lies at the exterior surface of theliposome, the C-terminal biotin would be accessible to thesolution outside the liposome (as the biotin group is polar,it is expected not to be protected by the membrane) andwould be able to bind to avidin and displace the HABA/avidin complex, with a consequent reduction in absor-bance at 510 nm. Liposomes were prepared in 150 mMNaCl, and ionic strength was carefully maintained duringall steps to avoid liposome osmotic shock. Biotin-labeledpeptides were incubated in the presence of POPC at pH 8for 2 h at room temperature (150:1 lipid/peptide ratio).For studies of C-terminal translocation, acetate buffer wasadded to the samples, resulting in a final pH of 4.3 prior to1 h of incubation with the peptide. The HABA/avidincomplex was added to the solution only after the finalconditions had been established. The final peptideconcentration for the measurement conditions was 3 μM.To determine the reversibility of the biotin translocation,we increased the pH by the addition of 10 mM sodiumborate buffer (pH 10.2) to give a final pH of 7.4.Absorbance was measured after 1 h of incubation. Forquantitation of the level of reversibility, the recovery ofabsorbance obtained for pHLIP labeled with biotin at itsC-terminus was taken as 100% reversibility, and that ofpHLIP labeled at its N-terminus was taken as 0%.Peptides were labeled at the C-terminal Cys residues
using the membrane-impermeable compoundmaleimide–PEG2–biotin (Thermo Scientific), which has a long polarspacer arm of 29.1 Å to allow adequate biotin binding toavidin. The synthesis reaction was performed in 10 mMphosphate buffer (pH 7.5; overnight incubation at 4 °C).Reaction products were purified by HPLC, and the massof the biotin-labeled peptides was checked by matrix-assisted laser desorption/ionization time-of-flight massspectrometry. The octanol/water partition coefficient ofmaleimide–PEG2–biotin was determined experimentallyby measuring the absorbance at 300 nm in the aqueousand octanol (previously preequilibrated with water)phases after 2 h of vortexing. A logP value of −1.07±0.02 was obtained. As this value does not take into accountthe chemical changes in the cross-linking reaction (forma-tion of a thioether bond between the maleimide moietyand the Cys side chain), the QikProp 3.0 software was
employed to predict the logP value of the reacted form,resulting in a value of −1.4, which is in the range ofmolecules that can be translocated by pHLIP.21
Supplementary materials related to this article can befound online at doi:10.1016/j.jmb.2011.08.010
Acknowledgements
The authors are thankful to Miriam Alonso,Ming An, Justin Fendos (Yale University), and JoséLuis Neira (Universidad Miguel Hernández) forstimulating discussions and insightful commentson the manuscript. D.M.E. was supported byNational Institutes of Health grant GM073857-04.O.A.A., D.M.E., and Y.K.R. were supported byNational Institutes of Health grant CA133890-03. F.N.B.was the recipient of a postdoctoral fellowship fromthe Fundación Alfonso Martín Escudero.
References
1. Hunt, J. F., Rath, P., Rothschild, K. J. & Engelman,D. M. (1997). Spontaneous, pH-dependent mem-brane insertion of a transbilayer alpha-helix. Bio-chemistry, 36, 15177–15192.
2. Andreev, O. A., Dupuy, A. D., Segala, M., Sandugu,S., Serra, D. A., Chichester, C. O. et al. (2007).Mechanism and uses of a membrane peptide thattargets tumors and other acidic tissues in vivo. Proc.Natl Acad. Sci. USA, 104, 7893–7898.
3. Reshetnyak, Y. K., Andreev, O. A., Lehnert, U. &Engelman, D. M. (2006). Translocation of moleculesinto cells by pH-dependent insertion of a transmem-brane helix. Proc. Natl Acad. Sci. USA, 103, 6460–6465.
4. Reshetnyak, Y. K., Andreev, O. A., Segala, M.,Markin, V. S. & Engelman, D. M. (2008). Energeticsof peptide (pHLIP) binding to and folding across alipid bilayer membrane. Proc. Natl Acad. Sci. USA,105, 15340–15345.
5. White, S. H. & Wimley, W. C. (1999). Membraneprotein folding and stability; physical principles.Annu. Rev. Biophys. Biomol. Struct. 28, 319–365.
6. Andreev, O. A., Karabadzhak, A. G., Weerakkody, D.,Andreev, G. O., Engelman, D. M. & Reshetnyak, Y. K.(2010). pH (low) insertion peptide (pHLIP) insertsacross a lipid bilayer as a helix and exits by a differentpath. Proc. Natl Acad. Sci. USA, 107, 4081–4086.
7. Musial-Siwek, M., Karabadzhak, A., Andreev, O. A.,Reshetnyak, Y. K. & Engelman, D. M. (2009). Tuningthe insertion properties of pHLIP. Biochim. Biophys.Acta, 1798, 1041–1046.
8. Melnyk, R. A., Partridge, A. W., Yip, J., Wu, Y., Goto,N. K. & Deber, C. (2003). Polar residue tagging oftransmembrane peptides. Biopolymers, 71, 675–685.
9. Cunningham, F. & Deber, C. M. (2007). Optimizingsynthesis and expression of transmembrane peptidesand proteins. Methods, 41, 370–380.
10. Fernandez-Escamilla,A.M., Rousseau, F., Schymkowitz,J. & Serrano, L. (2004). Prediction of sequence-dependent
371Carboxyl Groups in Transmembrane Peptide Insertion
and mutational effects on the aggregation of peptidesand proteins. Nat. Biotechnol. 22, 1302–1306.
11. Reshetnyak, Y. K., Segala, M., Andreev, O. A. &Engelman, D. M. (2007). A monomeric membranepeptide that lives in three worlds: in solution, attachedto, and inserted across lipid bilayers. Biophys. J. 93,2363–2372.
12. Wu, Y., Huang, H. W. & Olah, G. A. (1990). Method oforiented circular dichroism. Biophys. J. 57, 797–806.
13. Merzlyakov, M., Li, E. & Hristova, K. (2006). Directedassembly of surface-supported bilayers with trans-membrane helices. Langmuir, 31, 1247–1253.
14. Kiessling, V. & Tamm, L. K. (2003). Measuringdistances in supported bilayers by fluorescenceinterference-contrast microscopy: polymer supportsand SNARE proteins. Biophys. J. 84, 408–418.
15. Woody, R. W. (1985). Circular dichroism of peptides.In The Reptides (Udenfriend, S. & Meienhofler, J., eds),pp. 15–114, Academic Press, New York, NY.
16. Pace, C. N., Grimsley, G. R. & Scholtz, J. M. (2009).Protein ionizable groups: pK values and their contri-bution to protein stability and solubility. J. Biol. Chem.284, 13285–13289.
17. Bechinger, B. (1996). Towards membrane proteindesign: pH-sensitive topology of histidine-containingpolypeptides. J. Mol. Biol. 263, 768–775.
18. Ladokhin, A. S. & White, S. H. (2004). Interfacialfolding and membrane insertion of a designed helicalpeptide. Biochemistry, 43, 5782–5791.
19. Harms,M. J., Castaneda, C.A., Schlessman, J. L., Sue,G.R., Isom, D. G., Cannon, B. R. & Garcia-Moreno, E. B.(2009). The pK(a) values of acidic and basic residuesburied at the same internal location in a protein aregoverned by different factors. J. Mol. Biol. 389, 34–47.
20. Lanyi, J. K. (2006). Proton transfers in the bacterio-rhodopsin photocycle. Biochim. Biophys. Acta, 1757,1012–1018.
21. Thevenin, D., An, M. & Engelman, D. M. (2009).pHLIP-mediated translocation of membrane-imper-meable molecules into cells. Chem. Biol. 16, 754–762.
22. Kuyper, C. L., Kuo, J. S., Mutch, S. A. & Chiu, D. T.(2006). Proton permeation into single vesicles occursvia a sequential two-step mechanism and is heteroge-neous. J. Am. Chem. Soc. 128, 3233–3240.
23. Deamer, D. W. & Nichols, J. W. (1989). Proton fluxmechanisms in model and biological membranes. J.Membr. Biol. 107, 91–103.
24. Vavere, A. L., Biddlecombe, G. B., Spees, W. M.,Garbow, J. R., Wijesinghe, D., Andreev, O. A. et al.(2009). A novel technology for the imaging of acidicprostate tumors by positron emission tomography.Cancer Res. 69, 4510–4516.
25. Bränden, M., Sanden, T., Brzezinski, P. & Widengren,J. (2006). Localized proton microcircuits at thebiological membrane–water interface. Proc. NatlAcad. Sci. USA, 103, 19766–19770.
26. Schuck, P. (2000). Size-distribution analysis of macro-molecules by sedimentation velocity ultracentrifuga-tion and Lamm equation modeling. Biophys. J. 78,1606–1619.
27. Burstein, E. A., Abornev, S. M. & Reshetnyak, Y. K.(2001). Decomposition of protein tryptophan fluores-cence spectra into log-normal components:I. Decomposition algorithms. Biophys. J. 81, 1699–1709.
28. Shen, C., Menon, R., Das, D., Bansal, N., Nahar, N.,Guduru, N. et al. (2008). The protein fluorescence andstructural toolkit: database and programs for theanalysis of protein fluorescence and structural data.Proteins, 71, 1744–1754.
29. Ionescu, R. M. & Eftink, M. R. (1997). Global analysisof the acid-induced and urea-induced unfolding ofstaphylococcal nuclease and two of its variants.Biochemistry, 36, 1129–1140.
30. Kelly, S. M. & Price, N. (2000). The use of circulardichroism in the investigation of protein structure andfunction. Curr. Protein Pept. Lett. 1, 349–384.
31. Nicol, F., Nir, S. & Szoka, F. C., Jr (1999). Orientationof the pore-forming peptide GALA in POPC vesiclesdetermined by a BODIPY-avidin/biotin bindingassay. Biophys. J. 76, 2121–2141.


