Embed Size (px)
Citation preview

Copyright is owned by the Author of the thesis. Permission is given for a copy to be downloaded by an individual for the purpose of research and private study only. The thesis may not be reproduced elsewhere without the permission of the Author.
Root restriction and root-shoot
relationships in tomato
(Lycopersicon esculentum Mill.)
A thesis presented in partial fulfilment
of the requirements for the degree of
DOCTOR OF PHILOSOPHY
In
Horticultural Science
at Massey University.
Bruce R MacKay
1995

rx:.,:: .

We shall not cease from exploration
And the end of all our exploring
Will be to arrive where we started
And know the place for the first time. -T.S.Eliot Four Quartets
Abstract
The potential for controlling plant growth and productivity by manipulating
root growth and development has not been realised because of a lack of
understanding of how root growth influences shoot growth. Until such
responses are understood, matching container design and volume to desired
plant output will continue to be based solely on anecdotal evidence. A series
of experiments were conducted to explore the role of physical root restriction
on the vegetative growth and development of tomato (Lycopersicon esculentum
Mill. 'Moneymaker'). Concurrent with these experiments, a statistical model
was developed for non-destructively estimating leaf area, cluster analysis was
adapted to improve experimental precision, and an improved form of growth
analysis developed. Additionally, a review of oxygen and major nutrient
uptake rates by tomato established the operational parameters of a hydro
ponic system developed specifically for the study.
Rooted tomato cuttings were grown in 0.025 or 10 litre (control) containers
in the hydroponic system. After 31 days in 0.025 litre containers, plants
were de-restricted into either 0.05 or 10 litre containers, or retained in the
0.025 litre containers. Plants with physically restricted root systems had
lower total plant biomass and total leaf area, were shorter in both height and
total root length, and had fewer roots, leaves, and lateral shoots than
unrestricted plants. Restriction reduced root number after 31 days, but
reductions in root length and dry biomass did not occur until after 45 days.
Leaf dry biomass was reduced in restricted plants after 45 days; reductions
in stem height, leaf area, number and total dry biomass) were apparent after
67 days. Short periods (31 days) of root restriction had long term (67-99
days) effects on leaf growth. Leaf expansion was more sensitive than leaf
biomass accumulation to root restriction. A strong linear relationship,
independent of root restriction, was observed between the relative rates of
root elongation and leaf expansion. Similar relationships with the relative
ii
rates of increase in root number and dry biomass were due to their covariance
with root elongation. These data are consistent with the hypothesis that root
elongation is functionally linked to leaf expansion via the synthesis of
hormones in actively growing root apices.
The influence of partial root restriction on leaf expansion was also examined.
One or both halves of a split root system was enclosed in a 30 cm3 polyethyl
ene cell. Leaf expansion was reduced in plants with only a portion of their
total root system physically restricted. Compensatory growth in the
unrestricted portion of the root systems resulted in total root growth at final
harvest being similar to plants with all their root system unrestricted.
Analysis of the relative rate of leaf expansion (RA) of individual leaves along
the stem axis revealed two distinct phases in response to root restriction. In
the first phase, apparent about 28 days after treatments were initiated (DAD
and observed in leaves that started expansion 3, 7, and 1 4 DAI, RA was
reduced in plants with one or both root sub-systems in a restriction cell. The
second phase, detected 42 DAI and observed in leaves that started expanding
2 1 and 28 DAI, was characterised by a higher RA in plants with a portion of
their root system restricted compared to unrestricted plants. Proportionately
more assimilate was partitioned to stems of plants with two restricted root
sub-systems compared to plants with either a single or non-restricted root
sub-system. No differences in leaf water potential or photosynthesis of leaves
were observed among treatments.
Conclusions drawn from these data support the involvement of chemical
signals in maintaining coordination between root and shoot growth in
container-grown plants. These conclusions are discussed with reference to
the literature, and a model is proposed to explain root-shoot coordination in
terms of root-sourced cytokinin and shoot-sourced auxin. Avenues for future
research to test hypotheses arising from this model are identified and
discussed, as are possible horticultural ramifications.
iii
Emphasis was placed in the study on improving analytical methodology of
growth analysis of whole-plant studies. Experimental precision was increased
in these experiments by using cluster analysis to allocate plants to blocks
based on leaf area, with a developmental study showing that the mean
coefficient of variation of groups formed from cluster analysis was between
two and fives times smaller than that of groups formed from visual
assessment. A statistical model for non-destructively estimating the leaf
area of tomatoes was developed based on the length of the mib-rib of each
compound leaf and its position on the stem. Although the model was accurate
to within about 2.5% of actual leaf area, it was not stable in time. It was
concluded that when non-destructive estimation of tomato leaf area is
required, the prediction model must be developed while the main experiment
is being conducted. A hybrid method of growth analysis, incorporating both
functional and univariate statistical approaches, provided more flexibility and
information than standard functional or classical analytical methods. The
hybrid method yielded replicated estimates of growth analysis indices,
providing opportunity for further evaluation of the derived data using
multivariate analytical techniques including path, canonical correlation, and
canonical discriminant analysis.
keywords: allometric relationships, assimilate partitioning, biometrics, Chanter function, cluster
a nalysis, containerised plants, hydroponics, leaf expansion, local error control, plant
growth analysis, relative growth rate, Richards function.

iv
Acknowledgements
Dr David Chalmers, when Head of the Department of Horticultural Science,
provided the opportunity, challenge, and supervision for me to undertake this
study. I am particularly grateful to Dr Chalmers, during his time as my Chief
Supervisor, for the space he gave me to widen my professional development
through this study. In making me realise that there was more to science than
'doing an experiment', Dr Chalmers made me aware of the power and beauty of
the philosophy and communication of the discipline.
I am extremely grateful to Dr David Woolley (Department of Plant Science),
latterly my Chief Supervisor, for his challenging and rigorous critiques of my
thesis throughout its preparation.
I am very appreciative of the patient assistance that my third supervisor, Mr Greg Arnold (Department of Statistics), gave to my statistical queries.
I thank Massey University and the Department of Plant Science for giving me
the opportunity to pursue postgraduate study.
I acknowledge the assistance that Dr Michael Carter (Department of Mathe
matics) gave to me in differentiating the Chanter function (Chapter 6), and that
the staff of the Plant Growth Unit, Massey University, provided in constructing
the hydroponic system and maintaining the greenhouse systems and environ
ment.
I thank my family and friends for their patience and understanding of my
preference to spend my time with my thesis rather than with them. Nigel Banks
and Lisa Emerson deserve special mention for the flawless timing of their
encouragement.
Finally, but most importantly, I thank my wife Marion for her unflagging and
selfless support and encouragement over the years that it has taken me to fmish
this study.
v
Table of contents
Abstract . . . . . . . . . . . . . . . . . . . . . . . . . . . . . . . . . . . . . . . . . . . . . . . . . . . . . . i Acknowledgements ............................................. iv Table of contents ........... . . . . . . . . . . . . . . . . . . . . . . . . . . . . . . . . . . . . . v List of abbreviations ............................................. x List of tables .................................................. xii List of figures ..................... .. . ........................ XVll
1.0 Introduction ....... .... .... ....... .. .. .. .... .... ........... 1
1.1 Introduction ........................... ................ 2
2.0 Development of a hydroponic system for root restriction studies ... . .... 7
2.1 Introduction .. ..... ................ . ....... ........... . 8
2.1.1 pH . . . .. ........ ............ . .... . .. . . . ..... .. . 1 1
2.1.2 Nutrient regime ... . .............................. 1 2
2.1.3 Nutrient and oxygen replacement .... ... .. . . .. ........ 1 2
Solution flow rates: theory ...... . ................ 1 4
2.1.4 Statistical independence ...... ...................... 1 7
2.2 Methods .. .. .. ..... .............. ....... ............ . 1 8
2.2.1 Base system .............. ............... ........ 1 8
2.2.2 Contaminant control . . . . . . . . . . . . . . . . . . . . . . . . . . . . . .. 20
2.2.3 Solution composition. . . . . . . . . . . . . . . . . . . . . . . . . . . . . .. 2 2
2.2.4 Solution flow rates ............ ....... ... . ......... 2 3
Nutrient calculations ........... ... . .. . ....... .. 2 3
Oxygen calculations ............ .... . .. ......... 2 4
2.3 Discussion ............................................ 26
3.0 Growth ontogeny under root restriction .. . .... ........ . .... ...... 28
3.1 Introduction .... ... ..... ... . .. . .. .............. ....... 29
3.2 Materials and methods . ........... ... .. ... .. ..... . ...... 33
3.2.1 Cultural methods. . . . . . . . . . . . . . . . . . . . . . . . . . . . . . . . .. 33
Plant material . ......... . . ............... ... .. 33
Hydroponic system .. . . . . . . . . . . . . . . . . . . . . . . . . . .. 34
3.2.2 Environmental ................................... 34
3.2.3 Experimental .................................... 34
3.2.3.1 Experimental design and data collection . . ... . .. 36
3.2.3.2 Pre-analysis adjustment of raw data .. ...... . . . 38
Adjustment for root turnover .. . . . . . . . . . . . .. 38
vi
Adjustment for deterioration of roots in storage . 39
3.2.4 Data analysis . .. .......... .. . .......... . . .... .... 42
Univariate analysis and time ........ ...... ....... 42
Significance testing . . . . . . . . . . . . . . . . . . . . . . . . . . . .. 43
Missing data . . . . . . . . . . . . . . . . . . . . . . . . . . . . . . . . .. 43
Multivariate analyses . . . . . . . . . . . . . . . . . . . . . . . . . .. 43
Path analysis ................................. 44
Canonical correlation analysis .................. .. 46
Canonical discriminant analysis ......... : ......... 47
3.2.5 Plant growth analysis . . . . . . . . . . . . . . . . . . . . . . . . . . . . .. 48
Relative growth rates and relative rates of increase .... 48
3.2.5.1 Classical approach ......................... 5 0
Relative growth rate ...... ............... 5 0
Net assimilation rate .......... ........... 5 1
Other ratio indices . . . . . . . . . . . . . . . . . . . . . .. 5 5
3.2.5.2 Functional approach. . . . . . . . . . . . . . . . . . . . . . .. 57
Background and theory ................... 57
Incorporating structured experimental designs . 5 8
Analytical procedures ..................... 59
Curve fitting and calculating growth analysis indices ..................................... 6 1
3.2.5.3 Allometric relationships ..... . . . . . . . . . . . . . . .. 63
3.3 Results ............... . ............... .. . .. .......... 66
3.3.1 Stress indicators . . . . . . . . . . . . . . . . . . . . . . . . . . . . . . . . .. 66
Leaf water potential ............................ 66
Leaf epinasty ........................ ......... 67
3.3.2 Growth ontogeny . .. ................ .............. 68
Root growth ..... .............. . . ..... ... ..... 69
Shoot growth ..... .......... . . ................ 76
Among treatment comparisons of within-plant relationships ........................................... 79
Relationships between the components of root and shoot growth ... ................................ ... 85
3.3.3 Growth analysis ................. . . . . . . . . . . . . . . . .. 89
Methodology . . . . . . . . . . . . . . . . . . . . . . . . . . . . . . . . . . . .. 89
Relative growth rate . ... .................. ..... . ... 91
Net assimilation rate . ................ .. ........... 98
Relative growth rates and indices of leaf growth .......... 98
Patterns of assimilate partitioning . . . . . . . . . . . . . . . . . . . 102 Allometric relationships ................ .... . ...... 102
vii
Relationships between relative growth rates of components 107
3.4 Discussion ............................... ...... ...... 1 17
4.0 Non-destructive estimation of leaf area .............. . .......... 143
4.1 Introduction ................................. ........ 144
4.2 Materials and methods ......... ... ............. ........ 147
4.2.1 Cultural ................ ........... ............ 147
4.2.2 Environmental .. .................... ............ 148
4.2.3 Experimental ............. ........... .. .. ...... . 148
4.2.4 Development of predictive models . . . . . . . . . . . . . . . . . . .. 149
4.2.4.1 Data collection and preparation ....... ....... 149
Collection . . . . . . . . . . . . . . . . . . . . . . . . . . . .. 149
Positional indices . . . . . . . . . . . . . . . . . . . . . .. 15 0
Developmental indices . ... .. .. . . ... . . . . .. 15 0
Environmental indices . . . . . . . . . . . . . . . . . .. 15 1
Data preparation ............. .... ...... 15 1
Data partitioning . . . . . . . . . . . . . . . . . . . . . .. 15 1
Reduction of the number of independent variables .................................... 15 2
4.2.4.2 Model refinement and selection . ..... . . .... .. 15 4
Decision rules ..... . . ..... ........... .. 15 4
Residual analysis . . . . . . . . . . . . . . . . . . . . . .. 15 5
Stability . . . . . . . . . . . . . . . . . . . . . . . . . . . . .. 15 6
Multicollinearity ..... ....... ...... ... .. 15 6
4.2.4.3 Model validation . ... ......... .. ........ . . 15 8
4.3 Results .......... . .................. ........... ..... 160
4.3.1 Predicting compound leaf area from leaflet area (experiment 1)
............................................. 160
4.3.2 Predicting compound leaf area (experiment 2) .......... 163
Preliminary model selection .. . ........ ... ... .... 163
Other models .......... .... .... ..... ....... . . 164
Model refinement .......... . . . . . . . . . . . . . . . . . .. 17 1
Model stability . . . ...... . .. . . . . . . . . . . . . . . . . . .. 175
Final selection .. ... ... .... .. ... ...... ....... . 176
4.4 Discussion .. ........ .......................... ....... 179
5.0 Reduction of experimental error using cluster analysis .... ......... 185
5.1 Introduction . .. .... ............... ....... .. .. ........ 186
Control of experimental error in plant growth studies ....... 187
Cluster analysis . . . . . . . . . . . . . . . . . . . . . . . . . . . . . . . . . . .. 188
viii
Cluster analysis and local error control .... .. ...... 190
5.2 Materials and methods . ... ........ ... ...... ..... ....... 190
5.2.1 Plant culture ... ........ ..... ... ..... ... ..... 190
5.2.2 Experiment 1 ................................ 19 1
5.2.3 Experiment 2 ................................ 19 1
5.2.4 Data collection and analysis ...... ....... .... .... 192
Cluster analysis .... ... .... .. .......... .. . .. 192
Assessment criteria and analysis ..... ......... . 193
5.3 Results ........ ... ... .. .... ... ......... ......... .... 194
5.3.1 Blocking by leafiness (Experiment 1 ) .............. 195
5.3.2 Blocking by leafiness and height (Experiment 2) ..... 196
5.4 Discussion ........ ... ................ ..... ....... .... 200
6.0 Leaf expansion under partial root restriction .. . . . . . . . . . . . . . . . . . .. 205
6.1 Introduction ............. .... ...................... .. 206
6.2 Materials and methods ..... ..................... .... .. . 2 10
6.2. 1 Cultural . .. .... ..... .... ........ .... .......... . 2 10
6.2.2 Environmental ....................... ... .... ... . 2 1 1
6.2.3 Experimental ....................... ... ...... ... 2 1 1
Experimental design . . . . . . . . . . . . . . . . . . . . . . . . . .. 2 1 1
Treatments . . . . . . . . . . . . . . . . . . . . . . . . . . . . . . . . .. 2 1 1
6.2.4 Data collection . .. ..... ... ........ .......... ... .. 2 12
Estimation of leaf area .. ...... ........ ..... . . .. 2 12
Leaf area ontogeny . . . . . . . . . . . . . . . . . . . . . . . . . . .. 2 13
Leaf sampling . ...... ....... . .. .... ......... " 2 15
Relative rate of leaf area expansion ........... .... 2 18
Duration of leaf expansion .................. .... 2 19
Rate of leaf appearance .. ................. .. ... 2 19
Actual leaf area measurement Water potential measurements
2 19
2 19
Photosynthesis measurements ...... ........ .. ... 2 2 0
Biomass measurements .......... .. ...... . .. ... 2 2 0
6.2.5 Data analysis ... ... . . . . . . . . . . . . . . . . . . . . . . . . . . . .. 2 2 1
Analysis of variance ... .... .. ........... .... ... 2 2 1
Principal component analysis ... .... . ..... .. .. .. . 2 2 3
Repeated measures analyses ....... .. ...... .. ... . 2 2 3
6.3 Results ..... . .............. .... ..... ..... .. ... ...... 2 2 4
6.3.1 Root growth . ........... ... ... ........ .... ... ... 2 2 4
6.3.2 Leaf growth . .. .. . .......... ....... . ..... ... .... 2 2 5
Validation of leaf area model ....... ... ...... .... 2 2 5
ix
6.3.3 Leaf expansion ..... .............. . . . . . . . . . . . . . .. 226
6.3.3.1 Individual leaf ontogeny . . . . . . . . . . . . . . . . . . .. 226
Monitored leaf groups ................... 226
Leaves developing before day 2 1 ........... 227
Inserting roots into the restriction cells ...... 235
Leaves developing after day 2 1 ............ 236
Rate of leaf appearance ............... . .. 237
Relative leaf expansion rate . . . . . . . . . . . . . .. 238
6.3.2.2 Total leaf area ........................... 244
6.3.4 Leaf function ............................... . ... 246
Photosynthesis ....... . ......... . ........... . . 246
Leaf water potential . . . . . . . . . . . . . . . . . . . . . . . . . .. 246
6.3.5 Whole plant growth ......................... . . . .. 247
Vegetative growth components ................... 247
Assimilate partitioning . . . . . . . . . . . . . . . . . . . . . . . .. 248
6.4 Discussion ........................................... 250
7.0 General discussion . . . . . . . . . . . . . . . . . . . . . . . . . . . . . . . . . . . . . . . .. 272
7.1 General discussion ..................................... 273
8.0 References . ................... . .......................... 309
List of abbreviations
Eij
Eja
Ejw
Ai 2 X obs
'4'w A C C AN COVA ANOVA BA e CA eDA eDF CDF1(31) Cp CR eRD CV CVUT CVLA DAI D CR DFT EA gL gR gST gw INDEX k LAR LIP LNAREA LNMRIB LPI LWR
mean net assimilation rate CI5w ·m-2·day-.I )
mean plant relative growth rate (g .g-I·day-I ) residual error (of ReB model ) among-treatment error within-treatment error ith eigenvalue of canonical discriminant function observed chi-square value leaf water potential (MFa ) 1-amino-cyclopropane- 1-carboxylic acid
analysis of covariance analysis of variance benzyladenine canonical correlation analysis canonical discriminant analysis canonical discriminant function first canonical discriminant function of data at 3 1 DAI Mallows statistic continuously restricted completely randomised design coefficient of variation coefficient of variation for plant height coefficient of variation for leaf area days after initiation (of experiment ) double cell restricted root system Deep Flow Technique (hydroponic system ) net assimilation rate (gw ·m·2·day-l ) leaf dry weight (g ) root dry weight (g ) stem dry weight (g ) plant dry weight (g ) relative leaf position on stem allometric coefficient
leaf area ratio (m2 ·gw·1 ) leaf insertion position log., leaf area (cm2 ) log., leaf mid-rib (cm) leaf plastochron index leaf weight ratio
x
MSE n
NAA NFT NS C OLS
P1(13) Pij RI(13) R2
R2adj RA Rav RCB
RD
RDD
R1(RN) Rl(variable) riJ RL RPF
RR RRL
Rs RSM
RsT Rw RWR SCR SE
SEOD
SLA SLW SO C SPF SR SRL SWR
UR
mean square of error number of observations naphthaleneacetic acid Nutrient Film Technique Non-Split Control ordinary least squares first predictor canonical variable of data at 1 3 DAI path coefficient between variables i and j first response canonical variable of data at 1 3 DAI coefficient of multiple determination adjusted coefficient of determination relative leaf expansion rate (m2·m,2 ·day,l ) mean relative growth rate (over a given period ). randomised complete block design restricted-derestricted restricted-derestricted-derestricted relative rate of increase in root number relative rate of increase of variable (e.g. leaf or root number ) correlation coefficient between variables i and j leaf relative growth rate (g.g'l ·day'l) root produced factor root relative growth rate (g.g'l·day'l ) relative root extension rate (m -m'l·day'l ) shoot relative growth rate (g_g'l ·day'l ) root specific mass (mg'm'l ) stem relative growth rate (g.g'l·day'l) plant relative growth rate (g-g'l ·day'l ) root weight ratio single cell restricted root system standard error of mean standard error of difference between means specific leaf area (m2-gL,I ) specific leaf weight (gL'm,2 ) Split Only Control s hoot prod uced factor shoot:root ratio specific root length (m-gR,I) stem weight ratio unrestricted (control )
xi
xii
List of tables
Table 2.1 Major and minor elements in hydroponic solution .............. 22
Table 2.2 Nitrogen and potassium uptake data for tomato . ........... .. . 24
Table 2.3 Oxygen consumption rates of tomato plants, calculated from data in the literature .. .. .. ................................. .... ....... .. . 2 5
Table 2. 4 Calculations of O2 supply and solution flow rate for hydroponic system ........ .... .. ...... .. .... ...... . .... .... .... ...... .... ...... 2 5
Table 2.5 Summary of operating criteria of hydroponic system . . . . . . . . . . . . 26
Table 3. 1 Details of experiment .............. ..... ....... .. ....... 3 6
Table 3.2 Percentage of dead tissue in root system (by length ) ...... ...... 39
Table 3. 3 Leaf water potential of tomato plants (n=6) . . . . . . . . . . . . . . . . . .. 6 7
Table 3.4 Effect of root restriction treatments on epinastic curvature of petiole and adventitious root formation ............. .. ..... .. ......... ..... .. . 6 8
Table 3.5a Summary statistics from univariate analysis of plant response to root restriction at 13 and 3 1 DAI .............. .. ........... ..... . ..... 7 3
Table 3. 5b Summary statistics from univariate analysis of plant response to root restriction at 4 5 and 6 7 DAI ............. ... ... .. ... ......... ..... 7 4
Table 3. 5c Summary statistics from univariate analysis o f plant response t o root restriction at 99 DAI . ... ....... ....... .. ................ .... .... 7 5
Table 3.6 Canonical discriminant functions and treatment means of growth variables at each harvest . . . . . . . . . . . . . . . . . . . . . . . . . . . . . . . . . . . . . . . . . 82
Table 3.7 Percent (%) change in plant response between plants with restricted root systems ( CR treatment only ) and unrestricted root systems (UR treatment) .. 8 5
Table 3. 8a Path analysis of the effects of root growth components on shoot dry weight and plant height. Significance levels are presented for the direct effects and simple correlations only. (n=114.) .................................. 8 7
xiii
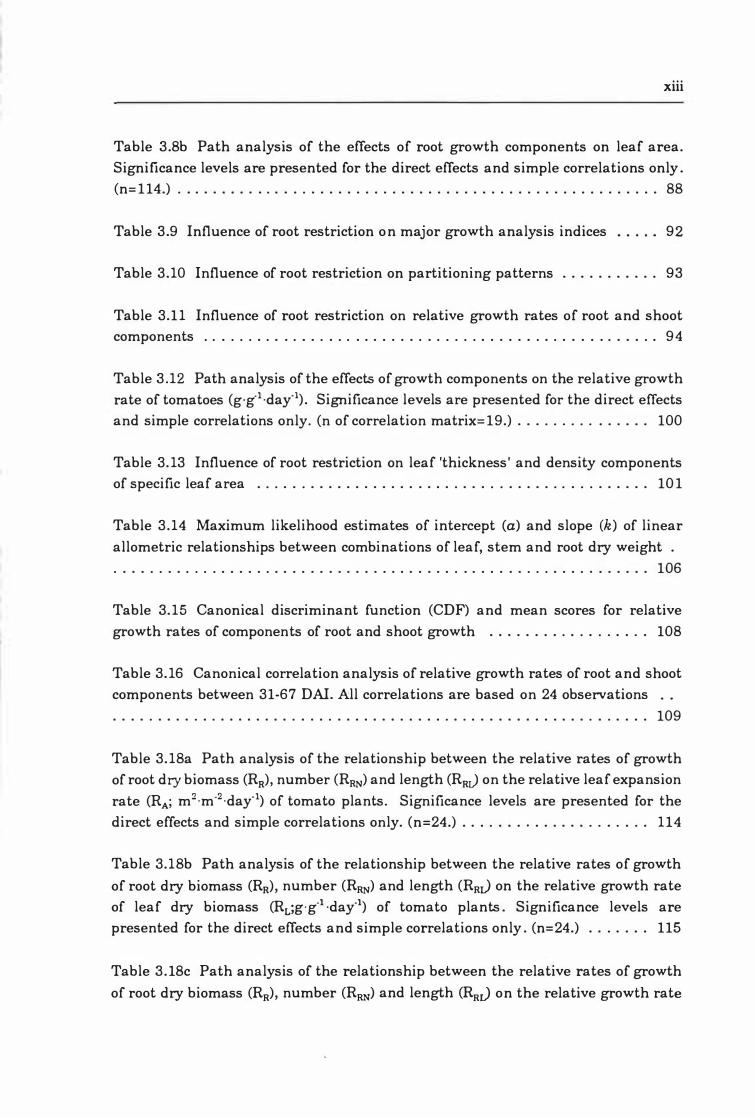
Table 3.8b Path analysis of the effects of root growth components on leaf area. Significance levels are presented for the direct effects and simple correlations only. (n= 1 14.) ...................................................... 88
Table 3.9 Influence of root restriction on major growth analysis indices 9 2
Table 3.10 Influence of root restriction on partitioning patterns ........... 9 3
Table 3.1 1 Influence of root restriction on relative growth rates of root and shoot components ... .................................. ............ .. 9 4
Table 3.12 Path analysis of the effects of growth components on the relative growth rate of tomatoes (g.g.l ·day·I). Significance levels are presented for the direct effects and simple correlations only. (n of correlation matrix= 19.) ............... 1 0 0
Table 3. 13 Influence of root restriction on leaf 'thickness' and density components of specific leaf area ..... ................. .... .......... ........ 1 0 1
Table 3.14 Maximum likelihood estimates of intercept (a) and slope (k) of linear allometric relationships between combinations of leaf, stem and root dry weight . . ... . .... . . .... ..... .. .. .. ..... ... . ... ... .. . . ... .... . , ...... 1 06
Table 3. 15 Canonical discriminant function (CDF) and mean scores for relative growth rates of components of root and shoot growth .......... .. ...... 1 08
Table 3. 16 Canonical correlation analysis of relative growth rates of root and shoot components between 3 1 ·6 7 DAI. All correlations are based on 24 observations .... ..... ........... ................................... ..... 1 09
Table 3. 18a Path analysis of the relationship between the relative rates of growth of root dry biomass (RR)' number (RRN) and length (RRJ on the relative leaf expansion rate (RA; m2·m·2·day·l) of tomato plants. Significance levels are presented for the direct effects and simple correlations only. (n= 24.) . . . . . . . . . . . . . . . . . . . .. 114
Table 3.18b Path analysis of the relationship between the relative rates of growth of root dry biomass (RR)' number (RRN) and length (RRJ on the relative growth rate of leaf dry biomass (RL;g·g·l·day·l) of tomato plants. Significance levels are presented for the direct effects and simple correlations only. (n= 24.) .. . . . .. 1 1 5
Table 3.18c Path analysis of the relationship between the relative rates of growth of root dry biomass (RR)' number (RRN) and length (RRJ on the relative growth rate
xiv
of stem dry biomass CRsT;g ·gol·dayOl) of tomato plants. Significance levels are presented for the direct effects and simple correlations only. (n= 24.) . . . . . . . 116
Table 4. 1 Partial sums of squares and means squares for preliminary model for estimating compound leaf area from linear measures of leaflets .. ... .. . .. 1 5 2
Table 4.2 Regression and validation diagnostics of candidate model predicting compound leaf area from leaflet area . . . . . . . . . . . . . . . . . . . . . . . . . . . . . . . 16 2
Table 4. 3 Performance of Ross's ( 19 4 6) and Salter's ( 19 5 8) model for predicting tomato leaf area from the model lear area (cm2) = a + mid-rib length2 • • • • • • 16 4
Table 4. 4 Range of values of data examined .. .... ..... . . . . . . . . . . . . .. 16 5
Table 4. 5 'Best' main factor models for each month from all-possible-regressions selection procedure ............ ...... .... ....... . .... ..... ... .. 16 9
Table 4. 6 Correlation coefficients between leaf area and predictor variables . 17 0
Table 4. 7 Summary of regression fit and validation statistics for refined candidate models for predicting log, leaf area .. . .. ... ... . .. .. .. ... ... .. .... . . 174
Table 4.8 Plant height and SLA between months .......... .. . . . . . . . .. 17 5
Table 4.9 Relative performance of common model structures between months 177
Table 4. 10 Coefficients and prediction intervals of selected models . . . . . . .. 178
Table 5. 1 Number of experimental units per block of blocked designs reported in the Journal of the American Society for Horticultural Science 19 89 - 19 9 1 ( vol. 1 1 4- 116) inclusive .... ...... .. ... . . ... . ... .. ....... ..... ... ... .. ... ... 19 2
Table 5. 2 Mean plant leaf area and coefficient of variation of blocks determined by cluster analysis and visual differentiation . . 0 • • • • • • • • • • • • • • • • • • • • • • • • 19 5
Table 5. 3 Mean coefficient of variation of leaf area ( CVLA) and height (CVHT) within determined blocks . . . .. . .. .. . . . . . . ... . .... . . . .. .. .. ... . . ..... .. 196
Table 5. 4 Number of blocks of given size (n) 'extracted' from the pool of plants by visual or clustering methods ...... . ... . .. .. .. .. .. ... . . .... . .. . . . . 2 0 0
xv
Table 6.1 Treatment description and codes . . . . . . . . . . . . . . . . . . . . . . . . .. 2 12
Table 6.2 Individual leaf area and within -group variation by stem position and clustered group .......... . ..... ... . ........................... 217
Table 6.3 Percentage (%) of leaves in clustered groups from different stem positions .. ... ........ ..... ......... ............. ... ... .... .... ...... 217
Table 6.4 Dry weight of restricted and unrestricted portions of the root systems at final harvest ( 4 9 DAI ) ... ........................... ... .. .. ..... 224
Table 6.5 Characteristics of monitored groups of individual leaves .. . .... . 226
Table 6.6 Analysis of parameter estimates of the Chanter function for leaf expansion over time . . . . . . . . . . . . . . . . . . . . . . . . . . . . . . . . . . . . . . . . . . . . . . . . . . . . 229
Table 6. 7 Analysis of parameter estimates of Richards function for leaf expansion over time . . . . . . . . . . . . . . . . . . . . . . . . . . . . . . . . . . . . . . . . . . . . . . . . . . .. 23 0
Table 6. 8 Analysis of derivatives of Richards function coefficients for leaf expansion over time . . . . . . . . . . . . . . . . . . . . . . . . . . . . . . . . . . . . . . . . . . . . . . . . . . .. 23 1
Table 6.9 Analysis of parameter estimates of Richards function for relative and absolute rates of leaf expansion over time .. . . . . . . . . . . . . . . . . . . . . . . . .. 23 2
Table 6.10 Individual and pooled regression coefficients relating appearance of leaves of 3 cm mid-rib length against time (days from transfer into hydroponic system ) ...... . ..... ................. ......... .... ....... ... . 23 8
Table 6.1 1 Relative leaf expansion rates eRA ) of leaves commencing expansion growth 3.5 DAI at, and between, different times ... ... .. .. . ......... .. 24 0
Table 6.12 Relative leaf expansion rates eRA ) of leaves commencing expansion growth 7 days after treatment application (DAI ) at, and between, different days . . . . .. . ... ... . .. . . ..... .... .... ...... . .. . .. ....... . .. . .. .. . .. 24 1
Table 6. 13 Relative leaf expansion rates (RA ) of leaves commencing expansion growth 14 DAI at and between different times ... ......... ..... ...... 24 2
Table 6. 14 Relative leaf expansion rates eRA) of leaves commencing expansion growth 21 DAI at and between different times . . ............. .. . ..... 24 3
xvi
Table 6. 1 5 Relative leaf expansion rates (R,J of leaves commencing expansion growth 28 DAI at and between different times . . . . . . . . . . . . . . . . . . . . . . . 24 3
Table 6. 16 Photosynthesis rates and leaf water potential during experimental period . . . . . . . . . . . . . . . . . . . . . . . . . . . . . . . . . . . . . . . . . . . . . . . . . . . . . . . . . . . . 246
Table 6. 17 Principal component of standardised vegetative growth parameters under levels of root restriction at final harvest . . . . . . . . . . . . . . . . . . . . . . . . . . . . 24 7
Table 6.18 Influence of root restriction treatments on plant dry biomass at final harvest . . ... . . . . .... . . . ..... . . . . . . . . . . . . . . . . . . . . . . . . . . .. . . . . 24 8
Table 6. 19 Partitioning and growth analysis indices at final harvest . . .. . . 24 9
Table 7.1 Estimate of the allometric coefficient, k, from the ratio of relative growth rates (R) of components i andj (i_j), using the non-paired method of Causton and Venus ( 19 8 1; equation 3. 5 ) with block-adjusted data . . . . . . . . . . . . ....... 279
xvii
List of figures
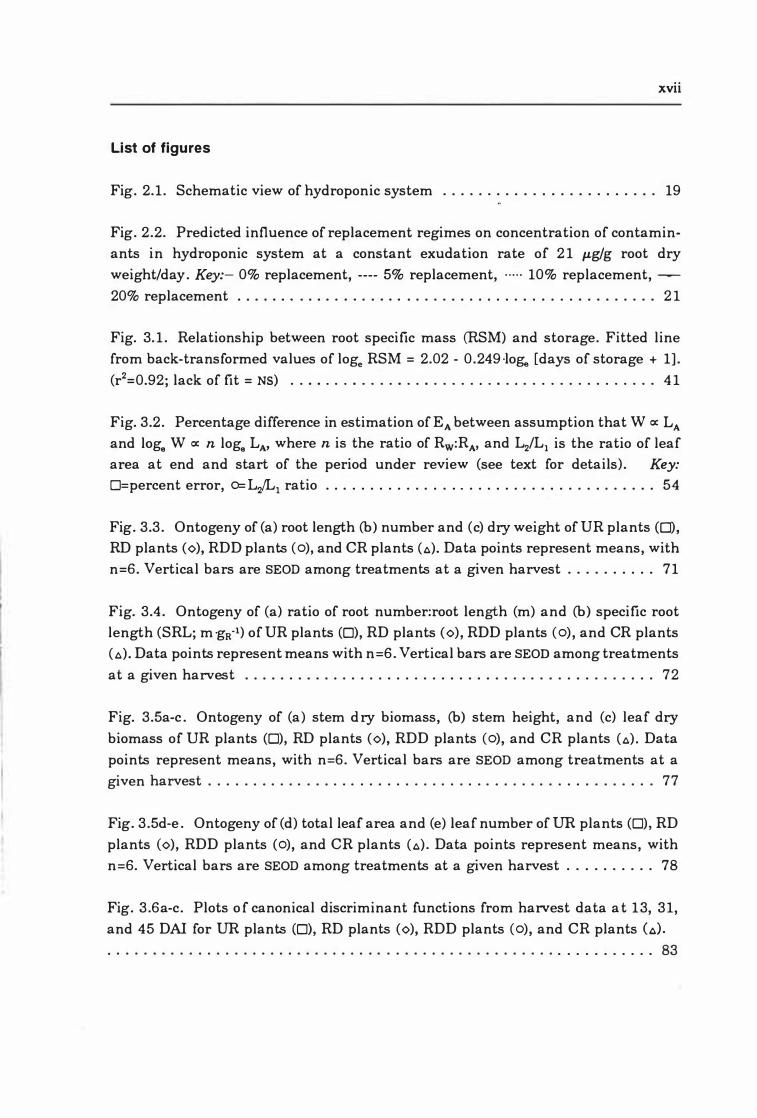
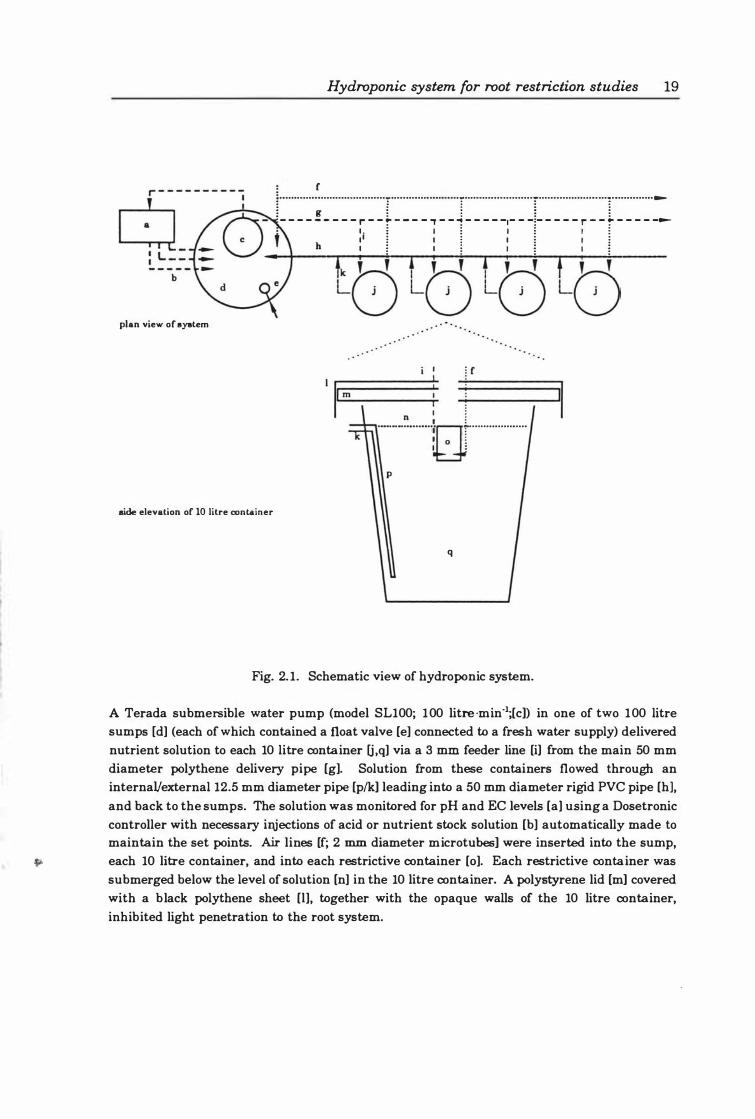
Fig. 2.1. Schematic view of hydroponic system ......... ... ............ 19
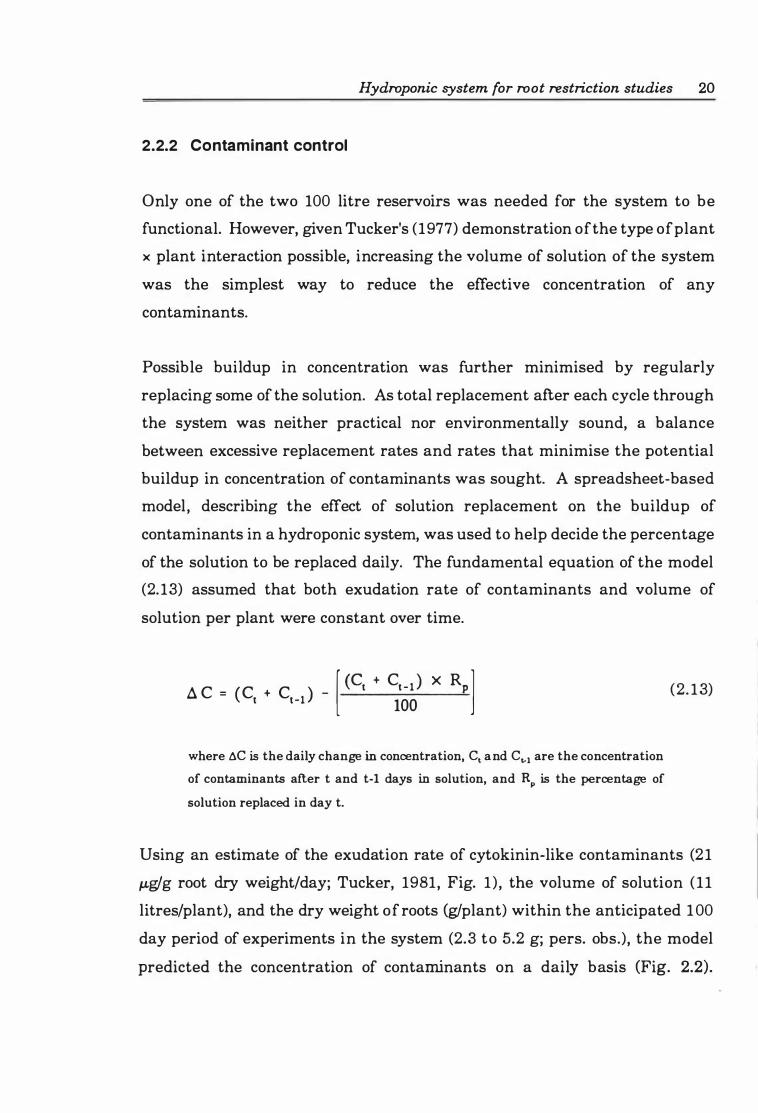
Fig. 2.2. Predicted influence of replacement regimes on concentration of contaminants in hydroponic system at a constant exudation rate of 2 1 J.Lg/g root dry weight/day. Key:- 0% replacement, ---- 5% replacement, ····· 10% replacement, � 20% replacement ............ ...................... ............. 2 1
Fig. 3.1. Relationship between root specific mass (RSM ) and storage. Fitted line from back-transformed values of loge RSM = 2.0 2 - 0.24 9 ·loge [days of storage + 1]. (r2=0.9 2; lack of fit = NS) . . • • . . . • . . . . • . . • . . . . . . . • . . . . . . . . . . . . . . . . . 4 1
Fig. 3.2. Percentage difference in estimation of EA between assumption that W oc LA and loge W oc n loge LA> where n is the ratio of Rw:RA> and L2/Ll is the ratio of leaf area at end and start of the period under review (see text for details). Key:
o=percent error, o=LJLl ratio ..................................... 5 4
Fig. 3.3. Ontogeny of (a) root length (b) number and (c) dry weight of UR plants (0), RD plants (0), RDD plants (0), and CR plants (A). Data points represent means, with n=6. Vertical bars are SEOD among treatments at a given harvest .......... 7 1
Fig. 3.4. Ontogeny of (a) ratio of root number:root length (m ) and (b) specific root length (SRL ; m·gR·1) ofUR plants (0), RD plants (0), RDD plants (0), and CR plants (A). Data points represent means with n=6. Vertical bars are SEOn among treatments at a given harvest .............................................. 72
Fig. 3. 5a-c. Ontogeny of (a ) stem dry biomass, (b) stem height, and (c) leaf dry biomass of DR plants (0), RD plants (0), RDD plants (0), and CR plants (A). Data points represent means, with n=6. Vertical bars are SEOD among treatments at a given harvest . . . . . . . . . . . . . . . . . . . . . . . . . . . . . . . . . . . . . . . . . . . . . . . . .. 7 7
Fig. 3. 5d-e. Ontogeny of (d ) total leaf area and (e ) leaf number of UR plants (0), RD plants (0), RDD plants (0), and CR plants (A). Data points represent means, with n=6. Vertical bars are SEOD among treatments at a given harvest .......... 78
Fig. 3.6a-c. Plots of canonical discriminant functions from harvest data at 1 3, 3 1, and 4 5 DAI for UR plants (0), RD plants (0), RDD plants (0), and CR plants (A) . . . ... ... . . . ..... ............. ... ....... ........... .. ... ..... . 83
xviii
Fig. 3. 6d -e. Plots of canonical discriminant functions from harvest data at 6 7 and 99 DAI for UR plants (0), RD plants (0), RDD plants (0), and CR plants (6). . 84
Fig. 3. 7. Path analysis diagram of relationships between the components of root growth (i.e. root number, length and dry biomass) and shoot growth (i.e. leaf area and number, shoot dry biomass, and stern height). . . . .. . ... .. .. .... ... . 86
Fig. 3. 8. Mean relative growth rates (a) and net assimilation rates (b) of plants. Data bars represent means with n=6. Vertical bars are ± SE .. . ....... . . .. 89
Fig. 3. 9. Comparison of pooled standard errors of the standard and hybrid methods of analysis in calculating Rw (. ), EA (0), LAR (6), SLA (0) and LWR (0) . .. .. 9 0
Fig. 3. 10. Effect of root restriction o n the relative growth rates, net assimilation rates and leaf area ratio of UR plants (0), RD plants (0), RDD plants (0), and CR plants (.:.). Data points represent means with n=6. Vertical bars are SEOn among treatments at a given harvest ... .. ..... .. .............. . . . . .. .... . . 9 5
Fig. 3. 1 1. Effect of root restriction on (a) the specific leaf area, (b) leaf weight ratio and (c ) relative leaf expansion rate ofUR plants (0), RD plants (0), RDD plants (0), and CR plants (6). Data points represent means with n=6. Vertical bars are SEOn among treatments at a given harvest. . .. . . . . ... ... . ... . ..... ..... ... 96
Fig. 3. 12. Effect of root restriction on (a ) stern weight ratio, (b) root weight ratio and (c ) shoot:root ratio ofUR plants (0), RD plants (0), RDD plants (0), and CR plants (6) . Data points represent means with n=6. Vertical bars are SEOn among treatments at a given harvest. . . . . . . . . . . . . . . . . . . . . . . . . . . . . . . . . . . . . . . . . . . . . . . 9 7
Fig. 3. 13. Path diagram of structural relationship between the components (variables 1-4) of the whole plant relative growth rate (variable 0 rRw]). Singleheaded arrows represent the direct effects, measured by path coefficients (P ij' Table 3. 12), and the double-headed arrows depict simple correlations (rij' Table 3. 1 2)
between Rw and net assimilation rate (NAR), leaf area ration (LAR), specific leaf area (SLA ), and leaf weight ratio (LWR) . . . . . ....... . . . .. . . . .. . . .. . . . . 9 9
Fig. 3. 14. Harvest means of data between (a ) stern and root (b) leaf and root and (c ) leaf and stern weight ofUR plants (0), RD plants (0), RDD plants (0), and CR plants (6). . . . . . . . . . . . . . . . . . . . . . . . . . . • . . . . . . . . . . . . . . . . . . . . . . . . . . . . . 10 4
Fig. 3. 1 5. Canonical correlation between relative growth rates of root components (dry biomass, extension and number) and shoot components (leaf and stem dry
xix
biomass, leaf expansion) of DR plants (D), RD plants (0), RDD plants (0), and CR plants Ct.). • . . . . • . • • • • • • • • • • • • • • • • . . . • . . • • • • . . • • • • • • • . . . • . . . . . 1 10
Fig. 3.16. Path diagram of structural relationships between the relative growth rates of the components of root growth (variables 1- 3 ; number [RRN]' length [RRJ, and dry biomass [RR)) with those of shoot growth (variables 4- 6; leaf area expansion [RLA]' leaf dry biomass [RJ, and stem dry biomass rRsT))' Single-headed arrows represent the direct effects, measured by path coefficients (Pii' Tables 3.1 7a-c), and the doubleheaded arrows depict simple correlations (rii, Tables 3.1 7a-c ). . . . . . . . . . . .. 111
Fig. 3.1 7. Relationship between relative plant growth rates (Rw), relative leaf expansion rates (RLA) and relative root elongation rates (RaJ growth rates of DR plants (D), RD plants (0), RDD plants (0), and CR plants (t.) . ............ 1 13
Fig. 4.1a-d. Upper and lower 9 5% confidence levels of an individual prediction of the leaf area of randomly selected leaves of (a) 5. 5 cm, (b) 7.3 cm length, (c) 10.5 cm, and (d ) 14.0 cm length. . . . . . . . . . . . . . . . . . . . . . . . . . . . . . . . . . . . . . . . . . . . .. 1 61
Fig. 4.2. Relationship between mid-rib length and leaf area of L. esculentum
'Moneymaker' ........................................... ..... 163
Fig. 4.3. Relationship between lo� mid-rib length and lo� leaf area of L. esculentum
'Moneymaker' at each month . . . . . . . . . . . . . . . . . . . . . . . . . . . . . . . . . . . .. 1 66
Fig. 4.4. Plots of studentised residuals from regression of loge mid -rib length and loge leaf area for each month. . . . . . . . . . . . . . . . . . . . . . . . . . . . . . . . . . . . . . . .. 167
Fig. 4. '5. Inter-relationships between regressors in March 1990 data set, but typical of all data sets. ............................................... 17 1
Fig. 5. 1. Effect of blocking technique on within-block CV of (a) leaf area and (b) plant height in blocks containing different numbers of plants. Key: visual (0), leaf area-specific cluster analysis (e:.), stem height-specific cluster analysis (0), and bivariate cluster analysis (D). Data are presented as means ± SE; n ranges from 3 to 4 6 . ................................... ................... 19 7
Fig. 5.2. Relationship between plant height and total leaf area for cutting-grown tomato plants. Second degree polynomial regression (SE coefficient in brackets) is: Leaf area = 199.3 4( 5 7.4 3) - 17.29( 5.0 8) x height + 0. 7 2( 0. 11) x height2, R2=0.89,
P<O.OOOI . . . . . . . . . . . . . . . . . . . . . . . . . . . . . . . . • . . . . . . . . . . . . . . . . . " 198
xx
Fig. 5.3. Relationship between coefficients of variation of leaf area and height within blocks discriminated visually or through cluster analysis ............... 199
Fig. 6.1. Relationship between estimated total leaf area and actual area measured at final harvest for individual plants. The relationship is described by Y = 0.074 +
1.078X, r2= 0.74. Key: O:DCR, �:SCR, o:SOC, <>:NSC ................... 22 5
Fig. 6.2. Chanters functions describing growth of leaves commencing expansion about 3, 7, and 14 days after initiation of treatment. Each value is the mean of 9- 12 plants. Key: O:DCR, �:SCR, o:SOC, <>:NSC . . . . . . . . . . . . . . . . . . . . . . . . .. 23 3
Fig. 6.3. Richards functions describing the growth of leaves commencing expansion about 3,7, and 14 days after initiation of treatment. Each value is the mean of 9- 12 plants. Key: O:DCR, �:SCR, o:SOC, <>:NSC .......................... 23 4
Fig. 6.4. Leaf area at point of inflexion of La, L7, and L14 leaves. Bars are ± SE . . ........... '" ............................................. 23 5
Fig. 6.5. Expansion ontogeny of leaves commencing development (a ) 2 1 days or (b) 28 days after treatment application. Each point is the mean ± SE from 1 0-12 plants.
Key: O:DCR, �:SCR, o:SOC ....................................... 23 7
Fig. 6.6. Expansion ontogeny of (a ) total plant leaf area, (b) leaves present at treatment initiation, leaves commencing expansion (c ) 0- 2 0 DAI, and (d ) > 2 1 DAI. Each point is the mean ± SE from 1 0- 12 plants. Key: O:DCR, �:SCR, o:SOC, <>:NSC . ..... . . . ........ .................. ... .... . . ..... . .. ... . . . ... 24 5
Fig. 6.7. Relationship between shoot dry weight and root dry weight. Each value is the block mean of 2- 3 plants. Y= 18.7 + 6.3 9X, R2= 0.9 2. Key: O:DCR, �:SCR, o:SOC, o:NSC ................................................ 24 9

Chapter 1
Introduction
1.1 Introduction
Introduction 2
A greater understanding of the root-shoot relationships of plants growing in
containers is required. Crop production in containers is a dominant feature
of the nursery, cut flower and greenhouse vegetable sectors of the horti
cultural industry in New Zealand. Over 97% of nurseries listed in the New
Zealand Nursery Register (Anon, 1993) produce plants in containers, and the
majority of greenhouse vegetables are raised in some form of container
system. Crops traditionally grown in the open ground are increasingly being
produced in containers. Bare-rooted vegetable seedling transplants are now
rarely seen, having been replaced by higher quality transplants produced in
5-15 cm3 cells., Forestry seedlings are increasingly being produced in
containers, with the conservatism and longstanding antagonism of this sector
to container production (van Dorsser, 1982) now giving way to greater
acceptance of the improved quality, growth control and flexibility in
production scheduling achievable with container produced stock (Tinus and
McDonald, 1979).
Producing plants in containers rather than in the field or greenhouse soils
increases the grower's financial risk. Container production necessitates a
considerable financial investment in containers and soilless growing medium
before production starts, whereas both real and opportunity costs associated
with soil-grown crops tend to rise towards the end of the production cycle.
Growers are, therefore, more demanding of crops produced in containers.
They require rapid growth to minimise the time required to produce the plant
or its saleable component and to maximise the number of crops that can be
cycled through their production areas (e.g. greenhouses) annually. Producers
of woody ornamental plants, for example, aim to maximise growth at all
stages of the production process from liner (small container) through the
progression of potting-on (transplanting) up to the final container size.
Seedling growers seek to produce high quality plants with either good shelf
life (bedding plants) or capable of withstanding transplant shock (forestry and·
Introduction 3
vegetable seedlings). Growers of houseplants often seek to control excessive
growth (e.g. height) to maintain a compact, aesthetically pleasing growth
habit.
Planned reduction of growth of containerised plants is currently achieved by
withholding water or through the use of synthetic chemical growth retar
dants. Neither option, however, is sustainable. Withholding water from a
container growing medium can substantially increase its salinity (Handreck
and Black, 1991). In doing so, the chance of root damage is increased, as is
consequent attack from root-rot pathogens drawn to the roots by stress
induced exudates or by gaining direct access through damaged tissue (Snapp
and Shennan, 1994). Future use of chemical growth retardants (e.g.
daminozide, chlormequat) to control the growth and appearance of orna
mental plants is itself likely to be retarded. Increasing public antagonism
towards such chemicals, increasingly stringent environmental laws regarding
their use, and increasingly high costs for developing and maintaining their
registration for a relatively small market sector (Davis and Curry, 1991) are
likely to combine to at least narrow the range of use of such chemicals, if not
completely eliminate their use.
Plants with highly controlled characteristics, developed through the recent
advances in molecular biology and plant breeding, are unlikely to provide a
solution. The horticultural industry is a small component of plant-based
production industries, and in turn, those sectors of the industry that grow
plants in containers (e.g. nursery, greenhouse vegetables, cut flowers) are
small components of the horticultural industry. As a consequence, the
market is too small and the range and diversity of crops grown too large for
breeding and associated crop improvement programmes to offer realistic
solutions in a realistic time frame.
Some alternative, more environmentally-friendly growth control strategies
have been developed. For example, careful management of day and night'
Introduction 4
temperatures provides predictive control of internode length and plant height
in several pot and bedding plants (Erwin et al. , 1 989; Karlsson et al., 1989;
Moe et al., 1992; Mortensen and Moe, 1993). Unfortunately, responses across
species and environments are often variable (Vogelezang et al. , 1993), and by
requiring control over the aerial environment, use of this strategy outside of
greenhouses is effectively precluded.
Moreover, such control strategies do not provide control over partitioning of
assimilate, and it is in this area that considerable opportunities exist for
improving productivity in container-grown crops. There are many production
scenarios in which maximum growth and manipulation of that growth within
the plant is required. As examples, a grower aiming to improve the trans
planting success of container grown vegetable or forestry seedlings might
seek, prior to transplanting, to increase reserves in the seedlings' root
systems to sustain subsequent rapid root growth and establishment in the
field. Greenhouse vegetable growers might seek to reduce the sink strength
of the root system to 'free up' assimilate for fruit growth, and thereby
increase the harvest index.
If this degree of crop management is to be realised, a greater understanding
of the root-shoot relationships of plants grown in containers is required. The
container environment is, in many ways, unique. This makes extrapolating
current knowledge of root-shoot relationships under field conditions to
anticipate the performance of plants in a container environment unlikely to
be of benefit. Although a container environment has a limited volume,
properly managed it can be regarded as being non-limiting in nutrient and
water supply. While not impossible in a field situation, such non-limiting
conditions are considerably more difficult to achieve. Furthermore, as supply
of water and nutrients can be directed to the entire root system in a
container, there is less 'need' for the expansive growth of the root system in
the field to 'seek' supply. The container environment places a physical
impediment to growth and development of the entire root system. In
Introduction 5
contrast, physical restriction to the root system in the field is of less
consequence as the root system is 'free' to explore other less restrictive areas.
Container design will be the dominant tool by which root growth is managed
to achieve the desired pattern of whole-plant growth. Unfortunately, most
studies into the effects of container design on plant growth have approached
the task empirically, without any prior reasoning of expected root-shoot
response. One approach has been to empirically test the growth response (Le.
total shoot biomass) of different species in containers of different linear
dimensions. Some of these studies have reported that for containers of the
same diameter, shoot growth is always less in long containers (Falloon and
Schurink, 1982; Hanson et aI., 1987; Smith and Schwabe, 1980). Other
studies, however, have shown that the natural form of the root system must
be taken into account, with naturally shallow rooted species performing better
in wide, shallow containers than naturally deep-rooted species (Biran and
Eli assaf, 1980; Keever et al. , 1985).
The other main target of container design studies has been the reduction of
root circling (or binding). Whitcomb ( 1981, 1984), for example, developed
containers with either vertical slits to air prune root tips as they circled the
container, or with 'steps' on the internal wall of the container to inhibit root
elongation and promote lateral root development. More recent studies have
focused on using a copper-based coating on the inside surface of the container
to chemically prune root apices and thereby avoid root circling (Arnold and
Struve, 1993; Beeson and Newton, 1992). As with the studies of container
dimension, the results of these studies have been inconclusive with respect
to root response and shoot growth.
While this general lack of consistent response of plant growth in container
design studies may have been due, in part, to the confounding action of
changes in aeration and water availability that occur down the vertical axis
of a container (Bunt, 1988; Milks et al. , 1 989), a major factor has been the
Introduction 6
lack of understanding of the relationships between root and shoot growth in
containers. As a consequence, many studies have not measured the
important variables. In this regard, the study by Liptay and Edwards (1994)
is typical. Working with tomato seedlings in small cells, these workers
reported that only shoot growth (height, total shoot dry biomass weight)
responded to changes in the shape of the cells. Unfortunately, the only
measure of root performance taken by these workers was the dry biomass of
the root system. Yet numerous studies have demonstrated a link between the
number of root apices and shoot growth. Ooyama and Toyoshima ( 1965), for
example, reported a strong, positive correlation between the number of roots
and subsequent growth in height of pine seedlings. Reduced shoot growth of
peach seedlings and fruiting tomato plants was associated with lower
numbers of root apices (Richards, 1981 ; Richards and Rowe, 1977a). Bentz
et al. (1985) demonstrated that stem cuttings of woody plants required a
minimum number of roots, which was species-dependent, before measurable
shoot growth was initiated. Importantly, the number of roots is depressed
when plants are grown in containers that are too small (by volume) to
accommodate the root system without physically impeding it (Carmi and
Heuer, 1981 ; Hameed et al. , 1987; Richards and Rowe, 1977a; Tschaplinski
and Blake, 1985).
By not using the opportunity to control root growth, current methods of
producing plants in containers are not realising the full potential that
containerised production provides. Future crop production in containers will
be advanced by the development of specially designed containers that will
sustain actively growing plants and manipulate partitioning of their
assimilate to fulfill the growers' (or their clients) specifications. Such
potential will not be realised, however, until a better understanding is gained
of how root growth in the physically restricting environment of a container
influences the various components that make up shoot growth. This study
aims to increase our understanding of this aspect of root-shoot relationships.

Chapter 2
Development of a hyd roponic
system for root restriction studies
2.1 Introduction
Hydroponic system for root restriction studies 8
A root environment in which a physical barrier is the only factor l imiting root
growth is critical to a successful study of the effect of root restriction on plant
growth. If other factors present in the environment limit root growth, the
results may be confounded. Even if these factors are known, it may be
impossible to disentangle their respective contributions to the observed plant
response. In some instances, reported responses to root restriction may be
experimental artefacts of the design of the restricting system. For example,
consider the reduction in shoot:root ratio (SR) of tomato plants with restricted
roots reported by Ruff et al. (1987). These workers grew plants in containers
filled with a soil-based potting medium under frequent (4-6 times per day)
overhead irrigation. Soil-based potting media have inherently poor drainage
and low aeration characteristics (Bunt, 1988; Handreck and Black, 1991) . Add
to this the reliance of tomato shoot growth on oxygen diffusion in the root
zone (Doyle and MacLean, 1958), the high frequency of overhead irrigation
and small container volume, and it is likely, even probable, that restricted
plants lacked sufficient oxygen for 'normal' growth. In reaching a similar
conclusion, Peterson et al . (1991b) concluded that oxygen deficiency was a
confounding element of hydroponic systems which rely on passive uptake of
solution into the restricting container (e.g. AI-Sahaf, 1984; Carmi and Heuer,
1981; Carmi et aI., 1983; Hameed et aI. , 1987; Tschaplinski and Blake, 1985).
Increases in SR of 60-170% in restricted plants (Al-Sahaf, 1984; Carmi and
Heuer, 1981; Hameed et al., 1987; Tschaplinski and Blake, 1985) are mark
edly higher than those where solution was actively moved into, or agitated
within, the restriction container (e.g. Richards and Rowe, 1977a) .
Nevertheless, hydroponic systems are ideally suited to root growth studies,
provided they are correctly designed. The ease of access to root system and
the absence of particles of solid media on the roots simplifies manipulation,
recovery, and measurement of root systems. Properly managed, the root .
Hydroponic system for root restriction studies 9
environment in hydroponic systems is more uniform and controllable than
that in alternative growing systems (e.g. peat or bark-based solid media)
where oxygen and water characteristics vary within the root environment
(Bunt, 1988; Spomer, 1975). Furthermore, confounding interactions among
roots and the physical characteristics of solid media are absent, making
hydroponic systems of particular value to studies of the influence of root
restriction on whole plant relationships.
Despite their wide use (Carmi, 1986a; Carmi and Heuer, 1981; Carmi et al.,
1983; Hameed et al., 1987; Peterson et al., 1991a; Richards and Rowe, 1977a;
Tschaplinski and Blake, 1985), few guidelines are available for designing
hydroponic systems for research purposes. Peterson and Krizek (1992)
provide a detailed description for constructing a complex hydroponic system
for studies of root restriction, but the physiological basis for several
components of the system is inadequately explained. In contrast, the work
of Cooper (1975) and his colleagues from the Glasshouse Crops Research
Institute in the mid 1970s to mid 1980s provided considerable information of
the physiological responses of plants in hydroponic systems. Unfortunately,
their system, the Nutrient Film Technique (NIT), is unsuited to studies of
root growth because roots of adjacent plants within a channel quickly
intertwine, making it difficult to selectively impose treatments on, and
harvest, individual root systems. Nevertheless, their work identified
potentially confounding factors that must be considered in designing a
hydroponic system suitable for root restriction studies.
Hydroponic systems are either static or recirculating (Jensen and Collins,
1985) . Static systems do not require expensive pumps or the associated
distribution network, and their relative ease of construction makes them a
popular research choice over the recirculating alternative (Carmi, 1986a;
Carmi and Heuer, 1981; Carmi et al., 1 983; Hameed et al., 1987; Richards
and Rowe, 1977a; Tschaplinski and Blake, 1985). Unfortunately, static .
Hydroponic system for root restriction studies 10
systems have several disadvantages. The pH and concentrations of nutrients
and oxygen (02) in the solution constantly change with plant uptake. This
requires frequent replacement of solutions (e.g. Hameed et al. , 1 987) to avoid
large changes in the chemical composition of the root environment. Not only
is this time-consuming, but the risk of physical damage and temperature
fluctuations in the root zone is increased. Inadequate flux results in localised
zones of depleted O2, particularly in densely packed root systems, leading to
reduced growth (Jackson, 1980). Recirculating systems (e.g. Peterson and
Krizek, 1992) avoid several of these problems. The root environment can be
maintained at set levels of nutrient concentration and pH by adjusting the
main reservoirs. Attention to the flow rate of the solution minimises
occurrence of localised zones of low concentrations of both O2 and nutrients
near absorbing roots (Clement et al. , 1974; Hurd, 1978).
Flow rates appropriate to the system are important if correct conclusions are
to be made from data (Edwards and Asher, 1974). Rates of 60-240
litres ·hour-1 are quoted (Gisler�d and Kempton, 1983; Hurd, 1978; Jackson
et al., 1984; Jenner, 1980; Mahler, 1977), but these are for NFT systems in
which a single channel may hold over 40 plants. Willumsen (1983) reported
that flow rates between 4.4-5.8 litres ·hour-1 per plant in seven litre contain
ers were sufficient to avoid O2 deficiency in the root zone. Peterson et al.
(1991a) used flow rates of 0.72 and 3.6 litres ·hour-1 in 0.025 and 1 .5 litre
containers respectively, but did not justify the rates or the differences among
treatments.
Whereas flow rates of the solution are important in replenishing nutrients in
the root zone, solution temperature markedly influences nutrient uptake.
Uptake, particularly of phosphorus (P) and iron (Fe), in tomatoes is reduced
at temperatures below 1 5°C (Moorby and Graves, 1980). Ganmore-Neumann
and Kafkafi (1980) reported that potassium (K) and nitrate-nitrogen (NOa--N)
accumulated in tomato roots at low solution temperatures « 16°C). They .
Hydroponic system for root restriction studies 1 1
suggested that poor translocation of these ions at low temperature
contributed to slow growth under such conditions. The broad optimum root
temperature for tomatoes is between 20-30°C (Gosselin and Trudel, 1982;
Moorby and Graves, 1980; Morgan and O'Haire, 1978) .
Recirculating systems, and some static systems (e.g. Carmi et al., 1983;
Richards and Rowe, 1977a), have a common reservoir into which solution
from all, or single treatments, combine. This practice raises an important,
and often overlooked (cf. Wilcox, 1982) statistical issue; true treatment
differences may not be detected in experiments using a common reservoir due
to potential interaction among treatments (Jarrett and Chanter, 1981).
Contaminants arising from specific treatments will circulate to all plants in
the system, and due to the closed nature of the system, their concentration
will steadily increase. Statistical problems also exist with systems in which
all replicates of each treatment share a single reservoir (e.g. Peterson and
Krizek, 1992). In such systems, random fluctuations in the behaviour of the
reservoir systems confound treatment effects, consequently increasing the risk
of incurring Type I errors.
Development of a hydroponic system suitable for root restriction studies
requires that these potential constraints be accommodated in the design of
the system. This experiment identifies and quantifies the critical levels of
inputs necessary to minimise any confounding of root restriction experiments
by artefacts of the hydroponic system.
2. 1 . 1 pH
Solution pH influences the solubility, and therefore availability, of nutrients
to plants. Left unchecked, considerable drift in pH occurs in hydroponic
solutions supporting tomatoes (Winsor et al . , 1979). As tomatoes are
Hydroponic system for root restriction studies 12
intolerant of ammonium-nitrogen (NH,,+-N) (Pill and Lambeth, 1 977; Winsor
and Massey, 1978), N03--N is the preferred nitrogen source. Solutions
containing N03--N become alkaline due to differential uptake of N03- ions
and principal cations (Salisbury and Ross, 1978). The more rapid absorption
of N03- ions than cations increases pH as bicarbonate (HC03-) and hydroxyl
(OH-) ions are transported out of the root to satisfy the charge difference.
The pH recommended for NIT systems is between 5.5 and 6 .5 (Graves, 1983;
Willumsen, 1980). At this pH, phosphates remain in the more soluble
dihydrogen form (Steiner, 1966) and iron chelates remain associated and
therefore less liable to precipitation.
2 . 1 .2 N utrient regi me
Tomatoes in recirculating systems tolerate a wide range of nutrient
concentrations. Negligible differences in yield have been observed with plants
grown at nitrogen (N) concentrations ranging from 10-320 mg N03--N/litre
(Massey and Winsor, 1980a), 20-375 mg potassium (K)/litre (Winsor and
Massey, 1978), and 5-200 mg phosphate (P)/litre (Massey and Winsor, 1 980b).
Although growth is not depressed at low concentrations, high concentrations
are generally used to provide a reserve of nutrients within the system
(Winsor et al. , 1980). As a consequence, the tolerance to a range of nutrient
concentrations has generated several nutrient formulations (Benton-.Jones,
1982; Cooper, 1979; Winsor et al., 1 979).
2.1 .3 N utrient and oxygen replacement
An advantage of hydroponic systems over solid media systems is that a
uniform environment within the root zone can be maintained. To maximise
Hydroponic system for root restriction studies 13
this advantage, flow rates must be high enough to ensure that minimal
depletion of nutrients and O2 occurs as the solution passes through each root
system (Asher, 1981). The lack of response of tomatoes to low concentrations
of major elements (Massey and Winsor, 1980a, 1980b; Massey and Winsor,
1978) is attributed to flow rates sufficient to replace nutrients absorbed from
the immediate root zone.
Leaves of poorly aerated tomatoes wilt, develop an epinastic curvature,
become chlorotic, and often abscise prematurely (Erickson, 1946; Jackson,
1980). Rates of leaf expansion and dry matter accumulation are reduced,
stem growth is slowed and yield reduced (Jackson et al. , 1984). Anoxic roots
produce 1 -amino-cyclopropane-1-carboxylic acid (ACC), a precursor of ethylene
production (Jackson and Campbell, 1976; Jackson et al. , 1978) . Physiological
consequences of this include swollen stem bases and adventitious roots
developing on aerial portions of the stem. Such responses will develop with
only part of the root system affected.
Environmental factors strongly influence the O2 content of hydroponic
solutions. Water saturated with air contains about 9. 1 mg·litre·1 of dissolved
O2 at 20°C. Nutrient salts reduce this capacity by 2-3% (Hitchman, 1978) .
The O2 content decreases as the temperature of the solution increases, a rise
from 20-30°C depressing the O2 content of air-saturated water to 7 .5
mg·litre·1 (Hitchman, 1978). Increasing temperatures also increase the
respiratory demand for O2 by the roots. Thus, a combination of lowered
reserves and greater consumption of dissolved O2 increases the possibility
that the O2 supply may become limiting. Microorganisms in the solution
exacerbate the problem by competing with roots for 02. At temperatures
between 20-23°C, O2 consumption by microorganisms in nutrient solutions is
about 0.3-0.4 mg·litre·1 ·hour·1 (Jackson, 1980) .
Hydroponic system for root restriction studies 14
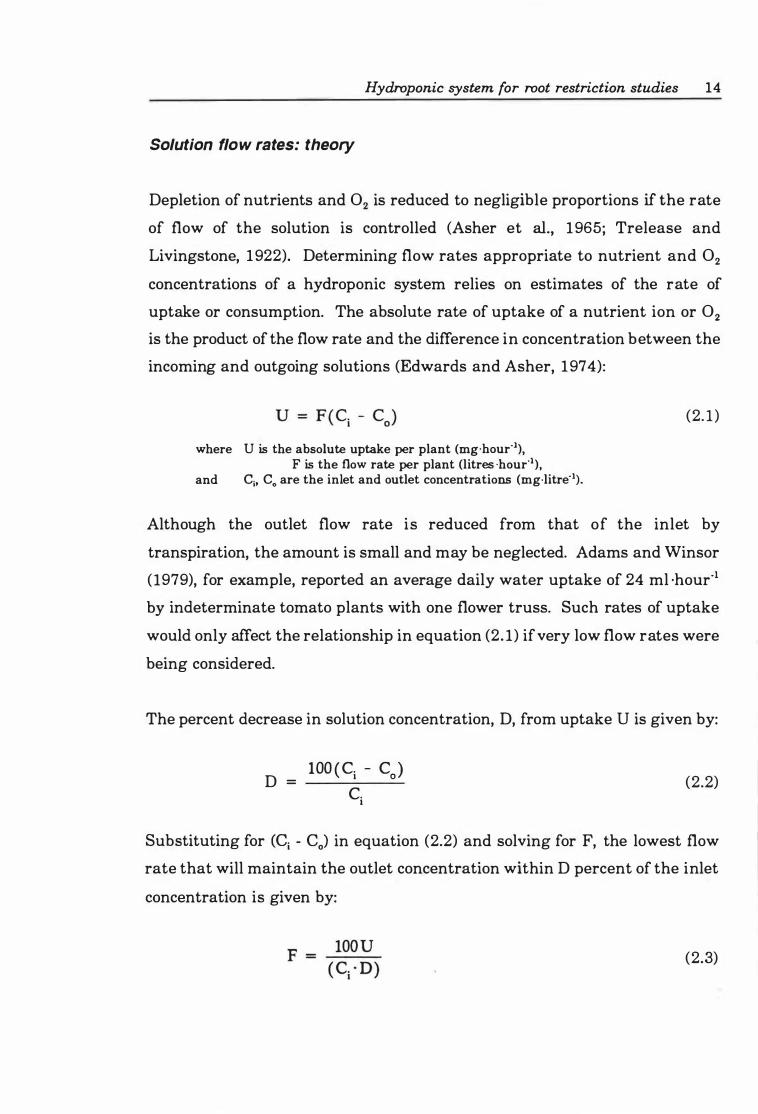
Solution flow rates: theory
Depletion of nutrients and O2 is reduced to negligible proportions if the rate
of flow of the solution is controlled (Asher et aI., 1965; Trelease and
Livingstone, 1922). Determining flow rates appropriate to nutrient and O2
concentrations of a hydroponic system relies on estimates of the rate of
uptake or consumption. The absolute rate of uptake of a nutrient ion or O2 is the product of the flow rate and the difference in concentration between the
incoming and outgoing solutions (Edwards and Asher, 1974):
where U is the absolute uptake per plant (mg·hour·I), F is the flow rate per plant (litres ·hour·I),
and Ci, Co are the inlet and outlet concentrations (mg·litre·I).
(2. 1 )
Although the outlet flow rate is reduced from that of the inlet by
transpiration, the amount is small and may be neglected. Adams and Winsor
(1979), for example, reported an average daily water uptake of 24 ml ·hour·1
by indeterminate tomato plants with one flower truss. Such rates of uptake
would only affect the relationship in equation (2. 1) ifvery low flow rates were
being considered.
The percent decrease in solution concentration, D, from uptake U is given by:
D = lOO (Cj - Co)
Cj (2.2)
Substituting for (Ci - Co) in equation (2.2) and solving for F, the lowest flow
rate that will maintain the outlet concentration within D percent of the inlet
concentration is given by:
(2.3)
Hydroponic system for root restriction studies 15
Besides estimates of O2 consumption in hydroponic solutions, the theoretical
replacement rate needed to satisfy the O2 demand requires estimates of the
rate of O2 consumption by microorganisms, the size of root system and the
volume of solution for each plant.
Each plant in the hydroponic system has V p litres of solution where:
V. V = p n
where V. is the total solution volume of the system (litres), and n is the number of plants in the system.
(2.4)
The rate of O2 consumption by microorganisms (Om) on a per plant basis (Omp)
is thus:
amp = am · V p (mg 02/plant/hour) (2.5)
Oxygen consumption by roots (OJ is derived either from the product of the
root respiration rate, Rr (mg OJg root fresh weight/hour) and the root fresh
weight per plant, Wr (g root fresh weight/plant), thus:
(2.6)
or from direct measurements of total plant root consumption (e.g. Gasim and
Hurd, 1980).
Total O2 consumption on a per plant basis (Ot) is given by:
(2.7)
The O2 content of the solution, Ole' expressed on a per plant basis, is the
product of the measured O2 concentration of the solution, Orone' and Vp.
Hydroponic system for root restriction studies 16
0sc = Ocone ' Vp (mg 02/litre/plant) (2.8)
From equation (2.2), the rate of consumption of O2 in a flowing solution is the
product of the flow rate (F) and the difference in concentration between the
incoming (O.c) and outgoing solutions (0800) :
0te = F (OIC - 0.cJ (mg 02/plant/hour) (2.9)
The percent decrease, D, In solution concentration resulting from
consumption, Ote, is given by:
D =
Substituting for (O.c - O.co) in equation (2. 10) and solving for F:
Substituting for Ote from equation (2.8)
100 ( Omp + 0c) F = (litres ·hour -1)
(Osc ' D)
(2. 10)
(2. 1 1)
(2. 12)
Hydroponic system for root restriction studies 17
2.1 .4 Statistical independence
Although static systems allow statistically independent treatment x replicate
combinations (Jarrett and Chanter, 1981), this advantage is outweighed by
the lack of control inherent in these systems. Additionally, it is possible that
tomato plants themselves interact in a shared hydroponic system. In a
somewhat equivocal study, Tucker (1977) reported a correlation between root
death and the concentration of cytokinin-like substances exuded into the
solution from the roots. In a subsequent study, however, while confirming
the presence of cytokinin-like substances, Tucker (1981) found no evidence of
their accumulation or consequent root death. Certainly, Tucker (1977) was
unable to show whether roots were killed by the buildup in contaminants or
whether they were released by aged and dying roots. Similarly, neither Hurd
and Gay (1977) nor Sims (1977) observed detrimental effects on germination
or early seedling growth using solution from systems in which root growth
was poor and dead roots existed. Nevertheless, it is not possible, within any
experiment, to be absolutely certain that no interaction among treatments is
taking place.
Interaction among treatments is aided primarily by the closed nature of
hydroponic systems. This ensures complete dispersal of the contaminants
throughout the system and facilitates an increase in their concentration.
Tucker's (1977) demonstration was made under conditions likely to maximise
occurrence of interaction. Plants were grown in NFT channels, in a serial
layout, and the total volume of solution per plant was about 0.6-0.8 litres,
which is a common feature of NFT systems (Graves, 1983). Low volume
systems accentuate small increases in absolute levels of contaminants to
comparatively large increases in their concentration (Hurd, 1978).
Jarrett and Chanter (1981) suggested that peristaltic pumps, supporting
several different supply lines, would avoid problems arising from interacting
Hydroponic system for root restriction studies 18
treatments, while still providing a recirculating system. This is an expensive
option, and does not directly address the problem of contaminant buildup.
2.2 Methods
2.2. 1 Base system
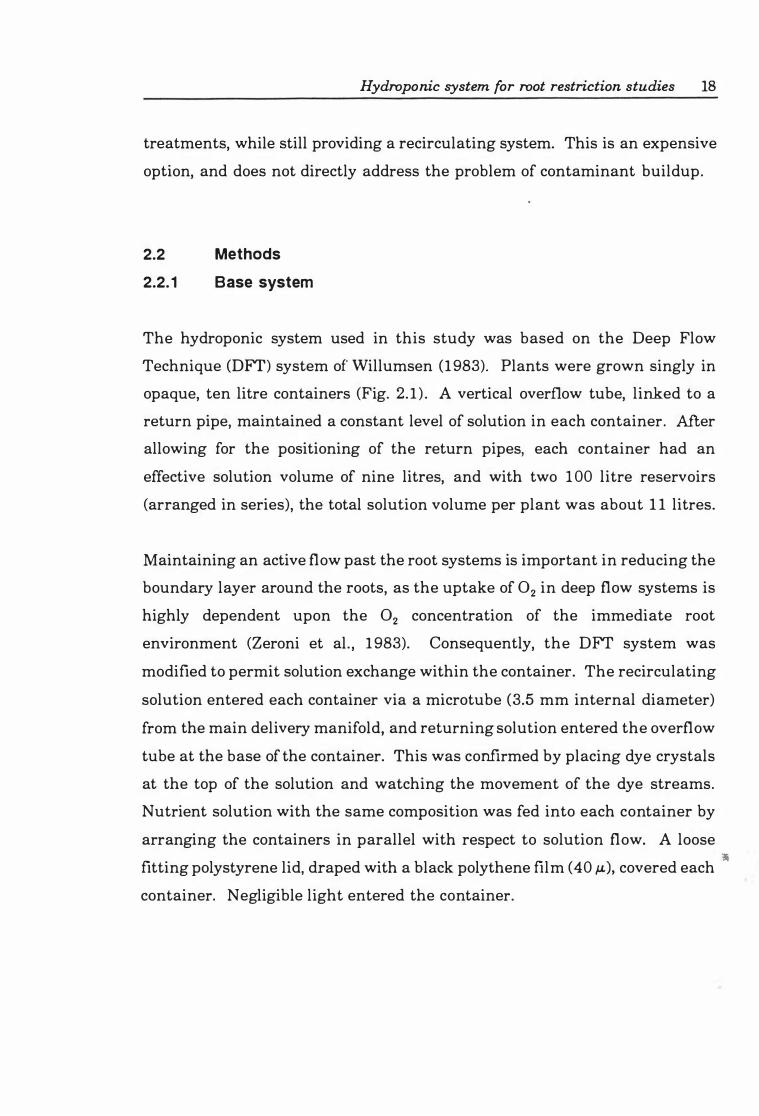
The hydroponic system used in this study was based on the Deep Flow
Technique (DFT) system of Willumsen (1983). Plants were grown singly in
opaque, ten litre containers (Fig. 2. 1 ) . A vertical overflow tube, linked to a
return pipe, maintained a constant level of solution in each container. After
allowing for the positioning of the return pipes, each container had an
effective solution volume of nine litres, and with two 100 litre reservoirs
(arranged in series), the total solution volume per plant was about 1 1 litres.
Maintaining an active flow past the root systems is important in reducing the
boundary layer around the roots, as the uptake of O2 in deep flow systems is
highly dependent upon the O2 concentration of the immediate root
environment (Zeroni et al. , 1983). Consequently, the DFT system was
modified to permit solution exchange within the container. The recirculating
solution entered each container via a microtube (3.5 mm internal diameter)
from the main delivery manifold, and returning solution entered the overflow
tube at the base of the container. This was confirmed by placing dye crystals
at the top of the solution and watching the movement of the dye streams.
Nutrient solution with the same composition was fed into each container by
arranging the containers in parallel with respect to solution flow. A loose Ji
fitting polystyrene lid, draped with a black polythene film (40 /-L), covered each
container. Negligible light entered the container.
b
plan view of lIystem
lIide elevation of 10 litre container
r
Hydroponic system for root restriction studies 19
;····································r·······················r·······················:··················· .. ··.: .............. -.
!- - - - ! - - - - � - - � - - - - , - -� - - - - �- - -� - - - - r - - � - - - - --I . : I : I : I : I I : I : I : : I i i i i i
K LU
-------"1 n ···················:·Q t ...... ·············· �
p
q
Fig. 2. 1. Schematic view of hydroponic system.
A Terada submersible water pump (model SL100; 100 litre·min·1;[c)) in one of two 100 litre sumps Cd] (each of which contained a float valve [e] connected to a fresh water supply) delivered nutrient solution to each 10 litre container [j,q] via a 3 mID feeder line [i] from the main 50 mm diameter polythene delivery pipe [g]. Solution from these containers flowed through an internallexternal 12.5 mm diameter pipe [p/k) leading into a 50 rom diameter rigid PVC pipe [h), and back to the sumps. The solution was monitored for pH and EC levels [a] using a Dosetronic controller with necessary iqjections of acid or nutrient stock solution [b] automatically made to maintain the set points. Air lines [f; 2 mm diameter microtubes) were inserted into the sump, each 10 litre container, and into each restrictive container [0]. Each restrictive container was submerged below the level of solution en] in the 10 litre container. A polystyrene lid em) covered with a black polythene sheet [1], together with the opaque walls of the 10 litre container, inhibited light penetration to the root system.
Hydroponic system for root restriction studies 20
2.2.2 Contaminant control
Only one of the two 100 litre reservoirs was needed for the system to be
functional. However, given Tucker's (1977) demonstration of the type of plant
x plant interaction possible, increasing the volume of solution of the system
was the simplest way to reduce the effective concentration of any
contaminants.
Possible buildup in concentration was further minimised by regularly
replacing some of the solution. As total replacement after each cycle through
the system was neither practical nor environmentally sound, a balance
between excessive replacement rates and rates that minimise the potential
buildup in concentration of contaminants was sought. A spreadsheet-based
model, describing the effect of solution replacement on the buildup of
contaminants in a hydroponic system, was used to help decide the percentage
of the solution to be replaced daily. The fundamental equation of the model
(2. 13) assumed that both exudation rate of contaminants and volume of
solution per plant were constant over time.
[ (c + C ) x R 1 � C = (C + C ) _ t t - l p
t t - l 100
where �C is the daily change in concentration, Ct and Ct.-l are the concentration
of contaminants after t and t-l days in solution, and Rp is the percentage of
solution replaced in day t.
(2. 13)
Using an estimate of the exudation rate of cytokinin-like contaminants (21
J.Lg/g root dry weight/day; Tucker, 1981, Fig. 1) , the volume of solution (11
litres/plant), and the dry weight of roots (g/plant) within the anticipated 100
day period of experiments in the system (2.3 to 5.2 g; pers. obs.), the model
predicted the concentration of contaminants on a daily basis (Fig. 2.2).
Hydroponic system for root restriction studies 2 1
Results from the model suggested that a daily replacement rate of 10% would
avoid a buildup in the concentration of any contaminant.
-0.9 -:......
bO ::t 0.8 '-" s::
.9 0.7 � (oj $... �
s:: 0.6 Q) � s:: 0 0.5 � � s:: (oj 0.4 .5 E
0.3 (oj � s:: 0 � 0.2
"'0 Q) � 0.1 .�
"'0 Q) $... 0.0 p...
0
---------------------------
--
-------.. . .. .. .. . . . .. - - - - - - - _ .. .. - - _ .. .. . . . .. .. - .. - _ . - .. . - .. .�::::�: .. ::: :.:: -,:: " :.. -
- - - ---
- _. -- --
- -- -- ---
- _ .
10 20 30 40 50 60 70
Days in solution 80 90 100
Fig. 2.2. Predicted influence of replacement regimes on concentration of contaminants in hydroponic system at a constant exudation rate of 21 J-Lg/g root dry weight/day. Key: - 0% replacement, --- 5% replacement, . . . . . 10% replacement, - '- 20% replacement.
Sensitivity analyses were conducted using various combinations of replace
ment rates (0, 5, 10 and 20%) and exudation rates (21 , 21 x 101, 21 X 102, and
21 x 103 p.,g/g root dry weight/day). Even at the highest rate of exudation
tested, the predicted concentration after 100 days, using a 10% daily replace
ment rate, was 92 p.g·litre·l• considerably less than the 10-80 mg·litre·l
associated with root death (Tucker, 1977).
The replacement rate was obtained by allowing a delivery line from the pump
to run to waste at 3.8 litres ·hour·l . Float valves in the reservoirs
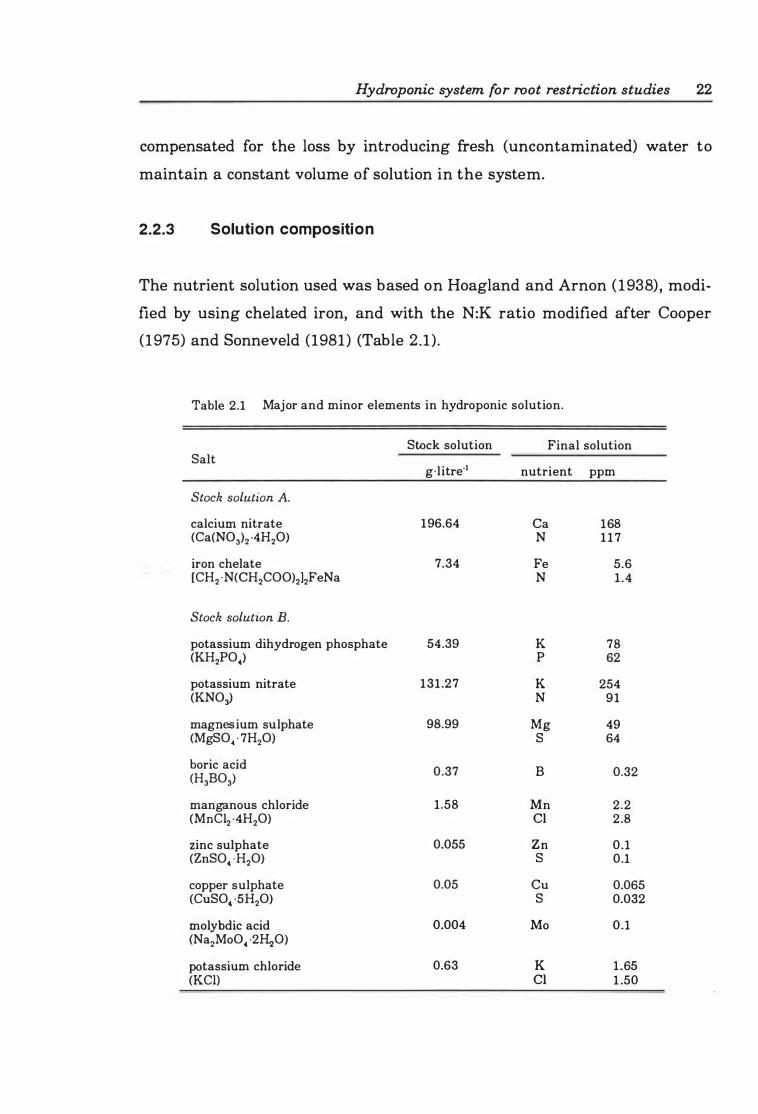
Hydroponic system for root restriction studies 22
compensated for the loss by introducing fresh (uncontaminated) water to
maintain a constant volume of solution in the system.
2.2.3 Solution composition
The nutrient solution used was based on Hoagland and Arnon (1938) , modi
fied by using chelated iron, and with the N:K ratio modified after Cooper
(1975) and Sonneveld (1981) (Table 2.1) .
Table 2.1 Major and minor elements in hydroponic solution.
Stock solution Final solution Salt
g'litre'l nutrient ppm
Stock solution A.
calcium nitrate 196.64 Ca 168 (Ca(N03)2 ·4H2O) N 1 1 7
iron chelate 7.34 Fe 5.6 [CH2 ' N(CH2COO)212FeNa N 1 .4
Stock solution B. potassium dihydrogen phosphate 54.39 K 78 (KH2PO.) P 62
potassium nitrate 131 .27 K 254 (KN0:J N 91
magnesium sulphate 98.99 Mg 49 (MgSO. · 7H2O) S 64
boric acid 0.37 B 0.32 (H3B03)
manganous chloride 1.58 Mn 2.2 (MnCI2 ·4H2O) CI 2.8
zinc sulphate 0.055 Zn 0.1 (ZnSO . . H2O) S 0.1
copper sulphate 0.05 Cu 0.065 (CuSO . . 5H2O) S 0.032
molybdic acid 0.004 Mo 0.1 (NazMo04 ·2�O)
potassium chloride 0.63 K 1.65 (KCn CI 1 .50
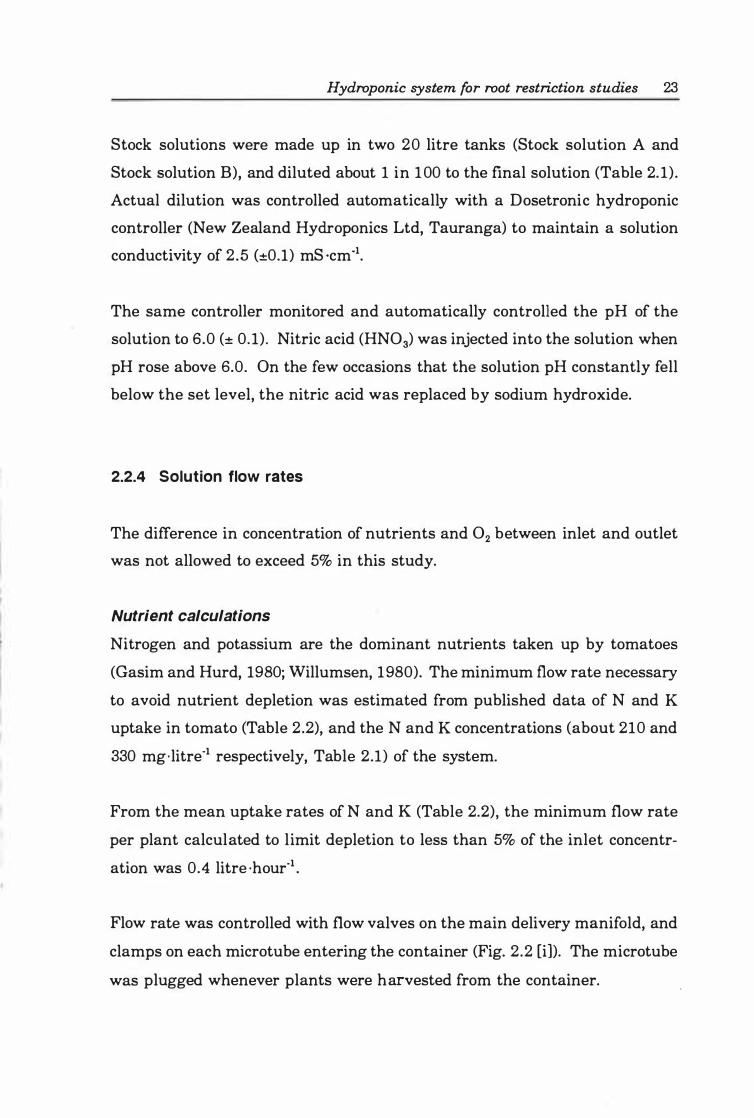
Hydroponic system for root restriction studies 23
Stock solutions were made up in two 20 litre tanks (Stock solution A and
Stock solution B), and diluted about 1 in 100 to the final solution (Table 2. 1) .
Actual dilution was controlled automatically with a Dosetronic hydroponic
controller (New Zealand Hydroponics Ltd, Tauranga) to maintain a solution
conductivity of 2 .5 (±0.1) mS ·cm·l.
The same controller monitored and automatically controlled the pH of the
solution to 6.0 (± 0. 1) . Nitric acid (HN03) was injected into the solution when
pH rose above 6.0. On the few occasions that the solution pH constantly fell
below the set level, the nitric acid was replaced by sodium hydroxide.
2.2.4 Solution flow rates
The difference in concentration of nutrients and O2 between inlet and outlet
was not allowed to exceed 5% in this study.
Nutrient calculations
Nitrogen and potassium are the dominant nutrients taken up by tomatoes
(Gasim and Hurd, 1980; Willumsen, 1980). The minimum flow rate necessary
to avoid nutrient depletion was estimated from published data of N and K
uptake in tomato (Table 2.2), and the N and K concentrations (about 210 and
330 mg·litre-l respectively, Table 2.1) of the system.
From the mean uptake rates of N and K (Table 2.2), the minimum flow rate
per plant calculated to limit depletion to less than 5% of the inlet concentr
ation was 0.4 litre ·hour-l .
Flow rate was controlled with flow valves on the main delivery manifold, and
clamps on each microtube entering the container (Fig. 2.2 [i]). The microtube
was plugged whenever plants were harvested from the container.
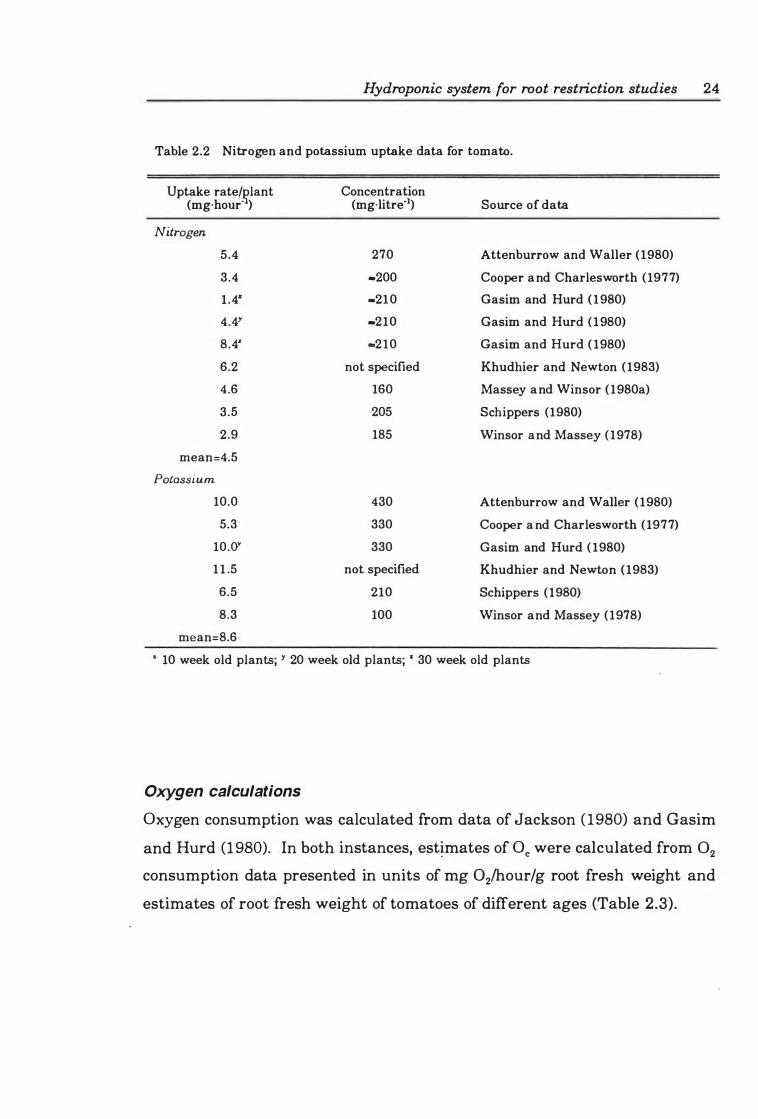
Hydroponic system for root restriction studies 24
Table 2.2 Nitrogen and potassium uptake data for tomato.
Uptake rate/�lant (mg·hour· )
Nitrogen 5.4
3 .4
1 .4"
4.41
8.4'
6.2
4.6
3.5
2.9
mean=4.5
Pota.ssium 10.0
5.3
10.QY
1 1 .5
6.5
8.3
mean=8.6
Concentration (mg·litre·1)
270
-200
-21 0
-210
.. 210
not specified
160
205
185
430
330
330
not specified
210
100
Source of data
Attenburrow and Waller ( 1980)
Cooper and Charlesworth ( 1977)
Gasim and Hurd ( 1 980)
Gasim and Hurd ( 1 980)
Gasim and Hurd ( 1980)
Khudhier and Newton ( 1983)
Massey and Winsor ( 1980a)
Schippers (1980)
Winsor and Massey (1978)
Attenburrow and Waller ( 1980)
Cooper a nd Charlesworth ( 1977)
Gasim and Hurd ( 1980)
Khudhier and Newton ( 1983)
Schippers ( 1980)
Winsor and Massey (1978)
x 10 week old plants; Y 20 week old plants; • 30 week old plants
Oxygen calculations
Oxygen consumption was calculated from data of Jackson ( 1980) and Gasim
and Hurd (1980). In both instances, est�mates of Oc were calculated from O2
consumption data presented in units of mg 02/hour/g root fresh weight and
estimates of root fresh weight of tomatoes of different ages (Table 2.3).
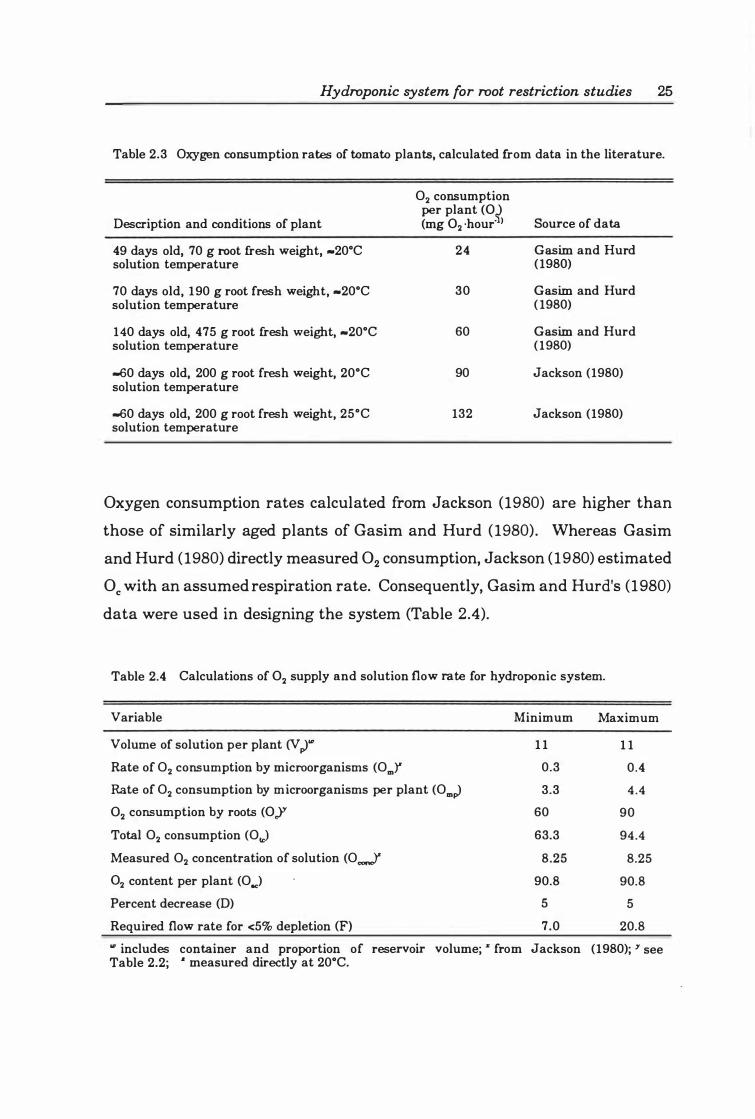
Hydroponic system for root restriction studies 25
Table 2.3 Oxygen consumption rates of tomato plants, calculated from data in the literature.
Description and conditions of plant
49 days old, 70 g root fresh weight, _20°C solution temperature
70 days old, 190 g root fresh weight, _20°C solution temperature
140 days old, 475 g root fresh weight, _20°C solution temperature
-60 days old, 200 g root fresh weight, 20°C solution temperature
-60 days old, 200 g root fresh weight, 25°C solution temperature
O2 consumption per plant (01 (mg 02 ·hour· )
24
30
60
90
132
Source of data
Gasim and Hurd (1980)
Gasim and Hurd ( 1980)
Gasim and Hurd (1980)
Jackson (1980)
Jackson (1980)
Oxygen consumption rates calculated from Jackson (1980) are higher than
those of similarly aged plants of Gasim and Hurd (1980). Whereas Gasim
and Hurd (1980) directly measured O2 consumption, Jackson (1980) estimated
Oc with an assumed respiration rate. Consequently, Gasim and Hurd's (1980)
data were used in designing the system (Table 2.4).
Table 2.4 Calculations of 02 supply and solution flow rate for hydroponic system.
Variable Minimum Maximum
Volume of solution per plant (V �III Rate of O2 consumption by microorganisms (OmY
Rate of O2 consumption by microorganisms per plant (Om� 02 consumption by roots (0.1
Total O2 consumption (OJ
Measured O2 concentration of solution (OJ
02 content per plant (Ooc)
Percent decrease (D)
Required flow rate for <5% depletion (F)
1 1
0.3
3.3
60
63.3
8.25
90.8
5
7.0
1 1
0.4
4.4
90
94.4
8.25
90.8
5
20.8
III includes container and proportion of reservoir volume; " from Jackson (1980); Y see Table 2.2; " measured directly at 20°C.
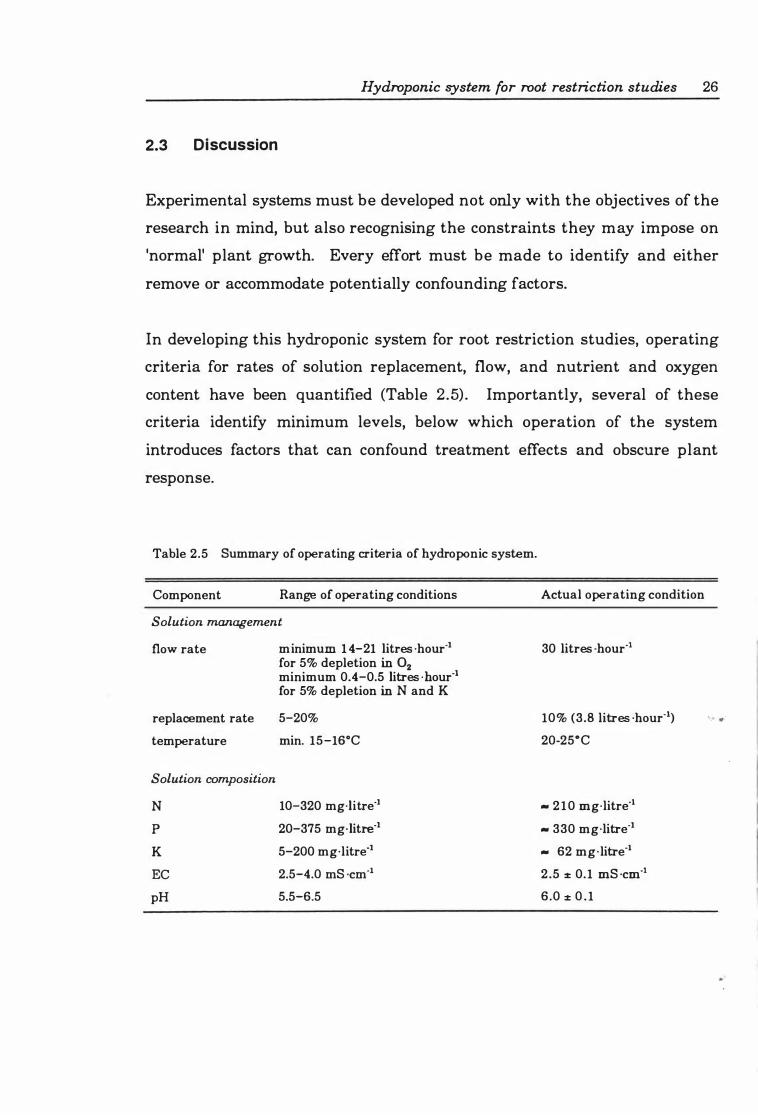
Hydroponic system for root restriction studies 26
2.3 Discussion
Experimental systems must be developed not only with the objectives of the
research in mind, but also recognising the constraints they may impose on
'normal' plant growth. Every effort must be made to identify and either
remove or accommodate potentially confounding factors.
In developing this hydroponic system for root restriction studies, operating
criteria for rates of solution replacement, flow, and nutrient and oxygen
content have been quantified (Table 2.5) . Importantly, several of these
criteria identify minimum levels, below which operation of the system
introduces factors that can confound treatment effects and obscure plant
response.
Table 2.5 Summary of operating criteria of hydroponic system.
Component Range of operating conditions
Solution management
flow rate minimum 1 4-21 Iitres ·hour·l for 5% depletion in O2 minimum 0.4-0.5 litres · hour"l for 5% depletion in N and K
replacement rate 5-20%
temperature min. 15-16°C
Solution composition
N 10-320 mg·litre·l
p 20-375 mg"litre"l
K 5-200 mg·litre"l
EC 2.5-4.0 mS ·cm"1
pH 5.5-6.5
Actual operating condition
30 litres ·hour"l
10% (3.8 litres ·hour"l) . ....
20-25°C
- 2 1 0 mg·litre"l
- 330 mg·litre"l
- 62 mg·litre"l
2.5 :1: 0.1 mS ·cm"1
6.0 :I: 0 . 1
• •
Hydroponic system for root restriction studies 27
This study highlights the relative importance of oxygen and nutrient
concentrations. The flow rates of solution necessary to maintain a similar
oxygen concentration throughout the root system are considerably higher
than those required to maintain a similar nutrient environment (Table 2.5).
The hydroponic system developed here does not resolve the issue of statistical
independence of experimental units (Jarrett and Chanter, 1981) . It does,
however, reduce this source of interaction to negligible physiological levels.
The compromise reached between the possibility of statistical interaction and
the need for a practical and uncomplicated system has taken the problem to
one of being theoretically possible, but unlikely to occur. There is every
reason to believe that results from experiments in this system are statistically
and physiologically valid .

Chapter 3
G rowth o ntogeny u nder
root restrictio n
Growth ontogeny of tomato plants under root restriction 29
3.1 Introduction
The physical restriction of roots of plants growing in containers induces a
variety of responses, ranging from no response (McGowan and Devereux,
1989) to enhanced harvest index (Al-Sahaf, 1984; Carmi and Shalhevet, 1983;
Richards, 1981 ; Ruff et al. , 1987) through to senescence and death (Tschap
linski and Blake, 1985). Such divergence of response makes the management
of container-grown plants an inexact science for plant growers, and frustrates
the efforts of scientists seeking to explain the mechanistic basis of plant
response to root restriction. Studies of the effects of root restriction on plant
growth are difficult to interpret because the nature of the treatment changes
through time. Unlike studies investigating growth responses to light and
temperature, a root restriction treatment cannot be controlled at a given
level. As roots grow throughout the container, the level of restriction they
encounter increases, and therefore the intrinsic nature of the treatment
changes. This factor is a major contributor to the diversity of both the
reported effects of root restriction on plant growth and the mechanisms
controlling them.
In their widely cited paper, Richards and Rowe (1977a) suggested, after
observing a 39 per cent reduction in root dry weight and a 'consequent'
comparable (34 per cent) reduction in top dry weight of container-grown
peach (Prunus persica Batsch) seedlings, that the root regulated the growth
of the top. Because application of benzyladenine partially restored shoot
growth of the seedlings, Richards and Rowe ( 1977a) concluded that growth in
small containers was restricted by a reduction in supply of cytokinins from
root apices. Implicit in this view is the idea of an hormonal equilibrium (van
Noordwijk and de Willigen, 1987) in which continuous activity of hormone
producing root meristems is required for normal shoot growth. Fluctuations
in this production, possibly resulting from root restriction, limit plant growth
independently of nutrient and water uptake.
Growth ontogeny of tomato plants under root restriction 30
Although internal regulation of root and shoot growth can be overruled by
exogenous application of growth substances (Carmi and Heuer, 1981 ; Rich
ards, 1980; Richards and Rowe, 1977a), the modification is usually short
lived, with the plants returning to their pretreatment balance between root
and shoot growth even when exogenous hormone supply is maintained
(Thuantavee, 1991). On the other hand, equilibrium between root and shoot
growth is unlikely to be the simple maintenance of ratios of biomass (cf.
Richards and Rowe, 1977a). Rather, any role that roots may have in
regulating shoot growth through the supply of hormones is likely to be
through maintenance of functional equilibria.
Functional equilibria describe precise balances between the respective outputs
of the root and shoot systems: the product of root weight and uptake
(nutrients and water) activity remains in constant proportion to the product
of shoot weight and the photosynthetic activity of the shoot (Brouwer, 1963;
Davidson, 1969a; Hunt, 1975; Thornley, 1975). Such equilibria relating root
uptake functions with shoot and plant biomass production have been
empirically described with data collected from single-harvest experiments
involving a range of differently treated plants (Richards, 1977, 1980; Richards
and Rowe, 1977b). Seeking to similarly describe relationships between the
growth characteristics of root and shoots under conditions of root restriction
have proven more difficult. Many studies have based their inferences on
results from a single harvest, despite reports (e.g. Carmi et aI. , 1 983) showing
that the relative reductions in growth between restricted and unrestricted
plants progressively increase with time. Assessment of single-harvest experi
ments invariably yields simple ratios of biomass and organ counts. Their use
in interpreting results promotes, probably inadvertently, the idea of morpho
genetic equilibria (i.e. "the more roots the better the shoot growth"; van
Noordwijk and de Willigen, 1987), thus masking the possible involvement of
a functional equilibrium between root and shoot growth characteristics. One
possible solution to avoid this problem is to examine the dynamic nature of
Growth ontogeny of tomato plants under root restriction 3 1
plant response to root restriction treatments and seek, through appropriate
growth analysis, those relationships between root and shoot growth remaining
in proportion or balance over time, irrespective of the degree of root
restriction encountered by the plant.
Two general approaches, the classical and the functional, dominate plant
growth analysis (Causton and Venus, 1981; Hunt, 1 982). The classical
approach measures the efficiency and productivity of the plant based on cal
culations using data between adjacent harvests. In the functional approach,
a single curve is fitted to the data from all harvests, effectively using the
information content of the whole data set. Neither approach on its own,
however, will provide the necessary information required to detect stable
relationships between shoot and root growth under conditions of root
restriction. Although the classical approach yields many estimates of indices
that can be further analysed to detect treatment differences (e.g. analysis of
variance (ANOVA)), local (short term) disturbances in growth at either
adjacent harvest can increase the variance of mean values. The classical
approach is also resource intensive, requiring large (many replicates) harvests
taken frequently if short-term fluctuations in response are to be detected.
The functional approach, on the other hand, is less demanding of resources
and is more flexible in its requirements for replication and harvesting
frequency. The data 'smoothing', however, that accompanies the curve fitting
procedure can reduce the sensitivity of the approach to short-term changes
in growth (Wickens and Cheeseman, 1988). As currently presented (e.g.
Causton and Venus, 1981 ; Hunt, 1982; Hunt and Evans, 1980), many func
tional procedures inadequately accommodate structured experimental designs
in non-constant environmental conditions (e.g. greenhouses). The " . . . economy
of expression . . . " afforded by the functional approach (Hunt, 1982), in which
large data sets are condensed into estimates of a few parameters, can be a
disadvantage if further analysis of the parameters is desired. A hybrid
Growth ontogeny of tomato plants under root restriction 32
method, merging the advantages of the classical and functional approaches
with the benefits of alternative approaches, is required.
A rapid improvement in the range of techniques available for analysing plant
growth occurred during the late 1970s and early 1980s (reviewed by Causton
and Venus, 1981 ; Hunt, 1982). Difficulties associated with pairing plants
from adjacent harvests in calculating relative growth and net assimilation
rates were overcome (Venus and Causton, 1979b), and in concert with
concurrent developments in linear and nonlinear regression (Myers, 1990),
the range of functions suitable for describing plant growth, and the rigour of
their application, was improved (Causton and Venus, 1981; Elias and
Causton, 1976; Nicholls and Calder, 1973). Allometric analysis, having its
genesis in zoology (Huxley, 1924; 1932) and previously sporadic use in
agronomy (e.g. Troughton, 1955), was increasingly used to describe the
partitioning ratio between root and shoot growth in studies throughout the
wider spectrum of plant science. More recently, however, plant growth
analysis techniques have not kept pace with, or taken advantage of, advances
in the computing and statistical tools now available to plant scientists. The
few alternative approaches suggested (e.g. Poorter, 1989; Poorter and Lewis,
1986) have tended to be inwards-looking, seeking to merge existing
approaches rather than incorporate new methods, or have been oriented
towards crop growth analysis (Hardwick, 1984; Hunt et al. , 1984; Warren
Wilson et al., 1986). Use of both classical and functional approaches has
tended to be self-terminating, with little subsequent use of their output for
secondary analyses. In particular, use of multivariate analysis techniques
has been conspicuously absent in recent studies involving growth analysis, yet
these techniques have considerable potential for accessing and interpreting
the interactional complexity of plant growth.
The main purpose of this study was to follow the ontogeny of relationships
between root and shoot growth of tomato plants in response to root restric-
Growth ontogeny of tomato plants under root restriction 33
tion. Additionally, I sought to incorporate and compare the efficacy of
different statistical methods suited to plant growth analysis to describe this
ontogeny in a way that allowed insight into its complexity.
3.2 Materials and methods
3.2.1 Cultural methods.
Plant material
Seed of the indeterminate tomato L. esculentum Mill. 'Moneymaker' were
germinated under mist in a glasshouse. Air temperature was maintained
between a minimum of 16°C and a maximum of 25°C. Seedlings were trans
planted to 5.0 x 5.0 x 8.0 cm tapered tubes (200 cm3) when the cotyledons
were fully expanded, and grown on in the glasshouse for six weeks. During
this phase, the seedlings were grown in 3 peat: 2 pumice (by volume) medium
amended with dolomite (3.0 kg·m·3) and PG Mix (14-7-15 NPK + trace
elements, 3.0 kg·m·3, Windmill, Holland), a base starter fertiliser. Stem
cuttings, 6-7 cm tall, were rooted in a 1 peat:9 pumice (by volume) prop
agation medium under closed mist. Four days later, the cuttings were
transferred to an open mist system for hardening off. On average, plants
were 16±0.5 cm tall, with a leaf area of 1 19±9 cm2, 58±6 roots with a total
length of 1 .3±0. 1 m, and a total plant dry weight of 0.9±0.08 g.
Stem cuttings, rather than seedlings, were used to limit the type of root being
evaluated. Just as there is diversity in the components of a shoot system, a
root system is a heterogenous collection of components with different internal
structure and function (Waisel and Eshel, 1 991 ; Zobel, 1992b). Using
tomatoes as an example, Zobel (1986) identified four types of root: radicle,
lateral, adventitious, and basal. By using stem cuttings, this potential
Growth ontogeny of tomato plants under root restriction 34
variation was limited to only adventitious and lateral roots. In addition, to
distinguish between hypocotyl adventitious roots (Byrne and Aung, 1974) and
true adventitious roots (Zobel, 1 986), the cuttings were taken above the
cotyledonary node. Studying the influence of adventitious root restriction was
also consistent with the widespread production in containers of crops raised
from cuttings.
Hydroponic system
The hydroponic system was based on the Deep Flow Technique (DFT) system
of Willumsen (1983) as detailed in Chapter 2. In this system solution
exchange is effected by vertical flow within the container. The containers
were arranged in parallel with respect to solution flow, ensuring that the
solution entering all containers had the same composition. The nutrient
solution was a modified Hoagland solution (Table 2 .1) .
3.2.2 Environmental
Air temperature in the glasshouse was maintained at 15°C nurumum at
night, with ventilation triggered when temperature rose above 25°C. Daily
mean temperature ranged from 1 8-23°C.
3.2.3 Experimental
The influence of a series of root restriction and de-restriction with container
volumes of 0.025, 0.05, and 10 litres on plant growth was examined (Table
3.1) . The 0.025 and 0.05 I containers were constructed from sections of PVC
pipe, 2 cm and 4 cm internal diameter respectively. Both ends of the
container were covered with black polythene film. A 3 mm irrigation fitting .
Growth ontogeny of tomato plants under root restriction 35
was tapped into the base of the container for connection to the hydroponic
delivery pipes. The smaller containers were fitted into polystyrene lids placed
over the 10 I containers. As root temperature strongly influences shoot
growth in tomatoes (Maletta and Janes, 1987), possibly through altered
balances in the hormone content of xylem sap (Menhenett and Wareing,
1975), the small containers were immersed in the hydroponic solution flowing
through the 10 I container to ensure that root temperatures in all treatments
were similar. The polystyrene lids and 10 I containers were covered with
black plastic film to exclude light from the root environment.
Treatments were initiated immediately after the plants were introduced into
the hydroponic system. Roots present on cuttings at this time did not appear
to continue growing. New roots appeared from the immersed stem after
about 3 days; the root system developed from these latter roots. No visual
signs of water stress were observed in the plants during this transition
period.
Plants were supported vertically by crop training twine (Veg-Gro Supplies,
Auckland) attached around the centre of the stem and connected to an
overhead grid of supporting wires (2. 1 m above the greenhouse floor). Plants
were destructively harvested 13, 31 , 45, 67, and 99 days later. After 3 1 days
after initiation of the experiment (DAI) , pre-assigned plants were de
restricted from 0.025 I containers into either 10 I containers (RD) or 0.05 I
containers (RDD). After 67 DAI, plants in 0.05 I containers were de-restricted
into 10 I containers (Table 3.1) .
Growth ontogeny of tomato plants under root restriction 36
Table 3.1 Details of experiment
Treatment description unrestricted, UR (10 1) continuously restricted, CR (0.025 1)
res trict-derestrict, RD (0.025 1 -+ 10 1) restrict-derestrict-derestrict, RDD (0.025 -+ 0.05 -+ 10 1)
3.2.3.1 Experimental design and data collection
A randomised complete block (RCB) design incorporating 6 blocks was used
to provide local error control against known profiles of temperature and light
within the glasshouse. From a pool of 168 rooted cuttings, 120 similarly sized
plants (experimental units) were selected and randomly allocated to the
blocks (i.e. 20 plants per block). Treatments were randomly allocated to
positions within each block, and harvest dates then randomly allocated to
plants within each treatment position. Thus, each block consisted of 4
restriction treatments, with each treatment consisting of 5 plants, one for
each of the destructive harvests. At any one destructive harvest, 24 plants
were removed from the system and assessed.
Blocks were harvested sequentially, with the shoot growth variables
(component fresh weight, plant height, leaf area and leaf counts) completed
for each plant within 30 minutes of removal from the hydroponic system. In
contrast, the time required to record the length and number of roots of a
single plant increased from 1 .5 to 6.5 hours as the experiment progressed.
Therefore, root systems were not measured until the shoot measurements for
all plants were completed. After shoot removal, root systems were stored
intact and submerged in water in 10 1 plastic buckets in a cold (4-7°C) store.
A compressed air line inserted into each root system avoided development of
anaerobic conditions.
Growth ontogeny of tomato plants under root restriction 37
Total leaf area was measured with a Li-Cor LI-3100 leaf area meter (Lambda
Instruments Co., Lincoln, NE, USA) and root length measured with a Comair
root length scanner (Commonwealth Aircraft Co., Melbourne, Australia) . Root
number was measured by eye by counting the number of branches (Evans,
1976) of portions of the root system suspended in water in a petri dish laid
against a dark background.
Root numbers of the entire root system of each plant were counted for the
first two harvests (13 and 31 DAI). By 45 DAI, however, root systems were
too large for this task to be practically accomplished and a sampling
procedure was introduced. Roots were cut into about 2.5 cm lengths and laid
onto a sampling tray (45 x 60 cm) in sufficient water to allow the roots to be
distributed uniformly over the tray. Once achieved, the water was slowly
removed through a drain at the centre of the tray. From a grid of 9 x 12 cm
squares drawn on the base of the tray, 2.5 squares 00% of the area of the
tray) were randomly selected, and the roots removed after cutting the outline
of the grid through the root mass. The length of the complete root system
was measured at each harvest.
Leaf water potential was measured early morning (730-830 h) and at solar
noon 0200-1300 h) with a pressure chamber (model 3005, Soilmoisture
Equipment Corporation, USA). A leaflet ("",60 cm2) fully exposed to sunlight
and next to the terminal leaflet was measured. The leaflet was enclosed in
a plastic bag containing moistened filter paper, cut immediately below the
petiole-stem junction, and within 10 seconds was transferred to the pressure
chamber in a laboratory attached to the greenhouse. A humid environment
was maintained in the pressure chamber by a lining of moistened capillary
matting. Extrusion errors were avoided by ensuring the petiole length
protruding from the chamber did not exceed 5 mm (Turner, 1981) . The
chamber was pressurised at about 0.2-0.25 bar ·s·l (Lakso, 1992) until the end
point was approached after which the rate was reduced to 0 .1-0.125 bar ·s·l .
Growth ontogeny of tomato plants under root restriction 38
Leaf epinasty (downward growth) and appearance of adventitious roots on
stems are symptoms of oxygen stress in tomato (Jackson and Campbell,
1976). Estimates of leaf epinasty were made at 31, 45, and 67 DAI by
measuring the angle between the stem and the adaxial surface of the lower
(oldest) six to eight petioles on the plant (Jackson and Campbell, 1976).
Counts of adventitious roots were taken as required.
Dry weights of all components of plant biomass were measured after 48 h
drying at 80°C in a forced air oven.
3.2.3.2 Pre-analysis adjustment of raw data
Adjustment for root senescence and turnover
Although root senescence and turnover is a normal characteristic of all crops
(Klepper, 1991; Vogt and Bloomfield, 1991), root dieback in fruiting tomato
plants grown in hydroponic systems can be severe. Little or no replacement
of new roots occurs, leaves display symptoms of transient water stress and
shoot growth is retarded (Hurd and Price, 1977). Although usually associated
with the onset of fruit growth (Hurd and Gay, 1977), Tucker (1981) has sug
gested that root dieback is a consequence of a change in the auxin/cytokinin
balance in the roots. As root restriction may influence cytokinin levels
(Carmi and Heuer, 1981; Richards and Rowe, 1 977a), and possibly their
balance with auxin levels (Costa et al. , 1992), restricted root systems might
contain proportionately more dead root tissue than unrestricted systems.
Without adjusting root data for these differences, direct comparisons among
root characteristics (e.g. length, number and mass) and shoot growth
functions of the treatments would not be valid.
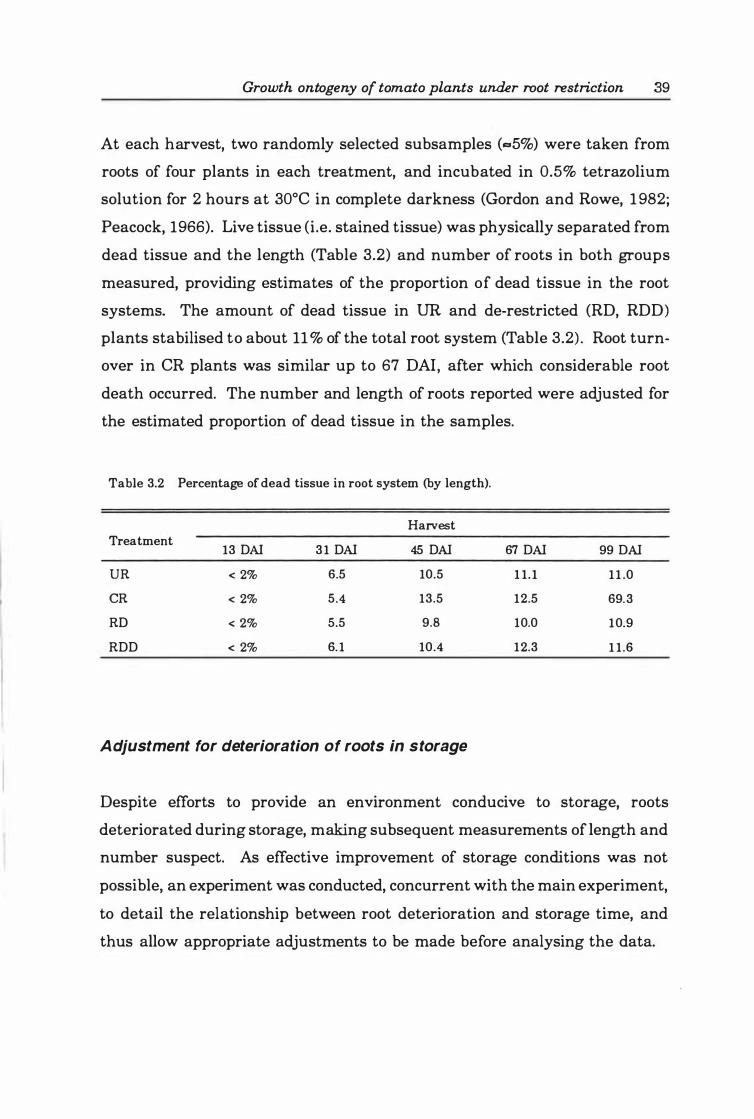
Growth ontogeny of tomato plants under root restriction 39
At each harvest, two randomly selected subsamples ( ... 5%) were taken from
roots of four plants in each treatment, and incubated in 0.5% tetrazolium
solution for 2 hours at 30°C in complete darkness (Gordon and Rowe, 1 982;
Peacock, 1966). Live tissue (i.e. stained tissue) was physically separated from
dead tissue and the length (Table 3.2) and number of roots in both groups
measured, providing estimates of the proportion of dead tissue in the root
systems. The amount of dead tissue in DR and de-restricted (RD, RDD)
plants stabilised to about 11 % of the total root system (Table 3.2) . Root turn
over in CR plants was similar up to 67 DAI, after which considerable root
death occurred. The number and length of roots reported were adjusted for
the estimated proportion of dead tissue in the samples.
Table 3.2 Percentage of dead tissue in root system (by length).
Harvest Treatment
13 DAI 3 1 DAI 45 DAI 67 DAI 99 DAI
UR < 2% 6.5 10.5 1 1. 1 1 1 .0
CR < 2% 5.4 13.5 12.5 69.3
RD < 2% 5.5 9.8 10.0 10.9
RDD < 2% 6. 1 10.4 12.3 1 1 .6
Adjustment for deterioration of roots in storage
Despite efforts to provide an environment conducive to storage, roots
deteriorated during storage, making subsequent measurements of length and
number suspect. As effective improvement of storage conditions was not
possible, an experiment was conducted, concurrent with the main experiment,
to detail the relationship between root deterioration and storage time, and
thus allow appropriate adjustments to be made before analysing the data.
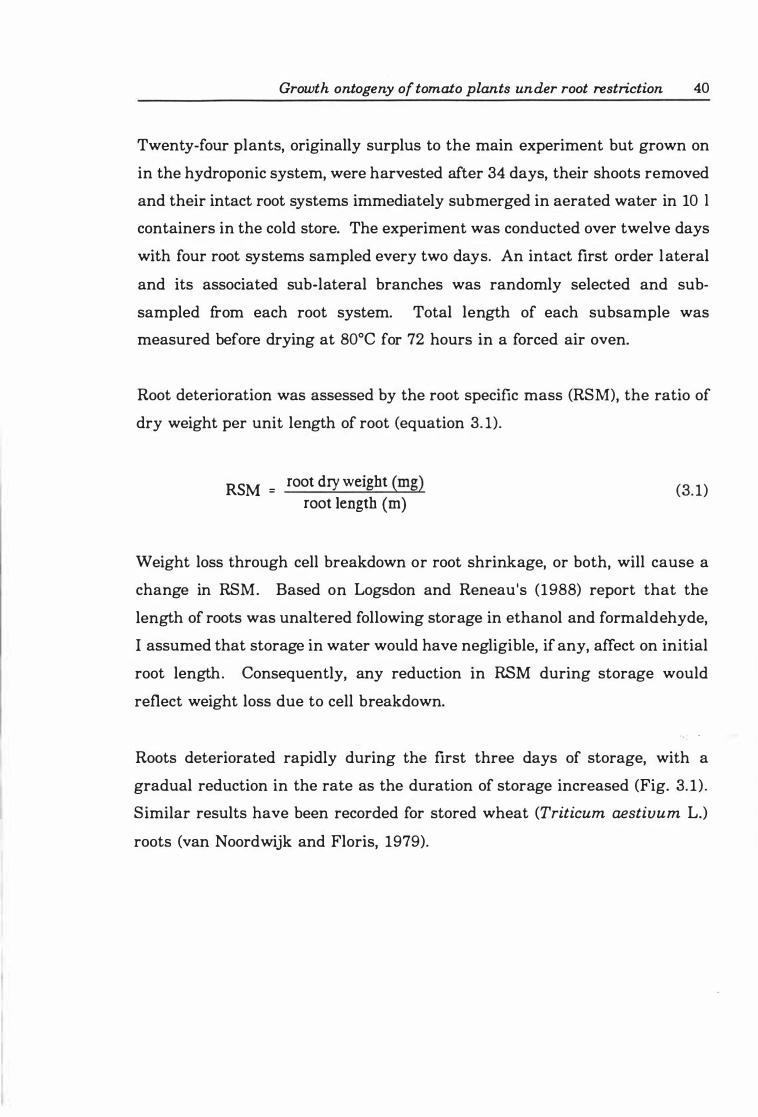
Growth ontogeny of tomato plants under root restriction 40
Twenty-four plants, originally surplus to the main experiment but grown on
in the hydroponic system, were harvested after 34 days, their shoots removed
and their intact root systems immediately submerged in aerated water in 10 1
containers in the cold store. The experiment was conducted over twelve days
with four root systems sampled every two days. An intact first order lateral
and its associated sub-lateral branches was randomly selected and sub
sampled from each root system. Total length of each subsample was
measured before drying at 80°C for 72 hours in a forced air oven.
Root deterioration was assessed by the root specific mass (RSM), the ratio of
dry weight per unit length of root (equation 3. 1) .
RSM = root dry weight (mg) root length (m) (3. 1)
Weight loss through cell breakdown or root shrinkage, or both, will cause a
change in RSM. Based on Logsdon and Reneau's (1988) report that the
length of roots was unaltered following storage in ethanol and formaldehyde,
I assumed that storage in water would have negligible, if any, affect on initial
root length. Consequently, any reduction in RSM during storage would
reflect weight loss due to cell breakdown.
Roots deteriorated rapidly during the first three days of storage, with a
gradual reduction in the rate as the duration of storage increased (Fig. 3. 1) .
Similar results have been recorded for stored wheat (Triticum aestiuum L.)
roots (van Noordwijk and Floris, 1979).
Growth ontogeny of tomato plants under root restriction 4 1
9 0 -
� � 8 b.O S
ci 7 � ........ . 8 6 .... � J... .... -fn 5 .-Q) � � 4 0
0 0 0 � 3
0 1 2 3 4 5 6 7 8 9 10 11 12
Storage (days) Fig. 3 .1 Relationship between root specific mass (RSM) and storage. Fitted line from back-transformed values of log., RSM = 2.02 - 0.249 1og., [days of storage + 1] . (r = 0.92; lack of fit = NS.)
As this relationship was curvilinear, adjusting root dry weight for storage
effects through analysis of covariance was not possible (Steel and Torrie,
1 980) . Regression analysis of loge transformed storage data yielded the
equation:
loge RSMas = 2.020 - 0.249 loge T
( r 2 = 0.92, lack of fit:NS)
where RSM .. is the root weight ratio (g dry weight/m) measured after storage, T is days of storage + 1 , and the rate constant (-0.249) measures the rate of weight loss per root length per day of storage (g·m·1 ·day·l).
(3.2)
The rate constant, with the coefficient terms, provide the adjustment for
storage. Equation (3.2) has the formy = a - bx, where b is the rate constant,
and a is the value of y when x equals zero. In this instance, a is the RSM before storage (RSMbe). Rearranged, the equation yields:
Growth ontogeny of tomato plants under root restriction 42
or,
RSM = RSM ·T °.249 hi as
where RS� is an estimate of the initial (before storage) root dry weight per metre at harvest (i.e. RSM at t=O)
(3.3)
Through equation (3.3), raw data of root dry weight were adjusted to account
for the duration the roots were stored before measurement.
3.2.4 Data analysis
Univariate analysis and time
Analyses of measured and derived variables were completed for each harvest.
Time was not included as a variable in the statistical models used because it
was possible that the changing nature of the treatments may have influenced
different, or additional, physiological processes as the experiment progressed
(Mead, 1 990). Therefore, the nature of response would also change during the
experiment. In this experiment, the nature of the treatment was expected to
change during the experiment. For example, the root restriction 'treatment'
encountered by CR plants 31 DAI was not the same root restriction treatment
encountered by CR plants 67 DAI. Such change would have compromised the
assumptions of heterogenous variance, additivity and normality, required for
the analysis of variance of the more commonly used split-plot-in-time (with
time used as the split plot factor) (Mead, 1990). In addition, the non
randomness of time would have created dependency in the error structure.
Therefore, the AN OVA model (equation 3.4) was fitted to data from each
month.
Y., = II + ex , + A , + € .. IJ r- I .... } I} (3.4)
where i=l , . . . , 4 andj=l, ... , 6.
Growth ontogeny of tomato plants under root restriction 43
The appropriateness of the model, and absence of outliers, for each variable
was checked using standard diagnostics of model residuals (Myers, 1990).
Significance testing
Standard statistical practice dictates that treatment differences are examined
only if the overall F statistic is significant. The power of the F test to detect
treatment differences, however, depends on the average of the squares of
treatment deviations. As Mead (1990) argues, this ignores the possibility of
detecting one substantial treatment effect that could be otherwise lost if all
other treatment deviations are much smaller. Therefore, orthogonal contrasts
were tested and reported irrespective of the overall F statistic being
significant.
Unless otherwise stated, significance tests are presented at the 5% level of
probability.
Missing data
A single missing value (root dry weight of treatment 1 , block 4, 99 DAD was
estimated using analysis of covariance with dummy variables for the missing
datum and non-missing data (Steel and Torrie, 1980).
Multivariate analyses
Multivariate statistical techniques enable simultaneous examination of
observations on several different variables for several individuals. The many
techniques available can be broadly classified as variable-directed, where
primary concern is directed at the relationships among variables, and
individual-directed, where primary concern is focused on the relationships
among individuals (Chatfield and Collins, 1980). Variable-directed techniques
Growth ontogeny of tomato plants under root restriction 44
(e.g. canonical correlation analysis (CCA) and multiple regression analysis
and its variants), reduce the dimensionality of the data set, exposing
important underlying themes among variables, and highlighting redundant
variables. Individual-directed techniques (e.g. canonical discriminant analysis
(CDA» , provide the mechanism for discriminating among individuals or types
on a quantifiable and repeatable basis.
Path analysis
Path analysis is a form of structured multiple linear regression analysis,
investigating the relationships among standardised variables. The advantage
of such an analysis is that the effect of one variable on another can be
isolated from influences of other variables. By calculating the sign and
significance of path coefficients, the direct effect of each variable on another
is revealed following removal of the indirect effects exerted by other variables.
Path coefficients significantly different from zero indicate that a change in a
causal variable significantly affects the targeted response variable, with the
greater the magnitude of the path coefficient, the greater its direct effect.
Importantly, the terms causal and effect are used here in the statistical
context of independent and dependent variables; a change in the direction of
the path coefficients will yield coefficients of identical magnitude.
A major application of path analysis involves constructing and evaluating
alternative structural models. Given a set of observed correlations among all
the variables being considered, path analysis provides a tool to reproduce the
correlations by a heuristic path diagram (Sokal and Rolfe, 1981) . The
technique relies heavily on path diagrams, which specify the proposed
structure of the relationships among several variables. This structure is
formed subjectively by the researcher as a plausible interpretation of these
relationships, consistent with the observed data on all the variables involved.
This characteristic distinguishes path analysis from multiple regression.
Growth ontogeny of tomato plants under root restriction 45
Whereas multiple regression is concerned solely with predicting an 'effect'
from several 'causes', path analysis tests whether a proposed causal structure
is compatible with the observed data.
Credited to Wright (1921), and popularised by Li (1975), path analysis has
received considerable attention in social science and genetics research (e.g.
Duncan, 1966; Heise, 1 969; Kempthorne, 1957). Apart from use in evaluating
yield components in agronomic crops (e.g. Dewey and Lu, 1959; McGiffen et
al., 1994; Pandey and Torrie, 1973; Shasha's et al., 1973), path analysis is
infrequently used in plant research (Hicklenton, 1990; Karlsson et al.; 1988) .
The reasons for this are not clear. Certainly, the structural equations implied
by a path diagram must be linear, and while linear relationships may often
be unrealistic in some plant physiology contexts, they nevertheless exist in
others. Moreover, transforming nonlinearly related variables may make their
relationship linear or at least approximately so (Li, 1 975). As it is not a fixed
and routine method of handling data, path analysis is absent from statistical
software packages, making it a less than readily available application for
general data analysis.
In this study, path analysis provided the opportunity to examine several
possible structural relationships between root and shoot growth. Moreover,
given the considerable evidence existing that these relationships are often
linear (Richards, 1981; Richards and Rowe, 1977a; Wilson, 1988), the linear
ity inherent in the analysis technique was considered to be biologically valid.
Correlation coefficients were calculated from the raw data using the SAS
(Statistical Analysis System, Cary, N.C.; SAS Institute, 1989) procedure
CORR. The path coefficients are equivalent to standardised partial
regression coefficients. Raw data were standardised to zero mean and unity
variance and multiple linear regressions conducted (using the SAS Institute
(1989) procedures STANDARD and REG) as shown by the postulated path
Growth ontogeny of tomato plants under root restriction 4 6
diagrams. As estimates of regression coefficients are distorted i f excessive
collinearity exists among the independent variables in the model, appropriate
measures of collinearity (e.g. condition indexes, variance decomposition and
inflation factors; Myers, 1990) were calculated with each regression as a
check.
Canonical correlation analysis
Latent relationships between the components of root and shoot growth were
identified using canonical correlation analysis. The aim of canonical correl
ation analysis is to simplify the relationships between two groups of data.
Pairs of linear functions (canonical variables) are defined which are linear
and additive combinations of the original variables such that the correlation
between the pairs of functions is as large as possible (Johnson and Wichern,
1988).
When variables in either group in a canonical correlation analysis are highly
correlated (Le. within-group correlation is high), interpreting the canonical
variables solely on the magnitude and sign of the coefficients is prone to
error. For example, if one variable of a group is highly correlated with one
or more of the other variables in that group, then part of the effect of that
variable will be accounted for by the coefficients of the other variables. Under
such circumstances, interpretation based on these canonical coefficients is
only approximate and potentially misleading (Reyment, 1 972; Monmonier and
Finn, 1973; Manly, 1986; Young, 1981) and should be supplemented by the
canonical structure (Le. the correlations between the canonical variables and
the original variables).
More recently, however, this approach has been criticised as viewing a
multivariate issue in a univariate way. Johnson and Wichern (1988) and
Rencher (1992) favour assessing the contributions of the original variables .
Growth ontogeny of tomato plants under root restriction 47
directly from the standardised coefficients since the correlations between the
canonical variates and the original variables do not show how the original
variables contribute jointly to the canonical analyses. This approach was
adopted in this study, using guidelines from Hair et al. (1987) for determining
which loadings were worth considering. In short, loadings greater than ±O.30
were considered important, loadings greater that ±OAO considered more
important, and if the loadings were ±O.50 or greater, they were considered
very important. Thus, the larger the absolute size of the loading, the more
important it is in interpreting the function.
Canonical discriminant analysis
By reducing the dimensionality of data sets, canonical discriminant analysis
identifies and summarises important differences among treatments, while
recognising the complex relationships among many characteristics (Cruz
Castillo et aI., 1994). The aim of canonical discriminant analysis is to find
linear functions of variables that separate two or more groups of individuals
given measurements for these individuals on several variables. Heuristically,
for the canonical discriminant functions (CDFs) Zl' Z2' . . . , Zn' Zl reflects group
differences as much as possible; Z2 captures as much as possible the group
differences not displayed by Zl; Z3 reflects as much as possible the group
differences not displayed by Zl and Z2 and so on (Manly, 1986).
Canonical discriminant analysis proceeds under the assumptions of multi
variate normal distributions and homogeneity of the within-group covariance
matrix of all groups under examination. Failure of these assumptions
influences the reliability of the significance tests (Manly, 1 986). Curvilinear
or nonlinear relationships between two variables will not be reflected in the
results of the analysis unless suitable transformations are first performed on
the original data for those variables (Matthew et aI . , 1994). The need for
Growth ontogeny of tomato plants under root restriction 48
such transformations was checked by plotting each variable pair by each
harvest.
When correlation exists among some of the original variables, inferences
based on the correlation between the CDFs and original variables (the
canonical structure) is recommended (Afifi and Clark, 1990). But, as with
canonical correlation analysis, this approach has been criticised (Rencher,
1992). In standardised form, the canonical coefficients of each CDF provide
information about the joint contribution of the variables to that
CDF-inferences from the canonical structure do not provide any information
about the multivariate contribution of any variable.
3.2.5 P lant growth analysis
Relative growth rates and relative rates of increase
West et al. (1920) considered that the term 'relative growth rate' better
described Blackman's (1919) efficiency index of dry weight production.
Nevertheless, Blackman's (1919) explanation ofthis term, the efficiency of the
plant as a producer of new material, is still widely accepted. When related
to a specific organ (e.g. root) or group of organs (e.g. shoot), Warren Wilson
(1972) suggested that the relative growth rate measured the sink activity of
that organ group. As this also implies that the organ (sink) is entirely
responsible for accumulating assimilate, Warren Wilson's (1972) view is not
universally shared. Ho (1988), for example, pointed out that a considerable
proportion of assimilate imported by a sink organ is used for respiration.
Therefore, indices based upon biomass increase fail to assess the true ability
of the sink organ to import assimilate, and only reflect the organ's apparent
sink strength. Wareing and Patrick ( 1975) noted that Warren Wilson's ( 1972)
definition of sink activity carried with it the implicit, and demonstrably
Growth ontogeny of tomato plants under root restriction 49
invalid, assumption that assimilate uptake was unaffected by neighbouring
sinks.
These concepts of relative growth rates are not entirely relevant when com
paring the relative change in the number or length of roots or length of stem
over an interval. Yet some basis of standardisation is needed to compare
differences in time as the size of a plant influences the increase in magnitude
of its components. For this purpose, I have introduced the term relative rate
of increase (Ry(variable» to describe the relative increase of a variable (e.g. leaf
or root number) over time, with respect to the initial size. While mathe
matically identical to whole plant relative growth rate, this term better
describes the derived variable. This approach extends Hunt's (1982) attempt
at distinguishing between whole and component 'relative growth rates' to
assist in comparing the effects of treatments on the causal process
contributing to the gross performance of the plant. Hunt ( 1982), however,
supported use of the term specific growth rate to describe whole plant relative
growth rates, and relative growth rate to describe that of the components.
Specific growth rate has not gained widespread acceptance in scientific
literature, possibly because the dubious association between organ efficiency
and sink strength still exists. Consequently, in this thesis, the term relative
growth rate is confined to whole plant dry biomass (Rw, g.g-l ·day-l), shoot
dry biomass (i.e. L[leaves, petioles, stem] ; Rs, g.g-l ·day-l), leaf dry biomass
(RL, g.g.I ·day-I) , stem dry biomass (RsT' g.g.I ·day-l) and root dry biomass
eRR' g.g-I ·day-I) . The standardised increase in leaf area is termed the
relative leaf expansion rate (RA, m2 ·m-2 ·day·l) .
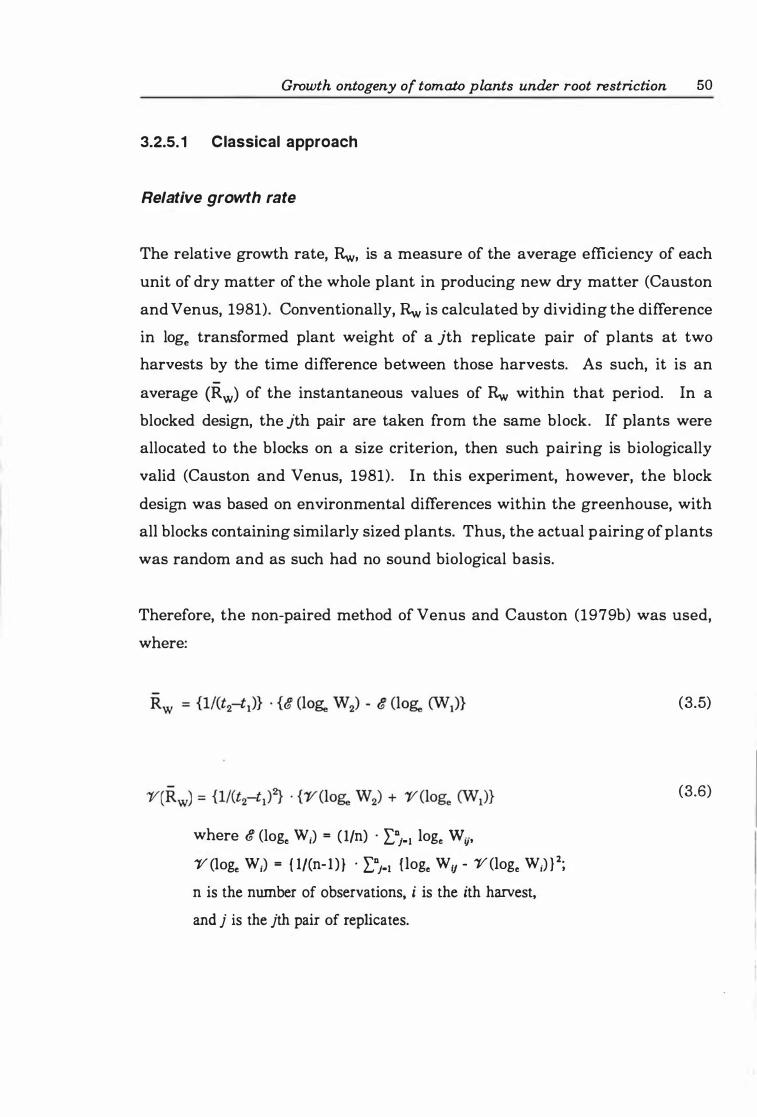
Growth ontogeny of tomato plants under root restriction 50
3.2.5. 1 Classical approach
Relative growth rate
The relative growth rate, Rw, is a measure of the average efficiency of each
unit of dry matter of the whole plant in producing new dry matter (Causton
and Venus, 1981). Conventionally, Rw is calculated by dividing the difference
in loge transformed plant weight of a jth replicate pair of plants at two
harvests by the time difference between those harvests. As such, it is an
average (Rw) of the instantaneous values of Rw within that period. In a
blocked design, the jth pair are taken from the same block. If plants were
allocated to the blocks on a size criterion, then such pairing is biologically
valid (Causton and Venus, 1981). In this experiment, however, the block
design was based on environmental differences within the greenhouse, with
all blocks containing similarly sized plants. Thus, the actual pairing of plants
was random and as such had no sound biological basis.
Therefore, the non-paired method of Venus and Causton (1979b) was used,
where:
where 8 (loge Wi) = ( lIn) . LDj_l loge W ij'
'P (loge Wi) = ( l/(n- l ) } . LDj_l { loge Wlj - 'P(loge Wi) } 2; n is the number of observations. i is the ith harvest,
and j is the jth pair of replicates.
(3.5)
(3.6)
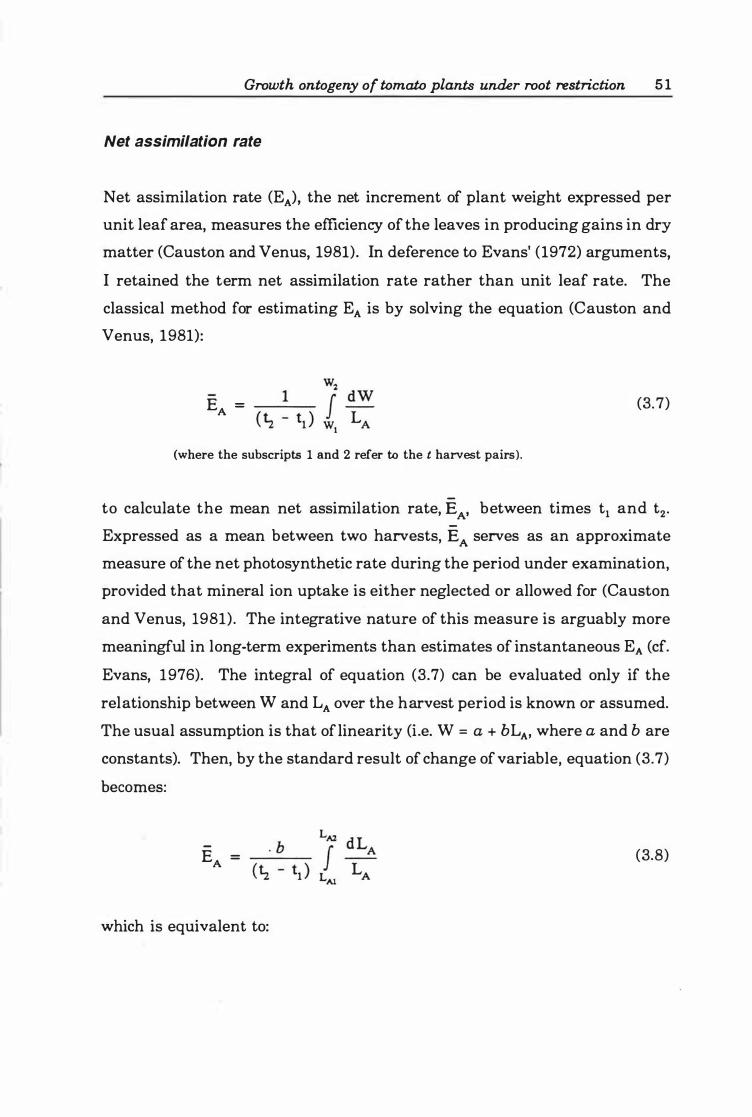
Growth ontogeny of tomato plants under root restriction 5 1
Net assimilation rate
Net assimilation rate (EA), the net increment of plant weight expressed per
unit leaf area, measures the efficiency of the leaves in producing gains in dry
matter (Causton and Venus, 1981). In deference to Evans' (1972) arguments,
I retained the term net assimilation rate rather than unit leaf rate. The
classical method for estimating EA is by solving the equation (Causton and
Venus, 1981):
E = A
(where the subscripts 1 and 2 refer to the t harvest pairs).
(3.7)
to calculate the mean net assimilation rate, E A' between times tl and t2 .
Expressed as a mean between two harvests, E A serves as an approximate
measure of the net photosynthetic rate during the period under examination,
provided that mineral ion uptake is either neglected or allowed for (Causton
and Venus, 1981) . The integrative nature of this measure is arguably more
meaningful in long-term experiments than estimates of instantaneous EA (cf.
Evans, 1976). The integral of equation (3.7) can be evaluated only if the
relationship between W and LA over the harvest period is known or assumed.
The usual assumption is that of linearity (Le. W = a + bLA, where a and b are
constants). Then, by the standard result of change of variable, equation (3.7)
becomes:
-E = A
which is equivalent to:
(3. 8)
Growth ontogeny of tomato plants under root restriction 52
(where LA} and LA2 are the leaf areas at the fIrst and second harvest).
For the respective harvests, WI = a + bLAI and W2 = a + bLA2• Rearranging
these equations with respect to b yields:
b = (3. 10)
Substituting for b in equation (3.9) gives:
(3. 1 1)
Whitehead and Myerscough (1962) generalised this equation for calculat
ing EA for relationships of the form W = a + bLAn (of which linearity (n= l) is
a special case) as:
(3. 12)
The value of the index n is the ratio of the mean relative growth rates of the
plant and leaf area (RA):
n = (loge W2 - loge Wt) (loge LA2 - loge LAl )
(3. 13)
Growth ontogeny of tomato plants under root restriction 53
Whale et al. (1985) noted that if the equation W = a + b ·LAn is written in loge
form (Le. 10& W = 10& b + n ·log, LA)' then n can be estimated as the
regression coefficient of 10& W on log, LA.
In classical growth analysis, equations (3.7)-(3.9) and (3. 1 1)-(3.12) are solved
for discrete pairs of data for the harvest interval (t2 - tl) . As with Rw' Venus
and Causton (1979b) noted that unless such pairing was based on a size
criterion, it lacked a sound biological basis. They proposed an alternative
method for estimating the expected value of B A that utilised standard
theorems for a linear combination of variates for the equation (3. 1 1) :
Z'B = Z'(W2 - W1) ( loge Z'(LA2) - loge Z'(LAl» A
( Z'LA2 - Z'LAl ) (!z - t1 ) where ?,{WI) = lin (I WI) etc and (n = no. observations, j .. . n)
(3. 14)
Whale et al. ( 1985) subsequently extended this approach for the equation
form (3. 12). As the four attributes Wl' W2, LAl, and LA2 are combined in the
non-linear form of equation (3. 1 1), only approximate estimates of &{EA) and
its variance, '1(EA), are obtainable. Venus and Causton (1979b) and Whale
et al. (1985) provide such approximations, derived from formulae given by
Kendall and Stuart (1977).
The assumption of linearity was tested by plotting loge W against loge LA for
each treatment. These plots indicated deviations from linearity which were
confirmed subsequently by regression analysis with significant quadratic
terms detected in the relationship for each treatment. Coombe (1960) and
Evans (1972) tabulated the percentage differences between mean values ofEA
calculated on the assumption that W = a + bLAn and the corresponding value
for the assumption that W = a + bLA2. Coombe (1960) noted that if the ratio
of LA2/LAl is less than 2, the difference between estimates of EA when n=1 or
n=2 are negligible. As the LdLAl ratio ranged between 3 and 16 for all
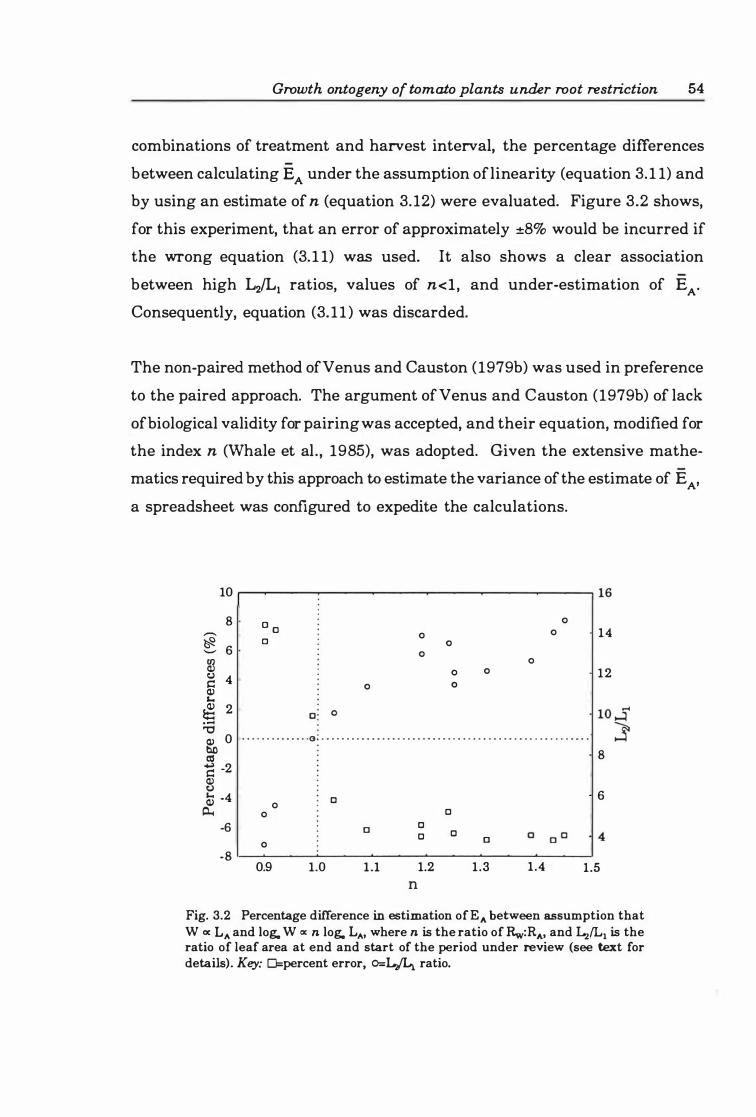
Growth ontogeny of tomato plants under root restriction 54
combinations of treatment and harvest interval, the percentage differences
between calculating EA under the assumption of linearity (equation 3. 1 1) and
by using an estimate of n (equation 3. 12) were evaluated. Figure 3.2 shows,
for this experiment, that an error of approximately ±8% would be incurred if
the wrong equation (3. 1 1) was used. I t also shows a clear association
between high L2/Ll ratios, values of n<l, and under-estimation of EA.
Consequently, equation (3. 1 1 ) was discarded.
The non-paired method of Venus and Causton (1979b) was used in preference
to the paired approach. The argument of Venus and Causton (1979b) of lack
of biological validity for pairing was accepted, and their equation, modified for
the index n (Whale et al . , 1985), was adopted. Given the extensive mathe
matics required by this approach to estimate the variance of the estimate of E A'
a spreadsheet was configured to expedite the calculations.
10
8 -� 6 -en <l) CJ 4 � <l) s.. � 2 ..... � <l) 0 bD � s:: -2 <l) CJ � -4
� -6
-8
��----�------------------�----�----� 16
D O o
o
o
o o
o o
o o
o o 14
12
· · · · · · · · · · · · · ·0; · · · · · · · · · · · · · · · · · · · · · · · · · · · · · · · · · · · · · · . . . . . . . . . . . . . . .
0 0 0
0 0
0.9 1.0 1 .1 n
0 0 0 0
1.2
0
1.3
8
6
1.4 1.5
Fig. 3.2 Percentage difference in estimation of EA between assumption that W ex LA and log. W oc n log. LA' where n is the ratio of Rw:RA• and Lz/Ll is the ratio of leaf area at end and start of the period under review (see text for details). Key: O=percent error, o=LfLI ratio.
Growth ontogeny of tomato plants under root restriction 55
Other ratio indices
The fundamental equation in growth analysis relates instantaneous plant
relative growth rate as a linear function of EA and the leaf area ratio (LAR), the ratio of leaf area (LA) to total plant dry weight (W). The LAR reflects the
ratio of photosynthesizing to respiring material in the plant (Hunt, 1978).
R = E · IAR w A
LA R = E . -w A
W
(3. 15)
(3. 16)
In turn, the LAR is the product of the leaf weight ratio (L WR), an index of
the leafiness of the plant on a weight basis (equation 3. 17), and the specific
leaf area (SLA):
� = EA . SIA . LWR
= E A
(where WL = leaf dry weight)
(3. 17)
The SLA is a morphological index of the expansion in space of the dry matter
in leaves. Although commonly viewed as an indicator of leafthickness, where
a high ratio corresponds to a thin leaf (e.g. Causton and Venus, 1981; Friend
and Helson, 1965; Hunt, 1 982), changes in SLA may also result from sole or
joint changes in leaf thickness, density, or composition (Dijkstra, 1990; van
Arendonk and Poorter, 1994; Witkowski and Lamont, 1991) . Dijkstra (1990)
pointed out that although being a component of SLA, the index itself was not
an appropriate measure of leaf thickness, because the ratio between dry
weight and fresh weight of leaves may vary. Similarly, as leaf density may
change independently of leaf thickness (Lewandowska and Jarvis, 1977;
Purohit et al. , 1988), SLA itself could only give a coarse estimate of density.
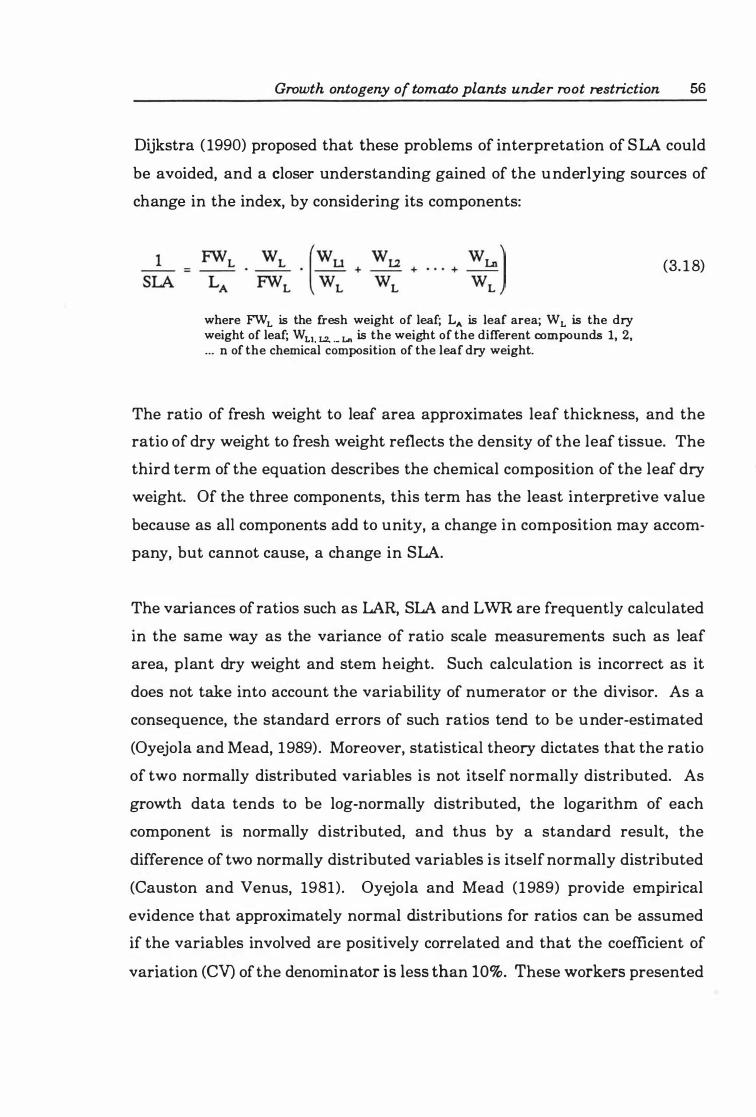
Growth ontogeny of tomato plants under root restriction 56
Dijkstra ( 1990) proposed that these problems of interpretation of SLA could
be avoided, and a closer understanding gained of the underlying sources of
change in the index, by considering its components:
where FWL is the fresh weight of leaf; LA is leaf area; WL is the dry weight of leaf; WL1• L2. ._ Ln is the weight of the different compounds 1, 2, ... n of the chemical composition of the leaf dry weight.
(3. 18)
The ratio of fresh weight to leaf area approximates leaf thickness, and the
ratio of dry weight to fresh weight reflects the density of the leaf tissue. The
third term of the equation describes the chemical composition of the leaf dry
weight. Of the three components, this term has the least interpretive value
because as all components add to unity, a change in composition may accom
pany, but cannot cause, a change in SLA.
The variances of ratios such as LAR, SLA and LWR are frequently calculated
in the same way as the variance of ratio scale measurements such as leaf
area, plant dry weight and stem height. Such calculation is incorrect as it
does not take into account the variability of numerator or the divisor. As a
consequence, the standard errors of such ratios tend to be under-estimated
(Oyejola and Mead, 1989). Moreover, statistical theory dictates that the ratio
of two normally distributed variables is not itself normally distributed. As
growth data tends to be log-normally distributed, the logarithm of each
component is normally distributed, and thus by a standard result, the
difference of two normally distributed variables is itself normally distributed
(Causton and Venus, 1981). Oyejola and Mead (1989) provide empirical
evidence that approximately normal distributions for ratios can be assumed
if the variables involved are positively correlated and that the coefficient of
variation (CV) of the denominator is less than 10%. These workers presented
Growth ontogeny of tomato plants under root restriction 57
a method for correcting the standard error of a ratio to account for the
variability of the denominator term. When correlation is unlikely to exist
between the numerator terms, the standard error of the difference of two
ratios is calculated from the standard errors of the two separate ratios. When
correlation exists, Oyejola and Mead (1989) recommend a conservative
correction to the standard error using the larger of the two standard error to
mean ratios (Le. the less precise ratio). When the CV of the denominator
term exceeds 25%, the distribution of the ratio is skewed, affecting inferences
of significance involving t-tests. Thus, as the unadjusted standard errors are
probably smaller than actual, a more conservative approach must be adopted
when interpreting differences among treatments.
In the classical analysis component of this study, however, the CV of the
denominator term sometimes exceeded 25%, making any interpretation of the
data adjusted by Oyejola and Mead's ( 1989) method open to objective assess
ment. As both normal probability plots and the Shapiro-Wilk statistic
(Shapiro and Wilk, 1965; calculated by the SAS (1989) procedure
UNIVARIATE) indicated the data of each ratio could be treated as a random
sample from a normal distribution, the ratios were treated as normally
distributed variables.
3.2.5.2 Functional approach
Background and theory
Regardless of the experimental protocol taken, a reality of taking sequential
observations of plant growth is that random errors will be incurred at each
stage of the measurement process (Hunt, 1982). Any one of the subsamples
harvested may not necessarily be representative of the whole population at
the time of harvest. Both accidental and unavoidable differences between the
Growth ontogeny of tomato plants under root restriction 58
treatment of different individuals within each subsample will occur by
manner of the physical layout of the plants in the experimental environment
and harvesting techniques used. Seedling variation and variation within
clonal material (Burdon and Harper, 1980; Skirvin et al., 1 994) will result in
individuals growing at slightly different rates. Thus, while observational data
may parallel reality, it never mirrors it. Hunt (1982) argued that " . . . if
attempts to assess the reality of growth result in a random scatter of
observations about that reality, then a mathematical function fitted to those
observations may be expected to regain much of the clarity with which the
reality is perceived by the experimenter . . . " . A fitted function, Hunt ( 1982)
continued, reflected back towards the reality of which the observational data
were imperfect estimates.
The correct choice of curve function to fit to the data is crucial to the success
ofthe functional approach. This topic has received considerable attention and
many papers published during the initial development and refinement of the
functional approach focused on the choice of curve to fit (Hughes and
Freeman, 1 967; Nicholls and Calder, 1973). Towards the end of this period,
Venus and Causton (1979b) compared the indices of growth analysis derived
from fitted Richards functions with those from the family of polynomial
exponential functions. Although no statistical differences between the two
sets of indices were detected, they recommended the Richards function as the
time trends of indices derived from it were biologically more meaningful than
those from the polynomial exponential functions.
Incorporating structured experimental designs
An effort was made in this study to extend the work of Causton and Venus
(1981) and Hunt (1982) to accommodate the structured experimental design
of the randomised complete block in functional growth analysis. As previous
analyses of variables in the data set had revealed significant block effects on
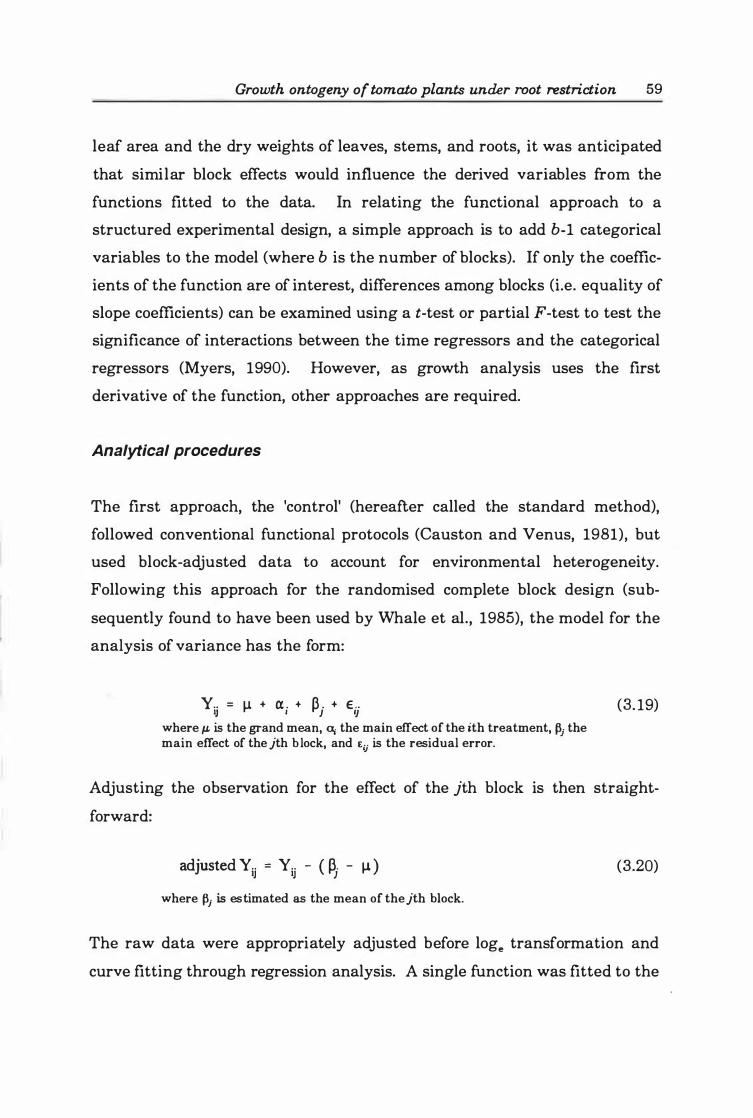
Growth ontogeny of tomato plants under root restriction 59
leaf area and the dry weights of leaves, stems, and roots, it was anticipated
that similar block effects would influence the derived variables from the
functions fitted to the data. In relating the functional approach to a
structured experimental design, a simple approach is to add b-1 categorical
variables to the model (where b is the number of blocks). If only the coeffic
ients of the function are of interest, differences among blocks (Le. equality of
slope coefficients) can be examined using a t-test or partial F-test to test the
significance of interactions between the time regressors and the categorical
regressors (Myers, 1990). However, as growth analysis uses the first
derivative of the function, other approaches are required.
Analytical procedures
The first approach, the 'control' (hereafter called the standard method),
followed conventional functional protocols (Causton and Venus, 1981), but
used block-adjusted data to account for environmental heterogeneity.
Following this approach for the randomised complete block design (sub
sequently found to have been used by Whale et al. , 1985), the model for the
analysis of variance has the form:
Y .. = � + Ct . + p . + E .. IJ ' J 'J where J.L is the grand mean, u, the main effect of the ith treatment, �j the main effect of the jth b lock, and Eij is the residual error.
(3. 19)
Adjusting the observation for the effect of the jth block is then straight
forward:
adjusted Yij = Yij - ( � - � ) (3.20)
where �J is estimated as the mean of thejth block.
The raw data were appropriately adjusted before loge transformation and
curve fitting through regression analysis. A single function was fitted to the
Growth ontogeny of tomato plants under root restriction 60
pooled (over blocks) adjusted data for each treatment. With several observ
ations at each time node, this method also permitted a lack of fit analysis
(Myers, 1990). A function was fitted (see next section), and its derivatives
calculated from the resulting parameter estimates. The standard errors of
the derivatives were calculated from the standard error of the predicted mean
reported for each function.
The second approach, hereafter referred to as the hybrid method, sought to
use a functional approach without losing block information, thereby main
taining b estimates of each derivative of interest for each treatment at each
harvest. Not only did this approach account for variation in individual plant
response to its environment (i.e. biotime; Bradford and Trewavas, 1994), but
the derived data set could be used for subsequent analysis. In this method,
a function was fitted to the loge transformed raw data of each block x
treatment combination (Mead, 1990). The derivatives of interest were calcul
ated (see next section) and analysed by conventional analysis of variance
(ANOVA) or its variants (e.g. analysis of covariance, ANCOV A), or in
multivariate statistical techniques.
The nature of the computations involved for these two approaches create two
important differences between them. First, the hybrid method provides a
more robust estimate of residual variation than the standard method. The
residual term of the standard-method contains both within-time and between
plot variation. In contrast, because the hybrid method is based on one value
per plot, the residual term only contains between-time variation. Second, the
response variables being regressed are not equal. The standard method
regresses the quantity logeCYij - �) against time whereas the hybrid method
regresses logecy ij) against time. A linear change of scale between these
response variables would not alter the rate coefficients derived from any
function fitted to the two data sets. The logarithmic transformation, however,
is non-linear and the change in scale coincident with this transformation
Growth ontogeny of tomato plants under root restriction 6 1
means that the difference between the response variables is not constant in
time. The size of this difference in this study, however, was small as the block
effects were very small relative to the values of the Y variables.
Curve fitting and calculating growth analysis indices
In choosing the function to fit to the log, transformed data to calculate the
relative growth rates of the whole plant, its root and shoot components, and
its leaf area, preliminary scatterplots of the data revealed that within the
limits of the information supplied by the experimental data (Hunt, 1982;
Hurd, 1977), the second degree polynomial exponential function (hereafter
termed the quadratic function):
loge Y = a + {3 1 t + {3 2 t 2 (3.21 )
was appropriate. When differentiated with respect to time, this function
yields the relative growth rate of the dependent variable:
(3.22)
No inherent physiological importance is given to the quadratic function by its
use. Rather, its use is consistent with the primary aims of the functional
approach to growth analysis: goodness of fit (Richards, 1969), and parsimony
(Nicholls and Calder, 1973; Hunt, 1982). In some instances, the quadratic
term was statistically insignificant. However, since the relative growth rate
must decrease in time as an increasingly larger amount of the plant becomes
purely structural and therefore incapable of providing further increases in dry weight, the term was included since the "biological expectation" (Hurd, 1977)
of the term remained.
Growth ontogeny of tomato plants under root restriction 62
Statistically valid use of regression analysis techniques to fit curves requires
three assumptions to be met (or at least closely met): that the independent
variable (in this instance, time (t)) is measured without error; that the
distributions of replicated dependent variables are normally distributed at
each node of the independent variable; and that the variance of these
distributions should be uniform and unchanged in magnitude with increasing
levels of the independent variable. The first assumption was easily met since
time is measured without error. With plant data, the latter two assumptions
are largely met by analysing the logarithmic transformation of the dependent
variable.
With quadratic functions fitted to logarithmic transformed data of total leaf
area, total plant dry weight and leaf, shoot, and root dry weights, estimates
of LAR, LWR, SLA, EA and SR were also made. As it is usually assumed that
plant weights and leaf areas are lognormally distributed (Causton and Venus,
1981; Flewelling and Pienaar, 1981), calculating these ratios followed the
pattern described here for the LAR:
At time t (Le. a particular harvest), and for IA = lo� LA a nd w=lo� W, then (after CausUm and Venus, 1981):
(3.23)
(3.24)
where � denotes an expected value, r is a variance, and � is a covariance.
From the relationship between the lognormal and normal distribution
(Flewelling and Pienaar, 1981), then after Causton and Venus (1981):
(3.25)
Growth ontogeny of tomato plants under root restriction
r(LA/W) = exp [2 ·� (log, (LA/W) + r(loge (LA/W) ] x (exp [r(log, (LA/W)]-l)
63
(3.26)
The net assimilation rate (EA) was calculated after Causton and Venus (1981) :
� (EA)=� (Rw)/� (LA/W)+� (Rw) ·r(LA/W)/{� (LA/W)}3
- re (Rw, LA/W)/{� (LA/W)}2
r(EA)= r(Rw)/{� (LiW)}2
+ {� (Rw))2·r(LA/W)/{(LA/W)}'
- 2 ·� (Rw) ·re (Rw, LA/W)/{� (LA/W)}3
3.2.5.3 Allometric relationships
(3.27)
(3.28)
The study of the relative size of different parts of an organism and how the
parts grow in relation to each other is called allometry. Huxley ( 1924, 1932)
proposed a simple model for allometric growth in which the ratio of the
relative growth rates of two components remains constant. Taking two
organs or plant parts, denoted by Wl and W2, the model describes an
allometric relationship by:
1 dW2 k dWI (3.29) _ . _- = _ . _-W2 dt WI dt or
d loge W2 = k ·
d logee WI (3.30) dt dt where the parameter k, the allometric constant, is the ratio of the relative
growth rates of components Wl and W2• Integrating both sides of equation
(3.30) gives:
or
Growth ontogeny of tomato plants under root restriction 64
W - aW k 2 - 1 (3.32)
This power function, commonly referred to as the allometric equation,
expresses the size of one component as proportional to the size of another
component raised to some power k (Reiss, 1989). Allometry has been widely
used in plant science, particularly in the examination of root-shoot
relationships (Hunt, 1978). In noting the constancy of k within a population
of plants, often of different age and subjected to different manipulative
treatments, several authors (Barnes, 1 979; Chalmers and van den Ende,
1975; Richards, 1981; Troughton, 1968) concluded that a physiologically
significant relationship exists between the relative growth rates of root and
shoot. This relationship has important ramifications for crop husbandry.
Factors which reduce the growth of the root system (expressed as RR) will,
indirectly through the allometric link, also proportionately limit shoot growth
(expressed as Rs), and vice versa.
Despite many reports of an allometric relationship between root and shoot
growth, some workers have expressed reservations. Some point out that with
little evidence to suggest any substantial mechanistic basis to the
relationship, the model is largely empirical (Richards, 1 969; Thornley and
Johnson, 1990; Wilson, 1 988). Others have demonstrated that allometric
relationships can be unstable, arising in a casual, inadvertant way. Dormer
(1965), for example, showed that any two Gompertz curves with the same
value for the rate constant will produce an approximately allometric
relationship. Richards ( 1969) observed that an allometric relationship wil l
appear to exist between two components whose growth rate is exponential,
since the individual relative growth rate remain constant. Causton and
Venus (1981) provided mathematical theorems demonstrating that linear
Growth ontogeny of tomato plants under root restriction 65
allometry may not physically exist, even though data plots suggest that it
does. Thus, while all components (e.g. root, shoot) of a plant may be related
allometrically, linear allometry cannot simultaneously exist among these
components and between a component and the whole plant. Furthermore, for
an allometric relationship between root and shoot growth to be physically
possible, either the slope of the linear allometric relationship between sub
components of the shoot (i .e. leaf or stem) is unity, or no linear allometric
relationships exist between any combinations of leaf, stem and root. Few, if
any, authors have critically evaluated the apparent allometric relationships
in their data against these criteria. Therefore, the assertion that root and
shoot growth is allometrically bound in a relationship of physiological
significance (Barnes, 1979; Chalmers and van den Ende, 1 975; Richards, 1981
Troughton, 1968) may be founded on mathematical artefacts.
The correct use of allometry, like all mathematical tools, relies on several
conditions that impinge on the validity of its interpretation being met. There
is little doubt that an uncritical approach to allometry has been adopted in
many previous reports of allometric relationships among plant components
(Zar, 1968). Previous studies on root-shoot relationships have been incon
sistent in the structure of the regression and allometric models tested. Some
workers have viewed root growth as the dependent variable (Pearsall, 1 927;
Richards, 1981; Troughton, 1956), while others regard it as the independent
variable (Chalmers and van den Ende, 1 975; Drew and Ledig, 1980) . Such
inconsistency is surprising since the rhizosphere generally imposes greater
limitations on growth than the atmosphere (Passioura, 1988a; Schulze et al.,
1 988; Sharp and Davies, 1989). Moreover, most studies of root function have
been aimed at eventually improving shoot performance and productivity. It
seems clear that root growth should be treated as the 'independent' variable.
The issue of dependent and independent variables, however, should not be
over-emphasised. Although many authors refer to the power function Y =aXk
Growth ontogeny of tomato plants under root restriction 66
as the allometric equation, the mathematically equivalent model lo&, Y = loge
a + k·loge X, is invariably fitted using the method of least squares, also called
ordinary least squares (OLS) regression. However, the models are not statis
tically equivalent for OLS solutions, particularly with respect to the structure
of the residuals (Zar, 1968). An assumption of OLS regression that one
variate is measured without error is untenable as both variables are random
(Le. subject to random error). Under such circumstances the use of OLS
regression is inappropriate, leading to inefficient estimation of the para
meters, and inaccurate estimates of the variability structure of the data
(Causton and Venus, 1981). In instances where two variates are both subject
to independent random error, the general method of maximum likelihood
must be used to calculate the parameter estimates.
In this study, the components of the maximum likelihood solution given by
Causton and Venus (1981) were programmed into a Quattro Pro (ver.4,
Borland) spreadsheet. Although some attempts have been made to provide
a physiological role for the intercept of equation (3.31) (White and Gould,
1965;· Gould, 1966), none are convincing. Thus, while the intercept value is
reported for completeness, its standard error is not.
3.3 Results
3 .3. 1 Stress indicators
Leaf water potential
Despite very dense root systems developing in the restrictive containers, leaf
water potential, measured 44 and 66 DAI, did not reveal any signs of water
stress (Table 3.3).
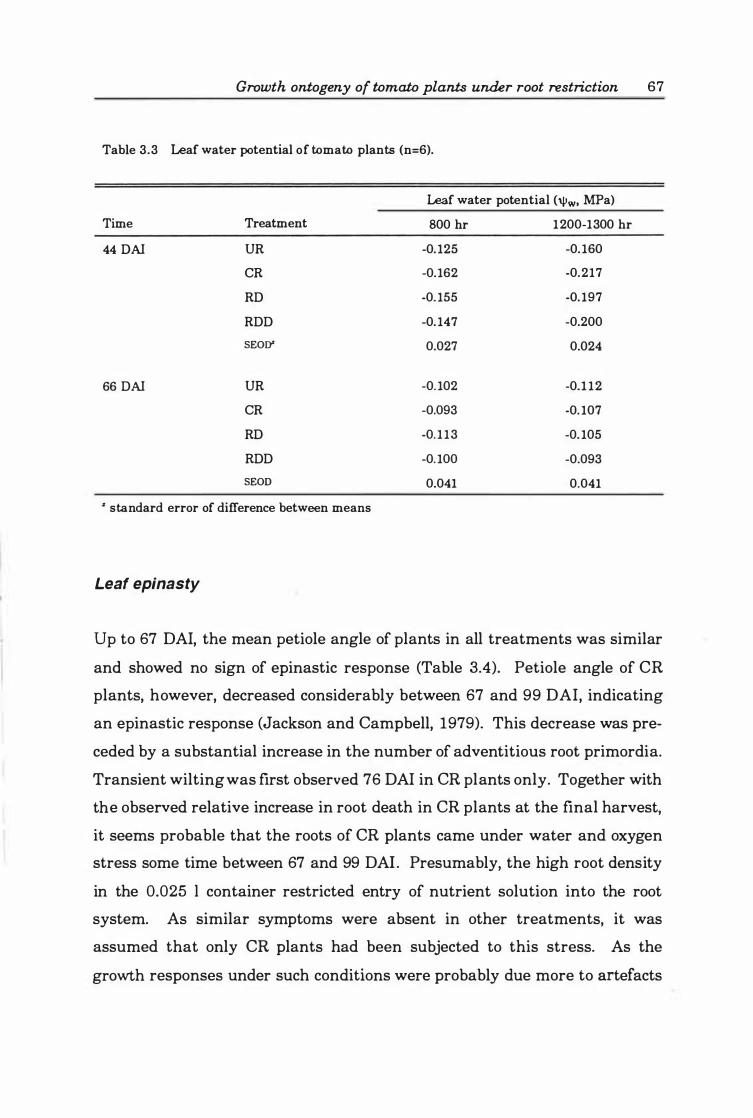
Growth ontogeny of tomato plants under root restriction 67
Table 3.3 Leaf water potential of tomato plants (n=6).
Leaf water potential ('Pw. MPa)
Time Treatment 800 hr 1200-1300 hr
44 DAI UR -0. 125 -0. 160
CR -0.162 -0.217
RD -0. 155 -0. 197
RDD -0. 147 -0.200
SEOlY 0.027 0.024
66 DAI UR -0. 102 -0.1 12
CR -0.093 -0. 107
RD -0. 1 13 -0. 105
RDD -0. 100 -0.093
SEOD 0.041 0.041
Z standard error of difference between means
Leaf epinasty
Up to 67 DAI, the mean petiole angle of plants in all treatments was similar
and showed no sign of epinastic response (Table 3.4). Petiole angle of CR
plants, however, decreased considerably between 67 and 99 DAI, indicating
an epinastic response (Jackson and Campbell, 1979). This decrease was pre
ceded by a substantial increase in the number of adventitious root primordia.
Transient wilting was first observed 76 DAI in CR plants only. Together with
the observed relative increase in root death in CR plants at the final harvest,
it seems probable that the roots of CR plants came under water and oxygen
stress some time between 67 and 99 DAI. Presumably, the high root density
in the 0.025 I container restricted entry of nutrient solution into the root
system. As similar symptoms were absent in other treatments, it was
assumed that only CR plants had been subjected to this stress. As the
growth responses under such conditions were probably due more to artefacts
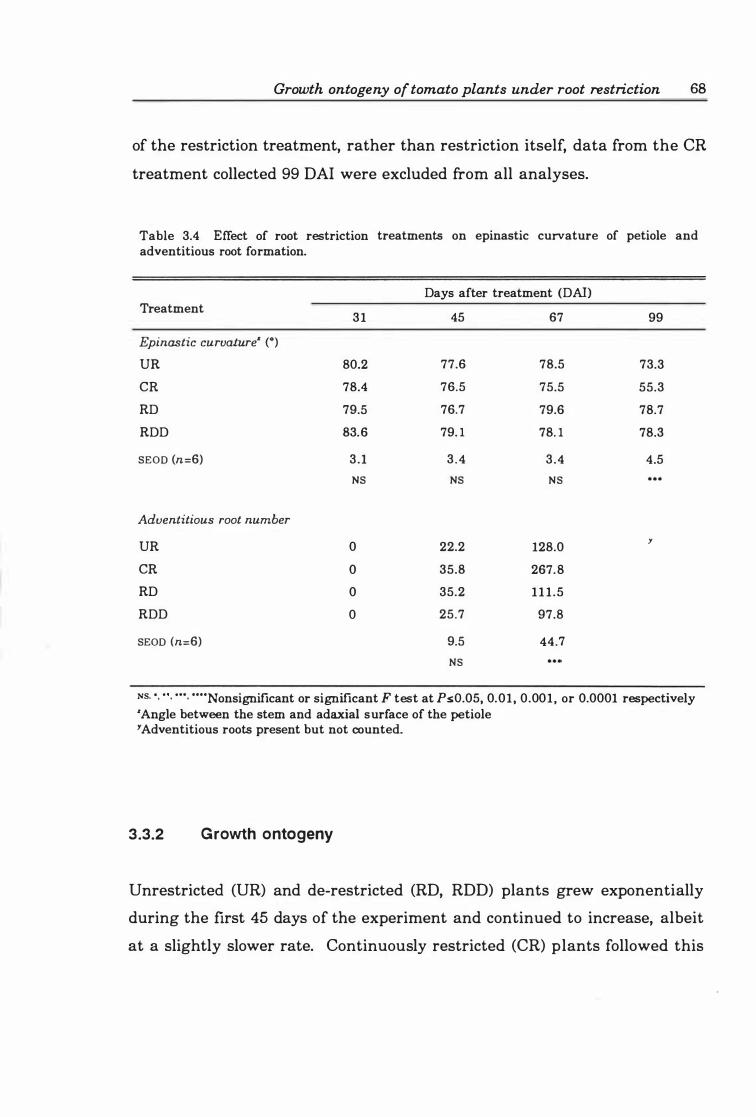
Growth ontogeny of tomato plants under root restriction 68
of the restriction treatment, rather than restriction itself, data from the CR
treatment collected 99 DAI were excluded from all analyses.
Table 3.4 Effect of root restriction treatments on epinastic curvature of petiole and adventitious root formation.
Days after treatment (DAn Treatment
3 1 45 67 99
Epinastic curvature' (0)
UR 80.2 77.6 78.5 73.3
CR 78.4 76.5 75.5 55.3
RD 79.5 76.7 79.6 78.7
RDD 83.6 79. 1 78. 1 78.3
SEon (n=6) 3 . 1 3 . 4 3 .4 4.5
NS NS NS
Adventitious root number
UR 0 22.2 128.0 y
CR 0 35.8 267. 8
RD 0 35.2 1 1 1 . 5
RDD 0 25.7 97.8
SEon (n=6) 9.5 44.7
NS
NS. ·. " . • • • . ····Nonsignificant or significant F test at PsO.05, 0.01, 0.001, or 0.0001 respectively 'Angle between the stem and adaxial surface of the petiole Y Adventitious roots present but not counted.
3.3.2 Growth ontogeny
Unrestricted (UR) and de-restricted (RD, RDD) plants grew exponentially
during the flrst 45 days of the experiment and continued to increase, albeit
at a slightly slower rate. Continuously restricted (CR) plants followed this
Growth ontogeny of tomato plants under root restriction 69
trend up to 67 DAI, after which a stress-induced decline In the rate of
increase of all measured variables was observed.
Root growth
Root length was similar in all treatments for 31 days. Mter 45 days CR and
RDD plants had shorter root systems than UR or RD plants. By 67 DAI,
plants in 0.025 I containers (CR) had significantly shorter root systems than
those in 0.05 I containers (RDD) and this pattern continued to 99 DAI.
Physically restricting root systems consistently reduced the number of roots
(Fig. 3.3b, Tables 3.5a-c). The number of roots of all restricted plants was
significantly smaller than unrestricted plants 31 DAI, while effects on other
variables were inconsistent. By 45 DAI, UR plants had more roots than CR,
RD or RDD plants, although by 67 DAI , UR and RD plants had similar
numbers of roots. Continuously restricted (CR) plants had significantly fewer
roots than UR plants from day 31 onwards. Plants released from restriction
(RD and RDD) tended to have fewer roots than DR plants.
By 45 DAI, restricting roots in 0.025 I containers had significantly reduced
root dry biomass increment. By 67 DAI, restricting roots in 0.05 I containers
also significantly depressed accumulation of dry root biomass relative to
plants growing in 10.0 I containers (i.e. DR and RD plants) . Releasing roots
from the 0.05 I containers stimulated accumulation of dry biomass by roots,
so that by the final harvest the root dry weight of RDD and RD plants was
similar.
There was considerable treatment and ontogenetic drift in the indices of root
morphology (Fig. 3.4ab). By 31 DAI, roots of restricted plants (CR, RD, RDD)
had a lower branching density and were either thicker or had a higher tissue
density than unrestricted plants. By 45 DAI, however, the branching density
Growth ontogeny of tomato plants under root restriction 70
of UR and CR plants was similar while that of RD and RDD plants was
significantly lower. The SRL of de-restricted plants was significantly lower
than CR or UR plants. As CR, RD and RDD plants differed in root dry
weight rather than root length at this harvest (Table 3.5b), de-restriction
appears to have stimulated a proportionately greater increase in root biomass
than elongation. De-restricted roots may have produced fewer sub-laterals
than UR or CR plants, with the result that the average density of the root
tissue increased. A large change in the tissue morphology of RDD roots
occurred between 45 and 67 DAI, with roots being substantially thinner than
at previous harvests. The branching density of RDD root systems also
increased relative to RD plants. Together with CR plants, restricted plants
had more roots per unit length than unrestricted (UR and RD) plants.
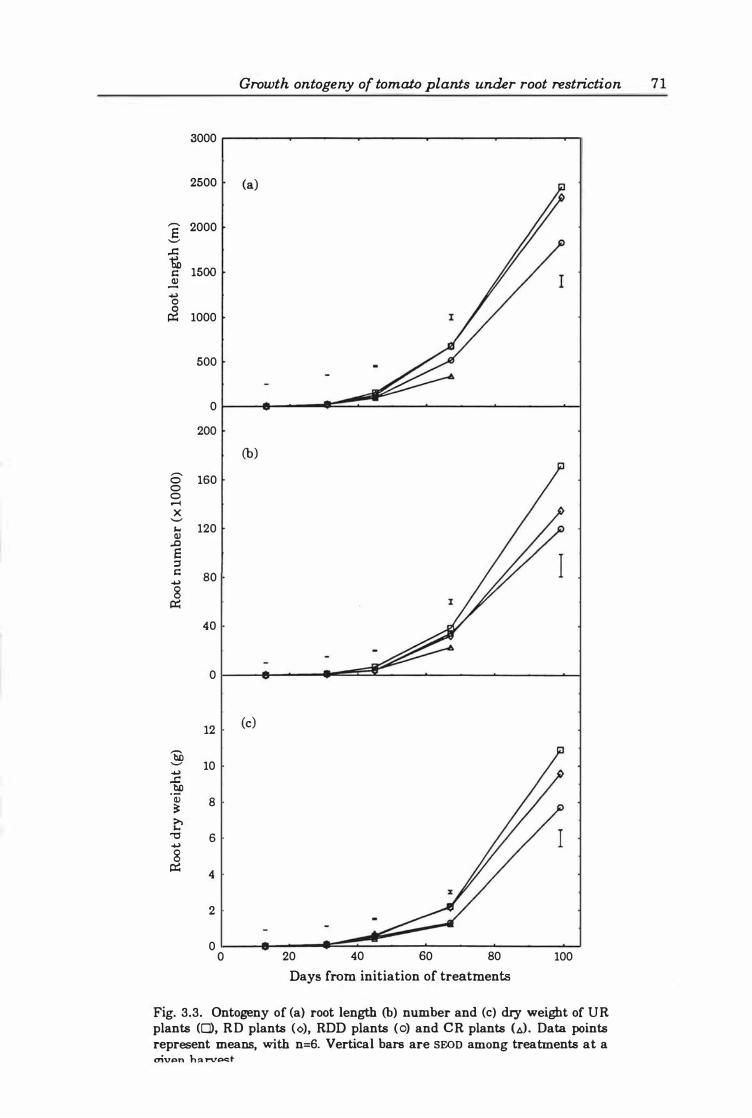
,-... S '-'
...c to r:: .! � 0 0 IX:
,-... 0 0 0 .-I X '"' III .LJ S =' r::
� 8
IX:
bO '-' � ...c bO 'Qj � � "0
� 8 IX:
3000
2500
2000
1500
1000
500
0
200
160
120
80
40
0
12
10
8
6
4
2
0 0
Growth ontogeny of tomato plants under root restriction 7 1
(a)
(b)
(c)
20 40 60 80 100
Days from initiation of treatments
Fig. 3.3. Ontogeny of (a) root length (b) number and (c) dry weight of UR plants (0), RD plants (<» , ROD plants (0) and eR plants (.t.). Data points represent means, with n=6. Vertical bars are SEOn among treatments at a ",;vl>n h " rv .... t
0 :z CIl ,..
.l: bo c .Sl .... 8 ,.. i.: C1) � E =' c
.... 0 �
---bO S
...i � en '-" .l: bo c � .... 0 0 ,.. u � al c..
en
100
90
80 70
60
50
40
30
20
10
0
450
400
350
300
250
200
150
100
50
0 0
Growth ontogeny of tomato plants under root restriction 72
I
I
20 40 60 80 1 00 Days from initiation of treatments
Fig. 3.4. Ontogeny of (a) ratio of root number:root length (m) and (b) specific root length (SRL; m gR·1) of UR plants (CD, RD plants (¢), RDD plants (0) and CR plants (.�). Data points represent means with n=6. Vertical bars are SEOn among treatments at a given harvest.
Table 3.5a Summary statistics from univariate analysis of plant response to root restriction at 13 and 31 DAIz.
Plant component
Treatment Root Root Root dry Total leaf Leaf Average leaf Leaf dry Stem Stem dry length (m) number weight (g) area (m2) number area (cm2) weight (g) height (m) weight (g)
13 DAl
UR 1 .97 133 0.01 0.005 9.0 5.3NS 0.08 0.0 1 1 0.03
CR 2.31 190 0.02 0.005 9.3 5.6 0.09 0.009 0.03
RD 2.19 179 0.01 0.005 8.5 5.4 0.09 0.009 0.03
RDD 3.06 201 0.02 0.007 9.7 6.9 0. 12 0.01 1 0.04
SEOD (n=6) 0.433 25.6 0.003 0.0008 0.57 0.86 0.011 0.0047 0.004
NS NS NS NS NS NS NS
contrasts
RD vs RDD NS NS NS NS NS •• NS
CR VB [RD+RDD] NS NS NS NS NS NS NS NS NS
UR VB [CR+RD+RDD] NS NS NS NS NS NS NS
31 DAl
UR 24. 15 1264 0.09 0.079 14.3 56.5 1 . 13 0.026 0.36
CR 23.72 1042 0.09 0.083 14.0 59.6 1.22 0.029 0.42
RD 20. 16 872 0.08 0.070 13.8 49.9 1.07 0.028 0.38
RDD 22.69 977 0.10 0.070 13.7 5 1 .5 1.33 0.027 0.38
SEOD (n=6) 2.579 1 01.9 0.013 0.0140 0.37 10.41 0. 185 0.0146 0.039
NS NS NS NS NS NS NS NS
contrasts
RD vs RDD NS NS NS NS NS NS NS NS NS
CR VB [RD+RDD] NS NS NS NS NS NS NS NS NS
UR VB [CR+RD+RDD] NS . . NS NS NS NS NS NS NS
% Days after initiation of treatments NS. · . . . . . . . . . . . . Nonsignificant or significant F test at PsO.05, 0.01 , 0.001 , or 0.0001 respectively ...J C..:>
Table 3.5b Summary statistics from univariate ana lysis of plant response to root restriction at 45 and 67 DAlz.
Plant component
Treatment Root Root Root dry Total leaf Leaf Average leaf Leaf dry Stem Stem dry length (m) number weight (g) area (m2) number area (cm2) weight (g) height (m) weight (g)
45 DAI
UR 155.3 6668 0.55 0.274 32.2 85.2 4.39 0.097 2.88
CR 94.6 4262 0.39 0.285 29.7 96.5 4.39 0.093 2.81
RD 126.9 3967 0.61 0.344 36.0 95.7 4.97 0. 109 3.10
RDD 103.7 3838 0.50 0.290 30.3 93.8 4.54 0.099 3.03
SEOD (n=6) 15.84 491 0.065 0.0417 3.70 6.90 0.563 0.0124 0.413 " • • • • NS NS NS NS NS NS
contrasts
RD VB RDD NS NS NS NS NS NS NS NS NS
CR VB [RD+RDD] NS NS NS NS NS NS NS NS
UR VB [CR+RD+RDD] " • • • • NS NS NS NS NS NS
67 DAI
UR 672. 1 38508 2.19 1 .467 92 .7 158.4 21 .40 0.496 18.95
CR 338. 1 22671 1 . 19 0.971 7 1 .5 137.3 16.81 0.337 15.58
RD 673.6 32199 2.15 1 . 1 17 76.5 147.0 17 .86 0.369 1 5.45
RDD 514.9 34259 1.27 1 .056 66.5 162.6 16.99 0.342 13.86
SEOD (n=6) 59.98 3778 0. 178 0. 133 8.58 15.23 1 .575 0.0502 1 .964 . . . . " • • • • " NS NS
contrasts
CR VB RDD " " NS NS NS NS NS NS NS
UR vs RD NS NS NS NS NS NS
[UR+RD] vs [CR+RDD] • • • • NS NS
Z Daxs after initiation of treatments -.J NS. '. ' . .... . . . . Nonsignificant or significant F test at PsO.05, 0.01 , 0.001 , or 0.0001 respectively .I:>-
--- - -----------
Table 3.5c Summary statistics from univariate analysis of plant response to root restriction at 99 DAIz.
Treatment lWot lWot Root dry Total leaf Leaf Average length (m) number weight (g) area (m2) number leaf area
(m2)
99 DAI
UR 2449.5 17 1685 10.89 4.21 359.2 117 .28
CR (465.3) (44596) (2.37) ( 1 .24) (1 22.3) (101.4)
RD 2331 .2 134893 9.58 3.67 307.2 121.6
RDD 1824.7 119987 7.72 2.99 242.8 123.1
SEOD (n=6) 126.98 18379 0.953 0.221 22.60 7.55 • • • • • • • • • NS
contrasts
UR vs RD NS NS NS NS
£UR+RDJ VB RDD . . . II NS
Z Da,Y,s after initiation of treatments NS. ·. ' . .... .... Nonsignificant or significant F test at PsO.05, 0.01, 0.00 1 , or 0.0001 respectively ( ) Data not included in analysis
Leaf dry Stem Stem dry weight (g) height (m) weight (g)
127.33 2.022 80.12
(46.7) (0.526) (40.4)
1 14.00 1 .698 74.74
107.27 1 .198 68.52
8. 1 16 0.2694 4.765 NS NS
NS NS NS NS NS
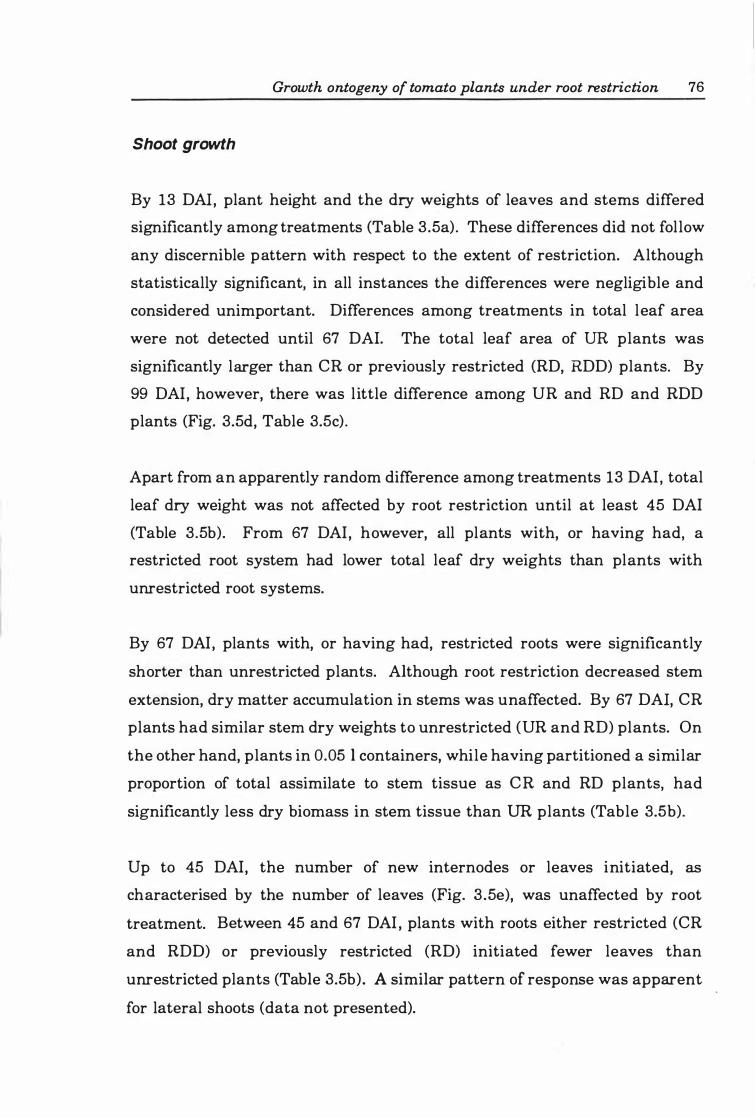
Shoot growth
Growth ontogeny of tomato plants under root restriction 76
By 13 DAI, plant height and the dry weights of leaves and stems differed
significantly among treatments (Table 3.5a). These differences did not follow
any discernible pattern with respect to the extent of restriction. Although
statistically significant, in all instances the differences were negligible and
considered unimportant. Differences among treatments in total leaf area
were not detected until 67 DAI. The total leaf area of UR plants was
significantly larger than CR or previously restricted (RD, RDD) plants. By
99 DAI, however, there was l ittle difference among UR and RD and RDD
plants (Fig. 3.5d, Table 3.5c) .
Apart from an apparently random difference among treatments 13 DAI, total
leaf dry weight was not affected by root restriction until at least 45 DAI
(Table 3.5b). From 67 DAI, however, all plants with, or having had, a
restricted root system had lower total leaf dry weights than plants with
unrestricted root systems.
By 67 DAI, plants with, or having had, restricted roots were significantly
shorter than unrestricted plants. Although root restriction decreased stem
extension, dry matter accumulation in stems was unaffected. By 67 DAI, CR
plants had similar stem dry weights to unrestricted (UR and RD) plants. On
the other hand, plants in 0.05 I containers, while having partitioned a similar
proportion of total assimilate to stem tissue as CR and RD plants, had
significantly less dry biomass in stem tissue than UR plants (Table 3.5b).
Up to 45 DAI, the number of new internodes or leaves initiated, as
characterised by the number of leaves (Fig. 3 .5e), was unaffected by root
treatment. Between 45 and 67 DAI , plants with roots either restricted (CR
and RDD) or previously restricted (RD) initiated fewer leaves than
unrestricted plants (Table 3.5b). A similar pattern of response was apparent
for lateral shoots (data not presented).
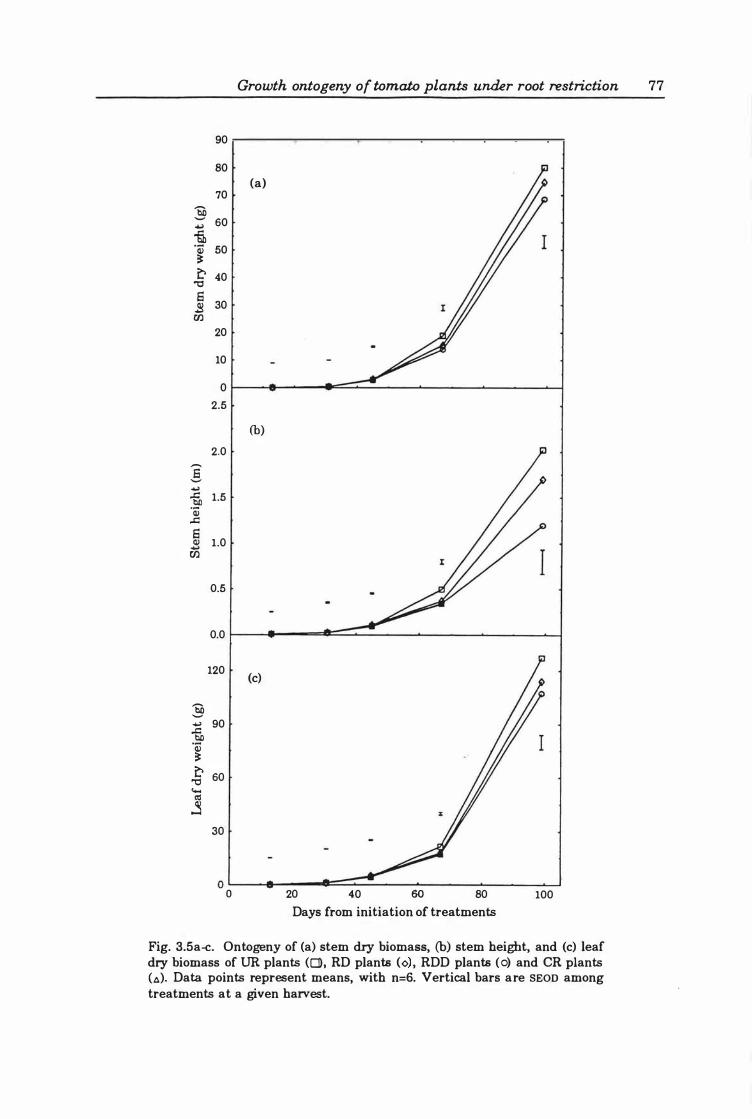
:§ ... ib .4i � �
"0 S .s 00
E '-' ... ..c tIC .4i ..c S Q) ..., 00
:§ ..., ..c tIC .4i � � "0
.... al j
90
80
70
60
50
40
30
20
10
0
2.5
2.0
1.5
1.0
0.5
0.0
120
90
60
30
Growth ontogeny of tomato plants under root restriction 77
(a)
(b)
(c)
o L---__ ----���--��----�----� o 20 40 60 80 100
Days from initiation of treatments
Fig. 3.5a-c. Ontogeny of (a) stem dry biomass, (b) stem height, and (c) leaf dry biomass of UR plants ([]), RD plants (<» , RDD plants (0) and CR plants C�.). Data points represent means, with n=6. Vertical bars are SEOD among treatments at a given harvest.
Growth ontogeny of tomato plants under root restriction 78
Fig. 3.5d-e. Ontogeny of (d) total leaf area and (e) leaf number of UR plants ([], RD plants (<» , RDD plants (0) and CR plants C�) . Data points represent means, with n=6. Vertical bars are SEOD among treatments at a given harvest.
Growth ontogeny of tomato plants under root restriction 79
Among treatment comparisons of within-plant relationships
The canonical discriminant functions extracted from data collected 13 DAI did
not reveal significant differences among groups (Fig. 3.6a). At 31 DAI, treat
ment groups were separated by a single CDF (CDF1(31) ' accounting for about
77% of total variance, which contrasted root mass against shoot mass (Table
3.6, Fig. 3.6b). Plants with unrestricted root systems had significantly higher
scores than those with restricted root systems, reflecting the early depression
of root growth (particularly root number) relative to shoot growth
(particularly leaf dry biomass) in restricted plants.
Two discriminant functions (CDF1(45)' CDF2(45» together accounted for about
99% of total variation of data collected 45 DAI. Treatment groups were
maximally separated by CDF 1(45)' which contrasted root number with leaf dry
weight. Stem dry weight was contrasted with root and stem length, although
these contributions to the function were small. Plants with high scores for
this function would be characterised by either a highly branched root system
and low leaf dry weight, or vice versa. This function reflects different sites
of growth of plants in the treatments. Unrestricted (UR) plants had
significantly higher scores for CDF1(45) than all other treatment groups. While
having a more multibranched root system than plants in the CR, RD and
RDD treatments, UR plants had similar leaf dry biomass. Between the
restricted or previously restricted groups, RD and RDD plants had signifi
cantly lower mean scores for CDF1(45) than CR plants. The RD and RDD
plants tended to have fewer roots and higher leaf dry weights than plants
under continuous root restriction. Taken with their low scores for CDF 1(45)'
this suggests that following de-restriction 31 DAI, RD and RDD plants
diverted energy to leaf growth rather than increasing root number.
Root dry weight dominated CDF2(45)' with smaller contrasts with root length
and shoot biomass (stem and leaf dry weight). Plants in continuous
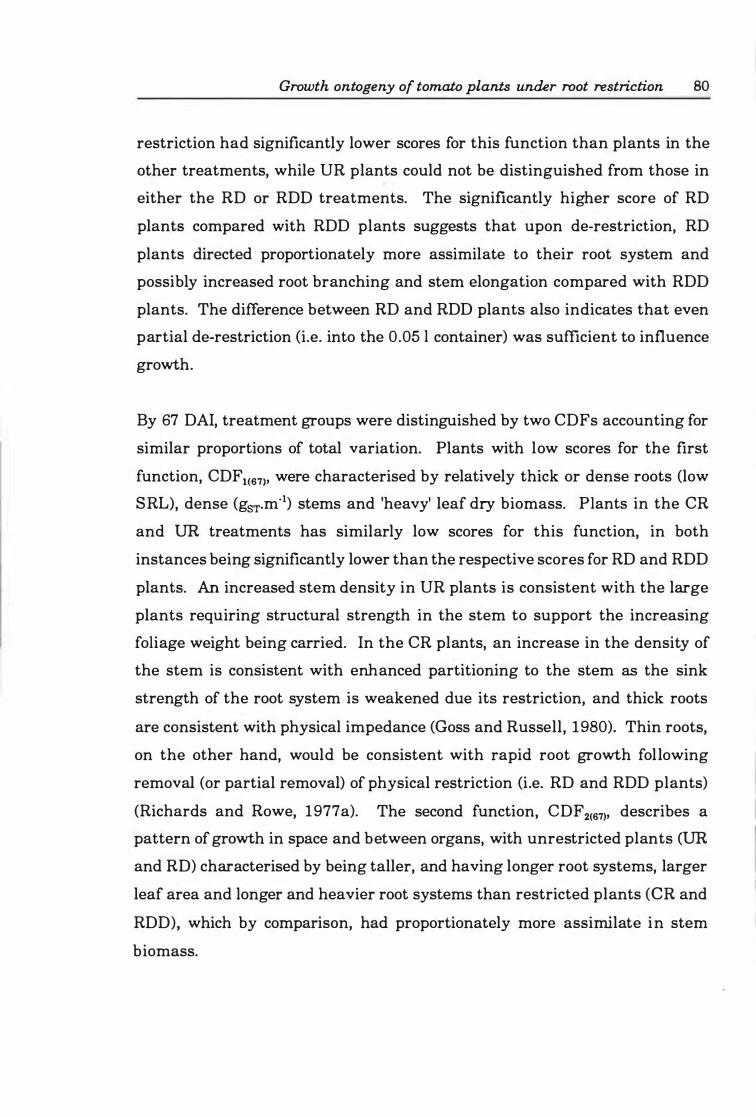
Growth ontogeny of tomato plants under root restriction 80
restriction had significantly lower scores for this function than plants in the
other treatments, while UR plants could not be distinguished from those in
either the RD or RDD treatments. The significantly higher score of RD
plants compared with RDD plants suggests that upon de-restriction, RD
plants directed proportionately more assimilate to their root system and
possibly increased root branching and stem elongation compared with RDD
plants. The difference between RD and RDD plants also indicates that even
partial de-restriction (i.e. into the 0.05 1 container) was sufficient to influence
growth.
By 67 DAI, treatment groups were distinguished by two CDFs accounting for
similar proportions of total variation. Plants with low scores for the first
function, CDF 1(67), were characterised by relatively thick or dense roots (low
SRL), dense (gST.mo1) stems and 'heavy' leaf dry biomass. Plants in the CR
and UR treatments has similarly low scores for this function, in both
instances being significantly lower than the respective scores for RD and RDD
plants. An increased stem density in UR plants is consistent with the large
plants requiring structural strength in the stem to support the increasing
foliage weight being carried. In the CR plants, an increase in the density of
the stem is consistent with enhanced partitioning to the stem as the sink
strength of the root system is weakened due its restriction, and thick roots
are consistent with physical impedance (Goss and Russell, 1980). Thin roots,
on the other hand, would be consistent with rapid root growth fol lowing
removal (or partial removal) of physical restriction (Le. RD and RDD plants)
(Richards and Rowe, 1977 a). The second function, CDF 2(67), describes a
pattern of growth in space and between organs, with unrestricted plants (UR and RD) characterised by being taller, and having longer root systems, larger
leaf area and longer and heavier root systems than restricted plants (CR and
RDD), which by comparison, had proportionately more assimilate in stem
biomass.
Growth ontogeny of tomato plants under root restriction 81
The main discriminator between unrestricted and de-restricted groups at the
final harvest (99 DAD contrasts leaf dry weight with root length and stem dry
weight. CDF1(99) is interpreted as a balance among these variables. The near
zero score of UR suggests the 'control' balance. Relative to this, RDD plants
appear to have partitioned more assimilate to increasing leaf biomass than
to stem biomass or root length. On the other hand, the partitioning pattern
in RD plants appears to have been in the opposite direction. The remaining
CDF (CDF2(99») contrasts stem growth (biomass) with leaf growth (area and
biomass). From the scores, it appears that de-restricted plants (RD and RDD)
had poorer developed canopies than stems compared to UR plants.
Table 3.6 Canonical discriminant functions and treatment means of growth variables at each harvest.
31 DAl 45 DAl 67 DAI 99 DAl Growth variable
CDF1 CDF1 CDF2 CDF1 CDF2 CDF1 CDF2
Leaf area -0.53 0.32 -0.62 -0.35 0.92 -0.98 -5.13
Stem length 0.05 -0.72 1 .85 -1.84 0.59 0.57 1 .30
Leaf dry weight -1 .67 -2.25 -0.92 -1.77 -0.53 -4.61 -3.67
Stem dry weight -0.90 0.98 -1 .88 2.02 -1 .22 2.77 6.31
Root dry weight 1.24 -0.43 4.08 -2.59 0.84 0.29 -0.21
Root number 1.50 3 .97 1 . 18 0.63 0. 17 -1 .71 -1 .22
Root length 0,65 -0.66 -2. 17 3 .18 0.67 4.54 1.65
� 2.01 10.91 2.37 2.46 2.35 4.19 1 .65
X2OO1 19.3' 43.3 .... 21.3" 21.7" 2 1.2" 19.8' 17.1NS
df 9 9 7 9 7 8 6
percent total variance 77 81 18 45 43 65 34
ANOVA means
UR 2.15 4.84 0.91 -1 .74 1.43 0.17 -1.90
CR -0.25 0.06 -2. 17 -0.98 -2.17
RD - 1 .30 -3.13 1 .51 0.86 1 .00 2 .19 1 .06
RDD -0.59 -1 .77 -0.26 1.87 -0.27 -2.37 0.84
SEOO (n=6) 0.59 0.62 0.59 0.61 0.51 0.58 0.59 • • • • • • • • . . . . . . . . • • • • • • • • , . ,
NS. ', " . .... .... Nonsignificant or significant X2
test (CDFs) or F test (ANOVA means) at PsO.05, 0.01, 0.001, or 0.0001 respectively �:eigenvalue of ith canonical discriminant function (Xl �
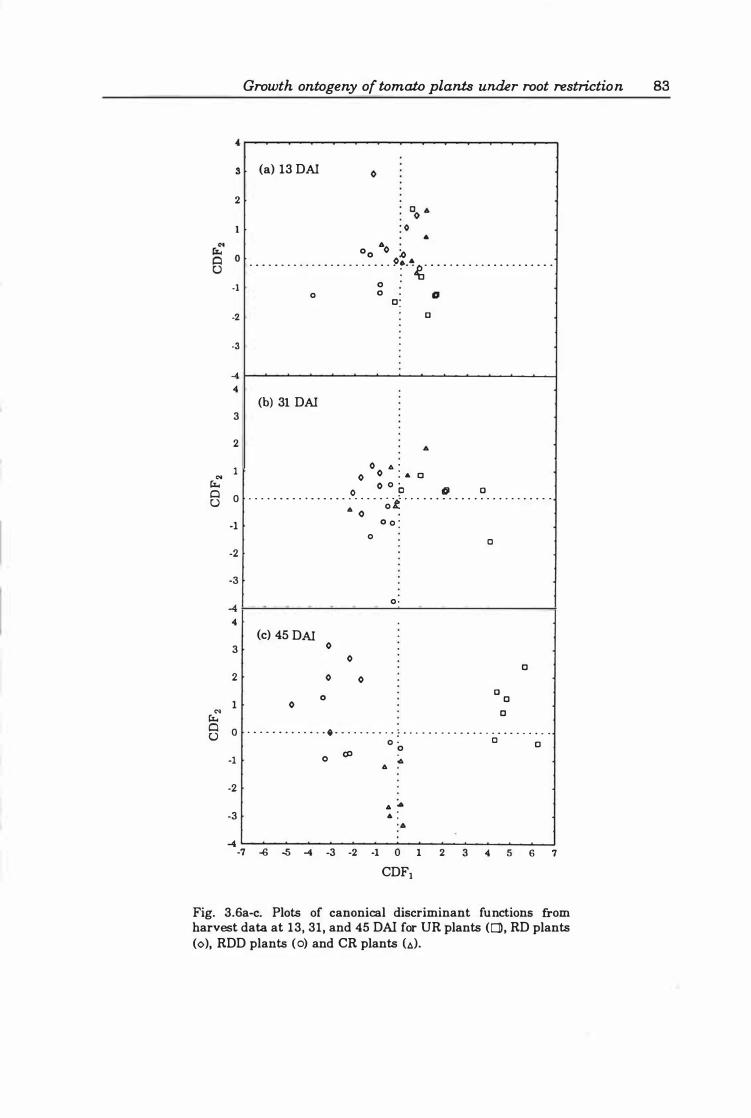
Growth ontogeny of tomato plants under root restriction 83
3 (a) 13 DAI
2
1 ..
.. 00 0 :0 . . . . . . . . . . . . . . . . . . . . . . . 9r·��· · · · · · · · . . . . . . . . . . . . . o o ·1
o 0: ·2 o
·3
4 r-�--���--��--��--��--��--�� '"
(b) 31 DAI 3
2
o .. : C'O 1 0 0 . " c � 0 0 0 § 0 g 0 . . . . . . . . . . . . . . . . �O· · · · · oi · · · . . . . . . . . . . . . . . . . . . . . .
o .
C'O �
. 1 0 0 : 0
-2
-3 o · -4
'" (c) 45 DAI
3 0 0
2 0 0 0
1 0
0
0
0 0 0
o 0 . • . . • • . . . . • . . • . . . . . . . . . . : . . . . . . . . . . . . . . . . . . . . . . . . u 0 : 0 o o
-1 0 CSJ <-..
-2 .. ...
-3 .. : . ..
-4 -7 -6 -5 -4 -3 -2 -1 0 1 2 3 '" 5 6
CDF1
7
Fig. 3.6a-c. Plots of canonical discriminant functions from harvest data at 13, 31, and 45 DAI for UR plants (e], RD plants (0), RDD plants (0) and CR plants (.�)_
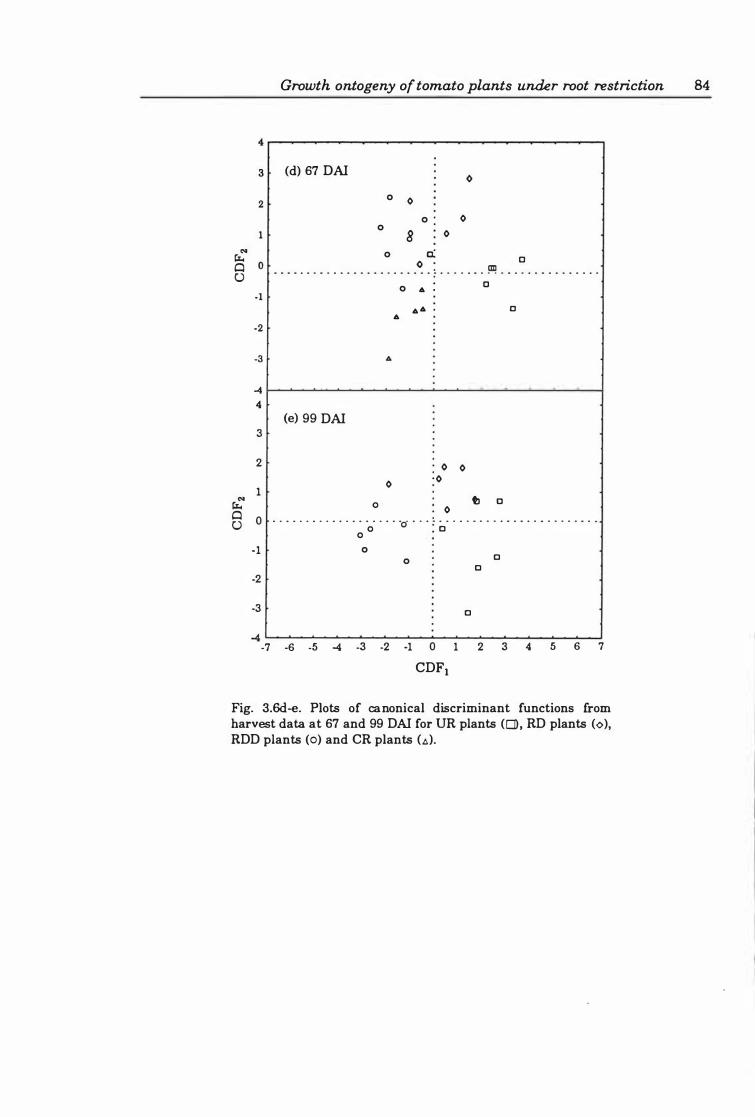
... � 0 U
... � 0 U
Growth ontogeny of tomato plants under root restriction 84
4�--------------------------------------�
3 (d) 67 DAI
2
1
0
-I
-2
-3
-4 4
3
2
1
0
-1
-2
-3
o
o 0
o
o : 0 8 0
o 0: o . _ _ _ _ . • . _ . • • • • • • • • . . • • • • • ; . . . . . _ . !II! . _ . . . • • • • • • • • . .
(e) 99 DAI
0 0
o 6 : 0
66 • 6
0 '0
0
0
tI
o
0 . . . . . . . . . . . . . . . . . . . ·0· · · · ; · · · · · _ . . . . _ . . . . . . . . . . - . .
0 0 . c o
o c c
c
4��--�----�----�----�----��--��� -7 -6 -5 4 -3 -2 -1 0 1 2 3 4 5 6 7
CDF1
Fig. 3.6d-e. Plots of canonical discriminant functions from harvest data at 67 and 99 DAI for UR plants (0), RD plants (¢), RDD plants (0) and CR plants (b).
Growth ontogeny of tomato plants under root restriction 85
Relationships between the components of root and shoot growth
There was no consistent pattern in the percent reduction between CR and DR plants for root and shoot variables (Table 3.7).
Table 3.7 Percent (%) change in plant response between plants with restricted root systems (CR treatment only) and unrestricted root systems (UR treatment).
Plant variable
Harvest Root Root Root Shoot Leaf Leaf Leaf Stem
(DAl) length number dry dry dry area number length weight weight weight
13 21 43 10 6 10 10 3 -12
31 0 -18 8 10 8 5 -2 8
45 -39 -36 0 - 1 0 -5 -8 -4
67 -61 -41 -21 - 18 -21 -34 -23 -32
Path analysis was used to gain more insight to the inter-relationships
between root and shoot variables. The hypothesized model investigated (Fig.
3.7) explicitly gave an independent role to root size (dry biomass weight) in
addition to root number and length. Although a mechanistic role for root size
in the model is not immediately apparent, its inclusion in this analysis is
warranted as root biomass increased independently of increases in root length
(SRL; Fig. 3.4b).
Simple correlations alone would have led to the erroneous conclusion that the
number, weight and length of roots were all strongly associated with total leaf
area, leaf number, shoot dry weight and stem height. The path analysis
revealed that the strong correlations between root number and dry weight
and the shoot variables were invariably due to the covariance of these root
variables with root length (Tables 3.Sa-b). With the contribution of root
length removed, the direct effects between both root number and weight on
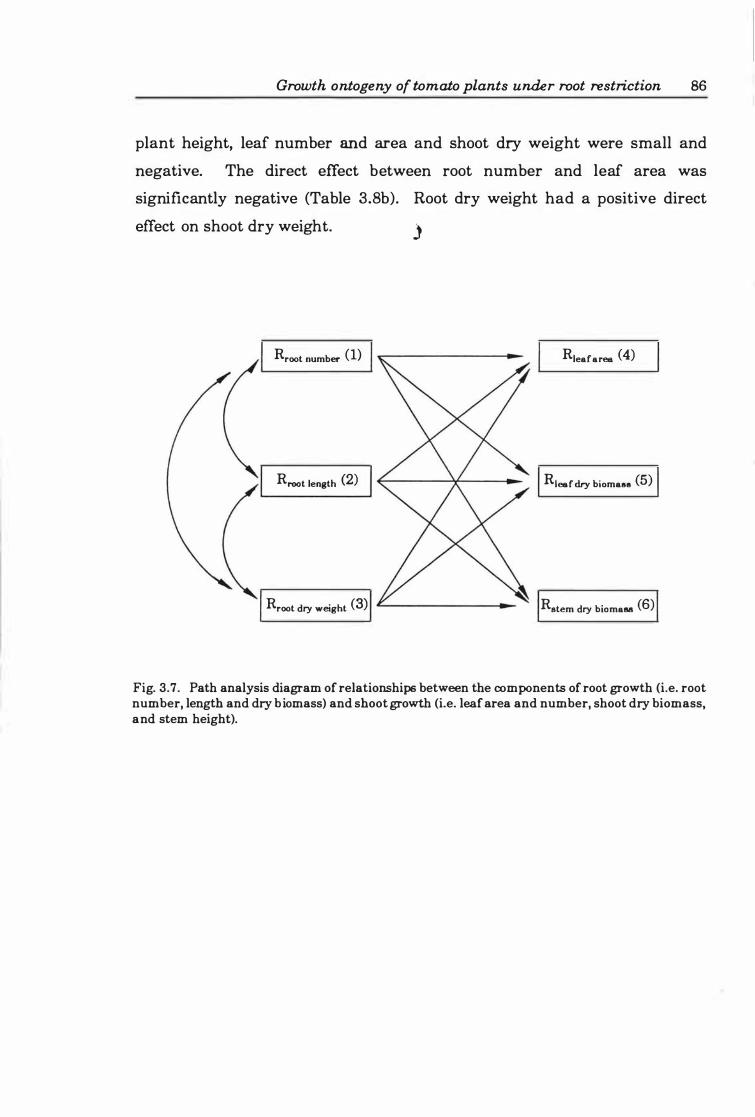
Growth ontogeny of tomato plants under root restriction 86
plant height, leaf number and area and shoot dry weight were small and
negative. The direct effect between root number and leaf area was
significantly negative (Table 3.8b). Root dry weight had a positive direct
effect on shoot dry weight. -'
Rroot number ( 1) Rleafares (4)
Rroot length (2) Rleafdry biomallll (5)
Rroot dry weight (3) Rlltem dry bioma811 (6)
Fig. 3.7. Path analysis diagram of relationships between the components of root growth (i.e. root number, length and dry biomass) and shoot growth (i.e. leaf area and number, shoot dry biomass, and stem height).
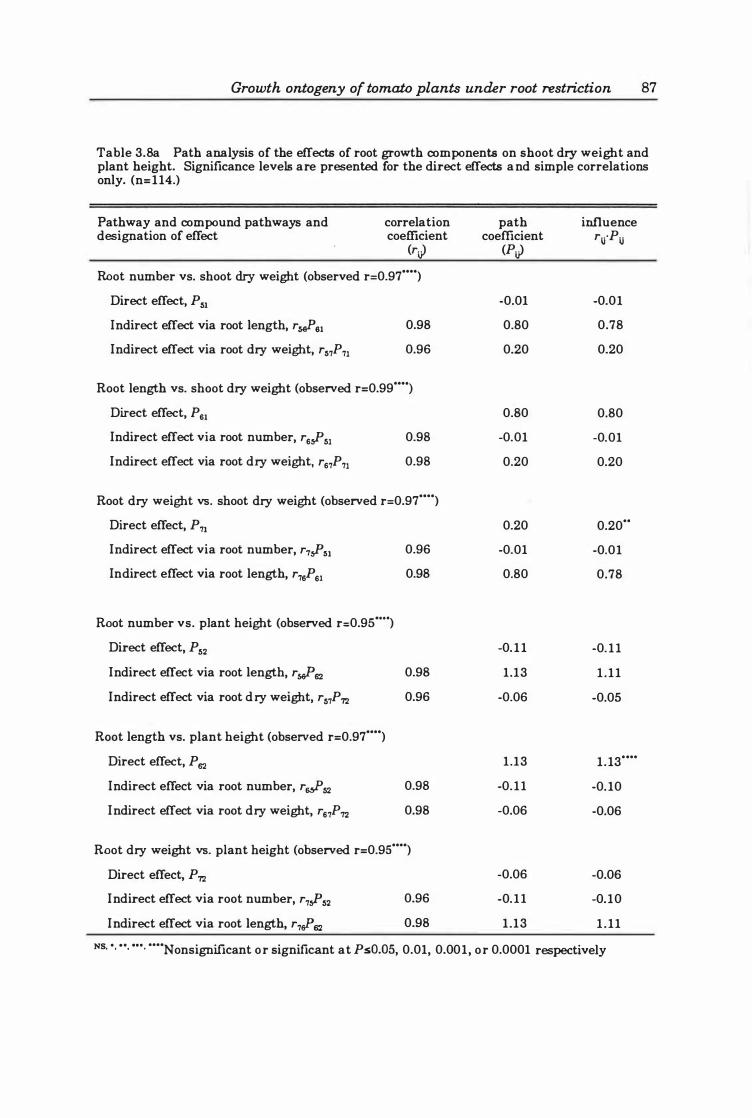
Growth ontogeny of tomato plants under root restriction 87
Table 3.Sa Path analysis of the effects of root growth components on shoot dry weight and plant height. Significance levels are presented for the direct effects and simple correlations only. (n=114.)
Pathway and compound pathways and correlation path influence designation of effect coefficient coefficient rij'Pij
(r) (PJ
Root number vs. shoot dry weight (observed r=0.97····)
Direct effect, P51 -0.01 -0.01
Indirect effect via root length, rJsI 0.98 0.80 0.78
Indirect effect via root dry weight, r57P71 0.96 0.20 0.20
Root length vs. shoot dry weight (observed r=0.99···)
Direct effect, PSI 0.80 0.80
Indirect effect via root number, rS?51 0.98 -0.01 -0.01
Indirect effect via root dry weight, rS7P71 0.98 0.20 0.20
Root dry weight vs. shoot dry weight (observed r=0.97····)
Direct effect, P71 0.20 0.20··
Indirect effect via root number, r7?51 0.96 -0.01 -0.01
Indirect effect via root length, r76PSI 0.98 0.80 0.78
Root number vs. plant height (observed r=0.9S· .. ·)
Direct effect, P 52 -0. 1 1 -0. 1 1
Indirect effect via root length, rJ ftl 0.98 1 .13 1 . 1 1
Indirect effect via root dry weight, r57P72 0.96 -0.06 -0.05
Root length vs. plant height (observed r=0.97····)
Direct effect, P ftl 1.13 1 . 13····
Indirect effect via root number, rJ52 0.98 -0. 11 -0. 10
Indirect effect via root dry weight, rS7P72 0.98 -0.06 -0.06
Root dry weight vs. plant height (observed r=0.9S····)
Direct effect, P 72 -0.06 -0.06
Indirect effect via root number, r7?52 0.96 -0. 1 1 -0.10
Indirect effect via root length, r7aP 62 0.98 1.13 1 . 11
NS. · • • •• •••. ····Nonsignificant or significant at PsO.OS, 0.01, 0.001, or 0.0001 respectively
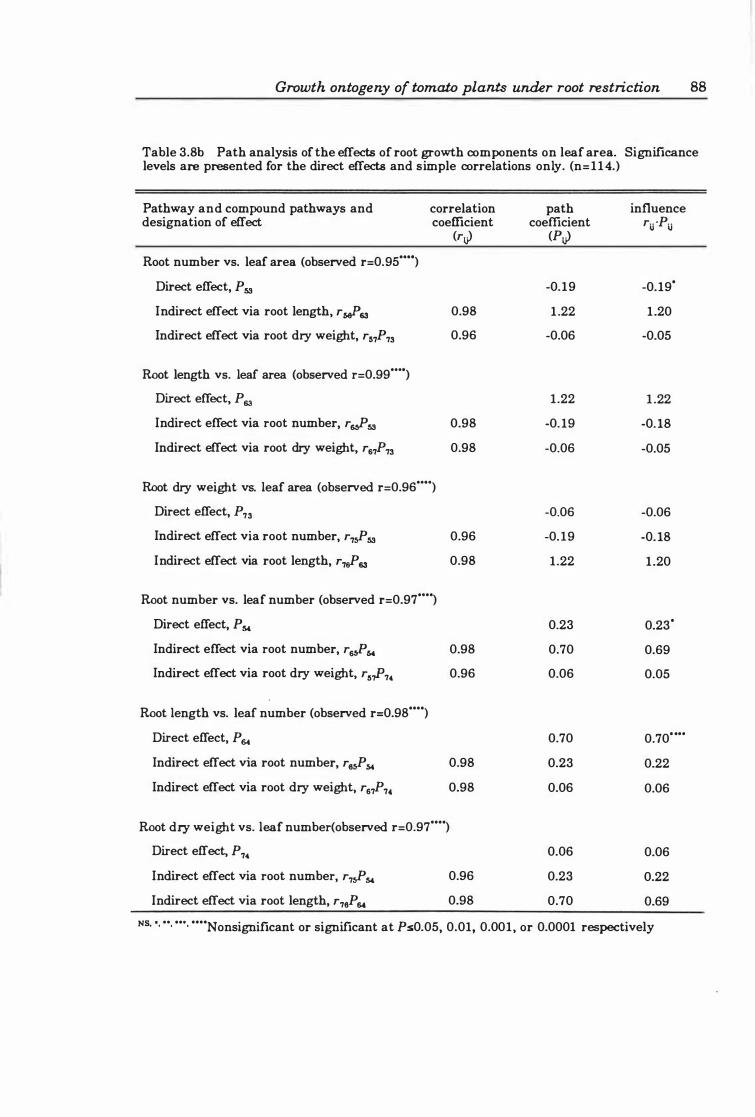
Growth ontogeny of tomato plants under root restriction 88
Table 3.Sb Path analysis of the effects of root growth components on leaf area. Significance levels are presented for the direct effects and simple correlations only. (n=114.)
Pathway and compound pathways and correlation designation of effect coefficient
Root number vs. leaf area (observed r=0.95····)
Direct effect, P 53
Indirect effect via root length, rsJ> 63
Indirect effect via root dry weight, rr,7P73
Root length vs. leaf area (observed r=0.99···")
Direct effect, P 63
Indirect effect via root number, rsJ!53
Indirect effect via root dry weight, r67P73
Root dry weight vs. leaf area (observed r=0.96····)
Direct effect, P 73
Indirect effect via root number, r7sP53
Indirect effect via root length, r7sP 63
Root number vs. leaf number (observed r=0.97 .... )
Direct effect, P 54
Indirect effect via root number, r6sP54
Indirect effect via root dry weight, rr,?7'
Root length vs. leaf number (observed r=0.9S .... )
Direct effect, P &I.
Indirect effect via root number, r6sP54
Indirect effect via root dry weight, r67P7•
(rJ
0.9S
0.96
0.9S
0.9S
0.96
0.9S
0.9S
0.96
0.9S
0.9S
Root dry weight vs. leaf number(observed r=0.97 .... )
Direct effect, P 7.
Indirect effect via root number, r7sP54
Indirect effect via root length, r7eP &I.
0.96
0.9S
path coefficient
(PJ
-0.19
1 .22
-0.06
1.22
-0. 19
-0.06
-0.06
-0. 19
1.22
0.23
0.70
0.06
0.70
0.23
0.06
0.06
0.23
0.70
influence rij ·Pij
-0.19'
1 .20
-0.05
1 .22
-O. lS
-0.05
-0.06
-O. lS
1 .20
0.23'
0.69
0.05
0.70 . ...
0.22
0.06
0.06
0.22
0.69
NS. '. " . .... .... Nonsignificant or significant at PsO.05, 0.01, 0.001, or 0.0001 respectively
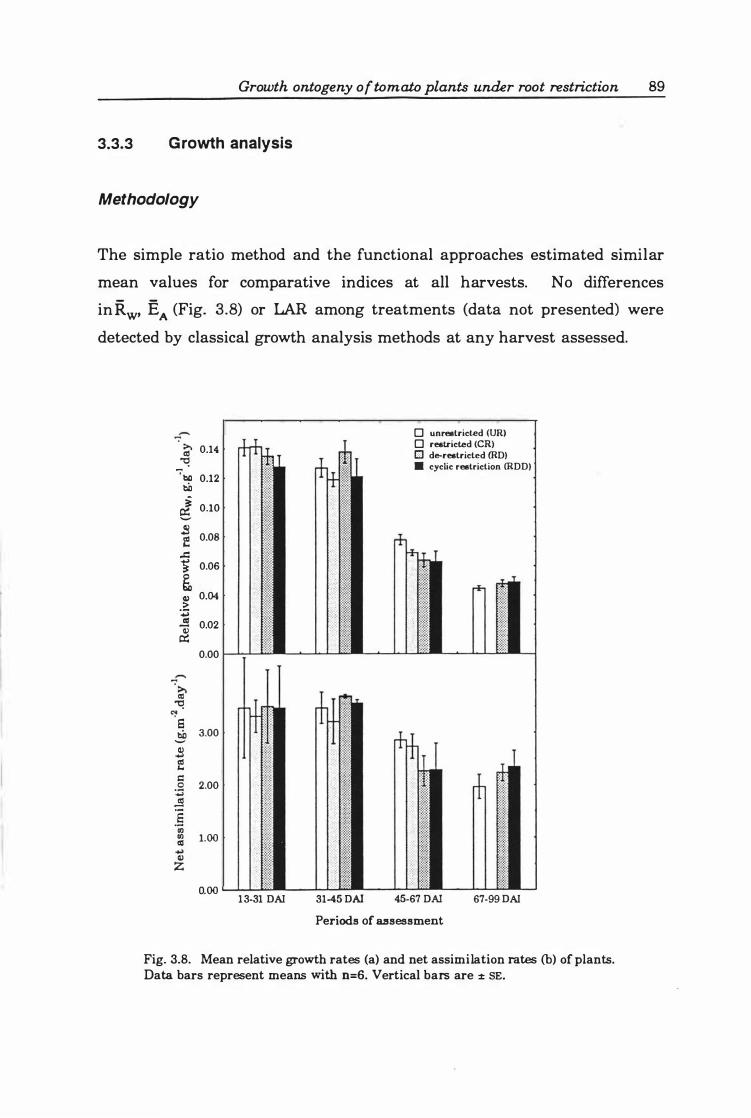
3.3.3
Growth ontogeny of tomato plants under root restriction 89
Growth analysis
Methodology
The simple ratio method and the functional approaches estimated similar
mean values for comparative indices at all harvests. No differences
inRw' EA (Fig. 3.8) or LAR among treatments (data not presented) were
detected by classical growth analysis methods at any harvest assessed.
;;- 0.14 ""t:!
"7bQ 0.12 bO � 0.10
!l f! 0.08 ..c: � 0.06
� � 0.04 :;; CIS 4i 0.02 p::
0.00 I--''-L� � >. CIS
""t:! � El .§ 3.00 II) .., CIS ... d 2.00 0 :;:l � :§ III III 1.00 CIS ., II) Z
o. 00 L-..J'-'-� 13-31 DAI
o unrestricted (UR) o restricted (CR) Cl de-restricted (RD) • cyclic restriction (RDD)
31-45 DAl 45-67 DAl 67-99 DAI
Periods of assessment
Fig. 3.8. Mean relative growth rates (a) and net assimilation rates (b) of plants. Data bars represent means with n=6. Vertical bars are % SE.
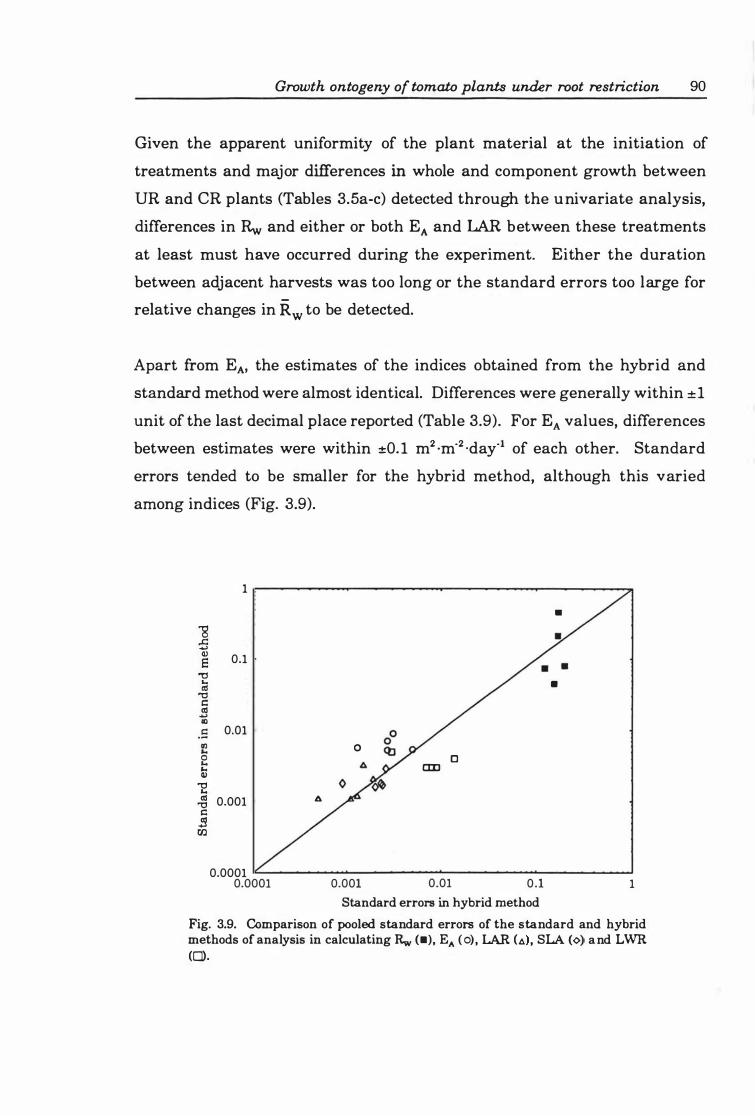
Growth ontogeny of tomato plants under root restriction 90
Given the apparent uniformity of the plant material at the initiation of
treatments and major differences in whole and component growth between
UR and CR plants (Tables 3.5a-c) detected through the univariate analysis,
differences in Rw and either or both EA and LAR between these treatments
at least must have occurred during the experiment. Either the duration
between adjacent harvests was too long or the standard errors too large for
relative changes in Rw to be detected.
Apart from EA' the estimates of the indices obtained from the hybrid and
st�ndard method were almost identical. Differences were generally within ±l unit of the last decimal place reported (Table 3.9). For EA values, differences
between estimates were within ±O. l m2 ·m·2 ·day·l of each other. Standard
errors tended to be smaller for the hybrid method, although this varied
among indices (Fig. 3.9).
1
•
"8 ..c: +> Q) 0.1 S
"tl ... -as "tl
c:: ell +> III
.S 0.01 III 0 ... 0 0 ... CID ... Q)
"tl ... ell 0.001 l>. "tl c:: !l CIJ
0.0001 0.0001 0.001 0.01 0 .1 1
Standard errors in hybrid method
Fig. 3.9. Comparison of pooled standard errors of the standard and hybrid methods of analysis in calculating Rw (-), EA ( 0), LAR (t» , SLA (<» and LWR (0).
Growth ontogeny of tomato plants under root restriction 91
As the hybrid method yielded near-identical means and standard errors of
similar magnitude compared with the standard method, it was adopted for all
subsequent analyses and all further data presented is from this analysis
method. When, however, the two methods diverged considerably in their
output, mention is made in the text.
Relative growth rate
The relative growth rate of plants in all treatments decreased during the
experiment as the relative amount of tissue not directly contributing to
overall growth increased (Fig 3 .10). Small differences, inconsistently
associated with root environment, were detected between treatments 13 and
31 DAI (Table 3.9) . By 45 DAI, Rw of restricted plants (CR and RDD) was
significantly lower than that of unrestricted (UR and RD) plants. Following
release from the 0.025 I container 31 DAI, the Rw of RDD plants increased
relative to unrestricted plants so that by 67 DAI the Rw of RDD plants was
similar to that of unrestricted plants. By 67 DAI, the continued restriction
in 0.025 I containers manifested in Rw of CR plants being markedly lower
than all other treatments.
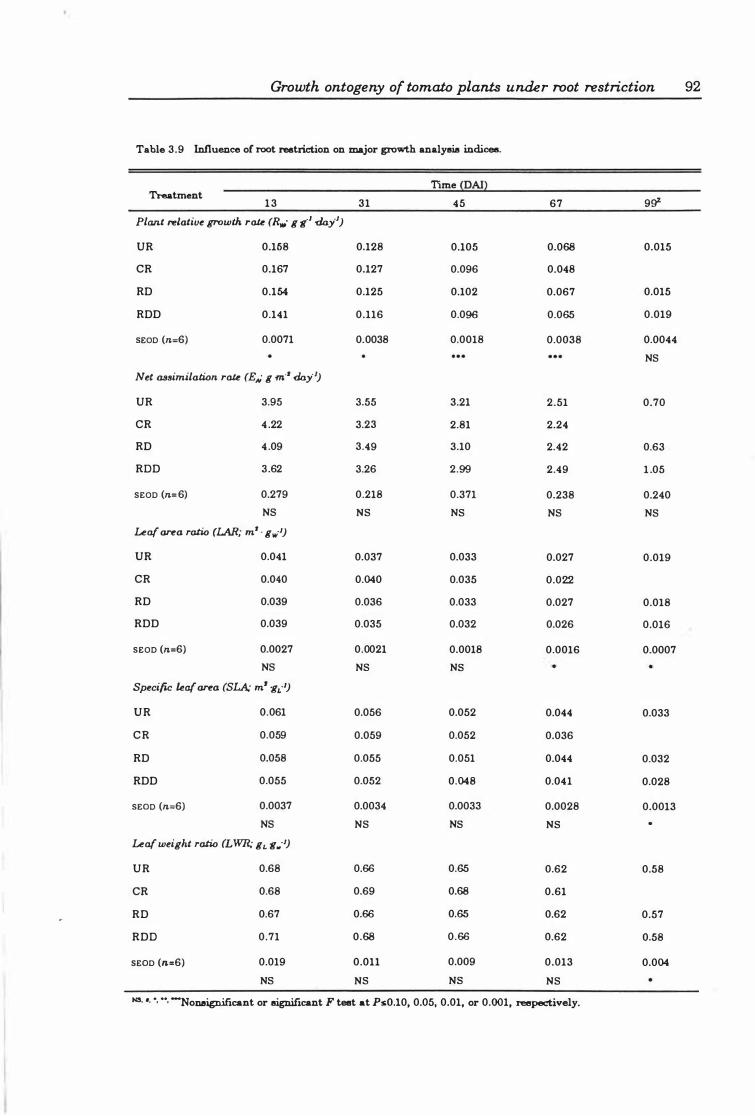
Growth ontogeny of tomato plants under root restriction 92
Table 3.9 Influence of root rMtriction on major growth analyaia indices.
Time (DAl) Treatment
1 3 31 45 67 9gz
Plant relative growth rak (R.· g g.J .Jay"J)
UR 0.168 0.128 0.105 0.068 0.015
CR 0.167 0.127 0.096 0.048
RD 0.154 0.125 0.102 0.067 0.015
RDD 0.141 0.116 0.096 0.065 0.019
SEOD (n=6) 0.0071 0.0038 0.0018 0.0038 0.0044
NS Net assimilation rak (EN g m·' .Jay"J)
UR 3.95 3.55 3.21 2.51 0.70
CR 4 .22 3.23 2.81 2.24
RD 4 .09 3.49 3.10 2.42 0.63 .
RDD 3.62 3.26 2.99 2.49 1 .05
SEOD (n= 6) 0.279 0.218 0.371 0.238 0.240
NS NS NS NS NS Leaf area ratio (LAR; m' · gw·J)
UR 0.041 0.037 0.033 0.027 0.019
CR 0.040 0.040 0.035 0.022
RD 0.039 0.036 0.033 0.027 0.018
RDD 0.039 0.035 0.032 0.026 0.016
SEOD (n=6) 0.0027 0.0021 0.0018 0.0016 0.0007
NS NS NS Specific kaf area (SLA; m' 'KL·J)
UR 0.061 0.056 0.052 0.044 0.033
CR 0.059 0.059 0.052 0.036
RD 0.058 0.055 0.051 0.044 0.032
RDD 0.055 0.052 0.048 0.041 0.028
SEOD (n=6) 0.0037 0.0034 0.0033 0.0028 0.0013
NS NS NS NS Leaf weigkt ratio (LWR; gL g ... J)
UR 0.68 0.66 0.65 0.62 0.58
CR 0.68 0.69 0.68 0.61
RD 0.67 0.66 0.65 0.62 0.57
RDD 0.71 0.68 0.66 0.62 0.58
SEOD (n=6) 0.019 0.011 0.009 0.013 0.004
NS NS NS NS tiS. ' • •• ••• -Nonsignificant or significant F teet at PsO.I0, 0.05, 0.01, or 0.001, reapectively.
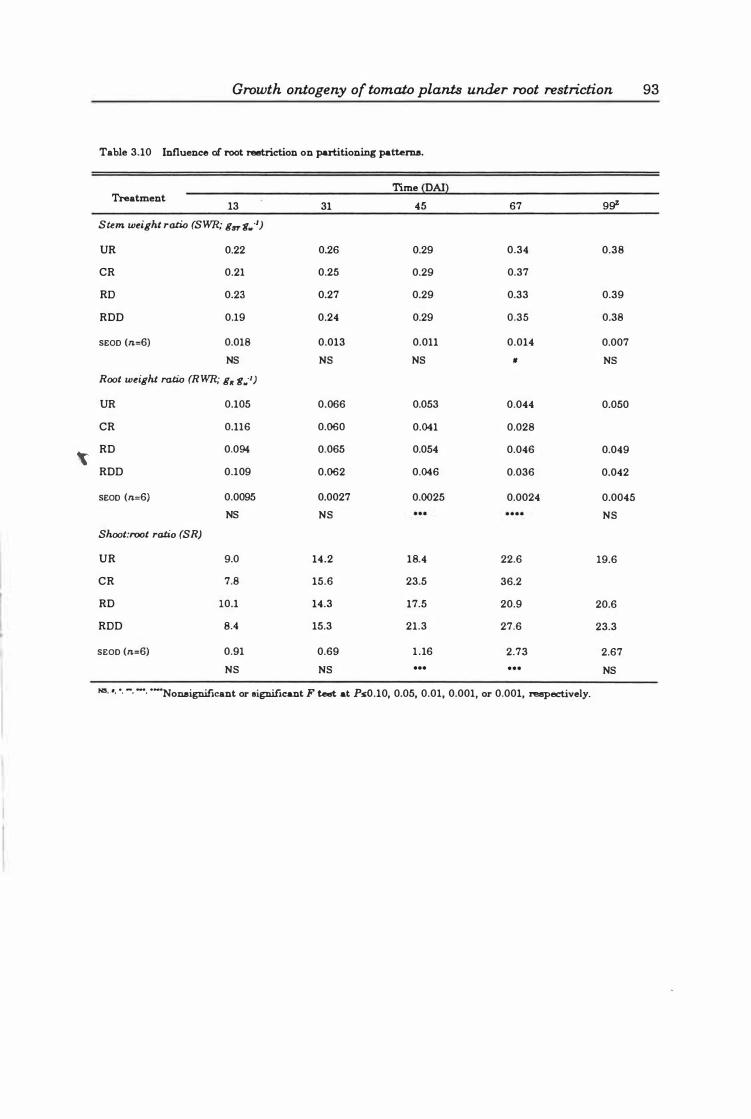
�
Growth ontogeny of tomato plants under root restriction 93
Table 3.10 Influence of root restriction on partitioning pattel'1ll!l.
Time (OAl) 'Ireatment
13 31 45 67 9gz
Stem weight ratio (SWR; gn 'll . . ·J)
UR 0.22 0.26 0.29 0.34 0.38
CR 0.21 0.25 0.29 0.37
RO 0.23 0.27 0.29 0.33 0.39
ROD 0.19 0.24 0.29 0.35 0.38
SEOD (n=6) 0.018 0.013 0.011 0.014 0.007
NS NS NS /I NS Root weight ratio (RWR; gR 'II .. ·J)
UR 0.105 0.066 0.053 0.044 0.050
CR 0.116 0.060 0.041 0.028
RO 0.094 0.065 0.054 0.046 0.049
ROD 0.109 0.062 0.046 0.036 0.042
SEOD (n=6) 0.0095 0.0027 0.0025 0.0024 0.0045
NS NS NS Shoot:root ratio (SR)
UR 9.0 14.2 18.4 22.6 19.6
CR 7.8 15.6 23.5 36.2
RO 10.1 14.3 17.5 20.9 20.6
ROD 8.4 15.3 21.3 27.6 23.3
SEOD (n=6) 0.91 0.69 1 .16 2.73 2.67
NS NS ... . . . NS
!<s. ' • •• -. -, ·-Nonsignificant or significant F test at PsO.10, 0.05, 0.01, 0.001, or 0.001, reepeciively.
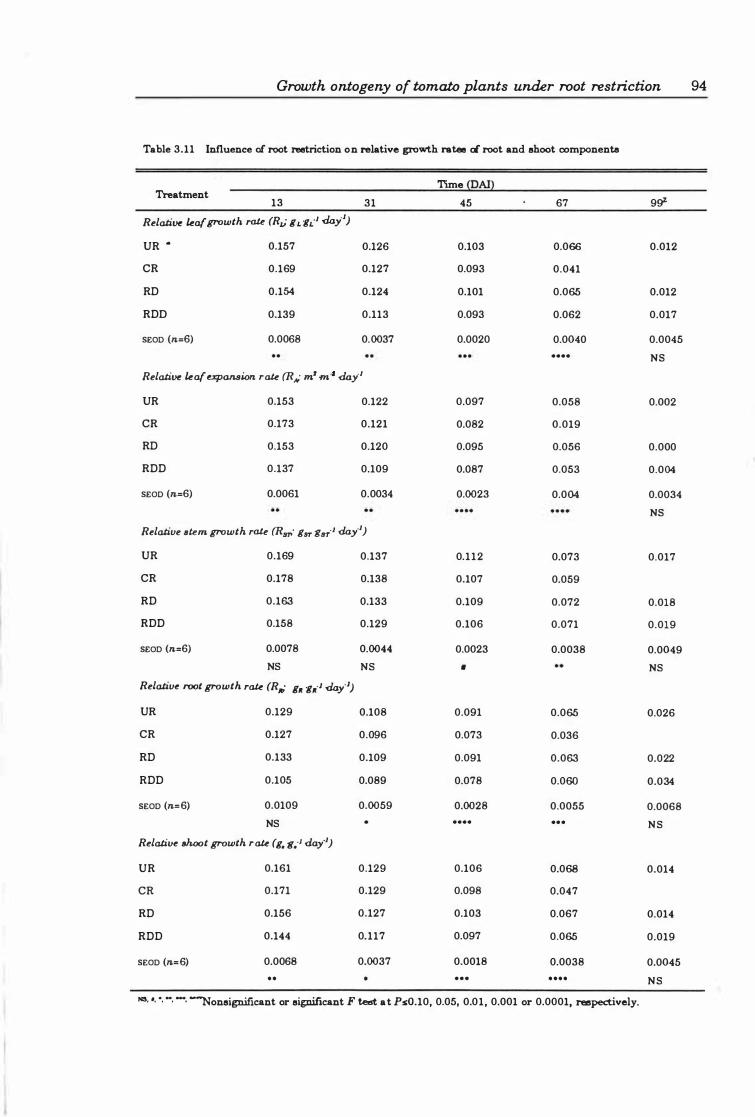
Growth ontogeny of tomato plants under root restriction 94
Table 3.11 Influence of root restriction on relative growth ratee cL root and ehoot components
Time (OAl) Treatment
13 31 45 67 9g2=
RelaJive leaf growth rate (Rv gL "6L·I -day.l)
UR · 0.157 0.126 0.103 0.066 0.012
CR 0.169 0.127 0.093 0.041
RO 0.154 0.124 0.101 0.065 0.012
ROD 0.139 0.113 0.093 0.062 0.017
SEOD (n=6) 0.0068 0.0037 0.0020 0.0040 0.0045 . . . . NS
RelaJive leaf e%pQ.ll.8Wn rate (RAi m' m" -day-I
UR 0.153 0.122 0.097 0.058 0.002
CR 0.173 0.121 0.082 0.019
RO 0.153 0.120 0.095 0.056 0.000
ROO 0.137 0.109 0.087 0.053 0.004
SEOD (n=6) 0.0061 0.0034 0.0023 0.004 0.0034
NS RelaJiue Btem growth rate (Rs,,' gST gST·I day-I)
UR 0.169 0.137 0.112 0.073 0.017
CR 0.178 0.138 0.107 0.059
RO 0.163 0.133 0.109 0.072 0.018
ROO 0.158 0.129 0.106 0.071 0.019
SEOD (n=6) 0.0078 0.0044 0.0023 0.0038 0.0049
NS NS • NS RelaJiue root growth rate (RII; g,. "6,..1 -day"I)
UR 0.129 0.108 0.091 0.065 0.026
CR 0.127 0.096 0.073 0.036
RO 0.133 0.109 0.091 0.063 0.022
ROO 0.105 0.089 0.078 0.060 0.034
SEOD (n=6) 0.0109 0.0059 0.0028 0.0055 0.0068
NS . . . . . . . NS RelaJive aJwot growth rate (g. g.-I day-I)
UR 0.161 0.129 0.106 0.068 0.014
CR 0.171 0.129 0.098 0.047
RO 0.156 0.127 0.103 0.067 0.014
ROO 0.144 0.117 0.097 0.065 0.019
SEOD (n=6) 0.0068 0.0037 0.0018 0.0038 0.0045 • • . . . • • • • NS
lIS, ', ·, -, -, �oneignificant or eignificant F teet at PsO.10, 0.05, 0.01, 0.001 or 0.0001, respectively.
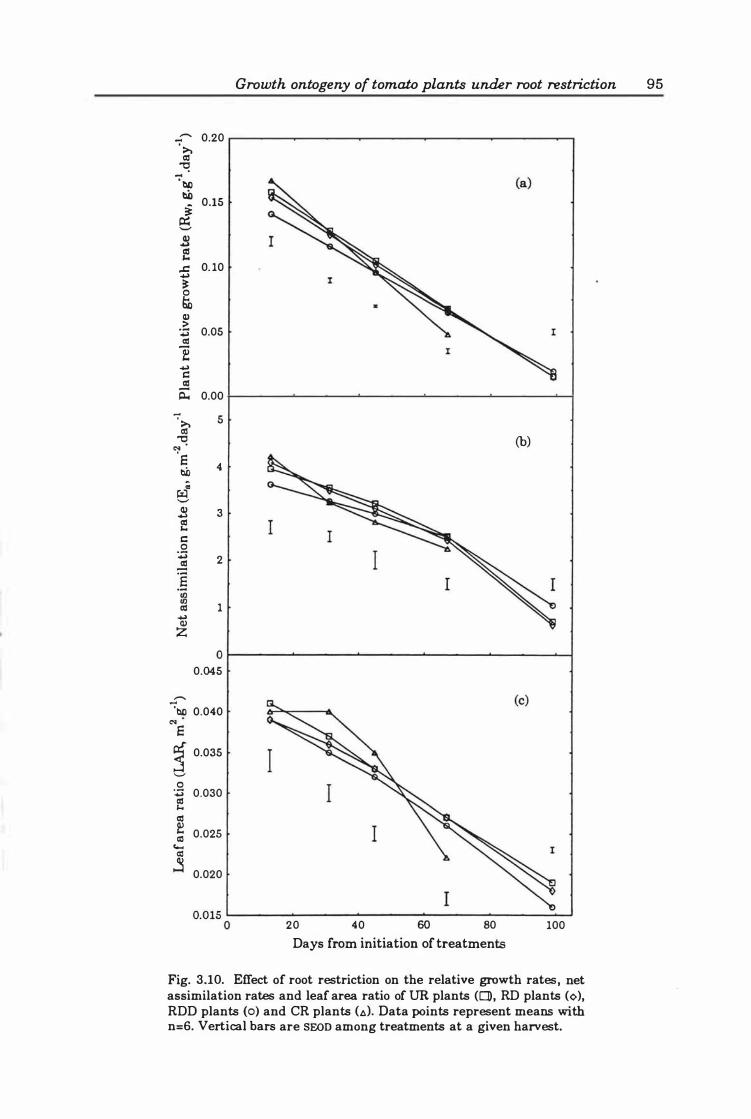
-"7 >. til � "7 bI) tID
:i � '-'"
11) ... f
...c ... � 0 6'0 11) >
:;:; til 1! ... c:: .! �
"7 >. til � �
S tID
; � '-'
11) ... til '"' c:: 0 :z .! �§ III III til
... Q) Z
.... -
0.20
0.15
0. 10
0.05
0.00
5
4
3
2
1
Growth ontogeny of tomato plants under root restriction 95
(b)
O �------�------�------�------�------�� 0.045
'bI) 0.040 ""
S � 0.035
'-' 0 :;:; 0.030 til '"' til � 0.025 III ..... III � 0.020
0.0 15 '--______ """""-______ � _____________ � ______ __'_....J o 20 40 60 80 100
Days from initiation of treatment.c;;
Fig. 3.10. Effect of root restriction on the relative growth rates, net assimilation rates and leaf area ratio of UR plants (0, RD plants (¢), RDD plants (0) and CR plants Ct.). Data points represent means with n=6. Vertical bars are SEOn among treatments at a given harvest.
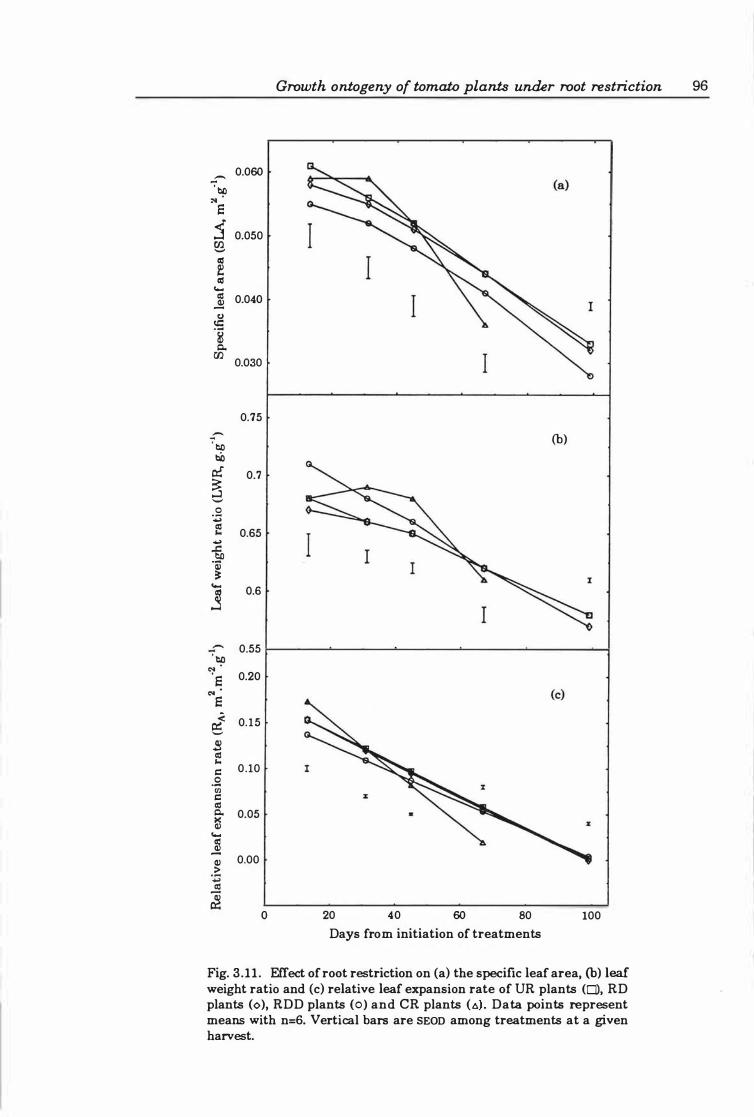
--:--bp � E j 00 "-II! f II! .... II! � u � al c.. 00
:--bO bO
� � "-
0 :z II! '"' � fo .OJ � ....
j ..:-
bO � E ... E rl $ II! '"' c: .2 Ul c: II! c.. >< Q) .... �
Q) >
:z II! �
0.060
0.050
0.040
0.030
0.75
0.7
0.65
0.6
0.55
0.20
0. 15
0.10
0.05
0.00
o
Growth ontogeny of tomato plants under root restriction 96
(b)
20 40 60 80 100
Days from initiation of treatments
Fig. 3 .11 . Effect of root restriction on (a) the specific leaf area, (b) leaf weight ratio and (c) relative leaf expansion rate of UR plants (0), RD plants (0), RDD plants (0) and CR plants (.t» . Data points represent means with n=6. Vertical bars are SEOD among treatments at a given harvest.
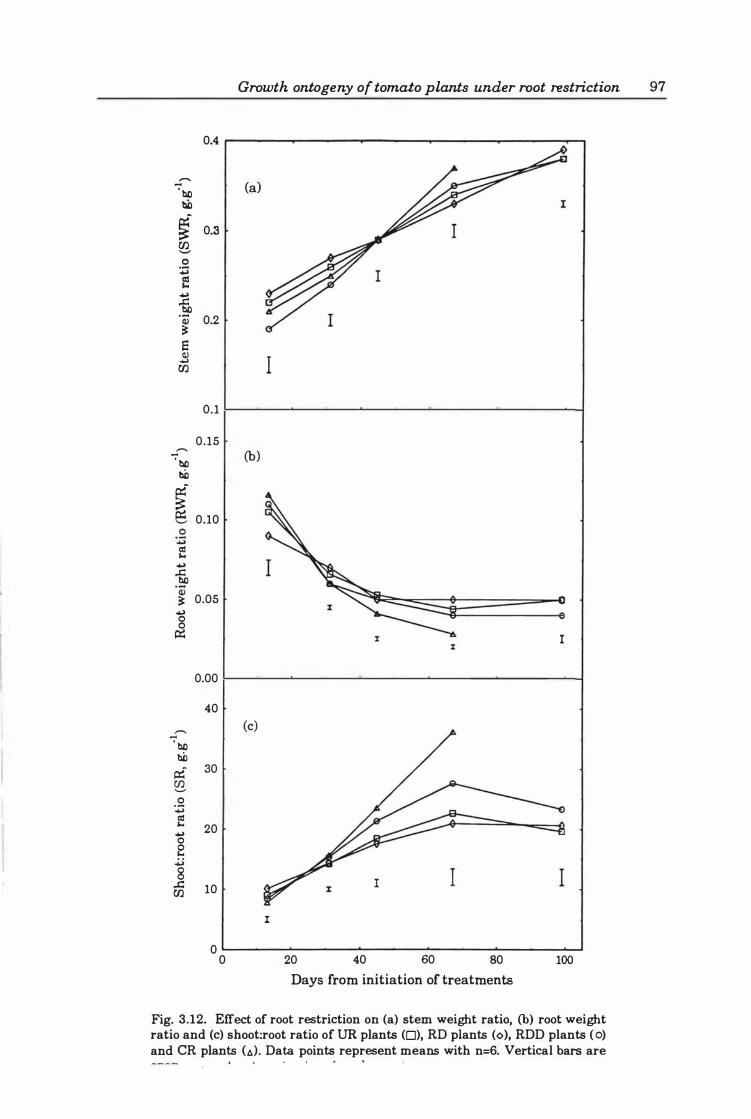
-,-... be bD
�� 00 '-' .� .. fl
.. �
4) � E (1) ..
00
..f' be tID
l 0
:;:; a! ,..
.. �
(1) � .. 0 0
p::
,-... -be tID
p::"' �
0 :;:;
a! ,.. .. 0 e
.;; 8
..s:: 00
0.4
0.3
0.2
0.1
0.15
0.10
0.05
0.00
40
30
20
10
0 0
Growth ontogeny of tomato plants under root restriction 97
(a)
I
(b)
I I
(c)
I
20 40 60 80 100
Days from initiation of treatments
Fig. 3.12. Effect of root restriction on (a) stem weight ratio, (b) root weight ratio and (c) shoot:root ratio of UR plants (0), RD plants (0), RDD plants ( 0) and CR plants C�). Data points represent means with n=6. Vertical bars are , . .
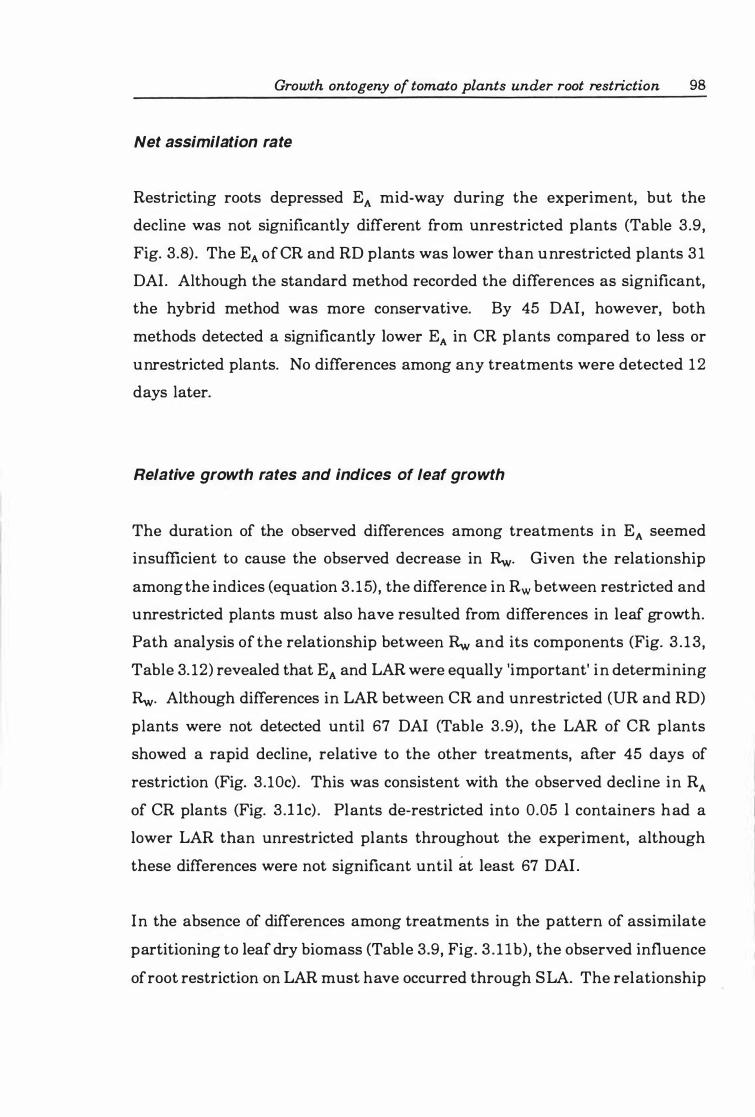
Growth ontogeny of tomato plants under root restriction 98
Net assimilation rate
Restricting roots depressed EA mid-way during the experiment, but the
decline was not significantly different from unrestricted plants (Table 3.9,
Fig. 3.8). The EA of CR and RD plants was lower than unrestricted plants 3 1
DAI. Although the standard method recorded the differences as significant,
the hybrid method was more conservative. By 45 DAI, however, both
methods detected a significantly lower EA in CR plants compared to less or
unrestricted plants. No differences among any treatments were detected 12
days later.
Relative growth rates and indices of leaf growth
The duration of the observed differences among treatments in EA seemed
insufficient to cause the observed decrease in Rw. Given the relationship
among the indices (equation 3 .15), the difference in Rw between restricted and
unrestricted plants must also have resulted from differences in leaf growth.
Path analysis of the relationship between Rw and its components (Fig. 3 . 13,
Table 3. 12) revealed that EA and LAR were equally 'important' in determining
Rw. Although differences in LAR between CR and unrestricted (UR and RD)
plants were not detected until 67 DAI (Table 3 .9), the LAR of CR plants
showed a rapid decline, relative to the other treatments, after 45 days of
restriction (Fig. 3.10c). This was consistent with the observed decline in RA
of CR plants (Fig. 3 .l lc) . Plants de-restricted into 0.05 1 containers had a
lower LAR than unrestricted plants throughout the experiment, although
these differences were not significant until at least 67 DAI .
In the absence of differences among treatments in the pattern of assimilate
partitioning to leaf dry biomass (Table 3.9, Fig. 3 . 1 Ib), the observed influence
of root restriction on LAR must have occurred through SLA. The relationship
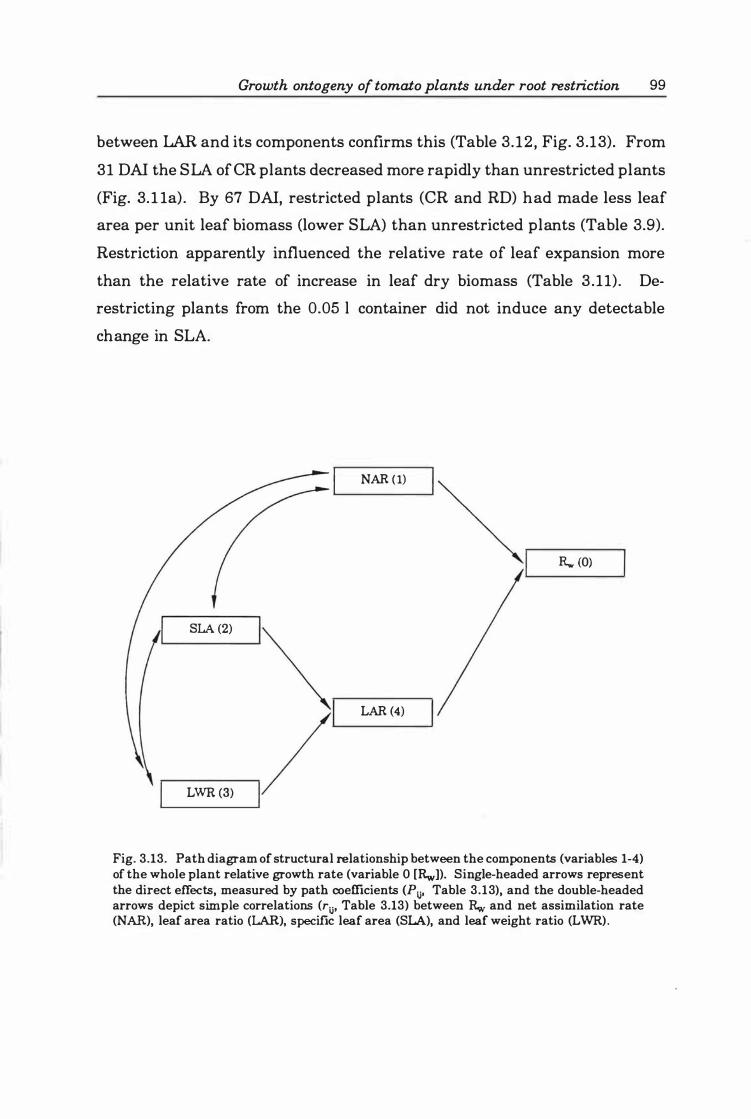
Growth ontogeny of tomato plants under root restriction 99
between LAR and its components confirms this (Table 3. 12 , Fig. 3.13). From
31 DAI the SLA ofCR plants decreased more rapidly than unrestricted plants
(Fig. 3. 1 1a) . By 67 DAI, restricted plants (CR and RD) had made less leaf
area per unit leaf biomass (lower SLA) than unrestricted plants (Table 3.9).
Restriction apparently influenced the relative rate of leaf expansion more
than the relative rate of increase in leaf dry biomass (Table 3 .11) . De
restricting plants from the 0.05 I container did not induce any detectable
change in SLA.
NAR ( 1)
R.. (0)
SLA (2)
LAR (4)
LWR (3)
Fig. 3.13. Path diagram of structural relationship between the components (variables 1-4) of the whole plant relative growth rate (variable 0 [Rw)). Single-headed arrows represent the direct effects, measured by path coefficients (Pu, Table 3.13), and the double-headed arrows depict simple correlations (ru, Table 3.13) between Rw and net assimilation rate (NAR), leaf area ratio (LAR), specific leaf area (SLA), and leaf weight ratio (LWR).
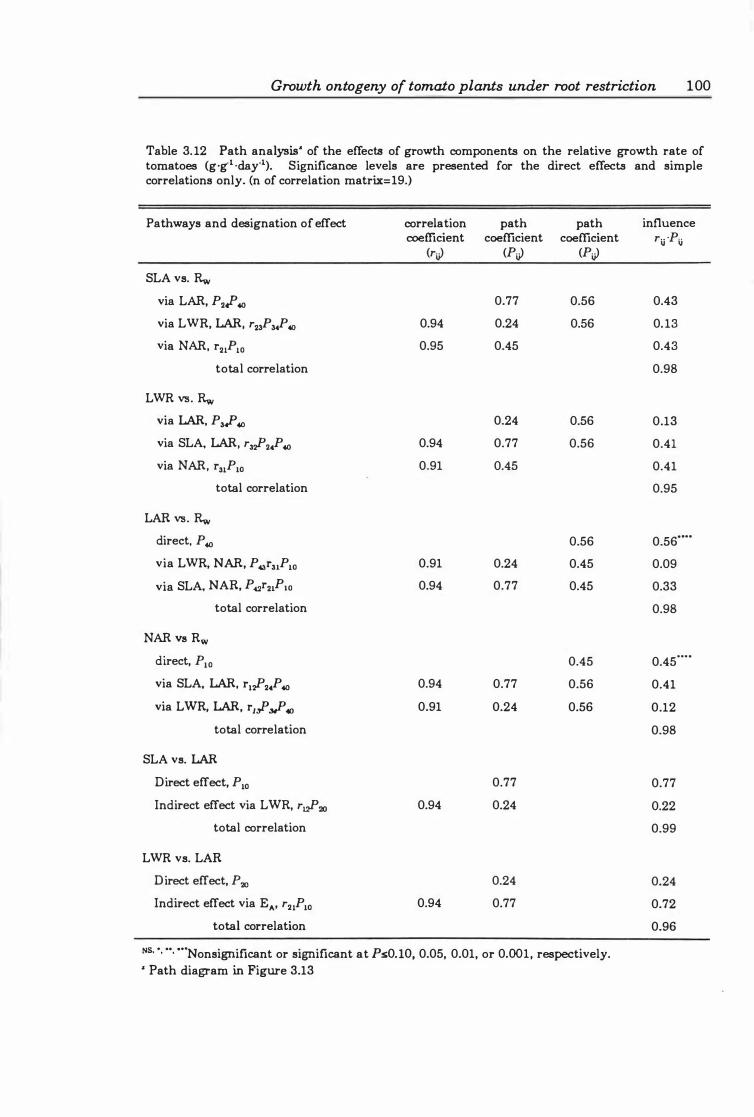
Growth ontogeny of tomato plants under root restriction 100
Table 3. 12 Path analysis' of the effects of growth components on the relative growth rate of tomatoes (g.g-l ·day·l). Significance levels are presented for the direct effects and simple correlations only. (n of correlation matrix=19.)
Pathways and designation of effect correIa tion path path influence coefficient coefficient coefficient rij 'Pij
(rU> (PU> (PU> SLA vs. Rw
via LAR, P2'p 40 0.77 0.56 0.43
via LWR, LAR, r23P3(P4O 0.94 0.24 0.56 0. 13
via NAR, r21P1O 0.95 0.45 0.43
total correlation 0.98
LWR vs. Rw
via LAR, P3'p 40 0.24 0.56 0.13
via SLA. LAR, r3�2.P 40 0.94 0.77 0.56 0.41
via NAR, r3lPIO 0.91 0.45 0.41
total correlation 0.95
LAR vs. Rw
direct, P 40 0.56 0.56 . . • •
via LWR, NAR, P .ar31PIO 0.91 0.24 0.45 0.09
via SLA, NAR, P 42r21PIO 0.94 0.77 0.45 0.33
total correlation 0.98
NAR v8 Rw
direct, PIO 0.45 0.45····
via SLA. LAR, r l� 2.P 40 0.94 0.77 0.56 0.41
via LWR, LAR, rJj!J¥) 0.91 0.24 0.56 0.12
total correlation 0.98
SLA vs. LAR Direct effect, PIO 0.77 0.77
Indirect effect via LWR, r�'JIJ 0.94 0.24 0.22
total correlation 0.99
LWR vs. LAR
Direct effect, P 'JIJ 0.24 0.24
Indirect effect via EA, r21PIO 0.94 0.77 0.72
total correlation 0.96
liS, ·, •• , ··"Nonsignificant or significant at PsO.IO, 0.05, 0.01, or 0.001, respectively. , Path diagram in Figure 3.13
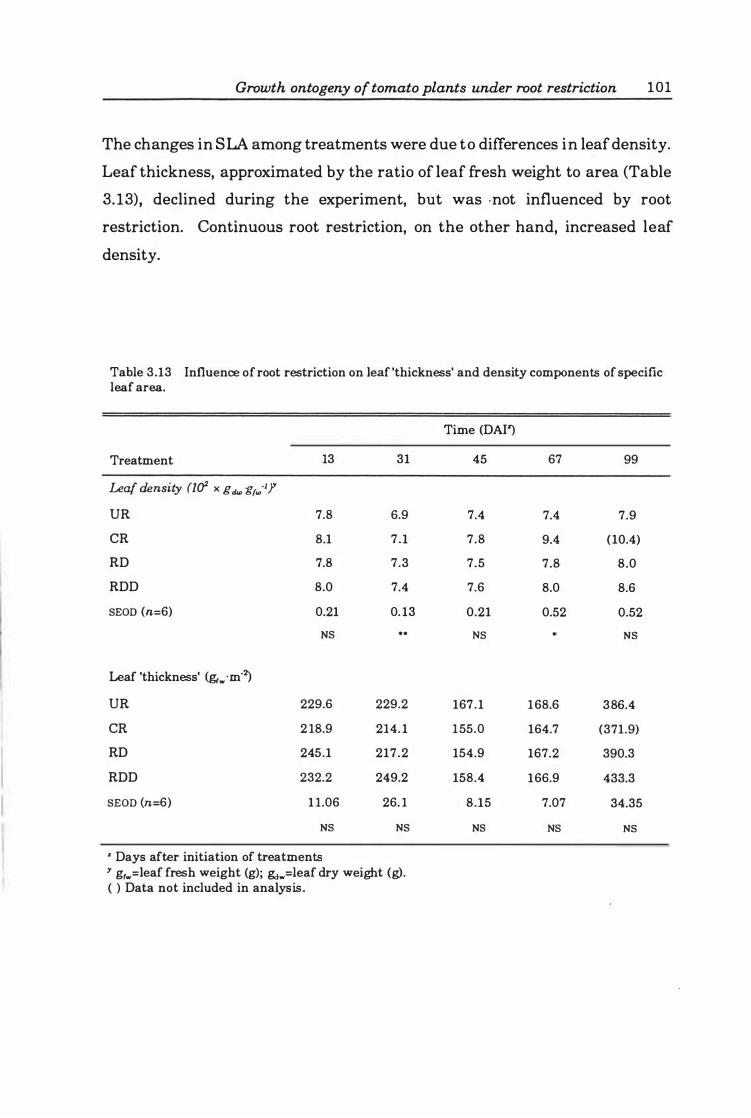
Growth ontogeny of tomato plants under root restriction 101
The changes in SLA among treatments were due to differences in leaf density.
Leaf thickness, approximated by the ratio of leaf fresh weight to area (Table
3. 13), declined during the experiment, but was ·not influenced by root
restriction. Continuous root restriction, on the other hand, increased leaf
density.
Table 3.13 Influence of root restriction on leaf 'thickness' and density components of specific leaf area.
Time (DAI�
Treatment 13 31 45 67 99
Leaf density (1(f x g,Ju, g/w·1Y UR 7.8 6.9 7.4 7.4 7.9
CR 8.1 7.1 7 .8 9.4 (lO.4)
RD 7.8 7.3 7.5 7.8 8.0
RDD 8.0 7.4 7.6 8.0 8.6
SEon (n=6) 0.21 0. 13 0.21 0.52 0.52 NS NS NS
Leaf 'thickness' <&w ·m·�
UR 229.6 229.2 167 .1 168.6 386.4
CR 2 18.9 214. 1 155.0 164.7 (371.9)
RD 245.1 217.2 154.9 167.2 390.3
RDD 232.2 249.2 158.4 166.9 433.3
SEon (n=6) 1 1.06 26. 1 8.15 7.07 34.35
NS NS NS NS NS
• Days after initiation of treatments Y grw=leaf fresh weight (g); &!w=leaf dry weight (g). ( ) Data not included in analysis.
Growth ontogeny of tomato plants under root restriction 102
Patterns of assimilate partitioning
Across all treatments, the relative amount of assimilate partitioned to roots
declined from -10% to .. 5% over the course of the experiment (Fig 3 . 12b). By
31 DAI, proportionately less assimilate was partitioned to the restricted root
systems (CR and RDD). Although this change in partitioning pattern was
only statistically significant in the standard analysis, within two weeks the
influence of restriction had become more pronounced and by 67 DAI, CR
plants had allocated significantly less assimilate to their roots than RDD
plants and unrestricted roots. During this period, plants in the 0.05 I containers had significantly lower RWR than unrestricted (UR and RD)
plants, a pattern retained at 99 DAI despite a slight increase by all these
treatments. Changes in partitioning patterns to the stem were less pro
nounced. By 67 DAI, plants in 0.025 I containers had partitioned compara
tively more assimilate to stems than unrestricted plants, with the response
of plants in the 0.05 I containers midway between these groups. These
relative changes in assimilate partitioning among individual organs were
amplified by a significant increase in the SR ratio in plants with restricted
root systems between 31 and 45 DAI (Fig. 3 .12c). De-restriction from the
0.05 I container resulted in an immediate decrease in the SR ratio as
assimilate was re-directed to leaf tissue (Fig. 3. 1 1b) at the expense of root and
stem tissue (Figs. 3. 1 2a,b).
Allometric relationships
For an allometric relationship between root and shoot growth to be physically
possible, either the slope of the linear allometric relationship between leaf
and stem is unity, or linear allometric relationships cannot exist between any
combinations of leaf, stem and root. Paraphrasing Causton and Venus ( 1981) ,
a tomato plant consists of two components, the root and shoot (QR and Qs).
Growth ontogeny of tomato plants under root restriction 103
The shoot component, in turn, consists of two further sub-components of stem
and leaf (QS(.tem) and QSOeaf) ' If a linear allometric relationship exists between
QS(atem) and QSOeaf)' and between QS(leaO (or QS(atem» and QR' then a linear
allometric relationship can exist between QR and Qs only if the linear
allometric relationship between QS(atem) and Qg(leaO is unity. Evaluating the
data according to this theorem indicated that a linear allometric relationship
between shoot and root was physically impossible as allometric relationships
with k values significantly different from one existed between the root, leaf
and stem components (Table 3. 14).
Following Causton and Venus (1981), curves were segmented visually into
two or more linear phases (Fig. 3. 14). The visual criterion was made on
graphs of harvest means, not only because data trends are easier to see, but
because harvest mean values were used to estimate the parameters.
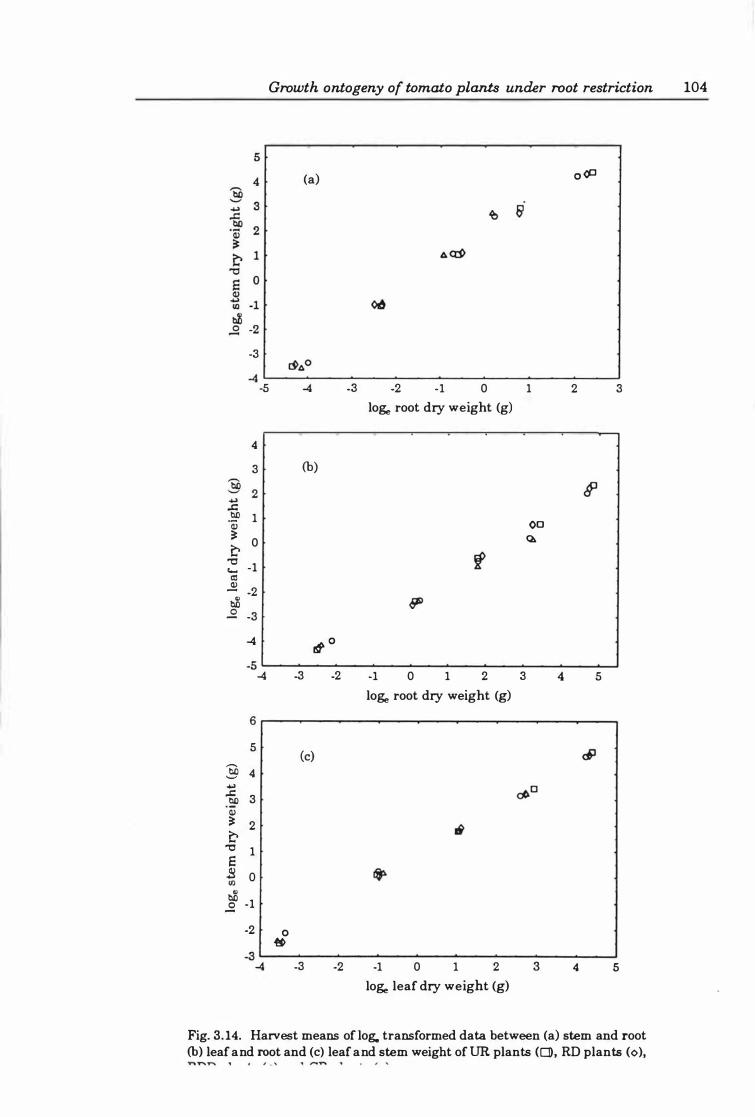
Growth ontogeny of tomato plants under root restriction 104
(a) o <P
-3
4�--�----------�------------------�----� -5
4
3 (b)
..., ..c: .� 1 III � 0 C � -1 c:s � -2 � ..£ -3
4 d' 0
-3 -2 -1 0 1
lo� root dry weight (g)
00 Q.
2 3
-5�--�----------�------------�--�----� 4 -3 -2
5
§ 4 ...,
� 3 III � 2 C
'1:! 1 S .s 0 I/J � ..£ -1
-2 ° �
(c)
-1 0 1 2 3 4 5
lo� root dry weight (g)
-3�------�----�------------�--�--------� 4 -3 -2 -1 0 1 2 3 4 5
lo� leaf dry weight (g)
Fig. 3. 14. Harvest means of log. transformed data between (a) stem and root (b) leaf and root and (c) leaf and stem weight of UR plants (CD, RD plants (0),
Growth ontogeny of tomato plants under root restriction 105
Regardless of treatment, comparatively more assimilate was proportioned to
stem tissue than root or leaf (Table 3.14). Using NeIder's ( 1963) terminology,
the demand of stem tissue for assimilate was greater than that of leaves and
roots. Up to 67 DAI, leaves and stems of unrestricted plants (UR) exhibited
higher demand (10 1) for assimilates than roots. During this time, the
demand of stem tissue for assimilates was higher than that of leaves. A
change occurred between 67 and 99 DAI, when assimilate demand by roots
increased substantially (k< l). In both instances, this change was brought
about by the relative growth rates of stem and leaf tissue declining faster
than that of root tissue (-0.00237 and -0.00220 vs. -0.00168 g.g>l ·day>l) .
The response of RDD plants was consistent with these patterns. In the
periods immediately preceding de-restriction (13-31 DAI, 45-67 DAD,
comparatively more assimilate was partitioned to leaf and stem tissue than
roots (10 1). Following de-restriction 31 DAI, the relative growth rates of
leaves and roots was similar (Le. h=ol), while that of stem tissue was greater
than leaves or roots.
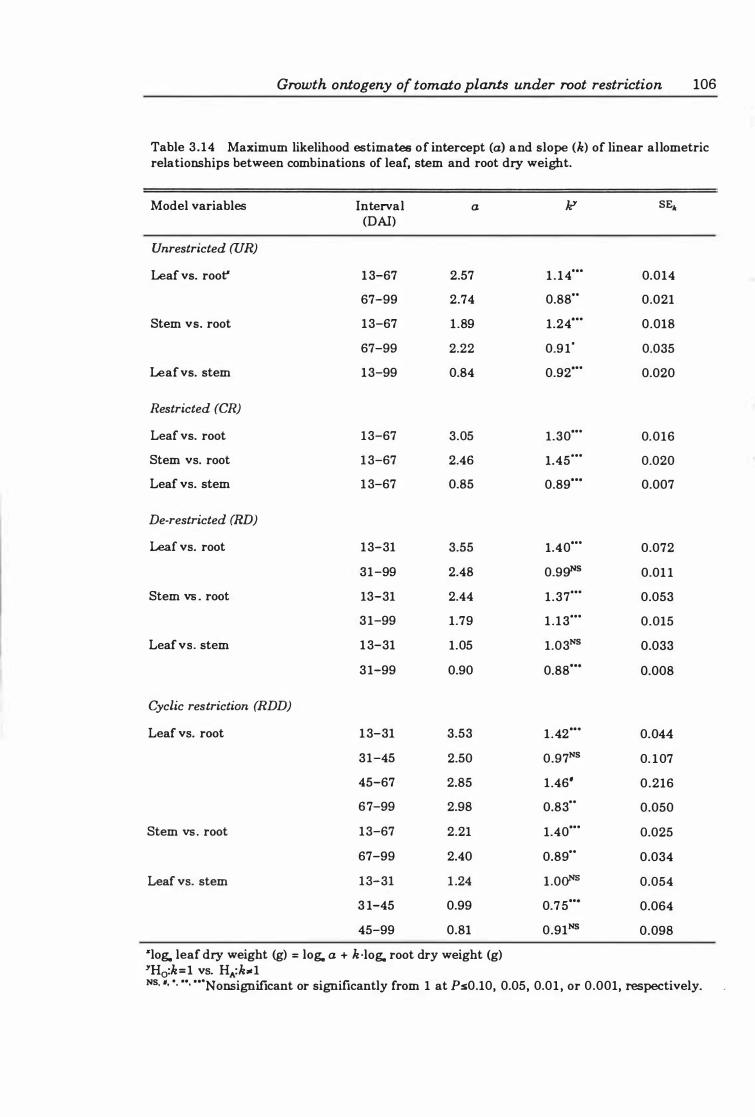
Growth ontogeny of tomato plants under root restriction 106
Table 3.14 Maximum likelihood estimates of intercept (a) and slope (k) of linear allometric relationships between combinations of leaf, stem and root dry weight.
Model variables Interval a kY SE. (DAI)
Unrestricted (UR)
Leaf vs. root" 13-67 2.57 1 . 14'" 0.014
67-99 2.74 O.SS" 0.021
Stem vs. root 13-67 1 .S9 1.24'" O.OlS
67-99 2.22 0.91' 0.035
Leaf vs. stem 13-99 0.S4 0.92'" 0.020
Restricted (CR)
Leaf vs. root 13-67 3.05 1.30'" 0.016
Stem VS. root 13-67 2046 1.45'" 0.020
Leaf VS. stem 13-67 0.S5 0.S9'" 0.007
De-restricted (RD)
Leaf VS. root 13-31 3.55 lAO'" 0.072
31-99 2.48 0.9gNs 0.01 1
Stem vs . root 13-31 2.44 1.37'" 0.053
31-99 1.79 1 . 13'" 0.015
Leaf VS. stem 13-31 1.05 1.03NS 0.033
31-99 0.90 O.SS'" O.OOS
Cyclic restriction (RDD)
Leaf VS. root 13-31 3.53 1 .42'" 0.044
31-45 2.50 0.97NS 0. 107
45-67 2.S5 1 046' 0.216
67-99 2.9S 0.S3"
0.050
Stem vs . root 13-67 2.21 1.40'" 0.025
67-99 2040 0.S9" 0.034
Leaf VS. stem 13-31 1 .24 LOoNS 0.054
3 1-45 0.99 0.75'" 0.064
45-99 O.Sl 0.91NS 0.09S
"log. leaf dry weight (g) = log. a + k . log. root dry weight (g) "Ho:k=l VS. HA:k .. 1 NS. ', ', ", "'Nonsignificant or significantly from 1 at PsO.10, 0.05, 0.01 , or 0.001, respectively.
Growth ontogeny of tomato plants under root restriction 107
Relationships between relative growth rates of components
The k values of the allometric analysis demonstrate that root restriction
altered the distribution patterns of assimilate and resulted in different
relative growth rates of the plant's components. The SLA of root restricted
plants decreased more rapidly than that of unrestricted plants (Fig. 3. 1 1a) .
Against a LWR that changed uniformly across all treatments (Fig. 3 .1 1b), this
decrease occurred because the restriction of root growth depressed the
relative rate of leaf area expansion more than the relative rate of growth in
leaf biomass (Table 3. 1 1) . The rate of root growth is composed of changes in
the number and length of roots and biomass of the whole system. The
relationships between the relative growth rates of growth of these components
(i.e. relative rate of increase in dry biomass, RR; relative rate of elongation,
�L; relative rate of increase in number, �N) and the components of shoot
growth (Le. relative rate of increase in leaf (RL) and stem (RsT) biomass;
relative rate of leaf area expansion (RA» was examined.
Canonical discriminant analysis of this data showed that, up to 67 DAI, the
main source of variation separating the treatments was a difference in the
relative growth rates of root components and shoot components (Table 3. 1 5).
CDF 1(13) contrasts the relative rates of leaf growth, particularly leaf
expansion, against the relative increase in root number and, to a lesser
extent, root length. Similarly, CDF1(3l) contrasts the relatives rates of leaf
(biomass and expansion) growth with root (biomass, elongation and number)
growth. At 45 DAI, the discriminant function maximally separating the
treatments (CFD4S(l) was dominated by the relative rate of root elongation.
From the mean scores, it appears that the two levels of root restriction (0.025
and 0.05 1) reduced RRL to different degrees, with the score for CR signifi
cantly lower than RDD, which in turn was significantly lower than that for
the unrestricted treatments (UR and RD). After 67 days of treatment, plants
in CR treatments has significantly lower scores than all other treatments,
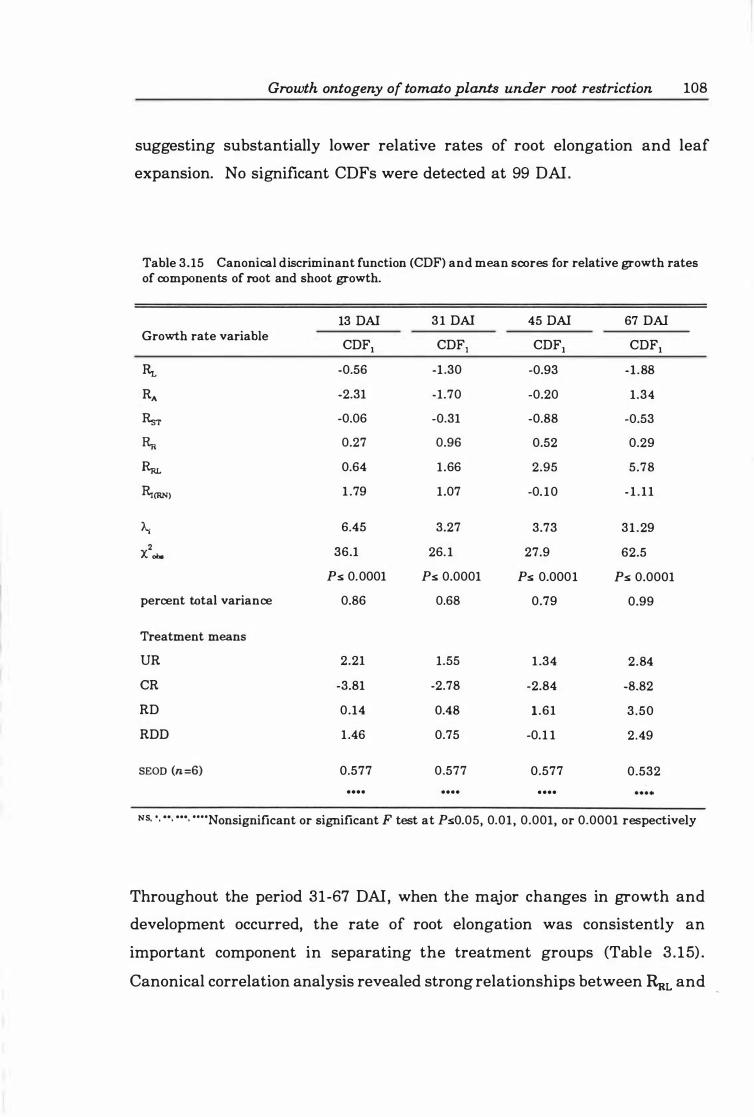
Growth ontogeny of tomato plants under root restriction 108
suggesting substantially lower relative rates of root elongation and leaf
expansion. No significant CDFs were detected at 99 DAI.
Table 3.15 Canonical discriminant function (CDF) and mean scores for relative growth rates of components of root and shoot growth.
13 DAl 31 DAl 45 DAl 67 DAI Growth rate variable
CDF1 CDF1 CDF1 CDF1
R,. -0.56 -1 .30 -0.93 -1 .88
RA -2.31 -1.70 -0.20 1.34
Rsr -0.06 -0.31 -0.88 -0.53
� 0.27 0.96 0.52 0.29
Rru. 0.64 1.66 2.95 5.78
�(RN) 1 .79 1.07 -0. 10 - 1 . 1 1
A; 6045 3.27 3.73 31 .29
l. 36.1 26. 1 27.9 62.5
Ps 0.0001 Ps 0.0001 Ps 0.0001 Ps 0.0001
percent total variance 0.86 0.68 0.79 0.99
Treatment means
UR 2.21 1.55 1 .34 2.84
CR -3.81 -2.78 -2.84 -8.82
RD 0.14 0.48 1 .61 3 .50
RDD 1 046 0.75 -0.1 1 2.49
SEOD (71.=6) 0.577 0.577 0.577 0.532 . . . . . . . . . . . .
N S • •• ••• •••• ····Nonsignificant or significant F test at PsO.05, 0.01, 0.001, or 0.0001 respectively
Throughout the period 31-67 DAI, when the major changes in growth and
development occurred, the rate of root elongation was consistently an
important component in separating the treatment groups (Table 3 .15) .
Canonical correlation analysis revealed strong relationships between �L and
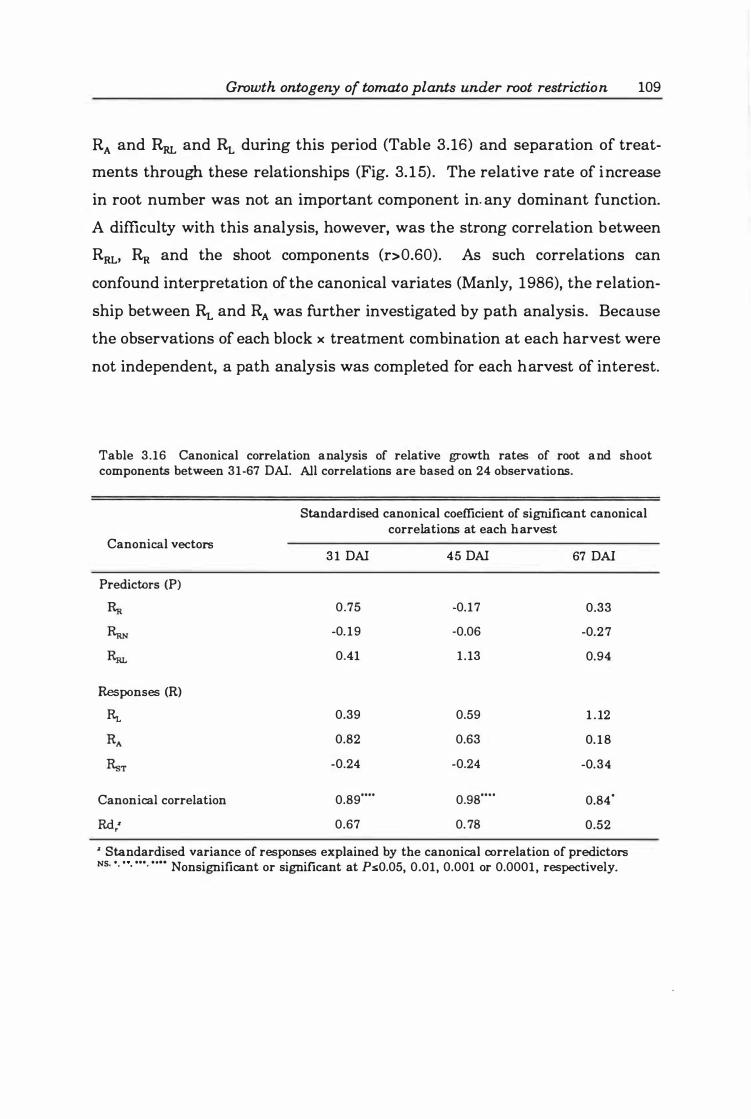
Growth ontogeny of tomato plants under root restriction 109
RA and Rru. and Rr. during this period (Table 3.16) and separation of treat
ments through these relationships (Fig. 3. 15) . The relative rate of increase
in root number was not an important component in. any dominant function.
A difficulty with this analysis, however, was the strong correlation between
RRL, � and the shoot components (r>O.60). As such correlations can
confound interpretation of the canonical variates (Manly, 1986), the relation
ship between Rr. and RA was further investigated by path analysis. Because
the observations of each block x treatment combination at each harvest were
not independent, a path analysis was completed for each harvest of interest.
Table 3.16 Canonical correlation analysis of relative growth rates of root and shoot components between 31-67 DAI. All correlations are based on 24 observations.
Canonical vectors
Predictors (P)
Responses (R)
�
Canonical correlation
Rd ' r
Standardised canonical coefficient of significant canonical correlations at each harvest
31 DAI
0.75
-0. 19
0.41
0.39
0.82
-0.24
0.89 ....
0.67
45 DAI
-0.17
-0.06
1 .13
0.59
0.63
-0.24
0.98 ....
0. 78
67 DAI
0.33
-0.27
0.94
1 . 12
0. 18
-0.34
0.84'
0.52
, Standardised variance of responses explained by the canonical correlation of predictors NS. ' . " • •••• •••• Nonsignificant or significant at PsO.05, 0.01, 0.001 or 0.0001, respectively.
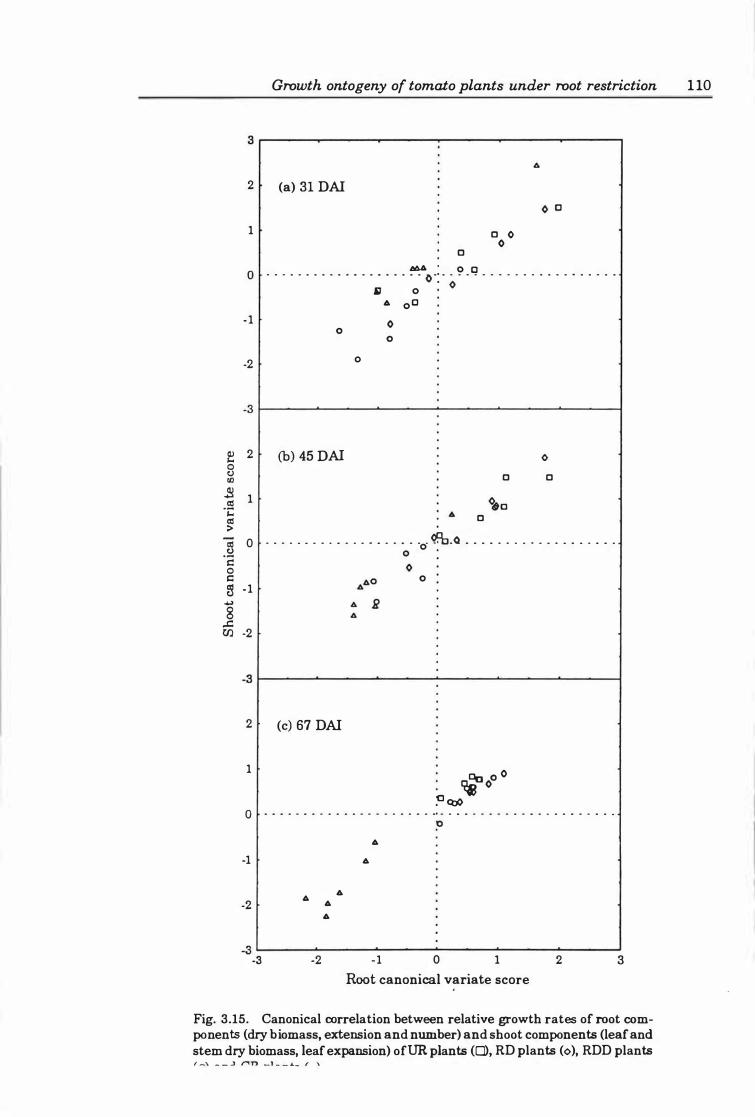
Growth ontogeny of tomato plants under root restriction 1 10
3 �----------------------------�------------�
2 (a) 31 DAI
1
o
o 0 o 1JA4 . 0 0 o . . . . . . . . . . . . . . . . . . . . �.: . <> . . . . . . . . . . . . . . . . . . . .
� 0
-1 o
-2 o
.6 0 0
o o
-3 r-----�------�------�------�----�------_4
� 2 o C) Ul
$ 1 a:! .;:: a:! >
(b) 45 DAI o o
o
= 0 . . . . - - .. .. .. .. .. .. .. .. .. .. .. .. .. .. .. �_a .. .. .. .. .. .. .. .. .. .. .. .. .. .. .. .. .. .. .. . � 0 0 : s:: o s:: 5 -1
.. 8 ..s::
U) -2
o
-3 r-----�------�------�------�----��----�
2
1
(c) 67 DAI
�oO O � CbO
o . . . . . . . . . . . . . . . . . . . . . .. . . . . . . . . . . . . . . . . . . . . . . 0
.6
-1 .6
-2 .6 .6
.6 .6
��----�------�------�------�------�----� -3 -2 -1 0 1 2 3
Root canonical variate score
Fig. 3.15. Canonical correlation between relative growth rates of root components (dry biomass, extension and number) and shoot components (leaf and stem dry biomass, leaf expansion) ofUR plants (0), RD plants (0), RDD plants t .... \ _ _ .1 �n _l _ _ L_ I ,
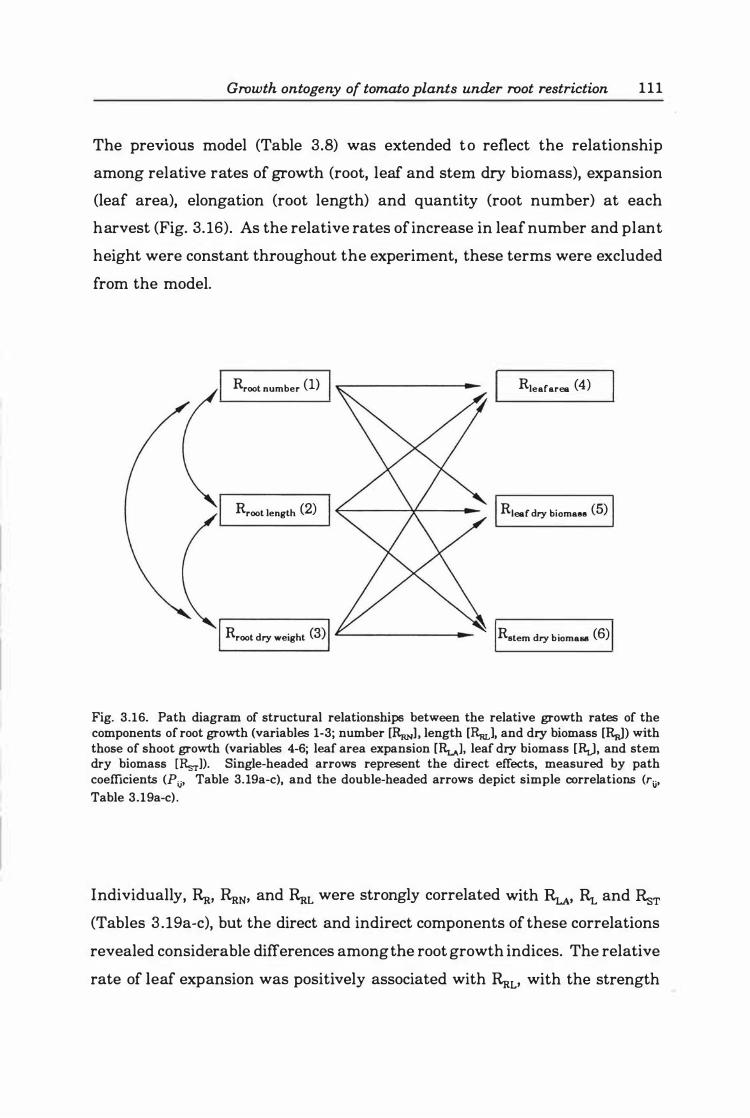
Growth ontogeny of tomato plants under root restriction 111
The preVIOUS model (Table 3.8) was extended to reflect the relationship
among relative rates of growth (root, leaf and stern dry biomass), expansion
(leaf area), elongation (root length) and quantity (root number) at each
harvest (Fig. 3. 16). As the relative rates of increase in leaf number and plant
height were constant throughout the experiment, these terms were excluded
from the model.
Rroot number ( 1) Rleafarea ( 4)
Rroot length (2) Rleafdry biomass (5)
I Rroot dry weight (3) I '--------- Rstem dry biomass (6)
Fig. 3.16. Path diagram of structural relationships between the relative growth rates of the components of root growth (variables 1-3; number [�], length [RmJ, and dry biomass [RaJ) with those of shoot growth (variables 4-6; leaf area expansion [Hou], leaf dry biomass [RJ, and stem dry biomass [Rs-r]). Single-headed arrows represent the direct effects, measured by path coefficients (Pij, Table 3.19a-c), and the double-headed arrows depict simple correlations (rij, Table 3.19a-c) .
Individually, �, RRN' and �L were strongly correlated with Ru, Rr. and HosT (Tables 3 . 19a-c), but the direct and indirect components of these correlations
revealed considerable differences among the root growth indices. The relative
rate of leaf expansion was positively associated with �L' with the strength
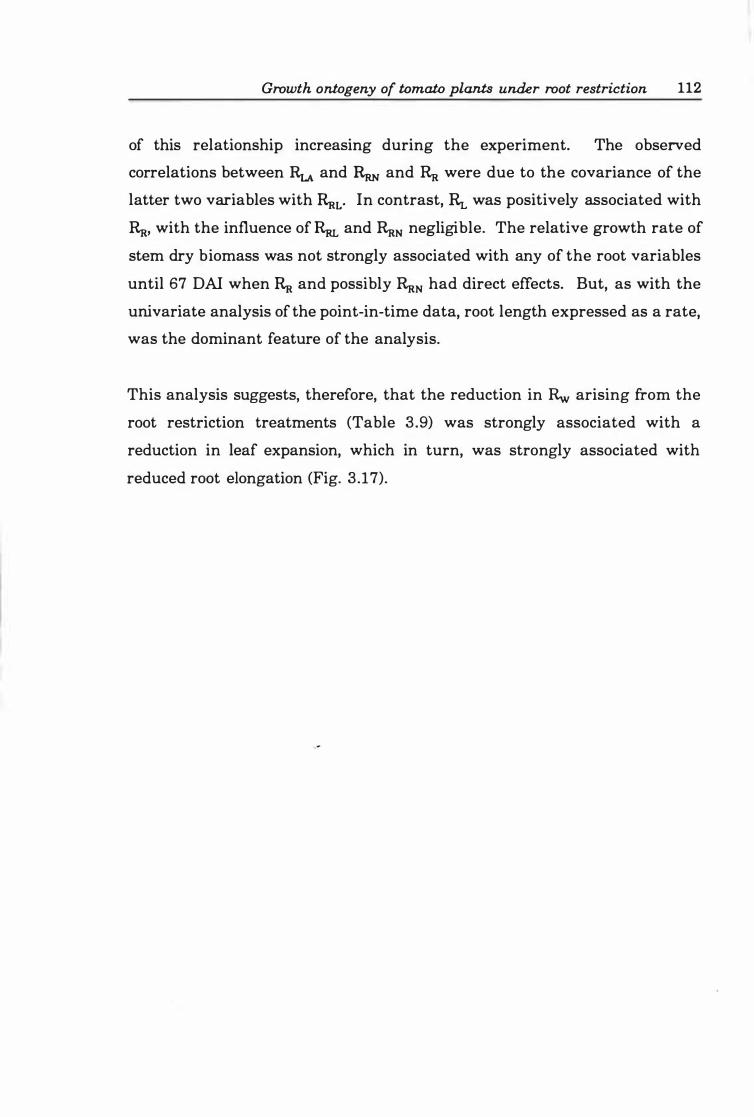
Growth ontogeny of tomato plants under root restriction 112
of this relationship increasing during the experiment. The observed
correlations between Ru and � and � were due to the covariance of the
latter two variables with �L" In contrast, � was positively associated with
�, with the influence of Rm. and �N negligible. The relative growth rate of
stem dry biomass was not strongly associated with any of the root variables
until 67 DAI when � and possibly �N had direct effects. But, as with the
univariate analysis of the point-in-time data, root length expressed as a rate,
was the dominant feature of the analysis.
This analysis suggests, therefore, that the reduction in Rw arising from the
root restriction treatments (Table 3.9) was strongly associated with a
reduction in leaf expansion, which in turn, was strongly associated with
reduced root elongation (Fig. 3 .17).
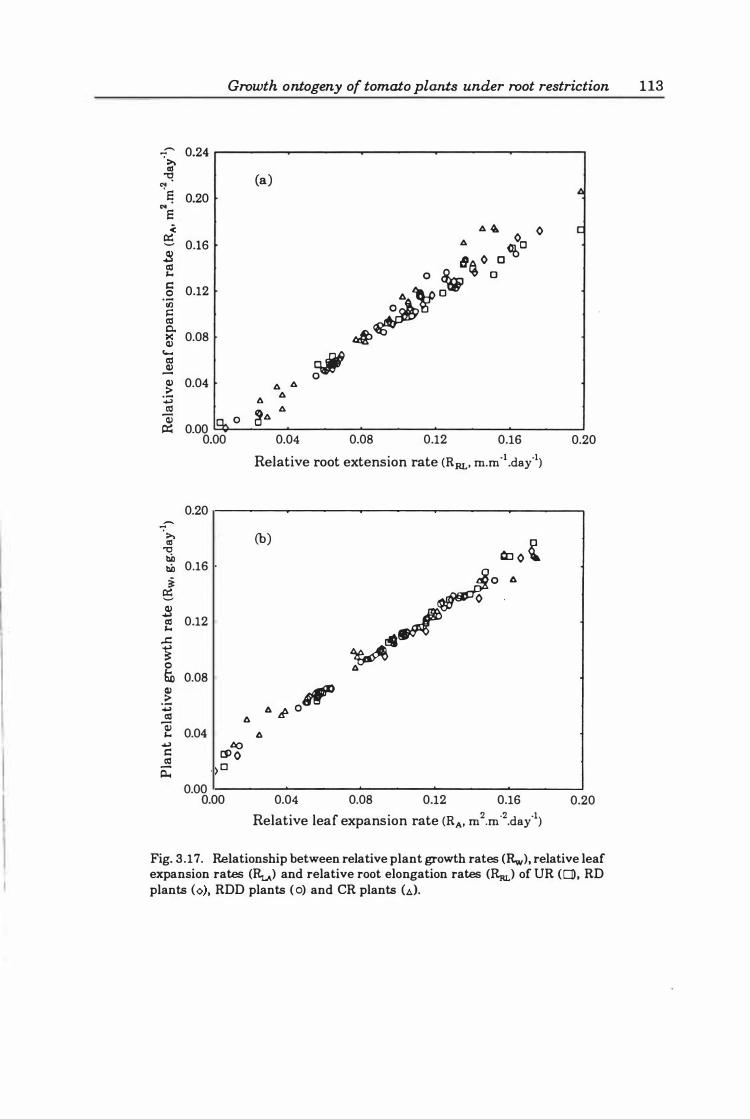
"7-->-as � � � ... S -< �
.s til � c: 0 ·w c: til 0.. >< cv ..... til � cv .� ..., til
Q) �
....... >-as
"tl tID tID � �
cv ..., til � ..c: � 0 6'0 cv .� ..., til
Q) � ..., c:
� �
Growth ontogeny of tomato plants under root restriction 1 13
0.24
0.20
0.16
0.12
0.08
0.04
0.00 CJ,.. 0 0.00
0.20
0.16
0.12
0.08
6. 0.04
I:JO CP o ) 0 0.00
0.00
(a)
6. � 0 6. 00 8 0 C CO
o � � 0 �'VD
d> rgI 6. 6.
11 6. 86. 6.
0.04 0.08 0.12 0.16
Relative root extension rate (RRL' m.m·l.day·l)
(b)
I1 � O , 11
0.04
O:l o t �o . o .
�� �
0.08 0.12 0.16
Relative leaf expansion rate (RA• m2.m"2.day"l)
/j
C
0.20
0.20
Fig. 3.17. Relationship between relative plant growth rates (Rw), relative leaf expansion rates (Ru) and relative root elongation rates (Rm) of UR (CD, RD plants (<» , RDD plants ( 0) and CR plants (11).
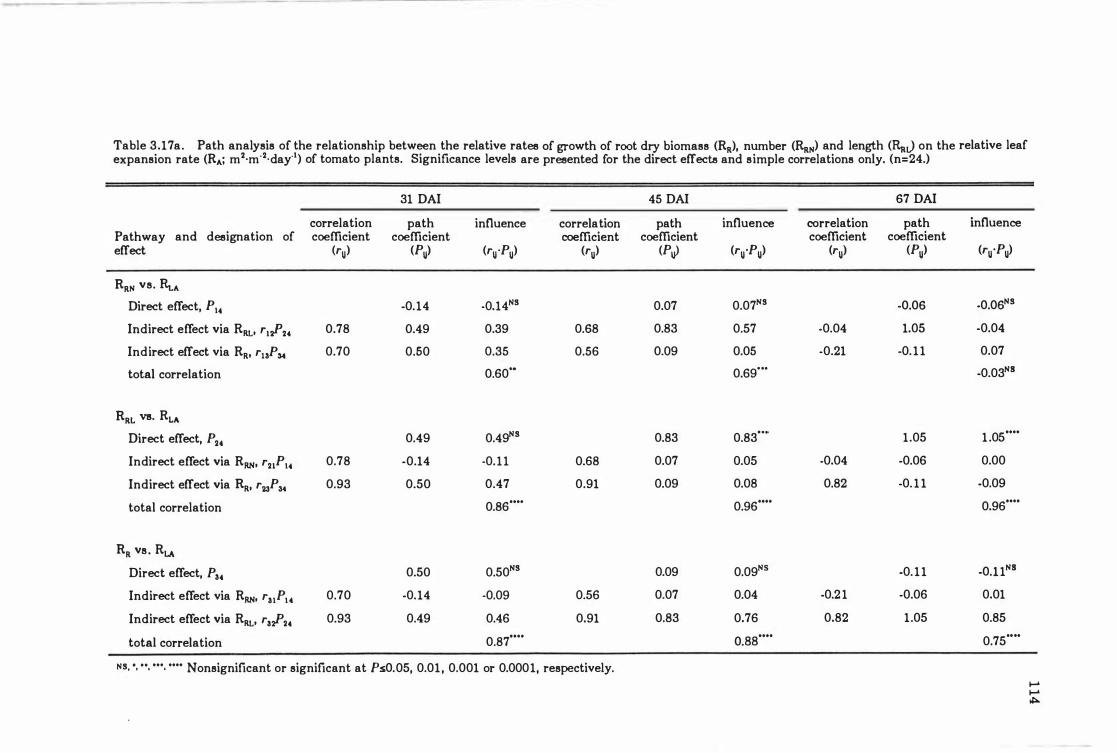
Table 3.17a. Path analysis of the relationship between the relative rates of growth of root dry biomass (RR)' number (RRN) and length (�J on the relative leaf expansion rate (RA; m2·m·2·day·l) of tomato plants. Significance levels are presented for the direct effects and simple correlations only. (n=24.)
31 DAI 45 DAI S7 DAI
correlation path influence correIa tion path influence correlation path influence Pathway and designation of coefficient coefficient coefficient coefficient coefficient coefficient effect (ru) (Pu) (ru 'Pu) (ru) (P� (ru'Pu) (ru) (Pu) (ru'Pu)
RRN vs. Rt.A
Direct effect, P14 -0.14 _0.14NS 0.07 0.07NS -O.OS _O.OSNS
Indirect effect via RRL' rl�24 0.78 0.49 0.39 0.S8 0.83 0.57 -0.04 1.05 -0.04
Indirect effect via RR' rl3PM 0.70 0.60 0.35 0.56 0.09 0.05 -0.21 -0. 1 1 0.07
total correlation 0.60" 0.69'" _0.03NB
RRL VS. RLA
Direct effect, P24 0.49 0.49NS 0.83 0.83'" 1 .05 1 .05 ....
Indirect effect via RRN' r21P14 0.78 -0.14 -0. 11 0.68 0.07 0.05 -0.04 -0.06 0.00
Indirect effect via RR' r23P M 0.93 0.50 0.47 0.91 0.09 0.08 0.82 -0. 1 1 -0.09
total correlation 0.86 .... 0.96 .... 0.96 ....
RR vs . RLA
Direct effect, P34 0.50 0.50NS 0.09 0.09NS -0. 1 1 _O.l1NB
Indirect effect via RRN' r31PI4 0.70 -0.14 -0.09 0.56 0.07 0.04 -0.2 1 -0.06 0.01
Indirect effect via RRL' r3�24 0.93 0.49 0.46 0.91 0.83 0.76 0.82 1 .05 0.85
total correlation 0.87 .... O.SS .... 0.75 ....
NS. · . ... .... .... Nonsignificant or significant at PsO.05, 0.01 , 0.001 or 0.0001, respectively. � � �
Table 3 .17b Path analysis of the relationship between the relative rates of growth of root dry biomass (RR)' number (RRN) and length (RaJ on the relative growth rate of leaf dry biomass (RL; g.g.l ·day·l) of tomato plants. Significance levels are presented for the direct effects and simple correlations only. (n=24.)
31 DAI 45 DAI 67 DAI
correlation path influence correlation path influence correIa tion path influence Pathway and designation of coefficient coefficient coefficient coefficient coefficient coefficient effect (ru) (Pu) (ru 'Pu) (ru) (PU> (ru'Pij) (ru) (Pu) (ru 'Pu)
RRN VB. �
Direct effect, PI5 -0.10 _0.10NS 0.14 0.14NS 0.03 0.03NS
Indirect effect via RRL' rl.J>25 0.78 0.23 0.18 0.68 0. 19 0.13 -0.04 0.83 -0.03
Indirect effect via RR' rl3PU 0.70 0.72 0.50 0.66 0.66 0.37 -0.2 1 0.16 -0.03
total correlation 0.59" 0.64'" _0.03NS
RRL VB. RL Direct effect, P25 0.23 0.23NS 0.19 0.19NS 0.83 0.83 .
. ••
Indirect effect via RRN' r21P15 0.78 -0.10 -0.08 0.68 0.14 0. 10 -0.04 0.03 -0.00
Indirect effect via RR' r23PU 0.93 0.72 0.67 0.91 0.66 0.60 0.80 0.16 0.13
total correlation 0.82 .... 0.88· .. • 0.95 ....
RR vs. RL Direct effect, P35 0.72 0.72' 0.66 0.66" 0.16 0.16
Indirect effect via RRN' r3\P15 0.70 -0.10 -0.07 0.56 0. 14 0.08 -0.12 0.03 -0.01
Indirect effect via RRL' ra.J>25 0.93 0.23 0.22 0.91 0. 19 0. 17 0.80 0.83 0.67
total correlation 0.86 .... 0.91
.... 0.82 ....
NS. ·. " . .... .... Nonsignificant or significant at PsO.05, 0.01 , 0.001 or 0.0001, respectively. � � en
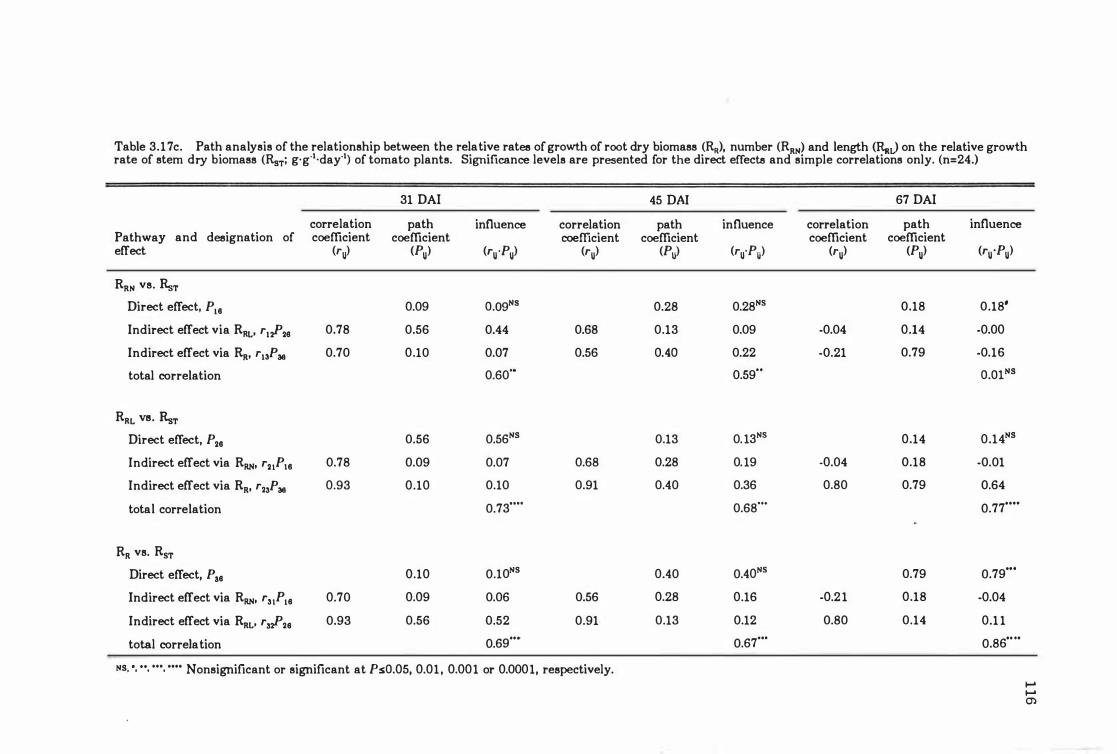
Table 3.17c. Path analysis of the relationship between the relative rates of growth of root dry biomass (RR)' number (RRN) and length (RaJ on the relative growth rate of stem dry biomass (RsT; g.g.l·day·l) of tomato plants. Significance levels are presented for the direct effects and simple correlations only. (n=24.)
Pathway and designation of effect
RRN vs. RsT
Direct effect, PI6 Indirect effect via RRL' rl�26 Indirect effect via RR' ruPae
total correlation
RRL VB. HosT
Direct effect, P26 Indirect effect via RRN' r21PI8
Indirect effect via RR' r23Pae
total correlation
RR vs. RST
Direct effect, Pa6 Indirect effect via RRN' r31PI6 Indirect effect via RRL' r3�26 total correia tion
correlation coefficient
(ru)
0.78
0.70
0.78
0.93
0.70
0.93
31 DAl
path influence correlation coefficient coefficient
(Pu) (ru 'Pu) (ru)
0.09 O.ogNs
0.56 0044 0.68
0.10 0.07 0.56
0.60"
0.56 0.56NS
0.09 0.07 0.68
0.10 0.10 0.91
0.73 ....
0.10 0.10NS
0.09 0.06 0.56
0.56 0.52 0.91
0.69'"
NS. · . ... .... .... Nonsignificant or significant at PsO.05, 0.01 , 0.001 or 0.0001, respectively.
45 DAI 67 DAl
path influence correlation path influence coefficient coefficient coefficient
(Pij) (ru'Po) (ru) (Pu) (ru 'Pu)
0.28 0.28NS 0.18 0.18'
0.13 0.09 -0.04 0.14 -0.00
DAD 0.22 -0.21 0.79 -0.16
0.59" O.OlNS
0.13 0. 13NS 0.14 0.14NS
0.28 0. 19 -0.04 0.18 -0.01
0.40 0.36 0.80 0.79 0.64
0.68'" 0.77 ....
0040 0.40NS 0.79 0.79'"
0.28 0.16 -0.2 1 0.18 -0.04
0.13 0.12 0.80 0.14 0.1 1
0.67'" 0.86 .. ..
...... ...... 0)
Growth ontogeny of tomato plants under root restriction 1 1 7
3.4 Discussion
The data obtained in the present study provide additional information on the
time course of the response of shoot growth to root restriction, new
information on the response of root growth to physical restriction and provide
support for a suggested mechanism through which physically inhibited root
systems influence shoot growth.
General growth characteristics Tomato plants with physically restricted root
systems had lower total plant biomass and total leaf area, were shorter "in
height and total root length, and had fewer roots, leaves, and lateral shoots
than unrestricted plants. The extent of depression parallelled the duration
and extent of restriction (i.e. CR > RDD > RD). Importantly, relatively short
periods of root restriction were sufficient to have long term effects on leaf
growth. The foliage of plants whose roots were restricted for 31 days before
being released (RD) was as small and light 36 days later (67 DAI) as those
plants whose roots were continually restricted (CR, RDD). By 99 DAI, RD
plants were still shorter with fewer and smaller leaves than UR plants,
although their leaf dry biomass was similar.
Components of root growth responded differently to root restriction
treatments. Reduced root number was the first detected response . to root
restriction (Table 3.5). By 31 DAI, restricted (CR, RDD, RD) plants had
produced fewer roots than unrestricted (UR) plants. Corresponding decreases
in root dry weight and length were not detected until 45 DAI (Table 3.5,
Table 3.6). The reverse response occurred upon de-restriction, with recovery
in root length in RD plants after 67 DAI occurring before recovery in root
number. Such recovery is consistent with Grime's (1979) description of
tomato as adopting a competitive-ruderal strategy to environmental stress.
According to Grime (1979), competitive-ruderals respond to stress with rapid
morphogenetic responses to maximise vegetative growth (e.g. changes in SR,
Growth ontogeny of tomato plants under root restriction 1 18
leaf area, root surface area), or if capable of flowering, will rapidly redirect
resources from vegetative growth to flowering.
The recovery in root elongation occurred without a concurrent increase in
laterals, with the root systems of plants de-restricted 31 DAI considerably
less branched than those of the unrestricted (UR) plants. Continuously
restricted roots had a similar branching density to those of unrestricted (UR)
plants throughout the experiment. By 67 DAI, however, restricted plants (CR
and RDD) had more roots per unit length than unrestricted (UR and RD)
plants. This is probably a consequence of the pattern of acropetal lateral root
initiation in tomatoes being stable and independent of the rate of root elong
ation (Barlow and Adam, 1988). It is also possible that roots of unrestricted
plants produced fewer sublaterals than those of restricted plants. As such
sublaterals would be thinner than the 'parent' lateral, the net result to the
root system would be denser root tissue (low SRL), as Table 3.6 reports.
The reported SRL values (Fig. 3.4) were similar to the 300-400 m ·gR·l range
reported in other studies with cv. 'Moneymaker' (de Willigen and van
Noordwijk, 1987). Although it is difficult to uncouple the effect of ontogenetic
drift from treatment responses, roots of continually restricted (CR) plants
tended to have thicker roots (lower SRL) than unrestricted plants. With the
increase in root branching density towards the end of the experiment (67
DAD, this suggests that restriction promoted development of thick, highly
branched sublateral systems. Derestriction at 31 DAI (RD and RDD plants)
and at 67 DAI (RDD plants) resulted in a major decrease in SRL. This
probably reflects the reduced number of laterals produced (Fig. 3.4), rather
than an increase in the density or thickness of roots. The large increase in
SRL of RDD plants between 45 and 67 DAI reflected the development of
thinner roots as the root branching density of these plants was low during
this period (Fig. 3 .4).
Growth ontogeny of tomato plants under root restriction 119
As to overall response, however, these variations in root biomass and number
among treatments were considerably smaller than the variation in length.
Although root biomass and number varied in relation to each other and to the
restriction treatments, root length was consistently the major component of
linear combinations of variables discriminating among the treatments (Table
3.6) . It is possible that the apparent importance of root length reflects its
close relationship to root surface area, and hence could be explained in terms
of water absorptivity. This is unlikely as the water absorption capacity of
tomato roots changes with transpirational demand and is independent of root
length (Tan and Fulton, 1985; Tan et aI. , 1981). Moreover, Hameed et al .
(1987) noted that the ratio between root length and leaf area was substan
tially larger in tomato plants with a restricted root system than those with
unrestricted root systems, suggesting that restricted roots were more effective
in water uptake per unit length. Richards et al. (1979) also reported evidence
of changes in the absorptive activities of tomato root systems, in concert with
changes to shoot activity, in maintaining a functional equilibrium between
root and shoot that was independent of ontogenetic drift, root restriction, and
a change from vegetative to reproductive growth.
Root-shoot relationships All three root components were strongly correlated
with each other and with variables of shoot growth. Path analysis of these
associations, however, revealed that the strong correlations between the shoot
variables and both root length and dry weight could be explained by the
covariance between the latter two variables and root length (Tables 3.8a-b).
Thus, although a strong correlation was observed between root number and
leaf area, consistent with Richards' (1981) observation, the direct effect of root
number when assessed together with root length and dry weight was actually
negative. The major canonical discriminant functions extracted from 31 and
45 DAI also revealed a negative relationship between total root number and
leaf growth (Table 3.6). These results may reflect the greater increase in
length relative to root number for the first 45 days of the experiment (Fig.
Growth ontogeny of tomato plants under root restriction 120
3.4), during which time leaf area was increasing. It is also possible that as
root elongation and leaf expansion were impeded by restriction, the relative
number of roots, presumably lateral and sublaterals, increased. The simple
conclusion from the path analysis is that impeding root elongation was more
detrimental to both leaf expansion and overall shoot growth than any
decrease in root number.
The pattern and manner of distribution of assimilates within a plant has a
major role in determining horticultural yield and the relationships between
plant parts. Plots between the logarithms of shoot and root dry weights for
each treatment suggested that a linear relationship existed between these
components (data not presented). Critical evaluation of the relationship
between stem, leaf, and root dry weights, however, revealed that allometry
between shoot and root was not physically possible as the allometric
coefficients between stem, leaf, and root growth were greater than unity.
Thus, as the respective sizes of stem, leaf and root system did not increase at
a fIxed proportion to each other during the experimental period, then neither
did the root and shoot system increase in size proportionally with each other.
This suggests that a functional relationship between root and shoot based on
relative sink strength was not a factor in the response of the plants to root
restriction.
When roots were restricted, their mobilising ability was either decreased, or
that of the stems and leaves increased. This was most apparent with CR
plants, but appeared to also occur in the period prior to de-restriction of RD
plants, and the first de-restriction of RDD plants. Following de-restriction,
RL and RR were similar, suggesting that the relationship between leaf and
root growth was supply-limited. Relatively more assimilate was proportioned
to stem tissue than the roots over the same period (Table 3. 14). This result
is consistent with those from other studies on root restriction involving
tomatoes (AI-Sahaf, 1984; Hameed et al. , 1987; Peterson et aI. , 1991a) and
Growth ontogeny of tomato plants under root restriction 1 2 1
other crops (Carmi et al. , 1983; Richards and Rowe, 1977a). These results
contrast with those of Ruff et al. (1987) who reported that the relative
amount of assimilate in roots of root-restricted plants of tomato was
significantly greater than in leaves and stems. On the other hand, this result
and the lower SR reported by these workers could also be interpreted as
symptoms of water stress (Dale, 1988; Krizek et aI., 1985). Root restriction
may cause symptoms of water stress in plants even under conditions in which
water is available in the root zone in non-limiting amounts. Under conditions
of high transpiration for example, such a phenomenon may result from a
physiological change that leads to a decreased ability of water absorption
(Hameed et al., 1987) . Alternatively, the difference in results may reflect
cultivar differences. Krizek et al. ( 1985), for example, reported considerable
differences in relative assimilate partitioning to roots among various cultivars
of soybeans.
The magnitude and time trends of Rw, EA and LAR of unrestricted plants
(controls) were similar to those previously reported for tomato plants of
comparative age in growing conditions of similar temperature and light (Hurd
and Thornley, 1974; Paul et al . , 1984; Thornley and Hurd, 1974) and
hydroponic culture (Hameed et aI., 1987). In contrast, the Rw and EA values
reported here are considerably lower than those reported by Peterson and
Krizek (1992) and Nagel et al. (1994) for L. esculentum 'Moneymaker' grown
in hydroponic systems in greenhouses and controlled environment rooms.
Restricting roots reduced the relative growth rate of the plant by influencing
the assimilatory efficiency of the plant (EA) and the extent and morphology
of the leaves (LAR). Path analysis revealed that EA and LAR were similarly
important in influencing Rw (Table 3. 12). The net assimilation rate is largely
the balance between the rate of photosynthesis and that of respiration (of
both photosynthetic and non-photosynthetic tissue) in the whole plant
(Konings, 1990). Between 12-30% of assimilate produced daily is consumed
Growth ontogeny of tomato plants under root restriction 122
by root respiration (Lambers, 1985, 1987; Lambers et al. , 1 990; Veen, 1 981).
As respiration of restricted tomato roots can decline to less than 50% of
unrestricted controls (mm3 02 ·g-1
root dry weight; Peterson et al. , 1991b), a
rise in EA might therefore be expected in plants with restricted roots. As a
slight decrease was detected in restricted (CR and RDD) plants (Table 3.9,
Fig. 3.8), root restriction must have resulted in a decline in the rate of
photosynthesis (assuming similar rates of shoot respiration among treatment
groups). Reduced assimilate supply changes partitioning of assimilate so that
root growth is inhibited to a greater extent than shoot growth (Brouwer,
1962; Mooney, 1972; Nagarajah and Schulze, 1983). The partitioning
patterns were consistent with this response (Tables 3. 10, 3. 14), suggesting
that photosynthesis may have been inhibited in root restricted plants.
In view of reports of increased starch concentrations in leaf tissue of root
restricted plants of cotton (Gossypium hirsutum L.), cucumber (Cucumis
sativus) and tobacco (Nicotiana tanacum) (Herold and McNeil, 1979; Robbins
and Pharr, 1988; Thomas and Strain, 1991), it is possible that accumulated
starch grains were responsible for the increase in leaf density (Table 3.13).
The decrease in SLA between restricted and unrestricted plants is certainly
c,onsistent with previous reports of buildup of assimilates in leaves of
restricted tomato plants (AI-Sahaf, 1984) and other crops (Carmi et al., 1 983;
Cresswell and Causton, 1988; Herold and McNeil, 1979; Robbins and Pharr,
1988; Thomas and Strain, 1991).
Starch accumulation is also consistent, albeit indirectly, with the slight
reduction in EA in root restricted (CR, RDD) plants (Fig. 3.8). Herold and
McNeil (1979), Robbins and Pharr (1988) and Thomas and Strain (1991) all
reported an inverse relationship between photosynthetic rate and level of
accumulated starch in leaves. In tomato, decreases in SLA are associated
with reduction in leaf photosynthetic rate as a result of negative feedback
control resulting from low sink demand (Starck, 1983). Such 'sink regulation'
Growth ontogeny of tomato plants under root restriction 123
(Gifford and Evans, 1981; Goldschmidt and Huber, 1992; Herold, 1 980; Neales
and Incoll, 1968) has been described in tomato plants by Heuvelink and
Buiskool (1995) under 'extreme' conditions of a single fruit per truss. In the
current study, plants had no fruit and restricted root systems, conditions that
could also be described as extreme. If translocation rates of assimilates to
'usual' sinks are reduced, as would occur if root metabolism (and hence root
sink strength) was reduced by root restriction, and partitioning to alternative
sinks (e.g. stem tissue: Table 3 . 11 ; Al-Sahaf, 1984; Friis-Nielsen, 1973a;
Hameed et al . , 1987; Hammond et al . , 1984; Hewitt et al . , 1982), sink-limited
feedback inhibition of photosynthesis would result in lower rates of EA.
Root restriction affected total leaf biomass and leaf area differently. Of the
components defining LAR, SLA was dominant (Table 3. 12). Similar propor
tions of total assimilate were apportioned to leaf biomass (LWR) no matter
the level of restriction (Fig. 3. 1 1 ). On the other hand, the ratio of leaf area
to total plant weight (LAR) decreased with restriction (Fig. 3. 10) . Leaves
were smaller in area, but weighed more per unit area (i.e. SLA declined; Fig.
3 .1 1). Taken together, these indices suggest that leaf area expansion was
more sensitive to root restriction than accumulation of biomass. These
results show that the faster decline in Rw of CR plants compared with the
other treatments was due more to the effect of continued restriction on leaf
development in space (i .e. leaf expansion, reflected through SLA) than the
amount of assimilate invested in leaf tissue (reflected by LWR). The strong
association between the leaf expansion and whole plant growth, revealed
through their respective relative growth rates (Fig. 3 .17), is consistent with
observations made with many species grown under a range of environments
(Delaney and Dobrenz, 1974; EI-Sharkawy et al. , 1 965; Hanson, 1971;
Patterson et al. , 1978; Potter and Jones, 1977; Watson, 1947a, 1947b). Potter
and Jones (1977), for example, reported that for nine species they studied,
growth responses due to temperature shifts were more sensitive to changes
in relative leaf expansion rates than to net assimilation rates.
Growth ontogeny of tomato plants under root restriction 124
Adventitious root formation and petiole epinasty Appearance of both adven
titious root primordia and petiole epinasty are common responses to
waterlogging in tomatoes (e.g. Bradford and Dilley, 1978; Jackson and
Campbell, 1976; Railton and Reid, 1973). The epinastic movement, due to
more rapid expansion of cells on the adaxial side of the petiole compared to
cells on the abaxial side (Bradford and Yang, 1981), is triggered by ethylene.
Under waterlogged conditions, anaerobiosis of the root system stimulates 1-
aminocyclopropane-1-carboxylate (ACC) synthase production in roots and
shoots (Bradford and Yang, 1980). As conversion of ACC to ethylene in
tomato roots is inhibited by low levels of O2, ACC is apparently transported
to the leaves where it is converted to ethylene (Wang and Arteca, 1992).
It is unlikely, however, that waterlogging initiated the epinastic response and
development of adventitious roots (Table 3.4) given the attention placed on
aerating the hydroponic solution (2.2.2.3). Two lines of evidence from the
literature suggest the responses were due to the involvement of ethylene
mediated by the physical stress encountered by the restricted roots. First,
the rate of production of ethylene and its precursor 1 -aminocyclopropane-1 -
carboxylic acid (ACC) i s positively correlated with the extent of root
impedance. Kays et al. ( 1974) reported a sixfold increase in ethylene prod
uction by physically restricting roots of bean (Vicia (aha L.). Rates of
ethylene production increased proportionately with reduced axial growth of
roots and shoots growing under different pressures, returning to normal rates
after the impedance was removed (Sarquis et al. , 1991) . Whalen (1988)
recorded a significant increase in ACe biosynthesis within 5 hours of
physically impeding primary roots of maize (Zea mays). S arquis et al. (1992)
similarly reported significant accumulation of ACC within 1 hour of applying
physical impedance to maize roots, although considerable conjugation also
occurred, presumably reducing release of stress-induced ethylene. Second,
application of exogenous ethylene reproduces the physiological responses to
impedance (Dawkins et al. , 1983; Whalen and Feldman, 1990) and inhibitors
Growth ontogeny of tomato plants under root restriction 125
of either ethylene production or action counteract them (Clarke and Moore,
1 986; Sarquis et al., 1991; Zacarias and Reid, 1992). Third, ethylene retards
extension of stems in tomatoes (Woodrow et al. , 1988), suggesting that the
reduced height and epinasty observed in CR plants may have had a common
mediator. Finally, both the epinastic response and the appearance of
adventitious roots may have resulted from an auxin-ethylene interaction.
Zimmerman and Wilcoxon (1935) reported that 'gaseous emanations' following
application of the endogenous auxin indoleacetic acid (lAA) to tomato shoots
caused epinasty in adjacent marigolds (Tagetes spp.). They speculated
(subsequently verified by Morgan and Hall, 1964) that ethylene had been
released. Wample and Reid (1979) suggested that ethylene, produced in
response to flooding, stimulated adventitious roots by causing auxin to
accumulate in the shoot (Le. ethylene-inhibited auxin transport). This is
supported by Jusaitis's (1986) observation of stimulated production of
adventitious roots in the presence of ACC and auxin.
Many of the observed plant responses were very similar to those reported in
studies involving plant growth in high resistance soils. The rate of root
elongation declines as the level of resistance increases (Barley, 1962; Goss,
1977; Goss and Russell, 1 980). The rate of leaf expansion quickly declines
(Ludlow et al., 1989; Masle, 1990), independently of leaf water potential,
osmotic potential and turgor (Andrade et aI., 1993), through reduced leaf
n';1mber and average leaf area (Masle and Passioura, 1987). In the current
study, as roots of CR plants became increasingly restricted, their rate of
elongation and the ratio between dry root biomass weight per length of root
declined, while the ratio between the number of roots and root length
increased. The decline in RA occurred early in the experiment ( .. 31 DAD
before morphological differences were detected in root growth. Restricted
roots tended to be thicker and more branched than unrestricted roots (Fig.
3.4), a result consistent with those of other workers who have observed fewer
total roots with increased radial growth and enhanced development of lateral
Growth ontogeny of tomato plants under root restriction 126
branches in physically impeded root systems (Barley, 1962; Goss, 1977; Goss
and Russell, 1980; Lachno et al., 1 982; Masle, 1992; Veen, 1 982; Wilson et al. ,
1977).
There are, however, inconsistencies in response. High resistance soils affect
shoot dry biomass more than root biomass, leading to a decrease in SR
(Masle, 1 992; Masle and Passioura, 1987). By contrast, the S R increased in
the current study as root dry biomass was affected more than shoot dry
weight as restriction increased. As the partitioning coefficient between leaf
and stem shows (Table 3. 14), restriction affected leaf dry biomass more than
stem dry biomass. As Masle's studies (1990; 1 992) were conducted with
young wheat seedlings that lack appreciable stem tissue, the preferential
partitioning to the root may have been a storage mechanism and not a
reflection of root activity. On the other hand, there is no reason to assume
that partitioning patterns in a monocotyledonous annual should be similar to
those in a dicotyledonous herbaceous perennial (Schulze, 1983). Rates of
photosynthesis were higher in plants in high resistance soils (Masle et al. ,
1990; Masle and Farquhar, 1988). Carmi et al. (1983) also reported enhanced
rates of photosynthesis in leaves of root restricted beans although in other
container-based studies, the photosynthetic rates of restricted plants have
been either reduced (Robbins and Pharr, 1988; Thomas and Strain, 1991) or
unaffected (Krizek et al., 1 985). Masle's (1990; 1 992) results imply a weak
association between RA and Rr. as the reduction in RA due to high resistance
soils could be transitory whereas Rr. of plants in high resistance soils was
consistently lower than control plants. In contrast, the relationship of RA and
Rr. in the current study was strong and consistent in time.
Mechanisms Multivariate analysis of the relationships among the relative
growth rates of the components of root and shoot growth (Tables 3 .15-3.17a-c)
confirmed a close association between root elongation and leaf area expansion
that was foreshadowed in the univariate analysis (Tables 3.5a-c, Fig. 3.3, 3.5).
Growth ontogeny of tomato plants under root restriction 127
In addition, the analysis showed that the strong relationships among root
number and root dry weight and shoot growth variables were due to their
covariance with root elongation. It seems logical, at least in a teleological
sense, that a functional balance should exist in plants between the
transpiration area of canopy (largely leaf area) and the absorptive area of the
root system (approximated in this study by root length). It would similarly
follow that the dynamic nature of such a balance would be reflected in the
comparative rates of increase of these components.
The functional equilibrium model empirically interprets relationships between
root and shoot growth from the view that their outputs (size x activity) are
in precise balance (Brouwer, 1963; Davidson, 1969a). The plasticity of root
function and its independence of root size predicted by this model has been
demonstrated in root restricted (Al-Sahaf, 1984; Richards, 1981) and water
stressed (Tan et aI. , 1981) tomato plants. Tan et al. ( 1981) have shown that
water uptake per unit length can be at least doubled to maintain the root's
functional balance with the shoot. Richards (1981) demonstrated that uptake
of N was proportional to the growth increment, and independent of root size.
AI-Sahaf ( 1984) reported that the efficiency of K., Ca and Mg uptake was
greater in plants with restricted root systems compared to those with
unrestricted root systems. As root length is a major determinant of water
and nutrient acquisition (Molz, 1981; Nye and Tinker, 1 977), it seems logical
to infer a similar interpretation on the relationship between �L and RA
demonstrated in this experiment. Thus, whatever the level of root restriction
being encountered, the plants maintained a functional equilibrium between
uptake potential (root length) and transpiration surface (leaf area). As the
gain in size (length) of the root system in restricted containers declined, the
activity of the root (e.g. water uptake) would increase to maintain the
equilibrium. The higher ratio of leaf area:root length of CR plants suggests
that water uptake per unit length of root must have been higher in these
roots than those of less or unrestricted plants. Such plasticity, however, is
Growth ontogeny of tomato plants under root restriction 128
a response mechanism to short term periods of stress, and thus either leaf
size (expansion) or activity (photosynthesis) or both would be expected to
decline. Such a decline in leaf expansion with declining root elongation
(increasing root restriction) was clearly observed, and albeit indirectly
through EM there is some evidence that photosynthesis rates also declined.
As leaf area is a function of cell expansion (Dale and Milthorpe, 1 983), an
expected outcome of this model would be an increase in leaf density
associated with decreased cell size (Casal et aI . , 1 987; Myers et aI., 1987).
Such an increase would be accentuated if the restricted roots were unable to
maintain an adequate supply of water to the leaves, thereby inducing leaf
water stress (Hsaio, 1973; Rascio et al. 1 990). An important observation,
therefore, is that root restriction increased the density component of SLA
(Table 3. 13). Furthermore, if water stress was a feature of the response, then
the observed reduction in leaf number would also be expected. Krizek et al .
( 1985), for example, reported a large reduction in the emergence rate of new
leaves of soybean plants and their rate of growth when subjected to water
stress in the exponential phase of development.
Several lines of argument suggest, however, that the relationship between
root elongation and leaf expansion was not functionally based on water
uptake. Although data on leaf turgor would be more definitive, differences
in leaf water potential during the period of most rapid growth change
between treatments were not detected (Table 3.3). In addition, other indirect
pieces of evidence taken together suggest that water stress was not a major
factor in this experiment. Average leaf area was similar in all treatments,
yet a reduction in this parameter would be expected under conditions of water
stress as the effect of stress progressively reduces expansion of leaves
unfolding at higher stem positions (Clough and Milthorpe, 1975). Increased
partitioning of assimilate to the root system and a large decrease in the ratio
between leaf area and root length are commonly encountered responses to
water stress (Brouwer, 1983; Hsaio, 1973; Krizek et al. , 1985). In the current
Growth ontogeny of tomato plants under root restriction 129
experiment, however, plants with restricted root systems increasingly
partitioned assimilate to stem biomass at the expense of root biomass (Table
3.14), and the leaf area:root length ratio of restricted plants was consistently
higher than those with unrestricted root systems (Fig. 3.4c). Given the
indirect measurement of leaf density used in this study (i.e. gdw ·grw) , it is also
possible that the observed increase was due to a buildup of 'unused'
assimilate in the leaves due to reduced sink demand elsewhere in the plant
(Heuvelink and Buiskool, 1995; Rufty and Huber, 1983). Increases in starch
concentration in leaves of root restricted plants have been previously observed
(Herold and McNeil, 1979; Robbins and Pharr, 1988). Finally, with average
leaf area similar, and total leaf area quite different among treatments (Tables
3.5a-c), the reduction in total leaf area appears to have been effected through
fewer or slower initiation of leaves.
Cell initiation and division are both hormonally-directed activities, and as
Richards and Rowe (1977a) speculated, better related to the synthesis of
hormones from root apices than water uptake along the length of a root
system. As synthesis of hormones is a normal function or activity of the root
system (Itai and Birnbaum, 1991), a functional equilibrium might exist
between the root-based synthesis of hormones and the shoot-based response
to their effect. The growth responses, particularly the relationship between
leaf expansion and root elongation, reported in the current study are consis
tent with such an equilibrium. Under such a model, export of hormones to
the shoot is reduced or impeded as the root tip (the site of hormone
production) is either damaged or alters activity as physical impedance to root
elongation increases. Consequently, the function of the target organs in the
shoot would similarly decline or be impeded. Partitioning to the root system
would also be expected to decline as the mobilizing ability (Daie, 1985; Gifford
and Evans, 1981) of the root system is weakened due to its reduced activity.
Growth ontogeny of tomato plants under root restriction 130
Expansion of this model is premature and is reserved to a more speculative
chapter (7.0). Comment is confined here to features of the observed responses
consistent with an hormonally-mediated system. As· root apices are sites of
hormone synthesis, such a model would predict that an association exists
between root number and shoot growth or function. The immediate and
critical issue to address is the apparent lack of association between root
number and leaf growth. While the ontogeny of root number, length and dry
weight all mirrored that of leaf area (Fig. 3.3, 3.5), in all the multivariate
analyses when its association with leaf area was assessed jointly with root
length and root dry biomass (Tables 3.8a-b, 3. 15-3. 17), root number was a
minor contributor to the multivariate function being described. The contri
bution of root number relative to length decreased between harvests as the
effects of the treatments on root and shoot growth likewise increased. The
strong association between �L and RA (Tables 3 .16 , 3. 17; Fig. 3 . 17) was
particularly interesting as it presents a stable and biologically meaningful
relationship that incorporates, through the calculation of the respective
relative growth rates, the ontogeny of the plant.
The expectation that, as the biosynthetic source of the putative hormone
signal for the shoot system, root number should be closely linked with leaf
area may be reconciled with these results with the hypothesis that as root
elongation requires an intact, active root apex (Barlow and Rathfelder, 1 985;
Biddington and Dearman, 1982; 1 984; Clowes and Stewart, 1967), the RRL of
a root system may be a better indicator of root activity (Le. hormone
synthesis) than �N. This assumes that root elongation and hormone
biosynthesis are concurrent processes. Although the literature does not
address this issue directly, there are reports that provide indirect support for
this assumption. The quiescent centre of the root apex has been suggested
as the site of hormone biosynthesis (Clowes, 1969; Short and Torrey, 1972),
although more recent studies suggest that synthesis results from an
interaction between the quiescent centre and the proximal meristem (Barlow,
Growth ontogeny of tomato plants under root restriction 131
1 994; Feldman, 1979a, 1979b, 1980; Sossountzov et al., 1988; Zavala and
Brandon, 1983) . Removing carbohydrate sources from roots results in a
cessation of meristematic activity in the apex (Van't Hof, 1 968) and a
reduction in the rate of root elongation (Barlow and Adam, 1988). Low
temperatures inhibit root elongation (Bowen, 1991 and references therein).
At the root apex, low temperatures result in a virtual cessation of meristem
activity. Returning chilled roots to room temperature is followed sequentially
by cell division in the quiescent centre, the formation of a new meristem at
the root apex, the appearance of a new quiescent centre within this meristem,
and resumption of root elongation (Clowes and Stewart, 1 967; Barlow and
Rathfelder, 1985). In high resistance soils, the decrease in root extension rate
results from a reduced rate of cell elongation accompanied by a possible
decrease in rate of cell production at the apex (Bennie, 1991). With respect
to inter-organ relationships, root elongation is more sensitive to soil temper
ature than gain in root biomass (Cumbus and Nye, 1982) or increase in
lateral numbers (Nambiar et al., 1979). Finally, root elongation x shoot
relationships are not necessarily limited to relationships between the
exogenous root functions of water and mineral absorption and transpiration
by leaf area. Jesko (1981), for example, reported an apparent causal
relationship between cytokinins produced by emerging (elongating) nodal
roots of maize and a transient increase in photosynthetic activity of leaves
close to the site of roots.
Several other observed responses are compatible with an hormonally
mediated control system. Root restriction increased branching density (Fig.
3.4). Although the pattern of lateral root initiation in tomato is apparently
stable and resistant to experimental modification (Barlow and Adam, 1988),
adventitious lateral initiation appears subject to the interplay between
stimulatory and inhibitory influences that are largely hormonal in nature
(Wightman and Thimann, 1980; Wightman et al., 1980). Studies with cyto
kinin mutants suggest that whereas auxin is necessary for primary root
Growth ontogeny of tomato plants under root restriction 132
growth, cytokinins counteract growth of primary roots and stimulate growth
of root hairs in normal plants (Su and Howell, 1992). Benzyladenine (BA)
stimulated the number of lateral root primordia on the cultured tomato roots
(Finnie and van Staden, 1985) and the primary root of tomato seedlings
(Aung, 1982). In the same experiment, interference of auxin transport with
TIBA resulted in a significant reduction of root primordia on hypocotyls. Low
concentrations of other cytokinins have stimulated lateral root primordia in
peas (Street, 1969; Wightman et al. , 1980) and lettuce (Biddington and
Dearman, 1982; MacIssac et al., 1989). Cytokinins and auxins are both
inhibitors of root growth (not initiation) (Stenlid, 1982), and together
stimulate ethylene production, often synergistically, (Stenlid, 1982; Yu et al . ,
1981), which reduces root growth. The interaction between auxin and
ethylene in the development of adventitious roots on the stem has been
discussed. The possible involvement of auxin in this response is supported
by the report by Costa et al. (1992) of enhanced lAA oxidase activity in the
lower stem region of root-restricted peach rootstocks. In addition, a buildup
of auxin in the lower stem of tomatoes may have attracted assimilate towards
the stem (Gersani et al . , 1980), thereby explaining the preferential partition
ing to stem biomass (Fig. 3. 12, Table 3. 12). Finally, other studies have
reported that reduced root elongation under mechanical impedance, as
observed in this study (Fig. 3.3), was associated with altered levels of IAA in
the root apex (Lachno et al . , 1982).
Growth analysis methodology Growth analysis methods should not impose
excessive requirements on experimental resources such as greenhouse space,
plant material and technical input. I t is often difficult to find a balance
between collecting sufficient data to detect differences over time, and having
sufficient space and time to accommodate experiments involving several
treatments. Causton and Venus (1981), for example, suggested that with
data with a coefficient of variation of about 20% and 10 replicates, the
harvest frequency should be about 6 days. Such a frequency, however, may
Growth ontogeny of tomato plants under root restriction 133
be impractical. For example, in the experiment reported here, delays in
completing harvests altered a feasible harvest frequency of 14 days, given the
resources available, to one that ranged between 14 and 32 days. Such
difficulties withstanding, like all tools, growth analysis techniques can only
be expected to work within their operational boundaries. In this study, the
duration between successive harvests was probably too long for differences
in Rw calculated by the classical approach to be detected. As the functional
approaches yielded equivocal results of the relative magnitude of EA among
treatments, it is not possible to decide whether the harvest periods were too - -
long for meaningful estimates of EA' Nevertheless, calculation of EA without
cognisance of the relationship between leaf area and plant dry weight would
have decreased the sensitivity of the analysis about 8% (Fig 3.3).
The hybrid method, an amalgam of functional and univariate approaches to
growth analysis, performed well against the established functional approach
of Causton and Venus (1981). Estimates of mean values of parameters were
almost identical, and standard errors were similar (Fig. 3.9). The principle
benefits of the hybrid approach were the replicated estimates ofthe important
growth analysis indices (Maindonald, 1992), its flexibility in accounting for
differences in biotime between individual plants (e.g. Bradford and Trewavas,
1994), and the flexibility that the derived data sets provided. The hybrid
method provides many more observations (estimates) than are possible from
the standard method. This provides the opportunity to use other relevant
statistical procedures, such as path analysis, canonical correlation and
canonical discriminant function analysis. Although not utilised in this
experiment, the hybrid method would allow analysts to account for
ontogenetic drift in interpreting growth analyses (Evans, 1972; Hunt, 1978)
by using appropriate variables as covariates in analysis of covariance
procedures or as concomitant variables in regression analyses.
Growth ontogeny of tomato plants under root restriction 134
The hybrid method does, however, require improvement. Causton and
Venus's (1981) functional approach is inherently more robust than the hybrid
method as the regression procedure at its base has more degrees of freedom
to estimate the residual (or error) variance. For example, with the data sets
used in this experiment, 27 error degrees of freedom were present in the per
treatment regressions in the standard method compared with 2 degrees of
freedom in each of the treatment x block regressions of the modified method.
This is important because the estimate of the residual variance plays a major
role in calculating the estimated standard errors of the coefficients in the
model for hypothesis testing. The residual variance is also used to estimate
the standard errors of predicted values, values of which are required in the
subsequent calculations of the rates and derived ratios. In addition, with
repeated observations at each level of the independent variable (in this
instance, DAI), the standard method provides an opportunity, lacking in the
hybrid method, of objectively determining the validity of the model being
fitted with a lack-of-fit test (Myers, 1 990), rather than relying on the more
subjective assessment of residual plots.
The low number of error degrees of freedom is the principle weakness of the
modified method. If the raw data are highly variable, or if high order
polynomial or other functions (e.g. Richards function) must be fitted to best
model the data, there may be insufficient error degrees of freedom available
to accurately fit the function and test the quality of its fit. In general, it is
unlikely that more than 4 degrees of freedom will be required for fitting the
function. A Richards function will 'consume' one degree of freedom for each
of its four parameters. Fitting polynomials of three or more terms is
considered unwise because overfitting leads to spurious changes in such
derived indices as How, EA and LAR (Causton, 1967; Elias and Causton, 1 976;
Hurd, 1977; Nicholls and Calder, 1973; Poorter, 1 989; Venus and Causton,
1 979a). Therefore, a minimum of six observations for each block x treatment
combination are required to avoid over-parameterisation of the model. This
Growth ontogeny of tomato plants under root restriction 135
only provides a single degree of freedom for estimating the residual variance,
which would concern most biometricans. Increasing either the number of
harvests or the number of subsamples per b lock x treatment combination will
lessen or avoid this problem.
The steady and uniform decline in the relative growth rates of the
components of root and shoot growth (Table 3. 1 1) are probably artefacts of the
second order exponential polynomial fitted to the raw data. It is possible that
the 'smoothing' action of the regression has masked momentary, but
physiologically important, changes in the relative growth rates or their rate
of decline. Fitting the data to a different function (e.g. a Richards function)
may have overcome this difficulty (Venus and Causton, 1979a). Harvests
were, however, too infrequent and too widely spaced for either of these issues
to be resolved with this data set.
The hybrid method lacks the definition present in more recent hybrids of the
classical and functional approaches. For example, Poorter (1989) sought to
merge the strengths of the classical and functional approaches by fitting
polynomials through stepwise regression to indices calculated using classical
techniques. However, while having merit for data sets that do not lend
themselves to easy curve fitting, the reliance of Poorter's (1989) technique on
many frequent harvests to adequately calculate the indices is a major
practical constraint. For example, Poorter (1989) used data from an
experiment lasting 38 days that consisted of a single treatment with 24
harvests each of five plants, with either 1 or 2 days between each harvest.
Following this protocol with four treatments running for 99 days would have
required about 1200 plants, 6 greenhouses and 6 hydroponic systems.
The blocked design used in the present study was successfully accounted for
in the standard method by using data adjusted for block effects. This
adjustment, however, was difficult to program with SAS. Future use of this
Growth ontogeny of tomato plants under root restriction 136
approach should aim to increase the number of harvests or observations per
harvest to gain sufficient 'spare' degrees of freedom to include additional
terms in the model to account for block and block x time interactions. This
would avoid the need to adjust the raw data for block effects before analysis.
Experimental system Despite selecting similarly sized plants for the experi
ment, early differences in growth between similarly treated plants were
observed. By 13 DAI, the Rw of plants in CR treatments was significantly
greater than those in RD treatments. At 31 DAI, the relative growth rates
ofthe plant and its components in RD and RDD treatments were significantly
lower than CR plants. It is unclear why such differences in growth response
should exist between plants in these treatments (Table 3.5a) when the plants
were in identically-sized (0.025 1) containers. The differences may have been
artefacts of the polynomial fitted to the data in the functional methods.
Analysis of Rw between 1 3-31 DAI calculated using the non-paired classical
method did not detect treatment differences (data not presented). Other
workers have also encountered problems with values at the extreme of fitted
curves. Hurd and Thornley (1974), for example, ignored such values, only
reporting those 'well within the limits of the curves'. The differences may
have arisen either by chance, or resulted from poor grading and
randomisation of plants during the set up of the experiment. Alternatively,
the problem may have resulted from using non-homogenous plant material
being distributed among the treatments, with the observed differences due to
ontogenetic drift. Although unlikely given the double random allocation
method used, it is possible that a disproportionate number of 'large sized'
plants were allocated to CR treatments. Similarly sized plants were chosen
for this experiment. Given the importance of leaf area and leaf area
expansion rates to plant growth, it is possible that similarly sized plants are
not equivalent to similarly leafed plants. Re-analysis of the data at 13 and
3 1 DAI using plant dry weight or leaf area as a covariate adjustment
accounted for a significant portion of the variation and resulted in no
Growth ontogeny of tomato plants urukr root restriction 137
significant treatment effects being detected (data not presented). Clearly,
greater care must be taken in selecting plants for use in studies, particularly
when the variables being measured are sensitive to ontogenetic drift.
Rooted cuttings inserted into the hydroponic system developed a new set of
roots before appreciable shoot growth occurred. Presumably the electrical
conductivity of the hydroponic solution was too high for the roots present at
planting and damage occurred. New roots, presumably conditioned to the
osmotic potential of their environment, were then produced. While not
explaining the observed differences between similarly treated plants 13 DAI
(Table 3.5a), this disruption to growth, effectively a transplant shock, may
have increased the variation in growth between the plants. As the rate of
plant growth during early vegetative stages is often exponential (Fig. 3.3, 3.5;
Moorby and Graves, 1980), it is critical that young plants establish quickly
in the hydroponic system. Early growth of young tomato plants in
hydroponic solutions is influenced by the manner in which they are raised
(Cooper, 1 978) . A contributory factor is the different morphology and
physiology of roots grown in solid substrates compared to those in hydroponic
solutions (de Lint and Klapwijk, 1 986). In solid substrates, roots are
characteristically thin, with root hairs appearing behind the growing tip,
whereas those developed in hydroponic solutions are thicker and more fleshy,
with root hairs generally absent (de Lint and Klapwijk, 1986). Roots
developed in hydroponic solution will continue to grow and develop when
placed in a solid medium. But, as observed in this experiment, roots
developed in solid substrates die when transferred into hydroponic solution.
I t is possible that the change in osmotic potential arising from the roots being
shifted from an environment of low conductivity (i.e. tap water: 0.2 mS ·cm"l)
to the relative high conductivity (2.5 mS ·cm"l) hydroponic solution may have
damaged the root cells (Lee-Stadelmann and Stadelmann, 1989). It is likely
that the same response was responsible for the problems encountered with
root storage (Fig. 3. 1) . Future studies on growth responses to root restriction
Growth ontogeny of tomato plants under root restriction 138
must reduce such transplant shock, particularly if early growth responses to
restriction are being studied.
Difficulties in assessing root restriction studies arise because the nature of
the treatment changes in time as the degree of root restriction increases,
making general inferences based on point-in-time comparisons difficult to
sustain. As with all external environmental factors (Hunt and Nicholls,
1986), root restriction operates on a continuum that induces sub-optimal,
optimal and supra-optimal responses from the plant. Physically restricting
roots for 31 days in a 0.025 1 container caused changes to root and shoot
growth that were still apparent 68 days later. Unfortunately, until a method
for quantifying the level of root restriction encountered by the plants is
developed, the lack of an adequate benchmark against which these responses
can be compared makes any comment solely qualitative.
Summary Richards and Rowe (1977 a) based their premise of distinct regula
tory and uptake functions of roots on similarities between the percent
reduction in root number and stem height, shoot dry weight, leaf number and
between the percent reduction in root length and total water uptake, nitrate
uptake and leaf area. A similar analysis of my data did not reveal similar
groupmgs. I t also showed that the relationships between the percent
reductions in the variables change over time (Table 3.7), and in doing so,
revealed the fragility of Richard and Rowe's (1977a) analytical technique.
Indeed, in the same way that calculating absolute growth rates to compare
the performance of a 10 g and 1 g plant is flawed (see Hunt, 1978), comparing
absolute values of components of root and shoot growth to explain how root
and shoot growth might be connected is unlikely to be revealing. Changes in
shoot growth arising from changes to root growth can be episodic (Bevington
and Castle, 1985; Drew, 1982; Drew and Ledig, 1980; Williamson and Coston,
1989), or simply delayed. Restricting root systems reduced root numbers
after 31 DAI, but differences in shoot dry weight between restricted and
Growth ontogeny of tomato plants under root restriction 139
unrestricted plants were not detected until 67 DAI (Table 3.5b). Moreover,
such quantitative approaches imply that a 'morphogenetic equilibrium' exists
(Le. the more roots, the better shoot growth), a concept refuted (van
Noordwijk and de Willigen, 1987) and largely replaced with the concept of a
functional equilibrium (reviewed by Brouwer, 1983). One solution to this
problem of interpretation was to assess root and shoot relationships over
time, incorporating ontogenetic drift into the analysis, and seeking stable and
biologically meaningful relationships. As the data presented in this study
show (Fig. 3.3, 3 .5), the relative reductions in growth between restricted and
unrestricted plants progressively increased with time. Estimates of the
relative rates of increases of the components of root and shoot growth
provided insight into how physically restricted roots might influence shoot
growth.
Three important physiological responses dominated the results of this
analysis. First, a consistent, strong linear relationship was observed between
the relative rates of root elongation and leaf expansion of the plants that was
independent of root restriction. This was interpreted as indicating a
physiologically meaningful relationship exists between the root and leaf
growth. It was not possible, however, to disentangle the relative contribution
of leaf count and individual leaf area to the reduction in total leaf area
resulting from root restriction. Leaf area expansion is the product of the
number of leaves and the area of each of those leaves. Although a reduction
in leaf number resulting from root restriction was detected in the previous
experiment, it was not possible to decide whether this reduction was due to
reduced initiation or delayed emergence of initiated leaves. Similarly
equivocal is the information about individual leaf expansion. Although
average leaf area was similar in all treatments, expansion of individual leaves
at similar positions on the stem may have differed between treatments
according to the extent of root restriction being encountered. The similarity
in average leaf area among all treatments at all harvests suggests that root
Growth ontogeny of tomato plants under root restriction 140
restriction did not influence the expansion of individual leaves. On its own,
however, average leaf area does not provide sufficient definition of the
response of individual leaves to root restriction. Leaves at different positions
on the stem axis might respond differently to the treatments because the
nature of the restriction treatments changed throughout the experiment.
Similarly, greater movements in SLA, along with differences among
treatments, would probably have been apparent had individual, or at least
newly developing leaves (after each harvest), been analysed separately. For
example, root restriction may have reduced the rate of expansion or the
maximum final area, or both of individual leaves. Derestriction may have
had the opposite effects. As every leaf or perhaps every leaflet of each leaf
(Ho and Shaw, 1977) on an axis is unlikely to be equally affected by root
restriction (Peterson et al., 1991a) because of the changing 'intensity' of
restriction with time, further studies must analyse leaf growth on a leaf by
leaf basis. Therefore, greater definition of the effect of root restriction on the
components of total leaf area will only be gained if a closer assessment of
individual leaf expansion was made. Besides requiring a method for
measuring leaf expansion, such assessment also requires that the leaves
being measured were at similar stages of growth at the time measurement
commenced. Relative growth rates are extremely sensitive to ontogenetic
drift (Figs. 3. 10, 3. 1 1), and small differences in biomass or leaf area between
treatment groups can seriously confound between-group interpretation of
relative growth rates derived from these variables. Solving this problem
requires greater attention to obtaining uniformity in the initial plant material
and the individual leaves being compared.
Second, comparatively short periods of qualitatively low levels of root restric
tion can have long term consequences for components of shoot growth. At the
time growth responses were first detected in plants in small containers (31
DAl), the root system in these containers did not appear 'restricted' .
Although roots filled the area of the container and were wrapping around its
Growth ontogeny of tomato plants under root restriction 141
interior surface, the root matrix was very porous. Roots approaching the
interior surface of the container would presumably have been impeded, but
there was ample space elsewhere in the matrix for expansion of the root
system. This raises the possibility that only part of a root system needs to
be 'restricted' for a response to be generated. Responses from localised parts
of a root system causing physiological and developmental changes are well
documented; the chemical signal ABA sent from drying parts of a root system
to the shoot brings about stomatal closure in the absence of detectable shoot
water deficit (Davies and Zhang, 1991 and references therein). As several of
the observed responses to restriction were speculatively interpreted as being
hormonally-mediated, it is possible that if chemical signals move between a
restricted root system and the leaves, then restricting elongation of part of
the root system should restrict expansion of leaf area.
It is also interesting that plants derestricted after 31 days had fewer leaves
and smaller total leaf area, yet similar leaf dry biomass and average leaf
areas compared to control (unrestricted) plants at the end of the experiment.
This implies that the photosynthetic efficiency per unit area of these plants
was higher than unrestricted plants, and raises the possibility that
derestriction stimulated a compensatory growth response.
The third important result is the discrimination of response and effect
achieved within the variable commonly called 'root growth'. There was little
evidence to suggest that the reduction in root numbers per se caused by root
restriction had any direct influence on shoot biomass or its major deter
minant, leaf area. The direct influence of �, a measure of the relative
increase in the size of the root sink, in its strong correlation between RA was
small, suggesting that activity of the root system had a more important role
in leaf growth. It was postulated that this activity was connected with
hormone synthesis in actively growing roots, and as such, the relative rate of
elongation of a root system was a better indicator of synthetic activity than
Growth ontogeny of tomato plants under root restriction 142
the relative rate of increase in root number. By implication, the relationship
between the relative rates of root elongation and leaf expansion can be
described as a functional, rather than morphogenetic, equilibrium.
In the following chapters I report on further investigation into this relation
ship and on efforts to address some of the constraints identified in the current
experiment. In Chapter 4, an improved method for propagating the tomato
cuttings destined for hydroponic systems is introduced and an empirical
model for non-destructively estimating the expansion of individual leaves of
tomato developed. In Chapter 5, a multivariate technique is adapted to
better characterise and group plant material in order to reduce within-block
variation. These tools are used in Chapter 6 to further investigate and
characterise the relationship between root restriction and leaf expansion, with
particular emphasis on partial root restriction and the response of individual
leaves on the stem axis. Finally, in Chapter 7, I summarise the results of my
research programme and outline future research directions.

Chapter 4
Non-destructive esti mation
of leaf area
Non-destructive estimation of tomato 'Moneymaker' leaf area 144
4.1 Introduction
The development and extent of leaf area is a fundamental aspect of analysis
and interpretation of plant growth (Causton and Venus, 1 981; Hunt, 1982).
A common method for describing the ontogeny of leaf area involves
destructively harvesting whole plants throughout the experimental period and
analysing the leaf area data using classical or functional growth analysis
techniques (Hunt, 1982). This approach, however, is not always suited to
studies following the development of individual leaves. It assumes that
sampled leaves on sequentially harvested plants follow identical physiological
time traces. Thus, the physiological age of leaf L on plant} harvested at time
t must have been identical to that of leaf l on plant i harvested at time t-1 .
Physiological age is important as both cell division and expansion contribute
to development throughout lamina expansion (Steer, 1971; Sunderland, 1960).
Leaf area is measured with leaf scanners or estimated using empirical
models, with the choice of method usually depending on whether leaves are
destructively or non-destructively harvested. Many leaf area scanners require
detached (i.e. destructively harvested) leaves for measuring. Use of those
scanners capable of in situ measurements (Le. non-destructive) is limited by
the width of the leaf the scanner can process. Empirical models based on leaf
length and width are commonly used to non-destructively estimate leaf area
(Marshall, 1 968). The area of simple leaves of apple (Malus domestica
Borkh), peach (Prunus domestica L.), pear (Pyrus communis L), bean
(Phaseolus vulgaris), sweetcorn (Zea mays) and rice (Oryza spp.) can be
rapidly and accurately estimated using polynomials based on length and
width measurements (Ackley et al., 1958; Bhan and Pande, 1 966; McKee,
1964). Estimating area of compound leaves, however, is made difficult by the
different shapes of leaflets. Nevertheless, Akoroda (1993), Hughes and
Proctor (1981), Lim and Narayanan (1972) and Wiersma and Bailey ( 1975)
reported accurate predictive models of total compound leaf area using the
Non-destructive estimation of tomato 'Moneymaker' leaf area 145
terminal leaflets of fluted pumpkin (Telfairia occidentalis), ginseng (Pan ax
quinquefolius L.), rubber (Hevea brasiliensis) and soybean (Glycine max L.)
respectively. Ross (1946) and Salter (1958) non-destructively estimated
tomato leaf area using either length and width of leaflets or mid-rib length
of the compound leaf.
Empirical models arise from applying mathematical or statistical formulae to
observational data. Although this process is unconstrained by the need for
any knowledge of scientific principles or mechanism, a basic understanding
of the system being modelled is generally necessary when deciding what to
observe and measure. Although empirical models can be deterministic,
whenever the data is statistically analysed a probability distribution is
associated with the model and its output. Many reported empirical models
for predicting leaf area inadequately address this issue. Estimates of the
variation associated with the model are often ignored (e.g. Hoffman, 1971 ;
NeSmith, 1991 ; Whitworth et al. , 1992). Moreover, models designed for
prediction purposes are often evaluated on current performance, rather than
predictive ability (e.g. Hughes and Proctor, 1981 ; Sepaskhah, 1 977).
The robustness of models for environments or cultivars different from those
under which the models were developed has received limited attention.
Neither cultivar nor plant age influenced coefficients of a model estimating
leaf area of cotton (Ashley et al., 1963). McKee (1964) reported that a derived
relationship for corn leaf area was stable under field and greenhouse
environments with seven varieties. On the other hand, N autiyal et al. (1990)
recommended correction factors for predicting leaf area of different cultivars
of apples. This model was, however, stable over location. Sepulveda and
Kliewer (1983) reported site and cultivar differences in linear equations for
estimating leaf area of grapes. Robbins and Pharr (1987) observed that the
relationship between length, width and area leaves of several cucumber
cultivars changed with cultural system. Hoffman (1971 ) reported that
Non-destructive estimation of tomato 'Moneymaker' leaf area 146
relative humidity and root medium salinity h ad no effect on a log-linear
relationship between leaf length and area for onion (Allium cepa L. hyb) .
Hoffman's data, however, shows clear evidence of heteroscedasticity, and
slope and intercept coefficients show consistent change with increasing
salinity. Hoffman (1971) does not present estimates of residual variation,
perhaps because residual variation was too great to detect real differences.
Salter (1958) applied his model (relating compound leaf mid-rib length to leaf
area) to an experimental system in which plants of tomato were subjected to
different water regimes, subsequently reporting that the model was robust.
Few authors report the robustness over time of their models. The study by
McKee (1964) is cited (Hoffman, 1971 ; Hughes and Proctor, 1981) as evidence
that predictive leaf area models are robust over time, but McKee's
description, " . . . two quite different seasons . . . " , provides insufficient detail to
warrant such confidence. Nautiyal et al. (1990) developed their models over
six years, and although they tested for robustness over location, they did not
report on robustness over time. The apparent lack of concern by model
developers about the influence of time is surprising since there is good
evidence that leaf morphology is significantly influenced by prevailing
temperature and light conditions. Warrington and Norton ( 1991) demonstra
ted in several crops, including corn and cucumbers, that specific leaf weight
(SL W) was linearly related to daily quantum integral. Van Volkenburgh and
Davies ( 1977) reported that SLW of cotton and soybean was negatively
correlated with day temperature. It seems reasonable to expect that seasonal
changes in daily light integrals and temperature could alter leaf morphology
to such an extent that empirical models developed from data collected during
the winter, for example, would prove unreliable when used to estimate leaf
area of crops grown during summer.
This chapter reports the development of an empirical model for non
destructively estimating leaf area of tomato. It builds on the studies of Ross
Non-destructive estimation of tomato 'Moneymaker' leaf area 147
(1946) and Salter (1958), and discusses factors which should be taken into
account when developing such models.
4.2 Materials and methods
4.2. 1 Cultural
Seed of the indeterminate tomato L. esculentum Mill . 'Moneymaker' were
germinated in trays (28 cm long x 40 cm wide x 6 cm deep) containing peat
and pumice (3:2 v/v) with bottom heat under mist in a heated glasshouse.
When their cotyledons were fully expanded, seedlings were transplanted to
200 cm3 tubes containing a peat:pumice (3:2 v/v) growing medium, and grown
on in the glasshouse. Plants were fed daily with Peters 20+8.6+ 16.6 (NPK,
Grace-Sierra Horticultural Products, USA) at 100 ppm N.
After six weeks, shoots were excised immediately above the cotyledon node
and rooted in an aerated water bath under mist. The water bath was
constructed from an opaque plastic container (30 x 40 x 8 cm) covered with
an inverted 273 plug tray. Cuttings were inserted through the cells into the
water, immersing the lower 2 cm of stem. The cuttings 'hung' from their
cotyledons resting on the top of the plug cells. As the extent of rooting is
influenced by the O2 content of the solution (Soffer and Burger, 1988) an
aquarium pump supplied air continuously to the water bath via three
microtubes (2 mm internal diameter) . The O2 content of the solution,
measured at 20°C with a YSI Dissolved Oxygen Monitor (model 57), was 8.55
mg·litre·l . Excess water, accumulating from the mist system, drained to
waste from the water bath. Cuttings rooted after about five days and were
weaned from the system by gradually reducing the mist frequency from six
seconds/minute (daylight hours) to zero over the ensuing four days.
Non-destructive estimation of tomato 'Moneymaker' leaf area 148
Rooted cuttings were placed in individual 10 litre containers in a deep flow
hydroponic system (Section 2.0) . The electrical conductivity of the solution
was increased daily in 0.5 mS · cm·1 increments from 0.5 to the final operating
level of 2.5 mS ·cm·1 • The solution was replaced at monthly intervals.
Lateral shoots and flower trusses were removed as soon as practicable to
restrict the assimilate sinks to the primary shoot system and roots.
4.2.2 Environmental
Glasshouse air temperature was maintained at 15°C minimum at night, with
ventilation triggered when air temperature rose above 25°C during the day.
Daily mean temperature ranged from 18°C during the spring and autumn
months to 26°C during summer.
4.2.3 Experimental
Experiment 1 Conducted in October 1989, the objective of this
experiment was to estimate total compound leaf area from length and width
measurements of leaflets. Measurements were taken from the terminal and
two adjacent leaflets on leaves at nodes 4-6, 9-1 1 and 13-15 (numbered
acropetally from the cotyledonary node). Width measurements were taken at
positions 25, 50 and 75% along the leaflet blade. Leaflet length was exclusive
of the petiole. Twenty five plants were used in the experiment, with 27
leaflets measured on each plant.
Experiment 2 Total compound leaf area was estimated from the length
of the mid-rib of the leaf (Le. the combined length of the rachis and the
terminal leaflet). This experiment was repeated four times: January and
Non-destructive estimation of tomato 'Moneymaker' leaf area 149
March, 1990, April 1991, and April 1992. The number of plants used varied;
40 plants were harvested in January 1990, 34 in March 1990, 15 in April
1991, and 25 in April 1992. Depending on the size of the plant, between 6
and 13 leaves were harvested from each plant.
4.2.4 Development of predictive models
Models were developed in four phases (Neter et al . , 1990):
(i) data collection and preparation
(ii) reduction of the number of independent variables
(iii) model refinement
(iv) model validation and selection
4.2.4. 1 Data collection and preparation
Collection
All length measurements were made to the closest millimetre using a flexible
tape. The smallest mid-rib length was about 30 mm; shorter leaves could not
be measured without physically damaging the expanding lamina. The area
of each compound leaf was measured with a Li-Cor LI-3000 leaf area meter
(Lambda Instruments Corporation, USA). Leaflets were removed from the
petioles before area measurement and then dried for 72 hours at Boac in a
forced air drying oven before weighing.
Tomato leaf size changes with position on the stem axis. The area of fully
expanded leaves at nodes immediately above the cotyledon node are smaller
than fully expanded leaves at higher insertions, despite being both physio
logically and chronologically older. Thus, leaves become progressively larger
then progressively smaller as insertion position increases. Positional and .
Non-destructive estimation of tomato 'Moneymaker' leaf area 150
developmental indices were used in the model building process to account for
this trend.
Positional indices
Two positional indices were used: the leaf insertion position (LIP), measured
acropetally from the cotyledon node; and INDEX, calculated as leaf insertion
position divided by the number of leaves on the stem (i.e. LIP n!LIP max) ' This
index standardised leaf position between plants of different age or height.
Developmental indices
Plant height (HT) was used as a coarse index of whole plant development and
the leaf plastochron index (LPn as a precise measure.
The LPI is an established index of plant development and has been success
fully used with tomato (Andrews and Chalmers, 1989; Coleman and Greyson,
1976a). The duration between initiation of successive leaf primordia on the
main stem apex defines a plastochron. A nondestructive estimate of a plasto
chron is the time required for successive leaves to reach a specified length
(termed the reference length). Erickson and Michelini ( 1957) extended the
plastochron concept to the plastochron index (PI) with a method that
estimates the number of developed plastochrons plus the fractional com
ponent of the plastochron currently undergoing development (equation. 4. 1) .
and,
LPIa = PI - j where i is the serial number of that leaf (counting from the cotyledon node) that first exceeds the reference length (4.,; 30 mm), log. L; is the log. length (mm) of leafi, log �i+l) is the log., length (mm) of leaf i+l. log., L,.,., is the log" reference length, andj is the serial number for any given leafj on the shoot apex.
(4. 1)
(4.2)
Non-destructive estimation of tomato 'Moneymaker' leaf area 1 5 1
Valid derivation of PI assumes that early leaf growth occurs at an exponential
rate, early growth of successive leaves on a single plant occurs at the same
relative rate, and successive plastochrons are the same length for a particular
plant (Lamoreaux et al., 1978). This was confirmed for all the sets of data
examined (data not shown). A reference length of 30 mm was used to
calculate LPI.
Environmental indices
Light and temperature data were not available for all data sets (months). The
demonstration that SLW is functionally related to daily quantum integral and
day temperature (van Volkenburgh and Davies, 1977; Warrington and
Norton, 1991) suggested that this index might better reflect light and
temperature effects than simultaneous measurements. Specific leaf area
(SLA), the reciprocal of S LW, was used as an environmental index since the
focus of the study was to develop a leaf area model. Two randomly selected
leaves were destructively harvested from guard plants every 2-3 weeks during
each repeat of the experiment. The average SLA during respective repeats
was used in the model.
Data preparation
Gross data errors and extreme outliers were identified through scatterplots
of model variables against leaf area. Data entry mistakes were corrected,
and in seven instances, a data case was removed from the main data set.
Data partitioning
Each data set was randomly divided into a model-building sample and a
validation sample (Snee, 1977). In the absence of firm guidelines for
respective sizes of each sample, a 2: 1 split was used. Both sets satisfied the
liberal rule that sample number n should be greater than 2p + 20, where p
is the number of regressor variables in the model (Myers, 1990).
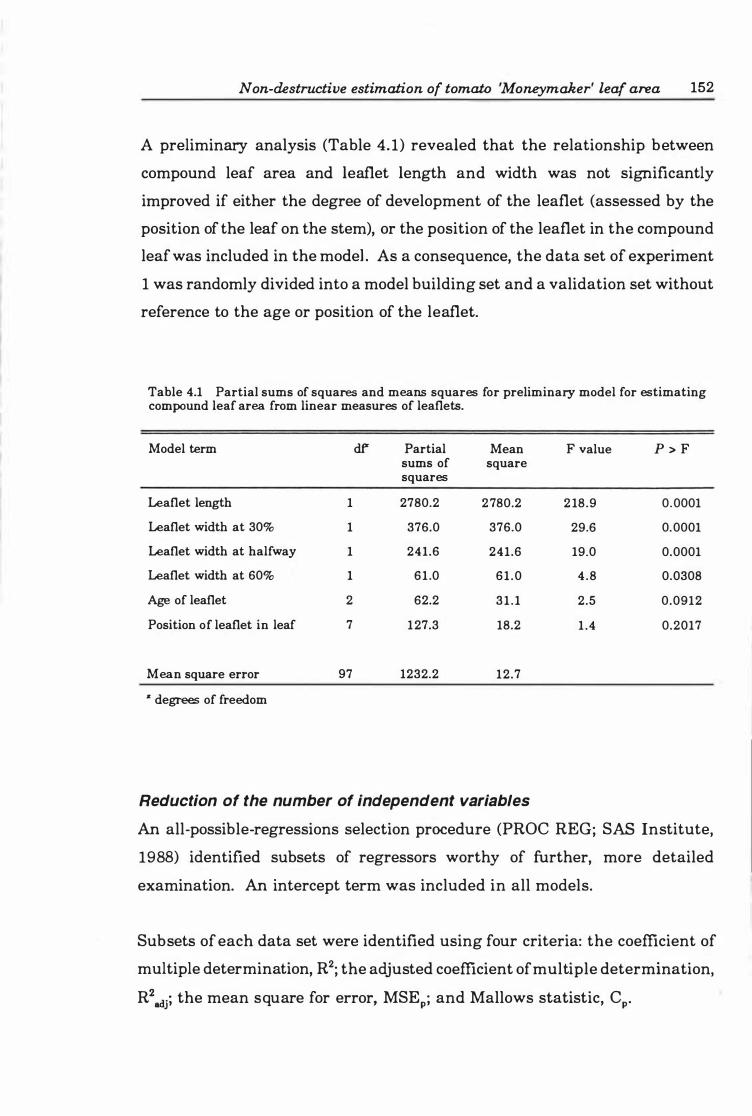
Non-destructive estimation of tomato 'Moneymaker' leaf area 152
A preliminary analysis (Table 4. 1) revealed that the relationship between
compound leaf area and leaflet length and width was not significantly
improved if either the degree of development of the leaflet (assessed by the
position of the leaf on the stem), or the position of the leaflet in the compound
leafwas included in the model . As a consequence, the data set of experiment
1 was randomly divided into a model building set and a validation set without
reference to the age or position of the leaflet.
Table 4.1 Partial sums of squares and means squares for preliminary model for estimating compound leaf area from linear measures of leaflets.
Model term df' Partial Mean F value P > F sums of square squares
Leaflet length 1 2780.2 2780.2 2 18.9 0.0001
Leaflet width at 30% 1 376.0 376.0 29.6 0.0001
Leaflet width at halfway 1 241.6 241.6 19.0 0.0001
Leaflet width at 60% 1 61 .0 61 .0 4 .8 0.0308
Age of leaflet 2 62.2 31 . 1 2.5 0.0912
Position of leaflet in leaf 7 127.3 18.2 1 .4 0.2017
Mean square error 97 1232.2 12.7
• degrees of freedom
Reduction of the number of independent variables
An all-possible-regressions selection procedure (PROC REG; SAS Institute,
1988) identified subsets of regressors worthy of further, more detailed
examination. An intercept term was included in all models.
Subsets of each data set were identified using four criteria: the coefficient of
multiple determination, R2; the adjusted coefficient of multiple determination,
R2 adj; the mean square for error, MSEp; and Mallows statistic, Cpo
Non-destructive estimation of tomato 'Moneymaker' leaf area 153
The coefficient of multiple determination (R2) is defined as the fraction of the
total sums of squares (SSTO) accounted for by a regression model of p
parametersl (SSRp):
(4.3)
This criterion is used subjectively; the intent is to find the point where the
gain in R2 after adding a further regressor is very small.
Subjective use of R2 is necessary as incorporating additional regressors into
the model will, by definition, increase its value, a point which is frequently
overlooked (e.g. Gamiely et al., 1991; Hughes and Proctor, 1981; NeSmith,
1992; Robbins and Pharr, 1987; Sepulveda and Kliewer, 1983; Whitworth et
aI., 1992). The coefficient of multiple determination varies inversely with the
error sums of squares for a given regression (SSEp), as the SSTO is constant
for all possible regressions from a given data set. As a consequence, R2 is
maximised when all p - 1 regressors are added to the model. The adjusted
coefficient of multiple determination, R2adj, takes into account the number of
parameters in the regression model:
2 _ tn - I ) SSE Radj = 1 n - p SSTO MSE (4.4)
= I - SSTO n - I The adjusted coefficient of multiple determination (R2
adj) increases only if
MSE decreases, since SSTO/(n-1) is fixed for the given data set; hence, R2adj and MSEp are equivalent criteria. The favoured model is that for which
Ip _ 1 predictor variables plus the intercept term
Non-destructive estimation of tomato 'Moneymaker' leaf area 154
MSEp is at the minimum, or so close to the minimum that adding more
regressors is not worthwhile.
Under-specification of the model (Le. when important regressors are absent
from the model) results in biased coefficients and prediction while large
variances in both coefficients and prediction arise from over-specification.
Mallows' Cp statistic provides a compromise between bias and variance:
c = P MSE - (n - 2p) Pma
(4.5)
Models with a value of Cp close to p are favoured as they do not contain
estimated bias. In other words, all error in the predicted y estimates is
variance, and the model is not under-specified.
4.2.4.2 Model refinement and selection
Decision rules
The basic decision rule for accepting or rejecting a fitted regression equation
is whether or not the regression F ratio (F model) exceeds the critical F factor
(F crit) , the I-a percentile of the central F with p and n - p - 1 degrees of
freedom (where p is the number of parameters in the model, excluding the
intercept, and n is the number of observations). When F model is statistically
significant, it implies that a significantly large amount of the variation in the
data about the mean has been accounted for by the regression equation.
While some authors record F model for candidate models (e.g. Robbins and
Pharr, 1987), it is usually assumed that F crit. has been exceeded.
Accepting the decision rule has l imited value; acceptance simply means that
the fitted equation is a better predictor of the response than an equation
Non-destructive estimation of tomato 'Moneymaker' leaf area 155
containing only the mean. As Draper and Smith ( 1981, p.93) noted: "Unless
the range of values predicted by the fitted equation is considerably greater
than the size of the random error, prediction will be of no value even though
a 'significant' F-value has been obtained, since the equation will be 'fitted to
the errors' only". Box and Wetz (1973) proposed that statistically significant
and worth while prediction equations could be distinguished from statistically
significant equations of limited practical value by the Ym criterion. This
criterion quantifies the ratio of changes in predicted response over the
variation of the estimators of these changes. Algebraically, the usual test for
significance of regression tests the hypotheses:
Ho:Y = 0 versus HI:y > 0
by comparing the F model to Ferit." The Ym criterion tests:
Ho:Y = Yo (Yo � 0) versus H1:y > Yo
The value of F model is compared to F'crit. where F'crit. - ( 1 + i)F a,b,n-m.lJ m is the
number of parameters in the model, not including the constant term, and
b = m(1 + y2)2j(1 + 2l) (Suich and Derringer, 1977).
In all tests, Ym was taken as 4 (Draper and Smith, 1981). In other words, I
required assurance that the standard deviations of the estimators of leaf area
were at least four times smaller than the range of changes in leaf area in the
regressIOn zone.
Residual analysis
Models selected during the screening process underwent detailed residual
analysis, using the PROC REG procedure of SAS (SAS Institute, 1988) .
Residual plots illustrated the degree of variance heterogeneity and
highlighted systematic trends usually indicative of an incorrectly specified
model. Studentised residuals and HAT matrix diagonals pointed to outliers and influential data points. Benchmarks for the average HAT and highly
Non-destructive estimation of tomato 'Moneymaker' leaf area 156
influential observations were calculated as p ·n·l and 2p ·n-l respectively
(Belsley et aI., 1980). Distributional normality of residuals was assessed
using box and normal probability plots of studentised residuals.
Stability
The stability In time of models common between months was tested by
examining the homogeneity of slopes and intercepts of the models with time
(months) added to the model as qualitative (dummy) variables. The signifi
cance of the coefficients of the interaction terms between the time and
positional, developmental or environmental indices within the model were
tested using partial F tests of the general linear model approach (Neter et aI. ,
1990).
Multicollinearity
Multicollinearity IS a problem of models involving regressors that are
dependent on each other and thus incorporate redundant information (Myers,
1990) . The potential for multicollinearity was assessed from the correlation
matrix of regressors (the eigenstructure X'X); highly correlated regressors
indicate a potential multicollinearity problem.
The seriousness and number of dependencies was determined by the condition
number and condition index of X'X. The condition number of the
eigenstructure IS given by cp, the ratio of the largest to the smallest
eigenvalue.
4> = (4.6)
If the condition number is less than 100, there is no serious problem with
multicollinearity_ Condition numbers between 100 and 1 000 imply moderate
Non-destructive estimation of tomato 'Moneymaker' leaf area 157
to strong multicollinearity. Severe multicollinearity is indicated when the
condition number exceeds 1 000 (Montgomery and Peck, 1992; Myers, 1990).
The condition index of the ith eigenvalue of the eigenstructure, CPi' is the ratio
of the largest to the ith eigenvalue.
(4.7)
The number of large CPi (Le. � 1000) indicates the number of multi collineari ties
in the data set.
Variance decomposition proportions of X'X indicated the extent of
involvement of regressors in each dependency, i.e. they reflect the proportion
of the variance of the coefficient of the ith regressor that can be attributed to
the collinearity characterised by the jth eigenvalue (Myers, 1990).
Variance inflation factors (VI F) reflected the extent of damage of the
dependency to individual regressor coefficients. For each regressor term, VIF
is given as:
1 VIF = ---I - RJ
where R2j is the coefficient of determination of the regression of the ith regressor variable against the other regressor variables.
(4.8)
The VIFs represent the inflation that each regression coefficient experiences
due to associations among the regressor variables. Generally accepted
guidelines for interpretation are that regression coefficients with VIFs
exceeding 10 are poorly estimated (Myers, 1 990).
The extent of multicollinearity was minimised by removing offending
regressors from the model wherever justified, and by centering the raw .
Non-destructive estimation of tomato 'Moneymaker' leaf area 158
regressor data (Le. (xii - x), where Xv is the ith observation of the jth
regressor). Removing regressors from the model was not always desirable as
performance of the model was detrimentally affected. Although it is
conventional practice to retain non-significant main factors if they contribute
to significant interaction terms, such factors were removed if they contributed
to a multicollinearity problem.
4.2.4.3 Model va lidation
Ordinary residuals do not generally indicate how well a regression model will
predict, as the predicted value of an observation is dependent on the
observation. Thus, ordinary residuals measure quality of fit, not quality of
future prediction (Myers, 1990). The quality of future prediction of candidate
models was assessed by (i) cross validation, (ii) calibrating the predictive
capability of the model, and (iii) using the PRESS (prediction sum of squares)
criterion.
Several procedures exist for cross validation (Myers, 1990; Neter et al. , 1990;
Snee, 1977). In this study, leaf area of observations in a validation sample
was predicted by the candidate models. The coefficients of determination (r) between actual and predicted leaf area and the candidate model (Rp 2) were
compared. A decrease between these values of more than 1 0% (i .e. Rp 2 - r2 �
0. 1) signalled a poor model.
Preliminary choice of a regression model is based, at least in large part, on
how well it fits the data at hand. Because different models may have been
chosen for different random outcomes in the data set, the MSE of the selected
model will tend to underestimate the inherent variability of future predictions
made from it. One method of calibrating the actual predictive capability of
the selected model is to use it to predict each case in the new data set and
Non-destructive estimation of tomato 'Moneymaker' leaf area 159
then to calculate the mean of the squared prediction errors (i.e. the MSPR).
The MSPR is given as:
n L (Yi - y;)2 MSPR = _i-_1 ___ _
n
where: Y. is the value of the response variable in the ith validation observation, Y. is the predicted value for the ith validation observation based on the model-building sample, and n' is the number of cases in the validation sample.
(4.9)
If the MSPR is similar to the MSE of the regression fit to the model-building
sample, the MSE is not seriously biased and reflects the predictive ability of
the model (Neter et al., 1990). However, if considerably larger than the MSE,
the MSPR provides a better indication of how well the candidate model will
predict.
The PRESS criterion is the sum of n PRESS residuals associated with a given
model, where a press residual at the ith observations (�) is the difference
between the actual Y value (Y) and the predicted Y cY) when the regression
model is fitted without the ith observation:
d. = Y. - Y.( . ) , , , ,
n
PRESSp = L d� i � l n
= L (Yi - Yj(iy i � l
Models with small PRESS values are considered favourably.
(4. 10)
(4. 11 )
PRESS residuals were used to generate the statistic R2 PRESS' whose similar
format to Rp 2 aids interpretation of the PRESS criterion, where:
Non-destructive estimation of tomato 'Moneymaker' leaf area 160
2 PFUESS RpRESS = 1 - -----
11
L (Yi - y )2 (4. 12)
i-I
R2 PRESS values are interpreted as the percent of variability in predicting new
observations 'explained' by the model.
The 'best' model of each month selected by these procedures was re-calculated
using the PROC REG of SAS (SAS Institute, 1 988) with the full data set since
accuracy of coefficients and MSE is a positive function of n. The standard
error of individual predicted values was determined, and from these the mean
standard error of leaves with mid-rib lengths of 1 0, 20, 30, 40 and 50 cm (±
0.5 cm) calculated.
4.3 Results
4.3.1 Predicting compound leaf area from leaflet area (experiment 1 )
Preliminary analysis indicated that neither leaflet age nor position i n the
compound leaf were important factors in the prediction model (Table 4. 1) .
Consequently, data were pooled on these variables for subsequent analyses.
Mallows Cp statistic was optimised only when leaflet length and all three
width measures were in the model. A second-order model accounted for about
99% of total variation and exceeded the Ym criterion (Table 4.2). Using models
with fewer terms, but less optimal values of Mallows Cp statistic, would have
resulted in predicted values with inflated confidence intervals relative to this
second order model (Fig. 4 .1 ; model A vs. models B-H).
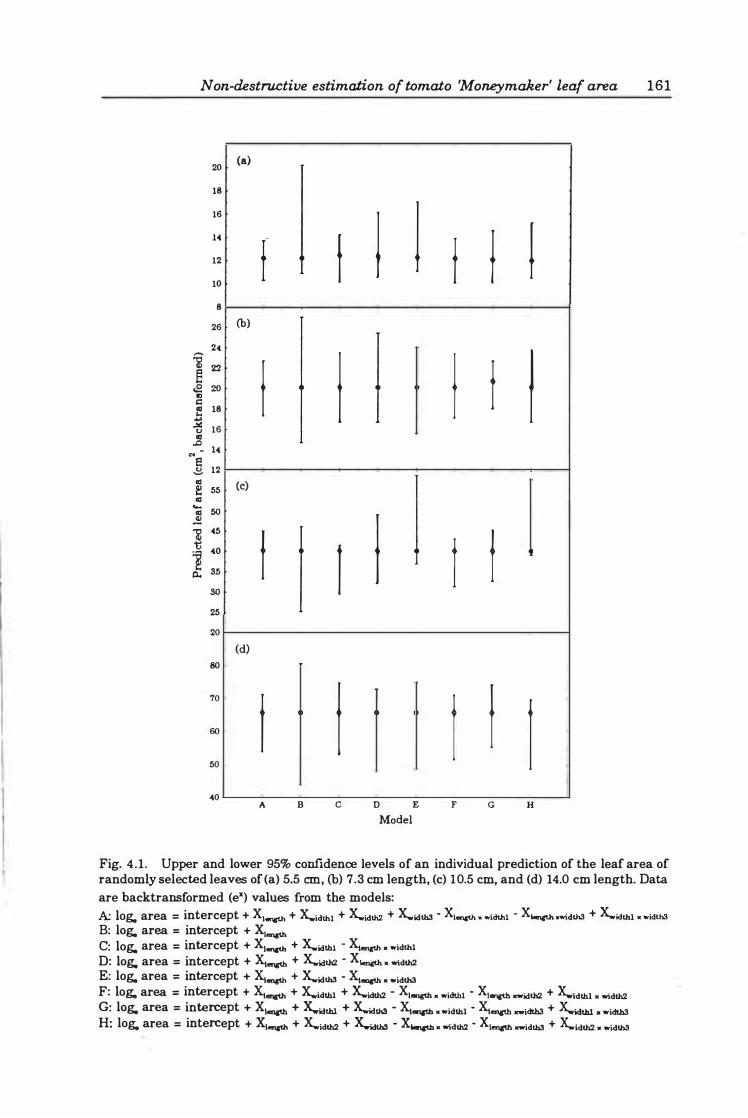
Non-destructive estimation of tomato 'Moneymaker' leaf area 161
20 (a) 18
16
1.(
12
10 I ! t I f f I 8
26
24
� 22 � cE 20 ., c f 18 ..., ..!IO: 16 0 '" .Q - 14 <" e � 12 '" e 55 '" .... 50 '"
�
1 45
] 40
p.. S5
so
25
20
80
70
60
50
40
(b)
I (c)
!
(d)
! A B
I
1 I
I c D E
Model
I I I
I I
I t 1 F G H
Fig. 4.1 . Upper and lower 95% confidence levels of an individual prediction of the leaf area of randomly selected leaves of (a) 5.5 em, (b) 7.3 cm length, (c) 10.5 cm, and (d) 14.0 cm length. Data are backtransformed (e"') values from the models: A log. area = intercept + Xlensth + x"idthl + x"idth2 + x"idth3 - X1ensth • widthl - Xlencth xwidth3 + x"idthl • width3 B: log. area = intercept + Xlensth c: log. area = intercept + Xlencth + x"idthl - �en,u. • widthl D: log. area = intercept + �en,u. + x"idth2 - XIenctb • width2 E: log. area = intercept + �en,th + x"idth3 - �."u. . widtb3 F: log, area = intercept + �en,th + x"idthl + x"idth2 - X1omgth • widthl - X10ncth _idth2 + x";dthl • width2 G: log. area = intercept + Xleoath + �thl + x"idthS - �omgth • widthl - �encth _idtb3 + x"idthl . widtb3 H: log. area = intercept + X1en,th + x"idth2 + �th3 - XIoncth• width2 - XI� _idth3 + x..idth2 . widthS
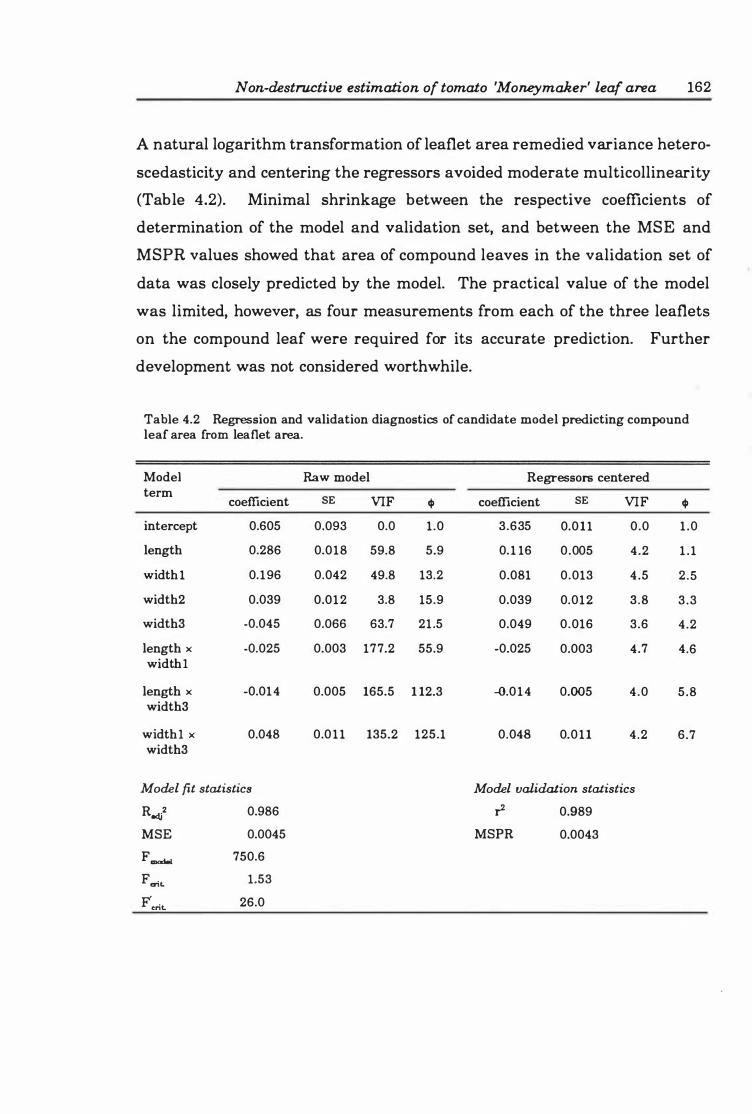
Non-destructive estimation of tomato 'Moneymaker' leaf area 162
A natural logarithm transformation of leaflet area remedied variance hetero
scedasticity and centering the regressors avoided moderate multicollinearity
(Table 4.2). Minimal shrinkage between the respective coefficients of
determination of the model and validation set, and between the MSE and
MSPR values showed that area of compound leaves in the validation set of
data was closely predicted by the model. The practical value of the model
was limited, however, as four measurements from each of the three leaflets
on the compound leaf were required for its accurate prediction. Further
development was not considered worthwhile.
Table 4.2 Regression and validation diagnostics of candidate model predicting compound leaf area from leaflet area.
Model Raw model Regressors centered term
coefficient SE VIF cp coefficient SE VIF cp
intercept 0.605 0.093 0.0 1 .0 3.635 0.0 1 1 0.0 1 .0
length 0.286 0.018 59.8 5.9 0. 1 16 0.005 4.2 1 . 1
width 1 0.196 0.042 49.8 13.2 0.081 0.013 4.5 2.5
width2 0.039 0.012 3.8 15.9 0.039 0.012 3 .8 3 .3
width3 -0.045 0.066 63.7 21 .5 0.049 0.016 3.6 4.2
length x -0.025 0.003 177.2 55.9 -0.025 0.003 4.7 4.6 width 1
length x -0.014 0.005 165.5 1 12.3 -0.0 1 4 0.005 4.0 5.8 width3
width1 x 0.048 0.0 1 1 135.2 125.1 0.048 0.0 1 1 4.2 6.7 width3
Model fit statistics Model validation statistics
Recij2 0.986 r2 0.989
MSE 0.0045 MSPR 0.0043
FmodeI 750.6
F criL 1.53
F'eriL 26.0
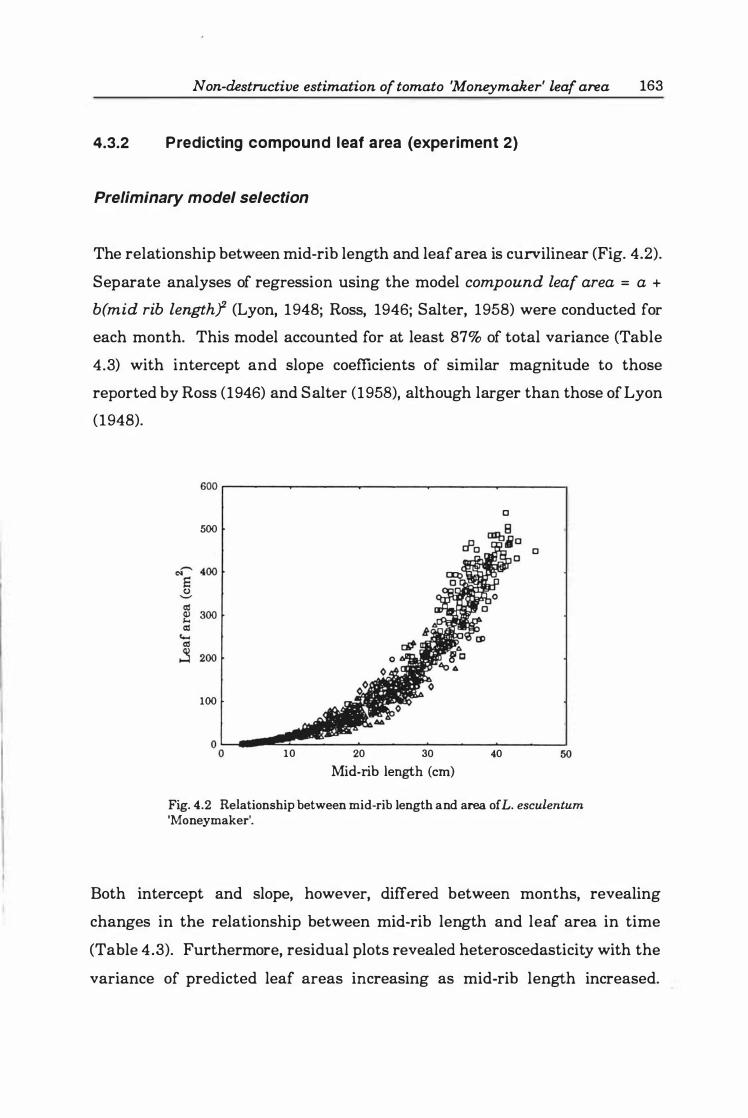
Non-destructive estimation of tomato 'Moneymaker' leaf area 163
4.3.2 Predicting compound leaf area (experiment 2)
Preliminary model selection
The relationship between mid-rib length and leaf area is curvilinear (Fig. 4.2).
Separate analyses of regression using the model compound leaf area = a + b(mid rib length? (Lyon, 1948; Ross, 1946; Salter, 1958) were conducted for
each month. This model accounted for at least 87% of total variance (Table
4.3) with intercept and slope coefficients of similar magnitude to those
reported by Ross (1946) and Salter (1958), although larger than those of Lyon
(1948).
600r-----�------�------�----�------_,
500
100
10 20 30
Mid-rib length (em)
o
o
40 50
Fig. 4.2 Relationship between mid-rib length and area orL. esculentum 'Moneymaker'.
Both intercept and slope, however, differed between months, revealing
changes in the relationship between mid-rib length and leaf area in time
(Table 4.3). Furthermore, residual plots revealed heteroscedasticity with the
variance of predicted leaf areas increasing as mid-rib length increased.
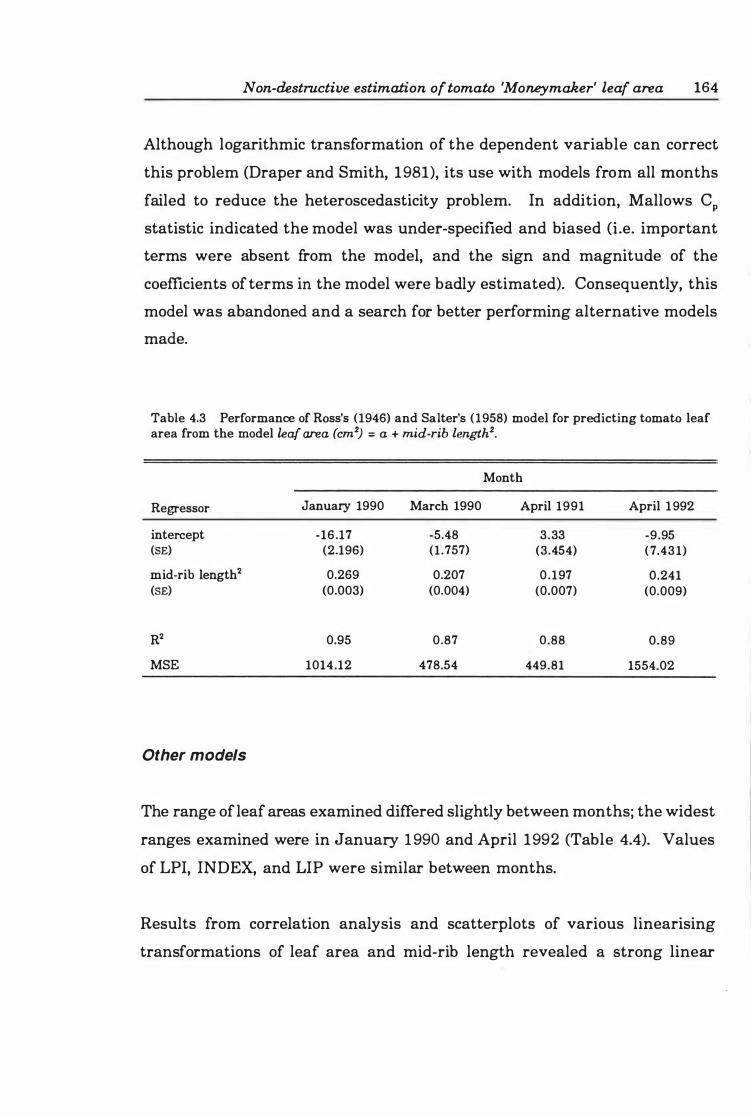
Non-tkstroctive estimation of tomato 'Moneymaker' leaf area 164
Although logarithmic transformation of the dependent variable can correct
this problem (Draper and Smith, 1981), its use with models from all months
failed to reduce the heteroscedasticity problem. In addition, Mallows Cp
statistic indicated the model was under-specified and biased (Le. important
terms were absent from the model, and the sign and magnitude of the
coefficients of terms in the model were badly estimated). Consequently, this
model was abandoned and a search for better performing alternative models
made.
Table 4.3 Performance of Ross's (1946) and Salter's ( 1958) model for predicting tomato leaf area from the model leaf area (cm2) = a + mid-rib length2•
Month
Regressor January 1990 March 1990 April 1991 April 1 992
intercept -16.17 -5.48 3.33 -9.95 (SE) (2.196) (1 . 757) (3.454) (7.43 1)
mid-rib length2 0.269 0.207 0 .197 0.241 (SE) (0.003) (0.004) (0.007) (0.009)
R2 0.95 0.87 0.88 0.89
MSE 1014.12 478.54 449.81 1554.02
Other models
The range of leaf areas examined differed slightly between months; the widest
ranges examined were in January 1 990 and April 1992 (Table 4.4). Values
of LPI, INDEX, and LIP were similar between months.
Results from correlation analysis and scatterplots of various linearising
transformations of leaf area and mid-rib length revealed a strong linear
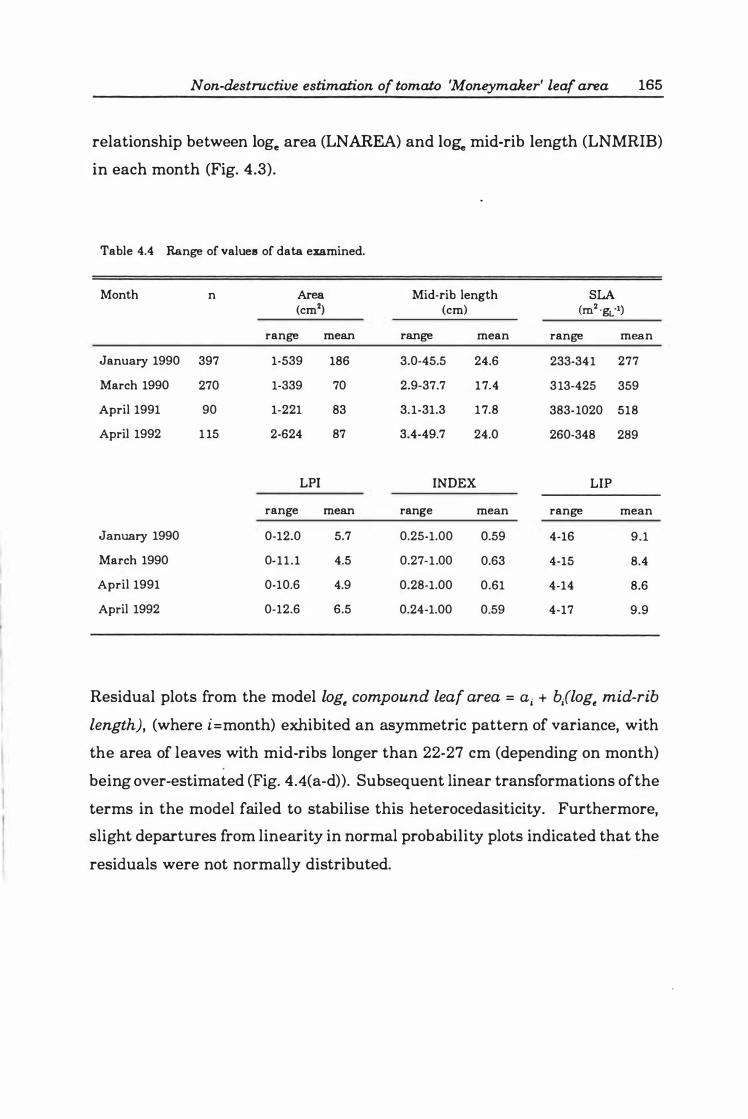
Non-destructive estimation of tomato 'Moneymaker' leaf area 165
relationship between loge area (LNAREA) and lo� mid-rib length (LNMRIB)
in each month (Fig. 4.3).
Table 4.4 Range of value8 of data examined.
Month n Area Mid-rib length SLA (cm2) (cm) (m2 ·gL-1)
range mean range mean range mean
January 1990 397 1-539 186 3.0-45.5 24.6 233-341 277
March 1990 270 1-339 70 2.9-37.7 17.4 313-425 359
April 1991 90 1-221 83 3. 1-31.3 17.8 383-1020 518
April 1992 1 15 2-624 87 3.4-49.7 24.0 260-348 289
LPI INDEX LIP
range mean range mean range mean
January 1990 0-12.0 5.7 0.25-1.00 0.59 4-16 9.1
March 1990 0-11 .1 4.5 0.27-1.00 0.63 4-15 8.4
April 1991 0-10.6 4.9 0.28-1.00 0.61 4-14 8.6
April 1992 0-12.6 6.5 0.24-1.00 0.59 4-17 9.9
Residual plots from the model loge compound leaf area = ai + blloge mid-rib
length), (where i =month) exhibited an asymmetric pattern of variance, with
the area of leaves with mid-ribs longer than 22-27 cm (depending on month)
being over-estimated (Fig. 4.4(a-d)). Subsequent linear transformations ofthe
terms in the model failed to stabilise this heterocedasiticity. Furthermore,
slight departures from linearity in normal probability plots indicated that the
residuals were not normally distributed.
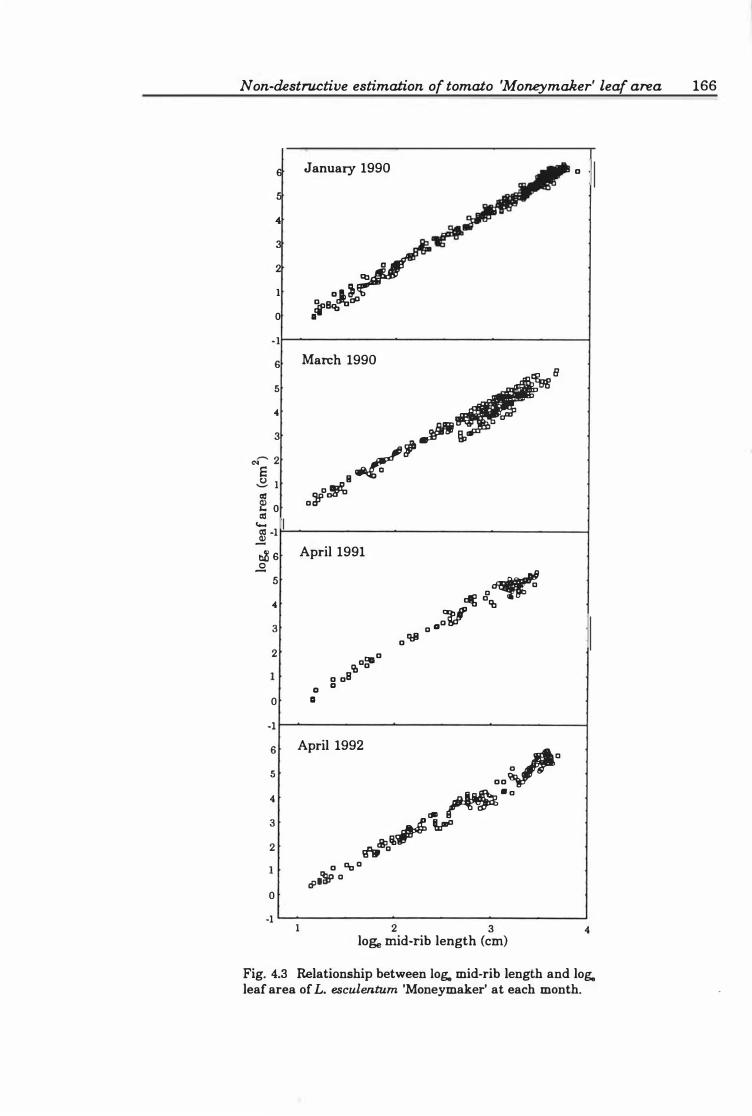
Non-destructive estimation of tomato 'Moneymaker' leaf area 166
6 January 1990 a
5
..
3 ;� 2
. :,J.t.� 1
0 .� -1
6 March 1990 �8 5
.,,; ..
3
CN--' 2 /.iP
E 3 1 H til D'i� E 0 til c... til -1 � � 6 April 1991
.£ � 8� 5
..
a:tf 3 D a llli
2 �a roDa
a aB a a
0 •
-1
6 April 1992
aa�D
5
4 � �h 3 &§P.Q,; t,-o 2 rlW D
a ag D
cP'� D 0
-1 1 2 3 4 lo� mid-rib length (em)
Fig. 4.3 Relationship between log" mid-rib length and log" leaf area of L. esculentum 'Moneymaker' at each month.
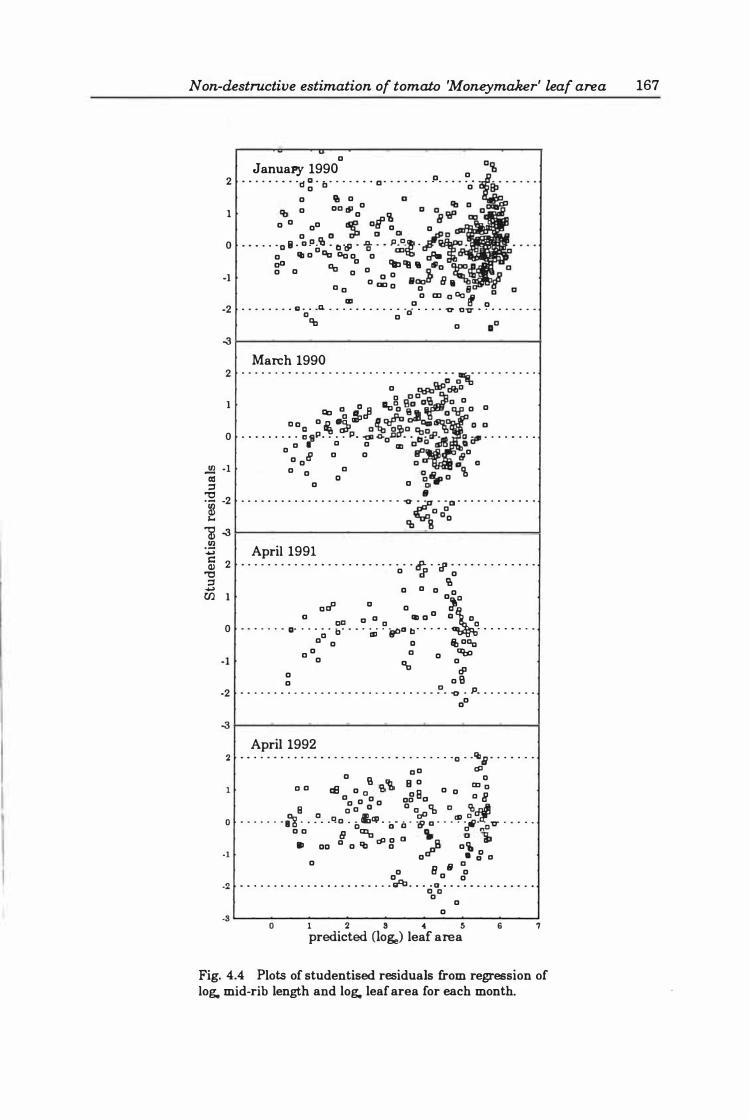
Non-destructive estimation of tomato 'Moneymaker' leaf area 167
.$ ell =' "'0
.� "i .� .... s:: Q) "'0 =' .... U)
a JanuaPy 1990 a 2 · · · · · · · · ·d Cl · c · · · · · · · o · · · · · · · P . . . . . . a a
1
0
·1
·2
-3
2
1
0
·1
·2
-3
2
1
0
·1
·2
-3
a VI a "- a 00 11' a .." a y, a a 00 .se of a a a o cJl o o
• • • • • ' 0 B · CI PafQ • 0 '19 • "'l; . • .D�.jj • a 'II a CIa Do a a ""ijj rP-aD Da a a � " II 1110 a a a a q a :. a .Datl /J I a 0 0 a a::J a Da ", ID a If a . . . . . . . . a ·o· ·Q. · · · · · · · · · · � "0- · · · · v av · · · · · · · · ·
'b a
March 1990 . . . . . . . . . . . . . . . . . . . . . . . . . . . . . . �.� . . . . . . . . .
a �Q:P dbO g 13�0�..)0 a
Da � �JI Ile a � �':I9:P a a . . . . . . . ���9:.��P. ���.o.i;�dl� o :.� . . . . . . . o . a a a ID a 0 !IID a a-° e o a fP 0 a 0 a ! 0 a a 0
0 � o!L. a 'b a a a ..... iii · . . . . . . . . . . . . . . . . . . . . . . . � ;;Po'o�o . . . . . . . . . . . .
'b�8 0
April 1991 · . . . . . . . . . . . • . . . . . . . . . . . . . If.: . i:P • . • • • • • . . • • . . o d' a
'i!I o a 0 a o�o . . . . . . . o. � . . :��� . . �; !lsoo
o: � � . . C:� . . . . . . . . o a 0 Ii, aDa 0 0 0 0 'Ibo a 'b a
a 19 o o B . . . . . . . . . . . . . . . . . . . . . . . . . . . . . !'. � . P • • • • • • • . • 00
April 1992 2 · · · · · · · · · · · · · · · · · · · · · · · · · · · · · · · ·o · ·lGli · · · · · · ·
0 0 dl 00 a B n\ B 0 CD � cB a 0 " 0 8 a a 8 00 a a a 00 a a
o • . . . . . • • '1B . . . 0 • • qo � �i� . a· ilo
. ���. '����v " ' " 0 0 /1 a::Ia " A � · 1
o dl a 0 -_8 ill II 00 a CO a F o'i! a . � o a a 8 iii 00 a a a ·2 • • • . . . • • • . • • • • • • • • • • . • . a'b . • · coo · · · · · · · · · · · · . .
a a a ·s�-------------------------------------------J
o 1 2 S 4 5 predicted (10&) leaf area
6 7
Fig. 4.4 Plots of studentised residuals from regression of log" mid-rib length and log" leaf area for each month.
Non-destructive estimation of tomato 'Moneymaker' leaf area 168
Preliminary regression analyses of models containing INDEX, LIP, LPI terms
in addition to LNMRIB revealed that no simple model was consistently
superior across all months (data not shown). Significant interaction terms
between month and other regressors in the model indicated that the
relationship between the regressor terms and the loge transformed leaf area
term varied through time.
Although LNMRIB accounted for most of the variation, distribution of
residuals and overall model performance was improved by adding positional
and developmental indices to the model. The number and form of terms (e.g.
main factor or interaction term) required to satisfy selection criteria varied
between months. Criteria for R2 adj' Cp' and MSEp were met with a single term
model for the January 1 990 data set, two terms in March 1 990 and April
1991 , and three terms for April 1992 (Table 4.5) . With the exception of
January 1 990, the analysis confirmed that models comprising of only
LNMRIB were under-specified.
Extreme multicollinearity was revealed in some models fitted to raw data,
with VIF and <p exceeding their benchmark values. This was not surprising
given the high correlation between INDEX, LIP, LPI and LNMRIB (Table 4.6,
Fig. 4.5) . As there was no need to study the efficiency with which the
intercept (in the natural variables) was being estimated, or the role of the
intercept in the multicollinearity problem, the natural data were centered.
This reduced, and in some models, eliminated the problem.
Non-destructive estimation of tomato 'Moneymaker' leaf area 169
Table 4.5 'Best' main factor models for each month from all-possible-regressions selection procedure.
Regressors R2.<\i Cp MSE January 1990
XLNMRIB 0.9922 1.86 0.02186
XLNMRIBXUP 0.9922 1.73 0.02 1 77
XLNMRIBXsLA 0.9923 1 .99 0.02 1 79
XLNMRIBXINDEX 0.9923 2.25 0.02181
XLNMRISXLP1 0.9922 2.86 0.02186
XLNMRIBXSLAXUP 0.9923 1 .80 0.02169
XLNMRISXSLAXINDEX 0.9922 2.50 0.02 1 75
XLNMRIBXSLAXLP/ 0.9923 3.07 0.02179
March 1990
XLNMRISXINDEX 0.9849 1.71 0.02626
XLNMRISXINDEXXLPI 0.9853 2.59 0.02559
XLNMRISXINDEXXUP 0.9851 3.99 0.02581
XLNMRISXINDEXXSLAXLP/ 0.9852 4.02 0.02566
XLNMRISXLPIXsLAXINDEX 0.9852 4.29 0.02570
April 1991
XLNMRIsXUP 0.9822 -0.05 0.03584
XLNMRISXINDEX 0.9815 1 .80 0.03739
XLNMRIBXLPIXINDEX 0.9819 1 .66 0.03638
XLNMRISXUp2(INDEX 0.9819 1 .75 0.03646
XLNMRIsXupXgLA 0.9819 1 .89 0.03658
XLNMRIsXup2(LP/ 0.9819 1.95 0.03663
XLNMRISXLP1XmXINDEX 0.9818 3.05 0.03668
XLNMRISXUp2(LPI�NDEX 0.9818 3.13 0.03675
April 1992
XLNMRISXU� 0.9849 3.65 0.03386
XLNMRIsXupXgLAXLP/ 0.9851 4.08 0.03353
XLNMRISXUpXgLAXINDEX 0.9849 4.61 0.03382
Non-destructive estimation of tomato 'Moneymaker' leaf area 170
Table 4.6 Correlation coefficients between leaf area and predictor variables.
LNMRIB LIP INDEX LPI SLA HT
January 1990
LNAREA 0.99 -0.81 -0.82 0.82 0.03 0.09
LNMRIB -0.81 -0.83 0.83 0.05 0.09
LIP 0.98 -0.97 0.004 0.06
INDEX -0.98 0.01 -0.03
LPI 0.009 0.08
SLA 0.21
March 1990
LNAREA 0.98 -0.56 -0.64 0.67 -0.01 0.26
LNMRIB -0.68 -0.76 0.78 -0.001 0.23
LIP 0.95 -0.88 -0.03 0.23 INDEX -0.97 -0.02 -0.02
LPI 0.01 0.19
SLA -0.02
April 1991
LNAREA 0.99 -0.81 -0.83 0.82 -0.01 0.07 LNMRIB -0.86 -0.87 0.87 -0.02 0.07 LIP 0.98 -0.95 -0.02 0.09 INDEX -0.99 -0.01 -0.05
LPI 0.03 0.13 SLA -0.002
April 1 992
LNAREA 0.98 -0.70 -0.70 -0.71 0.06 0.03
LNMRIB -0.77 -0.77 -0.78 0.05 0.03
LIP 0.99 -0.98 -0.19 0.06
INDEX -0.99 -0.1 1 -0.03
LPI 0.05 0.09
SLA -0.47
LNAREA= log. leaf area; LNMRIB=log. mid-rib length; LIP=leaf position on stem; INDEX=relative leaf position on stem; LPI=leaf plastochron index; SLA=specific leaf area; HT=plant height.
Non-destructive estimation of tomato 'Moneymaker' leaf area 171
1 .0 • • • O.e 0.1
�0.7 00.8 Z -0.6
0 •• O.s 0.2
2 3 log. mid ... ib length (LNMRIB)
16 • • � 14 • • c.. 8 11 o. 0 ,, 12 0 .. 0 � 11 • • !10 • 00 § 9 � a . • :: 7 'Cl 6 j 5
•
12 11 C I0 � 9 .. OJ :5 1
E 8 ..c:. 6 � ..
. .. . .. • • _ 00 • • • • • o •
• . _ . - _ . - 0 • 0 • • . .. - - - -- - - . .
• 00 _ __ _
. . .. � . - . ... - --- . . . __ . .
-
_
.. • - - •
2 3 log. mid·rib length (LNMRIB)
• • • • •
: . ' •• e . . � " a · f: ·' · · · �.o.t ... . . . .�� .
. ;R
..
. � . o �";:k� .. c.. ..... .. j
3 00 « .. 2 • . :: 4't'" · .. · :-. ,0r!tA' • • 0 1 0 ell 0 "; • . - .
2
0 3
log. mid·rib length (LNMRIB)
1.0 o.e 0.1
� 0.7 o 0.6 � 0.5
0 .. 0.3 0.2
1.0 0.9 0.1
� 0.7 0 0.6 � 0.5
0 .. o.s O.J
12 11 10 � 9 .. ., "0 7 "
" 8 E ..c:. 6 � • .. , c.. ..... 2 ..
j 1
• I
• • •
I • •
-....-.� �. .�� ..
: 8 •
• • • • •
I 8
I • • 0 0
5 6
oo� .0 .�oo· . . 0 _ 00 • • • • -:.=, ... 0, • • • -8\0\0 ·8 •
--· W.-0 8. • •
3 • 5 6 7 a Leaf plaatochron indeI (LPI)
• • • 0 • • • • 0 • • • • · •
• • 0 ° • • • • · • • • ·
7 a 9 10 11 12 Leaf inaertion pooilion (LIp)
• • • • • •
I • • •
I • • •
I • • • I • • • I • • • 0 • I • · 7 a 9 10 11 12
Leaf inaertion pooilion (LIP)
0 • •
13
• • I
13
10 11 12
• • •
H 15
• 0 •
14 15
Fig. 4.5 Inter-relationships between regressors in March 1990 data set, but typical of all data sets.
Model refinement
I n refining the models, emphasis was placed on minimising MSE . This was
reduced by half in some models after second-order interaction terms were
added (Table 4.7). Identifying and, when warranted, deleting influential
Non-destructive estimation of tomato 'Moneymaker' leaf area 172
outliers also improved the models. For example, influence diagnostics of the
model YLNAREA = XLNMRIB + XINDEX + XsLA (January 1 990 data set) identified
eight observations, all from a single plant, responsible.for the S LA term. This
cluster of observations suggests that either the plant was a rogue, or that the
plant was poorly measured (i.e. human error) . Both alternatives are
reasonable grounds for deleting data. As a consequence, SLA was eliminated
from the model as both a main factor and interaction term.
January 1990 Although all refined models performed well, conditions for fit
and validation statistics were maximised in the model Y LNAREA = XLNMRIB+
XINDEX - XLNMRIB_INDEX·
March 1990 The model Y LNAREA = XLNMRIB + Xup + XL1P"INDEX was the best
performing model. The INDEX term was only significant in combination with
LIP, and as its presence as a main factor caused a slight multicollinearity
problem, it was removed from the model. While the MSPR statistic of the
simpler model Y LNAREA = XLNMRIB + XINDEX suggested the MSE was inflated, this
model had the l argest PRESS residuals and lowest R2 adj of the candidate
models.
April 1991 Models with three or more terms were superior to two factor
models, with PRESS residuals and MSE markedly smaller than the two
factor models. I n all higher term models the MSPR values were over 30%
larger than the MSE estimates, indicating that the MSE estimates were
biased and that predictive precision of the models was poorer than the MSE
indicated. Of the higher term models, Y LNAREA = XLNMRIB + XLPI + XINDEX +
XLPhlNDEX and Y LNAREA = XLNMRIB + Xup + XINDEX + XL1P"INDEX exhibited superior
residual and fit statistics. Moderate multicollinearity was detected in both
models, with VIF max associated with the INDEX term. I n the model Y LNAREA
= XLNMRIB + XLPI + XINDEX + XLP1"INDEX variance decomposition proportions
showed the problem due to INDEX and LIP as main factor terms. In the
Non-destructive estimation of tomato 'Moneymaker' leaf area 173
model Y LNAREA = XLNMRIB + Xup + X1NDEX + XUPlCINDEX variance decomposition
proportions showed the problem 'shared' between all terms. While there is
little to distinguish between the two models, the model Y LNAREA = XLNMRIB +
XLIP + XINDEX + XUPlCINDEX was favoured by the smaller disparity between MSE
and MSPR and its smaller MSPR.
April 1992 The relationship between LIP and INDEX was stronger in this
data set than others, with the consequence that all models incorporating
these regressors showed moderate multicollinearity. Differences in the SLA
of leaves in the April 1992 data set were sufficiently large to be a useful
determinant of leaf area. The considerable effort required to obtain estimates
of SLA, however, makes models not requiring this regressor more attractive.
The model Y LNAREA = XLNMRIB + XLIP - XINDEX - XUPlCINDEX had slightly poorer
regression fit diagnostics than other models, but its estimate of future
residual was considerably smaller than that of other models, and for this
reason is the favoured model. Given its moderate level of multicollinearity,
however, prediction of leaf area outside of the data region would be
inaccurate. If extrapolation was likely, the model YLNAREA = XLNMRIB + XLP1 +
XLFPIlCLPh with minimal multicollinearity problems and comparable
performance characteristics, would be favoured.
As the Ferit. at Ym=4 was exceeded for all models in all months, it had no
discriminatory value. The maximum value of Ym (Ymax) before Fait.> Fmode1 was
iteratively calculated and revealed that changes in leaf area were 24-1 85
times as large as the variation of the estimators of these changes (Table 4.7).
The criterion Ymax provided similar discriminatory power to R2. Within each
data set, and for models with the same number of terms, the model with the
highest Ymax coincided with the model with the largest R2.
Table 4.7
Month
Jan. 1 990
March
1990
April
1991
April
1 992
Summary of regression fit and validation statistics for refined candidate models for predicting log" leaf area.
Model
4.53 + 2.28XLNMRIB
4.47 + 2 .38XLNMRIB + O.Ol�IP - 0.02�MRIB.LIP
4.47 + 2.44XLNMRlB - 0.02Xu'l + 0.03�MRIB.LPI
4.47 + 2.45XLNMRIB + 0.31�NDEX - 0.47XLNMRIB.INDEX
3.72 + 2.45XLNMRIB + 1.54�NDEX
3.88 + 2.17XLNMRlB + 0.07�IP - 0.28�IP.INDEX
3.80 + 2.33XLNMRlB + 1 . 1 1�NDEX + 0.042XLNMRlBaLPl + 0.26XLPI.INDEX
3.73 + 2.45XLNMRlB + 0.08Xup
3.75 + 2.48XLNMRlB + 1 . 19�NDEX
3.78 + 2.42XLNMRlB - 0.07XLPI
3.91 + 1.94XLNMRlB + 0.15�PI + 1 .63X1NDEX + 0.37XLPI.INDEX
3.98 + 1.87XLNMRlB + 0.13�IP - 2.34�NDEX - 0.38XuP.INDEX
3.92 + 2.00XLNMRIB + 0.03J41T + 0.33XLPI.INDEX - 0.09XHTaINDEX
3.95 + 1.99XLNMRlB + O. 1 1�IP + 0.13XLP1 - 0.24XLNMRIBoLPl - 3.45�NMRIB.INDEX -
0.36XLF1P.INDEX
4.74 + 1.82XLNMRlB + 0.15Xup + 0.003XsLA - 2 .83�NDEX - 0.43�IP.INDEX
4.76 + 1.75XLNMRlB + 0.14Xup + 0.005XsLA + 0.17�PI + 0.03XUP.LPI
4.72 + 1.79XLNMRlB + 0.08�IP - 1.71X1NDEX - 0.44XuP.INDEX
4.75 + 1.72XLNMRIB + 0.04�PI + 0.03XUPoLPI
Ymu
185
1 10
1 12
1 13
68
63
52
34
30
28
39
32
30
24
R2 R2 • .u
0.995 0.995
0.995 0.995
0.995 0.995
0.996 0.995
0.987 0.986
0.990 0.989
0.989 0.989
0.989 0.988
0.984 0.983
0.982 0.98 1
0.996 0.996
0.994 0.994
0.993 0.992
0.993 0.992
0.995 0.994
0.995 0.995
0.994 0.994
0.994 0.993
r' 0.995
0.995
0.995
0.995
0.990
0.992
0.987
0.991
0.990
0.988
0.992
0.992
0.986
0.991
0.992
0.992
0.993
0.990
R2PRE88 PRESS MSE MSPR VIF .. u + 0.994 3.319 0.014 0.015 1 .0 1
0.995 3.240 0.013 0.015 6.6 25
0.995 3.009 0.013 0.014 10.0 39
0.995 2 .952 0.012 0.014 9.6 38
0.986 3.780 0.023 0.015 2.4 7
0.989 2.894 0.018 0.0 15 2.9 9
0.988 3.272 0.019 0.020 5.2 26
0.987 1.249 0.026 0.029 3.3 1 1
0.982 1.742 0.034 0.032 3.8 13
0.979 1 .985 0.039 0.031 3.6 12
0.995 0.434 0.009 0.028 44.9 204
0.993 0.579 0.012 0.022 37.8 193
0.99 1 0.83 1 0.017 0.046 1.4 3
0 .991 0.880 0.Q18 0.027 76.9 610
0.993 0.899 0.013 0.025 101.3 529
0.994 0 .824 0.012 0.029 77.1 396
0.993 0.969 0.015 0.018 67.8 334
0.993 1 .010 0.015 0.024 20.6 80
Ymu: Box and Wetz F test criterion; PRESS: prediction sums of squares; MSE: mean square error; MSPR: mean squared prediction residuals; VIF mOIl: maximum variance inflation factor;
+: condition number � ..;J �
Non-destructive estimation of tomato 'Moneymaker' leaf area 175
Model performance within and between months was not improved by
including either HT or SLA, despite large differences in these variables
between months (Table 4.8). Changes in SLA appeared to parallel changes
in leaf morphology. Sequential sums of squares showed that SLA accounted
for a significant portion of total variance when added as the first term in the
models. However, its contribution in the presence of other terms, adjudged
by partial sums of squares, was always non-significant (data not shown) ,
indicating the other terms in the model accounted for this variance.
Table 4.8 Plant height and SLA between months.
Height (em)
Month mean SE
January 1990 48.5 0.35
March 1990 34.1 0.33
April 1991 46.2 0.39
April 1992 36.7 1.06
Model stability
SLA (cm2'gL'!)
mean SE
277.3 1.31
359.2 1.83
402.0 1.30
296. 1 2.36
Although no single model structure was common to all months, some
structures were common between pairs of months (Table 4.9). Coefficients of
the model Y LNAREA = XLNMRIB + Xup + XINDEX + XINDEXxLIP did not significantly
change between April 1991 and April 1992. Similarly, coefficients of the
model Y LNAREA = XLNMRIB + XINDEX were not significantly different between the
March 1990 and April 1991 data sets. The common models accounted for
similar proportions of total variation, and the MSE of the common model was
similar to the model from the contributing data sets. In both instances,
however, the predictive ability of the common model was suspect. Despite
little shrinkage between r and R2, the expected residual mean squares
Non-destructive estimation of tomato 'Moneymaker' leaf area 176
(MSPR) were considerably larger than that of the common model (MSE). The
estimation bias of MSE this represents would be reflected in an increase in
the width of the confidence limits of prediction and decreased prediction
accuracy.
The relationship between mid-rib length and leaf area along the stem axis
changed between months. In January 1990, the interaction between loge mid
rib and positional and developmental indices was significant, indicating that
the relationship between mid-rib length and leaf area varied along the stem
axis. This inconsistency, however, was largely absent in plants grown in
other months.
Both INDEX and LPI indices varied in their respective contributions between
models. In particular, INDEX often contributed to multicollinearity in the
model (data not shown), reflecting the robust relationship between it and
LNMRIB, LIP and LPI (e.g. Fig. 4.5a,b).
Final selection
In the absence of a single model that was consistent in terms and stable in
time (between months), a model was selected for each month (Table 4 .10).
Coefficients for LNMRIB and LIP were consistent in sign and magnitude
between models. The sign of the coefficient of the I NDEX term varied
between models, making a positive adjustment in the January 1990 model,
and negative adjustments in the April 1991 and 1 992 models. The negative
signs in April 1991 and 1992 were due to the inclusion of LIP. The change
in sign is probably a consequence of multicollinearity.
Non-destructive estimation of tomato 'Moneymaker' leaf area 177
Table 4.9 Relative performance of common model structures between months.
Model
YLNAREA = a + � + � -XINDEX - Xw...nmEl( intercept
LNMRIB
LIP
INDEX
LIPxINDEX
R2
R2 -.ij
r MSE.
MSPR
MSPW April 1981
MSPRApril lG92
Y LNAREA = a + Xua.ouB + XINDEX intercept
LNMRIB
INDEX
R2
R2 -.ij
r MSE.
MSPR
MSP�ardl l990
MSPRApril l981
Data set
April 91 April 92
3.980 4.716
1.868 1.791
0. 135 0.075
-2.342 -1.709
-0.384 -0.441
0.9942 0.9940
0.9936 0.9936
0.9923 0.9925
0.0123 0.0147
0.0222 0.0178
March 1990 April 1991
3.722 3.752
2.452 2.478
1.542 1.196
0.9865 0.9839
0.9864 0.9832
0.9899 0.9900
0.0227 0.0344
0.0148 0.0323
�alidation data set for indicated month only
Combined model
4.526
1.869
0.1 18
-2.039
-0.387
0.9939
0.9936
0.9901
0.0142
0.2211
0.0496
0.3142
3.825
2.452
1.448
0.9872
0.9871
0.9842
0.0223
0.0748
0.0827
0.0472
Non-destructive estimation of tomato 'Moneymaker' leaf area 178
Table 4.10 Coefficients and prediction intervals of selected models
Month
Parameter January 1990 March 1990 April 1991 April 1992
intercept 4.456 3.856 4.034 3.814 (8E) (0.0106) (0.0129) (0.0362) (0.0216)
LNMRIB 2.460 2.174 1.841 2.022 (8E) (0.0254) (0.2264) (0.0937) (0.0604)
LIP 0.077 0. 124 0.075 (8E) (0.0043) (0.0239) (0.0129)
INDEX 0.303 -2.352 -0.848 (8E) (0.0576) (0.4578) (0.3328)
LNMRIBxLIP -0.026 (8E) (0.0092)
LNMRIBxINDEX -0.497 -0.398 (8E) (0.0726) (0.0458)
LIPxINDEX -0.253 -0.415 (8E) (0.0201) (0.0572)
n 379 264 83 160
MSE 0.0126 0.0159 0.0158 0.0183
8E;P(lor 0. 1127 0.1265 0. 1269 0.1363
8E;P(20) 0.1 127 0.1265 0. 1301 0.137 1
8E;P(30) 0. 1130 0.1265 0. 1276 0.1369
8�40) 0.1 129 na· 0.1286 0.1374
8E;p(so) na na na 0.1381
"Centered regressors Ymean standard error of individual predicted values of leaves with mid-rib length of (x):0.5 cm. ·No leaves within the range were present in the data set.
Non-destructive estimation of tomato 'Moneym�r' leaf area 179
4.4 Discussion
A conventional statistical approach, standard in its sequence and procedures
(Draper and Smith, 1981 ; Myers, 1990; Neter et al., 1 990), was used to
develop the models reported here. Many of the regression diagnostics and
measures of model adequacy used were developed between 1970-1980. Allen
( 1971a, 1971b, 1974) proposed the MSPR and PRESS statistics; Cook (1977)
proposed the D statistic to identify influential points; Snee (1977) introduced
data-splitting as an effective method of evaluating model performance;
Hoaglin and Welsch (1978) discussed the role of the HAT matrix in
identifying influential observations; and Belsley et al. (1980) are credited for
statistics that assess multicollinearity (e.g. cp) and the DFBETAS, DFFITS,
and COVRATIO statistics to identify those observations influencing
regression coefficients. The techniques are now well established in statistical
literature and software (e.g. Minitab, 1 991; SAS Institute, 1988), yet their
utility has largely been overlooked in recent literature presenting empirical
models for predicting leaf area.
The position of the leaf on the stem was an important factor in predicting leaf
area. Both positional factors accounted for this change, with LIP being
slightly more stable in the sign of its coefficient than INDEX. Significant
interactions between positional indices and LNMRIB in some months but not
in others (Table 4.7) signalled a variable relationship between mid-rib length
and leaf area along the stem axis. It is unclear whether this change is due
to position or stage of development. The strong relationship between INDEX
and LPI (Table 4.6) makes it difficult to distinguish whether I NDEX was
important for expressing position or for indirectly expressing the stage of leaf
development.
Variation in the relationship between mid-rib length and leaf area is possibly
due to non-uniform expansion either between leaflets within the compound
leaf, or within leaflets. Ho and Shaw (1979) reported leaflets on the same
compound leaf mature at different times. The latter report is supported by
Non-destructive estimation of tomato 'Moneymaker' leaf area 180
the observation that tomato leaflets expand in at least six layers of cells
(Maksymowych, 1973). Moreover, varying rates of cell division within the
different layers (Coleman and Greyson, 1976b) results in different sizes and
shapes of cells and air spaces in the mature leaf (Picken et al., 1986). This
developmental response was not reflected in models incorporating
developmental indices. On the other hand, models incorporating LPI were
consistently out-performed by those incorporating positional indices.
While closely paralleled by INDEX (Table 4.6, Fig. 4.5), LIP was an important
main factor in many models, apparently contributing information not pro
vided by INDEX Within a sample of plants, INDEX values define the
relative stem position of the leaves, whereas LIP values reflect absolute
position. Leaves at absolute nodal positions have predefined source-sink
functions (Picken et al., 1 986) which may influence the rate at which leaflets
reach full expansion in a manner independent of the development stage (LPn
or relative position (INDEX) of the compound leaf.
Due to changes between months in the predictive value of positional and
developmental regressors (Table 4.7), no single model accurately predicted
leaf area. Thus, although LNMRIB accounted for most of the variance in
each month's data set, the relative importance of regressors for leaf position
and development stage differed between months. Model structures common
in some months (e.g. YLNAREA = �RIB + �NDEX in March 1990 and April 1 991)
were not robust over time, with the magnitude of all partial regression
coefficients changing between months (Table 4.8) . These changes were not
due to multicollinearity, as models with negligible multicollinearity also
displayed this condition.
Incorporating SLA into models did not improve model performance between
months, despite there being significant differences in this index between
months (Table 4.9). Presumably the mid-rib length and positional and
development indices were sufficiently robust to accommodate changes in leaf
'thickness' or 'density'. This also indicates that changes in the partial
Non-destro.ctive estimation of tomato 'Moneymaker' leaf area 181
coefficients of these regressors between months were not due to morphological
changes associated with SLA. Although seasonal changes in average plant
SLA of greenhouse grown tomatoes are of sufficient magnitude to be detected
(Heuvelink, 1995), the sample SLA values made in the current study may
have been too imprecise. Steer (1971), for example, reported that large
changes in SLA in sunflower and maize leaves occurred with stem position
and stage of lamina development. The mean SLA calculated from leaves
randomly selected from any position on the stem may have provided such a
coarse measure to be of no value in the model.
Photoperiod influences leaf length in some tomato cultivars (Aung and
Austin, 1971). Under long days, leaves at node positions less than about 6
were shorter than similarly positioned leaves under short days; at positions
greater than about 6 the response was reversed. The SD treatments of Aung
and Austin (1971) were 8 h, and the LD treatments 1 1-13 h. Although the
response of 'Moneymaker' to photoperiod is unknown, because day length
exceeded 1 1 hours in all months in which data was collected, it is unlikely
that the differences between months were due to photoperiod.
Potential collinearity between the regressors was signalled by strong
correlation between LNMRIB and the developmental and positional indices
(Table 4.6), and later conflrIIled by VIF and eigensystem condition
diagnostics. Deleting ill-conditioned variables was not a satisfactory solution
as the resulting models were under-specified. Use of variables uncorrelated
with LNMRIB (e.g. SLA and HT) was also unsuccessful as these variables
were weak regressors. Centering raw data before regression analysis
reduced, and in some models eliminated, multicollinearity. The assumption
required by this procedure, that prediction of zero levels of the response
variable (Le. lo� leaf area) was not important (Myers, 1990), was justified.
The best performing models from the March 1990, April 1 991 and 1992 data
sets exhibited moderate levels of multicollinearity (Table 4.10). Potential
problems associated with multicollinearity must be assessed in context with
Non-destructive estimation of tomato 'Moneymaker' leaf area 182
the intended use of the model. Models accounting for a high proportion of
total variation (i.e. high R2) and having a small residual mean square can be
fitted despite multicollinearity between the fitted regressors. Prediction
outside the data region using such models, however, is usually associated
with unacceptably large prediction confidence intervals. Valid use of the
models developed in this study outside the month in which data was collected
is precluded by their instability in time, and is thus restricted to data sets
collected concurrently from plants of the same cultivar under the same
cultural conditions. Under these restrictions, physiological age, mid-rib
lengths, and stem position would be within the data region on which the
model was based, and the presence of multicollinearity would not decrease
the accuracy of prediction.
Estimating compound leaf area as the sum of predicted leaflet area is
statistically rigorous but impractical. Three measures of leaflet width, and
one of length, were required for satisfactory performance of the model (Table
4.1) . Ross (1946) estimated leaflet area from the product of their length and
maximum width. My results (Table 4.4) suggest this model structure is
under-specified and increasingly inaccurate as either leaflet length or width
increases.
Insufficient attention is given to validating and checking the robustness of
models in time. None of the models in the surveyed literature were
apparently validated. While use of PRESS residuals (Allen, 197 1a, 197 1b,
1974) has been made easier through recent advances in computing power,
there seems no reason to ignore the value of split data sets (Snee, 1977) to
develop and test proposed models. Stability of models in time is closely
linked with the overall concept of prediction. Prediction describes the future;
it follows that predictive models should be tested in time as part of a formal
validation procedure.
Indeed, the essential nature of prediction is often overlooked. Authors
present statistics that reflect current, rather than future, performance of the
Non-destructive estimation of tomato 'Moneymaker' leaf area 183
model. In this regard, authors routinely misrepresent R2 values, interpreting
them as measures of the predictive ability of the model. The R2 criterion is
not, however, conceptually prediction orientated (i.e. prediction performance
based), but rather a measure of the capacity of the model to fit the present
data. Moreover, a large R2 does not imply the fitted model is a useful one.
The fitted model may not be useful if most predictions require extrapolation
outside the region of observations. Again, a large R2 can often be accom
panied by a MSE too large for inferences to be useful when high precision is
required (Neter et al., 1990). As demonstrated in my study, the R2 criterion
can be a poor discriminator of models, particularly when all models have high
R2 values. For these reasons, R2 is not recommended as the sole criteria for
choosing the best prediction model from a set of candidate models (Myers,
1 990).
Confidence intervals and standard errors of prediction are rarely presented
in reports of predictive models. Many authors present estimates of MSE, but
the magnitude of standard errors of prediction calculable for this statistic
depends on the position of the observation in the data space, with
observations close to the mean having smaller standard errors of prediction
than those distant. Authors who do present MSE estimates do not provide
sufficient information concerning the data space from which the model was
developed to allow estimates of confidence intervals to be calculated. Indeed,
recently published models have not presented estimates of MSE at all
(Hoffman, 1971 ; NeSmith, 1991; Whitworth et al., 1992), or have overlooked
their interpretation. NeSmith (1992) concluded that summer squash leaf area
was best estimated by a squared function of width since only one
measurement need be collected. The proposed model, however, exhibited
increasing variability with increasing width, and the MSE of an alternate
model using the product of leaf length and width was 50% smaller than that
of the chosen model. NeSmith (1992) was apparently prepared to sacrifice
considerable precision for modest gains in efficiency of measurement.
Non-destructive estimation of tomato 'Moneymaker' leaf area 184
The potential utility of models that are stable in time is questioned by this
study. The performance of models whose structure was common between
pairs of months was poor (Table 4.8) . Thus, while stability in time is a basic
premise in developing a predictive model, the whole issue of stability becomes
irrelevant if the stable model does not predict accurately. Model developers
must distinguish between structural and performance stab ility. Consistency
of regressors between different data sets reflects structural stability; only
model validation can confirm performance stability.
Evaluating a model is not a wholly objective exercise. The researcher's
opinion of the utility, simplicity, and appropriateness to objectives of the
model also contributes to its final worth (Thornley and Johnson, 1990). As
different researchers attach different weights to these items, it is not
surprising that models in the same problem area are ranked differently by
different people. Nevertheless, although the level of precision gained with
one model might be sacrificed for gains in utility in another (e.g. NeSmith,
1992), complete information on the precision and predictive ability of both
models is still required if an informed decision is to be made.
Developing statistical models to predict leaf area from length and width
measurements requires more effort than assessment of R2. Because poorly
specified models are often masked by high R2 values, analysis of residuals is
required to detect such models. Validating the model with independent data
is necessary to assess its predictive ability. In tomato, the relationship ... between area and leaf or leaflet length and width changes within the plant,
and in time. Neither the physiological stage of development of the plant, nor
SLA nor photoperiod are influential factors in these changing relationships.
When non-destructive estimation of tomato leaf area is required, the
prediction model must be developed while the main experiment is being
conducted.
..
Chapter 5
Red uctio n of experi m ental error
using cl uster analys is
5.1 Introduction
Local error control using cluster analysis 186
Biometrics texts recommend blocked designs for overcoming differences
within the immediate environment of an experiment (e.g. Cochran and Cox,
1 957; Zar, 1 984). Less attention is given to the use of blocked designs to
manage initial (before-treatment) differences in the morphology of the experi
mental units. Such differences can inflate within-group variation,
particularly if the variables being measured are subject to ontogenetic drift..
This problem confounds analysis of many indices used in growth analysis, e.g.
relative growth rates and shoot:root ratios (Hunt, 1 978) . Additionally, accom
modating uniform groups of plants of different size or shape in a structured
experimental design increases the range of experimental units over which
conclusions can be made.
An underlying premise of experimental design is the valid imposition of
restrictions to the otherwise random allocation of treatments to experimental
units. These restrictions partition the total variance into comparisons of
interest to the researcher, and provide local error control. Local error control
uses a form of restricted randomisation commonly termed blocking to reduce
experimental error. Experimental units are blocked into groups in which
they are homogeneous in one or more of the variables characteristic of the
units (Gill, 1978) . By allocating blocks along existing clines (e.g. a gradient
in soil fertility, temperature, light, or size of experimental units), these
additional sources of variation are accounted for in the analysis.
Although experimental error is reduced using homogeneous experimental
units, the results of the experiment are only valid for the range encompassed
by those units. A wider range of experimental units makes conclusions valid
over a broader range (Neter et aI., 1990; Pearce, 1 979), but increased
variation among experimental units reduces the precision of the experiment.
Local error control using cluster analysis 187
Blocking resolves this dilemma, accounting for the increased variation
without a concomitant reduction in precision.
Blocking reduces among-treatment error, leaving the residual mainly as
within-treatment variation. As variation within blocks is reduced through
blocking, block differences represent variation across clines. For example, in
the unblocked completely randomised design (CRD), the residual is the sum
of among-treatment and within-treatment error. By contrast, in the blocked
randomised complete block (RCB) design, the block effect estimates among
treatment error and the residual estimates within-treatment error. Thus,
residual variance in the RCB model is partitioned into variation across
contours (among treatments), and variation along clines (within treatments),
with the result that the residual error of a RCB design is less than that of a
CRD design. Insignificant block effects in an RCB analysis' suggest the
presence of a homogeneous environment or experimental units, or use of an
inappropriate blocking practice. In the latter, blocks lie along the cline
(across contours), and the block effect is therefore composed of both among
and within-treatment components. Under such circumstances the residual
error of the incorrect RCB will approach that of the CRD.
Control of experimental error in plant growth studies
It is often difficult in plant growth studies to obtain a uniform population of
plants (experimental units). Morphological characteristics of plants of the
same chronological age may vary due to inherent variability. In such cases
similar plants are blocked into groups by visual size (Lieth et al., 1991;
Proebsting et al., 1989), height (Biasi et al., 1989; Early and Martin, 1988;
Erwin and Heins, 1990), trunk circumference (Erf and Proctor, 1989; Maust
and Williamson, 1 994), leaf and lateral shoot number (Erwin and Heins,
1990; Erwin et al., 1 991), or fruit ripeness (An and Paull, 1990), shape or size
(Cabrera and Saltveit, 1990) before randomly allocating treatments to the
plants within each block.
Local error control using cluster analysis 188
Common to these examples of blocking strategy is a single source of variation.
S imple classification becomes more difficult, however, when the sources of
potential variation among units increase. Although additional sources of
potential variation can be fitted to the model as covariates (Mead, 1990; Neter
et al., 1990), this approach requires covariates to be linearly related to the
response variable. This restriction may not always be met by these sources
of potential variation.
The variable used as the blocking criterion is often chosen more for its ease
of assessment than direct value to the study. Such blocking strategies
implicitly assume a correlation between this variable and other variables
more relevant to the study's objectives. For example, blocking visually by size
or plant height assumes a strong correlation between these variables and
such variables as total leaf area, leaf number, or stage of development. For
example, Biasi et al. (1989) blocked peach seedlings by height, but assessed
treatment effects through leaf area, leaf number, and fresh and dry weights.
These assumptions are rarely acknowledged or tested, raising doubt about the
degree of local error control actually achieved by the blocking strategy.
Cluster analysis
Cluster analysis is a multivariate statistical technique. Its basic aim is to
find natural groupings within a set of individuals. Individuals are allocated
to mutually exclusive groups; individuals within a group are similar to each
other while individuals in different groups are dissimilar. Clear groups that
emerge are named and their properties summarized, enabling efficient
organising and retrieval of the information available. In other words, simpli
fication with minimal loss of information is sought.
Cluster analysis procedures fall into three groups: hierarchical , partitioning,
and clumping methods (Pimentel, 1979). All groups impose a certain struc
ture on the data. A hierarchical approach summarises how groups in a
Local error control using cluster analysis 189
partition are related at different levels. Hierarchical techniques are either
agglomerative, which proceed by a series of successive fusions of n
observations into groups, or divisive, which successively partition the set of
n observations into finer partitions. Both types of hierarchical technique find
the most efficient juncture at each stage of the progressive subdivision or
synthesis of the population. Results of both subdivisions are presented in a
dendrogram, a two-dimensional diagram illustrating the fusions or partitions
made at each successive level.
Partitioning methods partition the set of n observations into a specified
number of disjoint groups, g, so that each observation belongs to one and only
one group. The value of g is specified by the researcher and analyses are
usually repeated using different values. Groups produced by partitioning
methods have, by definition, no members in common with one another. On
occasion this is unnecessarily restrictive; in clumping methods the groups are
allowed to overlap.
An assumption made in these methods is that all the relevant relationships
within the set of n observations can be summarized by a matrix containing
'proximity' or distance values between each pair of observations. Thus each
pair of observations will have an associated numerical value, Pij' which
depicts the extent to which the ith andjth observations resemble each other.
Similarity and dissimilarity are terms also used in this context. Thus, in
performing cluster analysis, the similarity (or dissimilarity) of every pair of
individuals is measured, with the raw data matrix X (n observations x p attributes) replaced by a matrix of proximity coefficients.
This step is important and substantial information is lost if done incorrectly.
The information within the set of variables describing the observations is
subsumed into the set of proximity coefficients. It is important that these
coefficients accurately reflect the relevant features of the data. Thus, atten-
Local error control using cluster analysis 190
tion must be given to scaling the data, so that the (dis)similarity matrix
represents the relationships within the set of observations. This is
particularly important when variables are measured in non-commensurable
units, or are strongly correlated with each other. Both conditions are charac
teristics common to biological data.
Cluster analysis and local error control
Pimentel (1979) defined cluster analysis as allocating individuals to mutually
exclusive and exhaustive groups, such that individuals within a group are
similar to each other while individuals in different groups are dissimilar.
Clearly, for local error control, these groups could be regarded as blocks.
Moreover, the multivariate nature of cluster analysis would allow several
potential sources of variation to be considered concurrently.
To my knowledge, cluster analysis has not been used to improve the local
error control afforded by blocked experimental designs. This chapter presents
results from experiments comparing cluster analysis with visual grading in
allocating tomato plants to blocks based on total leaf area and plant height.
In focusing on these variables, I assumed that (i) the area of leaves available
for photosynthesis was an important contributor to growth, and (ii) total leaf
area was closely related to the stage of plant development.
5.2 Materials and Methods
5.2 .1 P lant culture
In both experiments, seedlings of tomato 'Moneymaker' were transplanted
into 200 ems plastic pots at first true leaf stage (10 days after sowing). Six
weeks later, shoots were excised below the cotyledonary node and rooted
under mist in an aerated water bath (Chapter 4). When adventitious root
Local error control using cluster analysis 191
length was approximately 2 cm, plants were individually numbered and
transferred to a deep flow hydroponic system (Chapter 2).
5.2.2 Experiment 1
Plants were randomly divided into two groups of 50. Total leaf area of each
plant was determined as the sum of the individual leaf areas, the latter
estimated from linear, positional and developmental characteristics (Chapter
4) according to the formula:
LNAREA = 1 .841(LNMRIB) + O.l24(LIP) - 2.352(INDEX) - O.41S(LIP . INDEX)
where LNAREA = log. leaf area (cm�. LNMRIB = log" leaf mid-rib (em), LIP = leaf insertion position, and INDEX = relative leaf position on stem.
(5. 1)
Two independent observers were each asked to arrange, from the pool of 50
plants, six sub-groups each containing five similarly 'sized' plants based on
a visual assessment of 'leafiness' and height. Plants in the second group
were allocated to six groups containing five plants by cluster analysis of their
height and estimated leaf area, individually and together. Whenever a
clustered group contained more than five plants, the first five plants listed in
that group were chosen.
5.2.3 Experiment 2
Fifty-one plants were prepared in the manner described. Height, leaf mid-rib
lengths and leaf position on the stem were recorded and total leaf area of
each plant calculated from equation (5.1 ). Two independent observers each
visually graded the plants, on the basis of leafiness and height, into sub-
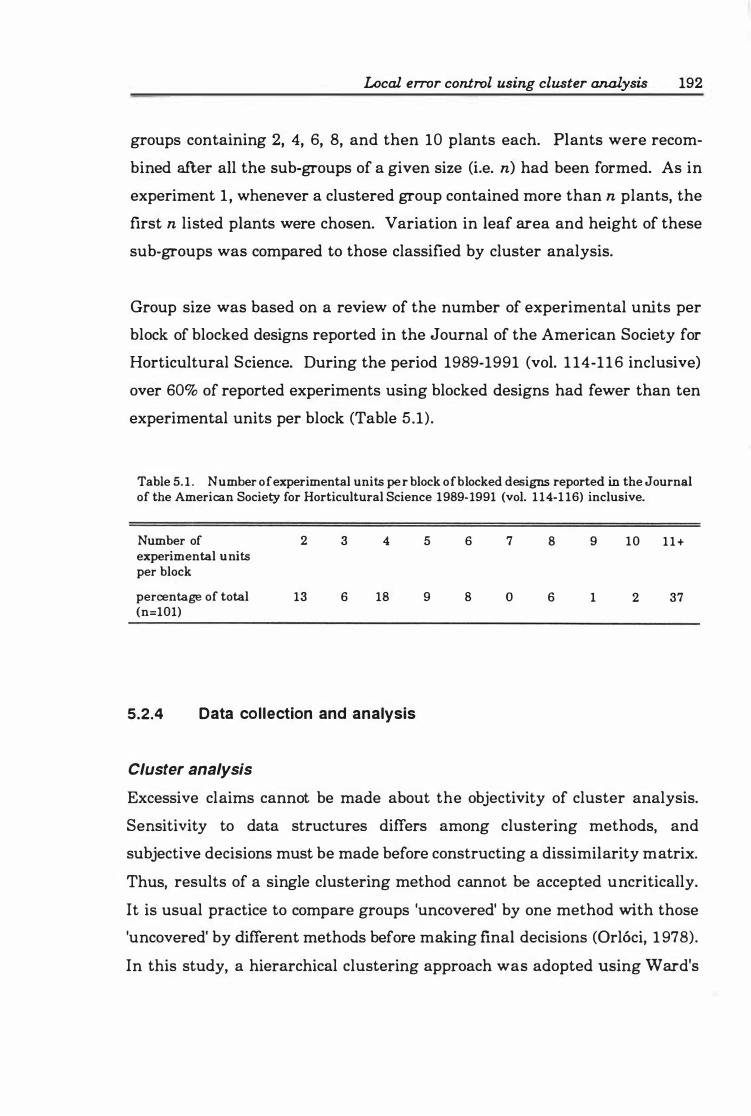
Local eTlOr control using cluster analysis 192
groups containing 2, 4, 6, 8, and then 10 plants each. Plants were recom
bined after all the sub-groups of a given size (Le. n) had been formed. As in
experiment 1 , whenever a clustered group contained more than n plants, the
first n listed plants were chosen. Variation in leaf area and height of these
sub-groups was compared to those classified by cluster analysis.
Group size was based on a review of the number of experimental units per
block of blocked designs reported in the Journal of the American Society for
Horticultural Science. During the period 1989-1991 (vol. 1 14-11 6 inclusive)
over 60% of reported experiments using blocked designs had fewer than ten
experimental units per block (Table 5.1) .
Table 5. 1 . Number of experimental units per block of blocked designs reported in the Journal of the American Society for Horticultural Science 1989-1991 (vol. 1 14-1 16) inclusive.
Number of experimental units per block
percentage of total (n=101)
2
13
3 4
6 18
5.2.4 Data collection and analysis
Cluster analysis
5
9
6 7 8
8 o 6
9
1
10 1 1+
2 37
Excessive claims cannot be made about the objectivity of cluster analysis.
Sensitivity to data structures differs among clustering methods, and
subjective decisions must be made before constructing a dissimilarity matrix.
Thus, results of a single clustering method cannot be accepted uncritically.
It is usual practice to compare groups 'uncovered' by one method with those
'uncovered' by different methods before making final decisions (Orl6ci, 1 978).
In this study, a hierarchical clustering approach was adopted using Ward's
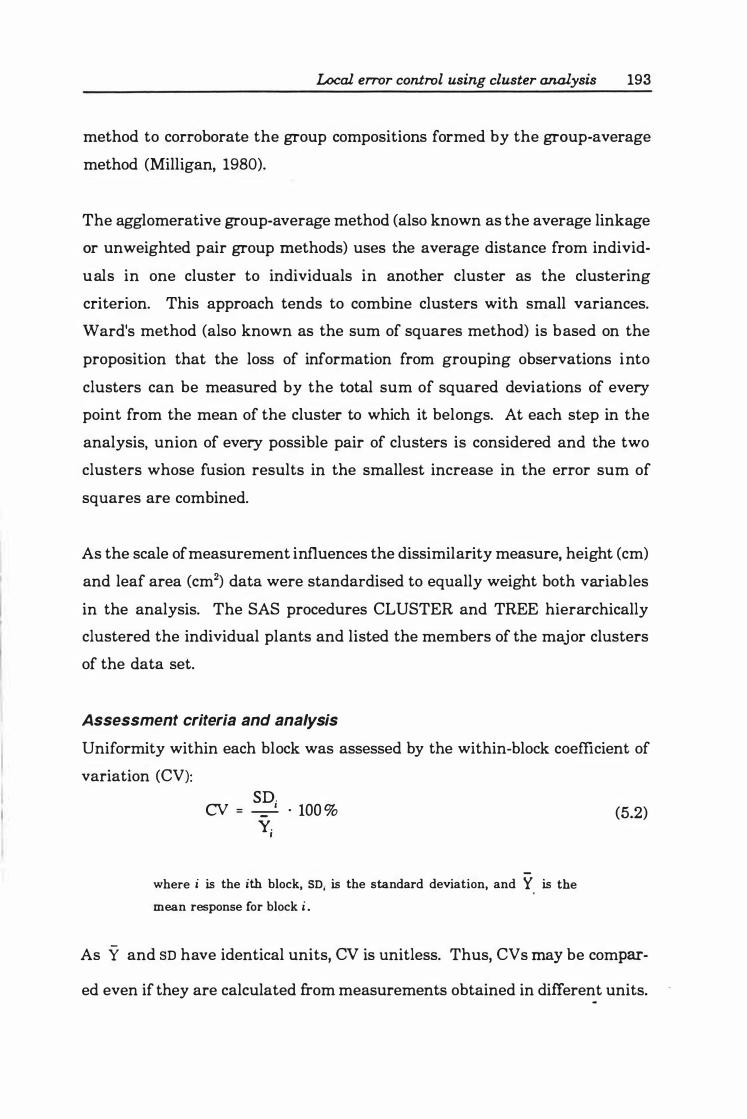
Local error control using cluster analysis 193
method to corroborate the group compositions formed by the group-average
method (Milligan, 1980).
The agglomerative group-average method (also known as the average linkage
or unweighted pair group methods) uses the average distance from individ
uals in one cluster to individuals in another cluster as the clustering
criterion. This approach tends to combine clusters with small variances.
Ward's method (also known as the sum of squares method) is based on the
proposition that the loss of information from grouping observations into
clusters can be measured by the total sum of squared deviations of every
point from the mean of the cluster to which it belongs. At each step in the
analysis, union of every possible pair of clusters is considered and the two
clusters whose fusion results in the smallest increase in the error sum of
squares are combined.
As the scale of measurement influences the dissimilarity measure, height (cm)
and leaf area (cm2) data were standardised to equally weight both variables
in the analysis. The SAS procedures CLUSTER and TREE hierarchically
clustered the individual plants and listed the members of the major clusters
of the data set.
Assessment criteria and analysis
Uniformity within each block was assessed by the within-block coefficient of
variation (CV): SD. CV = � · 100 % Y. I
-where i is the ith block, SD. is the standard deviation, and Y; is the
mean response for block i .
(5.2)
As Y and SD have identical units, CV is unitless. Thus, CVs may be compar-
ed even if they are calculated from measurements obtained in different units.
Local error control using cluster analysis 194
The coefficient of variation is conventionally used as an index of the reliability
of the experiment, indicating the degree of precision with which the
treatments were compared (Gomez and Gomez, 1 984). Without published
benchmarks against which to assess within-block CV, 15% was adopted as the
upper desirable limit. This was based on my experience of whole experiment
CV in plant research, and that of Gomez and Gomez ( 1984) and Colwell
(1994). Gomez and Gomez ( 1984) reported acceptable ranges of CV for yields
of rice of 6-8% for variety trials, 10-12% for fertiliser trials, and 13-15% for
insecticide and herbicide trials. Colwell (1994) considered 10-15% an average
range of CV for fertiliser experiments.
In Experiment 1 , differences between the within-block CV of each clustered
or visually graded group were analysed by t-tests. In the second experiment,
ANOV A sums of squares were partitioned into a priori orthogonal contrasts.
Orthogonal orthogonal contrasts are calculable when 11;, the number of
individuals within each treatment group, is different (Hicks, 1982). Despite
this, I adopted a simpler approach by assuming that I had the best available
estimates of the respective treatment population means and consequently
calculated the contrasts as if nj were equal in each group.
5.3 Results
There was consistent agreement in both experiments between the group
average method and Ward's method in the composition of clustered groups.
Of the two methods, only results arising from the group-average method are
presented.
Local error control using cluster analysis 195
5.3.1 B locking by leafiness (Experiment 1 ).
Cluster analysis of estimates of total plant leaf area was superior to visual
grading in reducing within-block CV. The mean CV of clustered blocks was
about four times smaller than visually graded blocks (Table 5.2). Mean leaf
area, averaged over all blocks, was similar between visually graded blocks
and those established by cluster analysis. Cluster analysis increased the
range of leaf area between the blocks, with the mean leaf area of visually
graded blocks ranging from about 200 to 500 cm2, and from 150 to 600 cm2
for clustered blocks.
Table 5.2. Mean plant leaf area and coefficient of variation of blocks determined by cluster analysis and visual differentiation.
Blocking method Block number Total leaf area (cm�
mean CV"
Cluster analysis 1 602.6 2.9
2 364.1 1.5
3 332.2 4.1
4 274.9 4.9
5 207 .1 6.8
6 150. 1 10.8
mean 321.8 5.2
Visual 1 484.8 26.3
2 465.4 23.3
3 396.7 19.4
4 355.7 13.0
5 255.1 30.2
6 218.0 10.3
mean 362.6 20.4
t-tests (cluster analysis vs visual) NS 0 0
1Ia, ', .. , "'Nonsignificant or significant t test at P<0.05, 0.01, or 0.001 respectively. " Coefficient of variation
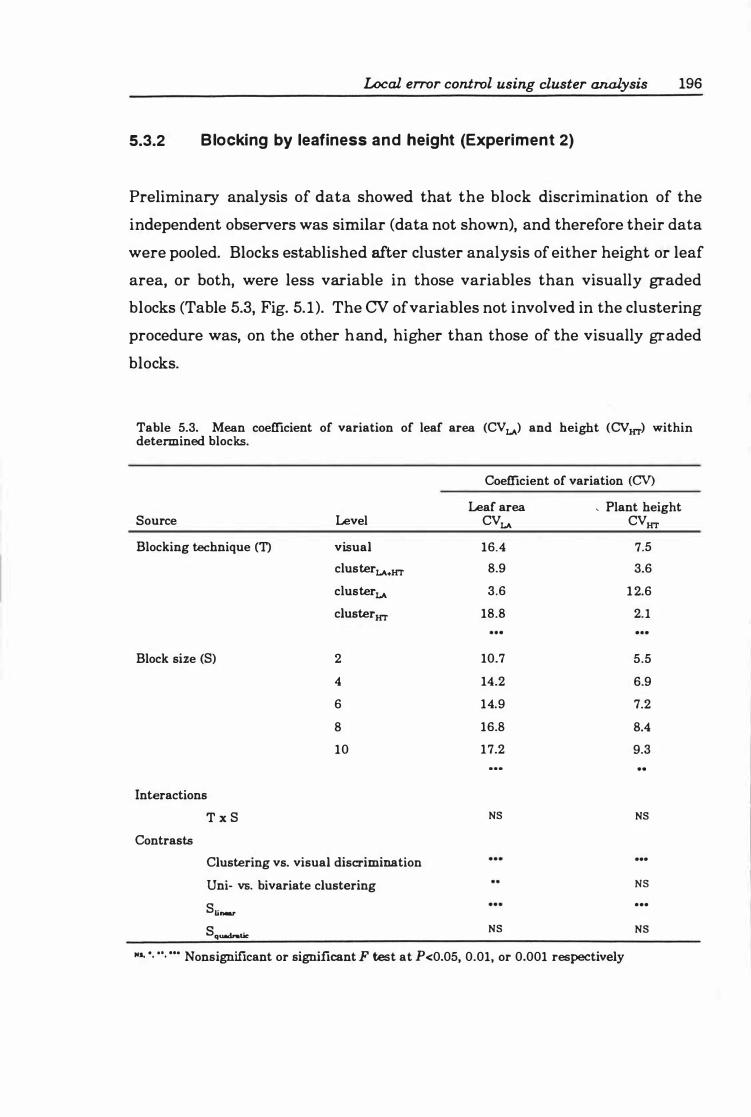
Local error control using cluster analysis 196
5.3.2 B locking by leafiness and height (Experiment 2)
Preliminary analysis of data showed that the block discrimination of the
independent observers was similar (data not shown), and therefore their data
were pooled. Blocks established after cluster analysis of either height or leaf
area, or both, were less variable in those variables than visually graded
blocks (Table 5.3, Fig. 5. 1). The CV of variables not involved in the clustering
procedure was, on the other hand, higher than those of the visually graded
blocks.
Table 5.3. Mean coefficient of variation of leaf area (CVLA) and height (CVm) within determined blocks.
Source Level
Blocking technique (T) visual
clusterLA+m
clusterLA
clusterm
Block size (S) 2
4
6
8
10
Interactions
T x S
Contrasts
Clustering vs. visual discrimination
Uni- vs. bivariate clustering
Sli .....
Sq....v.tie
Coefficient of variation (CV) Leaf area , Plant height
CVLA CVm
16.4 7.5
8.9 3.6
3.6 12.6
18.8 2.1 . . .
10.7 5.5
14.2 6.9
14.9 7.2
16.8 8.4
17.2 9.3
NS NS
...
NS . . .
NS NS
.... ' . • ' . ... Nonsignificant or significant F test at P<0.05, 0.01, or 0.001 respectively
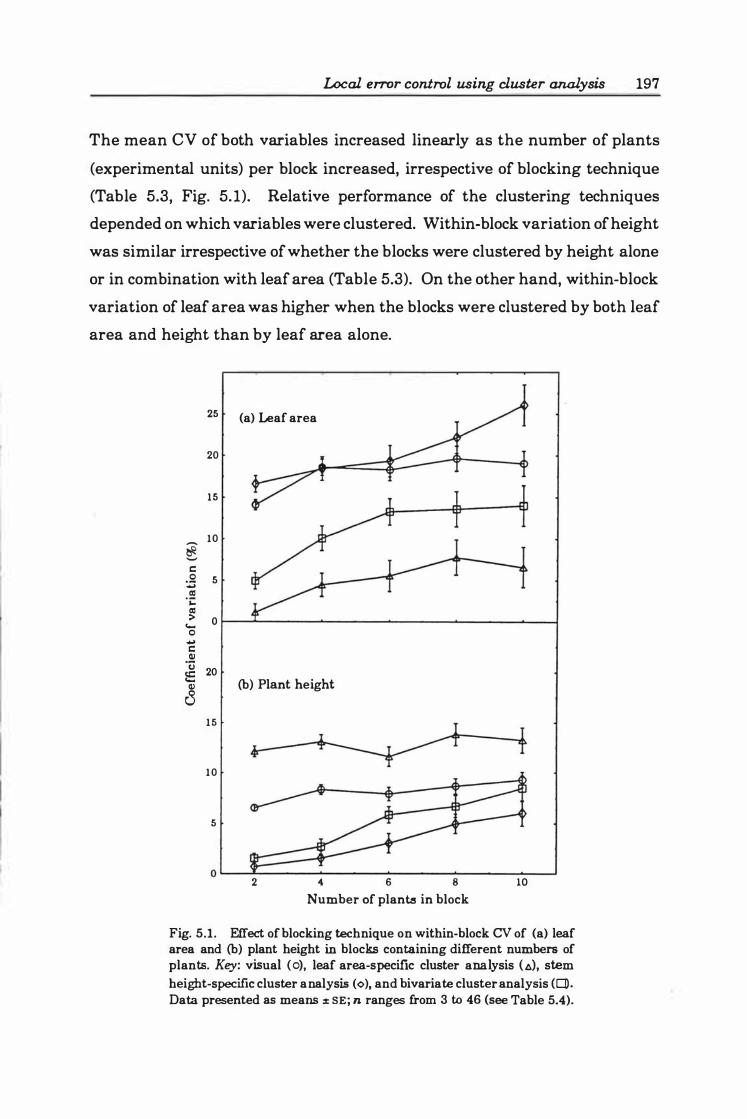
Local error control using cluster analysis 197
The mean CV of both variables increased linearly as the number of plants
(experimental units) per block increased, irrespective of blocking technique
(Table 5.3, Fig. 5. 1). Relative performance of the clustering techniques
depended on which variables were clustered. Within-block variation of height
was similar irrespective of whether the blocks were clustered by height alone
or in combination with leaf area (Table 5.3). On the other hand, within-block
variation of leaf area was higher when the blocks were clustered by both leaf
area and height than by leaf area alone.
25 (a) Leaf area
20
1 5
� 1 0
c 0 5 � CI!
.j;; CI! > 0 .... 0
.... c Q)
·u 20 15 Q) (b) Plant height 8
1 5
1 0
5
o���----�------�------�------�--� 2 .( 6 8 10
Number of plan� in block
Fig. 5.1. Effect of blocking technique on within-block CV of (a) leaf area and (b) plant height in blocks containing different numbers of plants. Key: visual (0), leaf area-specific cluster analysis (A), stem height-specific cluster analysis (¢), and bivariate cluster analysis (C]. Data presented as means :to SE; n ranges from 3 to 46 (see Table 5.4).
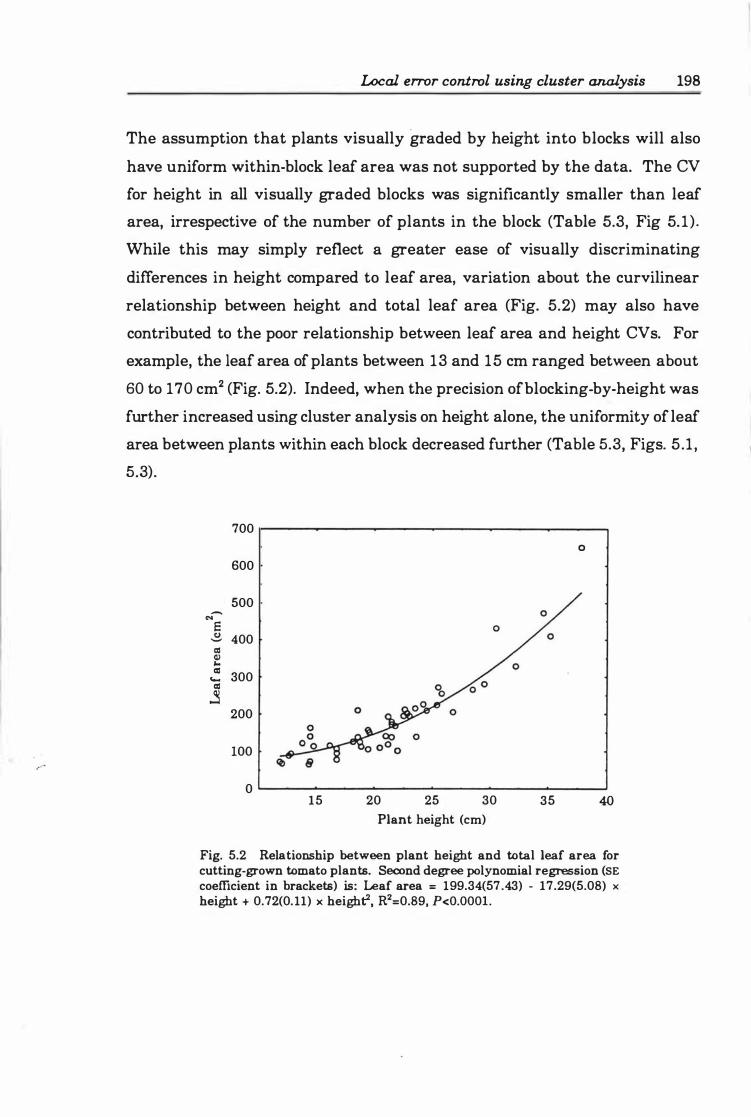
Local error control using cluster analysis 198
The assumption that plants visually graded by height into blocks will also
have uniform within-block leaf area was not supported by the data. The CV
for height in all visually graded blocks was significantly smaller than leaf
area, irrespective of the number of plants in the block (Table 5.3, Fig 5. 1 ) .
While this may simply reflect a greater ease of visually discriminating
differences in height compared to leaf area, variation about the curvilinear
relationship between height and total leaf area (Fig. 5.2) may also have
contributed to the poor relationship between leaf area and height CV s. For
example, the leaf area of plants between 13 and 15 cm ranged between about
60 to 170 cm2 (Fig. 5.2). Indeed, when the precision of blocking-by-height was
further increased using cluster analysis on height alone, the uniformity of leaf
area between plants within each block decreased further (Table 5.3, Figs. 5 .1 ,
5.3).
700 0
600
500 -... S u 400 '-' al � "" as
300 ..... as
j 200
100
0 15 20 25 30 35 40
Plant height (cm)
Fig. 5.2 Relationship between plant height and total leaf area for cutting-grown tomato plants. Second degree polynomial regression (SE coefficient in brackets) is: Leaf area = 199.34(57.43) - 17.29(5.08) x height + 0.72(0. 11) x heighf. R2=0.89. P<O.OOOl.
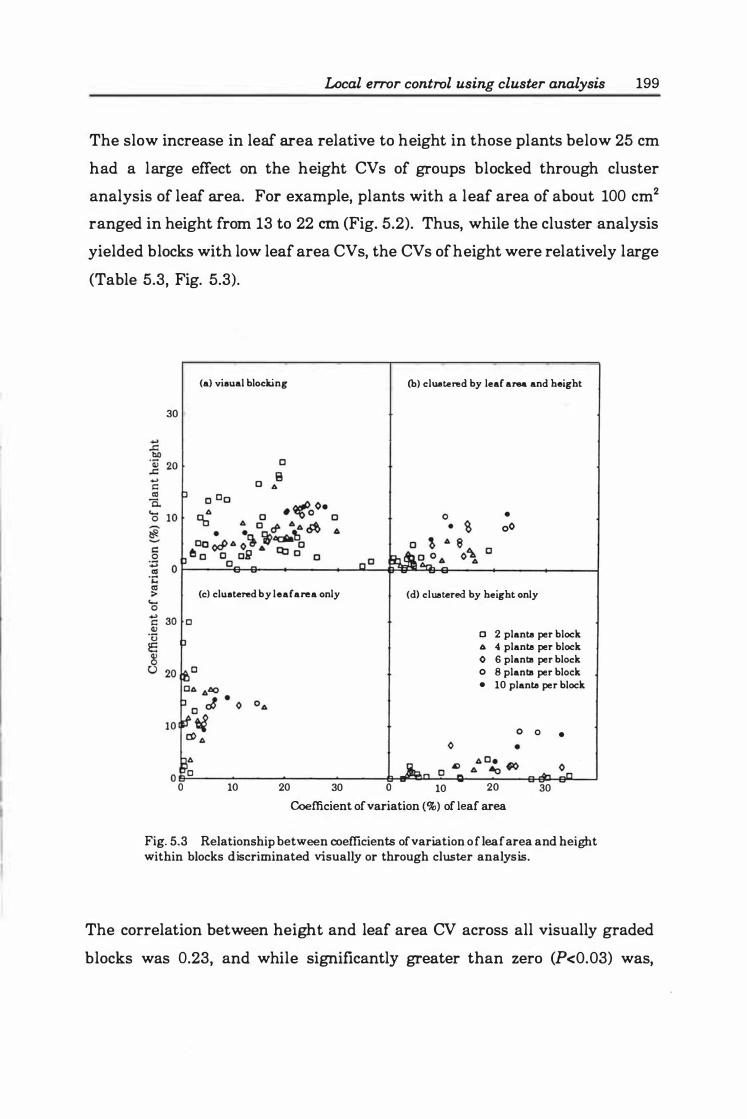
Local error control using cluster analysis 199
The slow increase in leaf area relative to height in those plants below 25 cm
had a large effect on the height CVs of groups blocked through cluster
analysis of leaf area. For example, plants with a leaf area of about 100 cm2
ranged in height from 13 to 22 em (Fig. 5.2). Thus, while the cluster analysis
yielded blocks with low leaf area CVs, the CVs of height were relatively large
(Table 5.3, Fig. 5.3).
30
�� o 0
o
(a) visual blocking
(c) clustered by leaf area only
10 20 30 o
(b) clustered by leaf area and height
• 00
(d) clustered by height only
o 2 planta per block � 4 planta per block o 6 plants per block o 8 plants per block • 10 planta per block
10 20
o 0
30
•
Coefficient of variation (%) of leaf area
Fig. 5.3 Relationship between coefficients of variation of leaf area and height within blocks discriminated visually or through cluster analysis.
The correlation between height and leaf area CV across all visually graded
blocks was 0.23, and while significantly greater than zero (P<0.03) was,
Local error control using cluster analysis 200
nevertheless, very low. Clustering by height alone also yielded blocks in
which total leaf area was highly variable (Table 5.3, Figs. 5.1, 5.3).
Reduced block CV through cluster analysis of ?1easured variables did not
occur at the expense of fewer blocks. When two or ten plants per block were
required, cluster analysis tended to be more conservative; with six plants per
block bivariate cluster analysis discriminated one block more than visual
discrimination (Table 5.4).
Table 5.4. Number of blocks of given size (n) 'extracted' from the pool of plants by visual or clustering methods.
Number of Number of blocks plants within
block (n) visual #1% visual #? clusterbY clusterLA clUSterSH
2 18 18 18 17 18
4 9 10 8 9 9
6 6 6 7 5 5
8 4 4 4 4 5
10 4 4 3 3 3
% data of two independent observers Y clusterb : bivariate cluster analysis; clusterLA : cluster analysis using leaf area only;
clusterSH: cluster analysis using stem length only
5.4 Discussion
'.
Allocating plants to blocks by cluster analysis of measured characteristics
consistently resulted in smaller within-block CV than blocks formed by visual
grading. Over both experiments, the mean CV of clustered blocks was
between two and five times less thi:m visually discriminated b locks. Blocks
clustered on a single variable had smaller CVs than identical sized blocks
formed by bivariate clustering.
Local error control using cluster analysis 201
Although cluster analysis was more effective than visual grading in reducing
block CV, regardless of the number of plants required per block (Table 5.3),
the relative effectiveness of the technique decreased as the number of plants
required per block increased (Fig. 5.1). Clustering specifically for leaf area
was significantly more effective than visual grading for all block sizes
evaluated. Specific or bivariate clustering for leaf area was more effective in
reducing block heterogeneity than visual grading when the block consisted of
four or fewer plants. In the wider scope of reported experimental unit sizes
(Table 5. 1), a cumulative 36% of reported units had four or fewer individuals.
The improvement (Le. reduction) in CV achieved by group through cluster
analysis of the variables of interest did not reduce the number of blocks that
could be 'extracted' from the pool of plants (Table 5.4). This indicates that
the reduced CV was due to better blocking of the plants available, rather than
an increased number of plants deemed as being unsuitable. Given the similar
number of blocks between the methods, it appears that grading visually or
via cluster analysis were similarly effective in rejecting unsuitable plants.
Within-block CV was a good discriminatory measure of the different blocking
strategies. By standardising within-block variation against the mean size of
the variable, allowance is made for the tendency in biological studies for
variation to increase with plant size. The CVs reported, however, should not
be taken as absolute values suitable for extrapolation to other studies.
Although the 15% benchmark proved appropriate for leaf area, it was prob
ably too conservative for plant height. Simpson et al. (1960) concluded that
CVs less than 4% in zoomorphological studies indicated that the sample size
was insufficient to show variability. Applying this benchmark to the present
study gives ambiguous results. The CV of blocks of up to six plants clustered
by height was less than 4%, yet the CV of blocks of identical size grouped
visually exceeded the benchmark. Determining appropriate benchmark CV s
for blocking strategies requires further study.
Local error control using cluster analysis 202
Mean CV s of plant height and leaf area in visually graded blocks suggest that
visual grading is influenced more by plant height than leafiness (Table 5.3).
Taken together, height and leafiness reflect plant size. Therefore, blocking
by plant size may yield blocks of plants more similar in height than leafiness.
The effectiveness of the local error control realised under such conditions
would depend on the variables being measured. For example, Proebsting et
a1. (1989) blocked peach seedlings by size, but measured evapotranspiration
and leaf water relations. These variables are physiologically related more to
leaf area than height; local error control may have been improved by blocking
on some estimate of leaf area.
There was no support for the often implied assertion that blocks of plants of
similar height or 'size' will have similar leaf area. Despite a relatively strong
relationship between the height and leaf area of the tomato plants used in
this study (Fig. 5.2), both visual grading and cluster analysis by height
yielded blocks of plants with leaf area CV over the 15% lower limit (Table 5.3,
Fig. 5.1) . This suggests that blocking tomato plants visually by height to
obtain homogeneous leaf area within blocks will not be successful. As leaf
area is considerably more important than height or size to subsequent
expressions of growth (Brown, 1 984), the use of the latter characteristics (e.g.
Biasi et aI., 1989; Early and Martin, 1988; Erwin and Heins, 1990; Lieth et
aI., 1991; Proebsting et al., 1989), as suitable criteria for blocking requires
revlew.
Unfortunately, leaf area is difficult to assess non-destructively. In this study,
leaf area was estimated using a known mathematical relationship between
leaf mid-rib length and leaf area. As such relationships are usually not
immediately available for the crop under investigation, researchers may resist
the added burden of developing such relationships before block membership
can be determined. Development of simpler methods to non-destructively
estimate leaf area, for example video imagery (Lindsey and Bassuk, 1 992),
Local error control using cluster analysis 203
may provide more accurate and more easily obtainable data to effectively
block on leaf area. Alternatively, non-destructive estimates of canopy volume
(Ludwig et al., 1975) or leaf area index (e.g. Devitt et. al. , 1994) may be more
consistent indicators of leaf area than height and size, and should be
investigated as possible blocking criteria.
The differences in within-block CV among the methods reflect, to some extent,
the difference between qualitative (visual blocking) and quantitative (cluster
analysis of measured characteristics) assessment. Following this reasoning,
it is possible that had the two observers had access to the plant height and
leaf area data, then by ranking the plants by either characteristic, they would
have discriminated blocks with lower CVs than they achieved visually.
Further processing of the data through cluster analysis must add value to the
blocking procedure if it is to become an accepted procedure. Cluster analysis
achieves this requirement in two ways. First, it retains objectivity. Ranking
data carries the problem of deciding which individual will be the first member
of the group-in other words, where should the group boundaries be drawn
on the list. This objective decision must be made with each group formed,
and as a consequence, different people may draw the line at different places.
Cluster analysis avoids this problem by producing a unique classification from
a given sample of individuals (OrI6ci, 1978). Second, cluster analysis
facilitates easy blocking of individuals when more than one characteristic
contributes to among-treatment error. Although grouping individuals is
possible from a single ranked measurement, 'it becomes very difficult when
the individuals are to be grouped based on the rankings of two or more
characteristics (Manly, 1986).
A design that assesses treatment effects across a range of some specific
attribute (e.g. height, age, or leaf area) offers considerably more scope for
general interpretation or application of the results. For example, if a uniform
grade of short plants is used within the experimental units, the results of the

Local error control using cluster analysis 204
experiment are strictly only applicable to short plants. On the other hand,
assigning plants of different height to particular blocks to reduce within-block
variation broadens the population range to which the conclusions of the
experiment are applicable. This widens the inferential base, and helps
prevent misleading generalisation of results. These results show that, in
addition to reducing within-block CV, blocking plants by cluster analysis of
measured leaf area effectively broadens the range of leaf area over which the
treatments are evaluated.

Chapter 6
Leaf expans ion under
partial root restriction
6.1 Introduction
Leaf expansion in root restricted plants 206
The often b alanced reduction in root and shoot biomass or relative growth
rates that accompanies root restriction is interpreted by several authors as
evidence of a coordinated and dynamically controlled relationship between
roots and shoots (Krizek et al., 1985; LaRoche, 1 980; Menzel et al., 1 994;
Reiger and Marra, 1994; Richards and Rowe, 1977a; Robbins and Pharr,
1988). Several mechanisms have been advanced to explain the nature of this
relationship. Hameed et al. (1987) concluded that reduced growth of tomato
plants in small containers grown in a hydroponic solution resulted from
drought stress induced by increased hydraulic resistance in the restricted root
system. Tschaplinski and Blake (1985), working with alder (Alnus glutinosa
Gaertn.), and Proebsting et al. (1989) with peach, also concluded that the
mechanism involved changes in the plant water balance. Proebsting et al.
(1989) found evidence that these changes were mediated through changes in
stomatal conductance, rather than leaf water potential or osmotic potential.
However, water stress is not always responsible for reduced growth in small
containers. Carmi and Heuer (1981) reported higher leaf water potential in
restricted compared to unrestricted bean seedlings. Krizek et al. ( 1985)
concluded that growth impairment caused by water stress and restricted root
volumes involves different physiological mechanisms. Water stress reduced
leaf water potentials and stomatal conductance, induced preferential parti
tioning to the root, inhibited leaf initiation and decreased the rate of photo
synthesis. Such responses were absent in restricted plants which showed a
balanced overall decrease in growth throughout the plant (Le. the SR was
similar to unrestricted plants). On finding no inferential evidence of water
stress in the reduced expansion rates of cotton leaves, Mutsaers ( 1983)
postulated that limiting mineral nutrition was the principal cause. Reiger
and Marra (1994) reached a similar conclusion with young peach trees under
severe root restriction. In contrast, neither Carmi and Heuer ( 1981), Carmi
and Shalhevet (1983), Menzel et al. ( 1994), Peterson et al. ( 1984) nor Robbins
Leaf expansion in root restricted plants 207
and Pharr (1988) found any relationship between measured nutrient levels
and reduced shoot and root growth of root-restricted plants of bean, cotton,
passionfruit (Passiflora sp.) , wheat or cucumber. On finding that exogenous
applications of cytokinins (Richards and Rowe, 1 977 a) and gibberellins (Carmi
and Heuer, 1981) partially restored shoot growth in restricted plants, a
possible role for root-synthesised hormones in controlling shoot growth,
possibly via photosynthesis (Carmi and Koller, 1978; Carmi et al., 1983;
Herold and McNeil, 1979), has been postulated.
The involvement of cytokinins in this control system has received popular
support. Apparently initiated by the work of Richards and Rowe (1 977a) and
Carmi and Heuer (1981) with the synthetic cytokinin benzyladenine, this
support has yet to be validated by any demonstration of a correlative
relationship among restricted roots, endogenous levels of any cytokininl and
shoot growth. There is no doubt that cytokinins are synthesised in roots
(Goodwin, 1978; Koda and Okazawa, 1978; Letham, 1978; Vaadia and Itai,
1968), probably at the root apex (Feldman, 1 975). The concentration of
cytokinins in xylem sap responds to changes in environment, plant condition
and ontogeny. Export is reduced in plants under water or salinity stress
(Bano et al., 1993; Itai et al., 1968; Torrey, 1976; Vaadia and Itai, 1968) while
increased concentrations have been measured following disbudding, floral
initiation and removal of flower buds (Beever and Woolhouse, 1973; Colbert
and Beever, 1981; Menary and van Staden, 1976) and decapitation of the
shoot (Bangerth, 1994). Considerable qualitative and quantitative variation
in cytokinin fluxes in xylem sap through time have been linked to their
postulated regulation of reproductive growth (Heindl et al., 1982). Exogenous
application of cytokinins to shoot tissue has increased chlorophyll production
and reduced its degradation, stimulated chloroplast development, mobilised
nutrients to the site of application, regulated leaf expansion, and promoted
lCarnes et al. (1975) identified eight different endogenous cytokinins in root exudate of tomato.
Leaf expansion in root restricted plants 208
the production and increased the activity of ribulose bisphosphate
carboxylase, an essential photosynthetic enzyme (Beltrano et al. , 1994; Brock
and Cleland, 1990; Feierabend, 1969; Kaminek, 1992; Leopold and Kawase,
1964; Lerbs et al. , 1984; Ulvskov et al. , 1 992). Missing, however, is any in
situ evidence linking root restriction to shoot growth through the mediation
of cytokinins.
Positive, negative, accumulative, and debit chemical signals have been
implicated linking the function of root and shoot under conditions in the
rhizosphere which limit growth (Cannell and Jackson, 1982; Jones, 1 990;
Jackson, 1993). A positive signal may be produced by the root when a stress
induces or increases supply of some physiologically active substance (PAS) to
the shoot; reduced supply of a PAS normally transmitted to the shoot results
in a negative signal. Accumulative signals may occur when a substance
normally transmitted to the root accumulates in the shoot, while debit signals
are formed when the root system becomes a more active sink for such a
substance.
Negative signals have not received widespread support in the literature. For
example, Jones (1990) considered that a negative signal generated by a drying
soil did not contain sufficient information, since the magnitude of the signal
would vary with root volume, whether or not some roots were stressed.
Jackson (1990) reached a similar conclusion after observing that only a few
unstressed roots were sufficient to maintain growth when the larger part of
the root system was waterlogged. He concluded that a system consisting of
a negative signal could not provide sufficient sensitivity to maintain shoot
growth and avoid leaf senescence. Although Kramer (1988) and Boyer ( 1989)
cautioned against a perceived abandonment of the concept of water potential
and consequent transmission of hydraulic signals in response to falling shoot
water status, it is generally accepted that the root is the primary sensor of
changes in the water status of rhizosphere (Passioura, 1 988a; Schulze et al.,
Leaf expansion in root restricted plants 209
1988; Sharp and Davies, 1989). Accordingly, the root is directly implicated
in the altered propagation of a biochemical signal to the shoot system.
Accordingly, neither accumulative nor debit signals have been regarded as
likely candidates for the operational signal and have largely been ignored.
In contrast, Davies and Zhang's (1991) review of root signals and water stress
revealed that the hypothesis that positive signals convey chemical infor
mation from roots to stomata in response to drying soil is widely accepted.
Gowing et al. (1990a) provided the earliest evidence that leaf growth was
reduced by an inhibitor synthesised in the root, when they showed apple leaf
growth recovered to control levels after the water-stressed half of the root
system was excised. A characteristic of a positive signal is that its
'signalling', and the consequences of that signalling, should increase as the
level of stress it is reporting increases (e.g. Fig. 4, Cornish and Zeevaart,
1985), up to some point after which damage caused by the stress perturbs
propagation or transport of the signal. It is now clear that ABA is the
positive signal produced by plant roots in response to drying soil. As soil
dries, ABA is synthesised in roots and transported to leaves where it causes
stomata to close (Cornish and Zeevaart, 1985; Hartung and Radin, 1989;
Neales et al., 1989; Schurr and Gollan, 1990; Zhang and Davies, 1987, 1989,
1990a, 1990b, 1991).
The nature of the communication system linking root and shoot growth has
not been characterised in previous studies of root restriction. These studies
were pre-occupied with restricting the whole root system, an approach which
has impeded understanding of the relationship between roots and shoots.
Root systems are rarely completely restricted. With the exception of bonsai,
plants grown in containers are usually repotted into larger containers, and
in most cases (e.g. bedding plants, shrubs and trees) finally transplanted into
the soil. More commonly, when growth is slowed or impeded in one part of
the root, it is enhanced elsewhere to compensate (Drew and Saker, 1 975;
Leaf expansion in root restricted plants 210
Klepper, 1990). In addition, it is difficult to apply and maintain root
restriction at levels that can be quantified. Although root restriction is
commonly quantified by the volume available for root growth, the actual
degree of restriction encountered will range from slight to extreme as roots
progressively occupy the available space.
The objectives of this study were to use split root system experiments to
investigate further the influence of root restriction on leaf area expansion in
tomatoes and the nature of the signal involved.
' 6.2
6.2.1
Materials and Methods
Cultural
Seed of the indeterminate tomato variety L. eseulentum Mill. 'Moneymaker'
were germinated under mist in a heated glasshouse. Seedlings were trans
planted to 5.0 x 5.0 x 8.0 em tubes (200 cm3) when the cotyledons were fully
expanded, and grown on in the glasshouse for six weeks. Plants were excised
immediately above the cotyledon node and rooted in an aerated water bath
under mist (Chapter 4.2.1). After five days, rooted cuttings were weaned
from the mist system by gradually reducing the mist frequency to zero over
the next four days.
Rooted cuttings were placed in individual 10 I containers in the deep flow
hydroponic system previously described (Chapter 3). The electrical
conductivity of the solution was increased daily in 0.5 mS ·em·l increments
from 0.5 to the final operating level of 2.5 mS ·em-l•
Lateral shoots and flower trusses were removed as soon as possible to restrict
the assimilate sink to the primary shoot system and roots.
6.2.2 Environmental
Leaf expansion in root restricted plants 211
Air temperature in the glasshouse was maintained at 15°C minimum at
night, with ventilation triggered when temperature rose above 25°C. Daily
mean temperature ranged from 1 8-23°C. Light levels ranged between 500
to 1000 J.Lmol ·m·2 ·s·1 photosynthetically active radiation (PAR) at solar noon
under the frequently cloudy conditions encountered during the experiment.
6.2.3 Experimental
Experimental design
A randomised complete block design with 4 blocks and 2-3 single plant sub
samples per block was used in the study. The block design provided local
error protection for known temperature and light profiles within the
glasshouse. Cluster analysis of total estimated leaf area at the start of the
experiment, following the methods outlined in Chapter 5.0, provided an
objective basis for allocating plants of similar leaf area to a given block. The
average total leaf area of cuttings when treatments were initiated was 234
± 14 cm2•
Treatments
The influence on growth characteristics of root restriction to none, one, or two
sub-systems of the root system was evaluated (Table 6. 1). Root systems were
divided into two sub-systems of visually similar size by gently teasing the
roots apart in the hydroponic solution, and a 2 em longitudinal cut made up
the stem from the cutting base. Each sub-system to be restricted was placed
in a 10.5 x 4 em (30 em3) polyethylene bag 'cell' drawn up the split stem to
enclose the sub-system. The top of the cell was left open to allow solution
Leaf expansion in root restricted plants 212
escape. Two air lines and two nutrient supply lines were provided for each
container. Each restricted root sub-system had an air line and a nutrient
supply line inserted into the cell. Both lines discharged at the base of the cell
and overflowed through the open top.
Two unrestricted control treatments were established: a split stem and an
intact (non-split) stem. The latter was included as a reference against
possible growth responses induced by the stem splitting. New roots that
developed from the stem above this point were permitted to develop freely. It
was not possible to direct them into the bags and because ethylene is released
by wounded roots (Saltveit and Locy, 1982), removing the roots may have
introduced an unnecessary source of variation into the experiment.
Table 6.1 Treatment description and axles
Treatment
code
DCR
SCR
SOC
NSC
Treatment description
Split stem with both root sub-systems placed in individual restriction cells
(Double Cell Restriction)
Split stem with a single root sub-system placed in a restriction cell (Single
Cell Restriction)
Split stem with no root restriction (Split Only Control)
Intact stem with no root restriction (Non-Split Control)
6.2.4 Data col lection
Estimation of leaf area
Leaf expansion was closely monitored on a total plant and individual leaf
basis. It was anticipated that any possible treatment effects would not
Leaf expansion in root restricted plants 213
influence all leaves equally, and thus, treatment responses would be a
function of the stage of development of each leaf. Consequently, individual
leaf area was estimated non-destructively from the leafs linear, positional
and developmental characteristics (Chapter 3) according to the formula:
LNAREA =3.814 + 2.022 ·LNMRIB + 0.075 ·LFIP - 0.848 ·INDEX - 0.026 ·(LNMRIB . LFIP) - 0.398·(LNMRIB . INDEX)
where LNAREA = log. leaf area (em�, LNMRIB = log. leaf mid-rib (em), LFIP = leaf insertion position, INDEX = relative leaf position on stem
(6. 1 )
Seven days after treatments were initiated (DAI; 14 days after transfer to the
hydroponic system), leaves of similar size were identified by cluster analysis
(Chapter 5.0) of estimates of leaf area. It was assumed that treatment effects
would not have been present at this stage of the experiment. Furthermore,
at this early stage leaves of similar area would also be at a similar
developmental stage. Analysis of total plant leaf area at day 7 did not detect
treatment differences (Fig. 6.6), supporting this assumption. Total estimated
leaf area was calculated as the sum of individual leaf areas.
Leaf area ontogeny
Concise quantification of the ontogeny of leaf growth is aided by its
determinant nature. Under conditions where the measured attribute reaches
and maintains a maximum level, a class of asymptotic functions provides a
biologically meaningful insight to the nature of the observed growth pattern.
For example, these functions estimate maximum values for the y axis
parameter, points of inflexion, and mean relative and absolute growth rates.
Causton and Venus (1981) and Hunt (1982) both provide excellent reviews of
the applications of the major asymptotic functions used in biological studies.
Individual leaf growth has been described using the monomolecular, the
logistic and the Gompertz functions (e.g. Amer and Williams, 1957; Constable
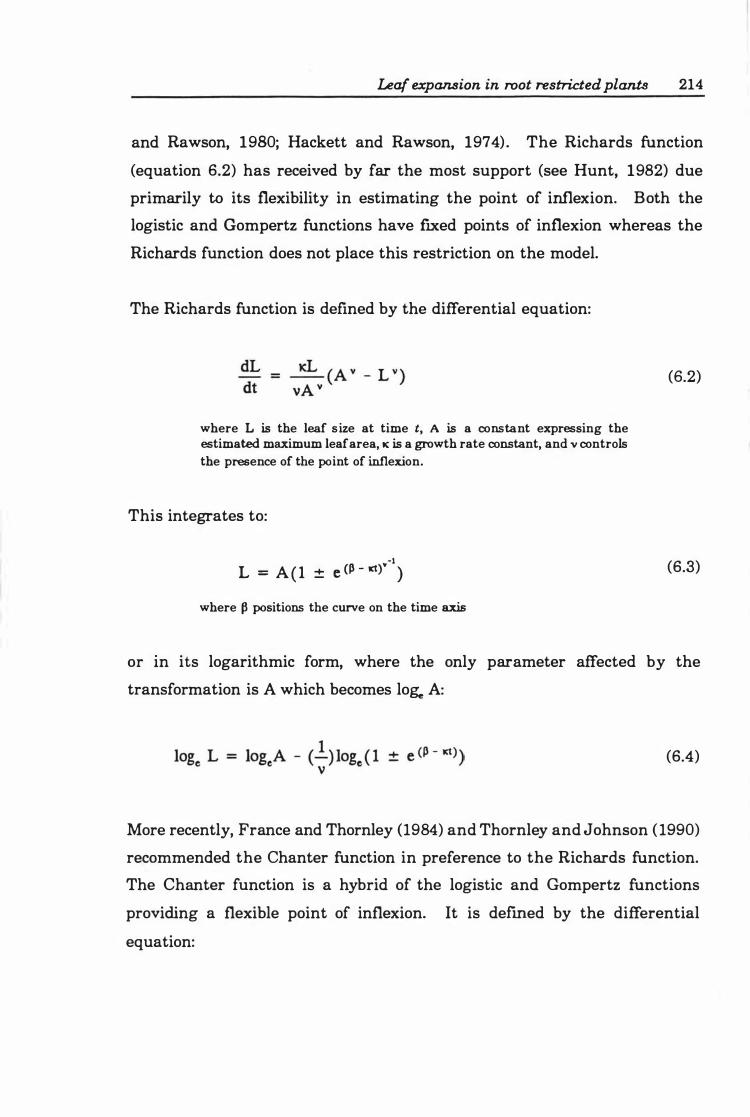
Leaf expansion in root restricted plants 214
and Rawson, 1980; Hackett and Rawson, 1974) . The Richards function
(equation 6.2) has received by far the most support (see Hunt, 1982) due
primarily to its flexibility in estimating the point of inflexion. Both the
logistic and Gompertz functions have fIxed points of inflexion whereas the
Richards function does not place this restriction on the model.
The Richards function is defIned by the differential equation:
where L is the leaf size at time t, A is a constant expressing the estimated maximum leaf area, K is a growth rate constant, and v controls the presence of the point of inflexion.
This integrates to:
-1 L = A ( l ± e (P - lCt)Y )
where p positions the curve on the time axis
(6.2)
(6.3)
or In its logarithmic form, where the only parameter affected by the
transformation is A which becomes lo� A:
(6.4)
More recently, France and Thornley (1984) and Thornley and Johnson (1990)
recommended the Chanter function in preference to the Richards function.
The Chanter function is a hybrid of the logistic and Gompertz functions
providing a flexible point of inflexion. It is dermed by the differential
equation:
Leaf expalUJion in root restricted plants
dL _ L (1 L ) -Dt - - J,L - - e dt B
which integrates to:
L =
where L is leaf area, J.I, is the initial relative growth rate, Lo is the leaf area at t=O, B is substrate level, and the product Dt is interpreted as differentiation, development, or senescence.
215
(6.5)
(6.6)
This function is intuitively attractive, predicting first that the relative growth
rate depends linearly on substrate level (1 - LRl), as in the logistic function,
and secondly, e-Dt (where D is a constant), on the passage of time. The latter
may be interpreted as differentiation, development or senescence, and is para
llelled in the Gompertz function. There is, however, no reported use of the
Chanter function, making it difficult to assess its claimed superiority over the
widely supported Richards function. Consequently, both the Chanter and the
Richards function were chosen to describe the ontogeny ofindividual leaf area
expanSIon.
The SAS procedure NLIN (SAS Institute, 1989) was used to fit the data to the
logarithmic form of the Richards function (equation 6.4) and the standard
form of the Chanter equation (equation 6.6).
Leaf sampling
In choosing leaves for curve fitting and evaluation, it was assumed that
leaves of a similar area would also be at a similar developmental stage.
Identifying leaves of similar size or developmental age by stem position
Leaf expansion in root restricted plants 216
proved impossible. This was possibly due to, or at least accentuated by, some
leaf abscission from cuttings while under propagation. Analysis confirmed
the lack of correlation between leaf area and stem position with large
coefficient of variation (CV) of estimated area of leaves at day 7 at acropetal
stem positions 10-15 (Table 6.2).
This problem was overcome by identifying leaves of similar size at the start
of the experimental period. Cluster analysis using the group average method
(through the SAS procedure CLUSTER) grouped leaves into three major size
categories and 16 smaller categories. The major size categories coincided
with leaves having just commenced (L� or undergoing (L7, Lu) expansion
growth, where the subscripts denote the number of days after initiation of the
treatments (DAl). Smaller groups were rejected as they did not have a full
complement of treatments in any single group. The CV of the three major
groups was substantially smaller than groups based on stem position (Table
6.2). Using Lewontin's (1966) procedure for testing the difference between
CVs, the CV of pooled clustered groups was significantly (P<O.OOl) smaller
than the CV of the pooled stem position groups.
Each group contained leaves from different stem positions (Table 6.3). There
was, however, clear bias to older leaves (lower stem position) as leaf area of
the cluster increased.
Table 6.2 Individual leaf area and within-group variation by stem position and clustered group
Leaf position on stem-
9 10 1 1 12 13 14 15
mean leaf area (cm2) 147.0 85.4 4 1 . 1 18.3 6.9 2.7 1.2
Coefficient of variation 56.6 66.6 81 .6 1 17.2 129.7 125.2 63.3
- acropetal from cotyledon node
Table 6.3 Percentage (%) of leaves in clustered groupe from different stem positions.
Leaf position on stem-
Clustered group 9 10 1 1 12 13 14
L, 22 41 37 0 0 0
� 0 21 39 40 0 0
L14 0 0 0 35 29 36
�I 0 0 0 0 0 30
�8 0 0 0 0 0 0
• acropetal from cotyledon node
Clustered groupe
L, � L14 �l Lu 58.7 24.2 3.1 3.3 1 .2
13.6 36.7 53.2 25.6 47.S
15 16 1 7 18
0 0 0 0
0 0 . 0 0
0 0 0 0
37 27 6 0
0 8 50 42
Leaf expansion in root restricted plants 218
Relative rate of leaf area expansion
A functional approach (Hunt, 1982) to calculating relative leaf expansion
rates (RA) was adopted. Components and derivatives from the Chanter and
Richards functions estimated RA at the start of leaf growth, point of inflexion,
and overall average. More focused information of the comparative ontogeny
of RA among treatments was gained by calculating the RA at each harvest. For
leaves developing at, or within 14 DAI, the first derivative of the Richards
function estimated RA at seven day intervals from the start of expansion:
1 dL ICe P - x1 RLER = - '- = -----
L dt v ( 1 ± e P - Itt) (6.7)
Leaves developing later than 14 DAI had not developed sufficiently by the
completion of the experiment for a Richards function to be fitted to the data.
A second order polynomial of the form:
(6.8)
where L is leaf area (cm� at t days (OA!)
was fitted to the individual leaf data with coefficients of determination (R2)
consistently exceeding 0.98 (data not shown). The RA at given t was
calculated by the first derivative of the polynomial:
(6.9)
A characteristic of this function is that differences between tx and tx•1 are
equal.
Duration of leaf expansion
Leaf expan.sion in root restricted plants 219
The duration of leaf expansion from 5 to 95% of maximum estimated area (A)
was calculated for each leaf based on the Richards function coefficients fitted
for that leaf. For a given leaf area La, rearranging the Richards function
provides an estimate of the time t at which that area was reached as:
(6. 10)
Rate of leaf appearance
A mid-rib length of 3 cm, the nurumum length practically and safely
measurable, was used as the reference length for leaf appearance rates. The
number of days required for each leaf to reach the reference length was either
measured directly (during the weekly measurements), or estimated by solving
the exponential function between mid-rib length and time that existed during
the first 3 weeks of development (data not presented). The rate of leaf
appearance was estimated from the slope of the curve relating leaf number
to time.
Actual leaf area measurement
At the completion of the experiment, leaf area was measured with a Li-Cor
LI-3000 leaf area meter (Lambda Instruments Corporation, USA). Leaflets
were removed from the petioles prior to measurement.
Water potential measurements
Leaf water potential was measured at solar noon using a pressure chamber
(model 3005, Soilmoisture Equipment Corporation, USA). A leaflet fully
Leaf expansion in root restricted plants 220
exposed to sunlight and next to the tenninal leaflet was measured. Leaflet
size was about 60 cm2• The leaflet was enclosed in a plastic bag containing
moistened filter paper, cut immediately below the petiole-stem junction, and
transferred to the pressure chamber, in a laboratory attached to the green
house. Time from excision to measurement did not exceed 1 0 seconds. A
humid environment was maintained in the pressure chamber by a lining of
moistened capillary matting. Extrusion errors were avoided by ensuring the
petiole length protruding from the chamber did not exceed 5 rnm (Turner,
1981). The chamber was pressurised at about 0.2-0.25 bar ·S·l (Lakso, 1 992)
until the end point was approached after which the rate was reduced to 0 .1-
0. 125 bar ·s·l .
Photosynthesis measurements
Photosynthetic functions of the leaves was measured with a Li-Cor LI-6200
portable photosynthesis system (Lambda Instruments Corporation, USA).
Primary parameters used in the operation of the unit were 1020 mbar
atmospheric pressure, 1149 cm3 system volume, 0. 1775 s ·cm·l boundary layer
resistance, 1 1.40 cm2 leaf area, and maximum desiccant flow rate of 1392-
1460 p.mol ·s·l. A stomatal ratio of 0.5 was used, reflecting the ratio of
stomata on the adaxial:abaxial surface of the tomato leaf (Rudich and
Luchinsky, 1986). Measurements routinely commenced one hour prior to
solar noon and were completed two hours later.
Biomass measurements
Plants were harvested by block over two days. Harvested material was dried
for 72 hours in metal tins in a forced air oven operating at 80°C. Dried
material was sequentially removed from the oven to standardise the
equilibration period to room conditions to about 30 minutes.
Leaf expansion in root restricted plants 221
6.2.5 Data analysis
Analysis of variance
The analysis of variance (ANOVA) model for the growth curve coefficient
analysis followed a split-plot design with a factorial arrangement of four
levels of root restriction and three levels of leaf size. The root restriction
treatments were the whole plots and leaf sizes the split (sub) plots:
where p. = overall mean, ai = root restriction effects, �j = block effects, P. = leaf size effects, a�" = whole plot error term for root restriction treatments, ap ... = interaction term for root restriction and leaf size, and tv. = residual error term.
(6. 1 1 )
The model for the final, destructive harvest data and derived parameters
followed the model:
Y .. = II + ex . + n . + £ .. IJ ,.. 1 tJ) I)
where p. = overall mean, aj = root restriction effects, �j = block effects, and tijk = residual error term.
(6. 12)
Photosynthesis measurements were made under intermittent cloudy
conditions. Changes in photosynthetically active radiation (PAR) during and
between measurement periods were accounted for by using PAR as a
concomitant variable in analysis of covariance (Saunders, 1991). This
approach assumed that the photosynthesis rate x PAR relationship was linear
in the range encountered. The covariate adjustment reduced the estimate
of error variance estimate and standardised photosynthesis measurements
with respect to the different light levels encountered. Reported mean values
are adjusted for the PAR covariate.
Leaf expansion in root restricted plants 222
Two orthogonal sets of contrasts were constructed a priori and tested within
each ANOVA. Although contrasts are conventionally limited to a single
orthogonal set within any analysis, the questions asked of the data did not
fit this constraint. In the ANOVA analyses, attention focused on the
influence of restriction on the variables being examined. The primary set of
contrasts tested some restriction (SCR and DCR) against no restriction (SOC
and NSC), SCR versus DCR, and SOC versus NSC. Interpreting a significant
contrast between restricted and unrestricted plants became irrelevant if the
contrast between the unrestricted controls (SOC vs NSC) was also significant.
Consequently, a second set of orthogonal contrasts that focused on the split
stems was required. Linear and quadratic contrasts for leaf types were
calculated by the algorithm of Khanizadeh and Fanous (1992), using the
average leaf area of the respective groups at 14 DAI.
In all ANOVA analyses, the generalised linear models procedure (GLM) of
SAS (SAS Institute, 1989) was used. A consequence of using cluster analysis
to distinguish groups of leaves at similar developmental stage is that there
is no guarantee that each treatment will be represented in each block. Leaves .
of plants of each treatment were represented in each group in similar, but not
identical numbers. In some instances, plants of a particular treatment within
a particular block were not represented. Therefore, the presented means are
least square means (LSMEANS), an option of PROC GLM that accounts for
missing data.
Standard errors of differences between means of variables expressed as ratios
(e.g. SLA, LWR, and SR ratio) were adjusted for the variability of the divisor
following the method of Oyejola and Mead (1989).
Principal component analysis
Leaf expansion in root restricted plants 223
Principal components reduced the dimensionality of the original data set of
vegetative growth components into a set of new variables (components)
retaining most of the variation present in the original variables. In achieving
this, a perspicuous description of the vegetative growth components was
expected. The SAS procedure PRINCOMP (SAS Institute, 1989) calculated
principal components of the standardised (mean=O, variance= 1) vegetative
data. Following Jolliffe (1972), all principal components with a variance
(eigenvalue) less than 0.7 were rejected. Use of ANOVA of the important
principal components provided discrimination of the relative influence of root
restriction on the new composite variables.
Repeated measures analyses
Analysis of measures taken from the same experimental units over time
usually requires some form of repeated measures analysis, because a major
assumption of any variance analysis or curve-fitting technique is that sample
observations at each harvest, ti, are independent of one another (Mead, 1990).
Comparison of the weekly increment of individual leaf area, through either
estimation from the growth curve of the leaf, or directly from mid-rib
measurements, would lead to problems of dependence. This was avoided by
one of two approaches, depending on the data source. Parameter estimates
and derivatives of the Richards and Chanter function of each monitored leaf
were analysed by conventional ANOVA (Mead, 1990). The second approach
followed the contrast method of Mead (1990). Analysis of RA and variables
derived from these data were performed for each separate time variable and
for derived variables representing averages or changes over time.
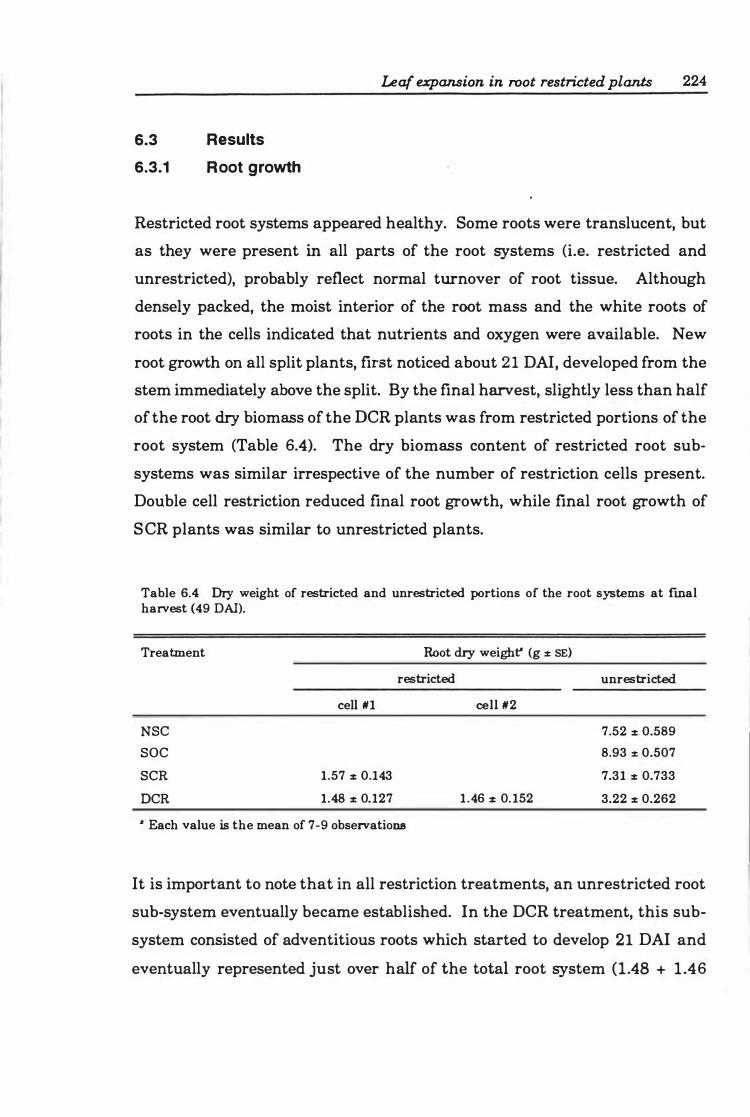
6.3 Results
6.3.1 Root growth
Leaf expansion in root restricted plants 224
Restricted root systems appeared healthy. Some roots were translucent, but
as they were present in all parts of the root systems (i.e. restricted and
unrestricted), probably reflect normal turnover of root tissue. Although
densely packed, the moist interior of the root mass and the white roots of
roots in the cells indicated that nutrients and oxygen were available. New
root growth on all split plants, first noticed about 2 1 DAI, developed from the
stem immediately above the split. By the final harvest, slightly less than half
of the root dry biomass of the nCR plants was from restricted portions of the
root system (Table 6.4). The dry biomass content of restricted root sub
systems was similar irrespective of the number of restriction cells present.
Double cell restriction reduced final root growth, while final root growth of
S CR plants was similar to unrestricted plants.
Table 6.4 Dry weight of restricted and unrestricted portions of the root systems at fmal harvest (49 DAI).
Treatment Root dry weight" (g :t: SE)
restricted unrestricted
cell N1 cell N2
NSC 7.52 :t: 0.589
SOC 8.93 :t: 0.507
SCR
nCR
1.57 :t: 0.143
1.48 :t: 0.127
• Each value is the mean of 7-9 observations
1.46 :t: 0. 152
7.31 :t: 0.733
3.22 :t: 0.262
It is important to note that in all restriction treatments, an unrestricted root
sub-system eventually became established. In the DCR treatment, this sub
system consisted of adventitious roots which started to develop 2 1 DAI and
eventually represented just over half of the total root system (1 .48 + 1.46
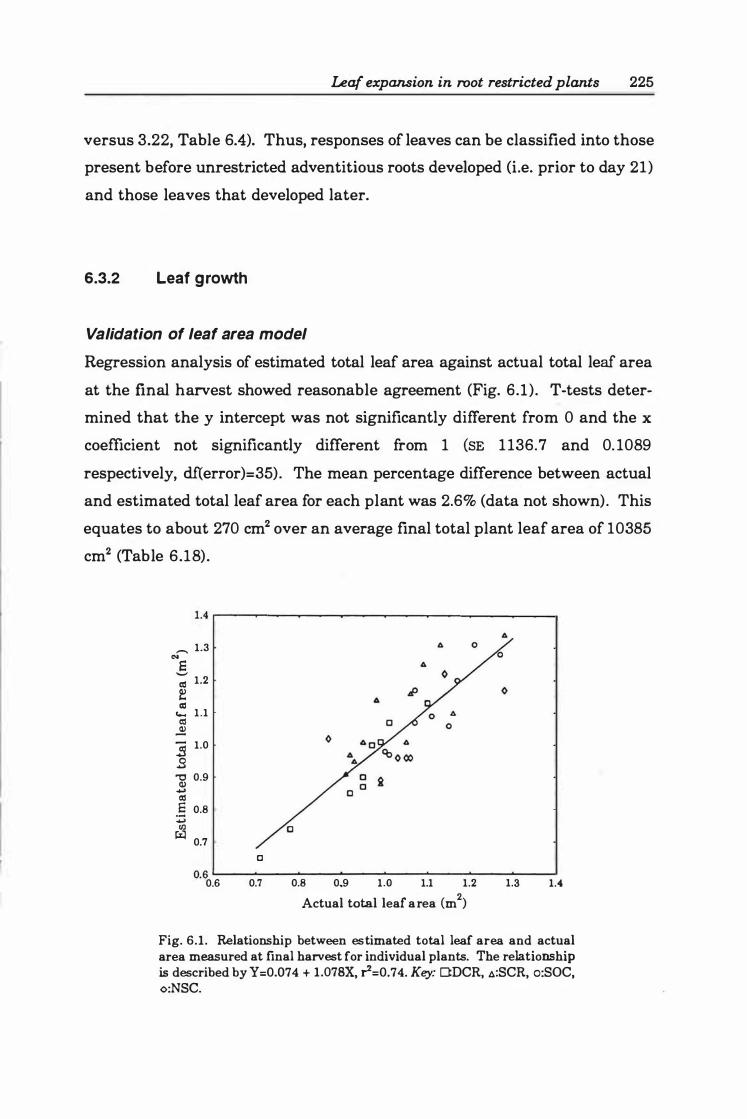
Leaf expansion in root restricted plants 225
versus 3.22, Table 6.4). Thus, responses of leaves can be classified into those
present before unrestricted adventitious roots developed (Le. prior to day 21)
and those leaves that developed later.
6.3.2 Leaf growth
Validation of leaf area model
Regression analysis of estimated total leaf area against actual total leaf area
at the final harvest showed reasonable agreement (Fig. 6 .1) . T-tests deter
mined that the y intercept was not significantly different from 0 and the x
coefficient not significantly different from 1 (SE 1 136.7 and 0. 1089
respectively, df(error)=35). The mean percentage difference between actual
and estimated total leaf area for each plant was 2.6% (data not shown). This
equates to about 270 cm2 over an average final total plant leaf area of 10385
cm2 (Table 6.18).
1 . 4 ,.---........ ---,.--...------.---�-........ ---..-____,
,..... 1.3 ...
E ';; 1.2
� ell
.... 1.1 ell � .s 1.0
B '" 0.9 Q) ...
ell .§ 0.8 ... rJJ � 0.7
6
c 0.6 L..-.-_� _ ____" __ .-. _____ '___� _ ____" _ ____'
0.6 0.7 0.8 0.9 1.0 1.1 1.2 2 Actual total leaf area (m )
1.3 1.4
Fig. 6.1. Relationship between estimated total leaf area and actual area measured at final harvest for individual plants. The relationship is described by Y=O.074 + 1.078X, r=O.74. Key: DDCR, t.:SCR, o:SOC, o:NSC.
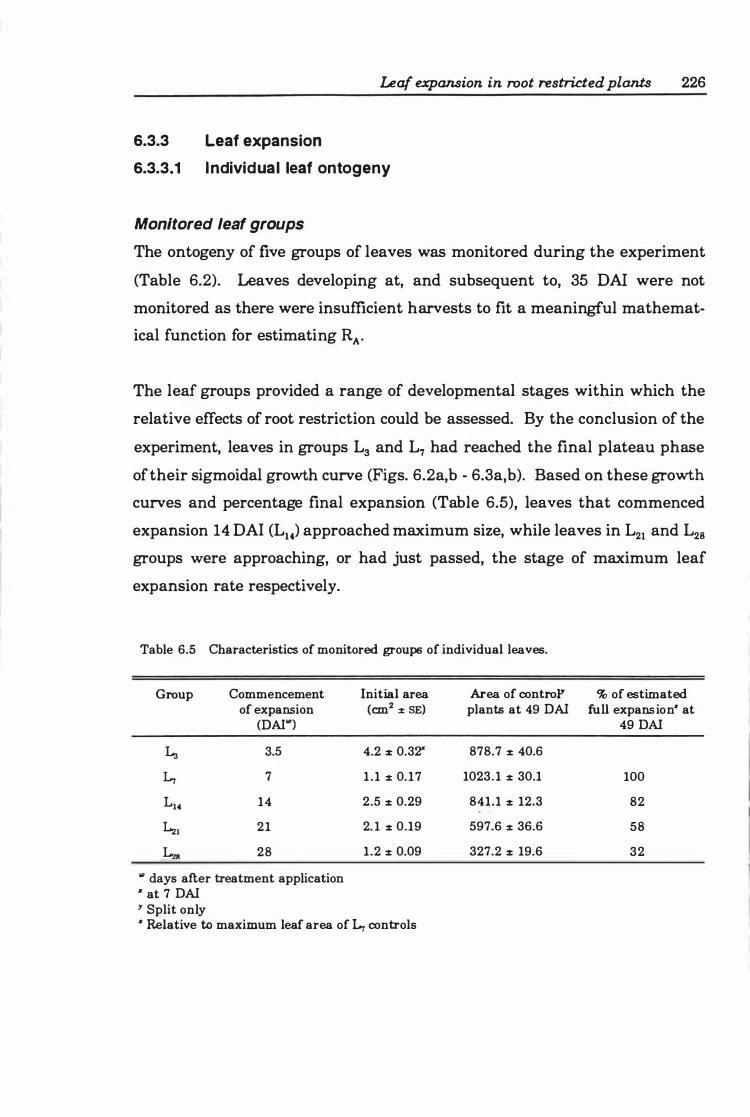
Leaf expansion in root restricted plants 226
6.3.3 Leaf expansion
6.3.3.1 Individual leaf ontogeny
Monitored leaf groups
The ontogeny of five groups of leaves was monitored during the experiment
(Table 6.2). Leaves developing at, and subsequent to, 35 DAr were not
monitored as there were insufficient harvests to fit a meaningful mathemat
ical function for estimating RA•
The leaf groups provided a range of developmental stages within which the
relative effects of root restriction could be assessed. By the conclusion of the
experiment, leaves in groups L3 and L7 had reached the final plateau phase
of their sigmoidal growth curve (Figs. 6.2a,b - 6.3a,b). Based on these growth
curves and percentage final expansion (Table 6.5), leaves that commenced
expansion 14 DAI (Lu) approached maximum size, while leaves in L21 and L28
groups were approaching, or had just passed, the stage of maximum leaf
expansion rate respectively.
Table 6.5 Characteristics of monitored groups of individual leaves.
Group Commencement of expansion
(OAl"')
3.5
7
14
�l 21
28
'" days after treatment application • at 7 OAI 7 Split only
Initial area (cm2 :to SE)
4.2 :to 0.3T
1.1 :to 0.17
2.5 :to 0.29
2. 1 :to 0.19
1.2 :to 0.09
• Relative to maximum leaf area of Lr controls
Area of controP' plants at 49 OAI
878.7 :to 40.6
1023.1 :to 30.1
841.1 :to 12.3
597.6 :to 36.6
327.2 :to 19.6
% of estimated full expansion· at
49 0Al
100
82
58
32
Leaf expansion in root restricted plants 227
Leaves developing before day 21 Significant differences were detected between the two unrestricted controls
in the rate of leaf area increase to A (Le. ,,), estimated maximum leaf area
(Table 6.7), the mean RA and the time taken to reach the point of inflexion
(Table 6.8). These data indicated that the intact stem control (NSC) was not
a valid control against which effects of restriction could be assessed.
Accordingly, further comparison between restricted and unrestricted plants
excludes this treatment. Similarly, the non-split control was not included in
analyses of leaf groups at higher stem insertions (Le. L2l J L28).
Analysis of the Chanter estimates of maximum leaf area (�ax) of L3, L7 and
L14 leaves indicated that root restriction reduced maximum leaf area (Table
6 .6). A similar, albeit non-significant, pattern was observed in the Richards
estimates of maximum leaf area (A, Table 6.7). Expressing the extent of
reduction as a percentage of the estimated maximum leaf area of control
(SOC) plants, L7 leaves on restricted (DCR or SCR) plants were reduced by
an average 15%, with L3 and L14 leaves by about 8%. Reduced leaf area in
restricted plants was detected about 20 DAI as L3 leaves reached the point
of inflexion, although reduction was more pronounced 5 days later as L7
leaves reached the same stage of growth (Table 6.9, Fig. 6.4). The major
differences in leaf expansion between restricted and unrestricted treatments
apparently occurred after the point of inflexion (Figs. 6.2, 6.3), with a
comparatively rapid fall in expansion rate occurring in restricted plants. As
the duration of expansion was similar between all treatments (Table 6.8), the
reduction of leaf area in restricted plants was apparently due to an overall
lower mean absolute rate of leaf expansion (Table 6.9).
Leaf development within groups and stages of growth was similar, irrespec
tive of treatment, confirming the assumption made in the preparatory
grouping by cluster analysis. Initial relative growth rate of leaves (p.) of all
treatments and sizes was similar (Table 6.6). The initial leaf area (Lo) at
Leaf expansion in root restricted plants 228
which measurement was initiated, was also similar within any one category,
although a statistically significant difference between plants in double cell
restriction and those in single cell restriction (Table 6.6) was detected. This
difference (1.3 cm� is, however, within the error bounds of the leaf area
model. Analysis of variance of area at t = 0 within each clustered group did
not detect differences among treatments, suggesting that the La differences
were by chance (Le. Type II error). Indeed, analysis of the Chanter
coefficients p., D, B, and �u with Lo as a covariate confIrmed that differences
in La among treatments was inconsequential to these components of leaf
growth (i.e. the covariate term (La> was nonsignificant).
Leaf expansion in root restricted plants 229
Table 6.6. Analysis of parameter estimates of the Chanter function for leaf expansion over time. Values presented are least square means (�E).
Treatment Chanter function coefficient and parameter estimates
source level n JJ. 1)"' 1..0 B A...-. root restriction NSC 9 0.326 0.014 3.71 924.7 922.1 (R) (0.0329) (0.817) (39.25) (38.97)
SOC 10 0.319 0.017 3.43 931.4 929.9 (0.0289) (0.817) (33.99) (33.75)
SCR 11 0.359 0.019 3.25 870.4 867.5 (0.0252) (0.624) (29.98) (29.77)
OCR 12 0.314 0.011 4.97 808.2 807.82 (0.0233) (0.578) (27.76) (27.56)
NS NS /I /I
leaf size L14 15 0.312 0.008 3.09 867.1 867.4 (LS) (0.0174) (0.380) (17.02) (16.46)
L, 12 0.348 0.021 2.76 948.7 945.08 (0.0222) (0.485) (21.47) (20.77)
Ls 15 0.329 0.017 5.67 835.3 833.08 (0.0188) (0.414) (17.33) (16.76)
NS ••• •• • •
interaction R x LS NS NS NS NS
contrasts
root restriction
[NSC+SOC] vs [SCR+DCR] NS NS • •
DCR vs SCR NS /I NS NS
NSC vs SOC NS NS NS NS
[SCR+DCR] vs SOC NS NS • •
DCR vs SCR NS II NS NS
Stem split vs no split NS NS NS NS
leaf size
linear NS •••• II •
quadratic NS • •• ••
NS ••• •••••••••• . . • Non significant or significant F test at P<O.l, 0.05, 0.01, 0.001 or 0.0001 respectively "Means only given (see text for explanation)
Leaf expan.sion in root restricted plants 230
Table 6.7. Analysis of parameter estimates of Richards function for leaf expansion over time. Values presented are least square means (:tSE).
Treatment Richards function coefficient estimate
source level n A K V
root restriction NSC 9 1092.9 0.126 0. 196 (R) (48.95) (0.0084) (0.0463)
SOC 10 988.1 0.149 0.271 (42.39) (0.0072) (0.0401)
SCR 11 941.6 0. 144 0.226 (37.39) (0.0064) (0.0354)
OCR 12 869.5 0.160 0.307 (34.6) (0.0059) (0.0328)
NS
leaf size L14 15 1007.9 0.139 0.278 (LS) (24.33) (0.0059) (0.0346)
Lr 12 1050.5 0.132 0.200 (30.71) (0.0074) (0.0436)
� 15 860.7 0.162 0.272 (24.78) (0.0059) (0.0352)
.... •• NS
interaction R x LS NS NS NS
contrasts
root restriction.
[NSC+SOC] vs [SCR+ OCR] " NS
DCR vs SCR NS NS NS
NSC vs SOC NS " NS
[SCR+DCR] vs SOC NS NS NS
DCR vs SCR NS NS NS
Stem split vs no split .. NS
leaf size
linear • • • • N S
quadratic . . " NS
NS.'.·.··.···.···· Non significant or significant F test at P<O.Ol, 0.05, 0.01, 0.001 or 0.0001 respectively
Leaf expansion in root restricted plants 231
Table 6.8. Analysis of derivatives of Richards function coefficients for leaf expansion over time. Values presented are least square means (:tSE).
Treatment Richards function coefficient derivatives
source level n point of % final leaf leaf area at duration of inflexion area at por point of expansion
(days)" inflexion (days)"
root NSC 9 20.9 40.0 434.5 29.4 restriction (R) (0.45) (0.73) (19.79) (1.77)
SOC 10 18.9 41.2 4Q7.8 26.2 (0.39) (0.63) (17.14) (1.45)
SCR 11 18.6 40.5 385.5 25.9 (0.34) (0.55) (15.12) (1.3)
DCR 12 18.0 41.8 361.4 26.2 (0.32) (0.51) (13.99) (1.02)
NS • NS
leaf size La 15 20.6 41.3 419.5 26.8 (LS) (0.38) (0.51) (10.06) (1.25)
� 12 20.9 40.0 418.4 3 1.6 (0.48) (0.65) (12.69) (1.90)
Ls 15 15.7 41.3 353.9 22.2 (0.39) (0.52) (10.24) (1.42)
NS
interaction R x LS NS NS NS NS
contrasts
root restriction
[NSC+SOC] vs [SCR+DCR] NS NS
DCR vs SCR NS I NS NS
NSC vs SOC NS NS NS
[SCR+DCR] vs SOC NS NS NS NS
DCR vs SCR NS NS NS NS
Split stem vs no split NS NS
leaf size
linear NS
quadratic NS NS
� standardised to 0 DAI Y point of inflexion " duration from 5 to 95% A NS.I.·.··.· ... •••• Non significant or significant F test at P<0. 10, 0.05, 0.01, 0.001 or 0.0001 respectively
Leaf expansion in root restricted plants 232
Table 6.9. Analysis of parameter estimates of Richards function for relative and absolute rates of leaf expansion over time. Values presented are least square means (�E).
Treatment Richards function rate coefficient derivatives
source level n R (cm2 an·2• mean R mean absolute day!1) at point of (cm2'Cm'�' rate of expansion
inflexion day·I) (cm2<tay·I)
root restriction NSC 9 0.353 0.103 59.9 (R) (0.0421) (0.0026) (3.49)
SOC 10 0.292 0. 1 1 7 64.4 (0.0343) (0.0022) (3.03)
SCR 1 1 0.317 0.1 1 7 60.9 (0.0315) (0.0019) (2.67)
DCR 12 0.323 0.1 1 9 57.9 (0.0243) (0.0018) (2.47)
NS NS
leaf size Lu 15 0.288 0.109 61.4 (LS) (0.0207) (0.0018) (1. 73)
� 12 0.365 0.109 60.9 (0.0314) (0.0022) (2.19)
L, 15 0.311 0. 125 60.0 (0.0234) (0.0018) (1.77)
NS NS
interaction R x LS NS NS NS
contrasts
root restriction
[NSC+SOC] vs [SCR+DCR] NS NS
DCR vs SCR NS NS NS
NSC vs SOC NS NS
[SCR+DCR] vs SOC NS NS NS
DCR vs SCR NS NS NS
Split stem vs no split NS NS
leaf size
linear NS NS
quadratic NS NS
NS.'.·.··.···.···· Non significant or significant F test at P<0.10, 0.05, 0.01, 0.001 or 0.0001 respectively
1000
900
800
700
600
500
400
300
200
100
0
1000
900
800
C<� 700 E � 600 f
III 500 ....
j "00
300
200
100
0
1000
900
800
700
600
500
400
300
200
100
0 0
(a) Ls leaves
(b) Lr leaves
(c) L14 leaves
7 14
Leaf expansion in root restricted plants 233
21 28 35 42 "9
Days from initiation of treatments
Fig. 6.2. Chanters functions describing growth of leaves commencing expansion about 3, 7, and 14 days after initiation of treatment. Each value is the mean of 9-12 plants. Key: DDCR, t.:SCR, o:SOC, o:NSC.
1000 900
800 700 600
600 400 300 200 100
0
1000 900 800
er-a 700 y -; 600 f 600 III
-III 400 j
300 200 100
0
1000
900
800 700 600 600 400 300 200 100
0 0
(a) La leaves
(b) L.r leaves
(c) L14 leaves
7 14
Leaf expansion in root restricted plants 234
21 28 36 42 49 Days from initiation of treatments
Fig. 6.3. Richards functions describing growth of leaves commencing expansion about 3, 7, and 14 days after initiation of treatment. Each value is the mean of 9-12 plants. Key: O DCR, t.:SCR, o:SOC, ¢:NSC.
500
400
�8 () -; 300 I) .. • ... • � 200
100
O DCR O SCR 1m NSC • SOC
Leaf expansion in root restricted plants 235
Leaf group
Fig. 6.4. Leaf area at the point of inflexion of La, L" and �( leaves. Bars are :l: SE
Inserting roots into the restriction cells
Early leaf ontogeny was not influenced by the root restriction treatments.
Initial relative growth rates and days to the point of inflexion (Tables 6.6, 6.8,
6.9) were similar among all treatments in those leaves that began expanding
soon after initiation of treatment (i.e. Ls, L7 and L1.). These data, coupled
with the absence of effect on photosynthesis and leaf water potential (see
later results), indicated that either no physiologically significant damage to
the roots occurred when inserted into the restriction cells, or that they had
fully recovered from damage by the time these lower leaves commenced
expansion. Ethylene is released by wounded roots (Saltveit and Locy, 1982)
but epinastic leaf curvature, a characteristic response of tomato to ethylene
(Jackson and Campbell, 1976), was not observed. Subsequent growth
responses can therefore be assumed to be due to root restriction, rather than
artefacts of treatment application.
Leaf expan8ion in root restricted plants 236
Estimates of the D parameter of the Chanter function were extremely vari
able. This precluded meaningful statistical analysis and only means are
presented (Table 6.6). By definition, D must lie in the range 0 :s; D :s;
J.LDo�(�u: ·Lo·I)] · As D approaches 0 the Chanter function reduces to the
logistic equation; as D approaches the upper limit it reduces to the Gompertz
equation (Thornley and Johnson, 1 990). Values for loge(�u: ·Lo·I) differed
only among leaf sizes, ranging from 0.053 and 0.058 for the L14 and L7
categories respectively to 0.068 for the Ls category. Compared to these, the
values for D were small, suggesting that curves tended to be logistic in
character.
Leaves developing after day 21 The increment in leaf area of �1 leaves tended to be higher in SOC plants,
although differences among all treatments were negligible (Fig 6.5). Leaves
of both SCR and DCR plants that commenced expansion 28 DAI were
significantly smaller than SOC leaves after seven days, but the total leaf area
of both restriction treatments was similar to that of control treatments 49
DAI (Fig. 6.6).
100
100
eoo
1500
400
100
r 200 S U 100 '-' as e 0 as
.... as j 700
600
500
400
300
200
100
0
(a)
(b)
21 28
Leaf expansion in root restricted plants 237
35 42 49 Days after initiation of treatments
Fig. 6.5. Expansion ontogeny ofleaves commencing development (a) 21 days or (b) 28 days after treatment application. Each point is the mean � SE from 10-12 plants. key: D=DCR, o=SCR, �=SOC.
Rate of leaf appearance
The rate of leaf appearance in each treatment was constant throughout the
experiment (Table 6.10). Moreover, there were no significant rate differences
among treatments. The rate coefficient calculated from the pooled data set
equates to slightly over 2 leaves being produced per week.
Leaf e%paTl8ion in root restricted plants 238
Table 6.10. Individual and pooled regression coefficients relating appearance ofleaves of3 cm mid-rib length against time (days from transfer into hydroponic system).
Treatment
NSC
soc
SCR
DCR
pooled regression line
x-axis intercept (SE)
9.25 (0.355)
9.59 (0.297)
9.80 (0.248)
8.85 (0.258)
9.42 (0.149)
Relative leaf expansion rate
rate coefficient (SE)
0.29 0.92 (0.013)
0.30 0.93 (0.011)
0.31 0.94 (0.010)
0.31 0.95 (0.009)
0.30 0.92 (0.006)
The relative leaf expansion rate of leaves of all groups, irrespective of
treatment, gradually decreased over time with ontogenetic drift and the
determinate nature of individual leaf growth.
The initial RA of leaves developing soon after treatments were applied (Le. L3, L7, and L14) was similar for all treatments. Estimates of initial RA, calculated
from the first differential of the Richards function (equation 6.3), were higher
than those estimated by the Chanter function but, as for the Chanter function
estimates, no consistent treatment differences were detected. Relative leaf
expansion rate at the point of inflexion was similar to that reported by
Freijsen and Veen ( 1989) for tomato. Neither maximum RA (i.e. RA at the
point of inflexion) nor mean RA were influenced by restriction treatment
(Table 6.9). Presence of a split stem, however, increased the mean RA over
plants with non-split stems.
Leaf expansion in root restricted plants 239
Root restriction had no effect on point estimates of RA of leaves in the Ls
group (Table 6.11). The presence of a split stem influenced RA of leaves in the
L7 group more than whether the root system was restricted or not (Table
6. 12). The RA of leaves that had started expanding 14 DAI was lower in
restricted (SCR and DCR) than unrestricted (SOC) plants between 28 and 35
DAI. In contrast, leaves of restricted plants that started expanding 21 and
28 DAI exhibited higher RA than unrestricted plants from 42 and 49 DAI
respectively (Tables 6.13, 6. 14). Restriction slowed the rate of decrease in L28 leaves, but not in �l leaves.
Table 6. 1 1 . Relative leaf expansion rates (RA) of leaves commencing expansion growth 3.5 DAI at and between different times.
Level of root restriction (R) contrasts contrasts variable SD
NSC SOC SCR DCR [NSC+SOC] SCR V8 SOC V8 [SCR+DCR] Split V8 no vs DCR NSC VB SOC split
[SCR+DCR]
n 5 4 7 6
RA7 0.415 0.451 0.438 0.448 0.0685 NS NS NS NS NS
RAt4 0.295 0.297 0.305 0.304 0.02 1 4 NS NS NS NS NS
RA21 0. 158 0. 149 0.154 0.153 0.0110 NS NS NS NS NS
RA28 0.065 0.057 0.057 0.058 0.0072 NS NS NS NS
RA35 0.024 0.019 0.018 0.019 0.0059 NS NS NS NS NS
RA42 0.009 0.007 0.006 0.006 0.0036 NS NS NS NS NS
RA49 0.003 0.002 0.002 0.002 0.0019 NS NS NS NS NS
RAt4 - RA7 -0.1 19 -0. 154 -0. 133 -0. 1 44 0.0617 NS NS NS NS NS
RA21 - RA14 -0.137 -0. 147 -0. 151 -0.152 0.0215 NS NS NS NS NS
RA28 - RA21 -0.093 -0.093 -0.097 -0.095 0.01 15 NS NS NS NS NS
RA35 - RA28 -0.041 -0.038 -0.038 -0.039 0.0038 NS NS NS NS NS
RA42 - RA35 -0.015 -0.013 -0.012 -0.013 0.0026 NS NS NS NS NS
RA49 - RA42 -0.005 -0.004 -0.004 -0.004 0.0018 NS NS NS NS NS
1018.· .. .. • ..... • • Non significant or significant F test at P<0.05, 0.01 , 0.001 or 0.0001 respectively dflerror)=18 t-:l
� 0
Table 6. 12. Relative leaf expansion rates (RA) of leaves commencing expa nsion growth 7 days after treatment application (DAI) at, and between, different days.
Level of root restriction (R) contrasts contrasts variableoAl SD
NSC SOC SCR DCR [NSC+SOC) SCR VB SOC VB [SCR+DCR) Split VB no VB DCR NSC VB SOC Bplit
[SCR+DCR)
n 3 4 5 7
RA7 0.466 0.443 0.483 0.429 0. 1025 NS NS NS NS NS
RAl4 0.355 0.354 0.368 0.335 0.0383 NS NS NS NS NS
RA21 0.209 0.224 0. 194 0.219 0.0283 NS NS NS NS NS
RA28 0.118 0. 1 1 4 0.091 0. 104 0.0204 , NS NS NS NS
RA35 0.064 0.048 0.039 0.037 0.0094 ••• NS • • NS • •
RA42 0.034 0.018 0.017 0.012 0.0054 ••• NS •• NS •••
RA49 0.018 0.007 0.006 0.004 0.0033 0 0 ' NS ... NS • • •
RAl4 - RA7 -0.148 -0.097 -0. 138 -0.094 0.0846 NS NS NS NS NS
RA21 - RAI4 -0. 145 -0. 129 -0. 174 -0.1 16 0.0452 NS NS NS NS
RA28 - RA21 -0.092 -0. 1 10 -0.103 -0. 1 15 0.0117 NS NS NS NS
RA35 - RA28 -0.054 -0.066 -0.051 -0.067 0.0137 NS , NS NS NS
RA42 - RA35 -0.029 -0.029 -0.022 -0.025 0.0056 , NS NS NS NS
RA49 - RA42 -0.016 -0.01 1 -0.009 -0.008 0.0024 ••• NS , • • •
NS.'.·.··.···.···· Non significant or significant F test at P<0. 10, 0.05, 0.01, 0.001 or 0.0001 respectively df(error)=15
� � �
Table 6. 1 3. Relative leaf expansion rates (RA) of leaves commencing expa nsion growth 14 DAI at and between different times.
Level of root restriction (R) contrasts contrasts variable so
NSC SOC SCR DCR [NSC+SOC] SCR vs SOC vs [SCR+DCR] Split VB no vs DCR NSC VB SOC split
[SCR+DCR]
n 10 6 7 1 1
RAI4 0.397 0.425 0.415 0.401 0.0578 NS NS NS NS NS
RA21 0.313 0.341 0.3 14 0.305 0.0370 NS NS NS NS NS
RA28 0.213 0.226 0.191 0. 191 0.0366 NS NS NS
RA35 0. 122 0. 1 19 0.091 0.095 0.0304 NS NS II NS
RA42 0.059 0.052 0.037 0.042 0.0191 NS NS NS
RA49 0.026 0.020 0.014 0.018 0.0099 , NS NS NS
RA21 - RAI4 -0.084 -0.084 -0.098 -0.096 0.0406 NS NS NS NS NS
RA28 - RA21 -0.099 -0. 1 14 -0. 123 -0. 1 14 0.0263 NS NS NS NS NS
RA35 - RA28 -0.091 -0. 107 -0.099 -0.095 0.0159 NS NS , NS NS
RA42 - RA35 -0.063 -0.068 -0.054 -0.053 0.0142 NS NS NS
RA49 - RA42 -0.034 -0.032 -0.023 -0.024 0.0100 •• NS NS II II
NS ••• •••• ... •••••• Non significant or significant F test at P<0. 10, 0.05, 0.01, 0.001 or 0.0001 respectively df( error )=30
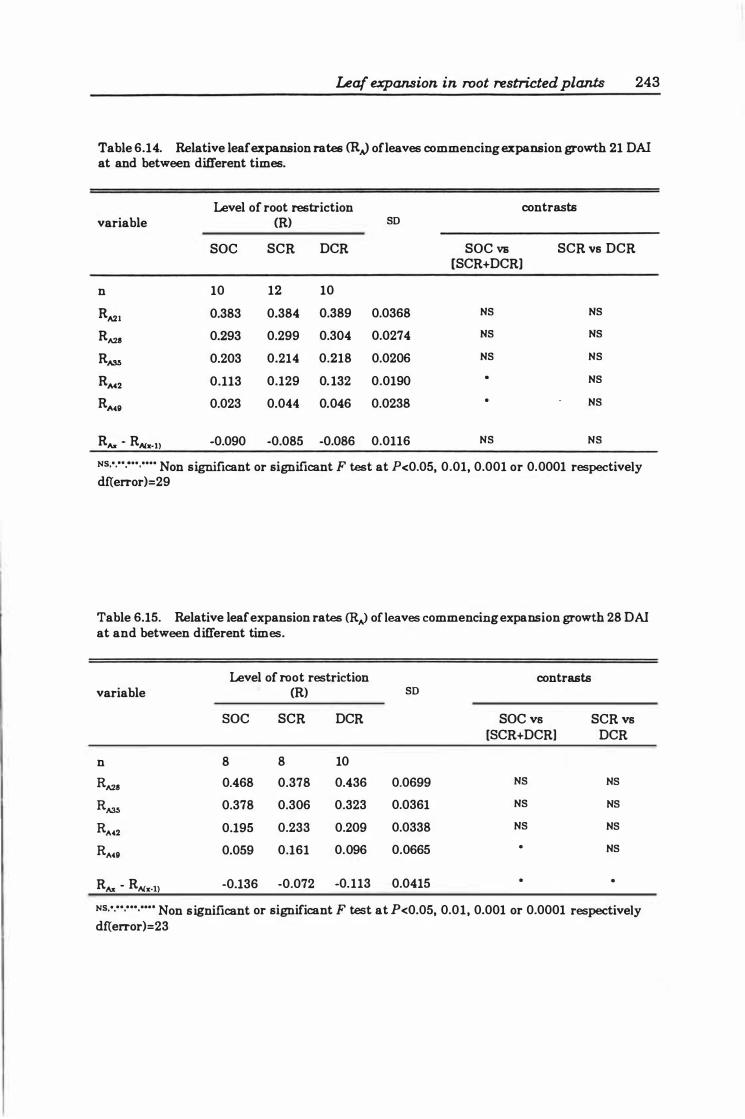
Leaf expansion in root restricted plants 243
Table 6.14. Relative leaf expansion rates (R.J ofleaves commencing expansion growth 21 OAI at and between different times.
Level of root restriction contrasts variable (R) SD
SOC SCR OCR SOC vs SCR vs OCR [SCR+OCR]
n 10 12 10
RA21 0.383 0.384 0.389 0.0368 NS NS
RA2I 0.293 0.299 0.304 0.0274 NS NS
RA35 0.203 0.214 0.218 0.0206 NS NS
R.M2 0.113 0.129 0. 132 0.0190 NS
RA49 0.023 0.044 0.046 0.0238 NS
R ..... - RA(1[.1) .0.090 -0.085 -0.086 0.0116 NS NS
NS.·.··.···.···· Non significant or significant F test at P<0.05, 0.01, 0.001 or 0.0001 respectively df(error)=29
Table 6.15. Relative leaf expansion rates (R.J ofleaves commencing expansion growth 28 OAI at and between different times.
Level of root restriction contrasts variable (R) SD
SOC SCR OCR SOC vs SCR vs [SCR+OCR] OCR
n 8 8 10
RA2I 0.468 0.378 0.436 0.0699 NS NS
RA35 0.378 0.306 0.323 0.0361 NS NS
RA42 0.195 0.233 0.209 0.0338 NS NS
RA49 0.059 0.161 0.096 0.0665 NS
R ..... - RA(1[.l) -0.136 -0.072 -0.113 0.0415
NS.· .. ... . • .... . Non significant or significant F test at P<0.05, 0.01, 0.001 or 0.0001 respectively df(error)=23
6.3.2.2 Total leaf area
Leaf expansion in root restricted plants 244
Double cell restricted plants had developed smaller leaf canopies than SCR
plants by the conclusion of the experiment (Fig. 6.6a; Table 6.18). Analysis
of estimated total leaf area at 49 DAI revealed a similar pattern, although the
statistical difference between the two groups was less distinct (P<0.057).
These results contradict those obtained for individual leaf growth (Tables 6.6,
6.7), where maximum area of individual leaves of plants under DCR and SCR
was not significantly different. Closer examination of these data, however,
shows that individual leaf area of DCR plants was consistently smaller than
SCR. Presumably, the accumulated leaf area totals magnified the small
differences between individual leaf areas.
Total leaf area was re-examined after apportioning total leaf area on any
plant to three groups; (1) leaves present at treatment application (Fig. 6.6b),
(2) leaves commencing expansion 0-20 DAI (includes L3, L7 and La leaf
groups; Fig. 6.6c), and (3) leaves commencing expansion 21 DAI (includes L21
and L28 leaves; Fig. 6.6d). Ontogeny of total estimated leaf area of the 0-20
DAI group is consistent with the results of the individual leaf analysis
(6.3.2.1), with unrestricted plants developing larger leaf area than restricted
plants (Fig. 6.6c). No differences among treatments were observed in those
leaves that started expanding 21 DAI (Fig. 6.6d).
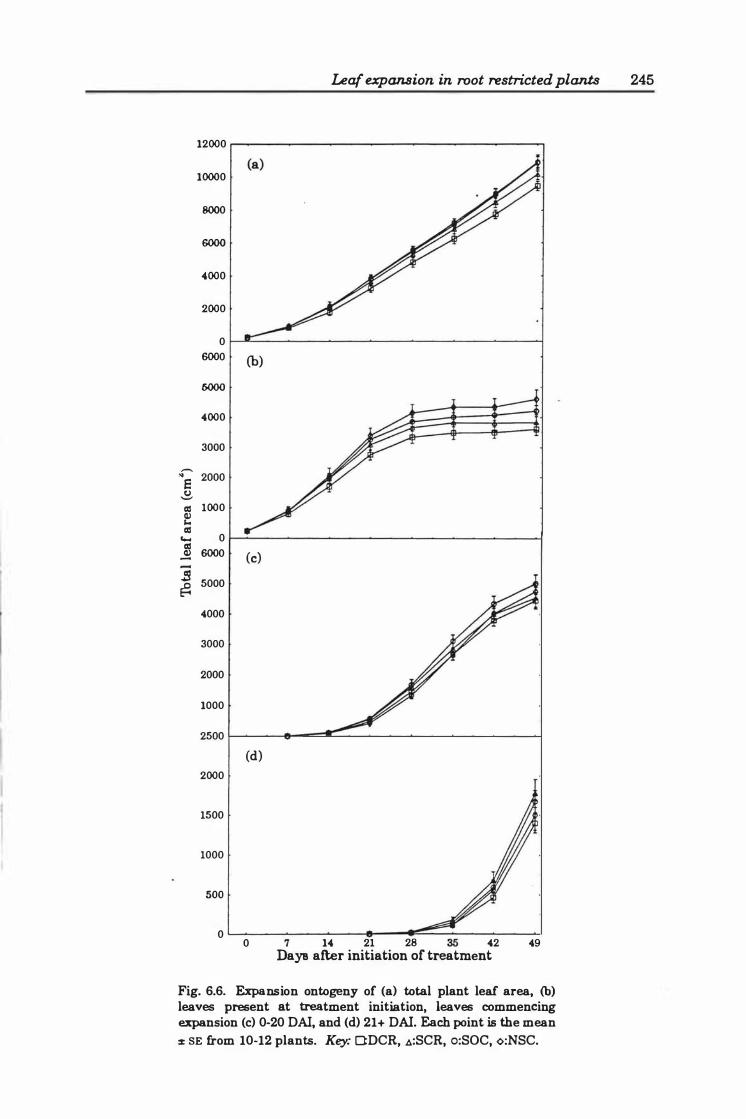
12000
10000
8000
6000
4000
2000
0
6000
5000
4000
3000
'"""' ,. 2000 S () '-' II! 1000 IV .... II!
.... 0 II! 6000 �
-.s 5000 �
4000
3000
2000
1000
2500
2000
1500
1000
SOO
0
(b)
(c)
(d)
0 7
Leaf expansion in root restricted plants 245
14 21 28 35 42 49 Days after initiation of treatment
Fig. 6.6. Expansion ontogeny of (a) total plant leaf area, (b) leaves present at treatment initiation, leaves commencing expansion (c) 0-20 DAI, and (d) 21+ DAI. Each point is the mean
:2: SE from 10-12 plants. Key: ODCR, �:SCR, o:SOC, ¢:NSC.
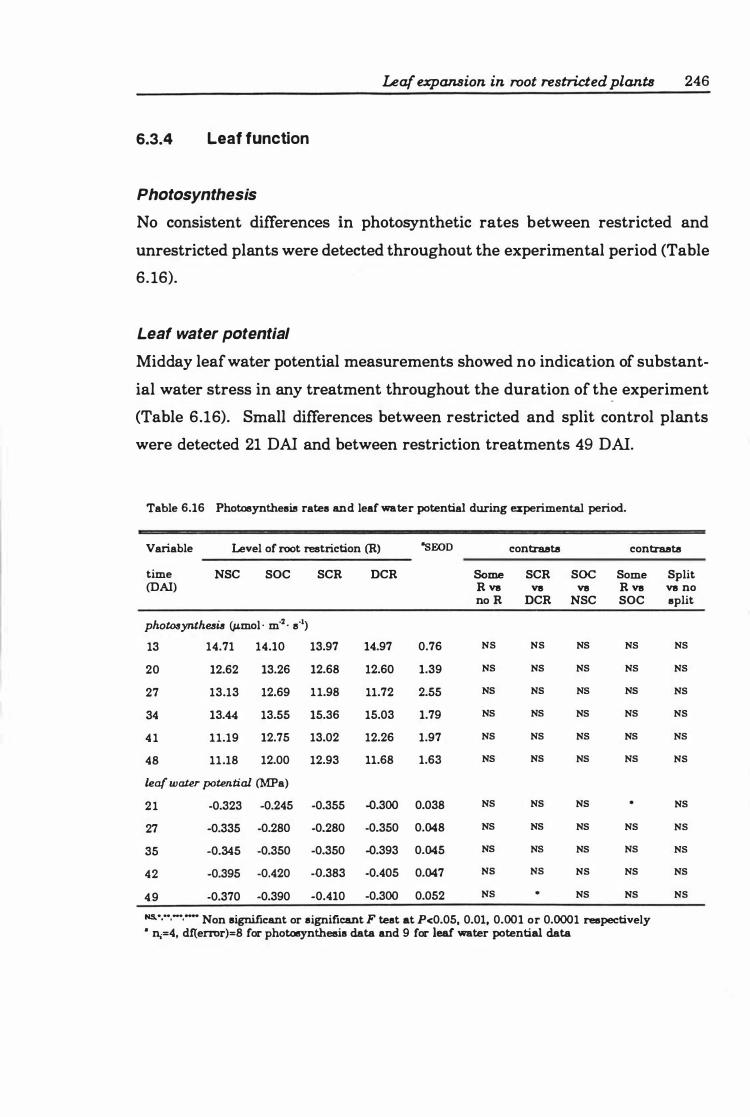
Leaf expansion in root restricted plants 246
6.3.4 Leaf function
Photosynthesis
No consistent differences In photosynthetic rates between restricted and
unrestricted plants were detected throughout the experimental period (Table
6. 16).
Leaf water potential
Midday leaf water potential measurements showed no indication of substant
ial water stress in any treatment throughout the duration of the experiment
(Table 6.16). Small differences between restricted and split control plants
were detected 21 DAI and between restriction treatments 49 DAI.
Table 6.16 Photosynthesi!! rates and leaf water potential during experimental period.
Variable Level of root restriction (R) "sEOD contrasts contrasts
time NSC SOC SCR DCR Some SCR SOC Some Split (DAl) R VII VII VII R VII VII no
no R DCR NSC SOC IIplit
photoaynthesia (p.mol · m·2 • S·l) 13 14.71 14.10 13.97 14.97 0.76 NS NS NS NS NS
20 12.62 13.26 12.68 12.60 1.39 NS NS NS NS NS
27 13.13 12.69 ll.98 ll.72 2.55 NS NS NS NS NS
34 13.44 13.55 15.36 15.03 1.79 NS NS NS NS NS
4 1 ll.19 12.75 13.02 12.26 1.97 NS NS NS NS NS
48 ll.18 12.00 12.93 ll.68 1.63 NS NS NS NS NS
leaf watu potential (MFa)
21 -0.323 -0.245 -0.355 -0.300 0.038 NS NS NS NS
27 -0.335 -0.280 -0.280 -0.350 0.048 NS NS NS NS NS
35 -0.345 -0.350 -0.350 -0.393 0.045 NS NS NS NS NS
42 -0.395 -0.420 -0.383 -0.405 0.047 NS NS NS NS NS
49 -0.370 -0.390 -0.410 -0.300 0.052 NS NS NS NS
NS. ••••• -•• -- Non significant or lIignificant F test at P<0.05, 0.01, 0.001 or 0.0001 respectively • n,-=4, df(error)=8 for photosynthesis data and 9 for leaf water potential data
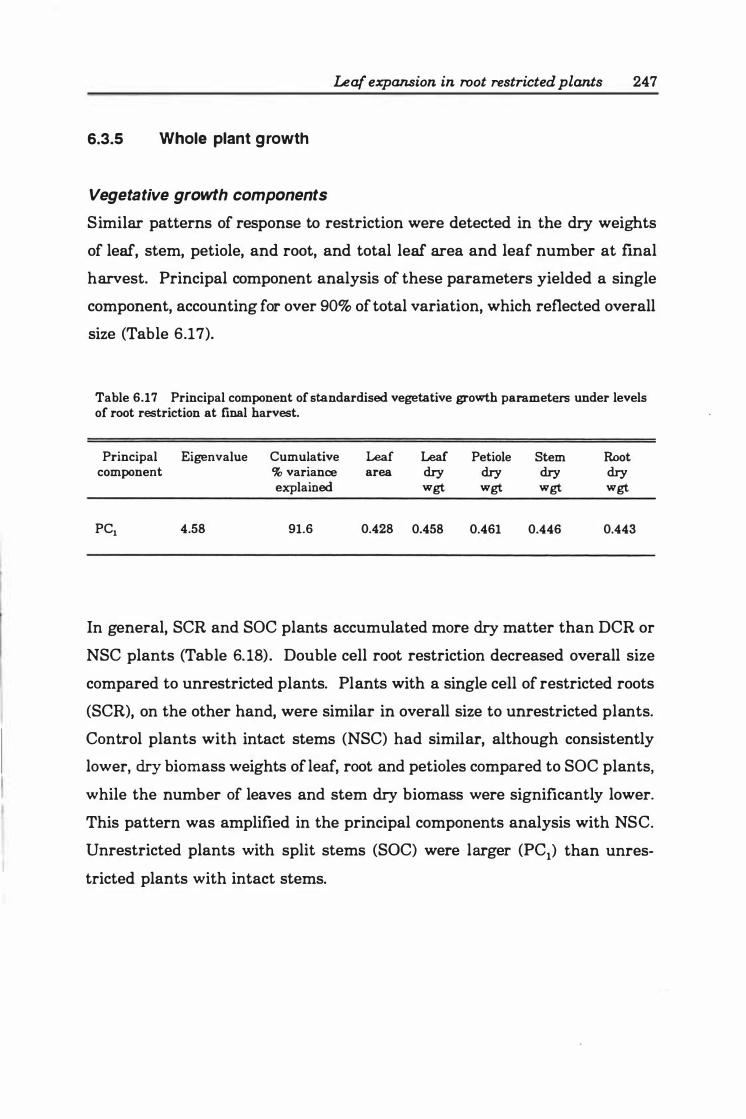
Leaf expansion in root restricted plants 247
6.3.5 Whole plant growth
Vegetative growth components
Similar patterns of response to restriction were detected in the dry weights
of leaf, stem, petiole, and root, and total leaf area and leaf number at fmal
harvest. Principal component analysis of these parameters yielded a single
component, accounting for over 90% of total variation, which reflected overall
size (Table 6.17).
Table 6.17 Principal component of standardised vegetative growth parameters under levels of root restriction at final harvest.
Principal Eigenvalue Cumulative Leaf Leaf Petiole Stem Root component % variance area dry dry dry dry
explained wgt wgt wgt wgt
PCl 4.58 91.6 0.428 0.458 0.461 0.446 0.443
In general, SCR and SOC plants accumulated more dry matter than DCR or
NSC plants (Table 6. 18). Double cell root restriction decreased overall size
compared to unrestricted plants. Plants with a single cell of restricted roots
(SCR), on the other hand, were similar in overall size to unrestricted plants.
Control plants with intact stems (NSC) had similar, although consistently
lower, dry biomass weights of leaf, root and petioles compared to SOC plants,
while the number of leaves and stem dry biomass were significantly lower.
This pattern was amplified in the principal components analysis with NSC.
Unrestricted plants with split stems (SOC) were larger (PCI) than unres
tricted plants with intact stems.
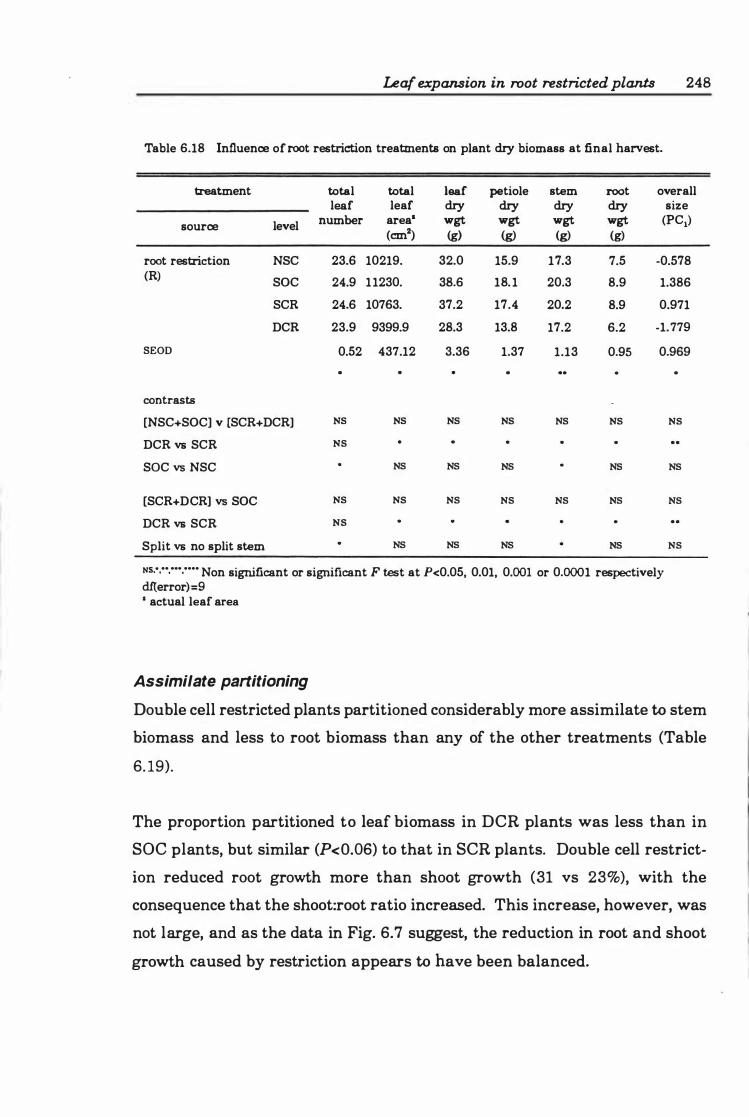
Leaf expansion in root restricted plants 248
Table 6.18 Influence of root restriction treatments on plant dry biomass at final harvest.
treatment total total leaf petiole stem root overall leaf leaf dry dry dry dry size
level number area" wgt wgt wgt wgt (PC1) source (cm2) (g) (g) (g) (g)
root restriction NSC 23.6 10219. 32.0 15.9 17.3 7.5 -0.578 (R) SOC 24.9 11230. 38.6 18. 1 20.3 8.9 1.386
SCR 24.6 10763. 37.2 17.4 20.2 8.9 0.971
DCR 23.9 9399.9 28.3 13.8 17.2 6.2 -1.779
SEOD 0.52 437.12 3.36 1.37 1.13 0.95 0.969
contrasts
[NSC+SOC] v [SCR+DCR] NS NS NS NS NS NS NS
DCR vs SCR NS
SOC vs NSC NS NS NS NS NS
[SCR+DCR] vs SOC NS NS NS NS NS NS NS
DCR vs SCR NS
Split vs no split stem NS NS NS NS NS
NS.·.··.···.···· Non significant or significant F test at P<0.05, 0.01, 0.001 or 0.0001 respectively dfterror) =9 • actual leaf area
Assimilate partitioning
Double cell restricted plants partitioned considerably more assimilate to stem
biomass and less to root biomass than any of the other treatments (Table
6. 19).
The proportion partitioned to leaf biomass in DCR plants was less than in
SOC plants, but similar (P<O.06) to that in SCR plants. Double cell restrict
ion reduced root growth more than shoot growth (31 vs 23%), with the
consequence that the shoot:root ratio increased. This increase, however, was
not large, and as the data in Fig. 6.7 suggest, the reduction in root and shoot
growth caused by restriction appears to have been balanced.
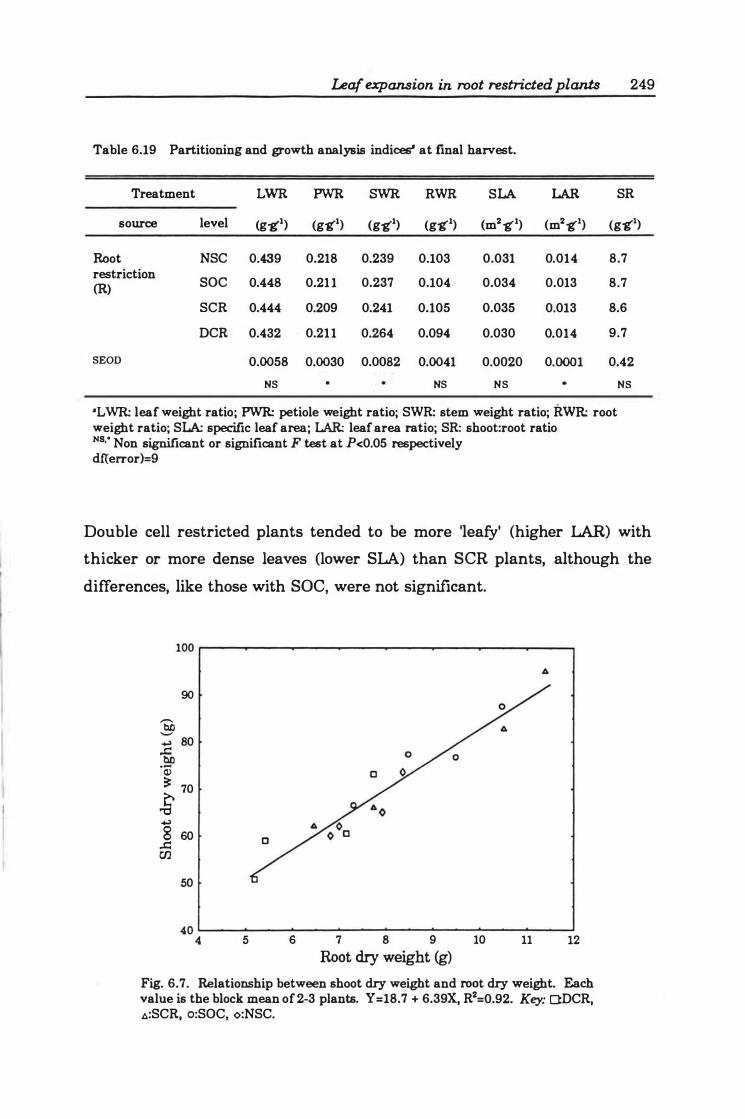
Leaf expansion in root restricted plants 249
Table 6.19 Partitioning and growth analysis indices" at final harvest.
Treatment LWR PWR SWR RWR SLA LAR SR
source level (g-gI) (ggl) (ggl) (ggl) (m2gl) (m2gl) (ggl)
Root NSC 0.439 0.218 0.239 0.103 0.031 0.014 8.7 restriction
SOC 0.448 0.21 1 0.237 0.104 0.034 0.013 8.7 (R)
SCR 0.444 0.209 0.241 0.105 0.035 0.013 8.6
DCR 0.432 . 0.21 1 0.264 0.094 0.030 0.014 9.7
SEOD 0.0058 0.0030 0.0082 0.0041 0.0020 0.0001 0.42
NS NS NS NS
aLWR: leaf weight ratio; PWR: petiole weight ratio; SWR: stem weight ratio; RWR: root weight ratio; SLA: specific leaf area; LAR: leaf area ratio; SR: shoot:root ratio NS,· Non significant or signifIcant F test at P<0.05 respectively dfierror)=9
Double cell restricted plants tended to be more 'leafy' (higher LAR) with
thicker or more dense leaves Gower SLA) than SCR plants, although the
differences, like those with SOC, were not significant.
100 �--�----�----�--------------------�--�
90
-tID '-'" .... 80 -So .-Q) � 70
$ .... 8 60
..c: rn
50
40 �--�----�----�------------------------� 4 5 6 7 8 9 10 11 12
Root dry weight (g)
Fig. 6.7. Relationship between shoot dry weight and root dry weight. Each value is the block mean of 2-3 plants. Y=18.7 + 6.39X, R2=0.92. Key: O:DCR, t.:SCR, o:SOC, o:NSC.
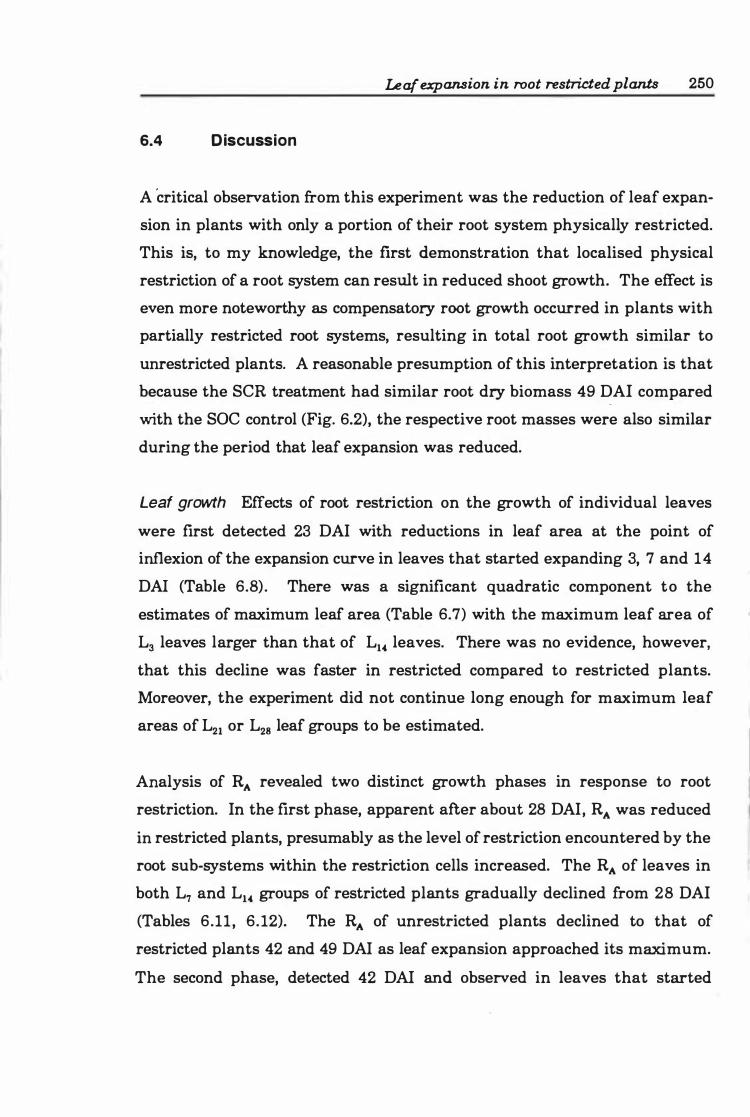
6.4 Discussion
Leaf expansion in root restricted plants 250
A 'critical observation from this experiment was the reduction of leaf expan
sion in plants with only a portion of their root system physically restricted.
This is, to my knowledge, the frrst demonstration that localised physical
restriction of a root system can result in reduced shoot growth. The effect is
even more noteworthy as compensatory root growth occurred in plants with
partially restricted root systems, resulting in total root growth similar to
unrestricted plants. A reasonable presumption of this interpretation is that
because the SCR treatment had similar root dry biomass 49 DAI compared
with the SOC control (Fig. 6.2), the respective root masses were also similar
during the period that leaf expansion was reduced.
Leaf growth Effects of root restriction on the growth of individual leaves
were first detected 23 DAI with reductions in leaf area at the point of
inflexion of the expansion curve in leaves that started expanding 3, 7 and 14
DAI (Table 6.8). There was a significant quadratic component to the
estimates of maximum leaf area (Table 6.7) with the maximum leaf area of
La leaves larger than that of Ll• leaves. There was no evidence, however,
that this decline was faster in restricted compared to restricted plants.
Moreover, the experiment did not continue long enough for maximum leaf
areas of L21 or L28 leaf groups to be estimated.
Analysis of RA revealed two distinct growth phases in response to root
restriction. In the first phase, apparent after about 28 DAI, RA was reduced
in restricted plants, presumably as the level of restriction encountered by the
root sub-systems within the restriction cells increased. The RA of leaves in
both L7 and Ll• groups of restricted plants gradually declined from 28 DAI
(Tables 6.11, 6. 12). The RA of unrestricted plants declined to that of
restricted plants 42 and 49 DAI as leaf expansion approached its maximum.
The second phase, detected 42 DAI and observed in leaves that started
Lea{ expansion in root restricted plants 251
expanding 2 1 and 28 DAI, was characterised by an increase in RA in
restricted plants compared to unrestricted plants (Tables 6.13, 6.14).
Root restriction affected leaf expansion at all stages of development. The
nature of this response, however, changed in time. Reduced leaf area and RA
were flrst detected in Ls' 1" and La groups during periods of decreasing,
maximum, and increasing expansion rates respectively (Le. after, during, and
preceding the point of inflexion, Figs. 6.2, 6.3). It is a little puzzling that
expansion of 1, leaves was, on a percent basis of flnal size, reduced more than
Lw This may be an artefact of the curve fitting procedures; few data were
available near the asymptote, and it is possible that the estimates of
maximum leaf area do not accurately represent the actual final areas gained
by the leaves in any of the treatments. Alternatively, the effect of root
restriction may have been magnified in 1, leaves because in reaching the
point of inflexion, they were at their maximum rate of expansion, whereas L14 leaves had not yet reached this stage of development (Fig. 6.3; Table 6.9).
Similarly, enhanced RA of L21 leaves, but not �8 leaves, at 42 DAI probably
reflects the differences in stages of development (Tables 6.14, 6.15). From
estimates of maximum leaf area and time from emergence to the point of
inflexion (Table 6.7, 6.8), at 42 DAI L21 leaves were about 40% fully expanded
and nearing the maximum rate of expansion; L28 leaves, on the other hand,
did not reach a similar stage of development until about 49 DAI (Fig. 6.5).
An interesting parallel with this response is found in recent work by Ainley
et al. (1993). Using transgenic tobacco plants in which endogenous cytokinin
biosynthesis could be conditionally stimulated by heat shock, these workers
reported that expansion was only increased in leaves that were rapidly
growing at the time enhanced cytokinin levels were induced.
Responsiveness of leaf expansion to root restriction may depend on the stage
of functional development. Ho and Shaw (1977) showed that net import of
carbohydrate into a tomato leaf ceased when it was between 12-50% fully
Leaf expansion in root restricted plants 252
expanded. In a later study, these authors (1979) observed that rates of
accumulation of minerals, water and organic carbon were greatest when the
leaf was 22-24 days old. In both instances, these stages of growth encompass
the period around the point of inflexion (Table 6.8) during which the changes
in expansion rates were detected. It is unlikely, however, that the changes
in leaf expansion rates were due to changes in assimilate supply. Although
a restriction-induced reduction in the sink strength of roots might provide
more assimilate for shoot growth, the usual response to a reduction in sink
strength is either a reduction in shoot activity or preferential partitioning of
assimilate to the root system as, teleologically, the plant adjusts to maintain
a functional equilibrium between the root and the shoot (Brouwer, 1 963;
Davidson, 1969a; Richards and Rowe, 1977a, 1977b). Neither of these
responses were observed (Tables 6.18, 6. 19). On the other hand, if maximurn
rates of accumulation of growth substances also coincide with the period of
maximum leaf expansion, changes in growth would be most visible at the
time of maximum expansion rate (Le. the point of inflexion). Although
exogenously applied cytokinins and gibberellins stimulate cell division in
young leaves (Humphries and Wheeler, 1960) and induce rapid leaf cell
enlargement (Brock and Cleland, 1989, 1990; Nielsen and Ulvskov, 1 992;
Powell and Griffith, 1960), it is only recently that a correlation between the
rate of leaf expansion and the distribution of endogenous cytokinins in leaves
has been demonstrated (Ulvskov et aI., 1992).
The size of leaves is determined by the size and number of cells and inter
cellular spaces (Dale, 1976; Dale and Milthorpe, 1 983; Paul, 1984a). Milthorpe
and Newton (1963) observed both reduced leaf cell number and final cell size
in leaves of cucumbers growing in '5 inch' versus '7 inch' containers. While
some reduction in cell size was noted, Cresswell and Causton (1988) reported
that reduced cell number largely accounted for the smaller leaf area of
Brussels sprouts (Brassica oleracea var. gemmifera DC) seedlings grown in
90 em3 containers compared to those grown in larger volume (210, 550 and
Leaf expansion in root restricted plants 253
1600 ems) containers. The small leaf size of root restricted bonsai trees was
associated with reduced leaf cell number, not size (Korner et al., 1989). In
instances where leaf cell division has been limited, for example by temper
ature (Paul, 1984a), initial rates of RA (pre-point of inflexion) are similar, with
the major contributor to variation in final leaf size between temperature
regimes being the RA following the point of inflexion (Fig. 1 . in Paul, 1984a).
In contrast, when leaf cell expansion is reduced, for example through reduced
leaf water potential and turgor pressure (Takami et al., 1981), initial rates
of RA are reduced. Although the main features of leaf shape and structure
are established at unfolding and rapid expansion of the lamina, over 70% of
leaf cells arise from divisions occurring after this time and up to 40% of full
expansion (Dale, 1988; Milthorpe and Newton, 1963; Nelson and Larson,
1984; Sunderland, 1960). It is noteworthy, therefore, that in the current
study 40% of full leaf expansion coincided with the point of inflexion. Root
restriction in SCR and DCR had, by this stage, already resulted in reduced
leaf area (Table 6.8), despite similar leaf ontogeny (as inferred by the shape
of the curve via the parameter v (Table 6.7), and duration of growth (Table
6.8» , and relative rates of leaf expansion (Table 6.9) among treatments. In
addition, the major differences in leaf expansion between restricted and
unrestricted treatments occurred after the point of inflexion (Figs. 6.2, 6.3).
These data suggest that leaf expansion was reduced by root restriction
through an effect on cell division.
Root growth In all previous studies in which leaf area was reduced by root
restriction, the entire root system was restricted. A critical feature of the
current experiment was that all 'restricted' plants were allowed to develop
unrestricted root systems. Thus, while at the start of the experiment nCR
plants had 100% of their roots in a restricting cell, by the end of the
experiment over 50% of the root system (by dry biomass) of DCR plants was
unrestricted, outside of these cells. Similarly, while initially 50% of the root
system of SCR plants was restricted, by 49 DAI less than 20% of the total
Leaf expansion in root restricted plants 254
root system was restricted (Table 6.4). Teleologically speaking, restricted
plants could avoid the restrictive environment and clearly by 49 DAI they had
done that.
Assimilate partitioning Plants respond to short term changes in the environ
ment by altering the specific activity of their roots and shoots (Davidson,
1969a; Brouwer, 1 963). If the environmental change persists, however, the
long term response is a change in the SR ratio to one suitable for that
environment (Chalmers and van den Ende, 1975). The b alanced reduction in
SR ratio (Table 6.19) indicates that the adjustment in root and shoot growth
of restricted plants was towards an environment in which unrestricted root
growth was the 'norm' (Le. as reflected in the SR ratio of SOC and NSC
plants). In other words, the SR ratio reflected the environment of the
unrestricted part of their root systems, not the restricted part.
In contrast, the partitioning pattern of DCR plants appeared to respond to
the restricted part of their root system. These plants partitioned more assim
ilate (P < 0.005) to the stem at the expense of root and leaf growth than SCR
or unrestricted plants (Table 6.19). This pattern of within-shoot partitioning
of DCR plants is consistent with those in experiments with whole-root
restriction in which increased partitioning to the stem occurs at the expense
of root and leaf growth (Carmi and Shalhevet, 1983; Peterson et al., 1991a;
Richards and Rowe, 1977 a). Increased partitioning to the stem of tomatoes
is also observed when fruit trusses, flowers or leaves are removed. The
common conclusion is that the stem tissue acts as an alternative sink in
tomato (AI-Sabaf, 1984; Friis-Nielsen, 1973a; Hameed et aI., 1987; Hammond
et aI., 1984; Hewitt et al., 1982; Peterson et al. , 1991a). When fruiting
trusses were removed from (unrestricted) tomato plants, the stem operated
as a substitute sink for the excess assimilate produced by the leaves (Ham
mond et al. , 1984). Al-Sabaf ( 1984) concluded that the stem was a more
competitive accumulator of assimilates in restricted compared to unrestricted
Leaf expansion in root restricted plants 255
plants because the former lacked active alternative sinks in roots and leaves.
It is interesting, therefore, that despite have an unrestricted root sub-system,
DCR plants still preferentially partitioned assimilate to the stem. This
suggests that either the stem is a stronger sink than has been previously
regarded, or that the partitioning patterns are not a simple function of
relative sink strength.
The accumulation of assimilates in the stems could also have resulted from
either reduced phloem unloading to normally strong sinks such as roots
(Geiger, 1975), or through increased use within the stem due to enhanced
activity of the cambial meristem arising from altered hormonal status
(Chalmers, 1985). In my study, however, preferential partitioning of assi
milate to the stem occurred in DCR plants despite the presence of a sink (Le.
the unrestricted root sub-system). One further explanation is that reduced
activity in leaf and root sinks may have resulted in accumulating photo
synthate (Robbins and Pharr, 1988; Warren Wilson, 1972) being stored in the
stem. Whatever the mechanism, the absence of partitioning changes in SCR
plants (Table 6.19) suggests that stem storage is a short term measure.
Stored assimilates may have been consumed to support new leaf growth as
the unrestricted root sections became free of the postulated correlative
inhibition of the restricted root systems. Early growth of SCR leaves above
L21 tended to be more rapid than DCR leaves (Fig. 6.5), possibly reflecting
earlier recovery of SCR plants from root restriction. Richards and Rowe
(1977a) reported a similar pattern of assimilate movement after peach roots
were released from restriction, with partitioning from the butt in favour of
leaf growth. Since both sets of data represent discrete points in time in a
dynamic process, however, more detailed analysis of changes in partitioning
patterns is required, with particular emphasis on the ontogeny of partitioning
between restricted and unrestricted root sub-systems.
Leaf U]JalUJion in root restricted plants 256
Clearly, the partitioning response to restriction is more complex than
proposed (Al-Sahaf, 1984). Although the sink activity of the unrestricted root
sub-system was. likely to have been correlatively inhibited (Gersani and
Sachs, 1992) by the restricted root sub-system, the substantial growth of the
unrestricted root system in SCR plants indicates that such correlative control
can be broken, and thus cannot be regarded as a factor influencing the
perceived sink strength of the root system. Physical blockage of assimilate
transport through the phloem arising from callose deposition in sieve tubes
is also an unlikely explanation, as the high auxin/low cytokinin level expected
in the stems of root restricted plants (Richards and Rowe, 1977 a; Carmi and
Heuer, 1981) would favour callose dissolution (Aloni et al., 1990, 1991). A
possibility worthy of further investigation is that the observed increased SWR
was a temporal artefact, having occurred when most of the root system of
DCR plants was still in the restriction cells. Thus, the final harvest simply
occurred before the assimilate stored in the stem had been redistributed to
support the growth of either the unrestricted root system or leaf growth.
The pattern of assimilate partitioning is also relevant to discussion of root
restriction in a container and root impedance in soils of high strength. As might be expected, many of the responses reported here to root restriction are
similar to those of plants whose roots are physically impeded in soils of high
strength. Root elongation and leaf expansion rates are reduced in both
systems. There is good evidence that hormones are involved in the response
to root restriction and root impedance. For the latter, Masle and Passioura
(1987) suggested that the response of shoot growth to soil strength is
controlled by hormones produced in the roots. Passioura and Gardner (1990)
separated the confounding interaction of soil moisture content from soil
strength and reported that the signal sent in response to soil strength and
which lead to a reduction in RA was independent of soil water content. Masle
(1992) traced the time course of growth and stomatal response to root growth
in compacted soil and concluded that the effect of soil resistance on cell
Leaf expansion in root restricted plants 257
expansion and division involved either a different signal or a different percep
tion of a common signal from that involved in regulating stomatal guard cells.
Soil compaction had no significant effect on pre-dawn or midday leaf water
potential, osmotic potential or leaf turgor of sunflower plants, yet RA
decreased linearly with increasing soil strength (Andrade et al. , 1 993). In
contrast, Tardieu et al. (1991) found no evidence to support the effect of
mechanical stress on roots in control of stomata in field-grown maize. These
workers concluded that observed reductions in conductance of plants in
compacted soils were due to reduced water uptake by the root system.
The major difference, however, between both phenomena is the partitioning
patterns between root and shoot. In all but two studies of root restriction
(Ruff et al., 1987; Ternesi et al., 1994), the SR either remains unchanged or
increases. In studies of soil compaction, the SR decreases. Dawkins et al.
(1983) working with peas (Pisum sativum), Atwell (1990a) with wheat
(Triticum aestivum), and Andrade et al. (1993) with sunflowers all reported
a decrease in SR of plants growing in compacted soils. In also observing
preferential partitioning of assimilate to roots of wheat and barley growing
in high strength soils, Masle et al. (1990) postulated that root-produced signal
retarded shoot growth, providing more assimilate to become available for root
growth. These workers speculated that the signal was similar to ABA in its
effects on assimilate partitioning between shoot and root and stomatal con
ductance. Subsequent studies with ABA-deficient mutants of L. esculentum
'Moneymaker' discounted this possibility, with leaf area expansion and trans
piration being reduced in high resistance soils at levels similar to the wild
type controls (Masle, 1990). It would be interesting to grow this mutant in
a container of restricting volume and compare the partitioning pattern with
that observed by Masle et al. (1990).
Compensatory growth The spatiotemporal influence of root restriction on leaf
area expansion rates was a critical observation in this experiment. Expansion
Leaf expansion in root restricted plants 258
was reduced in leaves that started expanding within the first three weeks of
the experiment, but in leaves that started expanding after this time (21 DAD,
the RA was higher in restricted plants than in unrestricted plants (Tables
6.14, 6.15). The experiment was terminated before these leaves were fully
expanded, so it is not possible to determine whether this early difference in
RA would have resulted in larger leaves in plants with a restricted root
system, or in smaller leaves which were fully expanded before those of
unrestricted plants. Unfortunately, the ontogeny of root growth was not
similarly followed. From observations, however, the period of reduced RA
occurred as the root system become restricted in the cells, while the period
of increased RA was coincident with the initiation and growth of new roots
outside of the restricted sub-system. The increased RA may have resulted
from compensatory growth associated with the release from the stress
conditions 'imposed' by the restricted root systems by the development of the
unrestricted root sub-system some time after 21 DAI. Other studies have
reported compensatory growth following release from stress, although almost
all have been associated with water stress. BassiriRad and Caldwell ( 1992)
recorded a three-fold increase (compared to well watered plants) in the
relative rate of extension of roots of previously water stressed plants of the
perennial shrub Artemisa tridentata following re-watering. Restoring
irrigation to all quadrants of peach roots resulted in growth rates equal to or
greater than fully irrigated trees (Proebsting et al., 1 989). Acevedo et al.
(1971) observed that reduced growth of maize leaves following a very mild
and short period of water stress was fully compensated by a transitory phase
of enhanced growth of the same leaves.
Compensatory growth is not, however, a widely accepted phenomenon.
Measurements purporting to show such growth have often been confounded
with other physiological 'by-products' of the stress. Hopkinson ( 1968)
reported that relative leaf expansion rates of tobacco increased substantially
after water stress was removed, to the extent that stressed or root damaged
Leaf expansion in root restricted plants 259
plants had final total leaf areas that exceeded unstressed, undamaged plants.
Flower initiation in stressed plants, however, was delayed and leaf number
consequently increased in stressed plants, making it difficult to distinguish
between the recovery effect and the displacement of development in time.
Hsiao and Acevedo (1974) re-interpreted reports of compensatory growth in
tomato lasting several days after stress was released (Gates, 1955a, 1 955b)
as showing that growth of control leaves had slowed upon maturation, rather
than growth had increased in stressed leaves at the same developmental
stage. Moreover, both Gates (1955a, 1955b) and Hopkinson (1968) restricted
water to the extent that wilting was the criterion for the stressed treatment.
According to Hsiao et al. (1976), the metabolic processes responsible for the
'stored growth' of Acevedo et al. (1971) would also be inhibited at such levels
of water stress. In all these studies, compensatory growth following recovery
from water stress was most noticeable on lower (older) leaves. Upper
(younger) leaves either failed to respond (Hopkinson, 1968) or did not fully
reestablish leaf areas similar to unstressed plants (Gates, 1955a, 1955b). On
the other hand, Takami et al. (1981) reported enhanced leaf expansion of H.
annuus leaves emerging after recovery from water stress.
In my study, compensatory growth was only detected in leaves that
commenced development after the restriction treatments were started (Le. 21
DAl). These growth responses are not easily discounted by the above argu
ments. Compensatory growth was not the resumption of a postponed growth
event (Acevedo et aI., 1971) because the duration of expansion of 'reduced'
leaves was not increased (Table 6.8). Moreover, it occurred in leaves other
than those in which expansion growth was reduced by the restriction
treatments. The increased expansion rate of leaves of restricted plants was
not due to slowing growth of control leaves as they approached maturity (cf. Hsiao and Acevedo, 1974); unrestricted leaves had only reached 40% full
expansion (based on final leaf area of lower leaves). Finally, compensatory
growth cannot be attributed to ontogenetic drift because the monitored leaves
Leaf e%pan8ion in root restricted plants 260
can be assumed to have been at the same developmental stage due to the
clustering procedure used to objectively sample the population (Table 6.5).
Under conditions of low nitrogen nutrition, levels of cytokinin nucleotides in
young leaves and stem tissue increase relative to control plants despite
reduced export of cytokinins from the roots (Wagner and Beck, 1993), suggest
ing that de TWUO synthesis in situ may contribute to the cytokinin level in
these tissues (Chen et al., 1985). Perhaps such synthesis, stimulated by
reduced levels of root-synthesised cytokinin in plants under root restriction,
induces relatively stronger mobilising sinks or stimulates higher rates of cell
division, expansion, or both, in these tissues than unrestricted plants.
Leaf number The rate of leaf appearance was similar to those reported under
winter light levels (Coleman and Greyson, 1976b), day/night temperatures
(Paul, 1984b), and over a range of leaf insertions (Klapwijk, 1981) similar to
those encountered during this experiment. There was no evidence of delayed
emergence of leaves arising from root restriction (Table 6.10). This result
neither supports nor refutes that of the earlier experiment (Chapter 3) as
reduction in leaf number was not detected in that experiment until after 67
days of restriction.
Leaf function Root restriction affected individual and total plant leaf area
without precipitating the gross changes in leaf function and whole plant
development characteristic of other studies into root restriction (e.g.
Tschaplinski and Blake, 1985; Hameed et aI., 1987). Neither photosynthesis
nor leaf water potential was influenced markedly by root restriction.
Measured rates of photosynthesis were similar to those published for well
watered tomato plants (Saunders, 1991; Zerbi et al., 1990). Altered patterns
of partitioning, for example, to the stem and leaves (Table 6 .19), without any
decrease in dry matter accumulation (Table 6.18) suggest that photosynthesis
was not a major response centre during the initial responses of roots to
Leaf expansion in root restricted plants 26 1
physical restriction. Small differences in leaf water potential were observed
between restricted and split control plants 21 DAI and among restriction
treatments at 49 DAI. In both cases the difference was small, and in context
of the range of values recorded, of negligible physiological importance
(Saunders, 1991).
On the other hand, the protocol for selecting leaves for measurement did not
recognise the different growth responses occurring in different leaves on the
same plant. Given the specific response of individual leaves to root
restriction, it is possible that the measurements of leaf function taken did not
accurately reflect the condition of leaves in which expansion rate was
undergoing inhibition (Le. L3, L7 and Lt.,) or stimulation (Le. L21, L2J by root
restriction. The measurement protocol for all measurements involved samp
ling a young leaf in the upper canopy. Consequently, the leaf function
measurements can only be interpreted as indicating that no gross pertur
bations, sufficiently large to influence whole plant function, arose from the
root restriction treatments. The leaf function data may not reflect the rate
of photosynthesis or the leaf water status of leaves in which expansion was
reduced. Future studies must account for localised effects of root restriction
on leaf growth at different insertions into the main stem when measuring leaf
function.
Source-sink relationships It is unlikely that reduced carbohydrate supply was
a factor in leaf area reduction. Restriction did not noticeably reduce photo
synthetic activity. The lack of effect on photosynthesis does not support the
hypothesis that inhibited root growth leads to an increase of carbohydrate in
the leaves with consequent feedback inhibition of leaf photosynthesis (Masle
and Passioura, 1 987; Neales and Incoll, 1968).
Water and other limiting exogenous resources Water relations measurements
were not sufficiently rigorous to exclude the possibility that leaf expansion
Leaf expansion in root restricted plants 262
was reduced by insufficient turgor resulting from decreased osmotic pressure
of the cell (see Dale, 1988; Hsiao, 1973). Nevertheless, the data does not
support the hypothesis that growth reduction induced by root restriction in
these experiments is mediated predominately through a gross water stress
response (Hameed et al., 1987; Tschaplinski and Blake, 1987). Although
Hameed et al. (1987) did not report leaf water potential measurements of
their root-restricted tomatoes, their observations of wilting and increased
diffusive resistance of leaves on restricted plants suggests a water potential
approaching the threshold 'lip range for stomatal closure in tomato of -0.8 to
-1 .0 MPa (Brix, 1962; Duniway, 1971) . In my study, midday leaf water
potential measurements did not approach the threshold 'lip range and did not
indicate water stress occurred in any treatment throughout the duration of
the experiment (Table 6. 1 6).
Several lines of analysis of these and other data provide indirect evidence
that water stress was not responsible for the observed growth reductions. As
root growth is less sensitive to water stress than shoot growth, SR ratios are
smaller in water stressed plants compared to unstressed plants (Bradford and
Hsiao, 1 982; EI Nadi et aI., 1969; Gales, 1979; Hsiao and Jing, 1987; Klepper,
1991; Robertson et al., 1990; Sharp and Davies, 1979). The same pattern was
observed in tomatoes (Tan et al., 1 981). In my study, however, DCR affected
root growth more than shoot growth, resulting in a marginal increase in SR
ratio (Table 6.19).
Root restriction need not affect plant water relations. Localised drying in the
root zone is compensated by increased water uptake in other parts of the root
system. In this way, the total flux of water and resulting water relations of
the plant remain unaffected (Gallardo et al., 1994; Lawlor, 1973; S aab and
Sharp, 1989; Tan and Buttery, 1982). In tomato, Tan et al. (1981) applied
water to 50% of the root system without reducing transpiration, photo
synthesis, stomatal conductance, or leaf area. Accordingly, little or no
Leaf expansion in root restricted plants 263
reduction in leaf area would be expected in tomato plants with less than half
of their root systems unrestricted. The significant reduction in leaf area
(Table 6. 18) supports the argument that the change was independent of the
bulk water potential of the leaves, and thus indicative of a non-hydraulic
signal between restricted roots and expanding leaves.
Water stress also inhibits leaf initiation (Gowing et al., 1990a; Krizek et al.,
1 985; Marc and Palmer, 1976; Ticha et al., 1985) or delays emergence
(Takami et al., 1981). Root restriction did not reduce either leaf number
(Table 6.18) or the rate of leaf emergence (Table 6.10), confirming the general
trend of other root restriction studies reporting leaf initiation data. For
example, Krizek et al. (1985) found no appreciable effect of root restriction on
the number of new internodes and leaves initiated or on the rate of leaf
initiation in soybean. Takami et al. (1981) reported that water stress
increased the duration of leaf expansion in sunflowers. In the present study,
the duration of expansion was similar, irrespective of the presence or extent
of root restriction (Table 6.8).
Reduced growth resulting from root restriction has also been correlated with
reduced availability of either nutrients or oxygen (Mutsaers, 1983; Peterson
et al., 1991b). Given the experimental system and the plant material used
in this experiment, however, there are no reasons to conclude such resources
were limiting. Water, oxygen and nutrients were supplied in non-limiting
amounts by an automatic, highly aerated, nutrient dispensing system.
Furthermore, as unrestricted root systems were present in all treatments,
and as tomatoes can fully maintain leaf function and root integrity under
conditions of stress in the root environment (Tan et al. , 1981; Taylor and
Fenn, 1985), it is highly unlikely that growth responses observed were due
to a lack of some exogenous essential factor.
Leaf expansion in root restricted plants 264
Moreover, in studies supporting the hypothesis that exogenous resources limit
growth following root restriction, morphological responses were greater and
occurred more rapidly than those recorded in my study. For example, Ruff
et al. (1987) reported that total leaf area in tomatoes restricted in a 450 em3
container filled with solid medium was 32% smaller after two weeks,
compared to plants in 13,500 ems containers. After three weeks in a 25 cm3
container attached to a hydroponic system, Peterson et a1. (1991a) reported
a 50% reduction in total leaf area compared to unrestricted plants. Hameed
et a1. (1987) observed a 60% reduction in total leaf area of tomato seedlings
after two weeks in 75 cm3 containers in a hydroponic system. In my study
however, total leaf area of DCR plants at 14 DAI was only 8% smaller than
SOC plants 14 DAI, and 10% smaller 28 DAI. At the point of inflexion (-28
DAI), the area ofL7 leaves, which showed the greatest response to restriction,
was 20% smaller in DCR than SOC plants (Fig. 6.5). Furthermore, root
restriction in my study resulted in a balanced growth reduction between roots
and shoot (Fig. 6. 12), which is characteristic of some (Krizek et al., 1985;
LaRoche, 1 980; Richards and Rowe, 1977a; Richards et al. , 1979; Robbins and
Pharr, 1988), but not other reports (Al-Sahaf, 1984; Carmi and Heuer, 1981;
Hameed et aI., 1987; Peterson et al., 1991a; Tschaplinski and Blake, 1 985).
In contrast to those reports of balanced reductions in root and shoot biomass,
this response occurred regardless of the proportion of the total root system
being restricted.
In nature, the entire root system is seldom restricted. As stress factors
develop in the rhizosphere, plants adapt through compensatory growth and
increased efficiency of water and nutrient uptake in other parts of the root
system. In my study, shoot growth was reduced despite having unrestricted
root sub-systems and the capacity to improve the efficiency of nutrient and
water uptake (Tan et aI., 1981 ; Taylor and Fenn, 1985). These data point to
the conclusion that root restriction reduces shoot growth via an endogenous
regulation system, but that many experiments designed to examine this
Leaf expansion in root restricted plants 265
phenomenon have created artefacts that appear to implicate exogenous
factors.
Root-shoot communication Expansion of specific leaves of restricted plants
was reduced despite an unrestricted root sub-system being available with
which to 'escape' restriction, and with leaf function (photosynthetic rates and
leaf water potential) and normal leaf ontogeny apparently maintained. This
response is consistent with the putative role of chemical signals exported from
roots to stomata in response to drying soil (section 6.1; Davies and Zhang,
1991, and references therein). Moreover, the concurrent balanced reduction
in root growth (Fig. 6.7) suggests that the signal(s) are an important
component of the communication mechanism interrelating root and shoot
growth.
It is possible that the signal depends on the build up of an inhibitor in the
transpiration stream (Le. a positive signal). Healthy roots were present in
the restricted cells; it can be assumed they were metabolically active, and
that tissue integrity was maintained (Tan et al. , 1981, Taylor and Fenn,
1985). If such a positive, inhibitory signal operates under conditions of
increasing root restriction, a steady reduction in leaf area expansion and
possibly leaf function along the entire stem axis should be expected.
Moreover, if the inhibitor was a compounding factor, then reductions In
growth would also compound. Accordingly, a progressive decrease In
individual leaf area would be expected. The decreasing rate of leaf expansion
in 'restricted' leaves developing from 0-21 DAI is consistent with a positive
signal (Fig. 6.6).
On the other hand, the higher RA of leaves expanding after 2 1 DAI (Tables
6. 14, 6 .15) in restricted plants compared with unrestricted plants, together
wi th the absence of marked changes in photosynthetic rates and leaf water
potential, are inconsistent with a positive (inhibitor) signal model. In
Leaf expansion in root restricted plants 266
addition, individual leaf growth from subsequent leaf groups did not exhibit
progressive decreases in leaf area. This latter response parallels that
reported by Mutsaers ( 1983, Fig. 4), in which the relative reduction in fmal
area between successive leaves was similar, despite increasing root
restriction. These results should be compared to those of Clough and
Milthorpe (1975) with tobacco plants, in which the role of a positive inhibitor
is well supported. In their study, leaf area at higher stem positions was
progressively reduced as water stress increased; the area of leaves at
positions 6-12 was 39 to 95% smaller than leaves at the same positions on
fully irrigated plants.
Reduced leaf expansion during periods of root restriction could be due to
reduced supply and transport of a chemical signal to the shoot system, i.e. a
negative signal. Reduced expansion of leaves in groups L3t L7, and Lu, followed by recovery and stimulated expansion in �l and L28 leaves, are
consistent with a system in which a root produced factor (RPF) necessary for
growth is available in limiting and then stimulating amounts. Insufficient
data exist to identify whether such a process was occurring, but it is useful
to consider the possibilities. Despite having unrestricted sub-systems, roots
of SCR and DCR plants may have continued to grow in the restriction cells
until a common level of restriction was reached. The similar dry root biomass
in the restrictive cells of these plants (Table 6.4) supports this suggestion.
During this phase (phase 1), synthesis or transport of the postulated RPF to
the shoot system may have been reduced or inhibited as the rate of root
elongation was progressively reduced by the increasingly physically restrictive
environment. As a result, expansion of leaves was retarded (Tables 6.7, 6.7,
6.8). Once the common level of root restriction was reached, growth was
presumably· diverted to the unrestricted sub-systems because of their more
favourable local environment (Gersani and Sachs, 1992), as indicated by the
comparative differences between the dry biomass data of the restricted and
unrestricted systems (Table 6.4). Enhanced growth (e.g. increased rates of
Leaf expansion in root restricted plants 267
root elongation) of the unrestricted sub-system would have lead to the
resumption of the supply of the RPF to the shoot system (phase 2), and as a
consequence, the uninhibited growth of leaves expanding at this time. The
kinetics of this proposed sequence were not, unfortunately, studied. However,
the observed reduction in area of La and L, leaves after 13-19 days growth
(Table 6.7, Figs. 6.2, 6.3) and the absence of reduced leaf area in L21 leaves
(Fig. 6.5c) suggests that phase 2 started about 33 DAI (21+ 13).
The spatially and temporally distinct responses of leaf expansion do not lend
total support to a communication model in which both types of signals are
involved, with leaf expansion being a function of their relative balance. The
reduced expansion of leaves that commenced development between 0-21 DAI
(Table 6.7, Figs. 6.2, 6.3) is consistent with a high inhibitor:promoter ratio.
Such a ratio would have arisen as root restriction induced synthesis and
transport of a growth inhibitor (positive signal) to the shoot system, while
reducing the 'normal' output of a growth promoter (negative signal) . However,
the enhanced expansion of leaves developing after this period (Tables 6.14,
6.15; Fig. 6.5d), coincident with the development of a new, unrestricted root
sub-system, and by implication, resumed export of growth promoter, is not
consistent with a dual signal model. Resumption of export of a growth
promoter would likely only decrease the inhibitor:promoter balance, partic
ularly since the restricted root sub-system would still be exporting the
inhibitor.
An interaction between the RPF and the assimilate accumulating in the shoot
may have stimulated leaf growth. When severely restricted plants of tobacco
were transferred to larger pots (de-restricted), previously reduced photo
synthetic rates were rapidly restored to 'normal', with rates of CO2 uptake
and RuBP carboxylase activity frequently exceeding those of the non
restricted plants (Herold and McNeil, 1979). These authors proposed that the
accumulated starch was mobilised, providing an immediate source of carbo-
Leaf expansion in root restricted plants 268
hydrate building blocks. This resulted in anabolic activities to occur at rates
that were not possible in unrestricted plants. My study did not continue long
enough to determine the duration of enhanced expansion. It is possible that
a sustained growth advantage was obtained, as found for stem splitting.
Alternatively, L21 and �8 leaves may have reached full expansion sooner,
because of enhanced rates of expansion. As compensatory growth cycles
reported for root anellor shoot pruned plants diminish as the SR balance is
regained (Abod and Webster, 1989; Buttrose and Mullins, 1 968; Carmi and
Heuer, 1981; Gilliam et aI., 1986), the latter outcome seems more likely.
Negative signals have not received wide support in the literature, but the
arguments provided are equivocal. Initially proposed to explain root-shoot
responses to waterlogging (Cannell and Jackson, 1 982), they were su..b
sequently applied to explain responses to soil drying (Davies and Zhang,
1991). In reviewing root-shoot communication models under anaerobic root
environments, Jackson (1990) concluded that negative signals lacked
sensitivity to respond to oxygen stress, especially when only part of the root
system was inundated. However, in both papers cited by Jackson (Drew et
aI., 1979; Jackson and Campbell, 1976), the time between inundation of part
of the root system and assessment was sufficient for compensatory growth to
have occurred in the unstressed part of the root system. Davies and Zhang
(1991) also overemphasise the case against negative signals. They argue that
any reduction in levels of a putative substance normally moving from root to
shoot would be too small for the shoot to 'read' with sufficient precision. Yet
in all the studies cited by these authors in which leaf conductance or growth
was reduced, more than 30% of the root system was dehydrated. Jones (1990)
considered that a negative signal would not have the required information
content by itself; the magnitude of the signal would vary with root volume,
whether or not some roots were stressed. Jones (1990) concluded that such
a signal would need to be combined with other information, such as total root
volume. Indeed, if the synthesis or transport of the signal is linked to the
Leaf expansion in root restricted plants 269
rate of root extension (as suggested in Chapter 3), or is under correlative
control within the root system, or both, then the magnitude of the signal
would reflect the prevailing edaphic conditions throughout the entire root
system. Extending Gersani and Sach's (1992) suggestion that an hormonally
driven mechanism was responsible for correlative relationships within a root
system, if conditions for root extension are non-limiting throughout the entire
root environment, synthesis and transport would be unimpeded. When
conditions in part of the environment impeded root extension, the extent of
synthesis and transport would be an integrative function of the conditions in
the more favourable part of the environment and the influence of the other
roots of the plant. Finally, given the considerable elasticity in root and shoot
function (e.g. Ovaska et al., 1992; Tan and Buttery, 1982; Tan et al., 1981),
the speed and precision of the response expected for stomatal control are
probably greater than those expected for maintaining a balance between root
and shoot growth that is appropriate to the prevailing environment.
Stem wounding Splitting the stem slightly reduced the expansion of those
leaves present (Fig. 6.6b). On the other hand, split-stem plants commenced
growth earlier than intact stem plants (Figs. 6.2, 6.3), and the rate at which
leaf expansion increased to its maximum (K), was higher in split than intact
plants (Table 6.6). Splitting the stem enhanced final total leaf area and
overall size (Table 6. 18). It is unclear ·whether this growth was stimulated
by incision of the stem, or arose through delayed growth following recovery
from the incision. Richards and Rowe (1977a) suggested a functional relation
ship existed between shoot growth and growth substances produced by root
apIces. In propagating apple (Malus pumila) rootstocks from hardwood
cuttings, Howard (1981) and Howard and Harrison-Murray (1982) promoted
root initials by splitting the base of the cutting. Milligan and Dale (1988)
noted that leaf expansion following excision of root tips coincided with
appearance of new roots (apices). It is possible that splitting the tomato
cuttings increased the number of root initials. This may have stimulated
L£a( expansion in root restricted plants 270
production of growth substances (e.g. cytokinins; Forsyth and van Staden,
1 981), providing an additional stimulus to growth. Certainly, the
approximate time (21 DAI) when the development of new root initials in the
SCR and DCR plants was fIrst observed coincides with the time those leaves
whose expansion rates were later observed to be higher in restricted plants
fIrst started expanding. Plant propagation and nursery production may
benefIt from further, more critical evaluation of this hypothesis.
Growth analysis methodology Thornley and Johnson (1990) preferred the
Chanter function to the Richards function because the parameter v was non
physiological and, in their experience, the Richards function was very
sensitive to variation in v. Although no sensitivity analysis was conducted,
parameters derived from v (Table 6.7) had CVs within acceptable bounds
(Simpson et aI., 1960). Furthermore, the highly variable estimates of the D
parameter severely weakened the explanatory power of the Chanter function.
Without other reports using Chanter function, it is unclear whether this is a
characteristic of the function or this data set. Overall, the Richards function
provided more consistent and revealing information than the Chanter
function.
Summary In conclusion, this study has shown that responses to root
restriction are specifIc in relation to - tfme and leaf position on the stem
(space). Restricting all or part of a plant's root system initially reduces rates
of expansion of individual leaves. Expansion rates of leaves developing later
are not affected by the presence of a restricted root sub-system. In some
instances leaf expansion rates of 'restricted' plants were higher than
unrestricted control plants. The spatiotemporal nature of these results is
best explained by a root-shoot communication model which includes a
negative, root produced signal acting in combination with a factor produced
by the shoot. Further research is required to determine the role of correlative
inhibition between restricted and non-restricted sub-systems of roots in the

Leaf expansion in root restricted plants 271
propagation of the signal and growth recovery. Supply of exogenous factors
such as water, nutrients, and oxygen was not limiting in this experiment.
Indeed, experiments in which these factors were implicated are likely to have
been confounded by artefacts. In this regard, experimental systems using
split-root systems for root restriction studies appear to avoid such problems,
and offer an improved technique for studying effects of root restriction on
whole plant growth.

C h a pter 7
General d iscussion
7.1 General discussion
General discussion 273
The dynamism of plant response to root restriction and the plasticity of 'root
restriction' as a treatment were highlighted throughout this study. Reduced
root number preceded reductions in root length or dry biomass and shoot
growth of plants in cells restricting root growth (Chapter 3). Although total
leaf area was reduced in all root ·restricted plants (Chapter 3, 6), the extent
of this reduction varied between leaves on the stem (Chapter 6). Such
temporal responses to root restriction exposed the fragility of conclusions
made from root restriction experiments involving only a single harvest. The
multiple harvest approach taken in the current study overcame the single
harvest problem, as did assessment (using multivariate techniques) of
changes in within-plant relationships over time. Atkinson et al. (1989)
argued that it was difficult to make realistic interpretations of the importance
of instantaneously determined parameters in influencing control of growth,
as it is a process that is integrated over time. The estimates of instantaneous
parameters obtained using the hybrid functional approach to growth analysis
developed in my study avoid this criticism because they arise from a fitted
function that describes the progression of growth of an individual plant
through time. Thus, growth responses to root restriction that might feed back
through the growth process and influence subsequent response (Morrison,
1991) are accommodated by the fitted function.
The question of the usefulness of instantaneous measurements of plant
function can be extended further. The possibility cannot be discounted that
root restriction caused reduced leaf expansion via water stress or that
reduced photosynthetic rates resulted in lower total plant biomass. Measure
ments of photosynthetic rates and leaf water potential discounted major
perturbations in these processes (cf. Hameed et al., 1987; Tschaplinski and
Blake, 1985), but were not sufficiently sensitive to detect mild, persistent ,
reductions in either process resulting from root restriction. This criticism
General discussion 274
accepted, it nevertheless remains difficult to decide on the appropriate level
of measurement in studies at the whole plant or crop level in the
organisational hierarchy of plant science research (Thornley, 1 980). As Evans
(1976) foreshadowed, integrating observations of photosynthesis, water status
or transpiration made over periods of minutes to a plant or crop whose
growth is measured in weeks, months or years has yet to be adequately
resolved. The issue is further complicated by considerable variation during
the day in stomatal responsiveness to water stress (Tardieu and Davies,
1992). Moreover, several authors (e.g. Evans, 1976; Hunt, 1 978; Passioura,
1979; Thornley, 1980; Trewavas, 1986; Wallace and Zobel, 1 994) have argued
that an overly reductionist approach to plant science may actually remove the
integrative picture of plant growth from sight. Thus, just as equipment
capable of measuring the photosynthetic rate or water flux in real time have
their place in the armoury of plant scientists, investigations into whole plant
response to restriction will continue to find analysis of integrative plant
growth more interpretable.
Allometric relationships Applying Causton and Venus's (1981) theorems
revealed that an allometric relationship between root and shoot was not
physically possible (Chapter 3). Richards (1969) considered that there was
no a priori reason to suppose that during development the relative growth
rates of different parts or dimensions should remain proportional to one
another. The relative growth rate of an organ measures the efficiency by
which that organ can produce new material. Strictly speaking, it is only of
use during the early stages of plant growth when all tissue is contributing.
From a physiological standpoint, the relative growth rate of an organ which
consists largely of tissue that is mature and unable to grow is meaningless
(cf. de Wit and Penning de Vries, 1 983). Non-respiring tissues accounts for
a higher proportion of total biomass of woody plants than of annuals and
herbaceous perennials (Schulze, 1983). Early attempts were made to bypass
this problem by defining a relative growth rate for only meristematic tissue
General discussion 275
(Brouwer and de Wit, 1 968), but knowledge of morphogenetic processes is too
fragmentary to make this approach useful. When comparing the relative
growth rates of different organs, a required, but infrequently acknowledged,
assumption is that the proportion of growing tissue to total tissue is the same
in both shoot and roots. There have been no apparent attempts to test this
assumption. Indeed, it is difficult to accept that the proportion of actively
growing tissue in shoots and roots is similar. U sing tomato as an example,
its fibrous root system could be expected to have a high proportion of actively
growing tissue. On the other hand, the proportion of actively growing tissue
in its shoot system is likely to be lower given the higher proportion of
structural tissue.
Moreover, relative growth rate is, at best, a measure of apparent sink
strength. For example, as a large proportion (40-60%) of assimilate imported
by a root sink is used for respiration (Farrar, 1 985; Lambers, 1988; Lambers
et al., 1991) and a significant proportion (-5-10%) lost as root exudates and
through root turnover (Atwell, 1990b; Keith et al., 1986; Lambers, 1988;),
discussion of sink strength in terms of net accumulation rate of dry biomass
fails to assess the true ability of the sink organ to receive assimilate (Ho,
1988). In other words, the actual sink strength of the root is probably
considerably higher than that implied by the relative growth rate. Consistent
with this, Ho (1988) concluded that Warren Wilson's (1972) definition of sink
strength as the product of sink size and sink activity was flawed. Ho (1988)
reasoned that sink size was better defined as the physical constraint and sink
activity the physiological constraint upon a sink organ's assimilate transport.
Indeed, Watson and Casper (1984) find sufficient evidence in the literature
to question the validity of dry biomass weight as a measure of allocation,
preferring instead the use of fixed carbon to reflect patterns of biomass
allocation in response to environment.
General discussion 276
This issue aside, many authors regard the allometric coefficient k as a useful
summary variable. Hunt and Nicholls (1986) concluded that k was sufficient
ly stable to represent the whole of the vegetative phase of growth without
serious loss of information, while remaining responsive to genetic and
environmental influences. Causton and Venus (1981) extended Warren
Wilson's (1972) notion of relative growth rates as measures of sink activity,
suggesting that k summarised the ratio of sink activities of the two compon
ents. In the current study, however, interpreting k required previous
interpretation of the univariate analyses of the variables being summarised
through the allometric approach. An allometric coefficient significantly
greater than unity is usually interpreted as a reflecting a higher demand for
assimilate by the dependent variable compared to the independent variable
(Causton and Venus, 1981; NeIder, 1963). Thus, under intense root
restriction (Le. CR), plants appeared to partition relatively more assimilate
to leaves and stems than the roots, a result similar to that reported by
Richards et al. (1979). Yet as both the univariate and CDF analyses revealed
(Tables 3.5a, 3.6), root growth ofCR plants was significantly lower than other
treatments by 31 DAI, whereas stem dry biomass weight and leaf dry biomass
weight was not significantly lower than other treatments until 67 DAI. The
correct conclusion, therefore, was that the allometric coefficient reflected a
lowered demand for assimilate by roots.
The conclusions drawn from the study of the allometric relationships between
roots and the components of shoot growth also revealed changes in the
partitioning behaviour of the plants. For example, stems and leaves tend to
receive proportionately more assimilate than roots up to 67 DAI, after which
roots were favoured. This observation is consistent with the high stem
density-high leaf biomass-low root density CDF extracted from the 67 DAI
data (Table 3.6). On the other hand, the observed reversal of partitioning
(Table 3.14) was an inevitable consequence of dissimilar rates of decline in
the relative growth rates, with the rates of decrease of Rm- and Rx. faster than
General discussion 277
� (Table 3.11). Changes in allometric relationships, often occurring
abruptly, have been previously described, but have been associated with
morphological switches such as the onset of flowering or fruiting (Richards,
1 981; Troughton, 1956, 1960), phenomena avoided in the current study by
removing flower clusters. It is possible that the fitted linear segments (Fig.
3.14) are poor estimates of a curvilinear allometric relationship (Barnes,
1 979), reflecting a decrease in the proportion of actively growing tissue in
shoot tissue to that in roots (Causton and Venus, 1981), or dissimilar rates
of maintenance respiration (Barnes, 1979). Both Hansen and Jensen (1977)
and Veen (1981) reported higher respiration rates in roots than shoots. Alter
natively, it is possible that bias may have been introduced into that analysis
through the subjective segmentation of the data. Others might be tempted
to fit a single line over more harvests, arguing that the deviations are minor.
Certainly, regression is used to 'smooth out' variations in response (Myers,
1990).
On the other hand, if we accept that leaf and stem growth are closely linked
with root growth, then smoothing out variations will mask consequences of
this close link and deny identity of an 'odd occurrence' (Popper, 1972).
Comparing the data in Table 7.1 with those in Table 3.14 shows that for
components i and j, the allometric coefficient k describes the ratio of their
mean relative growth rates between times t and t+ 1 , but provides no
information of short term movements in the relative growth rates within this
duration. As Poorter (1989) has shown, such changes do occur. This has
important consequences when interpreting treatment responses. First, the
major changes in partitioning patterns indicated in plots of the logarithms of
the variables of interest may not be signalling real changes in partitioning or
changes in relative sink strengths. The plots of stem, leaf dry biomass weight,
and root dry biomass weight (Figs. 3.3, 3.5, 3.6) suggest that a major change
in partitioning patterns between UR and CR plants occurred between 45 and
67 DAI. However, dissimilar rates of decrease in the relative growth rates
General discussion 278
of stem, leaf and root dry biomass resulted in � exceeding that of Rr. and Rs-r between 67 and 99 DAI (Fig. 3.11, 3. 12). As a consequence, the S R ratio
declined (Fig. 3. 12, Table 3. 1 0), and the value of k fell below unity (Table
3. 14). Second, as a consequence of these unequal rates of change in RGR, the
value of k is not constant, as conventional application of allometry assumes.
Third, because k is a mean value, short term variations in partitioning
patterns between root and shoot are likely to be masked if the period covered
by the data is too long. For example, despite observing stimulated vegetative
growth upon releasing tomato plants from root restriction, Richards (1981)
reported similar values of k in restricted plants and those released from
restriction. In this example, the experiment lasted 140 days. In calculating
k over this duration, Richards (1981) was effectively calculating the ratio
between the mean shoot relative growth rate over 140 days and the mean
root relative growth rate over the same period, i.e.:
loge W 5(t-14O) - loge W 5(to() k =
(140-0) loge W R(t-14O) - loge W R(to()
(140-0)
Thus, it was not possible for the allometric analysis to reflect short term
divergent movements in the relative growth rates of shoot or root.
On a broader level, the classical growth analysis in the current study did not
detect differences in Rw among treatments. Nevertheless, Rw must have
differed at some stage because similarly sized plants at the beginning of the
experiment were significantly different in size at its conclusion. This lack of
definition has been highlighted by other workers (e.g. Poorter, 1989; Poorter
and Lewis, 1986). The lack of definition provided by the classical analysis in
the current study was probably due to the 14 and 18 day gaps between
harvests. Although allometric analysis does not arrive at its estimate of k via
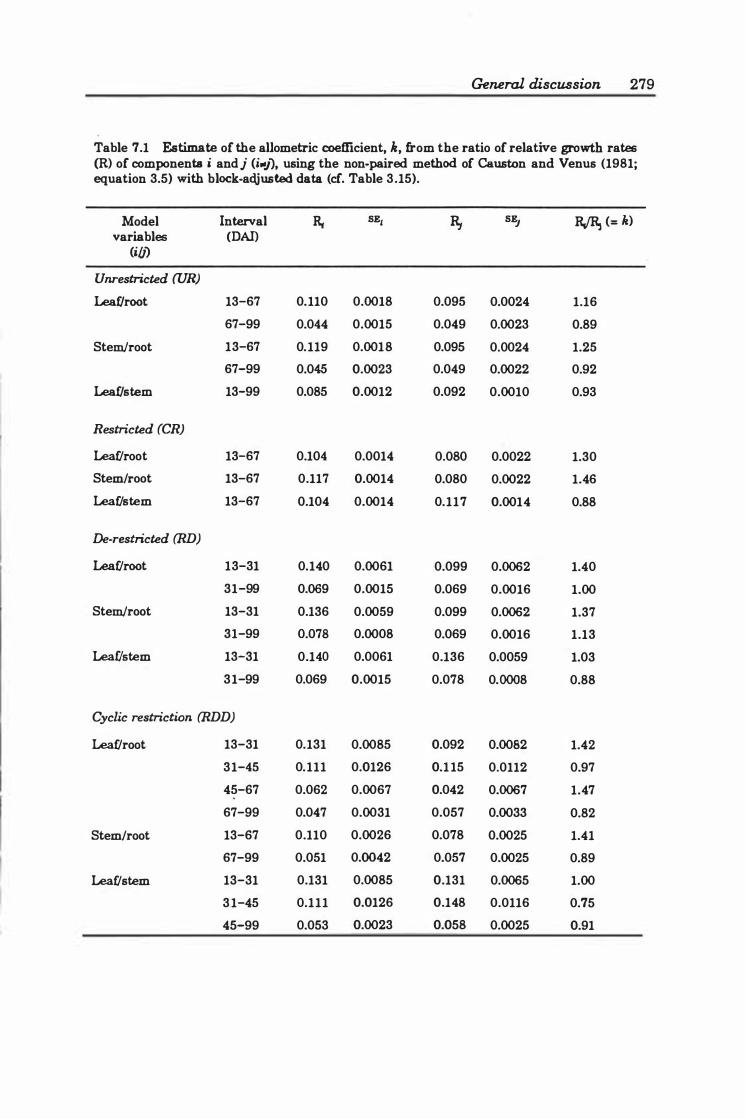
General discussion 279
Table 7.1 Estimate of the allometric coefficient, k, from the ratio of relative growth rates (R) of components i andj (i-J), using the non-paired method of Causton and Venus (1981; equation 3.5) with block-acljusted data (cf. Table 3 .15).
Model Interval Rr SEI R, SE) RJR, (= k) variables (DAl)
(ib) Unrestricted (UB) Leaf/root 13-67 0.110 0.0018 0.095 0.0024 1.16
67-99 0.044 0.0015 0.049 0.0023 0.89
Stem/root 13-67 0.119 0.0018 0.095 0.0024 1.25
67-99 0.045 0.0023 0.049 0.0022 0.92
Leaf/stem 13-99 0.085 0.0012 0.092 0.0010 0.93
Restricted (CR)
Leaf/root 13-67 0.104 0.0014 0.080 0.0022 1.30
Stem/root 13-67 0.117 0.0014 0.080 0.0022 1.46
Leaf/stem 13-67 0.104 0.0014 0.117 0.0014 0.88
De-restricted (RD) Leaf/root 13-31 0.140 0.0061 0.099 0.0062 1.40
31-99 0.069 0.0015 0.069 0.0016 1.00
Stem/root 13-31 0.136 0.0059 0.099 0.0062 1.37
31-99 0.078 0.0008 0.069 0.0016 1.13
Leat/stem 13-31 0.140 0.0061 0.136 0.0059 1.03
31-99 0.069 0.0015 0.078 0.0008 0.88
Cyclic restriction (RDD) Leaf/root 13-31 0.131 0.0085 0.092 0.0082 1.42
31-45 0.111 0.0126 0.1 15 0.0112 0.97
45-67 0.062 0.0067 0.042 0.0067 1.47
67-99 0.047 0.0031 0.057 0.0033 0.82
Stem/root 13-67 0.110 0.0026 0.078 0.0025 1.41
67-99 0.051 0.0042 0.057 0.0025 0.89
Leaf/stem 13-31 0.131 0.0085 0.131 0.0065 1.00
3 1-45 0.111 0.0126 0.148 0.0116 0.75
45-99 0.053 0.0023 0.058 0.0025 0.91
General discussion 280
the same route, it is nevertheless estimating a value based on durations far
in excess of 14 and 18 days.
Moreover, as the ratio of two lines, each constructed from points at their
extremities, is a straight line, the marked absence of reports of no allometric
relationship between plant components is more readily understood. Other
workers have recognised the coarseness of definition offered by allometric
analysis, but have viewed it much more positively. Hunt and Nicholls (1986)
argued k was a more useful measure of partitioning over a period of study as
it was not simultaneously subject to genetic, ontogenetic and environmental
control in the same way that instantaneous ratios between root and shoot size
were subject. The difficulty in this view, and that of others who have
reported a constancy of k over seasons and vegetative and generative growth,
is that the degree of constancy becomes a function of the period being
reviewed. Viewed over several short consecutive periods, k may be expected
to show major deviations according to the treatments imposed (e.g. Table
3. 14), whereas viewing the same data as a single period, k will 'appear' stable.
Given these factors, the general utility of allometric analysis must therefore
be questionable. Indeed, and in contrast to Thuantavee's (1991) conclusion,
detecting short term changes in partitioning patterns between different
organs is arguably one of the few useful applications of linear allometry, if
only because it is arithmetically more efficient than calculating the respective
relative growth rates.
Integrating the effects of root restriction into a model The emphasis placed in •
Chapter 6 on the possible nature and origin of the root signal responsible,
directly or indirectly, for the reduction in leaf expansion in root restricted
plants does not assume a .single hormonal control system. In most, if not all,
hormonal messenger systems, multiple rather than single hormonal control
systems appear to operate (Leopold and Nooden, 1984), a point apparently
forgotten in recent reviews of root-shoot communication (Jackson, 1990, 1 993).
General discussion 281
Root elongation is controlled by auxin (Bjorkman and Cleland, 1991; Jackson
and Barlow, 1981; MacIssac et al., 1989; Wightman et al., 1980; Zeaden and
McLeod, 1 984) synthesised in the shoot (Rowntree and Morris, 1979). Hence,
if Rm. influences RA then we should consider a model with a root produced
factor (RPF) and a shoot produced factor (SPF).
If we assume that auxin (or a derivative) is the SPF and cytokinin (or a
derivative) is the RPF (given the strong qualitative support for this group of
hormones), how consistent are the observed responses with an hormone
control system? It is significant that leaf expansion was not increased by root
restriction (Tables 3.5a-c; Table 6.8). Individua1 1eaves are both sources and
sinks (Ho and Shaw, 1977; Nielsen and Veierskov, 1990; Russell and Morris,
1 983), yet a reduction in sink strength of roots is not mirrored by a com
parative increase in leaf expansion, despite the close proximity of the source.
This suggests that root restriction disturbed another factor(s) crucial to leaf
expansion.
An important result in Chapter 6 was the observation of increased parti
tioning to the stem in DCR plants. Such partitioning is a characteristic of
root restricted plants, and is regarded as evidence of a secondary sink
operating in the absence of a functioning root sink. In DCR plants, however,
a functioning and unrestricted root sink was present (Le. those roots formed
outside the restriction cells). Metabolism of accumulating amounts of a shoot
produced factor (SPF) in stems may account for the preferential partitioning
towards the stems of DCR plants. This would infer an asymmetric distribut
ion or activity of a SPF along the stem axis. Auxin displays such character
istics under both stress and non-stress conditions. Everat-Bourbouloux and
Bonnemain (1980) reported that labelled auxin, eH-IAA) applied to the apical
bud of broad bean plants (Vicia (aha L.) accumulated in the cotyledonary node
zone, encompassing the lower half of the first internode and the upper half
of the hypocotyl. Changes in hormonal activity in this transitional zone
General discussion 282
between the vascular systems of the root and shoot (Esau, 1965) h ave also
been recorded in apple trees following root and shoot pruning (Grochowska
et al., 1984; Grochowska and Karaszewska, 1990). Grochowska et al. (1994)
applied TIBA to the transition zone of apple seedlings, inhibiting basipetal
transport of 14C-1-IAA. The resulting supra-optimal concentration of auxin
above the TIBA 'girdle' induced ethylene which, in turn, resulted in leaf
epinasty. Jaramillo et al. (1992) presented anatomical evidence from
physically impeded roots showing that the structural arrangement of xylem
vessels was disrupted at the junction of primary root and hypocotyl. The
potential conductivity of this zone was estimated to be considerably less than
in zones with normal vessel structure. This observation is consistent with the
conclusion of Hameed et al. (1987) that increased hydraulic conductivity in
roots of restricted plants was a major reason for growth reduction in root
restricted plants. After reviewing the effect of stem girdling experiments,
Chalmers (1985) concluded that stimulation of cambial activity above girdles
was regulated by auxin turnover. Significantly, working with root-restricted
peach rootstocks, Costa et al. (1992) reported enhanced IAA oxidase activity
in the lower stern region, a region to which assimilates are preferentially
partitioned (Richards and Rowe, 1977a). Such an increase in IAA metabolism
in root restricted plants in which cytokinin export to the shoot has been
reduced is consistent with reports that cytokinins may protect auxins from
degradation. N oar-Saleh and Hemberg (1980) detected increased amounts of
IAA in bean plants previously treated with kinetin. A similar response was
observed in subsequent studies using roots of bean, maize and oats (Avena
spp.) irrigated with a kinetin solution (Noor-Saleh, 1 981).
There is also circumstantial evidence that auxin is involved in the control
loop. Wareing et al. (1968) suggested that decreased competition between
leaves for root-produced cytokinins was responsible for observed increases in
photosynthetic rates of leaves remaining after partial defoliation treatments.
Beever and Woolhouse (1973) reported that decapitation and continual
General discussion 283
removal of axillary buds promoted export of cytokinins from the roots. Similar
increases following removal of axillary buds (sources of IAA) have been
observed in tomato and tobacco (Colbert and Beever, 1 981). These reports,
and those detailing increases in leaf area, SLA, protein content, Rubisco
(Callow and Woolhouse, 1973; Carmi and Koller, 1979) and chloroplast
ribosomal RNA synthesis (Callow and Woolhouse, 1973) following bud
removal or decapitation, are consistent with demonstrated roles of cytokinin.
Interestingly, root restriction reduces all these phenomena.
The postulated model presumes a dominant role for cytokinin in leaf
expansion. The stimulated expansion of rapidly growing leaves in transgenic
tobacco plants exhibiting enhanced biosynthesis of endogenous cytokinins
(Ainley et al. , 1993) clearly points to the involvement of cytokinins in leaf
expansion. The actual nature of their role is, however, still unclear.
Exogenously applied cytokinins stimulate cell division in young leaves
(Humphries and Wheeler, 1960), induce rapid leaf cell enlargement (Brock
and Cleland, 1989, 1990; Leopold and Kawase, 1964; Nielsen and Ulvskov,
1992; Powell and Griffith, 1960), and can partially compensate the retardative
effects of root restriction on leaf expansion (Carmi and Heuer, 1 981; Richards
and Rowe, 1977a) . Largely based on studies involving exogenous application
of cytokinins (e.g. Crosby et al., 1981; Fletcher et al., 1970; Gersani et al.,
1980; McDavid et al., 1974; Nakata and Leopold, 1967; Richards, 1980;
Richards and Rowe, 1977a; Shindy and Weaver, 1970; Shindy et al., 1973;
Weaver et al., 1969; Wittwer and Dedolph, 1 963; Zack and Loy, 1984), the
putative role of cytokinin in leaf growth was its ability to enhance sink
activity by diverting and retaining assimilates to treated tissue. More recent
studies, however, have cast doubt on this role, with the demonstration that
while leaf expansion in pepper leaf disks is stimulated by BA, it occurs
without significant changes in sucrose or leucine uptake, the concentration
offructose-2,6-bisphosphate (a promoter of glycolytic metabolism; Black et al. ,
1987), activities of acid invertase or phosphofructokinase, or partitioning of
General discussion 284
photosynthates (Ulvskov et al., 1992; Nielsen and mvskov, 1 992). It is also
important to note that the use of BA or kinetin, often at unphysiologic ally
high concentrations (e.g. Carmi and Heuer, 1981; Richards and Rowe, 1977a),
in many of these studies limits their value in elucidating the role of
cytokinins in leaf expansion because the metabolism of BA and kinetin is
different to that of zeatin-type cytokinins (the dominant group of endogenous
cytokinins; Letham and Palni, 1983) (Fox et al., 1 973; Letham, 1 994).
Threshold ratios or direct interaction with other hormones may be required
for response. Gibberellins, for example, promote leaf expansion (Brock and
Cleland, 1990; Steffens et aI., 1985; mvskov et al., 1992), and applying both
gibberellin and cytokinin to root-restricted bean plants restores the growth
of leaves and stems (Carmi and Heuer, 1981).
While the functional link between cytokinins and leaf expansion currently
remains obscured, recent developments in three different areas give some
hope of progress. First, a correlation between the rate of leaf expansion and
the spatial distribution of endogenous cytokinins in leaves has been demon
strated (Ulvskov et aI., 1992). The distribution of zeatin and zeatin riboside
in rapidly expanding leaves of pepper was correlated with the rate of leaf
expansion which was high in the basal leaf tissue and low near the root apex.
Second, developments in understanding of the biophysical components of cell
growth indicate that cytokinin (albeit BA) promotes leaf cell expansion by
increasing cell wall extensibility (Le. the relaxation ('loosening') of the cell
wall prerequisite to its irreversible expansion; Cosgrove, 1 993) (Brock and
Cleland, 1989, 1990; Cleland, 1986; Tomos and Pritchard, 1994). Taylor et
al. (1993) reported that the reduced leaf area and expansion rates of shrub
willow (Salix uiminalis) grown under sub-optimal supplies of nitrate were due
to a reduction in cell wall extensibility. This result links the mechanism of
leaf expansion to the third area of recent development, the relationship
between nitrogen supply, cytokinin levels and assimilate partitioning. Kuiper
(1988) and Kuiper et al. (1988, 1989) attributed the rapidity of growth
General discussion 285
response (e.g. &W, SR) of plantain (Plantago major ssp pleiosperma) to
changes in nutrient regimes as being mediated by cytokinins. Samuelson et
al. (1992), working with barley (Hordeum vulgare) reached a similar
conclusion, although suggested that cytokinins responded to short-term rather
than long-term changes in nitrogen supply. The concentration of trans-zeatin
and trans-zeatin ribosides in roots and the daily fluxes of these hormones
from roots to shoots in stinging nettle (Urtica dioica L.) were correlated with
SR (Beck and Wagner, 1 994; t'etene et al., 1993; Wagner and Beck, 1993) and
similarly responded to nitrogen supply. These results suggest that reduced N
concentrations result in reduced cytokinin synthesis and delivery to the
shoots. Taken together, the advances in these three areas reaffrrm a role for
cytokinin in leaf expansion. More study is required, however, before the
relative contributions to cell division and cell expansion of this role can be
assessed. For example, the zones of rapid expansion in sweet pepper leaves
in which high concentrations of cytokinins were found (Ulvskov et aI, 1992) .
were likely to have contained both dividing and expanding cells.
The relationship described between the relative rate of root elongation and
the relative rate of leaf expansion (Chapter 3) is a simple empirical model.
Although some workers regard all empirical models of negligible value
(Wilson, 1988), others are less dismissive, recognising that the deductions
from empirical models become the hypotheses for further study and
ultimately progress (Pease and Bull, 1992). Moreover, the line between
empirical and mechanistic models is often blurred. For example, Thornley
(1976) observed that most modelling exercises contain elements of both
empiricism and mechanism, and McN aughton et al. (1985) acknowledged that
empirical models often have, at their centre, a notional state of plant
development that progresses continuously in time. The importance and need
to validate statistical models was emphasised in Chapter 4. In keeping with
the 'working hypothesis' status of a scientific theory, validation is assumed
to mean a failed attempt at falsification (Popper, 1 959, 1963). Indeed, as
General discussion 286
Johnson et al. (1991) reflect, all models in science are probably false in a
rigorous sense, yet their value in defining principles, providing clarity in
analysis and aiding interpretation is enormous. The specific mechanism by
which root restriction might regulate shoot growth in tomato cannot be
determined from the data presented in the current study. Thus, the following
model explaining the mechanism through which root restriction influences
shoot growth seeks only to integrate ideas and to act as a guide to future
experimental work.
This model is based on a control loop first considered by Thimann in 1937,
and subsequently refined by Sachs (1972). Under steady-state conditions,
auxins synthesised in the shoot are transported towards the roots where, in
low concentrations, they stimulate root growth. I n turn, cytokinins
synthesised in the root system are exported to the shoot where they promote
growth. When roots become physically restricted or their rate of elongation
is reduced (Chapter 3), or both, auxin concentration within the root tissue
increases (Lachno et aI., 1982; Saugy and Rivier, 1 988), possibly as a result
of reduced metabolic activity, and root elongation declines further. As auxin
can stimulate cytokinin degradation in a range of plant tissues (Palmer et aI.,
1984; Palni et aI., 1988), it is possible that the increased concentration of
auxin in the root apex may increase degradation of cytokinins produced in the
quiescent centre (Clowes, 1969; Feldman, 1980; Short and Torrey, 1 972).
Alternatively, or in conjunction, synthesis of cytokinins may be reduced
through a decline in the metabolic activity of the impeded root apex. Either
path would result in decreased export of cytokinins from the root system, as
found by Bangerth (1994), and as a consequence, their concentration in xylem
and phloem tissue (Komor et aI. , 1993) would decline. Without their
'protection' (Bourquin and Pilet, 1990; Noor-Saleh, 1981; Yip and Yang, 1 986),
auxin in the transition zone between the vascular systems of the root and
shoot is metabolised (Costa et al., 1992). This turnover of auxin and the
resultant stimulation of cambial activity (Chalmers, 1985) would increase the
General discussion 287
sink. strength of the stem (Wyse and Sartner, 1 982). With both a root sink
weakened by reduced growth (elongation) and a leaf sink weakened through
reduced expansion (Chapter 3) due to a deficiency of cytokinins needed for
expansion (cf. Ulvskov et al., 1992; Zhang et al., 1 995), the basal section of
the stem becomes a dominant sink., and assimilate is preferentially partition
ed to it (Chapters 3 and 6; Carmi and Shalhevet, 1 983; Peterson et al., 1 991a;
Richards and Rowe, 1977a). The high concentrations of auxin either in the
root tissue or at the transition zone would stimulate the synthesis of ethylene
(Dubucq et al., 1978). The observed development of adventitious roots and
epinastic leaves (Chapters 3 and 6) are consistent with reported responses to
both hormones at elevated concentrations (Davis et al., 1988 and references
therein; Woodrow et al., 1988). Alternatively, the ethylene might arise
within the root system due to the physical impedance (Kays et al., 1974;
Sarquis et al., 1991; Sarquis et al., 1992; Whalen, 1988).
Although this model nominates auxin as the SPF, it is also possible that root
synthesized cytokinin might cycle back, via the phloem (Komor et al., 1 993),
to the roots and regulate cytokinin biosynthesis. Thuantavee (1991) stimulat
ed growth of tomato plants by applying a low concentration (10-8M) of BA to
the root system, and inhibited growth with a higher concentration (lO-6M). She postulated that cytokinin was part of the feedback loop responsible for
manipulating de novo synthesis of cytokinin in the root system. Alter
natively, if loading of cytokinin into the xylem stream is slower than its rate
of synthesis, synthesis could be feedback-inhibited by the increasing
concentrations in the root tissue.
Lockard and Schneider (1981) proposed a model similar to that developed
here to expiain the dwarfing mechanism of scion-rootstock combinations. If
this model was valid and either cytokinin biosynthesis or export, or both, in
roots was positively controlled by a shoot-produced factor, then assuming that
vigour is a function of hormonal output, interactions in growth response
General discussion 288
between scion and rootstock would be expected. Weak scions on vigorous
rootstocks should produce vigorous trees, while weak scions on weak
rootstocks would produce dwarf trees. On the other hand, vigorous scions
would be expected to 'cancel out' vigorous rootstocks, yet have little effect on
weak rootstocks. It is interesting that grafting studies involving a wide
range of species have revealed that few such interactions occur, with both
scion and rootstock contributing to the growth of the shoot (de Vries and
Dubois, 1989; Lehman et al., 1990; Tubbs, 1 977, 1 980; Zijlstra and Nijs, 1987;
Zijlstra et aI., 1994). Moreover, the results from these grafting studies
contrast uncomfortably with recent demonstrations of a possible regulatory
role for auxin on cytokinin concentrations in shoot tissue. Bangerth (1994),
for example, reported that applying naphthaleneacetic acid (NAA) to the
decapitated shoots of bean seedlings almost completely eliminated the rapid
increase in cytokinin concentration in the xylem exudate that followed
decapitation. Zhang et al. (1995) also provide evidence of auxin-induced
down-regulation of cytokinin levels through their demonstration that applying
auxin to transgenic tobacco tissue expressing an ipt gene (encoding enzymes
for cytokinin biosynthesis) promoted conversion of zeatin-type cytokinins to
adenine derivatives.
Contrary to the general interpretation of others (e.g. Jackson, 1 990, 1993;
Wilson, 1988) of root-shoot communication models involving cytokinins, there
is no implicit notion in the model postulated here that the potential supply
of cytokinin to the shoot system is proportional to the number of active root
apices. The important difference in this model is that it focuses on elongating
and, by implication, biosynthetically active root apices. A decrease in root
elongation, caused by physical restriction of part of the root system, would
only be expected to result in decreased cytokinin delivery to the shoot system,
and consequently reduced rates of leaf expansion, if elongation of the whole
root system was impeded (Chapter 3). Provided roots in other parts of the
root system were physically free to grow and were not correlatively inhibited
General discussion 289
by the restricted sub-system, reduced activity of root apices in one part of the
root system would result in increased activity of those in unrestricted
portions, and initiation of new apices, possibly by the SPF, elsewhere in the
root system (Chapter 6).
Jackson (1993) was critical of studies concluding links between root function
(mineral acquisition and cytokinin synthesis) and shoot growth. He argued
that models of root to shoot communication based on either of these factors
were weakened by reports of large reductions in root size, achieved by volume
restriction or pruning, apparently sustained with little change in shoot
growth, and others in which increases in cytokinin levels and shoot growth
occurred after root apices were removed. Taking Popper's (1959, 1963) view
of validating an hypothesis, it is a useful exercise to re-evaluate Jackson's
( 1993) falsification of the hypothesis that root-synthesised cytokinins are
significant components of root-shoot communication in view of the conclusions
of the study reported here. Jackson (1993) cited Tschaplinski and Blake's
(1985) study, in which they reported a reduction in the dry biomass of alder
seedlings from 1.73 g to 0.70 g following extended (96 days) restriction in a
small container without any accompanying decline in leaf area as evidence of
the apparent insensitivity of shoot growth to a loss in the putative output of
growth-promoting cytokinin. Buttrose and Mullins' (1968) study in which
roots of grape vine (Vitis uinifera) were pruned to about 75% of the volume
of unpruned control plants every week for 8 weeks without any statistically
significant effects on shoot growth, and Carmi and van Staden's (1983) study
in which large decreases in cytokinin concentrations in leaves and petioles of
decapitated bean seedlings that occurred 8 days following removal of two
thirds of the root system were not accompanied by statistically significant
changes in leaf area were similarly presented as evidence against the
putative role of root-sourced cytokinin in shoot growth. In all these studies,
the concerns raised by Jackson (1993) do not acknowledge the possibility of
a spatiotemporal response to stress-induced changes in root growth and
General discussion 290
function. It is likely that use of total plant leaf area in Buttrose and Mullins'
(1968) and Tschaplinski and Blake's (1985) study masked treatment-induced
changes in younger, expanding leaves. Although Jackson (1993) noted that
in Carmi and van Staden's (1983) study reductions in total leaf area had not
occurred within 8 days of partially excising roots, a significant decline in leaf
area had occurred by the time of the next harvest (16 days). As reported in
the present study, decline in total leaf area is not detected until some time
after reduction in root growth occurs (Tables 3.5a-c), yet reduction in
individual leaf growth is likely to be observed much sooner, particularly if the
leaf is rapidly expanding at the time of onset of root restriction (e.g. Table
6.7).
Additionally, Jackson (1993) appears to assume that a reduction in its dry
biomass signals a reduction in root length and number, and that a .root
system is an homogenous 'tissue'. As noted previously, root systems are
heterogenous in size and function (Waisel and Eshel, 1991; Zobel, 1992b).
The relationship between root number and dry biomass is not constant
(Tables 3.5a-c; Richards and Rowe, 1977a) and neither should this be
expected. Both physical and chemical stress, for example, can cause major
alterations to the distribution of root size and type. Physically impeded roots
have a greater proportion of lateral and sub-lateral roots compared to
unrestricted roots (Chapter 3; Barley, 1962; Goss, 1977; Goss and Russell,
1980; Lachno et aI., 1982; Ran et al., 1992; Veen, 1982; Wilson et aI., 1 977).
Similar changes in distribution of root size occur when root apices are
chemically pruned by copper coatings on the inside of containers. Such
perturbation results in large changes in root dry biomass without concurrent
changes in shoot growth (Gilman and Beeson, 1995).
Both ABA and gibberellins are absent from the postulated model. As root
sourced ABA plays an important role in shoot growth and physiology and
gibberellins influence leaf growth, the reasons for their exclusions deserve
General discussion 291
expansion. In addition to influencing stomatal aperture and plant water
relations (Correia et al., 1995; Walton et al., 1976; Zhang and Davies, 1 990a),
ABA can increase sink strength when applied locally (Brenner, 1987;
Karmoker and van Steveninck, 1979; Patrick, 1990) or when it accumulates
at a certain site (Saab et al., 1990). Abscisic acid is synthesized in tomato
roots, and only a mild water stress is required to stimulate biosynthesis in
hydroponically grown plants (Cornish and Zeevaart, 1985; Parry et al. , 1 992).
The role for ABA in reducing leaf expansion is, however, very weak. Zhang
and Davies (1990b) observed a negative log-linear relationship between leaf
extension in maize and sunflower leaves and ABA concentrations in xylem
sap. However, the low light conditions under which the study was conducted,
coupled with the significant reduction in stomatal conductance that occurred
before leaf expansion started to decline, suggests that the results were
confounded by carbon limitation (Munns and Sharp, 1993). Dodd and Davies
(1994) also observed that the growth response of leaves to ABA was
temperature-dependent, making it difficult to assign a unique relationship
between leaf growth inhibition and ABA concentration. Furthermore, the
concentration range within which ABA-induced leaf growth inhibition occurs
is considerably higher than ABA concentrations in xylem sap (Munns, 1 990;
van Volkenburgh and Davies, 1983). Young expanding leaves on unstressed
plants of the castor oil plant (Ricinus communis) contain higher levels of ABA
than mature leaves (Zeevart, 1977), suggesting that, at least in these
circumstances, it is not inhibitory to leaf growth. Abscisic acid is apparently
not needed for expansion in tomato leaves; the flacca mutant, which does not
produce ABA, develops normal leaves.
In addition, leaf expansion of ABA-deficient mutants of L. esculentum
'Moneymaker' grown in soils of high strength was reduced (Masle, 1 990),
suggesting a lack ofinvolvement of ABA in inhibiting leaf expansion. Tardieu
et al. (1991) reported enhanced ABA concentrations in the xylem sap of maize
plants from field plots growing on compacted soil, but later (Tardieu et al.,
General discussion 292
1992) concluded that the increase probably resulted from root dehydration
due to a limited water supply to the roots in the compacted soil. A similar
conclusion is reached from a subsequent study by Hartung et al. (1994).
These workers recorded a 10-fold increase in ABA concentration in the xylem
sap of young maize seedlings in fully compacted soils. This increase para
lleled a decrease in leaf elongation and coincided with a reduction in leaf
water potential and turgor. All these responses were, however, transitory
and after 8-10 days no longer apparent, despite the continued presence of
compacted soil. In a second experiment in which maize seedlings were
placed in pots containing a compacted layer, neither ABA concentration in the
xylem nor leaf elongation rates were affected, provided the plants were well
watered and supplied with nutrients. It is also significant that although ABA
accumulates in root tissue under water stress (Cornish and Zeevaart, 1985;
Parry et al. , 1992), physical root impedance only marginally increases ABA
concentrations in root tissue (Lachno et al., 1 982; Masle and Passioura, 1987;
Moss et al., 1988; Tardieu et al., 1991, 1992).
A further argument against the role for ABA in plant responses to compacted
soil is that high xylem concentrations of ABA generally promotes root growth
while inhibiting shoot growth (Creelman et al., 1990; Saab et al., 1990, 1 992).
Yet studies with the ABA-deficient tomato mutants found no support for the
hypothesis that ABA has a direct effect on the sink strength of plant organs,
concluding instead that the changed biomass allocations result from altered
water relations in the plants (Nagel et al., 1994). In lupin (Lupinus cosentinii
L.), maize, sunflower, Scots pine (Pinus sylvestris), Sitka spruce (Pinus
sitchensis (Bong.) Carr.), a threshold leaf water potential of about -1.0 MPa
appears necessary before ABA concentrations increase in xylem (Gallardo et
al., 1994; Hartung et al., 1990, 1994; Jackson et al. , 1995; Zhang and Davies,
1990b). Specific data on the threshold leaf water potential for tomato is
lacking. However, given that the threshold stress range for stomatal closure
in tomato is -0.8 to -1.0 MPa (Brix, 1962; Duniway, 1971), it seems reasonable
General discussion 293
to assume that a similar threshold level of stress before ABA concentrations
increase in xylem sap exists in tomato. It is noteworthy then that
measurements of leaf water potential throughout the study did not approach
this threshold value (Table 6. 15).
The study by Ternesi et al. (1994) is particularly relevant to the current study
as it reports a seven-fold increase in ABA concentration in the xylem sap of
root-restricted, hydroponically-grown seedlings of sunflower. This increase
in ABA concentration was associated with a significant reduction in total leaf
area expansion and ratio of shoot to root fresh weight. Similar ABA
concentrations in hydroponically-grown sunflower seedlings have also been
associated with a slight reduction in the rate of leaf expansion (Zhang and
Davies, 1990b). Despite these associations, other results presented in this
paper provide a basis for caution in concluding that the observed increase in
xylem ABA concentration and reduced shoot growth is linked. Of particular
concern was the observation that the daily transpiration rate of restricted
plants was similar to control plapts (2.5 ml ·m·2 vs. 2.0 ml ·m·2). This was
unexpected because although transpiration rate is only an indirect measure
of stomatal conductance, similar concentrations of ABA in xylem sap (-50-100
nM) have significantly reduced the stomatal conductance of both soil- and
hydroponically-grown sunflower seedlings to between 50-65% of unstressed
control plants (e.g. Masia et aI., 1994; Neales et aI., 1989; Zhang and Davies,
1989). If ABA was responsible for reduced leaf expansion, it must have
mediated this influence directly to leaf cells (e.g. by influencing cell wall
extensibility). As developed above, however, the evidence for ABA influ
encing cell growth is weak. Indeed, the high ABA concentrations in the
xylem sap may arisen from an accumulation of the hormone due to reduced
export in the phloem to active sinks such as root apices, shoot apices and
underdeveloped leaves (cf. Hocking et al., 1972; Shindy et al., 1973). As root
restriction reduces the activity of all these sinks (Chapter 3, 6), the observed
General discussion 294
increase in ABA in the restricted plants may be a symptom, rather than an
agent, of root restriction.
Roots are a site of synthesis (Carr and Reid, 1 968; Jones and Phillips, 1966;
Sitton et al., 1967) or inter conversion (Crozier and Reid, 1 971) of gibberellins.
As a group, gibberellins are involved in several responses frequently touted
as evidence of cytokinin involvement. Exogenously applied gibberellins
enhance RuDP carboxylase activity and increase chlorophyll content of leaves
(Briant, 1974; Treharne and Stoddart, 1968) and increase the rates of cyclic
and non-cyclic photophosphorylation (Yakushina and Pushkina, 1975).
Wheeler (1960) reported a correlation between gibberellin content and leaf
expansion in bean. Stem length and leaf area were increased when low doses
of gibberellic acid (GAs) were applied to the apex of intact tomato plants
subjected to low root temperatures (Menhenett and Wareing, 1975). Exo
genous gibberellins promote leaf expansion in bean (Brock and Cleland, 1990)
and apple leaves (Steffens et al., 1985), but in contrast, Thuantavee (1991)
reported increases in only stem length and dry biomass accumulation in
tomato plants with foliage or roots treated with GAs. Exogenous application
of GAs to the procera mutant of tomato changes its leaf shape (Jones, 1987)
and leaf growth is reduced in gibberellin-responsive dwarf mutants of lettuce
(Lactuca sativa L. ; Waycott and Taiz, 1991; Waycott et aI., 1991), sweet pea
(Lathyrus odoratus L; Ross et al., 1993), tomato (Koornneef et al. , 1 990), and
turnip (Brassica rapa; Zanewich et al., 1990). It is possible that gibberellins
act in concert with cytokinins in leaf growth; applying both gibberellin and
cytokinin to root-restricted bean plants was necessary to restore the growth
of leaves and stems (Carmi and Heuer, 1981). These reports withstanding,
that shoot tissues are also vigorous producers of gibberellins (Jones and
Phillips, 1966; MacMillan, 1987) to the extent that they may be self-sufficient
in their production makes the notion of root-sourced gibberellins playing a
major role in root-shoot communication considerably less tenable than that
postulated for other hormones. For example, Ross et al. (1993) noted that the
General discussion 295
precursors of GAl' the gibberellin suspected of regulating leaf growth in sweet
pea (Ross et al., 1990), were synthesised in young leaflets and internodes.
Considerations for future enquiry The literature dealing with the effects of root
restriction on growth and development can be divided into two broad groups
based upon the probable cause of the effects. One group concludes growth is
reduced directly when 'normal' levels of either water, oxygen, or nutrients are
reduced (Hameed et aI., 1987; Mutsaers, 1983; Peterson et aI., 1991b;
Tschaplinski and Blake, 1985). The other group concludes that the activity
of root-produced factors, responsible for the maintenance of balanced root and
shoot growth, is perturbed by root restriction (Carmi and Heuer, 1981;
Richards and Rowe, 1977a). As root restriction encompasses a wide spectrum
of responses, the conclusions of both groups are probably correct. Under
conditions where nutrients, oxygen, and water uptake and transport are not
limiting, restricting root growth results in a balanced reduction in root and
shoot growth. Shoot:root ratios are similar, irrespective of the level of
restriction (Fig 6. 12; Krizek et al., 1985; Richards and Rowe, 1977a; Robbins
and Pharr, 1988). Later, however, as increasing root restriction results in the
availability of water and oxygen to the root system becoming limiting, root
sink strength would decline. Root growth would be detrimentally affected
more than shoot growth and, as a consequence, the SR would increase. For
example, availability of oxygen is likely to be limiting when plants are grown
in passive hydroponic systems (e.g. Al-Sahaf, 1984; Carmi and Heuer, 1981;
Carmi et al., 1983; Hameed et al., 1987; Tschaplinski and Blake, 1985).
Finally, as the rhizosphere environment fully limits root growth, ensuing root
death would result in a further increase in SR ratio (e.g. Tschaplinski and
Blake, 1985).
Common to all these studies, and the current one, is the absence of a suitable
method for quantifying the extent of root restriction. Unlike nutrition or
plant growth regulator experiments, plants subjected to root restriction are
General discussion 296
not treated with exact, statistically continuous levels of the treatment factor.
Immediately after 'treatment' roots of plants in 'restricted' treatments share
a similar immediate environment as those in 'unrestricted' treatments. As
the experiment progresses, roots in restricted containers encounter ever
changing levels of restriction. Not only does this make comparison of
experiments difficult, but analysis of within-experiment treatments is also
made difficult. Trend or regression analysis, using restriction volume is
unreliable, as results depend greatly upon when the harvest is taken. Plants
in containers of different volumes will encounter the same level of restriction,
but at different ontogenetic stages of development. For example, Cresswell
and Causton (1988), in reporting curvilinear relationships between container
volume and growth responses of Brussels sprouts, observed that had the
experiment been continued until root growth in the largest container had
been limiting, a linear response might have been obtained. Additionally, the
range of container volumes used is such that the largest volume often
assumes a level of (statistical) influence in any regression analysis that far
exceeds its importance to any physiological response. AI-Sahaf (1984), for
example, regressed growth variables against container volumes of 0. 1, 0.25,
0.6, 1.0 and 4.5 1. Given the asymmetric nature of this range, it seems
reasonable to speculate that HAT diagonals or R-student values (Myers, 1990)
associated with observations at the 4.5 I node would have signalled that these
observations exerted undue influence to the coefficients of the fitted
regression line.
What is required is a measure of the impact pressure of roots, or some index
that reflects the extent of restriction. Standard techniques for measuring
the mechanical impedance of soil to root growth (Bengough and Mullins,
1990) are not useful. Simple measures examined in this study such as root
length per volume container, the resistance of the root ball against a
penetrometer, or the porosity of the root matrix were all too coarse and
variable (data not presented). Veen and Boone (1981) related the elongation
General discussion 297
rate of corn roots to the pore volume of compacted soil. On the other hand,
Henry (1993) found no evidence of a relationship between root growth and the
percent of pore space occupied by grape (Vi tis vinifera L.) roots. Bengough
and MacKenzie (1994) reported a method for simultaneously measuring root
force and elongation of a single root, but as the root is grown in a nutrient
and water-free environment, the physiological validity of data from this
method must be questioned. Without a baseline, the different responses to
restriction will remain independent observations, and the progression of
response to restriction will remain obscured. Without an understanding of
the progression of response, management of roo� restriction in horticultural
production will be impossible. It will remain solely as an experimental
strategy for elucidating root-shoot relationships, and never develop to a
rigorous horticultural practice for non-chemically controlling plant growth.
Although the bulk of the circumstantial evidence in Chapter 6 points to the
involvement of a negative signal such as cytokinins in the response of tomato
plants to root restriction, further study is required. As with all hormonal
responses, it is not possible to view single hormones in isolation (Trevawas,
1986). For example, cell division and morphogenesis are very sensitive to the
relative concentrations of cytokinin and auxin in tissue (Fosket, 1977;
Greshoff, 1978; Maldiney et al., 1986; Morris et al., 1982; Skoog and Miller,
1957); cytokinin and auxin jointly regulate plant genes (Dominov et al., 1992;
Mohnen et al., 1985; Shinshi et al., 1987); enhancement of nitrate reductase
mRNA transcription by cytokinin is antagonised by ABA (Chen et al., 1992;
Lu et al., 1992); ABA inhibits GAs induction of a-amylase synthesis and the
level of its mRNA in aleurone layers (Chrispeels and Varner, 1966; Muthu
krishnan et al., 1983); plant senescence involves interaction among auxins,
cytokinins, ethylene, and ABA (Nooden et al., 1990; Thimann et al., 1982).
Even the well documented response of plants to drying soil conditions through
increased concentrations of ABA (Davies and Zhang, 1991) may also be due
to a change in the balance between ABA and cytokinins, given their observed
General discussion 298
decline in concentration in xylem sap with soil drying (Bano et al., 1 993; Itai
and Vaadia, 1965; Itai et aI., 1968) coupled with their role in maintaining
stomatal conductance ancoll and Jewer, 1987).
The possibility that response to root restriction is also due to a balance
between positive and negative signals therefore deserves investigation. In
observing an increase in leaf expansion after the part of a root system in a
drying environment was excised from the plant, Gowing et al. (1990a)
reasoned that a positive inhibitor (speculatively ABA), produced by the roots
but influencing shoot growth, had been removed. As this group's observation
is also consistent with a positive signal model involving oligosaccharides
(Campbell et al., 1995a, 1995b) or with a negative signal model from a root
sub-system in drying soil, it would be interesting to examine whether root
restricted plants responded similarly if a restricted portion of the root system
was removed. Furthermore, if the response was a balance between positive
and negative signals, then increasing the delivery rate of the negative signal
in a plant with a restricted portion of the root system should overcome any
reduction in shoot growth. Thuantavee (1991), for example, demonstrated
that 10-8M BA applied to tomato roots can supplement the endogenous
concentrations of cytokinins in the plant. After enhancing import of zeatin
riboside into shoots of stinging nettle (Urtica dioica L.) by immersing less
than 10% of the root system (minus root apices) in solutions of various
concentrations, Fetene and Beck (1993) observed substantial increases in both
fIxation of l·e in expanding leaves and export of assimilates to the shoot apex.
If cytokinins are the negative signal, then similarly supplementing endo
genous levels should overcome any decline in leaf expansion in root-restricted
plants.
Although this approach would progress understanding of the relative
importance of hormones in response to root restriction, it is, nevertheless,
difficult to interpret the effect of exogenously supplied hormones on internal
\
General discussion 299
hormone ratios and concentrations (Feldman, 1984; Horgan, 1 990; McGaw
et al., 1984). Alternative approaches, such as the use of transgenic plants in
which hormone ratios have been modified in vivo (Ainley et aI., 1993;
Guiltinan and Deikman, 1994; Hamill, 1993; Romano et al., 1991, 1993;
Zhang et al., 1995) may help resolve many of the outstanding questions. If
high concentrations of auxin or ethylene or low concentrations of cytokinins,
induced by stress, are in some way responsible for inhibition of root or shoot
growth, then the effect of root restriction on mutants with reduced
biosynthesis or altered sensitivity to these hormones (Blonstein et aI., 1991 ;
Cao et aI. , 1993; King, 1988; Schiefelbein and Benfey, 1991; Zobel, 1986, 1991)
would prove interesting. As the rate of leaf expansion of ABA-deficient
mutants of L. esculentum 'Moneymaker' was reduced when grown in soils of
high strength, Masle (1990) largely discounted ABA of having a major
influence in plant response to the physical impedance of root growth. Zacarias
and Reid (1992) concluded that ethylene was involved in the physiological
response of plants to physical impedance after observing the failure of roots
of an ethylene-resistant mutant of Arabidopsis thaliana to penetrate
compressed media. Root growth of the diageotropica mutant of tomato (Zobel,
1974) normalises after treatment of the shoot with low concentrations of
ethylene. Production of this mutant and its wild type under conditions of root
restriction might provide an insight into the role of ethylene in the root
restriction response. The bushy root (brt) mutant of tomato is characterised
phenotypically by large numbers of roots developing from the basal portion
of the hypocotyl and tap root and a small weak shoot, and physiologically by
extensive starch deposition in the basal portion of the shoot and root (Zobel,
1972). If a normal shoot is grafted onto the mutant's roots, the shoot
assumes the characteristics of a mutant shoot. Given the preferential
partitioning of assimilate to the stem in restricted plants (Tables 3.10, 6.19),
together with the possibility that response to root restriction is mediated
through changes in the transition zone between root and shoot tissue (cf. Costa et aI., 1992; Grochowska et aI., 1994; Hameed et aI., 1987; Jaramillo et
General discussion 300
al., 1992), it would be useful to examine the anatomy of the transition zone
in the mutant and its auxin:cytokinin ratio in stem and root tissue.
Direct comparative analysis is required of cytokinin delivery rates from roots
to shoots of restricted and unrestricted plants. Measurement of cytokinin
concentration is, by itself, not sufficient evidence of changes of the passage of
the hormone into the xylem sap from roots. As Jackson and his coworkers
(Else et aI., 1994; Jackson, 1993) have warned, many reports of stress-induced
changes in hormone concentrations in xylem sap have not taken into account
the confounding effect of reductions in sap flow rate on concentration. It is
important that analysis of delivery rates of cytokinins within root and stern
tissue either side of the transition zone is undertaken. If cytokinin delivery
rates in shoot tissue are reduced in root restricted plants, it must be
determined whether this arises from inhibited transport of the cytokinins
through the transition zone or reduced synthesis in the root apices. If only
export is inhibited during restriction, continuing synthesis would lead, at
least in the short term, to an increase in cytokinin concentration in root
tissue. This increase may contribute to the reduced growth of restricted roots
(Chapter 3, Chapter 6), because high concentrations of cytokinins inhibit root
growth (Stenlid, 1982). If de-restriction, either by removal of a restricting
container (Chapter 3) or development of an unrestricted portion of the root
system (Chapter 6), removes a blockage within the transition zone, the
increased delivery rates of cytokinin within the restricted root systems might
'flood' the shoot, inducing higher rates of leaf expansion. It would be
interesting to determine whether, in restricted plants, the increase in RA of
leaves expanding at the same time as unrestricted roots were developing
(Chapter 6) was mediated by higher-than-normal delivery rates of cytokinins
to the leaves. Certainly, the study by Ainley et al. (1993) of the effects of
pulsed enhancement of cytokinin levels on leaf growth indicates that such a
response is possible, given that in their study, expansion rates were
accelerated in actively growing leaves only.
General discussion 301
A corollary of this hypothesis is that a reduction in supply of cytokinin from
a physically restricted root system would result in reduced leaf expansion. In
my study, however, analysis of the expansion parameters of the Richards
functions fitted to individual leaves developing 3, 7 and 14 days after
restriction treatments were initiated (Fig. 6.3; Table 6.5, 6.6) indicated that
the effect of restriction was through reduced cell numbers, a conclusion
consistent with results from studies in which cell number and size in leaves
of root restricted plants were counted (Cresswell and Causton, 1988;
Milthorpe and Newton, 1963). Although cell division and expansion are not
mutually exclusive processes in explaining the effect of root restriction on leaf
growth, it is clear that the relative importance of the two processes on leaf
growth can not be resolved with the data available. Future studies need to
consider both processes when quantifying the effect of root restriction on leaf
growth.
Root restriction often (Chapter 3; Al-Sahaf, 1984; Hameed et al., 1987;
Peterson et al., 1991a) but not always (Chapter 6; Robbins and Pharr, 1987)
results in an increase in SR. Increasing the level of zeatin riboside in shoot
tissue of stinging nettle increased the SR ratio (Fetene and Beck, 1993). As
zeatin and zeatin riboside are also dominant cytokinins in tomato (Davey and
van Staden, 1976), it would be interesting to relate their concentrations in
roots as they progressively become restricted, to changes in the partitioning
between roots and shoots. Such a study might use the dwarf root mutant of
tomato (Zobel, 1975). The roots of this mutant are dwarfed under all
conditions of culture. In contrast, high nutrient concentrations in hydroponic
systems result in normal shoot development. If the concentration is reduced
below 25% of those necessary for normal shoot growth, the shoot takes on a
dwarf-like appearance (Zobel, 1986). Assuming this response is mediated by
a nitrogen-cytokinin synthesis interaction, and that root restriction reduces
cytokinin synthesis, physically restricting roots of this mutant in a high
nutrient environment should cause the shoot to be dwarfed.
General discussion 302
The relationship between the temporal distribution of cytokinin concentrat
ions in leaves, particularly with respect to their daily modulation by
temperature and light (photoperiod and irradiance), and the influence of these
factors on leaf expansion requires further elucidation. Cytokinin concentra
tions in leaves and leaf expansion are both modulated by temperature and
light (Dale, 1988 and references therein; Hansen et al., 1988).
More substantive analysis of the role of ABA in the root restriction response
is required. Early emphasis should be given to determining the effect of root
restriction on stomatal conductance. Stomatal response to root-sourced ABA
is independent of leaf water potential or leaf turgor (Bates and Hall, 1981;
Dwyer and Stewart, 1984; Gollan et al., 1986; Tardieu et al., 1992), and
without more detailed attention to these variables, a role of ABA analogous
to its role in plant response to drying soil cannot be ruled out. While
photosynthesis, which is normally limited by stomatal conductance, was not
manifestly affected by restriction (Table 6.16), the lack of data on stomatal
conductance in this study is, in hindsight, a major constraint to full
interpretation of the data collected. This stated, it is also important to note
that future studies must measure leaf function throughout the stem axis, as
the effect of root restriction has both a temporal and spatial element (Chapter
6). Measuring leaf function of the 'most recently expanded leaf alone will
not provide sufficient definition of the effect of restriction on leaf function
throughout the plant.
Future attention should be directed to possible interaction of ABA with
cytokinins. Cytokinins inhibit ABA biosynthesis (Cowan and Railton, 1 987;
Norman et al., 1983) and promote its conjugation (Even-Chen and Itai, 1 975).
Abscisic acid may change cytokinin transport and metabolism (Back et al., 1972; Sondheimer and Tzou, 1971). The antagonistic relationship (Evans,
1984; Thimann, 1992) that appears to operate between ABA and cytokinins
is also reflected in the decline of cytokinin concentrations and increase in
General discussion 303
ABA concentrations in water stressed plants. Parenthetically, this antagon
istic relationship may explain why, despite reported reductions in cytokinin
concentrations in xylem sap of water-stressed plants (Hubick et al., 1986; !tai
and Vaadia, 1965; Rosa da Costa et al., 1987), the relationship between these
and stomatal conductance has either been simply implied (Bano et al., 1993)
or found to be uncorrelated (Fu.Beder et al., 1992).
The split root technique provides a flexible system for studying plant response
to root restriction. Further development of this technique must focus on why
growth is stimulated by splitting the stem (Figs. 6.2, 6.3; Table 6. 17).
Although plant propagators may be satisfied to vertically split the stems of
their cuttings to stimulate growth, the split may be introducing a chemical
factor into the plant system which confounds any subsequent physiological
analysis of plant response.
An important area for more study using the split-root system is the extent of
correlative inhibition within a root system under conditions of partial
restriction. This is important because the correlative phenomenon in roots
appears to involve the inhibition of initiation of root apices (Gersani and
S achs, 1992). Given the postulated importance of actively growing root apices
to leaf expansion (Chapter 3), the possibility that restricted roots might
inhibit formation of new roots in unrestricted portions of the root system
deserves investigation. This issue also has horticultural relevance. The
extent of correlative inhibition existing between a restricted root sub-system
and unrestricted sub-systems will have a major impact on container design.
For example, if a root (or root sub-system) that is impeded by a container
wall, correlatively inhibits compensatory growth in other unrestricted parts
of the root system, then container designers should aim to minimise the
internal surface area of containers for those crops in which growth is to be
maximised.
General discussion 304
Future studies should consider test plants other than tomato. Leaf expansion
of tomato is difficult to model non-destructively, requiring concurrent studies
to develop a valid predictive model (Chapter 4). Orthostichy in tomato
(Gifford and Evans, 1981; Russell and Morris, 1983) will make studies of
assimilate or hormonal flows difficult. Furthermore, as internal and external
phloem, usually responsible for transporting assimilate in opposite directions,
develops at different rates in tomato, the pattern of translocation is subject
to ontogenetic drift, depending on the developmental stage of the particular
leaf and that of the plant. This could add unnecessary complication to any
study of the postulated auxin-cytokinin control loop. In all these respects,
sweet pepper and sunflowers offer a simpler system. Moreover, as both
plants have been used in studies involving root stress and leaf expansion,
there is depth in the literature to support further studies in these areas.
An unresolved difficulty in this study is that discussion of root growth has
assumed that the root system is an homogenous mass of tissue. Comparing
the relative growth rates of leaf expansion with root extension is probably an
oversimplification. Treatment of roots as a single class in experiments is
similar to pooling data from leaf, petiole and stem to determine the function
of the shoot (Zobel, 1986). As with a shoot system, a root system is made up
of constituent parts, each of which probably reacts differently to various
environmental and physiological factors, and consequently affects the behav
iour of the entire plant differently (Eissenstat, 1992; Waisel and Eshel, 1991).
For example, the height and total dry biomass of pea (Pisum sativum), rape
(Brassica nap us), linseed (Linum usitatissimum), safllower (Carthamus
tinctorius), sunflower and wheat grown under various levels of soil impedance
was more strongly correlated with reductions in seminal root lengths than
total root length (Whiteley and Dexter, 1982). Reducing the classes of roots
on the plants to adventitious and lateral roots (Chapter 3) may have reduced
variation in the observed correlations between root and shoot growth
(Chapter 3), but future studies should attempt to discriminate the response
General discussion 305
of different root classes to restriction, and relate these responses to those of
the components of shoot growth.
Because of our lack of understanding of the respective functions of the
different components of a root system, it is not yet possible to determine
whether the cytokinin delivery from a root system containing a large number
of roots each elongating a small amount is equivalent to that of a root system
with a small number of roots, each of which elongates considerably. The
relative rate of elongation of both root systems would be similar: whether
their sum activity is also similar is unknown and requires study.
While important from a physiological standpoint, this issue also has import
ant practical considerations. For example, should growers produce plants in
containers designed to maximise root number or in those designed to
maximise root elongation? Some studies on the effect of container size and
shape on plant growth have reported that for containers of the same
diameter, shoot growth is always less in long containers (Hanson et al., 1987;
Smith and Schwabe, 1980). This suggests that restriction of tap root growth
in shorter containers may enhance lateral root development, thereby
increasing shoot growth. On the other hand, other studies have pointed to
genetic factors being important to growth responses to container design. For
example, both Biran and Eliassaf (1980) and Keever et al. (1985) concluded
that naturally shallow rooted species should be grown in shallow, wide
containers, and deep-rooted species in deep containers. Unfortunately, as
studies in this area tend to use a solid soilless medium, such as peat or bark,
it is difficult to avoid confounding the effect of container depth with changes
in aeration and water and nutrient availability down the profile of the
containers. Use of a deep flow hydroponic system (Chapter 2) would avoid
the confounding actions of these factors, and should provide more conclusive
evidence of the type of root system whose development should be encouraged.
General discussion 306
High strength soils tend to depress biomass gain in shoot tissue more than
in roots (Andrade et al., 1993; Atwell, 1 990a; Dawkins et al., 1 983; Masle,
1992; Masle and Passioura, 1 987). In contrast, sink strength in roots declines
with the extent of restriction within a container, and root growth is reduced
more than shoot growth. It is possible that root restriction induces changes
in the transition zone between the vascular systems of the root and shoot
systems, thereby impeding transport of both assimilate and water. Certainly,
the cambium in dicotyledons can change its orientation according to relations
among organs (Gersani and Sachs, 1984; Kirschner et al. , 1971), and under
root restriction, differentiation of vascular tissue might be disrupted.
Anatomical studies are required to investigate this possibility. Such studies
might reveal whether the assimilate buildup in stems (Tables 3. 1 0, 6.19) (pre
sumably at the base of the stem) was due to disrupted transport, or the
absence of alternative sinks (e.g. fruit; Heuvelink and Buiskool, 1 995; Ho,
1992). If the latter is found true, and several reports (AI-Sahaf, 1 984; Carmi
and Shalhevet, 1983; Richards, 1981, 1986; Ruff et al. 1987) suggests this
might be so, it may prove possible to manage root restriction to improve
harvest index, particularly if root restriction can be applied without a
concurrent depression in photosynthesis or development of water stress (Table
3.3, 3.9, 6.1 5).
Liberty Hyde Bailey (1907) wrote that research was " ... not so much a matter
of the subject, as of the intention, the point of view, and the method of work".
I conclude this thesis by reviewing my doctoral programme from the pers
pective of the nature of research.
Progress in research (Thornley, 1 980), as in learning (Kolb et aI., 1979),
follows a cyclic path. Current theories provide a starting point, and through
a sequence of observation, hypothesis generation and testing, we arrive at a
General discussion 307
new starting point with a more articulate and precise understanding of the
problem or phenomenon being researched. The study of the ontogeny of
tomato plants under varying levels of root restriction (Chapter 3) evolved, in
the manner of Kuhn (1963, 1970), to focus on the relative dynamics of root
elongation and whole-plant leaf area expansion, and from this, to study '
expansion of individual leaves of plants to which root restriction was spatially
applied (Chapter 6). The demonstration of an increase in leaf expansion in
the presence of a restricted root sub-system (Chapter 6) provided an
unexpected leap (Popper, 1959) and adds significantly to our understanding
of the type of communication between root and shoot under physically
restrictive root conditions.
My progress through the cycles that this work reflects was tempered by a
continuing conflict between substance and process. This conflict occurs when
deciding between working directly to get the right answer to a problem (the
substance), and working on the right way of getting the answer (the process)
(Badaracco and Ellsworth, 1989). This conflict occurred in deciding between
simply using a hydroponic system, and the concern about nutrient and oxygen
uptake rates and the need to match the flow rate of the system with these
(Chapter 2); between simply calculating the mean net assimilation rate for a
particular group of plants, and determining the best method for calculating
the net assimilation rate (Chapter 3); between assuming positional and tem
poral stability in a model that estimates leaf area, and testing those assum
ptions (Chapter 4); and between visually blocking plants by 'size' and blocking
by highly discriminatory quantitative techniques (Chapter 5). The currency
of this conflict is time. And in the finite time of my academic research
programme, time spent on process was time lost to substance, to finding
answers to the original problem.
Now, at the end of the study, I find myself at a beginning, with a clear under
standing of where to target future research to characterise the mechanistic
General discussion 308
basis of plant response to root restriction in containers. The strong circum
stantial evidence of a negative signal that involves cytokinins and influences
shoot growth in response to physical impedance of the root system must be
validated with direct measurements of cytokinin delivery from root to stem
to leaf. The probable roles of other hormones as 'co-respondents' to physical
root restriction cannot be ignored, and in this regard, ABA (as a partner in
the leaf growth response), and auxin (as a partner in the root growth and
partitioning response) are likely participants. The response to root restriction
of mutant or transgenic plants, deficient in and sensitive to one or more of
these hormones, will progress this work. In particular, growth analysis of the
ontogeny of root and leaf expansion in both mutant and wild type plants
under partial root restriction (Le. in a split root system) will provide needed
information of the relative kinetics of response. Although tomato would be
a satisfactory test plant, both sweet pepper and sunflower provide simpler
leaf forms on which to cluster for local error control and to model expansion.
In all these studies, a managed deep flow hydroponic system would provide
the necessary rigour in maintaining a root environment that was only
limiting in space.
What we call the beginning is often the end
And to make an end is to make a beginning.
The end is where we start from.
-T .s.Eliot Four Quartets

Chapter 8
Referen ces
References 3 10
Abod, S.A. and A.D. Webster. 1989. Root and shoot growth of newly transplanted apple trees as affected by rootstock cultivar, defoliation and time after transplanting. J. hort. Sci. 64:655-666.
Acevedo, E., T.C. Hsiao and D.W. Henderson. 1971. Immediate and subsequent growth responses of maize leaves to changes in water stress. Physiol. Plant. 48:631-636.
Ackley, W.B., P.C. Crandall, and T.S. Russell. 1958. The use of linear measurements in estimating leaf areas. Proc. Amer. Soc. Hort. Sci. 72:326-330.
Adams, P. and G.W. Wmsor. 1979. Nutrient uptake. Rep. Glasshouse Crops Res. Inst. 1978.
Adedipe, N.O., L.A. Hunt, and R.A. Fletcher. 1971. Effects of benzyladenine on photosynthesis, growth and senescence of the bean plant. Physiol. Plant. 25:151-153.
Mill, A.A. and V. Clark. 1990. Computer-aided multivariate analysis. Van Nostrand, New York.
Akoroda, M.D. 1993. Non-destructive estimation of area and variation in shape of leaf lamina in the fluted pumpkin (Telfairia occidentalis). Scientia Hortic. 53:261-267.
Ainley, W.M., K.J. McNeil, J.W. Hill, W.L. Lingle, R.B. Simpson, M.L. Brenner, R.T. Nagao, and J.L. Key. 1993. Regulatable endogenous production of cytokinins up to 'toxic' levels in transgenic plants and plant tissues. Plant Molecular Biology 22:13-23.
AI-Sahaf, F .H. 1984. The effect of root confmement and calcium stress on the physiology, morphology and cation nutrition in tomatoes (Lycopersicon esculentum Mill.). PhD thesis. Lincoln University.
Allen, D.M. 1971a. Mean square error of prediction as a criterion for selecting variables. Technometrics 13:469-475.
Allen, D.M. 1971b. The prediction sum of squares as a criterion for selecting prediction variables. Technical Report No.23, Department of Statistics, University of Kentucky. (cited by Allen, 1974).
AIlen, D.M. 1974. The relationship between variable selection and data augmentation and a method for prediction. Technometrics 16:125-127.
Aloni, R. 1993. The role of cytokinin in organised differentiation of vascular tissues. Aust. J. Plant Physiol. 20:601-608.
References 311
Aloni, R., S .F. Baum and C .A. Peterson. 1990. Role of cytokinin in sieve tube regeneration and callose production in Coleus internodes. Plant Physiol. 93:982-989.
Aloni, R., A. Raviv, and C.A. Peterson. 1991. The role of auxin in the removal of donnancy callose and resumption of phloem activity in Vitis vinifera. Can. J. Bot. 69:1825-1832.
Amer, F.A. and W.T. Williams. 1957. Leaf-area growth in Pelargonium zonale. Ann. Bot. 21:339-342.
An, Jo-Feng, and R.E. Paull. 1990. Storage temperature and ethylene influence on ripening of papaya fruit. J. Amer. Soc. Hort. Sci. 115:949-953.
Andrade, A., D.W. Wolfe, and E. Fereres. 1993. Leaf expansion, photosynthesis, and water relations of sunflower plants grown on compacted soil. Plant and Soil 149:175-184.
Andrews, P .K. and D.J. Chalmers. 1989. Effects of N6-benzylaminopurine on growth and water relations of tomato. J. hort. Sci. 62:343-349.
Anon, 1993. New Zealand Nursery Register 1993/1994. The Reference Publishing Company, Epsom, Auckland, New Zealand.
Arnold, M.A. and D.K. Struve. 1993. Root distribution and mineral uptake of coarse-rooted trees grown in cupric hydroxide-treated containers. HortScience 28:988-992.
Asher, C.J. 1981. Limiting external concentrations of trace elements for plant growth: use of flowing solution culture techniques. J. Plant Nutrition 3:163-180.
Asher, C.J., P.G. Ozanne, and J.F. Loneragan. 1965. A method for controlling the ionic environment of plant roots. Soil Science 100:149-156.
Ashley, D.A., B.D. Doss, and O.L. Bennett. 1963. A method of determining leaf area in cotton. Agron. J. 55:584-585.
Atkinson, C.J., T.A Mansfield, A.M. Kean, and W.J. Davies. 1989. Control of stomatal aperture by calcium in isolated epidermal tissue and whole leaves of Commelina communis L. New Phytol. 111:9-17.
Attenburrow, D.C. and P.L. Waller. 1980. Sodium chloride: its effect on nutrient uptake and crop yields with tomatoes in NFT. Acta Hortic. 98:229-237.
Atwell, B.J. 1990a. The effect of soil compaction on wheat during early tillering. I . Growth, development and root structure. New Phytol. 1 15:29-35.
References 3 12
Atwell, B.J. 1990b. The effect of soil compaction on wheat during early tillering. III. Fate of carbon transported to the roots. New Phytol. 115:43-49.
Aung, L.H. 1982. Root initiation in tomato seedlings. J. Amer. Soc. Hort. Sci. 107:1015-1018.
Aung, L.H. and M.E. Austin. 1971. Vegetative and reproductive responses of Lycopersicon esculentum Mill. to photoperiod. J. expo Bot. 73:906-14.
Back, A., S. Bittner and A.E. Richmond. 1972. The effect of abscisic acid on the metabolism of kinetin in detached leaves of Rumex pulcher. J. expo Bot. 23:744-750.
Badaracco, J.L. and R.R. Ellsworth. 1989. Leadership and the quest for integrity. Harvard Business School Press, Boston, Mass.
Bailey, L.H. 1907. The teaching, experiment and research phases of horticulture. Proc. Amer. Soc. Hort. Sci. 6:12-16.
Bangerth, F. 1994. Response of cytokinin concentration in the xylem exudate of bean (Phaseolus vulgaris L.) plants to decapitation and auxin treatment, and relationship to apical dominance. Planta 194:439-442.
Bano, A., K Dorffling, D. Bettin, and H. Hahn. 1993. Abscisic acid and cytokinins as possible root-to-shoot signals in xylem sap of rice plants in drying soil. Aust. J. Plant Physiol. 20:109-115.
Barley, K.P. 1962. The effects of mechanical stress on the growth of roots. J. expo Bot. 13:95-110.
Barlow, P.W. 1994. Structure and function at the root apex - phylogenic and ontogenetic perspectives on apical cells and quiescent centres. Plant and Soil 167:1-16.
Barlow, P.W. and J.S. Adam. 1988. The position and growth of lateral roots on culture root axes of tomato, Lycopersicon esculentum (Solanaceae). Plant Syst. Evol. 158:141-154.
Barlow, P.W. and E.L. Rathfelder. 1985. Cell division and regeneration in primary root meristems of Zea mays recovering from cold treatment. Environ. Exp. Bot. 25:303-314.
Barnes, A. 1979. Vegetable plant part relationships. II. A quantitative hypothesis for shoot/storage root development. Ann. Bot. 43:487-499.
Baskin, T.I., W.R. Briggs, and M. lino. 1986. Can lateral redistribution of auxin account for phototropism of maize coleoptiles? Plant Physiol. 81:306-309.
References 313
BassiriRad, H. and M.M. Caldwell. 1992. Root growth, osmotic adjustment and NOs- uptake during and after a period of drought in Artennisia tridentata. Aust. J. Plant Physiol. 19:493-500.
Bates, L.M. and A.E. Hall. 1981. Stomatal closure with soil water depletion not associated with changes in bulk leaf water status. Oecologia 50:62-65.
Baum, S .F., R Aloni, and C.A. Peterson. 1991. The role of cytokinin in vessel regeneration in wounded Coleus tnternodes. Ann. Bot. 67:543-548.
Beck, E. and B.M. Wagner. 1994. Quantification of the daily cytokinin transport from root to shoot of Urtica dioica L. Bot. Acta. 107:342-348.
Beeson, RC., Jr. and R Newton. 1992. Shoot and root responses of eighteen southeastern woody landscape species grown in cupric-hydroxide-treated containers. J. Environ. Hort. 10:214-217.
Beever, J.E. and H.W_ Woolhouse. 1973. Increased cytokinin from the root system of Perilla {rutescens and flower and fruit development. Nature (New BioI.) 246:31-32.
Belsley, D.A., E. Kuh, and R.E. Welsch. 1980. Regression analysis: identifying influential data and sources of collinearity. John Wiley & Sons, New York.
Beltrano, J., D.O. Caldiz, R. Barreyro, G. Sanchez Vallduvi, and R. Bezus. 1994. Effects of foliar applied gibberellic acid and benzyladenine upon yield components in sunflower (Helianthus annuus L.). Plant Growth Regulation 15:101-106.
Bengough, A.G. and C.E. Mullins. 1990. Mechanical impedance to root growth: a review of experimental techniques and root growth responses. J. Soil Science 41:341-358.
Bengough, A.G. and C.J. MacKenzie. 1994. Simultaneous measurement of root force and elongation for seedling pea roots. J. expo Bot. 45:95-102.
Bennie, A.T.P. 1991. Growth and mechanical impedance, p. 393-414. In: Y. Waisel, A. Eshel, and U. Kafkafi (eds.). Plant roots: The hidden half. Marcel Dekker, New York.
Benton-Jones, J. 1982. Hydroponics: its history and use in plant nutrition studies. J. Plant Nutr. 5:1003-1030.
Bentz, S.E., D.P. Stimart, and M.S. McIntosh. 1985. Root and shoot growth patterns in newly rooted woody plants. J. Amer. Soc. Hort. Sci. 1 10:308-313.
References 3 14
Bevington, K.B. and W.S. Castle. 1985. Annual root growth pattern of young citrus trees in relation to shoot growth, soil temperature, and soil water content. J. Amer. Soc. Hort. Sci. 1 10:840-845.
Bhan, V.M. and H.K. Pande. 1966. Measurement of leaf area of rice. Agron. J. 58:454.
Biasi, R., G. Costa, F. Succ� C. Nishijima, and G.C. Martin. 1989. Paclobutrazol and root zone water content influence peach seedling behaviour. J. Amer. Soc. Hort. Sci. 114:923-926.
Biddington, N .L. and A.S. Dearman. 1982. The involvement of the root apex and cytokinins in control of lateral root emergence in lettuce seedlings. Plant Growth Regul. 1:183-193.
Biddington, N .L. and A.S. Dearman. 1984. Shoot and root growth of lettuce seedlings following root pruning. Ann. Bot. 53:663-668.
Biran, 1. and A. Eliassaf. 1980. The effect of container shape on the development of roots and canopy of woody plants. Scientia Hortic. 12:183-193.
Bjorkman, T. and R.E. Cleland. 1991. Root growth regulation and gravitropism in maize roots does not require the epidermis. Planta 185:34-37.
Black, C.C., L. Mustardy, S.S. Sung, P.P. Kormanik, D.-P. Xu, and N. Paz. 1987. Regulation and roles for alternative pathways of hexose metabolism in plants. Physiol. Plant. 69:387-394.
Blackman, V.H. 1919. The compound interest law and plant growth. Ann. Bot. 15:373-409.
Blonstein, A.D., A.D. Parry, R. Horgan and P.J. King. 1991. A cytokinin-resistant mutant of Niconana plumbaginifolia is wilty. Planta 183:244-250.
Bourquin, M. and P.-E. Pilet. 1990. Effect of zeatin on the growth and indolyl-3-acetic acid and abscisic acid levels in maize roots. Physiol. Plant. 80:342-349.
Bowen, G.D. 1991. Soil temperature, root growth, and plant function, p. 309-330. In: Y. Waisel, A. Eshel, and U. Kafkafi (eds.). Plant roots: The hidden half. Marcel Dekker, New York.
Box, G.E.P. and J.M. Wetz. 1973. Criteria for judging adequacy of estimation by an approximating response function. Technical Report No. 9. Department of Statistics, University of Wisconsin, Madison, WISCOnsin. (cited by Draper and Smith, 1981.)
Boyer, J.S. 1989. Water potential and plant metabolism: comments on Dr P.J. Kramer's article 'Changing concepts regarding plant water relations',
References 3 15
Volume 11, Number 7, pp. 565-568, and Dr J.B. Passioura's Response, pp. 569-571. Plant, Cell and Environ. 12:213-216.
Bradford, K.J. 1983. Involvement of plant growth substances in the alteration of leaf gas exchange of flooded tomato plants. Plant Physiol. 73:480-483.
Bradford, K.J. and D.R. Dilley. 1978. Effects of root anaerobiosis on ethylene production, epinasty, and growth of tomato plants. Plant Physiol. 61:506-509.
Bradford, K.J. and T.C. Hsiao. 1982. Physiological responses to moderate water deficit, p. 263-323. In: O.L. Lange, P.S . Nobel, C.B. Osmond, and H. Ziegler (eds.). Physiological plant ecology II. Water relations and carbon metabolism. Encyclopedia of Plant Physiology, New Series, Vol. 12B. Springer Verlag, Berlin.
Bradford, K.J. and S. F. Yang. 1980. Xylem transport of 1-aminocyclopropane-1-carboxylic acid, an ethylene precursor, in waterlogged tomato plants. Plant Physiol. 65:322-326.
Bradford, K.J. and S.F. Yang. 1981. Physiological responses of plants to waterlogging. HortScience 16:25-30.
Bradford, K.J. and A.J. Trewavas. 1994. Sensitivity thresholds and variable time scales in plant hormone action. Plant Physiol. 105:1029-1036.
Brenner, M.L. 1987. The role of hormones in photosynthate partitioning and seed filling, p. 474-493. In: P.J. Davies (ed.). Plant hormones and their role in plant growth and development. Martinus Nijhoff Publishers, Dordrecht.
Briant, R.E. 1974. An analysis of the effects of gibberellic acid on tomato leaf growth. J. expt. Bot. 25:764.
Brix, H. 1962. The effect of water stress on the rates of photosynthesis and respiration in tomato plants and loblolly pine seedlings. Physiol. Plant. 15:10-20.
Brock, T.G. and R.E. Cleland. 1989. Role of acid effiux during growth promotion of primary leaves of Phaseolus vulgaris L. by hormones and light. Planta 177:476-482.
Brock, T.G. and R.E. Cleland. 1990. Biophysical basis of growth promotion in primary leaves of Phaseolus vulgaris L. by hormones versus light. Solute accumulation and growth potential. Planta 182:427-431.
Brouwer, R. 1962. Distribution of dry matter in the plant. Neth. J. agric. Sci. 10:361-376.
References 3 16
Brouwer, R. 1963. Some aspects of the equilibrium between overground and underground plant parts. Jaarb. Inst. BioI. Schiekd. (Wageningen) 1963: 31-39.
Brouwer, R. 1981. Co-ordination of growth phenomena within a root system of intact maize plants, p. 269-276. In: R. Brouwer, O. Ga§parikova, J. Lolek and B.C. Loughman (eds.). Structure and function of plant roots. Developments in plant and soil sciences 4. Martinus NijhofT/Dr W. Junk Publishers, The Hague.
Brouwer, R. 1983. Functional equilibrium: sense or nonsense? Neth. J. agric. Sci. 31:335-348.
Brouwer, R. and C.T. de Wit. 1968. A simulation model of plant growth with special attention to root growth and its consequences, p. 224-242. In: W.J. Whittington (ed.). Root growth. Proceedings of the 15th Easter School of Agricultural Science, University of Nottingham. Butterworths, London.
Brown, R.H. 1984. Growth of the green plant, p. 153-174. In: M .B. Tesar (ed.). Physiological basis of crop growth and development. American Society of Agronomy-Crop Science Society of America, Madison.
Bruggemann, W., T.A. W. van der Kooij, and P.R. van Hasselt. 1992. Long-term chilling of young tomato plants under low light and subsequent recovery. II. Chlorophyll fluorescence, carbon metabolism and activity of ribulose-1,5-bisphosphate carboxylase/oxygenase. Planta 186:179-187.
Bunt, A.C. 1988. Media and mixes for container-grown plants. Unwin Hyman, London.
Burdon, J.J. and J.L. Harper. 1980. Relative growth rates of individual members of a plant population. J. Eco1. 68:953-957.
Buttrose, M.S. and M.G. Mullins. 1968. Proportional reduction in shoot growth of grapevines with root systems maintained at constant relative volumes by repeated pruning. Aust. J. BioI. Sci. 21:1095-1101.
Byrne, J. and L. Aung. 1974. Adventitious root development in the hypocotyl of Lycopersicon eSculentum Mill. var. Fireball. Amer. J. Bot. 61:Suppl. 54. (Abstr.)
Cabrera, R.M. and M.E. Saltveit, Jr. 1990. Physiological response to chilling temperatures of intermittently warmed cucumber fruit. J. Amer. Soc. Hort. Sci. 115:256-261.
Callow, M.E. and H.W. Woolhouse. 1973. Changes in nucleic acid metabolism in regreening leaves of Perilla. J. expo Bot. 24:285-294.
References 317
Campbell, J.A., A.M. Drake, V.W.K. Lee, and S. Strother. 1995a. A putative oligosaccharin growth promoter from Vitis vinifera L. primary cell walls. Ann. Bot. 75:359-363.
Campbell, J.A., B.R. Loveys, V.W.K. Lee and S. Strother. 1995b. Growth-inhibiting properties of xylem exudate from Vitis vinifera. Aust. J. Plant Physiol. 22:7-13.
Cannell, R.Q. and M.B. Jackson. 1982. Alleviating aeration stresses, p. 141- 192. In: G.F. Arkin and H.M. Taylor (eds.). Modifying the root environment to reduce crop stress. American Soc. Agric. Engineers, St Joseph.
Cao, Y., A.D.M. Glass, and N.M. Crawford. 1993. Ammonium inhibition of Arabidopsis root growth can be reversed by potassium and by auxin resistance mutations au..xl , a:x:rl , and axr2. Plant Physiol. 102:983-989.
Carmi, A. 1986a. Effects of cytokinins and root pruning on photosynthesis and growth. Photosynthetica 20:1-8.
Carmi, A. 1986b. Effects of root zone volume and plant density on the vegetative and reproductive development of cotton. Field Crops Research 13:25-32.
Carmi, A. and B. Heuer. 1981. The role of roots in control of bean shoot growth. Ann. Bot. 48:519-527.
Carmi, A. and D. Koller. 1978. Effects of the roots on the rate of photosynthesis in primary leaves of bean CPhaseolus vulgaris L.). Photosynthetica 12:178-184.
Carmi, A. and D. Koller. 1979. Regulation of photosynthetic activity in the primary leaves of bean CPhaseolus vulgaris L.) by materials moving in the water�onducting system. Plant Physiol. 64:285-288.
Carmi, A. and J. Shalhevet. 1983. Root effects on cotton growth and yield. Crop Science. 23:875-878.
Carmi, A. and J. van Staden. 1983. Role of roots in regulating the growth rate and cytokinin content in leaves. Plant Physiol. 73:76-78.
Carmi, A., J.D. Hesketh, W.T. Enos, and D.B. Peters. 1983. Interrelationships between shoot growth and photosynthesis, as affected by root growth restriction. Photosynthetica 17:240-245.
Carnes, M.G., M.L. Brenner and C.R. Anderson. 1975. Comparison of reversedphase high-pressure liquid chromatography with Sephadex LH-20 for cytokinin analysis of tomato root pressure exudate. J. Chromatography 108:95-106.
References 3 18
V Carr, D.J. and D.M. Reid. 1968. The physiological significance of the synthesis to hormones in roots and of their export to the shoot system, p. 1169-1185. In: F. Wightman and G. Setterfield (eds.). Biochemistry and physiology of plant growth substances. Runge Press, Ottawa.
Casal, J.J., P .J. Aphalo and R.A. Sanchez. 1987. Phytochrome effects on leaf growth and chlorophyll content in Petunia axilaris. Plant, Cell and Environ. 10:509-514 (cited by Dijkstra, 1990).
Causton, D.R. 1967. Some mathematical properties of growth curves and applications to plant growth analysis. PhD thesis. University of Wales. (cited by Causton and Venus, 1981.)
Causton, D.R. and J.C. Venus. 1981. The biometry of plant growth. Edward Arnold, London.
Causton, D.R., C.O. Elias, and P. Hadley. 1978. Biometrical studies of plant growth. I. The Richards function, and its application in analysing the effects of temperature on leaf growth. Plant, Cell and Environ. 1 :163-184.
Cerda, A. and J.P.N.L. Roorda van Eysinga. 1981. Tomato plant growth as affected by horizontally unequal osmotic concentrations in rock wool. Neth. J. agric. Sci. 29:189-197.
Chalmers, D.J. 1985. Position as a factor in growth and development effects, p. 169-192. In: R.P. Pharis and D.M. Reid (eds.). Hormonal regulation of development III. Encyclopaedia of Plant Physiol. Vol. II. Springer-Verlag, Berlin.
Chalmers, D.J. and B. van den Ende. 1975. Productivity of peach trees: factors affecting dry-weight distribution during tree growth. Ann. Bot. 39:423-432.
Chatfield, C. and AJ. Collins. 1980. Introduction to multivariate analysis. Chapman and Hall, New York.
Chen, C.M., J.R. Ertl, S .M. Leisner, and C.C. Chang. 1985. Localization of cytokinin biosynthetic sites in pea plants and carrot roots. Plant Physiol. 78:510-513.
Chen, C.M., JL. Lu., J.R. Ertl, L.E. Chovan and J.A. Salituro. 1992. Transcriptional regulation of plant gene expression by cytokinin and abscisic acid, p. 141-147. In: M. Kamfnek, D.W.S. Mok and E. Zaifmalova (eds.). Physiology and biochemistry of cytokinins in plants. SPB Academic Publishing bv, The Hague, Netherlands.
Chrispeels, M.J. and J.E. Varner. 1966. Inhibition of gibberellic acid-induced formation of a-amylase by abscisin II. Nature 212:1066-1067.
References 3 19
Clarke, C. and K.G. Moore. 1986. Effects of seed treatments on the emergence of oil seed rape seedlings from compacted soil. Ann. Bot. 58:363-369.
Cleland, R.E. 1986. The role of hormones in wall loosening and plant growth. Aust. J. Plant Physiol. 13:93-103.
Clement, C.R., M.J. Hopper, R.J. Canaway, and L.H.P. Jones. 1974. A system of measuring the uptake of ions by plants from flowing solutions of controlled composition. J. expo Bot. 25:81-99.
Clough, B.F. and F .L. Milthorpe. 1975. Effects of water deficit on leaf development in tobacco. Aust. J. Plant Physiol. 2:291-300.
Clowes, F .A.L. 1969. Anatomical aspects of structure and development, p. 3- 19. In: W.J. Whittington (ed.). Root growth. Butterworth, London.
Clowes, F .A.L. and H.E. Stewart. 1967. Recovery from dormancy in roots. New Phytol. 66:115-123.
Cochran, W.G. and G.M. Cox. 1957. Experimental designs. 2nd ed. John Wiley & Sons, New York.
Colbert, K.A. and J.E. Beever. 1981. Effect of disbudding on root cytokinin export and leaf senescence in tomato and tobacco. J. expo Bot. 32:121-127.
Coleman, W.K. and R.1. Greyson. 1976a. The growth and development of the leaf in tomato (Lycopersicon esculentum}. 1. The plastochron index, a suitable basis for description. Can. J. Bot. 54:2421-2428.
Coleman, W.K. and R.1. Greyson. 1976b. The growth and development of the leaf in tomato (Lycopersicon esculentum). II. Leaf ontogeny. Can. J. Bot. 54:2704-2717.
Colwell, J.D. 1994. Estimating fertilizer requirements. CAB International, Wallingford, UK.
Constable, G.A. and H.M. Rawson. 1980. Carbon production and utilization in cotton: inferences from a carbon budget. Aust. J. Plant Physiol. 7 :539-553.
Cook, R.D. 1977. Detection of influential observation in linear regression. Technometrics 19: 15-18.
Coombe, D.E. 1960. An analysis of the growth of Trema guineensis. J. Ecol. 48:219-231.
Cooper, A.J. 1975. Crop production in recirculating nutrient solution. Scientia Hortic. 3 :251-258.
References 320
Cooper, AJ. 1978. Methods of establishing young plants in a nutrient-rllm tomato crop. J. hort. Sci. 53:189- 193.
Cooper, A.J. 1979. ABC of NFT. Grower Books Ltd., England.
Cooper, A.J. and R.R. Charlesworth. 1977. Nutritional control of a nutrient-fIlm tomato crop. Scientia Hortic. 7 :189-195.
Cornish, K. and J.A.D. Zeevaart. 1985. Abscisic acid accumulation by roots of Xanthium strumarium L. and Lycopersicon esculentum Mill. in relation to water stress. Plant Physiol. 79:653-658.
Correia, M.J., J.S . Pereira, M.M. Chaves, M.L. Rodrigues, and C.A. Pacheco. 1995. ABA xylem concentrations detennine maximum daily leaf conductance of field-grown Vitis vinifera L. plants. Plant, Cell and Environ. 18:5 11-521.
Costa, G., G. Vizzotto, and A. Maroe. 1992. Root restriction and growth manipulations in peach. Acta Hortic. 322:221-230.
Cosgrove, D.J. 1993. Tansley Review No. 46. Wall extensibility: its nature, measurement and relationship to plant cell growth. New Phytol. 124: 1-23.
Cowan, A.K. and LD. Railton. 1987. Cytokinins and ancymidol inhibit abscisic acid biosynthesis in Persea gratissima. J. Plant Physiol. 130:273-277.
Creelman, R.J., H.S. Mason, R.J. Bensen, J.S. Boyer, and J.E. Mullet. 1990. Water deficit and abscisic acid cause differential inhibition of shoot versus root growth in soybean seedlings. Plant Physiol. 92:205-214.
Cresswell, A. and D.R. Causton. 1988. The effect of rooting space on whole plant and leaf growth in brussels sprouts Wrassica oleracea var. gemmifera). Ann. Bot. 62:549-558.
Crosby, K.E., L.H. Aung, and G.R. Buss. 1981. Influence of 6-benzyl-aminopurine on fruitset and seed development in two soybean, Glycine max (L.) Merr. genotypes. Plant Physiol. 68:985-988.
Crozier, A. and D.M. Reid. 1971. Do roots synthesize gibberellins? Can. J. Bot. 49:967-975.
Cruz-Castillo, J.G., S. Ganeshanandam, B.R. MacKay, G.S . Lawes, C.R.O. Lawoko, and D.J. Woolley. 1994. Applications of canonical discriminant analysis in horticultural research. HortScience 29: 1 1 15-1 1 19.
Cumbus, I.P. and P.H. Nye. 1982. Root zone temperature effects on growth and nitrate absorption in rape (Brassica nupus cv. Emerald). J. expo Bot. 33:1138-1446.
References 321
Daie, J. 1985. Carbohydrate partitioning and metabolism in crops. Hort. Rev. 7:69-108.
Dale, J.E. 1976. Cell division in leaves, p. 315-345. In: M.M. Yeoman (ed.). Cell division in higher plants. Academic Press, London.
Dale, J.E. 1988. The control of leaf expansion. Ann. Rev. Plant Physiol. Plant Mol. BioI. 39:267-295.
Dale, J.E. and F .L. Milthorpe. 1983. The growth and functioning of leaves. Cambridge University Press, Cambridge.
Davey, J.E. and J. Van Staden. 1976. Cytokinin translocation: changes in zeatin and zeatin-riboside levels in the root exudate of tomato plants during their development. Planta 130:69-72.
Davidson, R.L. 1969a. Effect of root/leaf temperature differentials on root/shoot ratios in some grasses and clover. Ann. Bot. 33:57 1-577.
Davidson, R.L. 1969b. Effects of edaphic factors on the soluble carbohydrate content of roots of Lolium perenne L. and Trifolium repens L. Ann. Bot. 33:579-589.
Davies, W.J. and J. Zhang. 1991. Root signals and the regulation of growth and development of plants in drying soil. Annu. Rev. Plant Physiol. Plant Mol. BioI. 42:55-76.
Davis, T.D. and E.A. Curry. 1991. Chemical regulation of vegetative growth. Critical Rev. Plant Science 10:151-188.
Davis, T.D., B.E. Haissig, and N. Sankhla. 1988. Adventitious root formation in cuttings. Advances in Plant Science Series, Vol. 2. Dioscorides Press, Oregon.
Dawkins, T.C.K., J.R. Roberts, and J.C. Brereton. 1983. Mechanical impedance and root growth - the role of endogenous ethylene, p. 55-7 1. In: M .B. Jackson and A.D. Stead (eds.). Growth regulators in root development. British Plant Growth Regulator Group, Monograph No. 18. Parchments (Oxford) Ltd, UK.
de Lint, P.J.A.L. and D. Klapwijk, 1986. Physiology of tomato roots with respect to substrate culture. Acta Hortic. 190:467-469.'
de Vries, D.P. and A.M. Dubois. 1989. Variation for the shoot production of Rosa hybrida, 'Sonia', as induced by different edelcamna rootstock clones. Gartenbauwissenschaft 53:211-215.
References 322
de Willigen, P. and M. van Noordwijk, 1987. Roots, plant production and nutrient use efficiency. PhD thesis, Agricultural University, Wageningen. (cited by Konings, 1990; van Noordwijk and Brouwer, 1991).
de Wit, C.T. 1970. Dynamic concepts in biology, p. 17-23. In: 1. Setlik (ed.). Prediction and measurement of photosynthetic productivity. Pudoc, Wageningen.
Vde Wit, C.T. and F.W.T. Penning de Vries. 1983. Crop growth models without hormones. Neth. J. agric. Sci. 31:3 13-323.
Delaney, R.H. and AK. Dobrenz, 1974. Yield of alfalfa as related to carbon exchange. Agron. J. 66:498-500.
Devitt, D.A., R.L. Morris, and D.S. Neuman. 1994. Evapotranspiration and growth response of three woody ornamental species placed under varying irrigation regimes. J. Amer. Soc. Hort. Sci. 119:452-457.
Dewey, D.R. and KH. Lu. 1959. A correlation and path coefficient analysis of components of crested wheatgrass seed production. Agron. J. 5 1:5 15-5 18.
Digby, J. and R.D. Firn. 1985. Growth substances and leaf growth, p. 57-76. In: N .R. Baker, W.J. Davies, and C.K. Dng (eds.). Control of leaf growth. Cambridge University Press, Cambridge.
Dijkstra, P. 1990. Cause and effect of differences in specific leaf area, p. 125-140. In: H. Lambers et a1. (eds.). Causes and consequences of variation in growth rate and productivity of higher plants. SPB Academic Publishing bv, The Hague, The Netherlands.
Dominov, J.A., L. Stenzler, S. Lee, J.J. Schwarz, S . Leisner, and S.H. Howell. 1992. Cytokinins and auxins control the expression of a gene in Nicotiana plumbaginifolia cells by feedback regulation. Plant Cell 4:45 1-461.
Dodd, I.C. and W.J. Davies. 1994. Leaf growth responses to ABA are temperature dependent. J. expo Bot. 45:903-907.
Dormer, K.J. 1965. Correlations in plant development: general and basic aspects, p. 452-478. In: W. Ruhland (ed.). Encyclopedia of plant physiology, Vol. 15. Differentiation and development. Springer-Verlag, Berlin.
Doyle, J.J. and A.A. MacLean. 1958. The effect of soil aggregate size on availability of.oxygen and on growth of tomatoes. Can. J. Soil Sci. 38:143-146.
Draper, N.R. and H. Smith. 1981. Applied regression analysis. 2nd ed. John Wiley & Sons, New York.
Drew, A.P. 1982. Shoot-root plasticity and episodic growth in red pine seedlings. Ann. Bot. 49:347-357.
References 323
Drew, A.P. and F.T. Ledig. 1980. Episodic growth and relative shoot:root balance in loblolly pine seedlings. Ann. Bot. 45:143-148.
Drew, M.C. and L.R. Saker. 1975. Nutrient supply and the growth of seminal root system in barley. II. Localized compensatory increase in lateral root growth and rates of nitrate uptake when nitrate supply is restricted to only part of the root system. J. expo Bot. 24:79-90.
Drew, M.C., E.J. Sisworo, and L.R. Saker. 1979. Alleviation of waterlogging damage to young barley plants by application of nitrate and a synthetic cytokinin, and comparison between the effects of waterlogging, nitrogen deficiency and root excision. New Phytol. 82:3 15-329.
Dubucq, M., M. Hofmger, and T. Gaspar. 1978. Auxin-controlled root growth and ethylene production. Plant, Cell and Environ. 1:151- 153.
Duncan, O.D. 1966. Path analysis - sociological examples. Am. J. Sociol. 72:1-16.
Duniway, J.M. 1971. Water relations of Fusarium wilt in tomato. Physiol. Plant Pathol. 1 :537-546.
Dywer, L.M. and D.W. Stewart. 1984. Indicators of water stress in com. Can. J. Plant Sci. 64:537-546.
Early, J.D., Jr., and G.C. Martin. 1988. Sensitivity of peach seedling vegetative growth to paclobutrazol. J. Amer. Soc. Hort. Sci. 1 13:23-27.
Edwards, D.G. and C.J. Asher. 1974. The significance of solution flow rate in flowing culture experiments. Plant and Soil 41:161-175.
Eissenstat, D.M. 1992. Costs and benefits of constructing roots of small diameter. J. Plant Nutrition 15:763-782.
Eissenstat, D.M. and L.W. Duncan. 1992. Root growth and carbohydrate responses in bearing citrus trees following partial canopy removal. Tree Physiology 10:245-257.
EI Nadi, A.H., R. Brouwer, and J. Th. Locher. 1969. Some responses of the root and the shoot ofVicia faha plants to water stress. Neth. J. agric. Sci. 17:133-142.
EI-Sharkawy, M., J. Hesketh and H. Muramoto. 1965. Leaf photosynthetic rates and other growth characteristics among 26 species of Gossypium. Crop. Sci. 5:173-175.
Elias, C.O. and D.R. Causton. 1976. Studies on data variability and the use of polynomials to describe plant growth. New Phytol. 77:421-430.
References 324
Else, M.A., W.J. Davies, P.N. Whitford, K.C. Hall, and M.B. Jackson. 1994. Concentrations of abscisic acid and other solutes in xylem sap from root systems to tomato and castor-oil plants are distorted by wounding and variable sap flow rates. J. expo Bot. 45:317-323.
Erf, J.A. and J.T.A. Proctor. 1989. Growth, leaf mineral nutrition, and leaf water status of mature apple trees subjected to various crop loads and soil water conditions. J. Amer. Soc. Hort. Sci. 1 14:191-196.
Erickson, R.O. and F.J. Michelini. 1957. The plastochron index. Amer. J. Bot. 44:297 -305.
Erickson, L.C. 1946. Growth of tomato roots as influenced by oxygen in the nutrient solution. Amer. J. Bot. 33:551-561.
Erwin, J.E. and R.D. Heins. 1990. Temperature effects on lily development rate and morphology from the visible bud stage until anthesis. J. Amer. Soc. Hort. Sci. 1 15:644-646.
Erwin, J.E., R.D. Heins, and M.G. Karlsson. 1989. Thermomorphogenesis in Lilium longiflorum. Am. J. Bot. 76:47-52.
Erwin, J.E., R.D. Heins, and R. Moe. 1991. Temperature and photoperiod effects on Fuchsia x hybrida morphology. J. Amer. Soc. Hort. Sci. 116:955-960.
Esau, K. 1965. Plant anatomy. John Wiley & Sons, New York.
Evans, G.C. 1972. The quantitative analysis of plant growth. Blackwell Scientific Publications, Oxford.
Evans, G.C. 1976. A sack of uncut diamonds: the study of ecosystems and the future resources of mankind. J. Ecology 64:1-39.
Evans, M.L. 1984. Functions of hormones at the cellular level of organisation, p. 23-79. In: T.K. Scott (ed.) . Hormonal regulation of development. II. The functions of hormones from the level of the cell to the whole plant. Encyclopedia of Plant Physiology, New Series Vol. 10. Springer-Verlag, Berlin.
Evans, P .S. 1970. Root growth of Lolium perenne L. I. Effects of plant age, seed weight, and nutrient concentration on root weight, length and number of apices. N.Z. J. Bot. 8:344-356.
Evans, P.S. 1971. Root growth of Lolium perenne L. II. Effects of defoliation and shading. N .Z. J. Agric. Res. 14:552-562.
Even-Chen, Z. and C. Itai. 1975. The role of abscisic acid in senescence of detached tobacco leaves. Physiol. Plant. 34:91-100.
References 325
Everat-Bourbouloux, A. and J. Bonnemain. 1980. Distribution of labelled auxin and derivatives in stem tissues of intact and decapitated broad-bean plants in relation to apical dominance. Physiol. Plant. 50:145-152.
Falloon, P.G. and P .J. Schurink. 1982. Effects of commercial pot type on asparagus seedling growth. N.z. Agric. Sci. 16:63-65.
Farrar, J.F. 1985. Fluxes of carbon in roots of barley plants. New Phytol. 99:57-69.
Feierabend, J. 1969. Der einfluss von cytokinin auf die bildung von photosyntheseenzyme im Roggenkeimlingen. Planta 84:11-29.
Feldman, L.J. 1975. Cytokinins and quiescent center activity in roots of Zea, p. 55-71. In: J.G. Torrey and D.T. Clarkson (eds.). The development and function of roots. Academic Press, New York.
Feldman, L.J. 1979a. Cytokinin biosynthesis in roots of com. Planta 145:3 15-321.
Feldman, L.J. 1979b. The proximal meristem in the root apex of Zea mays L. Ann. Bot. 43: 1-9.
Feldman, L.J. 1980. Auxin biosynthesis and metabolism in isolated roots of Zea mays. Physiol. Plant. 49:145-150.
Feldman, L.J. 1984. Regulation of root development. Ann. Rev. Plant Physiol. 35:223-242.
Ferree, D.C. 1989. Growth and carbohydrate distribution of young apple trees in response to root pruning and tree density. HortScience 24:62-65.
Fetene, M. and E . Beck. 1993. Reversal of the direction of photosynthate allocation in Urtica dioica L. plants by increasing cytokinin import into the shoot. Bot. Acta. 106:235-240.
Fetene, M., I. Moller, and E. Beck. 1993. The effect of nitrogen supply to Urtica dioica L. plants on the distribution of assimilate between shoot and roots. Bot. Acta. 106:228-234.
Finnie, J.F. and J. van Staden. 1985. Effect of seaweed concentrate and applied hormones in in vitro cultured tomato roots. J. Plant Physiol. 120:215-222.
Fitter, A.H. 1991. Characteristics and functions of root systems, p. 3-25. In: Y. Waisel, A. Eshel, and U. Kafkafi (eds.). Plant roots: The hidden half. Marcel Dekker, New York.
Fletcher, R.A., G. Hofstra, and N.O. Adedipe. 1970. Effects of benzyladenine on bean leaf senescence and the translocation of I·C-assimilates. Physiol. Plant. 23:1144-1 148.
References 326
Flewelling, J.W. and L.V. Pienaar. 1981. Multiplicative regression with lognormal errors. Forest Sci. 27:281-289.
Forsyth, C. and J. van Staden. 1981. The effects of root decapitation on lateral root formation and cytokinin production in Pisum sativum. Physiol. Plant. 51:375-379.
Fosket, D.E. 1977. Regulation of the plant cell cycle by cytokinins, p. 66-91. In: T.L. Rost and E.M. Gifford (eds.). Mechanisms and control of cell division. Dowden, Hutchison and Ross, New York.
Fox, J.E., J. Cornette, G. Deleuze, W. Dyson, C. Giersak, P. Niu, J. Zapata, and J.D. McChesney. 1973. The formation, isolation and biological activity of a cytokinin 3-glucoside. Plant Physiol. 52:627-632.
France, J. and J.H.M. Thornley. 1984. Mathematical models in agriculture. Butterworths, London.
Freijsen, A.H.J. and B.W. Veen. 1989. Phenotypic variation in growth as affected by N-supply: nitrogen productivity, p. 19-33. In: H. Lambers, M .L. Cambridge, H. Konings and T.L. Pons (eds.). Causes and consequences of variation in growth rate and productivity of higher plants. S PB Academic Publishing bv, The Hague.
Friend, D.J.C. and V.A. Helson. 1965. Changes in the leaf area ratio during growth of Marquis wheat, as affected by temperature and light intensity. Can. J. Bot. 43:15-28.
Friis-Nielsen, B. 1973a. Growth, water and nutrient status of plants in relation to patterns of variations in concentrations of dry matter and nutrient elements in base-to-top leaves. I . Distribution of contents and concentrations of dry matter in tomato plants under different growth conditions. Plant and Soil 39:661-673.
Friis-Nielsen, B. 1973b. Growth, water and nutrient status of plants in relation to patterns of variations in concentrations of dry matter and nutrient elements in base-to-top leaves. II. Relations between distribution of concentrations of dry matter and nutrient elements in tomato plants. Plant and Soil 39:675-686.
FuBeder, A., A. Wartinger, W. Hartung, Schultze, E.-D., and H. Heilmeier. 1992. Cytokinins in the xylem sap of desert-grown almonds (Prunus dulcis) trees: daily courses and their possible interactions with abscisic acid and leaf conductance. New Phytol. 122:45-52.
Gales, K. 1979. Effect of water supply on partitioning of dry matter between roots and shoots of Lotium perenne. J. appl. Ecol. 16:863-877.
References 327
Vuallardo, M., N.C. Turner and C. Ludwig. 1994. Water relations, gas exchange and abscisic acid content of Lupinu8 cosentinii leaves in response to drying different proportions of the root system. J. expo Bot. 45:909-918.
Gamiely, S., W.M. Randle, H.A. Mills and D.A. Smittle. 1991 . A rapid and nondestructive method estimating leaf area of onions. HortScience 26:206.
Ganmore-Neumann, R. and U. Kafkafi. 1980. Root temperature and percentage NOs-lNH: effect on tomato development II. Nutrients composition of tomato plants. Agron. J. 72:762-766.
Gasim, A.A. and R.G. Hurd. 1980. The root activity of fruiting tomato plant. Acta Hortic. 98:265-279.
Gates, C.T. 1955a. The response of the young tomato plant to a brief period of water shortage. I. The whole plant and its principal parts. Aust. J. bioI. Sci. 8:196-214.
Gates, C.T. 1955b. The response of the young tomato plant to a brief period of water shortage. II. The individual leaves. Aust. J. bioI. Sci. 8:215-230.
Geiger, D.R. 1975. Phloem loading, p. 395-431. In: M.H. Zimmerman, J.A. Milburn (eds.). Encyclopedia of plant physiology, Transport in plants. New Series, Vol. I. Springer, Berlin.
Gersani, M., S .H. Lips, and T. Sachs. 1980. The influence of shoots, roots, and hormones on the distribution of leucine, phosphate, and benzyladenine. J. expo Bot. 31:777-782.
Gersani, M. and T. Sachs. 1984. Polarity reorientation in beans expressed by vascular differentiation and polar auxin transport. Differentiation 25:205-208.
Gersani, M. and T. Sachs. 1992. Development correlations between roots in heterogeneous environments. Plant, Cell and Environ. 15:463-469.
Gifford, R.M. and L.T. Evans. 1981. Photosynthesis, carbon partitioning, and yield. Ann. Rev. Plant Physiol. 32:485-509.
Gill, J.L. 1978. Design and analysis of experiments in the animal and medical sciences. Iowa State University Press.
Gilliam, C.H., G.S. Cobb, and D.C. Fare. 1986. Effects of pruning on root and shoot growth of Ilex crenata 'Compacta'. J. Environ. Hort. 4:41-43.
Gilman, E.F. and R.J. Beeson. 1995. Copper hydroxide affects root distribution of Ilex cassine in plastic containers. HortTechnology 5:48-49.
References 328
GislellSd, H.R. and R.J. Kempton. 1983. The oxygen content of flowing nutrient solutions used for cucumber and tomato culture. Scientia Hortic. 20:23-33.
Goldschmidt, E.E. and S.C. Huber. 1992. Regulation of photosynthesis by endproduct accumulation in leaves of plants storing starch, sucrose and hexose sugars. Plant Physiol. 99:1443-1448.
Gomez, K.A. and A.A. Gomez. 1984. Statistical procedures for agricultural research. 2nd ed. John Wiley & Sons, New York.
Gollan, T., J.B. Pass ioura , and R. Munns . 1986. Soil water status affects the stomatal conductance of fully turgid wheat and sunflower leaves. Aust. J. Plant Physiol. 13:459-464.
Goodwin, P .B. 1978. Phytohonnones and growth and development of organs of the vegetative plant, p. 3 1-173. In: D.S. Letham, P.B. Goodwin and T.V. Higgins (eds.). The biochemistry of phytohormones and related compounds: a comprehensive treatise. Vol. II . ElsevierINorth Holland, Amsterdam.
Gordon, A.G. and D.C.F. Rowe. 1982. Seed manual for ornamental trees and shrubs. Forestry Commission Bulletin 59. HMSO, London.
Gordon, A.J., G.J.A. Ryle, D.F. Mitchell, and C.E. Powell. 1985. The flux of l4C_ labelled photosynthate through soy-bean root nodules during N 2 fIxation. J. expo Bot. 46:756-759.
Goss, M.J. 1977. Effects of mechanical impedance on root growth in barley (Hordeum vulgare L.). J. expo Bot. 28:96-111.
Goss, M.J. and R.S. Russell. 1980. Effects of mechanical impedance on root growth in barley <Hordeum vulgare L.). III. Observations on the mechanism of response. J. expo Bot. 31:577-588.
Gosselin, A. and M.J. Trudel. 1982. Influence de la temperature du substrat sur 1a criossance, Ie developpement et Ie contenu en elements mine raux de plants de tomate (cv. Vendor). Can. J. Plant Sci. 62:751-757.
Gould, S.J. 1966. Allometry and size in ontogeny and phylogeny. BioI. Rev. 41:587-640.
Gowing, D.J.G., W.J. Davies, and H.G. Jones. 1990a. A positive root-sourced signal as an indicator of soil drying in apple, MaluB % domestica Borkh. J. expo Bot. 41:1535-1540.
Gowing, D.J.G., W.J. Davies, and H.G. Jones. 1990b. A root-sourced signal of drying soil in apple Malus % domestica Borkh, p. 274-277. In: W..J. Davies and B. Jeffcoat (eds.). Importance of root to shoot communication
References 329
in the responses to environmental stress. Monograph 21. British Soc. Plant Growth Regulation, Bristol.
Graves, C.J. 1983. The nutrient fllm technique. Hort. Rev. 5:1-44.
Greshoff, P.M. 1978. Phytohormones and growth and differentiation of cells and tissues cultured in vitro, p. 1-29. In: D.S. Letham, P.B. Goodwin and T.V. Higgins (eds.). The biochemistry of phytohormones and related compounds: a comprehensive treatise. Vol. II. ElsevierINorth Holland, Amsterdam.
Grime, J.P. 1979. Plant strategies and vegetation processes. John Wiley & Sons, Great Britain.
Grochowska, M.J. and A. Karaszewska. 1990. The root collar modulates hormone transport affected by pruning of shoot and root of the apple trees. Fruit Sci. Rep. 17:9-20.
Grochowska, M.J., U. Dzimciol, and A Miszczak. 1994. Active participation of the root/shoot transition region treated with triiodobenzoic acid in basipetal transport in 14C-indole-3-acetic acid and ethylene evolution in the stem of apple seedlings. Scientia Hort. 59:207-215.
Grochowska, M.J., A. Karas zewska , B. Janlowska, and M.W. Williams. 1984. Dormant pruning influence on auxin, gibberellin and cytokinin levels in apple trees. J. Amer. Soc. Hort. Sci. 109:3 12-3 18.
Guiltinan, M.J. and J. Deikman. 1994. Molecular and genetic approaches to the study of plant hormone action. Hort. Rev. 16:1-32.
Hackett, C. and H.M. Rawson. 1974. An exploration of the carbon economy of the tobacco plant. II. Patterns of leaf growth and dry matter partitioning. Aust. J. Plant Physiol. 1:271-281.
Hair, J.F. Jr., R.E. Anderson, and R.L. Tatham. 1987. Multivariate data analysis with readings. 2nd ed. Macmillan Publishing Company, New York.
Haissig, B.E. 1974. Origins of adventitious roots. N. Z. J. For. Sci. 4:299-310.
Hall, A.J. 1977. Assimilate source-sink ' relationships in Capsicum annuum L. I . The dynamics of growth in fruiting and deflorated plants. Aust. J. Plant Physiol. 4:623-636.
Hameed, M .A., J.B. Reid, and R.N. Rowe. 1987. Root confmement and its effects on the water relations, growth and assimilate partitioning of tomato (Lycopersicon esculentum Mill). Ann. Bot. 5 9:685-692.
References 330
Hamill, J.D. 1993. Alterations in auxin and cytokinin metabolism of higher plants due to expression of specific genes from pathogenic bacteria: a review. Aust. J. Plant Physiol. 20:405-423.
Hammond, J.B.W., K.S. Burton, A.F. Shaw, and L.C. Ho. 1984. Source-sink relationships and carbon metabolism in tomato leaves 2. Carbohydrate pools and catabolic enzymes. Ann. Bot. 53:307-314.
Handreck, K. and N. Black. 1991. Growing media for ornamental plants and turf. New South Wales University Press, Kensington, NSW, Australia.
Hansen, C.E., C. Kopperud, and O.M. Heide. 1988. Identity of cytokinins in Begonia leaves and their variation in relation to photoperiod and temperature. Physiol. Plant. 73:387-391.
Hansen, G.K. and C.R. Jensen. 1977. Growth and maintenance respiration in whole plants, tops, and roots of Lolium multiforum. Physiol. Plant. 39:155- 164.
Hanson, P.J., R.K. Dixon, and R.E. Dickson. 1987. Effect of container size and shape on the growth of Northern red oak seedlings. HortScience 22:1293-1295.
Hanson, W.D. 1971. Selection for differential productivity among juvenile maize plants: associated net photosynthetic rate and leaf area changes. Crop. Sci. 1 1:334-339.
Hardwick, R.C. 1984. Some recent developments in growth analysis-e. review. Ann. Bot. 54:807-812.
Hartung, W. and J.W. Radin. 1989. Abscisic acid in the mesophyll apoplast and the root xylem sap of water -stressed plants: the significance of pH gradients, p. 110-124. In: D.D. Randall and D.G. Blevins (eds.). Current topics in plant biochemistry and physiology ) Vol. 8. Columbia Univ. MissouriColumbia.
Hartung, W., J. Zhang and W.J. Davies. 1994. Does abscisic acid play a stress physiological role in maize plants growing in heavily compacted soil? J. expo Bot. 45:221-226.
Hartung, W., H. Heilmeier, A. Wartinger, I. Kettemann, and E.D. Schulze. 1990. Ionic and abscisic acid relationships of Anastatica hierochuntica L. under arid conditions. Israel J. Bot. 39:373-382.
Heindl, J.C., D.R. Carlson, W.A. Brun, and M.L. Brenner. 1982. Ontogenetic variation of four cytokinins in soybean root pressure exudate. Plant Physiol. 70:1619-1625.
References 33 1
Heise, D.R. 1969. Problems in path analysis and causal inference, p. 38-73. In: E.F. Borgatta (ed.). Sociological Methodology. Jossey-Bass, San Francisco.
Henry, C.C. 1993. The effect of container volume and pore diameter on the growth of grapevines (Vitis vinifera L.). Masterate thesis, Lincoln University.
Herold, A. 1980. Regulation of photosynthesis by sink activity - the missing link. New Phytol. 86:131-144.
Herold, A. and P.H. McNeil. 1979. Restoration of photosynthesis in pot-bound tobacco plants. J. expo Bot. 119:1187-1194.
Heuvelink, E. 1995. Growth, development and yield of a tomato crop: periodic destructive measurements in a greenhouse. Scientia Hortic. 6 1:77-99.
Heuvelink, E. and R.P.M. Buiskool. 1995. Influence of sink-source interaction on dry matter production in tomato. Ann. Bot. 75:381-389.
Hewitt, J.D., M. Dinar and M.A. Stevens. 1982. Sink strength of fruit of two tomato genotypes differing in total fruit solids content. J. Amer. Soc. Hort. Sci. 107:896-900.
Hicklenton, P.R. 1990. Growth analysis of 'Plumosa Compacta' Juniper and 'Coral Beauty' cotoneaster subjected to different nitrogen fertilizer regimes. J. Environ. Hort. 8: 192-196.
Hicks, C.R. 1982. Fundamental concepts in the design of experiments. 3rd ed. Holt, Rinehart and Winston. New York.
Hitchman, M.L. 1978. Measurement of dissolved oxygen. John Wiley & Sons, New York.
Ho, L.C. 1988. Metabolism and compartmentation of imported sugars in sink organs in relation to sink strength. Ann. Rev. Plant Physiol. Plant Mol. BioI. 39:355-378.
Ho, L.C. 1992. The possible effects of sink demand for assimilate on photosynthesis, p. 729-737. In: N. Murata (ed.). Research in photosynthesis IV. Kluwer, Dordrecht.
Ho, L.C. and A.F. Shaw. 1977. Carbon economy and translocation of 14C in leaflets of the seventh leaf of tomato during leaf expansion. Ann. Bot. 41:833-848.
Ho, L.C. and A.F. Shaw. 1979. Net accumulation of minerals and water and the carbon budget in an expanding leaf of tomato. Ann. Bot. 43:45-54.
Hoagland, D.R. and D.l. Amon. 1938. The water culture method for growing plants without soil. Circ. Calif. Agric. Exp. Sta. No. 347.
References 332
Hoaglin, D.C. and R.E. Welsch. 1978. The bat matrix in regression and ANaVA Amer. Statist. 32: 17-22.
Hocking, T.J., J.R. Hillman, and M.B. Willdns. 1972. Movement of abscisic acid in Phaseolus vulgaris plants. Nature 235:124-125.
Hodgkinson, K.C. and H.G.B. Becking. 1977. Effect of defoliation on root growth of some arid zone perennial plants. Aust. Jour. Agric. Res. 29:31-42.
Hoffman, G.J. 1971. Estimating leaf area from length measurements for hybrid granex onion. Agron. J. 63:948-949.
Hopkinson, J.M. 1968. Effects of early drought and transplanting on the subsequent development of the tobacco plant. Aust. J. agric. Res. 19:47-57.
Horgan, R. 1990. Present and future prospects for cytokinin research, p. 3-13. In: M. Kamfnek, D.W.S . Mok and E. Zazfmalova (eds.). Physiology and biochemistry of cytokinins in plants. SPB Academic Publishing bv, The Hague, Netherlands.
Howard, B.H. 1981. Wounding responses in cuttings. Ann. Rep. E. MaIling Res. Stn for 1980, 62-64.
Howard, B.H. and R.S. Harrison-Murray. 1982. Cutting techniques. Ann. Rep. E. MaIling Res. Stn for 1981, 61-64.
Hsiao, T.C. 1973. Plant responses to water stress. Ann. Rev. Plant Physiol. 24:5 19-570.
Hsiao, T.C. and E. Acevedo. 1974. Plant responses to water deficits, water-use efficiency, and drought resistance. Agric. Meteorol. 14:59-84.
Hsiao, T.C. and J. Jing. 1987. Leaf and root expansive growth in response to water deficits, p. 180-192. In: D.J. Cosgrove and D.P. Knievel (eds.). Physiology of cell expansion during plant growth. American S oc. Plant Physiologists, Rockville, MD.
Hsiao, T.C., E. Acevedo, E. Fereres, and D.W. Henderson. 1976. Stress metabolism. Water stress, growth, and osmotic adjustment. Phil. Trans. R. Soc. Lond. B. 273:479-500.
Hubick, K.T., J.S. Taylor and D.M. Reid. 1986. The effect of drought on levels of abscisic acid, cytokinins, gibberellins and ethylene in aeroponicallygrown sunflower plants. Plant Growth Reg. 4:139-151.
Hughes, B.R. and J.T.A. Proctor. 1981. Estimation of leaflet, leaf, and total leaf area of Panax quinquefolius L. using linear measurements. J. Amer. Soc. Hort. Sci. 106:167-170.
References 333
Hughes, A.P. and P.R. Freeman. 1967. Growth analysis using frequent small harvests. J. appl. Ecol. 4:553-560.
Humphries, E.C. 1958. Effect of removal of a part of the root system on the subsequent growth of the root and shoot. Ann. Bot. 22:251-257.
Humphries, E.C. and A.W. Wheeler. 1960. The effects of kinetin, gibberellic acid, and light on expansion and cell division in leaf disks of dwarf bean (Phaseolus vulgaris). J. expo Bot. 11: 81-85.
Hunt, R 1975. Further observations on root-shoot equilibria in perennial ryegrass (Lalium perenne L.). Ann. Bot. 39:745-755.
.
Hunt, R. 1978. Plant growth analysis. Studies in Biology no. 96. Edward Arnold, London.
Hunt, R 1982. Plant growth curves: a functional approach to plant growth analysis. Edward Arnold. London.
Hunt, R and G.C. Evans. 1980. Classical data on the growth of maize: curve fitting with statistical analysis. New Phytol. 86:155-180.
Hunt, R. and A.O. Nicholls. 1986. Stress and the coarse control of growth and rootshoot partitioning in herbaceous plants. Oikos 47:149-158.
Hunt, R., J. Warren Wilson, D.W. Hand and D.G. Sweeney. 1984. Integrated analysis of growth and light interception in winter lettuce. I. Analytical methods and environmental influences. Ann. Bot. 54:743-757.
Hurd, RG. 1977. Vegetative plant growth analysis in controlled environments. Ann. Bot. 41:779-787.
Hurd, RG. 1978. The root and its environment in the nutrient fllm technique of water culture. Acta Hortic. 82:87-97.
Hurd, RG. and A.P. Gay. 1977. Effect of old nutrient solution on growth of tomato seedlings. Rep. Glasshouse Crops Res. Inst. for 1976. p.49.
Hurd, R.G. and D. Price. 1977. Root death and mid-crop wilting of tomatoes in nutrient film. Hortic. Ind. pp. 15, 18. (cited by Tucker, 1981.)
Hurd, RG. and J.H.M. Thornley. 1974. An analysis of the growth of young tomato plants in water culture at different light integrals and CO2 concentrations. I. Physiological aspects. Ann. Bot. 38:375-388.
Huxley, J.S. 1924. Constant differential growth rates. Nature 114:895-896.
Huxley, J.S. 1932. Problems of relative growth. Methuen & Co. Ltd., London.
References 334
Incoll, L.D. and P.C. Jewer. 1987. Cytokinins and stomata, p. 281-292. In: E. Zeiger, G.D. Farquhar and I .R. Cowan (eds.). Stomatal function. Stanford University Press, Stanford.
ltai, C. and H. Birnbaum. 1991. Synthesis of plant growth regulators by roots, p. 163-177. In: Y. Waisel, A. Eshel, and U. Katkafi (eds.). Plant roots: The hidden half. Marcel Dekker, New York.
ltai, C. and Y. Vaadia. 1965. Kinetin-like activity in root exudate of water-stressed sunflower plants. Physiol. Plant. 18:941-944.
ltai, C., A. Richmond and Y. Vaadia. 1968. The role of root cytokinins during water and salinity stress. Israel J. Bot. 17:187-195.
Jackson, G.E., J. Irvine, J. Grace and A.A.M. Khalil. 1995. Abscis ic acid concentrations and fluxes in droughted conifer saplings. Plant, Cell and Environ. 18:13-22.
Jackson, M.B . 1980. Aeration in the nutrient film technique of glasshouse crop production and the importance of oxygen, ethylene and carbon dioxide. Acta Hortic. 98:61-78.
Jackson, M.B. 1990. Communication between the roots and shoots of flooded plants, p. 1 15-133. In: W.J. Davies and B. Jeffcoat (eds.). Importance of root to shoot communication in the responses to environmental stress. Monograph 21. British Soc. Plant Growth Regulation, Bristol.
Jackson, M.B . 1993. Are plant hormones involved in root to shoot communication? Adv. Bot. Res. 19:103-187.
Jackson, M.B. and P.W. Barlow. 1981. Root geotropism and the role of growth regulators from the cap: a re-examination. Plant, Cell and Environ. 4:107-123.
Jackson, M.B. and D.J. Campbell. 1976. Waterlogging and petiole epinasty in tomato: the role of ethylene and low oxygen. New Phytol. 76:21-29.
Jackson, M.B. and D.J. Campbell. 1979. Effects of benzyladenine and gibberellic acid on the responses of tomato plants to anaerobic root environments and to ethylene. New Phytol. 82:331-340.
Jackson, M.B., P.S. Blackwell, J.R. Chrimes and T.V. Sims. 1984. Poor aeration in NFT and a means for its improvement. J. hort. Sci. 59:439-448.
Jackson, M .B ., K. Gales, and D .J. Campbell. 1978. Effect of water logged soil conditions on the production of ethlene and on water relationships in tomato. J. expo Bot. 29:183-193.
References 335
Jaramillo-C. G., J.W. White, and G. de la Cruz-A. 1992. The effect of soil compaction on differentiation of late metaxylem in common bean (Phaseolus vulgaris L.). Ann. Bot. 70:105-1 10.
Jarrett, A.F. and D.O. Chanter. 1981. The design and interpretation of nutrient f11m technique experiments. Hort. Res. 21:49-56.
Jenner, G. 1980. Hydroponics - reality or fantasy? Scientific Hort. 31 :19-26.
Jensen, M.H. and W.L. Collins. 1985. Hydroponic vegetable production. Hort. Rev. 7:483-558.
Jesko, T. 1981. Inter-organ control of photosynthesis mediated by emerging nodal roots in young maize plants, p. 367-371. In: R. Brouwer, O. Ga§parikova, J. Lolek and B.C Loughman (eds.). Structure and function of plant roots. Developments in plant and soil sciences 4. Martinus NijhofflDr W. Junk Publishers, The Hague.
Johnson, LR. and J.H.M. Thornley. 1987. A model of shoot:root partitioning with optimal growth. Ann. Bot. 60:133-142.
Johnson, LR., J.J. Melkonian, J.H.M. Thomley and S.J. Riha. 1991. A model of water flow through plants incorporating shoot/root 'message' control of stomatal conductance. Plant, Cell and Environ. 14:531-544.
Johnson, R.A. and D.W. Wichern. 1988. Applied multivariate statistical analysis . 2nd ed. Prentice Hall, Englewood Cliffs, New Jersey.
Jolliffe, LT. 1972. Discarding variables in a principal component analysis. II: Artificial data. Appl. Statist. 22:21-31.
Jones, H.G. 1990. Control of growth and stomatal behaviour at the whole plant level: effects of soil drying, p. 81-93. In: W.J. Davies and B. Jeffcoat (eds.). Importance of root to shoot communication in the responses to environmental stress. Monograph 21. British Soc. Plant Growth Regulation, Bristol.
Jones, M.G. 1987. Gibberellins and the procera mutant of tomato. Planta 172:280-284.
Jones, R.L. and LD.J. Phillips. 1966. Organs of gibberellin synthesis in light grown sunflower plants. Plant Physiol. 41:1381-1386.
Jusaitis, M. 1986. Rooting of intact mung beans in stimulated by auxin, ACC, and lower temperature. HortScience 21:1024-1025.
Kallarackal, J. and J.A. Milburn. 1985. Respiration and phloem translocation in the roots of chickpea (Cicer arietinum). Ann. Bot. 56:211-218.
References 336
Kaminek, M. 1992. Progress in cytokinin research. TIB-TECH 10: 159- 164.
Karlsson, M.G., M.P. Pritts, and R.D. Heins. 1988. Path analysis of chrysanthemum growth and development. HortScience 23:372-375.
Karlsson, M.G., R.D. Heins, J.E. Erwin, R.D. Berhage, W.H. Carlson and J.A. Biernbaun. 1989. Temperature and photosynthetic photon flux influence Chrysanthemum shoot development and flower initiation under short day conditions. J. Amer. Soc. Hort. Sci. 1 14:158-163.
Karmoker, J.L., van Steveninck, R.F.M. 1979. The effect of abscisic acid on sugar levels in seedlings of Phaseolus vulgaris L. cv. Redland Pioneer. Planta 146:25-30.
Kays, S .J., C.W. Nicklow, and D.H. Simons. 1974. Ethylene in relation to the response of roots to physical impedance. Plant and Soil 40:565-571.
Keith, H. , J.M. Oades, and J.K. Martin. 1986. Input of carbon to soil from wheat plants. Soil Biology and Biochemistry 18:445-449.
Kempthorne, O. 1957. An introduction to genetic statistics. John Wiley & Sons, New York.
Kendall, M.G. and A. Stuart. 1977. The advanced theory of statistics. Vol.1. (4th ed). Griffm & Co., London. (cited by Causton and Venus, 1981.)
Keever, G.J., G.S . Cobb, and R.B. Reed. 1985. Effects of container dimension and volume on growth of three woody ornamentals. HortScience 20:276-278.
Khanizadeh, S. and M.A. Fanous. 1992. Statistical methods: a computer program to calculate orthogonal polynomial coefficients. HortScience 27 :367 .
Khuciheir, G.A. and P. Newton. 1983. Water and nutrient uptake by tomato plants grown with the nutrient film technique in relation to fruit production. Acta Hortic. 133:67-88.
King, P.J. 1988. Plant hormone mutants. Trends Genet. 4:157-162.
Kirschner, H., T. Sachs, and A. Fahn. 1971. Secondary xylem reorientation as a special case of vascular tissue differentiation. Israel J. Bot. 20:184-198.
Klapwijk, D. 198 1. Effect of season on early tomato growth and development rates. Neth. J. agric. Sci. 29:179-188.
Klepper, B. 1990. Root growth and water uptake, p. 281-322. In: B .A. Stewart and D.R. Nielsen (eds.). Irrigation of Agricultural Lands. Am. Soc. Agron., Madison, Wisconsin.
References 337
Klepper, B. 1991. Development and growth of crop root systems, p. 1-25. In: J.L. Hatfield and B.A. Stewart (eds.). Limitations to plant root advances. Advances in Soil Science. Vol. 19. Springer Verlag, New York.
Koda, Y. and Y. Okazawa. 1978. Cytokinin production by tomato root: occurrence of cytokinins in staled medium of root culture. Physiol. Plant. 44:412-416.
Kolb, D.A., 1.M. Rubin, and J.M. McIntyre. 1979. Organisational psychology: An experiential approach. 3rd ed. Prentice-Hall Inc., New Jersey.
Komor, E., 1. Liegel and C. Schobert. 1993. Loading and translocation of various cytokinins in phloem and xylem of the seedlings of Ricinus communis L. Planta 191:252-255.
Konings, H. 1990. Physiological and morphological differences between plants with a high NAR or a high LAR as related to environmental conditions, p. 101-123. In: H. Lambers, M.L. Cambridge, H. Konings and T.L. Pons (eds.). Causes and consequences of variation in growth rate and productivity of higher plants. SPB Academic Publishing bv, The Hague, The Netherlands.
Koornneef, M., T.D.G. Bosma, C.J. Hanhart, J.H. van der Veeen, and J.A.D. Zeevaart. 1990. The isolation and characterization of gibberellin-deficient mutants in tomato. Theor. Appl. Genet. 80:852-857.
Korner, C., S. Pelaez Mendez-Riedl, and P.C.S. John. 1989. Why are bonsai plants small? A consideration of cell size. Aust. J. Plant Physiol. 16:443-448.
Kramer, P.J. 1988. Changing concepts regarding plant water relations. Plant, Cell and Environ. 1 1:565-7.
Krizek, D.T., A. Carmi, R.M. Mirecki, F.W. Synder, and J.A. Bunce. 1985. Comparative effects of soil moisture stress and restricted root zone volume on morphogenetic and physiological responses of soybean [Glycine max (L.) Merr.]. J. expo Bot. 36:25-38.
Kuiper, D. 1988. Growth responses of Plantago major L. ssp. pleiosperma (Pilger) to changes in mineral supply. Plant Physiol. 87:555-557.
Kuiper, D., J. Schuit and P.J.C. Kuiper. 1988. Effects of internal and external cytokinin concentrations on root growth and shoot to root ratio of Plantago major spp. pleiosperma at different nutrient conditions. Plant and Soil 231-236.
Kuiper, D., P.J.C. Kuiper, H. Lambers, J. Schuit, and M. Staal. 1989. Cytokinin concentration in relation to mineral nutrition and benzyladenine treatment in Plantago major spp. pleiosperma. Physiol. Plant. 75:5 11-517.
References 338
Kuhn, T.S. 1963. The structure of scientific revolutions. University Press, Chicago.
Kuhn, T.S. 1970. Logic of discovery or psychology of research?, p. 1-23. In: I . Lakatos and A.E. Musgrave (eds.). Criticism and the growth of knowledge. University Press, Cambridge.
Lachno, D.R., R.S . Harrison-Murray, and L.J. Audus. 1982. The effects of mechanical impedance to growth on the levels of ABA and IAA in root tips of Zea mays L. J. expo Bot. 33:943-951.
Lakso, A. 1992. National workshop on methodology for photosynthesis and plant water relations. DSIR Fruit and Trees, Palmerston North, New Zealand (unpublished proceedings).
Lambers, H. 1985. Respiration in intact plants and tissues: Its regulation and dependence on environmental factors, metabolism and invaded organisms, p. 418-473. In: R. Douce and D.A. Day (eds.). Encyclopedia of Plant Physiology. N.S. Vol. 18. Springer-Verlag, Berlin.
Lambers, H. 1987. Growth, respiration, exudation and symbiotic associations; the fate of carbon translocated to the roots, p. 125-145. In: P .J. Gregory, J.V. Lake and D.A. Rose (eds.). Root development and function. Society for Experimental Biology Seminar Series 30. Cambridge University Press, Cambridge, UK.
Lambers, H. 1988. Growth, respiration, exudation and symbiotic associations: the fate of carbon translocated to the roots, p. 125-145. In: P.J. Gregory et al. (eds.) Root development and function (Soc. Exp. BioI. Seminar Series vol. 30). Cambridge University Press, Cambridge.
Lambers, H., A. van der Werf, and H. Konnings. 1991. Respiratory patterns in roots in relation to their functioning, p. 229-263. In: Y. Waisel, A. Eshel, and U. Kafkafi (eds.). Plant roots: The hidden half. Marcel Dekker, New York.
Lambers, H., A.H.J. Freijsen, J.' Poorter, T. Hirose, and A. van der Werf. 1990. Analyses of growth based on net assimilation rate and nitrogen productivty. Their physiological background, p. 1-17. In: H. Lambers, M.L. Cambridge, H. Konings and T.L. Pons (eds.). Causes and consequences of variation in growth rate and productivity of higher plants. SPB Academic Publishing bv, The Hague, The Netherlands.
Lamoreaux, R.J., W.R. Chaney, and K.M. Brown. 1978. The plastochron index: a review after two decades of use. Amer. J. Bot. 65:586-593.
LaRoche, G. 1980. The effects of restricting root growing space, decreasing nutrient supply and increasing water stress on the phenetics of Aquilegia canadensis L. (Ranunculaceae). Bul. Torrey Bot. Club. 107:220-23 1.
References 339
Lawlor, D.W. 1973. Growth and water absorption of wheat with parts of the roots at different water potentials. New Phytol. 72:297-305.
Lee-Stadelmann, O.Y. and E.J. Stadelmann. 1989. Plasmolysis and de-plasmolysis. Methods Enzymol. 174:225-246.
Lehman, L.J., E. Young, and C.R. Unrath. 1990. Growth dynamics of young apple trees as influenced by scion and rootstock vigour. J. hort. Sci. 65: 1 23-127 .
Leopold, A.C. and M. Kawase. 1964. Benzyladenine effects on bean leaf growth and senescence. Am. J. Bot. 5 1:294-298.
Leopold, A.C. and L.D. Nooden. 1984. Hormonal regulatory systems in plants, p. 4-22. In: T.K. Scott (ed.). Hormonal regulation of development. II. The functions of hormones from the level of the cell to the whole plant. Encyclopedia of Plant Physiology, New Series Vol. 10. Springer-Verlag, Berlin.
Lerbs, S ., W. Lerbs, N.L. Klyachko, E.G. Romanko, O.N. Kulaeva, R. Wollgiehn, and B. Parthier. 1984. Gene expression in cytokinin- and light-mediated plastogenesis of Cucurbita cotyledons: ribulose- 1,5-bisphosphate carboxylase/oxygenase. Planta 162:289-298.
Letham, D.S. 1978. Cytokinins, p. 205-263. In: D .S . Letham, P .B. Goodwin and T.V. Higgins (eds.). The biochemistry of phytohormones and related compounds: a comprehensive treatise. Vol. II. Elsevier/North Holland, Amsterdam.
Letham, D.S. 1994. Cytokinins as phytohormones - sites of biosynthesis, translocation, and function of translocated cytokinin, p. 57-80. In: D .W.S . Mok and M.C. Mok (eds.). Cytokinins: chemistry, activity, and function. CRC Press, Florida.
Letham, D.S. and L.M.S. Palni. 1983. The biosynthesis and metabolism of cytokinins. Ann. Rev. Plant Physiol. 43:163-197.
Lewandowska, P. and P.G. Jarvis. 1977. Changes in chlorophyll and carotenoid content, specific leaf area and dry weight fraction in S itka spruce, in response to shading and season. New Phytol. 79:247-256. (cited by Dijkstra, 1990).
Lewontin, R.C. 1966. On the measurement of relative variability. Systematic Zoo1. 15:141-142.
Li, C.C. 1975. Path analysis - a primer. The Boxwood Press, California.
Lieth, J.H., R.H. Merritt, and H.C. Kohl, Jr. 199 1. Crop productivity of petunia in relation to photosynthetically active radiation and air temperature. J. Amer. Soc. Hort. Sci. 116:623-626.
References 340
Lim, T.M. and R. Narayanan. 1972. Estimation of the area of rubber leaves (Jlevea brasiliensis Muell. Arg.) using two leaflet parameters. Exp!. Agric. 8:3 11-314.
Lindsey, P.A. and N.L. Bassuk. 1992. A nondestructive image analysis technique for estimating whole-tree leaf area. HortTechnology 2:66-72.
Liptay, A. and D. Edwards. 1994. Tomato seedling growth in response to variation in root container shape. HortScience 29:633-635.
Lockard, R.G. and G.W. Schneider. 1981. Stock and scion growth relationships and the dwarfmg mechanism in apple. Hort. Rev. 3:315-375.
Logsdon, S.D. and R.B. Reneau, Jr. 1988. Influence of storage methods on corn root length measurements. Plant and Soil 1 1 1: 155-157.
Lu, J.L., J.R. Ertl and C.M. Chen. 1992. Transcriptional regulation of nitrate reductase mRNA levels by cytokinin-abscisic acid interactions in etiolated barley leaves. Plant Physio!. 98:1255- 1260.
Ludlow, M.M., K.J. Sommer, D.J. Flower, R. Ferraris, and H.B. So. 1 989. Influence of root signals resulting from soil dehydration and high soil strength on the growth of crop plants. Current Topics Plant Biochem. Physio!. 8:81-99.
Ludwig, J.A., J.F. Reynolds, and P.D. Whitson. 1975. Size-biomass relationships of several Chihuahuan desert shrubs. Amer. Midland Nat!. 94:45 1-46 1.
Lyon, C.J. 1948. A factor method for the area of tomato leaves. Plant Physio!. 23:634-635.
MacIssac, S.A., V.K. Sawhney, and Y. Pohorecky. 1989. Regulation of lateral root formation in lettuce CLactuca sativa) seedling roots: interacting effects of a-naphthalene acetic acid and kinetin. Physiol. Plant. 7 7:287-293.
MacMillan, J. 1987. Gibberellin-deficient mutants of maize and pea and the molecular action of gibberellins, p. 73-87. In: G.V. Hoad, J.R. Lenton, M .B. Jackson and R.K. Atkin (eds.). Hormone action in plant development. A critical appraisal. Butterworths, London.
Mahler, M.J. 1977. The use of hydroponics for the production of greenhouse tomatoes in Ireland, p. 161-169. In: Proceedings of the 4th International
r- Congress on Soilless Culture. I.S .0.S.C. Wageningen.
Maindonald, J.H. 1992. Statistical design, analysis, and presentation issues. N.Z. Jour. Agric. Research. 35:121-141 .
Maksymowych, R . 1973. Analysis of leaf development. Cambridge University Press, Cambridge.
References 341
Maldiney, R., F. Pelese, G. Pilate, B. Sotta, L. Sossountzov and E. M iginiac. 1986. Endogenous levels of abscisic acid, indole-3-acetic acid, zeatin 8.I}d zeatinriboside dwing the course of adventitious root formation in cuttings of Craigella and Craigella lateral suppressor tomatoes. Physiol. Plant. 68:426-430.
Maletta, M. and H.W. Janes. 1987. Interrelation of root and shoot temperatures on dry matter accumulation and root growth in tomato seedlings. J. hort. Sci. 62:49-54.
Manly, B.F .J. 1986. Multivariate statistical methods: a primer. Chapman and Hall, London.
Marc, J. and J.H. Palmer. 1976. Relationship between water potential and leaf and inflorescence initiation inHelianthus annuus. Physiol. Plant. 36:101-104.
Marshall, J.K. 1968. Methods for leaf area measurement of large and small leaf samples. Photosynthetica 2:41-47.
Masia, A., A. Pitacco, L. Braggio, and C. Giulivo. 1994. Hormonal responses to partial drying of the root system of Helianthus annuus. J. expo Bot. 45:69-76.
Masle, J. 1990. Growth and stomatal behaviour: response to soil resistance to root penetration, p. 95-1 13. In: W.J. Davies and B. Jeffcoat (eds.). Importance of root-to-shoot communication in the responses to root penetration. Monograph 21, British Society for Plant Growth Regulation. University of Lancaster, UK.
Masle, J. 1992. Genetic variation in the effects of root impedance on growth and transpiration rates of wheat and barley. Aust. J. Plant Physiol. 19:109-125.
Masle, J. and G.D. Farquhar. 1988. Effects of soil strength on the relation of wateruse efficiency and growth to carbon isotope discrimination in wheat seedlings. Plant Physiol. 86:32-38.
Masle, J. and J.B., Passioura. 1987. The effect of soil strength on the growth of young wheat plants. Aust. J. Plant Physiol. 14:643-656.
Masle, J., G.D. Farquhar, and R. M. Gifford. 1990. Growth and carbon economy of wheat seedlings as affected by soil resistance to penetration and ambient partial pressure of CO2• Aust. J. Plant Physiol. 17:465-487.
Massey, D.M. and G.W. Winsor. 1980a. Some responses of tomatoes to nitrogen in recirculating solutions. Acta Hortic. 98:127-137.
References 342
Massey, D.M. and G.W. Wmsor. 1980b. Some responses of tomato plants to phos phorus concentration in nutrient fl1m culture, p . 205-214. Proc. 5th Intern. Cong. on Soilless Culture I.S.0.S.C. Wageningen.
Matthew, C., C.R.O. Lawoko, C.J. Korte, and D. Smith. 1994. Application of canonical discriminant analysis, principal component analysis, and canonical correlation analysis as tools for evaluating differences in pasture botanical composition. N.Z. Jour. Agr. Res. 37:509-520.
Maust, B.E. and J.G. Williamson. 1994. Nitrogen nutrition of containerised citrus nursery plants. J. Amer. Soc. Hort. Sci. 119: 195-201.
McConnaughay, K.D.M., G.M. Berntson, and F.A. Bazzaz. 1993. Limitations to CO2-induced growth enhancement in pot studies. Oecologia 94:550-557.
McDavid, C.R., G.R. Sagar and C. Marshall. 1974. The effect of root pruning and 6-benzylaminopurine on the chlorophyll content, 14C02 fIXation and the shoot/root ratio in seedlings of Pisum sativum L. New Phytol. 72:465-470.
McGaw, B .A., I .M. Scott and R. Horgan. 1984. Cytokinin biosynthesis and metabolism, p. 105-133. In: A. Crozier and J.R. Hillman (eds.). The biosynthesis and metabolism of plant hormones. Cambridge University Press, Cambridge.
McGiffen, M.E. Jr., D.J. Pantone, and J.B. Masiunas. 1994. Path analysis of tomato yield components in relation to competition with black and eastern black nightshade. J. Amer. Soc. Hort. Sci. 1 19:6-1 1 .
McGowan, M. and C. Devereux. 1989. Does restricted root space influence plant growth?, p. 301-302. In: W.J. Davies and B. Jeffcoat (eds.). Importance of root-to-shoot communication in the responses to root penetration. Monograph 21, British Society for Plant G�owth Regulation. University of Lancaster, UK.
McKee, G.W. 1964. A coefficient for computing leaf area in hybrid com. Agron. J. 56:240-241.
McNaughton, K.G., P.W. Gandar, and H.G. McPherson. 1985. Estimating the effects of varying temperature on the rate of development of plants. Ann . Bot. 56:579-595.
Mead, R. 1990. The design of experiments. Statistical principles for practical application. Cambridge University Press. Cambridge.
Menary, R.C. and J. van Staden. 1976. Effect of phosphorus nutrition and cytokinins on flowering in the tomato, Lycopersicon esculentum Mill. Aust. J. Plant Physiol. 3:201-205.
References 343
Menhenett, R. and P.F. Wareing. 1975. Possible involvement of growth substances in the response of tomato plants (Lycopersicon esculentum Mill.) to different soil temperatures. J. hort. Sci. 50:38 1-397.
Menzel, C.M., D.W. Turner, V.J. Doogan, and D.R. Simpson. 1994. Root shoot interactions in passionfruit CPassiflora sp.) under the influence of changing root volumes and soil temperatures. J. hort. Sci. 69:553-564.
Milligan, G. 1980. An examination of the effect of six types of error perturbation on flfteen clustering algorithms. Psychometrica 45:325-342.
Milligan, S.P. and J.E. Dale. 1988. The effects of root treatments on growth of primary leaves of Phaseolus vulgaris L: General features. New Phytol. 108:27-35.
Milks, R.R., W.C. Fonteno, and R.A. Larson. 1989. Hydrology of horticultural substrates: III. Predicting air and water content of limited-volume plug cells. J. Amer. Soc. Hort. Sci. 114:57-61.
Milthorpe, F.L. and P. Newton. 1963. Studies on the expansion of the leaf surface. III. The influence of radiation on cell division and leaf expansion. J. expo Bot. 14:483-495 .
. Minitab Inc., 1991. Minitab reference manual. PC Version, Release 8. University Park, PA.
Moe, R., T. Fjeld and L.M. Mortensen. 1992. Stem elongation and keeping quality in poinsettia (Euphorbia pulcherrima Willd.) as affected by temperature and supplementary light. Scientia Hortic. 50: 127-136.
Mohnen, D., D. Shinshi, H., G. Felix, and F. Meins. 1985. Honnonal regulation of �-1,3 glucanase mRNA levels in cultured tobacco Nicotiana tabacum Havana 425 tissues. EMBO Journal 4:1631-1636.
Molz, F.J. 1981. Models of water transport in the soil-plant system: a review. Water Resources Res. 17:1245-1260.
Monmonier, M.S. and F .E. Finn. 1973. Improving the intercorrelation of geographical canonical correlation models. Prof. Geogr. 25:140-142.
Montgomery, D.C. and E.A. Peck. 1992. Introduction to linear regression analysis. 2nd ed. John Wiley & Sons, New York.
Mooney, H.A. 1972. The carbon balance of plants. Ann. Rev. Ecol. Syst. 3:315-346.
Moorby, J. and C.J. Graves. 1980. Root and air temperature effects on growth and yield of tomatoes and lettuce. Acta Hortic. 98:29-43.
References 344
Morgan, P.W. and W.C. Hall. 1964. Accelerated release of ethylene by cotton following application of indolyl-3-acetic acid. Nature 201:99.
Morgan, J.V. and R. O'Haire. 1978. Heated hydroponic solutions as an energy saving technique. Acta Hortic. 76:173J180.
Morris, R.O ., D.E. Akiyoshi, E.M.S. MacDonald, J.W. Morris, D.A. Regier and J.N. Zaerr. 1982. Cytokinin metabolism in relation to tumour induction by Agrobacterium tumefaciens, p. 175-183. In: P.F. Wareing (ed.). Plant growth substances 1982. Academic Press, New York.
Morrison, F. 1991. The art of modeling dynamic systems. Wiley, New York.
Mortensen, L.M. and R. Moe. 1993. Effects of various day and night temperature treatments on morphogenesis nd growth of some greenhouse and bedding plant species. Acta Hortic. 327:77-86.
Moss, G.!', K.C. Hall and M.B. Jackson. 1988. thylene and the response of roots of maize (Zea mays L.) to physical im dance. New Phytol. 109:303-311.
Munns, R. 1990. Chemical signals moving m roots to shoots: the case against ABA, p. 175-184. In: W.J. Davies and B. Jeffcoat (eds.). Importance of root to shoot communication in the responses to environmental stress. Monograph 21. British Soc. Plant Growth Regulation, Bristol.
Munns, R. 1992. A leaf elongation bioassay detects an unknown growth inhibitor in xylem sap from wheat and barley. Aust. J. Plant Physiol. 19:127- 135.
Munns, R. and R.E. Sharp. 1993. Involvement of abscisic acid in controlling plant growth in soils of low water potential. Aust. J. Plant Physiol. 20:425-437.
Muthukrishman, S., G.R. Chandra and G.P. Albaugh. 1983. Modulation of abscisic . acid and S-2 aminoethyl- 1-cysteine of a-amylase mRNA in barley aleurone cells. Plant Molecular Biology 2:249-258.
Mutsaers, H.J.W. 1983. Leaf growth in cotton (Gossypium hirsutum L.) 2. The influence of temperature, light, water stress and root restriction on the growth and initiation of leaves. Ann. Bot. 5 1:521-529.
Myers, B.J., R.H. Robichaux, G.L. Unwin, and I.E. Craig. 1987. Leaf water relations and anatomy of a tropical rainforest tree species vary with crown position. Oecologia 74:81-85. (cited by Dijkstra, 1990).
Myers, R.H. 1990. Classical and modem regression with applications. 2nd ed. PWS and Kent Publishing Co., Inc. Boston.
Nagarajah, S. and E.-D. Schulze. 1983. Responses of Vigna unguiculata (L.) Walp. to atmospheric and soil drought. Aust. J. Plant Physiol. 10:385-394.
References 345
Nagel, O.W., H. Konings and H. Lambers. 1994. Growth rate, plant development and water relations of the ABA-deficient mutant sitiens. Physiol. Plant. 92:102-108.
Nakata, S and A.C. Leopold. 1967. Radioautographic study of translocation in bean leaves. Am. J. Bot. 54:769-772.
Nambiar, E.K.S., G.D. Bowen, and R. Sands. 1979. Root regeneration and plant water status of Pinus radiata at different soil temperatures. J. expo Bot. 30:1 1 19-1 131.
Nautiyal, M.C., P.K. Singh, R.N. Shukla, S. Prakash, and A. Kumar. 1990. Correcting leaf area measurement by conventional methods: a new approach for apple (Malus oomestica Borkh). J. hort. Sci. 65:15-18.
Neales, T.F. and L.D. Incoll. 1968. The control of leaf photosynthesis rate by the level of assimilate concentration in the leaf: a review of the hypothesis. Bot. Rev. 34:107-125.
Neales, T.F., H. Masia, J. Zhang, and W.J. Davies. 1989. The effects of partially drying part of the root system of Helianthus annuus on the abscisic acid content in the roots, xylem sap and leaves. J. expo Bot. 40:1 1 13-1 120.
NeIder, J.A. 1963. Quantitative genetics and growth analysis, p. 445-454. In: W.D. Hanson and H.F. Robinson (eds.). Statistical genetics and plant breeding. National Academy of Science (NRC 982) Council, Washington D.C. (cited by Causton and Venus, 1981.)
Nelson, C.J. and K.L. Larson. 1984. Seedling growth, p. 93-129. In: M.B . Tesar (ed.). Physiological basis of crop growth and development. American Society of Agronomy-Crop Science Society of America, Madison.
NeSmith, D.S . 199 1. Nondestructive leaf area estimation of rabbiteye blueberries. HortScience 26: 1332.
NeSmith, D.S . 1992. Estimating summer squash leaf area nondestructively. HortScience 27 :77.
Neter, J., W. Wasserman, and M.H. Kutner. 1990. Applied linear statistical models. 3rd ed. Irwin, Homewood, IL.
Neuman, D.S., S .B. Rood, and B.A. Smit. 1990. Does cytokinin transport from rootto-shoot in the xylem sap regulate leaf responses to root hypoxia? J. expo Bot. 23 1: 1325-1333.
Nicholls, A.O . and D.M. Calder. 1973. Comments on the use of regression analysis for the study of plant growth. New Phytol. 72:571-582.
References 346
Nielsen, T.H. 1990. Enzymology of the carbohydrate metabolism during leaf development in sweet pepper. (Abstr.) Physiol. Plant. 79: A131, 749.
Nielsen, T.H. and P. Ulvskov. 1992. Cytokinins and leaf development in sweet pepper (Capsicum annuum L.). II. Sink metabolism in relation to cytokinin-promoted leaf expansion. Planta 188:78-84.
Nielsen, T.H. and B. Veierskov. 1990. Regulation of carbon partitioning in source and sink leaf parts in sweet pepper (Capsicum annuum L.) plants. Role of fructose 2,6-bisphosphate. Plant Physiol. 93:637-641 .
Nooden, L.D., J.J. Guiamet, S. Singh, D.S. Letham, J . Tsuji and M.J. Schneider. 1990. Hormonal control of senescence, p. 537-546. In: R.P. Pharis and S .B. Rood (eds.). Plant growth substances. Springer-Verlag, Berlin.
Noor-Saleh, A. 1981. The effect of kinetin on the indoleacetic acid level and indoleacetic acid oxidase activity in roots of young plants. Physiol. Plant. 51:399-401.
Noor-Saleh, A. and T. Hemberg. 1980. The influence of kinetin on the endogenous content of indoleacetic acid in swelling seeds of Phaseolus, Zea, and Pinus and young plants of Phaseolus. Plant Physiol. 50:99- 102.
Norman, S .M., R.D. Bennett, V.P. Maier, and S .M. Poling. 1983. Cytokinins inhibit abscisic acid biosynthesis in Cercospora rosicola. Plant Sci. Lett. 28:255-263.
Nowak, R.S. and M.M. Caldwell. 1984. A test of compensatory photosynthesis in the field: implications for herbivory tolerance. Oecologia 61:3 1 1-318.
Nye, P.H. and P.B. Tinker. 1977. Solute movement in the soil-root system. Blackwell Scientific Publ., Oxford, UK.
Ooyama, N. and A. Toyoshima. 1965. Rooting ability of pine cuttings and its promotion. Bul. Gov. For. Expt. Sta. 179:99-125. (cited by Bentz et aI., 1985.)
Orl6ci, L. 1978. Multivariate analysis in vegetation research. Dr. W. Junk B .V., The Hague.
Ovaska, J., M. Walls, and P. Mutikainen. 1992. Changes in leaf gas exchange properties of cloned Betula pendula saplings after partial defoliation. J. expo Bot. 43:1301- 1307.
Oyejola, B.A. and R. Mead. 1989. On the standard errors and other moments for ratios of biological measurements. Expl. Agric. 25:473-484.
References 347
Palmer, M.V., D.8. Letham, and B.E.S. Gunning. 1984. Cytokinin metabolism in non-dividing and auxin-induced dividing explants of Helianthus tuberosus L. tuber tissue. J. Plant Growth Regul. 2:289-298.
Palni, L.M.S., L. Burch, and R. Horgan. 1988. The effect of auxin concentration on cytokinin stability and metabolism. Planta 174:23 1-234.
Pandey, J.P. and J.H. Torrie. 1973. Path coefficient analysis of seed yield components in soybeans (Glycine max (L.) Merr.) . Crop Science 13:505-507.
Parry, A.D., A. Griffiths, and R. Horgan. 1992. Abscisic acid biosynthesis in roots. II. The effects of water-stress in wild-type and abscisic-acid-deficient mutant (notabilis) plants of Lycopersicon esculentum Mill. Planta 187:192-197.
Passioura, J.B. 1979. Accountability, philosophy and plant physiology. Search 10:347-350.
Passioura, J.B. 1988a. Response to Dr P .J. Kramer's article, 'Changing concepts regarding plant water relations', vol. 11, No. 7, pp.565-568. Plant, Cell and Environ. 11:569-571.
Passioura, J.B. 1988b. Root signals control leaf expansion in wheat seedlings growing in drying soil. Aust. J. Plant Physiol. 15:687-693.
Passioura, J.B. and P.A. Gardner. 1990. Control of leaf expansion in wheat seedlings growing in drying soil. Aust. J. Plant Physiol. 17:149-157.
Patrick, J.W. 1990. Sieve element unloading: cellular pathway, mechanism and control. Physiol. Plant. 78:298-308.
Patterson, D.T., C.R. Meyer and P.C .. Quimby, Jr. 1978. Effects of irradiance on relative growth rates, net assimilation rates, and leaf area partitioning in cotton and three associated weeds. Plant Physiol. 62:14-17.
Paul, E.M.M. 1984a. The response to temperature of leaf area in tomato genotypes. I. The area of an individual leaf. Euphytica 33:347-354.
Paul, E.M.M. 1984b. The response to temperature of leaf area in tomato genotypes. II. The rate of leaf production. Euphytica 33:355-364.
Paul, E.M.M., R.C. Hardwick, and P.F. Parker. 1984. Genotypic variation in the responses to sub-optimal temperatures of growth in tomato (Lycopersicon esculentum Mill.). New Phytol. 98:221-230.
Peacock, H.A. 1966. Elementary microtechnique. Edward Arnold, London.
Pearce, S.C. 1979. Experimental design: RA Fisher and some modem rivals. The Statistican 28:153-161.
References 348
Pearsall, W.H. 1927. Growth studies. VI. On the relative sizes of growing plant organs. Ann. Bot. 41:549-556.
Pease, C.M. and J.J. Bull. 1992. Is science logical? BioScience 42:293-298.
Peterson, C.M., B. Klepper, F.V. Pumphrey, and R.W. Rickman. 1984. Restricted rooting decreases tillering and growth of winter wheat. Agron. J. 76:861-863.
Peterson, T.A. and D.T. Krizek. 1992. A flow-through hydroponic system for the study of root restriction. J. Plant Nutr. 15:893-91 1.
Peterson, T .A., M.D. Reinsel and D.T. Krizek. 1991a. Tomato (Lycopersicon esculentum Mill., cv 'Better Bush') plant response to root restriction. I . Alteration of plant morphology. J. expo Bot. 42:1233-1240.
Peterson, T .A., M.D. Reinsel, and D.T. Krizek. 1991b. Tomato (Lycopersicon esculentum Mill., cv. 'Better Bush') plant response to root restriction. II . Root respiration and ethylene generation. J. expo Bot. 42: 1241-1249.
Phillips, I.D.J. 1964. Root-shoot hormone relations. I. The importance of an aerated root system in the regulation of growth hormone levels in the shoot of Helianthus annuus. Ann. Bot., N .S. 28:37-45.
Picken, A.J.F., K. Stewart, and D. Klapwijk. 1986. Germination and vegetative development, p. 111-166. In: J.G. Atherton and J. Rudich (eds.). The
. tomato crop: a scientific basis for improvement. Chapman and Hall, New York.
Pill, W.G. and V.N. Lambeth. 1977. Effects of NH. and N Os nutrition with and without pH adjustment on tomato growth, ion composition, and water relations. J. Amer. Soc. Hort. Sci. 102:78-81.
Pimentel, R.A. 1979. Morphometries: the multivariate analysis of biological data. KendalllHunt Publishing Company, Iowa.
Poorter, H. 1989. Plant growth analysis: towards a synthesis of the classical and the functional approach. Physiol. Plant. 75:237-244.
Poorter, H. and C. Lewis. 1986. Testing differences in relative growth rate: a method avoiding curve fitting and pairing. Physiol. Plant. 67:223-226.
Popper, K.R. 1959. The logic of scientific discovery. Hutchinson, London.
Popper, K.R. 1963. Conjectures and refutations. Harper, New York.
Popper, K.R. 1972. Objective knowledge. Oxford University Press, London.
References 349
Potter, J.R. and J.W. Jones. 1977. Leaf area partitioning as an important factor in growth. Plant Physiol. 59:10-14.
Powell, R.D. and M.M. Griffith. 1960. Some anatomical effects of kinetin and red light on disks of bean leaves. Plant Physiol. 35: 273-275.
Proebsting, E.L., P.H. Jerie, and J. Irvine. 1989. Water deficits and rooting volume modify peach tree growth and water relations. J. Amer. Soc. Hort. Sci. 1 14:368-372.
Pugmire, C. 1991. GLE 3.2 User Manual. Physical Sciences, Information Technology Group, Department of Scientific and Industrial Research. Lower Hutt, New Zealand.
Purohit, A.N., A.R. Nautiyal, and P. Thapliyal. 1988. Leaf optical properties of an alpine perennial herb, Selinum vaginatum Clarke. grown at two altitudes. BioI. Plant. 30:373-378. (cited by Dijkstra, 1990).
Railton, I .D. and D.M. Reid. 1973. Effects of benzyladenine on the growth of waterlogged tomato plants. Planta 1 1 1:261-266.
Ran, Y., B. Bar-Yosef, and A. Erez. 1992. Root volume influence on dry matter production and partitioning as related to nitrogen and water uptake rates by peach trees. J. Plant Nutr. 15:713-726.
Rascio, A., M.C. Cedola., M. Topani, Z. Flagella and G. Wittmer. 1990. Leaf morphology and water status changes in Triticum durum under water stress. Physiol. Plant. 78:462-467.
Reiger, M. and F. Marra. 1994. Responses of young peach trees to root confmement. J. Amer. Soc. Hort. Sci. 1 19:223-228.
Reiss, M.J. 1989. The allometry of growth and reproduction. Cambridge University Press, Cambridge.
Rencher, A.C. 1992. Interpretation of canonical discriminant functions, canonical variates, and principal components. Amer. Stat. 46:217-225.
Reyment, R.A. 1972. Models for studying the occurrence of lead and zinc in a deltaic environment. In: D.F. Merriam (ed.) . Mathematical models of sedimentary processes. Plenum Press. New York.
Richards, D. 1977. Root-shoot interactions: a functional equilibrium for water uptake in peach (pronus persica L. Batch). Ann. Bot. 41:279-281.
Richards, D. 1980. Root-shoot interactions: effects of cytokinin applied to the root and/or shoot of apple seedlings. Scientia Hortic. 12:143-152.
References 350
Richards, D. 1981. Root-shoot interactions in fruiting tomato plants, p. 373-380. In: R. Brouwer, O. GaSparfkova, J. Lolek and B.C Loughman (eds.). Structure and function of plant roots. Developments in plant and soil sciences 4. Martinus Nijhoff/Dr W. Junk Publishers, The Hague.
Richards, D. 1986. Tree growth and productivity - the role of roots. Acta Hortic. 175:27-36.
Richards, D. and R.N. Rowe. 1977a. Effect of root restriction, root pruning and 6-benzylaminopurine on the growth of peach seedlings. Ann . Bot. 41:729-740.
Richards, D. and R.N. Rowe. 1977b. Root-shoot interactions in peach: the function of the root. Ann. Bot. 41:1211-1216.
Richards, D., F.H. Goubran, and K.E. Collins. 1979. Root-shoot equilibria in fruiting tomato plants. Ann. Bot. 43:401-404.
Richards, F.J. 1969. The quantitative analysis of growth, p. 1-76. In: F.C. Steward (ed.). Plant physiology - a treatise. VA. Analysis of growth: behavior of plants and their organs. Academic Press, London.
Robbins, N.S. and D.M. Pharr, 1987. Leaf area prediction models for cucumber from linear measurements. HortScience 22: 1264-1266.
Robbins, N.S . and D.M. Pharr. 1988. Effect of restricted root growth on carbohydrate metabolism and whole plant growth of Cucumis sativus L. Plant Physiol. 87:409-413.
Robertson, J.M., K.T. Hubick, E.C. Yeung, and D.M. Reid. 1990. Developmental responses of drought and abscisic acid in sunflower roots. J. expo Bot. 41:325-337.
Romano, C.P., M.B. Hein and H.J. Klee. 1991. Inactivation of auxin in tobacco transformed with the indoleacetic acid-lysin synthetase gene of Pseudomonas savastanoi. Genes Dev. 5:438-446.
Romano, C.P., M.L. Cooper, and H.J. Klee. 1993. Uncoupling auxin and ethylene effects in transgenic tobacco and arabidopsis plants. Plant Cell 5:181-189.
Rosa da Costa, A., J� Metcalfe, T.A. Lodge and W.J. Davies. 1987. Soil drying and the resulting chemical and hydraulic effects on leaf growth, 267-275. In: J.D. Tenhunen, F.M. Catarino, O.L. Lange and W.C. Oechel (eds.). Plant response to stress: functional analysis in Mediterranean ecosystems. NATO ASI series Series G: Ecological Sciences. Springer-Verlag, Berlin.
Ross, A.A. 1946. Studies of growth correlations in the tomato. Qsl. J. Agric. Sci. 3 :121-156.
References 351
Ross, J.J, I .C. Murfet, and J.B. Reid. 1990. Internode length in Lathyrus odoratus L.: the expression and interaction of genes L and Lb. J. Hered. 81 :201-204.
Ross, J.J., I .C. Mtirfet, and J.B. Reid. 1993. Distribution of gibberellins in Lathyrus odoratus L. and their role in leaf growth. Plant PhysioL 102:603-608.
Rowntree, R.A. and D.A. Morris. 1979. Accumulation of HC from exogenous labelled auxin in lateral root primordia of intact pea seedlings (Pisum sativum L.). Planta 144:463-466.
Rudich, J. and U. Luchinsky. 1986. Water economy, p. 335-367. In: J.G. Atherton and J. Rudich (eds.). The tomato crop: a scientific basis for improvement. Chapman and Hall, London.
Ruff, M.S., D.T. Krizek, R.M. Mirecki, and D.W. Inouye. 1987. Restricted root zone volume: influence on growth and development of tomato. J. Amer. Soc. Hort. Sci. 112:763-769.
Rufty, T.W. and S.C. Huber. 1983. Changes in starch formation and activities of sucrose phosphate synthase and cytoplasmic fructosel,6-bisphosphatase in response to source-sink alterations. Plant PhysioL 72:474-480.
Russell, C.R. and D.A. Morris. 1983. Patterns of assimilate distribution and sourcesink relationships in the young reproductive tomato plant (Lycopersicon esculentum Mill.). Ann. Bot. 36:363-375.
Saab, LN. and R.E. Sharp. 1989. Non-hydraulic signals from maize roots in drying soil: inhibition of leaf elongation but not stomatal conductance. Planta 179:466-474.
Saab, LN., R.E. Sharp, J. Pritchard, and G.S. Voetberg. 1990. Increased endogenous abscisic acid maintains primary root growth and inhibits shoot growth of maize seedlings at low water potentials. PhysioL Plant. 93:1329-1336.
Saab, LN., R.E. Sharp, J. Pritchard, and G.S. Voetberg. 1992. Effect of inhibition of abscisic acid accumulation on the spatial root and mesocotyl of maize at low water potentials. Plant Physiol. 99:26-33.
Sachs, T. 1968. The role of the root in the induction of xylem differentiation in peas. Ann. Bot. 32:391-399.
Sachs, T. 1972. Possible basis for apical organisation in plants. J. theor. BioI. 37:353-61.
Salisbury, F.B. and C.W. Ross. 1978. Plant physiology. 2nd ed. Wadsworth Publishing Co. Inc. California.
References 352
Salter, P .J. 1958. The effects of different water-regimes on the growth of plants under glass. IV. Vegetative growth and fruit development in the tomato. J. hort. Sci. 33:1-12.
Saltveit, M.E., Jr. and R.D. Locy. 1982. Cultivar differences in ethylene production by wounded sweet potato roots. J. Amer. Soc. Hort. Sci. 107:11 14- 1 1 17.
Samuelson, M.E., L. Eliasson, and C. Larsson. 1992. Nitrate-regulated growth and cytokinin responses in seminal roots of barley. Plant Physiol. 98:309-3 15.
Sarquis, J.L, W.R. Jordan, and P .W. Morgan. 1991. Ethylene evolution from maize (Zea mays L.) seedling roots and shoots in response to mechanical impedance. Plant Physiol. 98:1342-1348.
Sarquis, Jl., P.W. Morgan and W.R. Jordan. 1992. Metabolism of 1-aminocyclopropane I-carboxylic acid in etiolated maize seedlings grown under mechanical impedance. Plant Physiol. 98:1342-1348.
SAS Institute. 1988. SAS/STAT User's Guide, Release 6.03 Edition. SAS Institute Inc., Cary. 1082 pp.
SAS Institute. 1989. SAS User's Guide: Statistics. version 6, 4th ed. vol. 1. SAS Institute, Cary, N.C.
Saugy, M. and L. Rivier. 1988. GC-MS quantifications of free and ester indol-3ylacetic acid in relation to root growth and gravitropism, p. 441-9. In: R.P. Pharis and S.B. Rood (eds.). Plant growth substances 1988. SpringerVerlag, Berlin.
Saunders, A.B. 1991. The effect of mild water stress on vegetative growth in tomato (Lycopersicon esculentum Mill.) and Pyrus betulaefolia Bunge. PhD thesis, Massey Univ., Palmerston North, N.Z.
Schiefelbein, J.W. and P.N. Benfey. 1991. The development of plant roots: new approaches to underground problems. Plant Cell 3 :1147-1154.
Schippers, P.A. 1980. Composition changes in the nutrient solution during the growth of plants in recirculating nutrient culture. Acta Hortic. 98:103-117.
Schulze, E.-D. 1983. Root-shoot interactions and plant life forms. Neth. J. agric. Sci. 4:291-303.
Schulze, E.-D., E. Steudle, T. Gollan, and U. Schurr. 1988. Response to Dr P .J. Kramer's article, 'Changing concepts regarding plant water relations', vol. 11, No. 7, pp.565-568. Plant, Cell and Environ. 11 :569-57 1.
Schurr, U. and T. GolIan. 1990. Composition of xylem sap of plants experiencing root water streSS-6 descriptive study, p. 201-214. In: W.J. Davies and
References 353
B. Jeffcoat (eds.). Importance of root to shoot communication in the responses to environmental stress. Monograph 21. British Soc. Plant Growth Regulation, Bristol.
Sepaskhah, A.R. 1977. Estimation of individual and total leaf areas of safflowers. Agron. J. 69:783-785.
Sepulveda, G.R. and W.M. Kliewer. 1983. Estimation of leaf area of two grapevine cultivars (Vitia vinifera L.) using laminae linear measurements and fresh weight. Am. J. Enol Vitic. 34:221-226.
Shapiro, S.S. and M.B. Wilko 1965. An analysis of variance test for normality (complete samples). Biometrika 52:591-611 .
Sharp, R.E. and W.J. Davies. 1979. Solute regulation and growth by roots and shoots of water stressed maize plants. Planta 147:43-49.
Sharp, R.E. and W.J. Davies. 1989. Regulation of growth and development of plants growing with a restricted supply of water, p. 72-93. In: H.G. Jones, T.L. Flowers, and M.B. Jones (eds.). Plants under stress. Cambridge University Press, Cambridge.
Shasha's, N.S., W.P. Nye, and W.F. Campbell. 1973. Path coefficient analysis of correlation between honey bee activity and seed. yield in Allium cepa L. J. Amer. Soc. Hort. Sci. 98:341-347.
Shindy, W.W. and R.J. Weaver. 1970. Export ofphotosynthate affected when leaves are pretreated with growth substances. Nature 227:301-302.
Shindy, W.W., W.M. Kliewer, and R.J. Weaver. 1973. Benzyladenine-induced movement of 14C-labelled photosynthate in roots of Vitis vinifera. Plant Physiol. 51:345-3
Shindy, W.W., C.M. Asmundson, O.E. Smith, and J. Kumamoto. 1973. Absorption and distribution of high specific radioactivity 2-14C-abscisic acid in cotton seedlings. Plant Physiol. 52:443-447.
Shininger, T.L. 1980. Biochemical and cytochemical analyses of RNA synthesis in kinetin-treated pea root parenchyma. Plant Physio!. 65:838-843.
Shinshi, H., D. Mohnen, D. and F. Meins. 1987. Regulation ofa plant pathogenesisrelated enzyme: Inhibition of chitinase and chitinase mRNA accumulation in cultured tobacco tissues by auxin and cytokinin. Proc. Nat. Acad. Sci. USA 84:89-93.
Short, K.C. and J.G. Torrey. 1972. Cytokinins in seedling roots of pea. Plant Physio!. 49:155-160.
References 354
Simpson, G.G., A. Roe, and R.C. Lewontin. 1960. Quantitative Zoology. Harcourt, Brace and Co. New York.
Sims, T. 1977. Tomatoes heated. Nutrient fllm. technique GP26/21. Progress report. Ann. Rpt. Efford Expt. Hort. Sta. 1977, pp. 16-21.
Sitton, D. , A. Richmond, and Y. Vaadia. 1967. On the synthesis of gibberellins in roots. Phytochem. 6:1101-1 105.
Skirvin, R.M., K.D. McPheeters and M. Norton. 1994. Sources and frequency of somaclonal variation. HortScience 29:1232-1237.
Skoog, F. and C.O. Miller. 1957. Chemical regulation of growth and organ formation in plant tissues cultured in vitro. Symposium Society of Experimental Biology 11:118-23 1.
Smith, D.J. and W.W. Schwabe. 1980. Cytokinin activity in oak (Quercus robud with particular reference to transplanting. Physiol. Plant. 48:27-32.
Smith, P.G. and J.E. Dale. 1988. The effects of root cooling and excision treatments on the growth of primary leaves of Phaseolus vulgaris L. New Phytol. 110:293-300.
Snapp, S.S. and C. Shennan. 1994. Salinity effects on root growth and senescence in tomato and the consequences for severity of phytophthora root rot infection. J. Amer. Soc. Hort. Sci. 119:458-463.
Snee, R.D. 1977. Validation of regression models: methods and examples. Technometrics 19:415-428.
Soffer, H. and D.W. Burger. 1988. Effects of dissolved oxygen concentrations in aero-hydroponics on the formation and growth of adventitious roots. J. Amer. Soc. Hort. Sci. 1 13:218-221.
Sokal, R.R. and F.J. Rohlf. 1981. Biometry. 2nd ed. Freeman, New York.
Sondheimer, E. and D.S. Tzou. 197 1. The metabolism of hormones during seed germination and dormancy. II. The metabolism of 8-i'C-zeatin in bean axes. Plant Physiol. 47:5 16-520.
Senn9'l91d, C. 19S1 Items for appJicatioD of macro-elements in soilless cultures. Acta Hortic. 126:187-195.
Sossountzov, L., R. Maldiney, B. Sotta, I. Sabbagh, Y. Habricot, M. Bonnet, and E. Miginiac. 1988. Immunocytochemical localization of cytokinins in Craigella tomato and a sideshootless mutant. Planta 175: 291-304.
Spomer, L.A. 1975. Small soil containers as experimental tools: soil water relations. Comm. in Soil Sci. and Plant Analysis. 6:21-26.
References 355
Starck, Z. 1983. Photosynthesis and endogenous regulation of the source-sink relation in tomato plants. Photosynthetica 17:1267-1270.
Steel, R.G.D. and J.H. Tonie. 1980. Principles and procedures of statistics. 2nd ed. McGraw-Hill Kogakusha, Tokyo.
Steer, B.T. 1971. Leaf growth parameters and photosynthetic capacity in expanding leaves of Capsicum frutescens. Ann. Bot. 36:377-384.
Steffens, G.L., J.K. Byun and S.Y. Wang. 1985. Controlling plant growth via the gibberellin biosynthesis system-I. Growth parameter alterations in apple seedlings. Physiol. Plant. 63: 163-168.
Steiner, A.A. 1966. The influence of chemical composition of a nutrient solution on the production of tomato plants. Plant and Soil 24:424-426.
Stenlid, G. 1982. Cytokinins as inhibitors of root growth. Physiol. Plant. 56:500-506.
Street, H.E. 1969. Factors affecting the initiation and activity of meristems in roots, p. 20-41. In: W.J. Whittington (ed.). Root growth. Butterworths, London.
Su, W. and S .H. Howell. 1992. A single genetic locus, Ckrl , dermes Arabidoposis mutants in which root growth is resistant to low concentrations of cytokinin. Plant Physiol. 99:1569-1574.
Suich, R. and G.C. Derringer. 1977. Is the regression equation adequate? - one criterion. Technometrics 19:213-216.
Sunderland, N. 1960. Cell division and expansion in the growth of the leaf. J. expo Bot. 11 :68-80.
Takami, S., N.C. Turner, and H.M. Rawson. 1981. Leaf expansion offour sunflower (Helianthus annuus L.) cultivars in relation to water deficits. I . Patterns during plant development. Plant, Cell and Environ. 4:399-407.
Tan, C.S. and B.R. Buttery. 1982. The effect of soil moisture stress to various fractions of the root system on transpiration, photosynthesis, and internal water relations of peach seedlings. J. Amer. Soc. Hort. Sci. 107:845-849.
Tan, C.S. and J.M. Fulton. 1985. Water uptake and root distribution by com and tomato at different depths. HortScience 20:686-688.
Tan, C.S., A. Comelisse, and B.R. Buttery. 1981 . Transpiration, stomatal conductance, and photosynthesis of tomato plants with various proportions of root system supplied with water. J. Amer. Soc. Hort. Sci. 106:147-151.
References 356
Tardieu, F. and W.J. Davies. 1992. Stomatal response to ABA is a function of current plant water status. Plant Physiol. 98:540-545.
Tardieu, F., N. Katerji, O. Bethenod, J. Zhang, and W.J. Davies. 1991. Maize stomatal conductance in the field: its relationship with soil and plant water potentials, mechanical constraints and ABA concentration in the xylem sap. Plant, Cell and Environ. 14:121-126.
Tardieu, F., J. Zhang, N. Katerji, O. Bethenod, S. Palmer and W.J. Davies. 1992. Xylem ABA controls the stomatal conductance of field-grown maize subjected to soil compaction or soil drying. Plant, Cell and Environ. 15:185- 191.
Taylor, G., A.J.S. McDonald, !. Stadenberg, and P.H. Freer-Smith. 1993. N itrate supply and the biophysics of leaf growth in Salix vimirialis. J. expo Bot. 44:155-164.
Taylor, R.M. and L.B. Fenn. 1985. Translocation of water within root systems of pecan, grape and tomato. HortScience 20: 104-105.
Temesi, M., A.P. Andrade, J. Jorrin, and M. Benlloch. Root-shoot signalling in sunflower plants with confmed root systems. Plant and Soil 166:3 1-36.
Thimann, K.V. 1937. On the nature of inhibitions caused by auxin. Amer. J. Bot. 24:407 -412.
Thimann, K.V. 1992. Antagonisms and similarities between cytokinins, abscisic acid and auxin (mini review), p. 395-400. In: M. Kamfnek, D.W.S. Mok and E. Zazfmalova (eds.). Physiology and biochemistry of cytokinins in plants. SPB Academic Publishing bv, The Hague, Netherlands.
Thimann, K.V., S.O. Satler, and Trippi, V. 1982. Further extension of the syndrome of leaf senescence, p. 539-548. In: P.F. Wareing (ed.). Plant growth substances 1982. Academic Press, New York.
Thomas, R.B. and B.R. Strain. 1991. Root restriction as a factor in photosynthetic acclimation of cotton seedlings grown in elevated carbon dioxide. Plant Physiol. 96:627-634.
Thornley, J.H.M. 1975. Comment on a recent paper by Hunt of shoot:root ratios. Ann. Bot. 39:1149-1150.
Thornley, J.H.M. 1976. Mathematical models in plant physiology. Academic Press, London.
Thornley, J.H.M. 1980. Research strategy .in the plant sciences. Plant, Cell and Environ. 3:233-236.
References 357
Thornley, J.H.M. and R.G. Hurd. 1974. An analysis of the growth of young tomato plants in water culture at different light integrals and CO2 concentrations. II. A mathematical model. Ann. Bot. 38:389-400.
Thornley, J.H.M. and I.R. Johnson. 1990. Plant and crop modelling: a mathematical approach to plant and crop physiology. Oxford University Press, Oxford, UK.
Thuantavee, S. 1991. Shoot-root allometry and growth of nashi and tomato effects of budding, gibberellins and cytokinins. PhD Thesis. Massey Univ., Palmerston North, N.Z.
Ticha, I., F. Catsky, D. Hodanova, F. Posipsilova, M. Kase, and Z. Sestak. 1985. Gas exchange and dry matter accumulation during leaf development, p. 157-216. In: Z. Sestak (ed.). Photosynthesis during leaf development: tasks for vegetation science 11. Dr W. Junk Publishers, Dordrecht.
Tinus, R.W. and S.E. McDonald. 1979. How to grow tree seedlings in greenhouses. General Technical Report RM-60. Rocky Mountain Forest and Range Experiment Station Forest Service. U.S. Department of Agriculture.
Tomos, D. and J. Pritchard. 1994. Biophysical and biochemical control of cell expansion in roots and leaves. J. expo Bot. 45:1721-1731.
Torrey, J.G. 1976. Root hormones and plant growth. Ann. Rev. Plant Physiol. 27:435-459.
Treharne, K.J. and J.L. Stoddart. 1968. Effects of gibberellins on photosynthesis in red clover (Trifolium pratense L.). Nature 220:457.
Trelease, S.F. and B.E. Livingstone. 1922. Continuous renewal of nutrient solution for plants in water cultures. Science 55:483-486.
Trewavas, A. 1981. How do plant growth substances work? Plant, Cell and Environ. 4:203-228.
Trewavas, A. 1986. Understanding the control of plant development and the role of growth substances. Aust. J. Plant Physiol. 13:447-457.
Troughton, A. 1955. The application of the allometric formula to the study of the relationship between the roots and shoots of young grass plants. Agricultural Progress 30:59-65.
Troughton, A. 1956. Studies on the growth of young grass plants with special reference to the relationship between the shoot and root systems. J. Brit. Grassland Soc. 6:56-65.
Troughton, A. 1960. Further studies on the relationship between shoot and root systems of grasses. J. Brit. Grassland Soc. 15:41-47.
'.
References 358
Troughton, A. 1968. Influence of genotype and mineral nutrition on distribution of growth within plants of Lolium perenne L. grown in soil. Ann. Bot. 32:411-423.
Tschaplinski, T.J. and T.J. Blake. 1985. Effects of root restriction on growth correlations, water relations and senescence of alder seedlings. Physiol. Plant. 64:167- 176.
Tubbs, F .R. 1977. The relative influences of fruit clones when present as rootstock or as scion. J. hort. Sci. 52:37-48.
Tubbs, F.R. 1980. Growth relations of rootstock and scion in apples. J. hort. Sci. 55:181-189.
Tucker, D.J. 1977. Plant hormones and root development of tomatoes grown in nutrient film. Rep. Glasshouse Crops Res. Inst. for 1976. pp. 148-154.
Tucker, D.J. 198 1. A comparative study of the cytokinins present in the roots of tomato plants grown in nutrient-fl1m culture and in soil. Scientia Hortic. 14:201-206.
Turner, N.C. 1981. Techniques and experimental approaches for the measurement of plant water status. Plant and Soil 58:339-366.
Ulvskov, P., T.H. Nielsen, P. Seiden and J. Marcussen. 1992. Cytokinins and leaf development in sweet pepper (Capsicum annuum L.) 1. Spatial distribution of endogenous cytokinins in relation to leaf growth. Planta 188:70-77.
Vaadia, Y. and C. ltai. 1968. Interrelationships of growth with reference to the distribution of growth substances, p. 65-79. In: W.J. Whittington (ed.). Root growth. Plenum Publishing Corp., New York.
van Arendonk, J.J.C.M. and H. Poorter. 1994. The chemical composition and anatomical structure of leaves of grass species differing in relative growth rate. Plant, Cell and Environ. 17:963-970.
van Dorsser, J.C. 1982. Container-grown trees and shrubs: good and bad nursery practice. N .Z. Agric. Sci. 16:32-35.
van Noordwikj, M. and G. Brouwer. 1991. Review of quantitative root length data in agriculture, p. 515-525. In: B.L. McMichael and H. Persson (eds.). P lant roots and their environment. Developments in agricultural and managed-forest ecology 24. Elsevier Science Publishers bv, Amsterdam.
van Noordwikj, M. and P. de Willigen. 1987. Agricultural concepts of roots: from morphogenetic to functional equilibrium between root and shoot growth. Neth. J. Agric. Sci. 35:487-496.
References 359
van Noordwijk, M. and J. Floris. 1979. Loss of dry weight during washing and storage of root samples. Plant and Soil 53:239-243.
van Volkenburgh, E. and W.J. Davies. 1977. Leaf anatomy and water relations of plants grown in controlled environments and in the field. Crop Sci. 17 :353-358.
van Volkenburgh, E. and W.J. Davies. 1983. Inhibition of light-stimulated leaf expansion by abscisic acid. J. expo Bot. 34:835-845.
Van't Hof, J. 1968. Control of cell progression through the mitotic cycle of carbohydrate provision: 1 . Regulation of cell division in excised plant tissue. J. Cell BioI. 37:773-778.
Veen, B.W. 1981. Relation between root respiration and root activity. Plant and Soil 63:73-76.
Veen, B .W. 1982. The influence of mechanical impedance on the growth of maize roots. Plant and Soil 66:101-109.
Veen, B.W. and F.R. Boone. 1981. The influence of mechanical resistance and phosphate supply on morphology and function of corn roots. Plant and Soil 63:77-8 1.
Venus, J.C. and D.R. Causton. 1979a. Plant growth analysis: the use of the Richards function as an alternative to polynomial exponentials. Ann. Bot. 43:623-632.
Venus, J.C. and D.R. Causton. 1979b. Plant growth analysis: a re-examination of the methods of calculation of relative growth and net assimilation rates without using fitted functions. Ann. Bot. 43:633-638.
Vogelezang, J., R. Moe, H. SchUssler, L. Hendriks, L. Cuijpers and E. Ueber. 1993. Cooperative European research on temperature strategies for bedding plants. Acta Hortic. 327:1 1-16.
Vogt, KA. and J. Bloomfield. 1991. Tree root turnover and senescence, p. 309-414. In: Y. Waisel, A. Eshel, and U. Kafkafi (eds.). Plant roots: The hidden half. Marcel Dekker, New York.
Wagner, B.M. and E. Beck. 1993. Cytokinins in the perennial herb Urtica dioica L. as influenced by its nitrogen status. Planta 190:5 1 1-5 18.
Waisel, Y. and A. Eshel. 1991. Multiform behavior of various constituents of one root system, p. 39-52. In: Y. Waisel, A. Eshel, and U. Kafkafi (eds.). Plant roots: The hidden half. Marcel Dekker, New York.
References 360
Wallace, D.H. and R.W. Zobel. 1994. Whole-system research complements reductive research, p. 833-848. In: M. Pessarakli (ed.). Handbook of plant and crop physiology. Marcel Dekker, New York.
Walton, D.C., M.A. Harrison, and P . Cote. 1976. The effects of water stress on abscisic acid levels and metabolism in roots of Phaseolus vulgaris and other plants. Planta 131:141-144.
Wample, R.L. and D.M. Reid. 1979. The role of endogenous auxins and-ethylene in the formation of adventitous roots and hypocotyl hypertrophy in flooded sunflower plants (Jlelianthus annuus). Physiol. Plant. 45:219-226.
Wang, T-W. and R.N. Arteca. 1992. Effects of low O2 root stress on ethylene biosynthesis in tomato plants (Lycopersicon esculentum Mill. cv Heinz 1350). Plant Physiol. 98:97-100.
.
Wareing, P.F. and J. Patrick. 1975. Source-sink relations and . the partition of assimilates in the plant. In: J.P. Cooper (ed.). Photosynthesis and productivity in different environments. Cambridge University Press, London.
Wareing, P.F., M.M. Khalifa, and K.J. Treharne. 1968. Rate-limiting processes in photosynthesis to saturating light intensities. Nature 220:453-457.
Warren Wilson, J. 1972. Control of crop processes, p. 7-30. In: AR. Rees, K.E. Cockshull, D.W. Hand, and R.G. Hurd (eds.). Crop processes in controlled environments. Academic Press, London.
Warren Wilson, J. 1986. Philosophical aspects of measurements, equations and inferences in plant growth studies. Ann. Bot. 58:73-80.
Warrington, I .J. and RA Norton. · 1991. An evaluation of plant growth and development under various daily quantum integrals. J. Amer. Soc. Hort. Sci. 116:544-55 1.
.
Watson, D.J. 1947a. Comparative physiological studies on the growth of field crops. I. Variation in net assimilation rate and leaf area between species and varieties and within and between years. Ann. Bot. 1 1:41-76.
Watson, D.J. 1947b. Comparative physiological studies on the growth offield crops. II. The effect of varying nutrient supply on net assimilation rate and leaf area. Ann. Bot. 1 1:375-407.
Watson, M.A. and B.B. Casper. 1984. Morphogenetic constraints on patterns of carbon distribution in plants. Ann. Rev. Ecol. Syst. 15:233-258.
Waycott, W. and L. Taiz. 1991. Phenotypic characterization of lettuce dwarf mutants and their response to applied gibberellins. Plant Physiol. 95:1 162-1 168.
References 361
Waycott, W., V.A. Smith, P. Gaskin, J. MacMillan, and L. Taiz. 1991. The endogenous gibberellins of dwarf mutants of lettuce. Plant Physiol. 95: 1169-1 173.
Weaver, R.J., W.W. Shindy, and W.M. Kliewer, 1969. Effect of growth regulators on movement of photosynthetic products into fruit of 'Black Corinth' grapes. Plant Physiol. 44:183-188.
Weiler, E.W. and H. Ziegler. 1981. Determination of phytohormones in phloem exudate from tree species by radioimmunoassay. Planta 152:168-170.
West, C., G.E. Briggs, and F. Kidd. 1920. Methods and significant relations in the quantitative analysis of plant growth. New Phytol. 19:200-207.
Whale, D.M., H. Heilmeier, and H. Milbrodt. 1985. The appliCation of growth analysis to structured experimental designs and a new procedure for estimating unit leaf rate and its variance. Ann . Bot. 56:63 1-650.
Whalen, M. 1988. The effect of mechanical impedance on ethylene production by maize roots. Can. J. Bot. 66:2139-2142.
Whalen, M. and L.J. Feldman. 1990. Effects of mechanical impedance on root development, p. 260-267. In: J.E. Box Jr. and L.C. Hammond (eds.). Rhizosphere dynamics. MAS selected symposium 1 13. Westview, Boulder, Colorado.
Wheeler, A.W. 1960. Changes in a leaf growth substance in cotyledons and primary leaves during the growth of dwarf bean seedlings. J. expt. Bot. 11:217-226.
Whitcomb, C.E. 1981. A vertical air-root-pruning container. Proc. Int. Plant Prop. Soc. 3 1:591-596.
Whitcomb, C.E. 1984. Plant production in containers. Lacebark Publications, Oklahoma.
White, J.G. and S .J. Gould. 1965. Interpretation of the coefficient in the allometric equation . Am. Nat. 99:5-18.
Whitehead, F.H. a ad P.J. Myerscough. 1962. Growth analysis of plants. The ratio of mean relative growth rate to mean relative rate of leaf area increase. New Ph. f1;ol. 61:3 14-321.
Whiteley, G.M. and A.R. Dexter. 1982. Root development and growth of oilseed, wheat and pea crops on tilled and non-tilled soil. Soil and Tillage Res. 2:379-393.
Whitworth, J.L., A. Mauromoustakos, and M.W. Smith. 1992. A nondestructive method for estimation of leaf area in pecan. HortScience 27:85 1.
References 362
Wickens, L.K. and J.M. Cheeseman. 1988. Application of growth analysis to physiological studies involving environmental discontinuities. Physiol. Plant. 73:27 1-277.
Wiersma, J.V. and T.B. Bailey. 1975. Estimation of leaflet, trifoliate, and total leaf areas of soybeans. Agron. J. 67:26-30.
Wightman, F. and K. V. Thimann. 1980. Hormonal factors controlling the initiation and development of lateral roots. I. Sources of primordia-inducing substances in the primary root of pea seedlings. Physiol. Plant. 49: 13-20.
Wightman, F., E.A. Schneider, and K.V. Thimann. 1980. Hormonal factors controlling the initiation and development of lateral roots. II. Effects of exogenous growth factors on lateral root fromation in pea roots. Physiol. Plant. 49:304-314.
.
Wilcox, G.E. 1982. The future of hydroponics as a research and plant production method. J. Plant Nutr. 5:103 1-1038.
Williamson, J.G. and D.C. Coston. 1989. The relationship among root growth, shoot growth, and fruit growth of peach. J. Amer. Soc. Hort. Sci. 1 14:180- 183.
Willumsen, J. 1980. pH of the flowing nutrient solution. Acta Hortic. 98: 191- 199.
Willumsen, J. 1983. A comparison of hydroponic systems for tomatoes. Acta Hortic. 150:421-428.
Wilson, A.J., A.W. Robards, and M.J. Goss. 1977. Effects of mechanical impedance on root growth in barley, Hordeum vulgare L. J. expo Bot. 28:1216-1227.
Wilson, J.B. 1988. A review of evidence on the control of shoot:root ratio, in relation to models. Ann. Bot. 61:433-449.
Winsor, G.W. and D.M. Massey. 1978. Some aspects of the nutrition of tomatoes grown in recirculating solution. Acta Hortic. 82:121-132.
Winsor, G.W., R.G. Hurd, and D. Massey. 1980. New light on nutrition. Suppl. Grower 93:99, 103.
Winsor, G.W. R.G. Hurd, and D. Price. 1979. Nutrient filin technique. Grower's Bul. Glasshouse Crops Res. Inst., England.
Witkowski, E.T.F. and B.B. Lamont. 1991. Leaf specific mass confounds leaf density and thickness. Oecologia 88:486-493.
Wittwer, S.H. and R.R. Dedolph. 1963. Some effects of kinetin on the growth and flowering of intact green plants. Am. J. Bot. 50:330-334.
References 363
Woodrow, L., R.G. Thompson, and B . Grodzinski. 1988. Effects of ethylene on photosynthesis and partitioning in tomato, Lycopersicon esculentum Mill. J. expo Bot. 39:667-684.
Wright, S. 1921. Systems of matings, I, II, II, IV, V. Genetics 6:111-178.
Wyse, R.E. and R.A. Saftner. 1982. Reduction in sink mobilizing ability following periods of high carbon flux. Plant Physio!. 69:226-228.
Yakushina, N.!. and G.P. Pushkina (1975). Changes in the rate of photo phosphorylation in com seedlings under the influence of gibberellin and kinetin. Fisiologiya Rastanii 22:994 (cited by Jackson and Campbell, 1979).
Yip, W.-K. and S.F. Yang. 1986. Effect of thidiazuron, a cytokinin-active urea derivative, in cytokinin-dependent ethylene production systems. Plant Physio!. 80:515-519.
Young, J.E. 1981. The use of canonical correlation analysis in the investigation of relationships between plant growth and environmental factors . Ann. Bot. 48:81 1-825.
Yu, Y.-B., S.F. Yang, J. Corse, J.A. Kuhnle, S .-S. Hua, 1981. St�tures of cytokinins influence synergistic production of ethylene. Phytochemistry 20:1 191-1195.
Zacarias, L. and M.S. Reid. 1992. Inhibition of ethylene action prevents root penetration through compressed media in tomato (Lycopersicon esculentum) seedlings. Physiol. Plant. 86:301-307.
Zack, C. D. and J.B. Loy. 1984. Comparative effects of GA and benzyladenine on dry matter partitioning and osmotic and water potentials in seedling organs of dwarf watermelon. J. Plant Growt� Regul. 3 :65-73 .
. " Zanewich, K.P., S.B. Rood and P.H. Williams. 1990. Growth and development of
Brassica genotypes differing in endogenous gibberellin content. ! . Leaf and reproductive development. PhysioI. Plant. 79:673-678.
Zar, J.H. 1968. Calculation and miscalculation of the allometric equation as a model in biological data. BioScience 18: 1 1 18-1120.
Zar, J.H. 1984. Biostatistical analysis. 2nd ed. Prentice-Hall, Englewood Cliffs, NJ.
Zavala, M.E. and D.L. Brandon. 1983. Localisation of a phytohormone using immunocytochemistry. J. Cell BioI. 97:1235-1239.
Zeaden, S .M. and R.D. McLeod. 1984. Some effects of indol-3-yl acetic acid on lateral root development in attached and excised roots of Pisum sativum L. Ann. Bot. 54:759-766.
References 364
Zeevaart, JAD. 1977. Sites of ABA synthesis and metabolism in Ricinus communis L. Plant Physiol. 74:934-939.
Zerbi, G., D .R. Lecain, and J.A. Morgan. 1990. Concurrent action of salinity and water stress on leaf gas exchange and water relations in tomato. J. hort. Sci. 65:675-681.
Zeroni, M., J. Gale and J. Ben-Asher. 1983. Root aeration in a deep hydroponic system and its effect on growth and yield of tomato. Scientia Hortic. 19:213-220.
Zhang, J. and W.J. Davies. 1987. Increased synthesis of ABA in partially dehydrated root tips and ABA transport from roots to leaves. J. expo Bot. 38:2015-2023.
Zhang, J. and W.J. Davies. 1989. Sequential responses of whole plant water relations towards prolonged soil drying and the mediation by xylem sap ABA concentrations in the regulation of stomatal behaviour of sunflower plants. New Phytol. 113:167-174.
Zhang, J. and W.J. Davies. 1990a. Changes in the concentration of ABA in xylem sap as a function of changing soil water status will account for changes in leaf conductance. Plant, Cell and Environ. 13: 277-285.
Zhang, J. and W.J. Davies. 1990b. Does ABA in the xylem control the rate of leaf growth in soil-dried maize and sunflower plants? J. expo Bot. 41:1 125-1 132.
Zhang, J. and W.J. Davies. 1991. Anti-transpirant activity in the xylem sap of maize plants. J. expo Bot. 42: 3 17-321.
Zhang, R., X. Zhang, J. Wang, D.S. Letham, S.A. McKinney and T.J.V. Higgins. 1995. The effect of auxin on cytokinin levels and metabolism in transgenic tobacco tissue expressing an ipt gene. Planta 196:84-94.
Zijlstra, S. and A.P .M. den Nijs. 1987. Effects of root systems of tomato genotypes on growth and earliness, studied in grafting experiments at low temperature. Euphytica 36:693-700.
Zijlstra, S., S.P .C. Groot, and J. Jansen. 1994. Genotypic variation of rootstocks for growth and production in cucumber; possibilities for improving the root system by plant breeding. Scientia Hortic. 56:185-196.
Zimmerman, P.W. and F. Wilcoxon. 1935. Several chemical growth substances which cause initiation of roots and other responses in plants. Contr. Boyce Thompson Inst. 7:209-229.
' .
"
References 365
Zobel, R.W. 1972. Genetics and physiology of two root mutants in tomato, Lycopersicon esculentum Mill. PhD Diss., Univ. of California, Davis. (cited by Zobel, 1986).
Zobel, R.W. 1974. Control of morphogenesis in the ethylene-requiring tomato mutant, diageotropica. Can. J. Bot. 52:735-741.
Zobel, R.W. 1975. The genetics of root development, p. 261-275. In: J.G. Torrey and D.F. Clarkson (eds.). The development and function of roots. Academic Press, London.
Zobel, R.W. 1986. Rhizogenetics (root genetics) of vegetable crops. HortScience 21:956-959.
Zobel, R.W. 1991. Genetic control of root systems, p. 3-25. In: Y. Waisel, A. Eshel, and U. Katkafi (eds.). Plant roots: The hidden half. Marcel Dekker, New York.
Zobel, R.W. 1992a. Soil environment constraints to root growth. Advances in Soil Science 19:27-51.
Zobel, R.W. 1992b. Root morphology and development. J. Plant Nutr. 15:677-684.

"
, I
. ,
� I


