Embed Size (px)
Citation preview
SaunthararajahRadivoyevitch, John W. Crabb and YogenJohn S. Crabb, Reda Mahfouz, Tomas Xiaorong Gu, Zhenbo Hu, Quteba Ebrahem, Leukemia Differentiation TherapyIdentifies Specific Molecular Targets forCorepressor/Coactivator Exchange Runx1 Regulation of Pu.1Molecular Bases of Disease:
published online April 2, 2014J. Biol. Chem.
10.1074/jbc.M114.562447Access the most updated version of this article at doi:
.JBC Affinity SitesFind articles, minireviews, Reflections and Classics on similar topics on the
Alerts:
When a correction for this article is posted•
When this article is cited•
to choose from all of JBC's e-mail alertsClick here
Supplemental material:
http://www.jbc.org/content/suppl/2014/04/02/M114.562447.DC1.html
http://www.jbc.org/content/early/2014/04/02/jbc.M114.562447.full.html#ref-list-1
This article cites 0 references, 0 of which can be accessed free at
at CL
EV
EL
AN
D C
LIN
IC FO
UN
DA
TIO
N on A
pril 5, 2014http://w
ww
.jbc.org/D
ownloaded from
at C
LE
VE
LA
ND
CL
INIC
FOU
ND
AT
ION
on April 5, 2014
http://ww
w.jbc.org/
Dow
nloaded from

1
Title: Runx1 Regulation of Pu.1 Corepressor/Coactivator Exchange Identifies Specific Molecular Targets for Leukemia Differentiation Therapy Xiaorong Gu1, Zhenbo Hu1, Quteba Ebrahem1, John S. Crabb2, Reda Mahfouz1, Tomas Radivoyevitch3, John W. Crabb2, Yogen Saunthararajah1 1Translational Hematology and Oncology Research, Taussig Cancer Institute, Cleveland Clinic. 2Ophthalmic Research, Cole Eye Institute, Cleveland Clinic 3Department of Epidemiology and Biostatistics, Case Western Reserve University, Cleveland, OH44106, USA Running Title: RUNX1 and PU.1 cooperation Key Words: epigenetics, leukemogenesis, chromatin modifying enzymes, enhanceosome, protein interactome Correspondence: Yogen Saunthararajah, MD, Taussig Cancer Institute, 9500 Euclid Avenue R40, Cleveland, OH44195, tel: 216 444 8170, email: [email protected] Word and other countsAbstract: 244 words
:
Text (introduction, materials and methods, results and discussion): 4,831 words Tables/Figures: 9 figures, 1 table, 4 supplementary tables, 1 supplementary figure References: 46 Potential conflicts of interest: The authors disclose no potential conflicts of interests.
http://www.jbc.org/cgi/doi/10.1074/jbc.M114.562447The latest version is at JBC Papers in Press. Published on April 2, 2014 as Manuscript M114.562447
Copyright 2014 by The American Society for Biochemistry and Molecular Biology, Inc.
at CL
EV
EL
AN
D C
LIN
IC FO
UN
DA
TIO
N on A
pril 5, 2014http://w
ww
.jbc.org/D
ownloaded from
2
Background: Leukemia cells highly express master differentiation-driving transcription factors yet paradoxically, terminal differentiation genes are epigenetically repressed. Results: The hematopoietic transcription factors RUNX1 and PU.1 cooperated to exchange corepressors for coactivators, and deficiency of RUNX1, frequent in leukemia, caused aberrant recruitment of specific corepressors instead of coactivators to PU.1. Conclusion: This mechanism explains the paradox. Significance: Inhibition of the specific corepressors restored terminal differentiation. ABSTRACT Gene activation requires cooperative assembly of multiprotein transcription factor/coregulator complexes. Disruption to cooperative assemblage could underlie repression of tumor suppressor genes in leukemia cells. Mechanisms of cooperation and its disruption were therefore examined for PU.1 and RUNX1, transcription factors that cooperate to activate hematopoietic differentiation genes. PU.1 is highly expressed in leukemia cells, whereas RUNX1 is frequently inactivated by mutation or translocation. Thus, coregulator interactions of Pu.1 were examined by immunoprecipitation coupled with tandem mass spectrometry/Western blot in wild-type and Runx1-deficient hematopoietic cells. In wild-type cells, the NuAT and Baf families of coactivators coimmunoprecipitated with Pu.1. Runx1-deficiency produced a striking switch to Pu.1 interaction with the Dnmt1, Sin3A, Nurd, CoRest and B-Wich corepressor families. Corepressors of the Polycomb family, that are frequently inactivated by mutation or deletion in myeloid leukemia, did not interact with Pu.1. The most significant gene ontology association of Runx1-Pu.1 co-bound genes was with macrophages, therefore, functional consequences of altered corepressor/coactivator exchange were examined at Mcsfr, a key macrophage differentiation gene. In chromatin-immunoprecipitation analyses, high level Pu.1 binding to the Mcsfr promoter was not decreased by Runx1-deficiency. However, the Pu.1-driven shift from histone repression to activation marks at this locus, and terminal macrophage differentiation, were substantially diminished. DNMT1 inhibition, but not Polycomb inhibition,
in RUNX1-translocated leukemia cells induced terminal differentiation. Thus, RUNX1 and PU.1 cooperate to exchange corepressors for coactivators, and the specific corepressors recruited to PU.1 as a consequence of RUNX1 deficiency could be rational targets for leukemia differentiation therapy. INTRODUCTION Exogenous and endogenous signals, integrated by transcription factors, are transmitted to chromatin via an interchange of multisubunit coregulator complexes (coactivators, corepressors) containing chromatin modifying enzymes (1). The chromatin modifying enzymes create epigenetic activation marks (coactivators) or repression marks (corepressors)(1-4). This cooperative process mediates coordinated gene expression program changes that define cell fate yet the actual molecular forces that mediate it are mostly mysterious (1). Mechanisms of cooperation and its oncogenic disruption were therefore examined for the key hematopoietic transcription factors RUNX1 and PU.1. RUNX1 is frequently inactivated by mutation or translocation in the myeloid cancers myelodysplastic syndrome (MDS) and acute myeloid leukemia (AML) (~20% of cases) (5-7). RUNX1 by itself is a weak activator of transcription (8-12), however, RUNX1 synergistically augments transcription activation by multiple hematopoietic lineage-specifying transcription factors: PU.1, CEBPA, ETS1, GATA1, GATA2, FLI1, PAX5, SCL and ERG (9-19). Previously, we demonstrated a mechanism determining corepressor recruitment by RUNX1 and one such partner, the macrophage-differentiation driving transcription factor PU.1: RUNX1 and PU.1 separately interacted with the corepressors SIN3A, ETO2 and HDAC2, however, when RUNX1 and PU.1 were together, the corepressors were excluded (20). Substitution of wild-type RUNX1 in the RUNX1/PU.1 complex with truncated versions that initiate leukemogenesis (e.g., RUNX1-ETO), or deficiency of RUNX1, compromised corepressor exclusion: PU.1 interacted with SIN3A, ETO2 and HDAC2 again and PU.1 target genes were repressed instead of activated, accompanied by a decrease in histone activation marks (20).
These first-time observations regarding cooperation between two DNA-binding transcription factors to exclude corepressors provoked important new questions: is there exchange of corepressors for coactivators instead? Such an observation would extend the existing model in which ligand-binding to
at CL
EV
EL
AN
D C
LIN
IC FO
UN
DA
TIO
N on A
pril 5, 2014http://w
ww
.jbc.org/D
ownloaded from

3
nuclear receptors drives coregulator exchange (1). If so, which of the numerous coactivators that are expressed in hematopoietic cells are specifically recruited to the RUNX1/PU.1 complex? Answering these questions could provide insight into leukemogenesis, since a putative method by which leukemia cells repress proliferation-terminating differentiation genes is by genetic inactivation of coactivator subunits that mediate their activation. Other questions have direct treatment implications: of the hundreds of chromatin regulators that are expressed in hematopoietic cells, the specific subset aberrantly recruited to differentiation-promoting transcription factors in leukemia cells would be logical targets for inhibition to restore terminal differentiation (21). Since public-private efforts such as the Structural Genomics Consortium (www.thesgc.org) are generating chemical probes (inhibitors) specific for each of hundreds of chromatin regulators expressed in hematopoietic cells, such information could have near-term practical impact via provision of a biological rationale to prioritize some inhibitors over others.
Thus, our overall purpose was to examine, in a manner that would provide insights into leukemogenesis and identify specific drugable targets for therapy, if Runx1 regulates Pu.1 corepressor/coactivator exchange. EXPERIMENTAL PROCEDURES Models used for analyses Immunoprecipitation coupled with tandem mass spectrometry (LC/MSMS) and Western blot were used to comprehensively evaluate Pu.1 interactions in primary hematopoietic cells from the bone marrow and spleen of wild-type and Runx1-haplosufficient mice (gift of Jim Downing laboratory(22)), in a cell line model of Pu.1-driven macrophage differentiation (PUER) (gift of Harinder Singh laboratory(23)), and in patient-derived leukemia cells containing translocated RUNX1 (Kasumi1 cells). PUER are Pu.1 knock-out hematopoietic precursor cells that have been retrovirally transduced to express Pu.1 fused to the estrogen receptor. To generate PUER cells with stable suppression of Runx1 expression a lentiviral vector pLenti6-DEST (Invitrogen, Carlsbad, CA) was used to construct short hairpin (sh) RNA for Runx1. Three shRNA Oligos specific to 19-bp target sequences of mouse Runx1 (sh RUNX1-Clone 1
5’-GGCACTCTGGTCACCGTCA-3’; sh Runx1-Clone 2 5’-GGCCATGAAGAACCAGGTA-3’; sh Runx1-Clone 3 5’GGCAAGAGCTTCACTCTGA-3’) were designed using Invitrogen’s BLOCK-iT™ RNAi Designer and synthesized in sense and antisense orientation by Integrated DNA Technology (IDT). The single-strand oligos were then annealed to form double-strand oligos, and subsequently ligated with pENTRY vector (Invitrogen, Carlsbad, CA) downstream of an RNA promoter. The ligated constructs were transformed into E. Coli TOPO10. Positive clones were verified by DNA sequencing. The verified clones were then recombined into pLenti6-DEST vector using Invitrogen’s ViralPack kit, resulting in pLenti6-shRunx1. The pLenti6-shRunx1 or empty vector pLenti6 (to generate PUER Control cells) were then transfected together with envelop encoding plasmid (VSVG) into 293FT packaging cell line to produce lentivirus. The supernatant containing lentivirus was harvested at 48 hours after transfection. Titers were determined on NIH3T3 cells as transducing units using serial dilutions of vector stocks with 8 µg/ml polybrene (Sigma Chemical, St. Louis, MO). PUER cells were grown in Iscove's modified Eagle's medium, without phenol-red, with 10% fetal bovine serum, 5 ng/ml mIL-3, 1μg/ml Puromycin, 55μM beta-ME, 1% penicillin/streptomycin at 37°C in a humidified atmosphere with 5% CO2 in air. The lentivirus-containing supernatant was added to the cell culture at appropriate 4 particles/cell concentration with 8 µg/ml polybrene. Twenty-four hours after infection, 4ug/ml of blasticidin (bln) was added to the cell culture for positive clone selection. The Bln-resistant cells were analyzed for Runx1 by QRT-PCR and Western blot. Cell fractionation and nuclear protein extraction Approximately 50 million each of Runx1-haploinsufficient and wild-type littermate control bone marrow or spleen cells (pooled from multiple mice), or 100 million each PUER and PUER shRunx1 cells, were used in the preparation. After removal of the medium, cells were transferred to 15-mL conical tubes and washed twice with 10 mL ice-cold 1X PBS that contained protease inhibitors (Sigma-Aldrich, A8340). Cells were resuspended in 500 μL of 1X hypotonic buffer containing 10mM N-2-hydroxyethylpiperazine-N′-2-ethanesulfonic acid, 1.5mM MgCl2, 10mM KCl, 0.5mM dithiothreitol, 10mM PMSF, and protease inhibitors (Sigma-Aldrich, A8340). A total of 20 μL of 10% NP-40 was added to cell suspensions to break the cell membrane. After 5-minute incubation on ice, cell
at CL
EV
EL
AN
D C
LIN
IC FO
UN
DA
TIO
N on A
pril 5, 2014http://w
ww
.jbc.org/D
ownloaded from

4
suspensions were centrifuged at 344g for 10 minutes. The supernatant was transferred to clean 1.5-mL Eppendorf tubes and labeled as the cytoplasmic fraction. Nuclear pellets were washed twice with ice-cold 1X PBS, and resuspended in 100 μL of 50mM Tris-HCl, pH 8.0, 1mM MgCl2, 10mM PMSF, protease inhibitor cocktail (Sigma-Aldrich, A8340) and Benzonase (Sigma-Aldrich, D5915, 250 units). The nuclear suspensions were incubated on ice for 90 minutes with vigorous vortex every 5 minutes. At the end of incubation, 500 μL protein extraction buffer containing 1.5% NP-40, 500mM NaCl, 5mM dithiothreitol, 10mM PMSF, and 5 μL of protease inhibitor cocktail (Sigma-Aldrich, A8340) in 50mM phosphate buffer (pH 7.4) were added. After 30-minute incubation on ice with vortexing every 5 minutes, the mixture was centrifuged at 12396g for 15 minutes. The same extraction process was repeated two more time with 300 μL and 200 μL of extraction buffer. The supernatant containing nuclear proteins was combined and transferred to clean tubes, and protein concentration was determined by BCA assay. Covalent bound antibody to protein G beads Goat anti-Pu.1 (SCBT, sc-5949) and control goat IgG were covalently coupled to Sepharose-protein G beads using dimethylpimelimidate. Briefly, 25 mg of protein G-Sepharose CL-4B (GE Healthcare, 17-0780-01) was swelled in 1 mL 1X PBS overnight and incubated with 200 μL of antibody (50 μg) solution (1X PBS) for 1 hour at room temperature. Antibody bound protein G beads were then incubated with 1% chicken egg ovalbumin in PBS for another hour to block nonspecific binding sites. After 3 washes with 1X PBS, 25 mg of dimethylpimelimidate in 1 mL of 200mM triethanyl amine was added, and coupling reaction was proceeded at room temperature for 30 minutes. The reaction was repeated 2 more times with fresh addition of dimethylpimelimidate and quenched with 50mM ethanol amine. The reacted protein G beads were washed extensively with 1X PBS before immunoprecipitation. Immunoprecipitation Nuclear protein extracts (~10 mg protein) were transferred to tubes with antibody bound protein G beads and rocked gently at 4°C overnight. Nonspecific bound proteins were removed with
5 washes of 1X PBS containing 1% NP-40. Immunoprecipitation products were extracted from the protein G beads using Laemmli sample buffer. Protein identification by LC-MS/MS Anti-Pu.1 and isotype antibody immunoprecipitation products were subjected to SDS-polyacrylamide gel electrophoresis and stained with colloidal Coomassie Blue (Gel Code Blue, Pierce Chemical). Gel slices were excised from the top to the bottom of the lane; proteins were reduced with dithiothreitol (10mM), alkylated with iodoacetamide (55mM), and digested in situ with trypsin. Peptides were extracted from gel pieces 3 times using 60% acetonitrile and 0.1% formic acid/water. The dried tryptic peptide mixture was redissolved in 15 μL of 0.1% formic acid and 5% acetonitrile for mass spectrometric analysis. Tryptic peptide mixtures were analyzed by on-line LC-coupled tandem mass spectrometry (LC-MS/MS) on a QTOF2 mass spectrometer (Waters) using a Cap LC XE system (Waters), a 0.3 × 5-mm trapping column (C18 PepMap 100, LC Packings), a reverse phase separating column (75 μm × 5 cm, Vydac C18), and a flow rate of 250 nL/min. Gradient LC separation was achieved with aqueous formic acid/acetonitrile solvents. The QTOF2 mass spectrometer was operated in standard MS/MS switching mode with the 4 most intense ions in each survey scan subjected to MS/MS analysis. Instrument operation and data acquisition used MassLynx Version 4.1 software (Waters). Initial protein identifications from MS/MS data used the online Mascot search engine and the Swiss Protein mouse sequence database (May 2012 release, 16529 total sequences). The Swiss Protein database search parameters included 4 missed tryptic cleavage sites allowed, precursor ion mass tolerance of 1.2 Da, fragment ion mass tolerance of 0.6 Da, protein modifications for Met oxidation, and Cys carbamidomethylation. MS/MS datasets were also analyzed by the same search engine and parameters against all mammals (May 2012 release, 36529 total sequence). A minimum Mascot ion score of 25 was used for automatically accepting all peptide MS/MS spectra. A Mascot-integrated decoy database search calculated a false discovery of ≤ 3.55% when searching was performed on the concatenated mgf files with an ion score cut-off of 25 and a significance threshold of p ≤ 0.01. Only peptides with ion scores of ≥25 and only proteins with at least one unique peptide ranked as top candidate (bold red in Mascot) were considered and re-imported into Progenesis software. All protein identifications including peptide sequences are listed in Tables S1-
at CL
EV
EL
AN
D C
LIN
IC FO
UN
DA
TIO
N on A
pril 5, 2014http://w
ww
.jbc.org/D
ownloaded from

5
S2. Identifications and quantifications of proteins based on only one peptide adhered to published Molecular Cellular Proteomics guidelines and were accepted with caution for the explorative phase (pathway enrichment and protein network analyses) with confirmation in additional model systems and by Western blot. Identification and quantification data is presented in the supplementary material including spectra for each single peptide with y- and b-series labeled (Figure S1). Label-Free Peptide Quantifications The acquired spectra were loaded (Waters raw files) to Progenesis software (version 2.5, Nonlinear) for label free quantification. Profile data of the MS scans were transformed to peak lists with the Progenesis LC-MS algorithm. Peaks were then modeled in non-noisy areas to record their peak m/z value, intensity, abundance (area under the peak) and m/z width. One Pu.1 IP experiment was selected as a reference and other samples within the experiment were automatically aligned. Peaks with only one charge or more than five charges are masked at this point and were excluded from further analyses. Mascot search results were imported to connect each peptide with protein identification. For quantification, all peptides (with Mascot score ≥ 30 and p < 0.01) of an identified protein were included and the total cumulative abundance was calculated by summing the abundances of all peptides allocated to the respective protein. To correct for experimental variation, each protein abundance was normalized to the abundance of the bait protein (Pu.1). Calculations of the protein p value (one-way ANOVA) were then performed on the sum of the normalized abundances across all runs. ANOVA values of p ≤ 0.05 and fold-changes of ≥ 2 or ≤ 0.5 were regarded as significant. Pathway Enrichment Analysis and Protein Network Analysis Protein-protein interactions were evaluated using Significance Analysis of INTeractome (SAINT). SAINT is a software package for scoring protein‐protein interactions based on label‐free quantitative proteomics data (e.g., spectral count or peptide peak intensity) in affinity purification–mass spectrometry (AP‐MS) experiments. iProbability is calculated for each protein based on the strength of identification and the likelihood for
contamination imbedded in the CRAPOME database (Contaminant Repository for Affinity Purification and Mass Spectrometry). Any protein with an average P value (AvgP) >0.5 is considered to be significant interaction between the bait protein (Pu.1) and prey proteins (Table S4).
The ''Core Analysis' function included in IPA (Ingenuity System Inc, USA) was used to interpret the data in the context of biological processes, pathways and networks. All Identifier Types were selected since more than one type of identifier exists in our dataset (working file). Both up- and down-regulated identifiers were defined as value parameters for the analysis. 1D SDS-polyacrylamide gel electrophoresis and Western blot analysis Immunoprecipitation products, control immunoprecipitation products, 100μg of nuclear protein extracts from wild-type/Runx1+/- murine bone marrow, wild-type/Runx1+/- murine spleen or PUER Empty Vector/PUER shRunx1, together with molecular weight markers, were subjected to 1D SDS-polyacrylamide gel electrophoresis on precast 4% to 12% NuPAGE gels (Invitrogen). After electrophoresis per the manufacturer's instructions (Invitrogen), proteins were transferred to polyvinylidene difluoride membranes (Millipore) at 35 constant voltage for 1 hour using Invitrogen's XCell II Blot module. Primary antibodies used in the study are anti-PU.1 (Cell Signaling, 2266), anti-Runx1 (SCBT, sc-101146), anti-ETO2 (SCBT, sc-28694), anti-Sin3A (SCBT, sc-994), anti-HDAC1 (SCBT, sc-7872), anti-HDAC2 (SCBT, sc-7899), anti-SMARCA4 (Brg1, Cell Signaling, 3508S), anti-CHD4 (NB100-57521, Novus Biologicals), anti-LSD1 (sc-271720, SCBT), anti-DNMT1 (ab92453, ABCAM), anti-NCOA5 (A300-790A, BETHYL LABORATORIES), anti-RUVB1 (3918-1, Epitomics), anti-RUVB2 (2889-1, Epitomics), anti-RBBP4 (ab38135, ABCAM), anti-SMARCA5 (05-698, Millipore), anti-MBD2 (sc-9397, SCBT), anti-PHB2 (sc-133094, SCBT), and anti–β-actin peroxidase (Sigma-Aldrich, A3854). Secondary antibodies, anti–rabbit (GE Healthcare, NA934) and anti–mouse (GE Healthcare, NXA931), were used at 1:5000 and 1:10 000 dilutions, respectively. Histone Purification Purified Nuclear pellets from PUER and PUERshRUNX1 were resuspended in 0.2 N HCl. Acid extract the histone overnight at 4oC, and centrifuged at 6,500 g for 15 minutes to pellet debris. The supernatant enriched with histone
at CL
EV
EL
AN
D C
LIN
IC FO
UN
DA
TIO
N on A
pril 5, 2014http://w
ww
.jbc.org/D
ownloaded from

6
proteins were transferred to a clean tube, and dried. The purified histone proteins were stored in -20oC before usage. Chromatin Immunoprecipitation (ChIP) Assays 5x10⁶ cells were crosslinked with 1% formaldehyde for 10 min at room temperature and subsequently harvested, washed with ice cold PBS. Crosslinked cells were lysed with 250 µL SDS lysis buffer with fresh protease inhibitors (1mM PMSF, 1ug/ml aprotinin and 1 ug/ml pepstatin A), followed by sonication for a total of 10 minutes at 20 second intervals using a Fisher Scientific Sonic Dismembrator 550 equipped with microtip (setting 3; 10% input). Gel electrophoresis was used to confirm that fragments were ~200 bp in size. 50 µL of sonicated chromatin lysates were saved as input. The remaining lysates were diluted to 900 µL with 1% NP-40, 5mM dithiothreitol, 10mM PMSF, and 5 μL of protease inhibitor cocktail (Sigma-Aldrich, A8340) in 1X PBS (pH 7.4). The diluted lysates were equally divided and used for immunoprecipitations with di-methyl H3K4 (Pierce, PA5-17174), di-methyl H3K9 (Cell Signaling, 4658) antibodies, Pu.1(Cell Signaling #5931), Runx1 (SCBT, DW71), and normal Mouse or Rabbit IgG as control. Lysates were incubated with antibodies at 4oC overnight with rotation. Immunoprecipitates were then collected with salmon sperm DNA/Protein A agarose slurry beads (Millipore, Cat#16-157C). After extensive wash of the protein-DNA bound beads, protein/DNA crosslinks were reversed by incubating at 65oC for 4hours, followed by incubation with 0.05µg/ml protease K for one hour at 45oC. DNA was recovered by phenol/chloroform extraction and ethanol precipitation. ChIP DNA containing gene promoters associated with Pu.1, Runx1, H3K4me2 and H3K9me2 were analyzed by QRT-PCR. Primers targeting the proximal promoters of macrophage-colony stimulating factor receptor (Mcsfr/Csf1r), and granulocyte-colony stimulating factor receptor (Gcsfr/Csfr3) were: Mcsfr: forward 5’-GGAGTGATTTGTCTACAGG-3’, reverse 5’-ATCTGCCCTTAAGGCAGAAGG-3’ (Mcsfr promoter from -260 to -105). Gcsfr: forward 5’-TAAGACCCCTGAGGCAGGAA-3’, reverse 5’-CTAGCCCCGTCGTTAATGACA-3’ (Gcsfr promoter from -222 to -37). The QRT-PCR results were calculated with ΔΔCt-method and
presented as fold of enrichment relative to control rabbit IgG. Chromatin regulator inhibitor treatment of leukemia cells EZH2 and G9A inhibitors were obtained from SGC (http://www.thesgc.org/chemical-probes). EZH2 inhibitor SGC code #UNC1999 (Ei) inhibits EZH2 with an IC50 of 2nM, with >22-fold higher IC50 for EZH1 and >1000-fold higher IC50 for other histone methyltransferases (HMTs). EZH2 inhibitor SGC code #GSK343 (Ei2) inhibits EZH2 with an IC50 of 4nM, with >60-fold higher IC50 for EZH1 and >1000-fold higher IC50 for other HMTs. G9A inhibitor SGC code #UNC0642 (Gi) inhibits G9a with an IC50 <15nM, with >100-fold higher IC50 for 13 other HMTs. G9A inhibitor SGC code #A-366 (Gi2) inhibits G9a with an IC50 of 3 nM, with > 100-fold higher IC50 over other HMTs. All the above inhibitors were added to cells at 5 µM every 24 hours. Decitabine (Tocris, Cat# 2624) was used to deplete DNMT1 and added to cells at 0.5 µM on day 1 and 0.2 µM on day 2. Cells treated were patient-derived leukemia cell lines: Kasumi1 containing RUNX1-ETO, OCI-AML2 containing DNMT3A, MLL and FLT3 mutations and OCI-AML3 containing DNMT3A, NPM1, and NRAS mutations. Analysis of public ChIP-Seq data The R programming environment [R Core Team (2012). R: A language and environment for statistical computing. R Foundation for Statistical Computing, Vienna, Austria. ISBN 3-900051-07-0, URL http://www.R-project.org/.] was used to analyze the chip-seq data of Wilson et al (2010). A script was written that identified all genes that had Pu.1 and RUNX1 binding sites within 50 base pairs of each other. Peak to gene mapping was per the original publication (17). Expression levels of these genes where then compared across various experimental conditions. Micro-array gene expression data analysis Quality controlled data (GSE24006(24), GSE13125(25)) were downloaded from Gene Expression Omnibus (GEO) datasets (www.ncbi.nlm.nih.gov/geo) or TCGA. Heat-maps were generated using ArrayStar® v3.0 (DNASTAR). Functional ontology enrichment analysis For gene tissue expression annotation gene lists were uploaded into DAVID (26). Enrichment analysis involves matching an "omics" data set to terms in
at CL
EV
EL
AN
D C
LIN
IC FO
UN
DA
TIO
N on A
pril 5, 2014http://w
ww
.jbc.org/D
ownloaded from

7
functional ontologies, providing a ranked representation of ontologies that are most saturated or "enriched" with the input data. Statistical relevance of the found ontology matches was calculated as p-value, or a probability of a match to occur by chance, given the size of the database. RESULTS Runx1 deficiency switched Pu.1 interaction from coactivators to corepressors Primary AML cells, including cells containing mutations or translocations of RUNX1, express very high levels of master drivers of hematopoietic lineage-differentiation compared to non-malignant hematopoietic stem and progenitor cells (e.g., PU.1, CEBPA)(Figure 1)(20,27-29). Yet, the AML cells are differentiation arrested by morphology and demonstrate epigenetic repression of key differentiation target genes of these same transcription factors (20,27-29).
One possible cause of this epigenetic repression is altered coregulator recruitment to master differentiation driving transcription factors, caused by leukemia-initiating events such as RUNX1 deficiency. Proteins that coimmunoprecipitated with endogenous Pu.1 from primary bone marrow and spleen cells from Runx1 haploinsufficient (Runx1+/-) and wild-type litter-mate control mice were therefore evaluated by Western blot for components representative of different coactivator and corepressor families (2). In wild-type cells, multiple coactivators (Smarca4, Ncoa5, Ruvbl1, Ruvbl2) were pulled down with Pu.1. Runx1-deficiency produced a striking switch to Pu.1 interaction with multiple corepressors (Chd4, Rest, Lsd1, Rbbp4, Mbd2, Smarca5, Phb2) (Figure 2).
To examine the time-course of Pu.1 corepressor/coactivator interactions during progressive macrophage maturation, we utilized a cell line model of Pu.1-driven macrophage differentiation (PUER: Pu.1 knock-out hematopoietic precursor cells retrovirally transduced to express Pu.1 fused to the estrogen receptor). The addition of tamoxifen to these cells translocates Pu.1 into the nucleus and triggers terminal macrophage differentiation (20,23,30). Runx1 deficiency was produced in this model by lentiviral transduction with shRNA (PUER shRunx1). PUER cells
transduced with pLenti6empty vector were used as controls (PUER control) (20). Pu.1 was immunoprecipitated from the control and Runx1-deficient cells at various time-points after Pu.1 introduction into the nucleus by OHT (Figure 3). At the earliest time-point after Pu.1 introduction into the nucleus (5 minutes) in control cells, there was substantial coactivator (Smarca4, Ncoa5) interaction with Pu.1 (Figure 3). However, in shRunx1 cells, there was no detectable Smarca4 and substantially less Ncoa5 interaction with Pu.1 (Figure 3), instead, there was substantially increased recruitment of corepressors (Sin3a, Chd4, Dnmt1, Kdm1a/Lsd1, Eto2, Hdac1, Hdac2) to Pu.1 at all time-points (Figure 3). As previously observed, progressive maturation of PUER shRunx1 cells was impeded and these cells demonstrated a proliferative advantage over Empty Vector controls (Figure 3)(20). Thus, Runx1 regulation of Pu.1 corepressor/coactivator exchange is immediate and persistent during Pu.1-driven progressive maturation.
Then, to more comprehensively catalogue the corepressor and coactivator interactions of Pu.1 in the wild-type and Runx1-deficient context with a scope not possible by Western blot, proteins that co-immunoprecipitated with Pu.1 from PUER control and shRunx1 cells were resolved by 1D SDS-PAGE then analyzed by LC/MSMS. In three independent experiments, the NuAT and Baf families of coactivators reproducibly coimmunoprecipitated with Pu.1 in control cells. Runx1 deficiency produced a conspicuous and significant switch to Pu.1 interaction with Dnmt1 and the Sin3A, Nurd, CoRest and B-Wich corepressor families (Figure 4, 5). Interestingly, two chromatin-remodeling protein families implicated in leukemogenesis, the Trithorax (Mll) family associated with activation and the Polycomb families associated with repression (Polycomb Repressor Complex 1 and 2 - PRC1, PRC2), did not interact with Pu.1 in either control or Runx1 deficient cells (Figure 5). Neither did Dnmt3a, another chromatin modifying enzyme that is a PRC2 component and is frequently genetically inactivated in myeloid neoplasms (Figure 5)(31,32). These immunoprecipitation-LC/MSMS results were verified by Western blot (Figure 3).
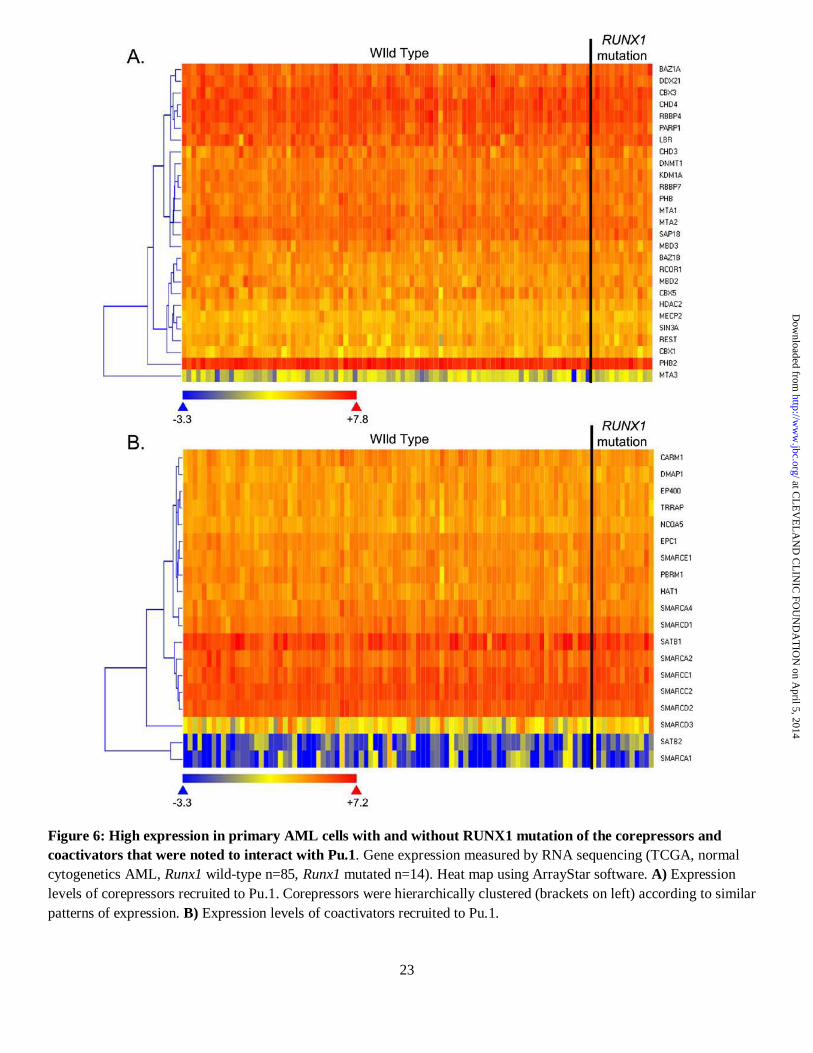
As an additional indication that these coactivators and corepressors are relevant to normal and malignant human hematopoiesis, the majority were expressed at similar high levels in primary AML cells (RNA sequencing, normal cytogenetics AML, TCGA, n=99) (Figure 6A, B), and Runx1-deficiency per se did not alter the overall expression
at CL
EV
EL
AN
D C
LIN
IC FO
UN
DA
TIO
N on A
pril 5, 2014http://w
ww
.jbc.org/D
ownloaded from

8
of these coactivators and corepressors, since expression was similar in primary AML cells containing wild-type or mutated RUNX1 (Figure 6A, B). Runx1-deficiency did not decrease Pu.1 binding to a key target gene, but impaired the Pu.1-driven shift from histone repression to histone activation marks Lists of genes which are bound by Pu.1 and Runx1 together in proximity (within 50bp), and lists of genes that were bound by Pu.1 but without Runx1, were generated from ChIP-Seq analyses of Runx1 and Pu.1 binding in murine hematopoietic precursor cells (17). The most significant tissue expression association of Runx1-Pu.1 cobound genes in DAVID gene ontology analyses was with macrophages, a Pu.1-dependent hematopoietic lineage. In contrast, Pu.1 binding without Runx1 had tissue expression associations with non-hematologic tissues (Table 1). Accordingly, the functional consequences of disrupted Pu.1 corepressor/coactivator exchange were measured at a key macrophage differentiation gene (Mcsfr) versus a key granulocyte differentiation gene (Gcsfr) in PUER control and shRunx1 cells. By chromatin-immunoprecipitation, there was a severe decrease in Runx1 binding to the Mcsfr and Gcsfr promoters in Runx1-deficient compared to control cells (Figure 7A). Pu.1 binding to Mcsfr and Gcsfr promoters, however, was not decreased by Runx1-deficiency (Figure 7A). In control cells, 12 and 24 hours after addition of OHT to trigger Pu.1 nuclear entry, there was a substantial increase from baseline in the histone activation mark H3K4Me2 at the Mcsfr promoter but not the Gcsfr promoter in control cells (Figure 7B). In contrast, in Runx1-deficient cells, there was a 7-fold lower level of this activation mark at the Mcsfr promoter (relevant to the actions of the Lsd1/Kdm1a containing Nurd corepressor complex), both at baseline and after Pu.1 translocation into the nucleus. Activation mark levels were also lower at the Gcsfr promoter in Runx1-deficient compared to control cells (Figure 7B). The repression mark H3K9Me2 demonstrated the opposite pattern: it was higher in Runx1-deficient compared to control cells at both promoters at all time-points before and after Pu.1 translocation into the nucleus (Figure 7C). As expected, Runx1-deficiency impeded macrophage differentiation (Figure 3)(20).
DNMT1 inhibition, but not Polycomb inhibition, in RUNX1-translocated leukemia cells restored terminal differentiation A non-cytotoxic inhibitor is available for DNMT1, a chromatin modifying enzyme recruited to Pu.1 in the Runx1-deficient cells. In patient derived RUNX1-ETO leukemia cells (Kasumi1), this inhibitor (decitabine) activated MCSFR, upregulated protein levels of the cyclin-dependent kinase inhibitor p27/CDKN1B that mediates cell cycle exit by differentiation, and decreased proliferation (Figure 8A-C). Non-cytotoxic inhibitors are also available for Polycomb corepressors (EZH2, G9a) that were not recruited to Pu.1 in Runx1-deficient cells (Structural Genomics Consortium). In contrast, to the results with the DNMT1-inhibitor, the EZH2 and G9a inhibitors did not decrease MYC protein or decrease proliferation of the RUNX1-ETO leukemia cells (Figure 8D-F). Polycomb (EZH2, G9a) inhibition increased differentiation and decreased proliferation of leukemia cells containing DNMT3A, MLL, FLT3 and NPM1 alterations but wild-type RUNX1 The EZH2 and G9a inhibitors did, however, decrease proliferation, decrease MYC protein and increase differentiation of leukemia cells (OCI-AML2, OCI-AML3) that do not contain RUNX1 alterations (OCI-AML2 contains DNMT3A, MLL and FLT3 mutations and OCI-AML3 contains DNMT3A, NPM1, and NRAS mutations)(Figure 9). DISCUSSION High expression in leukemia cells of master differentiation driving transcription factors PU.1 and CEBPA yet epigenetic repression of differentiation target genes suggests that coregulator recruitment to the differentiation drivers could be altered (20,27-29). In wild-type hematopoietic cells, Pu.1 interacted with coactivators of the NuAT and Baf families. Deficiency of RUNX1, a frequent leukemia-initiating event, disrupted this cooperative corepressor/coactivator exchange, to produce a striking switch to Pu.1 interaction with corepressors Dnmt1, Prmt5, Sin3A, Nurd, CoRest and B-Wich. Such altered coregulator interaction likely contributes to the global decrease in histone activation and increase in histone repression marks which is observed in RUNX1-deficient primary leukemia cells (20,33). A fraction of the hundreds of transcription factors expressed in cells are master drivers of lineage-specification and differentiation.
at CL
EV
EL
AN
D C
LIN
IC FO
UN
DA
TIO
N on A
pril 5, 2014http://w
ww
.jbc.org/D
ownloaded from

9
Leukemia cells express high levels of such master differentiation-drivers, and these continue to bind the promoters and enhancers of the differentiation genes (17). Taken together with the dynamic nature of corepressor/coactivator interchange (3,20), this suggests that antagonizing corepressors that are aberrantly recruited to the differentiation drivers may restore differentiation gene expression. Accordingly, depletion of DNMT1 by genetic methods (34,35) or by repurposing of the clinically available drug decitabine, restored expression of late-differentiation genes and progressive maturation even in p53/p16-null leukemia cells resistant to standard apoptosis-based therapy (28,29). Genetic or pharmacologic suppression of KDM1A (LSD1), a component of the NURD corepressor complex aberrantly recruited to Pu.1 in Runx1-deficient cells, also induced terminal maturation in murine leukemia models (36,37). Similarly, inhibition of HDAC1 and HDAC2, chromatin-modifying enzyme components of the SIN3A and NURD corepressor families aberrantly recruited to Pu.1 in Runx1-deficient cells, also restored expression of epigenetically repressed differentiation genes and terminal maturation (38-41). By extension, SMARCA5, an ATP-dependent chromatin-remodeler recruited to Pu.1 in Runx1-deficient cells and which is over-expressed in primary AML (42), and PRMT5, an arginine methyl-transferase recruited to Pu.1 in Runx1-deficient cells, are presumably suitable molecular targets for therapies aiming to induce cell cycle exit by terminal differentiation. Notably, such cell cycle exits do not require master apoptosis regulators such as p53 and p16/CDKN2A that are recurrently genetically deleted in leukemia cells, and which are needed for the actions of standard cytotoxic treatments (29,43).
Another suggestion of these results is that genetic inactivation of specific coactivators that mediate the actions of differentiation-driving transcription factors could be another method (besides RUNX1 inactivation etc.) by which leukemia cells impede activation of proliferation-terminating differentiation genes - SMARCB1 is a chromatin-modifying enzyme component of the BAF coactivator complex that was recruited to PU.1/RUNX1: SMARCB1 is deleted in 36% of chronic myeloid leukemia cases transforming into blast crisis (secondary AML), a transformation defined by impairment
of progressive myeloid maturation (44). Similarly, SMARCD3, another BAF coactivator component, is frequently homo- or heterozygously deleted (13%) in AML (TCGA).
Polycomb family members that mediate transcription repression did not interact with Pu.1. Accordingly, Polycomb inhibitors (EZH2 and G9a inhibitors) did not induce differentiation in leukemia cells containing translocated RUNX1. However, these Polycomb inhibitors did induce differentiation in leukemia cells with genetic alterations other than in RUNX1. One possible explanation for this observation is that other leukemogenic genetic events may cause EZH2 or G9a to be aberrantly recruited to differentiation-driving transcription factors. Another speculation is suggested by the conserved role of Polycomb Repressor Complex 2 (PRC2) in repressing lineage-programs: inactivating mutations or deletions of PRC2 components are frequent in leukemia (e.g., EZH2 or ASXL1 mutation or deletion), events associated with derepression of particular lineage programs, presumably because of the MYC upregulation and vigorous proliferation that accompanies this (45,46). For e.g., EZH2 inactivation is linked with upregulation of the megakaryocyte specifying transcription factor FLI1, high platelet counts and acute megakaryocytic leukemia; ASXL1 inactivation is linked with upregulation of the macrophage specifying transcription factor PU.1 and chronic myelomonocytic leukemia (45). Leukemia cells lineage-specified in this way presumably also contain genetic/epigenetic alterations that efficiently obstruct progressive maturation within the de-repressed lineage-paths. Alternative differentiation paths may not be as vigorously obstructed, explaining why inhibiting other PRC2 components may release these alternative differentiation directions (45).
The mode of cooperation demonstrated by RUNX1/PU.1, combining to exclude corepressors and recruit coactivators instead, could also mediate RUNX1 synergy with other lineage-specifying transcription factors (e.g., CEBPA, FLI1, etc.), and explains the repression by epigenetic means of multiple key late-differentiation genes in leukemia cells despite high-level expression of the lineage-specifying transcription factors that usually activate these genes. The corepressors aberrantly recruited to differentiation-drivers as a consequence of genetic events such as RUNX1 inactivation are specific and drugable targets for therapy that aims to produce leukemia cell cycle exit by differentiation, as an
at CL
EV
EL
AN
D C
LIN
IC FO
UN
DA
TIO
N on A
pril 5, 2014http://w
ww
.jbc.org/D
ownloaded from

10
alternative to frequently ineffective apoptosis-based therapy. ACKNOWLEDGEMENTS We gratefully acknowledge the Harinder Singh laboratory (University of Chicago) for the gift of
PUER cells and the Jim Downing laboratory (St Jude Children’s Research Hospital) for the gift of Runx1 haploinsufficient mice. YS is funded by NIH (R01CA138858), Dept. of Defense (PR081404) and Case Western Reserve University/Cleveland Clinic CTSA UL1RR024989.
at CL
EV
EL
AN
D C
LIN
IC FO
UN
DA
TIO
N on A
pril 5, 2014http://w
ww
.jbc.org/D
ownloaded from

11
REFERENCES 1. Rosenfeld, M. G., Lunyak, V. V., and Glass, C. K. (2006) Sensors and signals: a coactivator/corepressor/epigenetic code for integrating signal-dependent programs of transcriptional response. Genes Dev 20, 1405-1428
2. Perissi, V., Jepsen, K., Glass, C. K., and Rosenfeld, M. G. (2010) Deconstructing repression: evolving models of co-repressor action. Nat Rev Genet 11, 109-123
3. Wang, Z., Zang, C., Cui, K., Schones, D. E., Barski, A., Peng, W., and Zhao, K. (2009) Genome-wide mapping of HATs and HDACs reveals distinct functions in active and inactive genes. Cell 138, 1019-1031
4. Ram, O., Goren, A., Amit, I., Shoresh, N., Yosef, N., Ernst, J., Kellis, M., Gymrek, M., Issner, R., Coyne, M., Durham, T., Zhang, X., Donaghey, J., Epstein, C. B., Regev, A., and Bernstein, B. E. (2011) Combinatorial patterning of chromatin regulators uncovered by genome-wide location analysis in human cells. Cell 147, 1628-1639
5. Niimi, H., Harada, H., Harada, Y., Ding, Y., Imagawa, J., Inaba, T., Kyo, T., and Kimura, A. (2006) Hyperactivation of the RAS signaling pathway in myelodysplastic syndrome with AML1/RUNX1 point mutations. Leukemia 20, 635-644
6. Miyoshi, H., Shimizu, K., Kozu, T., Maseki, N., Kaneko, Y., and Ohki, M. (1991) t(8;21) breakpoints on chromosome 21 in acute myeloid leukemia are clustered within a limited region of a single gene, AML1. Proc.Natl.Acad.Sci.U.S.A 88, 10431-10434
7. Yergeau, D. A., Hetherington, C. J., Wang, Q., Zhang, P., Sharpe, A. H., Binder, M., Marin-Padilla, M., Tenen, D. G., Speck, N. A., and Zhang, D. E. (1997) Embryonic lethality and impairment of haematopoiesis in mice heterozygous for an AML1-ETO fusion gene. Nat.Genet. 15, 303-306
8. Puig-Kroger, A., Sanchez-Elsner, T., Ruiz, N., Andreu, E. J., Prosper, F., Jensen, U. B., Gil, J., Erickson, P., Drabkin, H., Groner, Y., and Corbi, A. L. (2003) RUNX/AML and C/EBP factors regulate CD11a integrin expression in myeloid cells through overlapping regulatory elements. Blood 102, 3252-3261
9. Zhang, D. E., Hetherington, C. J., Meyers, S., Rhoades, K. L., Larson, C. J., Chen, H. M., Hiebert, S. W., and Tenen, D. G. (1996) CCAAT enhancer-binding protein (C/EBP) and AML1 (CBF alpha2) synergistically activate the macrophage colony-stimulating factor receptor promoter. Mol.Cell Biol. 16, 1231-1240
10. Petrovick, M. S., Hiebert, S. W., Friedman, A. D., Hetherington, C. J., Tenen, D. G., and Zhang, D. E. (1998) Multiple functional domains of AML1: PU.1 and C/EBPalpha synergize with different regions of AML1. Mol.Cell Biol. 18, 3915-3925
11. Elagib, K. E., Racke, F. K., Mogass, M., Khetawat, R., Delehanty, L. L., and Goldfarb, A. N. (2003) RUNX1 and GATA-1 coexpression and cooperation in megakaryocytic differentiation. Blood 101, 4333-4341
12. Waltzer, L., Ferjoux, G., Bataille, L., and Haenlin, M. (2003) Cooperation between the GATA and RUNX factors Serpent and Lozenge during Drosophila hematopoiesis. EMBO J. 22, 6516-6525
13. Tagoh, H., Ingram, R., Wilson, N., Salvagiotto, G., Warren, A. J., Clarke, D., Busslinger, M., and Bonifer, C. (2006) The mechanism of repression of the myeloid-specific c-fms gene by Pax5 during B lineage restriction. EMBO J.
14. Huang, H., Yu, M., Akie, T. E., Moran, T. B., Woo, A. J., Tu, N., Waldon, Z., Lin, Y. Y., Steen, H., and Cantor, A. B. (2009) Differentiation-dependent interactions between RUNX-1 and FLI-1 during megakaryocyte development. Mol.Cell Biol. 29, 4103-4115
15. Kim, W. Y., Sieweke, M., Ogawa, E., Wee, H. J., Englmeier, U., Graf, T., and Ito, Y. (1999) Mutual activation of Ets-1 and AML1 DNA binding by direct interaction of their autoinhibitory domains. EMBO J. 18, 1609-1620
at CL
EV
EL
AN
D C
LIN
IC FO
UN
DA
TIO
N on A
pril 5, 2014http://w
ww
.jbc.org/D
ownloaded from
12
16. Goetz, T. L., Gu, T. L., Speck, N. A., and Graves, B. J. (2000) Auto-inhibition of Ets-1 is counteracted by DNA binding cooperativity with core-binding factor alpha2. Mol.Cell Biol. 20, 81-90
17. Wilson, N. K., Foster, S. D., Wang, X., Knezevic, K., Schutte, J., Kaimakis, P., Chilarska, P. M., Kinston, S., Ouwehand, W. H., Dzierzak, E., Pimanda, J. E., de Bruijn, M. F., and Gottgens, B. (2010) Combinatorial transcriptional control in blood stem/progenitor cells: genome-wide analysis of ten major transcriptional regulators. Cell Stem Cell 7, 532-544
18. Zhang, D. E., Hohaus, S., Voso, M. T., Chen, H. M., Smith, L. T., Hetherington, C. J., and Tenen, D. G. (1996) Function of PU.1 (Spi-1), C/EBP, and AML1 in early myelopoiesis: regulation of multiple myeloid CSF receptor promoters. Curr.Top.Microbiol.Immunol. 211, 137-147
19. Xu, G., Kanezaki, R., Toki, T., Watanabe, S., Takahashi, Y., Terui, K., Kitabayashi, I., and Ito, E. (2006) Physical association of the patient-specific GATA1 mutants with RUNX1 in acute megakaryoblastic leukemia accompanying Down syndrome. Leukemia 20, 1002-1008
20. Hu, Z., Gu, X., Baraoidan, K., Ibanez, V., Sharma, A., Kadkol, S., Munker, R., Ackerman, S., Nucifora, G., and Saunthararajah, Y. (2011) RUNX1 regulates corepressor interactions of PU.1. Blood 117, 6498-6508
21. Saunthararajah, Y., Triozzi, P., Rini, B., Singh, A., Radivoyevitch, T., Sekeres, M., Advani, A., Tiu, R., Reu, F., Kalaycio, M., Copelan, E., Hsi, E., Lichtin, A., and Bolwell, B. (2012) p53-Independent, normal stem cell sparing epigenetic differentiation therapy for myeloid and other malignancies. Semin Oncol 39, 97-108
22. Sun, W., and Downing, J. R. (2004) Haploinsufficiency of AML1 results in a decrease in the number of LTR-HSCs while simultaneously inducing an increase in more mature progenitors. Blood 104, 3565-3572
23. Walsh, J. C., DeKoter, R. P., Lee, H. J., Smith, E. D., Lancki, D. W., Gurish, M. F., Friend, D. S., Stevens, R. L., Anastasi, J., and Singh, H. (2002) Cooperative and antagonistic interplay between PU.1 and GATA-2 in the specification of myeloid cell fates. Immunity. 17, 665-676
24. Gentles, A. J., Plevritis, S. K., Majeti, R., and Alizadeh, A. A. (2010) Association of a leukemic stem cell gene expression signature with clinical outcomes in acute myeloid leukemia. JAMA 304, 2706-2715
25. Weigelt, K., Lichtinger, M., Rehli, M., and Langmann, T. (2009) Transcriptomic profiling identifies a PU.1 regulatory network in macrophages. Biochem Biophys Res Commun 380, 308-312
26. Huang da, W., Sherman, B. T., and Lempicki, R. A. (2009) Systematic and integrative analysis of large gene lists using DAVID bioinformatics resources. Nat Protoc 4, 44-57
27. Agrawal, S., Hofmann, W. K., Tidow, N., Ehrich, M., van den, B. D., Koschmieder, S., Berdel, W. E., Serve, H., and Muller-Tidow, C. (2007) The C/EBPdelta tumor suppressor is silenced by hypermethylation in acute myeloid leukemia. Blood 109, 3895-3905
28. Negrotto, S., Ng, K. P., Jankowska, A. M., Bodo, J., Gopalan, B., Guinta, K., Mulloy, J. C., Hsi, E., Maciejewski, J., and Saunthararajah, Y. (2012) CpG methylation patterns and decitabine treatment response in acute myeloid leukemia cells and normal hematopoietic precursors. Leukemia 26, 244-254
29. Ng, K. P., Ebrahem, Q., Negrotto, S., Mahfouz, R. Z., Link, K. A., Hu, Z., Gu, X., Advani, A., Kalaycio, M., Sobecks, R., Sekeres, M., Copelan, E., Radivoyevitch, T., Maciejewski, J., Mulloy, J. C., and Saunthararajah, Y. (2011) p53 independent epigenetic-differentiation treatment in xenotransplant models of acute myeloid leukemia. Leukemia 25, 1739-1750
30. Hu, Z., Negrotto, S., Gu, X., Mahfouz, R., Ng, K. P., Ebrahem, Q., Copelan, E., Singh, H., Maciejewski, J. P., and Saunthararajah, Y. (2010) Decitabine maintains hematopoietic precursor self-renewal by preventing repression of stem cell genes by a differentiation-inducing stimulus. Mol Cancer Ther 9, 1536-1543
at CL
EV
EL
AN
D C
LIN
IC FO
UN
DA
TIO
N on A
pril 5, 2014http://w
ww
.jbc.org/D
ownloaded from

13
31. Rush, M., Appanah, R., Lee, S., Lam, L. L., Goyal, P., and Lorincz, M. C. (2009) Targeting of EZH2 to a defined genomic site is sufficient for recruitment of Dnmt3a but not de novo DNA methylation. Epigenetics 4, 404-414
32. Vire, E., Brenner, C., Deplus, R., Blanchon, L., Fraga, M., Didelot, C., Morey, L., Van Eynde, A., Bernard, D., Vanderwinden, J. M., Bollen, M., Esteller, M., Di Croce, L., de Launoit, Y., and Fuks, F. (2006) The Polycomb group protein EZH2 directly controls DNA methylation. Nature 439, 871-874
33. Ptasinska, A., Assi, S. A., Mannari, D., James, S. R., Williamson, D., Dunne, J., Hoogenkamp, M., Wu, M., Care, M., McNeill, H., Cauchy, P., Cullen, M., Tooze, R. M., Tenen, D. G., Young, B. D., Cockerill, P. N., Westhead, D. R., Heidenreich, O., and Bonifer, C. (2012) Depletion of RUNX1/ETO in t(8;21) AML cells leads to genome-wide changes in chromatin structure and transcription factor binding. Leukemia
34. Broske, A. M., Vockentanz, L., Kharazi, S., Huska, M. R., Mancini, E., Scheller, M., Kuhl, C., Enns, A., Prinz, M., Jaenisch, R., Nerlov, C., Leutz, A., Andrade-Navarro, M. A., Jacobsen, S. E., and Rosenbauer, F. (2009) DNA methylation protects hematopoietic stem cell multipotency from myeloerythroid restriction. Nat.Genet. 41, 1207-1215
35. Trowbridge, J. J., Sinha, A. U., Zhu, N., Li, M., Armstrong, S. A., and Orkin, S. H. (2012) Haploinsufficiency of Dnmt1 impairs leukemia stem cell function through derepression of bivalent chromatin domains. Genes Dev 26, 344-349
36. Schenk, T., Chen, W. C., Gollner, S., Howell, L., Jin, L., Hebestreit, K., Klein, H. U., Popescu, A. C., Burnett, A., Mills, K., Casero, R. A., Jr., Marton, L., Woster, P., Minden, M. D., Dugas, M., Wang, J. C., Dick, J. E., Muller-Tidow, C., Petrie, K., and Zelent, A. (2012) Inhibition of the LSD1 (KDM1A) demethylase reactivates the all-trans-retinoic acid differentiation pathway in acute myeloid leukemia. Nat Med 18, 605-611
37. Harris, W. J., Huang, X., Lynch, J. T., Spencer, G. J., Hitchin, J. R., Li, Y., Ciceri, F., Blaser, J. G., Greystoke, B. F., Jordan, A. M., Miller, C. J., Ogilvie, D. J., and Somervaille, T. C. (2012) The histone demethylase KDM1A sustains the oncogenic potential of MLL-AF9 leukemia stem cells. Cancer Cell 21, 473-487
38. Warrell, R. P., Jr., He, L. Z., Richon, V., Calleja, E., and Pandolfi, P. P. (1998) Therapeutic targeting of transcription in acute promyelocytic leukemia by use of an inhibitor of histone deacetylase. J.Natl.Cancer Inst. 90, 1621-1625
39. Kosugi, H., Towatari, M., Hatano, S., Kitamura, K., Kiyoi, H., Kinoshita, T., Tanimoto, M., Murate, T., Kawashima, K., Saito, H., and Naoe, T. (1999) Histone deacetylase inhibitors are the potent inducer/enhancer of differentiation in acute myeloid leukemia: a new approach to anti-leukemia therapy. Leukemia 13, 1316-1324
40. Wang, J., Saunthararajah, Y., Redner, R. L., and Liu, J. M. (1999) Inhibitors of histone deacetylase relieve ETO-mediated repression and induce differentiation of AML1-ETO leukemia cells. Cancer Res 59, 2766-2769
41. Nowak, D., Stewart, D., and Koeffler, H. P. (2009) Differentiation therapy of leukemia: 3 decades of development. Blood 113, 3655-3665
42. Stopka, T., Zakova, D., Fuchs, O., Kubrova, O., Blafkova, J., Jelinek, J., Necas, E., and Zivny, J. (2000) Chromatin remodeling gene SMARCA5 is dysregulated in primitive hematopoietic cells of acute leukemia. Leukemia 14, 1247-1252
43. Saunthararajah, Y. (2013) Key clinical observations after 5-azacytidine and decitabine treatment of myelodysplastic syndromes suggest practical solutions for better outcomes. Hematology Am Soc Hematol Educ Program 2013, 511-521
44. Grand, F., Kulkarni, S., Chase, A., Goldman, J. M., Gordon, M., and Cross, N. C. (1999) Frequent deletion of hSNF5/INI1, a component of the SWI/SNF complex, in chronic myeloid leukemia. Cancer Res 59, 3870-3874
45. Saunthararajah, Y., and Maciejewski, J. (2012) Polycomb segment myeloid malignancies. Blood 119, 1097-1098
at CL
EV
EL
AN
D C
LIN
IC FO
UN
DA
TIO
N on A
pril 5, 2014http://w
ww
.jbc.org/D
ownloaded from

14
46. Goodliffe, J. M., Wieschaus, E., and Cole, M. D. (2005) Polycomb mediates Myc autorepression and its transcriptional control of many loci in Drosophila. Genes Dev. 19, 2941-2946
at CL
EV
EL
AN
D C
LIN
IC FO
UN
DA
TIO
N on A
pril 5, 2014http://w
ww
.jbc.org/D
ownloaded from

15
Table 1: Top 5 tissue expression associations of genes which are bound by both Pu.1 with Runx1 in proximity (within 50bp of each other) compared to genes bound by Pu.1 but without Runx1 co-binding. Pu.1 and Runx1 binding peak to gene mapping per Wilson et al (17). Gene ontology analysis by DAVID(26) (UP_Tissue).
Tissue Gene Count Benjamini corrected p-value Runx1-Pu.1 cobound genes
Macrophage 60 5.6 x 10⁻⁸ Bone marrow 105 5.0 x 10⁻⁸ Thymus 156 2.0 x 10⁻⁸ Spleen 75 1.3 x 10⁻⁵ Mast cell 24 1.7 x 10⁻⁵
Pu.1 bound without Runx1 co-binding Liver 1326 1.0 x 10-78 Bone marrow 669 2.1 x 10-74 Brain 2245 1.1 x 10-40 Thymus 895 1.0 x 10⁻³⁵ Mammary gland 779 3.4 x 10⁻³⁴
at CL
EV
EL
AN
D C
LIN
IC FO
UN
DA
TIO
N on A
pril 5, 2014http://w
ww
.jbc.org/D
ownloaded from

16
FIGURE LEGENDS Figure 1: A) Primary Acute myeloid leukemia (AML) cells, even ‘leukemia stem cells (LSC)’ and ‘leukemia progenitor cells (LPC)’, express high levels of master differentiation driving transcription factors CEBPA (granulocyte differentiation) and PU.1 (macrophage differentiation) compared to normal bone marrow hematopoietic stem cells (HSC), multipotent progenitors (MPP), granulocyte monocyte progenitors (GMP) and megakaryocyte erythroid progenitors (MEP). Shown for reference are expression levels also of GATA1 (master driver of erythroid differentiation). Raw data downloaded from Geo Datasets GSE24006. Gene expression microarray data Affymetrix U133 Plus 2.0 microarrays from cell populations purified by fluorescence-activated cell sorting: AML LSC (Lin-CD34+CD38-CD90-, n=7), AML PC (Lin-CD34+CD38+, n=7), AML Blasts (Lin-CD34-), normal hematopoietic stem cells (HSC, in-CD34+CD38-CD90+CD45RA-; n=4), multipotent progenitors Lin-CD34+CD38-CD90-CD45RA-; n=4), common myeloid progenitors Lin-CD34+CD38+CD123+CD45RA-; n=4), granulocyte-monocyte progenitors (Lin-CD34+CD38+CD123+CD45RA+; n=4), and megakaryocyte-erthythrocyte progenitors (Lin-CD34+CD38+CD123-CD45RA-; n=4). B) Primary acute myeloid leukemia cells representative of the morphologic/genetic spectrum of disease (TCGA, n=179) express high levels of key hematopoietic lineage specifying transcription factors (TF) (TCGA RNA Seq). For comparison purposes, expression levels of a key hematopoietic stem cell (HSC) driving TF, and embryonic stem cell (ESC) TF are shown. M0=minimally differentiated, M1=without maturation, M2=with maturation, M3=promyelocytic, M4=myelomonocytic, M5=monocytic, M6=erythroid, M7=megakaryocytic. Figure 2. Coactivators and corepressors that coimmunoprecipitated (co-IPed) with endogenous Pu.1 from wild-type (Wt) and Runx1 haploinsufficient (R+/-) murine bone marrow and spleen. These results were reproduced in triplicate using independent cell harvests (different mice). A) Coactivators (Smarca4, Ncoa5, Ruvbl1 and Ruvbl2) are more abundant and vice-versa for corepressors (Chd4, Smarca5, Lsd1, Mbd2) in Pu.1 coIP from bone marrow cells from Wt versus R+/- mice. 1% input from WT BM and R+/- BM, and Control IP with WT BM and R+/- BM are also shown. Bottom panels show Western analysis of IPed Pu.1 and coIPed Runx1. Histograms are results of densitometric quantification of co-IPed bands relative to the intensity of IPed Pu.1 bands. B) Similar results were observed in the Pu.1 coIP from primary spleen cells from Wt and R+/- mice (coactivators – Smarca4, Ncoa5, Ruvbl1, Ruvbl2; corepressors – Rest, Smarca5, Lsd1, Phb2, Mbd2). 1% input from WT spleen and R+/- spleen, and Control IP with WT spleen and R+/- spleen are also shown. Bottom panels show Western analysis of IPed Pu.1 and coIPed Runx1. Since protein expression varied by the source of cells (bone marrow, spleen), there was some variation in the coactivator/corepressor proteins analyzed. Figure 3. Runx1 regulation of Pu.1 corepressor/coactivator exchange is immediate and persistent during Pu.1-driven progressive maturation. Pu.1 was IPed from PUER controls (Empty Vector pLenti6) and PUER shRunx1 cells at various time-points after Pu.1 introduction into the nucleus by OHT. The coIP was analyzed by Western blot. A) Coactivator (Smarca4, Ncoa5) and corepressor (Sin3a, Chd4, Dnmt1, Lsd1, Eto2, Hdac1 and Hdac2) abundance in the Pu.1 coIP during progressive macrophage differentiation of PUER controls and PUER shRunx1 cells. Bottom panels show Western analysis of IPed Pu.1 and coIPed Runx1. Histograms are results of densitometric quantification of co-IPed bands relative to the intensity of IPed Pu.1 bands. B) Pu.1 translocation from the cytoplasm into the nucleus with addition of OHT. C) Morphology of PUER control and PUER shRunx1 cells before and 24 hours after addition of OHT (macrophage differentiation). Giemsa-stained cytospin preparations of cells 200X (Microscope model Leica DMR, Leica Microsystems, IL). Images were captured using the attached CRI Nuance NzMSI-FX multispectral imaging system with Nuance software version 2.8 (NuanceCRI ). These results were reproduced in three independent experiments. Figure 4. LC/MSMS was used to comprehensively catalogue and quantify coactivators and corepressors pulled down with Pu.1 from control or Runx1-deficient cells. Peak intensity based label-free comparative proteomic analysis of coactivators and corepressors pulled down with Pu.1 from control (PUER Empty Vector) and Runx1-deficient (PUER shRunx1) cells by Progenesis LCMS software. Left panel – enrichment heatmap of protein complexes clustered by functional groups. Three independent IP experiments. Coactivator/corepressor protein abundance was normalized to the bait protein (Pu.1) abundance for each immunoprecipitation (log2 scale). Right panel – statistical analyses - ratio of protein abundance in control cells versus Runx1-deficient cells, mean ± standard deviation of 3 independent experiments, *p < 0.05, Student t-test.
at CL
EV
EL
AN
D C
LIN
IC FO
UN
DA
TIO
N on A
pril 5, 2014http://w
ww
.jbc.org/D
ownloaded from

17
Figure 5. A summary figure of the switch from Pu.1 interaction with coactivators to corepressors caused by Runx1 deficiency. Two hours after cells were treated with tamoxifen to translocate Pu.1 into the nucleus, corepressors and coactivators that co-immunoprecipitated (coIPed) with Pu.1 from PUER controls (empty vector pLenti6) and PUER shRunx1 cells were quantified by LC MS/MS total spectra counts. For ease of interpretation, the tabular data (Table S1-S3) is presented here in figure form as the gradient of color towards RED (more enrichment in shRunx1 cells) or GREEN (more enrichment in control cells). Clear double ring symbols are proteins that were not identified in any of the IP experiments, but which are linked to myeloid cancer pathogenesis by recurrent genetic abnormalities. The reproducibility of protein identification in three independent Pu.1-IP experiments is indicated by shapes of the protein symbols: Not identified (clear double ring), identified once (circle), identified twice (diamond), and identified in all experiments (hexagon) (figure generated using Ingenuity Pathway Analysis). Figure 6: High expression in primary AML cells with and without RUNX1 mutation of the corepressors and coactivators that were noted to interact with Pu.1. Gene expression measured by RNA sequencing (TCGA, normal cytogenetics AML, Runx1 wild-type n=85, Runx1 mutated n=14). Heat map using ArrayStar software. A) Expression levels of corepressors recruited to Pu.1. Corepressors were hierarchically clustered (brackets on left) according to similar patterns of expression. B) Expression levels of coactivators recruited to Pu.1.
Figure 7. Runx1-deficiency does not decrease Pu.1 binding to the Mcsfr promoter, but impairs the Pu.1-driven shift from histone repression to histone activation marks at this locus. For comparision, a key granulocyte differentiation gene, Gcsfr, was also analyzed. A) Runx1-deficiency severely decreased Runx1 binding but did not decrease Pu.1 binding to Mcsfr promoter. Chromatin-immunoprecipitation with anti-Pu.1 and anti-Runx1 12 hours after addition of OHT to trigger Pu.1 nuclear entry into PUER Empty Vector (control) and PUER shRunx1 (Runx-deficient) cells. Co-immunoprecipitated promoter regions were quantified by QRT-PCR, presented as fold enrichment relative to control rabbit IgG. Mean ± standard deviation. ** = p<0.01, Student t-test. Experiments performed in triplicate. B) In Runx1-deficient cells, the histone activation mark H3K4Me2 was decreased at Mcsfr and Gcsfr promoters at various time-points before and after Pu.1 introduction into the nucleus compared to control cells. Chromatin-immunoprecipitation with anti-H3K4Me2. Analysis as per previous panel. C) In contrast, the histone repression mark H3K9Me2 was increased in Runx1-deficient cells. Chromatin-immunoprecipitation with anti-H3K9Me2. Analysis as per panel ‘A’. Figure 8. DNMT1 inhibition, but not Polycomb inhibition, in RUNX1-translocated (RUNX1-ETO) leukemia cells (Kasumi1) induced terminal differentiation. A) DNMT1-inhibition decreased RUNX1-ETO leukemia cell proliferation. Non-cytotoxic concentrations of the DNMT1-inhibitor decitabine (DAC) (0.5 µM day 1, 0.2 µM day 2). Cell counts by automated counter. B) DNMT1-inhibition activated MCSFR. QRT-PCR, relative expression with GAPDH as internal standard. C) p27/CDKN1B that mediates cell cycle exit by differentiation was upregulated. Histogram shows results of densitometric analysis relative to Actin. D) Specific inhibitors of EZH2 (Ei, Ei2, 5 µM daily) and G9a (Gi, Gi2, 5 µM daily), that were not aberrantly recruited to Pu.1, did not decrease RUNX1-ETO leukemia cell proliferation. Highly specific inhibitors obtained from SGC. Data points = mean±standard deviation, 3 independent experiments. E) The DNMT1-inhibitor decreased MYC protein. Time-course Western bots and densitometry histogram (normalized to Actin). DNMT1, but not DNMT3A, was inhibited. F) The EZH2 and G9a inhibitors did not decrease MYC. Time-course Western bots and densitometry graph (normalized to Actin). Figure 9. Polycomb (EZH2, G9a) inhibition increased differentiation and decreased proliferation of leukemia cells with wild-type RUNX1. Patient derived leukemia cell lines OCI-AML2 that contains DNMT3A, MLL and FLT3 mutations, and OCI-AML3 that contains DNMT3A, NPM1, and NRAS mutations, were treated with specific EZH2 (Ei, Ei2) and G9a (G9i, G9i2) inhibitors from SGC (5 µM added daily). A) Polycomb inhibitors decreased proliferation. Cell counts by automated counter. DAC=DNMT1 inhibitor decitabine. B) Polycomb inhibitors decreased MYC protein. Time-course Western bots and densitometry graph (normalized to Actin). DNMT1-inhibitor DAC also decreased MYC protein (data not shown). C) Polycomb inhibitors induced morphologic differentiation (decreased nuclear/cytoplasmic ratio, nuclear margination and segmentation). Giemsa-stained cytospin preparations day 5 (200X, Leica DMR, Leica Microsystems, IL). Images captured by CRI Nuance NzMSI-FX multispectral imaging system with Nuance software version 3.0 (NuanceCRI). DAC also induced morphologic differentiation (data not shown). D) Polycomb inhibitors increased expression of myeloid differentiation markers CD11b and/or CD14. Measurements by flow cytometry on day 7.
at CL
EV
EL
AN
D C
LIN
IC FO
UN
DA
TIO
N on A
pril 5, 2014http://w
ww
.jbc.org/D
ownloaded from

18
Figure 1: A) Primary Acute myeloid leukemia (AML) cells, even ‘leukemia stem cells (LSC)’ and ‘leukemia progenitor cells (LPC)’, express high levels of master differentiation driving transcription factors CEBPA (granulocyte differentiation) and PU.1 (macrophage differentiation) compared to normal bone marrow hematopoietic stem cells (HSC), multipotent progenitors (MPP), granulocyte monocyte progenitors (GMP) and megakaryocyte erythroid progenitors (MEP). Shown for reference are expression levels also of GATA1 (master driver of erythroid differentiation). Raw data downloaded from Geo Datasets GSE24006. Gene expression microarray data Affymetrix U133 Plus 2.0 microarrays from cell populations purified by fluorescence-activated cell sorting: AML LSC (Lin-CD34+CD38-CD90-, n=7), AML PC (Lin-CD34+CD38+, n=7), AML Blasts (Lin-CD34-), normal hematopoietic stem cells (HSC, in-CD34+CD38-CD90+CD45RA-; n=4), multipotent progenitors Lin-CD34+CD38-CD90-CD45RA-; n=4), common myeloid progenitors Lin-CD34+CD38+CD123+CD45RA-; n=4), granulocyte-monocyte progenitors (Lin-CD34+CD38+CD123+CD45RA+; n=4), and megakaryocyte-erthythrocyte progenitors (Lin-CD34+CD38+CD123-CD45RA-; n=4). B) Primary acute myeloid leukemia cells representative of the morphologic/genetic spectrum of disease (TCGA, n=179) express high levels of key hematopoietic lineage specifying transcription factors (TF) (TCGA RNA Seq). For comparison purposes, expression levels of a key hematopoietic stem cell (HSC) driving TF, and embryonic stem cell (ESC) TF are shown. M0=minimally differentiated, M1=without maturation, M2=with maturation, M3=promyelocytic, M4=myelomonocytic, M5=monocytic, M6=erythroid, M7=megakaryocytic.
A
B
at CL
EV
EL
AN
D C
LIN
IC FO
UN
DA
TIO
N on A
pril 5, 2014http://w
ww
.jbc.org/D
ownloaded from

19
Figure 2. Coactivators and corepressors that coimmunoprecipitated (co-IPed) with endogenous Pu.1 from wild-type (Wt) and Runx1 haploinsufficient (R+/-) murine bone marrow and spleen. These results were reproduced in triplicate using independent cell harvests (different mice). A) Coactivators (Smarca4, Ncoa5, Ruvbl1 and Ruvbl2) are more abundant and vice-versa for corepressors (Chd4, Smarca5, Lsd1, Mbd2) in Pu.1 coIP from bone marrow cells from Wt versus R+/- mice. 1% input from WT BM and R+/- BM, and Control IP with WT BM and R+/- BM are also shown. Bottom panels show Western analysis of IPed Pu.1 and coIPed Runx1. Histograms are results of densitometric quantification of co-IPed bands relative to the intensity of IPed Pu.1 bands. B) Similar results were observed in the Pu.1 coIP from primary spleen cells from Wt and R+/- mice (coactivators – Smarca4, Ncoa5, Ruvbl1, Ruvbl2; corepressors – Rest, Smarca5, Lsd1, Phb2, Mbd2). 1% input from WT spleen and R+/- spleen, and Control IP with WT spleen and R+/- spleen are also shown. Bottom panels show Western analysis of IPed Pu.1 and coIPed Runx1. Since protein expression varied by the source of cells (bone marrow, spleen), there was some variation in the coactivator/corepressor proteins analyzed.
at CL
EV
EL
AN
D C
LIN
IC FO
UN
DA
TIO
N on A
pril 5, 2014http://w
ww
.jbc.org/D
ownloaded from

20
Figure 3. Runx1 regulation of Pu.1 corepressor/coactivator exchange is immediate and persistent during Pu.1-driven progressive maturation. Pu.1 was IPed from PUER controls (Empty Vector pLenti6) and PUER shRunx1 cells at various time-points after Pu.1 introduction into the nucleus by OHT. The coIP was analyzed by Western blot. A) Coactivator (Smarca4, Ncoa5) and corepressor (Sin3a, Chd4, Dnmt1, Lsd1, Eto2, Hdac1 and Hdac2) abundance in the Pu.1 coIP during progressive macrophage differentiation of PUER controls and PUER shRunx1 cells. Bottom panels show Western analysis of IPed Pu.1 and coIPed Runx1. Histograms are results of densitometric quantification of co-IPed bands relative to the intensity of IPed Pu.1 bands. B) Pu.1 translocation from the cytoplasm into the nucleus with addition of OHT. C) Morphology of PUER control and PUER shRunx1 cells before and 24 hours after addition of OHT (macrophage differentiation). Giemsa-stained cytospin preparations of cells 200X (Microscope model Leica DMR, Leica Microsystems, IL). Images were captured using the attached CRI Nuance NzMSI-FX multispectral imaging system with Nuance software version 2.8 (NuanceCRI ). These results were reproduced in three independent experiments.
at CL
EV
EL
AN
D C
LIN
IC FO
UN
DA
TIO
N on A
pril 5, 2014http://w
ww
.jbc.org/D
ownloaded from

21
Figure 4. LC/MSMS was used to comprehensively catalogue and quantify coactivators and corepressors pulled down with Pu.1 from control or Runx1-deficient cells. Peak intensity based label-free comparative proteomic analysis of coactivators and corepressors pulled down with Pu.1 from control (PUER Empty Vector) and Runx1-deficient (PUER shRunx1) cells by Progenesis LCMS software. Left panel – enrichment heatmap of protein complexes clustered by functional groups. Three independent IP experiments. Coactivator/corepressor protein abundance was normalized to the bait protein (Pu.1) abundance for each immunoprecipitation (log2 scale). Right panel – statistical analyses - ratio of protein abundance in control cells versus Runx1-deficient cells, mean ± standard deviation of 3 independent experiments, *p < 0.05, Student t-test.
at CL
EV
EL
AN
D C
LIN
IC FO
UN
DA
TIO
N on A
pril 5, 2014http://w
ww
.jbc.org/D
ownloaded from

22
Figure 5. A summary figure of the switch from Pu.1 interaction with coactivators to corepressors caused by Runx1 deficiency. Two hours after cells were treated with tamoxifen to translocate Pu.1 into the nucleus, corepressors and coactivators that co-immunoprecipitated (coIPed) with Pu.1 from PUER controls (empty vector pLenti6) and PUER shRunx1 cells were quantified by LC MS/MS total spectra counts. For ease of interpretation, the tabular data (Table S1-S3) is presented here in figure form as the gradient of color towards RED (more enrichment in shRunx1 cells) or GREEN (more enrichment in control cells). Clear double ring symbols are proteins that were not identified in any of the IP experiments, but which are linked to myeloid cancer pathogenesis by recurrent genetic abnormalities. The reproducibility of protein identification in three independent Pu.1-IP experiments is indicated by shapes of the protein symbols: Not identified (clear double ring), identified once (circle), identified twice (diamond), and identified in all experiments (hexagon) (figure generated using Ingenuity Pathway Analysis).
at CL
EV
EL
AN
D C
LIN
IC FO
UN
DA
TIO
N on A
pril 5, 2014http://w
ww
.jbc.org/D
ownloaded from
23
Figure 6: High expression in primary AML cells with and without RUNX1 mutation of the corepressors and coactivators that were noted to interact with Pu.1. Gene expression measured by RNA sequencing (TCGA, normal cytogenetics AML, Runx1 wild-type n=85, Runx1 mutated n=14). Heat map using ArrayStar software. A) Expression levels of corepressors recruited to Pu.1. Corepressors were hierarchically clustered (brackets on left) according to similar patterns of expression. B) Expression levels of coactivators recruited to Pu.1.
at CL
EV
EL
AN
D C
LIN
IC FO
UN
DA
TIO
N on A
pril 5, 2014http://w
ww
.jbc.org/D
ownloaded from

24
Figure 7. Runx1-deficiency does not decrease Pu.1 binding to the Mcsfr promoter, but impairs the Pu.1-driven shift from histone repression to histone activation marks at this locus. For comparision, a key granulocyte differentiation gene, Gcsfr, was also analyzed. A) Runx1-deficiency severely decreased Runx1 binding but did not decrease Pu.1 binding to Mcsfr promoter. Chromatin-immunoprecipitation with anti-Pu.1 and anti-Runx1 12 hours after addition of OHT to trigger Pu.1 nuclear entry into PUER Empty Vector (control) and PUER shRunx1 (Runx-deficient) cells. Co-immunoprecipitated promoter regions were quantified by QRT-PCR, presented as fold enrichment relative to control rabbit IgG. Mean ± standard deviation. ** = p<0.01, Student t-test. Experiments performed in triplicate. B) In Runx1-deficient cells, the histone activation mark H3K4Me2 was decreased at Mcsfr and Gcsfr promoters at various time-points before and after Pu.1 introduction into the nucleus compared to control cells. Chromatin-immunoprecipitation with anti-H3K4Me2. Analysis as per previous panel. C) In contrast, the histone repression mark H3K9Me2 was increased in Runx1-deficient cells. Chromatin-immunoprecipitation with anti-H3K9Me2. Analysis as per panel ‘A’.
at CL
EV
EL
AN
D C
LIN
IC FO
UN
DA
TIO
N on A
pril 5, 2014http://w
ww
.jbc.org/D
ownloaded from

25
Figure 8. DNMT1 inhibition, but not Polycomb inhibition, in RUNX1-translocated (RUNX1-ETO) leukemia cells (Kasumi1) induced terminal differentiation. A) DNMT1-inhibition decreased RUNX1-ETO leukemia cell proliferation. Non-cytotoxic concentrations of the DNMT1-inhibitor decitabine (DAC) (0.5 µM day 1, 0.2 µM day 2). Cell counts by automated counter. B) DNMT1-inhibition activated MCSFR. QRT-PCR, relative expression with GAPDH as internal standard. C) p27/CDKN1B that mediates cell cycle exit by differentiation was upregulated. Histogram shows results of densitometric analysis relative to Actin. D) Specific inhibitors of EZH2 (Ei, Ei2, 5 µM daily) and G9a (Gi, Gi2, 5 µM daily), that were not aberrantly recruited to Pu.1, did not decrease RUNX1-ETO leukemia cell proliferation. Highly specific inhibitors obtained from SGC. Data points = mean±standard deviation, 3 independent experiments. E) The DNMT1-inhibitor decreased MYC protein. Time-course Western bots and densitometry histogram (normalized to Actin). DNMT1, but not DNMT3A, was inhibited. F) The EZH2 and G9a inhibitors did not decrease MYC. Time-course Western bots and densitometry graph (normalized to Actin).
at CL
EV
EL
AN
D C
LIN
IC FO
UN
DA
TIO
N on A
pril 5, 2014http://w
ww
.jbc.org/D
ownloaded from

26
Figure 9. Polycomb (EZH2, G9a) inhibition increased differentiation and decreased proliferation of leukemia cells with wild-type RUNX1. Patient derived leukemia cell lines OCI-AML2 that contains DNMT3A, MLL and FLT3 mutations, and OCI-AML3 that contains DNMT3A, NPM1, and NRAS mutations, were treated with specific EZH2 (Ei, Ei2) and G9a (G9i, G9i2) inhibitors from SGC (5 µM added daily). A) Polycomb inhibitors decreased proliferation. Cell counts by automated counter. DAC=DNMT1 inhibitor decitabine. B) Polycomb inhibitors decreased MYC protein. Time-course Western bots and densitometry graph (normalized to Actin). DNMT1-inhibitor DAC also decreased MYC protein (data not shown). C) Polycomb inhibitors induced morphologic differentiation (decreased nuclear/cytoplasmic ratio, nuclear margination and segmentation). Giemsa-stained cytospin preparations day 5 (200X, Leica DMR, Leica Microsystems, IL). Images captured by CRI Nuance NzMSI-FX multispectral imaging system with Nuance software version 3.0 (NuanceCRI). DAC also induced morphologic differentiation (data not shown). D) Polycomb inhibitors increased expression of myeloid differentiation markers CD11b and/or CD14. Measurements by flow cytometry on day 7.
at CL
EV
EL
AN
D C
LIN
IC FO
UN
DA
TIO
N on A
pril 5, 2014http://w
ww
.jbc.org/D
ownloaded from


