Embed Size (px)
Citation preview

1
Rusk Junior High School
037-907-041
2014-2015
Campus Plan
Total Student Count: 532 Number of At-Risk: 277 Percent At-Risk: 52.1% Title I, Part A Campus
Regardless of the circumstance into which a child is born, we will give them the best that can be offered!
We Learn…… No Excuses
2
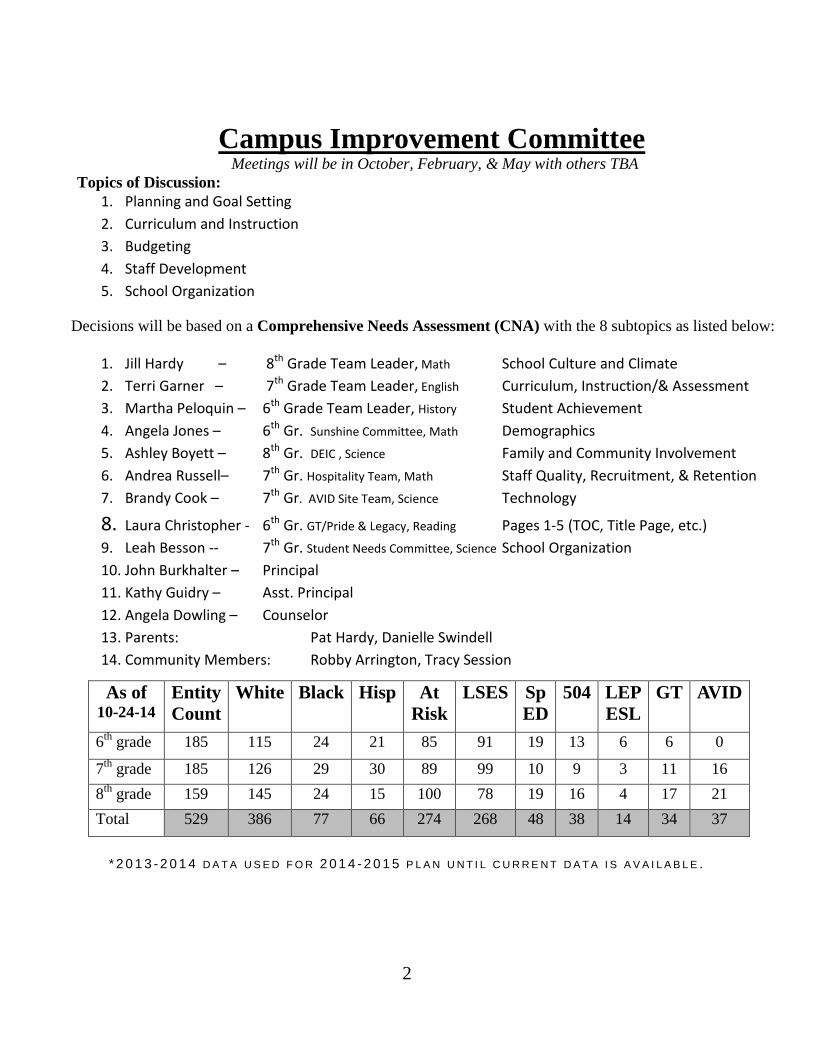
* 2 0 1 3 - 2 0 1 4 D A T A U S E D F O R 2 0 1 4 - 2 0 1 5 P L A N U N T I L C U R R E N T D A T A I S A V A I L A B L E .
* 2 0 1 3 - 2 0 1 4 D A T A U S E D F O R 2 0 1 4 - 2 0 1 5 P L A N U N T I L C U R R E N T D A T A I S A V A I L A B L E .
As of 10-24-14
Entity Count
White Black Hisp At Risk
LSES Sp ED
504 LEP ESL
GT AVID
6th grade 185 115 24 21 85 91 19 13 6 6 0
7th grade 185 126 29 30 89 99 10 9 3 11 16 8th grade 159 145 24 15 100 78 19 16 4 17 21 Total 529 386 77 66 274 268 48 38 14 34 37
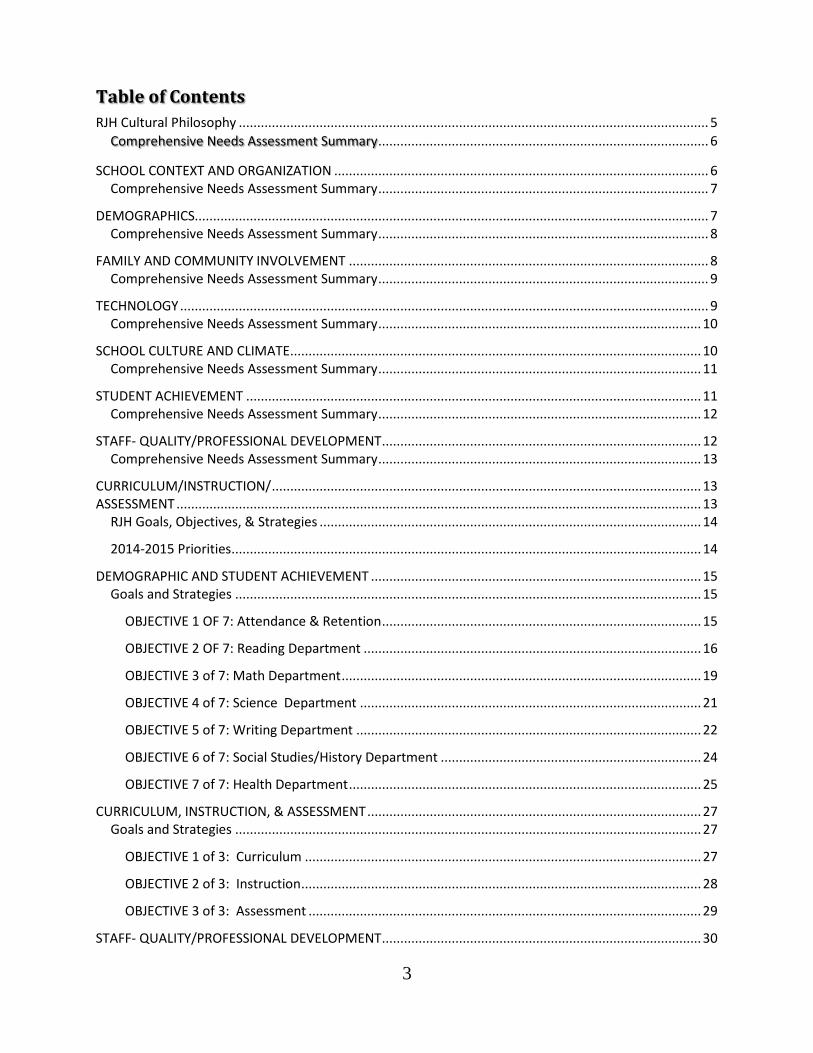
Campus Improvement Committee Meetings will be in October, February, & May with others TBA
Topics of Discussion: 1. Planning and Goal Setting 2. Curriculum and Instruction 3. Budgeting 4. Staff Development 5. School Organization
Decisions will be based on a Comprehensive Needs Assessment (CNA) with the 8 subtopics as listed below:
1. Jill Hardy – 8th Grade Team Leader, Math School Culture and Climate 2. Terri Garner – 7th Grade Team Leader, English Curriculum, Instruction/& Assessment 3. Martha Peloquin – 6th Grade Team Leader, History Student Achievement 4. Angela Jones – 6th Gr. Sunshine Committee, Math Demographics 5. Ashley Boyett – 8th Gr. DEIC , Science Family and Community Involvement 6. Andrea Russell– 7th Gr. Hospitality Team, Math Staff Quality, Recruitment, & Retention 7. Brandy Cook – 7th Gr. AVID Site Team, Science Technology
8. Laura Christopher - 6th Gr. GT/Pride & Legacy, Reading Pages 1-5 (TOC, Title Page, etc.) 9. Leah Besson -- 7th Gr. Student Needs Committee, Science School Organization 10. John Burkhalter – Principal 11. Kathy Guidry – Asst. Principal 12. Angela Dowling – Counselor 13. Parents: Pat Hardy, Danielle Swindell 14. Community Members: Robby Arrington, Tracy Session
3
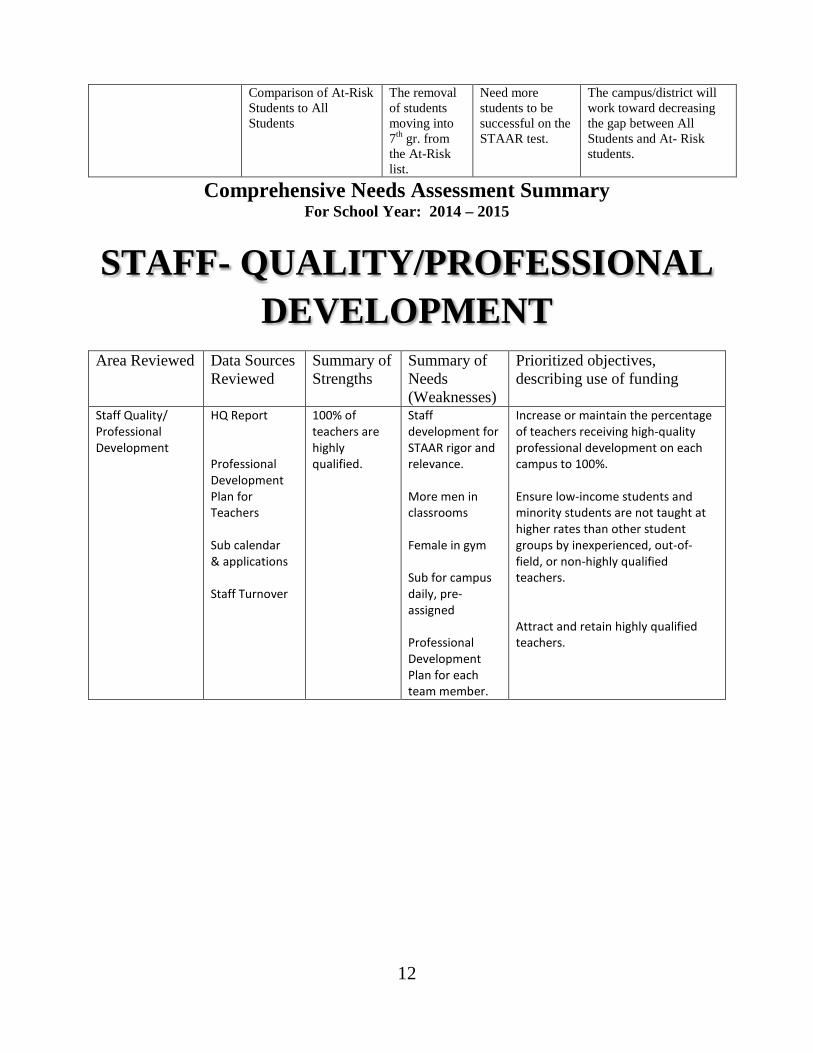
Table of Contents RJH Cultural Philosophy ................................................................................................................................ 5
.......................................................................................... 6 Comprehensive Needs Assessment Summary
SCHOOL CONTEXT AND ORGANIZATION ...................................................................................................... 6 Comprehensive Needs Assessment Summary .......................................................................................... 7
DEMOGRAPHICS............................................................................................................................................ 7 Comprehensive Needs Assessment Summary .......................................................................................... 8
FAMILY AND COMMUNITY INVOLVEMENT .................................................................................................. 8 Comprehensive Needs Assessment Summary .......................................................................................... 9
TECHNOLOGY ................................................................................................................................................ 9 Comprehensive Needs Assessment Summary ........................................................................................ 10
SCHOOL CULTURE AND CLIMATE ................................................................................................................ 10 Comprehensive Needs Assessment Summary ........................................................................................ 11
STUDENT ACHIEVEMENT ............................................................................................................................ 11 Comprehensive Needs Assessment Summary ........................................................................................ 12
STAFF- QUALITY/PROFESSIONAL DEVELOPMENT ....................................................................................... 12 Comprehensive Needs Assessment Summary ........................................................................................ 13
CURRICULUM/INSTRUCTION/ ..................................................................................................................... 13 ASSESSMENT ............................................................................................................................................... 13
RJH Goals, Objectives, & Strategies ........................................................................................................ 14
2014-2015 Priorities ................................................................................................................................ 14
DEMOGRAPHIC AND STUDENT ACHIEVEMENT .......................................................................................... 15 Goals and Strategies ............................................................................................................................... 15
OBJECTIVE 1 OF 7: Attendance & Retention ....................................................................................... 15
OBJECTIVE 2 OF 7: Reading Department ............................................................................................ 16
OBJECTIVE 3 of 7: Math Department .................................................................................................. 19
OBJECTIVE 4 of 7: Science Department ............................................................................................. 21
OBJECTIVE 5 of 7: Writing Department .............................................................................................. 22
OBJECTIVE 6 of 7: Social Studies/History Department ....................................................................... 24
OBJECTIVE 7 of 7: Health Department ................................................................................................ 25
CURRICULUM, INSTRUCTION, & ASSESSMENT ........................................................................................... 27 Goals and Strategies ............................................................................................................................... 27
OBJECTIVE 1 of 3: Curriculum ............................................................................................................ 27
OBJECTIVE 2 of 3: Instruction ............................................................................................................. 28
OBJECTIVE 3 of 3: Assessment ........................................................................................................... 29
STAFF- QUALITY/PROFESSIONAL DEVELOPMENT ....................................................................................... 30

4
Goals and Strategies ............................................................................................................................... 30
OBJECTIVE 1 of 1: Professional Development .................................................................................... 30
FAMILY and COMMUNITY INVOLVEMENT .................................................................................................. 32 Goals and Strategies ............................................................................................................................... 32
OBJECTIVE 1 of 2: Communication ................................................................................................... 32
OBJECTIVE 2 of 2: Healthy Career Exploration ................................................................................. 34
SCHOOL CULTURE & CLIMATE .................................................................................................................... 35 Goals and Strategies ............................................................................................................................... 35
OBJECTIVE 1of 4 : Student Character and Discipline .......................................................................... 35
OBJECTIVE 2 of 4: Staff Morale ........................................................................................................... 37
OBJECTIVE 3 of 4 : Drop Out Rate ....................................................................................................... 38
OBJECTIVE 4 of 4 : Healthy, Safe & Orderly School Environment ....................................................... 38
TECHNOLOGY .............................................................................................................................................. 40 Goals and Strategies ............................................................................................................................... 40
OBJECTIVE 1 of 3: Technology for Student Performance ................................................................... 40
OBJECTIVE 2 of 3: Internet Presence ................................................................................................. 42
OBJECTIVE 3 of 3: Staff Development with Technology ..................................................................... 42
SCHOOL CONTEXT & ORGANIZATION ......................................................................................................... 44 Goals and Strategies ............................................................................................................................... 44
OBJECTIVE 1 of 2: Leadership For School Staff And Facilities ............................................................ 44
OBJECTIVE 2 of 2: State Compensatory Education Funded Activities ............................................... 44

5
RJH Cultural Philosophy Mission – The WHY…..
Regardless of the circumstance into which a child is born, we will give them the best that can be offered!
We Learn….. No Excuses
Vision – What we aspire to become. To combine relevant knowledge with real-world situations.
Values – Our Commitments…. 1. We Believe…... that building relationships with students and staff that foster
motivation, support and teamwork is top priority. 2. We Believe…… we must create a caring and stimulating environment for maximum
student success. 3. We Believe….. we must be positive, open minded, cooperative, friendly, and
courteous to all we encounter.
Goals – Our Achievements…. 1. US HISTORY – TO HAVE 75% OF ALL STUDENTS AND ALL SUB-
POPS IN 8TH GRADE PASS THE STATE TEST. ALL FACULTY WILL
INCLUDE STRATEGIES TO MEET THIS GOAL. 2. RTI NEEDS – MOVEMENT WITHING TIERS BASED ON DATA EACH
QUARTER 3. PLC – TO BE DATA DRIVEN TO DETERMINE OUR INTERVENTIONS
AND ENRICHMENTS

6
Comprehensive Needs Assessment Summary For School Year: 2014 – 2015
SCHOOL CONTEXT AND ORGANIZATION
Area Reviewed Data Sources
Reviewed Summary of Strengths
Summary of Needs (Weaknesses)
Prioritized objectives, describing use of funding
Leadership for school staff and facilities State Compensatory Education Funded Activities
CIC meetings Team meetings Faculty surveys Master Schedule Staff Handbook Duty Rosters 2013-2014 Campus Plan
Structures in place Expectations for professionalism among staff Schedule – maximizing time Administrators who listen to staff for ideas Global Calls Skyward Access Internal and External
Facility updates… sign, cleaning, new lettering on front Improve communication between campus leadership teams Vertical alignment within JH grades along with Intermediate and HS
Work with the maintenance department for facility updates. Our campus will work toward putting processes and structures in place to support intervention of target students.

7
Comprehensive Needs Assessment Summary For School Year: 2014 – 2015
DEMOGRAPHICS
Area Reviewed Data Sources
Reviewed Summary of Strengths
Summary of Needs (Weaknesses)
Prioritized objectives, describing use of funding
Attendance • Skyward Database • 13-14 Campus Plan • AVID Data System • Special Populations
Reports • Transfer Student
Data
• LSES numbers are stable.
• Free breakfast to all students
• AVID student feedback along with future goals.
Increase attendance among low performing students
To have our attendance rate match or surpass last year’s rates.

8
Comprehensive Needs Assessment Summary For School Year: 2014 – 2015
FAMILY AND COMMUNITY INVOLVEMENT
Area Reviewed Data Sources
Reviewed Summary of Strengths
Summary of Needs (Weaknesses)
Prioritized objectives, describing use of funding
Communication Healthy Career Exploration
Parent – Teacher conferences Registration participation Attendance at extra-curricular functions Website Emails Skyward Family Access
Open door policy for parents with less than 24 hour turnaround for returned calls.
Keeping a positive perception.
To provide open lines of positive communication between the parents, staff and students. To improve the skills of students which will work in our community.

9
Comprehensive Needs Assessment Summary For School Year: 2014 – 2015
TECHNOLOGY Area Reviewed Data Sources
Reviewed Summary of Strengths
Summary of Needs (Weaknesses)
Prioritized objectives, describing use of funding
Student Performance Internet Presence Staff Development
STAR Chart results Teacher survey CIC meeting minutes Team meetings
Technology Department’s willingness to work for solutions. Flexibility of staff and students.
Teacher familiarity and comfort with use of laptops for instructional purposes. Reliability of connectivity with the laptops.
Increase technology use in classrooms to enhance student performance Regular updates of RJH webpage Increase the appropriate use of technology for students and staff

10
Comprehensive Needs Assessment Summary For School Year: 2014 – 2015
SCHOOL CULTURE AND CLIMATE
Area Reviewed Data Sources
Reviewed Summary of Strengths
Summary of Needs (Weaknesses)
Prioritized objectives, describing use of funding
Staff Morale Student Character and Discipline Student Drop-Out Healthy, Safe & Orderly School Environment
Last Year’s Campus Plan Staff participation in social activities Dialogue participation in lunch conversations Drop Out Data Teacher and Student Survey
Staff morale Character Days Drop Out rate is minimal. Volunteer Mentor Program Staff Involvement in Support Committees Adjustment of the School Calendar with a break every month except February.
Staff morale is a challenge with no time for academic teaming for teachers to communicate effectively The need for more parental involvement
We will take active steps to foster positive morale on campus. Our campus will work toward reducing the number of conduct problems referred to the office and increase character. Our campus will strive to reduce the drop- out rate. RJH will strive to provide an environment that is designed to prevent or reduce violence and illegal activities as well as an efficient response to all emergencies keeping all students safe and healthy.

11
Comprehensive Needs Assessment Summary For School Year: 2014 – 2015
STUDENT ACHIEVEMENT
Area Reviewed Data Sources Reviewed
Summary of Strengths
Summary of Needs (Weaknesses)
Prioritized objectives, describing use of funding
Attendance Reading Math Science Writing Social Studies/History Health Education
2014 STAAR raw scores grades 6-8
Areas that scored at or above the state average in the Spring of 2014 included: Reading 6th - +6 7th - +6 8th - +4 Math 6th - +4 8th - +12 Writing +6 Science +9
Improvement in the following areas will allow us to exceed the state averages and improve our number of students receiving an Advanced Performance: 7th Gr. Math -2 8th Gr. Hist. -20
In each testing area of STAAR the district will work toward all subgroups scoring above state average. Subgroups include: All Students A. American Hispanic White Male Female Eco Dis At-Risk
Student Pregnancy Rates
No pregnancies between any of our students
Continue to be pro-active to build positive and healthy esteems. Continue Choosing the Best.
Strengthen and utilize the School Health Advisory Council to support the implementation of all school health policies and practices – SCE Funds
TELPAS Results
Many students advanced one proficiency level
In TELPAS RJH will move toward each student advancing at least one proficiency level each year to meet AMAO Objectives and standards
Retention Rates
One retention for 13-14 last year.
Continue to seek motivational strategies
The district will work toward a retention rate less than the state average.
12
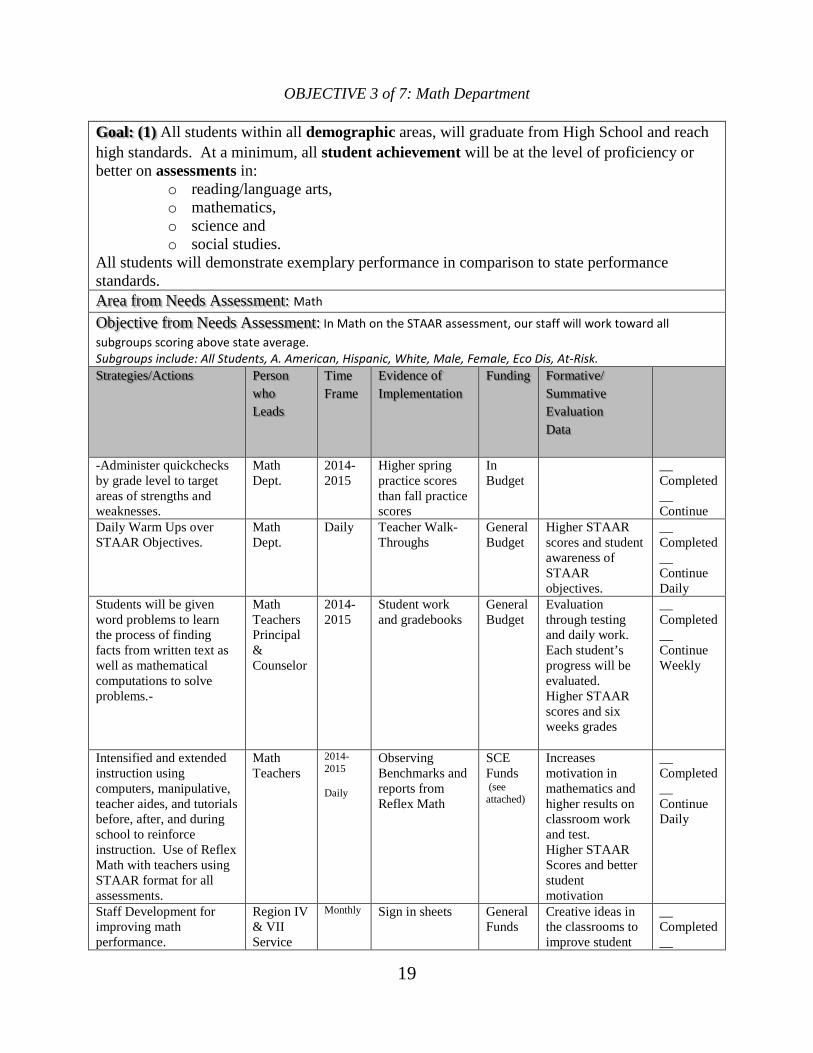
Comparison of At-Risk Students to All Students
The removal of students moving into 7th gr. from the At-Risk list.
Need more students to be successful on the STAAR test.
The campus/district will work toward decreasing the gap between All Students and At- Risk students.
Comprehensive Needs Assessment Summary For School Year: 2014 – 2015
STAFF- QUALITY/PROFESSIONAL DEVELOPMENT
Area Reviewed Data Sources
Reviewed Summary of Strengths
Summary of Needs (Weaknesses)
Prioritized objectives, describing use of funding
Staff Quality/ Professional Development
HQ Report Professional Development Plan for Teachers Sub calendar & applications Staff Turnover
100% of teachers are highly qualified.
Staff development for STAAR rigor and relevance. More men in classrooms Female in gym Sub for campus daily, pre-assigned Professional Development Plan for each team member.
Increase or maintain the percentage of teachers receiving high-quality professional development on each campus to 100%. Ensure low-income students and minority students are not taught at higher rates than other student groups by inexperienced, out-of-field, or non-highly qualified teachers. Attract and retain highly qualified teachers.

13
Comprehensive Needs Assessment Summary For School Year: 2014-2015
CURRICULUM/INSTRUCTION/ ASSESSMENT
Area Reviewed Data
Sources Reviewed
Summary of Strengths
Summary of Needs (Weaknesses)
Prioritized objectives, describing use of funding
Curriculum
Scope and Sequence Listings TEKS
Implementing Dr. Bill Daggett’s and Margaret Kilgo strategies.
Teachers reported the need for more STAAR resources
Campus will work toward 100% of grade levels/subjects having a complete sequence showing student expectations. Campus will work toward 100% of teachers utilizing their grade/subject sequence. Campus will work toward training all teachers on the Teacher Toolkit in planning with the targeted student expectations.
Instruction
Master Schedule Professional Development Calendar
Maximum efficiency in the Master Schedule
Campus will work toward all teachers using the Teacher Toolkit in planning including selecting research based instructional strategies Campus will work toward all teachers knowing and teaching the standards.
Assessment Academic assessments Quick Checks
Past success on STAAR
Campus will work toward all teachers requiring that kids show proof of learning at least daily. Campus will work toward all teachers improving their questioning strategies.

14
RJH Goals, Objectives, &
Strategies
2014-2015 Priorities Goals, objectives and strategies address our identified needs for 2014 – 2015: Beginning with 2014 – 2015, Rusk ISD has identified the following goals:
• (1) All students within all demographic areas, will graduate from High School and reach high standards. At a minimum, all student achievement will be at the level of proficiency or better on assessments in:
o reading/language arts, o mathematics, o science and o social studies.
All students will demonstrate exemplary performance in comparison to state performance standards. • (2) All students will be provided a well-balanced and appropriate curriculum, keeping abreast of the
development of creative and innovative instructional techniques, to improve learning. • (3) All students will be taught by highly qualified staff current in professional development. • (4) All students in the community will have families that are full partners with educators in the education
of their children. • (5) All students will be educated in a school culture and climate that is safe, drug-free, and conducive to
learning. • (6) All students will have the benefit of technology that is implemented and used to increase the
effectiveness of student learning, instructional management, staff development and administration. • (7) All students will be educated in a school context and organization which ensures processes,
structures, decision-making and overall leadership address quality teaching and learning.

15
DEMOGRAPHIC AND STUDENT ACHIEVEMENT
Goals and Strategies
OBJECTIVE 1 OF 7: Attendance & Retention
Goal: (1) All students within all demographic areas, will graduate from High School and reach high standards. At a minimum, all student achievement will be at the level of proficiency or better on assessments in:
o reading/language arts, o mathematics, o science and o social studies.
All students will demonstrate exemplary performance in comparison to state performance standards. Area from Needs Assessment: Attendance and Retention Objective from Needs Assessment: To have our attendance rate match or surpass last year’s rates. The district will work toward a retention rate less than the state average. Strategies/Actions Person
Responsible
Funding Resources
Timelines Evidence of Implementation
Formative/ Summative Evaluation Data
__ Completed __ Continue
Celebrate perfect Teachers, None EOY Increase perfect Attendance __ Completed
2003-04
2004-05
2005-06
2006-07
2007-08
2008-09
2009-10
2010-11
2011-12
6th Grade 96.21 96.6 96.86 96.62 96.62 96.26 96.16 96.74 96.397th Grade 95.82 95.97 96.49 96.63 95.55 96.76 95.83 96.77 96.688th Grade 95.45 95.48 95.84 96.63 95.9 96.02 96.08 96.19 96.31
94.5
95
95.5
96
96.5
97
6th Grade
7th Grade
8th Grade

16
attendance.
Assistant Principal
Ceremony
attendance for each grade level
Reports __ Continue
Increase extra-curricular and co-curricular choices for more interest and participation
Principal
None Fall 2014 and Spring 2015
More interest in school because of participation
Attendance and participation
__ Completed __ Continue
Send letter to parents and contact parent by phone. Initiate legal action through Truant Officer when necessary.
Attendance Clerk on campus, Assistant Principal and Principal
None Weekly each Thursday
Increase attendance
Improved attendance rate
__ Completed __ Continue
OBJECTIVE 2 OF 7: Reading Department Goal: (1) All students within all demographic areas, will graduate from High School and reach high standards. At a minimum, all student achievement will be at the level of proficiency or better on assessments in:
o reading/language arts, o mathematics, o science and o social studies.
All students will demonstrate exemplary performance in comparison to state performance standards.
ReadingArea from Needs Assessment: RJH will toward each student advancing at least one proficiency level each Objective from Needs Assessment:
year to meet AMAO Objectives and standards for the TELPAS assessment as well as advance all of our students reading levels to meet or exceed the state average in all subgroups. Strategies/Actions Person to be
Leader
Time Frame
Evidence of Implementation
Funding Resources
Formative/ Summative Evaluation Data
*Develop student’s profiles using disaggregation of STAAR data and the A/R STAR test. We will assess needs of individual students for effective instructional purposes in the classroom, TEAM, and content mastery. Computer assisted instruction will be provided through content
Teachers
2014-2015
Improve STAAR scores through practice and mastery of objective. Computer printouts on student achievements and lesson plans also will be used.
General Budget and SCE Funds
Evaluation through content mastery reports, progress reports, and report cards. Evaluations by comparing test scores, six weeks
__ Completed __ Continue

17
mastery and I-Station via individual laptops. In addition extended instruction is provided by teacher during TEAMs and in tutorials during conference time, before/after school, and during elective class time. .
grades, Benchmark tests, STAAR practice tests, daily observations and daily grades.
*The Accelerated Reading Program will be continued in all subjects areas. Various incentives will be used to motivate students.
Librarian Teachers, and Aides
2014-2015
Students will be STAR tested to determine individual reading levels. A plan of action according to specific abilities will be established to improve reading comprehension and fluency, accumulated A/R points and A/R passing percentage.
General Budget and SCE Funds
Improvement on Renaissance STAR grading levels and improved goals through the year.
__ Completed __ Continue
Use of Rosetta Stone to assistant LEP students reading and understanding levels
ESL Certified Teachers and CM
2014-2015
Teacher input ESL Funds TELPAS analysis
__ Completed __ Continue
Glencoe Literature Texas Treasures 6th, 7th, 8th McGraw-Hill Reading (6th)
Reading Teachers
2014-2015
Teacher observation
General Funds
Improvement in TEKS Based Test Scores - Benchmarks
__ Completed __ Continue
Provide tutoring for students in need of special teacher instruction.
Principal Counselor Faculty
2014-2015
Improved STAAR scores and quarterly grades.
General Budget and SCE Funds
Team meetings, individual student reports, and lesson plans will be a tool used to evaluate.
__ Completed Continue
Tier II - Reading Labs (SALT or Read 180) including maintenance agreement to support Read 180 system. Students identified as Dyslexic will be served through these instructional
Boyett, Wright, Christopher, Renner
2014-2015
Low student-teacher ratio for reinforcement of target objectives in reading including phonics, fluency and
General & SCE Funds
STAAR scores
__ Completed __ Continue

18
setting when appropriate. Tier III – EE Reading
comprehension.
Improve reading fluency, comprehension, listening skills, and general self-confidence of students through the community volunteers who listen to students read and interact with students one on one.
Principal
2014-2015
Sign in sheets
Activity Funds
Volunteer Celebration in late Spring with student feedback
__ Completed __ Continue
Staff Development
Region VII. Service Center & Principal
2014-2015
Sign in sheets Title Funds and General Funds
Creative ideas in the classrooms to improve student performance
__ Completed __ Continue
Provide enrichment programs and extended activities for GT students
Principal & GT Teachers
2014-2015
Improving STAAR Scores, student daily grades, increased AR points, behavior management Greater participation and achievement at UIL
GT Funds Leadership development among our students
__ Completed __ Continue
Practice State Assessments will be administered throughout the year with students working in workshop settings based on results.
Principal Counselor Subject area Teachers
2014-2015
Student Participation
General Funds
Improved STAAR scores
__ Completed __ Continue
Performance rewards will be used to enhance the educational advancement of our students.
Central Office and Principal
2014-2015
Checks being delivered in November
General Funds
High staff morale and improved student STAAR scores
__ Completed __ Continue
Teachers create and adjust quickchecks parallel to STAAR assessment.
Reading Teachers
June 2015
Observation of Quickchecks and their updates
General Funds
Quickchecks and other assessments are in line with the STAAR assessment.
__ Completed __ Continue
19
OBJECTIVE 3 of 7: Math Department Goal: (1) All students within all demographic areas, will graduate from High School and reach high standards. At a minimum, all student achievement will be at the level of proficiency or better on assessments in:
o reading/language arts, o mathematics, o science and o social studies.
All students will demonstrate exemplary performance in comparison to state performance standards.
MathArea from Needs Assessment: In Math on the STAAR assessment, our staff will work toward all Objective from Needs Assessment:
subgroups scoring above state average. Subgroups include: All Students, A. American, Hispanic, White, Male, Female, Eco Dis, At-Risk. Strategies/Actions Person
who Leads
Time Frame
Evidence of Implementation
Funding
Formative/ Summative Evaluation Data
-Administer quickchecks by grade level to target areas of strengths and weaknesses.
Math Dept.
2014-2015
Higher spring practice scores than fall practice scores
In Budget
__ Completed __ Continue
Daily Warm Ups over STAAR Objectives.
Math Dept.
Daily
Teacher Walk-Throughs
General Budget
Higher STAAR scores and student awareness of STAAR objectives.
__ Completed __ Continue Daily
Students will be given word problems to learn the process of finding facts from written text as well as mathematical computations to solve problems.-
Math Teachers Principal & Counselor
2014-2015
Student work and gradebooks
General Budget
Evaluation through testing and daily work. Each student’s progress will be evaluated. Higher STAAR scores and six weeks grades
__ Completed __ Continue Weekly
Intensified and extended instruction using computers, manipulative, teacher aides, and tutorials before, after, and during school to reinforce instruction. Use of Reflex Math with teachers using STAAR format for all assessments.
Math Teachers
2014-2015 Daily
Observing Benchmarks and reports from Reflex Math
SCE Funds (see attached)
Increases motivation in mathematics and higher results on classroom work and test. Higher STAAR Scores and better student motivation
__ Completed __ Continue Daily
Staff Development for improving math performance.
Region IV & VII Service
Monthly Sign in sheets General Funds
Creative ideas in the classrooms to improve student
__ Completed __

20
Center & Principal
performance Continue Monthly
Targeted students will be given extended instruction through Math Lab, morning and afternoon tutorials
Math Teachers, Math Lab Teachers
2014-2015
Lesson Plans and Department Meetings
SCE Funds (see attached)
Higher scores, achievement through periodic check of time spent in Math Lab for Math instruction.
__ Completed __ Continue bi-weekly in PLC’s.
EE – Math for Tier III purposes
McCown Each Quarter
RtI Participation
General Budget
Higher STAAR scores Reduction in Tier II & III students.
__ Completed __ Continue
Provide extended learning opportunities for G/T students through the GATES programs.
Math Teachers
2014-2015
Administrative Observations
General Budget
Commended performance results on STAAR
__ Completed __ Continue
Provide teacher aide to work with students. Use Content Mastery for support in teaching lessons. Provide IEP modification and intervention programs for students.
Math Teacher, C.M. Teacher Aide
Daily
Sign in sheets and ARD meetings
SCE Funds (see attached)
Staff evaluations __ Completed __ Continue Daily
Grade level Math teachers will create a PLC that will meet on a regular basis to improve communication and planning.
Math Teachers
Bi Weekly
Meeting Minutes and Observations
General Budget
Higher Scores __ Completed __ Continue
Word Wall in each classroom to strength/reinforce vocabulary
Math Teachers
2014-2015
Classroom Observations
General Budget
More aligned curriculum and share ideas.
Oct 20 Completed __ Continue
Practice State Assessments will be administered in Spring with students working in tutorial settings based on results
Principal Counselor Teachers
2014-2015
Administrative Observations
General Funds
Improved STAAR scores
__ Completed __ Continue
Performance rewards will be used to enhance the educational advancement of our students.
Central Office and Principal
Weekly
Checks being delivered in November
General Funds
High staff morale and improved student STAAR scores
__ Completed __ Continue
CAMT Betty Collins
July 2015
Meal Reimbursement Forms
Title II-A
Attain new ideas and instructional strategies to assist our students to be successful.
__ Completed __ Continue

21
OBJECTIVE 4 of 7: Science Department
Goal: (1) All students within all demographic areas, will graduate from High School and reach high standards. At a minimum, all student achievement will be at the level of proficiency or better on assessments in:
o reading/language arts, o mathematics, o science and o social studies.
All students will demonstrate exemplary performance in comparison to state performance standards.
ScienceArea from Needs Assessment: In 8th Grade Science on the STAAR assessment, our staff will work Objective from Needs Assessment:
toward all subgroups scoring above state average. Subgroups include: All Students A. American Hispanic White Male Female Eco Dis At-Risk Strategies/Actions Person who
Leads
Time Frame
Evidence of Implementation
Funding
Formative/ Summative Evaluation Data
Field Trips and Critical problem solving activities and guest speakers.
Science Teachers
2014-2015
Students will participate in field trips that expose them to career opportunities, validate the importance of science & reinforce classroom concepts
General Funds
Successful STAAR scores
__ Completed __ Continue
Instruction more individualized based on pre-test assessment with daily warm-ups over STAAR Objectives
Science Teachers
2014-2015
Students will be given a selection of quickcheck questions to examine.
No cost Grades on integrated assignment in each class as well as successful STAAR scores
__ Completed __ Continue
Professional Development of Science Department
Science Department Betty Collins
2014-2015
Attend CAST by Science Teachers and
Title VI General Fund
1. To increase instructional strategies and
Oct 20 Completed __

22
J. Burkhalter have Science Teachers involved with Region VII Collaboratives.
ideas 2.To develop leadership among our teachers
Continue
Use technology to support STAAR requirements
Classroom Teachers and Technology Department
2014-2015
Classroom Observations
General Budget
Higher STAAR Scores Quickchecks
__ Completed __ Continue
Teachers create and adjust quickchecks parallel to STAAR level questioning and show mastery of the TEKS
Science Teachers
2014- 2015
Administrative Observations
General Budget
Benchmarks and other assessments are in line with the STAAR assessment.
__ Completed __ Continue
We will assess needs of individual students for effective instructional purposes in the classroom, TEAM, and content mastery. In addition extended instruction is provided by teacher during TEAM and in tutorials during conference time, before/after school, and during elective class time.
Science Teachers along with entire 8th grade PLC
2014-2015
Improve STAAR scores through practice and mastery of objective. DMAC data and lesson plans also will be continually evaluated.
General Budget; SCE
Evaluation through content mastery reports, progress reports, and report cards. Evaluations by comparing test scores, quarterly grades, Quickchecks, STAAR practice tests, daily observations and daily grades.
__ Completed __ Continue
Spend increased lab time with hands-on experiences targeting STAAR objectives where students scored lowest according to quickchecks.
Science Teachers
2014-2015
Students will see more relevance to what they are learning which enhances their performance.
General Budget
Better results on lab assignments, which guide students through hands-on experimentation and inquiry.
__ Completed __ Continue
OBJECTIVE 5 of 7: Writing Department Goal: (1) All students within all demographic areas, will graduate from High School and reach high standards. At a minimum, all student achievement will be at the level of proficiency or better on assessments in:
o reading/language arts, o mathematics, o science and o social studies.

23
All students will demonstrate exemplary performance in comparison to state performance standards.
WritingArea from Needs Assessment: In 7th Grade Writing on the STAAR assessment, our staff will work toward Objective from Needs Assessment:
all subgroups scoring above state average. Subgroups include: All Students A. American Hispanic White Male Female Eco Dis At-Risk Strategies/Actions Person who
Leads
Time Frame
Evidence of Implementation
Funding
Formative/ Summative Evaluation Data
Disaggregating of information through 7th grade PLC will assess needs of individual students for effective instructional purposes.
Garner Thompson Counselor
2014-2015
Student Schedules
General Budget
Results of quickcheck tests will show improvement
__ Completed __ Continue
Emphasis on capitalization and punctuation in all content areas.
All classroom teachers & aides
2014-2015
Lesson Plans and Administrative Observations
General Budget
Students will show improvement in punctuation and capitalization.
__ Completed __ Continue
Daily Oral Language (DOL) journals, and proofreading will be directed towards STAAR objective
English Teachers
2014-2015
Teacher observation
General Budget
Student grade will reflect improvement of STAAR skills
__ Completed __ Continue
Teach methods of writing geared toward STAAR prompts with emphasis on grammar
English Teachers
2014-2015
Pre and Post test will reflect improvement
General Budget
Improvement on Quickchecks
Use of Writing 6th & 7th 2014- Administrative General Students will __ Completed

24
With Power, Glencoe Texas Treasures Literature, Write Source, Scholastic Action, Scholastic Scope
Grade English Teachers
2015
Observations
Budget show improvement in language and literature skills
__ Continue
Use of Study Island as an instructional technology tool.
Language Arts Teachers
2014-2015
Lesson Plans and Administrative Observations
General Budget
All English students will be given quickchecks to determine mastery of skills
__ Completed __ Continue
OBJECTIVE 6 of 7: Social Studies/History Department
Goal: (1) All students within all demographic areas, will graduate from High School and reach high standards. At a minimum, all student achievement will be at the level of proficiency or better on assessments in:
o reading/language arts, o mathematics, o science and o social studies.
All students will demonstrate exemplary performance in comparison to state performance standards. Social Studies/HistoryArea from Needs Assessment:
The campus/district will work toward decreasing the gap between All Students Objective from Needs Assessment:and At-Risk students and ensure students grasp a useful knowledge of history from 1607-1865. Strategies/Actions Person who
Leads
Time Frame
Evidence of Implementation
Funding
Formative/ Summative Evaluation Data
Social Studies curriculum development will be based on STAAR indicators through incorporating TEKS material in all levels of instruction.
History teachers and principal
2014-2015
ASA sub-populations and ASA of all populations meet minimum expectations on the Social Studies STAAR test.
General Funds
Successful STAAR scores
__ Completed __ Continue
Sponge and Warm-up activities will be directed toward STAAR objectives.
History teachers
2014-2015
Administrative Observations
General Funds
Students daily sponge activities will improve
__ Completed __ Continue

25
Extended and intensified instruction will be implemented using the resources available in the Library and on Internet.
History teachers
2014-2015
Lesson Plans and Observations
General Funds
Successful STAAR scores
__ Completed __ Continue
Disaggregating quickcheck scores
History Department
2014-2015
DMAC results General Funds
Specified lessons to target weaknesses
__ Completed __ Continue
Safari Montage will be used to support TEKS requirements
History Teachers
2014-2015
Lesson Plans and Observations
General Funds
Successful STAAR scores
__ Completed __ Continue
Administer quickchecks by grade level to target areas of strengths and weaknesses
History teachers, Content Mastery teachers, and all teachers
2014-2015
Lesson Plans and Observations
General Funds
ASA of sub-populations will pass the Social Studies STAAR test. ASA of all populations will pass the Social Studies STAAR test.
__ Completed __ Continue
Word Wall
History teachers
2014-2015
Classroom Observation
General Budget
Improve Knowledge of Words
__ Completed __ Continue
Channel One News
All Homeroom 1st Period Teachers
2014-2015
Classroom Observation
No Expenses
Improve knowledge of world events
__ Completed __ Continue
OBJECTIVE 7 of 7: Health Department Goal: (1) All students within all demographic areas, will graduate from High School and reach high standards. At a minimum, all student achievement will be at the level of proficiency or better on assessments in:
o reading/language arts, o mathematics, o science and o social studies.
All students will demonstrate exemplary performance in comparison to state performance standards.
HealthArea from Needs Assessment: Strengthen and utilize the School Health Advisory Council to support the Objective from Needs Assessment:
implementation of all school health policies and practices

26
Strategies/Actions Person who Leads
Time Frame
Evidence of Implementation
Funding
Formative/ Summative Evaluation Data
Use of daily activities that will ensure students success on Fitness Gram
Health and PE teachers as well as coaches
May 2015
Use of daily activities that will ensure students success on Fitness Gram
General Funds
100% of students within the Health Fitness Zone
__ Completed __ Continue
Implementation of all recommendations from the SHAC.
Counselor, Principal
May 2015
All recommendations will be met.
General Funds
Implementation of all recommendations from the SHAC.
__ Completed __ Continue
All PE classes to be using the Health textbook and other resources to teach the TEKS
Health and PE teachers Principal
2014-2015
Administrative Observations
General Funds
Health Awareness among students
__ Completed __ Continue
Develop a favorable menu to meet all federal and state guidelines for all student meals
Food Service Director
2014-2015
Lunch Menus Food Service Funding
Meals eaten by students
__ Completed __ Continue

27
CURRICULUM, INSTRUCTION, & ASSESSMENT
Goals and Strategies
OBJECTIVE 1 of 3: Curriculum Goal: (2) All students will be provided a well-balanced and appropriate curriculum, keeping abreast of the development of creative and innovative techniques, to improve learning. Area from Needs Assessment: Curriculum Objective from Needs Assessment: Campus will work toward 100% of grade levels/subjects having a complete sequence showing student expectations, 100% of teachers utilizing their grade/subject sequence, and all teachers using the Teacher Toolkit in planning with targeted student expectations. Strategies/Actions Lead Person
Funding Resources
Time Frame Evidence of Implementation
Formative/ Summative Evaluation Data
Administrative Updates and Reminders via meetings and emails.
Office Team General Funds
2014-2015 Email Memos Does the staff know the ABC’s of RISD?
__Met Strategy __Continue Strategy
Targeted Intervention and Enrichment during TEAM times.
Grade Level PLC Leaders
General Funds SCE
2014-2015 Rosters Pre & Post Assessment STAAR Results
Teacher feedback and STAAR results
__Met Strategy __Continue Strategy
Reflex Math Usage for the lowest students.
Math Dept. General Funds
2014-2015 Reflex Math Reports
STAAR Results
__Met Strategy __Continue Strategy
All dyslexic students will have the opportunity to receive additional support in academic areas.
CM teachers Glynis Friederich L. Christopher Ashley Renner Betty Frazer Reading Teachers
General Funds
On-going Use of the following: Content Mastery, System 44, Read 180, SALT
Improved scores in Reading, Math and Writing
__Met Strategy __Continue Strategy
G.T. students will participate in training sessions for academic competition (U.I.L)
Angela Jones General Funds
Fall Semester
Practice Schedules of all UIL Coaches
U.I.L. Academic District Meet Participation
__Met Strategy __Continue Strategy
GT students have an opportunity to work on curriculum that has increased depth and complexity and may be accelerated.
GT Certified Teachers
GT Funding
August – Face to Face with observations throughout the year.
Administrative Observations
Participation in 6 Hour Annual Update in August of 2015.
__Met Strategy __Continue Strategy

28
Offering of advanced classes of rigor: Pre-Algebra 7th Algebra I 8th
TSDE 8th
Agriculture 8th
Mashell Gates Jill Hardy Shonda Rogers Ag Teacher Counselor Principal
General Funds
2014-2015 Master Schedule
Student participation - rosters
Oct 20 CIC – Met __Continue
Listen to PLC’s to discuss District and Campus Goals
Principal with all teachers
General Funds
Calendar of dates and times throughout the year.
Meeting Minutes Teacher and Administrative Feedback
__Met Strategy __Continue Strategy
OBJECTIVE 2 of 3: Instruction Goal: (2) All students will be provided a well-balanced and appropriate curriculum, keeping abreast of the development of creative and innovative techniques, to improve learning. Area from Needs Assessment: Instruction Objective from Needs Assessment: Campus will work toward all teachers using the Teacher Toolkit in planning including selecting research based instructional strategies and knowing and teaching the standards. Strategies/Actions Lead
Person
Funding Resources
Time Frame
Evidence of Implementation
Formative/ Summative Evaluation Data
Increase the number of Special Ed students served in mainstream or instructional setting of 41 and taking STAAR.
Principal, Counselor and Special Ed. Dept.
Special Education Funding
May 2014to plan for 13-14
Reports that include all 41 and 42 on the campus.
Did the number decrease? Did we adjust our schedule to reflect 79 minutes or less of instructional delivery in a sped setting?
Oct 20 CIC – Met __Continue
Provide an additional reading class centered on reading improvement (SALT or Read 180)
Friederich, Renner, Christopher, Boyett
General Funds; SCE
2014-2015 Class Rosters Improved Reading scores Renaissance Enterprise & STAAR
Oct 20 CIC – Met __Continue
All students who have not mastered STAAR objectives will have an opportunity to improve their reading, writing, science, history and/or math skills.
All Teachers General Funds
2014-2015 Use of TEAM times for targeted interventions
Improved student confidence and STAAR scores
__Met Strategy __Continue Strategy

29
Tutorials before and after school for at-risk students
All Teachers General Funds
2014-2015 Attendance STAAR Results
__Met Strategy __Continue Strategy
Ensure FAPE is provided to students in ISS and/or DAEP.
Asst. Principal
All Year Student BIP’s ensure that all measures are utilized before general education academic instruction is altered due to time in ISS.
10 Day Charts – No student has exceeded.
__Met Strategy __Continue Strategy
Accelerated Instruction Plan (AIP) Students that fail STAAR Reading and Math
Reading & Math Teachers
General Funds
May, June, July 2015
Observation during 1st Six Weeks
STAAR Results
Oct 20 CIC – Met __Continue
OBJECTIVE 3 of 3: Assessment Goal: (2) All students will be provided a well-balanced and appropriate curriculum, keeping abreast of the development of creative and innovative techniques, to improve learning. Area from Needs Assessment: Assessment Objective from Needs Assessment: Campus will work toward all teachers improving their questioning strategies with all teachers requiring that kids show proof of learning at least weekly. Strategies/Actions Lead
Person
Funding Resources
Time Frame
Evidence of Implementation
Formative/ Summative Evaluation Data
8th graders will participate in CAPS assessment and Career Cruising along with the Explore Test.
Counselor
Testing Materials Budget SCE
May 2015
Student participation.
Counselor and student feedback.
__Met Strategy __Continue Strategy
6th grade GATES reassessment to identify areas of academic strengths.
Counselor General Funds
Spring 2015 Reassessment results
Correct academic placement by subject area strength
__Met Strategy __Continue Strategy
Improved Reading Scores
Reading Teachers
General Funds
All Year Renaissance Enterprise Reports
Correct academic placement by subject area strength
__Met Strategy __Continue Strategy
Improved Math Scores
Math Teachers General Funds
All Year Renaissance Enterprise Reports
Correct academic placement by subject area strength
__Met Strategy __Continue Strategy

30
STAFF- QUALITY/PROFESSIONAL DEVELOPMENT
Goals and Strategies
OBJECTIVE 1 of 1: Professional Development Goal: (3) All students will be taught by highly qualified staff current in professional development.
Area from Needs Assessment: Professional Development Objective from Needs Assessment: Increase or maintain the percentage of teachers receiving high-quality professional development on campus to 100% by participating in local, regional and state and national professional development. Strategies/Actions Person
Responsible
Funding Resources
Time Frame
Evidence of Implementation
Formative/ Summative Evaluation Data
__Met Strategy __Continue Strategy
System 44/Read 180
Read 180 Specialist Special Ed and RTI Teachers
Title I SCE
Dates TBA
Special Education and RTI students enrolled in and using System 44/Read 180
# of Students showing growth from BOY to EOY
__ Completed __ Continue
Conference for Advancement of Math Teaching (CAMT)
Betty Collins J. Burkhalter, Math Teachers
Title I June 24-26, 2015 Houston GR Brown
Teachers implement knowledge gained into classroom
STAAR scores above state average
__ Completed __ Continue
Conference for the Advancement of Science Teaching (CAST)
B. Collins J. Burkhalter Science Teachers
Title I Nov. 20-22, 2014 Dallas Anatole
Teachers implement knowledge gained into classroom
STAAR scores above state average
__ Completed __ Continue
Space Exploration Educators Conference (SEEC)
B. Collins J. Burkhalter Boyett, Cook
Title I Feb. 6-8, 2015 Austin
Teachers implement knowledge gained into classroom
STAAR scores above state average
__ Completed __ Continue
AVID Summer Institute
TBA, Russell Watkins
High School Allotment
June 2015 Dallas
AVID Teachers implementation of strategies
AVID student success stories
__ Completed __ Continue
Gifted & Talented Certification 6 Hour Update
J. Burkhalter GT Certified Staff
General 2014-2015 Through the year
Certificates from Region VII
Delivery of GT instruction to applicable students
__ Completed __ Continue
Gifted & Talented Certification 30 Hour Initial Training
Kellis General Summer 2015
Certificates from Region VII
Delivery of GT instruction to applicable
__ Completed __ Continue

31
students Professional Learning Community (PLC) Study
Burkhalter Peloquin, Garner, Hardy
General July 16-18, 2015 San Antonio
Sign in Sheets Improved implementation of PLC’s on campus.
__ Completed __ Continue
Texas Computer Educators Assoc. Conference (TCEA)
Betty Collins J. Burkhalter Henderson
Title II,A Feb. 3-7, Austin
Teachers implement knowledge gained into classroom
Increased technology in instruction.
__ Completed __ Continue
TASSP - Leadership Conference
J Burkhalter K Guidry Teacher Leaders
General 2nd week of June 2015
Leadership ideas implemented.
Increased leadership among staff
__ Completed __ Continue
PLC Updates Theresa Gates
General Every other month from 1-4 p.m.
Attendance by Burkhalter Hardy, Garner, Peloquin or their designee
Improved PLC’s on campus.
__ Completed __ Continue
Summer Staff Development for Curriculum, Instruction and Assessment (ELA, Math, Social Studies & Science) with focus on collaboration between Special Ed and Regular Ed teachers
Betty Collins J. Burkhalter Teachers
Title I June 3-4, 2015
Scope and Sequence, Instructional Practice and benchmark assessments (modified and general) reviewed
STAAR scores above state average
__ Completed __ Continue
Maintain highly qualified teachers in all subject areas
J. Burkhalter B. Collins
General Funds
August 2014
100% Highly Qualified Staff
HQ Report submitted by T. Gates
__ Completed __ Continue
Job Fair Attendance J. Burkhalter B. Collins S. Davis
General Funds
Spring and Summer of 2014
HQ Applications for positions available
All positions filled with HQ applicants
__ Completed __ Continue
32
FAMILY and COMMUNITY INVOLVEMENT
Goals and Strategies
OBJECTIVE 1 of 2: Communication
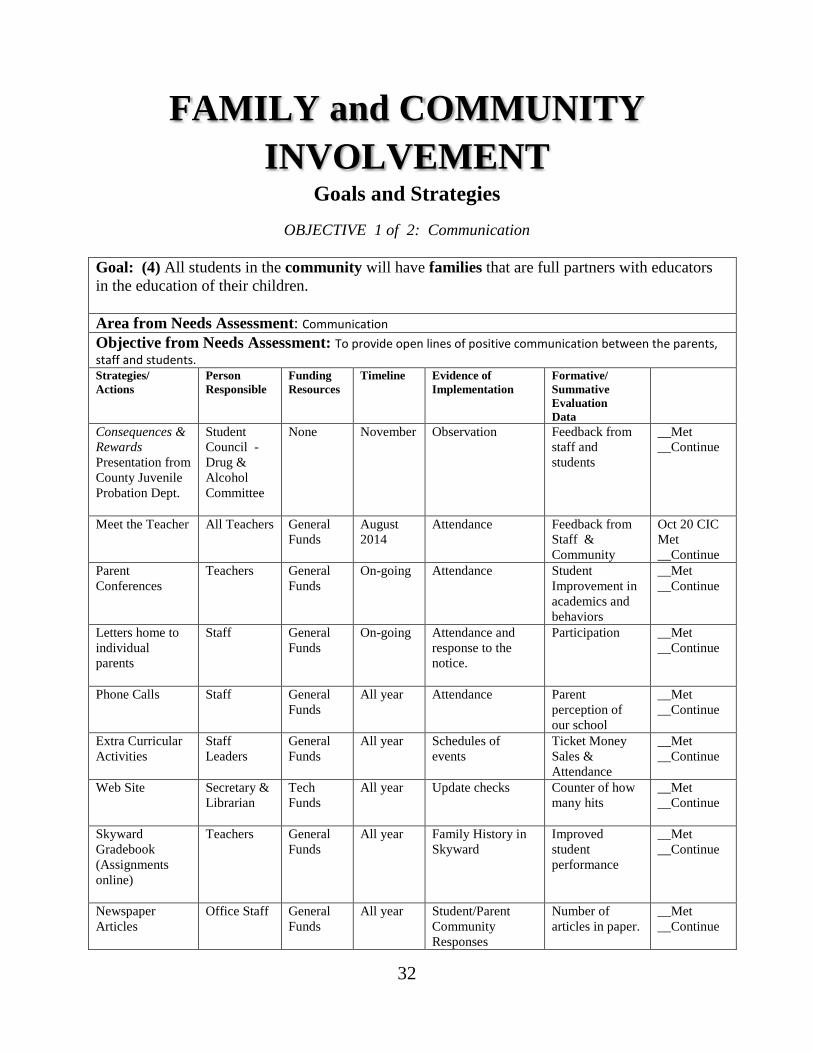
Goal: (4) All students in the community will have families that are full partners with educators in the education of their children.
Area from Needs Assessment: Communication Objective from Needs Assessment: To provide open lines of positive communication between the parents, staff and students. Strategies/ Actions
Person Responsible
Funding Resources
Timeline Evidence of Implementation
Formative/ Summative Evaluation Data
Consequences & Rewards Presentation from County Juvenile Probation Dept.
Student Council - Drug & Alcohol Committee
None
November
Observation
Feedback from staff and students
__Met __Continue
Meet the Teacher
All Teachers
General Funds
August 2014
Attendance
Feedback from Staff & Community
Oct 20 CIC Met __Continue
Parent Conferences
Teachers
General Funds
On-going
Attendance
Student Improvement in academics and behaviors
__Met __Continue
Letters home to individual parents
Staff
General Funds
On-going
Attendance and response to the notice.
Participation
__Met __Continue
Phone Calls Staff
General Funds
All year Attendance
Parent perception of our school
__Met __Continue
Extra Curricular Activities
Staff Leaders
General Funds
All year Schedules of events
Ticket Money Sales & Attendance
__Met __Continue
Web Site Secretary & Librarian
Tech Funds
All year Update checks
Counter of how many hits
__Met __Continue
Skyward Gradebook (Assignments online)
Teachers
General Funds
All year Family History in Skyward
Improved student performance
__Met __Continue
Newspaper Articles
Office Staff
General Funds
All year Student/Parent Community Responses
Number of articles in paper.
__Met __Continue

33
G/T –Parent Breakfast
Principal and GT Team
Activity Funds
September
Attendance
Understanding of GT.
__Met __Continue
Volunteer Program
Principal and Office Team
Activity Funds
October Attendance
Mentor Program Participation
Oct 20 CIC – Met __Continue
Volunteer Program Appreciation Celebration
Office Team and Hospitality Committee
Activity Funds
April
Attendance
Positive comments from mentors and mentees
__Met __Continue
Parent Table in Foyer
Office personnel
General Funds
On going
Replenishing of supplies regularly
Observing perusal of guests
Oct 20 CIC – Met __Continue
Provision of individual assessment results of academic assessments
Counselor General Funds
On going Awareness of student results through parent communication.
Improved student performance
__Met __Continue
Parent Newsletter
Office Team
General Funds
Each Report Card
Attached to each report card.
Listening to Parent Feedback
__Met __Continue
Global Calls Principal General Funds
Quarterly or as needed
Reports of each call generated.
Reports of each answered call.
__Met __Continue
Notices of concerns
Secretary General Funds
Sept. 12 Oct. 3 Nov. 7 Dec. 5 Jan. 30 Feb. 27 April 17 May 8
Mail outs Are grades improving on each report card?
__Met __Continue
Community Speakers during PLC Grade Level Teams Meetings
Principal and Counselor
General Funds
Sept. 15 Dec. 15 Feb. 9 March 23 April 27
Student participation
Student Feedback
__Met __Continue

34
OBJECTIVE 2 of 2: Healthy Career Exploration
Goal: (4) All students in the community will have families that are full partners with educators in the education of their children.
Area from Needs Assessment: Healthy Career Exploration Objective from Needs Assessment: To improve the skills of students which will work in our community. Strategies/ Actions
Person Responsible
Timeline
Evidence of Implementation
Funding Resources
Formative/ Summative Evaluation Data
Learn to use correct finger positions in use of technology
All Students 2014-2015
Improvement in speed and accuracy while using a keyboard
General Budget
WPM at the end of the year
__ Completed __ Continue
Learn to use Parliamentary rules and procedures
FFA students
2014-2015
Classroom Observation
General Budget
Teacher Feedback
__ Completed __ Continue
Learn to use the internet & strengthen problem solving skills
TEAM Teachers
2014-2015
Class Projects General Budget
STAAR Results
__ Completed __ Continue
Provide career investigation opportunities through the use of Career Cruising and guest speakers.
AVID Site Team, Counselor, Teachers
2014-2015
Community and Teacher Observation during Enrichment Times.
General Budget
Feedback from Counseling Office
__ Completed __ Continue

35
SCHOOL CULTURE & CLIMATE Goals and Strategies
OBJECTIVE 1of 4 : Student Character and Discipline
Goal: (5) All students will be educated in a school culture and climate that is safe, drug-free, and conducive to learning.
Area from Needs Assessment: Student Character and Discipline Objective from Needs Assessment: Our campus will work toward reducing the number of conduct problems referred to the office and increase character. Strategies/Actions Person
Responsible
Timeline Evidence of Implementation
Funding Formative/ Summative Evaluation Data
Honor Code will be learned by all staff and students at RJH
All Staff 2014-2015
Daily Announcements and postings on campus
General Fund
Knowledge of Honor Code in May of 2015
Oct 20 CIC – Met __Continue
RISD School Song will be learned by all staff and students at RJH
All Staff 2014-2015
Postings in all classrooms and in gym and cafeteria for assemblies
Activity Funds
Knowledge of School Song in May of 2015
Oct 20 CIC – Met __Continue
Maltreatment training
Instructional Department
August 2014
Sign-in sheets
General Fund
Accurate reporting of maltreatment
Oct 20 CIC – Met __Continue
Bullying training
Counselor
August 2014
Sign-in sheets
General Fund
Accurate reporting of bullying
Oct 20 CIC – Met __Continue
Red Ribbon Week Counselor October 2014
Observation of student behavior in the school climate
Counselor’s Budget
Student Feedback
Oct 20 CIC – Met __Continue
Teachers will display and model character words among students. Lessons will encompass character words.
Teachers
Ongoing Observation of student behavior in the school climate
General Funding
Teacher and Student Behaviors
__ Completed __ Continue
-Banners are posted throughout the school
Student Leadership Class/
Through May 2015
Observations General Budget
Monthly Viewing
Oct 20 CIC – Met __Continue

36
displaying character words.
Counselor
-The newspaper will be sent pictures and/or articles about accomplishment and activities for character development throughout the year.
Office Team
Ongoing Number of Local Newspaper articles that reflect student accomplishments
General Budget
File of clippings
__ Completed __ Continue
Morning Routines All Staff and Student Leadership Class
Daily Use of Channel One followed by pledges to flags and the RISD Honor Code along with the moment of silence.
General Budget
Daily Viewings
__ Completed __ Continue
-Counseling Groups
Counselor
ThroughMay 2015
Improved self images of students involved.
In Budget
__ Completed __ Continue
Character Days Counselor’s office
Early Release Days
Observations of student creations from discussions
General Budget
Teacher and student evaluation
__ Completed __ Continue
- AVID will use notebooks, teamwork training, guest speakers and field trips to address various character qualities
AVID Teachers
ThroughMay 2015
Number of discipline referrals by grade level (7th and 8th AVID) will decrease
High School Allotment Funding
Calendar of trips, events, and speakers.
__ Completed __ Continue
-Encourage student and teacher to wear red and black on Fall Thursdays to promote and show school pride
Teachers Coaches Teams
Football season
Student participation
No cost Thursday viewings
__ Completed __ Continue
To create positive self-awareness and positive choices among our students.
Counseling Office
August 2014/May 2015
Few student problems Better choices made by students in the program.
In Budget Counselor feedback
__ Completed __ Continue
Reinforce teachers along with common and consistent classroom management procedures across
J. Burkhalter and Guidry
Ongoing
Calm and safe atmosphere is present in our
building.
In Budget
Referral Records
__ Completed __ Continue

37
the grade levels and the campus.
Create a system of disciplinary management with an understandable filing system and parent contact procedure.
Mrs. Guidry and Team Leaders
Ongoing Calm and safe atmosphere is present in our building.
General Budget
Guest Feedback
Oct 20 CIC – Met __Continue
Provide Disciplinary Alternative Education Program (DAEP) services including teacher, assistant, supplies, etc.
Principal AEP Teacher
August 2014/May 2015
Master Schedule SCE Reduced discipline referrals and increased STAAR scores
__ Completed __Continue
OBJECTIVE 2 of 4: Staff Morale Goal: (5) All students will be educated in a school culture and climate that is safe, drug-free, and conducive to learning.
Area from Needs Assessment: Staff Morale Objective from Needs Assessment: We will take active steps to foster positive morale on campus. Strategies/Actions Person
Responsible
Timeline Evidence of Implementation
Funding Formative/ Summative Evaluation Data
Encouraging word, notes and emails
All Staff
Weekly Basis
Email Folder $0 Staff morale is high and upbeat
__ Completed __ Continue
Beginning of Year “Positive Party”
Office Team
First day of in-service
Observation $50
Staff morale is high and upbeat
Oct 20 CIC – Met __Continue
Birthday Celebrations & Cards
Secretary & Hospitality Committee
Monthly for Cards
Signatures from office team
$80
Smiles are created.
__ Completed __ Continue
Back to School Meal
J. Burkhalter August
PO for purchases
$300
Feedback from participants
Oct 20 CIC – Met __Continue
Weekly “Kudos” in Principal emails
J. Burkhalter Weekly
Email Folder $0
Morale of Staff is encouraged
__ Completed __ Continue
Christmas Cards from Office
Office Staff
December
Secretary feedback
$135 Feedback from recipients.
__ Completed __ Continue
Encouragement Gifts
All Staff
November & February
Office Team Feedback
$400
Staff morale is high and
__ Completed __ Continue

38
upbeat Fun Fridays
J. Burkhalter Fridays
Staff Participation
$0
Morale of Staff is encouraged
__ Completed __ Continue
December Social & Secret Santa Celebration
All Staff Invited
December
Staff Participation
$200
Number of those participating
__ Completed __ Continue
Grade Level Activities
Grade Level Teams
On Going
Staff Participation
$0
Morale of Staff is encouraged
__ Completed __ Continue
All Staff Appreciation Luncheons
Sunshine Committee
November, February, May
PO for purchases
$900
Comments from participants
__ Completed __ Continue
Monthly Meeting Treats
Office Team Monthly Petty cash receipt book
8 @ $40= $320
Consumption of goodies.
__ Completed __ Continue
OBJECTIVE 3 of 4 : Drop Out Rate Goal: (5) All students will be educated in a school culture and climate that is safe, drug-free, and conducive to learning.
Area from Needs Assessment: Student Drop Out Rate Objective from Needs Assessment: Our campus will to reduce the drop- out rate. Strategies/Actions Person
Responsible
Timeline Evidence of Implementation
Funding Formative/ Summative Evaluation Data
Rusk Junior High will continue maintenance less than .5% for the school year 2014-2015.
Attendance clerk, principal, and assistant principal
Throughout the year.
Drop Out Rate General Budget
Number of “98” codes on record
__ Completed __ Continue
OBJECTIVE 4 of 4 : Healthy, Safe & Orderly School Environment Goal: (5) All students will be educated in a school culture and climate that is safe, drug-free, and conducive to learning.
Area from Needs Assessment: Healthy, Safe & Orderly School Environment Objective from Needs Assessment: RJH will strive to provide an environment that is designed to prevent or reduce violence and illegal activities as well as an efficient response to all emergencies keeping all students safe
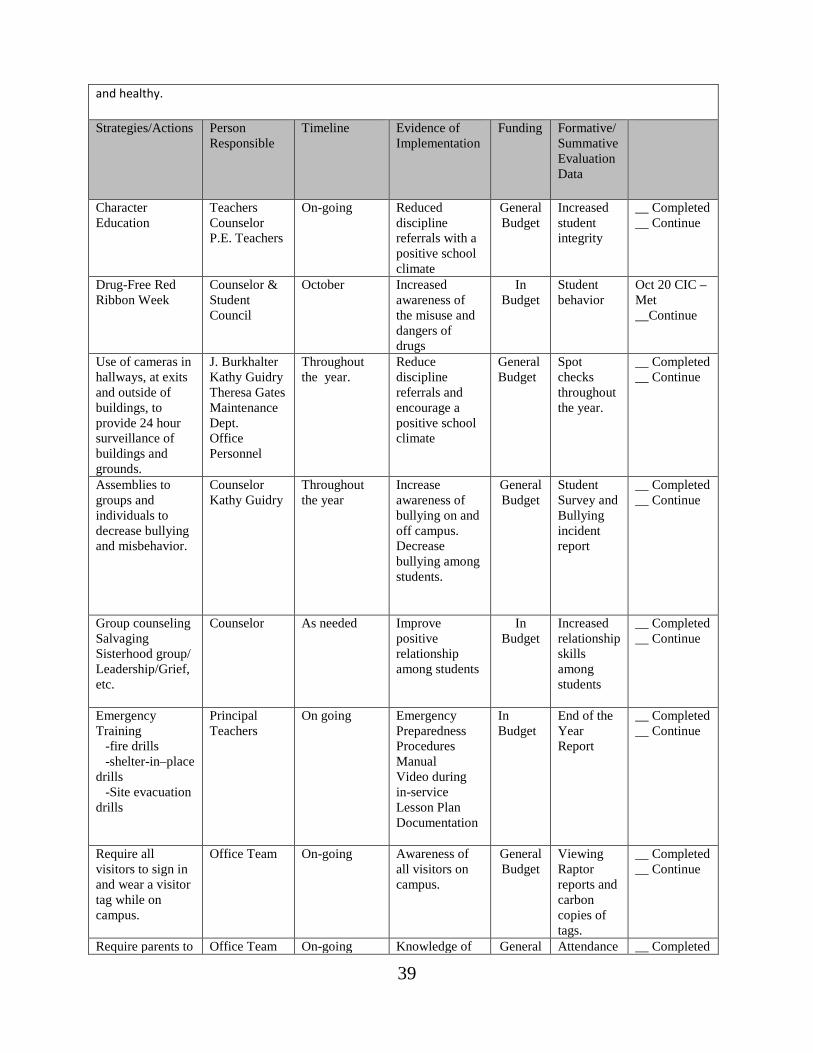
39
and healthy. Strategies/Actions Person
Responsible
Timeline Evidence of Implementation
Funding Formative/ Summative Evaluation Data
Character Education
Teachers Counselor P.E. Teachers
On-going
Reduced discipline referrals with a positive school climate
General Budget
Increased student integrity
__ Completed __ Continue
Drug-Free Red Ribbon Week
Counselor & Student Council
October Increased awareness of the misuse and dangers of drugs
In Budget
Student behavior
Oct 20 CIC – Met __Continue
Use of cameras in hallways, at exits and outside of buildings, to provide 24 hour surveillance of buildings and grounds.
J. Burkhalter Kathy Guidry Theresa Gates Maintenance Dept. Office Personnel
Throughout the year.
Reduce discipline referrals and encourage a positive school climate
General Budget
Spot checks throughout the year.
__ Completed __ Continue
Assemblies to groups and individuals to decrease bullying and misbehavior.
Counselor Kathy Guidry
Throughout the year
Increase awareness of bullying on and off campus. Decrease bullying among students.
General Budget
Student Survey and Bullying incident report
__ Completed __ Continue
Group counseling Salvaging Sisterhood group/ Leadership/Grief, etc.
Counselor
As needed
Improve positive relationship among students
In Budget
Increased relationship skills among students
__ Completed __ Continue
Emergency Training -fire drills -shelter-in–place drills -Site evacuation drills
Principal Teachers
On going
Emergency Preparedness Procedures Manual Video during in-service Lesson Plan Documentation
In Budget
End of the Year Report
__ Completed __ Continue
Require all visitors to sign in and wear a visitor tag while on campus.
Office Team
On-going
Awareness of all visitors on campus.
General Budget
Viewing Raptor reports and carbon copies of tags.
__ Completed __ Continue
Require parents to Office Team On-going Knowledge of General Attendance __ Completed

40
sign out students who leave campus before school is dismissed
the location of all students
Budget records. __ Continue
Provide random drug dog visits
J. Burkhalter Fall & Spring Decreased use of drugs
General Budget
Student Survey
__ Completed __ Continue
TECHNOLOGY Goals and Strategies
OBJECTIVE 1 of 3: Technology for Student Performance
Goal: (6) All students and staff will have the benefit of technology that is implemented and used to increase the effectiveness of student learning, instructional management, staff development and administration. Area from Needs Assessment: Student Performance Objective from Needs Assessment: Increase technology use in classrooms to enhance student performance Strategies/Actions Person
Responsible
Timelines Evidence of Implementation
Funding Formative/ Summative Evaluation Data
Each classroom will have a set of computers for student use.
Classroom Teacher
All Year
All students will have access to a laptop in each classroom.
General Fund Title I Title II, A
Feedback will be ongoing.
Oct 20 CIC – Met __Continue
Update calculators to ensure up-to-date technologies are used in the classrooms
Hardy
March 2015
Students will be proficient in the use of calculators in problem solving
Title VI
Observation of calculator use in class.
Oct 20 CIC – Met __Continue
Implement use of Channel One before school
D. Miller
May 2015
Students will exhibit proficient knowledge of current events and improve base of knowledge of world news.
No Cost
Monitoring daily use.
__Completed __Continue
Use of Brain Pop, Edhelper, Spelling City & Study Island, Safari Montage, IStation, Renaissance Place
Science, Math, ELA, & History Depts.
Throughout the year.
100% success in the technology applications expectations as well as increased knowledge and
SCE Funds
Lesson Plans and Observations
__Completed __Continue

41
motivation to learn
Read 180 implementation for Tier 2.
Renner & Williams
May 2015
Improve scores in classes and on STAAR
General Funds
Leveled progress reports
__Completed __Continue
SALT (Strategies and Literary Tactics) using Don Johnson, Lexia, Read Naturally, and Renaissance Enterprise.
Christopher, C. Guidry
All Year
Students will exhibit proficient knowledge of current events research abilities.
General Funds
Renaissance Enterprise Reports
__Completed __Continue
Career Cruising
Angela Dowling
2nd , 4th, 6th Six Weeks
Students will be more knowledgeable of possible careers and education requirements use of technology
General Budget as well as SCE Funds
Student Feedback
__Completed __Continue
Reflex Math
Math Labs and EE – Tier 2 & 3
All Year
Students will be better prepared for computation.
General Budget as well as SCE Funds
Better understanding of basic math facts.
__Completed __Continue
Parent laptop checkout system
J.Burkhalter
May 2015
Increased student use of technology when computers are not present in the home.
General Budget
Parent feedback
__Completed __Continue
Complete trouble tickets as they arise for the Tech Team to mend.
All Staff Ongoing Help Desk Reports General Budget
Weekly Reports
__Completed __Continue
Internet Safety Training
TEAM Rosters
Fall Semester
Signed certificates of completion
General Budget
Safe behavior while on the internet
Oct 20 CIC – Met __Continue
Renaissance Place Products and Rosetta Stone
Ms. Miller & ESL Teacher
All Year Increased student knowledge through on-going instruction in the integration of information technology and information literacy.
General Budget
STAAR test scores
__Completed __Continue

42
OBJECTIVE 2 of 3: Internet Presence Goal: (6) All students and staff will have the benefit of technology that is implemented and used to increase the effectiveness of student learning, instructional management, staff development and administration. Area from Needs Assessment: Internet Presence Objective from Needs Assessment: Regular updates of RJH webpage Strategies/Actions Person
Responsible
Timelines Evidence of Implementation
Funding Formative/ Summative Evaluation Data
Use of Webpage by parents, students, and community for research
All Staff
Weekly
Students, teachers, and parents will be more knowledgeable and abreast of school activities
General Fund Titles I;II- A,VI
Counter on websites
__Completed __Continue
Updated webpages with current information.
All Staff Ongoing Increased digital understanding and improved communication
General Fund Titles I;II- A,VI
Observations and Teacher Survey
__Completed __Continue
OBJECTIVE 3 of 3: Staff Development with Technology Goal: (6) All students and staff will have the benefit of technology that is implemented and used to increase the effectiveness of student learning, instructional management, staff development and administration. Area from Needs Assessment: Technology for Staff Development Objective from Needs Assessment: Increase the appropriate use of technology for staff. Strategies/Actions Person
Responsible
Timelines Evidence of Implementation
Funding Formative/ Summative Evaluation Data
Teacher use Skyward Gradebook, Edhelper, Study Island, IStation Renaissance, etc. Online card
All Teachers Miller
Ongoing Ongoing
Administrative Observations Administrative
General Fund Titles I;II- A,VI along with SCE Funds
Gradebook and classroom observations Interview
__Completed __Continue __Completed

43
catalogue and video library
Observations with Miller __Continue
Use of data projectors, Write Pads, visual presenters in the classrooms.
Principal
Ongoing
Use by teachers Increase student interest and improve student assessment techniques
Classroom observations
__Completed __Continue
Provide teachers a laptop computer
Principal
Ongoing
Increase research and teacher technology.
Teacher survey
Oct 20 CIC – Met __Continue
Ongoing training of staff on instructional software
Technology Instructional Specialist
All Year
Increase use of instructional technology in the classroom
Schedule of trainings provided
__Completed __Continue
Every student/teacher sign AUP
Tech Dept
Sept.. 2014
Random File Checks
In Budget
Look at binder.
Oct 20 CIC – Met __Continue
Use of Password Responsibility Chart
Office Team Oct. 2014 Delivery to all staff.
General Budget
Teacher Survey
Oct 20 CIC – Met __Continue
Wireless capabilities school wide
Principal
Check Status Fall and Spring
Students and teachers will have increased access to research and teaching technology
Technology Budget
Connectivity abilities
__Completed __Continue

44
SCHOOL CONTEXT & ORGANIZATION
Goals and Strategies
OBJECTIVE 1 of 2: Leadership For School Staff And Facilities
(7) All students will be educated in a school context and organization which ensures Goal: processes, structures, decision-making and overall leadership address quality teaching and learning.
Leadership For School Staff And FacilitiesArea from Needs Assessment: Work with the maintenance department for facility updates. Objective from Needs Assessment:
Strategies/Actions Person
Responsible
Funding Resources
Timelines Evidence of Implementation
Formative/ Summative Evaluation Data
Increase communication and ownership among campus leadership teams
Principal and CIC
General funds
Ongoing Meeting minutes PLC evidences
Teacher Survey
__Completed __Continue
Continue to foster a voice for all staff in decision making
Office Team General funds
Ongoing Meeting among teams and PLC’s.
Teacher Survey
__Completed __Continue
OBJECTIVE 2 of 2: State Compensatory Education Funded Activities
(7) All students will be educated in a school context and organization which ensures Goal:
processes, structures, decision-making and overall leadership address quality teaching and learning.
State Compensatory Education Funded ActivitiesArea from Needs Assessment: Our campus will work toward creating processes and structures to Objective from Needs Assessment:
support intervention of target students. Strategies/Actions Person
Responsible
Funding Resources
Timelines Evidence of Implementation
Formative/ Summative Evaluation Data
__Completed __Continue
Content Mastery Christina SCE Ongoing CM Reports Student __Completed

45
will enhance lessons with small group help
Gault
Funds success on STAAR and benchmarks
__Continue
Summer School – Accelerated Instruction will be provided for students in need.
Principal and Asst. Principal
SCE Funds
By May 2015
Sign in sheets Student success on June tests
__Completed __Continue
Teacher aides will be used in classroom and in pull out programs to enhance learning
Principal SCE Funds
Ongoing Schedules of Teacher Assistants
Teacher feedback
__Completed __Continue
TEAM times will be used with all students for intervention and enrichment time.
Grade Level Leaders
SCE Funds
August Student schedules
Teacher and student feedback
__Completed __Continue
Students will plan for their academic future
Counselor SCE Funds
Fall and Spring
EXPLORE test results
Career Cruising activity
__Completed __Continue

46
Activities/Strategies Partially or Wholly Budgeted with SCE: ACTIVITIES/ STRATEGIES
HIGH SCHOOL JR. HIGH INTERMEDIATE ELEMENTARY PRIMARY
Individualized Instruction/ Small Group
X S. Nimitz
(EOC) Payroll Costs $19,478
FTE’s-.40
X CM- C. Gault
$2,735 FTE’s-.07
Targeted Instruction- Besson, G. Blackmon,
Boyett, Burkhalter, Christopher, Cook,
Day, Eckel, Friederich, Garner, Gates, C. Guidry, Harris,
Henderson, Kellis, Moore, Peloquin, Robbins, Russell,
Thompson, Wallace, Watkins, B Williams,
C Williams $69,448
FTE’s-1.68 Math-Day, Jones,
Gates, Russell $47,572
FTE’s-1.21
X Reading Lab/Small
Group-Turner $54,558
FTE’s-1.0 Math Lab/Small Group-
Franklin, Priest $64,403
FTE’s-1.23 Targeted Instruction-
Bixler, Bottoms, Boudreaux, Bowman, Carroll, Cox, Dominy,
Frazer, Fredericks, Lucas, Oliver, Pepin, C Ruiz
$77,132 FTE’s-1.70
X Lab/Small Group- Gordon, Kearney,
Nichols $97,581
FTE’s-1.92 Targeted Instruction-
Beck, Brogdon, Clayton, Cook,
Hickman, Hoffman, Howell, Jinkins,
Kadlecek, Mabry, Moore, Peters, Sunday,
Tucker $44,675
FTE’s-1.02
X Targeted Instruction- Berryman, Blackmon, Cahalane, Covington, Dyess, Eckel, Garner, Goff, Peters, Sanders,
Simpson, Starkey, Thompson, Williams,
Y’Barbo $42,465
FTE’s-1.06
Specialized Reading Program
X Reading Lab-
Christopher, C Guidry, C Williams
$50,228 FTE’s-1.28
Pre-Kindergarten-4 Year Old Program-Extended to Full-day
X Teachers and Aides-
Payroll Costs-$198,119 FTE’s-7.8
Pre-Kindergarten-3 Year Old Program
X Teachers and Aides-
Payroll Costs-$64,858 FTE’s-2.0
Pre-Kindergarten X Supplies-$2,000
Misc Oper Costs-$8,150 TOTAL:$10,150
Targeted Interventionist Program
X McCown $50,293
FTE’s-.93
X M. Black $49,401
FTE’s-1.0
X Morgan $37,161
FTE’s-1.0
X Gunn, McNew
$57,642 FTE’s-1.47
Teacher Aides/Assistants X $31,587
FTE’s-1.77
X $30,387
FTE’s-1.68
X $32,931
FTE’s-1.62
X $102,733
FTE’s-5.20 Extended Day X
Payroll Costs-$1,041 (EOC)
X Payroll Costs-$17,435
Misc Oper Costs-$2,000
TOTAL:$19,435
X Payroll Costs-$20,037
Supplies-$500 Misc Oper Costs-$2,000
TOTAL:$22,537
X Payroll Costs-$20,036
Misc Oper Costs-$2,000 TOTAL:$22,036
X Payroll Costs-$14,832
Misc Oper Costs-$1,000 TOTAL:$15,832
Extended Year (Summer School)
X Payroll Costs-$5,204
(EOC)
X Payroll Costs-$8,326
Supplies-$500 TOTAL:$8,826
X Payroll Costs-$9,887
Supplies-$500 Misc Oper Costs-$500
TOTAL:$10,887
X Payroll Costs-$5,203
X Payroll Costs-$3,644
Disciplinary Alternative Education Program (DAEP)-Basic Services
X Payroll Costs-Teacher and Assistant-$44,332 Contracted Svc-$5,848
Supplies-$500 Janitorial-$1,785
Utilities-$984 TOTAL-$53,449
X Payroll Costs-Teacher and Assistant-$6,331 Contracted Svc-$866
Supplies-$250 Janitorial-$1,785
Utilities-$984 TOTAL-$10,216

47
Activities/Strategies from prior years that are not budgeted with SCE:
ACTIVITIES/ STRATEGIES
HIGH SCHOOL
JR. HIGH INTERMEDIATE
ELEMENTARY PRIMARY
DOR-Dropout Recovery (Nondisciplinary Alternative Education Program-NAEP)
X
General Fund
Head Start X General Fund
Class-size Reduction
Saturday School X General Fund
Pregnancy Services X General Fund
X General Fund
FTE’s-1.33 FTE’s-.19 Dyslexia Program X
Supplies-$175 Travel-$100
TOTAL-$275
X Dyslexia-Collins
$18,562 Supplies-$2,250
Travel-$300 TOTAL-$21,112
FTE’s-.50
X Dyslexia-Collins
$18,562 Supplies-$400
Testing Materials-$500 Travel-$300
TOTAL-$19,762 FTE’s-.50
X Supplies-$955
Testing Materials-$250 Travel-$100
TOTAL-$1,305
Contracted Services-Instructional
X $1,050
X $1,050
Supplies-Instructional X $650
X Supplies-$1,000
Reading Material-$500
X Supplies $1,250
Reading Materials $250
X $600
Guidance & Counseling X Testing Materials-
$250
X Testing Materials-$300
X Testing Materials-$100
X Testing Materials-$250

48
JUNIOR HIGH (SW w/ ED DISADV >=40%) Teachers:
BESSON, LEAH 7% 0.07 TARGETED INSTRUCTION BLACKMON, GEORGE 7% 0.07 TARGETED INSTRUCTION BOYETT, ASHLEY 7% 0.07 TARGETED INSTRUCTION BURKHALTER, ANGELA 7% 0.07 TARGETED INSTRUCTION CHRISTOPHER, LAURA 28% 0.28 READING LAB/IMPROVEMENT CHRISTOPHER, LAURA 7% 0.07 TARGETED INSTRUCTION COOK, BRANDY 7% 0.07 TARGETED INSTRUCTION
GAULT, CHRISTINA 7% 0.07 CONTENT MASTERY-INDIVIDUALIZED INSTRUCTION, TUTORIALS
DAY, SHERRY 43% 0.43 MATH LAB/IMPROVEMENT DAY, SHERRY 7% 0.07 TARGETED INSTRUCTION ECKEL, JOSEPH 7% 0.07 TARGETED INSTRUCTION FRIEDERICH, GLYNIS 7% 0.07 TARGETED INSTRUCTION GARNER, TERESA 7% 0.07 TARGETED INSTRUCTION GATES, BARBARA MASHELL 14% 0.14 MATH LAB/IMPROVEMENT GATES, BARBARA MASHELL 7% 0.07 TARGETED INSTRUCTION GUIDRY, CASEY 14% 0.14 READING LAB/IMPROVEMENT GUIDRY, CASEY 7% 0.07 TARGETED INSTRUCTION HARRIS, BRITTANY 7% 0.07 TARGETED INSTRUCTION HENDERSON, CRYSTAL 7% 0.07 TARGETED INSTRUCTION JONES, ANGELA 50% 0.50 MATH LAB/IMPROVEMENT KELLIS, AMANDA 7% 0.07 TARGETED INSTRUCTION MCCOWN, DONNA 93% 0.93 TARGETED INTERVENTIONIST MOORE, SONNIE 7% 0.07 TARGETED INSTRUCTION PELOQUIN, MARTHA 7% 0.07 TARGETED INSTRUCTION ROBBINS, REBECCA 7% 0.07 TARGETED INSTRUCTION RUSSELL, ANDREA 14% 0.14 MATH LAB/IMPROVEMENT RUSSELL, ANDREA 7% 0.07 TARGETED INSTRUCTION THOMPSON, DENISE 7% 0.07 TARGETED INSTRUCTION WALLACE, JENNIFER 7% 0.07 TARGETED INSTRUCTION WATKINS, STEVEN 7% 0.07 TARGETED INSTRUCTION WILLIAMS, BRIAN 7% 0.07 TARGETED INSTRUCTION WILLIAMS, CHRISTINE 86% 0.86 READING LAB/IMPROVEMENT WILLIAMS, CHRISTINE 7% 0.07 TARGETED INSTRUCTION
Aides: FRAZER, BETTY 77% 0.77 TEACHER ASSISTANT
GUILLEN, STEPHANIE/N JENNINGS 100% 1.00 TEACHER ASSISTANT
TOTAL PIC 30 FTEs % 6.94
DAEP BASIC SERVICES-PIC 29 Teachers: ALLISON, ZACHERY 7% 0.07 DAEP BASIC SERVICES
ROSE, ROBIN 1% 0.01 DAEP BASIC SERVICES SMITH, MICAH 1% 0.01 DAEP BASIC SERVICES WALLEY, BILLIE 1% 0.01 DAEP BASIC SERVICES
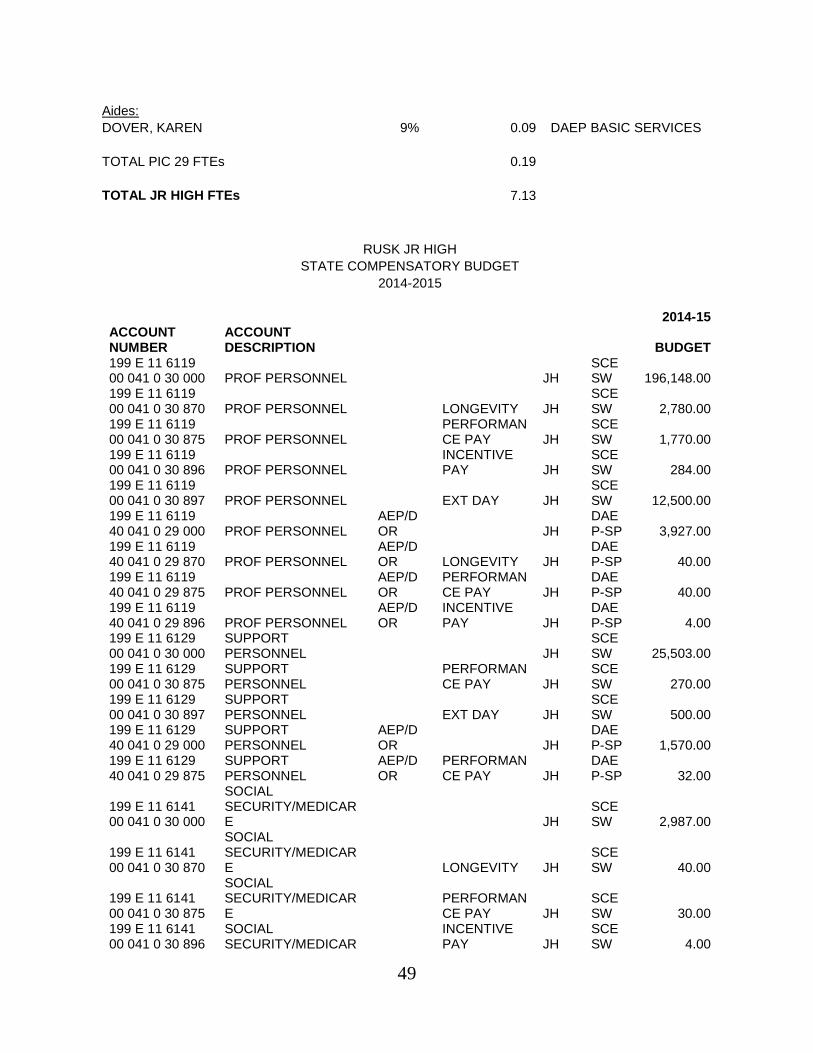
49
Aides: DOVER, KAREN 9% 0.09 DAEP BASIC SERVICES
TOTAL PIC 29 FTEs
0.19
TOTAL JR HIGH FTEs
7.13
RUSK JR HIGH STATE COMPENSATORY BUDGET
2014-2015
2014-15 ACCOUNT NUMBER
ACCOUNT DESCRIPTION
BUDGET
199 E 11 6119 00 041 0 30 000 PROF PERSONNEL
JH
SCE SW 196,148.00
199 E 11 6119 00 041 0 30 870 PROF PERSONNEL
LONGEVITY JH
SCE SW 2,780.00
199 E 11 6119 00 041 0 30 875 PROF PERSONNEL
PERFORMANCE PAY JH
SCE SW 1,770.00
199 E 11 6119 00 041 0 30 896 PROF PERSONNEL
INCENTIVE PAY JH
SCE SW 284.00
199 E 11 6119 00 041 0 30 897 PROF PERSONNEL
EXT DAY JH
SCE SW 12,500.00
199 E 11 6119 40 041 0 29 000 PROF PERSONNEL
AEP/DOR
JH
DAEP-SP 3,927.00
199 E 11 6119 40 041 0 29 870 PROF PERSONNEL
AEP/DOR LONGEVITY JH
DAEP-SP 40.00
199 E 11 6119 40 041 0 29 875 PROF PERSONNEL
AEP/DOR
PERFORMANCE PAY JH
DAEP-SP 40.00
199 E 11 6119 40 041 0 29 896 PROF PERSONNEL
AEP/DOR
INCENTIVE PAY JH
DAEP-SP 4.00
199 E 11 6129 00 041 0 30 000
SUPPORT PERSONNEL
JH
SCE SW 25,503.00
199 E 11 6129 00 041 0 30 875
SUPPORT PERSONNEL
PERFORMANCE PAY JH
SCE SW 270.00
199 E 11 6129 00 041 0 30 897
SUPPORT PERSONNEL
EXT DAY JH
SCE SW 500.00
199 E 11 6129 40 041 0 29 000
SUPPORT PERSONNEL
AEP/DOR
JH
DAEP-SP 1,570.00
199 E 11 6129 40 041 0 29 875
SUPPORT PERSONNEL
AEP/DOR
PERFORMANCE PAY JH
DAEP-SP 32.00
199 E 11 6141 00 041 0 30 000
SOCIAL SECURITY/MEDICARE
JH
SCE SW 2,987.00
199 E 11 6141 00 041 0 30 870
SOCIAL SECURITY/MEDICARE
LONGEVITY JH
SCE SW 40.00
199 E 11 6141 00 041 0 30 875
SOCIAL SECURITY/MEDICARE
PERFORMANCE PAY JH
SCE SW 30.00
199 E 11 6141 00 041 0 30 896
SOCIAL SECURITY/MEDICAR
INCENTIVE PAY JH
SCE SW 4.00

50
E
199 E 11 6141 00 041 0 30 897
SOCIAL SECURITY/MEDICARE
EXT DAY JH
SCE SW 189.00
199 E 11 6141 40 041 0 29 000
SOCIAL SECURITY/MEDICARE
AEP/DOR
JH
DAEP-SP 70.00
199 E 11 6141 40 041 0 29 870
SOCIAL SECURITY/MEDICARE
AEP/DOR LONGEVITY JH
DAEP-SP 1.00
199 E 11 6141 40 041 0 29 875
SOCIAL SECURITY/MEDICARE
AEP/DOR
PERFORMANCE PAY JH
DAEP-SP 1.00
199 E 11 6142 00 041 0 30 000
GROUP HEALTH & LIFE INSURANCE
JH
SCE SW 15,687.00
199 E 11 6142 40 041 0 29 000
GROUP HEALTH & LIFE INSURANCE
AEP/DOR
JH
DAEP-SP 459.00
199 E 11 6143 00 041 0 30 000
WORKER'S COMPENSATION
JH
SCE SW 1,108.00
199 E 11 6143 00 041 0 30 870
WORKER'S COMPENSATION
LONGEVITY JH
SCE SW 14.00
199 E 11 6143 00 041 0 30 875
WORKER'S COMPENSATION
PERFORMANCE PAY JH
SCE SW 10.00
199 E 11 6143 00 041 0 30 896
WORKER'S COMPENSATION
INCENTIVE PAY JH
SCE SW 1.00
199 E 11 6143 00 041 0 30 897
WORKER'S COMPENSATION
EXT DAY JH
SCE SW 65.00
199 E 11 6143 40 041 0 29 000
WORKER'S COMPENSATION
AEP/DOR
JH
DAEP-SP 28.00
199 E 11 6145 00 041 0 30 000
UNEMPLOYMENT COMPENSATION
JH
SCE SW 147.00
199 E 11 6145 00 041 0 30 870
UNEMPLOYMENT COMPENSATION
LONGEVITY JH
SCE SW 2.00
199 E 11 6145 00 041 0 30 875
UNEMPLOYMENT COMPENSATION
PERFORMANCE PAY JH
SCE SW 1.00
199 E 11 6145 00 041 0 30 897
UNEMPLOYMENT COMPENSATION
EXT DAY JH
SCE SW 8.00
199 E 11 6145 40 041 0 29 000
UNEMPLOYMENT COMPENSATION
AEP/DOR
JH
DAEP-SP 4.00
199 E 11 6146 00 041 0 30 000
TEACHER RETIREMENT/TRS CARE
JH
SCE SW 4,968.00
199 E 11 6146 00 041 0 30 870
TEACHER RETIREMENT/TRS CARE
LONGEVITY JH
SCE SW 61.00
199 E 11 6146 00 041 0 30 875
TEACHER RETIREMENT/TRS CARE
PERFORMANCE PAY JH
SCE SW 46.00
199 E 11 6146 00 041 0 30 897
TEACHER RETIREMENT/TRS CARE
EXT DAY JH
SCE SW 267.00
199 E 11 6146 40 041 0 29 000
TEACHER RETIREMENT/TRS CARE
AEP/DOR
JH
DAEP-SP 154.00
199 E 11 6146 40 041 0 29 870
TEACHER RETIREMENT/TRS
AEP/DOR LONGEVITY JH
DAEP-SP 1.00

51
CARE
199 E 11 6146 40 041 0 29 875
TEACHER RETIREMENT/TRS CARE
AEP/DOR
PERFORMANCE PAY JH
DAEP-SP 2.00
199 E 11 61-- -- --- - -- --- *PAYROLL COSTS
271,723.00
199 E 11 6249 00 041 0 30 000 CONTRACTED R&M
JH
SCE SW 1,050.00
199 E 11 6299 40 041 0 29 000
MISC CONTRACTED SERVICES
AEP/DOR
JH
DAEP-SP 756.00
199 E 11 62-- -- --- - -- ---
*CONTRACTED & PROF. SERVICES
1,806.00
199 E 11 6399 00 041 0 30 000 GENERAL SUPPLIES
JH
SCE SW 650.00
199 E 11 6399 00 041 0 30 912 GENERAL SUPPLIES
DYSLEXIA JH
SCE SW 175.00
199 E 11 6399 40 041 0 29 000 GENERAL SUPPLIES
AEP/DOR
JH
DAEP-SP 250.00
199 E 11 63-- -- --- - -- ---
*SUPPLIES & MATERIALS
1,075.00
199 E 11 6499 00 041 0 30 897
MISC OPERATING COSTS
EXT DAY JH
SCE SW 2,000.00
199 E 11 64-- -- --- - -- ---
*OTHER OPERATING COSTS
2,000.00
199 E 11 ---- -- --- - -- --- *INSTRUCTION
276,604.00
199 E 13 6299 40 041 0 29 000
MISC CONTRACTED SERVICES
AEP/DOR
JH
DAEP-SP 110.00
199 E 13 62-- -- --- - -- ---
*CONTRACTED & PROF. SERVICES
110.00
199 E 13 6411 00 041 0 30 912
TRAVEL-EMPLOYEE ONLY
DYSLEXIA JH
SCE SW 100.00
199 E 13 64-- -- --- - -- ---
*OTHER OPERATING COSTS
100.00
199 E 13 ---- -- --- - -- ---
*CURRICULUM DEV.& INST.STF DEV
210.00
199 E 21 6119 00 041 0 30 897 PROF PERSONNEL
EXT DAY JH
SCE SW 1,000.00
199 E 21 6141 00 041 0 30 897
SOCIAL SECURITY/MEDICARE
EXT DAY JH
SCE SW 15.00
199 E 21 6143 00 041 0 30 897
WORKER'S COMPENSATION
EXT DAY JH
SCE SW 5.00
199 E 21 6145 00 041 0 30 897
UNEMPLOYMENT COMPENSATION
EXT DAY JH
SCE SW 1.00
199 E 21 6146 00 041 0 30 897
TEACHER RETIREMENT/TRS CARE
EXT DAY JH
SCE SW 21.00
199 E 21 61-- -- --- - -- --- *PAYROLL COSTS
1,042.00
199 E 21 ---- -- --- - -- ---
*INSTRUCTIONAL LEADERSHIP
1,042.00
199 E 23 6129 00 041 0 30 897
SUPPORT PERSONNEL
EXT DAY JH
SCE SW 1,000.00
199 E 23 6141 00 041 0 30 897
SOCIAL SECURITY/MEDICAR
EXT DAY JH
SCE SW 15.00

52
E 199 E 23 6143 00 041 0 30 897
WORKER'S COMPENSATION
EXT DAY JH
SCE SW 5.00
199 E 23 6145 00 041 0 30 897
UNEMPLOYMENT COMPENSATION
EXT DAY JH
SCE SW 1.00
199 E 23 6146 00 041 0 30 897
TEACHER RETIREMENT/TRS CARE
EXT DAY JH
SCE SW 21.00
199 E 23 61-- -- --- - -- --- *PAYROLL COSTS
1,042.00
199 E 23 ---- -- --- - -- ---
*SCHOOL LEADERSHIP
1,042.00
199 E 31 6339 00 041 0 30 000 TESTING MATERIALS
JH
SCE SW 250.00
199 E 31 63-- -- --- - -- ---
*SUPPLIES & MATERIALS
250.00
199 E 31 ---- -- --- - -- ---
*GUIDANCE & COUNSELING
250.00
199 E 51 6259 40 041 0 29 000 UTILITIES
AEP/DOR
JH
DAEP-SP 326.00
199 E 51 6299 40 041 0 29 959
MISC CONTRACTED SERVICES
AEP/DOR JANITOR JH
DAEP-SP 1,785.00
199 E 51 62-- -- --- - -- ---
*CONTRACTED & PROF. SERVICES
2,111.00
199 E 51 ---- -- --- - -- ---
*PLANT MAINTENANCE & OPERATIONS
2,111.00
199 E 93 6492 40 041 0 29 000
PAYMENTS TO FISCAL AGENTS SSA
AEP/DOR
JH
DAEP-SP 658.00
199 E 93 64-- -- --- - -- ---
*OTHER OPERATING COSTS
658.00
199 E 93 ---- -- --- - -- ---
*PAYMENTS TO FISCAL AGENTS\MBRS
658.00
199 E -- ---- -- --- - -- --- *Expense
281,917.00
199 - -- ---- -- --- - -- --- *GENERAL FUND
281,917.00
TRANSPORTATION-EXTENDED DAY
1,822.00
SCE BUDGET EXCLUDING SUMMER SCHOOL
283,739.00
SUMMER SCHOOL 199 E 11 6119
00 699 0 30 041 PROF PERSONNEL
JH SUMM
SCE SW 6,500.00
199 E 11 6129 00 699 0 30 041
SUPPORT PERSONNEL
JH
SUMM
SCE SW 1,000.00
199 E 11 6141 00 699 0 30 041
SOCIAL SECURITY/MEDICARE
JH
SUMM
SCE SW 109.00
199 E 11 6143 00 699 0 30 041
WORKER'S COMPENSATION
JH
SUMM
SCE SW 38.00
199 E 11 6145 00 699 0 30 041
UNEMPLOYMENT COMPENSATION
JH
SUMM
SCE SW 5.00

53
199 E 11 6146 00 699 0 30 041
TEACHER RETIREMENT/TRS CARE
JH
SUMM
SCE SW 154.00
199 E 11 61-- -- --- - -- --- *PAYROLL COSTS
7,806.00
199 E 11 6399 00 699 0 30 041 GENERAL SUPPLIES
JH
SUMM
SCE SW 500.00
199 E 11 63-- -- --- - -- ---
*SUPPLIES & MATERIALS
500.00
199 E 11 ---- -- --- - -- --- *INSTRUCTION
8,306.00
199 E -- ---- -- --- - -- --- *Expense
8,306.00
199 - -- ---- -- --- - -- --- *GENERAL FUND
8,306.00
TRANSPORTATION-SUMMER SCHOOL
520.00
SCE SUMMER SCHOOL BUDGET
8,826.00
TOTAL STATE COMPENSATORY BUDGET
292,565.00

54
Rusk Jr. High School
State Compensatory Education Funds Additional Information as Required By Section 42.152, Texas Education Code
2014-2015 Supplemental direct costs and personnel attributed to compensatory education and accelerated instruction budgeted and addressed in the campus improvement plan are as follows: Expenditure Amount Full Time Equivalents (FTEs)
(Does not include extended day, week, or year FTEs)
Payroll Costs $283,955 7.13 Professional and Contracted Services
4,027
Supplies and Materials 1,825 Other Operating Costs 2,758 Debt Service 0 Capital Outlay 0 TOTAL $292,565
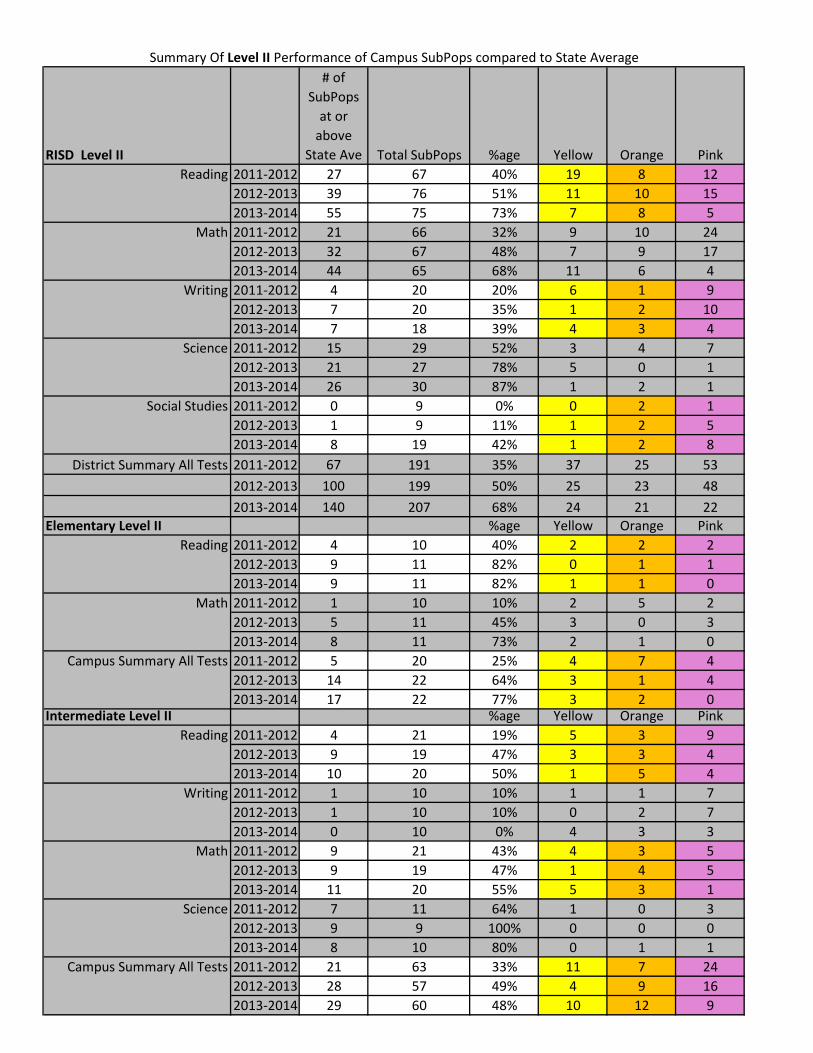
RISD Level II
# of SubPops
at or above
State Ave Total SubPops %age Yellow Orange PinkReading 2011-2012 27 67 40% 19 8 12
2012-2013 39 76 51% 11 10 152013-2014 55 75 73% 7 8 5
Math 2011-2012 21 66 32% 9 10 242012-2013 32 67 48% 7 9 172013-2014 44 65 68% 11 6 4
Writing 2011-2012 4 20 20% 6 1 92012-2013 7 20 35% 1 2 102013-2014 7 18 39% 4 3 4
Science 2011-2012 15 29 52% 3 4 72012-2013 21 27 78% 5 0 12013-2014 26 30 87% 1 2 1
Social Studies 2011-2012 0 9 0% 0 2 12012-2013 1 9 11% 1 2 52013-2014 8 19 42% 1 2 8
District Summary All Tests 2011-2012 67 191 35% 37 25 532012-2013 100 199 50% 25 23 482013-2014 140 207 68% 24 21 22
Elementary Level II %age Yellow Orange PinkReading 2011-2012 4 10 40% 2 2 2
2012-2013 9 11 82% 0 1 12013-2014 9 11 82% 1 1 0
Math 2011-2012 1 10 10% 2 5 22012-2013 5 11 45% 3 0 32013-2014 8 11 73% 2 1 0
Campus Summary All Tests 2011-2012 5 20 25% 4 7 42012-2013 14 22 64% 3 1 42013-2014 17 22 77% 3 2 0
Intermediate Level II %age Yellow Orange PinkReading 2011-2012 4 21 19% 5 3 9
2012-2013 9 19 47% 3 3 42013-2014 10 20 50% 1 5 4
Writing 2011-2012 1 10 10% 1 1 72012-2013 1 10 10% 0 2 72013-2014 0 10 0% 4 3 3
Math 2011-2012 9 21 43% 4 3 52012-2013 9 19 47% 1 4 52013-2014 11 20 55% 5 3 1
Science 2011-2012 7 11 64% 1 0 32012-2013 9 9 100% 0 0 02013-2014 8 10 80% 0 1 1
Campus Summary All Tests 2011-2012 21 63 33% 11 7 242012-2013 28 57 49% 4 9 162013-2014 29 60 48% 10 12 9
Summary Of Level II Performance of Campus SubPops compared to State Average

Jr. High Level II %age Yellow Orange PinkReading 2011-2012 14 28 50% 10 3 1
2012-2013 13 28 46% 6 2 72013-2014 20 25 80% 4 1 0
Writing 2011-2012 3 10 30% 5 0 22012-2013 6 10 60% 1 0 32013-2014 7 8 88% 0 0 1
Math 2011-2012 10 27 37% 3 2 122012-2013 17 28 61% 2 3 62013-2014 17 25 68% 3 2 3
Science 2011-2012 3 9 33% 1 1 42012-2013 9 9 100% 0 0 02013-2014 9 10 90% 0 1 0
Social Studies 2011-2012 0 9 0% 0 2 72012-2013 1 9 11% 1 2 52013-2014 0 10 0% 0 2 8
Campus Summary All Tests 2011-2012 30 83 36% 19 8 262012-2013 46 84 55% 10 7 212013-2014 53 78 68% 7 6 12
High School Level II %age Yellow Orange PinkEnglish I/II 2011-2012 5 8 63% 2 0 0
2012-2013 8 18 44% 2 4 32013-2014 16 19 84% 1 1 1
Algebra I 2011-2012 1 8 13% 0 0 52012-2013 1 9 11% 1 2 32013-2014 8 9 89% 1 0 0
Biology 2011-2012 5 9 56% 1 3 02012-2013 3 9 33% 5 0 12013-2014 9 10 90% 1 0 0
US History 2011-2012 NA NA NA NA NA NA2012-2013 NA NA NA NA NA NA2013-2014 8 9 89% 1 0 0
Campus Summary All Tests 2011-2012 11 25 44% 3 3 62012-2013 12 36 33% 8 6 72013-2014 41 47 87% 4 1 1

RISD Level III
# of SubPops
at or above
State Ave Total SubPops %age Yellow Orange PinkReading 2011-2012 18 67 27% 20 17 12
2012-2013 21 76 28% 26 16 132013-2014 21 75 28% 25 19 10
Math 2011-2012 12 66 18% 18 13 232012-2013 12 65 18% 13 27 132013-2014 16 66 24% 20 14 12
Writing 2011-2012 1 20 5% 15 1 32012-2013 4 19 21% 11 4 02013-2014 1 18 6% 12 4 1
Science 2011-2012 7 29 24% 13 7 22012-2013 15 27 56% 9 1 22013-2014 9 30 30% 9 7 5
Social Studies 2011-2012 0 9 0% 5 2 22012-2013 0 9 0% 3 2 42013-2014 7 19 37% 6 1 5
District Summary All Tests 2011-2012 38 191 20% 71 40 422012-2013 52 116 45% 62 50 322013-2014 54 208 26% 72 49 33
Elementary Level III %age Yellow Orange PinkReading 2011-2012 1 10 10% 1 3 5
2012-2013 9 11 82% 1 0 12013-2014 2 11 18% 2 5 2
Math 2011-2012 2 10 20% 6 1 12012-2013 10 11 91% 1 0 02013-2014 4 11 36% 3 4 0
Campus Summary All Tests 2011-2012 3 20 15% 7 4 62012-2013 19 22 86% 2 0 12013-2014 6 22 27% 5 9 2
Intermediate Level III %age Yellow Orange PinkReading 2011-2012 7 21 33% 4 6 4
2012-2013 5 19 26% 5 6 32013-2014 7 20 35% 4 7 2
Writing 2011-2012 0 10 0% 9 1 02012-2013 1 9 11% 6 2 02013-2014 0 10 0% 8 2 0
Math 2011-2012 2 20 10% 5 7 62012-2013 1 19 5% 2 12 42013-2014 4 20 20% 7 4 5
Science 2011-2012 3 11 27% 4 4 02012-2013 7 9 78% 2 0 02013-2014 3 10 30% 4 3 0
Campus Summary All Tests 2011-2012 12 62 19% 22 18 102012-2013 14 56 25% 15 20 72013-2014 14 60 23% 23 16 7
Summary Of Level III Performance of Campus SubPops compared to State Average

Jr. High Level III %age Yellow Orange PinkReading 2011-2012 7 27 26% 10 7 3
2012-2013 3 28 11% 11 7 72013-2014 4 25 16% 10 6 5
Writing 2011-2012 1 10 10% 6 0 32012-2013 3 10 30% 5 2 02013-2014 1 8 13% 4 2 1
Math 2011-2012 8 27 30% 5 4 102012-2013 1 27 4% 9 13 42013-2014 7 26 27% 9 8 2
Science 2011-2012 2 9 22% 3 2 22012-2013 3 9 33% 5 0 12013-2014 2 10 20% 1 3 4
Social Studies 2011-2012 0 9 0% 5 2 22012-2013 0 9 0% 3 2 42013-2014 2 10 20% 3 1 4
Campus Summary All Tests 2011-2012 18 82 22% 29 15 202012-2013 10 83 12% 33 24 162013-2014 16 79 20% 27 20 16
High School Level III %age Yellow Orange PinkEnglish I/II 2011-2012 3 9 33% 5 1 0
2012-2013 4 18 22% 9 3 22013-2014 8 19 42% 9 1 1
Algebra I 2011-2012 0 9 0% 2 1 62012-2013 0 8 0% 1 2 52013-2014 1 9 11% 1 2 5
Biology 2011-2012 2 9 22% 6 1 02012-2013 5 9 56% 2 1 12013-2014 4 10 40% 4 1 1
US History 2011-2012 NA NA NA NA NA NA2012-2013 NA NA NA NA NA NA2013-2014 5 9 56% 3 0 1
Campus Summary All Tests 2011-2012 5 27 19% 13 3 62012-2013 9 35 26% 12 6 82013-2014 18 47 38% 17 4 8

STAAR Scores - Reading Level II
Green – At or above state averageYellow – 1 to 4 points below state averageOrange – 5 to 8 points below state average
Pink - More than 8 points below state average
St. Reg. RISD St. Reg. RISD St. Reg. RISD St. Reg. RISD St. Reg. RISD St. Reg. RISD St. Reg. RISD St. Reg. RISD St. Reg. RISD St. Reg. RISD St. Reg. RISD2012 Phase-In I Lev II 76 75 76 66 60 72 71 68 62 86 83 80 83 76 * 74 72 70 79 78 81 66 63 55 53 51 60 69 66 65 63 61 552013 Phase-In I Lev II 79 79 87 69 65 64 74 70 77 89 87 91 86 76 67 77 77 86 81 82 85 68 64 75 59 61 91 71 73 82 66 66 712014 Phase-In I Lev II 76 76 81 63 58 55 71 68 77 87 85 85 83 77 86 74 74 81 78 77 81 65 62 72 56 56 83 67 68 76 62 62 63
St. Reg. RISD St. Reg. RISD St. Reg. RISD St. Reg. RISD St. Reg. RISD St. Reg. RISD St. Reg. RISD St. Reg. RISD St. Reg. RISD St. Reg. RISD St. Reg. RISD2012 Phase-In I Lev II 77 76 77 66 59 57 72 70 68 88 84 84 85 76 * 75 74 69 79 78 82 61 58 40 51 49 45 70 67 71 58 55 442013 Phase-In I Lev II 72 71 70 60 55 30 65 60 52 85 80 80 81 76 * 70 68 64 74 73 73 53 45 33 46 47 75 62 62 62 54 51 492014 Phase-In I Lev II 74 72 75 62 57 79 69 65 62 84 80 76 81 74 * 71 70 72 77 74 78 58 56 43 49 49 40 65 64 70 55 53 50
His.St. Reg. RISD St. Reg. RISD St. Reg. RISD St. Reg. RISD St. Reg. RISD St. Reg. RISD St. Reg. RISD St. Reg. RISD St. Reg. RISD St. Reg. RISD St. Reg. RISD
2012 Phase-In I Lev II 77 76 75 68 60 54 72 68 46 87 84 83 85 83 50 75 74 71 79 78 80 51 45 0 46 48 40 70 66 61 55 53 442013 Phase-In I Lev II 77 85 83 68 74 69 74 78 74 89 92 90 85 78 * 75 73 75 79 77 78 53 47 * 49 69 75 69 80 75 73 67 572014 Phase-In I Lev II 76 75 76 66 60 56 71 67 70 88 84 81 85 82 * 74 73 74 78 78 79 52 48 43 50 50 100 68 67 63 59 58 60
St. Reg. RISD St. Reg. RISD St. Reg. RISD St. Reg. RISD St. Reg. RISD St. Reg. RISD St. Reg. RISD St. Reg. RISD St. Reg. RISD St. Reg. RISD St. Reg. RISD2012 Phase-In I Lev II 75 75 71 68 62 63 67 65 63 86 84 74 84 75 80 72 71 69 77 79 74 38 36 * 36 39 80 67 65 67 49 50 442013 Phase-In I Lev II 71 72 66 63 55 38 63 61 50 85 82 75 82 80 * 69 70 64 73 74 73 32 29 * 34 42 * 61 63 51 67 45 352014 Phase-In I Lev II 77 77 83 68 62 77 71 72 77 88 84 86 85 80 * 74 74 83 80 80 83 48 48 * 41 45 * 69 70 80 56 56 70
St. Reg. RISD St. Reg. RISD St. Reg. RISD St. Reg. RISD St. Reg. RISD St. Reg. RISD St. Reg. RISD St. Reg. RISD St. Reg. RISD St. Reg. RISD St. Reg. RISD2012 Phase-In I Lev II 76 75 81 70 62 70 70 70 77 86 82 83 85 75 * 72 71 74 80 80 86 37 37 * 34 32 71 69 66 75 52 52 502013 Phase-In I Lev II 77 78 78 71 63 87 71 69 73 88 86 73 86 79 83 75 75 73 80 81 79 38 35 * 38 42 88 69 70 83 52 54 522014 Phase-In I Lev II 75 75 81 66 57 62 68 67 71 87 84 86 84 80 * 72 70 75 78 78 88 34 31 * 37 38 * 65 66 71 51 52 67
St. Reg. RISD St. Reg. RISD St. Reg. RISD St. Reg. RISD St. Reg. RISD St. Reg. RISD St. Reg. RISD St. Reg. RISD St. Reg. RISD St. Reg. RISD St. Reg. RISD2012 Phase-In I Lev II 80 80 85 73 65 76 74 75 76 90 87 87 88 85 87 78 79 84 82 82 86 34 33 * 40 39 * 73 72 80 58 59 652013 Phase-In I Lev II 84 90 92 78 82 100 79 86 97 92 95 91 91 89 80 80 81 76 87 87 85 46 48 * 46 63 86 77 86 87 75 78 822014 Phase-In I Lev II 83 82 86 76 70 83 77 75 83 92 89 88 90 83 83 80 78 84 85 86 89 43 41 * 47 47 * 75 75 84 66 65 75
St. Reg. RISD St. Reg. RISD St. Reg. RISD St. Reg. RISD St. Reg. RISD St. Reg. RISD St. Reg. RISD St. Reg. RISD St. Reg. RISD St. Reg. RISD St. Reg. RISD2012 Phase-In I Lev II 68 69 73 59 54 43 59 57 57 82 78 80 79 73 * 62 63 64 74 75 81 18 16 * 24 23 * 57 57 61 42 43 532013 Phase-In I Lev II 65 65 67 55 47 33 56 55 53 81 76 76 78 70 * 60 59 59 70 72 76 18 14 * 22 21 59 54 55 59 40 40 422014 Phase-In I Lev II 62 63 77 53 47 59 55 53 79 78 75 81 76 70 80 56 56 67 69 71 87 21 16 * 23 26 55 52 54 72 44 44 56
St. Reg. RISD St. Reg. RISD St. Reg. RISD St. Reg. RISD St. Reg. RISD St. Reg. RISD St. Reg. RISD St. Reg. RISD St. Reg. RISD St. Reg. RISD St. Reg. RISD
All AA His. White
At-Risk
His. White 2+ ELL SPED
All AA
All AA His. White 2+
At-Risk
ELL SPED ECODISMale Female
At-Risk
At-Risk
At-Risk
ELL SPED ECODIS At-Risk
2+
2+ ELL SPED ECODIS
ELL SPED ECODISMale Female
All AA ECODIS
All AA His. White 2+ ELL SPED ECODIS
His. White 2+
Male Female
At-RiskAll AA ECODIS
All AA White
ELL SPEDHis. White 2+ Male Female
Male Female
ECODIS At-RiskAll AA His. White 2+ ELLMale Female
Male Female
Male Female
SPED
8 Reading
Eng. I
Eng. II
3 Reading
4 Reading
5 Reading
6 Reading
7 Reading

STAAR Scores - Reading Level II
Green – At or above state averageYellow – 1 to 4 points below state averageOrange – 5 to 8 points below state average
Pink - More than 8 points below state average
R 2012 Phase-In I Lev II 61 46 NA 54 27 NA 60 42 NA 64 51 NA 65 59 NA 55 36 NA 68 57 NA 21 12 NA 20 17 NA 53 36 NA 38 23 NA R 2013 Phase-In I Lev II 78 78 72 71 67 54 71 68 79 88 84 73 87 80 * 75 74 60 81 81 83 31 25 * 36 32 39 69 69 61 61 61 61
R/W 2014 Phase-In I Lev II 66 66 72 55 48 36 58 56 68 81 77 80 79 78 * 61 60 66 71 73 78 20 16 * 22 19 14 55 56 70 46 46 50

STAAR Scores - Reading Level III
Green – At or above state averageYellow – 1 to 4 points below state averageOrange – 5 to 8 points below state average
Pink - More than 8 points below state average
St. Reg. RISD St. Reg. RISD St. Reg. RISD St. Reg. RISD St. Reg. RISD St. Reg. RISD St. Reg. RISD St. Reg. RISD St. Reg. RISD St. Reg. RISD St. Reg. RISD2012 Level III 21 17 13 12 7 3 14 12 5 30 23 17 28 17 * 19 16 6 23 19 19 10 7 0 9 10 20 11 10 6 8 6 12013 Level III 20 18 25 11 8 14 14 10 23 30 24 28 27 20 17 18 16 24 22 20 26 9 7 25 9 9 22 11 11 16 7 6 92014 Level III 17 14 12 9 5 18 10 7 13 27 20 12 23 10 0 15 13 10 18 15 13 7 4 0 7 6 0 9 8 7 6 5 3
St. Reg. RISD St. Reg. RISD St. Reg. RISD St. Reg. RISD St. Reg. RISD St. Reg. RISD St. Reg. RISD St. Reg. RISD St. Reg. RISD St. Reg. RISD St. Reg. RISD2012 Level III 19 16 20 10 5 3 12 9 14 29 22 27 27 18 * 18 16 22 19 16 19 5 4 0 7 8 27 9 9 10 5 5 72013 Level III 20 17 18 11 7 0 14 11 10 31 24 24 28 17 * 19 17 12 22 18 23 6 5 0 8 8 0 12 11 15 7 6 32014 Level III 18 15 18 10 6 5 12 8 14 27 21 22 25 14 * 16 13 11 20 17 24 6 4 0 7 7 20 10 9 11 5 4 6
His.St. Reg. RISD St. Reg. RISD St. Reg. RISD St. Reg. RISD St. Reg. RISD St. Reg. RISD St. Reg. RISD St. Reg. RISD St. Reg. RISD St. Reg. RISD St. Reg. RISD
2012 Level III 17 15 8 10 7 4 11 8 0 26 20 9 24 18 17 15 14 8 18 16 7 3 2 0 5 6 0 8 8 4 4 3 22013 Level III 20 17 14 12 6 4 13 9 9 31 24 18 29 19 * 19 15 15 22 18 12 4 2 * 6 7 13 11 10 12 5 4 62014 Level III 20 18 14 10 7 6 13 10 5 32 25 18 28 22 * 19 16 6 21 19 21 4 2 0 7 8 0 11 11 7 5 5 1
St. Reg. RISD St. Reg. RISD St. Reg. RISD St. Reg. RISD St. Reg. RISD St. Reg. RISD St. Reg. RISD St. Reg. RISD St. Reg. RISD St. Reg. RISD St. Reg. RISD2012 Level III 17 15 10 10 6 6 10 7 6 28 22 11 25 13 20 16 14 9 19 17 12 2 0 * 3 2 0 8 7 11 3 2 02013 Level III 20 19 16 12 7 5 13 10 0 32 26 20 29 23 * 19 18 14 21 20 18 2 1 * 5 7 * 11 11 6 4 4 22014 Level III 15 12 12 8 4 0 9 7 3 24 17 17 22 14 * 13 10 11 17 14 13 2 1 * 3 3 * 7 7 7 2 2 0
St. Reg. RISD St. Reg. RISD St. Reg. RISD St. Reg. RISD St. Reg. RISD St. Reg. RISD St. Reg. RISD St. Reg. RISD St. Reg. RISD St. Reg. RISD St. Reg. RISD2012 Level III 18 15 14 11 7 10 11 9 6 28 21 17 27 18 * 15 13 14 21 18 14 1 1 * 3 1 0 9 8 9 3 3 42013 Level III 16 15 10 9 6 0 10 8 13 26 21 11 24 14 17 14 13 13 18 17 7 1 1 * 3 3 17 8 8 9 3 2 02014 Level III 19 18 17 11 6 5 12 9 7 31 24 20 28 21 * 18 16 15 21 19 19 1 1 * 4 4 * 10 10 8 3 3 3
St. Reg. RISD St. Reg. RISD St. Reg. RISD St. Reg. RISD St. Reg. RISD St. Reg. RISD St. Reg. RISD St. Reg. RISD St. Reg. RISD St. Reg. RISD St. Reg. RISD2012 Level III 19 17 17 11 7 24 12 9 14 30 23 17 28 21 * 17 15 9 21 19 25 1 0 * 3 2 * 9 9 11 3 3 42013 Level III 24 22 20 15 10 11 17 14 10 36 29 24 34 23 0 21 19 20 28 85 20 2 1 * 4 4 0 14 13 11 5 6 32014 Level III 23 21 13 14 9 6 15 12 11 35 28 13 32 20 33 20 18 10 26 23 16 1 0 * 4 4 * 13 12 13 5 4 3
St. Reg. RISD St. Reg. RISD St. Reg. RISD St. Reg. RISD St. Reg. RISD St. Reg. RISD St. Reg. RISD St. Reg. RISD St. Reg. RISD St. Reg. RISD St. Reg. RISD2012 Level III 8 7 7 4 3 0 4 3 0 13 10 9 12 10 * 6 5 1 10 10 12 0 0 * 1 0 0 3 3 3 1 1 32013 Level III 11 9 7 6 3 5 6 4 0 18 13 8 18 10 * 7 6 5 14 12 10 0 0 * 1 1 0 4 4 1 1 1 22014 Level III 6 5 4 2 1 0 3 2 3 12 7 6 11 7 0 4 3 3 9 7 5 0 0 * 0 0 0 2 2 4 1 0 1
MaleAll AA His. White 2+
All AA His. White 2+ At-Risk
Female ELL SPED ECODIS At-Risk
Male Female ELL SPED ECODIS
ELL SPED ECODIS At-Risk
All AA His. White 2+ Male
All AA White 2+ Male Female
All AA His. White 2+ ECODIS At-Risk
Female ELL SPED ECODIS At-Risk
Male
Male Female ELL SPED
All AA His. White 2+
All AA His. White 2+ ECODIS At-Risk
Female ELL SPED ECODIS At-Risk
Male Female ELL SPED
3 Reading
4 Reading
5 Reading
6 Reading
7 Reading
8 Reading
Eng. I

STAAR Scores - Reading Level III
Green – At or above state averageYellow – 1 to 4 points below state averageOrange – 5 to 8 points below state average
Pink - More than 8 points below state average
St. Reg. RISD St. Reg. RISD St. Reg. RISD St. Reg. RISD St. Reg. RISD St. Reg. RISD St. Reg. RISD St. Reg. RISD St. Reg. RISD St. Reg. RISD St. Reg. RISD R 2012 Level III 9 4 NA 5 1 NA 6 1 NA 11 6 NA 11 9 NA 7 3 NA 10 6 NA 0 0 NA 0 1 NA 5 2 NA 1 1 NA R 2013 Level III 21 18 20 11 7 15 13 11 0 31 23 24 30 21 * 18 14 12 24 22 26 1 0 * 2 2 0 11 10 10 5 4 6
R/W 2014 Level III 6 4 5 2 1 0 3 2 0 10 6 7 10 6 * 4 3 0 7 6 10 0 0 * 0 0 0 2 1 2 0 0 2
Female ELL SPED ECODIS At-RiskEng. II
All AA His. White 2+ Male

STAAR Scores - Mathematics Level II
Green – At or above state averageYellow – 1 to 4 points below state averageOrange – 5 to 8 points below state average
Pink - More than 8 points below state average
All AA His. White 2+ ELL SPED ECODIS At-RiskSt. Reg. RISD St. Reg. RISD St. Reg. RISD St. Reg. RISD St. Reg. RISD St. Reg. RISD St. Reg. RISD St. Reg. RISD St. Reg. RISD St. Reg. RISD St. Reg. RISD
2012 Phase-In I Lev II 68 66 64 50 43 38 64 64 57 79 73 72 74 69 * 68 66 66 68 65 63 64 64 50 45 44 80 60 57 55 55 51 482013 Phase-In I Lev II 79 69 77 69 48 40 74 66 64 89 76 93 86 66 50 69 68 83 70 69 71 68 61 67 59 49 87 71 62 71 57 55 542014 Phase-In I Lev II 70 69 77 53 48 45 67 66 84 80 77 79 74 66 71 70 69 76 70 69 79 67 65 79 47 44 60 62 61 72 59 56 64
All AA His. White 2+ ELL SPED ECODIS At-RiskSt. Reg. RISD St. Reg. RISD St. Reg. RISD St. Reg. RISD St. Reg. RISD St. Reg. RISD St. Reg. RISD St. Reg. RISD St. Reg. RISD St. Reg. RISD St. Reg. RISD
2012 Phase-In I Lev II 68 65 69 52 45 33 64 64 67 78 73 79 73 64 * 68 64 63 68 66 73 61 57 58 41 39 73 60 57 60 52 46 382013 Phase-In I Lev II 68 65 63 52 45 23 64 63 52 79 72 73 74 70 * 68 65 60 69 66 66 60 52 33 41 40 54 60 58 53 55 50 432014 Phase-In I Lev II 70 68 72 53 49 55 66 64 76 80 74 75 76 66 * 70 67 76 71 68 68 62 60 57 44 44 43 62 60 69 52 49 48
All AA His. White 2+ ELL SPED ECODIS At-RiskSt. Reg. RISD St. Reg. RISD St. Reg. RISD St. Reg. RISD St. Reg. RISD St. Reg. RISD St. Reg. RISD St. Reg. RISD St. Reg. RISD St. Reg. RISD St. Reg. RISD
2012 Phase-In I Lev II 77 75 77 65 57 54 74 71 71 86 81 83 83 77 50 77 74 72 78 76 83 64 55 40 47 45 80 71 67 69 59 54 522013 Phase-In I Lev II 75 86 88 61 73 69 71 84 76 85 91 96 81 75 * 75 72 82 75 74 82 62 54 * 46 67 89 68 82 83 76 71 612014 Phase-In I Lev II 79 76 80 65 60 67 75 73 70 87 83 84 84 75 * 78 76 81 79 77 80 67 63 57 52 53 80 72 70 70 64 62 68
All AA His. White 2+ ELL SPED ECODIS At-RiskSt. Reg. RISD St. Reg. RISD St. Reg. RISD St. Reg. RISD St. Reg. RISD St. Reg. RISD St. Reg. RISD St. Reg. RISD St. Reg. RISD St. Reg. RISD St. Reg. RISD
2012 Phase-In I Lev II 77 77 73 64 58 38 73 74 69 87 84 79 83 78 100 77 76 66 78 79 82 59 57 * 41 43 50 71 70 69 56 56 472013 Phase-In I Lev II 74 75 72 61 56 50 69 71 36 85 82 80 81 76 * 73 74 67 75 75 56 52 49 * 38 46 43 66 68 60 51 52 422014 Phase-In I Lev II 79 79 82 66 63 77 74 77 68 88 85 86 84 79 * 77 78 81 80 80 82 62 61 * 47 50 * 72 73 76 61 61 68
All AA His. White 2+ ELL SPED ECODIS At-RiskSt. Reg. RISD St. Reg. RISD St. Reg. RISD St. Reg. RISD St. Reg. RISD St. Reg. RISD St. Reg. RISD St. Reg. RISD St. Reg. RISD St. Reg. RISD St. Reg. RISD
2012 Phase-In I Lev II 71 72 60 56 52 38 65 69 52 83 78 65 83 74 * 70 71 59 71 72 61 45 48 * 34 36 25 63 63 51 46 49 192013 Phase-In I Lev II 71 74 78 58 55 59 66 70 73 83 81 80 78 72 100 71 73 44 72 75 50 49 48 * 37 43 88 64 67 73 49 51 572014 Phase-In I Lev II 67 67 65 54 46 33 61 61 57 81 76 70 75 70 * 67 66 62 68 68 69 41 34 * 34 33 * 58 58 49 44 42 44
All AA His. White 2+ ELL SPED ECODIS At-RiskSt. Reg. RISD St. Reg. RISD St. Reg. RISD St. Reg. RISD St. Reg. RISD St. Reg. RISD St. Reg. RISD St. Reg. RISD St. Reg. RISD St. Reg. RISD St. Reg. RISD
2012 Phase-In I Lev II 76 78 85 64 61 59 70 75 90 87 85 88 83 82 * 76 78 83 76 79 86 50 52 * 44 46 * 69 71 80 55 59 692013 Phase-In I Lev II 77 89 92 67 79 93 74 87 100 86 93 92 84 74 * 77 80 87 77 82 85 59 60 * 48 74 83 71 85 88 74 78 862014 Phase-In I Lev II 79 82 91 68 65 89 76 79 89 88 88 92 84 84 100 79 81 89 80 82 94 60 59 * 52 55 * 73 77 89 65 67 85
All AA His. White 2+ ELL SPED ECODIS At-RiskSt. Reg. RISD St. Reg. RISD St. Reg. RISD St. Reg. RISD St. Reg. RISD St. Reg. RISD St. Reg. RISD St. Reg. RISD St. Reg. RISD St. Reg. RISD St. Reg. RISD
2012 Phase-In I Lev II 83 81 70 75 73 57 79 79 79 90 85 69 89 80 * 81 80 45 84 83 71 60 58 * 50 49 * 77 76 60 66 64 442013 Phase-In I Lev II 78 79 65 69 67 55 74 75 67 88 83 67 86 79 * 76 76 63 81 81 69 51 53 * 43 45 58 71 73 65 59 60 552014 Phase-In I Lev II 81 81 88 72 71 89 77 78 88 90 86 86 87 77 * 79 79 89 83 84 87 56 53 * 46 50 100 75 76 88 67 68 78
Male Female
Male Female
Male Female
Male
Male Female
Male Female
Male Female
Female
3 Math
6 Math
7 Math
8 Math
Algebra I
5 Math
4 Math

STAAR Scores Mathematics - Level III
Green – At or above state averageYellow – 1 to 4 points below state averageOrange – 5 to 8 points below state average
Pink - More than 8 points below state average
All AA His. White 2+ ELL SPED ECODIS At-RiskSt. Reg. RISD St. Reg. RISD St. Reg. RISD St. Reg. RISD St. Reg. RISD St. Reg. RISD St. Reg. RISD St. Reg. RISD St. Reg. RISD St. Reg. RISD St. Reg. RISD
2012 Level III 15 12 14 6 3 3 10 11 5 21 15 18 19 11 * 15 13 11 14 12 17 10 10 0 7 7 30 8 7 6 7 5 32013 Level III 16 13 24 7 5 5 12 10 36 22 17 25 20 14 33 16 13 27 15 13 22 11 10 42 7 6 11 10 9 21 8 6 132014 Level III 16 13 14 7 4 0 12 10 13 21 17 15 20 9 29 16 13 13 15 12 15 12 9 5 7 7 0 10 9 12 8 6 5
All AA His. White 2+ ELL SPED ECODIS At-RiskSt. Reg. RISD St. Reg. RISD St. Reg. RISD St. Reg. RISD St. Reg. RISD St. Reg. RISD St. Reg. RISD St. Reg. RISD St. Reg. RISD St. Reg. RISD St. Reg. RISD
2012 Level III 13 10 10 5 3 3 10 8 5 18 12 14 18 10 * 13 10 7 13 9 13 7 5 * 5 6 18 7 6 5 6 4 32013 Level III 16 13 7 7 4 0 12 11 5 23 16 9 20 14 * 16 12 9 15 13 6 8 8 0 6 6 20 10 9 3 7 6 02014 Level III 20 15 17 9 6 0 16 13 14 28 19 21 25 13 * 20 15 15 20 16 18 12 10 0 8 7 14 13 11 10 8 6 10
All AA His. White 2+ ELL SPED ECODIS At-RiskSt. Reg. RISD St. Reg. RISD St. Reg. RISD St. Reg. RISD St. Reg. RISD St. Reg. RISD St. Reg. RISD St. Reg. RISD St. Reg. RISD St. Reg. RISD St. Reg. RISD
2012 Level III 19 15 9 9 5 0 14 10 0 27 20 12 25 13 0 19 15 11 19 14 7 7 3 0 6 6 0 10 8 4 6 4 02013 Level III 21 17 13 10 7 4 16 11 9 30 22 17 28 17 * 22 17 11 20 16 16 9 4 * 7 7 11 13 11 7 8 4 32014 Level III 22 17 19 12 8 6 17 14 0 30 21 24 29 13 * 22 17 19 22 17 19 10 6 0 7 7 20 14 12 5 7 5 7
All AA His. White 2+ ELL SPED ECODIS At-RiskSt. Reg. RISD St. Reg. RISD St. Reg. RISD St. Reg. RISD St. Reg. RISD St. Reg. RISD St. Reg. RISD St. Reg. RISD St. Reg. RISD St. Reg. RISD St. Reg. RISD
2012 Level III 19 18 4 9 7 0 13 13 0 29 22 6 26 15 0 20 18 4 19 18 4 5 3 * 4 5 13 11 10 0 5 3 02013 Level III 16 14 9 8 5 0 11 10 0 24 18 11 22 14 * 16 14 9 16 14 9 4 3 * 4 4 * 9 8 3 4 3 02014 Level III 17 15 14 8 5 0 12 11 4 26 19 19 24 15 * 18 14 11 17 15 16 5 4 * 4 4 * 10 9 8 4 3 1
All AA His. White 2+ ELL SPED ECODIS At-RiskSt. Reg. RISD St. Reg. RISD St. Reg. RISD St. Reg. RISD St. Reg. RISD St. Reg. RISD St. Reg. RISD St. Reg. RISD St. Reg. RISD St. Reg. RISD St. Reg. RISD
2012 Level III 11 9 3 4 3 0 7 7 0 18 12 5 16 9 * 11 10 4 11 9 2 2 1 * 2 2 0 5 4 1 2 2 22013 Level III 9 9 2 3 2 0 6 6 0 15 12 4 13 7 0 9 8 2 9 9 4 2 1 * 2 1 11 4 5 3 1 1 02014 Level III 11 9 4 4 2 0 7 5 0 18 13 5 16 10 * 11 10 3 11 9 4 2 1 * 2 2 * 5 5 3 2 1 0
All AA His. White 2+ ELL SPED ECODIS At-RiskSt. Reg. RISD St. Reg. RISD St. Reg. RISD St. Reg. RISD St. Reg. RISD St. Reg. RISD St. Reg. RISD St. Reg. RISD St. Reg. RISD St. Reg. RISD St. Reg. RISD
2012 Level III 7 6 11 2 2 6 4 3 0 11 8 14 9 6 * 7 6 12 6 6 11 1 1 * 1 0 * 3 3 5 1 1 02013 Level III 5 5 0 2 2 0 3 3 0 8 6 0 7 5 * 5 4 0 5 5 0 1 1 * 1 1 0 2 3 0 1 1 02014 Level III 8 8 9 3 2 0 5 5 6 13 11 12 12 7 0 8 8 8 8 8 9 1 1 9 1 1 * 4 4 10 1 1 2
All AA His. White 2+ ELL SPED ECODIS At-RiskSt. Reg. RISD St. Reg. RISD St. Reg. RISD St. Reg. RISD St. Reg. RISD St. Reg. RISD St. Reg. RISD St. Reg. RISD St. Reg. RISD St. Reg. RISD St. Reg. RISD
2012 Level III 17 12 1 8 5 0 11 9 0 24 16 2 24 14 * 17 13 2 16 12 0 4 1 * 3 2 0 9 7 0 3 2 02013 Level III 16 13 2 7 5 0 10 9 0 24 16 2 23 13 * 16 12 3 16 13 0 3 1 * 2 1 * 8 8 0 3 2 22014 Level III 18 14 4 8 6 0 12 10 3 28 19 5 25 15 * 17 13 5 19 15 3 3 2 * 2 2 17 10 8 4 3 2 2
Female
Male Female
Male Female
Male Female
3 Math
4 Math
5 Math
6 Math
7 Math
8 Math
Algebra I
Male Female
Male Female
Male Female
Male

STAAR Scores - Writing Level II
Green – At or above state averageYellow – 1 to 4 points below state averageOrange – 5 to 8 points below state average
Pink - More than 8 points below state average
St. Reg. RISD St. Reg. RISD St. Reg. RISD St. Reg. RISD St. Reg. RISD St. Reg. RISD St. Reg. RISD St. Reg. RISD St. Reg. RISD St. Reg. RISD St. Reg. RISD71 68 62 61 51 35 67 61 68 81 77 68 78 70 * 67 62 53 76 75 68 54 48 40 37 36 36 63 59 54 51 46 3671 67 61 62 55 52 65 59 40 80 75 68 78 71 * 66 62 51 76 73 71 54 45 0 38 35 38 62 59 56 53 25 3173 70 70 63 56 60 69 63 57 81 76 74 80 70 * 68 64 61 79 75 78 59 55 29 39 37 33 65 62 63 55 50 37
AllSt. Reg. RISD St. Reg. RISD St. Reg. RISD St. Reg. RSID St. Reg. RISD St. Reg. RISD St. Reg. RISD St. Reg. RISD St. Reg. RISD St. Reg. RISD St. Reg. RISD
71 72 71 64 60 50 65 64 61 82 78 80 81 74 40 65 65 63 78 79 79 30 30 * 27 25 57 63 62 62 45 48 4270 71 71 63 59 53 63 63 73 81 78 72 79 74 67 64 64 62 76 79 77 30 29 * 26 24 69 61 63 64 42 45 4370 71 76 63 55 52 64 63 64 82 79 82 79 78 * 63 64 67 78 79 87 30 26 * 27 30 * 61 62 66 46 46 56
St. Reg. RISD St. Reg. RISD St. Reg. RISD St. Reg. RISD St. Reg. RISD St. Reg. RISD St. Reg. RISD St. Reg. RISD St. Reg. RISD St. Reg. RISD St. Reg. RISD55 54 47 45 39 21 44 41 41 70 64 53 68 56 * 49 48 33 60 61 61 8 6 * 11 10 0 41 41 38 26 26 3048 47 51 37 30 36 38 37 39 64 58 53 62 51 * 41 40 38 55 56 61 9 7 * 10 8 45 35 35 41 22 23 30
2014 Phase-In (Combined with Reading- Scores reported with Reading)
St. Reg. RISD St. Reg. RISD St. Reg. RISD St. Reg. RISD St. Reg. RISD St. Reg. RISD St. Reg. RISD St. Reg. RISD St. Reg. RISD St. Reg. RISD St. Reg. RISD46 30 NA 38 17 NA 43 28 NA 49 32 NA 50 48 NA 39 22 NA 52 38 NA 9 8 NA 8 11 NA 36 23 NA 20 10 NA52 51 50 38 32 38 43 40 47 68 60 52 64 51 * 47 45 33 57 57 61 10 8 * 11 29 17 39 39 37 27 27 30
2014 Phase-In (Combined with Reading- Scores reported with Reading)
ELL
AA His. White
Male
2+ ELL
Female
Male Female
His. White 2+ EcoDis At-Risk
SPED EcoDis At-Risk
SPED
EcoDis At-Risk
2+ ELL
2+ ELL SPED
SPED EcoDis At-Risk
Male Female
Male Female
All AA His. White
AA His. White
Eng. II Writing
2013 Phase-In I Lev II
2014 Phase-In I Lev II
AA
All
All
2012 Phase-In I Lev II
2013 Phase-In I Lev II
Eng. I Writing
2013 Phase-In I Lev II
4 Writing2012 Phase-In I Lev II
2014 Phase-In I Lev II
7 Writing2012 Phase-In I Lev II
2013 Phase-In I Lev II
2012 Phase-In I Lev II

STAAR Scores - Writing Level III
Green – At or above state averageYellow – 1 to 4 points below state averageOrange – 5 to 8 points below state average
Pink - More than 8 points below state average
St. Reg. RISD St. Reg. RISD St. Reg. RISD St. Reg. RISD St. Reg. RISD St. Reg. RISD St. Reg. RISD St. Reg. RISD St. Reg. RISD St. Reg. RISD St. Reg. RISD7 5 4 3 1 0 4 2 0 11 7 6 11 7 * 5 3 1 9 6 5 2 0 0 2 3 0 3 2 2 2 1 07 5 3 3 2 4 4 2 0 11 6 3 11 4 * 5 3 1 9 6 4 1 1 * 2 1 0 3 2 2 1 0 06 4 2 3 2 5 4 2 0 10 6 2 9 4 * 4 3 1 9 6 3 1 1 0 2 1 0 3 2 1 1 1 0
AllSt. Reg. RISD St. Reg. RISD St. Reg. RISD St. Reg. RSID St. Reg. RISD St. Reg. RISD St. Reg. RISD St. Reg. RISD St. Reg. RISD St. Reg. RISD St. Reg. RISD
7 6 1 3 2 0 3 3 0 12 8 1 13 7 20 5 3 1 10 8 1 0 0 * 1 0 0 2 2 1 1 0 05 4 3 2 2 0 2 2 0 8 6 2 8 4 17 3 3 3 7 6 2 0 0 * 1 0 0 2 2 1 0 0 06 5 1 3 1 0 3 2 0 10 8 1 10 7 * 4 3 0 9 8 1 0 0 * 1 1 * 2 2 1 0 0 0
St. Reg. RISD St. Reg. RISD St. Reg. RISD St. Reg. RISD St. Reg. RISD St. Reg. RISD St. Reg. RISD St. Reg. RISD St. Reg. RISD St. Reg. RISD St. Reg. RISD3 2 2 1 1 0 1 1 0 5 3 3 6 2 * 2 1 3 4 3 1 0 0 * 0 0 0 1 1 0 0 0 02 2 3 1 0 0 1 1 0 4 3 4 5 2 * 1 1 1 3 2 5 0 0 * 0 0 0 1 1 1 0 0 0
2014 Level III (Combined with Reading- Scores reported with Reading)
St. Reg. RISD St. Reg. RISD St. Reg. RISD St. Reg. RISD St. Reg. RISD St. Reg. RISD St. Reg. RISD St. Reg. RISD St. Reg. RISD St. Reg. RISD St. Reg. RISD2 1 NA 1 0 NA 1 1 NA 3 1 NA 3 0 NA 2 0 NA 3 1 NA 0 0 NA 0 0 NA 1 0 NA 0 0 NA3 2 1 1 1 0 1 1 0 4 3 2 5 2 * 2 1 2 3 3 1 0 0 * 0 0 0 1 1 0 0 0 0
2014 Level III (Combined with Reading- Scores reported with Reading)
Female ELL SPED EcoDis At-Risk
2013 Level III
AA His. White
MaleAll AA His. White 2+
At-Risk
2013 Level III
All AA His. White 2+ Male
2+ Male Female ELL SPED EcoDis
Female ELL
EcoDis
SPED EcoDis At-Risk
2013 Level III
All AA His. WhiteEng. II Writing
2012 Level III2013 Level III
At-Risk
4 Writing2012 Level III
2014 Level III
7 Writing2012 Level III
2014 Level III
2012 Level IIIEng. I Writing
2+ Male Female ELL SPED

STAAR Scores - Science Level II
Green – At or above state averageYellow – 1 to 4 points below state averageOrange – 5 to 8 points below state average
Pink - More than 8 points below state average
St. Reg. RISD St. Reg. RISD St. Reg. RISD St. Reg. RISD St. Reg. RISD St. Reg. RISD St. Reg. RISD St. Reg. RISD St. Reg. RISD St. Reg. RISD St. Reg. RISD73 71 77 59 52 50 67 61 50 85 82 86 81 71 80 75 74 79 70 68 75 49 39 0 44 44 83 64 61 67 51 50 5273 71 74 58 53 68 67 61 68 85 81 85 82 74 * 75 73 88 70 69 74 54 45 * 44 48 50 65 63 73 53 49 6173 71 81 59 51 63 68 61 62 86 81 88 82 77 * 76 73 86 71 68 78 53 44 38 46 47 56 65 62 68 57 54 71
St. Reg. RISD St. Reg. RISD St. Reg. RISD St. Reg. RISD St. Reg. RISD St. Reg. RISD St. Reg. RISD St. Reg. RISD St. Reg. RISD St. Reg. RISD St. Reg. RISD70 69 71 59 48 38 67 61 55 85 78 79 81 78 * 73 72 74 67 66 67 49 26 * 44 29 20 64 57 60 44 42 3275 73 86 63 56 74 68 65 77 86 81 90 84 69 * 77 75 87 73 71 85 43 34 * 36 36 88 66 65 78 52 50 6771 67 79 59 48 67 64 58 83 84 78 79 79 78 100 73 69 81 69 66 77 35 24 * 31 29 40 61 58 73 48 42 67
St. Reg. RISD St. Reg. RISD St. Reg. RISD St. Reg. RISD St. Reg. RISD St. Reg. RISD St. Reg. RISD St. Reg. RISD St. Reg. RISD St. Reg. RISD St. Reg. RISD87 88 86 83 83 77 82 84 86 94 91 86 93 87 * 86 87 80 88 89 92 58 62 * 57 57 63 81 82 81 73 76 7885 85 84 80 75 67 80 79 79 93 91 90 93 90 * 84 85 81 86 85 91 55 51 * 54 57 73 79 79 82 71 70 6891 92 95 86 86 91 88 90 93 96 95 95 95 95 100 89 91 94 92 93 96 69 71 * 66 74 100 87 89 93 83 85 88
At-RiskAll AA Male Female EcoDis
At-Risk
2013 Phase-In I Lev II
All AA His. White 2+
ELL SPEDAll AA His. White
2014 Phase-In I Lev IIAt-Risk
EcoDis
His. White 2+
ELL SPED
ELL SPED
2+ Male Female
Male Female EcoDis
2014 Phase-In I Lev II
5 Science2012 Phase-In I Lev II
8 Science2012 Phase-In I Lev II
2012 Phase-In I Lev IIBiology
2013 Phase-In I Lev II
2014 Phase-In I Lev II2013 Phase-In I Lev II

STAAR Scores - Science Level III
Green – At or above state averageYellow – 1 to 4 points below state averageOrange – 5 to 8 points below state average
Pink - More than 8 points below state average
St. Reg. RISD St. Reg. RISD St. Reg. RISD St. Reg. RISD St. Reg. RISD St. Reg. RISD St. Reg. RISD St. Reg. RISD St. Reg. RISD St. Reg. RISD St. Reg. RISD12 10 10 5 3 0 7 5 0 19 13 13 19 14 20 14 11 13 10 8 7 6 1 0 4 4 0 6 5 7 3 2 411 9 15 4 2 0 7 4 5 19 14 20 17 10 * 13 10 14 10 8 15 3 1 * 4 4 10 6 5 11 3 2 611 8 9 4 2 0 7 5 0 17 12 13 16 7 * 12 10 7 9 7 11 3 1 0 4 4 11 6 4 1 3 2 5
St. Reg. RISD St. Reg. RISD St. Reg. RISD St. Reg. RISD St. Reg. RISD St. Reg. RISD St. Reg. RISD St. Reg. RISD St. Reg. RISD St. Reg. RISD St. Reg. RISD12 9 5 4 2 6 6 5 0 19 12 6 19 11 * 14 11 4 9 7 7 1 1 * 2 2 20 5 4 4 2 1 014 11 11 5 2 6 8 6 10 23 15 13 21 8 * 16 13 13 12 8 9 1 0 * 3 2 0 7 6 6 2 2 220 15 13 9 5 0 13 9 0 31 21 20 27 14 0 22 17 16 17 13 11 2 1 * 4 2 20 11 9 11 4 2 2
St. Reg. RISD St. Reg. RISD St. Reg. RISD St. Reg. RISD St. Reg. RISD St. Reg. RISD St. Reg. RISD St. Reg. RISD St. Reg. RISD St. Reg. RISD St. Reg. RISD9 7 7 4 2 0 4 4 0 15 9 10 15 5 * 10 8 9 8 5 6 1 1 * 2 2 0 3 3 3 1 1 1
12 8 10 5 2 13 7 5 11 21 12 10 20 9 * 13 9 6 12 8 15 1 0 * 2 1 0 6 4 6 2 1 412 9 9 5 3 4 6 4 3 19 12 10 18 8 20 12 10 14 11 8 4 1 0 * 2 1 0 5 4 9 2 1 2
SPED EcoDis At-RiskAll AA His. White 2+5 Science
2012 Level III
Male Female ELL
Female ELL SPED
2013 Level III
All AA His.
White 2+
White 2+ Male
ELL SPED EcoDis At-Risk
EcoDis At-Risk2014 Level III
2014 Level III
2014 Level III
8 Science2012 Level III
2013 Level III2012 Level III
BiologyMale Female
2013 Level III
All AA His.

Green - At or above state averageYellow -- 1 to 4 points below state averageOrange -- 5 to 8 points below state average
Pink -- More than 8 points below state average
STAAR Scores - Social Studies Level IISt. Reg. RISD St. Reg. RISD St. Reg. RISD St. Reg. RISD St. Reg. RISD St. Reg. RISD St. Reg. RISD St. Reg. RISD St. Reg. RISD St. Reg. RISD St. Reg. RISD
2012 Phase-In I Lev II 59 55 47 49 36 25 50 45 25 74 63 54 71 60 * 64 59 58 55 50 35 22 15 * 27 20 20 48 42 35 33 29 1963 59 51 55 43 52 55 51 39 76 68 55 75 59 * 66 63 58 61 56 44 28 24 * 28 25 56 52 50 45 38 34 3362 56 41 51 40 33 53 46 44 76 66 42 72 58 50 65 59 45 58 53 38 25 17 * 27 25 20 50 46 42 37 32 26
St. Reg. RISD St. Reg. RISD St. Reg. RISD St. Reg. RISD St. Reg. RISD St. Reg. RISD St. Reg. RISD St. Reg. RISD St. Reg. RISD St. Reg. RISD St. Reg. RISD2012 Phase-In I Lev II 63 65 NA 52 47 NA 59 58 NA 70 72 NA 69 51 NA 63 65 NA 63 65 NA 38 28 NA 33 27 NA 55 55 NA 47 44 NA
73 75 NA 61 60 NA 65 66 NA 83 83 NA 86 82 NA 75 79 NA 71 71 NA 35 33 NA 37 51 NA 65 68 NA 56 58 NA92 89 94 89 83 91 89 86 100 96 93 93 95 89 * 93 91 93 91 88 96 70 65 * 67 70 80 88 85 91 86 82 91
EcoDis At-RiskWhite 2+ Male Female ELL SPED
Male Female ELL SPED At-RiskEcoDis
2014 Phase-In I Lev II2013 Phase-In I Lev II
US History
8 Soc. Studies2+All AA His. White
2013 Phase-In I Lev II
All AA2014 Phase-In I Lev II
His.

Green - At or above state averageYellow -- 1 to 4 points below state averageOrange -- 5 to 8 points below state average
Pink -- More than 8 points below state average
STAAR Scores - Social Studies Level IIISt. Reg. RISD St. Reg. RISD St. Reg. RISD St. Reg. RISD St. Reg. RISD St. Reg. RISD St. Reg. RISD St. Reg. RISD St. Reg. RISD St. Reg. RISD St. Reg. RISD
12 9 5 6 3 0 7 5 5 20 12 6 20 12 * 15 11 5 10 7 6 1 1 * 3 2 0 5 4 3 2 1 013 9 3 7 3 0 7 5 3 20 13 3 20 8 * 15 11 4 11 7 1 1 1 * 3 2 0 6 5 0 2 2 014 10 4 7 4 6 8 6 0 22 13 4 21 9 17 16 12 6 11 7 2 1 1 * 3 1 20 6 5 4 2 2 2
St. Reg. RISD St. Reg. RISD St. Reg. RISD St. Reg. RISD St. Reg. RISD St. Reg. RISD St. Reg. RISD St. Reg. RISD St. Reg. RISD St. Reg. RISD St. Reg. RISD5 5 NA 2 1 NA 3 2 NA 9 7 NA 8 3 NA 7 6 NA 4 4 NA 1 0 NA 1 0 NA 2 3 NA 1 1 NA7 5 NA 4 1 NA 3 3 NA 9 7 NA 18 3 NA 8 7 NA 5 3 NA 1 3 NA 1 2 NA 3 2 NA 1 1 NA
16 11 17 9 4 0 10 7 12 25 14 22 23 14 * 20 14 26 12 8 11 2 1 * 4 4 0 9 7 10 6 3 7
SPED EcoDis At-Risk8 Soc. Studies
All AA His. White 2+
AA His.
Male Female ELL
EcoDis At-Risk
2013 Level III2014 Level III
2012 Level III
2012 Level III
White 2+ Male Female ELL SPED
2013 Level III2014 Level III
US HistoryAll

Accountability Indexes
Texas RISD RHS RJH Int Elem Texas RISD RHS RJH Int Elem Texas RISD RHS RJH Int Elem Texas RISD RHS RJH Int Elem2013 77 77 76 78 77 83 34 35 21 39 40 NA 71 68 69 71 68 79 85 81 81 NA NA NA2014 77 80 84 78 79 80 40 37 NA 35 36 59 38 38 43 39 38 44 69 61 64 29 26 28
Index 1 - Student Achievment Index 2 - Student ProgressIndex 3 - Closing Performance
GapsIndex 4 - Postsecondary
Readiness

Distinction Designation
* Distinction Earned
Year RHS RJH Int Elem Prim RHS RJH Int Elem Prim RHS RJH Int Elem Prim2012-2013 *33% 0% 0% 0% 0% *33% 25% 0% 0% 0% None None None NA NA
Year RHS RJH Int Elem Prim RHS RJH Int Elem Prim RHS RJH Int Elem Prim RHS RJH Int Elem Prim RHS RJH Int Elem Prim RHS RJH Int Elem Prim RHS RJH Int Elem Prim2013-2014 0% 25% 33% *67% *67% 17% 25% 33% *100% 100% 0% 50% 50% NA NA *33% 50% NA NA NA NA Q2 Q4 *Q1 *Q1 Q2 Q2 Q3 Q2 Q2 14% 0% 0% 0% 0%
Postsecondary ReadinessAcademic Achievement in
Social StudiesTop 25 % in Student Progress
Top 25% in Closing Performance Gaps
Academic Achievement in Reading/ELA Top 25 Percent Student ProgressAcademic Achievement in Math
Academic Achievement in Reading/ELA
Academic Achievement in Math Academic Achievement in Science

System Safeguards
State Region RISD RHS RJH Int Elem Prim State Region RISD RHS RJH Int Elem Prim State Region RISD RHS RJH Int Elem Prim State Region RISD RHS RJH Int Elem Prim State Region RISD RHS RJH Int Elem Prim2012-2013 95% 91% 94% 90% 91% 100% 100% 100% 100% 100% 100% 100% 100% 100% 100% 100% 82% 90% 100% 100% NA NA NA NA 100% NA 0% NA NA NA NA NA 94% 93% 94% 93% 94% 100% 100% 100%2013-2014 96% 94% 100% 100% 86% 100% 100% 100% 100% 100% 100% 100% 100% 100% 100% 100% 91% 90% 100% 100% NA NA NA NA 0% NA 0% NA NA NA NA NA 96% 95% 98% 100% 91% 100% 100% 100%
Total System Safeguards ScoreParticipation Rates Graduation Rates Met Federal Limits on Alternative AssessmentsPerformance Rates

STAAR Reading Vertical AlignmentReporting Category 1
Year K 1st 2nd2012-2013 Rpt Cat 1 74% Rpt Cat 1 72% Rpt Cat 1 68% Rpt Cat 1 71% Rpt Cat 1 65% Rpt Cat 1 72% Rpt Cat 1 49% Rpt Cat 1 58%2013-2014 Rpt Cat 1 73% Rpt Cat 1 68% Rpt Cat 1 65% Rpt Cat 1 66% Rpt Cat 1 67% Rpt Cat 1 72% Rpt Cat 1 58% Rpt Cat 1 52%
2012-2013 5 ( A ) 4 ( A ) 75% 2 ( A ) NT 2 ( A ) NT 2 ( A ) NT 2 ( A ) 45% 2 ( A ) 80% 1 ( A ) NT 1 ( A ) NT2013-2014 5 ( A ) 4 ( A ) NT 2 ( A ) 78% 2 ( A ) NT 2 ( A ) 70% 2 ( A ) 66% 2 ( A ) 65% 1 ( A ) NT 1 ( A ) NT
2012-2013 6 ( C ) 5 ( B ) 4 ( B ) 70% 2 ( B ) 74% 2 ( B ) 63% 2 ( B ) 77% 2 ( B ) 75% 2 ( B ) 71% 1 ( B ) 79% 1 ( B ) 65%2013-2014 6 ( C ) 5 ( B ) 4 ( B ) 76% 2 ( B ) 69% 2 ( B ) 63% 2 ( B ) 67% 2 ( B ) 60% 2 ( B ) 70% 1 ( B ) 77% 1 ( B ) 76%
2012-2013 5 ( C ) 6 ( D ) 5 ( C ) 4 ( C ) 88% 2 ( C ) NE 2 ( C ) NE 2 ( C ) NE 2 ( C ) NE 2 ( C ) NE 1 ( C ) NE 1 ( C ) NT2013-2014 5 ( C ) 6 ( D ) 5 ( C ) 4 ( C ) 58% 2 ( C ) NE 2 ( C ) NE 2 ( C ) NE 2 ( C ) NE 2 ( C ) NE 1 ( C ) NE 1 ( C ) NT
2012-2013 4 ( D ) NE 2 ( D ) NE 2 ( D ) NE 2 ( D ) NE 2 ( D ) NE 2 ( D ) NE 1 ( D ) NT 1 ( D ) NT2013-2014 4 ( D ) NE 2 ( D ) NE 2 ( D ) NE 2 ( D ) NE 2 ( D ) NE 2 ( D ) NE 1 ( D ) NT 1 ( D ) NT
2012-2013 5 ( D ) 6 ( E ) 5 ( D ) 4 ( E ) NE 2 ( E ) 84% 2 ( E ) 88% 2 ( E ) 74% 2 ( E ) NT 2 ( E ) NT 1 ( E ) NT 1 ( E ) NT2013-2014 5 ( D ) 6 ( E ) 5 ( D ) 4 ( E ) NE 2 ( E ) 97% 2 ( E ) NT 2 ( E ) 90% 2 ( E ) 89% 2 ( E ) NT 1 ( E ) NT 1 ( E ) 87%
2012-2013 6 ( B ) 7 ( A ) 6 ( A ) 5 ( A ) NE 3 ( A ) NE 3 ( A ) NT 3 ( A ) NE 3 ( A ) NE 3 ( A ) NT 2 ( A ) NT 2 ( A ) NT2013-2014 6 ( B ) 7 ( A ) 6 ( A ) 5 ( A ) NE 3 ( A ) NE 3 ( A ) NT 3 ( A ) NE 3 ( A ) NE 3 ( A ) NT 2 ( A ) NT 2 ( A ) NT
2012-2013 6 ( D ) 7 ( B ) 6 ( B ) 5 ( B ) NE 3 ( B ) NE 3 ( B ) NE 3 ( B ) NE 3 ( B ) NE 3 ( B ) NT 2 ( B ) NE 2 ( B ) NE2013-2014 6 ( D ) 7 ( B ) 6 ( B ) 5 ( B ) NE 3 ( B ) NE 3 ( B ) NE 3 ( B ) NE 3 ( B ) NE 3 ( B ) NT 2 ( B ) NE 2 ( B ) NE
2012-2013 3 ( C ) NE 3 ( C ) NT 3 ( C ) NE 3 ( C ) NE 2 ( C ) NE 2 ( C ) NE
2013-2014 3 ( C ) NE 3 ( C ) NT 3 ( C ) NE 3 ( C ) NE 2 ( C ) NE 2 ( C ) NE
2012-2013 10 (A ) 10 ( A ) 9 ( A ) NE 7 ( A ) NT 7 ( A ) NE 7 ( A ) NT 7 ( A ) NT 7 ( A ) NE 6 ( A ) NE 6 ( A ) NE2013-2014 10 (A ) 10 ( A ) 9 ( A ) NE 7 ( A ) NT 7 ( A ) NE 7 ( A ) NT 7 ( A ) NT 7 ( A ) NE 6 ( A ) NE 6 ( A ) NE
2012-2013 9 ( A ) 13 ( A ) 13 ( A ) 12 ( A ) NE 10 ( A ) NE 10 ( A ) NE 9 ( A ) NT 9 ( A ) NT 9 ( A ) NT 8 ( A ) NE 8 ( A ) NE
2013-2014 9 ( A ) 13 ( A ) 13 ( A ) 12 ( A ) NE 10 ( A ) NE 10 ( A ) NE 9 ( A ) NT 9 ( A ) NT 9 ( A ) NT 8 ( A ) NE 8 ( A ) NE
2012-2013 14 ( A ) NE 12 ( A ) NE 12 ( A ) NE 11 ( A ) NT 11 ( A ) NE 11 ( A ) NT 11 ( A ) NE 11 ( A ) NE2013-2014 14 ( A ) NE 12 ( A ) NE 12 ( A ) NE 11 ( A ) NT 11 ( A ) NE 11 ( A ) NT 11 ( A ) NE 11 ( A ) NE
2012-2013 11 ( E ) NE 10 ( D ) NE 10 ( D ) NE 10 ( D ) NE 9 ( D ) NT 9 ( D ) NT2013-2014 11 ( E ) NE 10 ( D ) NE 10 ( D ) NE 10 ( D ) NE 9 ( D ) NT 9 ( D ) NT
2012-2013 Fig 19 ( D ) Fig 19 ( D ) Fig 19 ( D ) Fig 19 ( D ) NE Fig 19 ( D ) NE Fig 19 ( D ) NE Fig 19 ( D ) NE Fig 19 ( D ) NE Fig 19 ( D ) NE Fig 19 ( B ) 61% Fig 19 ( B ) 66%2013-2014 Fig 19 ( D ) Fig 19 ( D ) Fig 19 ( D ) Fig 19 ( D ) NE Fig 19 ( D ) NE Fig 19 ( D ) NE Fig 19 ( D ) NE Fig 19 ( D ) NE Fig 19 ( D ) NE Fig 19 ( B ) 64% Fig 19 ( B ) 67%
2012-2013 Fig 19 ( F ) Fig 19 ( F ) Fig 19 ( F ) Fig 19 ( F ) NE Fig 19 ( F ) 66% Fig 19 ( F ) 69% Fig 19 ( F ) 65% Fig 19 ( F ) 60% Fig 19 ( F ) 68%2013-2014 Fig 19 ( F ) Fig 19 ( F ) Fig 19 ( F ) Fig 19 ( F ) NE Fig 19 ( F ) 58% Fig 19 ( F ) 67% Fig 19 ( F ) 57% Fig 19 ( F ) 61% Fig 19 ( F ) 75%
NE indicates that the student expectation is not eligible for testing for that grade level.NT indicates student expectations that were not tested for that testing year.Whole numbers without a letter distinguish genres tested with Figure 19Red indicates performance of less than 70% student masteryGreen indicates perfomrance greater than or equal to 70%.Figure 19 questions are represented twice in the chart above but counted once in STAAR scores. See whole numbers for Figure 19 breakdown by genre.
Eng I Eng II3rd 4th 5th 6th 7th 8th

STAAR Reading Vertical AlignmentReporting Category 2
Year K 1st 2nd2012-2013 Rpt Cat 2 67% Rpt Cat 2 62% Rpt Cat 2 69% Rpt Cat 2 67% Rpt Cat 2 62% Rpt Cat 2 74% Rpt Cat 2 61% Rpt Cat 2 67%2013-2014 68% 68% 64% 65% 68% 69% 65% 57%
2012-2013 4 4 3 2 NT2013-2014 4 4 3 2 NT
2012-2013 4 ( B ) 4 ( B ) 3 ( B ) 2 (B ) NT2013-2014 4 ( B ) 4 ( B ) 3 ( B ) 2 (B ) 78%
2012-2013 6 7 6 5 NT 3 60% 3 NT 3 58% 3 76% 3 78% 2 NT 2 79%2013-2014 6 7 6 5 81% 3 79% 3 59% 3 NT 3 44% 3 62% 2 61% 2 45%
2012-2013 6 ( B ) 7 ( A ) 6 ( A ) 5 ( A ) 73% 3 ( A ) NT 3 ( A ) NE 3 ( A ) 68% 3 ( A ) NT 3 ( A ) NE 2 ( A ) NE 2 ( A ) NE2013-2014 6 ( B ) 7 ( A ) 6 ( A ) 5 ( A ) NT 3 ( A ) NT 3 ( A ) NE 3 ( A ) NT 3 ( A ) NT 3 ( A ) NE 2 ( A ) NE 2 ( A ) NE
2012-2013 6 ( D ) 7 ( B ) 6 ( B ) 5 ( B ) NE 3 ( B ) NT 3 ( B ) NT 3 ( B ) NT 3 ( B ) NT 3 ( B ) NE 2 ( B ) NT 2 ( B ) NT2013-2014 6 ( D ) 7 ( B ) 6 ( B ) 5 ( B ) NE 3 ( B ) NT 3 ( B ) NT 3 ( B ) NT 3 ( B ) NT 3 ( B ) NE 2 ( B ) NT 2 ( B ) NT
2012-2013 3 ( C ) NT 3 ( C ) NE 3 ( C ) NT 3 ( C ) NT 2 ( C ) NT 2 ( C ) 70%2013-2014 3 ( C ) NT 3 ( C ) NE 3 ( C ) NT 3 ( C ) NT 2 ( C ) 83% 2 ( C ) NT
2012-2013 7 8 7 6 60% 4 61% 4 71% 4 65% 4 72% 4 73% 3 58% 3 62%2013-2014 7 8 7 6 77% 4 59% 4 71% 4 71% 4 76% 4 52% 3 NT 3 77%
2012-2013 7 ( A ) 8 ( A ) 7 ( A ) 6 ( A) 69% 4 ( A ) 65% 4 ( A ) NT 4 ( A ) 67% 4 ( A ) 82% 4 ( A ) NT 3 ( A ) 70% 3 ( A ) NT2013-2014 7 ( A ) 8 ( A ) 7 ( A ) 6 ( A) 28% 4 ( A ) 80% 4 ( A ) 58% 4 ( A ) NT 4 ( A ) 56% 4 ( A ) 84% 3 ( A ) NT 3 ( A ) 50%
2012-2013 8 7 NE 5 70% 5 76% 5 NT 5 54% 5 NT 4 NT 4 NT2013-2014 8 7 NE 5 68% 5 NT 5 61% 5 NT 5 NT 4 44% 4 NT
2012-2013 8 ( A ) 7 ( A ) NE 5 ( A ) 27% 5 ( A ) NE 5 ( A ) NE 5 ( A ) 64% 5 ( A ) NT 4 ( A ) NT 4 ( A ) NT2013-2014 8 ( A ) 7 ( A ) NE 5 ( A ) NT 5 ( A ) NE 5 ( A ) NE 5 ( A ) NT 5 ( A ) NT 4 ( A ) 67% 4 ( A ) NT
2012-2013 8 9 9 8 64% 6 49% 6 NT 6 69% 6 49% 6 67% 5 65% 5 67%2013-2014 8 9 9 8 51% 6 70% 6 62% 6 59% 6 60% 6 50% 5 NT 5 60%
2012-2013 8 ( A ) 9 ( A ) 9 ( A ) 8 ( A ) 67% 6 ( A ) 54% 6 ( A ) 69% 6 ( A ) 57% 6 ( A ) 68% 6 ( A ) 54% 5 ( A ) 52% 5 ( A ) NT2013-2014 8 ( A ) 9 ( A ) 9 ( A ) 8 ( A ) 76% 6 ( A ) 68% 6 ( A ) 74% 6 ( A ) 61% 6 ( A ) NT 6 ( A ) 61% 5 ( A ) NT 5 ( A ) NT
2012-2013 8 ( B ) 9 ( B ) 9 ( B ) 8 ( B ) 73% 6 ( B ) 72% 6 ( B ) 58% 6 ( B ) NT 6 ( B ) 58% 6 ( B ) 84% 5 ( B ) 72% 5 ( B ) NT2013-2014 8 ( B ) 9 ( B ) 9 ( B ) 8 ( B ) 78% 6 ( B ) 78% 6 ( B ) 75% 6 ( B ) NT 6 ( B ) 64% 6 ( B ) 65% 5 ( B ) 66% 5 ( B ) NT
2012-2013 8 ( C ) NE 6 ( C ) NT 6 ( C ) NT 6 ( C ) 83% 6 ( C ) 58% 6 ( C ) NT 5 ( C ) 43% 5 ( C ) NT2013-2014 8 ( C ) NE 6 ( C ) NT 6 ( C ) NT 6 ( C ) NT 6 ( C ) NT 6 ( C ) 72% 5 ( C ) NT 5 ( C ) 45%
2012-2013 10 10 9 NT 7 NE 7 NT 7 NE 7 57% 7 NT 6 NT 6 NT2013-2014 10 10 9 74% 7 NE 7 42% 7 NE 7 71% 7 72% 6 NT 6 NT
2012-2013 10 ( A ) 10 ( A ) 9 ( A ) NE 7 ( A ) NE 7 ( A ) NT 7 ( A ) NE 7 ( A ) NE 7 ( A ) NT 6 ( A ) NT 6 ( A ) 60%2013-2014 10 ( A ) 10 ( A ) 9 ( A ) NE 7 ( A ) NE 7 ( A ) 69% 7 ( A ) NE 7 ( A ) NE 7 ( A ) NT 6 ( A ) NT 6 ( A ) NT
2012-2013 11 10 71% 8 82% 8 NT 8 NT 8 60% 8 80% 7 67% 7 68%2013-2014 11 10 NT 8 NT 8 NT 8 79% 8 NT 8 83% 7 62% 7 59%
2012-2013 11 ( A ) 10 ( A ) 72% 8 ( A ) NT 8 ( A ) 73% 8 ( A ) 58% 8 ( A ) 67% 8 ( A ) 83% 7 ( A ) NT 7 ( A ) NT2013-2014 11 ( A ) 10 ( A ) 57% 8 ( A ) NT 8 ( A ) 69% 8 ( A ) 71% 8 ( A ) 77% 8 ( A ) NT 7 ( A ) NT 7 ( A ) 53%
2012-2013 12 16 16 16 NT 14 NT 14 NT 13 NT 13 NT 13 NT 12 42% 12 NT2013-2014 12 16 16 16 NT 14 NT 14 67% 13 NT 13 NT 13 NT 12 NT 12 NT2012-2013 12 ( A ) 16 ( A ) 16 ( A ) 16 ( A ) NE 14 ( A ) NE 14 ( A ) NE 13 ( A ) NT 13 ( A ) NT 13 ( A ) NT 12 ( A ) NT 12 ( A ) NT2013-2014 12 ( A ) 16 ( A ) 16 ( A ) 16 ( A ) NE 14 ( A ) NE 14 ( A ) NE 13 ( A ) NT 13 ( A ) NT 13 ( A ) NT 12 ( A ) NT 12 ( A ) NT
Eng I Eng II3rd 4th 5th 6th 7th 8th

STAAR Reading Vertical AlignmentReporting Category 2
2012-2013 14 ( C ) NT 13 ( B ) NT 13 ( C ) NT 13 ( C ) NT 12 ( C ) NE 12 ( C ) NE2013-2014 14 ( C ) NT 13 ( B ) NT 13 ( C ) NT 13 ( C ) NT 12 ( C ) NE 12 ( C ) NE
2012-2013 16 ( C ) 16 ( C ) NE 14 ( C ) NE 14 ( D ) NE 13 ( D ) NE 13 ( D ) NE 13 ( D ) NT 12 ( D ) NT 12 ( D ) NT2013-2014 16 ( C ) 16 ( C ) NE 14 ( C ) NE 14 ( D ) NE 13 ( D ) NE 13 ( D ) NE 13 ( D ) NT 12 ( D ) NT 12 ( D ) NT
2012-2013 Fig 19 ( D ) Fig 19 ( D ) Fig 19 ( D ) Fig 19 ( D ) 63% Fig 19 ( D ) 62% Fig 19 ( D ) 72% Fig 19 ( D ) 69% Fig 19 ( D ) 67% Fig 19 ( D ) 72% Fig 19 ( B ) 61% Fig 19 ( B ) 66%2013-2014 Fig 19 ( D ) Fig 19 ( D ) Fig 19 ( D ) Fig 19 ( D ) 68% Fig 19 ( D ) 66% Fig 19 ( D ) 65% Fig 19 ( D ) 62% Fig 19 ( D ) 64% Fig 19 ( D ) 68% Fig 19 ( B ) 64% Fig 19 ( B ) 67%
2012-2013 Fig 19 ( E ) Fig 19 ( E ) Fig 19 ( E ) Fig 19 ( E ) 58% Fig 19 ( E ) 64% Fig 19 ( E ) 66% Fig 19 ( E ) 58% Fig 19 ( E ) 47% Fig 19 ( E ) NT Fig 19 ( A ) NE Fig 19 ( A ) NE2013-2014 Fig 19 ( E ) Fig 19 ( E ) Fig 19 ( E ) Fig 19 ( E ) 56% Fig 19 ( E ) 59% Fig 19 ( E ) 41% Fig 19 ( E ) 73% Fig 19 ( E ) 53% Fig 19 ( E ) NT Fig 19 ( A ) NE Fig 19 ( A ) NE
NE indicates that the student expectation is not eligible for testing for that grade level.NT indicates student expectations that were not tested for that testing year.Whole numbers without a letter distinguish genres tested with Figure 19Red indicates performance of less than 70% student masteryGreen indicates perfomrance greater than or equal to 70%.Figure 19 questions are represented twice in the chart above but counted once in STAAR scores. See whole numbers for Figure 19 breakdown by genre.

STAAR Reading Vertical AlignmentReporting Category 3
Years K 1st 2nd2012-2013 Rpt Cat 3 71% Rpt Cat 3 62% Rpt Cat 3 64% Rpt Cat 3 61% Rpt Cat 3 69% Rpt Cat 3 66% Rpt Cat 3 76% Rpt Cat 3 72%2013-2014 Rpt Cat 3 63% Rpt Cat 3 66% Rpt Cat 3 69% Rpt Cat 3 67% Rpt Cat 3 63% Rpt Cat 3 63% Rpt Cat 3 69% Rpt Cat 3 69%
2012-2013 9 13 13 12 NT 10 65% 10 NT 9 65% 9 70% 9 74% 8 NT 8 NT2013-2014 9 13 13 12 44% 10 63% 10 NT 9 59% 9 55% 9 67% 8 NT 8 NT
2012-2013 9 ( A ) 13 ( A ) 13 ( A ) 12 ( A ) NE 10 ( A ) NE 10 ( A ) 68% 9 ( A ) NE 9 ( A ) NE 9 ( A ) NE 8 ( A ) 79% 8 ( A ) 73%2013-2014 9 ( A ) 13 ( A ) 13 ( A ) 12 ( A ) NE 10 ( A ) NE 10 ( A ) 81% 9 ( A ) NE 9 ( A ) NE 9 ( A ) NE 8 ( A ) 76% 8 ( A ) 70%
2012-2013 10 14 14 13 58% 11 NT 11 60% 10 67% 10 65% 10 72% 9 NT 9 NT2013-2014 10 14 14 13 65% 11 NT 11 65% 10 69% 10 56% 10 52% 9 NT 9 NT
2012-2013 10 ( A ) 14 ( A ) 14 ( A ) 13 ( A ) 81% 11 ( A ) 74% 11 ( A ) 61% 10 ( A ) 46% 10 ( A ) 73% 10 ( A ) 58% 9 ( A ) 76% 9 ( A ) 77%2013-2014 10 ( A ) 14 ( A ) 14 ( A ) 13 ( A ) 61% 11 ( A ) 65% 11 ( A ) 72% 10 ( A ) 74% 10 ( A ) 56% 10 ( A ) 52% 9 ( A ) NT 9 ( A ) NT
2012-2013 10 ( A ) 14 ( B ) 14 ( B ) 13 ( B ) 68% 11 ( B ) NT 11 ( B ) NT 10 ( B ) 45% 10 ( B ) NT 10 ( B ) 49% 9 ( B ) NT 9 ( B ) 94%2013-2014 10 ( A ) 14 ( B ) 14 ( B ) 13 ( B ) 58% 11 ( B ) NT 11 ( B ) NT 10 ( B ) NT 10 ( B ) NT 10 ( B ) NT 9 ( B ) 83% 9 ( B ) NT
2012-2013 10 ( B ) 14 ( C ) 14 ( C ) 13 ( C ) 80% 11 ( C ) 60% 11 ( C ) 64% 10 ( C ) 69% 10 ( C ) 57% 10 ( C ) 70% 9 ( C ) 75% 9 ( C ) 68%2013-2014 10 ( B ) 14 ( C ) 14 ( C ) 13 ( C ) 76% 11 ( C ) 81% 11 ( C ) NT 10 ( C ) 74% 10 ( C ) NT 10 ( C ) 88% 9 ( C ) 62% 9 ( C ) 68%
2012-2013 10 ( D ) 14 ( D ) 14 ( D ) 13 ( D ) NT 11 ( D ) NT 11 ( D ) 60%2013-2014 10 ( D ) 14 ( D ) 14 ( D ) 13 ( D ) 72% 11 ( D ) 76% 11 ( D ) NT
2012-2013 11 ( E ) 71% 10 ( D ) 59% 10 ( D ) 76% 10 ( D ) 68% 9 ( D ) NE 9 ( D ) NE2013-2014 11 ( E ) 61% 10 ( D ) 84% 10 ( D ) 70% 10 ( D ) 64% 9 ( D ) NE 9 ( D ) NE
2012-2013 14 NE 12 NE 12 NT 11 NT 11 NT 11 59% 10 NT 10 NT2013-2014 14 NE 12 NE 12 NT 11 NT 11 76% 11 63% 10 61% 10 76%
2012-2013 14 ( A ) NE 12 ( A ) NE 12 ( A ) NT 11 ( A ) NE 11 ( A ) NT 11 ( A ) NE 10 ( A ) NT 10 ( A ) NT2013-2014 14 ( A ) NE 12 ( A ) NE 12 ( A ) NT 11 ( A ) NE 11 ( A ) NT 11 ( A ) NE 10 ( A ) 74% 10 ( A ) 72%
2012-2013 12 ( B ) NT 11 ( B ) NT 11 ( B ) NT 11 ( B ) 65% 10 ( B ) NT 10 ( B ) NE2013-2014 12 ( B ) NT 11 ( B ) NT 11 ( B ) 62% 11 ( B ) NT 10 ( B ) NT 10 ( B ) NE
2012-2013 11 15 15 15 NT 13 62% 13 NT 12 NT 12 72% 12 NT 11 NT 11 NT2013-2014 11 15 15 15 NT 13 NT 13 63% 12 NT 12 NT 12 NT 11 NT 11 52%
2012-2013 11 ( A ) 15 ( A ) 15 ( A ) 15 ( A) NE 13 ( A ) NT 13 ( A ) NT 12 ( A ) NE 12 ( A ) NE 12 ( A ) NE 11 ( A ) 84% 11 ( A ) 59%2013-2014 11 ( A ) 15 ( A ) 15 ( A ) 15 ( A) NE 13 ( A ) NT 13 ( A ) NT 12 ( A ) NE 12 ( A ) NE 12 ( A ) NE 11 ( A ) NT 11 ( A ) 72%
2012-2013 11 ( B ) 15 ( B ) 15 ( B ) 15 ( B ) 65% 13 ( B ) NT 13 ( B ) 71% 12 ( B ) NT 12 ( B ) 80% 12 ( B ) 70% 11 ( B ) 61% 11 ( B ) NT2013-2014 11 ( B ) 15 ( B ) 15 ( B ) 15 ( B ) 70% 13 ( B ) NT 13 ( B ) NT 12 ( B ) NT 12 ( B ) 73% 12 ( B ) NT 11 ( B ) NT 11 ( B ) NT
2012-2013 12 16 16 16 49% 14 NT 14 NT 13 69% 13 NT 13 NT 12 NT 12 NT2013-2014 12 16 16 16 69% 14 NT 14 67% 13 71% 13 NT 13 NT 12 72% 12 NT
2012-2013 12 ( A ) 16 ( A ) 16 ( A ) 16 ( A ) NE 14 ( A ) NE 14 ( A ) NE 13 ( A ) 69% 13 ( A ) NT 13 ( A ) NT 12 ( A ) NT 12 ( A ) 73%
2013-2014 12 ( A ) 16 ( A ) 16 ( A ) 16 ( A ) NE 14 ( A ) NE 14 ( A ) NE 13 ( A ) NT 13 ( A ) NT 13 ( A ) NT 12 ( A ) NT 12 ( A ) NT
Eng I Eng II3rd 4th 5th 6th 7th 8th

STAAR Reading Vertical AlignmentReporting Category 3
2012-2013 14 ( C ) NT 13 ( B ) NT 13 ( C ) NT 13 ( C ) NT 12 ( C ) NE 12 ( C ) NE2013-2014 14 ( C ) NT 13 ( B ) NT 13 ( C ) 61% 13 ( C ) 58% 12 ( C ) NE 12 ( C ) NE
2012-2013 16 ( C ) 16 ( C ) NE 14 ( C ) NE 14 ( D ) NE 13 ( D ) NE 13 ( D ) NT 13 ( D ) NE 12 ( D ) NT 12 ( D ) NT2013-2014 16 ( C ) 16 ( C ) NE 14 ( C ) NE 14 ( D ) NE 13 ( D ) NE 13 ( D ) NT 13 ( D ) NE 12 ( D ) NT 12 ( D ) NT
2012-2013 Fig 19 ( D ) Fig 19 ( D ) Fig 19 ( D ) Fig 19 ( D ) 58% Fig 19 ( D ) 62% Fig 19 ( D ) 72% Fig 19 ( D ) 69% Fig 19 ( D ) 67% Fig 19 ( D ) 72% Fig 19 ( B ) NT Fig 19 ( B ) NT2013-2014 Fig 19 ( D ) Fig 19 ( D ) Fig 19 ( D ) Fig 19 ( D ) 68% Fig 19 ( D ) 66% Fig 19 ( D ) 65% Fig 19 ( D ) 62% Fig 19 ( D ) 64% Fig 19 ( D ) 68% Fig 19 ( B ) 64% Fig 19 ( B ) 67%
2012-2013 Fig 19 ( E ) Fig 19 ( E ) Fig 19 ( E ) Fig 19 ( E ) 63% Fig 19 ( E ) 64% Fig 19 ( E ) 66% Fig 19 ( E ) 58% Fig 19 ( E ) 47% Fig 19 ( E ) 72% Fig 19 ( A ) NE Fig 19 ( A ) NE2013-2014 Fig 19 ( E ) Fig 19 ( E ) Fig 19 ( E ) Fig 19 ( E ) 56% Fig 19 ( E ) 59% Fig 19 ( E ) 41% Fig 19 ( E ) NT Fig 19 ( E ) 53% Fig 19 ( E ) 42% Fig 19 ( A ) NE Fig 19 ( A ) NE
NE indicates that the student expectation is not eligible for testing for that grade level.NT indicates student expectations that were not tested for that testing year.Whole numbers without a letter distinguish genres tested with Figure 19Red indicates performance of less than 70% student masteryGreen indicates perfomrance greater than or equal to 70%.Figure 19 questions are represented twice in the chart above but counted once in STAAR scores. See whole numbers for Figure 19 breakdown by genre.

STAAR Writing Vertical AlignmentReporting Category 1/4 Essay
Years K 1st 2nd2012-2013 Rpt Cat 1 46% Rpt Cat 1 54% Rpt Cat 4 55% Rpt Cat 4 61%2013-2014 Rpt Cat 1 51% Rpt Cat 1 55% Rpt Cat 4 58% Rpt Cat 4 60%2012-2013 13 ( B ) 17 ( B ) 17 ( B ) 17 ( B ) 15 ( B ) 15 ( B ) 14 ( B ) 14 ( B ) 14 ( B ) 13 ( B ) 13 ( B )2013-2014 13 ( B ) 17 ( B ) 17 ( B ) 17 ( B ) 15 ( B ) 15 ( B ) 14 ( B ) 14 ( B ) 14 ( B ) 13 ( B ) 13 ( B )2012-2013 13 ( C ) 17 ( C ) 17 ( C ) 17 ( C ) 15 ( C ) 15 ( C ) 14 ( C ) 14 ( C ) 14 ( C ) 13 ( C ) 13 ( C )2013-2014 13 ( C ) 17 ( C ) 17 ( C ) 17 ( C ) 15 ( C ) 15 ( C ) 14 ( C ) 14 ( C ) 14 ( C ) 13 ( C ) 13 ( C )2012-2013 13 ( D ) 17 ( D ) 17 ( D ) 17 ( D ) 15 ( D ) 15 ( D ) 14 ( D ) 14 ( D ) 14 ( D ) 13 ( D ) 13 ( D )2013-2014 13 ( D ) 17 ( D ) 17 ( D ) 17 ( D ) 15 ( D ) 15 ( D ) 14 ( D ) 14 ( D ) 14 ( D ) 13 ( D ) 13 ( D )2012-2013 14 18 18 18 16 NE 16 15 15 NE 15 14(Literary) 14 NE2013-2014 14 18 18 18 16 NE 16 15 15 NE 15 14(Literary) NE 14 NE2012-2013 14 ( A ) 18 ( A ) 18 ( A ) 18 ( A ) 16 ( A ) NE 16 ( A ) 15 ( A ) 15 ( A ) NE 15 ( A ) 14 ( A ) 60% 14 ( A ) NE2013-2014 14 ( A ) 18 ( A ) 18 ( A ) 18 ( A ) 16 ( A ) NE 16 ( A ) 15 ( A ) 15 ( A ) NE 15 ( A ) 14 ( A ) NE 14 ( A ) NE2012-2013 19 17 (Narrative) 17 16 16(Narrative) 162013-2014 19 17 (Narrative) 17 16 16(Narrative) 162012-2013 19 ( A ) 17 ( A ) 48% 17 ( A ) 16 ( A ) 16 ( A ) 56% 16 ( A )2013-2014 19 ( A ) 17 ( A ) 53% 17 ( A ) 16 ( A ) 16 ( A ) 59% 16 ( A )2012-2013 15 19 19 20 18(Expository) 18 17 17(Expository) 17 15(Expository) 15(Expository)2013-2014 15 19 19 20 18(Expository) 18 17 17(Expository) 17 15(Expository) 15(Expository) NE2012-2013 15 ( A ) 19 ( A ) 19 ( A ) 20 ( A ) 18 ( A ) 43% 18 ( A ) 17 ( A ) 17 ( A ) 53% 17 ( A ) 15 ( A ) 49% 15 ( A ) 62%2013-2014 15 ( A ) 19 ( A ) 19 ( A ) 20 ( A ) 18 ( A ) 49% 18 ( A ) 17 ( A ) 17 ( A ) 51% 17 ( A ) 15 ( A ) 58% 15 ( A ) NE2012-2013 20 ( A ) i 18 ( A ) i2013-2014 20 ( A ) i 18 ( A ) i2012-2013 20 ( A ) iii 18 ( A ) iii 18 ( A ) i 17 ( A ) i 17 ( A ) i 17 ( A ) i 15 ( A ) i 15 ( A ) i2013-2014 20 ( A ) iii 18 ( A ) iii 18 ( A ) i 17 ( A ) i 17 ( A ) i 17 ( A ) i 15 ( A ) i 15 ( A ) i NE2012-2013 18 ( A ) iv 17 ( A ) iv 17 ( A ) v 17 ( A ) v 15 ( A ) ii 15 ( A ) ii2013-2014 18 ( A ) iv 17 ( A ) iv 17 ( A ) v 17 ( A ) v 15 ( A ) ii 15 ( A ) ii NE2012-2013 18 ( A ) ii 17 ( A ) ii 17 ( A ) ii 17 ( A ) ii 15 ( A ) iii 15 ( A ) iii2013-2014 18 ( A ) ii 17 ( A ) ii 17 ( A ) ii 17 ( A ) ii 15 ( A ) iii 15 ( A ) iii NE2012-2013 20 ( A ) ii 18 ( A ) ii 18 ( A ) iii 17 ( A ) iii 17 ( A ) iii 17 ( A ) iii 15 ( A ) iv 15 ( A ) iv2013-2014 20 ( A ) ii 18 ( A ) ii 18 ( A ) iii 17 ( A ) iii 17 ( A ) iii 17 ( A ) iii 15 ( A ) iv 15 ( A ) iv NE2012-2013 17 ( A ) iv 17 ( A ) iv
2013-2014 17 ( A ) iv 17 ( A ) iv2012-2013 15 ( A ) v 15 ( A ) v2013-2014 15 ( A ) v 15 ( A ) v NE2012-2013 15 ( A ) vi2013-2014 15 ( A ) vi NE2012-2013 20 21 19 NE 19 18 18 NE 18 16 NE 16(Persuasive) 60%2013-2014 20 21 19 NE 19 18 18 NE 18 16 NE 16(Persuasive) 60%2012-2013 20 ( A ) 21 ( A ) 19 ( A ) NE 19 ( A ) 18 ( A ) 18 ( A ) NE 18 ( A ) 16 ( A ) NE 16 ( A )2013-2014 20 ( A ) 21 ( A ) 19 ( A ) NE 19 ( A ) 18 ( A ) 18 ( A ) NE 18 ( A ) 16 ( A ) NE 16 ( A )2012-2013 18 ( C ) NE 18 ( C ) 16 ( D ) NE 16 ( D )2013-2014 18 ( C ) NE 18 ( C ) 16 ( D ) NE 16 ( D )2012-2013 16 ( E ) NE 16 ( E )
2013-2014 16 ( E ) NE 16 ( E )
Eng I Eng II3rd 4th 5th 6th 7th 8th

STAAR Writing Vertical AlignmentReporting Category 1/4 Essay
Scores reported indicate performance broken down by type of essay.Student Expectations listed are tested within the essay.NE indicates a Student Expectation that is not eligible for testing at that grade level.Red indicates performance below 70%.Green indicates performance at or above 70%.

STAAR Writing Vertical AlignmentReporting Category 2/5 Revising
Years K 1st 2nd2012-2013 Rpt Cat 2 57% Rpt Cat 2 66% Rpt Cat 5 66% Rpt Cat 5 73%2013-2014 Rpt Cat 2 67% Rpt Cat 2 71% Rpt Cat 5 71% Rpt Cat 5 69%2012-2013 13 ( C ) 17 ( C ) 17 ( C ) 15 ( C ) 59% 14 ( C ) 59% 13 ( C ) 74% 13 ( C ) 76%2013-2014 13 ( C ) 17 ( C ) 17 ( C ) 15 ( C ) 70% 14 ( C ) 70% 13 ( C ) 70% 13 ( C ) 69%2012-2013 15 ( A ) 19 ( A ) 19 ( A ) 18 ( A ) 49% 17 ( A ) 75% 15 ( A ) NT 15 ( A ) 64%2013-2014 15 ( A ) 19 ( A ) 19 ( A ) 18 ( A ) 48% 17 ( A ) 71% 15 ( A ) 71% 15 ( A ) 72%2012-2013 18 ( A ) i NT2013-2014 18 ( A ) i NT2012-2013 18 ( A ) iii NT 17 ( A ) i NT 15 ( A ) i NT 15 ( A ) i NT2013-2014 18 ( A ) iii NT 17 ( A ) i NT 15 ( A ) i NT 15 ( A ) i NT2012-2013 17 ( A ) v NT 15 ( A ) ii NT 15 ( A ) ii NT2013-2014 17 ( A ) v NT 15 ( A ) ii NT 15 ( A ) ii NT2012-2013 17 ( A ) ii NT 15 ( A ) iii NT 15 ( A ) iii NT2013-2014 17 ( A ) ii NT 15 ( A ) iii NT 15 ( A ) iii NT2012-2013 18 ( A ) ii NT 17 ( A ) iii NT 15 ( A ) iv NT 15 ( A ) iv NT2013-2014 18 ( A ) ii NT 17 ( A ) iii NT 15 ( A ) iv NT 15 ( A ) iv NT2012-2013 17 ( A ) iv NT2013-2014 17 ( A ) iv NT2012-2013 15 ( A ) v NT 15 ( A ) v NT2013-2014 15 ( A ) v NT 15 ( A ) v NT2012-2013 15 ( A ) vi NE 15 ( A ) vi NT2013-2014 15 ( A ) vi NE 15 ( A ) vi NT2012-2013 20 ( A ) 19 ( A ) NE 18 ( A ) NT 16 ( A ) 51% 16 ( A ) 67%2013-2014 20 ( A ) 19 ( A ) NE 18 ( A ) NT 16 ( A ) 73% 16 ( A ) 55%2012-2013 16 ( C ) NT 16 ( C ) NT2013-2014 16 ( C ) NT 16 ( C ) NT2012-2013 18 ( C ) 49% 16 ( D ) 69% 16 ( D) NT2013-2014 18 ( C ) 73% 16 ( D ) 77% 16 ( D) 87%2012-2013 16 ( E ) 70% 16 ( E ) NT2013-2014 16 ( E ) NT 16 ( E ) NT2012-2013 16 ( F ) NT2013-2014 16 ( F ) NT
NT indicates student expectations not tested during this testing year.NE indicates student expectations not eligible for testing at that grade level.Red indicates performance less than 70%.Green indicates performance at or above 70%.
17 ( C )17 ( C )
15 ( C )15 ( C )18 ( A )18 ( A )
14 ( C )14 ( C )
14 ( C )14 ( C )17 ( A )17 ( A )
17 ( A ) i17 ( A ) i17 ( A ) v17 ( A ) v17 ( A ) ii17 ( A ) ii
17 ( A )17 ( A )
17 ( A ) i17 ( A ) i
20 ( A )20 ( A )
18 ( C )
18 ( A )18 ( A )19 ( A )21 ( A )21 ( A ) 19 ( A ) 18 ( A ) 18 ( A )
18 ( C )
17 ( A ) iii17 ( A ) iii17 ( A ) iv17 ( A ) iv
17 ( A ) iii18 ( A ) iii20 ( A ) ii20 ( A ) ii
18 ( A ) iii 17 ( A ) iii
20 ( A ) iii20 ( A ) iii
18 ( A ) iv18 ( A ) iv18 ( A ) ii18 ( A ) ii
18 ( A ) i18 ( A ) i
17 ( A ) iv17 ( A ) iv17 ( A ) ii17 ( A ) ii
18 ( A ) i18 ( A ) i
Eng I Eng II3rd 4th 5th 6th 7th 8th
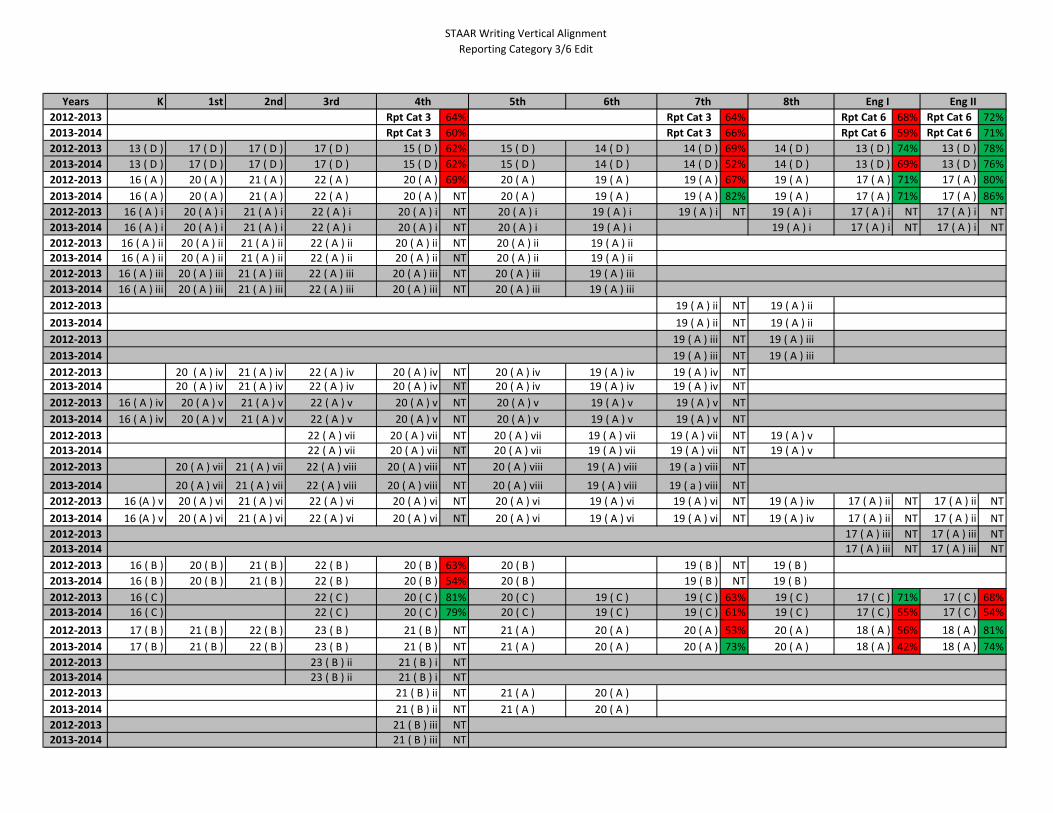
STAAR Writing Vertical AlignmentReporting Category 3/6 Edit
Years K 1st 2nd2012-2013 Rpt Cat 3 64% Rpt Cat 3 64% Rpt Cat 6 68% Rpt Cat 6 72%2013-2014 Rpt Cat 3 60% Rpt Cat 3 66% Rpt Cat 6 59% Rpt Cat 6 71%2012-2013 13 ( D ) 17 ( D ) 17 ( D ) 15 ( D ) 62% 14 ( D ) 69% 13 ( D ) 74% 13 ( D ) 78%2013-2014 13 ( D ) 17 ( D ) 17 ( D ) 15 ( D ) 62% 14 ( D ) 52% 13 ( D ) 69% 13 ( D ) 76%2012-2013 16 ( A ) 20 ( A ) 21 ( A ) 20 ( A ) 69% 19 ( A ) 67% 17 ( A ) 71% 17 ( A ) 80%2013-2014 16 ( A ) 20 ( A ) 21 ( A ) 20 ( A ) NT 19 ( A ) 82% 17 ( A ) 71% 17 ( A ) 86%2012-2013 16 ( A ) i 20 ( A ) i 21 ( A ) i 20 ( A ) i NT 19 ( A ) i NT 17 ( A ) i NT 17 ( A ) i NT2013-2014 16 ( A ) i 20 ( A ) i 21 ( A ) i 20 ( A ) i NT 17 ( A ) i NT 17 ( A ) i NT2012-2013 16 ( A ) ii 20 ( A ) ii 21 ( A ) ii 20 ( A ) ii NT2013-2014 16 ( A ) ii 20 ( A ) ii 21 ( A ) ii 20 ( A ) ii NT2012-2013 16 ( A ) iii 20 ( A ) iii 21 ( A ) iii 20 ( A ) iii NT2013-2014 16 ( A ) iii 20 ( A ) iii 21 ( A ) iii 20 ( A ) iii NT2012-2013 19 ( A ) ii NT2013-2014 19 ( A ) ii NT2012-2013 19 ( A ) iii NT2013-2014 19 ( A ) iii NT2012-2013 20 ( A ) iv 21 ( A ) iv 20 ( A ) iv NT 19 ( A ) iv NT2013-2014 20 ( A ) iv 21 ( A ) iv 20 ( A ) iv NT 19 ( A ) iv NT2012-2013 16 ( A ) iv 20 ( A ) v 21 ( A ) v 20 ( A ) v NT 19 ( A ) v NT2013-2014 16 ( A ) iv 20 ( A ) v 21 ( A ) v 20 ( A ) v NT 19 ( A ) v NT2012-2013 20 ( A ) vii NT 19 ( A ) vii NT2013-2014 20 ( A ) vii NT 19 ( A ) vii NT2012-2013 20 ( A ) vii 21 ( A ) vii 20 ( A ) viii NT 19 ( a ) viii NT
2013-2014 20 ( A ) vii 21 ( A ) vii 20 ( A ) viii NT 19 ( a ) viii NT2012-2013 16 (A ) v 20 ( A ) vi 21 ( A ) vi 20 ( A ) vi NT 19 ( A ) vi NT 17 ( A ) ii NT 17 ( A ) ii NT2013-2014 16 (A ) v 20 ( A ) vi 21 ( A ) vi 20 ( A ) vi NT 19 ( A ) vi NT 17 ( A ) ii NT 17 ( A ) ii NT2012-2013 17 ( A ) iii NT 17 ( A ) iii NT2013-2014 17 ( A ) iii NT 17 ( A ) iii NT2012-2013 16 ( B ) 20 ( B ) 21 ( B ) 20 ( B ) 63% 19 ( B ) NT2013-2014 16 ( B ) 20 ( B ) 21 ( B ) 20 ( B ) 54% 19 ( B ) NT2012-2013 16 ( C ) 20 ( C ) 81% 19 ( C ) 63% 17 ( C ) 71% 17 ( C ) 68%2013-2014 16 ( C ) 20 ( C ) 79% 19 ( C ) 61% 17 ( C ) 55% 17 ( C ) 54%2012-2013 17 ( B ) 21 ( B ) 22 ( B ) 21 ( B ) NT 20 ( A ) 53% 18 ( A ) 56% 18 ( A ) 81%2013-2014 17 ( B ) 21 ( B ) 22 ( B ) 21 ( B ) NT 20 ( A ) 73% 18 ( A ) 42% 18 ( A ) 74%2012-2013 21 ( B ) i NT2013-2014 21 ( B ) i NT2012-2013 21 ( B ) ii NT2013-2014 21 ( B ) ii NT2012-2013 21 ( B ) iii NT2013-2014 21 ( B ) iii NT
19 ( A ) ii19 ( A ) ii19 ( A ) iii19 ( A ) iii
19 ( A ) iv19 ( A ) iv
20 ( A )20 ( A )
23 ( B ) ii23 ( B ) ii
20 ( A )
21 ( A )
21 ( A )
21 ( A )
23 ( B ) 20 ( A )
19 ( C )19 ( B )
19 ( C )20 ( C )20 ( C )
23 ( B )
19 ( C )19 ( C )20 ( A )20 ( A )
21 ( A )22 ( C )
22 ( B )22 ( C )
22 ( A ) iv22 ( A ) iv22 ( A ) v22 ( A ) v
22 ( A ) vii22 ( A ) vii22 ( A ) viii
22 ( A ) viii22 ( A ) vi22 ( A ) vi
22 ( B ) 20 ( B ) 19 ( B )
20 ( A ) vi20 ( A ) vi 19 ( A ) vi
19 ( A ) v19 ( A ) v
19 ( A ) vii19 ( A ) vii19 ( A ) viii
19 ( A ) viii19 ( A ) vi
20 ( B )
20 ( A ) iv20 ( A ) iv20 ( A ) v20 ( A ) v
20 ( A ) vii20 ( A ) vii20 ( A ) viii
20 ( A ) viii
19 ( A ) v19 ( A ) v
19 ( A ) iv19 ( A ) iv
22 ( A ) iii22 ( A ) iii
20 ( A ) ii20 ( A ) ii20 ( A ) iii20 ( A ) iii
22 ( A ) ii19 ( A ) ii19 ( A ) ii19 ( A ) iii19 ( A ) iii
22 ( A ) ii
22 ( A )22 ( A )
22 ( A ) i22 ( A ) i
20 ( A ) i20 ( A ) i
19 ( A ) i19 ( A ) i
20 ( A ) 19 ( A )20 ( A ) 19 ( A )
19 ( A ) i19 ( A ) i
19 ( A )19 ( A )
17 ( D ) 15 ( D ) 14 ( D ) 14 ( D )
Eng I Eng II3rd 4th 5th 6th 7th 8th
14 ( D )17 ( D ) 15 ( D ) 14 ( D )
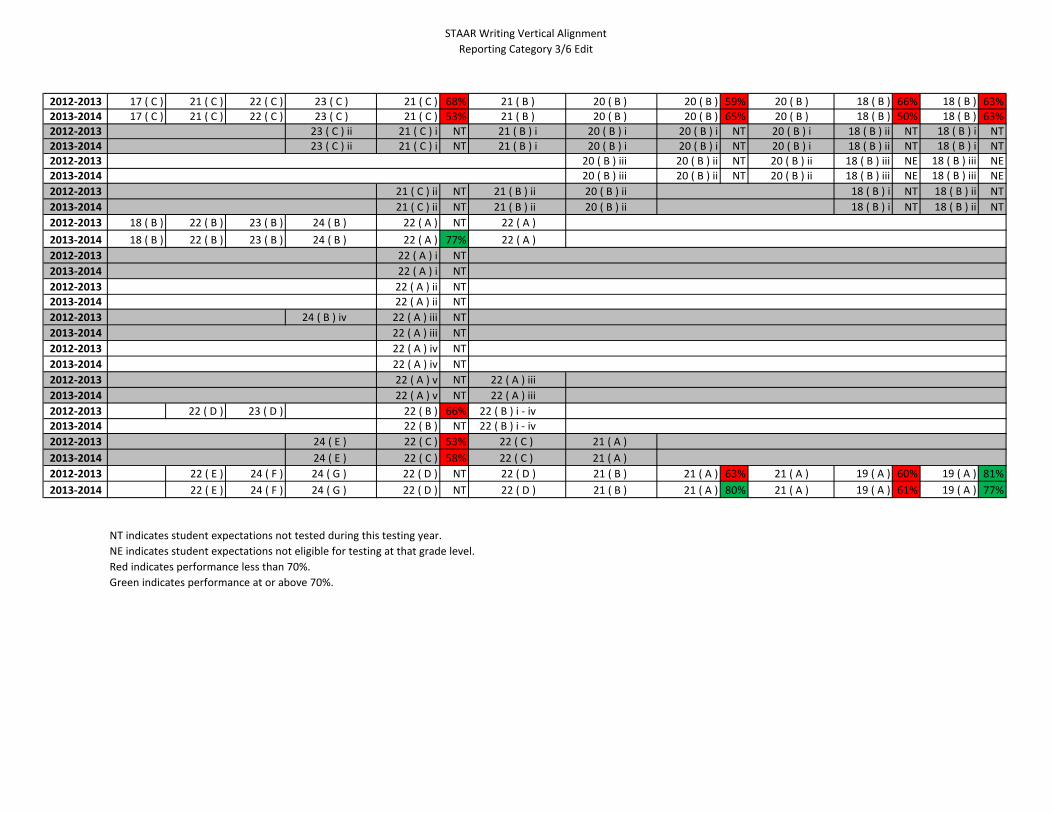
STAAR Writing Vertical AlignmentReporting Category 3/6 Edit
2012-2013 17 ( C ) 21 ( C ) 22 ( C ) 21 ( C ) 68% 20 ( B ) 20 ( B ) 59% 18 ( B ) 66% 18 ( B ) 63%2013-2014 17 ( C ) 21 ( C ) 22 ( C ) 21 ( C ) 53% 20 ( B ) 20 ( B ) 65% 18 ( B ) 50% 18 ( B ) 63%2012-2013 21 ( C ) i NT 20 ( B ) i 20 ( B ) i NT 18 ( B ) ii NT 18 ( B ) i NT2013-2014 21 ( C ) i NT 20 ( B ) i 20 ( B ) i NT 18 ( B ) ii NT 18 ( B ) i NT2012-2013 20 ( B ) iii 20 ( B ) ii NT 18 ( B ) iii NE 18 ( B ) iii NE2013-2014 20 ( B ) iii 20 ( B ) ii NT 18 ( B ) iii NE 18 ( B ) iii NE2012-2013 21 ( C ) ii NT 21 ( B ) ii 20 ( B ) ii 18 ( B ) i NT 18 ( B ) ii NT2013-2014 21 ( C ) ii NT 21 ( B ) ii 20 ( B ) ii 18 ( B ) i NT 18 ( B ) ii NT2012-2013 18 ( B ) 22 ( B ) 23 ( B ) 24 ( B ) 22 ( A ) NT 22 ( A )2013-2014 18 ( B ) 22 ( B ) 23 ( B ) 24 ( B ) 22 ( A ) 77% 22 ( A )2012-2013 22 ( A ) i NT2013-2014 22 ( A ) i NT2012-2013 22 ( A ) ii NT2013-2014 22 ( A ) ii NT2012-2013 24 ( B ) iv 22 ( A ) iii NT2013-2014 22 ( A ) iii NT2012-2013 22 ( A ) iv NT2013-2014 22 ( A ) iv NT2012-2013 22 ( A ) v NT 22 ( A ) iii2013-2014 22 ( A ) v NT 22 ( A ) iii2012-2013 22 ( D ) 23 ( D ) 22 ( B ) 66% 22 ( B ) i - iv2013-2014 22 ( B ) NT 22 ( B ) i - iv2012-2013 24 ( E ) 22 ( C ) 53% 22 ( C ) 21 ( A )2013-2014 24 ( E ) 22 ( C ) 58% 22 ( C ) 21 ( A )2012-2013 22 ( E ) 24 ( F ) 24 ( G ) 22 ( D ) NT 22 ( D ) 21 ( B ) 21 ( A ) 63% 19 ( A ) 60% 19 ( A ) 81%2013-2014 22 ( E ) 24 ( F ) 24 ( G ) 22 ( D ) NT 22 ( D ) 21 ( B ) 21 ( A ) 80% 19 ( A ) 61% 19 ( A ) 77%
NT indicates student expectations not tested during this testing year.NE indicates student expectations not eligible for testing at that grade level.Red indicates performance less than 70%.Green indicates performance at or above 70%.
21 ( A )21 ( A )
20 ( B ) i20 ( B ) i20 ( B ) ii
23 ( C ) ii
20 ( B ) ii
21 ( B ) i
23 ( C )23 ( C )
23 ( C ) ii20 ( B )20 ( B )
21 ( B ) i
21 ( B )21 ( B )

STAAR Math Vertical AlignmentReporting Category 1
Years K 1st 2nd2014-2015 Rpt Cat 1 Rpt Cat 1 Rpt Cat 1 Rpt Cat 1 Rpt Cat 1 Rpt Cat 1 Rpt Cat 1
2014-2015 2(A) 2(A) 2(A)
3(A)3(D)3(C)
2(B)2(F) 3(B) 2(C) 2(B)
2(l) 2(B) 2(A)2( C) 2(B) 2(B)
2(B) 2(A)2(E)
2(G)2(H)
2(F)2(G)
2(F)
2(D)
4(G) C2
2(F) 2(E)2(H)
2014-2015 3(B) 3(C)
3(A) 2(E)3(B)
2014-2015 3(C) 3(E)
2014-2015 3(F)
2014-2015 3(G) 3(C)
2014-2015 3(H) 3(D)
2014-2015 3(G)
2014-2015 6(A)
2(C)4(B)
3(D)
3(A)
2(C)2(A)
2(A)
Alg I3rd 4th 5th 6th 7th 8th
2(D) 2(C)2(D)2(D)2(B)
2014-2015
2(G)
2(C)2014-2015
2014-2015
2014-2015
2(E)2(D)
2014-2015
2014-2015
C2

STAAR Math Vertical AlignmentReporting Category 1
2014-2015 6(C)
2014-2015 6(D)
2014-2015 6(E)
2014-2015 6(H)
2014-2015 6(I)
2014-2015 4(C)
2014-2015 4(D) 4(A) C2
4(E)4(F)4(G)
2(G)4(D) C2
2014-2015 5(B) 7(A) 4(A)
2014-2015 4(I)
5(C) C2 4(E)4(F)
5(D)5(E)
5(B) C2
2014-2015 7(C)
2014-2015 7(D)
8(A) C3 3(C) C38(B) C38(C) C3 10(C) C3
NE indicates a Student Expectation that is Not Eligible for testing at that grade.NT indicates not tested that testing year.If there is a C1, C2, or C3, that indicates that the Student Expectation is eligible for testing in the category noted. Cells filled with grid indicates no Student Expectation at that grade level.Red indicates performance of less than 70% student masteryGreen indicates performance of greater than or equal to 70%.
11(A) C3
5(C)
7(A)
4(D) C2
2014-2015 9(C) 7(A)
2014-2015
2014-2015
2014-2015 7(B)4(B) C25(A) C27(C) 5(A) C2

STAAR Math Vertical AlignmentReporting Category 2
Years K 1st 2nd2014-2015 Rpt Cat 2 Rpt Cat 2 Rpt Cat 2 Rpt Cat 2 Rpt Cat 2 Rpt Cat 2 Rpt Cat 22015-2016 Rpt Cat 2 Rpt Cat 2 Rpt Cat 2 Rpt Cat 2 Rpt Cat 2 Rpt Cat 2 Rpt Cat 22014-2015 4(A)2015-20162014-2015 4(B)2015-2016
2014-2015 4(C)2015-2016
3(A) 3(B)3(B) 3(C)3(C) 3(E) 4(B)
3(F) 3(K)6(A) 4(D)
4(E)4(F)4(G) 4(C)4(K) 4(E)
4(F)4(H)
3(J)4(J) 3(A)
3(C)3(D)
2015-20163(A) 4(C)3(D) 4(A)3(F) 4(D)
3(E) 3(H)
4(G) 4(D)
4(H)3(D)3(E)3(I)3(F)3(G)3(L)
3(B)2015-2016
3(E)
2014-2015
2014-2015
4(A) 4(A) 3(A)
3(B)
3(B)
3(C)
4(B)
3(B)
3(A)3(E)
Algebra I3rd 4th 5th 6th 7th 8th
3(A)4(A)4(A)

STAAR Math Vertical AlignmentReporting Category 2
4(D) C14(G)
2014-2015 6(B) 4(H)
4(D) C15(A)
5(E) 4(C) 5(A)4(D) 4(C) 5(E)
2015-20162014-2015 4(B)2015-2016
6(A) 5(B)6(C) 5(F)6(B) 5(I)
2015-20162014-2015 4(B)2015-2016
4(E) C14(F) C14(G) C15(B)5(C) C1
2015-20162014-2015 5(G)2015-20162014-2015 5(H)2015-20162014-2015 9(A) 10(A) 8(A)2015-20162014-2015 9(B) 10(B)2015-20162014-2015 9(C) 10(C) 8(B)2015-2016
5(F) 7(C) 5(A) 10(A) 11(A) 8(C)5(G) 5(D)
5(B)5(D)5(E)
5(B)
2014-2015 5(C) 4(E) C1 7(A) C1
2014-2015
7(C) 5(A)
4(B)2014-2015 2(C) C1
2014-2015 4(D)
2014-20155(B)
2014-2015 5(A) 4(B)
7(B) C1
4(A)
4(A)
10(B) 11(B) 9(A)
7(A)

STAAR Math Vertical AlignmentReporting Category 2
NE indicates a Student Expectation that is Not Eligible for testing at that grade.NT indicates not tested that testing year.If there is a C1, C2, or C3, that indicates that the Student Expectation is eligible for testing in the category noted. Cells filled with grid indicates no Student Expectation at that grade level.Red indicates performance of less than 70% student masteryGreen indicates performance of greater than or equal to 70%.

STAAR Math Vertical AlignmentReporting Category 3
Years K 1st 2nd2014-2015 Rpt Cat 3 Rpt Cat 3 Rpt Cat 3 Rpt Cat 3 Rpt Cat 3 Rpt Cat 3 Rpt Cat 32015-2016 Rpt Cat 3 Rpt Cat 3 Rpt Cat 3 Rpt Cat 3 Rpt Cat 3 Rpt Cat 3 Rpt Cat 3
6(A) 6(C) 6(A) 3(A)6(B) 3(B)6(C)
2014-2015 6(D)
6(G)6(H)
8(A) 3(C)
8(B)
8(C) 10(C)2015-20162014-2015 7(C)
2014-2015 7(D)
2014-2015 7(E)
8(A)8(B)8(C)
2015-20167(A) 7(A) 9(D)
7(B)7(D)7(C) 9(B)
9(E) 7(B)7(E) 9(G) 7(C)
2014-2015 5(A)2015-20162014-2015 5(B)2015-20162014-2015 5(C)2015-20162014-2015 5(C) NE 4(G) NE 8(B) 8(A) NE 6(A)2015-20162014-2015 8(C) NE 6(C)
6(D)6(D)2014-2015
6(E)2014-2015
8(A) 6(B)
2014-2015
Algebra I3rd 4th 5th 6th 7th 8th
11(A)7(A) C19(C)2014-2015
4(E)4(H)7(A)
9(A)8(C)2014-2015

STAAR Math Vertical AlignmentReporting Category 3
2015-20168(C)
9(A) 7(A)9(B)
2015-20169(C)9(D) 7(B)
2015-20162014-2015 7(C)2015-20162014-2015 7(D)2015-20162014-2015 8(A) 11(C) 8(D)2015-20162014-2015 6(C) 6(B) 10(A)2015-20162014-2015 10(B)2015-20162014-2015 10(C)2015-2016
6(E) 6(A) 8(C)8(B)
7(D) 10(D)7(E)
7(B)
2014-2015 9(F) 6(A) 10(D)
2014-2015 6(C) 6(B)
NE indicates a Student Expectation that is Not Eligible for testing at that grade.NT indicates not tested that testing year.If there is a C1, C2, or C3, that indicates that the Student Expectation is eligible for testing in the category noted. Cells filled with grid indicates no Student Expectation at that grade level.Red indicates performance of less than 70% student masteryGreen indicates performance of greater than or equal to 70%.
4(H)
5(A)6(D)6(A)
8(D)
8(D)
2014-2015
2014-2015
7(A)8(C)
2014-2015
2014-20155(D)

STAAR Math Vertical AlignmentReporting Category 4
Years K 1st 2nd2014-2015 Rpt Cat 4 Rpt Cat 4 Rpt Cat 4 Rpt Cat 4 Rpt Cat 4 Rpt Cat 4 Rpt Cat 42015-2016 Rpt Cat 4 Rpt Cat 4 Rpt Cat 4 Rpt Cat 4 Rpt Cat 4 Rpt Cat 4 Rpt Cat 42014-2015 4(C) 5(A) 4(C)
2014-2015 5(C)2015-20162014-2015 5(D)2015-2016
2014-2015 9(B) 11(A)2015-20162014-2015 6(G)2015-20162014-2015 8(B) 8(B) 10(B) 8(A) 9(A) 9(A) 12(A)2015-2016
12(B)12(C) 11(B)12(D)
2015-20162014-2015 12(B)2015-20162014-2015 12(C) 11(C) NE2015-2016
8(C) 8(C) 10(D)10(C) 8(B) 9(B) 9(C)
2015-20162014-2015 13(B)2015-20162014-2015 11(C) 10(D) NE 10(D) NE 14(A)2015-20162014-2015 11(D) 9(D) 10(E) 10(C) NE 14(B) 12(A)2015-20162014-2015 14(C)2015-20162014-2015 11(D) 14(E) 12(E) NE2015-20162014-2015 11(E) 14(F)2015-20162014-2015 11(D) 14(G)2015-20162014-2015 9(A) 9(A) 9(A) 10(A) 10(A) 13(A)2015-20162014-2015 10(F) 13(B)2015-20162014-2015 11(F) 9(B) 10(B)
2014-2015 13(C)2015-2106
13(A)2014-2015
2014-2015 12(A)
Algebra I3rd 4th 5th 6th 7th 8th

STAAR Math Vertical AlignmentReporting Category 4
2014-2015 13(D)2015-20162014-2015 11(B) 9(C) NE 13(F) 12(C)2015-20162014-2015 9(C) 11(A) 9(E) 10(C) NE 13(E) 12(D)2015-20162014-2015 9(D) 9(B) 10(B) 14(H) 12(G)2015-20162014-2015 10(E)
NE indicates a Student Expectation that is Not Eligible for testing at that grade.NT indicates not tested that testing year.
If there is a C1, C2, or C3, that indicates that the Student Expectation is eligible for testing in the category noted. Cells filled with grid indicates no Student Expectation at that grade level.Red indicates performance of less than 70% student masteryGreen indicates performance of greater than or equal to 70%.
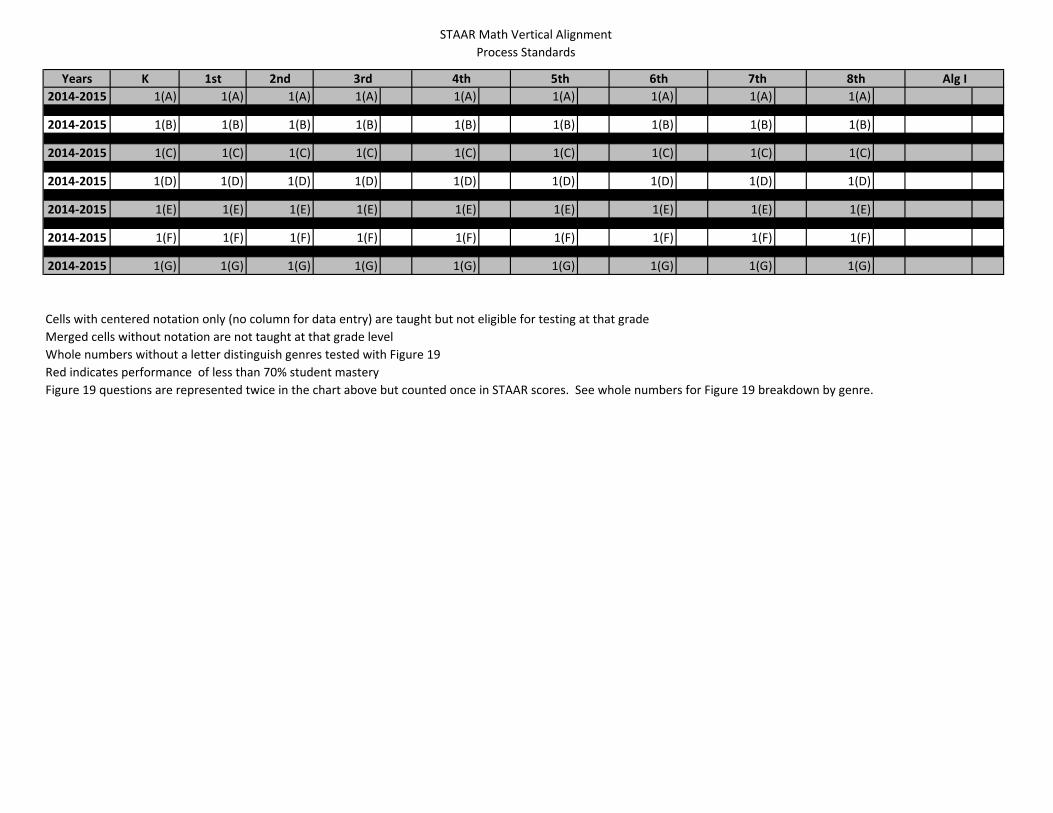
STAAR Math Vertical AlignmentProcess Standards
Years K 1st 2nd2014-2015 1(A) 1(A) 1(A) 1(A) 1(A) 1(A) 1(A) 1(A) 1(A)2015-20162014-2015 1(B) 1(B) 1(B) 1(B) 1(B) 1(B) 1(B) 1(B) 1(B)2015-20162014-2015 1(C) 1(C) 1(C) 1(C) 1(C) 1(C) 1(C) 1(C) 1(C)2015-20162014-2015 1(D) 1(D) 1(D) 1(D) 1(D) 1(D) 1(D) 1(D) 1(D)2015-20162014-2015 1(E) 1(E) 1(E) 1(E) 1(E) 1(E) 1(E) 1(E) 1(E)2015-20162014-2015 1(F) 1(F) 1(F) 1(F) 1(F) 1(F) 1(F) 1(F) 1(F)2015-20162014-2015 1(G) 1(G) 1(G) 1(G) 1(G) 1(G) 1(G) 1(G) 1(G)
Cells with centered notation only (no column for data entry) are taught but not eligible for testing at that gradeMerged cells without notation are not taught at that grade levelWhole numbers without a letter distinguish genres tested with Figure 19Red indicates performance of less than 70% student masteryFigure 19 questions are represented twice in the chart above but counted once in STAAR scores. See whole numbers for Figure 19 breakdown by genre.
Alg I3rd 4th 5th 6th 7th 8th


