Embed Size (px)
Citation preview
ARTICLE
Multisite phosphorylation drives phenotypicvariation in (p)ppGpp synthetase-dependentantibiotic toleranceElizabeth A. Libby 1,2,3, Shlomi Reuveni2,4,5,6 & Jonathan Dworkin1*
Isogenic populations of cells exhibit phenotypic variability that has specific physiological
consequences. Individual bacteria within a population can differ in antibiotic tolerance, but
whether this variability can be regulated or is generally an unavoidable consequence of
stochastic fluctuations is unclear. Here we report that a gene encoding a bacterial (p)ppGpp
synthetase in Bacillus subtilis, sasA, exhibits high levels of extrinsic noise in expression. We
find that sasA is regulated by multisite phosphorylation of the transcription factor WalR,
mediated by a Ser/Thr kinase-phosphatase pair PrkC/PrpC, and a Histidine kinase WalK of a
two-component system. This regulatory intersection is crucial for controlling the appearance
of outliers; rare cells with unusually high levels of sasA expression, having increased antibiotic
tolerance. We create a predictive model demonstrating that the probability of a given cell
surviving antibiotic treatment increases with sasA expression. Therefore, multisite phos-
phorylation can be used to strongly regulate variability in antibiotic tolerance.
https://doi.org/10.1038/s41467-019-13127-z OPEN
1 Department of Microbiology and Immunology, College of Physicians and Surgeons, Columbia University, New York, NY 10032, USA. 2Department ofSystems Biology, Harvard Medical School, Boston, MA 02115, USA. 3Wyss Institute for Biologically Inspired Engineering, Harvard University, Boston, MA02115, USA. 4 School of Chemistry, Tel-Aviv University, 6997801 Tel-Aviv, Israel. 5 Center for the Physics and Chemistry of Living Systems, Tel AvivUniversity, 6997801 Tel Aviv, Israel. 6 The Sackler Center for Computational Molecular and Materials Science, Tel Aviv University, 6997801 Tel Aviv, Israel.*email: [email protected]
NATURE COMMUNICATIONS | (2019) 10:5133 | https://doi.org/10.1038/s41467-019-13127-z | www.nature.com/naturecommunications 1
1234
5678
90():,;
Many bacterial phenotypes, including antibiotic toleranceand virulence, often reflect the phenotype of a subset ofthe population rather than the average behavior1,2.
Subpopulations of bacteria can arise through purely stochasticprocesses, as well as by regulatory and signaling pathways3.Theoretically, one way to create phenotypic diversity via a signalingpathway is multisite phosphorylation, in which each successivephosphorylation changes the activity of a protein4,5. However, ithas not been experimentally shown in bacterial populations thatmultisite phosphorylation regulates variation in gene expressionbetween cells, and subsequently, the emergence of phenotypicdiversity. Recently, multisite phosphorylation of transcriptionfactors have been observed in pathways involved in antibiotictolerance and virulence6, suggesting that dynamics of multisitephosphorylation could have particular physiological relevance.
Bacterial signaling is often characterized in the context of two-component signal transduction systems (TCS) that generallyconsist of a histidine kinase that phosphorylates a response reg-ulator on a single residue, which then acts as a transcriptionfactor7. The stimulus-dependent response of this type of signalingsystem architecture has been analyzed theoretically8,9 andexperimentally10,11, with little cell-to-cell variability observed (asquantified by CV), regardless of inducer level. This suggests thatextensive cell-to-cell variability is not a general feature of bacterialTCS. However, some notable exceptions have been found for two-component systems with more complex architectures, such as thebroad distribution of gene expression in the E. coli TorS/TorRregulon12 which has recently been shown to be an importantfactor for cell survival during oxygen depletion13. The networkarchitecture of bacterial signal transduction systems may there-fore play an underappreciated role in the dynamics and survivalof bacterial populations.
In addition to TCS, bacteria also have eukaryotic-like (alsocalled Hank’s type) Ser/Thr kinase – phosphatase pairs withhomology to eukaryotic systems that perform reversible phos-phorylation on Ser and Thr residues14. One particular subfamilyof these systems appears to be universally conserved acrossGram-positive bacteria and plays key roles in growth and viru-lence for many clinically important pathogens including thestreptococci, S. aureus, M. tuberculosis, E. faecalis, and others6,15.Genetic and proteomic studies indicate that these Ser/Thr kinasescan perform transcriptional regulation of key cellular processesinvolved in antibiotic tolerance and persistence through multisitephosphorylation of transcription factors. However, to date, theconsequences of multisite phosphorylation for gene regulation atthe single-cell-level has not been quantified. In this context themodel gram-positive bacterium B. subtilis presents a compara-tively straightforward system to quantify the contribution of theadditional Ser/Thr phosphorylation in vivo: the homologouskinase-phosphatase pair is PrkC/PrpC, and it has been verified toregulate gene expression through additional phosphorylation of aresponse regulator.
It has been apparent for over 60 years that bacterial populationscontain rare cells that display increased phenotypic resistance toantibiotics16. These cells, presumed to be quiescent, have beenimplicated in antibiotic treatment failure in genetically susceptiblebacterial infections17. To date, it remains unclear to what extent theappearance of these rare cells is subject to regulation. Emergingevidence strongly implicates elevated levels of the nucleotide secondmessenger (p)ppGpp as a causative agent of quiescence in manybacterial species18,19. (p)ppGpp downregulates essential cellularprocesses such as transcription, translation, and DNA replication20.Although the precise mechanism of (p)ppGpp synthesis andits direct cellular targets vary between bacterial species, highlyelevated levels of (p)ppGpp confer a quiescent state to the bacterialcell. As many antibiotics target active cellular processes, the
resulting quiescent cells exhibit increased antibiotic tolerance21,suggesting that cell-to-cell variability in (p)ppGpp may be involvedin phenotypic resistance to antibiotics.
The mechanistic origin of cell-to-cell variability in (p)ppGpplevels across bacterial populations remains a major open question.To date, this has been best studied in E. coli, in the context of theRelA (p)ppGpp synthetase and the SpoT hydrolase22. In contrast,other bacterial species often possess dedicated (p)ppGpp syn-thetases, termed small alarmone synthetases (SAS), in addition tobi-functional synthetase-hydrolases23. These SAS proteins can beactivated transcriptionally20, suggesting that cell-to-cell variabilityin (p)ppGpp levels could originate in the transcriptional regula-tion of the synthetases themselves. In the Gram-positivebacterium B. subtilis, three distinct proteins, RelA, SasA, andSasB synthesize (p)ppGpp24. B. subtilis RelA is a bi-functional(p)ppGpp synthetase-hydrolase, and both SasA and SasB arededicated synthetases. Although relA and sasB transcripts areboth readily detectable during log phase growth, sasA (formerlyywaC) transcripts are found at considerably lower levels. How-ever, sasA is inducible by certain classes of cell-wall-activeantibiotics25,26, and its induction by alkaline shock increases thecellular levels of ppGpp24. Since sasA expression stops growth27,SasA-mediated (p)ppGpp synthesis provides a mechanism toinduce cellular quiescence in response to environmental stresses.To date, SasA is only known to be regulated transcriptionally, sosignificant cell-to-cell variability in sasA expression could producephysiologically relevant cell-to-cell variability in (p)ppGpp levels.The pre-existing distribution of sasA expression may therefore becritical in predicting the relative survival of cells under conditionsthat do not specifically induce sasA.
In this work, we demonstrate that sasA expression displaysphysiologically relevant amounts of extrinsic noise, although theaverage level of sasA expression is very low during growth undernon-inducing conditions. Furthermore, we find that both thedistribution of sasA expression and the frequency of outliers arestrongly regulated by the activity of a highly conservedeukaryotic-like Ser/Thr kinase system and its subsequent multi-site phosphorylation of a transcription factor. Using quantitativeanalysis of the full distributions of sasA expression, we find thatmultisite phosphorylation is responsible for exponentially reg-ulating the abundance of cells with a given level of SasA, and wegenerate a predictive model for sasA-expression-dependent anti-biotic tolerance.
ResultssasA expression exhibits high levels of extrinsic noise. While thepopulation average level of sasA expression during growthis extremely low25, the average behavior may mask importantphenotypic variation between cells. We therefore generated atranscriptional reporter for sasA (PsasA-yfp) to study the populationat the single-cell level. Surprisingly, there was considerable cell-to-cell variability in PsasA-yfp (coefficient of variation, CV ~ 4.95 ±0.42, mean ± SEM), with most cells having very low expression,and rare cells showing significantly higher levels of expression(Fig. 1a). Quantification of YFP fluorescence revealed that a smallfraction of the population had much higher (>~10×) levels offluorescence than the mean, and rare cells had ~100×. Note thata typical bacterial gene has a CV in the range 0.1–128–30.Consistently, we measured the B. subtilis gene veg to have a CV of0.4 ± 0.02 (mean ± SEM, Supplementary Fig. 1).
The high levels of cell-to-cell variability in sasA expressioncould be caused by intrinsic noise from the promoter itself, or byextrinsic noise originating in an upstream process31. Todifferentiate between these mechanisms, we used a strain withdual fluorescent reporters, PsasA-yfp and PsasA-mcherry (Fig. 1b).
ARTICLE NATURE COMMUNICATIONS | https://doi.org/10.1038/s41467-019-13127-z
2 NATURE COMMUNICATIONS | (2019) 10:5133 | https://doi.org/10.1038/s41467-019-13127-z | www.nature.com/naturecommunications
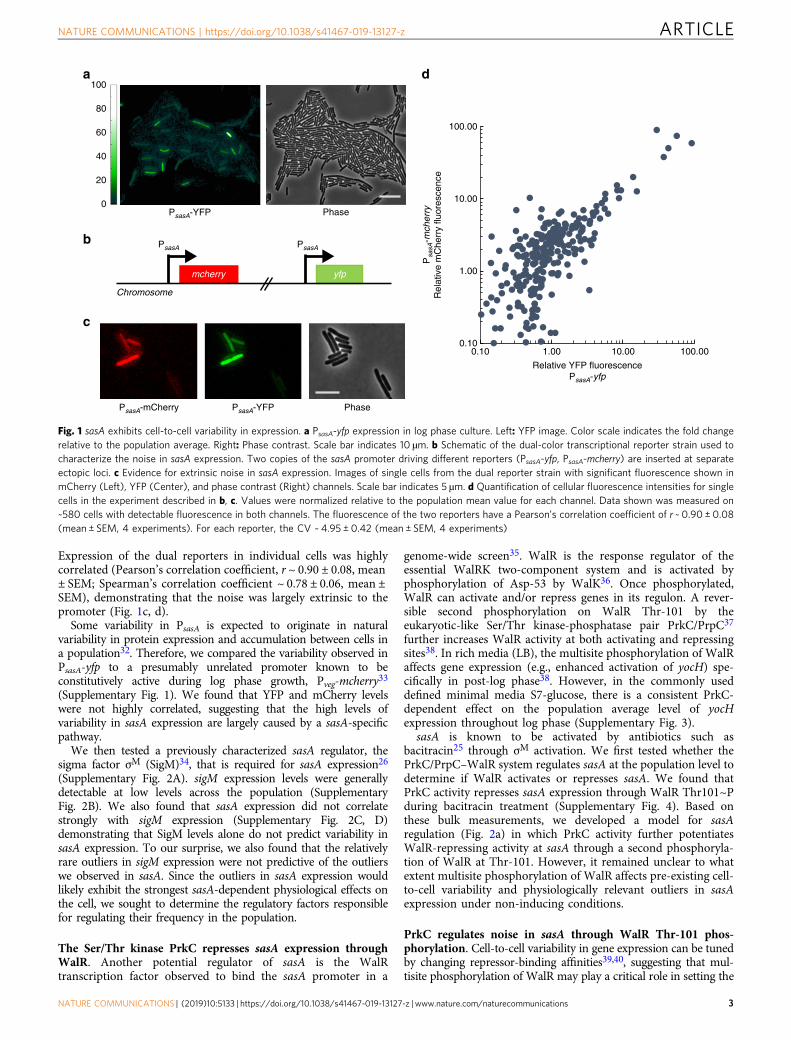
Expression of the dual reporters in individual cells was highlycorrelated (Pearson’s correlation coefficient, r ~ 0.90 ± 0.08, mean± SEM; Spearman’s correlation coefficient ~ 0.78 ± 0.06, mean ±SEM), demonstrating that the noise was largely extrinsic to thepromoter (Fig. 1c, d).
Some variability in PsasA is expected to originate in naturalvariability in protein expression and accumulation between cells ina population32. Therefore, we compared the variability observed inPsasA-yfp to a presumably unrelated promoter known to beconstitutively active during log phase growth, Pveg-mcherry33
(Supplementary Fig. 1). We found that YFP and mCherry levelswere not highly correlated, suggesting that the high levels ofvariability in sasA expression are largely caused by a sasA-specificpathway.
We then tested a previously characterized sasA regulator, thesigma factor σM (SigM)34, that is required for sasA expression26
(Supplementary Fig. 2A). sigM expression levels were generallydetectable at low levels across the population (SupplementaryFig. 2B). We also found that sasA expression did not correlatestrongly with sigM expression (Supplementary Fig. 2C, D)demonstrating that SigM levels alone do not predict variability insasA expression. To our surprise, we also found that the relativelyrare outliers in sigM expression were not predictive of the outlierswe observed in sasA. Since the outliers in sasA expression wouldlikely exhibit the strongest sasA-dependent physiological effects onthe cell, we sought to determine the regulatory factors responsiblefor regulating their frequency in the population.
The Ser/Thr kinase PrkC represses sasA expression throughWalR. Another potential regulator of sasA is the WalRtranscription factor observed to bind the sasA promoter in a
genome-wide screen35. WalR is the response regulator of theessential WalRK two-component system and is activated byphosphorylation of Asp-53 by WalK36. Once phosphorylated,WalR can activate and/or repress genes in its regulon. A rever-sible second phosphorylation on WalR Thr-101 by theeukaryotic-like Ser/Thr kinase-phosphatase pair PrkC/PrpC37
further increases WalR activity at both activating and repressingsites38. In rich media (LB), the multisite phosphorylation of WalRaffects gene expression (e.g., enhanced activation of yocH) spe-cifically in post-log phase38. However, in the commonly useddefined minimal media S7-glucose, there is a consistent PrkC-dependent effect on the population average level of yocHexpression throughout log phase (Supplementary Fig. 3).
sasA is known to be activated by antibiotics such asbacitracin25 through σM activation. We first tested whether thePrkC/PrpC–WalR system regulates sasA at the population level todetermine if WalR activates or represses sasA. We found thatPrkC activity represses sasA expression through WalR Thr101~Pduring bacitracin treatment (Supplementary Fig. 4). Based onthese bulk measurements, we developed a model for sasAregulation (Fig. 2a) in which PrkC activity further potentiatesWalR-repressing activity at sasA through a second phosphoryla-tion of WalR at Thr-101. However, it remained unclear to whatextent multisite phosphorylation of WalR affects pre-existing cell-to-cell variability and physiologically relevant outliers in sasAexpression under non-inducing conditions.
PrkC regulates noise in sasA through WalR Thr-101 phos-phorylation. Cell-to-cell variability in gene expression can be tunedby changing repressor-binding affinities39,40, suggesting that mul-tisite phosphorylation of WalR may play a critical role in setting the
PhasePsasA-YFPPsasA-mCherry
Psa
sA-m
cher
ryR
elat
ive
mC
herr
y flu
ores
cenc
e
0.10
1.00
10.00
100.00
0.10 1.00 10.00 100.00
Relative YFP fluorescencePsasA-yfp
PsasA-YFP Phase
a
c
d
b PsasA PsasA
mcherry yfp
Chromosome
0
40
20
60
80
100
Fig. 1 sasA exhibits cell-to-cell variability in expression. a PsasA-yfp expression in log phase culture. Left: YFP image. Color scale indicates the fold changerelative to the population average. Right: Phase contrast. Scale bar indicates 10 µm. b Schematic of the dual-color transcriptional reporter strain used tocharacterize the noise in sasA expression. Two copies of the sasA promoter driving different reporters (PsasA-yfp, PsasA-mcherry) are inserted at separateectopic loci. c Evidence for extrinsic noise in sasA expression. Images of single cells from the dual reporter strain with significant fluorescence shown inmCherry (Left), YFP (Center), and phase contrast (Right) channels. Scale bar indicates 5 µm. d Quantification of cellular fluorescence intensities for singlecells in the experiment described in b, c. Values were normalized relative to the population mean value for each channel. Data shown was measured on~580 cells with detectable fluorescence in both channels. The fluorescence of the two reporters have a Pearson’s correlation coefficient of r ~ 0.90 ± 0.08(mean ± SEM, 4 experiments). For each reporter, the CV ~ 4.95 ± 0.42 (mean ± SEM, 4 experiments)
NATURE COMMUNICATIONS | https://doi.org/10.1038/s41467-019-13127-z ARTICLE
NATURE COMMUNICATIONS | (2019) 10:5133 | https://doi.org/10.1038/s41467-019-13127-z | www.nature.com/naturecommunications 3
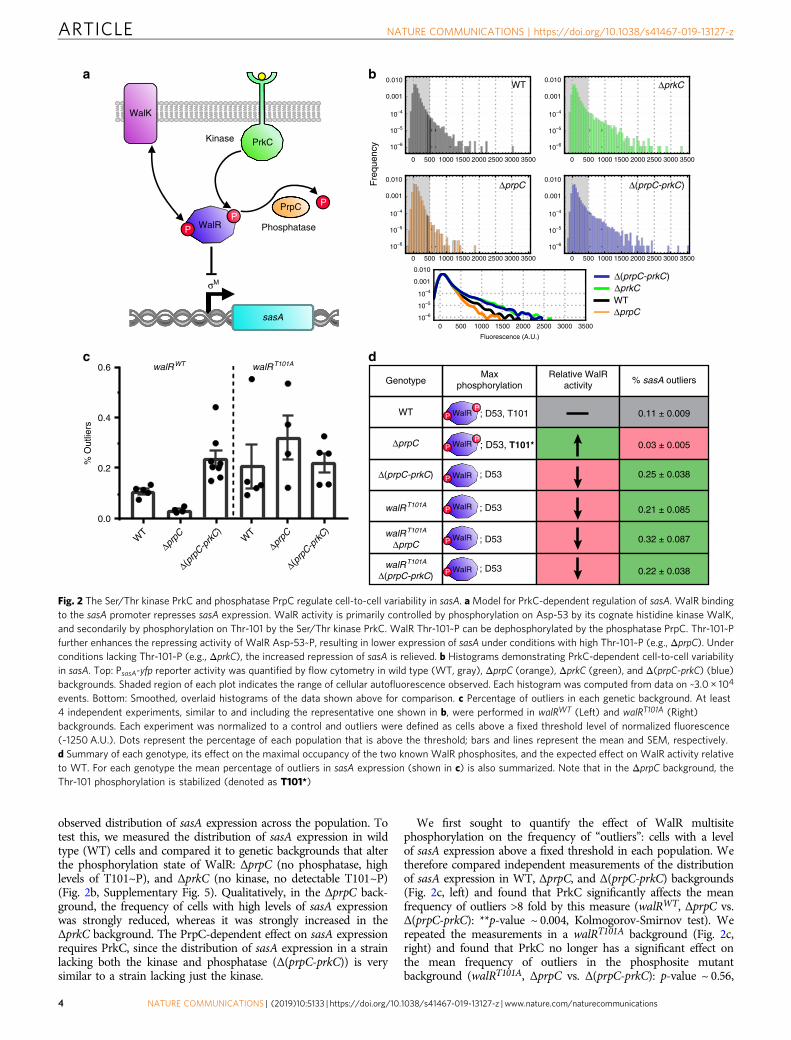
observed distribution of sasA expression across the population. Totest this, we measured the distribution of sasA expression in wildtype (WT) cells and compared it to genetic backgrounds that alterthe phosphorylation state of WalR: ΔprpC (no phosphatase, highlevels of T101~P), and ΔprkC (no kinase, no detectable T101~P)(Fig. 2b, Supplementary Fig. 5). Qualitatively, in the ΔprpC back-ground, the frequency of cells with high levels of sasA expressionwas strongly reduced, whereas it was strongly increased in theΔprkC background. The PrpC-dependent effect on sasA expressionrequires PrkC, since the distribution of sasA expression in a strainlacking both the kinase and phosphatase (Δ(prpC-prkC)) is verysimilar to a strain lacking just the kinase.
We first sought to quantify the effect of WalR multisitephosphorylation on the frequency of “outliers”: cells with a levelof sasA expression above a fixed threshold in each population. Wetherefore compared independent measurements of the distributionof sasA expression in WT, ΔprpC, and Δ(prpC-prkC) backgrounds(Fig. 2c, left) and found that PrkC significantly affects the meanfrequency of outliers >8 fold by this measure (walRWT, ΔprpC vs.Δ(prpC-prkC): **p-value ~ 0.004, Kolmogorov-Smirnov test). Werepeated the measurements in a walRT101A background (Fig. 2c,right) and found that PrkC no longer has a significant effect onthe mean frequency of outliers in the phosphosite mutantbackground (walRT101A, ΔprpC vs. Δ(prpC-prkC): p-value ~ 0.56,
a b
GenotypeMax
phosphorylation % sasA outliersRelative WalR
activity
0.11 ± 0.009
0.03 ± 0.005
0.22 ± 0.038
0.32 ± 0.087
0.21 ± 0.085
0.25 ± 0.038
; D53, T101
; D53, T101*
; D53
; D53
; D53
; D53
WT
ΔprpC
Δ(prpC-prkC)
walRT101A
walRT101A
ΔprpC
walRT101A
Δ(prpC-prkC)
Fluorescence (A.U.)
Fre
quen
cy
WT
ΔprpC
ΔprkC
ΔprpC
ΔprkC
Δ(prpC-prkC)
Δ(prpC-prkC)
WT
WW
0 500 1000 1500 2000 2500 3000 3500
10–6
10–5
10–4
0.001
0.010
10–6
10–5
10–4
0.001
0.010
10–6
10–5
10–4
0.001
0.010
10–6
10–5
10–4
0.001
0.010
10–6
10–5
10–4
0.001
0.010
r
0 500 1000 1500 2000 2500 3000 3500
(p(p C rk
0 500 1000 1500 2000 2500 3000 3500
r
0 500 1000 1500 2000 2500 3000 3500
0 500 1000 1500 2000 2500 3000 3500
c
0.0
0.2
0.4
0.6
% O
utlie
rs
WT
ΔprpC
Δ(prp
C-prk
C)
walRT101AwalRWT
WT
ΔprpC
Δ(prp
C-prk
C)
d
PrpC
PP
P
WalR
sasA
σM
Kinase
Phosphatase
WalK
PrkC
WalR
WalR
WalR
WalR
WalR
WalR
P
P
P
P
P
P
P
P
Fig. 2 The Ser/Thr kinase PrkC and phosphatase PrpC regulate cell-to-cell variability in sasA. aModel for PrkC-dependent regulation of sasA. WalR bindingto the sasA promoter represses sasA expression. WalR activity is primarily controlled by phosphorylation on Asp-53 by its cognate histidine kinase WalK,and secondarily by phosphorylation on Thr-101 by the Ser/Thr kinase PrkC. WalR Thr-101~P can be dephosphorylated by the phosphatase PrpC. Thr-101~Pfurther enhances the repressing activity of WalR Asp-53~P, resulting in lower expression of sasA under conditions with high Thr-101~P (e.g., ΔprpC). Underconditions lacking Thr-101~P (e.g., ΔprkC), the increased repression of sasA is relieved. b Histograms demonstrating PrkC-dependent cell-to-cell variabilityin sasA. Top: PsasA-yfp reporter activity was quantified by flow cytometry in wild type (WT, gray), ΔprpC (orange), ΔprkC (green), and Δ(prpC-prkC) (blue)backgrounds. Shaded region of each plot indicates the range of cellular autofluorescence observed. Each histogram was computed from data on ~3.0 × 10⁴
events. Bottom: Smoothed, overlaid histograms of the data shown above for comparison. c Percentage of outliers in each genetic background. At least4 independent experiments, similar to and including the representative one shown in b, were performed in walRWT (Left) and walRT101A (Right)backgrounds. Each experiment was normalized to a control and outliers were defined as cells above a fixed threshold level of normalized fluorescence(~1250 A.U.). Dots represent the percentage of each population that is above the threshold; bars and lines represent the mean and SEM, respectively.d Summary of each genotype, its effect on the maximal occupancy of the two known WalR phosphosites, and the expected effect on WalR activity relativeto WT. For each genotype the mean percentage of outliers in sasA expression (shown in c) is also summarized. Note that in the ΔprpC background, theThr-101 phosphorylation is stabilized (denoted as T101*)
ARTICLE NATURE COMMUNICATIONS | https://doi.org/10.1038/s41467-019-13127-z
4 NATURE COMMUNICATIONS | (2019) 10:5133 | https://doi.org/10.1038/s41467-019-13127-z | www.nature.com/naturecommunications
ns, Kolmogorov-Smirnov test). These results are consistent withincreased WalR activity by Thr-101 phosphorylation causingincreased repression of sasA, and thereby regulating the frequencyof sasA outliers (Fig. 2d). Furthermore, heterologous expression ofPrkC was sufficient to reduce the frequency of outliers observed inthe ΔprkC background (Supplementary Fig. 6A). Heterologousexpression of PrkC was also able to further reduce the variability tobelow that observed in the ΔprpC background, approaching thelevel of cellular autofluorescence (Supplementary Fig. 6B). Thissuggests that at least some of the remaining variability in the ΔprpCbackground arises due to incomplete saturation of WalR T101~P.
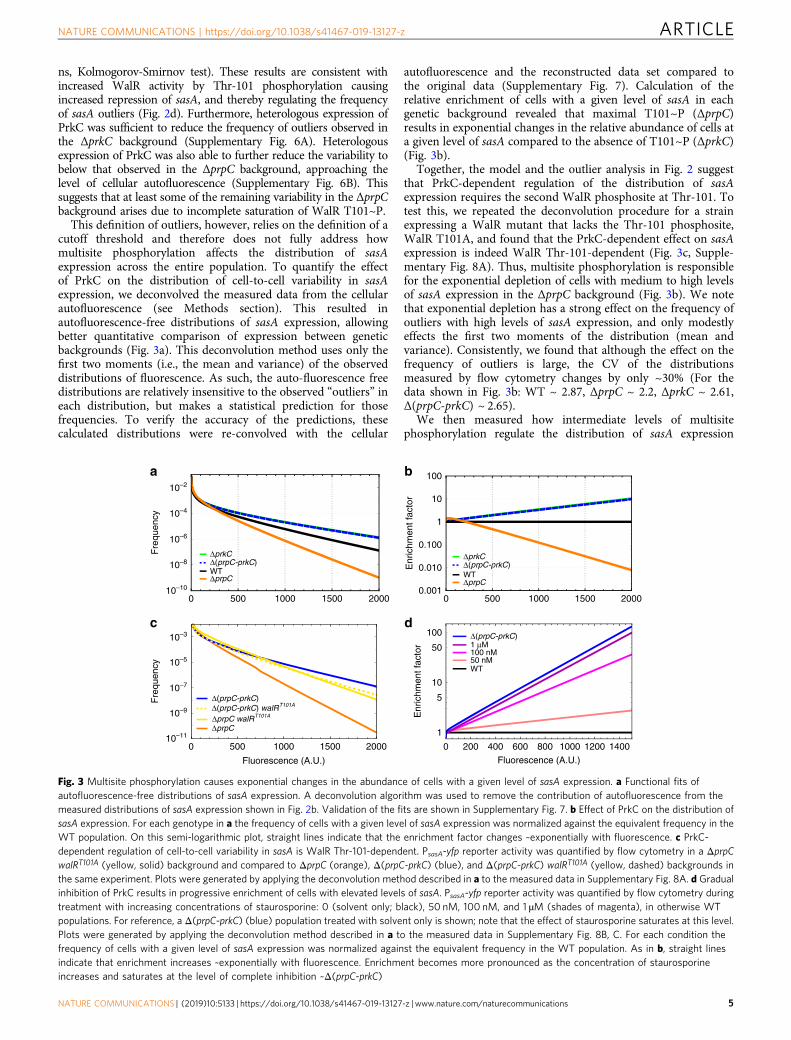
This definition of outliers, however, relies on the definition of acutoff threshold and therefore does not fully address howmultisite phosphorylation affects the distribution of sasAexpression across the entire population. To quantify the effectof PrkC on the distribution of cell-to-cell variability in sasAexpression, we deconvolved the measured data from the cellularautofluorescence (see Methods section). This resulted inautofluorescence-free distributions of sasA expression, allowingbetter quantitative comparison of expression between geneticbackgrounds (Fig. 3a). This deconvolution method uses only thefirst two moments (i.e., the mean and variance) of the observeddistributions of fluorescence. As such, the auto-fluorescence freedistributions are relatively insensitive to the observed “outliers” ineach distribution, but makes a statistical prediction for thosefrequencies. To verify the accuracy of the predictions, thesecalculated distributions were re-convolved with the cellular
autofluorescence and the reconstructed data set compared tothe original data (Supplementary Fig. 7). Calculation of therelative enrichment of cells with a given level of sasA in eachgenetic background revealed that maximal T101~P (ΔprpC)results in exponential changes in the relative abundance of cells ata given level of sasA compared to the absence of T101~P (ΔprkC)(Fig. 3b).
Together, the model and the outlier analysis in Fig. 2 suggestthat PrkC-dependent regulation of the distribution of sasAexpression requires the second WalR phosphosite at Thr-101. Totest this, we repeated the deconvolution procedure for a strainexpressing a WalR mutant that lacks the Thr-101 phosphosite,WalR T101A, and found that the PrkC-dependent effect on sasAexpression is indeed WalR Thr-101-dependent (Fig. 3c, Supple-mentary Fig. 8A). Thus, multisite phosphorylation is responsiblefor the exponential depletion of cells with medium to high levelsof sasA expression in the ΔprpC background (Fig. 3b). We notethat exponential depletion has a strong effect on the frequency ofoutliers with high levels of sasA expression, and only modestlyeffects the first two moments of the distribution (mean andvariance). Consistently, we found that although the effect on thefrequency of outliers is large, the CV of the distributionsmeasured by flow cytometry changes by only ~30% (For thedata shown in Fig. 3b: WT ~ 2.87, ΔprpC ~ 2.2, ΔprkC ~ 2.61,Δ(prpC-prkC) ~ 2.65).
We then measured how intermediate levels of multisitephosphorylation regulate the distribution of sasA expression
b
d
Enr
ichm
ent f
acto
rE
nric
hmen
t fac
tor
Fluorescence (A.U.)
a
Fre
quen
cyF
requ
ency
WTΔprpC
Δ(prpC-prkC)ΔprkC
WTΔprpC
Δ(prpC-prkC)ΔprkC
0 500 1000 1500 200010–10
10–3
10–5
10–7
10–9
10–11
10–8
10–6
10–4
10–2
0 500 1000 1500 20000.001
0.010
0.100
1
10
100
ΔprpC walRT101A
ΔprpC
Δ(prpC-prkC) walRT101AΔ(prpC-prkC)
c
0 500 1000 1500 2000 0 200 400 600 800 1000 1200 1400
1
5
10
50
100 Δ(prpC-prkC)
WT
1 μM
50 nM100 nM
Fluorescence (A.U.)
Fig. 3 Multisite phosphorylation causes exponential changes in the abundance of cells with a given level of sasA expression. a Functional fits ofautofluorescence-free distributions of sasA expression. A deconvolution algorithm was used to remove the contribution of autofluorescence from themeasured distributions of sasA expression shown in Fig. 2b. Validation of the fits are shown in Supplementary Fig. 7. b Effect of PrkC on the distribution ofsasA expression. For each genotype in a the frequency of cells with a given level of sasA expression was normalized against the equivalent frequency in theWT population. On this semi-logarithmic plot, straight lines indicate that the enrichment factor changes ~exponentially with fluorescence. c PrkC-dependent regulation of cell-to-cell variability in sasA is WalR Thr-101-dependent. PsasA-yfp reporter activity was quantified by flow cytometry in a ΔprpCwalRT101A (yellow, solid) background and compared to ΔprpC (orange), Δ(prpC-prkC) (blue), and Δ(prpC-prkC) walRT101A (yellow, dashed) backgrounds inthe same experiment. Plots were generated by applying the deconvolution method described in a to the measured data in Supplementary Fig. 8A. d Gradualinhibition of PrkC results in progressive enrichment of cells with elevated levels of sasA. PsasA-yfp reporter activity was quantified by flow cytometry duringtreatment with increasing concentrations of staurosporine: 0 (solvent only; black), 50 nM, 100 nM, and 1 µM (shades of magenta), in otherwise WTpopulations. For reference, a Δ(prpC-prkC) (blue) population treated with solvent only is shown; note that the effect of staurosporine saturates at this level.Plots were generated by applying the deconvolution method described in a to the measured data in Supplementary Fig. 8B, C. For each condition thefrequency of cells with a given level of sasA expression was normalized against the equivalent frequency in the WT population. As in b, straight linesindicate that enrichment increases ~exponentially with fluorescence. Enrichment becomes more pronounced as the concentration of staurosporineincreases and saturates at the level of complete inhibition ~Δ(prpC-prkC)
NATURE COMMUNICATIONS | https://doi.org/10.1038/s41467-019-13127-z ARTICLE
NATURE COMMUNICATIONS | (2019) 10:5133 | https://doi.org/10.1038/s41467-019-13127-z | www.nature.com/naturecommunications 5
using the kinase inhibitor staurosporine to progressively inhibitPrkC activity41 (Supplementary Fig. 8B; 9). The distributions ofsasA expression were again deconvolved (Supplementary Fig. 8C),and we calculated the relative enrichment of cells with a givenlevel of sasA fluorescence at increasing concentrations ofstaurosporine (Fig. 3d). Titration of PrkC activity resulted inexponential enrichment of cells with a given level of sasA.Therefore, even small changes in PrkC activity result in largechanges in the abundance of “outliers”, cells with unusually highlevels of sasA.
sasA expression level continuously predicts antibiotic toler-ance. Cell-to-cell variability in (p)ppGpp production has beenproposed to result in cell-to-cell variability in antibiotic survi-val42–45. However, a direct and quantitative relationship betweenthe expression of a transcriptionally regulated (p)ppGpp syn-thetase and the probability of survival for an individual cell hasnot been demonstrated. We therefore sought to determine if cellswith pre-existing high levels of sasA preferentially survive anti-biotic exposure, and if so, to provide a model for how the level ofsasA expression influences the probability of survival for agiven cell.
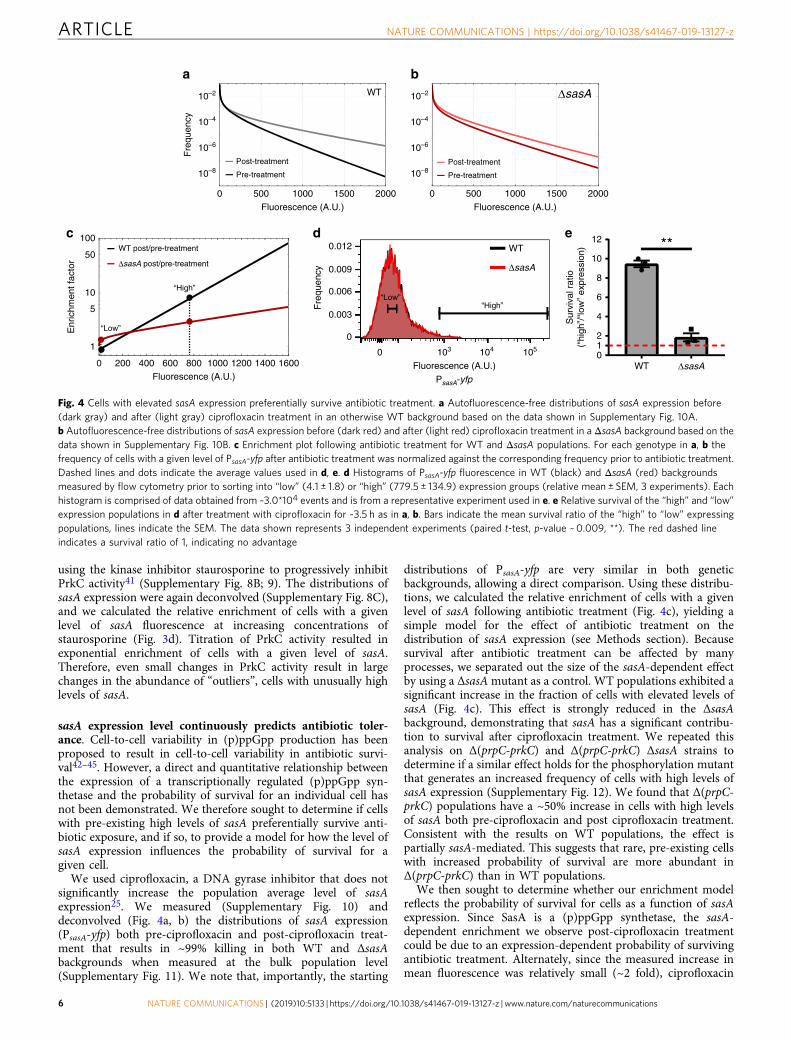
We used ciprofloxacin, a DNA gyrase inhibitor that does notsignificantly increase the population average level of sasAexpression25. We measured (Supplementary Fig. 10) anddeconvolved (Fig. 4a, b) the distributions of sasA expression(PsasA-yfp) both pre-ciprofloxacin and post-ciprofloxacin treat-ment that results in ~99% killing in both WT and ΔsasAbackgrounds when measured at the bulk population level(Supplementary Fig. 11). We note that, importantly, the starting
distributions of PsasA-yfp are very similar in both geneticbackgrounds, allowing a direct comparison. Using these distribu-tions, we calculated the relative enrichment of cells with a givenlevel of sasA following antibiotic treatment (Fig. 4c), yielding asimple model for the effect of antibiotic treatment on thedistribution of sasA expression (see Methods section). Becausesurvival after antibiotic treatment can be affected by manyprocesses, we separated out the size of the sasA-dependent effectby using a ΔsasAmutant as a control. WT populations exhibited asignificant increase in the fraction of cells with elevated levels ofsasA (Fig. 4c). This effect is strongly reduced in the ΔsasAbackground, demonstrating that sasA has a significant contribu-tion to survival after ciprofloxacin treatment. We repeated thisanalysis on Δ(prpC-prkC) and Δ(prpC-prkC) ΔsasA strains todetermine if a similar effect holds for the phosphorylation mutantthat generates an increased frequency of cells with high levels ofsasA expression (Supplementary Fig. 12). We found that Δ(prpC-prkC) populations have a ~50% increase in cells with high levelsof sasA both pre-ciprofloxacin and post ciprofloxacin treatment.Consistent with the results on WT populations, the effect ispartially sasA-mediated. This suggests that rare, pre-existing cellswith increased probability of survival are more abundant inΔ(prpC-prkC) than in WT populations.
We then sought to determine whether our enrichment modelreflects the probability of survival for cells as a function of sasAexpression. Since SasA is a (p)ppGpp synthetase, the sasA-dependent enrichment we observe post-ciprofloxacin treatmentcould be due to an expression-dependent probability of survivingantibiotic treatment. Alternately, since the measured increase inmean fluorescence was relatively small (~2 fold), ciprofloxacin
a b
Fluorescence (A.U.)
Fre
quen
cy
WT
Post-treatment
Pre-treatment
0 500 1000 1500 2000
10–8
10–6
10–4
10–2
10–8
10–6
10–4
10–2
Fluorescence (A.U.)
ΔsasAsasAΔΔ
Post-treatment
Pre-treatment
0 500 1000 1500 2000
c d
Fluorescence (A.U.)
PsasA-yfp
“Low”“High”
0
0
0.012
0.009
0.006
0.003
103 104 105
Fre
quen
cy
WT
ΔsasA
Fluorescence (A.U.)
Enr
ichm
ent f
acto
r
WT post/pre-treatment
ΔsasA post/pre-treatment
0 200 400 600 800 1000 1200 1400 1600
1
5
10
50
100
“Low”
“High”
0
2
4
6
8
10
12
Sur
viva
l rat
io(“
high
”/“lo
w”
expr
essi
on)
1
WT ΔsasA
e**
Fig. 4 Cells with elevated sasA expression preferentially survive antibiotic treatment. a Autofluorescence-free distributions of sasA expression before(dark gray) and after (light gray) ciprofloxacin treatment in an otherwise WT background based on the data shown in Supplementary Fig. 10A.b Autofluorescence-free distributions of sasA expression before (dark red) and after (light red) ciprofloxacin treatment in a ΔsasA background based on thedata shown in Supplementary Fig. 10B. c Enrichment plot following antibiotic treatment for WT and ΔsasA populations. For each genotype in a, b thefrequency of cells with a given level of PsasA-yfp after antibiotic treatment was normalized against the corresponding frequency prior to antibiotic treatment.Dashed lines and dots indicate the average values used in d, e. d Histograms of PsasA-yfp fluorescence in WT (black) and ΔsasA (red) backgroundsmeasured by flow cytometry prior to sorting into “low” (4.1 ± 1.8) or “high” (779.5 ± 134.9) expression groups (relative mean ± SEM, 3 experiments). Eachhistogram is comprised of data obtained from ~3.0*104 events and is from a representative experiment used in e. e Relative survival of the “high” and “low”expression populations in d after treatment with ciprofloxacin for ~3.5 h as in a, b. Bars indicate the mean survival ratio of the “high” to “low” expressingpopulations, lines indicate the SEM. The data shown represents 3 independent experiments (paired t-test, p-value ~ 0.009, **). The red dashed lineindicates a survival ratio of 1, indicating no advantage
ARTICLE NATURE COMMUNICATIONS | https://doi.org/10.1038/s41467-019-13127-z
6 NATURE COMMUNICATIONS | (2019) 10:5133 | https://doi.org/10.1038/s41467-019-13127-z | www.nature.com/naturecommunications
could act in a complex, expression-dependent, manner togenerate the observed post-treatment distribution of sasAexpression without affecting survival. To differentiate betweenthese hypotheses, we used FACS to sort bacteria prior tociprofloxacin treatment from both WT and ΔsasA populationsinto “high” (upper ~ 1%) and “low” (~average) PsasA-yfpexpression groups (Fig. 4d). Importantly, sorting cells by sasAexpression level prior to ciprofloxacin treatment allows moresensitive measurements of the survival advantage conferred bySasA than traditional bulk population level CFU measurements.In addition, cells were measured and sorted prior to antibiotictreatment and assayed by CFUs to avoid confounding survivalmeasurements with changes in cell physiology, fluorescentprotein expression, or lysis in response to ciprofloxacin.Following ciprofloxacin treatment (as in Fig. 4a, b, Supplemen-tary Fig. 10), the relative survival of “high” and “low” expressioncells, or the survival ratio, was assayed by plating for CFUs(Fig. 4e). We observed that cells with high levels of sasAexpression had a survival advantage of 9.5 ± 0.6 for WT, but only1.8 ± 0.7 in ΔsasA background, demonstrating that cells with highlevels of sasA expression prior to antibiotic treatment preferen-tially survive.
The average fluorescence cutoff values used in the FACSexperiments, low: 4.1 ± 1.8 and high: 779.5 ± 134.9 (mean ±SEM, 3 experiments), were then used as inputs for a modelwhere the enrichment of cells with increased levels of sasA(Fig. 4c) is caused by increased survival (see Methods section).The model yielded good agreement with the results of the FACSexperiments: it predicted relative survival ratios of ~9 for wild-type, and ~2 for ΔsasA, respectively, compared to the measuredvalues of ~9.5 ± 0.6 (WT) and 1.8 ± 0.7 (ΔsasA) (Fig. 4e). Wefound that relaxing the experimental cutoff for the “high”threshold to ~60% of the value in Fig. 4d resulted in a strongreduction of the survival advantage for WT: 2.3 ± 0.7 foldrelative survival for WT, and 0.9 ± 0.4 fold for ΔsasA (mean ±range, 2 experiments) (Supplementary Fig. 13). This is inreasonably good agreement with a model prediction of 3.7 and2.0-fold, respectively. Therefore, the enrichment of cells withelevated levels of sasA post-ciprofloxacin treatment can belargely attributed to the increased survival probability of pre-existing cells in the population with elevated sasA expression.
Taken together, our results demonstrate that an importantconsequence of PrkC-dependent multisite phosphorylation ofWalR is the regulation of cell-to-cell variability, or noise, in theWalR regulon gene sasA. By comparing the full distributions ofgene expression, we demonstrate that this effect is not justconfined to the regulation of outliers in gene expression abovean arbitrary threshold, but has an exponential effect on therelative abundance of cells with a given level of expression in thepopulation. By analyzing the full distributions of expression, weare also able to demonstrate that sasA expression continuouslyaffects the antibiotic tolerance of individual cells: specifically,the survival probability during a fixed course antibiotictreatment. This model (see Methods section) is consistent withcell sorting experiments that explicitly demonstrate that theobserved distributions are a consequence of differential survivalprobabilities.
DiscussionAntibiotic tolerance is believed to be an important factor in thefailure of antibiotic treatments and a key step toward the devel-opment of antibiotic resistance46. Noise in expression of genesthat regulate cellular quiescence are hypothesized to play animportant role in cell-to-cell variability in tolerance. We thereforesought to trace the origin of the cell-to-cell variability in
expression of the (p)ppGpp synthetase sasA and determine if itcan be regulated by genetic or chemical means. Noise in geneexpression can be conceptually separated into intrinsic andextrinsic noise. Although it is difficult to design strategies tospecifically target events generated by intrinsic noise, extrinsicnoise may have upstream regulatory pathways that can bemodulated. Therefore, it is significant that the cell-to-cell varia-bility in sasA was dominated by extrinsic noise at high levels ofexpression (Fig. 1) that have the strongest effect on antibiotictolerance (Fig. 4). Furthermore, since multisite phosphorylation isresponsible for setting the observed distribution of cell-to-cellvariability (Figs. 2, 3), this regulatory pathway could be a novelantibiotic target.
Multisite phosphorylation can expand the range of a protein’sfunction, generating both switch-like47,48, and graded49,50 chan-ges in average activity. In contrast, here we observed only mini-mal changes in the average levels of sasA expression as a functionof PrkC activity, but measured up to a ~100-fold effect on thefrequency of “outliers”, cells with particularly high levels ofexpression (Fig. 3b). This response was shown to be graded,rather than switch-like, likely arising as a consequence of theintegration of signals from two distinct signaling systems. Asingle phosphorylation at WalR Asp-53 strongly, but imperfectly,represses the sasA promoter. The addition of the second phos-phorylation at Thr-101 by a distinct signaling system then acts asa second input to further regulate WalR. Interestingly, even smallchanges in activity of the second system result in marked changesin the frequency of outliers. Heterologous expression of PrkC iscapable of reducing the variability observed to nearly cellularautofluorescence, but does not eliminate it completely. Thisremaining variability in sasA may be due to PrkC overexpressionstill being unable to completely saturate WalR phosphorylation,intrinsic noise at the promoter, or as yet unidentified sources.This demonstrates that PrkC activity is likely heterogeneous inour culture condition, but does not pinpoint the cause or origin ofthe variability. For example, from this study we cannot rule outthat cells with high levels of sasA expression originate in a PrkC-dependent manner from the colony itself.
Transcriptional regulation of outliers in eukaryotes has beenshown to be predictive of which cancer cells survive drug treat-ment51. Here, we found that transcriptional regulation by mul-tisite phosphorylation is also critical for setting the pre-existingdistribution of survival probabilities for cells within a bacterialpopulation. Distinct from bacterial persistence, which is char-acterized by bi-phasic killing, these survival probabilities reflectantibiotic tolerance or the killing kinetics during a relatively short,fixed time-course, antibiotic treatment52. In the ΔsasA back-ground, we observed a much weaker dependence of antibiotictolerance on sasA expression. This residual dependence is con-sistent with previous results that have implicated many globalprocesses in antibiotic tolerance including heterogeneity ingrowth state53–55 and enhanced expression of drug effluxpumps56–58. This is also consistent with the relatively weak cor-relation in expression between sasA and the constitutive promoterveg (Supplementary Fig. 2). Indeed, it remains to be seen preciselyhow cellular physiology changes in a sasA-expression dependentmanner. SasA has been shown to be important for ribosomedimerization in B. subtilis27 and for survival during envelopestress in S. aureus59. More generally, various cellular processes areknown to be directly and indirectly affected by rising (p)ppGpplevels including inhibition of DNA primase activity60, andreduction in intracellular GTP pools61 thereby downregulatingrRNA transcription62. As our results show that antibiotic survivalincreases continuously with sasA expression, they suggest thatSasA exerts a continuous effect proportional to its level on phy-siological processes that effect ciprofloxacin killing. Therefore,
NATURE COMMUNICATIONS | https://doi.org/10.1038/s41467-019-13127-z ARTICLE
NATURE COMMUNICATIONS | (2019) 10:5133 | https://doi.org/10.1038/s41467-019-13127-z | www.nature.com/naturecommunications 7
multisite phosphorylation may provide a “bet-hedging” strategyto regulate the phenotypic diversity of a bacterial population,serving as a broadly useful mechanism to tune the frequency ofrare phenotypes that facilitate survival under adverse conditions.
MethodsStrain construction. For a listing of strains used in figures, see SupplementaryTable 1. All strains are derivatives of B. subtilis 168 trpC2 unless otherwise noted.For additional details of strain and plasmid construction, see Supplementary Data 1and 2, respectively. For a table of oligos used in this study, seeSupplementary Table 2.
Media and culture conditions. B. subtilis cultures were grown in the chemicallydefined minimal medium S760, modified from63, supplemented with trace ele-ments64 and L-tryptophan to early log phase. In each experiment, strains werestreaked out from frozen stocks on LB Lennox and grown overnight (~15 h) at37 °C. Single colonies were used to inoculate 3 ml liquid cultures in S7 (supple-mented with inducers as indicated) and cultures were grown to early log phase(OD600 ~ 0.1–0.2). Dilutions for OD600 matching, if required, were no morethan 1:3.
Microscopy and image analysis. Microscopy was performed on live cellsimmobilized on 1% agarose pads prepared with S7 media. Imaging was performedusing a Nikon 90i or a TE2000 microscope with a Phase contrast objective (CFIPlan Apo Lambda DM ×100 Oil, NA 1.45), an X-Cite light source, a HamamatsuOrca ER-AG, and the following filter cubes: YFP (ET Sputter 500/20×, Dm515,535/30 m), and mCherry (ET Sputter Ex560/40 Dm585 Em630/75). To generaterepresentative fields of log phase cultures, cultures were concentrated ~20–100×immediately prior to imaging. Images were processed using Fiji65.
Quantitative measurement of gene expression was performed similarly to ref. 66.Briefly, phase contrast and fluorescence images (e.g., YFP, mCherry) were acquiredof well separated bacterial cells immobilized on agarose pads. The resulting imagestacks were segmented based on the phase contrast image, and the correspondingaverage florescence per pixel within each cell was calculated for each fluorescencechannel using Matlab. A non-fluorescent control strain, treated with antibiotics asneeded, was used as a control to subtract background and autofluorescence in eachchannel.
Luminescence assays. Luminescence assays were performed similarly to asdescribed38. Briefly, the cultures were initially grown to early log phase in a rollerdrum at 37 °C. 150 μl of each culture was then loaded into 96 well plates and100 µg/ml bacitracin added as indicated. Measurements were performed in a TecanInfinite 200 plate reader. Luminescence and OD600 were measured at 5 minintervals with continuous shaking and the values of all samples at a defined timepoint after the luminescence reached ~steady state, about 1 h post-treatment, arereported.
Flow cytometry and cell sorting. Cultures were grown to early log phase anddiluted 2–4 fold with additional S7 media to obtain the optimal density for flowcytometry. The resulting samples were vortexed vigorously prior to measurementto disrupt aggregates. Flow cytometry and sorting were performed on a BDBiosciences FACS Aria II-SORP or a Miltenyi MACSquant VYB (SupplementaryFigures 6 and 12 only). YFP was detected using a blue laser (488 nm) with a 525/50dichroic, and a 505 long pass filter for both flow cytometers. mCherry was detectedusing a yellow/green laser (561 nm) with a 582/15 dichroic, and a 570 long passfilter (BD Aria only). Fluorescence values were quantitatively compared betweenexperiments by rescaling each experiment by the mean fluorescence of a controlsample. Sorting was performed with a 70 nm nozzle at 70 PSI. Detection voltageswere set such that the non-fluorescent control had a median value of ~100. Unlessotherwise noted, flow cytometry data shown is representative of at least 3 biologicalreplicates.
The sorting thresholds were chosen such that the “high” expression gatecorresponds to approximately 1% of the starting population and can be sorted in~10 min. Higher thresholds than this result in very long sort times due to decreasesin overall sorting efficiency, and also appeared to introduce unwanted variability incell physiology. Lower thresholds (e.g., as in Supplementary Fig. 13), resulted in astrong reduction of the size of the effect.
Survival assays. ~1.5 × 10⁴ cells were sorted by fluorescence and dispensed intoequal volumes of chemically defined growth media (S7). Cultures were incubated ina roller drum at 37 °C for 10 min, then treated with 500 ng/ml ciprofloxacin for3.5 h. Serial dilutions of each population were plated for colony forming units(CFUs) on LB and grown overnight at 30 °C and survival ratios were calculated bycomparing the CFU values between the high and low fluorescence groups. In eachexperiment, wild-type and mutant strains were tested in parallel.
Autofluorescence deconvolution method and validation. For each flow cyto-metry experiment, data from both sasA reporter strains and a nonfluorescentcontrol were measured. As nonfluorescent controls for each genotype were verifiedto have similar autofluorescence, typically a single control measurement was per-formed for each experiment. Raw measurements of fluorescence intensities fromtranscriptional reporter strains have two contributions: (i) the transcriptionalreporter for sasA expression (e.g., PsasA-yfp), the signal of interest; and (ii) back-ground fluorescence originating from other sources. Measuring the statistics of thebackground fluorescence using a non-fluorescent control allowed extraction(deconvolution) of the sasA transcriptional reporter signal from the total rawmeasurement consisting of the sum of this signal and background fluorescence67.
We note that on our data sets, brute force deconvolution in absence of any priorknowledge of the signal statistics is quite noisy and error prone. However, inbacteria, the statistics of protein copy numbers is known to be well described by theGamma distribution, which is a great advantage as this distribution is fullyspecified in terms of its mean and variance. Given the measured mean and varianceof the raw fluorescence intensity and of the autofluorescence, the mean andvariance of the signal can be estimated by assuming that the signal from the sasAtranscriptional reporter is not correlated with background fluorescence. (Thisassumption is supported by fluorescence microscopy experiments showing that cellsize was not well correlated with sasA expression, and by computationally verifyingthat simple forms of dependency are inconsistent with the observed data.) Themean and variance of fluorescence from the sasA transcriptional reporter couldthen be uniquely determined, as described in more detail in the mathematicaldetails of the deconvolution procedure.
As mentioned above, we used a Gamma distribution to model the distributionof the fluorescence signal for a given mean and variance (we separately verified thatother distribution choices, such as lognormal, did not capture the data as well). TheGamma distribution is routinely applied to fit gene expression data,30 but here weadditionally verified that it closely mimics the underlying signal coming from thereporter by an in-silico re-convolution of the Gamma-distribution-fittedautofluorescence-free signal with measured background fluorescence. This wasdone by drawing two random fluorescence intensities: one from the estimatedGamma distribution for the clean (autofluorescence-free) signal and one from themeasured autofluorescence distribution. Adding these two random contributionsgave a single, re-convolved, data point. Repeating this procedure for a number oftimes equaling the size of the measured data set yielded the full re-convolved dataset. The empirical distributions of the measured and re-convolved data sets werethen compared (Supplementary Fig. 7) and found to be almost indistinguishablefrom those that were originally measured (Supplementary Fig. 3). No smoothingwas applied.
Mathematical details of deconvolution procedure. The raw fluorescenceintensity (R) measured from transcriptional reporter strains were assumed to havetwo statistically independent contributions. One coming from the signal of interest(S), and one coming from other sources, collectively treated here as noise (N). Onethen has
R ¼ Sþ N ð1Þfor every measurement taken, and averaging over all measurements immediatelygives the following relation
<R> ¼ <S>þ <N> ð2Þbetween the mean fluorescence values of the raw fluorescence intensity, the signalof interest, and the noise. Statistical independence then asserts that the variance inthe fluorescence intensity could also be decomposed in a similar way
VarðRÞ ¼ VarðSÞ þ VarðNÞ: ð3ÞThese relations, and the fact <R>, <N>, Var (R), Var (N) could all be directly
computed from measured data allowed us to estimate the mean, <S>, and variance,Var (S), of the signal of interest. The full distribution of the signal of interest wasthen assumed to be well described by a Gamma distribution, since this haspreviously been shown to correctly describe gene expression data in bacteria30 andwe have moreover verified that this assumption is internally consistent with thedata (see Autofluorescence deconvolution method and validation). The probabilitydensity function describing S was therefore modeled as
f sð Þ ¼ 1
ΓðkÞθk sk�1e�s=θ ; ð4Þ
where Γ �ð Þ denotes the gamma function, and the parameters k and θ are uniquelyset by their relations to the mean
<S> ¼ kθ; ð5Þand variance
Var Sð Þ ¼ kθ2; ð6Þof the signal.
ARTICLE NATURE COMMUNICATIONS | https://doi.org/10.1038/s41467-019-13127-z
8 NATURE COMMUNICATIONS | (2019) 10:5133 | https://doi.org/10.1038/s41467-019-13127-z | www.nature.com/naturecommunications
Mathematical details of enrichment model. Deconvolved fluorescence intensitiesof cells before, fb(s), and after, fa(s), ciprofloxacin treatment were modeled by theGamma distribution to test the hypothesis that they are related via
fa sð Þ ¼ C � fb sð Þ � p sð Þ; ð7Þwhere p(s) stands for the probability of a cell with fluorescence intensity s to survivethe prescribed treatment and C is a normalization constant assuring thatZ 1
0fa sð Þds ¼
Z 1
0C � fb sð Þ � p sð Þds ¼ 1: ð8Þ
Following treatment, we define the enrichment factor (in the probability density) ofcells with fluorescence level s as
EFðsÞ ¼ fa sð Þ=fb sð Þ: ð9ÞOne could then write the ratio between the survival probability of cells withfluorescence s1 and s2 (Survival ratio) in the following way
Survival ratio ¼ p s1ð Þp s2ð Þ ¼
C � p s1ð ÞC � p s2ð Þ ¼
fa s1ð Þ=fb s1ð Þfa s2ð Þ=fb s2ð Þ ð10Þ
This relation was then used to predict survival ratios and compare with data asdescribed in the main text.
Significance testing for % outlier data shown in Fig. 2. In Fig. 2c at least 4independent experiments measuring sasA expression were performed in WT,ΔprpC, and Δ(prpC-prkC) in otherwise walRWT and walRT101A backgrounds. Foreach genotype, the % of cells above a fixed fluorescence threshold was measuredand is shown as black dots. To test if the % values obtained for each genotype arestatistically significant, we treated the independent measurements of %s as mem-bers of a distribution and performed Kolmogorov-Smirnov testing to determine thelikelihood that the % outliers observed for a comparison genotype pair could bedrawn from the same distribution.
Reporting summary. Further information on research design is available inthe Nature Research Reporting Summary linked to this article.
Data availabilityThe data that support the findings of this study are provided in the paper itself andassociated source data files.
Received: 25 October 2018; Accepted: 21 October 2019;
References1. Arnoldini, M. et al. Bistable expression of virulence genes in salmonella leads
to the formation of an antibiotic-tolerant subpopulation. PLoS Biol. 12,e1001928 (2014).
2. Norman, T. M., Lord, N. D., Paulsson, J. & Losick, R. Stochastic switching ofcell fate in microbes. Annu. Rev. Microbiol 69, 381–403 (2015).
3. Maamar, H., Raj, A. & Dubnau, D. Noise in gene expression determines cellfate in Bacillus subtilis. Science 317, 526–529 (2007).
4. Gunawardena, J. Multisite protein phosphorylation makes a good thresholdbut can be a poor switch. Proc. Natl Acad. Sci. USA 102, 14617–14622(2005).
5. Ortega, F., Garces, J. L., Mas, F., Kholodenko, B. N. & Cascante, M. Bistabilityfrom double phosphorylation in signal transduction. Kinet. Struct. Requir.FEBS J. 273, 3915–3926 (2006).
6. Wright, D. P. & Ulijasz, A. T. Regulation of transcription by eukaryotic-likeserine-threonine kinases and phosphatases in Gram-positive bacterialpathogens. Virulence 5, 863–885 (2014).
7. Laub, M. T. & Goulian, M. Specificity in two-component signal transductionpathways. Annu. Rev. Genet 41, 121–145 (2007).
8. Batchelor, E. & Goulian, M. Robustness and the cycle of phosphorylation anddephosphorylation in a two-component regulatory system. Proc. Natl Acad.Sci. USA 100, 691–696 (2003).
9. Shinar, G., Milo, R., Martinez, M. R. & Alon, U. Input output robustness insimple bacterial signaling systems. Proc. Natl Acad. Sci. USA 104,19931–19935 (2007).
10. Batchelor, E., Silhavy, T. J. & Goulian, M. Continuous control in bacterialregulatory circuits. J. Bacteriol. 186, 7618–7625 (2004).
11. Miyashiro, T. & Goulian, M. High stimulus unmasks positive feedback in anautoregulated bacterial signaling circuit. Proc. Natl Acad. Sci. USA 105,17457–17462 (2008).
12. Roggiani, M. & Goulian, M. Oxygen-dependent cell-to-cell variability in theoutput of the Escherichia coli Tor phosphorelay. J. Bacteriol. 197, 1976–1987(2015).
13. Carey, J. N. et al. Regulated stochasticity in a bacterial signaling networkpermits tolerance to a rapid environmental change. Cell. https://doi.org/10.1016/j.cell.2018.02.005 (2018).
14. Pereira, S. F., Goss, L. & Dworkin, J. Eukaryote-like serine/threonine kinasesand phosphatases in bacteria. Microbiol. Mol. Biol. Rev. 75, 192–212 (2011).
15. Manuse, S., Fleurie, A., Zucchini, L., Lesterlin, C. & Grangeasse, C. Role ofeukaryotic-like serine/threonine kinases in bacterial cell division andmorphogenesis. FEMS Microbiol. Rev. 40, 41–56 (2016).
16. Bigger, J. W. Treatment of staphylococcal infections with penicillin byintermittent sterilisation. Lancet 244, 497–500 (1944).
17. Fauvart, M., De Groote, V. N. & Michiels, J. Role of persister cells in chronicinfections: clinical relevance and perspectives on anti-persister therapies. J.Med. Microbiol. 60, 699–709 (2011).
18. Abranches, J. et al. The molecular alarmone (p)ppGpp mediates stressresponses, vancomycin tolerance, and virulence in Enterococcus faecalis. J.Bacteriol. 191, 2248–2256 (2009).
19. Gaca, A. O. et al. Basal levels of (p)ppGpp in Enterococcus faecalis: the magicbeyond the stringent response. MBio 4, e00646–00613 (2013).
20. Liu, K., Bittner, A. N. & Wang, J. D. Diversity in (p)ppGpp metabolism andeffectors. Curr. Opin. Microbiol. 24, 72–79 (2015).
21. Nguyen, D. et al. Active starvation responses mediate antibiotic tolerance inbiofilms and nutrient-limited bacteria. Science 334, 982–986 (2011).
22. Cashel, M., Gentry, D., Hernandez, V. & Vinella, D. in Esherichia coli andSalmonella; Cellular and Molecular Biology Vol. 2, 1458–1496 (ASM Press,Washington DC, 1996).
23. Atkinson, G. C., Tenson, T. & Hauryliuk, V. The RelA/SpoT homolog (RSH)superfamily: distribution and functional evolution of ppGpp synthetases andhydrolases across the tree of life. PLoS ONE 6, e23479 (2011).
24. Nanamiya, H. et al. Identification and functional analysis of novel (p)ppGppsynthetase genes in Bacillus subtilis. Mol. Microbiol. 67, 291–304 (2008).
25. D’Elia, M. A. et al. Probing teichoic acid genetics with bioactive moleculesreveals new interactions among diverse processes in bacterial cell wallbiogenesis. Chem. Biol. 16, 548–556 (2009).
26. Eiamphungporn, W. & Helmann, J. D. The Bacillus subtilis sigma(M) regulonand its contribution to cell envelope stress responses. Mol. Microbiol. 67,830–848 (2008).
27. Tagami, K. et al. Expression of a small (p)ppGpp synthetase, YwaC, in the (p)ppGpp(0) mutant of Bacillus subtilis triggers YvyD-dependent dimerization ofribosome. MicrobiologyOpen 1, 115–134 (2012).
28. Pedraza, J. M. & van Oudenaarden, A. Noise propagation in gene networks.Science 307, 1965–1969 (2005).
29. Milo, R., Jorgensen, P., Moran, U., Weber, G. & Springer, M. BioNumbers-thedatabase of key numbers in molecular and cell biology. Nucleic Acids Res. 38,D750–D753 (2010).
30. Taniguchi, Y. et al. Quantifying E. coli proteome and transcriptome withsingle-molecule sensitivity in single cells. Science 329, 533–538 (2010).
31. Elowitz, M. B., Levine, A. J., Siggia, E. D. & Swain, P. S. Stochastic geneexpression in a single cell. Science 297, 1183–1186 (2002).
32. Leveau, J. H. & Lindow, S. E. Predictive and interpretive simulation of greenfluorescent protein expression in reporter bacteria. J. Bacteriol. 183,6752–6762 (2001).
33. Radeck, J. et al. The Bacillus BioBrick Box: generation and evaluation ofessential genetic building blocks for standardized work with Bacillus subtilis. J.Biol. Eng. 7, 29 (2013).
34. Thackray, P. D. & Moir, A. SigM, an extracytoplasmic function sigma factor ofBacillus subtilis, is activated in response to cell wall antibiotics, ethanol, heat,acid, and superoxide stress. J. Bacteriol. 185, 3491–3498 (2003).
35. Salzberg, L. I. et al. The WalRK (YycFG) and sigma(I) RsgI regulatorscooperate to control CwlO and LytE expression in exponentially growing andstressed Bacillus subtilis cells. Mol. Microbiol. 87, 180–195 (2013).
36. Dubrac, S., Bisicchia, P., Devine, K. M. & Msadek, T. A matter of life anddeath: cell wall homeostasis and the WalKR (YycGF) essential signaltransduction pathway. Mol. Microbiol. 70, 1307–1322 (2008).
37. Gaidenko, T. A., Kim, T. J. & Price, C. W. The PrpC serine-threoninephosphatase and PrkC kinase have opposing physiological roles in stationary-phase Bacillus subtilis cells. J. Bacteriol. 184, 6109–6114 (2002).
38. Libby, E. A., Goss, L. A. & Dworkin, J. The Eukaryotic-Like Ser/Thr KinasePrkC Regulates the Essential WalRK Two-Component System in Bacillussubtilis. PLoS Genet. 11, e1005275 (2015).
39. Jones, D. L., Brewster, R. C. & Phillips, R. Promoter architecture dictates cell-to-cell variability in gene expression. Science 346, 1533–1536 (2014).
40. Sanchez, A., Garcia, H. G., Jones, D., Phillips, R. & Kondev, J. Effect ofpromoter architecture on the cell-to-cell variability in gene expression. PLoSComput. Biol. 7, e1001100 (2011).
NATURE COMMUNICATIONS | https://doi.org/10.1038/s41467-019-13127-z ARTICLE
NATURE COMMUNICATIONS | (2019) 10:5133 | https://doi.org/10.1038/s41467-019-13127-z | www.nature.com/naturecommunications 9
41. Shah, I. M., Laaberki, M. H., Popham, D. L. & Dworkin, J. A eukaryotic-likeSer/Thr kinase signals bacteria to exit dormancy in response to peptidoglycanfragments. Cell 135, 486–496 (2008).
42. Fisher, R. A., Gollan, B. & Helaine, S. Persistent bacterial infections andpersister cells. Nat. Rev. Microbiol. 15, 453–464 (2017).
43. Hahn, J., Tanner, A. W., Carabetta, V. J., Cristea, I. M. & Dubnau, D.ComGA-RelA interaction and persistence in the Bacillus subtilis K-state. Mol.Microbiol. 97, 454–471 (2015).
44. Germain, E., Castro-Roa, D., Zenkin, N. & Gerdes, K. Molecular mechanismof bacterial persistence by HipA. Mol. Cell 52, 248–254 (2013).
45. Kaspy, I. et al. HipA-mediated antibiotic persistence via phosphorylation ofthe glutamyl-tRNA-synthetase. Nat. Commun. 4, 3001 (2013).
46. Levin-Reisman, I. et al. Antibiotic tolerance facilitates the evolution ofresistance. Science 355, 826–830 (2017).
47. Ferrell, J. E. Jr. & Ha, S. H. Ultrasensitivity part II: multisite phosphorylation,stoichiometric inhibitors, and positive feedback. Trends Biochem. Sci. 39,556–569 (2014).
48. Nash, P. et al. Multisite phosphorylation of a CDK inhibitor sets a thresholdfor the onset of DNA replication. Nature 414, 514–521 (2001).
49. Zaytsev, A. V. et al. Multisite phosphorylation of the NDC80 complex graduallytunes its microtubule-binding affinity. Mol. Biol. Cell 26, 1829–1844 (2015).
50. Pufall, M. A. et al. Variable control of Ets-1 DNA binding by multiplephosphates in an unstructured region. Science 309, 142–145 (2005).
51. Shaffer, S. M. et al. Rare cell variability and drug-induced reprogramming as amode of cancer drug resistance. Nature 546, 431–435 (2017).
52. Kester, J. C. & Fortune, S. M. Persisters and beyond: mechanisms ofphenotypic drug resistance and drug tolerance in bacteria. Crit. Rev. Biochem.Mol. Biol. 49, 91–101 (2014).
53. Balaban, N. Q., Merrin, J., Chait, R., Kowalik, L. & Leibler, S. Bacterialpersistence as a phenotypic switch. Science 305, 1622–1625 (2004).
54. Conlon, B. P. et al. Persister formation in Staphylococcus aureus is associatedwith ATP depletion. Nat. Microbiol. 1, 16051 (2016).
55. Gutierrez, A. et al. Understanding and sensitizing density-dependentpersistence to quinolone antibiotics. Mol. Cell 68, 1147–1154 (2017). e1143.
56. Adams, K. N. et al. Drug tolerance in replicating mycobacteria mediated by amacrophage-induced efflux mechanism. Cell 145, 39–53 (2011).
57. Pu, Y. et al. Enhanced efflux activity facilitates drug tolerance in dormantbacterial cells. Mol. Cell 62, 284–294 (2016).
58. El Meouche, I. & Dunlop, M. J. Heterogeneity in efflux pump expressionpredisposes antibiotic-resistant cells to mutation. Science 362, 686–690 (2018).
59. Geiger, T., Kastle, B., Gratani, F. L., Goerke, C. & Wolz, C. Two small (p)ppGpp synthases in Staphylococcus aureus mediate tolerance against cellenvelope stress conditions. J. Bacteriol. 196, 894–902 (2014).
60. Wang, J. D., Sanders, G. M. & Grossman, A. D. Nutritional control ofelongation of DNA replication by (p)ppGpp. Cell 128, 865–875 (2007).
61. Kriel, A. et al. Direct regulation of GTP homeostasis by (p)ppGpp: a criticalcomponent of viability and stress resistance. Mol. Cell 48, 231–241 (2012).
62. Krasny, L. & Gourse, R. L. An alternative strategy for bacterial ribosomesynthesis: Bacillus subtilis rRNA transcription regulation. EMBO J. 23,4473–4483 (2004).
63. Vasantha, N. & Freese, E. Enzyme changes during Bacillus subtilis sporulationcaused by deprivation of guanine nucleotides. J. Bacteriol. 144, 1119–1125 (1980).
64. Harwood, C. R. & Cutting, S. M. in Modern Microbiological Methods (Wiley,New York, 1990).
65. Schindelin, J. et al. Fiji: an open-source least 4 independent experimentsplatformfor biological-image analysis. Nat. Methods 9, 676–682 (2012).
66. Miyashiro, T. & Goulian, M. Single-cell analysis of gene expression byfluorescence microscopy. Methods Enzymol. 423, 458–475 (2007).
67. Corsetti, J. P. et al. Correction of cellular autofluorescence in flow cytometryby mathematical modeling of cellular fluorescence. Cytometry 9, 539–547(1988).
AcknowledgementsWe thank Eric Brown for the strain EB1385, Isaac Plant (Silver lab) for pIP384 andIP563, and Amir Figueroa at the Microbiology and Immunology Core Facility atColumbia University for assistance with flow cytometry and cell sorting. This work wassupported by NIH GM114213 and a BWF Investigators in the Pathogenesis of InfectiousDisease award to J.D., a grant from the Department of Systems Biology at HarvardMedical School to E.A.L., and S.R. was supported by NIH GM095784 and gratefullyacknowledges support from the Azrieli Foundation.
Author contributionsConceived and designed the experiments E.A.L. and J.D. E.A.L. performed the experi-ments. E.A.L. and S.R. analyzed data. Contributed reagents/materials/analysis tools:E.A.L. and S.R. Wrote the paper: E.A.L., S.R., and J.D.
Competing interestsThe authors declare no competing interests.
Additional informationSupplementary information is available for this paper at https://doi.org/10.1038/s41467-019-13127-z.
Correspondence and requests for materials should be addressed to J.D.
Peer review information Nature Communications thanks the anonymous reviewers fortheir contribution to the peer review of this work. Peer reviewer reports are available.
Reprints and permission information is available at http://www.nature.com/reprints
Publisher’s note Springer Nature remains neutral with regard to jurisdictional claims inpublished maps and institutional affiliations.
Open Access This article is licensed under a Creative CommonsAttribution 4.0 International License, which permits use, sharing,
adaptation, distribution and reproduction in any medium or format, as long as you giveappropriate credit to the original author(s) and the source, provide a link to the CreativeCommons license, and indicate if changes were made. The images or other third partymaterial in this article are included in the article’s Creative Commons license, unlessindicated otherwise in a credit line to the material. If material is not included in thearticle’s Creative Commons license and your intended use is not permitted by statutoryregulation or exceeds the permitted use, you will need to obtain permission directly fromthe copyright holder. To view a copy of this license, visit http://creativecommons.org/licenses/by/4.0/.
© The Author(s) 2019
ARTICLE NATURE COMMUNICATIONS | https://doi.org/10.1038/s41467-019-13127-z
10 NATURE COMMUNICATIONS | (2019) 10:5133 | https://doi.org/10.1038/s41467-019-13127-z | www.nature.com/naturecommunications


