Embed Size (px)
Citation preview
Saddle points in innovation diffusion curves: an explanation from bounded rationality
Lorena Cadavid1 and Carlos Jaime Franco Cardona1
1Universidad Nacional de Colombia – sede Medellín, Medellín, Colombia {dlcadavi, cjfranco}@unal.edu.co
ABSTRACT. Empirical evidence shows that mostly complete and successful processes of innovation diffusion are S-shaped. However, some diffusion pro-cesses exhibit a non-perfect S-curve, but show a saddle point, which is dis-played as a double-S. The reasons behind this phenomenon have been little studied in the literature. This paper addresses the emergence of the double-S phenomenon in the innovation diffusion process and provides an explanation for it. In order to do that, the authors develop an agent-based simulation model to representing the diffusion of two innovations in a competitive market consid-ering elements of bounded rationality. The results show saddle points appear as a result of three characteristics: (1) the heterogeneity in the population, (2) the presence of asymmetric information and (3) the satisfaction criterion for selec-tion.
Keywords: Innovation Diffusion, Agent-based Modeling, Bounded Rationality
1 Introduction
The spread of an innovation over markets is known as innovation diffusion, a process by which an innovation is communicated through certain channels over time among members of a social system [1]. Empirical studies show that successful and complete processes of innovation diffusion take S shape [2], as many natural phenomena; hence, theoretical studies attempt to find the rate and amount of adopters in a specific population during a period of time [3].
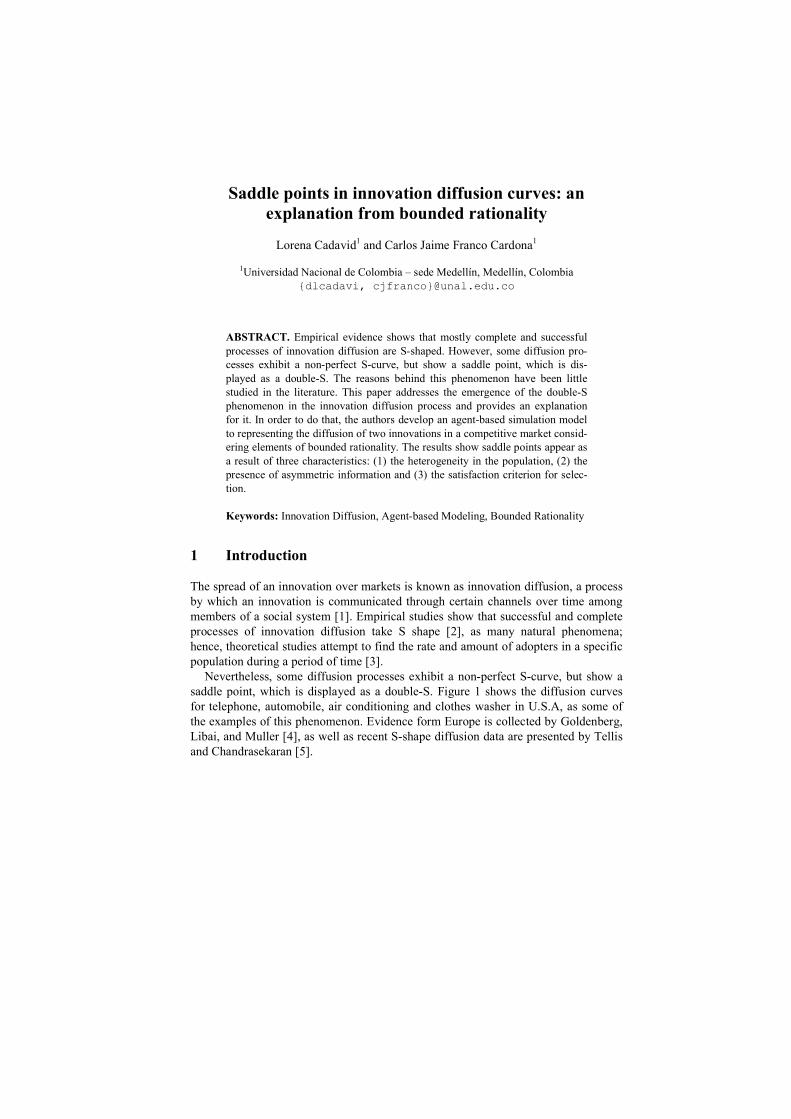
Nevertheless, some diffusion processes exhibit a non-perfect S-curve, but show a saddle point, which is displayed as a double-S. Figure 1 shows the diffusion curves for telephone, automobile, air conditioning and clothes washer in U.S.A, as some of the examples of this phenomenon. Evidence form Europe is collected by Goldenberg, Libai, and Muller [4], as well as recent S-shape diffusion data are presented by Tellis and Chandrasekaran [5].
Fig. 1. Double-S phenomenon – the USA case (Source: the authors, based on Walton and Rockoff [2])
It is possible to see, a few periods after diffusion takeoff point, how diffusion slows down; even, it is evident a decrease in amount of adopters during that deceleration time (“dis-adoption” decisions). This phenomenon does not make sense in light of classic innovation diffusion theory [6]; according to it, the more individuals become adopters, the stronger word-of-mouth force and, therefore, the more adopters market will have.
Several questions arise from this issue. Why individuals or households stop adopt-ing the innovation after diffusion takes off? What other “force”, besides the word-of-mouth, affecting the adoption decision? And what happens during that non-diffusion period, which makes diffusion takes off again after some time?
While numerous studies try to reproduce the classic S-shaped diffusion phenome-na, little attention has been paid in the double-S diffusion phenomena, and the reasons behind this emergent behavior remain still confusing for researchers and practitioners.
Therefore, this paper addresses the emergence of the double-S phenomenon in the innovation diffusion process and provides an explanation for it based on bounded rationality guideless. The authors use agent based modeling as a tool for this purpose, and find the emergent phenomenon after the interaction among individuals, who must choose between two identical innovations and have imperfect information and limited calculation capacity.
This research has an explanatory scope. It is not aimed to policy evaluation, since the double-S phenomenon cannot be considered good or bad by itself; however, un-cover reasons which underlie the emergence of the phenomenon can be useful for several managerial purposes.
2 Diffusion of Innovations
An important part of the innovation diffusion literature can be classified in two domi-nant research families: (1) those that characterize the mechanisms and patterns of
diffusion (innovation diffusion), and (2) those that seek to understand and character-ize the structure of decision-making and individual processes of adoption of innova-tion (innovation adoption) [3]. These families are presented below.
2.1 Innovation Diffusion Modeling
Mathematical or computational representation of the process of diffusion of an inno-vation is known as innovation diffusion modeling, and has been a topic of academic and practical relevance since the 60s, when the first models emerged [7]. It is possible distinguish two trends in innovation diffusion modeling: (1) modeling through aggre-gation of collective behavior and (2) modeling through individual behavior represen-tation [8, 9].
Diffusion models at the aggregate level have produced a vast literature in the last 50 years in the field of innovation diffusion [7, 10, 11]. These models provide an empirical generalization based on the mathematical formulation of differential equa-tions.
However, literature has identified several limitations for these models. Perhaps the most notable of them is that they do not explicitly consider the individuals heteroge-neity and the complex dynamics of social processes that shape the phenomenon of diffusion, so they explain only a limited set of theoretical issues [12, 13]. Hence, re-cently research has been focused to an individual modeling, which considers both, the individual heterogeneity as the complexity of interaction networks between them.
Diffusion models at the individual-level are composed of two main elements: (1) modeling of adoption decision-making of analysis units (individuals, households and organizations, etc.), and (2) modeling of social interaction between those units. Inter-action or social influence is associated with the way in which individuals are interre-lated, while the modeling of decision-making allows adoption decisions of individuals are explicitly incorporated into diffusion models [14].
2.2 Innovation Adoption Modeling
Adoption decisions at individual-level modeling began in the 70s, and has been a major field of research over the past 20 years [10]. Approaches have been mainly based on bounded rationality [15], because the asymmetric information and the partial understanding of market dynamics by actors in the diffusion process [9, 16].
Kiesling et al. [11] find that adoption models used in individual diffusion models are a kind of heuristics, that is to say, mechanisms that enable individuals to go direct-ly to the conclusions of your thoughts without following a detailed process of reason-ing [17, 18]. These models can be grouped into five categories; the simplest of these corresponds to the threshold heuristics, while the most complex refers to psychosocio-logical approaches.
Implementation of heuristics implies the concept of heterogeneity in individuals, which is particularly important when this decision rule is considered. Overall, the population heterogeneity refers to variation in the degree of consumer innovation, patience, price sensitivity and needs; among those, heterogeneity in the propensity to
adopt is a common approach to incorporate the heterogeneity of individuals [11]. It is supposed these differences allow the product takes place over a market, and their distribution in a specific social system determines the shape of the pattern of diffusion [10, 14].
3 The Double-S Phenomenon
Commonly, diffusion models predict a monotonic increase in sales after the launching of product and up to the peak of growth. Despite that, evidence shows that in some markets, a sudden decrease in sales may follow an initial rise. This special point in diffusion curves is referred as a slowdown phenomenon [19] or “saddle” point (con-cept proposed by Goldenberg, Libai and Muller [4].
After a literature review, Tellis and Chandrasekaran [5] point out three possible explanations for this phenomenon, two of which can be considered as external expla-nations and one of them as an internal one: economic contraction and important tech-nological advance (external) and discontinuity in the transition between the early and late markets (internal). The authors find, after using a discrete-time split population survival model for several products in several countries, that all the reasons influence the S-shape phenomenon in some extent.
In a previous work, Golder and Tellis [20] argue that this phenomenon is due to in-formational cascades, which happen when people collectively adopt a behavior with increasing momentum, and declining individual evaluation of the merits of such be-havior after, because of their tendency to infer information from the behavior of prior adopters.
Nonetheless, although their argument lies in individual behavior, they propose a hazard model to determine the impact of explanatory variables such as price declines, income declines, and market penetration on the time to saddle point; whereby their hypothesis is not completely tested at the individual level (as in the Tellis and Chan-drasekaran [5] study).
At individual level, Goldenberg, Libai, and Muller [4] use cellular automata to de-scribe the process by which internal communication breaks down between the early adopters and early majority, which could lead to a saddle point in the diffusion curve. Nevertheless, cellular automata models do not allow modeling socioeconomic charac-teristics of population, so conclusions from them are very limited.
Peres et al. [10] point out that one of the further research line on innovation diffu-sion is still to explain saddle formation and incorporate the findings into the diffusion framework.
4 Methodology
In order to analyze the emergence of the double-S phenomenon in the innovation diffusion process, it was developed an agent based simulation model, which repre-sents the diffusion of two identical innovations in a market. The model was developed
in NetLogo language and environment [21]. The agents are individuals that are inter-connected according to a specific network structure.
Considered innovations correspond to theoretical exercises, which were simulated for a population of 100 individuals (which compose one only agent breed, besides observer) in a horizon of 20 periods. In each simulation step, only those individuals who have not chosen one of the innovations use the heuristic to make a decision. Al-so, it is assumed that the decision-making process is not reversible, i.e. once one of the individual adopted one of the innovations, he/she cannot change his/her mind about it (this is equivalent to a model of first purchases, as suggested by Bass [6] in their original research).
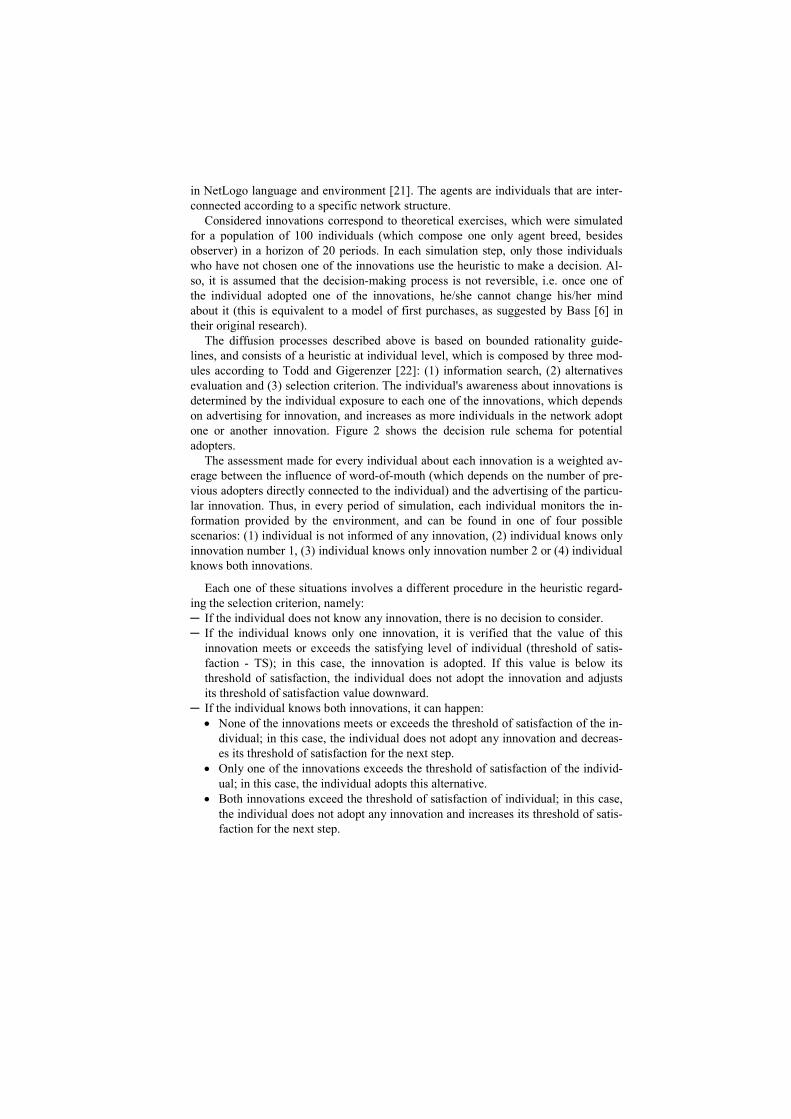
The diffusion processes described above is based on bounded rationality guide-lines, and consists of a heuristic at individual level, which is composed by three mod-ules according to Todd and Gigerenzer [22]: (1) information search, (2) alternatives evaluation and (3) selection criterion. The individual's awareness about innovations is determined by the individual exposure to each one of the innovations, which depends on advertising for innovation, and increases as more individuals in the network adopt one or another innovation. Figure 2 shows the decision rule schema for potential adopters.
The assessment made for every individual about each innovation is a weighted av-erage between the influence of word-of-mouth (which depends on the number of pre-vious adopters directly connected to the individual) and the advertising of the particu-lar innovation. Thus, in every period of simulation, each individual monitors the in-formation provided by the environment, and can be found in one of four possible scenarios: (1) individual is not informed of any innovation, (2) individual knows only innovation number 1, (3) individual knows only innovation number 2 or (4) individual knows both innovations.
Each one of these situations involves a different procedure in the heuristic regard-ing the selection criterion, namely: ─ If the individual does not know any innovation, there is no decision to consider. ─ If the individual knows only one innovation, it is verified that the value of this
innovation meets or exceeds the satisfying level of individual (threshold of satis-faction - TS); in this case, the innovation is adopted. If this value is below its threshold of satisfaction, the individual does not adopt the innovation and adjusts its threshold of satisfaction value downward.
─ If the individual knows both innovations, it can happen: None of the innovations meets or exceeds the threshold of satisfaction of the in-
dividual; in this case, the individual does not adopt any innovation and decreas-es its threshold of satisfaction for the next step.
Only one of the innovations exceeds the threshold of satisfaction of the individ-ual; in this case, the individual adopts this alternative.
Both innovations exceed the threshold of satisfaction of individual; in this case, the individual does not adopt any innovation and increases its threshold of satis-faction for the next step.
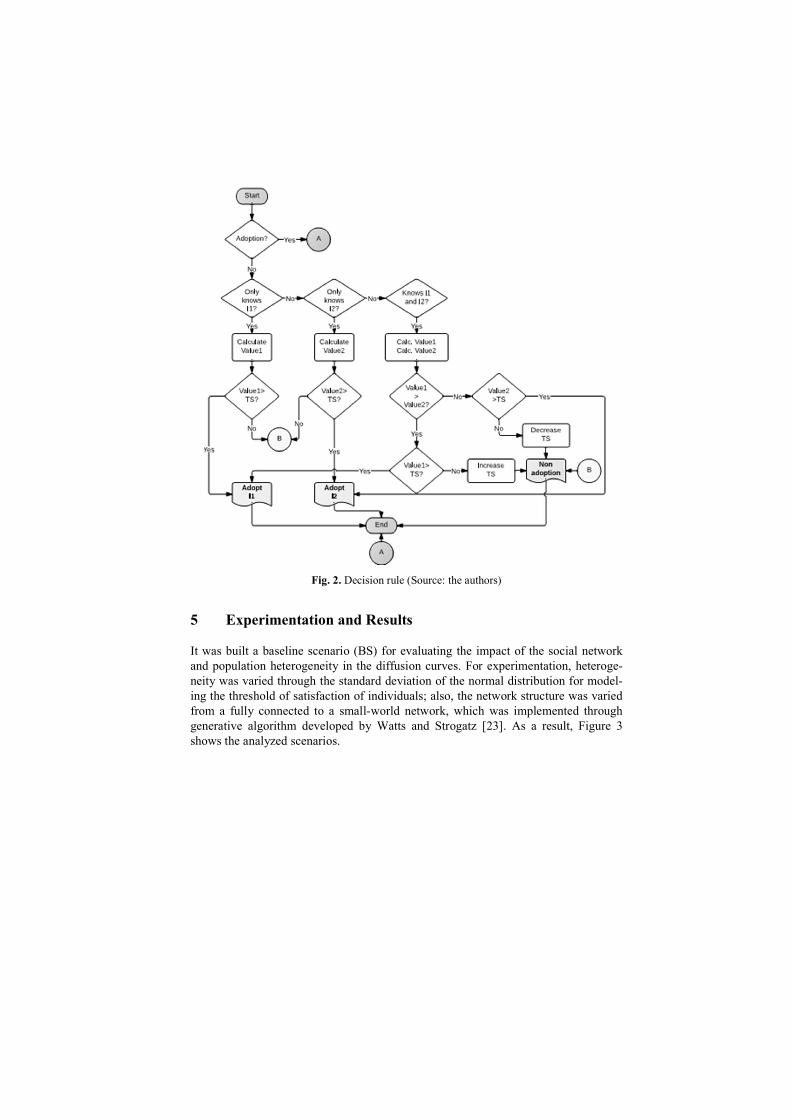
Fig. 2. Decision rule (Source: the authors)
5 Experimentation and Results
It was built a baseline scenario (BS) for evaluating the impact of the social network and population heterogeneity in the diffusion curves. For experimentation, heteroge-neity was varied through the standard deviation of the normal distribution for model-ing the threshold of satisfaction of individuals; also, the network structure was varied from a fully connected to a small-world network, which was implemented through generative algorithm developed by Watts and Strogatz [23]. As a result, Figure 3 shows the analyzed scenarios.
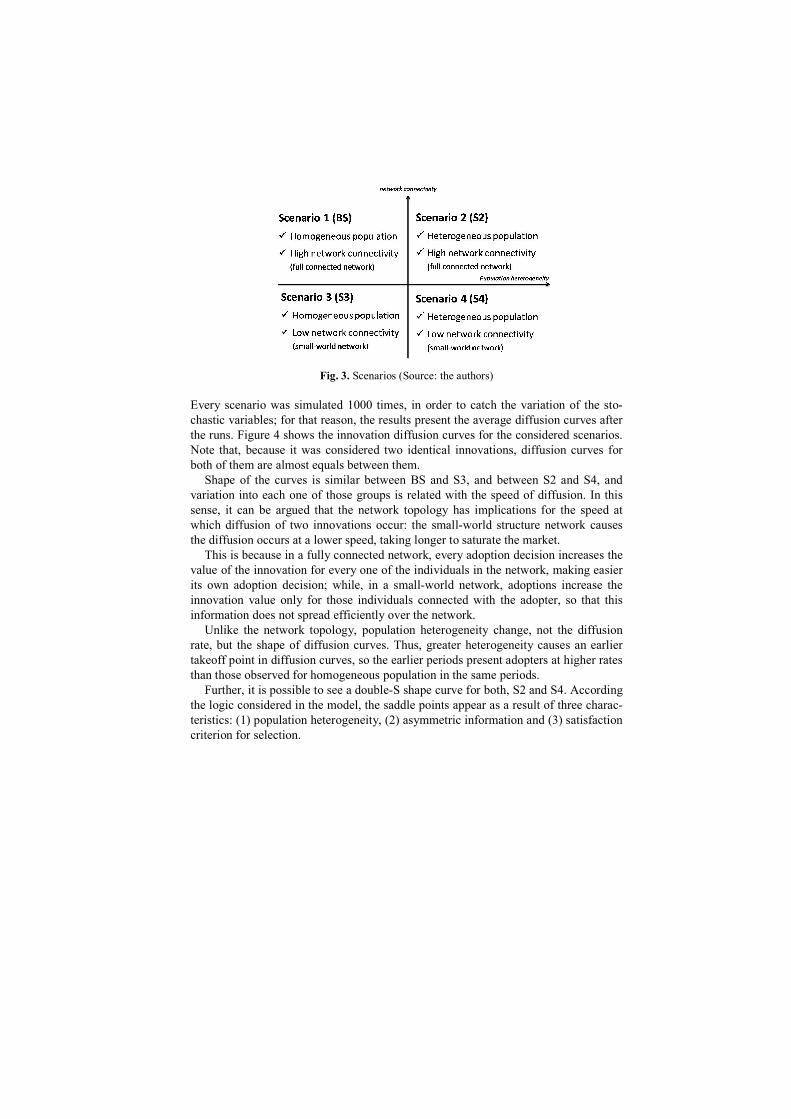
Fig. 3. Scenarios (Source: the authors)
Every scenario was simulated 1000 times, in order to catch the variation of the sto-chastic variables; for that reason, the results present the average diffusion curves after the runs. Figure 4 shows the innovation diffusion curves for the considered scenarios. Note that, because it was considered two identical innovations, diffusion curves for both of them are almost equals between them.
Shape of the curves is similar between BS and S3, and between S2 and S4, and variation into each one of those groups is related with the speed of diffusion. In this sense, it can be argued that the network topology has implications for the speed at which diffusion of two innovations occur: the small-world structure network causes the diffusion occurs at a lower speed, taking longer to saturate the market.
This is because in a fully connected network, every adoption decision increases the value of the innovation for every one of the individuals in the network, making easier its own adoption decision; while, in a small-world network, adoptions increase the innovation value only for those individuals connected with the adopter, so that this information does not spread efficiently over the network.
Unlike the network topology, population heterogeneity change, not the diffusion rate, but the shape of diffusion curves. Thus, greater heterogeneity causes an earlier takeoff point in diffusion curves, so the earlier periods present adopters at higher rates than those observed for homogeneous population in the same periods.
Further, it is possible to see a double-S shape curve for both, S2 and S4. According the logic considered in the model, the saddle points appear as a result of three charac-teristics: (1) population heterogeneity, (2) asymmetric information and (3) satisfaction criterion for selection.
Fig. 4. Diffusion curves of scenarios (Source: the authors)
Unlike in homogeneous population, the presence of extreme points in the thresholds of satisfaction of individuals in heterogeneous population ensures the existence of individuals whose thresholds are below the valuations of innovations they know.
Given that in the first periods there are many individuals who know only one of the innovations, the threshold adjustment process is not necessary and, therefore, adop-tions make an early appearance. These adoption decisions increase the value of inno-vation for other individuals, so the diffusion process is energized.
However, when the number of individuals who know only one of the innovations decreases, the diffusion makes slower, because of individuals must now wait until their thresholds of satisfaction reach suitable levels to make an adoption decision. This deceleration takes the shape of saddle point, which is observed in the graphs. Once satisfaction levels reach values around the valuations of the innovations, diffu-sion is accelerated again until market gets saturated, so the double-S shape in the curve is done.
6 Conclusions and recommendations
This paper proposed an alternative explanation for the double-S shape observed in several complete and successful innovation diffusion processes, which is based on the rationality of individuals instead of technological change, macroeconomic events or interactions among people.
For the analyzed phenomenon, the heterogeneity in population has a high impact on the diffusion curves, changing its shape pattern. In this sense, competing diffusion that happens in heterogeneous populations with asymmetric information tends to have saddle points that give a double S-shaped; while homogeneous populations allow the formation of simple S-shaped curve typically analyzed in simple diffusion models.
As well, it was shown that the network structure affects the speed of the diffusion, but not the shape of it; i.e, the network structure has not any incidence on the S-shape phenomenon.
This analysis differ from previous analysis for the same phenomenon, because it models explicitly the individual rationality. It was possible because the use of an agent based model, and perhaps because of the recent appearance of this technique in the innovation diffusion field, this analysis could not have been explored by previous research.
At the methodological level, this research shows the potential of using agent based models to address more questions about diffusion of innovations, especially those related with the individual rationality; thus, the individual level modeling can allow the integration between adoption and diffusion models through the explicit modeling of making adoption decision process.
References
1. Rogers, E.M.: Diffusion of Innovations. Collier Macmillan Publishers, London (1983).
2. Walton, G.M., Rockoff, H.: History of the American economy. South-Western Pub, Canadá
(2010).
3. Montalvo, C., Kemp, R.: Cleaner technology diffusion: case studies, modeling and policy.
Journal of Cleaner Production. 16, S1–S6 (2008).
4. Goldenberg, J., Libai, B., Muller, E.: Riding the Saddle: How Cross-Market Communica-
tions Can Create a Major Slump in Sales. Journal of Marketing. 66, 1–16 (2002).
5. Tellis, G.J., Chandrasekaran, D.: Getting a Grip on the Saddle: Chasms or Cycles. Working
paper series. 52, 463–479 (2012).
6. Bass: A new product gowth for model consumer durables. Management Science. 15, 215–
227 (1969).
7. Mahajan, V., Muller, E., Bass, F.: New Product Diffusion Models in Marketing: A Review
and Directions for Research. The Journal of Marketing. 54, 1–26 (1990).
8. Goldenberg, J., Efroni, S.: Using cellular automata modeling of the emergence of innova-
tions. Technological Forecasting and Social Change. 68, 293–308 (2001).
9. Georgescu, S., Okuda, H.: A Distributed Multi-Agent Framework for Simulating the Diffu-
sion of Innovations. Journal of Power and Energy Systems. 2, 1320–1332 (2008).
10. Peres, R., Muller, E., Mahajan, V.: Innovation diffusion and new product growth models: A
critical review and research directions. International Journal of Research in Marketing.
(2010).
11. Kiesling, E., Günther, M., Stummer, C., Wakolbinger, L.M.: Agent-based simulation of
innovation diffusion: a review. Cent Eur J Oper Res. (2011).
12. Berger, T.: Agent-based spatial models applied to agriculture: a simulation tool for technol-
ogy diffusion, resource use changes and policy analysis. Agricultural Economics. 25, 245–
260 (2001).
13. Rahmandad, H., Sterman, J.: Heterogeneity and network structure in the dynamics of diffu-
sion: Comparing agent-based and differential equation models. Management Science. 54,
998–1014 (2008).
14. Kemp, R., Volpi, M.: The diffusion of clean technologies: a review with suggestions for
future diffusion analysis. Journal of Cleaner Production. 16, S14–S21 (2008).
15. Simon, H.A.: A behavioral model of rational choice. The Quarterly Journal of Economics.
69, 99–118 (1955).
16. Collantes, G.O.: Incorporating stakeholders’ perspectives into models of new technology
diffusion: The case of fuel-cell vehicles. Technological Forecasting and Social Change. 74,
267–280 (2007).
17. Manson, S.M.: Bounded rationality in agent-based models: experiments with evolutionary
programs. International Journal of Geographical Information Science. 20, 991–1012 (2006).
18. Secchi, D.: Extendable Rationality. , Estados Unidos (2011).
19. Chandrasekaran, D., Tellis, G.J.: A critical review of marketing research on diffusion of
new products. Review of marketing research. 39–80 (2007).
20. Golder, P., Tellis, G.J.: Growing, Growing, Gone: Cascades, Diffusion, and Turning Points
in the Product Life Cycle. Marketing Science. 23, 207–218 (2004).
21. Willensky, U.: NetLogo. The Center for Connected Learning (CCL) and Computer-Based
Modeling, Northwestern University (2012).
22. Todd, P.M., Gigerenzer, G.: Bounding rationality to the world. Journal of Economic Psy-
chology. 24, 143–165 (2003).
23. Watts, D.J., Strogatz, S.H.: Models of the Small World. Nature. 393, 440–442 (1998).


