Embed Size (px)
Citation preview
DIRECTIONS IN DEVELOPMENT
Safety NetPrograms andPoverty ReductionLessons from Cross-Country Experience
K. SUBBARAO
ANIRUDDHA BONNERJEE KENE EZEMENARI
JEANINE BRAITHWAITE CAROL GRAHAM
SONIYA CARVALHO ALAN THOMPSON
V
Kg,e _3v S, _
~~~~~ A~~~~~~~9-. -
B. k _ X ...'
Pub
lic D
iscl
osur
e A
utho
rized
Pub
lic D
iscl
osur
e A
utho
rized
Pub
lic D
iscl
osur
e A
utho
rized
Pub
lic D
iscl
osur
e A
utho
rized

DIRECTIONS IN DEVELOPMENT
Safety Net Programsand Poverty Reduction
Lessons from Cross-Country Experience
K. SubbaraoAniruddha BonnerjeeJeanine Braithwaite
Soniya CarvalhoKene EzemenariCarol Graham
Alan Thompson
The World BankWashington, D.C.
C) 1997 The International Bank for Reconstructionand Development/ THE WORLD BANK
1818 H Street, N.W.Washington, D.C. 20433
All rights reservedManufactured in the United States of AmericaFirst printing March 1997
The findings, interpretations, and conclusions expressed in this study are entirelythose of the authors and should not be attributed in any manner to the WorldBank, to its affiliated organizations, or to members of its Board of ExecutiveDirectors or the countries they represent.
K. Subbarao and Jeanine Braithwaite are principal economist and human resourceseconomist, respectively, in the Poverty, Gender, and Public Sector ManagementDepartment of the World Bank. Aniruddha Bonnerjee, Soniya Carvalho, KeneEzemenari, and Alan Thompson are consultants at the World Bank. Carol Graham isa fellow at the Brookings Institution, she was a visiting fellow at the World Bankwhen the study was written.
Cover photo: Curt Carnemark, The World Bank
Library of Congress Cataloging-in-Puiblication Data
Safety net programs and poverty reduction: lessons from cross-countryexperience / [prepared by] K. Subbarao ... [et al.].
p. cm.Includes bibliographical references.ISBN 0-8213-3890-01. Income maintenance programs-Case studies. 2. Economic
assistance, Domestic-Case studies. I. Subbarao, K.HC79.15S24 1997362.5'82-dc2l 97-3168
CIP
Contents
Foreword v
Acknowledgments vii
Abbreviations ix
1 Introduction 1What Constitutes a Safety Net? 2Who Needs Safety Nets? 3Notes 13
2 Conceptual Issues in the Analysis of Social Assistanceand Poverty-Targeted Programs 15Targeting Costs 15Targeting Mechanisms 20The Choice between Cash and In-Kind Transfers 21Conclusion 23Notes 23
3 Cross-Country Patterns of Cash Transfers 25Famnily Assistance 26Social Assistance 35Cash Transfers in Eastern Europe
and Countries of the Former Soviet Union 39Notes 42
4 Cross-Country Patterns of In-Kind Transfers 45Food Subsidies 45Housing Subsidies 55Energy Subsidies 60Conclusion 65Notes 66
iii
iv SAFETY NET PROGRAMS AND POVERTY REDUCTION
5 Income Generation Programs 69Public Works 69Livelihood Programs 85Notes 91
6 Innovations in the Delivery and Organizationof Social Assistance and Poverty-Targeted Programs 93Alternative Delivery Models 93Program Experiences under Public and Private Delivery 97Lessons of Experience 111Notes 114
7 Modes of Financing Social Assistance Programs 117Sources of Financing and Trade-Offs 117A Cross-Country Analysis of Funding 121Transfer Spending, Social Services, and Budget Deficits 125Fiscal Federalism, Decentralization,
and Public Expenditure Management 126The Specific Challenges of Financing in the Economies in Transition 129Notes 133
8 The Political Economy of Social Assistance Programs 135Protecting the Poor during Adjustment
in Latin America and the Caribbean 138Sub-Saharan Africa: Social Funds and Social Action Programs 144Safety Net Issues in Transition Economies 148Politics of Safety Nets: Some Generalizations 155Notes 157
9 Choosing and Designing Programs 159A Framework for Choosing among Programs 161Appropriate Program Design 164Conclusion 170Note 170
References 171
Foreword
There is now a widespread consensus on the need for safety nets asa key component of a poverty reduction strategy. Safety nets arebasically income maintenance programs that protect a person orhousehold against two adverse outcomes: a chronic incapacity towork and earn, and a decline in this capacity caused by imperfectlypredictable life-cycle events (such as the sudden death of a bread-winner), sharp shortfalls in aggregate demand or expenditureshocks (through economic recession or transition), or very bad har-vests. Safety net programs serve two important roles: redistribution(such as transfers to disadvantaged groups) and insurance (such asdrought relief).
The ongoing structural adjustment programs and the unprece-dented economic and political transition of countries of the formerSoviet Union and Eastern Europe have given rise to a renewed inter-est in social safety net programs. Economic crisis-whatever itssources-is most likely to impinge harshly on vulnerable groups inthe short run, underscoring the need for countervailing measures.Moreover, the role of these policies in specific countries depends onthe way the economy distributes resources in the absence of safetynet policies. A propoor development path will place less demandson safety net policies.
Over the past three decades several developing countries haveembarked on a variety of programs, including cash transfers, subsi-dies in-kind, public works, and income-generation programs. Fewstudies have synthesized the lessons from widely differing countryexperiences. Moreover, there is little guidance on appropriate pro-gram design for countries and international donors supporting suchsafety net initiatives. This book fills the gap. It reviews the concep-tual issues in the choice of programs, synthesizes cross-countryexperience, and analyzes how country- and region-specific con-straints help explain why different approaches are successful in dif-ferent countries.
v
vi SAFETY NET PROGRAMS AND POVERTY REDUCTION
It is hoped that World Bank staff, members of other internationalaid agencies, policymakers in client countries, and the academiccommunity will benefit from this collaborative work of the Povertyand Social Policy Department.
Ishrat HusainDirector
Poverty and Social Policy DepartmentWorld Bank
Acknowledgments
This book was prepared by a team comprising K. Subbarao (teamleader and main author), Aniruddha Bonnerjee, Jeanine Braithwaite,Soniya Carvalho, Kene Ezemenari, Carol Graham, and AlanThompson. Nicholas Barr and Soonwon Kwon contributed back-ground papers. The study was carried out under the overall directionof Oey Astra Meesook and Ishrat Husain, the former manager and thedirector, Poverty Analysis and Social Policy Department.
For helpful comments and suggestions, the authors wish to thankPetros Aklilu, Harold Alderman, Nicholas Barr, Bruce Fitzgerald,Louise Fox, Fredrick Golladay, Margaret Grosh, Lshrat Husain,Emmanuel Jimenez, Polly Jones, Steen Jorgensen, Shahid Khandker,Kathie Krumm, Soonwon Kwon, Peter Lanjouw, Samuel Lieberman,Kathy Lindert, William McGreevey, Oey Astra Meesook, TawhidNawaz, John Newman, Nick Prescott, Sandor Sipos, Elisabeth Stock,Dominique van de Walle, Jack van Holst Pellekaan, and LawrenceWolff.
Michael Lipton, professor of economics at the University of Sussex,served as an external peer reviewer. The study benefited greatly fromhis valuable comments and suggestions.
Successive drafts of the paper were processed by Gay Santos andMaria Paz Felix. Ilyse Zable edited the book and Glenn McGrath laidit out.
vii

Abbreviations
AGETIP Agence d'Execution des Travaux d'Interet PublicContre le Sous-Emploi
AIDS Acquired immune deficiency syndromeAKRSP Aga Khan Rural Support ProjectAPRA American Popular Revolutionary AllianceBKK Badon Kredit KecamatanBRAC Bangladesh Rural Advancement CommitteeBRI Bank Rakyat IndonesiaCDP Community Development ProgramDIRE Delegation a l'Insertion et le Reinsertion a l'EmploiEEP Export Enhancement ProgramESF Emergency Social FundFIS Fondo de Inversi6n SocialGDP Gross domestic productGNP Gross national productICDS Integrated Child Development Services1CM Brazil's general value added taxIFAD International Fund for Agricultural DevelopmentIFPRI International Food Policy Research InstituteILO International Labour OrganizationIMF International Monetary FundIRDP Integrated Rural Development ProgramJRY Jawahar Rojgar YojunaLAC Latin America and the CaribbeanMCHN Mother/child health and nutritionMEGS Maharashtra Employment Guarantee SchemeMENPROSIF Mendoza Provencial Program for Basic Social
InfrastructureMMD Movement for Multi-Party DemocracyMPU Microprojects UnitMYRYDA The Mysovre Resettlement and Development AgencyNGO Nongovernmental organizationNIA Philippines Communal Irrigation ProjectNBU National Bank of Ukraine
.x
x SAFETY NET PROGRAMS AND POVERTY REDUCTION
OECD Organization for Economic Cooperation andDevelopment
PAIT Temporary Income Support ProgramPAU Urban Action ProgramPEM Minimum Employment ProgramPOJH Occupational Program for Household HeadsPPP Purchasing power parityPRADAN Professional Assistance for Development ActionPRI Institutional Revolutionary PartyPRONASOL National Solidarity ProgramRMP Rural Maintenance ProgramSAPs Social Action ProgramsSedesol Secretariat of Social DevelopmentSEWA Self-Employed Women's AssociationSF Social fundSPARC Society for Promotion of Area Residence CentresSRF Social Recovery FundSRP Social Recovery ProjectTINP Tamil Nadu Integrated Nutrition ProjectUNICEF United Nations Children's FundUNIP United National Independence PartyUSAID United States Agency for International DevelopmentWFP World Food ProgramWGTFI Working Group in Targeted Food Interventions
1Introduction
The current proliferation of structural adjustment programs andmacroeconomic stabilization measures has given rise to a renewedinterest in social safety net programs.' The economic and politicaltransition of the countries of the former Soviet Union and EasternEurope has contributed to this renewed interest as well. Countries inthis region are restructuring their economic systems at the same timethat they are attempting to liberalize prices and stabilize external bal-ances, provide public services, and protect the well-being of their cit-izens. These countries have inherited systems of social protection thatare no longer fiscally sustainable or able to protect economically andsocially vulnerable groups. Public spending on social protection(social insurance and social assistance payments) as a share of grossdomestic product (GDP) continues to be high, though many of thenewly emerging working poor remain unprotected. 2 Evidence showsthat poverty increased by as much as 100 percent between 1987 and1993-the years immediately preceding and following transition. Theunskilled laborer was most likely to experience worsening povertyduring this period.
In low- and middle-income countries in the process of adjusting,formal safety nets and community and family support networks areincreasingly unable to cope with the extent of need in the wake ofevents-such as the massive numbers of AIDS-orphaned children inAfrica-unforeseen a decade ago.3
Regardless of a country's location, be it in Africa, Latin America,Asia, the former Soviet Union, or Eastern Europe, economic crisis andthe adjustment or transition that follows have adverse short-termeffects on the living standards of vulnerable groups. And shrinkingbudgets are severely restricting the amount of resources available forsocial assistance. There is clearly an acute need to protect the new poorand the chronically poor by introducing social assistance programs orrestructuring existing ones in ways that make them fiscally, politically,and administratively sustainable.
1
2 SAFETY NET PROGRAMS AND POVERTY REDUCTION
Added to the urgent need to revisit safety net issues is the ongoingdebate over the optimal policy mix between the indirect growth-oriented path to poverty reduction and the direct path of targetedtransfers to the poor. Should all scarce resources be allocated so as tomaximize economic growth, the benefits of which will eventuallytrickle down to the poor, or should a part of these resources be trans-ferred to the poor to improve and maintain their living standards dur-ing the process of economic growth? A third option is to give the pooraccess to assets (such as land) that provide them with a source of eco-nomic growth based on their absolute advantagthat is, labor.
Although diverting scarce resources directly to the poor compro-mises economic growth in the short run, the forgone cost of notaccounting for the poor may compromise economic growth in thelong-run. In order to survive, the poor may seek to minimize incomeor consumption risks, resort to criminal or marginalized activities, orbe forced to accept extreme insecurity and risk of death. Moreover,denying the poor access to economic and educational opportunitiesaccentuates inequality-an outcome likely to retard economic growth(Lipton 1995). In democratic societies neglect of the poor, particularlyduring reform, can also lead to political instability.
Some conflict between direct poverty-targeted programs andgrowth-promoting activities is inevitable in most countries. But thedichotomy between the direct and indirect paths to poverty reductionmay be minimized if a country adopts a growth-oriented adjustmentprogram that is sufficiently broad-based to include all socioeconomicgroups, particularly the poor, in productive activities. Finally, the pathtaken by a specific country, and the relative weight given to poverty-targeted programs, will depend on the level of institutional andadministrative capacity, and on the quantity (and quality) of humancapital. If the forgone cost of not including the poor-especially theaccentuation of inequality in the short run-is a major consideration,then safety nets will need to be a strategic component of the path thatis taken to poverty reduction.
What Constitutes a Safety Net?
Safety nets are programs that protect a person or household against twoadverse outcomes: chronic incapacity to work and earn (chronic poverty)and a decline in this capacity from a marginal situation that providesminimal means for survival with few reserves (transient poverty). Achronic incapacity to work or earn will usually result from physical ormental disability, long-term illness, or old age. A decline in the capaci-ty to work is usually caused by imperfectly predictable life-cycle events(such as the birth of twins or a sudden death of a bread-winner); a
INTRODUCnON 3
sharp fall in aggregate demand or expenditure shocks (through eco-nomic recession or transition, during unavoidable cutbacks in publicspending, as a result of a decline in production in sectors from whichworkers are immobile); or poor harvests (due to drought, flood, orpests, especially when they affect prices and production over a widearea), which cause the rural poor to lose the usual sources of protectionoffered by informal transfers (see discussion below).
There is a broad range of mechanisms for protecting individualsfrom acute deprivation or inadvertent declines in income. In somesocieties informal or community-based arrangements (private safetynets) help mitigate the adverse outcomes in welfare. In addition, pub-licly supported social safety nets also help the vulnerable. Theseinclude social services (health and education in particular), socialinsurance programs such as pensions, all publicly funded transfers(cash transfers such as family allowances and in-kind transfers such asfood subsidies), and income-generation programs targeted to the poor(such as public works). This book focuses on publicly funded transfersaimed at the poor and on income-generation programs. Althoughsocial insurance programs constitute the most dominant form of cashtransfer in most countries of Eastern European and the former SovietUnion, and provide relief to the poor in the formal sectors, these pro-grams are not addressed here because issues pertaining to pensionswere the focus of a recent World Bank policy study (Fox 1994). Wherenecessary (as in the discussion on cash transfers in countries of the for-mer Soviet Union), the study will make reference to the interfacebetween social insurance and social assistance programs.
Who Needs Safety Nets?
In every society some individuals are able to take advantage of emergingopportunities better than others, in the same way that some individualsare more vulnerable to chronic or transient declines in income. Individualsare likely to be at a disadvantage in either situation if they are:* Most prone to unpredictable, sharp falls in real spending power.* Least resilient to a reduction in real spending power.* Least likely to have formal insurance.* Least likely to be attractive to informal insurance groups (such as
reciprocal savings or insurance societies), which seek dependableco-contributors.Thus the poor are most likely to be in need of safety nets. In the
absence of publicly supported safety nets the poor are likely to turntheir production and consumption behavior toward risk avoidanceinstead of toward income maximization. In other words, the poor oftencannot afford to be entrepreneurial-and may remain underproductive
4 SAFETY NET PROGRAMS AND POVERTY REDUCTION
and poor. In order to counteract this, cash and in-kind transfers, andpoverty-targeted programs-the main focus of this study-should beexamined in a broad developmental context, while ensuring that thepoor also have access to the gains from economic growth.
Cash and In-Kind Transfers in a Developmental Context
Any cash or in-kind transfer requires real resources, and budgetarylimitations imply that there are often difficult trade-offs between trans-fers and other programs supported by tax revenues. Therefore, it isimportant to coordinate transfer programs with broader developmen-tal goals. These programs must be formulated in the context of apoverty-reduction strategy, comprising initiatives for labor-demanding growth and expanded access to social services for thepoor. Targeted transfers to provide temporary relief to the poor shouldnever replace development programs, such as irrigation, education, orinfrastructure development, that enable long-term escape from pover-ty. In some countries or regions investments in drought-proofing or inactivities such as village-to-market roads can significantly stabilize thepoor's employment possibilities and incomes, dramatically reducingthe need for short-term poverty relief (Ahmed and Donovan 1992;Binswanger, Khandker, and Rosenzweig 1993).
Thus the type and structure of demand for safety nets may vary withan economy's size, age structure, health, real average income, and typeand extent of fluctuations in production, and may interact with other eco-nomic policies. A consequence is that as growth or redistribution increas-es a poor person's expected (average) annual real income, his or hercapacity to save, insure, spread short-term risks, and meet both acute andchronic shocks without disaster also increases. In addition, governmentsopting for fast liberalization must factor in both the need for more spend-ing on safety nets in the short to medium run and the likelihood that thisspending will drop in the longer run. Well-distributed real incomereduces the need for safety nets and increases an individual's ability tocope with distress. Also, policies that spend scarce resources on irriga-tion, control of infectious illness, labor-intensive production, and landredistributions-whatever their advantages or drawbacks-saveresources by reducing the need for publicly provided safety nets.Therefore, under no circumstances should safety net policies be framedas alternatives to investments in labor-demanding growth activities.
Public Transfers and Private Safety Nets
Valuable empirical information is now available demonstrating theimportance of personal reciprocity and informal safety nets in devel-
INTRODUCTION 5
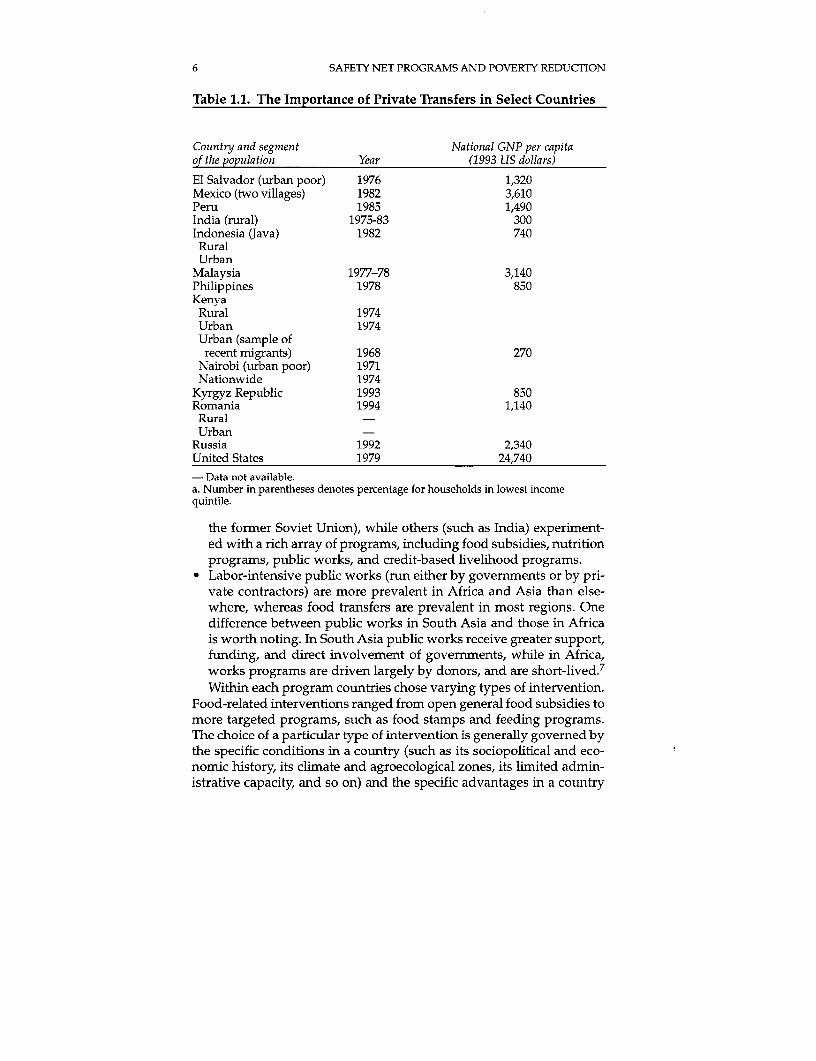
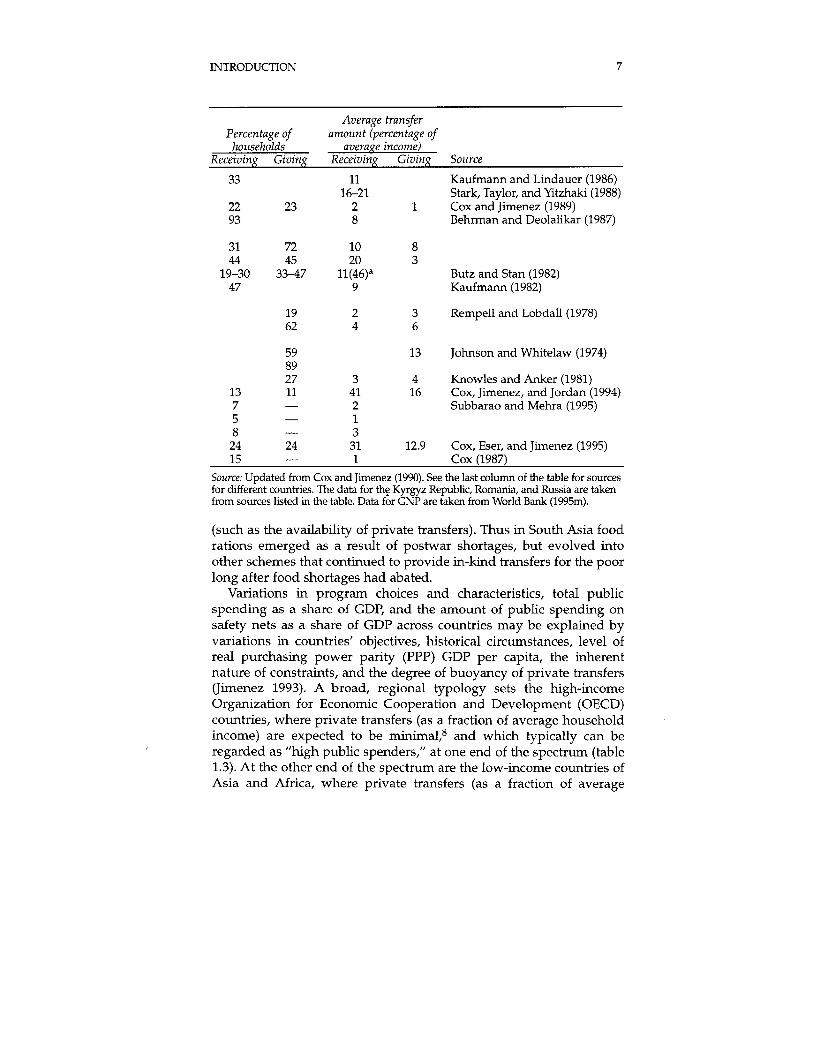
oping countries and in some economies in transition (table 1.1).Traditional coping mechanisms reduce economic insecurity.4 Publictransfers, therefore, should complement not only broader develop-mental activities, but also the prevailing traditional arrangements. Theusefulness of public transfers for poverty relief is greatly reduced ifpublic transfers induce reductions in private transfers (remittances,and so on) to the poor. But it is important not to exaggerate the role ofprivate transfers in poverty reduction-as is commonly done bywealthy taxpayers to undermine public support for the poor. Privatetransfers could be minimal if an entire country or parts of a country arevisited by a drought, or if transfers are made between groups that arepoor.5
Cross-Country Patterns in Program Choice
Many countries have experimented with a wide array of social assis-tance and poverty-targeted programs. The choice and scope of instru-ments varied a great deal across countries, depending on circum-stances. The degree of success in reaching the poor in a cost-effectiveway also varied with the extent and depth of poverty, the compositionof target groups, the speed and sequencing of reforms, the availabilityof financing, administrative capacity, and political economy factors.Often, the same instrument produced quite different outcomes andeffects on the poor in different countries and across regions in the samecountry.
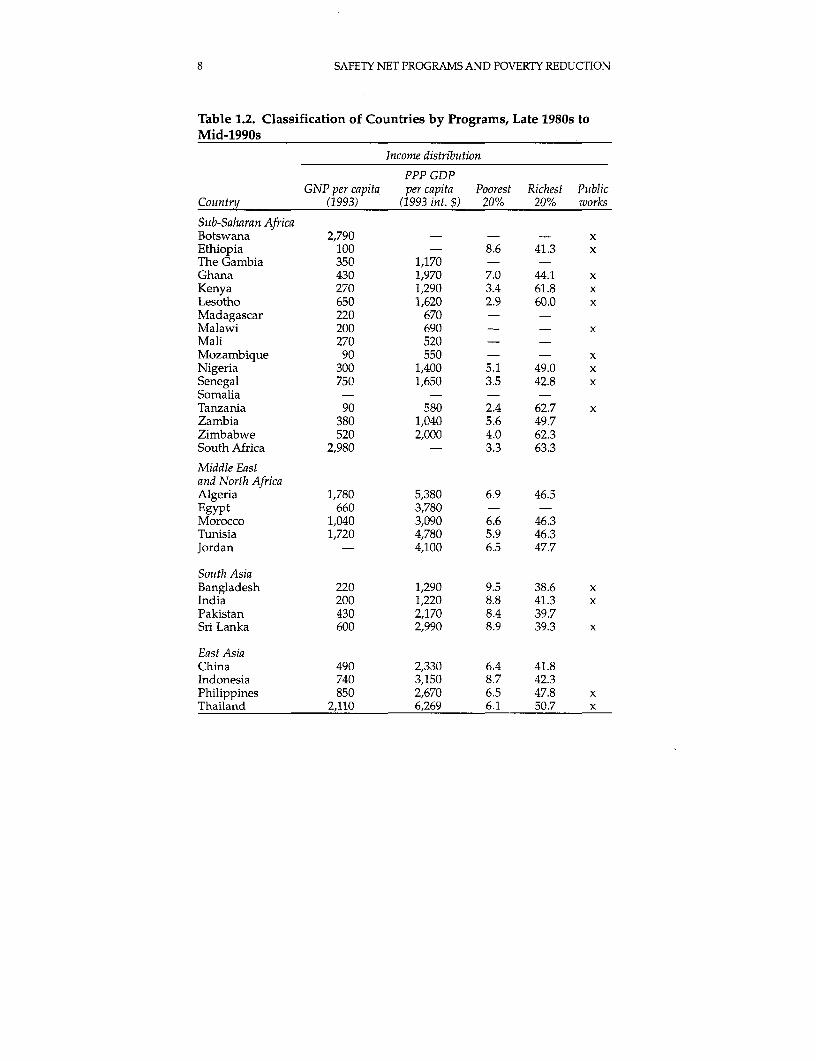
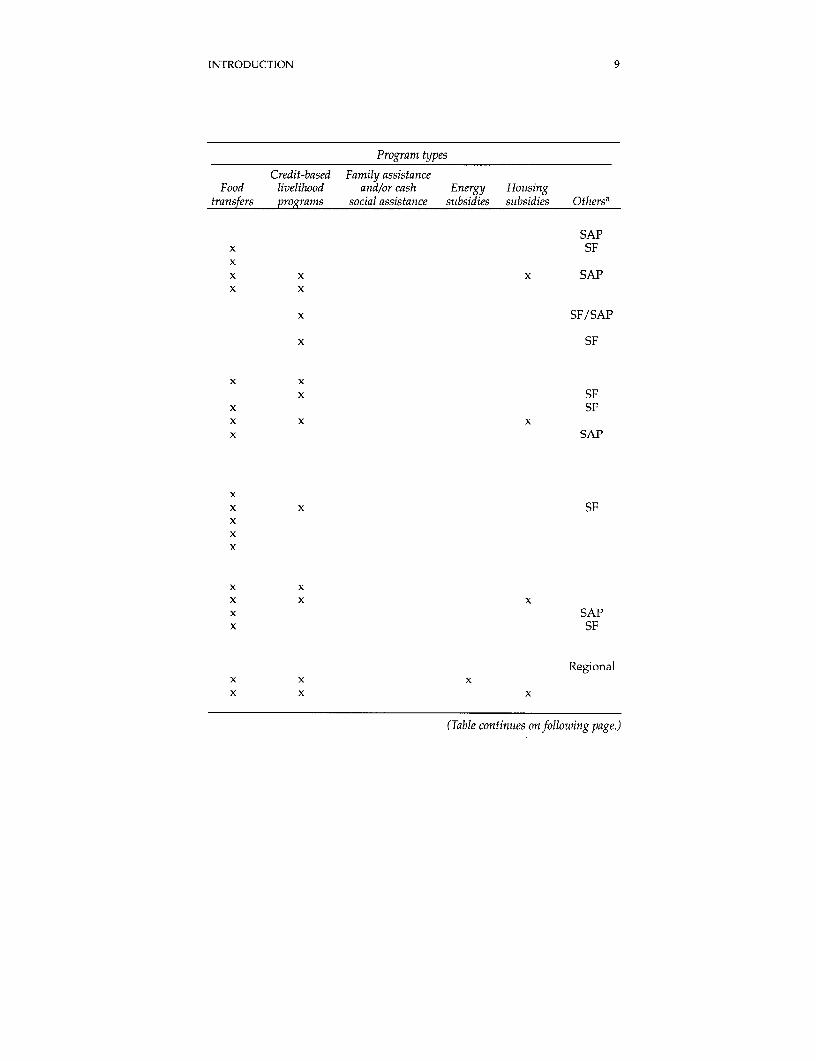
The situation prevailing from the mid-1980s to the mid-1990s is theresult of the historical evolution of programs (table 1.2). Four patternsare worth noting:@ Program choice was to some extent influenced by the nature and
availability of food aid. Thus in the 1950s and 1960s food aid (par-ticularly from the United States) led to the emergence of food-for-work programs, especially in South Asia. With the decline of foodaid in the 1970s and 1980s, food-for-work programs also diminishedin importance-now, only two countries have such programs.6
During the 1980s availability of direct nonfood assistance by (bilat-eral) donors and an eagerness to channel such assistance throughnongovernmental channels led to the emergence of social funds.
* A few countries sought to realize multiple objectives with one pro-gram. For example, public works programs that give staple food aswages seek to relieve poverty by ensuring that participants haveaccess to food, are able to smooth their consumption, and buildinfrastructure-thus complementing economic growth.
* Countries varied in the pervasiveness of interventions: some reliedon one major program (such as family assistance in the countries of
6 SAFETY NET PROGRAMS AND POVERTY REDUCTION
Table 1.1. The Importance of Private Transfers in Select Countries
Country and segment National GNP per capitaof the population Year (1993 US dollars)
El Salvador (urban poor) 1976 1,320Mexico (two villages) 1982 3,610Peru 1985 1,490India (rural) 1975-83 300Indonesia (Java) 1982 740RuralUrban
Malaysia 1977-78 3,140Philippines 1978 850KenyaRural 1974Urban 1974Urban (sample ofrecent migrants) 1968 270
Nairobi (urban poor) 1971Nationwide 1974
Kyrgyz Republic 1993 850Romania 1994 1,140RuralUrban
Russia 1992 2,340United States 1979 24,740- Data not available.a. Number in parentheses denotes percentage for households in lowest incomequintile.
the former Soviet Union), while others (such as India) experiment-ed with a rich array of programs, including food subsidies, nutritionprograms, public works, and credit-based livelihood programs.
* Labor-intensive public works (run either by governments or by pri-vate contractors) are more prevalent in Africa and Asia than else-where, whereas food transfers are prevalent in most regions. Onedifference between public works in South Asia and those in Africais worth noting. In South Asia public works receive greater support,funding, and direct involvement of governments, while in Africa,works programs are driven largely by donors, and are short-lived. 7
Within each program countries chose varying types of intervention.Food-related interventions ranged from open general food subsidies tomore targeted programs, such as food stamps and feeding programs.The choice of a particular type of intervention is generally governed bythe specific conditions in a country (such as its sociopolitical and eco-nomic history, its climate and agroecological zones, its limited admin-istrative capacity, and so on) and the specific advantages in a country
INTRODUCTION 7
Average transferPercentage of amount (percentage of
households average income)Receiving Giving Receiving Giving Source
33 11 Kaufmann and Lindauer (1986)16-21 Stark, Taylor, and Yitzhaki (1988)
22 23 2 1 Cox and Jimenez (1989)93 8 Behrman and Deolalikar (1987)
31 72 10 844 45 20 3
19-30 33-47 11(46)' Butz and Stan (1982)47 9 Kaufmann (1982)
19 2 3 Rempell and Lobdall (1978)62 4 6
59 13 Johnson and Whitelaw (1974)8927 3 4 Knowles and Anker (1981)
13 11 41 16 Cox, Jimenez, and Jordan (1994)7 - 2 Subbarao and Mehra (1995)5 - 18 - 324 24 31 12.9 Cox, Eser, and Jimenez (1995)15 - 1 Cox (1987)
Source: Updated from Cox and Jimenez (1990). See the last column of the table for sourcesfor different countries. The data for the Kyrgyz Republic, Romania, and Russia are takenfrom sources listed in the table. Data for GNP are taken from World Bank (1995m).
(such as the availability of private transfers). Thus in South Asia foodrations emerged as a result of postwar shortages, but evolved intoother schemes that continued to provide in-kind transfers for the poorlong after food shortages had abated.
Variations in program choices and characteristics, total publicspending as a share of GDP, and the amount of public spending onsafety nets as a share of GDP across countries may be explained byvariations in countries' objectives, historical circumstances, level ofreal purchasing power parity (PPP) GDP per capita, the inherentnature of constraints, and the degree of buoyancy of private transfers(Jimenez 1993). A broad, regional typology sets the high-incomeOrganization for Economic Cooperation and Development (OECD)countries, where private transfers (as a fraction of average householdincome) are expected to be minimal, 8 and which typically can beregarded as "high public spenders," at one end of the spectrum (table1.3). At the other end of the spectrum are the low-income countries ofAsia and Africa, where private transfers (as a fraction of average
8 SAFETY NET PROGRAMS AND POVERTY REDUCTION
Table 1.2. Classification of Countries by Programs, Late 1980s toMid-1990s
Income distribution
PPP GDPGNP per capita per capita Poorest Richest Puiblic
Country (1993) (1993 int. $) 20% 20% works
Suib-Saharan AfricaBotswana 2,790 - - - xEthiopia 100 - 8.6 41.3 xThe Gambia 350 1,170 - -
Ghana 430 1,970 7.0 44.1 xKenya 270 1,290 3.4 61.8 xLesotho 650 1,620 2.9 60.0 xMadagascar 220 670 - -
Malawi 200 690 - - xMali 270 520 - -
Mozambique 90 550 - - xNigeria 300 1,400 5.1 49.0 xSenegal 750 1,650 3.5 42.8 xSomalia - - - -
Tanzania 90 580 2.4 62.7 xZambia 380 1,040 5.6 49.7Zimbabwe 520 2,000 4.0 62.3South Africa 2,980 - 3.3 63.3
Middle Eastand North AfricaAlgeria 1,780 5,380 6.9 46.5Egypt 660 3,780 - -Morocco 1,040 3,090 6.6 46.3Tunisia 1,720 4,780 5.9 46.3Jordan - 4,100 6.5 47.7
Souith AsiaBangladesh 220 1,290 9.5 38.6 xIndia 200 1,220 8.8 41.3 xPakistan 430 2,170 8.4 39.7Sri Lanka 600 2,990 8.9 39.3 x
East AsiaChina 490 2,330 6.4 41.8Indonesia 740 3,150 8.7 42.3Philippines 850 2,670 6.5 47.8 xThailand 2,110 6,269 6.1 50.7 x
INTRODUCTION 9
Program types
Credit-based Family assistanceFood livelihood and/or cash Energy Houising
transfers programs social assistance suibsidies suzbsidies Othersa
SAPx SFxx x x SAPx x
x SF/SAP
x SF
x xx SF
x SFx x xx SAP
xx x SFxxx
x xx x xx SAPx SF
Regionalx x xx x x
(Table continutes on following page.)
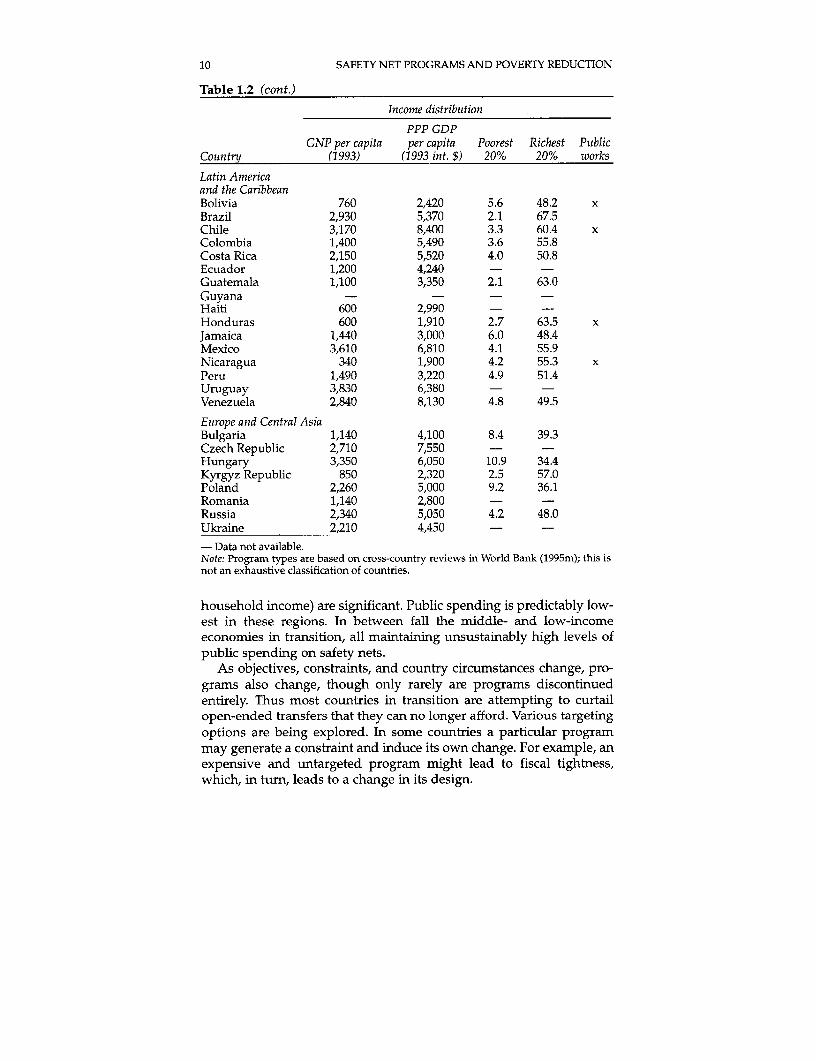
10 SAFETY NET PROGRAMS AND POVERTY REDUCTION
Table 1.2 (cont.)
Income distribution
PPP GDPGNP per capita per capita Poorest Richest Public
Country (1993) (1993 int. $) 20% 20% works
Latin Americaand the CaribbeanBolivia 760 2,420 5.6 48.2 xBrazil 2,930 5,370 2.1 67.5Chile 3,170 8,400 3.3 60.4 xColombia 1,400 5,490 3.6 55.8Costa Rica 2,150 5,520 4.0 50.8Ecuador 1,200 4,240 - -Guatemala 1,100 3,350 2.1 63.0Guyana - - - -Haiti 600 2,990 - -
Honduras 600 1,910 2.7 63.5 xJamaica 1,440 3,000 6.0 48.4Mexico 3,610 6,810 4.1 55.9Nicaragua 340 1,900 4.2 55.3 xPeru 1,490 3,220 4.9 51.4Uruguay 3,830 6,380 - -
Venezuela 2,840 8,130 4.8 49.5
Eitrope and Central AsiaBulgaria 1,140 4,100 8.4 39.3Czech Republic 2,710 7,550 - -
Hungary 3,350 6,050 10.9 34.4Kyrgyz Republic 850 2,320 2.5 57.0Poland 2,260 5,000 9.2 36.1Romania 1,140 2,800 - -
Russia 2,340 5,050 4.2 48.0Ukraine 2,210 4,450 - -
- Data not available.Note: Program types are based on cross-country reviews in World Bank (1995m); this isnot an exhaustive classification of countries.
household income) are significant. Public spending is predictably low-est in these regions. In between fall the middle- and low-incomeeconomies in transition, all maintaining unsustainably high levels ofpublic spending on safety nets.
As objectives, constraints, and country circumstances change, pro-grams also change, though only rarely are programs discontinuedentirely. Thus most countries in transition are attempting to curtailopen-ended transfers that they can no longer afford. Various targetingoptions are being explored. In some countries a particular programmay generate a constraint and induce its own change. For example, anexpensive and untargeted program might lead to fiscal tightness,which, in turn, leads to a change in its design.
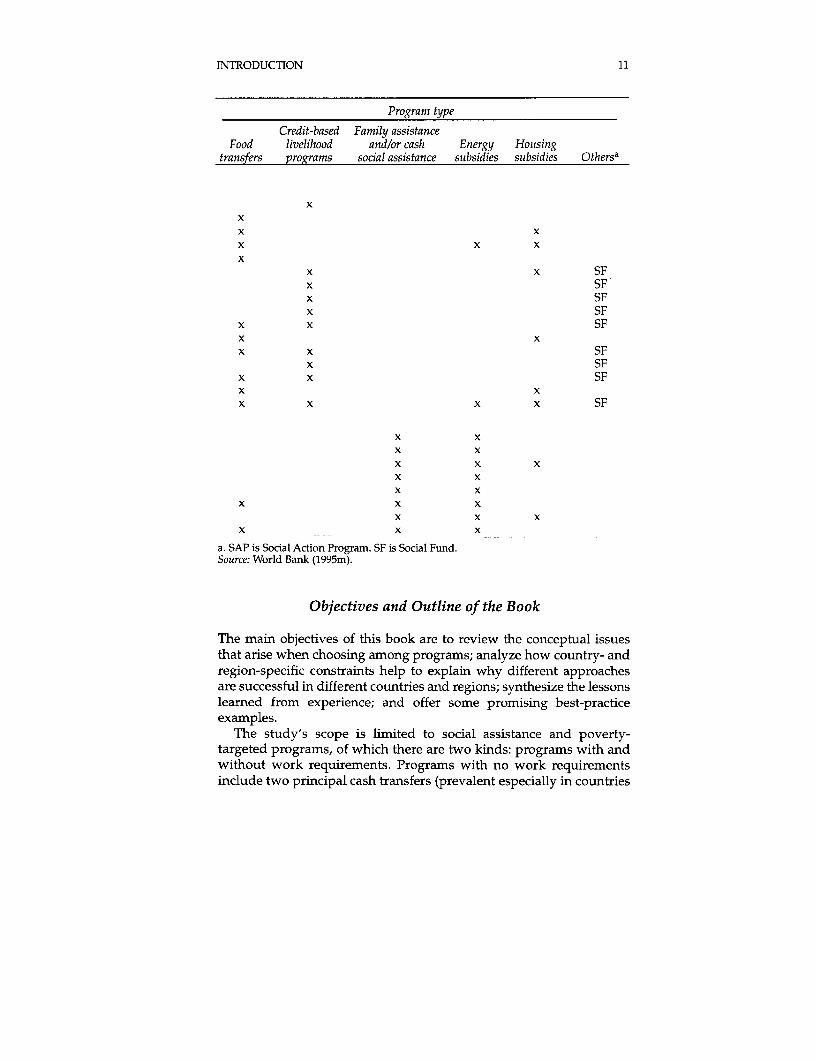
INTRODUCTION 11
Program type
Credit-based Family assistanceFood livelihood and/or cash Energy Houtsing
transfers programs social assistance subsidies sutbsidies Othersa
xxx xx x xx
x x SFx SFx SFx SF
x x SFx xx x SF
x SFx x SFx xx x x x SF
x xx xx x xx xx x
x x xx x x
x x x
a. SAP is Social Action Program. SF is Social Fund.Source: World Bank (1995m).
Objectives and Outline of the Book
The main objectives of this book are to review the conceptual issuesthat arise when choosing among programs; analyze how country- andregion-specific constraints help to explain why different approachesare successful in different countries and regions; synthesize the lessonslearned from experience; and offer some promising best-practiceexamples.
The study's scope is limited to social assistance and poverty-targeted programs, of which there are two kinds: programs with andwithout work requirements. Programs with no work requirementsinclude two principal cash transfers (prevalent especially in countries
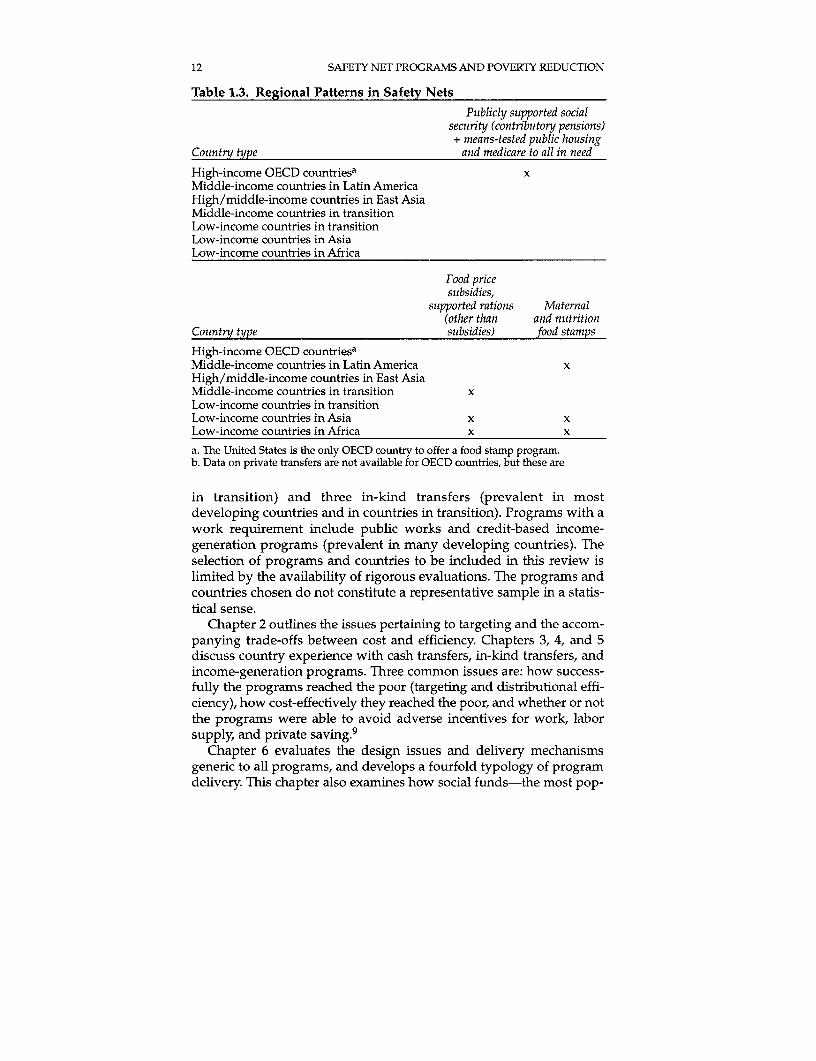
12 SAFETY NET PROGRAMS AND POVERTY REDUCTION
Table 1.3. Regional Patterns in Safety Nets
Pu7blicly suipported socialsecturity (contributory pensions)+ means-tested public houtsing
Coutntry type and medicare to all in need
High-income OECD countriesa xMiddle-income countries in Latin AmericaHigh/middle-income countries in East AsiaMiddle-income countries in transitionLow-income countries in transitionLow-income countries in AsiaLow-income countries in Africa
Food pricesubsidies,
supported rations Maternal(other than and nutrition
Cotntry type subsidies) food stamps
High-income OECD countriesaMiddle-income countries in Latin America xHigh/middle-income countries in East AsiaMiddle-income countries in transition xLow-income countries in transitionLow-income countries in Asia x xLow-income countries in Africa x x
a. The United States is the only OECD country to offer a food stamp program.b. Data on private transfers are not available for OECD countries, but these are
in transition) and three in-kind transfers (prevalent in mostdeveloping countries and in countries in transition). Programs with awork requirement include public works and credit-based income-generation programs (prevalent in many developing countries). Theselection of programs and countries to be included in this review islimited by the availability of rigorous evaluations. The programs andcountries chosen do not constitute a representative sample in a statis-tical sense.
Chapter 2 outlines the issues pertaining to targeting and the accom-panying trade-offs between cost and efficiency. Chapters 3, 4, and 5discuss country experience with cash transfers, in-kind transfers, andincome-generation programs. Three common issues are: how success-fully the programs reached the poor (targeting and distributional effi-ciency), how cost-effectively they reached the poor, and whether or notthe programs were able to avoid adverse incentives for work, laborsupply, and private saving.9
Chapter 6 evaluates the design issues and delivery mechanismsgeneric to all programs, and develops a fourfold typology of programdelivery. This chapter also examines how social funds-the most pop-
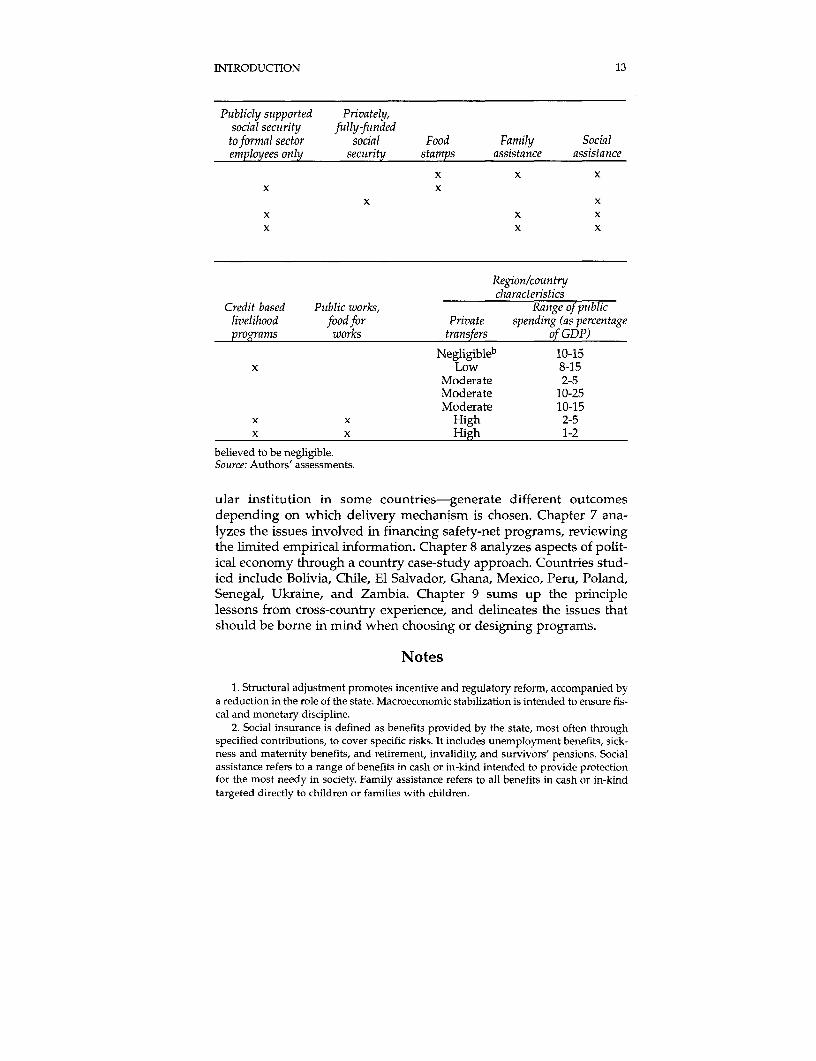
INTRODUCTION 13
Publicly supported Privately,social sectrity filly-fundedtoformal sector social Food Family Socialemployees only secuirity stamps assistance assistance
x x xx x
x xx x xx x x
Region/countrycharacteristics
Credit-based Putblic works, Range of puebliclivelihood food for Private spending (as percentageprograms works transfers of GDP)
Negligibleb 10-15x Low 8-15
Moderate 2-5Moderate 10-25Moderate 10-15
x x High 2-5x x High 1-2
believed to be negligible.Source: Authors' assessments.
ular institution in some countries-generate different outcomesdepending on which delivery mechanism is chosen. Chapter 7 ana-lyzes the issues involved in financing safety-net programs, reviewingthe limited empirical information. Chapter 8 analyzes aspects of polit-ical economy through a country case-study approach. Countries stud-ied include Bolivia, Chile, El Salvador, Ghana, Mexico, Peru, Poland,Senegal, Ukraine, and Zambia. Chapter 9 sums up the principlelessons from cross-country experience, and delineates the issues thatshould be borne in mind when choosing or designing programs.
Notes
1. Structural adjustment promotes incentive and regulatory reform, accompanied bya reduction in the role of the state. Macroeconomic stabilization is intended to ensure fis-cal and monetary discipline.
2. Social insurance is defined as benefits provided by the state, most often throughspecified contributions, to cover specific risks. It includes unemployment benefits, sick-ness and maternity benefits, and retirement, invalidity, and survivors' pensions. Socialassistance refers to a range of benefits in cash or in-kind intended to provide protectionfor the most needy in society. Family assistance refers to all benefits in cash or in-kindtargeted directly to children or families with children.
14 SAFETY NET PROGRAMS AND POVERTY REDUCTION
3. Numerous case studies in the household-coping literature have examined how dif-ferent shocks (environmental, economic, social, and political) affect, and at times under-mine, traditional coping mechanisms based on community and family networks. Thisliterature examines how households deal ex ante with anticipated shocks and what expost coping strategies they apply following an adverse event. In particular, see Platteau(1991); Agarwal (1991); regarding the economic impact of AIDS, see Ainsworth and Over(1992); see Alderman and Paxson (1992) for a discussion of issues pertaining to risk shar-ing and consumption smoothing.
4. Private transfers may take various forms. In Sub-Saharan Africa community-levelsaving societies contribute to pooling and spreading of income risks. In Mali urban asso-ciations called 'tontines" function as saving and insurance clubs, providing cash tomembers in difficult times (World Bank 1993a). There are similar groups in The Gambiaand Burkina Faso (von Braun 1989; World Bank 1993b). Chapter 4 discusses the Islamic-based Zakat and Ushr system, which is a common form of safety net in parts of SouthAsia and some African countries. In Mongolia exchange of animals is a common form ofprivate transfer (Subbarao and Ezemenari 1995).
5. Recent evidence from the Philippines illustrates this. Subbarao, Ahmed, and Teklu(1995) found that remittances from abroad were a significant source of household incomein the relatively more developed regions of the country. In addition, within these regionsa large proportion of the transfers went to upper-income groups. Domestic remittances, onthe other hand, are predominant among the poorer income groups. The study concludedthat foreign remittances accentuated income inequality among regions and households.
6. A food-for-work program, largely driven by P.L. 480 food aid from the UnitedStates, operated in India until the mid-1960s. The program was replaced by a regularemployment program (now known as the Jawahar Rojgar Yojuna) with wages paid incash rather than in-kind. As the composition of food aid changed from grains to infantformula, a program (introduced in the mid-1970s) aimed at improving child nutritionbegan to absorb the donor-supplied infant food.
7. A relatively lower emphasis in Africa than in Asia on labor-intensive public worksprograms, or other comparable programs for consumption smoothing, is probably the rea-son for the harsher impact of a drought in Africa than in South Asia. Thus a massivedrought visited India in 1987, affecting nearly one-third of the population. Yet there wasnot a single drought-related mortality. This was because of the prevalence of consumption-smoothing public works programs, an administrative and institutional framework that iswell-adapted (over time) to drought situations, and a free press. By contrast, a drought ofmuch smaller magnitude in Ethiopia caused considerable distress and mortality in 1991.Moreover, rural infrastructure has remained in a very poor and neglected state in Africa-hurting the poor both as sellers (low product prices) and as buyers (high input prices).
8. As of now, no data exist on the share of private transfers in average householdincome for most OECD countries.
9. Not all of the issues could be addressed for each of the programs owing to pauci-ty of data. In particular, data limitations narrowed the scope of chapter 3 (cash transfers).
2Conceptual Issues in
the Analysis of Social Assistanceand Poverty-Targeted Programs
This chapter reviews the conceptual issues pertaining to public trans-fers and targeting, the impact of poverty-targeted programs on con-sumption decisions and labor market behavior, fiscal sustainability,and some political economy factors. The chapter suggests that theissue of whether to target or not depends on the costs and benefits ofdoing so. It then discusses how to target by describing the conceptualideas behind the different targeting mechanisms. It concludes with adiscussion of the trade-offs in delivering benefits in cash or in-kind.
The rationale for targeting is that the social returns for a given levelof transfers are higher for individuals or households at the lower endof the income distribution than at the upper end.1 To maximize thewelfare effect of a transfer program, the appropriate target would bethe population segment deemed poor according to some criterion.Thus the ability to measure poverty and identify the poor is essentialfor designing any targeted transfer program.
Targeting gains depend on initial country conditions and the type oftargeting mechanism adopted. Targeting the poorest and most vulner-able saves budgetary resources by confining benefits initially to thosewho need them most, provided the administrative costs of identifyingthe poor are not high. Saving budgetary resources allows for greaterbenefits for the poor, greater expenditures on other programs-possi-bly income-generation programs-or the reduction in public revenuecollection through potentially distortionary taxes.
Targeting Costs
Targeting is beneficial when it increases the efficiency of antipovertyprograms, but it also entails costs. Four types of costs stand out:administrative, incentive (deadweight), stigma, and political.
15
16 SAFETY NET PROGRAMS AND POVERTY REDUCTION
Administrative Costs
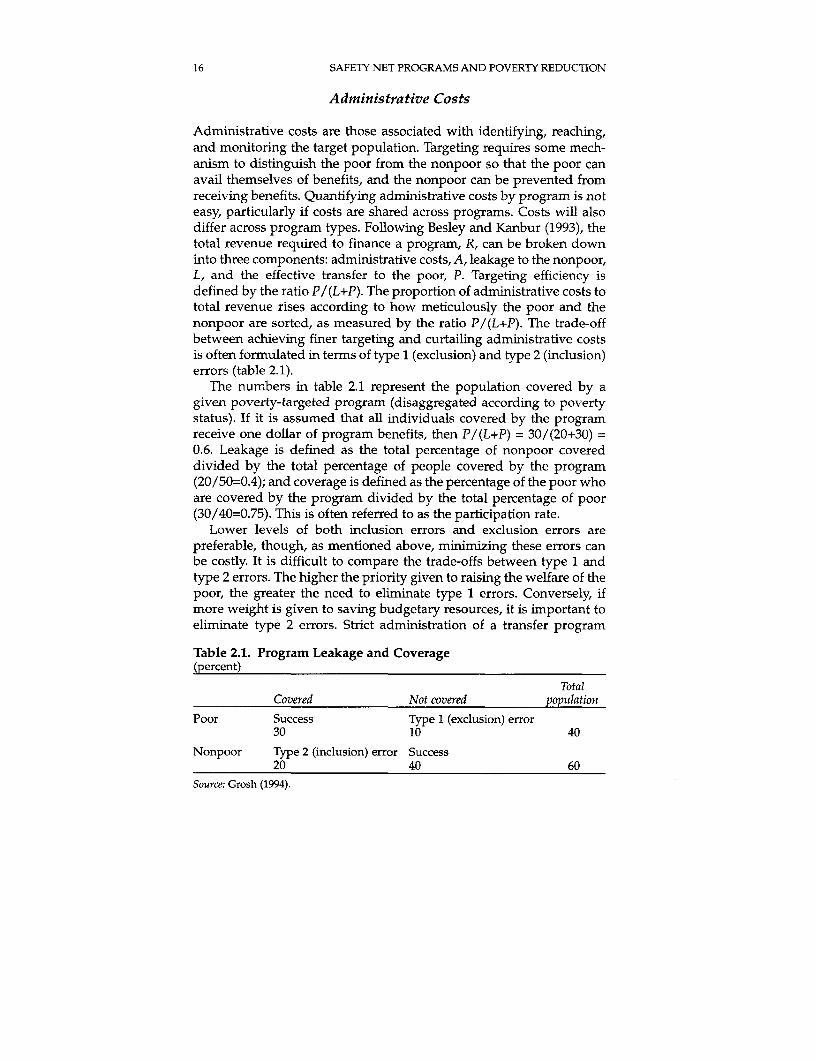
Administrative costs are those associated with identifying, reaching,and monitoring the target population. Targeting requires some mech-anism to distinguish the poor from the nonpoor so that the poor canavail themselves of benefits, and the nonpoor can be prevented fromreceiving benefits. Quantifying administrative costs by program is noteasy, particularly if costs are shared across programs. Costs will alsodiffer across program types. Following Besley and Kanbur (1993), thetotal revenue required to finance a program, R, can be broken downinto three components: administrative costs, A, leakage to the nonpoor,L, and the effective transfer to the poor, P. Targeting efficiency isdefined by the ratio P/(L+P). The proportion of administrative costs tototal revenue rises according to how meticulously the poor and thenonpoor are sorted, as measured by the ratio P/(L+P). The trade-offbetween achieving finer targeting and curtailing administrative costsis often formulated in terms of type 1 (exclusion) and type 2 (inclusion)errors (table 2.1).
The numbers in table 2.1 represent the population covered by agiven poverty-targeted program (disaggregated according to povertystatus). If it is assumed that all individuals covered by the programreceive one dollar of program benefits, then P/(L+P) = 30/(20+30) =0.6. Leakage is defined as the total percentage of nonpoor covereddivided by the total percentage of people covered by the program(20/50=0.4); and coverage is defined as the percentage of the poor whoare covered by the program divided by the total percentage of poor(30/40=0.75). This is often referred to as the participation rate.
Lower levels of both inclusion errors and exclusion errors arepreferable, though, as mentioned above, minimizing these errors canbe costly. It is difficult to compare the trade-offs between type 1 andtype 2 errors. The higher the priority given to raising the welfare of thepoor, the greater the need to eliminate type 1 errors. Conversely, ifmore weight is given to saving budgetary resources, it is important toeliminate type 2 errors. Strict administration of a transfer program
Table 2.1. Program Leakage and Coverage(percent)
TotalCovered Not covered population
Poor Success Type 1 (exclusion) error30 10 40
Nonpoor Type 2 (inclusion) error Success20 40 60
Source: Grosh (1994).
CONCEPTUAL ISSUES 17
may exclude not only some of the nonpoor but also some of the poor.At times, it may be prudent to deliberately allow leakage so as not toexclude any of the poor.
Whether it is worth incurring the administrative costs to improvethe targeting efficiency of a program depends not only on how well thetargeting mechanism screens eligible persons but also on the value ofthe benefit delivered. Administrative costs are determined by the levelof targeting (self-targeting is less costly than geographic targeting, andindividual assessment is the most costly); the level of automation andinformation exchange (computers that hold data on all governmentprograms reduce the cost of income testing an individual); theincome/asset profile of the country (formal income is relatively easy toassess, whereas informal income and the value of land is difficult toassess); and the frequency of change in the benefit rate (the needs of apensioner are likely to remain unchanged, whereas the needs of anunemployed family member could change frequently). A judgmentmust be made about the administrative costs of a benefit relative to theprogram costs. Grosh (1994) estimates (across various programs andcountries) that targeted transfers cost about 3-8 percent more than asimilar universal transfer.
Administrative costs also vary with the type of mechanism used,the level of existing information, the institutional capacity of a country,and the local costs of personnel and equipment needed to carry out thetargeting.
Incentive Costs
Targeting schemes may foster both positive and negative incentiveeffects. Three negative incentive effects that may outweigh the benefi-cial impact of targeting are distortions in the labor-leisure choice,migration to advantaged areas, and the unproductive use of resourcesor time (moral hazard problems). Targeted programs can also fosterpositive incentives: a food subsidy targeted to parents whose childrenattend school encourages higher school enrollments.
The disincentive to work is one problem associated with programstargeted according to a means test (usually income). Agents maychange their behavior by altering their labor supply and hence theirincome. For example, imagine a means test that proposes a monthlyincome of $350 as an eligibility threshold. Individuals with a monthlyincome less than $350 are eligible to receive $50 in benefits with nowork requirement. Individuals with monthly incomes in the range$350-$399 (in the absence of the program) would be better off adjust-ing their labor supply to earn just less than $350, thus qualifying forthe $50 income supplement. Their incomes would be higher than
18 SAFETY NET PROGRAMS AND POVERTY REDUCTION
before, and they would be better off. But society as a whole would losetheir output. Furthermore, program costs would go up since the num-ber of claimants would go up.2 Programs can also generate disincen-tive effects in the community-a generous food subsidy may lowercommunity self-help efforts.
To the extent that marginal tax rates affect incentives to work, andthus income, income is an endogenous variable and depends on thetax rate implicit in the targeted program (Besley and Kanbur 1993).With a 100 percent marginal tax rate, no one with an income below thepoverty threshold would have an incentive to work-they wouldinstead choose to receive government payments to pull them out ofpoverty. But if all those with incomes below the poverty line chose notto work, the financial burden of the transfer would rise substantially,since each person below the poverty line would require a transferequal to the full poverty gap. This result implies that the marginal taxrates on the rich would have to be higher to finance the program'sincreased costs. In turn, the rich would now have fewer incentives towork (since their incomes are being taxed away), meaning less rev-enue would be available for the intervention. Thus labor supplyeffects are important, though only some targeted programs haveadverse effects.
Relocation is another potentially undesirable effect. If benefits aretargeted geographically, people might have an incentive to migrate toareas covered by benefits. If the bulk of the movers are poor, then anincrease in costs is justifiable, since more of the poor are being covered.But if better-off households also move, then program costs wouldincrease without justification. If the relocation also causes problems,such as congestion in service delivery and a reduction in the numberof benefits available per eligible person, the net costs to society couldbe large. The extent of the relocation effect depends on the size oramount of the benefits gained relative to the moving costs. If the richhave access to more efficient transportation and information networks,their unit costs of transportation may be low, and the relocation effectcould be quite large.
Incentive compatibility problems also give rise to undesirable pro-gram effects. For example, in a child nutrition program rations givento children are planned according to what children were fed beforethey entered the program. Two kinds of incentive compatibility prob-lems may arise. Mothers may feed children less (because they knowthey are being fed in nutrition programs) so that other members of thehousehold can eat more (adverse incentive problem). Or, an inadver-tent moral hazard problem may arise because the nutritional status ofthe children does not improve. Thus these children must stay in theprogram for a longer period. 3
CONCEPTUAL ISSUES 19
Dreze and Sen (1989) provide a rather drastic example of the adverseincentive problem. If food supplements in a nutrition program arebased on children's nutritional status, mothers may have an incentiveto gain eligibility by underfeeding their children before weighing them.Even though there is little empirical evidence to support this example,this type of behavior would generate a "deadweight" loss, since awedge is created between private and social (collective) welfare.
Stigma Costs
Stigma is a possible negative consequence of means-tested govern-ment transfer programs. It arises from two main sources. First, recipi-ents may lose their self-esteem because they regard themselves as fail-ures who must rely on public support. In such cases needy people areunnecessarily screened out. Second, nonrecipients may have negativeattitudes toward recipients, and recipients may be treated differentlyfrom nonrecipients by both program officials and the general public.4
Individuals not wanting to be classified as needy could refuse subsi-dies and depress the take-up rate.
Stigma may not act as a deterrent to the nonpoor, particularly if thereceipt of one transfer offers access to other transfers or privileges. Or,stigma may assist in targeting. Requiring welfare recipients to performmenial tasks may impose relatively smaller costs on the intended recip-ients who have very limited options anyway, while deterring impostorswho may have other attractive options (Nichols and Zeckhauser 1982).5
Political Economy Costs
Targeting raises interesting political economy issues. First, any inter-vention creates losers as well as gainers. The goal is to transferresources from the gainers to the losers so that the losers are just com-pensated for their losses, while the gainers are still better off than theywould have been without the targeted intervention. But the distribu-tion of political power in a country may not permit this goal to be real-ized. Second, the interests of the different players involved in admin-istering the program will shape how it is eventually implemented. Thepoorest strata of society are often the most difficult and costly to reach,and therefore intervention efforts tend to focus on the most vocal andorganized groups, which are not necessarily poor. Third, very fine tar-geting may sometimes run counter to the interests of the poor. If aprogram is well-targeted and the poor are relatively disenfranchised,the program may have scant political support and be allotted a smallbudget. In contrast, a broadly targeted program may elicit greaterpolitical support and a larger budget. 6
20 SAFETY NET PROGRAMS AND POVERTY REDUCTION
Good targeting should increase take-up rates among intended ben-eficiaries and reduce leakage. It should minimize distortions, reduceprogram costs, and distribute scarce public resources fairly and effi-ciently. These objectives invariably imply difficult trade-offs. Leakageis minimized only at the expense of higher administrative costs. Finertargeting carries some benefits, but it also imposes costs and distor-tions, and may lead to loss of political support. The decision to targetmore finely, therefore, hinges on the balance between these benefitsand costs, which vary from country to country depending on the eco-nomic, political, and social fabric of specific economies. These consid-erations imply that targeting mechanisms should provide incentivesfor the target group (and no others) to seek the subsidy.
Targeting Mechanisms
The mechanisms used to identify the poor can be classified accordingto three broad categories: individual targeting, geographic or indicatortargeting, and self-targeting. Any of these types of targeting could beapplied to the individual or the group. This flexibility is importantbecause some of the information and incentive problems that seemdaunting at the individual level may not be so at the group level.
An example of an individual assessment is a means test that ascer-tains whether household income is below the cutoff point. The test useseither income, nutritional status, or type of dwelling (with or withoutelectricity, toilet, and so on) as a criterion. If it is possible to conduct a"perfect" means test, cash transfers dominate other forms of interven-tions because they carry only an income effect and do not distort pri-vate consumption decisions at the margin. But because of the informa-tional and administrative constraints, means testing may not be perfectand may induce costly leakages and create adverse incentives.7
These considerations have led to a variety of schemes for indicator tar-geting, whereby transfers are made contingent on some correlates ofpoverty. Geographic and indicator targeting mechanisms grant eligibili-ty to groups of individuals on the basis of an easily identifiable sharedcharacteristic. The idea is to find an indicator that is less costly to identi-fy (than income) but is sufficiently correlated with income to be useful foridentifying the poor (Besley and Kanbur 1993). Although some leakageis inevitable, the cost of leakage can be offset in part by reduced admin-istrative costs. The indicators used for targeting should not be easilymanipulable during the course of the intervention since adverse incen-tive effects could result. For example, individuals might fake attributesthat would qualify them for assistance (such as ownership of land orother durable assets) or change their behavior to legitimately acquiresuch attributes. Indicators that are good predictors of income are land
CONCEPTUAL ISSUES 21
ownership, house (floor area) or other durable asset ownership, numberof children, level of education, and so on. Most of these indicators areeasy to observe and difficult to manipulate in the short run. But if thenumber of indicators increases, the situation may degenerate to one inwhich every individual is "tagged" separately, enhancing administrativecosts.8 Geographic targeting allocates resources to states, municipalities,or neighborhoods based on their average welfare leveL The headcountindex is commonly used to establish a geographic ranking of poverty.
Alternatively, combinations of region, residence, and householdcharacteristics could be used, as in Colombia, where areas of povertywere first identified as part of the national development plan. Foodsubsidies were then targeted to households with children under five,or to pregnant or lactating mothers. Prospects for reaching the poorthrough regional and indicator targeting depend on a number of fac-tors, including local administrative infrastructure, the incentives fac-ing local administrators, their social relations with the poor, and theextent of political representation of the poor.
Self-targeting occurs when a program is ostensibly available to allbut is designed to discourage the nonpoor from participating. Forexample, participants can be requived to work, as in public employ-ment programs. Alternatively, a low-quality product could be subsi-dized, inducing the nonpoor to stay away from the program. If indi-viduals are heterogeneous with respect to ability and tastes, then in-kind transfers of goods or services preferred by the target group mayhelp ward off impostors (Nichols and Zeckhauser 1982). For example,subsidies on coarse flour in Egypt accrued disproportionately to lower-income groups. It is not always easy, though, to obtain accurate infor-mation about the preference structure of individuals. Nevertheless, animportant advantage of self-targeted programs is that they are less vul-nerable to admninistrative corruption and bureaucratic manipulation.
One problem with all targeted approaches is that along with thenonpoor, some of the very poor may also be screened out. Self-targetedapproaches are no exception. For instance, self-selection methods oftargeting used in public employment schemes by lowering wage ratesdo screen out the nonpoor, but some of the poor may also be screenedout in the process. The aged, the infirm, or the physically handicappeddo not participate in such schemes. Thus countries depending largelyon self-targeted public works programs must develop other programsto protect vulnerable groups that are unable to work.
The Choice between Cash and In-Kind Transfers
In theory, cash transfers are preferable to in-kind transfers becausethey do not distort individual consumption or production choices at
22 SAFETY NET PROGRAMS AND POVERTY REDUCTION
the margin. But only rarely would actual country conditions allow thisproposition to be true. Less-than-ideal circumstances (such as the costsinvolved in conducting means tests) often tilt the choice in favor of in-kind subsidies.
There are situations when in-kind transfers are equivalent to cashtransfers. For example, a ration of commodity x at a unit price r (wherer < p is the price to the target group, and p is the market price) is equiv-alent to a lump-sum transfer of m dollars-that is, m = (p - r)x. Thisequivalence holds providing there are no restrictions on (or exorbitantcosts to) the resale of the subsidized commodity. Even if the subsidizedcommodity cannot be physically resold (as in the case of educationand health services), there may still be an equivalence to a lump-sumtransfer under specific conditions. This equivalence can arise if house-holds prefer as much or more of the free commodity (inframarginaltransfer), in which case the composition of consumption is not affect-ed (Gill, Jimenez, and Shalitz 1991).
Where means tests are imperfect and costly, in-kind transfers may bepreferable to cash transfers. When information is less than perfect, gov-ernments must develop mechanisms that enable members of the targetgroup to select a consumption bundle different from the one offered tothe nontarget group. Since governments cannot distinguish betweenindividuals, the provision of subsidies with a self-selection mechanismwill weed out impostors and constrain program costs (such as subsi-dizing coarse grains consumed only by the poor). While such in-kindsubsidies may cause distortions at the margin, these deadweight lossesmay be outweighed by the decline in leakage. And in some countrieswith high levels of inflation in-kind transfers have higher real denomi-nations than nonindexed cash transfers. This difference occurs onlybecause the program provider absorbs the cost of inflation when mak-ing an in-kind transfer, while, without indexation, the recipient absorbsthat cost. For that reason governments may think they have greatercontrol over the cost of cash transfers. In countries with weak institu-tional and administrative capacities it may be easier to implement in-kind subsidies than cash transfers. In-kind transfers can also be used toreduce intrahousehold discrimination against women or children. Thusinformation gaps, inflationary conditions, and the need to realize spe-cific policy goals (household food security, nutrition to children) mayinduce governments to opt for in-kind transfers. 9
When in-kind subsidies are chosen, one question that arises imme-diately is which commodity to subsidize? In theory, the governmentshould try to find commodities that form a significant part of the poor's(but not the nonpoor's) food expenditures. The chosen goods do nothave to be inferior goods, but they must be goods that are consumeddisproportionately by the poor when their prices drop. If these com-
CONCEPTUAL ISSUES 23
modities are consumed only by households below the poverty line,leakage will be eliminated. But because it is difficult to isolate com-modities that only the poor consume, errors of exclusion may still arise.
Conclusion
Poverty-targeted interventions could be provided to the entire popu-lation or aimed at only certain individuals. Because of informationgaps, perfect targeting is rarely achieved. The decisions of whether ornot to target, which targeting mechanism to use, and how to targetdepend on the economic and opportunity costs of targeting, negativeincentive effects, the size of the target group relative to the total popu-lation, the prevailing differences in consumption patterns between thepoor and the nonpoor, the characteristics of the commodity or servicesselected for targeting (including the size of demand and income elas-ticities), and administrative capability and political economy consider-ations. In particular, minimizing leakage and reducing costs simulta-neously may involve trade-offs. It is important to be aware of theselimitations, even if it is not possible to estimate the leakage and costsassociated with targeted programs.
Notes
1. This chapter draws from Barr (1995), Besley and Kanbur (1993), Lipton andRavallion (1995), and Gill, Jimenez, and Shalitz (1991).
2. For a thorough treatment of the incentive effects on labor supply see Besley andKanbur (1988) and Kanbur, Keen, and Tuomala (1994).
3. Kennedy and Alderman (1987) discuss the conceptual issues and empiricalevidence associated with program leakage of this kind. Pinstrup-Andersen (1988a) pro-vides estimates of this type of leakage.
4. See Besley and Coate (1991) for additional details regarding the ramifications ofstigma associated with targeting.
5. While the problem of stigma is much referred to in the literature on transfer pro-grams, there is very little empirical evidence on this issue. Ranney and Kushman (1987)examine this problem in the context of food stamps in the United States.
6. The history of food subsidies in Sri Lanka since 1977 is a case in point. With the intro-duction of targeting the poor lost the support of the middle class, and the real value of foodstamps was allowed to depreciate. Similarly, a food subsidy directed to the poor inColombia was so tightly targeted that it lacked an effective pohtical constituency and wasdropped subsequently with a change of government. A broadly targeted program mayfoster links between the middle dass and the poor, though at a higher budgetary cost.
7. An interesting counterexample of a successful means test based on communityidentification is provided by the Antyodaya Program in Rajasthan, India, where the vil-lage elders decide which are the poorest ten families in the village.
8. Ravallion and Chao (1989) illustrate the intuitive proposition that the percentagegains from targeting using indicators are greater when budgetary resources are smaller.See also Glewwe and Kannan (1989) and Grosh and Baker (1995).
9. Basu (1996) argues that in-kind transfers also insulate nonrecipients against sup-ply pressures that cash transfers may create.

�j
3Cross-Country Patterns
of Cash Transfers
This chapter reviews cross-country experience with providing cashtransfers for poverty reduction, and explains differences in the typeand scale of programs adopted among regions.1 The review highlightsissues most relevant to the design and implementation of cashtransfers. Cash benefit programs are frequently designed to help indi-viduals and families with incomes just below the poverty line. Often,the programs require that only small amounts of assistance go to theindividual or family. A dearth of reliable household data limits thescope for determining how effectively cash transfer programs meettheir objectives. Nevertheless, wherever possible, the implications ofvarious programs and targeting mechanisms for reducing poverty arediscussed.
Common cash transfer programs include social assistance programsand family assistance programs. Social assistance refers to a range ofbenefits given in cash or in-kind intended to protect the most needypersons in society. Family assistance refers to all benefits given in cashor in-kind targeted directly to children or families with children. Theseprograms are found in various forms in different countries. All havethe same primary objective: poverty relief. But the secondary objec-tives vary widely Social assistance has the greatest impact when it istargeted to the poorest and most vulnerable. In most countries chil-dren greatly outnumber adults in households with incomes that arebelow the poverty level. Thus family assistance will help reducepoverty even when provided to all children.
Family assistance and social assistance often have very differentobjectives. Consequently, seemingly similar programs can have differ-ent outcomes. It is possible to draw conclusions about the effectivenessof one scheme compared with another in terms of costs and effects onpoverty-but it is wrong to attempt to rank the outcome indicatorsbecause of differing objectives. This point is important to many coun-tries of Eastern Europe and the former Soviet Union that seek to
25
26 SAFETY NET PROGRAMS AND POVERTY REDUCTION
emulate Western European models without determining the bestmodel for their specific situation and the best time scale for movingfrom one model to another.
A cross-country comparison suggests that social assistance and fam-ily assistance are used in two different ways. OECD countries usesocial and family assistance as part of a broader social safety net pro-gram, which often features a social insurance program. Developingeconomies in Africa, South Asia (and part of India), and parts of LatinAmerica rely more on social and family assistance as the primarytransfer mechanism in their social safety net.
Countries of Eastern Europe and the former Soviet Union are in aconfused position because their inherited social safety nets were builtaround a social insurance program. Their starting point was thereforemore akin to the OECD model. But the changes during transition havebeen great: loss of secure incomes, steeply rising unemployment,increasing inability to fund social insurance programs, and risingnumbers of poor spread throughout society rather than in isolated andidentifiable groups. Such changes have forced these countries to cutback on social insurance programs and rely more on social and familyassistance programs. Because they now rely so much on social andfamily assistance, their position is more akin to that of developingcountries.
Designing the best system for the countries of Eastern Europeanand the former Soviet Union is difficult because their economies are intransition. The problems of poverty are emerging in different sectionsof the community and are changing at different rates. Also, the inher-ited family assistance and social assistance schemes had differentobjectives. These countries will require a variety of long-term cashtransfer systems for the poor. The type of system will depend on thespeed of transition and on the emphasis given to different aspects oftransition. The policy context of the chosen system will depend on thelong-term prognosis for the economy in general and the social welfaresystem in particular. It would be helpful, therefore, in designing sys-tems for economies in transition, to compare objectives and outcomesin developed economies with those in developing or emerging marketeconomies.
Family Assistance
Family assistance programs are usually tied to the number of childrenin a household. Family assistance can have two main financial objec-tives: to smooth consumption over the life cycle by maintaining percapita household income with each additional child or to maintain alevel of income that allows one parent to care for the children full-time.
CROSS-COUNTRY PATTERNS OF CASH TRANSFERS 27
In some economies family assistance also has other pronatal objectives.For example, given the aging populations and acute labor shortages, inthe former Soviet Union, family assistance was employed to promotehigh fertility rates (Sipos 1994).
Several mid- to high-income countries (such as Argentina, Brazil,Chile, and Uruguay) in Latin America have adopted family assistanceprograms. They usually help people covered by social insurance,mainly the nonpoor. Family assistance in Latin America accounted forbetween 3 and 14 percent of total social security spending in 1988(Mesa-Lago 1990).2
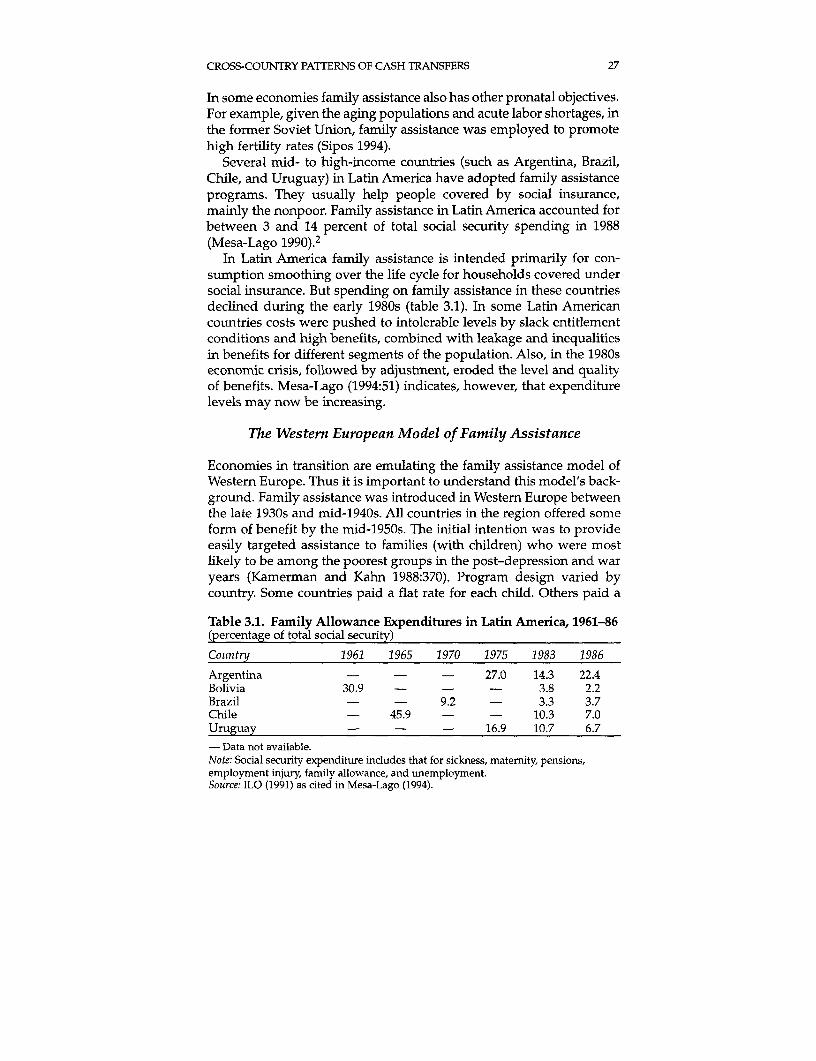
In Latin America family assistance is intended primarily for con-sumption smoothing over the life cycle for households covered undersocial insurance. But spending on family assistance in these countriesdeclined during the early 1980s (table 3.1). In some Latin Americancountries costs were pushed to intolerable levels by slack entitlementconditions and high benefits, combined with leakage and inequalitiesin benefits for different segments of the population. Also, in the 1980seconomic crisis, followed by adjustment, eroded the level and qualityof benefits. Mesa-Lago (1994:51) indicates, however, that expenditurelevels may now be increasing.
The Western European Model of Family Assistance
Economies in transition are emulating the family assistance model ofWestern Europe. Thus it is important to understand this model's back-ground. Family assistance was introduced in Western Europe betweenthe late 1930s and mid-1940s. All countries in the region offered someform of benefit by the mid-1950s. The initial intention was to provideeasily targeted assistance to families (with children) who were mostlikely to be among the poorest groups in the post-depression and waryears (Kamerman and Kahn 1988:370). Program design varied bycountry. Some countries paid a flat rate for each child. Others paid a
Table 3.1. Family Allowance Expenditures in Latin America, 1961-86(percentage of total social security)
Coutntry 1961 1965 1970 1975 1983 1986Argentina - - - 27.0 14.3 22.4Bolivia 30.9 - - - 3.8 2.2Brazil - - 9.2 - 3.3 3.7Chile - 45.9 - - 10.3 7.0Uruguay - - - 16.9 10.7 6.7
- Data not available.Note: Social security expenditure includes that for sickness, matemity, pensions,employment injury, family allowance, and unemployment.Source: ILO (1991) as cited in Mesa-Lago (1994).
28 SAFETY NET PROGRAMS AND POVERTY REDUCTION
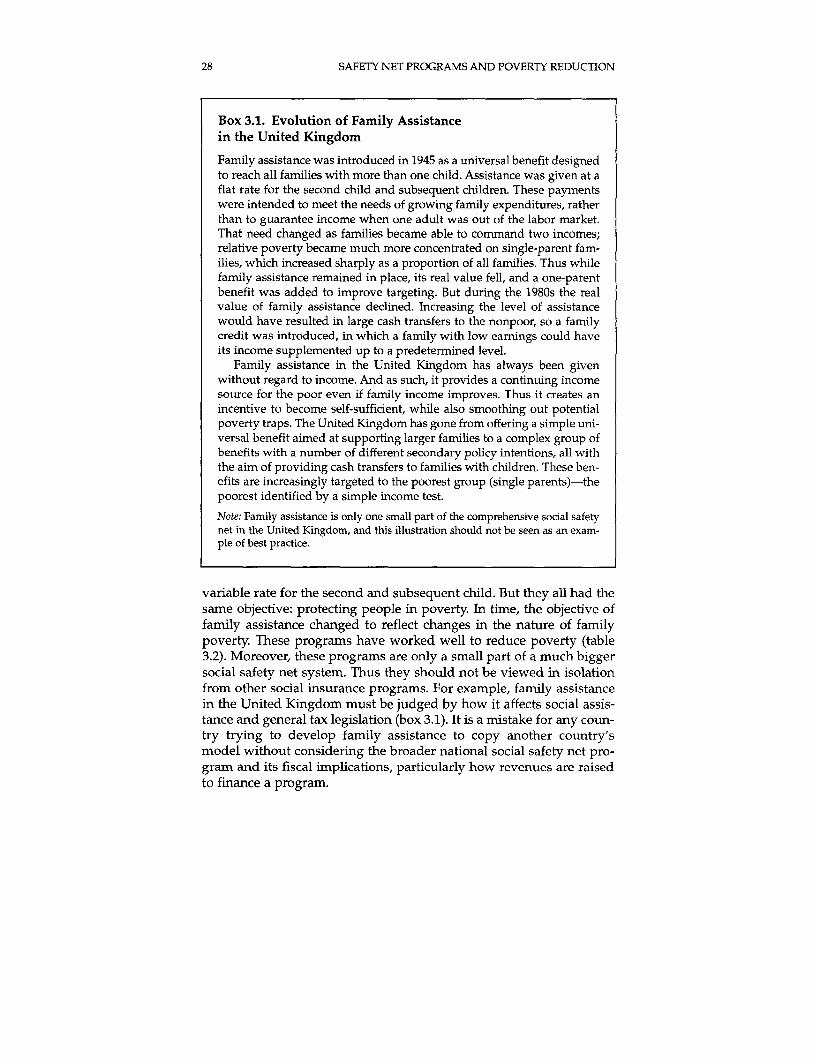
Box 3.1. Evolution of Family Assistancein the United Kingdom
Family assistance was introduced in 1945 as a universal benefit designedto reach all families with more than one child. Assistance was given at aflat rate for the second child and subsequent children. These paymentswere intended to meet the needs of growing family expenditures, ratherthan to guarantee income when one adult was out of the labor market.That need changed as families became able to command two incomes;relative poverty became much more concentrated on single-parent fam-ilies, which increased sharply as a proportion of all families. Thus whilefamily assistance remained in place, its real value fell, and a one-parentbenefit was added to improve targeting. But during the 1980s the realvalue of family assistance declined. Increasing the level of assistancewould have resulted in large cash transfers to the nonpoor, so a familycredit was introduced, in which a family with low eamings could haveits income supplemented up to a predetermined level.
Family assistance in the United Kingdom has always been givenwithout regard to income. And as such, it provides a continuing incomesource for the poor even if family income improves. Thus it creates anincentive to become self-sufficient, while also smoothing out potentialpoverty traps. The United Kingdom has gone from offering a simple uni-versal benefit aimed at supporting larger families to a complex group ofbenefits with a number of different secondary policy intentions, all withthe aim of providing cash transfers to families with children. These ben-efits are increasingly targeted to the poorest group (single parents)-thepoorest identified by a simple income test.
Note: Family assistance is only one small part of the comprehensive social safetynet in the United Kingdom, and this illustration should not be seen as an exam-ple of best practice.
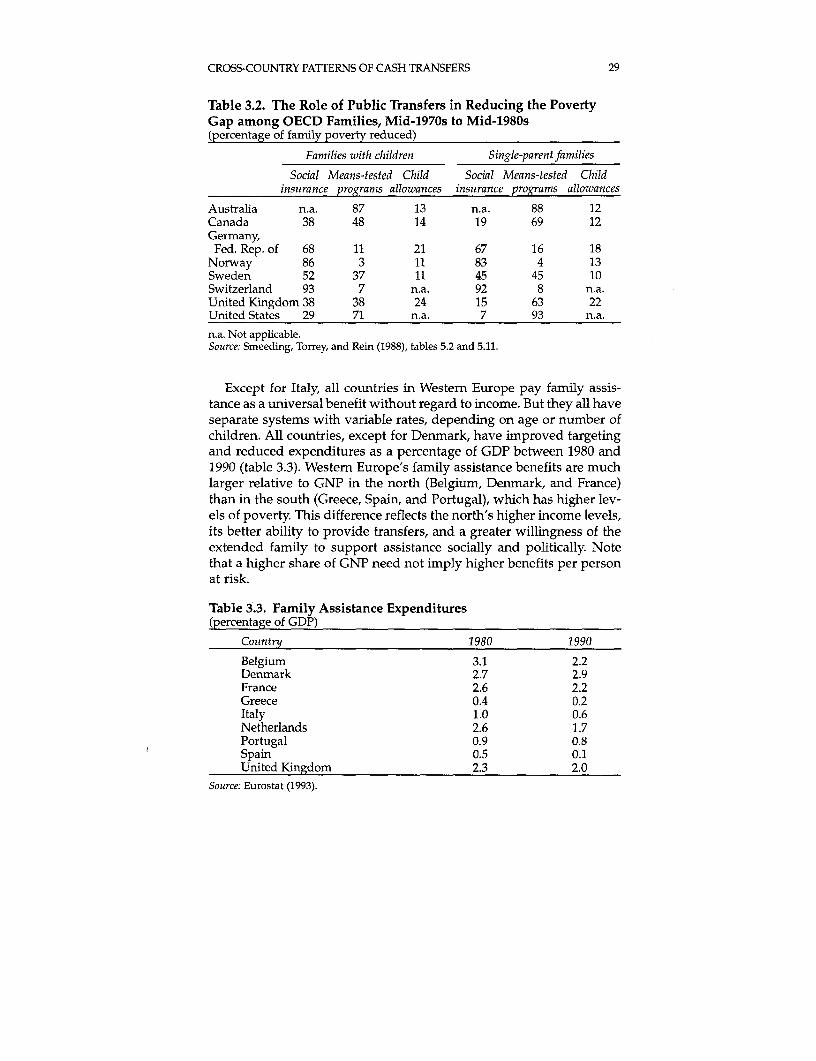
variable rate for the second and subsequent child. But they all had thesame objective: protecting people in poverty. In time, the objective offamily assistance changed to reflect changes in the nature of familypoverty. These programs have worked well to reduce poverty (table3.2). Moreover, these programs are only a small part of a much biggersocial safety net system. Thus they should not be viewed in isolationfrom other social insurance programs. For example, family assistancein the United Kingdom must be judged by how it affects social assis-tance and general tax legislation (box 3.1). It is a mistake for any coun-try trying to develop family assistance to copy another country'smodel without considering the broader national social safety net pro-gram and its fiscal implications, particularly how revenues are raisedto finance a program.
CROSS-COUNTRY PATTERNS OF CASH TRANSFERS 29
Table 3.2. The Role of Public Transfers in Reducing the PovertyGap among OECD Families, Mid-1970s to Mid-1980s(percentage of family poverty reduced)
Families with children Single-parentfamilies
Social Means-tested Child Social Means-tested Childinsutrance programs allowances insutrance programs allowances
Australia n.a. 87 13 n.a. 88 12Canada 38 48 14 19 69 12Germany,Fed. Rep. of 68 11 21 67 16 18
Norway 86 3 11 83 4 13Sweden 52 37 11 45 45 10Switzerland 93 7 n.a. 92 8 n.a.United Kingdom 38 38 24 15 63 22United States 29 71 n.a. 7 93 n.a.
n.a. Not applicable.Source: Smeeding, Torrey, and Rein (1988), tables 5.2 and 5.11.
Except for Italy, all countries in Western Europe pay family assis-tance as a universal benefit without regard to income. But they all haveseparate systems with variable rates, depending on age or number ofchildren. All countries, except for Denmark, have improved targetingand reduced expenditures as a percentage of GDP between 1980 and1990 (table 3.3). Western Europe's family assistance benefits are muchlarger relative to GNP in the north (Belgium, Denmark, and France)than in the south (Greece, Spain, and Portugal), which has higher lev-els of poverty. This difference reflects the north's higher income levels,its better ability to provide transfers, and a greater willingness of theextended family to support assistance socially and politically. Notethat a higher share of GNP need not imply higher benefits per personat risk.
Table 3.3. Family Assistance Expenditures(percentage of GDP)
Country 1980 1990
Belgium 3.1 2.2Denmark 2.7 2.9France 2.6 2.2Greece 0.4 0.2Italy 1.0 0.6Netherlands 2.6 1.7Portugal 0.9 0.8Spain 0.5 0.1United Kingdom 2.3 2.0
Source: Eurostat (1993).
30 SAFETY NET PROGRAMS AND POVERTY REDUCTION
Family Assistance in Economies in Transition
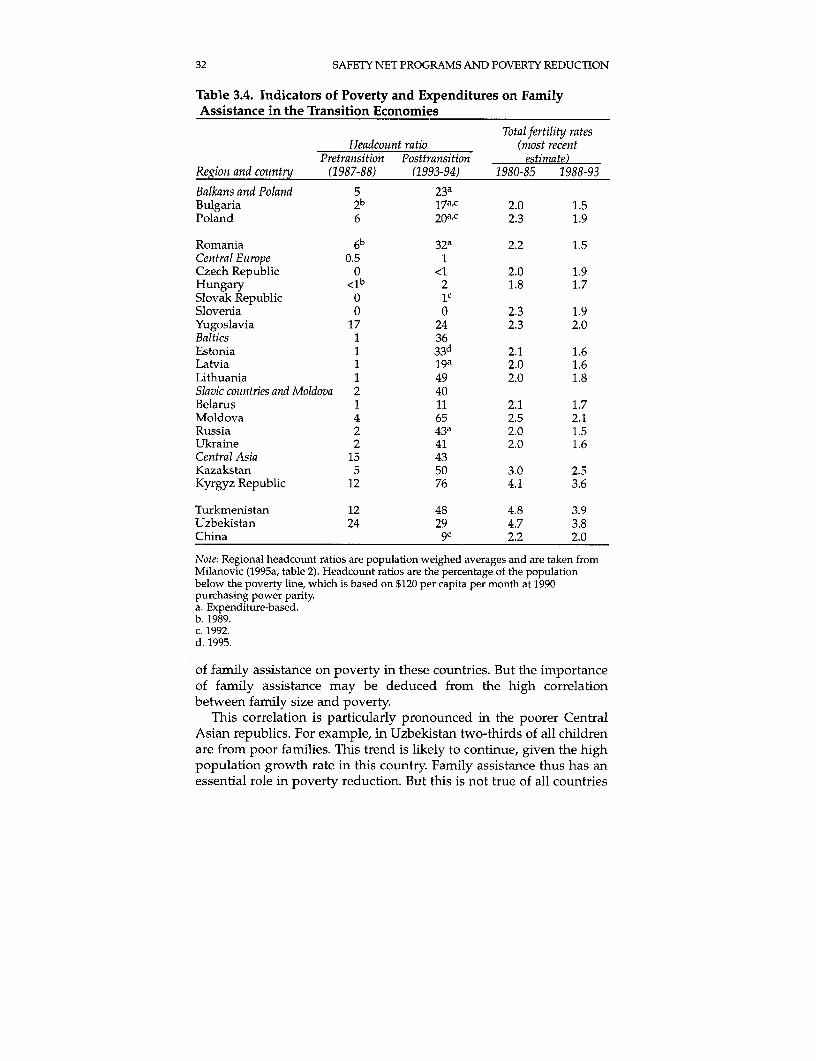
Prior to the transition the objective of family assistance programs inEastern Europe and the former Soviet Union was to maintain a level ofper capita income as family size increased. Assistance was alsoprovided as a supplement to wages. Take-up of the allowance wasalmost universal; administration was handled by the enterprise. Ifboth parents worked or if one parent worked for more than oneemployer, duplicate payments were common. Family assistance nowaccounts for 2-4 percent of GDP among countries in the former Sovietbloc, and up to 7 percent of household expenditures in the KyrgyzRepublic (table 3.4).
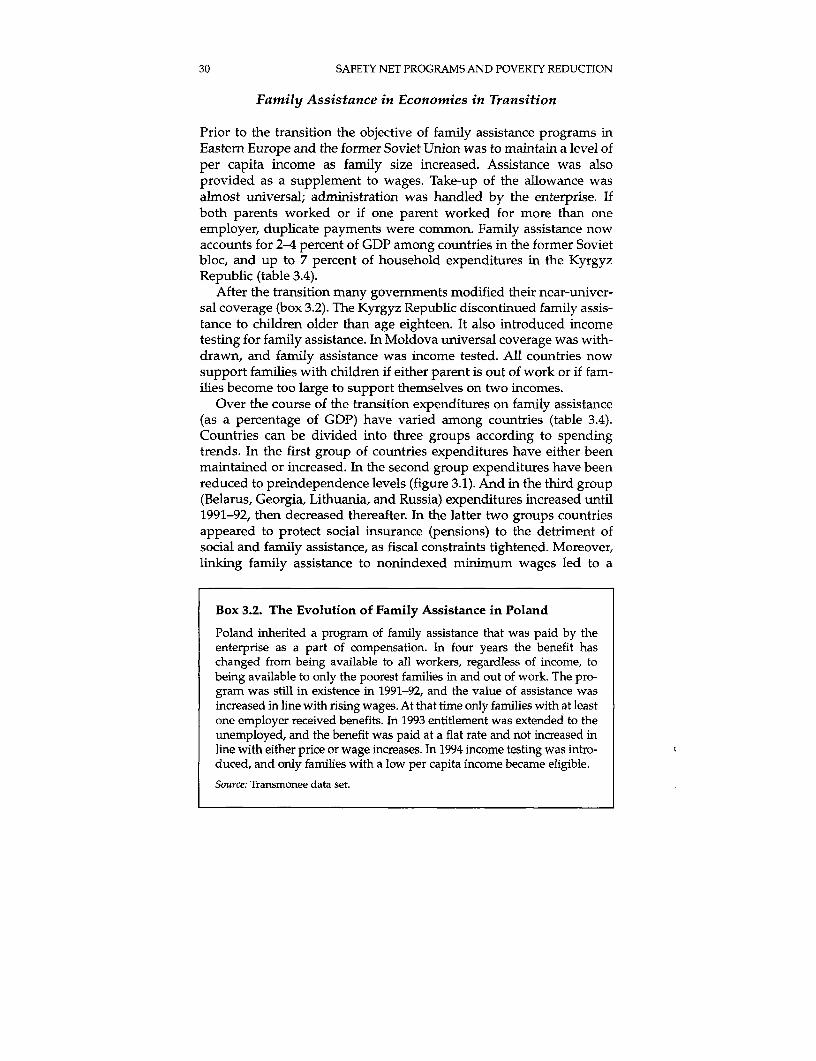
After the transition many governments modified their near-univer-sal coverage (box 3.2). The Kyrgyz Republic discontinued family assis-tance to children older than age eighteen. It also introduced incometesting for family assistance. In Moldova universal coverage was with-drawn, and family assistance was income tested. All countries nowsupport families with children if either parent is out of work or if fam-ilies become too large to support themselves on two incomes.
Over the course of the transition expenditures on family assistance(as a percentage of GDP) have varied among countries (table 3.4).Countries can be divided into three groups according to spendingtrends. In the first group of countries expenditures have either beenmaintained or increased. In the second group expenditures have beenreduced to preindependence levels (figure 3.1). And in the third group(Belarus, Georgia, Lithuania, and Russia) expenditures increased until1991-92, then decreased thereafter. In the latter two groups countriesappeared to protect social insurance (pensions) to the detriment ofsocial and family assistance, as fiscal constraints tightened. Moreover,linking family assistance to nonindexed minimum wages led to a
Box 3.2. The Evolution of Family Assistance in Poland
Poland inherited a program of family assistance that was paid by theenterprise as a part of compensation. In four years the benefit haschanged from being available to all workers, regardless of income, tobeing available to only the poorest families in and out of work. The pro-gram was still in existence in 1991-92, and the value of assistance wasincreased in line with rising wages. At that time only families with at leastone employer received benefits. In 1993 entitlement was extended to theunemployed, and the benefit was paid at a flat rate and not increased inline with either price or wage increases. In 1994 income testing was intro-duced, and only families with a low per capita income became eligible.
Source: Transmonee data set.
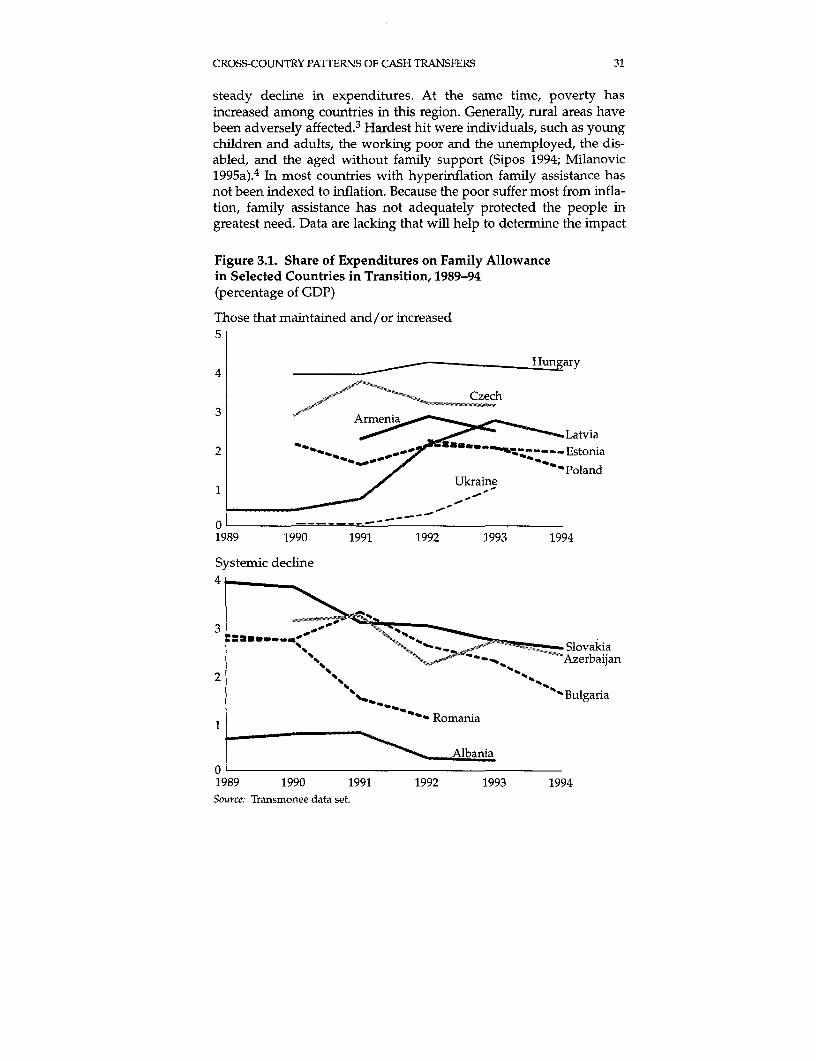
CROSS-COUNTRY PATTERNS OF CASH TRANSFERS 31
steady decline in expenditures. At the same time, poverty hasincreased among countries in this region. Generally, rural areas havebeen adversely affected. 3 Hardest hit were individuals, such as youngchildren and adults, the working poor and the unemployed, the dis-abled, and the aged without family support (Sipos 1994; Milanovic1995a).4 In most countries with hyperinflation family assistance hasnot been indexed to inflation. Because the poor suffer most from infla-tion, family assistance has not adequately protected the people ingreatest need. Data are lacking that will help to determine the impact
Figure 3.1. Share of Expenditures on Family Allowancein Selected Countries in Transition, 1989-94(percentage of GDP)
Those that maintained and/or increased5
4 H gary
3 >,w >_ ~~~~~Czech4
''ArmeniaLatvia
2 7ts"Z**__* _------ EstoniaPoland
1 ~~~~~~~~~Ukraine
1989 1990 1991 1992 1993 1994
Systemic decline4
" -_ - Slovakia" '~~~~-^,^ A~~~~Azerbaijan
2Bulgaria
1 ''* ~~~~~Romania
01989 1990 1991 1992 1993 1994Source: Transmonee data set.
32 SAFETY NET PROGRAMS AND POVERTY REDUCTION
Table 3.4. Indicators of Poverty and Expenditures on FamilyAssistance in the Transition Economies
Totalfertility ratesHeadcount ratio (most recent
Pretransition Posttransition estimate)Region and cointry (1987-88) (1993-94) 1980-85 1988-93
Balkans and Poland 5 23aBulgaria 2b 17a,c 2.0 1.5Poland 6 20a,c 2.3 1.9
Romania 6b 32a 2.2 1.5Central Eutrope 0.5 1Czech Republic 0 <1 2.0 1.9Hungary <lb 2 1.8 1.7Slovak Republic 0 1cSlovenia 0 0 2.3 1.9Yugoslavia 17 24 2.3 2.0Baltics 1 36Estonia 1 33d 2.1 1.6Latvia 1 19a 2.0 1.6Lithuania 1 49 2.0 1.8Slavic couintries and Moldova 2 40Belarus 1 11 2.1 1.7Moldova 4 65 2.5 2.1Russia 2 43a 2.0 1.5Ukraine 2 41 2.0 1.6Central Asia 15 43Kazakstan 5 50 3.0 2.5Kyrgyz Republic 12 76 4.1 3.6
Turkmenistan 12 48 4.8 3.9Uzbekistan 24 29 4.7 3.8China 9c 2.2 2.0
Note: Regional headcount ratios are population weighed averages and are taken fromMilanovic (1995a, table 2). Headcount ratios are the percentage of the populationbelow the poverty line, which is based on $120 per capita per month at 1990purchasing power paritya. Expenditure-based.b. 1989.c. 1992.d. 1995.
of family assistance on poverty in these countries. But the importanceof family assistance may be deduced from the high correlationbetween family size and poverty.
This correlation is particularly pronounced in the poorer CentralAsian republics. For example, in Uzbekistan two-thirds of all childrenare from poor families. This trend is likely to continue, given the highpopulation growth rate in this country. Family assistance thus has anessential role in poverty reduction. But this is not true of all countries
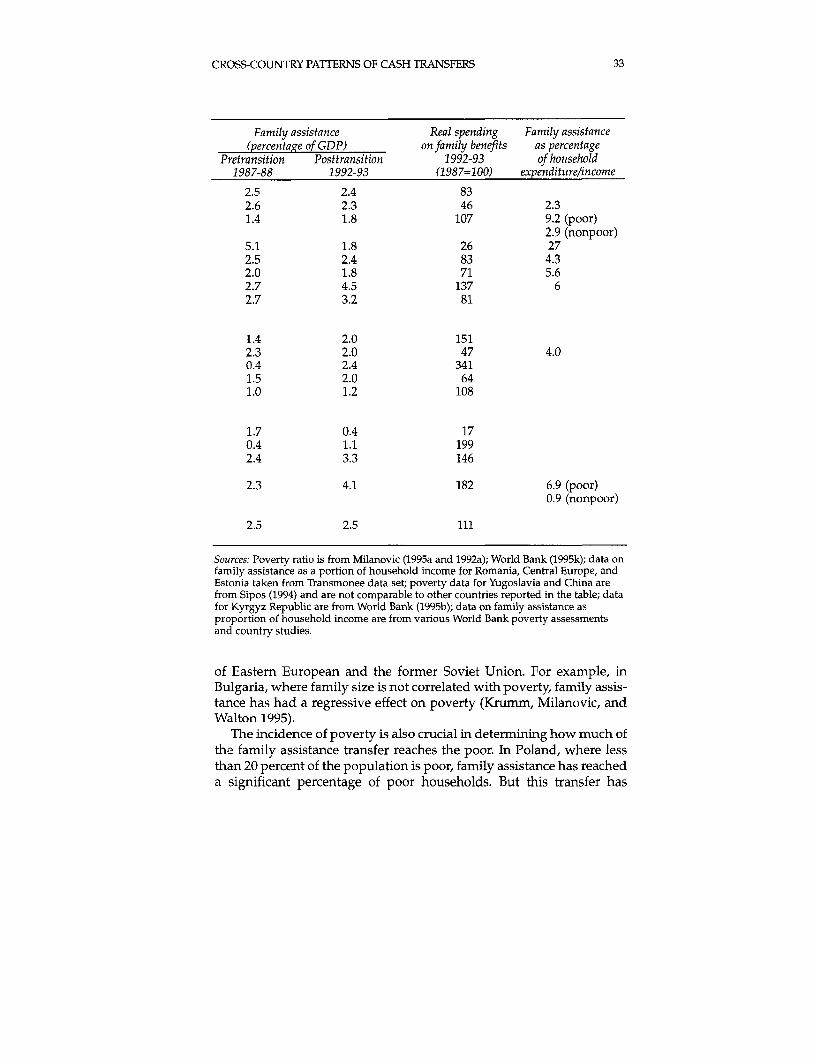
CROSS-COUNTRY PATTERNS OF CASH TRANSFERS 33
Family assistance Real spending Family assistance(percentage of GDP) on family benefits as percentage
Pretransition Posttransition 1992-93 of hotusehold1987-88 1992-93 (1987=100) expenditure/income
2.5 2.4 832.6 2.3 46 2.31.4 1.8 107 9.2 (poor)
2.9 (nonpoor)5.1 1.8 26 272.5 2.4 83 4.32.0 1.8 71 5.62.7 4.5 137 62.7 3.2 81
1.4 2.0 1512.3 2.0 47 4.00.4 2.4 3411.5 2.0 641.0 1.2 108
1.7 0.4 170.4 1.1 1992.4 3.3 146
2.3 4.1 182 6.9 (poor)0.9 (nonpoor)
2.5 2.5 111
Sources: Poverty ratio is from Milanovic (1995a and 1992a); World Bank (1995k); data onfamily assistance as a portion of household income for Romania, Central Europe, andEstonia taken from Transmonee data set; poverty data for Yugoslavia and China arefrom Sipos (1994) and are not comparable to other countries reported in the table; datafor Kyrgyz Republic are from World Bank (1995b); data on family assistance asproportion of household income are from various World Bank poverty assessmentsand country studies.
of Eastern European and the former Soviet Union. For example, inBulgaria, where family size is not correlated with poverty, family assis-tance has had a regressive effect on poverty (Krumm, Milanovic, andWalton 1995).
The incidence of poverty is also crucial in determining how much ofthe family assistance transfer reaches the poor. In Poland, where lessthan 20 percent of the population is poor, family assistance has reacheda significant percentage of poor households. But this transfer has
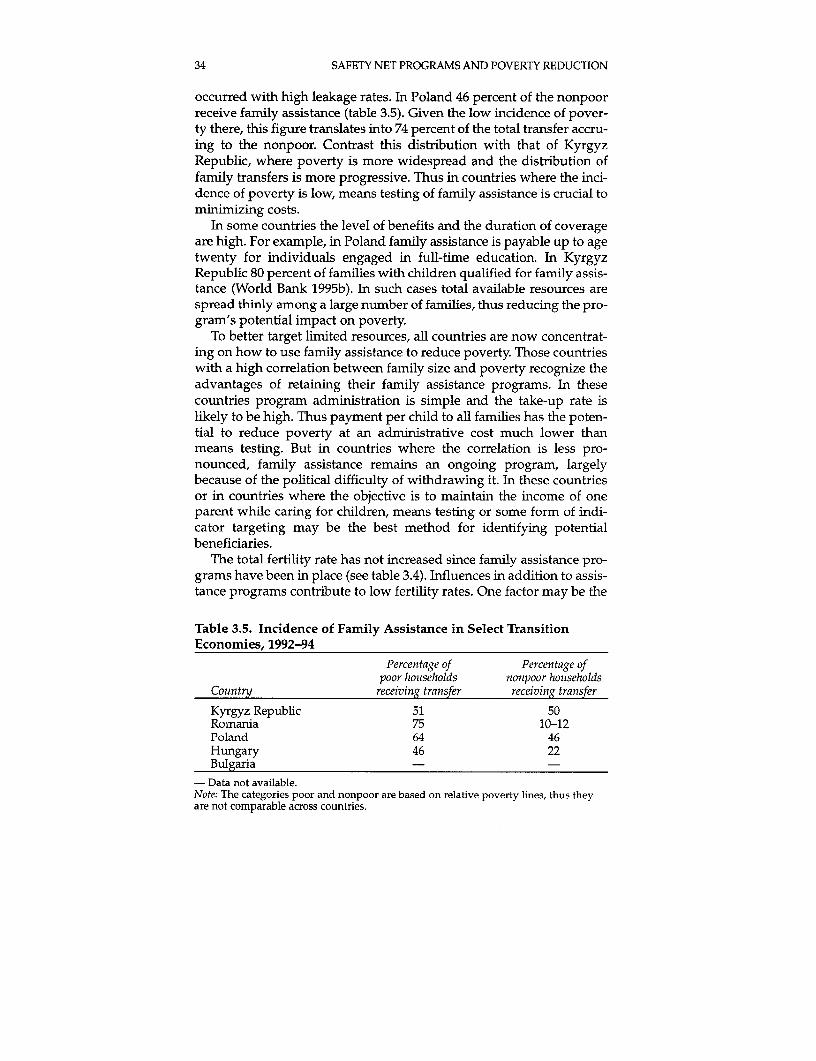
34 SAFETY NET PROGRAMS AND POVERTY REDUCTION
occurred with high leakage rates. In Poland 46 percent of the nonpoorreceive family assistance (table 3.5). Given the low incidence of pover-ty there, this figure translates into 74 percent of the total transfer accru-ing to the nonpoor. Contrast this distribution with that of KyrgyzRepublic, where poverty is more widespread and the distribution offamily transfers is more progressive. Thus in countries where the inci-dence of poverty is low, means testing of family assistance is crucial tominimizing costs.
In some countries the level of benefits and the duration of coverageare high. For example, in Poland family assistance is payable up to agetwenty for individuals engaged in full-time education. In KyrgyzRepublic 80 percent of families with children qualified for family assis-tance (World Bank 1995b). In such cases total available resources arespread thinly among a large number of families, thus reducing the pro-gram's potential impact on poverty.
To better target limited resources, all countries are now concentrat-ing on how to use family assistance to reduce poverty. Those countrieswith a high correlation between family size and poverty recognize theadvantages of retaining their family assistance programs. In thesecountries program administration is simple and the take-up rate islikely to be high. Thus payment per child to all families has the poten-tial to reduce poverty at an administrative cost much lower thanmeans testing. But in countries where the correlation is less pro-nounced, family assistance remains an ongoing program, largelybecause of the political difficulty of withdrawing it. In these countriesor in countries where the objective is to maintain the income of oneparent while caring for children, means testing or some form of indi-cator targeting may be the best method for identifying potentialbeneficiaries.
The total fertility rate has not increased since family assistance pro-grams have been in place (see table 3.4). Influences in addition to assis-tance programs contribute to low fertility rates. One factor may be the
Table 3.5. Incidence of Family Assistance in Select TransitionEconomies, 1992-94
Percentage of Percentage ofpoor households nonpoor houiseholds
Country receiving transfer receiving transfer
Kyrgyz Republic 51 50Romania 75 10-12Poland 64 46Hungary 46 22Bulgaria - -
- Data not available.Note: The categories poor and nonpoor are based on relative poverty lines, thus theyare not comparable across countries.
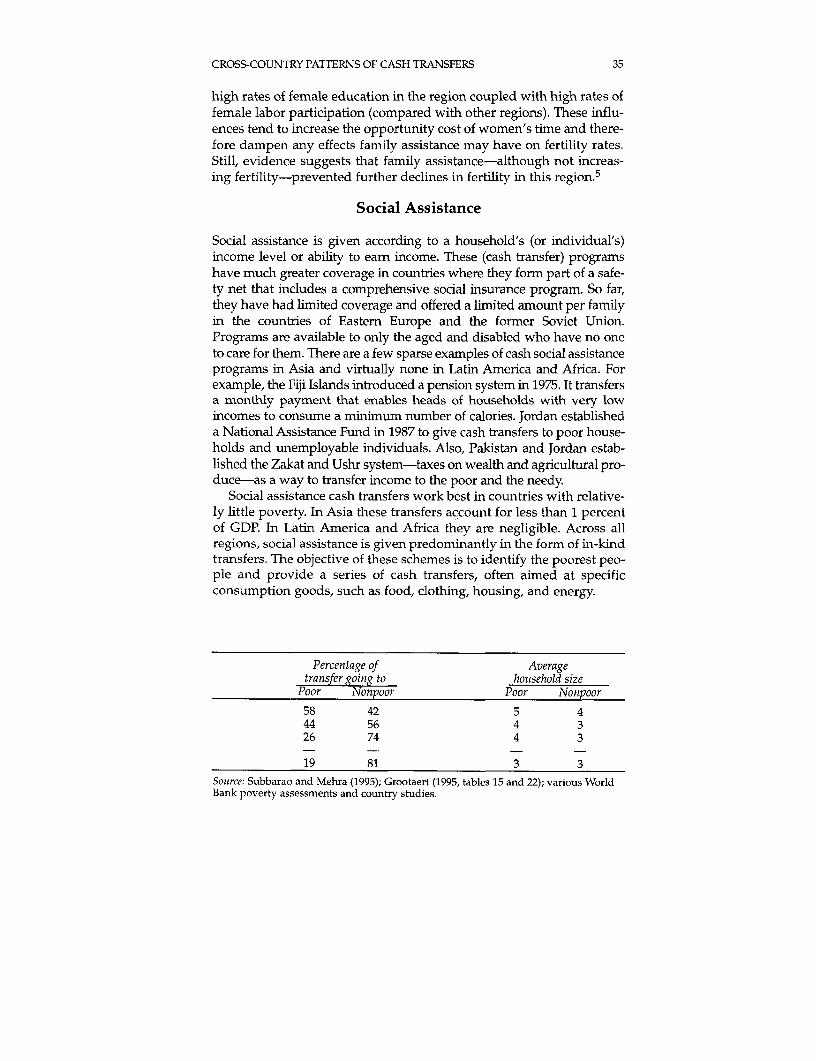
CROSS-COUNTRY PATTERNS OF CASH TRANSFERS 35
high rates of female education in the region coupled with high rates offemale labor participation (compared with other regions). These influ-ences tend to increase the opportunity cost of women's time and there-fore dampen any effects family assistance may have on fertility rates.Still, evidence suggests that family assistance-although not increas-ing fertility-prevented further declines in fertility in this region.5
Social Assistance
Social assistance is given according to a household's (or individual's)income level or ability to earn income. These (cash transfer) programshave much greater coverage in countries where they form part of a safe-ty net that includes a comprehensive social insurance program. So far,they have had limited coverage and offered a limited amount per familyin the countries of Eastern Europe and the former Soviet Union.Programs are available to only the aged and disabled who have no oneto care for them. There are a few sparse examples of cash social assistanceprograms in Asia and virtually none in Latin America and Africa. Forexample, the Fiji Islands introduced a pension system in 1975. It transfersa monthly payment that enables heads of households with very lowincomes to consume a minimum number of calories. Jordan establisheda National Assistance Fund in 1987 to give cash transfers to poor house-holds and unemployable individuals. Also, Pakistan and Jordan estab-lished the Zakat and Ushr system-taxes on wealth and agricultural pro-duce-as a way to transfer income to the poor and the needy.
Social assistance cash transfers work best in countries with relative-ly little poverty. In Asia these transfers account for less than 1 percentof GDP. In Latin America and Africa they are negligible. Across allregions, social assistance is given predominantly in the form of in-kindtransfers. The objective of these schemes is to identify the poorest peo-ple and provide a series of cash transfers, often aimed at specificconsumption goods, such as food, clothing, housing, and energy.
Percentage of Averagetransfer going to household size
Poor Nonpoor Poor Nonpoor
58 42 5 444 56 4 326 74 4 3
19 81 3 3Source: Subbarao and Mehra (1995); Grootaert (1995, tables 15 and 22); various WorldBank poverty assessments and country studies.
36 SAFETY NET PROGRAMS AND POVERTY REDUCTION
For example, the Zakat and Ushr system in Pakistan accounts for 0.3percent of GDP. This program, however, has a limited impact in reduc-ing poverty for several reasons. First, although most recipients ofZakat and Ushr are poor, the program reaches only 2 to 11 percent ofthe poor.6 Second, the method of selection is broad with no standardcriteria; selection is at the discretion of local Zakat committee mem-bers. In fact, selection appears to be strongly related to familiarity withZakat committee members. Also, the status of beneficiaries is not keptup to date; beneficiaries may continue to receive support for yearsafter their initial entry into the program, regardless of their current sta-tus. Third, the amounts received are small and erratic. For example, inKarachi and Dhaka transfers account for only an estimated 1 to 2 per-cent of monthly household spending.
In India only Kerala state has an old-age pension scheme. It targetsextremely needy destitutes. Yet only 20 percent of the extremely needyand destitute receive transfers from this scheme. Also, men benefitmore than women. The reason for this bias lies in the method of tar-geting, which is based on individual application as opposed to village-level participatory decisionmaking. The application procedure limitsaccess of the poor: proof of age, residency, and limited sources ofincome are required. Individuals in targeted age groups are oftenunable to provide proof of age. Proof of residency is difficult for thepoorest and homeless people to furnish, especially in urban areas.Finally, procedures related to providing proof of limited incomesources put a stigma on beneficiaries. A pension for widows hasrecently been introduced in Kerala, however, which corrects for thegender bias of old-age pensions (Dreze 1990).
In China, the Republic of Korea, and Thailand public spending onsocial assistance is low relative to countries with similar per capitaincomes (those in Latin America, Europe, and Central Asia). This pat-tern stems from a tradition of holding social goals in high regard, evenat the cost of private objectives (Kwon 1995). This tradition puts theonus of social assistance on the family and community, rather than thegovernment. Mutual help is encouraged through voluntary efforts ofclans, charitable groups, and religious organizations (Ahmad andHussain 1991; Kwon 1995). For example, spending on social assistancein the Republic of Korea and China reflects an important Confucianethic that emphasizes close solidarity within the family-which is animportant form of safety net. Thus the level of public social assistance(both in-kind and cash) is quite low.7 A similar emphasis on the clan orcommunity is also found in Africa and South Asia.
Like the economies in transition, China based its social assistance inthe urban formal sector on enterprises. In China's rural areas there is asystem for the vulnerable (widows, orphans, and the elderly without
CROSS-COUNTRY PATTERNS OF CASH TRANSFERS 37
family or kin support) called wu bao (translated, "the five guarantees").This system puts more emphasis on preventing the nonpoor from get-ting relief than on ensuring that all the eligible poor are covered. Inaddition, severe social stigma restricts take-up rates and maintains theelderly's reliance on sons (Ahmad and Hussain 1991).
Social Assistance Objectives
As with family assistance, social assistance programs in different coun-tries have different objectives. Small programs not linked to socialinsurance programs aim to ease poverty by identifying the poorestpeople and providing either a single or continuing cash payment. Thesuccess of these programs is directly related to the level of objectivityin the selection process and the level and duration of support given.
Social assistance coupled with a strong social insurance schemeattempts to ensure that the income of an individual (or family) doesnot fall below a predetermined level (that is, a country-specific pover-ty line). To succeed, these programs require a sophisticated adminis-tration capable of identifying and tracking the income of each individ-ual or family on a daily, weekly, or monthly basis. These are theschemes most prevalent in Western European-style economies. Thedevelopment and cost of social assistance programs have grown as thelevel of coverage and the real value of the associated social insurancescheme have fallen. These patterns are evident among the OECDcountries (see table 3.2). In countries where the social insurance pro-gram plays a large role in poverty reduction (for example, Germany,Norway, and Switzerland), social assistance programs play a smallerrole (type "A" countries as defined by Sipos 1994). Their primaryobjective is to ensure that no one falls below the poverty line. Similarly,those countries that ascribe a smaller role to social insurance in pover-ty reduction (for example, Australia and the United States) rely moreon social assistance to reduce poverty (type "B" countries as definedby Sipos 1994).
Social Assistance in Eastern Europeand the Countries of the Former Soviet Union
As a percentage of GDP, cash transfers for social assistance are negli-gible in all of the former centralized economies. There, social assis-tance has a limited effect in reducing poverty. In Poland 9.6 percent ofpoor households receive cash transfers compared with 2.5 percent ofnonpoor households; in Hungary 20.8 percent of the poorest decile ofhouseholds receive social assistance compared with 5.2 percent of thewealthiest decile.
38 SAFETY NET PROGRAMS AND POVERTY REDUCTION
The way social assistance developed in these countries explains thelimited effect of cash transfers. Before the transition cash social assis-tance was a small budget item. It was narrowly targeted to the physi-cally handicapped and the aged, and it was paid at the discretion ofthe social worker without means testing because near-guaranteedemployment protected people of working age, while pensions withhigh replacement rates protected people who were out of the workforce. Also, eligibility for social assistance was not related to any realmeasure of a minimum consumption basket or social policy; instead, itwas based on perceived poverty. As a result, people in poverty tendedto be outside of accepted social norms (nonworking alcoholics, peoplewith long prison records and limited work records). They were theunacceptable poor in society, and their financial security was at thediscretion of the social worker (Ferge 1991; Sipos 1994).
Economic transition worsened poverty. The contraction of enterprisesforced large numbers of people into open unemployment or, where jobshave been artificially maintained, very low earnings have generated aworking poor. Generous social insurance benefits linked more to earn-ings than to years of work cannot continue to be paid at the prevailinghigh levels. In addition, the withdrawal of subsidies on items such asheating, housing, and food hurts most people with low fixed incomes.These changes have increased the number of people in poverty and thespread of poverty across different parts of society. Most countries havereacted by changing their policy design-first, to increase provisions tocope with the increased depth of poverty and second, to increase cover-age to cope with the greater breadth of poverty, improve targeting andefficiency, and reduce costs. This approach has proved difficult and con-fusing for the poor because the legislation has been changed frequently.But changing the policy design is a simple process compared with chang-ing political and public attitudes toward the new poor. The acceptance ofunemployment and poverty in working families is a slow process, and isjust beginning to show. Adopting a more structured approach to identi-fy the poor requires an institutional capacity not yet in place.
Social assistance is not a static problem, particularly in EasternEurope and the former Soviet Union. It is closely related to changes insocial insurance. Since 1990 the old ideals of universal coverage withsome form of social insurance protection have been revised. The newmovement is toward restricting the coverage of universal benefitswhile attempting to target limited resources to the poorest people. Thistrend follows a similar pattern in Western Europe. The northernEuropean countries in the 1940s and 1950s intended to provide uni-versal social insurance without means testing. This practice gave wayin the 1970s and 1980s to restricted social insurance benefits and agreater reliance on means testing.
CROSS-COUNTRY PATTERNS OF CASH TRANSFERS 39
A similar pattern has been emerging in all Eastern European andformer Soviet Union economies since 1990.8 These countries hoped toretain their comprehensive pay-as-you-go pension system and stillprovide a high replacement rate at a low pension age. Rising numbersof pensioners and falling numbers of workers made this objectiveunattainable. Consequently, the scheme began to change to the moretargeted approach of social assistance. The first change was to scaleback social insurance benefits, placing greater reliance on social assis-tance provided as in-kind benefits. Now, a number of countries arereplacing their in-kind programs with cash transfer programs.
Such changes are driven more by the need to contain expendituresthan by a desire to reach the poor. Thus the focus is often on keepingindividuals off the benefit system rather than ensuring full coverage ofthe target population. Such a strategy often reduces the effectivenessof the program. The task of reaching all the poor becomes even harderin transition economies, which have a growing gray-black economyand a legacy of distrusting government.
Cash Transfers in Eastern Europeand Countries of the Former Soviet Union
Economies in transition handle family assistance differently than othercountries because of the cash transfer structure inherited from the pre-vious regime. Were it not for their political history, the current social andeconomic structure of some transition countries would suggest a cashtransfer program aimed directly at the poorest people. Their politicalhistory, however, makes it difficult to enforce such narrow targeting.
Rising Expenditures
Expenditures on total cash transfers increased significantly from1987-88 to 1993 in transition economies (table 3.6). In Poland theincrease has been as high as 9.1 percent of GDP. None of the countrieshas reduced total spending, however, many have increased theirspending on pensions, crowding out the ability to increase spendingon family and social assistance. For example, in Romania expenditureson pensions rose by 2.9 percent of GDP, and overall cash transfers fellby 0.4 percent of GDP, while social assistance expenditures fell by 3.2percent of GDP. By 1993 total expenditures on cash transfers weregreater than 10 percent of GDP in twelve countries in this region andgreater than 15 percent of GDP in four. This rise in expenditures hasforced governments to review their assistance policies and attempt totarget better, reduce spending, and make more effective use of limitedresources.
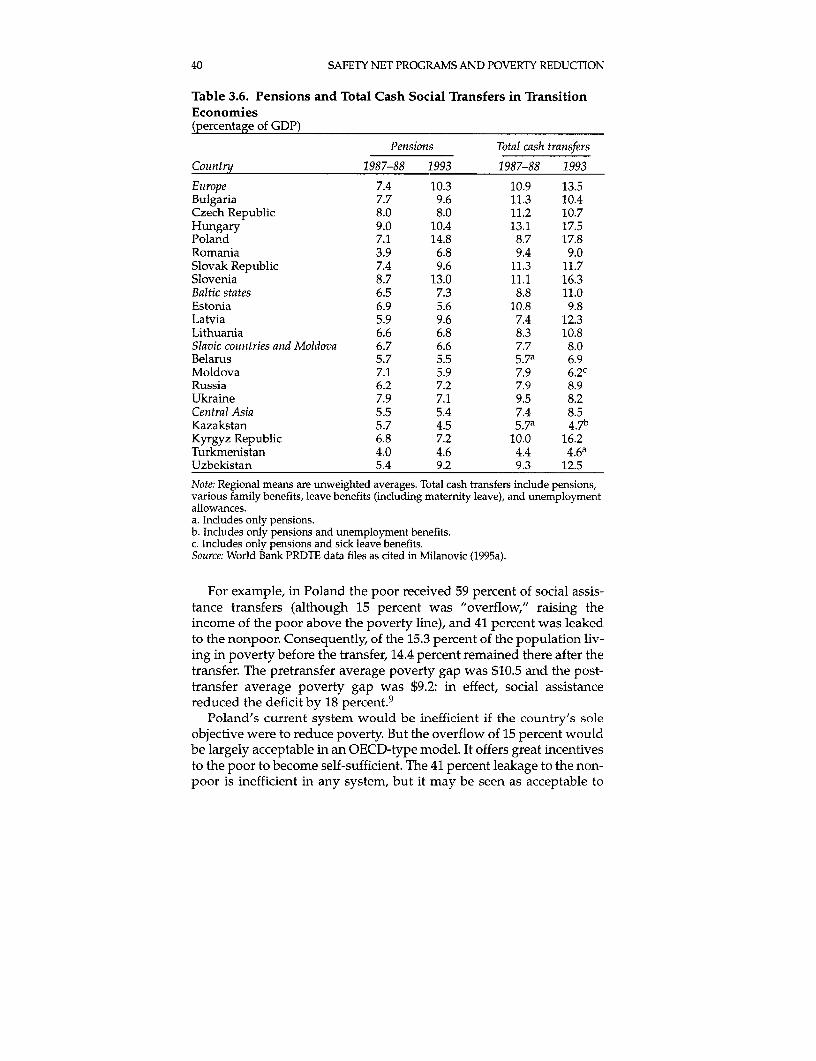
40 SAFETY NET PROGRAMS AND POVERTY REDUCTION
Table 3.6. Pensions and Total Cash Social Transfers in TransitionEconomies(percentage of GDP)
Pensions Total cash transfers
Country 1987-88 1993 1987-88 1993
Eutrope 7.4 10.3 10.9 13.5Bulgaria 7.7 9.6 11.3 10.4Czech Republic 8.0 8.0 11.2 10.7Hungary 9.0 10.4 13.1 17.5Poland 7.1 14.8 8.7 17.8Romania 3.9 6.8 9.4 9.0Slovak Republic 7.4 9.6 11.3 11.7Slovenia 8.7 13.0 11.1 16.3Baltic states 6.5 7.3 8.8 11.0Estonia 6.9 5.6 10.8 9.8Latvia 5.9 9.6 7.4 12.3Lithuania 6.6 6.8 8.3 10.8Slavic courntries and Moldova 6.7 6.6 7.7 8.0Belarus 5.7 5.5 5,7a 6.9Moldova 7.1 5.9 7.9 6.2cRussia 6.2 7.2 7.9 8.9Ukraine 7.9 7.1 9.5 8.2Central Asia 5.5 5.4 7.4 8.5Kazakstan 5.7 4.5 5,7a 4,7bKyrgyz Republic 6.8 7.2 10.0 16.2Turkmenistan 4.0 4.6 4.4 4.6aUzbekistan 5.4 9.2 9.3 12.5
Note: Regional means are unweighted averages. Total cash transfers include pensions,various family benefits, leave benefits (including maternity leave), and unemploymentallowances.a. Includes only pensions.b. Includes only pensions and unemployment benefits.c. Includes only pensions and sick leave benefits.Source: World Bank PRDTF data files as cited in Milanovic (1995a).
For example, in Poland the poor received 59 percent of social assis-tance transfers (although 15 percent was "overflow," raising theincome of the poor above the poverty line), and 41 percent was leakedto the nonpoor. Consequently, of the 15.3 percent of the population liv-ing in poverty before the transfer, 14.4 percent remained there after thetransfer. The pretransfer average poverty gap was $10.5 and the post-transfer average poverty gap was $9.2: in effect, social assistancereduced the deficit by 18 percent. 9
Poland's current system would be inefficient if the country's soleobjective were to reduce poverty. But the overflow of 15 percent wouldbe largely acceptable in an OECD-type model. It offers great incentivesto the poor to become self-sufficient. The 41 percent leakage to the non-poor is inefficient in any system, but it may be seen as acceptable to
CROSS-COUNTRY PATTERNS OF CASH TRANSFERS 41
ensure that 100 percent of the poor receive benefits (as with universalfamily assistance in the United Kingdom). 10
Because of fiscal constraints, poverty reduction must be the short- tomedium-term objective in Easterm Europe and the former SovietUnion. Countries there have taken Western European-style social safe-ty net systems as their models, but their effectiveness and efficiencycan be tested only against basic objectives of poverty reduction. Testedagainst Western European systems, Poland is moving toward an effec-tive system, but tested against the sole objective of poverty reduction,it fails in both effectiveness and efficiency.
Focusing on Poverty Reduction
Constant changes in cash transfer legislation keep policy moving indirections that are not always clear. What is clear is that the objectivesmust be understood before the cash transfer program is designed.Cross-country experience concludes that, given fiscal constraints, cashtransfer systems will be effective and efficient only if the objective ispoverty reduction. Family assistance and targeted social assistance areeffective tools for short-term poverty reduction. Countries vary in howmuch social assistance they can use to reduce poverty in the shortterm. Thus in countries where posttransition poverty is widespread(that is, headcount ratios are exceptionally high, as in the KyrgyzRepublic; 11 see also table 3.4), the role of transfers is limited: there is noalternative to quick resumption of the growth process. In sucheconomies income-generating programs and public works seem morerelevant than transfer programs.
In countries where poverty ratios have not risen to high levels, tar-geting social assistance is critical. The appropriate targeting mecha-nism will depend on the country situation, type of program, and sizeof the target population relative to the nontarget population. Targetingmechanisms should be as simple as possible. One simple indicator isfamily size. Family size is often negatively correlated with householdincome, and the poverty rate among single-parent households can behigh in some countries. But one should use caution in employing theseas the sole indicators of poverty. Data from Russia show that less than8 percent of the very poor are from female-headed households, andonly 9 percent of very poor households have more than three children(see World Bank 1995f). Unless most of the poor are found amongthese households, targeting based on family characteristics may notreach a significant proportion of the poor. Thus the particular methodof targeting adopted can either raise or reduce errors and costs.
The basic problem for many countries in transition is that whilegeneral economic policy pushes individuals to become self-sufficient,
42 SAFETY NET PROGRAMS AND POVERTY REDUCTION
some may not be able to become so. While attempting to move awayfrom central control, the state must decide how involved it should bein smoothing out income variations by providing cash transfers tothose in need. At the same time the state needs to address issues ofeducation, improved access to markets, insurance, and information.
The natural tendency is to try to ensure equality. But wideningwage distributions makes this objective impossible. Protection of thepoorest people requires greater transfers from wealthier people, how-ever, the institutional capacity is not in place to ensure that only thebetter off contribute or only the poorest benefit. In a few countriespoverty is so widespread that the scope for redistributive taxation islimited.
Addressing these issues, many countries of Eastern Europe and theformer Soviet Union are copying Western Europe's model of socialassistance. But they run into a number of problems when trying to tar-get the poorest people with limited resources.* Combining state social insurance and private provisions, the social
safety net policy in Western European countries minimizes the needfor social assistance. Without these inputs the costs would be toogreat, requiring a much more restrictive program.
* As reliance on social assistance increases, the ability to become self-sufficient decreases. Also, the need to design more mechanisms thatdiscourage disincentives to work reduces programs' cost-effective-ness by increasing real economic costs.
* To be effective, social assistance should not be given based onwhether the beneficiary is among the new or old poor. This require-ment often conflicts with the subjective approach to poverty, whichgives better treatment to the aged and disabled (the "acceptable"poor) than to the unemployed and single parents (the "unaccept-able" poor). 12
• Western European-style programs have dealt with these problemsthrough a series of incremental changes over fifty years. Economiesin transition are forced to adapt their programs to rapidly changingsituations over a much shorter period. Financially, countries cannotafford the old universal coverage, and, politically, countries find ithard to cut back on existing programs (see chapter 8). Yet thereappears to be no alternative to concentrating benefits on the poorestif economic and social costs of transition are to be minimized.
Notes
1. Special thanks are due to Sandor Sipos, who provided the authors with unlimitedaccess to the Transmonee dataset. Transmonee is a stand-alone statistical database appli-cation developed by the Central and Eastern Europe in Transition Monitoring PublicPolicies and Social Conditions' project, undertaken by the Economic and Social Policies
CROSS-COUNTRY PATTERNS OF CASH TRANSFERS 43
Research Program of the UNICEF International Child Development Centre, Florence,Italy.
2. Family assistance was promised only to those formal sector employees who werecovered under pension schemes. Thus the source of funding for social assistance camefrom social insurance funds. Social security includes social insurance and socialassistance.
3. Rural areas suffered more than urban areas, presumably because of larger familysizes. Armenia, however, is an exception. There, land was privatized so that larger fam-ilies secured more land. As the return on the land improved, it contributed to generallylower poverty rates in rural areas. Armenia's experience with land privatization standsin sharp contrast to that of livestock privatization in Mongolia, where families withyoung children (often headed by women) were given fewer animals (compared to thosewith relatively more adults) because it was felt that adults were necessary for managinglivestock. Rural poverty and inequality increased dramatically as a consequence(Subbarao and Ezemenari 1995).
4. Milanovic (1995a:13) reports that in 1993 both heads of household worked in oneof seven poor households in Poland. In addition, in Bulgaria, Hungary, and Poland, thepoverty rates for households with at least one member who was unemployed were 2.5to 4 times greater than the country average.
5. See also Andorka (1990a). He argues that family assistance in Hungary helped stopthe already declining trend in fertility rates, although it did not succeed in increasing fer-tility rates to the same level as the population replacement rate. Andorka (1990b) furtherargues that the higher education rate for women has had a dampening effect on fertili-ty rates in Hungary.
6. World Bank (1990b) reported that in 1984-85, 73 percent of Zakat and Ushr recipi-ents were not working. Of this number 27 percent were children (0-9 years of age), 10percent were elderly or disabled, and the remaining 36 percent were either housewives,students, or the unemployed. Roughly 12 percent were widowed, and of those working,54 percent were self-employed, with the rest divided between unpaid family workersand the self-employed.
7. In-kind benefits are based primarily on food subsidies and a funeral grant.8. A reference to social insurance reform in this and other paragraphs is necessary,
though pension-related issues are beyond the scope of this paper. In some countriessocial assistance and insurance payments are made from the same source; thus if insur-ance payments increase, social assistance gets crowded out. This pattern can be seen intable 3.2 for OECD countries. The need for social assistance in transition economies is atleast partly determined by the insurance systems that are being reformed. For compre-hensive treatment of issues in social insurance, see Fox (1994).
9. See World Bank (1995n). The deficit mentioned here is used to distinguish the totalamount of the shortfall from the average shortfall or gap. This distinction is necessarybecause the average varies with the reduction in the deficit and with the resulting reduc-tion in the number of poor (the denominator).
10. Acceptable is used in the context of a known outcome that is either allowed tohappen or is dealt with in some other program.
11. Using a poverty line of Som 1,048 per year per individual, estimates are that 40percent of the population is poor. This estimated poverty line is substantially below the"official" poverty line, according to which more than 50 percent of the population ispoor (World Bank 1995b).
12. The "old acceptable poor" refers to the old socialist definition of the needy, thatis, primarily orphans, invalids, the aged, and others in institutions with no family. The,new unacceptable poor" refers to the working poor whose ranks have grown since thetransition.

4Cross-Country Patterns of
In-Kind Transfers
Although cash transfers are preferred to in-kind transfers for minimiz-ing distortions in the economy, the choice may tilt in favor of in-kindtransfers if the objective is to encourage the consumption of a particu-lar commodity, if the objective is to encourage the modification ofbehavior, and if there are political objectives that are better servedthrough in-kind transfers. Also, taxpayers may object less if an in-kindsubsidy program is targeted to such vulnerable groups as children inschool feeding programs. In addition, in-kind transfers lend them-selves more easily to self-selection than cash transfers, enable bettertargeting, and hold their real value during periods of inflation.
In-kind subsidies can be administered in various ways. For exam-ple, governments can raise the quantity of commodities and servicesconsumed disproportionately by the poor (for example, increase theproduction of low-cost bread); provide direct subsidies (for example,food rations); provide cash compensation or cash equivalents (forexample, food stamps); or resort to price controls (for example, legallycontrol the consumer price of bread). Each of these interventions hasdifferent implications for producer and consumer incentives.
Three in-kind transfers are evaluated in this chapter: food subsidies,housing subsidies, and energy subsidies. 1 Because better targeting isthe main purpose of in-kind transfers, attention is devoted to targetingand distributional incidence. The implications for economic efficiencyand incentives are also analyzed. Where possible, cost effectivenessand budgetary implications are reviewed.
Food Subsidies
Food subsidies have existed for more than four decades in some Asiancountries. Three programs are used: open general subsidies, quantityrationing, and food stamps. In addition, some programs haveaddressed the nutritional deficiencies of specific groups, such as
45
46 SAFETY NET PROGRAMS AND POVERTY REDUCTION
children and pregnant women. Among the programs involving subsi-dies, food stamp programs may enhance welfare more than price sub-sidies or quantity rations. Food stamps are the least distortionary pro-gram in that they allow the consumer the widest choice ofcommodities.
But in some countries wider consumer choice may perpetuateintrahousehold discrimination. Food stamps allow adults to makefood choices that may not raise children's welfare. Thus quantityrations on food staples with high transaction costs might be morebeneficial to children than food stamps. Moreover, if transport costsor local monopolies prevent isolated regions from operating compet-itive markets in food staples, then public distribution may be neces-sary, and food stamps may be irrelevant for addressing basic foodneeds.
Regional Patterns in Program Choice
Some regional patterns are worth noting. Quantity rationing is thepreferred form of intervention in South Asia, food with work require-ments in Latin America and the Caribbean, and open general pricesubsidies (often with heavy involvement of parastatals) in someAfrican and Middle East and North African countries (table 4.1).2There are nutrition and school feeding programs in all regions,though predominately in Latin American countries. Why do countriesdiffer in their choice of programs? Broad patterns suggest that theadministrative and physical infrastructure required to implementprograms such as food stamps is lacking in Africa compared withSouth Asia or Latin America. Food-for-work programs are prevalentin only a few countries that have a low level of infrastructural devel-opment and a high headcount poverty ratio (for example, Bangladeshand Ethiopia). Conversely, there are food stamp programs in coun-tries that have more developed infrastructure and a lower incidenceof poverty.3
Political economy and administrative considerations also determineprogram choice: it is politically infeasible and administratively diffi-cult to run finely targeted programs in countries where the incidenceof poverty is high and households in need are difficult to separate fromthose that are not.4
Changes in the character or coverage of programs over time havebeen driven by fiscal tightness (Sri Lanka and Tunisia), poor cost-effectiveness (the Philippines and India), or high inclusion and exclu-sion errors (Egypt and Brazil). Most countries introduced a food-based intervention (not necessarily targeted to the poor) in responseto shocks that disrupted household food security. They remained with
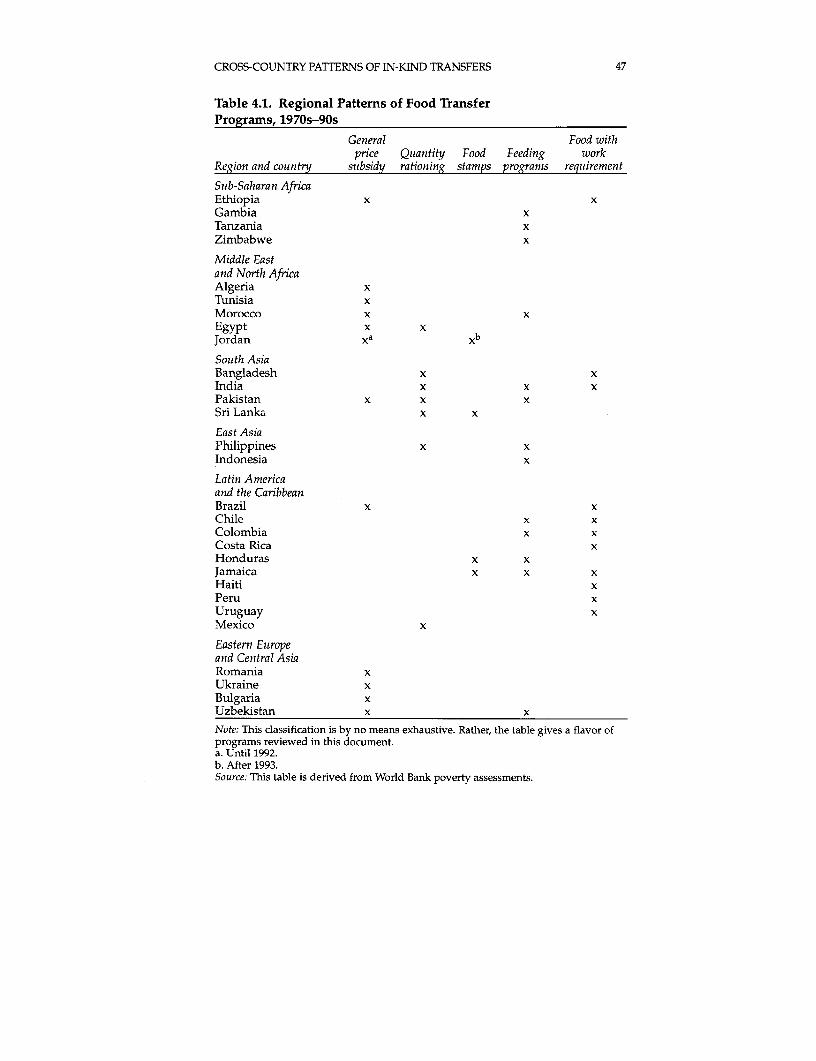
CROSS-COUNTRY PA1TERNS OF IN-KIND TRANSFERS 47
Table 4.1. Regional Patterns of Food TransferPrograms, 1970s-90s
General Food withprice Qutantity Food Feeding work
Region and country suibsidy rationing stamps programs requirement
Sub-Saharan AfricaEthiopia x xGambia xTanzania xZimbabwe x
Middle Eastand North AfricaAlgeria xTunisia xMorocco x xEgypt x xJordan xa xb
South AsiaBangladesh x xIndia x x xPakistan x x xSri Lanka x x
East AsiaPhilippines x xIndonesia x
Latin Americaand the CaribbeanBrazil x xChile x xColombia x xCosta Rica xHonduras x xJamaica x x xHaiti xPeru xUruguay xMexico x
Eastern Eturopeand Central AsiaRomania xUkraine xBulgaria xUzbekistan x xNote: This classification is by no means exhaustive. Rather, the table gives a flavor ofprograms reviewed in this document.a. Until 1992.b. After 1993.Source: This table is derived from World Bank poverty assessments.
48 SAFETY NET PROGRAMS AND POVERTY REDUCTION
the chosen intervention until one of the above-mentioned considera-tions dictated a change in the program. The pattern of changedepended on political economy considerations. Some governmentsresponded by modifying the existing program, some by replacing itwith a new program, and some by eliminating it altogether. In somecountries attempts to totally eliminate a program resulted in riots,eventually forcing governments to resort to a much less targeted pro-gram than had been planned. Bangladesh, Egypt, India, Pakistan, andSri Lanka all initiated universal ration programs in the early 1940s(Ahmed 1988; Alderman 1988, 1991; Edirisinghe 1987; Subbarao1989).
Almost all of these countries are restructuring their programs. Forexample, in Sri Lanka the universal ration program in operation priorto 1979 cost the government up to 5 percent of GDP. The unsustainablyhigh cost drove the government to institute food stamp programs. Themove cut costs to 1.3 percent of GDP.5 Tunisia also cut costs from 4 per-cent to 2 percent of GDP by moving from a universal price subsidy toa more targeted program. Other countries that have switched fromuniversal to targeted programs and have lowered costs includeBangladesh, Honduras, Jamaica, Jordan, and Mexico.
India is slowly reforming its expensive and poorly targeted nation-wide program, the Public Distribution System. Some programs run bystates, such as the program that sells a kilogram of rice for 2 rupees (6cents) in Andhra Pradesh, are proving to be extremely expensive andwasteful. 6 But India also has some innovative and better-targeted pro-grams, such as the Integrated Child Development Services and theTamil Nadu Nutrition Program. At the state level Kerala's record inreaching the poor with subsidized food is much better.
Many countries operate food supplement and nutrition interven-tions for women and children. These programs operate as temporarysafety nets for poor families and as direct measures to improve thenutritional status of vulnerable individuals. Three types of programscan be distinguished: general maternal and child nutrition programs,covering all pregnant and lactating mothers, and preschool children(MCHN programs); targeted nutrition programs, aimed only at moth-ers and children who are at nutritional risk, in combination with nutri-tion education and growth monitoring; and school feeding programs.
In terms of program outcomes, three questions are relevant: Howwell were the poor reached? Were programs cost-effective? Have therebeen any disincentive effects for food and labor supply? The answersto these questions may differ among important subgroups, such as theultrapoor (those in extreme poverty), poor women, the poor in remoteareas, the urban poor, the transient poor, and the chronic poor (thosewho are ill or elderly).
CROSS-COUNTRY PATTERNS OF IN-KIND TRANSFERS 49
Targeting Efficiency
Whether or not a program reaches the poor depends on how effective-ly the program is targeted. Leakage is measured as the amount of trans-fers going to the nonpoor as a percentage of the total transfer. Generally,the proportion of leakage is higher under price subsidies and quantityrationing, modest under food stamps, and lowest under programsinvolving food with work requirements (table 4.2).7 Maternal and childnutrition programs appear to be better targeted than most other pro-grams, presumably because targeting women and children requires lessadministrative effort. But targeting efficiency is tied not only to the typeof food program adopted, but also to its design. For example, Tunisiawas able to greatly improve the targeting efficiency of a universal pricesubsidy by subsidizing only those foods consumed by the poor (WorldBank 1995j). In Bangladesh leakage to the nonpoor from the ration pro-gram was greatly reduced by tying distribution to primary schoolattendance (Ahmed and Billah 1994). In the case of food stamps target-ing was improved in Honduras and Jamaica by linking stamp deliveryto health clinics (Subbarao, Ahmed, and Teklu 1995).8 Thus cross-coun-try and cross-program experience suggest that leakage can be prevent-ed mainly by innovative delivery systems.
Program Costs
Program costs include administrative costs and food costs. The usualmeasures adopted for program costs are cost per beneficiary, cost as apercentage of GDP, or cost per unit of nutrient (calories) transferred.Total costs for general price subsidies and quantity rations, as a percent-age of GDP, are typically higher than they are under more targeted pro-grams, such as school feeding (table 4.3).9 Costs vary across programsaccording to the administrative requirements of each program and theamount of food transferred. Transferring calories to only the poor ismore expensive, because the narrower is the targeting of the program,the more expensive is it to administer. In some instances the savings onfood costs by better targeting are more than offset by additional admin-istrative costs. In most countries and programs the cost of leakage can beextremely high (figure 4.1). Also, studies on Latin America show thatfood costs contribute more to total costs than do administrative costs(Grosh 1994; World Bank 1991c). Typically, programs that have workrequirements or other obligations (such as sending children to school)have proved to be much more cost-effective than food rations.
Universal maternal and child nutrition programs, and targetednutrition programs aimed at mothers and children at nutritional riskare much more cost-effective, efficient, and nutritionally beneficial
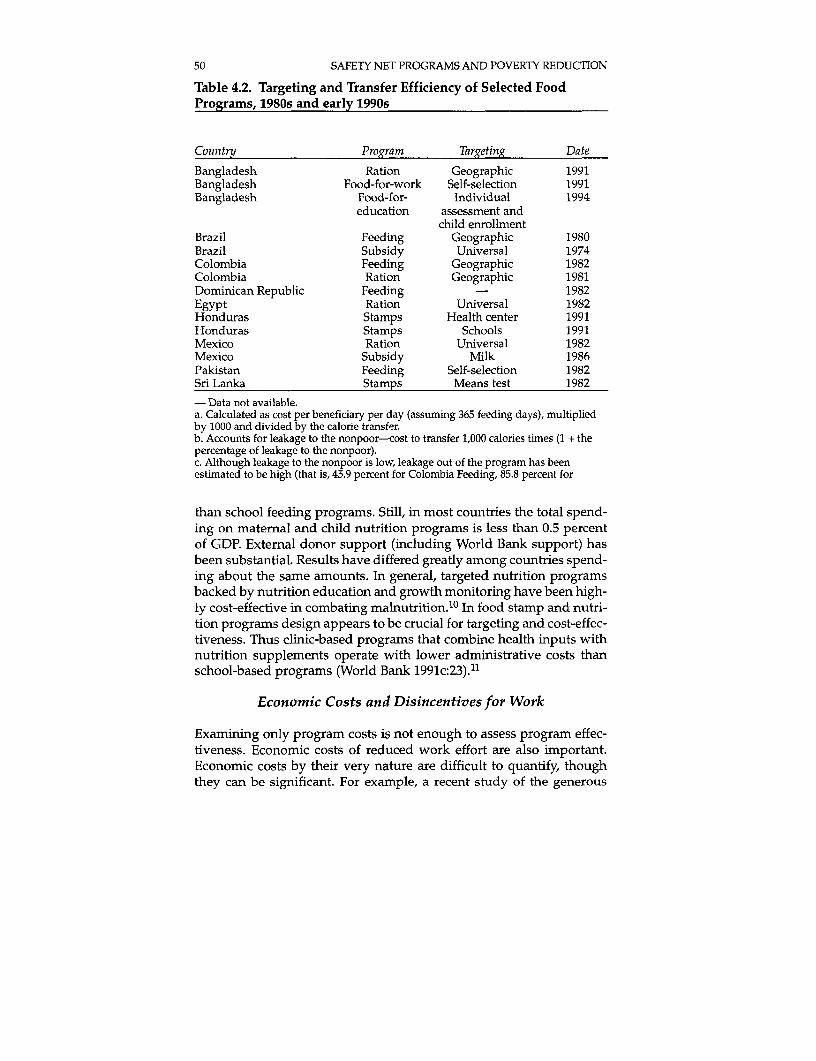
50 SAFETY NET PROGRAMS AND POVERTY REDUCTION
Table 4.2. Targeting and Transfer Efficiency of Selected FoodPrograms, 1980s and early 1990s
Country Program Targeting Date
Bangladesh Ration Geographic 1991Bangladesh Food-for-work Self-selection 1991Bangladesh Food-for- Individual 1994
education assessment andchild enrollment
Brazil Feeding Geographic 1980Brazil Subsidy Universal 1974Colombia Feeding Geographic 1982Colombia Ration Geographic 1981Dominican Republic Feeding - 1982Egypt Ration Universal 1982Honduras Stamps Health center 1991Honduras Stamps Schools 1991Mexico Ration Universal 1982Mexico Subsidy Milk 1986Pakistan Feeding Self-selection 1982Sri Lanka Stamps Means test 1982
- Data not available.a. Calculated as cost per beneficiary per day (assuming 365 feeding days), multipliedby 1000 and divided by the calorie transfer.b. Accounts for leakage to the nonpoor-cost to transfer 1,000 calories times (1 + thepercentage of leakage to the nonpoor).c. Although leakage to the nonpoor is low, leakage out of the program has beenestimated to be high (that is, 45.9 percent for Colombia Feeding, 85.8 percent for
than school feeding programs. Still, in most countries the total spend-ing on maternal and child nutrition programs is less than 0.5 percentof GDP. External donor support (including World Bank support) hasbeen substantial. Results have differed greatly among countries spend-ing about the same amounts. In general, targeted nutrition programsbacked by nutrition education and growth monitoring have been high-ly cost-effective in combating malnutrition.1 0 In food stamp and nutri-tion programs design appears to be crucial for targeting and cost-effec-tiveness. Thus clinic-based programs that combine health inputs withnutrition supplements operate with lower administrative costs thanschool-based programs (World Bank 1991c:23).11
Economic Costs and Disincentives for Work
Examining only program costs is not enough to assess program effec-tiveness. Economic costs of reduced work effort are also important.Economic costs by their very nature are difficult to quantify, thoughthey can be significant. For example, a recent study of the generous
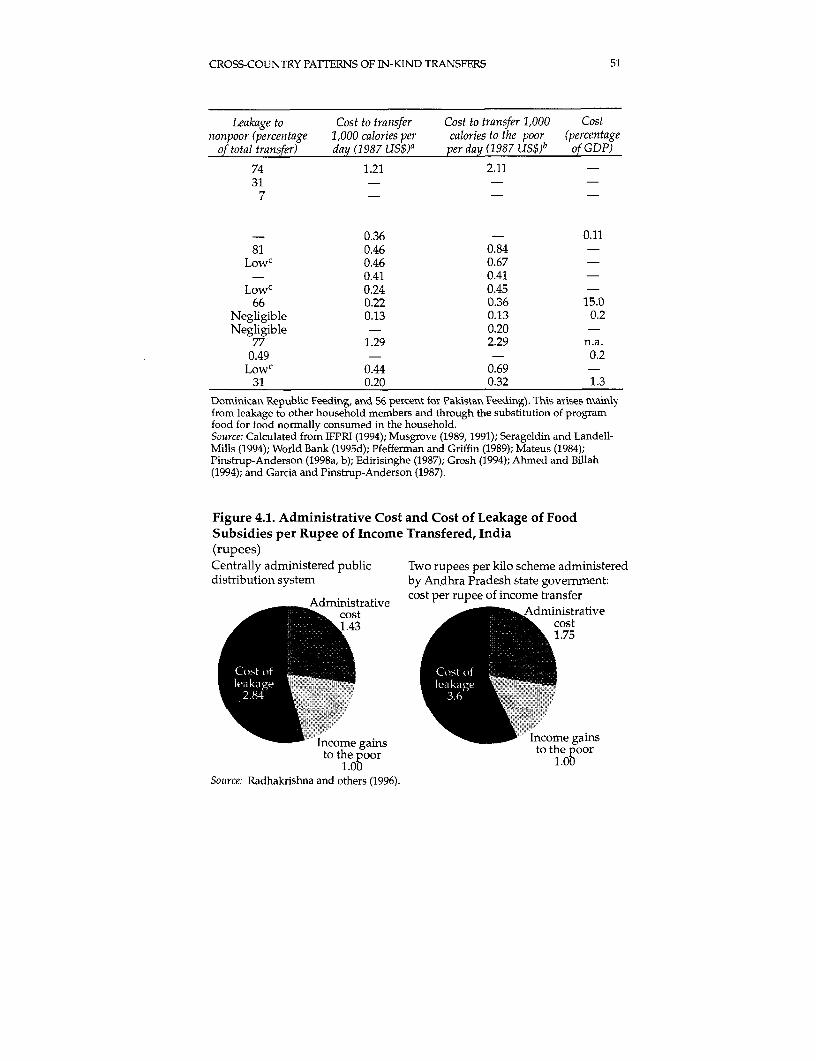
CROSS-COUNTRY PATTERNS OF IN-KIND TRANSFERS 51
Leakage to Cost to transfer Cost to transfer 1,000 Costnonpoor (percentage 1,000 calories per calories to the poor (percentage
of total transfer) day (1987 US$)a per day (1987 US$)b of GDP)
74 1.21 2.1131 -
7 -
- 0.36 - 0.1181 0.46 0.84 -
Lowc 0.46 0.67 --OWC 0.41 0.41 -
Lowc 0.24 0.45 -66 0.22 0.36 15.0
Negligible 0.13 0.13 0.2Negligible - 0.20
77 1.29 2.29 n.a.0.49 - - 0.2
Lowc 0.44 0.69 -31 0.20 0.32 1.3
Dominican Republic Feeding, and 56 percent for Pakistan Feeding). This arises mainlyfrom leakage to other household mernbers and through the substitution of programfood for food normally consumed in the household.Source: Calculated from IFPRI (1994); Musgrove (1989, 1991); Serageldin and Landell-Mills (1994); World Bank (1995d); Pfefferman and Griffin (1989); Mateus (1984);Pinstrup-Anderson (1998a, b); Edirisinghe (1987); Grosh (1994); Ahmed and Billah(1994); and Garcia and Pinstrup-Anderson (1987).
Figure 4.1. Administrative Cost and Cost of Leakage of FoodSubsidies per Rupee of Income Transfered, India(rupees)Centrally administered public Two rupees per kilo scheme administereddistribution system by Andhra Pradesh state government:
Administrative cost per rupee of income transfer- cost - . Administrative
1.43 cost1.75
Cost of Cost of .leakage leakage
2.84 3.6~~~~~~~~~~~~~~~~~~~~~~~~~~~~~~.... ........ ...
Income gains - Income gainsto the poor to the poor
1.00 1.00Source: Radhakrishna and others (1996).
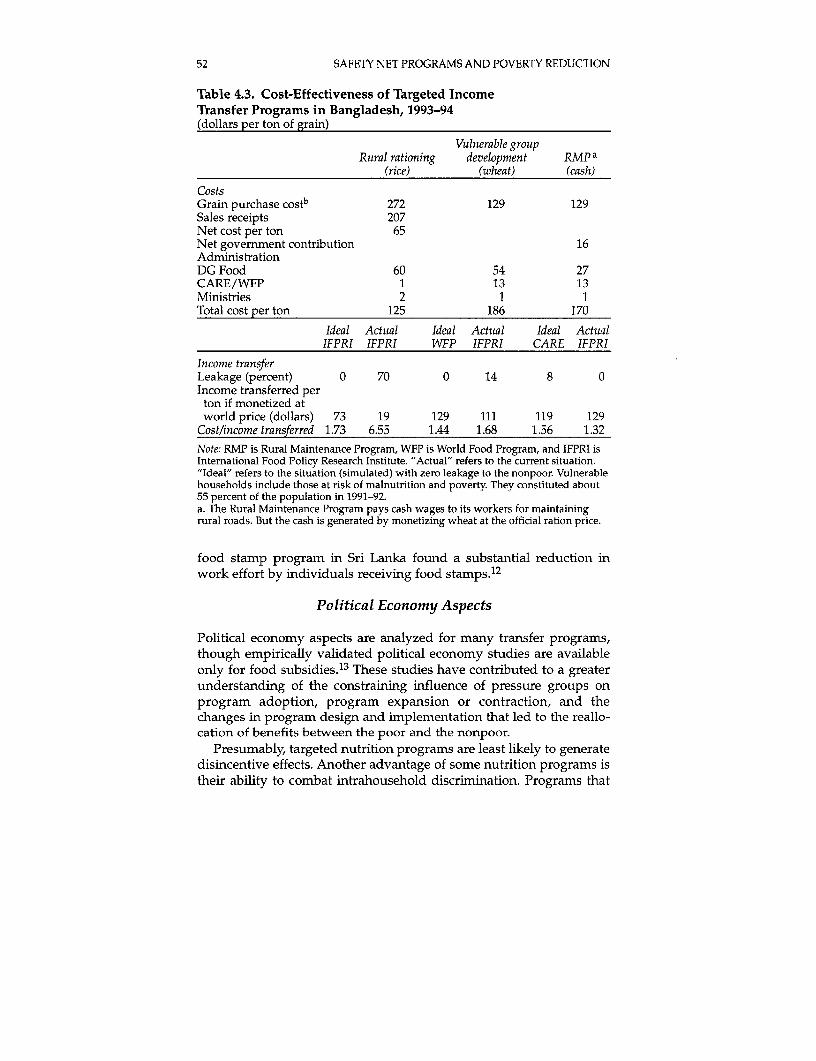
52 SAFETY NET PROGRAMS AND POVERTY REDUCTION
Table 4.3. Cost-Effectiveness of Targeted IncomeTransfer Programs in Bangladesh, 1993-94(dollars per ton of grain)
Vulnerable groupRural rationing development RA4p a
(rice) (wheat) (cash)
CostsGrain purchase costb 272 129 129Sales receipts 207Net cost per ton 65Net government contribution 16AdministrationDG Food 60 54 27CARE/WFP 1 13 13Ministries 2 1 1Total cost per ton 125 186 170
Ideal Actual Ideal Actutal Ideal ActualIFPRI IFPRI WFP IFPRI CARE IFPRI
Income transferLeakage (percent) 0 70 0 14 8 0Income transferred perton if monetized atworld price (dollars) 73 19 129 111 119 129
Cost/income transferred 1.73 6.55 1.44 1.68 1.56 1.32
Note: RMP is Rural Maintenance Program, WFP is World Food Program, and IFPRI isInternational Food Policy Research Institute. "Actual" refers to the current situation."Ideal" refers to the situation (simulated) with zero leakage to the nonpoor. Vulnerablehouseholds include those at risk of malnutrition and poverty. They constituted about55 percent of the population in 1991-92.a. The Rural Maintenance Program pays cash wages to its workers for maintainingrural roads. But the cash is generated by monetizing wheat at the official ration price.
food stamp program in Sri Lanka found a substantial reduction inwork effort by individuals receiving food stamps.1 2
Political Economy Aspects
Political economy aspects are analyzed for many transfer programs,though empirically validated political economy studies are availableonly for food subsidies. 13 These studies have contributed to a greaterunderstanding of the constraining influence of pressure groups onprogram adoption, program expansion or contraction, and thechanges in program design and implementation that led to the reallo-cation of benefits between the poor and the nonpoor.
Presumably, targeted nutrition programs are least likely to generatedisincentive effects. Another advantage of some nutrition programs istheir ability to combat intrahousehold discrimination. Programs that
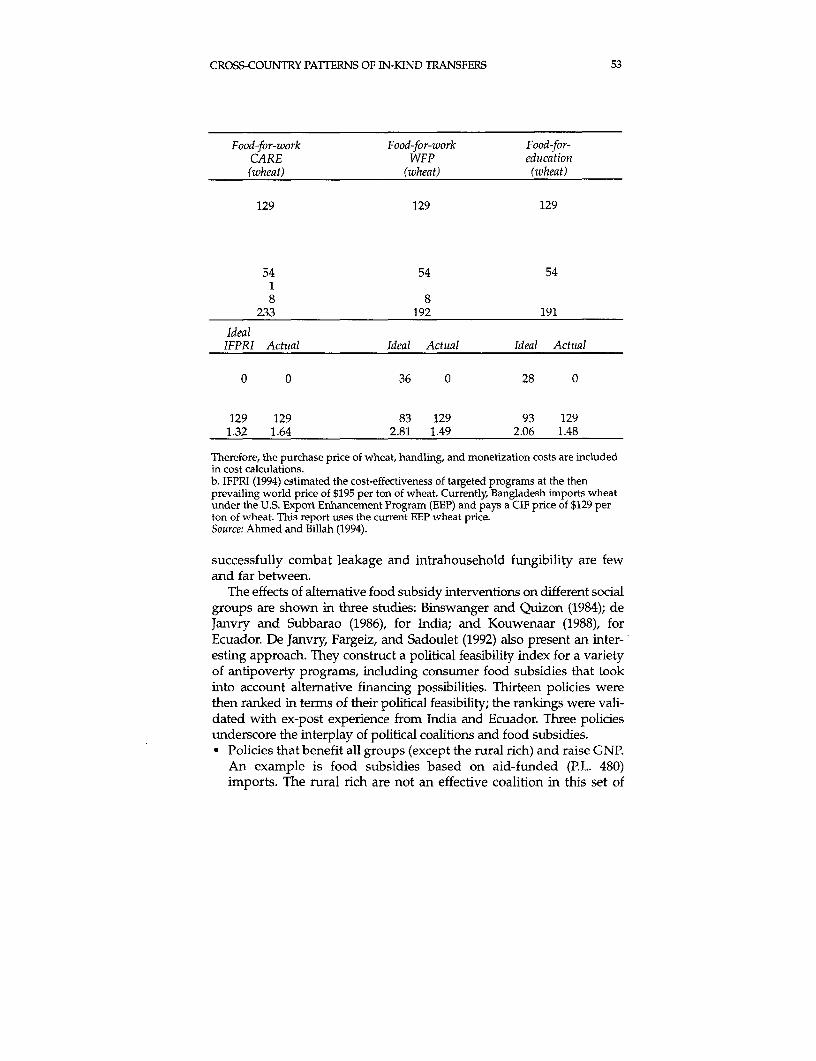
CROSS-COUNTRY PATrERNS OF IN-KIND TRANSFERS 53
Food-for-work Food-for-work Food-for-CARE WFP edutcation(wheat) (wheat) (wheat)
129 129 129
54 54 5418 8
233 192 191
IdealIFPRI Actual Ideal Actual Ideal Actual
0 0 36 0 28 0
129 129 83 129 93 1291.32 1.64 2.81 1.49 2.06 1.48
Therefore, the purchase price of wheat, handling, and monetization costs are includedin cost calculations.b. IFPRI (1994) estimated the cost-effectiveness of targeted programs at the thenprevailing world price of $195 per ton of wheat. Currently, Bangladesh imports wheatunder the U.S. Export Enhancement Program (EEP) and pays a CIF price of $129 perton of wheat. This report uses the current EEP wheat price.Source: Ahmed and Billah (1994).
successfully combat leakage and intrahousehold fungibility are fewand far between.
The effects of alternative food subsidy interventions on different socialgroups are shown in three studies: Binswanger and Quizon (1984); deJanvry and Subbarao (1986), for India; and Kouwenaar (1988), forEcuador. De Janvry, Fargeiz, and Sadoulet (1992) also present an inter-esting approach. They construct a political feasibility index for a varietyof antipoverty programs, including consumer food subsidies that tookinto account alternative financing possibilities. Thirteen policies werethen ranked in terms of their political feasibility; the rankings were vali-dated with ex-post experience from India and Ecuador. Three policiesunderscore the interplay of political coalitions and food subsidies.* Policies that benefit all groups (except the rural rich) and raise GNP.
An example is food subsidies based on aid-funded (P.L. 480)imports. The rural rich are not an effective coalition in this set of
54 SAFETY NET PROGRAMS AND POVERTY REDUCTION
policies. Political feasibility is the highest, 13, for this intervention(validated with the experience of India and Bangladesh; such aid-funded intervention lasts as long as food aid lasts).
* Policies that confer exceptional benefits to the rural poor from abase of domestic supply and taxation of the rural rich. Attemptswere made to form a coalition of the rural poor and the rural rich.But the political feasibility rank was the lowest, 1 (validated byIndia's experience). India tried a "producer levy" during the mid-1970s. Most large farmers evaded the levy and protested, and thelevy was withdrawn after 18 months (Subbarao 1993).
* Policies that benefit both the urban poor and the rural rich. Theseare food subsidies for the urban poor and production subsidies forall farmers in theory, but in practice a disproportionate share goesto rich farmers. A political coalition of the urban poor and the ruralrich is feasible (as is clear from the experiences of India andEcuador). Political feasibility ranks for such policies are 7, 8, and 9.This ranking is validated by country experience. This set of policiesprevailed for the longest period in India and Ecuador. The most vis-ible symptom of such political distortion is the urban bias that foodsubsidy programs have displayed for so long in Bangladesh, India,and Pakistan. Such policies benefit the politically vocal urban pop-ulation, who are not at nutritional risk. They also hurt the rural poor(the landless in particular), who face food prices that are both high-er and more unstable in the absence of government procurementand food subsidies (de Janvry and Subbarao 1986).
Transfer policies benefiting both the poor and the rich require heavysubsidies. As programs expand in response to the demands of politicalcoalitions for rents from the state, 14 explicit trade-offs emerge betweenspending on safety net programs and investments for growth. Theresulting fiscal drain and macroeconomic disequilibrium set in motionthe difficult political process of scaling down. In addition to India,Bangladesh, Egypt, Morocco, Pakistan, Sri Lanka, and Tunisia are invarious stages of scaling down to better target food subsidyprograms.1 5
Political economy issues seem to prevail even in programs aimed atthe welfare and protection of children. Growth monitoring and target-ed food supplements for children under three years of age, and forpregnant and lactating women have proven to be cost-effective andnutritionally beneficial. Despite such proof, the less-effective schoolfeeding programs are often used purely for political economy reasons.An example is India. The ruling party suffered many reverses in the1995 interim elections in states that introduced populist transfer pro-grams, including expensive and notoriously untargeted food subsi-dies. The ruling party, with an eye to the general elections in 1996,
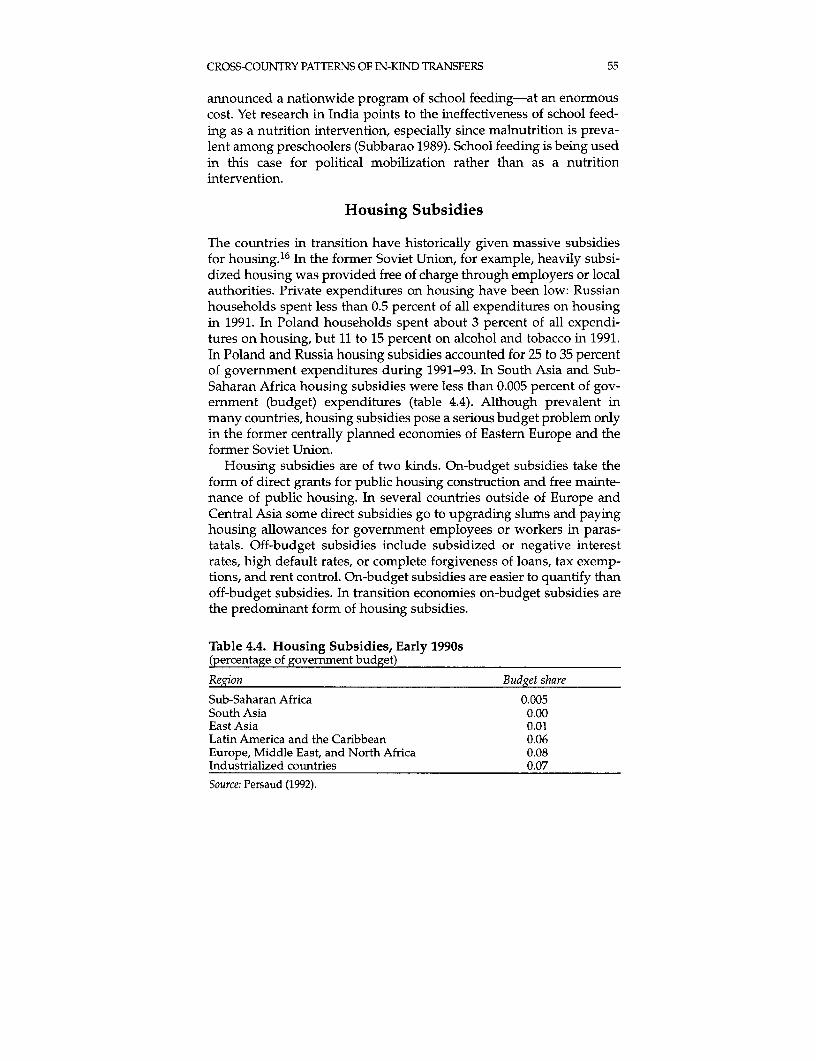
CROSS-COUNTRY PATTERNS OF IN-KIND TRANSFERS 55
announced a nationwide program of school feeding-at an enormouscost. Yet research in India points to the ineffectiveness of school feed-ing as a nutrition intervention, especially since malnutrition is preva-lent among preschoolers (Subbarao 1989). School feeding is being usedin this case for political mobilization rather than as a nutritionintervention.
Housing Subsidies
The countries in transition have historically given massive subsidiesfor housing. 16 In the former Soviet Union, for example, heavily subsi-dized housing was provided free of charge through employers or localauthorities. Private expenditures on housing have been low: Russianhouseholds spent less than 0.5 percent of all expenditures on housingin 1991. In Poland households spent about 3 percent of all expendi-tures on housing, but 11 to 15 percent on alcohol and tobacco in 1991.In Poland and Russia housing subsidies accounted for 25 to 35 percentof government expenditures during 1991-93. In South Asia and Sub-Saharan Africa housing subsidies were less than 0.005 percent of gov-ernment (budget) expenditures (table 4.4). Although prevalent inmany countries, housing subsidies pose a serious budget problem onlyin the former centrally planned economies of Eastern Europe and theformer Soviet Union.
Housing subsidies are of two kinds. On-budget subsidies take theform of direct grants for public housing construction and free mainte-nance of public housing. In several countries outside of Europe andCentral Asia some direct subsidies go to upgrading slums and payinghousing allowances for govern ment employees or workers in paras-tatals. Off-budget subsidies include subsidized or negative interestrates, high default rates, or complete forgiveness of loans, tax exemp-tions, and rent control. On-budget subsidies are easier to quantify thanoff-budget subsidies. In transition economies on-budget subsidies arethe predominant form of housing subsidies.
Table 4.4. Housing Subsidies, Early 1990s(percentage of government budget)
Region Budget share
Sub-Saharan Africa 0.005South Asia 0.00East Asia 0.01Latin America and the Caribbean 0.06Europe, Middle East, and North Africa 0.08Industrialized countries 0.07Source: Persaud (1992).
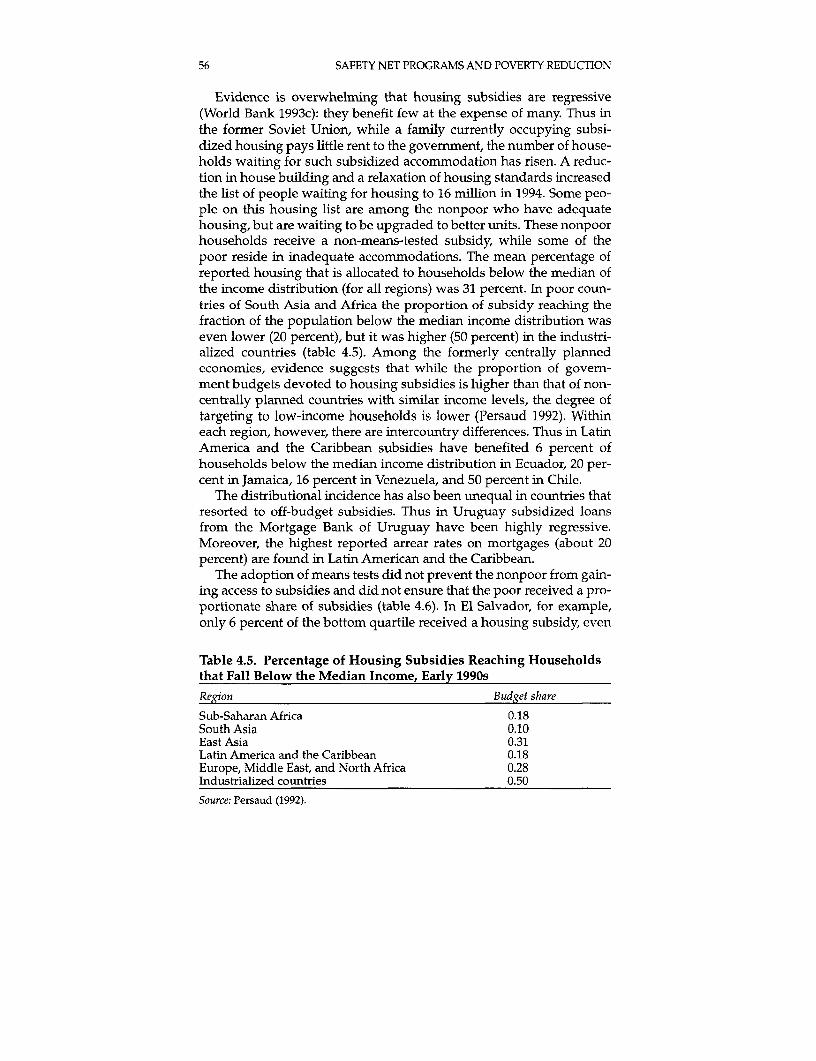
56 SAFETY NET PROGRAMS AND POVERTY REDUCTION
Evidence is overwhelming that housing subsidies are regressive(World Bank 1993c): they benefit few at the expense of many. Thus inthe former Soviet Union, while a family currently occupying subsi-dized housing pays little rent to the government, the number of house-holds waiting for such subsidized accommodation has risen. A reduc-tion in house building and a relaxation of housing standards increasedthe list of people waiting for housing to 16 million in 1994. Some peo-ple on this housing list are among the nonpoor who have adequatehousing, but are waiting to be upgraded to better units. These nonpoorhouseholds receive a non-means-tested subsidy, while some of thepoor reside in inadequate accommodations. The mean percentage ofreported housing that is allocated to households below the median ofthe income distribution (for all regions) was 31 percent. In poor coun-tries of South Asia and Africa the proportion of subsidy reaching thefraction of the population below the median income distribution waseven lower (20 percent), but it was higher (50 percent) in the industri-alized countries (table 4.5). Among the formerly centrally plannedeconomies, evidence suggests that while the proportion of govern-ment budgets devoted to housing subsidies is higher than that of non-centrally planned countries with similar income levels, the degree oftargeting to low-income households is lower (Persaud 1992). Withineach region, however, there are intercountry differences. Thus in LatinAmerica and the Caribbean subsidies have benefited 6 percent ofhouseholds below the median income distribution in Ecuador, 20 per-cent in Jamaica, 16 percent in Venezuela, and 50 percent in Chile.
The distributional incidence has also been unequal in countries thatresorted to off-budget subsidies. Thus in Uruguay subsidized loansfrom the Mortgage Bank of Uruguay have been highly regressive.Moreover, the highest reported arrear rates on mortgages (about 20percent) are found in Latin American and the Caribbean.
The adoption of means tests did not prevent the nonpoor from gain-ing access to subsidies and did not ensure that the poor received a pro-portionate share of subsidies (table 4.6). In El Salvador, for example,only 6 percent of the bottom quartile received a housing subsidy, even
Table 4.5. Percentage of Housing Subsidies Reaching Householdsthat Fall Below the Median Income, Early 1990s
Region Budget share
Sub-Saharan Africa 0.18South Asia 0.10East Asia 0.31Latin America and the Caribbean 0.18Europe, Middle East, and North Africa 0.28Industrialized countries 0.50
Source: Persaud (1992).
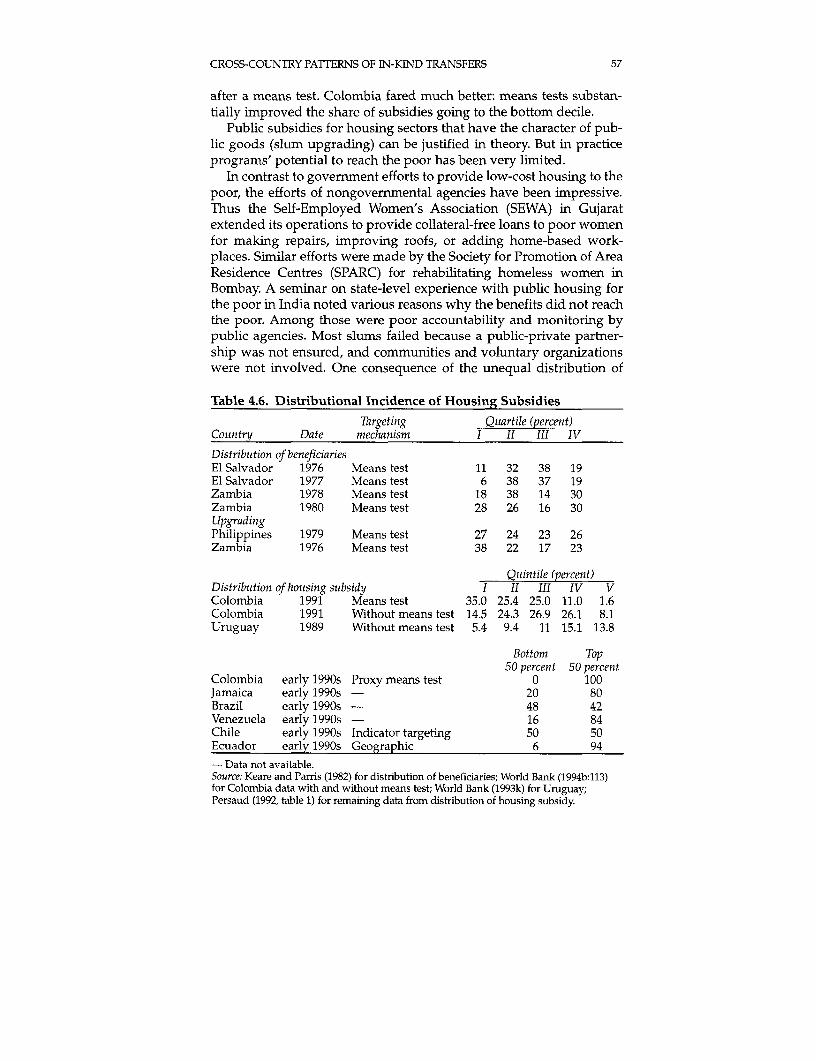
CROSS-COUNTRY PATTERNS OF IN-KIND TRANSFERS 57
after a means test. Colombia fared much better: means tests substan-tially improved the share of subsidies going to the bottom decile.
Public subsidies for housing sectors that have the character of pub-lic goods (slum upgrading) can be justified in theory. But in practiceprograms' potential to reach the poor has been very limited.
In contrast to government efforts to provide low-cost housing to thepoor, the efforts of nongovernmental agencies have been impressive.Thus the Self-Employed Women's Association (SEWA) in Gujaratextended its operations to provide collateral-free loans to poor womenfor making repairs, improving roofs, or adding home-based work-places. Similar efforts were made by the Society for Promotion of AreaResidence Centres (SPARC) for rehabilitating homeless women inBombay. A seminar on state-level experience with public housing forthe poor in India noted various reasons why the benefits did not reachthe poor. Among those were poor accountability and monitoring bypublic agencies. Most slums failed because a public-private partner-ship was not ensured, and communities and voluntary organizationswere not involved. One consequence of the unequal distribution of
Table 4.6. Distributional Incidence of Housing Subsidies
Targeting Qtuartile (percent)Cotuntry Date mechanism I II III IV
Distribution of beneficiariesEl Salvador 1976 Means test 11 32 38 19El Salvador 1977 Means test 6 38 37 19Zambia 1978 Means test 18 38 14 30Zambia 1980 Means test 28 26 16 30UpgradingPhilippines 1979 Means test 27 24 23 26Zambia 1976 Means test 38 22 17 23
Qtuintile (percent)Distribution of htoutsing subsidy I II III IV VColombia 1991 Means test 35.0 25.4 25.0 11.0 1.6Colombia 1991 Without means test 14.5 24.3 26.9 26.1 8.1Uruguay 1989 Without means test 5.4 9.4 11 15.1 13.8
Bottom Top50 percent 50 percent
Colombia early 1990s Proxy means test 0 100Jamaica early 1990s - 20 80Brazil early 1990s - 48 42Venezuela early 1990s - 16 84Chile early 1990s Indicator targeting 50 50Ecuador early 1990s Geographic 6 94- Data not available.Source: Keare and Parris (1982) for distribution of beneficiaries; World Bank (1994b:113)for Colombia data with and without means test; World Bank (1993k) for Uruguay;Persaud (1992, table 1) for remaining data from distribution of housing subsidy.
58 SAFETY NET PROGRAMS AND POVERTY REDUCTION
housing subsidies is the relatively high private expenditures incurredby the poor, even in economies in transition. In Russia very poorhouseholds spent 2.1 percent of their expenditures on housing, where-as nonpoor households spent only 0.2 percent.
Housing Subsidies, Efficiency Losses, and the Labor Market
The worst efficiency loss from housing subsidies in Eastern Europeand the former Soviet Union comes from the labor market. A change ofjob, which may involve giving up an advanced position in one hous-ing queue and entering another, simply reduces labor mobility, labormarket efficiency, and impedes the adjustment process.
Where governments have provided an alternative-heavily subsi-dized accommodation to the population living in urban slums (forexample, in India)-the results have not been entirely sanguine.Because families received housing at a price much lower than the free-market price, they were prone to dispose a part of or the entire housefor a profit. Thus slum dwellers in cities who had been rehabilitatedwith subsidized housing again returned to the slums after selling theirhouses at a profit-a financial gain to specific families but not to thegovernment. Even when beneficiaries had been carefully screened andmonitored, estimates suggest that after five to six years, a third or halfof the accommodations were sold or leased by the beneficiaryhouseholds.
In principle there is nothing wrong with the beneficiaries renting apart of their subsidized housing, but there is no willingness to meetrepayment obligations, notwithstanding the heavily subsidized priceof the units. Most of the occupants of shelter homes were able to repay,but they were unwilling to do so because they knew they would not beevicted for nonpayment. Evidence also suggests that despite chronicarrears on highly subsidized units, governments-democratic andnondemocratic-have never resorted to eviction.
Housing subsidies also distort housing prices that nonrecipientsconfront. Such adverse effects are strong when subsidies take the formof less-than-market interest rates. For example, in Malaysia in the early1980s subsidized mortgage loans were made available to civil servantsat 4 percent (compared with 11 percent for the general public). Thisprogram caused subsidized mortgage lending as a percentage of totalmortgage lending to increase from 0 to about 40 percent in barely fiveyears. There was considerable upward pressure on housing prices anda drop in demand by nonrecipients (World Bank 1993c:126).
Rent controls are the most common off-budget subsidy in manydeveloping countries. Where this form of subsidy was adopted, pri-vate investment in rental housing was reduced drastically because
CROSS-COUNTRY PATrERNS OF IN-KIND TRANSFERS 59
owners of rent controlled houses could not obtain adequate returns ontheir investments.
Reforn of Housing Subsidies
In all of the countries of Eastern Europe and the former Soviet Unionthe housing sector is undergoing a major reform. At the core of thereform are privatization, easing of restrictions on rentals andexchanges, and a revised rent control system. These changes are boundto increase labor mobility, apart from reducing the fiscal burden. Inmoving toward a liberalized housing market, it is important to protectthe poor from sharply increased costs for dwellings and utilities.
In Russia reform is proceeding along two tracks: privatization andimproved cost recovery through increased rentals. Privatization trans-ferred about a third of Russia's total housing stock to its occupants bythe close of 1994. A major problem with "housing giveaways" is thepriority extended to existing tenants, thus perpetuating pastinequities. One solution would be to design a mechanism that allowspeople on the waiting list who have not yet received any housing unitto be compensated by tenants who have. Housing giveaways, howev-er, are not always inappropriate. Where current tenants are poor, hous-ing giveaways are probably the best immediate safety net because ofthe economywide gains in labor mobility. But the first round of rapidprivatization was taken advantage of by rich and better-located ten-ants, who quickly made substantial profits. Relatively poorer tenantsowning apartments of only moderate value are still waiting because oftheir inability to pay higher fees for maintenance, utilities, and prop-erty taxes (Struyk and Daniell 1995).
Some of the housing stock has been transferred to local authorities,along with the responsibility for housing services. Because local gov-ernments have not explored revenue-raising possibilities and becausethey are strapped for resources, transfer of the housing stock generat-ed enormous incentives to jack up sales prices well beyond the meansof ordinary citizens. Thus reform, including privatization, proceededslowly. It is more expedient politically to sell the acquired housingstock at high prices than to raise revenues through redistributivetaxation.
The second track of reform deals with enhancing rentals on publichousing. To mitigate the impact of increased housing (and utilities)costs on poor families, some local governments in Russia have intro-duced "housing allowances," administered by separate offices aftermeans testing. Relatively simple procedures have been established formeans testing. But the take-up rate in the housing allowance programhas been very low (about 10 percent). Because the scheme is new, lack
60 SAFETY NET PROGRAMS AND POVERTY REDUCTION
of information could be one problem. It is not clear how well the poorliving in poorer localities (mostly rural) are being protected. Evidencesuggests that the cost of administering the program averaged about 1.5percent of the incremental rent collected-thus increased rental rev-enues contributed to local budgets and to improved maintenance andrepair of houses. The demands on the program will grow as the realcosts of housing and utilities rise further and take-up rates increase.
Reform should aim at enabling individuals to build and own hous-es and use their housing assets to increase their incomes. Such a devel-opment is possible only when housing finance systems are in place.Russia is still far from setting up mortgage lending institutions. ButHungary is not. Housing subsidy reform in Hungary has progressedrapidly. Interest rate subsidies, which accounted for as much as 3 per-cent of GDP, have been eliminated. In place of the earlier complex andinequitable system of subsidies, a targeted housing allowance wasintroduced. Only low-income households (identified after carefulmeans testing) are eligible for housing allowances. Rents were broughtup to market levels. Hungary has proposed to privatize its entire hous-ing stock. Hungary clearly has an edge over Russia in housing reform.One important factor that contributed to Hungary's speedy reformwas the existence of well-functioning, local-level social assistanceoffices that successfully identified the poor.
In Africa, Asia, and Latin America off-budget subsidies dominate,and reform has been slow and implementation ineffective. For exam-ple, in Chile the government moved from poorly targeted credit sub-sidies to direct, explicit, one-time subsidies that allowed households topurchase housing on the private market. But Chile permitted high lev-els of arrears without loan foreclosures, and many of the advantages ofthe reformed subsidy system (such as transparency) were lost. In othercountries, such as India and Ghana, rent control has proved an ineffi-cient way to protect the poor; yet reform has been slow in coming.
Energy Subsidies
Energy use by the poor follows distinct regional patterns. In the tran-sition economies of Eastern Europe and the former Soviet Union thepoor (particularly the urban poor) use such nontraditional fuels ascoal-fired steam heating plants, district heat, gas, and electricity.17 Bycontrast, the poor in much of Africa, Asia, and Latin America use tra-ditional fuels, wood, charcoal, animal dung, and agricultural residue.Moreover, in all regions traditional fuels are consumed by the ruralpoor. Further, in Africa, Asia, and Latin America (more than in Europeand Central Asia) the urban poor spend a higher percentage of theirtotal expenditures on energy than the nonpoor (Barnes and others
CROSS-COUNTRY PATTERNS OF IN-KIND TRANSFERS 61
1994). But in Europe and Central Asia the middle- and high-incomeconsumers spend more of their budget on energy than low-incomeconsumers (Freund and Wallich 1995).
Because of the varying patterns of energy consumption by the poorand the nonpoor, tax and subsidy policies may generate unintendedconsequences (beneficial or adverse) for the poor. Thus a tax in Asia orAfrica on nontraditional fuels consumed by the nonpoor may encour-age the substitution of traditional fuels. In such a case traditional fuelprices may increase, causing the poor to suffer real income losses. InEurope and Central Asia a subsidy on nontraditional fuels will benefitthe poor, but the nonpoor will benefit more than the poor. Moreover,owing to variations in consumption, energy subsidies help accentuatealready prevalent inequality in rural and urban living standards. Ingeneral, energy subsidies on nontraditional fuels (with few exceptions,such as kerosene) have benefited the urban poor and nonpoor morethan rural dwellers.
Energy Subsidies and the Budget
In Europe and Central Asia and most other developing countries theenergy sector is dominated by public sector enterprises. Prices are gen-erally set by governments. Depending on how well the administeredprices cover the economic cost of producing the energy, governmentsubsidies vary among regions and among countries within regions. InEurope and Central Asia, prior to the transition, real or perceived dis-tribution problems were sought to be solved by underpricing or inef-ficient pricing of energy (as much as for housing, food, transport, andseveral other services). The reluctance to raise the average price stemsfrom the (misplaced) fear of contributing to inflation (and wage pres-sure). In reality, subsidization may actually increase the potential forinflation-because subsidies eventually feed into budget deficits. If theresulting budget deficits are financed by inflation-which is most like-ly to be the case-keeping energy prices low may actually contributeto inflation. 18
The problem now facing countries in Europe and Central Asia ishow to manage the change from subsidizing energy to charging aneconomic price. The problem is compounded because energy is cen-trally controlled; many families are unable to control their individualconsumption and therefore cannot reduce their costs by lowering theirconsumption. Removing all subsidies overnight would leave manyfamilies unable to pay their energy costs. Countries are approachingthis problem with a mixture of continuing subsidies, lifeline rates, andtargeted cash transfers. The important issue is to ensure that the poorcontinue to have access to energy, particularly in areas where the
62 SAFETY NET PROGRAMS AND POVERTY REDUCTION
climate is harsh. Whatever program is adopted, it should offer thegreatest incentive for the individual to conserve energy.
Targeting and Distributional Implications
The benefit to the poor from energy price subsidies (or the loss sus-tained by removing or reducing energy subsidies) depends on thepoor's share of energy expenditures, the responsiveness of energydemand to prices, and the possibility of replacing subsidized fuel withnonsubsidized fuels.
In Africa, Asia, and Latin America it is not clear whether energysubsidies actually benefit poor people. The fuels consumed by thepoor for heating (such as coal or firewood) or for transportation are notnecessarily the ones that are subsidized. Thus gasoline subsidies-per-vasive in low-income developing countries-are not necessarilydirectly beneficial to the poor, because motor vehicles are owned bythe nonpoor. If gasoline subsidies are intended to keep public trans-portation costs low and keep benefits from leaking to nontargetgroups, subsidizing public transportation fares may be more efficientthan subsidizing gasoline.19 Because the poor use kerosene for lightingand cooking in many low-income countries, a subsidy on kerosenemay be justified. But even so, the urban poor (whose average incomestend to be higher than those of the rural poor) benefit disproportion-ately. Moreover, where kerosene is supplied under rationing schemes(for example, in India), the requirement of a permanent residence hasprecluded the ultrapoor (who live in urban slums) from using thesubsidy.
Because of the asymmetry between energy subsidies and the poor'spattern of energy consumption, the distributional effects of energysubsidies in Africa, Asia, and Latin America have not been propoor. InColombia 81 percent of the lowest quintile had access to electricity in1992, compared with 98 percent of the highest quintile. Households inthe lowest quintile received a smaller share of the subsidy than therichest quintile. In Ecuador energy subsidies (mostly for liquifiedpetroleum gas) benefited the top quintile disproportionately. InVenezuela petroleum and electricity subsidies in the late 1980s andearly 1990s benefited the nonpoor more than the poor. In Indonesia thepoorest 40 percent of the population received 22 percent of the energysubsidy, whereas the top 60 percent received 78 percent. The main rea-son for the regressive incidence in Indonesia was the preponderance ofsubsidies on automotive diesel rather than kerosene, the main fuelconsumed by the urban poor.
In all transition economies of Eastern Europe and the former SovietUnion subsidizing energy prices is common practice. An analysis
CROSS-COUNTRY PATITERNS OF IN-KIND TRANSFERS 63
shows that this policy is regressive. While it does help the poor by pro-viding lower cost energy, it is more useful to the rich, who consumemore energy (Freund and Wallich 1995). It is not even clear whether allthe poor benefit from energy subsidies in this region. Evidence fromthe Russia Longitudinal Monitoring Survey shows that only 48 percentof the poor had access to gas and 61 percent had access to central heat-ing. According to that survey the current structure of consumption ofhousing utilities prevents the suibsidy from reaching many poorhouseholds, particularly those in rural areas and small towns. InKyrgyz Republic the heavily subsidized district heating and naturalgas are available only in urban areas. A universal subsidy on districtheating is clearly inequitable (apart from being inefficient).
Bearing in mind consumption and country differences between thetransition economies and developing countries in Africa, Asia, andLatin America, the conclusion is overwhelming: the impact of energysubsidies has been regressive. If energy subsidies are prominent in acountry's budget, the main reason is political economy. When it comesto energy pricing, many governments are concerned not so much withthe poor, but with the more vocal, broad (and growing, in countrieslike India) urban middle class.
Energy Subsidy Reform
In recent years some countries in Europe, Central Asia, and the formerSoviet Union have raised energy utility prices to cover average finan-cial costs, but not economic costs. Moreover, in many countries gov-ernments have maintained the old structure of prices, subsidizing theresidential consumer more than the industrial and commercial user.Policy changes on energy pricing are still evolving. Thus only theimplications of alternative policies under consideration can beassessed.
The options under consideration, following a reduction or removalof energy subsidies, focus on four sets of compensation policies: life-line rates, vouchers, targeted cash compensations to the poor, and tar-geted in-kind payments (Freund and Wallich 1995).
Lifeline rates involve charging a discounted rate for a small block ofenergy consumed. If not targeted, every person-the rich and thepoor-benefits from a low tariff. It is not clear if targeting for the pur-pose of block pricing is cost-effective, given that means tests are expen-sive and unreliable in transition economies. The amount of leakagedepends on how successfully beneficiaries are screened. Administeringa lifeline pricing system would pose problems because there is nometering system. There is no evidence on the correlation of dwellingsize and income level (Freund and Wallich 1995).20 Thus the
64 SAFETY NET PROGRAMS AND POVERTY REDUCTION
distributional impact of lifeline pricing, based on square meters of floorspace rather than actual consumption, is difficult to assess. Lifelinepricing may also exclude some of the most needy people in rural areas,who do not have access to district housing. But one advantage of blockpricing must be recognized: when the subsidy is paid out of the bud-get, the utility and the industry are not burdened with distortions.Despite its disadvantages, lifeline pricing may have merits for electric-ity pricing.
Vouchers are like food rations. Following a price increase, the eligiblepoor are protected with a voucher that enables them to buy a certainamount of energy at a fixed price. Unlike lifeline pricing, vouchers canreflect differences in household size and composition. But vouchers donot create incentives for energy conservation: every consumer will con-sume the entire quantity allowed. If consumers are able to trade invouchers, the system amounts to the poor receiving cash grants, howev-er, in the process some of the benefits leak to the nonpoor. How many ofthe poor (versus the nonpoor) benefit depends on the transaction costs invoucher trading. Vouchers are clearly very difficult to administer.
Targeted cash compensations following an increase in energy pricesis the third option. Since energy prices are not manipulated, the result-ing allocation of resources will be more efficient. But desired resultsdepend on the ability to identify households according to their welfareposition, which then determines the cash payment. Bulgaria is alreadyusing this system. Households are grouped into three categories byincome, and a predetermined subsidy (transfer) is paid to each group.The transfer falls as income goes up. Households in the poorest groupare fully compensated. The main advantage of the system is that itencourages more efficient energy use. It would have been more appro-priate, however, to use income (consumption) per person, or per adultequivalent, rather than per household.
Cash compensations can work if local social assistance offices arealready reasonably efficient, and the poor are already being identified.Such is the case in Hungary. In other countries, where mechanisms fortargeting social assistance at the grass roots level are not in place or arenot efficient, cash compensation can lead to gross abuses.
Some countries are aiming to provide social assistance based on a"minimum income guarantee" (for example, Romania). In such casesit would be wise to include cash compensation for energy price rises.Such a strategy would avoid a proliferation of offices administeringvarious types of assistance.
Tied cash transfers may be politically more acceptable in some coun-tries than in others. Under this system, once the social assistance officeidentifies a poor person or household, the office pays the consumer'sheating and power bill directly to the heating or utility company.
CROSS-COUNTRY PATTERNS OF IN-KIND TRANSFERS 65
Whether paid in cash or in-kind, the critical factors determining thesuccess of such programs are data availability, and institutions andpractices that can track new information (on the income and welfareposition of households including household size), which can then befed into the system to weed out ineligible households and to includenew households. Many countries neglect the need to include newhouseholds (especially if they are immigrants, refugees, or ethnicgroups). Obviously, the preferred approach depends on the situationof the individual country.
Conclusion
Almost every country that adopted open-ended food price subsidiesto protect the poor has found the policy fiscally unsustainable, and dis-tortionary to the agricultural sector.21 Many countries have resorted totargeted approaches. No particular targeted method has been found tobe perfect; yet programs that are imperfectly targeted have been betterat reaching the poor and keeping costs down than those with no tar-geting at all. Moreover, leakage appears to be lowest in programs thatselected beneficiaries not on income-based means tests but on benefi-ciaries' (or their children's) participation in primary schools or clin-ics.2 2 Tying beneficiary participation (or time contribution) to foodtransfers not only reduces leakage, it may also lower economic costsassociated with work disincentives.
The cost of transferring income to the poor is lower for food stampsand targeted food and nutrition programs than for quantity rations orgeneral subsidies. Nevertheless, it is difficult to rank the targeted pro-grams in terms of their cost effectiveness and incentive costs becauseof the significant variation across countries and programs. Also, evi-dence on incentive costs is unavailable in many countries. The cost-effectiveness of a program depends greatly on the choice of a particu-lar targeting method and the design and delivery of the program. Thatchoice, in turn, depends on the needs of beneficiaries and on country-specific constraints. Generous coverage leads to incentive costs andadverse effects on labor supply.
Finally, political economy considerations are a major country-specific constraint in designing sustainable food transfer programs. Inparticular, too much fine tuning in targeting may erode political sup-port for food transfers. 2 3
As for housing subsidies, on-budget and off-budget subsidies rarelyever reached the poor. In Africa, Asia, and Latin America the urbanmiddle class benefited most from public housing programs. Vast num-bers of rural poor did not benefit at all. Off-budget subsidies do notappear to be a good instrument for protecting the poor, least of all the
66 SAFETY NET PROGRAMS AND POVERTY REDUCTION
rural poor. The urban poor are protected best by increasing andencouraging low-cost housing production and upgrading slums (byproviding sanitary facilities). Such help appears more desirable thanoff-budget, nontransparent subsidies, which are generally captured bythe nonpoor. In Europe and Central Asia housing reform is takingplace, and major subsidies must be removed to achieve fiscal balance.Thus a targeted housing allowance must form an important compo-nent of the overall safety net. Perhaps the best way to achieve thisobjective is to institute a targeted housing allowance that would pre-ceed freeing up rents, establishing housing finance institutions, andprivatizing the housing stock. In this effort the danger of passing on allthe benefits to owners of supply-inelastic urban land is very real;where such benefits accrued, the scope for mopping up tax revenuesmay have to be explored. The resources thus raised could be used fortargeting benefits to the poor. The exact mechanism for targeting toprotect the poor will vary among countries, depending on the admin-istrative competence of local social assistance offices.
Like housing subsidies, energy subsidies have also been regres-sive. But in Europe and Central Asia reduction or elimination of ener-gy subsidies is bound to hurt the urban poor in the short run. Manyapproaches are being floated for compensating the poor in countriesof Eastern Europe and the former Soviet Union. These optionsinclude lifeline rates, vouchers, cash compensations, and in-kindtransfers. Lifeline pricing has definite merits for electricity pricing.For other sources of energy, vouchers or cash compensations canwork only in countries where local social assistance offices arealready efficient. Current domestic energy consumption is muchhigher in Europe and Central Asia than in Western countries, andany new system adopted should include incentives that lead to ener-gy conservation.
Notes
1. Credit subsidies for the poor are prevalent in many countries, but these subsidiesdo not fall into the same category as food, energy, and housing subsidies. Unlike theselatter subsidies, credit subsidies involve some obligation to work, and recipients have torepay at least a part of their loans. Credit subsidies are assessed in chapter 5.
2. The objective of protecting the consumer and the belief that private marketingchannels are exploitative led to the creation of parastatals throughout Africa. Theadverse impact of administered price regimes implemented by the parastatals for pro-ducer and consumer welfare and equity is well-known. Reform and reduction (if notelimination) of parastatals is an important component of the ongoing adjustment policyframework of many African countries.
3. This does not imply that food-for-work programs are easier to organize and targetcost-effectively than food stamp programs.
4. This is not to argue that a generalized price subsidy that lowers staple food prices forall consumers is the best way of approaching the problem. Indeed, such a policy had the
CROSS-COUNTRY PATTERNS OF IN-KIND TRANSFERS 67
opposite effect in some African countries: by enforcing lower farm prices and bluntingincentives to producers, it exacerbated supply responses and aggravated the food problem.
5. The program in Sri Lanka could be better targeted, and its costs could be furtherreduced-nearly half of the country's population has access to food stamps, whereas theincidence of poverty is less than 30 percent. Sahn and Alderman (1995) have estimatedpotential adverse effects on labor supply from what appears to still be a generous trans-fer program.
6. These two programs were so expensive that other critical expenditures have hadto be cut. See Subbarao (1989) and Radhakrishna and others (1996).
7. Different national poverty lines and systems of measurement make comparisonacross countries difficult.
8. In most voucher and stamp schemes leakage (defined as the value of vouchers andstamps going to the nonpoor) is low. But vouchers and stamps are tradable, and the realtest is how much of their value reaches the poor.
9. One might argue that primary schooling is so important that school feeding maybe necessary to encourage attendance. School feeding, therefore, might be a good ideaeven if it is expensive. It may be important for political reasons as well.
10. India's Tamil Nadu Integrated Nutrition Project program confirms this finding-mothers who brought their first child into the program and who were given "nutritioneducation" absorbed the lessons. This result was evident in that they brought their sec-ond child and subsequent children into the program (Shekar 1994).
11. But school feeding programs may achieve other objectives, such as promotingschool enrollments, particularly of girls, or improving the learning abilities of students.If this is the case then school feeding programs should be assessed not as nutrition inter-ventions but as programs meant to realize other social objectives.
12. Sahn and Alderman (1995) found that in the rural areas of Sri Lanka, the reduc-tion in work effort had a value of 50 percent (for males) and 40 percent (for females) ofthe value of the subsidy.
13. This section draws heavily from de Janvry, Fargeiz, and Sadoulet (1992) and deJanvry and Subbarao (1986).
14. An example is the substantial improvement in the coverage of food subsidies inrural India following severe criticisms of urban bias.
15. It is difficult to speculate on what configuration of political forces will eventual-ly bring about the desired change. In economic markets the equilibria between demandand supply are derived from consumers maximizing profits. Presumably, in politicalmarkets equilibria are reached when neither supporters nor opponents of a program,nor politicians, are willing to alter the form or intensity of government interventions. Achange in government intervention away from this equilibrium would lead potentiallosers to at least partially compensate potential gainers, while gainers would be willingto offer up to a certain amount to secure the intervention. In the case of food subsidiesin developing countries the potential losers of a more targeted program are usually thenonpoor, while the potential gainers are the poor. Obviously, if all markets are perfectand there is no cost to acquiring information and forming coalitions, the amount offeredby potential losers (the nonpoor) to oppose the change would always exceed the amountoffered by the potential gainers (the poor). As a result, country experiences show thatredistributive government interventions usually occur in favor of the groups that arepolitically more effective at managing this transformation. For programs such as foodsubsidies, again, the demands of the most malnourished will rarely have the same polit-ical clout as the demands of the better organized, who usually constitute the nonpoor(de Janvry and Subramanian 1985).
16. This section draws heavily on World Bank (1993c) and other recent papers andsector reports on housing issues in countries in transition.
17. District heat refers to an arrangement whereby apartment complexes receivesteam heat through a district heating grid, which also provides hot water. District
68 SAFETY NET PROGRAMS AND POVERTY REDUCTION
heating has been found to be highly energy efficient. It is the typical heating system inmany cities of the former Soviet Union.
18. It is worth stressing that this conclusion is valid only for the posttransition peri-od, which witnessed a complete breakdown of fiscal discipline. With a balanced budget,a policy of subsidizing wage goods could be disinflationary, assuming labor markets arefunctioning normally.
19. In some countries subsidies on diesel fuel have led to inefficient dieselization ofindustrial equipment and automobiles, and leakage of benefits to unintended groupsand sectors.
20. Freund and Wallich (1995) do not refer to correlation between household size andincome level, in addition to mere household size.
21. Although not discussed here, some of these policies that tax agriculture have haddeleterious effects on production, particularly in Sub-Saharan Africa.
22. The reference here is not to school feeding, but to programs such as food rationsthat are given subject to the household's willingness to send children to schools.
23. Gelback and Pritchett (1995) argue that too much indictor-based targeting mayresult in expenditure cuts that offset the benefits of better targeting. Self-targeting maysurvive politically more than other forms of targeting, because the politician can say theindividual decided to participate or not to participate. It was not a government decision.
5Income Generation Programs
Unlike cash and in-kind transfers, income generation programs oblig-ate the recipient to exchange labor time for an income transfer. Twoprograms have been used widely: labor-intensive public works andcredit-based self-employment (livelihood) programs. While publicworks can be used as a temporary measure for consumption smooth-ing during economic or natural shocks (such as a drought), or as year-long poverty reduction programs, credit-based livelihood programsaim to raise the average real income of the poor in the long term.Public works provide immediate income; credit programs aim to gen-erate medium-term income streams. Both of these programs involvesubsidies of varying degrees.
Public Works
Public works have been an important countercyclical intervention inindustrial and developing countries. 1 These programs were used insome Western countries during the depression years of the 1930s andalso during the mid-1950s (especially in Germany). Public works orig-inated in India in the nineteenth century as massive antifamine inter-ventions, though the works consisted of useless excavating-type pro-grams (Dreze 1989). India's programs had their origin in England'sworkhouses under the 1834 Poor Law Amendment Act (Besley andCoate 1991). Prior to the formal launching of public works by govern-ments, Kenya had a tradition of voluntary labor contributions to buildschools, known as harambee (schoolbuilding) and other communityinfrastructure. India tried shramadan (donation of labor), pioneered bysocial worker Vinoba Bhave. But these earlier experiments were notincome generation programs-they were more like community self-help programs.
While the argument for public works in nineteenth century Englandand India centered around the ethic of work (often long and nastywork), their relevance for developing countries is in using labor for
69
70 SAFETY NET PROGRAMS AND POVERTY REDUCTION
production and to build infrastructure. The scale of public worksoperations (in terms of employment generated) was as high as 21 per-cent of the labor force in Botswana in 1985-86, 13 percent in Chile in1983, and 5 percent in Honduras in 1990-93. In terms of number ofworkers employed (or person-days of employment created) the pro-grams in Bangladesh and India are probably the largest in the world.During the mid-1980s the Maharashtra Employment GuaranteeScheme (MEGS) in India created about 150-170 person-days ofemployment per person per year (Dev 1995b). Employment in India'smassive Jawahar Rojgar Yojuna (JRY) program reached 1 billion work-days by 1995, covering 123 underdeveloped districts of the country's350 districts (India, Ministry of Rural Development). In 1992 JRY gen-erated about 20 person-days of employment per person, or 62 person-days of employment per family (India, Ministry of RuralDevelopment).
There are several variants of public works programs in differentcountries. They can be distinguished by the mode of payment, dura-tion and timing of employment (whether or not there is a guarantee ofemployment), and extent of private sector involvement. Thus in the1950s and 1960s availability of bilateral food aid (mostly wheat underU.S. P.L. 480) facilitated the emergence of the food-for-work programin South Asia, where wages were paid in food and the program wasoriented toward road construction. These programs were also a majorpolicy response to severe droughts and floods that visited parts ofIndia and Bangladesh. In the 1980s the food-for-work program dimin-ished in importance in Asia. But the program continues in a fewAfrican countries largely with multilateral food aid from the WorldFood Program. Independently of food aid, some countries pay part ofwages in-kind and part in cash. Their motivation is to ensure foodsecurity at the household level. But now most countries pay wages incash.
Unlike credit-based self-employment schemes, public works pro-vide mainly current benefits. They are not meant to function as a per-manent escape route from poverty. In fact, most countries offer onlytemporary employment during off-seasons, when agricultural work islimited. Thus programs are expected to offer only stabilization benefits(consumption-smoothing in poor households), not transfer long-runbenefits. Moreover, sudden and unanticipated declines in farm activi-ty during bad agricultural years offer greater scope for consumptionsmoothing than do anticipated declines during slack seasons. TheMEGS in India differs from others in that it makes employment avail-able year-round within 5 kilometers of an individual's residence, andemployment at the worksite is guaranteed. 2 Whether or not employ-ment is guaranteed, public work programs in South Asia are massive
INCOME GENERATION PROGRAMS 71
and offer employment for a long period-often more than 100 person-days of employment per person in some provinces-and duringexceptionally bad agricultural years (Subbarao 1997). The source offunding also affected the duration of employment. In most Africancountries bilateral donors funded many public works. Programs lastedonly as long as donor support, and they offered only short-termemployment. In countries where public works are domesticallyfunded, either partially (as in Bangladesh) or entirely (as in India),programs have operated for much longer periods. Thus depending onhistorical circumstances and sources of financing, there is much cross-country variation in the scale of operation of public works (table 5.1).
Public works are implemented by governments directly (throughline ministries), the private sector (contractors), or nongovernmentalorganizations (NGOs).3 The exact nature of the institutional frame-work and implementing agencies differ a great deal across countries(table 5.2). In some countries in Africa and Latin America public worksare funded by social funds, but executed by private contractors.
The central issues in the management of public works are:* How to implement programs cost effectively.* How to target programs to the poor.* How to strengthen the secondary benefits from assets, and how to
share these benefits between the poor and the nonpoor.* How to design the program so as to minimize transaction costs to
the poor, exploit potential complementarities with other develop-mental projects, and encourage private sector involvement andNGO participation.
Cost per Job Created
Many countries have explicitly stated that the objective of publicworks is to create temporary jobs. But few countries have actually paidattention to keeping the costs of such job creation low. The most criti-cal factor governing the cost per job created is the share of wages intotal cost. In general, countries in which the ratio of wage cost to totalcost is 0.5 or higher have a lower cost per job created (table 5.1). Butthere is much cross-country variation-from as low as $1 per person-day of employment created in Bangladesh to $8 in Bolivia and $11 inNiger. To place cross-country comparisons in perspective, table 5.1also shows mean consumption per person per month. The main find-ing is that not all countries managed to create jobs at low cost; cost perjob created is low in Asia, but with few exceptions, high in Africa.4
There are, however, similarities. Low-income developing countriesin Asia and Africa-Bangladesh, India, Botswana, and Tanzania-have incurred a cost per person-day in the (modest) range of $1-$2.
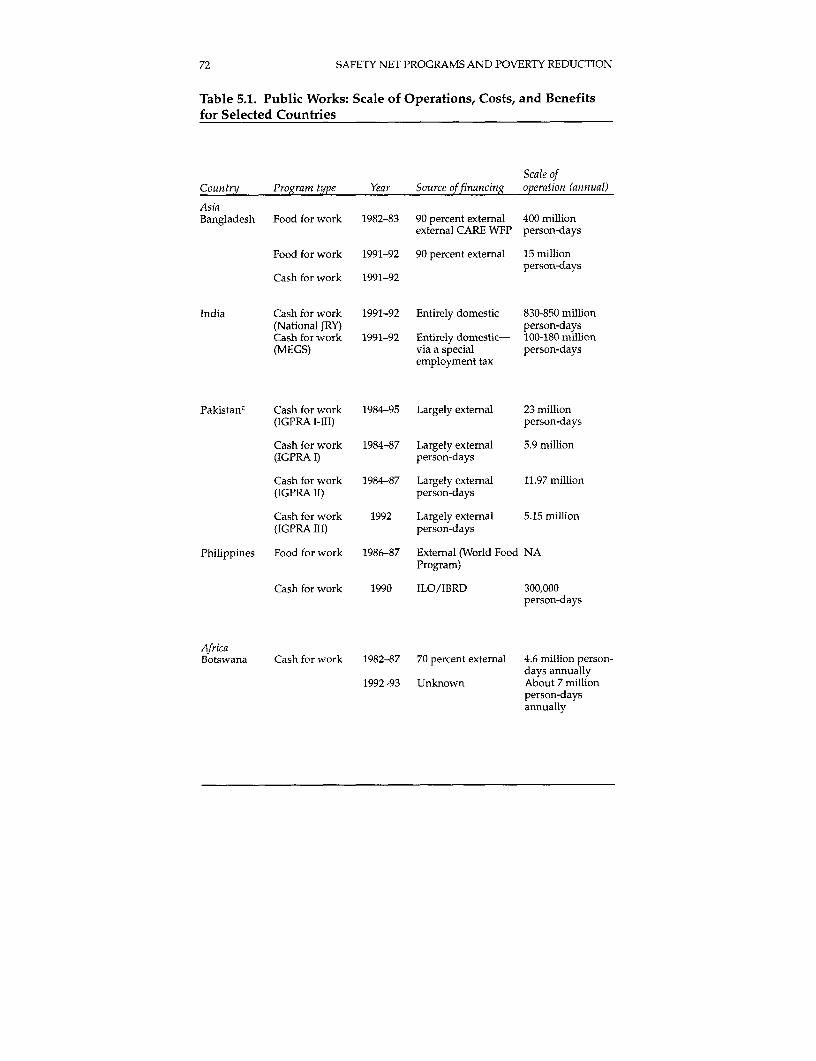
72 SAFETY NET PROGRAMS AND POVERTY REDUCTION
Table 5.1. Public Works: Scale of Operations, Costs, and Benefitsfor Selected Countries
Scale ofCountry Program type Year Source offinancing operation (annual)
AsiaBangladesh Food for work 1982-83 90 percent external 400 million
external CARE WFP person-days
Food for work 1991-92 90 percent extemal 15 millionperson-days
Cash for work 1991-92
India Cash for work 1991-92 Entirely domestic 830-850 million(National JRY) person-daysCash for work 1991-92 Entirely domestic- 100-180 million(MEGS) via a special person-days
employment tax
Pakistanc Cash for work 1984-95 Largely external 23 million(IGPRA I-III) person-days
Cash for work 1984-87 Largely external 5.9 million(IGPRA I) person-days
Cash for work 1984-87 Largely external 11.97 million(IGPRA II) person-days
Cash for work 1992 Largely external 5.15 million(IGPRA III) person-days
Philippines Food for work 1986-87 External (World Food NAProgram)
Cash for work 1990 ILO/IBRD 300,000person-days
AfricaBotswana Cash for work 1982-87 70 percent external 4.6 million person-
days annually1992-93 Unknown About 7 million
person-daysannually
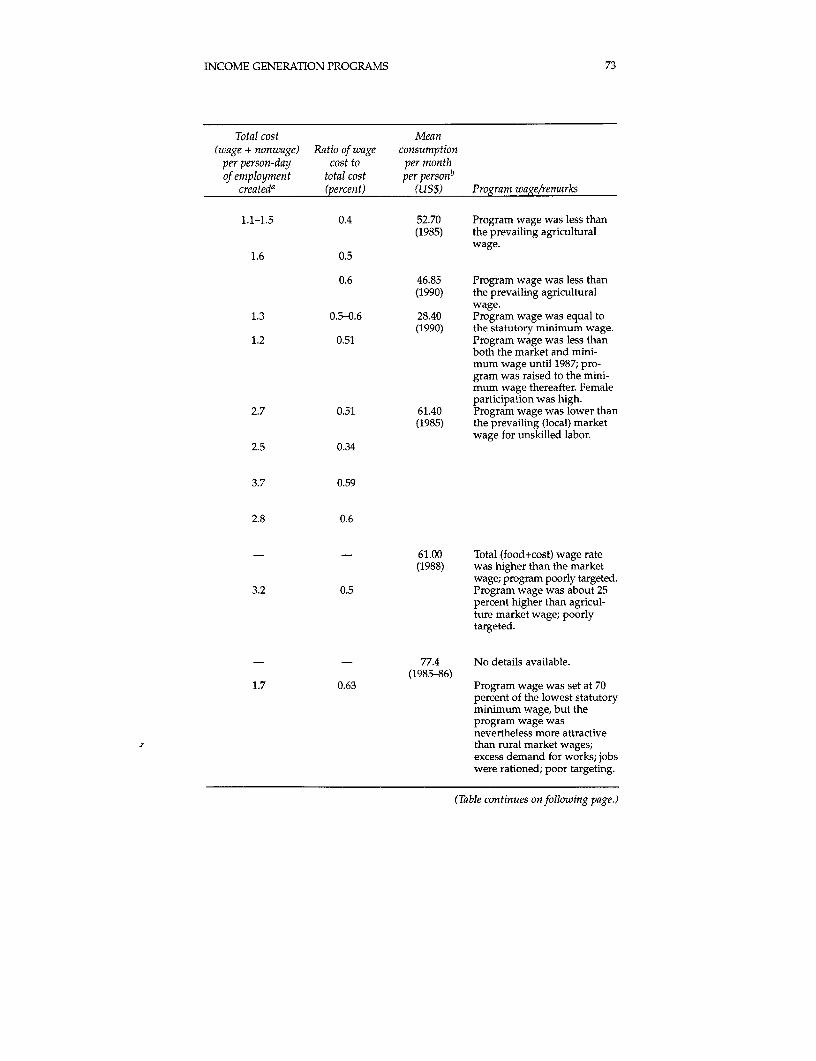
INCOME GENERATION PROGRAMS 73
Total cost Mean(wage + nonwage) Ratio of wage consumption
per person-day cost to per monthof employment total cost per personb
createda (percent) (US$) Program wage/remarks
1.1-1.5 0.4 52.70 Program wage was less than(1985) the prevailing agricultural
wage.1.6 0.5
0.6 46.85 Program wage was less than(1990) the prevailing agricultural
wage.1.3 0.5-0.6 28.40 Program wage was equal to
(1990) the statutory minimum wage.1.2 0.51 Program wage was less than
both the market and mini-mum wage until 1987; pro-gram was raised to the mini-mum wage thereafter. Femaleparticipation was high.
2.7 0.51 61.40 Program wage was lower than(1985) the prevailing (local) market
wage for unskilled labor.2.5 0.34
3.7 0.59
2.8 0.6
- - 61.00 Total (food+cost) wage rate(1988) was higher than the market
wage; program poorly targeted.3.2 0.5 Program wage was about 25
percent higher than agricul-ture market wage; poorlytargeted.
- - 77.4 No details available.(1985-86)
1.7 0.63 Program wage was set at 70percent of the lowest statutoryminimum wage, but theprogram wage wasnevertheless more attractivethan rural market wages;excess demand for works; jobswere rationed; poor targeting.
(Table continues on following page.)
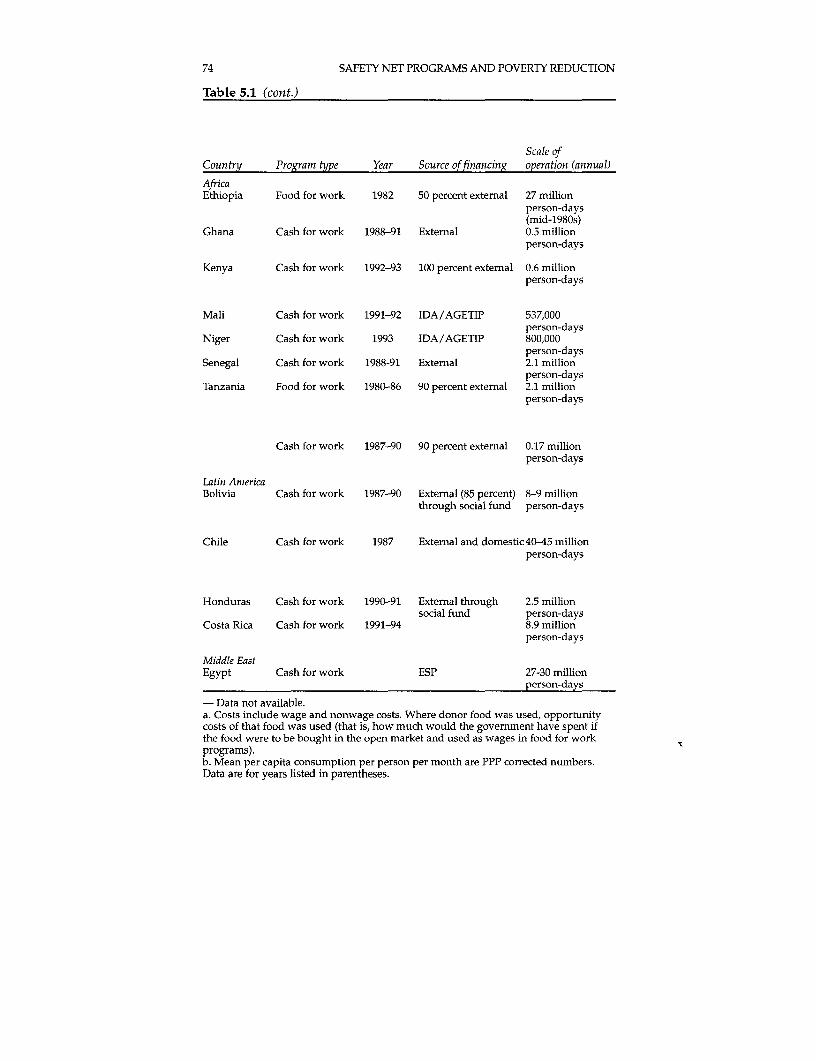
74 SAFETY NET PROGRAMS AND POVERTY REDUCTION
Table 5.1 (cont.)
Scale ofCountry Program type Year Source offinancing operation (annual)
AfricaEthiopia Food for work 1982 50 percent external 27 miltion
person-days(mid-1980s)
Ghana Cash for work 1988-91 External 0.5 millionperson-days
Kenya Cash for work 1992-93 100 percent external 0.6 millionperson-days
Mali Cash for work 1991-92 IDA/AGETIP 537,000person-days
Niger Cash for work 1993 IDA/AGETIP 800,000person-days
Senegal Cash for work 1988-91 External 2.1 millionperson-days
Tanzania Food for work 1980-86 90 percent external 2.1 millionperson-days
Cash for work 1987-90 90 percent external 0.17 millionperson-days
Latin AmericaBolivia Cash for work 1987-90 External (85 percent) 8-9 million
through social fund person-days
Chile Cash for work 1987 External and domestic 40-45 millionperson-days
Honduras Cash for work 1990-91 External through 2.5 millionsocial fund person-days
Costa Rica Cash for work 1991-94 8.9 millionperson-days
Middle EastEgypt Cash for work ESP 27-30 million
person-days
- Data not available.a. Costs include wage and nonwage costs. Where donor food was used, opportunitycosts of that food was used (that is, how much would the government have spent ifthe food were to be bought in the open market and used as wages in food for workprograms).b. Mean per capita consumption per person per month are PPP corrected numbers.Data are for years listed in parentheses.
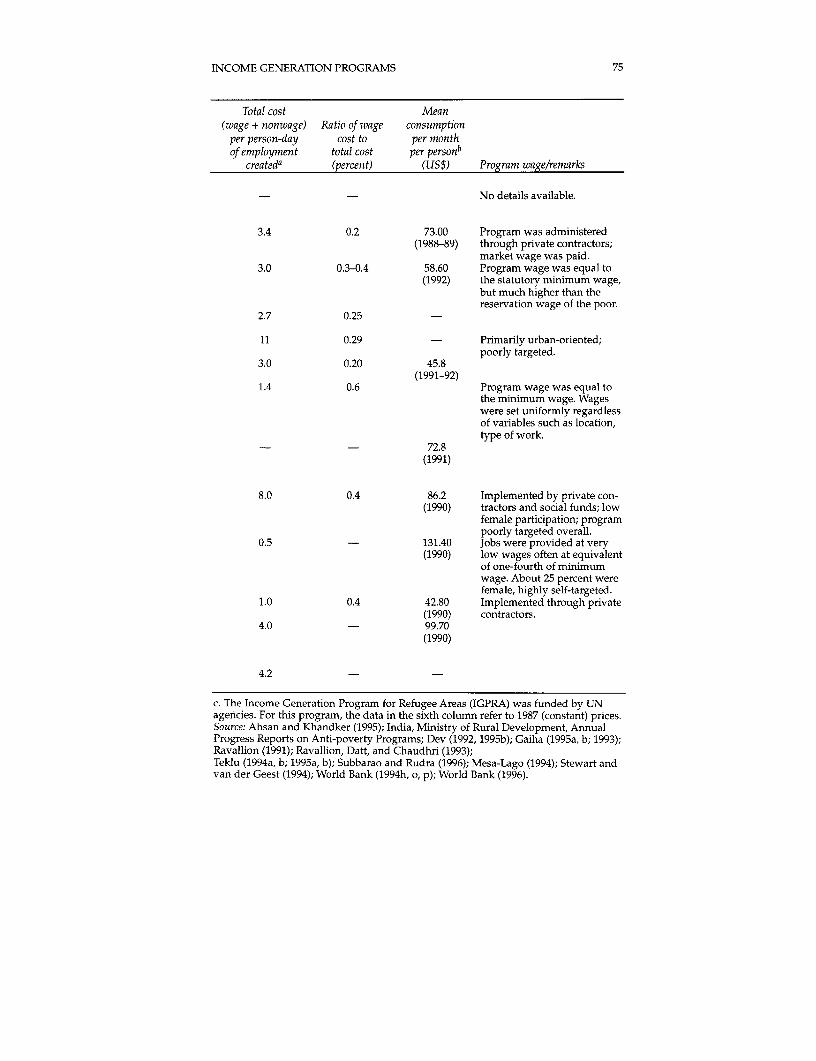
INCOME GENERATION PROGRAMS 75
Total cost Mean(wage + nonwage) Ratio of wage consumption
per person-day cost to per monthof employment total cost per personb
createda (percent) (US$) Program wage/remarks
- - No details available.
3.4 0.2 73.00 Program was administered(1988-89) through private contractors;
market wage was paid.3.0 0.3-0.4 58.60 Program wage was equal to
(1992) the statutory minimum wage,but much higher than thereservation wage of the poor.
2.7 0.25 -
11 0.29 - Primarily urban-oriented;poorly targeted.
3.0 0.20 45.8(1991-92)
1.4 0.6 Program wage was equal tothe minimum wage. Wageswere set uniformly regardlessof variables such as location,type of work.
- - 72.8(1991)
8.0 0.4 86.2 Implemented by private con-(1990) tractors and social funds; low
female participation; programpoorly targeted overall.
0.5 - 131.40 Jobs were provided at very(1990) low wages often at equivalent
of one-fourth of minimumwage. About 25 percent werefemale, highly self-targeted.
1.0 0.4 42.80 Implemented through private(1990) contractors.
4.0 - 99.70(1990)
4.2 -
c. The Income Generation Program for Refugee Areas (IGPRA) was funded by UNagencies. For this program, the data in the sixth column refer to 1987 (constant) prices.Source: Ahsan and Khandker (1995); India, Ministry of Rural Development, AnnualProgress Reports on Anti-poverty Programs; Dev (1992, 1995b); Gaiha (1995a, b; 1993);Ravallion (1991); Ravallion, Datt, and Chaudhri (1993);Teklu (1994a, b; 1995a, b); Subbarao and Rudra (1996); Mesa-Lago (1994); Stewart andvan der Geest (1994); World Bank (1994h, o, p); World Bank (1996).
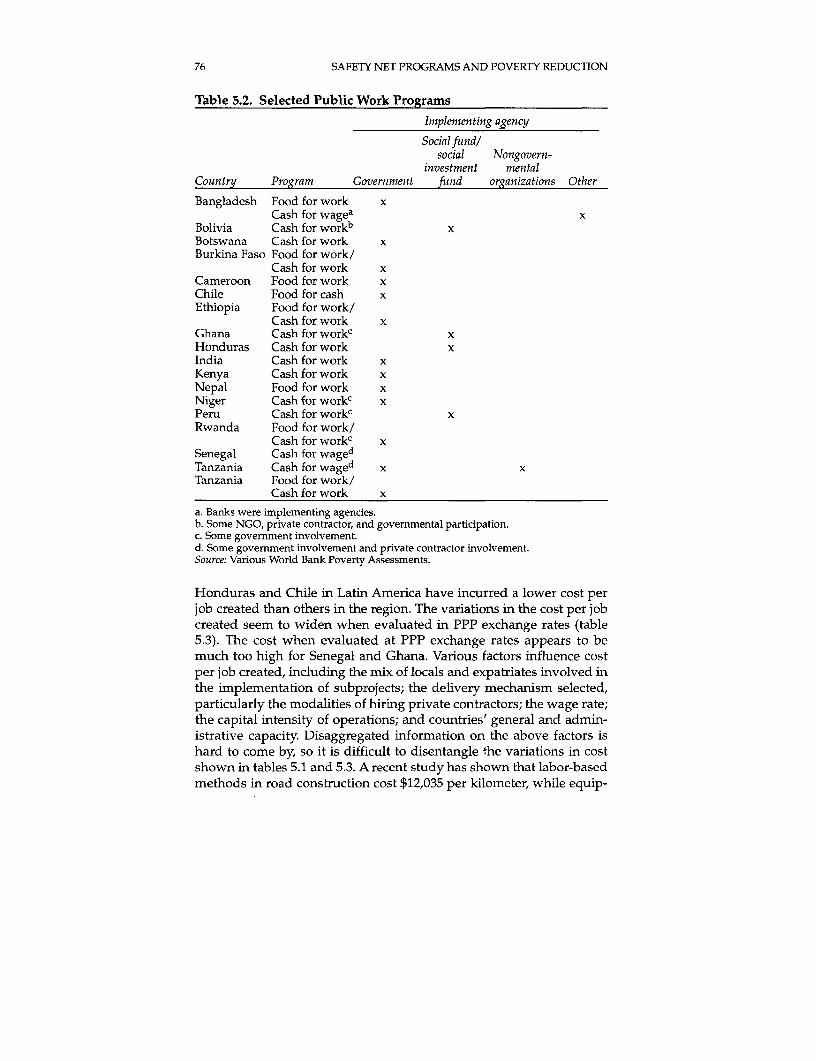
76 SAFETY NET PROGRAMS AND POVERTY REDUCTION
Table 5.2. Selected Public Work Programs
Implementing agency
SocialfiLndlsocial Nongovern-
investment mentalCountry Program Government fiund organizations Other
Bangladesh Food for work xCash for wagea x
Bolivia Cash for workb xBotswana Cash for work xBurkina Faso Food for work/
Cash for work xCameroon Food for work xChile Food for cash xEthiopia Food for work/
Cash for work xGhana Cash for workc xHonduras Cash for work xIndia Cash for work xKenya Cash for work xNepal Food for work xNiger Cash for workc xPeru Cash for workc xRwanda Food for work/
Cash for workc xSenegal Cash for wagedTanzania Cash for waged x xTanzania Food for work/
Cash for work xa. Banks were implementing agencies.b. Some NGO, private contractor, and governmental participation.c. Some government involvement.d. Some government involvement and private contractor involvement.Source: Various World Bank Poverty Assessments.
Honduras and Chile in Latin America have incurred a lower cost perjob created than others in the region. The variations in the cost per jobcreated seem to widen when evaluated in PPP exchange rates (table5.3). The cost when evaluated at PPP exchange rates appears to bemuch too high for Senegal and Ghana. Various factors influence costper job created, including the mix of locals and expatriates involved inthe implementation of subprojects; the delivery mechanism selected,particularly the modalities of hiring private contractors; the wage rate;the capital intensity of operations; and countries' general and admin-istrative capacity. Disaggregated information on the above factors ishard to come by, so it is difficult to disentangle the variations in costshown in tables 5.1 and 5.3. A recent study has shown that labor-basedmethods in road construction cost $12,035 per kilometer, while equip-
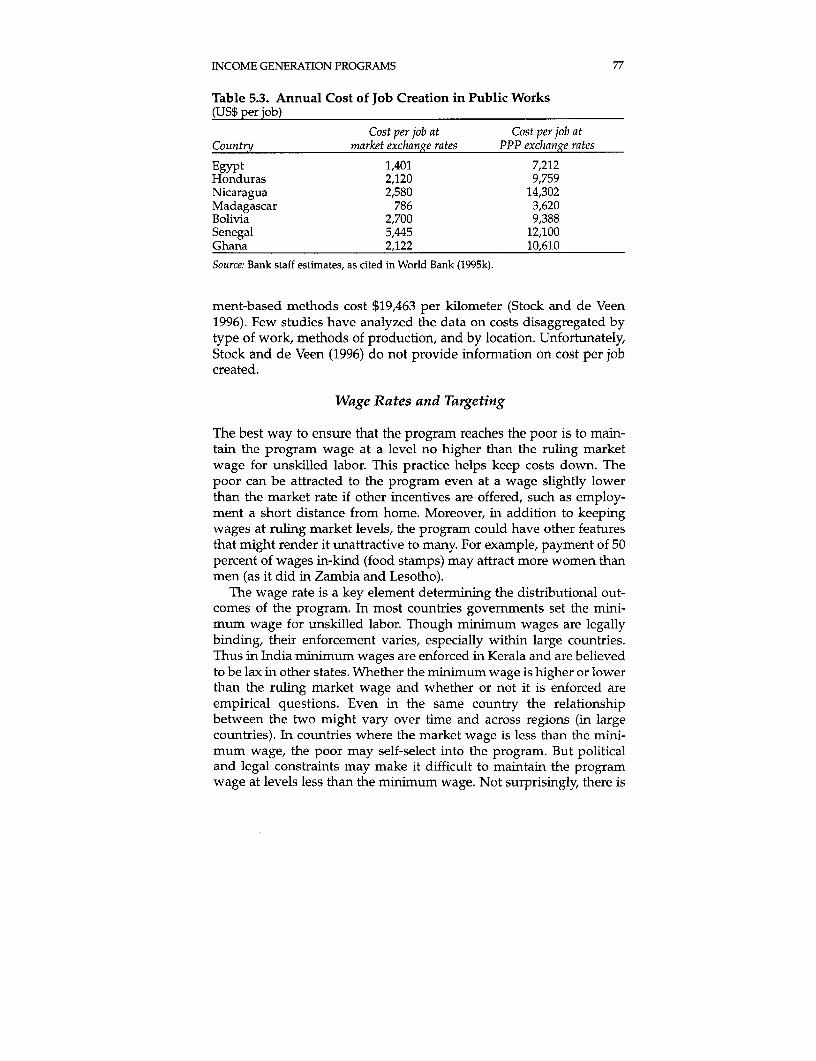
INCOME GENERATION PROGRAMS 77
Table 5.3. Annual Cost of Job Creation in Public Works(US$ per job)
Cost per job at Cost per job atCountry market exchange rates PPP exchange rates
Egypt 1,401 7,212Honduras 2,120 9,759Nicaragua 2,580 14,302Madagascar 786 3,620Bolivia 2,700 9,388Senegal 5,445 12,100Ghana 2,122 10,610Source: Bank staff estimates, as cited in World Bank (1995k).
ment-based methods cost $19,463 per kilometer (Stock and de Veen1996). Few studies have analyzed the data on costs disaggregated bytype of work, methods of production, and by location. Unfortunately,Stock and de Veen (1996) do not provide information on cost per jobcreated.
Wage Rates and Targeting
The best way to ensure that the program reaches the poor is to main-tain the program wage at a level no higher than the ruling marketwage for unskilled labor. This practice helps keep costs down. Thepoor can be attracted to the program even at a wage slightly lowerthan the market rate if other incentives are offered, such as employ-ment a short distance from home. Moreover, in addition to keepingwages at ruling market levels, the program could have other featuresthat might render it unattractive to many. For example, payment of 50percent of wages in-kind (food stamps) may attract more women thanmen (as it did in Zambia and Lesotho).
The wage rate is a key element determining the distributional out-comes of the program. In most countries governments set the mini-mum wage for unskilled labor. Though minimum wages are legallybinding, their enforcement varies, especially within large countries.Thus in India minimum wages are enforced in Kerala and are believedto be lax in other states. Whether the minimum wage is higher or lowerthan the ruling market wage and whether or not it is enforced areempirical questions. Even in the same country the relationshipbetween the two might vary over time and across regions (in largecountries). In countries where the market wage is less than the mini-mum wage, the poor may self-select into the program. But politicaland legal constraints may make it difficult to maintain the programwage at levels less than the minimum wage. Not surprisingly, there is
78 SAFETY NET PROGRAMS AND POVERTY REDUCTION
much cross-country variation. The program wage rate was 70 percentof the minimum wage in Chile, about 25 percent higher than agricul-tural market wages in the Philippines, and equal to the statutory min-imum wage in Kenya and Tanzania (see table 5.1, column 9). In India'sMEGS, until 1988, the wage rate was equal to the minimum wage, butlower than prevailing peak season agricultural market wage forunskilled labor. In 1988 the minimum wage and the MEGS wage weredoubled, and both wage rates exceeded the market wage rate forunskilled labor. The wage hike reduced the program's self-targetingability; person-days of employment also dropped (Subbarao 1993).
Maintaining a low program wage ensures that participation ratesare low, attracting only the poorest to work sites. In the well-researched MEGS Datt and Ravillion (1994) reconfirm Subbarao's(1993) finding-that the upward revision of the wage rate contributedto rationing, thereby eroding the guarantee of employment expectedof the program. It is worth stressing, however, that even though thetransfer benefits of the program were reduced following the wage hikein 1988, MEGS continued to offer stabilization benefits (Subbarao1997). Both before (1981) and after the wage hike (1991), the programoperated intensively in slack sessions.
In Tanzania and Botswana, as well, jobs had to be rationed-partic-ularly during droughts, when the need for public works was the great-est-because the program wage rate was maintained at a level higherthan the market wage for comparable unskilled activities (Teklu1994a). The program wage in Kenya was also higher than the marketwage for unskilled labor. As a result substantial numbers of nonpoorwere attracted to the program (Teklu 1994b). In Burkina Faso andSenegal program wages were generally lower than market wages,enabling high participation rates by the poor. In Sri Lanka publicworks under the Janasaviya Program were generally well-targeted,since program wage rates were below ruling market wage rates. In thePhilippines the total wage rate (food plus cash) in the food-for-workprogram was maintained at levels higher than the market wage. Thehigher level not only limited the scope for self-targeting, but alsoattracted many nonpoor to the program.
In Chile public works were an important safety net during the mid-1980s. Nearly 13 percent of the labor force participated. Wage rateswere kept low to make the program unattractive to the nonpoor. In theRepublic of Korea a public works program was used effectively toreduce poverty in the 1960s. The program worked as long as there wasan excess supply of labor. As the Korean economy entered its boomperiod in the 1970s and 1980s, wages for manual labor soared. As aresult only old and less-active workers participated in public works.Thus the program's effectiveness diminished, and in the late 1980s it
INCOME GENERATION PROGRAMS 79
was abandoned (Kwon 1995). In terms of introducing and abandoningthe program, Korea's timing was perfect.
While a lower program wage is most likely to make a program self-targeted, other features, such as careful timing (so as to synchronizework with the agricultural slack season) might also help in targeting.India's most important safety net has been the JRY, the nationwideprogram of public works. This program has been generating morethan 800-850 million person-days of employment annually, with 55million people employed in the agricultural off-season. In the JRY theprogram wage has always equaled the minimum wage. The durationof employment offered was generally lower than under the MEGS.Nevertheless, the program operated intensively during the agricultur-al off-season. A recent evaluation shows that the benefits of the pro-gram were reasonably well-targeted to the poor-more than 70 per-cent of the person-days were used by people living below the povertyline, and more than half by people belonging to socially deprived com-munities (the scheduled castes and tribes) and the landless. Because ofthe timing of the program, consumption-smoothing benefits were con-siderable. Yet the disadvantages are worth noting. Transfer benefitstend to be low, and the program attracts some of the nonpoor. In Kenyaand Tanzania not only are program wage rates higher, but the timingof public works is synchronized with the busy agricultural season,thereby significantly diminishing the stabilization benefits to the poor(Teklu 1994a,b). In Bangladesh the food-for-work program was poorlysynchronized with seasonal work and food needs.
It is never easy to perfectly predict seasonal food needs in any coun-try. It is reasonable, however, to expect even poor people to anticipateseasonal shortfalls and plan in advance. Even assuming that the pooranticipate off-season distress, they may not be able to protect them-selves fully, owing to a fall in their purchasing power and hence effec-tive demand. Therefore, the expectation is that in off-seasons workprograms may provide much-needed purchasing power to the poorand protect them from seasonal undernutrition.
Timing public works is very difficult in countries where these pro-grams are executed by private sector contractors. When the privatesector is involved, the government must schedule works, prepare con-tract documents, and tender works during the lean agricultural sea-son. This has been very difficult for most countries. This timing is alsovery closely related to government financing. The rministry adminis-tering the program is at the mercy of the funding body (treasury ordonors) in terms of being able to pay contractors or having resourcesavailable to draw up a contract. In Ghana the Department of FeederRoads often has no money (from the Treasury) during the lean agri-cultural seasons. Thus the financial management of works programs
80 SAFETY NET PROGRAMS AND POVERTY REDUCTION
also determine the extent to which programs can be synchronized withlean season (Stock and de Veen 1996).
Share of Wages in Total Costs
In most programs the share of wages in total program costs variedbetween 30 and 60 percent. While a higher share is desirable in thathigher transfer benefits are conferred on the poor, many factors deter-mine this ratio, including the nature of the asset to be created, the dura-tion and timing of the works, and, most importantly, the availability oftechnically and economically feasible labor-based methods of produc-tion. In most road construction activities the share of wages in total costsranged from 40 to 50 percent. Where the work has been entrusted to pri-vate contractors, the share of wages in total costs is often unpredictable.
It is not clear whether labor-based methods are readily adopted byprivate entrepreneurs. Evidence from Ghana suggests that timelyavailability of project funds is often a critical factor for the adoption oflabor-based methods. For example, where the project is financed bybilateral donors and funds are available without delays, contractorshave shown a willingness to adopt labor-based methods. Where pro-ject funds originated from government departments, enormous delayswere experienced in the receipt of funds, witlh corresponding delays inpayment of wages. Fearing strikes and agitation by laborers, contrac-tors opted for machine-based methods (Stock 1996). Thus the institu-tional delivery mechanisms and the efficiency with which projects arefinanced are often critical determinants of the extent of labor use inpublic works programs.
Use and Maintenance of Created Assets
Two sets of issues are relevant: how to improve the quality of outputof public works, including better maintenance of the assets created,and how to share the secondary benefits from the created assetsbetween the poor and the nonpoor. Where the proportion of capitalinputs was maintained at extremely low levels (to expand labor use),the quality of assets created suffered. This shortcoming is being cor-rected in many countries, and now nearly 60 percent of the total expen-diture on a typical activity (such as road construction) constitutes cap-ital inputs. Even then, quality of work can be improved with bettersupervision, and with possible incentives for field officers.
Whether or not the created assets confer long-term benefits on thepoor is an important issue. India's two leading programs-the JRY andthe MEGS-have both sought to create minor irrigation infrastructureon small farms. These assets are bound to increase labor use and
INCOME GENERATION PROGRAMS 81
incomes of small farmers. The MEGS also focused on drought-proofing infrastructure. This effort included soil conservation andafforestation, which are most likely to benefit relatively poor dry-landfarmers, although, recently, road building has dominated (Dev 1992).In Bolivia and Honduras many public works focused on health andeducation infrastructure (construction of primary health clinics andschools). But the choice of assets is fraught with potential conflicts ofinterest. If only the poor benefit from the created assets, the rich maynot (fiscally) support employment schemes. If assets that serve the richare also created, and if these activities involve a high proportion ofcapital inputs, benefits to the poor may be reduced (since the wagecomponent will be low).
Maintaining created assets is extremely important. Few countrieshave actually made any financial allocations for maintenance. Poormaintenance has resulted in the erosion of economywide benefits frompublic works (Teklu 1994a, b).
Impact on Incomes, Poverty, and Social Life
Evaluations of works programs in general, and the MEGS in particular,suggest significant income gains. Thus the annual wage incomes ofMEGS households were found to be higher than those of non-MEGShouseholds (Acharya and others 1988). Numerous microeconomicstudies have shown that 60 to 70 percent of the participants of both thenationwide program and the MEGS belonged to poor households. Theimmediate net income gain from works programs as a percentage oftotal gross eamings is high. For example, the severity (not the inci-dence) of poverty has fallen from 5.0 percent to 3.2 percent because ofparticipation in the MEGS (Datt and Ravallion 1992). But simulationsby Datt and Ravallion suggest that the effect on poverty of additionalincome eamed from the program is no more than could be achievedthrough a uniform allocation of the same gross program budget acrossall rural households. This result stems from losses associated with for-gone income and administrative and other nonwage costs.Nevertheless, significant (though unquantifiable) social gains areattributable to the MEGS. Dev (1992) notes that the MEGS has "madeconsiderable impact on the social life of the workers. Concentratinglarge numbers of workers in one place in similar conditions andincreasing their interaction helps to break down social differences. Thishas resulted in increasing social understanding of workers belonging tovarious castes. The MEGS also discourages sexual barriers and inequal-ity. Emergence of women on works in large numbers has created confi-dence among them. Women now dress better and their economicpower has given them a better status in their families" (p. 54).
82 SAFETY NET PROGRAMS AND POVERTY REDUCTION
Even if the wage rate is low and self-targeting is promoted, it is notimmediately obvious that public works constitute the most cost-effec-tive option for transferring benefits (income) to the poor. Muchdepends on whether or not participants forego income (and howmuch) from alternative activities while participating in public worksprograms. Evidence on this issue is difficult to find. Evidence for theMEGS shows that the foregone income is small-the opportunity costof participation for the poor was typically quite low (Datt andRavallion 1994).
It is possible to reduce the potential cost of foregone income bydesigning public works appropriately. Thus projects where pieceworkwas adopted attracted women because participation did not crowd outtheir other activities (that is, women were better able to dovetail wagework and household work). Correspondingly, the danger of foregoingincome from other sources was diminished. In a village survey inTanzania women expressed a preference for working for payment onspecific tasks in road projects because task-based payment enabledthem to work whenever they had leisure time, without crowding outother activities. Flexibility in timing can enhance women's participa-tion in public works and reduce the potential for forgone earnings.
Providing work close to homes and villages is another way to pro-mote higher female participation. The MEGS has been a pioneer inproviding employment within 5 kilometers of a person's village. Thisconvenience is another reason why female participation is much high-er in the MEGS than in the nationwide JRY.5 In determining programdesign, it useful to ask: how is the opportunity cost of participants'time in general and women's time in particular affected by thescheme's timing?
Another way to reduce potential foregone income is to make theprogram available in rural areas during the agricultural slack season.Such timing would also maximize income-smoothing benefits. Howthis scheme is likely to affect transfer benefits depends on the relation-ship between the public works' seasonal operation and the agricultur-al wage rate in the peak season. If public works operating in the slackseason raise the peak season wage rate, transfer benefits are improved.But this outcome is unlikely. It is more reasonable to expect peak sea-son work programs to raise peak season wage rates in the private sec-tor. Given the overall scarcity of resources, it may be difficult to pro-vide significant transfer benefits by timing public works in peak sea-sons. Not surprisingly, some countries (especially those in semiaridzones prone to greater weather and agricultural production variabili-ty) modestly aim for the provision of income-smoothing benefits to thepoor during slack seasons, with the possibility of second-round bene-fits from the infrastructure created.
INCOME GENERATION PROGRAMS 83
The poor who participate in public works may have to pay part oftheir wages to officials, contractors, or politicians; incur transportationcosts; or bear other related transaction costs that may potentiallyreduce program benefits. Appropriately designed public works pro-grams should be able to reduce such transaction costs. For example,offering a guarantee of employment at a low wage will substantiallyreduce leakage. Involving NGOs is critical for organizing participantsinto pressure groups, through which they can articulate their griev-ances with work managers (Lipton 1995). Piece-rates, if properlysupervised and enforced, can also reduce the scope for corruption.Provisions for tendering contracts to private contractors (on a compet-itive bidding basis) can also reduce transaction costs, but the proce-dures may be time-consuming and may not always prevent abuse.6
Encouraging grass roots participation can prevent abuse in publicworks as much as in other transfer programs.
The Political Economy of Public Works
Since public works are usually highly visible and always must be imple-mented locally (in villages), political factors are likely to be important inshaping their design (the wage rate offered, the choice of project, the tim-ing of activities, and the overall size of the program). Three interestgroups are usually involved in the design and execution of public works:the politicians and bureaucrats who influence the size and design of theprogram, the poor who benefit from the program, and others who mayor may not benefit from the program-such as large farmers or privatecontractors-but who wield considerable political and social power inmany societies. Each of these groups perceives the advantages and dis-advantages of public works differently. While the poor who participatein a program may favor the positive impact on the peak season's agri-cultural wage rate, large farmers who hire laborers may oppose any suchprogram. Politicians may see the program as an opportunity to rewardexisting political supporters, while bureaucrats may fear losing control ofthe program to another agency (such as a social fund). The targetgroup-the poor-may resist low wage rates, even though a low wagemay encourage self-targeting and render the program propoor.
Although it is difficult to empirically establish the precise influenceof each of these political factors, evidence is overwhelming that newpublic works programs have usually been introduced before elections(such as in Bangladesh, India, Indonesia, Pakistan, and thePhilippines). In some countries public works are introduced to fulfiilelection promises immediately after a new government has beenformed (as in Jamaica). Civil disturbances also triggered theemergence of public works programs in India and Tunisia.
84 SAFETY NET PROGRAMS AND POVERTY REDUCTION
The potential for absorbing labor in road construction and rehabili-tation public works is substantial. Comparative studies of labor-basedversus equipment-based approaches in feeder road construction andrehabilitation carried out in Rwanda (Martens 1989), Ghana (Bentall1990; Stock 1996), and Botswana (ILO 1991) showed the cost-effective-ness of labor-based construction methods. These approaches proved tobe 10 to 30 percent less costly than equipment-based methods, reducedforeign exchange expenditures by 50 to 60 percent, and created 240 to320 percent more employment-particularly benefiting unskilledlabor-thus contributing substantially to poverty alleviation amongthe low-income target group (Majeres 1993). Yet labor-based methodsare often resisted. Target groups are generally unorganized and politi-cally weak, so they are unlikely to have much say in program design.Where public works have been implemented by private contractors,large, powerful contractors have been successful in paying extremelylow wages and substituting capital for labor when low wages wereresisted. In other countries private contractors actually preferred touse labor-based methods in projects funded by bilateral donorsbecause quick payment of contract funds was assured (Stock 1996).
Five general conclusions can be drawn from the reviewedexperience.* The wage rate is critical in determining the distribution of program
benefits, as well as how well the program is targeted. Maintaining theprogram wage equal to the ruling market wage for unskilled labor isthe best way to improve the transfer of program benefits to the poor.
* The timing and duration of employment determine the nature ofbenefits offered by the program. In general, the more narrowly theprogram is restricted to agricultural slack seasons, the lower are thetransfer benefits and the higher are the stabilization benefits. It isimportant to bear in mind the nature of poverty in a country beforerendering a public works program for only consumption smooth-ing. Such an approach is appropriate where poverty is transient. Incountries subject to yearly fluctuations (such as Ethiopia), publicworks activity must intensify in bad years, lasting almost year-round. Also, in countries where poverty-gap ratios are high, theneed to run the program year-round (and thus raise transfer bene-fits to the poor) assumes greater importance.
* The program can be designed to encourage greater participation ofwomen, more involvement of the private sector, lower transactioncosts for participation, and greater involvement of NGOs and grassroots organizations to prevent abuse.
* To enhance the program's long-term benefits for the poor, it ispreferable to choose assets that have high long-term employmentmultiplier effects.
INCOME GENERATION PROGRAMS 85
* To maximize the economic returns to public works activity, it isdesirable to estimate economic rates of return to different projects indifferent regions prior to project selection, integrate the programwith broader national development plans, and introduce a compo-nent to maintain the assets created.
Livelihood Programs
Programs to promote access to institutional credit date back to theearly 1950s.7 Some countries, such as India, have nationalized bank-ing services with a view to forcing commercial banks to extend theiroutreach to the rural poor. The major justification offered was theneed to extend credit facilities in order to encourage rural growthand technology adoption. The early 1970s, however, saw the emer-gence of a new view. The role of credit was not merely to channelfunds to the most productive uses, it was also to bring about socialjustice by lending at lower (subsidized) interest rates to disadvan-taged groups. 8 But channeling massive amounts of subsidized creditthrough state-run banks left much to be desired (see Besley 1995).The consensus in the 1980s was that private lending rates accuratelyreflected the costs and risks of lending, and that state-subsidizedcredit rarely reached the rural poor. There were simply too manyrent-seeking intermediaries.
The populism of massive, subsidized, state-directed credit has abat-ed in the 1990s. There has been a recognition that: the poor's problemis not high interest rates, but the inability to borrow because they lackcollateral; although formal lending institutions can reduce the covari-ance of default risks, they do not have the local knowledge needed tolend to the collateralless poor and, as such, cannot avoid adverse selec-tion (loans are sought only to be abused) and moral hazard (lendersmay take excessive risks because they know that risks can be sharedwith borrowers); formal lending institutions lack sufficient knowledgeabout borrowers and, therefore, face great problems in enforcingrepayment, even where legal provisions and collateral exist; and whilelending to the poor is expensive, the poor are not necessarily bad cred-it risks (Lipton 1995).9 Several new financial institutions, largely initi-ated by NGOs, have sought to overcome these problems (includingmarket failure) with lending to the poor.
Objectives and Regional Patterns
Four types of institutions must be distinguished:* Public banking institutions, cooperatives, and commercial banks-
all with local branches but under the control of the central bank.
86 SAFETY NET PROGRAMS AND POVERTY REDUCTION
* Special programs, such as the Integrated Rural DevelopmentProgram (IRDP) in India, administered by a central ministry, thatare directly targeting the poor and are extending (subsidized) cred-it, usually for the purchase of income-earning assets.
* NGO-administered, formal credit institutions.* Self-help groups, also assisted by the NGOs that operate informally
and on a small scale, each with an outreach often restricted to a fewvillages.
The central objective of all these institutions is to advance credit, butsome-particularly NGO-mediated institutions and self-helpgroups-strongly encourage savings as well. Specialized programsusually advance credit contingent on the purchase of an income-earn-ing asset. While public credit institutions usually insist on collateral,special programs target credit directly to those identified as poor, andcollateral is not necessary in most NGO-run programs. The institutionsalso differ with respect to the role played by NGOs. At least three vari-ants can be distinguished: charismatic leadership plays an importantrole in the establishment, training, and administration of a credit pro-gram, such as the Grameen Bank in Bangladesh; an NGO acts as afinancial intermediary between a bank or government ministry andthe poor or a self-help group, as in the Philippines; or an NGO helpsorganize a self-help group and plays a facilitating role, for example, bylinking a bank with a self-help group or advising on general perfor-mance, as with the Mysove Resettlement and Development Agency(MYRYDA) in India.
The success of credit-based programs can be assessed according tohow many of the deserving poor were able to obtain credit, how manyof the nonpoor managed to enter the program, whether or not the poorwere able to earn a high enough rate of return on the amount bor-rowed to repay the loan and escape from poverty, whether or not theincome generated is sustained over time, and whether or not the loansare repaid and the program is financially viable in the long term.Though several evaluations of programs are available, information israrely found on these four criteria (Lipton 1995). There are method-ological problems as well. It is often empirically difficult to disaggre-gate income earned from various sources. It is also difficult to track theend-use of a loan-even if the end-use is tracked, it is not clearwhether the loan only encouraged the consumption of other adultgoods, since all money is fungible. 10
Targeting
Program and country experience suggests that (by far) the least effec-tive way to reach the poor is to directly target subsidized credit to
INCOME GENERATION PROGRAMS 87
individuals and households identified as poor by bureaucrats or pro-ject managers. Where targets for poverty reduction were set, bureau-crats had a direct incentive to select people living just below the pover-ty line. And the nonpoor entered the scheme when powerful localinterests collided with bureaucrats."1 In practice, therefore, subsidieshave attracted the nonpoor in practically every country that has exper-imented with such programs.' 2 The principal problem with the IRDPin India is that the central ministry rates its success by the number ofbeneficiaries who "crossed the poverty line." Bureaucrats at the locallevel thus have an incentive to select people who are not poor or areclose to the poverty line.' 3 The scope for deliberate mistargeting is thusinherent in program design. Most credit managers at the local levellack the time to verify whether or not a household is poor. Also, manyprograms (including India's IRDP) measure poverty in terms of house-hold poverty, disregarding household size. Thus substantial leakagewas observed in many large-scale credit programs run by the govem-ment's usual administrative machinery.
Programs that used communities, local groups, and NGOs to iden-tify the poor have had much better targeting records. Even in India'sIRDP, the states that used village councils to select beneficiaries havehad a much smaller proportion of ineligible households participate(Copestake 1992). Programs administered by NGOs or self-helpgroups have used various methods other than income for targeting,including geography and land ownership. Some have enforced rulesthat make loans more attractive to the poor than to the nonpoor(amounting to self-targeting). In Bangladesh the Grameen Bank targetscredit to families owning less than 0.5 acres of land. This criterionprobably ensures that most borrowers are poor (keeping inclusionerrors low), though it certainly excludes many households with largefamilies owning more than 0.5 acres, or owning poor quality land. InIndonesia the requirement for one credit program was the ownershipof a house or a plot of land, which excluded the poorest from theprogram.
The Grameen Bank, the Bangladesh Rural AdvancementCommittee (BRAC), and MYRADA have generally succeeded in reach-ing the poor because the programs eliminated the requirement for col-lateral, advanced small loans, and avoided delays. In addition, theGrameen Bank relied on group lending and peer monitoring to ensurethat credit was used for developmental purposes (income generation)and that loans were repaid. In many countries even commercial banksare searching for alternatives to physical collateral. Local intermedia-tion by NGOs was used by commercial banks in some provinces inNigeria and India; local agents (typically the influential people in vil-lages) were used by Badan Kredet Kecamatan (BKK) in Indonesia to
88 SAFETY NET PROGRAMS AND POVERTY REDUCTION
speak on behalf of the borrowers. MYRYDA has been more successfulin reaching the poor (without resorting to group lending) than BKK,whose clients are moderately poor or not poor.
Special programs that used innovative methods to identify benefi-ciaries and some programs initiated by NGOs (such as MYRYDA)have reached poor women in large numbers, unlike the state-run pro-grams. An interesting contrast is found in India: the large, state-runIRDP has less than 25 percent women beneficiaries, compared withmore than 60 percent in MYRADA (and more than 90 percent inGrameen Bank).
Repayments, Sustainability, and Cost-Effectiveness
Programs administered by public banks or special programs adminis-tered by line ministries generally have very poor repayment records.Political economy factors have encouraged delinquency; it is notuncommon in some countries to promise loan write-offs prior to elec-tions. Default risks usually increase with loan size and with a borrow-er's wealth (Lipton 1995). Women borrowers have had better repay-ment records, presumably because it is far more important for them tomaintain a line of credit than for men. Subsidy-driven special pro-grams, such as the IRDP in India, have an especially poor repaymentrecord. Also, many rural financial institutions have incurred heavylosses, even with better repayment records, because of inadequateindexation to inflation, as in Brazil and Mexico.
It is not, however, imperative that a large government-initiated pro-gram have a poor repayment record. The two Indonesian institu-tions-BRI and BKK-have offered innovative monthly interest raterebates for prompt repayment. In addition, BKK's average loan sizewas small, and the institution has collected repayments weekly. BKKeven permitted daily repayments when justified (Yaron 1994). "A BKKstaff member, for example, visited a different village each week, oftenon a market day, collecting savings deposits and weekly loan repay-ments" (Yaron 1994). Such practices have greatly reduced clients'transaction costs, standing in sharp contrast to the heavy red tape andhigh transaction costs clients experienced in large loan programs inIndia. The delivery mechanism, loan size, and innovative policies thatreduced transaction costs have been critical to ensuring a high recov-ery rate. Government-led programs that lacked these components suf-fered accordingly.
Repayment records have not necessarily been high in programsmediated by NGOs. For example, many programs in the Philippines inwhich NGOs have acted as financial intermediaries have had excep-tionally poor repayment records (Subbarao, Ahmed, and Teklu 1995).
INCOME GENERATION PROGRAMS 89
The high repayment record of the Grameen Bank is due to group lend-ing and peer monitoring, which ensure discipline (in repayments)-one member's failure to repay renders the entire group liable, and thegroup cannot borrow again until debts by all members are cleared. Theprogram's design virtually eliminated the possibility of free riding.14
The self-help groups also have better repayment records than the state-run financial institutions. These operate on a small scale, saving isstrongly encouraged, and there is some oversight and advice given byNGOs. Presumably the social stigma from defaulting is high.
Three issues are relevant to sustainability. First, clients must earnlivelihoods through activities that are sustainable over time. Second,clients (on prompt repayment of debts) must have continuing access tocredit. Third, the program itself must be sustainable over time, whichis possible only if any subsidy elements of the loan program are mini-mal and repayments are prompt. (Some government-run programsinvolving heavy subsidies-programs where political expediencytakes precedence over economic viability-may be sustained over timeeven in the face of high default rates.)
Evidence for sustainable income generation is strong only forGrameen Bank (Khandker, Khalily, and Khan 1995). Grameen Bankdemonstrates that it is possible for targeted credit interventions to gen-erate sustainable livelihoods for the poor. Evidence from other pro-grams is not as strong, yet it is reasonable to hypothesize that poorhouseholds who have invested in self-employment ventures wouldmake every effort to retain their assets, even in the face of severe eco-nomic hardship. Several microeconomic studies of India's IRDP bearsout this prediction. In Uttar Pradesh, one of India's poorest states, 82percent of the assets purchased under the IRDP were intact after twoyears, and 59 percent were intact even after four years (Pulley 1989).But evidence from India suggests significant variations in sustainabil-ity across different types of investment (Pulley 1989). Investment indairy (milk cows) showed the highest retention and sustainability.Further, an analysis of the probability of retaining assets showed thatsustainability and asset retention rates were high for households thathad preprogram incomes above the poverty line, higher literacy levels,low asset divisibility, and experienced no major weather-inducedshocks following the purchase of the asset (Pulley 1989). To the extentthat assisted households belong to a very poor population with a lowlevel of education, sustainable income generation requires additionalefforts (such as back-up loans, or technology or marketing support) onthe part of lending agencies.
Continuing access to credit is critical for poor households embark-ing on self-employment ventures. Again, the BKK and the GrameenBank have an excellent record in this respect. By contrast, one of the
90 SAFETY NET PROGRAMS AND POVERTY REDUCTION
major shortcomings of India's IRDP is its failure to open up a continu-ing line of credit, even for those poor households that did not defaulton past loans (Pulley 1989). Political economy factors may be impor-tant: while the poor may want a continuing line of credit, politiciansmight be more interested in widening their constituency by expandingprogram coverage to new households (whether poor or not), ratherthan lending to the same poor households year after year.
The third aspect of sustainability relates to program design. In gen-eral, subsidy-driven programs impose a fiscal drain, eventually neces-sitating a cutback of the program itself. With limited resources largelyfinanced by donors, programs are often discontinued when donorsupport is withdrawn, or scaled down to serve only more promisingclients or areas. Four factors contribute to program sustainability: pos-itive interest rates, high repayment rates, low administrative costs, andencouragement of saving (Yaron 1992a, b). Only a few programs havebeen successful in realizing the above goals. Barring the BKK, the BRI,and the Grameen Bank, the more successful programs are extremelysmall in outreach (often limited to a few provinces in a country). Thusin India MYRADA (the more successful program) manages 20 millionrupees and serves about 450,000 people, compared with the nation-wide IRDP (the less successful program), which manages 12 billionrupees and serves approximately 135 million people. Successful pro-grams have endured over time, but the size of such programs isextremely small relative to the size of the country's poor population.
Finally, several programs supported by donors and implementedby NGOs have proved to be financially viable. But funds wereobtained free of cost from donors. If the opportunity cost of donorfunds was also taken into account, many programs (including theGrameen Bank) would not yet be economically viable (Khandker,Khalily, and Khan 1994a, b).
The Politics of Credit Programs
As Lipton (1995) remarks, most countries have "electoral creditcycles." The conflict between politicians' interests and economic via-bility is nowhere more real than in subsidized credit programs. Withthe approach of elections, default rates usually increase, and partiescompete with promises of loan write-offs; program outreach isexpanded, overlooking eligibility criteria; and beneficiaries' transac-tion costs rise as payments have to be made to local party officials (tofinance elections) to gain entry into programs. The same political econ-omy factors that tend to increase the resources available for subsidizedcredit programs in the budgets of provincial and central governmentsalso tend to divert allotted resources away from the deserving poor.
INCOME GENERATION PROGRAMS 91
Bureaucratic management has often resulted in the poor having toshare some of the program's benefits with officials. Yet even if someprogram benefits do not leak to the nonpoor and other rent-seekingplayers, sustainability of the program would still be in jeopardy.
The real solution lies in the organization of beneficiaries-potentialas well as actual. But organizing beneficiaries is not a costless, risk-free, or painless activity. NGOs have certainly played a role in somecountries (organizing the landless labor and tribal groups in India, forexample). Often, the organizing was performed by a single pioneer.One example is the social worker who organized the poor women veg-etable sellers in the Indian city of Ahmedabad. The group has nowblossomed into a major NGO, the Self-Employed Women'sAssociation.
What can we learn from the reviewed experience? If credit pro-grams are to succeed in reaching the poor, it is important to:* Reduce transaction costs (such as many trips to the credit office,
payments to officials, complex procedures for repayment).* Subsidize transaction costs where necessary, but not interest rates.* Avoid direct targeting of credit programs based on means tests, but
use local groups.* Alter program design (small and repeated loans, peer pressure, and
group monitoring) to promote self-selection.• Organize beneficiaries into groups and incorporate incentives for
both borrowers and lenders to enforce repayment discipline.* Incorporate savings as a necessary component.
Notes
1. This section draws from Lipton (1995), Subbarao (1997), Subbarao and Rudra(1996), Ravallion (1991), and Teklu (1994a, b).
2. The "guarantee" may have been substantially eroded following large increases inthe wage rate in 1988 (Subbarao 1993; Datt and Ravallion 1994).
3. The general presumption that public works necessarily encourage more govern-mental involvement is clearly wrong. In fact, in some countries, such as Tanzania, pub-lic works greatly encouraged private sector initiatives. The works financed by socialfunds in several countries (such as Bolivia) have employed private contractors duringimplementation.
4. In other areas, such as education and health, most francophone countries haverecorded much higher unit costs than countries in Asia.
5. Evidence also shows that socially deprived communities were overrepresented inthe MEGS, and children of women who participated in the MEGS had improved nutri-tion.
6. The implications of using private contractors for program wages are not entirelyclear. There are two possibilities. Private contractors might offer competitive marketwages to laborers. In this case the wage rate may not act as a screening device for self-targeting. Private contractors have also offered wages substantially less than the marketor program wage to laborers, but they actually claim the market wage rate in their costsof operation and (illegally) retain for themselves the difference between the actual wage
92 SAFETY NET PROGRAMS AND POVERTY REDUCTION
paid and the program wage. In this case there is a transfer of income from the govern-ment to private contractors-and the income transfer meant for the poor is reduced.
7. This section draws from Gaiha (1993); Lipton (1995); Subbarao, Ahmed, and Teklu(1995); Subbarao, Braithwaite, and Jalan (1995); Khandker, Khalily, and Khan (1995);Yaron (1992a, b; 1994); and Pulley (1989).
8. India subscribed to this philosophy in 1971 with the introduction of the DifferentialRates of Interest scheme, whereby public sector banks were instructed to channel creditat less than market interest rates to families with landholdings below a certain thresh-old.
9. For an overview of literature on risk and consumption of the poor, see Aldermanand Paxson (1992).
10. Valiant efforts have been made to collect carefully disaggregated data to isolatethese effects. A recent contribution is that of Pitt and Khandker (1996).
11. Better results would have been realized had the officials been instructed to targetgroups (single woman without assets) or areas with highest severity and incidence ofpoverty.
12. See Pulley (1989); Subbarao, Braithwaite, and Jalan (1995); and Subbarao (1985).13. On the problems associated with a criterion such as the "proportion of beneficia-
ries crossing the poverty line" as a measure of success of IRDP, see Subbarao (1985).14. Although self-selection makes the program self-targeted, it has a downside. The
very poor who were either extremely risk-averse or evaluated themselves as not partic-ularly suited for self-employment could not bring themselves to agree to the rigorousdiscipline imposed by the Grameen Bank with respect to saving and repayment.Consequently, these poor stayed out of the program. In Grameen Bank villages only 40percent of the poor participated in the program (Khandker, Khalily, and Khan 1995).
6Innovations in the Delivery
and Organization of Social Assistanceand Poverty-Targeted Programs
The effectiveness of social assistance and poverty-targeted programs isinfluenced by the way these programs are delivered. 1 An inappropri-ate delivery mechanism can result in services that are unavailable tosome of the poor, neither needed nor desired by the poor, captured bythe nonpoor, of low quality, unsustainable, cost-ineffective, or deliv-ered more slowly than necessary to respond to urgent needs. 2 Socialassistance and poverty-targeted programs may be vulnerable to theseproblems for two reasons. First, the institutions that have responsibil-ity for these programs-social sector ministries, local governments,and NGOs in remote areas-are often weak. Second, the poor are like-ly to lack a "voice," and attempts to transfer income to them may meetopposition.
The aim of this chapter is modest: to examine the characteristics ofdifferent delivery models and to highlight some general principles foreffective service delivery based on program experiences. The aim isnot to establish a unique ranking of delivery models; such an effort isinfeasible because such a ranking would depend on the type of serviceto be delivered, the nature of poverty, and the institutional setting ofthe country concerned. The chapter addresses two main issues. First, itdiscusses the main mechanisms for delivering social assistance andpoverty-targeted programs, including such recent innovations associal funds. Second, it synthesizes lessons from experience and pre-sents some general principles for effective delivery.
Alternative Delivery Models
Service delivery includes two key activities:* Provision-the designing and organizing of a service, often includ-
ing its financing or purchasing.
93
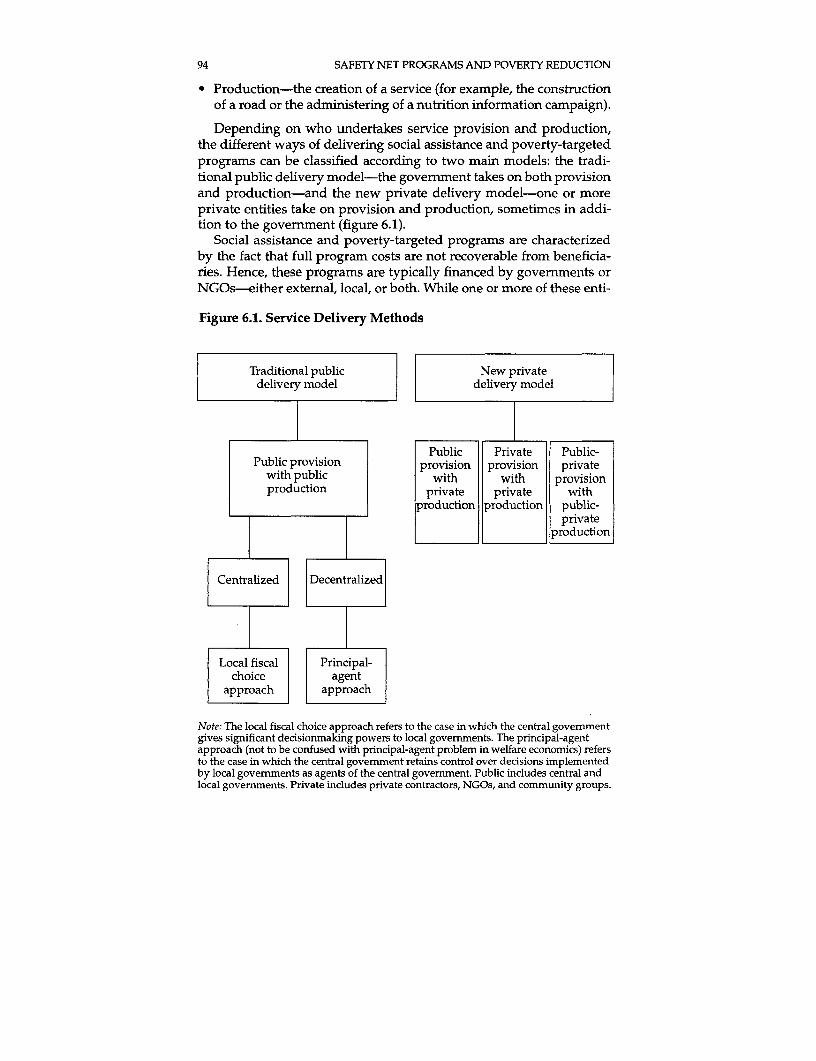
94 SAFETY NET PROGRAMS AND POVERTY REDUCTION
Production-the creation of a service (for example, the constructionof a road or the administering of a nutrition information campaign).
Depending on who undertakes service provision and production,the different ways of delivering social assistance and poverty-targetedprograms can be classified according to two main models: the tradi-tional public delivery model-the government takes on both provisionand production-and the new private delivery model-one or moreprivate entities take on provision and production, sometimes in addi-tion to the government (figure 6.1).
Social assistance and poverty-targeted programs are characterizedby the fact that full program costs are not recoverable from beneficia-ries. Hence, these programs are typically financed by governments orNGOs-either external, local, or both. While one or more of these enti-
Figure 6.1. Service Delivery Methods
Traditional public New privatedelivery model delivery model
Public Private Public-Public provision provision provision private
with public with with provisionproduction private private with
production production public-private
production
Centralized Decentralized
Local fiscal Principal-choice agent
approach approach
Note: The local fiscal choice approach refers to the case in which the central governmentgives significant decisionmaking powers to local governments. The principal-agentapproach (not to be confused with principal-agent problem in welfare economics) refersto the case in which the central govermnent retains control over decisions implementedby local governments as agents of the central government. Public includes central andlocal governments. Private includes private contractors, NGOs, and community groups.
INNOVATIONS IN DELIVERY AND ORGANIZATION 95
ties is also involved in the provision or production of social assistanceand poverty-targeted programs, in some cases the entity that financesor purchases the service may be distinct from the entity that under-takes service provision or production.
The Traditional Public Delivery Model
In the traditional public delivery model the main (and often the only)player is the government-the central government and any of thelower levels of government. The government undertakes both serviceprovision and production. An example of this delivery model is India'snationwide public works program, the JRY. It is designed, organized,fully funded, and implemented by the government.
Public delivery may be centralized (for example, when the centralgovernment takes charge of both provision and production activities)or decentralized (for example, when the central government retainsresponsibility for some provision or production activities but handsthe rest to local governments). In the case of decentralized publicdelivery two analytical approaches are relevant:3 the local fiscal choiceapproach, in which the central government gives local governments(and sometimes even citizens) significant decisionmaking powers,including powers to determine the pattern of spending, and the prin-cipal-agent approach, in which the central government retains a largemeasure of control over program and project decisions that are imple-mented by local governments acting as agents of the central govem-ment (Campbell, Petersen, and Bazark 1991).4 The local fiscal choiceapproach allows for power sharing among different levels of govern-ment. The principal-agent approach allows the central government topromote policy design. But the principal-agent approach may limit theability of agents to adapt programs to local conditions. Elements ofboth approaches are found in some programs.
An example of the principal-agent approach is India's IntegratedChild Development Services (ICDS) program. The central governmentcontrols program design, supplying a common package of servicesthroughout the country. State governments implement the program,acting as agents of the center. By contrast, Mexico's Urban ActionProgram (PAU), a civil works initiative designed to rehabilitate the cityof Tijuana, is an example of the local fiscal choice approach. In PAUworks are developed and proposed by the municipality, do not involvethe central government, and depend critically on approval (even thevote) of the citizens (Campbell and Katz 1996).
The principal-agent and local fiscal choice approaches have beencombined in some programs. For example, Mexico's NationalSolidarity Program (PRONASOL) combines the two approaches in its
96 SAFETY NET PROGRAMS AND POVERTY REDUCTION
matching grant system. However, the principal-agent approach ismore dominant-although Mexico has a federal system of governmentwith some powers vested in municipalities to determine local invest-ments, municipalities are steered by strong central government control(Campbell 1995a).
While there are some successful examples of public delivery, it hasoften been susceptible to political interference, driven by supply pres-sures, and poor in quality (OED 1995), although other forms of deliv-ery are not necessarily immune to these problems.5 In most cases it isthe lack of incentives-to public employees, financiers, and con-sumers-and inappropriate organizational forms and rules that havereduced the effectiveness of public delivery. Even when decentralized,public delivery has not always succeeded in adapting programs to dif-fering regional circumstances; the incentive problem has persisted.The tightening budgets associated with structural adjustment pro-grams may have led some governments to delegate specific servicedelivery responsibilities to private entities, thus speeding up the emer-gence of the private delivery model.
The New Private Delivery Model
The private delivery model involves a range of service deliverers,notably, private contractors, NGOs, and community groups some-times in addition to public agencies. The different private sectorproviders are by no means similar-each operates under different setsof incentives.6
The inability to recover the full program cost from beneficiariesrules out privately financing social assistance and poverty-targetedprograms. But it does not rule out the involvement of the private com-mercial sector in service delivery. The government can buy the servicesof the private deliverer if the private deliverer enjoys a comparativeadvantage in either managing or producing the service.
The private delivery model may incorporate any one of the follow-ing three institutional arrangements:* The government is the provider, but a private entity produces the
service (for example, the government designs and organizes a pub-lic works program, but a private contractor builds the infrastruc-ture).7 Senegal's Agence d'Execution des Travaux d'Interet Public(AGETIP) is an example of this delivery arrangement. Central min-istries and municipalities determine the infrastructure to be built, itsdesign, and its location, but private contractors build it.
* A private entity provides and produces the service (for example, acommunity-based organization designs, organizes, and administersa nutrition program). The Zambia Social Recovery Project typifies
INNOVATIONS IN DELIVERY AND ORGANIZATION 97
this arrangement, with its stress on community groups as theproviders and producers of social assistance and poverty-targetedprograms.The govemrnment and private entities collaborate on service provi-sion and/or production activities. Indonesia's Village Infrastructureproject and Mongolia's Poverty Alleviation for Vulnerable Groupsproject are examples of this arrangement. The govemment andcommunity groups are involved in designing and organizing theservices, and the services are often produced collaboratively.
Both the public and private delivery models may be supported bythe govemment or by a donor. Altematively, one or both of the mod-els may be supported through an autonomous intermediary agency,such as a social fund.8 A social fund is generally managed by repre-sentatives of government and private agencies, projects are selected inresponse to local demands, and eligibility criteria are generally laid-out up front.9 To this extent, a social fund is neither a service providernor a service producer-it merely facilitates service provision and pro-duction. While social funds do not necessarily exclude the publicdelivery model, they are most commonly associated with the privatedelivery model. Social funds may include any one or more of the threeinstitutional arrangements for private delivery.
Program Experiences under Public and Private Delivery
This section examines the experience and outcomes of some socialassistance and poverty-targeted programs implemented under alter-native delivery models. Four aspects of program experience are ana-lyzed: targeting, cost-effectiveness, sustainability, and speed of servicedelivery. The purpose is not to rank delivery models, but to delineatepatterns based on qualitative information.
Targeting
Some delivery models are more conducive to supporting particulartypes of self-targeting, individual targeting, and household targetingthan others. Some programs are directed at individuals within ahousehold to address, for example, the problem of intrahouseholddiscrimination. Leakages can occur if the intended beneficiary fails toreceive the transfer, even if the household receives it. Thus whereindividuals are targeted, the choice of delivery model is morecomplex.
In general, the public delivery model is more conducive to self-targeting, through low wages, than the private delivery model. Thedegree of self-targeting through wages depends on the prevailing
98 SAFETY NET PROGRAMS AND POVERTY REDUCTION
relationship between the minimum wage, market wage, and programwage, as well as how well minimum wage laws are observed. Theseconditions vary from country to country. In countries where marketwages are higher than minimum wages, a government-run programwould attract only those in need by offering the minimum wage.Enforcing wage (or quantity) restrictions can be difficult when work-ing through private contractors or other private entities, especially ifthe private entities expect low wages to attract inferior workers-thusgenerating few overall cost savings.
India's MEGS is an example of a public delivery scheme in whichthe government designs and organizes infrastructure works, and car-ries out the construction, using government engineers and govern-ment-owned equipment. This program self-targets through wages.Until 1988 the program wage was less than the minimum wage, butequal to the farm market wage. (In Maharashtra, farmers generally donot observe minimum wage laws). As a result, the program attractedthe poor-about 90 percent of MEGS workers lived below the povertyline-and employed every willing, able worker (male and female)within 5 kilometers of the worker's residence. There was no rationingof jobs (Ravallion 1991; Dev 1995a). Overall, the MEGS has helped mil-lions of ultrapoor people. More than half are women, and many arefrom socially deprived communities (Lipton 1995). Given that the gov-ernment was the service provider and the producer, it was possible forthe government to control the wage rate. Since 1988, however, thewage offered has increased to the level of the minimum wage. Thepoor still participate in the program, but jobs are now rationed (Dattand Ravallion 1994).
Chile's Special Employment Programs-Minimum EmploymentProgram (PEM) and Occupational Program for Household Heads(POJH)-are examples of public sector employment programs thatpay lower-than-minimum wages. The targeting in both programs isgood. On average, following participation in the program, PEM work-ers ended up in the second decile of the income distribution and POJHworkers in the third decile. Without the PEM and POJH income (andmaking no allowance for alternative activities), all participant familieswould have been in the poorest decile (Grosh 1994). As in the MEGSwages could be used as a targeting instrument because the Chileanprograms incorporated the public delivery model, with the govern-ment acting as service provider and producer.
Bolivia's Emergency Social Fund (ESF) is an example of a privatedelivery model in which public agencies provide the infrastructureand private contractors handle production. Bolivia's ESF offers marketwages because the introduction of market signals was basic to theadjustment program, which ESF was complementing. Moreover, it
INNOVATIONS IN DELIVERY AND ORGANIZATION 99
was thought that any wage less than the prevailing market wagemight lead to low motivation and low quality work-apart from trans-ferring insufficient income to workers (Jorgensen, Grosh, and Schacter1992). Outcome information shows that about 25 percent of ESFworkers would have belonged to the poorest decile of the urban pop-ulation had they not participated. With the ESF job, none belonged tothe poorest group. Seventy-six percent of ESF workers would havebelonged to the poorest 40 percent of the urban population without theESF jobs. With the jobs, only 15 percent fell in this range (Grosh1994).l1 Furthermore, on average, participants in the program earned51 percent more than they would have earned without ESF. It is, how-ever, important to consider foregone earnings. About two-thirds of thetransfer was required to replace foregone incomes, and not all of thenet transfer accrued to lower-income groups (Squire 1991). Thus,although it reached many poor people, the ESF was not cost-effectivein transferring income to the poor. The wages paid failed to act as ascreening device-those workers who participated were not necessar-ily the poorest. The targeting outcome of Bolivia's privately deliveredESF thus seems less favorable than the outcome achieved on the twopublicly delivered programs, which used low wages as their targetinginstrument.
As with public works and infrastructure programs, credit programsalso exhibit a link between the price at which the service (credit in thiscase) is offered and the type of delivery model supported. Subsidizedinterest rates tend to be associated with government credit programs,while privately delivered credit programs tend to offer credit at mar-ket interest rates. The price at which the credit is offered also influ-ences the targeting outcome. But unlike public works, in which a lowwage improves targeting, a below-market interest rate encourages cor-ruption, rent seeking, and leakage.
Bangladesh's Grameen Bank incorporates the private deliverymodel with an NGO as the service provider and producer. The pro-gram offers credit at market interest rates. The targeting outcome isgood-a 1985 field survey of 975 Grameen borrowers showed thatonly 4.2 percent belonged to nontarget households (Hossain 1988). Bycontrast, India's IRDP incorporates the public delivery model. Unlikethe Grameen Bank, IRDP provides subsidized credit. Its targetingoutcome leaves much to be desired. Bribery and corruption are ram-pant (Dreze 1989), and affluent and influential households are well-represented among IRDP beneficiaries (Dreze, Lanjouw, and Sharmaforthcoming). While NGO delivery proved better than governmentdelivery in some credit schemes, NGO success is often due to charis-matic leadership or dedicated workers who are sometimes willing towork at less-than-market wages.
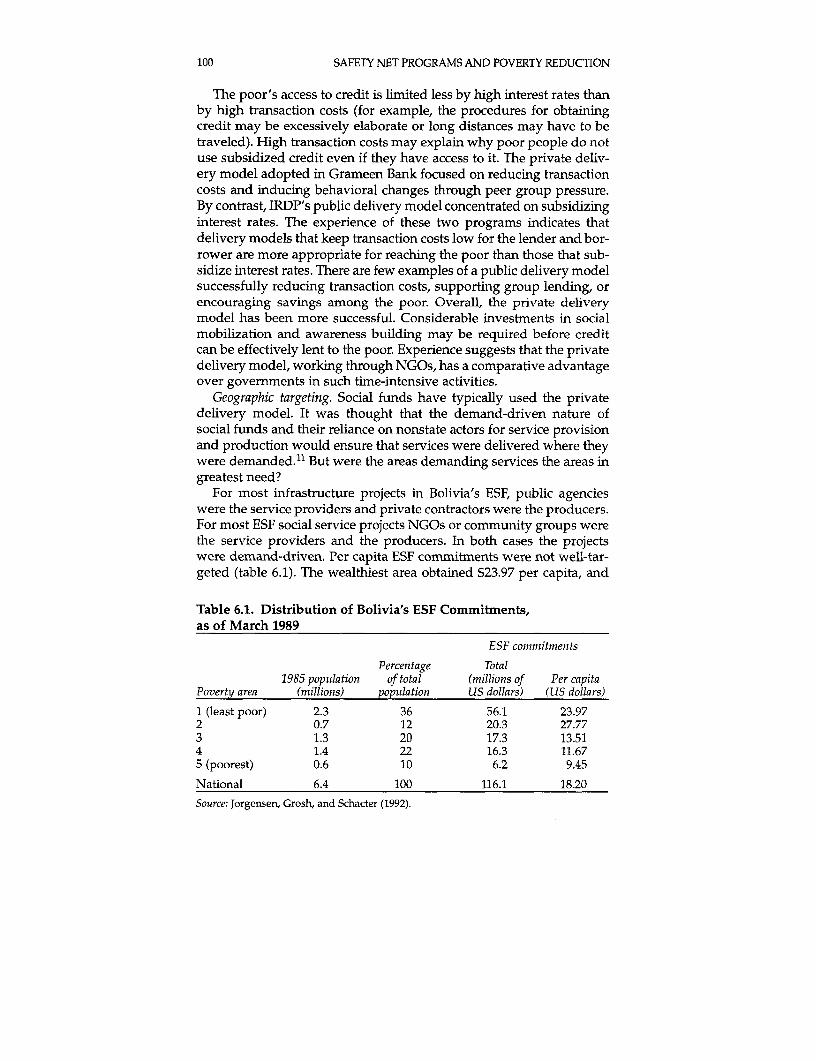
100 SAFETY NET PROGRAMS AND POVERTY REDUCTION
The poor's access to credit is limited less by high interest rates thanby high transaction costs (for example, the procedures for obtainingcredit may be excessively elaborate or long distances may have to betraveled). High transaction costs may explain why poor people do notuse subsidized credit even if they have access to it. The private deliv-ery model adopted in Grameen Bank focused on reducing transactioncosts and inducing behavioral changes through peer group pressure.By contrast, IRDP's public delivery model concentrated on subsidizinginterest rates. The experience of these two programs indicates thatdelivery models that keep transaction costs low for the lender and bor-rower are more appropriate for reaching the poor than those that sub-sidize interest rates. There are few examples of a public delivery modelsuccessfully reducing transaction costs, supporting group lending, orencouraging savings among the poor. Overall, the private deliverymodel has been more successful. Considerable investments in socialmobilization and awareness building may be required before creditcan be effectively lent to the poor. Experience suggests that the privatedelivery model, working through NGOs, has a comparative advantageover governments in such time-intensive activities.
Geographic targeting. Social funds have typically used the privatedelivery model. It was thought that the demand-driven nature ofsocial funds and their reliance on nonstate actors for service provisionand production would ensure that services were delivered where theywere demanded. 11 But were the areas demanding services the areas ingreatest need?
For most infrastructure projects in Bolivia's ESF, public agencieswere the service providers and private contractors were the producers.For most ESF social service projects NGOs or community groups werethe service providers and the producers. In both cases the projectswere demand-driven. Per capita ESF commitments were not well-tar-geted (table 6.1). The wealthiest area obtained $23.97 per capita, and
Table 6.1. Distribution of Bolivia's ESF Commitments,as of March 1989
ESF commitments
Percentage Total1985 population of total (millions of Per capita
Poverty area (millions) population US dollars) (US dollars)
1 (least poor) 2.3 36 56.1 23.972 0.7 12 20.3 27.773 1.3 20 17.3 13.514 1.4 22 16.3 11.675 (poorest) 0.6 10 6.2 9.45
National 6.4 100 116.1 18.20Source: Jorgensen, Grosh, and Schacter (1992).
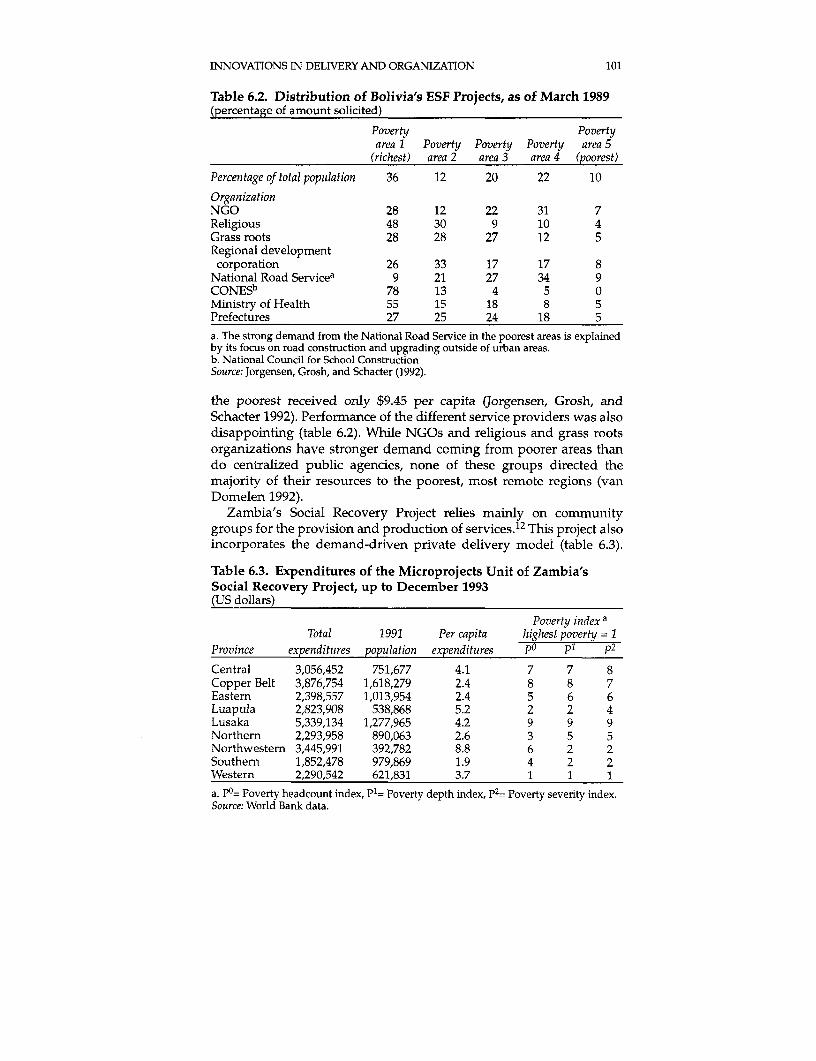
INNOVATIONS IN DELIVERY AND ORGANIZATION 101
Table 6.2. Distribution of Bolivia's ESF Projects, as of March 1989(percentage of amount solicited)
Poverty Povertyarea 1 Poverty Poverty Poverty area 5
(richest) area 2 area 3 area 4 (poorest)
Percentage of total popuilation 36 12 20 22 10
OrganizationNGO 28 12 22 31 7Religious 48 30 9 10 4Grass roots 28 28 27 12 5Regional developmentcorporation 26 33 17 17 8
National Road Servicea 9 21 27 34 9CONESb 78 13 4 5 0Ministry of Health 55 15 18 8 5Prefectures 27 25 24 18 5a. The strong demand from the National Road Service in the poorest areas is explainedby its focus on road construction and upgrading outside of urban areas.b. National Council for School ConstructionSource: Jorgensen, Grosh, and Schacter (1992).
the poorest received only $9.45 per capita (Jorgensen, Grosh, andSchacter 1992). Performance of the different service providers was alsodisappointing (table 6.2). While NGOs and religious and grass rootsorganizations have stronger demand coming from poorer areas thando centralized public agencies, none of these groups directed themajority of their resources to the poorest, most remote regions (vanDomelen 1992).
Zambia's Social Recovery Project relies mainly on communitygroups for the provision and production of services. 12 This project alsoincorporates the demand-driven private delivery model (table 6.3).
Table 6.3. Expenditures of the Microprojects Unit of Zambia'sSocial Recovery Project, up to December 1993(US dollars)
Poverty index aTotal 1991 Per capita highest poverty = 1
Province expenditures poputlation expendittures PO Pi P2
Central 3,056,452 751,677 4.1 7 7 8Copper Belt 3,876,754 1,618,279 2.4 8 8 7Eastern 2,398,557 1,013,954 2.4 5 6 6Luapula 2,823,908 538,868 5.2 2 2 4Lusaka 5,339,134 1,277,965 4.2 9 9 9Northern 2,293,958 890,063 2.6 3 5 5Northwestern 3,445,991 392,782 8.8 6 2 2Southern 1,852,478 979,869 1.9 4 2 2Western 2,290,542 621,831 3.7 1 1 1
a. P0= Poverty headcount index, P1= Poverty depth index, P2= Poverty severity index.Source: World Bank data.
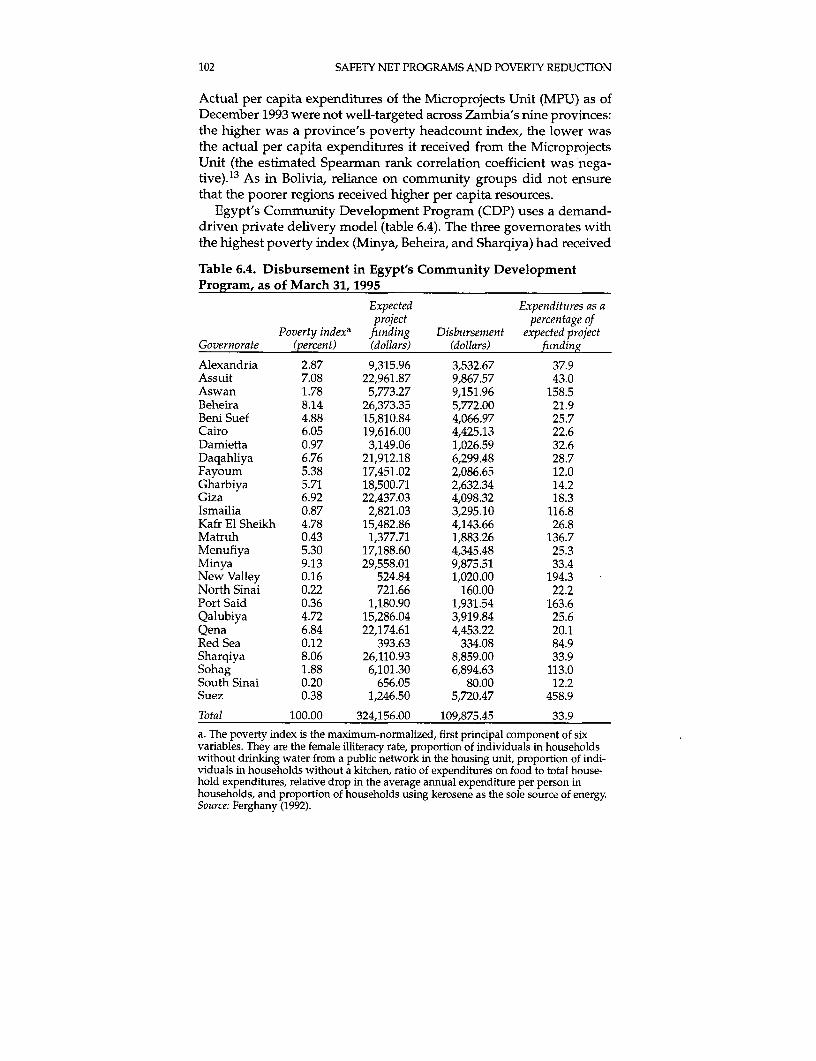
102 SAFETY NET PROGRAMS AND POVERTY REDUCTION
Actual per capita expenditures of the Microprojects Unit (MPU) as ofDecember 1993 were not well-targeted across Zambia's nine provinces:the higher was a province's poverty headcount index, the lower wasthe actual per capita expenditures it received from the MicroprojectsUnit (the estimated Spearman rank correlation coefficient was nega-tive).13 As in Bolivia, reliance on community groups did not ensurethat the poorer regions received higher per capita resources.
Egypt's Community Development Program (CDP) uses a demand-driven private delivery model (table 6.4). The three govemorates withthe highest poverty index (Minya, Beheira, and Sharqiya) had received
Table 6.4. Disbursement in Egypt's Community DevelopmentProgram, as of March 31, 1995
Expected Expenditiures as aproject percentage of
Poverty indexa fuinding Disbursement expected projectGovernorate (percent) (dollars) (dollars) fiunding
Alexandria 2.87 9,315.96 3,532.67 37.9Assuit 7.08 22,961.87 9,867.57 43.0Aswan 1.78 5,773.27 9,151.96 158.5Beheira 8.14 26,373.35 5,772.00 21.9Beni Suef 4.88 15,810.84 4,066.97 25.7Cairo 6.05 19,616.00 4,425.13 22.6Damietta 0.97 3,149.06 1,026.59 32.6Daqahliya 6.76 21,912.18 6,299.48 28.7Fayoum 5.38 17,451.02 2,086.65 12.0Gharbiya 5.71 18,500.71 2,632.34 14.2Giza 6.92 22,437.03 4,098.32 18.3Ismailia 0.87 2,821.03 3,295.10 116.8Kafr El Sheikh 4.78 15,482.86 4,143.66 26.8Matruh 0.43 1,377.71 1,883.26 136.7Menufiya 5.30 17,188.60 4,345.48 25.3Minya 9.13 29,558.01 9,875.51 33.4New Valley 0.16 524.84 1,020.00 194.3North Sinai 0.22 721.66 160.00 22.2Port Said 0.36 1,180.90 1,931.54 163.6Qalubiya 4.72 15,286.04 3,919.84 25.6Qena 6.84 22,174.61 4,453.22 20.1Red Sea 0.12 393.63 334.08 84.9Sharqiya 8.06 26,110.93 8,859.00 33.9Sohag 1.88 6,101.30 6,894.63 113.0South Sinai 0.20 656.05 80.00 12.2Suez 0.38 1,246.50 5,720.47 458.9
Total 100.00 324,156.00 109,875.45 33.9a. The poverty index is the maximum-normalized, first principal component of sixvariables. They are the female illiteracy rate, proportion of individuals in householdswithout drinking water from a public network in the housing unit, proportion of indi-viduals in households without a kitchen, ratio of expenditures on food to total house-hold expenditures, relative drop in the average annual expenditure per person inhouseholds, and proportion of households using kerosene as the sole source of energy.Source: Perghany (1992).
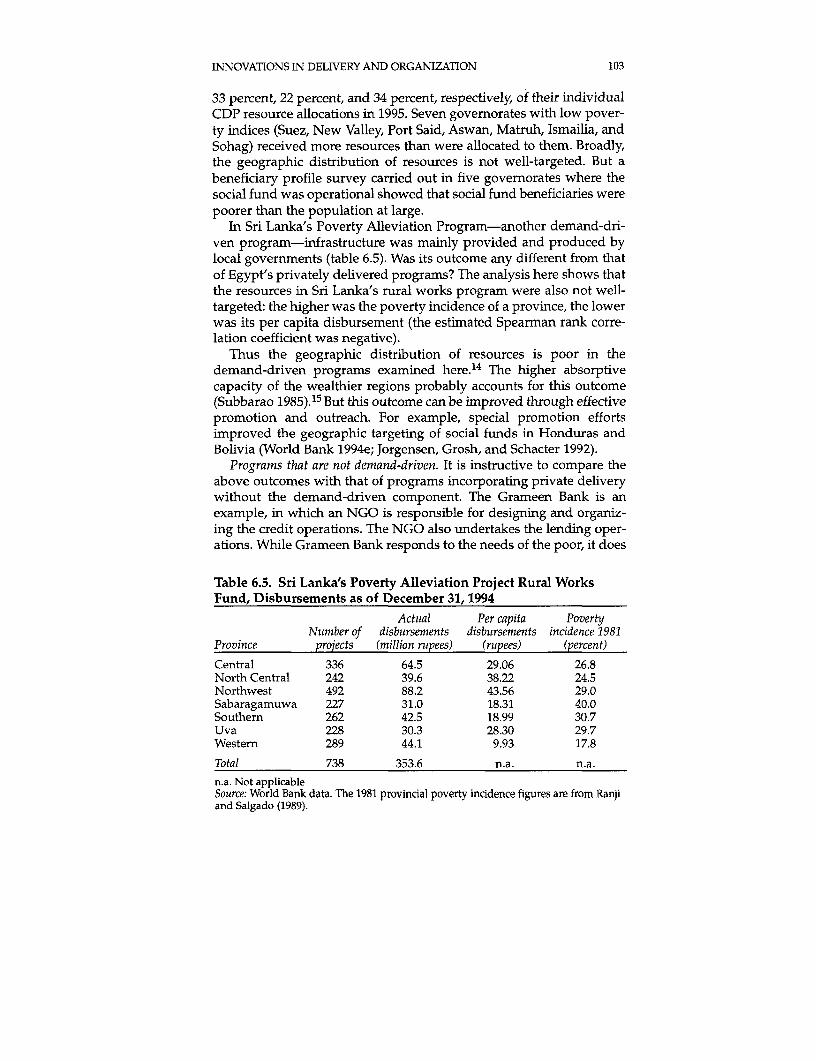
INNOVATIONS IN DELIVERY AND ORGANIZATION 103
33 percent, 22 percent, and 34 percent, respectively, of their individualCDP resource allocations in 1995. Seven govemorates with low pover-ty indices (Suez, New Valley, Port Said, Aswan, Matruh, Ismailia, andSohag) received more resources than were allocated to them. Broadly,the geographic distribution of resources is not well-targeted. But abeneficiary profile survey carried out in five govemorates where thesocial fund was operational showed that social fund beneficiaries werepoorer than the population at large.
In Sri Lanka's Poverty Alleviation Program-another demand-dri-ven program-infrastructure was mainly provided and produced bylocal governrments (table 6.5). Was its outcome any different from thatof Egypt's privately delivered programs? The analysis here shows thatthe resources in Sri Lanka's rural works program were also not well-targeted: the higher was the poverty incidence of a province, the lowerwas its per capita disbursement (the estimated Spearman rank corre-lation coefficient was negative).
Thus the geographic distribution of resources is poor in thedemand-driven programs examined here.14 The higher absorptivecapacity of the wealthier regions probably accounts for this outcome(Subbarao 1985).15 But this outcome can be improved through effectivepromotion and outreach. For example, special promotion effortsimproved the geographic targeting of social funds in Honduras andBolivia (World Bank 1994e; Jorgensen, Grosh, and Schacter 1992).
Programs that are not demand-driven. It is instructive to compare theabove outcomes with that of programs incorporating private deliverywithout the demand-driven component. The Grameen Bank is anexample, in which an NGO is responsible for designing and organiz-ing the credit operations. The NGO also undertakes the lending oper-ations. While Grameen Bank responds to the needs of the poor, it does
Table 6.5. Sri Lanka's Poverty Alleviation Project Rural WorksFund, Disbursements as of December 31, 1994
Actual Per capita PovertyNumber of disbursements disbursements incidence 1981
Province projects (million rupees) (rmpees) (percent)
Central 336 64.5 29.06 26.8North Central 242 39.6 38.22 24.5Northwest 492 88.2 43.56 29.0Sabaragamuwa 227 31.0 18.31 40.0Southern 262 42.5 18.99 30.7Uva 228 30.3 28.30 29.7Western 289 44.1 9.93 17.8
Total 738 353.6 n.a. n.a.n.a. Not applicableSource: World Bank data. The 1981 provincial poverty incidence figures are from Ranjiand Salgado (1989).
104 SAFETY NET PROGRAMS AND POVERTY REDUCTION
not respond to formal project proposals from community groups orother agencies.
What determines the geographic distribution of Grameen Bankbranches? In theory, the chances of a branch remaining profitablewould be higher in areas with more favorable characteristics (such asareas less prone to flooding and areas with good roads), but the pover-ty objective would be better addressed by locating branches in lessfavorable areas. A study of Grameen Bank branch placement showedthat placement does not respond to better agroclimatic and locationalfactors (Khandker, Khalily, and Khan 1995). In contrast, both govern-ment and commercial banks respond positively to better agroclimaticand locational conditions. For example, both locate their branches insubdistricts that are closer to district headquarters, thus reducing theirtransaction costs. On the other hand, Grameen Bank's decision to openbranches in a certain area is not conditioned by its proximity to admin-istrative centers. To serve the poor, Grameen Bank may locate itsbranches in some areas that other banks would deem too risky. ThusGrameen Bank is more concerned with the behavioral risk of lendingdue to adverse selection than with the risk of low or saturated demandin poorly endowed regions. Its non-demand-driven delivery mecha-nism may be better targeted geographically than demand-drivensocial funds.' 6
Cost-effectiveness. It is difficult to compare costs across projects. First,weaknesses in reporting cost data often make it difficult to determinewhich costs are excluded and which included in average cost figures.Second, it is almost impossible to obtain cost information for differentprograms that control the speed of service delivery, quality of services,and the location of services.
Reviews suggest that classrooms built under Hon.duras's SocialFund, through the private delivery model, cost many times less tobuild than ministry-supported classrooms (World Bank 1994h).Projects financed by PRONASOL in Mexico through the MunicipalFund have a much lower cost than similar projects implemented byline ministries. In the case of primary school construction the savingsamount to 30-40 percent (Silverman 1993). Also, in Mexico's MendozaProvincial Program for Basic Social Infrastructure (MENPROSIF) pri-vate contractors' bidding for projects has resulted in savings of up to35 percent compared with works carried out by the public works min-istry. In addition, contractors are offering warranties for their works,sometimes up to five years (Campbell 1995a). In Senegal privatelydelivered AGETIP-supported projects are able to achieve unit prices 5to 40 percent lower than government programs (World Bank 1992e).
Grameen Bank's experience with credit programs is interesting. Itsinvestment in organizing groups, mobilizing resources, and supervis-
INNOVATIONS IN DELIVERY AND ORGANIZATION 105
ing loan repayments raises its administrative costs above those of pro-grams not offering such services-such as the Small FarmersDevelopment Program in Nepal (SFDP) and the Small Farmer CreditInstitutions (SFCIs) throughout the world (Holt 1991). GrameenBank's administrative costs as a percentage of total disbursements in1984 was 12.3 percent compared with 7.6 percent for SFDP and 4.68percent for SFCIs. But for Grameen Bank higher administrative coststranslated into reduced loan arrears: in 1983-84 its arrears rate was 1.6percent compared with 11.7 percent for SFDP and 39 percent for SFCIs.And the high repayment rates contributed to Grameen Bank's abilityto cover costs and sometimes even make a profit.
Chile's publicly delivered Special Employment Programs (PEM andPOJH), though successful in targeting the poor, were not cost-effective.Their design contributed to high costs. The requirement that laborcosts be at least 80 percent of total project costs was difficult to enforcewithout inflating the cost of the work. Generally, work days wereshorter than stipulated, and even while workers were ostensibly work-ing, they were not required to work hard. A survey of project workersreported that they could accomplish their work in about twenty-sevenhours as opposed to the statutory thirty-five hours. Thus the actualwork done was 22 percent less than the programmed work. Absenteerates ran at about 12 percent. Consequently, the effective work donewas about a third less than the programmed work (Grosh 1994).
Within public delivery, it is instructive to compare two large nutri-tion programs in India with similar objectives: Tamil Nadu IntegratedNutrition Project (TINP) and the nationwide ICDS. Though both pro-grams were publicly delivered, there were considerable differences inthe cost of delivery. The annual per capita cost for TINP is 10 rupees,compared with roughly 18 rupees for comparable services in the samestate under ICDS. The cost of expanding TINP to cover the full statewould account for less than 0.5 percent of state GDP, compared withmore than 1.0 percent for ICDS. ICDS in Tamil Nadu has reduced casesof advanced malnutrition by 20 to 25 percent-an impressive achieve-ment. If the reduction in malnutrition achieved by TINP is assumed tobe 50 percent (the approximate midpoint between the monitoring andevaluation data), TINP delivers about twice the benefits for slightlymore than half the cost. This finding is fairly robust for different defi-nitions of costs (Subbarao 1989; Heaver 1989; Shekar 1994).
What factors account for the observed variations in cost-effective-ness? The most important factors contributing to lower costs includethe use of private contractors who had to compete for projects; theinvolvement of beneficiary communities in project execution throughcontributions of management time, labor, and cash; and the highlymotivated and qualified staff of social funds compared with their often
106 SAFETY NET PROGRAMS AND POVERTY REDUCTION
inefficient counterparts in government public works departments. Inthe case of Grameen Bank up-front investments in social mobilizationappear to have paid off in terms of better repayment rates. In Chile thereduced cost-effectiveness of the Special Employment Programs wasdue to weak program design-particularly the programs' excessivefocus on labor use.17 In India's TINP cost-effectiveness came as a resultof a tightly targeted approach to nutrition that concentrated on target-ing children during the most important two and a half years of theirlives nutritionally; maintaining high worker quality by training work-ers to perform only a few critical tasks; ensuring high motivationamong nutrition workers by encouraging supportive supervision thatemphasized problem solving rather than fault finding; ensuring ade-quate supplies for workers, enabling them to perform their tasks effi-ciently; requiring nutrition workers to reinforce health and familyplanning messages (thus maximizing beneficial externalities); andselecting nutrition workers from the community itself (Berg 1987a;Subbarao 1989; Shekar 1994).
Sustainability of Services
Four issues are relevant to sustainability: consistency with sectoral pri-orities, recurrent costs, beneficiary participation, and flexibility in ser-vice delivery.'8
Consistency with sectoral priorities. Coordinating interventions withsectoral plans is critical to the success of social assistance and poverty-targeted programs. Programs' services will be difficult to sustain if theyare uncoordinated or conflict with other interventions in the sector.Services provided through social funds (which are typically indepen-dent of government structures) are particularly susceptible to this prob-lem. Their activities often have little input from sectoral ministries abouthow well they fit with other planned or ongoing activities. Unless spe-cial measures are taken, social fund activities may be uncoordinatedwith government interventions (Carvalho 1994b). In Bolivia's ESF theservices that were funded were not necessarily the ones that best metsectoral priorities. ESF's emphasis on speed and its autonomy from theline ministries worked against fitting each project into a predeterminedsectoral plan. But adopting the public delivery model does not neces-sarily guarantee that consistency with sectoral priorities will beachieved. A mission studying India's publicly delivered MEGS reportedthis finding: the annual plan for the implementation of MEGS was amere collection of ad hoc works suggested by various governmentdepartments. Also, the plan lacked sectoral coordination.
Governmental agencies, such as sectoral ministries, have informa-tion about sectoral needs and the actions proposed by various public
INNOVATIONS IN DELIVERY AND ORGANIZATION 107
bodies. These agencies might, therefore, be better able to design inter-ventions consistent with sectoral plans. Hence, some recent socialfunds have tried to involve sectoral ministries in defining technicalstandards for the planned activities and in clearing projects for social-fund financing. For example, in Cambodia's social fund the line min-istries will define the fund's sectoral policy guidelines and standardsfor infrastructure construction. The line ministries will also provide a"no objection" clearance to projects before they are funded. InZambia's Social Recovery Project (SRP) local government officialsaccompany SRP staff on appraisal visits and participate in deskreviews of project proposals.
Recutrrent costs. Sustainability also depends on adequate financing ofrecurrent costs. The experience of Bolivia's ESF indicates that publicagencies are better equipped to meet recurrent costs through thenational budget process than are NGOs and community groups. Thelatter's biggest challenge is the continued financing of recurrent costsover the long term Jorgensen, Grosh, and Schacter 1992). A 1990 sur-vey for ESF in Bolivia found that projects sponsored by central gov-ernment agencies were most likely to survive, while projects spon-sored by grass roots organizations were least likely to survive (WorldBank 1992a).
But governments do not necessarily meet recurrent costs effectively.Consider India's publicly delivered MEGS. One of the weakest aspectsof the program was the virtual absence of operation and maintenanceof completed works according to the 1992 fact finding mission studyin the MEGS. Similarly, in Egypt's social fund the public works pro-gram (with the government as provider) had difficulty maintainingworks after completion. Regional and local authorities had givenassurances to provide maintenance funds, but these intentions werenot always honored in an era of shrinking resources (World Bank1995h). Maintenance of completed works has become a problem inmost government-implemented public works programs (Teklu 1994a,b; 1995a, b).
The recurrent cost problem can be particularly severe in social fundsbecause individual projects are not determined up front (only theeligibility criteria are). Thus the precise recurrent costs may be difficultto pin down when the government sets its annual budget. To addressthe recurrent cost problem, the eligibility criteria recently adopted insocial funds (and some other privately delivered programs) requirethat the service provider has established links with public agenciesand has presented evidence that some public agency will pick up atleast part of the recurrent cost. Contributions in cash or labor from thebeneficiaries for the operation and maintenance of the works are alsobeing encouraged.
108 SAFETY NET PROGRAMS AND POVERTY REDUCTION
Beneficiary participation. A recent empirical study of 121 water sup-ply projects showed that participation by beneficiaries in decision-making made a major contribution to project effectiveness (Narayan1995).19 Proximity of the service deliverer to beneficiaries, the capacityto respond creatively to unforeseen problems, and a project cycle thatis not time-bound all promote beneficiary participation. The privatedelivery model operating through NGOs and community-based orga-nizations will likely display these characteristics more frequently thanthe public delivery model.2 0
In general, few central government agencies have the necessaryskills and orientation to foster continued interaction with a wide rangeof small, and perhaps scattered, beneficiary groups. For example, afact-finding mission for the MEGS found that works under this pro-gram were designed and implemented by government departmentswith minimal participation from beneficiaries or NGOs. Consequently,designs did not take into consideration the socioeconomic situation atthe grass roots level according to the 1992 fact finding mission study inthe MEGS. However, the MEGS did enhance the economic power ofthe poor by generating workers' pressure groups, especially women'sgroups (Dev 1995a).
Making govemmental structures participatory is important. SmallNGOs have an impact only in a few villages. The problem remains ofhow to assist all other villages (Korten and Siy 1988). Governments aremajor investors in development, so finding ways for governmentagencies to implement participatory strategies may be one solution.Significant to this point is the experience of the Philippines CommunalIrrigation Program. The initiative for developing a participatoryapproach in this program came from a government agency that hadbeen developing and testing the approach for five years (Nagle andGhose 1990).
Beneficiary participation can be costly and difficult. Most impor-tantly, poor peoples' time has opportunity costs (especially if they areworking poor), and they will get involved only if they anticipatesufficient returns. Zambia's Beneficiary Assessment for the SocialRecovery Project (SRP) reports that some women declined to be onproject committees; they argued that they were simply too busy(Milimo and Njobvu 1993). Moreover, the rationale for communityparticipation is often that local entities know best what their clientsneed and the appropriate way to meet those needs. But local entitiesmay lack the broader sectoral perspective of public agencies, and theymay not necessarily be propoor. For example, in Pakistan's Zakat andUshr program beneficiaries are selected by local committees mainlyaccording to personal preferences rather than poverty criteria.Consequently, only 2-10 percent of beneficiaries are from low-income
INNOVATIONS IN DELIVERY AND ORGANIZATION 109
households, and although lists and committees are supposed tochange every six months, neither does (OED 1995). Communities arerarely harmonious units, and traditional structures often reflect theinterests of the elite (Holt 1991). Beneficiary participation throughNGOs may run into other problems. For example, many NGOs arelocated in cities or towns and tend to work in these areas rather thanin the poorest regions.
The experience of Zambia's SRP with beneficiary participationshows interesting trade-offs. Parent-teacher associations implementedabout 48 percent of projects, NGOs and churches about 18 percent, dis-trict councils about 7 percent, project committees about 18 percent, andpolitical functionaries about 8 percent. Where there was maximumbeneficiary participation (parent-teacher association projects, forexample), workmanship tended to suffer (table 6.6). The Zambianexample also shows that community groups such as parent-teacherassociations can be highly participatory, yet not necessarily account-able to beneficiaries.
Flexibility in service delivery. Social assistance and poverty-targetedprograms aim to address the needs of target groups whose response isnot always easy to predict in advance. The more uncertain is a pro-gram's operating environment, the more flexible must the deliverymechanism be. The mechanism must allow considerable learning totake place before the program can be successfully implemented (Holt1991). Flexible and learning-oriented organizational setups are morelikely to be found among NGOs and community-based organizationsthan in government bureaucracies. NGOs and community-based orga-nizations may have greater field presence and orientation. They thusenjoy an advantage in initiating new approaches at the grass rootslevel and responding flexibly to emerging problems. The limited flex-ibility of bureaucracies may restrict their ability to respond to the poor,who often need customized assistance.
Pakistan's NGO-run, privately delivered Aga Khan Rural SupportProject (AKRSP) features an open management style, free communica-tion along the management chain, and meticulous record keeping. Allof these characteristics contribute to a dynamic and responsive prob-lem-solving environment. The closeness of AKRSP's general managerand senior management staff to events in the field is critical to the pro-ject's successful implementation. The time that they spend in the fieldis well-structured (the length of time is not as important as its quality)and fully recorded. The management and villages are close and are infrequent contact with each other. The net effect of the field visits andextensive reporting is a system of written and oral communication thatenhances decisionmaking by managers, field staff, and beneficiaries. Italso enables midcourse corrections. AKRSP establishes its objectives,
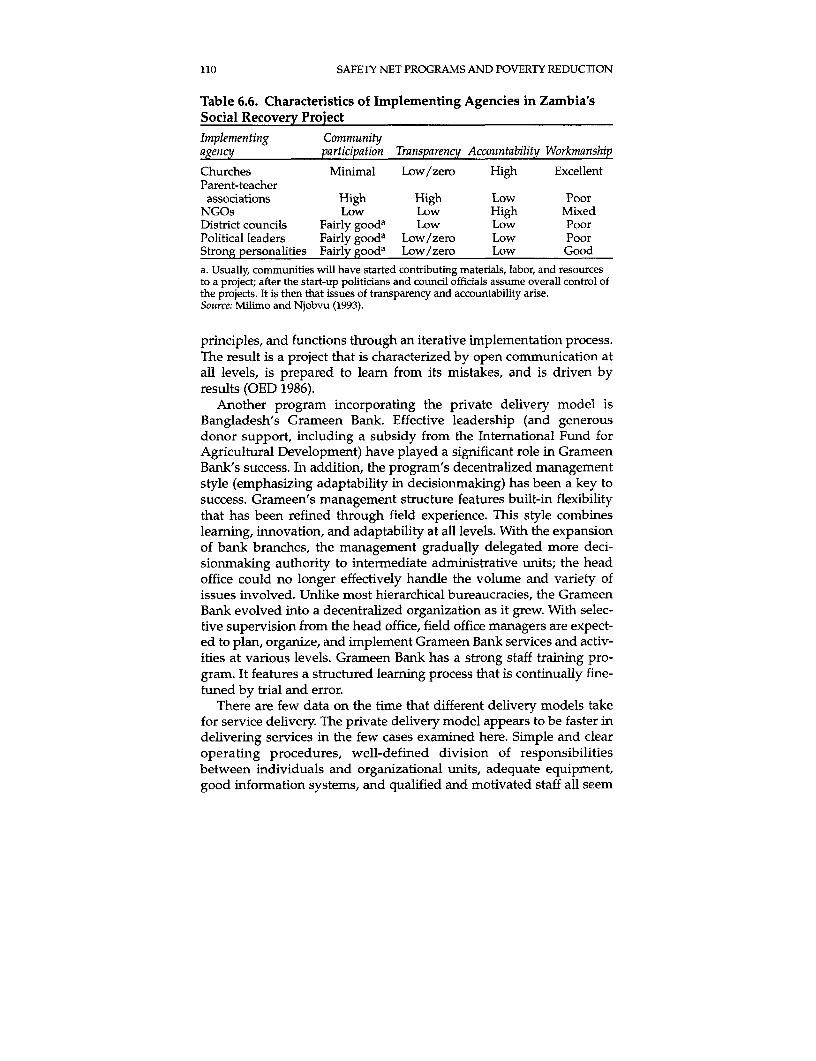
110 SAFETY NET PROGRAMS AND POVERTY REDUCTION
Table 6.6. Characteristics of Implementing Agencies in Zambia'sSocial Recovery ProjectImplementing Communityagency participation Transparency Accountability Workmanship
Churches Minimal Low/zero High ExcellentParent-teacherassociations High High Low Poor
NGOs Low Low High MixedDistrict councils Fairly gooda Low Low PoorPolitical leaders Fairly gooda Low/zero Low PoorStrong personalities Fairly gooda Low/zero Low Gooda. Usually, communities will have started contributing materials, labor, and resourcesto a project; after the start-up politicians and council officials assume overall control ofthe projects. It is then that issues of transparency and accountability arise.Source: Milimo and Njobvu (1993).
principles, and functions through an iterative implementation process.The result is a project that is characterized by open communication atall levels, is prepared to learn from its mistakes, and is driven byresults (OED 1986).
Another program incorporating the private delivery model isBangladesh's Grameen Bank. Effective leadership (and generousdonor support, including a subsidy from the International Fund forAgricultural Development) have played a significant role in GrameenBank's success. In addition, the program's decentralized managementstyle (emphasizing adaptability in decisionmaking) has been a key tosuccess. Grameen's management structure features built-in flexibilitythat has been refined through field experience. This style combinesleaming, innovation, and adaptability at all levels. With the expansionof bank branches, the management gradually delegated more deci-sionmaking authority to intermediate administrative units; the headoffice could no longer effectively handle the volume and variety ofissues involved. Unlike most hierarchical bureaucracies, the GrameenBank evolved into a decentralized organization as it grew. With selec-tive supervision from the head office, field office managers are expect-ed to plan, organize, and implement Grameen Bank services and activ-ities at various levels. Grameen Bank has a strong staff training pro-gram. It features a structured learning process that is continually fine-tuned by trial and error.
There are few data on the time that different delivery models takefor service delivery. The private delivery model appears to be faster indelivering services in the few cases examined here. Simple and clearoperating procedures, well-defined division of responsibilitiesbetween individuals and organizational units, adequate equipment,good information systems, and qualified and motivated staff all seem
INNOVATIONS IN DELIVERY AND ORGANIZATION 111
to be associated with quick service delivery. While these characteristicscan be found in public agencies, they are more common in privateagencies. In fact, one reason to create social funds as autonomous bod-ies outside the normal bureaucratic structure is to avoid the red tapeand delays associated with public delivery.
Faster turnaround time in managing such processes as bidding andprocurement should mean speedier service delivery. It takes Senegal'sAGETIP two months to complete the whole bidding process, while ittakes the government administration six months to do the same(World Bank 1992c). In the Honduras social fund, while line ministriessometimes take up to a year to complete the bidding process, socialfund management turns in a bid for the same type of project within amonth (World Bank 1994f). In India's publicly delivered ICDS pro-gram there is often a considerable lag between the program's sanc-tioning by the central government and the program's becoming oper-ational. Sometimes the lag time runs up to seven years (Subbarao1989). Anecdotal evidence indicates that private contractors and NGOstry to minimize delays to keep costs down; hence they are typicallyquicker service deliverers than are public agencies.
Lessons of Experience
Based on program experiences, it is possible to identify some key prin-ciples for the effective delivery of social assistance and poverty-targeted programs. These principles include tapping institutionalcomplementarity, balancing demand-driven systems and demandmanagement, and fostering beneficiary participation.21
Tapping Institutional Complementarity
Many countries have a weak institutional capacity for reaching thepoor. Hence, it is critical to tap the strengths and resources of alldevelopment agencies-whether private or public, central or local-according to their comparative advantages. Generally, some blend willbe most appropriate. The issue is to determine the optimal mix ofinputs required in each case and to divide responsibilities among orga-nizations accordingly.22
The case of the infrastructure component of Bolivia's ESF is a goodexample of tapping the complementarities between public and pri-vate agencies. Most of the infrastructure projects financed by ESFwere designed and organized by public agencies, but the actualbuilding was contracted out to private firms. This division of laborreflects the comparative advantages of public and private agencies.Because public agencies were in a better position to fit activities with-
112 SAFETY NET PROGRAMS AND POVERTY REDUCTION
in sectoral priorities and ensure that the recurrent costs implied bythe capital investments would be met, ESF vested service provisionin public agencies. On the other hand, given their capacity to deliverservices fast, private contractors were hired to produce theinfrastructure.
There are also more and more cases in which an effective division oflabor is established between public agencies and NGOs. This trend isgrowing as governments take advantage of NGO flexibility and grassroots orientation, and NGOs benefit from governments' sectoral infor-mation base and resources. For example, Professional Assistance forDevelopment Action (PRADAN)-an Indian NGO-has been work-ing with government IRDP officials to improve the effectiveness ofpoverty alleviation programs at the subdistrict level. This effort hasimproved targeting and loan repayment (Holt 1991).
The sanitation component of the Honduras Social Fund is a goodexample of the partnership between different service deliverers. Thesocial fund works closely with the Ministry of Health's HealthEducation and Sanitation Division and NGOs to design the compo-nent (public-private provision). The social fund hires private contrac-tors to build latrines (private production) and NGOs to providesimultaneous sanitation education (private production). A 1994 ex-post evaluation of the social fund showed that about 88 percent of thebeneficiaries were using the services and were adopting appropriatesanitary practices (Webb, Lee, and Sant' Anna 1995).
Balancing Demand-Driven Systems and Demand Management
Though sensitive to the needs of the poor, demand-driven institutions(such as social funds) are not free from problems. First, some types ofprojects (such as family planning) may not be demanded at all (for cul-tural or other reasons), although these activities may have high socialreturns. Second, social funds do not necessarily have favorable geo-graphic targeting because the poor may have a limited capacity toabsorb and hence demand projects. Third, reliance on a purelydemand-driven approach may lead to the financing of projects that canbe prepared quickly rather than those that are most needed. For exam-ple, in Honduras's FHIS about 62 percent of the funds allocated to thebasic needs component had gone to a school desk manufacturing pro-gram, an arguably low-priority item. In Zambia's SRP about 70 percentof the projects were in the education sector, mainly school constructionand rehabilitation.23 In Honduras manufacturing desks was popularbecause such project proposals could be easily prepared. In Zambiathe fact that the parent-teacher association was active and experiencedin undertaking school projects led to a profusion of viable project pro-
INNOVATIONS IN DELIVERY AND ORGANIZATION 113
posals for schools, neglecting other potentially needy projects in theprocess. Fourth, demand-driven programs without a funding con-straint leads to demand for everything-the wish-list problem. Even ifthere is a funding constraint, people may prefer that resources are usedto generate pure benefits (such as a road) rather than for things thatprovide a flow of benefits but require complementary inputs (such asan irrigation canal). Finally, demand-driven projects may be biasedagainst the poor because the poor are often less ready than the non-poor to articulate their needs.
In response to these shortcomings the fully demand-drivenapproach has evolved into a demand-managed approach. Demandmanagement, for example, in the Cambodia Social Fund has beenachieved by using several instruments:* Eligibility principles, which lay out the broad policy framework
governing the social fund's activities.* A project menu, which lists the different kinds of projects that can
be financed by the social fund.* Eligibility criteria, which outline the various activities that are eligi-
ble for social fund financing.* Appraisal criteria, which further narrow the activities and the form
of acceptable projects.* Targeting criteria, which lay out the groups, type of projects, and
provinces that will receive priority in processing applications inorder to ensure that the poor benefit.24 An additional instrument ofdemand management used in social funds, especially to stimulatedemand for projects among poorer communities, is outreach andpromotion. Outreach and promotion may include one (or more) ofthree activities, each representing progressively higher levels ofassistance.* Information dissemination, which aims at making a social fund
popular by passing out general information about its objectivesand project selection criteria.
* Facilitation, which aims at explaining the project selection crite-ria, helping to determine if specific projects meet those criteria,and clarifying procedures for proposing projects.
* And, lastly, training and technical assistance, which focuses onhelping communities acquire skills to effectively prepare, man-age, and implement projects (Carvalho 1994b).
Demand management is not without limitations. It may increase thetime it takes to appraise projects, thereby, reducing the social fund'sagility in responding to demand and increasing its administrativecosts. It may also result in less ownership of projects. Whatever thedelivery model, the key is to strike an appropriate balance betweendemand-driven systems and demand management.
114 SAFETY NET PROGRAMS AND POVERTY REDUCTION
Fostering Beneficiary Participation
Where programs have succeeded, they have been tailored to the localenvironment, and beneficiaries have felt involved and "owned" theprograms. The highly successful Philippines Communal Irrigationproject (NIA) showed that securing beneficiaries' full-scale participa-tion takes a tremendous effort-but such an effort pays off handsome-ly with a sustainable project in which farmers truly assume ownershipand are motivated to maintain it. In general, the short-term costs ofparticipation are likely to be outweighed by the longer-term benefitsemanating from more effective and sustainable projects. Importantpolicy and design features needed for effective beneficiary participa-tion include: creation of social infrastructure (identification of keyactors, their social organization and leadership, and their interest andcapacity to manage the physical infrastructure) to sustain the physicalinfrastructure, and flexibility in allowing different forms and intensityof participation (Narayan 1995).
Beneficiary participation will be more desirable in some projectsthan in others. For example, in projects that depend on participationby a large number of beneficiaries and require regular maintenanceand supervision, local involvement and grass roots participation atalmost all stages of project design and implementation may add sig-nificantly to project effectiveness and sustainability. By contrast, inprojects that require lumpy capital investments, such as infrastructureconstruction, ensuring that the needs of beneficiaries (for example,project location or resettlement) are taken into account may be enough.Participation in such projects tends to be more consultative than par-ticipatory. In these circumstances services can be provided throughexisting central organizations or private contractors.
Notes
1. The term "delivery" includes both institutional and organizational issues.Institutions refer to the "rules of the game" and organizations to "how the game isplayed" (North 1990).
2. Being unsustainable is not bad under all circumstances. A poverty-targeted pro-gram need not be sustained forever. It must be sustained only until the problem it tack-les has gone away or can be better handled by other means.
3. The two approaches are based on a distribution of responsibilities among differentlevels of government-the distribution of resources is a separate issue. Block grantseither earmarked (for specific activities that are to be encouraged) or unearmarked areinstruments for distributing resources. Block grants may include matching grants, espe-cially if domestic resource generation is desired.
4. Under the fiscal choice model local authorities can also raise revenue for the program.5. Moreover, it is worth stressing that some disincentive effects-such as crowding
out family and community thrift-are not delivery system issues. Disincentives raisecosts and harm program objectives whatever the delivery model is.
INNOVATIONS IN DELIVERY AND ORGANIZATION 115
6. Under some private delivery models information and actions are often "hidden"and not available to the public, making it difficult to compare the models.
7. The decision of whether services should be privately produced and, if so, whichprivate entity should produce them, is generally made by the service provider, althoughthis decision may be influenced by the entity financing the service.
8. Social funds channel resources, typically in grant form, according to predeter-mined criteria, to any public agency, NGO, or community group that has demonstratedthe capacity to effectively deliver basic services to the poor. The recipient entities ofteninvolve private contractors in the production of the services.
9. The section on social funds has benefited greatly from discussions with RodrigoCisneros.
10. These results are based on a comparison of two situations: what workers wouldhave earned had they not worked for ESF and the amount that workers with similarcharacteristics would earn while working for ESF.
11. Demand-driven programs are programs that let potential beneficiaries determinethe services they need or want and then make their own request for financing.
12. Private contractors are hired to produce services only for large projects, usuallythose above $100,000.
13. The Microprojects Unit operates as the social fund for the Social Recovery Project.14. This finding should be interpreted with the caveat that geographic targeting
reveals only so much about the extent to which poor households may or may not be ben-efiting; a program may be well-targeted geographically, but it may be benefiting non-poor households (or vice versa). Also, especially in credit programs, a poor geographicdistribution of resources may be justified if activities in poor regions do not ensure a rea-sonable net return.
15. In an early evaluation of India's IRDP, Subbarao showed that the districts withthe highest levels of scheme-related infrastructure (such as chilling plants for dairyingactivity) received a high proportion of funds-the same districts also made up the suc-cess stories. But these districts were not necessarily the poorer or needier ones.
16. It is not clear, though, how Grameen Bank's focus on poorer regions, given (like-ly) lower returns to lending, affects its cost-effectiveness in reducing poverty.
17. Labor share in public works is a contentious issue. Maintaining a seasonally highlabor share is critical for employment generation, but if it is set too high, the quality ofworks can suffer.
18. A distinction is made between sustainability of the program and sustainability ofthe services provided by the program. The program need not be sustained forever. Butin most cases the sustainability of its services is desirable.
19. "Beneficiary participation" is defined as a voluntary process that enables people,including the disadvantaged, to influence or control the project decisions that affectthem (Narayan 1995).
20. Where private commercial entities (not NGOs) provide or produce services, thepoorest beneficiaries may not be involved in decisionmaking or be enrolled in the pro-gram, especially since private entities typically lack the idealism of NGOs.
21. "Demand management" refers to steering the demand for services in specificdirections based on the specific objectives of the deliverer. One way of doing this is toinvite proposals from potential beneficiaries but to restrict and specify the kinds of ser-vices that will be eligible for support.
22. Efforts to tap institutional complementarities may bias projects toward better-offareas where institutions are concentrated; this problem should be considered in deter-mining the desired level of institutional complementarity.
23. The percentages reported are from the midterm reviews for both Honduras'sFHIS and Zambia's SRP.
24. While most of these instruments were found in earlier social funds, the emphasisput on them has grown in recent social funds.

7Modes of Financing
Social Assistance Programs
The mode of financing influences the choice of social assistance pro-gram, its sustainability, and its ultimate impact on the poor.Alternative sources of financing are discussed, and some of the trade-offs and implications for program sustainability are described. Thatdiscussion is followed by an empirical analysis of the limited informa-tion on how countries have chosen to finance social assistance pro-grams. Because such programs make competing claims on realresources, it is important to assess whether they crowd out other long-term investments for growth. This issue is reviewed using a small sam-ple of countries for which data are available. Further, we explore thegrowing tendency to decentralize fiscal responsibility for social assis-tance programs. Finally, financing issues are addressed. Financingsocial assistance programs is particularly challenging in the economiesin transition because of their output and fiscal contractions.
Because funds have alternative uses, it is important to be aware of theextent to which a particular financing mechanism displaces others. Butthe lack of adequate data precludes sorting out the effects of fungibility.For the purposes of this chapter zero fungibility (perfect earmarking) isassumed, and the different sources of financing are treated as mutuallyindependent and exclusive. Obviously, this view is an oversimplification.
Sources of Financing and Trade-Offs
There is considerable heterogeneity among countries when it comes tofinancing social assistance programs. Broadly, social assistance pro-grams may be financed from external or internal (domestic) sources(figure 7.1). Internally, a program may be funded from general tax rev-enues, payroll taxes, or specific taxes, or "covered" by arrears.' Iffinancing is intended to come from general revenues, but there is adeficit, the deficit can be covered domestically by money financing,debt financing (bond sales), or arrears.
117
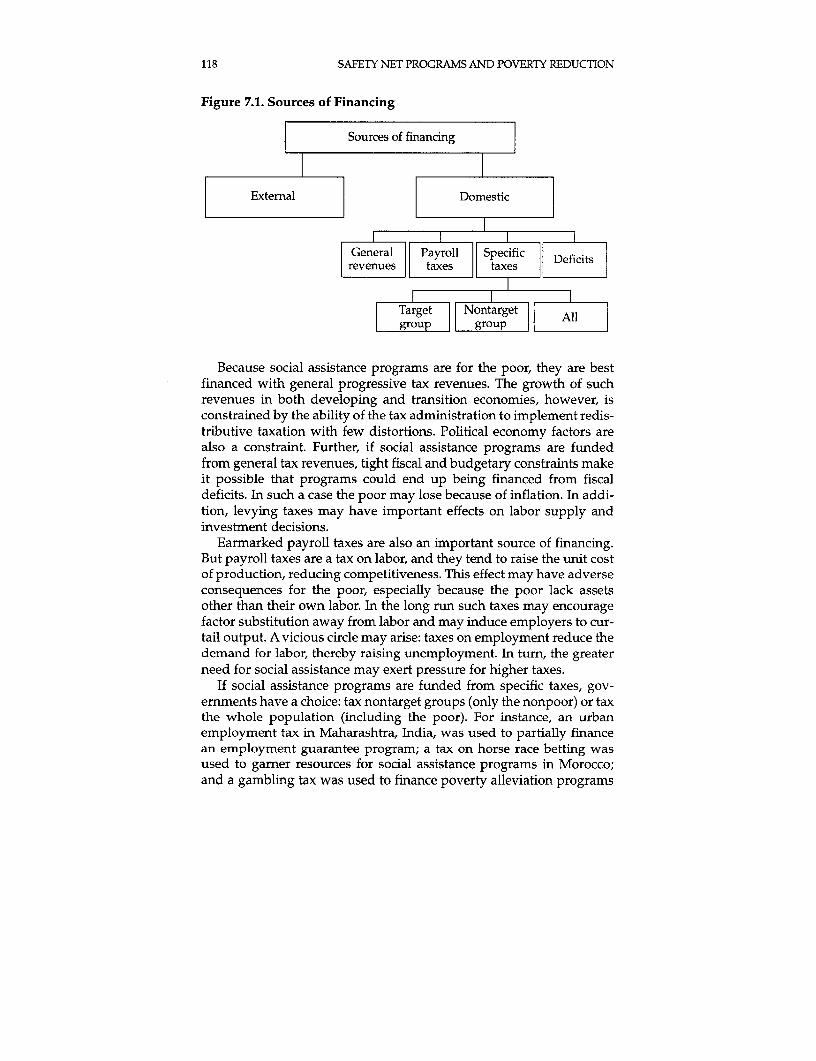
118 SAFETY NET PROGRAMS AND POVERTY REDUCTION
Figure 7.1. Sources of Financing
Sources of financing
l ~ ~~~ l
External Domestic
General Payroll Specific Dfctrevenues taxes taxes
Target Nontarget Allgroup 1 [ group
Because social assistance programs are for the poor, they are bestfinanced with general progressive tax revenues. The growth of suchrevenues in both developing and transition economies, however, isconstrained by the ability of the tax administration to implement redis-tributive taxation with few distortions. Political economy factors arealso a constraint. Further, if social assistance programs are fundedfrom general tax revenues, tight fiscal and budgetary constraints makeit possible that programs could end up being financed from fiscaldeficits. In such a case the poor may lose because of inflation. In addi-tion, levying taxes may have important effects on labor supply andinvestment decisions.
Earmarked payroll taxes are also an important source of financing.But payroll taxes are a tax on labor, and they tend to raise the unit costof production, reducing competitiveness. This effect may have adverseconsequences for the poor, especially because the poor lack assetsother than their own labor. In the long run such taxes may encouragefactor substitution away from labor and may induce employers to cur-tail output. A vicious circle may arise: taxes on employment reduce thedemand for labor, thereby raising unemployment. In turn, the greaterneed for social assistance may exert pressure for higher taxes.
If social assistance programs are funded from specific taxes, gov-ernments have a choice: tax nontarget groups (only the nonpoor) or taxthe whole population (including the poor). For instance, an urbanemployment tax in Maharashtra, India, was used to partially financean employment guarantee program; a tax on horse race betting wasused to garner resources for social assistance programs in Morocco;and a gambling tax was used to finance poverty alleviation programs
MODES OF FINANCING SOCIAL ASSISTANCE PROGRAMS 119
in Paraguay. Such funding may seem equitable in the sense thatresources are being redistributed. But if every program is funded thisway, the administrative burden will become heavy as the tax machin-ery grows increasingly complex. Furthermore, in some countries thepoor are disproportionately represented among those participating inlotteries and gambling. And depending on the political clout of thegroups being taxed, the fiscal sustainability of these sources of financ-ing is questionable.
Programs may also be partially funded from resources obtainedfrom target groups in the form of "self-help" contributions. One exam-ple would be the public works programs in some Asian and Africancountries (for example, some public works programs in Africa haveused free labor and user-contributed land).2 To the extent that the con-tributors of land are from the poorer strata of society, this form offinancing may be less equitable, because there is no guarantee that thecontributions will be offset by program gains.
User charges are a potentially important source of finance for con-tinuing programs or meeting recurrent costs. They may benefit thepoor if the revenue generated is used to extend the supply of essentialservices or improve quality. But if instituted at equal levels for all pro-gram participants, they are likely to be regressive. The impact of usercharges on revenue collected is determined by the elasticity of demandfor the services rendered. If demand is elastic, the imposition of userfees may reduce service use and hence revenue. Conversely, if demandis inelastic, households may not greatly reduce their use, but they mayhave to reduce their consumption of some other commodity (in theabsence of savings)-and suffer a welfare loss. Further, while there isoften untapped potential to collect user fees and partial cost recovery,there are likely to be poor groups in every society that must be exemptfrom such fees.
If properly structured, user charges incorporate signals and incen-tives that help curtail leakage and lead to a more efficient use ofresources. In addition, the patterns of demand observed when thereare user fees may convey information to planners about how differentconsumer groups value different services. These considerations sug-gest that, while being an important source of cost recovery, user feesby themselves may not automatically improve the efficiency or thequality of social assistance programs. The structure adopted is crucial.Who is responsible for collecting fees? What happens to the revenuegenerated from such fees? What incentives are created? These ques-tions must be addressed when designing the program.
Asset sales are yet another option for raising revenue. This option ispossible in countries with large publicly held natural resource reservesor in countries emerging from state planning and state ownership of
120 SAFETY NET PROGRAMS AND POVERTY REDUCTION
enterprises (such as Chile, Mexico, Russia, and Venezuela). For instance,in Russia the Fund for the Social Support of the Population has received10 percent of privatization proceeds and some assets of the communistparty. But the real value of these assets eroded because of rapid infla-tion.3 An important problem is that asset sales offer only a one-shotsource of financing, not a continuing source. They are therefore unlike-ly to sustain programs if they are the sole source of financing.
Finally, programs can be funded externally. The sustainability of aprogram that is fully funded externally is always in doubt. Moreover,the availability of donor financing may slacken efforts to mobilizedomestic resources in the recipient country. External funds may beregarded as a substitute for domestic funds and may discourage redis-tributive taxation. These problems notwithstanding, donor funds haveplayed a major role in financing social assistance programs in Africa,Asia, and Latin America.
A few countries have adopted other financing strategies. Theseinclude reducing current government expenditures; converting externaldebt into social assistance programs (as in Chile, the DominicanRepublic, and Ecuador); and increasing contributions from participants.
Like every other spending activity, the financing of social assistanceprograms claims scarce resources. Therefore, it is necessary to assessthe opportunity cost of forgone alternatives. Trade-offs arise betweenlong-term investments in growth and human resources, and short-term investments in social assistance programs. Whether a particularprogram has crowded out other long-term investments, is, however,an empirical issue. Not every social assistance program competes forscarce resources. In fact, social assistance programs could complementdevelopmental expenditures in some countries. For example, a well-designed public works program could create socially useful ruralinfrastructure, enhancing economic growth. Similarly, cash transfers tothe poor may be both desirable and necessary to the extent that theycomplement the reform or adjustment process by preventing the ero-sion of living standards in the interim and harnessing political supportfor reform. Some consumption-smoothing programs can encouragethe poor to accept high-risk portfolios with greater expected returns orincome, thereby raising GNP.
The mode of financing affects the ultimate impact on the poor. Thecost of poorly targeted social action programs may be prohibitive andrequire deficit financing. If the deficit is monetized, ensuing inflation-ary pressures may hurt the poor disproportionately. 4 The LatinAmerican experience of the 1980s highlights the narrow limits of infla-tionary finance-and its dramatic costs. Insofar as inflation is a tax onreal resources and the poor have less access to other forms of wealth,benefits can be more than offset by inflation, which erodes the real
MODES OF FINANCING SOCIAL ASSISTANCE PROGRAMS 121
value of the poor's limited cash balances. In addition, social assistanceprograms requiring a larger slice of the budget (the case in some tran-sition economies) are difficult to sustain in an era of structural adjust-ment or austerity, as governments take corrective measures to reducedeficits.
A Cross-Country Analysis of Funding
Four findings emerge from the regional pattems of financing socialassistance programs. First, food and nonfood external aid were thedominant funding sources in Africa and Asia for most programs.Many Asian countries (India and Bangladesh in particular) supple-mented external aid with several programs funded out of general taxrevenues. Second, few countries have used special taxes (India'semployment tax is a notable exception). Third, in countries in transi-tion social assistance programs are funded from general taxes, partic-ularly from state and local budgets. So far, external aid has played lit-tle or no role. Fourth, all public works programs (regardless of geo-graphic location) for which there are data have relied on some form ofextemal food aid (except for the program in India). 5 Many Africancountries received both food and nonfood external aid for their publicworks projects (for example, Burkina Faso, Kenya, and Niger). Somemajor credit-based programs (for instance, the Grameen Bank inBangladesh, the Banco Solidavio in Bolivia, the Credit Solidaire pro-gram in Burkina Faso, and the Bumkin Raya Karkara program inNiger) relied partially or wholly on nonfood external aid. The value ofaid is partly dependent on whether it is given in-kind (food aid) or incash.
Nearly 80 to 90 percent of total social assistance spending in Africais supported by external finances. In Latin America external financingis also an important source. But within Latin America extemal financ-ing did not necessarily focus on the poorer countries; some middle-income countries like Venezuela also obtained a high proportion ofexternal funding. Mexico is the only country where the entire programwas domestically funded.
Data on annual average spending on social assistance and the pro-portion of the total population below the poverty line suggest thataverage spending is usually higher in countries that have more peopleliving below the poverty line (figure 7.2). For example, countries likeMadagascar, Mexico, Uganda, Venezuela, and Zambia had higheraverage annual levels of spending on social assistance programs.These were also the countries that had more of their population livingbelow the poverty line. El Salvador and Somalia rank low in bothareas.
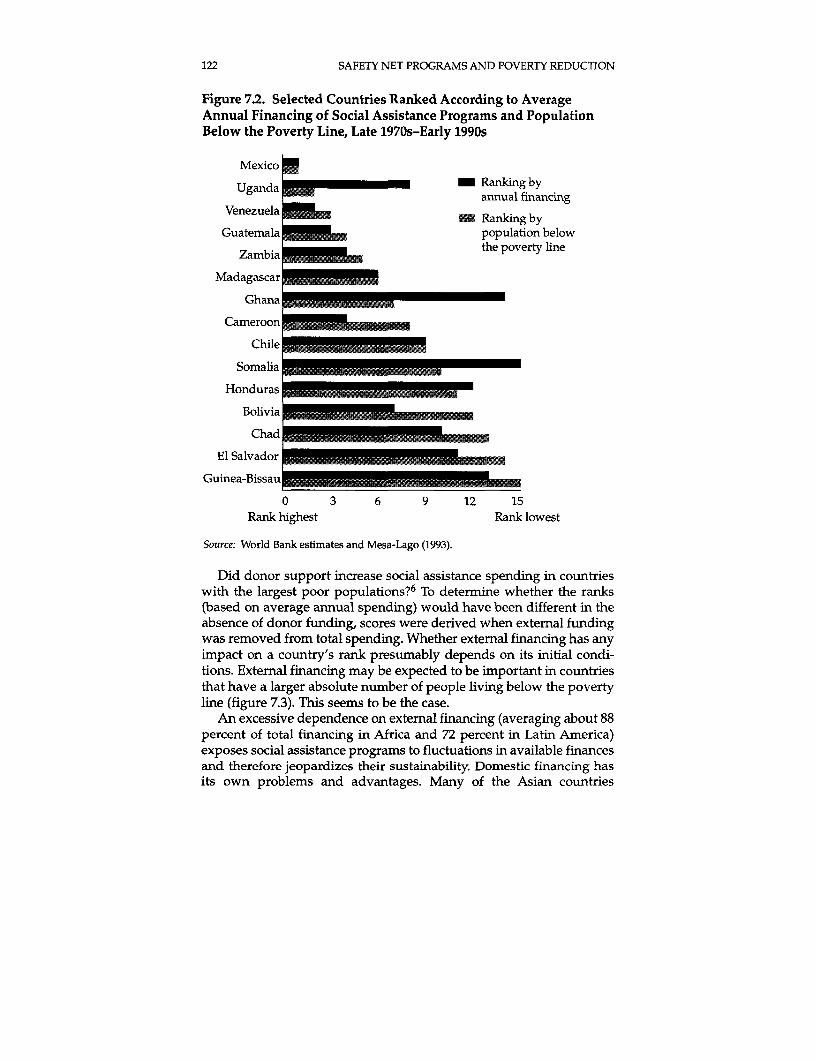
122 SAFETY NET PROGRAMS AND POVERTY REDUCTION
Figure 7.2. Selected Countries Ranked According to AverageAnnual Financing of Social Assistance Programs and PopulationBelow the Poverty Line, Late 1970s-Early 1990s
Mexico
Uganda - Ranking byannual financing
Venezuela - Ranking by
Guatemala population belowZambia the poverty line
Madagascar
Ghana
Cameroon
Chile
Somalia
Honduras
Bolivia _
Chad
El Salvador ._........._ _
Guinea-Bissau _. .........
0 3 6 9 12 15Rank highest Rank lowest
Source: World Bank estimates and Mesa-Lago (1993).
Did donor support increase social assistance spending in countrieswith the largest poor populations? 6 To determine whether the ranks(based on average annual spending) would have been different in theabsence of donor funding, scores were derived when external fundingwas removed from total spending. Whether external financing has anyimpact on a country's rank presumably depends on its initial condi-tions. External financing may be expected to be important in countriesthat have a larger absolute number of people living below the povertyline (figure 7.3). This seems to be the case.
An excessive dependence on external financing (averaging about 88percent of total financing in Africa and 72 percent in Latin America)exposes social assistance programs to fluctuations in available financesand therefore jeopardizes their sustainability. Domestic financing hasits own problems and advantages. Many of the Asian countries

MODES OF FINANCING SOCIAL ASSISTANCE PROGRAMS 123
Figure 7.3. Selected Countries Ranked According to AnnualForeign Financing and Population Living Below the PovertyLine, Late 1970s-Early 1990s
Mexico
Uganda - Ranking by
Venezuela annual foreignfinancingGuatemala _ Ranking by
Zambia _ population below
Madagascar the poverty line
Ghana
Cameroon
Chile
Somalia E
Honduras _I
BoliviaChad 6__ _ _
El Salvador _
Guinea-Bissaun
0 3 6 9 12 15Rank highest Rank lowest
Source: World Bank estimates and Mesa-Lago (1993).
financed social assistance programs out of domestic sources. Suchpractices contribute to ownership and sustainability, though force atough choice between allocating scarce resources for long-term invest-ment and growth or for short-term poverty alleviation.
The number of donors involved in funding a particular programinfluences its outcome. A large number of donors with smaller con-tributing shares may create an environment in which negotiations,approvals, and disbursement of funds are difficult. Conversely, a small-er number of donors with a higher concentration of shares would prob-ably make these tasks easier. The Bolivia ESF is an example of the lat-ter, having only nine donors (with two financing more than half of therequirement). Hence negotiations, approvals, and disbursement wereaccomplished rapidly-in about one-sixth the average time (Mesa-Lago 1993). Honduras has almost twice as many donors (sixteen), but
124 SAFETY NET PROGRAMS AND POVERTY REDUCTION
two of the donors provided most of the funds, so start-up was rapid.Ghana received less than half the funds allocated to Bolivia's ESF, but ithad twice the number of donors, each with very small shares.Disagreements between the government and the donors (compoundedby the donors' unwillingness to simplify and shorten their procedures)contributed to massive delays in start-up (Mesa-Lago 1993).
To the extent that social assistance programs can target the poor, thebest form of financing is clearly redistributive taxation. But all taxesare distortionary to some extent. If resources needed for financingtransfers from general tax revenues are not kept within limits, the dis-tortions imposed by increased levels of taxation might more than out-weigh the benefits accruing to the poor from transfer programs. Forexample, indirect taxation, with all its attendant distortions, is excep-tionally high in some countries (like India). Moreover, while the cov-erage of any given direct tax is low, the levels of taxation are high, thusinducing evasion and other inefficiencies. These considerations sug-gest that a desirable transfer program involving substantive domesticfinancing depends very much on how efficient countries are in raisingtax revenues.
Another aspect of domestic financing is participant financing. Thedata suggest that participant financing (as measured by the contribu-tion of managing agencies and beneficiaries) is not a significant sourceof finance for social assistance programs (about 8 percent in LatinAmerica and 1 percent in Africa). The Bolivia ESF has the highestcounterpart share (23 percent), and it allows labor contributions, there-by reducing the charity stigma from the program. But this practiceraises the issue of how to measure contributions and monitor financialflows. Shares in rural projects are usually higher than shares in urbanareas (Jorgensen, Grosh, and Schacter 1992). Honduras generally sets ashare of 10 percent, and participants are expected to contribute at least15 percent in cost recovery for sanitation projects. In Mexico, as inBangladesh and other Asian countries, beneficiaries' contributions(particularly in primary health care projects) are made in communalwork and occasionally in land or local materials.
A few countries have imposed specific taxes designed to fund socialassistance programs. For instance, Paraguay, though providing noformal safety net, allows the autonomous agency DIBEN (which wasdesigned to help the poor satisfy their basic needs) to impose a levy ongambling. The Entraide National, a public establishment mandated topromote social welfare in Morocco, is financed by taxes on horse bet-ting, festivals, and plays, and a surtax on animal slaughtering. Yetanother example is the MEGS in India. It is partially funded from anurban tax that was initially envisaged to dampen rural-urbanmigration.
MODES OF FINANCING SOCIAL ASSISTANCE PROGRAMS 125
In transition countries social assistance programs are quite limitedand financed primarily or exclusively by payroll taxes. Payroll taxesfinance predominately social insurance programs, which are not tar-geted to the poor. But such taxes increase the costs of production, intro-duce tax compliance problems, reduce competitiveness, and are dis-tortionary. Payroll taxes are very high-ranging from 35 percent to 52percent (Ukraine).
Finally, some countries (the poorest in Africa, or those caught up inthe tumult of transition) may lack resources to finance any social assis-tance programs, and thus may have to incur a budget deficit. In thissituation financing recommendations for social assistance programsdo not differ from general recommendations about financing the over-all deficit, although, typically, the share of the deficit devoted to socialassistance (though difficult to pin down) is usually not large. This isbecause absolute spending on social assistance programs is small.
Transfer Spending, Social Services,and Budget Deficits
Does spending on social assistance programs crowd out other criticalexpenditures on health and education, and increase the budget deficit?It is difficult to test this proposition empirically. First, data on welfarespending are available only for a few countries, and only for centralgovernment sources. Second, available data are aggregated for socialsecurity and welfare, which includes social insurance and social assis-tance. Public spending on social security is generally for the nonpoor,while welfare is generally for the poor. Third, the budget deficit, aswell as social sector spending, might rise or fall for other reasons. InJordan, Nepal, and Nicaragua social welfare expenditures increasedsubstantially in 1980-93. In Nepal this increase was financed througha budget deficit. In Nicaragua, while the deficit decreased slightly, therelative spending on health declined. Moreover, Nicaragua was facedwith massive macroeconomic instability-its inflation rate hoveredover 600 percent. In such a situation it is questionable if raising welfarespending will bring any relief to the poor.
In some countries social welfare spending has increased modestly,and in most the budget deficit position has improved. Thus, there is noevidence of a worsening deficit, even in countries where spending onsocial assistance programs has increased. In a few countries the relativeshare of health and education expenditures have also increased. But inothers spending on one of the two sectors has increased only slightly ordecreased. Thus the evidence is not robust. However, countries thatmanaged to sustain welfare spending without hurting education orhealth spending were typically successful in raising tax revenues (such
126 SAFETY NET PROGRAMS AND POVERTY REDUCTION
as Ghana) or curtailing expenditures (such as Sri Lanka). Generally,countries unable to raise revenues were unable to sustain spending onsocial welfare without hurting either health or education.
In many countries the responsibility for financing social assistanceprograms is devolving to local governments. Where such fiscal decen-tralization is taking place, the sustainability and viability of programs,as well as interprovincial equity, are real concerns.
Fiscal Federalism, Decentralization,and Public Expenditure Management
Spending and revenue decisions must be decentralized to ensure thatpoverty alleviation programs and policies reflect the preferences,needs, and fiscal abilities of different regions of the country. The natureof decentralization and the driving force behind it depend on a coun-try's specific circumstances. The momentum to decentralize publicadministration and public finances has partly reflected the decentral-izing objectives of each government and, in transition countries, thedisintegration of the centrally planned economies.
Decentralization is a paradox. It demands more sophisticated polit-ical skills at the national level to guide the process, but at the sametime it requires that the dependence on the center be broken. This isthe case in Latin America and some Asian countries, such as China,where decentralization represents a clear break after many decades ofcentralism. A complicated dynamic emerges as national governmentsand political elites transfer power to local authorities. Governancebecomes more difficult just when it is most important for providing acommon, coherent set of goals for social programs.
Not surprisingly, decentralization has had limited success. Forinstance, the propoor services throughout Vietnam are underfunded(Bird, Litvack, and Rao 1995). This problem is particularly acute inpoorer areas compared with larger cities. Improvements in the systemof intergovernmental finances could help ensure that each level of gov-ernment, even in the poorer provinces, is adequately funded-andgiven sufficient expenditure and revenue-raising autonomy-so as tosupport, operate, and maintain local investments. Because poorprovinces are often less able to mobilize local revenues to supportsocial services, well-designed intergovernmental transfers are particu-larly important.
Provinces must play a greater role in raising revenues and in allo-cating expenditures. Incentives should be built in to ensure thatprovinces perform these roles responsibly and efficiently. Now, mostlocal governments raise very little revenue, the extent of which variesfrom year to year, depending on central transfers. Such uncertainties
MODES OF FINANCING SOCIAL ASSISTANCE PROGRAMS 127
affect most local expenditures, including transfer expenditures. Localgovemments must-to be accountable-have some responsibility fordetermining local tax rates. This power would give them the flexibili-ty to collect more revenue to finance more social programs if they sochoose. At the same time it would allow the central authorities todesign its transfers to ensure that they do not discourage local fiscalefforts. This concem is real because local authorities may simplyregard central transfers as an easy altemative to their own revenue-raising efforts.
Countries that have decentralized revenue sharing, such as Braziland India, have assigned some major tax bases to subnational govem-ments. Such assignments aim to ease the revenue situation at theprovincial level. For example, in Brazil the general value added tax(ICM) has been assigned to the states. In India the sales tax has beenassigned to the states. In the former Soviet Union the individualincome tax and many excise taxes have been assigned to subnationalgovemments (Bahl 1994), though this strategy has raised insignificantamounts of revenue.
Richer provinces will undoubtedly collect more revenue. A particu-larly striking feature in almost every country, developed or develop-ing, is the difference between big city governments and other localgovernments. In Colombia, for example, per capita tax revenues werealmost ten times higher (in the 1970s) in Bogota than in the other,smaller rural municipalities. Some redistribution is therefore necessaryif national social action programs are to succeed across heterogeneouslocales. This is an important consideration because decentralization isoften viewed as a means used by richer communities to opt out ofsocial assistance programs run by higher levels of govermment.
For decentralization to be successful both expenditures and rev-enues must be decentralized. But the search for "good taxes" thatcould be exploited by local jurisdictions has not produced very goodresults (Bahl and Linn 1994; Bird 1986). The verdict on this issue is thatthe taxes local govenmments often raise, especially in developing coun-tries, tend to be poor in quality. And their poor quality generates manyeconomic distortions. Thus a question arises: if decentralization isdefended on the grounds that it improves the allocation of resourceson the expenditure side, how much efficiency is lost when resourcesare raised using distortionary methods?
These issues underscore the difficulty of financing social assistanceprograms under fiscal decentralization (box 7.1). The process is typicalof economies undergoing structural changes and market reforms.Fiscal pressures at the local level increase as national govemmentstransfer many of the expenditure responsibilities of social assistanceprograms to local authorities. At the same time the revenue crisis is
128 SAFETY NET PROGRAMS AND POVERTY REDUCTION
Box 7.1. Budgetary Problems and Decentralizationin Kyrgyz Republic, Latvia, and Hungary
In the Kyrgyz Republic expenditures on state pensions are taken from anextrabudgetary fund called the social fund. The social fund collects rev-enue from employers and employees, and passes the money to theMinistry of Labor and Social Protection to pay pensions. The moneynever passes through the Ministry of Finance and therefore never showsup as an entry on the general budget. Social assistance spending comesfrom the general budget and does show up as a line item. (The aim for1996 is to keep social assistance to 4.7 percent of GDP). A problem arisesbecause the budget line item for social assistance must cover all socialexpenditures, including currency shortfall in the social fund budget.Although it appears that social insurance is self-contained and is almost5 percent of GDP, in fact the first claim is to cover the deficit in socialinsurance revenue collection. Social assistance receives only the remain-ing balance. The effect is a budget line entry that appears to show 4.7 per-cent of GDP going to the poor. In fact, most covers revenue collectionsfrom defaulting enterprises and is thus an indirect subsidy to enterprises.
Latvia has a different problem. Latvian social assistance legislation pro-vides for a uniform income-tested benefit across the country. But in attemptto give local authorities more control, budgets have been devolved to localauthorities. Each local authority is allocated money from the general bud-get to meet its estimated needs. This devolved budget includes an amountto cover social assistance. But the money allocated for the estimated socialassistance needs can be used however the local authority decides. Theresult is provision in some areas above the envisaged level, because thelocal authorities supplement the general budget allocation, and provisionin other areas below the envisaged level. Therefore, there is considerablevariation in actual spending across regions.
In Hungary the financing of local government spending does notallow for earmarking resources for social assistance. Fiscal pressures onlocal governments, especially on poorer ones, are likely to divert increas-ing parts of social assistance allocations to other purposes. Given thatlocal governments rarely levy local taxes, there is a danger that the safe-ty net system might break down and add to the increasing differentiationof social services across localities. Local pressures for equal treatmentmay easily lead to benefits that are too low and doled out to too manyclients (inclusion errors). Or, such pressure may lead to exclusion errors.
forcing central governments in transition to withdraw revenue-sharing instruments from local governments without providing sub-stitutes. Uncertainties of the transition, including lack of clarity in taxassignments, give rise to ambiguities in intergovernmental relationsand obligations. The danger that financing programs for the poor will"fall between the cracks" of vague responsibilities is very real.
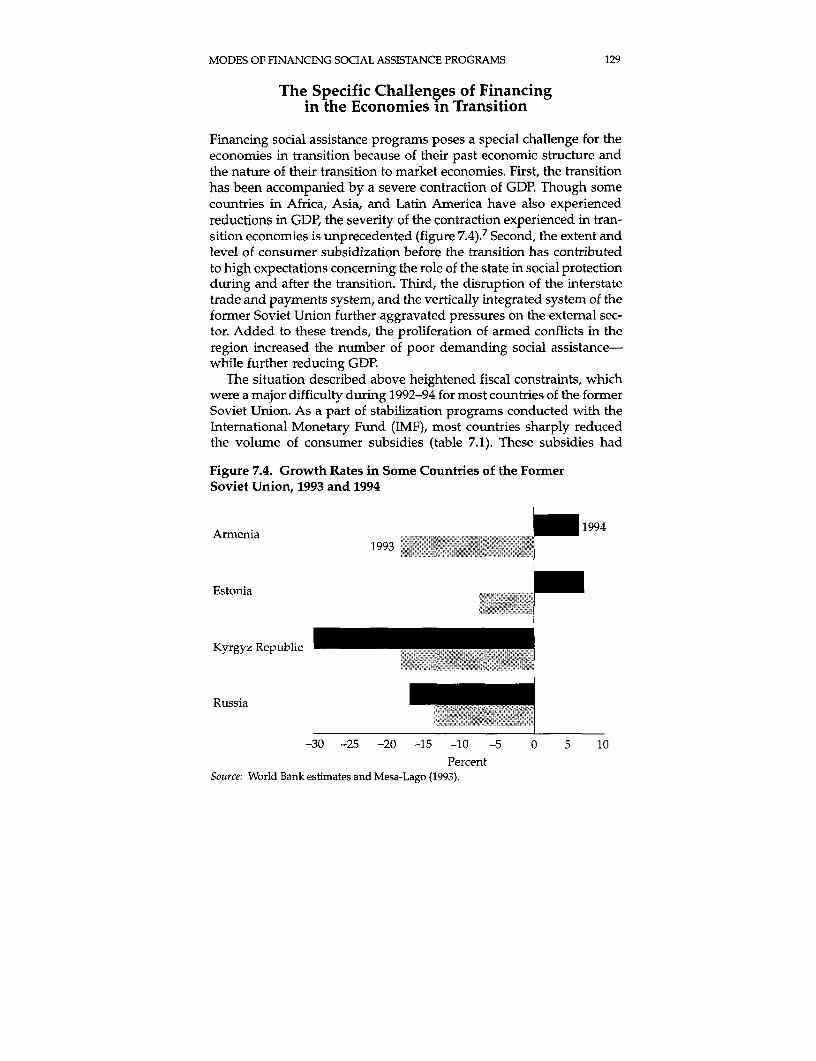
MODES OF FINANCING SOCIAL ASSISTANCE PROGRAMS 129
The Specific Challenges of Financingin the Economies in Transition
Financing social assistance programs poses a special challenge for theeconomies in transition because of their past economic structure andthe nature of their transition to market economies. First, the transitionhas been accompanied by a severe contraction of GDP. Though somecountries in Africa, Asia, and Latin America have also experiencedreductions in GDP, the severity of the contraction experienced in tran-sition economies is unprecedented (figure 7.4).7 Second, the extent andlevel of consumer subsidization before the transition has contributedto high expectations concerning the role of the state in social protectionduring and after the transition. Third, the disruption of the interstatetrade and payments system, and the vertically integrated system of theformer Soviet Union further aggravated pressures on the external sec-tor. Added to these trends, the proliferation of armed conflicts in theregion increased the number of poor demanding social assistance-while further reducing GDP.
The situation described above heightened fiscal constraints, whichwere a major difficulty during 1992-94 for most countries of the formerSoviet Union. As a part of stabilization programs conducted with theInternational Monetary Fund (IMF), most countries sharply reducedthe volume of consumer subsidies (table 7.1). These subsidies had
Figure 7.4. Growth Rates in Some Countries of the FormerSoviet Union, 1993 and 1994
Armenia 19941993
Estonia
Kyrgyz Republic
Russia
-30 -25 -20 -15 -10 -5 0 5 10Percent
Source: World Bank estimates and Mesa-Lago (1993).
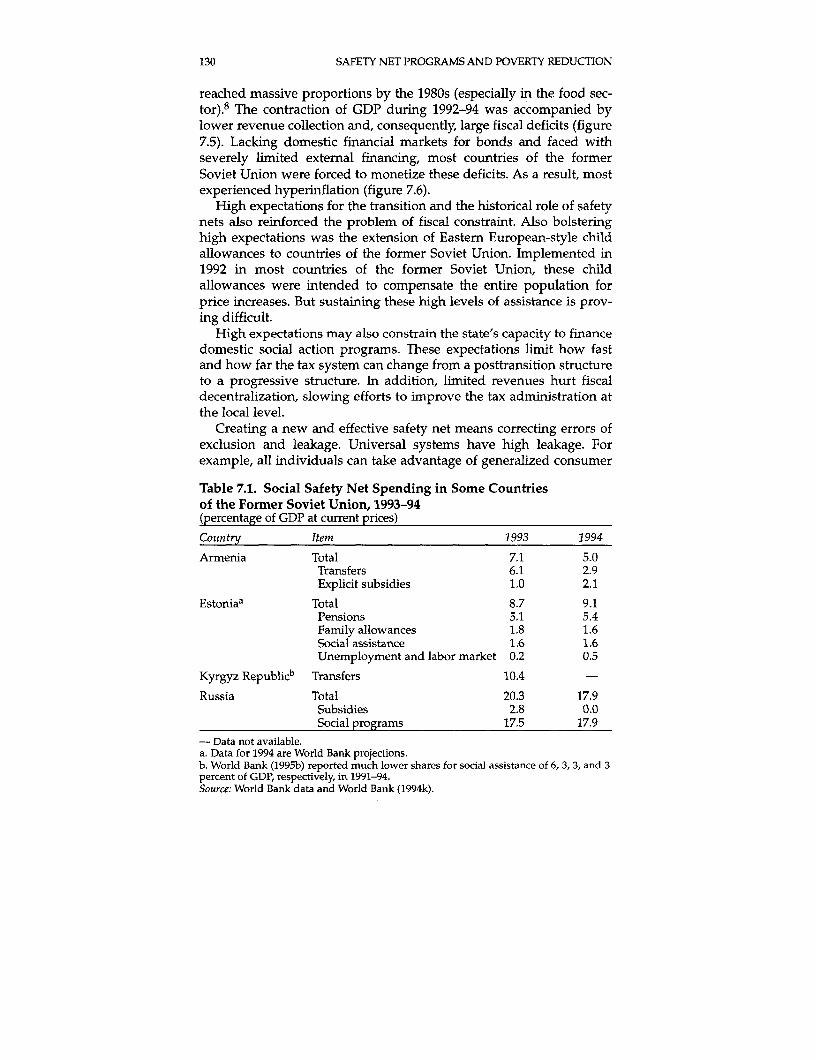
130 SAFETY NET PROGRAMS AND POVERTY REDUCTION
reached massive proportions by the 1980s (especially in the food sec-tor).8 The contraction of GDP during 1992-94 was accompanied bylower revenue collection and, consequently, large fiscal deficits (figure7.5). Lacking domestic financial markets for bonds and faced withseverely limited external financing, most countries of the formerSoviet Union were forced to monetize these deficits. As a result, mostexperienced hyperinflation (figure 7.6).
High expectations for the transition and the historical role of safetynets also reinforced the problem of fiscal constraint. Also bolsteringhigh expectations was the extension of Eastern European-style childallowances to countries of the former Soviet Union. Implemented in1992 in most countries of the former Soviet Union, these childallowances were intended to compensate the entire population forprice increases. But sustaining these high levels of assistance is prov-ing difficult.
High expectations may also constrain the state's capacity to financedomestic social action programs. These expectations limit how fastand how far the tax system can change from a posttransition structureto a progressive structure. In addition, limited revenues hurt fiscaldecentralization, slowing efforts to improve the tax administration atthe local level.
Creating a new and effective safety net means correcting errors ofexclusion and leakage. Universal systems have high leakage. Forexample, all individuals can take advantage of generalized consumer
Table 7.1. Social Safety Net Spending in Some Countriesof the Former Soviet Union, 1993-94(percentage of GDP at current prices)
Country Item 1993 1994
Armenia Total 7.1 5.0Transfers 6.1 2.9Explicit subsidies 1.0 2.1
Estoniaa Total 8.7 9.1Pensions 5.1 5.4Family allowances 1.8 1.6Social assistance 1.6 1.6Unemployment and labor market 0.2 0.5
Kyrgyz Republicb Transfers 10.4 -
Russia Total 20.3 17.9Subsidies 2.8 0.0Social programs 17.5 17.9
- Data not available.a. Data for 1994 are World Bank projections.b. World Bank (1995b) reported much lower shares for social assistance of 6, 3, 3, and 3percent of GDP, respectively, in 1991-94.Source: World Bank data and World Bank (1994k).
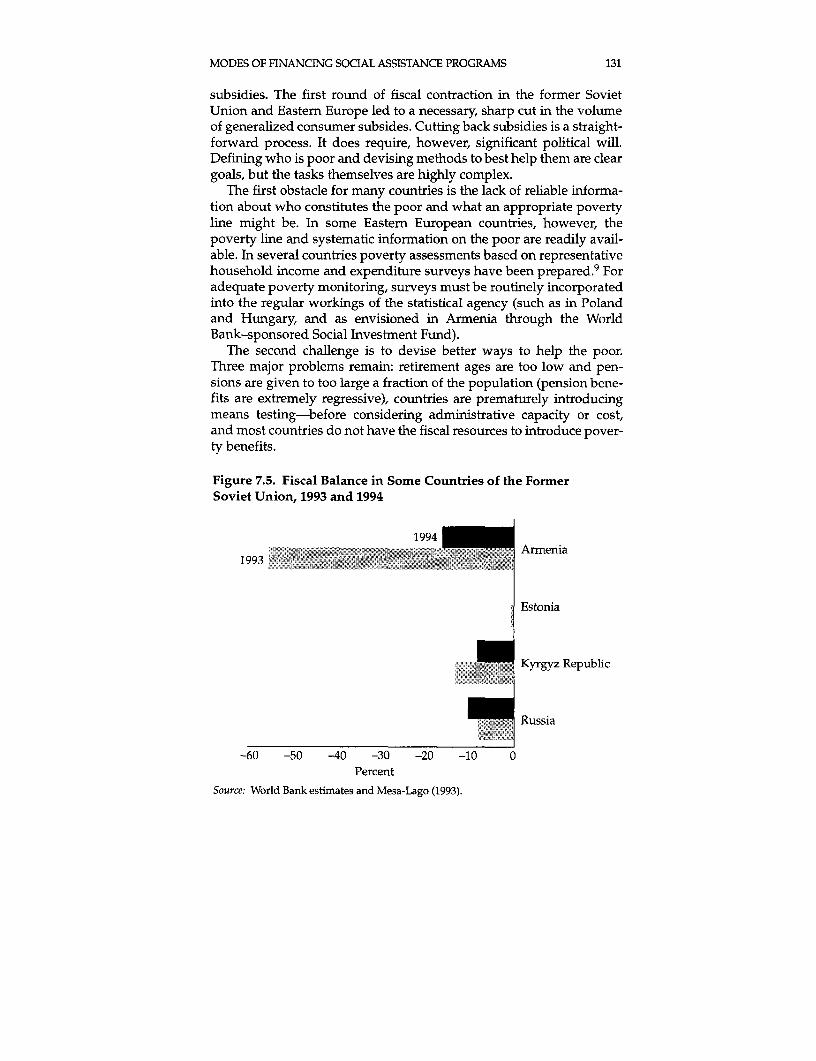
MODES OF FINANCING SOCIAL ASSISTANCE PROGRAMS 131
subsidies. The first round of fiscal contraction in the former SovietUnion and Eastern Europe led to a necessary, sharp cut in the volumeof generalized consumer subsides. Cutting back subsidies is a straight-forward process. It does require, however, significant political will.Defining who is poor and devising methods to best help them are cleargoals, but the tasks themselves are highly complex.
The first obstacle for many countries is the lack of reliable informa-tion about who constitutes the poor and what an appropriate povertyline might be. In some Eastern European countries, however, thepoverty line and systematic information on the poor are readily avail-able. In several countries poverty assessments based on representativehousehold income and expenditure surveys have been prepared.9 Foradequate poverty monitoring, surveys must be routinely incorporatedinto the regular workings of the statistical agency (such as in Polandand Hungary, and as envisioned in Armenia through the WorldBank-sponsored Social Investment Fund).
The second challenge is to devise better ways to help the poor.Three major problems remain: retirement ages are too low and pen-sions are given to too large a fraction of the population (pension bene-fits are extremely regressive), countries are prematurely introducingmeans testing-before considering administrative capacity or cost,and most countries do not have the fiscal resources to introduce pover-ty benefits.
Figure 7.5. Fiscal Balance in Some Countries of the FormerSoviet Union, 1993 and 1994
1994Armenia
1993
Estonia
Kyrgyz Republic
Russia
-60 -50 -40 -30 -20 -10 0Percent
Source: World Bank estimates and Mesa-Lago (1993).
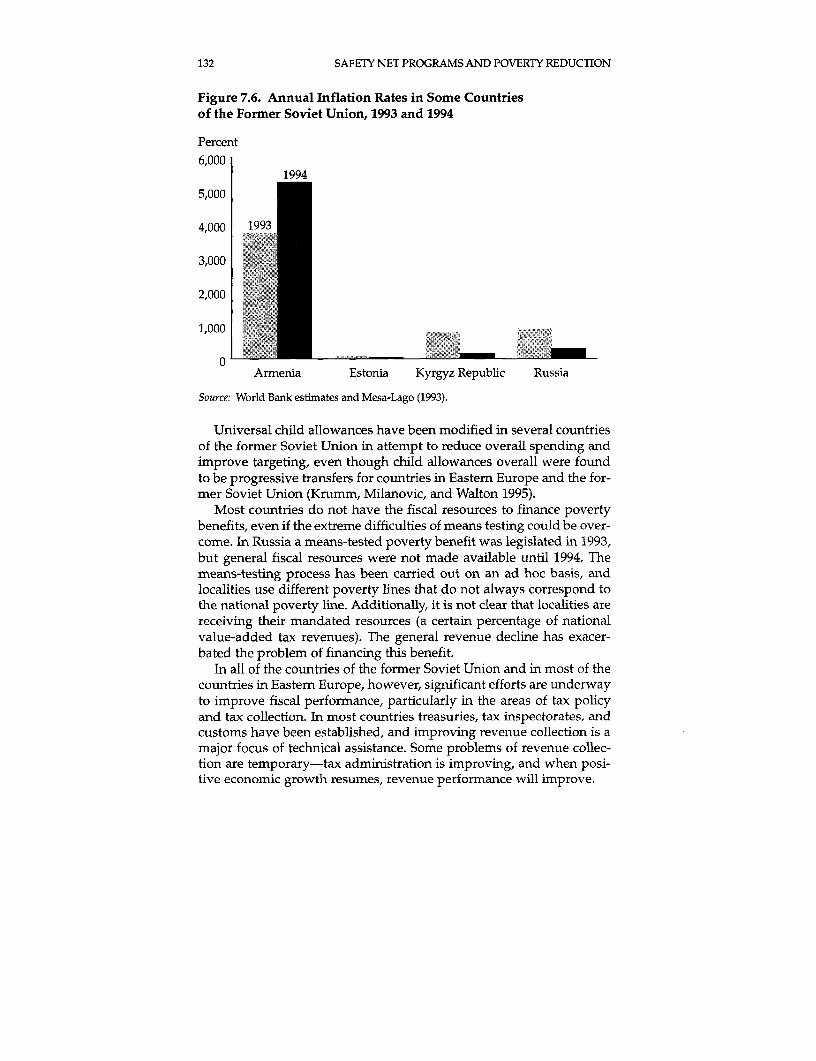
132 SAFETY NET PROGRAMS AND POVERTY REDUCTION
Figure 7.6. Annual Inflation Rates in Some Countriesof the Former Soviet Union, 1993 and 1994
Percent6,000
1994
5,000
4,000 1993
3,000
2,000
1,000 11110
Armenia Estonia Kyrgyz Republic Russia
Source: World Bank estimates and Mesa-Lago (1993).
Universal child allowances have been modified in several countriesof the former Soviet Union in attempt to reduce overall spending andimprove targeting, even though child allowances overall were foundto be progressive transfers for countries in Eastern Europe and the for-mer Soviet Union (Krumm, Milanovic, and Walton 1995).
Most countries do not have the fiscal resources to finance povertybenefits, even if the extreme difficulties of means testing could be over-come. In Russia a means-tested poverty benefit was legislated in 1993,but general fiscal resources were not made available until 1994. Themeans-testing process has been carried out on an ad hoc basis, andlocalities use different poverty lines that do not always correspond tothe national poverty line. Additionally, it is not clear that localities arereceiving their mandated resources (a certain percentage of nationalvalue-added tax revenues). The general revenue decline has exacer-bated the problem of financing this benefit.
In all of the countries of the former Soviet Union and in most of thecountries in Eastern Europe, however, significant efforts are underwayto improve fiscal performance, particularly in the areas of tax policyand tax collection. In most countries treasuries, tax inspectorates, andcustoms have been established, and improving revenue collection is amajor focus of technical assistance. Some problems of revenue collec-tion are temporary-tax administration is improving, and when posi-tive economic growth resumes, revenue performance will improve.
MODES OF FINANCING SOCIAL ASSISTANCE PROGRAMS 133
Notes
1. These sources are not mutually exclusive. A single program could be funded fromany combination of these sources.
2. The Harambee schools in Kenya and the ShramDan (donate labor) movement inIndia were early harbingers of these kinds of programs.
3. Asset sales may have other macroeconomic and microeconomic effects whoseimpacts on the poor are difficult to assess a priori.
4. In addition, excessive inflation also has adverse effects for the poor with respect toresource allocation (capital flight) and income distribution.
5. Prior to the 1960s India also financed some of its food-for-work programs with P.L.480 grain assistance from the United States.
6. The approach in this paragraph draws on behavioral and theoretic analyses ofwhether more donor spending is associated with more or less domestic spending perperson. As such, the approach here is ex post and merely provides a descriptive scenario.
7. Some of the contraction in output arises from data limitations, concealment (non-recording), and informalization of output. The extent and significance of these biases aredifficult to quantify.
8. These subsidies were financed through general budget revenues. In addition, sig-nificant noncash benefits were provided by state enterprises, including housing subsi-dies, day-care centers, clinics, cafeterias providing subsidized meals (and often kitchengardens to stock cafeterias), and a system of subsidized stays at health and recreationalfacilities. Depending on the type of enterprise, workers with seniority could have pref-erential access to waiting lists for automobiles and other consumer durables. A strict sys-tem of residence permits (propiska) meant that larger enterprises could offer authoriza-tion to live in the more desirable cities and large towns. When food and consumer short-ages increased significantly in the 1980s, many enterprises organized buying services foremployees or maintained small shops where employees could purchase food and othergoods (Braithwaite 1991).
9. The World Bank financed or provided technical assistance for household incomeand expenditure surveys in Kyrgyzstan, Romania, Russia, and Ukraine. The World Bankis able to use existing or new surveys in Armenia, Bulgaria, Estonia, Hungary, Poland,and Slovakia. World Bank-sponsored (or administered) work on various other sorts ofsurveys is occurring in Azerbaijan, Kazakstan, Moldova, and Uzbekistan. But most ofthe surveys in the former Soviet Union were one-off, and, more seriously, little signifi-cant financing to date has been provided for social assistance programs.

8The Political Economy
of Social Assistance Programs
Social assistance programs are influenced strongly by domestic politi-cal economy concerns. 1 Targeting objectives and outcomes, and cost-effectiveness, for example, vary a great deal according to political con-texts. While focusing the benefits of social assistance on poor and vul-nerable groups may make sense based on fiscal and poverty concerns,many governments face competing claims for assistance from morevocal and organized, but far less needy groups. Because these groupsoften wield more political influence than the poor, at least some of thebenefits of social assistance are often allocated to them. This motiveleads to outcomes that are less cost-effective but often more feasiblepolitically.
In addition, political objectives can often influence how social assis-tance programs affect beneficiaries' incentives to seek alternativeemployment or to save. For example, if the target group of unem-ployed previously earned relatively high wages and are highly orga-nized and politically influential, they may refuse to work in a low-wage public works program that provides minimal income relief. Inthis case the optimal employment program from a technical stand-point may be insufficient to meet the government's political need toplacate a potentially powerful opposition.
Politics often affect the sustainability of social assistance programs.In some contexts it may be necessary to divert part of the benefits ofsocial assistance to less needy groups to ensure political support forthose programs. In other contexts, where demand-based programs(such as social funds) are able to effectively incorporate the poor, thepoor's organizational potential and political ability may be enhanced.Then, shifting public expenditures toward the poor is more likely to besustainable.
Finally, choices about the speed of service provision are directlyaffected by politics. Although designing the optimal social assistanceprogram takes time-to compile adequate information about who the
135
136 SAFETY NET PROGRAMS AND POVERTY REDUCTION
poor are and how to reach them-many governments implementsocial assistance programs during economic transitions or crises, whenpolitics demands rapid and visible assistance. Many governments, forexample, face strong and immediate pressure to "do something aboutthe social costs of adjustment." In such situations objectives such astargeting often become secondary to political expediency.
This chapter describes the effects that politics can have on socialassistance programs. It also identifies approaches to social assistancethat, at least in some cases, allow governments to avoid the politicaltrade-offs in which social assistance benefits are provided to less needygroups at the expense of the poor. Using a country case-studyapproach, the chapter explores three central propositions: that partic-ular political and institutional contexts affect social assistance pro-grams and their beneficiaries, that safety nets can (but do not always)reduce poverty in the long term, and that safety nets can contribute tothe political sustainability of ongoing economic transition. The find-ings are based on field studies of social assistance programs in severalcountries. While the cases under study are all of economies undergo-ing reform, some of the lessons that emerge are also relevant to coun-tries not undertaking reform. Particular attention is paid to the politi-cal economy of using the demand-based approach to implementingsafety nets. This approach is emphasized because of its increasing pre-dominance and its potential to enhance the political voice, as well asthe economic capacity of the poor.
On the policy front establishing a consistent macroeconomic frame-work that will enable poverty reduction requires economic adjust-ments that are often difficult to sustain politically. On the programfront implementing safety nets directed at particular groups entailsthe allocation of scarce public resources. Therefore program choicesare based on politics and on efficiency considerations. The conven-tional wisdom holds that the poor have a weak political voice. Inaddition, while the poor may bear some of the social costs of adjust-ment or have the least ability to absorb negative shocks or cyclicaldownturns, they are often not the most negatively affected.Governments usually have legitimate concerns about sustainability inthe face of opposition from organized or powerful groups. Thesegroups range from organized labor and political parties to the privatesector. Thus governments have few immediate political incentives tohelp the poor. An additional dilemma is that the poorest and mostneedy groups are often the most difficult (and costly) to reach.Therefore, compensatory efforts during transition tend to focus onmore vocal, organized, and privileged groups for reasons of politicalsustainability. Such efforts are usually made at the expense of pover-ty alleviation objectives.
THE POLITICAL ECONOMY OF SOCIAL ASSISTANCE PROGRAMS 137
The country experiences reviewed here suggest that this need notbe the case. Safety nets can be designed to contribute to long-termpoverty reduction, as well as to the sustainability of economic reformprograms. Some of the cases in this chapter yield lessons about how toreduce poverty and enhance the political sustainability of adjustment.Dramatic political change or extreme economic crisis, for example, canalter or undermine the relative weights of powerful interest groups.Such change can create opportunities for governments to redirect pub-lic resources to less-privileged groups. Reaching out to previouslymarginal groups rather than focusing on the vocal opponents ofreform may allow governments to circumvent the traditional "newpoor" and "old poor" dilemma. This approach may also requireencouraging the participation of the poor, both in the implementationof social assistance programs and in politics. Such efforts are needed tomake resource shifts toward the poor sustainable in the future.Effective communication on the part of governments can be crucial tosuch a process.
Still, in some cases it may be necessary to extend safety net servicesto nonpoor groups that lose out in relative terms during reform. But,ultimately, if reform efforts are abandoned for a return to unsustain-able fiscal distortions or "populist" economic policies, the poor willsuffer most.
Recent international trends demonstrate the possibility of directingsafety net services to the poor rather than to vocal groups. In somecountries the focus of government spending has shifted from develop-ment efforts that relied on large-scale infrastructure projects and uni-versal subsidies to universal provision of only basic health and educa-tion services combined with targeted interventions to help the needi-est groups. In several other countries, however, such shifts have beenpostponed-mainly for political reasons-at a high cost in terms of fis-cal sustainability and effective protection for the poor.
Largely influenced by the experience of Bolivia's ESF, social fundshave become a primary means for delivering social assistance. Theconcept of incorporating market principles-through the demands ofbeneficiaries-into program design has proven a powerful tool forenhancing poverty alleviation and institutional development locally.The most evident drawback of the social fund approach is that thepoorest groups, which tend to be poorly organized, are the leastequipped to solicit benefits from demand-based programs. While boththe nonpoor and poor can benefit from a variety of productivity-enhancing measures, such as credit schemes or increased investmentin education, the poorest often face other obstacles, such as malnutri-tion or chronic diseases, that may prevent them from benefiting fromsuch policies.
138 SAFETY NET PROGRAMS AND POVERTY REDUCTION
Three messages emerge from the reviewed country experiences.First, open political environments provide greater opportunities forbuilding broad-based support for economic reform and, therefore, apolicy environment in which effective poverty reduction can takeplace.2 Effective government communication with the public is animportant element, because there is a need to increase popular under-standing of the reform process in order to create support for change. 3
Second, open political systems are more likely to encourage the partic-ipation of diverse groups, such as NGOs and local institutions, in theirantipoverty strategies. And, third, in the absence of strategies toencourage participation of the poor, vocal and organized groups arelikely to make more effective claims on government resources. In con-trast, closed political regimes, which are less vulnerable to thedemands of interest groups, may have less difficulty targetingresources to the poor, even without the poor's participation. 4
Strategies that rely on participation of beneficiaries and the organi-zations that represent them (such as social funds) can strengthen thecapacity of these institutions. Stronger capacity gives previously mar-ginal groups a more effective political voice and makes longer-termcontributions to poverty reduction through institutional and politicaldevelopment. Giving previously marginalized groups a new stake inthe system and increased influence may result in the creation of newcoalitions supporting economic reform.
Protecting the Poor during Adjustmentin Latin America and the Caribbean
Latin America and the Caribbean was the first region to begin theprocess of policy reform and to grapple with the social dimensions ofreform. As a result this regioin has had a longer time in which to exam-ine the political consequences of policy reform. The duration of pro-grams, along with the variety of experience, makes this region an idealstarting point for examining the effects of safety nets during reform.This section reviews the experiences of Chile, Peru, Bolivia, andMexico, which mirror the regional variation in political economy andprogram outcomes.
Chile
One of the first and most effective efforts to protect the poor duringadjustment was implemented in Chile (1973-89). But the authoritariannature of Chile's regime limits the ability to replicate that experience,at least in terms of the political dynamics determining the allocation ofpublic resources. Chile had an extensive social welfare structure prior
THE POLITICAL ECONOMY OF SOCIAL ASSISTANCE PROGRAMS 139
to adjustment; the system was revamped and targeted to the poorestgroups during the Pinochet years. While social spending per capitadeclined overall during the adjustment years, it increased for the poor-est two deciles. Still, many people at the margin lost access to what hadbeen one of the most comprehensive social systems in Latin America.This loss was not necessarily a positive result, nor was it one that amore responsive government could have prevented. But the systemproved extremely effective in protecting the poorest sectors duringsevere economic crisis. The infant mortality rate, for example, not onlycontinued to decline, but accelerated its rate of decline. It is now oneof the lowest on the continent, below that of Argentina, Colombia, andMexico.
In conjunction with targeting social sector spending, large-scaleemployment programs were implemented in 1975-87. At the height ofthe economic crisis in 1982, with unemployment at almost 30 percent,the programs employed up to 13 percent of the workforce. Programspaid between one-fourth and one-half of the minimum wage, provid-ing a self-targeting mechanism, although many critics argue that thesubsidy was far too low. Implementation at the beginning was a bithaphazard-labor was often used unproductively, tainting the imageof the programs. With time, program design was improved, incorpo-rating some private sector hiring and training. Workers in the privatesector-linked programs were often able to find permanent jobs withthe same firms: a positive effect in terms of poverty alleviation.
While the programs had several flaws-particularly their authori-tarian manner-even their harshest critics agree that their existence,and their sheer scale and duration, reduced the potential for socialexplosion at a time of unprecedented unemployment. It is unlikelythat a demand-based program could attain the systematic coverage,scale, and speed in implementation that the Chilean programs did,particularly with the resources available relative to population size. In1987 the programs were allocated 5 billion pesos (approximately $20million) from the government's total social spending budget of 274 bil-lion pesos and employed approximately 165,000 people (about 13 per-cent of the labor force). In comparison, Bolivia's ESF had approxi-mately $240 million for its four years of operations, and on average itemployed approximately 3,000 or 0.3 percent of the economicallyactive population.
Chile's record (compared with that of its neighbors) in protectingthe basic health and welfare of the poor during a period of adjustment,and targeting and reaching the poorest is indeed remarkable. Yetaccording to other indicators, such as income distribution and percapita consumption, Chile fares less well. Further, a major flaw in thePinochet government's approach was its failure to incorporate benefi-
140 SAFETY NET PROGRAMS AND POVERTY REDUCTION
ciary participation. The authoritarian government's top-down mannerprecluded the kind of participation from below that often enhances thesustainability of programs. It also limited the program's positive polit-ical effects. Jobs were withdrawn from shantytowns that were active inpolitical protests, for example. Because targeting of social welfarespending entails political as well as economic choices and because thePinochet regime was free of the constraints faced by most democraticregimes, Chile's lessons on political sustainability are not clear cut.
Peru
The Peruvian case demonstrates that programs designed to protect orbenefit the poor, if poorly implemented, can do more harm than good.They often alienate potential beneficiaries, as in the case of thePeruvian Temporary Income Support (PAIT) program. The PAIT pro-gram was a public works employment program modeled on Chile'sprograms. It was implemented in Lima's shantytowns by the 1985-90American Popular Revolutionary Alliance (APRA) government.
The program provided sorely needed income support and somesocially useful infrastructure. Yet it was implemented in an extremelytop-down and partisan manner, with a great deal of clientelism in hir-ing and constant political manipulation of the workers. PAIT workerswere often taken to political rallies, for example. The program's bud-get was also manipulated. It rose drastically prior to elections and thenquietly faded out afterward. Consequently, applicants were in a con-stant state of uncertainty. And while some PAIT projects provided use-ful services for poor areas, such as painting schools or laying seweragepipes, in many cases such projects were begun and left unfinished.Many projects achieved very low worker productivity and had no per-manent effects, such as the cleaning of beaches for primarily upper-income residents in Lima. Finally, jobs were concentrated in Lima,which is extremely important politically, but has lower poverty ratesthan the rest of the country.
The perception that the program was used as a tool by the govern-ing party ultimately undermined its public image. Most damaging,however, was the program's excessive centralism and top-down imple-mentation. The program duplicated and undermined the efforts of localself-help groups, which are critical to the survival of the poor in Peru.It is little surprise that the program's paying of wages for the samework that had previously been volunteered by communities under-mined ongoing projects. Its effects ran directly counter to the capacitybuilding that is integral to poverty reduction. The marginal effects thePAIT program had on poverty alleviation were temporary, while thedisruption of local organizations often had permanent effects.
THE POLITICAL ECONOMY OF SOCIAL ASSISTANCE PROGRAMS 141
Bolivia
Bolivia's ESF was the first social fund of its kind, and it attracted agreat deal of national and international attention.5 Enthusiasts of theESF cite its demand-based approach, its efficiency and transparency,and its quick results. Critics question the program's ability to perma-nently alleviate poverty or to target the poorest sectors. They are alsowary of the fact that the program is separate from the governmentbureaucracy. The program did not reach the people most directlyaffected by adjustment (for example, the tin miners). It also had a dis-proportionately low reach to the two poorest deciles. The poorestregions benefited least from the ESF in per capita expenditures: thewealthiest of five income areas received $23.97 per capita, while thepoorest received $9.45. ESF workers represented 6.25 percent and 7.75percent of workers in the two poorest deciles, but 13.25 percent, 21.5percent, and 15.3 percent in the next highest deciles. By regional stan-dards, however, the three higher deciles in Bolivia are still consideredquite poor. Because the program operated separately from govern-ment ministries, it did little to further central-level institutional orsocial sector reform. Indeed, its large and visible scale may have evenprovided the government with an excuse to postpone more difficultinstitutional reforms. Still, the program clearly had positive effects,particularly in demonstrating that different types of public sectoroperations were possible.6
The ESF administered $240 million in its four years of operation.The projects that it created, which ranged from infrastructure (such ashealth posts, schools, and low-income homes) to services (such as jobcreation and school lunch programs), benefited more than 1 millionpoor people-a large number in a population of less than 7 million.Despite relatively weak targeting, the program had a substantialimpact on the political sustainability of economic reform and onpoverty alleviation.
The ESF had a positive political impact. It demonstrated that such aprogram could work in a transparent and nonpartisan manner-withlocal governments and NGOs of all political bents-in a country whereaid programs were usually influenced by patronage politics. The ESFresulted in an unprecedented collaboration of efforts between NGOs-the groups with the closest ties to the poor-and the state. This team-work allowed the fund to reach the poor in remote communities,which had rarely, if ever, seen the state follow through on promises.The fund also enhanced local governments' capacities by providingthem with funds independent from the central government. And,because of its demand-based structure, the fund could not be monop-olized by any one political actor at election time: a diversity of actors,
142 SAFETY NET PROGRAMS AND POVERTY REDUCTION
from the governing party to local governments and NGOs, could claimcredit for ESF projects. Thus there was no correlation between the allo-cation of ESF funds and the outcomes of the 1989 presidential electionand 1987-89 municipal elections.7
The Fund handed the poor a way to help themselves, thereby giv-ing them a stake in the ongoing process of economic reform. By doingso it generated support for the government at a critical time-if not forthe adjustment program per se-among previously marginal groups,which enhanced the feasibility of economic reform. Even if the ESFhad focused its efforts on people who were directly affected by theadjustment program-the tin miners-it is unlikely that it could haveeroded their entrenched opposition to the government's economicstrategy. Meanwhile, the rapid pace of adjustment, coupled with thecrash in world tin prices, reduced the political power of the miners'traditionally influential confederation. This does not imply that peoplewho are directly affected by adjustment do not merit compensation.8
Rather, it implies that most efforts directed at those groups will have amarginal impact on the political sustainability of adjustment. Propoorprograms implemented during adjustment may create opportunitiesfor building proreform coalitions among the poorest groups byenhancing the poor's economic potential and political voice.
Mexico
A program that is gaining increasing national and international atten-tion is Mexico's PRONASOL. The program is a Bolivia-style, demand-based social fund, but it is being implemented on a much larger scale.The ESF administered $240 million in four years; PRONASOL startedwith a budget of $680 million in 1989, which rose to a projected $2.3billion for 1992.9 If administrative and infrastructure costs werewaived, the ESF would have spent approximately $50 per year on eachof its 1.2 million beneficiaries.10 With its 1992 budget, PRONASOLwould spend $135 on each of the 17 million people living in extremepoverty in Mexico. PRONASOL's highly visible nature-such as itsprominent appearance in President Salinas' 1992 annual address to thenation-also suggests that the program is having an impact politically.And like the ESF, the effects of PRONASOL's outreach to groups thathad rarely, if ever, received state attention in the past cannot beunderestimated.
PRONASOL's design was influenced by the ESF and other demand-based social funds. It was also an outgrowth of President Salinas' doc-toral research,1' as well as of previous government programs thatrelied on community initiatives in the form of manual labor and foodfor work.12 There are 64,000 solidarity committees nationwide; they
THE POLITICAL ECONOMY OF SOCIAL ASSISTANCE PROGRAMS 143
are elected locally. In response to popular demands the committeesdesign projects in collaboration with government staff. There are fourprogram areas: food support, which includes extensive support forongoing targeted food subsidy programs; production; social services;and infrastructure (Dresser 1991). In addition to these activitiesPRONASOL has three programs aimed at increasing the earningpotential of the poor. Solidarity funds for production provide credit tofarmers undertaking high-risk, low-yield activities; solidarity fundsfor indigenous communities support ethnic groups involved in localdevelopment activities; and solidarity funds for women provide cred-it to workshops and small industries run by women. PRONASOL sup-ports sectoral ministries by expanding the country's health and edu-cation facilities, and through scholarship and school feeding pro-grams. Finally, PRONASOL supports municipal development andbuilds infrastructure for poor communities through its municipal andregional solidarity funds (Dresser 1991).
The wide range and large number of programs makes it difficult toform a singular judgment of PRONASOL. In addition, it is difficult toseparate what may be justified criticisms of the political system-asemi-authoritarian system in the process of liberalizing (in theory)-from those of the actual design or content of the program. Ultimately,PRONASOL's success as a demand-based program hinges on howcommitted the government is to genuine political opening and toallowing actors and organizations of all political bents to join.
PRONASOL's record varies depending on the nature of the local partypower structure and the capacity of grass roots and community organi-zations. In many regions the program has conflicted with authoritarianparty bosses at the local level. Such clashes indicate that nontraditionalactors have been able to benefit to some extent.13 While President Salinasdemonstrated a willingness to let solidarity committees undermine localauthorities, he was less willing to allow the conmmittees to operate inde-pendently in municipalities controlled by the opposition.14 The extent towhich PRONASOL is able to reach previously marginalized groups andto serve as an alternative to Mexico's dominant political party, theInstitutional Revolutionary Party (PRI), by providing a channel "throughwhich popular groups can express their demands" (Dresser 1991:26), willdetermine whether it can raise the economic potential and political voiceof the poor as did funds like the ESF.
As with many similar programs, the origins of PRONASOL can betraced to politics. In the 1988 elections, given new mobilizing forces onthe left, the PRI had the worst electoral showing in its history, andPresident Salinas took power amid widespread accusations of fraud.While Salinas did not fear massive social unrest as did the govern-ments of Chile, Poland, and Senegal, for example, he was well aware
144 SAFETY NET PROGRAMS AND POVERTY REDUCTION
of how unpopular the cutting of social services by the de la Madridgovernment had been. PRONASOL was a gamble that reversing thattrend would change popular perceptions of government legitimacy.The government increased PRONASOL activity in several regionswhere opposition was strong, such as in Michaocan, Morelos, andNueva Laguna, and was able to reverse its electoral fortunes. Yet it isnot clear whether the electoral results were influenced by the curbingof inflation, the renewal of economic growth, or PRONASOL.
PRONASOL was criticized as a populist tool and as a means forPresident Salinas to build up his personal power base. The first criticismstemmed from the president's tactics, such as using the proceeds fromthe privatization of the national airline to provide electricity to 500,000homes in the poorest regions. Populist or not, he cleverly combinedsalesmanship with the philosophy underlying orthodox economicreform: get the state out of production and into service provision.Inasmuch as PRONASOL is generating support for a new governmentapproach to providing social services and for a new channel to commu-nicate with both central and local governments, the program is con-tributing to poverty alleviation and to institutional development. It isdifficult, therefore, to criticize the government for reaping the rewardsof a good program, as happens in most countries. Yet where PRONA-SOL is re-enforcing traditional cientelistic structures controlled by thePRI, its potential to contribute to local capacity building is being severe-ly curtailed. The building of local capacity through PRONASOL, ratherthan the PRI, may be a very effective means to undermine the party'sauthoritarian structure and monopoly control. Finally, given the sizeand range of activities, and the divergent records of PRONASOL pro-grams, it is difficult to draw conclusions about their performance.
Another issue is the future of PRONASOL, given its institutionalautonomy and its close connection with Salinas. The creation ofSecretariat of Social Development (Sedesol) in 1992 as an umbrellaagency to coordinate and direct PRONASOL activities indicated somegovernment desire to institutionalize the program more permanently.The Zedilio government continued to place a fair amount of impor-tance on the program, given the negative impact of the 1994 peso cri-sis on employment and living standards. Yet fiscal constraints also dic-tated a narrowing of the program's mandate.
Sub-Saharan Africa: Social Fundsand Social Action Programs
The Africa cases in the study-Senegal and Zambia-provide an inter-esting contrast in how they reached the poor, capacity-building, andsustaining adjustments. Two kinds of approaches to safety nets are
THE POLITICAL ECONOMY OF SOCIAL ASSISTANCE PROGRAMS 145
examined here. One is the social fund mechanism. The other is socialaction programs (SAPs). Compared with social funds, SAPs tend tohave closer institutional links with the existing public sector bureau-cracy, cover a broader range of activities, and are not necessarilydemand-driven. In general, they have been less successful than socialfunds, mainly because their objectives were never clearly defined atthe outset.
Senegal
In Senegal adjustment has progressed at a slow pace for more than adecade, and the political system has remained a relatively stable, iflimited, democracy. Certain groups, such as civil servants and univer-sity students, had far more political weight and effective representa-tion in the governing party than did the majority of society-the urbanand rural poor, many of whom were illiterate. The first major attemptto compensate the losers from adjustment was the Delegation al'Insertion et le Reinsertion a l'Emploi (DIRE), set up in 1987. Fundedby the United States Agency for International Development (USAID),the World Bank, and the government of Senegal, the DIRE providedcredits of up to $50,000 to civil servants who had retired voluntarily(the deflates) and university graduates who had previously worked inthe civil service (the maitrisards) to start their own businesses. Becauseof a lack of training and follow-up, and the prevalence of clientelism inthe disbursement of loans, the DIRE had a very poor record in termsof repayment and mortality of enterprises (32 percent). In addition,because the program's budget was administered through the publictreasury, approximately $3 million was lost or "filtered" in the process.The beneficiaries were a relatively privileged group, and the projectsfunded included bookstores and travel agencies in central Dakar. Inshort, an enormous amount of resources for a country as poor asSenegal were squandered on privileged groups.
DIRE's poor record resulted in its gradual fading. Despite the pro-gram's initial high visibility, its effects on the political sustainability ofadjustment were minimal: the program's image limited its impact ongroups other than direct beneficiaries. Meanwhile, the program hadlittle impact on poverty alleviation.
After a wave of civil unrest in February 1988, the government madeanother attempt to address the social costs of adjustment. It estab-lished the AGETIP program in conjunction with the World Bank. TheAGETIP was influenced by the success of Bolivia's ESF, and it was alsoset up as an independent agency with a private sector director, insharp contrast to the DIRE. The AGETIP responded to proposals frommunicipalities for labor-intensive infrastructure projects. In terms of
146 SAFETY NET PROGRAMS AND POVERTY REDUCTION
efficiency and number of projects completed, the AGETIP has beenremarkably successful. From its inception in 1990 to the end of 1991,the program implemented more than 100 projects and created morethan 11,000 temporary jobs, primarily for unskilled urban youth. It haseven been cited as a model for reforming the Senegalese public sector.
Yet the AGETIP is also influenced by politics. There is no arguingabout reaching the poor and needy groups in Senegal, nor is there acooperative relationship between the government and NGOs, whichare the only organizations with extensive links to the poor. TheAGETIP does not use poverty criteria to allocate its projects. In addi-tion, as the opposition boycotted the 1990 municipal elections, the onlyproposals that the AGETIP funds are those from mayors of the gov-erning party. While in some cases such proposals are directly related topoverty reduction, such as installing sewerage and water facilities, inothers they may be pet projects of the mayor, such as renovating thetown hotel. On the other hand, the agency does employ primarily itstarget group, unskilled youth, usually at below-market wages.
Because the AGETIP does not work with NGOs, it has very weaklinks to the poorest groups. There is a widespread popular perceptionthat the AGETIP is "of the system" or a tool of the governing party.Thus its impact on the political sustainability of adjustment-at leastamong groups other than the governing party-has been limited. Itsrecord on poverty alleviation is mixed: while it has provided a largenumber of temporary jobs and sorely needed infrastructure in poorareas, weak beneficiary participation has limited its potential in termsof project sustainability and capacity building.
In Senegal the debate over poverty has been subordinate to theinterests of politically vocal groups. The slow pace of reform has giventhese groups much more opportunity to protect their privileged posi-tions within the system. Meanwhile, the limited nature of political par-ticipation has generated a great deal of suspicion of government-spon-sored initiatives-undoubtedly hampering the potential impact of theAGETIP.
Zambia
Zambia stands in sharp contrast to Senegal. Adjustment in Zambiawas postponed for years under the United National IndependenceParty (UNIP) government, and many state benefits were linked toparty membership. But the October 31, 1991 elections ushered in dra-matic political change. Frederick Chiluba and the Movement for Multi-Party Democracy (MMD), which campaigned on a proadjustmentplatform, took more than 75 percent of the vote. Taking office, the gov-emnment began to implement an economic strategy that favored free
THE POLITICAL ECONOMY OF SOCIAL ASSISTANCE PROGRAMS 147
markets and made reaching the poorest and most vulnerable groups apriority. Because of the dramatic political change, groups that tradi-tionally had privileged access to state resources found their influencereduced substantially. This shift allowed the government to focus itsefforts on the poorest people. The sustainability of these changes willdepend on the coherence of the MMIvD coalition and on how well pre-viously marginalized groups can exercise an effective political voice.
The price policy for maize meal is telling. The heavily subsidizedprice of maize-which consumed more than 15 percent of governmentrevenue-had been a political Achilles' heel for the Kaunda govern-ment. Repeated attempts to raise the price resulted in food riots-andeven a coup attempt in 1990. The coupon system, intended to providecheaper maize to poor groups, had become a tool of the UNIP party.Thus many of the poor were marginalized from the system and had topay three to four times the official price of maize on the black market.When the Chiluba government liberalized the price of maize inDecember 1991-keeping subsidies on roller meal (the coarse grindthat only the poorest eat)-there was no popular unrest. This calmresulted largely because the government publicly explained the mea-sures and the need to allocate scarce resources to the most vulnerablegroups. This policy differed greatly from that of the Kaunda govern-ment, which usually announced and carried out measures overnight. Inaddition, the Kaunda government was much more dependent for polit-ical support on entrenched interest groups with a stake in state subsi-dies. The dramatic political change and the pace of reform underminedthe influence of these groups and allowed for greater focus on the poor.
Another telling contrast arises between SAPs under the tworegimes. The Kaunda government's SAP was set up in 1990 as a catch-all social assistance program. The SAP was extremely slow getting offthe ground, and it ultimately delivered few tangible social benefits. Itwas cumbersome because of its diffuse design and objectives, and bla-tant government attempts to manipulate it for political purposes. Incontrast, the Social Recovery Fund (SRF) and Microprojects Unit(MPU) programs in Zambia, funded by the World Bank and theEuropean Community, and run out of the government's NationalDevelopment Planning Office, are good examples of programs thatreach the needy rather than the privileged. The SRF and MPU, influ-enced by the ESF, respond to proposals from community organiza-tions, mostly for renovation of infrastructure.15 The programs requirecommunity contributions in cash or in labor. They have been success-ful in revitalizing the self-help spirit in many communities and inreaching remote areas long neglected by the state. While the programswere very small-scale during the Kaunda years, they grew substan-tially under the Chiluba government.
148 SAFETY NET PROGRAMS AND POVERTY REDUCTION
By giving communities contact with and a stake in a governmentpoverty alleviation program, the SRF and MPU approach mayenhance the political sustainability of economic reform and create abasis of support among previously marginalized but numerically sig-nificant groups.' 6 In addition, its demand-based nature inherentlyencourages such groups to exercise their political voice-a choiceunprecedented in Zambia, where a one-party state dominated for sev-eral decades. A significant drawback, however, is the small scale of theprograms relative to the extensive poverty in Zambia (approximately70 percent of the population lives below the poverty line). This gapprevents the programs from serving as a widespread safety net. Amore positive element, however, which highlights the importance ofthe demonstrative effects of demand-based programs, is that the com-munity contribution approach was incorporated on a much largerscale in the government's drought relief program. This program reliedon food for work, provided relief on a major scale, and delivered ser-vices in a nonpartisan manner during the height of a severe drought in1992-93.17
Safety Net Issues in Transition Economies
Safety net issues, particularly their political implications, vary tremen-dously in Eastern Europe and East Asia.18 In the newly democratizedand politically fragile countries of Eastern Europe, addressing safetynet issues in the immediate term has particular political salience. EastAsia places far less political urgency on safety net issues. Thus gov-ernments can focus more attention on reforming and creating longer-term social welfare institutions. With the exception of Mongolia, polit-ical reform in East Asia lags far behind economic reform. Also, in EastAsia economic reform has entailed much less dislocation of the laborforce. In Eastern Europe, in contrast, until short-term social welfareconcems are addressed, it is unlikely that any political consensus willdevelop on how to reform the region's extensive, but financiallyunsustainable social welfare institutions.
In Eastem Europe economic distortions and the predominance ofthe heavily industrial and state-owned sector of the economy left pol-icymakers with no realistic altematives to a big-bang approach toreform. This step included dismantling unsustainable state-ownedindustrial sectors and suffering severe declines in output. In mostcountries this approach entailed-or will entail-displacing largenumbers of highly specialized workers and significant increases inpoverty and unemployment. In societies that had traditionallyespoused egalitarian values and supported an extensive state role inthe provision of social welfare, these trends were politically explosive.
THE POLITICAL ECONOMY OF SOCIAL ASSISTANCE PROGRAMS 149
In addition to short-term safety net issues, these countries mustreform their basic social welfare and social insurance systems. Thesesystems are based on universal provision of services by the state, andthey are no longer fiscally or operatively sustainable. Yet politicallydifficult and initially costly reforms of pension and health systems, forexample, will be impossible until governments are able to alleviatepublic anxiety over increasing poverty and unemployment, and gen-erate at least minimal societal consensus in favor of reform.
The implementation of short-term safety nets to protect the poorand vulnerable has become as much a political as an economic neces-sity in many countries. For example, pensioners and laid off or soon tobe laid off public sector workers, who tend to be organized in politi-cally powerful trade unions, have become major political opponents ofreform. Their needs dominate the debate on social welfare, often at theexpense of poorer and less vocal groups. As in other countries, themost vocal and organized groups are not necessarily the poorest andmost vulnerable. This fact forces difficult choices for resource-strappedgovernments. Families with many children, for example, tend to forma much higher proportion of the poor than either pensioners or laid offworkers, but families are rarely organized politically. 19 Political sus-tainability and poverty concerns will frame these choices. While thisissue applies to many countries, it is particularly salient in this regionbecause public sector unions are particularly well-organized and con-trol strategic economic sectors.
Poland
In January 1990, soon after its inauguration, the first noncommunistgovernment in Poland launched a dramatic, Bolivia-style stabilizationand adjustment program. The program successfully stabilized hyper-inflation. Yet political uncertainty soon stalled structural reforms, asseveral attempts to maintain a coherent government coalition inParliament failed. Reforms such as privatization of state industrialconglomerates have been postponed. This delay has created an unsus-tainable drain on the state budget. The longer such reforms are post-poned, the greater will be the anxiety about their potential social costs.Such anxiety increases political opposition to the adjustment program,despite the absence of any viable alternatives. This possibility wasdemonstrated by the December 1995 presidential elections: LechWalesa was defeated by former communist Alexander Kwasniewski.
The rapidly increasing budget deficit makes it unviable for the gov-ernment to maintain the current social welfare system. The system isbased on universal free access to all benefits. Even prior to the collapseof public finances, the system was characterized by its poor quality
150 SAFETY NET PROGRAMS AND POVERTY REDUCTION
services, unequal access, growing system of "informal" payments forservices, and skewed incentive system. Among other negative effects,the incentive structure promotes premature retirement and excessiveuse of specialized care and emergency and hospital services. Suchabuse creates dramatic shortages. Government insolvency coupledwith the need to protect the poor and unemployed (whose numberswill increase in the future) dictate an immediate revamping of thesocial welfare system.
Proposed reform of the health and social security systems wouldguarantee basic health care and social security insurance for those inneed. It would also introduce private providers and choice of servicesfor those who could afford them. Such reform would alleviate thefinancial burden on the government and enhance service quality byintroducing competition. At the same time government resourceswould be targeted to providing a safety net for the increasing numberof poor and unemployed. Unemployment prior to 1990 in Poland washidden by the maintenance of excess workers on government andindustrial payrolls. But it now stands at roughly 15 percent and pover-ty at 14.4 percent of the population.20 There is a clear need for programsthat are more extensive than unemployment insurance. In Poland aneffort across sectors, such as a social fund or Chilean-style publicworks, would be an ideal mechanism for improving employment andinfrastructure, while giving impetus to municipal government devel-opment. Unfortunately, the political debate on the safety net lags farbehind the proposals for reform, centering on emotional criticisms ofgovernment proposals rather than on realistic alternatives.
At the popular level there is widespread ignorance-and anxiety-about future social welfare. This problem stems from the incoherentdebate and the government's past failure to explain the ongoingreform process to the public. Populist opposition movements havebeen quick to capitalize on this anxiety. By the summer of 1992, failureto adequately address the safety net issue and anxiety about the poten-tial social costs of reform led to a series of industrial strikes. They vir-tually paralyzed the government, forcing it to make safety nets a pri-ority. In September 1992 the government announced a social pact onthe future of state enterprises. The pact was to be negotiated withunions and the private sector. While the government's new attempt tocommunicate its proposals to the public and to incorporate popularparticipation were first steps toward a realistic treatment of safety netand poverty issues, they were too little too late. The Suchocka govern-ment received a vote of no confidence in May 1993 because of theopposition's concern about the social costs of reform. The govern-ment's subsequent replacement with a coalition of former communistswas a major setback for reform.
THE POLITICAL ECONOMY OF SOCIAL ASSISTANCE PROGRAMS 151
The delivery mechanisms for new forms of social assistance areseverely underdeveloped. Elected local govemments were only recent-ly constituted, yet they have been given primary responsibility for pro-viding benefits to the poor and unemployed. There are a host of unre-solved issues about the nature of benefits, their delivery and financing,and about eligible beneficiaries. Without progress, the appeal of right-and left-wing strains of authoritarian populists has begun to rise. Thissurge is based on latent fears about social welfare, as was demonstrat-ed by the 1995 election of a former communist. Failure to resolve thepoverty and safety net issues threatens to derail the economic reformprocess and jeopardizes the democratic transition. Poland can learn agreat deal from Latin American experiences with social funds, publicworks programs, and other safety nets. Attention to safety net issues isparticularly important in the former socialist economies becausedemocracy is very new, public understanding of market economics isvery low, and anxiety about its social costs is very high.
Ukraine
Ukraine has launched one of the most recent efforts at macroeconomicreform in the former socialist economies. There are few places in theworld where the need for reform is more evident; there are also fewplaces where the political constraints are greater. Since independence in1991, Ukraine's economy has been in a downward free-fall. This trendis in part due to the major economic downturn in Russia-Ukraine'smost important trading partner. But, more, it is a result of incoherentmacroeconomic management. Economic policy since independence hasbeen politically driven in a context where democratic institutions arenovel and fragile, and politicians are inexperienced and still committedto centrally planned economics (see Dabrowski 1994).
In 1993 Ukraine had an inflation rate of 4,735 percent-the highest ofany country in the world not at war. The average wage deteriorated 80percent between November 1991 and March 1994, and GDP declined 38percent in 1990-93. The most recent manifestation of this decline was theoutbreak of cholera in mid-1994. Poverty is increasing. Comprehensivedata for 1993 are not available, but given inflation and wage trends, andbenefits indexed to the minimum wage, it is evident that elderly pen-sioners on fixed incomes and families with many children are at risk.While estimates of the poverty headcount ratio for 1992 range from 12percent to 29.35 percent, they are likely to be far too low when the latesttrends are taken into account.21 Social welfare and social insurance sys-tems, meanwhile, are based on universal benefits. These benefits areadministered through the state enterprise system, and they are for themost part insolvent. Thus the social systems are ill-equipped to cope
152 SAFETY NET PROGRAMS AND POVERTY REDUCTION
with increasing poverty and unemployment levels. Government trans-fers in 1992, for example, had a regressive effect on overall income dis-tribution (Kakwani 1995). To date, the relatively widescale availability ofmicroplots in the Ukraine and an increasing reliance on self-productionfor food have served as a safety net for many poor.
Reform attempts since independence have been stop-and-go incharacter. While the collapse in production and the high inflation rateare due to unsustainable macroeconomic distortions (such as a budgetdeficit of 36 percent of GDP in 1992), most of the public, as well as thenation's politicians attribute the collapse to market reforms.2 2
The extent and severity of Ukraine's economic crisis should come asno surprise, given the unstable nature of the country's political institu-tions. Also, a central planning mentality is still pervasive at all levels.There is no clear division of responsibilities between the executive andthe legislature, for example, and authority over the budget and creditexpansion is unclear. As a result, inflation has been driven primarily byexpansion of the fiscal deficit and expansion of credit by the semi-inde-pendent central bank, the National Bank of Ukraine (NBU), althoughthere have been some attempts at monetary restraint.2 3 Political insta-bility and increases in the money supply are strongly correlated. Theexecutive often tries to restrain credit expansion in the early half of theyear, but a few months later Parliament completes its budgetary reviewand dramatically increases the deficit.2 4 In addition, the public has lit-tle understanding of the fiscal crisis. This knowledge gap is exacerbat-ed by the government, which continues to provide public services vir-tually free of charge, despite the obvious inflationary implications.Public services such as buses and telephones continue to operate forfree, for example, because the coins that are used as payment havebecome worthless with hyperinflation. Electricity and fuel, meanwhile,are heavily subsidized-and are in extremely short supply.
Meanwhile, the pension system is completely insolvent. Its implicitdebt, not accounting for new entrants into the system, is more than 200percent of GDP-putting it among the highest such debts in the world(Kane and Morissot 1993). The state also continues to provide "solu-tions" to the crisis. The Employment Fund, for example, subsidizesworker retraining in state enterprises without any clear indication offuture demand for the skills the enterprises are providing. The payrolltax, from which the Employment Fund's activities are funded, is thehighest in the world.
In other countries in transition a public sense of the economic crisishas been a key factor in enabling the implementation of difficultreforms. In Ukraine there is a clear need for a public relations and edu-cation campaign. People must be educated about the implications offurther postponing reform and about market economics.
THE POLITICAL ECONOMY OF SOCIAL ASSISTANCE PROGRAMS 153
October 1994 marked a turning point for Ukraine. Newly electedPresident Kuchma introduced a coherent stabilization and adjustmentprogram. The program had the firm backing of the international com-munity, the World Bank and the International Monetary Fund in par-ticular. President Kuchma made a major effort to sell the plan to theParliament and the public. He presented it as the only solution at atime of dire national crisis. He said that the alternative to rapid anddramatic reform was for Ukraine to fall permanently behind the rest ofthe world. He called for dialogue with the relevant actors, such as stateenterprise unions and business associations. He also called for theimplementation of targeted social assistance programs to protect thepoor and vulnerable, whom he correctly identified as elderly pension-ers and families with many children.
The Parliament's initial reactions toward the reform package werefavorable, and it approved the plan by a vote of 231 to 54 on October19 (Intelnews 1994). But support soon dissipated as the social costs ofthe needed price liberalization policies became evident. The socialistand communist parties, which hold a majority of the seats inParliament, immediately began to criticize the plan as "wild west cap-italism," which would impoverish the masses and make Ukraine sub-servient to international institutions. Unions had initially agreed to asix-month moratorium on strikes, but they broke that agreement,beginning with a prolonged strike in one of the most strategic indus-tries: coal mining.
With the backing of external donors, the government raisedallowances and other supplements, such as housing for those with lessthan a minimum income or less than a minimum pension, as a safetynet. The number of eligible people was expected to increase as realincomes eroded further with price rises. From a technical standpointthis was a good short-term safety net strategy: the allowance systemfunctions reasonably well, and targeting it is the only financially viableway of making allowances large enough to protect the poor.
Yet there is clearly a need for a more visible safety net, for politicalreasons and as a means to cope with increasing numbers of long-termunemployed. A social fund would be a visible means of providing nec-essary income relief and socially useful infrastructure; it would play aneven more important role in encouraging autonomous community ini-tiatives and stimulating local institutional development. Meanwhile,public works employment could be administered through such a fundor through the Employment Fund. The Employment Fund already hasa legal mandate to implement public works. To date, it has acted onlyon a small scale, mainly because of lack of experience. Participantshave been primarily women and unemployed youth, indicating thatmore skilled workers are finding better opportunities in the informal
154 SAFETY NET PROGRAMS AND POVERTY REDUCTION
sector. It also indicates that public works would be a good means totarget needy and vulnerable groups, and people who can not findalternative employment. These efforts could be funded by theEmployment Fund's current budget surplus, which has been losingvalue because of inflation. Only recently was the fund placed in aninterest-bearing account.
The political sustainability of reform in Ukraine hinges on the gov-ernment's ability to communicate and sell the reform to the public,especially to assuage fears about its social costs (as well as protect thetruly needy). More visible social assistance programs, such as thoseimplemented in many of the above case studies, could be an importantpart of this process. The political moment is both opportune and criti-cal for such an effort.
East Asia
The main social welfare issues in East Asia differ markedly from thosein Eastem Europe. In East Asia the state-owned industrial sector ismuch smaller relative to the overall economy, and the agrarian sectoris large, fairly unequal, and labor-intensive. Thus the primary concernin the transition has been the development of the private economy,beginning with reform and productivity increases in the agrarian sec-tor. In addition, the East Asian economies began from much lower lev-els of income and state social service provision.
Reforms have created pockets of poverty and increased inequality,particularly in Mongolia, where the state's role in social welfare provi-sion was the most extensive. Yet, in general, reform and the resultingincreases in economic growth and agricultural productivity have beenwelfare-enhancing for most of the population, including many of therural poor (Thomas and Wang 1994). In all three cases studied here-China, Mongolia, and Vietnam-reforms began in the agricultural sec-tor. Reform of state-owned industries proceeded at different paces inthe three countries, but in all they affect a small percentage of workers,who were privileged relative to the rest of the labor force. Of the threecountries, only Mongolia has introduced widescale political liberaliza-tion along with economic reform. Thus the political salience of socialwelfare issues related to reform is much lower in East Asia, particular-ly in Vietnam and China, than in most Eastern Europe transitioneconomies.
Yet East Asia needs effective safety nets for vulnerable groups-female-headed households in Mongolia (see Subbarao and Ezemenari1995); single and elderly pensioners, and the very poor in ruralVietnam; and the aging rural population in China. More generally,widespread poverty remains a major concern. In part, poverty will be
THE POLITICAL ECONOMY OF SOCIAL ASSISTANCE PROGRAMS 155
eased by sustained growth, but growth must be complemented withmore broadly based and equitable social services and social insurancesystems, in addition to safety nets. In the longer term the major socialwelfare issue is the creation of effective institutions to protect socialwelfare and provide social insurance in both public and private sectorsof the economy. There are public systems in all three countries, butthey serve only a small proportion of the labor force, and they areadministratively fragmented and financially unsustainable. The mini-mal coverage of these systems suggests that the political obstacles toreforming them are far less formidable than those in the universalEastern European schemes.
Politics of Safety Nets: Some Generalizations
Temporary social assistance programs implemented during economicreform can reduce poverty and help to sustain economic reform andtransition. They are also much less likely to arouse political oppositionthan more obvious, long-term asset transfers, such as land reform.Such transfers are rarely attempted in the context of economicreform.2 5 Yet the success of such programs hinges on, among otherthings, transparency and securing the participation of the poor, there-by enhancing their economic potential and political influence. A pro-gram's ability to perform in such a manner on a large scale depends onavailable resources, institutional structure, and commitment from thehighest levels to insulate it from partisan pressures-a commitmentpresent in Bolivia, not fully clear in Mexico, and clearly missing inPeru. In the countries where these conditions were absent, targeting,cost-effectiveness, the impact of the programs on incentives, the man-ner and speed of implementation, and, ultimately, program sustain-ability were affected more strongly by politics. Such conditions forcegreater trade-offs between political objectives and poverty reductionobjectives.
To a certain extent the political leadership in Bolivia was the excep-tion rather than the rule. But even there, the ESF was not able to reachthe poorest. Indications are that other demand-based programs, suchas the AGETIP in Senegal and the PRONASOL program in Mexico,have not been able to either (Moguel 1990). In some countries, such asSenegal, the authoritarian and clientelist nature of the party and localgovernment structures serve as additional constraints to reaching thepoorest sectors.
There is no empirically established link between democracy andserving the poor, however. Even in democracies the poor usually lacka political voice in addition to resources. Ironically, of the cases cov-ered here the Pinochet regime had the most success in targeting the
156 SAFETY NET PROGRAMS AND POVERTY REDUCTION
poorest groups. Presumably, the regime could target successfullybecause it did not have the political constraints of a democratic regime,namely, having to answer to the more vocal middle class. On the otherhand, a broader view of poverty reduction would include the poor'sparticipation in designing their own solutions. Such a view mightplace less value on the ability to target the poorest compared with theprogram's ability to incorporate the participation of disadvantagedgroups, even if they are not the poorest. Meanwhile, raising beneficia-ry participation may enhance their political voice and their economicpotential, and therefore increase the likelihood that resource shifts intheir direction are politically sustainable. Many projects, such as newschools or health posts, also have indirect positive effects on poorergroups that do not participate in project design. And reaching thepoorest groups may require a separate set of policies from those usedto reach the rest of the poor.2 6 Targeting can entail high costs in termsof time and resources. In this light the success or failure of demand-based programs hinges more on their ability to generate autonomousgrass roots participation than on reaching the poorest groups.
Institutional autonomy and positioning of social assistance pro-grams are issues in many countries. On the one hand, autonomyallows for rapid, transparent action that bypasses public sectorbureaucratic procedures (which are often costly and time-consuming),reduces administrative costs, and directly channels benefits to thepoor. On the other hand, there is the issue of longevity of extra-institutional social assistance programs; neither their budgets nor theiroperating procedures have any permanent guarantees. If such pro-grams are considered short-term measures during periods of adjust-ment or recovery, then institutional autonomy is less of a concern. Ifthey are considered longer-term complements to social sector policies,then it is usually necessary to establish institutional links.
Institutional development plays a key role in determining theappropriate kind of program and its delivery mechanism. Chile andCosta Rica, for example, both had a tradition of efficient public socialsectors and strong propoor political parties; these countries couldimplement safety net policies through existing public sector institu-tions. In Bolivia, on the other hand, such institutions were notoriouslyweak, and the only means to launch a widescale effort with relativespeed was to bypass them altogether.
The ability of governments to communicate their reform policies hasan important impact on how they are received politically, as the casesof Peru and Zambia demonstrate. This same ability may facilitate redi-recting resources to the poor. This was clearly the case in Zambia. Thecontrasting case of Poland demonstrates how the failure to communi-cate can result in political stalemate and heightened popular anxiety.
THE POLITICAL ECONOMY OF SOCIAL ASSISTANCE PROGRAMS 157
Notes
1. This chapter draws from Graham (1992,1995). At relevant places, the contributionsfrom Marc, Graham, Schacter, and Schmidt (1995), Milanovic (forthcoming), Kakwani(1995), and Subbarao and Ezemenari (1995) are acknowledged.
2. A caveat must be mentioned: several nondemocratic regimes, such as Chile andIndonesia, have some of the best records at implementing propoor policies. This is thecase if propoor policies are narrowly defined as basic service provision, but not if theyare more broadly defined as fostering the independent capacity-building initiatives thatare integral to long-term poverty reduction (Stewart and van der Geest 1994).
3. Even in authoritarian Chile, an active and very effective public relations cam-paign-in support of so-called "capitalism popular"-was used to generate public sup-port for the privatization of the social security system, which was initially an extremelycontroversial policy measure, but now has relatively widespread support.
4. For discussion of the political constraints to targeting without including the par-ticipation of beneficiaries, see Gelbach and Pritchett (1995).
5. For more details on this case, see Graham (1992) or Jorgensen, Grosh, and Schacter(1992).
6. The ESF's successor, the Fundo Investment Sociale (FIS), attempted to affect thesocial sector ministries more directly by requiring all projects to go to the ministries priorto approval. If the ministries delayed for more than a week, however, they forfeited theirright to have input on project decisions.
7. The 'neutral' political effects of demand-based ftmds also depend on an executivecommitment to allow actors of diverse political bents to compete freely for projects. Thiswas clearly the case with the ESF. In Sucre, for example, the largest recipient of ESFfunds for health projects was an NGO affiliated with the Marxist left-hardly a sup-porter of the "neoliberal" Paz Estenssoro government (Graham 1992).
8. Tm miners were granted relatively generous one-shot severance payments whenthey were laid off.
9. It is somewhat difficult to accurately quantify PRONASOL's budget, as somemoney may have been diverted from what would previously have been social sectorspending. See Dresser (1991) and Golden (1992).
10. Administrative costs were approximately 5 percent of total costs.11. The framework for the PRONASOL program is detailed in his Ph.D. dissertation.
For details, see Grayson (1991).12. Dresser (1991:15). Community labor and programs to encourage children to go to
school have been implemented in Mexico for decades. See Knight (1992).13. For details on these relations, see Fox (1992) and Craig (1992).14. A case in point is the withholding of benefits from the tortivales program from 48
Mexico City municipalities where the opposition was particularly active (Dresser 1991).For details see Fox (1992) and Craig (1992).
15. The proposals must go through local governments to prevent duplication and toensure that they are in line with local government priorities. To prevent bureaucraticlags, however, the proposals are simultaneously sent directly to the MPU. Thus if aviable proposal seems to be unfairly held up in or denied by the local government, theMPU is able to follow up on it.
16. As in the case of most demand-based programs, communities participate on a vol-untary basis. The project includes a promotion department, which informs communitiesabout the program and provides some initial assistance with formulating proposals. Toensure that projects do not conflict with local government priorities, communities mustalso get approval from local governments during the course of submitting a proposal. Andin considering proposals, the program seeks to attain a regional and provincial balance.
158 SAFETY NET PROGRAMS AND POVERTY REDUCTION
17. The food-for-work program was extended beyond the crisis period. At that pointpartisan political objectives seemed to override those of encouraging community contri-bution and participation, and the program began to operate far less effectively (Graham1995).
18. Here, Eastern Europe refers to the European states of the former Soviet Union, notthose of Central Asia.
19. See Milanovic (forthcoming). In contrast, as Leszek Balcerowicz stated in his pre-sentation describing the situation in Poland at the November conference in Prague,"pensioners have a great deal of time to organize."
20. Some estimates for poverty in Poland, even by the same author, are higher andplace the headcount ratio at 26 percent. The lower estimate uses the minimum pensionas the poverty line, the higher one a poverty line of $4 per day, which is much higherthan the World Bank's $1-per-day definition of poverty across countries. For details onPoland, see Milanovic (1994).
21. For details on the lower estimate, see Milanovic (1994) and Kakwani (1995).Kakwani uses the 29 percent figure to estimate that 16.88 percent of the people wereultrapoor in 1992.
22. For an account of economic "myths" that are pervasive in the public psyche, seeKaufmann (1994).
23. But absent fiscal restraint, these have been ineffective. As in many countries of theformer Soviet Union, the central bank is independent of the executive but subordinateto the Parliament.
24. For details see Dabrowski (1994).25. This point has been raised by Nelson (1992) and by Haggard (1991).26. Participatory strategies are likely to have difficulty reaching the poorest of the
poor. The constraints they face often range from hunger to mental illness and drugaddiction (Lipton 1988).
9Choosing and Designing Programs
Social assistance and poverty-targeted programs have had varyingdegrees of success in different countries. Many countries are attempt-ing to reform existing poverty-targeted programs in response tochanging economic and political conditions. Others are introducingnew programs. The results of this study confirm that, aside fromappropriate program choice, program design and delivery are key tosuccessfully and efficiently reaching the poor. Seven principal lessonsemerge from cross-country experience:e The design and delivery of a program can significantly alter its out-
come in favor of the poor and particular subsets of the poor who areoften inadequately served by some safety nets (poor women, forexample). Countries as diverse as Bangladesh, Jamaica, andMongolia have adopted innovative designs, delivery mechanisms,and administrative procedures to stimulate participation of thepoor. But in regions where the poor are overrepresented, directpoverty-targeted programs alone may not reduce the severity ofpoverty.
- Maintaining low program costs (as a percentage of the total budget)ensures a program's sustainability. Fiscal imperatives vary byregions. They are of paramount importance in transition countriesbecause of the severity of fiscal contractions there. But it is impor-tant not to dilute critical transfers (family assistance and social assis-tance) in attempt to reduce fiscal deficits. It is also important toensure that maintaining core safety net transfers does not inducechanges that are harmful to the poor, especially in sectors that arecritical for long-term poverty reduction, such as primary health careand education. For the countries in transition the critical challengeis to avoid pressures from established lobbies (such as pensioners)that are cornering a larger share of a smaller (transfer) cake at theexpense of the new poor (such as the working poor, children, andsingle-parent families with many children). Transparency (movingfrom off-budget to on-budget) and decentralization are good in
159
160 SAFETY NET PROGRAMS AND POVERTY REDUCTION
theory, but the danger that protecting the poor may becomenobody's business is very real. This danger is already apparent inrelatively poorer countries of Eastern Europe and the former SovietUnion, where the responsibility for social assistance is being trans-ferred to local authorities who have scant resources.
* In all programs generally, and in credit programs particularly, keep-ing transaction costs low is important in order to avoid eroding thenet value of transfers. Thus credit programs that have attempted tosubsidize interest rates have not been successful because they haveled to market distortions-resulting in higher transaction costs forthe borrower.
* On- and off-budget housing and energy subsidies in Eastern Europeand the former Soviet Union, and open general subsidies in Africa,Asia, and Latin America have proven unsustainable, apart frombeing inefficient and distortionary. Targeting, within the boundariesof political feasibility, is critical. Some countries have resorted to tar-geting these transfers, especially in Eastern Europe and the formerSoviet Union. But the targeting mechanism adopted has not alwaysbeen appropriate to the country and the type of program. Also, inmost cases the choice of a particular targeting mechanism has notsufficiently accounted for the size of the target group (relative to thetotal population) and the information constraints.
* Universal food subsidies are fiscally unsustainable and distor-tionary. Targeting, therefore, is necessary for sustainable and cost-effective programs. While self-targeted approaches are politicallymore acceptable, country experiences point to other ways of target-ing that tie the transfer to an obligation from recipients withoutexcessive increases in transaction costs.
* All social assistance transfers generate incentive costs. It is often dif-ficult to measure these costs empirically. Yet it is important to beaware of the behavioral changes triggered by transfer programs thatraise programs' real economic costs. The best way to minimizeincentive costs is to keep the amount of transfers modest.
* The political environment and opposing interests of various politi-cal coalitions ultimately determine programs' political acceptanceand continuity. The poor may actually lose from too much fine tun-ing in targeting. In certain countries self-targeted approaches maybe more cost-effective than finely targeted approaches, even if theformer may not prevent leakage completely.
In addition to the above the book showed that in most countries thechoice of programs was closely tied to two factors: the type of programsalready existing and fiscal constraints. Also, program choice based sole-ly on these two factors (without considering the nature of poverty andother country-specific constraints) led to inefficient design and delivery.
CHOOSING AND DESIGNING PROGRAMS 161
A Framework for Choosing among Programs
Three factors are key to the choice of programs: the extent and natureof poverty, the mix of existing programs, and country-specific con-straints or conditions, including growth prospects, policy reforms, andsocioeconomic and infrastructure constraints.
The Extent and Nature of Poverty
A clear understanding of the nature of poverty is usually the startingpoint for choosing a new program or revamping an existing one. Severalquestions must be addressed. Is poverty a permanent, structural problem(chronic poverty) or a temporary problem of insufficient income (tran-sient poverty)? Which types of households are likely to be chronicallypoor or transient-poor, and why? Estimates of the depth and severity ofpoverty provide useful information for the type of program chosen.'
Characteristics unique to the poor also inform program choice.These traits include income and expenditure characteristics, incomesources and variability, and the pattern of asset ownership; labor mar-ket characteristics; demographic characteristics, including the correla-tion of poverty with gender, age, fertility, and household composition;the geographic or ethnic concentration of the poor; and indicators ofliving standards, such as the poor's mortality, nutritional status, andliteracy, and the extent of the poor's access to social services.
The nature of poverty should determine the objectives to be soughtfrom programs. Three primary target groups and objectives are:e For those who are able to work but whose incomes are low and
irregular: income and consumption smoothing in slack seasons, ormore regular livelihood creation.
* For those who are unable to provide for themselves through work(such as the handicapped): long-term assistance.
- For those capable of earning adequate incomes, but cannot earntemporarily because of shocks (such as economic reform or transi-tion): short-term assistance, public works, and/or income genera-tion programs.
Experience with Existing Programs
The choice of a program usually depends on a country's historical cir-cumstances. Rarely is a social assistance program chosen in a vacuum.Most often, the country has made previous attempts to address pover-ty among specific groups or in the country as a whole.
Some countries are seeking to reform social protection systems-often because of increasing fiscal pressure and renewed concerns
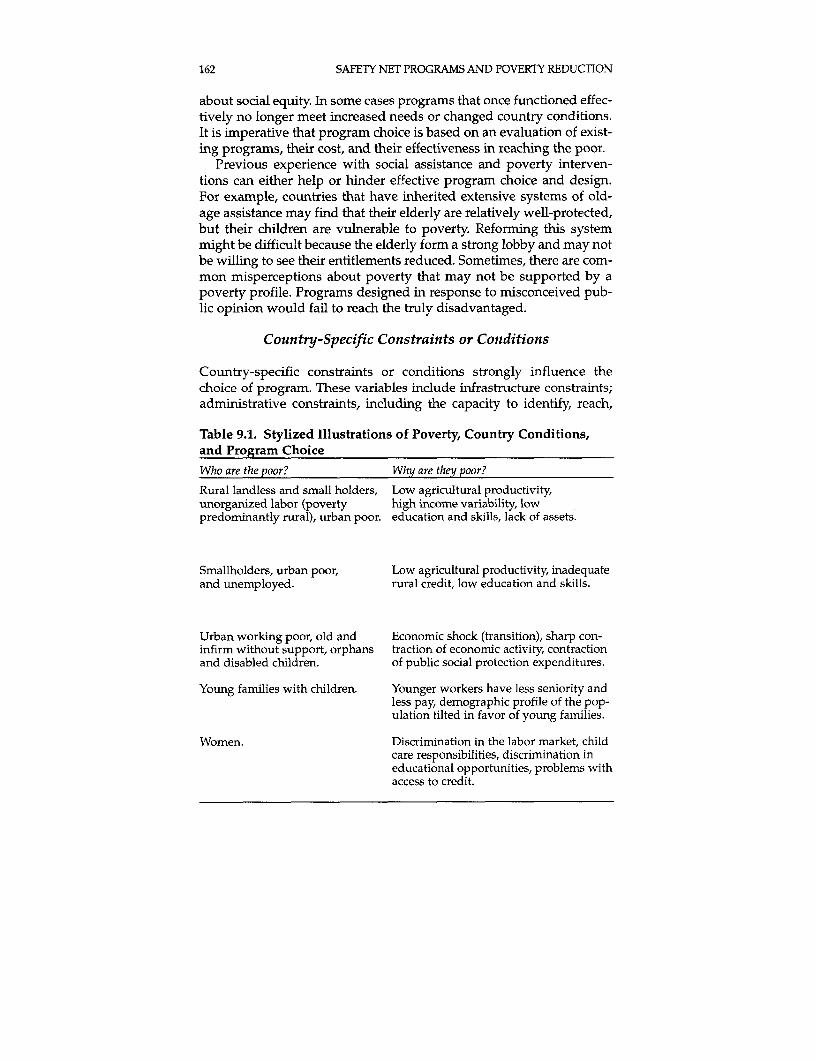
162 SAFETY NET PROGRAMS AND POVERTY REDUCTION
about social equity. In some cases programs that once functioned effec-tively no longer meet increased needs or changed country conditions.It is imperative that program choice is based on an evaluation of exist-ing programs, their cost, and their effectiveness in reaching the poor.
Previous experience with social assistance and poverty interven-tions can either help or hinder effective program choice and design.For example, countries that have inherited extensive systems of old-age assistance may find that their elderly are relatively well-protected,but their children are vulnerable to poverty. Reforming this systemmight be difficult because the elderly form a strong lobby and may notbe willing to see their entitlements reduced. Sometimes, there are com-mon misperceptions about poverty that may not be supported by apoverty profile. Programs designed in response to rnisconceived pub-lic opinion would fail to reach the truly disadvantaged.
Country-Specific Constraints or Conditions
Country-specific constraints or conditions strongly influence thechoice of program. These variables include infrastructure constraints;administrative constraints, including the capacity to identify, reach,
Table 9.1. Stylized Illustrations of Poverty, Country Conditions,and Program Choice
Who are the poor? Why are they poor?
Rural landless and small holders, Low agricultural productivity,unorganized labor (poverty high income variability, lowpredominantly rural), urban poor. education and skills, lack of assets.
Smallholders, urban poor, Low agricultural productivity, inadequateand unemployed. rural credit, low education and skills.
Urban working poor, old and Economic shock (transition), sharp con-infirm without support, orphans traction of economic activity, contractionand disabled children. of public social protection expenditures.
Young families with children. Younger workers have less seniority andless pay, demographic profile of the pop-ulation tilted in favor of young families.
Women. Discrimination in the labor market, childcare responsibilities, discrimination ineducational opportunities, problems withaccess to credit.
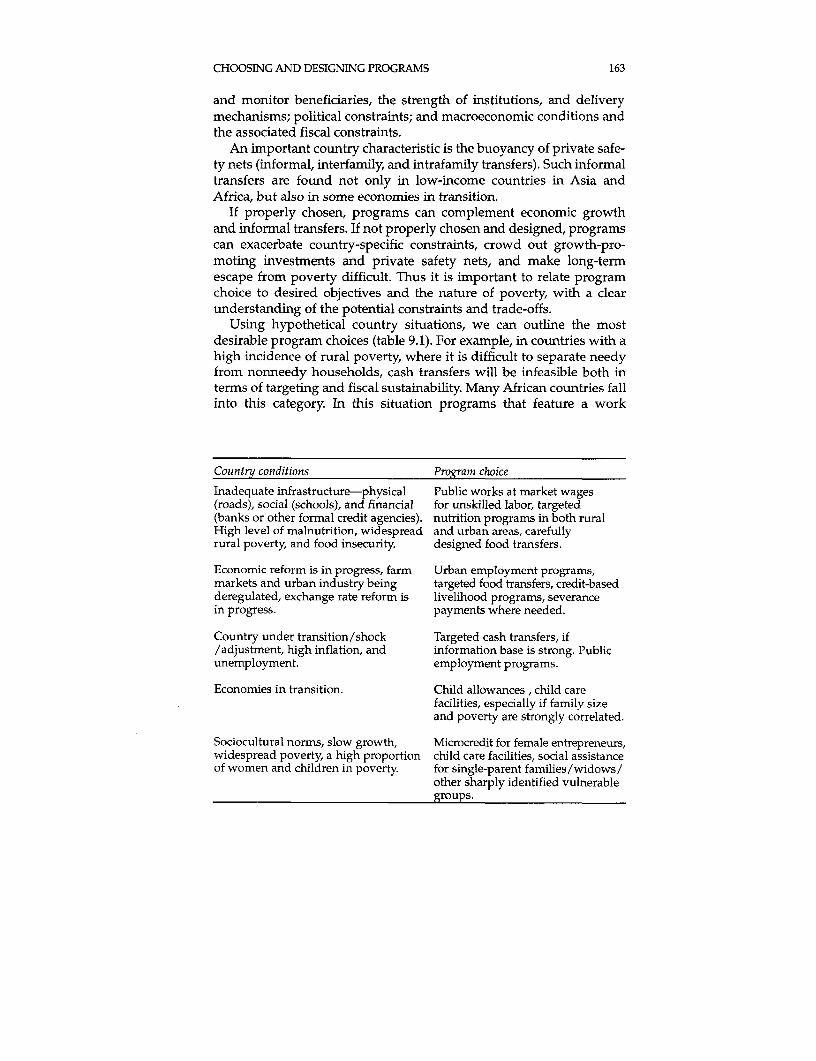
CHOOSING AND DESIGNING PROGRAMS 163
and monitor beneficiaries, the strength of institutions, and deliverymechanisms; political constraints; and macroeconomic conditions andthe associated fiscal constraints.
An important country characteristic is the buoyancy of private safe-ty nets (informal, interfamily, and intrafamily transfers). Such informaltransfers are found not only in low-income countries in Asia andAfrica, but also in some economies in transition.
If properly chosen, programs can complement economic growthand informal transfers. If not properly chosen and designed, programscan exacerbate country-specific constraints, crowd out growth-pro-moting investments and private safety nets, and make long-termescape from poverty difficult. Thus it is important to relate programchoice to desired objectives and the nature of poverty, with a clearunderstanding of the potential constraints and trade-offs.
Using hypothetical country situations, we can outline the mostdesirable program choices (table 9.1). For example, in countries with ahigh incidence of rural poverty, where it is difficult to separate needyfrom nonneedy households, cash transfers will be infeasible both interms of targeting and fiscal sustainability. Many African countries fallinto this category. In this situation programs that feature a work
Country conditions Program choice
Inadequate infrastructure-physical Public works at market wages(roads), social (schools), and financial for unskilled labor, targeted(banks or other formal credit agencies). nutrition programs in both ruralHigh level of malnutrition, widespread and urban areas, carefullyrural poverty, and food insecurity. designed food transfers.
Economic reform is in progress, farm Urban employment programs,markets and urban industry being targeted food transfers, credit-basedderegulated, exchange rate reform is livelihood programs, severancein progress. payments where needed.
Country under transition/shock Targeted cash transfers, if/adjustment, high inflation, and information base is strong. Publicunemployment. employment programs.
Economies in transition. Child allowances, child carefacilities, especially if family sizeand poverty are strongly correlated.
Sociocultural norms, slow growth, Microcredit for female entrepreneurs,widespread poverty, a high proportion child care facilities, social assistanceof women and children in poverty for single-parent families/widows/
other sharply identified vulnerablegroups.
164 SAFETY NET PROGRAMS AND POVERTY REDUCTION
requirement (such as public works) may be more appropriate. Cashtransfers are more feasible in countries where the poor are relativelyfew and are easily identified and reached. Where poverty is mostlyrural, income variability high, and infrastructure inadequate, publicworks in slack seasons are appropriate. Where poverty is concentratedamong the urban poor, targeted food transfers and temporary urbanemployment programs (urban public works) may be necessary. Intransition countries or those experiencing sudden shocks, targetedcash transfers can work only if the information base is strong enough.Where information gaps are large but poverty is strongly correlatedwith family size, untargeted cash transfers-such as family allowances(already prevailing in transition countries)-can be as effective as asafety net.
While these considerations enable us to broadly determine whichprograms are most appropriate, the issue of program design is stillcrucial. In focusing on design, it is useful to consider two sets of prin-ciples: those generic to all programs and those that are program-specific.
Appropriate Program Design
A few generic design principles are pertinent to all programs.* Private transfers are pervasive in most developing countries. These
transfers may not necessarily be redistributive in nature. In fact, insome countries the poor often help the poor. Nonetheless, publictransfers will greatly diminish in utility if they crowd out privatetransfers. It is not clear how a public transfer can be designed so asnot to reduce at least some private transfers. Transfers involvingwork requirements may be more suitable in countries with perva-sive private transfers. In countries where sharing food is very com-mon (as in Mongolia), publicly supported food transfers may not beappropriate, except for the destitute. Similarly, in some countriesharnessing community support is critical for targeted food andnutrition programs.
• Behavioral responses to public transfers must be factored in whenchoosing and designing a program, as they may inflate the real (eco-nomic) cost of transfer programs. A public works program with arelatively high wage rate might pull participants away from mar-ket-driven (farm) activities, thus contributing to rationing-andreducing the poverty impact. Such behavioral responses can alsooccur even if the transfers are made in cash. A means-tested cashtransfer may reduce labor supply at the margin.
* Transfer programs must deal with the problem of fungibility ofmoney. The degree of fungibility may vary across program types.
CHOOSING AND DESIGNING PROGRAMS 165
Thus it is important to allow for the possibility that the beneficiarymay not use the entire transfer for the intended purpose.Considering that households are basically rational, such a diversionof money for consumption smoothing may not be entirely inappro-priate, even if the overall impact of a credit program on livelihoodgeneration may not be fully realized.
* In most targeted programs identifying the poorest is probably a big-ger problem than including the nonpoor. There is a trade-offbetween minimizing exclusion errors and minimizing inclusionerrors. Program conditions should not be so stringent that theyresult in the poorest self-selecting themselves out of the program.
* Most developing countries are fiscally strapped. To this extent,transfers that complement economic growth impose a lower implic-it burden on the tax payer than do others. It is useful to rank trans-fers in the order of their complementarity with growth-promotingactivities, and pick the ones with the closest interface. In this waygreater cost-effectiveness can be achieved, in addition to reducingthe need for distortionary taxes.
* For some programs it is important to pretest demand. Considerwhat happens if this is not done for a credit-based livelihood pro-gram. If, without pretesting, credit is advanced to two poor house-holds to start a bullock cart business in a village, and if there isalready one bullock cart owner in that village earning an incomeslightly above the poverty threshold, the credit program wouldonly cut into the profits of that owner. The result is a classic zero-sum game-the village will now have three households in povertyinstead of two.
Country experience reviewed in previous chapters suggests that cer-tain country-specific design features ensure that a program has a betterchance of reaching the poor cost-effectively. For each of the four majorgroups of programs, the pros and cons, and the most desirable designfeatures that can produce the expected outcomes are discussed below.
Cash Transfers
Without the right level of administrative capacity, any form of income-targeted social assistance is open to potential abuse. Targeting socialassistance toward the poor who are identified by a standard other thanincome or assets reduces the need for sophisticated administration andcould be effective if there is a strong correlation between poverty andthe group chosen. It does, however, increase the risk of leakage and therisk of not reaching all the poor. Cross-country experience highlightsthe advantages and disadvantages of cash transfer programs. It alsopoints to some general lessons regarding these programs:
166 SAFETY NET PROGRAMS AND POVERTY REDUCTION
* Where programs are relatively small and the poorest are easily iden-tifiable, cash transfers are an effective means of providing povertyrelief.
* In transition economies where poverty ratios have risen to excep-tionally high levels, cash social assistance has a limited role. Meanstests to limit coverage will improve program effectiveness.
* In transition countries where poverty ratios are not high, cash socialassistances is necessary, but must be targeted. If family size isstrongly correlated with poverty, it is best to target assistance tofamilies with children. Where the number of children in a house-hold does not reflect its welfare position and where informationgaps are formidable, it is best to consider alternatives to cash socialassistance, rather than administer costly and often ineffective meanstests.
* Cash transfers can lead to adverse labor supply decisions.
Since destitute children are universally recognized as acceptablepoor, there is less political resistance for family assistance transfers. Asa universal benefit, family assistance provides a decent income-smoothing mechanism. Family assistance is typically provided as auniversal benefit without consideration of family income. But then asignificant portion of program benefits go to the nonpoor. This distri-bution mechanism often proves to be fiscally unstable. Some countrieshave attempted to income test family assistance and quickly found thisonerous. If introduced in a country with social assistance, the value ofthe transfer must be sufficient to place a family with children on equalfinancial footing with a childless family. The administration of familyassistance is wasted if the family still has to rely on social assistance tobring them out of poverty.
The key lesson from cross-country experience is that this program ismost appropriate when there is a strong correlation between povertyand family size. Where family size does not adequately reflect thehousehold's welfare position, it is best to target on the basis of house-hold characteristics (in addition to income). Where information gapson household characteristics are pervasive, alternatives to familyallowance should be considered, in particular transfers with a workrequirement, or other programs, such as targeted nutritioninterventions.
In designing programs, the following steps might help:* Consider all possible targeting mechanisms, such as self-assessment
and geographical targeting, and use individual assessment only ifother methods do not identify the target group correctly. The scopefor self-selection and geographical targeting must be consideredfirst as filters so as to circumvent the need for individualassessment.
CHOOSING AND DESIGNING PROGRAMS 167
* When targeting by individual assessment, assets can be includedamong the criteria if they are verifiable. Otherwise, look for expen-diture patterns that will exclude the nonpoor from the program onthe basis of ownership of land, a car, or some other commodity, andinclusion of the poor on the basis of household characteristics, suchas female headship.
* Consider regional variations, particularly in large countries. Urbanand rural or different rural areas may warrant variations in eitherthe poverty line or in the treatment of income and assets.
* All cash transfers can create poverty traps and give rise to difficulttrade-offs. In designing programs, especially consider the adminis-trative cost of more refined targeting relative to cost of leakage, thedisincentives to work relative to the cost of leakage, the level of thepoverty line relative to value of required cash transfers, and infor-mation gaps and administrative capacity.
Food Transfers
Food transfers have been by far the most popular in-kind transfer inmany developing countries. Evidence from previous chapters strong-ly suggests that universal food transfers are not financially sustainable,although they may be politically desirable. More recently, countries areusing innovative targeting means to reach the poor, while minimizingleakage. Nutrition (direct feeding and food supplementation) pro-grams, unlike other food transfer programs, provide limited incomegains. Instead, these programs are intended for easily identifiable,high-risk individuals (preschoolers and mothers). Three key lessonsare derived from country experience:* Untargeted food transfers-whatever the form-are bound to be
fiscally unsustainable, and should be avoided.• Approaches that impose an obligation on the part of the recipient
(such as a labor or time requirement) are best in screening out thenonneedy. But such obligations should not be so onerous that theyraise significant transaction costs.
* Though administration-intensive, food transfers targeted to womenand children, along with other services (such as immunization), canbe a very effective means of supporting the poor with minimal dis-tortions, provided communities are involved and the approach isdemand-driven.The choice and design of the program can be suitably adjusted to
ensure efficient targeting, while accounting for country-specific condi-tions and minimizing adverse incentives. For example, food stampshave been known to perpetrate disincentives to work and cause otherkinds of consumption distortions at the margin. This type of program
168 SAFETY NET PROGRAMS AND POVERTY REDUCTION
works best if its benefits are linked to some obligation. The exactnature of that obligation may differ from country to country. Gooddesign features should incorporate these considerations.
Public Works
Public works have been adopted as an important countercycical inter-vention in many countries. They usually involve a transfer, either incash or in-kind, in exchange for labor. If they create socially usefulinfrastructure, public works also complement economic growth. But ifprovisions are not in place to ensure that quality assets are created andmaintained, these programs are not cost-effective. One merit of publicworks is that they are flexible and could be expanded or contracted asneeded. They thus have relevance in transition countries or in coun-tries emerging from conflict. The potential for self-targeting by fixingwages no higher than those for unskilled labor makes public works anattractive option where it is not possible to identify the truly needyBut minimum wage regulations may make it impossible to fix publicworks wages at an appropriate level. Further, foregone earnings canreduce the overall gain from public works programs. It must beremembered that public works are essentially a temporary safety netand should never be used as a permanent escape route from poverty.Cross-country experience points to the following lessons:* Public works have proved to be a very effective means of con-
sumption smoothing for poor households.* Improved targeting can be achieved through various methods: self-
targeting through type of work, form of payment, and level ofwage; targeting of women through piece rates, location of work,provision of daycare; and targeting of regions adversely affected byshocks (geographic targeting).
* Program wages should be close to prevailing market wages forunskilled labor to minimize labor market distortions.
* Careful attention should be given to the quality of assets createdand their maintenance to improve program cost-effectiveness.Although the design of public works programs vary a great deal
across countries, depending on the mode of transfer used, durationand timing of employment, and the extent of private sector involve-ment, the design features contributing to the success of public worksprograms are fairly consistent across countries.
The most important design element is the determination of thewage rate. In addition, a number of other design features can increasethe gains to the poor. Tendering discreet public employment activitiesto private contractors or organizers of works is certainly conducive toefficiency. It avoids much bureaucratization (especially competition

CHOOSING AND DESIGNING PROGRAMS 169
between line departments), apart from ensuring that only marketwages (and not above-market wages) are paid to laborers. Timing theprogram in the slack seasons; offering piece rates in some situations (alarge family can share the work); providing task-based wage payments(especially for women, who can then dovetail their work with choresat home); and providing basic amenities to workers at work sites aresome other features that may contribute to the effectiveness of theseprograms.
Another critical design aspect is how to minimize transaction costsfor the poor. Properly enforced piece rates are one approach. Further,peer monitoring by workers themselves is important for avoidingleakage to program administrators. Encouraging grass roots pressuregroups is probably the only way to prevent abuse. In a World Bankproject in Mongolia a mechanism for such monitoring is built into thedesign of the program.
The form in which wages should be paid-cash or food-has beenmuch debated. Food has advantages, especially during droughts, pro-vided it is made available to workers through several different retail-ers (as it occurred in Botswana) and not through a governmentmonopoly agency. Payment of wages in food brought more women towork sites in Zambia.
Credit Programs
Credit programs aim at improving the poor's access to financialresources by providing subsidized or unsubsidized loans, often with-out the need for collateral. Some credit programs also provide otherfinancial services (such as savings facilities) in addition to loans. Creditprograms promote self-employment through income-generating activ-ities in the informal sector and could thus complement economicgrowth. They are particularly relevant in economies with high unem-ployment or underemployment, and where there is little scope forexpanding public sector employment. They have been undertaken inresponse to transitional poverty resulting from economic shocks ornatural disasters, and to address chronic poverty in low-growth situa-tions. Most credit programs aim to provide an income stream over themedium term. But unlike other social assistance programs, credit pro-grams require high, specialized levels of financial and managerialcapacity. In addition, since credit is fungible, the funds may be used forpurposes other than that for which they were intended. Even the mostsuccessful credit programs have had only a modest record in reachingthe ultrapoor.
To maximize the participation of the poor and ensure sustainability,the design of any credit program must determine how to minimize
170 SAFETY NET PROGRAMS AND POVERTY REDUCTION
transaction costs both for the lender and the borrower, how to reducecovariate risks, how to rationally select target groups, and how tobuild performance incentives for program managers. Cross-countryexperience suggest four key lessons:* Reduce transaction costs for the poor by simplifying loan process-
ing procedures to avoid delays and repeat visits. Where necessary,subsidize transaction costs, not interest rates.
* Do not rely on program-manager (bureaucrat), income-based iden-tification of potential beneficiaries. Rather, rely on communities,NGOs, and other local groups.
* Promote saving as an integral part of the program.* Reduce covariate risks to borrowers and lenders through group
lending, small loans, repeat loans to those who promptly repay, andso on.
Conclusion
There is no formula for providing the best or most appropriate pro-gram for a particular country. This book has attempted to provideguidance on what to consider when developing more effective andefficient programs, and to point out the pitfalls to be avoided and thepositive features to be enhanced. We have brought together some ofthe best practices and worst examples, and asked the questions: whatmakes programs work well and how could they be made to work evenbetter? Passing on that experience, it is hoped, should help improvemany publicly funded safety net programs all over the world.
Note
1. "Incidence" refers to the number of poor (individuals with incomes below thepoverty line). "Depth" refers to the average income shortfall (from the poverty line), ofthose who are poor. "Severity" refers to how far the income of the poorest fall below thepoverty line. This last measure accounts for the distribution of income among the poor(Lipton and Ravallion 1995). Poverty is considered "shallow" when most of the poor areclustered close to the poverty line, in which case the severity of poverty is low.
References
Abel-Smith, B. 1979. "Income Testing of In-Kind Transfers." In Garfinkel, ed., Income-Tested Transfer Programs: The Casefor and Against. New York: Academic Press.
Acharya, S., V. P. Panwalker, A. Rea, and R. Falk. 1988. "The Employment GuaranteeScheme in Maharashtra: Impact on Male and Female Labor." Regional ResearchPaper. The Population Council, Bangkok.
Adelman, I., K. Subbarao, and P. Vashishta. 1985. "Some Dynamic Aspects of RuralPoverty in India." Economic and Political Weekly 20(39): A103-16.
Agarwal, B. 1991. "Social Security and the Family: Coping with Seasonality andCalamity in Rural India." In E. Ahmad, J. Dreze, J. Hills, and A. Sen, eds., SocialSecurity in Developing Countries. Oxford: Clarendon Press.
Ahmad, E., and A. Hussain. 1991. "Social Security in China: A Historical Perspective."In E. Ahamd, J. Dreze, J. Hills, and A. Sen eds., Social Security in Developing Countries.Oxford: Clarendon Press.
Ahmed, A., and K. Billah. 1994. "Food for Education in Bangladesh: An EarlyAssessment." Intemational Food Policy Research Institute, Washington D.C.
Ahmed, R. 1988. "Structure, Costs, and Benefits of Food Subsidies in Bangladesh." In P.Pinstrup-Andersen, ed., Food Subsidies in Developing Countries: Costs, Benefits, andPolicy Options. Baltimore, Md.: Johns Hopkins University Press.
Ahmed, R. and C. Donovan. 1992. Issues of Infrastructural Development: A Synthesis of theLiterature. Washington D.C.: Intemational Food Policy Research Institute.
Ahsan, S. M., and S. Khandker. 1995. "Cost-Effectiveness of Altemative PovertyAlleviation Instruments: A Comparison of Targeting Credit and Non-CreditPrograms." World Bank, Poverty and Social Policy Department, Washington, D.C.
Ainsworth, M., and M. Over. 1992. "The Economic Impact of AIDS: Shocks, Responsesand Outcomes." Population, Health, and Nutrition Technical Working Paper 1.World Bank, African Technical Department, Washington, D.C.
Alderman, H. 1988. "The Twilight of Flour Rationing in Pakistan." Food Policy 13(3): 245-56.. 1991. "Food Subsidies and the Poor." In G. Psacharopoulos, ed., Essays on
Poverty, Equity, and Growth. Oxford: Pergamon Press.Alderman, H., and C. H. Paxson. 1992. "Do the Poor Insure?" Policy Research Working
Paper 1008. World Bank, Agriculture and Rural Development Department,Washington, D.C.
Alderman, H., and J. von Braun. 1984. The Effects of the Egyptian Food Ration and SubsidySystem on Income Distribution and Consumption. Research Report 45. Washington,D.C.: International Food Policy Research Institute.
. 1986. "Egypt's Food Subsidy Policy: Lessons and Options." Food Policy11(August): 223-37.
Alesina, A., and D. Drazen. 1991. "Why Are Stabilizations Delayed?" American EconomicReview 81(5): 170-80.
Andorka, R. 1990a. "Models of Demographic Policy: The Hungarian Case." Paper pre-pared for the Conference on Population, Society and Demographic Policies forEurope, Giovanni Agnelli Foundation, Torino. April.
171
172 SAFETY NET PROGRAMS AND POVERTY REDUCTION
.1990b. "Pro-natalist Population Policies and Their Impact in Hungary." Politiquesde Population 5(3): 16-24.
Atkinson, A. B., L. Rainwater, and T. M. Smeeding. 1995. Income Distribution in OECDCountries: Evidence from the Luxembourg Income Study. Paris: Organization forEconomic Cooperation and Development.
Bahl, Roy. 1994. "Revenue Sharing in Russia." College of Business AdministrationReprint Series 61. Georgia State College, Atlanta.
Bahl, Roy, and J. F. Linn. 1992. Urban Public Finance in Developing Countries. New York:Oxford University Press.
Bamberger, Michael, and Abdul Aziz. 1991. The Design and Management of SustainableProjects to Alleviate Poverty in South Asia. Economic Development Institute SeminarSeries. Washington, D.C.: World Bank.
Barnes, D. F., J. Dowd, L. Qian, K. Krutilla, and W Hyde. 1994. "Urban Energy Transitions,Poverty, and the Environment: Understanding the Role of Urban Household Energy inDeveloping Countries." World Bank, Industry and Energy Department, PowerDevelopment, Efficiency, and Household Fuels Division, Washington, D.C.
Barr, Nicholas. 1992. Income Transfers and the Social Safety Net in Russia. Studies ofEconomies in Transformation No. 4. Washington, D.C.: World Bank.
. ed. 1994. Labor Markets and Social Policy in Central and Eastern Europe: TheTransition and Beyond. New York: Oxford University Press.
- 1995. "On the Design of Social Safety Nets." ESP Discussion Paper Series 65.World Bank, Education and Social Policy Department, Washington, D.C.
Basu, K. 1981. "Food for Works Programs: Beyond Roads That Get Washed Away."Economic and Political Weekly 16(26): 112.
- 1996. "Relief Programs: When It May Be Better to Give Food Instead of Cash."World Development 24(1): 91-6.
Bentall, P. H. 1990. Ghana Feeder Roads Project: Labor-based Rehabilitation and Maintenance.Geneva: International Labour Office.
Behrman, J., and A. B. Deolalikar. 1987. "Interhousehold Transfers in Rural India: Altruismor Exchange?" University of Pennsylvania, Department of Economics, Philadelphia.
Berg, Alan. 1987a. Malnutrition: What Can Be Done?: Lessons from World Bank Experience.Baltimore, Md.: Johns Hopkins University Press.
- 1987b. "Nutrition Review." Population, Health, and Nutrition Technical Note8721. World Bank, Population and Human Resources Department, Washington, D.C.
Bertaud, Alain, and Bertrand Renaud. 1994. Cities without Land Markets: Lessons of theFailed Socialist Experiment. World Bank Discussion Paper 227. Washington, D.C.:World Bank.
Bertz, William P., and Peter G. E. Stan. 1982a. "Household Composition andInterhousehold Exchange in Malaysia." Population and Development Review 8 (March):92-115.
- 1982b. "The Strategic Bequest Motive." Journal of Political Economy93(December): 1045-76.
Besley, Timothy. 1990. "Means Testing versus Universal Provision in Poverty AlleviationProgrammes." Economica 57(225): 119-29.
-1995. "Savings, Credit, and Insurance." In J. Behrman and T. N. Srinivasan, eds.,Handbook of Development Economics, vol. 3. Amsterdam: North Holland.
Besley, Timothy, and Stephen Coate. 1991. "Workfare versus Welfare: IncentiveArguments for Work Requirements in Poverty Alleviation Programmes." AmericanEconomic Review 82(1): 249-61.
Besley, Timothy, and Ravi Kanbur. 1988. "Food Subsidies and Poverty Alleviation."Economic Journal 98(September): 701-19.
- 1993. "The Principles of Targeting." In M. Lipton and J. van der Gaag, eds.,Including the Poor. Proceedings of a Symposium Organized by the World Bank andthe Intemational Food Policy Research Institute. Washington D.C.: World Bank.
REFERENCES 173
Bienen, H. S., and Mark Gersovitz. 1985. "Economic Stabilization, Conditionality, andPolitical Stability." International Organization 39(4): 729-54.
Biggs, T. S., Donald R. Snodgrass, and Pradeep Srivastava. 1990. "On Minimalist CreditPrograms." Development Discussion Paper 331. Harvard University, HarvardInstitute for International Development, Cambridge, Mass.
Binswanger, H. P., S. R. Khandker, and M. R. Rosenzweig. 1993. "How Infrastructure andFinancial Institutions Affect Agricultural Output and Investment in India." Journal ofDevelopment Economics 41(2): 337-66.
Binswanger, H. P., and J. Quizon. 1984. "Distributional Consequences of AlternativeFood Policies in India." Discussion Paper No. 20. World Bank, Agriculture and RuralDevelopment Department, Research Unit, Washington, D.C.
Bird, R. 1986. Federal Finance in Comparative Perspective. Toronto: Canadian TaxFoundation.
Bird, R., R. D. Ebel, and C. I. Wallick. 1995. Decentralization of the Socialist State. Regionaland Sectoral Studies. Washington, D.C.: World Bank.
Bird, R., J. I. Litvack, and M. G. Rao. 1995. "Intergovernmental Fiscal Relations andPoverty Alleviation in Vietnam." World Bank, East Asia and Pacific CountryDepartment I, Country Operations Division, Washington, D.C.
Blackorby, C., and D. Donaldson. 1988. "Cash versus Kind, Self-selection and EfficientTransfers." American Economic Review 78(4): 691-700.
Bleier, M. I., and A. Chearty, eds. 1993. How to Measure the Fiscal Deficit. Washington,D.C.: International Monetary Fund.
Bogetic, Z., and A. L. Hillman, eds. 1995. Financing Government in the Transition-Bulgaria: The Political Economy of Tax Policies, Tax Bases, and Tax Evasion. Washington,D.C.: World Bank.
Braithwaite, J. 1990a. "Income Distribution and Poverty in the Soviet Republics." Journalof Soviet Nationalities 1(3): 158-73.
. 1990b. "Poverty Differentials in the USSR: Implications for Social Stability."Paper prepared for Brown Bag Luncheon Seminar, Market Reform in SocialistEconomies. U.S. Department of State, Economic Planning and Analysis Staff, July,Washington, D.C.
. 1991. "The Social Safety Net in the Sovereign Republics." Paper Presented at theTwenty-Third American Association for the Advancement of Slavic Studies NationalConference, November 25, Miami, Florida.
. 1995a. "Armenia: A Poverty Profile." PSP Working Paper and Armenia PovertyAssessment Background Paper 80. World Bank, Poverty and Social PolicyDepartment, Washington, D.C.
. 1995b. "The Old and New Poor in Russia: Trends in Poverty." ESP DiscussionPaper 57. World Bank, Education and Social Policy Department, Washington, D.C.
Braithwaite, J., and T. Heleniak. 1990. "Social Welfare in the USSR: The Income RecipientDistribution." U.S. Bureau of the Census, Center for International Research,Washington D.C.
Braverman, Avishay, and Ravi Kanbur. 1987. "Urban Bias and the Political Economy ofAgricultural Price Reform." World Development 15(9): 1179-87.
Bruce, N., and M. Walsman. 1988. "Transfers In-Kind: Why They Can Be Efficient andNon-Paternalistic." Working Paper 532. University of California at Los Angeles,Department of Economics.
Buckley, R. M. 1988. "The Measurement and Targeting of Housing Finance Subsidies:The Case of Argentina." World Bank, Infrastructure and Urban DevelopmentDepartment, Policy, Planning, and Research Staff, Washington, D.C.
Buckley, R. M., D. Faulk, and L. Olajide. 1993. "Private Sector Participation, StructuralAdjustment and Nigeria's New National Housing Policy: Lessons from ForeignExperience." Working Paper 5. World Bank, Transportation, Water and UrbanDevelopment Department, Urban Development Division, Washington, D.C.
174 SAFETY NET PROGRAMS AND POVERTY REDUCTION
Buckley, R. M., Patric H. Hendershott, and K. Villani. 1994. "Rapid HousingPrivatization in Reforming Economies: Pay the Special Dividend Now." TWURDWorking Paper 12. World Bank, Transportation, Water and Urban DevelopmentDepartment, Urban Development Division, Washington, D.C.
Butz, William P., and P. J. E. Stan. 1982. "Household Composition and InterhouseholdExchange in Malaysia." Population and Development Review 8(March): 92-115.
Campbell, T. 1995a. "Mendoza Provincial Program for Basic Social Infrastructure (MEN-PROSIF). Case Study: Decentralization in LAC: Policy Lessons and Best Practices."World Bank, Latin America and the Caribbean Technical Department AdvisoryGroup, Washington, D.C.
- 1995b. "Quasi-Matching Grants and Decentralization in Mexico." LATIEDissemination Note. World Bank, Latin America and the Caribbean TechnicalDepartment Advisory Group, Washington, D.C.
Campbell, T., and T. Katz. 1996. "The Politics of Participation in Tijuana, Mexico:Inventing a New Style of Governance. Case Study: Decentralization in LAC: BestPractices and Policy Lessons." World Bank, Latin America and the CaribbeanTechnical Department Advisory Group, Washington, D.C.
Campbell, T., G. Petersen, and J. Bazark. 1991. "Decentralization to Local Government inLAC: National Strategies and Local Response in Planning, Spending andManagement." LAC Regional Studies Program Report 5. World Bank, Latin Americaand the Caribbean Technical Department, Washington, D.C.
Carvalho, S. 1994a. Indicators for Monitoring Poverty Reduction. World Bank DiscussionPaper 254. Washington, D.C.
- 1994b. "Social Funds: Guidelines for the Design and Implementation." HCDWorking Paper 34. World Bank, Poverty and Social Policy Department, Washington,D.C.
Chen, S., G. Datt, and M. Ravallion. 1994. "Is Poverty Increasing in the DevelopingWorld?" World Bank, Policy Research Department, Washington, D.C.
Christen, R. P., E. Rhyne, and R. C. Vogel. 1995. "Maximizing the Outreach ofMicroenterprise Finance: An Analysis of Successful Programs." US Agency forInternational Development Program and Operations Assessment Report 10.Reference PN-ABS-51. Washington, D.C.
Cleaver, K. M. 1982. "Agricultural Development Experience of Algeria, Morocco, andTunisia: A Comparison of Strategies for Growth." World Bank Staff Working Paper552. World Bank, Washington D.C.
Copestake, J. 1987. "Loans for Livelihoods? An Assessment of Government SponsoredCredit Schemes Designed to Promote Rural Development in India Based on FieldWork Undertaken in the Madurai Region of Tamil Nadu, between September 1984and August 1986." Credit for Rural Development in Southern Tamil Nadu, TamilNadu Agricultural University, India.
-1992. "The Integrated Rural Development Project" In B. Harris, S. Guhan, andR. Cassen, eds., Poverty in India. Bombay: Oxford University Press.
Cornelius, W., A. L. Craig, and J. Fox, eds. 1994. Transforming State-Society Relations inMexico: The National Solidarity Strategy. San Diego, Calif.: University of CaliforniaPress.
Cox, D. 1987. "Motives for Private Income Transfers." Journal of Political Economy95(June): 508-46.
Cox, D., and E. Jimenez. 1989. "Private Transfers and Public Policy in DevelopingCountries: A Case Study for Peru." Policy Research Working Paper 345. World Bank,Policy Research Department, Washington, D.C.- . 1990. "Achieving Social Objectives Through Private Transfers-A Review."World Bank Research Review 5(2): 205-18.
Cox, D., E. Jimenez, and B. Jordan. 1994. "Family Safety Nets and Economic Transition:A Study of Private Transfers in Kyrgyzstan." National Seminar in Poverty and Social
REFERENCES 175
Protection in the Kyrgyz Republic, Economic Development Institute, World Bank,Washington, D.C.
Cox, D., Z. Eser, and E. Jimenez. 1995. "Family Safety Nets during Economic Transition:A Study of Interhousehold Transfers in Russia." World Bank, Policy ResearchDepartment, Washington D.C.
Craig, A. 1992. "Solidarity: Deconstructing Discourse and Practice in the Politics ofConcertation." Paper presented at the University of California at San Diego work-shop "Mexico's Solidarity Program: A Preliminary Assessment," February.
Dabrowski, M. 1994. "The Ukranian Way to Hyperinflation." Communist Economies andEconomic Transformation 6(2): 115-37.
Datt, G, and M. Ravallion. 1992. "Behavioral Responses to Workfare: Evidence for RuralIndia." World Bank, Policy Research Department, Washington, D.C.
. 1994. "Income Gains for the Poor from Public Works Employment: Evidencefrom Two Indian Villages." Living Standards Measurement Study Working Paper100. World Bank, Policy Research Department, Washington, D.C.
Davis, Jeffrey. 1977. "The Fiscal Role of Food Subsidy Programs." IMF Staff Papers.International Monetary Fund, Washington, D.C.
de Ferranti, D. 1985. Paying for Health Services in Developing Countries: An Overview.Washington, D.C.: World Bank.
de Janvry, A., and K. Subbarao. 1986. Agricultural Price and Income Distribution in India.Oxford: Oxford University Press.
de Janvry, A., and S. Subramanian. 1985. "The Politics and Economics of Food andNutrition Policies and Programs: An Interpretation." Paper presented at theInternational Food Policy Research Institute Conference on "The Political Economyof Nutritional Improvements," June 10-14, Berkeley Springs, West Virginia.
de Janvry, A., A. Fargeiz, and E. Sadoulet. 1992. "The Political Feasibility of RuralPoverty Reduction." Journal of Development Economics 37(November): 351-67.
Deolalikar, A.B. 1990. "Rural Services and Public Works in Developing Countries: TheRole of Access to Credit, Primary Health Services, and Public Works in PovertyAlleviation." Background paper for Food and Agriculture Organization. Universityof Washington, Seattle.
Deolalikar, A., and R. Gaiha. 1992. "Targeting of Rural Public Works: Are Women Lesslikely to Participate?" School of Business Management, Delhi University, India.
Deschamps, Jean-Jacques. 1989. Credit for the Rural Poor: The Experience in Six AfricanCountries: Synthesis Report. Washington D.C.: Development Alternatives, Inc.
Dev, S. M. 1992. "Poverty Alleviation Programmes: A Case Study of Maharashtra WithEmphasis on the Employment Guarantee Scheme." Discussion Paper 77. IndiraGandhi Institute of Development Research, Bombay, India.
. 1995a. "Government Interventions and Social Security for Rural Labor." TheIndia Journal of Labor Economics 38(3): 419-41.
. 1995b. "India's MEGS: Lessons from Long Experience." In J. von Braun, ed.,Employmentfor Poverty Reduction and Food Security. Washington, D.C.: InternationalFood Policy Research Institute.
Ditch, J., and H. Barnes. 1994. "Social Assistance: Coverage, Finance, andAdministration." University of York, Social Policy Research Unit, York, UnitedKingdom.
Dresser, Denise. 1991. Neopopulist Solutions to Neoliberal Problems: Mexico's National SolidarityProgram. Current Issues Brief Series No. 3. La Jolla, Calif.: Center for U.S.-MexicanStudies, University of California San Diego.
Dreze, J. 1989. "Social Insecurity in India." Suntory-Toyota Intemational Centre forEconomics and Related Disciplines (STICERD), London School of Economics,Development Economics Research Programme, London.
. 1990. "Widows in Rural India." Development Economics Research ProgramDiscussion Paper 26. London School of Economics.
176 SAFETY NET PROGRAMS AND POVERTY REDUCTION
Dreze, J., and Amartya Sen. 1989. Hunger and Public Action. Oxford: Clarendon Press.Dreze, J., P. Lanjouw, and N. Sharma. Forthcoming. "Credit in a North Indian Village-
An Empirical Investigation." In P. Lanjouw and N. Stern, eds., A Growvth of Sorts:Palanpur 1957-1993. New York: Oxford University Press.
Echeverri-Gent, John. 1988. "Guaranteed Employment in an Indian State: TheMaharashtra Experience." Asian Survey 28(December): 1294-310.
Economic Commission for Latin America and the Caribbean (ECLAC). 1994. SocialPanorama of Latin America. Santiago: United Nations.
Edirisinghe, N. 1987. The Food Stamp Scheme in Sri Lanka: Costs, Benefits, and Options forModifications. Research Report 58. Washington, D.C.: International Food PolicyResearch Institute.
Esanu, C. 1996. "Food Subsidy and Price Policies in Romania." ASAL Food PolicyBackground Paper Series. Romania.
Eurostat. 1993. Digest of Statistics on Social Protection in Europe: Volume 4-Family.Luxembourg.
Ezemenan, K. 1997. "The Link between Public and Private Interhousehold Transfers-Implications for the Design of Safety Net Programs in Developing Countries."Paper presented at the Allied Social Science Association Meetings, New Orleans,January.
Ferghany, N. 1992. "Poverty and Unemployment Profiles on the Level ofAdministrative Units (Kism and Markaz) by Urban-Rural Classifications andImplied Allocations of Funds." Almishkat Center for Research and Training, Giza,Egypt.
Ferge, Z. 1991. "Social Security Systems in the New Democracies of Central and EastemEurope: Past Legacies and Possible Futures." In G.A. Cornia and S. Sipos, eds.,Children and the Transition to the Market Economy: Safety Nets and Social Policies inCentral and Eastern Europe. Hants, England: Arebury Press.
Fox, J. 1992. "The Difficult Transition from Clientelism to Citizenship: Lessons fromMexico." Paper presented at the University of California at San Diego workshop"Mexico's Solidarity Program: A Preliminary Addessment," February.
Fox, L. 1994. "Old Age Security in Transitional Economies." Policy Research WorkingPaper 1257. World Bank, Policy Research Department, Poverty and HumanResources Division, Washington, D.C.
Freund, C. L., and C. I. Wallich. 1995. "Raising Household Energy Prices in Poland: WhoGains? Who Loses?" Policy Research Working Paper 1495. World Bank, Europe andCentral Asia Country Department II, Office of the Director, Washington, D.C.
Gaiha, R. 1991. "Poverty Alleviation Programmes in Rural India: An Assessment."Development and Change 22(January): 117-54.
- 1993. Design of Poverty Alleviation Strategies in Rural Areas. Economic and SocialDevelopment Paper 115. Rome, Italy: Food and Agriculture Organization of theUnited Nations.
- 1995a. "How Dependent Are the Rural Poor on the Employment GuaranteeScheme in India?" University of Delhi, Faculty of Management Studies, India.
- 1995b. "Wages, Participation, and Targeting-The Case of the EmploymentGuarantee Scheme in India." University of Delhi, Faculty of Management Studies,India.
Garcia, M. 1988. "Food Subsidies in the Philippines: Preliminary Results." In P. Pinstrup-Andersen, ed., Food Subsidies in Developing Countries: Costs, Benefits, and PolicyOptions. Baltimore, Md.: Johns Hopkins University Press.
Garcia, M., and P. Pinstrup-Andersen. 1987. "The Pilot Food Price Subsidy Scheme in thePhilippines: Its Impact on Income, Food Consumption, and Nutritional Status."International Food Policy Research Report 61. Washington, D.C.
Garfinkel, I. 1979. Income-Tested Transfer Programs: The Case For and Against. New York:Academic Press.
REFERENCES 177
Gaude, J., A. Guichaona, B. Martens, and S. Miller. 1987. "Rural Development andLabour-Intensive Schemes: Impact Studies of Some Pilot Programmes." InternationalLabour Review 126(4): 423-46.
Gaude, J., and S. Miller, eds. 1992. "Productive Employment for the Poor." InternationalLabour Review 131(1): 1-137.
Gelback, J., and L. Pritchett. 1995. "Does More for the Poor Mean Less for the Poor? ThePolitics of Tagging." Policy Research Working Paper 1523. World Bank, PolicyResearch Department, Washington, D.C.
Gertler, P., and J. van der Gaag. 1988. The Willingness to Payfor Medical Care: EvidencefromTwo Developing Countries. Washington D.C.: World Bank.
Getubig, I.P., M. Y Johari, and A. M. K. Thas, eds. 1993. Overcoming Poverty throughCredit: The Asian Experience in Replicating the Grameen Bank Approach. Kuala Lumpur,Malaysia: Asian and Pacific Development Centre, and Sabah, Malaysia: Institute forDevelopment Studies.
Gill, I., and A. Dar. 1994. "Labor Market Policies and Interventions for SustainableEmployment Growth." World Bank, Education and Social Policy Department,Washington, D.C.
Gill, I., E. Jimenez, and Z. Shalitz. 1991 "Targeting Consumer Subsidies for PovertyAlleviation: A Survey and a Primer of Basic Theory." World Bank, Country EconomicDepartment, Public Economics Division, Washington, D.C.
Glaessner, P., Kye Woo Lee, Anna Maria Sant'Anna, and Jean-Jacques de St. Antoine.1994. Poverty Alleviation and Social Investment Funds: The Latin American Experience.World Bank Discussion Paper 261. Washington, D.C.: World Bank.
Glewwe, P. and Oussama Kanaan. 1989. "Targeting Assistance to the Poor UsingHousehold Survey Data." World Bank, Population and Human ResourcesDepartment, Washington, D.C.
Golden, T. 1992. "Mexico's Leader Cautiously Backs Some Big Chances." The New YorkTimes November 2, 1992, page A3.
Graham, C. 1992. "The Politics of Protecting the Poor During Adjustment. Bolivia'sEmergency Social Fund." World Development 20(9): 1233-51.
. 1995. "Strategies for Addressing Other Social Costs of Market Reforms: Lessonsfor Transitioning Economies in East Asia and Eastern Europe." World Bank,Education and Social Policy Department, Washington, D.C.
Gray, D. 1995. Reforming the Energy Sector in Transition Economies. World Bank DiscussionPaper 296. Washington, D.C.: World Bank.
Grayson, G. 1991. "Mexico's New Politics. Building Sewers, Reaping Votes."Commonweal 118(October 25): 612-14.
Griffith, G. 1987. "Missing the Poorest: Participant Identification by a Rural DevelopmentAgency in Gujarat." Institute of Development Studies Discussion Paper 230. Sussex,United Kingdom.
Grootaert, C. 1995. "Poverty and Social Transfers in Poland." Policy Research WorkingPaper 1440. World Bank, Policy Research Department, Washington, D.C.
Grosh, M. 1992. "The Jamaican Food Stamp Programme: A Case Study in Targeting."Food Policy 17(1): 23-40.
. 1994. Administering Targeted Social Programs in Latin America: From Platitudes toPractice. World Bank Regional and Sectoral Studies Series. Washington, D.C.: World Bank.
Grosh, M., and J. Baker. 1995. "Proxy Means Tests for Targeting Social Programs:Simulations and Speculation." Living Standards Measurement Study Working Paper118. Policy Research Department, World Bank, Washington, D.C.
Gurgand, M., G. Pederson, and J. Yaron. 1994. Outreach and Sustainability of Six RuralFinance Institutions in Sub-Saharan Africa. World Bank Discussion Paper 248.Washington, D.C.: World Bank.
Haggard, S. 1991. "Markets, Poverty Alleviation, and Income Distribution: AnAssessment of Neoliberal Claims." Ethics and International Affairs 5.
178 SAFETY NET PROGRAMS AND POVERTY REDUCTION
Hasan, M. 1992. "The Effect of Subsidy Reduction on Food Consumption and Its Impacton Vulnerable Groups." Cairo University, Faculty of Medicine, Cairo, Egypt.
Heaver, Richard. 1989. Improving Family Planning, Health and Nutrition in India: Experiencefrom Some World Bank-Assisted Programs. World Bank Discussion Paper 59.Washington, D.C.: World Bank.
Hicks, N. 1994. "Ecuador: Replacing the LPG Subsidy with a Targeted Program."World Bank, Latin America and the Caribbean Country Department III,Washington, D.C.
Holt, S. 1991. "The Role of Institutions in Poverty Reduction." Policy Research WorkingPaper 627. Background paper for World Development Report 1990. World Bank,Washington, D.C.
Hope, E., and B. Singh. 1995. "Energy Price Increases in Developing Countries: CaseStudies of Colombia, Ghana, Indonesia, Malaysia, Turkey, and Zimbabwe." PolicyResearch Working Paper 1442. World Bank, Policy Research Department, PublicEconomics Division, Washington, D.C.
Horton, S. 1992. "Unit Costs, Cost-Effectiveness and Financing of NutritionInterventions." Policy Research Working Paper 952. World Bank, Policy ResearchDepartment, Washington D.C.
Hossain, M., 1988. 'Credit for Alleviation of Rural Poverty: The Grameen Bank inBangladesh." Research Report 65. International Food Policy Research Institute in col-laboration with Bangladesh Institute of Development Studies, Washington, D.C.
India, Ministry of Rural Development. 1995. "Progress Report on Anti-PovertyPrograms." Delhi.
Intelnezvs. 1994. Kiev. October 20.IFPRI (International Food Policy Research Institute). 1994. Options for Targeting Food
Interventions in Bangladesh. Washington, D.C.ILO (International Labour Organization). 1991. The Cost of Social Security, 1984-1986.
Geneva: International Labour Office.Jehle, G.A. 1994. "Zakat and Inequality: Some Evidence from Pakistan." Review of Income
and Wealth 40(2): 205-15.Jha, Shikha. 1992. "Consumer Subsidies in India: Is Targeting Effective?" Development
and Change 23(4): 101-28.- 1995. "Foodgrains Price and Distribution Policies in India: Performance,
Problems and Prospects." Asia-Pacific Development Journal of the United NationsEconomic and Social Commission for Asia and the Pacific 2: 45-63.
Jimenez, Emmanuel. 1993. "Cash Versus In-Kind Transfers." Lecture Notes, EDI Seminaron Labor Market and the Social Safety Net in the Former Soviet Union/CISCountries. World Bank, Washington, D.C.
Johnson, G. E., and W E. Whitelaw. 1974. "Urban-Rural Income Transfer in Kenya: AnEstimated-Remittances Function." Economic Development and Cultural Change 22(3):473-79.
Jorgensen, Steen, Margaret Grosh, and Marc Schacter, eds. 1992. Bolivia's Answer toPoverty, Economic Crisis and Adjustment: The Emergency Social Fund. Washington, D.C.:World Bank.
Kakwani, N. 1995. "Income Inequality, Welfare and Poverty: An Illustration UsingUkrainian Data." Policy Research Working Paper 1411. World Bank, Policy ResearchDepartment, Washington, D.C.
Kakwani, N., and K. Subbarao. 1990. "Rural Poverty and Its Alleviation in India."Economic and Political Weekly 25(March 31): A2-A16.
Kamerman, S. B., and A. J. Kahn. 1988. "Social Policy and Children in the United Statesand Europe." In J. L. Palmer, T. Smeeding, and B. B. Torrey, eds., The Vulnerable.Washington, D.C.: Urban Institute Press.
Kanbur, R., M. Keen, and M. Tuomala. 1994. "Labor Supply and Targeting in PovertyAlleviation Programs." The World Bank Economic Review 8(May):191-211.
REFERENCES 179
Kane, C. and J. Morissot. 1993. "Who Would Vote for Inflation in Brazil?" PolicyResearch Working Paper 1183. World Bank, Latin America and the CaribbeanCountry Department I, Washington D.C.
Kaufman, D. 1982. "Social Interaction as a Strategy for Economic Survival Among theUrban Poor: Theory and Evidence." Ph.D. dissertation, Harvard University,Department of Economics, Cambridge, Mass.
. 1994. "The Train and Disseminate Approach to Public Education: AnApplication to Ukraine." World Bank Resident Mission, Kiev, Ukraine.
Kaufman, D., and D. L. Lindauer. 1986. "A Model of Income Transfers for the UrbanPoor." Journal of Development Economics 22(2): 337-50.
Keare, D., and S. Parris. 1982. "Evaluation of Shelter Programs for the Urban Poor:Principal Findings." World Bank Staff Working Paper 547. World Bank, UrbanDevelopment and Rural Development Department, Washington, D.C.
Kennedy, E. T., and H. Alderman. 1987. "Comparative Analyses of NutritionalEffectiveness of Food Subsidies and Other Food-Related Interventions."International Food Policy Research Institute and Joint WHO-UNICEF NutritionSupport Programme, Washington D.C.
Khadiagala, L. 1995. "Social Funds: Strengths, Weaknesses, and Conditions for Success."ESP Discussion Paper 52. World Bank, Education and Social Policy Department,Washington, D.C.
Khandker, S., B. Khalily, and Z. Khan. 1994a. "Sustainability of a Government-TargetedCredit Program: The Bangladesh Rural Development Board's Rural Development-12Project in Bangladesh." World Bank, Poverty and Social Policy Department,Washington, D.C.
. 1994b. "Sustainability of Grameen Bank: What Do We Know?" World Bank,Poverty and Social Policy Department, Washington, D.C.
. 1995. Grameen Bank: Performance and Sustainability. World Bank Discussion Paper306. Washington, D.C.: World Bank.
Knight, A. 1992. "Solidarity: Historical Continuities and Contemporary Implications."Paper presented at the University of California at San Diego workshop "Mexico'sSolidarity Program: A Preliminary Assessment," February.
Knowles, J. C., and Richard Anker. 1981. "An Analysis of Income Transfers in aDeveloping Country: The Case of Kenya." Journal of Development Economics 8(April):205-26.
Korten, E and R. Siy. 1988. "Transforming a Bureaucracy: The Experience of thePhilippine National Irrigation Administration." West Hartford, Connecticut:Kumarian Press.
Kouwenaar, A. 1988. A Basic Needs Policy Model: A General Equilibrium Analysis withSpecial Reference to Ecuador. Contributions to Economic Analysis No. 174. Amsterdam:North-Holland.
Krumm, K., B. Milanovic, and M. Walton. 1995. "Transfers and the Transition fromSocialism: Key Trade-offs." World Bank, Europe and Central Asia Regional Officeand Policy Research Department, Washington, D.C.
Kwon, S. 1993. Social Policy in Korea: Challenges and Responses. Research Monograph 93-01. Seoul: Korea Development Institute.
. 1995. "The Role of Public and Private Transfers to Vulnerable Groups:Experiences of the East Asian Countries." World Bank, Education and Social PolicyDepartment, Washington, D.C.
Lipton, M. 1977. Why Poor People Stay Poor. Canberra: Australian National UniversityPress.
.1988. The Poor and the Poorest. World Bank Discussion Paper 25. Washington,D.C.: World Bank.
1995. "IHLS Contract: Successes in Antipoverty." University of Sussex, School ofAfrican and Asian Studies, Brighton, United Kingdom.
180 SAFETY NET PROGRAMS AND POVERTY REDUCTION
Lipton, M., and M. Ravallion. 1995. "Poverty and Policy." In J. Behrman and T.N.Srinivasan, eds., Handbook of Development Economics. vol 3. Amsterdam: ElsevierScience.
Macedo, R. 1987. "The Mistargeting of Social Programs in Brazil: The Federal Health andNutrition Programs." University of Sao Paolo, Brazil.
Macrae, J., and A. B. Zwi. 1992. "Food as an Instrument of War in Contemporary AfricanFamines: A Review of the Evidence." Disasters: The Journal of Disaster Studies andManagement 16(12): 299-321.
Majeres, J. 1993. "Implementation of Employment Programmes: Key Issues andOptions." International Food Policy Research Institute International PolicyWorkshop Paper. International Labour Office, Geneva.
Marc, A., C. Graham, M. Schacter, and M. Schmidt. 1995. Social Action Programs and SocialFunds: A Review of Design and Implementation in Sub-Saharan Africa. World BankDiscussion Paper 274. Washington, D.C.: World Bank.
Martens, B. 1989. Economic Development that Lasts: Labor-intensive Projects in Nepal andTanzania. Geneva: International Labour Office.
Mateus, A. 1984 "Targeting Food Subsidies for the Needy: The Use of Cost-BenefitAnalysis and Institutional Design." World Bank Staff Working Paper 617. WorldBank, Washington D.C.
McCleary, W. 1991. "The Earmarking of Government Revenue: A Review of Some WorldBank Experience." The World Bank Research Observer 6(1): 81-104.
Mesa-Lago, C. 1990. "Economic and Financial Aspects of Social Security in LatinAmerica and the Caribbean: Tendencies, Problems and Alternatives for the Year2000." Discussion Paper, World Bank, Latin America and the Caribbean TechnicalDepartment, Washington, D.C.
. 1993. "Safety Nets and Social Funds to Alleviate Poverty: Performance,Problems, and Policy Options." United Nations Conference on Trade andDevelopment (UNCTAD), Geneva.
. 1994. Changing Social Security in Latin America. Boulder: Lynne RiennerPublishers, Inc.
Milanovic, B. 1992a. "Distributional Impact of Cash and In-Kind Social Transfers inEastern Europe and Russia." Policy Research Working Paper 1054. World Bank,Policy Research Department, Washington, D.C.
. 1992b. "Income Distribution in Late Socialism: Poland, Hungary,Czechoslovakia, Yugoslavia and Bulgaria Compared." World Bank, CountryEconomic Department, Washington, D.C.
. 1994. "Poverty in Transition." World Bank, Policy Research Department,Washington, D.C.
- 1995a. "Poverty, Inequality and Social Policy in Transition Economies." PolicyResearch Working Paper 1530. World Bank, Policy Research Department,Washington, D.C.
.1995b. "Social Assistance and Higher Utility Prices." Office Memorandum.World Bank, Policy Research Department, Washington, D.C.
-Forthcoming. Poverty in Transition Economies. Washington, D. C.: World Bank.Milimo, J. T., and C. A. Njobvu. 1993. "Report on the Beneficiary Assessment Study,
Phase I." University of Zambia, Lusaka.Miller, B.D., and C. Stone. 1987. "Household Expenditure Effects of the Jamaican
Food Stamp Programme." Staff Paper 36. Syracuse University, MetropolitanStudies Program, Jamaica Tax Structure Examination Project, Syracuse, NewYork.
Mitchell, Donald. 1996. "Food Subsidies in Ukraine." World Bank, Country EconomicsDepartment, Washington, D.C.
Moguel, J. 1990. "National Solidarity Program Fails to Help the Very Poor." Voices ofMexico 15 (October-December): 15-16.
REFERENCES 181
Moser, C. 1993. "Urban Social Policy and Poverty Reduction." TWURD Working Paper10. World Bank, Transportation, Water and Urban Development Department, UrbanDevelopment Division, Washington, D.C.
Musgrove, P. 1989. Fighting Malnutrition. World Bank Discussion Paper 60. Washington,D.C.: World Bank,
. 1991. "Feeding Latin America's Children, An Analytical Survey of FoodPrograms." Regional Studies Series Report 11. World Bank, Latin America and theCaribbean Technical Department, Washington, D.C.
Mutua, K. 1995a. "The Experience of the Kenya Rural Enterprise Program (K-REP) inDeveloping Effective Micro Credit Schemes." Occasional Paper. Kenya RuralEnterprise Programme, Nairobi.
. 1995b. "K-REPS Credit Operations: A Comparative Analysis of Systems."Occasional Paper, Kenya Rural Enterprise Programme, Nairobi.
Nagle, B., and S. Ghose, 1990. "Community Participation in World Bank SupportedProjects." World Bank, Washington, D.C.
Narayan, D., 1995. The Contribution of People's Participation: Evidencefrom 1221 Rural WaterSupply Projects. Environmentally Sustainable Development Occasional Paper 1.Washington, D.C.: World Bank.
Narayana, N. S. S., K. S. Parikh, and T. N. Srinivasan. 1988. "Rural Works Programs inIndia: Costs and Benefits." Journal of Development Economics 29(2): 131-56.
Nelson, J. 1992. "Poverty, Equity, and the Politics of Economic Adjustment." In S.Haggard and B. Kaufmann, eds., The Politics of Economic Adjustment. Princeton:Princeton University Press.
Nichols, A. L., and R. Zeckhauser. 1982. "Targeting Transfers through Restrictions onRecipients." American Economic Review Papers and Proceedings 72(May): 372-77.
North, D. 1990. "Institutions, Institutional Change and Economic Performance." NewYork: Cambridge University Press.
OED (Operations Evaluation Department). 1986. "Pakistan Aga Khan Rural SupportProgram Interim Evaluation." Report 6562-PAK. World Bank, Operations EvaluationDepartment, Washington, D.C.
- 1995. "The Social Impact of Adjustment Operations." Report 14776. World Bank,Operations Evaluation Department, Washington, D.C.
Pakistan, Planning and Development Division. 1993. "Pakistan: Social ActionProgramme (SAP)-Implementation Plans of Key Reforms." Karachi.
Persaud, T. 1991. "Chile's Housing Subsidy Program: Preliminary Indications ofResults." Dissemination Note. World Bank, Latin America and the CaribbeanTechnical Department. Washington, D.C.- 1992. "Housing Delivery System and the Urban Poor: A Comparison Among SixLatin American Countries." World Bank, Latin America and the Caribbean TechnicalDepartment, Infrastructure and Energy Division, Washington, D.C.
Pfeffermann, G., and C. Griffin. 1989. "Nutrition and Health Programs in Latin America:Targeting Social Expenditures." World Bank and International Centre for EconomicGrowth, Washington D.C. and Panama City.
Pinstrup-Andersen, P. 1988a. "Assuring Food Security and Adequate Nutrition for thePoor." In D. E. Bell, and M. R. Reich, eds., Health, Nutrition, and Economic Crises:Approaches to Policy in the Third World. Dover, Mass.: Auburn House PublishingCompany.
, ed. 1988b. Food Subsidies in Developing Countries. Baltimore, Md.: Johns HopkinsUniversity Press.
Pitt, Mark M., and S.R Khandker. 1996. Household and Intrahousehold Impact of theGrameen Bank and Similar Targeted Credit Programs in Bangladesh. World BankDiscussion Paper 320. Washington, D.C.: World Bank.
Platteau, J. P. 1991. "Traditional Systems of Social Security and Hunger Insurance: PastAchievements and Modern Challenges." In E. Ahmad, J. Dreze, J. Hills, and A. Sen,
182 SAFETY NET PROGRAMS AND POVERTY REDUCTION
eds., Social Security in Developing Countries. Oxford: Clarendon Press.Psacharopoulos, G., ed. 1993. Essays on Poverty, Equity and Growth. Oxford: Pergamon
Press.Pulley, R. V. 1989. Making the Poor Creditworthy: A Case Study of the Integrated Rural
Development Program in India. World Bank Discussion Paper 58. Washington, D.C.:World Bank.
Radhakrishna, R., S. Indrakant, C. Ravi, and K. Subbarao. 1996. "India's PublicDistribution System: A National and International Perspective." World Bank,Poverty and Social Policy Department, Washington, D.C.
Ranji, M. and P. Salgado. 1989. "Report on Fiscal Aspects of the Public SectorRestructuring Project." Colombo, Sri Lanka.
Ranney, Christine K., and John E. Kushman. 1987. "Cash Equivalence, Welfare Stigma,and Food Stamps." Southern Economic Journal 53(April): 1011-27.
Ravallion, M. 1989. "Land-Contingent Poverty Alleviation Schemes." World Development17(8): 1223-33.
. 1991. "Reaching the Rural Poor through Public Employment: Arguments,Evidence, and Lessons from South Asia." World Bank Research Observer 6(2): 153-75.
Ravallion, M., and Kalvin Chao. 1989. 'Targeted Policies for Poverty Alleviation underImperfect Information: Algorithms and Applications." Journal of Policy Modelling 11:213-24.
Ravallion, M., Gaurav Datt, and Shubham Chaudhuri. 1993. "Does Maharashtra'sEmployment Guarantee Scheme Guarantee Employment?" Economic Developmentand Cultural Change 41(2): 251-75.
Ravallion, M., and L. Dearden. 1988. "Social Security in a 'Moral' Economy: AnEmpirical Analysis for Java." Review of Economics and Statistics 70(February): 36-44.
Rempell, Henry, and Richard A. Lobdell. 1978. "The Role of Urban-to-Rural Remittancesin Rural Development." Journal of Dezvelopment Studies 14(April): 324-41.
Renaud, B. 1991. Housing Reform in Socialist Economies. World Bank Discussion Paper 125.Washington, D.C.: World Bank.
Sahn, D. and H. Alderman. 1995. "The Effect of Food Subsidies on Labor Supply in SriLanka." In D. van de Walle and K. Nead, eds., Public Spending and the Poor. Baltimore,Md.: Johns Hopkins University Press.
Salamin, J., and M. Floro. 1993. "Hungary in the 1980's: A Review of National and UrbanLevel Economic Reforms." TWURD Working Paper 2. World Bank, Transportation,Water and Urban Development Department, Urban Development Division,Washington, D.C.
Schneider, R. R. 1984. "A Framework for Analyzing Food Subsidies." InternationalMonetary Fund, Fiscal Affairs Department, Washington D.C.
Schubert, B., and G. Balzer. 1990. Social Security Systems in Developing Countries: Transfersas a Social Policy Option for Securing the Survival of the Destitute. Eschbom: DeutscheGesellschaft fur Technische Zusammenarbeit (GTZ).
Selden, T. M., and M. J. Wasylenko. 1995. "Measuring the Distributional Effects of PublicEducation in Peru." In D. van de Walle and K. Nead, eds., Public Spending and thePoor: Theory and Evidence. Baltimore, Md.: Johns Hopkins University Press.
Selowsky, M. 1979. "Target Group-Oriented Food Programs: Cost EffectivenessComparisons." American Journal of Agricultural Economics 61(5): 988-94.
Serageldin, I., and P. Landell-Mills, eds. 1994. Overcoming Global Hunger. ESDProceedings Series 3. Washington, D.C.: World Bank.
Sen, Amartya. 1981. Poverty and Famines. Oxford: Clarendon Press.- 1990. "Levels of Poverty: Policy and Change." World Bank Staff Working Paper
401. World Bank, Washington, D.C.Shekar, M. 1994. "The Tamil Nadu Integrated Nutrition Project (TINP-1) Revisited: An
Evaluation Perspective." World Bank, Operations Evaluation Department,Washington, D.C.
REFERENCES 183
Silverman, A. 1993. "Municipal Funds in Rural Southern Mexico: SupportingParticipatory Rural Development." World Bank, Washington, D.C.
Singh, I. 1978. "Rural Works Programs in South Asia: A Note." Studies in Employmentand Rural Development 48. World Bank, Development Policy Staff, Employment andRural Development Division, Washington, D.C.
Sipos, S. 1994. "Income Transfers: F-mily Support and Poverty Relief." In Nicholas Barr,ed., Labor Markets and Social Policy in Central and Eastern Europe: The Transition andBeyond. Washington, D.C. and London: World Bank and London School ofEconomics.
Smeeding, T., B. B. Torrey, and M. Rein. 1988. "Patterns of Income and Poverty: TheEconomic Status of Children and the Elderly in Eight Countries." In J. L. Palmer, T.Smeeding, and B. B. Torrey, eds., The Vulnerable. Washington, D.C.: Urban InstitutePress.
Squire, L. 1991. "Introduction: Poverty and Adjustment in the 1980s." The World BankEconomic Review 5(2): 177-85.
Stark, O., J. Edward Taylor, and Shlomo Yitzhaki. 1988. "Migration, Remittances, andInequality: A Sensitivity Analysis Using the Extended Gini Index." Journal ofDevelopment Studies 28(May): 309-22.
Stewart, F., and W. van der Geest. 1994. "Adjustment and Social Funds: Political Panaceaor Effective Poverty Reduction." Working Paper, International Labour Organization,Geneva.
Stock, E. A. 1996. "The Problems Facing Labor-based Road Programs and What to DoAbout Them: Evidence from Ghana." Sub-Saharan Africa Transport Policy ProgramWorking Paper 24. World Bank, Washington, D.C.
Stock, E. A., and J. de Veen. 1996. "Expanding Labor-based Methods in Road Programs."World Bank, Africa Region, Technical Department, Enviromnentally SustainableDivision, Washington, D.C.
Struyk, R., and J. Daniell. 1995. "Housing Privatization in Russia." The Economics ofTransition 3(2): 197-214.
Subbarao, K. 1985. "Regional Variations in the Impact of Anti-Poverty Programs."Economic and Political Weekly (October 26) 20(43): 1829-34.
. 1989. Improving Nutrition in India: Policies and Programs and their Impacts. WorldBank Discussion Paper 49. Washington, D.C.: World Bank.
1. 993. "Interventions to Fill Nutrition Gaps at the Household Level: A Review ofIndia's Experience." In B. Harris, S. Gahan, and R. H. Cassen, eds., Poverty in India:Research and Policy. Bombay: Oxford Chicago Press.
. 1995. "Safety Nets and Poverty-Targeted Programs in Tanzania." World Bank,Poverty and Social Policy Department, Washington, D.C.
1997. "Public Works As An Anti-Poverty Program: An Overview of Cross-Country Experience." Paper presented at the Allied Social Science AssociationMeetings, New Orleans, January 3-5.
Subbarao, K., and K. Ezemenari. 1995. "Transition, Poverty and Social Assistance inMongolia." ESP Discussion Paper 55. World Bank, Education and Social PolicyDepartment, Washington, D.C.
1997. "Social Assistance Cash Transfers and Poverty Relief: Economies inTransition in a Global Contest." World Bank, Poverty, Gender, and Public SectorManagement Department, Washington, D.C.
Subbarao, K., and K. Mehra. 1995. "Social Assistance and the Poor in Romania." ESPDiscussion Paper 66. World Bank, Education and Social Policy Department,Washington, D.C.
Subbarao, K., and K. Rudra. 1996. "Protecting the Poor in a High Growth Economy:Effectiveness of Poverty-Targeted Programs in Thailand." World Bank, Poverty andSocial Policy Department, Washington, D.C.
Subbarao, K., A. Ahmed, and T. Teklu. 1995. Philippines Social Safety Net Programs:
184 SAFETY NET PROGRAMS AND POVERTY REDUCTION
Targeting, Cost Effectiveness and Optionsfor Reform. Discussion Paper 317. Washington,D.C.: World Bank.
Subbarao, K., J. Braithwaite, and J. Jalan. 1995. "Protecting the Poor During Adjustmentand Transitions." Human Capital Development and Operations Policy WorkingPaper 58. World Bank, Poverty and Social Policy Department, Washington, D.C.
Tanzi, V. 1995. "Fiscal Federalism and Decentralization: A Review of Some Efficiencyand Macroeconomic Aspects." Paper presented for the World Bank's Annual BankConference on Development Economics, Washington, D.C.,May 1-2.
Teklu, T. 1994a. "Labor-Intensive Rural Roads in Kenya, Tanzania, and Botswana: SomeEvidence on Design and Practice." International Food Policy Research Institute,Washington, D.C.
- 1994b. "Minor Roads Program in Kenya: Potential for Short-Term PovertyReduction Through Asset Creation." International Food Policy Research Institute,Washington, D.C.
-1995a. "Employment Programs for Food Security in Sub-Saharan Africa." 2020Brief 28. International Food Policy Research Institute, Washington, D.C.
- 1995b. "Labor-Intensive Public Works: The Experience of Botswana andTanzania." In J. von Braun, ed., Employment for Poverty Reduction and Food Security.Washington, D.C.: Intemational Food Policy Research Institute.
Thomas, V., and Y. Wang. 1994. "Asian Socialist and Non-Socialist TransitionExperiences." Paper presented at the Asia Foundation Project Comparing Transitionsin East Asia and Eastern Europe, Prague, December 2-3.
Tolley, George S. 1991. Urban Housing Reform in China: An Economic Analysis. World BankDiscussion Paper 123. Washington, D.C.: World Bank.
Tuck, L., and K. Lindert. 1996. From Universal Food Subsidies to a Self-Targeted Program. ACase Study in Tunisian Reform. World Bank Discussion Paper 381. Washington, D.C.:World Bank.
UNICEF. 1995. "Monitoring Economic and Social Welfare Indicators in Central andEastern European Countries." Trans Monee Database. Economic and Social PoliciesResearch Programme, International Child Development Centre, Florence, Italy.
van de Walle, D., and K. Nead. 1995. Public Spending and the Poor: Theory and Evidence.Baltimore, Md.: Johns Hopkins University Press.
van de Walle, D., M. Ravallion, and M. Gautam. 1994. "How Well Does the Social SafetyNet Work? The Incidence of Cash Benefits in Hungary, 1987-89." Living StandardsMeasurement Study Working Paper 102. World Bank, Policy Research Department,Washington, D.C.
van Domelen, Julie. 1992. "Working with Non-Governmental Organizations." In S.Jorgensen, M. Grosh, and M. Schacter, eds., Bolivia's Answer to Poverty, EconomicCrisis, and Adjustment: The Emergency Social Fund. Washington, D.C.: World Bank.
Vivian, J. 1994. "Social Safety Nets and Adjustment in Developing Countries." UnitedNations Research Institute for Social Development (UNRISD), Geneva.
von Braun, Joachim. 1989. "Social Security in Sub-Saharan Africa: Reflections on PolicyChallenges." Development Economics Research Programme Discussion Paper 22.London School of Economics and Political Science.
von Braun, Joachim, T. Teklu, and Patrick Webb, eds., 1992. "Labour-Intensive PublicWorks for Food Security in Africa: Past Experience and Future Potential."International Labour Review 131(1): 19-33.
Walker, Bridget M., and Gabriel L. Dava. 1994. "The Social Dimensions of Adjustmnent(SDA) Initiative in Mozambique." One World Action, London.
Webb, A., K. Y. Lee, and A. San't Anna. 1995. The Participation of NongovernmentalOrganizations in Poverty Alleviation: A Case Study of the Honduras Social InvestmentFund Project. World Bank Discussion Paper 295. Washington, D.C.: World Bank.
Weitzman, M. L. 1977. "Is the Price System or Rationing More Effective in Getting aCommodity to Those who Need it Most?" Bell Journal of Economics 8(2): 517-24.
REFERENCES 185
Wijga, A. 1983. "The Nutritional Impact of Food-for-Work Programmes." NetherlandsUniversities Foundation for International Cooperation, Wageningen, TheNetherlands.
World Bank. 1983. "Bangladesh: Selected Issues in Rural Employment." Report 4292-BD.South Asia Programs Department, Washington, D.C.
.1989a. "Domestic Energy Pricing Policies." Industry and Energy Working Paper,Energy Series Paper 13. Industry and Energy Department, Washington, D.C.
.1989b. Feeding Latin America's Children. Latin American and the CaribbeanRegion Intemal Discussion Paper. Washington, D.C.
.1989c. "Senegal: Public Works and Employment Project." Report 8032. AfricaRegion, Sahelian Department, Infrastructure Division, Washington, D.C.
. 1990a. Morocco: Reaching the Disadvantaged: Social Expenditure Priorities in the1990s. Washington, D.C.
.1990b. Pakistan: A Profile of Poverty. Report 8848. Country Operations Division,Washington, D.C.
1991a. America's Children: Survey of Food Programs. Washington, D.C.1991b. Democratic and Popular Republic of Algeria: Consumer Price Subsidy Reform.
Washington, D.C.1991c. Nepal: Poverty and Incomes. Washington, D.C.1991d. "Staff Appraisal Report: Burkino Faso Public Works and Employment
Project." Report 9535-BUR. Africa Region, Sahelian Department, InfrastructureOperations Division, Washington, D.C.
. 1991e. "Staff Appraisal Report: Republic of Niger Public Works andEmployment Project." Report 9032-NIR. Africa Region, Sahelian Department,Infrastructure Operations Division, Washington, D.C.
-1992a. Bolivia Emergency Social Fund II. Project Completion Report 11471.Washington, D.C.
. 1992b. "Conference on Public Expenditures and the Poor: Incidence andTargeting." June 17-19, Washington D.C.
. 1992c. "Memorandum and Recommendation of the President of theInternational Development Association to the Executive Directors on a ProposedCredit in an Amount Equivalent to SDR 109.5 Million to the Republic of Zimbabwefor an Emergency Drought Recovery and Mitigation Project." Report P-5819-ZIM.Washington, D.C.
. 1992d. "Memorandum and Recommendation of the President of theInternational Development Association to the Executive Directors on a ProposedCredit in the Amount Equivalent to US$20 Million to the Republic of Mali for aPublic Works and Capacity Building Project." Report P-5742-MLI. Washington, D.C.
-. 1992e. Senegal Second Public Works and Employment Project. Staff Appraisal Report10421. Africa Region, Sahelian Department, Infrastructure Division, Washington,D;C.
. 1993a. Ethiopia: Toward Poverty Alleviation and a Social Action Program.Washington D.C.
.1993b. The Gambia: An Assessment of Poverty. Washington, D.C.
. 1993c. Housing-Enabling Markets to Work with Technical Supplements. World BankPolicy Paper. Washington, D.C.
1993d. Indonesia: Public Expenditures and the Poor. Washington D.C.1993e. Latvia: The Transition to a Market Economy. World Bank Country Study.
Washington, D.C.1993f. Mali: Assessment of Living Conditions. Washington, D.C.1993g. "Memorandum and Recommendation of the President of the International
Development Association to the Executive Directors on a Proposed Credit in theAmount Equivalent to SDR $7.9 Million to the Republic of the Gambia for a PublicWorks and Capacity Building Project." Report P-6092-GM. Washington, D.C.
186 SAFETY NET PROGRAMS AND POVERTY REDUCTION
. 1993h. Poland: Income Support and the Social Safety Net during the Transition. WorldBank Country Study. Washington, D.C.
- . 1993i. "Project Completion Report Republic of Ghana: Priority Works Project(Credit 1874-GH)." Africa Regional Office, Country Department IV, InfrastructureDivision, Washington, D.C.
. 1993j. Ukraine: The Social Sectors during Transition. World Bank Country Study.Washington, D.C.
- . 1993k. "Uruguay Poverty Assessment: Public Social Expenditures and TheirImpact on the Income Distribution." Latin America and the Caribbean Region,Washington, D.C.
- 19931. Uzbekistan: An Agenda for Economic Reform. World Bank Country Study.Washington, D.C.
. 1994a. Averting the Old Age Crisis: Policy Options for a Graying World. New York:Oxford University Press.
1994b. Colombia Poverty Assessment. Washington, D.C.1994c. Ecuador: Energy Pricing, Subsidies and Interfuel Substitution. Report 11798-
EC. Energy Sector Management Assistance Programme, Latin America and theCaribbean Region, Washington, D.C.
- . 1994d. Hashemite Kingdom of Jordan: Poverty Assessment. Washington, D.C..1994e. Honduras Country Economic Memorandum/Poverty Assessment. Washington,
D.C.-1994f. Honduras Social Investment Fund. Project Completion Report 13573. Latin
America and the Caribbean Region, Washington, D.C.- . 1994g. Honduras Social Investment Fund. Mid-term Review. Washington, D.C.
.1994h. Honduras Social Investment Fund. Project Performance Audit Report 13839-HO. Latin America and the Caribbean Region, Washington, D.C.
-1994i. Indonesia: Stability, Growth and Equity in Repelita VI. Washington, D.C.- . 1994j. Kingdom of Morocco: Poverty, Adjustment, and Growth. Volumes I and II.
Washington, D.C.-1994k. "Kyrgyz Republic Economic Report." Report 12942. Washington, D.C.
1 19941. "Mauritania Poverty Assessment." Report 12182-MAU. Africa Region,Sahelian Department, Country Operations Division, Washington, D.C.
- 1994m. "Memorandum and Recommendation of the President of theInternational Development Association to the Executive Directors on a ProposedCredit in the Amount Equivalent to SDR 12.4 Million to the Republic of Chad for aPublic Works and Capacity Building Project." Report P-6211-CD, Washington, D.C.
.1994n. "Memorandum and Recommendation of the President of the InternationalDevelopment Association to the Executive Directors on a Proposed SupplementalCredit in the Amount Equivalent to SDR 6.8 Million to the Republic of Chad for theSocial Development Action Project." Report P-6309-CD. Washington, D.C.
. 1994o. "Memorandum and Recommendation of the President of theIntemational Development Association to the Executive Directors on a ProposedSupplemental Credit in the Amount Equivalent to SDR 6.9 Million to the Republic ofMali for a Public Works and Capacity Building Project." Report P-6285-MLI.Washington, D.C.
.1994p. "Memorandum and Recommendation of the President of the IntemationalDevelopment Association to the Executive Directors on a Proposed SupplementalCredit in the Amount Equivalent to SDR 6.9 Million to the Republic of Niger for aPublic Works and Employment Project." Report P-6283-NIR. Washington, D.C.
. 1994q. Moldova: Moving to a Market Economy. World Bank Country Study.Washington, D.C.
. 1994r. "Russia: Social Protection During Transition and Beyond." Report 11748-RU, Vol. II. Europe and Central Asia Region Country Department III, HumanResources Division, Washington, D.C.
REFERENCES 187
. 1994s. Statistical Handbook 1994. States of the Former USSR. Studies of Economies inTransformation No. 10. Washington, D.C.
11994t. Ukbekistan (Adjusting Social Protection). Washington, D.C.. 1994u. Zambia: Poverty Assessment, Washington, D.C.1995a. Hungary: Structural Reforms for Sustainable Growth. Washington, D.C.1995b. The Kyrgyz Republic Poverty Assessment and Strategy. Volume 1 (Main
Report) and Volume 2 (Statistical Annex). Washington, D.C.. 1995c. "Memorandum and Recommendation of the President of the
International Development Association to the Executive Directors on a ProposedCredit in the Amount Equivalent to US$40.0 Million to the Republic of Madagascarfor a Social Fund II Project." Report P-6635-MAG. Washington, D.C.
. 1995d. "Performance Audit Report Honduras Social Investment Fund Projects Iand II (Credits 2212-HO and 2401-HO)." Report 13839-HO. Washington, D.C.
1995e. "Philippines: Selected Social Safety Net Programs: Targeting, Cost-Effectiveness and Options for Reform." Report 13921-PH. East Asia and PacificRegion Country Department I, Human Resources Operations Division, Washington,D.C.
. 1995f. "Poverty in Russia: An Assessment." Report 14110-RU. Europe andCentral Asia Country Department III, Human Resources Division, Washington, D.C.
. 1995g. "Chile: Second Housing Sector Project." Project Completion Report13769. Latin America and the Caribbean Region, Washington, D.C.
.1995h. "Project Preparation Mission, Egypt Social Fund for Development II."Middle East and North Africa Region, Washington, D.C.
-. 1995i. "Republic of Madagascar Social Fund II Project." Staff Appraisal Report14489-MAG. Sub-Saharan Africa Region, Washington, D.C.
.1995j. "Republic of Tunisia: From Universal Food Subsidies to a Self-TargetedProgram." Report 14596. Middle East and North Africa Country Department I,Washington, D.C.
1995k. Social Indicators of Development. Washington, D.C.19951. Sri Lanka: Poverty Assessment. Washington, D.C.1995m. World Development Report 1995: Workers in an Integrating World. New
York: Oxford University Press.. 1995n. Understanding Poverty in Poland. A World Bank Country Study.
Washington, D.C.. 1996. "Pakistan-First, Second, and Third Income Generating Projects for
Refugee Areas." Operations Evaluation Department, Washington, D.C.Yaron, Jacob. 1992a. Assessing Development Finance Institutions: A Public Interest Analysis.
World Bank Discussion Paper 174. Washington, D.C.: World Bank.. 1992b. Successful Rural Finance Institutions. World Bank Discussion Paper 150.
Washington, D.C.: World Bank.. 1994. "What Makes Rural Finance Institutions Successful?" The World Bank
Research Observer 9(1): 49-70.
Directions in Development
Begun in 1994, this series contains short essays, written for a generalaudience, often to summarize published or forthcoming books or tohighlight current development issues.
Africa's Management in the 1990s and Beyond: Reconciling Indigenousand Transplanted Institutions
Building Human Capital for Better Lives
Class Action: Improving School Performance in the Developing Worldthrough Better Health and Nutrition
Decentralization of Education: Community Financing
Decentralization of Education: Politics and Consensus
Decentralization of Education: Teacher Management
Deep Crises and Reform: What Have We Learned?
Early Child Development: Investing in the Future
Financing Health Care in Sub-Saharan Africa through User Fees andInsurance
Global Capital Supply and Demand: Is There Enough to Go Around?
Implementing Projects for the Poor: What Has Been Learned?
Improving Early Childhood Development: An Integrated Program for thePhilippines
India's Family Welfare Program: Moving. to a Reproductive and ChildHealth Approach (with a separate supplement)
Investing in People: The World Bank in Action
Managing Commodity Booms - and Busts
Meeting the Infrastructure Challenge in Latin America and the Caribbean
Monitoring the Learning Outcomes of Education Systems
MIGA: The First Five Years and Future Challenges

Nurturing Development: Aid and Cooperation in Today's Changing World
Nutrition in Zimbabwe: An Update
Poverty Reduction in South Asia: Promoting Participation of the Poor
Private and Public Initiatives: Working Together for Health and Education
Private Sector Participation in Water Supply and Sanitation in Latin America
Reversing the Spiral: The Population, Agriculture, and Environment Nexusin Sub-Saharan Africa (with a separate supplement)
A Strategy for Managing Water in the Middle East and North Africa
Taxing Bads by Taxing Goods: Pollution Control with Presumptive Charges
Toward Sustainable Management of Water Resources
Trade Performance and Policy in the New Independent States
The Transition from War to Peace in Sub-Saharan Africa
Unshackling the Private Sector: A Latin American Story
The Uruguay Round: Widening and Deepening the World Trading System
THE WORLD BANK
1818 H Street, NW.Washington, D.C. 20433, U.S.A.
rEl.l P 1ONI: (202) 477-1234FACSIMILE: (202) 477-6391TFELEX: Mci 64145 WORILDBANK
MCI 248423 WORI-DBANK
CABLE ADDRESS: INTBAFRAD)
WASH INGTONr)('
INTIRN I1: http://www.worldbank.org//
COVER DESIGN: THE MAGAZINE GROUP ISBN 0-8213-3890-0