Embed Size (px)
Citation preview

Helsinki CommissionBaltic Marine Environment Protection Commission
Baltic Sea Environment Proceedings No. 126A
Salmon and Sea Trout Populations and Rivers in the Baltic Sea
HELCOM assessment of salmon (Salmo salar) and sea trout (Salmo trutta) populations and habitats in
rivers fl owing to the Baltic Sea.


Salmon and Sea Trout Populations and Rivers in the Baltic SeaHELCOM assessment of salmon (Salmo salar) and sea trout (Salmo trutta) populations and habitats in rivers fl owing to the Baltic Sea.
Baltic Sea Environment Proceedings No. 126A
Helsinki Commission
Baltic Marine Environment Protection Commission

2
Published by:Helsinki CommissionKatajanokanlaituri 6 BFI-00160 HelsinkiFinlandhttp://www.helcom.fi
AuthorsMiia Mannerla (author and editor), Mikael Andersson, Janis Birzaks, Piotr Debowski, Erik Degerman, Alpo Huhmarniemi, Håkan Häggström, Erkki Ikonen, Erkki Jokikokko, Eero Jutila, Martin Kesler, Vytautas Kesminas, Antanas Kontautas, Stig Pedersen, Jens Persson, Atso Romakkaniemi, Ari Saura, Sergey Shibaev, Sergey Titov, Herki Tuus, Konstantin Tylik and Timo Yrjänä.
A draft of this report was peer reviewed by two (Peter Hutchinson and Bror Jonsson) internationally recognised salmon experts independent of Baltic Sea salmonid research. The peer review was organised by ICES. Atso Romakkaniemi from the Finnish Game and Fisheries Research Institute (RKTL) has provided scientifi c advice during the project.
Layout: Leena Närhi, Bitdesign
For bibliographic purposes this document should be cited as: HELCOM, 2011 Salmon and Sea Trout Populations and Rivers in the Baltic Sea – HELCOM assessment of salmon (Salmo salar) and sea trout (Salmo trutta) populations and habitats in rivers fl owing to the Baltic Sea. Balt. Sea Environ. Proc. No. 126A.
Information included in this publication or extracts thereof are free for citing on the condition that the complete reference of the publication is given as stated above.
Copyright 2011 by the Baltic Marine EnvironmentProtection Commission – Helsinki Commission –
This report has been funded through a co-fi nancing agreement between the European Union (European Commission, Directorate General for Maritime Affairs and Fisheries) and HELCOM (Overview of the state of salmon (Salmo salar) and sea trout (Salmo trutta) populations in rivers fl owing to the Baltic Sea – SI2.546540).
HELCOM has the sole responsibility for this report and the European Commission is not responsible for any use that may be made of the information contained therein.
Photo credits: Front cover: big photo, Jan Nielsen. Small photos (from left to right): Erik Degerman, Esa Lehtinen, Erik Degerman.Back cover: Herki Tuus.
Inner pages: Page 6, Erik Degerman. Page 7, Ari Saura. Page 8 lower, Jørgen Skole Mikkelsen. Page 8 upper, Kimmo Aronsuu. Page 11, Kimmo Aronsuu. Page 12, Erik Degerman. Page 14, Erik Degerman. Page 16, Antanas Kontautas. Page 17, S. Stakenas. Page 18, Piotr Dębowski. Page 20, Robin Ade. Page 21, Ari Saura. Page 23, Ville Vähä. Page 24, Piotr Dębowski. Page 25, Finn Sivebæk. Page 26, Erik Degerman. Page 27, Erik Degerman. Page 28, Konstantin Tylik. Page 30, Konstantin Tylik. Page 31, Finn Sivebæk. Page 32, Finn Sivebæk. Page 34, S. Stakenas. Page 35, Ari Saura. Page 36, Timo Yrjänä, Page 37, Vytautas Kesminas. Page 38, Lauri Närhi. Page 39, Vytautas Kesminas. Page 41, Piotr Dębowski. Page 42, Konstantin Tylik. Page 43, Erik Degerman. Page 44, Erik Degerman. Page 45, Erik Degerman. Page 47, Erik Degerman. Page 48, Jan Nielsen. Page 49, Ville Vähä. Page 51, Kimmo Aronsuu. Page 52, Piotr Dębowski. Page 53, Erik Degerman. Page 54, Alpo Huhmarniemi. Page 56, Timo Yrjänä. Page 57, Erik Degerman. Page 58, Erik Degerman. Page 59, Erik Degerman. Page 60, Ville Vähä. Page 61 upper, Jukka Tuohino. Page 61 lower, Finn Sivebæk.
Number of pages: 79 Printed by: Erweko Painotuote Oy, Finland
ISSN 0357-2994

Table of Contents
Table of Contents. . . . . . . . . . . . . . . . . . . . . . . . . . . . . . . . . . . . . . . . . . . . . . . . . . . .3
Executive summary . . . . . . . . . . . . . . . . . . . . . . . . . . . . . . . . . . . . . . . . . . . . . . . . . .6
1 Introduction . . . . . . . . . . . . . . . . . . . . . . . . . . . . . . . . . . . . . . . . . . . . . . . . . . . .7
2 Status of salmon and sea trout populations in the Baltic Sea . . . . . . . . . . . .82.1 Salmon rivers . . . . . . . . . . . . . . . . . . . . . . . . . . . . . . . . . . . . . . . . . . . . . . . . . . . . . . . . . . . . . . .8
2.1.1 Salmon population trends . . . . . . . . . . . . . . . . . . . . . . . . . . . . . . . . . . . . . . . . . . . . . . . .8Population indicators . . . . . . . . . . . . . . . . . . . . . . . . . . . . . . . . . . . . . . . . . . . . . . . . . . . .8Parr density and smolt production . . . . . . . . . . . . . . . . . . . . . . . . . . . . . . . . . . . . . . . . .9Post-smolt survival . . . . . . . . . . . . . . . . . . . . . . . . . . . . . . . . . . . . . . . . . . . . . . . . . . . . . 12Number of salmon ascending rivers . . . . . . . . . . . . . . . . . . . . . . . . . . . . . . . . . . . . . . . 12Catches of salmon . . . . . . . . . . . . . . . . . . . . . . . . . . . . . . . . . . . . . . . . . . . . . . . . . . . . . .14
2.1.2 Management of salmon fi sheries . . . . . . . . . . . . . . . . . . . . . . . . . . . . . . . . . . . . . . . . .14From IBSFC to the Common Fisheries Policy . . . . . . . . . . . . . . . . . . . . . . . . . . . . . . . . .14
2.1.3 Re-establishment of salmon in potential rivers . . . . . . . . . . . . . . . . . . . . . . . . . . . . . .16Estonia . . . . . . . . . . . . . . . . . . . . . . . . . . . . . . . . . . . . . . . . . . . . . . . . . . . . . . . . . . . . . . .16Finland . . . . . . . . . . . . . . . . . . . . . . . . . . . . . . . . . . . . . . . . . . . . . . . . . . . . . . . . . . . . . . .16Lithuania . . . . . . . . . . . . . . . . . . . . . . . . . . . . . . . . . . . . . . . . . . . . . . . . . . . . . . . . . . . . .16Poland . . . . . . . . . . . . . . . . . . . . . . . . . . . . . . . . . . . . . . . . . . . . . . . . . . . . . . . . . . . . . . .16Russia . . . . . . . . . . . . . . . . . . . . . . . . . . . . . . . . . . . . . . . . . . . . . . . . . . . . . . . . . . . . . . . .16Sweden . . . . . . . . . . . . . . . . . . . . . . . . . . . . . . . . . . . . . . . . . . . . . . . . . . . . . . . . . . . . . .16
2.2 Sea trout rivers . . . . . . . . . . . . . . . . . . . . . . . . . . . . . . . . . . . . . . . . . . . . . . . . . . . . . . . . . . . . . 172.2.1 Sea trout population trends . . . . . . . . . . . . . . . . . . . . . . . . . . . . . . . . . . . . . . . . . . . . . 17
Population indicators . . . . . . . . . . . . . . . . . . . . . . . . . . . . . . . . . . . . . . . . . . . . . . . . . . . 17Parr density . . . . . . . . . . . . . . . . . . . . . . . . . . . . . . . . . . . . . . . . . . . . . . . . . . . . . . . . . . .18Number of ascending sea trout . . . . . . . . . . . . . . . . . . . . . . . . . . . . . . . . . . . . . . . . . . .18Catches of sea trout . . . . . . . . . . . . . . . . . . . . . . . . . . . . . . . . . . . . . . . . . . . . . . . . . . . .18
2.3 Stocking of salmon and sea trout . . . . . . . . . . . . . . . . . . . . . . . . . . . . . . . . . . . . . . . . . . . . . .19
3 Habitat and water quality requirements of Baltic salmon and sea trout populations . . . . . . . . . . . . . . . . . . . . . . . . . . . . . . . . . . . . . . . . . . .20
3.1 Life in the sea . . . . . . . . . . . . . . . . . . . . . . . . . . . . . . . . . . . . . . . . . . . . . . . . . . . . . . . . . . . . . .213.2 Upriver migration . . . . . . . . . . . . . . . . . . . . . . . . . . . . . . . . . . . . . . . . . . . . . . . . . . . . . . . . . .213.3 Spawning . . . . . . . . . . . . . . . . . . . . . . . . . . . . . . . . . . . . . . . . . . . . . . . . . . . . . . . . . . . . . . . . .213.4 Embryo development . . . . . . . . . . . . . . . . . . . . . . . . . . . . . . . . . . . . . . . . . . . . . . . . . . . . . . .223.5 Early life . . . . . . . . . . . . . . . . . . . . . . . . . . . . . . . . . . . . . . . . . . . . . . . . . . . . . . . . . . . . . . . . . .223.6 Smolting and smolt run . . . . . . . . . . . . . . . . . . . . . . . . . . . . . . . . . . . . . . . . . . . . . . . . . . . . . .23
4 The infl uence of climate change on the populations of Baltic salmon and sea trout . . . . . . . . . . . . . . . . . . . . . . . . . . . . . . . . . . . . . . .24
4.1 Climate change in the Baltic Sea region. . . . . . . . . . . . . . . . . . . . . . . . . . . . . . . . . . . . . . . . .244.2 Infl uence of climate change on Baltic salmon and sea trout . . . . . . . . . . . . . . . . . . . . . . . .25
5 Categorisation of salmon and sea trout populations in the Baltic Sea . . . . . . . . . . . . . . . . . . . . . . . . . . . . . . . . . . . . . . . . . . . . . . . . . . .27
6 European Union and Russian Federation legislation concerning river and sea waters . . . . . . . . . . . . . . . . . . . . . . . . . . . . . . . . . . . . . . . . . . . . .28
3

4
7 Overview of salmon and sea trout populations and rivers in the Baltic Sea countries . . . . . . . . . . . . . . . . . . . . . . . . . . . . . . . . . . .29
7.1 Belarus . . . . . . . . . . . . . . . . . . . . . . . . . . . . . . . . . . . . . . . . . . . . . . . . . . . . . . . . . . . . . . . . . . . .297.1.1 State of the salmonid habitats in Belarus . . . . . . . . . . . . . . . . . . . . . . . . . . . . . . . . . . .297.1.2 State of the salmon populations in Belarus . . . . . . . . . . . . . . . . . . . . . . . . . . . . . . . . .297.1.3 State of the sea trout populations in Belarus . . . . . . . . . . . . . . . . . . . . . . . . . . . . . . . .297.1.4 Fishing regulations in the Belarusian rivers . . . . . . . . . . . . . . . . . . . . . . . . . . . . . . . . .30
7.2 Denmark . . . . . . . . . . . . . . . . . . . . . . . . . . . . . . . . . . . . . . . . . . . . . . . . . . . . . . . . . . . . . . . . . .317.2.1 State of the salmonid habitats in Denmark . . . . . . . . . . . . . . . . . . . . . . . . . . . . . . . . .317.2.2 State of the salmon populations in Denmark . . . . . . . . . . . . . . . . . . . . . . . . . . . . . . .327.2.3 State of the sea trout populations in Denmark . . . . . . . . . . . . . . . . . . . . . . . . . . . . .327.2.4 Fishing regulations in Danish rivers . . . . . . . . . . . . . . . . . . . . . . . . . . . . . . . . . . . . . . .33
7.3 Estonia . . . . . . . . . . . . . . . . . . . . . . . . . . . . . . . . . . . . . . . . . . . . . . . . . . . . . . . . . . . . . . . . . . .337.3.1 State of the salmonid habitats in Estonia . . . . . . . . . . . . . . . . . . . . . . . . . . . . . . . . . . .337.3.2 State of the salmon populations in Estonia . . . . . . . . . . . . . . . . . . . . . . . . . . . . . . . . .347.3.3 State of the sea trout populations in Estonia . . . . . . . . . . . . . . . . . . . . . . . . . . . . . . . .347.3.4 Fishing regulations in Estonian rivers . . . . . . . . . . . . . . . . . . . . . . . . . . . . . . . . . . . . . .34
7.4 Finland . . . . . . . . . . . . . . . . . . . . . . . . . . . . . . . . . . . . . . . . . . . . . . . . . . . . . . . . . . . . . . . . . . .357.4.1 State of the salmonid habitats in Finland . . . . . . . . . . . . . . . . . . . . . . . . . . . . . . . . . . .357.4.2 State of the salmon populations in Finland . . . . . . . . . . . . . . . . . . . . . . . . . . . . . . . . .367.4.3 State of the sea trout populations in Finland . . . . . . . . . . . . . . . . . . . . . . . . . . . . . . .367.4.4 Fishing regulations in the Finnish rivers . . . . . . . . . . . . . . . . . . . . . . . . . . . . . . . . . . . .37
7.5 Latvia . . . . . . . . . . . . . . . . . . . . . . . . . . . . . . . . . . . . . . . . . . . . . . . . . . . . . . . . . . . . . . . . . . . . .377.5.1 State of the salmonid habitats in Latvia . . . . . . . . . . . . . . . . . . . . . . . . . . . . . . . . . . .377.5.2 State of the salmon populations in Latvia . . . . . . . . . . . . . . . . . . . . . . . . . . . . . . . . . .387.5.3 State of the sea trout populations in Latvia . . . . . . . . . . . . . . . . . . . . . . . . . . . . . . . . .387.5.4 Fishing regulations in Latvian rivers . . . . . . . . . . . . . . . . . . . . . . . . . . . . . . . . . . . . . . .38
7.6 Lithuania . . . . . . . . . . . . . . . . . . . . . . . . . . . . . . . . . . . . . . . . . . . . . . . . . . . . . . . . . . . . . . . . . .397.6.1 State of the salmonid habitats in Lithuania . . . . . . . . . . . . . . . . . . . . . . . . . . . . . . . . .397.6.2 State of the salmon populations in Lithuania . . . . . . . . . . . . . . . . . . . . . . . . . . . . . . .397.6.3 State of the sea trout populations in Lithuania . . . . . . . . . . . . . . . . . . . . . . . . . . . . . .397.6.4 Fishing regulation in Lithuanian rivers . . . . . . . . . . . . . . . . . . . . . . . . . . . . . . . . . . . . .40
7.7 Poland . . . . . . . . . . . . . . . . . . . . . . . . . . . . . . . . . . . . . . . . . . . . . . . . . . . . . . . . . . . . . . . . . . . .407.7.1 State of the salmonid habitats in Poland . . . . . . . . . . . . . . . . . . . . . . . . . . . . . . . . . . .407.7.2 State of the salmon populations in Poland . . . . . . . . . . . . . . . . . . . . . . . . . . . . . . . . . .407.7.3 State of the sea trout populations in Poland . . . . . . . . . . . . . . . . . . . . . . . . . . . . . . . . 417.7.4 Fishing regulations in Polish rivers . . . . . . . . . . . . . . . . . . . . . . . . . . . . . . . . . . . . . . . . .41
7.8 Russia . . . . . . . . . . . . . . . . . . . . . . . . . . . . . . . . . . . . . . . . . . . . . . . . . . . . . . . . . . . . . . . . . . . .427.8.1 State of the salmonid habitats in Russia . . . . . . . . . . . . . . . . . . . . . . . . . . . . . . . . . . . .427.8.2 State of the salmon populations in Russia . . . . . . . . . . . . . . . . . . . . . . . . . . . . . . . . . .427.8.3 State of the sea trout populations in Russia. . . . . . . . . . . . . . . . . . . . . . . . . . . . . . . . .427.8.4 Fishing regulations in Russian rivers . . . . . . . . . . . . . . . . . . . . . . . . . . . . . . . . . . . . . . .43
7.9 Sweden . . . . . . . . . . . . . . . . . . . . . . . . . . . . . . . . . . . . . . . . . . . . . . . . . . . . . . . . . . . . . . . . . . .437.9.1 State of the salmonid habitats in Sweden . . . . . . . . . . . . . . . . . . . . . . . . . . . . . . . . . .437.9.2 State of salmon populations in Sweden . . . . . . . . . . . . . . . . . . . . . . . . . . . . . . . . . . . .447.9.3 State of the sea trout populations in Sweden . . . . . . . . . . . . . . . . . . . . . . . . . . . . . . .457.9.4 Fishing regulations in Swedish rivers . . . . . . . . . . . . . . . . . . . . . . . . . . . . . . . . . . . . . .45

5
8 Synthesis on the state of salmon and sea trout populations and river habitats in the Baltic Sea . . . . . . . . . . . . . . . . . . . . . . . . . . . . . . . . . . . . .46
8.1 Salmon populations . . . . . . . . . . . . . . . . . . . . . . . . . . . . . . . . . . . . . . . . . . . . . . . . . . . . . . . . .468.2 Sea trout populations . . . . . . . . . . . . . . . . . . . . . . . . . . . . . . . . . . . . . . . . . . . . . . . . . . . . . . .478.3 Salmon and sea trout passage in rivers, river habitats, hydrology and water quality . . .47
9 Defi ning criteria for prioritising populations/rivers and recommending actions . . . . . . . . . . . . . . . . . . . . . . . . . . . . . . . . . . . . . . . . . . .49
9.1 Criteria for prioritising populations/rivers . . . . . . . . . . . . . . . . . . . . . . . . . . . . . . . . . . . . . . .499.1.1 Original populations in their native rivers . . . . . . . . . . . . . . . . . . . . . . . . . . . . . . . . . .499.1.2 Potential populations and rivers . . . . . . . . . . . . . . . . . . . . . . . . . . . . . . . . . . . . . . . . . . 51
Original populations maintained as brood stocks and by stocking . . . . . . . . . . . . . . 51Salmon rivers with large potential for reproduction . . . . . . . . . . . . . . . . . . . . . . . . . 51
9.2 Criteria for and description of appropriate actions . . . . . . . . . . . . . . . . . . . . . . . . . . . . . . .52River water and habitat . . . . . . . . . . . . . . . . . . . . . . . . . . . . . . . . . . . . . . . . . . . . . . . . .52Passage in rivers . . . . . . . . . . . . . . . . . . . . . . . . . . . . . . . . . . . . . . . . . . . . . . . . . . . . . . .53River fi sheries management . . . . . . . . . . . . . . . . . . . . . . . . . . . . . . . . . . . . . . . . . . . . .54Fishing regulations and culture . . . . . . . . . . . . . . . . . . . . . . . . . . . . . . . . . . . . . . . . . . .54Fish stock management, enforcement and sanctions . . . . . . . . . . . . . . . . . . . . . . . . .54
10 Recommendations . . . . . . . . . . . . . . . . . . . . . . . . . . . . . . . . . . . . . . . . . . . . . .5610.1 Salmon populations/rivers . . . . . . . . . . . . . . . . . . . . . . . . . . . . . . . . . . . . . . . . . . . . . . . . . . .56
10.1.1 Original salmon populations in their native rivers . . . . . . . . . . . . . . . . . . . . . . . . . .56Original salmon populations in the MSY traffi c light red list . . . . . . . . . . . . . . . . .56Original salmon populations in the MSY traffi c light yellow list . . . . . . . . . . . . . . .56Original salmon populations in the MSY traffi c light green list . . . . . . . . . . . . . . .58Original salmon populations available in hatcheries for possible re-establishment 58Salmon rivers with large potential that may be restored for salmon production .58
10.1.2 Potential salmon populations and rivers . . . . . . . . . . . . . . . . . . . . . . . . . . . . . . . . . .5810.1.3 Other salmon populations . . . . . . . . . . . . . . . . . . . . . . . . . . . . . . . . . . . . . . . . . . . . .58
10.2 Sea trout populations/rivers . . . . . . . . . . . . . . . . . . . . . . . . . . . . . . . . . . . . . . . . . . . . . . . . .5910.3 River waters, habitats and accessibility . . . . . . . . . . . . . . . . . . . . . . . . . . . . . . . . . . . . . . . .5910.4 River fi sheries management . . . . . . . . . . . . . . . . . . . . . . . . . . . . . . . . . . . . . . . . . . . . . . . . .5910.5 Restoration and development plans for salmon rivers . . . . . . . . . . . . . . . . . . . . . . . . . . . .60
Original salmon populations in their native rivers (preliminary list) . . . . . . . . . . . .60Potential salmon populations and rivers . . . . . . . . . . . . . . . . . . . . . . . . . . . . . . . . . .60
11 Implementation of actions in the HELCOM Baltic Sea Action Plan relevant for salmon and sea trout populations . . . . . . . . . . . . . . . . . . . . . . .61
12 References . . . . . . . . . . . . . . . . . . . . . . . . . . . . . . . . . . . . . . . . . . . . . . . . . . . . .62
13 Acknowledgements . . . . . . . . . . . . . . . . . . . . . . . . . . . . . . . . . . . . . . . . . . . . .66
Annex I . . . . . . . . . . . . . . . . . . . . . . . . . . . . . . . . . . . . . . . . . . . . . . . . . . . . . . . . . . .67Annex II . . . . . . . . . . . . . . . . . . . . . . . . . . . . . . . . . . . . . . . . . . . . . . . . . . . . . . . . . .69Annex III . . . . . . . . . . . . . . . . . . . . . . . . . . . . . . . . . . . . . . . . . . . . . . . . . . . . . . . . . .77

Executive summary
The state of Baltic Sea salmon and sea trout popu-lations vary from a very healthy state to being at the verge of extinction. The river habitats of salmonids have in many cases been destroyed or have deteriorated and have often been blocked for passage of fi sh when they are harnessed for hydro-power production.
This report presents an overview, inventory and classifi cation of salmon and sea trout populations in rivers fl owing to the Baltic Sea and makes rec-ommendations for measures for the restoration of river habitats and waters, opening of passage in rivers and fi sheries management measures in rivers. The report proposes a defi nition of a sal-monid habitat in good state. It also proposes that an assessment should be made of the possibilities of opening passage through rivers that have man-made migration hindrances. Also it is proposed that a set of effective and proportionate fi shing rules is developed based on a participatory and open process. These measures are intended to improve the status of Baltic Sea salmon and sea trout populations and restore the natural fi sh pro-duction capacity of riverine habitats.
The report has identifi ed that the original salmon populations of the rivers Daugava, Emån, Gauja, Göta älv (tributaries Brattorpsån, Grönån, Lärjeån, Säveån and Västerlandaån), Keila, Kunda, Kungs-backaån, Luga, Löftaån, Nissan (tributary Sennan), Pärnu, Rickleån, Rönne å, Saka, Tvååkersån,
Vasalemma, Öreälven and the tributaries of the Nemunas river system Šventoji, Žeimena, Vilia, Vilnia and Neris are in urgent need of recovery measures. These populations should be the focus of immediate and effective conservation meas-ures that allow them to recover towards a state of Maximum Sustainable Yield. Progress towards this goal will be publicly available on a red list of salmon rivers displayed on a GIS-map at the HELCOM website. The report also identifi es that a total of 299 original sea trout populations are in urgent need of recovery measures.
The report also makes the observation that the original salmon populations of the rivers Dalälven, Iijoki, Indalsälven, Ljusnan, Luleälven, Skellefteälven and Ångermanälven are currently maintained as brood stocks and do not reproduce in the riverine habitats. These populations should where appro-priate be re-established in their native rivers or a nearby river in the same assessment unit.
Furthermore the report identifi es that the rivers Kymijoki, Kemijoki and Oulujoki have lost their original salmon populations, but as river habitats still have a large potential smolt production capac-ity. Passage for salmonids through these rivers or the transport of spawners to reproduction areas should be provided where an assessment shows that mobilising the reproductive areas in these rivers is justifi ed. The reared populations men-tioned above and the salmon rivers mentioned in this paragraph are defi ned as potential salmon populations and rivers.
With the view of implementing the recommen-dations of this report and the commitments of the HELCOM Baltic Sea Action Plan, it is recom-mended that the original salmon populations/rivers of Daugava, Emån, Gauja, Kunda, Luga, Nemunas (tributaries Neris, Šventoji, Žeimena, Vilnia and Vilia), Pärnu, Rickleån, Rönne å and Saka (preliminary list) and the potential salmon populations/rivers of Iijoki, Kemijoki, Kymijoki, Ljusnan, Luleälven and Ångermanälven are selected for a second phase project to be coor-dinated by HELCOM. The fi nal list of the original salmon populations would be decided at the beginning of such a project. The project would have the objective of producing restoration and development plans that could serve as the basis for a third phase of practical implementation.6

1 Introduction
The drainage area of the Baltic Sea is more than four times larger than the sea area itself. As a consequence a large number of rivers and streams have formed to channel water into the Baltic Sea. These rivers and streams serve as a habitat for migratory fi sh species which in addition to their marine life either reproduce (anadromous species) or feed (catadromous species) in freshwater habi-tats. Baltic salmon (Salmo salar), sea trout (Salmo trutta), whitefi sh (Coregonus sp.) and river lamprey (Lampetra fl uviatilis) are examples of important anadromous fi sh species, while the eel (Anguilla anguilla) is a catadromous species.
The overall ecological condition of the Baltic rivers and the status of their fi sh populations have deteriorated from their pristine state. This is a consequence of anthropogenic impacts caused by many activities in the drainage area, in the rivers and in the Baltic Sea. In the rivers, the most detrimental activities have been damming, dredg-ing and channelizing rivers for hydropower, log driving and agricultural purposes. Also indirect impacts of human activities such as elevated nutrient and sediment loads from agriculture and forestry practices and from discharges of domes-tic sewage have adversely affected the ecological condition of Baltic rivers.
This report is based on the HELCOM SALAR project that focused on the state of salmon (Salmo salar) and sea trout (Salmo trutta) populations in rivers fl owing into the Baltic Sea. The project was funded through a co-fi nancing agreement between the European Commission (DG MARE) and HELCOM. It forms a basis for implementing some of the fi sh-eries actions in the strategic HELCOM Baltic Sea Action Plan (BSAP) to radically reduce pollution to the sea and restore the good ecological status of the marine environment by 2021. The BSAP sets the target to reach a salmon smolt production of at least 80% of the potential or for weaker popula-tions 50% of the potential production.
The report presents an overview, inventory and classifi cation of Baltic rivers with salmon and/or sea trout populations. The report also recommends measures for the restoration of river habitats and waters, opening of passage and fi sheries manage-ment measures in rivers for the improvement of the status of salmon and sea trout populations. A prioritization of Baltic salmon and sea trout popu-
lations in need of urgent actions for their recovery is also included. The recommendations and prior-itizations will allow for the development of inter-national and national programs for the planning, funding and systematic realization of these actions.
The report’s recommendations relate only to the riverine areas, in accordance with the project agreement between the European Commission and HELCOM. The management of salmon fi sher-ies in the marine area of the Baltic Sea is subject to defi nition and implementation of management measures by the European Union and the Russian Federation.
The report has been prepared in co-operation with nominated salmonid and river habitat experts of the Baltic Sea countries as mentioned on the second page. The work is based on an agreed common format for reporting on the state of sal-monid populations and habitats. In addition to this report, the project has produced descriptions of individual salmon and sea trout rivers (BSEP 126B) as well as data in excel sheets on salmonid popula-tions and habitats. These descriptions and data have been produced by the nominated experts and edited by the project staff. The river descriptions are available as web publications at www.helcom.fi as well as a GIS map on salmon rivers. The excel sheets are available from the HELCOM Secretariat and at the institutions of the nominated experts. 7
2 Status of salmon and sea trout populations in the Baltic Sea
2.1.1 Salmon population trends
Population indicatorsThe information on the abundance and exploita-tion of wild salmon in the Baltic is mainly based on electrofi shing for parr, smolt trapping and counts of returning adults in the rivers, and catch and effort data from the commercial and recreational fi sheries.
Parr and smolt production are important indica-tors of the status of salmon populations. Data on sea survival of young salmon (post-smolts) is also an important indicator as the survival rate strongly affects the development of populations.
Towards the later part of the life-cycle, monitor-ing the number of salmon ascending rivers is an important indicator, since it refl ects the size of the spawning stock. Other important indicators are catches offshore, at the coast and in rivers. Salmon are caught in commercial fi sheries in the sea and recreational fi sheries both in the sea and rivers.
The Baltic salmon populations are separate enti-ties which are optimally assessed on a river-by-river basis. The International Council for the Exploration of the Sea (ICES) has used six assessment units for the Baltic salmon stocks (Figure 2.1). The division is based on biological and genetic characteristics of the stocks. Stocks of a particular unit have genetic proximity and are assumed to exhibit similar migra-tion patterns. It can, therefore, be assumed that they are subjected to the same fi sheries, experience the same exploitation rates, and could be managed in the same way (ICES 2010a). The development of salmon populations in the assessment units is the most important population status indicator.
2.1 Salmon rivers
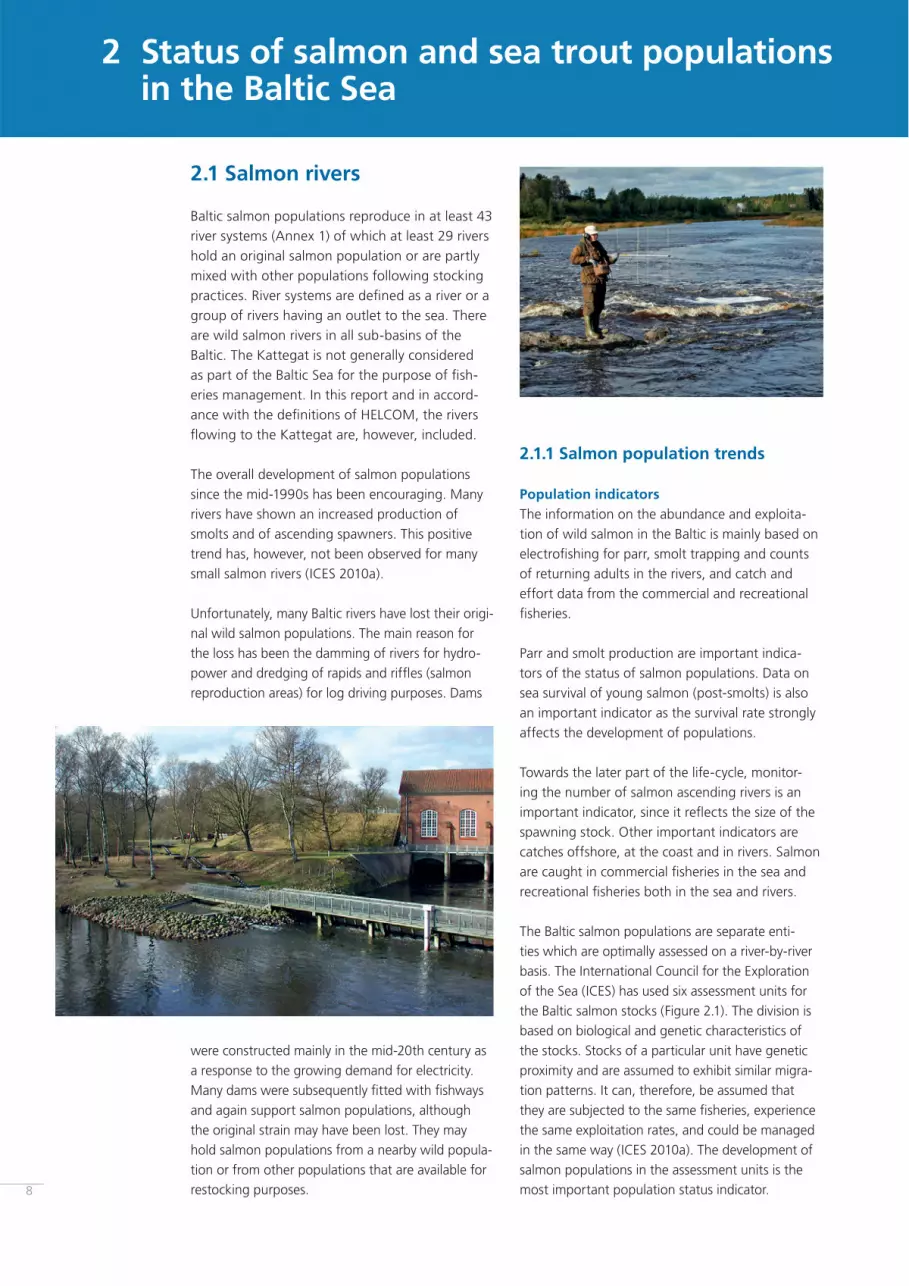
Baltic salmon populations reproduce in at least 43 river systems (Annex 1) of which at least 29 rivers hold an original salmon population or are partly mixed with other populations following stocking practices. River systems are defi ned as a river or a group of rivers having an outlet to the sea. There are wild salmon rivers in all sub-basins of the Baltic. The Kattegat is not generally considered as part of the Baltic Sea for the purpose of fi sh-eries management. In this report and in accord-ance with the defi nitions of HELCOM, the rivers fl owing to the Kattegat are, however, included.
The overall development of salmon populations since the mid-1990s has been encouraging. Many rivers have shown an increased production of smolts and of ascending spawners. This positive trend has, however, not been observed for many small salmon rivers (ICES 2010a).
Unfortunately, many Baltic rivers have lost their origi-nal wild salmon populations. The main reason for the loss has been the damming of rivers for hydro-power and dredging of rapids and riffl es (salmon reproduction areas) for log driving purposes. Dams
were constructed mainly in the mid-20th century as a response to the growing demand for electricity. Many dams were subsequently fi tted with fi shways and again support salmon populations, although the original strain may have been lost. They may hold salmon populations from a nearby wild popula-tion or from other populations that are available for restocking purposes.8

9
of parr has increased markedly within rivers of assessment units 1 and 2. In assessment units 3 and 4 the densities have not shown the same increase, but in assessment unit 5 increases in parr densities have been observed since 2003. In assessment unit 6, parr densities have shown large variation (Table 2.1 and Figure 2.2).
Parr density and smolt productionThe ICES Baltic Salmon and Trout Assessment Working Group (WGBAST) report of 2010 (ICES 2010a) presents data on the density of salmon parr in 40 Baltic rivers. The parr are divided into fi rst summer parr (0+) and parr of 1–4 years (> 0+). Since the end of the 1990s, the density
Figure 2.1. The ICES assessment units (1–6) for the salmon stocks in the Baltic Sea, based on management objec-tives and biological and genetic characteristics of the stocks contained in a unit (ICES 2010a).
12
4
6
5
3
Luga
Neva
Narvaas Klemma
aeila
Estonia
ja
Daugava
LithuaniaNeumunas, Minja
Russia
Latvia
Poland
Russia
Finland
Sweden
Germany
0 100 200 km
Åbyälven
Drawa
Odr
a
IijokiSimojoki
Tornionjoki
Oulujoki
Råneälven Byskeälven
Emån
Mörrumsån
Vistula
Saka Venta
Irbe
Gau
V
Kokemäenjoki
Gulf of Finland
BothnianSea
Baltic Main Basin
Dalälven
Skellefteälven Vindelälven
Umeälven Lögdeälven
Ångermanälven
Piteälven
Kalixälven Luleälven
Indalsälven
Ljungan
Ljusnan
Salaca
Assessment
Units
Loobu
Kunda

10
production capacity (PSPC) of these rivers. The total wild smolt production has increased almost tenfold in assessment units 1–2 since 1997 (Figure 2.3). The largest and most productive rivers are in these units. The trend in smolt production has
ICES (2010a) reports that the smolt production of the 27 assessed rivers in the Main Basin and the Gulf of Bothnia has increased by more than 60% since 2003. The production in 2009 was estimated to be about 70% of the potential smolt
0
5
10
15
20
25
30
35
40
45
50
1993
1992
1994
1995
1996
1997
1998
1999
2000
2001
2002
2003
2004
2005
2006
2007
2008
2009
Num
er o
f 0+
par
r/10
0m2
Kunda
Keila
Vasalemma
(95 parr/100 m²)
Table 2.1. Densities of >0+ salmon parr in fi ve rivers of assessment units 1–5 (ICES 2010a).
Figure 2.2. Densities of 0+ salmon parr in the three wild Estonian salmon rivers (ICES 2010a).
Number of parr/ 100 m2
Year Simojoki (unit 1) Åbyälven (unit 2) Ljungan (unit 3) Mörrumsån (unit 4) Salaca (unit 5)
1990 2.55 2.38 4.8 60 No data1991 2.63 4.47 0.6 55 No data1992 No data 3.82 No data 78 No data1993 1.33 5.18 No data 21 4.91994 1.11 2.62 0.2 8 2.61995 0.49 2.95 0.9 5 2.81996 0.76 4.99 6.5 50 0.91997 1.85 5.05 2.1 15 3.11998 4.34 No data No data 29 2.81999 14.16 8.31 7.9 35 42000 16.65 8.05 6.5 21 0.82001 11.48 5.34 No data 22 4.42002 12.69 3.73 2.6 14 10.32003 7.41 4.56 0.2 28 1.32004 8.8 1.32 1.4 21 2.72005 10.3 2.02 2.3 29 3.82006 20.47 13.14 No data 2.0 34 17.92007 4.22 11.06 2.0 10 6.92008 5.12 6.14 0.3 16 4.92009 15.58 7.45 No data 14 10.3

11
duction of smolts in these rivers is estimated to be about 125,000 smolts (mean of years 2005–2009) which represents 52% of the estimated PSPC of the rivers (fi gures provided by Erik Degerman, Swedish Board of Fisheries).
been more varied and modest within the other assessment units.
To evaluate the current state of the stocks, ICES (2010a) uses the smolt production relative to the PSPC on a river-by-river basis. Stocks are con-sidered very likely to reach the reference points of 50% or 75% of PSPC when the probability is more than 90%; they are considered likely to reach the reference points when the probability is between 70% and 90% and it is considered uncertain if the reference point will be achieved when the probability is between 30% and 70%. When the probability of reaching the reference point is less than 30%, it is considered unlikely that the reference point will be achieved.
According to ICES (2010a), 11 of the 27 assessed rivers are likely or very likely to reach the 50% target in the short-term, while 8 rivers are unlikely and 8 rivers uncertain to reach the 50% target. The reference points of the natural production capacity are more likely to be met in the produc-tive rivers fl owing into Bothnian Bay.
There are 16 original salmon populations in the Swedish rivers fl owing to the Kattegat. The pro-
0
500
1000
1500
2000
2500
3000
96 97 98 99 00 01 02 03 04 05 06 07 08 09
Smol
ts (x
100
0)
Salmon smolt production in the Baltic Sea
Assessment unit 1
Assessment unit 2
Assessment unit 3
Assessment unit 4
Assessment unit 5
Assessment unit 6
Figure 2.3. Natural salmon smolt production in the Baltic Sea during 1996–2009 by ICES assessment unit. Data for assessment unit 5 from 1996–2000 is lacking (ICES 2010a).
12
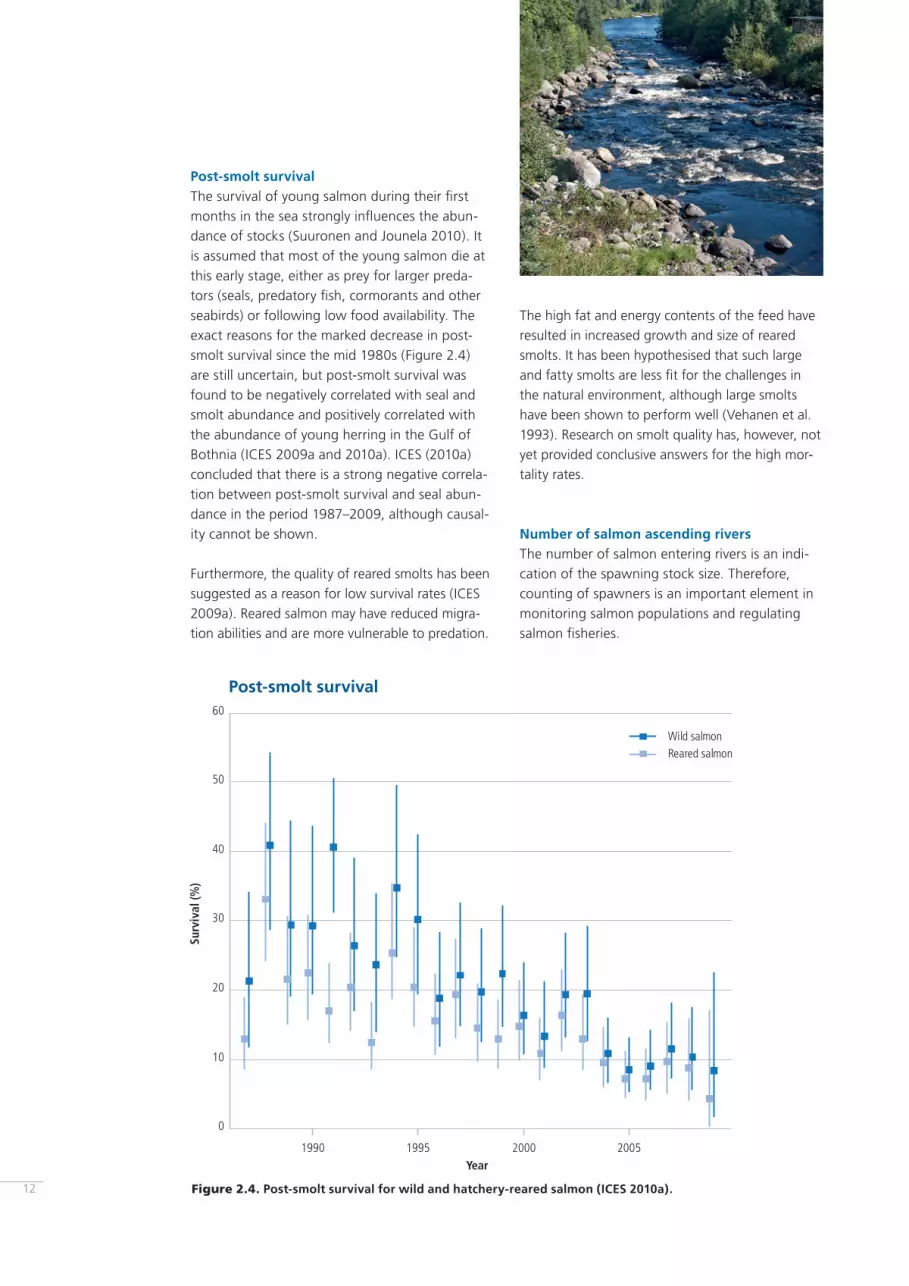
The high fat and energy contents of the feed have resulted in increased growth and size of reared smolts. It has been hypothesised that such large and fatty smolts are less fi t for the challenges in the natural environment, although large smolts have been shown to perform well (Vehanen et al. 1993). Research on smolt quality has, however, not yet provided conclusive answers for the high mor-tality rates.
Number of salmon ascending riversThe number of salmon entering rivers is an indi-cation of the spawning stock size. Therefore, counting of spawners is an important element in monitoring salmon populations and regulating salmon fi sheries.
Post-smolt survivalThe survival of young salmon during their fi rst months in the sea strongly infl uences the abun-dance of stocks (Suuronen and Jounela 2010). It is assumed that most of the young salmon die at this early stage, either as prey for larger preda-tors (seals, predatory fi sh, cormorants and other seabirds) or following low food availability. The exact reasons for the marked decrease in post-smolt survival since the mid 1980s (Figure 2.4) are still uncertain, but post-smolt survival was found to be negatively correlated with seal and smolt abundance and positively correlated with the abundance of young herring in the Gulf of Bothnia (ICES 2009a and 2010a). ICES (2010a) concluded that there is a strong negative correla-tion between post-smolt survival and seal abun-dance in the period 1987–2009, although causal-ity cannot be shown.
Furthermore, the quality of reared smolts has been suggested as a reason for low survival rates (ICES 2009a). Reared salmon may have reduced migra-tion abilities and are more vulnerable to predation.
1990 1995 2000 2005
0
10
20
30
40
50
60
Post-smolt survival
Year
Surv
ival
(%)
Wild salmonReared salmon
Figure 2.4. Post-smolt survival for wild and hatchery-reared salmon (ICES 2010a).

13
are used in the rivers Piteälven, Åbyälven, Byskeäl-ven, Rickleån, Kalixälven and Slupia. In the rivers Kalixälven and Slupia, fi sh are also recorded using video camera to enable species identifi cation. In the river Ume/Vindelälven salmon are trapped and counted manually at the fi sh ladder.
In the Baltic rivers, counting of salmon is currently undertaken in nine rivers. A new DIDSON (Dual frequency IDentifi cation SONar) echo sounder has been used in the river Simojoki since 2008 and in the river Tornionjoki since 2009. Infrared fi sh counters (Riverwatcher) situated in fi sh ladders
0
1000
2000
3000
4000
5000
6000
7000
1974
1977
1980
1983
1986
1989
1992
1995
1998
2001
2004
2007
2009
No.
of f
ish
Salmon (wild)
Sea trout (wild)
Figure 2.5. The number of ascending wild salmon and sea trout at the Stornorrforsen fi sh ladder of Ume/Vindelälven in 1974–2009 (Swedish University of Agricultural Science, Umeå).
May 24
June 3June 1
3June 2
3July 3
July 13
July 23
August 2
August 12
August 22
0
100
200
300
400
500
600
700
800
900
1000
Num
ber
of s
alm
on
Figure 2.6. The daily number of ascending wild salmon and sea trout in the river Tornionjoki in 2010 (Finnish Game and Fisheries Research Institute).

14
while the proportions taken in the coastal fi sheries and recreational river fi sheries have increased.
Fishing for salmon has decreased as a consequence of fi shing regulations and natural causes such as seal predation. Fishing with driftnets was phased out within the EU during the years 2005–2007 and prohibited in 2008. Consequently, the main fi shing gear and technique used in the offshore fi sheries was eliminated.
The natural causes for decreased catches appear to be the increased seal population and low post-smolt survival. The increased grey seal population (Halich-oerus grypus) has both caused damage to fi shing gear and fi sh catches and reduced the effectiveness of fi shing gear (Fjälling 2005, Kauppinen et al. 2005 and Jounela et al. 2006). Adult salmon have been observed to be a common prey for seals in the Gulf of Bothnia (Lundström et al. 2007).
2.1.2 Management of salmon fi sheries
From IBSFC to the Common Fisheries PolicySalmon fi sheries as well as other major fi sheries in the Baltic were for over two decades regulated by the International Baltic Sea Fisheries Commission (IBSFC). Following the accession of Finland and Sweden to the European Union in 1995 and the accession of Estonia, Latvia, Lithuania and Poland
In Figure 2.5 the increasing trend of ascending salmon since the millenium shift in the Ume/Vindelälven is shown. Figure 2.6 shows the daily number of ascending salmon and sea trout in the river Tornionjoki in 2010. The location of the DIDSON echo sounder in Tornionjoki is in the Kat-tilakoski rapids located 100 km from the sea. The salmon that stayed downstream of Kattilakoski or that where caught in this area of the river were not detected and the total number of ascending salmon is, therefore, somewhat higher than the detected number.
In 2010, the numbers of ascending salmon in the rivers of the Gulf of Bothnia decreased to approximately half the numbers counted in 2009. In 2008, a peak was observed in the numbers of ascending salmon.
Catches of salmonSalmon are fi shed in offshore areas as well as in coastal and river areas. They are the target of both commercial and recreational fi sheries. The total harvest has decreased since the 1990s (Figure 2.7).
The nominal catch of salmon in the whole Baltic Sea (including rivers) has declined signifi cantly from 5,633 tonnes in 1990 to 1,103 tonnes in 2009 (Table 2.2). A decreasing proportion of the total salmon catch has been taken in the offshore areas

15
for a comprehensive management of Baltic fi sher-ies, including salmon and sea trout.
In 1997, the IBSFC adopted a Salmon Action Plan (SAP) 1997 - 2010. The plan was progressive as it was the fi rst multi-annual fi sheries management plan in the Baltic. The principal aim of the SAP was
in 2005, the IBSFC ceased to exist at the end of 2005. Since then, fi sheries management in the Baltic Sea is a matter for the European Union, in accordance with its Common Fisheries Policy, and for the Russian Federation. In 2009, the EU and Russia signed an agreement on cooperation on Baltic fi sheries. The agreement provides the basis
REPORTED CATCHES (TONNES)
Year Denmark Estonia Finland Germany Latvia Lithuania Poland Russia Sweden Total
1990 729 93 2,294 36 607 66 195 148 1,468 5,6361991 625 86 2,171 28 481 62 77 177 1,096 4,8031992 645 32 2,121 27 278 20 170 66 1,189 4,5481993 575 32 1,626 31 256 15 191 90 1,134 3,9661994 737 10 1,209 10 130 5 184 45 851 3,1811995 556 9 1,324 19 139 2 133 63 795 3,0401996 525 9 1,316 12 150 14 125 47 940 3,1381997 489 10 1,357 38 170 5 110 27 824 3,0301998 495 8 850 42 125 5 118 36 815 2,4941999 395 14 720 29 166 6 135 25 672 2,1622000 421 23 757 44 149 5 144 27 771 2,3422001 443 16 606 39 136 4 180 37 616 2,0762002 334 16 509 29 108 11 197 66 572 1,8412003 454 10 410 29 47 3 198 22 454 1,6272004 370 7 654 35 34 3 88 16 879 2,0872005 214 8 616 24 23 3 114 15 719 1,7362006 178 8 370 18 14 2 117 5 497 1,2082007 79 7 408 15 26 2 95 6 484 1,1232008 34 9 451 25 9 2 44 6 460 1,0392009 78 7 434 9 15 1 51 2 507 1,103
Table 2.2. Nominal catches of Baltic salmon (tonnes) round fresh weight from the sea, coast and rivers in 1990-2009 in subdivisions 22-32. Data is taken from the WGBAST Report (ICES 2010a).
Figure 2.7. Total reported catches of Baltic salmon in 1990–2009 (ICES 2010a).
0
1000
2000
3000
4000
5000
6000
0908070605040302010099989796959493929190
Salmon catches
Catc
hes
of s
alm
on (t
onne
s)
Year

16
The member States of the European Union and the Russian Federation have implemented national management measures for salmon fi sher-ies. These include technical measures and spatial/temporal measures, such as the delayed opening of the fi sheries during the spawning migration in the Gulf of Bothnia and closed areas outside many salmon rivers.
2.1.3 Re-establishment of salmon in potential riversThe Salmon Action Plan also included the objective of re-establishing self-sustaining salmon stocks in potential rivers, where salmon stocks existed in the past, but had been lost. The rivers selected by the countries as potential rivers are:
EstoniaValgejỏgi, Jägala and Vääna
FinlandKiiminkijoki, Kuivajoki and Pyhäjoki
LithuaniaŠventoji, Siesartis, Virinta, Vilnia, Vokè, Jura, Neris, Dubysa, Baltic Šventoji and Minija.
PolandNo potential rivers were selected, but releases of salmon have been made in the rivers Vistula, Odra and Pomeranian rivers.
RussiaGladyshevka
SwedenKågeälven and Testeboån
There has been some success in achieving wild production in the potential rivers, but in general the numbers of spawners have been low and parr abundance has remained lower than for wild salmon rivers. The reasons are attributed to lower productivity of salmon in potential rivers than in wild salmon populations. The low productivity
to reach a production level of wild smolts that cor-responded to at least 50% of the estimated produc-tion capacity of rivers. The SAP also included the objective of re-establishing salmon populations in potential rivers and maintaining the salmon fi sheries.
The IBSFC made recommendations for total allow-able catch (TAC) levels, their allocation as quotas among contracting parties and technical measures for salmon fi sheries. Among the technical meas-ures employed were summer closures, closures for drift netting and long-lining, minimum landing sizes and restrictions on the number and size of long-line hooks and total length of driftnets.
The European Union has agreed decisions on TACs and technical measures for salmon fi sheries. There has, however, not been a formal salmon manage-ment plan, since the SAP was never incorporated as part of the Common Fisheries Policy. However, the European Commission is developing a proposal for a multiannual management plan for salmon stocks in the Baltic Sea. The proposal will be subject to a co-decision procedure by the European parliament and the Council and the adopted regulation will provide for the management of salmon stocks by the EU.
The most signifi cant decision on salmon manage-ment taken by the EU in recent years is the ban on driftnets from the start of 2008. Driftnets had been the principal fi shing gear in the Main Basin since the 1960s and the prohibition had a major impact on salmon fi sheries and catches. In 2008 and 2009 salmon catches shifted from offshore to coastal areas and rivers.
17
2.2.1 Sea trout population trends
Population indicatorsThe sea trout populations in the Baltic are assessed using the same indicators as salmon populations described above. The sea trout populations are monitored for each Baltic Sea basin. The develop-ment in the overall situation of the wild sea trout populations is summarised below.
is in part due to poor habitat conditions (ICES 2010b). Moreover, reared salmon of non-native origin must normally be stocked in order to initi-ate the natural life-cycle of salmon in potential rivers. Survival and reproductive fi tness of reared salmon have been shown to be inferior to those of wild salmon, and the use of non-native strains for re-establishment further reduces performance (Fleming and Petersson 2001, Araki et al. 2007, Romakkaniemi 2008). As a result, establishment of natural reproduction in a potential river is expected to be a slow and unstable process.
2.2 Sea trout rivers
The Baltic Sea contains approximately 1,000 sea trout populations of which about 500 repro-duce naturally in Baltic rivers (Annex II). These populations do not include resident populations of brown trout. Rivers and tributaries with land-locked populations above man-made migration barriers are listed as potential rivers. A large majority of the sea trout rivers fl ow into the Main Basin. There are no estimates of the historical numbers of sea trout populations or quantitative observations of the historical total natural smolt production.
CATCHES (TONNES)
Year Denmark Estonia Finland Germany Latvia Lithuania Poland Sweden Total
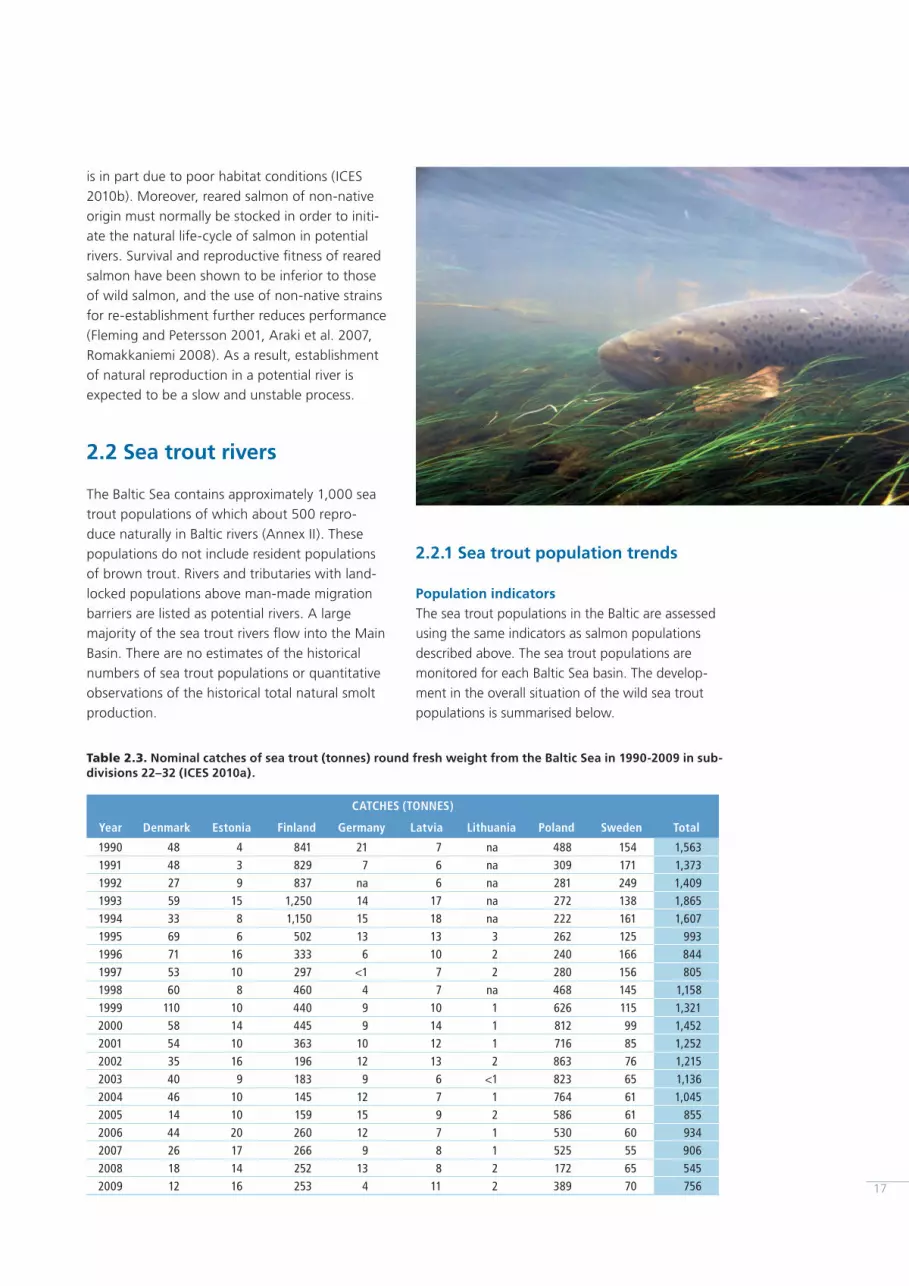
1990 48 4 841 21 7 na 488 154 1,5631991 48 3 829 7 6 na 309 171 1,3731992 27 9 837 na 6 na 281 249 1,4091993 59 15 1,250 14 17 na 272 138 1,8651994 33 8 1,150 15 18 na 222 161 1,6071995 69 6 502 13 13 3 262 125 9931996 71 16 333 6 10 2 240 166 8441997 53 10 297 <1 7 2 280 156 8051998 60 8 460 4 7 na 468 145 1,1581999 110 10 440 9 10 1 626 115 1,3212000 58 14 445 9 14 1 812 99 1,4522001 54 10 363 10 12 1 716 85 1,2522002 35 16 196 12 13 2 863 76 1,2152003 40 9 183 9 6 <1 823 65 1,1362004 46 10 145 12 7 1 764 61 1,0452005 14 10 159 15 9 2 586 61 8552006 44 20 260 12 7 1 530 60 9342007 26 17 266 9 8 1 525 55 9062008 18 14 252 13 8 2 172 65 5452009 12 16 253 4 11 2 389 70 756
Table 2.3. Nominal catches of sea trout (tonnes) round fresh weight from the Baltic Sea in 1990-2009 in sub-divisions 22–32 (ICES 2010a).

18
Catches of sea trout Sea trout are mainly fi shed in coastal and river areas and only to some extent in the offshore areas. They are the target of both commercial and recreational fi sheries. The overall trend of sea trout catches has been decreasing since 1990 (Figure 2.8). The nominal catches of sea trout in the whole Baltic Sea (including rivers) have declined from 1,563 tonnes in 1990 to 756 tonnes in 2009 (Table 2.3). The largest proportion of the total catch is taken in the Main Basin, while the Gulf of Bothnia and Gulf of Finland are other important fi shing areas.
Parr densityThe ICES Baltic Salmon and Trout Assessment Working Group (WGBAST) report of 2010 (ICES 2010a) presents data on the density of sea trout parr. In general, the densities of parr are low in the Gulf of Bothnia and Gulf of Finland. There are, however, some positive exceptions of rivers with higher parr densities. The situation in the Main Basin is much more favourable. Data on sea trout smolt production is lacking.
Number of ascending sea troutThe number of ascending sea trout is monitored in the same rivers as described for salmon.
Figure 2.8. Nominal catches of sea trout in the Baltic Sea in 1990–2009 (ICES 2010a).
0
500
1000
1500
2000
0908070605040302010099989796959493929190
Sea trout catches
Catc
hes
of s
ea t
rout
(ton
nes)
Year

19
also be undertaken in order to enhance the develop-ment of a wild population in need of recovery or for the establishment or reintroduction of a salmon population in a potential or former salmon river. Stocking is also currently undertaken with the sole purpose of increasing the future catch possibilities.
Since 1990, salmon smolts have been stocked into the Baltic Sea at levels varying from 4.3 to 5.8 million smolts per year while sea trout stocking has increased from 1.6 to 3.6 million smolts per year (Table 2.4).
2.3 Stocking of salmon and sea trout
Stocking of salmon and sea trout is widely prac-tised with the aim of increasing their production. Stocking can be undertaken using eggs, alevin or parr into the nursery areas in rivers or by releasing smolts in the river or the river mouth area.
Stocking can be based on mandatory court rulings as compensation for the damming of rivers. It can
Salmon smolts released (x 1000) Sea trout smolts released (x 1000)
Year MB, BS and BB* GF* Total MB* GB* GF* Total
1990 4,350 524 4,874 282 1,042 260 1,584
1991 4,052 518 4,569 246 1,118 270 1,6341992 4,300 354 5,654 208 1,147 330 1,6851993 5,592 470 5,061 192 942 318 1,4521994 3,950 398 4,347 263 1,001 287 1,5511995 4,081 489 4,570 243 1,159 348 1,7501996 4,369 542 4,911 245 1,244 177 1,6661997 4,893 449 5,342 289 1,087 331 1,7071998 5,158 507 5,665 305 939 331 1,5751999 4,986 597 5,583 386 923 398 1,7072000 5,215 584 5,799 1,396 901 380 2,6772001 4,977 801 5,778 1,421 982 427 2,8302002 4,713 681 5,394 1,935 911 373 3,2192003 4,673 644 5,317 1,925 890 329 3,1442004 4,460 817 5,277 1,921 681 291 2,8932005 4,403 865 5,268 2,322 776 198 3,2962006 4,750 742 5,492 2,513 1,072 301 3,8862007 4,621 635 5,256 2,406 1,113 364 3,8832008 4,865 778 5,643 2,439 1,086 352 3,8772009 4,608 700 5,308 2,242 1,018 322 3,582
*MB= Main Basin, BS=Bothnian Sea, BB=Bothnian Bay, GF=Gulf of Finland, GB=Gulf of Bothnia
Table 2.4. Salmon and sea trout smolt releases to the Baltic Sea excluding the Kattegat (ICES 2010a).
0
1000
2000
3000
4000
5000
6000
7000
No.
sm
olts
rel
ease
d
salmonsea trout
1990
1991
1992
1993
1994
1995
1996
1997
1998
1999
2000
2001
2002
2003
2004
2005
2006
2007
2008
2009
Figure 2.9. Releases of salmon and sea trout smolts (x 1000) to the Baltic Sea excluding the Kattegat (ICES 2010a).

Baltic salmon and sea trout inhabit freshwater and marine habitats. They may swim hundreds of kilometers during their migration, encountering different environments during their lives. Several studies have attempted to categorize salmonid habitats, since they have a direct applicability to the conservation and reintroduction of stocks (e.g. Bardonnet and Bagliniere 2000, Armstrong et al. 2003, Gibson 1993, Heggenes et al. 1999, Heggenes 1991).
One way to understand the habitat requirements of salmon and sea trout is to consider these at each life stage. In fresh water, the life stages during which salmon and sea trout are most prone to mortality are the early juvenile stages (Huusko et al. 2007). A common factor to all life stages is that fi sh need refuges in which to hide from predators. Refuges are created by vegetation, river banks, fallen trees,
3 Habitat and water quality requirements of Baltic salmon and sea trout populations
debris, stones, turbulence and deep pools. Refuges also provide protection against water current in rivers (Cowx and Welcomme 1998).
The life cycle is similar for salmon and sea trout (Figure 3). Both species spawn and deposit eggs in the autumn. The fry hatch in the spring in rivers and streams. Alevins (i.e. the fry or larvae) have a yolk sack attached to them constituting their food reserve. After emergence from the gravel the fry and then parr feed on invertebrates of aquatic and terrestrial origin. After 1–4 years in the rivers the parr become smolts which are silvery in color and physiologically adapted to marine life. In the spring, the smolts migrate to sea. The length of the marine life phase varies from one to a few years. From the spring to the fall adult salmon and sea trout return to their home rivers to spawn. Subsequent to spawning Baltic salmon males often migrate to sea
Figure 3. Life cycle of Atlantic Salmon (Source: Atlantic Salmon Trust).20

21
3.2 Upriver migration
When surface water temperature and day length increase in the spring, maturing salmon and sea trout migrate from their offshore and coastal feeding areas in the Baltic Sea into their native rivers to spawn. Salmonids use olfactory cues during the fi nal stage of their migration to fi nd their home streams, which is one reason that suffi cient water fl ow is important. The exact mechanism used by salmonids in locating their home streams is not fully understood (Limburg et al. 2001, Hasler 1971).
Environmental conditions are very different in rivers compared with those in the sea. Fish have to adapt physiologically to changes in salinity, and to adjust their swimming behavior to the shallow depth and unidirectional water current. During the upstream migration, salmon cease to feed and spend time in sheltered pools, sometimes called “holding pools” (Bardonnet and Bagliniere 2000). In France, salmon may spend several months in the holding pools, but in Baltic rivers the migration to spawning grounds is generally more rapid. The quantity and quality of holding pools probably represent an important habitat feature infl uencing the safe upstream migra-tion of adult salmon. Holding pools are character-ized by deep, still and cool waters and some cover.
3.3 Spawning
Salmon and sea trout spawn during the autumn and winter months. In the fall, salmon and sea trout move to the spawning grounds, and females excavate nests of around 20 cm or even deeper in the substrate. Males court females, and the females lay a small quantity of large eggs in several egg pockets. A series of nests is called “a redd”. The redds can cover large areas, in some cases up to 11 m2. During the egg stage, mortal-ity is often low because the embryos are well
(Österdahl 1969). A lot of energy is spent on spawn-ing, and many salmon and sea trout die after it. Adult salmon normally die after having returned to sea (Jonsson et al. 1991). Some individuals succeed to spawn a second or even third time. Salmon and trout are iteroparous species meaning that they can spawn several times (Klemetsen et al. 2003). A pro-portion of male salmon and trout parr mature in the river and do not migrate to the sea.
3.1 Life in the sea
Baltic salmon spend from one to four years in the sea before their fi rst spawning, and those that survive to second or third spawning may spend additional years at sea. Generally, sea trout exhibit a similar length of the marine life to the salmon, but iteroparous individuals are more common and a wider range of marine life history patterns are found among sea trout. During life at sea, growth is rapid due to a diet consisting mainly of fi sh.
Sea trout mostly spend time in littoral areas feeding on invertebrates and fi sh. The marine feeding ecology of sea trout is not fully under-stood (Rikardsen et al. 2006), but according to the studies conducted to date Baltic herring (Clupea harengus membras) are the main component of the diet. Sea trout may also occasionally utilize pelagic areas for feeding (Rikardsen and Amundsen 2005). Sea trout are visual and opportunistic (diet varies between individuals) feeders (Klemetsen et al. 2003) and turbidity, due to eutrophication, may alter its diet (Stuart-Smith et al. 2004).
Salmon, on the other hand, are most often found in pelagic waters feeding on sprat shoals (Sprattus sprattus). They also feed on herring and three-spined sticklebacks (Gasterosteus aculeatus) and may occasionally eat sandeel (Ammodytes spp.), cod (Gadus morhua) and garfi sh (Belone belone) (Karlsson et al. 1999). The salmon migrate greater distances than sea trout. For example, salmon populations from northern rivers in the Bothnian Bay migrate as far as the southern Baltic Sea. Baltic salmon populations predominantly migrate to the Main Basin for feeding, but the migratory behavior is stock specifi c and some stocks (e.g. the Neva stock used to stock the river Kymijoki in the Gulf of Finland) undertake more limited migrations (Ikonen 2006).

22
3.5 Early life
Hatching occurs after one or more months. The time from spawning to hatching is dependent on temperature, and stress or environmental disturbance may cause eggs to hatch earlier. The larvae, called alevins, live for several weeks in the gravel nourished by their yolk sacs. Salmon alevins emerge later and disperse further from the spawning area, but trout may remain in the redds until the yolk is consumed completely (Bardonnet and Bagliniere 2000, Klemetsen et al. 2003). The period of a few weeks following emergence is criti-cal for the strength of the year-class, since mortal-ity at this stage can be very high.
For salmon parr, water velocity is considered to be the environmental variable of primary impor-tance, since they feed on organisms drifting with the current (Armstrong et al. 2003). For sea trout, water depth is considered as the most important habitat variable, suffi cient areas with low water fl ows also being important (Heggenes et al. 1999). The preferred habitats of juvenile salmo-nids are often size dependent. Larger and older parr prefer deeper areas and tolerate faster water velocity than younger and smaller parr. Older parr can also feed in wider range of fl ows than young parr (Heggenes et al. 1999).
During their fi rst year, young sea trout and salmon prefer shallow areas located along the river bank with moderate to fast fl ows. Small trout parr are typically found in water depths of 20–30 cm with fl ows of 10–50 cm/ s and cobble substrates. Young sea trout parr have been found to migrate to the Baltic Sea already during their fi rst summer. The early migration may be an adaptation to the brackish water conditions of the Baltic Sea (Landergren 2001 and 2004, Lander-gren and Vallin 1998, Limburg et al. 2001). Young salmon parr inhabit riffl es in or near the redd site (Bardonnet and Bagliniere 2000, Klemetsen et al. 2003) and prefer coarse substrate and water velocities of 30–50cm/s. As they grow older and larger, salmon and trout move into deeper water. The distribution of different age classes occupying different habitats is probably due to competi-tion between older and younger parr. Older parr displace the fry and restrict their habitat choice (Heggenes 1991, Heggenes et al. 1999, Klemet-sen et al. 2003, Armstrong et al. 2003).
protected in the substrate. However, the rate of interstitial water fl ow, presence of various toxic materials, sedimentation and low oxygen concen-trations can affect egg survival negatively. Also, in the northernmost latitudes of the Baltic area, the movement of gravel beds in association with ice formation, ice break-ups, and high fl ows may wash out eggs (Huusko et al. 2007).
The duration of the spawning period varies from two weeks to seven months depending on lati-tude, altitude and temperature (Armstrong et al. 2003, Bardonnet and Bagliniere 2000). The females leave after spawning, but males remain at the redd sites. Eggs incubate in the gravel and the embryos develop during the following spring (Klemetsen et al. 2003).
Salmon prefer to spawn in shallow areas near the river bank, with swift-running water (Bardonnet and Bagliniere 2000, Barlaup et al. 2008). A good spawning substrate for salmon has been found to consist of 40–80% gravel and 10–40% cobble (Semple 1991). Silt and sand contents of 20% in the spawning substrate can be detrimental to embryonic survival (Malcolm et al. 2003). The water depth in spawning sites varies between 25 cm to 50 cm (Armstrong et al. 2003, Heggberget 1991, Moir et al. 1998, Beland et al. 1982). Mean water velocity for spawning salmon in Norway has been measured as 40 cm/s (Heggberget 1991), but higher velocities (up to 53.6 cm/s) have been recorded in Scotland and Canada (Moir et al. 1998, Beland et al. 1982). Sea trout tend to spawn earlier than salmon, and primarily in smaller headwaters (Armstrong et al. 2003).
3.4 Embryo development
Embryos develop within redds for several months. Substrate composition and the location of the redds are important for the survival of the embryos (Bardonnet and Bagliniere 2000). The substrate should be permeable, so that the embryos obtain enough oxygen and the fry can emerge (Bardon-net and Bagliniere 2000). Oxygen is essential for the survival and development of alevins. Substrate quality (especially the proportion of fi ne particles), temperature, water velocity, and discharge all infl u-ence oxygen availability (Armstrong et al. 2003, Rubin and Glimsäter 1996).

23
3.6 Smolting and smolt run
Juveniles remain in their natal rivers from one to more than four years. In the spring, the older parr undergo smolting. In the smolting process, fi sh become physiologically adapted to marine life (their salt tolerance increases) and gain a silvery color. Hor-mones, such as growth hormone and cortisol, are responsible for the physiological and morphologi-cal changes associated with smolting. The thyroid hormones and the insulin-like growth factor-I are also important hormones infl uencing the smolting process (McCormick et al. 2002). For instance, the thyroid hormones have a direct role in the silvering of the smolts (Hutchison and Iwata 1998).
A marked increase in day length is generally con-sidered to be the main environmental cue for smolting (Sigholt et al. 1998). Temperature is also important, but its role is more complicated (McCormick et al. 2002). The smolt run (i.e. the time of the migration of smolts to the sea) is mainly controlled by temperature (Jonsson and Jonsson 2009). Mortality at sea is believed to be highest during the fi rst weeks and months, i.e. during the post-smolt stage (Salminen et al. 1995, Hansen and Quinn 1998, Crozier et al. 2003). Smolts initially feed on insects trapped in the water surface but soon adopt a diet of small fi sh (Ikonen 2006). Smolts migrate towards the feeding areas in the Baltic Sea, where they remain until as adults they begin their spawning migration.
Juvenile salmon and sea trout establish and defend territories. The size of the territory depends on many factors (food abundance, fi sh size, morphology, substrate, gradient, water quantity and quality, turbidity etc.), and the total availability of habitats for all freshwater life stages determines the production capacity of the river (Grant 1993, Grant and Kramer 1990, Grant et al. 1998). Where the two species coexist, there is often competition for habitats. Sea trout are generally described as being more aggressive and may limit the habitat available to salmon (Heggenes 1991). Salmon and sea trout normally reproduce in different parts of the northern Baltic Sea rivers, salmon in the main stem and sea trout in the tributaries. Therefore, competition for space is less intense in this area than in southern rivers where reproduction areas overlap.
There are seasonal changes in habitat use in both species related to water temperature (Heggenes et al. 1999, Heggenes 1991). Winter survival of juve-nile salmonids has been found to be rather low. For example, in Danish rivers an average survival of 40% has been estimated over the fi rst winter. However, there is variation between years and between locations. Winter mortality occurs due to predation and the depletion of energy reserves, often in combination with harsh physical condi-tions (Huusko et al. 2007).
The M74 syndrome is a reproductive disorder of Baltic salmon, which causes mortality of yolk-sac fry. The syndrome has adversely affected Baltic salmon populations since 1990. During 2003-2005, the situation improved, and M74 mortality was less than 5% in the rivers fl owing into the Gulf of Bothnia. The mortality rate is highly variable and cannot be predicted. The typical symptoms are loss of negative phototaxis, lethargy, lack of coor-dination and precipitates in the yolk sac as well as erratic swimming (such as spiral swimming), convulsing and swimming upside down. The exact cause of M74 is still unknown but it results in a thiamin defi ciency in fi sh eggs (Keinänen et al. 2000 and 2008). The frequency of M74 is lower in wild populations compared to reared strains and in more southern populations (ICES 2010a).
4 The infl uence of climate change on the populations of Baltic salmon and sea trout
systems (IPCC 2007). Regime shifts refer to abrupt and persistent changes in ecosystem functioning that occur at a large spatial scale and are observed at different trophic levels (deYoung et al 2004). In the central Baltic and in the North Sea, synchro-nous ecological regime shifts were observed in the late 1980s. In the central Baltic Sea phytoplank-ton biomass increased, the growing season was extended and changes occurred in the abundance of the dominant copepod species of the central Baltic (Pseudocalanus sp., Temora longicornis and Acartia spp). These copepods are the main food items for the larvae of cod, herring and sprat. T. longicornis and Acartia spp. increased dramatically in the 1980s whereas Pseudocalanus sp. initially increased and then decreased in abundance. At higher trophic levels, cod abundance reached historic low values in the 1990s while Baltic sprat thrived (Alheit et al. 2005) and formed the dominant predator. This regime shift has been demonstrated to cascade through trophic levels in the open pelagic areas of the Baltic Sea (Casini et al. 2008) affecting zoo- and phytoplankton biomasses.
It is predicted that during the 21st century temper-ature will continue to rise in all of sub-regions of the Baltic Sea. Regional modeling studies, suggest an increase in the mean annual temperature in the order of 3–5° C during the century. Consequently, the surface water temperatures of the Baltic Sea could increase by approximately 2–4° C (HELCOM 2009). A dramatic decrease in the ice cover is expected to occur in parts of the area as a result of the increased temperatures. The length of the ice season may decrease by 1–2 months in the north-ern parts of the Baltic Sea and by 2–3 months in the central parts. Winters are expected to become shorter and milder, and growing seasons longer in the region (HELCOM 2009, BACC Author Team 2008). The frequency of extreme weather events and their severity of are expected to increase resulting in increased fl oods and periods of droughts (IPCC 2007). An increase in the water temperature may increase bacterial activity, which may affect the recycling and biological uptake of nutrients. Higher summer temperatures and milder winters may result in the establishment of new species and the extinction of some native species or ecosystem functions (HELCOM 2009).
Increase in precipitation, particularly in the north is expected. In the south, summers would become
4.1 Climate change in the Baltic Sea region
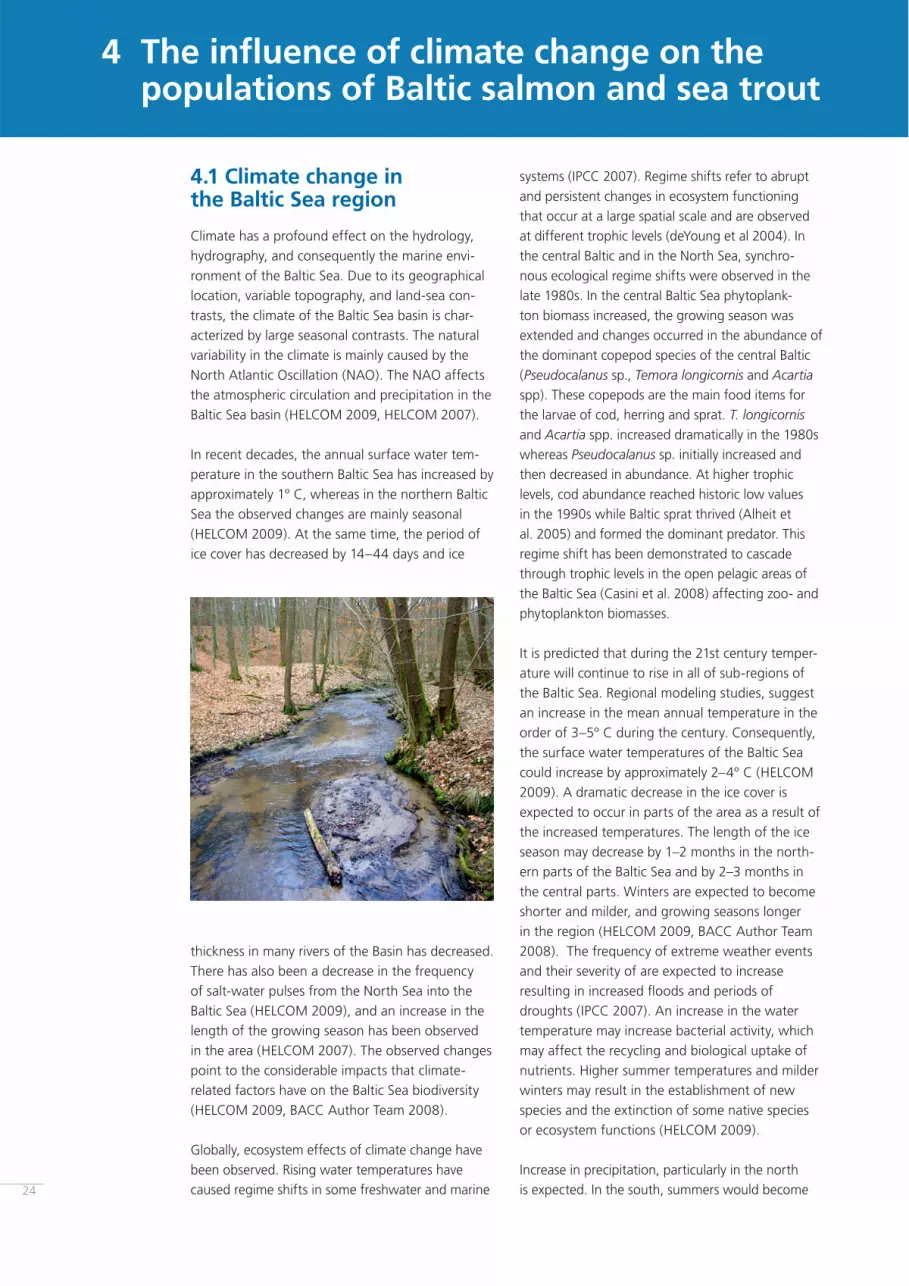
Climate has a profound effect on the hydrology, hydrography, and consequently the marine envi-ronment of the Baltic Sea. Due to its geographical location, variable topography, and land-sea con-trasts, the climate of the Baltic Sea basin is char-acterized by large seasonal contrasts. The natural variability in the climate is mainly caused by the North Atlantic Oscillation (NAO). The NAO affects the atmospheric circulation and precipitation in the Baltic Sea basin (HELCOM 2009, HELCOM 2007).
In recent decades, the annual surface water tem-perature in the southern Baltic Sea has increased by approximately 1° C, whereas in the northern Baltic Sea the observed changes are mainly seasonal (HELCOM 2009). At the same time, the period of ice cover has decreased by 14–44 days and ice
thickness in many rivers of the Basin has decreased. There has also been a decrease in the frequency of salt-water pulses from the North Sea into the Baltic Sea (HELCOM 2009), and an increase in the length of the growing season has been observed in the area (HELCOM 2007). The observed changes point to the considerable impacts that climate-related factors have on the Baltic Sea biodiversity (HELCOM 2009, BACC Author Team 2008).
Globally, ecosystem effects of climate change have been observed. Rising water temperatures have caused regime shifts in some freshwater and marine 24

25
decreasing salinity and increasing temperature (HELCOM 2007). In the 1990s, the Baltic herring in the Bothnian Sea has experienced decreased growth rates that may be related to the decrease in the abundance of Pseudocalanus sp. and an increase of herring density (ICES 2009, HELCOM 2007). This illustrates the effects that climate changes can have through the food web.
4.2 Infl uence of climate change on Baltic salmon and sea trout
The infl uence of climate change on fi sh is the subject of increasing research. Climate change may infl uence species distribution and abundance through changes in growth, survival, reproduction, or through responses to changes at other trophic levels (Brander 2010, Perry et al. 2005). Shifts in
geographical distribution of fi sh occur in response to climate change and are generally most evident near the northern or southern boundaries of the geographic range of a species. Such shifts have been observed in the North Sea and other parts of Europe (Pörtner and Peck 2010).
As ectothermic animals salmonids are affected by temperature in terms of their rate of development and growth as well as migration behaviour. The anadromous salmonids are affected by climatic factors during their different life stages includ-ing the embryo development, hatching, juvenile
drier. The higher precipitation is projected to increase winter runoff, by an average of 15% for Baltic Sea area. As a consequence, salinity would decline and there would be higher nutrient loads from the surrounding catchment area (HELCOM 2009). Together with the warming of the surface water of the Baltic Sea, the increased nutrient runoff could increase eutrophication (HELCOM 2007).
Acidifi cation (declining pH) of sea water is associ-ated with increased atmospheric CO2 concentra-tions. Oceans are a major sink for CO2, storing about 30% of the anthropogenic CO2 emissions. The IPCC predicts that by 2100 the pH of world oceans will fall by 0.30 assuming an increase of atmospheric CO2 concentration to 650 ppm (HELCOM 2009). Acidifi cation of seawater leads fi rst to a decrease of calcifi cation and, eventu-ally, to dissolution of calcifi ed structures of, for example, certain plankton groups, bivalves and snails. In the Baltic Sea, where calcifi cation is already low because of low salinity, this effect may be more pronounced than in the oceans. Over the past 20–30 years, acidifi cation of 0.15 pH units has been detected in the Baltic Sea (HELCOM 2009). In conjunction with climate change, acidifi cation may alter the conditions of the Baltic Sea ecosystem profoundly.
The possible reduction in salinity related to fresh-water run-off may have a direct infl uence on the phytoplankton species composition (HELCOM 2007). Freshwater species are likely to increase at the expense of marine species. Phytoplankton communities are expected to change towards warm-water species. Salinity also controls biodiver-sity and species composition of zooplankton. The surface community consists mainly of cladocerans, smaller copepods and rotifers, whereas the deeper more saline waters are inhabited by the large and fatty marine copepods (such as Pseudocalanus sp. and T. longicornis) (HELCOM 2007).
Changes in the salinity towards a fresh-water ecosystem are expected to infl uence the species composition of zooplankton so that freshwater species become more common and marine species become less common. Pseudocalanus sp. and T. longicornis are important food items of the Baltic herring and sprat, respectively. During the last two decades, the Bothnian Sea has undergone changes in the food web composition driven primarily by

26
genic disturbances and the natural environmental fl uctuations that determine the fi nal state of popu-lations (Walther et al. 2002, HELCOM 2007).
In the Baltic Sea the expected changes in the plankton communities may affect the entire food chain. During their marine phase, salmon and sea trout feed on sprat and herring. If herring and sprat stocks are weakened through changes in the zooplankton community that they feed on, there may be adverse effects on salmon and sea trout stocks that prey on these fi sh species.
Groups of species that would be expected to benefi t from the warming of the Baltic Sea are cyprinids and perciformes (e.g. Sander lucioperca). Eutrophication may enable these species to expand their reproduction areas in the shallow coastal zones. Increased precipitation may intensify eutrophication in the Baltic Main Basin as a result of increased runoff and nutrient loads. Cyprinids and perciformes may, therefore, compete more effi ciently with, in particular, sea trout smolts for prey such as crustaceans (e.g. Gammarus and mysid sp.). Mysids, that are bottom feeding organ-isms, may also be further limited due to increased oxygen defi cit events.
It can be hypothesized how higher runoff may infl uence sea trout and salmon. For example, sea trout spawning in smaller headwater streams might increase fl ow conditions favored upstream migra-tion. Longer growing seasons may also reduce the time required to reach the smolt stage leading to earlier migration to sea (phone conversation with Ari Saura, March 19, 2010). On the other hand, increased levels of nutrients and sediment in the water may have a negative impact on spawning. For example, eroded clay and sand may hinder nest construction in spawning areas or reduce oxygen supply to the eggs and alevins. These impacts have already been observed in some areas near the Gulf of Finland. Long, dry summers could also nega-tively affect spawning, through delaying riverine entry (phone conversation with Ari Saura, March 19, 2010) and production. A reduction in available habitats has already been observed in Denmark. Also extreme fl ow conditions (low/high) due to heavy rainfall or droughts may cause high mortal-ity levels. Small streams may be seriously damaged through hydraulic overload as a result of more fre-quent heavy rainfall.
stages, smolting and migration (Jonsson and Jonsson 2009, Elliott and Hurley 1998). Salmonids are cold water species with high oxygen demands, and the expected temperature rise may extirpate populations especially at the southern end of their distribution range (Jonsson and Jonsson 2009).
Recent scientifi c reviews suggest that climate change may have a range of effects on salmon and sea trout (Jonsson and Jonsson 2009, Pankhurst and King 2010, Todd et al. 2010, Jonsson et al. 2005). The distribution range of salmon could move north- and eastwards in Europe due to altered temperature, rainfall and runoff. Arctic rivers that are currently unsuitable for salmonids could become habitable while the salmonid pro-duction decreases in the southern part of the dis-tribution range. Several fi sh diseases may become more virulent while the salmonids become stressed by high temperatures and their disease resistance drops (Jonsson and Jonsson 2009).
Also, population traits of salmon and sea trout may be altered by the climate change. For example, the time of spawning could be delayed, feeding opportunities for fry could be improved and winter mortality in northern rivers may increase. Shifts in time of smolting and seaward migration as well as upstream migration may occur, post-smolts may experience reduced growth and higher mortality, and warmer temperatures may result in younger sea age at maturity (Jonsson and Jonsson 2009). At the very end, it is the sum of the local anthropo-

5 Categorisation of salmon and sea trout populations in the Baltic Sea
The Baltic Salmon and sea trout populations can be categorised in various ways, depending on the purpose of the categorisation. Such categorisa-tion can be developed based on a large variety of factors.
In this report the categorisation is based on • The historical occurrence of salmon/sea trout
populations in the river• The level of natural production• The origin of the population• Stocking activities• Current occurrence of habitats suitable for repro-
duction
Using these criteria, the salmon and sea trout populations have been grouped into eight categories as follows:
Category Status of salmon/ sea trout in river WILD smolt production
1. Wild self-sustaining production of original strainRiver with natural reproduction of salmon and/or sea trout of original strain, no releases of reared fi sh during the latest ten years.
2.Wild self-sustaining production of introduced strain
River with natural reproduction of salmon and/or sea trout of introduced strain, no releases of reared fi sh during the latest ten years.
3. Wild productionRiver with natural reproduction of salmon and/or sea trout and without large continuous releases of reared fi sh. Of the total smolt production > 90% are wild.
4. Mixed productionRiver with natural reproduction and with large continuous releases of reared fi sh. Of the total smolt production 10–90% are wild.
5. Mixed, some wild production documentedRiver with large continuous releases of reared fi sh and smoe natural reproduc-tion. Of the total smolt production 0.1–10% are wild.
6. PotentialRiver with possibilities for natural reproduction and potential (river not irrevers-ibly destroyed for salmon/sea trout) of becoming one of the Wild -categories.
7. Reared
River with no or almost no natural reproduction, with signifi cant migratory hindrances and limited reproductive areas and with large continuous releases of reared fi sh. Of the total smolt production < 0.1% are wild and there is no poten-tial for signifi cant wild smolt production.
8. Historical
River with natural reproduction of salmon and/or sea trout in the past, but cur-rently unsuitable for the fi sh. The original strain is probably lost, and the river is without potential, so no or only minor releases are made and no wild smolts are documented.
Based on the categorisation and the latest information on the population status, the salmon and sea trout populations in the Baltic Sea fall into categories as indicated in Annexes I and II.
27

6 European Union and Russian Federation legislation concerning river and sea waters
their intrinsic conditions, and the use of the marine environment is at a level that is sustainable, thus safeguarding the potential for uses and activities by current and future generations”. The goal of the Marine Strategy Framework Directive is in line with the objectives of the Water Framework Directive. It requires Member States to draw up marine strate-gies with actions for the development of the state of the marine environment. Member States shall cooperate through regional sea conventions, where they share a marine region. In the Baltic Sea this has been done in HELCOM through the process of adopting the Baltic Sea Action Plan.
The Council Directive 92/43/EEC of 21 May 1992 on the conservation of natural habitats and of wild fauna and fl ora or the Habitats Directive (together with the Birds Directive) forms the cornerstone of Europe’s nature conservation policy. It is built around two pillars: the Natura 2000 network of protected sites and the strict system of species protection. In total, the Directive protects over 1,000 animals and plant species and over 200 so called “habitat types” (e.g. special types of forests, meadows, wetlands, etc.), which are of European importance.
Freshwater populations of salmon (with the exception of Finnish populations) are listed as a species of European importance in the Habitats Directive. This requires EU Member States to des-ignate special areas of conservation in order for the species to be restored and maintained at a favourable conservation status. The latest Article 17 Report on the implementation of the Habitats Directive assessed salmon as having an unfavorable conservation status across the bioregions in the Baltic Sea catchment.
The Russian Federation has two areas with Baltic salmon and sea trout rivers; the Kaliningrad Oblast and the St. Petersburg area. The Water Code was adopted by the Russian Federation in 1995 and amended in 2001–2005. In contrast to the WFD, the focus of the Water Code is on resources, rather than on the ecological status. The Water Code does not defi ne the basic management unit as the WFD defi nes the river basin. The Water Code also lacks the mechanisms of realization, such as the provisions determining aims, organizational basis, economic and fi nancial provisions and terms for achievement of the target indicators (Alexeev 2008).
The European Union has adopted legislation that aims at achieving a good status of the waters in the rivers and in sea areas. These are Directive 2000/60/EC of the European Parliament and of the Council of 23 October 2000 establishing a framework for Community action in the fi eld of water policy (Water Framework Directive) and the Directive 2008/56/EC of the European Parliament and of the Council of 17 June 2008 establishing a framework for Community action in the fi eld of marine environmental policy (Marine Strategy Framework Directive).
The Water Framework Directive (WFD) sets the goal of achieving a good quality of all European surface freshwaters and ground water bodies by 2015. The freshwater bodies include lakes, streams, rivers, estuaries, and coastal waters, which should all reach “a good ecological and chemical status” in terms of low levels of chemical pollution and in terms of a healthy ecosystem. Each Member State of the European Union is required to establish River Basin Management Plans with actions for the development of water status. The actions of the plans include some measures that benefi t salmonid populations, both with regard to habitat conditions and migratory passage.
The goal of the Marine Strategy Framework Direc-tive is to achieve “a good environmental status” in the marine environment by the year 2020. According to the directive, marine waters reach a good environmental status when “they provide ecologically diverse and dynamic oceans and seas which are clean, healthy and productive within
28

7 Overview of salmon and sea trout popula-tions and rivers in the Baltic Sea countries
7.1.2 State of the salmon populations in BelarusThe current population of Baltic salmon in Belarus is at a critically low level. The most dramatic decrease in population size occurred during the 1950s and 1960s as a result of dam installations and intensive poaching activities. There has been no comprehensive investigation of the salmon populations in the river Vilia and its tributaries.
Since 2005, ichthyologists of the Academy of Sci-ences have undertaken monitoring of salmonids in some tributaries of the river Vilia. Baltic salmon are far less numerous than sea trout in Belarus. The unu-sually warm weather in December 2004 is thought to have prevented salmon reaching the rivers Sen-kanka, Tartak and Unnamed brook. No salmon spawning sites have been observed in these areas. There is a signifi cant annual variation in the numbers of returning spawners within and between rivers.
In September 2009, permission to use electrofi sh-ing equipment was granted for the fi rst time by the Belarusian authorities. The staff of the Academy of Sciences of Belarus was to conduct monitoring in the Vilia basin for several days. The monitoring covered a relatively large area including a 1 km long section of the river Vilia (downstream of the Oshmianka tributary), the Oshmianka tributary itself, the river Tartak and the river Dudka. No salmon were found in the rivers Osmianka and Tartak, but some were found in the river Dudka.
7.1.3 State of the sea trout populations in BelarusSea trout is regularly observed in the tributar-ies of the river Vilia in Belarus. The estimate of sea trout individuals is based on the numbers of redds observed in the spawning rivers. The highest densities of trout have been observed in the river Kemelina, with regular observations in the rivers Tartak, Senkanka and Unnamed brook.
During the fi rst week of September 2010, joint sal-monid monitoring was organized by Lithuanian and Belarusian specialists. Electrofi shing equipment was provided by Lithuanian specialists. Unfortunately the weather conditions were not favorable due to heavy rains which caused the water level in the Vilia tributaries to rise by 60 - 80 cm. The amount of monitoring planned was limited due to the weather
7.1 Belarus
7.1.1 State of the salmonid habitats in BelarusBelarus is landlocked and does not have a Baltic coastline but it has numerous tributaries with sal-monid spawning habitats; mainly the upstream areas of the western river Dvina/Daugava and of the river Neman/Nemunas. Dams built on the rivers of the Western Dvina and Neman in the 1950s and 1960s block access to former upstream spawning areas in Belarusian territory beyond the Latvian and Lithuanian borders. No fi shways have been con-structed, and there is no legislation requiring their construction in the rivers of Belarus.
Salmon migration had been observed in the river Neman and its tributaries prior to the installation of the Kaunas Dam in 1959. Since then, salmon has not been documented in the Belarus offi cial fi sh records. Salmon is considered extinct in the rivers of Belarus.
Free passage for salmon remains throughout the river Neris, a tributary of the river Nemunas at Kaunas. The river Nemunas changes its name to Vilia at the border of Lithuania and Belarus. Until recently there have been no observations of salmon migra-tion further upstream into the river Vilia.
Baltic salmon migrate 500–600 km upstream in the river Neman basin to enter spawning sites in the River Vilia and its tributaries of Petropol-sky brook, Tartak, Senkanka, Gazovka, Dudka, Unnamed brook, and Kemelina. The tributaries are mainly small and shallow rivers located in the Ostrovets District of the Grodno Oblast. The rivers Oshmjanka and Stracha have been regulated with dams since the early 1970s preventing salmon from reaching their natural spawning grounds further upstream. The river Stracha has the greatest poten-tial as a salmon river. It has more than 15 km of potential spawning habitat above the dam. The river Oshmjanka is affected by industrial pollution.
Beaver dams on small rivers are a serious problem to salmonids. During the winter of 2009/2010 it was reported that beavers built two dams on the river Tartak, which is less than 5 km long. About half of the river Senkanka is not accessible to migrating salmonids due to beaver dams. 29

30
Both sea trout and Baltic salmon are listed in the 2004 Belarus National Red Data book. Fishing for salmon is prohibited. However, enforcement measures for poaching and illegal activities are poorly defi ned. Offi cial statistics showed that only one person was charged with illegal electrofi shing in the Vilia basin in 2005 (Polutskaya 2005).
The Action Plan for the protection of Baltic salmon and sea trout in the Ostrovets District of the Grodno Oblast was adopted in 2008 by the Ministry of Natural Resources and Environmental Protection of the Republic of Belarus. This Plan is approved by the State Wildlife Inspectorate under the President of Belarus, the State Bioresources Research Centre under the Academy of Sciences of Belarus, the Ostrovets District Administra-tion and the NGO Ecohome. The plan includes the monitoring of spawning sites, investigation of fi sh-ladder construction, actions to eliminate beaver dams in spawning areas, protection against poachers and communication of activities to the media. A similar plan for 2010-2011 has been developed by the Ministry but has not yet been adopted (MNREPRB 2008).
and the high water fl ow in the tributaries. However, data collected from the monitoring that was under-taken in 2010 shows that the highest density of sea trout is found in the river Tartak. Additional observa-tions were made in the rivers Kemelina, Dudka and Senkanka. The majority of fi sh observed were smolts of ages 1+ and 2+. No observations were made in rivers Stracha, Vilia and Sorochanka.
7.1.4 Fishing regulations in the Belarusian riversPoaching is a signifi cant problem in Belarus and has historically been a major factor affecting the numbers of salmon in the rivers. Poaching is thought to have peaked in the 1950s and 1960s when explo-sives where used to catch fi sh. According to local people, poaching using harpoon and electrofi shing still occur during the migration season.
According to the enforcement offi cer, there are diffi culties in preventing such activities and with enforcing the regulatory system. Many poaching sites are extremely isolated and issuing a notice does not seem to be a deterrent.

31
the salmonid life cycle. Many barriers still exist and canalized streams often do not offer suitable habi-tats for young trout.
In a number of streams, artifi cial lakes in the low-ermost part of the stream have been constructed with the purpose of reducing the level of nutrient transport (mainly nitrogen) to coastal areas. Such lakes have been demonstrated to have a devastat-ing effect on migratory salmonids, resulting in heavy smolt loss during seaward migration. It has been demonstrated that the mortality level during passage through a new artifi cial lake was so high that a sea trout population could exist. Several pro-jects involving these lakes are planned for the future.
In large areas erosion of sand from areas around the streams (fi elds, roads, urban areas, construction sites etc.) and heavy sediment transport results in sand smothering the spawning gravel and reducing the available habitat. Sedimentation of the spawning gravel results in the loss of spawning possibilities, severely reduced egg survival and loss of habitats for young trout. Habitat variation is reduced when sand covers the entire bottom of the stream resulting in a reduction of suitable habitats for fry.
Climate change is predicted to result in more precipitation and in turn in higher river discharge, especially during winter when the fl ow is gener-ally at its highest. During the summer, heavy rainfall in connection with thunderstorms is pre-dicted to increase and dry periods are expected to become longer.
7.2 Denmark
7.2.1 State of the salmonid habitats in DenmarkDenmark has several hundred sea trout rivers and one former salmon river in the HELCOM area. The majority of the sea trout streams are small (less than 2 m wide).
Historically, practically all Danish streams were subject to regulation (canalization, alignment, deepening and damming for construction of water mills, hydropower stations or fi sh farms). Until a few decades ago many steams were also subject to substantial organic pollution. As a consequence of canalization and deepening of the streams, large parts of the gravel areas needed for spawning of trout and salmon were lost. Weirs at hydropower stations and weirs built for regulation of water level in the surrounding agricultural land created barriers to upstream migration (either because fi sh passes were not functional or were lacking) and resulted in elevated mortality during downstream migration as the fi sh passed through artifi cial lakes at weirs and dams. This resulted in a depletion of stocks and indeed, in many streams, in combina-tion with frequent pollution incidents, the loss of trout populations.
The only salmon population in the HELCOM area was found in the Gudenå, which is the longest river in Denmark. This population had its main spawning area in parts of the river to which access was effectively blocked by the construction of a hydropower station in 1921.
In recent years, many of the migration barri-ers have been removed or fi sh passes have been improved. Restoration work in many streams has improved both the accessibility and the possibilities for spawning by the addition of spawning gravel in suitable places. In a few places, larger projects have been carried out involving the hydrological system also in the surrounding meadows. Restoration pro-cesses have in many cases been led by local sports fi shing associations that have been very active both in promoting projects and in actually carrying out restoration projects on their own.
In spite of this, the conditions are in many places still far from optimal with respect to all phases of

32
These fl uctuations have a negative impact on salmon and sea trout populations, especially in the smaller catchment areas.
Point emissions of sewage and industry are not a general problem, but have been observed locally in the upper reaches and tributaries. Sudden and heavy pollution with organic material from farms occur from time to time, either when semi-liquid manure is spread on the fi elds as fertilizer or as a result of mishaps at the farms. Occasionally pollu-tion from industry is observed resulting in fi sh kills.
7.2.2 State of the salmon populations in DenmarkThe only Danish salmon population (Gudenå) in the HELCOM area was lost after the construc-tion of a hydropower station at Tange in 1921. The station has a non-functional fi sh pass some 36 km upstream from the outlet. Upstream from the power plant a 13 km long lake has drowned out the previous spawning grounds. Attempts to improve the fi sh pass have had little effect. Very high mortalities have been found for smolt migrat-ing through the lake.
There have been attempts to restore the salmon population in the stream by stocking, but the majority of suitable habitat is situated upstream of the power plant. Occasional spawning has been observed both in the lower parts of the river and in small tributaries.
7.2.3 State of the sea trout populations in Denmark In general, the Danish sea trout populations have developed positively during the last couple of decades, showing a steady increase in popula-tion size. In short, the main reasons for this are improved water quality, improved habitat condi-tions as a result of restoration work, improved marine survival as a result of fi shing regulations and restocking by releases of fi sh derived from wild spawners.
Since the 1970s, the water quality has improved signifi cantly due to the construction of effective sewage treatment plants and signifi cant reduc-tions in pollution from farms. In a large number of smaller streams, restoration works have been
A general higher fl ow has already been observed in some parts of the country, and also the frequency of the hydraulic overload of small streams from heavy rainfall during the summer appears to be increasing. This increase in fl ow, results in signifi -cant increases in erosion and sediment transport. Longer periods without precipitation will result in a reduction of the size of the reproduction area and consequently reduced smolt production.
A number of streams are affected by water extrac-tion for consumption, especially near larger cities and on some of the Danish islands. This results in reduced minimum fl ows, in some places compen-sated by artifi cially releases of water to the streams during critical periods.
The maintenance of streams, such as cutting stream macrophytes, removal of accumulated sediments and removal of woody debris, is under-taken in most streams regularly according to the regulations for the individual streams. In recent years the maintenance has become increasingly environmentally friendly. However, in many streams the maintenance is still unnecessarily heavy. In the coming Water Management Plans a reduced, or more lenient, maintenance is proposed as a way to improve the river habitat quality.
The majority of the land used for agriculture has been drained, and together with large areas with solid surface (roads etc.) and rapid run-off through ditches, results in large fl uctuations in discharge.

33
The minimum distance between fi xed gears in streams is 100 m. The mesh size (bar length) in the cod end of fyke nets must be at least 32 mm. Around the fi sh passages 50 m both upstream and downstream are closed to fi shing. Only landowners, or long term leasers of the land, are allowed to use fi xed gears. the river There are closed areas in the estuaries.
If the river at the outlet is at least 2 m wide, the closed area has a radius of 500 m and is per-manently closed all year. In many of the larger streams, the closed area is expanded, and some derogation for fi shing inside such areas exist. If the river at the outlet is less than 2 m wide, the closed area has a radius of 500 m in which fi shing is generally prohibited from 16 September – 15 March. Closed areas in the sea at the outlet of streams are published on maps on the internet at: http://fredning.fd.dk/. In lakes larger than 10 ha on streams with a width of at least 1 m, fi shing is not allowed inside an area with a radius of 50 m both at the inlet and outlet of the stream. In addition to the above rules, there are rules allow-ing authorities to require fi sh passes at stems and turbines, and requiring installation of grids at tur-bines and at fi sh farms etc.
7.3 Estonia
7.3.1 State of the salmonid habitats in EstoniaThe most profound impact on salmonid habitat availability is from hydropower development, and artifi cial migration obstacles are common in most of the rivers. However, habitat reduction has been particularly severe in the large rivers like Narva, Pärnu and Jägala resulting in little or no wild sal-monid recruitment. In the salmon rivers alone (sea trout rivers not included) there are about 30 man-made migration obstacles preventing migration to about 70% of the historical habitat. Presently there is only one largely ineffective fi shway at the Sindi dam on the Pärnu River. Therefore, improving the fi sh passage at these dams would be the most effi -cient way to enhance salmonid recruitment.
In the past, poor water quality in the rivers Purtse, Selja, Loobu, Valgejõgi, Vääna and Keila severly reduced salmonid production. The situation has,
carried out. Barriers have been removed or made passable by constructing faunal passages, thus providing access to areas that were for many years inaccessible. Gravel has been added in many places where it had previously been removed during regu-lation of the streams.
In the sea, the survival of sea trout has improved signifi cantly through regulation of the fi shery; most importantly by the establishment of a 100-m zone closed for net fi shing along the coast, and by the establishment of larger closed areas around the river mouths.
By planned and closely managed releases, by taking the observed population into account and in recent years by using only fi sh originating from wild spawners, stocking has increased the size of many trout populations. In recent years the trend has been a gradual replacement of releases with restoration of suitable streams.
While the general trend in the development of the trout populations has been positive for the last couple of decades, this has not been the case in all parts of the country. Even in the parts of the country where the development is positive the total production is still considerably below the potential if habitats and accessibility to spawning and nursery areas were optimal. The development has been particularly positive in many streams along the Southern and Central East coast of Jutland, in parts of the islands Funen and Zealand, and on the island of Bornholm.
In the rest of the country (inside the HELCOM area), the sea trout populations have responded less positively. The main reasons are that less resto-ration work has been carried out; maintenance of the streams is relatively severe or natural conditions for the trout are not as favourable as in the most productive streams.
7.2.4 Fishing regulations in Danish riversThe minimum legal harvestable size forsalmon is 60 cm and 40 cm for sea trout. The closed season is 15 November – 15 January (in most rivers a vol-untarily extended period of 1 November – 28/29 February applies). Two-thirds of the main stream must be kept open when fi shing with fi xed gear.

34
of extinction. Except for the River Pärnu, the situ-ation has somewhat improved in recent years. However all populations are still considered to be in a poor state.
7.3.3 State of the sea trout populations in EstoniaEstonia has about 75 sea trout rivers. Most of them (40) are located in the Gulf of Finland area, 19 in the Gulf of Riga area and 16 in the Baltic Main Basin area. In general, the status of these stocks is the same in all areas. One third of the populations presently have smolt production above 50% of the potential and the remaining remain below 50%. As for the salmon, the main problem is the loss of habitat by damming. Some streams are also dredged and thus have reduced habitat quality. Sea trout is also prone to overfi sh-ing in the coastal areas where an intensive gillnet fi shery takes place.
7.3.4 Fishing regulations in Estonian riversThe legal harvestable size for salmon in the sea and rivers is 60 cm and for sea trout 50 cm.
The following fi shing rules apply in the Estonian rivers:• Gillnets and trapnets are forbidden in all salmon
and sea trout rivers;• In the salmon rivers, rod fi shing for salmon
and sea trout is forbidden from 1 October – 30 November (except with special licence in the rivers Narva, Purtse, Selja, Valgejõgi, Jägala, Pirita and Vääna);
• In the sea trout rivers, rod fi shing for sea trout is forbidden from 1 September – 31 October;
• Wading is forbidden in rivers with salmonid spawning during the closed season;
• Fishing in 26 rivers and brooks is forbidden throughout the year;
• Fishing in 11 rivers is forbidden downstream from the fi rst defi nite migration obstacle;
• Fishing in fi sh ladders and within 50 m upstream of them is forbidden;
• Fishing downstream of dams is forbidden for a distance of 100 – 500 m.
however, improved, but is still not ideal, and presently salmonid production occurs regularly in all of these rivers. Further improvement is still needed.
Habitat degradation (channelization and deepen-ing of the river bed) has mainly occurred in some streams and small rivers and, therefore, affects the sea trout populations. Dredging has resulted in a shortened but higher spring fl ow period and a longer and lower fl ow period in the summer. Habitat restoration work has to date been rare and further such work is needed.
7.3.2 State of the salmon populations in EstoniaHistorically there were 12 salmon populations in Estonia. In the rivers Narva and Jägala the populations are maintained by regular releases of reared fi sh and only minor irregular wild repro-duction occurs in the River Jägala. In the rivers Purtse, Selja, Loobu, Valgejõgi and Pirita modest but regular wild reproduction occurs, however enhancement releases are carried out regularly in all of these rivers. Wild reproduction without releases occurs only in the Kunda, Keila, Vääna, Vasalemma and in Pärnu. The situation is most favourable in the River Keila and the least favour-able in the River Pärnu which is presently at risk

35
Compared to the northern rivers the human impact in this area is even higher, which together with the acidity problem impedes natural spawning of sal-monids almost completely in most of these rivers. In the Water Resources Management Program, the sulphate soil problem will be considered seriously, although the problem cannot be removed but only mitigated by good planning of ditching and ground utilization. The recovery of salmon and sea trout populations in this area is thus not certain. In the rivers where sea trout still exist, only very strict control of fi shing together with habitat and water quality protection will prevent their extinction.
Most rivers fl owing to the Gulf of Finland and to the Archipelago Sea have very few lakes in the catchment area. Therefore, the water fl ow in these rivers varies greatly. The majority of the Finnish population lives in the South and Southwest of the country. Hence pollution from municipal waste waters is in many places reducing the water quality of the rivers. The rivers also fl ow through areas with intense farming and agriculture, and large quantities of nutrients enter the water. Because of the additional nutrients that end up in the river systems, the primary production level in the rivers is very high. The soil consists of clay and silt which also causes the water to be turbid, especially during periods of heavy rains when increased sedi-ment loading often occurs. The water in the upper parts of the catchment areas is clearer because the rivers typically emerge from the esker area, and the pH regime is generally stable. The growing season in Southern Finland is longer than it is in the North.
7.4 Finland
7.4.1 State of the salmonid habitats in FinlandAlmost all large Finnish rivers fl owing to the Baltic Sea have been dammed for hydropower produc-tion. The remaining nursery habitats in the former salmon rivers are often partially or totally isolated from the sea by dams and by river impoundments.
In the watersheds that have not been harnessed for hydropower production habitats are in a moder-ate condition. The sediment load in the catchment areas has decreased the quality of the reproduction habitats in many rivers because of heavy forestry operations (above all the transformation of 6 million hectares of wetlands into productive forest). Large scale ditching of the catchment areas has also had negative impacts on the hydrology and water quality in the salmon rivers. Few rivers in Finland have been totally channelized but most of the Finnish rivers were dredged for timber fl oating 50–100 years ago. Today, most of these dredged rivers have been restored, but their recovery towards a natural habitat structure will take decades.
The state of the Finnish salmon and sea trout rivers in the Northern Bothnian Bay area is mainly satisfactory. However, the catchment areas are affected by large scale ditching due to forestry and peat mining and agriculture. The human impacts, together with the fact that the water has always been rich in humus, mean that the survival or recovery of salmon and sea trout stocks in these rivers requires both control of the fi shing and res-toration of the river habitats.
Habitats have been restored in many rivers after the dredging of rapids for timber fl oating, but the protection of the catchment areas must be raised to a high status in the future. Silting of the spawning grounds, eutrophication and the exces-sive water level fl uctuation may be detrimental for natural reproduction of salmonids in these rivers. This should be taken into account in the future when nationwide Water Management Plans are being designed.
In the Southern Bothnian Bay and the Quark area, the sulphate soil in the catchment area is the main problem since sulphate increases water acidity.
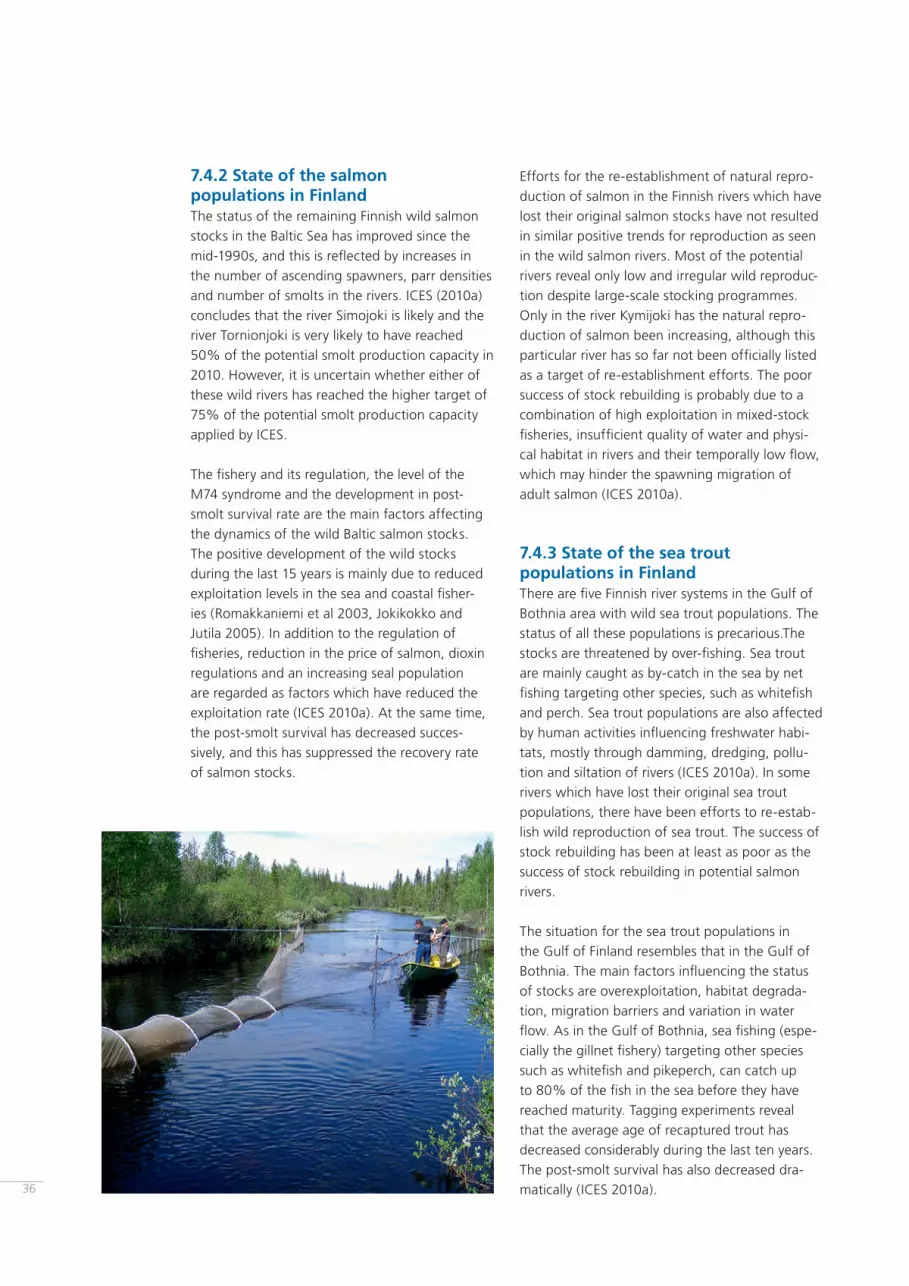
36
Efforts for the re-establishment of natural repro-duction of salmon in the Finnish rivers which have lost their original salmon stocks have not resulted in similar positive trends for reproduction as seen in the wild salmon rivers. Most of the potential rivers reveal only low and irregular wild reproduc-tion despite large-scale stocking programmes. Only in the river Kymijoki has the natural repro-duction of salmon been increasing, although this particular river has so far not been offi cially listed as a target of re-establishment efforts. The poor success of stock rebuilding is probably due to a combination of high exploitation in mixed-stock fi sheries, insuffi cient quality of water and physi-cal habitat in rivers and their temporally low fl ow, which may hinder the spawning migration of adult salmon (ICES 2010a).
7.4.3 State of the sea trout populations in Finland There are fi ve Finnish river systems in the Gulf of Bothnia area with wild sea trout populations. The status of all these populations is precarious.The stocks are threatened by over-fi shing. Sea trout are mainly caught as by-catch in the sea by net fi shing targeting other species, such as whitefi sh and perch. Sea trout populations are also affected by human activities infl uencing freshwater habi-tats, mostly through damming, dredging, pollu-tion and siltation of rivers (ICES 2010a). In some rivers which have lost their original sea trout populations, there have been efforts to re-estab-lish wild reproduction of sea trout. The success of stock rebuilding has been at least as poor as the success of stock rebuilding in potential salmon rivers.
The situation for the sea trout populations in the Gulf of Finland resembles that in the Gulf of Bothnia. The main factors infl uencing the status of stocks are overexploitation, habitat degrada-tion, migration barriers and variation in water fl ow. As in the Gulf of Bothnia, sea fi shing (espe-cially the gillnet fi shery) targeting other species such as whitefi sh and pikeperch, can catch up to 80% of the fi sh in the sea before they have reached maturity. Tagging experiments reveal that the average age of recaptured trout has decreased considerably during the last ten years. The post-smolt survival has also decreased dra-matically (ICES 2010a).
7.4.2 State of the salmon populations in FinlandThe status of the remaining Finnish wild salmon stocks in the Baltic Sea has improved since the mid-1990s, and this is refl ected by increases in the number of ascending spawners, parr densities and number of smolts in the rivers. ICES (2010a) concludes that the river Simojoki is likely and the river Tornionjoki is very likely to have reached 50% of the potential smolt production capacity in 2010. However, it is uncertain whether either of these wild rivers has reached the higher target of 75% of the potential smolt production capacity applied by ICES.
The fi shery and its regulation, the level of the M74 syndrome and the development in post-smolt survival rate are the main factors affecting the dynamics of the wild Baltic salmon stocks. The positive development of the wild stocks during the last 15 years is mainly due to reduced exploitation levels in the sea and coastal fi sher-ies (Romakkaniemi et al 2003, Jokikokko and Jutila 2005). In addition to the regulation of fi sheries, reduction in the price of salmon, dioxin regulations and an increasing seal population are regarded as factors which have reduced the exploitation rate (ICES 2010a). At the same time, the post-smolt survival has decreased succes-sively, and this has suppressed the recovery rate of salmon stocks.

37
7.5 Latvia
7.5.1 State of the salmonid habitats in Latvia The total area of salmon spawning and nursery habitat in the rivers of Latvia is estimated to be roughly 60–100 ha (main rivers without tributaries).
An estimated 60% of the country territory is inac-cessible to migratory fi sh species due to artifi cial obstacles e.g. the main salmon river Daugava was blocked by a cascade of hydropower dams, when the last stations were built in 1974. Thereafter, the river lost all salmon habitat.
The water quality is estimated according to the standards of the EC Directive 78/659/EEC (FD). None of the Latvian salmon rivers meet the cri-teria of the FD water quality requirements. Nev-ertheless, monitoring data demonstrates than the main environmental requirements of Baltic Salmon, such as oxygen content, acidity and temperature are adequate. Together the loss of habitat and the development of the hydropower industry are the main reasons for the decline of the wild salmon populations in the Latvian rivers.
7.4.4 Fishing regulations in the Finnish riversThe government sets the general fi shing rules in the sea and in fresh water. Local fi shing right owners or associations of fi shing right owners may strengthen the rules in their own waters, for example by setting a minimum mesh size in the gillnet fi shery. Moreover, the government has set some additional rules for salmon fi shing in the sea and in the wild salmon rivers Tornionjoki and Simo-joki. Hence, fi shing rules vary between rivers.
At sea, the minimum size of salmon and sea trout generally follow the international Baltic fi shing rules (Council Regulation (EC) No 2187/2005). However, the minimum size of sea trout is nation-ally set at 50 cm.
For about two decades, there has been an early season ban on coastal salmon fi shing in the Gulf of Bothnia. The length of the ban has varied. Terminal fi shing areas with relaxed fi shing rules have been established outside rivers that have dams with large-scale compensatory stocking (rivers Kemijoki, Iijoki and Oulujoki). In the terminal fi shing area of Kemi, salmon fi shing may start on 11 June, but there is no closed period set for fi shing on the other terminal areas. There are closed areas for fi shing in the estuaries of the rivers Simojoki and Tornionjoki, and the early season ban is extended to zones next to the closed areas. In the area outside the estuary of the River Simojoki, salmon fi shing may start on 16 July and outside the river Tornionjoki a limited fi shing by commercial fi shers may start on 27 June.
Fishing for sea trout and salmon is always prohib-ited in fresh water during the spawning period, but the dates may vary depending on the river. Generally the closed season is 11 September – 15 November. A bag limit is seldom used in the national regulation of the fi shery, but only one salmon per fi sherman per day is allowed for rod and line fi shing in the wild salmon rivers. Net fi shing for salmon and sea trout is generally forbid-den in the rivers with wild populations. However, fi shing is allowed with special kinds of traditional nets (drifting nets, special seines) but strictly restricted in the river Tornionjoki.

38
7.5.3 State of the sea trout populations in LatviaIn Latvia, the exact number of sea trout popula-tions is not known. Sea trout occur in the same river basins as salmon, and also exist in tens of small rivers and brooks.
Sea trout occur in 15 rivers and in tens of small rivers and brooks discharging into the Gulf of Riga and Baltic Main Basin. The rivers Salaca, Gauja and Venta have the highest wild smolt production. Sea trout populations have been supported by releases of reared fry, parr and smolt mostly into the upper sections of dammed rivers. Wild sea trout parr were monitored by electrofi shing surveys in the rivers Salaca, Gauja, Venta, Saka, Vitrupe, and Riva basins and by smolt trapping in the river Salaca. Estimated production in all Latvian rivers was about 61,000 smolts in 2009; the same as in 2007 and 2008. In the river Salaca, the number of sea trout smolts has decreased during the last decade.
7.5.4 Fishing regulations in Latvian riversThe commercial fi shing and angling at sea, and in coastal and inland waters are regulated by the Latvian government. Salmon and sea trout fi shing in Latvian rivers is not permitted except in the rivers Daugava and Bullupe that have reared stocks. The brood stock fi shery carried out in the rivers Venta and Gauja is limited by the number of gear units, and there is a daily catch limit. Fishing for special purposes (e.g. brood stock and research) is allowed with the permission of the Ministry of Agriculture and Environment.
Angling of sea trout and salmon is allowed in the rivers Salaca and Venta by a special license (fee) in springtime, i.e. angling of kelts is allowed. The number of licenses is limited. In coastal waters and in the rivers Daugava and Bullupe, salmon and sea trout angling is allowed throughout the year. The legal size which applies for all fi sheries and waters is 60 cm for salmon and 50 cm for sea trout. All large and mid-sized rivers have closed areas at their outlets where fi shing and angling are not allowed. The bag limit for anglers is one salmon or sea trout per day. The closed season for salmon and sea trout in coastal waters of Latvia is 1 October – 15 November.
7.5.2 State of the salmon populations in LatviaThere are 10 rivers in Latvia where spawning of salmon occurs regularly. The rivers Gauja, Irbe, Peterupe, Saka, Salaca, Venta, Vitrupe and Uzava are classifi ed as having at least some wild pro-duction. The river Daugava has a reared salmon stock. Stocking of hatchery reared parr and smolt is carried out annually, and hence the stocks are a mixture of wild and reared fi sh.
The wild stock of the river Salaca has been moni-tored by smolt trapping since 1964 and by electro-fi shing for parr since 1992, and the status of the stock is stable. The status of the other populations is not known due to the lack of regular monitoring, habitat inventory and mapping. Parr electrofi sh-ing results demonstrate that salmon reproduction occurs regularly in the rivers Vitrupe, Gauja, Venta, Užava and Saka.

39
stabilize the salmon population and prevented it from becoming extinct.
The largest increases in smolt production were observed in the rivers Neris, Žeimena, Šventoji and Siesartis which together account for for 96% of the total smolt production of the Lithuanian rivers. The smolt production in the other salmon rivers is signifi cantly lower and ranges from 0–1,352 individuals.
7.6.3 State of the sea trout populations in LithuaniaThe status of sea trout in Lithuania is better than that of salmon. Wild and mixed stocks of sea trout are found in many of the tributaries of the Nemunas Basin, and in the rivers Bartuva, Šventoji (Baltic Sea), Šventoji, Dubysa, Akmena-Dangė, Smiltelė, Venta, Minija and Žeimena. The stocks of the fi ve latter rivers are original and self-sustaining wild populations. Sea trout have been introduced to the rivers Šventoji and Dubysa as enhancement releases from the Jūra strain, and the stocks are, therefore, mixed.
In surveys conducted at 104 sites, the mean density of juveniles varied from 3.7–58.3/100 m2 (with a mean of 19.7 individuals/100 m2). Sea
7.6 Lithuania
7.6.1 State of the salmonid habitats in LithuaniaLithuanian rivers are lowland rivers with turbid, warm and slow-fl owing waters. Only some river stretches are suitable for salmonids. The water temperature in the Lithuanian rivers was well above the yearly average during the past few years and the water levels were below the yearly average.
Pollution remains one of the main concerns in the salmon rivers, but the water quality is improving since the implementation of the Water Framework Directive. Severe problems still exist e.g. due to the lack of sewage water treatment in cities and nutrient load from agriculture which affect water quality in many places.
Another problem is the rather high mortality rate of salmon and sea trout due to predation. Typical pred-ators are otter, mink, pike, pikeperch, cormorant and heron. Also beaver dams cause indirect mortality.
7.6.2 State of the salmon populations in LithuaniaIn total, 12 rivers in Lithuania have salmon popula-tions, but the status of the populations varies. The river Žeimena (with its tributaries Mera and Saria) has an original salmon population. Mixed popula-tions are found in the rivers Neris, Šventoji, Vilnia, B. Šventoji, Dubysa, Siesartis, Širvinta and Vokė. The rivers Virinta, Jūra and Minija (and some of their smaller tributaries) have reared salmon popu-lations. In these rivers artifi cially reared salmon juveniles have been released for several years.
The salmon restocking program in Lithuania started in 1998 and several measures are implemented every year to enhance the salmon populations. These measures include, for example, artifi cial rearing, construction of fi sh ladders, protection of spawning grounds, stock monitoring, and others. Despite these actions, the smolt production in the Nemunas basin has increased very slowly. Large increases in production were observed only during recent years; the smolt production increased from 13,900 to 35,937 during 2007–2009. Despite the delayed improvement of the status of the stocks, the measures of the restocking program helped to

40
7.7 Poland
7.7.1 State of the salmonid habitats in PolandThere are two large regions inhabited by salmonid fi shes in Poland: one mountainous upland region in southern Poland (in the upper sections of the biggest river systems of Vistula and Odra), and another in the moraine hills in northern Poland that are drained by tributaries of the lower Vistula and Odra and by rivers fl owing directly into the sea.
The rivers in the southern region are affected by many barriers to salmonid migration. In the Odra system, the barriers are mainly located in the tribu-taries of the upper part, and some of the barriers are more than one hundred years old. In the Vistula there are also some dams in the upper tributaries. The main hindrance is, however, the hydropower station and dam of Włocławek that was built in 1969 in the middle section of the river. Almost none of these barriers are equipped with effective fi sh-ways. A new fi shway at the Włocławek dam is cur-rently in the design phase, as are some others.
The rivers in the northern region have several hydropower stations that were generally built in the beginning of the 20th century, often to replace older structures. Some of them have fi shways, but only a few are effective. The accessibility of all of the rivers in the region is, at least, partly limited.
Many rivers, especially the smaller rivers in the southern region, are regulated or channelized and have an altered substratum. The river bed has been destroyed by removal of gravel in mountain areas, and the dynamics of the river fl ow are unnatural because of impoundments and changes of charac-ter of the drainage area. The quality of water used to be very poor in the past, especially in the bigger rivers and in southern Poland, but it has very much improved in recent years.
7.7.2 State of the salmon populations in PolandThe main spawning grounds of salmon in the Vistula river system used to be in the Carpathian tributaries. The salmon stocks gradually diminished during the 20th Century and the last spawning salmon were observed in the Vistula in the 1950s.
trout smolt production was 32,000 in both 2009 and 2010. The Minija river basin has a particu-larly strong sea trout stock, with an average parr density of 15.6 individuals/100m2 and a smolt pro-duction of 12,500 individuals.
In recent years, the sea trout smolt production varied substantially in other rivers basins, but remained relatively low. The average production of sea trout smolts in the Neris, Šventoji, Dubysa river basins was 5,100 – 4,600 per year. In the Žeimena basin the production was about 2,000. In the river basins of Bartuva, Akmena-Dangė, Šyša, B. Šventoji, Jūra and Venta the sea trout smolt production was signifi cantly lower and varied from 200–1,000 per year.
Smolt production mainly depends on the ecological conditions of the river and on spawner abundance. Monitoring of salmonids in small streams and rivers is carried out each year and the smolt production of all streams and small rivers is estimated to be larger than 10,000–15,000, giving a total smolt production of 42,000–47,000.
7.6.4 Fishing regulation in Lithuanian riversDuring spawning of salmonids (from 1 October – 31 December) all fi shing is prohibited in 161 streams. In larger rivers such as the Neris and Šventoji special zones are designated where shoaling of salmon and sea trout occurs. In these selected places only licensed fi shing is permitted from 16 September – 15 October and from 16 October – 31 December respectively, all fi shing is prohibited. From 1 January, licensed salmon and sea trout fi shing for kelts is permitted in Minija, Veiviržas, Skirvytė, Jūra, Atmata, Nemunas, Neris, Dubysa, Siesartis and Šventoji rivers. Licensed fi shing is permitted from 1 January – 1 October in designated stretches of the listed rivers. A bag limit of one salmon or sea trout per angler and licence is applied. In 2009, a total of 1,199 licenses were sold for salmon and sea trout, but the number of fi sh caught is unknown. The minimum size of salmon and sea-trout for the commercial fi shery is 60 cm.

41
spawners in the largest streams (Słupia, Wieprza, Parsęta and Rega). In all of them, the accessibil-ity of historical/potential spawning grounds is very limited and the populations are supported by intense stocking of 0.4 million smolts and 5 – 6 million parr and fry. The six largest rivers are stocked with offspring of spawners caught in these rivers and the others by spawners caught in the neighbouring rivers. Some of the populations are believed to be self-sustaining. There is intensive angling in the majority of the Pomeranian rivers focused mainly on kelts.
7.7.4 Fishing regulations in Polish riversThe common regulation for salmon and sea trout in the Polish rivers are: • A closed season from 1 October – 31 December
for all rivers except Vistula (in Vistula the closure applies from 1 October – 31 December from Thursday to Sunday and from 1 December – 28/29 February from Friday to Sunday above the Włocławek dam, and from 1 March – 31 Decem-ber below the Włocławek dam);
• The minimum legal size for sea trout and salmon is 35 cm;
• Only fi shing with rod and artifi cial lure is allowed;• A maximum daily catch of two fi sh (sea trout and
salmon) is allowed.
Odra salmon became extinct in the upper part of the river system a few hundred years ago but survived in some tributaries of the lower Odra until the end of the 1980s when the last spawners were observed in river Drawa. Historically there were also salmon populations in some of the Pomera-nian rivers fl owing directly to the sea, but they were smaller than the sympatric sea trout popula-tion. These populations became extinct probably between 1950–1970.
A salmon restoration program started in the mid-1990s and the stocking was based on the Daugava salmon strain. The upper part of the Vistula system has been stocked with fry and parr, and the lower Vistula and some of its tributaries mainly with smolts. In the Odra system, stocking has been conducted mainly in the river Drawa. Some Pomeranian rivers have also been stocked. The released fi sh are offspring of the hatchery broodstock and spawners caught in some rivers. The stocking resulted in catches of returning salmon by anglers in some Pomeranian rivers (Reda, Słupia, Wieprza, Parsęta and Rega) and for breeding purposes in the lower Vistula, Wieprza, Parsęta and Rega. Salmon redds were observed in a few rivers but wild offspring were caught only in the Słupia.
7.7.3 State of the sea trout populations in PolandThe Włocławek dam cut off the main sea trout spawning grounds in the Vistula River system in the Carpathian tributaries. Among a few tributar-ies of the lower section of the Vistula, only Drwęca has accessible but has very limited spawning areas. In fact, the existence of sea trout in the Vistula and some tributaries is a result of a large-scale stocking effort of about 0.8 – 1 million smolts and more than 2 million parr and fry that were released mainly into the lower Vistula. There is commercial net fi shing in the lower Vistula and angling in some of the tributaries. The opening of the Włocławek dam would improve the situation dramatically.
A few small mixed populations exist in the tributar-ies of the lower Odra. Most sea trout populations are found in the rivers fl owing directly to the sea. It is estimated that there are a total of 15 popula-tions. Their sizes range from a few tens of spawn-ers in the smallest streams to more than 10,000
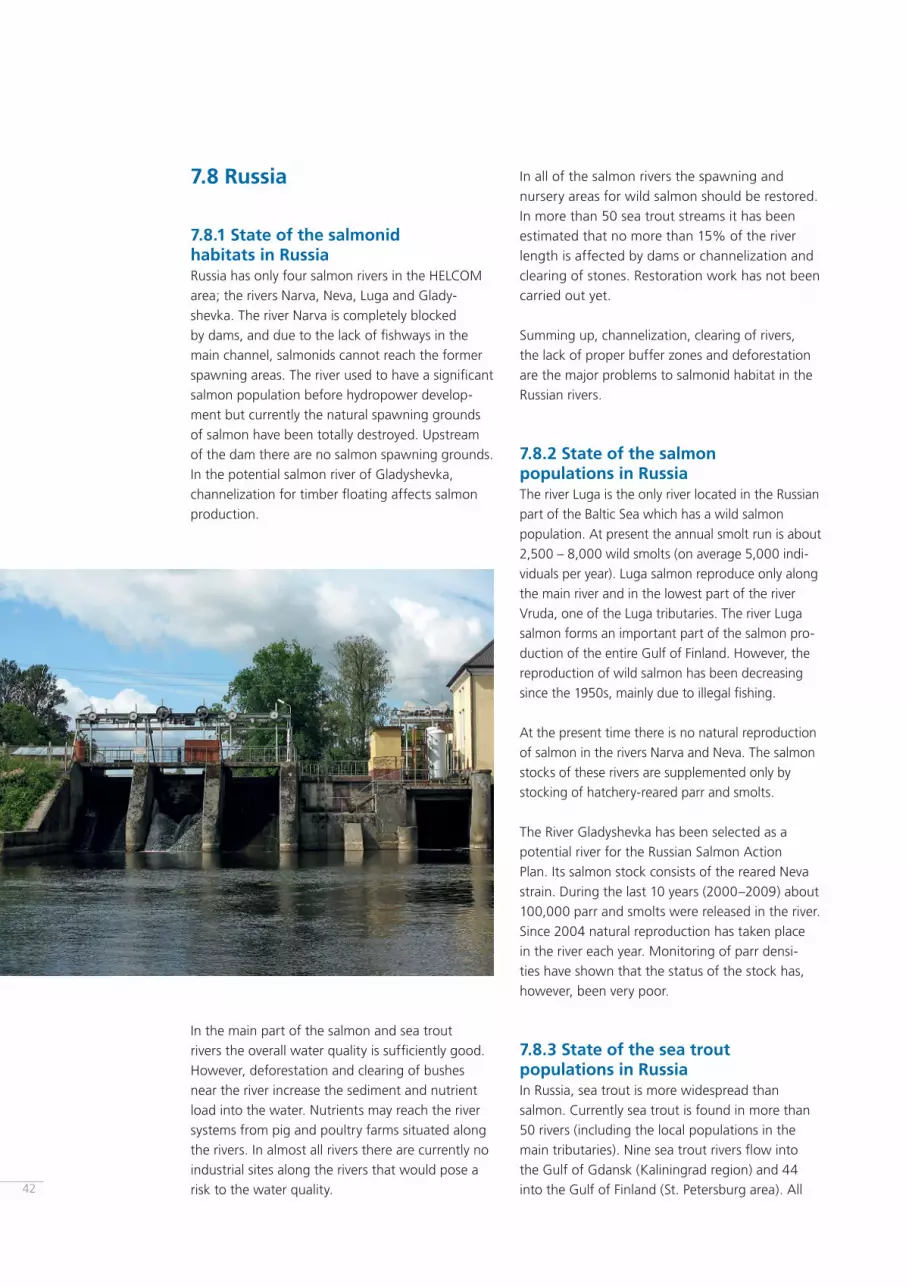
42
In all of the salmon rivers the spawning and nursery areas for wild salmon should be restored. In more than 50 sea trout streams it has been estimated that no more than 15% of the river length is affected by dams or channelization and clearing of stones. Restoration work has not been carried out yet.
Summing up, channelization, clearing of rivers, the lack of proper buffer zones and deforestation are the major problems to salmonid habitat in the Russian rivers.
7.8.2 State of the salmon populations in RussiaThe river Luga is the only river located in the Russian part of the Baltic Sea which has a wild salmon population. At present the annual smolt run is about 2,500 – 8,000 wild smolts (on average 5,000 indi-viduals per year). Luga salmon reproduce only along the main river and in the lowest part of the river Vruda, one of the Luga tributaries. The river Luga salmon forms an important part of the salmon pro-duction of the entire Gulf of Finland. However, the reproduction of wild salmon has been decreasing since the 1950s, mainly due to illegal fi shing.
At the present time there is no natural reproduction of salmon in the rivers Narva and Neva. The salmon stocks of these rivers are supplemented only by stocking of hatchery-reared parr and smolts.
The River Gladyshevka has been selected as a potential river for the Russian Salmon Action Plan. Its salmon stock consists of the reared Neva strain. During the last 10 years (2000–2009) about 100,000 parr and smolts were released in the river. Since 2004 natural reproduction has taken place in the river each year. Monitoring of parr densi-ties have shown that the status of the stock has, however, been very poor.
7.8.3 State of the sea trout populations in RussiaIn Russia, sea trout is more widespread than salmon. Currently sea trout is found in more than 50 rivers (including the local populations in the main tributaries). Nine sea trout rivers fl ow into the Gulf of Gdansk (Kaliningrad region) and 44 into the Gulf of Finland (St. Petersburg area). All
7.8 Russia
7.8.1 State of the salmonid habitats in RussiaRussia has only four salmon rivers in the HELCOM area; the rivers Narva, Neva, Luga and Glady-shevka. The river Narva is completely blocked by dams, and due to the lack of fi shways in the main channel, salmonids cannot reach the former spawning areas. The river used to have a signifi cant salmon population before hydropower develop-ment but currently the natural spawning grounds of salmon have been totally destroyed. Upstream of the dam there are no salmon spawning grounds. In the potential salmon river of Gladyshevka, channelization for timber fl oating affects salmon production.
In the main part of the salmon and sea trout rivers the overall water quality is suffi ciently good. However, deforestation and clearing of bushes near the river increase the sediment and nutrient load into the water. Nutrients may reach the river systems from pig and poultry farms situated along the rivers. In almost all rivers there are currently no industrial sites along the rivers that would pose a risk to the water quality.

43
and lost habitat, there are problems with the fl ow regulation that affects salmon production and is reported from 65% of the salmon rivers.
In 98% of the Swedish salmon rivers channeliza-tion for timber fl oating, hydropower development or drainage of agricultural areas affect salmon production. Restoration of the river habitat has been carried out in parts of 84% of these rivers, but further restoration is required in all. For sea trout streams, it has been estimated that 64% of them are affected by channelization and clearing of stones (Degerman et al. 2005). Although much restoration work has been carried out, only a small portion of streams have been restored (op. cit.).
In agricultural areas, recurring clearing of streams is carried out, according to water court decisions, to improve drainage capacity, without a proper consideration of fauna or habitat diversity. Several catchments have also been subject to land drain-ing and lake lowering for the benefi t of agricul-ture and forestry. This has led to large fl uctua-tions and lowering of the water table, which has a negative impact on salmon and sea trout popu-lations, especially in the smaller catchments. In 42% of the salmon rivers this has been identifi ed as a problem, and in sea trout streams the situa-tion is probably even more pronounced, but exact data are missing. The occurrence of extreme low fl ow conditions that has arisen should in the short- term be prevented by regulation of the usage of water for irrigation purposes, and in the long- term by hydrological restoration of affected catchments.
of these rivers have an original wild sea trout stock but only about 20% of them are in a favourable state. In the rivers fl owing to the Gulf of Finland, the status of the sea trout stocks is better than in the rivers of the Kaliningrad region.
The largest sea trout stock (consisting of some local populations) is found in the River Luga. At present the annual smolt run is about 5,000 indi-viduals per year. Sea trout is a protected species in Russia and it is included in the Red List of the Russian part of the Baltic Sea (the Red List covers the rivers and the open sea).
7.8.4 Fishing regulations in Russian riversFishing of salmon in all the rivers is prohibited during the whole year and is only allowed for brood stock collection. The minimum size of salmon is 60 cm.
7.9 Sweden
7.9.1 State of the salmonid habitats in SwedenSweden has 43 former or present salmon rivers in the HELCOM area. Of these eleven lack fi shways in the main channel and dams block access to former spawning areas. Some of these rivers are large and had signifi cant salmon production before the development of hydropower production. Overall, artifi cial migration obstacles are common. For example, in the River Emån there are as many as 240 obstacles and 150 of them are not passable. Thirty-eight of these obstacles are signifi cant migration hindrances for salmon and sea trout. It was recently estimated by the Environmental Pro-tection Agency that there is the need for 6,000 new fi shways in Sweden. Furthermore, down-stream migration at most power plants and dams needs to be enhanced.
Due to Swedish legislation, hydropower develop-ment has increased substantially in recent years. A few salmon rivers still lack hydropower plants, e.g. the rivers Kalixälven, Råneälven, Kågeälven, Lögdeälven, Törlan, Himleån and Löftaån. The remaining 84% have hydropower plants, often several, and beside the problems with fi sh passage

44
In summary, the lost connectivity with large areas of habitat being inaccessible, channelization and clearing of rivers, fl ow regulation, drainage of the landscape for agriculture and forestry, the lack of proper buffer zones and acidifi cation are the major problems affecting the salmonid habitat in Sweden.
7.9.2 State of salmon populations in SwedenThe status of the remaining Swedish wild salmon stocks in the Baltic Sea has generally improved since the mid-1990s and this is refl ected by increases in the number of ascending spawners and parr densities in many rivers, particularly in the large or medium-sized rivers in the Gulf of Bothnia. ICES (2010a) concludes that among the 14 Swedish rivers included in the assessment of Baltic salmon stocks, from the river Tornionjoki in the north to the river Mörrumsån in the south, eight are likely or very likely to reach 50% of the potential smolt production capacity by 2010, whereas it is uncer-tain or unlikely if the remaining six stocks will reach this target. However, in 2010, none of the 14 rivers are likely to reach the higher target of 75% of the potential smolt production capacity now applied by ICES, which is based on the MSY concept.
The fi shery and its regulation, the level of the M74 syndrome and the development in post-smolt sur-vival rate are the main factors affecting the dynam-ics of the wild Baltic salmon stocks. The positive development of many wild stocks during the last 15 years is mainly due to reduced exploitation levels in the sea and coastal fi sheries, in combina-tion with relatively low M74 levels. National regula-tions, such as time period closures, and reduced fi shing opportunities due, for example to the dioxin regulations and an increasing seal population, are regarded as the main reasons for the reduction in exploitation rate. At the same time, the post-smolt survival has decreased successively during the same time period, and this has suppressed the recovery rate of salmon stocks. The fact that some rivers have not responded positively to the decrease in M74 and exploitation rate at sea indicate problems in the freshwater environment, for example imped-iments to migration (see above).
On the Swedish west coast, Atlantic salmon stocks have been declining since the beginning of the 1990s, and electrofi shing data from a number of
Excessive load of nutrients and sediment was reported from roughly 50% of the salmon rivers. For sea trout streams, 38% are so eutrophied that it affects trout production (Degerman et al. 2005). The water quality could be improved at low cost by establishing buffer zones along the rivers. Increased buffer zones would also provide shade, leaf litter and large woody debris – all essential for a good ecological status. However, 36% of visited sites in sea trout streams investigated throughout the country had no or very small riparian buffer zones (op. cit.)
Point emissions of sewage and waste from industry is not a general problem, and was reported from only 14% of sea trout streams (op. cit.). Upper parts and tributaries of two of the salmon rivers are thought to have some local problems with mine effl uents.
Acidifi cation from air-borne pollutants is still a signifi cant problem in Sweden. 79% of the salmon rivers had liming operations to improve water quality for sea trout and salmon. Earlier studies have shown that half of the salmon smolt production on the Swedish west coast would be lost without liming (Appelberg et al. 1989). Although the acid load has declined, liming will be required for several decades, especially in south-western Sweden.

45
of salmon in Baltic streams and rivers is generally 50 cm. For sea trout it is 35 cm (Bothnian Bay and Sea), 45 cm (Kattegat rivers) or 50 cm (rivers and streams of the Baltic Main Basin). The low size of 35 cm in some areas is being reviewed by the Swedish Board of Fisheries.
In the Main Basin (subdivisions 23–29), closed areas are frequent in the estuaries during the spawning migration. In the Bothnian Sea (30) and Bothnian Bay (31), normally only larger salmon rivers have closed areas. Instead all rivers and streams have an area of 200m radius from the mouth were fi shing is prohibited during 1 Septem-ber – 31 December.
Fishing for trout and salmon is always prohibited during spawning in fresh water, but the dates differ. There is a general ban on net fi shing in fresh water (rivers) where salmon and sea trout are present. However, in the larger salmon rivers of the Bothnian Bay there are areas, lake-like sections, where fi shing for other species (perch, whitefi sh) is allowed.
A bag limit is seldom used in the national regula-tion of the fi shery, but only one salmon per fi sher-man per day is allowed for rod and line fi shing in northern salmon rivers. It has been suggested that this limit also be applied to trout fi shing in fresh waters in the Bothnian Bay area because of the weakness of the stocks.
Swedish streams show that parr densities have dropped dramatically during this time period. This decline in stock status has been observed around the North Atlantic area, despite the fact that exploitation in the sea fi shery has declined mark-edly. It appears that growth mediated mortality may be responsible, possibly because of a warmer climate affecting food abundance for post-smolts (Friedland et al. 2009).
7.9.3 State of the sea trout populations in Sweden Sweden has a long coast with hundreds of sea trout streams. In general, the stocks are in a good state in the Main Basin and in the Kattegat. Investigations of parr densities (recruitment) have shown that the stocks have been stable during the last decade. Locally some streams may show low recruitment, often due to problems with the habitat or stream connectivity.
In Bothnian Bay, stocks are threatened by over-fi shing (ICES 2010a), and trout is mainly caught as by-catch in net fi shing aimed at whitefi sh or perch. In the Bothnian Sea the status of the stocks is better than in the Bothnian Bay, but not as good as in southern Sweden. A reason may be that also in this area trout is by-catch in the coastal net fi shing for other species (ICES 2010a).
7.9.4 Fishing regulations in Swedish riversThe government sets the fi shing rules in the sea and in fresh waters up to the fi rst defi nitive migra-tion barrier for salmonids. Local fi shing right owners or associations of fi shing right owners may strengthen the rules in their own waters, e.g. by establishing bag limits. Hence, fi shing rules vary between rivers, although a basic set of national rules always applies.
The minimum size of salmon is 60cm in the Baltic and 45 cm in the Kattegat area. Recently the minimum size of sea trout was raised from 40 to 50 cm in Bothnian Bay (ICES subdivision 31). Pres-ently the minimum size is, therefore, 50 cm in the whole Swedish part of the Baltic Sea, except in the Bothnian Sea (ICES subdivision 30) where it remains 40 cm. In the Kattegat, the minimum size is 45cm for trout. In fresh water the minimum size

8 Synthesis on the state of salmon and sea trout populations and river habitats in the Baltic Sea
of the century. The level of smolt production ini-tially stabilised but has decreased in recent years. In 2009, the production was estimated at about 100,000 smolts, which represents less than 30% of the total PSPC in this area of approximately 380,000 smolts.
Since the turn of the century the smolt produc-tion in the assessment unit 6 (the Gulf of Finland) has increased, although the production has varied remarkably. In 2009, the production was esti-mated at 30,000 smolts, which represents 12% of the total PSPC of 250,000 smolts. In the Gulf of Finland, the River Kymijoki dominates the overall picture, as it produces the majority of the smolts, albeit of the introduced Neva strain. The Russian Luga River and many Estonian rivers have low levels of production, although a few Estonian rivers have increasing trends in recent years.
One of the major factors that has promoted the recovery of salmon populations is the applica-tion of fi sheries management measures. Fishing for salmon has decreased as a consequence of fi shing regulations. Fishing with driftnets, the main fi shing gear, was phased out within the EU during the years 2005–2007 and prohibited from 2008. Long-lining for salmon is now the only offshore fi shing technique and to date catches have been lower than with drift nets, although long-lining has increased during 2008 and 2009.
Also the application of closed seasons during the spawning run has been a signifi cant measure sup-porting the recovery. A summer closure applies for the EU Member States beyond 4 nautical miles from the baselines. Additional closed seasons are applied both along the Finnish and Swedish coasts up to the shoreline in the Gulf of Bothnia. Many countries also apply fi shing prohibitions or restric-tions outside river mouths and nearby coastal areas. The objective of these measures is to allow for the salmon spawning migration before the fi sheries are opened. Together with a decreasing number of professional fi shermen, these measures have played an important role in the recovery of salmon populations in the Gulf of Bothnia (Romak-kaniemi et al. 2003).
These developments have been partly offset by a decreasing post-smolt survival rate. The declining survival rate has adversely affected both salmon
8.1 Salmon populations
The overall state of the Baltic salmon populations has developed positively since 1995 (ICES 2010a and 2010b). This encouraging development is seen in the natural reproduction of salmon popula-tions. In 2009, the 27 stocks in the Main Basin and Gulf of Bothnia and the 13 stocks in the Gulf of Finland that are assessed by ICES together produced slightly more than 2.5 million smolts (ICES 2010a and 2010b). This is about 65% of the total PSPC of these rivers, which is assessed at roughly 3.8 million smolts. In 1996 the total smolt production of these rivers was about 0.4 million smolts. The production has, therefore, increased more than six fold in 13 years. In the Kattegat the development has been less encouraging. The smolt production (mean of 2005–2009) has been estimated to be about 50% of the PSPC of the Kattegat rivers (fi gures by Erik Degerman, Swedish Board of Fisheries).
Such developments can be seen as a success story in the management of commercially exploited fi sh stocks. This particularly holds for the larger salmon populations in rivers fl owing to the north-ern Bothnian Bay in ICES assessment unit 1. The overall picture, however, disguises the situation for individual salmon stocks, where a more varied situation prevails. Of the total Baltic production of roughly 2.5 million wild smolts about 90% stem from the Bothnian Bay and about 75% from the two biggest rivers, Tornionjoki and Kalixälven. Tornionjoki alone produces almost half of the total production in the Baltic Sea. Tornionjoki is an example of salmon production increasing dramati-cally when a suffi cient number of spawners inhabit the available spawning areas.
Furthermore, in assessment unit 2, in the western part of Bothnian Bay, the overall situation has improved. In 2009, the production was estimated to be about 270,000 smolts, which represents 62% of the total PSPC in this area (429,000 smolts). In the Bothnian Sea, only one river, the Ljungan is included in the assessment. Ljungan produced about 1,300 smolts in 2009, which is at the same level as its estimated production capacity of 1,000 smolts.
The situation in ICES assessment units 4–5 of the Main Basin is less encouraging, although the total smolt production level increased around the turn 46

47
Sea, while it is better in south-western areas (ICES subdivisions 22–27).
In the Gulf of Bothnia, the sea trout popula-tions are in an endangered state. This has been observed both as low parr densities, low smolt numbers, low catches, and as a decline in age of fi sh caught and the number of ascending fi sh. The sea trout populations in the Gulf of Finland are also in an adverse state. The reasons are due to both excessive fi shing pressure, obstacles to migra-tion and habitat degradation. Nevertheless, there are some rivers and streams with populations in a more satisfactory state.
In the Main Basin area, sea trout populations have, in general, a better status than in the northern areas of the Baltic but there is also variation with migration barriers and poor habitat being the main problems.
8.3 Salmon and sea trout passage in rivers, river habitats, hydrology and water qualityFree passage to spawning grounds is fundamen-tal for migratory species such as salmon and sea trout. Juveniles and smolts also need access to nursery areas and as smolts their free passage to the sea is vital.
catches and the number of adult salmon ascend-ing rivers to form the spawning population. Also the increased size of the seal population has had an impact as salmon are an important prey item for seals. For these reasons, the increase in the smolt production has not resulted in a compara-ble increase in salmon catches and the size of the spawning run.
In 2010, the number of ascending salmon in the rivers of the Gulf of Bothnia decreased to roughly half the number detected in 2009. In 2008, a peak was observed in the numbers of ascending salmon. There is a large variation between years which has also been observed as catch fl uctuations in e.g. North Atlantic rivers such as the large Tana river. The reasons for the fl uctuations are diffi cult to identify, but they can be related to natural varia-tions, environmental conditions, post-smolt mortal-ity, increased fi shing effort or predation.
8.2 Sea trout populations
The state of the sea trout populations exhibits large variations between different regions of the Baltic Sea (ICES 2010a). The overall picture, based on electrofi shing surveys of parr densities in the nursery areas, indicates that stock status is poorest in eastern (ICES subdivisions 26 and 28) and north-ern (ICES subdivisions 29–32) areas of the Baltic

48
tats vary largely between regions and countries. Rivers were used for log driving until the 1970s particularly in Sweden and Finland. River beds, commonly rapids and riffl es, were dredged or excavated to remove stones and boulders to allow for smooth transport of logs. This had destructive effects since these areas form important spawn-ing and nursery habitats. Major efforts to restore such areas have been undertaken, but many areas are still suffering damage resulting from the log driving period.
In many rivers the amount of water is a limiting factor. Rivers can have large natural variation in fl ow, with periods of low fl ow during summer or winter. Effects of hydropower use and the use of water for irrigation or for drinking often result in insuffi cient water in the rivers for salmonid migra-tion, spawning and juvenile survival. Furthermore, the water quality in many rivers has declined due to nutrient and sediment loads from agriculture, forestry, peat mining and sewage sources. The presence of contaminants and the acidifi cation of waters are also threats to many salmonid popula-tions. Littering is also a negative anthropogenic factor in rivers running through cities and towns.
Most of the rivers emptying into the Baltic Sea have reduced salmonid accessibility. This is a result of the harnessing of rivers for energy produc-tion, which established barriers to migration. Hydropower dams and mill or irrigation dams are commonly found in all the Baltic countries. Most countries have made large efforts and investments in fi shways, ladders and passes to allow fi sh to pass such dams. Some fi shways function well, but in many cases they are only partly effective because of factors such as design, siting, water level and fl ow. Many important rivers are still inaccessible due to migratory hindrances and important repro-duction areas are either totally or partly excluded from salmonid production. Dams and other bar-riers may also affect kelts and smolts during their downstream migration towards the sea. The hydro-power turbines are known to cause high mortality rates for fi sh passing through.
High quality river habitats are also a precondition for salmonid reproduction. The quantity and fl ow of water, the meandering or sinuosity of rivers, the substrate, the water quality and the riverside vegetation all infl uence salmon and sea trout adults and juveniles. The conditions in river habi-

9 Defi ning criteria for prioritising popula-tions/rivers and recommending actions
of rivers a dangerously low level has been defi ned as a reproduction level of 20% or less of the PSPC. In such situations the recommended fi sheries man-agement measures and measures for the restora-tion of habitats are more stringent than otherwise.
Aside from the reproduction level criteria the essential criteria of biodiversity can also be derived from principles formed by the International Com-munity in the form of the Convention on Biological Diversity (CBD) from 1992. The principal objective of the Convention is to conserve biological diver-sity, both intra- and inter- specifi c diversity. On this basis an original salmonid population in its original river can and should objectively be prioritised over introduced populations or populations based on reared and stocked individuals.
Data on the reproductive state of original popula-tions is available in the ICES reports (ICES 2010a) and data gathered in the HELCOM SALAR project by salmon experts of the states around the Baltic Sea.
The two objective criteria:• Population productive level <50% of the PSPC• Original population strain can be combined in order to develop a priority list of populations and their rivers. A river with an orig-inal salmonid population with low reproduction would thereby be included in the top priority list. This priority list of populations and rivers should be the target of urgent implementation of the recom-mended recovery and restoration measures.
9.1 Criteria for prioritising populations/rivers
9.1.1 Original populations in their native riversThe salmon and sea trout populations in the Baltic Sea exhibit highly varying status. Some populations are in a very healthy state and already produce smolts at a level at or close to Maximum Sustain-able Yield (MSY), which is the highest average catch that in the long run can be taken from a fi sh stock without lowering its productive potential for future years. Other populations are on the verge of extinc-tion. The International Community including the EU and its Member States have set MSY as the objective for fi sh stock management. At the World Summit for Sustainable Development in Johannesburg in 2002, it was agreed to maintain or restore stocks to MSY levels with the aim of achieving these goals for depleted stocks on an urgent basis and where possible not later than 2015. MSY requires suffi cient spawning stock sizes and successful reproduction.
The objective of managing fi sh stocks at MSY level could be set in terms of the size of spawning runs, harvest rates or smolt production. The IBSFC SAP set its objective for stock rebuilding in terms of smolt production, and this has also by ICES been proposed for future salmon management (ICES 2008). The estimated production of smolt at MSY varies among rivers from about 60% to 80% of the potential smolt production. An objective of recovering or maintaining smolt production at or above 75% of the potential smolt production, approximately cor-responds to MSY management (ICES 2008). The HELCOM BSAP has set as the target attainment of at least 80% of the PSPC and for weak populations of at least 50 % of the PSPC, and these have conse-quently been adopted as target levels for prioritising rivers in the recommendations below.
Populations with low reproduction levels should be prioritised for recovery measures. The level of reproduction can objectively be measured as smolt production in relation to the PSPC of the river. In accordance with the targets of the HELCOM BSAP a production of less than 50% of the PSPC can be used as a criterion for low reproduction. Where the level of reproduction reaches dangerously low levels there is a need for urgent and effective recovery measures. In order to identify this group 49

50
The original salmonid populations that are repro-ducing at more secure levels can be grouped into two categories. These relate to the target of the HELCOM BSAP to reach a productive level of at least 80% of the PSPC. Hence populations would according to their state be grouped into three groups and given traffi c lights (fi gures 9.1. and 9.2.) as follows:• < 50% of PSPC Red Light• 50% – 79,9% of PSPC Yellow Light• At least 80% of PSPC Green Light
In order to moderate the variations in production between years a mean of the mode value for smolt production for the three latest observed years is used. For some salmon populations and for the sea trout populations smolt production observations are not available. In such cases, the production in relation to PSPC should be based on the best avail-able information and estimation by experts.
State of Baltic Salmon Populations, Grouped by MSY Traffic LightsSh
are
of t
he p
opul
atio
ns (%
)
Red <50 % PSPC Yellow 50 - 79 % PSPC Green >= 80 % PSPC
0
10
20
30
40
50
60
70
80
90
100
200920082007200620052004200320022001
Red <50 % PSPC Yellow 50 - 79 % PSPC Green >= 80 % PSPC
Num
ber
of P
opul
atio
ns
0
2
4
6
8
10
12
14
16
18
KattegatMain BasinGulf of RigaGulf of FinlandGulf of Bothnia
State of Baltic Salmon PopulationsGrouped by MSY Traffic Lights
Figure 9.1. Overview of the state of 31 Baltic salmon populations based on the number of smolts pro-duced (mode value) for each year of observation. The state is presented based on the MSY traffi c lights. The rivers fl owing into the Kattegat are not included while the large tributaries of Nemunas are included as one river system.
Figure 9.2. Overview of the state of 31 Baltic and 16 Kattegat salmon populations based on the smolt production as a mean of the mode values for the three latest observed years (2007-2009). The state is presented based on the MSY traffi c lights separately for each sea basin.

51
9.1.2 Potential populations and rivers
Original populations maintained as brood stocks and by stockingSome original populations of salmon or sea trout are only maintained as brood stocks and/or by releases of hatchery reared smolts as their native rivers are blocked to migratory fi sh and the repro-duction areas are partly or totally lost. Providing passage and restoring spawning and nursery areas in such rivers would provide for natural reproduc-tion of these original population strains. The origi-nal strain of these populations makes them com-parable to the populations reproducing naturally. The reintroduction of original salmon and sea trout populations into their natural habitats is consistent with the Convention on Biological Diversity.
It is therefore recommended that these popula-tions are safeguarded and where an assessment justifi es it re-established in their native river or a nearby potential river in the same assessment unit. The assessment should be conducted for the whole river system and may include elements such as the cost-effi ciency of re-establishment, estimated natural smolt production, alternative solutions for accessibility (e.g. fi shways or transport of spawn-ers/smolts), effects on native fi sh populations, mortality during up- and downstream migration
and migratory behavior. The assessment should include mapping of the quality and quantity of suitable spawning and nursery areas.
Salmon rivers with large potential for reproductionThe original salmon or sea trout populations of some rivers have been lost although the river itself may provide a suitable habitat for salmonid reproduction. Rivers that currently have natural smolt production of an introduced strain and that e.g. with the removal of man-made migra-tion obstacles have the largest PSPC should be selected for a list of the three salmon rivers with the greatest potential for restoration. Passage for salmonids through these rivers should be provided where an assessment for the whole river system shows that opening of the remaining reproductive areas in these rivers is justifi ed. The assessment should be conducted for the whole river system as described above.
Both the salmon populations for re-establishment and salmon rivers with large potential are defi ned in this report as potential salmon rivers. This relates to the commitment of the HELCOM Baltic Sea Action Plan to reintroduce native Baltic Sea salmon to at least four potential salmon rivers.

52
River water and habitatA good state of the riverine habitats is a precondi-tion for successful salmonid reproduction. The rec-ommendations for the restoration of river waters and habitats are based on the following defi nition of salmonid river habitat in good state:• The river has a natural meandering that provides
for diversity of habitats;• The quantity and velocity of waters are suffi cient
and the fl ow is maintained at an adequate level corresponding to the needs of salmon and sea trout eggs as well as young and adult fi sh;
• The water is cool and well oxygenated and stays within a limited pH range;
• There are spawning and nursery areas with the necessary bottom substrates (permeable gravel, cobble and sand);
• There are both deep pools and large boulders and stones as well as large woody debris suitable as hiding and resting sites for salmonids;
• The load of nutrients, organic substances, sedi-ments and sand from the river banks is low and littering or contaminants do not affect the waters or bottoms;
9.2 Criteria for and description of appropriate actions
The recommendations for actions for all the indi-vidual salmon and sea trout populations/rivers have been made for the following three main factors:
1. River water and habitat2. Passage in rivers 3. River fi sheries management
No priority is assigned to these factors and it is for the competent authorities to decide on which measures should be implemented based on legisla-tive provisions and nationally defi ned priorities.
The basis for these actions is the supporting data (ICES 2010a and 2010b and HELCOM SALAR data) concerning river waters and habitats, migratory barriers and state of the salmon and sea trout populations as well as the opinions of salmon and sea trout experts from Member States that have participated in the HELCOM SALAR project.

53
fi shways or transport of spawners/smolts), effects on existing fi sh populations, mortality during up- and downstream migration and migration behav-iour. The assessment should include mapping of the quality and quantity of suitable spawning and nursery areas. Passage in the river should be provided where the results of the assessment justifi es it.
Where, because of man-made obstacles to migra-tion, salmonids are unable to successfully ascend rivers to the spwaning areas, juveniles are unable to inhabit nursery areas or smolts/kelts are unable to migrate to the sea, the recommendation is to assess the removal of the obstacles, building fi shways over them or transporting fi sh over the dams. An assessment should also cover the pos-sibilities of improving the effectiveness of existing fi shways. These measures should be undertaken where the assessment shows a clear benefi t for the state of salmonid populations and the overall assessment justifi es it. The possibilities to enhance the natural reproduction of original salmonid populations in their native rivers should be given high priority.
The restoration of habitats and migratory routes also support the rebuilding of other populations of migratory fi sh such as eel, river lamprey and whitefi sh.
• Vegetation along the river provides for shade and predator protection for fi sh as well as habitats for insects that may disperse over the water as suit-able food items for salmonids;
• The growth of vegetation in the rivers is not excessive.
Where for instance the data or available informa-tion indicates that the water quality is low due to nutrient and sediment loading from agriculture, the recommendation is hence to establish effective protection zones along agricultural lands by the river. Other measures to reduce nutrient loading from the agriculture sector are beyond the scope of this report. Where there are problems due to acidifi cation the recommendation is to apply liming operations or to avoid causing leaching of acid soils. If water quantities and fl ow are insuffi cient and pose a risk for or impair the reproduction of salmonids the recommendation is to provide for a minimum fl ow or to reduce possibilities for rapid surface runoff.
Where the spawning or nursery habitats need restoration or a minimum water fl ow to be guar-anteed, such measures are hence recommended. Where rivers are straightened and riverbanks lack vegetation the recommendation is to restore the meandering of rivers and to allow for bushes and shrubs to grow along riverbanks and provide both shade for fi sh and a habitat and source for insects as food items for salmonids.
Passage in riversFree passage within the river up to the headwaters and in the spawning tributaries is another precon-dition for successful salmonid reproduction. The recommendations for the accessibility of rivers are based on the following elements:• The river system is free from physical, chemical or
biological barriers that prevent or impede ascend-ing or descending salmonids, or
• Where there are man-made migration hindrances an assessment should be made for the whole river system of the feasibility of removing them, providing fi shways over them and/or transporting fi sh over the dams or of enhancing the function-ing of current fi shways. The assessment may include elements such as the cost-effi ciency of re-establishment, estimated natural smolt pro-duction, options for improving accessibility (e.g.

54
• The introduction of a bag limit (maximum catch) of one or more salmon or sea trout per fi sher per day;
• The introduction of a closed season during the spawning and smolt migration period and other important conservation periods or areas;
• The application of a scheme for regulating fi shing effort by licensing or other means;
• The regulation of gillnetting in the river when and where salmon or sea trout are present;
Fish stock management, enforcement and sanctions• Setting of targets for the number of spawners for
each river/large tributary in addition to the level of smolt production in relation to PSPC;
• The use of original strains and as early life stages (eggs, alevins, parr) as possible when stocking salmonids;
• The clipping of the adipose fi n of reared salmo-nids to be stocked;
• The application of selective fi shing methods that target reared fi sh (e.g. fi nclipped) or that allow the release of wild fi sh;
• Arrangements for the reporting of catches in river fi sheries;
• Targeted inspection programs during important conservation periods;
• The effective enforcement and control of rules and the application of deterring sanctions when they are breached.
Where the population reproduces at a dangerously low level defi ned as 20% or less of the PSPC, the above recommendations are modifi ed to advice for a set of strict fi shing rules (e.g. a ban on fi shing of large wild individuals of salmon and sea trout) that in the short-term will enhance the recovery of the population towards MSY. In such cases, in addition to fi sheries management measures where applicable measures should be introduced as a matter of urgency for the restoration of habitats and opening of passage in rivers. This would spe-cifi cally apply for populations where the numbers of fi sh that participate in the spawning and/or the production of smolts are at a dangerously low level. This is relevant for many naturally reproduc-ing sea trout populations that on the basis of avail-able information are in a critical state. Where the number of smolts cannot be verifi ed by counting of individual fi sh the applicability of the 20% PSPC level should be based on the best available knowl-edge and estimates of experts.
River fi sheries managementThe recommendations for fi sheries management are, in accordance with the project agreement, confi ned to the rivers. The recommendations are based on the state of the naturally reproduc-ing salmonid populations. Where the population reproduces at a level of over 20% of PSPC the recommendation is to apply a set of effective and proportionate fi shing rules based on the state of the population and the local conditions that will enhance the development of the popu-lations towards MSY. The fi shing rules should be designed through a participatory and open process to include local stakeholder views and thereby gain acceptance and practical signifi cance. In many cases, rules already exist, but they may need amendment and thorough discussion with all stakeholders. The set of fi shing rules could be based on, inter alia, the following elements:
Fishing regulations and culture• The development of a sportfi shing culture to
allow large wild individuals of salmon and sea trout to be released back to the river;
• Where appropriate, a ban on fi shing and keeping of large wild salmon and sea trout;
• Where needed a total fi shing ban on salmon and/or sea trout;
• The defi nition of appropriate catch sizes (minimum/maximum size) to protect juveniles or mature fi sh (e.g. salmon over 10 kg);
• A prohibition on the use of barbed hooks and restrictions on the number of hooks and their size;
• The introduction of a rule that requires salmonids that are hooked outside the mouth to be released and to eliminate ‘foul hooking’;

55
The effectiveness of fi shing rules depends on the acceptance of them among fi shers and the possi-bility for them to participate in their development. Fishers are much more likely to breach rules that have been imposed on them through a top-down procedure. Controlling the compliance with rules and fi nding resources for controls is a huge chal-lenge due to the large number and long stretches of rivers. For these reasons the fi shing rules are best developed through a participatory and open process based on the elements outlined above. There is nevertheless, a need to enforce the rules and apply deterring sanctions when they are breached. These elements should therefore always form a part of the set of fi shing rules.
Management measures in the marine area of the EU will be based on the multiannual salmon management plan that will be adopted for Baltic salmon stocks and on national measures in accord-ance with it. The Russian Federation applies its own management measures. Where the EU and the Russian Federation have agreed on common measures, these will be adopted and applied by both parties. The sea trout stocks are mainly subject to national management measures.
The importance of large specimens of wild salmon or sea trout is emphasised since large salmonid females have high fecundity with crucial impor-tance for the successful reproduction of the popu-lation and both females and males genes for rapid growth (Gjerde et al. 1994). Where fi sh popula-tions experience high fi shing pressure, the larger older individuals have a higher probability of being removed from the population. Large individuals are, therefore, more susceptible to fi shing and often make an attractive target in sportfi shing. The classifi cation of salmon or sea trout as large indi-viduals depends on both the region of the river and the characteristics of the population. Therefore, a uniform defi nition is not proposed as the issue is more appropriately decided on a case-by-case basis by the competent authority.
The set of fi shing rules outlined above includes elements that allow for the release of fi sh with as little injury as possible. When using only one bar-bless hook, the lure is easier to release from the fi sh and it causes less damage to its tissues. The rules on hook size and numbers and the manda-tory release of fi sh hooked outside the mouth are needed to eliminate the destructive fi shing prac-tice of trying to hook the fi sh by dragging large hooks through pools with dense shoals of fi sh (foul-hooking).
The fi shing rules also include elements to reduce fi shing effort. They could apply at all times as a one fi sh rule or during spawning times as a closed season. In some cases a licensing scheme may be needed to reduce the overall fi shing pressure. Simi-larly, clipping of the adipose fi n allows the fi sher to identify wild individuals and thereby the devel-opment of selective fi shing practices that reduce overall fi shing pressure. Fishing practices which do not select for species or sizes and easily injure fi sh such as fi shing with nets may need to be prohib-ited as they easily entangle salmonids.

10 Recommendations
10.1 Salmon populations/rivers
10.1.1 Original salmon populations in their native riversIn accordance with the objective criteria presented under section 9, original salmon populations with low or impaired reproduction form the top priority list of populations to be the target of recovery or development measures.
Based on the ICES data and the data gathered in the HELCOM SALAR project the original salmon popula-tions in the MSY traffi c light red list to the left are recommended to be prioritised for recovery and res-toration actions. They should thereby be the target of immediate and effective conservation measures.
To follow-up the development of these popula-tions/rivers, it is recommended that they are included in a red list of salmon populations/rivers. The populations/rivers will be removed from the red list and put either on a yellow or green list where data or estimates indicate that they have recovered to a level of at least 50% or 80% of PSPC. The lists are to be displayed on a GIS-map at the HELCOM website and made publicly available. The MSY traffi c light yellow list is to the left and the green list is on page 58.
Original salmon populations in the MSY traffi c light red list
Population/river Sea BasinAttainment level of PSPC (mean of modal
values of the estimates for 2007-2009 (Kattegat rivers 2005-2009))
Pärnu GoR <1%Vilia* MB <1%Luga GoF 6%Rickleån BB 9%Vasalemma GoF 11%Šventoji* MB 12%Emån MB 14%Žeimena* MB 17%Vilnia* MB 19%Keila GoF 20%Göta älv tributaries** KG 22%Öreälven BS 23%Neris* MB 23%Kunda GoF 25%Saka MB 29%Daugava GoR 30%Nissan (trib. Sennan) KG 32%Löftaån KG 33%Tvååkersån KG 33%Rönne å KG 35%Kungsbackaån KG 36%Gauja GoR 44%
* Tributaries of the Nemunas river system** The Göta älv tributaries are Brattorpsån, Grönån, Lärjeån, Säveån and Västerlandaån
Original salmon populations in the MSY traffi c light yellow list
Population/river Sea BasinAttainment level of PSPC (mean of modal
values of the estimates for 2007-2009 (Kattegat rivers 2005-2009))
Ätran KG 50%Genevadsån KG 52%Peterupe GoR 53%Törlan KG 53%Ume/Vindelälven BB 56%Lagan KG 59%Viskan KG 59%Sävarån BB 61%Fylleån KG 62%Siesartis* MB 63%Lögdeälven BB 64%Rolfsån KG 65%Barta MB 67%Uzava MB 67%Vitrupe GoR 67%Mörrumsån MB 71%Salaca GoR 73%Venta MB 74%Suseån KG 76%Tornionjoki BB 78%Simojoki BB 78%
* Tributary of the Nemunas river system
The acronyms for the sea basins stand for the Main Basin (MB), Bothnian Bay (BB), Bothnian Sea (BS), Gulf of Finland (GoF), Gulf of Riga (GoR) and the Kattegat (KG). PSPC indicates potential smolt production capacity.56

57Figure 10.1. Map of Baltic Sea rivers with original salmon populations coloured according to the MSY traffi c lights.

58
10.1.2 Potential salmon populations and riversThe salmon populations and rivers in the two lowest tables are defi ned as potential salmon populations/rivers based on the availability of the original popu-lation and the large potential for reproduction in the river.
An assessment concerning man- made migration hindrances as proposed under section 9.2 (passage in rivers) should be made for rivers into which populations are planned to be re-established and for rivers with large potential. Passage in the rivers should be provided where the results of the assess-ment justifi es it.
Stocking of salmon or sea trout for enhancement purposes should be conducted on a temporary basis until natural reproduction reaches stable levels in these rivers. The stocked fi sh should be derived from the original strain or if not available from a nearby salmon population with genetic proximity and similar ecological conditions.
10.1.3 Other salmon populationsThe salmon populations and rivers that have not been referred to above are nonetheless important to maintain and develop in accordance with the recommendations for the three main factors.
Original salmon populations in the MSY traffi c light green list
Population/river Sea BasinAttainment level of PSPC (mean of
modal values of the estimates for 2007-2009 (Kattegat rivers 2005-2009))
Himleån KG 82%Åbyälven BB 82%Kalixälven BB 85%Stensån KG 85%Byskeälven BB 90%Irbe MB 93%Piteälven BB 102%Råneälven BB 113%Ljungan BS 132%
Original salmon populations available in hatcheries for possible re-establishment
Population/river Sea BasinPSPC or reproduction area that may be
mobilisedDalälven BS 41 haIijoki BB 600 ha
Indalsälven BSUnknown (470 ha available before
damming)Ljusnan BS 487 ha (840 ha available before damming)Luleälven BB 464 ha (1,431 ha available before damming)Skellefteälven BB Unknown
Ångermanälven BSUnknown (729 ha available before
damming)
Salmon rivers with large potential that may be restored for salmon production
Population/river Sea BasinPSPC or reproduction area that may be
mobilisedKymijoki GoF 100,000–200,000 smoltsKemijoki GoB 1,864 ha (in the tributary Ounasjoki)Oulujoki BB 50 ha

59
section 9. Recommendations for targeted actions concerning river waters and habitats are presented for each river or group of rivers in the separate reports for each Member State (BSEP 126B).
The restoration of waters and habitats should be a priority in the rivers that hold salmon or sea trout populations in the MSY traffi c light red list starting with rivers that have populations reproducing at a level of 20% or less of PSPC. If these rivers are not in need of restoration the focus should be on other rivers with natural reproduction or with signifi cant potential for natural reproduction.
Where rivers have man-made migration hindrances it is recommended that an assessment as presented under section 9.2 (passage in rivers) should be made concerning them. Passage in the river should be pro-vided where the results of the assessment justifi es it.
10.4 River fi sheries management
It is recommended that fi sheries management measures in salmonid rivers would be based on a set of fi shing rules as presented under section 9. The fi shing rules should be designed through a participatory and open process to include local
10.2 Sea trout populations/rivers
The objective criteria described for salmon popula-tions under section 9 are also valid for original sea trout populations of the Baltic Sea. The data on sea trout populations is however insuffi cient and their assessment must, therefore, be based on the best available information and estimates of experts.
Based on available information and expert opinions the original sea trout populations in Annex III are deemed to be below 50% of the PSPC of their native rivers (MSY traffi c light red list). The Annex lists 299 populations of which slightly over 100 are in Sweden and over 50 in Denmark and Estonia each. Russia has close to 50 populations in the Annex. The sea trout populations in Annex III are recommended to be prioritised for recovery and res-toration actions. They should therefore be the target of immediate and effective conservation measures.
10.3 River waters, habitats and accessibility
It is recommended that river waters and habitats are restored with the aim of achieving the defi nition of a salmonid habitat in good state as presented under

60
(preliminary list) and six potential populations/rivers are selected for a HELCOM salmon river restoration and development project.
Original salmon populations in their native rivers (preliminary list)DaugavaEmånGaujaKundaLugaPärnuRickleånRönne åSakaNemunas (tributaries Neris, Šventoji, Žeimena, Vilnia and Vilia).
The fi nal list of the ten original salmon populations to be covered by a second phase project should be decided through a dialog with the national admin-istrations and research institutes at the start of such a project.
Potential salmon populations and riversOriginal salmon populations for possible re-establishmentIijokiLjusnanLuleälvenÅngermanälven
Salmon rivers with large potential that may be mobilised for reproductionKemijokiKymijoki
Restoration and development plans for these popu-lations and rivers should be urgently advanced. Where applicable, the plans should include the recommended assessment concerning man-made migration hindrances and the mapping of the quality and quantity of suitable spawning and nursery areas.
stakeholder views so as to gain acceptance and ensure practical signifi cance. In many cases rules already exist, but they may need amendments and thorough discussions among stakeholders.
The fi shing rules should refl ect the state of the salmonid population that is subject to fi shing and enhance the development of the stock towards MSY. Where the population reproduces at a level of over 20% of the PSPC the recommendation is to apply a set of effective and proportionate fi shing rules and when the level is 20% or less of PSPC the recommendation is to apply a set of strict fi shing rules.
10.5 Restoration and development plans for salmon rivers
With a view to implementing the recommendations of this report and the commitment of the HELCOM Baltic Sea Action Plan to conserve at least ten and reintroduce at least four salmon populations and to develop restoration plans, it is recommended that salmon populations/rivers are selected for a second phase project to be coordinated by HELCOM.
Based on the salmon populations in the MSY traffi c light red list, the original salmon popula-tions for re-establishment and the salmon rivers with large potential as well as the state of the waters and habitats and the accessibility of rivers, it is recommended that the following ten original

11 Implementation of actions in the HELCOM Baltic Sea Action Plan relevant for salmon and sea trout populations
and duration for fi sheries to prevent capture of spawning and juvenile fi sh, and
• The further development and application in all cases of appropriate breeding and restocking practices for salmon and sea trout to safeguard the genetic variability of native wild stocks, by 2012.
The actions that are recommended in this report would contribute to the achievement of these measures as they would increase smolt production towards MSY, introduce new and targeted fi shing restrictions in rivers and safeguard the original strains of salmon and sea trout populations as well as the production of restoration plans for prioritized rivers.
Based on the reasoning and objective criteria described under section 9, the salmon populations and rivers listed in the recommendations under section 10 are proposed as a response for the implementation of the BSAP commitment of:• The active conservation of at least ten endan-
gered/threatened wild salmon river populations in the Baltic Sea region as well as the reintroduction of native Baltic Sea salmon in at least four poten-tial salmon rivers, and
• The development of restoration plans (includ-ing restoration of spawning sites and migration routes) in suitable rivers to reinstate migratory fi sh species.
The targets for these commitments in the BSAP are:
• By 2015, as the short-term goal, to reach production of wild salmon at least 80%, or at least 50% for some very weak salmon river populations, of the best estimate of potential production, and within safe genetic limits, based on an inventory and classifi cation of Baltic salmon rivers.
The BSAP furthermore urges the competent fi sher-ies authorities to take all the necessary measures:• To ensure that, by 2021, populations of all com-
mercially exploited fi sh species are within safe biological limits, reach Maximum Sustainable Yield, and are distributed through their natural range, and contain full size/age range,
• For continued designation of additional/improved spatial and/or temporal closures of suffi cient size
61

12 References
Brander, K. (2010). Impacts of climate change on fi sheries. Journal of Marine Systems 79: 389-402.
Casini M., Lövgren J., Hjelm J., Cardinale M., Molin-ero J. and Kornilovs G. (2008). Multi-level trophic cascades in a heavily exploited open marine ecosystem. Proceedings of the Royal Society, Biological sciences 275, 1793-1801.
Cowx, I. G., Welcomme, R. L. (editors) (1998). Rehabilitation of rivers for fi sh. FAO Fishing News Books. Alden Press. Great Britain. 260 p. European Commission (2010). Website: http://ec.europa.eu/environment/water/participation/map_mc/map.html (viewed 7 April, 2010)
Crozier W. W., Potter E. C. E., Prévost E., Schön P.-J., Ó Maoiléidigh N. E., 2003. A coordi-nated approach towards the development of a scientifi c basis for management of wild Atlantic salmon in the North-East Atlantic (SALMODEL). Queen’s University of Belfast, Belfast.
Degerman, E., Beier, U., Bergquist, B. (2005). Bedömning av miljötillstånd i kustvatten-drag med hjälp av fi sk. Finfo 2005: 1, 66 s.
deYoung, B., Harris, R., Alheit, J., Beaugrand, G., Mantua, N., Shannon, L. (2004). Detecting regime shifts in the ocean: data consid-erations. Progress in Oceanography 60: 143–164.
Elliott, J. M., Hurley, M. A. (1998). An individual-based model for predicting the emergence period of sea trout fry in a Lake District stream. Journal of Fish Biology 53: 414-433.
Fleming, I. A. Petersson, E., 2001. The ability of released, hatchery salmonids to breed and contribute to the natural productivity of wild populations. Nordic J. Freshw. Res. 75, 71-98.
Fjälling, A. (2005). The estimation of hidden seal-infl icted losses in the Baltic Sea set-trap salmon fi sheries. ICES Journal of Marine Science 62:1630–1635.
Friedland, K. D., MacLean, J. C., Hansen, L. P., Pey-ronnet, A. J., Karlsson, L., Reddin, D. G., Ó Maoiléidigh, N., McCarthy, J. L. (2009). The recruitment of Atlantic salmon in Europe. ICES Journal of Marine Science 66: 289–304.
Alexeev, F. E. (2008). Water resources manage-ment in the Kaliningrad Oblast; expedience and perspectives of applying the princi-ples and norms of the EU Water Frame Directive. Chapter 2 in the Transboundary waters and basins in the South-East Baltic, Chubarenko, B (editor). Kalingrad, Terra Baltica. Russian Academy of Sciences, P.P. Shirshov, Institute of Oceanology, Atlantic Branch, 305 pp.
Alheit, J., Möllmann, C., Dutz, J., Kornilovs, G., Loewe, P., Mohrholz, V., Wasmund, N. (2005). Synchronous ecological regime shifts in the central Baltic and the North Sea in the late 1980s. ICES Journal of Marine Science 62: 1205–1215.
Appelberg, M., Degerman, E., Johlander, A. & Karlsson, L. (1989). Liming increases the catches of Atlantic salmon on the west coast of Sweden. Nordic Journal of Fresh-water Research 65: 44–53.
Araki, H., Cooper, B., Blouin, M. S., 2007. Genetic effects of captive breeding cause a rapid, cumulative fi tness decline in the wild. Science 318, 100-103.
Armstrong, J. D., Kemp, P. S., Kennedy, G. J. A., Ladle, M., Milner, N. J. (2003). Habitat requirements of Atlantic salmon and brown trout in rivers and streams. Fisheries Research 62: 143-170.
BACC Author Team (2008). Assessment of Climate Change for the Baltic Sea Basin. Series: Regional Climate Studies. Springer-Verlag, Berlin Heidelberg. 473 pp.
Bardonnet, A., Bagliniere, J. L. (2000). Freshwater habitat of Atlantic salmon (Salmo salar). Canadian Journal of Fisheries and Aquatic Sciences 57: 497-506.
Barlaup, B. T., Gabrielsen, S. E., Skoglund, H, Wiers T. (2008). Addition of spawning gravel - A means to restore spawning habitat of Atlantic salmon (Salmo salar L.), and ana-dromous and resident brown trout (Salmo trutta L.) in regulated rivers. River Research and Applications 24 (5): 543-550.
Beland, K. F., Jordan, R. M., Meister, A. L. (1982). Water depth and velocity preferences of spawning Atlantic salmon in Maine rivers. North American Journal of Fisheries Man-agement 2: 11-13.
62

63
No 116B. Helsinki Commission, Helsinki. 188 pp. Available at: http://www.helcom.fi /stc/fi les/Publications/Proceedings/bsep116B.pdf (viewed 11 March, 2010)
Huusko, A., Greenberg, L., Stickler, M., Linnansaari, T., Nykänen, M., Vehanen, T., Koljonen, S., Louhi, P., Alfredsen, K. (2007). Life in the ice lane: the winter ecology of stream salmonids. River Research and Applications 23: 469-491.
ICES (2008). Report of the Workshop on Baltic Salmon Management Plan Request (WKBALSAL), 13–16 May, 2008. ICES CM 2008/ACOM:55.
ICES (2009a). Report of the Baltic Salmon and Trout Assessment Working Group (WGBAST), 24–31 March 2009, Oulu, Finland. ICES CM 2009/ACOM:05. 280 pp.
ICES (2009b). Advice Book 8. Herring in Subdivi-sion 30, (Bothnian Sea). Available at: http://www.ices.dk/committe/acom/comwork/report/2009/2009/Her-30.pdf.
ICES (2010a). Report of the Working Group on Baltic Salmon and Trout (WGBAST), 24-31 March 2010, St Petersburg, Russia. ICES CM 2010/ACOM: 08. 253 pp.
ICES (2010b). Advice Book 8. Salmon in the Main Basin and the Gulf of Bothnia (Subdivi-sions 22-31). Available at: http://www.ices.dk/committe/acom/comwork/ report/2010/2010/sal-2231.pdf
IPCC (2007). Fourth Assessment Report: Climate Change 2007. Contribution of Working Group II to the Fourth Assessment Report of the Intergovernmental Panel on Climate Change, 2007. Impacts, Adaptation and Vulnerability. Parry, M. L., Canziani, O.F., Palutikof, J. P., Van Der Linden, P. J., and Hanson, C. E. (eds.). Cambridge University Press, Cambridge, UK and New York, NY, USA. Available at: http://www.ipcc.ch/publications_and_data/ar4/wg2/en/con-tents.html (viewed 25 March, 2010).
Hutchison, M. J., Iwata, M. (1998). Effect of thyrox-ine on the decrease of aggressive behavior of four salmonids during the parr-smolt transformation. Aquaculture 168: 169-175.
Ikonen, E. (2006). The role of the feeding migra-tion and diet of Atlantic salmon (Salmo salar L.) in yolk-sack-fry mortality (M74) in the Baltic Sea. Academic disserta-tion. The Department of Biological and
Gibson, R. J. (1993). The Atlantic salmon in fresh water: spawning, rearing and production. Reviews in Fish Biology and Fisheries 3: 39-73.
Gjerde B., Simianer H., Refstie T. (1994). Estimates of genetic and phenotypic parameters for body weight, growth rate and sexual maturity in Atlantic salmon. Livestock Pro-duction Science 38:133-143.
Grant, J.W.A (1993). Self-thinning in stream-dwelling salmonids. Canadian Special Pub-lication of Fisheries and Aquatic Sciences 118:99-102.
Grant, J.W.A., Kramer, D.L. (1990). Territory size as a predictor of the upper limit to population density of juvenile salmonids in streams. Canadian Journal of Fisheries and Aquatic Sciences 47:1724-1737.
Grant, J.W.A., Steingrimsson, S.O., Keeley, E.R. (1998). Implications of territory size for the measurement and prediction of salmonid abundance in streams. Canadian Journal of Fisheries and Aquatic Sciences 55:181-190.
Hansen L. P., Quinn T. P., 1998. The marine phase of the Atlantic salmon (Salmo salar) life cycle, with comparison to Pacifi c salmon. Can. J. Fish. Aquat. Sci. 55, 104–118.
Hasler, A. D. (1971). Orientation and fi sh migration. Fish Physiology 6: 420–510.
Heggberget, T. G. (1991). Some environmental requirements for Atlantic salmon. Ameri-can Fisheries Society Symposium 10: 132-135.
Heggenes, J. (1991). Comparisons of habitat avail-ability and habitat use by an allopatric cohort of juvenile Atlantic salmon Salmo salar under conditions of low competition in a Norwegian stream. Holarctic Ecology 14: 51-62.
Heggenes, J., Bagliniere, J. L., Cunjak, R. A. (1999). Spatial niche variability for young Atlantic salmon (Salmo salar) and brown trout (S. trutta) in heterogeneous streams. Ecology of Freshwater Fish 8: 1-21.
HELCOM (2007). Climate change in the Baltic Sea Area. HELCOM Thematic Assessment in 2007. Baltic Sea Environment Proceedings No. 111. 49 pp.
HELCOM (2009). Biodiversity in the Baltic Sea: An integrated thematic assessment on biodi-versity and nature conservation in the Baltic Sea. Baltic Sea Environmental Proceedings

64
Landergren, P. (2001). Survival and growth of sea trout parr in fresh and brackish water. Journal of Fish Biology 58: 591-593.
Landergren, P. (2004). Factors affecting early migra-tion of sea trout Salmo trutta parr to brack-ish water. Fisheries Research 67: 283-294.
Landergren, P., Vallin, L. (1998). Spawning of sea trout, Salmo trutta L., in brackish waters: lost effort or successful strategy? Fish Res 35:229-236.
Limburg, K. E., Landergren, P., Westin, L., Elfman, M., Kristiansson, P. (2001). Flexible modes of anadromy in Baltic sea trout: making the most of marginal spawning streams. Journal of Fish Biology 59: 682-695.
Lundström, K., Hjerne, O., Alexandersson, A. and Karlsson O. (2007). Estimation of grey seal (Halichoerus grypus) diet composition in the Baltic Sea. NAMMCO Sci. Publ. 6:177–196.
Malcolm, I.A., Youngson, A.F., Soulsby, C. (2003). Survival of salmonid eggs in a degraded gravel-bed stream: effects of groundwater-surfacewater interactions. River research and Applications 19: 303-316.
McCormick S. D., Shrimpton, M., Moriyama, S., Björnsson B. T. (2002). Effects of an advanced temperature cycle on smolt devel-opment and endocrinology indicate that temperature is not a zeitgeber for smolting in Atlantic salmon. The Journal of Experi-mental Biology 205: 3553-3560.
MNREPRB (Ministry of Natural Resources and Envi-ronmental Protection of the Republic of Belarus) (2008). Plan of measures to protect Baltic salmon and Sea Trout in the Ostrovets District of the Grodno Oblast. (Translation from Russian).
Moir, H. J., Soulsby, C., Youngson, A. (1998). Hydraulic and sedimentary characteristics of habitat utilized by Atlantic salmon for spawning in the Girnock Burn, Scotland. Fisheries Management and Ecology 5: 241-254.
Pankhurst, N. W., King, H. R. (2010). Temperature and salmonid reproduction: implications for aquaculture. Journal of Fish Biology 76 (1): 69-85.
Perry, A. L., Low, P. J., Ellis, J. R., Reynolds, J. D. (2005). Climate Change and Distribution Shifts in Marine Fishes. Science 308: 1912-1915.
Environmental Sciences, Faculty of Bio-sciences, University of Helsinki, Finland.
Jokikokko, E., Jutila, E. (2005). Effect of fi shing regulation on the occurrence of repeat spawners and age distribution of Atlantic salmon in a northern Baltic river. Fisheries Management and Ecology 12: 341–347.
Jonsson, B., Jonsson, N. (2009). Review paper: A review of the likely effects of climate change on anadromous Atlantic salmon Salmo salar and brown trout Salmo trutta, with particular reference to water tempera-ture and fl ow. Journal of Fish Biology 75: 2381-2447.
Jounela, P., Suuronen, P., Millar, R.B. and Koljonen, M-L. (2006). Interactions between grey seal (Halichoerus grypus), Atlantic salmon (Salmo salar), and harvest controls on the salmon fi shery in the Gulf of Bothnia. ICES Journal of Marine Science: Journal du Conseil 2006 63(5):936-945.
Karlsson, L., Ikonen, E., Mitans, A., Hansson, S. (1999). The diet of salmon (salmo salar) in the Baltic Sea and connections with the M74 Syndrome. Ambio 28 (1): 37-42.
Kauppinen T., Siira A., Suuronen P. (2005). Tempo-ral and regional patterns in seal-induced catch and gear damage in the coastal trap-net fi shery in the northern Baltic Sea: effect of netting material on damage. Fish-eries Research 73:99–109.
Keinänen, M., Uddström, A., Mikkonen, J., Ryti-lahti, J., Juntunen, E.-P., Nikonen, S. & Vuo-rinen, P. J.(2008). The M74 syndrome of Baltic salmon: the monitoring results from Finnish rivers up until 2007. Riista- ja kala-talous – Selvityksiä 4/2008. 21 s.
Keinänen M., Tolonen T., Ikonen E., Parmanne R., Tigerstedt C., Rytilahti J., Soivio A., Vuo-rinen P. J. (2000). Reproduction disorder of Baltic salmon (the M74 syndrome): research and monitoring (Itämeren lohen lisääntymishäiriö - M74). Riista- ja kala-talouden tutkimuslaitos, Kalatutkimuksia - Fiskundersökningar 165, 38 pp.
Klemetsen, A., Amundsen, P-A-. Dempson, J. B., Jonsson, B., Jonsson, N., O’Connell, M. F., Mortensen, E. (2003). Atlantic salmon Salmo salar L., brown trout Salmo trutta L. and Arctic charr Salvelinus alpinus (L.): a review of aspects of their life histories. Ecology of Freshwater Fish 12: 1-59.

65
Semple, J. R. (1991). Atlantic salmon habitat survey: enhancement opportunities and problems in the Dunbar stream, Naswaak river, New Brunswick. Canadian Manu-script Report of Fisheries and Aquatic Sci-ences 2076: 1-35.
Sigholt, T., Åsgård, T., Staurnes, M. (1998). Timing of parr-smolt transformation in Atlantic salmon (Salmo salar): effects of changes in temperature and photoperiod. Aquaculture 160 (1-2): 129-144.
Stuart-Smith, R. D., Richardson, A. M. M., White, R. W. G. (2004). Increasing turbidity sig-nifi cantly alters the diet of brown trout: a multi-year longitudinal study. Journal of Fish Biology 65 (2): 376-388.
Suuronen, P., Jounela, P. (2010). Introducing run-size driven fi sheries management for the coastal fi shery of Atlantic salmon: Presea-son forecasts for policy makers. Marine Policy 34 (3): 679-689.
Todd, C.D., Friedland, K. D., MacLean, J. C., Hazon, N., Jensen, A. J. (2010). Atlantic Salmon Ecology: Change in Freshwater and Marine Environments (Chapter 16). Blackwell Pub-lishing Ltd. 496 pp.
Vehanen, T., Aspi, J. and Pasanen, P. (1993). The effect of size, fi n erosion, body silvering and precocious maturation on recaptures in Carlin-tagged Baltic salmon (Salmo salar L.). Ann. Zool. Fenn. 30: 277–285.
Walther, G-R., Post, E., Convey, P., Menzel, A., Parmesank, C., Beebee, T. J. C., Fromen-tin, J-M., Hoegh-Guldberg, O., Bairlein, F. (2002). Ecological responses to recent climate change. Nature 416: 389-395.
Österdahl, L. (1969). The smolt run of a small Swedish river. In: Northcote TG (ed) Salmon and trout in streams. HR MacMil-lan Lectures in Fisheries, University of British Columbia, Vancouver.
Polutskaya, N (2005). Atlantic Salmon in Rivers of Belarus. Neman Environmental Group. Coalition Clean Baltic.
Pörtner, H.O., Peck, M.A. (2010). Climate change effects on fi shes and fi sheries: towards a cause-and-effect understanding. Journal of Fish Biology 77: 1745-1779.
Rikardsen, A. H., Amundsen, P.-A. (2005). Brief communications: Pelagic marine feeding of Arctic charr and sea trout. Journal of Fish Biology 66: 1163-1166.
Rikardsen, A. H., Amundsen, P-A., Knudsen, R., Sandring, S. (2006). Seasonal marine feeding and body condition of sea trout (Salmo trutta) at its northern distribution. ICES Journal of Marine Science 63: 466-475.
Romakkaniemi, A., Perä, I., Karlsson, L., Jutila, E., Carlsson, U., and Pakarinen, T. (2003). Development of wild Atlantic salmon stocks in the rivers of the northern Baltic Sea in response to management measures. ICES Journal of Marine Science 60: 329-342.
Romakkaniemi, A. 2008. Conservation of Atlantic salmon by supplementary stocking of juve-nile fi sh. Ph.D. thesis. University of Helsinki, Department of Biological and Environ-mental Sciences, Faculty of Biosciences, and Finnish Game and Fisheries Research Institute.
Rubin, J.F., Glimsäter, C. (1996). Egg-to-fry sur-vival of the sea trout in some streams of Gotland. Journal of Fish Biology 48 (4): 585-606.
Salminen M., Kuikka S., Erkamo E., 1995. Annual variability in survival of sea-ranched Baltic salmon, Salmo salar L.: signifi cance of smolt size and marine conditions. Fisheries Management and Ecology 2, 171–184.

HELCOM appreciates the large effort of all the experts and acknowledges that this Report would not have been produced without their collective effort.
This report has been funded through a co-fi nanc-ing agreement between the European Union (Euro-pean Commission, Directorate General for Mari-time Affairs and Fisheries) and HELCOM (Overview of the state of salmon (Salmo salar) and sea trout (Salmo trutta) populations in rivers fl owing to the Baltic Sea – SI2.546540).
HELCOM has the sole responsibility for this report and the European Commission is not responsible for any use that may be made of the information contained therein.
This Report has been prepared by the project staff within the HELCOM Secretariat and by the Nomi-nated Experts to the HELCOM SALAR project as well as other experts within the national admin-istrations of Baltic Sea countries (the authors are mentioned on the second page of the Report). Also Gunnar Norén and Nils Höglund from the Coalition Clean Baltic (CCB) have participated and provided valuable input to the project. HELCOM is grateful for the efforts and good cooperation of all contributors, including Leena Närhi, Bitdesign for layout.
HELCOM is also greatful for the thourough work and constructive proposals of the peer reviewers Peter Hutchinson and Bror Jonsson as well as for the invaluable scientifi c advice provided by Atso Romakkaniemi from the Finnish Game and Fisher-ies Research Insitute (RKTL) and Henrik Sparholt from the ICES Secretariat during the course of the project.
13 Acknowledgements
66

Annex I
LATVIA Category43. Barta-Bartuva 644. Daugava 745. Gauja 4/546. Irbe 347. Peterupe 348. Riva49. Saka 350. Salaca 151. Uzava 352. Venta 4/553. Vitrupe 3
LITHUANIA Category54. Dubysa (Nemunas) 455. Mera (Nemunas) 156. Neris - Vilia (Belarus) (Nemunas) 457. Siesartis (Nemunas) 458. Širvinta (Nemunas) 459. Šventoji 460. Šventoji (Nemunas) 461. Venta No data62. Vilnia (Nemunas) 463. Virinta (Nemunas) 464. Vokė (Nemunas) 465. Žeimena (Nemunas) 1
POLAND Category66. Brda (Vistula) 767. Drawa (Odra) 668. Drwęca (Vistula) 669. Gwda (Odra) 770. Ina (Odra) 671. Łeba 672. Łupawa 873. Odra 774. Parsęta 675. Reda 676. Rega 677. Słupia 578. Vistula 779. Wda (Vistula) 780. Wieprza 681. Wierzyca (Vistula) 7
RUSSIA Category82. Gladyshevka 683. Luga 484. Narva 785. Neva 7
ESTONIA Category1. Jägala 72. Keila 13. Kunda 14. Loobu 45. Narva 76. Pirita 47. Purtse 58. Pärnu 19. Selja 410. Valgejõgi 511. Vasalemma 112. Vääna 3
FINLAND Category13. Aurajoki 714. Eurajoki 615. Fiskarsinjoki 816. Halikonjoki 817. Iijoki watercourse 618. Kalajoki watercourse 619. Karjaanjoki 620. Karvianjoki watercourse 521. Kemijoki watercourse 622. Kiiminkijoki watercourse 523. Kiskonjoki watercourse 824. Kokemäenjoki watercourse 725. Koskenkylänjoki 626. Kuivajoki 527. Kymijoki watercourse 528. Kyrönjoki 629. Lapuanjoki 830. Lestijoki 631. Mynäjoki 832. Oulujoki watercourse 733. Paimionjoki watercourse 834. Perhonjoki watercourse 635. Porvoonjoki 636. Pyhäjoki 537. Siikajoki 638. Simojoki 339. Tornionjoki watercourse 140. Uskelanjoki 841. Vantaanjoki 642. Ähtävänjoki 8
Salmon populations in rivers fl owing to the Baltic Sea by country and category (p. 27).
67

68
SWEDEN Category86. Alsterån 287. Byskeälven 188. Dalälven 589. Emån 190. Fylleån 191. Genevadsån 192. Gideälven 593. Göta älv 794. Helgeån 395. Himleån 196. Hörnån 697. Indalsälven 798. Kalixälven 199. Kungsbackaån 1100. Kågeälven 2101. Lagan 7102. Ljungan 3103. Ljusnan 7104. Luleälven 7105. Löftaån 1106. Lögdeälven 3107. Moälven 6108. Mörrumsån 1109. Nissan 5110. Piteälven 1111. Rickleån 3112. Rolfsån 1113. Råneälven 1114. Rönne å 1115. Sangisälven 6116. Skellefteälven 7117. Stensån 1118. Suseån 1119. Sävarån 3120. Testeboån 3121. Torneälven 1122. Tvååkerån 1123. Törlan 1124. Umeälven 7125. Vindelälven (Umeälven) 1126. Viskan 1127. Åbyälven 1128. Ångermanälven 7129. Ätran 1130. Öreälven 3
BELARUS Category131. Vilia 6

DENMARKRiver name River ID CategoryAskebæk 926 3Åstrup Bæk 1177 2Avbæk 1155 3Avlby Mølleå 1005 3Avnsbæk 1225 3Baggeå 103 1Bangsbo Å 1708 4Barritskov Bæk 1226 3Binderup Mølleå 1202 3Blå Å 1144 3Blykobbe Å 104 1Bobbe Å 133 3Bøgelunds Bæk 1154 2Brende Å 1012 3Brøndstrup Mølleå 1425 1Brorsbøl Bæk 1174 3Byåen 105 3Bybæk 1001 3Bygholm Å 1307 4Dalby Mølleå 1204 3Dammebæk 116 1Døndals Å 136 1Drikkær Bæk 1312a 1Dyrbæk 1147 2Dyrhave Bæk 1155a 3Egå 1321 4Elbæk 1128a 2Elling Å 1713 4Elsted Bæk 1158 4Elverdamsåen 334 3Erritsø Bæk 1209 1Esrum Å 204 6Fakse Å 519 4Fiskbæk 1136 3Fiskebæk 1304 3
Fiskebæk 1309 3Fladså 625 1Fruerbæk 1130 2Gårdbæk 1129 2Geelså 915 4Giber Å 1317 4Grenå 1417 4Græse Å 306 4Grødeby Å 112 3Grønnebæk 1114 3Grønsbæk 1201b 6Grubbe Mølleå 940 3Gudenå 1506-3 4Gudsø Bæk 1208 3Gudsø Mølleå 1207 3Gyldenså 123 3Haderslev Å 1176 4Haldrup Bæk 1310 5Halleby Å 419 5Hammerbro Bæk 931 4Hårby Å 1018 3Hattebæk 942 3Havelse Å 305 4Havmølle Å 1412 4Hede Å 1214 3Hellebjerg Bæk 1228 3Henrikebæk 114 1Herredsbæk 521 1Hevring Å 1430 3Hjortshøj Bæk 1322 3Hoed Å 1413 3Højbro Å 201 3Hulebæk 524 3Humlegårds Bæk 1175 3Hundbjerg Bæk 1134 3Hundekilde Å 1104 6Hundstrup Å 937 3Hygind Bæk 1010 3Ibæk 1215 3Kæmpeå 102 1Kær-Mølleå 1183 3Kampeløkke Å 142 3Karls Møllebæk 1613 1Kastbjerg Å 1604 3Kavslunde Å 921 8Kelse Å 128 3Kighanerende 213 6Klokkedal Å 1305 3Knudbæk 1181 1Kobbe Å 131 4
Annex II
Sea trout populations in rivers fl owing to the Baltic Sea by country and category (p. 27). If the river is a tributary, the name of its main branch is given in brackets.
BELARUSRiver name River ID CategoryVilia/Neris - -Petrapolsky brook - 6Kemelina - 1Tartak - 1Senkanka - 1Stracha - 6Oshmjanka - 6Gazovka - 1Dudka - 1
69

70
Kolå 1403 3Kolding Å 1205 3Kongshøj Å 925 3Kornerup Å 315 4Korup Å 1617 4Krambæk 1139 5Krobæk 522 1 Kruså 1128 3Køge Å 508 4Læså 111 3Lilleå 109 3Lillebæk 930 4Lollike Bæk 704 1Lunde Å 909 3Made Bæk 1213 3Malskær Bæk 1314 6Marenmølle Bæk 1606 3Melsted Å 132 3Melved Bæk 1111 3Mern Å 531 1Mølleå 1153 3Mølleå 1408 1Møllebæk 703 3Møllebæk 1156 3Møllebæk 1312 3Nejs Møllebæk 1137a 6Nivå 211 1Nybøl Bæk 1137 3Odder Å 1316 1Odderbæk 1201a 3Odense Å 912 4Øleå 115 1Onsild Å 1610 3Ørbæk Å 924 3Ørredbæk 1004 3Ørum/Rhoden Å 1220 3Pugemølle Å 1014 3Ringe Å 904 6Ringsgård Bæk 936 8Ris Møllebæk 1508 4Rislebæk 938 3Rønnebæk 624 1Rørmose Bæk 1146a 2Rosenvold Å 1222 3Rudbæk 1148 2Sæby Å 1706 6Sælsbæk 1159 3Saltbæk 1214b 3Saltø Å 621 3Sejet Nørremark Bæk 1303x 3Sellerup Skovbæk 1214a 3Sillebro Å 307 3Sillerup Bæk 1180 2Skæring Bæk 1323 3Skelbæk 1002 3Skelbækken 1303 1Skjold Å 1301 3
Skovsholm Bæk 120 1Snogbæk 1141 3Suså 622 4Søbæk 119 1Sølyst Bæk 125 1Søvind Bæk 1311 3Spang Å 1212 3Spangsbæk 1172 1Stambæk 1408a 1Stavids Å 911 3Stengård Møllebæk 941 3Stensby Møllebæk 705 1Stokkebæk 927 3Stolbro Bæk 1105 3Storå 1003 3Storå 1162 4Store Handsted Å 1308 3Strømmen 1103 4Stutteribækken 1006 6Sulbæk 1707 3Tange Å 928 3Taps Å 1182 2Tejn Å 139 3Tejn Møllebæk 140 3Tirsbæk 1218 3Treå 1426 3Tryggevælde Å 511 4Tubæk 525 3Tude Å 605 4Tuse Å 335 3Tvede Å 1512 3Ultang Møllebæk 1169 3Valsgård Bæk 1612 1Vandløb fra Kelstrup 1165 1Vandløb fra Nygård 1178 2Vandløb vest for Løjt 1173 3Vaseå 122 1Vedbæk 1161 3Vedskølle Å 510 4Vejle Å 1216 3Vejrup Å 913 4Vejstrup Å 932 3Vellens Å 108 3Viby Å 1007 3Villestrup Å 1614 3Vindinge Å 923 3Vintersbølle Bæk 707 3Vive Møllebæk 1615 1Vivede Mølleå 518 4Voers Å 1701 4Å-Å 1016 3Åkær Å 1313 3Ålebæk 901 2Ålebæk 1013 2Alling Å 1504 4Århus Å 1320 3

71
FINLANDRiver name River ID CategoryTornionjoki watercourse FI 67 4Tornionjoki (border river section)
FI 67.1-2 3
Muonionjoki (Tornionjoki)
FI 67.3-5 1
Könkämäeno (Tornionjoki)
FI 67.6 1
Lätäseno (Tornionjoki) FI 67.7 1Jietajoki (Tornionjoki) FI 67.53 5Palojoki (Tornionjoki) FI 67.57 5Pakajoki (Tornionjoki) FI 67.49 3Äkäsjoki (Tornionjoki) FI 67.34 4Liakanjoki (Tornionjoki) FI 67.111 6Martimojoki (Tornion-joki)
FI 67.14 -
Naamijoki (Tornionjoki) FI 67.8 5Olosjoki (Tornionjoki) FI 67.88 4Naalastojoki (Tornionjoki)
FI 67.87 4
Ylläsjoki (Tornionjoki) FI 67.37 5Niesajoki (Tornionjoki) FI 67.36 4Kuerjoki (Tornionjoki) FI 67.345 4Kangosjoki (Tornionjoki) FI 67.48 4Jerisjoki (Tornionjoki) FI 67.47 5Tarvantojoki (Tornionjoki)
FI 67.56 4
Maljasjoki (Tornionjoki) FI 67.55 5Olhavanjoki FI 62 6Iijoki watercourse FI 61 6Iijoki FI 61.1-3 6
Siuruanjoki (Iijoki) FI 61.4 -Livojoki (Iijoki) FI 61.5 6Pärjänjoki (Iijoki) FI 61.59 6Korpijoki (Iijoki) FI 61.7 6Kisosjoki (Iijoki) FI 61.29 6Loukusanjoki FI 61.27 6Kostonjoki (Iijoki) FI 61.6 6Kiiminkijoki watercourse FI 60 5Kiiminkijoki FI 60.01-04 5Nuorittajoki (Kiiminkijoki)
FI 60.06-07 6
Oulujoki watercourse FI 59 7Oulujoki FI 59.1-2 7Sanginjoki (Oulujoki) FI 59.14-15 6Muhosjoki (Oulujoki) FI 59.16-17 6Utosjoki (Oulujoki) FI 59.22-24 6Kutujoki (Oulujoki) FI 59.26 6Siikajoki FI 57 6Olkijoki FI 84.035 6Pattijoki FI 84.034 6Piehinkijoki FI 56 6Pyhäjoki FI 54 6Kalajoki watercourse FI 53 6Kalajoki FI 53.01-04 6Vääräjoki (Kalajoki) FI 53.09 6Siiponjoki FI 53.015-016 7Lestijoki FI 51 5Perhonjoki watercourse FI 49 6Perhonjoki FI 49.01-02 6Halsuanjoki (Perhonjoki) FI 49.03 6Ullavanjoki (Perhonjoki) FI 49.05 6Köyhäjoki (Perhonjoki) FI 49.06 6Ähtävänjoki FI 47 8Lapuanjoki FI 44 8Kyrönjoki FI 42 6Karvianjoki watercourse FI 36 5Merikarvianjoki FI 36.3 5Pohjajoki FI 36.2 5Eteläjoki (-Kristiskerinjoki)
FI 36.1 8
Kokemäenjoki watercourse
FI 35 6
Kokemäenjoki FI 35.1 -Harjunpäänjoki (Kokemäenjoki)
FI 35.14 6
Eurajoki FI 34 6Mynäjoki FI 30 6Aurajoki FI 28 6Paimionjoki watercourse FI 27 6
FI 27.01-05 -Vähäjoki (Paimionjoki) FI 27.014 -Halikonjoki FI 26 6Uskelanjoki FI 25 3Kiskonjoki watercourse FI 24 3Kiskonjoki FI 24.01 -
FI 24.04 -Fiskarsinjoki (Kiskonjoki) FI 82.001 3
ESTONIARiver name River ID CategoryNarva 622 8Tõrvajõgi 657 1Purtse 682 1Kunda 729 1Selja 746 3Sõmeru 756 1Muru - 1Loobu 779 1Valgejõgi 792 1Jägala 835 8Pirita 892 3Kuivajõgi 905 1Tuhala 914 1Angerja 917 1Leiva 922 1Vääna 945 1Vanamõisa 958 1Keila 961 1Vasalemma 992 1Pärnu 1235 8Reiu 1454 1

72
Vantaanjoki FI 21 6Longinoja (Vantaanjoki) - -Keravanjoki (Vantaanjoki)
FI 21.09 -
Tuusulanjoki (Vantaanjoki)
FI 21.08 -
Luhtajoki (Vantaanjoki) FI 21.05 -Palojoki (Vantaanjoki) FI 21.07 -Paalijoki FI 21.025 -Sipoonjoki FI 20 -Byabäcken (Sipoonjoki) FI 20.004 -Mustijoki FI 19 -Isoniitynoja (Mustijoki) FI 19.008 -Kungsbäcken (Mustijoki) FI 19.009 -Porvoonjoki FI 18 6Pikkujoki (Porvoonjoki) FI 18.013 -Ilolanjoki FI 17 -Koskenkylänjoki FI 16 6Loviisanjoki FI 81.027 -Taasianjoki FI 15 -Summanjoki FI 13 -Vehkajoki FI 12 -Ravijoki FI 81.07 -Virojoki FI 11 -Saarasjärvenoja (Vironjoki)
FI 11.005 -
Vaalimaanjoki FI 10 -Urpalanjoki FI 09 -Vilajoki FI 08 -Tervajoki FI 07 -Hounijoki FI 06 -Mustajoki FI 05.001 -Alhonpuro - -Pölkkyoja - -Soskuanjoki - -
Karjaanjoki watercourse FI 23 6Karjaanjoki FI 23 6Mustionjoki FI 23.01-02 6Nummenjoki FI 23.07 -Karjaanjoki-Vanjoki FI 23.04 -Vihtijoki FI 23.09 -Vantaanjoki watercourse FI 21 6Vantaanjoki FI 21.01-02 6Keravanjoki (Vantaanjoki)
FI 21.09 6
Porvoonjoki FI 18 6Koskenkylänjoki FI 16 6Kymijoki watercourse FI 14 5Viantienjoki FI 84.054 6Kaakamojoki FI 66 -Akkunusjoki FI 65.111 -Kemijoki watercourse FI 65 6Kemijoki FI 65.1-2 6Ounasjoki (Kemijoki) FI 65.5 6Runkausjoki (Kemijoki) FI 65.18 6Vähäjoki (Kemijoki) FI 65.17 6Suolijoki (Kemijoki) FI 65.174 6Raudanjoki (Kemijoki) FI 65.7 6Marrasjoki (Kemijoki) FI 65.55 6Molkojoki (Kemijoki) FI 65.58 6Lainiojoki (Kemijoki) FI 65.56 6Loukinen (Kemijoki) FI 65.69 6Seurujoki (Kemijoki) FI 65.697 6Syvä Tepastojoki (Kemijoki)
FI 65.68 6
Kuiva Tepastojoki (Kemijoki)
FI 65.686 6
Käkkälöjoki (Kemijoki) FI 65.67 6Närpiönjoki FI 39 -Teuvanjoki FI 38 -Isojoki FI 37 -Kärjenjoki (Isojoki) FI 37.06 -Karijoki (Isojoki) FI 37.04 -Heikkilänjoki (Isojoki) FI 37.05 -Laajoki FI 31 -Mynäjoki FI 30 6Hirvijoki FI 29 -Fiskarsinjoki FI 82.001 3Ingarskilanjoki FI 81.064 -Kocksbybäcken (Ingarskilanjoki)
- -
Solbergå (Ingarskilanjoki)
- -
Siuntionjoki FI 22 -Kirkkojoki (Siuntionjoki) FI 22.006 -Kvarnbäcken (Siuntionjoki)
- -
Mankinjoki FI 81.057 -Gumbölenjoki (Mankinjoki)
- -
Espoonjoki FI 81.055 -Glomså (Espoonjoki) - -Glimså (Espoonjoki) - -
LATVIARiver name River ID CategorySalaca - 4Svētupe - 4Vitrupe - 4Aģe - 4Pēterupe - 4Gauja - 5Roja - 4Irbe - 4Venta - 5Užava - 4Rīva - 4Saka - 4Bārta - 4

73
RUSSIARiver name River ID CategorySolka (Luga) - 1Azika (Luga) - 1Vruda (Luga) - 3Lemovzha (Luga) - 1Lubenka (Luga) - 1Khrevitsa (Luga) -- 1Oredezh (Luga) - 1Vidon (Luga) - 1Chornaja (Khabolovka) - 1Sista - 1Voronka - 1Gladyshevka - 1Roschinka (Gladyshevka) - 1Ptichja (Gladyshevka) - 1Malinovka - 1Petrovka - 1Seleznevka - 1Gusinaja (Seleznevka) - 1Velikaja - 1Peschanaja - 1Serga - 1Polevaja - 1Römpöti brook - 1Gorokhovka - 1Karasiovka - 1Chasovoi brook - 1Kriven brook - 1Lososinka (Seleznevka) - 1Maiskii brook - 1Jukkola (west) brook - 1Jukkola (middle) brook - 1Jukkola (east) brook - 1Privetnaja - 1Ushkovski brook - 1Bystryi brook - 1Huumosenoja brook - 1Bannyi brook - 1Lososinka - 1Kuokkala brook - 1Pastorski brook - 1Maiak brook - 1Razinskii brook - 1Sestra - 1Smoliachkov brook - 1
POLANDRiver name River ID CategoryBauda PL558 5Błotnica PL432 5Brda (Vistula) PL292 7Czarna Woda PL47734 4Drawa (Odra) PL1888 4Drwęca (Vistula) PL28 5Gowienica PL314 4Gwda (Odra) PL1886 7Ina (Odra) PL198 5Łeba PL476 5Łupawa PL474 7Odra PL1 7Parsęta PL44 4Pasłęka PL56 7Piaśnica PL4772 4Radunia (Vistula) PL4868 5Reda PL478 5Rega PL42 5Słupia PL472 4Vistula PL2 7Wda (Vistula) PL294 7Wieprza PL46 5Wierzyca (Vistula) PL298 7Wołczenica PL352 6Zagórska Struga PL4792 1
LITHUANIARiver name River ID CategoryNeris (Nemunas) LT1 -Žeimena (Nemunas) LT2 1Vilnia (Nemunas) LT3 -Vokė (Nemunas) LT4 -Mera (Nemunas) LT5 -Šventoji (Nemunas) LT6 4/5Siesartis (Nemunas) LT7 -Širvinta (Nemunas) LT8 -Virinta (Nemunas) LT9 -Dubysa (Nemunas) LT10 4/5Šventoji LT11 -Akmena-Dangė - 1Bartuva - -Jūra - -Kena (Nemunas) - -Minija - 1Musė (Nemunas) - -Smiltelė - 1Šyša - -Venta - 1

74
SWEDENRiver Name River ID Category
Ylinen Kihlankijoki (Torneälven)
001_1_2 1
Parkajoki (Torneälven) 001_1_3 1Merasjoki (Torneälven) 001_1_4 1
Alanen Kihlankijoki (Torneälven)
001_1_1 1
Skrövån (Kalixälven) 004_1_1 1Vettasjoki (Kalixälven) 004_1_2 1Valtiojoki (Kalixälven) 004_1_2_1 1Tolkkijoki (Kalixälven) 004_1_2_1_1 1
Ala-Leipojoki (Kalixälven)
004_1_3 1
Kutsasjoki (Kalixälven) 004_1_4 1Vassara älv (Kalixälven) 004_1_5 1Töre älv 005 1Vitån 006 1Norr-Lillån (Råneälven) 007_1 1Borgforsälven (Piteälven) 013_1 1Lillpiteälven 014 1Rokån 015 1Tvärån (Åbyälven) 017_1 1Malbäcken (Åbyälven) 017_2 1
Byskebäcken (Byskeälven)
018_1 1
Tvärån (Byskeälven) 018_2 1Kyrkbäcken (Byskeälven) 018_2_1 1Storbäcken 1819 1
Lillträskbäcken (Kågeälven)
019_1 4
Bure älv 021 3Tryssjöbäcken (Rickleån) 024_1 1Storbäcken 025_1 1Pålböleån (Sävarån) 026_1 1Klappmarksbäcken (Sävarån)
026_2 1
Gravån (Sävarån) 026_3 1Gärssjöbäcken (Sävarån) 026_4 1Brännbäcken (Sävarån) 026_5 1Malbäcken (Sävarån) 026_5_1 1Fällforsån/Tavelån 027 1Smörbäcken (Umeälven) 028_1 1
Idebäcken /Västanbäcken (Umeälven)
028_2 1
Sörmjöleån 28291 1Nättingtjärnbäcken 28292 1Norrmjöleån 28293 1Degerbäcken (Hörnån) 029_1 1Lillån (Öreälven) 030_1 1
Forstjärnbäcken (Öreälven)
030_2 1
Kälkvattsbäcken (Öreälven)
030_3 1
Prästbäcken 30311 1Levarbäcken 30312 1Torsbäcken 30313 1Sågbäcken (Lögdeälven) 032_1 1
Stockbäcken (Lögdeälven)
032_2 1
Rundbäcken (Lögdeälven)
032_3 1
Bladtjärnsbäcken (Lögdeälven)
032_4 1
Mjösjöån (Lögdeälven) 032_5 1Saluån 32331 1Stridbäcken 32332 1Skravelbäcken 32333 1Snörbäcken 32334 1Aspan 32335 1Husån 033 2Dombäcksbäcken 3334 1Svartvattbäcken /Flärkån (Gideälven)
3435 1
Idbyån 035 1Galasjöån (Moälven) 036_2 1Forsån (Moälven) 036_3 1Utterån (Moälven) 036_4 1Dalsjöbäcken 37381 1Näskeån 37382 1Kälaviksbäcken 37383 1Gålsjöbäcken 37384 1Vedån 37386 1Inviksån 37387 1Dockstaån/Utanskogså 37388 1Björkån (Ångermanälven)
038_1 1
Strinneån (Ångermanälven)
038_2 1
Älandsån 38391 1Utansjöån 38392 1Edsån 38393 1Vålångersbäcken 38394 1Överdalsån 38395 1Bollstaån 38396 1Gådeån 039 1Byån 39401 1Norrån 39402 1Sörån 39403 1Ljustorpsån (Indalsälven) 040_1 1Aspån (Indalsälven) 040_1_1 1Havstobäcken 40411 1Bänkåsbäcken 40412 1Bredsandsbäcken 40413 1Slädabäcken 40414 1Selångersån 041 1Vapelbäcken 4142 1Gnarpsån 043 1Harmångersån 044 3Tomashamnsbäcken 44451 1Pulsarvsbäcken 44452 1Storsandsbäcken 44453 1Halstaån 44454 1Björnbäcken 44455 1Medskogtjärnsbäcken 44456 1Hornån 44457 2

75
Bäck till Yxeltorpav 68694 1Vammarsmålaån 68695 1Passdalsån 68696 1Rävbrinksbäcken 68697 1Vindån 069 1Verkebäcksån 70711 1Gamlebyån 70712 1Blekhemsån (Almvikså 70713 1Loftaån 70714 1Marströmmen 072 1Virån 073 1Lillån 7475 1Ljungbyån 077 4Hagbyån 078 1Halltorpsån 7879 1Bruatorpsån 079 1Brömsebäcken 7980 1Lyckebyån 080 3Silletorpsån 8081 2Nättrabyån 081 3Heabybäcken 81821 1Listerbyån 81822 1Angelån 81823 1Ronnebyån 082 7Sörbybäcken 082_1 2Vierydsån 083 2Bräkneån 084 3Siggarpsån 8485 1Mieån 085 2Västra Orlundsån 86871 1Östra Orlundsån 86872 1Gallån 86873 1Skräbeån 087 1
Forsakarsbäcken /Igelgrop (Helgeån)
088_1 1
Mjöån (Helgeån) 088_2 1Vinne å (Helgeån) 088_4 1Vramsån (Helgeån) 088_3 1Bäck vid Brantevik 88891 1Kvarnbybäcken 88892 1Kabusaån 88893 1Kylsbäcken 88894 1Knäbäcken 88895 1Kungabäcken 88896 1Rörums Södra å 88897 1Segesholmsån 88898 1Mölleån 88899 1Norre å 888910 1Verkaån 888911 1Tommarpsån 888912 1Kippersbäcken 888913 1Oderbäcken 888914 1Rörums Norra å 888915 1Hannasån 888916 1Klammersbäck 888917 1Julebodaån 888918 1Komstadsån 888919 1
Hällkroksbäcken 44458 1Kolarviksbäcken 44459 1Delångersån 045 3Enångersån 4647 3Lötån 047 1Söderhamnsån 4748 1Kvarnån 48491 1Bäck Billingen-Järvs 48492 1Skärjån 049 3Hamrångerån 050 1Hilleviksbäcken/Björkeån 5051 1Gävleån 052 3
Hemlingbybäcken/Järvstabäcken
5253 1
Forsmarksån 055 1Gråskaån 56571 3Lavaröån 56572 2Skeboån 057 3Bodaån 57581 2Norsjöbäcken 57582 2Tullviksbäcken 57583 1Broströmmen 058 2Norrtäljeån 059 2Penningbyån 59601 1Enviksbäcken 59602 1Bergshamraån 59603 2Loån 59604 2Ullnaån 6061 3Erstaviksbäcken 6162 1Tyresån 062 3Kvarnbäcken 62631 2Åbyån 62632 1Ånäsbäcken 62633 3Bränningeån 62634 3Husbyån 62635 3Vinåkersbäcken 62636 1Skillebyån 62637 3Åvaån 62638 1Träskbäcken 62639 1Fitunaån 626311 1Moraån 626312 2Muskån 626313 1Sandemarsbäcken 626314 3Kagghamraån 626315 1Ålbergaån 066 1Vretaån 066_1 1Kvarsebobäcken 66671 1Svintunaån 66672 1Djupviksbäcken 66673 1Kolmårdsbäcken 66674 1Pjältån 66675 1Torshagsån 66676 1Getåbäcken 66678 1Vadsbäcken 6768 1Storån 068 1Fredriksnäsbäcken 68692 1Börrumsån 68693 1

76
Nisebäcken 1041051 1Kråkebäcken 1041052 1Paradisbäcken 1041053 1Lundaån 1051061 1Kvarnabäcken 1051062 1Ströan 1051063 1Torpaån 1051065 1Haga å 1071081 1Smalholmsbäcken 1071082 1Stockaån 1071083 1Kläppabäcken 1071084 1Kyviksbäcken 1071085 1Veån 1071086 1Lerkilsbäcken 1071087 1Krogabäcken 1071088 1Knapabäcken 1071089 1Gothemsån 117 1Storsundsån 1171181 1Hugraifsån 1171182 1Histillesån 1171183 1Gartarveån 1171184 1Nygårdsån 1171185 1Halsegårdaån 1171186 1Svajdeån 1171187 1Snoderån 118 1Brusebobäcken 1181171 1Kioskbäcken 1181172 1Hyluån 1181174 1Kohlens kvarnbäcken 1181175 1Lergravsbäcken 1181176 1Bångån 1181177 1Robbjänsån 1181178 1Hultungsån 1181179 1Kopparviksbäcken 11811710 1Lummelundaån 11811711 1Ireån 11811712 1Idån 11811713 1
Själsöån 11811714 1
Åbybäcken 119 1
Nybroån 089 1Sänkebäck 89901 1Strandhemsbäcken 89902 1Bäck vid Gislövsläge 89903 1Albäcken 89904 1Dybäcksån 89905 1Bäck 2 km V Vellinge 89906 1Sjötorpsbäcken 89907 1Bäck vid Bernstorp 89908 1Charlottenlundsbäcke 89909 1Gessiebäcken 899010 1Svartån 899011 1Ståstorpsån 899012 1Dalköpingeån 899013 1Tullstorpsån 899014 1Skivarpsån 899015 1Rosbäcken Bifl öde svartån)
899011_1 1
Hunnestadbäcken (bifl öde svartån)
899011_2 1
Sege å 090 1Höje å 091 1Kävlingeån 092 1Bråån 092_1 1Saxån 093 1Säbyholmsån 93941 1Säbybäcken 93942 1Rydebäcken 93943 1Råån 094 1Bäck vid utvälinge 94951 1Hittarpsbäcken 94952 1Skälebäcken 94953 1Döshultsbäcken 94954 1Bäck vid vattenmölla 94955 1Vege å 095 1Ängelbäcken 96971 1Appelrydsbäcken 96972 1Hovallshamnbäcken 96973 1Hovbäcken 96974 1Ripgårdsbäcken 96975 1Segeltorpsbäcken 96976 1Bäck vid vejbystrand 96977 1Myltebäck 96978 1Smårydsbäcken 96979 1Vadbäcken 969710 1Möllebäcken 969711 1Skintan 1021031 1Långasandsbäcken 1021032 1Hulabäck 1021031 1Killebäcken 1021032 1Nyrebäcken 1021031 1Knebildstorpsbäcken 1021032 1Kvarnabäcken 1021031 1Skreastrandsbäcken 1021031 1Ringsegårdsbäcken 1021032 1Vrångabäcken 1031043 1Nygårdsbäcken 1031044 1
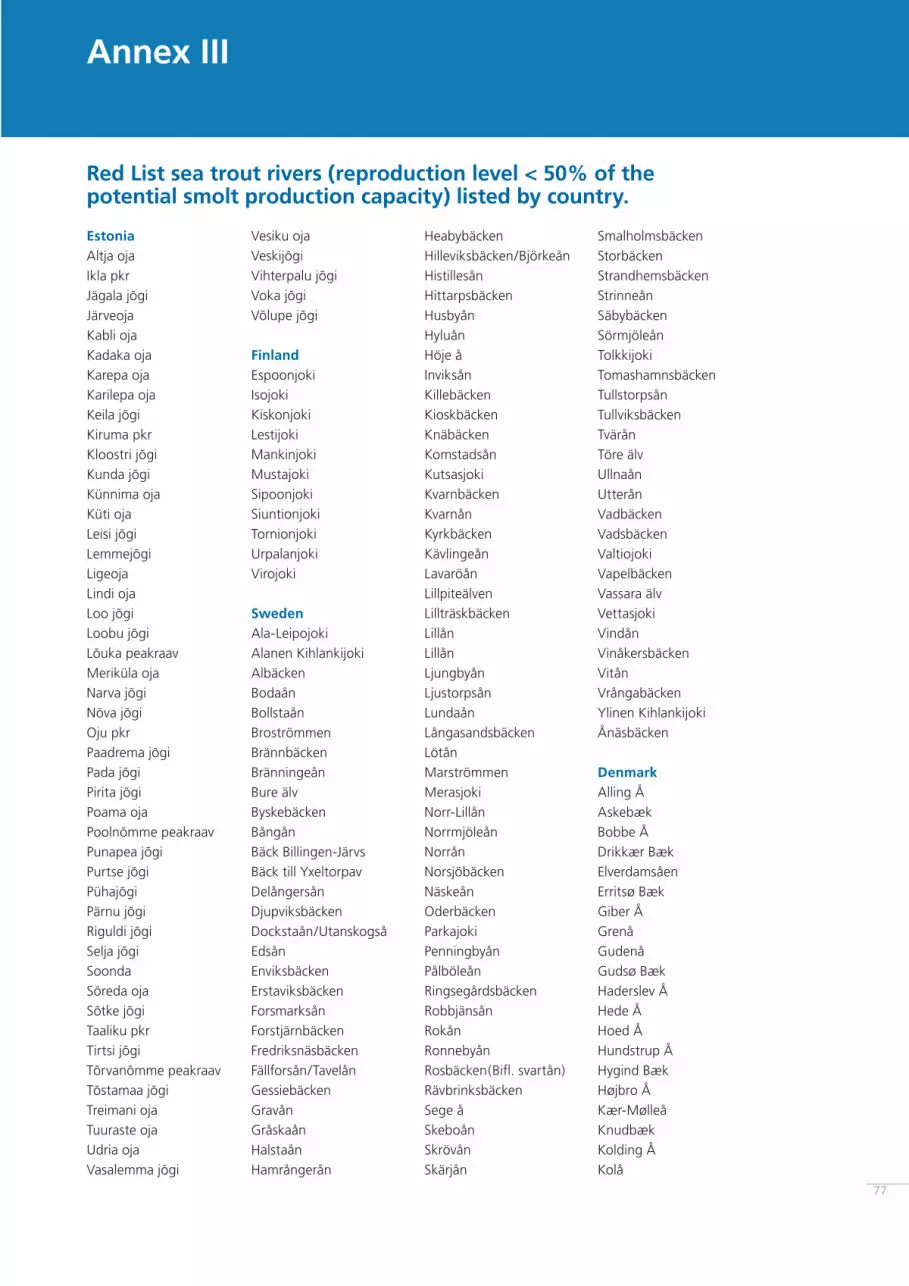
Annex III
Smalholmsbäcken Storbäcken Strandhemsbäcken Strinneån Säbybäcken Sörmjöleån TolkkijokiTomashamnsbäcken Tullstorpsån Tullviksbäcken Tvärån Töre älvUllnaån Utterån Vadbäcken Vadsbäcken ValtiojokiVapelbäcken Vassara älvVettasjokiVindån Vinåkersbäcken VitånVrångabäcken Ylinen Kihlankijoki Ånäsbäcken
Denmark Alling ÅAskebækBobbe ÅDrikkær BækElverdamsåenErritsø BækGiber ÅGrenåGudenåGudsø BækHaderslev ÅHede ÅHoed ÅHundstrup ÅHygind BækHøjbro ÅKær-MølleåKnudbækKolding ÅKolå
Heabybäcken Hilleviksbäcken/BjörkeånHistillesån Hittarpsbäcken Husbyån Hyluån Höje å Inviksån Killebäcken Kioskbäcken Knäbäcken Komstadsån KutsasjokiKvarnbäcken KvarnånKyrkbäcken Kävlingeån Lavaröån Lillpiteälven Lillträskbäcken Lillån Lillån Ljungbyån Ljustorpsån Lundaån Långasandsbäcken Lötån Marströmmen Merasjoki Norr-Lillån Norrmjöleån Norrån Norsjöbäcken Näskeån Oderbäcken Parkajoki Penningbyån Pålböleån Ringsegårdsbäcken Robbjänsån Rokån Ronnebyån Rosbäcken(Bifl . svartån) Rävbrinksbäcken Sege å Skeboån Skrövån Skärjån
Vesiku ojaVeskijõgiVihterpalu jõgiVoka jõgiVõlupe jõgi
FinlandEspoonjokiIsojokiKiskonjokiLestijokiMankinjokiMustajokiSipoonjokiSiuntionjokiTornionjokiUrpalanjokiVirojoki
SwedenAla-LeipojokiAlanen Kihlankijoki Albäcken Bodaån Bollstaån Broströmmen Brännbäcken Bränningeån Bure älv Byskebäcken Bångån Bäck Billingen-JärvsBäck till YxeltorpavDelångersån Djupviksbäcken Dockstaån/UtanskogsåEdsån Enviksbäcken Erstaviksbäcken Forsmarksån Forstjärnbäcken Fredriksnäsbäcken Fällforsån/Tavelån Gessiebäcken Gravån Gråskaån Halstaån Hamrångerån
EstoniaAltja ojaIkla pkrJägala jõgiJärveojaKabli ojaKadaka ojaKarepa ojaKarilepa ojaKeila jõgiKiruma pkrKloostri jõgiKunda jõgiKünnima ojaKüti ojaLeisi jõgiLemmejõgiLigeojaLindi ojaLoo jõgiLoobu jõgiLõuka peakraavMeriküla ojaNarva jõgiNõva jõgiOju pkrPaadrema jõgiPada jõgiPirita jõgiPoama ojaPoolnõmme peakraavPunapea jõgiPurtse jõgiPühajõgiPärnu jõgiRiguldi jõgiSelja jõgiSoondaSõreda ojaSõtke jõgiTaaliku pkrTirtsi jõgiTõrvanõmme peakraavTõstamaa jõgiTreimani ojaTuuraste ojaUdria ojaVasalemma jõgi
Red List sea trout rivers (reproduction level < 50% of the potential smolt production capacity) listed by country.
77

78
PiaśnicaRaduniaRedaRegaSłupiaVistulaWdaWieprzaWierzycaWołczenicaZagórska Struga
LithuaniaJuraMeraMuseSiesartisVokeZeimena
RussiaAzikaBannyi brookBystryi brookChasovoi brookChornajaGladyshevkaGorokhovkaGusinajaHuumosenoja brookJukkola (east) brookJukkola (middle) brookJukkola (west) brookKarasiovkaKhrevitsaKriven brookKuokkala brookLemovzhaLososinkaLososinkaLubenkaMaiak brook Maiskii brookMalinovkaOredezhPastorski brookPeschanajaPetrovkaPolevajaPrivetnajaPtichja
Kongshøj ÅKorup ÅKrusåKøge ÅMade BækMøllebækNivåOdder ÅOdense ÅPugemølle ÅRudbækSaltø ÅSillebro ÅSillerup BækSkelbækSnogbækSpang ÅStore Handsted ÅSusåTange ÅTaps ÅTryggevælde ÅUltang MøllebækVandløb fra KelstrupVejle ÅVejstrup ÅVoers ÅÅrhus ÅÅ-ÅØrbæk ÅØrum/Rhoden ÅUltang MøllebækVandløb fra KelstrupVejle ÅVejstrup Å
PolandBaudaBłotnicaBrdaCzarna WodaDrawaDrwęcaGowienicaGwdaInaŁebaŁupawaOdraParsętaPasłęka
Razinskii brookRoschinkaRömpöti brookSeleznevkaSergaSestraSistaSmoliachkov brookSolkaUshkovski brookVelikajaVidonVoronkaVruda
LatviaAģeRīvaUžava

79
Stream River ID Number of sections/tributaries Year
with prod. < 50% total in stream observed
1. Alling Å 1504 1 7 20032. Askebæk 926 1 1 20083. Bobbe Å 133 1 1 1989/19974. Drikkær Bæk 1312a 1 1 20035. Elverdamsåen 334 1 2 20056. Erritsø Bæk 1209 1 1 20087. Giber Å 1317 1 6 20068. Grenå 1417 2 14 20099. Gudenå 1506-3 8 30 200310. Gudsø Bæk 1208 1 1 200211. Haderslev Å 1176 2 4 200312. Hede Å 1214 1 1 200813. Hoed Å 1413 2 2 200314. Hundstrup Å 937 1 2 200815. Hygind Bæk 1010 1 2 200816. Højbro Å 201 1 1 200517. Knudbæk 1181 1 1 200318. Kolding Å 1205 8 17 200819. Kolå 1403 1 2 200320. Kongshøj Å 925 1 3 200821. Korup Å 1617 1 4 200822. Kruså 1128 1 1 200923. Kær-Mølleå 1183 1 2 200824. Køge Å 508 1 3 200525. Made Bæk 1213 1 1 200826. Møllebæk 1156 1 1 200327. Nivå 211 2 6 200528. Odder Å 1316 1 6 200829. Odense Å 912 1 18 200830. Pugemølle Å 1014 1 5 200831. Rudbæk 1148 1 1 200332. Saltø Å 621 1 2 200533. Sillebro Å 307 1 1 200534. Sillerup Bæk 1180 2 3 200335. Skelbæk 1002 1 2 200836. Snogbæk 1141 1 1 200937. Spang Å 1212 1 9 200838. Store Handsted Å 1308 2 11 200339. Suså 622 1 6 200540. Tange Å 928 1 1 200841. Taps Å 1182 2 9 200842. Tryggevælde Å 511 1 5 200543. Ultang Møllebæk 1169 1 1 200344. Vandløb fra Kelstrup 1165 1 1 200345. Vejle Å 1216 2 28 200846. Vejstrup Å 932 1 2 200847. Voers Å 1701 1 11 200448. Ørbæk Å 924 1 2 200849. Ørum/Rhoden Å 1220 6 11 200850. Århus Å 1320 4 11 200351. Å-Å 1016 1 2 2008
Further information on Danish rivers and streams

www.helcom.fi


