Embed Size (px)
Citation preview
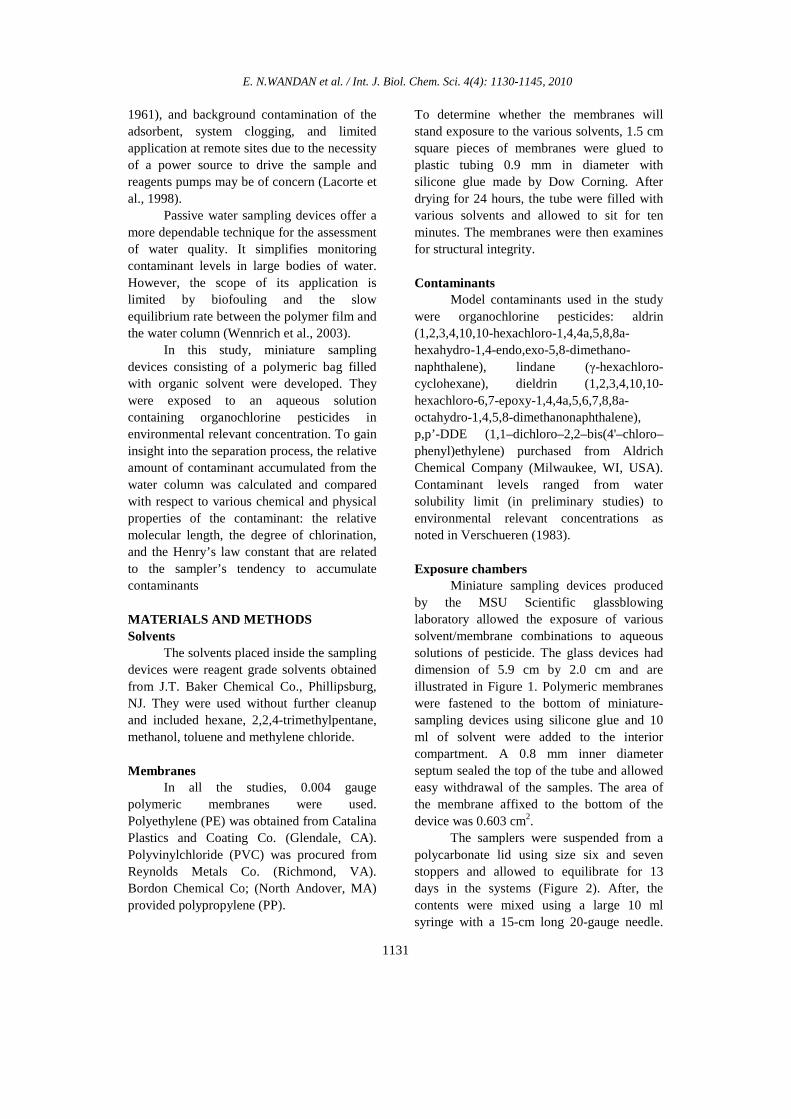
Available online at http://ajol.info/index.php/ijbcs
Int. J. Biol. Chem. Sci. 4(4): 1130-1145, August 2010
ISSN 1991-8631
© 2010 International Formulae Group. All rights reserved.
Original Paper http://indexmedicus.afro.who.int
Sampling device optimization for organochlorine pesticides
Eboua N. WANDAN 1*, Eric ELLEINGAND 2, Ernest KOFFI 3 and Adouby KOPOIN 2
1Département Eaux, Forêts et Environnement, Ecole Supérieure Agronomique, INP-HB, BP 1313
Yamoussoukro, Côte d’Ivoire. 2Département Génie chimique et Agroalimentaire, INP-HB BP 1313 Yamoussoukro, Côte d’Ivoire.
3Laboratoire de Biochimie et Sciences des Aliments, UFR Biosciences, Université de Cocody, 22 BP 582 Abidjan 22, Côte d’Ivoire.
* Corresponding author, E-mail: [email protected]
ABSTRACT
In this study, miniature sampling devices consisting of a polymeric bag filled with organic solvent were exposed to an aqueous solution containing organochlorine pesticides in environmental relevant concentration. The relative amount of contaminant accumulated from the water column was compared with respect to the following chemical and physical properties of the contaminant: the relative molecular length, the degree of chlorination, and the Henry’s law constant. The solvent/membrane systems accumulated contaminants to high levels and readily approached equilibrium fast. The polypropylene system was more universal in contaminant uptake. The membrane concentration factors (MCFs) calculated ranged from null to 1446 and were less than the biological concentration factors (BCFs) reported in literature due to the complex nature of biological systems. Dieldrin, the only oxygenated compound in the study did not follow a linear regression when the log MCF was plotted against the physical properties of the contaminant. The study showed a linear relationship of at least 4 orders of magnitude between the concentration of the contaminants accumulated by the devices and the original concentrations in the aqueous phase. The number of chlorine atoms, the molecules’ relative molecular length, and Henry’s law constant affect the equilibrium concentrations of the contaminant in the sampling device. © 2010 International Formulae Group. All rights reserved.
Keywords: Sampling, membrane, polymeric, uptake, contaminants, equilibrium INTRODUCTION
Trace analysis of complex mixtures is a formidable problem in analytical chemistry because sample size is often limited and the composition of the matrix is usually unknown. Traditionally, the extent of environmental contamination has been assessed using biomonitors such as fish (Eadie et al., 1983), birds (Byssche, 1981; Rocque and Winker, 2005), benthic species (Skalski, 1982; Eadie
et al., 1983; McKim et al., 1985; Tulp and Hutzinger, 1978) or zooplankton (Opperhulzen, 1985). But several problems are associated with the use of these organisms as environmental monitors (Eadie et al., 1983, Tulp and Hutzinger, 1978; Sodergren, 1987). To avoid these problems, direct water sampling has been used to assess water quality. Data derived from this technique is often of limited value (Derjagen and Churaev,
E. N.WANDAN et al. / Int. J. Biol. Chem. Sci. 4(4): 1130-1145, 2010
1131
1961), and background contamination of the adsorbent, system clogging, and limited application at remote sites due to the necessity of a power source to drive the sample and reagents pumps may be of concern (Lacorte et al., 1998).
Passive water sampling devices offer a more dependable technique for the assessment of water quality. It simplifies monitoring contaminant levels in large bodies of water. However, the scope of its application is limited by biofouling and the slow equilibrium rate between the polymer film and the water column (Wennrich et al., 2003).
In this study, miniature sampling devices consisting of a polymeric bag filled with organic solvent were developed. They were exposed to an aqueous solution containing organochlorine pesticides in environmental relevant concentration. To gain insight into the separation process, the relative amount of contaminant accumulated from the water column was calculated and compared with respect to various chemical and physical properties of the contaminant: the relative molecular length, the degree of chlorination, and the Henry’s law constant that are related to the sampler’s tendency to accumulate contaminants MATERIALS AND METHODS Solvents
The solvents placed inside the sampling devices were reagent grade solvents obtained from J.T. Baker Chemical Co., Phillipsburg, NJ. They were used without further cleanup and included hexane, 2,2,4-trimethylpentane, methanol, toluene and methylene chloride.
Membranes
In all the studies, 0.004 gauge polymeric membranes were used. Polyethylene (PE) was obtained from Catalina Plastics and Coating Co. (Glendale, CA). Polyvinylchloride (PVC) was procured from Reynolds Metals Co. (Richmond, VA). Bordon Chemical Co; (North Andover, MA) provided polypropylene (PP).
To determine whether the membranes will stand exposure to the various solvents, 1.5 cm square pieces of membranes were glued to plastic tubing 0.9 mm in diameter with silicone glue made by Dow Corning. After drying for 24 hours, the tube were filled with various solvents and allowed to sit for ten minutes. The membranes were then examines for structural integrity. Contaminants
Model contaminants used in the study were organochlorine pesticides: aldrin (1,2,3,4,10,10-hexachloro-1,4,4a,5,8,8a-hexahydro-1,4-endo,exo-5,8-dimethano-naphthalene), lindane (γ-hexachloro-cyclohexane), dieldrin (1,2,3,4,10,10-hexachloro-6,7-epoxy-1,4,4a,5,6,7,8,8a-octahydro-1,4,5,8-dimethanonaphthalene), p,p’-DDE (1,1–dichloro–2,2–bis(4'–chloro–phenyl)ethylene) purchased from Aldrich Chemical Company (Milwaukee, WI, USA). Contaminant levels ranged from water solubility limit (in preliminary studies) to environmental relevant concentrations as noted in Verschueren (1983).
Exposure chambers
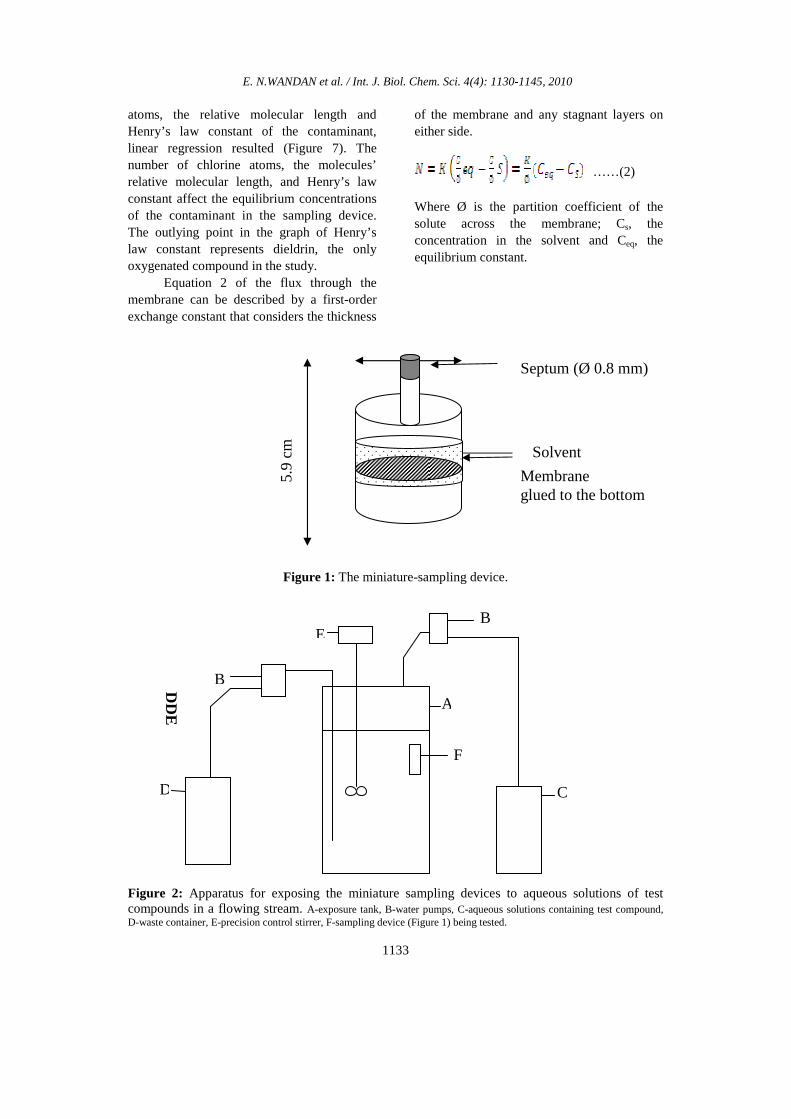
Miniature sampling devices produced by the MSU Scientific glassblowing laboratory allowed the exposure of various solvent/membrane combinations to aqueous solutions of pesticide. The glass devices had dimension of 5.9 cm by 2.0 cm and are illustrated in Figure 1. Polymeric membranes were fastened to the bottom of miniature-sampling devices using silicone glue and 10 ml of solvent were added to the interior compartment. A 0.8 mm inner diameter septum sealed the top of the tube and allowed easy withdrawal of the samples. The area of the membrane affixed to the bottom of the device was 0.603 cm2.
The samplers were suspended from a polycarbonate lid using size six and seven stoppers and allowed to equilibrate for 13 days in the systems (Figure 2). After, the contents were mixed using a large 10 ml syringe with a 15-cm long 20-gauge needle.
E. N.WANDAN et al. / Int. J. Biol. Chem. Sci. 4(4): 1130-1145, 2010
1132
0.5-ml samples were collected from each miniature sampler using a 2-ml syringe affixed to the same needle at 6 and 12 hours, 1, 2, 4, 6, 8, 10, and 13 days. Upon completion of the studies, the miniature sampling devices could be withdrawn through the holes that held the stoppers.
The exposure chamber (Figure 2) consisted of a 12-L glass tank. The system was stirred with a Talboy’s stirrer. Two Beckam solution metering pumps, pumping at 1.5 ml/min., were used to pump the water solution through 1/8” stainless steel tubing into the incubation chamber. A formal scientific model 2132 water bath was used to maintain constant temperature.
Organochlorine compounds were added to the bulk water solution to obatin the following final concentrations: aldrin 0.174 ppb, lindane 0.081 ppb, DDE 6.02 ppb, dieldrin 0.463 ppb. Duplicate samplers consisting of a variety of solvent/membrane pairs were exposed to the solution up to 14 days. Additional samplers, serving as blanks, were exposed to distilled water for 14 days.
The concentration of the contaminants accumulated by the devices was determined by direct injection into a Perkin-Elmer 8500 gas chromatograph equipped with an open tubular column (0.25 mm ID., 60 m length) with DB-5 stationary phase (J&W Scientific, Folson, CA) and an electron capture detector. RESULTS
The initial compatibility tests showed strong interaction between PVC and toluene or methylene chloride that led to the dissolution of PVC membrane. This may be due to solvent interactions that occured in regions on the membrane with different polarities (Cullen et al., 1994). This phenomenon was predicted by Hildebrand solubility parameters. Theoretically, the closer the parameters of the membrane and solvent match up, the greater their degree of interaction. This promotes membrane swelling, reduces membrane crystallinity, and increases membrane permeability. All stable
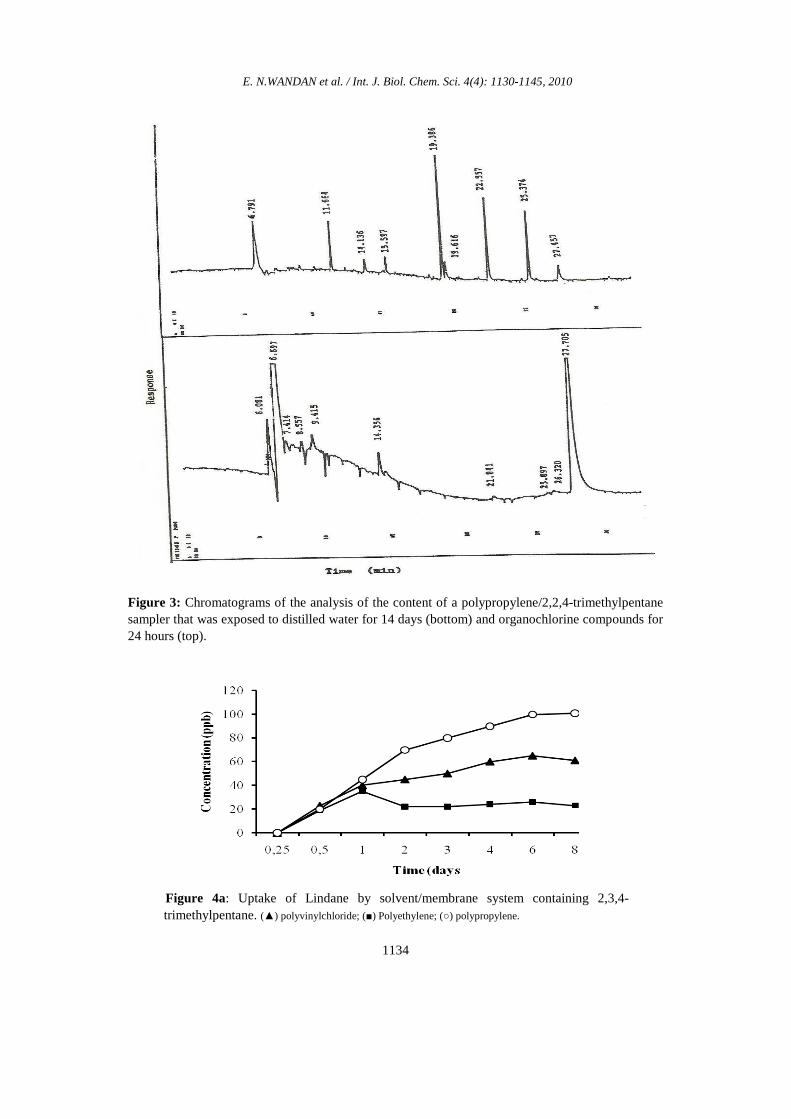
solvent/membrane combinations were used in subsequent studies to optimize the system In order to verify if there was a leaching of any plasticizer from the thin film into the content of the sampling devices, a sampling device (control) was exposed to distilled water for 14 days while the exposure of the organochlorine compounds was limited to 24 hours providing a worst case scenario. Figure 3 illustrates results from this analysis by gas chromatography. The top chromatogram, which resulted from the analysis of the contents of a polypropylene/2,2,4-trimethylpentane sampler that was exposed to organochlorine compounds for one day, illustrated how readily the compound were accumulated. The result from the analysis of the blank, which was exposed to distilled water revealed the effect that extended incubation periods have on plasticizer introduction into the sample. As this figure illustrates, after 14 days of contact with the solvent, substantial amounts of polymerizing material were not leached into the sample. The only major contribution from the polymer was represented by the peak eluting at approximately 27 min. Further analysis by GC/MS indicated that this peak represented a phthalate ester plasticizer (m/e at 149). The presence of this phthalate ester did not interfere with the chromatographic determination of the xenobiotics.
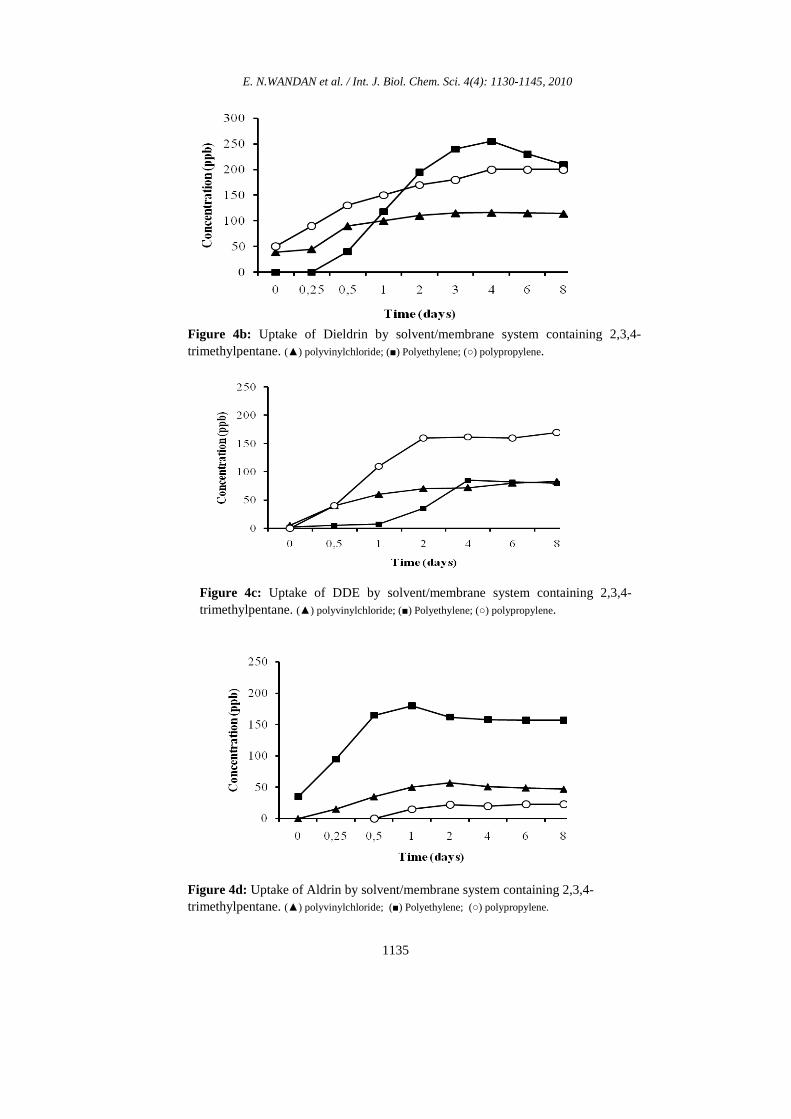
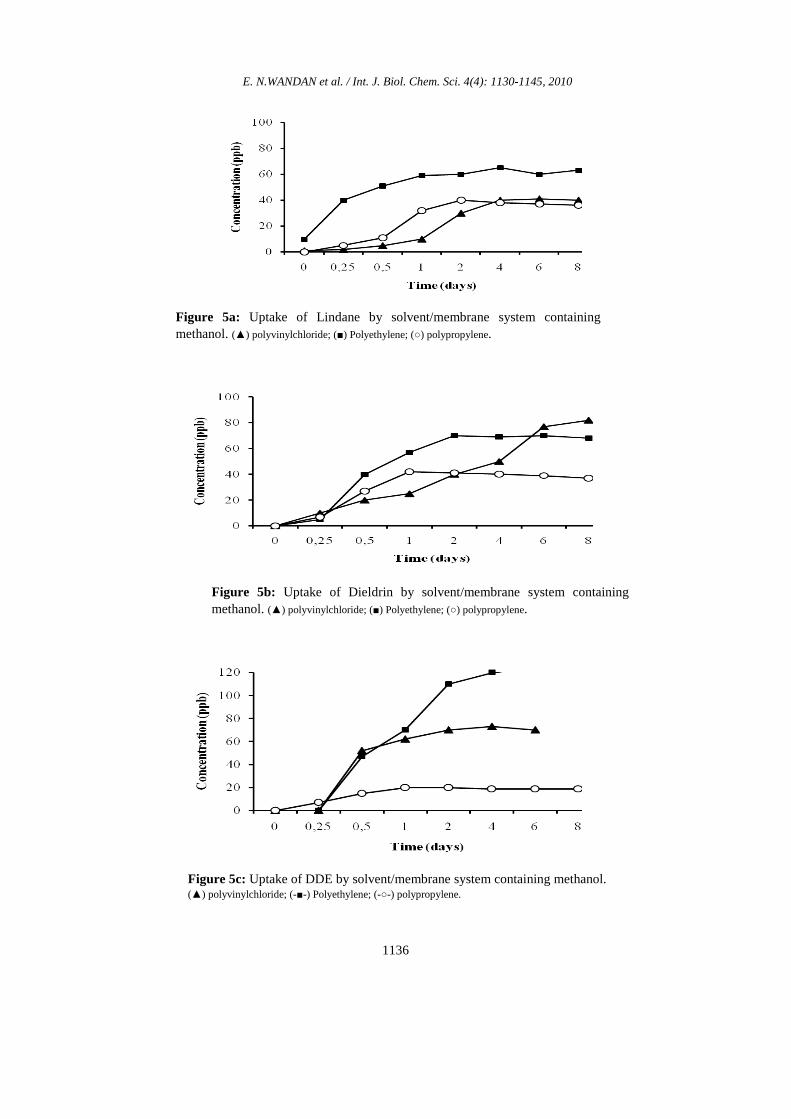
Figures 4a to 6d illustrate the uptake patterns for various chlorinated contaminants as a function of time for individual solvent/membrane combinations. For all the combinations, the equilibrium was approached usually after three to four days.
To compare and quantitate the partitioning process, membrane concentration factors, analogous to bioconcentration factors, were calculated with the above formula:
………………………………………….. (1) The membrane concentration factor
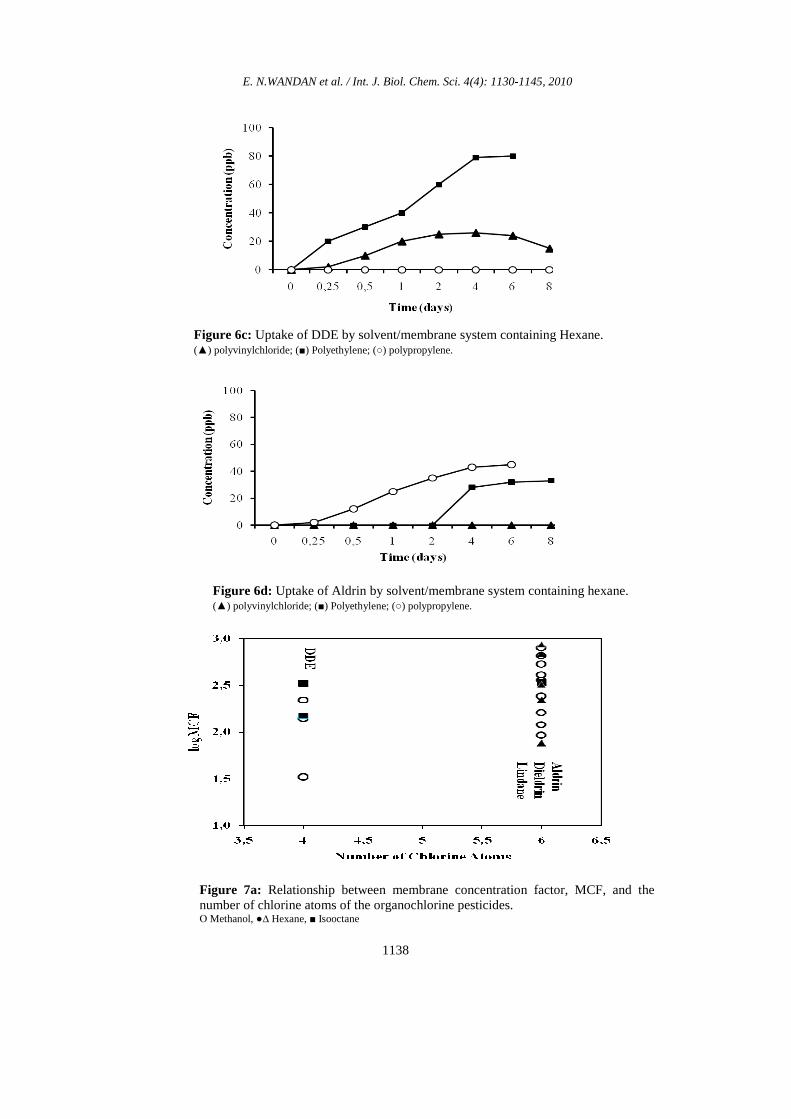
(MCFs) calculated ranged from null to 1446 and are listed in Table 1. When the log MCF was plotted against the number of chlorine
E. N.WANDAN et al. / Int. J. Biol. Chem. Sci. 4(4): 1130-1145, 2010
1133
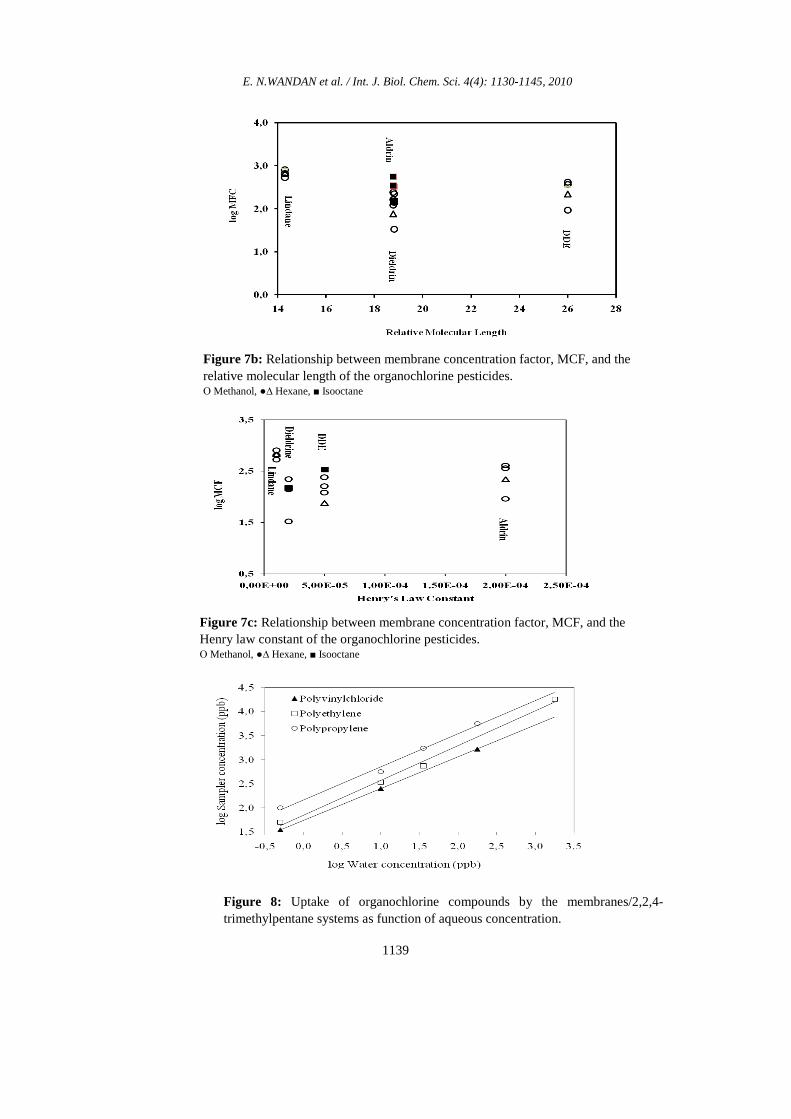
atoms, the relative molecular length and Henry’s law constant of the contaminant, linear regression resulted (Figure 7). The number of chlorine atoms, the molecules’ relative molecular length, and Henry’s law constant affect the equilibrium concentrations of the contaminant in the sampling device. The outlying point in the graph of Henry’s law constant represents dieldrin, the only oxygenated compound in the study.
Equation 2 of the flux through the membrane can be described by a first-order exchange constant that considers the thickness
of the membrane and any stagnant layers on either side.
……(2)
Where Ø is the partition coefficient of the solute across the membrane; Cs, the concentration in the solvent and Ceq, the equilibrium constant.
Figure 1: The miniature-sampling device.
Figure 2: Apparatus for exposing the miniature sampling devices to aqueous solutions of test compounds in a flowing stream. A-exposure tank, B-water pumps, C-aqueous solutions containing test compound, D-waste container, E-precision control stirrer, F-sampling device (Figure 1) being tested.
Septum (Ø 0.8 mm)
Solvent
Membrane glued to the bottom
5.9
cm
B
B
D C
F
A
ED
DE
E. N.WANDAN et al. / Int. J. Biol. Chem. Sci. 4(4): 1130-1145, 2010
1134
Figure 3: Chromatograms of the analysis of the content of a polypropylene/2,2,4-trimethylpentane sampler that was exposed to distilled water for 14 days (bottom) and organochlorine compounds for 24 hours (top).
Figure 4a: Uptake of Lindane by solvent/membrane system containing 2,3,4-trimethylpentane. (▲) polyvinylchloride; (■) Polyethylene; (○) polypropylene.
E. N.WANDAN et al. / Int. J. Biol. Chem. Sci. 4(4): 1130-1145, 2010
1135
Figure 4b: Uptake of Dieldrin by solvent/membrane system containing 2,3,4-trimethylpentane. (▲) polyvinylchloride; (■) Polyethylene; (○) polypropylene.
Figure 4c: Uptake of DDE by solvent/membrane system containing 2,3,4-trimethylpentane. (▲) polyvinylchloride; (■) Polyethylene; (○) polypropylene.
Figure 4d: Uptake of Aldrin by solvent/membrane system containing 2,3,4-trimethylpentane. (▲) polyvinylchloride; (■) Polyethylene; (○) polypropylene.
E. N.WANDAN et al. / Int. J. Biol. Chem. Sci. 4(4): 1130-1145, 2010
1136
Figure 5a: Uptake of Lindane by solvent/membrane system containing methanol. (▲) polyvinylchloride; (■) Polyethylene; (○) polypropylene.
Figure 5b: Uptake of Dieldrin by solvent/membrane system containing methanol. (▲) polyvinylchloride; (■) Polyethylene; (○) polypropylene.
Figure 5c: Uptake of DDE by solvent/membrane system containing methanol. (▲) polyvinylchloride; (-■-) Polyethylene; (-○-) polypropylene.

E. N.WANDAN et al. / Int. J. Biol. Chem. Sci. 4(4): 1130-1145, 2010
1137
Figure 5d: Uptake of Aldrin by solvent/membrane system containing methanol. (▲) polyvinylchloride; (■) Polyethylene; (○) polypropylene.
Figure 6a: Uptake of Lindane by solvent/membrane system containing hexane. (▲) polyvinylchloride; (■) Polyethylene; (○) polypropylene.
Figure 6b: Uptake of Dieldrin by solvent/membrane system containing hexane. (▲) polyvinylchloride; (■) Polyethylene; (○) polypropylene.
E. N.WANDAN et al. / Int. J. Biol. Chem. Sci. 4(4): 1130-1145, 2010
1138
Figure 6c: Uptake of DDE by solvent/membrane system containing Hexane. (▲) polyvinylchloride; (■) Polyethylene; (○) polypropylene.
Figure 6d: Uptake of Aldrin by solvent/membrane system containing hexane. (▲) polyvinylchloride; (■) Polyethylene; (○) polypropylene.
Figure 7a: Relationship between membrane concentration factor, MCF, and the number of chlorine atoms of the organochlorine pesticides. Ο Methanol, ●∆ Hexane, ■ Isooctane
E. N.WANDAN et al. / Int. J. Biol. Chem. Sci. 4(4): 1130-1145, 2010
1139
Figure 7b: Relationship between membrane concentration factor, MCF, and the relative molecular length of the organochlorine pesticides. Ο Methanol, ●∆ Hexane, ■ Isooctane
Figure 7c: Relationship between membrane concentration factor, MCF, and the Henry law constant of the organochlorine pesticides. Ο Methanol, ●∆ Hexane, ■ Isooctane
Figure 8: Uptake of organochlorine compounds by the membranes/2,2,4-trimethylpentane systems as function of aqueous concentration.
E. N.WANDAN et al. / Int. J. Biol. Chem. Sci. 4(4): 1130-1145, 2010
1140
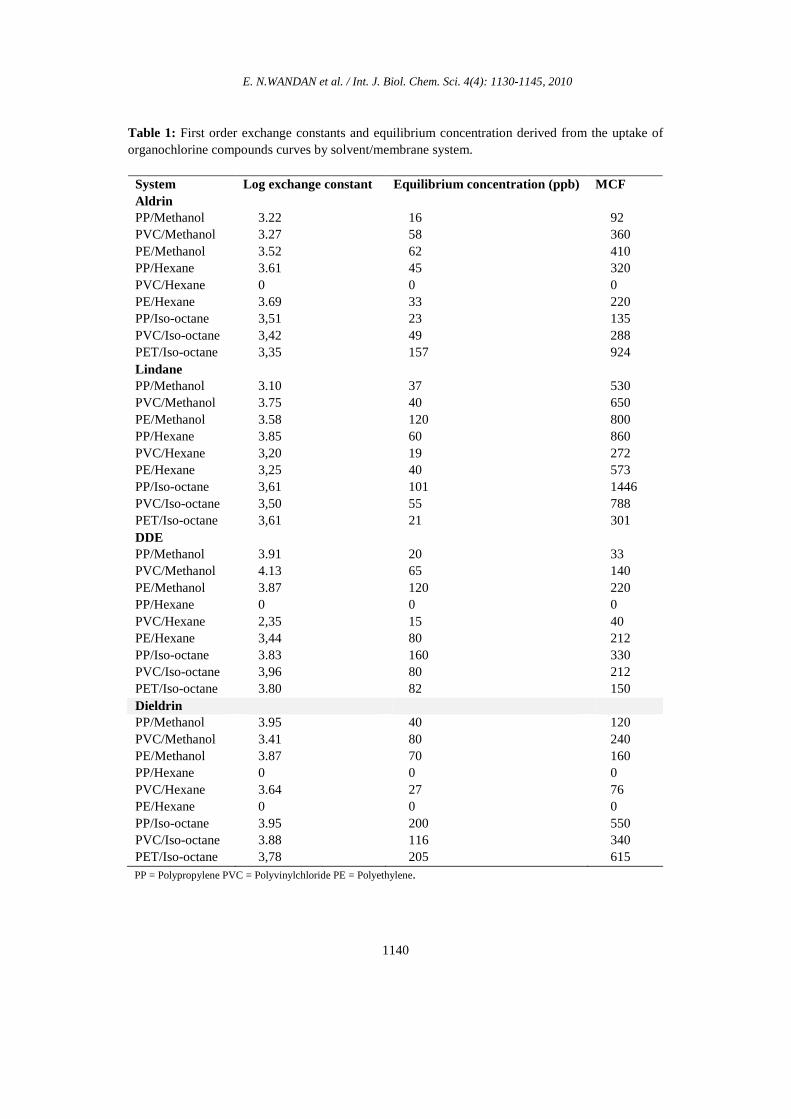
Table 1: First order exchange constants and equilibrium concentration derived from the uptake of organochlorine compounds curves by solvent/membrane system.
System Log exchange constant Equilibrium concentration (ppb) MCF Aldrin PP/Methanol 3.22 16 92 PVC/Methanol 3.27 58 360 PE/Methanol 3.52 62 410 PP/Hexane 3.61 45 320 PVC/Hexane 0 0 0 PE/Hexane 3.69 33 220 PP/Iso-octane 3,51 23 135 PVC/Iso-octane 3,42 49 288 PET/Iso-octane 3,35 157 924 Lindane PP/Methanol 3.10 37 530 PVC/Methanol 3.75 40 650 PE/Methanol 3.58 120 800 PP/Hexane 3.85 60 860 PVC/Hexane 3,20 19 272 PE/Hexane 3,25 40 573 PP/Iso-octane 3,61 101 1446 PVC/Iso-octane 3,50 55 788 PET/Iso-octane 3,61 21 301 DDE PP/Methanol 3.91 20 33 PVC/Methanol 4.13 65 140 PE/Methanol 3.87 120 220 PP/Hexane 0 0 0 PVC/Hexane 2,35 15 40 PE/Hexane 3,44 80 212 PP/Iso-octane 3.83 160 330 PVC/Iso-octane 3,96 80 212 PET/Iso-octane 3.80 82 150 Dieldrin PP/Methanol 3.95 40 120 PVC/Methanol 3.41 80 240 PE/Methanol 3.87 70 160 PP/Hexane 0 0 0 PVC/Hexane 3.64 27 76 PE/Hexane 0 0 0 PP/Iso-octane 3.95 200 550 PVC/Iso-octane 3.88 116 340 PET/Iso-octane 3,78 205 615
PP = Polypropylene PVC = Polyvinylchloride PE = Polyethylene.
E. N.WANDAN et al. / Int. J. Biol. Chem. Sci. 4(4): 1130-1145, 2010
1141
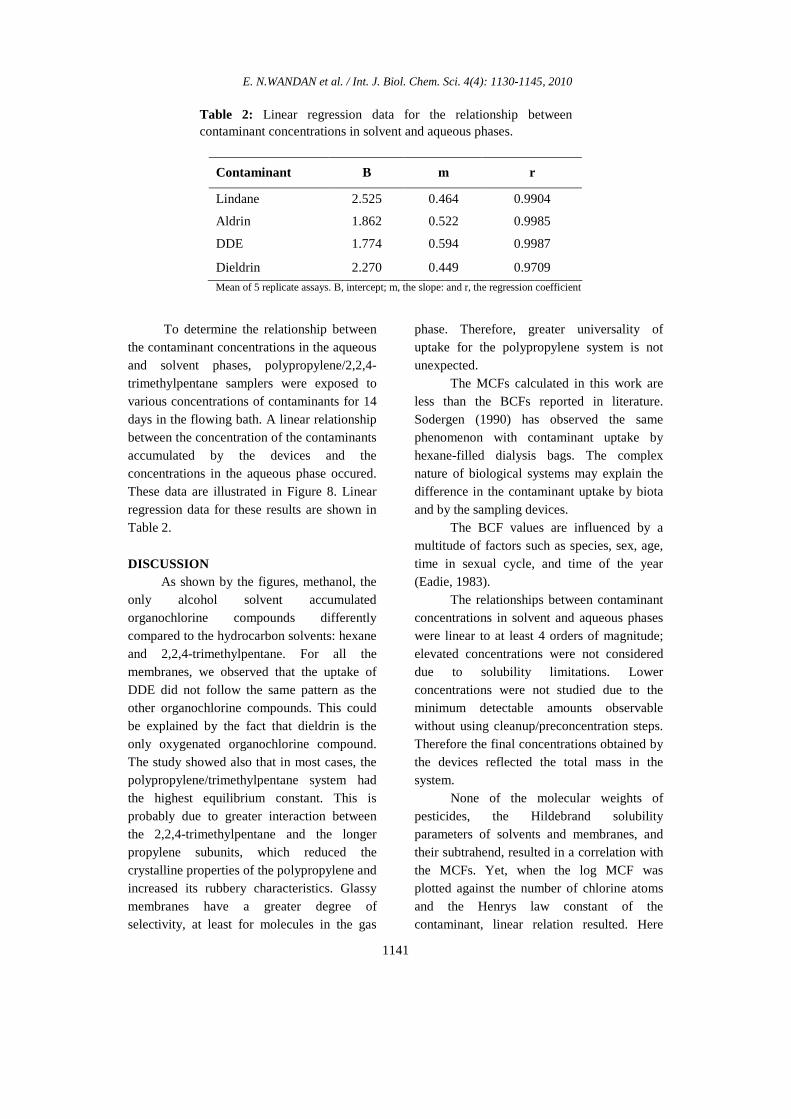
Table 2: Linear regression data for the relationship between contaminant concentrations in solvent and aqueous phases.
Contaminant B m r
Lindane 2.525 0.464 0.9904
Aldrin 1.862 0.522 0.9985
DDE 1.774 0.594 0.9987
Dieldrin 2.270 0.449 0.9709
Mean of 5 replicate assays. B, intercept; m, the slope: and r, the regression coefficient
To determine the relationship between the contaminant concentrations in the aqueous and solvent phases, polypropylene/2,2,4-trimethylpentane samplers were exposed to various concentrations of contaminants for 14 days in the flowing bath. A linear relationship between the concentration of the contaminants accumulated by the devices and the concentrations in the aqueous phase occured. These data are illustrated in Figure 8. Linear regression data for these results are shown in Table 2.
DISCUSSION As shown by the figures, methanol, the only alcohol solvent accumulated organochlorine compounds differently compared to the hydrocarbon solvents: hexane and 2,2,4-trimethylpentane. For all the membranes, we observed that the uptake of DDE did not follow the same pattern as the other organochlorine compounds. This could be explained by the fact that dieldrin is the only oxygenated organochlorine compound. The study showed also that in most cases, the polypropylene/trimethylpentane system had the highest equilibrium constant. This is probably due to greater interaction between the 2,2,4-trimethylpentane and the longer propylene subunits, which reduced the crystalline properties of the polypropylene and increased its rubbery characteristics. Glassy membranes have a greater degree of selectivity, at least for molecules in the gas
phase. Therefore, greater universality of uptake for the polypropylene system is not unexpected.
The MCFs calculated in this work are less than the BCFs reported in literature. Sodergen (1990) has observed the same phenomenon with contaminant uptake by hexane-filled dialysis bags. The complex nature of biological systems may explain the difference in the contaminant uptake by biota and by the sampling devices.
The BCF values are influenced by a multitude of factors such as species, sex, age, time in sexual cycle, and time of the year (Eadie, 1983).
The relationships between contaminant concentrations in solvent and aqueous phases were linear to at least 4 orders of magnitude; elevated concentrations were not considered due to solubility limitations. Lower concentrations were not studied due to the minimum detectable amounts observable without using cleanup/preconcentration steps. Therefore the final concentrations obtained by the devices reflected the total mass in the system.
None of the molecular weights of pesticides, the Hildebrand solubility parameters of solvents and membranes, and their subtrahend, resulted in a correlation with the MCFs. Yet, when the log MCF was plotted against the number of chlorine atoms and the Henrys law constant of the contaminant, linear relation resulted. Here
E. N.WANDAN et al. / Int. J. Biol. Chem. Sci. 4(4): 1130-1145, 2010
1142
also, we observed the outlying point in the graph of Henry’s law constant is represented by dieldrin, the only oxygenated compound in the study.
The number of chlorine atoms, the molecules’ relative molecular length, and Henry’s law constant affect the equilibrium concentrations of the contaminant in the sampling device.
Solution thermodynamics (Brey, 1978; Hermann, 1972; Soderlund et al., 2003; Llyod and Meluch, 1985) states that the analyte molecules are uniformly distributed in the bulk phase so the net intermolecular forces in a given molecule approach zero; When the contaminant molecules approach the thin film of water adjacent to the membrane surface, they encounter an imbalance of forces. The water molecules closest to the membrane are further apart and exhibit smaller forces of attraction for the analyte, creating a tendency for the contaminant to move back into the bulk phase. If kinetic energy is expended, the analyte molecule may enter the film. Once in the film, the analyte molecules move only laterally, instead of three dimensionally. It was postulated that this limited motion may be caused by an aqueous film that is a single layer in thickness (Hermann, 1972). This lateral motion has the effect of exerting a two-dimensional pressure on the surface of the aqueous film, and limits the tendency of other molecules to move into this film. Once molecules are in the film, they may diffuse through the membrane and into the solvent. Eventually, equilibrium will be established between the analyte molecules in the bulk aqueous phase, the aqueous film, and the solvent phases. Factors influencing the concentration of the analyte molecules in the aqueous film will concomitantly affect the equilibrium concentrations in the solvent inside the sampling devices. Hence, factors that influence the aqueous film concentrations of the analyte will affect the MCF.
As the chain length of the series of penetrant molecules is increased, the surface tension of the aqueous film is decreased (Soderlund et al., 2003; Llyod and Meluch, 1985). Therefore, as the length of a molecule increases, a lower concentration is required to cause a given decrease in the surface tension. Therefore, the larger organochlorine molecules may have formed a more dilute solution in aqueous boundary layer, decreasing the equilibrium concentration inside the sampling devices. Hence, MCF decreased as molecular length increased. Another possible explanation for this relationship is that as length is increased, there is a greater probability that the analyte molecule will interact with hydrophobic regions on the membrane through dispersion forces (Llyod and Meluch, 1985). Greater molecular length may increase size and limit negotiating through the pores of the membrane. However, previous studies (Stannett et al., 1979) using reverse osmosis systems containing ethyl acetate have shown that molecules exceeding the pore size easily passed through the membrane, possibly due to a fluctuation in pore size as function of time.
Figure 8 also illustrates a relationship between Henry’s law constant and the molecule’s tendency to be accumulated by the devices. The data represent the values for all viable solvent/membrane combinations. The outlaying point in the graph corresponds to dieldrin, the only oxygenated compound in the study. If additional oxygenated compounds were examined, another series of data points is anticipated that would fall in the line with the value for dieldrin, the polarity of the oxygen atom limiting the membrane penetration.
If Henry’s law constant (H) is defined as a partition coefficient between gas and liquid phases in dilute solutions, the following relationship between MCF and Henry’s law constant can be developed.
E. N.WANDAN et al. / Int. J. Biol. Chem. Sci. 4(4): 1130-1145, 2010
1143
Where: Cs and Cw are the concentrations of the solute; f, the fugacity; and Z the fugacity factor in the solvent and water respectively. An increase in Henry’s law constant should result in an enlarged membrane concentration factor (Stannett et al., 1979; Nakagawa at al., 1991; Stern and Frisch, 1981; Morgan and Lohmann, 2003) because both quantities are describing the molecules’ tendency towards increased entropy. Therefore, for a homologous series of compounds, the tendency for molecules to escape from the film at water-air interface also reflects their ability to permeate the polymeric membrane.
Conclusion Optimal membrane/solvent combina-
tions include polypropylene, polyethylene and polyvinylchlorine sampling devices filled with three solvents: methanol, hexane and 2,2,4-trimethylpentane. Equilibrium with the bulk aqueous concentration of contaminant is approached after approximately 4 days in the exposure system developed. Alterations in the contaminant levels in the water are reflected by changes in the concentration of the sampler contents; thus, the devices supply time-integrated estimates of contaminants levels. The partitioning phenomenon observed in this study depended on the ability of the contaminant molecules to enter the thin aqueous film adjacent to the membrane. Factors influencing the concentration in this layer will affect concentrations in this sampler. Factors which affect membrane passage have not been quantified. Resistance to transfer, presumably in the membrane, acts to slow down solute uptake. Because the membranes used in these studies have a variety of functional groups on the polymer chains, and the same resistance to the transfer was observed with all membranes, passage may be hindered by dispersion forces between
the xenobiotic and the membrane. Our results demonstrate that passive samplers are powerful tools for the sampling of organic contaminants in the environment.
REFERENCES Brey WS. 1978. Physical Chemistry and its
Biological Applications. Academic Press: New York; 403-4029.
Byssche SE. 1981. Bioconcentration factors in aquatic organisms. In Handbook of Chemical Property Estimation Methods: Environmental Behavior of Some organic Compounds, Lyman WJ, Reehl WF, Rosenblatt DH (eds). McGraw Hill Book Company: New York; 5.1-5.30.
Cullen WR, Herring FG, Nelson JC. 1994. Employing permeability coefficients to understand the biomobility and bioaccumulation of compounds sensitive to the environment. Bull. of Environ. Contamin. Toxicol., 52(2): 171-175.
Dejargen BV, Churaev NV. 1961. Structure of the boundary layers of liquids and its influence on Mass Transfer in Fine Pores. In Progress in Surface and Membrane Science (vol 14). Academic Press: New York; 69-130.
Eadie BJ, Faust WR, Landrum PF, Morehead NR, Gardner W, Nelpa T. 1983. Bioconcentration of Polynuclear Aromatic Hydrocarbons by some Benthic Organisms of the Great lakes. In Polynuclear Aromatic Hydrocarbons: Formation, Metabolism, and Measurement, (77th International Symposium), Cooke M, Dennis AJ (eds). Battelle Press: Columbus, OH; 437-439.
Hermann RB. 1972. Theory of hydrophobic bounding II. Correlation of hydrocarbon solubility in water with solvent cavity surface area. J. Phys. Chem., 76: 63-68.
Lacorte S, Vreuls J, Salau J, Ventura F, Barceló D. 1998. Monitoring of pesticides in river water using fully automated on-line solid-phase extraction
E. N.WANDAN et al. / Int. J. Biol. Chem. Sci. 4(4): 1130-1145, 2010
1144
and liquid chromatography with diode array detection with a novel filtration device. J. Chromatography A., 795(1): 71-82.
Llyod DR, Meluch TB. 1985. “Selection and evaluation of membrane materials”, materials science of synthetic membranes, ACS symposium series 269, American Chemical Society, Washing, D.C.: 47-79.
Morgan EJ, Lohmann R. 2003. Detecting air−water and surface−deep: Water Gradients of PCBs using polyethylene passive samplers. Environ. Sci. Technol, 5: 813–822.
McKim J, Schmieder P, Veith G. 1985. Absorption dynamics of organic chemical transport across trout gills as related to octanol-water partition coefficient. Tox. Appl. Pharm., 77(1): 1-10.
Nakagawa T, Naruse A, Higuchi A. 1991. Permeation of dissolved carbon dioxide in synthetic membranes. Journal of Applied Polymer Science, 42(2): 383-389.
Opperhulzen A, Veide EW, Gobas FAPC, Liem DAK, Steen JMD, Hutzinger O. 1985. Relationship between bioconcentration in fish and steric factors of hydrophobic chemicals. Chemosphere, 14: 11-12.
Rocque DA, Winker K. 2005. Use of bird collections in contaminant and stable-isotope studies. The Auk, 122(3): 990-994.
Skalski JR. 1982. Towards the use of faunal populations as cost-effective biomonitors. Symposium on Issues and Technology in the Management of Impacted Western Wildlife; 15 Nov 1982; Steamboat Springs, CO, USA.
Stannett VT, Koros DR, Paul WJ, Lonsdale HK, Baker RW. 1979. Recent Advances in Membrane Science and Technology (Vol. 32). Eds Springer: Berlin; 69-121.
Stern SA, Frisch HL. 1981. The Selective permeation of gases through polymers.
Annual Review of Materials Science, 11: 523-550.
Sodergren A. 1987. Solvent-filled dialysis membranes simulate uptake of pollutants by aquatic organisms. Environ. Sci. Technol., 21(9): 855-859.
Sodergren A. 1990. Monitoring of persistent lipophilic pollutants in water and sediment by solvent-filled dialysis membranes. Ecotoxicology and Environmental Safety, 19: 143-149.
Soderlund T, Alakoskela JMI, Pakkanen AL, Kinnunen PKJ. 2003. Comparison of the effects of surface tension and osmotic pressure on the interfacial hydration of a fluid phospholipid bilayer. Biophys. J., 85: 2333-2341.
Tulp MThM, Hutzinger 0. 1978. Some thoughts on aqueous solubilities and partition coefficients of PCB, and the mathematical correlation between bioaccumulation and physio-chemical properties. Chemosphere, 10: 849-860.
Verschueren K. 1983. Handbook of Environmental Data on Organic Chemicals. Van Nostrand and Reinold Co: New York; 168-172, 434-436, 513-518, 720-726, 890-900.
Wennrich L, Vrana B, Popp P, Lorenz W. 2003. Development of an integrative passive sampler for the monitoring of organic water pollutants. J. Environ. Monit., 5: 813 – 822.
Greenwood R, Mills GA, Vrana B, Allan IJ, Aguilar R, Morrison G. 2007. Passive sampling techniques in environmental monitoring. In Comprehensive Analytical Chemistry (Vol. 8), Greenwood R, Mills G, Vrana B (eds.). Harbound, Elsevier: Amsterdam, ISBN-10: 0-444-52225-5; 199–229.
Soderlund T, Alakoskela J-MI, Pakkanen AL; Kinnunen PKJ. 2003. Comparison of the effects of surface tension and osmotic pressure on the interfacial hydration of a

E. N.WANDAN et al. / Int. J. Biol. Chem. Sci. 4(4): 1130-1145, 2010
1145
fluid phospholipid bilayer. Biophys. J., 85: 2333-2341.
Herve S, Paukku R, Paasivirta J, Heinonen P, Sodergren A. 1991. Uptake of organochlorines from lake water by hexane-filled dialysis membranes and by mussels. Chemosphere, 22: 997-1001.
Hofelt C, Shea D. 1997. Accumulation of organochlorine pesticides and PCBs by semi-permeable membrane devices and Mytilus edulis in new bedford harbor. Environ. Sci. Technol., 31: 154-159.
Johnson GD. 1991. Hexane-filled dialysis bags for monitoring organic contaminants
in water. Environ. Sci. Technol., 255: 1897-1903.
Kingston JK, Greenwood R, Mills G.A, Morrison GM, Persson BL. 2000. Development of novel passive sampling system for the timeaveraged measurement of a range of organic pollutants in aquatic environments. J. Environ. Monitoring, 2: 487-495.
Namiesnik J, Zabiega B, Kot-Wasik A, Partyka M, Wasik A. 2005. Passive sampling and/or extraction techniques in environmental analysis: A review. Anal. Bioanal. Chem., 381: 279-301.