Embed Size (px)
Citation preview
FINAL
SHORT RANGE TRANSIT PLAN
MARCH 2008
SAN BENITO COUNTY LOCAL TRANSPORTATION AUTHORITY[ ]
SHORT RANGE TRANSIT PLAN
SAN BENITO LOCAL TRANSPORTATION AUTHORITY PAGE 1
San Benito County Local Transportation Authority Short Range Transit Plan
March 2008
Prepared for: San Benito County Local Transportation Authority
330 Tres Pinos Road, Suite C7 Hollister, CA 95023
Prepared in conjunction with: Moore & Associates, Inc.
28150 Avenue Stanford, Suite 110 Valencia, CA 91355
www.moore-associates.net The preparation of this Short Range Transit Plan has been funded in part by a grant from the United States Department of Transportation (USDOT), through Section 5305 of the Federal Transit Act and Congestion Mitigation and Air Quality (CMAQ) Improvement Program of the Federal Highway Administration. The contents of the Short Range Transit Plan does not necessarily reflect those of USDOT, Federal Transit Administration, or the Federal Highway Administration..
SHORT RANGE TRANSIT PLAN
SAN BENITO LOCAL TRANSPORTATION AUTHORITY PAGE 2
Special thanks to the following project contributors:
Local Transportation Authority Board of Directors George Dias, Chair, City Council Member for the City of San Juan Bautista
Anthony Botelho, Director, Supervisor for San Benito County
Don Marcus, Director, Supervisor for San Benito County
Brad, Pike, Director, Mayor for the City of Hollister
Pauline Valdivia, City Council Member for the City of Hollister
Local Transportation Authority Staff Lisa Rheinheimer, Executive Director
Mary Dinkuhn, Transportation Planning Manager
Veronica Lezama, Transportation Planner
Betty Li, Transportation Planner
Regina Valentine, Transportation Planning Intern
Alfredo Martinez, Transportation Planning Intern
Kathy Postigo, Administrative Services Specialist
Monica Gomez, Secretary
Frances Kelly, Office Assistant
Technical Advisory Committee Lisa Rheinheimer, Chair, Executive Director of Council of San Benito County Governments
Jerry Lo, Member, Director of San Benito County Public Works
Arthur Henriques, Member Director of San Benito County Planning and Building Inspection Services
Clint Quilter, Member, City Manager for the City of Hollister
Bill Avera, Member, Director of Development Services for the City of Hollister
Mark McCumsey, Member, Regional Planner, Caltrans
Brent Newman, Captain for California Highway Patrol
Janice McClintock, Member, City Manager for the City of San Juan Bautista
Social Services Transportation Advisory Committee Pauline Valdivia, Chair, Jovenes de Antaño
Kevin D. Toy, Member, HOPE Rehabilitation Service
J. Carmen Betancourt, Member, Community Service and Workforce Development
Dolly Devasier, Member
Clay Kempf, Member, Area Agency on Aging
Tony Mercado, Member, Transit Operations Manager
SHORT RANGE TRANSIT PLAN
SAN BENITO LOCAL TRANSPORTATION AUTHORITY PAGE 3
TABLE OF CONTENTS
1. EXECUTIVE SUMMARY 11
2. PROJECT OVERVIEW 15 Statement of Project Objectives 15 Situational Analysis 17 Overview of Methodology 19 Demand Assessment 21
3. SERVICE AND SYSTEM EVALUATION 29 County Express Service Overview 29 Jovenes de Antaño Service Overview 33 Fixed Route Performance Evaluation 35 Dial-A-Ride Performance Evaluation 42 Jovenes de Antaño Performance Evaluation 47
4. PEER REVIEW 53 Fixed Route 58 Dial-A-Ride 66
5. RIDECHECK ANALYSIS 75 Fixed Route On-Time Performance 75 Fixed Route Boarding and Alighting 78 Dial-A-Ride On-Time Performance 89 Dial-A-Ride Origin and Destination Study 91 Dial-A-Ride Cancellation and No-Show 94
6. ON-BOARD SURVEY ANALYSIS 97 Demographic Profile 98 On-Board Survey Findings 109
7. COMMUNITY SURVEY ANALYSIS 113 Demographic Profile 115 Community Survey Findings 123
8. COMMUNITY OUTREACH ANALYSIS 125
9. GOALS, OBJECTIVES, AND STANDARDS 127
SHORT RANGE TRANSIT PLAN
SAN BENITO LOCAL TRANSPORTATION AUTHORITY PAGE 4
10. MARKETING 131 Overview of Marketing Efforts 131 Comprehensive Marketing Strategy 137 Marketing Budget and Timeline 172
11. SERVICE RECOMMENDATIONS 175 Service Alternatives 175 Service Recommendations 189
12. CAPITAL AND FINANCIAL PLAN 201 Capital Plan 202 Financial Plan 210
13. PREFERRED SCENARIO 221 Fixed Route 221 Paratransit 229 Fare Structure 233
14. IMPLEMENTATION PLAN 241
15. APPENDICES 243 Appendix A: Survey Instruments 246 Appendix B: Additional Graphics 252 Appendix C: Marketing Tools 256 Appendix D: Proposed Template 258
SHORT RANGE TRANSIT PLAN
SAN BENITO LOCAL TRANSPORTATION AUTHORITY PAGE 5
TABLE OF EXHIBITS
Page Exhibit No. Exhibit Title No.
Exhibit 1-1 Local Transportation Authority Organizational Chart 11 Exhibit 2-1 Population Change 21 Exhibit 2-2 Overall County Population Distribution 22 Exhibit 2-3 Key Trip Generators 26 Exhibit 2-4 List of Trip Generators 27 Exhibit 3-1 Fixed Route and Intercounty Fares 30 Exhibit 3-2 Fixed Route Service Area 31 Exhibit 3-3 Dial-A-Ride Service Area 32 Exhibit 3-4 Dial-A-Ride and Paratransit Fares 33 Exhibit 3-5 Jovenes de Antaño Fares 34 Exhibit 3-6 Fixed Route Performance Measures and Indicators 36 Exhibit 3-7 Fixed Route Annual Ridership 37 Exhibit 3-8 Fixed Route Passengers/Vehicle Service Hour 38 Exhibit 3-9 Fixed Route Passengers/Vehicle Service Mile 39 Exhibit 3-10 Fixed Route Operating Cost/Vehicle Service Hour 40 Exhibit 3-11 Fixed Route Operating Cost/Passenger 40 Exhibit 3-12 Fixed Route Farebox Recovery 41 Exhibit 3-13 Dial-A-Ride and Paratransit Performance Measures and Indicators 42 Exhibit 3-14 Dial-A-Ride and Paratransit Annual Ridership 43 Exhibit 3-15 Dial-A-Ride and Paratransit Passengers/Vehicle Service Hour 43 Exhibit 3-16 Dial-A-Ride and Paratransit Passengers/Vehicle Service Mile 44 Exhibit 3-17 Dial-A-Ride and Paratransit Operating Cost/Vehicle Service Hour 45 Exhibit 3-18 Dial-A-Ride and Paratransit Operating Cost/Passenger 45 Exhibit 3-19 Dial-A-Ride and Paratransit Farebox Recovery 46 Exhibit 3-20 Jovenes de Antaño Performance Measures and Indicators 47 Exhibit 3-21 Jovenes de Antaño Annual Ridership 48 Exhibit 3-22 Jovenes de Antaño Passengers/Vehicle Service Hour 48 Exhibit 3-23 Jovenes de Antaño Passengers/Vehicle Service Mile 49 Exhibit 3-24 Jovenes de Antaño Operating Cost/Vehicle Service Hour 50 Exhibit 3-25 Jovenes de Antaño Operating Cost/Passenger 50 Exhibit 3-26 Jovenes de Antaño Farebox Recovery 51 Exhibit 4-1 Cornerstone Evaluation Criteria 53 Exhibit 4-2 Peer Systems Base Fares 59 Exhibit 4-3 Fixed Route Key Indicators (FY2005/06) 58 Exhibit 4-4 Fixed Route Operating Cost/Vehicle Service Hour 59 Exhibit 4-5 Peer Review: Fixed Route Operating Cost/Vehicle Service Mile 50 Exhibit 4-6 Peer Review: Fixed Route Operating Cost/Passenger 61 Exhibit 4-7 Peer Review: Fixed Route Passengers/Vehicle Service Hour 62
SHORT RANGE TRANSIT PLAN
SAN BENITO LOCAL TRANSPORTATION AUTHORITY PAGE 6
Page Exhibit No. Exhibit Title No.
Exhibit 4-8 Fixed Route Passengers/Vehicle Service Mile 63 Exhibit 4-9 Fixed Route Farebox Recovery 64 Exhibit 4-10 Fixed Route Average Fare/Passenger 65 Exhibit 4-11 Demand-Response Key Indicators (FY2005/06) 66 Exhibit 4-12 Demand-Response Operating Cost/Vehicle Service Hour 67 Exhibit 4-13 Demand-Response Operating Cost/Vehicle Service Mile 68 Exhibit 4-14 Demand-Response Operating Cost/Passenger 69 Exhibit 4-15 Demand-Response Passengers/Vehicle Service Hour 70 Exhibit 4-16 Demand-Response Passengers/Vehicle Service Mile 71 Exhibit 4-17 Demand-Response Farebox Recovery 72 Exhibit 4-18 Demand-Response Average Fare/Passenger 73 Exhibit 5-1 System-Wide On-Time Performance 76 Exhibit 5-2 Individual Fixed Route On-Time Performance 77 Exhibit 5-3 Fixed Route Average Boardings/Trip 78 Exhibit 5-4 Clockwise Loop Boarding and Alighting Activity 80 Exhibit 5-5 Counter-Clockwise Loop Boarding and Alighting Activity 82 Exhibit 5-6 Business District Line Boarding and Alighting Activity 84 Exhibit 5-7 Fourth Street Line Boarding and Alighting Activity 86 Exhibit 5-8 Intercounty Route Boarding and Alighting Activity 88 Exhibit 5-9 Dial-A-Ride and Paratransit On-Time Performance 990 Exhibit 5-10 Dial-A-Ride and Paratransit Weekend and Weekday Performance 90 Exhibit 5-11 Top 10 Dial-A-Ride Destinations 92 Exhibit 5-12 Top Trip Generator Categories - Origins 92 Exhibit 5-13 Top Trip Generator Categories - Destinations 93 Exhibit 5-14 Cancellations and “No-Shows” 95 Exhibit 6-1 Rider Age 99 Exhibit 6-2 Household Income 99 Exhibit 6-3 Trip Purpose 100 Exhibit 6-4 Incidence of Ridership 101 Exhibit 6-5 Length of Patronage 101 Exhibit 6-6 Access to Bus Stop 102 Exhibit 6-7 Reason for Riding County Express 102 Exhibit 6-8 Mobility Alternatives 103 Exhibit 6-9 Typical Fare 104 Exhibit 6-10 Service Attribute Satisfaction 104 Exhibit 6-11 Desired Service Improvements 105 Exhibit 6-12 On-Board Survey: Additional Trips Based on Service Improvement 106 Exhibit 6-13 On-Board Survey: Information Channels 107 Exhibit 6-14 On-Board Survey: Radio Stations 108 Exhibit 7-1 Community Survey: Household Income 115
SHORT RANGE TRANSIT PLAN
SAN BENITO LOCAL TRANSPORTATION AUTHORITY PAGE 7
Page Exhibit No. Exhibit Title No.
Exhibit 7-2 Ride Dependency 115 Exhibit 7-3 Awareness by Age Group 116 Exhibit 7-4 Awareness by Household Income 117 Exhibit 7-5 Barriers to Using County Express 117 Exhibit 7-6 Ridership Frequency 118 Exhibit 7-7 Service Patronage 118 Exhibit 7-8 Former Riders vs. Barriers 119 Exhibit 7-9 Attribute Satisfaction Ratings 120 Exhibit 7-10 Attribute Importance Ratings 120 Exhibit 7-11 Preferred Information Channels 121 Exhibit 7-12 Radio Stations 121 Exhibit 7-13 Print Media 122 Exhibit 9-1 Goals, Objectives, and Standards 128 Exhibit 10-1 Marketing Assessment 136 Exhibit 10-2 Marketing Timeline 173 Exhibit 11-1 Current System Map 177 Exhibit 11-2 Previous System Map 179 Exhibit 11-3 Service Reduction System Map 181 Exhibit 11-4 Service Expansion System Map 185 Exhibit 11-5 General Public Dial-A-Ride Proposed Service Area 188 Exhibit 11-6 Summary of Proposed Service Alternatives 188 Exhibit 11-7 Proposed Headways 190 Exhibit 12-1 Funding Matrix 201 Exhibit 12-2 County Express Fleet List and Proposed Replacement Year 203 Exhibit 12-3 Fleet Prices 203 Exhibit 12-4 Fare Cost Benefit Matrix 206 Exhibit 12-5 Service Alternative A (Current System) Capital Plan 207 Exhibit 12-6 Service Alternative B (Previous System) Capital Plan 208 Exhibit 12-7 Service Alternative C (Service Reduction) Capital Plan 208 Exhibit 12-8 Service Alternative D (Service Expansion) Capital Plan 209 Exhibit 12-9 Service Alternative E (General Public Dial-A-Ride) Capital Plan 209 Exhibit12-10 Fixed Route Operating Expenses & Performance (Service
Alternative A) 211
Exhibit 12-11 Dial-A-Ride and Paratransit Operating Expenses & Performance (Service Alternative A)
211
Exhibit 12-12 Financial Plan (Service Alternative A) 211 Exhibit 12-13 Fixed-Route Operating Expenses & Performance (Service
Alternative B) 213
Exhibit 12-14 ADA Paratransit Operating Expenses & Performance (Service Alternative B)
213
Exhibit 12-15 Financial Plan (Service Alternative B) 213
SHORT RANGE TRANSIT PLAN
SAN BENITO LOCAL TRANSPORTATION AUTHORITY PAGE 8
Page Exhibit No. Exhibit Title No.
Exhibit 12-16 Fixed Route Operating Expenses & Performance (Service Alternative C)
215
Exhibit 12-17 Dial-A-Ride and Paratransit Operating Expenses & Performance (Service Alternative C)
215
Exhibit 12-18 Financial Plan (Service Alternative C) 215 Exhibit 12-19 Fixed Route Operating Expenses & Performance (Service
Alternative D) 217
Exhibit 12-20 Dial-A-Ride and Paratransit Operating Expenses & Performance (Service Alternative D)
217
Exhibit 12-21 Financial Plan (Service Alternative D) 217 Exhibit 12-22 Dial-A-Ride Operating Expenses & Performance (Service
Alternative E) 218
Exhibit 12-23 Financial Plan (Service Alternative E) 219 Exhibit 12-24 Financial and Capital Comparison (Estimated for FY2007/08) 219 Exhibit 12-25 Financial and Capital Comparison (Estimated for FY2011/12) 220 Exhibit 13-1 Service Alternative B Alignment 223 Exhibit 13-2 Service Alternative B Alignment with Trip Generators 224 Exhibit 13-3 Blue Line Schedule 226 Exhibit 13-4 Green Line Schedule 226 Exhibit 13-5 Red Line Schedule 227 Exhibit 13-6 Intercounty – Gavilan Route Schedule 227 Exhibit 13-7 Intercounty – Caltrain Route Schedule 228 Exhibit 13-8 Intercounty – Greyhound Route Schedule 228 Exhibit 13-9 ADA Paratransit Service Area 230 Exhibit 13-10 Proposed Regular Fixed Route Fares (Option 1) 235 Exhibit 13-11 Proposed Discount Fixed Route Fares (Option 1) 235 Exhibit 13-12 Percent Differences of Proposed Fare and Ridership (Option 1) 236 Exhibit 13-13 Fixed Route Farebox Recovery Projections with Option 1 236 Exhibit 13-14 County Express Farebox Recovery Projections with Option 1 236 Exhibit 13-15 Preferred Service Alternative Financial Plan (Option 1) 237 Exhibit 13-16 Proposed Fixed Route Regular Fares (Option 2) 237 Exhibit 13-17 Proposed Fixed Route Discount Fares (Option 2) 238 Exhibit 13-18 Proposed Fare Restructure (Option 3) 239 Exhibit 14-1 First Year Implementation Timeline 242 Exhibit 14-2 Five Year Implementation Timeline 244 Exhibit A-1 On-Board Survey (English)Title 246 Exhibit A-2 On-Board Survey (Spanish) 247 Exhibit A-3 Community Survey (English) 248 Exhibit A-4 Community Survey (Spanish) 250 Exhibit B-1 Youth Population Distribution 252 Exhibit B-2 Senior Population Distribution 252
SHORT RANGE TRANSIT PLAN
SAN BENITO LOCAL TRANSPORTATION AUTHORITY PAGE 9
Page Exhibit No. Exhibit Title No.
Exhibit B-3 Disabled Population Distribution 253 Exhibit B-4 Low-Income Households Distribution 253 Exhibit B-5 Incidence of Vehicle Ownership 254 Exhibit B-6 Top 15 Dial-A-Ride Origins 254 Exhibit B-7 Top 15 Dial-A-Ride Destinations 255 Exhibit C-1 Comment Card (English) 256 Exhibit C-2 Comment Card (Spanish) 257 Exhibit D-1 Sample Proposed Monthly Service Report 258

SHORT RANGE TRANSIT PLAN
SAN BENITO LOCAL TRANSPORTATION AUTHORITY PAGE 10
Page Intentionally Blank
SHORT RANGE TRANSIT PLAN
SAN BENITO LOCAL TRANSPORTATION AUTHORITY PAGE 11
CHAPTER 1 – EXECUTIVE SUMMARY
Project Overview The purpose of the project was to update the 1995 Short Range Transit Plan for County
Express, the largest public transit provider in San Benito County and operated by the
Local Transportation Authority. Unlike the previous Plan, the 2008 Short Range Transit
Plan includes an evaluation of the County Express’ older and newer services, and
Jovenes de Antaño, a non-profit organization that Local Transportation Authority
contracts with for specialized transportation services. The Plan includes the following:
1. Review and update of goals, objectives, and performance standards;
2. Individual service and system evaluations;
3. Service and system recommendations;
4. Strategic marketing plan; and
5. Capital and financial plans.
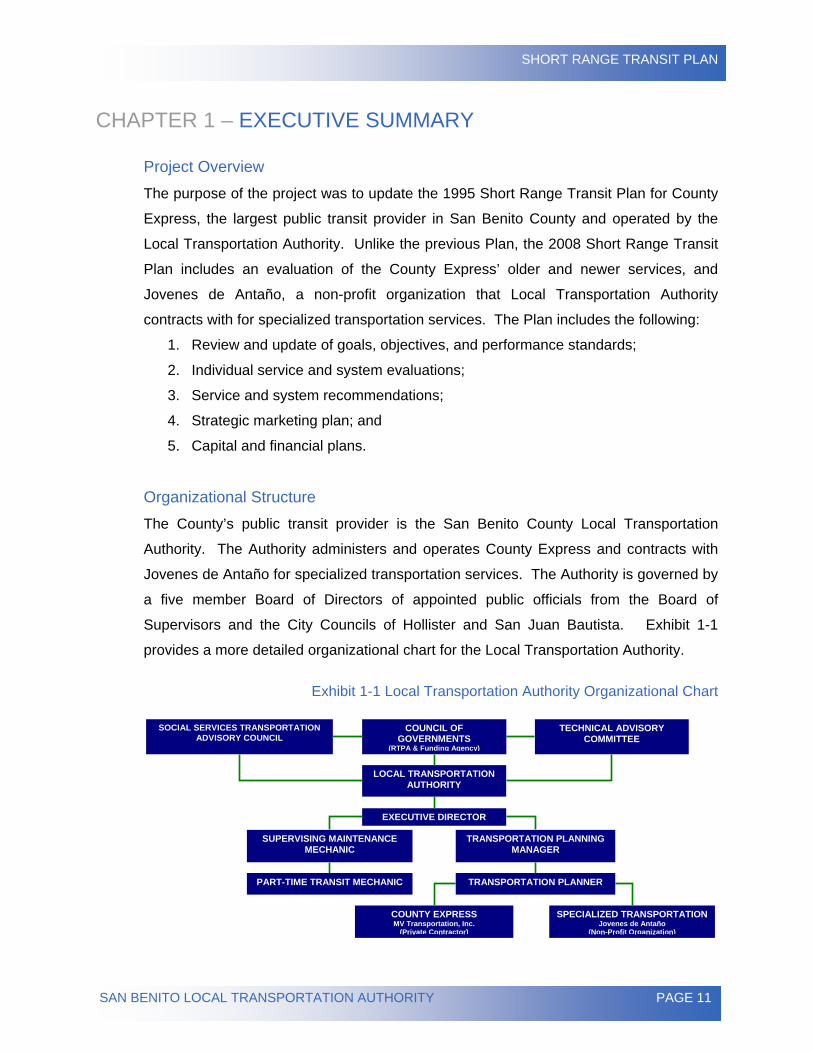
Organizational Structure The County’s public transit provider is the San Benito County Local Transportation
Authority. The Authority administers and operates County Express and contracts with
Jovenes de Antaño for specialized transportation services. The Authority is governed by
a five member Board of Directors of appointed public officials from the Board of
Supervisors and the City Councils of Hollister and San Juan Bautista. Exhibit 1-1
provides a more detailed organizational chart for the Local Transportation Authority.
Exhibit 1-1 Local Transportation Authority Organizational Chart
LOCAL TRANSPORTATION AUTHORITY
COUNCIL OF GOVERNMENTS
(RTPA & Funding Agency)
SOCIAL SERVICES TRANSPORTATION ADVISORY COUNCIL
TECHNICAL ADVISORY COMMITTEE
EXECUTIVE DIRECTOR
TRANSPORTATION PLANNING MANAGER
SUPERVISING MAINTENANCE MECHANIC
PART-TIME TRANSIT MECHANIC
COUNTY EXPRESS MV Transportation, Inc.
(Private Contractor)
SPECIALIZED TRANSPORTATION Jovenes de Antaño
(Non-Profit Organization)
TRANSPORTATION PLANNER
SHORT RANGE TRANSIT PLAN
SAN BENITO LOCAL TRANSPORTATION AUTHORITY PAGE 12
System Evaluation The Short Range Transit Plan’s system evaluation of County Express was conducted
with the following tools:
1. On-Board and community surveys;
2. Peer review; and
3. County Express’ performance and maintenance records.
Overall, the Plan concludes that there is a great need for Fixed Route services in San
Benito County. In a peer review, County Express’ Fixed Route and Dial-A-Ride to the
services was compared to the services of its peers of similar size, population, and
service area. For some performance indicators, County Express appeared to be on
track with its peers. However, there is room for improvement.
Other aspects of County Express were evaluated. Customer service, on-time
performance and marketing were found to be lacking. However, County Express is
involved in the community by participating in events, such as, Kids in the Park, Bike
Week, and Rideshare Week.
System Recommendations In response the findings in the service evaluation, there were five options evaluated for
route changes for Fixed Route:
1. Keep the current system;
2. Reverting back to 2004 system;
3. Reducing Fixed Route service;
4. Expanding Fixed Route service; and
5. Eliminating Fixed Route service and have only Dial-A-Ride.
The Short Range Transit Plan recommends that County Express return back to the 2004
system with some minor modifications, including an additional stop at the San Benito
County Jail.
In addition to the Fixed Route service recommendations, the Plan also provided
suggestions for improving the entire County Express operation. One recommendation is
to change to the previous Fixed Route naming system of colors. Currently, routes are
named “Counter-Clockwise” and “Clockwise.” These names created an issue with
translation from English to Spanish texts for customers who spoke and/or read only
SHORT RANGE TRANSIT PLAN
SAN BENITO LOCAL TRANSPORTATION AUTHORITY PAGE 13
Spanish. Implementing a simple naming system will be easier for staff to translate and
for customers to remember.
A capital and financial plan was developed that included a fleet replacement and
marketing plan to ensure fleet sustainability and attract and retain new ridership. Bus
stop amenities are also discussed in the capital portion of the plan. It also
recommended a change from tickets to tokens to save the printing expense. Tokens
may be reused for the life of the token, while tickets are only used once. The switch
from tickets to tokens would also be done in conjunction with fare increase hearings.
The Plan recommends that fare increase be implemented. Fare increases will only
occur after hearings allow for public comment
Implementation Timeline During the first year (2008) of implementation, there are 11 tasks that will be
accomplished. During the implementation process, the Local Transportation Authority
should continue to monitor the system’s performance and community outreach to ensure
that the public is aware of the coming changes. The implementation of the
recommendations should be concluded by December 2008.
During the second year (2009), the Authority should make adjustments to the Fixed
Route to address any unforeseen issues that may arise. Issues may include schedule
adjustments. A customer review survey should be conducted at the one-year
anniversary of the changes.
During the entire lifespan of the Short Range Transit Plan (2008 to 2012), the Authority
should continue to monitor County Express’ performance, strengthen marketing efforts,
and community outreach.

SHORT RANGE TRANSIT PLAN
SAN BENITO LOCAL TRANSPORTATION AUTHORITY PAGE 14
Page Intentionally Blank
SHORT RANGE TRANSIT PLAN
SAN BENITO LOCAL TRANSPORTATION AUTHORITY PAGE 15
CHAPTER 2 – PROJECT OVERVIEW
STATEMENT OF PROJECT OBJECTIVES
The San Benito County Local Transportation Authority administers and operates public
transportation services in the County. The Local Transportation Authority contracts with
a private operator to provide driver, dispatch, and management services for the transit
system. Under the name of County Express, the Local Transportation Authority
operates a Fixed Route transit service that serves the City of Hollister, a complementary
ADA Paratransit service, General Public Dial-a-Ride service, and Intercounty services to
the city of Gilroy in Santa Clara County. The Local Transportation Authority also
contracts with Jovenes de Antaño, a small non-profit organization that provides
specialized transportation to the elderly and persons with disabilities.
The San Benito County Local Transportation Authority, aware of changing travel needs
and concerned with decreasing transit ridership, published a Request for Proposals for
an update of the San Benito County Short Range Transit Plan. An independent
consultant was chosen via a competitive selection process.
Throughout the course of the project, discussions were held with the San Benito County
Local Transportation Authority Board of Directors as well as the staff charged with the
daily administration and operation of the County Express program. The erosion of
ridership and associated fare revenue called into question public transit in San Benito
County. Had County Express reached a point of diminishing return? Is the provision of
public transit a viable undertaking within San Benito County? Is there something so
fundamentally wrong that it causes County Express to perform in a manner contrary to
its peers and/or the transit industry at-large?
Based on a course of objective and comprehensive evaluation of transportation services
funded by the Local Transportation Authority, elimination of County Express is not
believed to be a viable alternative, from either a compliance or practical point-of-view.
Given the County Express’ 18-year existence, it would be virtually impossible to
conclude the need for affordable public transit as a mobility option no longer exists.
Although ridership across the last several years has decreased, findings from the
SHORT RANGE TRANSIT PLAN
SAN BENITO LOCAL TRANSPORTATION AUTHORITY PAGE 16
onboard survey conducted in December 2006 reveal a significant percentage (nearly 75
percent) of the respondents had patronized County Express for at least a year. Further,
arguably the clearest evidence of continuing “need” is reflected in the public testimony
gathered as part of the Local Transportation Authority’s annual Transportation
Development Act Article 8 public hearing process.
Adoption of a radically different service delivery strategy is both impractical and probably
not attainable within the framework of either immediate or probable funding. For
example, if the County Express were to transition away from its historic two-tier (i.e.,
fixed-route and demand-response) service delivery strategy to a strategy based on a
general-public demand-response service, the historic investment which the public has
made in the County Express across the past 18 years would be nullified because
residents may perceive that service to the area has been reduced. Beyond the capital
considerations, such a decision would negatively impact nearly every rider who has
come to rely on the County Express to enhance his or her personal mobility. Therefore,
identifying strategies for optimizing the value of the current framework of the County
Express services becomes the most reasonable and practical path to pursue.
A comprehensive, interrelated set of service options were subsequently developed
based on historic performance (i.e., ridership, travel patterns), community outreach, field
observations, industry “best practices,” and the professional experience of the
consultant.
In closing, it is essential the Local Transportation Authority regain the confidence of the
San Benito County community. It must embrace service strategies addressing the
mobility needs, funding realties, and political sensibilities of the community it serves.
SHORT RANGE TRANSIT PLAN
SAN BENITO LOCAL TRANSPORTATION AUTHORITY PAGE 17
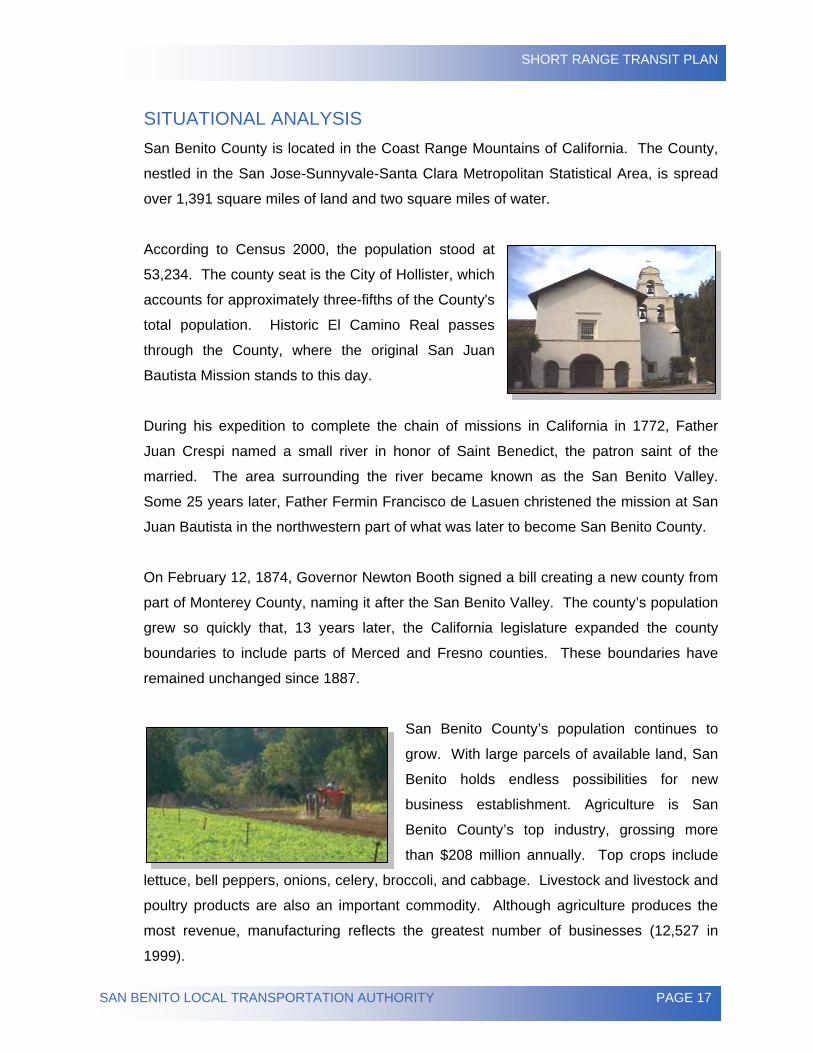
SITUATIONAL ANALYSIS San Benito County is located in the Coast Range Mountains of California. The County,
nestled in the San Jose-Sunnyvale-Santa Clara Metropolitan Statistical Area, is spread
over 1,391 square miles of land and two square miles of water.
According to Census 2000, the population stood at
53,234. The county seat is the City of Hollister, which
accounts for approximately three-fifths of the County's
total population. Historic El Camino Real passes
through the County, where the original San Juan
Bautista Mission stands to this day.
During his expedition to complete the chain of missions in California in 1772, Father
Juan Crespi named a small river in honor of Saint Benedict, the patron saint of the
married. The area surrounding the river became known as the San Benito Valley.
Some 25 years later, Father Fermin Francisco de Lasuen christened the mission at San
Juan Bautista in the northwestern part of what was later to become San Benito County.
On February 12, 1874, Governor Newton Booth signed a bill creating a new county from
part of Monterey County, naming it after the San Benito Valley. The county’s population
grew so quickly that, 13 years later, the California legislature expanded the county
boundaries to include parts of Merced and Fresno counties. These boundaries have
remained unchanged since 1887.
San Benito County’s population continues to
grow. With large parcels of available land, San
Benito holds endless possibilities for new
business establishment. Agriculture is San
Benito County’s top industry, grossing more
than $208 million annually. Top crops include
lettuce, bell peppers, onions, celery, broccoli, and cabbage. Livestock and livestock and
poultry products are also an important commodity. Although agriculture produces the
most revenue, manufacturing reflects the greatest number of businesses (12,527 in
1999).
SHORT RANGE TRANSIT PLAN
SAN BENITO LOCAL TRANSPORTATION AUTHORITY PAGE 18
San Benito County is served by eleven school
districts. Education in San Benito County begins early
with the accredited preschools of Sacred Heart,
Presbyterian Preschools, and Growth & Opportunity.
The area’s elementary schools have strong math and
reading programs, modern facilities, and up-to-date
equipment. They have been recognized throughout
California for the development and use of outstanding computer-assisted learning
programs. Secondary education takes place at the county’s two junior high schools, two
high schools, and one continuation high school. Higher education opportunities abound
at Gavilan College locations in Hollister and Gilroy as well as nearby California State
University campuses in Monterey Bay and San Jose.
As housing costs have risen in the San Francisco Bay Area, commuters have begun
relocating to San Benito County. Accordingly, the area has experienced an annual
growth rate of 5.8 percent. The Association of Monterey Bay Governments estimated of
the more than 13,000 individuals employed in San Benito County, 40 percent commuted
outside the county. The Association of Monterey Bay Area Governments estimates this
will increase by at least 53 percent each year, reaching over 9,000 commuters by 2010
and over 15,000 by 2020. This trend presents opportunities for San Benito County Local
Transportation Authority and its public transportation service, the County Express.
Service Area Characteristics
The county is traversed by California State Route 156, a direct east-west route from
Monterey County through San Juan Bautista to Hollister.
From north to south, California State Route 25 travels from Gilroy through Hollister, Tres
Pinos, and Paicines before terminating at the junction of California State Route 198.
U.S. Highway 101 passes through the western edge of the county, linking Los Angeles
with Oregon.
SHORT RANGE TRANSIT PLAN
SAN BENITO LOCAL TRANSPORTATION AUTHORITY PAGE 19
OVERVIEW OF METHODOLOGY
The methodology used in the development of San Benito’s Short Range Transit Plan
included the acquisition of data from a wide variety of sources. The following methods
were used in the collection of data required to evaluate the transit program and craft
meaningful service alternatives and recommendations.
Data Review
Among the documents reviewed in the preparation of the Short Range Transit Plan were
the prior Short Range Transit Plan (1995), Regional Transportation Plan (2005),
Triennial Performance Audit (2006), Transportation Development Act Article 8 Unmet
Needs summaries, monthly operator reports, and Dial-A-Ride and ADA Paratransit
driver logs. Planned and proposed development, both residential and commercial,
within San Benito County was also reviewed to analyze future transit demand. Finally,
recent and current marketing activities for County Express were examined to assess
impact and continued relevance.
Site Visits
Site visits and interviews were conducted with Local Transportation Authority Board of
Directors, Local Transportation Authority staff, and operations contractor staff to develop
a thorough understanding of the transit program, its governance and operation, current
fleet, and the environment in which it operates. The improved insight resulting from
these activities contributed to recommendations tailored specifically to San Benito
County.
Surveys
Several surveys were conducted between December 2006 and March 2007 to gather
information regarding the performance of the County Express service, assess customer
satisfaction, develop a demographic profile of the “typical” County Express rider,
evaluate marketing channels, and determine what the community perceives as barriers
to using public transportation in San Benito County. A ride check, an assessment of on-
time performance as well as service productivity (i.e., the number of passengers
boarding and alighting on each route and at each bus stop), was conducted in
December 2006. (Similar data was obtained for the Dial-A-Ride service through a
review of driver trip logs.) An on-board survey, conducted in December 2006, compiled
SHORT RANGE TRANSIT PLAN
SAN BENITO LOCAL TRANSPORTATION AUTHORITY PAGE 20
information on demographics, travel behavior, and customer satisfaction from current
County Express riders. A community survey, distributed by mail, in person, and via the
internet, asked residents (both riders and non-riders) to provide information such as
demographics, awareness of transit services, barriers to use, travel patterns, and
preferred informational channels. The data obtained through these surveys helped form
an overall picture of transit’s role in San Benito County, as well as revealing the
attributes and services most important to current transit customers.
Peer Review
A peer review was completed focusing on other transit operators of similar size, scope,
and service delivery. While no system can be an exact match to the fixed-route and
demand-response services provided by County Express, a range of “typical”
performance can be assessed by comparing standard performance indicators. This
peer review offers comparisons between San Benito County’s transit system and those
in Madera, Calaveras, Tulare, Amador, and Kings Counties.
Community Outreach
Community involvement is a vital component of any transit planning activity. In addition
to the surveys detailed above, community input was obtained through public workshops
and the County Express website. These opportunities for public involvement ensured
the resulting service modifications were appropriate for the community as a whole and
did not focus solely on the interests of a small population.
SHORT RANGE TRANSIT PLAN
SAN BENITO LOCAL TRANSPORTATION AUTHORITY PAGE 21
DEMAND ASSESSMENT
In order to determine where a demand for public transit is most likely to exist, it is
customary to identify concentrations of ride-dependent residents. An individual who is
considered ride- or transit-dependent relies on public transportation for some or all of his
or her basic mobility. Typically, a community’s ride-dependent population is composed
of youth, seniors, persons with disabilities, persons at or below the federal poverty level,
and persons without access to a private vehicle. Demand also revolves around trip
generators, which are locations likely to be frequented by large portions of the overall
population as well as those considered ride-dependent. Examples of trip generators
include schools, healthcare facilities, social service providers, and retail and employment
centers.
Because demographic information is collected every ten years as a part of the federal
census, it can be used to map concentrations of the above-mentioned population
groups. Using Environmental Systems Research Institute ArcView 9.2 and Geographic
Information Systems (GIS) software, zones within the County Express service area
exhibiting significant concentrations of ride-dependent persons are easily identified.
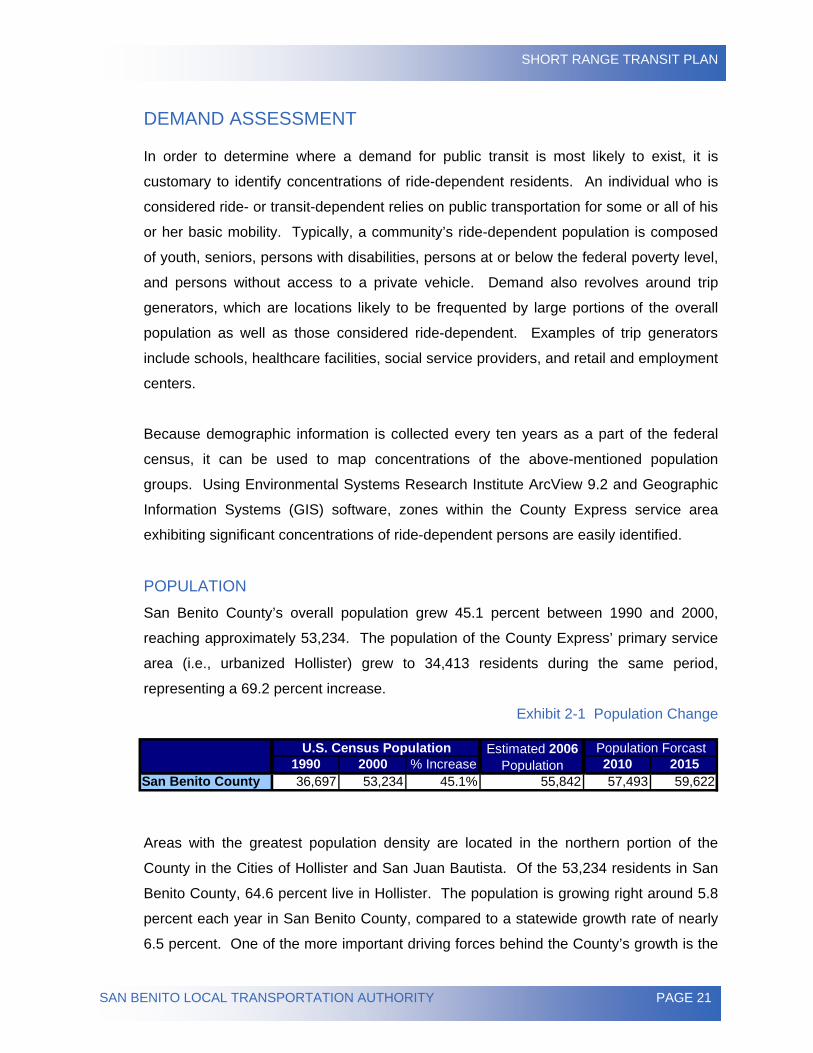
POPULATION San Benito County’s overall population grew 45.1 percent between 1990 and 2000,
reaching approximately 53,234. The population of the County Express’ primary service
area (i.e., urbanized Hollister) grew to 34,413 residents during the same period,
representing a 69.2 percent increase.
Exhibit 2-1 Population Change
1990 2000 % Increase 2010 2015San Benito County 36,697 53,234 45.1% 55,842 57,493 59,622
U.S. Census Population Estimated 2006 Population
Population Forcast
Areas with the greatest population density are located in the northern portion of the
County in the Cities of Hollister and San Juan Bautista. Of the 53,234 residents in San
Benito County, 64.6 percent live in Hollister. The population is growing right around 5.8
percent each year in San Benito County, compared to a statewide growth rate of nearly
6.5 percent. One of the more important driving forces behind the County’s growth is the
SHORT RANGE TRANSIT PLAN
SAN BENITO LOCAL TRANSPORTATION AUTHORITY PAGE 22
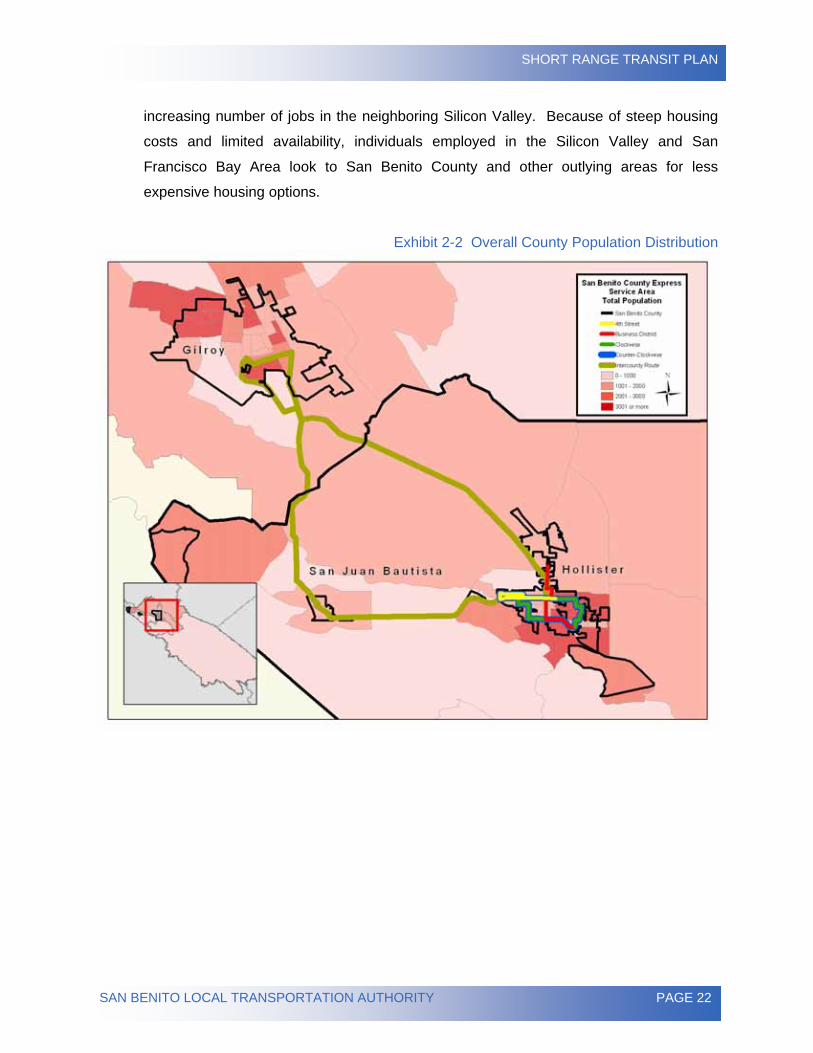
increasing number of jobs in the neighboring Silicon Valley. Because of steep housing
costs and limited availability, individuals employed in the Silicon Valley and San
Francisco Bay Area look to San Benito County and other outlying areas for less
expensive housing options.
Exhibit 2-2 Overall County Population Distribution
SHORT RANGE TRANSIT PLAN
SAN BENITO LOCAL TRANSPORTATION AUTHORITY PAGE 23
Youth Population
Youth are defined as individuals between the ages of 5 and 17. San Benito County has
a youth population of 12,479, or 23.4 percent of the total population. (Refer to Appendix
B for a graphical representation of the youth population distribution.) Because youth are
traditionally considered to be a ride-dependent population (due to lack of a driver license
and/or access to a personal vehicle), public transit is an important home-to-school travel
alternative.
Approximately 68 percent of the county’s youth population
resides within Hollister. The highest concentration of youth in
central Hollister reflects the fact that three of the four public
secondary schools in the county are located in this section of
the community. Two public middle schools are also located in
central Hollister: Rancho San Justo at Rancho Drive and East
Park Street, and Marguerite Maze on Meridian Street, east of Highway 25. San Benito
High School is located at the intersection of Monterey Street and Nash Road. San
Andreas Continuation High School is also located in central Hollister. The other public
high school in the County, Anzar High School, is in San Juan Bautista, which has a
modest enrollment. Elementary schools tend to be more community-based and are
therefore spread throughout the populated portions of the county.
Senior Population
Seniors are defined as individuals age 65 or older. The senior population of San Benito
County is 4,217, or 7.9 percent of the total population. (Refer to Appendix B for a
graphical representation of the senior population distribution.)
Of these 4,217 individuals, 2,151 reside in Hollister. Seniors are predominately
concentrated in the central and southern areas of the city. These areas boast relatively
easy access to healthcare services as well as retail and social services. This distribution
suggests many seniors choose to live close to their healthcare providers for
convenience. When taking into account this population distribution as well as data
arising from both the community and transit rider surveys, it is clear much of San
Benito’s senior population relies on public transit to access healthcare services.
SHORT RANGE TRANSIT PLAN
SAN BENITO LOCAL TRANSPORTATION AUTHORITY PAGE 24
Central Hollister is fairly densely populated with medical facilities such as the San Benito
County Health Foundation (Felice Drive at San Juan Road) and Hollister Community
Center (West Street and 3rd Street). Healthcare services in the southern section of the
community are offered at sites such as the Hazel Hawkins Memorial Hospital (Sunset
Drive and Memorial Drive) and Hollister Cardiac Rehabilitation Center (Sunnyslope
Road at Memorial Drive). Also within proximity of Hazel Hawkins Memorial Hospital are
several nursing and care homes such as Hazel Hawkins Convalescent Hospital,
Solutions Senior Mental Health Services, and the William and Inez Mabie Skilled
Nursing Facility.
Disabled Population
Under the Rehabilitation Act of 1973, a disability is defined as “a physical or mental
impairment that substantially limits one or more major life activities” (29 U.S.C. §705(9)).
These disabilities can be sensory, physical, or mental. There are 13,779 persons with
disabilities age 5 years and older within the study area, translating to approximately 25.9
percent of the total population. (Refer to Appendix B for a graphical representation of
the disabled population distribution.)
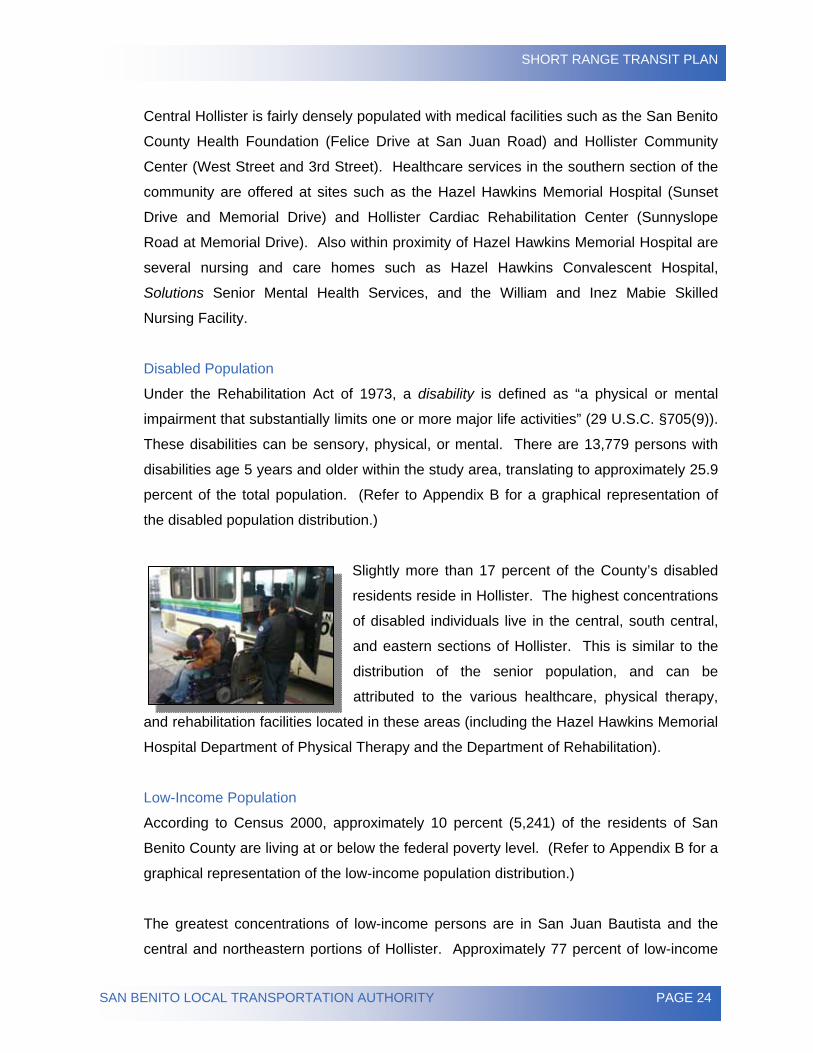
Slightly more than 17 percent of the County’s disabled
residents reside in Hollister. The highest concentrations
of disabled individuals live in the central, south central,
and eastern sections of Hollister. This is similar to the
distribution of the senior population, and can be
attributed to the various healthcare, physical therapy,
and rehabilitation facilities located in these areas (including the Hazel Hawkins Memorial
Hospital Department of Physical Therapy and the Department of Rehabilitation).
Low-Income Population
According to Census 2000, approximately 10 percent (5,241) of the residents of San
Benito County are living at or below the federal poverty level. (Refer to Appendix B for a
graphical representation of the low-income population distribution.)
The greatest concentrations of low-income persons are in San Juan Bautista and the
central and northeastern portions of Hollister. Approximately 77 percent of low-income
SHORT RANGE TRANSIT PLAN
SAN BENITO LOCAL TRANSPORTATION AUTHORITY PAGE 25
residents live in census block groups that are either completely or partially within
Hollister city limits. Another 6.3 percent reside within San Juan Bautista. These
individuals may not have access to a personal automobile as their primary mode of
transportation, and therefore may rely on public transit for their basic mobility needs.
Incidence of Vehicle Ownership
The number of households in San Benito County reporting no access to a personal
vehicle is 772. This translates to 4 percent of the total population. The distribution of
these households corresponds to those areas featuring high populations of youth,
seniors, and persons with disabilities (specifically, central and southern Hollister). These
high concentrations of ride-dependent persons suggest a large need and demand for
public transit services in those areas. (Refer to Appendix B for a graphical
representation of incidence of vehicle ownership.)
SHORT RANGE TRANSIT PLAN
SAN BENITO LOCAL TRANSPORTATION AUTHORITY PAGE 26
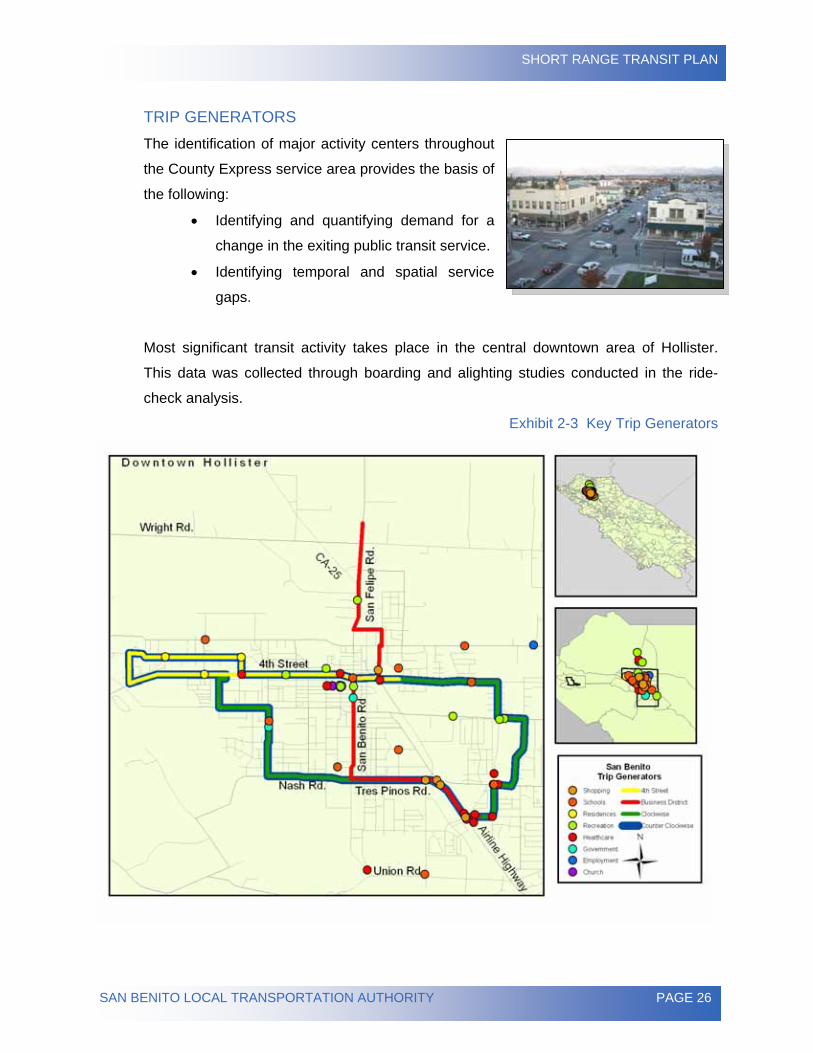
TRIP GENERATORS The identification of major activity centers throughout
the County Express service area provides the basis of
the following:
• Identifying and quantifying demand for a
change in the exiting public transit service.
• Identifying temporal and spatial service
gaps.
Most significant transit activity takes place in the central downtown area of Hollister.
This data was collected through boarding and alighting studies conducted in the ride-
check analysis. Exhibit 2-3 Key Trip Generators
SHORT RANGE TRANSIT PLAN
SAN BENITO LOCAL TRANSPORTATION AUTHORITY PAGE 27
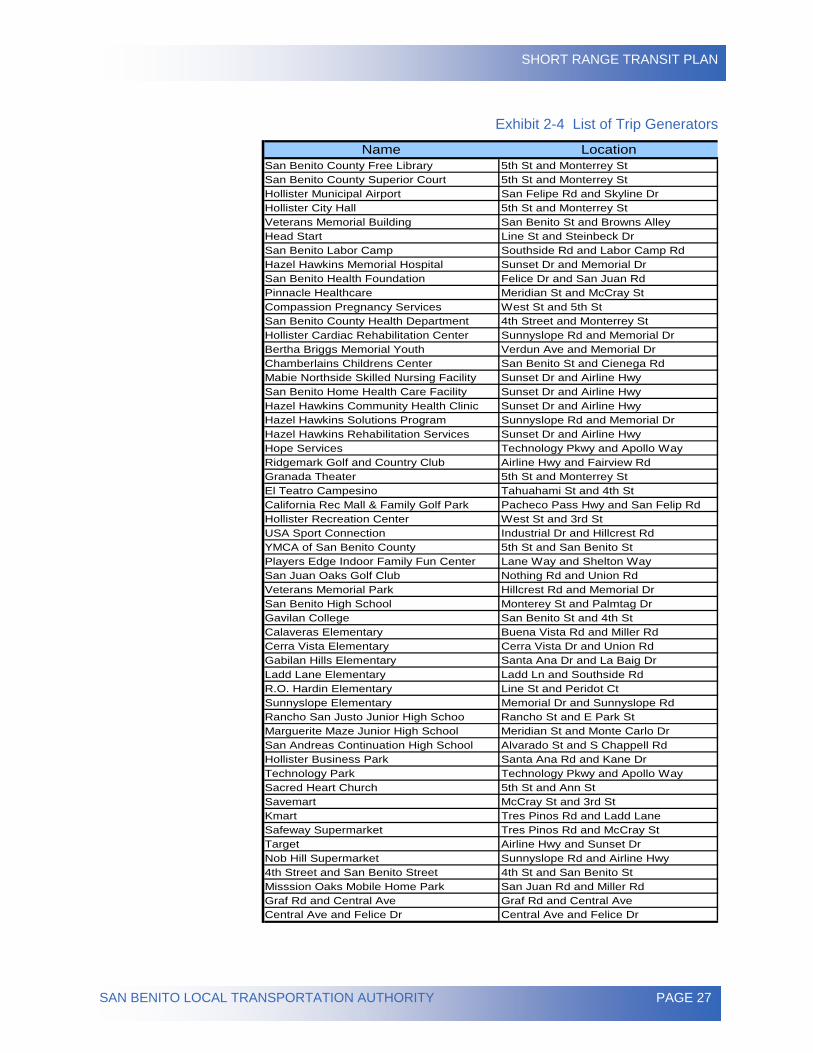
Exhibit 2-4 List of Trip Generators Name Location
San Benito County Free Library 5th St and Monterrey StSan Benito County Superior Court 5th St and Monterrey StHollister Municipal Airport San Felipe Rd and Skyline DrHollister City Hall 5th St and Monterrey StVeterans Memorial Building San Benito St and Browns AlleyHead Start Line St and Steinbeck DrSan Benito Labor Camp Southside Rd and Labor Camp RdHazel Hawkins Memorial Hospital Sunset Dr and Memorial DrSan Benito Health Foundation Felice Dr and San Juan RdPinnacle Healthcare Meridian St and McCray StCompassion Pregnancy Services West St and 5th StSan Benito County Health Department 4th Street and Monterrey StHollister Cardiac Rehabilitation Center Sunnyslope Rd and Memorial DrBertha Briggs Memorial Youth Verdun Ave and Memorial DrChamberlains Childrens Center San Benito St and Cienega RdMabie Northside Skilled Nursing Facility Sunset Dr and Airline HwySan Benito Home Health Care Facility Sunset Dr and Airline HwyHazel Hawkins Community Health Clinic Sunset Dr and Airline HwyHazel Hawkins Solutions Program Sunnyslope Rd and Memorial DrHazel Hawkins Rehabilitation Services Sunset Dr and Airline HwyHope Services Technology Pkwy and Apollo WayRidgemark Golf and Country Club Airline Hwy and Fairview RdGranada Theater 5th St and Monterrey StEl Teatro Campesino Tahuahami St and 4th StCalifornia Rec Mall & Family Golf Park Pacheco Pass Hwy and San Felip RdHollister Recreation Center West St and 3rd StUSA Sport Connection Industrial Dr and Hillcrest RdYMCA of San Benito County 5th St and San Benito StPlayers Edge Indoor Family Fun Center Lane Way and Shelton WaySan Juan Oaks Golf Club Nothing Rd and Union RdVeterans Memorial Park Hillcrest Rd and Memorial DrSan Benito High School Monterey St and Palmtag DrGavilan College San Benito St and 4th StCalaveras Elementary Buena Vista Rd and Miller RdCerra Vista Elementary Cerra Vista Dr and Union RdGabilan Hills Elementary Santa Ana Dr and La Baig DrLadd Lane Elementary Ladd Ln and Southside RdR.O. Hardin Elementary Line St and Peridot CtSunnyslope Elementary Memorial Dr and Sunnyslope RdRancho San Justo Junior High Schoo Rancho St and E Park StMarguerite Maze Junior High School Meridian St and Monte Carlo DrSan Andreas Continuation High School Alvarado St and S Chappell RdHollister Business Park Santa Ana Rd and Kane DrTechnology Park Technology Pkwy and Apollo WaySacred Heart Church 5th St and Ann StSavemart McCray St and 3rd StKmart Tres Pinos Rd and Ladd LaneSafeway Supermarket Tres Pinos Rd and McCray StTarget Airline Hwy and Sunset DrNob Hill Supermarket Sunnyslope Rd and Airline Hwy4th Street and San Benito Street 4th St and San Benito StMisssion Oaks Mobile Home Park San Juan Rd and Miller RdGraf Rd and Central Ave Graf Rd and Central AveCentral Ave and Felice Dr Central Ave and Felice Dr

SHORT RANGE TRANSIT PLAN
SAN BENITO LOCAL TRANSPORTATION AUTHORITY PAGE 28
Page Intentionally Blank
SHORT RANGE TRANSIT PLAN
SAN BENITO LOCAL TRANSPORTATION AUTHORITY PAGE 29
CHAPTER 3 – SERVICE AND SYSTEM EVALUATION
An operational assessment of the San Benito County Express Fixed Route and Demand
Response services was essential to the Short Range Transit Plan process. This
evaluation included an assessment of actual quantitative performance from year to year
as well as comparison with adopted standards.
COUNTY EXPRESS SERVICE OVERVIEW The County Express operates Monday through Friday from 5:30 a.m. to 8:30 p.m.
Saturday and Sunday service is available only through general public Dial-A-Ride from
8:00 a.m. to 3 p.m. or the Intercounty Gilroy Greyhound route from 7:40 a.m. to 5:55
p.m. Service holidays are New Year's Day, Memorial Day, Independence Day, Labor
Day, Thanksgiving Day, and Christmas Day. Fixed Route, Dial-A-Ride and ADA
Paratransit services are operated by a private contractor, while specialized
transportation services are available through Jovenes de Antaño, a non-profit
organization.
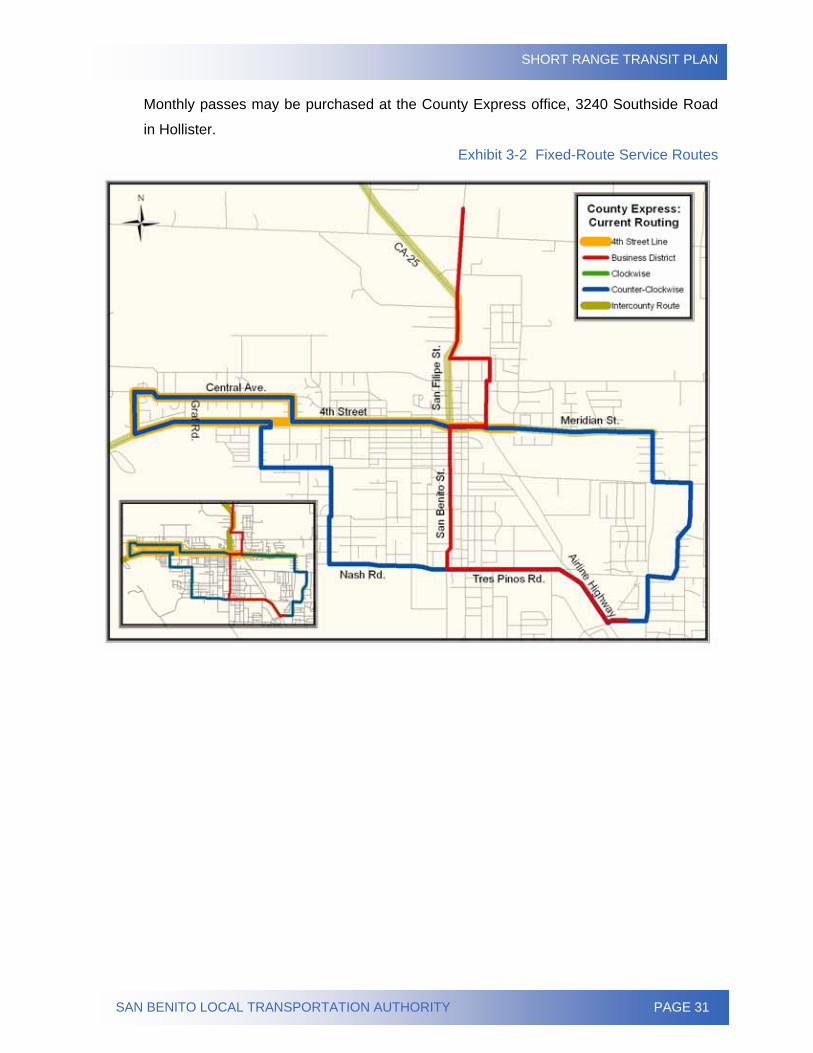
Fixed-Route Service
The County Express service includes four Fixed Routes in the City of Hollister, operating
Monday through Friday from 6:20 a.m. to 5:45 p.m. The Fourth Street Line, Business
District Line, Clockwise Loop, and Counter-Clockwise Loop outline Hollister and serve
the city’s most frequented locations. The primary service area is bounded by Graf Road
on the west, Fourth Street on the north, El Toro Drive on the east, and Sunset Drive on
the south; although the Business District Line extends northward along San Felipe Road.
Two Intercounty routes operate Monday through Friday, providing a critical link between
Hollister, San Juan Bautista and destinations in neighboring Santa Clara County. A third
Intercounty route operates on Saturday and Sunday only. Each route originates in
Hollister at Veteran’s Memorial Park and stops at the downtown transfer point at Fourth
Street and San Benito Street.
• Caltrain Route: County Express provides express bus service from
Hollister to the Caltrain commuter rail station in Gilroy. Buses connect
with train departures and arrivals Monday through Friday. This
SHORT RANGE TRANSIT PLAN
SAN BENITO LOCAL TRANSPORTATION AUTHORITY PAGE 30
service operates during peak commuting hours (5:30 a.m. to 8:15
a.m. and 4:35 p.m. to 8:35 p.m.).
• Gavilan College route: Service to Gavilan College operates Monday
through Friday linking Hollister, San Juan Bautista, and Gilroy.
Service days and times reflect the Gavilan College school year.
Limited service is available during school vacation periods. Patrons
may also connect with the Santa Clara Valley Transportation Authority
(VTA) bus system at Gavilan College in Gilroy.
• Gilroy Greyhound route: Service is provided on Saturday and Sunday
connecting Hollister and San Juan Bautista to the Greyhound Bus
Terminal in Gilroy. The route is designed to coordinate with
Greyhound departure times.
Intercounty services are widely used because of their variety of destinations and transfer
opportunities to other transit services. Approximately 30 percent of County Express
riders patronize the Intercounty services.
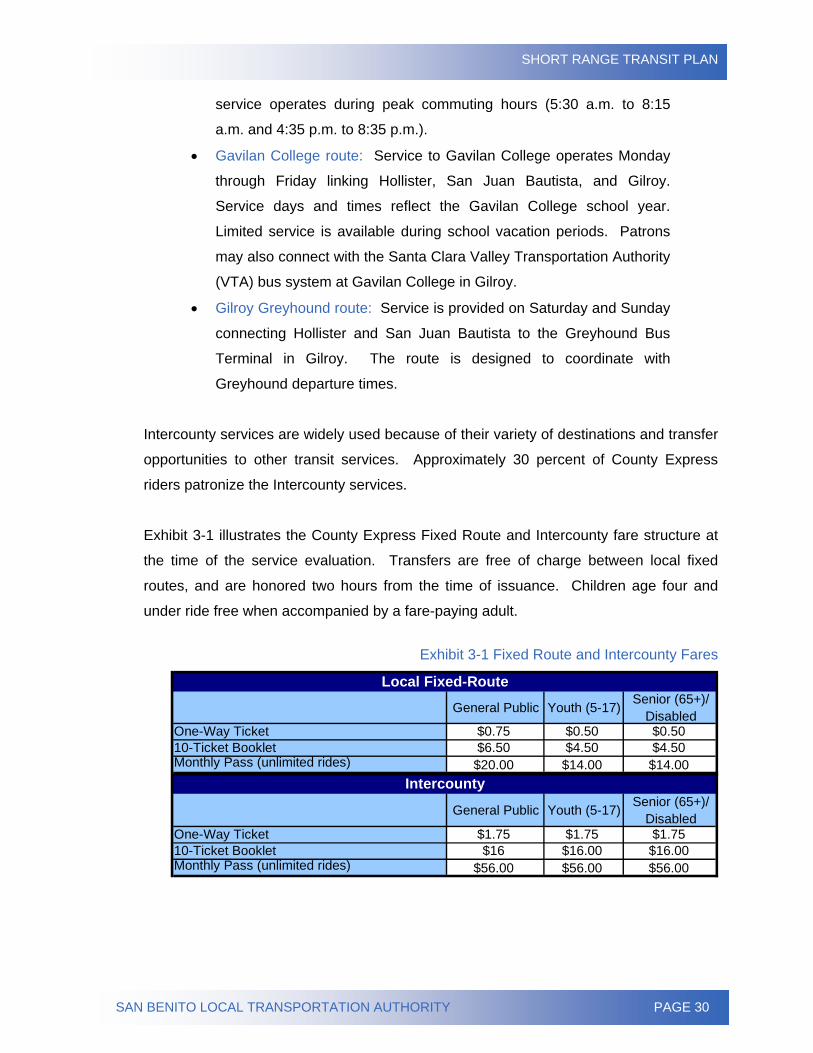
Exhibit 3-1 illustrates the County Express Fixed Route and Intercounty fare structure at
the time of the service evaluation. Transfers are free of charge between local fixed
routes, and are honored two hours from the time of issuance. Children age four and
under ride free when accompanied by a fare-paying adult.
Exhibit 3-1 Fixed Route and Intercounty Fares
General Public Youth (5-17) Senior (65+)/ Disabled
One-Way Ticket $0.75 $0.50 $0.5010-Ticket Booklet $6.50 $4.50 $4.50Monthly Pass (unlimited rides) $20.00 $14.00 $14.00
General Public Youth (5-17) Senior (65+)/ Disabled
One-Way Ticket $1.75 $1.75 $1.7510-Ticket Booklet $16 $16.00 $16.00Monthly Pass (unlimited rides) $56.00 $56.00 $56.00
Local Fixed-Route
Intercounty
SHORT RANGE TRANSIT PLAN
SAN BENITO LOCAL TRANSPORTATION AUTHORITY PAGE 31
Monthly passes may be purchased at the County Express office, 3240 Southside Road
in Hollister.
Exhibit 3-2 Fixed-Route Service Routes
SHORT RANGE TRANSIT PLAN
SAN BENITO LOCAL TRANSPORTATION AUTHORITY PAGE 32
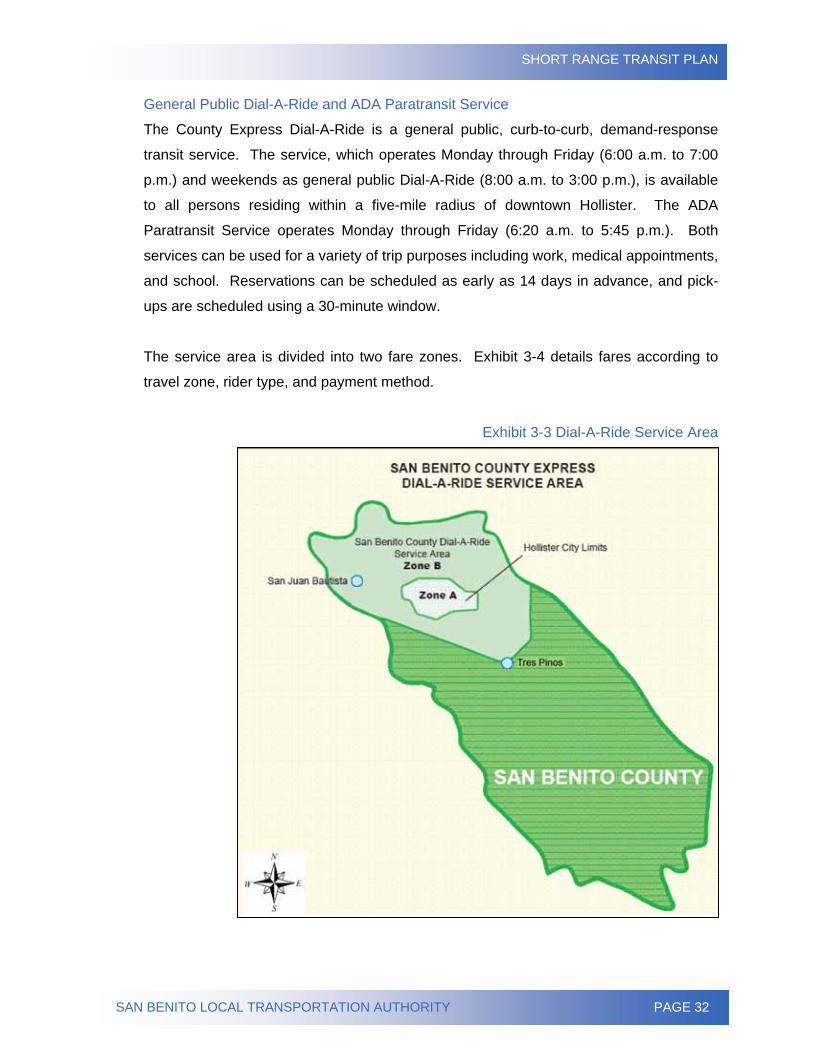
General Public Dial-A-Ride and ADA Paratransit Service
The County Express Dial-A-Ride is a general public, curb-to-curb, demand-response
transit service. The service, which operates Monday through Friday (6:00 a.m. to 7:00
p.m.) and weekends as general public Dial-A-Ride (8:00 a.m. to 3:00 p.m.), is available
to all persons residing within a five-mile radius of downtown Hollister. The ADA
Paratransit Service operates Monday through Friday (6:20 a.m. to 5:45 p.m.). Both
services can be used for a variety of trip purposes including work, medical appointments,
and school. Reservations can be scheduled as early as 14 days in advance, and pick-
ups are scheduled using a 30-minute window.
The service area is divided into two fare zones. Exhibit 3-4 details fares according to
travel zone, rider type, and payment method.
Exhibit 3-3 Dial-A-Ride Service Area
SHORT RANGE TRANSIT PLAN
SAN BENITO LOCAL TRANSPORTATION AUTHORITY PAGE 33
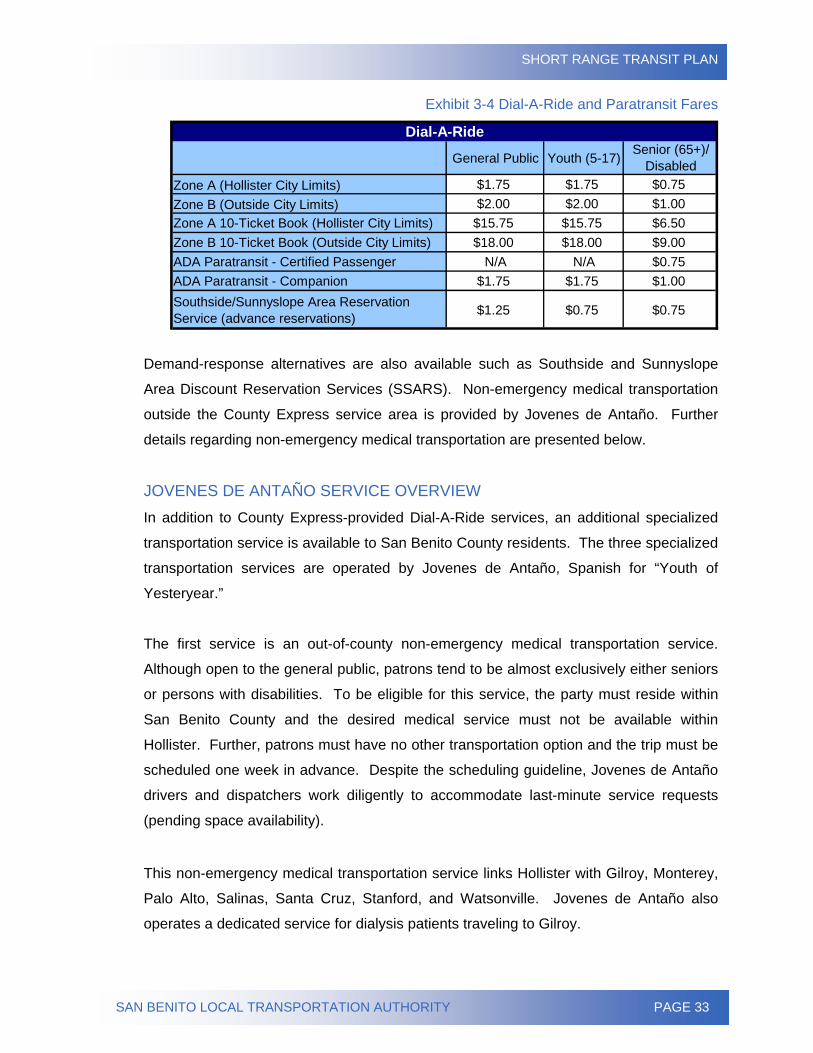
Exhibit 3-4 Dial-A-Ride and Paratransit Fares
General Public Youth (5-17) Senior (65+)/ Disabled
Zone A (Hollister City Limits) $1.75 $1.75 $0.75Zone B (Outside City Limits) $2.00 $2.00 $1.00Zone A 10-Ticket Book (Hollister City Limits) $15.75 $15.75 $6.50Zone B 10-Ticket Book (Outside City Limits) $18.00 $18.00 $9.00ADA Paratransit - Certified Passenger N/A N/A $0.75ADA Paratransit - Companion $1.75 $1.75 $1.00Southside/Sunnyslope Area Reservation Service (advance reservations) $1.25 $0.75 $0.75
Dial-A-Ride
Demand-response alternatives are also available such as Southside and Sunnyslope
Area Discount Reservation Services (SSARS). Non-emergency medical transportation
outside the County Express service area is provided by Jovenes de Antaño. Further
details regarding non-emergency medical transportation are presented below.
JOVENES DE ANTAÑO SERVICE OVERVIEW In addition to County Express-provided Dial-A-Ride services, an additional specialized
transportation service is available to San Benito County residents. The three specialized
transportation services are operated by Jovenes de Antaño, Spanish for “Youth of
Yesteryear.”
The first service is an out-of-county non-emergency medical transportation service.
Although open to the general public, patrons tend to be almost exclusively either seniors
or persons with disabilities. To be eligible for this service, the party must reside within
San Benito County and the desired medical service must not be available within
Hollister. Further, patrons must have no other transportation option and the trip must be
scheduled one week in advance. Despite the scheduling guideline, Jovenes de Antaño
drivers and dispatchers work diligently to accommodate last-minute service requests
(pending space availability).
This non-emergency medical transportation service links Hollister with Gilroy, Monterey,
Palo Alto, Salinas, Santa Cruz, Stanford, and Watsonville. Jovenes de Antaño also
operates a dedicated service for dialysis patients traveling to Gilroy.
SHORT RANGE TRANSIT PLAN
SAN BENITO LOCAL TRANSPORTATION AUTHORITY PAGE 34
A second service provided through Jovenes de Antaño is the Medical and Shopping
Assistance Program. This program provides transportation to non-healthcare
locations/services as well as healthcare appointments. Patrons must be at least 60
years of age or mobility impaired in order to be eligible for the Medical and Shopping
Assistance Program. The fee for this service is one dollar each way, and reservations
must be made two days prior to the desired trip date.
A third Jovenes de Antaño service is known as the San Juan Bautista Route. This free
service transports senior citizens from San Juan Bautista into Hollister for a publicly-
funded Nutrition Program.
Patron escort and Spanish translation are other aspects of this service. Jovenes de
Antaño drivers are trained to assist passengers with translations of initial forms and sign-
in sheets they may encounter at their medical appointments, though drivers do not go
into the actual consultation. Drivers will also escort any patrons requiring mobility
assistance to enter a facility. The service employs four part-time drivers and one full-
time driver. All Jovenes de Antaño vehicles are wheelchair-lift equipped. The hours of
operation for this service vary according to the number of persons traveling as well as
their respective appointment times.
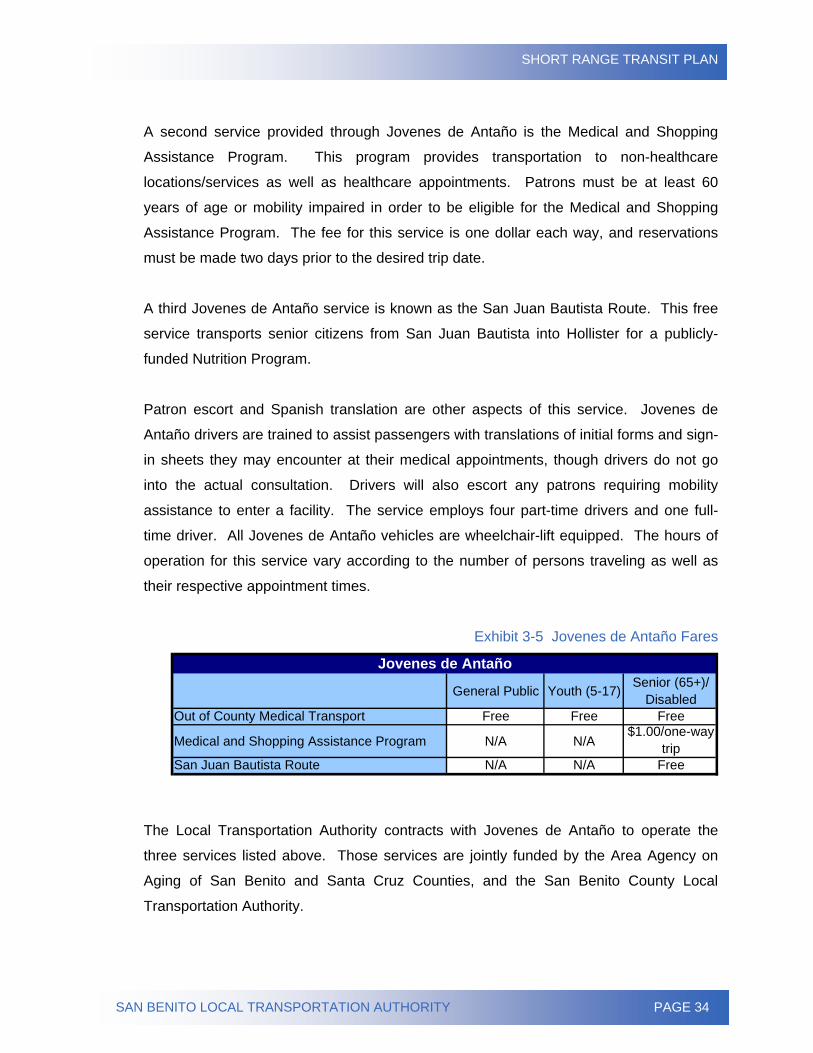
Exhibit 3-5 Jovenes de Antaño Fares
General Public Youth (5-17) Senior (65+)/ Disabled
Out of County Medical Transport Free Free Free
Medical and Shopping Assistance Program N/A N/A$1.00/one-way
tripSan Juan Bautista Route N/A N/A Free
Jovenes de Antaño
The Local Transportation Authority contracts with Jovenes de Antaño to operate the
three services listed above. Those services are jointly funded by the Area Agency on
Aging of San Benito and Santa Cruz Counties, and the San Benito County Local
Transportation Authority.
SHORT RANGE TRANSIT PLAN
SAN BENITO LOCAL TRANSPORTATION AUTHORITY PAGE 35
COUNTY EXPRESS SERVICE PERFORMANCE
The success of a transit service can be objectively assessed using indicators which are
standard evaluations of a service’s efficiency and effectiveness regarding cost and
service delivery. Using five common performance measures – operating cost, fare
revenue, vehicle service hours, vehicle service miles, and ridership – performance
indicators can be calculated to address the following:
• How much does it cost to carry one passenger? (Operating
Cost/Passenger)
• How much does it cost to provide one hour or mile of service?
(Operating Cost/Vehicle Service Hour or Vehicle Service Mile)
• How many passengers are carried for every hour or mile of service
provided? (Passengers/Vehicle Service Hour or Vehicle Service Mile)
• What is the average fare paid per passenger? (Average
Fare/Passenger)
• What percentage of the service’s operating cost is paid via passenger
fares? (Farebox Recovery Ratio)
These performance indicators can be compared to adopted standards to evaluate
operational performance, or compared to like-peer operations to establish a range of
acceptable performance (peer review). It should be noted that the following numbers
reflect a dramatic service change that County Express went through in 2004.
Fixed-Route Performance
Performance measures for County Express’ Fixed Route service were evaluated across
three fiscal years (FY 2003/04, FY 2004/05, and FY 2005/06). Performance indicators
were then calculated from these performance measures, providing the basis for the
following fixed-route performance evaluation. Each performance measure and indicator
is also represented by a graph indicating the trend through the three fiscal years
preceding this report.
SHORT RANGE TRANSIT PLAN
SAN BENITO LOCAL TRANSPORTATION AUTHORITY PAGE 36
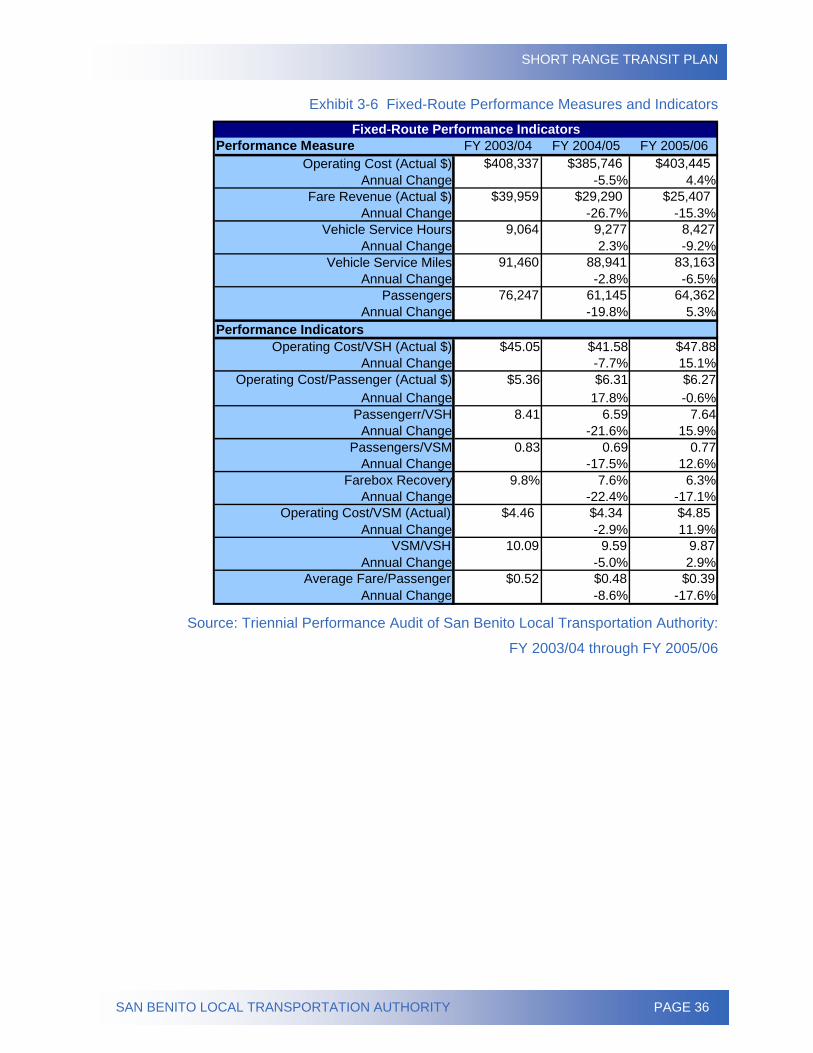
Exhibit 3-6 Fixed-Route Performance Measures and Indicators
Performance Measure FY 2003/04 FY 2004/05 FY 2005/06Operating Cost (Actual $) $408,337 $385,746 $403,445
Annual Change -5.5% 4.4%Fare Revenue (Actual $) $39,959 $29,290 $25,407
Annual Change -26.7% -15.3%Vehicle Service Hours 9,064 9,277 8,427
Annual Change 2.3% -9.2%Vehicle Service Miles 91,460 88,941 83,163
Annual Change -2.8% -6.5%Passengers 76,247 61,145 64,362
Annual Change -19.8% 5.3%
Operating Cost/VSH (Actual $) $45.05 $41.58 $47.88 Annual Change -7.7% 15.1%
Operating Cost/Passenger (Actual $) $5.36 $6.31 $6.27 Annual Change 17.8% -0.6%
Passengerr/VSH 8.41 6.59 7.64Annual Change -21.6% 15.9%
Passengers/VSM 0.83 0.69 0.77Annual Change -17.5% 12.6%
Farebox Recovery 9.8% 7.6% 6.3%Annual Change -22.4% -17.1%
Operating Cost/VSM (Actual) $4.46 $4.34 $4.85Annual Change -2.9% 11.9%
VSM/VSH 10.09 9.59 9.87Annual Change -5.0% 2.9%
Average Fare/Passenger $0.52 $0.48 $0.39Annual Change -8.6% -17.6%
Fixed-Route Performance Indicators
Performance Indicators
Source: Triennial Performance Audit of San Benito Local Transportation Authority:
FY 2003/04 through FY 2005/06
SHORT RANGE TRANSIT PLAN
SAN BENITO LOCAL TRANSPORTATION AUTHORITY PAGE 37
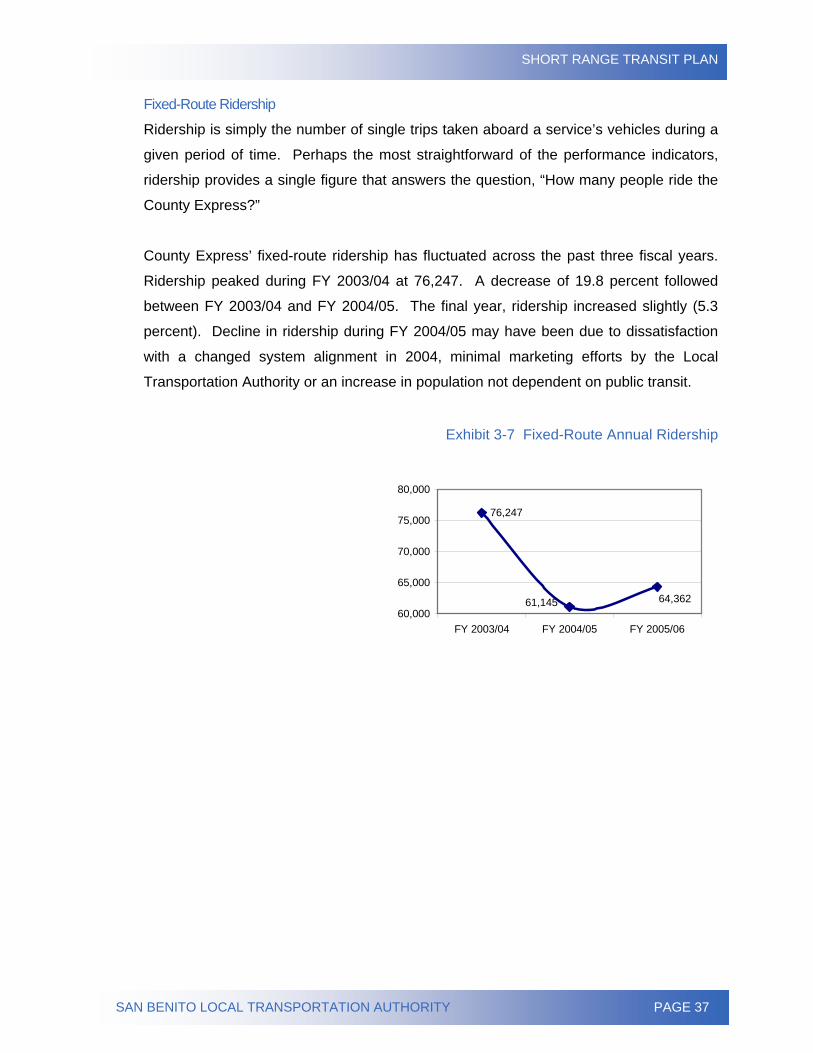
Fixed-Route Ridership Ridership is simply the number of single trips taken aboard a service’s vehicles during a
given period of time. Perhaps the most straightforward of the performance indicators,
ridership provides a single figure that answers the question, “How many people ride the
County Express?”
County Express’ fixed-route ridership has fluctuated across the past three fiscal years.
Ridership peaked during FY 2003/04 at 76,247. A decrease of 19.8 percent followed
between FY 2003/04 and FY 2004/05. The final year, ridership increased slightly (5.3
percent). Decline in ridership during FY 2004/05 may have been due to dissatisfaction
with a changed system alignment in 2004, minimal marketing efforts by the Local
Transportation Authority or an increase in population not dependent on public transit.
Exhibit 3-7 Fixed-Route Annual Ridership
76,247
64,36261,14560,000
65,000
70,000
75,000
80,000
FY 2003/04 FY 2004/05 FY 2005/06
SHORT RANGE TRANSIT PLAN
SAN BENITO LOCAL TRANSPORTATION AUTHORITY PAGE 38
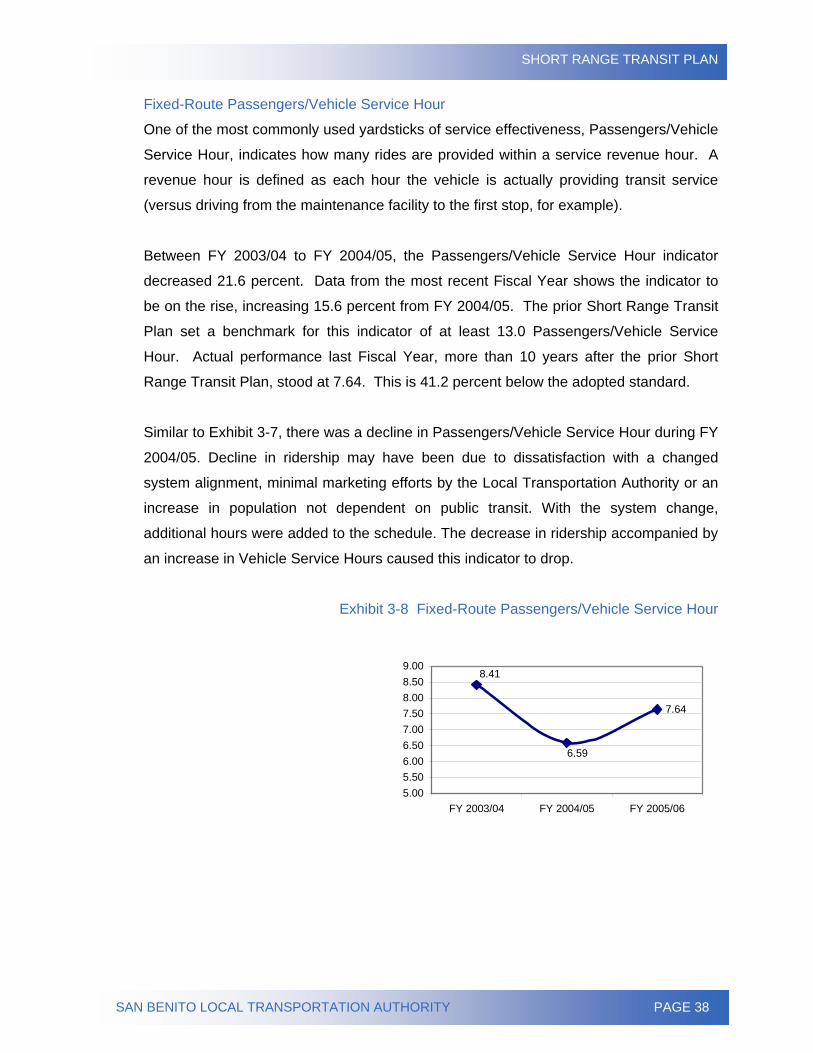
Fixed-Route Passengers/Vehicle Service Hour
One of the most commonly used yardsticks of service effectiveness, Passengers/Vehicle
Service Hour, indicates how many rides are provided within a service revenue hour. A
revenue hour is defined as each hour the vehicle is actually providing transit service
(versus driving from the maintenance facility to the first stop, for example).
Between FY 2003/04 to FY 2004/05, the Passengers/Vehicle Service Hour indicator
decreased 21.6 percent. Data from the most recent Fiscal Year shows the indicator to
be on the rise, increasing 15.6 percent from FY 2004/05. The prior Short Range Transit
Plan set a benchmark for this indicator of at least 13.0 Passengers/Vehicle Service
Hour. Actual performance last Fiscal Year, more than 10 years after the prior Short
Range Transit Plan, stood at 7.64. This is 41.2 percent below the adopted standard.
Similar to Exhibit 3-7, there was a decline in Passengers/Vehicle Service Hour during FY
2004/05. Decline in ridership may have been due to dissatisfaction with a changed
system alignment, minimal marketing efforts by the Local Transportation Authority or an
increase in population not dependent on public transit. With the system change,
additional hours were added to the schedule. The decrease in ridership accompanied by
an increase in Vehicle Service Hours caused this indicator to drop.
Exhibit 3-8 Fixed-Route Passengers/Vehicle Service Hour
7.64
8.41
6.59
5.005.506.006.507.007.508.008.509.00
FY 2003/04 FY 2004/05 FY 2005/06
SHORT RANGE TRANSIT PLAN
SAN BENITO LOCAL TRANSPORTATION AUTHORITY PAGE 39
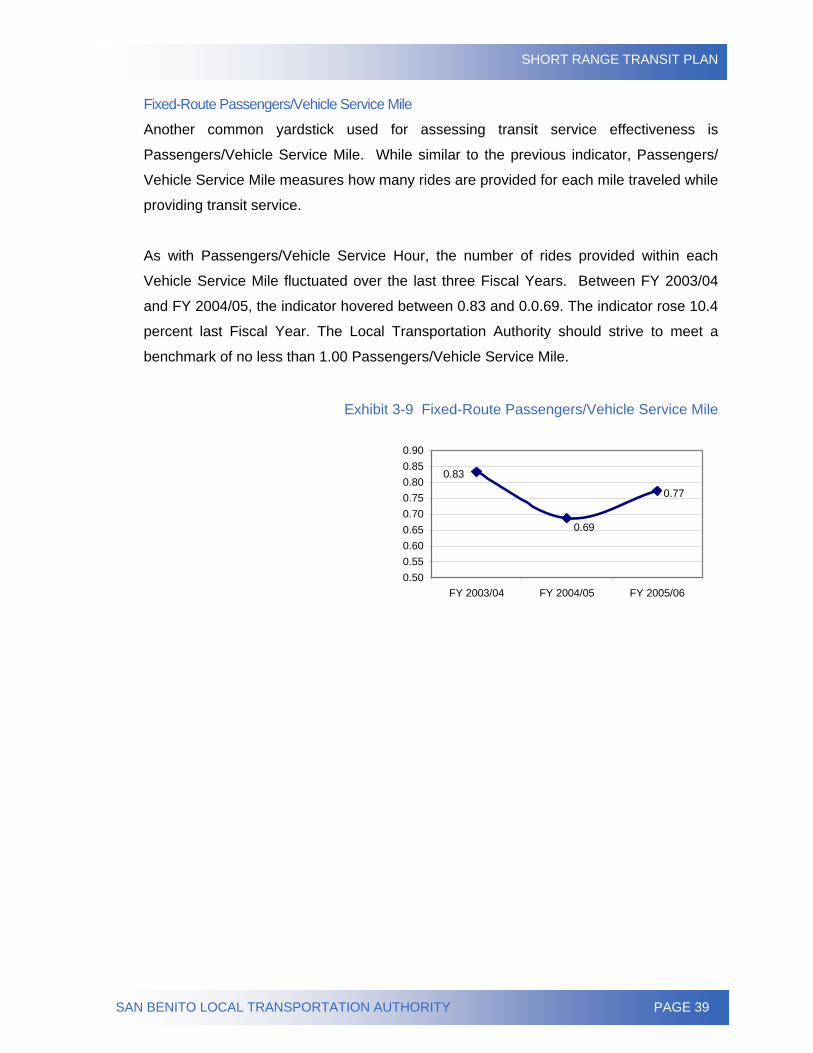
Fixed-Route Passengers/Vehicle Service Mile
Another common yardstick used for assessing transit service effectiveness is
Passengers/Vehicle Service Mile. While similar to the previous indicator, Passengers/
Vehicle Service Mile measures how many rides are provided for each mile traveled while
providing transit service.
As with Passengers/Vehicle Service Hour, the number of rides provided within each
Vehicle Service Mile fluctuated over the last three Fiscal Years. Between FY 2003/04
and FY 2004/05, the indicator hovered between 0.83 and 0.0.69. The indicator rose 10.4
percent last Fiscal Year. The Local Transportation Authority should strive to meet a
benchmark of no less than 1.00 Passengers/Vehicle Service Mile.
Exhibit 3-9 Fixed-Route Passengers/Vehicle Service Mile
0.83
0.69
0.77
0.500.550.600.650.700.750.800.850.90
FY 2003/04 FY 2004/05 FY 2005/06
SHORT RANGE TRANSIT PLAN
SAN BENITO LOCAL TRANSPORTATION AUTHORITY PAGE 40
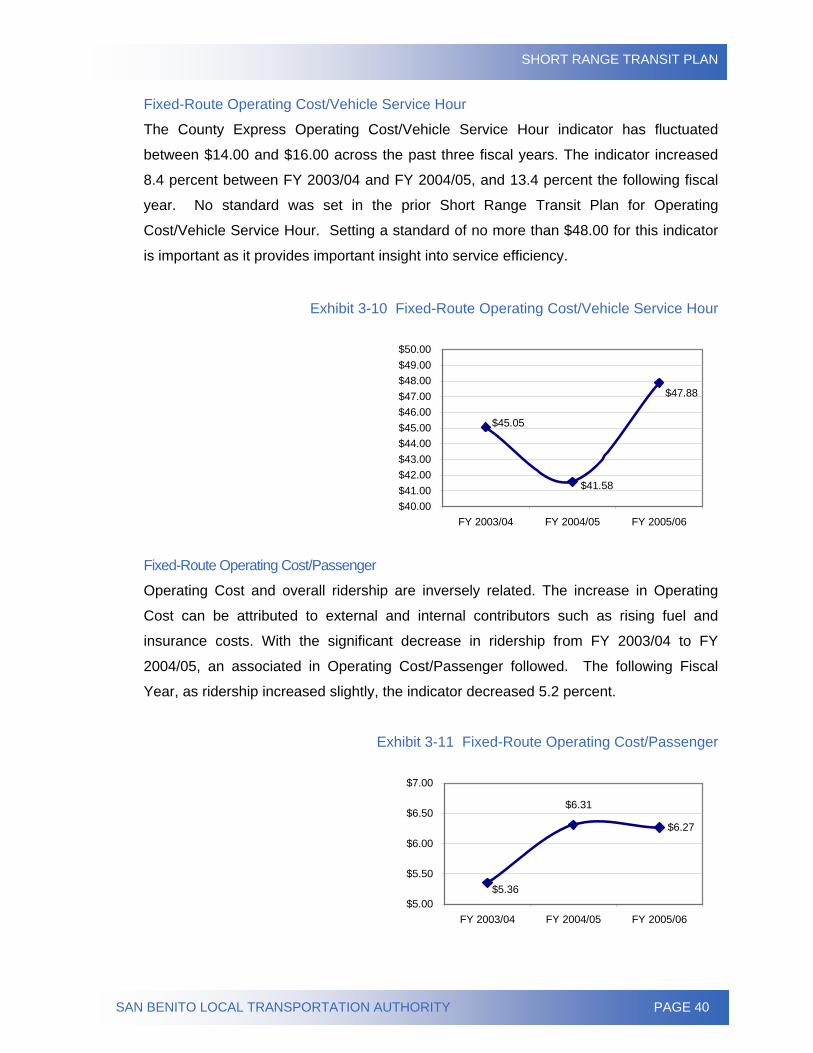
Fixed-Route Operating Cost/Vehicle Service Hour
The County Express Operating Cost/Vehicle Service Hour indicator has fluctuated
between $14.00 and $16.00 across the past three fiscal years. The indicator increased
8.4 percent between FY 2003/04 and FY 2004/05, and 13.4 percent the following fiscal
year. No standard was set in the prior Short Range Transit Plan for Operating
Cost/Vehicle Service Hour. Setting a standard of no more than $48.00 for this indicator
is important as it provides important insight into service efficiency.
Exhibit 3-10 Fixed-Route Operating Cost/Vehicle Service Hour
$41.58
$45.05
$47.88
$40.00$41.00$42.00$43.00$44.00$45.00$46.00$47.00$48.00$49.00$50.00
FY 2003/04 FY 2004/05 FY 2005/06
Fixed-Route Operating Cost/Passenger
Operating Cost and overall ridership are inversely related. The increase in Operating
Cost can be attributed to external and internal contributors such as rising fuel and
insurance costs. With the significant decrease in ridership from FY 2003/04 to FY
2004/05, an associated in Operating Cost/Passenger followed. The following Fiscal
Year, as ridership increased slightly, the indicator decreased 5.2 percent.
Exhibit 3-11 Fixed-Route Operating Cost/Passenger
$6.27
$5.36
$6.31
$5.00
$5.50
$6.00
$6.50
$7.00
FY 2003/04 FY 2004/05 FY 2005/06
SHORT RANGE TRANSIT PLAN
SAN BENITO LOCAL TRANSPORTATION AUTHORITY PAGE 41
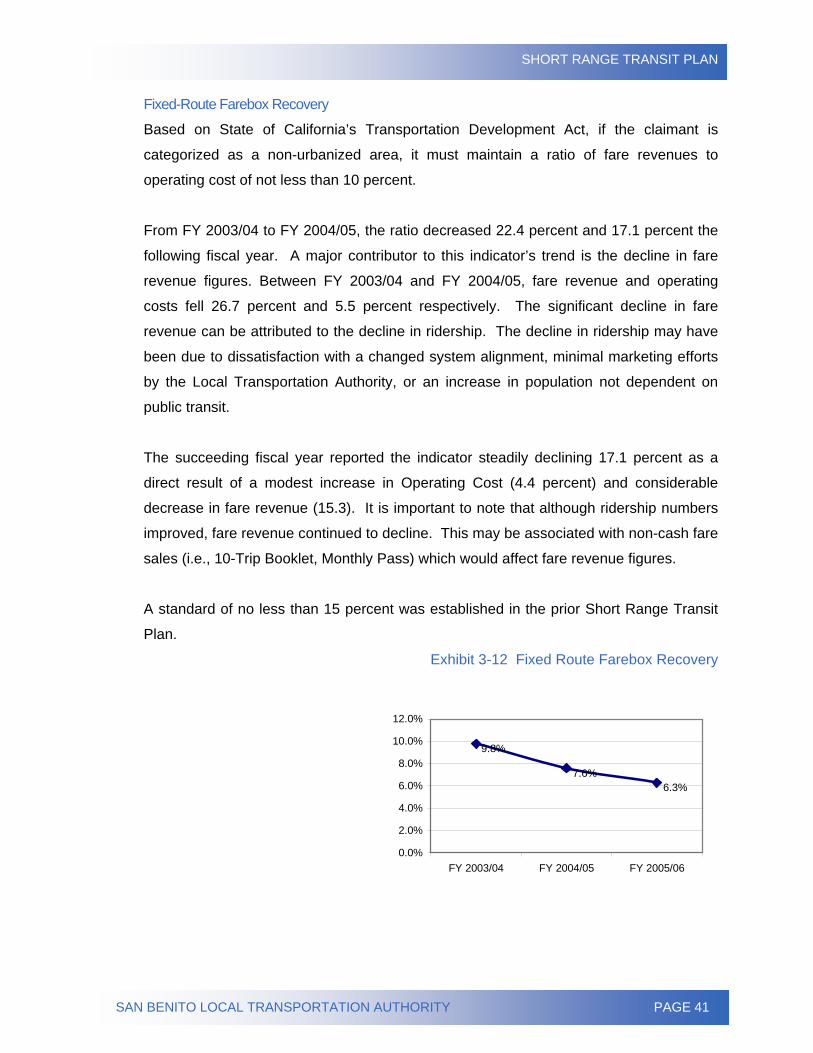
Fixed-Route Farebox Recovery Based on State of California’s Transportation Development Act, if the claimant is
categorized as a non-urbanized area, it must maintain a ratio of fare revenues to
operating cost of not less than 10 percent.
From FY 2003/04 to FY 2004/05, the ratio decreased 22.4 percent and 17.1 percent the
following fiscal year. A major contributor to this indicator’s trend is the decline in fare
revenue figures. Between FY 2003/04 and FY 2004/05, fare revenue and operating
costs fell 26.7 percent and 5.5 percent respectively. The significant decline in fare
revenue can be attributed to the decline in ridership. The decline in ridership may have
been due to dissatisfaction with a changed system alignment, minimal marketing efforts
by the Local Transportation Authority, or an increase in population not dependent on
public transit.
The succeeding fiscal year reported the indicator steadily declining 17.1 percent as a
direct result of a modest increase in Operating Cost (4.4 percent) and considerable
decrease in fare revenue (15.3). It is important to note that although ridership numbers
improved, fare revenue continued to decline. This may be associated with non-cash fare
sales (i.e., 10-Trip Booklet, Monthly Pass) which would affect fare revenue figures.
A standard of no less than 15 percent was established in the prior Short Range Transit
Plan.
Exhibit 3-12 Fixed Route Farebox Recovery
9.8%
7.6%6.3%
0.0%
2.0%
4.0%
6.0%
8.0%
10.0%
12.0%
FY 2003/04 FY 2004/05 FY 2005/06
SHORT RANGE TRANSIT PLAN
SAN BENITO LOCAL TRANSPORTATION AUTHORITY PAGE 42
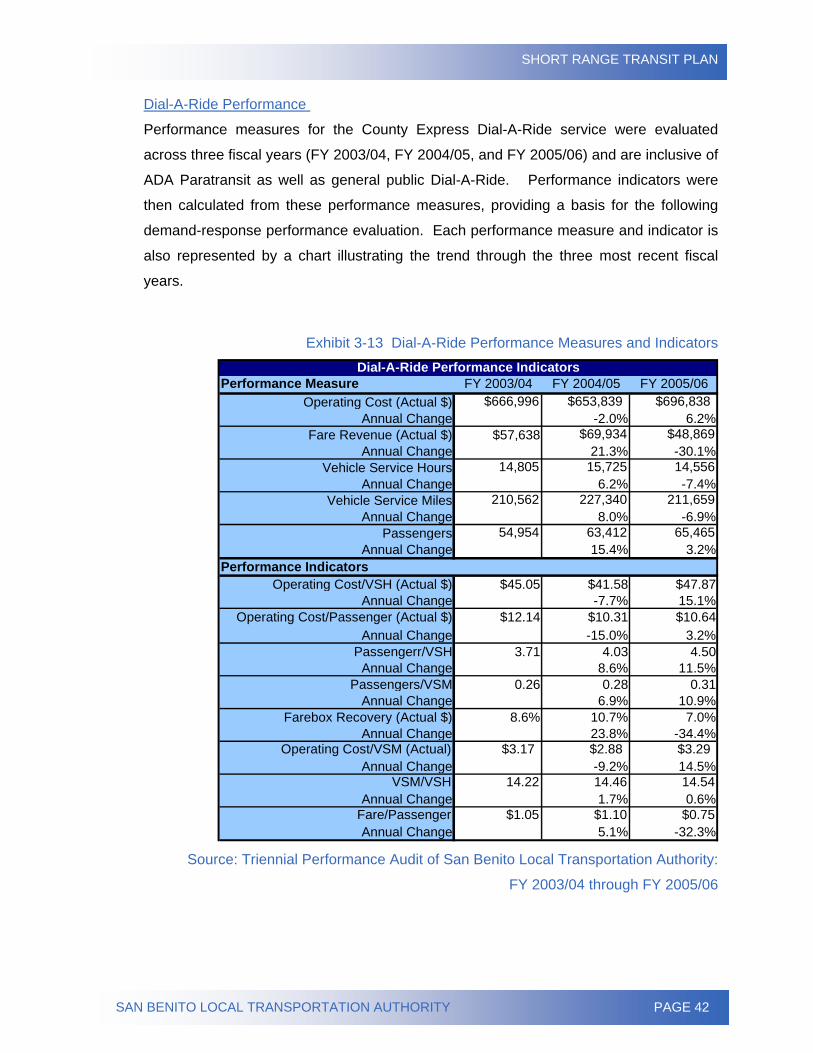
Dial-A-Ride Performance
Performance measures for the County Express Dial-A-Ride service were evaluated
across three fiscal years (FY 2003/04, FY 2004/05, and FY 2005/06) and are inclusive of
ADA Paratransit as well as general public Dial-A-Ride. Performance indicators were
then calculated from these performance measures, providing a basis for the following
demand-response performance evaluation. Each performance measure and indicator is
also represented by a chart illustrating the trend through the three most recent fiscal
years.
Exhibit 3-13 Dial-A-Ride Performance Measures and Indicators
Performance Measure FY 2003/04 FY 2004/05 FY 2005/06Operating Cost (Actual $) $666,996 $653,839 $696,838
Annual Change -2.0% 6.2%Fare Revenue (Actual $) $57,638 $69,934 $48,869
Annual Change 21.3% -30.1%Vehicle Service Hours 14,805 15,725 14,556
Annual Change 6.2% -7.4%Vehicle Service Miles 210,562 227,340 211,659
Annual Change 8.0% -6.9%Passengers 54,954 63,412 65,465
Annual Change 15.4% 3.2%
Operating Cost/VSH (Actual $) $45.05 $41.58 $47.87 Annual Change -7.7% 15.1%
Operating Cost/Passenger (Actual $) $12.14 $10.31 $10.64 Annual Change -15.0% 3.2%
Passengerr/VSH 3.71 4.03 4.50Annual Change 8.6% 11.5%
Passengers/VSM 0.26 0.28 0.31Annual Change 6.9% 10.9%
Farebox Recovery (Actual $) 8.6% 10.7% 7.0%Annual Change 23.8% -34.4%
Operating Cost/VSM (Actual) $3.17 $2.88 $3.29Annual Change -9.2% 14.5%
VSM/VSH 14.22 14.46 14.54Annual Change 1.7% 0.6%
Fare/Passenger $1.05 $1.10 $0.75Annual Change 5.1% -32.3%
Dial-A-Ride Performance Indicators
Performance Indicators
Source: Triennial Performance Audit of San Benito Local Transportation Authority:
FY 2003/04 through FY 2005/06
SHORT RANGE TRANSIT PLAN
SAN BENITO LOCAL TRANSPORTATION AUTHORITY PAGE 43
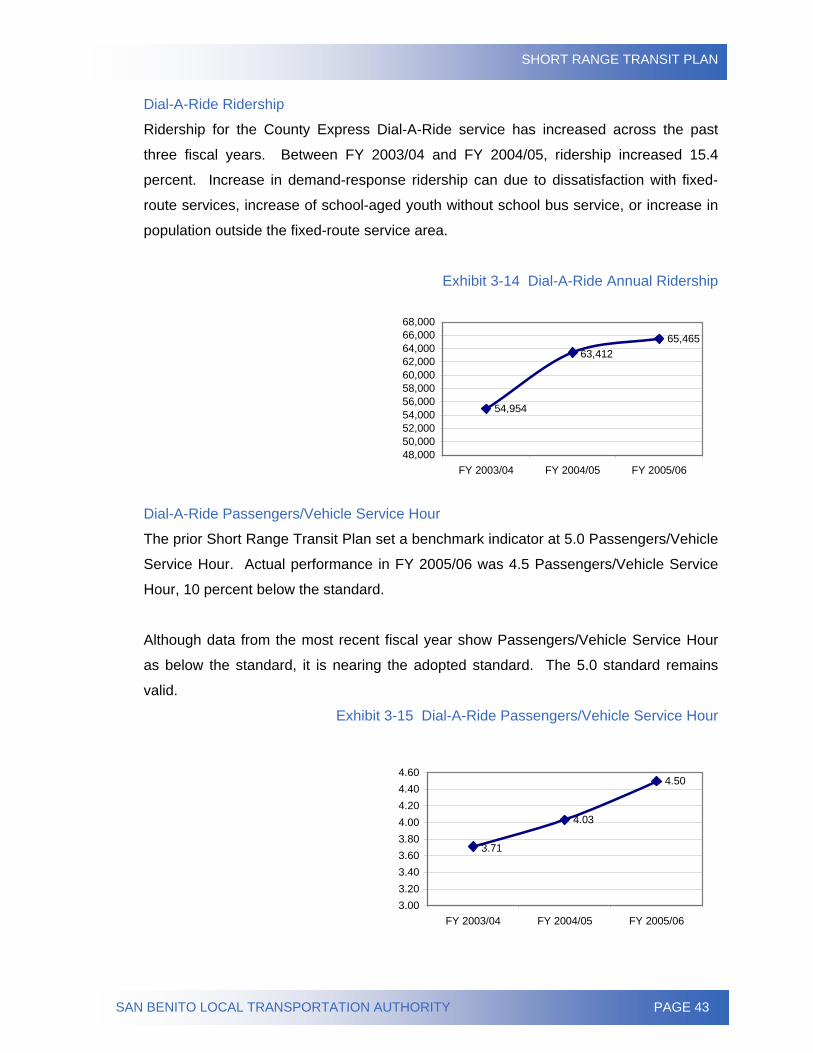
Dial-A-Ride Ridership Ridership for the County Express Dial-A-Ride service has increased across the past
three fiscal years. Between FY 2003/04 and FY 2004/05, ridership increased 15.4
percent. Increase in demand-response ridership can due to dissatisfaction with fixed-
route services, increase of school-aged youth without school bus service, or increase in
population outside the fixed-route service area.
Exhibit 3-14 Dial-A-Ride Annual Ridership
54,954
65,46563,412
48,00050,00052,00054,00056,00058,00060,00062,00064,00066,00068,000
FY 2003/04 FY 2004/05 FY 2005/06
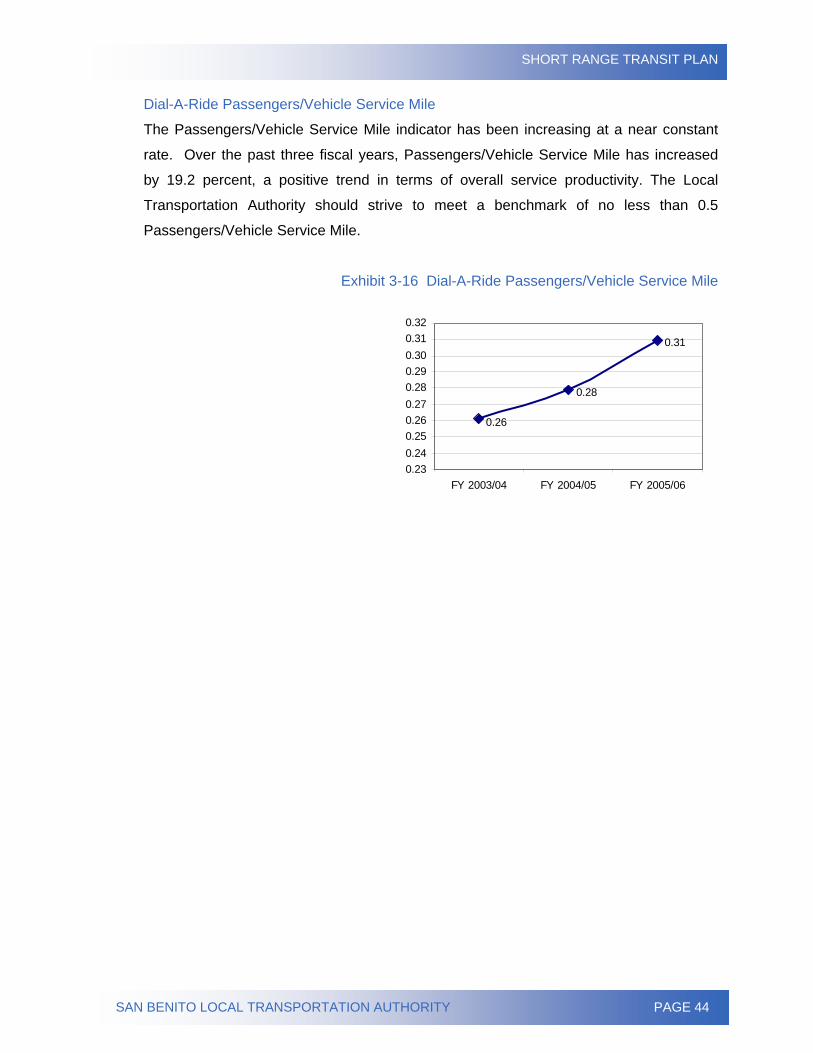
Dial-A-Ride Passengers/Vehicle Service Hour
The prior Short Range Transit Plan set a benchmark indicator at 5.0 Passengers/Vehicle
Service Hour. Actual performance in FY 2005/06 was 4.5 Passengers/Vehicle Service
Hour, 10 percent below the standard.
Although data from the most recent fiscal year show Passengers/Vehicle Service Hour
as below the standard, it is nearing the adopted standard. The 5.0 standard remains
valid.
Exhibit 3-15 Dial-A-Ride Passengers/Vehicle Service Hour
4.03
4.50
3.71
3.003.203.403.603.804.004.204.404.60
FY 2003/04 FY 2004/05 FY 2005/06
SHORT RANGE TRANSIT PLAN
SAN BENITO LOCAL TRANSPORTATION AUTHORITY PAGE 44
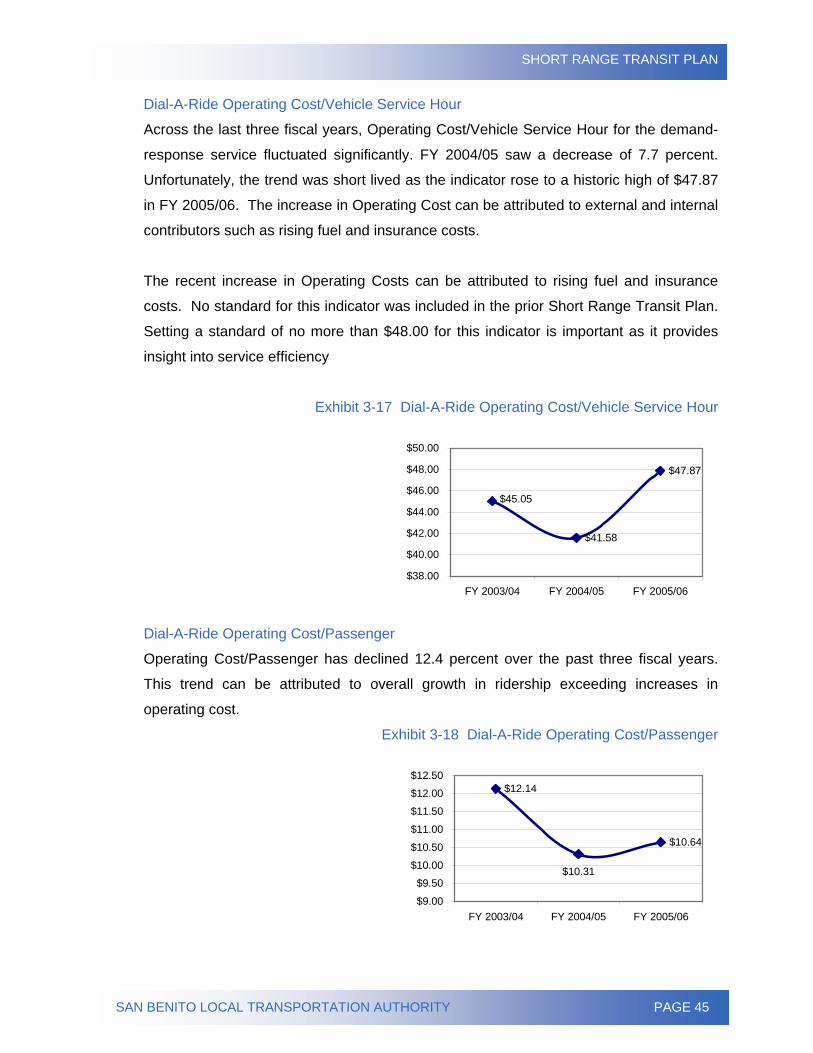
Dial-A-Ride Passengers/Vehicle Service Mile
The Passengers/Vehicle Service Mile indicator has been increasing at a near constant
rate. Over the past three fiscal years, Passengers/Vehicle Service Mile has increased
by 19.2 percent, a positive trend in terms of overall service productivity. The Local
Transportation Authority should strive to meet a benchmark of no less than 0.5
Passengers/Vehicle Service Mile.
Exhibit 3-16 Dial-A-Ride Passengers/Vehicle Service Mile
0.31
0.28
0.26
0.230.240.250.260.270.280.290.300.310.32
FY 2003/04 FY 2004/05 FY 2005/06
SHORT RANGE TRANSIT PLAN
SAN BENITO LOCAL TRANSPORTATION AUTHORITY PAGE 45
Dial-A-Ride Operating Cost/Vehicle Service Hour
Across the last three fiscal years, Operating Cost/Vehicle Service Hour for the demand-
response service fluctuated significantly. FY 2004/05 saw a decrease of 7.7 percent.
Unfortunately, the trend was short lived as the indicator rose to a historic high of $47.87
in FY 2005/06. The increase in Operating Cost can be attributed to external and internal
contributors such as rising fuel and insurance costs.
The recent increase in Operating Costs can be attributed to rising fuel and insurance
costs. No standard for this indicator was included in the prior Short Range Transit Plan.
Setting a standard of no more than $48.00 for this indicator is important as it provides
insight into service efficiency
Exhibit 3-17 Dial-A-Ride Operating Cost/Vehicle Service Hour
$41.58
$47.87
$45.05
$38.00
$40.00
$42.00
$44.00
$46.00
$48.00
$50.00
FY 2003/04 FY 2004/05 FY 2005/06
Dial-A-Ride Operating Cost/Passenger
Operating Cost/Passenger has declined 12.4 percent over the past three fiscal years.
This trend can be attributed to overall growth in ridership exceeding increases in
operating cost.
Exhibit 3-18 Dial-A-Ride Operating Cost/Passenger
$12.14
$10.64
$10.31
$9.00
$9.50
$10.00
$10.50
$11.00
$11.50
$12.00
$12.50
FY 2003/04 FY 2004/05 FY 2005/06
SHORT RANGE TRANSIT PLAN
SAN BENITO LOCAL TRANSPORTATION AUTHORITY PAGE 46
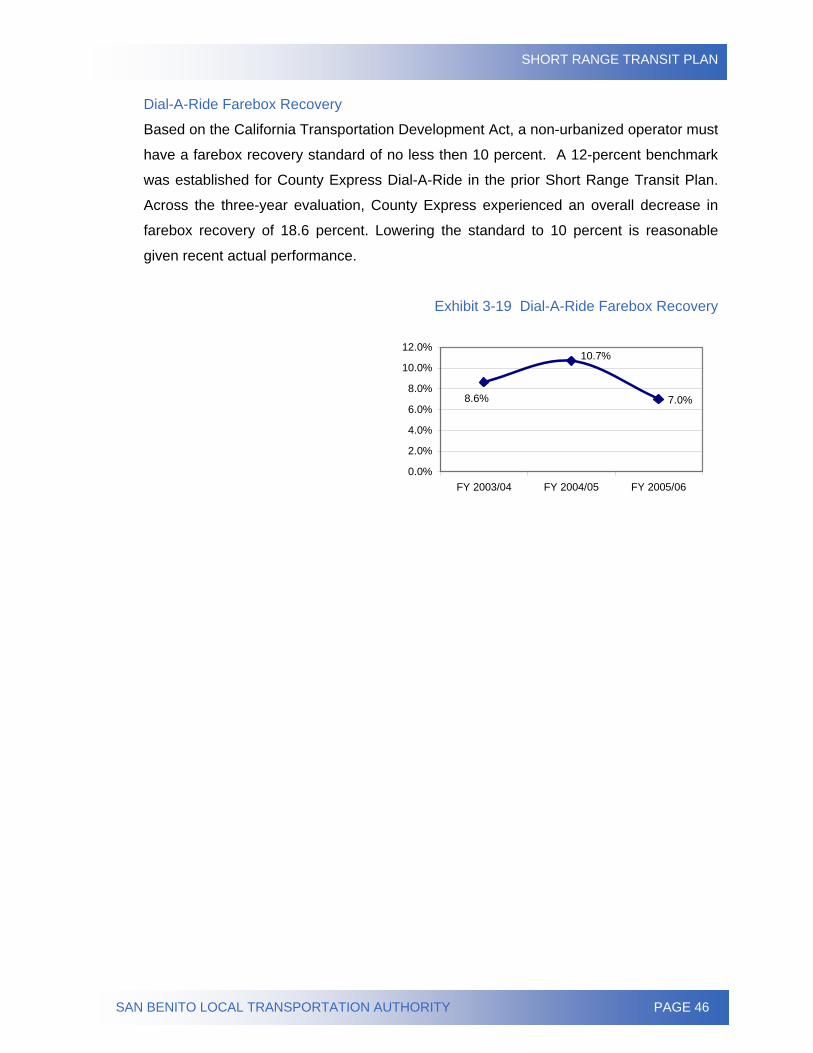
Dial-A-Ride Farebox Recovery
Based on the California Transportation Development Act, a non-urbanized operator must
have a farebox recovery standard of no less then 10 percent. A 12-percent benchmark
was established for County Express Dial-A-Ride in the prior Short Range Transit Plan.
Across the three-year evaluation, County Express experienced an overall decrease in
farebox recovery of 18.6 percent. Lowering the standard to 10 percent is reasonable
given recent actual performance.
Exhibit 3-19 Dial-A-Ride Farebox Recovery
8.6%
10.7%
7.0%
0.0%
2.0%
4.0%
6.0%
8.0%
10.0%
12.0%
FY 2003/04 FY 2004/05 FY 2005/06
SHORT RANGE TRANSIT PLAN
SAN BENITO LOCAL TRANSPORTATION AUTHORITY PAGE 47
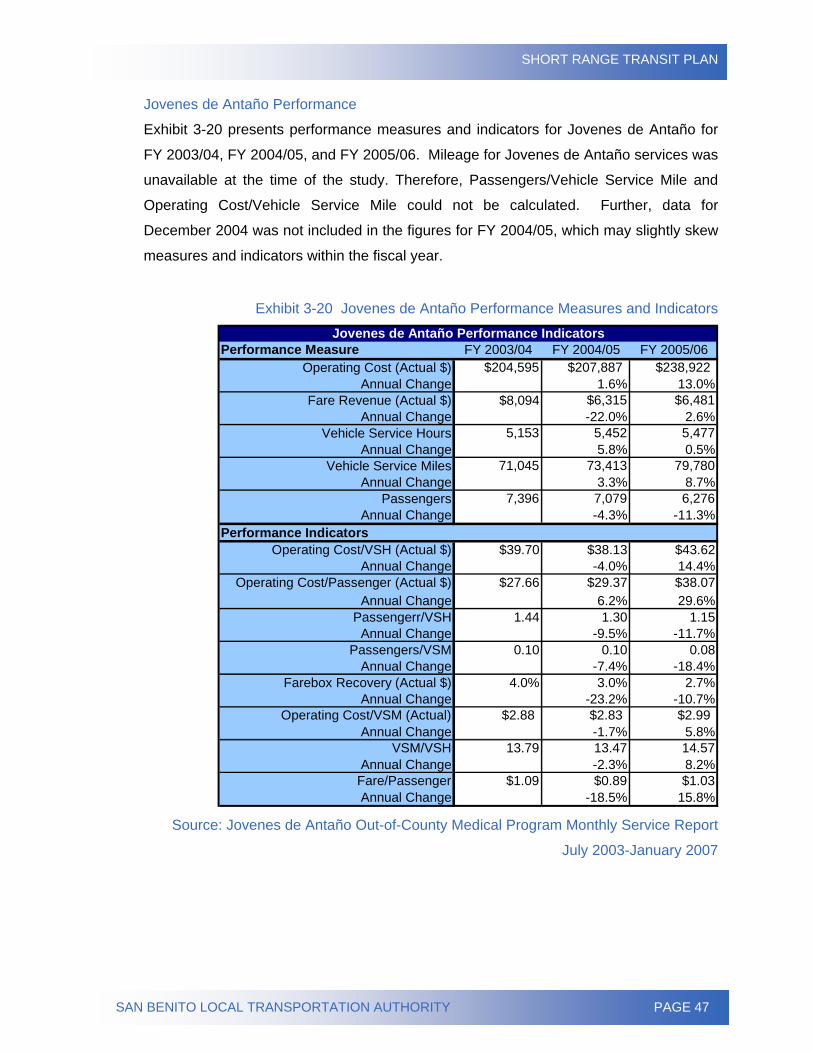
Jovenes de Antaño Performance
Exhibit 3-20 presents performance measures and indicators for Jovenes de Antaño for
FY 2003/04, FY 2004/05, and FY 2005/06. Mileage for Jovenes de Antaño services was
unavailable at the time of the study. Therefore, Passengers/Vehicle Service Mile and
Operating Cost/Vehicle Service Mile could not be calculated. Further, data for
December 2004 was not included in the figures for FY 2004/05, which may slightly skew
measures and indicators within the fiscal year.
Exhibit 3-20 Jovenes de Antaño Performance Measures and Indicators
Performance Measure FY 2003/04 FY 2004/05 FY 2005/06Operating Cost (Actual $) $204,595 $207,887 $238,922
Annual Change 1.6% 13.0%Fare Revenue (Actual $) $8,094 $6,315 $6,481
Annual Change -22.0% 2.6%Vehicle Service Hours 5,153 5,452 5,477
Annual Change 5.8% 0.5%Vehicle Service Miles 71,045 73,413 79,780
Annual Change 3.3% 8.7%Passengers 7,396 7,079 6,276
Annual Change -4.3% -11.3%
Operating Cost/VSH (Actual $) $39.70 $38.13 $43.62 Annual Change -4.0% 14.4%
Operating Cost/Passenger (Actual $) $27.66 $29.37 $38.07 Annual Change 6.2% 29.6%
Passengerr/VSH 1.44 1.30 1.15Annual Change -9.5% -11.7%
Passengers/VSM 0.10 0.10 0.08Annual Change -7.4% -18.4%
Farebox Recovery (Actual $) 4.0% 3.0% 2.7%Annual Change -23.2% -10.7%
Operating Cost/VSM (Actual) $2.88 $2.83 $2.99Annual Change -1.7% 5.8%
VSM/VSH 13.79 13.47 14.57Annual Change -2.3% 8.2%
Fare/Passenger $1.09 $0.89 $1.03Annual Change -18.5% 15.8%
Jovenes de Antaño Performance Indicators
Performance Indicators
Source: Jovenes de Antaño Out-of-County Medical Program Monthly Service Report
July 2003-January 2007
SHORT RANGE TRANSIT PLAN
SAN BENITO LOCAL TRANSPORTATION AUTHORITY PAGE 48
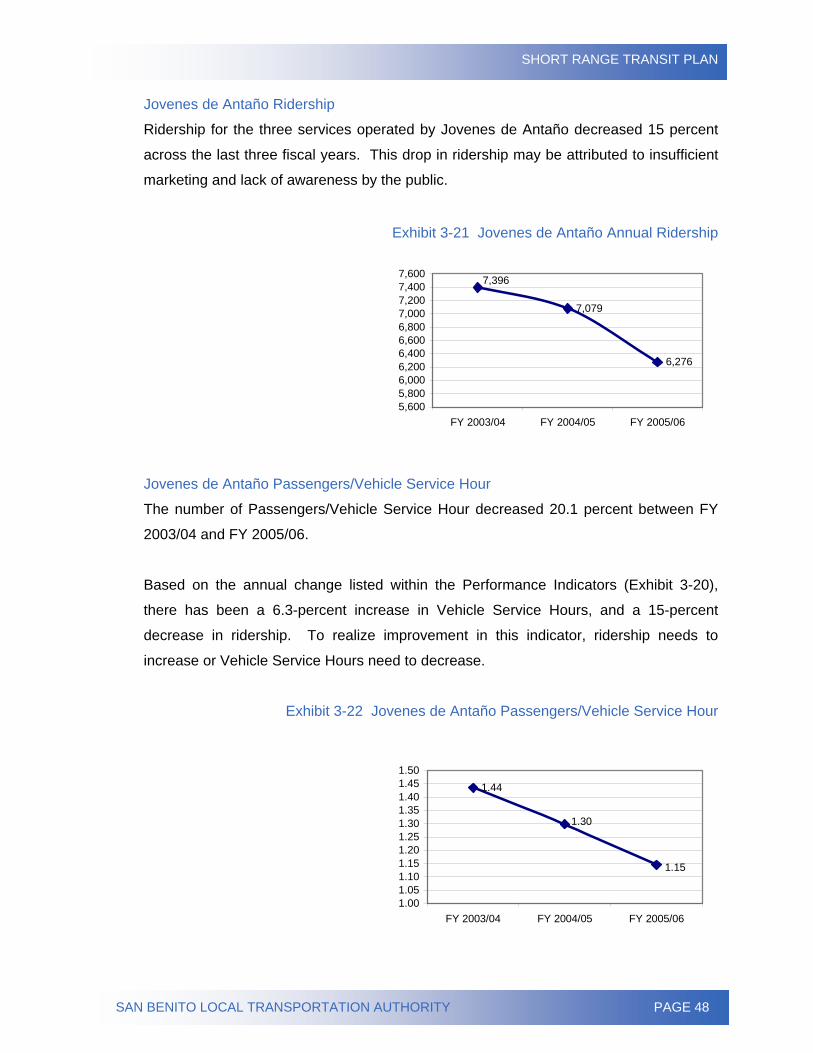
Jovenes de Antaño Ridership
Ridership for the three services operated by Jovenes de Antaño decreased 15 percent
across the last three fiscal years. This drop in ridership may be attributed to insufficient
marketing and lack of awareness by the public.
Exhibit 3-21 Jovenes de Antaño Annual Ridership
7,079
6,276
7,396
5,6005,8006,0006,2006,4006,6006,8007,0007,2007,4007,600
FY 2003/04 FY 2004/05 FY 2005/06
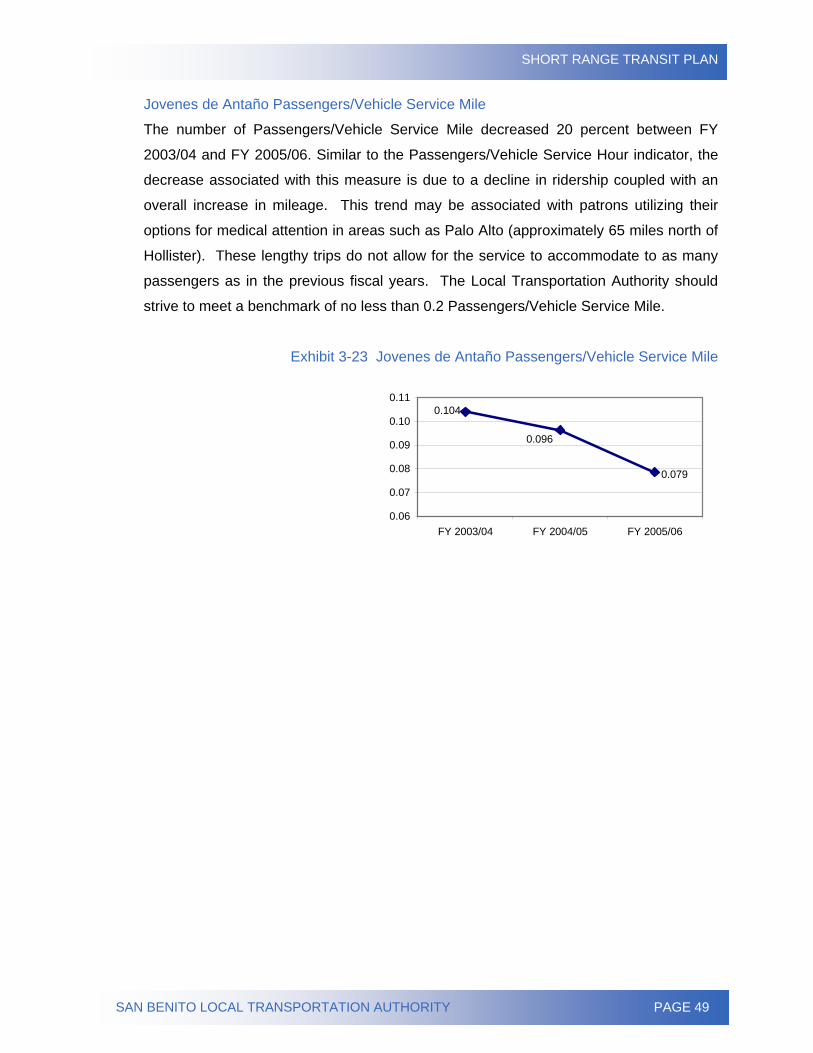
Jovenes de Antaño Passengers/Vehicle Service Hour
The number of Passengers/Vehicle Service Hour decreased 20.1 percent between FY
2003/04 and FY 2005/06.
Based on the annual change listed within the Performance Indicators (Exhibit 3-20),
there has been a 6.3-percent increase in Vehicle Service Hours, and a 15-percent
decrease in ridership. To realize improvement in this indicator, ridership needs to
increase or Vehicle Service Hours need to decrease.
Exhibit 3-22 Jovenes de Antaño Passengers/Vehicle Service Hour
1.44
1.15
1.30
1.001.051.101.151.201.251.301.351.401.451.50
FY 2003/04 FY 2004/05 FY 2005/06
SHORT RANGE TRANSIT PLAN
SAN BENITO LOCAL TRANSPORTATION AUTHORITY PAGE 49
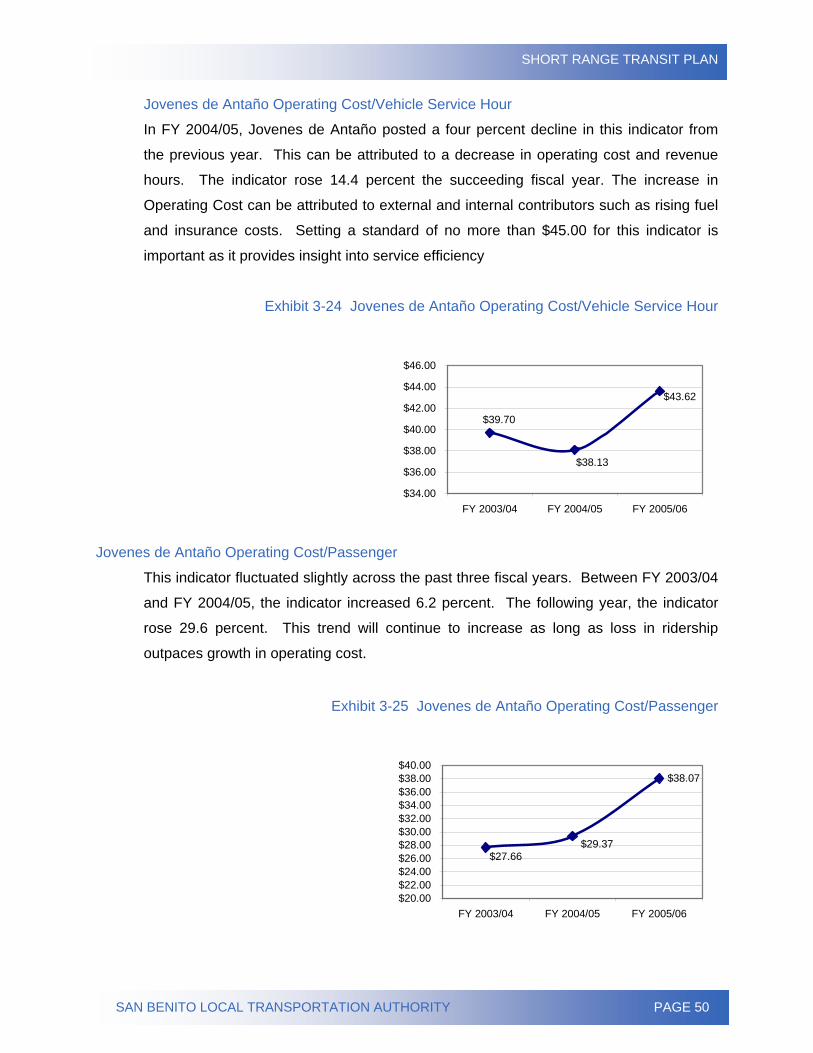
Jovenes de Antaño Passengers/Vehicle Service Mile
The number of Passengers/Vehicle Service Mile decreased 20 percent between FY
2003/04 and FY 2005/06. Similar to the Passengers/Vehicle Service Hour indicator, the
decrease associated with this measure is due to a decline in ridership coupled with an
overall increase in mileage. This trend may be associated with patrons utilizing their
options for medical attention in areas such as Palo Alto (approximately 65 miles north of
Hollister). These lengthy trips do not allow for the service to accommodate to as many
passengers as in the previous fiscal years. The Local Transportation Authority should
strive to meet a benchmark of no less than 0.2 Passengers/Vehicle Service Mile.
Exhibit 3-23 Jovenes de Antaño Passengers/Vehicle Service Mile
0.104
0.096
0.079
0.06
0.07
0.08
0.09
0.10
0.11
FY 2003/04 FY 2004/05 FY 2005/06
SHORT RANGE TRANSIT PLAN
SAN BENITO LOCAL TRANSPORTATION AUTHORITY PAGE 50
Jovenes de Antaño Operating Cost/Vehicle Service Hour
In FY 2004/05, Jovenes de Antaño posted a four percent decline in this indicator from
the previous year. This can be attributed to a decrease in operating cost and revenue
hours. The indicator rose 14.4 percent the succeeding fiscal year. The increase in
Operating Cost can be attributed to external and internal contributors such as rising fuel
and insurance costs. Setting a standard of no more than $45.00 for this indicator is
important as it provides insight into service efficiency
Exhibit 3-24 Jovenes de Antaño Operating Cost/Vehicle Service Hour
$43.62
$38.13
$39.70
$34.00
$36.00
$38.00
$40.00
$42.00
$44.00
$46.00
FY 2003/04 FY 2004/05 FY 2005/06
Jovenes de Antaño Operating Cost/Passenger
This indicator fluctuated slightly across the past three fiscal years. Between FY 2003/04
and FY 2004/05, the indicator increased 6.2 percent. The following year, the indicator
rose 29.6 percent. This trend will continue to increase as long as loss in ridership
outpaces growth in operating cost.
Exhibit 3-25 Jovenes de Antaño Operating Cost/Passenger
$38.07
$29.37$27.66
$20.00$22.00$24.00$26.00$28.00$30.00$32.00$34.00$36.00$38.00$40.00
FY 2003/04 FY 2004/05 FY 2005/06
SHORT RANGE TRANSIT PLAN
SAN BENITO LOCAL TRANSPORTATION AUTHORITY PAGE 51
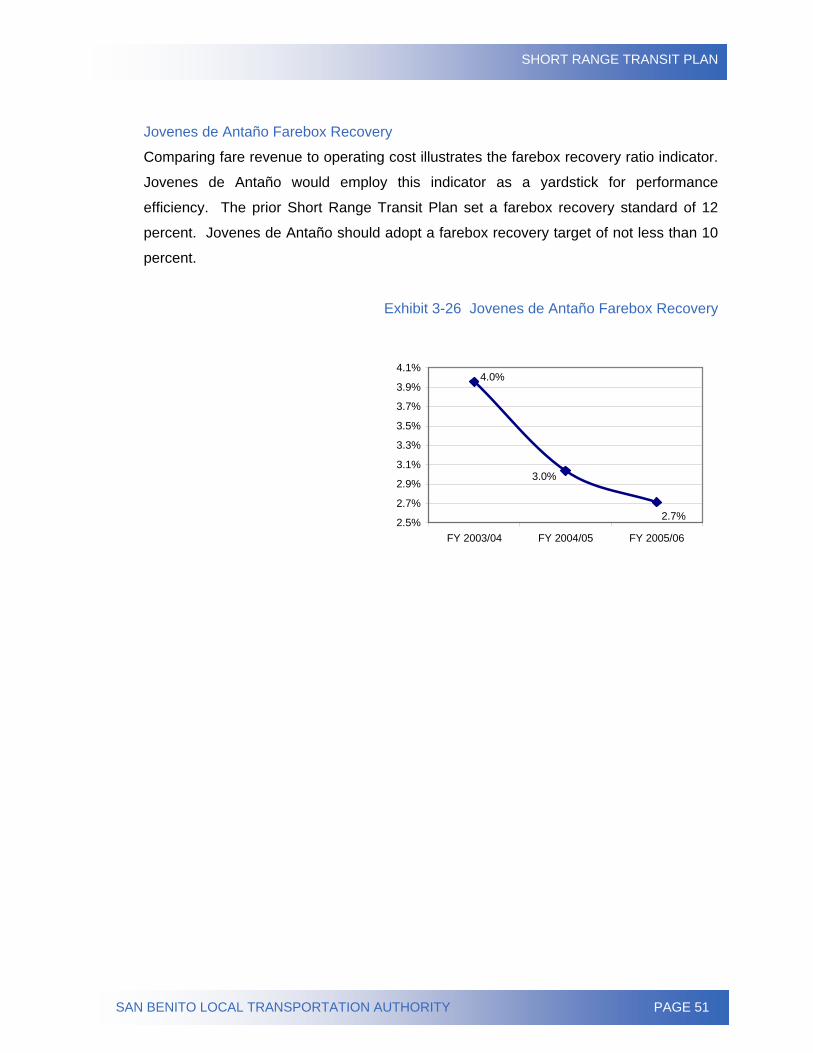
Jovenes de Antaño Farebox Recovery
Comparing fare revenue to operating cost illustrates the farebox recovery ratio indicator.
Jovenes de Antaño would employ this indicator as a yardstick for performance
efficiency. The prior Short Range Transit Plan set a farebox recovery standard of 12
percent. Jovenes de Antaño should adopt a farebox recovery target of not less than 10
percent.
Exhibit 3-26 Jovenes de Antaño Farebox Recovery
4.0%
3.0%
2.7%2.5%
2.7%
2.9%
3.1%
3.3%
3.5%
3.7%
3.9%
4.1%
FY 2003/04 FY 2004/05 FY 2005/06

SHORT RANGE TRANSIT PLAN
SAN BENITO LOCAL TRANSPORTATION AUTHORITY PAGE 52
Page Intentionally Blank
SHORT RANGE TRANSIT PLAN
SAN BENITO LOCAL TRANSPORTATION AUTHORITY PAGE 53
CHAPTER 4 – PEER REVIEW
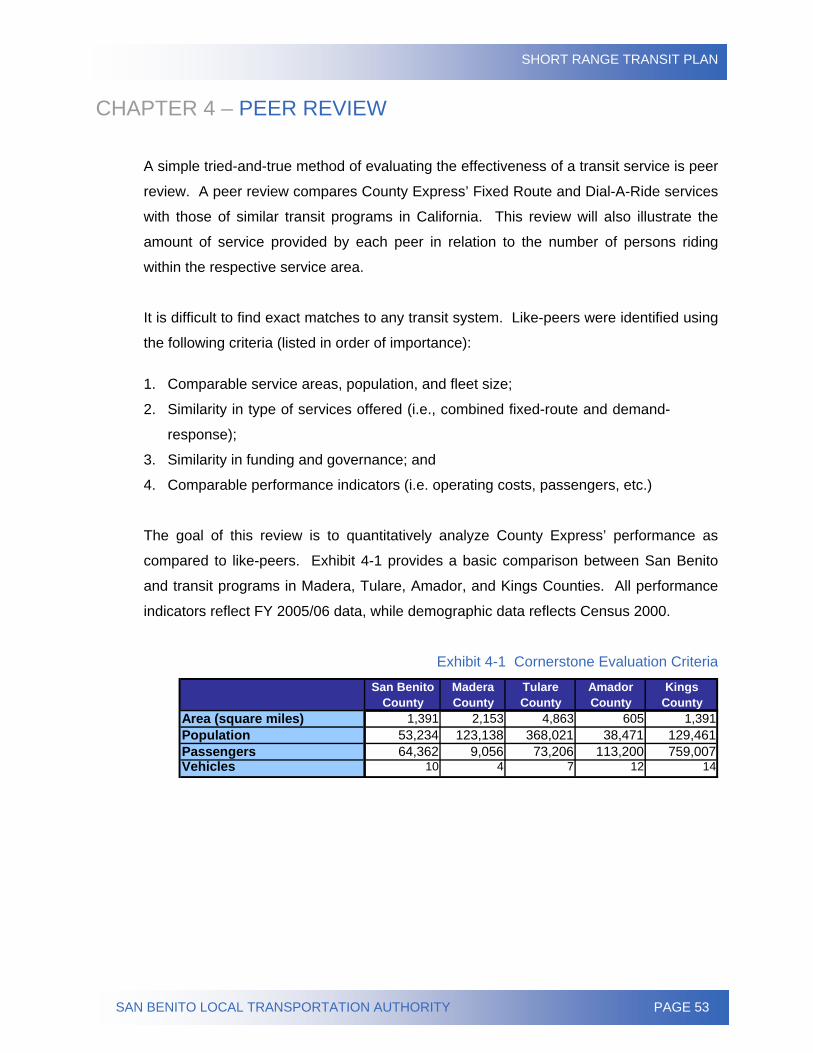
A simple tried-and-true method of evaluating the effectiveness of a transit service is peer
review. A peer review compares County Express’ Fixed Route and Dial-A-Ride services
with those of similar transit programs in California. This review will also illustrate the
amount of service provided by each peer in relation to the number of persons riding
within the respective service area.
It is difficult to find exact matches to any transit system. Like-peers were identified using
the following criteria (listed in order of importance):
1. Comparable service areas, population, and fleet size;
2. Similarity in type of services offered (i.e., combined fixed-route and demand-
response);
3. Similarity in funding and governance; and
4. Comparable performance indicators (i.e. operating costs, passengers, etc.)
The goal of this review is to quantitatively analyze County Express’ performance as
compared to like-peers. Exhibit 4-1 provides a basic comparison between San Benito
and transit programs in Madera, Tulare, Amador, and Kings Counties. All performance
indicators reflect FY 2005/06 data, while demographic data reflects Census 2000.
Exhibit 4-1 Cornerstone Evaluation Criteria
San Benito County
Madera County
Tulare County
Amador County
Kings County
Area (square miles) 1,391 2,153 4,863 605 1,391Population 53,234 123,138 368,021 38,471 129,461Passengers 64,362 9,056 73,206 113,200 759,007Vehicles 10 4 7 12 14
SHORT RANGE TRANSIT PLAN
SAN BENITO LOCAL TRANSPORTATION AUTHORITY PAGE 54
PEER PROFILES Madera County
Madera County, located in California’s Central Valley, lies to the east of San Benito
County. The Madera County Transportation Commission is responsible for the
administration of several transit services within the County of Madera. Services include
Madera Area Express and its complementary demand-response service (City of
Madera), Chowchilla Area Transit Express (City of Chowchilla), Madera County
Connection, and Eastern Madera County Senior Bus and Escort services.
Madera Area Express is a fixed-route service operating Monday through Friday, 7:00
a.m. until 6:30 p.m.; and Saturday 9:00 a.m. until 4:00 p.m. The base fare is seventy-
five cents. The City of Madera’s demand-response service is offered as a
complementary service having the same hours of operation as Madera Area Express,
with additional service on Sunday, 8:30 a.m. until 2:30 p.m. The fare for the general
public Dial-A-Ride is two dollars, which includes travel throughout the designated service
area. The base fare for seniors and persons with disabilities is one dollar within city
limits and two dollars for travel throughout the county.
Chowchilla Area Transit Express (CATX) is a general-public demand-response service
operating Monday through Friday, 8:00 a.m. until 3:30 p.m. The base fare is one dollar
within the designated “inner zone” and $1.50 in the designated “outer zone.”
Madera County Connection is an intercity fixed-route service that consists of three
routes: Eastern Madera County, Chowchilla and Fairmead, and Eastin Arcola-
Ripperdan-La Vina. The Eastern Madera County service operates Monday through
Friday, 6:00 a.m. until 8:00 p.m. and includes trips to Madera College, Children’s
Hospital, and Yosemite Lakes. The Chowchilla and Fairmead service operates Monday
through Friday, 7:30 a.m. until 6:30 p.m., traveling along Highway 99 from Chowchilla to
the Madera Municipal Airport. The Eastin Arcola-Ripperdan-La Vina service operates on
Wednesday and Friday, 8:00 a.m. until 6:30 p.m. The base fare for each of these
services is two dollars, while children age five and under ride free when accompanied by
a fare-paying adult.
SHORT RANGE TRANSIT PLAN
SAN BENITO LOCAL TRANSPORTATION AUTHORITY PAGE 55
The Eastern Madera County Senior Bus is a demand-response service operating
Monday through Friday, 8:00 a.m. until 5:00 p.m. This service is provided for seniors
and persons with disabilities and the base fare is $1.50.
The Eastern Madera County Escort Service is demand-response service utilizing
volunteer drivers and private vehicles. The service includes medical trips to Madera,
Fresno, and Clovis. Service is also available within the rural communities of North Fork,
Bass Lake, Oakhurst, Coarsegold, and Ahwahnee. The service operates Tuesday and
Thursday, 8:00 a.m. until 5:00 p.m., with a base fare of ten dollars. The Eastern Madera
County Escort Service also operates in the Madera Ranchos area Monday through
Friday, 8:00 a.m. until 4:00 p.m., with a base fare of five dollars.
Tulare County
Located just south of Fresno County in the San Joaquin Valley, Tulare County provides
deviated fixed-route service (Tulare County Area Transit) with complementary general-
public demand-response service. Deviations to the fixed-route service are restricted to
patrons with special needs. There are four intercity routes and five local circulator
routes. Service is provided Monday through Friday beginning as early as 5:40 a.m. and
ending as late as 7:30 p.m.
The four inter-city routes are designated North, South, Northeast, and Southeast County
routes. The North County Route travels between Cutler, Dinuba, East Orosi, Justice
Complex, Orosi, Patterson Tract, Seville, Sultana, Visalia, and Yettern. The South
County Route travels between Delano, Earlimart, Matheny Tract, Pixley, Richgrove,
Teviston, Tipton, and Tulare. The Northeast County Route travels between Ivanhoe,
Lemon Cove, Three Rivers, Visalia, and Woodlake. The Southeast County Route
travels between Lindsay, Porterville, Strathmore, and Visalia.
The community circulator route names reflect the areas they serve: Dinuba-London-
Traver-Delft Colony, Lindsay-Strathmore-Plainview-Porterville, Portervile-Springville
(Tuesday and Thursday only), Porterville-Terra Bella (Monday and Wednesday only),
and Woodville-Poplar-Porterville. The base fare for any Tulare County Area Transit
fixed-route service is $1.50.
SHORT RANGE TRANSIT PLAN
SAN BENITO LOCAL TRANSPORTATION AUTHORITY PAGE 56
General-public demand-response service is offered at different times, depending on the
individual service area. Service within the Dinuba/Sultana/Monson/Cutler/Orosi area
operates from 10:30 a.m. to 2:30 p.m. Service within Lindsay and Toneyville operates
from 7:00 a.m. to 3:00 p.m. Service within the Pixley/Tipton/Earlimart area operates
from 6:15 a.m. to 8:15 a.m., and again from 10:45 a.m. to 12:45 p.m. Service within the
City of Tulare operates from 7:00 a.m. to 11:00 a.m., and again from 1:00 p.m. to 3:00
p.m. All services operate Monday through Friday. The base fare is seventy-five cents.
Amador County
The Amador Regional Transit System operates as a deviated fixed-route service within
Amador County and its five incorporated cities: Ione, Amador City, Plymouth, Sutter
Creek, and Jackson. Deviations of up to one-half mile off the fixed route can be
accommodated. There are seven routes within the Amador Regional Transit System.
Route C (Sutter Hill/Ione/Camanche), Route V (Sutter Hill/Pine Grove/Volcano), Route S
(Jackson/Sutter Creek Shuttle), Route M (Jackson/Mace Meadow), Route P
(Jackson/Plymouth), Route I (Sutter Hill/Ione), and Route X (Amador/Sacramento
Express).
The adult base fare for the local routes is one dollar, with seniors and persons with
disabilities eligible for a discounted fare of fifty cents. Route X, the express route to
Sacramento, costs $3.50 each way for the entire trip ($1.85 for seniors and persons with
disabilities). Service begins as early as 5:40 a.m. and runs as late as 7:14 p.m. All
routes operate Monday through Friday.
Kings County
Kings Area Rural Transit, the largest public transit provider within Kings County, is
operated by the Kings County Area Public Transit Agency. Kings County is situated in
the San Joaquin Valley just south of Fresno County. Kings County Rural Transit
provides fixed-route and demand-response services throughout Kings County and into
neighboring counties, including the cities of Armona, Avenal, Corcoran, Fresno,
Grangeville, Hardwick, Kettleman City, Laton, Lemoore, Lemoore Naval Air Station,
Stratford, and Visalia.
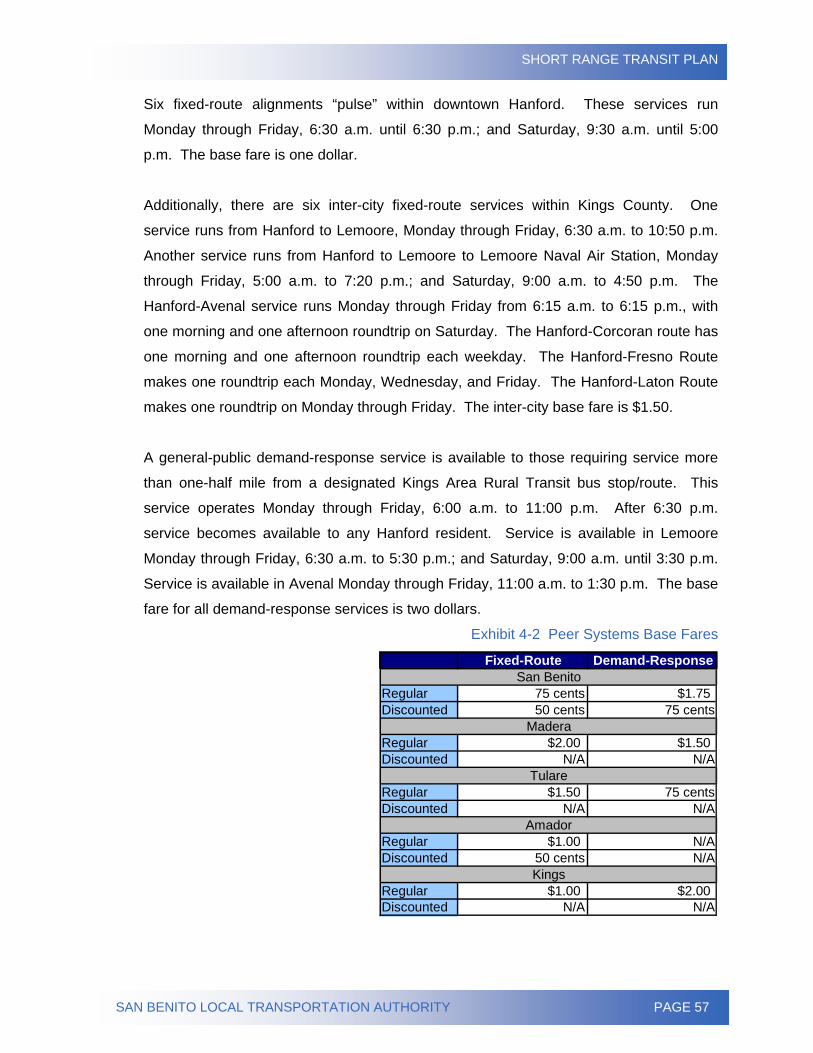
SHORT RANGE TRANSIT PLAN
SAN BENITO LOCAL TRANSPORTATION AUTHORITY PAGE 57
Six fixed-route alignments “pulse” within downtown Hanford. These services run
Monday through Friday, 6:30 a.m. until 6:30 p.m.; and Saturday, 9:30 a.m. until 5:00
p.m. The base fare is one dollar.
Additionally, there are six inter-city fixed-route services within Kings County. One
service runs from Hanford to Lemoore, Monday through Friday, 6:30 a.m. to 10:50 p.m.
Another service runs from Hanford to Lemoore to Lemoore Naval Air Station, Monday
through Friday, 5:00 a.m. to 7:20 p.m.; and Saturday, 9:00 a.m. to 4:50 p.m. The
Hanford-Avenal service runs Monday through Friday from 6:15 a.m. to 6:15 p.m., with
one morning and one afternoon roundtrip on Saturday. The Hanford-Corcoran route has
one morning and one afternoon roundtrip each weekday. The Hanford-Fresno Route
makes one roundtrip each Monday, Wednesday, and Friday. The Hanford-Laton Route
makes one roundtrip on Monday through Friday. The inter-city base fare is $1.50.
A general-public demand-response service is available to those requiring service more
than one-half mile from a designated Kings Area Rural Transit bus stop/route. This
service operates Monday through Friday, 6:00 a.m. to 11:00 p.m. After 6:30 p.m.
service becomes available to any Hanford resident. Service is available in Lemoore
Monday through Friday, 6:30 a.m. to 5:30 p.m.; and Saturday, 9:00 a.m. until 3:30 p.m.
Service is available in Avenal Monday through Friday, 11:00 a.m. to 1:30 p.m. The base
fare for all demand-response services is two dollars.
Exhibit 4-2 Peer Systems Base Fares
Fixed-Route Demand-Response
Regular 75 cents $1.75Discounted 50 cents 75 cents
Regular $2.00 $1.50Discounted N/A N/A
Regular $1.50 75 centsDiscounted N/A N/A
Regular $1.00 N/ADiscounted 50 cents N/A
Regular $1.00 $2.00Discounted N/A N/A
Kings
San Benito
Madera
Tulare
Amador
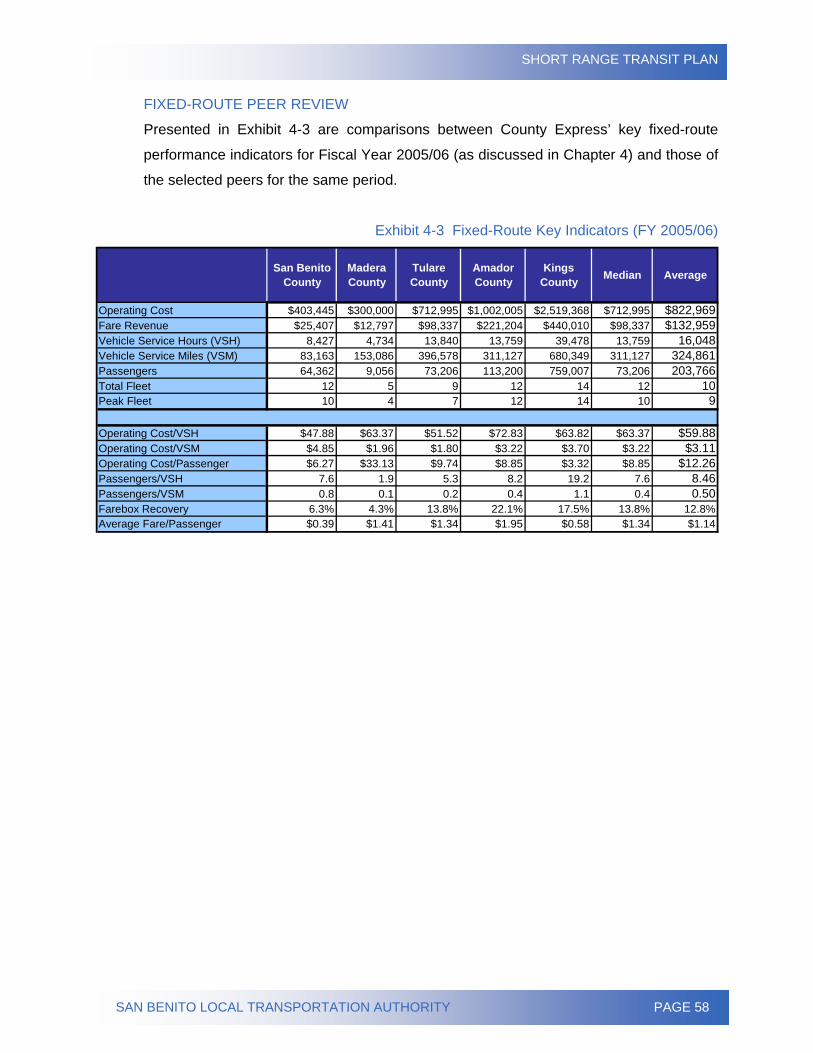
SHORT RANGE TRANSIT PLAN
SAN BENITO LOCAL TRANSPORTATION AUTHORITY PAGE 58
FIXED-ROUTE PEER REVIEW
Presented in Exhibit 4-3 are comparisons between County Express’ key fixed-route
performance indicators for Fiscal Year 2005/06 (as discussed in Chapter 4) and those of
the selected peers for the same period.
Exhibit 4-3 Fixed-Route Key Indicators (FY 2005/06)
San Benito County
Madera County
Tulare County
Amador County
Kings County Median Average
Operating Cost $403,445 $300,000 $712,995 $1,002,005 $2,519,368 $712,995 $822,969Fare Revenue $25,407 $12,797 $98,337 $221,204 $440,010 $98,337 $132,959Vehicle Service Hours (VSH) 8,427 4,734 13,840 13,759 39,478 13,759 16,048Vehicle Service Miles (VSM) 83,163 153,086 396,578 311,127 680,349 311,127 324,861Passengers 64,362 9,056 73,206 113,200 759,007 73,206 203,766Total Fleet 12 5 9 12 14 12 10Peak Fleet 10 4 7 12 14 10 9
Operating Cost/VSH $47.88 $63.37 $51.52 $72.83 $63.82 $63.37 $59.88Operating Cost/VSM $4.85 $1.96 $1.80 $3.22 $3.70 $3.22 $3.11Operating Cost/Passenger $6.27 $33.13 $9.74 $8.85 $3.32 $8.85 $12.26Passengers/VSH 7.6 1.9 5.3 8.2 19.2 7.6 8.46Passengers/VSM 0.8 0.1 0.2 0.4 1.1 0.4 0.50Farebox Recovery 6.3% 4.3% 13.8% 22.1% 17.5% 13.8% 12.8%Average Fare/Passenger $0.39 $1.41 $1.34 $1.95 $0.58 $1.34 $1.14
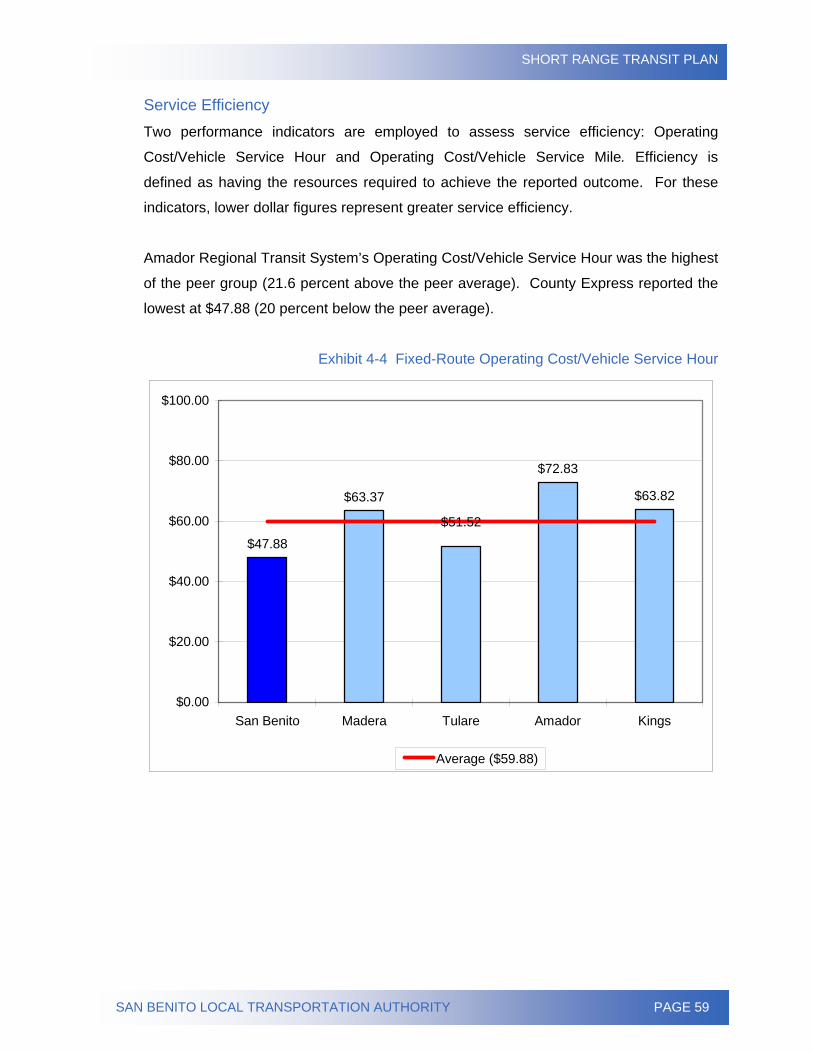
SHORT RANGE TRANSIT PLAN
SAN BENITO LOCAL TRANSPORTATION AUTHORITY PAGE 59
Service Efficiency Two performance indicators are employed to assess service efficiency: Operating
Cost/Vehicle Service Hour and Operating Cost/Vehicle Service Mile. Efficiency is
defined as having the resources required to achieve the reported outcome. For these
indicators, lower dollar figures represent greater service efficiency.
Amador Regional Transit System’s Operating Cost/Vehicle Service Hour was the highest
of the peer group (21.6 percent above the peer average). County Express reported the
lowest at $47.88 (20 percent below the peer average).
Exhibit 4-4 Fixed-Route Operating Cost/Vehicle Service Hour
$47.88
$63.37
$72.83
$63.82
$51.52
$0.00
$20.00
$40.00
$60.00
$80.00
$100.00
San Benito Madera Tulare Amador Kings
Average ($59.88)
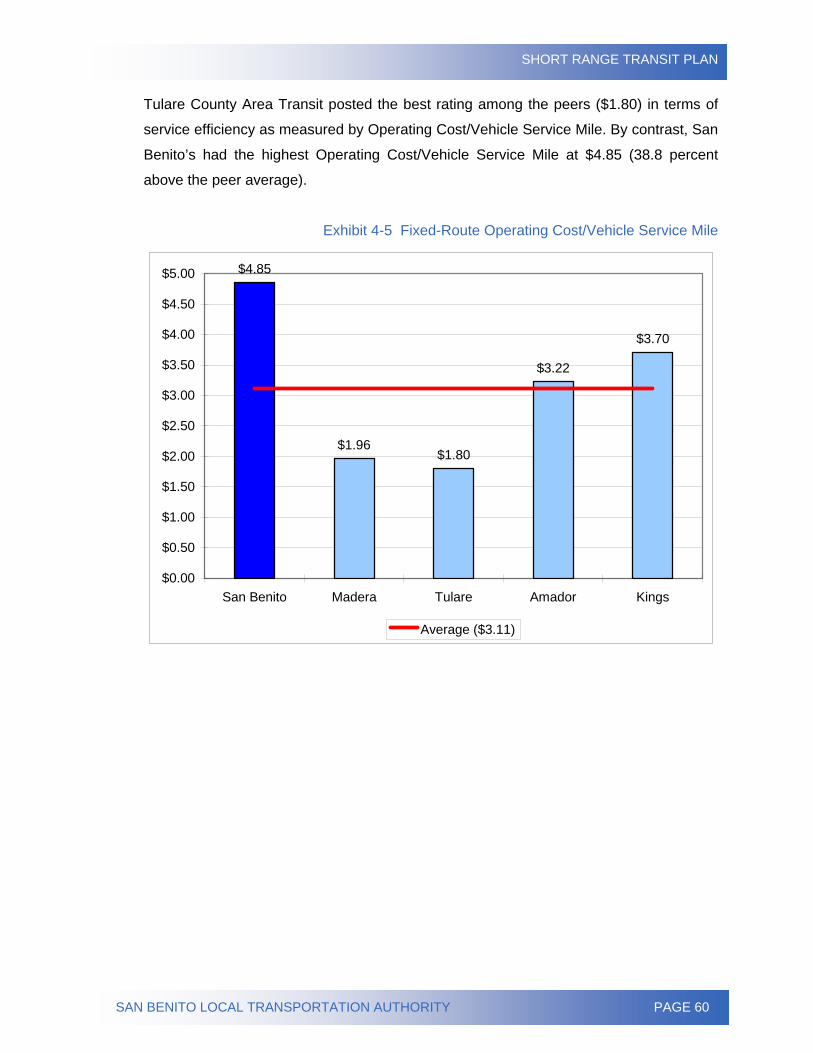
SHORT RANGE TRANSIT PLAN
SAN BENITO LOCAL TRANSPORTATION AUTHORITY PAGE 60
Tulare County Area Transit posted the best rating among the peers ($1.80) in terms of
service efficiency as measured by Operating Cost/Vehicle Service Mile. By contrast, San
Benito’s had the highest Operating Cost/Vehicle Service Mile at $4.85 (38.8 percent
above the peer average).
Exhibit 4-5 Fixed-Route Operating Cost/Vehicle Service Mile
$4.85
$1.96$1.80
$3.22
$3.70
$0.00
$0.50
$1.00
$1.50
$2.00
$2.50
$3.00
$3.50
$4.00
$4.50
$5.00
San Benito Madera Tulare Amador Kings
Average ($3.11)
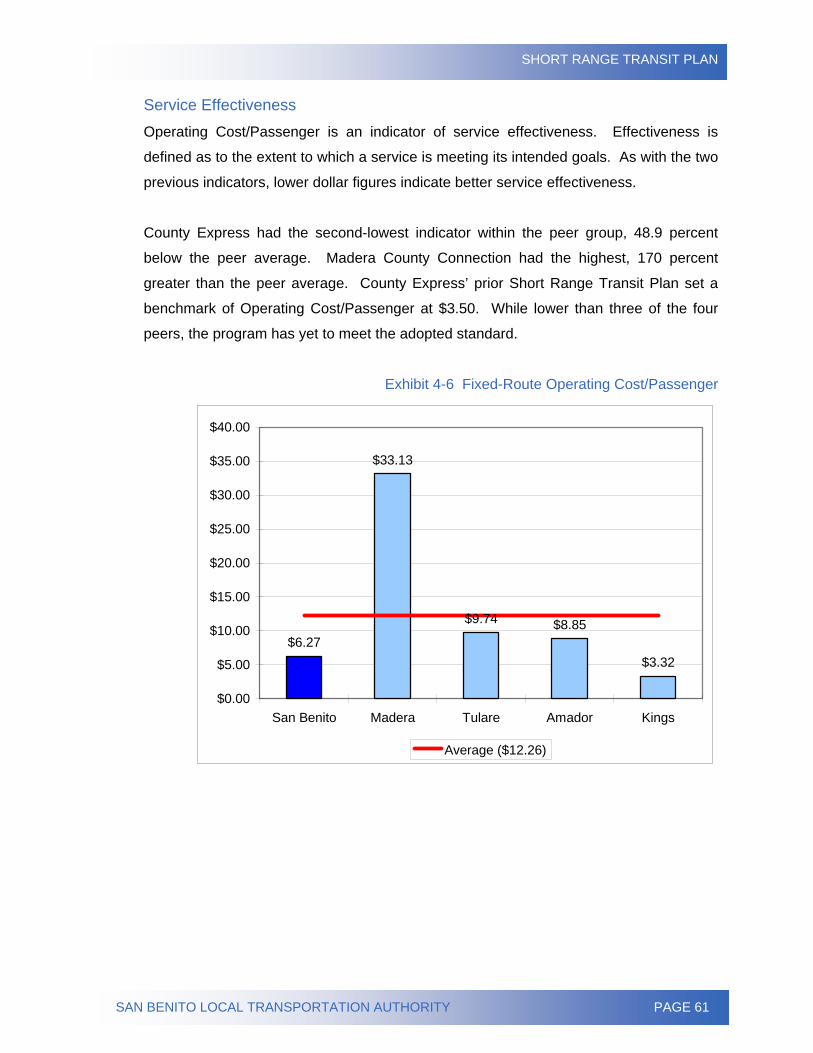
SHORT RANGE TRANSIT PLAN
SAN BENITO LOCAL TRANSPORTATION AUTHORITY PAGE 61
Service Effectiveness Operating Cost/Passenger is an indicator of service effectiveness. Effectiveness is
defined as to the extent to which a service is meeting its intended goals. As with the two
previous indicators, lower dollar figures indicate better service effectiveness.
County Express had the second-lowest indicator within the peer group, 48.9 percent
below the peer average. Madera County Connection had the highest, 170 percent
greater than the peer average. County Express’ prior Short Range Transit Plan set a
benchmark of Operating Cost/Passenger at $3.50. While lower than three of the four
peers, the program has yet to meet the adopted standard.
Exhibit 4-6 Fixed-Route Operating Cost/Passenger
$6.27
$33.13
$9.74 $8.85
$3.32
$0.00
$5.00
$10.00
$15.00
$20.00
$25.00
$30.00
$35.00
$40.00
San Benito Madera Tulare Amador Kings
Average ($12.26)
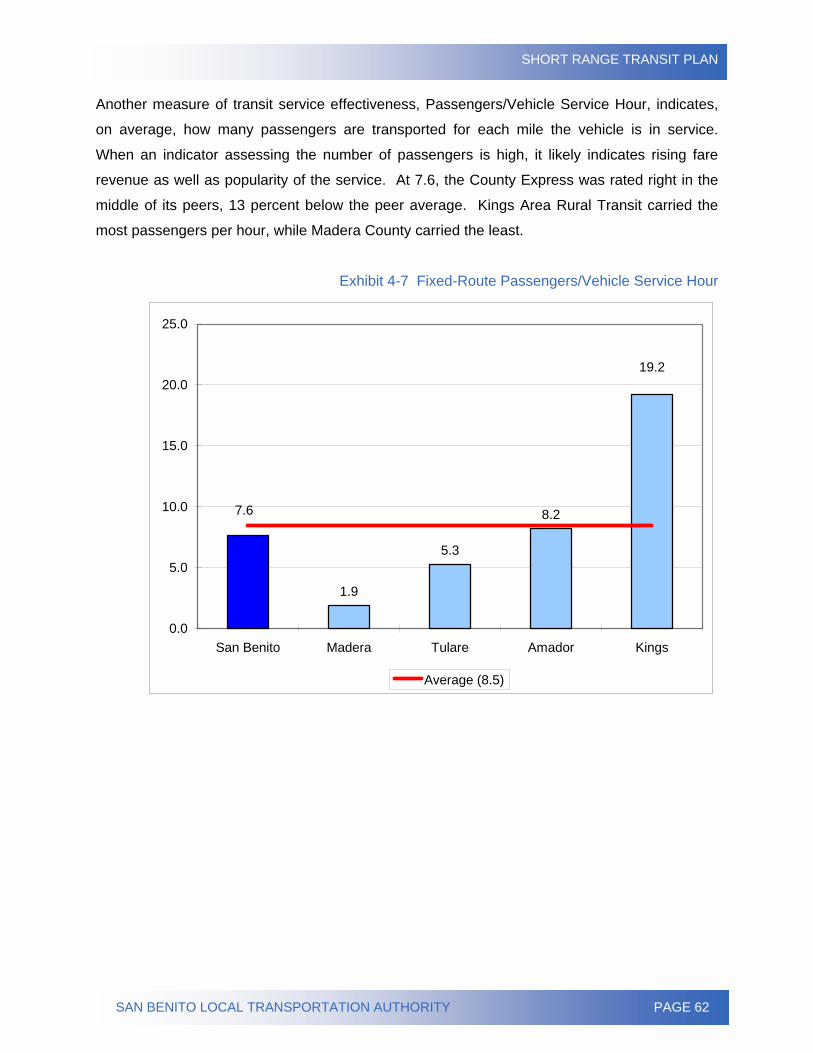
SHORT RANGE TRANSIT PLAN
SAN BENITO LOCAL TRANSPORTATION AUTHORITY PAGE 62
Another measure of transit service effectiveness, Passengers/Vehicle Service Hour, indicates,
on average, how many passengers are transported for each mile the vehicle is in service.
When an indicator assessing the number of passengers is high, it likely indicates rising fare
revenue as well as popularity of the service. At 7.6, the County Express was rated right in the
middle of its peers, 13 percent below the peer average. Kings Area Rural Transit carried the
most passengers per hour, while Madera County carried the least.
Exhibit 4-7 Fixed-Route Passengers/Vehicle Service Hour
1.9
5.3
8.27.6
19.2
0.0
5.0
10.0
15.0
20.0
25.0
San Benito Madera Tulare Amador Kings
Average (8.5)
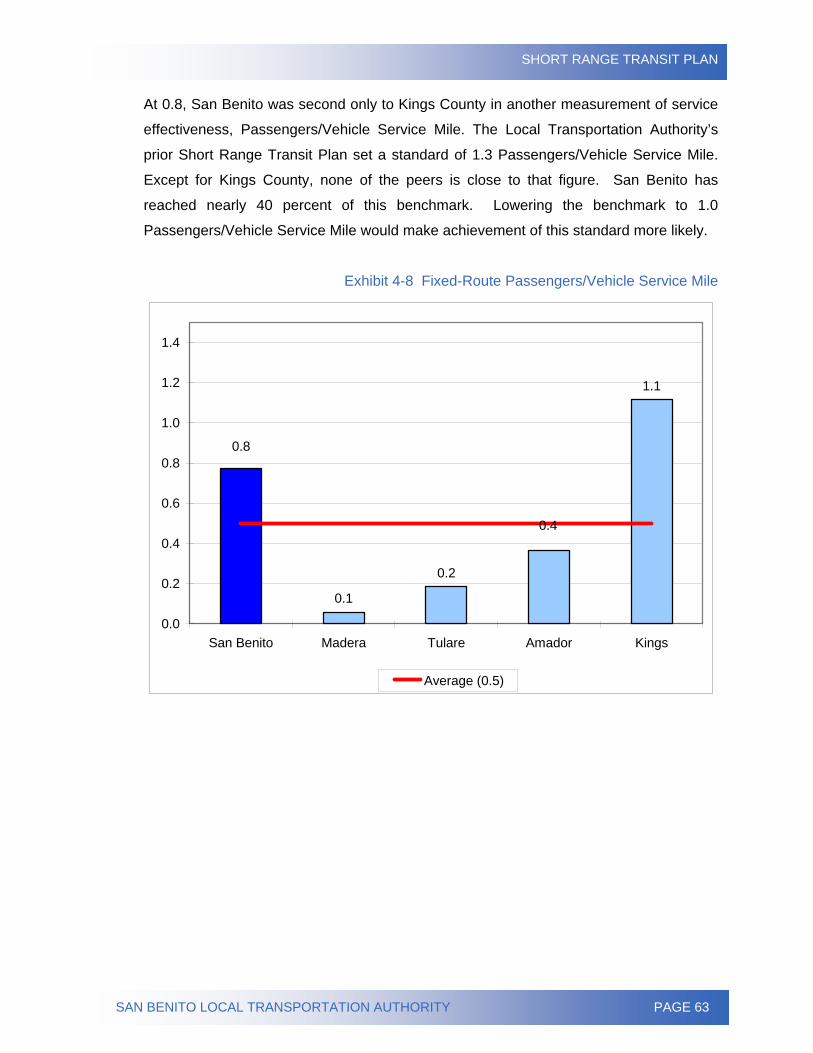
SHORT RANGE TRANSIT PLAN
SAN BENITO LOCAL TRANSPORTATION AUTHORITY PAGE 63
At 0.8, San Benito was second only to Kings County in another measurement of service
effectiveness, Passengers/Vehicle Service Mile. The Local Transportation Authority’s
prior Short Range Transit Plan set a standard of 1.3 Passengers/Vehicle Service Mile.
Except for Kings County, none of the peers is close to that figure. San Benito has
reached nearly 40 percent of this benchmark. Lowering the benchmark to 1.0
Passengers/Vehicle Service Mile would make achievement of this standard more likely.
Exhibit 4-8 Fixed-Route Passengers/Vehicle Service Mile
0.1
0.2
1.1
0.4
0.8
0.0
0.2
0.4
0.6
0.8
1.0
1.2
1.4
San Benito Madera Tulare Amador Kings
Average (0.5)
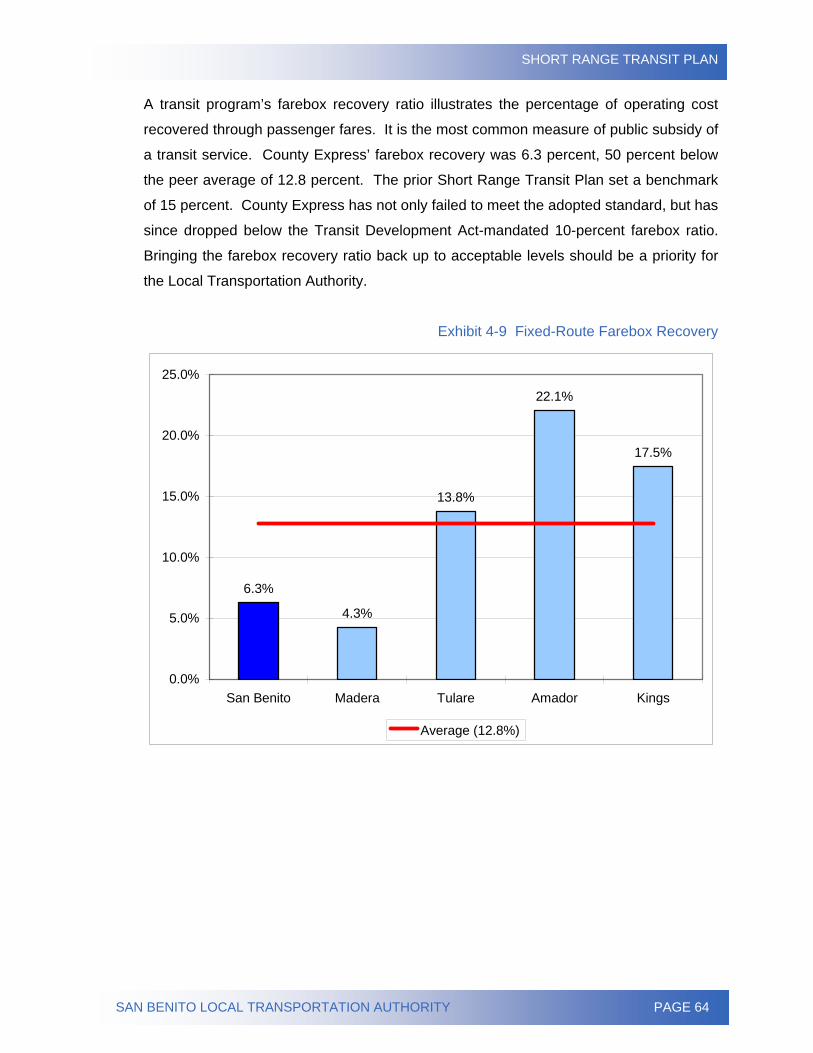
SHORT RANGE TRANSIT PLAN
SAN BENITO LOCAL TRANSPORTATION AUTHORITY PAGE 64
A transit program’s farebox recovery ratio illustrates the percentage of operating cost
recovered through passenger fares. It is the most common measure of public subsidy of
a transit service. County Express’ farebox recovery was 6.3 percent, 50 percent below
the peer average of 12.8 percent. The prior Short Range Transit Plan set a benchmark
of 15 percent. County Express has not only failed to meet the adopted standard, but has
since dropped below the Transit Development Act-mandated 10-percent farebox ratio.
Bringing the farebox recovery ratio back up to acceptable levels should be a priority for
the Local Transportation Authority.
Exhibit 4-9 Fixed-Route Farebox Recovery
6.3%
4.3%
13.8%
22.1%
17.5%
0.0%
5.0%
10.0%
15.0%
20.0%
25.0%
San Benito Madera Tulare Amador Kings
Average (12.8%)
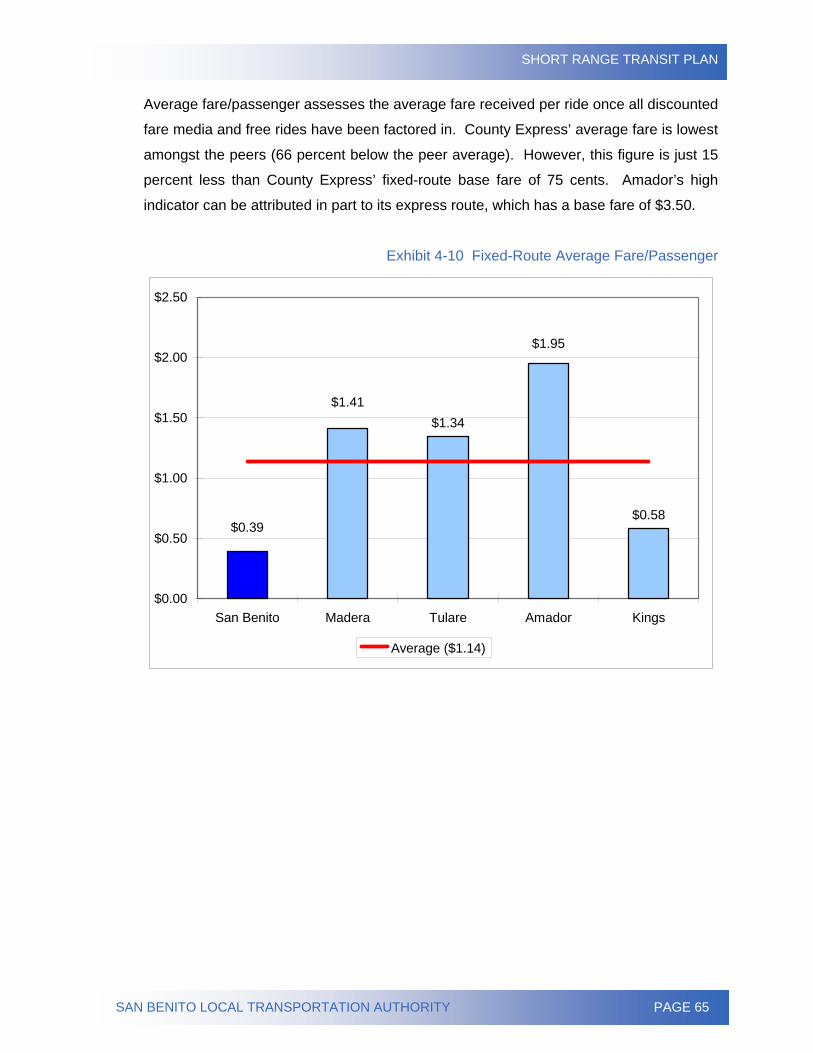
SHORT RANGE TRANSIT PLAN
SAN BENITO LOCAL TRANSPORTATION AUTHORITY PAGE 65
Average fare/passenger assesses the average fare received per ride once all discounted
fare media and free rides have been factored in. County Express’ average fare is lowest
amongst the peers (66 percent below the peer average). However, this figure is just 15
percent less than County Express’ fixed-route base fare of 75 cents. Amador’s high
indicator can be attributed in part to its express route, which has a base fare of $3.50.
Exhibit 4-10 Fixed-Route Average Fare/Passenger
$1.34
$0.58$0.39
$1.41
$1.95
$0.00
$0.50
$1.00
$1.50
$2.00
$2.50
San Benito Madera Tulare Amador Kings
Average ($1.14)
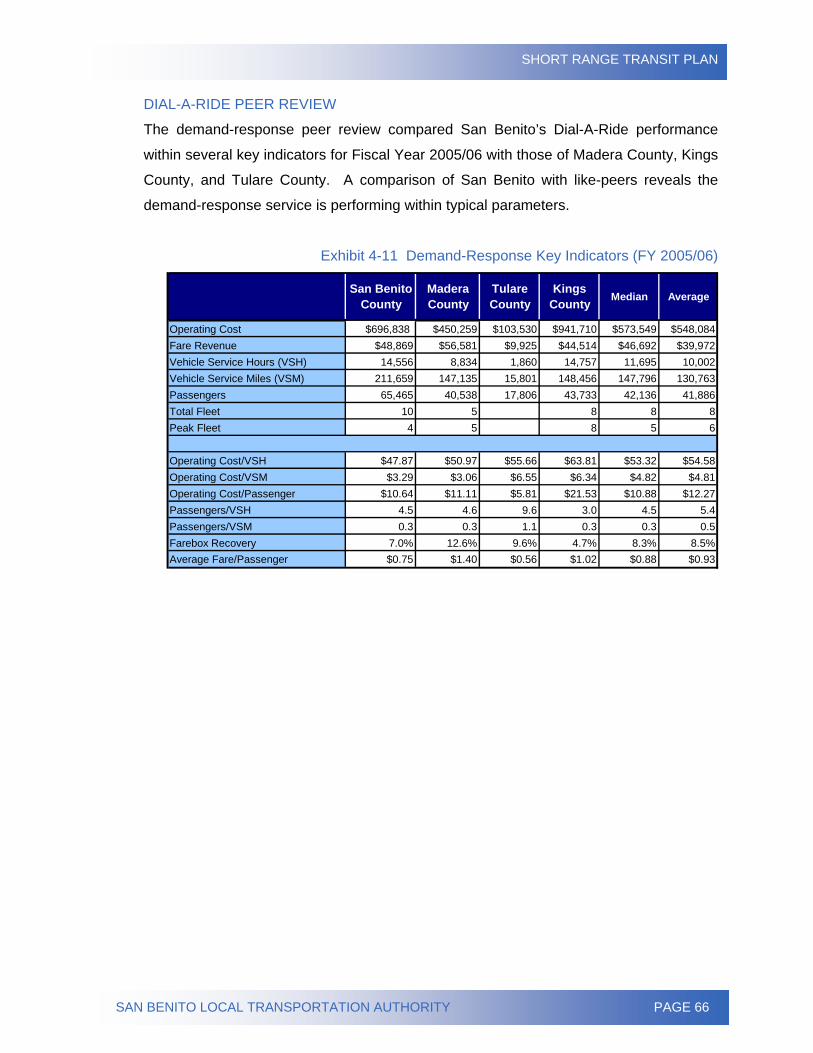
SHORT RANGE TRANSIT PLAN
SAN BENITO LOCAL TRANSPORTATION AUTHORITY PAGE 66
DIAL-A-RIDE PEER REVIEW
The demand-response peer review compared San Benito’s Dial-A-Ride performance
within several key indicators for Fiscal Year 2005/06 with those of Madera County, Kings
County, and Tulare County. A comparison of San Benito with like-peers reveals the
demand-response service is performing within typical parameters.
Exhibit 4-11 Demand-Response Key Indicators (FY 2005/06)
San Benito County
Madera County
Tulare County
Kings County Median Average
Operating Cost $696,838 $450,259 $103,530 $941,710 $573,549 $548,084Fare Revenue $48,869 $56,581 $9,925 $44,514 $46,692 $39,972Vehicle Service Hours (VSH) 14,556 8,834 1,860 14,757 11,695 10,002Vehicle Service Miles (VSM) 211,659 147,135 15,801 148,456 147,796 130,763Passengers 65,465 40,538 17,806 43,733 42,136 41,886Total Fleet 10 5 8 8 8Peak Fleet 4 5 8 5 6
Operating Cost/VSH $47.87 $50.97 $55.66 $63.81 $53.32 $54.58Operating Cost/VSM $3.29 $3.06 $6.55 $6.34 $4.82 $4.81Operating Cost/Passenger $10.64 $11.11 $5.81 $21.53 $10.88 $12.27Passengers/VSH 4.5 4.6 9.6 3.0 4.5 5.4Passengers/VSM 0.3 0.3 1.1 0.3 0.3 0.5Farebox Recovery 7.0% 12.6% 9.6% 4.7% 8.3% 8.5%Average Fare/Passenger $0.75 $1.40 $0.56 $1.02 $0.88 $0.93
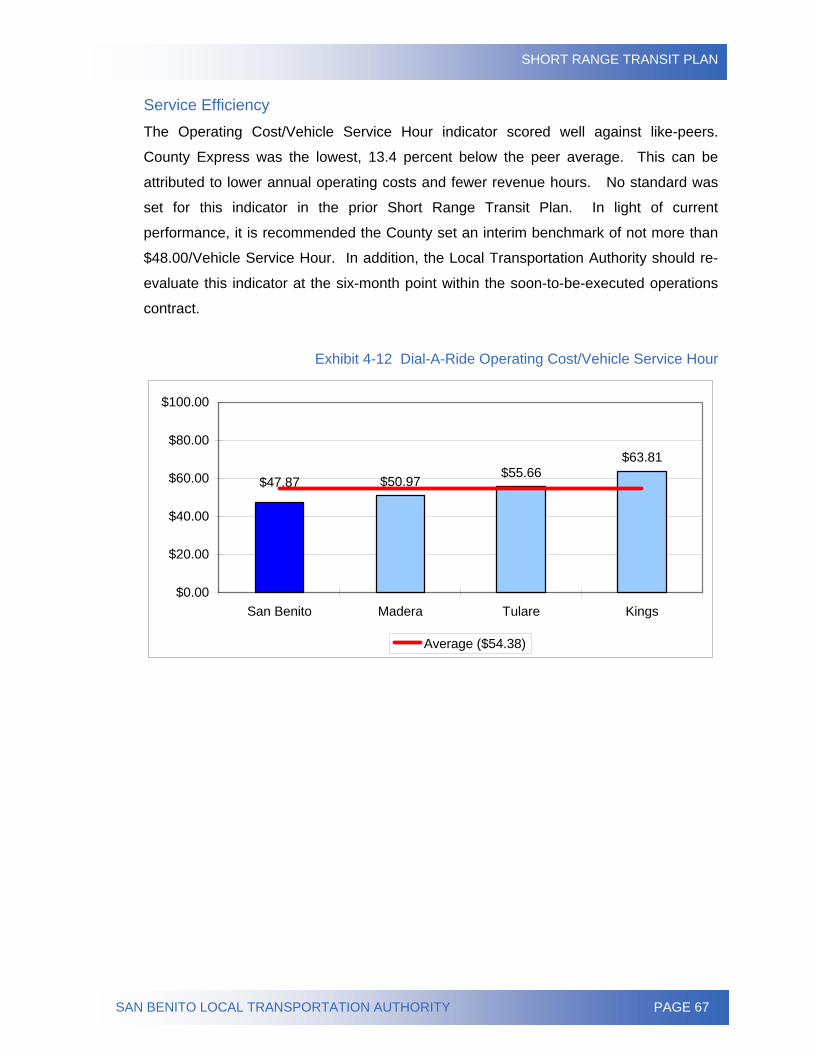
SHORT RANGE TRANSIT PLAN
SAN BENITO LOCAL TRANSPORTATION AUTHORITY PAGE 67
Service Efficiency The Operating Cost/Vehicle Service Hour indicator scored well against like-peers.
County Express was the lowest, 13.4 percent below the peer average. This can be
attributed to lower annual operating costs and fewer revenue hours. No standard was
set for this indicator in the prior Short Range Transit Plan. In light of current
performance, it is recommended the County set an interim benchmark of not more than
$48.00/Vehicle Service Hour. In addition, the Local Transportation Authority should re-
evaluate this indicator at the six-month point within the soon-to-be-executed operations
contract.
Exhibit 4-12 Dial-A-Ride Operating Cost/Vehicle Service Hour
$50.97$55.66
$63.81
$47.87
$0.00
$20.00
$40.00
$60.00
$80.00
$100.00
San Benito Madera Tulare Kings
Average ($54.38)
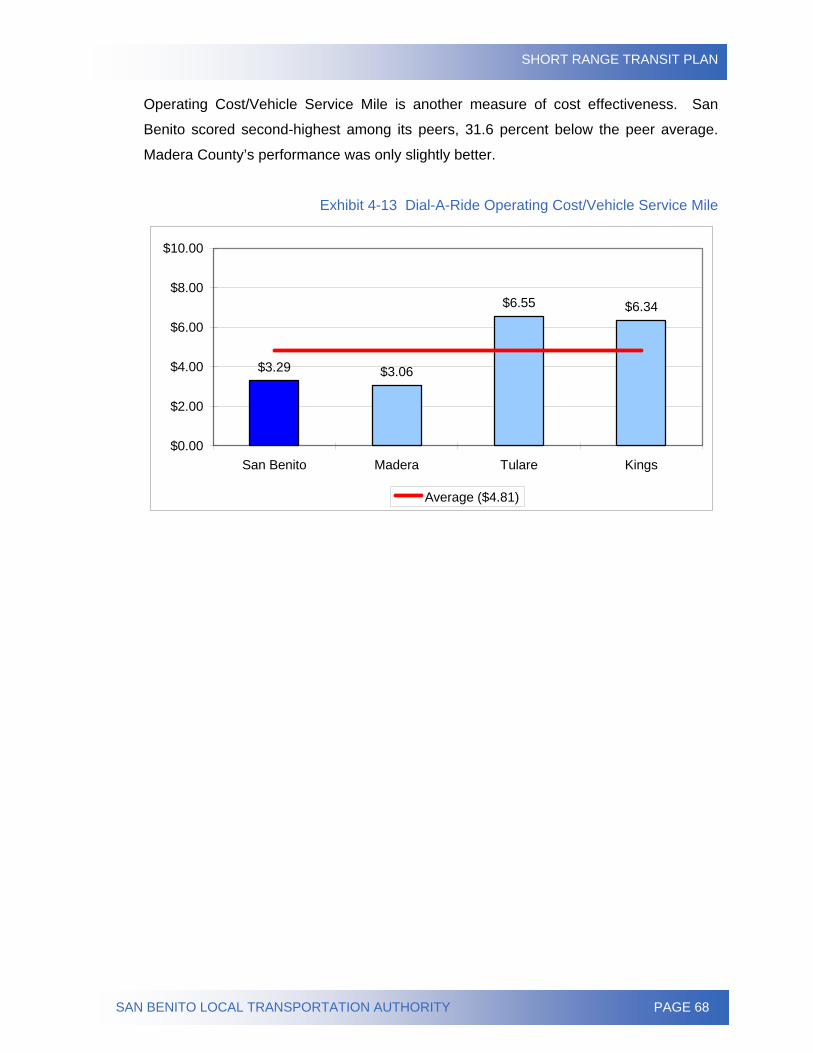
SHORT RANGE TRANSIT PLAN
SAN BENITO LOCAL TRANSPORTATION AUTHORITY PAGE 68
Operating Cost/Vehicle Service Mile is another measure of cost effectiveness. San
Benito scored second-highest among its peers, 31.6 percent below the peer average.
Madera County’s performance was only slightly better.
Exhibit 4-13 Dial-A-Ride Operating Cost/Vehicle Service Mile
$3.29 $3.06
$6.55 $6.34
$0.00
$2.00
$4.00
$6.00
$8.00
$10.00
San Benito Madera Tulare Kings
Average ($4.81)
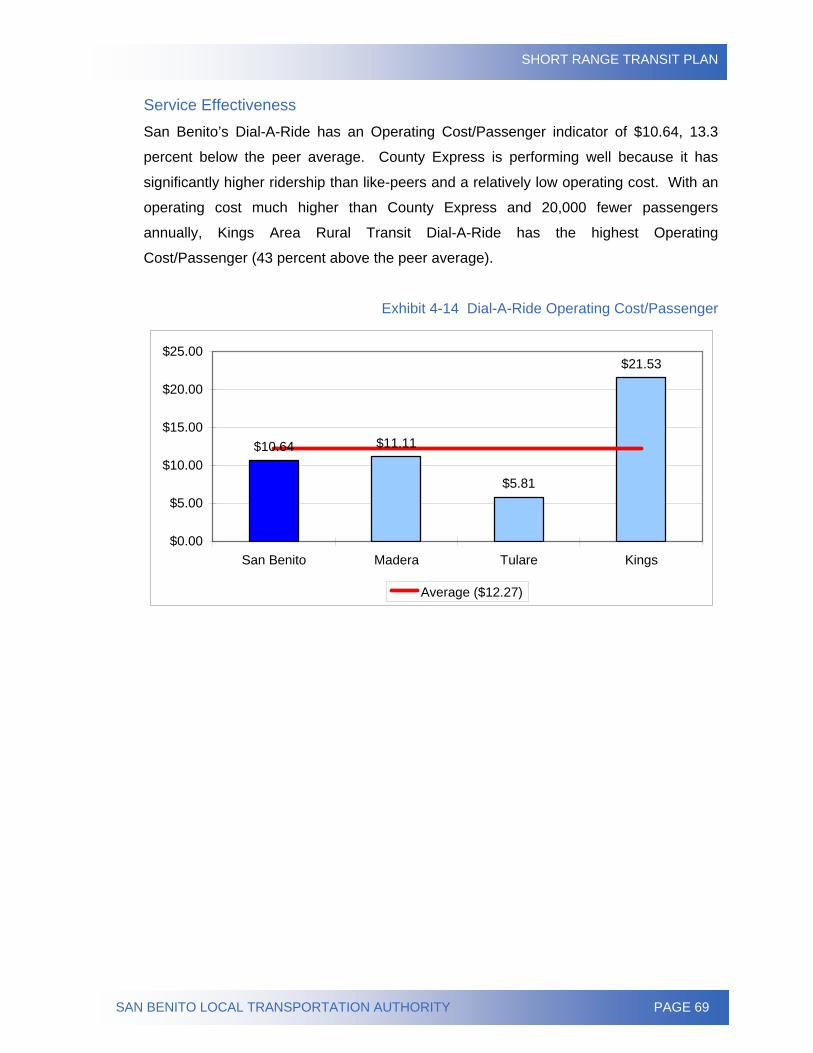
SHORT RANGE TRANSIT PLAN
SAN BENITO LOCAL TRANSPORTATION AUTHORITY PAGE 69
Service Effectiveness San Benito’s Dial-A-Ride has an Operating Cost/Passenger indicator of $10.64, 13.3
percent below the peer average. County Express is performing well because it has
significantly higher ridership than like-peers and a relatively low operating cost. With an
operating cost much higher than County Express and 20,000 fewer passengers
annually, Kings Area Rural Transit Dial-A-Ride has the highest Operating
Cost/Passenger (43 percent above the peer average).
Exhibit 4-14 Dial-A-Ride Operating Cost/Passenger
$10.64 $11.11
$5.81
$21.53
$0.00
$5.00
$10.00
$15.00
$20.00
$25.00
San Benito Madera Tulare Kings
Average ($12.27)
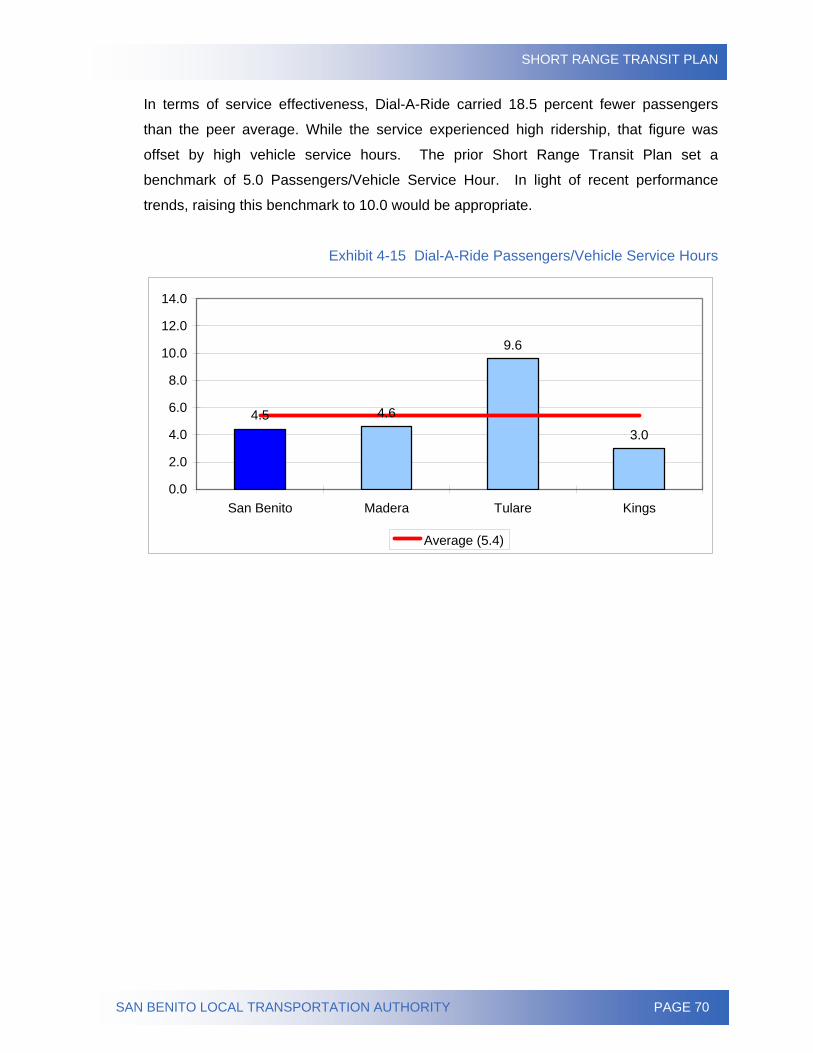
SHORT RANGE TRANSIT PLAN
SAN BENITO LOCAL TRANSPORTATION AUTHORITY PAGE 70
In terms of service effectiveness, Dial-A-Ride carried 18.5 percent fewer passengers
than the peer average. While the service experienced high ridership, that figure was
offset by high vehicle service hours. The prior Short Range Transit Plan set a
benchmark of 5.0 Passengers/Vehicle Service Hour. In light of recent performance
trends, raising this benchmark to 10.0 would be appropriate.
Exhibit 4-15 Dial-A-Ride Passengers/Vehicle Service Hours
4.6
9.6
3.04.5
0.0
2.0
4.0
6.0
8.0
10.0
12.0
14.0
San Benito Madera Tulare Kings
Average (5.4)
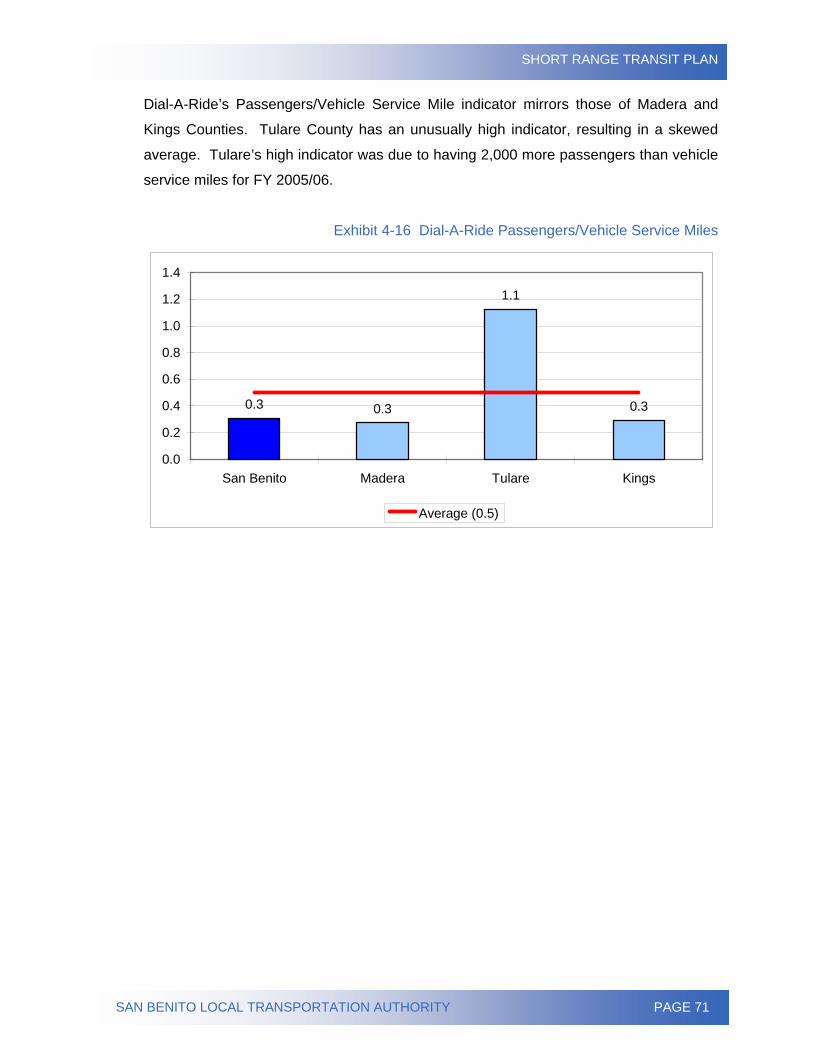
SHORT RANGE TRANSIT PLAN
SAN BENITO LOCAL TRANSPORTATION AUTHORITY PAGE 71
Dial-A-Ride’s Passengers/Vehicle Service Mile indicator mirrors those of Madera and
Kings Counties. Tulare County has an unusually high indicator, resulting in a skewed
average. Tulare’s high indicator was due to having 2,000 more passengers than vehicle
service miles for FY 2005/06.
Exhibit 4-16 Dial-A-Ride Passengers/Vehicle Service Miles
0.3 0.3
1.1
0.3
0.0
0.2
0.4
0.6
0.8
1.0
1.2
1.4
San Benito Madera Tulare Kings
Average (0.5)
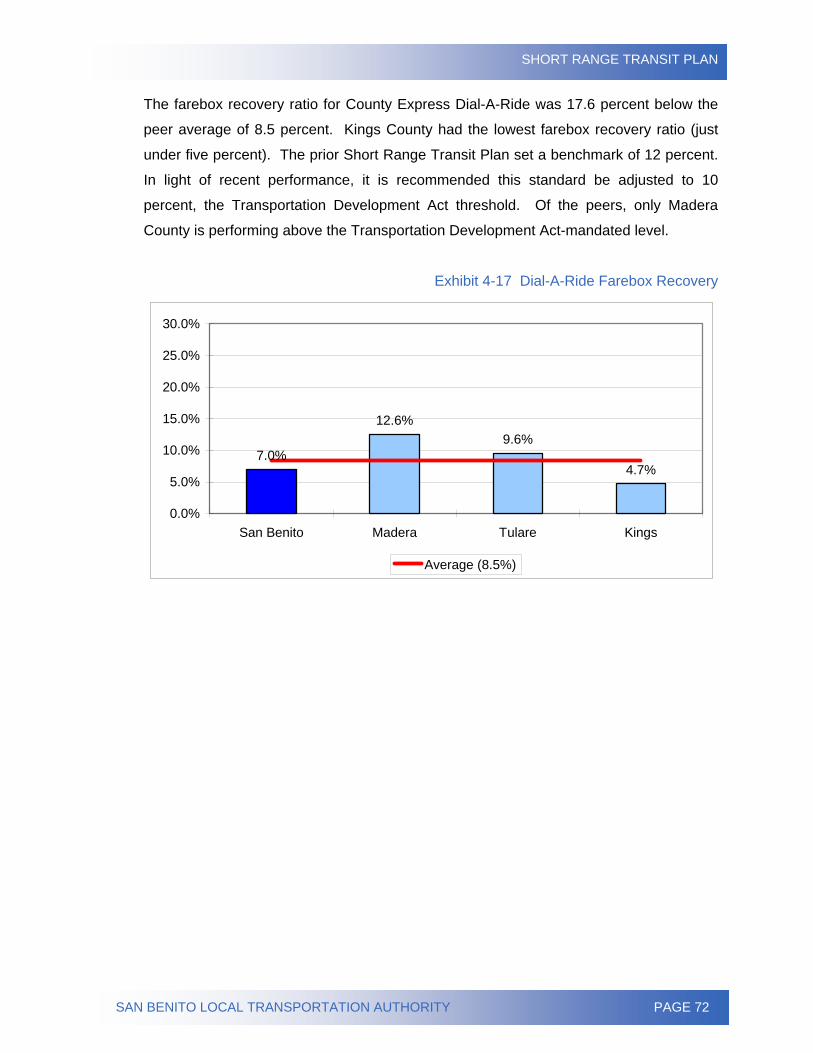
SHORT RANGE TRANSIT PLAN
SAN BENITO LOCAL TRANSPORTATION AUTHORITY PAGE 72
The farebox recovery ratio for County Express Dial-A-Ride was 17.6 percent below the
peer average of 8.5 percent. Kings County had the lowest farebox recovery ratio (just
under five percent). The prior Short Range Transit Plan set a benchmark of 12 percent.
In light of recent performance, it is recommended this standard be adjusted to 10
percent, the Transportation Development Act threshold. Of the peers, only Madera
County is performing above the Transportation Development Act-mandated level.
Exhibit 4-17 Dial-A-Ride Farebox Recovery
7.0%
12.6%9.6%
4.7%
0.0%
5.0%
10.0%
15.0%
20.0%
25.0%
30.0%
San Benito Madera Tulare Kings
Average (8.5%)
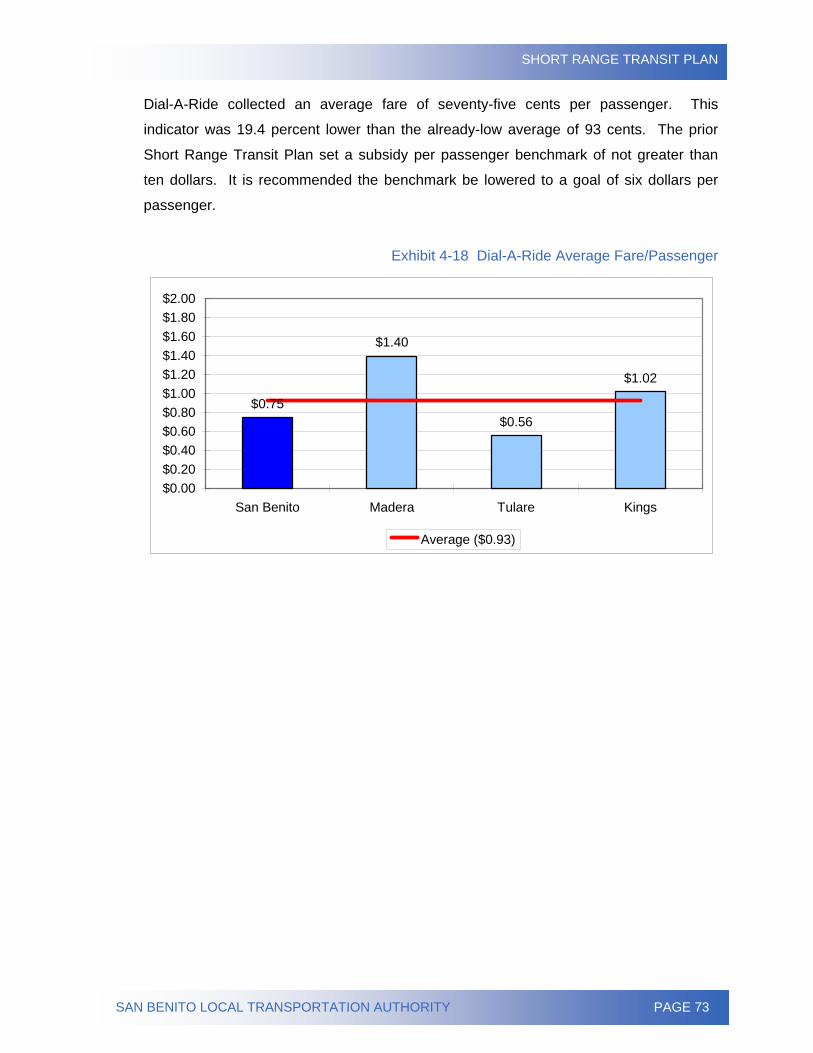
SHORT RANGE TRANSIT PLAN
SAN BENITO LOCAL TRANSPORTATION AUTHORITY PAGE 73
Dial-A-Ride collected an average fare of seventy-five cents per passenger. This
indicator was 19.4 percent lower than the already-low average of 93 cents. The prior
Short Range Transit Plan set a subsidy per passenger benchmark of not greater than
ten dollars. It is recommended the benchmark be lowered to a goal of six dollars per
passenger.
Exhibit 4-18 Dial-A-Ride Average Fare/Passenger
$0.75
$1.40
$0.56
$1.02
$0.00$0.20$0.40$0.60$0.80$1.00$1.20$1.40$1.60$1.80$2.00
San Benito Madera Tulare Kings
Average ($0.93)

SHORT RANGE TRANSIT PLAN
SAN BENITO LOCAL TRANSPORTATION AUTHORITY PAGE 74
Page Intentionally Blank
SHORT RANGE TRANSIT PLAN
SAN BENITO LOCAL TRANSPORTATION AUTHORITY PAGE 75
CHAPTER 5 – RIDE CHECK ANALYSIS A ride check of the Fixed Route service of County Express was conducted in
December 2006. The survey team recorded information regarding passenger loads,
running times, and schedule adherence. The benefit of conducting a ride check is two-
fold:
• Comparison of actual schedule adherence versus the published
timetable (on-time performance), and
• Assessment of service productivity at the individual route and bus
stop levels (boarding and alighting).
The ride check was undertaken across a five-day period (Monday through Friday) during
which a sampling of 170 trips were evaluated.
ON-TIME PERFORMANCE
A key aspect of the ride check was a comprehensive and objective evaluation of the on-
time performance of the County Express’ Fixed Route service under actual field
conditions. In determining on-time performance, the survey team synchronized their
timepieces with the County Express’ dispatching office so that all times were consistent.
The surveyors then rode the buses recording arrival and departure times at each
established time point along a given route. Following the ride check, collected data was
entered into the Statistical Package for the Social Sciences platform, where it was
cleaned, coded, and prepared for analysis.
Actual schedule adherence was assessed at the beginning of each trip (departure),
midpoint (departure), and end of trip (arrival).
• On-time is defined as any trip departing within four minutes after the
published time.
• Early is defined as any trip departing prior to the published time.
• Late is defined as any trip departing five minutes or more after the
published time.
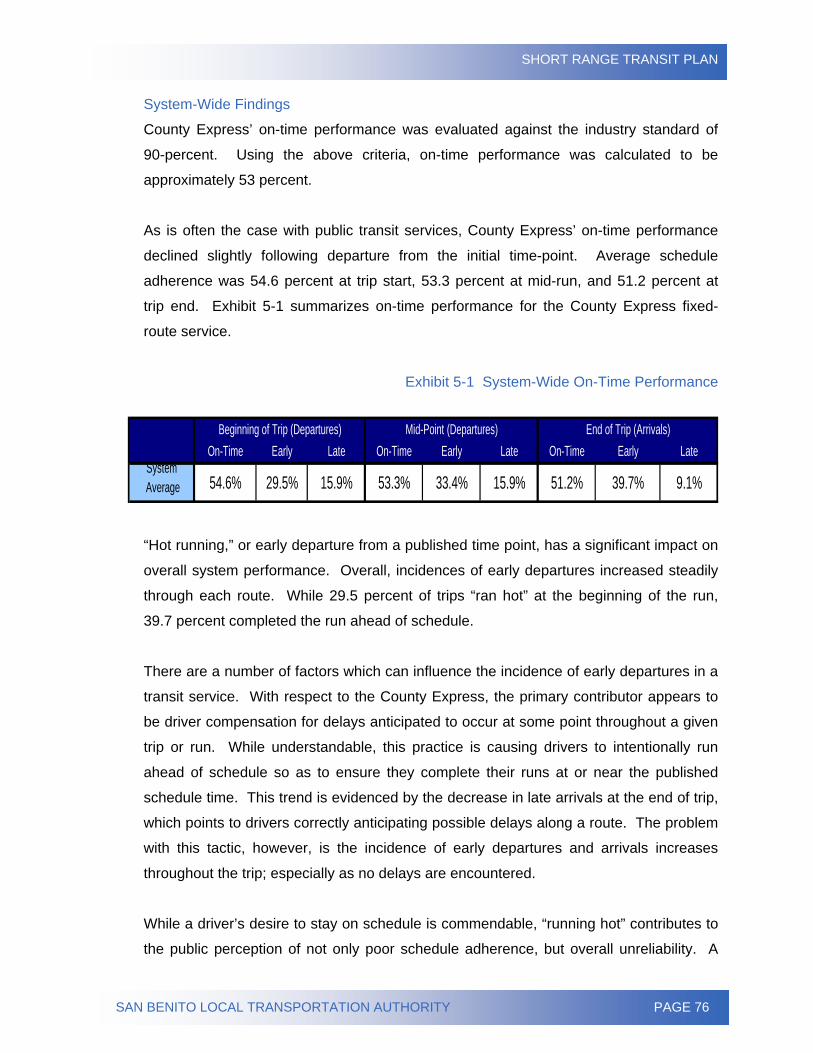
SHORT RANGE TRANSIT PLAN
SAN BENITO LOCAL TRANSPORTATION AUTHORITY PAGE 76
System-Wide Findings
County Express’ on-time performance was evaluated against the industry standard of
90-percent. Using the above criteria, on-time performance was calculated to be
approximately 53 percent.
As is often the case with public transit services, County Express’ on-time performance
declined slightly following departure from the initial time-point. Average schedule
adherence was 54.6 percent at trip start, 53.3 percent at mid-run, and 51.2 percent at
trip end. Exhibit 5-1 summarizes on-time performance for the County Express fixed-
route service.
Exhibit 5-1 System-Wide On-Time Performance
On-Time Early Late On-Time Early Late On-Time Early LateSystem
Average 54.6% 29.5% 15.9% 53.3% 33.4% 15.9% 51.2% 39.7% 9.1%
Beginning of Trip (Departures) Mid-Point (Departures) End of Trip (Arrivals)
“Hot running,” or early departure from a published time point, has a significant impact on
overall system performance. Overall, incidences of early departures increased steadily
through each route. While 29.5 percent of trips “ran hot” at the beginning of the run,
39.7 percent completed the run ahead of schedule.
There are a number of factors which can influence the incidence of early departures in a
transit service. With respect to the County Express, the primary contributor appears to
be driver compensation for delays anticipated to occur at some point throughout a given
trip or run. While understandable, this practice is causing drivers to intentionally run
ahead of schedule so as to ensure they complete their runs at or near the published
schedule time. This trend is evidenced by the decrease in late arrivals at the end of trip,
which points to drivers correctly anticipating possible delays along a route. The problem
with this tactic, however, is the incidence of early departures and arrivals increases
throughout the trip; especially as no delays are encountered.
While a driver’s desire to stay on schedule is commendable, “running hot” contributes to
the public perception of not only poor schedule adherence, but overall unreliability. A
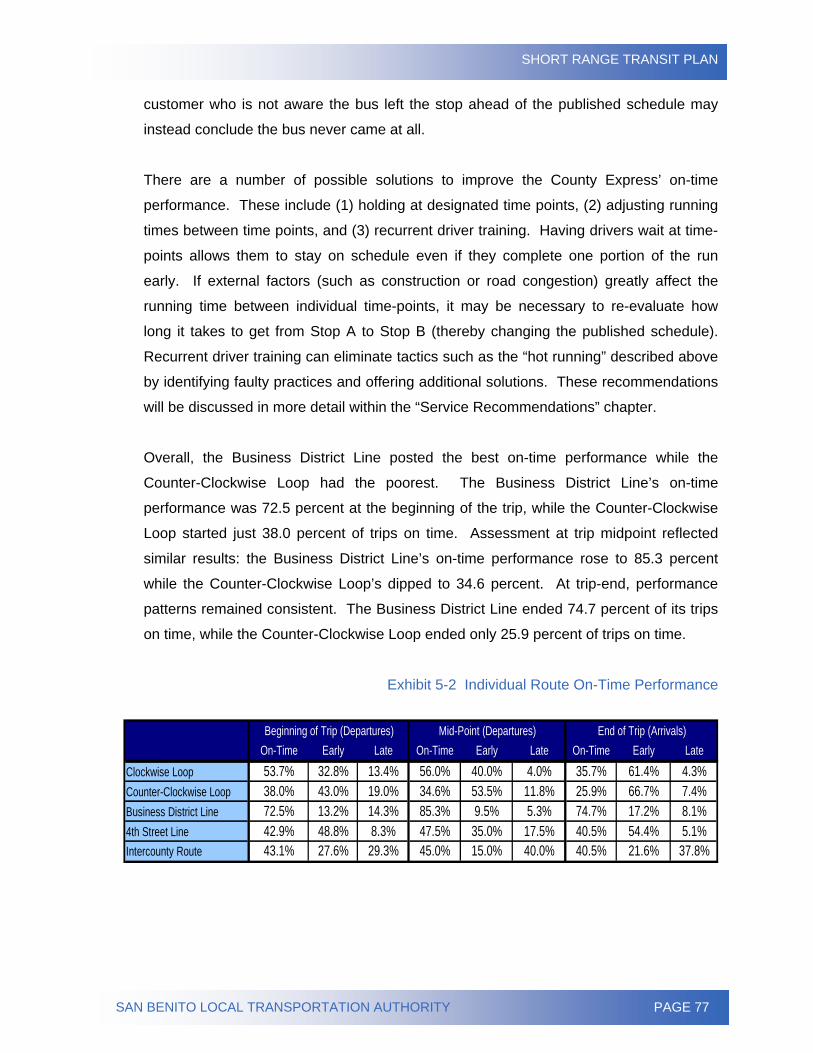
SHORT RANGE TRANSIT PLAN
SAN BENITO LOCAL TRANSPORTATION AUTHORITY PAGE 77
customer who is not aware the bus left the stop ahead of the published schedule may
instead conclude the bus never came at all.
There are a number of possible solutions to improve the County Express’ on-time
performance. These include (1) holding at designated time points, (2) adjusting running
times between time points, and (3) recurrent driver training. Having drivers wait at time-
points allows them to stay on schedule even if they complete one portion of the run
early. If external factors (such as construction or road congestion) greatly affect the
running time between individual time-points, it may be necessary to re-evaluate how
long it takes to get from Stop A to Stop B (thereby changing the published schedule).
Recurrent driver training can eliminate tactics such as the “hot running” described above
by identifying faulty practices and offering additional solutions. These recommendations
will be discussed in more detail within the “Service Recommendations” chapter.
Overall, the Business District Line posted the best on-time performance while the
Counter-Clockwise Loop had the poorest. The Business District Line’s on-time
performance was 72.5 percent at the beginning of the trip, while the Counter-Clockwise
Loop started just 38.0 percent of trips on time. Assessment at trip midpoint reflected
similar results: the Business District Line’s on-time performance rose to 85.3 percent
while the Counter-Clockwise Loop’s dipped to 34.6 percent. At trip-end, performance
patterns remained consistent. The Business District Line ended 74.7 percent of its trips
on time, while the Counter-Clockwise Loop ended only 25.9 percent of trips on time.
Exhibit 5-2 Individual Route On-Time Performance
On-Time Early Late On-Time Early Late On-Time Early LateClockwise Loop 53.7% 32.8% 13.4% 56.0% 40.0% 4.0% 35.7% 61.4% 4.3%Counter-Clockwise Loop 38.0% 43.0% 19.0% 34.6% 53.5% 11.8% 25.9% 66.7% 7.4%Business District Line 72.5% 13.2% 14.3% 85.3% 9.5% 5.3% 74.7% 17.2% 8.1%4th Street Line 42.9% 48.8% 8.3% 47.5% 35.0% 17.5% 40.5% 54.4% 5.1%Intercounty Route 43.1% 27.6% 29.3% 45.0% 15.0% 40.0% 40.5% 21.6% 37.8%
Beginning of Trip (Departures) Mid-Point (Departures) End of Trip (Arrivals)
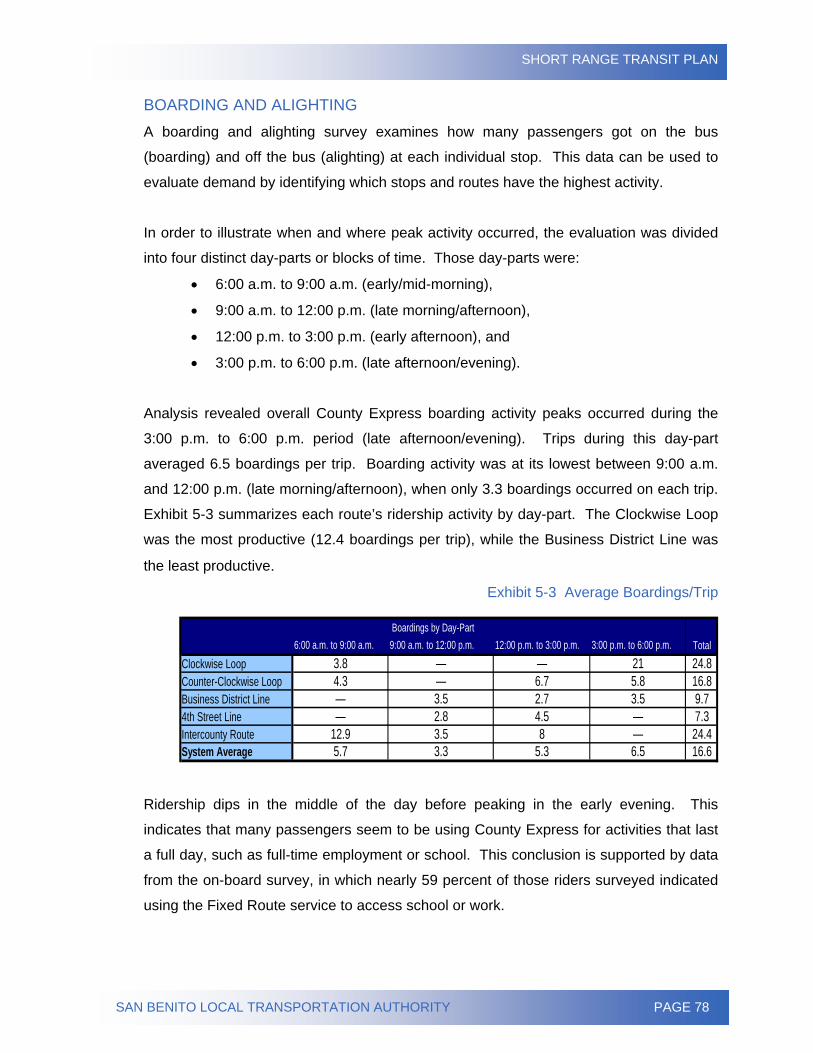
SHORT RANGE TRANSIT PLAN
SAN BENITO LOCAL TRANSPORTATION AUTHORITY PAGE 78
BOARDING AND ALIGHTING A boarding and alighting survey examines how many passengers got on the bus
(boarding) and off the bus (alighting) at each individual stop. This data can be used to
evaluate demand by identifying which stops and routes have the highest activity.
In order to illustrate when and where peak activity occurred, the evaluation was divided
into four distinct day-parts or blocks of time. Those day-parts were:
• 6:00 a.m. to 9:00 a.m. (early/mid-morning),
• 9:00 a.m. to 12:00 p.m. (late morning/afternoon),
• 12:00 p.m. to 3:00 p.m. (early afternoon), and
• 3:00 p.m. to 6:00 p.m. (late afternoon/evening).
Analysis revealed overall County Express boarding activity peaks occurred during the
3:00 p.m. to 6:00 p.m. period (late afternoon/evening). Trips during this day-part
averaged 6.5 boardings per trip. Boarding activity was at its lowest between 9:00 a.m.
and 12:00 p.m. (late morning/afternoon), when only 3.3 boardings occurred on each trip.
Exhibit 5-3 summarizes each route’s ridership activity by day-part. The Clockwise Loop
was the most productive (12.4 boardings per trip), while the Business District Line was
the least productive.
Exhibit 5-3 Average Boardings/Trip
6:00 a.m. to 9:00 a.m. 9:00 a.m. to 12:00 p.m. 12:00 p.m. to 3:00 p.m. 3:00 p.m. to 6:00 p.m. TotalClockwise Loop 3.8 — — 21 24.8Counter-Clockwise Loop 4.3 — 6.7 5.8 16.8Business District Line — 3.5 2.7 3.5 9.74th Street Line — 2.8 4.5 — 7.3Intercounty Route 12.9 3.5 8 — 24.4System Average 5.7 3.3 5.3 6.5 16.6
Boardings by Day-Part
Ridership dips in the middle of the day before peaking in the early evening. This
indicates that many passengers seem to be using County Express for activities that last
a full day, such as full-time employment or school. This conclusion is supported by data
from the on-board survey, in which nearly 59 percent of those riders surveyed indicated
using the Fixed Route service to access school or work.
SHORT RANGE TRANSIT PLAN
SAN BENITO LOCAL TRANSPORTATION AUTHORITY PAGE 79
Route-by-Route Findings Clockwise Loop (Green Route)
The Clockwise Loop (Green Route) operates during the peak-hour portions of the
service day. Morning service runs from 6:21 a.m. to 9:06 a.m. Afternoon service
operates from 2:35 p.m. until 5:43 p.m. The Clockwise Loop operates on an
approximate 40-minute headway.
The route travels eastbound in a clockwise direction throughout downtown Hollister. The
alignment covers Meridian Street, Tres Pinos Road, Central Avenue, and Fourth Street.
With respect to boardings and alightings 78.1 percent of ridership activity occurred
between 6:00 a.m. and 9:00 a.m. The route experiences considerably lower activity
(21.9 percent of unlinked trips) between 3:00 p.m. and 6:00 p.m.
Trip generators along the Clockwise Loop include Marguerite Maze Middle School,
Veterans Memorial Park, Sunnyslope School, Hazel Hawkins Memorial Hospital, Target,
Safeway, K-Mart, San Benito High School, Head Start, R.O. Hardin School, the Mission
Oaks Mobile Home Park, Calaveras School, San Benito Health Foundation, the County
Administration Building, Fremont School, and Gavilan College.
Bus stops with the greatest activity include Marguerite Maze Middle School, Veteran’s
Memorial Park, Rancho San Justo Middle School, San Benito High School, R.O. Hardin
School, and Mission Oaks Mobile Home Park. This activity is reflective of a large
number of students patronizing the route.
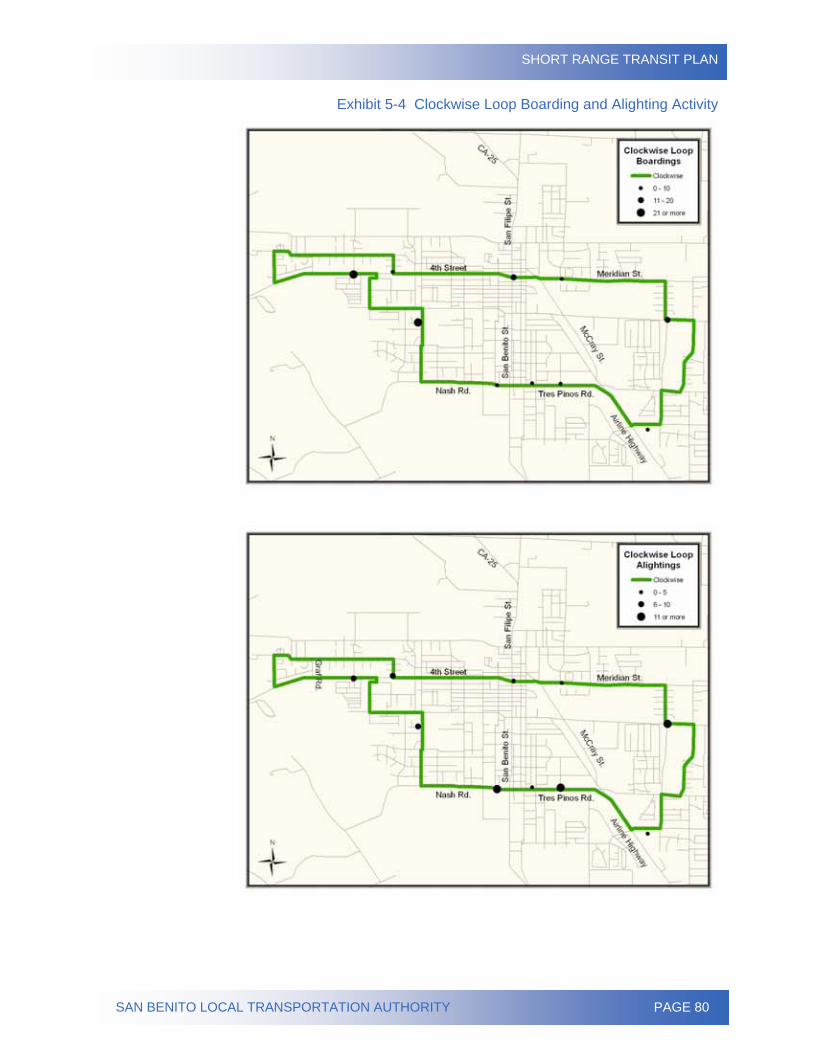
SHORT RANGE TRANSIT PLAN
SAN BENITO LOCAL TRANSPORTATION AUTHORITY PAGE 80
Exhibit 5-4 Clockwise Loop Boarding and Alighting Activity
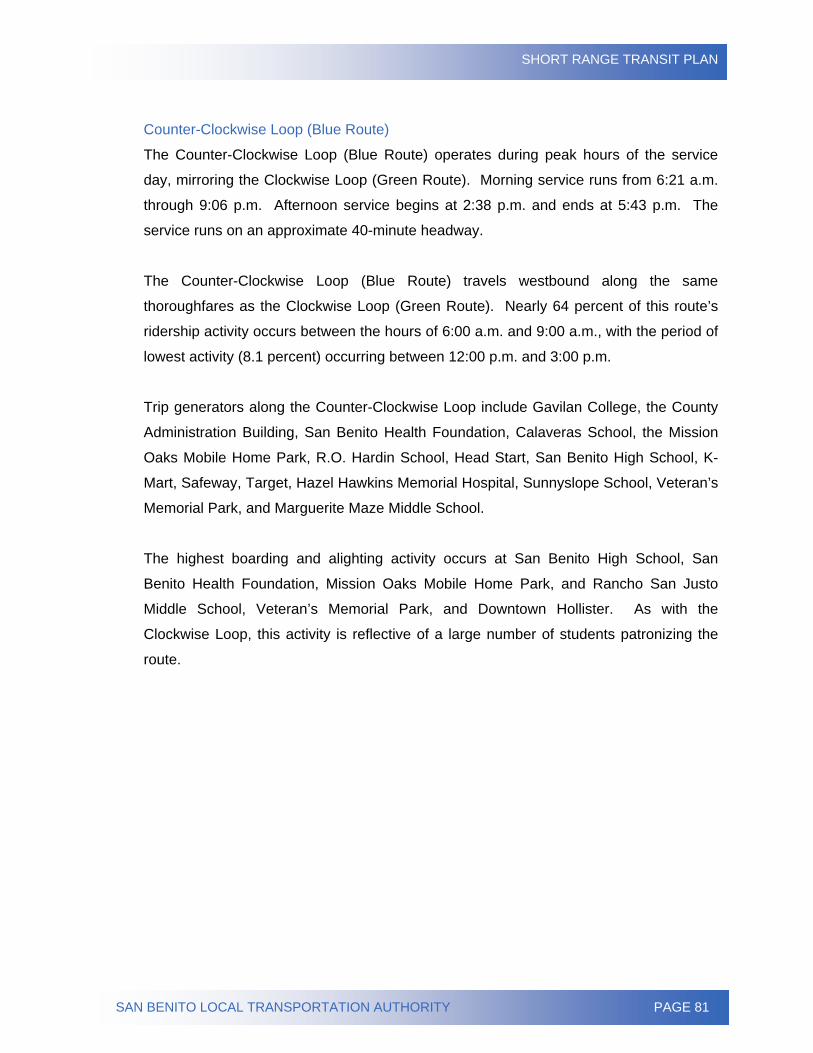
SHORT RANGE TRANSIT PLAN
SAN BENITO LOCAL TRANSPORTATION AUTHORITY PAGE 81
Counter-Clockwise Loop (Blue Route)
The Counter-Clockwise Loop (Blue Route) operates during peak hours of the service
day, mirroring the Clockwise Loop (Green Route). Morning service runs from 6:21 a.m.
through 9:06 p.m. Afternoon service begins at 2:38 p.m. and ends at 5:43 p.m. The
service runs on an approximate 40-minute headway.
The Counter-Clockwise Loop (Blue Route) travels westbound along the same
thoroughfares as the Clockwise Loop (Green Route). Nearly 64 percent of this route’s
ridership activity occurs between the hours of 6:00 a.m. and 9:00 a.m., with the period of
lowest activity (8.1 percent) occurring between 12:00 p.m. and 3:00 p.m.
Trip generators along the Counter-Clockwise Loop include Gavilan College, the County
Administration Building, San Benito Health Foundation, Calaveras School, the Mission
Oaks Mobile Home Park, R.O. Hardin School, Head Start, San Benito High School, K-
Mart, Safeway, Target, Hazel Hawkins Memorial Hospital, Sunnyslope School, Veteran’s
Memorial Park, and Marguerite Maze Middle School.
The highest boarding and alighting activity occurs at San Benito High School, San
Benito Health Foundation, Mission Oaks Mobile Home Park, and Rancho San Justo
Middle School, Veteran’s Memorial Park, and Downtown Hollister. As with the
Clockwise Loop, this activity is reflective of a large number of students patronizing the
route.
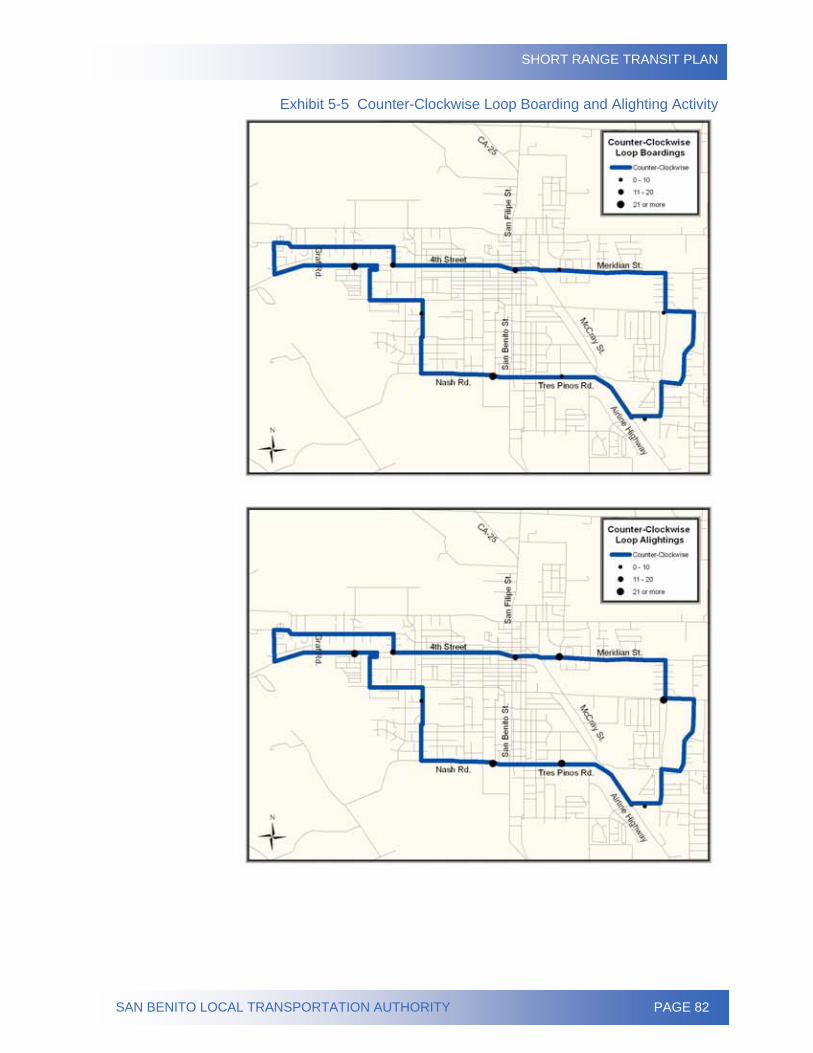
SHORT RANGE TRANSIT PLAN
SAN BENITO LOCAL TRANSPORTATION AUTHORITY PAGE 82
Exhibit 5-5 Counter-Clockwise Loop Boarding and Alighting Activity
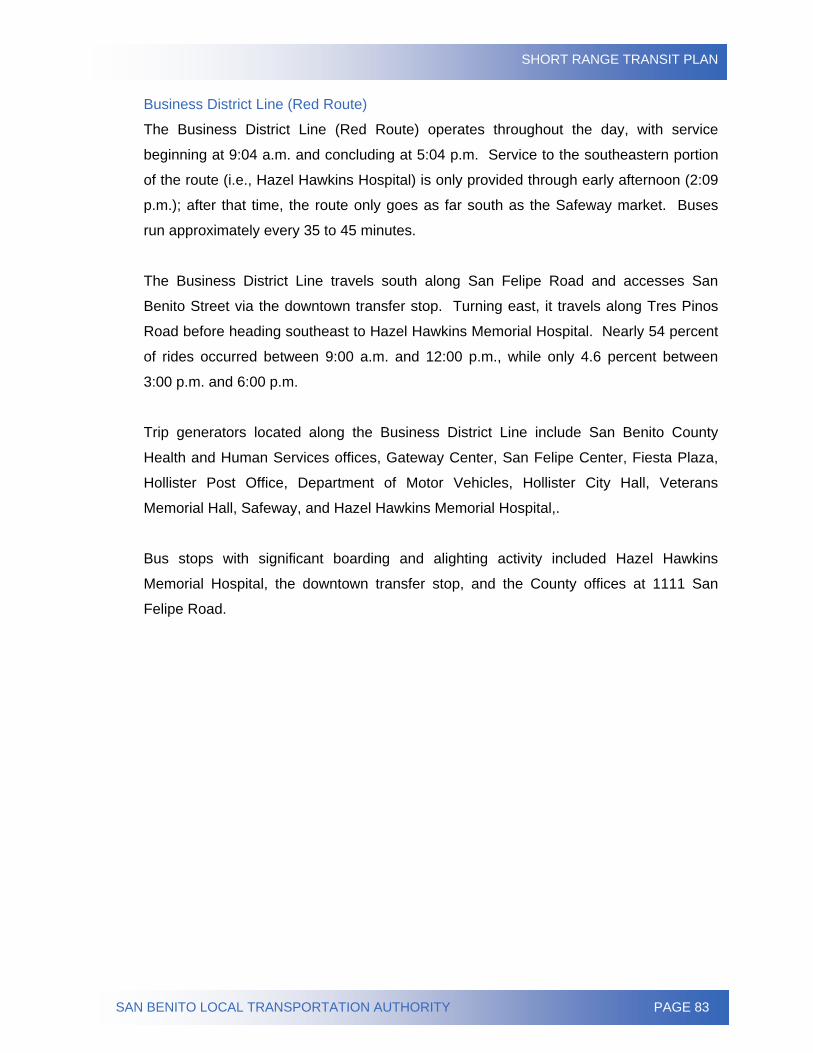
SHORT RANGE TRANSIT PLAN
SAN BENITO LOCAL TRANSPORTATION AUTHORITY PAGE 83
Business District Line (Red Route)
The Business District Line (Red Route) operates throughout the day, with service
beginning at 9:04 a.m. and concluding at 5:04 p.m. Service to the southeastern portion
of the route (i.e., Hazel Hawkins Hospital) is only provided through early afternoon (2:09
p.m.); after that time, the route only goes as far south as the Safeway market. Buses
run approximately every 35 to 45 minutes.
The Business District Line travels south along San Felipe Road and accesses San
Benito Street via the downtown transfer stop. Turning east, it travels along Tres Pinos
Road before heading southeast to Hazel Hawkins Memorial Hospital. Nearly 54 percent
of rides occurred between 9:00 a.m. and 12:00 p.m., while only 4.6 percent between
3:00 p.m. and 6:00 p.m.
Trip generators located along the Business District Line include San Benito County
Health and Human Services offices, Gateway Center, San Felipe Center, Fiesta Plaza,
Hollister Post Office, Department of Motor Vehicles, Hollister City Hall, Veterans
Memorial Hall, Safeway, and Hazel Hawkins Memorial Hospital,.
Bus stops with significant boarding and alighting activity included Hazel Hawkins
Memorial Hospital, the downtown transfer stop, and the County offices at 1111 San
Felipe Road.
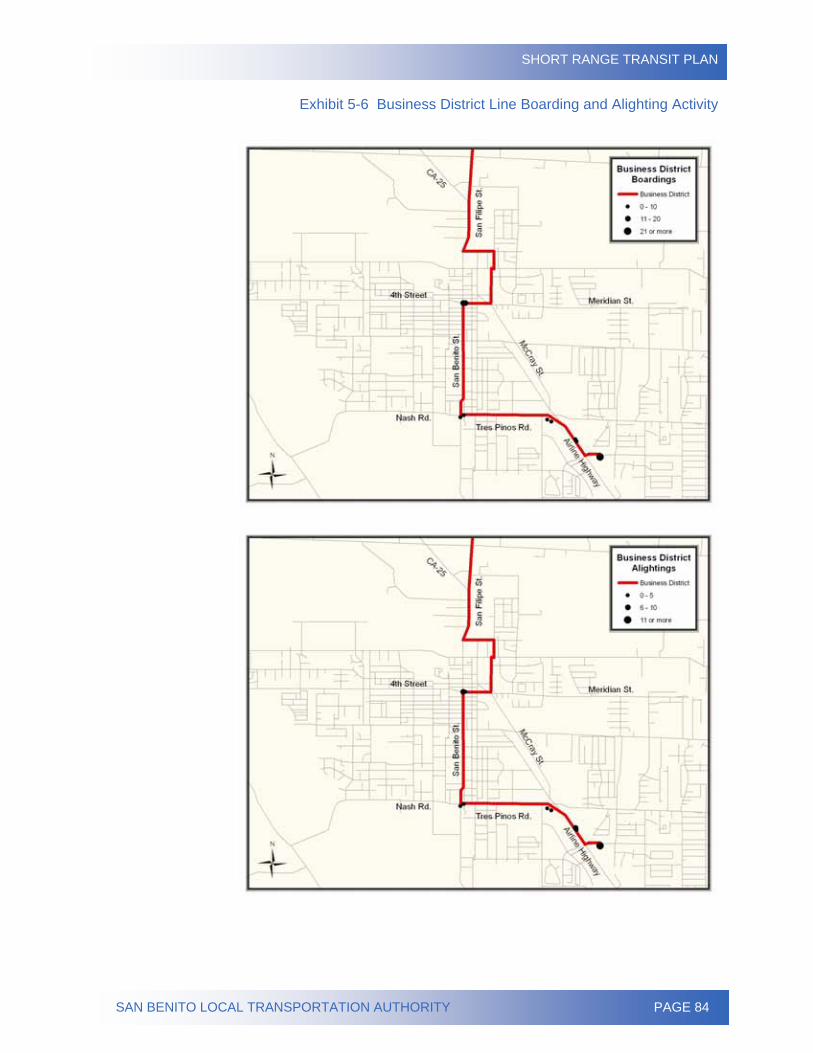
SHORT RANGE TRANSIT PLAN
SAN BENITO LOCAL TRANSPORTATION AUTHORITY PAGE 84
Exhibit 5-6 Business District Line Boarding and Alighting Activity
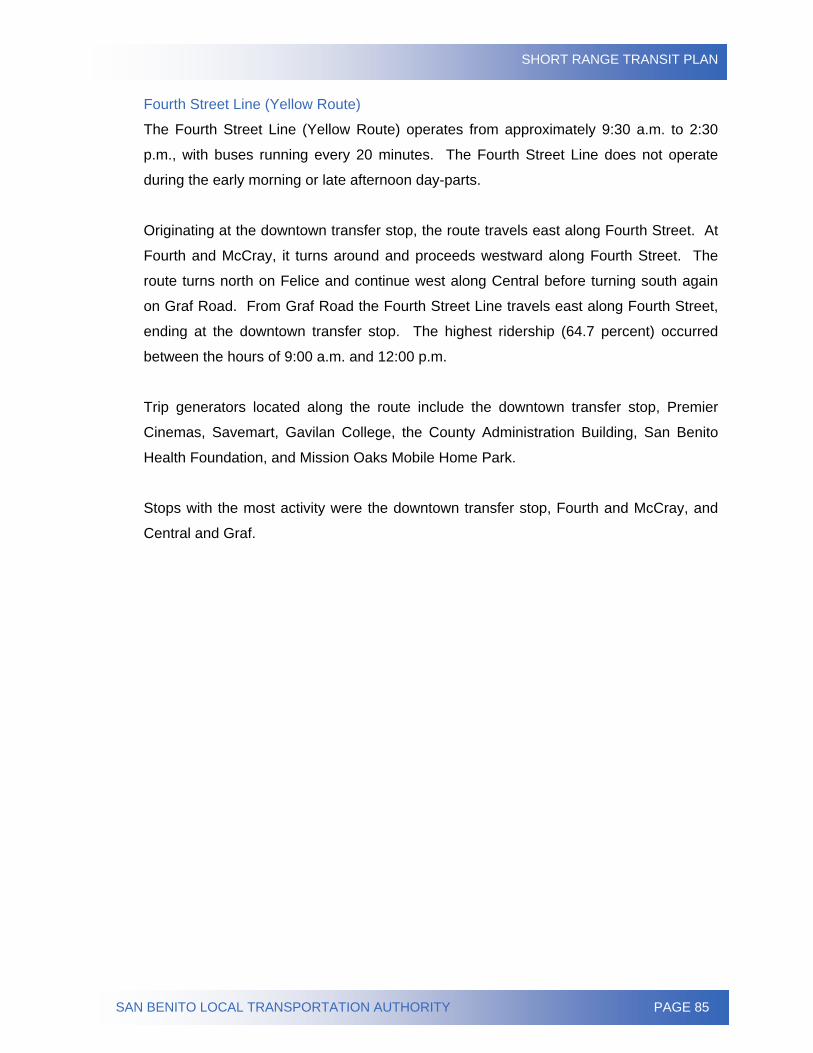
SHORT RANGE TRANSIT PLAN
SAN BENITO LOCAL TRANSPORTATION AUTHORITY PAGE 85
Fourth Street Line (Yellow Route)
The Fourth Street Line (Yellow Route) operates from approximately 9:30 a.m. to 2:30
p.m., with buses running every 20 minutes. The Fourth Street Line does not operate
during the early morning or late afternoon day-parts.
Originating at the downtown transfer stop, the route travels east along Fourth Street. At
Fourth and McCray, it turns around and proceeds westward along Fourth Street. The
route turns north on Felice and continue west along Central before turning south again
on Graf Road. From Graf Road the Fourth Street Line travels east along Fourth Street,
ending at the downtown transfer stop. The highest ridership (64.7 percent) occurred
between the hours of 9:00 a.m. and 12:00 p.m.
Trip generators located along the route include the downtown transfer stop, Premier
Cinemas, Savemart, Gavilan College, the County Administration Building, San Benito
Health Foundation, and Mission Oaks Mobile Home Park.
Stops with the most activity were the downtown transfer stop, Fourth and McCray, and
Central and Graf.
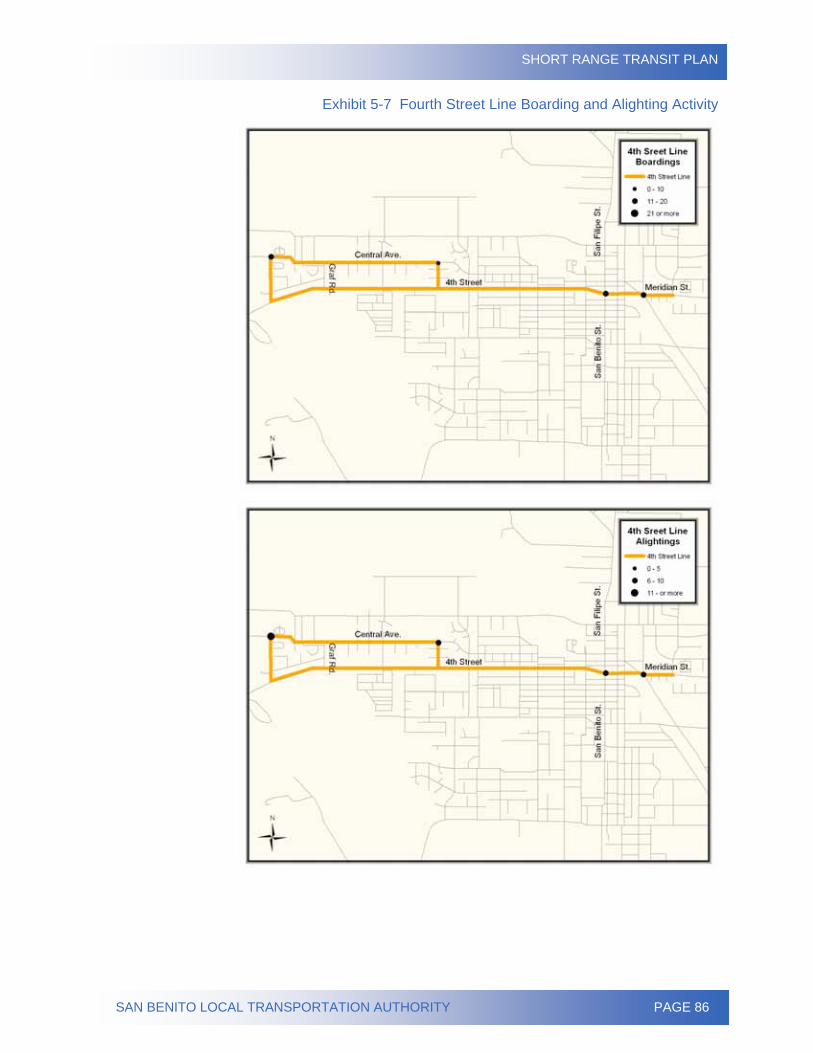
SHORT RANGE TRANSIT PLAN
SAN BENITO LOCAL TRANSPORTATION AUTHORITY PAGE 86
Exhibit 5-7 Fourth Street Line Boarding and Alighting Activity
SHORT RANGE TRANSIT PLAN
SAN BENITO LOCAL TRANSPORTATION AUTHORITY PAGE 87
Intercounty Routes (Gold Routes) Three Intercounty Routes (Gold Routes) link Hollister, San Juan Bautista, and Gilroy.
The Caltrain route offers weekday express service between Hollister and the Caltrain
Station between 5:30 a.m. and 7:25 a.m., and again from 4:35 p.m. to 8:35 p.m. These
trips also offer limited service to Gavilan College in Gilroy. The Gavilan College route
travels between Hollister and Gavilan College on weekdays between 7:00 a.m. and 6:10
p.m. About half of the trips travel via Abbe Park and Anzar High School in San Juan
Bautista. The Gilroy Greyhound route operates only on weekends, traveling from
Hollister to Gilroy via Abbe Park in San Juan Bautista between 7:40 a.m. and 5:55 p.m.
The Gavilan College and Gilroy Greyhound routes travel along State Route 156 and
U.S. Highway 101, providing service to San Juan Bautista. The Caltrain express route
travels via State Route 25. All service begins at Veterans Memorial Park in Hollister,
with additional stops along Fourth Street at the downtown transfer stop and Miller
(Gavilan College route). Important trip generators on the Intercounty Routes include the
Caltrain/Greyhound Station and Gavilan College in Gilroy, and Anzar High School and
Abbe Park in San Juan Bautista.
This route has two major activity periods: 6:00 a.m. to 9:00 a.m. and 12:00 p.m. to 3:00
p.m., with 168 boardings each. The most popular boarding and alighting points were the
downtown transfer stop and Gavilan College in Gilroy, with limited ridership associated
with the San Juan Bautista stops. It is clear the Intercounty Routes are used primarily to
link Hollister and Gilroy.
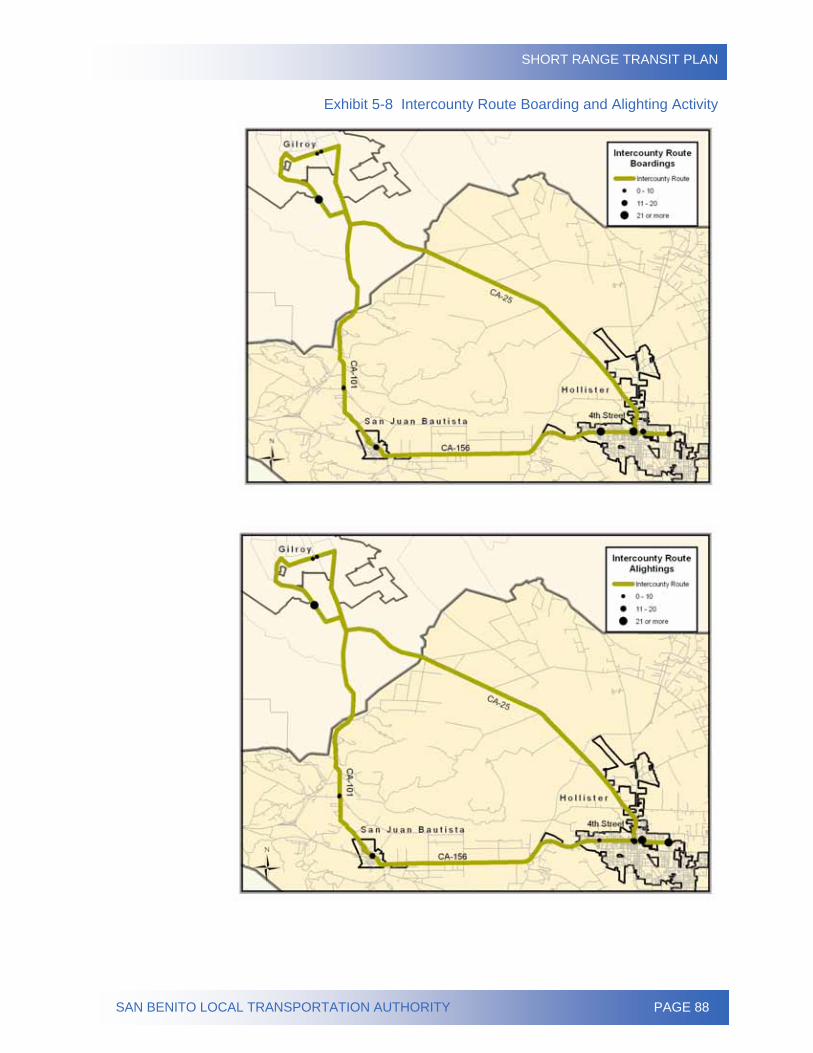
SHORT RANGE TRANSIT PLAN
SAN BENITO LOCAL TRANSPORTATION AUTHORITY PAGE 88
Exhibit 5-8 Intercounty Route Boarding and Alighting Activity
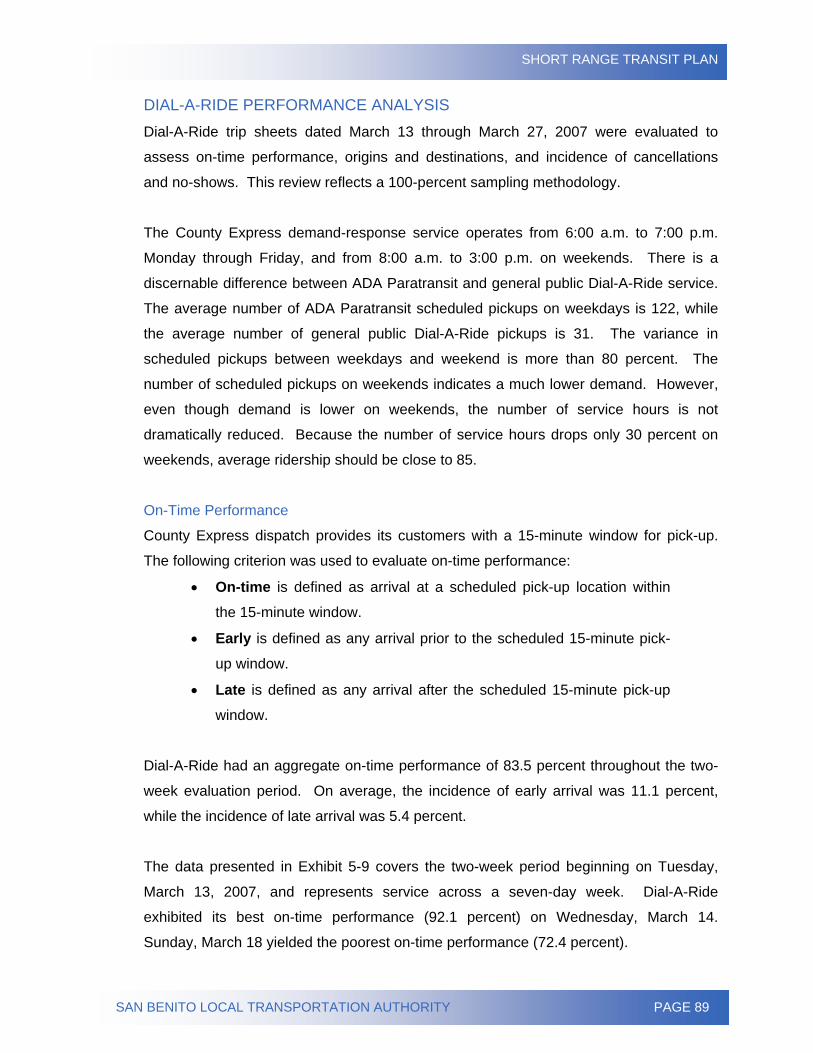
SHORT RANGE TRANSIT PLAN
SAN BENITO LOCAL TRANSPORTATION AUTHORITY PAGE 89
DIAL-A-RIDE PERFORMANCE ANALYSIS Dial-A-Ride trip sheets dated March 13 through March 27, 2007 were evaluated to
assess on-time performance, origins and destinations, and incidence of cancellations
and no-shows. This review reflects a 100-percent sampling methodology.
The County Express demand-response service operates from 6:00 a.m. to 7:00 p.m.
Monday through Friday, and from 8:00 a.m. to 3:00 p.m. on weekends. There is a
discernable difference between ADA Paratransit and general public Dial-A-Ride service.
The average number of ADA Paratransit scheduled pickups on weekdays is 122, while
the average number of general public Dial-A-Ride pickups is 31. The variance in
scheduled pickups between weekdays and weekend is more than 80 percent. The
number of scheduled pickups on weekends indicates a much lower demand. However,
even though demand is lower on weekends, the number of service hours is not
dramatically reduced. Because the number of service hours drops only 30 percent on
weekends, average ridership should be close to 85.
On-Time Performance
County Express dispatch provides its customers with a 15-minute window for pick-up.
The following criterion was used to evaluate on-time performance:
• On-time is defined as arrival at a scheduled pick-up location within
the 15-minute window.
• Early is defined as any arrival prior to the scheduled 15-minute pick-
up window.
• Late is defined as any arrival after the scheduled 15-minute pick-up
window.
Dial-A-Ride had an aggregate on-time performance of 83.5 percent throughout the two-
week evaluation period. On average, the incidence of early arrival was 11.1 percent,
while the incidence of late arrival was 5.4 percent.
The data presented in Exhibit 5-9 covers the two-week period beginning on Tuesday,
March 13, 2007, and represents service across a seven-day week. Dial-A-Ride
exhibited its best on-time performance (92.1 percent) on Wednesday, March 14.
Sunday, March 18 yielded the poorest on-time performance (72.4 percent).
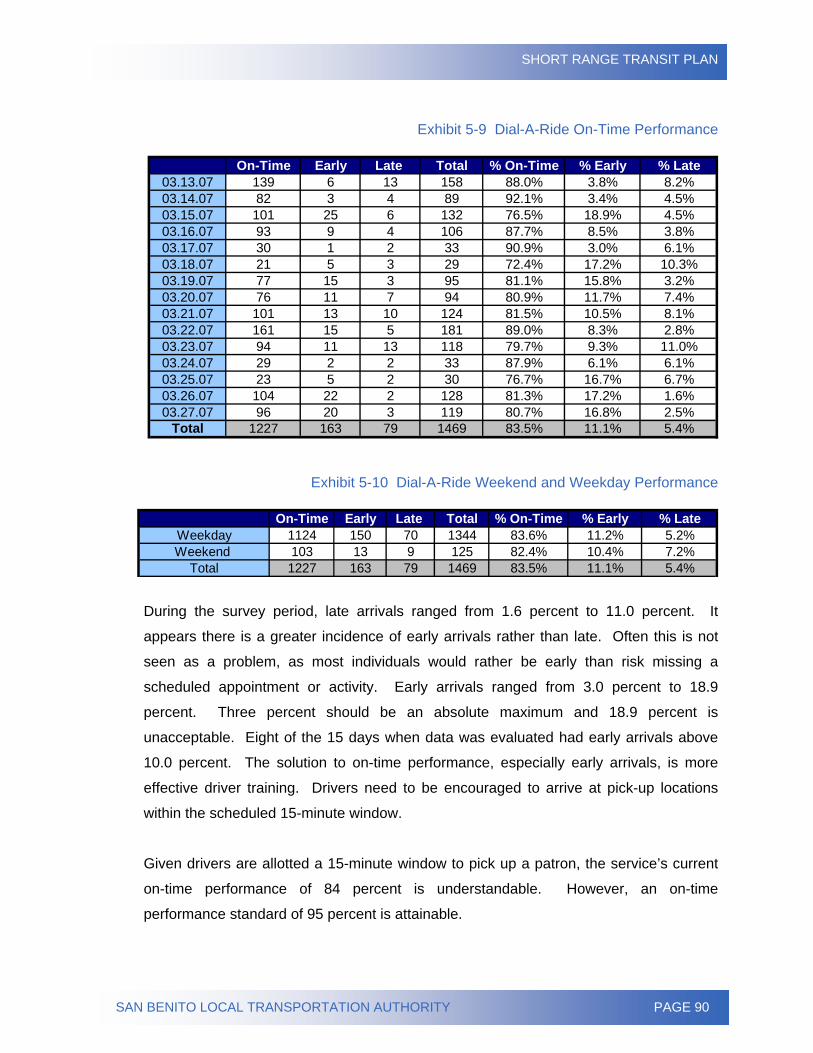
SHORT RANGE TRANSIT PLAN
SAN BENITO LOCAL TRANSPORTATION AUTHORITY PAGE 90
Exhibit 5-9 Dial-A-Ride On-Time Performance
On-Time Early Late Total % On-Time % Early % Late03.13.07 139 6 13 158 88.0% 3.8% 8.2%03.14.07 82 3 4 89 92.1% 3.4% 4.5%03.15.07 101 25 6 132 76.5% 18.9% 4.5%03.16.07 93 9 4 106 87.7% 8.5% 3.8%03.17.07 30 1 2 33 90.9% 3.0% 6.1%03.18.07 21 5 3 29 72.4% 17.2% 10.3%03.19.07 77 15 3 95 81.1% 15.8% 3.2%03.20.07 76 11 7 94 80.9% 11.7% 7.4%03.21.07 101 13 10 124 81.5% 10.5% 8.1%03.22.07 161 15 5 181 89.0% 8.3% 2.8%03.23.07 94 11 13 118 79.7% 9.3% 11.0%03.24.07 29 2 2 33 87.9% 6.1% 6.1%03.25.07 23 5 2 30 76.7% 16.7% 6.7%03.26.07 104 22 2 128 81.3% 17.2% 1.6%03.27.07 96 20 3 119 80.7% 16.8% 2.5%
Total 1227 163 79 1469 83.5% 11.1% 5.4%
Exhibit 5-10 Dial-A-Ride Weekend and Weekday Performance
On-Time Early Late Total % On-Time % Early % Late
Weekday 1124 150 70 1344 83.6% 11.2% 5.2%Weekend 103 13 9 125 82.4% 10.4% 7.2%
Total 1227 163 79 1469 83.5% 11.1% 5.4%
During the survey period, late arrivals ranged from 1.6 percent to 11.0 percent. It
appears there is a greater incidence of early arrivals rather than late. Often this is not
seen as a problem, as most individuals would rather be early than risk missing a
scheduled appointment or activity. Early arrivals ranged from 3.0 percent to 18.9
percent. Three percent should be an absolute maximum and 18.9 percent is
unacceptable. Eight of the 15 days when data was evaluated had early arrivals above
10.0 percent. The solution to on-time performance, especially early arrivals, is more
effective driver training. Drivers need to be encouraged to arrive at pick-up locations
within the scheduled 15-minute window.
Given drivers are allotted a 15-minute window to pick up a patron, the service’s current
on-time performance of 84 percent is understandable. However, an on-time
performance standard of 95 percent is attainable.
SHORT RANGE TRANSIT PLAN
SAN BENITO LOCAL TRANSPORTATION AUTHORITY PAGE 91
Origin and Destination Study
An examination of two weeks of driver trip logs for Dial-A-Ride revealed the most
frequented origins (trip starting points) and destinations (trip end points) for Dial-A-Ride
passengers. It should be noted that due to discrepancies in the drivers’ recordkeeping
(i.e., illegible penmanship) and variations in how locations are described (i.e., one
drivers logs in a street address, while another logs in the business name), some origins
and destinations were eliminated from calculation. Out of those entries where distinct
locations could be identified, definite patterns began to emerge.
Hope Services was by far the most frequent origin and destination. Many patrons used
Dial-A-Ride on a daily basis to travel to and from Hope’s location at 2300 Technology
Parkway. This may be due in part to the elimination of fixed-route service (Business
District Line) to Hope. However, because many of these passengers are
developmentally disabled, they may qualify for and prefer to ride the demand-response
service, and attempting to mode-shift them would likely result in few changes.
The medical district, including Hazel Hawkins Hospital and the surrounding medical
facilities such as the Mabie Skilled Nursing Facility and Rehabilitation Clinics, was the
second-most visited destination and the third-most frequent origin. Ladd Lane School
was the second-most frequent origin and fourth-most visited destination, as many
students use the service for their school transportation. The County Labor Camp was
the third-most visited destination, but did not rank among the top five origins. Cerra
Vista School was the fourth-most popular origin. A location in the 200 block of Daffodil
Drive (likely a residence or group home) ranked fifth on both lists; a fairly large group of
passengers traveled between this address and Hope Services on a daily basis. The top
ten origin and destination pairings are presented in Exhibits 5-11.
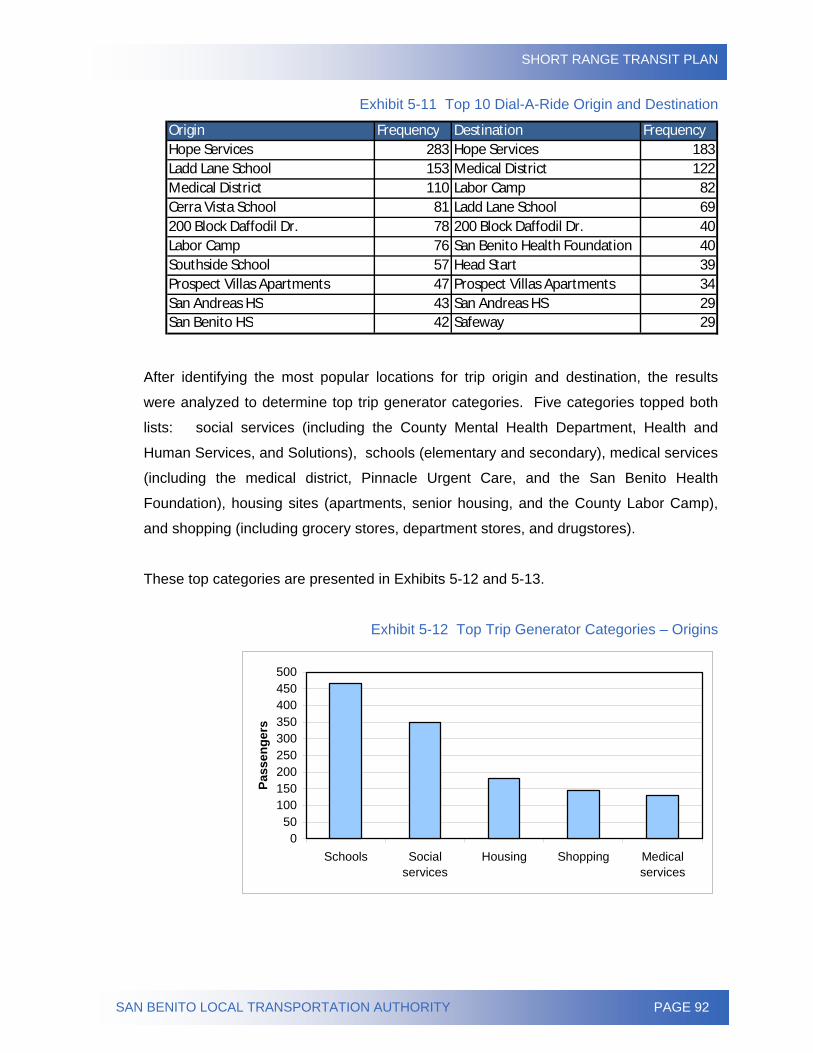
SHORT RANGE TRANSIT PLAN
SAN BENITO LOCAL TRANSPORTATION AUTHORITY PAGE 92
Exhibit 5-11 Top 10 Dial-A-Ride Origin and Destination
Origin Frequency Destination FrequencyHope Services 283 Hope Services 183Ladd Lane School 153 Medical District 122Medical District 110 Labor Camp 82Cerra Vista School 81 Ladd Lane School 69200 Block Daffodil Dr. 78 200 Block Daffodil Dr. 40Labor Camp 76 San Benito Health Foundation 40Southside School 57 Head Start 39Prospect Villas Apartments 47 Prospect Villas Apartments 34San Andreas HS 43 San Andreas HS 29San Benito HS 42 Safeway 29
After identifying the most popular locations for trip origin and destination, the results
were analyzed to determine top trip generator categories. Five categories topped both
lists: social services (including the County Mental Health Department, Health and
Human Services, and Solutions), schools (elementary and secondary), medical services
(including the medical district, Pinnacle Urgent Care, and the San Benito Health
Foundation), housing sites (apartments, senior housing, and the County Labor Camp),
and shopping (including grocery stores, department stores, and drugstores).
These top categories are presented in Exhibits 5-12 and 5-13.
Exhibit 5-12 Top Trip Generator Categories – Origins
050
100150200250300350400450500
Schools Socialservices
Housing Shopping Medicalservices
Pass
enge
rs
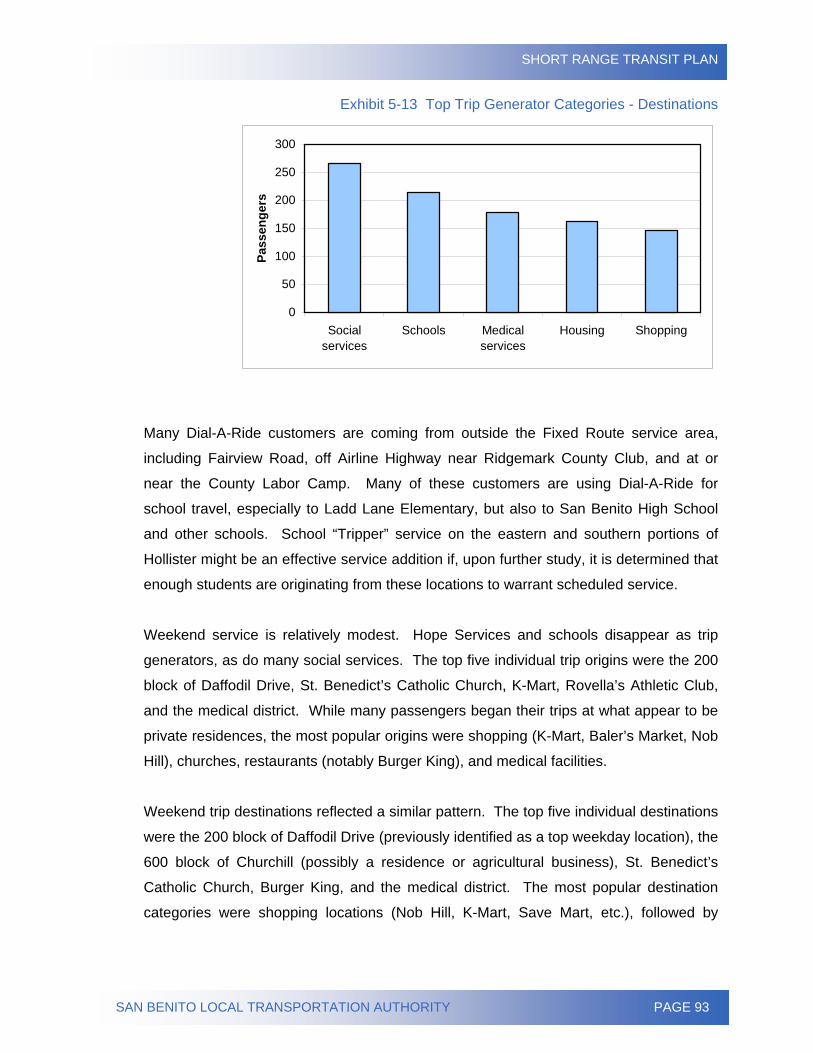
SHORT RANGE TRANSIT PLAN
SAN BENITO LOCAL TRANSPORTATION AUTHORITY PAGE 93
Exhibit 5-13 Top Trip Generator Categories - Destinations
0
50
100
150
200
250
300
Socialservices
Schools Medicalservices
Housing Shopping
Pass
enge
rs
Many Dial-A-Ride customers are coming from outside the Fixed Route service area,
including Fairview Road, off Airline Highway near Ridgemark County Club, and at or
near the County Labor Camp. Many of these customers are using Dial-A-Ride for
school travel, especially to Ladd Lane Elementary, but also to San Benito High School
and other schools. School “Tripper” service on the eastern and southern portions of
Hollister might be an effective service addition if, upon further study, it is determined that
enough students are originating from these locations to warrant scheduled service.
Weekend service is relatively modest. Hope Services and schools disappear as trip
generators, as do many social services. The top five individual trip origins were the 200
block of Daffodil Drive, St. Benedict’s Catholic Church, K-Mart, Rovella’s Athletic Club,
and the medical district. While many passengers began their trips at what appear to be
private residences, the most popular origins were shopping (K-Mart, Baler’s Market, Nob
Hill), churches, restaurants (notably Burger King), and medical facilities.
Weekend trip destinations reflected a similar pattern. The top five individual destinations
were the 200 block of Daffodil Drive (previously identified as a top weekday location), the
600 block of Churchill (possibly a residence or agricultural business), St. Benedict’s
Catholic Church, Burger King, and the medical district. The most popular destination
categories were shopping locations (Nob Hill, K-Mart, Save Mart, etc.), followed by
SHORT RANGE TRANSIT PLAN
SAN BENITO LOCAL TRANSPORTATION AUTHORITY PAGE 94
restaurants (Burger King, Taco Bell, Cedar House, Jerry’s), churches, and medical
facilities (the hospital area and urgent care).
Cancellations and “No Shows”
Cancellations that are made on-time (more than one hour prior to the scheduled pick-up)
do not affect the service negatively and can be excluded from this evaluation. Two other
types of cancellations are more problematic – those that provide little or no notice to the
Dial-A-Ride service. Cancellations made less than before the scheduled pick-up time
are considered “insufficient notice cancellations.” A “no show” occurs when there is no
effort by the patron to call ahead and cancel the service, resulting in the vehicle traveling
to the scheduled pick-up point.
The instance of cancellations during the two-week evaluation period was 1.7 percent,
while the instance of “no shows” during the same period was 6.8 percent. The greatest
incidence of cancellations was noted on March 18 (Sunday), while March 25 and 27
(Sunday and Tuesday) experienced the lowest. March 18 also experienced the greatest
number of “no shows” (13.9 percent). The lowest “no show” rate was 1.8 percent on
March 13 (Tuesday).
It is important to advise customers of the service impact when rides are cancelled late or
riders fail to show. This policy can be enforced by implementing a procedure that results
in a temporary loss of service privileges for patrons who exceed a set number of “no
shows” or cancel service without adequate notice too many times. Addressing the “no
show” problem could be the single-most important means of increasing program
productivity.
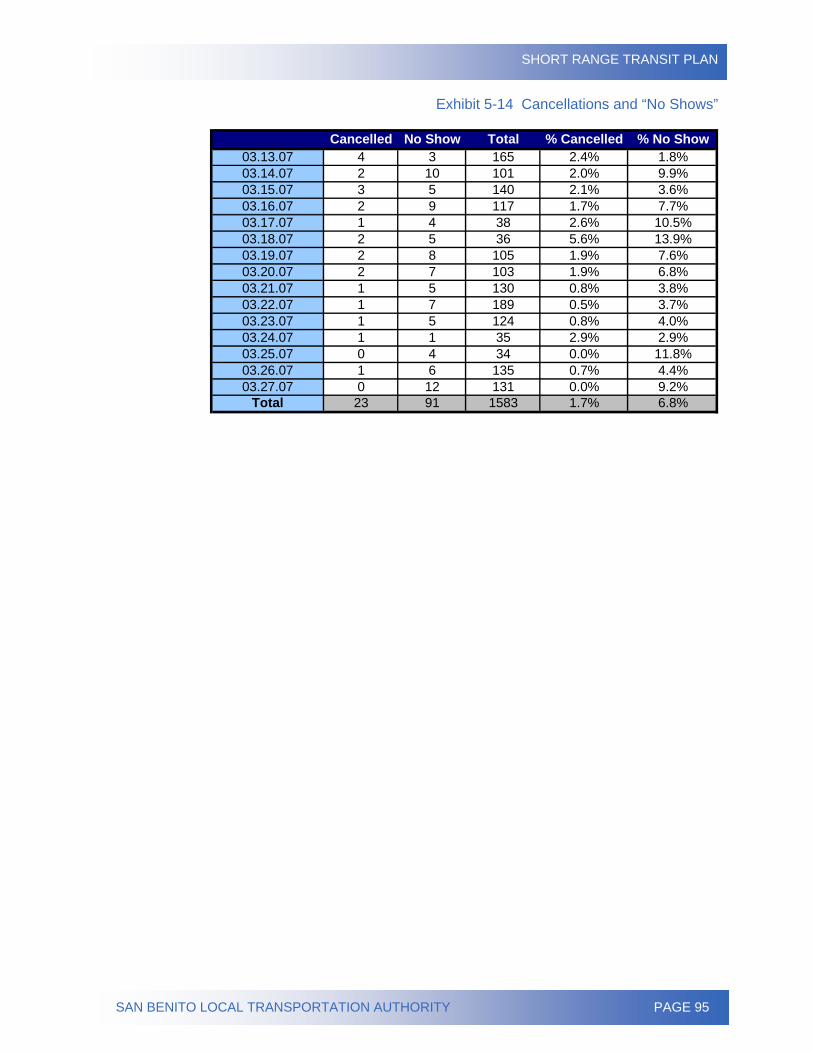
SHORT RANGE TRANSIT PLAN
SAN BENITO LOCAL TRANSPORTATION AUTHORITY PAGE 95
Exhibit 5-14 Cancellations and “No Shows”
Cancelled No Show Total % Cancelled % No Show03.13.07 4 3 165 2.4% 1.8%03.14.07 2 10 101 2.0% 9.9%03.15.07 3 5 140 2.1% 3.6%03.16.07 2 9 117 1.7% 7.7%03.17.07 1 4 38 2.6% 10.5%03.18.07 2 5 36 5.6% 13.9%03.19.07 2 8 105 1.9% 7.6%03.20.07 2 7 103 1.9% 6.8%03.21.07 1 5 130 0.8% 3.8%03.22.07 1 7 189 0.5% 3.7%03.23.07 1 5 124 0.8% 4.0%03.24.07 1 1 35 2.9% 2.9%03.25.07 0 4 34 0.0% 11.8%03.26.07 1 6 135 0.7% 4.4%03.27.07 0 12 131 0.0% 9.2%
Total 23 91 1583 1.7% 6.8%

SHORT RANGE TRANSIT PLAN
SAN BENITO LOCAL TRANSPORTATION AUTHORITY PAGE 96
Page Intentionally Blank
SHORT RANGE TRANSIT PLAN
SAN BENITO LOCAL TRANSPORTATION AUTHORITY PAGE 97
CHAPTER 6 – ON-BOARD SURVEY ANALYSIS A statistically-valid survey of persons riding on-board Fixed and Intercounty routes was
conducted. Administered across a six-day period in early December 2006, the survey
had a number of objectives:
• Collect information at the rider level.
• Assist in the development of a “transit rider” demographic profile.
• Codify “normal” travel patterns among transit riders.
• Assess customer satisfaction regarding various service attributes.
• Identify potential service enhancements and the propensity of current
customers to patronage them.
• Identify “most favored” marketing or promotional channels.
Survey Methodology
A self-administered survey of adults traveling on Fixed Route and Intercounty was
conducted during the week of December 10, 2006. For surveying purposes, the term
“adult” is defined as a person age 16 years or older. A bilingual survey instrument was
printed in English on one side and Spanish on the other so that customers could
complete the survey in their preferred language.
Three steps were taken to assure statistical validity. First, a stratified random-sample
methodology was employed. This approach allowed the survey team to obtain a
balanced sample reflecting each County Express route’s relative ridership. Second, the
survey was conducted across a six-day week, throughout all day-parts. In doing so, all
persons using transit throughout a typical service week were provided equal opportunity
to participate. Third, a bilingual instrument (English/Spanish) was used to ensure those
who are not fluent in English were equally represented.
The validity of each completed survey form was verified by the survey coordinator, who
also provided on-site supervision throughout the data collection process. Survey forms
reflecting partial completion or faulty data were not included in the final data sample so
as to reduce the incidence of data skewing. Further, a pre-test of the approved survey
instrument was conducted using a sample size equal to 10 percent of the overall survey
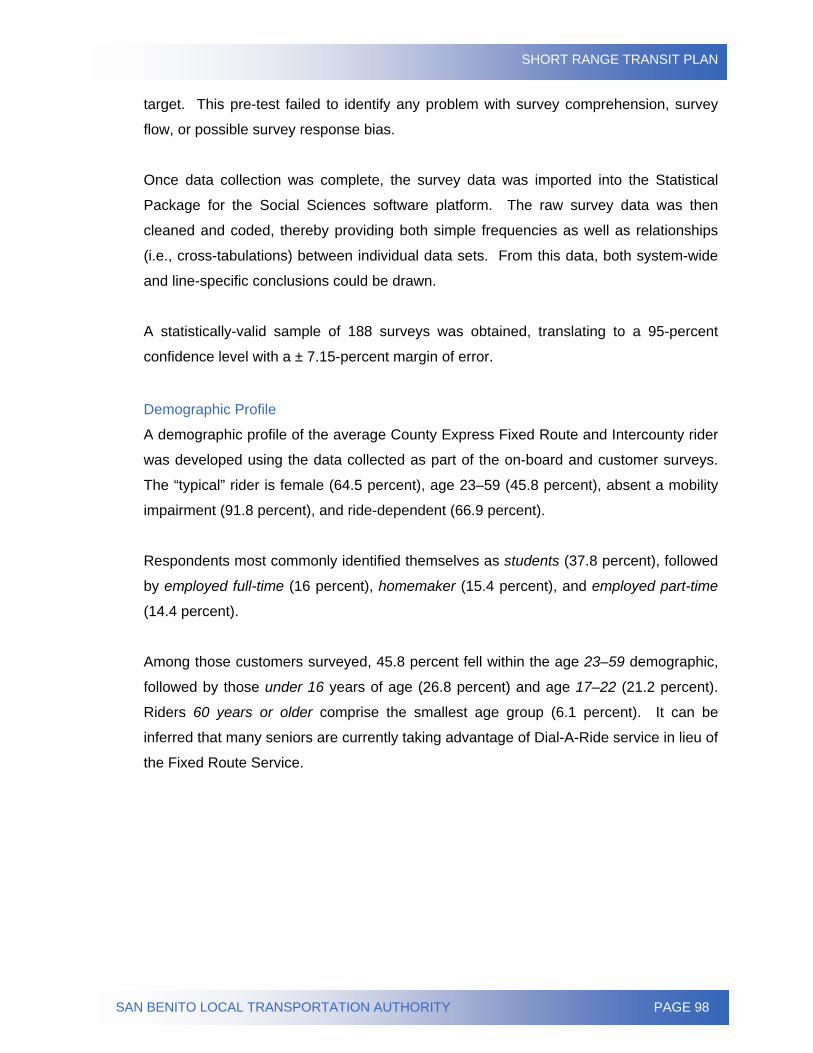
SHORT RANGE TRANSIT PLAN
SAN BENITO LOCAL TRANSPORTATION AUTHORITY PAGE 98
target. This pre-test failed to identify any problem with survey comprehension, survey
flow, or possible survey response bias.
Once data collection was complete, the survey data was imported into the Statistical
Package for the Social Sciences software platform. The raw survey data was then
cleaned and coded, thereby providing both simple frequencies as well as relationships
(i.e., cross-tabulations) between individual data sets. From this data, both system-wide
and line-specific conclusions could be drawn.
A statistically-valid sample of 188 surveys was obtained, translating to a 95-percent
confidence level with a ± 7.15-percent margin of error.
Demographic Profile
A demographic profile of the average County Express Fixed Route and Intercounty rider
was developed using the data collected as part of the on-board and customer surveys.
The “typical” rider is female (64.5 percent), age 23–59 (45.8 percent), absent a mobility
impairment (91.8 percent), and ride-dependent (66.9 percent).
Respondents most commonly identified themselves as students (37.8 percent), followed
by employed full-time (16 percent), homemaker (15.4 percent), and employed part-time
(14.4 percent).
Among those customers surveyed, 45.8 percent fell within the age 23–59 demographic,
followed by those under 16 years of age (26.8 percent) and age 17–22 (21.2 percent).
Riders 60 years or older comprise the smallest age group (6.1 percent). It can be
inferred that many seniors are currently taking advantage of Dial-A-Ride service in lieu of
the Fixed Route Service.
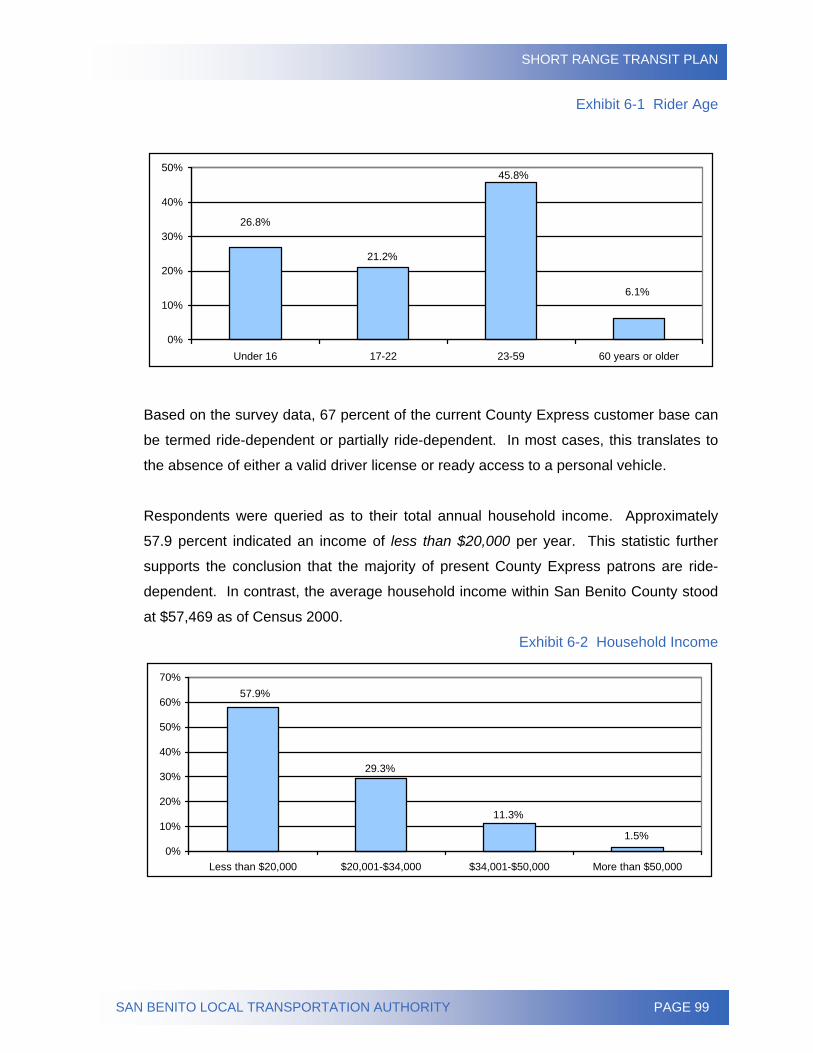
SHORT RANGE TRANSIT PLAN
SAN BENITO LOCAL TRANSPORTATION AUTHORITY PAGE 99
Exhibit 6-1 Rider Age
45.8%
21.2%
26.8%
6.1%
0%
10%
20%
30%
40%
50%
Under 16 17-22 23-59 60 years or older
Based on the survey data, 67 percent of the current County Express customer base can
be termed ride-dependent or partially ride-dependent. In most cases, this translates to
the absence of either a valid driver license or ready access to a personal vehicle.
Respondents were queried as to their total annual household income. Approximately
57.9 percent indicated an income of less than $20,000 per year. This statistic further
supports the conclusion that the majority of present County Express patrons are ride-
dependent. In contrast, the average household income within San Benito County stood
at $57,469 as of Census 2000.
Exhibit 6-2 Household Income
11.3%
29.3%
57.9%
1.5%0%
10%
20%
30%
40%
50%
60%
70%
Less than $20,000 $20,001-$34,000 $34,001-$50,000 More than $50,000
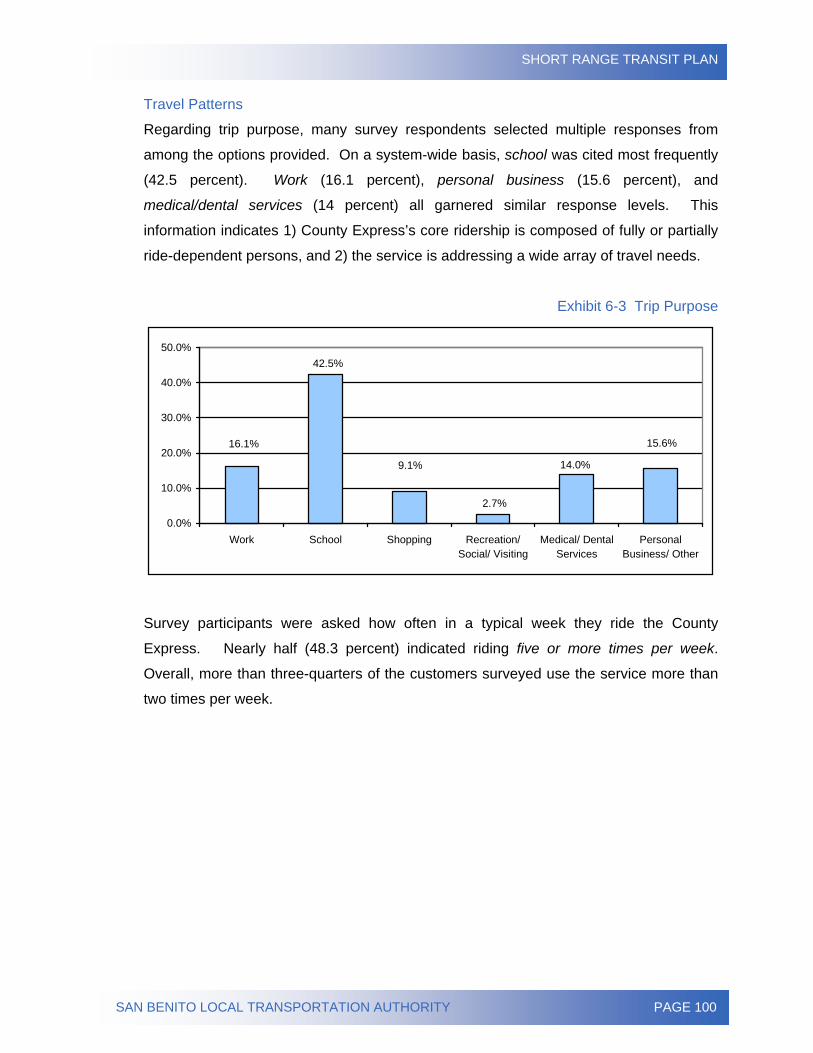
SHORT RANGE TRANSIT PLAN
SAN BENITO LOCAL TRANSPORTATION AUTHORITY PAGE 100
Travel Patterns
Regarding trip purpose, many survey respondents selected multiple responses from
among the options provided. On a system-wide basis, school was cited most frequently
(42.5 percent). Work (16.1 percent), personal business (15.6 percent), and
medical/dental services (14 percent) all garnered similar response levels. This
information indicates 1) County Express’s core ridership is composed of fully or partially
ride-dependent persons, and 2) the service is addressing a wide array of travel needs.
Exhibit 6-3 Trip Purpose
15.6%
14.0%
2.7%
9.1%
42.5%
16.1%
0.0%
10.0%
20.0%
30.0%
40.0%
50.0%
Work School Shopping Recreation/Social/ Visiting
Medical/ DentalServices
PersonalBusiness/ Other
Survey participants were asked how often in a typical week they ride the County
Express. Nearly half (48.3 percent) indicated riding five or more times per week.
Overall, more than three-quarters of the customers surveyed use the service more than
two times per week.
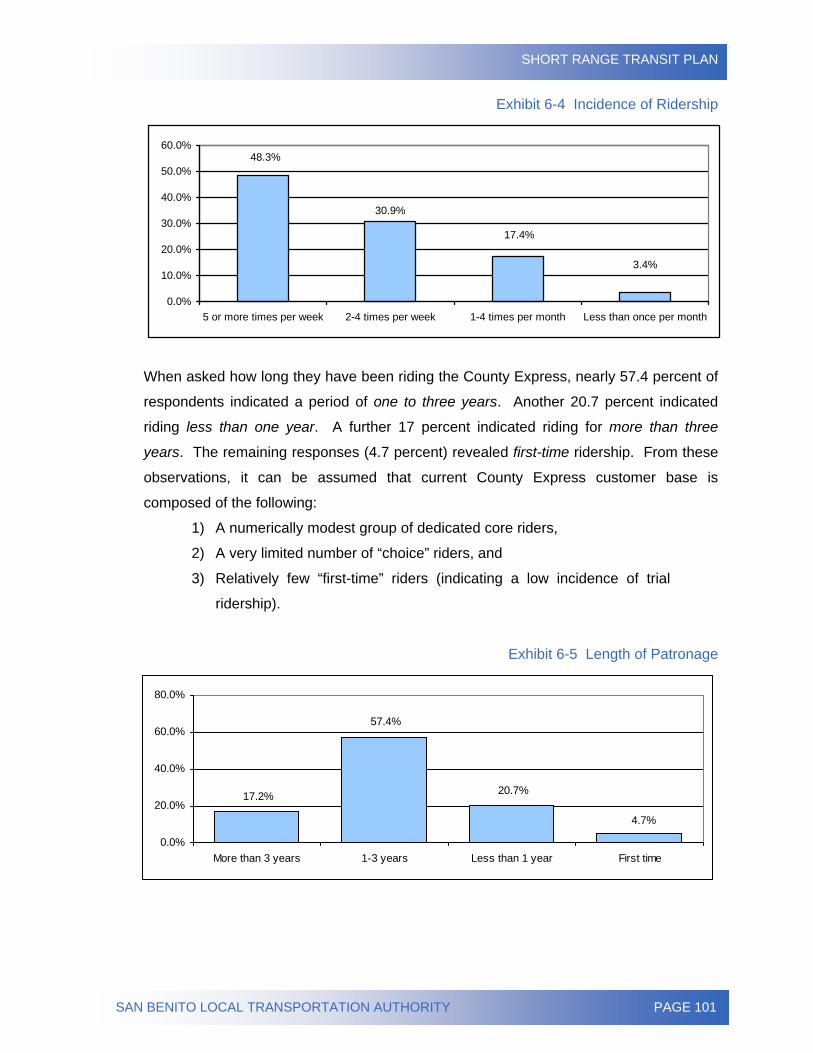
SHORT RANGE TRANSIT PLAN
SAN BENITO LOCAL TRANSPORTATION AUTHORITY PAGE 101
Exhibit 6-4 Incidence of Ridership
3.4%
17.4%
30.9%
48.3%
0.0%
10.0%
20.0%
30.0%
40.0%
50.0%
60.0%
5 or more times per week 2-4 times per week 1-4 times per month Less than once per month
When asked how long they have been riding the County Express, nearly 57.4 percent of
respondents indicated a period of one to three years. Another 20.7 percent indicated
riding less than one year. A further 17 percent indicated riding for more than three
years. The remaining responses (4.7 percent) revealed first-time ridership. From these
observations, it can be assumed that current County Express customer base is
composed of the following:
1) A numerically modest group of dedicated core riders,
2) A very limited number of “choice” riders, and
3) Relatively few “first-time” riders (indicating a low incidence of trial
ridership).
Exhibit 6-5 Length of Patronage
4.7%
20.7%
57.4%
17.2%
0.0%
20.0%
40.0%
60.0%
80.0%
More than 3 years 1-3 years Less than 1 year First time
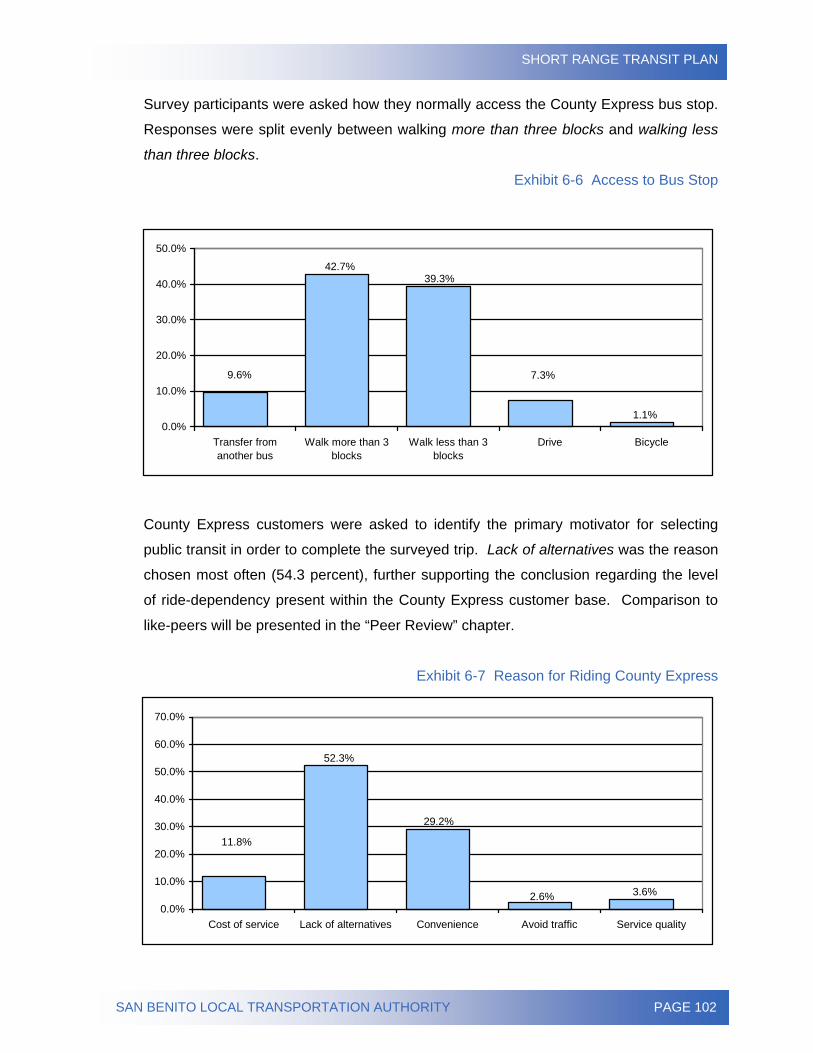
SHORT RANGE TRANSIT PLAN
SAN BENITO LOCAL TRANSPORTATION AUTHORITY PAGE 102
Survey participants were asked how they normally access the County Express bus stop.
Responses were split evenly between walking more than three blocks and walking less
than three blocks.
Exhibit 6-6 Access to Bus Stop
1.1%
7.3%
39.3%42.7%
9.6%
0.0%
10.0%
20.0%
30.0%
40.0%
50.0%
Transfer fromanother bus
Walk more than 3blocks
Walk less than 3blocks
Drive Bicycle
County Express customers were asked to identify the primary motivator for selecting
public transit in order to complete the surveyed trip. Lack of alternatives was the reason
chosen most often (54.3 percent), further supporting the conclusion regarding the level
of ride-dependency present within the County Express customer base. Comparison to
like-peers will be presented in the “Peer Review” chapter.
Exhibit 6-7 Reason for Riding County Express
3.6%2.6%
29.2%
52.3%
11.8%
0.0%
10.0%
20.0%
30.0%
40.0%
50.0%
60.0%
70.0%
Cost of service Lack of alternatives Convenience Avoid traffic Service quality
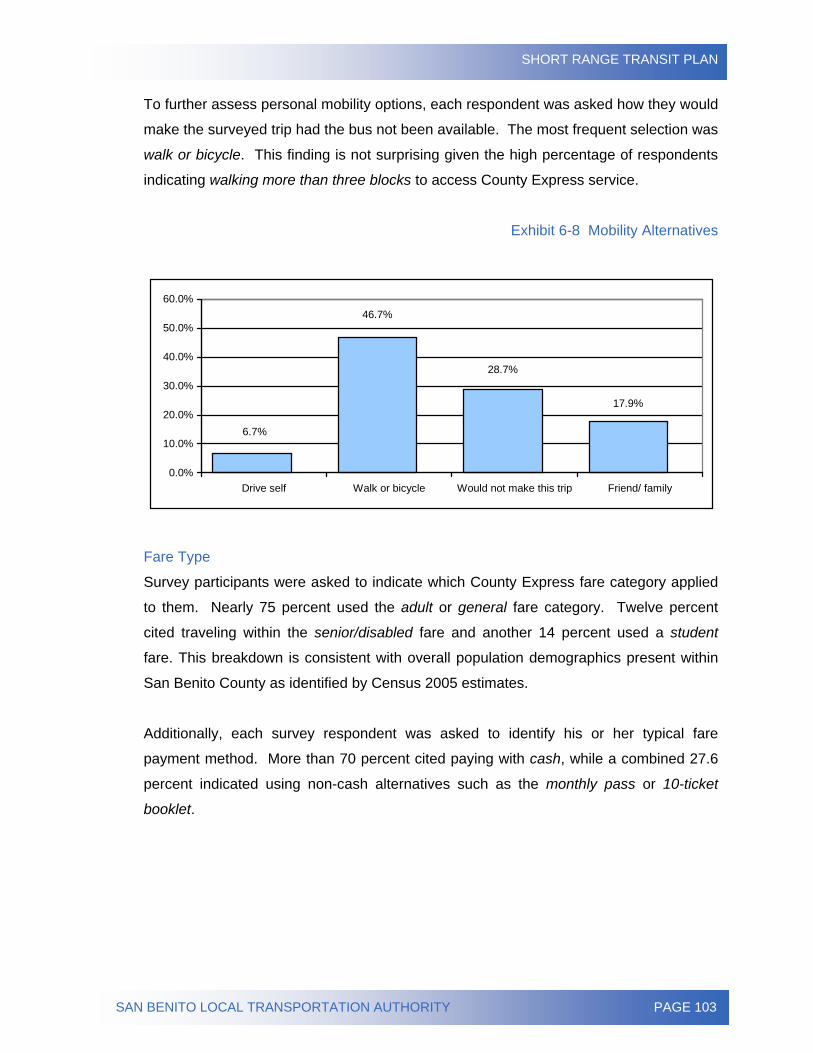
SHORT RANGE TRANSIT PLAN
SAN BENITO LOCAL TRANSPORTATION AUTHORITY PAGE 103
To further assess personal mobility options, each respondent was asked how they would
make the surveyed trip had the bus not been available. The most frequent selection was
walk or bicycle. This finding is not surprising given the high percentage of respondents
indicating walking more than three blocks to access County Express service.
Exhibit 6-8 Mobility Alternatives
17.9%
28.7%
46.7%
6.7%
0.0%
10.0%
20.0%
30.0%
40.0%
50.0%
60.0%
Drive self Walk or bicycle Would not make this trip Friend/ family
Fare Type
Survey participants were asked to indicate which County Express fare category applied
to them. Nearly 75 percent used the adult or general fare category. Twelve percent
cited traveling within the senior/disabled fare and another 14 percent used a student
fare. This breakdown is consistent with overall population demographics present within
San Benito County as identified by Census 2005 estimates.
Additionally, each survey respondent was asked to identify his or her typical fare
payment method. More than 70 percent cited paying with cash, while a combined 27.6
percent indicated using non-cash alternatives such as the monthly pass or 10-ticket
booklet.
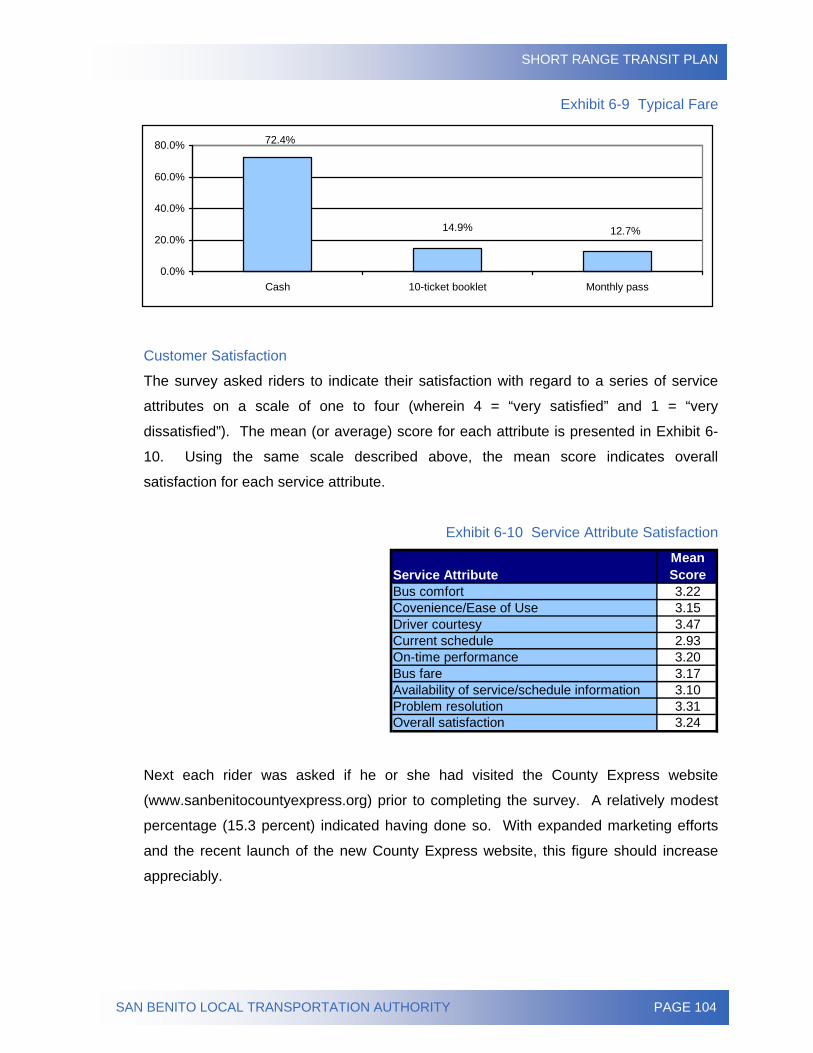
SHORT RANGE TRANSIT PLAN
SAN BENITO LOCAL TRANSPORTATION AUTHORITY PAGE 104
Exhibit 6-9 Typical Fare
12.7%14.9%
72.4%
0.0%
20.0%
40.0%
60.0%
80.0%
Cash 10-ticket booklet Monthly pass
Customer Satisfaction
The survey asked riders to indicate their satisfaction with regard to a series of service
attributes on a scale of one to four (wherein 4 = “very satisfied” and 1 = “very
dissatisfied”). The mean (or average) score for each attribute is presented in Exhibit 6-
10. Using the same scale described above, the mean score indicates overall
satisfaction for each service attribute.
Exhibit 6-10 Service Attribute Satisfaction
Service AttributeMean Score
Bus comfort 3.22Covenience/Ease of Use 3.15Driver courtesy 3.47Current schedule 2.93On-time performance 3.20Bus fare 3.17Availability of service/schedule information 3.10Problem resolution 3.31Overall satisfaction 3.24
Next each rider was asked if he or she had visited the County Express website
(www.sanbenitocountyexpress.org) prior to completing the survey. A relatively modest
percentage (15.3 percent) indicated having done so. With expanded marketing efforts
and the recent launch of the new County Express website, this figure should increase
appreciably.
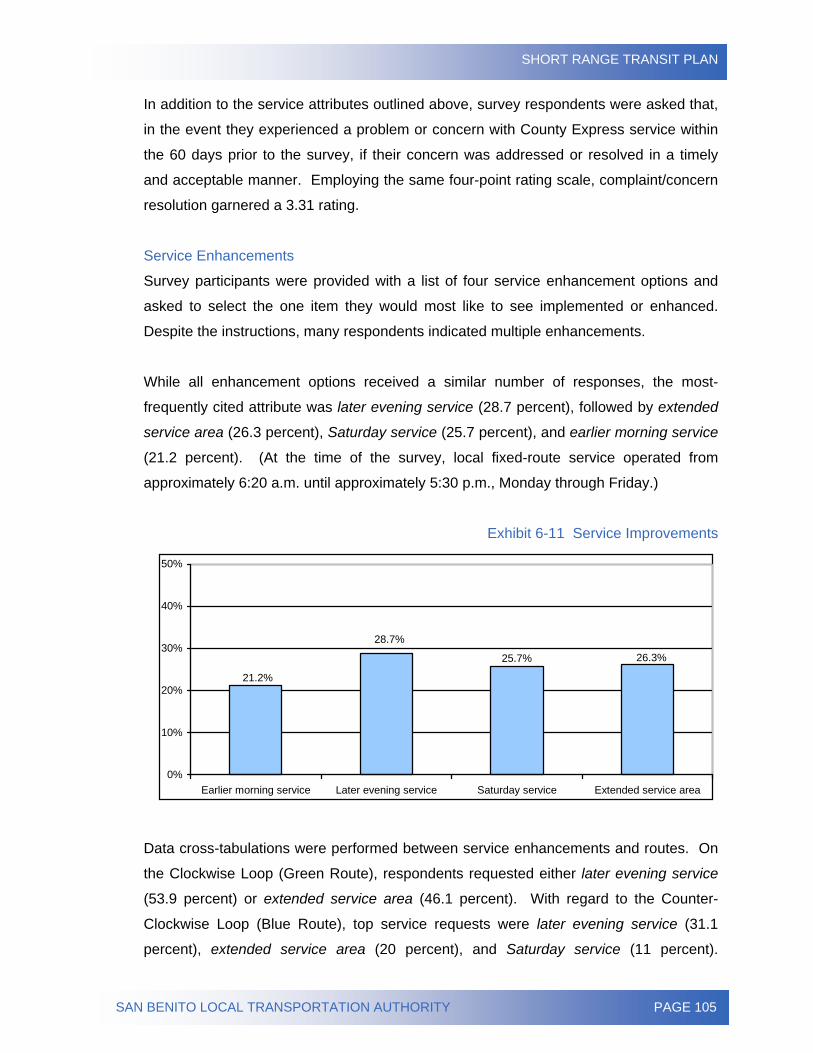
SHORT RANGE TRANSIT PLAN
SAN BENITO LOCAL TRANSPORTATION AUTHORITY PAGE 105
In addition to the service attributes outlined above, survey respondents were asked that,
in the event they experienced a problem or concern with County Express service within
the 60 days prior to the survey, if their concern was addressed or resolved in a timely
and acceptable manner. Employing the same four-point rating scale, complaint/concern
resolution garnered a 3.31 rating.
Service Enhancements
Survey participants were provided with a list of four service enhancement options and
asked to select the one item they would most like to see implemented or enhanced.
Despite the instructions, many respondents indicated multiple enhancements.
While all enhancement options received a similar number of responses, the most-
frequently cited attribute was later evening service (28.7 percent), followed by extended
service area (26.3 percent), Saturday service (25.7 percent), and earlier morning service
(21.2 percent). (At the time of the survey, local fixed-route service operated from
approximately 6:20 a.m. until approximately 5:30 p.m., Monday through Friday.)
Exhibit 6-11 Service Improvements
26.3%25.7%
21.2%
28.7%
0%
10%
20%
30%
40%
50%
Earlier morning service Later evening service Saturday service Extended service area
Data cross-tabulations were performed between service enhancements and routes. On
the Clockwise Loop (Green Route), respondents requested either later evening service
(53.9 percent) or extended service area (46.1 percent). With regard to the Counter-
Clockwise Loop (Blue Route), top service requests were later evening service (31.1
percent), extended service area (20 percent), and Saturday service (11 percent).
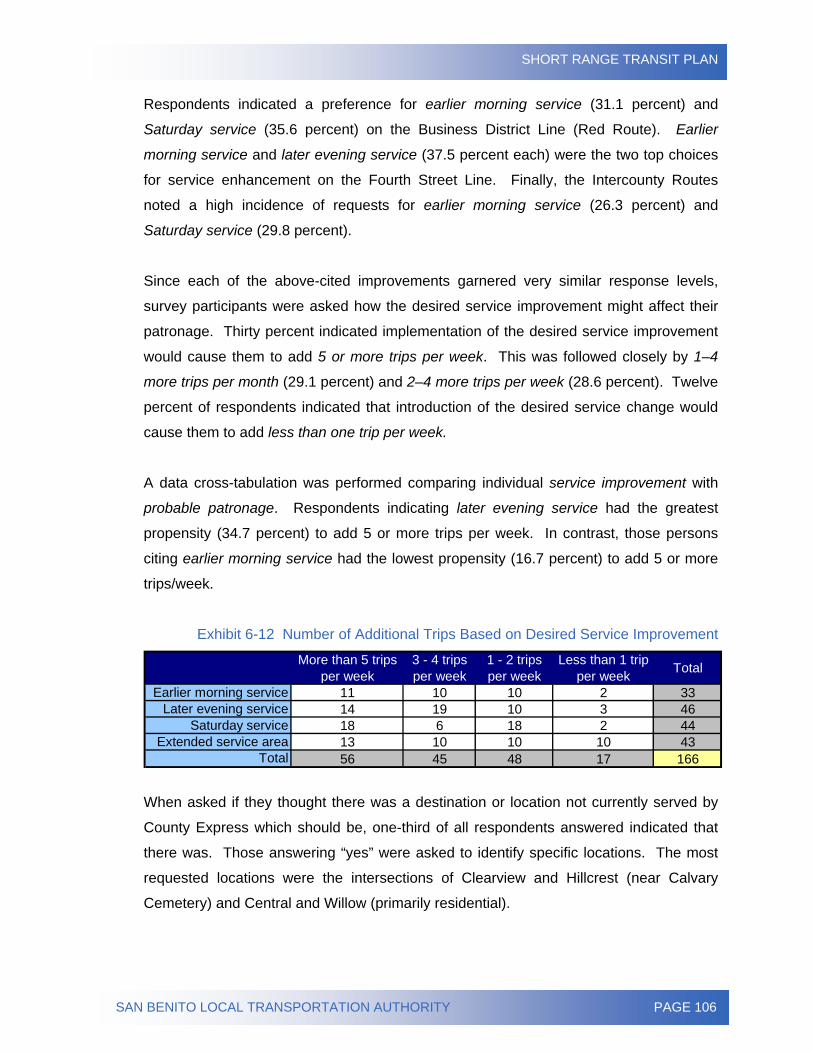
SHORT RANGE TRANSIT PLAN
SAN BENITO LOCAL TRANSPORTATION AUTHORITY PAGE 106
Respondents indicated a preference for earlier morning service (31.1 percent) and
Saturday service (35.6 percent) on the Business District Line (Red Route). Earlier
morning service and later evening service (37.5 percent each) were the two top choices
for service enhancement on the Fourth Street Line. Finally, the Intercounty Routes
noted a high incidence of requests for earlier morning service (26.3 percent) and
Saturday service (29.8 percent).
Since each of the above-cited improvements garnered very similar response levels,
survey participants were asked how the desired service improvement might affect their
patronage. Thirty percent indicated implementation of the desired service improvement
would cause them to add 5 or more trips per week. This was followed closely by 1–4
more trips per month (29.1 percent) and 2–4 more trips per week (28.6 percent). Twelve
percent of respondents indicated that introduction of the desired service change would
cause them to add less than one trip per week.
A data cross-tabulation was performed comparing individual service improvement with
probable patronage. Respondents indicating later evening service had the greatest
propensity (34.7 percent) to add 5 or more trips per week. In contrast, those persons
citing earlier morning service had the lowest propensity (16.7 percent) to add 5 or more
trips/week.
Exhibit 6-12 Number of Additional Trips Based on Desired Service Improvement
More than 5 trips per week
3 - 4 trips per week
1 - 2 trips per week
Less than 1 trip per week Total
Earlier morning service 11 10 10 2 33Later evening service 14 19 10 3 46
Saturday service 18 6 18 2 44Extended service area 13 10 10 10 43
Total 56 45 48 17 166
When asked if they thought there was a destination or location not currently served by
County Express which should be, one-third of all respondents answered indicated that
there was. Those answering “yes” were asked to identify specific locations. The most
requested locations were the intersections of Clearview and Hillcrest (near Calvary
Cemetery) and Central and Willow (primarily residential).
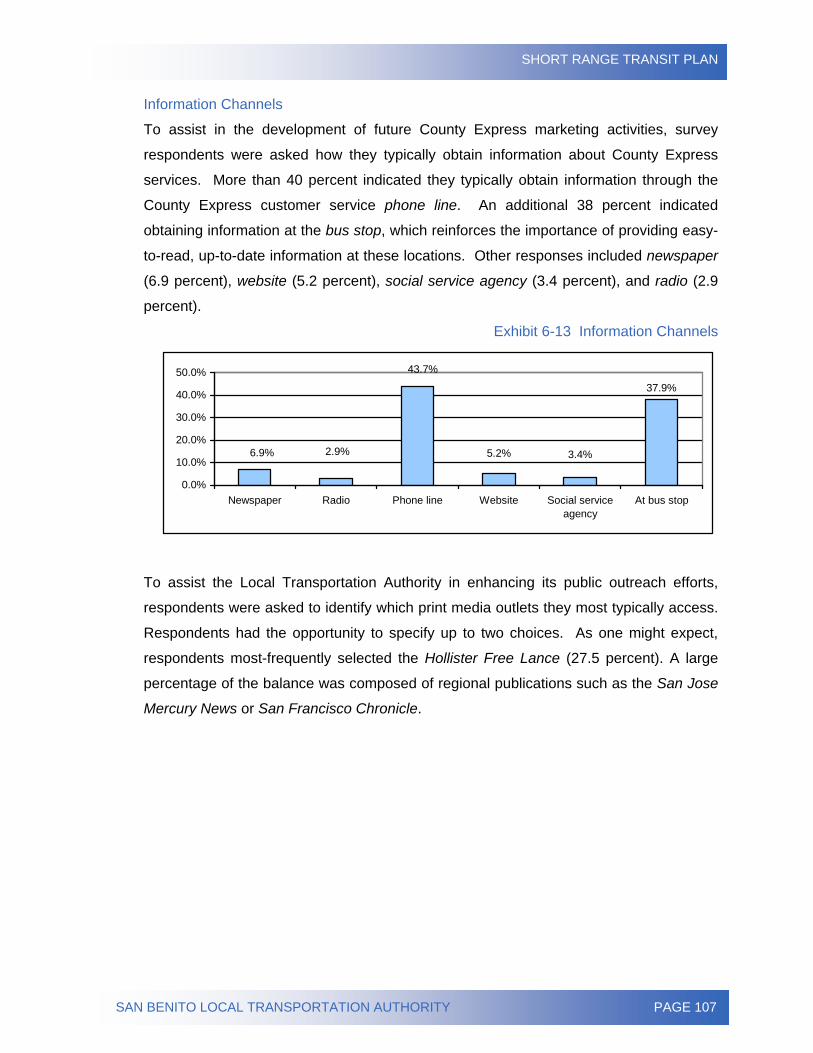
SHORT RANGE TRANSIT PLAN
SAN BENITO LOCAL TRANSPORTATION AUTHORITY PAGE 107
Information Channels
To assist in the development of future County Express marketing activities, survey
respondents were asked how they typically obtain information about County Express
services. More than 40 percent indicated they typically obtain information through the
County Express customer service phone line. An additional 38 percent indicated
obtaining information at the bus stop, which reinforces the importance of providing easy-
to-read, up-to-date information at these locations. Other responses included newspaper
(6.9 percent), website (5.2 percent), social service agency (3.4 percent), and radio (2.9
percent).
Exhibit 6-13 Information Channels
37.9%
3.4%5.2%
43.7%
2.9%6.9%
0.0%
10.0%
20.0%
30.0%
40.0%
50.0%
Newspaper Radio Phone line Website Social serviceagency
At bus stop
To assist the Local Transportation Authority in enhancing its public outreach efforts,
respondents were asked to identify which print media outlets they most typically access.
Respondents had the opportunity to specify up to two choices. As one might expect,
respondents most-frequently selected the Hollister Free Lance (27.5 percent). A large
percentage of the balance was composed of regional publications such as the San Jose
Mercury News or San Francisco Chronicle.
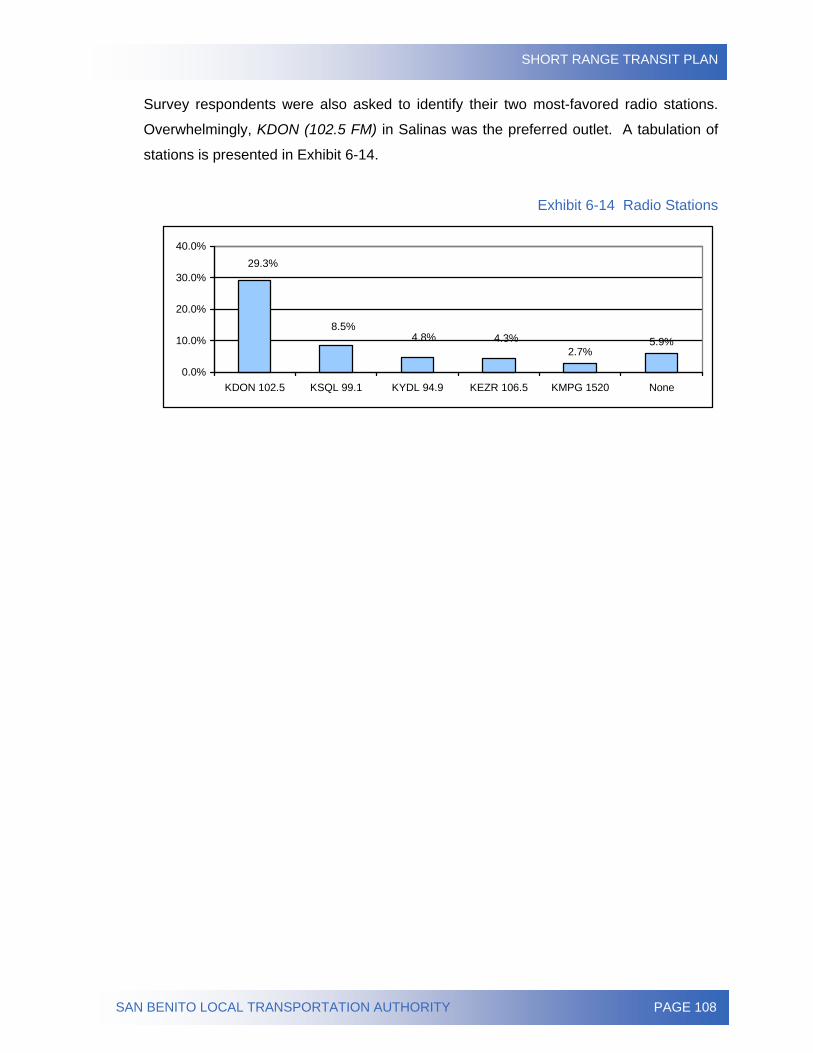
SHORT RANGE TRANSIT PLAN
SAN BENITO LOCAL TRANSPORTATION AUTHORITY PAGE 108
Survey respondents were also asked to identify their two most-favored radio stations.
Overwhelmingly, KDON (102.5 FM) in Salinas was the preferred outlet. A tabulation of
stations is presented in Exhibit 6-14.
Exhibit 6-14 Radio Stations
2.7%5.9%4.3%4.8%
8.5%
29.3%
0.0%
10.0%
20.0%
30.0%
40.0%
KDON 102.5 KSQL 99.1 KYDL 94.9 KEZR 106.5 KMPG 1520 None
SHORT RANGE TRANSIT PLAN
SAN BENITO LOCAL TRANSPORTATION AUTHORITY PAGE 109
Onboard Survey Findings On the surface, it appears public transit is not capturing a significant share of total trips
currently being made within the County Express service area. When combined with
findings from supplementary market research activities conducted in support of the Short
Range Transit Plan process, the current County Express customer base is numerically
modest and the primary motivator for selecting County Express is a high level of ride-
dependency within the core customer base.
The most successful public transit services are market-driven. It is impossible to realize
sustainable ridership growth by focusing principally on securing patronage from a ride-
dependant population. The reason for this is simple: The overriding goal of most ride-
dependent persons is to make enough money to buy a car. Therefore, the Local
Transportation Authority should undertake a series of targeted marketing campaigns
designed to expand the County Express’s customer base beyond ride-dependent
persons. Among the tactics recommended are direct mail advertising targeted at specific
population groups, free or reduced-cost trial ridership opportunities, and rewards for
long-time customers (i.e., customer loyalty program). These and other possible
marketing activities are more fully addressed in Chapter 7, “Marketing.”
Nearly 10 percent of respondents indicated they had to transfer from another bus in
order to complete the surveyed trip. This is noteworthy for a number of reasons. First,
the number of possible connections is rather limited. This response provides further
insight into customer travel patterns wherein use of more than one route is required in
order to complete a trip. Second, unless refuted by data associated with the concurrent
ride check, the use of transfers indicates that the current timed-transfer operation is
functioning effectively. Third, it identifies a ridership growth opportunity through targeted
marketing of the bus as a “systemic” travel alternative, versus travel that is redirected to
a single line or set of destinations. This is especially true of the Intercounty routes;
which offer connections to other public transportation systems, such as the Santa Clara
Valley Transportation Authority (VTA), through service to Gilroy.
Although San Benito County possesses numerous bike trails, only 1.1 percent of
respondents indicated using a bicycle to access a County Express bus stop. In many
communities, there is a lack of community awareness regarding the benefits of
SHORT RANGE TRANSIT PLAN
SAN BENITO LOCAL TRANSPORTATION AUTHORITY PAGE 110
intermodal connectivity, and San Benito is likely no exception. Initiation of a targeted
marketing campaign promoting the combined use of transit and bikes (such as “All
County Express buses feature easy-loading bike carriers, so your bike rides free”) is one
possible solution. The Local Transportation Authority may be able to secure
discretionary grant funding to support such an effort.
The fact that 70 percent of customers use a cash fare reveals a valuable ridership
growth opportunity. A majority of current County Express riders are not taking
advantage of multi-ride (i.e., discount) fare payment options. When combined with the
high incidence of persons making several trips via transit weekly, this conveys 1) an
overall lack of community awareness regarding County Express fare options and/or 2) a
lack of awareness within the County Express customer base as to the savings potential
available through non-cash fare options.
A major factor influencing the selection of non-cash fare alternatives is due to lack of
awareness of fare options, the shortage of pass sale outlets within the service area, or
combination of the both. Experience in similar communities reveals a symbiotic
relationship often develops between the transit provider and its fare sales partners.
A data cross-tabulation was performed to assess the relationship between fare type and
patronage (i.e., frequency of use). The use of non-cash fare media among persons who
rode County Express five or more times per week (the market segment most likely to
benefit from discounted multi-ride fare options) rose to nearly 35 percent. An interior
vehicle advertising campaign promoting convenience and affordability could be
implemented to promote non-cash fare use among this segment of ridership.
Transit operators also benefit from the availability of non-cash fare media. First, it
typically reduces average dwell time at bus stops, supporting on-time performance.
Second, it reduces administrative workload, including the time required to process cash
fares. Third, it reduces the incidence of fare evasion, as the customer enjoys
quantifiable savings with each subsequent trip made. Fourth, independent market
research reveals a positive relationship between use of non-cash fare media and
extended patronage or longevity.
SHORT RANGE TRANSIT PLAN
SAN BENITO LOCAL TRANSPORTATION AUTHORITY PAGE 111
Current schedule and availability of service/schedule information were the service
attributes that received the lowest ratings. The lack of service knowledge/awareness is
directly connected to the availability of service materials. The development of a formal
distribution schedule for providing printed schedules and other materials to high
traffic/high visibility outlets (i.e., libraries, schools, civic centers, key retailers, etc.) is one
possible solution. Often such an activity can be accomplished in partnership with the
service operations contractor.
The complaint/concern resolution rating of 3.31 offers County Express an opportunity for
growth in customer loyalty and the ridership that normally follows. When a County
Express customer receives good customer service, he or she will perhaps share the
experience with others, but more often than not will simply continue using the service. In
contrast, when a customer receives poor service, he or she will pass details of that
experience on to a large number of people, including fellow riders. Therefore, it is
important the Local Transportation Authority ensure all interaction between customers
and customer service staff is positive.

SHORT RANGE TRANSIT PLAN
SAN BENITO LOCAL TRANSPORTATION AUTHORITY PAGE 112
Page Intentionally Blank
SHORT RANGE TRANSIT PLAN
SAN BENITO LOCAL TRANSPORTATION AUTHORITY PAGE 113
CHAPTER 7 – COMMUNITY SURVEY ANALYSIS A statistically-valid survey of households in San Benito County Express service area was
conducted as part of the overall service assessment. Results of this and other surveys
will help shape the recommendations presented later in the Service Recommendations
chapter.
The community survey, completed between December 2006 and March 2007, had the
following objectives:
• Assess awareness.
• Identify and codify community travel patterns.
• Frame community perceptions.
• Identify possible barriers to patronage.
• Assess respondent satisfaction.
• Identify most-favored marketing or promotional channels.
Methodology
A direct mail survey was distributed during December 2006 to 1,000 households
throughout the San Benito County Express service area. The survey sample was
developed using a random-sample methodology. This approach ensures accurate
random number representation (i.e., both published and non-published) within a given
geographic area. The database from which the sample was developed was current
within one month prior to data collection.
To assure statistical validity, three additional steps were taken. First, in order to garner a
proportional sampling of representative households, numerical targets within individual
U.S. Postal Service postal codes were calculated. Second, to encourage the broadest
possible participation, a bilingual survey instrument (i.e., English/Spanish) was utilized.
Lastly, participants became eligible for a random drawing of fifty-dollar gift certificates to
Nob Hill Supermarket.
The direct mail survey campaign resulted in an extremely modest sample of 77
responses. This return rate of only 8 percent was too modest to reflect a thorough
assessment of community opinions regarding County Express.
SHORT RANGE TRANSIT PLAN
SAN BENITO LOCAL TRANSPORTATION AUTHORITY PAGE 114
To compensate for the lack of responses from the direct mail survey, an additional 1,000
bilingual surveys were distributed via:
• Public employees within San Benito County,
• The Hollister public library,
• County Labor Camp, and
• South County Housing Authority.
Bilingual surveys were also available for download from the San Benito County Express
website (http://www.SanBenitoCountyExpress.org). Respondents were instructed to
return the completed survey either to a central collection point or by mail.
The sample size for this second round of surveys was 98, reflecting a response rate of
9.8 percent. Still unsatisfied with the number of surveys collected, a third attempt at
community outreach was planned.
Through six bilingual community forums, residents were given an opportunity to ask
questions, voice their concerns, and discuss service requests and modifications
regarding County Express services. The same bilingual community survey form used in
the previous two efforts was available at each of the sessions.
Collectively, these outreach efforts resulted in a sample size of 181. A group of this size
has a + 7.28-percent margin of error at the 95-percent confidence level.
Once data collection was complete, the survey data was imported into the Statistical
Package for the Social Sciences software platform. The raw survey data was then
cleaned and coded. The raw data was then exported into Microsoft Excel where it was
translated into graphs and tables to provide a visual representation of the results.
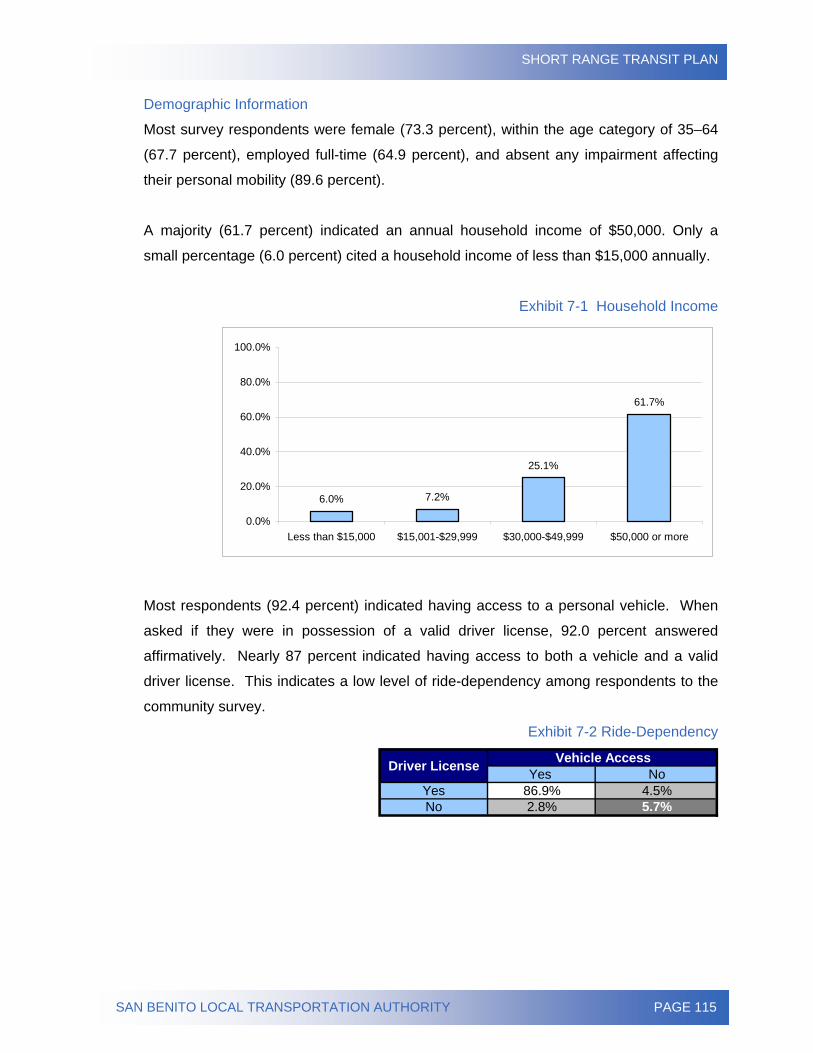
SHORT RANGE TRANSIT PLAN
SAN BENITO LOCAL TRANSPORTATION AUTHORITY PAGE 115
Demographic Information
Most survey respondents were female (73.3 percent), within the age category of 35–64
(67.7 percent), employed full-time (64.9 percent), and absent any impairment affecting
their personal mobility (89.6 percent).
A majority (61.7 percent) indicated an annual household income of $50,000. Only a
small percentage (6.0 percent) cited a household income of less than $15,000 annually.
Exhibit 7-1 Household Income
6.0% 7.2%
25.1%
61.7%
0.0%
20.0%
40.0%
60.0%
80.0%
100.0%
Less than $15,000 $15,001-$29,999 $30,000-$49,999 $50,000 or more
Most respondents (92.4 percent) indicated having access to a personal vehicle. When
asked if they were in possession of a valid driver license, 92.0 percent answered
affirmatively. Nearly 87 percent indicated having access to both a vehicle and a valid
driver license. This indicates a low level of ride-dependency among respondents to the
community survey.
Exhibit 7-2 Ride-Dependency
Yes NoYes 86.9% 4.5%No 2.8% 5.7%
Driver License Vehicle Access
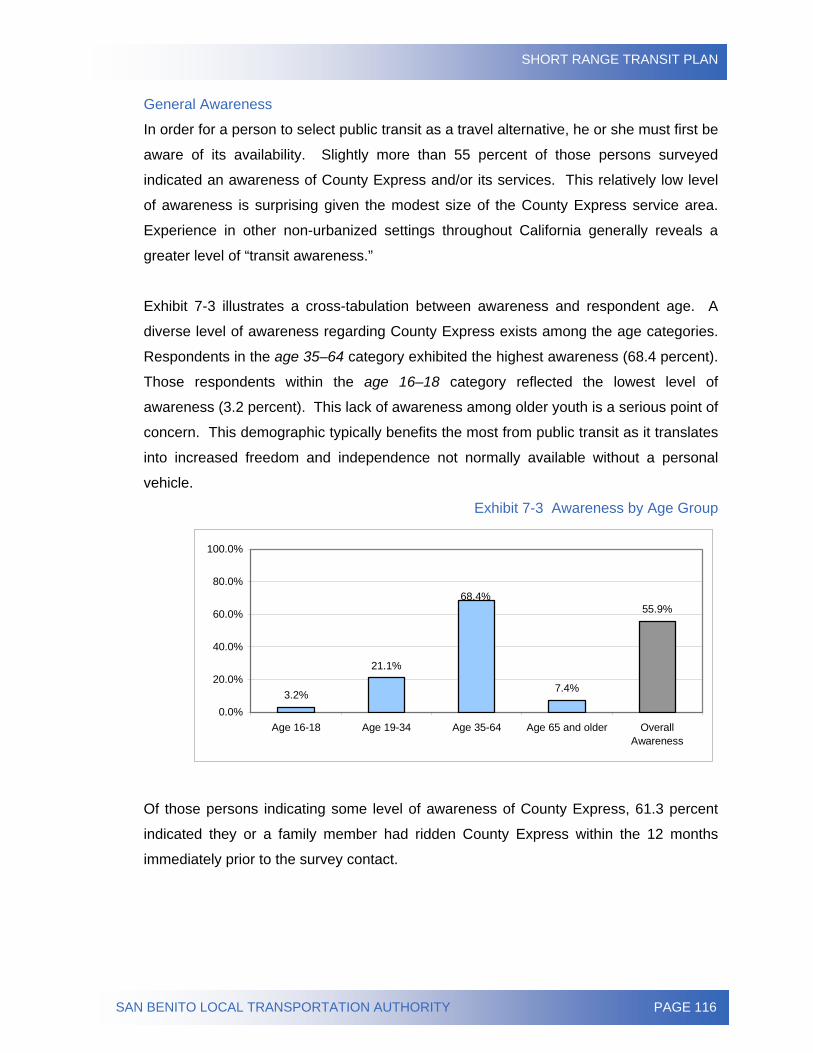
SHORT RANGE TRANSIT PLAN
SAN BENITO LOCAL TRANSPORTATION AUTHORITY PAGE 116
General Awareness
In order for a person to select public transit as a travel alternative, he or she must first be
aware of its availability. Slightly more than 55 percent of those persons surveyed
indicated an awareness of County Express and/or its services. This relatively low level
of awareness is surprising given the modest size of the County Express service area.
Experience in other non-urbanized settings throughout California generally reveals a
greater level of “transit awareness.”
Exhibit 7-3 illustrates a cross-tabulation between awareness and respondent age. A
diverse level of awareness regarding County Express exists among the age categories.
Respondents in the age 35–64 category exhibited the highest awareness (68.4 percent).
Those respondents within the age 16–18 category reflected the lowest level of
awareness (3.2 percent). This lack of awareness among older youth is a serious point of
concern. This demographic typically benefits the most from public transit as it translates
into increased freedom and independence not normally available without a personal
vehicle.
Exhibit 7-3 Awareness by Age Group
3.2%
21.1%
7.4%
55.9%68.4%
0.0%
20.0%
40.0%
60.0%
80.0%
100.0%
Age 16-18 Age 19-34 Age 35-64 Age 65 and older OverallAwareness
Of those persons indicating some level of awareness of County Express, 61.3 percent
indicated they or a family member had ridden County Express within the 12 months
immediately prior to the survey contact.
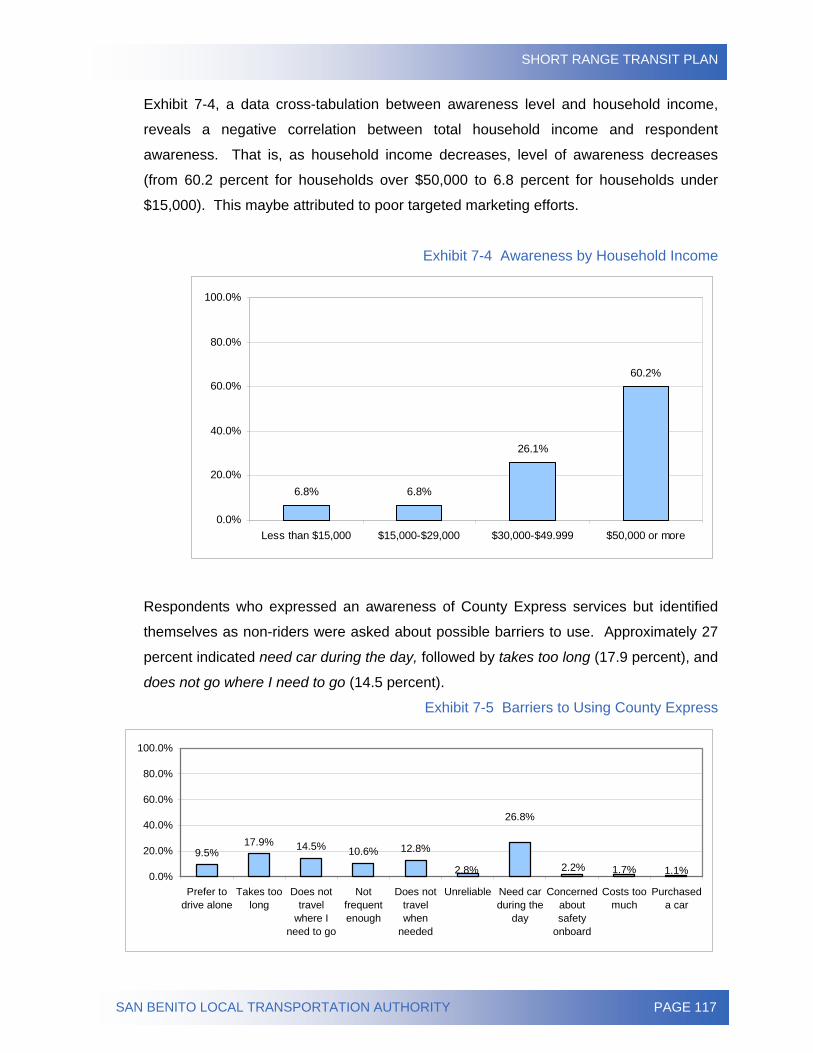
SHORT RANGE TRANSIT PLAN
SAN BENITO LOCAL TRANSPORTATION AUTHORITY PAGE 117
Exhibit 7-4, a data cross-tabulation between awareness level and household income,
reveals a negative correlation between total household income and respondent
awareness. That is, as household income decreases, level of awareness decreases
(from 60.2 percent for households over $50,000 to 6.8 percent for households under
$15,000). This maybe attributed to poor targeted marketing efforts.
Exhibit 7-4 Awareness by Household Income
6.8% 6.8%
26.1%
60.2%
0.0%
20.0%
40.0%
60.0%
80.0%
100.0%
Less than $15,000 $15,000-$29,000 $30,000-$49.999 $50,000 or more
Respondents who expressed an awareness of County Express services but identified
themselves as non-riders were asked about possible barriers to use. Approximately 27
percent indicated need car during the day, followed by takes too long (17.9 percent), and
does not go where I need to go (14.5 percent).
Exhibit 7-5 Barriers to Using County Express
9.5%17.9% 14.5% 10.6% 12.8%
1.1%1.7%2.2%
26.8%
2.8%0.0%
20.0%
40.0%
60.0%
80.0%
100.0%
Prefer todrive alone
Takes toolong
Does nottravel
where Ineed to go
Notfrequentenough
Does nottravelwhen
needed
Unreliable Need carduring the
day
Concernedaboutsafety
onboard
Costs toomuch
Purchaseda car
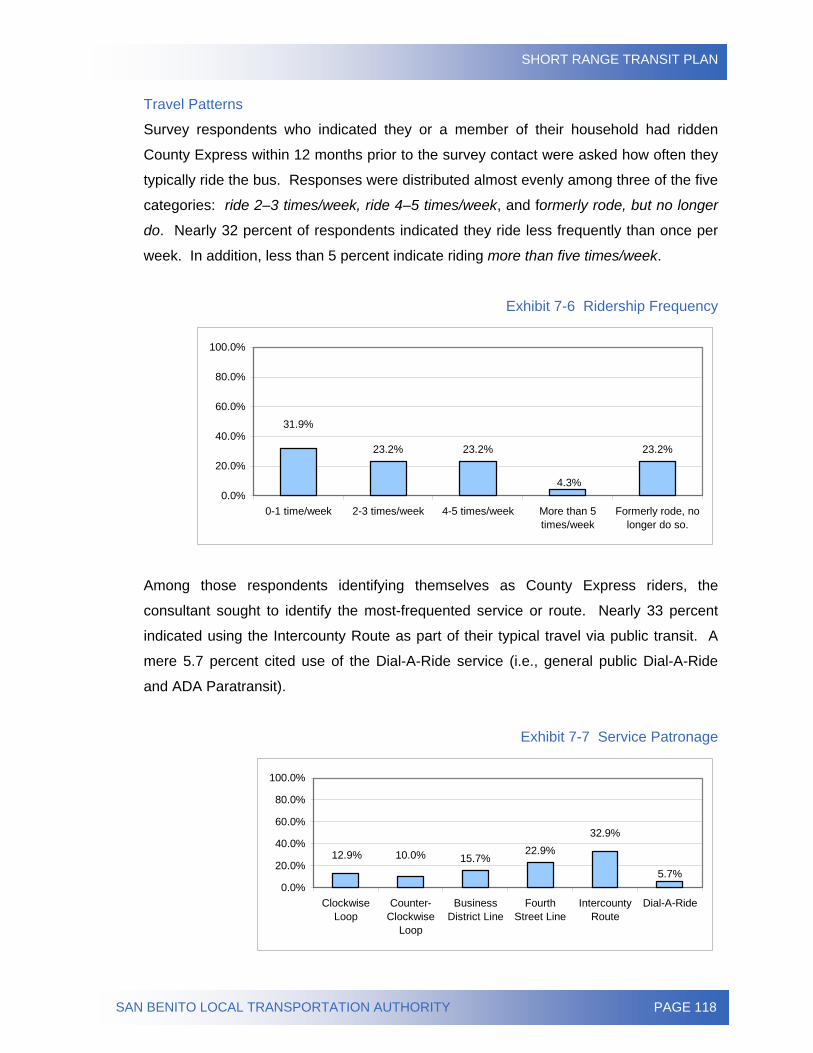
SHORT RANGE TRANSIT PLAN
SAN BENITO LOCAL TRANSPORTATION AUTHORITY PAGE 118
Travel Patterns
Survey respondents who indicated they or a member of their household had ridden
County Express within 12 months prior to the survey contact were asked how often they
typically ride the bus. Responses were distributed almost evenly among three of the five
categories: ride 2–3 times/week, ride 4–5 times/week, and formerly rode, but no longer
do. Nearly 32 percent of respondents indicated they ride less frequently than once per
week. In addition, less than 5 percent indicate riding more than five times/week.
Exhibit 7-6 Ridership Frequency
23.2% 23.2% 23.2%
4.3%
31.9%
0.0%
20.0%
40.0%
60.0%
80.0%
100.0%
0-1 time/week 2-3 times/week 4-5 times/week More than 5times/week
Formerly rode, nolonger do so.
Among those respondents identifying themselves as County Express riders, the
consultant sought to identify the most-frequented service or route. Nearly 33 percent
indicated using the Intercounty Route as part of their typical travel via public transit. A
mere 5.7 percent cited use of the Dial-A-Ride service (i.e., general public Dial-A-Ride
and ADA Paratransit).
Exhibit 7-7 Service Patronage
15.7%22.9%12.9%
5.7%
32.9%
10.0%
0.0%
20.0%
40.0%
60.0%
80.0%
100.0%
ClockwiseLoop
Counter-Clockwise
Loop
BusinessDistrict Line
FourthStreet Line
IntercountyRoute
Dial-A-Ride
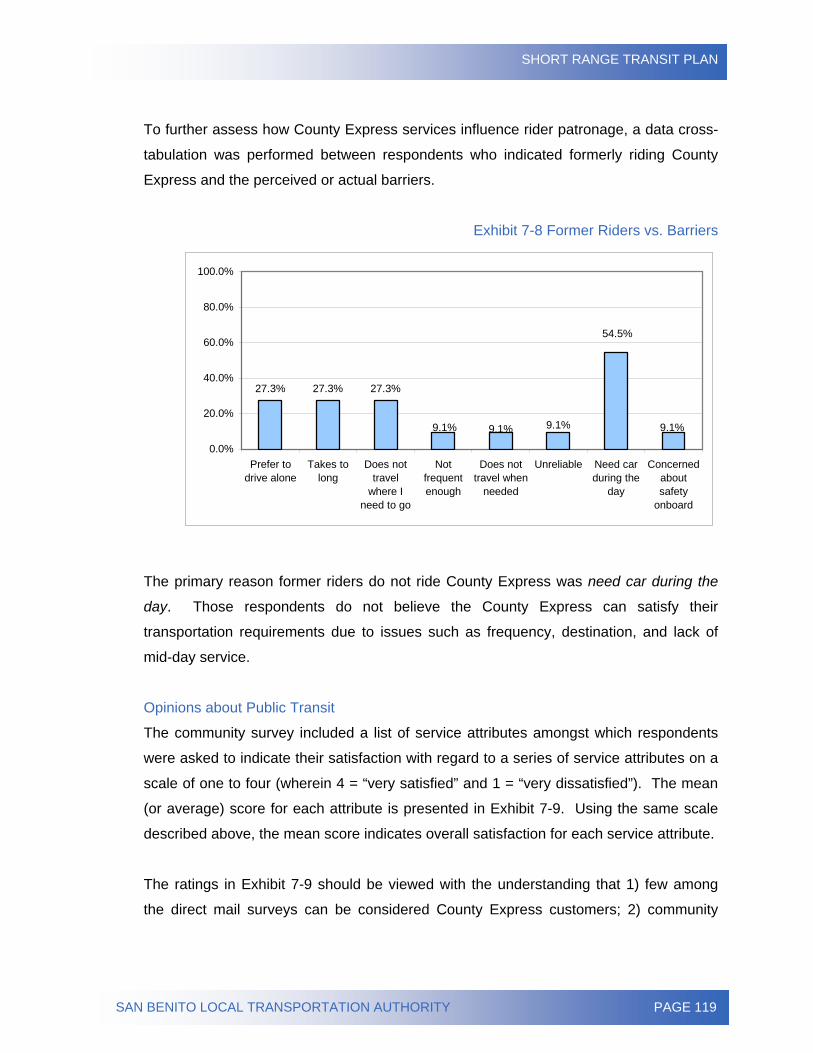
SHORT RANGE TRANSIT PLAN
SAN BENITO LOCAL TRANSPORTATION AUTHORITY PAGE 119
To further assess how County Express services influence rider patronage, a data cross-
tabulation was performed between respondents who indicated formerly riding County
Express and the perceived or actual barriers.
Exhibit 7-8 Former Riders vs. Barriers
27.3% 27.3% 27.3%
54.5%
9.1%9.1%9.1%9.1%
0.0%
20.0%
40.0%
60.0%
80.0%
100.0%
Prefer todrive alone
Takes tolong
Does nottravel
where Ineed to go
Notfrequentenough
Does nottravel when
needed
Unreliable Need carduring the
day
Concernedaboutsafety
onboard
The primary reason former riders do not ride County Express was need car during the
day. Those respondents do not believe the County Express can satisfy their
transportation requirements due to issues such as frequency, destination, and lack of
mid-day service.
Opinions about Public Transit
The community survey included a list of service attributes amongst which respondents
were asked to indicate their satisfaction with regard to a series of service attributes on a
scale of one to four (wherein 4 = “very satisfied” and 1 = “very dissatisfied”). The mean
(or average) score for each attribute is presented in Exhibit 7-9. Using the same scale
described above, the mean score indicates overall satisfaction for each service attribute.
The ratings in Exhibit 7-9 should be viewed with the understanding that 1) few among
the direct mail surveys can be considered County Express customers; 2) community
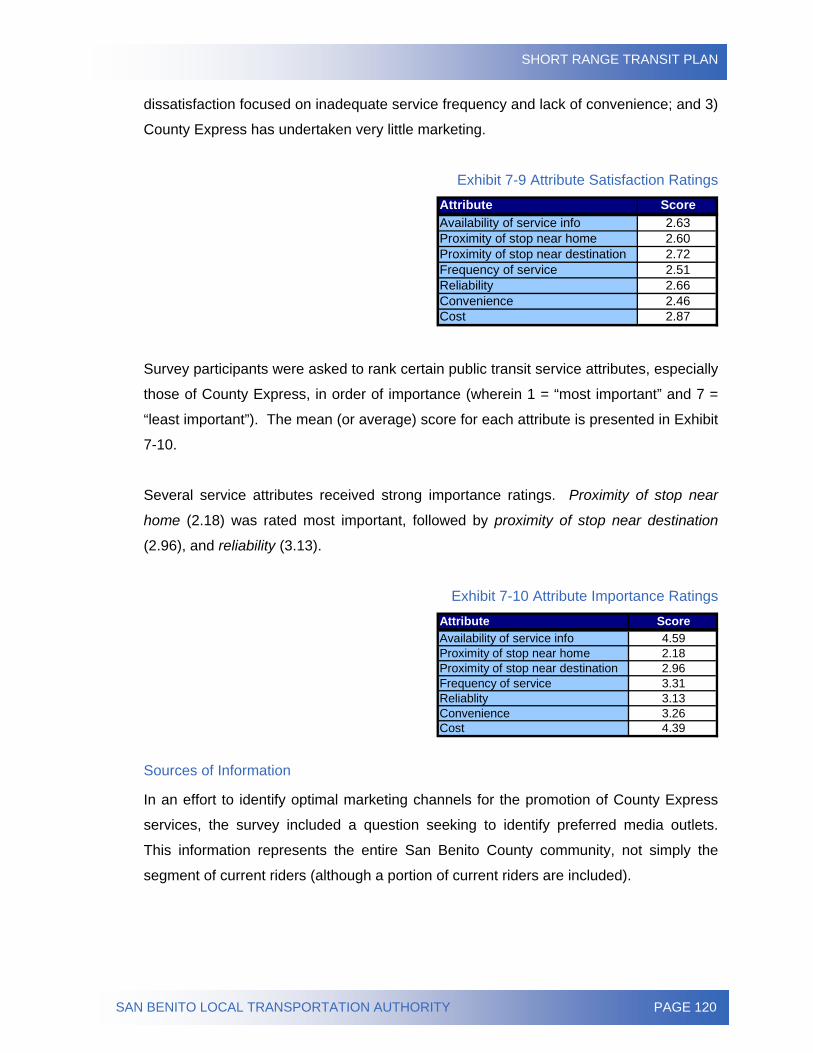
SHORT RANGE TRANSIT PLAN
SAN BENITO LOCAL TRANSPORTATION AUTHORITY PAGE 120
dissatisfaction focused on inadequate service frequency and lack of convenience; and 3)
County Express has undertaken very little marketing.
Exhibit 7-9 Attribute Satisfaction Ratings Attribute ScoreAvailability of service info 2.63Proximity of stop near home 2.60Proximity of stop near destination 2.72Frequency of service 2.51Reliability 2.66Convenience 2.46Cost 2.87
Survey participants were asked to rank certain public transit service attributes, especially
those of County Express, in order of importance (wherein 1 = “most important” and 7 =
“least important”). The mean (or average) score for each attribute is presented in Exhibit
7-10.
Several service attributes received strong importance ratings. Proximity of stop near
home (2.18) was rated most important, followed by proximity of stop near destination
(2.96), and reliability (3.13).
Exhibit 7-10 Attribute Importance Ratings
Attribute ScoreAvailability of service info 4.59Proximity of stop near home 2.18Proximity of stop near destination 2.96Frequency of service 3.31Reliablity 3.13Convenience 3.26Cost 4.39
Sources of Information
In an effort to identify optimal marketing channels for the promotion of County Express
services, the survey included a question seeking to identify preferred media outlets.
This information represents the entire San Benito County community, not simply the
segment of current riders (although a portion of current riders are included).
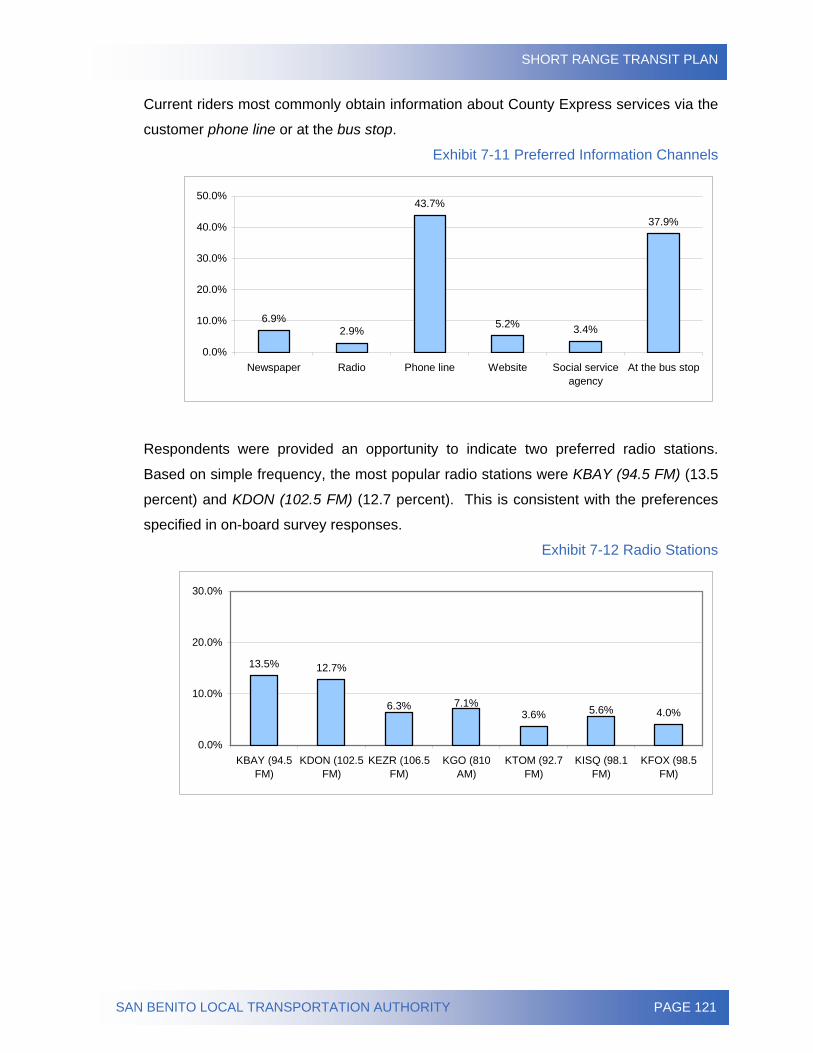
SHORT RANGE TRANSIT PLAN
SAN BENITO LOCAL TRANSPORTATION AUTHORITY PAGE 121
Current riders most commonly obtain information about County Express services via the
customer phone line or at the bus stop.
Exhibit 7-11 Preferred Information Channels
6.9%2.9%
43.7%
5.2% 3.4%
37.9%
0.0%
10.0%
20.0%
30.0%
40.0%
50.0%
Newspaper Radio Phone line Website Social serviceagency
At the bus stop
Respondents were provided an opportunity to indicate two preferred radio stations.
Based on simple frequency, the most popular radio stations were KBAY (94.5 FM) (13.5
percent) and KDON (102.5 FM) (12.7 percent). This is consistent with the preferences
specified in on-board survey responses.
Exhibit 7-12 Radio Stations
13.5% 12.7%
3.6% 4.0%6.3% 5.6%7.1%
0.0%
10.0%
20.0%
30.0%
KBAY (94.5FM)
KDON (102.5FM)
KEZR (106.5FM)
KGO (810AM)
KTOM (92.7FM)
KISQ (98.1FM)
KFOX (98.5FM)
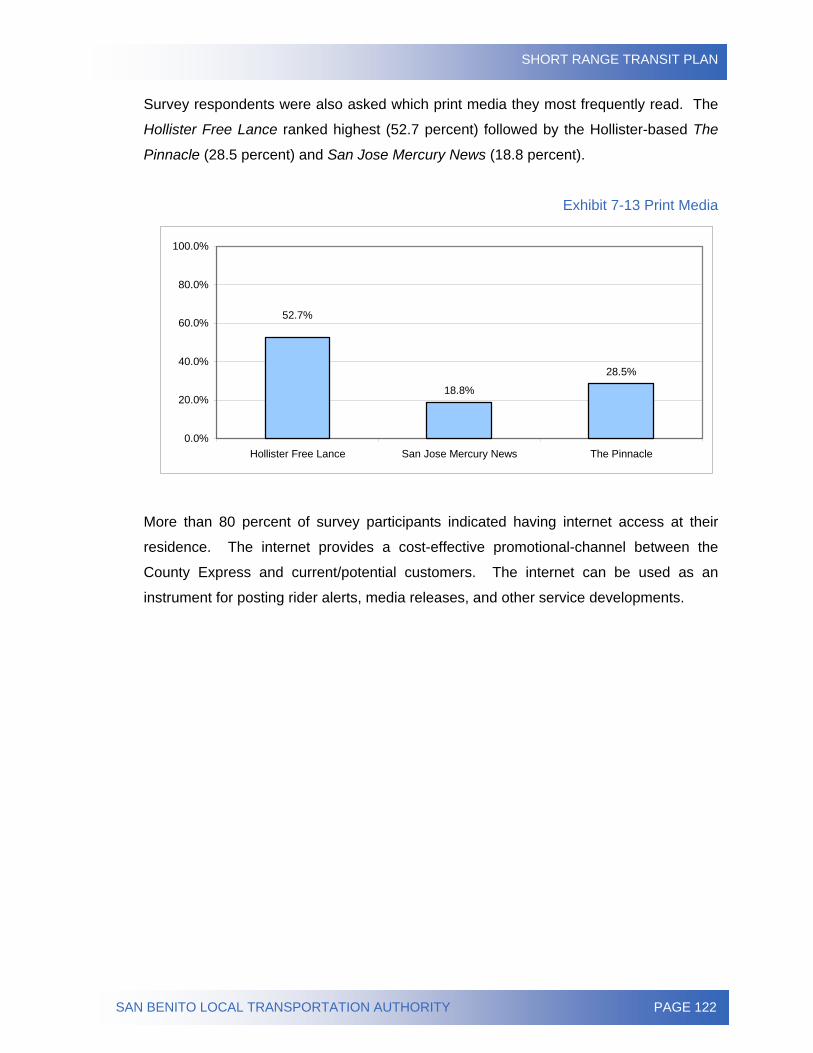
SHORT RANGE TRANSIT PLAN
SAN BENITO LOCAL TRANSPORTATION AUTHORITY PAGE 122
Survey respondents were also asked which print media they most frequently read. The
Hollister Free Lance ranked highest (52.7 percent) followed by the Hollister-based The
Pinnacle (28.5 percent) and San Jose Mercury News (18.8 percent).
Exhibit 7-13 Print Media
18.8%
28.5%
52.7%
0.0%
20.0%
40.0%
60.0%
80.0%
100.0%
Hollister Free Lance San Jose Mercury News The Pinnacle
More than 80 percent of survey participants indicated having internet access at their
residence. The internet provides a cost-effective promotional-channel between the
County Express and current/potential customers. The internet can be used as an
instrument for posting rider alerts, media releases, and other service developments.
SHORT RANGE TRANSIT PLAN
SAN BENITO LOCAL TRANSPORTATION AUTHORITY PAGE 123
Community Survey Findings
The negative correlation between awareness of County Express and household income
is significant, as transit market research traditionally confirms that persons of low-income
are among the core groups benefiting the greatest from publicly-funded transportation
alternatives. The second round of surveys skewed this finding. Of the 98 surveys
returned, more than 90 percent were completed by public employees who exhibited high
awareness of transit and typically have a higher-than-average household income.
Although the data did not confirm the general finding that people of lower income are
more aware of transit services because of potential ride-dependency, this was
evidenced at the community meetings. Attendees were in large part Hispanic, of
average to lower household income, with a modest incidence of vehicle ownership.
Persons expressing awareness of County Express services and not currently using its
services, may be a key demographic for County Express’ ridership growth. County
Express has failed to capture an appreciable share of the “choice rider” population within
its service area. This market segment is vital to sustainable ridership and may be
persuaded to mode-shift should County Express services be improved and/or modified
to better suit resident travel needs. Since choice riders are more reluctant to mode-shift,
County Express services must be perceived as being on a par with competing modes in
terms of reliability, flexibility, and cost.
Exhibit 7-6 – Ridership Frequency provides important insight into County Express’
competitive position as a transportation alternative, as 23.2 percent identified
themselves as former customers. This customer erosion can be attributed to a variety of
reasons including changes to schedules and routes, inconsistent on-time performance,
lack of service options, poor customer service, ineffective marketing, and an increase in
personal vehicle ownership.
Given nearly 33 percent of survey participants indicated a need for a car during the day,
it is clear people see it easier to fight traffic than ride County Express. Those persons
claiming it takes too long to get to a destination or the bus does not go where they need
to go may not be familiar with the County Express service area and/or transfer
opportunities enabling access to other transportation services within the region.
SHORT RANGE TRANSIT PLAN
SAN BENITO LOCAL TRANSPORTATION AUTHORITY PAGE 124
A sufficient number of respondents indicated a “work” zip code different from their
“home” zip code. Approximately 83 percent of respondents indicated residing in the zip
code corresponding to Hollister. A data cross-tabulation revealed 25 percent of
respondents both live and work within Hollister’s zip code (95023), correlating to the
finding regarding the service most frequently used by current San Benito County
Express customers. The Intercounty Route, which serves a broader region, travels
beyond areas served by other County Express services and allows riders the opportunity
to connect to other transit services.
Although it is gratifying to learn residents are utilizing the Intercounty Service, most of
the riders patronizing the Intercounty Service likely do so to travel out of Hollister, and
may not otherwise use transit for travel within Hollister. Marketing targeted toward work-
age persons traveling outside San Benito County represents a potential growth strategy.
By contrast, many other respondents (children and students) simply use San Benito
County Express’ Fixed Route and Dial-A-Ride within Hollister. Most are traveling within
the same zip code, and in doing so ride the County Express at least three times per
week.
The question regarding the importance of service attributes was directed towards the
community at-large, not specifically current County Express. The results reveal that the
community as a whole thinks more of the convenience of a transit system rather than its
cost. This finding serves to reinforce the conclusion that County Express services are
not fulfilling the community’s demand. It is a common belief that bus systems go to
popular and desirable destinations, but the difficulty is in originating bus stops where
they are available to large amounts of people. This importance rating confirms what
parents stated at the community workshop. Bus stops are located at most of the
schools, but not in some residential areas where transit-dependent students live.
SHORT RANGE TRANSIT PLAN
SAN BENITO LOCAL TRANSPORTATION AUTHORITY PAGE 125
CHAPTER 8 – COMMUNITY OUTREACH ANALYSIS In order to adequately consider the needs and concerns of the San Benito community,
several types of community outreach were undertaken as part of the Short Range
Transit Plan update process. As described in previous sections, an on-board survey and
community survey were conducted to collect information regarding demographics, travel
patterns, awareness of transit, preferred media channels, valued service attributes, and
desired service enhancements.
While surveys collect valuable data, they do not give respondents the opportunity to ask
questions and voice their own concerns. To that end, six community workshops were
held during March 2007 to allow members of the community to play a greater role in the
future of the County Express system. Each of the 90-minute meetings was conducted in
both English and Spanish to facilitate full participation by attendees.
The first two meetings were held at 1:00 p.m. and 6:00 p.m. on Wednesday, March 21,
at Ladd Lane School. The third meeting took place at 2:00 p.m. on Thursday, March 22,
at San Juan Bautista City Hall. The fourth meeting, also on Thursday, was held at 6:30
p.m. at the Veterans Memorial Building. The final two meetings took place at 1:00 p.m.
and 6:00 p.m. on Friday, March 23, at Spring Grove School.
Though attendance at these meetings was rather modest, three core concerns were
identified:
• Overall public frustration regarding the quality of customer service
provided through the County Express telephone call center.
• Overall frustration regarding the quality and reliability of the County
Express fleet.
• Overall frustration of County Express riders regarding the current
County Express route network versus the prior County Express route
network.
Several reasons explaining why some of the persons attending the community meetings
do not ride County Express were identified. Some felt the bus drivers were rude. Others
SHORT RANGE TRANSIT PLAN
SAN BENITO LOCAL TRANSPORTATION AUTHORITY PAGE 126
cited inconvenient schedule times, circulatory routing, or difficulties in obtaining basic
service information.
Attendees at the six community workshops were almost exclusively parents of
elementary school-aged children and elementary school teachers and staff. The primary
discussion of these meetings involved either a) concerns regarding the absence of
adequate home-to-school transportation and/or b) concerns regarding the quality of
transit service historically afforded these children (i.e., onboard the vehicle and via the
customer service phone line). This concern may be addressed through the introduction
of school trippers (Chapter 6, Service Alternative D).
Other attendees expressed frustration regarding their attempts to obtain basic service
information via the customer service phone line. Some teachers relayed that parents
would call the school crying because of poor treatment over the phone with County
Express. Teachers stated they too were often treated poorly when trying to reserve
seats for their students on the County Express demand-response service.
Parents and teachers who attended the community meetings expressed concern for the
reliability of the service as well as its frequency. School buses do not pick up children
who live near a County Express stop. Therefore, many children have no other option but
to take the Fixed Route service. Parents expressed concern due to bus overcrowding;
in some instances, children were denied a ride because the bus was at capacity. In
these cases, children had only the option of walking to school, regardless of distance.
Teachers are concerned because students may have to wait thirty minutes before a bus
picks them up after school or from after-school programs. Parents are concerned
because children may be late getting to school and late getting home.
SHORT RANGE TRANSIT PLAN
SAN BENITO LOCAL TRANSPORTATION AUTHORITY PAGE 127
CHAPTER 9 – GOALS, OBJECTIVES, AND STANDARDS
This section advances a Performance Measurement System for those public transit
services funded by the San Benito County Local Transportation Authority:
• County Express Fixed Route
• County Express Dial-A-Ride and Paratransit
• Jovenes de Antaño senior transportation services
• Local Transportation Authority
Although there is no exact match in services provided by County Express to those of
like-peers, there are programs with similar standards of performance. Combining the
prior Short Range Transit Plan and goals and objectives collected from like peers, the
consultant created a measurement system with a range of “probable performance” for
the County Express. Within the following tables are goals for safe and reliable service,
increased productivity, and minimizing of cost in contrast to the recent County Express
performance.
Goals, Objectives, and Measures An effective Performance Measurement System is composed of goals, objectives, and
standards.
• Goals are statements that qualify the desired results. They are the end
toward which efforts are directed. They are general and timeless, yet
theoretically attainable.
• Objectives provide quantifiable measures of the goals. They are more
precise and capable of both attainment and measurement.
• Measures set quantifiable targets for achieving the adopted goals.
The following tables link the adopted goal to the quantifiable measure; and then
document actual recent performance in relation to the specified goal.
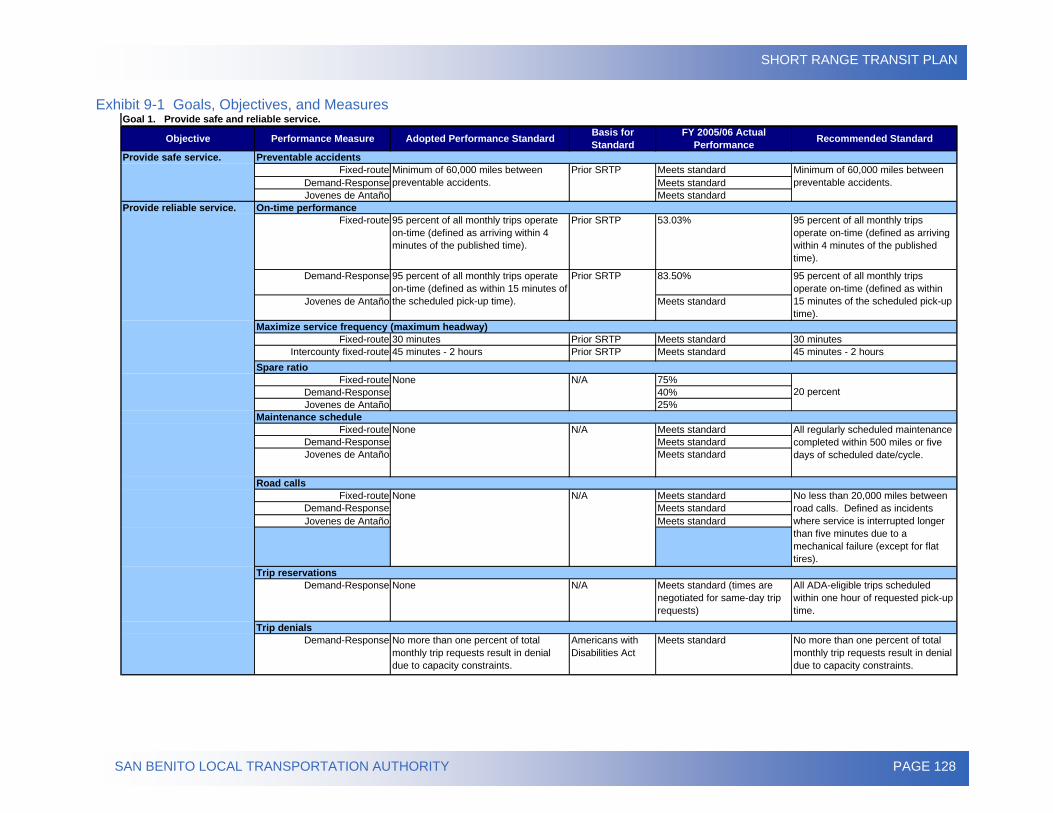
SHORT RANGE TRANSIT PLAN
SAN BENITO LOCAL TRANSPORTATION AUTHORITY PAGE 128
Exhibit 9-1 Goals, Objectives, and Measures Goal 1. Provide safe and reliable service.
Objective Performance Measure Adopted Performance Standard Basis for Standard
FY 2005/06 Actual Performance Recommended Standard
Fixed-route Meets standardDemand-Response Meets standardJovenes de Antaño Meets standard
Fixed-route 95 percent of all monthly trips operate on-time (defined as arriving within 4 minutes of the published time).
Prior SRTP 53.03% 95 percent of all monthly trips operate on-time (defined as arriving within 4 minutes of the published time).
Demand-Response 83.50%
Jovenes de Antaño Meets standard
Fixed-route 30 minutes Prior SRTP Meets standard 30 minutesIntercounty fixed-route 45 minutes - 2 hours Prior SRTP Meets standard 45 minutes - 2 hours
Fixed-route 75%Demand-Response 40%Jovenes de Antaño 25%
Fixed-route Meets standardDemand-Response Meets standardJovenes de Antaño Meets standard
Fixed-route Meets standardDemand-Response Meets standardJovenes de Antaño Meets standard
Demand-Response None N/A Meets standard (times are negotiated for same-day trip requests)
All ADA-eligible trips scheduled within one hour of requested pick-up time.
Demand-Response No more than one percent of total monthly trip requests result in denial due to capacity constraints.
Americans with Disabilities Act
Meets standard No more than one percent of total monthly trip requests result in denial due to capacity constraints.
95 percent of all monthly trips operate on-time (defined as within 15 minutes of the scheduled pick-up time).
None
None
Provide safe service.Minimum of 60,000 miles between preventable accidents.
N/A
N/A
N/A
Prior SRTP
Prior SRTP
Provide reliable service.
Road calls
Maintenance schedule
Spare ratio
Maximize service frequency (maximum headway)
On-time performance
Minimum of 60,000 miles between preventable accidents.
95 percent of all monthly trips operate on-time (defined as within 15 minutes of the scheduled pick-up time).
20 percent
All regularly scheduled maintenance completed within 500 miles or five days of scheduled date/cycle.
No less than 20,000 miles between road calls. Defined as incidents where service is interrupted longer than five minutes due to a mechanical failure (except for flat tires).
Preventable accidents
Trip reservations
Trip denials
None
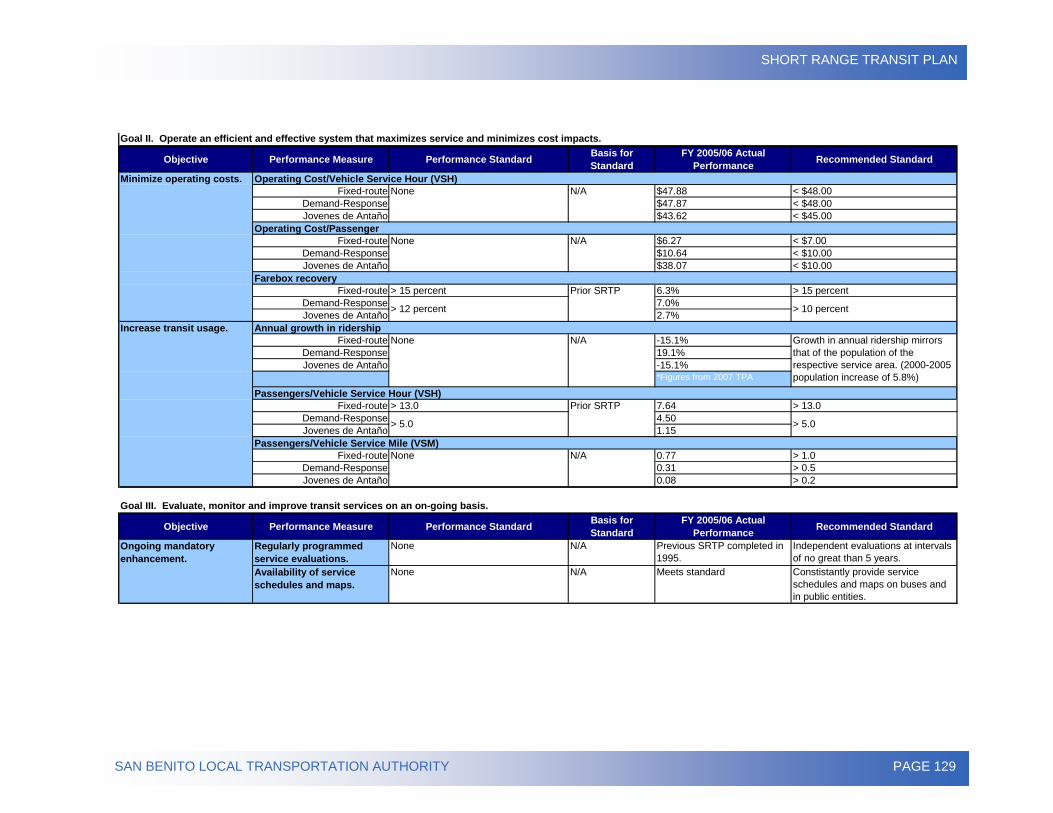
SHORT RANGE TRANSIT PLAN
SAN BENITO LOCAL TRANSPORTATION AUTHORITY PAGE 129
Goal II. Operate an efficient and effective system that maximizes service and minimizes cost impacts.
Objective Performance Measure Performance Standard Basis for Standard
FY 2005/06 Actual Performance Recommended Standard
Fixed-route $47.88 < $48.00Demand-Response $47.87 < $48.00Jovenes de Antaño $43.62 < $45.00
Fixed-route $6.27 < $7.00Demand-Response $10.64 < $10.00Jovenes de Antaño $38.07 < $10.00
Fixed-route > 15 percent 6.3% > 15 percentDemand-Response 7.0%Jovenes de Antaño 2.7%
Fixed-route -15.1%Demand-Response 19.1%Jovenes de Antaño -15.1%
*Figures from 2007 TPA
Fixed-route > 13.0 7.64 > 13.0Demand-Response 4.50Jovenes de Antaño 1.15
Fixed-route 0.77 > 1.0Demand-Response 0.31 > 0.5Jovenes de Antaño 0.08 > 0.2
Goal III. Evaluate, monitor and improve transit services on an on-going basis.
Objective Performance Measure Performance Standard Basis for Standard
FY 2005/06 Actual Performance Recommended Standard
Regularly programmed service evaluations.
None N/A Previous SRTP completed in 1995.
Independent evaluations at intervals of no great than 5 years.
Availability of service schedules and maps.
None N/A Meets standard Constistantly provide service schedules and maps on buses and in public entities.
NonePassengers/Vehicle Service Mile (VSM)
N/A
N/A
> 5.0
Operating Cost/Passenger
Farebox recovery
N/A
Increase transit usage.
Minimize operating costs.
> 12 percent
None
Ongoing mandatory enhancement.
> 10 percent
> 5.0
NoneOperating Cost/Vehicle Service Hour (VSH)
Prior SRTP
Prior SRTP
NoneAnnual growth in ridership
Passengers/Vehicle Service Hour (VSH)
Growth in annual ridership mirrors that of the population of the respective service area. (2000-2005 population increase of 5.8%)
N/A
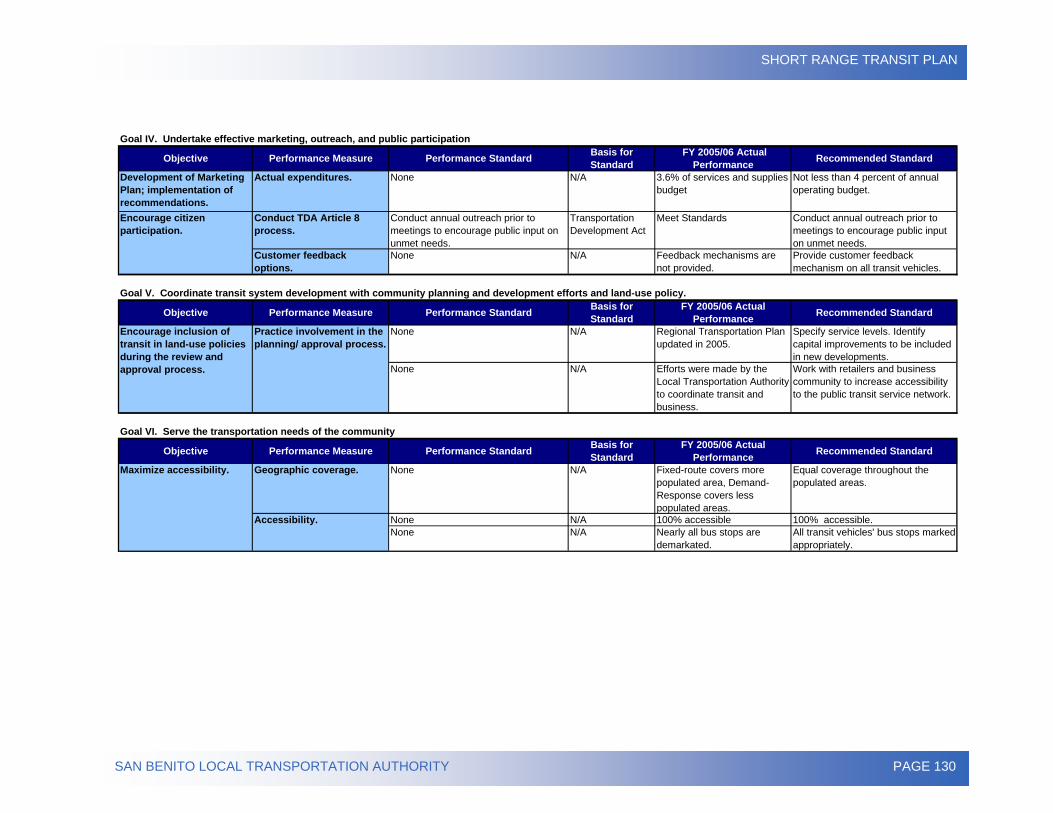
SHORT RANGE TRANSIT PLAN
SAN BENITO LOCAL TRANSPORTATION AUTHORITY PAGE 130
Goal IV. Undertake effective marketing, outreach, and public participation
Objective Performance Measure Performance Standard Basis for Standard
FY 2005/06 Actual Performance Recommended Standard
Development of Marketing Plan; implementation of recommendations.
Actual expenditures. None N/A 3.6% of services and supplies budget
Not less than 4 percent of annual operating budget.
Conduct TDA Article 8 process.
Conduct annual outreach prior to meetings to encourage public input on unmet needs.
Transportation Development Act
Meet Standards Conduct annual outreach prior to meetings to encourage public input on unmet needs.
Customer feedback options.
None N/A Feedback mechanisms are not provided.
Provide customer feedback mechanism on all transit vehicles.
Goal V. Coordinate transit system development with community planning and development efforts and land-use policy.
Objective Performance Measure Performance Standard Basis for Standard
FY 2005/06 Actual Performance Recommended Standard
None N/A Regional Transportation Plan updated in 2005.
Specify service levels. Identify capital improvements to be included in new developments.
None N/A Efforts were made by the Local Transportation Authority to coordinate transit and business.
Work with retailers and business community to increase accessibility to the public transit service network.
Goal VI. Serve the transportation needs of the community
Objective Performance Measure Performance Standard Basis for Standard
FY 2005/06 Actual Performance Recommended Standard
Geographic coverage. None N/A Fixed-route covers more populated area, Demand-Response covers less populated areas.
Equal coverage throughout the populated areas.
None N/A 100% accessible 100% accessible.None N/A Nearly all bus stops are
demarkated.All transit vehicles' bus stops marked appropriately.
Maximize accessibility.
Accessibility.
Encourage citizen participation.
Encourage inclusion of transit in land-use policies during the review and approval process.
Practice involvement in the planning/ approval process.
SHORT RANGE TRANSIT PLAN
SAN BENITO LOCAL TRANSPORTATION AUTHORITY PAGE 131
CHAPTER 10 – MARKETING
The success of any public transit program is dependent in large part on public
acceptance and understanding of the services offered. A strong marketing and
customer service strategy will assist the Local Transportation Authority in
retaining existing public transit customers, attracting new customers and
developing support for the new public transit incentives.
As a community resource since 1975, County Express’ marketing efforts have
been modest. Therefore, this Marketing narrative presents the foundation of a
strategic approach intended to enhance community mobility, broaden the County
Express customer base, increase annual ridership, and realize the lowest
reasonable public subsidy. To accomplish this, the Local Transportation
Authority should allocate no less than four percent of its annual operating budget
to marketing in the first year of this Plan, and 3.5 percent every year thereafter.
The strategies outlined herein are intended to support those service offerings in
place at the time of the evaluation, as well as those service recommendations
discussed herein. The proposed approach includes a mechanism for the
effectiveness of impact.
Overview of Marketing Efforts Some of the current marketing materials appeared to be out-of-date. Concurrent
with the development of this report, a redesign of the current County Express
website was completed.
Print The principal transit marketing tool is the County Express service brochure. The
brochure is presented in a double-sided, full-color, accordion-fold format with a
finished size of 5.5 inches by 3.75 inches. Basic individual design elements
include timetable, route map, fare details, and customer information. The
brochure is updated when significant service modifications are made. The most
recent changes were made in 2004 and again in 2006, with a print run of
approximately 5,900 units for the latter. Brochures are available at county/city
SHORT RANGE TRANSIT PLAN
SAN BENITO LOCAL TRANSPORTATION AUTHORITY PAGE 132
offices, major employers (including Granite Rock, Milgard, Hazel Hawkins,
Ridgemark, and San Benito Foods), and educational facilities throughout San
Benito County.
Broadcast As a service to the community, County Express has enjoyed complimentary radio
spots, via KMPG 1520, for rider alerts, service changes, and special events.
Internet Prior to its redesign, County Express’s website content appeared to be both
accurate and up-to-date. With the exception of its vibrant appearance, the site
appeared to be functioning properly. While it is always possible to make
enhancements to a site’s appearance, navigation, and content, none are more
crucial than site accessibility.
Further, in the December 2006 onboard survey, nearly half of all respondents
indicated no familiarity with the County Express website
(www.SanBenitoCountyExpress.org). It is recommended the website should be
included in all County Express marketing materials and that the site content be
updated no less frequently than once a quarter. Further, interior vehicle
advertisements can promote the website as the easiest way to retrieve the most
current information about the service.
Events It is vital to its success that County Express be viewed as a good neighbor and
benefit to its community. In the past year, the County Express has maintained a
presence at many local events in San Benito County. Events included the San
Benito County Fair, Hazel Hawkins Health Fair, Gavilan College registration, and
Career Fair. At each of these events, a representative has been present to pass
out transit brochures with information about Bike Week and Rideshare Week.
San Benito County is an area rich in community and has no shortage of events
throughout the year. As a result, it is recommended that County Express expand
SHORT RANGE TRANSIT PLAN
SAN BENITO LOCAL TRANSPORTATION AUTHORITY PAGE 133
its involvement to other events in the community. Further, to encourage and
reward trial ridership, the distribution of free-ride coupons is strongly encouraged.
Promotions
In recent months, County Express has promoted fitness, environmental
consciousness, safety, and cost-savings through its participation in the Council of
San Benito County Governments’ Bike Week, Rideshare Week, and Senior Safe
Mobility Week.
During the promotion of Bike Week, the County Express distributed free-ride
tickets to any persons riding their bike to a County Express bus stop. Posters
displayed throughout Downtown Hollister as well as brochure distribution served
to generate public awareness.
One of the events during Bike Week is the Commuter Bike Challenge where free
lunches are offered to the employer with the most participants and a drawing for
a $1,000 cash prize. Further, local news publications and radio stations were
also utilized as advertising outlets for the event. Both of these promotions had
their own web home, where people could learn about or register for the events.
County Express should become a more active participant in the event to
generate more public awareness and support for the system.
At the San Benito County Fair, the Local Transportation Authority and the
Council of Governments promote County Express services and Rideshare Week.
Rideshare Week is an event that is promoted by the Council of Governments in
partnership with the Association of Monterey Bay Area Governments. Like Bike
Week, County Express should become a more active participant in the even to
generate more public awareness and support for the system.
SHORT RANGE TRANSIT PLAN
SAN BENITO LOCAL TRANSPORTATION AUTHORITY PAGE 134
Bus Stop Amenities
Each bus stop functions as the “front door” to the County Express service.
Signage informs new riders where to catch the bus and potential riders that
transit service travels through the area. In addition, each sign creates an
impression among non-riders, generating service and brand awareness.
Based on the December 2006 ride check, it appears some of the “established”
bus stops throughout the County Express system were identified by “Intercounty”
stop signage. Signage was not clearly identified as a part of the County Express
Fixed Route system; as a result, it is recommended that the Local Transportation
Authority coordinate all appropriate stops with identifiable bus stop amenities.
Further, all bus stops and shelters were equipped with an identification sign that
included the County Express logo. While these signs are effective in function,
many are defaced or deteriorating. Damaged signage needs to be repaired or
replaced so that it may function properly.
Bus stop amenities such as pole-mounted schedules with service information
(info posts) are available at many bus stops. However, current bus stop
amenities are generic in design and provide contradictory information. Many
signs feature only some of the routes that stop there, while others had signs for
all routes that stop at that point. Those stops equipped with info posts were
inconsistent with the according stop signage as noted above. For instance,
some displayed the Intercounty signage, yet lacked an Intercounty timetable on
the associated info post.
Bus stop amenities are a cost-effective means of raising general community
awareness as well as providing a much-desired amenity to current customers.
Given the availability of effective, easy-to-read printed service information
materials, reworking these materials into an appropriate format for these bus stop
information display units appears to be a feasible undertaking, whether through
current staff or an outside consultant.
SHORT RANGE TRANSIT PLAN
SAN BENITO LOCAL TRANSPORTATION AUTHORITY PAGE 135
Vehicles
Each County Express vehicle was clearly identifiable from both a color scheme
and marking or signage point of view. At the time of the December 2006 ride
check, however, not all County Express vehicles had functioning headsigns. A
headsign, located on the outside front of the vehicle above the windshield,
displays the vehicles route or destination information. Some vehicles were
equipped with headsigns that were either broken or in poor condition.
Brochure holders were not installed on any County Express vehicles. Some
drivers were supplied with brochures that are distributed to passengers upon
request. All vehicles should be equipped with brochure holders (placed behind
the driver) which are fully stocked at all times.
Interior signs (i.e., car cards) were not present. This is a promotional channel
that can be used for the marketing of transit services as well as local/community-
based programs or services. This approach would work well for County Express,
and the installation of interior signage is recommended for all vehicles. Doing so
provides County Express with a captive audience.
Exterior vehicle advertising represents a desired balance between maintaining
the visual integrity of the fleet while also providing some revenue generation
element. At the time of evaluation, no vehicles display exterior advertising.
Given community sensibility, as well as the relatively modest fleet size,
maintaining visual integrity by opting not to include exterior advertising is an
appropriate decision.
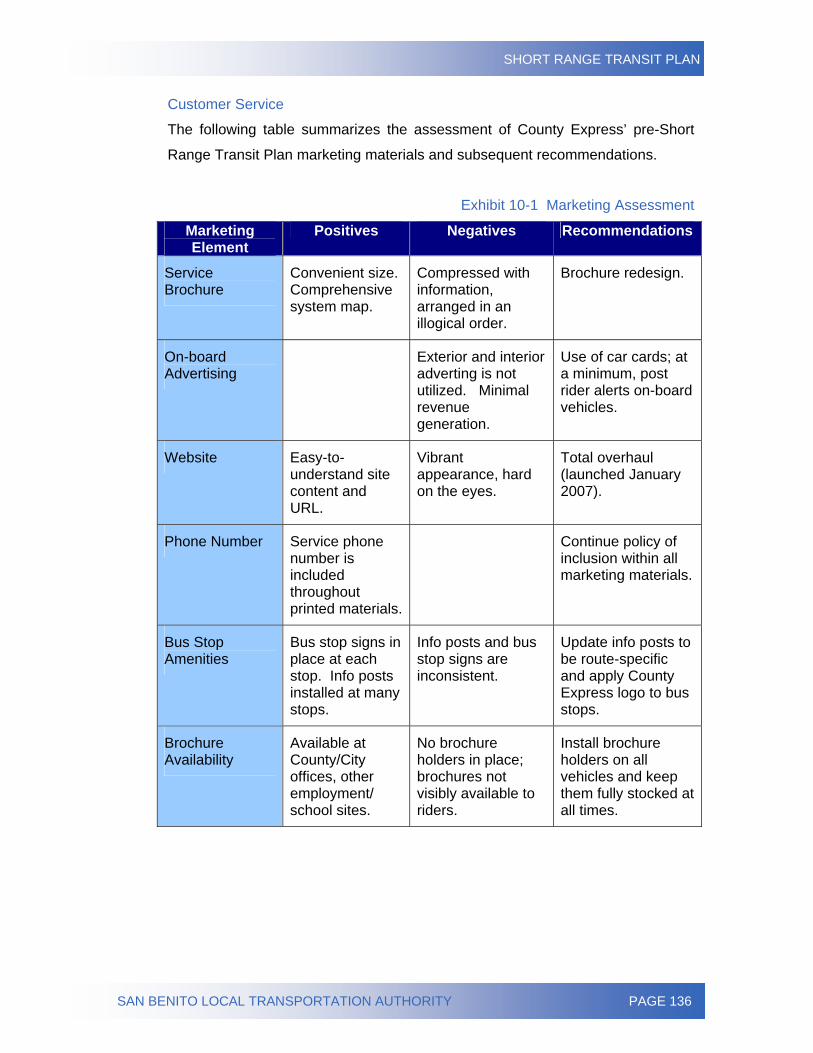
SHORT RANGE TRANSIT PLAN
SAN BENITO LOCAL TRANSPORTATION AUTHORITY PAGE 136
Customer Service
The following table summarizes the assessment of County Express’ pre-Short
Range Transit Plan marketing materials and subsequent recommendations.
Exhibit 10-1 Marketing Assessment
Marketing Element
Positives Negatives Recommendations
Service Brochure
Convenient size. Comprehensive system map.
Compressed with information, arranged in an illogical order.
Brochure redesign.
On-board Advertising
Exterior and interior adverting is not utilized. Minimal revenue generation.
Use of car cards; at a minimum, post rider alerts on-board vehicles.
Website Easy-to-understand site content and URL.
Vibrant appearance, hard on the eyes.
Total overhaul (launched January 2007).
Phone Number Service phone number is included throughout printed materials.
Continue policy of inclusion within all marketing materials.
Bus Stop Amenities
Bus stop signs in place at each stop. Info posts installed at many stops.
Info posts and bus stop signs are inconsistent.
Update info posts to be route-specific and apply County Express logo to bus stops.
Brochure Availability
Available at County/City offices, other employment/ school sites.
No brochure holders in place; brochures not visibly available to riders.
Install brochure holders on all vehicles and keep them fully stocked at all times.
SHORT RANGE TRANSIT PLAN
SAN BENITO LOCAL TRANSPORTATION AUTHORITY PAGE 137
Comprehensive Marketing Strategy Quality public transportation provides enhanced mobility, independence, access,
and choice for Americans. It strengthens communities by stimulating the
economy, mitigating roadway congestion, creating jobs, and preserving the
environment. One need not ride public transportation to benefit from it. Yet how
do you communicate this to the community at-large? You do it through
marketing.
Marketing plays a major role in the growth of a business, no matter what type of
business it is. The only way to get more customers is to get the word out. But
because marketing is a business tool that can work for or against you, it is
important to do it right the first time. While it is easier to keep a customer than
attract a new one, effective marketing can do both.
County Express is a service enterprise, and therefore requires a different
approach than a product marketer. A service-intensive business must
differentiate itself on the basis of its market understanding and customer service–
its ability to understand what the customer wants, and how those wants and
needs are changing.
The term "marketing" means different things to different people and is often the
subject of much confusion. Many assume marketing is simply a more glamorous
name for sales, though in reality they are quite different. Others take marketing
to mean the advertising, public relations, communications, and general
promotional activities of a company. Marketing incorporates these types of
activities and much more. The Local Transportation Authority must strive to
answer the following questions:
• Does it really understand its key markets, their size and growth
rate, and where they are headed over the longer term? Can it
quantify and rank specific target markets, by customer
segment, by geographic region, and by type of service?
• Can it define those market areas that its current strengths
allow it to best serve? Does it know what share of the
SHORT RANGE TRANSIT PLAN
SAN BENITO LOCAL TRANSPORTATION AUTHORITY PAGE 138
transportation market it currently holds in each of the definable
customer, geographic, and product markets?
• Does it regularly and formally review its service offerings and
extend, augment, or refashion them? Does it ask its
customers what they think of its services, and how they can be
improved?
• Does it adequately anticipate changes in external economic,
political, regulatory, and technological developments, or is it
frequently caught by surprise?
The classic marketing principle is based on the four Ps of marketing: product,
price, place, and promotion.
• Product – The service County Express intends to provide to
San Benito County.
• Price – The amount County Express will charge for its
service.
• Place – The geographic service areas, key destinations,
and eligibility requirements for providing service to the
customer. Essentially, is service accessible?
• Promotion – The strategies used to inform and persuade
potential customers to try public transit service.
By fusing these components, the Local Transportation Authority will be able to
guide its strategies more concisely and adjust its services accordingly. A large
portion of marketing efforts should be in the best interest of the customer. By
conducting the recent customer and community surveys, the Local
Transportation Authority has gained important insight into its customers’ needs
and wants, all of which has been used to develop this narrative.
Where does advertising fit into this?
Generally speaking, advertising and marketing go hand-in-glove. There are
various forms of advertising such as print media (newspaper, publications,
flyers), broadcast (television and radio), outdoor media (billboards), online
technology, and direct mail, just to name a few. Another form of advertising is
SHORT RANGE TRANSIT PLAN
SAN BENITO LOCAL TRANSPORTATION AUTHORITY PAGE 139
word-of-mouth. This method is the most popular and least expensive way to
advertise, although it certainly should not be the only channel. A strong
advertising campaign can be a useful tool in generating ridership growth for
County Express.
The following Plan is designed to meet the Local Transportation Authority goal
for a cohesive and comprehensive strategic marketing plan. No matter how well
a product is designed – or in this case, how excellent the service is – customers
will not emerge unless awareness is generated in the marketplace. Each
consumer wants to know how the product will affect his or her day-to-day life.
Although the County Express service is not a tangible product, it does provide
residents a means of enhancing their quality of life.
Strengths, Weaknesses, Opportunities, and Threats (SWOT) Analysis The approach to developing a successful marketing plan for County Express
includes a Strengths, Weaknesses, Opportunities, and Threats analysis. This
analysis provides important insight into County Express’ respective strengths,
weaknesses, opportunities, and threats. The following is an overview of the
questions that must be addressed regarding County Express:
Strengths
• What competitive advantages does County Express possess?
• What does County Express do particularly well?
• What resources does County Express have access to?
• What do others perceive as County Express’ core strengths?
Weaknesses
• How could County Express improve its offerings?
• What operational or service areas most warrant improvement?
Opportunities
• What practical, near-term opportunities exist?
• What important trends are present within San Benito County?
Threats
• What obstacles does County Express face?
• What is the competition doing?
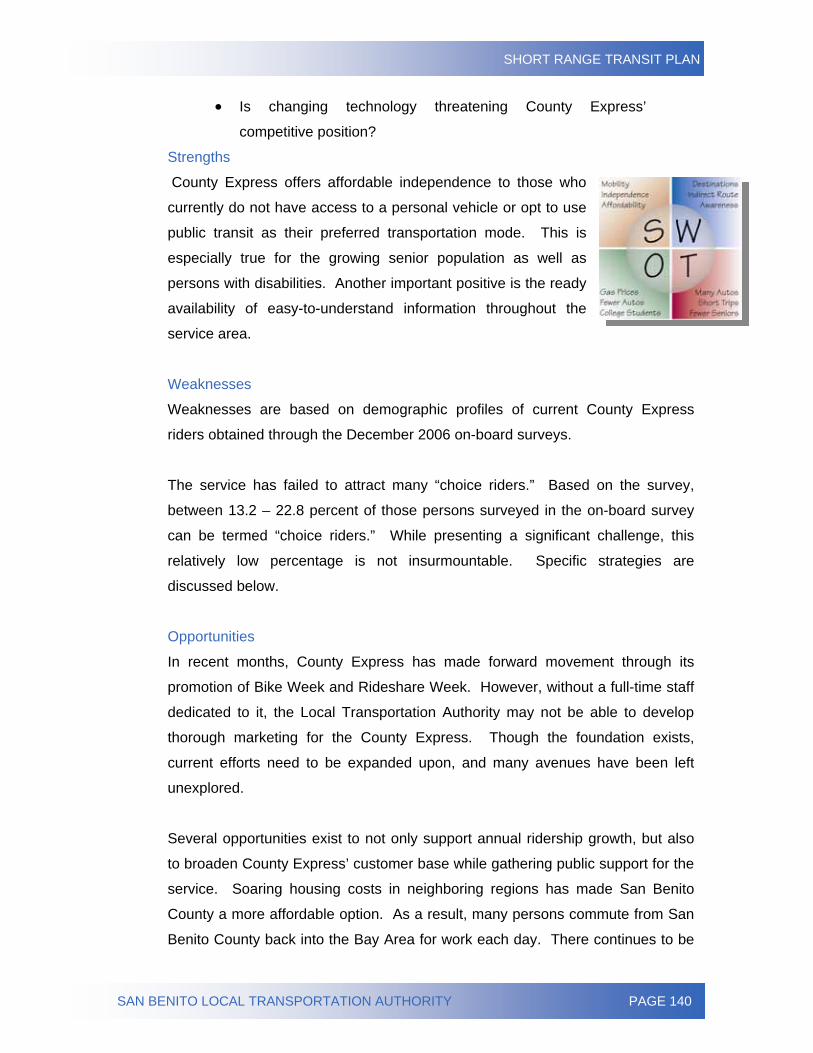
SHORT RANGE TRANSIT PLAN
SAN BENITO LOCAL TRANSPORTATION AUTHORITY PAGE 140
• Is changing technology threatening County Express’
competitive position?
Strengths
County Express offers affordable independence to those who
currently do not have access to a personal vehicle or opt to use
public transit as their preferred transportation mode. This is
especially true for the growing senior population as well as
persons with disabilities. Another important positive is the ready
availability of easy-to-understand information throughout the
service area.
Weaknesses
Weaknesses are based on demographic profiles of current County Express
riders obtained through the December 2006 on-board surveys.
The service has failed to attract many “choice riders.” Based on the survey,
between 13.2 – 22.8 percent of those persons surveyed in the on-board survey
can be termed “choice riders.” While presenting a significant challenge, this
relatively low percentage is not insurmountable. Specific strategies are
discussed below.
Opportunities
In recent months, County Express has made forward movement through its
promotion of Bike Week and Rideshare Week. However, without a full-time staff
dedicated to it, the Local Transportation Authority may not be able to develop
thorough marketing for the County Express. Though the foundation exists,
current efforts need to be expanded upon, and many avenues have been left
unexplored.
Several opportunities exist to not only support annual ridership growth, but also
to broaden County Express’ customer base while gathering public support for the
service. Soaring housing costs in neighboring regions has made San Benito
County a more affordable option. As a result, many persons commute from San
Benito County back into the Bay Area for work each day. There continues to be
SHORT RANGE TRANSIT PLAN
SAN BENITO LOCAL TRANSPORTATION AUTHORITY PAGE 141
an appreciable lack of service patronage amongst “choice riders.” This provides
an important opportunity to promote County Express as a preferred
transportation mode when commuting into the Bay Area, or transferring to
connecting services. Choice riders also readily embrace feel-good aspects.
Further, it is recommended the Local Transportation Authority give priority to the
“local faces” element of the proposed advertising campaign. By placing a “face”
on the County Express service, the broadening of the public transit customer
base will be realized.
Threats
Given the high incidence of vehicle ownership present throughout San Benito
County, the primary threat to County Express is the inherent freedom offered by
the car. With many new San Benito residents commuting to and from the Bay
Area, the appeal of the personal vehicle is especially inherent. Though
increasingly expensive to own and operate, the personal vehicle is the yardstick
against which all competing transportation modes are measured.
Marketing Strategies A strategic marketing plan is fundamental to effectively promoting public transit
within San Benito County. The County Express Marketing Plan and
accompanying implementation strategy are intended to achieve the following
goals and objectives.
1. Increase transit patronage among residents and visitors alike.
2. Increase transit’s market share of the region’s travel market.
3. Enhance the image of transit as a local and regional resource.
4. Mitigate the impact which increased development has had on
region’s air quality.
5. Assist in the mitigation of local roadway congestion.
6. Enhance personal mobility.
To be successful, strategies must be focused. The development of effective
marketing strategies require focus on (1) selected target markets, (2) selected
target market needs as related to selected product or service offerings, and (3)
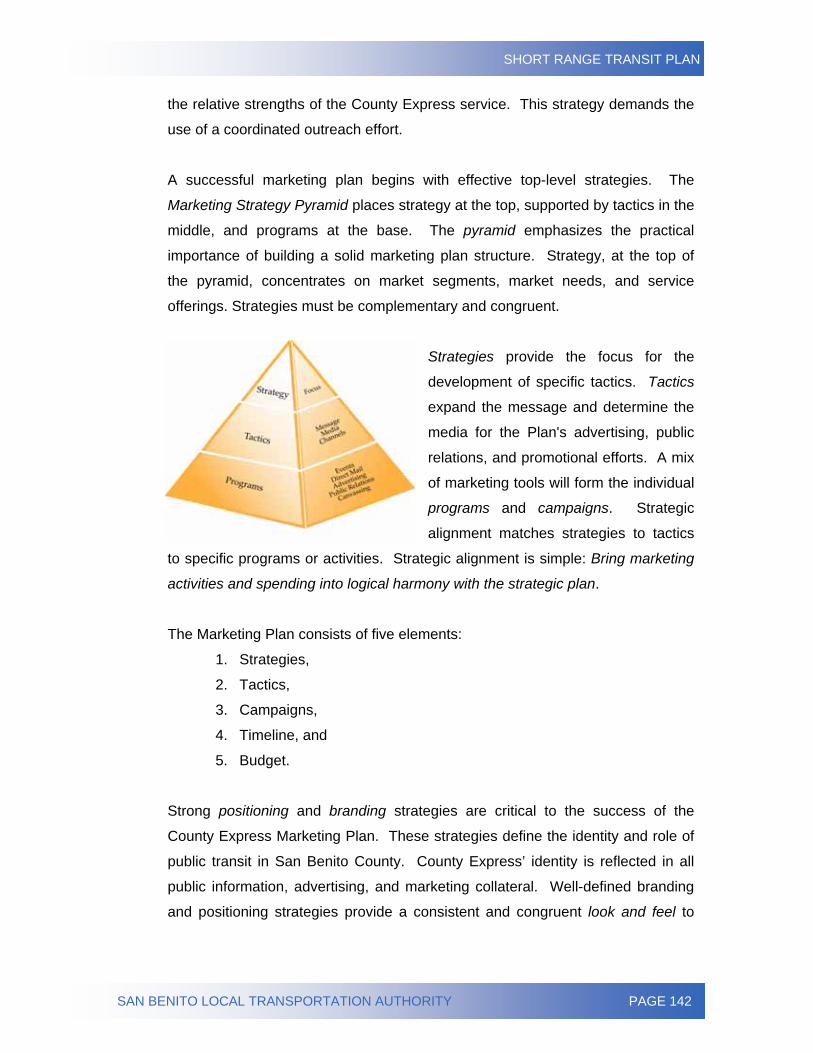
SHORT RANGE TRANSIT PLAN
SAN BENITO LOCAL TRANSPORTATION AUTHORITY PAGE 142
the relative strengths of the County Express service. This strategy demands the
use of a coordinated outreach effort.
A successful marketing plan begins with effective top-level strategies. The
Marketing Strategy Pyramid places strategy at the top, supported by tactics in the
middle, and programs at the base. The pyramid emphasizes the practical
importance of building a solid marketing plan structure. Strategy, at the top of
the pyramid, concentrates on market segments, market needs, and service
offerings. Strategies must be complementary and congruent.
Strategies provide the focus for the
development of specific tactics. Tactics
expand the message and determine the
media for the Plan's advertising, public
relations, and promotional efforts. A mix
of marketing tools will form the individual
programs and campaigns. Strategic
alignment matches strategies to tactics
to specific programs or activities. Strategic alignment is simple: Bring marketing
activities and spending into logical harmony with the strategic plan.
The Marketing Plan consists of five elements:
1. Strategies,
2. Tactics,
3. Campaigns,
4. Timeline, and
5. Budget.
Strong positioning and branding strategies are critical to the success of the
County Express Marketing Plan. These strategies define the identity and role of
public transit in San Benito County. County Express’ identity is reflected in all
public information, advertising, and marketing collateral. Well-defined branding
and positioning strategies provide a consistent and congruent look and feel to
SHORT RANGE TRANSIT PLAN
SAN BENITO LOCAL TRANSPORTATION AUTHORITY PAGE 143
public pieces, thereby underscoring recognition of County Express throughout
the service area.
Successful branding and positioning include an image development program.
This effort is already evident in County Express operations, collateral materials,
events, websites, advertising, and even the way the customer service telephone
is answered.
• Branding Strategy
A successful branding strategy clearly and creatively defines the
image of public transportation within the community. The branding
strategy communicates the image, identity, and personality of transit
within the community. This strategy determines the emotional impact
the brand has on customers, potential customers, stakeholders, and
the public. It shapes the opinion and attitude the market will have of
public transportation.
To develop the branding strategy, service features that reflect the
attributes transit riders most value will be emphasized. The look and
feel of the branding strategy is achieved by assigning qualities to the
features, which translate into benefits by the target market:
1. Convenience,
2. Affordability,
3. Reliability,
4. Accessibility, and
5. Safety.
By meeting basic needs, both for the individual customer as well as
the community at-large, positioning for County Express achieves an
emotional connection with respect to the following values:
1. Security,
2. Independence,
3. Empowerment,
4. Fulfillment.
SHORT RANGE TRANSIT PLAN
SAN BENITO LOCAL TRANSPORTATION AUTHORITY PAGE 144
This value system integrates well with the social-demographic and
psychographic profiles present throughout San Benito County.
Linking public transit to these values and supporting the benefits with
features of the service provide the branding context.
County Express has an effective, recognizable logo or service identity
already in place. Therefore, it is extremely important to use the brand
identity/logo in a consistent manner. The logo is the core of the
County Express branding and should always appear in the same
design, as well as the same colors. The logo should be included on
all marketing materials, including print media, vehicle branding,
letterhead, or bus stop signage.
• Positioning Strategy
To increase the significance of public transit in the minds of existing
and prospective patrons, it must be linked to other issues people care
about and support, (i.e., key personal values). Translating features
into benefits and describing how such benefits address the target’s
needs achieve the emotional connection.
In today’s society, mobility has evolved into a fundamental
physiological need. Public transit ensures mobility. It provides
access. By providing opportunity and choice, public transit is a way to
meet social needs. Public transit's relative low cost translates to
value for the consumer. Safety onboard and at the bus stops
provides security.
The positioning strategy compares the service to competing travel
modes. By focusing on the unique qualities of public transit, the
positioning strategy establishes its benefits over competing travel
modes, both to the rider and the community at-large. Still, benefits
(i.e., what the service offers the user) must be supported by features.
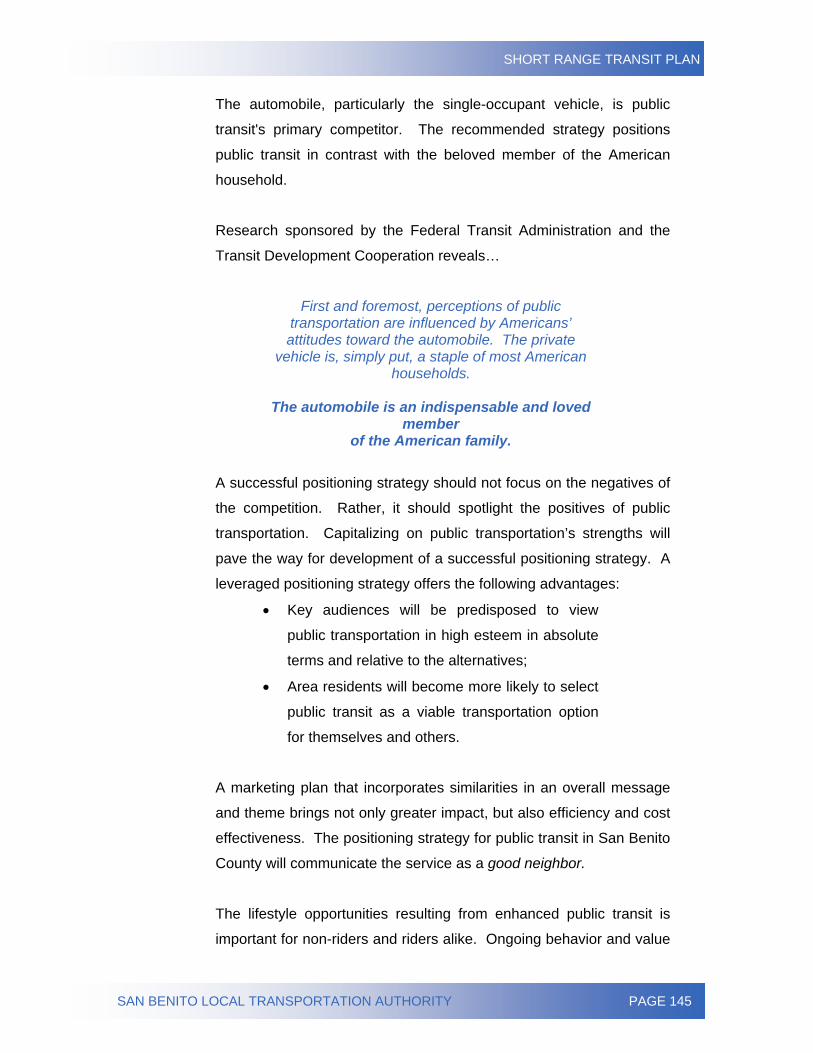
SHORT RANGE TRANSIT PLAN
SAN BENITO LOCAL TRANSPORTATION AUTHORITY PAGE 145
The automobile, particularly the single-occupant vehicle, is public
transit's primary competitor. The recommended strategy positions
public transit in contrast with the beloved member of the American
household.
Research sponsored by the Federal Transit Administration and the
Transit Development Cooperation reveals…
First and foremost, perceptions of public transportation are influenced by Americans’ attitudes toward the automobile. The private
vehicle is, simply put, a staple of most American households.
The automobile is an indispensable and loved
member of the American family.
A successful positioning strategy should not focus on the negatives of
the competition. Rather, it should spotlight the positives of public
transportation. Capitalizing on public transportation’s strengths will
pave the way for development of a successful positioning strategy. A
leveraged positioning strategy offers the following advantages:
• Key audiences will be predisposed to view
public transportation in high esteem in absolute
terms and relative to the alternatives;
• Area residents will become more likely to select
public transit as a viable transportation option
for themselves and others.
A marketing plan that incorporates similarities in an overall message
and theme brings not only greater impact, but also efficiency and cost
effectiveness. The positioning strategy for public transit in San Benito
County will communicate the service as a good neighbor.
The lifestyle opportunities resulting from enhanced public transit is
important for non-riders and riders alike. Ongoing behavior and value
SHORT RANGE TRANSIT PLAN
SAN BENITO LOCAL TRANSPORTATION AUTHORITY PAGE 146
research reveals although non-riders may not see themselves as
prospective transit customers, such transportation-advantaged
persons remain committed to public transit as an important quality of
life factor.
A tag line is a brief phrase or statement conveying the essential
unique message about public transit. A good tag line is a natural fit
with the branding and positioning strategies. It differentiates public
transit from the competition, establishes an image, and reflects
consistency throughout all marketing campaigns and programs.
Effective tag lines catch attention and thus are memorable. More
importantly, they convey a message to public transit’s many
audiences: riders, employees, stakeholders, and the community at-
large. It’s more than just a catchy phrase; it’s a streamlined vision or
mission statement encapsulated.
Each of the sponsoring partners will need to be comfortable with the
tag line. Below are a number of possible branding-related tag lines
that embody the branding and positioning strategies. However, during
discussions additional ideas may emerge:
1. San Benito County’s mobility solution.
2. Connecting you to (insert destination) just got easier.
3. Where will it take you?
4. Keeping San Benito County moving.
5. Connecting the community.
6. How will you ride it?
7. Wherever life takes you.
8. Going your way.
9. We’ll get you there.
10. Less expense. Less stress. Less is more.
11. What can San Benito County Express do for you?
12. Here to help
13. Serving you.
SHORT RANGE TRANSIT PLAN
SAN BENITO LOCAL TRANSPORTATION AUTHORITY PAGE 147
Outreach Strategy In coordination with the marketing strategies (branding and positioning), several
specific goal-related strategies have been delineated:
1. Extend the presence and visibility of public transit throughout
the community.
2. Expand promotional channels for providing information to
potential riders, stakeholders, and non-riders.
3. Customize promotions and offerings to address the values and
needs of specific demographic segments within urbanized San
Benito County.
• Extend Community Involvement
The positioning and branding strategies emphasize the importance
and value of public transit within the community. A regular and consistent presence in the community will strengthen the connection
of the County Express service to the San Benito community through
association.
The recommended association should be with organizations and
activities having a strong identity and placement within the individual
communities. While many of the envisioned activities should be on a
local (or service-specific) basis, it will be important to coordinate and
align local and regional activity to the greatest extent possible.
As discussed within the branding and positioning strategies, the most
important aspect of community involvement should be to provide
substance to the attributes and benefits of public transit as a good
neighbor. This is accomplished by participating in activities and
associating with organizations that reflect community values, exhibit
the area’s image, and can be connective with the positive benefits of
public transit: freedom, fulfillment, and independence.
Association is a classical marketing technique to assign a particular
attribute to a product or service. By partnering with organizations and
SHORT RANGE TRANSIT PLAN
SAN BENITO LOCAL TRANSPORTATION AUTHORITY PAGE 148
events that project an image of public transit’s positive benefits to the
community at-large, the same qualities would become associated with
County Express.
As noted earlier in this chapter, County Express has participated in
several noteworthy events. Continual and additional community
involvement may include the following activities:
1. Participation in community events and fairs.
2. Speaking at community clubs and associations.
3. Affinity marketing with other community-based
services/ programs.
4. Distribution of free ride vouchers at each community
activity.
• Customize Promotions
Faced with limited marketing funds, most transit agencies use
demographics, psychographics, and geography to segment
populations with the greatest propensity to use the service. Well-
managed target marketing can increase the Return on Investment
(ROI) on marketing dollars. Within the transit arena, ROI has been
historically measured by increasing ridership numbers. Target
markets should be reviewed periodically through biannual market
research activities.
An effective targeted marketing program focuses on the specific
benefits that may be of value to the particular market segment
targeted as part of the campaign or promotion. Each campaign and
promotion will identify a specific target market. Selection of media
and message would be customized to the demographic and lifestyle
profile of the market segment. Specific market segments for transit
services include the following:
1. Non-riders: Here, primary interest will be in the overall
value public transit offers the community and in some
cases, availability of travel options for themselves. Values
SHORT RANGE TRANSIT PLAN
SAN BENITO LOCAL TRANSPORTATION AUTHORITY PAGE 149
such as pride in their community and providing fulfillment
opportunities for themselves and others can generate
support. Transit market research has shown by simply
increasing the awareness and familiarity of individuals in
this segment, their support and approval of public
transportation increases.
2. Choice riders: In today’s automobile-dominated culture,
choice riders are perhaps the most difficult segment to
motivate. American Public Transit Association-sponsored
research reveals the larger the commute trip (or the cost
associated with the trip), the higher the probability a person
will consider public transportation as a means of
commuting. Reliability and flexibility are the most important
attributes for this segment. However, the key motivator is
employer support through a subsidy or other motivating
initiatives emphasizing the importance of employer
outreach.
3. Non-direct markets, such as business and social service agencies: Employers and social service
providers offer channels for reaching both workers and
other targeted market segments. The key message in
communicating with businesses is to promote the value of
transit in dollars and cents. Benefits must be greater than
cost. Promoting the realization of benefits (i.e., tax
savings, worker retention) with minimal administrative or
direct costs has proven generally appealing to this
segment. Specifics are more credible than generalities.
4. Seniors: As people age, their ability to drive often
becomes impaired and their need for reliable transportation
alternatives increases. Transportation needs center
around safe and convenient conveyance. Communication
with this market segment is most effectively achieved
through respected community leaders and targeted direct
mail. The key to success is instilling a high level of
SHORT RANGE TRANSIT PLAN
SAN BENITO LOCAL TRANSPORTATION AUTHORITY PAGE 150
confidence in the safety and reliability in the transit service.
Safety and independence can be motivating benefits.
5. Youth who have yet to reach driving age: This segment
is another target market for potential customers. Most
youth do not have an independent means of transportation
and therefore must rely on family or friends for travel.
Special youth fares and promotions have the capability to
attract this segment. Independence and freedom are
motivating benefits. Although safety is not usually a major
consideration for this segment, it is a primary concern of
parents and caregivers, who would most likely fund their
dependent’s travel.
6. Persons in the lowest income quadrant: This
demographic segment historically has been the primary
target market for public transportation. Many within this
segment are fully or partially transit-dependent.
Unfortunately, a large portion of this segment is
disenfranchised from the mainstream. As a result, this
segment is often difficult to reach through traditional media
and public outreach activities. Appealing to the
demographic market requires stressing value and low cost,
while also emphasizing how these features translate to
pride and empowerment.
Tactical Plan actics and programs make up the practical implementation of the County
Express marketing strategy. Tactics are the message (what you say), media
(how you deliver the message to the customer), and the look & feel (mood, tone,
and image). Programs consist of campaigns developed using your current
County Express marketing strategies and complementary tactics.
T
SHORT RANGE TRANSIT PLAN
SAN BENITO LOCAL TRANSPORTATION AUTHORITY PAGE 151
The Tactical Plan comprises four tactical areas:
1. Marketing materials,
2. Advertising,
3. Public relations, and
4. Channel marketing.
Marketing Materials This toolkit outlines the proposed approach for the design and production of
marketing and informational materials such as maps and schedules, media kits,
and other explanatory materials.
A portfolio piece would be ideal. This is a folder or dossier allowing marketing
materials to be customized for presentation to a particular customer through the
insertion of materials targeted to individual needs. For example, a portfolio to be
distributed to seniors would have materials promoting enhanced mobility, safety,
and reliability as they relate to County Express. It wound not include other
materials geared toward youth or choice riders. Doing so would allow for a single
resource kit that could be employed in coordinated marketing initiatives. A
phased approach would be used with the design standards developed for new
pieces and incorporated into revised pieces as appropriate.
All elements would be coordinated to present a professional and unified look to
the dossier. The most economical approach to this is a common size paper for
County Express system-route maps and schedules. The schedules could then
be used to provide local schedule information and in a unified portfolio.
The individual components of the kit, including schedules, could be designed and
reprinted using a phased-in approach once the basic design is adopted. Other
components of the resource kit could include the following:
1. A folder or portfolio that is specially die-cut to display
schedules and other reference materials as required. Another
alternative is a loose-leaf notebook with die-cut pockets for
SHORT RANGE TRANSIT PLAN
SAN BENITO LOCAL TRANSPORTATION AUTHORITY PAGE 152
individual schedules. The goal of this piece would be to
provide a single reference piece for a client.
2. A decision-tree matrix would direct the reader to the “right”
transit service for a particular trip or provide an explanation on
how to book a transit trip. The primary purpose of this piece
would be to assist social service clients in determining the
correct or best service to use in a given situation.
3. Aimed at employers, an Employer Incentives Overview would
identify both hard incentives (e.g., tax benefits) and soft
incentives (e.g., wider recruitment area and reduced turn-over)
for subsidizing employee use of transit.
4. The County Express system map would emphasize coverage,
destinations, and connections.
5. A Guaranteed Ride Home program provides no-cost
emergency transportation to those who utilize public transit.
This program ensures that public transit customers do not get
stranded if, for example, their carpool driver has to leave work
early or they themselves have to return home suddenly at a
time when their regular bus is not available. Information on
how the program works and how to register for the service
would be included.
6. A Media Release Layout Template is to be used for media
releases, both to local press and industry press; and
7. Posters for Employer and Agency posting (two per year).
Most of the individual pieces currently exist in one form or
another. The success of this effort would depend on
reformatting the individual mismatched pieces produced by
various agencies into a unified format and a consistent look &
feel that is representative of the positioning and branding
strategies for the coordinated transit marketing plan.
SHORT RANGE TRANSIT PLAN
SAN BENITO LOCAL TRANSPORTATION AUTHORITY PAGE 153
Advertising This section presents the recommendations for the design, production, and
distribution of direct mail advertising pieces, newspaper and other print
advertisements, radio and other broadcast media, and other media determined to
be appropriate for marketing public transit in San Benito County. The Advertising
Plan has two components: message and media.
• Message
Crafting an effective message is critical to the success of a marketing
program. The message consists of both the written copy and the
visual images. The impact of a creative message is often quantified
by a multiple of the frequency, the number of times a marketing
message reaches a target market in a given time frame. To achieve
optimal impact, the message delivered must adhere to the following:
1. The message needs to be consistent throughout all County
Express marketing materials. Having well developed
marketing strategies helps maintain a consistent message.
Developing a tag line or slogan is an effective mechanism
for achieving this result.
2. The message should focus on the benefits of the overall
branding and positioning strategy. Public transportation
is a good neighbor. It enhances life in the community
offering the following benefits:
• Safety,
• Freedom,
• Personal achievement,
• Pride,
• Empowerment, and
• Independence.
The qualities of the brand personality should reflect the following
attributes:
• Friendly,
• Approachable,
SHORT RANGE TRANSIT PLAN
SAN BENITO LOCAL TRANSPORTATION AUTHORITY PAGE 154
• Trustworthy,
• Community-conscious, and
• Affordable.
3. Features will support the benefits. The findings of both the
rider and community surveys provide supportive evidence
for the benefits embedded in the marketing message.
Marketing pieces must be frank, direct, and credible.
4. The marketing message must be unpredictable.
Predictable advertising is boring and will not get the
attention of the target markets. Curiosity and news can
stimulate the potential customer to learn more. However,
creativity that is not channeled to deliver the message may
be entertaining; yet, will not increase ridership or public
support.
5. The message must always be stated positively. A
marketing message that speaks to fear or discomfort
invokes negative images and emotions, which may, in turn,
become linked with County Express.
• Media
Media selection is how the message is delivered to the target market.
The media mix is the combination of media to be used in the
marketing program. Industry research reveals that in today’s
increasingly complex media world, the choice of media can have a
major impact on how an audience receives and responds to a
message. It is the consumer who controls where, when, and under
what circumstances he or she pays attention to advertising. The
strengths of each individual medium must be considered relative to its
ability to reach the target audience with the desired impact.
The qualities inherent to a type of media can be used to good
advantage for the message. The primary tactical objectives of this
plan are⎯
SHORT RANGE TRANSIT PLAN
SAN BENITO LOCAL TRANSPORTATION AUTHORITY PAGE 155
1. Increase awareness among the general public and
specifically within market segments exhibiting the highest
propensity to use public transit;
2. Influence potential customers to try transit and non-riders
to have a more positive opinion of the County Express
service.
3. Provide information potential customers require in
sampling public transit.
The optimal vehicles for delivering this type of message within San
Benito County are print, broadcast, direct mail, and the Internet. The selected media will support the advertising campaigns and, to a
limited degree, a number of the promotional campaigns.
Consistency and repetition are two key components for increasing
awareness. These components are also required to ensure the
information is available to potential riders at times when those
potential riders are receptive to accepting the information.
Within the realm of available print media, recommended
publications include:
• Hollister Free Lance
• The Pinnacle
• San Jose Mercury News
According to the community and on-board surveys, many
respondents (27.5 percent) indicated a preference for The
Hollister Free Lance. Hollister Free Lance is a publication
produced Tuesday and Friday. Average circulation varies
from 3,400 to 3,600.
The Pinnacle is a free publication for the Hollister and San
Juan Bautista areas. It is published weekly and retains a
SHORT RANGE TRANSIT PLAN
SAN BENITO LOCAL TRANSPORTATION AUTHORITY PAGE 156
circulation of approximately 54,500; it was listed as the
preferred publication by 12.7 percent of survey
respondents. Both publications are locally-focused and
include article topics such as news, business, sports,
entertainment, and classifieds. Although not truly local, the
San Jose Mercury News was preferred by 9 percent of
those surveyed. The daily covers the nation’s fifth largest
market, and thus possesses a wide demographic reach in
the area.
Smaller print buys (or preferably barters) for targeted
promotions in special interest publications are also
recommended:
• The Bridge/El Puente
• Downtown Digest
• The Chamber News
The Bridge/El Puente is San Benito County’s only bilingual
newspaper. The bi-monthly publication is extremely
community-oriented, with a community spotlight section
suitable for local advertisements. The Bridge enjoys a
circulation of approximately 6,000. Another local print
media outlet is Downtown Digest – the Hollister Downtown
Association publication distributed to new residents,
business, and visitors throughout the year. The publication
has a wide distribution and is produced monthly. Due to its
frequency, it is a valuable publication for County Express’s
marketing efforts. Because the Downtown Hollister area is
the center of commerce for the entire county, this
publication effectively targets many markets of interest to
the County Express. The Chamber News is a monthly
newsletter produced by the San Benito County Chamber of
Commerce. The publication showcases local members
SHORT RANGE TRANSIT PLAN
SAN BENITO LOCAL TRANSPORTATION AUTHORITY PAGE 157
and businesses, as well as provides sponsorship and
advertising opportunities.
○ Broadcast
Radio provides an excellent opportunity to reach specific
market segments in a relatively cost-effective manner.
Morning and evening “drive times” are ideal for reaching
choice riders and youth, as they get ready and travel to
work or school. Spanish-language stations provide a direct
avenue to the Hispanic market segment.
Based on audience/market data, the recommended radio
outlets within San Benito County are:
• KGO 810 – News/Talk
• KSQL 99.1 - Spanish, Santa Cruz
• KDON 102.5 – Top 40 hits, Salinas
• KBAY 94.5 – Soft Rock, Gilroy
• KMPG 1520 – Radio Bonita, Spanish
Traffic sponsorships are an effective way to convey the
same message numerous times to the target audience,
typically in a more cost-effective manner than straight
advertisements. Because each of the stations listed above
cater to a different audience, they can be used in
conjunction to promote an event or new service, and can
successfully be used individually to target each group.
Although not technically a broadcast medium,
cinema/theater typically falls into this category because of
its method of production and delivery. Pre-movie
advertisements provide an excellent means of reaching a
“captive” audience comprised of a broad cross-section of
target markets per exposure at a relatively low cost. As
moviegoers arrive early to secure the best seat, the
SHORT RANGE TRANSIT PLAN
SAN BENITO LOCAL TRANSPORTATION AUTHORITY PAGE 158
message will often reach choice riders, youth, and seniors
at the same time. There are limited theaters in the County
Express service area that offer this promotional
opportunity, however, nearly Gilroy is home to the Caltrain
station, as well as the Platinum and Gilroy Theatres.
Smaller local theaters include the Granada Theatre and
Premiere Cinemas, both of which are located in Hollister.
Television offers limited advertising opportunities on a
modest budget. Slides on public information channels are
inexpensive, yet often have minimal impact. Investing in
commercial production and placement can be expensive,
and the content typically loses its “freshness” rather
quickly.
○ Internet
A complete revamp of the County Express’ website was
recommended to provide the amount of information and
level of service today’s technologically savvy consumer
demand, while enhancing its visual appeal. On January 1,
2007, the newly designed County Express website was
launched. The website is accessible in both English and
Spanish. System maps for both the Fixed Route and
Intercounty Routes are available and printable by .pdf files.
General information including services, fares, operating
hours, and connecting services is expanded to also include
rider and bikes on bus tips and information. Viewers are
able to access County Express news, including press
releases and rider alerts.
○ Public Service Announcements
Most media outlets will allow non-profit organizations to
publicize their efforts by airing or printing public service
announcements. County Express can use public service
SHORT RANGE TRANSIT PLAN
SAN BENITO LOCAL TRANSPORTATION AUTHORITY PAGE 159
announcements created for print (newspaper and
magazines), television, and radio. Radio stations are the
outlets most likely to use public service announcements;
with television, magazines, and newspapers following.
Other written or orally communicated public service
announcements that have been used successfully to get a
message across include grocery bags, company elevators,
and billboards along highways and in public transit
terminals. In addition, local public channels offer another
public service announcement opportunity.
It is important that the public service announcements
structure a message that will spotlight the benefit of public
transportation to the community and its citizens rather than
an obvious advertisement to increase ridership.
Unfortunately, public transportation will be competing
against hundreds of other groups and worthy causes.
Because public service announcements can become stale
and not used, a quarterly cycle for updating the public
service announcements for the media is included in this
plan.
○ Other Media
Direct mail, bus stop information displays, utility bill inserts,
and point of purchase signage would provide targeted
marketing for route-specific or market-specific campaigns,
while outdoor advertising, including billboards, banners,
and transit vehicle advertising, could be employed when
appropriate and cost-effective to increase awareness.
As mentioned earlier, San Benito County has experienced
notable population growth over the past ten years. Many
California residents are seeking to escape the high costs of
SHORT RANGE TRANSIT PLAN
SAN BENITO LOCAL TRANSPORTATION AUTHORITY PAGE 160
living in the Bay Area by commuting to the Bay Area and
relocating to San Benito County.
County Express is a community asset, and new residents
in particular will need to be informed about the variety of
public transportation services. The distribution of a
“welcome packet” – consisting of information regarding
County Express services – to real estate personnel or
relocation agents will assist in this increased transit
awareness.
The placement of County Express service advertisements
on County Express vehicles provides awareness of the
accessible service. By highlighting the convenience and
reduction in stress and costs associated with driving,
single-occupant vehicle-dependant commuters may be
encouraged to try public transit, potentially resulting in a
decrease in auto travel. Transit advertising includes
interior as well as exterior vehicle opportunities. Interior
advertisements include car cards with transit facts and
information on new services. It is recommended there
always be route/service specific cards in place on all
vehicles.
Exterior advertisements will serve to underscore basic
contact information such as website and phone number.
Each vehicle’s rear panel is a revenue-generating place to
promote County Express services, new routes, and
upcoming events that County Express will be holding or
participating in.
Phone directory listings are an integral element of the
media plan with yellow page, white page, and
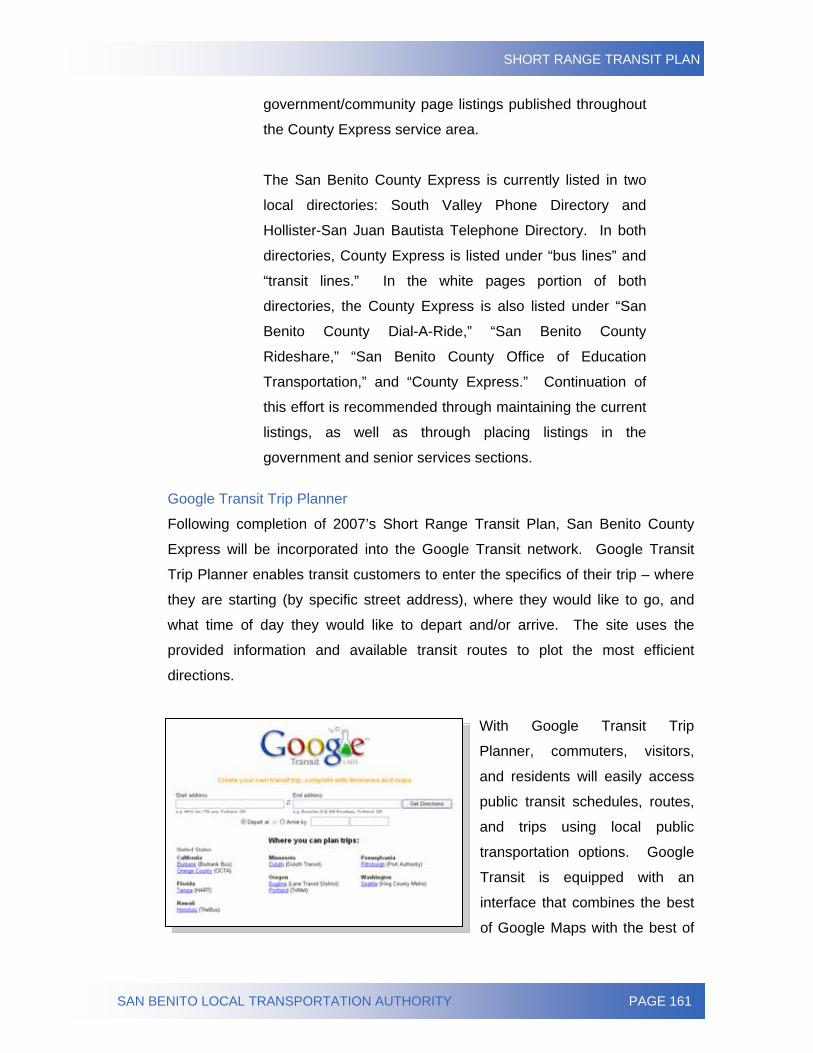
SHORT RANGE TRANSIT PLAN
SAN BENITO LOCAL TRANSPORTATION AUTHORITY PAGE 161
government/community page listings published throughout
the County Express service area.
The San Benito County Express is currently listed in two
local directories: South Valley Phone Directory and
Hollister-San Juan Bautista Telephone Directory. In both
directories, County Express is listed under “bus lines” and
“transit lines.” In the white pages portion of both
directories, the County Express is also listed under “San
Benito County Dial-A-Ride,” “San Benito County
Rideshare,” “San Benito County Office of Education
Transportation,” and “County Express.” Continuation of
this effort is recommended through maintaining the current
listings, as well as through placing listings in the
government and senior services sections.
Google Transit Trip Planner
Following completion of 2007’s Short Range Transit Plan, San Benito County
Express will be incorporated into the Google Transit network. Google Transit
Trip Planner enables transit customers to enter the specifics of their trip – where
they are starting (by specific street address), where they would like to go, and
what time of day they would like to depart and/or arrive. The site uses the
provided information and available transit routes to plot the most efficient
directions.
With Google Transit Trip
Planner, commuters, visitors,
and residents will easily access
public transit schedules, routes,
and trips using local public
transportation options. Google
Transit is equipped with an
interface that combines the best
of Google Maps with the best of
SHORT RANGE TRANSIT PLAN
SAN BENITO LOCAL TRANSPORTATION AUTHORITY PAGE 162
current transit trip planners. It informs customers where to walk and how long it
will take to do so, what route to take and when, plots it on the map (both walking
and riding, with flags to differentiate), and compares the cost of the trip to the
cost of driving.
The system finds the best routes based on the information entered for each trip.
If there are a limited number of transit options for a specific route, similar routes
with different departure times will be provided instead. When more transit
options are available for a trip, the list of departures may include different
methods of getting to that specified destination.
Google is a name known by virtually everyone. Partnering with such a high-
profile organization serves to increase County Express’ role in the community, as
well as the public transportation industry. Google’s Trip Planner is a free service
offered to the transit community. Nationwide, there are currently less than 10
transit systems incorporated into the Google network, none of which are in
Central California. The goal: to provide detailed instructions on traveling coast-
to-coast via the Google network. By doing so, County Express will establish itself
among the forefront of technology-enhanced transit systems.
Allowing users to quickly and easily enter location-to-location information and
receive accurate results with the use of state-of-the-art satellite imagery
technology will also improve customer service. Google Transit addresses the
needs of the community as well as established riders and Local Transportation
Authority employees.
Public Relations The Public Relations Plan develops the message as delineated in the advertising
plan and incorporates the plan's branding and positioning strategies as well as
other general marketing strategies. Public relations tools include non-paid media
communication, promotions, and community outreach.
Public relations objectives are designed to affect specific incremental behavior
over a short period of time, with tactics designed to accomplish the following:
SHORT RANGE TRANSIT PLAN
SAN BENITO LOCAL TRANSPORTATION AUTHORITY PAGE 163
1. Induce incremental customer behavior;
2. Focus on singular goal;
3. Be measurable and quantifiable;
4. Relate to a specific period of time;
5. Provide geographic focus;
6. Maintain budget constraints or profit parameters;
7. Focus on affecting one of the following target market behaviors:
• Retaining current riders,
• Increasing usage by current riders and potential riders, or
• Obtain repeat usage after initial trial.
Media Releases and Feature Articles
A major aspect in generating publicity is attracting attention and interest of
journalists and news people so that the story is communicated to the public.
Spotlighting County Express’s general operational practices or coverage of
specific campaigns within industry publications ensures positive attention by the
transit community, possibly leading to proposed increases in funding through the
support of elected officials.
Current efforts distribute media releases to limited community contacts. To
increase public support, it is recommended that the Local Transportation
Authority widely distribute to not only media contacts, but community and political
contacts as well.
To obtain publicity, each story must have an angle of interest (the hook) for the
reader. As a public service enterprise, County Express has the ability to attract
the interest of community publications more readily than private corporations.
Types of potential articles or news stories include:
• Straight media release announcing newsworthy event.
• Feature story exploring a subject of interest to the public.
• Human interest stories demonstrating how the qualities of
public transportation enhance the quality of life on a personal
level.
• “Concept” article describing the basic premise of public transit.
SHORT RANGE TRANSIT PLAN
SAN BENITO LOCAL TRANSPORTATION AUTHORITY PAGE 164
• Opinion pieces providing commentary on public transit service
and its impact and affect on the community.
The proposed plan includes monthly media releases disseminated to all media
outlets within San Benito County, as well as industry, local business, political,
and community specific publications, where appropriate. This plan includes a
minimum of two feature length articles suitable for industry press with
accompanying news releases to the local media.
Community Outreach
Positioning the County Express program/service within the community is a critical
component of the consultant’s marketing strategy. The community outreach
activities include four major components:
1. Promotions,
2. Events,
3. Social service outreach, and
4. Sponsorship.
• Campaigns
Two campaigns will be integrated into the overall marketing plan. The
campaigns have been developed to complement other marketing
opportunities.
○ Try Transit Week
Objective: Expand upon current
Rideshare Week efforts; take a more
transit-specific approach than in the
past to encourage trial ridership among
the general public and potential riders. Awareness; improve perception of
transit.
Description: Coordinate with Try Transit Week sponsors
and the Rideshare Week; contest with existing riders to
select the Exceptional Bus Driver (short essay contest)
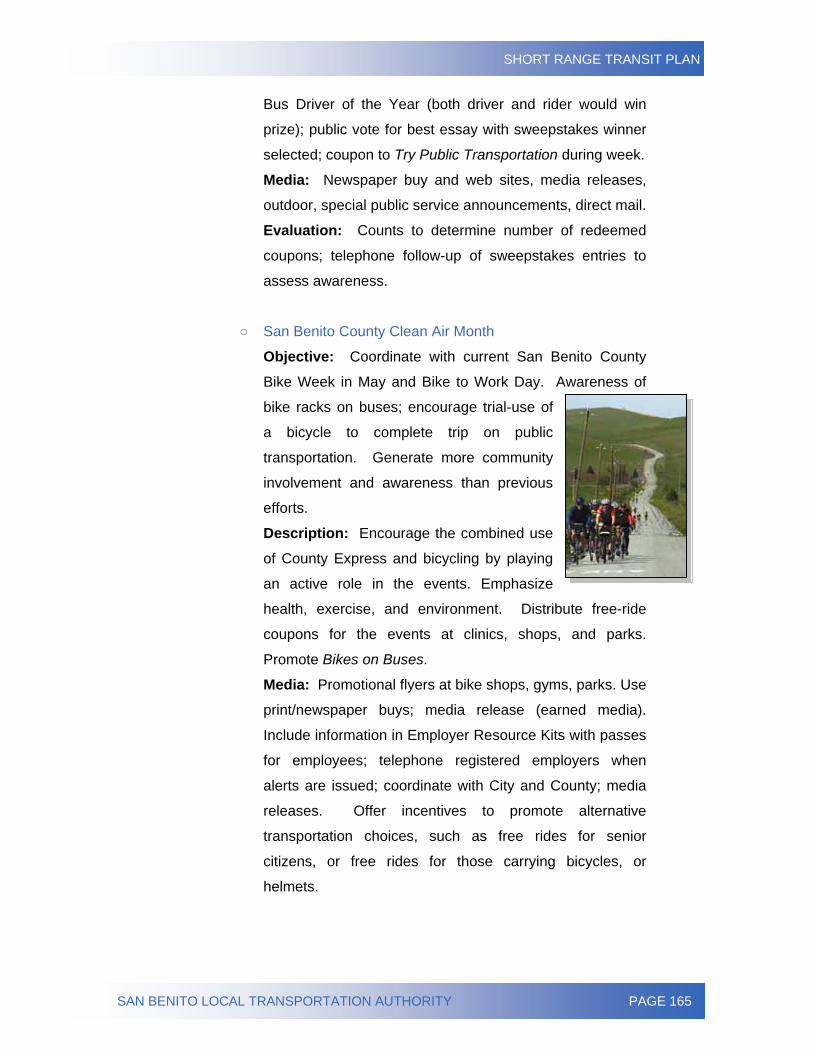
SHORT RANGE TRANSIT PLAN
SAN BENITO LOCAL TRANSPORTATION AUTHORITY PAGE 165
Bus Driver of the Year (both driver and rider would win
prize); public vote for best essay with sweepstakes winner
selected; coupon to Try Public Transportation during week.
Media: Newspaper buy and web sites, media releases,
outdoor, special public service announcements, direct mail.
Evaluation: Counts to determine number of redeemed
coupons; telephone follow-up of sweepstakes entries to
assess awareness.
○ San Benito County Clean Air Month
Objective: Coordinate with current San Benito County
Bike Week in May and Bike to Work Day. Awareness of
bike racks on buses; encourage trial-use of
a bicycle to complete trip on public
transportation. Generate more community
involvement and awareness than previous
efforts.
Description: Encourage the combined use
of County Express and bicycling by playing
an active role in the events. Emphasize
health, exercise, and environment. Distribute free-ride
coupons for the events at clinics, shops, and parks.
Promote Bikes on Buses.
Media: Promotional flyers at bike shops, gyms, parks. Use
print/newspaper buys; media release (earned media).
Include information in Employer Resource Kits with passes
for employees; telephone registered employers when
alerts are issued; coordinate with City and County; media
releases. Offer incentives to promote alternative
transportation choices, such as free rides for senior
citizens, or free rides for those carrying bicycles, or
helmets.
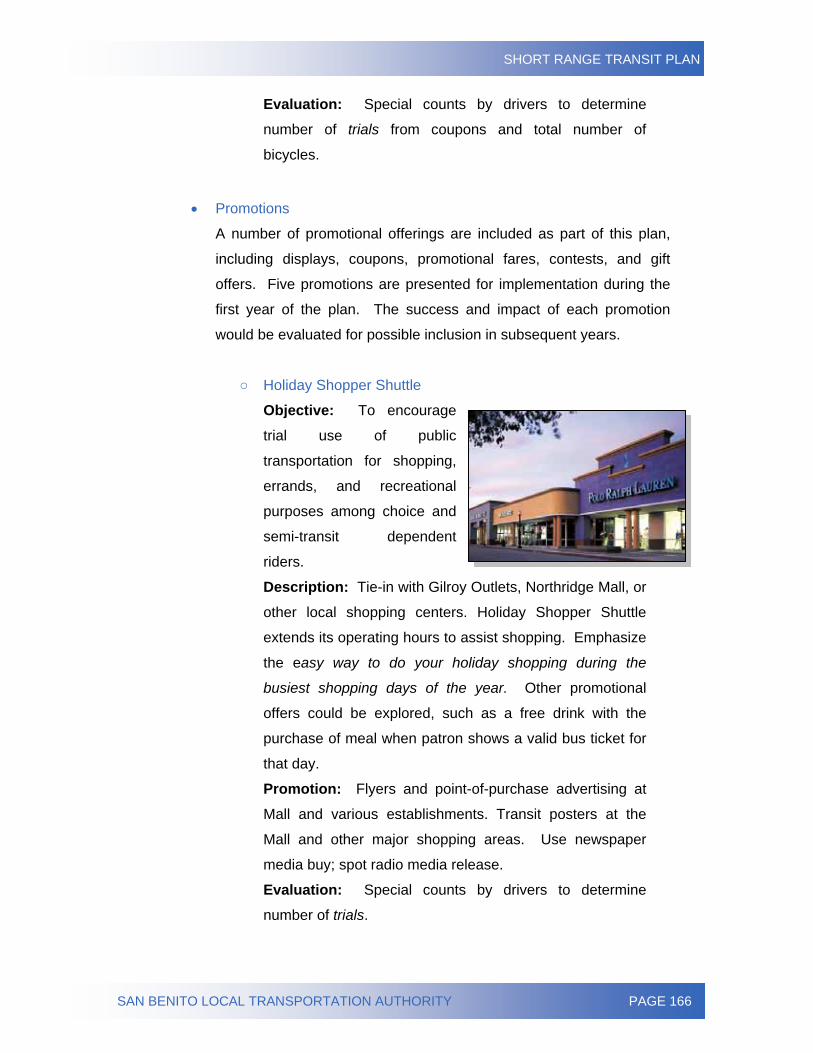
SHORT RANGE TRANSIT PLAN
SAN BENITO LOCAL TRANSPORTATION AUTHORITY PAGE 166
Evaluation: Special counts by drivers to determine
number of trials from coupons and total number of
bicycles.
• Promotions
A number of promotional offerings are included as part of this plan,
including displays, coupons, promotional fares, contests, and gift
offers. Five promotions are presented for implementation during the
first year of the plan. The success and impact of each promotion
would be evaluated for possible inclusion in subsequent years.
○ Holiday Shopper Shuttle
Objective: To encourage
trial use of public
transportation for shopping,
errands, and recreational
purposes among choice and
semi-transit dependent
riders.
Description: Tie-in with Gilroy Outlets, Northridge Mall, or
other local shopping centers. Holiday Shopper Shuttle
extends its operating hours to assist shopping. Emphasize
the easy way to do your holiday shopping during the
busiest shopping days of the year. Other promotional
offers could be explored, such as a free drink with the
purchase of meal when patron shows a valid bus ticket for
that day.
Promotion: Flyers and point-of-purchase advertising at
Mall and various establishments. Transit posters at the
Mall and other major shopping areas. Use newspaper
media buy; spot radio media release.
Evaluation: Special counts by drivers to determine
number of trials.
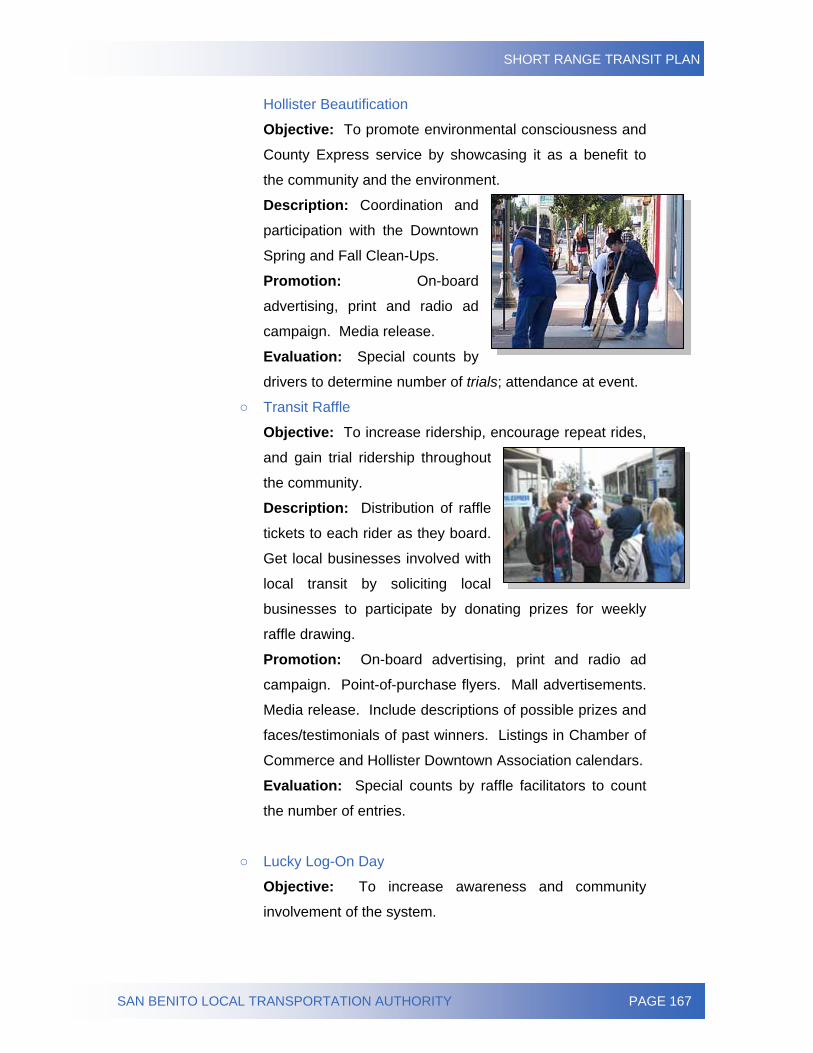
SHORT RANGE TRANSIT PLAN
SAN BENITO LOCAL TRANSPORTATION AUTHORITY PAGE 167
Hollister Beautification
Objective: To promote environmental consciousness and
County Express service by showcasing it as a benefit to
the community and the environment.
Description: Coordination and
participation with the Downtown
Spring and Fall Clean-Ups.
Promotion: On-board
advertising, print and radio ad
campaign. Media release.
Evaluation: Special counts by
drivers to determine number of trials; attendance at event.
○ Transit Raffle
Objective: To increase ridership, encourage repeat rides,
and gain trial ridership throughout
the community.
Description: Distribution of raffle
tickets to each rider as they board.
Get local businesses involved with
local transit by soliciting local
businesses to participate by donating prizes for weekly
raffle drawing.
Promotion: On-board advertising, print and radio ad
campaign. Point-of-purchase flyers. Mall advertisements.
Media release. Include descriptions of possible prizes and
faces/testimonials of past winners. Listings in Chamber of
Commerce and Hollister Downtown Association calendars.
Evaluation: Special counts by raffle facilitators to count
the number of entries.
○ Lucky Log-On Day
Objective: To increase awareness and community
involvement of the system.
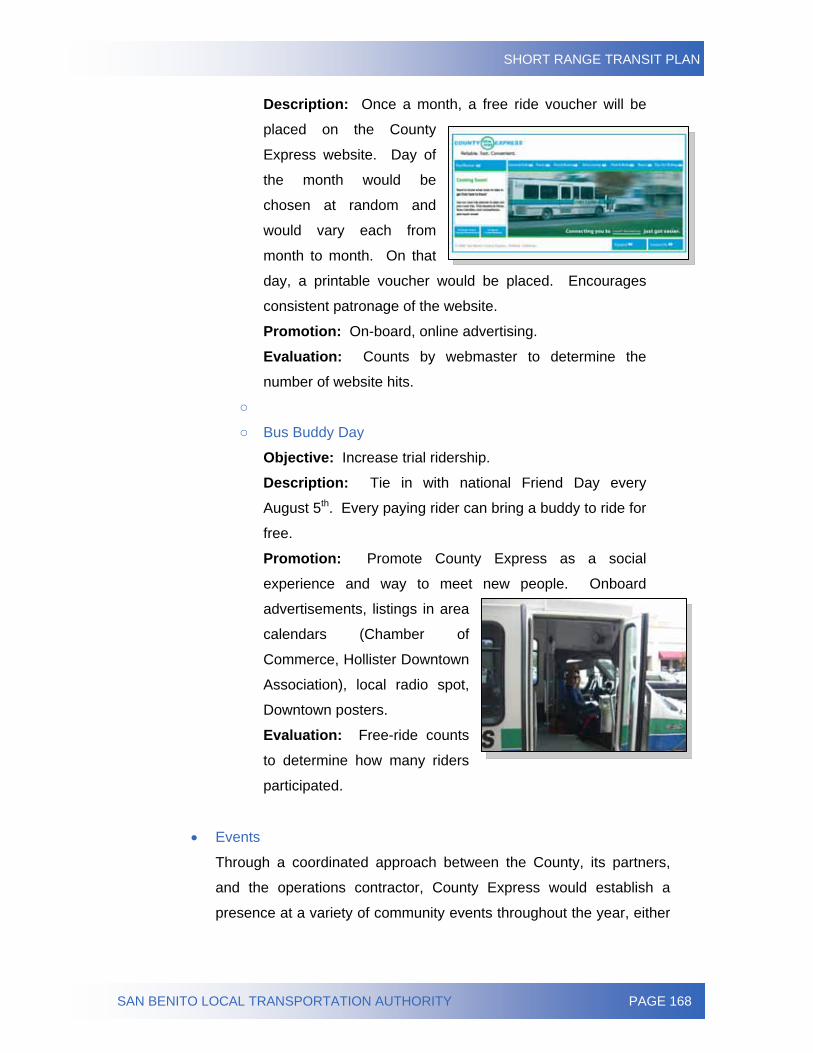
SHORT RANGE TRANSIT PLAN
SAN BENITO LOCAL TRANSPORTATION AUTHORITY PAGE 168
Description: Once a month, a free ride voucher will be
placed on the County
Express website. Day of
the month would be
chosen at random and
would vary each from
month to month. On that
day, a printable voucher would be placed. Encourages
consistent patronage of the website.
Promotion: On-board, online advertising.
Evaluation: Counts by webmaster to determine the
number of website hits.
○
○ Bus Buddy Day
Objective: Increase trial ridership.
Description: Tie in with national Friend Day every
August 5th. Every paying rider can bring a buddy to ride for
free.
Promotion: Promote County Express as a social
experience and way to meet new people. Onboard
advertisements, listings in area
calendars (Chamber of
Commerce, Hollister Downtown
Association), local radio spot,
Downtown posters.
Evaluation: Free-ride counts
to determine how many riders
participated.
• Events
Through a coordinated approach between the County, its partners,
and the operations contractor, County Express would establish a
presence at a variety of community events throughout the year, either
SHORT RANGE TRANSIT PLAN
SAN BENITO LOCAL TRANSPORTATION AUTHORITY PAGE 169
with a transit information booth, vehicle demo, or providing shuttle
service. Additional recurring events include:
• Downtown Concert Series
• Annual Street Festival and Sidewalk Sale
• Path of the Padres Hikes
• Mission 10-mile and 5K Run
• Bluegrass Festival
• Veteran’s Day Parade
• Lights On Celebration
• Gilroy Garlic Festival
• YMCA, 8th Annual Charity Golf Tournament
• Food, Wine, and Golf Classic at Ridgemark
• Social Service Outreach
Quarterly mailings would supplement telephone and personal visits to
agencies serving San Benito County. Inclusion in the organizations’
newsletters and mailing will increase County Express’ presence in the
community and specifically among the particular groups. Constructing
a program where the organization or group is able to purchase
discounted passes in order to either sell or give away to their
members provides an excellent means of not only increasing
awareness, while also increasing ridership as well as farebox
revenue. Agencies include the American Red Cross, Go Kids Inc.,
Hollister Youth Alliance, Health Foundation, Salvation Army, and
Veteran’s Services.
○ Speaker’s Bureau
For many organizations, a speech can have more impact
and generate more immediate influence than a paid
advertising campaign. Speakers are perceived as the
expert. If the talk is interesting, the speaker immediately
establishes credibility with the audience. A captivating
speech positions public transit within hand-shaking
distance of your audience.
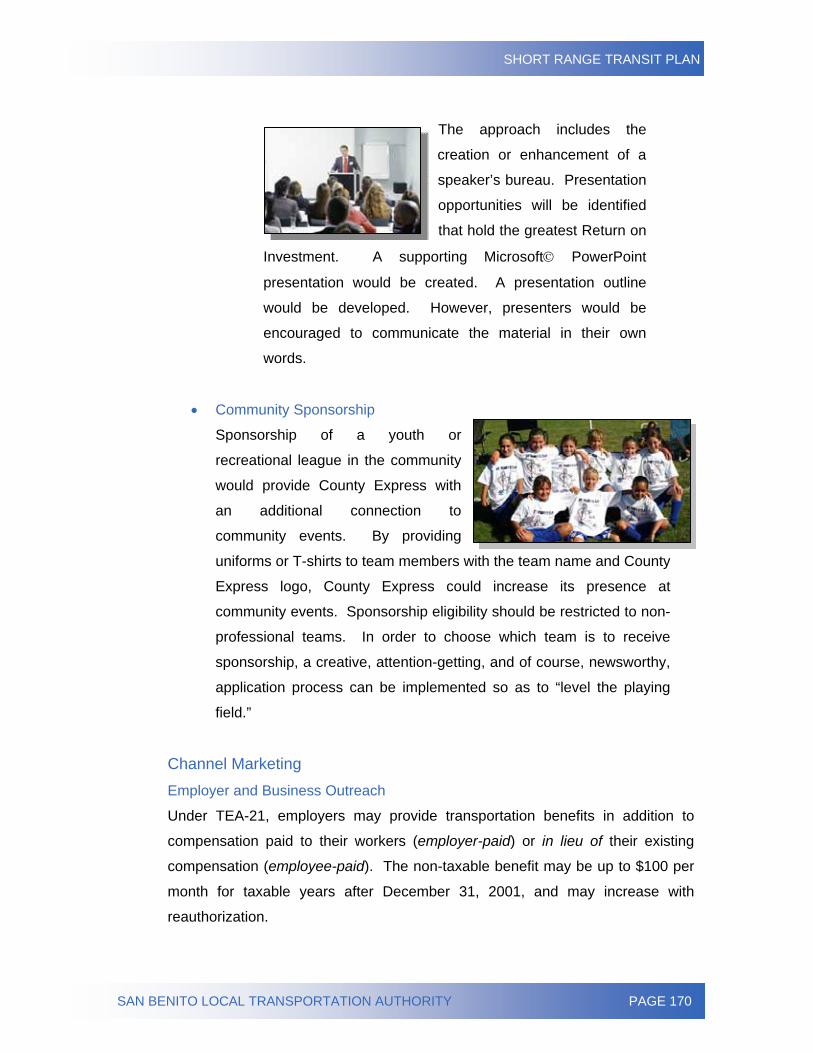
SHORT RANGE TRANSIT PLAN
SAN BENITO LOCAL TRANSPORTATION AUTHORITY PAGE 170
The approach includes the
creation or enhancement of a
speaker’s bureau. Presentation
opportunities will be identified
that hold the greatest Return on
Investment. A supporting Microsoft© PowerPoint
presentation would be created. A presentation outline
would be developed. However, presenters would be
encouraged to communicate the material in their own
words.
• Community Sponsorship
Sponsorship of a youth or
recreational league in the community
would provide County Express with
an additional connection to
community events. By providing
uniforms or T-shirts to team members with the team name and County
Express logo, County Express could increase its presence at
community events. Sponsorship eligibility should be restricted to non-
professional teams. In order to choose which team is to receive
sponsorship, a creative, attention-getting, and of course, newsworthy,
application process can be implemented so as to “level the playing
field.”
Channel Marketing Employer and Business Outreach
Under TEA-21, employers may provide transportation benefits in addition to
compensation paid to their workers (employer-paid) or in lieu of their existing
compensation (employee-paid). The non-taxable benefit may be up to $100 per
month for taxable years after December 31, 2001, and may increase with
reauthorization.
SHORT RANGE TRANSIT PLAN
SAN BENITO LOCAL TRANSPORTATION AUTHORITY PAGE 171
Companies with greater than 250
employees are asked to maintain a
rideshare program and designate an
Employee Transportation Coordinator
(ETC) responsible for ensuring the firm’s
compliance. Unfortunately, in many instances, the ETC role is an add-on
function and does not command a priority.
In addition, the coordinator may not be in a position to implement employee
transit incentives. However, frequent outreach combined with frequent and
complete information about current transportation alternatives, often results in an
empowering of the ETC network as an external sales force.
The key message in communicating with businesses is to promote the benefit of
transit in dollars and cents. Value must be greater than cost. Promoting the
realization of benefits (i.e., tax savings, worker retention, and recruitment) with
minimal administrative or direct costs is generally appealing to this segment.
Specifics are more credible than generalities.
The underlying goal of any work-trip marketing is to ensure current and user-
friendly information is readily available, and that top of mind presence is
maintained within the market segment.
The plan includes establishing and maintaining relationships with the individual
ETCs as well as employer networks. The plan would continue to nurture any
established programs, combined with additional incentives and promotional
pieces to stimulate more interest in transit as a transportation option. Posters
and paycheck inserts would be provided to promote public transportation in this
sector. It is also important to promote the benefits of public transportation to
decision-makers within each company.
Education Outreach
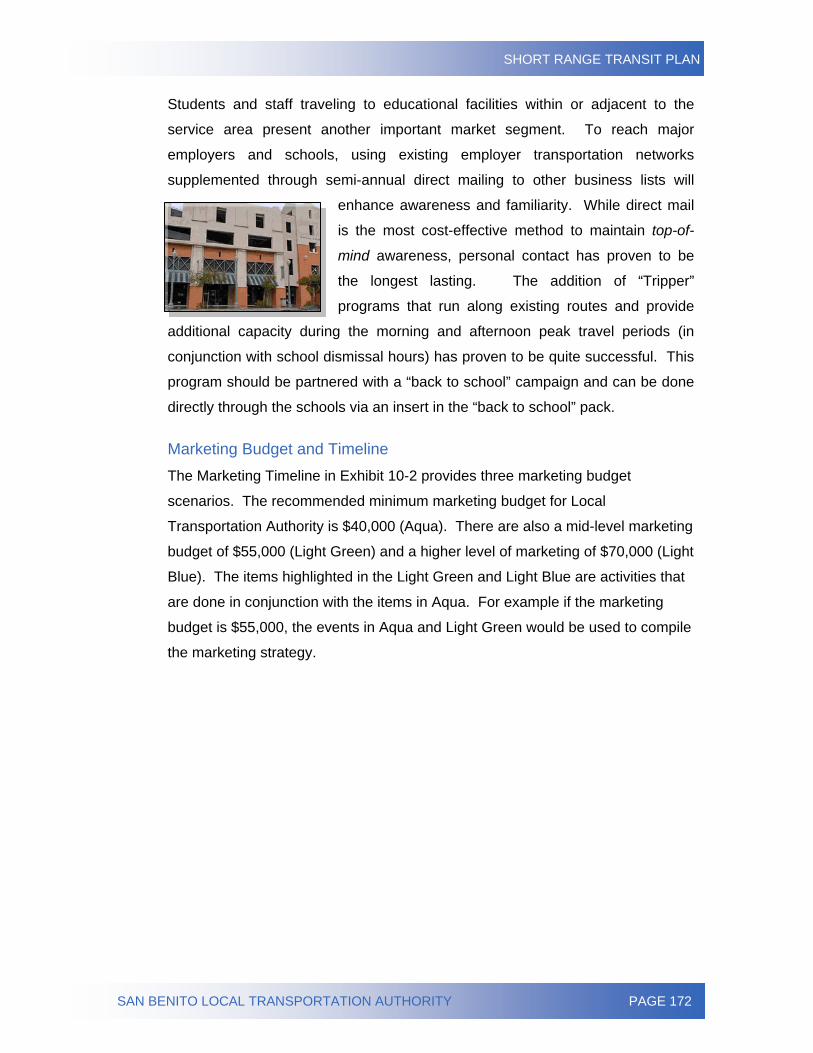
SHORT RANGE TRANSIT PLAN
SAN BENITO LOCAL TRANSPORTATION AUTHORITY PAGE 172
Students and staff traveling to educational facilities within or adjacent to the
service area present another important market segment. To reach major
employers and schools, using existing employer transportation networks
supplemented through semi-annual direct mailing to other business lists will
enhance awareness and familiarity. While direct mail
is the most cost-effective method to maintain top-of-
mind awareness, personal contact has proven to be
the longest lasting. The addition of “Tripper”
programs that run along existing routes and provide
additional capacity during the morning and afternoon peak travel periods (in
conjunction with school dismissal hours) has proven to be quite successful. This
program should be partnered with a “back to school” campaign and can be done
directly through the schools via an insert in the “back to school” pack.
Marketing Budget and Timeline The Marketing Timeline in Exhibit 10-2 provides three marketing budget
scenarios. The recommended minimum marketing budget for Local
Transportation Authority is $40,000 (Aqua). There are also a mid-level marketing
budget of $55,000 (Light Green) and a higher level of marketing of $70,000 (Light
Blue). The items highlighted in the Light Green and Light Blue are activities that
are done in conjunction with the items in Aqua. For example if the marketing
budget is $55,000, the events in Aqua and Light Green would be used to compile
the marketing strategy.
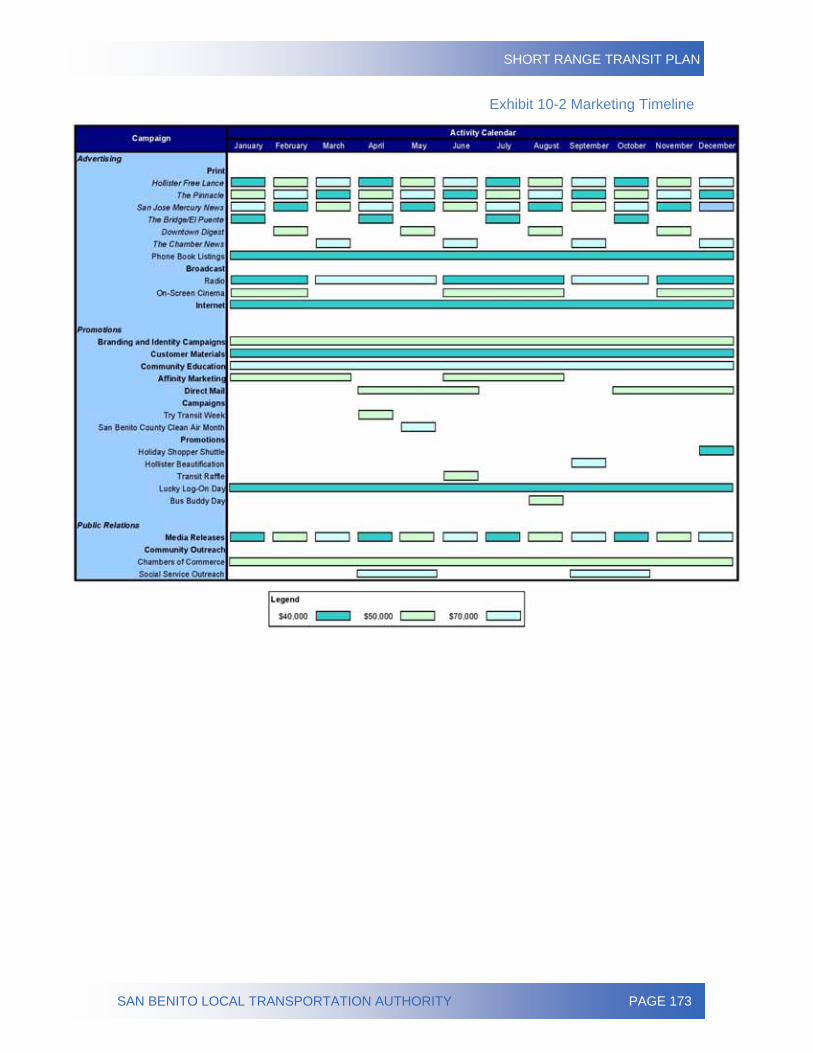
SHORT RANGE TRANSIT PLAN
SAN BENITO LOCAL TRANSPORTATION AUTHORITY PAGE 173
Exhibit 10-2 Marketing Timeline

SHORT RANGE TRANSIT PLAN
SAN BENITO LOCAL TRANSPORTATION AUTHORITY PAGE 174
Page Intentionally Blank
SHORT RANGE TRANSIT PLAN
SAN BENITO LOCAL TRANSPORTATION AUTHORITY PAGE 175
CHAPTER 11 – SERVICE RECOMMENDATIONS
The first step in the creation of service alternatives and recommendations for the
County Express program is to identify significant service gaps. Existing services
were evaluated using quantitative criteria such as area coverage and
performance, comparison to like-peers, and surveys of the community. Using
data from the previous steps, clear, attainable and effective alternatives and
recommendations were developed for enhancing County Express services
across the next five years.
The alternatives presented herein offer cost-effective, operational enhancement
opportunities designed to achieve greater system efficiency. These
recommendations are designed to produce qualitative and quantitative benefits
such as more efficient service area coverage and increased service frequency
based upon community outreach and field observation. Under most proposed
service options (all except Service Alternative E), the consultant does not
recommend any modifications to:
• the Intercounty Route,
• the Southside & Sunnyslope Discount Reservation,
• Jovenes de Antaño, and
• General Public Dial-A-Ride.
Each service alternative outlined below may be implemented with the current
organizational structure in place. Service Alternative E (elimination of Fixed
Route service and replace with Dial-A-Ride service) may require the private
operator to restructure some of its dispatching procedures or internal
organization. However, this would not effect the administration of County
Express or Jovenes de Antaño from the perspective of the Local Transportation
Authority.
SHORT RANGE TRANSIT PLAN
SAN BENITO LOCAL TRANSPORTATION AUTHORITY PAGE 176
Service Alternative A (Current System)
No changes would be implemented to the existing County Express service or
alignments. This would mean no change in the relationship between this service
and others such as Intercounty, Southside & Sunnyslope Discount Reservation,
or Jovenes de Antaño. Similarly, no changes to the ADA Paratransit or Dial-A-
Ride service areas would be required, nor would administrative structure
changes be necessary.
By choosing to continue the current service without change, the community
would not need to adjust to a new system. However, the County would be faced
with addressing farebox recovery issue. Increasing farebox recovery through
efforts to attract new riders and to increase the number of trips taken by current
riders could be explored through a strategic marketing campaign aimed at
educating residents about the services available.
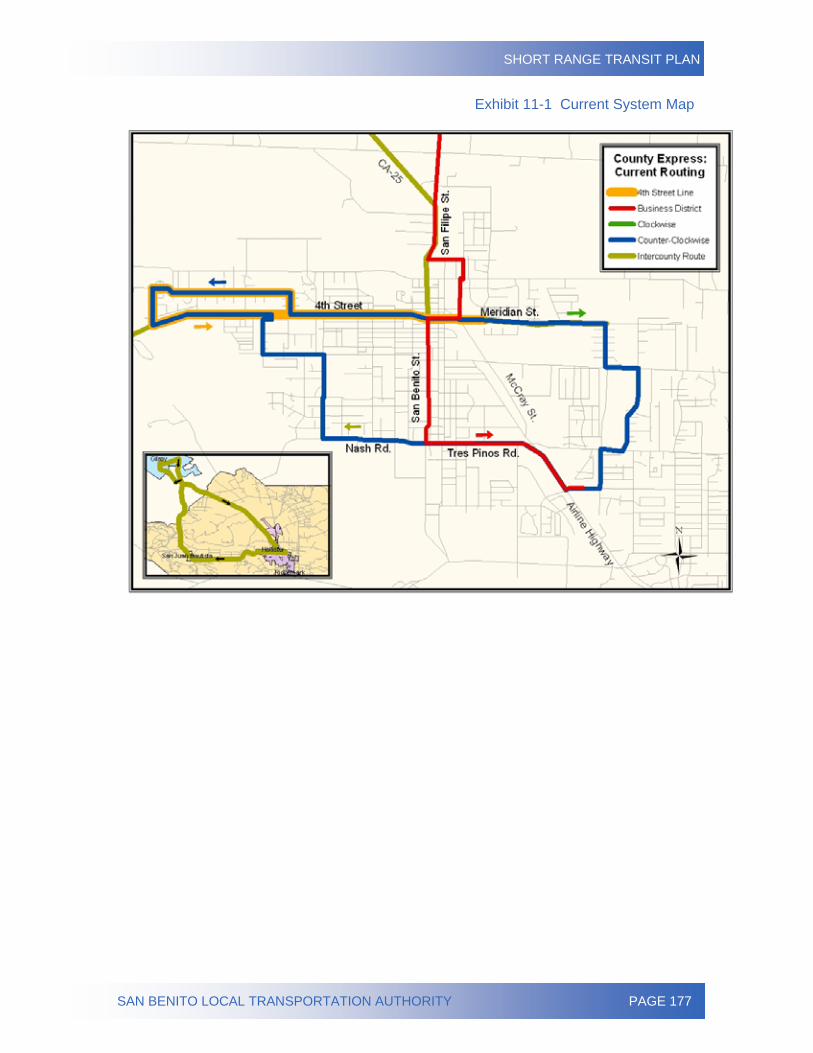
SHORT RANGE TRANSIT PLAN
SAN BENITO LOCAL TRANSPORTATION AUTHORITY PAGE 177
Exhibit 11-1 Current System Map
SHORT RANGE TRANSIT PLAN
SAN BENITO LOCAL TRANSPORTATION AUTHORITY PAGE 178
Service Alternative B (Revert to Previous Alignment)
Service Alternative B would revert entirely to the previous service plan. This
service alternative would reallocate its current assets with the slight realignment
of the Counter-Clockwise and Clockwise Loops, a northern extension of the
Business District Line, and elimination of the Fourth Street Line.
Service area would be comparable to the current system coverage. The system
would maintain coverage within areas where ride-dependent persons frequent.
Paratransit and Dial-A-Ride service boundaries would be slightly altered; the
Federal Transportation Authority requires service must be provided within three-
fourths of a mile of regular fixed-route service. Neither the County’s
administrative structure nor the specialized services such as Intercounty,
Southside & Sunnyslope Discount Reservation, or Jovenes de Antaño would
need to be updated.
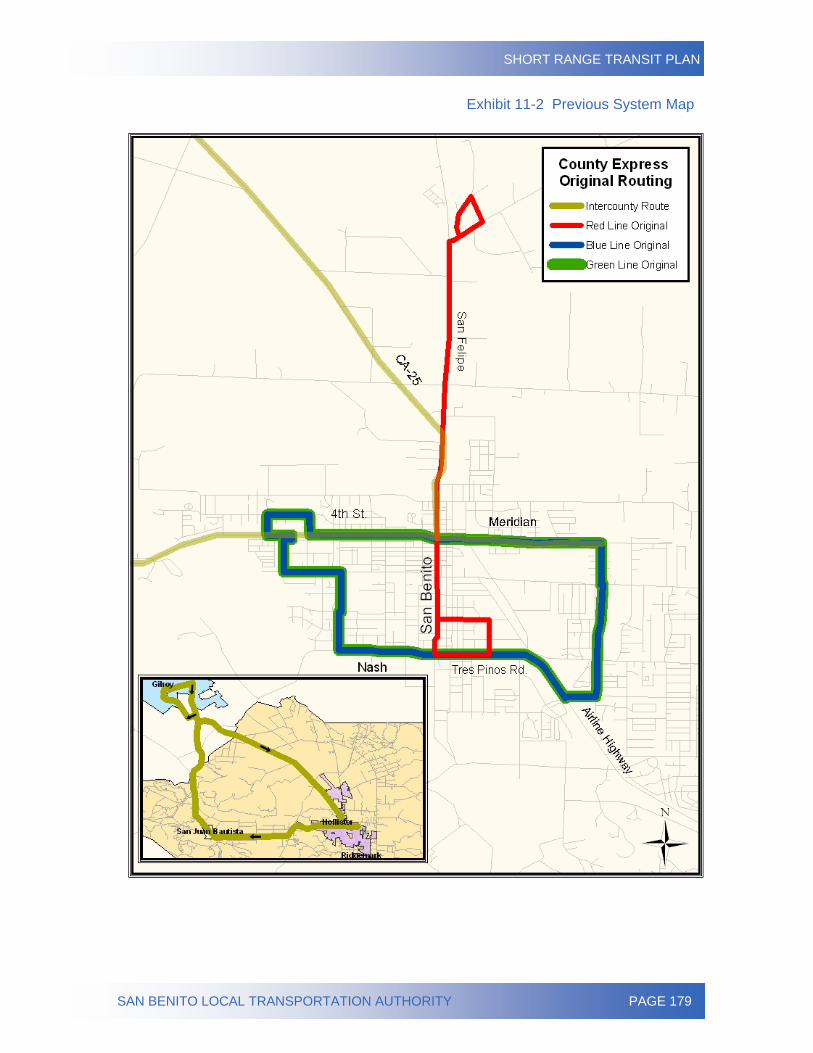
SHORT RANGE TRANSIT PLAN
SAN BENITO LOCAL TRANSPORTATION AUTHORITY PAGE 179
Exhibit 11-2 Previous System Map

SHORT RANGE TRANSIT PLAN
SAN BENITO LOCAL TRANSPORTATION AUTHORITY PAGE 180
Service Alternative C (Service Reduction)
Service Alternative C would reduce the total number of Vehicle Service Miles and
Vehicle Service Hours by eliminating both the Fourth Street Line and the
Counter-Clockwise Loop. These changes would leave only the Business District
Line and the Clockwise Loop.
Like Service Alternative B, service boundaries for Paratransit and Dial-A-Ride
Services would be slightly altered to meet ADA guidelines. Service Alternative C
would have no other effect on any other County transit service.
The benefits associated with having two routes cover a similar area in opposite
directions would be lost, but riders would still be able to reach all of the current
service points. This plan would allow the Local Transportation Authority to
consolidate service and concentrate on improving customer service and ridership
growth.
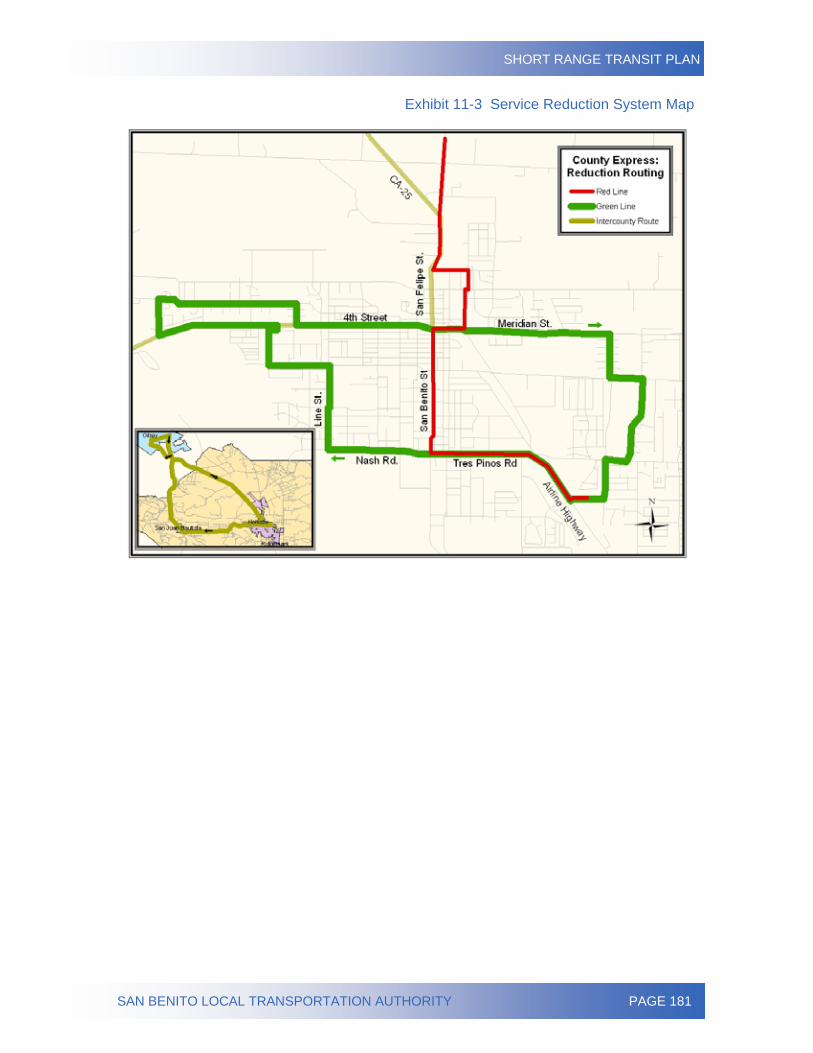
SHORT RANGE TRANSIT PLAN
SAN BENITO LOCAL TRANSPORTATION AUTHORITY PAGE 181
Exhibit 11-3 Service Reduction System Map
SHORT RANGE TRANSIT PLAN
SAN BENITO LOCAL TRANSPORTATION AUTHORITY PAGE 182
Service Alternative D (Service Expansion)
Service Alternative D was developed based on field observations, ride-check
analysis, on-board survey analysis, and community survey analysis.
This alternative would provide bi-directional service along San Benito Street,
increase service frequency, extend the service area, remove the Fourth Street
Line, and add another route serving McCray Street and northeast Hollister. All
route names would revert back to colors.
Service Alternative D would split the Clockwise and Counter-Clockwise Loops
into two separate routes with San Benito Street as a bisector and cover more
area. Because both these loops would run on 30-minute headways throughout
service hours, Service Alternative D would eliminate the need for the existing
Fourth Street Line.
The Western Loop (Blue) would begin at the Fourth Street and San Benito Street
transfer stop. It would then follow Fourth Street west, travel north on Felice
Drive, east on Central Avenue, north on Westside Boulevard, west on Buena
Vista Road, south on Beresini Lane, east on West Graf Road, south on
Bridgevale Road, east on Bridge Road which merges with San Juan Road, south
on Rajkovich Way, west on Wilma Drive, south on Summer Drive, east on South
Street, south on Line Street, east on Nash Road, then north on San Benito Street
back up to the Fourth and San Benito Street transfer stop.
To alleviate loads during school hours, a school tripper route extension is
recommended. The route would divert at the intersection of South and Line
Streets, and proceed north on Line Street, east on Seventh Street near Sacred
Heart School and Church, south on West Street, west on South Street and south
on Line Street to continue on the route’s original alignment.
The Eastern Loop (Green) would begin at the Fourth Street/San Benito Street
transfer stop. It would then follow San Benito Street south, turn east on Tres
Pinos Road, south on Cushman Street, east on Eastview Drive, north on Nora
Drive, east on Mary Drive, south on Olga Drive, east on Talbot Drive, south on
SHORT RANGE TRANSIT PLAN
SAN BENITO LOCAL TRANSPORTATION AUTHORITY PAGE 183
Ladd Lane, east on Southside Road, north on Sunset Drive, west on Talbot
Drive, north on Ladd Lane, east on Airline Highway, east on Sunset Drive, south
on Valley View road, east on Union Road, north on Highland Drive, west on
Sunnyslope Road, north on Memorial Street, and west on Meridian Street to end
up at the Fourth Street and San Benito Street transfer stop.
It is recommended the Eastern Loop (Green) operate an extension service to
Ladd Lane Elementary school during peak hours only. These trippers would
accommodate the current heavy student loads.
Unlike previous alignments for this area, the new routes would run unidirectional
service. Both routes would run counter-clockwise to create bi-directional service
on San Benito Street. Although there would only be unidirectional service within
each loop, these adjustments would allow for greater service frequency and
cover a broader service area than previous or status quo alternatives.
Service Alternative D would keep a Business District Line, but would modify it to
create higher frequency and less redundancy within the route system. With the
current Clockwise and Counter-Clockwise Loops bisected along San Benito
Street into two loops, the Business District Line would only go as far south as
Fourth Street.
The northern portion of Service Alternative D’s Business District Line (Red)
would remain the same until reaching the Fourth Street/San Benito Street
transfer stop, where the route would go east on Fourth Street, which turns into
Meridian Street, north on Chappell Road, north on Alvarado Street, west on
Santa Ana Road and back up north on San Benito Street. This southern loop in
the Business Direct Line would bring service to McCarthy Park and San Andreas
Continuation School, which are popular demand-response trip generators.
Drivers cited numerous complaints regarding the discontinuation of service to
2300 Technology Way; this realignment of the Business District Line would
alleviate that service gap.
SHORT RANGE TRANSIT PLAN
SAN BENITO LOCAL TRANSPORTATION AUTHORITY PAGE 184
Service Alternative D proposes the addition of a route that would serve McCray
Street and northeast Hollister (Yellow). Depending on the potential impact of the
Highway 25 Bypass project, this may only be a temporary route. Regardless,
there is currently a need for service along McCray Street, where numerous trip
generators are located. In addition, this route would serve the community in the
northeast area of Hollister, where federal census data shows a high population of
ride-dependent residents.
This recommended additional route would begin at the Fourth Street/San Benito
Street transfer stop and go north on San Benito Road, east on Santa Ana Road,
south on Fairview road, west on Hillcrest Road, south on Memorial Drive, west
on Sunnyslope Road, north on McCray Street, and west on Fourth Street to end
at the Fourth and San Benito Street transfer point.
Service Alternative D recommends keeping the Intercounty service in its current
configuration. The Local Transportation Authority should focus on the
development of services within Hollister before expanding services. If significant
demand is shown for service to Salinas and/or San Jose, an addition to the
Intercounty Route should then be taken into consideration.
Paratransit service boundaries would be slightly altered; the Federal
Transportation Authority requires service must be provided within three-fourths of
a mile of regular fixed-route service.
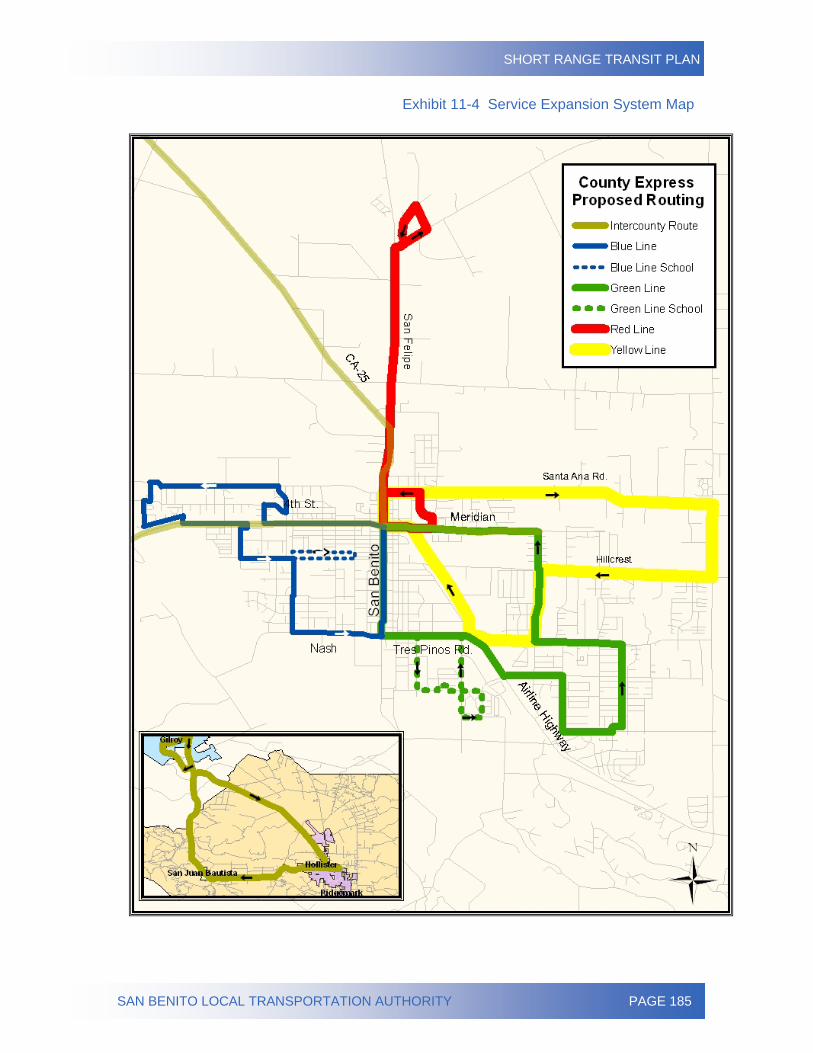
SHORT RANGE TRANSIT PLAN
SAN BENITO LOCAL TRANSPORTATION AUTHORITY PAGE 185
Exhibit 11-4 Service Expansion System Map
SHORT RANGE TRANSIT PLAN
SAN BENITO LOCAL TRANSPORTATION AUTHORITY PAGE 186
Service Alternative E (General Public Dial-A-Ride)
Service Alternative E would eliminate the Fixed Route service and its
complementary Paratransit service and replace it with general public Dial-A-Ride.
The Intercounty and Jovenes de Antaño services would not be modified.
However with the implementation of this service option, there would be no need
for the Southside & Sunnyslope Discount Reservation services.
Title II of the Americans with Disabilities Act (ADA) specifies the level of service
for ambulatory patrons provided by a publicly funded demand-response service
must be equivalent to the level of service offered to persons with disabilities (42
U.S.C § 12144). The Local Transportation Authority must ensure they maintain a
balanced level of service to secure all current funding sources.
While the proposed Dial-A-Ride service would be open to the general public,
priority trip reservations would be offered to ADA-certified patrons and seniors.
The proposed service could potentially inconvenience current Dial-A-Ride riders
because the service is open to anyone in the service area and may reduce
availability of reservations. As a result, there may be a longer wait time for a
pickup or cause the elimination of same day service.
By implementing the general public Dial-A-Ride service, the Local Transportation
Authority would combine the monies used to operated the Fixed Route and
Paratransit services, and reallocate those funds to a single, consolidated service
for the County.
Implementing this new service would require additional training and certification
for San Benito County Express drivers. All drivers must obtain a General Public
Paratransit Vehicle (GPPV) certificate by attending at least 12 hours of class,
eight hours of Certified Defensive Driving, and 20 hours behind the wheel training
in order to be certified to drive a General Public Paratransit Vehicle. A two-hour
refresher course is required every year. The Local Transportation Authority must
also ensure that vehicles from its fleet meet standards set forth by California
Vehicle Code Title 336.
SHORT RANGE TRANSIT PLAN
SAN BENITO LOCAL TRANSPORTATION AUTHORITY PAGE 187
A General Public Paratransit Vehicle is defined as any publicly owned and
operated transit system vehicle designed to provide local transportation to the
general public. This Code also stipulates pupils at or below the 12th-grade level
must be allowed to utilize the vehicle for trips to or from a public or private school
or school activity. Furthermore, the vehicle may carry no more than 24 persons
plus the driver and may operate as a dial-a-ride, subscription service, or route-
deviated bus service.
Based on the Local Transportation Authority provided fleet list, all current
demand-response vehicles meet the above specifications. However, the vehicle
cannot operate as a General Public Paratransit Vehicle until certified by the
California Highway Patrol.
In addition, service area boundaries must be clearly defined. It is recommended
the Local Transportation Authority restrict service to patrons within current limits
(i.e., City of Hollister, City of San Juan Bautista).
The general public Dial-A-Ride service would use the existing County Express
fleet and operate during comparable service hours.
If selected, it is recommended this service change be framed within the context
of a six-month demonstration project. In addition, an aggressive marketing
campaign should accompany the modification to mitigate the perception that
service to the area has been reduced.
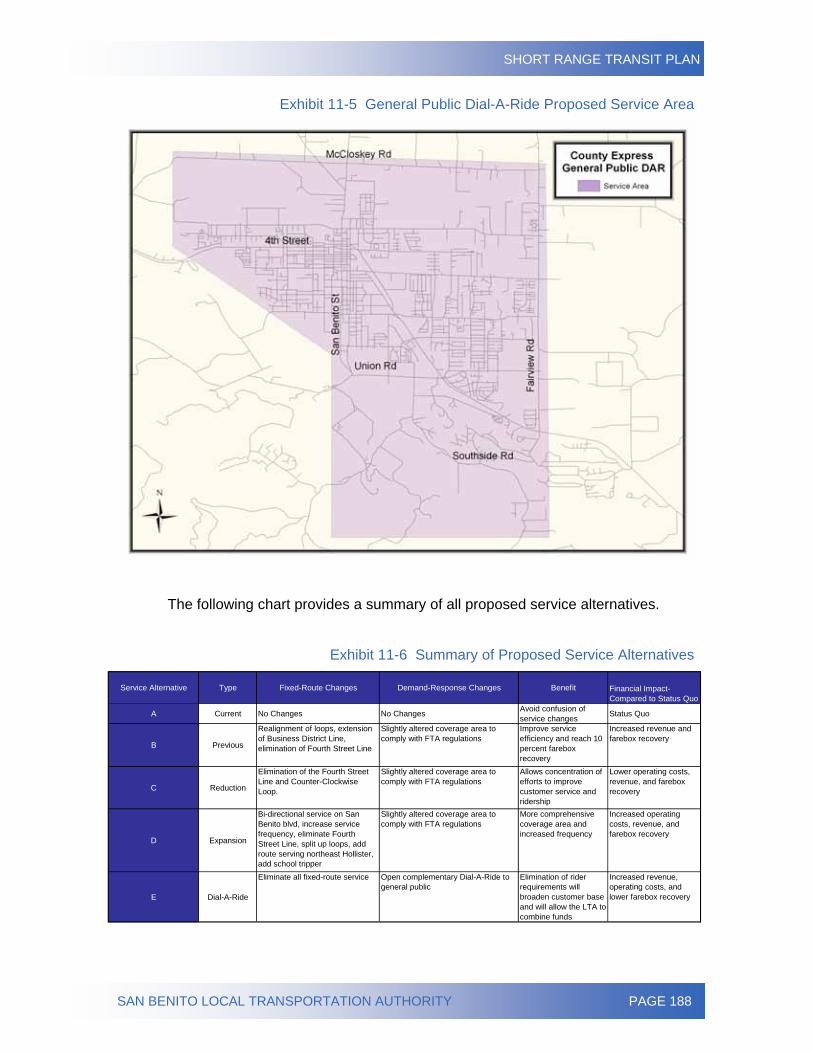
SHORT RANGE TRANSIT PLAN
SAN BENITO LOCAL TRANSPORTATION AUTHORITY PAGE 188
Exhibit 11-5 General Public Dial-A-Ride Proposed Service Area
The following chart provides a summary of all proposed service alternatives.
Exhibit 11-6 Summary of Proposed Service Alternatives
Service Alternative Type Fixed-Route Changes Demand-Response Changes Benefit Financial Impact- Compared to Status Quo
A Current No Changes No Changes Avoid confusion of service changes Status Quo
B Previous
Realignment of loops, extension of Business District Line, elimination of Fourth Street Line
Slightly altered coverage area to comply with FTA regulations
Improve service efficiency and reach 10 percent farebox recovery
Increased revenue and farebox recovery
C Reduction
Elimination of the Fourth Street Line and Counter-Clockwise Loop.
Slightly altered coverage area to comply with FTA regulations
Allows concentration of efforts to improve customer service and ridership
Lower operating costs, revenue, and farebox recovery
D Expansion
Bi-directional service on San Benito blvd, increase service frequency, eliminate Fourth Street Line, split up loops, add route serving northeast Hollister, add school tripper
Slightly altered coverage area to comply with FTA regulations
More comprehensive coverage area and increased frequency
Increased operating costs, revenue, and farebox recovery
E Dial-A-Ride
Eliminate all fixed-route service Open complementary Dial-A-Ride to general public
Elimination of rider requirements will broaden customer base and will allow the LTA to combine funds
Increased revenue, operating costs, and lower farebox recovery
SHORT RANGE TRANSIT PLAN
SAN BENITO LOCAL TRANSPORTATION AUTHORITY PAGE 189
Service Recommendations Sunnyslope and Southside Area
The boundaries for this service would not change.
General Public Dial-A-Ride
There are no recommendations for the General Public Dial-A-Ride services
because this is the sole provider of transportation service during the weekends.
Jovenes de Antaño
Services offered by Jovenes de Antaño exceed the requirements put forth by the
Federal Transportation Administration’s ADA standards. The only
recommendation to services is to alter current reservation protocol. Currently,
patrons of the service must make reservations at least one week in advance.
Those who would like to utilize the medical and shopping assistance program are
required to reserve space two days prior to their desired trip time. To streamline
the process, it is recommended Jovenes de Antaño services adopt a 24-hour
advance reservation policy. The proposed policy would attract more patrons
because of the less restrictive reservation requirements. This may shift regular
Dial-A-Ride patrons to Jovenes de Antaño services.
Service Hours
Under all proposed service options, it is recommended running all services
throughout the service hours of 6:00 a.m. until 6:20 p.m. To create less
congestion at the transit hub, it is recommended that route start times be
staggered.
In addition, to increase efficiency, it is recommended that the routes with the
heavier ridership (i.e. Clockwise Route, Counter-Clockwise Route) operate more
frequently during peak hours. The increased frequency would be achieved by
reducing the headway of the route and/or adding extra buses on the route. The
following chart is a guideline for proposed headways by day-part applicable to all
scenarios with Fixed Route services.
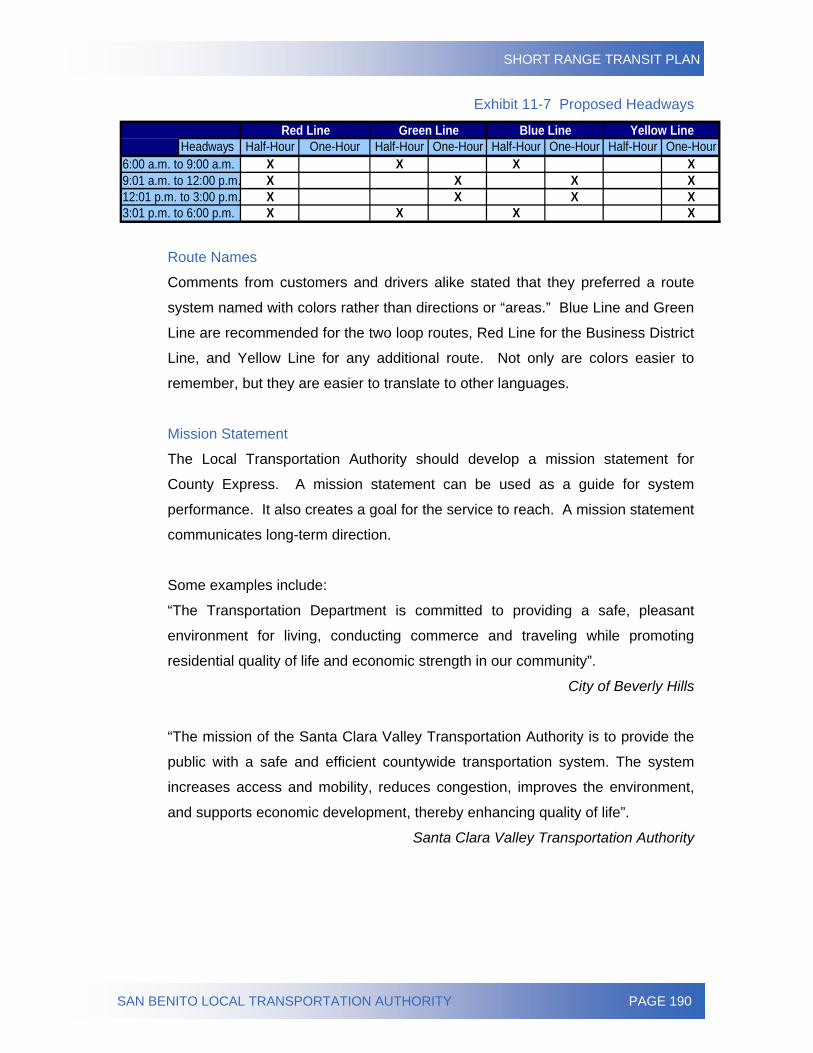
SHORT RANGE TRANSIT PLAN
SAN BENITO LOCAL TRANSPORTATION AUTHORITY PAGE 190
Exhibit 11-7 Proposed Headways
Half-Hour One-Hour Half-Hour One-Hour Half-Hour One-Hour Half-Hour One-HourX X X XX X X XX X X XX X X X3:01 p.m. to 6:00 p.m.
Yellow Line
6:00 a.m. to 9:00 a.m.9:01 a.m. to 12:00 p.m.12:01 p.m. to 3:00 p.m.
HeadwaysRed Line Green Line Blue Line
Route Names
Comments from customers and drivers alike stated that they preferred a route
system named with colors rather than directions or “areas.” Blue Line and Green
Line are recommended for the two loop routes, Red Line for the Business District
Line, and Yellow Line for any additional route. Not only are colors easier to
remember, but they are easier to translate to other languages.
Mission Statement
The Local Transportation Authority should develop a mission statement for
County Express. A mission statement can be used as a guide for system
performance. It also creates a goal for the service to reach. A mission statement
communicates long-term direction.
Some examples include:
“The Transportation Department is committed to providing a safe, pleasant
environment for living, conducting commerce and traveling while promoting
residential quality of life and economic strength in our community”.
City of Beverly Hills
“The mission of the Santa Clara Valley Transportation Authority is to provide the
public with a safe and efficient countywide transportation system. The system
increases access and mobility, reduces congestion, improves the environment,
and supports economic development, thereby enhancing quality of life”.
Santa Clara Valley Transportation Authority
SHORT RANGE TRANSIT PLAN
SAN BENITO LOCAL TRANSPORTATION AUTHORITY PAGE 191
“Yolo County Transportation District values excellence as we:
• Coordinate transportation planning and funding
• Provide transit service
• Advocate for transportation issues and services”
Yolo County Transportation District
Enhanced Customer Service
Customer service needs to become a high priority in order to retain customers,
attract new riders, and improve the system’s reputation in the community.
Customer service enhancement should include activities such as the regular
distribution of rider surveys, availability of a customer comment mechanism, and
ongoing training for all County Express staff.
• Rider Survey
In order for San Benito County Express to provide an efficient
and effective customer and transit service, County Express
must have a clear understanding of its customer’s needs and
opinions. To that end, the County Express should conduct a
rider survey at no less than 12-month intervals.
To facilitate comparison between data sets, the recommended
initial survey is based on the survey instrument utilized in this
evaluation. Doing so would provide the Local Transportation
Authority with insight regarding behavioral trends and service
request patterns.
By implementing this recommendation, Local Transportation
Authority would benefit by having a clearer understanding of
its customers needs. The survey would provide insight into
who is using the service, for what purpose, and customer
travel patterns.
The information collected as part of a customer survey would
also aid the Local Transportation Authority in gaining further
SHORT RANGE TRANSIT PLAN
SAN BENITO LOCAL TRANSPORTATION AUTHORITY PAGE 192
perspective as how to best channel its marketing efforts.
Conducting annual rider surveys provides valuable market
research that will assist County Express be proactive to
community needs. Customer surveys promote community
participation.
• Customer Comment Mechanism
There is a need to facilitate more proactive communication at
the customer level. In order to encourage such
communication, the Local Transportation Authority should
design and place aboard County Express vehicles a postage-
paid comment card.
The postage-paid element simplifies the process for the
customer, thereby encouraging use of this communications
channel.
The proposed customer comment card should collect the
following:
• Date,
• Comments (with adequate space allowed),
• Desired resolution or follow-up, and
• Contact information.
In addition, a comment/complaint specific mechanism should
be integrated into the County Express website. Currently
contact information for County Express is available, but it does
not necessarily invite comments. Creating a second email
(i.e., [email protected]) would garner valuable
insight for County Express.
Local Transportation Authority or its operations contractor staff
should respond to any comments received within five business
days.
SHORT RANGE TRANSIT PLAN
SAN BENITO LOCAL TRANSPORTATION AUTHORITY PAGE 193
The primary benefit of this recommendation is a mechanism
for candid feedback in an anonymous manner (if so desired).
It also establishes a line of communication and instills a sense
of “ownership” among riders.
• Recurring Dispatcher, Supervisor, and Driver Training
Driver courtesy and competency were not highly rated service
attributes among County Express’s Fixed Route, Dial-A-Ride
and Paratransit riders. In some cases, youth were denied
rides to school. Parents and teachers were having trouble
making reservations for students and received poor customer
service.
The operations contractor should conduct quarterly training
sessions with all operations staff. The focus of this training
should be operational issues (i.e., schedule adherence,
vehicle inspections, and equipment checks), maintaining safe
working and operating conditions, customer service, and how
to address/resolve customer concerns.
The recommended training sessions would also provide an
opportunity for drivers and contractor staff to provide the Local
Transportation Authority with valuable feedback regarding
customer concerns, shifts in travel patterns, and other
operational issues that may arise. This proactive approach
would ensure the County Express’ frontline ambassadors (i.e.,
drivers) understand the Local Transportation Authority’s goals
and objectives as well as the important role they play in
achieving such goals.
There may be a need to introduce additional phone lines to the
dispatching office and/or hiring more dispatchers. Further, a
voice mail system should be installed allowing callers to leave
SHORT RANGE TRANSIT PLAN
SAN BENITO LOCAL TRANSPORTATION AUTHORITY PAGE 194
a message with a trip request or listen to service information
outside of normal business hours.
If more phone lines and a voice mail service were put in place
the benefits would be 1) significantly reduced occurrence of
busy signals, 2) reduction in hold-time, and 3) improved
customer service. By enhancing public access to customer
information, the propensity to use the service increases.
Opportunities for Coordination and Consolidation While San Benito currently utilizes several types of demand response services,
these are specialized and non-redundant and do not offer an opportunity for
consolidation. Nevertheless, the Local Transportation Authority may consider the
benefits of a centralized call center. The implementation of such a program
would begin with the adoption of a single, toll-free phone number for all Local
Transportation Authority’s services. By channeling all callers to a single, central
dispatch, customer service would be streamlined. Furthermore, riders may be
directed by dispatch to the service(s) which most closely fit their need.
The Local Transportation Authority may explore approaching Gavilan College
regarding the possibility of offering their students and faculty discounted fares
through the federal transit commuter benefit program. This program permits
private employers, non-profit organizations, and public agencies to provide up to
$105 per month in pre-tax transit benefits. Through this effort, Gavilan College
would become a major purchaser of monthly transit passes, thereby providing a
new source of revenue for County Express.
The federal transit commuter benefit program would similarly benefit commuting
workers. Efforts to inform the Employee Transportation Coordinators of area
businesses should be undertaken.
Internet Promotion
In conjunction with the Short Range Transit Plan process, a website was
developed for San Benito County Express. This page can be accessed from the
SHORT RANGE TRANSIT PLAN
SAN BENITO LOCAL TRANSPORTATION AUTHORITY PAGE 195
Council of San Benito County Governments. Creating an easy access link on the
City of Hollister (www.hollister.ca.gov) and City of San Juan Bautista (www.san-
juan-bautista.ca.us) websites is recommended.
The County Express website should be constantly updated and maintained with
route cancellations, changes, or special services. At some point in the future
there may also be demand for implementation of the sales of County Express
passes from the website.
Establish Criteria for Establishing and Deleting Stops
To best serve the evolving needs of both County Express riders and the
community at-large, the Local Transportation Authority should establish a policy
that specifies criteria for the evaluation of individual stops within the fixed-route
system. Because this process would involve repeated requests over a several
month period, it is unlikely that stops would be constantly changing. Those that
are selected to be added or deleted could be well-publicized through media
releases, postings at bus stops, notices on vehicles, and the County Express
website prior to any changes. Therefore, establishing this process would not
result in confusion for County Express customers, but would allow them to
address their transit needs more proactively.
The proposed policy would establish guidelines for the creation of new bus stops
as well as the elimination of existing stops. The addition of a new bus stop would
reflect the following guidelines:
• A minimum of nine documented requests received for the
establishment of a stop at the same location over a three-
month period.
• The new stop would be located along an existing route
alignment.
• The requested stop location must not result in the creation of a
traffic hazard, and be deemed safe by Local Transportation
Authority staff and law enforcement personnel.
• The requested stop would not be located within one-eighth
mile of an existing transit stop.
SHORT RANGE TRANSIT PLAN
SAN BENITO LOCAL TRANSPORTATION AUTHORITY PAGE 196
• Any new stop would be considered temporary for a period of
ninety days. During the initial 90-day period, the Local
Transportation Authority should collect four separate activity
samples to measure the stop’s activity level/performance. In
the event a temporary stop does not meet the minimum
activity/performance criteria, the stop should be eliminated as
soon as possible.
The deletion of an existing bus stop should follow these guidelines:
• Stop activity is less than five boardings and alightings per
weekday. To account for any unusual boarding activity, an
average of five sample weekdays should be used as the
activity criteria.
• Location of the stop has created a measurable safety or health
concern for riders and/or area residents.
• A minimum of nine documented removal requests should be
received for the deletion of the same stop over a three-month
period.
• Elimination of stop would not result in a County Express patron
traveling more than one-quarter mile to the next available stop.
Strengthen No-Show Definition and Cancellation Policy
The County Express’ Dial-A-Ride and Paratransit services use four terms to
classify trips scheduled but not completed: no-show, on-time cancellation and
insufficient notice cancellation. According to the operations contractor, a no-
show occurs when a patron is not at the designated pick-up location within the
agreed-upon 15-minute window. Based on a two-week review of driver logs, the
no-show rate for the demand-response service averaged 6.8 percent of trips per
day. County Express seems to have a greater problem with no-shows than the
average like-peer.
Given the manner in which on-time cancellations were recorded, it was not
possible to calculate the frequency of occurrence. From those recorded on driver
SHORT RANGE TRANSIT PLAN
SAN BENITO LOCAL TRANSPORTATION AUTHORITY PAGE 197
trip sheets there was an average of 1.7 percent of trips per day that were
cancelled insufficiently.
To improve the efficiency of the County Express demand-response program, it is
recommended the Local Transportation Authority establish easily understood
“No-Show” and “Cancellation” definitions and policies and communicate these to
its transit customers. At a minimum, the adopted policy should address:
• Definition of a no-show and cancellation.
• The limits before action will be taken.
• Penalties for non-compliance.
• The process by which a patron will be notified.
• Available appeals process.
The adopted policy should clearly define no-show and late cancellation. The
proposed definitions are as follows:
• No-show: A patron who fails to cancel a scheduled trip; who is
not at the designated pick-up location at the scheduled time;
who is not ready to travel at the scheduled time.
• Insufficient notice cancellation: A patron who cancels a
scheduled ride less than two hours in advance of the
scheduled pick-up time.
When dealing with patrons with a pattern of no-shows or late cancellations, it is
recommended County Express adopt the following:
• Two no-shows or late cancellations within a two-month period
results in a written reminder.
• Three no-shows or late cancellations within a two-month
period results in possible service restriction for one month.
When notifying a patron of possible service restrictions, the Americans with
Disabilities Act (ADA) requires such communication be made in writing. When
requested by the customer, such notification should also be made available in
another “usable format,” such as audio recording or Braille print.
SHORT RANGE TRANSIT PLAN
SAN BENITO LOCAL TRANSPORTATION AUTHORITY PAGE 198
The ADA also requires a patron be allowed to appeal an imposed service
restriction. It is recommended the Local Transportation Authority allow any
patron facing restricted access to demand-response service be allowed to submit
a written appeal within 30 days of notification. The written appeal should be
addressed to the Local Transportation Authority and explain clearly why the
intended service restriction should not be imposed.
The purpose of the recommended policy is not to punish riders, but rather to
educate them. By explaining the impact an individual’s actions can have on the
operation of their service, patrons not only become proponents of the policy, they
can encourage compliance through peer pressure.
In order to effectively implement these recommendations, the operations
contractor must collect accurate data and share such information with the Local
Transportation Authority on a timely basis.
Lastly, it is recommended all written notification and decisions regarding service
restrictions should come from the Local Transportation Authority staff.
Maintenance and Safety
Vehicle maintenance is vital to a transit system’s safety and security. Regular
maintenance reduces the likelihood of accidents that may harm passengers,
employees, pedestrians, other motorists or the general public. Properly-
maintained vehicles ensure that equipment is in safe working order, and that
investments in the public transportation infrastructure are protected. Following
an effective maintenance program along with functional recordkeeping is a
critical first step to keep buses in service and eliminate hazards.
Similarly, proper training of drivers and dispatchers is a vital component to be
managed by County Express’ private operations contractor. The matrices
provided in the Goals, Objectives, and Standards chapter of this report review
current maintenance and safety practices and establish future guidelines.
SHORT RANGE TRANSIT PLAN
SAN BENITO LOCAL TRANSPORTATION AUTHORITY PAGE 199
It is recommended the Local Transportation Authority revise the monthly service
reports to include more detail. The revised service report should have separate
sections for services that fall under the “Dial-A-Ride” umbrella. The appendix
offers a sample of a revised monthly service report.

SHORT RANGE TRANSIT PLAN
SAN BENITO LOCAL TRANSPORTATION AUTHORITY PAGE 200
Page Intentionally Blank
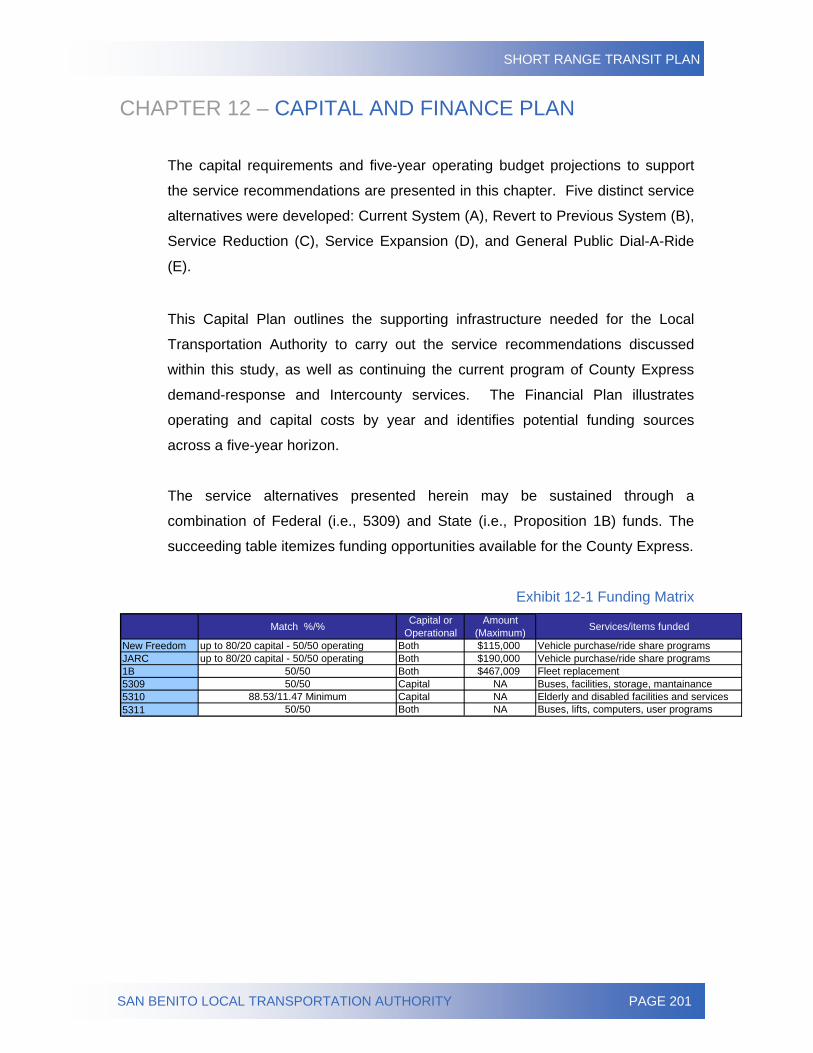
SHORT RANGE TRANSIT PLAN
SAN BENITO LOCAL TRANSPORTATION AUTHORITY PAGE 201
CHAPTER 12 – CAPITAL AND FINANCE PLAN
The capital requirements and five-year operating budget projections to support
the service recommendations are presented in this chapter. Five distinct service
alternatives were developed: Current System (A), Revert to Previous System (B),
Service Reduction (C), Service Expansion (D), and General Public Dial-A-Ride
(E). This Capital Plan outlines the supporting infrastructure needed for the Local
Transportation Authority to carry out the service recommendations discussed
within this study, as well as continuing the current program of County Express
demand-response and Intercounty services. The Financial Plan illustrates
operating and capital costs by year and identifies potential funding sources
across a five-year horizon.
The service alternatives presented herein may be sustained through a
combination of Federal (i.e., 5309) and State (i.e., Proposition 1B) funds. The
succeeding table itemizes funding opportunities available for the County Express.
Exhibit 12-1 Funding Matrix
Match %/% Capital or Operational
Amount (Maximum) Services/items funded
New Freedom up to 80/20 capital - 50/50 operating Both $115,000 Vehicle purchase/ride share programsJARC up to 80/20 capital - 50/50 operating Both $190,000 Vehicle purchase/ride share programs1B 50/50 Both $467,009 Fleet replacement5309 50/50 Capital NA Buses, facilities, storage, mantainance5310 88.53/11.47 Minimum Capital NA Elderly and disabled facilities and services5311 50/50 Both NA Buses, lifts, computers, user programs
SHORT RANGE TRANSIT PLAN
SAN BENITO LOCAL TRANSPORTATION AUTHORITY PAGE 202
CAPITAL PLAN Fleet Replacement
The current County Express fleet consists of 21 vehicles. However, six of these
vehicles are out of service; they had been dedicated to fixed-route service. The
Local Transportation Authority has been using Dial-A-Ride vehicles to substitute
those that are out of service. As a result, County Express does not have a
sufficient spare ratio.
A total of 11 vehicles need to be replaced, three need to be repaired, and two
need to be purchased within the period covered by this study. The Federal
Replacement Threshold for the heavy-duty vehicles (i.e., Bluebird) is 10 years,,
or 350,000 miles. Historically, County Express does not reach the allotted
number of miles within 10 years. The medium-duty vehicles in the fleet (i.e.,
Goshen Coach) have a Federal Replacement Threshold of 7 years, or
200,000 miles, which is adhered to by County Express. Exhibit 12-1 outlines the
proposed replacement schedule.
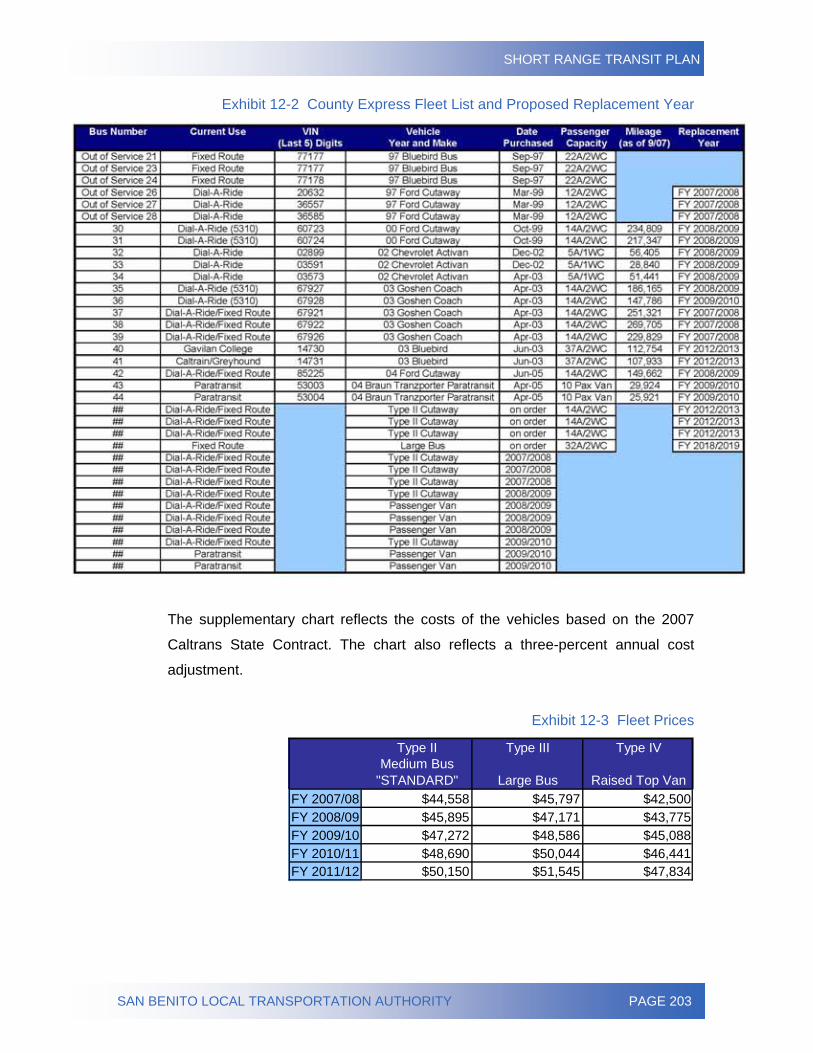
SHORT RANGE TRANSIT PLAN
SAN BENITO LOCAL TRANSPORTATION AUTHORITY PAGE 203
Exhibit 12-2 County Express Fleet List and Proposed Replacement Year
The supplementary chart reflects the costs of the vehicles based on the 2007
Caltrans State Contract. The chart also reflects a three-percent annual cost
adjustment.
Exhibit 12-3 Fleet Prices
Type II Type III Type IVMedium Bus
"STANDARD" Large Bus Raised Top VanFY 2007/08 $44,558 $45,797 $42,500FY 2008/09 $45,895 $47,171 $43,775FY 2009/10 $47,272 $48,586 $45,088FY 2010/11 $48,690 $50,044 $46,441FY 2011/12 $50,150 $51,545 $47,834
SHORT RANGE TRANSIT PLAN
SAN BENITO LOCAL TRANSPORTATION AUTHORITY PAGE 204
The Local Transportation Authority is encouraged to adopt the following changes
to its Capital Plan.
Purchase 40’ Coaches for Fixed-Route Services
Transit operators the size of County Express should purchase 40-foot vehicles
whenever possible for the fixed-route service. The benefits of this policy include
larger capacity and better dollar value. There is a demand and a need for larger
buses on the two Loop systems as well as Business District Line, especially
during peak hours.
On some routes, 40-foot vehicles are not feasible due to street width
considerations, making 35-foot or cutaway coaches a more viable option.
Purchase Alternative Energy Vehicles
While there is an initial cost savings associated with purchasing traditional ultra-
low sulfur diesel-powered vehicles, the Local Transportation Authority should
allocate additional funds for the purchase of vehicles with either hybrid or
compressed natural gas (CNG) engines. This practice could yield significant fuel
savings over diesel in the summer months and will limit emissions to help
preserve the region’s air quality. However, during the winter, CNG is extremely
expensive. The maintenance on CNG vehicles and fueling stations are more
expensive than traditional diesel engines.
Adjust Replacement Schedule for Cutaway Vehicles
The Local Transportation Authority should begin replacing demand-response
vehicles on a staggered schedule so not to purchase all necessary vehicles in
one year every seven years. This practice will require a less frequent investment
of capital funds; Local Transportation Authority will ultimately realize savings in
fuel and maintenance costs as the fleet will be composed of newer vehicles.
This practice will also ensure County Express remains compliant with California
Air Resources Board (CARB) regulations.
Maintain an Up-to-Date Fleet List
When reviewing the fleet list provided by Local Transportation Authority staff, it
became clear that there is no set replacement schedule in place. Local
SHORT RANGE TRANSIT PLAN
SAN BENITO LOCAL TRANSPORTATION AUTHORITY PAGE 205
Transportation Authority should develop a Capital Plan that will mirror the fleet
list and replacement schedule but will create the most efficient fleet possible and
inevitably save money by minimizing maintenance and time wasted with out-of-
service buses.
Update Passenger Amenities
The City of Hollister has a downtown transfer stop located at Fourth Street and
San Benito Street. The downtown transfer stop is a hub for all County Express
services (including the Intercounty routes). County Express has another major
transfer stop at the intersection of Tres Pinos Road and Airline Highway where
the Safeway market is located.
Within the scope of this Short Range Transit Plan, it is recommended the Local
Transportation Authority dedicate capital monies to passenger amenities.
Improvements include:
• Updating all bus stop informational units (i.e., signage, bus
schedule holders),
• Positioning trash receptacles at most patronized bus stops,
• Installing additional bus benches/shelters throughout the
system, and
• Replacing at least two of the system’s current bus shelters.
Improving passenger amenities at bus stops is an important component of transit
attractiveness to both exiting riders as well as prospective patrons in that it:
• Increases the visibility of County Express.
• Advances the attractiveness of County Express as a travel
alternative.
• Improves comfort of transit patrons (i.e., providing seating and
protection from weather).
• Communicates up-to-date service information.
Transit Tokens
During fiscal year 2006/07, Local Transportation Authority spent
$6,877.95 on printing fees for tickets and in fiscal year 2005/06, Local
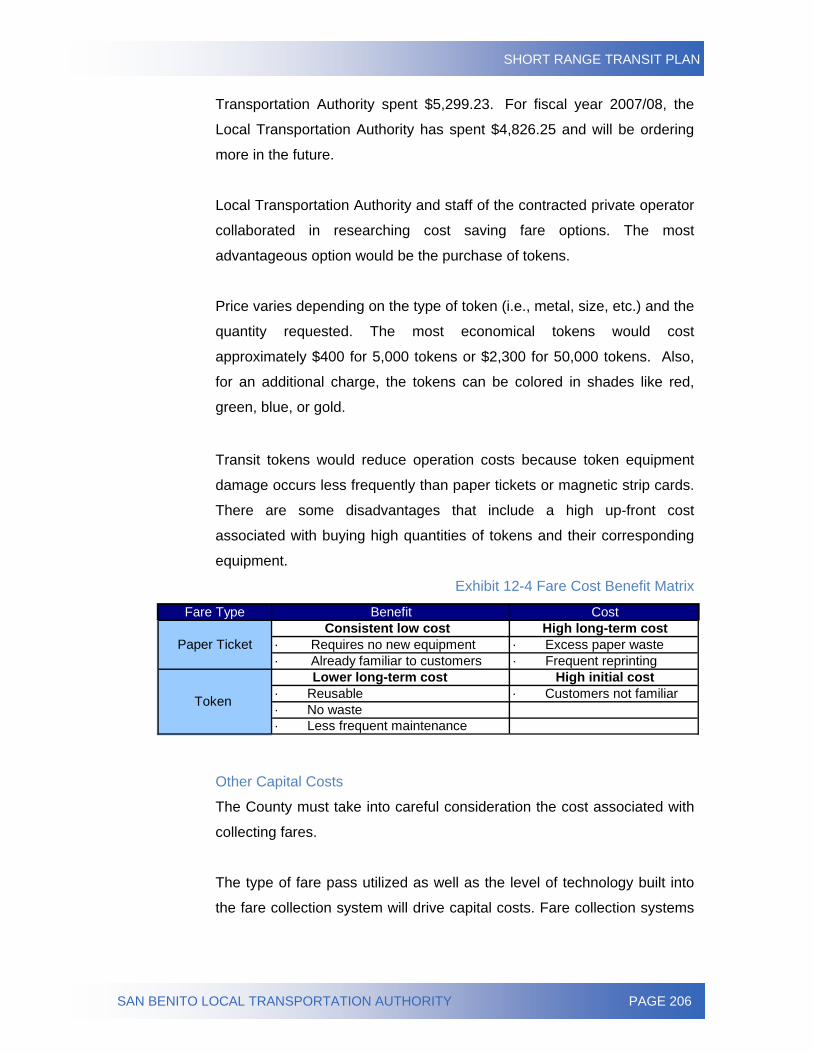
SHORT RANGE TRANSIT PLAN
SAN BENITO LOCAL TRANSPORTATION AUTHORITY PAGE 206
Transportation Authority spent $5,299.23. For fiscal year 2007/08, the
Local Transportation Authority has spent $4,826.25 and will be ordering
more in the future.
Local Transportation Authority and staff of the contracted private operator
collaborated in researching cost saving fare options. The most
advantageous option would be the purchase of tokens.
Price varies depending on the type of token (i.e., metal, size, etc.) and the
quantity requested. The most economical tokens would cost
approximately $400 for 5,000 tokens or $2,300 for 50,000 tokens. Also,
for an additional charge, the tokens can be colored in shades like red,
green, blue, or gold.
Transit tokens would reduce operation costs because token equipment
damage occurs less frequently than paper tickets or magnetic strip cards.
There are some disadvantages that include a high up-front cost
associated with buying high quantities of tokens and their corresponding
equipment.
Exhibit 12-4 Fare Cost Benefit Matrix
Fare Type Benefit CostConsistent low cost High long-term cost
· Requires no new equipment · Excess paper waste· Already familiar to customers · Frequent reprinting
Lower long-term cost High initial cost· Reusable · Customers not familiar· No waste · Less frequent maintenance
Paper Ticket
Token
Other Capital Costs
The County must take into careful consideration the cost associated with
collecting fares.
The type of fare pass utilized as well as the level of technology built into
the fare collection system will drive capital costs. Fare collection systems
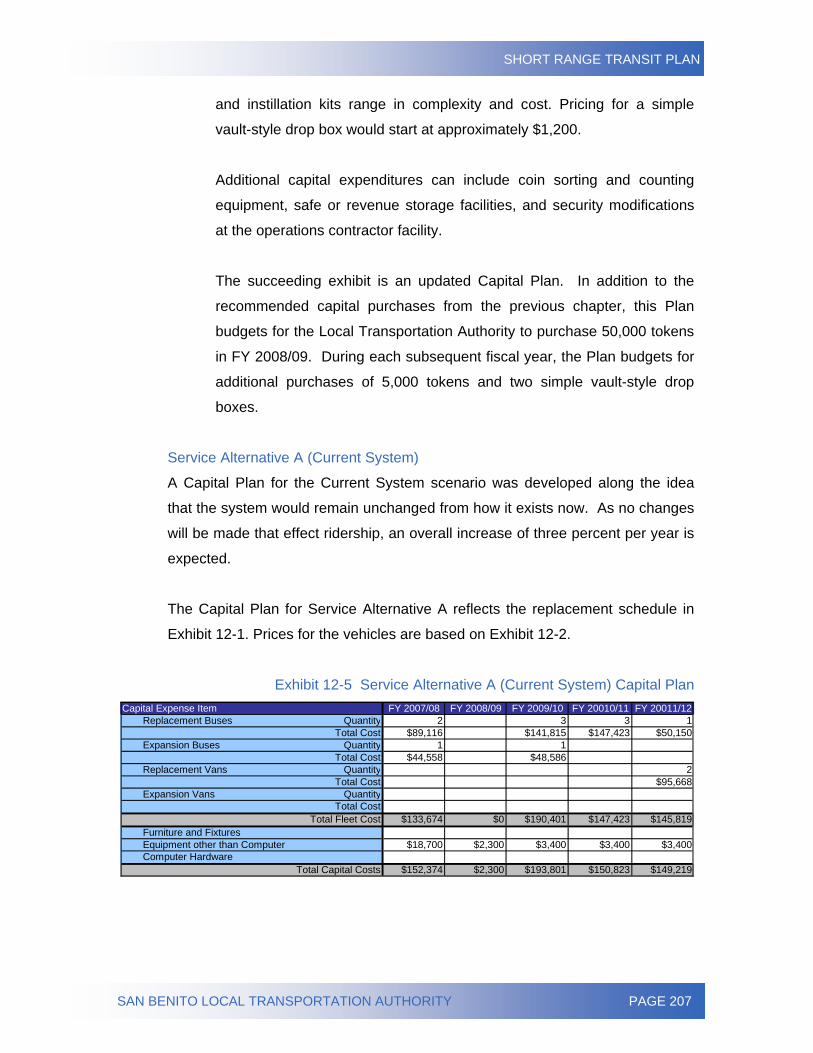
SHORT RANGE TRANSIT PLAN
SAN BENITO LOCAL TRANSPORTATION AUTHORITY PAGE 207
and instillation kits range in complexity and cost. Pricing for a simple
vault-style drop box would start at approximately $1,200.
Additional capital expenditures can include coin sorting and counting
equipment, safe or revenue storage facilities, and security modifications
at the operations contractor facility.
The succeeding exhibit is an updated Capital Plan. In addition to the
recommended capital purchases from the previous chapter, this Plan
budgets for the Local Transportation Authority to purchase 50,000 tokens
in FY 2008/09. During each subsequent fiscal year, the Plan budgets for
additional purchases of 5,000 tokens and two simple vault-style drop
boxes.
Service Alternative A (Current System)
A Capital Plan for the Current System scenario was developed along the idea
that the system would remain unchanged from how it exists now. As no changes
will be made that effect ridership, an overall increase of three percent per year is
expected.
The Capital Plan for Service Alternative A reflects the replacement schedule in
Exhibit 12-1. Prices for the vehicles are based on Exhibit 12-2.
Exhibit 12-5 Service Alternative A (Current System) Capital Plan FY 2007/08 FY 2008/09 FY 2009/10 FY 20010/11 FY 20011/12
Replacement Buses Quantity 2 3 3 1Total Cost $89,116 $45,895 $141,815 $147,423 $50,150
Expansion Buses Quantity 1 47,272 1Total Cost $44,558 $48,690 $48,586
Replacement Vans Quantity 50,150 2Total Cost $95,668
Expansion Vans QuantityTotal Cost
$133,674 $0 $190,401 $147,423 $145,819Furniture and FixturesEquipment other than Computer $18,700 $2,300 $3,400 $3,400 $3,400Computer Hardware
$152,374 $2,300 $193,801 $150,823 $149,219
Capital Expense Item
Total Fleet Cost
Total Capital Costs
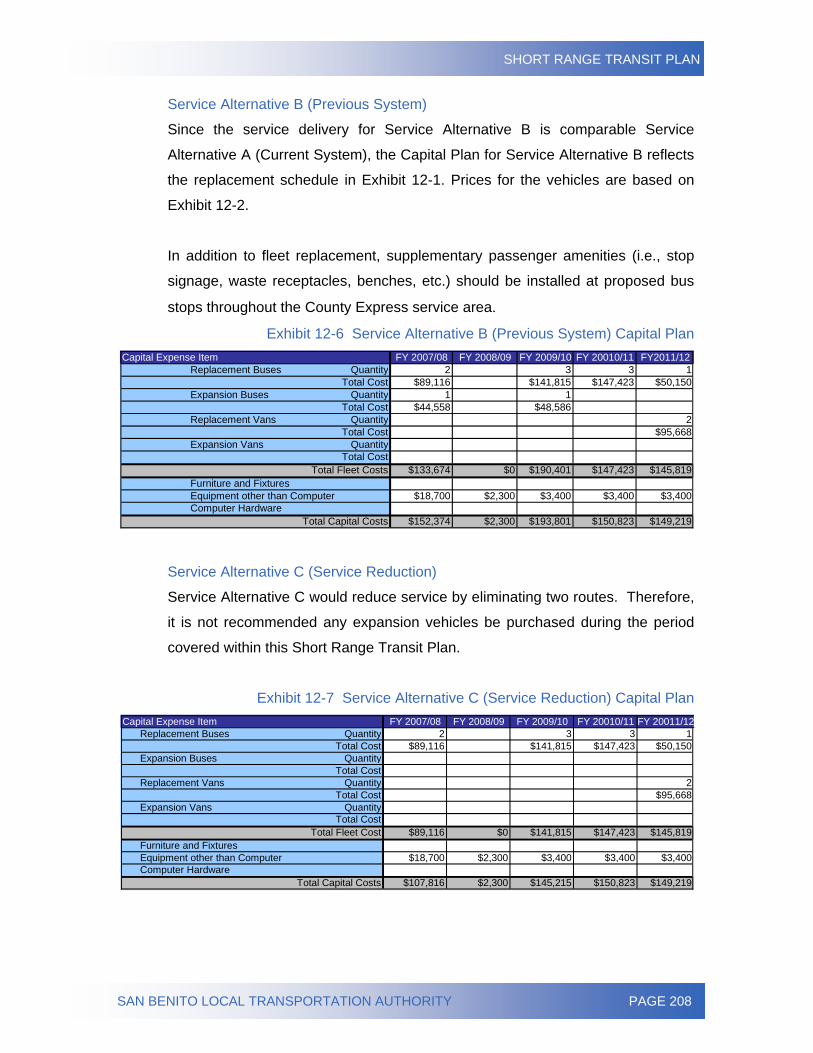
SHORT RANGE TRANSIT PLAN
SAN BENITO LOCAL TRANSPORTATION AUTHORITY PAGE 208
Service Alternative B (Previous System)
Since the service delivery for Service Alternative B is comparable Service
Alternative A (Current System), the Capital Plan for Service Alternative B reflects
the replacement schedule in Exhibit 12-1. Prices for the vehicles are based on
Exhibit 12-2.
In addition to fleet replacement, supplementary passenger amenities (i.e., stop
signage, waste receptacles, benches, etc.) should be installed at proposed bus
stops throughout the County Express service area.
Exhibit 12-6 Service Alternative B (Previous System) Capital Plan FY 2007/08 FY 2008/09 FY 2009/10 FY 20010/11 FY2011/12
Replacement Buses Quantity 2 3 3 1Total Cost $89,116 $141,815 $147,423 $50,150
Expansion Buses Quantity 1 67,800 1Total Cost $44,558 $48,586
Replacement Vans Quantity 130,000 2Total Cost $95,668
Expansion Vans QuantityTotal Cost
$133,674 $0 $190,401 $147,423 $145,819Furniture and FixturesEquipment other than Computer $18,700 $2,300 $3,400 $3,400 $3,400Computer Hardware
$152,374 $2,300 $193,801 $150,823 $149,219
Capital Expense Item
Total Fleet Costs
Total Capital Costs
Service Alternative C (Service Reduction)
Service Alternative C would reduce service by eliminating two routes. Therefore,
it is not recommended any expansion vehicles be purchased during the period
covered within this Short Range Transit Plan.
Exhibit 12-7 Service Alternative C (Service Reduction) Capital Plan FY 2007/08 FY 2008/09 FY 2009/10 FY 20010/11 FY 20011/12
Replacement Buses Quantity 2 3 3 1Total Cost $89,116 $141,815 $147,423 $50,150
Expansion Buses QuantityTotal Cost
Replacement Vans Quantity 2Total Cost $95,668
Expansion Vans QuantityTotal Cost
$89,116 $0 $141,815 $147,423 $145,819Furniture and FixturesEquipment other than Computer $18,700 $2,300 $3,400 $3,400 $3,400Computer Hardware
$107,816 $2,300 $145,215 $150,823 $149,219
Capital Expense Item
Total Fleet Cost
Total Capital Costs
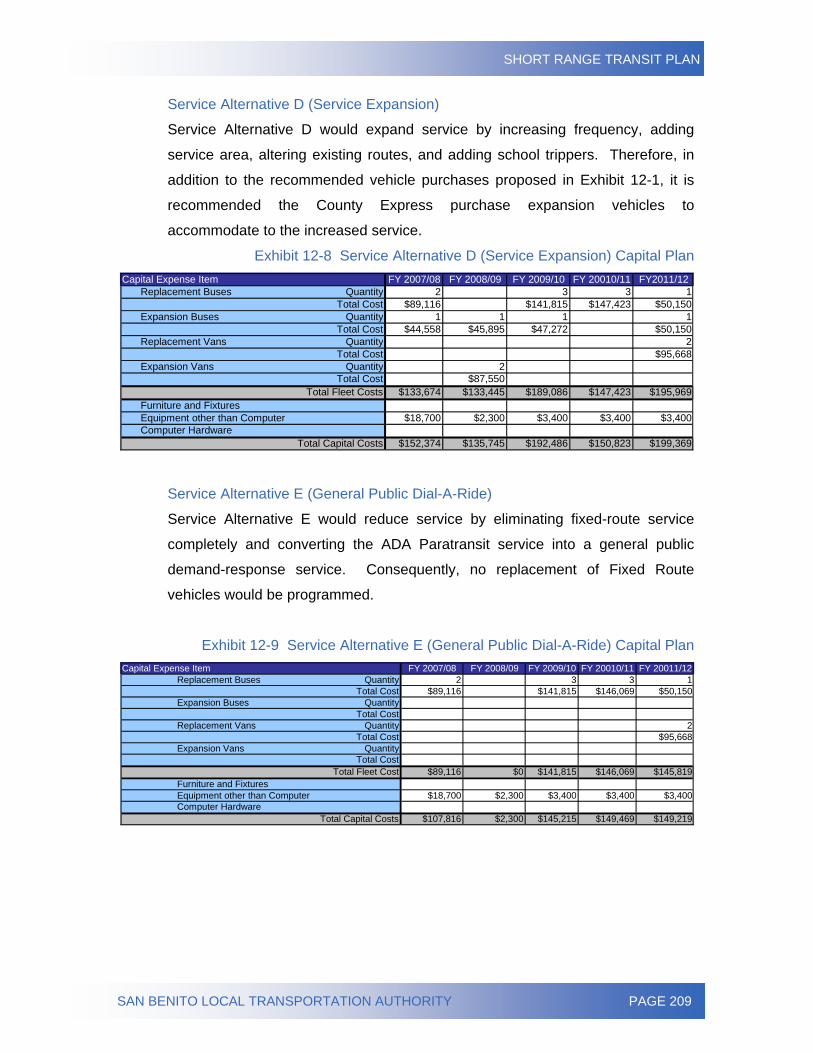
SHORT RANGE TRANSIT PLAN
SAN BENITO LOCAL TRANSPORTATION AUTHORITY PAGE 209
Service Alternative D (Service Expansion)
Service Alternative D would expand service by increasing frequency, adding
service area, altering existing routes, and adding school trippers. Therefore, in
addition to the recommended vehicle purchases proposed in Exhibit 12-1, it is
recommended the County Express purchase expansion vehicles to
accommodate to the increased service.
Exhibit 12-8 Service Alternative D (Service Expansion) Capital Plan FY 2007/08 FY 2008/09 FY 2009/10 FY 20010/11 FY2011/12
Replacement Buses Quantity 2 3 3 1Total Cost $89,116 $141,815 $147,423 $50,150
Expansion Buses Quantity 1 1 1 1Total Cost $44,558 $45,895 $47,272 $50,150
Replacement Vans Quantity 2Total Cost $95,668
Expansion Vans Quantity 2Total Cost $87,550
$133,674 $133,445 $189,086 $147,423 $195,969Furniture and FixturesEquipment other than Computer $18,700 $2,300 $3,400 $3,400 $3,400Computer Hardware
$152,374 $135,745 $192,486 $150,823 $199,369
Capital Expense Item
Total Fleet Costs
Total Capital Costs
Service Alternative E (General Public Dial-A-Ride)
Service Alternative E would reduce service by eliminating fixed-route service
completely and converting the ADA Paratransit service into a general public
demand-response service. Consequently, no replacement of Fixed Route
vehicles would be programmed.
Exhibit 12-9 Service Alternative E (General Public Dial-A-Ride) Capital Plan FY 2007/08 FY 2008/09 FY 2009/10 FY 20010/11 FY 20011/12
Replacement Buses Quantity 2 3 3 1Total Cost $89,116 $141,815 $146,069 $50,150
Expansion Buses QuantityTotal Cost
Replacement Vans Quantity 2Total Cost $95,668
Expansion Vans QuantityTotal Cost
$89,116 $0 $141,815 $146,069 $145,819Furniture and FixturesEquipment other than Computer $18,700 $2,300 $3,400 $3,400 $3,400Computer Hardware
$107,816 $2,300 $145,215 $149,469 $149,219
Capital Expense Item
Total Fleet Cost
Total Capital Costs
SHORT RANGE TRANSIT PLAN
SAN BENITO LOCAL TRANSPORTATION AUTHORITY PAGE 210
FINANCIAL PLAN Service Alternative A Operating Expenses and Performance Assumptions
Realistic five-year operating expenses have been projected for Service
Alternative A (Current System) using the following assumptions:
1. No recommendations outlined in the study will be
implemented.
2. Replacement vehicle purchases will take place during the
fiscal year identified within the Capital Plan.
3. All other purchases in the Capital Plan will take place during
the fiscal year identified.
4. Operational costs are based on County Express-provided data
for FY 2006/07.
5. Inflation is forecast at three percent per year.
6. Average fare/passenger is calculated by applying the three
percent inflation. This is then multiplied by the ridership to
show fare revenue.
7. Farebox recovery is calculated by dividing the fare revenue by
the operating cost.
8. No change in the County Express fare structure would occur
during the study’s implementation horizon.
As with any plan, should the assumptions change, the plan will need to be
modified accordingly. This plan assumes the procurement of 40 foot diesel
buses, as described in the previous chapter. Operating cost, revenue, and
ridership are based on figures provided by the San Benito Local Transportation
Authority. Maintenance costs are based on industry data. The farebox recovery
figures are calculated based on farebox revenue and operating cost data.
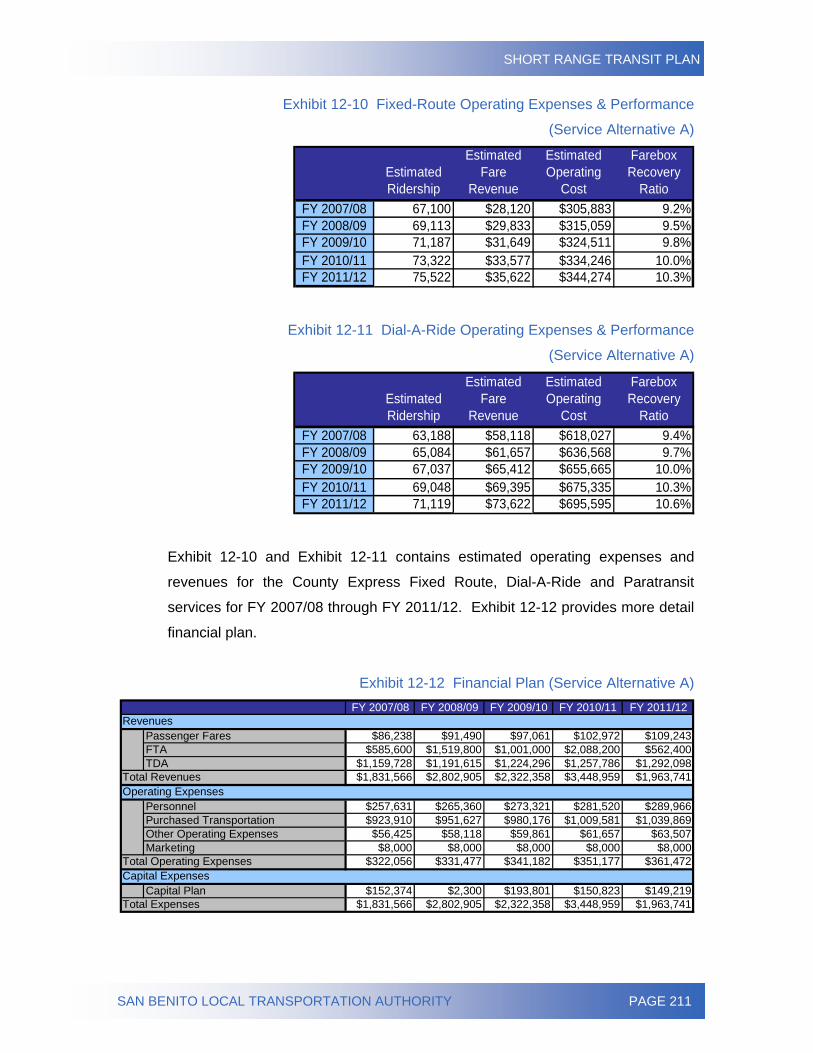
SHORT RANGE TRANSIT PLAN
SAN BENITO LOCAL TRANSPORTATION AUTHORITY PAGE 211
Exhibit 12-10 Fixed-Route Operating Expenses & Performance
(Service Alternative A)
Estimated Ridership
Estimated Fare
Revenue
Estimated Operating
Cost
Farebox Recovery
RatioFY 2007/08 67,100 $28,120 $305,883 9.2%FY 2008/09 69,113 $29,833 $315,059 9.5%FY 2009/10 71,187 $31,649 $324,511 9.8%FY 2010/11 73,322 $33,577 $334,246 10.0%FY 2011/12 75,522 $35,622 $344,274 10.3%
Exhibit 12-11 Dial-A-Ride Operating Expenses & Performance
(Service Alternative A)
Estimated Ridership
Estimated Fare
Revenue
Estimated Operating
Cost
Farebox Recovery
RatioFY 2007/08 63,188 $58,118 $618,027 9.4%FY 2008/09 65,084 $61,657 $636,568 9.7%FY 2009/10 67,037 $65,412 $655,665 10.0%FY 2010/11 69,048 $69,395 $675,335 10.3%FY 2011/12 71,119 $73,622 $695,595 10.6%
Exhibit 12-10 and Exhibit 12-11 contains estimated operating expenses and
revenues for the County Express Fixed Route, Dial-A-Ride and Paratransit
services for FY 2007/08 through FY 2011/12. Exhibit 12-12 provides more detail
financial plan.
Exhibit 12-12 Financial Plan (Service Alternative A) FY 2007/08 FY 2008/09 FY 2009/10 FY 2010/11 FY 2011/12
Passenger Fares $86,238 $91,490 $97,061 $102,972 $109,243FTA $585,600 $1,519,800 $1,001,000 $2,088,200 $562,400TDA $1,159,728 $1,191,615 $1,224,296 $1,257,786 $1,292,098
$1,831,566 $2,802,905 $2,322,358 $3,448,959 $1,963,741
Personnel $257,631 $265,360 $273,321 $281,520 $289,966Purchased Transportation $923,910 $951,627 $980,176 $1,009,581 $1,039,869Other Operating Expenses $56,425 $58,118 $59,861 $61,657 $63,507Marketing $8,000 $8,000 $8,000 $8,000 $8,000
$322,056 $331,477 $341,182 $351,177 $361,472
Capital Plan $152,374 $2,300 $193,801 $150,823 $149,219$1,831,566 $2,802,905 $2,322,358 $3,448,959 $1,963,741Total Expenses
Total Revenues
Total Operating ExpensesCapital Expenses
Operating Expenses
Revenues
SHORT RANGE TRANSIT PLAN
SAN BENITO LOCAL TRANSPORTATION AUTHORITY PAGE 212
Service Alternative B Operating Expenses and Performance Assumption
Realistic five-year operating expenses for Service Alternative B (Revert to Prior
Alignment) have been projected using the following assumptions:
1. Recommendations outlined in Recommendation B would be
implemented during the first quarter of FY 2007/08.
2. Fixed-route service would experience an annual ridership
increase of five percent.
3. Demand-response service would experience an annual
ridership increase of three percent.
4. Replacement vehicle purchases and demand-response
expansion vehicles would occur during the fiscal year
identified in the Capital Plan.
5. All other expenditures in the Capital Plan would occur during
the fiscal year identified.
6. Marketing is set at five percent of the total operating cost for
FY 2007/08, and not less than 3.5 percent every year
thereafter.
7. Operational costs were based on County Express-provided
data for FY 2006/07.
8. Inflation is forecast at three percent per year.
9. Average fare/passenger is calculated by applying the three
percent inflation. This is then multiplied by the ridership to
show fare revenue.
10. Farebox recovery is calculated by dividing the fare revenue by
the operating cost.
11. Proposed changes in fare structure and their expected impact
on farebox and ridership were detailed earlier in the report for
this, the Preferred Scenario.
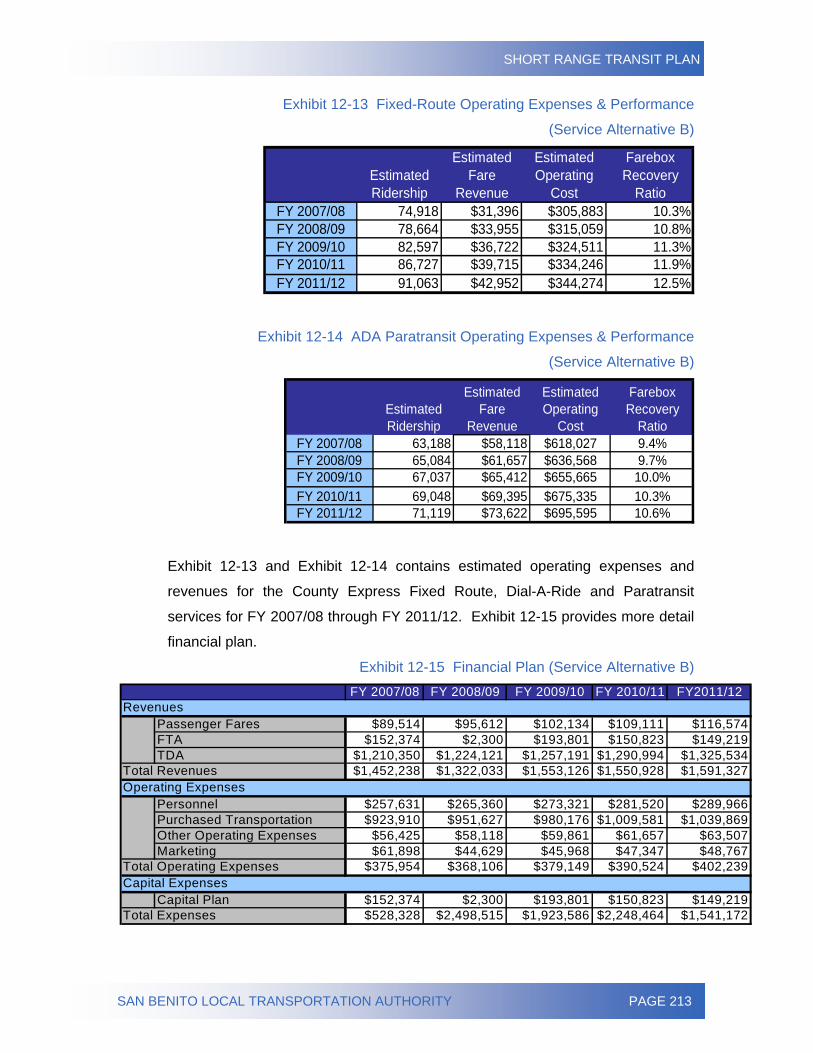
SHORT RANGE TRANSIT PLAN
SAN BENITO LOCAL TRANSPORTATION AUTHORITY PAGE 213
Exhibit 12-13 Fixed-Route Operating Expenses & Performance
(Service Alternative B)
Estimated Ridership
Estimated Fare
Revenue
Estimated Operating
Cost
Farebox Recovery
RatioFY 2007/08 74,918 $31,396 $305,883 10.3%FY 2008/09 78,664 $33,955 $315,059 10.8%FY 2009/10 82,597 $36,722 $324,511 11.3%FY 2010/11 86,727 $39,715 $334,246 11.9%FY 2011/12 91,063 $42,952 $344,274 12.5%
Exhibit 12-14 ADA Paratransit Operating Expenses & Performance
(Service Alternative B)
Estimated Ridership
Estimated Fare
Revenue
Estimated Operating
Cost
Estimated Farebox Recovery
RatioFY 2007/08 63,188 $58,118 $618,027 9.4%FY 2008/09 65,084 $61,657 $636,568 9.7%FY 2009/10 67,037 $65,412 $655,665 10.0%FY 2010/11 69,048 $69,395 $675,335 10.3%FY 2011/12 71,119 $73,622 $695,595 10.6%
Exhibit 12-13 and Exhibit 12-14 contains estimated operating expenses and
revenues for the County Express Fixed Route, Dial-A-Ride and Paratransit
services for FY 2007/08 through FY 2011/12. Exhibit 12-15 provides more detail
financial plan.
Exhibit 12-15 Financial Plan (Service Alternative B) FY 2007/08 FY 2008/09 FY 2009/10 FY 2010/11 FY2011/12
Passenger Fares $89,514 $95,612 $102,134 $109,111 $116,574FTA $152,374 $2,300 $193,801 $150,823 $149,219TDA $1,210,350 $1,224,121 $1,257,191 $1,290,994 $1,325,534
$1,452,238 $1,322,033 $1,553,126 $1,550,928 $1,591,327
Personnel $257,631 $265,360 $273,321 $281,520 $289,966Purchased Transportation $923,910 $951,627 $980,176 $1,009,581 $1,039,869Other Operating Expenses $56,425 $58,118 $59,861 $61,657 $63,507Marketing $61,898 $44,629 $45,968 $47,347 $48,767
$375,954 $368,106 $379,149 $390,524 $402,239
Capital Plan $152,374 $2,300 $193,801 $150,823 $149,219$528,328 $2,498,515 $1,923,586 $2,248,464 $1,541,172
Total Revenues
Total Operating Expenses
Total Expenses
Revenues
Operating Expenses
Capital Expenses
SHORT RANGE TRANSIT PLAN
SAN BENITO LOCAL TRANSPORTATION AUTHORITY PAGE 214
Service Alternative C Operating Expenses and Performance Assumption
Realistic five-year operating expenses for Service Alternative C (Service
Reduction) have been projected using the following assumptions:
1. Recommendations outlined in Recommendation C would be
implemented during the first quarter of FY 2007/08.
2. Fixed-route service would experience an annual ridership
increase of five percent following a decrease of 25 percent
during the first year of implementation.
3. Demand-response service would experience an annual
ridership increase of three percent.
4. Replacement vehicle purchases and demand-response
expansion vehicles would occur during the fiscal year
identified in the Capital Plan.
5. All other expenditures in the Capital Plan would occur during
the fiscal year identified.
6. Marketing is set at five percent of the total operating cost for
FY 2007/08, and not less than 3.5 percent every year
thereafter.
7. Operational costs were based on County Express-provided
data for FY 2006/07.
8. Inflation is forecast at three percent per year.
9. Average fare/passenger is calculated by applying the three
percent inflation. This is then multiplied by the ridership to
show fare revenue.
10. Farebox recovery is calculated by dividing the fare revenue by
the operating cost.
11. No change in the County Express fare structure would occur
during the Plan period.
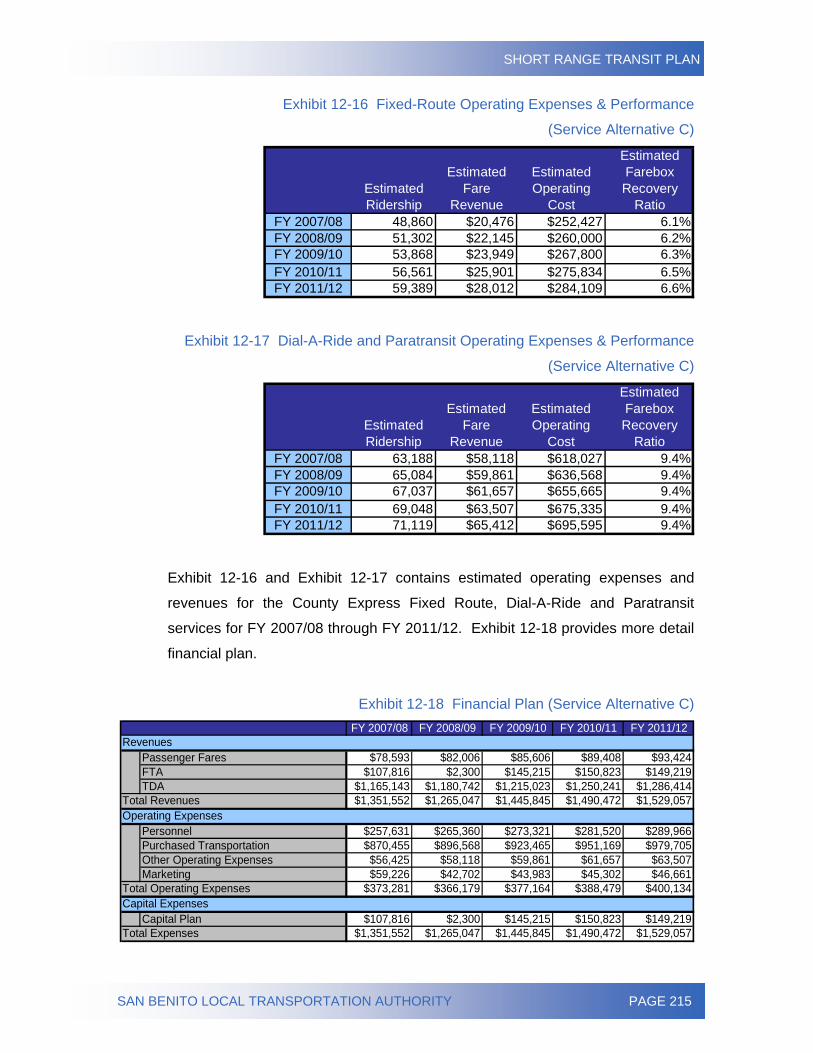
SHORT RANGE TRANSIT PLAN
SAN BENITO LOCAL TRANSPORTATION AUTHORITY PAGE 215
Exhibit 12-16 Fixed-Route Operating Expenses & Performance
(Service Alternative C)
Estimated Ridership
Estimated Fare
Revenue
Estimated Operating
Cost
Estimated Farebox Recovery
RatioFY 2007/08 48,860 $20,476 $252,427 6.1%FY 2008/09 51,302 $22,145 $260,000 6.2%FY 2009/10 53,868 $23,949 $267,800 6.3%FY 2010/11 56,561 $25,901 $275,834 6.5%FY 2011/12 59,389 $28,012 $284,109 6.6%
Exhibit 12-17 Dial-A-Ride and Paratransit Operating Expenses & Performance
(Service Alternative C)
Estimated Ridership
Estimated Fare
Revenue
Estimated Operating
Cost
Estimated Farebox Recovery
RatioFY 2007/08 63,188 $58,118 $618,027 9.4%FY 2008/09 65,084 $59,861 $636,568 9.4%FY 2009/10 67,037 $61,657 $655,665 9.4%FY 2010/11 69,048 $63,507 $675,335 9.4%FY 2011/12 71,119 $65,412 $695,595 9.4%
Exhibit 12-16 and Exhibit 12-17 contains estimated operating expenses and
revenues for the County Express Fixed Route, Dial-A-Ride and Paratransit
services for FY 2007/08 through FY 2011/12. Exhibit 12-18 provides more detail
financial plan.
Exhibit 12-18 Financial Plan (Service Alternative C) FY 2007/08 FY 2008/09 FY 2009/10 FY 2010/11 FY 2011/12
Passenger Fares $78,593 $82,006 $85,606 $89,408 $93,424FTA $107,816 $2,300 $145,215 $150,823 $149,219TDA $1,165,143 $1,180,742 $1,215,023 $1,250,241 $1,286,414
$1,351,552 $1,265,047 $1,445,845 $1,490,472 $1,529,057
Personnel $257,631 $265,360 $273,321 $281,520 $289,966Purchased Transportation $870,455 $896,568 $923,465 $951,169 $979,705Other Operating Expenses $56,425 $58,118 $59,861 $61,657 $63,507Marketing $59,226 $42,702 $43,983 $45,302 $46,661
$373,281 $366,179 $377,164 $388,479 $400,134
Capital Plan $107,816 $2,300 $145,215 $150,823 $149,219$1,351,552 $1,265,047 $1,445,845 $1,490,472 $1,529,057Total Expenses
Revenues
Operating Expenses
Capital ExpensesTotal Operating Expenses
Total Revenues
SHORT RANGE TRANSIT PLAN
SAN BENITO LOCAL TRANSPORTATION AUTHORITY PAGE 216
Service Alternative D Operating Expenses and Performance Assumption
Realistic five-year operating expenses for Service Alternative D (Service
Expansion) have been projected using the following assumptions:
1. Recommendations outlined in Recommendation D would be
implemented during the first quarter of FY 2007/08.
2. Fixed-route service would experience an annual ridership
increase of ten percent.
3. Demand-response service would experience an annual
ridership increase of three percent.
4. Purchases of County Express replacement vehicles and
demand-response expansion vehicles would occur during the
fiscal year identified in the Capital Plan.
5. All other expenditures in the Capital Plan would occur during
the fiscal year identified.
6. Marketing is set at five percent of the total operating cost for
FY 2007/08, and not less than 3.5 percent every year
thereafter.
7. Operational costs were based on County Express-provided for
FY 2006/07.
8. Inflation is forecast at three percent per year.
9. Average fare/passenger is calculated by applying the three
percent inflation. This is then multiplied by the ridership to
show fare revenue.
10. Farebox recovery is calculated by dividing the fare revenue by
the operating cost.
11. No change in the County Express fare structure would occur
during the Plan period.
12. No operating expenses or performance data for demand-
response was calculated, as there is no need to alter the
system from its current status. Refer to Exhibit 12-6 for
demand-response capital data.
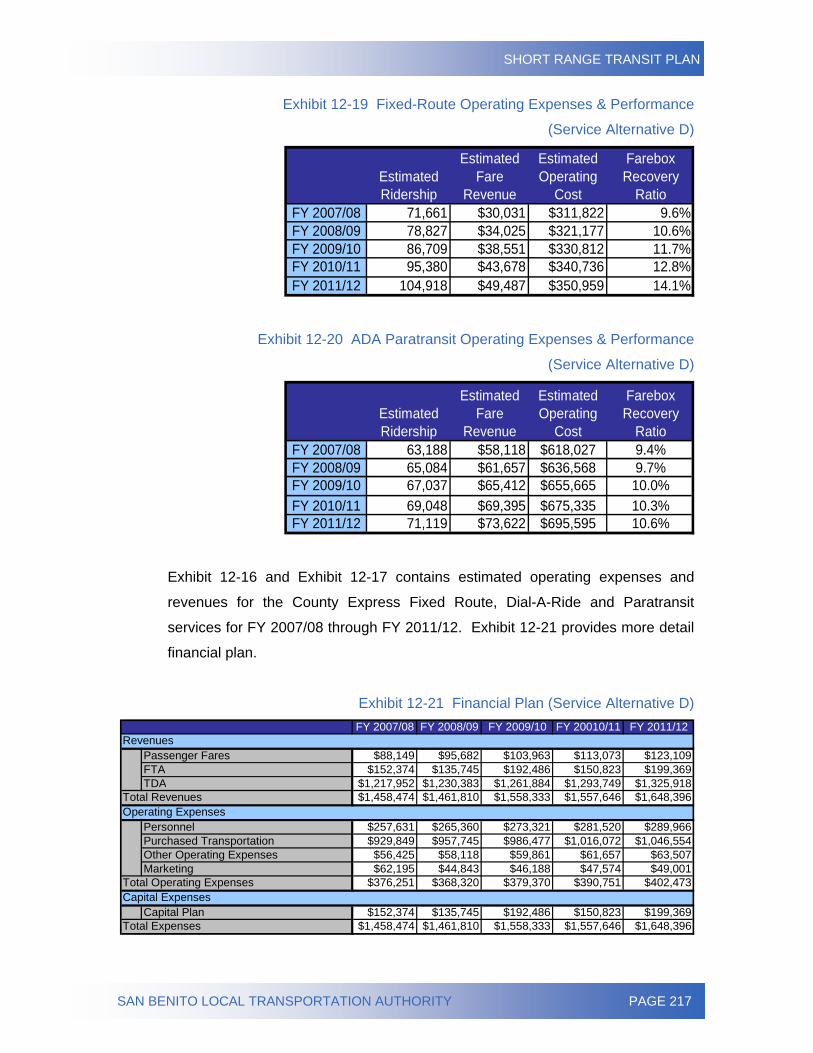
SHORT RANGE TRANSIT PLAN
SAN BENITO LOCAL TRANSPORTATION AUTHORITY PAGE 217
Exhibit 12-19 Fixed-Route Operating Expenses & Performance
(Service Alternative D)
Estimated Ridership
Estimated Fare
Revenue
Estimated Operating
Cost
Farebox Recovery
RatioFY 2007/08 71,661 $30,031 $311,822 9.6%FY 2008/09 78,827 $34,025 $321,177 10.6%FY 2009/10 86,709 $38,551 $330,812 11.7%FY 2010/11 95,380 $43,678 $340,736 12.8%FY 2011/12 104,918 $49,487 $350,959 14.1%
Exhibit 12-20 ADA Paratransit Operating Expenses & Performance
(Service Alternative D)
Estimated Ridership
Estimated Fare
Revenue
Estimated Operating
Cost
Estimated Farebox Recovery
RatioFY 2007/08 63,188 $58,118 $618,027 9.4%FY 2008/09 65,084 $61,657 $636,568 9.7%FY 2009/10 67,037 $65,412 $655,665 10.0%FY 2010/11 69,048 $69,395 $675,335 10.3%FY 2011/12 71,119 $73,622 $695,595 10.6%
Exhibit 12-16 and Exhibit 12-17 contains estimated operating expenses and
revenues for the County Express Fixed Route, Dial-A-Ride and Paratransit
services for FY 2007/08 through FY 2011/12. Exhibit 12-21 provides more detail
financial plan.
Exhibit 12-21 Financial Plan (Service Alternative D) FY 2007/08 FY 2008/09 FY 2009/10 FY 20010/11 FY 2011/12
Passenger Fares $88,149 $95,682 $103,963 $113,073 $123,109FTA $152,374 $135,745 $192,486 $150,823 $199,369TDA $1,217,952 $1,230,383 $1,261,884 $1,293,749 $1,325,918
$1,458,474 $1,461,810 $1,558,333 $1,557,646 $1,648,396
Personnel $257,631 $265,360 $273,321 $281,520 $289,966Purchased Transportation $929,849 $957,745 $986,477 $1,016,072 $1,046,554Other Operating Expenses $56,425 $58,118 $59,861 $61,657 $63,507Marketing $62,195 $44,843 $46,188 $47,574 $49,001
$376,251 $368,320 $379,370 $390,751 $402,473
Capital Plan $152,374 $135,745 $192,486 $150,823 $199,369$1,458,474 $1,461,810 $1,558,333 $1,557,646 $1,648,396
Total Operating Expenses
Total Expenses
Total Revenues
Revenues
Operating Expenses
Capital Expenses
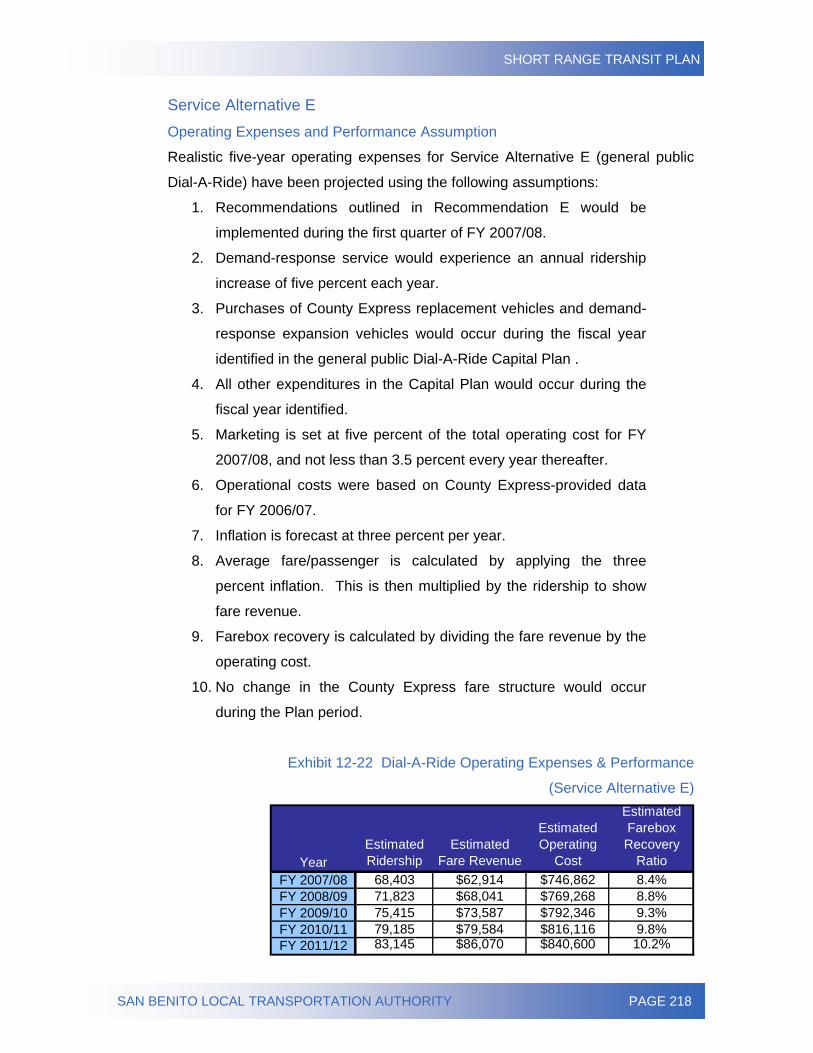
SHORT RANGE TRANSIT PLAN
SAN BENITO LOCAL TRANSPORTATION AUTHORITY PAGE 218
Service Alternative E Operating Expenses and Performance Assumption
Realistic five-year operating expenses for Service Alternative E (general public
Dial-A-Ride) have been projected using the following assumptions:
1. Recommendations outlined in Recommendation E would be
implemented during the first quarter of FY 2007/08.
2. Demand-response service would experience an annual ridership
increase of five percent each year.
3. Purchases of County Express replacement vehicles and demand-
response expansion vehicles would occur during the fiscal year
identified in the general public Dial-A-Ride Capital Plan .
4. All other expenditures in the Capital Plan would occur during the
fiscal year identified.
5. Marketing is set at five percent of the total operating cost for FY
2007/08, and not less than 3.5 percent every year thereafter.
6. Operational costs were based on County Express-provided data
for FY 2006/07.
7. Inflation is forecast at three percent per year.
8. Average fare/passenger is calculated by applying the three
percent inflation. This is then multiplied by the ridership to show
fare revenue.
9. Farebox recovery is calculated by dividing the fare revenue by the
operating cost.
10. No change in the County Express fare structure would occur
during the Plan period.
Exhibit 12-22 Dial-A-Ride Operating Expenses & Performance
(Service Alternative E)
YearEstimated Ridership
Estimated Fare Revenue
Estimated Operating
Cost
Estimated Farebox Recovery
RatioFY 2007/08 68,403 $62,914 $746,862 8.4%FY 2008/09 71,823 $68,041 $769,268 8.8%FY 2009/10 75,415 $73,587 $792,346 9.3%FY 2010/11 79,185 $79,584 $816,116 9.8%FY 2011/12 83,145 $86,070 $840,600 10.2%
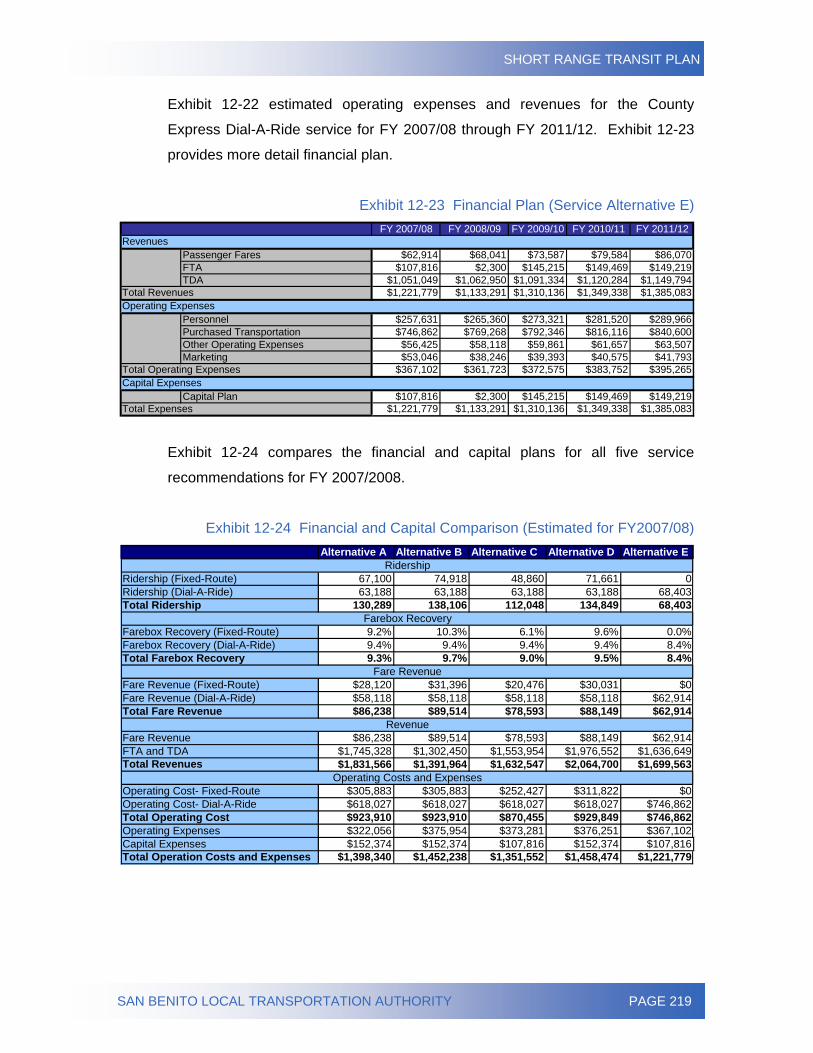
SHORT RANGE TRANSIT PLAN
SAN BENITO LOCAL TRANSPORTATION AUTHORITY PAGE 219
Exhibit 12-22 estimated operating expenses and revenues for the County
Express Dial-A-Ride service for FY 2007/08 through FY 2011/12. Exhibit 12-23
provides more detail financial plan.
Exhibit 12-23 Financial Plan (Service Alternative E) FY 2007/08 FY 2008/09 FY 2009/10 FY 2010/11 FY 2011/12
Passenger Fares $62,914 $68,041 $73,587 $79,584 $86,070FTA $107,816 $2,300 $145,215 $149,469 $149,219TDA $1,051,049 $1,062,950 $1,091,334 $1,120,284 $1,149,794
$1,221,779 $1,133,291 $1,310,136 $1,349,338 $1,385,083
Personnel $257,631 $265,360 $273,321 $281,520 $289,966Purchased Transportation $746,862 $769,268 $792,346 $816,116 $840,600Other Operating Expenses $56,425 $58,118 $59,861 $61,657 $63,507Marketing $53,046 $38,246 $39,393 $40,575 $41,793
$367,102 $361,723 $372,575 $383,752 $395,265
Capital Plan $107,816 $2,300 $145,215 $149,469 $149,219$1,221,779 $1,133,291 $1,310,136 $1,349,338 $1,385,083
Total Revenues
Revenues
Total Expenses
Operating Expenses
Total Operating ExpensesCapital Expenses
Exhibit 12-24 compares the financial and capital plans for all five service
recommendations for FY 2007/2008.
Exhibit 12-24 Financial and Capital Comparison (Estimated for FY2007/08) Alternative A Alternative B Alternative C Alternative D Alternative E
Ridership (Fixed-Route) 67,100 74,918 48,860 71,661 0Ridership (Dial-A-Ride) 63,188 63,188 63,188 63,188 68,403Total Ridership 130,289 138,106 112,048 134,849 68,403
Farebox Recovery (Fixed-Route) 9.2% 10.3% 6.1% 9.6% 0.0%Farebox Recovery (Dial-A-Ride) 9.4% 9.4% 9.4% 9.4% 8.4%Total Farebox Recovery 9.3% 9.7% 9.0% 9.5% 8.4%
Fare Revenue (Fixed-Route) $28,120 $31,396 $20,476 $30,031 $0Fare Revenue (Dial-A-Ride) $58,118 $58,118 $58,118 $58,118 $62,914Total Fare Revenue $86,238 $89,514 $78,593 $88,149 $62,914
Fare Revenue $86,238 $89,514 $78,593 $88,149 $62,914FTA and TDA $1,745,328 $1,302,450 $1,553,954 $1,976,552 $1,636,649Total Revenues $1,831,566 $1,391,964 $1,632,547 $2,064,700 $1,699,563
Operating Cost- Fixed-Route $305,883 $305,883 $252,427 $311,822 $0Operating Cost- Dial-A-Ride $618,027 $618,027 $618,027 $618,027 $746,862Total Operating Cost $923,910 $923,910 $870,455 $929,849 $746,862Operating Expenses $322,056 $375,954 $373,281 $376,251 $367,102Capital Expenses $152,374 $152,374 $107,816 $152,374 $107,816Total Operation Costs and Expenses $1,398,340 $1,452,238 $1,351,552 $1,458,474 $1,221,779
Ridership
Farebox Recovery
Fare Revenue
Revenue
Operating Costs and Expenses
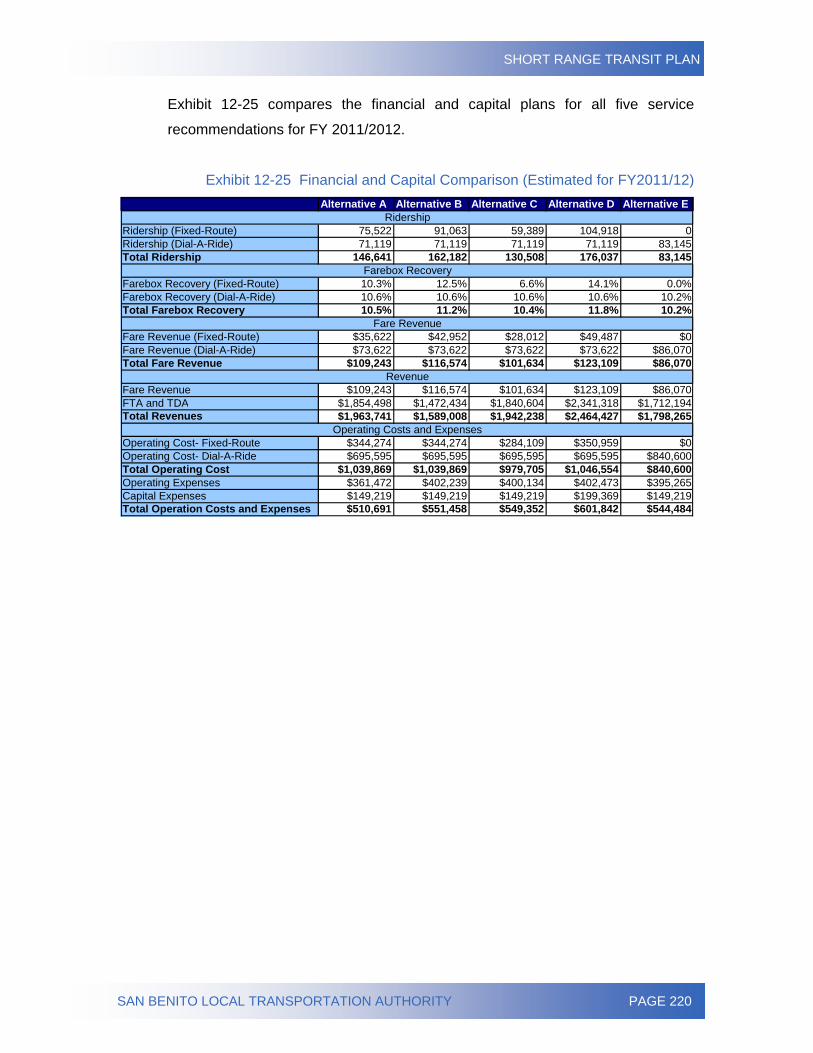
SHORT RANGE TRANSIT PLAN
SAN BENITO LOCAL TRANSPORTATION AUTHORITY PAGE 220
Exhibit 12-25 compares the financial and capital plans for all five service
recommendations for FY 2011/2012.
Exhibit 12-25 Financial and Capital Comparison (Estimated for FY2011/12) Alternative A Alternative B Alternative C Alternative D Alternative E
Ridership (Fixed-Route) 75,522 91,063 59,389 104,918 0Ridership (Dial-A-Ride) 71,119 71,119 71,119 71,119 83,145Total Ridership 146,641 162,182 130,508 176,037 83,145
Farebox Recovery (Fixed-Route) 10.3% 12.5% 6.6% 14.1% 0.0%Farebox Recovery (Dial-A-Ride) 10.6% 10.6% 10.6% 10.6% 10.2%Total Farebox Recovery 10.5% 11.2% 10.4% 11.8% 10.2%
Fare Revenue (Fixed-Route) $35,622 $42,952 $28,012 $49,487 $0Fare Revenue (Dial-A-Ride) $73,622 $73,622 $73,622 $73,622 $86,070Total Fare Revenue $109,243 $116,574 $101,634 $123,109 $86,070
Fare Revenue $109,243 $116,574 $101,634 $123,109 $86,070FTA and TDA $1,854,498 $1,472,434 $1,840,604 $2,341,318 $1,712,194Total Revenues $1,963,741 $1,589,008 $1,942,238 $2,464,427 $1,798,265
Operating Cost- Fixed-Route $344,274 $344,274 $284,109 $350,959 $0Operating Cost- Dial-A-Ride $695,595 $695,595 $695,595 $695,595 $840,600Total Operating Cost $1,039,869 $1,039,869 $979,705 $1,046,554 $840,600Operating Expenses $361,472 $402,239 $400,134 $402,473 $395,265Capital Expenses $149,219 $149,219 $149,219 $199,369 $149,219Total Operation Costs and Expenses $510,691 $551,458 $549,352 $601,842 $544,484
Revenue
Operating Costs and Expenses
Farebox Recovery
Ridership
Fare Revenue
SHORT RANGE TRANSIT PLAN
SAN BENITO LOCAL TRANSPORTATION AUTHORITY PAGE 221
CHAPTER 13 – PREFERRED SCENARIO
On October 16, 2007, a Special Board Meeting was scheduled to review options
for the San Benito County Express System. The Local Transportation Authority
Board of Directors and the Social Services Transportation Advisory Council
discussed the system’s current performance as well as each of the proposed
service options. The Authority’s Board of Directors raised concerns regarding
the system’s farebox recovery ratio, ridership, operating costs and how system
changes may affect the new operations contract with the private operator. The
Authority’s Board decided it was best for the San Benito County Express System
to revert to its prior alignment with some service modifications. Presented herein
is the preferred scenario option for the San Benito County Express System as
chosen by the Authority’s Board.
The preferred scenario option offers cost-effective improvements designed to
achieve greater system efficiency. Scenario Option B holds the greatest
likelihood of achieving the Board’s target of 10 percent farebox recovery.
Service change often warrants a revised marketing strategy to alert the
community and prepare them for the adjustment. Implementing the marketing
strategy prematurely risks riders losing interest in the service adjustment,
whereas delayed notification warrants implementing it late allows the possibility
of not giving riders an adequate adjustment period. Marketing the service
change one month prior allows current and potential riders to adapt to the service
changes.
Fixed-Route Service The San Benito County Express’ Fixed Route would revert to its prior
service plan, adopted in 2005 with minor modifications.
First, all route names would be re-labeled as “colors” rather than by
“direction” or “area.”

SHORT RANGE TRANSIT PLAN
SAN BENITO LOCAL TRANSPORTATION AUTHORITY PAGE 222
The Red Line, comparable to the current Business District route, would
commence its trip at Rancho Drive and Tres Pinos Road. This route
would provide coverage along San Benito Street/San Felipe Road from
Tres Pinos Road to the Hope Services Hollister Center at Technology
Parkway.
A member of the public requested a stop to be placed at the San Benito
County Jail, located just off San Benito Street at 710 Flynn Road. The
stop will be made as a stop along the Red Line and is subsequent to a 12
month demonstration project. The Local Transportation Authority should
review the activity level at this bus stop and determine whether to
implement a permanent stop at this location, or eliminate service.
The Blue and Green Lines are very similar to the Clockwise and Counter-
Clockwise Routes. The Blue and Green Lines, however, do not deviate
onto El Toro Drive, Hillcrest Road, and Sunnyslope Road. The lines
would remain on Memorial Drive. In addition, the routes will preserve
service in the northwestern segment (i.e., Graf Road and Central
Avenue). The prior Blue and Green Lines did not extend service to that
segment of the City.
There are no modifications to the Intercounty Route.
The following map illustrates the proposed Fixed Route service.
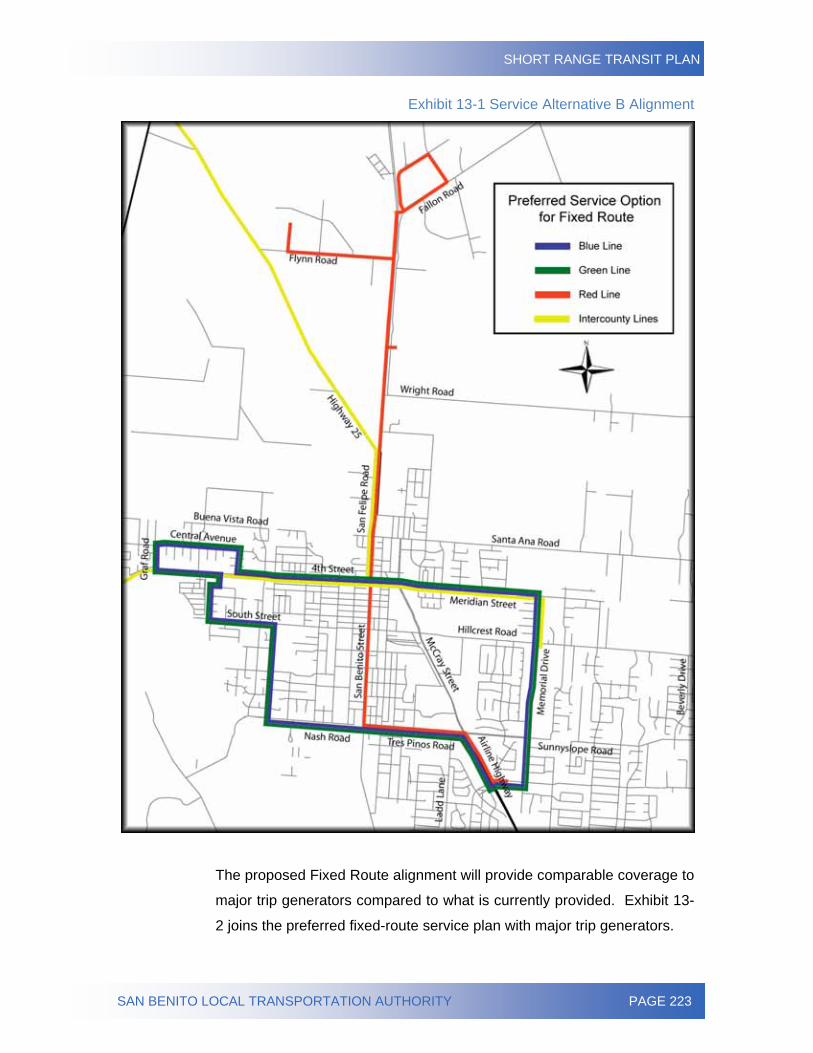
SHORT RANGE TRANSIT PLAN
SAN BENITO LOCAL TRANSPORTATION AUTHORITY PAGE 223
Exhibit 13-1 Service Alternative B Alignment
The proposed Fixed Route alignment will provide comparable coverage to
major trip generators compared to what is currently provided. Exhibit 13-
2 joins the preferred fixed-route service plan with major trip generators.
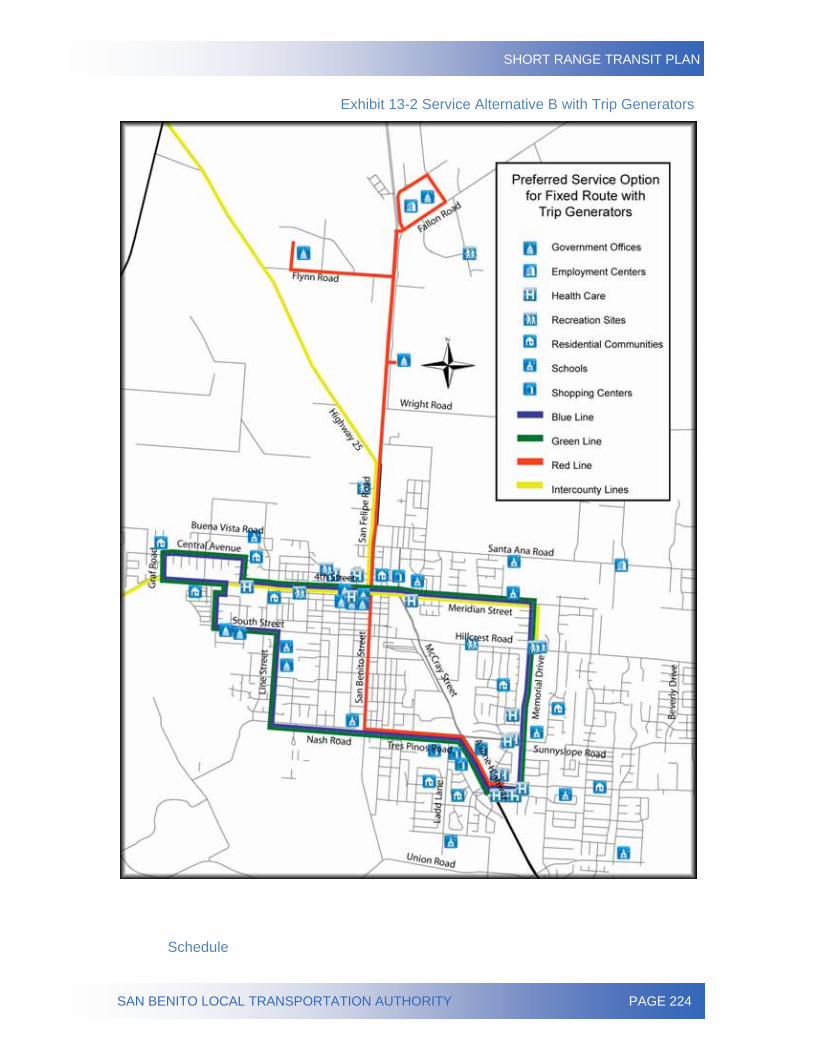
SHORT RANGE TRANSIT PLAN
SAN BENITO LOCAL TRANSPORTATION AUTHORITY PAGE 224
Exhibit 13-2 Service Alternative B with Trip Generators
Schedule

SHORT RANGE TRANSIT PLAN
SAN BENITO LOCAL TRANSPORTATION AUTHORITY PAGE 225
San Benito County Express fixed-route services will operate on slightly extended
hours: from approximately 6:00 a.m. to 6:20 p.m. The Blue and Green routes will
also serve a new stop at Central Avenue and Graf Road. The Intercounty Route
will maintain its current scheduling
.
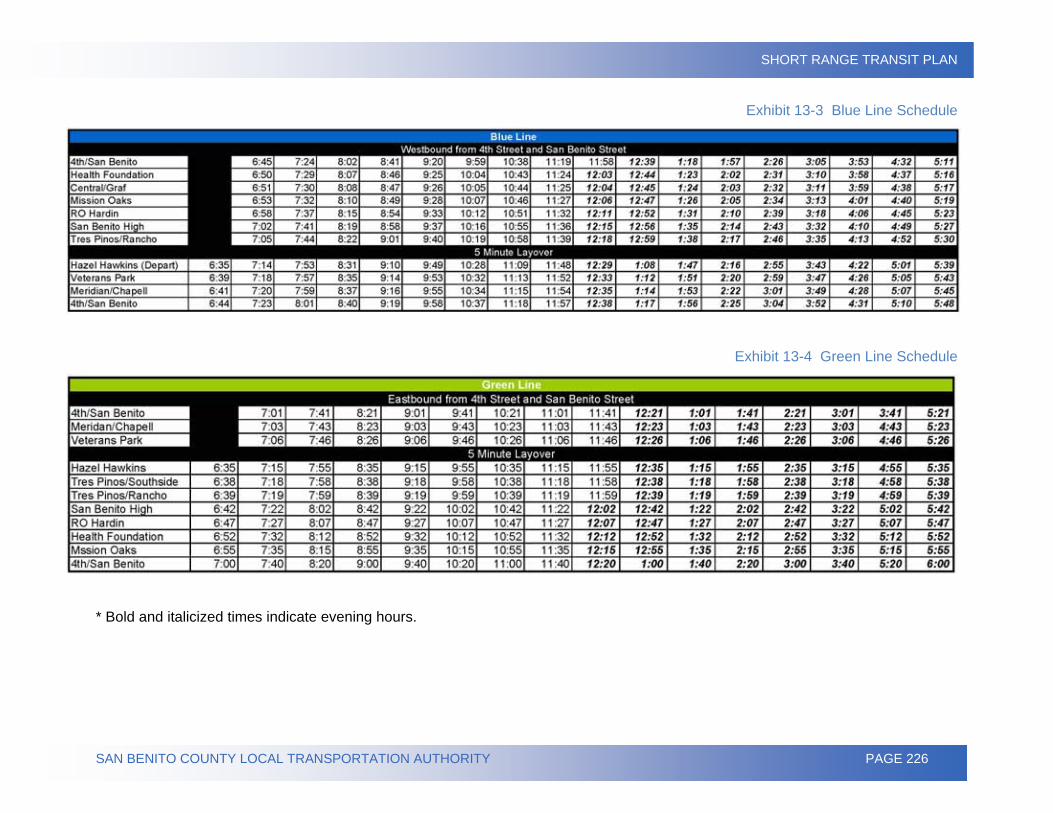
SHORT RANGE TRANSIT PLAN
SAN BENITO COUNTY LOCAL TRANSPORTATION AUTHORITY PAGE 226
Exhibit 13-3 Blue Line Schedule
Exhibit 13-4 Green Line Schedule
* Bold and italicized times indicate evening hours.
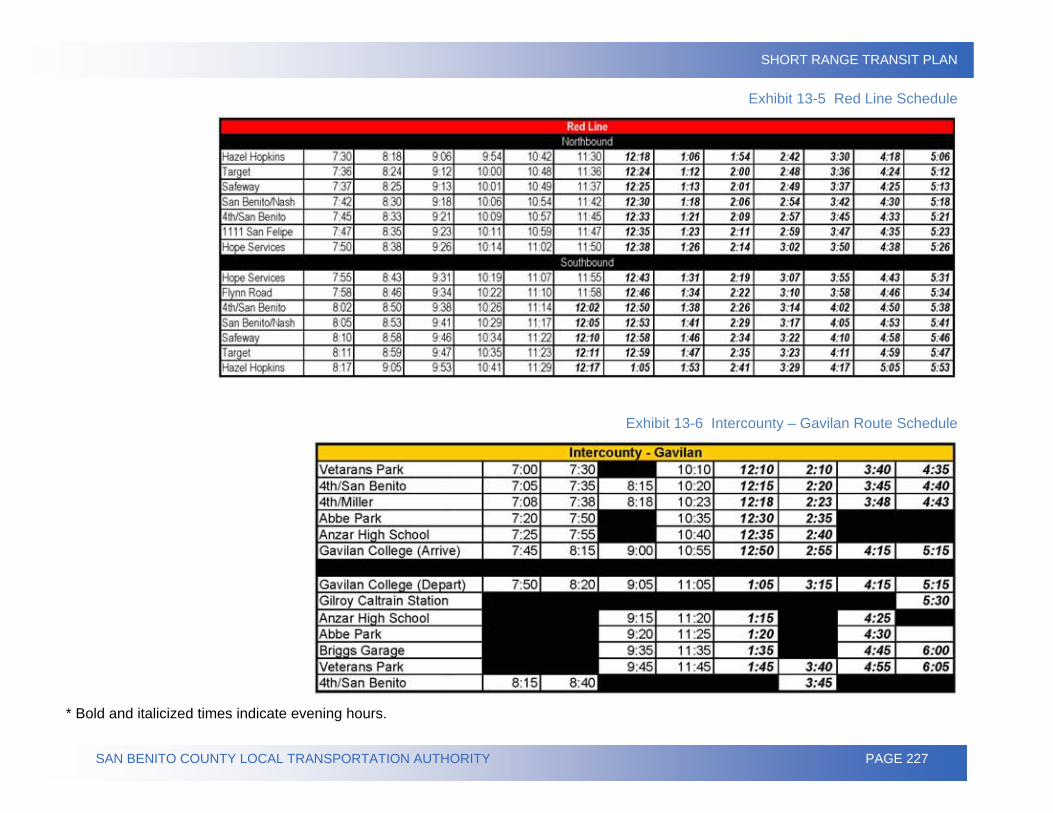
SHORT RANGE TRANSIT PLAN
SAN BENITO COUNTY LOCAL TRANSPORTATION AUTHORITY PAGE 227
Exhibit 13-5 Red Line Schedule
Exhibit 13-6 Intercounty – Gavilan Route Schedule
* Bold and italicized times indicate evening hours.
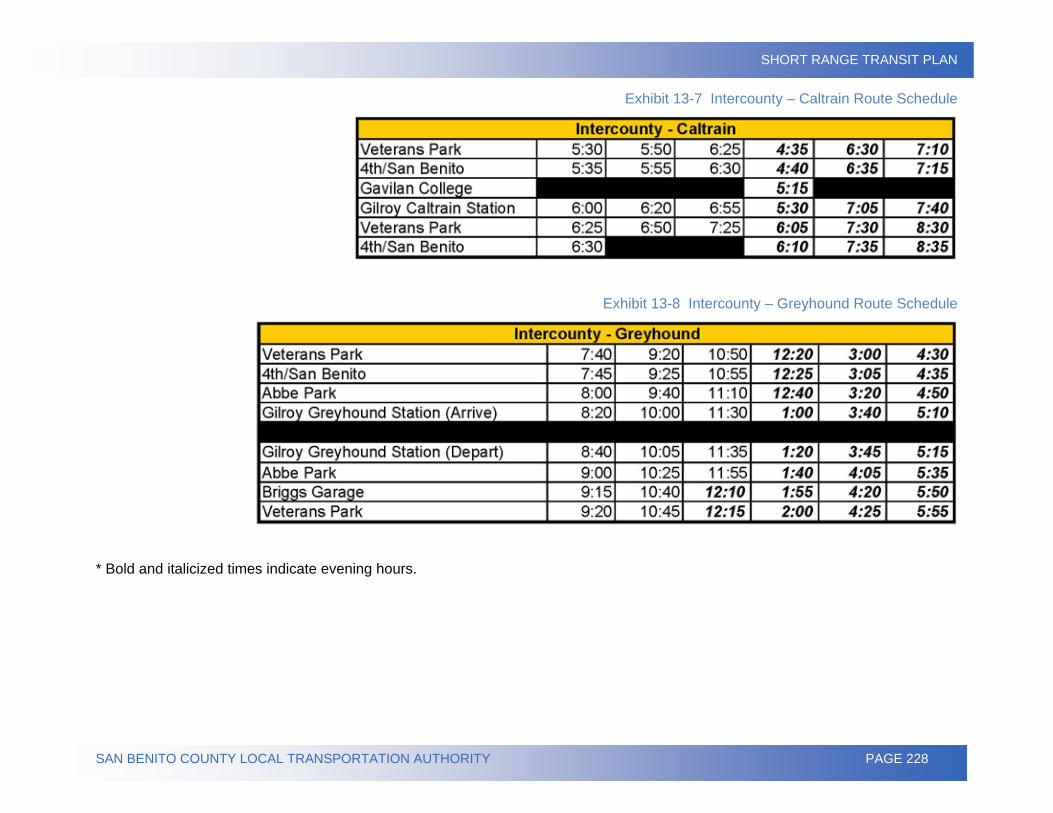
SHORT RANGE TRANSIT PLAN
SAN BENITO COUNTY LOCAL TRANSPORTATION AUTHORITY PAGE 228
Exhibit 13-7 Intercounty – Caltrain Route Schedule
Exhibit 13-8 Intercounty – Greyhound Route Schedule
* Bold and italicized times indicate evening hours.
SHORT RANGE TRANSIT PLAN
SAN BENITO COUNTY LOCAL TRANSPORTATION AUTHORITY PAGE 229
Paratransit Service Area
The changes of the Fixed Route alignments require modifications to the Paratransit
service area.
The Department of Transportation requires “each public entity operating a fixed-route
system shall provide Paratransit or other special service to individuals with disabilities
that is comparable to the level of service provided to individuals without disabilities who
use the fixed-route system” (49 CFR § 37.121 (c)). In addition, it is stipulated that the
complementary paratransit service is not required for commuter bus services (49 CFR §
37.121 (c)).
Paratransit service will only be required to run during the same hours of operation as the
Red, Blue and Green Lines - weekdays from approximately 6:00 a.m. until 6:20 p.m.
The service is not required to run during the hours of operation of the Intercounty Route
as this route is defined as a commuter bus system.
With the exception of on-call or Paratransit feeder services, (49 CFR § 37.129(a))
specifies “complementary Paratransit service for ADA Paratransit eligible persons shall
be origin-to-destination services.”
A document was released in September 2005 by the Department of Transportation’s
Disability Law Coordinating Council as guidance for the general public to better
comprehend the definition of “origin-to-destination” service.
According to the Council, this term was deliberately chosen to avoid using either the
term “curb-to-curb” service or the term “door-to-door” service and to emphasize the
obligation of transit providers to ensure that eligible passengers are actually able to use
Paratransit service to get from their points of origin to their destinations. To meet this
origin-to-destination requirement, service may be provided to some individuals, or at
some locations, in a manner that goes beyond curb-to-curb service. Drivers would not
exceed door-to-door service.1
Department of Transportation’s Disability Law Coordinating Council. (01 September 2005). Origin-to-Destination Service. Retrieved August 16, 2006, from http://fta.dot.gov/printer_friendly/civil_rights_3891.html.
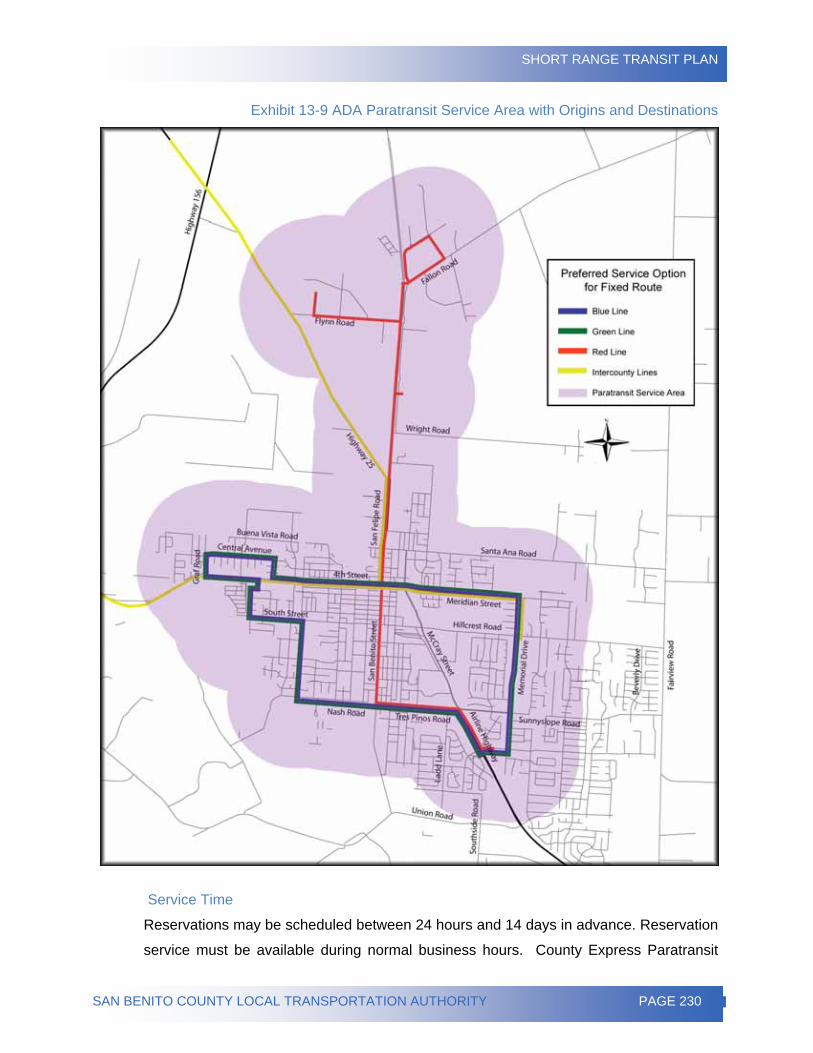
SHORT RANGE TRANSIT PLAN
SAN BENITO COUNTY LOCAL TRANSPORTATION AUTHORITY PAGE 230
Exhibit 13-9 ADA Paratransit Service Area with Origins and Destinations
Service Time
Reservations may be scheduled between 24 hours and 14 days in advance. Reservation
service must be available during normal business hours. County Express Paratransit
SHORT RANGE TRANSIT PLAN
SAN BENITO COUNTY LOCAL TRANSPORTATION AUTHORITY PAGE 231
services must accommodate passengers by scheduling trips no more than one hour
before or after the passenger’s desired time of departure. (49 CFR § 37.131(b)).
Vehicle Type
Industry standards consider an appropriate vehicle for paratransit services to be a
standard medium bus. Such a bus should be equipped with an ADA-approved lift,
accommodate a maximum of 14 ambulatory passengers (not including the driver), and
have a standard of two wheelchair positions and a maximum of four wheelchair
positions. The lifecycle for this vehicle type, based on the Federal Replacement
Threshold, is seven years or 200,000 miles.
Shifting Demand Response Customers to Fixed-route
The principal benefit of shifting Paratransit riders to other services is reducing the
demand for this more expensive transit service. The following are cost-saving options
for the County Express’ Paratransit service.
Stricter Certification Requirements for ADA Paratransit Patrons
Local Transportation Authority is recommended to develop a stricter certification
policy for its ADA Paratransit customers. Currently, ADA Paratransit services are
available to “certified ADA-eligible” persons. With the rising trend of both
operating costs and ridership, it is recommended the Local Transportation
Authority appoint selected physicians to certify riders. The stricter certification
requirements would reduce the number of ADA paratransit customers, which
would result in a reduction of operating costs.
Incentives and Educational Services
By shifting riders to Fixed Route, the Local Transportation Authority would reduce
operating costs on its ADA Paratransit service, increase ridership on Fixed Route
service, and ultimately increase the farebox recovery ratio. The preferred
scenario and current routing are very similar. As such, it is recommended the
Authority begin an outreach campaign aimed at educating residents about the
destinations to which the Fixed Route serves. This report outlines marketing
strategies designed to do this.
SHORT RANGE TRANSIT PLAN
SAN BENITO COUNTY LOCAL TRANSPORTATION AUTHORITY PAGE 232
The Authority could offer incentives or education services for ADA Paratransit
eligible riders to increase fixed-route ridership and decrease the cost of the
Paratransit service.
The following are some examples of different strategies the Local Transportation
Authority may implement2:
1. Free Rides: The Authority could offer free rides on Fixed Route for all
Paratransit eligible persons. The Charlottesville Transit System of
Virginia was able to save nearly $1 million annually by avoiding
Paratransit services for these trips.
2. Mobility Training: Other transit agencies have decided rider education is
an effective way of shifting paratransit riders onto fixed-route services.
Sacramento Regional Transit offers fixed-route coaching to seniors and
persons with disabilities. Riders are taught how to ride to and from
specific locations or basic trip training. By providing mobility training,
seniors and persons with disabilities are more independent and may feel
more connected to the community. This program has saved the County
just over $1 million in paratransit operating costs. Funding is available for
similar programs through SAFETEA-LU.
Subsidize Other Paratransit Services
Various transit agencies throughout the nation have identified cost-saving
paratransit alternatives to meet needs that are beyond the jurisdictions of
traditional public transit services.
Riverside County, for example, operates a volunteer reimbursement program
called the Transportation Reimbursement and Information Project (TRIP). The
County agrees to reimburse volunteers who transport individuals to/from outside
the public transit coverage area and/or individuals who are physically unable to
utilize public transit services. The program has saved the County over $1.5
2 Derived from case studies in the “Transit Cooperative Research Program: Report 91- Economic Benefits of Coordinating Human Service Transportation and Transit Services.”2
SHORT RANGE TRANSIT PLAN
SAN BENITO COUNTY LOCAL TRANSPORTATION AUTHORITY PAGE 233
million in operating costs. Certain limitations exist due to the volunteer-nature of
the drivers.
Subsidizing taxi services is a common form of paratransit alternatives. The
Specialized Transit for Arlington Residents (STAR) in Arlington, Virginia provides
the annual benefits of approximately $450,000. However, this may not be a
viable alternative for San Benito at this time due to the fact that only one taxi
company currently exists in Hollister.
Fare Structure
All of County Express services offer the following payment options:
• One-way cash fare,
• 10-ticket booklet, and
• Monthly pass.
However, there are no monthly passes for Dial-A-Ride services.
Youth (ages 5 through 17), seniors (over the age of 65), and persons with disabilities
may receive discounts on the local fixed-route fare payment options. Children 4 years of
age and younger may ride free when accompanied by a fare-paying adult (maximum two
per adult).
The Local Transportation Authority should consider the implementation of a day pass
priced at a threshold slightly higher than two one-way trips. Similar to the other multi-trip
fare options, the introduction of a day pass – with the appropriate marketing – would
influence ridership growth and provide another convenient fare option for riders.
Planned Fare Increase
During the October 2007, Special Meeting, the Local Transportation Authority
Board expressed concern with County Express’ Fixed Route’s inability to meet
the California Transportation Development Act farebox recovery standard of 10
percent. Members agreed the most effective method of reaching the desired
farebox ratio in the least amount of time would be to increase fares.
SHORT RANGE TRANSIT PLAN
SAN BENITO COUNTY LOCAL TRANSPORTATION AUTHORITY PAGE 234
The Short Range Transit Plan recommends three fare increases for County
Express services.
1. Annual fare increases for Fixed Route;
2. One-time fare increase during the first year and no increases for the
next four years for Fixed Route; and
3. Restructure entire fare structure with one-time fare increase.
All fare increases require a public hearing to inform and provide a forum for the
public to voice their concerns about the potential fare increases. During these
hearings, the public should be presented with the three fare increase options.
Prior to the hearings, extensive marketing and public outreach should be made to
ensure an adequate amount of participants.
At the end of FY 2011/12, the Authority may reevaluate the preferred fare
structure and determine whether, or not, a fare increase is need. Although
Option 2 and Option 3 include a planned one-time fare increase, the Authority
should continue to monitor farebox revenue. If there are extenuating
circumstances that warrant a fare increase before the lifespan of the Short
Range Transit Plan has been reached, the Authority may consider another fare
increase.
Option 1: Annual Increases for Fixed Route
The first option of fare increases is to incrementally increase Fixed Route fares
because market research revealed significant incidence of ride-dependency
throughout the County Express service area. An immediate significant increase
in fare level would result in a considerable decrease in County Express
patronage. Any sudden sizeable increase in fare level could be viewed as an
unfair mobility impairment for economically-disadvantaged persons throughout
the County Express service area.
Beginning FY 2008/09, the fares would increase 10 cents annually up to FY
2010/11. In FY 2011/12, the San Benito County Express’ fixed-route regular cash
fare would increase fares by 5 cents. The fare increase would proportionally
affect the regular 10-ticket booklet and regular monthly pass prices.
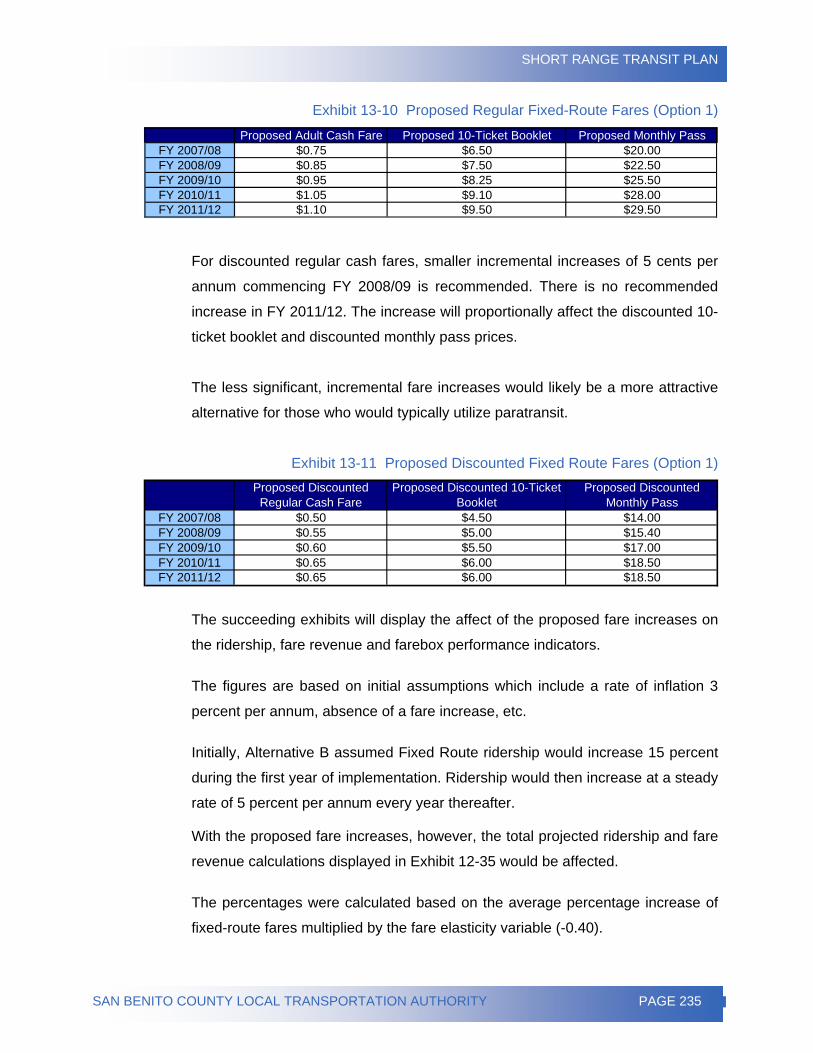
SHORT RANGE TRANSIT PLAN
SAN BENITO COUNTY LOCAL TRANSPORTATION AUTHORITY PAGE 235
Exhibit 13-10 Proposed Regular Fixed-Route Fares (Option 1)
Proposed Adult Cash Fare Proposed 10-Ticket Booklet Proposed Monthly PassFY 2007/08 $0.75 $6.50 $20.00FY 2008/09 $0.85 $7.50 $22.50FY 2009/10 $0.95 $8.25 $25.50FY 2010/11 $1.05 $9.10 $28.00FY 2011/12 $1.10 $9.50 $29.50
For discounted regular cash fares, smaller incremental increases of 5 cents per
annum commencing FY 2008/09 is recommended. There is no recommended
increase in FY 2011/12. The increase will proportionally affect the discounted 10-
ticket booklet and discounted monthly pass prices.
The less significant, incremental fare increases would likely be a more attractive
alternative for those who would typically utilize paratransit.
Exhibit 13-11 Proposed Discounted Fixed Route Fares (Option 1) Proposed Discounted Regular Cash Fare
Proposed Discounted 10-Ticket Booklet
Proposed Discounted Monthly Pass
FY 2007/08 $0.50 $4.50 $14.00FY 2008/09 $0.55 $5.00 $15.40FY 2009/10 $0.60 $5.50 $17.00FY 2010/11 $0.65 $6.00 $18.50FY 2011/12 $0.65 $6.00 $18.50
The succeeding exhibits will display the affect of the proposed fare increases on
the ridership, fare revenue and farebox performance indicators.
The figures are based on initial assumptions which include a rate of inflation 3
percent per annum, absence of a fare increase, etc.
Initially, Alternative B assumed Fixed Route ridership would increase 15 percent
during the first year of implementation. Ridership would then increase at a steady
rate of 5 percent per annum every year thereafter.
With the proposed fare increases, however, the total projected ridership and fare
revenue calculations displayed in Exhibit 12-35 would be affected.
The percentages were calculated based on the average percentage increase of
fixed-route fares multiplied by the fare elasticity variable (-0.40).
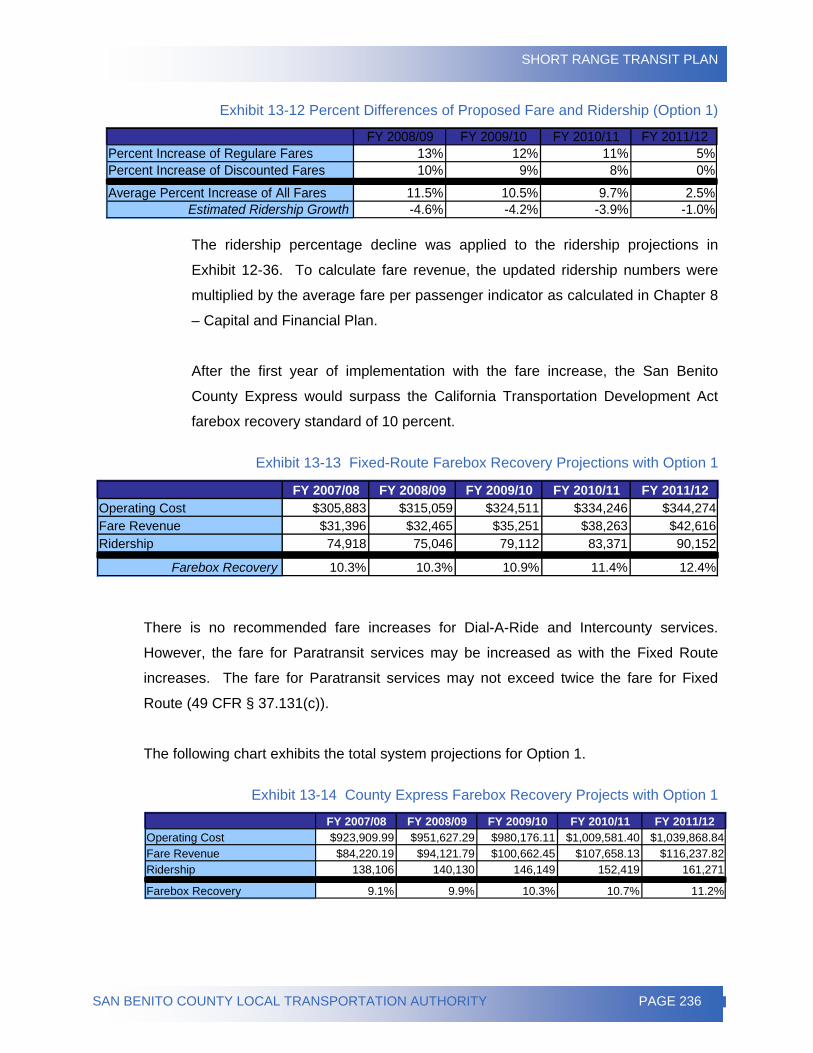
SHORT RANGE TRANSIT PLAN
SAN BENITO COUNTY LOCAL TRANSPORTATION AUTHORITY PAGE 236
Exhibit 13-12 Percent Differences of Proposed Fare and Ridership (Option 1)
FY 2008/09 FY 2009/10 FY 2010/11 FY 2011/12Percent Increase of Regulare Fares 13% 12% 11% 5%Percent Increase of Discounted Fares 10% 9% 8% 0%
Average Percent Increase of All Fares 11.5% 10.5% 9.7% 2.5%Estimated Ridership Growth -4.6% -4.2% -3.9% -1.0%
The ridership percentage decline was applied to the ridership projections in
Exhibit 12-36. To calculate fare revenue, the updated ridership numbers were
multiplied by the average fare per passenger indicator as calculated in Chapter 8
– Capital and Financial Plan.
After the first year of implementation with the fare increase, the San Benito
County Express would surpass the California Transportation Development Act
farebox recovery standard of 10 percent.
Exhibit 13-13 Fixed-Route Farebox Recovery Projections with Option 1
FY 2007/08 FY 2008/09 FY 2009/10 FY 2010/11 FY 2011/12Operating Cost $305,883 $315,059 $324,511 $334,246 $344,274Fare Revenue $31,396 $32,465 $35,251 $38,263 $42,616Ridership 74,918 75,046 79,112 83,371 90,152
Farebox Recovery 10.3% 10.3% 10.9% 11.4% 12.4%
There is no recommended fare increases for Dial-A-Ride and Intercounty services.
However, the fare for Paratransit services may be increased as with the Fixed Route
increases. The fare for Paratransit services may not exceed twice the fare for Fixed
Route (49 CFR § 37.131(c)).
The following chart exhibits the total system projections for Option 1.
Exhibit 13-14 County Express Farebox Recovery Projects with Option 1
FY 2007/08 FY 2008/09 FY 2009/10 FY 2010/11 FY 2011/12Operating Cost $923,909.99 $951,627.29 $980,176.11 $1,009,581.40 $1,039,868.84Fare Revenue $84,220.19 $94,121.79 $100,662.45 $107,658.13 $116,237.82Ridership 138,106 140,130 146,149 152,419 161,271
Farebox Recovery 9.1% 9.9% 10.3% 10.7% 11.2%
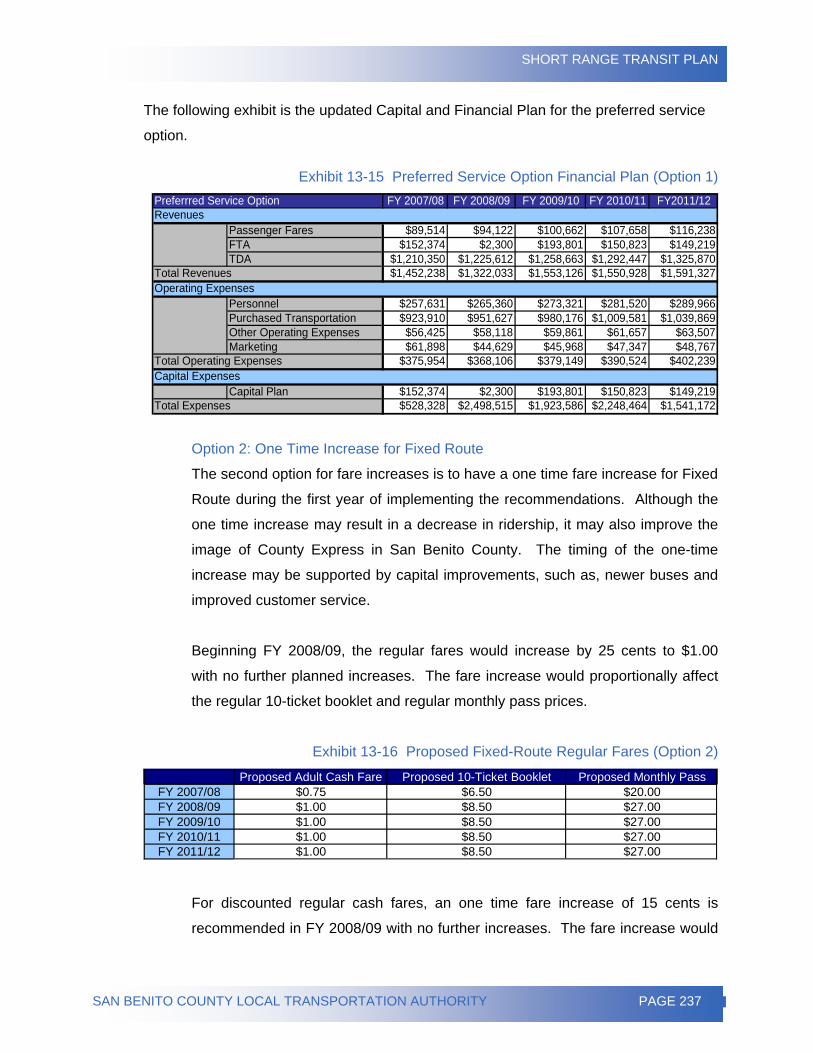
SHORT RANGE TRANSIT PLAN
SAN BENITO COUNTY LOCAL TRANSPORTATION AUTHORITY PAGE 237
The following exhibit is the updated Capital and Financial Plan for the preferred service
option.
Exhibit 13-15 Preferred Service Option Financial Plan (Option 1) FY 2007/08 FY 2008/09 FY 2009/10 FY 2010/11 FY2011/12
Passenger Fares $89,514 $94,122 $100,662 $107,658 $116,238FTA $152,374 $2,300 $193,801 $150,823 $149,219TDA $1,210,350 $1,225,612 $1,258,663 $1,292,447 $1,325,870
$1,452,238 $1,322,033 $1,553,126 $1,550,928 $1,591,327
Personnel $257,631 $265,360 $273,321 $281,520 $289,966Purchased Transportation $923,910 $951,627 $980,176 $1,009,581 $1,039,869Other Operating Expenses $56,425 $58,118 $59,861 $61,657 $63,507Marketing $61,898 $44,629 $45,968 $47,347 $48,767
$375,954 $368,106 $379,149 $390,524 $402,239
Capital Plan $152,374 $2,300 $193,801 $150,823 $149,219$528,328 $2,498,515 $1,923,586 $2,248,464 $1,541,172
Preferrred Service Option
Total Revenues
Total Operating Expenses
Total Expenses
Revenues
Operating Expenses
Capital Expenses
Option 2: One Time Increase for Fixed Route
The second option for fare increases is to have a one time fare increase for Fixed
Route during the first year of implementing the recommendations. Although the
one time increase may result in a decrease in ridership, it may also improve the
image of County Express in San Benito County. The timing of the one-time
increase may be supported by capital improvements, such as, newer buses and
improved customer service.
Beginning FY 2008/09, the regular fares would increase by 25 cents to $1.00
with no further planned increases. The fare increase would proportionally affect
the regular 10-ticket booklet and regular monthly pass prices.
Exhibit 13-16 Proposed Fixed-Route Regular Fares (Option 2)
Proposed Adult Cash Fare Proposed 10-Ticket Booklet Proposed Monthly PassFY 2007/08 $0.75 $6.50 $20.00FY 2008/09 $1.00 $8.50 $27.00FY 2009/10 $1.00 $8.50 $27.00FY 2010/11 $1.00 $8.50 $27.00FY 2011/12 $1.00 $8.50 $27.00
For discounted regular cash fares, an one time fare increase of 15 cents is
recommended in FY 2008/09 with no further increases. The fare increase would
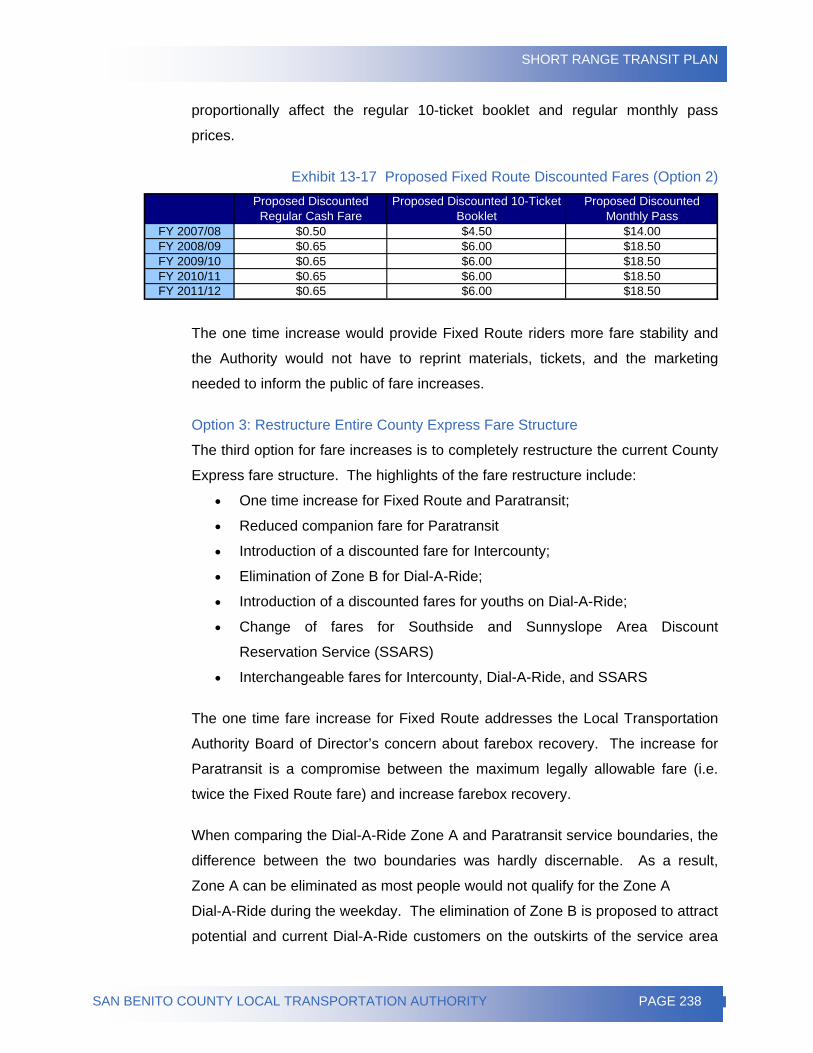
SHORT RANGE TRANSIT PLAN
SAN BENITO COUNTY LOCAL TRANSPORTATION AUTHORITY PAGE 238
proportionally affect the regular 10-ticket booklet and regular monthly pass
prices.
Exhibit 13-17 Proposed Fixed Route Discounted Fares (Option 2) Proposed Discounted Regular Cash Fare
Proposed Discounted 10-Ticket Booklet
Proposed Discounted Monthly Pass
FY 2007/08 $0.50 $4.50 $14.00FY 2008/09 $0.65 $6.00 $18.50FY 2009/10 $0.65 $6.00 $18.50FY 2010/11 $0.65 $6.00 $18.50FY 2011/12 $0.65 $6.00 $18.50
The one time increase would provide Fixed Route riders more fare stability and
the Authority would not have to reprint materials, tickets, and the marketing
needed to inform the public of fare increases.
Option 3: Restructure Entire County Express Fare Structure
The third option for fare increases is to completely restructure the current County
Express fare structure. The highlights of the fare restructure include:
• One time increase for Fixed Route and Paratransit;
• Reduced companion fare for Paratransit
• Introduction of a discounted fare for Intercounty;
• Elimination of Zone B for Dial-A-Ride;
• Introduction of a discounted fares for youths on Dial-A-Ride;
• Change of fares for Southside and Sunnyslope Area Discount
Reservation Service (SSARS)
• Interchangeable fares for Intercounty, Dial-A-Ride, and SSARS
The one time fare increase for Fixed Route addresses the Local Transportation
Authority Board of Director’s concern about farebox recovery. The increase for
Paratransit is a compromise between the maximum legally allowable fare (i.e.
twice the Fixed Route fare) and increase farebox recovery.
When comparing the Dial-A-Ride Zone A and Paratransit service boundaries, the
difference between the two boundaries was hardly discernable. As a result,
Zone A can be eliminated as most people would not qualify for the Zone A
Dial-A-Ride during the weekday. The elimination of Zone B is proposed to attract
potential and current Dial-A-Ride customers on the outskirts of the service area
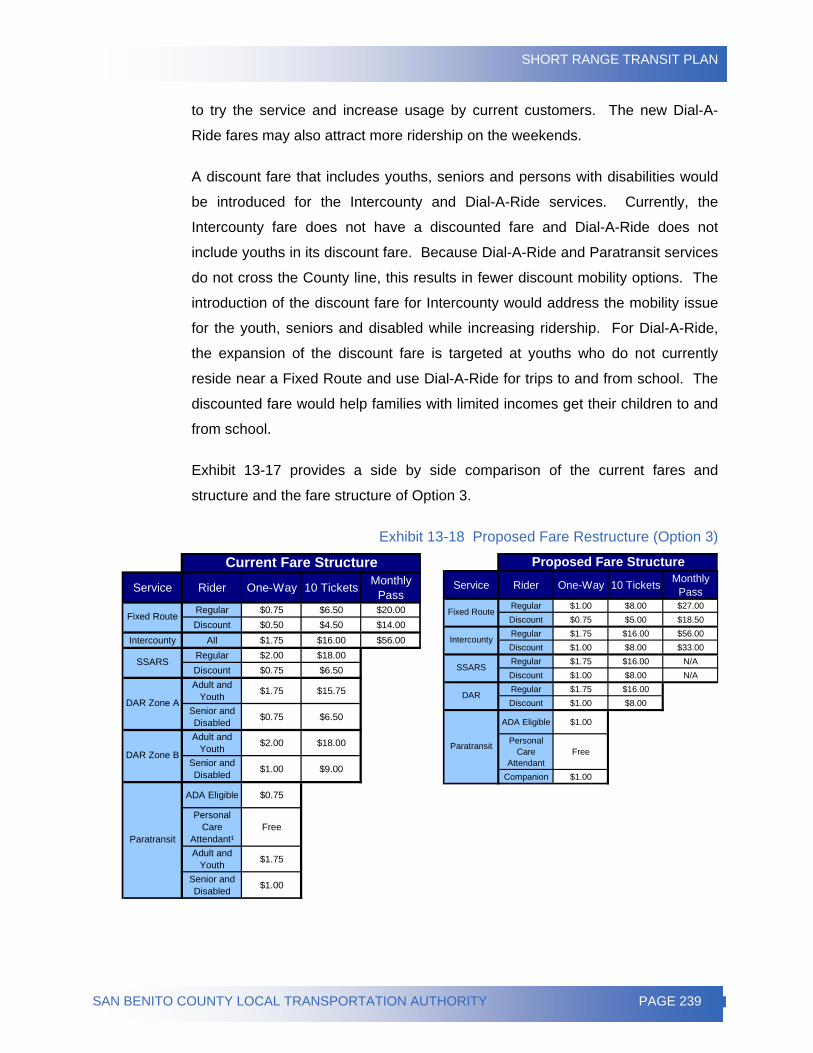
SHORT RANGE TRANSIT PLAN
SAN BENITO COUNTY LOCAL TRANSPORTATION AUTHORITY PAGE 239
to try the service and increase usage by current customers. The new Dial-A-
Ride fares may also attract more ridership on the weekends.
A discount fare that includes youths, seniors and persons with disabilities would
be introduced for the Intercounty and Dial-A-Ride services. Currently, the
Intercounty fare does not have a discounted fare and Dial-A-Ride does not
include youths in its discount fare. Because Dial-A-Ride and Paratransit services
do not cross the County line, this results in fewer discount mobility options. The
introduction of the discount fare for Intercounty would address the mobility issue
for the youth, seniors and disabled while increasing ridership. For Dial-A-Ride,
the expansion of the discount fare is targeted at youths who do not currently
reside near a Fixed Route and use Dial-A-Ride for trips to and from school. The
discounted fare would help families with limited incomes get their children to and
from school.
Exhibit 13-17 provides a side by side comparison of the current fares and
structure and the fare structure of Option 3.
Exhibit 13-18 Proposed Fare Restructure (Option 3)
Service Rider One-Way 10 Tickets Monthly Pass
Regular $0.75 $6.50 $20.00 Discount $0.50 $4.50 $14.00
Intercounty All $1.75 $16.00 $56.00 Regular $2.00 $18.00 Discount $0.75 $6.50 Adult and
Youth $1.75 $15.75
Senior and Disabled $0.75 $6.50
Adult and Youth $2.00 $18.00
Senior and Disabled $1.00 $9.00
ADA Eligible $0.75
Personal Care
Attendant¹Free
Adult and Youth $1.75
Senior and Disabled $1.00
DAR Zone B
Paratransit
Current Fare Structure
Fixed Route
SSARS
DAR Zone A
Service Rider One-Way 10 Tickets Monthly Pass
Regular $1.00 $8.00 $27.00 Discount $0.75 $5.00 $18.50 Regular $1.75 $16.00 $56.00 Discount $1.00 $8.00 $33.00 Regular $1.75 $16.00 N/ADiscount $1.00 $8.00 N/ARegular $1.75 $16.00 Discount $1.00 $8.00
ADA Eligible $1.00
Personal Care
AttendantFree
Companion $1.00
DAR
Paratransit
Proposed Fare Structure
Fixed Route
Intercounty
SSARS
SHORT RANGE TRANSIT PLAN
SAN BENITO COUNTY LOCAL TRANSPORTATION AUTHORITY PAGE 240
Under the current fare structure, there are eight different fares and results in
eight different tickets. Option 3 would condense the fares for Intercounty, Dial-A-
Ride, and SSARS services and customers may use the fares for each of those
services interchangeably. The restructured fares may also attract newer riders
because it is less confusing to understand than the current fare structure.
The condensed fare structure would also be more suitable for the switch from
tickets to tokens because it eliminates the need to have eight different colored
tokens.
SHORT RANGE TRANSIT PLAN
SAN BENITO COUNTY LOCAL TRANSPORTATION AUTHORITY PAGE 241
CHAPTER 14 – IMPLEMENTATION PLAN
The implementation plan is vital the success of the recommendations in the Short Range
Transit Plan. The implementation plan will provide a timeline of milestones and tasks
that must be completed. The timeline would include:
• Detailed first year timeline for implementation;
• Five year timeline for milestones and tasks; and
• Fleet replacement schedule.
Implementation Timeline During the first year (2008) of implementation, there are 16 tasks and milestones that will
be accomplished. Following the adoption of the Short Range Transit Plan, staff will
begin designing new signs and literature , including route maps and schedules. The
Local Transportation Authority will hold public hearings for the fare increases. Once a
preferred fare increase is selected and adopted by the Board, staff will design and order
tokens and related equipment. The anticipated first day of operations of the new County
Express Fixed Route system will be in August 2008.
The fleet replacement schedule should also be adhered to. There are two separate
orders for five replacement cutaways. The orders are expected to arrive by end
December 2008. In addition to the replacement vehicles, County Express will also
receive four spare vehicles that may be used to switch out cutaways for maintenance.
The spares may also be used to supplement the regular fleet during peak times to
alleviate pressure points and improve customer service.
During the implementation stage, the Authority will conduct extensive community
outreach to inform the public about service changes and improvements. It will be
extremely important to market the fare increases to ensure that the community is well
inform about the fare increases and to actively take part in decision-making process.
Having the community participate at the hearings may positively improve their
awareness of County Express services and image. Exhibit 14-1 provides a detailed
timeline of the tasks and milestones during the first year of implementation.
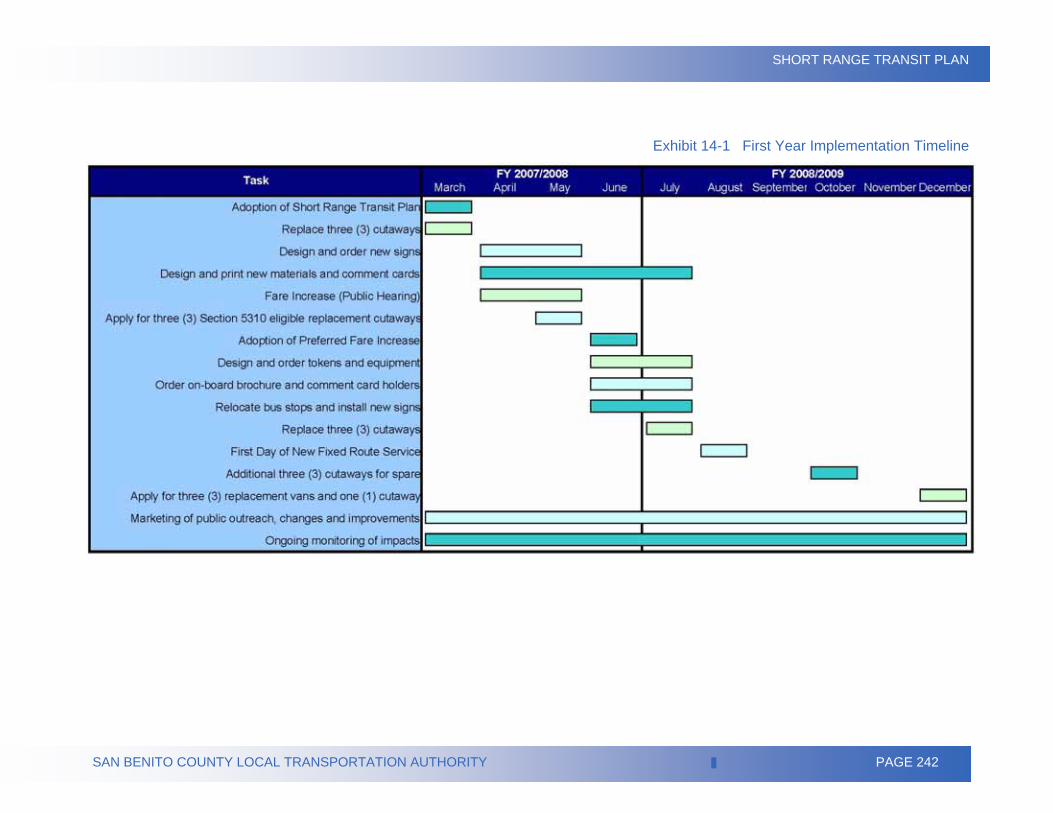
SHORT RANGE TRANSIT PLAN
SAN BENITO COUNTY LOCAL TRANSPORTATION AUTHORITY PAGE 242
Exhibit 14-1 First Year Implementation Timeline
SHORT RANGE TRANSIT PLAN
SAN BENITO COUNTY LOCAL TRANSPORTATION AUTHORITY PAGE 243
During the second year (2009) of implementation, the Authority should continue to make
adjustments to the Fixed Route, as issues arise or areas for improvement become
evident. The Authority should closely monitor ridership patterns and conduct a customer
review survey at the one-year anniversary of the route modifications. The Local
Transportation Authority will also undergo a Triennial Performance Audit, required for all
transit agencies receiving Transportation Development Act funds. The Audit evaluates
the effectiveness and efficiency of public transit service provided by the Authority.
For the following three years (2010 through 2012), staff will continue to monitor County
Express’s performance and make changes to service operations as warranted. In 2010,
there will be three major tasks for the Authority which are:
1. Develop a Request for Proposals for management and operations of specialized
transportation
2. Develop a Request for Proposals for County Express management and
operations
3. Prepare grant request for the update of the 2008 Short Range Transit Plan
Exhibit 14-2 provides a general overview of milestones and tasks for the next five years.
During the Short Range Transit Plan timeframe, the Authority should:
• Closely monitor ridership patterns and system performance;
• Make minor adjustments, as needed;
• Conduct customer surveys annually;
• Follow and update the fleet replacement schedule; and
• Continue marketing and community outreach about County Express
services, improvements and solicit comments.
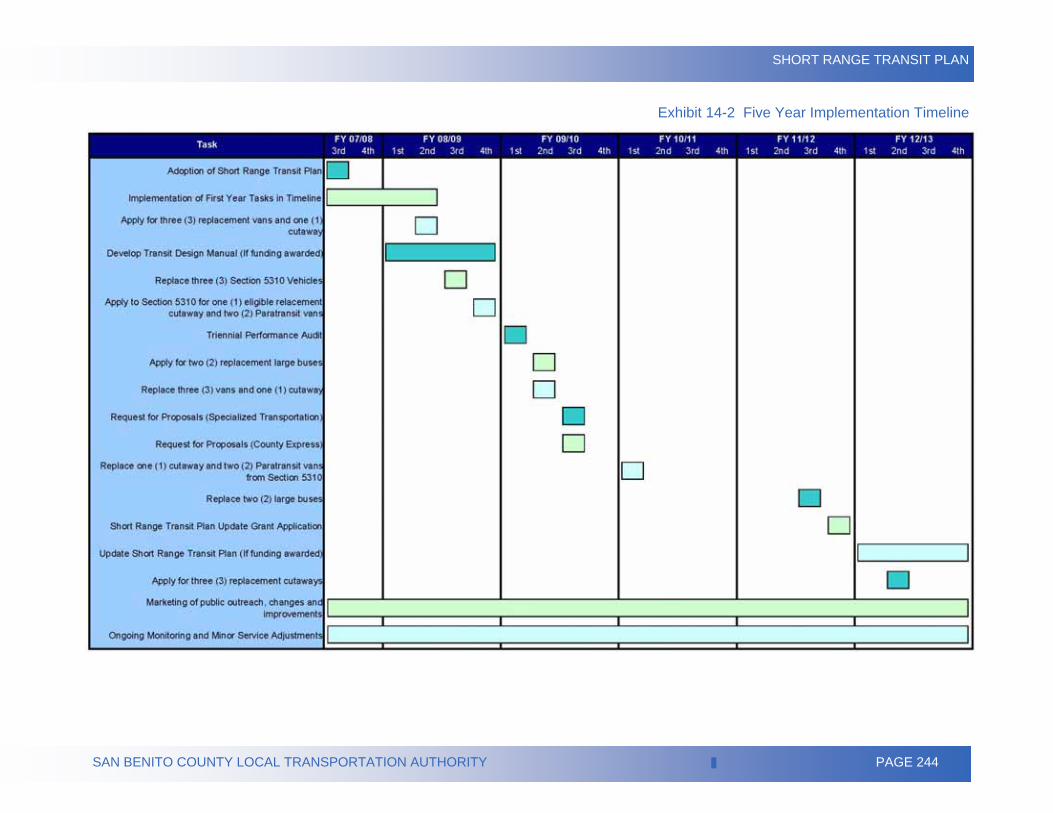
SHORT RANGE TRANSIT PLAN
SAN BENITO COUNTY LOCAL TRANSPORTATION AUTHORITY PAGE 244
Exhibit 14-2 Five Year Implementation Timeline

SHORT RANGE TRANSIT PLAN
SAN BENITO COUNTY LOCAL TRANSPORTATION AUTHORITY PAGE 245
APPENDIX A – SURVEY INSTRUMENTS
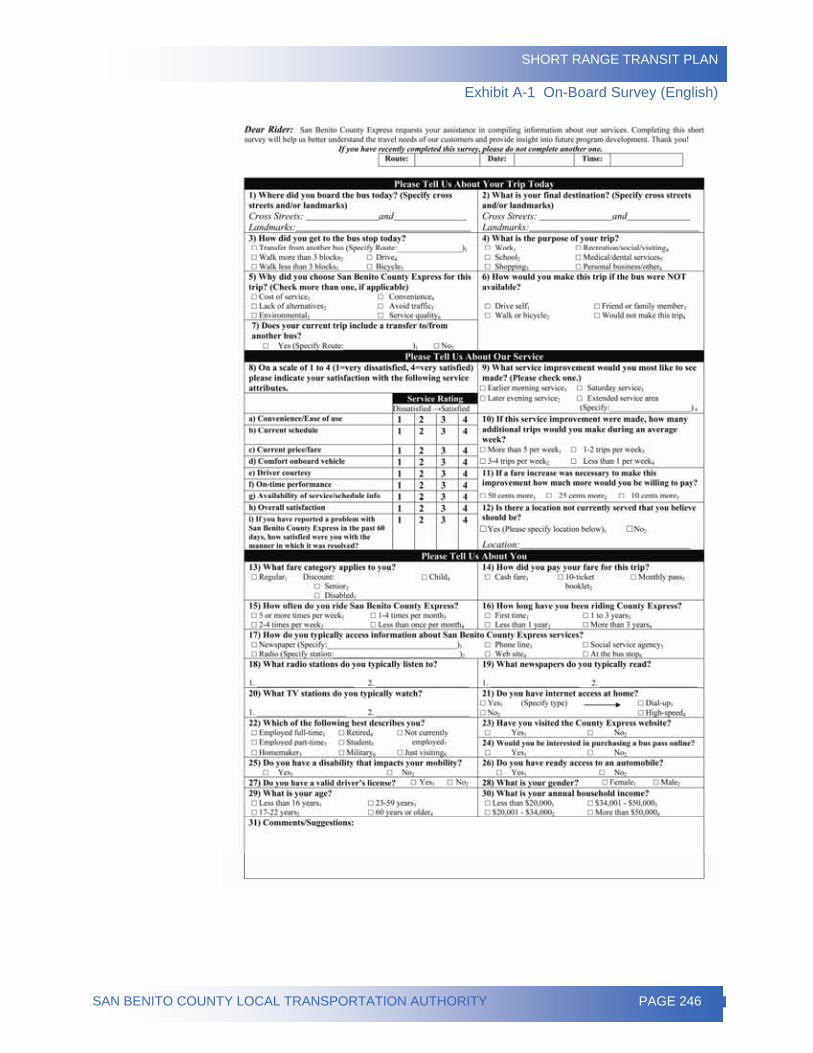
SHORT RANGE TRANSIT PLAN
SAN BENITO COUNTY LOCAL TRANSPORTATION AUTHORITY PAGE 246
Exhibit A-1 On-Board Survey (English)
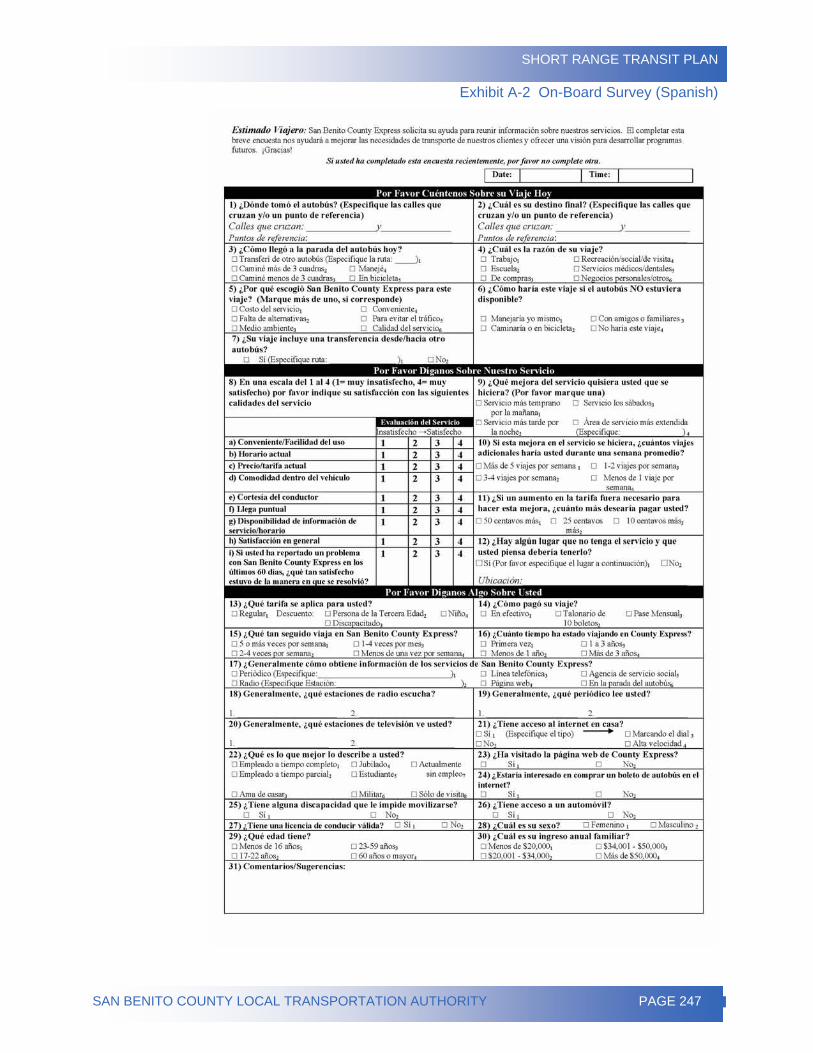
SHORT RANGE TRANSIT PLAN
SAN BENITO COUNTY LOCAL TRANSPORTATION AUTHORITY PAGE 247
Exhibit A-2 On-Board Survey (Spanish)
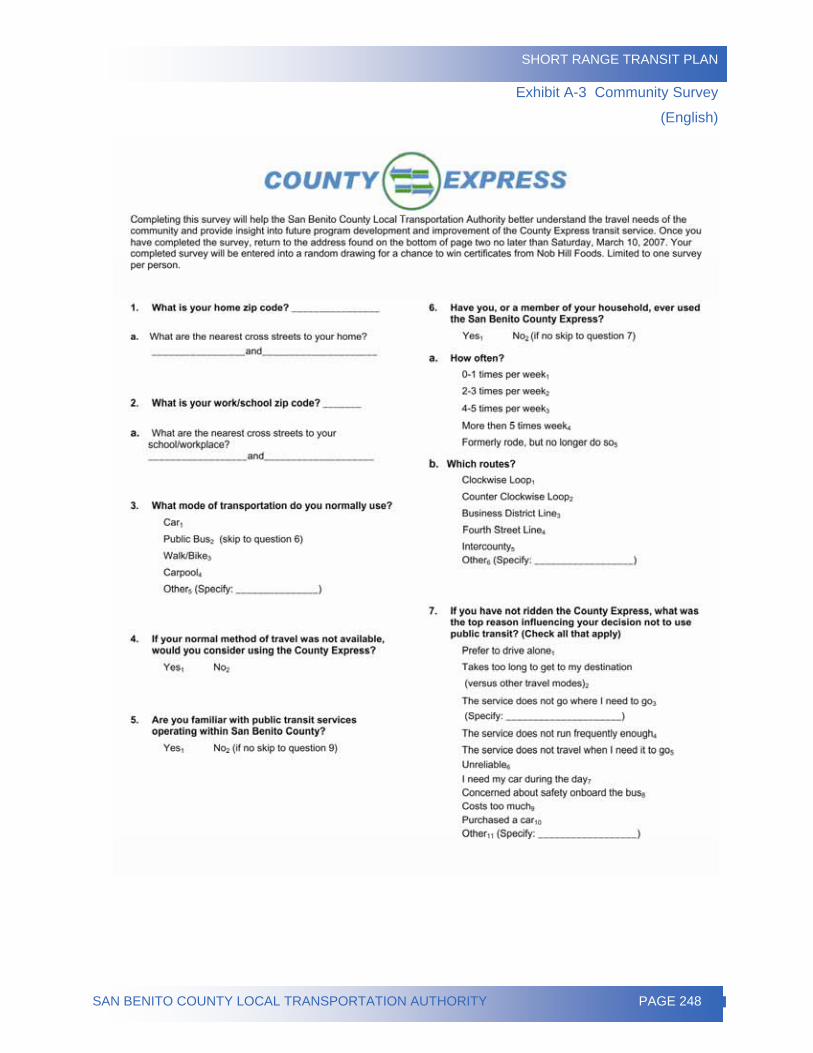
SHORT RANGE TRANSIT PLAN
SAN BENITO COUNTY LOCAL TRANSPORTATION AUTHORITY PAGE 248
Exhibit A-3 Community Survey
(English)
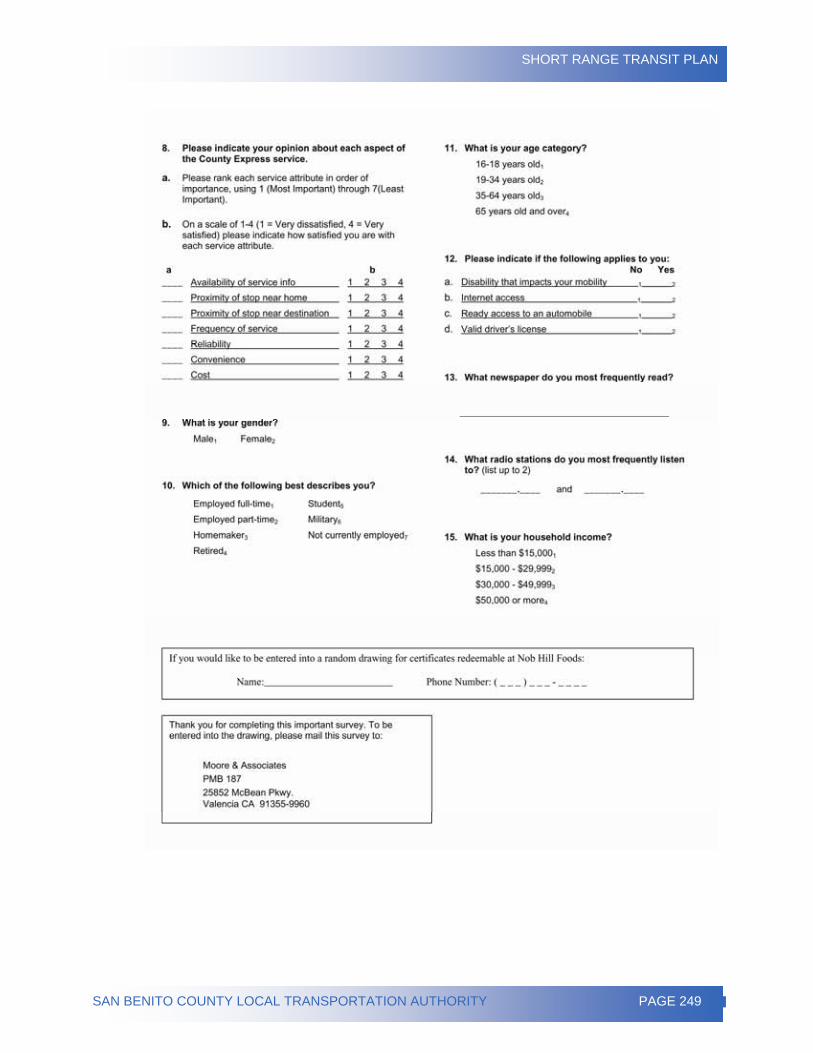
SHORT RANGE TRANSIT PLAN
SAN BENITO COUNTY LOCAL TRANSPORTATION AUTHORITY PAGE 249
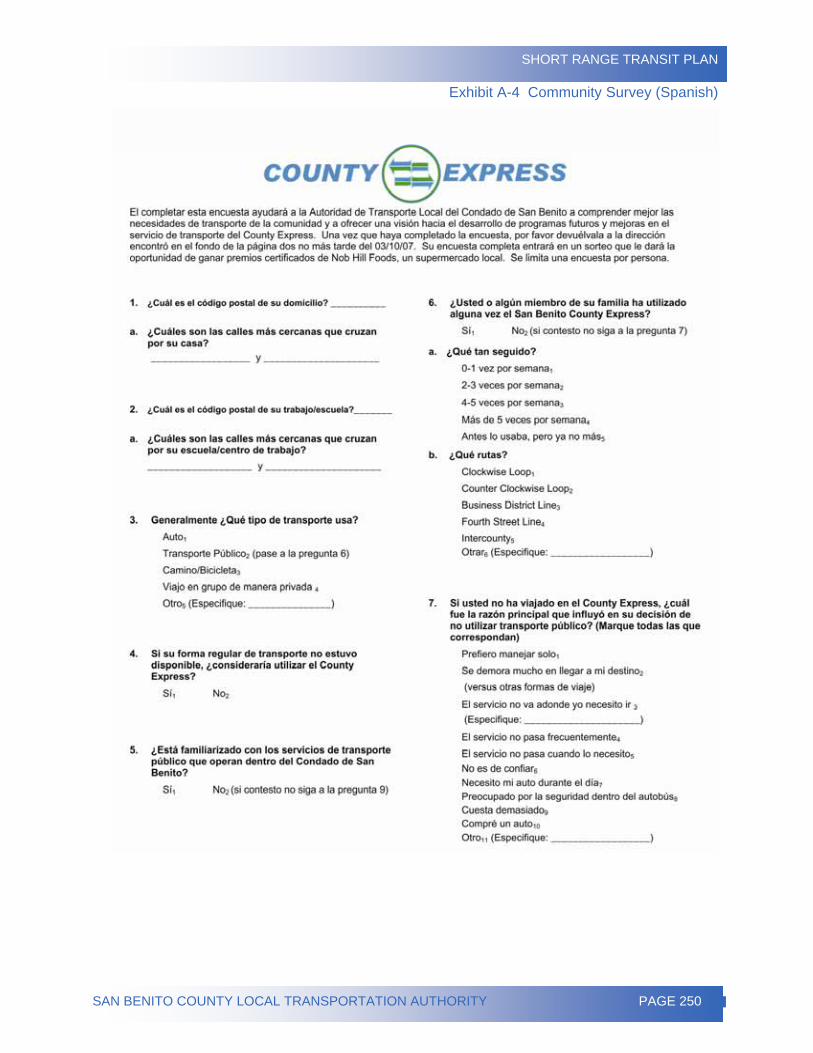
SHORT RANGE TRANSIT PLAN
SAN BENITO COUNTY LOCAL TRANSPORTATION AUTHORITY PAGE 250
Exhibit A-4 Community Survey (Spanish)
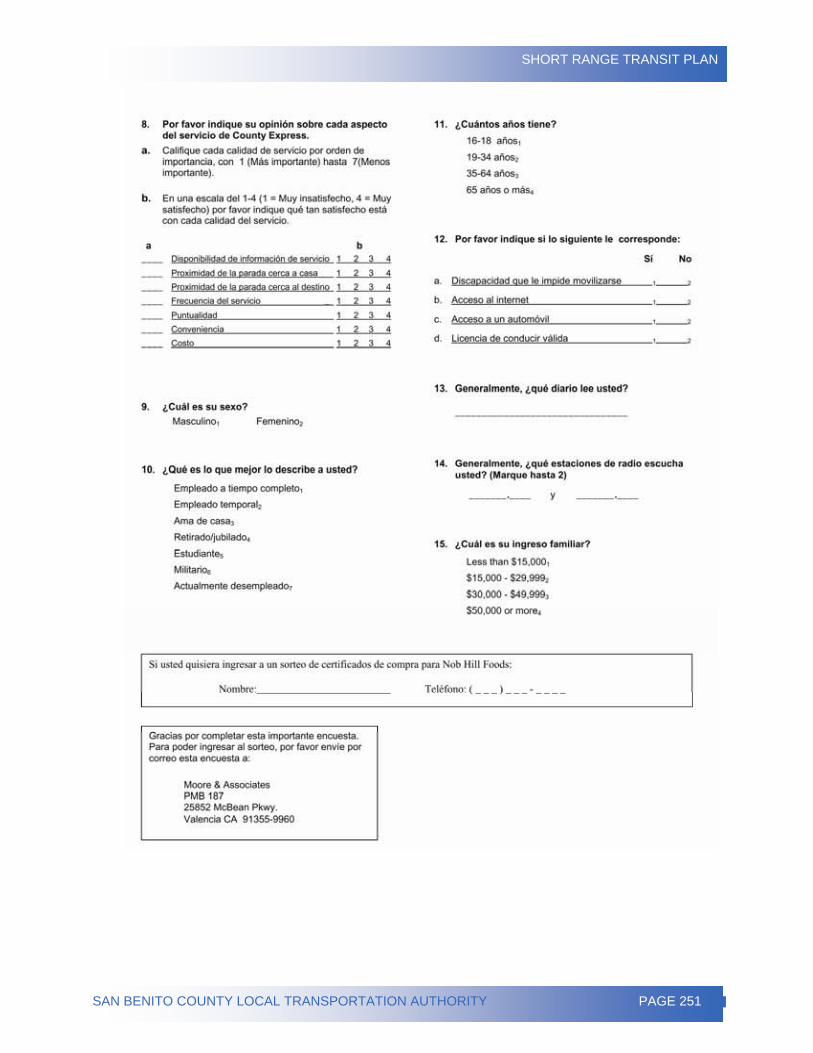
SHORT RANGE TRANSIT PLAN
SAN BENITO COUNTY LOCAL TRANSPORTATION AUTHORITY PAGE 251
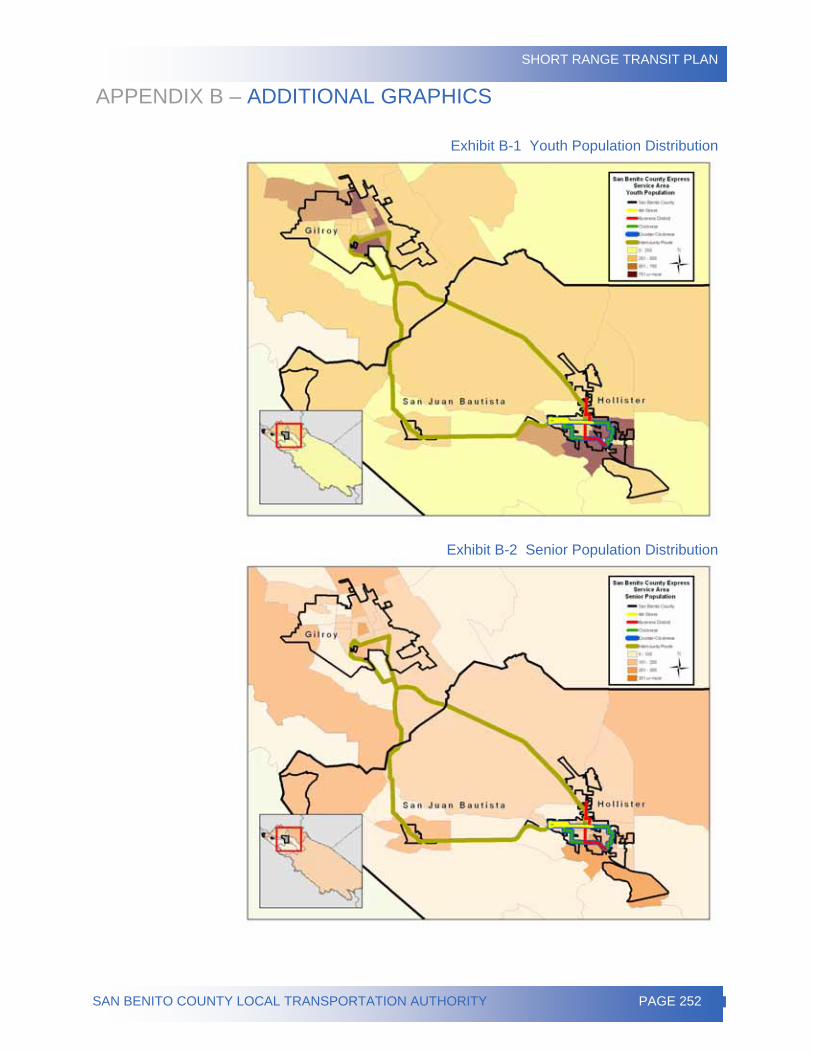
SHORT RANGE TRANSIT PLAN
SAN BENITO COUNTY LOCAL TRANSPORTATION AUTHORITY PAGE 252
APPENDIX B – ADDITIONAL GRAPHICS
Exhibit B-1 Youth Population Distribution
Exhibit B-2 Senior Population Distribution
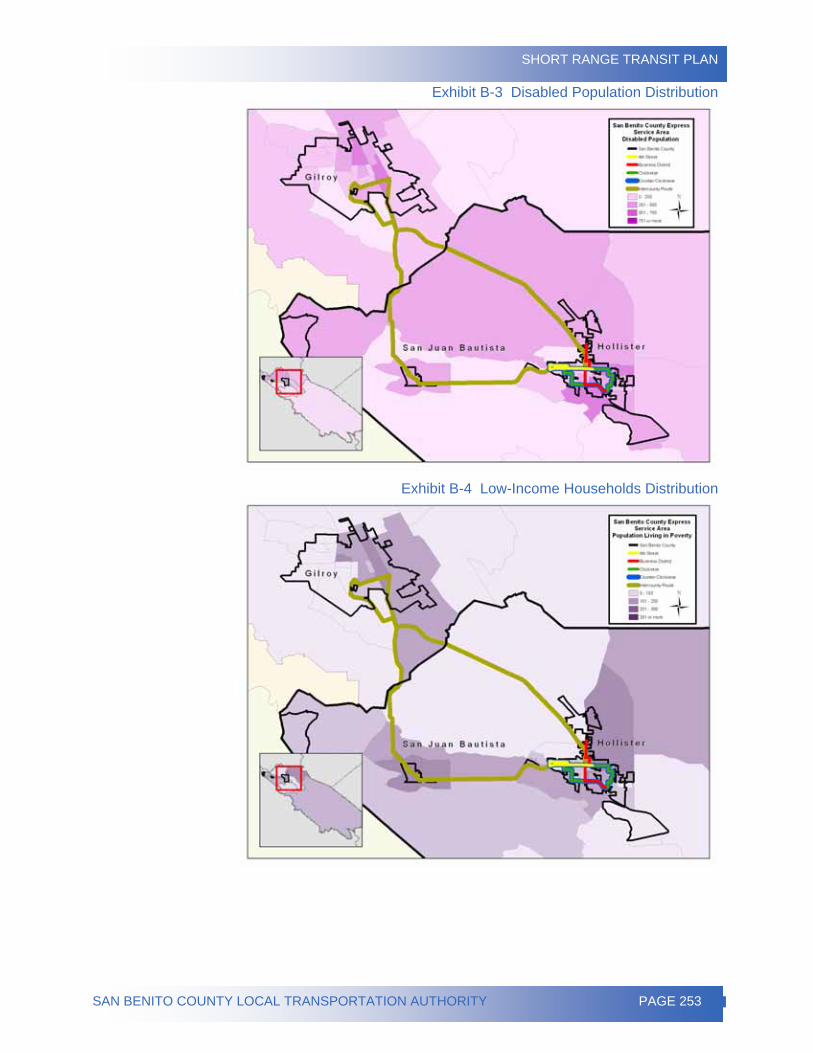
SHORT RANGE TRANSIT PLAN
SAN BENITO COUNTY LOCAL TRANSPORTATION AUTHORITY PAGE 253
Exhibit B-3 Disabled Population Distribution
Exhibit B-4 Low-Income Households Distribution
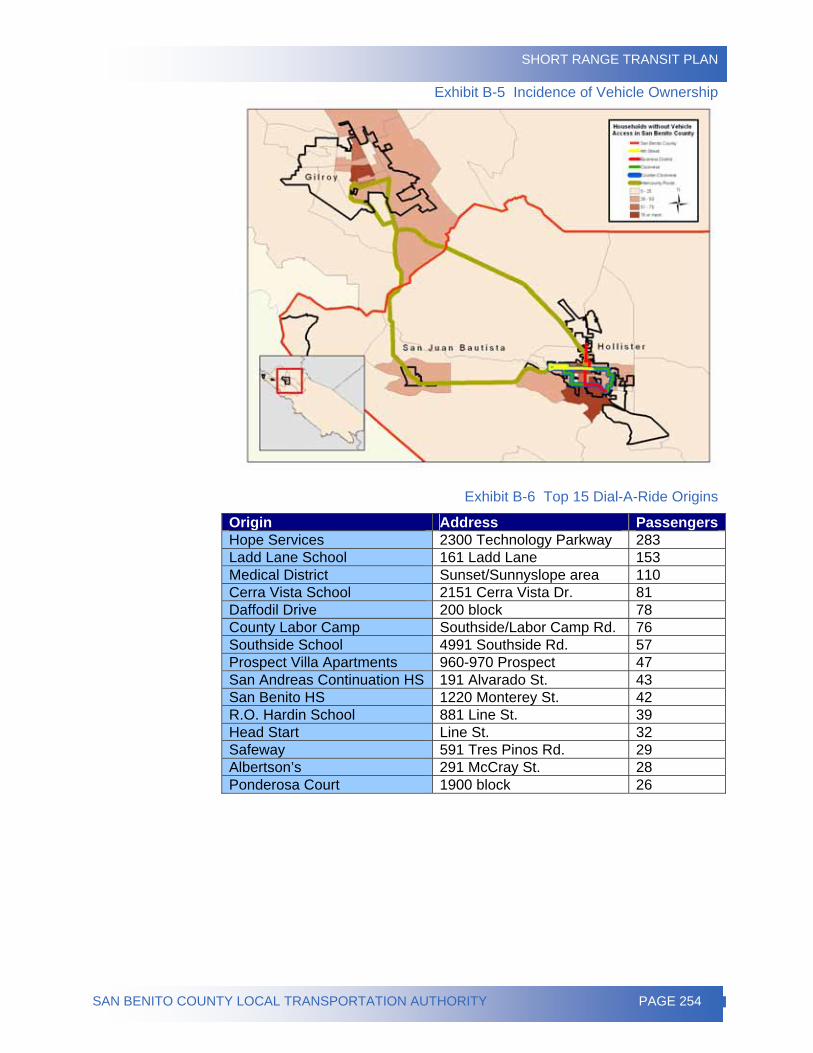
SHORT RANGE TRANSIT PLAN
SAN BENITO COUNTY LOCAL TRANSPORTATION AUTHORITY PAGE 254
Exhibit B-5 Incidence of Vehicle Ownership
Exhibit B-6 Top 15 Dial-A-Ride Origins
Origin Address PassengersHope Services 2300 Technology Parkway 283 Ladd Lane School 161 Ladd Lane 153 Medical District Sunset/Sunnyslope area 110 Cerra Vista School 2151 Cerra Vista Dr. 81 Daffodil Drive 200 block 78 County Labor Camp Southside/Labor Camp Rd. 76 Southside School 4991 Southside Rd. 57 Prospect Villa Apartments 960-970 Prospect 47 San Andreas Continuation HS 191 Alvarado St. 43 San Benito HS 1220 Monterey St. 42 R.O. Hardin School 881 Line St. 39 Head Start Line St. 32 Safeway 591 Tres Pinos Rd. 29 Albertson’s 291 McCray St. 28 Ponderosa Court 1900 block 26
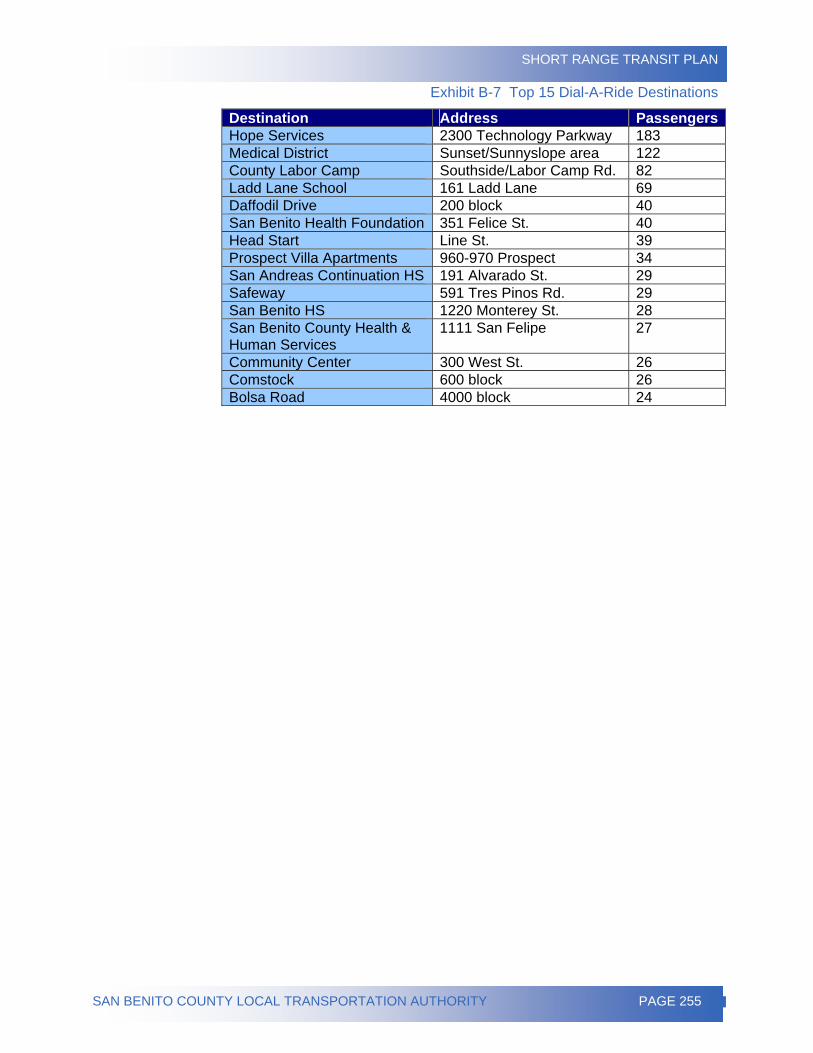
SHORT RANGE TRANSIT PLAN
SAN BENITO COUNTY LOCAL TRANSPORTATION AUTHORITY PAGE 255
Exhibit B-7 Top 15 Dial-A-Ride Destinations
Destination Address PassengersHope Services 2300 Technology Parkway 183 Medical District Sunset/Sunnyslope area 122 County Labor Camp Southside/Labor Camp Rd. 82 Ladd Lane School 161 Ladd Lane 69 Daffodil Drive 200 block 40 San Benito Health Foundation 351 Felice St. 40 Head Start Line St. 39 Prospect Villa Apartments 960-970 Prospect 34 San Andreas Continuation HS 191 Alvarado St. 29 Safeway 591 Tres Pinos Rd. 29 San Benito HS 1220 Monterey St. 28 San Benito County Health & Human Services
1111 San Felipe 27
Community Center 300 West St. 26 Comstock 600 block 26 Bolsa Road 4000 block 24
SHORT RANGE TRANSIT PLAN
SAN BENITO COUNTY LOCAL TRANSPORTATION AUTHORITY PAGE 256
APPENDIX C – MARKETING TOOLS
Exhibit C-1 Comment Card (English)
SHORT RANGE TRANSIT PLAN
SAN BENITO COUNTY LOCAL TRANSPORTATION AUTHORITY PAGE 257
Exhibit C-2 Comment Card (Spanish)
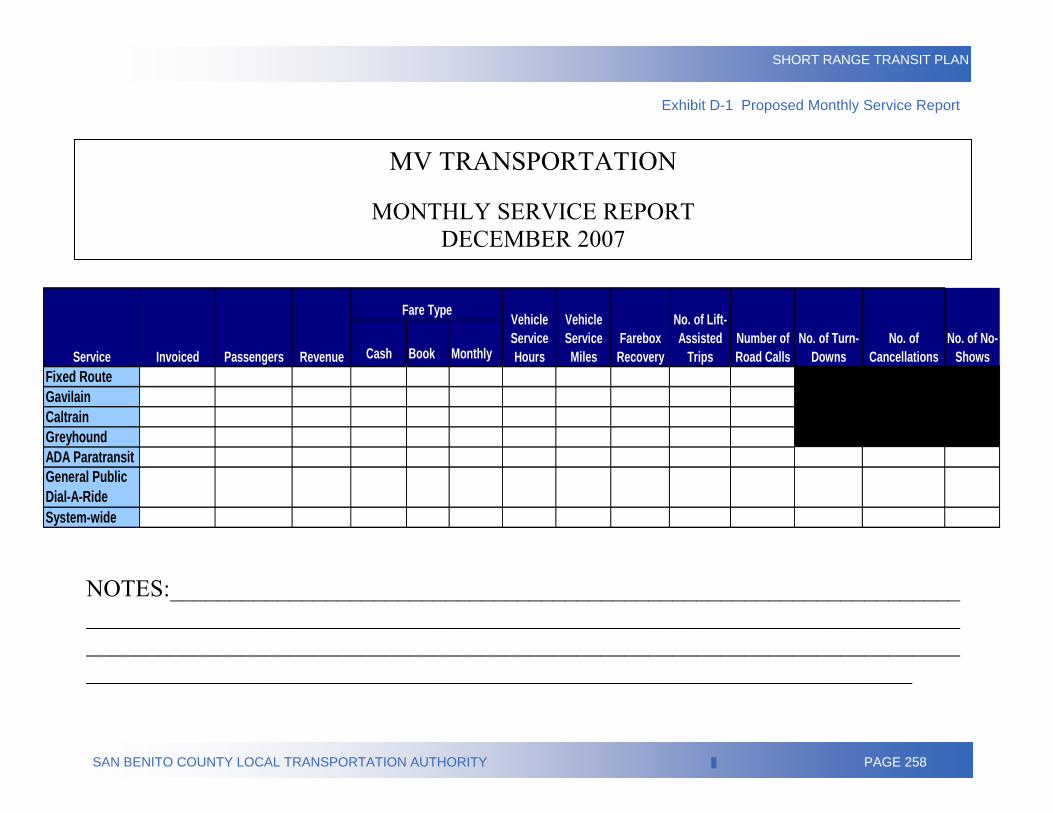
SHORT RANGE TRANSIT PLAN
SAN BENITO COUNTY LOCAL TRANSPORTATION AUTHORITY PAGE 258
Cash Book MonthlyFixed RouteGavilainCaltrainGreyhoundADA ParatransitGeneral Public Dial-A-RideSystem-wide
Service Invoiced Passengers Revenue
Fare Type
No. of Cancellations
No. of No-Shows
Farebox Recovery
No. of Lift-Assisted
TripsNumber of Road Calls
No. of Turn-Downs
Vehicle Service Hours
Vehicle Service Miles
NOTES:_________________________________________________________________________________________________________________________________________________________________________________________________________________________________________________________________________________________
MV TRANSPORTATION
MONTHLY SERVICE REPORT DECEMBER 2007
Exhibit D-1 Proposed Monthly Service Report