Embed Size (px)
Citation preview

Santos Ltd l Environment Management Plan: McArthur Basin Civil and Seismic Program l 3 April 2019
Appendices

Santos Ltd l Environment Management Plan: McArthur Basin Civil and Seismic Program l 5 April 2019
Appendix A: Detailed Lease Layout Plan

71.5 m 22 m
24 m
48 m
53 m
41 m
53 m
74.5 m
8 m
FLARE PIT
100.5 m 82.5 m
NOTE 1
45 m
13 m
46 m 37 m
17 m 10 m
Slot 1 Slot 2
9 m
9 mNOTE 2
8 m14 m
7 m
15 m
4 m
8 m
4 m
Inacumba-1 & Tanumbirini-2Lease LayoutRev2
NOTE 3
NOTE 3
NOTE 4 NOTE 4
43 m
Mas
t Len
gth
31 m
4 m
NOTE 6
NOTE 5
SUMP NOTE 5
FENCE
TEMPORARY FENCE
NOTES1. Lease level tolerance in rig pad area (grey shaded) = 25 mm (max) & ground
compaction firm enough to support rig.2. Rig Hardstand area (hatched) to be excavated to 0.6 m below lease pad level
and backfilled with approved thoroughly compacted material that will withstand sustained soakage while maintaining drill rig base stability.
3. Slope on skidding locations not to exceed 1 degree in direction of skid path.4. Lease access roads to be as straight as possible leading into the lease with
minimal slope and will taper back gradually 12 m wide at edge of lease to the standard Santos road specification of 6 m wide.
5. Sump & containment pit details found on subsequent pages.6. 4 m wide flat area to surround pits.7. 300 mm compacted bund and fence around all sides of the pits (temporary
fence on lease side)8. Leases will be fenced with lease entry equipped with gate or grids.
FENCE
FENCEFENCE
NOTE 8 NOTE 8

SUMPSlot 1
SUMPSlot 2
SumpSlot 3
54.5 m 2 m 3 m 22 m
31 m
24 m
15 m
LEASE & SUMP SPOIL (Material excavated from lease &/or pits during lease construction)
Top of Bund
1.0 m
PLAN VIEW
SIDE VIEW
3 m1:2 Slope 1:2 Slope 1:2 Slope 1:2 Slope 1:2 Slope 1:2 Slope
0.3 m
BOND WALL
4 m
FENCE
1.5 m
Inacumba-1 & Tanumbirini 2Sump and Pit DesignRev2
1.0 m
NOTES1. Sump (Slot 1, 2 & 3) to be lined as per permeability requirements2. Liner installed as per specification3. Weir system used to recycle drilling fluids & meet 1m freeboard requirements.4. Useable volume excludes 1m freeboard
NOTE 1
NOTE 1
Usable Volume 2310m^3Usable Volume 572m^3
Usable volume 1160m^3

Inacumba-1 & Tanumbirini-2Cellar DesignRev2
3.170 m
PLAN VIEW
SIDE VIEW
Steel Cellar:• Backside filled with compacted clay; or stabilised sand.
Cement Base(100 mm thick)
2.1 m
WELL CENTRE
Ground/Lease Level
1.80 m
NOTE 1
NOTES1. 20″ conductor to be set at ~16 – 24 m (two joints of conductor pipe)2. Cellar depth GL to top of cement at bottom of the cellar 1.64m (63.9”) to allow
for emergency 13-3/8” hanger to be installed. 3. Conductor to be installed vertically4. Conductor to be cemented via a backside stinger and agitated to improve
cement job.
NOTE 1
NOTE 2
NOTE 3
NOTE 4

71.5 m 22 m
24 m
48 m
53 m
41 m
53 m
74.5 m
12 m 12 m
SUMP (Fluid Storage Pits)
CUTTINGS SUMP
Medic | Geo | OCR
Geo | NOCR | OCR
ENSIGN
ENSIGN
SPERRY/MUDLOGGERS
Windsock
Mast RadiusHAL TAN
K A1
HAL TANK A2
HAL TANK S1
HAL TANK S2
HAL TANK C1
HAL TANK C2
H2SH2S
HS
H2S H2S Sensor
LEL
LEL
LEL
LEL LEL Sensor
ESD
ESD
ESD ESD Switch
M
M
M Muster Point
Santos Office
160 ft Exclusion Zone
ENSIGN
ENSIGN
ENSIGN
MU
D CH
EMIC
ALS
MU
D CH
EMIC
ALS
NEXTCASING
STORAGE
183 m
31 m
15 m
CFG CUTTINGS BIN
HAL OFFICE & MUD LAB
CEM
ENT
PUM
P
26.2 m
HPU
Santos
Pipe Storage
Pipe Storage
Vehicle Parking
Chem
ical
Sto
rage
Chemical Storage
Rubbish and steel recycling
bins
EP 161Lease Pad LayoutRev1
BHA
Com
pone
nt S
tora
ge
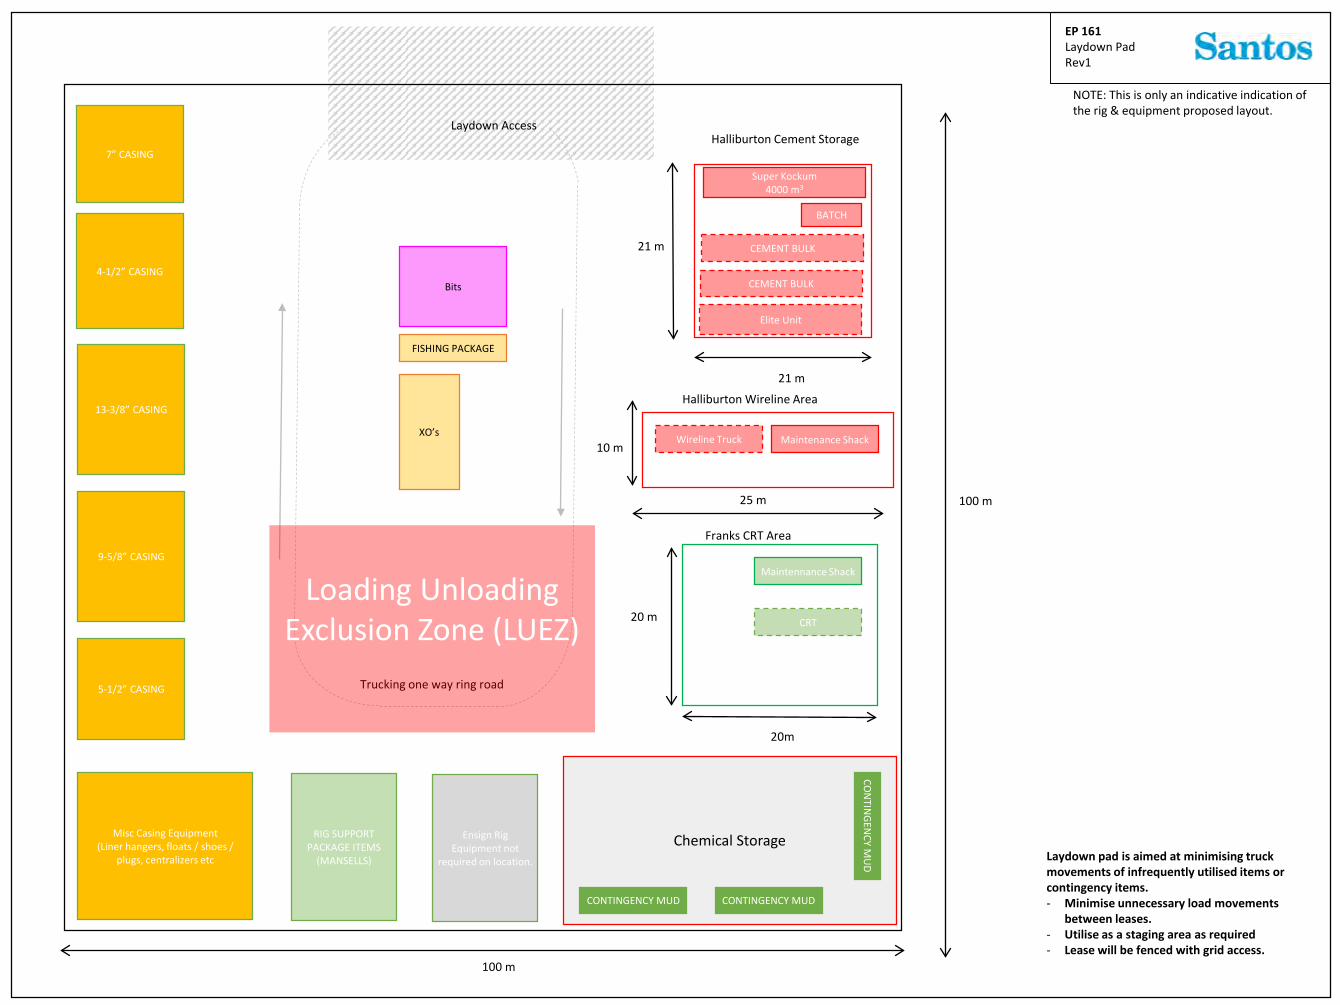
NOTE: This is only an indicative indication of the rig & equipment proposed layout.
100 m
100 m
EP 161Laydown PadRev1
21 m
21 m
Halliburton Cement Storage
Elite Unit
CEMENT BULK
CEMENT BULK
7” CASING
5-1/2” CASING
4-1/2” CASING
BATCH
RIG SUPPORT PACKAGE ITEMS
(MANSELLS)
Laydown Access
10 m
25 m
Halliburton Wireline Area
Maintenance ShackWireline Truck
FISHING PACKAGE
XO’s
Bits
20 m
20m
Franks CRT Area
Maintennance Shack
CRT
9-5/8” CASING
13-3/8” CASING
Chemical Storage
CON
TINGEN
CY MU
D
CONTINGENCY MUDCONTINGENCY MUD
Laydown pad is aimed at minimising truck movements of infrequently utilised items or contingency items. - Minimise unnecessary load movements
between leases. - Utilise as a staging area as required- Lease will be fenced with grid access.
Trucking one way ring road
Misc Casing Equipment(Liner hangers, floats / shoes /
plugs, centralizers etc
Ensign Rig Equipment not
required on location.
Super Kockum4000 m3
Loading Unloading Exclusion Zone (LUEZ)
NOTE: This is only an indicative indication of the rig & equipment proposed layout.

Santos Ltd l Environment Management Plan: McArthur Basin Civil and Seismic Program l 5 April 2019
Appendix B: Commonwealth Protected Matters Search Tool

����������������� ��������������������������������������������������������������������������������������������������������������������������������������������������������������������������������������������� ���������������������������������������������������������������������������������������������������������������������������������������������������������������������������������������!���������������������������������"���� �������������������������������#�$����������
�����%�&'�'(�
��������)�*�����������%�'+,&-,&.�&+%/+%&-���������������������������������$�������0����$����������������12�����������������3!�0�* ��-'&'
�������4�����������5������*�����

������������� ���� �������� �������� ����� �������� �������������� ������������ �� ������������������������ �� ��� ����������������� ������� ���������� ��������������� ����� ������ ���� �������� ������������������������������������������� ��������������������������������� ������� ��������� � �� �� ����������������� ����� ������������������ �������� �������������� ������������ ��������������������� ������ �� ������������������������ � ������!� �����"�������� ������������# �������� �����"���������$����� �%# ��� ��� ���������% !������� �&������'���� �����(���%)� ���������� ���� ���������� ����%# �������� ����������% !���*+!���
!���!� �����,�� ����(����%$��������� �� ���������%)�����,�� ����(����� �% !���!���*-����"(&$��� ���� �� � ������������ ����$��������� �������� ������������ ������ ����� ��� �������$��������� ������������ ������������ �������� ��� ��������$��������� ��������������� ��������������������������� ���� ���.��������� .�� �������� ���� ���"(&$��� ���� �� � ���$��������� ��,�� ��������������$��������� ��,�� ������������������ ������ ���������� ���������������������� � �%//������������� �������/��� ��������� ���� �������� ��������� ������ ������ �� ��������� ����� � �� ��������� �� �� ����������������� ���������������������0��������������������� � �� �� ������� �������� � ������������ ����$��������� ������������ ����� ������ ��� ���$��������� ����������� ������������ ��������������� ����� ���� �������$��������� ������������������������������0��������� ���$��������� �����$��������� ����������������� � ��������� ��� �� �������� ��������������� ����� ���� ������������ ���������������� ����������0����������� � ������������$��������� ������� �� ���������� ���������������� ��� ���� ���������������������������� ������������������ ������� ��������������������� ������ ������������������������ ��������������1 ���� � ���(�� �� ������ ���"(&$���
!���!���!���# ��� ����������%)���������1 ����$� �����% +2$��������� ��,�� ����(����% !���!���$� ����,�� � %$��������� ��#���%$��������� ��'����������� ���% !����� ������ �����(���%"3 ���������� �������� ���� �������� �������������� ��� �� ������������������� � �� ���������������������� ���!���!���� � ���������� ����'�����%!� ������������ �� �)� ����% !���'����������� ��������� %������������% **!���4���"������������ ����5 ����6

�������������� ������������� ������ ������ ����������� ������ ������� �������� ��� ���������� � !"� � ��������#���$� � �������� ���������%����������� ������� ������ ���� �$������&�����'�()*� +���� �%�� �������� ���������%������'��������� ������� ��# ��� �� �� ���� ������&������,�����)-.� #���$� � �������� ���������%����'���������� ������� ��# ��� � �$������� ������ �'�/���0�� ��� �12�� ��� ��� �'�/����*"3-.� +���� �%�� �������� ���������%������'��������� ������� ��,����������� �������������4��� �����������/�����24��� �����������������553.5� #���$� � �������� ���������%����������� ������� ������ ��������� ����6��'�7��0�� ��� �1�*"3) � +���� �%�� �������� ���������%������'��������� ������� ��������8�����������'��%� ��6�������� ��� �9����2��$���&�$�/:���� �2;�<��$������%����$� ��2;����<��6� ����..-� #���$� � �������� ���������%����������� ������� ������� ������������&��������-5)� +���� �%�� �������� ���������%������'��������� ������� ��6�� �� ��$�$��& ���� ���%��* *� +���� �%�� �������� ���������%������'��������� ������� ��6�� ������$������ ����� ���4����������!(* .� +���� �%�� �������� ���������%����'���������� ������� ������������������������� �/ ����������/��������2�� �/ ������������������"" (� +���� �%�� �������� ���������%����������� ������� ��������������������������������������������&����������$�� ����"5-(5� #���$� � �������� ���������%����������� ������� ��#�������8� ��'� ��
6���� �����������#�8� ����������$���������

������������ �������� �������������������������������������������������������������������������������������� ���!�"���������������������#$��� "�������� " ������������������ �����������%�&!��������'�����()*� ��������������������+������&�� ���������'��������� ������������������ �"������������������!�������'����'��*,(-,� ��������������������+������ ������'�����������������������.����������&��/�0�������1�����&����*((2-� ��������������������+������ ������'�����������������������������'����'��((3� ��������������������+������ ������'���������0������������4� �5�������(63� ��������������������+������ ������'�������������������������7����'�5�������(66� ��������������������+������ ������'����������������������8������ �5��������������������������������29:,9� ��������������������+������ ������'��������� �������� ������������!�����������������*)6� ��������������������+������ ������'������������������������������'�����������*2(� �������� ��������� ��������������������+������ ������'������������������������������������������*2*� ��������������������+������ ������'��������������������������.����������8�/�.�������;��������**3� ��������������������+������ ������'������������������8�����.������������������*6,� ��������������������+������ ������'���������4������������8���.��� ��923� ��������������������+������ ������'��������������������������

������������� ����� ������������������������ ���������������������������������������������������������������� ��������� ����������!"�� ������� # �������������������������� � ���$%&'%� � ��������� �������(����#������)����������������# ��������* ���+������%,-� � ��������� �������(����#������)������������������ ���.�/��������)�����0,-� � ��������� �������(�����/��#���������)�������� ��� �������+����*��1�2������*����$%$34� � ��������� �������(�����/��#���������)������������(�������*����$%$35� � ��������� �������(����#������)������������(���� ���������� � ���-,3� � ��������� �������(����#������)������������������������)���� � ���-$0� �������#�����*��� � ��������� �������(����#������)�����������������*������������� � ���-$-� � ��������� �������(����#������)����������������������6���������7�1�6������8��������--5� � ��������� �������(����#������)��������������7��������/��������/����,'$� � ��������� �������(����#������)���������#������#9��������6����������������-3'� � ��������� �������(����#������)�������+���������7��2�����(�����������*����%3&� � ��������� �������(�����/��#���������)�������:�������������*��������� ����)���)��$%3-'� � ��������� �������(����#������)�������:��������������)���)��005� � ��������� �������(����#������)�������:��������������(�)����������0,'� � ��������� �������(����#������)���������� �������+�#�2*�����035� � ��������� �������(����#������)������������������
6�������������������(#�������������

���� �������� ���� �� ����������������� ������� ����� ������� �� ������� ���������� ����� ����� ���� �������� ���!�"����� �#$%� ������� �� ������� ���������� ����� ����� �������� �������������� ���� �&&#� '�����( ������� �� ������� ���������� ����� ����� ����)��������� ���������� *���� ����+)�������,��������� -�������. /�����0� -�������./�����0� )�!�� -������� �1223� ������� �� ������� ���������� ����� ����� ����-�������� 4������'5��� 6��������6!���!� ������� � )������� 6�������� ����� ������� ���� ��� ��� %7 ������� �� ������ ���������� *����+. ���� ���� ����� ������� ��������� ��� ������� �� ��� ������ � ����������� �� ���� � ������������ ��������� ������ �� ����!������8 ����������� ����� ������ ��� �������9 :���. )� ,�5. -��. )�����. ���. ����� ;������ � -�� ���8 ��� ����<������ =����� ���4���. ������� <� � ����� )������� >���. %7718���� ������ ���� �� �������;���=���� ������� ��7$� ������� �� ������� ���������?��� �� ����� ����� ���������� ���������,����-�� ��� �&3%1&� ������� �� ������� ���������?��� �� ����� ����� ����)������ ����� ������@������� -����� �1�� ������� �� ������� ���������?��� �� ����� ����� ����;�� ����������� ;������. ����� ;������ �1� ������� �� ������� ���������?��� �� ����� ����� ����;������ �������@������� @�� �&%�$�� ������� �� ������� ���������?��� �� ����� ����� ����-��� ����� ����������@�?��. >�� ��� ������� �� ������� ���������?��� �� ����� ����� ����'A��� �����=���� �$� ������� �� ������� ���������?��� �� ����� ����� ����'A��� ��������

���� ������ ��� ���������������� ���������� ��������������� �������� ������������������������ � ����� ����������!������������"��#� �������� ������������������������ � ����� ����������������� ���������������$�������#��#� �������� �������������������� ����� ����������$��������� ����������%���&���'�����("������'�����'�����("������)*)�+� �������� ������������������������ � ����� ���������������������������

������������������ ����� ������������������������������������� ���� ������ ����������� ���������������� ���������������������������� ������������������������� ����������� ��������� � ������������������������������� ���
����������� ���� ���������������������������������������������� ��������������������� ������������ ������!�"������ ������������������ ���������������������������������������� �������������� �� � ���� ��������������!���������� ����� �� ������ ��� ���# ������������������������� �������$�� � �� �������������������������#������� ��������� ������ ����������!%������������������ ��������� � ������������� ��� ��� ��� �������#��������������� �����������������������&���������� ������������������ ��� ���������������������!�"�������������������� ��������� ��� ��� ��� �����������������#�������' �� ��������� ����������� ������ ���������������������� � �� ��� ��� ��� ������!
��������� ������������������������������ ���� ������������������ ������ ����&�������� ���� ���������� ����������������������� ����������������������(� ������ �������!
)���������� ����������� ������� ��� ��� ��� ��������������� �������������� �������������!��"����� ��� ��� ������������#������� �� ������� ������������� ����� ���� ���������� ����� ����� !�!������� ������ ������������������ ��������������� ������ ����������� ����� ������ ���������� ����� ��*������� �������������� ����(�+��)�����,-�.,(��� �������� �� ��� ����� ������� ��������� ���������������!
)��� ������ ������������ ���� ��������������������� ���������������������������#������������������������������!������� ��������)��������� ������� ����������� ��������� � ���������������������������������� ������������������������ ������/���� ��
)� ��������� ���� ��������� ��� �� ��� �� ����������� ��������������� ����������������� ������� � ������ �� ���������������� �������������� ������ � ���� ����������� �������0111!�,���������������� �������"�������� ����2�� ����������� ����"���������,������ ������� ����,������������������������&���3)��� ���������������� ��������������� ����������� ������� ������ ������������������ ��������� � ��!�(�� ��������������������� ������������������� ������!�(��������������������������������������������� ���������� ���!
��������������� ���� �������'� ����������� ��������������������������� ������ ��������������������������������� �����)��������� ������������������������������������������������������� ��� ��� �������������� ��/-���������������� ����������������������� ������� � ���������������������������������/"����������� ����� ������ ��� ��� ������������� ������������������������������$� ��� ���������� ������������������ ���� ����������4!45���4!46��� ��������������*����������������������� ����������������������� $�������� ������# ���������� ������������������������'����� *������������������������� ����������� ������������� ������#������ ���� ��������� !��,������������������������ ��� ��� ������ �����������0111������6444� � ��� ��� ����������� ����������������#���0447����6847���������������� ��������� ��� ��� ������!�(������� ��� ��� ��� ������ ������������������������������� ��� ��� ������� ������� ��!
�09!5::000�0;5!81:<09��09!6<6155�0;5!81:<09��09!6<6155�0;5!<9;:18��09!9<9;48�0;5!<81591��09!5:8:08�0;5!81168<��09!5:8:080;5!81168<��09!5::000�0;5!81:<09���� ����

������������� �������������������������� �������������������������� ��� ������� ��������������������������� ���� ����������������������� � �����!�������������������� �"������# ���������������������������$�%� �������������������� �������������������������������&�� ��� �'������(��������#������������$������������������������� �"��������������)������ ����������������������� �������$�%� �������*�����������������#���������� ���������������������������������������� �#������'�������������������������� ��+�������+�������� ���������������� ���������,���� ����������� � ���������� ������� ����� ������������+� ������+�� ����� �� ���-�����������(�����#�������"�+���������#��.����$�������������#�������������/��������������������������"�+����������������������
�������������0���$���������������$���������������� ��� ��� ����� �������� �0���� ����� ����������������������� ���� ����+�����,
�#�����������$��������������������)������ �(���������������#�������"�+����������+����'�$����������/�� ����� �#�������"�+���������*�������/����������������!�����������������%�����������$���!�����1���������������������������������(������)������ �"�+���������������������"�+����������������"�+������#������������$�"�+���������������������(�����(�����*�������2������$����# ������� ���%'!�!������������ ��� ��� ���������������(������� ����/����$��"�+�������������(������� ����/����$������#������������$�'��&�������$��������������������%��������(���������������������/�������#����������������������������������������������������"�+������������������������/�������3���������������������������)���*�������(������� ����/����$��%������������������� ������������������(��������#������"����$
4������� ���������������567�8�689:�7777���+��������86;7���������/�!���0�9<9��������������������������������������� �� +����������������2�����,

Santos Ltd l Environment Management Plan: McArthur Basin Civil and Seismic Program l 5 April 2019
Appendix C: Natural Resources Management Report

Custom area

Custom
Custom areaCustom area encompasses an area of 1807.39 sq kmextending from 16 deg 12.0 min to 16 deg 45.0 min S and 134deg 29.0 min to 134 deg 56.0 min E.Custom area is located in the Gulf Fall and Uplands, SturtPlateau, bioregion(s)
Location of Custom area

Custom area Climate
The closest long-term weather station is MCARTHUR RIVER MINE (16 deg 26.0 minS, 136.076E) 145 km E of the center of selected area
Statistics Annual Values Years of recordMean max temp (deg C) 34.6 39Mean min temp (deg C) 19.7 39Average rainfall (mm) 766.1 38Average days of rain 49.4 45
Climate summaries from Bureau of Meteorology (www.bom.gov.au)

Custom area Soils
Soil Types Area of soil types (Northcote Factual Key)
Category Area sq km Area%Kandosols, calcareous earths 972.43 53.80Rudosols, loams 834.96 46.20
Soil Types
Soils 1:2M Layer is a copy of the NT portion (1:2,000,000 scale dataset) of the CSIRO Atlas of Australian Soils - K.H. Northcote et al. Data scale: 1:2,000,000 ANZLIC Identifier: 2DBCB771205D06B6E040CD9B0F274EFE More details: Go to www.lrm.nt.gov.au/nrmapsnt/ and enter the ANZLIC identifier in the Spatial Data Search
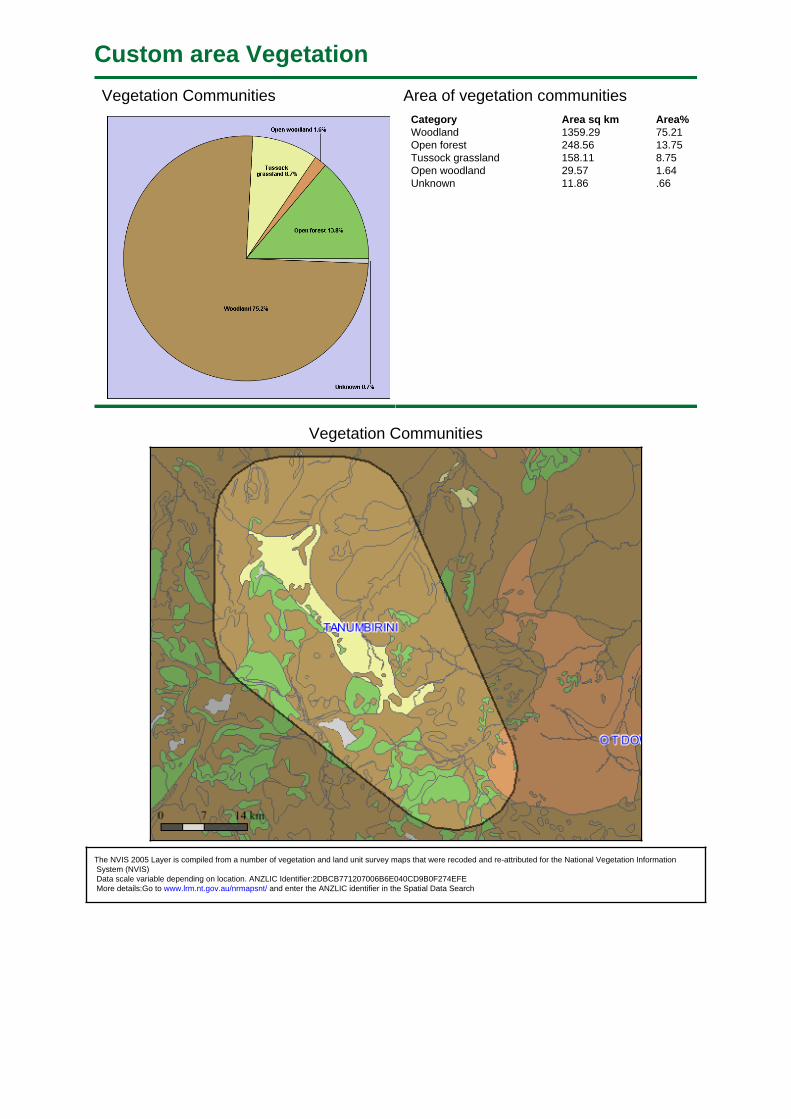
Custom area Vegetation
Vegetation Communities Area of vegetation communitiesCategory Area sq km Area%Woodland 1359.29 75.21Open forest 248.56 13.75Tussock grassland 158.11 8.75Open woodland 29.57 1.64Unknown 11.86 .66
Vegetation Communities
The NVIS 2005 Layer is compiled from a number of vegetation and land unit survey maps that were recoded and re-attributed for the National Vegetation Information System (NVIS) Data scale variable depending on location. ANZLIC Identifier:2DBCB771207006B6E040CD9B0F274EFE More details:Go to www.lrm.nt.gov.au/nrmapsnt/ and enter the ANZLIC identifier in the Spatial Data Search

Custom area Fire History
Fire frequency 2000-2017 area burnt for each fire frequencycategory 2000-2017
Category Area sq km Area%0 115.48 6.391 181.34 10.032 183.18 10.133 168.48 9.324 241.17 13.345 254.24 14.076 324.74 17.977 184.99 10.248 121.51 6.729 31.52 1.7410 .75 .04
Fire frequency 2000-2017
The fire frequency(250m) Layer is derived from satellite imagery sourced from the Moderate Resolution Imaging Spectroradiometer (MODIS) on the NASA Terra satellite Spatial Resolution: 250m x 250m pixels (at Nadir).

Late fire frequency(after July 31)2000-2017
area burnt in each late fire frequencycategory 2000-2017
Category Area sq km Area%0 181.75 10.061 226.39 12.532 289.26 16.003 403.91 22.354 217.82 12.055 259.01 14.336 146.42 8.107 56.96 3.158 25.71 1.429 .15 .01
Late fire frequency 2000-2017
The fire frequency(250m) Layer is derived from satellite imagery sourced from the Moderate Resolution Imaging Spectroradiometer (MODIS) on the NASA Terra satellite Spatial Resolution: 250m x 250m pixels (at Nadir).

Year last burnt 2000-2017 and area of each year categoryCategory Area sq km Area%pre-2000 115.48 6.392000 1.95 .112001 135.29 7.492002 1.42 .082003 1.42 .082004 6.29 .352005 4.12 .232006 34.31 1.902007 21.27 1.182008 .90 .052009 64.00 3.542010 56.25 3.112011 155.80 8.622012 596.58 33.012013 20.99 1.162014 26.46 1.462015 100.15 5.542016 67.19 3.722017 397.51 21.99
Year last burnt 2000-2017
The fire frequency(250m) Layer is derived from satellite imagery sourced from the Moderate Resolution Imaging Spectroradiometer (MODIS) on the NASA Terra satellite Spatial Resolution: 250m x 250m pixels (at Nadir).

Custom area Threatened Species
Threatened species recorded in Custom area (Records Updated: Sept 2013)
Group Common Name Scientific Name NTStatus
NationalStatus
ID #Observations (Latest) #Specimens (Latest) #Surveys (Latest)
Reptiles Mertens` Water Monitor Varanus mertensi VU . 347295 2 (1993) 0 (Unknown) 1 (1993)Mammals Carpentarian Antechinus Pseudantechinus mimulus . VU 176925 0 (Unknown) 1 (1987) 0 (Unknown)
EX = Extinct EW = Extinct in the Wild ER = Extinct in the NT EN = Endangered EN/VU = One Endangered subspecies/One Vulnerable subspecies VU=Vulnerable VU/- = One or more subspecies vulnerable EN/- = One or more subspecies endangered Survey = this category refers to data collected using systematic survey methodology Specimen = this category refers to museum or other records where a specimen has been collected and lodged Observation = this category refers to all other incidental recordings where systematic methodology may not have been used consistently. More species info: Go to www.landmanager.org.au/view/index.aspx?id=#### where #### is the ID number from the tables above for the species of interest.

Custom area Threatened Species Grid
Threatened species recorded in the grid cell(s) in which Custom area occurs (Records Updated: Sept 2013)
Group Family Name Scientific Name Common Name NTStatus
NationalStatus
#Observations LatestObservationDate
#Specimens LatestSpecimenDate
#Surveys LatestSurveyRecord
Reptiles Varanidae Varanus mertensi Mertens` Water Monitor VU 3 1993 0 Unknown 1 1993Mammals Dasyuridae Pseudantechinus mimulus Carpentarian
AntechinusVU 0 Unknown 1 1987 0 Unknown
EX = Extinct EW = Extinct in the Wild ER = Extinct in the NT EN = Endangered EN/VU = One Endangered subspecies/One Vulnerable subspecies VU=Vulnerable VU/- = One or more subspecies vulnerable EN/- = One or more subspecies endangered Survey = this category refers to data collected using systematic survey methodology Specimen = this category refers to museum or other records where a specimen has been collected and lodged Observation = this category refers to all other incidental recordings where systematic methodology may not have been used consistently. More species info: Go to www.landmanager.org.au/view/index.aspx?id=#### where #### is the ID number from the tables above for the species of interest.
Species listed in the table above were recorded from all the grid cells shown below (red/blue line) that overlap Custom area

Custom area Native Species
Native species that have been recorded in the grid cell(s) in which Custom area occurs
Group Family Name Scientific Name Common Name NTStatus
NationalStatus
#Observations #LatestObservationDate
#Specimens #LatestSpecimanDate
#Surveys #LatestSurveyRecord
Ferns Lygodiaceae Lygodium microphyllum Climbing Maidenhair Fern 0 Unknown 2 1977 0 UnknownFerns Marsileaceae Marsilea angustifolia Narrow-leaf Nardoo 0 Unknown 4 1977 0 UnknownFerns Lindsaeaceae Lindsaea brachypoda Wedgefern 0 Unknown 2 1977 0 UnknownFerns Lindsaeaceae Lindsaea ensifolia Common Wedgefern 0 Unknown 2 1977 0 UnknownFerns Pteridaceae Cheilanthes brownii Northern Rock-fern 0 Unknown 2 1977 0 UnknownFerns Pteridaceae Cheilanthes nudiuscula Fern 0 Unknown 10 1989 0 UnknownFerns Pteridaceae Cheilanthes pumilio Fern 0 Unknown 2 1967 0 UnknownFerns Pteridaceae Cheilanthes tenuifolia Rock Fern 0 Unknown 2 2001 0 UnknownFlowering Plants Lauraceae Cassytha filiformis Hairy Dodder-laurel 0 Unknown 0 Unknown 0 UnknownFlowering Plants Hernandiaceae Gyrocarpus americanus Stinkwood 0 Unknown 0 Unknown 0 UnknownFlowering Plants Alismataceae Caldesia oligococca var.
oligococcaCaldesia 0 Unknown 2 1994 0 Unknown
Flowering Plants Hydrocharitaceae Vallisneria rubra Eel Grass 0 Unknown 2 1994 0 UnknownFlowering Plants Colchicaceae Iphigenia indica Iphigenia 0 Unknown 1 1989 0 UnknownFlowering Plants Eriocaulaceae Eriocaulon carpentariae Hatpins DD 0 Unknown 4 1994 0 UnknownFlowering Plants Eriocaulaceae Eriocaulon cinereum Hatpins 0 Unknown 2 1993 0 UnknownFlowering Plants Cyperaceae Bulbostylis barbata Short-leaved Rush 0 Unknown 4 1983 0 UnknownFlowering Plants Cyperaceae Cyperus astartodes Sedge 0 Unknown 4 1983 0 UnknownFlowering Plants Cyperaceae Cyperus betchei Sedge 0 Unknown 2 1983 0 UnknownFlowering Plants Cyperaceae Cyperus betchei subsp.
commiscensSedge 0 Unknown 2 1977 0 Unknown
Flowering Plants Cyperaceae Cyperus carinatus Sedge 0 Unknown 4 1988 0 UnknownFlowering Plants Cyperaceae Cyperus castaneus Sedge 0 Unknown 2 1977 0 UnknownFlowering Plants Cyperaceae Cyperus concinnus Trim Sedge 0 Unknown 2 1991 0 UnknownFlowering Plants Cyperaceae Cyperus crispulus Sedge 0 Unknown 4 1987 0 UnknownFlowering Plants Cyperaceae Cyperus cristulatus Sedge 0 Unknown 0 Unknown 0 UnknownFlowering Plants Cyperaceae Cyperus cunninghamii
subsp. uniflorusSedge 0 Unknown 2 1983 0 Unknown
Flowering Plants Cyperaceae Cyperus dactylotes Sedge 0 Unknown 3 1988 0 UnknownFlowering Plants Cyperaceae Cyperus eleusinoides Sedge 0 Unknown 2 1986 0 UnknownFlowering Plants Cyperaceae Cyperus exaltatus Giant Sedge 0 Unknown 2 1986 0 UnknownFlowering Plants Cyperaceae Cyperus fucosus Sedge DD 0 Unknown 2 1947 0 UnknownFlowering Plants Cyperaceae Cyperus holoschoenus Umbrella Rush 0 Unknown 8 1986 0 UnknownFlowering Plants Cyperaceae Cyperus iria Rice Flat Sedge 0 Unknown 1 1983 0 UnknownFlowering Plants Cyperaceae Cyperus javanicus Saw Rush 0 Unknown 2 1977 0 UnknownFlowering Plants Cyperaceae Cyperus macrostachyos Tick Grass 0 Unknown 6 1995 0 UnknownFlowering Plants Cyperaceae Cyperus microcephalus Sedge 0 Unknown 4 1977 0 UnknownFlowering Plants Cyperaceae Cyperus oxycarpus Sedge DD 0 Unknown 2 1977 0 Unknown

Group Family Name Scientific Name Common Name NTStatus
NationalStatus
#Observations #LatestObservationDate
#Specimens #LatestSpecimanDate
#Surveys #LatestSurveyRecord
Flowering Plants Cyperaceae Cyperus polystachyos Bunchy Sedge 0 Unknown 0 Unknown 0 UnknownFlowering Plants Cyperaceae Cyperus pulchellus White Button Sedge 0 Unknown 2 1983 0 UnknownFlowering Plants Cyperaceae Cyperus sexflorus Sedge 0 Unknown 2 1983 0 UnknownFlowering Plants Cyperaceae Cyperus squarrosus Bearded Flatsedge 0 Unknown 2 1977 0 UnknownFlowering Plants Cyperaceae Cyperus tenuispica Pink-root Sedge 0 Unknown 4 1983 0 UnknownFlowering Plants Cyperaceae Eleocharis pallens Pale Spike-Rush 0 Unknown 1 1994 0 UnknownFlowering Plants Cyperaceae Eleocharis triquetra Spike-Rush 0 Unknown 4 1994 0 UnknownFlowering Plants Cyperaceae Fimbristylis acuminata Fringe-Rush 0 Unknown 1 1947 0 UnknownFlowering Plants Cyperaceae Fimbristylis bisumbellata Fringe-Rush DD 0 Unknown 2 1988 0 UnknownFlowering Plants Cyperaceae Fimbristylis caespitosa Fringe-Rush 0 Unknown 2 Unknown 0 UnknownFlowering Plants Cyperaceae Fimbristylis cardiocarpa Fringe-Rush 0 Unknown 2 1977 0 UnknownFlowering Plants Cyperaceae Fimbristylis corynocarya Fringe-Rush DD 0 Unknown 2 2001 0 UnknownFlowering Plants Cyperaceae Fimbristylis costiglumis Fringe-Rush 0 Unknown 2 1983 0 UnknownFlowering Plants Cyperaceae Fimbristylis depauperata Fringe-Rush 0 Unknown 2 1971 0 UnknownFlowering Plants Cyperaceae Fimbristylis dichotoma Eight Day Grass 0 Unknown 2 1988 0 UnknownFlowering Plants Cyperaceae Fimbristylis ferruginea Fringe-Rush 0 Unknown 2 1987 0 UnknownFlowering Plants Cyperaceae Fimbristylis laxiglumis Fringe-Rush 0 Unknown 2 1947 0 UnknownFlowering Plants Cyperaceae Fimbristylis littoralis Fringe-Rush 0 Unknown 6 1988 0 UnknownFlowering Plants Cyperaceae Fimbristylis littoralis var.
littoralisFringe-Rush 0 Unknown 0 Unknown 0 Unknown
Flowering Plants Cyperaceae Fimbristylis microcarya Fringe-Rush 0 Unknown 2 1991 0 UnknownFlowering Plants Cyperaceae Fimbristylis oxystachya Iukarrara 0 Unknown 2 1987 0 UnknownFlowering Plants Cyperaceae Fimbristylis phaeoleuca Water Grass 0 Unknown 3 1988 0 UnknownFlowering Plants Cyperaceae Fimbristylis rupestris Fringe-Rush 0 Unknown 2 1977 0 UnknownFlowering Plants Cyperaceae Fimbristylis schultzii Fringe-Rush 0 Unknown 2 1977 0 UnknownFlowering Plants Cyperaceae Fimbristylis sphaerocephala Fringe-Rush 0 Unknown 4 1977 0 UnknownFlowering Plants Cyperaceae Fimbristylis squarrulosa Fringe-Rush 0 Unknown 0 Unknown 0 UnknownFlowering Plants Cyperaceae Fimbristylis trigastrocarya Fringe-Rush 0 Unknown 2 1977 0 UnknownFlowering Plants Cyperaceae Fimbristylis tristachya Fringe-Rush 0 Unknown 2 1977 0 UnknownFlowering Plants Cyperaceae Rhynchospora exserta Star Sedge 0 Unknown 2 1976 0 UnknownFlowering Plants Cyperaceae Rhynchospora longisetis Tick Grass 0 Unknown 0 Unknown 0 UnknownFlowering Plants Cyperaceae Rhynchospora subtenuifolia Star Sedge 0 Unknown 2 1987 0 UnknownFlowering Plants Cyperaceae Rhynchospora wightiana Star Sedge 0 Unknown 4 1991 0 UnknownFlowering Plants Cyperaceae Schoenoplectus laevis Club-Rush 0 Unknown 2 1988 0 UnknownFlowering Plants Cyperaceae Scleria brownii Sedge 0 Unknown 2 1987 0 UnknownFlowering Plants Cyperaceae Scleria novae-hollandiae Sedge 0 Unknown 0 Unknown 0 UnknownFlowering Plants Cyperaceae Scleria rugosa Mildrop Sedge 0 Unknown 2 1987 0 UnknownFlowering Plants Cyperaceae Scleria sphacelata Razor Grass 0 Unknown 0 Unknown 0 UnknownFlowering Plants Poaceae Acrachne racemosa Goose Grass DD 0 Unknown 2 1991 0 UnknownFlowering Plants Poaceae Alloteropsis semialata Cockatoo Grass 0 Unknown 0 Unknown 0 UnknownFlowering Plants Poaceae Aristida calycina Dark Wiregrass 0 Unknown 4 2001 0 UnknownFlowering Plants Poaceae Aristida calycina var.
calycinaDark Wiregrass 0 Unknown 0 Unknown 0 Unknown
Flowering Plants Poaceae Aristida contorta Bunched Kerosene Grass 0 Unknown 0 Unknown 0 UnknownFlowering Plants Poaceae Aristida exserta Wire Grass 0 Unknown 2 1977 0 UnknownFlowering Plants Poaceae Aristida holathera Erect Kerosene Grass 0 Unknown 0 Unknown 0 Unknown

Group Family Name Scientific Name Common Name NTStatus
NationalStatus
#Observations #LatestObservationDate
#Specimens #LatestSpecimanDate
#Surveys #LatestSurveyRecord
Flowering Plants Poaceae Aristida holathera var.holathera
Erect Kerosene Grass 0 Unknown 4 1988 0 Unknown
Flowering Plants Poaceae Aristida hygrometrica Northern Kerosene Grass 0 Unknown 3 1991 0 UnknownFlowering Plants Poaceae Aristida inaequiglumis Unequal Threeawn 0 Unknown 2 2008 0 UnknownFlowering Plants Poaceae Aristida ingrata Wire Grass 0 Unknown 2 1977 0 UnknownFlowering Plants Poaceae Aristida latifolia Feathertop Wiregrass 0 Unknown 4 1986 0 UnknownFlowering Plants Poaceae Aristida perniciosa Noxious Wiregrass DD 0 Unknown 2 1977 0 UnknownFlowering Plants Poaceae Aristida pruinosa Gulf Feathertop Wiregrass 0 Unknown 2 1987 0 UnknownFlowering Plants Poaceae Aristida queenslandica var.
queenslandicaWire Grass 0 Unknown 1 1987 0 Unknown
Flowering Plants Poaceae Arundinella setosa Reed Grass 0 Unknown 1 1971 0 UnknownFlowering Plants Poaceae Astrebla lappacea Curly Mitchell Grass DD 0 Unknown 2 1971 0 UnknownFlowering Plants Poaceae Astrebla squarrosa Bull Mitchell Grass 0 Unknown 0 Unknown 0 UnknownFlowering Plants Poaceae Bothriochloa bladhii Forest Bluegrass 0 Unknown 4 1986 0 UnknownFlowering Plants Poaceae Bothriochloa bladhii subsp.
bladhiiForest Bluegrass 0 Unknown 2 1972 0 Unknown
Flowering Plants Poaceae Brachyachne convergens Spider Grass 0 Unknown 2 1971 0 UnknownFlowering Plants Poaceae Brachyachne tenella Slender Native Couch 0 Unknown 4 1988 0 UnknownFlowering Plants Poaceae Chionachne cyathopoda River Grass 0 Unknown 2 1971 0 UnknownFlowering Plants Poaceae Chloris lobata Lobed Chloris 0 Unknown 4 1995 0 UnknownFlowering Plants Poaceae Chrysopogon fallax Golden-beard Grass 0 Unknown 5 1991 0 UnknownFlowering Plants Poaceae Chrysopogon pallidus Ribbon Grass 0 Unknown 0 Unknown 0 UnknownFlowering Plants Poaceae Cymbopogon bombycinus Silky Oilgrass 0 Unknown 4 1987 0 UnknownFlowering Plants Poaceae Cymbopogon procerus Scentgrass 0 Unknown 2 1971 0 UnknownFlowering Plants Poaceae Cymbopogon refractus Barbed-Wire Grass 0 Unknown 0 Unknown 0 UnknownFlowering Plants Poaceae Dichanthium fecundum Curly Bluegrass 0 Unknown 7 1988 0 UnknownFlowering Plants Poaceae Dichanthium sericeum Queensland Bluegrass 0 Unknown 0 Unknown 0 UnknownFlowering Plants Poaceae Dichanthium sericeum
subsp. humiliusDwarf Bluegrass 0 Unknown 0 Unknown 0 Unknown
Flowering Plants Poaceae Dichanthium sericeumsubsp. polystachyum
Tassel Bluegrass 0 Unknown 2 1971 0 Unknown
Flowering Plants Poaceae Digitaria benthamiana Finger Grass DD 0 Unknown 0 Unknown 0 UnknownFlowering Plants Poaceae Digitaria brownii Cotton Panic Grass 0 Unknown 5 2001 0 UnknownFlowering Plants Poaceae Digitaria cowiei Finger Grass 0 Unknown 3 1991 0 UnknownFlowering Plants Poaceae Digitaria ctenantha Comb Finger Grass 0 Unknown 4 1991 0 UnknownFlowering Plants Poaceae Digitaria gibbosa Finger Grass 0 Unknown 0 Unknown 0 UnknownFlowering Plants Poaceae Digitaria longiflora Finger Grass 0 Unknown 2 1977 0 UnknownFlowering Plants Poaceae Digitaria nematostachya Finger Grass 0 Unknown 4 2001 0 UnknownFlowering Plants Poaceae Digitaria papposa Finger Grass 0 Unknown 2 1977 0 UnknownFlowering Plants Poaceae Ectrosia agrostoides Haresfoot Grass 0 Unknown 0 Unknown 0 UnknownFlowering Plants Poaceae Ectrosia leporina Haresfoot Grass 0 Unknown 0 Unknown 0 UnknownFlowering Plants Poaceae Ectrosia scabrida Haresfoot Grass 0 Unknown 2 1971 0 UnknownFlowering Plants Poaceae Elytrophorus spicatus Spike-grass 0 Unknown 4 1993 0 UnknownFlowering Plants Poaceae Enneapogon lindleyanus Wiry Nine-awn 0 Unknown 2 1971 0 UnknownFlowering Plants Poaceae Enneapogon oblongus Rock Nine-awn 0 Unknown 0 Unknown 0 UnknownFlowering Plants Poaceae Enneapogon pallidus Conetop Nine-awn 0 Unknown 2 1972 0 UnknownFlowering Plants Poaceae Enneapogon polyphyllus Leafy Nine-awn 0 Unknown 8 1991 0 Unknown

Group Family Name Scientific Name Common Name NTStatus
NationalStatus
#Observations #LatestObservationDate
#Specimens #LatestSpecimanDate
#Surveys #LatestSurveyRecord
Flowering Plants Poaceae Enneapogon purpurascens Purple Nineawn 0 Unknown 2 1972 0 UnknownFlowering Plants Poaceae Enteropogon minutus Windmill Grass DD 0 Unknown 2 1987 0 UnknownFlowering Plants Poaceae Eragrostis confertiflora Spike Lovegrass 0 Unknown 2 1991 0 UnknownFlowering Plants Poaceae Eragrostis cumingii Cuming`s Lovegrass 0 Unknown 10 1987 0 UnknownFlowering Plants Poaceae Eragrostis exigua Lovegrass 0 Unknown 4 1995 0 UnknownFlowering Plants Poaceae Eragrostis fallax Lovegrass 0 Unknown 6 1988 0 UnknownFlowering Plants Poaceae Eragrostis pubescens Giant Fairy Grass 0 Unknown 0 Unknown 0 UnknownFlowering Plants Poaceae Eragrostis schultzii Lovegrass 0 Unknown 2 1977 0 UnknownFlowering Plants Poaceae Eragrostis tenellula Delicate Lovegrass 0 Unknown 8 1988 0 UnknownFlowering Plants Poaceae Eriachne armitii Long-awn Wanderrie 0 Unknown 2 1971 0 UnknownFlowering Plants Poaceae Eriachne basalis Wanderrie Grass DD 0 Unknown 1 1947 0 UnknownFlowering Plants Poaceae Eriachne ciliata Slender Wanderrie 0 Unknown 2 1987 0 UnknownFlowering Plants Poaceae Eriachne glauca Pan Wanderrie 0 Unknown 4 1991 0 UnknownFlowering Plants Poaceae Eriachne glauca var. glauca Wanderrie Grass 0 Unknown 2 1987 0 UnknownFlowering Plants Poaceae Eriachne nervosa Plains Wanderrie 0 Unknown 2 1977 0 UnknownFlowering Plants Poaceae Eriachne nodosa Wanderrie Grass 0 Unknown 0 Unknown 0 UnknownFlowering Plants Poaceae Eriachne obtusa Northern Wanderrie 0 Unknown 6 1988 0 UnknownFlowering Plants Poaceae Eriachne schultziana Salt-and-Pepper Grass 0 Unknown 0 Unknown 0 UnknownFlowering Plants Poaceae Eriochloa pseudoacrotricha Early Spring Grass 0 Unknown 3 1995 0 UnknownFlowering Plants Poaceae Eulalia aurea Silky Browntop 0 Unknown 6 1988 0 UnknownFlowering Plants Poaceae Heterachne gulliveri Heterachne 0 Unknown 2 1987 0 UnknownFlowering Plants Poaceae Heteropogon contortus Black Speargrass 0 Unknown 0 Unknown 0 UnknownFlowering Plants Poaceae Iseilema macratherum Bull Flinders Grass 0 Unknown 4 1987 0 UnknownFlowering Plants Poaceae Iseilema vaginiflorum Red Flinders Grass 0 Unknown 2 1986 0 UnknownFlowering Plants Poaceae Leptochloa neesii Swamp Grass 0 Unknown 4 1972 0 UnknownFlowering Plants Poaceae Lepturus xerophilus Lepturus DD 0 Unknown 1 2001 0 UnknownFlowering Plants Poaceae Mnesithea formosa Red Grass 0 Unknown 5 1991 0 UnknownFlowering Plants Poaceae Mnesithea rottboellioides Northern Canegrass 0 Unknown 2 1977 0 UnknownFlowering Plants Poaceae Oryza australiensis Australian Wild Rice 0 Unknown 6 2002 0 UnknownFlowering Plants Poaceae Panicum decompositum Australian Millet 0 Unknown 0 Unknown 0 UnknownFlowering Plants Poaceae Panicum effusum Hairy Panic 0 Unknown 2 1987 0 UnknownFlowering Plants Poaceae Panicum laevinode Pepper Grass 0 Unknown 2 2002 0 UnknownFlowering Plants Poaceae Panicum latzii Panic DD 0 Unknown 1 1988 0 UnknownFlowering Plants Poaceae Panicum mindanaense Native Panic 0 Unknown 2 1987 0 UnknownFlowering Plants Poaceae Panicum trachyrhachis Whistle Grass 0 Unknown 2 1991 0 UnknownFlowering Plants Poaceae Panicum trichoides Jungle Grass 0 Unknown 4 2001 0 UnknownFlowering Plants Poaceae Paspalidium constrictum Knotty-butt Paspalidium 0 Unknown 2 1987 0 UnknownFlowering Plants Poaceae Paspalidium gracile Slender Panic DD 0 Unknown 6 2001 0 UnknownFlowering Plants Poaceae Paspalidium rarum Bunch Paspalidium 0 Unknown 6 1988 0 UnknownFlowering Plants Poaceae Paspalidium retiglume Paspalidium 0 Unknown 2 1971 0 UnknownFlowering Plants Poaceae Perotis rara Comet Grass 0 Unknown 4 1991 0 UnknownFlowering Plants Poaceae Pseudopogonatherum
contortumBlack Top 0 Unknown 0 Unknown 0 Unknown
Flowering Plants Poaceae Pseudoraphis spinescens Spiny Mudgrass 0 Unknown 8 1991 0 UnknownFlowering Plants Poaceae Schizachyrium fragile Fire Grass 0 Unknown 4 1991 0 UnknownFlowering Plants Poaceae Schizachyrium pseudeulalia Short-leaved Silk Grass 0 Unknown 0 Unknown 0 UnknownFlowering Plants Poaceae Sehima nervosum White Grass 0 Unknown 2 1987 0 Unknown

Group Family Name Scientific Name Common Name NTStatus
NationalStatus
#Observations #LatestObservationDate
#Specimens #LatestSpecimanDate
#Surveys #LatestSurveyRecord
Flowering Plants Poaceae Setaria apiculata Pigeon Grass 0 Unknown 0 Unknown 0 UnknownFlowering Plants Poaceae Setaria surgens Brown`s Pigeon Grass 0 Unknown 2 1991 0 UnknownFlowering Plants Poaceae Sorghum matarankense Sorghum 0 Unknown 4 1991 0 UnknownFlowering Plants Poaceae Sorghum plumosum Plume Sorghum 0 Unknown 2 1979 0 UnknownFlowering Plants Poaceae Sorghum plumosum var.
plumosumPlume Sorghum 0 Unknown 2 1988 0 Unknown
Flowering Plants Poaceae Sorghum timorense Downs Sorghum 0 Unknown 2 1987 0 UnknownFlowering Plants Poaceae Sporobolus australasicus Australian Dropseed 0 Unknown 4 1988 0 UnknownFlowering Plants Poaceae Thaumastochloa pubescens Thaumastochloa 0 Unknown 2 1977 0 UnknownFlowering Plants Poaceae Themeda arguens Annual Kangaroo Grass 0 Unknown 2 1988 0 UnknownFlowering Plants Poaceae Themeda avenacea Oat Kangaroo Grass 0 Unknown 0 Unknown 0 UnknownFlowering Plants Poaceae Themeda triandra Kangaroo Grass 0 Unknown 2 1986 0 UnknownFlowering Plants Poaceae Triodia bitextura Curly Spinifex 0 Unknown 8 1988 0 UnknownFlowering Plants Poaceae Triodia latzii Spinifex 0 Unknown 4 1988 0 UnknownFlowering Plants Poaceae Triodia microstachya Spinifex 0 Unknown 2 1977 0 UnknownFlowering Plants Poaceae Triodia stenostachya Spinifex 0 Unknown 0 Unknown 0 UnknownFlowering Plants Poaceae Tripogon loliiformis Five-minute Grass 0 Unknown 2 1988 0 UnknownFlowering Plants Poaceae Urochloa holosericea Silkytop Armgrass 0 Unknown 0 Unknown 0 UnknownFlowering Plants Poaceae Urochloa pubigera Armgrass Millet 0 Unknown 3 1991 0 UnknownFlowering Plants Poaceae Whiteochloa airoides Creeping Panic 0 Unknown 4 1988 0 UnknownFlowering Plants Poaceae Whiteochloa capillipes Whiteochloa 0 Unknown 4 1991 0 UnknownFlowering Plants Poaceae Yakirra australiensis Desert Flinders Grass 0 Unknown 2 1971 0 UnknownFlowering Plants Poaceae Yakirra majuscula Yakirra 0 Unknown 0 Unknown 0 UnknownFlowering Plants Poaceae Yakirra muelleri Yakirra DD 0 Unknown 2 1971 0 UnknownFlowering Plants Poaceae Yakirra nulla Yakirra 0 Unknown 0 Unknown 0 UnknownFlowering Plants Poaceae Yakirra pauciflora Yakirra 0 Unknown 4 1991 0 UnknownFlowering Plants Commelinaceae Commelina agrostophylla Commelina 0 Unknown 2 1979 0 UnknownFlowering Plants Commelinaceae Commelina ensifolia Wandering Jew 0 Unknown 2 1959 0 UnknownFlowering Plants Commelinaceae Cyanotis axillaris Commelina 0 Unknown 2 1994 0 UnknownFlowering Plants Commelinaceae Murdannia graminea Pink Swamp Lily 0 Unknown 5 1989 0 UnknownFlowering Plants Commelinaceae Murdannia vaginata Day Flower 0 Unknown 0 Unknown 0 UnknownFlowering Plants Pontederiaceae Monochoria cyanea Monochoria 0 Unknown 2 1979 0 UnknownFlowering Plants Haemodoraceae Haemodorum coccineum Scarlet-flowered Bloodroot 0 Unknown 2 1988 0 UnknownFlowering Plants Menispermaceae Tinospora smilacina Snake Vine 0 Unknown 1 1988 0 UnknownFlowering Plants Proteaceae Grevillea dryandri Dryander`s Grevillea 0 Unknown 2 1988 0 UnknownFlowering Plants Proteaceae Grevillea heliosperma Rock Grevillea 0 Unknown 2 1971 0 UnknownFlowering Plants Proteaceae Grevillea parallela Silver Grevillea 0 Unknown 2 1987 0 UnknownFlowering Plants Proteaceae Grevillea pteridifolia Fern-leaved Grevillea 0 Unknown 2 1988 0 UnknownFlowering Plants Proteaceae Grevillea refracta Silver-leaved Grevillea 0 Unknown 0 Unknown 0 UnknownFlowering Plants Proteaceae Grevillea refracta subsp.
refractaSilver-leaved Grevillea 0 Unknown 2 1971 0 Unknown
Flowering Plants Proteaceae Grevillea striata Western Beefwood 0 Unknown 0 Unknown 0 UnknownFlowering Plants Proteaceae Hakea arborescens Yellow Hakea 0 Unknown 2 1977 0 UnknownFlowering Plants Proteaceae Hakea chordophylla Northern Corkwood 0 Unknown 0 Unknown 0 UnknownFlowering Plants Proteaceae Hakea lorea subsp. borealis Northern Long-leaf
Corkwood0 Unknown 2 1947 0 Unknown
Flowering Plants Proteaceae Persoonia falcata Milky Plum 0 Unknown 0 Unknown 0 Unknown

Group Family Name Scientific Name Common Name NTStatus
NationalStatus
#Observations #LatestObservationDate
#Specimens #LatestSpecimanDate
#Surveys #LatestSurveyRecord
Flowering Plants Proteaceae Stenocarpus acacioides Stenocarpus 0 Unknown 2 1986 0 UnknownFlowering Plants Dilleniaceae Hibbertia lepidota Scaly Guinea Flower 0 Unknown 0 Unknown 0 UnknownFlowering Plants Droseraceae Drosera indica Narrow-leaved Sundew 0 Unknown 2 2001 0 UnknownFlowering Plants Caryophyllaceae Polycarpaea breviflora Polycarpaea 0 Unknown 2 1991 0 UnknownFlowering Plants Caryophyllaceae Polycarpaea corymbosa Polycarpaea 0 Unknown 0 Unknown 0 UnknownFlowering Plants Caryophyllaceae Polycarpaea involucrata Polycarpaea 0 Unknown 3 1987 0 UnknownFlowering Plants Caryophyllaceae Polycarpaea spirostylis Copper Plant 0 Unknown 2 1971 0 UnknownFlowering Plants Amaranthaceae Achyranthes aspera Prickly Chaff Flower 0 Unknown 5 1986 0 UnknownFlowering Plants Amaranthaceae Alternanthera denticulata
var. denticulataLesser Joyweed 0 Unknown 2 1991 0 Unknown
Flowering Plants Amaranthaceae Alternanthera nana Hairy Joyweed 0 Unknown 4 1988 0 UnknownFlowering Plants Amaranthaceae Alternanthera nodiflora Common Joyweed 0 Unknown 2 1986 0 UnknownFlowering Plants Amaranthaceae Amaranthus interruptus Native Amaranth 0 Unknown 2 1977 0 UnknownFlowering Plants Amaranthaceae Amaranthus pallidiflorus Pale-flowered Amaranth 0 Unknown 2 1977 0 UnknownFlowering Plants Amaranthaceae Gomphrena breviflora Gomphrena 0 Unknown 0 Unknown 0 UnknownFlowering Plants Amaranthaceae Gomphrena canescens Batchelor`s Buttons 0 Unknown 0 Unknown 0 UnknownFlowering Plants Amaranthaceae Gomphrena canescens
subsp. canescensBatchelor`s Buttons 0 Unknown 2 1987 0 Unknown
Flowering Plants Amaranthaceae Gomphrena flaccida Gomphrena Weed 0 Unknown 6 1995 0 UnknownFlowering Plants Amaranthaceae Gomphrena lanata Gomphrena 0 Unknown 7 1986 0 UnknownFlowering Plants Amaranthaceae Ptilotus exaltatus Pink Mulla Mulla 0 Unknown 6 2008 0 UnknownFlowering Plants Amaranthaceae Ptilotus fusiformis Skeleton plant 0 Unknown 6 1988 0 UnknownFlowering Plants Amaranthaceae Ptilotus polystachyus Long Pussy-tails 0 Unknown 4 2008 0 UnknownFlowering Plants Amaranthaceae Ptilotus spicatus Mulla Mulla 0 Unknown 2 1986 0 UnknownFlowering Plants Amaranthaceae Salsola australis Rolypoly 0 Unknown 2 1979 0 UnknownFlowering Plants Molluginaceae Glinus lotoides Hairy Carpet-weed 0 Unknown 2 1959 0 UnknownFlowering Plants Molluginaceae Glinus oppositifolius Slender Carpet-weed 0 Unknown 2 1977 0 UnknownFlowering Plants Portulacaceae Calandrinia quadrivalvis Parakeelya 0 Unknown 0 Unknown 0 UnknownFlowering Plants Portulacaceae Calandrinia uniflora Parakeelya 0 Unknown 2 1988 0 UnknownFlowering Plants Portulacaceae Portulaca bicolor Heart Plant 0 Unknown 0 Unknown 0 UnknownFlowering Plants Portulacaceae Portulaca sp. Elliott Pigweed 0 Unknown 2 1986 0 UnknownFlowering Plants Nyctaginaceae Boerhavia coccinea Scarlet Tar Vine 0 Unknown 6 1988 0 UnknownFlowering Plants Nyctaginaceae Boerhavia dominii Tar Vine 0 Unknown 4 1986 0 UnknownFlowering Plants Opiliaceae Opilia amentacea Opilia 0 Unknown 2 1977 0 UnknownFlowering Plants Santalaceae Santalum lanceolatum Plumbush 0 Unknown 8 1988 0 UnknownFlowering Plants Loranthaceae Amyema bifurcata Twin-fork Mistletoe 0 Unknown 0 Unknown 0 UnknownFlowering Plants Loranthaceae Amyema maidenii subsp.
maideniiPale-leaf Mistletoe 0 Unknown 2 1979 0 Unknown
Flowering Plants Loranthaceae Amyema miquelii Box Mistletoe 0 Unknown 2 1947 0 UnknownFlowering Plants Loranthaceae Amyema sanguinea Blood Mistletoe 0 Unknown 2 1986 0 UnknownFlowering Plants Loranthaceae Amyema villiflora Mistletoe 0 Unknown 2 1987 0 UnknownFlowering Plants Loranthaceae Dendrophthoe glabrescens Orange-Flowered Mistletoe 0 Unknown 4 1979 0 UnknownFlowering Plants Loranthaceae Diplatia grandibractea Royal Mistletoe 0 Unknown 2 1979 0 UnknownFlowering Plants Loranthaceae Lysiana spathulata subsp.
spathulataFlat-leaved Mistletoe 0 Unknown 2 1959 0 Unknown
Flowering Plants Haloragaceae Myriophyllum filiforme Water Milfoil 0 Unknown 2 1991 0 UnknownFlowering Plants Vitaceae Cayratia trifolia Native Grape 0 Unknown 2 1988 0 Unknown

Group Family Name Scientific Name Common Name NTStatus
NationalStatus
#Observations #LatestObservationDate
#Specimens #LatestSpecimanDate
#Surveys #LatestSurveyRecord
Flowering Plants Combretaceae Macropteranthes kekwickii Bullwaddy 0 Unknown 19 2001 0 UnknownFlowering Plants Combretaceae Terminalia bursarina Bendee 0 Unknown 8 1987 0 UnknownFlowering Plants Combretaceae Terminalia canescens Winged Nut Tree 0 Unknown 14 2008 0 UnknownFlowering Plants Combretaceae Terminalia platyphylla Red Plum 0 Unknown 5 1987 0 UnknownFlowering Plants Combretaceae Terminalia pterocarya Wing-fruited Terminalia 0 Unknown 0 Unknown 0 UnknownFlowering Plants Combretaceae Terminalia volucris Rosewood 0 Unknown 4 1991 0 UnknownFlowering Plants Lythraceae Ammannia multiflora Jerry-Jerry 0 Unknown 4 1986 0 UnknownFlowering Plants Lythraceae Nesaea muelleri Neasea 0 Unknown 4 1994 0 UnknownFlowering Plants Lythraceae Rotala diandra Rotala 0 Unknown 2 1991 0 UnknownFlowering Plants Lythraceae Rotala mexicana Rotala 0 Unknown 4 1994 0 UnknownFlowering Plants Onagraceae Ludwigia octovalvis Willow Primrose 0 Unknown 2 1988 0 UnknownFlowering Plants Onagraceae Ludwigia perennis Ludwigia 0 Unknown 2 1971 0 UnknownFlowering Plants Myrtaceae Calytrix exstipulata Turkey Bush 0 Unknown 10 1988 0 UnknownFlowering Plants Myrtaceae Corymbia bella Ghost Gum 0 Unknown 0 Unknown 0 UnknownFlowering Plants Myrtaceae Corymbia confertiflora Roughleaf Cabbage Gum 0 Unknown 4 1988 0 UnknownFlowering Plants Myrtaceae Corymbia dichromophloia Variable-barked Bloodwood 0 Unknown 0 Unknown 0 UnknownFlowering Plants Myrtaceae Corymbia drysdalensis Bloodwood 0 Unknown 5 1993 0 UnknownFlowering Plants Myrtaceae Corymbia ferruginea Rusty Bloodwood 0 Unknown 3 1986 0 UnknownFlowering Plants Myrtaceae Corymbia ferruginea subsp.
ferrugineaRusty Bloodwood 0 Unknown 2 1987 0 Unknown
Flowering Plants Myrtaceae Corymbia flavescens Cabbage Gum 0 Unknown 0 Unknown 0 UnknownFlowering Plants Myrtaceae Corymbia grandifolia Large-leaved Cabbage Gum 0 Unknown 0 Unknown 0 UnknownFlowering Plants Myrtaceae Corymbia grandifolia subsp.
grandifoliaLarge-leaved Cabbage Gum 0 Unknown 2 1988 0 Unknown
Flowering Plants Myrtaceae Corymbia polycarpa Long-fruited Bloodwood 0 Unknown 5 1988 0 UnknownFlowering Plants Myrtaceae Corymbia ptychocarpa Swamp Bloodwood 0 Unknown 0 Unknown 0 UnknownFlowering Plants Myrtaceae Corymbia ptychocarpa
subsp. ptychocarpaSwamp Bloodwood 0 Unknown 2 1986 0 Unknown
Flowering Plants Myrtaceae Corymbia terminalis Northern Bloodwood 0 Unknown 0 Unknown 0 UnknownFlowering Plants Myrtaceae Eucalyptus brevifolia Snappy Gum 0 Unknown 0 Unknown 0 UnknownFlowering Plants Myrtaceae Eucalyptus camaldulensis
subsp. obtusaNorthern River Red Gum 0 Unknown 10 1991 0 Unknown
Flowering Plants Myrtaceae Eucalyptus chlorophylla Green-leaf Box 0 Unknown 11 2001 0 UnknownFlowering Plants Myrtaceae Eucalyptus chlorophylla
subsp. chlorophyllaGreenleaf Box 0 Unknown 0 Unknown 0 Unknown
Flowering Plants Myrtaceae Eucalyptus cyanoclada Box 0 Unknown 4 2001 0 UnknownFlowering Plants Myrtaceae Eucalyptus distans Katherine Box 0 Unknown 2 1987 0 UnknownFlowering Plants Myrtaceae Eucalyptus leucophloia Snappy Gum 0 Unknown 4 1988 0 UnknownFlowering Plants Myrtaceae Eucalyptus leucophloia
subsp. euroaSnappy Gum 0 Unknown 2 1988 0 Unknown
Flowering Plants Myrtaceae Eucalyptus microtheca Western Coolibah 0 Unknown 2 1987 0 UnknownFlowering Plants Myrtaceae Eucalyptus miniata Darwin Woollybutt 0 Unknown 2 1971 0 UnknownFlowering Plants Myrtaceae Eucalyptus patellaris Weeping Box 0 Unknown 0 Unknown 0 UnknownFlowering Plants Myrtaceae Eucalyptus pruinosa Silver-leaf Box 0 Unknown 0 Unknown 0 UnknownFlowering Plants Myrtaceae Eucalyptus pruinosa subsp.
pruinosaSilver-leaf Box 0 Unknown 3 1988 0 Unknown

Group Family Name Scientific Name Common Name NTStatus
NationalStatus
#Observations #LatestObservationDate
#Specimens #LatestSpecimanDate
#Surveys #LatestSurveyRecord
Flowering Plants Myrtaceae Eucalyptus pruinosa subsp.tenuata
Silver-leaf Box 0 Unknown 4 1988 0 Unknown
Flowering Plants Myrtaceae Eucalyptus tectifica McArthur River Box 0 Unknown 0 Unknown 0 UnknownFlowering Plants Myrtaceae Eucalyptus tetrodonta Darwin Stringybark 0 Unknown 2 1988 0 UnknownFlowering Plants Myrtaceae Lithomyrtus hypoleuca Lithomyrtus 0 Unknown 2 1977 0 UnknownFlowering Plants Myrtaceae Lophostemon grandiflorus Northern Swamp Box 0 Unknown 0 Unknown 0 UnknownFlowering Plants Myrtaceae Melaleuca acacioides Coastal Paperbark 0 Unknown 2 1988 0 UnknownFlowering Plants Myrtaceae Melaleuca argentea Silver-leaved Paperbark 0 Unknown 2 1988 0 UnknownFlowering Plants Myrtaceae Melaleuca citrolens Lemon-scented Paperbark 0 Unknown 9 1988 0 UnknownFlowering Plants Myrtaceae Melaleuca leucadendra Weeping Paperbark 0 Unknown 2 1988 0 UnknownFlowering Plants Myrtaceae Melaleuca nervosa Yellow-barked Paperbark 0 Unknown 2 1988 0 UnknownFlowering Plants Myrtaceae Melaleuca viridiflora Broad-leaved Paperbark 0 Unknown 4 1988 0 UnknownFlowering Plants Zygophyllaceae Tribulopis angustifolia Tribulopis 0 Unknown 0 Unknown 0 UnknownFlowering Plants Celastraceae Denhamia cunninghamii Yellowberry Bush 0 Unknown 8 1988 0 UnknownFlowering Plants Celastraceae Denhamia obscura Orange Root 0 Unknown 2 1988 0 UnknownFlowering Plants Celastraceae Stackhousia intermedia Wiry Stackhousia 0 Unknown 2 1977 0 UnknownFlowering Plants Violaceae Hybanthus aurantiacus Orange Spade Flower 0 Unknown 0 Unknown 0 UnknownFlowering Plants Violaceae Hybanthus enneaspermus Blue Spade Flower 0 Unknown 7 1986 0 UnknownFlowering Plants Violaceae Hybanthus enneaspermus
subsp. enneaspermusBlue Spade Flower 0 Unknown 0 Unknown 0 Unknown
Flowering Plants Euphorbiaceae Euphorbia biconvexa Euphorbia 0 Unknown 10 1988 0 UnknownFlowering Plants Euphorbiaceae Euphorbia bifida Euphorbia 0 Unknown 4 1988 0 UnknownFlowering Plants Euphorbiaceae Euphorbia mitchelliana Native Gypsophila 0 Unknown 4 1986 0 UnknownFlowering Plants Euphorbiaceae Euphorbia schultzii var.
comansEuphorbia 0 Unknown 6 1989 0 Unknown
Flowering Plants Euphorbiaceae Euphorbia schultzii var.schultzii
Euphorbia 0 Unknown 6 1988 0 Unknown
Flowering Plants Phyllanthaceae Antidesma ghesaembilla Black Currant Bush 0 Unknown 2 1986 0 UnknownFlowering Plants Phyllanthaceae Antidesma parvifolium Currant Bush 0 Unknown 0 Unknown 0 UnknownFlowering Plants Phyllanthaceae Breynia cernua Breynia 0 Unknown 4 1988 0 UnknownFlowering Plants Phyllanthaceae Flueggea virosa White Currant 0 Unknown 8 1988 0 UnknownFlowering Plants Phyllanthaceae Flueggea virosa subsp.
melanthesoidesWhite Currant 0 Unknown 0 Unknown 0 Unknown
Flowering Plants Phyllanthaceae Margaritaria dubium-traceyi Tracey's Puzzle 0 Unknown 0 Unknown 0 UnknownFlowering Plants Phyllanthaceae Phyllanthus carpentariae Phyllanthus 0 Unknown 0 Unknown 0 UnknownFlowering Plants Phyllanthaceae Phyllanthus exilis Phyllanthus 0 Unknown 15 1995 0 UnknownFlowering Plants Phyllanthaceae Phyllanthus fuernrohrii Sand Spurge 0 Unknown 2 1988 0 UnknownFlowering Plants Phyllanthaceae Phyllanthus hebecarpus Phyllanthus 0 Unknown 3 1987 0 UnknownFlowering Plants Phyllanthaceae Phyllanthus indigoferoides Phyllanthus 0 Unknown 1 1971 0 UnknownFlowering Plants Phyllanthaceae Phyllanthus
maderaspatensisPhyllanthus 0 Unknown 2 1988 0 Unknown
Flowering Plants Phyllanthaceae Phyllanthus minutiflorus Phyllanthus 0 Unknown 2 1989 0 UnknownFlowering Plants Phyllanthaceae Phyllanthus virgatus Seed-under-leaf 0 Unknown 0 Unknown 0 UnknownFlowering Plants Phyllanthaceae Poranthera microphylla Small Poranthera 0 Unknown 4 1977 0 UnknownFlowering Plants Phyllanthaceae Sauropus rhytidospermus Sauropus 0 Unknown 0 Unknown 0 UnknownFlowering Plants Picrodendraceae Petalostigma banksii Quinine Bush 0 Unknown 4 1987 0 UnknownFlowering Plants Picrodendraceae Petalostigma pubescens Quinine Tree 0 Unknown 10 1988 0 Unknown

Group Family Name Scientific Name Common Name NTStatus
NationalStatus
#Observations #LatestObservationDate
#Specimens #LatestSpecimanDate
#Surveys #LatestSurveyRecord
Flowering Plants Erythroxylaceae Erythroxylum ellipticum Kerosene Wood 0 Unknown 2 1988 0 UnknownFlowering Plants Fabaceae Abrus precatorius Crab`s Eye 0 Unknown 3 1988 0 UnknownFlowering Plants Fabaceae Abrus precatorius subsp.
precatoriusCrab`s Eye 0 Unknown 0 Unknown 0 Unknown
Flowering Plants Fabaceae Acacia alleniana Needle-leaved Wattle 0 Unknown 3 1986 0 UnknownFlowering Plants Fabaceae Acacia ancistrocarpa Fitzroy Wattle 0 Unknown 0 Unknown 0 UnknownFlowering Plants Fabaceae Acacia calligera Wattle 0 Unknown 39 1993 0 UnknownFlowering Plants Fabaceae Acacia conspersa Wattle 0 Unknown 2 1971 0 UnknownFlowering Plants Fabaceae Acacia difficilis River Wattle 0 Unknown 4 1987 0 UnknownFlowering Plants Fabaceae Acacia dimidiata Swamp Wattle 0 Unknown 0 Unknown 0 UnknownFlowering Plants Fabaceae Acacia drepanocarpa subsp.
latifoliaWattle 0 Unknown 2 1977 0 Unknown
Flowering Plants Fabaceae Acacia galioides Wattle 0 Unknown 28 1986 0 UnknownFlowering Plants Fabaceae Acacia gonoclada Wattle 0 Unknown 8 1992 0 UnknownFlowering Plants Fabaceae Acacia hammondii Wattle 0 Unknown 11 1991 0 UnknownFlowering Plants Fabaceae Acacia hemignosta Club-leaf Wattle 0 Unknown 0 Unknown 0 UnknownFlowering Plants Fabaceae Acacia holosericea Candelabra Wattle 0 Unknown 4 1991 0 UnknownFlowering Plants Fabaceae Acacia humifusa Cape York Wattle 0 Unknown 2 1977 0 UnknownFlowering Plants Fabaceae Acacia latescens Ball Wattle 0 Unknown 4 1977 0 UnknownFlowering Plants Fabaceae Acacia limbata Wattle 0 Unknown 0 Unknown 0 UnknownFlowering Plants Fabaceae Acacia lycopodiifolia Cypress Wattle 0 Unknown 0 Unknown 0 UnknownFlowering Plants Fabaceae Acacia lysiphloia Turpentine Bush 0 Unknown 2 1987 0 UnknownFlowering Plants Fabaceae Acacia megalantha Wattle 0 Unknown 0 Unknown 0 UnknownFlowering Plants Fabaceae Acacia monticola Hill Turpentine 0 Unknown 0 Unknown 0 UnknownFlowering Plants Fabaceae Acacia oncinocarpa Wattle 0 Unknown 0 Unknown 0 UnknownFlowering Plants Fabaceae Acacia platycarpa Ghost Wattle 0 Unknown 0 Unknown 0 UnknownFlowering Plants Fabaceae Acacia plectocarpa Wattle 0 Unknown 0 Unknown 0 UnknownFlowering Plants Fabaceae Acacia plectocarpa subsp.
tanumbirinensisWattle 0 Unknown 4 1988 0 Unknown
Flowering Plants Fabaceae Acacia shirleyi Lancewood 0 Unknown 5 1991 0 UnknownFlowering Plants Fabaceae Acacia sublanata Spiny Wattle 0 Unknown 0 Unknown 0 UnknownFlowering Plants Fabaceae Acacia subternata Wattle 0 Unknown 6 1986 0 UnknownFlowering Plants Fabaceae Acacia umbellata Wattle 0 Unknown 0 Unknown 0 UnknownFlowering Plants Fabaceae Acacia wickhamii Wickham`s Wattle 0 Unknown 0 Unknown 0 UnknownFlowering Plants Fabaceae Acacia wickhamii subsp.
wickhamiiWattle 0 Unknown 0 Unknown 0 Unknown
Flowering Plants Fabaceae Aeschynomene indica Budda Pea 0 Unknown 2 1959 0 UnknownFlowering Plants Fabaceae Bauhinia cunninghamii Butterfly Tree 0 Unknown 4 1987 0 UnknownFlowering Plants Fabaceae Bossiaea bossiaeoides Holly-leaved Pea-flower 0 Unknown 0 Unknown 0 UnknownFlowering Plants Fabaceae Cajanus pubescens Pigeon-pea 0 Unknown 8 1986 0 UnknownFlowering Plants Fabaceae Chamaecrista absus var.
absusHairy Cassia 0 Unknown 12 1995 0 Unknown
Flowering Plants Fabaceae Chamaecrista mimosoides Five-leafed Cassia 0 Unknown 2 1986 0 UnknownFlowering Plants Fabaceae Chamaecrista nomame Cassia 0 Unknown 0 Unknown 0 UnknownFlowering Plants Fabaceae Chamaecrista nomame var.
nomameCassia 0 Unknown 2 1991 0 Unknown
Flowering Plants Fabaceae Chamaecrista symonii Dwarf Cassia 0 Unknown 6 1985 0 Unknown

Group Family Name Scientific Name Common Name NTStatus
NationalStatus
#Observations #LatestObservationDate
#Specimens #LatestSpecimanDate
#Surveys #LatestSurveyRecord
Flowering Plants Fabaceae Crotalaria brevis Rattlepod 0 Unknown 0 Unknown 0 UnknownFlowering Plants Fabaceae Crotalaria medicaginea Trefoil Rattlepod 0 Unknown 0 Unknown 0 UnknownFlowering Plants Fabaceae Crotalaria medicaginea var.
neglectaTrefoil Rattlepod 0 Unknown 2 1986 0 Unknown
Flowering Plants Fabaceae Crotalaria montana Rattlepod 0 Unknown 0 Unknown 0 UnknownFlowering Plants Fabaceae Crotalaria montana var.
angustifoliaRattlepod 0 Unknown 2 1988 0 Unknown
Flowering Plants Fabaceae Crotalaria novae-hollandiae New Holland Rattlepod 0 Unknown 0 Unknown 0 UnknownFlowering Plants Fabaceae Crotalaria ramosissima Rattlepod 0 Unknown 1 1988 0 UnknownFlowering Plants Fabaceae Cullen cinereum Annual Verbine 0 Unknown 2 1947 0 UnknownFlowering Plants Fabaceae Cullen plumosum Scurf-pea 0 Unknown 6 1987 0 UnknownFlowering Plants Fabaceae Desmodium brachypodum Large Tick-trefoil 0 Unknown 4 1989 0 UnknownFlowering Plants Fabaceae Desmodium campylocaulon Creeping Tick-trefoil 0 Unknown 4 2001 0 UnknownFlowering Plants Fabaceae Desmodium muelleri Tick-trefoil 0 Unknown 8 1994 0 UnknownFlowering Plants Fabaceae Dichrostachys spicata Single Thorn Prickly Bush 0 Unknown 2 1986 0 UnknownFlowering Plants Fabaceae Erythrina vespertilio subsp.
vespertilioBat Wing Coral Tree 0 Unknown 2 1987 0 Unknown
Flowering Plants Fabaceae Erythrophleumchlorostachys
Northern Ironwood 0 Unknown 2 1987 0 Unknown
Flowering Plants Fabaceae Flemingia pauciflora Flemingia 0 Unknown 0 Unknown 0 UnknownFlowering Plants Fabaceae Galactia muelleri Mueller's Pea 0 Unknown 2 1988 0 UnknownFlowering Plants Fabaceae Galactia tenuiflora Poison Pea 0 Unknown 2 1987 0 UnknownFlowering Plants Fabaceae Glycine tomentella Rusty Glycine 0 Unknown 4 2001 0 UnknownFlowering Plants Fabaceae Indigofera colutea Sticky Indigo 0 Unknown 2 1986 0 UnknownFlowering Plants Fabaceae Indigofera haplophylla Indigo 0 Unknown 6 1988 0 UnknownFlowering Plants Fabaceae Indigofera linifolia Native Indigo 0 Unknown 4 1988 0 UnknownFlowering Plants Fabaceae Indigofera linnaei Birdsville Indigo 0 Unknown 6 1988 0 UnknownFlowering Plants Fabaceae Indigofera trita Indigo 0 Unknown 6 1988 0 UnknownFlowering Plants Fabaceae Jacksonia dilatata Cladode Pea 0 Unknown 4 1977 0 UnknownFlowering Plants Fabaceae Jacksonia odontoclada Jacksonia 0 Unknown 2 1971 0 UnknownFlowering Plants Fabaceae Mirbelia viminalis Yellow Broom 0 Unknown 2 1977 0 UnknownFlowering Plants Fabaceae Neptunia dimorphantha Sensitive Plant 0 Unknown 0 Unknown 0 UnknownFlowering Plants Fabaceae Neptunia gracilis Native Sensitive Plant 0 Unknown 0 Unknown 0 UnknownFlowering Plants Fabaceae Neptunia monosperma One-seeded Sensitive Plant 0 Unknown 0 Unknown 0 UnknownFlowering Plants Fabaceae Rhynchosia minima Native Pea 0 Unknown 6 1988 0 UnknownFlowering Plants Fabaceae Senna costata Cassia 0 Unknown 4 1991 0 UnknownFlowering Plants Fabaceae Senna venusta Graceful Cassia 0 Unknown 2 1986 0 UnknownFlowering Plants Fabaceae Sesbania muelleri Peabush 0 Unknown 1 1986 0 UnknownFlowering Plants Fabaceae Tephrosia brachyodon Red Pea-bush 0 Unknown 4 1988 0 UnknownFlowering Plants Fabaceae Tephrosia brachyodon var.
longifoliaRed Pea-bush 0 Unknown 1 1991 0 Unknown
Flowering Plants Fabaceae Tephrosia conspicua Tephrosia 0 Unknown 2 1971 0 UnknownFlowering Plants Fabaceae Tephrosia delestangii Tephrosia 0 Unknown 0 Unknown 0 UnknownFlowering Plants Fabaceae Tephrosia leptoclada Tephrosia 0 Unknown 4 1986 0 UnknownFlowering Plants Fabaceae Tephrosia remotiflora Tephrosia 0 Unknown 2 1970 0 UnknownFlowering Plants Fabaceae Tephrosia rosea Flinder`s River Poison 0 Unknown 0 Unknown 0 UnknownFlowering Plants Fabaceae Tephrosia simplicifolia Tephrosia 0 Unknown 4 1979 0 Unknown

Group Family Name Scientific Name Common Name NTStatus
NationalStatus
#Observations #LatestObservationDate
#Specimens #LatestSpecimanDate
#Surveys #LatestSurveyRecord
Flowering Plants Fabaceae Tephrosia sp. OT Station Tephrosia 0 Unknown 8 1986 0 UnknownFlowering Plants Fabaceae Uraria lagopodioides Purple Clover-weed 0 Unknown 6 1989 0 UnknownFlowering Plants Fabaceae Vachellia ditricha Wattle 0 Unknown 6 1986 0 UnknownFlowering Plants Fabaceae Vachellia valida Wattle 0 Unknown 2 1986 0 UnknownFlowering Plants Fabaceae Vigna lanceolata Maloga Bean 0 Unknown 0 Unknown 0 UnknownFlowering Plants Fabaceae Vigna lanceolata var.
filiformisMaloga Bean 0 Unknown 0 Unknown 0 Unknown
Flowering Plants Fabaceae Vigna lanceolata var.lanceolata
Maloga Bean 0 Unknown 0 Unknown 0 Unknown
Flowering Plants Fabaceae Zornia albiflora Zornia 0 Unknown 2 1947 0 UnknownFlowering Plants Fabaceae Zornia muriculata Zornia 0 Unknown 6 1988 0 UnknownFlowering Plants Fabaceae Zornia muriculata subsp.
angustataZornia 0 Unknown 2 1972 0 Unknown
Flowering Plants Fabaceae Zornia prostrata Zornia 0 Unknown 2 1986 0 UnknownFlowering Plants Polygalaceae Polygala barbata Milkwort 0 Unknown 4 1991 0 UnknownFlowering Plants Polygalaceae Polygala longifolia Milkwort 0 Unknown 2 1995 0 UnknownFlowering Plants Polygalaceae Polygala orbicularis Milkwort 0 Unknown 0 Unknown 0 UnknownFlowering Plants Polygalaceae Polygala pterocarpa Milkwort 0 Unknown 2 2007 0 UnknownFlowering Plants Rhamnaceae Alphitonia excelsa Red Ash 0 Unknown 7 1989 0 UnknownFlowering Plants Rhamnaceae Ventilago viminalis Supplejack 0 Unknown 2 1987 0 UnknownFlowering Plants Cannabaceae Trema tomentosa Peach-leaved Poison-bush 0 Unknown 2 1977 0 UnknownFlowering Plants Moraceae Ficus cerasicarpa Fig 0 Unknown 6 1987 0 UnknownFlowering Plants Moraceae Ficus subpuberula Fig 0 Unknown 4 1977 0 UnknownFlowering Plants Moraceae Ficus virens var. virens Banyan 0 Unknown 2 1977 0 UnknownFlowering Plants Cucurbitaceae Cucumis argenteus Melon 0 Unknown 2 2008 0 UnknownFlowering Plants Cucurbitaceae Cucumis melo Ulcardo Melon 0 Unknown 0 Unknown 5 1991Flowering Plants Casuarinaceae Casuarina cunninghamiana
subsp. miodonRiver Oak 0 Unknown 2 1988 0 Unknown
Flowering Plants Capparaceae Capparis lasiantha Split-arse-jack 0 Unknown 2 1987 0 UnknownFlowering Plants Capparaceae Capparis umbonata Northern Wild Orange 0 Unknown 4 1986 0 UnknownFlowering Plants Cleomaceae Cleome viscosa Tickweed 0 Unknown 4 1991 0 UnknownFlowering Plants Bixaceae Cochlospermum fraseri Kapok Bush 0 Unknown 0 Unknown 0 UnknownFlowering Plants Bixaceae Cochlospermum gregorii Cotton Tree 0 Unknown 5 1989 0 UnknownFlowering Plants Malvaceae Abutilon fraseri subsp.
fraseriDwarf Lantern-bush 0 Unknown 0 Unknown 0 Unknown
Flowering Plants Malvaceae Abutilon hannii Mallow 0 Unknown 0 Unknown 0 UnknownFlowering Plants Malvaceae Abutilon hannii subsp.
prostrateLantern Bush 0 Unknown 7 1988 0 Unknown
Flowering Plants Malvaceae Abutilon otocarpum Desert Chinese Lantern 0 Unknown 6 1991 0 UnknownFlowering Plants Malvaceae Brachychiton diversifolius
subsp. diversifoliusNorthern Kurrajong 0 Unknown 2 1977 0 Unknown
Flowering Plants Malvaceae Brachychiton paradoxus Red-flowering Kurrajong 0 Unknown 2 1991 0 UnknownFlowering Plants Malvaceae Corchorus aestuans Grubweed 0 Unknown 2 1988 0 UnknownFlowering Plants Malvaceae Corchorus sidoides Flannel Weed 0 Unknown 2 1991 0 UnknownFlowering Plants Malvaceae Corchorus sidoides subsp.
sidoidesFlannel Weed 0 Unknown 8 1991 0 Unknown

Group Family Name Scientific Name Common Name NTStatus
NationalStatus
#Observations #LatestObservationDate
#Specimens #LatestSpecimanDate
#Surveys #LatestSurveyRecord
Flowering Plants Malvaceae Corchorus sidoides subsp.vermicularis
Flannel Weed 0 Unknown 2 1992 0 Unknown
Flowering Plants Malvaceae Corchorus tridens Grubweed 0 Unknown 2 2001 0 UnknownFlowering Plants Malvaceae Gossypium australe Native Cotton 0 Unknown 5 1991 0 UnknownFlowering Plants Malvaceae Grewia breviflora Coffee Fruit 0 Unknown 0 Unknown 0 UnknownFlowering Plants Malvaceae Grewia mesomischa Grewia 0 Unknown 0 Unknown 0 UnknownFlowering Plants Malvaceae Grewia retusifolia Emu Berries 0 Unknown 8 1987 0 UnknownFlowering Plants Malvaceae Helicteres isora Spiral Bush 0 Unknown 2 1972 0 UnknownFlowering Plants Malvaceae Herissantia crispa Indian Mallow 0 Unknown 6 1991 0 UnknownFlowering Plants Malvaceae Hibiscus leptocladus Variable-leaf Hibiscus 0 Unknown 2 1972 0 UnknownFlowering Plants Malvaceae Hibiscus meraukensis Ballerina Hibiscus 0 Unknown 8 1989 0 UnknownFlowering Plants Malvaceae Hibiscus pentaphyllus Native Hibiscus 0 Unknown 11 1991 0 UnknownFlowering Plants Malvaceae Hibiscus sturtii Sturt`s Hibiscus 0 Unknown 4 1989 0 UnknownFlowering Plants Malvaceae Hibiscus sturtii var.
campylochlamysSturt`s Hibiscus 0 Unknown 10 1979 0 Unknown
Flowering Plants Malvaceae Hibiscus sturtii var.grandiflorus
Sturt`s Hibiscus 0 Unknown 2 1987 0 Unknown
Flowering Plants Malvaceae Hibiscus verdcourtii Bladder Ketmia 0 Unknown 4 1979 0 UnknownFlowering Plants Malvaceae Hibiscus zonatus Pink Perennial Hibiscus 0 Unknown 1 1977 0 UnknownFlowering Plants Malvaceae Melhania oblongifolia Velvet Hibiscus 0 Unknown 6 1987 0 UnknownFlowering Plants Malvaceae Sida brachypoda Sida 0 Unknown 0 Unknown 0 UnknownFlowering Plants Malvaceae Sida fibulifera Silver Sida 0 Unknown 3 1986 0 UnknownFlowering Plants Malvaceae Sida filiformis Fine Sida 0 Unknown 2 1989 0 UnknownFlowering Plants Malvaceae Sida hackettiana Sida 0 Unknown 10 1987 0 UnknownFlowering Plants Malvaceae Sida rohlenae Shrub Sida 0 Unknown 2 1987 0 UnknownFlowering Plants Malvaceae Sida rohlenae subsp.
rohlenaeShrub Sida 0 Unknown 0 Unknown 0 Unknown
Flowering Plants Malvaceae Sida sp. Mt Bundey Sida 0 Unknown 2 2001 0 UnknownFlowering Plants Malvaceae Sida spinosa Spiny Sida 0 Unknown 0 Unknown 0 UnknownFlowering Plants Malvaceae Sida trichopoda High Sida 0 Unknown 2 1986 0 UnknownFlowering Plants Malvaceae Triumfetta fissurata Burbark DD 0 Unknown 2 1977 0 UnknownFlowering Plants Malvaceae Triumfetta glaucescens Burbark 0 Unknown 0 Unknown 0 UnknownFlowering Plants Malvaceae Triumfetta micracantha Burbark 0 Unknown 6 1986 0 UnknownFlowering Plants Malvaceae Triumfetta plumigera Burbark 0 Unknown 6 1986 0 UnknownFlowering Plants Malvaceae Waltheria indica Waltheria 0 Unknown 3 1987 0 UnknownFlowering Plants Thymelaeaceae Thecanthes punicea Red Wax Plant 0 Unknown 6 2001 0 UnknownFlowering Plants Thymelaeaceae Thecanthes sanguinea Thecanthes 0 Unknown 2 1985 0 UnknownFlowering Plants Sapindaceae Atalaya hemiglauca Whitewood 0 Unknown 0 Unknown 0 UnknownFlowering Plants Sapindaceae Dodonaea hispidula False Hopbush 0 Unknown 1 1986 0 UnknownFlowering Plants Sapindaceae Dodonaea lanceolata Yellow Hop-bush 0 Unknown 2 1987 0 UnknownFlowering Plants Sapindaceae Dodonaea lanceolata var.
lanceolataYellow Hop-bush 0 Unknown 2 1979 0 Unknown
Flowering Plants Sapindaceae Dodonaea oxyptera Hop Bush 0 Unknown 2 1977 0 UnknownFlowering Plants Sapindaceae Dodonaea physocarpa Balloon Hopbush 0 Unknown 17 1989 0 UnknownFlowering Plants Sapindaceae Dodonaea platyptera Hop Bush 0 Unknown 0 Unknown 0 UnknownFlowering Plants Sapindaceae Dodonaea stenophylla Netted Hopbush 0 Unknown 15 2001 0 UnknownFlowering Plants Meliaceae Owenia vernicosa Emu Apple 0 Unknown 2 1988 0 Unknown

Group Family Name Scientific Name Common Name NTStatus
NationalStatus
#Observations #LatestObservationDate
#Specimens #LatestSpecimanDate
#Surveys #LatestSurveyRecord
Flowering Plants Rutaceae Boronia lanceolata Boronia 0 Unknown 2 1977 0 UnknownFlowering Plants Ebenaceae Diospyros humilis Small-leaved Ebony 0 Unknown 2 1987 0 UnknownFlowering Plants Ebenaceae Diospyros rugosula Iron Tree 0 Unknown 0 Unknown 0 UnknownFlowering Plants Boraginaceae Coldenia procumbens Coldenia 0 Unknown 2 1988 0 UnknownFlowering Plants Boraginaceae Ehretia saligna Coonta 0 Unknown 2 1988 0 UnknownFlowering Plants Boraginaceae Ehretia saligna var.
membranifoliaCoonta 0 Unknown 4 1988 0 Unknown
Flowering Plants Boraginaceae Heliotropium bracteatum Heliotrope 0 Unknown 0 Unknown 0 UnknownFlowering Plants Boraginaceae Heliotropium glabellum Heliotrope 0 Unknown 4 1986 0 UnknownFlowering Plants Boraginaceae Heliotropium tenuifolium Devil’s Son 0 Unknown 0 Unknown 0 UnknownFlowering Plants Boraginaceae Trichodesma zeylanicum Cattle Bush 0 Unknown 2 1988 0 UnknownFlowering Plants Rubiaceae Gardenia ewartii subsp.
ewartiiNative Gardenia 0 Unknown 6 1988 0 Unknown
Flowering Plants Rubiaceae Gardenia megasperma Native Gardenia 0 Unknown 0 Unknown 0 UnknownFlowering Plants Rubiaceae Gardenia pyriformis subsp.
orientalisNative Gardenia 0 Unknown 2 1977 0 Unknown
Flowering Plants Rubiaceae Oldenlandia argillacea Oldenlandia 0 Unknown 2 1986 0 UnknownFlowering Plants Rubiaceae Oldenlandia galioides Oldenlandia 0 Unknown 4 1995 0 UnknownFlowering Plants Rubiaceae Oldenlandia mitrasacmoides Oldenlandia 0 Unknown 4 1991 0 UnknownFlowering Plants Rubiaceae Psydrax attenuata var.
myrmecophilaCanthium 0 Unknown 2 1977 0 Unknown
Flowering Plants Rubiaceae Spermacoce auriculata Buttonweed 0 Unknown 2 1988 0 UnknownFlowering Plants Rubiaceae Spermacoce brachystema Buttonweed DD 0 Unknown 0 Unknown 0 UnknownFlowering Plants Rubiaceae Spermacoce dolichosperma Buttonweed 0 Unknown 10 2001 0 UnknownFlowering Plants Rubiaceae Spermacoce platyloba Buttonweed 0 Unknown 2 1977 0 UnknownFlowering Plants Rubiaceae Spermacoce stenophylla Blue Buttonweed 0 Unknown 0 Unknown 0 UnknownFlowering Plants Rubiaceae Tarenna dallachiana subsp.
expandensTree Ixora 0 Unknown 0 Unknown 0 Unknown
Flowering Plants Loganiaceae Mitrasacme micrantha Mitre Plant 0 Unknown 2 2001 0 UnknownFlowering Plants Apocynaceae Carissa lanceolata Conkerberry 0 Unknown 4 1987 0 UnknownFlowering Plants Apocynaceae Marsdenia australis Bush Banana 0 Unknown 4 1987 0 UnknownFlowering Plants Apocynaceae Marsdenia geminata Milkvine 0 Unknown 6 2001 0 UnknownFlowering Plants Apocynaceae Marsdenia trinervis Milkvine 0 Unknown 0 Unknown 0 UnknownFlowering Plants Apocynaceae Marsdenia viridiflora subsp.
tropicaBush Banana 0 Unknown 4 1988 0 Unknown
Flowering Plants Apocynaceae Sarcostemma viminale Caustic Vine 0 Unknown 0 Unknown 0 UnknownFlowering Plants Apocynaceae Sarcostemma viminale
subsp. brunonianumCaustic Vine 0 Unknown 2 1979 0 Unknown
Flowering Plants Apocynaceae Secamone elliptica Corky Milk Vine 0 Unknown 7 1991 0 UnknownFlowering Plants Apocynaceae Tylophora cinerascens Tylophora 0 Unknown 0 Unknown 0 UnknownFlowering Plants Apocynaceae Tylophora flexuosa Tylophora 0 Unknown 0 Unknown 0 UnknownFlowering Plants Apocynaceae Wrightia saligna Milk Bush 0 Unknown 0 Unknown 0 UnknownFlowering Plants Hydroleaceae Hydrolea zeylanica False Fiddle-leaf 0 Unknown 3 1991 0 UnknownFlowering Plants Solanaceae Physalis angulata Wild Gooseberry 0 Unknown 2 1988 0 UnknownFlowering Plants Solanaceae Solanum dioicum Wild Tomato 0 Unknown 2 1977 0 UnknownFlowering Plants Solanaceae Solanum echinatum Wild Tomato 0 Unknown 4 1989 0 UnknownFlowering Plants Solanaceae Solanum ferocissimum Spiny Potato-bush 0 Unknown 0 Unknown 0 Unknown

Group Family Name Scientific Name Common Name NTStatus
NationalStatus
#Observations #LatestObservationDate
#Specimens #LatestSpecimanDate
#Surveys #LatestSurveyRecord
Flowering Plants Solanaceae Solanum lucani Thorny Nightshade 0 Unknown 4 1972 0 UnknownFlowering Plants Convolvulaceae Bonamia brevifolia Bonamia 0 Unknown 0 Unknown 0 UnknownFlowering Plants Convolvulaceae Bonamia media Grey-vine 0 Unknown 3 1991 0 UnknownFlowering Plants Convolvulaceae Bonamia pannosa Bonamia 0 Unknown 4 1986 0 UnknownFlowering Plants Convolvulaceae Evolvulus alsinoides Blue Periwinkle 0 Unknown 8 1987 0 UnknownFlowering Plants Convolvulaceae Evolvulus alsinoides var.
decumbensBlue Periwinkle 0 Unknown 2 1979 0 Unknown
Flowering Plants Convolvulaceae Ipomoea argillicola Cow-vine 0 Unknown 0 Unknown 0 UnknownFlowering Plants Convolvulaceae Ipomoea eriocarpa Small Pink Convolvulus 0 Unknown 2 1986 0 UnknownFlowering Plants Convolvulaceae Ipomoea gracilis Slender Bindweed 0 Unknown 0 Unknown 0 UnknownFlowering Plants Convolvulaceae Ipomoea nil Morning Glory 0 Unknown 1 2001 0 UnknownFlowering Plants Convolvulaceae Ipomoea plebeia Bell Vine 0 Unknown 4 2001 0 UnknownFlowering Plants Convolvulaceae Ipomoea polymorpha Silky Cow-vine 0 Unknown 0 Unknown 0 UnknownFlowering Plants Convolvulaceae Jacquemontia paniculata Purple-flowered Jungle
Creeper0 Unknown 4 1991 0 Unknown
Flowering Plants Convolvulaceae Merremia gemella Merremia 0 Unknown 2 1988 0 UnknownFlowering Plants Convolvulaceae Merremia incisa Merremia DD 0 Unknown 2 1986 0 UnknownFlowering Plants Convolvulaceae Operculina aequisepala Potato Vine 0 Unknown 2 1979 0 UnknownFlowering Plants Convolvulaceae Polymeria ambigua Creeping Polymeria 0 Unknown 5 1991 0 UnknownFlowering Plants Convolvulaceae Xenostegia tridentata Morning Vine 0 Unknown 2 1987 0 UnknownFlowering Plants Oleaceae Jasminum molle Stiff Jasmine 0 Unknown 8 1989 0 UnknownFlowering Plants Acanthaceae Brunoniella australis Blue Trumpet 0 Unknown 5 1991 0 UnknownFlowering Plants Acanthaceae Hygrophila angustifolia Hygrophila 0 Unknown 4 1983 0 UnknownFlowering Plants Acanthaceae Hypoestes floribunda Rosy Hypoestes 0 Unknown 0 Unknown 0 UnknownFlowering Plants Acanthaceae Hypoestes floribunda var.
cinereaRosy Hypoestes 0 Unknown 4 1991 0 Unknown
Flowering Plants Acanthaceae Rostellularia adscendens Pink Tongues 0 Unknown 2 1989 0 UnknownFlowering Plants Acanthaceae Rostellularia adscendens
var. clementiiPink Tongues 0 Unknown 2 1989 0 Unknown
Flowering Plants Acanthaceae Rostellularia adscendensvar. latifolia
Pink Tongues 0 Unknown 2 1988 0 Unknown
Flowering Plants Bignoniaceae Dolichandrone filiformis Whistling Tree 0 Unknown 0 Unknown 0 UnknownFlowering Plants Bignoniaceae Dolichandrone heterophylla Lemon Wood 0 Unknown 4 1989 0 UnknownFlowering Plants Lamiaceae Clerodendrum floribundum Smooth Spiderbush 0 Unknown 4 1988 0 UnknownFlowering Plants Lamiaceae Premna acuminata Premna 0 Unknown 0 Unknown 0 UnknownFlowering Plants Phrymaceae Glossostigma diandrum Two-Anther Mud-Mat 0 Unknown 2 1991 0 UnknownFlowering Plants Phrymaceae Peplidium muelleri Pepilidium 0 Unknown 4 1995 0 UnknownFlowering Plants Orobanchaceae Buchnera linearis Dainty Bush Flower 0 Unknown 0 Unknown 0 UnknownFlowering Plants Plantaginaceae Bacopa floribunda Bacopa 0 Unknown 2 1971 0 UnknownFlowering Plants Plantaginaceae Stemodia glabella Smooth Bluerod 0 Unknown 4 1988 0 UnknownFlowering Plants Plantaginaceae Stemodia lathraia Bluerod 0 Unknown 2 1991 0 UnknownFlowering Plants Plantaginaceae Stemodia lythrifolia Bluerod 0 Unknown 0 Unknown 0 UnknownFlowering Plants Plantaginaceae Stemodia viscosa Sticky Bluerod 0 Unknown 2 1978 0 UnknownFlowering Plants Plantaginaceae Striga curviflora Witchweed 0 Unknown 2 1991 0 UnknownFlowering Plants Lentibulariaceae Utricularia stellaris Bladderwort DD 0 Unknown 4 1987 0 UnknownFlowering Plants Araliaceae Trachymene didiscoides Wild Parsnip 0 Unknown 2 1977 0 UnknownFlowering Plants Campanulaceae Isotoma sp. Tanumbirini Isotome DD 0 Unknown 4 2001 0 Unknown

Group Family Name Scientific Name Common Name NTStatus
NationalStatus
#Observations #LatestObservationDate
#Specimens #LatestSpecimanDate
#Surveys #LatestSurveyRecord
Flowering Plants Campanulaceae Lobelia dioica Lobelia 0 Unknown 4 1991 0 UnknownFlowering Plants Campanulaceae Lobelia douglasiana Slender Lobelia 0 Unknown 2 1991 0 UnknownFlowering Plants Campanulaceae Wahlenbergia
caryophylloidesNorthern Bluebell 0 Unknown 2 1977 0 Unknown
Flowering Plants Stylidiaceae Stylidium adenophorum Trigger Plant 0 Unknown 2 1977 0 UnknownFlowering Plants Stylidiaceae Stylidium floodii Trigger Plant 0 Unknown 2 1991 0 UnknownFlowering Plants Menyanthaceae Nymphoides crenata Wavy Marshwort 0 Unknown 7 1994 0 UnknownFlowering Plants Goodeniaceae Brunonia australis Blue Pincushion 0 Unknown 0 Unknown 0 UnknownFlowering Plants Goodeniaceae Goodenia armitiana Narrow-leaved Goodenia 0 Unknown 2 1947 0 UnknownFlowering Plants Goodeniaceae Goodenia byrnesii Split-end Goodenia 0 Unknown 2 1991 0 UnknownFlowering Plants Goodeniaceae Goodenia gracilis Slender Goodenia 0 Unknown 7 2001 0 UnknownFlowering Plants Goodeniaceae Goodenia hispida Goodenia 0 Unknown 6 2001 0 UnknownFlowering Plants Goodeniaceae Goodenia janamba Goodenia 0 Unknown 2 1947 0 UnknownFlowering Plants Goodeniaceae Goodenia lamprosperma Goodenia 0 Unknown 6 2001 0 UnknownFlowering Plants Goodeniaceae Goodenia leiosperma Goodenia 0 Unknown 2 1989 0 UnknownFlowering Plants Goodeniaceae Goodenia odonnellii Goodenia 0 Unknown 2 1977 0 UnknownFlowering Plants Goodeniaceae Goodenia pilosa Hairy Goodenia 0 Unknown 4 1991 0 UnknownFlowering Plants Goodeniaceae Goodenia viscidula Goodenia 0 Unknown 4 1991 0 UnknownFlowering Plants Goodeniaceae Scaevola revoluta Fanflower 0 Unknown 4 1983 0 UnknownFlowering Plants Asteraceae Bidens bipinnata Cobbler's Pegs 0 Unknown 4 1989 0 UnknownFlowering Plants Asteraceae Blumea diffusa Daisy 0 Unknown 2 1977 0 UnknownFlowering Plants Asteraceae Blumea integrifolia Daisy 0 Unknown 2 1978 0 UnknownFlowering Plants Asteraceae Blumea saxatilis Daisy 0 Unknown 2 1989 0 UnknownFlowering Plants Asteraceae Blumea tenella Daisy 0 Unknown 8 2001 0 UnknownFlowering Plants Asteraceae Centipeda minima subsp.
macrocephalaSpreading Sneezeweed 0 Unknown 4 1991 0 Unknown
Flowering Plants Asteraceae Centipeda nidiformis Sneezeweed 0 Unknown 2 1987 0 UnknownFlowering Plants Asteraceae Eclipta sp. Humpty Doo Twin-heads 0 Unknown 2 1978 0 UnknownFlowering Plants Asteraceae Flaveria australasica Yellow Twin Stem 0 Unknown 2 1979 0 UnknownFlowering Plants Asteraceae Pterocaulon serrulatum Fruit Salad Bush 0 Unknown 0 Unknown 0 UnknownFlowering Plants Asteraceae Pterocaulon serrulatum var.
velutinumFruit Salad Bush 0 Unknown 2 1987 0 Unknown
Flowering Plants Asteraceae Pterocaulon sphacelatum Apple Bush 0 Unknown 4 1988 0 UnknownFlowering Plants Asteraceae Wedelia verbesinoides Daisy 0 Unknown 1 1977 0 UnknownFrogs Myobatrachidae Crinia bilingua Bilingual Froglet 0 Unknown 2 1987 0 UnknownFrogs Myobatrachidae Crinia deserticola Desert Froglet 0 Unknown 12 1977 0 UnknownFrogs Myobatrachidae Uperoleia lithomoda Stonemason Toadlet 0 Unknown 3 2010 0 UnknownFrogs Hylidae Litoria australis Giant Frog 1 1988 2 2006 0 UnknownFrogs Hylidae Litoria caerulea Green Tree-frog 12 2001 0 Unknown 1 1991Frogs Hylidae Litoria cultripes Knife-footed Frog 0 Unknown 1 2001 0 UnknownFrogs Hylidae Litoria pallida Pale Frog 1 1987 14 1987 0 UnknownFrogs Hylidae Litoria rothii Roth`s Tree-Frog 0 Unknown 2 1977 0 UnknownFrogs Hylidae Litoria rubella Red Tree-frog 2 2001 5 1987 0 UnknownReptiles Crocodylidae Crocodylus johnstoni Freshwater Crocodile 1 1987 0 Unknown 0 UnknownReptiles Gekkonidae Diplodactylus conspicillatus Fat-tailed Gecko 11 1994 3 1994 2 1991Reptiles Gekkonidae Gehyra australis Northern Dtella 2 1988 6 2001 2 1991
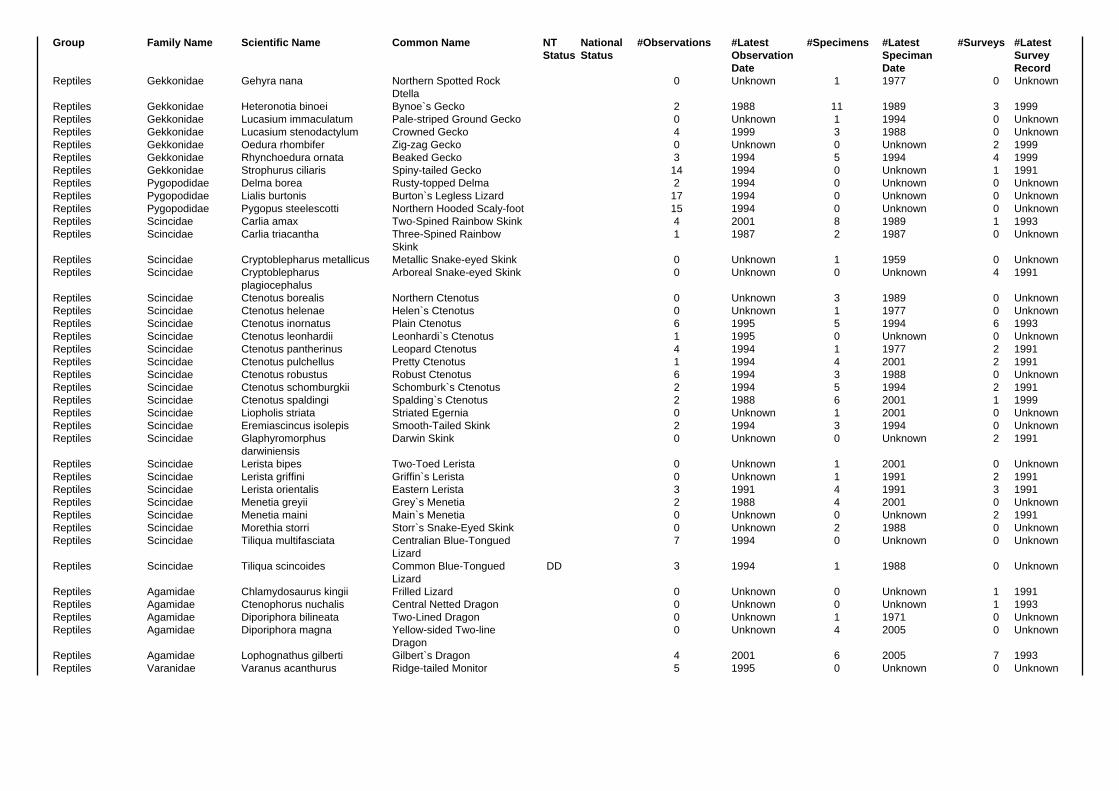
Group Family Name Scientific Name Common Name NTStatus
NationalStatus
#Observations #LatestObservationDate
#Specimens #LatestSpecimanDate
#Surveys #LatestSurveyRecord
Reptiles Gekkonidae Gehyra nana Northern Spotted RockDtella
0 Unknown 1 1977 0 Unknown
Reptiles Gekkonidae Heteronotia binoei Bynoe`s Gecko 2 1988 11 1989 3 1999Reptiles Gekkonidae Lucasium immaculatum Pale-striped Ground Gecko 0 Unknown 1 1994 0 UnknownReptiles Gekkonidae Lucasium stenodactylum Crowned Gecko 4 1999 3 1988 0 UnknownReptiles Gekkonidae Oedura rhombifer Zig-zag Gecko 0 Unknown 0 Unknown 2 1999Reptiles Gekkonidae Rhynchoedura ornata Beaked Gecko 3 1994 5 1994 4 1999Reptiles Gekkonidae Strophurus ciliaris Spiny-tailed Gecko 14 1994 0 Unknown 1 1991Reptiles Pygopodidae Delma borea Rusty-topped Delma 2 1994 0 Unknown 0 UnknownReptiles Pygopodidae Lialis burtonis Burton`s Legless Lizard 17 1994 0 Unknown 0 UnknownReptiles Pygopodidae Pygopus steelescotti Northern Hooded Scaly-foot 15 1994 0 Unknown 0 UnknownReptiles Scincidae Carlia amax Two-Spined Rainbow Skink 4 2001 8 1989 1 1993Reptiles Scincidae Carlia triacantha Three-Spined Rainbow
Skink1 1987 2 1987 0 Unknown
Reptiles Scincidae Cryptoblepharus metallicus Metallic Snake-eyed Skink 0 Unknown 1 1959 0 UnknownReptiles Scincidae Cryptoblepharus
plagiocephalusArboreal Snake-eyed Skink 0 Unknown 0 Unknown 4 1991
Reptiles Scincidae Ctenotus borealis Northern Ctenotus 0 Unknown 3 1989 0 UnknownReptiles Scincidae Ctenotus helenae Helen`s Ctenotus 0 Unknown 1 1977 0 UnknownReptiles Scincidae Ctenotus inornatus Plain Ctenotus 6 1995 5 1994 6 1993Reptiles Scincidae Ctenotus leonhardii Leonhardi`s Ctenotus 1 1995 0 Unknown 0 UnknownReptiles Scincidae Ctenotus pantherinus Leopard Ctenotus 4 1994 1 1977 2 1991Reptiles Scincidae Ctenotus pulchellus Pretty Ctenotus 1 1994 4 2001 2 1991Reptiles Scincidae Ctenotus robustus Robust Ctenotus 6 1994 3 1988 0 UnknownReptiles Scincidae Ctenotus schomburgkii Schomburk`s Ctenotus 2 1994 5 1994 2 1991Reptiles Scincidae Ctenotus spaldingi Spalding`s Ctenotus 2 1988 6 2001 1 1999Reptiles Scincidae Liopholis striata Striated Egernia 0 Unknown 1 2001 0 UnknownReptiles Scincidae Eremiascincus isolepis Smooth-Tailed Skink 2 1994 3 1994 0 UnknownReptiles Scincidae Glaphyromorphus
darwiniensisDarwin Skink 0 Unknown 0 Unknown 2 1991
Reptiles Scincidae Lerista bipes Two-Toed Lerista 0 Unknown 1 2001 0 UnknownReptiles Scincidae Lerista griffini Griffin`s Lerista 0 Unknown 1 1991 2 1991Reptiles Scincidae Lerista orientalis Eastern Lerista 3 1991 4 1991 3 1991Reptiles Scincidae Menetia greyii Grey`s Menetia 2 1988 4 2001 0 UnknownReptiles Scincidae Menetia maini Main`s Menetia 0 Unknown 0 Unknown 2 1991Reptiles Scincidae Morethia storri Storr`s Snake-Eyed Skink 0 Unknown 2 1988 0 UnknownReptiles Scincidae Tiliqua multifasciata Centralian Blue-Tongued
Lizard7 1994 0 Unknown 0 Unknown
Reptiles Scincidae Tiliqua scincoides Common Blue-TonguedLizard
DD 3 1994 1 1988 0 Unknown
Reptiles Agamidae Chlamydosaurus kingii Frilled Lizard 0 Unknown 0 Unknown 1 1991Reptiles Agamidae Ctenophorus nuchalis Central Netted Dragon 0 Unknown 0 Unknown 1 1993Reptiles Agamidae Diporiphora bilineata Two-Lined Dragon 0 Unknown 1 1971 0 UnknownReptiles Agamidae Diporiphora magna Yellow-sided Two-line
Dragon0 Unknown 4 2005 0 Unknown
Reptiles Agamidae Lophognathus gilberti Gilbert`s Dragon 4 2001 6 2005 7 1993Reptiles Varanidae Varanus acanthurus Ridge-tailed Monitor 5 1995 0 Unknown 0 Unknown

Group Family Name Scientific Name Common Name NTStatus
NationalStatus
#Observations #LatestObservationDate
#Specimens #LatestSpecimanDate
#Surveys #LatestSurveyRecord
Reptiles Varanidae Varanus gouldii Sand Goanna 3 2001 1 1999 3 1991Reptiles Varanidae Varanus mertensi Mertens` Water Monitor VU 3 1993 0 Unknown 1 1993Reptiles Varanidae Varanus scalaris Spotted Tree Monitor DD 2 1988 0 Unknown 0 UnknownReptiles Varanidae Varanus tristis Black-tailed Monitor 1 2001 1 1977 0 UnknownReptiles Typhlopidae Ramphotyphlops diversus Northern Blind Snake 0 Unknown 1 2001 0 UnknownReptiles Typhlopidae Ramphotyphlops
unguirostrisClaw-snouted Blind Snake 1 1988 1 1988 0 Unknown
Reptiles Pythonidae Antaresia childreni Children`s Python 4 1994 1 1988 1 1991Reptiles Elapidae Brachyurophis incinctus Unbanded Shovel-nosed
Snake1 1994 0 Unknown 0 Unknown
Reptiles Elapidae Brachyurophis roperi Northern Shovel-nosedSnake
2 1994 0 Unknown 0 Unknown
Reptiles Elapidae Demansia olivacea Olive Whip Snake DD 2 1994 0 Unknown 0 UnknownReptiles Elapidae Demansia papuensis Papaun Whip Snake 0 Unknown 1 1978 0 UnknownReptiles Elapidae Furina ornata Orange-naped Snake 1 1994 1 1994 0 UnknownReptiles Elapidae Pseudechis australis King Brown Snake 1 1988 0 Unknown 0 UnknownReptiles Elapidae Pseudonaja nuchalis Western Brown Snake 2 1994 0 Unknown 0 UnknownReptiles Elapidae Suta punctata Little Spotted Snake 4 1994 0 Unknown 0 UnknownBirds Phasianidae Coturnix ypsilophora Brown Quail 4 2001 0 Unknown 3 1999Birds Anatidae Chenonetta jubata Australian Wood Duck 1 1987 0 Unknown 0 UnknownBirds Anatidae Anas superciliosa Pacific Black Duck 2 1987 0 Unknown 0 UnknownBirds Podicipedidae Tachybaptus
novaehollandiaeAustralasian Grebe 1 1978 0 Unknown 0 Unknown
Birds Podicipedidae Poliocephalus poliocephalus Hoary-headed Grebe 1 1988 0 Unknown 0 UnknownBirds Columbidae Phaps chalcoptera Common Bronzewing 3 1999 0 Unknown 1 1993Birds Columbidae Ocyphaps lophotes Crested Pigeon 11 2000 0 Unknown 2 1993Birds Columbidae Geophaps plumifera Spinifex Pigeon 0 Unknown 0 Unknown 1 1993Birds Columbidae Geopelia cuneata Diamond Dove 15 2000 0 Unknown 15 1993Birds Columbidae Geopelia striata Peaceful Dove 23 2000 1 1987 5 1993Birds Columbidae Geopelia humeralis Bar-shouldered Dove 7 2000 0 Unknown 4 1993Birds Podargidae Podargus strigoides Tawny Frogmouth 2 1991 0 Unknown 2 1993Birds Eurostopodidae Eurostopodus argus Spotted Nightjar 3 2000 0 Unknown 0 UnknownBirds Aegothelidae Aegotheles cristatus Australian Owlet-nightjar 4 2001 0 Unknown 4 1993Birds Anhingidae Anhinga novaehollandiae Australasian Darter 1 1987 0 Unknown 0 UnknownBirds Phalacrocoracidae Microcarbo melanoleucos Little Pied Cormorant 1 1987 0 Unknown 0 UnknownBirds Pelecanidae Pelecanus conspicillatus Australian Pelican 1 1987 0 Unknown 0 UnknownBirds Ciconiidae Ephippiorhynchus asiaticus Black-necked Stork 1 2000 0 Unknown 0 UnknownBirds Ardeidae Ardea pacifica White-necked Heron 3 1987 0 Unknown 0 UnknownBirds Ardeidae Ardea modesta Eastern Great Egret 1 1978 0 Unknown 0 UnknownBirds Ardeidae Egretta novaehollandiae White-faced Heron 2 1987 0 Unknown 1 1993Birds Ardeidae Nycticorax caledonicus Nankeen Night Heron 2 1987 0 Unknown 0 UnknownBirds Threskiornithidae Threskiornis spinicollis Straw-necked Ibis 1 1978 0 Unknown 0 UnknownBirds Threskiornithidae Platalea regia Royal Spoonbill 2 1987 0 Unknown 0 UnknownBirds Threskiornithidae Platalea flavipes Yellow-billed Spoonbill 2 1987 0 Unknown 0 UnknownBirds Accipitridae Elanus axillaris Black-shouldered Kite 1 2001 0 Unknown 0 UnknownBirds Accipitridae Haliastur sphenurus Whistling Kite 4 2000 0 Unknown 1 1993Birds Accipitridae Milvus migrans Black Kite 4 2001 0 Unknown 1 1993

Group Family Name Scientific Name Common Name NTStatus
NationalStatus
#Observations #LatestObservationDate
#Specimens #LatestSpecimanDate
#Surveys #LatestSurveyRecord
Birds Accipitridae Accipiter fasciatus Brown Goshawk 4 1993 0 Unknown 3 1993Birds Accipitridae Accipiter cirrocephalus Collared Sparrowhawk 1 1998 0 Unknown 1 1993Birds Accipitridae Circus assimilis Spotted Harrier 3 1999 0 Unknown 0 UnknownBirds Accipitridae Aquila audax Wedge-tailed Eagle 3 2000 0 Unknown 2 1993Birds Accipitridae Hieraaetus morphnoides Little Eagle 1 1999 0 Unknown 0 UnknownBirds Falconidae Falco cenchroides Nankeen Kestrel 2 1999 0 Unknown 0 UnknownBirds Falconidae Falco berigora Brown Falcon 16 2001 0 Unknown 3 1993Birds Falconidae Falco longipennis Australian Hobby 1 1979 0 Unknown 1 1993Birds Gruidae Grus rubicunda Brolga 3 1989 0 Unknown 0 UnknownBirds Otididae Ardeotis australis Australian Bustard 7 2000 0 Unknown 0 UnknownBirds Burhinidae Burhinus grallarius Bush Stone-curlew 8 2001 0 Unknown 2 1993Birds Charadriidae Elseyornis melanops Black-fronted Dotterel 2 1987 0 Unknown 0 UnknownBirds Charadriidae Vanellus miles Masked Lapwing 1 1987 0 Unknown 0 UnknownBirds Turnicidae Turnix maculosus Red-backed Button-quail 3 2001 0 Unknown 2 1991Birds Turnicidae Turnix pyrrhothorax Red-chested Button-quail 0 Unknown 0 Unknown 1 1993Birds Turnicidae Turnix velox Little Button-quail 2 1991 0 Unknown 2 1991Birds Cacatuidae Calyptorhynchus banksii
macrorhynchusRed-tailed Black-cockatoo N 14 2001 0 Unknown 0 Unknown
Birds Cacatuidae Eulophus roseicapilla Galah 19 2002 0 Unknown 7 1999Birds Cacatuidae Nymphicus hollandicus Cockatiel 6 1999 0 Unknown 1 1993Birds Psittacidae Trichoglossus haematodus Rainbow Lorikeet 0 Unknown 0 Unknown 1 1993Birds Psittacidae Psitteuteles versicolor Varied Lorikeet 3 2001 0 Unknown 1 1993Birds Psittacidae Aprosmictus erythropterus Red-winged Parrot 14 2001 0 Unknown 2 1993Birds Psittacidae Psephotus dissimilis Hooded Parrot 0 Unknown 0 Unknown 1 1993Birds Psittacidae Melopsittacus undulatus Budgerigar 3 1991 0 Unknown 3 1993Birds Cuculidae Centropus phasianinus Pheasant Coucal 3 2001 0 Unknown 1 1993Birds Cuculidae Eudynamys orientalis Eastern Koel 3 1999 0 Unknown 0 UnknownBirds Cuculidae Scythrops novaehollandiae Channel-billed Cuckoo 1 1988 0 Unknown 0 UnknownBirds Cuculidae Chalcites basalis Horsfield`s Bronze-Cuckoo 4 2001 0 Unknown 1 1991Birds Cuculidae Cacomantis pallidus Pallid Cuckoo 2 1998 0 Unknown 0 UnknownBirds Cuculidae Cacomantis variolosus Brush Cuckoo 2 1999 0 Unknown 0 UnknownBirds Strigidae Ninox novaeseelandiae Southern Boobook 6 2001 0 Unknown 3 1991Birds Alcedinidae Ceyx azureus Azure Kingfisher 1 1987 0 Unknown 0 UnknownBirds Halcyonidae Dacelo leachii Blue-winged Kookaburra 4 2001 0 Unknown 0 UnknownBirds Halcyonidae Todiramphus pyrrhopygius Red-backed Kingfisher 2 1991 0 Unknown 2 1991Birds Halcyonidae Todiramphus sanctus Sacred Kingfisher 3 1999 0 Unknown 1 1991Birds Meropidae Merops ornatus Rainbow Bee-eater 12 2001 0 Unknown 2 1993Birds Climacteridae Climacteris melanura Black-tailed Treecreeper 6 2001 0 Unknown 3 1999Birds Ptilonorhynchidae Ptilonorhynchus nuchalis Great Bowerbird 15 2002 0 Unknown 2 1993Birds Maluridae Malurus melanocephalus Red-backed Fairy-wren 9 2001 0 Unknown 1 1993Birds Maluridae Malurus lamberti Variegated Fairy-wren 11 1999 0 Unknown 6 1991Birds Acanthizidae Smicrornis brevirostris Weebill 15 2001 0 Unknown 8 1999Birds Acanthizidae Gerygone albogularis White-throated Gerygone 6 1999 0 Unknown 0 UnknownBirds Pardalotidae Pardalotus rubricatus Red-browed Pardalote 2 2000 0 Unknown 0 UnknownBirds Pardalotidae Pardalotus striatus Striated Pardalote 12 2001 2 1977 5 1999Birds Meliphagidae Lichenostomus virescens Singing Honeyeater 16 2001 0 Unknown 8 1993Birds Meliphagidae Lichenostomus plumulus Grey-fronted Honeyeater 7 2000 0 Unknown 4 1999

Group Family Name Scientific Name Common Name NTStatus
NationalStatus
#Observations #LatestObservationDate
#Specimens #LatestSpecimanDate
#Surveys #LatestSurveyRecord
Birds Meliphagidae Lichenostomus flavescens Yellow-tinted Honeyeater 5 2001 0 Unknown 1 1993Birds Meliphagidae Acanthagenys rufogularis Spiny-cheeked Honeyeater 1 1987 0 Unknown 0 UnknownBirds Meliphagidae Ramsayornis fasciatus Bar-breasted Honeyeater 1 1978 0 Unknown 0 UnknownBirds Meliphagidae Conopophila rufogularis Rufous-throated Honeyeater 15 2000 0 Unknown 8 1993Birds Meliphagidae Cissomela pectoralis Banded Honeyeater 3 2001 0 Unknown 0 UnknownBirds Meliphagidae Lichmera indistincta Brown Honeyeater 7 2001 0 Unknown 6 1993Birds Meliphagidae Melithreptus gularis Black-chinned Honeyeater 1 1993 0 Unknown 0 UnknownBirds Meliphagidae Melithreptus albogularis White-throated Honeyeater 2 1999 0 Unknown 0 UnknownBirds Meliphagidae Entomyzon cyanotis Blue-faced Honeyeater 0 Unknown 0 Unknown 1 1993Birds Meliphagidae Philemon argenticeps Silver-crowned Friarbird 1 1999 0 Unknown 2 1993Birds Meliphagidae Philemon citreogularis Little Friarbird 4 2000 0 Unknown 3 1993Birds Pomatostomidae Pomatostomus temporalis Grey-crowned Babbler 31 2002 0 Unknown 10 1993Birds Neosittidae Daphoenositta chrysoptera Varied Sittella 10 2001 0 Unknown 4 1999Birds Campephagidae Coracina novaehollandiae Black-faced Cuckoo-shrike 18 2001 0 Unknown 3 1993Birds Campephagidae Coracina papuensis White-bellied Cuckoo-shrike 1 1987 0 Unknown 1 1993Birds Campephagidae Lalage sueurii White-winged Triller 17 2001 0 Unknown 4 1991Birds Pachycephalidae Pachycephala rufiventris Rufous Whistler 37 2001 0 Unknown 17 1999Birds Pachycephalidae Colluricincla harmonica Grey Shrike-thrush 14 2001 4 1977 8 1999Birds Pachycephalidae Oreoica gutturalis Crested Bellbird 3 1991 0 Unknown 4 1999Birds Oriolidae Oriolus sagittatus Olive-backed Oriole 4 2000 0 Unknown 0 UnknownBirds Artamidae Artamus personatus Masked Woodswallow 2 1991 0 Unknown 2 1991Birds Artamidae Artamus superciliosus White-browed Woodswallow 1 2001 0 Unknown 0 UnknownBirds Artamidae Artamus cinereus Black-faced Woodswallow 18 2001 0 Unknown 9 1999Birds Artamidae Artamus minor Little Woodswallow 7 2001 0 Unknown 0 UnknownBirds Artamidae Cracticus torquatus Grey Butcherbird 1 1987 0 Unknown 0 UnknownBirds Artamidae Cracticus nigrogularis Pied Butcherbird 18 2000 0 Unknown 6 1999Birds Artamidae Cracticus tibicen Australian Magpie 3 1999 0 Unknown 1 1993Birds Rhipiduridae Rhipidura albiscapa Grey Fantail 2 1991 0 Unknown 3 1991Birds Rhipiduridae Rhipidura leucophrys Willie Wagtail 36 2002 0 Unknown 16 1999Birds Corvidae Corvus orru Torresian Crow 24 2001 0 Unknown 3 1993Birds Monarchidae Myiagra rubecula Leaden Flycatcher 2 2000 0 Unknown 1 1999Birds Monarchidae Myiagra inquieta Restless Flycatcher 11 2001 0 Unknown 7 1993Birds Monarchidae Grallina cyanoleuca Magpie-lark 21 2000 0 Unknown 4 1993Birds Corcoracidae Struthidea cinerea Apostlebird 26 2002 0 Unknown 7 1993Birds Petroicidae Microeca fascinans Jacky Winter 11 2001 0 Unknown 5 1999Birds Petroicidae Melanodryas cucullata
picata/westralensisHooded Robin 11 2001 0 Unknown 6 1991
Birds Megaluridae Cincloramphus mathewsi Rufous Songlark 2 2001 0 Unknown 0 UnknownBirds Hirundinidae Petrochelidon nigricans Tree Martin 1 1987 0 Unknown 0 UnknownBirds Nectariniidae Dicaeum hirundinaceum Mistletoebird 5 2001 0 Unknown 1 1991Birds Estrildidae Taeniopygia guttata Zebra Finch 4 1989 0 Unknown 1 1993Birds Estrildidae Taeniopygia bichenovii Double-barred Finch 13 2002 0 Unknown 4 1993Birds Estrildidae Poephila acuticauda Long-tailed Finch 18 2002 0 Unknown 4 1999Birds Estrildidae Poephila personata Masked Finch 1 1980 0 Unknown 0 UnknownBirds Estrildidae Heteromunia pectoralis Pictorella Mannikin 2 2001 0 Unknown 1 1993Mammals Tachyglossidae Tachyglossus aculeatus Echidna 1 1994 0 Unknown 1 1993Mammals Dasyuridae Pseudantechinus mimulus Carpentarian Antechinus VU 0 Unknown 1 1987 0 Unknown

Group Family Name Scientific Name Common Name NTStatus
NationalStatus
#Observations #LatestObservationDate
#Specimens #LatestSpecimanDate
#Surveys #LatestSurveyRecord
Mammals Dasyuridae Planigale maculata Common Planigale 2 1987 2 1987 0 UnknownMammals Dasyuridae Sminthopsis macroura Stripe-faced Dunnart 2 1987 2 1987 0 UnknownMammals Pseudocheiridae Petropseudes dahli Rock Ringtail 1 1987 0 Unknown 0 UnknownMammals Macropodidae Lagorchestes conspicillatus Spectacled Hare-wallaby 35 1991 13 1992 4 1991Mammals Macropodidae Macropus agilis Agile Wallaby N 2 1987 1 1996 0 UnknownMammals Macropodidae Macropus robustus Common Wallaroo 2 2001 0 Unknown 6 1993Mammals Macropodidae Macropus rufus Red Kangaroo 0 Unknown 0 Unknown 1 1993Mammals Macropodidae Onychogalea unguifera Northern Nailtail Wallaby 13 1991 5 1987 7 1991Mammals Pteropodidae Pteropus scapulatus Little Red Flying-fox 0 Unknown 0 Unknown 1 1993Mammals Emballonuridae Saccolaimus flaviventris Yellow-bellied Sheath-tailed
Bat0 Unknown 1 1959 0 Unknown
Mammals Emballonuridae Taphozous georgianus Common Sheath-tailed Bat 0 Unknown 1 1977 0 UnknownMammals Molossidae Mormopterus beccarii Beccari`s Free-tailed Bat 1 1982 0 Unknown 0 UnknownMammals Vespertilionidae Nyctophilus geoffroyi Lesser Long-eared Bat 2 1987 2 1987 0 UnknownMammals Vespertilionidae Chalinolobus nigrogriseus Hoary Wattled Bat 2 1987 3 1987 0 UnknownMammals Vespertilionidae Scotorepens greyii Little Broad-nosed Bat 1 1982 1 1982 0 UnknownMammals Muridae Leggadina lakedownensis Northern Short-tailed Mouse 2 1988 5 2001 4 1999Mammals Muridae Pseudomys delicatulus Delicate Mouse 0 Unknown 1 2001 0 UnknownMammals Muridae Zyzomys argurus Common Rock-rat 0 Unknown 0 Unknown 1 1993Mammals Canidae Canis lupus Dingo / Wild dog N 1 1987 0 Unknown 1 1993
EX = Extinct EW = Extinct in the Wild ER= Extinct in the NT EN = Endangered EN/VU = One Endangered subspecies/One Vulnerable subspecies VU=Vulnerable VU/- = One or more subspecies vulnerable EN/- = One or more subspecies endangered
Survey = this category refers to data collected using systematic survey methodology Specimen = this category refers to museum or other records where a specimen has been collected and lodged Observation = this category refers to all other incidental recordings where systematic methodology may not have been used consistently.
More species info: Go to www.landmanager.org.au/view/index.aspx?id=#### where #### is the ID number from the tables above for the species of interest.
Species listed in the table above were recorded from all the grid cells (red/blue line) shown below that overlap Custom area

Custom area Weeds and Potential Weeds
Introduced plants recorded in the grid cell(s) in which Custom area occurs and that have been identified as problem weeds in one or more locations in northernAustralia. Occurrence based on Northern Territory Government databases.
Family Name Scientific Name Common Name NTStatus
NationalStatus
Other Status #Surveys Latest Record
Poaceae Cenchrus ciliaris Buffel Grass MP Gr G&M DEU 0 UnknownCucurbitaceae Cucumis melo Ulcardo Melon DEU 5 1991Poaceae Echinochloa colona Awnless Barnyard Grass DEU 2 1991Fabaceae Macroptilium atropurpureum Siratro C&E 0 UnknownMalvaceae Malvastrum americanum Spiked Malvastrum DEU 1 1988Plantaginaceae Scoparia dulcis Bitter Broom DEU 0 UnknownMalvaceae Sida rhombifolia Paddy`s Lucerne B C MP G&M DEU 0 UnknownMalvaceae Sida spinosa Spiny Sida DEU 0 UnknownFabaceae Stylosanthes hamata Caribbean Stylo DEU 0 UnknownPoaceae Urochloa mosambicensis Sabi Grass DEU 0 UnknownAsteraceae Xanthium strumarium Noogoora Burr B C MP WA1 WA2 WA4
DEU NSW SA0 Unknown
Status Codes: 1. NATIONAL STATUS CODES Alert, Alert List for Environmental Weeds (Please call Exotic Plant Pest Hotline 1800 084 881 if you think you have seen this weed) Sleeper, National Sleeper Weed Target,Targeted for eradication. (www.landmanager.com.au/view/index.aspx?id=449837) WONS, Weeds of National Significance
2. NT STATUS CODES A, NT Class A Weed (to be eradicated) B, NT Class B Weed (growth & spread to be controlled) C, NT Class C Weed (not to be introduced) (www.landmanager.com.au/view/index.aspx?id=449869)
3. OTHER STATUS CODES C&E, Csurhes, S. & Edwards, R. (1998) Potential Environmental Weeds in Australia. Candidate Species for Preventative Control. Environment Australia, Canberra (www.landmanager.com.au/view/index.aspx?id=394504) CYP, Draft Cape York Peninsula Pest Management Plan 2006-2011 (www.landmanager.com.au/view/index.aspx?id=371200) DEU, Plants listed as environmental weeds by the Desert Uplands Strategic Land Resource Assessment (www.landmanager.com.au/view/index.aspx?id=332123) G&M, Grice AC, Martin TG. 2005. The Management of Weeds and Their Impact on Biodiversity in the Rangelands. Cooperative Research Centre (CRC) for Australian Weed Management and CSIRO Sustainable Ecosystems. Commonwealth Australia (www.landmanager.com.au/view/index.aspx?id=163572) Gr, Groves et al. 2003. Weed categories for natural and agricultural ecosystem management. Bureau of Rural Sciences (www.landmanager.com.au/view/index.aspx?id=388018) K0, High Priority Weeds not yet established in the Katherine region K1, High Priority Weeds posing environmental threats in the Katherine region K2, High Priority Weeds posing existing threats in the Katherine region, as described in the Katherine Regional Weed Management Strategy 2005-2010 (www.landmanager.com.au/view/index.aspx?id=130286) MP, Northern Territory Parks & Conservation Masterplan (www.landmanager.com.au/view/index.aspx?id=144141) NAQS, North Australian Quarantine Strategy Target List (www.landmanager.com.au/view/index.aspx?id=449416) NSW, Declared Noxious Weed in NSW (www.landmanager.com.au/view/index.aspx?id=449983) Q1, QLD Class 1 Weed (not to be introduced, kept or supplied- Q2, Class 2 Weed (eradicate where possible, not to be introduced, kept or supplied) Q3, Qld Class 3 Weed (to be controlled near environmentally sensitive areas- not to be supplied/sold without a permit) (www.landmanager.com.au/view/index.aspx?id=190714) SA, Declared Plant in South Australia (www.landmanager.com.au/view/index.aspx?id=449996) WeedsAus, Listed as a significant weed by Weeds Australia (www.landmanager.com.au/view/index.aspx?id=14576) WA1, WA Weed Class P1 (movement prohibited) WA2, WA Weed Class P2 (aim to eradicate)

WA3, WA Weed Class P3 (control infestations) WA4, WA Weed Class P4 (prevent spread) WA5, WA Weed Class P3 (control infestations on public land) (www.landmanager.com.au/view/index.aspx?id=449884).
Survey = this category refers to data collected using systematic survey methodology Specimen = this category refers to museum or other records where a specimen has been collected and lodged Observation = this category refers to all other incidental recordings where systematic methodology may not have been used consistently.
More species info: Go to www.landmanager.org.au/view/index.aspx?id=#### where #### is the ID number from the tables above for the species of interest.
Plants listed in the table above were recorded from all the grid cells shown below (red/blue line) that overlap Custom area
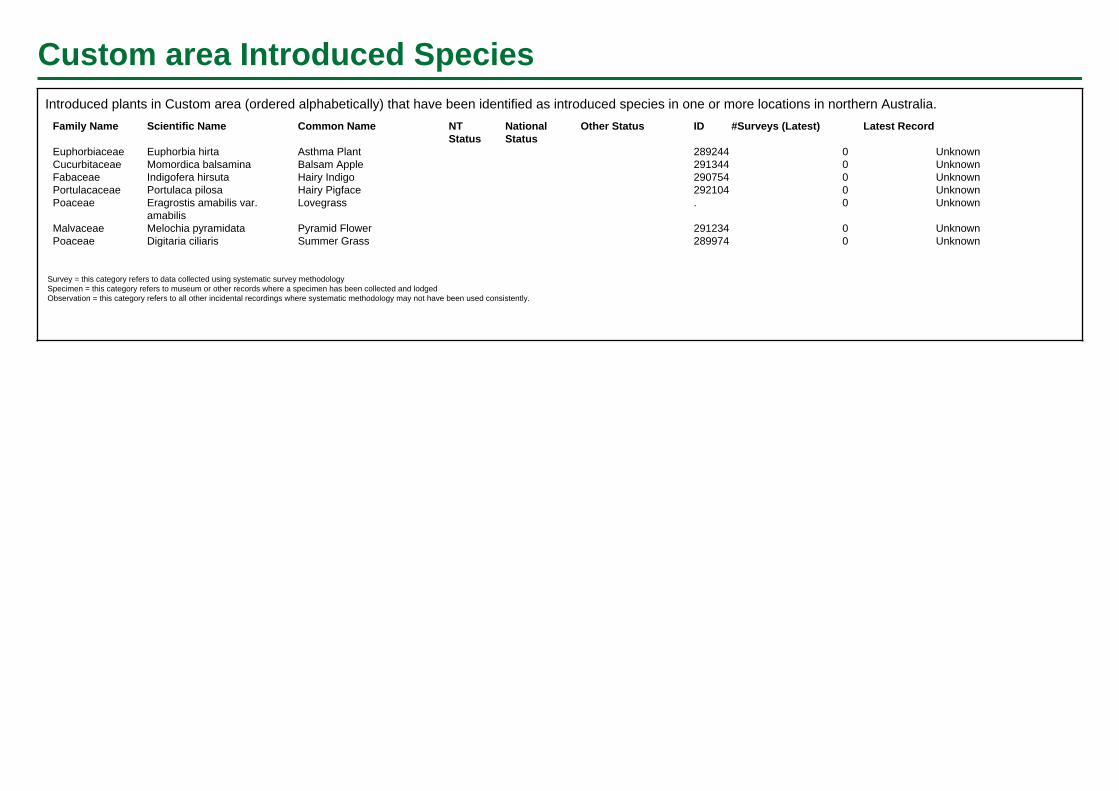
Custom area Introduced SpeciesIntroduced plants in Custom area (ordered alphabetically) that have been identified as introduced species in one or more locations in northern Australia.
Family Name Scientific Name Common Name NTStatus
NationalStatus
Other Status ID #Surveys (Latest) Latest Record
Euphorbiaceae Euphorbia hirta Asthma Plant 289244 0 UnknownCucurbitaceae Momordica balsamina Balsam Apple 291344 0 UnknownFabaceae Indigofera hirsuta Hairy Indigo 290754 0 UnknownPortulacaceae Portulaca pilosa Hairy Pigface 292104 0 UnknownPoaceae Eragrostis amabilis var.
amabilisLovegrass . 0 Unknown
Malvaceae Melochia pyramidata Pyramid Flower 291234 0 UnknownPoaceae Digitaria ciliaris Summer Grass 289974 0 Unknown
Survey = this category refers to data collected using systematic survey methodology Specimen = this category refers to museum or other records where a specimen has been collected and lodged Observation = this category refers to all other incidental recordings where systematic methodology may not have been used consistently.

Custom area Pest and Potential Pest Animals
Animals with pest potential recorded in the grid cell(s) in which Custom area occurs. Occurrence based on Northern Territory Government databases.
Common Name Scientific Name NTStatus
NationalStatus
ID #Observations (Latest) #Specimens (Latest) #Surveys (Latest)
Cane Toad Rhinella marina P . 183252 1 (2001) 0 (Unknown) 1 (1993)Red-tailed Black-cockatoo Calyptorhynchus banksii
macrorhynchusN . 223765 14 (2001) 0 (Unknown) 0 (Unknown)
Agile Wallaby Macropus agilis N . 223786 2 (1987) 1 (1996) 0 (Unknown)Dingo / Wild dog Canis lupus N . 183280 1 (1987) 0 (Unknown) 1 (1993)Horse Equus caballus P . 183315 1 (1987) 0 (Unknown) 0 (Unknown)Cattle Bos taurus P . 183266 1 (1987) 0 (Unknown) 2 (1993)
NT STATUS CODES: Int, Introduced species (all non-prohibited vertebrates, and all other exotic species (www.landmanager.com.au/view/index.aspx?id=280771)N, Native species with pest potential.P, Prohibited species (all exotic vertebrates except those listed as non-prohibited (www.landmanager.com.au/view/index.aspx?id=450509) Survey = this category refers to data collected using systematic survey methodology Specimen = this category refers to museum or other records where a specimen has been collected and lodged Observation = this category refers to all other incidental recordings where systematic methodology may not have been used consistently. More species info: Go to www.landmanager.org.au/view/index.aspx?id=#### where #### is the ID number from the tables above for the species of interest.
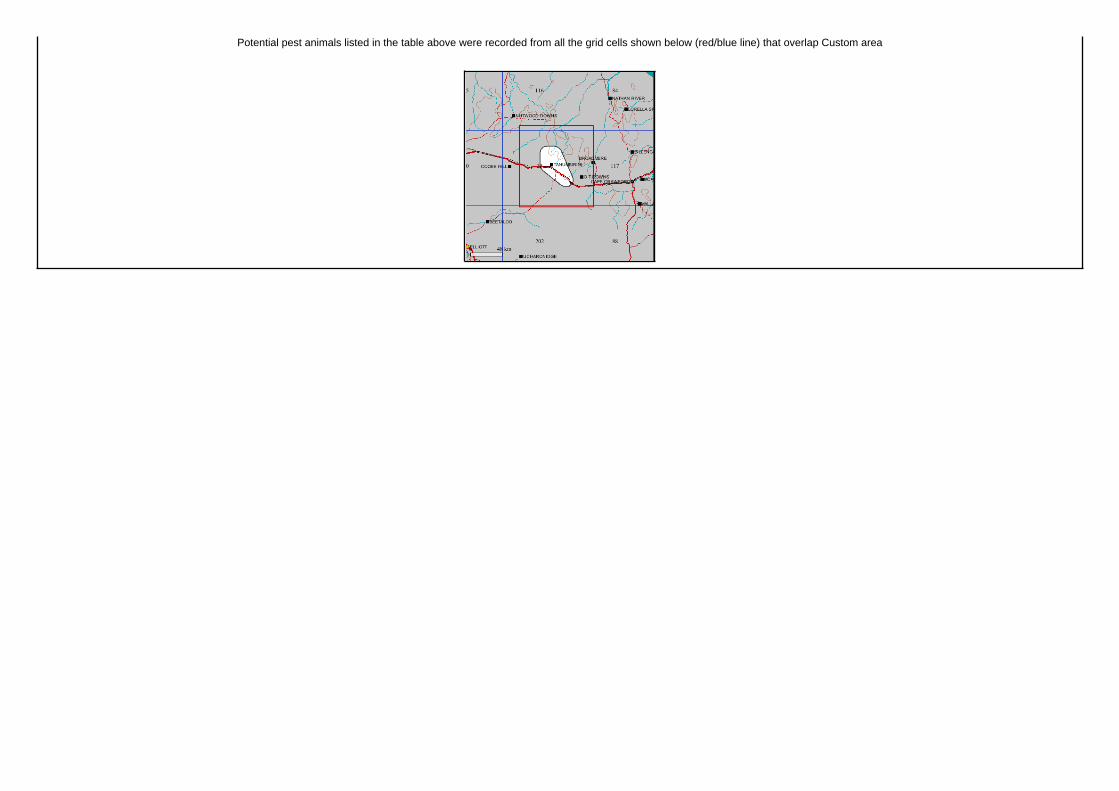
Potential pest animals listed in the table above were recorded from all the grid cells shown below (red/blue line) that overlap Custom area

Generated from NT Infonet (http://www.infonet.org.au) Wed Dec 05 12:04:10 CST 2018
Soils and vegetation graphs and tables refer to area of soils and vegetation only. Fire graphs andtables refer to entire selected area including sea if present. Calculations are derived from map imagesor vector data, and should be taken as a guide only. Accuracy cannot be guaranteed. For small areas,figures should be rounded to the nearest whole number.
Fire map layers used in these reports have been updated in 2018 so their pixels are aligned to thesame grid.

Santos Ltd l Environment Management Plan: McArthur Basin Civil and Seismic Program l 5 April 2019
Appendix D: Ecological Assessment Report

1.
Ecology report2019 exploration program
Santos

Santos iEcology report – 2019 work program
DOCUMENT CONTROL RECORD
Job EZ19041
Document ID 176327-33
Author(s) Aiden Campbell
DOCUMENT HISTORY
Rev Reviewed by Approved by Issued to Date
1 Felicity Watt Ray Hall Santos 27 March 20192 Felicity Watt Ray Hall Santos 2 April 2019
Recipients are responsible for eliminating all superseded documents in their possession.
EcOz Pty Ltd.ABN: 81 143 989 039Winlow House, 3rd Floor75 Woods Street DARWIN NT 0800GPO Box 381, Darwin NT 0800
Telephone: +61 8 8981 1100Facsimile: +61 8 8981 1102Email: [email protected]: www.ecoz.com.au
RELIANCE, USES and LIMITATIONSThis report is copyright and is to be used only for its intended purpose by the intended recipient, and is not to be copied or used in any other way. The report may be relied upon for its intended purpose within the limits of the following disclaimer.
This study, report and analyses have been based on the information available to EcOz Environmental Consultants at the time of preparation. EcOz Environmental Consultants accepts responsibility for the report and its conclusions to the extent that the information was sufficient and accurate at the time of preparation. EcOz Environmental Consultants does not take responsibility for errors and omissions due to incorrect information or information not available to EcOz Environmental Consultants at the time of preparation of the study, report or analyses.

Santos iiEcology report – 2019 work program
TABLE OF CONTENTS
1 INTRODUCTION........................................................................................................................................1
1.1 Purpose and objectives .......................................................................................................................1
1.2 Scope ..................................................................................................................................................2
1.3 Report structure...................................................................................................................................2
2 PROJECT AREA .......................................................................................................................................3
2.1 Survey area .........................................................................................................................................4
2.1.1 Desktop assessment....................................................................................................................42.1.2 Field surveys ................................................................................................................................4
3 DESKTOP ASSESSMENT ........................................................................................................................6
3.1 Environmental context.........................................................................................................................6
3.1.1 Climate .........................................................................................................................................63.1.2 Bioregions ....................................................................................................................................6
3.2 Methods...............................................................................................................................................8
3.2.1 Land systems ...............................................................................................................................83.2.2 Vegetation ....................................................................................................................................83.2.3 Sensitive vegetation communities................................................................................................83.2.4 Watercourses, wetlands and waterholes .....................................................................................83.2.5 Threatened species......................................................................................................................93.2.6 Migratory and marine species ....................................................................................................10
3.3 Results ..............................................................................................................................................11
3.3.1 Land condition............................................................................................................................113.3.2 Land systems .............................................................................................................................123.3.3 Vegetation ..................................................................................................................................163.3.4 Sensitive vegetation communities..............................................................................................193.3.5 Watercourses, wetlands and waterholes ...................................................................................203.3.6 Threatened species....................................................................................................................203.3.7 Migratory species .......................................................................................................................243.3.8 Avifauna observations................................................................................................................24
3.4 Conclusion and recommendations ....................................................................................................25
3.4.1 Land condition............................................................................................................................253.4.2 Biodiversity values .....................................................................................................................253.4.3 Recommendations .....................................................................................................................26
4 FIELD ASSESSMENT .............................................................................................................................28
4.1 Purpose and scope ...........................................................................................................................28
4.2 Weed survey .....................................................................................................................................28
4.2.1 Background ................................................................................................................................284.2.2 Methods .....................................................................................................................................304.2.3 Results .......................................................................................................................................30
4.3 Threatened species habitat ...............................................................................................................32
4.3.1 Background ................................................................................................................................32

Santos iiiEcology report – 2019 work program
4.3.2 Methods .....................................................................................................................................324.3.3 Results .......................................................................................................................................32
4.4 Riparian and sensitive vegetation .....................................................................................................36
4.4.1 Background ................................................................................................................................364.4.2 Methods .....................................................................................................................................374.4.3 Results .......................................................................................................................................37
4.5 Discussion .........................................................................................................................................41
5 REFERENCES.........................................................................................................................................43
TablesTable 3-1. Priority weeds within the Katherine Region Weed Management Plan ..........................................11Table 3-2. Land systems within the survey area (as per Lynch & Wilson 1998) ............................................13Table 3-3. Threatened species ‘Likelihood of Occurrence’ assessment (summary) ......................................21Table 3-4. Migratory species ‘likelihood of occurrence’ assessment (summary)............................................24Table 3-5. List of avian species observed during field surveys ......................................................................25Table 4-1. Declared weed species recorded within the EP ............................................................................28Table 4-2. Potential weeds within the project area .........................................................................................29Table 4-3. Declared weed species with Tanumbirini-2 survey area ...............................................................30Table 4-4. Habitat characteristics of E. leucophloia patches within survey area. ...........................................35
FiguresFigure 2-1. Map of project area and survey area..............................................................................................5Figure 3-1. Average monthly temperature and rainfall Daly Waters airstrip, Northern Territory.......................6Figure 3-2. Map showing bioregions within survey area...................................................................................7Figure 3-3. IUCN list categories of risk for threatened species ........................................................................9Figure 3-4. Map of Land Systems within the survey area...............................................................................15Figure 3-5. Map showing NVIS vegetation within the survey area .................................................................18Figure 3-6. Photos showing typical riparian vegetation within the survey area ..............................................19Figure 3-7. Map of proximate records for medium likelihood threatened species ..........................................23Figure 4-1. Weed occurrences within, or adjacent to, project area ................................................................31Figure 4-2. Location of E. leucophloia patches near the project area ............................................................34Figure 4-3. Examples of sensitive riparian vegetation (left) and drainage line vegetation (right). ..................36Figure 4-4. Photos of riparian (left) and drainage line (right) vegetation within Inacumba-1 survey area ......37Figure 4-5. Map showing location of riparian and drainage line vegetation within Inacumba 1 survey area..38Figure 4-6. Photos of drainage line vegetation along transects radiating from Tanumbirini-2........................39Figure 4-7. Map showing locations of drainage line vegetation along transects from Tanumbirini-2 .............40

Santos 1Ecology report – 2019 exploration program
1 INTRODUCTION
Santos is planning their 2019 exploration program within their Exploration Permit area (EP161) on Tanumbirini Station. The exploration works will be regulated through an Environmental Management Plan (EMP) approved by the Department of Environment and Natural Resources (DENR). For the development of the EMP, an assessment of biodiversity values within the exploration area and the 2019 exploration program footprint (project area) is required.
1.1 Purpose and objectives
EcOz Environmental Consultants (EcOz) were engaged to complete a desktop assessment of the biodiversity values within a defined survey area.
The desktop assessment had two objectives:
To provide sufficient information for Santos to update their EMP for the proposed exploratory drilling program, or develop future EMPs for exploratory drilling or seismic operations.
To identify biodiversity values within the survey area, such that Santos can incorporate this information into project planning. This includes determining the ‘likelihood of occurrence’ of threatened species occurring within the survey area.
The desktop assessment is largely desktop based, with some supplementary fieldwork to verify biodiversity values. Fieldwork was limited to the use of existing access tracks within the survey area. The report includes a description of habitat types, and a ‘likelihood of occurrence’ assessment of threatened species listed under the Commonwealth Environment Protection and Biodiversity Conservation Act 1999 (EPBC Act) and NT Territory Parks and Wildlife Conservation Act (TPWC Act). This information can be used to avoid any adverse impacts on identified biodiversity values and to meet the (DENR) requirements during the update of the EMP or development of future EMPs for exploratory drilling or seismic operations. It is also used to identify specific environmental values which warrant further field based investigation.
The desktop report provided a number of recommendations for Santos to consider when planning any further works. Principally, it was recommended that:
Undertaking a weed survey at exploratory drilling and/or seismic exploration sites and along access tracks would provide baseline data. This would enable Santos to ensure that activities do not introduce or spread weeds.
Prior to more intensive works being undertaken, further assessment of habitat for Gouldian Finch and potential impact to this species be undertaken. This would include desktop assessment and on-ground studies and would be assessed in relation to a project area.
As the identified exploration activities may intersect watercourses that may support sensitive vegetation in the form of riparian vegetation, Santos required the location of any sensitive vegetation to be identified so that potential impact to these communities could be avoided or minimised during exploration.
Given that Santos is planning to undertake the 2019 exploration program, EcOz was engaged to complete surveys targeting these recommendations within the project area. EcOz completed the following two assessments of environmental values within the project area (Section 2.1):
Ecology report – EP161 work program 2018 (field assessment) (EcOz, 2018a) Inacumba bore weed survey and sensitive vegetation assessment (field assessment) (EcOz, 2018b)
Santos has reduced the scope and project area of the 2019 exploration program from the areas identified in the above assessments. The project area has also deviated slightly from the surveyed areas. Additionally,

Santos 2Ecology report – 2019 exploration program
the Northern Territory Government (NTG) has provided feedback on the draft Environmental Management Plan, and requested clarifications around the assessment of the above listed environmental values.
1.2 Scope
The scope of this report is to consolidate the existing environmental assessments to focus on the two proposed drilling sites and associated activities relevant to the project area.
No new field assessment has been undertaken as part of this report. Data and information detailed in the existing reports has been drawn on, along with available datasets and an updated exploration program layout (provided by Santos). EcOz has reviewed the information presented in the existing reports, addressed any issues raised by Government departmental review, and provided clarity in this report where required.
1.3 Report structure
To achieve the outlined purpose, this report contains three primary sections as outlined below:
Section 2 – details the project area and the relationship of this area to that which has been surveyed.
Section 3 – details the methods and results of the desktop assessment undertaken in 2017 and provides recommendations for further work to be undertaken.
Section 4 – details the outcomes of the field surveys completed for the project area, based on the recommendations of the desktop assessment.

Santos 3Ecology report – 2019 exploration program
2 PROJECT AREA
The project area includes the following components:
Two new exploration wellso Tanumbirini-2 o Inacumba-1
A single 2D seismic profiling line crossing the proposed Tanumbirini-2 well site Access tracks Borrow pits
The components of the 2019 exploration program are shown in Figure 2-1
Tanumbirini-2 will be located within the existing Tanumbiri-1 lease area, which was drilled in 2014. Exploration activities are expected to occur within the existing disturbance footprint of Tanumbirini-1; however, may extend outside the previously disturbed area, but not more than 500 m from the well head. Inacumba-1 is located south east of Tanumbirini-2, but still within Tanumbirini Station. The proposed well is approximately 12 km north of the Carpentaria Highway. All disturbance for the wells (well drill pad, camps, dams etc.) will be located within a 500 m buffer of the proposed well locations; however, the development will not disturb the entirety of this area.
The proposed 2D seismic profiling line runs in a NNW-SSE direction passing through the proposed Tanumbirini-2 well site. The 2D seismic profiling line extends 5 km each side of the proposed well. The seismic profiling will involve 2-3 small trucks with measurement instruments (hydrophone, geophone or similar) driving along the 2D seismic profiling line and recoding reflected seismic energy originating from an energy source. A tracked bulldozer, with blade up, will precede the seismic trucks to ensure passage. The bulldozer will avoid the majority of trees along the 2D seismic profiling line but may remove obstacles such as termite mounds and understorey thicket, and reduce the approach angle for trucks at watercourse crossings. The bulldozer will remove only what is required for passage of trucks.
Access to Tanumbirini-2 will be along existing station access tracks. These tracks were used for access to the previously drilled Tanumbirini-1. Existing tracks will be used for the majority of the access to Inacumba-1. The access track starts from the Carpentaria Highway and follows a route north-east to the north west side of the proposed Inacumba-1 location. One of two new access tracks would be created from here to reach to Inacumba-1 well location; each of these proposed new access tracks is less than 900 m in length
Two locations for borrow pits have been identified - one location is adjacent to the access track to Inacumba-1 and the other is along the access track to Tanumbirini-2. The borrow pits will be located within one or both of the identified locations, however, only a portion of the identified area will be disturbed for borrow material.
There will also be a laydown area along the access track to Tanumbirini-2.

Santos 4Ecology report – 2019 exploration program
2.1 Survey area
2.1.1 Desktop assessment
Santos defined a survey area, which incorporated all existing and planned exploration drilling activities including the project area. The survey area, along with the project area, is shown in Figure 2-1.
2.1.2 Field surveys
Two surveys have been completed within the project area; locations and survey tracks are shown in Figure 2-1. Both surveys were undertaken by a team of environmental consultants, all with experience in surveyingweeds and vegetation in the Northern Territory. Surveys were completed in August 2018 (Tanumbirini-2 andassociated areas) and November 2018 (Inacumba-1 and associated areas).
The area covered by the surveys included:
• The 500 m buffer of the proposed Tanumbirini-2 and Inacumba-1 well sites• Access track to Tanumbirini• Access track Option 1 and 2 to Inacumba-1• 40 km of linear transects radiating from Tanumbirini-2
Within each 500 m buffer, a 100 m x 100 m grid was applied over the area. Surveyors walked transects through these areas ensuring they passed through each 100 m x 100 m grid cell once. Field maps of these grid cells were displayed as a moving map on a GPS enabled device for accurate interpretation and field navigation.
Access tracks to the well sites were surveyed by vehicle. Tracks were driven slowly and where a weed species was seen, the vehicle was stopped and data recorded. Stock watering points were also searched for weeds.
Surveyors walked a total of 40 km of linear transects radiating from Tanumbirini-2. There were eight transects in total – each 5 km long. Locations of the transects were based on the previous scope of the exploration program provided by Santos.
The exact location of the 2D seismic line identified in the 2019 exploration program is slightly different to the linear transects surveyed. There is one survey transect in close proximity to the proposed 2D seismic line; the landforms and vegetation through which the updated 2D seismic line passes are consistent with those of this survey transect. The location of the borrow pits have not been surveyed.

!(
!(
Carpentaria Highway
Laydownarea
Inacumba- 1
Tanumbirini-1/2H
460000 470000 48000081
7000
0
8170
000
8180
000
8180
000
8190
000
8190
000
0 2.5 51.25
Kilometres
"
"
Daly Waters
Katherine OMAP INFORMATIONProjection: GDA 1994 MGA Zone 53Date Saved: 4/1/2019Client: SantosAuthor: F Watt (review A Campbell)DATA SOURCEProject components: ClientImagery: ESRI basemap (Digital Globe)
Path: Z:\01 EcOz_Documents\04 EcOz Vantage GIS\EZ19041 - Santos EP161 EMP aspects\01 Project Files\Figure 2-1. 2019 exploration program.mxd
Figure 2-1. Map of project area and survey area
Legend!( Proposed well
2D Seismic line
Borrow pits
Exploration permit161
Intensive weedsurvey locations
Road
Access tracksexisting
proposed
EcOz survey tracks
Red box indicates map extent
!(
Tanumbirini -2survey area
!(
Inacumba -1survey area
0 2.5 51.25Kilometres
0 5 102.5Kilometres
5

Santos 6Ecology report – 2019 exploration program
3 DESKTOP ASSESSMENT
3.1 Environmental context
3.1.1 Climate
The survey area experiences two distinct seasons - a dry season with little/no rainfall between approximately May to October, and a monsoonal wet season from November to March. The nearest weather station with Bureau of Meteorology regional climatic data is the Daly Waters’ airport weather station, which lies 120 km to the east of the survey area.
Figure 3-1 provides a summary of climate information; January and February are the wettest months, both with over 150 mm rainfall on average per year. June and July are the coolest months, with an average maximum of 29oC, contrasting with an average maximum of 38oC in the hottest month of November.
Figure 3-1. Average monthly temperature and rainfall Daly Waters airstrip, Northern Territory
3.1.2 Bioregions
The Interim Biogeographic Regionalisation for Australia divides Australia into geographically-distinct units – called bioregions – of broadly similar climate, landform, geology and biodiversity (Baker et al. 2005). The survey area covers the following two bioregions (see Figure 3-2):
The south-western portion of the survey area falls within the Sturt Plateau bioregion, a gentlyundulating plain. Vegetation is mostly Eucalyptus dichromophloia woodlands with spinifexunderstorey. There are also large areas of Lancewood thickets (Acacia shirleyi), BullwaddyWoodlands (Macropteranthes kekwickii) and open Eucalyptus woodlands to the north.
Approximately two-thirds of the survey area (the north-east) falls within the Gulf Fall and Uplandsbioregion, which is comprised of scattered low steep hills on skeletal soils. Vegetation is mostlyEucalyptus tetrodonta and Corymbia dichromophloia woodland with a spinifex understorey, andalso Eucalyptus tectifica with a tussock grass understorey.

!(
!(
Carpentaria Highway
Inacumba- 1
Tanumbirini-1/2H
440000 450000 460000 470000 480000 490000 50000081
6000
0
8160
000
8170
000
8170
000
8180
000
8180
000
8190
000
8190
000
8200
000
8200
000
8210
000
8210
000
8220
000
8220
000
0 5 102.5
Kilometres
"
"
Daly Waters
Katherine OMAP INFORMATIONProjection: GDA 1994 MGA Zone 53Date Saved: 4/1/2019Client: SantosAuthor: F Watt (review A Campbell)DATA SOURCEProject components: ClientImagery: ESRI basemap (Digital Globe)
Path: Z:\01 EcOz_Documents\04 EcOz Vantage GIS\EZ19041 - Santos EP161 EMP aspects\01 Project Files\Figure 3-2. Map showing survey area, project area and bioregions.mxd
Figure3-2. Map showing bioregions within survey area
Legend!( Proposed well
2D Seismic line
Borrow pits
Road
Access tracksexisting
proposed
Survey area
Exploration permit161
BioregionGulf Fall andUplands
Sturt Plateau
Red box indicates map extent
7

Santos 8Ecology report – 2019 exploration program
3.2 Methods
The assessment of biodiversity values primarily utilised government databases to identify values within the survey area. This was augmented by an on-ground survey to verify the land system, identify important habitat for threatened species, and look for any other biodiversity values on site. This section of the report describes the methods used for both the desktop and field surveys.
3.2.1 Land systems
A land system is ‘an area or group of areas throughout which there is a recurring pattern of topography, soils and vegetation’ (Christian & Stewart 1968). This recurrent composition gives each land system a characteristic pattern which can be mapped from aerial imagery.
Land systems within the survey area were determined using the Land Systems of the Northern Part of the NT (1:250,000) dataset (DENR 2008) and the Land Systems of the Southern Part of the NT (1: 1,000,000) dataset (DENR 2011). The datasets are managed by the Northern Territory Government.
Land systems were verified through on-ground assessment of land form and vegetation characteristics. This land systems’ mapping has then been used to assist in the determination of the presence of suitable habitat for threatened species.
3.2.2 Vegetation
Vegetation within the survey area was determined using the National Vegetation Information System 4.2 (DEE 2016) spatial dataset, which is maintained by the Commonwealth Department of Environment and Energy (DEE).
3.2.3 Sensitive vegetation communities
Sensitive vegetation types are those considered to be significant under the NT Land Clearing Guidelines (NRETAS 2010), such as monsoon forest, riparian vegetation, mangrove, groundwater-dependent ecosystems, and wetlands. These areas are either unique to the region and/or have high biodiversity values. A review of existing vegetation mapping, land systems, and aerial imagery indicated that two sensitive vegetation types could occur within the survey area – riparian vegetation and wetlands.
Ecologists visited areas of potential sensitive vegetation communities during surveys and assessed whether sensitive vegetation communities were present.
3.2.4 Watercourses, wetlands and waterholes
The major watercourses, lakes, dams and wetlands within the survey area were identified using Bureau of Meteorology geo-fabric and aerial imagery. The Directory of Important Wetlands in Australia – a database of nationally-important wetlands, compiled in cooperation with conservation agencies and other resource managers in all jurisdictions – was queried to identify wetlands within the survey area.
All accessible watercourses were assessed during on-ground biodiversity values assessment. An assessment of the stream order at each watercourse survey site was made, along with identification of the vegetation community and a description of the watercourse profile. Photos were taken at each site.
Permanent waterholes are important habitat for biodiversity. Waterholes which are potentially permanent through the dry season were identified from aerial imagery. Site visits were undertaken where access to permanent waterholes was possible. Characterisation of potential habitat value was undertaken at these sites.
Santos 9Ecology report – 2019 exploration program
3.2.5 Threatened species
A ‘likelihood of occurrence’ assessment was conducted to determine which threatened species have potential to occur within the survey area. This is a preliminary assessment and, although augmented by a field visit, may require further field work for future approvals.
The International Union for the Conservation of Nature (IUCN) nominates a set of criteria used to identify species at risk of extinction which is used to define categories of risk (Figure 3-3). These criteria and categories are used by both the NT Government to identify threatened species listed under the TPWC Act, and by the Commonwealth Government to identify national threatened species under the EPBC Act. The focus of this report is species that are listed as threatened under either the TPWC Act or the EPBC Act (or both) – i.e. species that are listed as Vulnerable, Endangered, or Critically Endangered.
Figure 3-3. IUCN list categories of risk for threatened species
The following datasets were searched to generate a list of potential threatened species:
EPBC Protected Matters Search Tool (PMST). An online database managed by DEE which interrogates existing flora and fauna records and uses predictive habitat modelling to return a list of species which may occur in the defined area and a likelihood of each of these threatened and migratory species occurring. This dataset was interrogated within a 100 km buffer of the survey area. The results of the PMST search are provided in Appendix A.
Northern Territory Flora & Fauna Atlas. A database maintained by the Department of Environment and Natural Resources (DENR) of point records of fauna and flora species identified through biological surveys (either as validated incidental observations or voucher specimens) conducted in the NT under a Wildlife Permit. The updated dataset was obtained by EcOz from the DENR on 17 October 2016. The dataset was spatially interrogated using the boundaries of the Gulf Fall and Uplands, and Sturt Plateau bioregions.
For each of the species returned from the database searches, the likelihood of it occurring within the survey area was assessed based on habitat requirements, distribution, and the number and dates of proximate records. On-ground habitat assessment was also used to assist the assessment.
In this assessment, the likelihood of a species occurring is ranked as none, low, medium, and high. In the context of this report, this means:
None – There is no likelihood of this species occurring within the survey area.

Santos 10Ecology report – 2019 exploration program
Low – The survey area occurs outside of the core distribution for the species and there is no or only marginally-suitable habitat. Some vagrant records may exist.
Medium – There is suitable habitat within the survey area but records are either old, infrequent or some distance from the survey area.
High – There is suitable habitat within the survey area and records are proximate and recent.
3.2.6 Migratory and marine species
Listed migratory and marine species are protected in Australia due to Australia’s obligations under international conventions.
Migratory and marine species, which potentially occur within the survey area, were identified through the PMST database search (100 km buffer around the survey area). This search area includes a portion of coastline and marine habitat in the Gulf of Carpentaria. This inclusion expands the list of identified species. A ‘likelihood of occurrence’ assessment for these species was done following the same procedure as for threatened species.

Santos 11Ecology report – 2019 exploration program
3.3 Results
3.3.1 Land condition
Pastoralism
The survey area is located within Tanumbirini Station, an active pastoral property. Impact across the survey area was evident during field surveys. Cattle impact consisted of grazing to understorey species and trampling impacts around watercourses – this trampling has led to erosion around these watercourses.
Weeds and pests
NT listed weeds identified within the region include Prickly Acacia (Acacia nilotica), Bellyache Bush (Jatropha gossypiifolia), Spinyhead Sida (Sida acuta), Noogoora Burr (Xanthium pungens / X. strumarium), Parkinsonia (Parkinsonia aculeata), Mesquite (Prosopis spp.), Khaki Weed (Alternanthera pungens), Rubber Bush (Calotropis procera), and Hyptis (Hyptis suaveolens) (DLRM 2017). Mexican poppy (Argemone ochroleuca) occurs in some catchments including the McArthur River, and Rubber Vine (Cryptostegia grandiflora) is a potential threat in this region.
The Katherine Regional Weed Management Plan 2015-2020 (Weed Management Plan) (DLRM 2015) includes the survey area. The Weed Management Plan identifies priority weeds within the region (Table 3-1).
Table 3-1. Priority weeds within the Katherine Region Weed Management Plan
Species Class Weed of National Significance (WoNS)
Mesquite - Prosopis spp. A/C YPrickly acacia - Vachellia nilotica A/C YParkinsonia - Parkinsonia aculeata B/C YChinee Apple - Ziziphus mauritiana A/C -Mimosa - Mimosa pigra A/C YBellyache Bush - Jatropha gossypiifolia A/C YGamba Grass - Andropogon gayanus A/C YNeem - Azadirachta indica B/C -Grader grass - Themeda quadrivalvis B/C YSnake weed - Stachytarpheta spp. B/C -Devils Claw - Martynia annua A/C -
There are a number of records of Parkinsonia, Gamba Grass and Bellyache Bush near to the survey area. Hyptis was observed within the survey area.
Weed distribution is often related to environmental disturbances caused by the construction of roads and tracks, cattle grazing and feral animals. Weeds are most prevalent on land under pastoral lease, with infestations generally concentrated around infrastructure such as water points, fence lines and tracks, and also along the banks of watercourses where cattle and feral animals tend to congregate.
Pests that may occur within the survey area include Goat, Red Fox, Cat, Rabbit, Pig, Water Buffalo, Donkey and Cane Toads (DoE 2017). Donkeys and Pigs were observed during field surveys.

Santos 12Ecology report – 2019 exploration program
3.3.2 Land systems
There are 13 land systems mapped within the survey area (Table 3-2 and Figure 3-4). The land systems within the survey area consist primarily of lateritic plains, lateritic plateau, alluvial plains, and sandstone plains and rises. The landform and vegetation characteristics at each of the survey sites corresponded to the mapped land system.

Santos 13 Ecology report – 2019 exploration program
Table 3-2. Land systems within the survey area (as per Lynch & Wilson 1998)
Name Landform Soils Main vegetation*
Beetaloo (BE) Plains and rises on weathered sedimentary rocks
Red clayey sands, red earths and texture contrast soils
Acacia shirleyi Lancewood forest
Dalglese (Tcd)
Plains and rises associated with deeply weathered profiles (laterite) including sand sheets and other depositional products
Sandy and earth soils Mid‐high open woodland of Eucalyptus pruinosa, Corymbia terminalis, Erythrophleum chlorostachys, Melaleuca citrolens, Lysiphyllum cunninghamii over sparse grass cover (Chrysopogon fallax, Sehima nervosum, Heteropogon contortus)
Inacumba (Lwi)
Plains and rises associated with deeply weathered profiles (laterite) including sand sheets and other depositional products
Sandy and earth soils Mid‐high open woodland of C. dichromophloia, E. miniata, E. tetrodonta, Corymbia ferruginea, E. leucophloia with isolated stands of A. shirleyi on steeper slopes over Eriachne spp, Chrysopogon fallax, Triodia pungens
Lancewood 2 (Lwl)
Crenulate escarpments, rugged low hills and gently undulating lower slopes on actively eroding, ferruginised Lower Cretaceous sediments (claystone and laterite)
Grey and Brown Vertosols and Leptic Rudosols; shallow soils with rock outcrop
Mid high open woodland of E. pruinosa with areas of mixed grasslands, Acacia shirleyi on cliffs and slopes
Lancewood 3 (Lwl)
McArthur (Tam)
Broad or narrow fluvial corridors conducting regional drainage across various Land Systems towards the coast
Aquic Vertosols, Red and Yellow Kandosols and Orthic Tenosols; sandy, silty and clay soils on Quaternary alluvium
Mid high open woodland of E. microtheca with some Corymbia papuana and Corymbia polycarpa, tall fringing riparian vegetation often including Melaleuca spp.
Miller (Tcm) Level plains to gently undulating clay plains Cracking clay soils Mid‐high open woodland of E. pruinosa over Eulalia fulva, Chrysopogon fallax, Aristida inaequiglumis
Tanumbirini (Tct)
Plains and rises associated with deeply weathered profiles (laterite) including sand sheets and other depositional products
Sandy and earth soils Mid‐high open woodland of Eucalyptus chlorophylla, Erythrophleum chlorostachys, Corymbia polycarpa, Eucalyptus tetrodonta, Terminalia grandifolia over Chrysopogon fallax, Eulalia fulva, Triodia pungens
Bukalara (Asb)
Rugged rocky plateaux and steep linear ridges on massive sandstones such as the Bukalara and Kombolgie Sandstones
Leptic Rudosols; shallow sandy soils and rock outcrop
Mid high open woodland of Eucalyptus dichromophloia with Eucalyptus miniata, Eucalyptus tetrodonta and Eucalyptus leucophloia, some Eucalyptus kombolgiensis
Coolibah (Tac)
Level to gently undulating plains on unconsolidated, transported materials, rarely sedentary
Aquic Vertosols; sandy, silty and clay soils on Quaternary alluvium
Mid high open woodland of Eucalyptus microtheca with some Excoecaria parvifolia and Corymbia papuana
Cresswell (Lwc)
Erosionally stable, gently undulating lateritic plains and rises
Leptic Rudosols, Leptic Tenosols, Red and Yellow Kandosols; sandy and earth soils
Mid high open woodland of C. dichromophloia and Corymbia bleeseri with isolated stands of Acacia shirleyi

Santos 14 Ecology report – 2019 exploration program
Name Landform Soils Main vegetation*
Lansen (All) Long, low, often terraced rises with linear outcrop on prominently bedded sandstones
Leptic Rudosols; commonly shallow soils with surface stone and rock outcrop
Mid high open woodland of E. ferruginea with some Lysiphyllum cunninghamii
Seigal (Als) Gently undulating to undulating rises with abundant, often linear rocky outcrops
Leptic Rudosols and Leptic Tenosols; often linear rocky outcrops and shallow sandy soils
Mid high open woodland of Eucalyptus miniata, Eucalyptus tetrodonta and Eucalyptus ferruginea with Corymbia. dichromophloia and Eucalyptus leucophloia

!(
!(
Carpentaria Highway
Inacumba- 1
Tanumbirini- 2
440000 450000 460000 470000 480000 490000 50000081
6000
0
8160
000
8170
000
8170
000
8180
000
8180
000
8190
000
8190
000
8200
000
8200
000
8210
000
8210
000
8220
000
8220
000
0 5 102.5
Kilometres
"
"
Daly Waters
Katherine OMAP INFORMATIONProjection: GDA 1994 MGA Zone 53Date Saved: 4/1/2019Client: SantosAuthor: F Watt (review A Campbell)DATA SOURCEProject components: ClientImagery: ESRI basemap (Digital Globe)
Path: Z:\01 EcOz_Documents\04 EcOz Vantage GIS\EZ19041 - Santos EP161 EMP aspects\01 Project Files\Figure 3-4. Map land systems intersected by the survey and project areas.mxd
Figure 3-4. Map of Land Systems within the survey area
Legend!( Proposed well
2D Seismic line
Borrow pits
Road
Access tracksexisting
proposed
Survey area
Exploration permit161
Red box indicates map extent
Land SystemsBukalara
Coolibah
Cresswell
Dalglese
Inacumba
Lancewood 2
Lancewood 3
Lansen
McArthur
Miller
Seigal
Tanumbirini
Beetaloo
15

Santos 16Ecology report – 2019 exploration program
3.3.3 Vegetation
The dominant vegetation types within the survey area are Eucalyptus and Corymbia communities (in the plains and undulating hills), Acacia woodlands/forests, and Melaleuca communities (within drainages lowlands, and depressions), Lancewood woodland/forests and Bulwaddy woodlands.
Although not indicated on the NVIS mapping, sections of the survey area were identified during the field survey as tussock grasslands on lateritic plains or alluvial plains. These areas were too small to be picked up at the NVIS scale. These grasslands were surrounded by either Eucalyptus or Melaleuca woodlands.
Vegetation exhibited impacts from cattle. Understorey grass species showed extensive impact from cattle grazing. Trampling and impacts to the soil surface was also evident.
Eucalyptus woodlands containing Eucalyptus leucophloia, which occurs on rises (particularly within the lateritic plateau land systems), may provide habitat for Gouldian Finch (see Section 5). This species is one of the preferred nesting trees.
Photos of typical vegetation communities within the survey area are shown below.
Eucalyptus woodlands with tussock understorey Eucalyptus woodlands with hummock understorey
Corymbia woodlands Tussock grassland
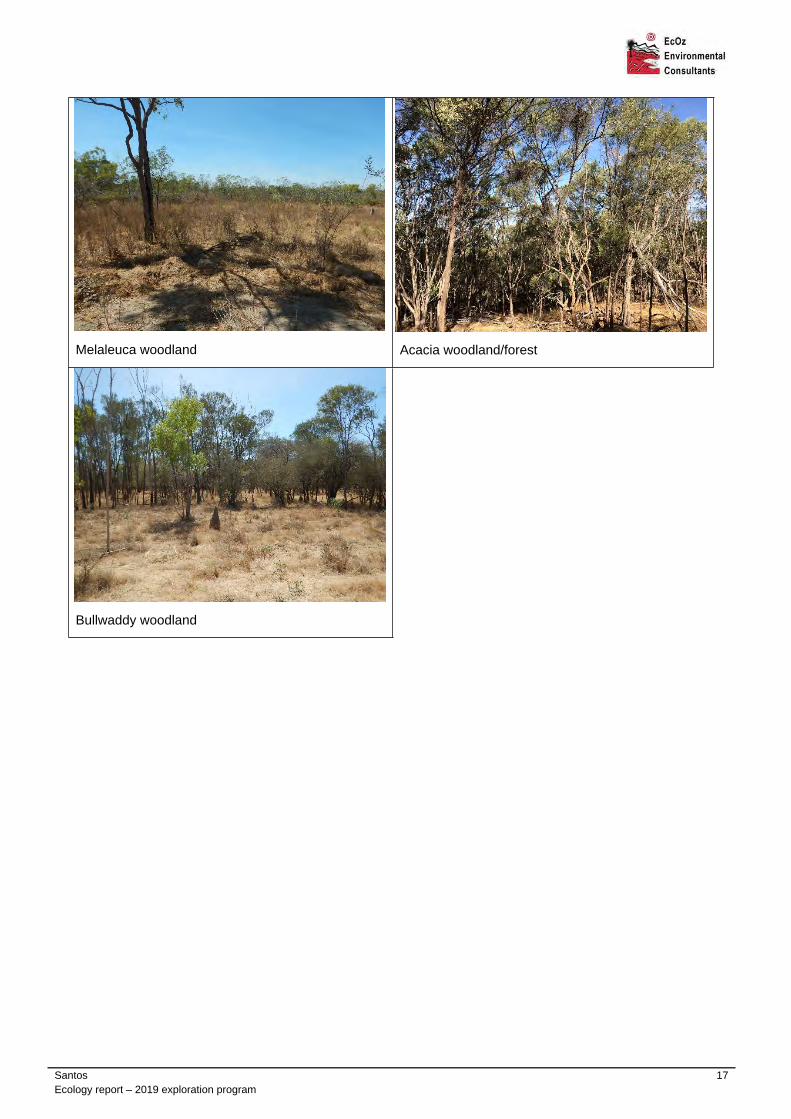
Santos 17Ecology report – 2019 exploration program
Melaleuca woodland Acacia woodland/forest
Bullwaddy woodland

!(
!(
Inacumba- 1
Tanumbirini- 2
440000 450000 460000 470000 480000 490000 500000 51000081
5000
0
8150
000
8160
000
8160
000
8170
000
8170
000
8180
000
8180
000
8190
000
8190
000
8200
000
8200
000
8210
000
8210
000
8220
000
8220
000
8230
000
8230
000
0 5 102.5
Kilometres
"
"
Daly Waters
Katherine OMAP INFORMATIONProjection: GDA 1994 MGA Zone 53Date Saved: 4/2/2019Client: SantosAuthor: F Watt (review A Campbell)DATA SOURCEProject components: ClientImagery: ESRI basemap (Digital Globe)
Path: Z:\01 EcOz_Documents\04 EcOz Vantage GIS\EZ19041 - Santos EP161 EMP aspects\01 Project Files\Figure 3-5. Map showing NVIS vegetation within the survey and project areas.mxd
Figure 3-5. Map showing NVIS vegetation within the survey area
Legend!( Proposed well
2D Seismic line
Borrow pits
Road
Access tracksexisting
proposed
Survey area
Exploration permit161
Red box indicates map extent
NVIS Vegetation GroupAcacia (+/- low) open woodlands andsparse shrublands +/- tussock grass
Cleared, non-native vegetation, buildings
Eucalyptus low open woodlands withhummock grass
Eucalyptus low open woodlands withtussock grass
Eucalyptus open forests with a grassyunderstorey
Eucalyptus open woodlands with a grassyunderstorey
Eucalyptus woodlands with a hummockgrass understorey
Eucalyptus woodlands with a tussockgrass understorey
Melaleuca open forests and woodlands
Other Acacia forests and woodlands
Other forests and woodlands
Other open woodlands
Tropical mixed species forests andwoodlands
18

Santos 19Ecology report – 2019 exploration program
3.3.4 Sensitive vegetation communities
There was a single sensitive vegetation community type identified within the survey area.
Riparian vegetation occurs along freshwater waterways (ephemeral or permanent). It is a distinct, closed forest community that creates suitable conditions for a range of species (terrestrial and aquatic) by providing shade (DLRM 2013). It covers a relatively small land area and provides unique habitat features and dry season refuge for a range of native fauna species (DLRM 2013).
Six riparian sites were visited during field survey (this is a representative set of sites within the survey area). Typical riparian vegetation in the region consists of Eucalyptus and Melaleuca communities with tussock grass understoreys. Riparian vegetation within the survey area was confined to the banks of the watercourse and did not extend far into the surrounding country.
Like other areas within the survey area, riparian vegetation exhibited impacts from cattle. Erosion from cattle trampling was evident on the banks of all watercourses visited. Understorey grass species showed extensive impact from cattle grazing; this has likely exacerbated the erosion along the watercourse banks.
Figure 3-6. Photos showing typical riparian vegetation within the survey area

Santos 20Ecology report – 2019 exploration program
3.3.5 Watercourses, wetlands and waterholes
There are no wetlands of international or national significance within the survey area.
There are two ephemeral (seasonal) watercourses within the survey area – Lagoon Creek, and Tanumbirini Creek. Newcastle Creek is also within the survey area. These watercourses are associated with the McArthur land system.
Three permanent waterholes were visited during field survey (those which were accessible using existing access tracks). One of these permanent waterholes, ‘Rocky Hole’, is used for pastoral operations (water is pumped from this site and it is evidently visited by stock). Rocky Hole is a relatively large waterhole with a sandstone cliff to the upstream end. It is fringed with Melaleuca sp. with a tussock grass understorey. Multiple Freshwater Crocodiles (Crocodylus johnstonii) were observed within the waterhole, and numerous bird species were utilising this environment.
The second waterhole was a large, elongate waterhole which appeared to have a similar profile to the surrounding watercourse. The waterhole is located between two bands of quartz sandstone outcropping to the north-east of the survey area. The third waterhole was smaller and was surrounded by flat plains. This waterhole was on the same watercourse as Rocky Hole, further upstream.
Aerial imagery indicates that there are multiple other waterholes in the survey area; however, access to these was not possible.
3.3.6 Threatened species
There are records for 31 threatened species (Commonwealth and/or Northern Territory-listed) within the two relevant bioregions – 30 fauna and one flora species. It should be noted that the project occurs within Beetaloo Basin, an area which has very few records of threatened species compared to the savanna woodland habitats to the north and in the arid lands to the south (DEWHA 2009).
The key points of the ‘likelihood of occurrence’ assessment are summarised below and in Table 3-3, and detailed in Appendix B.
No species were ranked as having a ‘high’ chance of occurring within the survey area.
Four species were ranked as having a ‘medium’ chance of occurring within the survey area.
Thirteen species were ranked as having a ‘low’ chance of occurring within the survey area
Fifteen species were considered to not occur within the survey area.
Only species which have a medium likelihood of occurring within the survey area are considered further in this report.
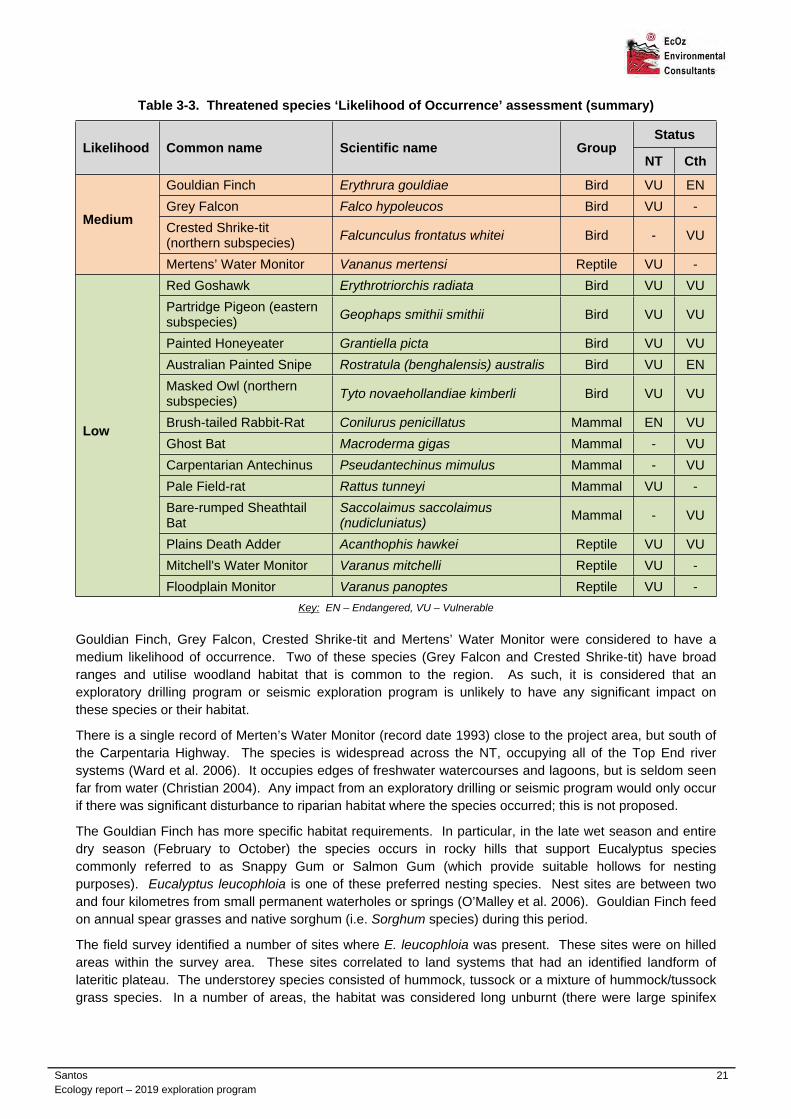
Santos 21Ecology report – 2019 exploration program
Table 3-3. Threatened species ‘Likelihood of Occurrence’ assessment (summary)
StatusLikelihood Common name Scientific name Group
NT Cth
Gouldian Finch Erythrura gouldiae Bird VU ENGrey Falcon Falco hypoleucos Bird VU -Crested Shrike-tit (northern subspecies) Falcunculus frontatus whitei Bird - VU
Medium
Mertens’ Water Monitor Vananus mertensi Reptile VU -Red Goshawk Erythrotriorchis radiata Bird VU VUPartridge Pigeon (eastern subspecies) Geophaps smithii smithii Bird VU VU
Painted Honeyeater Grantiella picta Bird VU VUAustralian Painted Snipe Rostratula (benghalensis) australis Bird VU ENMasked Owl (northern subspecies) Tyto novaehollandiae kimberli Bird VU VU
Brush-tailed Rabbit-Rat Conilurus penicillatus Mammal EN VUGhost Bat Macroderma gigas Mammal - VUCarpentarian Antechinus Pseudantechinus mimulus Mammal - VUPale Field-rat Rattus tunneyi Mammal VU -Bare-rumped Sheathtail Bat
Saccolaimus saccolaimus (nudicluniatus) Mammal - VU
Plains Death Adder Acanthophis hawkei Reptile VU VUMitchell's Water Monitor Varanus mitchelli Reptile VU -
Low
Floodplain Monitor Varanus panoptes Reptile VU -Key: EN – Endangered, VU – Vulnerable
Gouldian Finch, Grey Falcon, Crested Shrike-tit and Mertens’ Water Monitor were considered to have a medium likelihood of occurrence. Two of these species (Grey Falcon and Crested Shrike-tit) have broad ranges and utilise woodland habitat that is common to the region. As such, it is considered that an exploratory drilling program or seismic exploration program is unlikely to have any significant impact on these species or their habitat.
There is a single record of Merten’s Water Monitor (record date 1993) close to the project area, but south of the Carpentaria Highway. The species is widespread across the NT, occupying all of the Top End river systems (Ward et al. 2006). It occupies edges of freshwater watercourses and lagoons, but is seldom seen far from water (Christian 2004). Any impact from an exploratory drilling or seismic program would only occur if there was significant disturbance to riparian habitat where the species occurred; this is not proposed.
The Gouldian Finch has more specific habitat requirements. In particular, in the late wet season and entire dry season (February to October) the species occurs in rocky hills that support Eucalyptus species commonly referred to as Snappy Gum or Salmon Gum (which provide suitable hollows for nesting purposes). Eucalyptus leucophloia is one of these preferred nesting species. Nest sites are between two and four kilometres from small permanent waterholes or springs (O’Malley et al. 2006). Gouldian Finch feed on annual spear grasses and native sorghum (i.e. Sorghum species) during this period.
The field survey identified a number of sites where E. leucophloia was present. These sites were on hilled areas within the survey area. These sites correlated to land systems that had an identified landform of lateritic plateau. The understorey species consisted of hummock, tussock or a mixture of hummock/tussock grass species. In a number of areas, the habitat was considered long unburnt (there were large spinifex

Santos 22Ecology report – 2019 exploration program
hummocks) and there were considerable hollows that, through preliminary assessment, appeared to be suitable nesting locations.
From the field observations and the available land system mapping of the survey area, Gouldian Finch breeding habitat may occur within the following land systems – Lancewood 22, Inacumba and Bukalara. There are areas of each of these land systems in the survey area.
2 Although Eucalyptus leucophloia is not associated with the Lancewood 2 land system in Table 3-2, the field survey identified numerous areas of this within the land system.

_̂
_̂_̂
_̂_̂
_̂_̂ _̂
_̂ _̂_̂
_̂
_̂
_̂_̂
_̂
_̂
_̂
_̂
_̂
_̂
_̂_̂
_̂_̂
_̂
_̂_̂
_̂
_̂_̂_̂
_̂
_̂
_̂
_̂
_̂
_̂_̂_̂
_̂
_̂
_̂ _̂_̂_̂
_̂
_̂
_̂
_̂_̂
_̂
_̂_̂
_̂
_̂
_̂_̂
_̂
_̂
_̂
_̂
_̂
_̂
_̂_̂_̂_̂_̂_̂_̂
_̂_̂
_̂
_̂
_̂
_̂
_̂̂_ _̂
_̂̂_̂_
_̂_̂
" Carpentaria Highway
Stuart Highway
Daly Waters
300000 320000 340000 360000 380000 400000 420000 440000 460000 480000 500000 520000 540000 560000 580000 60000080
0000
0
8000
000
8020
000
8020
000
8040
000
8040
000
8060
000
8060
000
8080
000
8080
000
8100
000
8100
000
8120
000
8120
000
8140
000
8140
000
8160
000
8160
000
8180
000
8180
000
8200
000
8200
000
8220
000
8220
000
8240
000
8240
000
8260
000
8260
000
8280
000
8280
000
8300
000
8300
000
8320
000
8320
000
8340
000
8340
000
8360
000
8360
000
Path: Z:\01 EcOz_Documents\04 EcOz Vantage GIS\EZ19041 - Santos EP161 EMP aspects\01 Project Files\Figure 3-7. Map of proximate records for medium likelihood threatened species.mxd
0 25 5012.5
Kilometres
"
"
"
Daly Waters
Katherine OMAP INFORMATIONProjection: GDA 1994 MGA Zone 53Date Saved: 4/2/2019Client: SantosAuthor: F Watt (review A Campbell)DATA SOURCEProject components: ClientImagery: ESRI basemap (Digital Globe)
Figure 3-7. Map of proximate records for medium likelihood threatened species
LegendSurvey areaExploration permit 161
Threatened species records
_̂ Australian Painted Snipe, Rostratula australis
_̂ Crested Shrike-tit, Falcunculus frontatus
_̂ Gouldian Finch, Erythrura gouldiae
_̂ Grey Falcon, Falco hypoleucosRed box indicates map extent
23

Santos 24Ecology report – 2019 exploration program
3.3.7 Migratory species
A Protected Matters Search Report identified 16 EPBC-listed migratory species as potentially occurring within the survey area. Three of the migratory species were identified by a Likelihood of Occurrence assessment as having a medium likelihood of occurrence in the survey area, and a further eight had a low likelihood of occurrence, the remaining five were assessed as having no likelihood of occurring within the survey area.
When assessing if a project will significantly impact upon a migratory species, the key considerations under the EPBC Significant Impact Guidelines 1.1 (DOE 2013) are whether an important habitat for a migratory species or an ecologically-significant population of a migratory species is involved. Although the migratory species in question have very different habitats and ecologies, they are all similar in that the project area neither represents important habitat for them, nor are ecologically-significant populations likely to be present.
Table 3-4. Migratory species ‘likelihood of occurrence’ assessment (summary)
Likelihood Common name Scientific name Group
Fork-tailed Swift Apus pacificus Migratory marine birdOriental Plover Charadrius veredus Migratory wetland speciesMedium
Oriental Pratincole Glareola maldivarum Migratory wetland speciesOriental Cuckoo Cuculus optatus Migratory marine speciesBarn Swallow Hirundo rustica Migratory terrestrial speciesRed-rumped Swallow Cecropis daurica Migratory terrestrial speciesGrey Wagtail Motacilla cinerea Migratory terrestrial speciesYellow Wagtail Motacilla flava Migratory terrestrial speciesCommon Sandpiper Actitis hypoleucos Migratory wetland speciesSharp-tailed Sandpiper Calidris acuminata Migratory wetland species
Low
Pectoral Sandpiper Calidris melanotos Migratory wetland species
None of the three species identified as having a medium likelihood of occurring within the survey area are expected to be impacted by an exploratory drilling program. The Fork-tailed Swift would only be found above the survey area as it is an exclusively aerial species. The Oriental Plover and the Oriental Pratincole potentially occur within the survey area, however, these species are unlikely to be impacted by an exploratory drilling program or seismic exploration program as the area of disturbance will be small and the species’ preferred habitat covers large areas.
3.3.8 Avifauna observations
Thirty-three species were observed within the survey area during field surveys (August 2017) – see Table 3-5. Avian species were recorded in all land systems; however, the majority of records come from areas surrounding the waterholes/watercourses, and the Eucalypt/Corymbia woodlands. No threatened species were observed.
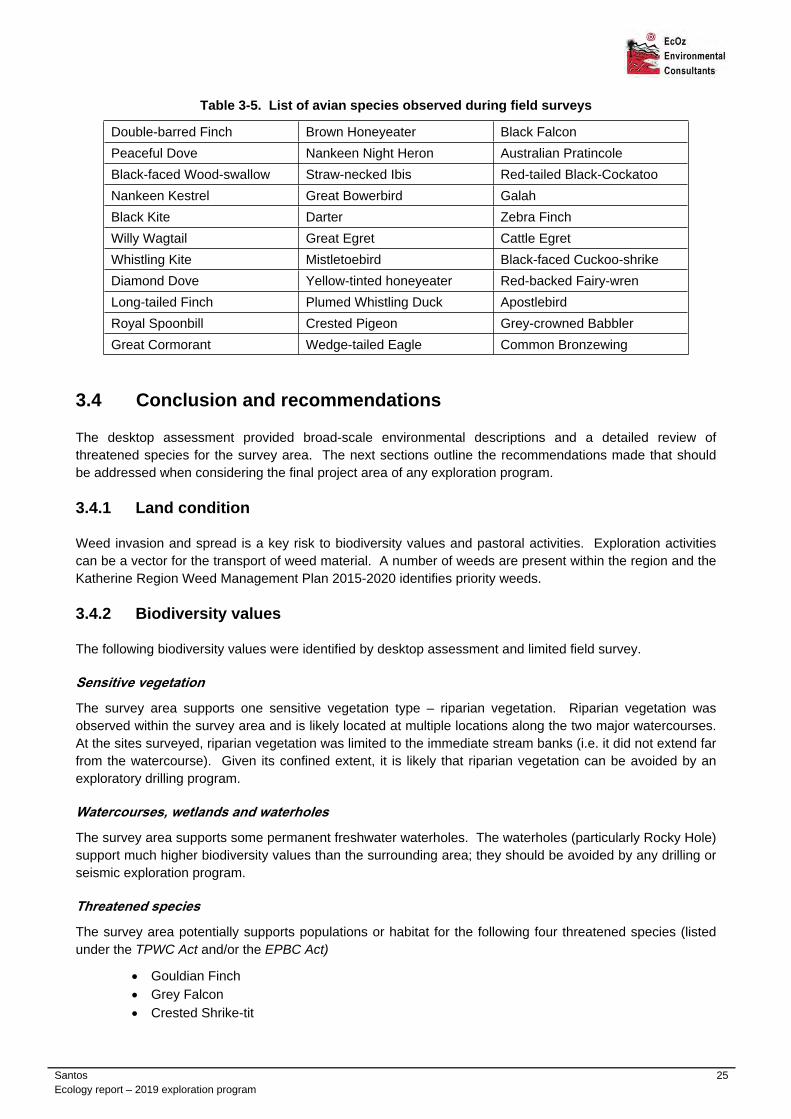
Santos 25Ecology report – 2019 exploration program
Table 3-5. List of avian species observed during field surveys
Double-barred Finch Brown Honeyeater Black FalconPeaceful Dove Nankeen Night Heron Australian PratincoleBlack-faced Wood-swallow Straw-necked Ibis Red-tailed Black-CockatooNankeen Kestrel Great Bowerbird GalahBlack Kite Darter Zebra FinchWilly Wagtail Great Egret Cattle EgretWhistling Kite Mistletoebird Black-faced Cuckoo-shrikeDiamond Dove Yellow-tinted honeyeater Red-backed Fairy-wrenLong-tailed Finch Plumed Whistling Duck ApostlebirdRoyal Spoonbill Crested Pigeon Grey-crowned BabblerGreat Cormorant Wedge-tailed Eagle Common Bronzewing
3.4 Conclusion and recommendations
The desktop assessment provided broad-scale environmental descriptions and a detailed review of threatened species for the survey area. The next sections outline the recommendations made that should be addressed when considering the final project area of any exploration program.
3.4.1 Land condition
Weed invasion and spread is a key risk to biodiversity values and pastoral activities. Exploration activities can be a vector for the transport of weed material. A number of weeds are present within the region and the Katherine Region Weed Management Plan 2015-2020 identifies priority weeds.
3.4.2 Biodiversity values
The following biodiversity values were identified by desktop assessment and limited field survey.
Sensitive vegetation
The survey area supports one sensitive vegetation type – riparian vegetation. Riparian vegetation was observed within the survey area and is likely located at multiple locations along the two major watercourses. At the sites surveyed, riparian vegetation was limited to the immediate stream banks (i.e. it did not extend far from the watercourse). Given its confined extent, it is likely that riparian vegetation can be avoided by an exploratory drilling program.
Watercourses, wetlands and waterholes
The survey area supports some permanent freshwater waterholes. The waterholes (particularly Rocky Hole) support much higher biodiversity values than the surrounding area; they should be avoided by any drilling or seismic exploration program.
Threatened species
The survey area potentially supports populations or habitat for the following four threatened species (listed under the TPWC Act and/or the EPBC Act)
Gouldian Finch Grey Falcon Crested Shrike-tit

Santos 26Ecology report – 2019 exploration program
Mertens’ Water Monitor
As two of these species (Grey Falcon and Crested Shrike-tit) have broad ranges and utilise woodland habitat that is common to the region, it is considered that an exploratory drilling or seismic exploration program is unlikely to have any significant impact on these species or their habitat.
The Gouldian Finch has more specific habitat requirements. There was potential habitat for the species found within the survey area. These areas were associated with hilled regions were there was Eucalyptus leucophloia present (nesting habitat).
Potential impacts to this species will be associated with clearing vegetation for drill pads, roads, and other related infrastructure; with the main direct impact being removal of current (or potential) nest sites. If the project avoids areas of Snappy Gum (Eucalyptus leucophloia), then there will not be a significant impact to the species. Even if areas of Snappy Gum need to be removed for project operations, it is unlikely that there will be a significant impact on the species; however, this should be confirmed prior to operations.
If more extensive works are proposed to be undertaken (for example a production operation), it is recommended that further work be undertaken to assess the risk and impact to Gouldian Finch. The steps involved in such work are outlined below:
Phase 1: Conduct a habitat suitability assessment (desk-based assessment), which will include inspection if the proposed disturbance area falls within the land systems containing suitable habitat.
Phase 2: If potential habitat is suspected to occur, follow up with on-ground studies to refine habitat features and update the ‘likelihood of occurrence’ assessment for the specific disturbance sites. For this species, the on-ground studies should also include a survey for evidence of Gouldian Finch (i.e. direct observation, potential nest sites, viable food resources, proximity to dry season water supply) and also characterisation of nesting habitat based on known hollow requirements. These surveys can be conducted at any time of year. Surveys should include a detailed habitat assessment of the site.
Phase 3: If the habitat assessment indicates it is possible that Gouldian Finch inhabit the site, and if the habitat cannot be avoided from disturbance activities, more intensive survey methodology will be required to provide a more rigorous interrogation of the species’ likelihood of occurrence. Standard survey techniques applicable for Gouldian Finch detection will be to undertake surveillance (i.e. stake-outs) on the suspected nest sites to determine if they are active, and if they belong to Gouldian Finch. Confirmed nest sites will be considered to be significant, and potential nest sites will also be considered to be significant if ‘flyover’ sightings are observed in the area. These surveys should occur in the late wet to mid dry season to ensure that breeding populations are encountered.
The abovementioned methods align with the Survey Guidelines for Australia’s Threatened Birds (Commonwealth of Australia 2010).
Migratory species
Although there are three migratory species identified as having a medium likelihood of occurring within the survey area, it is not expected that an exploratory drilling program or seismic exploration program will have a significant impact on the species.
3.4.3 Recommendations
The biodiversity values mentioned in this document are either associated with habitat types that can be avoided (i.e. riparian vegetation) or that will not be significantly impacted through an exploratory drilling program or seismic exploration program (i.e. threatened species) due to the small area of disturbance.

Santos 27Ecology report – 2019 exploration program
Given the results of the biodiversity values assessment contained within this report, the following recommendations are made to minimise environmental impact:
Ensure that the minimum setback distance as per the Land Clearing Guidelines are met to avoid impact to sensitive vegetation. These buffers should be measured from the boundary of the disturbance area to the edge of the riparian vegetation (rather than from the drill site/well head).
Where possible, locate drill sites and seismic exploration activities within lateritic plains land systems, as field surveys and ‘likelihood of occurrence’ assessment indicated that these systems are the least likely to provide significant habitat for threatened species.
Where possible, avoid impacts to Snappy Gums (E. leucophloia) (located primarily in the lateritic plateau land system but can occur on any rise); this will minimise any impact to Gouldian Finch.
Prior to more-intensive works, further assessment of habitat for Gouldian Finch and potential impact to this species should be undertaken. This would include desktop assessment and on-ground studies, and assessed in relation to a project area (see Section 3.3.6).
Prior to any works being undertaken ensure that appropriate weed management procedures are in place. All vehicles and equipment should be certified wee free prior to entry onto the property.
Undertaking a weed survey at exploratory drilling sites and/or seismic exploration sites and along access tracks would provide baseline data. This would enable Santos to ensure that activities do not introduce or spread weeds.

Santos 28Ecology report – 2019 exploration program
4 FIELD ASSESSMENT
4.1 Purpose and scope
Santos has identified a project area for the 2019 exploration program (Section 2). Field assessments were undertaken in 2018 to address the recommendations of the desktop assessment. Particularly:
Undertaking a weed survey at exploratory drilling and/or seismic exploration sites and along access tracks would provide baseline data. This would enable Santos to ensure that activities do not introduce or spread weeds.
Prior to more intensive works being undertaken, it is recommended that further assessment of habitat for Gouldian Finch and potential impact to this species be undertaken. This would include desktop assessment and on-ground studies and would be assessed in relation to a project area
As the identified exploration activities may intersect watercourses that may support sensitive vegetation in the form of riparian vegetation, Santos required the location of any sensitive vegetation to be identified so that potential impact to these communities could be avoided or minimised during exploration.
The project area is within the 2018 survey areas, as discussed in Section 2 and depicted in Figure 2-1.
4.2 Weed survey
4.2.1 Background
There are three classes of weeds declared under the NT Weeds Management Act, some of which are also considered Weeds of National Significance (WoNS). These weed classes, categorised based on the risk of impact and how difficult they are to control, are:
Class A – to be eradicated Class B – growth and spread to be controlled Class C – not to be introduced into the NT (all Class A and B weeds are also Class C).
Weed surveys within EP 161 focused on the weed species already recorded on the property (see Table 4-1). Potential weeds of concern within the Katherine Region, outlined in the Katherine Regional Weed Management Plan 2015-2020 (DLRM 2015), were also considered (see Table 4-2).
Table 4-1. Declared weed species recorded within the EP
Common name Scientific name NT Class
Hyptis Hyptis suaveolens B/CRubber Bush3 Calotropis procera B/CSpinyhead sida Sida acuta B/CSicklepod Senna obtusifolia B/C
3 Although Rubber Bush is only declared south of 16°30' S, it was included in this list as current exploration areas are just north of this latitude and EP161area crosses this line of declaration.

Santos 29Ecology report – 2019 exploration program
Table 4-2. Potential weeds within the project area
Common name Scientific name NT Class WoNS
Mesquite* Prosopis spp. A/C YPrickly acacia* Vachellia nilotica A/C YParkinsonia Parkinsonia aculeata B/C YChinee Apple* Ziziphus mauritiana A/CMimosa* Mimosa pigra A/C YBellyache Bush* Jatropha gossypiifolia A/C4 YGamba Grass* Andropogon gayanus A/C YNeem* Azadirachta indica B/CGrader grass* Themeda quadrivalvis B/C YSnake weed Stachytarpheta spp. B/C
Katherine region priority weeds
Devils Claw Martynia annua A/CParthenium5 Parthenium hysterophorus A/C YStarburr Acanthospermum hispidum B/CMossman River Grass Cenchrus echinatus B/CSpiny-head Sida Sida acuta B/CFlannel Weed Sida cordifolia B/CPaddy`s Lucerne Sida rhombifolia B/CCaltrop Tribulus terrestris B/CNoogoora Burr Xanthium strumarium B/C
Other declared weeds
Khaki Weed Alternanthera pungens B/C* indicates weeds with an associated weed management plan
EcOz liaised with the Department of Environment and Natural Resources (DENR) Weeds Management Branch to confirm that the lists of species in Table 4-1 and Table 4-2 were comprehensive. The Weeds Management Branch agreed that the lists covered all weeds for which surveys should be conducted, whilst noting it was the wrong time of year (November) to survey for some weeds, e.g. Parthenium and Grader Grass.
The Weeds Management Branch were also consulted on the survey approach. The agreed approach was to walk all disturbance areas to search for weeds. The Weeds Management Branch also suggested surveying surrounding areas adjacent to the project area, i.e. infrastructure and access tracks, as any disturbance may provide opportunity for the establishment of weed seeds present within the soil.
4 Bellyache bush classification depends on its location within the NT; the EP is within the Class A eradication zone.5 Parthenium, previously eradicated from the NT, has recently been recorded in the Katherine region.
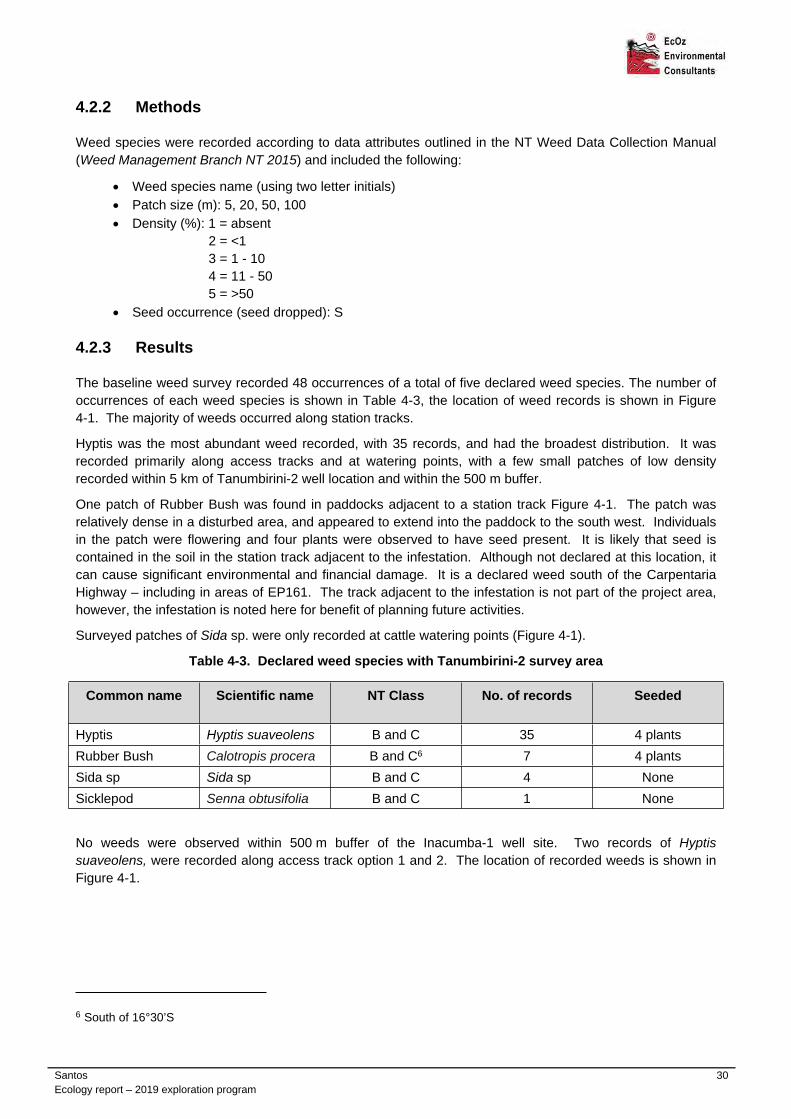
Santos 30Ecology report – 2019 exploration program
4.2.2 Methods
Weed species were recorded according to data attributes outlined in the NT Weed Data Collection Manual (Weed Management Branch NT 2015) and included the following:
Weed species name (using two letter initials) Patch size (m): 5, 20, 50, 100 Density (%): 1 = absent
2 = <1 3 = 1 - 10 4 = 11 - 50 5 = >50
Seed occurrence (seed dropped): S
4.2.3 Results
The baseline weed survey recorded 48 occurrences of a total of five declared weed species. The number of occurrences of each weed species is shown in Table 4-3, the location of weed records is shown in Figure 4-1. The majority of weeds occurred along station tracks.
Hyptis was the most abundant weed recorded, with 35 records, and had the broadest distribution. It was recorded primarily along access tracks and at watering points, with a few small patches of low density recorded within 5 km of Tanumbirini-2 well location and within the 500 m buffer.
One patch of Rubber Bush was found in paddocks adjacent to a station track Figure 4-1. The patch was relatively dense in a disturbed area, and appeared to extend into the paddock to the south west. Individuals in the patch were flowering and four plants were observed to have seed present. It is likely that seed is contained in the soil in the station track adjacent to the infestation. Although not declared at this location, it can cause significant environmental and financial damage. It is a declared weed south of the Carpentaria Highway – including in areas of EP161. The track adjacent to the infestation is not part of the project area, however, the infestation is noted here for benefit of planning future activities.
Surveyed patches of Sida sp. were only recorded at cattle watering points (Figure 4-1).
Table 4-3. Declared weed species with Tanumbirini-2 survey area
Common name Scientific name NT Class No. of records Seeded
Hyptis Hyptis suaveolens B and C 35 4 plantsRubber Bush Calotropis procera B and C6 7 4 plantsSida sp Sida sp B and C 4 NoneSicklepod Senna obtusifolia B and C 1 None
No weeds were observed within 500 m buffer of the Inacumba-1 well site. Two records of Hyptis suaveolens, were recorded along access track option 1 and 2. The location of recorded weeds is shown in Figure 4-1.
6 South of 16°30’S

#*
#*#*#*#*
#*#*
#*
#*
#*
#*#*#*#*#*#*#*#*#*#*#*
#*
#*
#*#*#*
#*
#*#*#*
#*
#*
#*#*#*
#*
#*#*#*#*#*#*
#*#*#*
#*
#*
#*
#*
#*
!(
!(
Carpentaria Highway
Laydownarea
Inacumba- 1
Tanumbirini- 2
460000 470000 48000081
7000
0
8170
000
8180
000
8180
000
8190
000
8190
000
Path: Z:\01 EcOz_Documents\04 EcOz Vantage GIS\EZ19041 - Santos EP161 EMP aspects\01 Project Files\Figure 3-2. Location of weed occurrences within or adjacent to 2019 exploration program area.mxd
0 2.5 51.25
Kilometres"
"Daly Waters
Katherine OMAP INFORMATIONProjection: GDA 1994 MGA Zone 53Date Saved: 3/28/2019Client: SantosAuthor: F Watt (review A Campbell)DATA SOURCEProject components: ClientImagery: ESRI basemap (Digital Globe)
Figure 4-1. Weed occurrences within, or adjacent to, project area
Legend!( Proposed well
2D Seismic line
Borrow pits
Exploration permit161
Access tracksexisting
proposed
Weed species#* Hyptis
#* Rubber Bush
#* Senna
#* Sida sp
Red box indicates map extent
31

Santos 32Ecology report – 2019 exploration program
4.3 Threatened species habitat
4.3.1 Background
The desktop assessment determined that Gouldian Finch (Erythrura gouldiae) had a medium chance of occurring with the survey area (which included the project area) (Section 3.2.5). Gouldian Finch is listed as endangered under both the Environment Protection and Biodiversity Conservation Act (EPBC Act) (1999) and the Territory parks and Wildlife Conservation Act (TPWC Act).
The critical components of suitable habitat for the Gouldian Finch vary seasonally. In the dry season, the critical components are hollow-bearing Eucalyptus trees (especially E. tintinnans, E. brevifolia and E. leucophloia) (Higgins et al. 2006; O'Malley 2006; Tidemann 1996; Tidemann et al. 1999) with an understorey of the favoured annual grass (Sorghum spp., Schizachyrium spp.) and a nearby (within 4 km) source of surface water. In the wet season, Gouldian finches rely on a variety of perennial grass species, and birds will move from area to area as the seeds from each species become available (Dostine and Franklin 2002; Dostine et al. 2001).
The breeding season extends from February to April, with a longer season (January to August) in years of extended wet season rainfall (Woinarski & Tidemann 1991; Tidemann & Woinarski 1994; Tidemann et al. 1999). Individuals or groups appear first to select patches of habitat with high densities of potential nesting sites, and breeding pairs then select specific nest sites based on a suite of preferred hollow morphometric attributes (Brazill-Boast et al. 2010).
The field inspections as part of the previous study (EcOz 2017) identified a number of sites where E. leucophloia was present on hilled areas within EP 161. The understorey species at these sites consisted of hummock, tussock or a mixture of hummock/tussock grass species. In a number of areas, the habitat was considered long unburnt (given the presence of large spinifex hummocks) and there were considerable hollows, which, through preliminary assessment, appeared to be suitable nesting locations.
4.3.2 Methods
Surveyors marked any occurrence of E. leucophloia within the project area. At each patch of E. leucophloia the following information was recorded:
Tree density Tree heights (m) Type of trunk (single or ‘Mallee’) Hollow heights (m) Number of hollow > 25 mm General hollow angle Understorey vegetation description Fire impact
The habitat suitability of each patch of E. leucophloia for Gouldian Finch was categorised based on these characteristics.
4.3.3 Results
There are few patches of E. leucophloia within the project area. There is a small patch of E. leucophloia within the 500 m buffer of Tanumbirini-2. There are an additional nine patches of E. leucophloia within 5 km of Tanumbirini-2; the linear transects radiating out from Tanumbirini-2 crossed seven patches, and another two patches were observed opportunistically. The locations of E. Leucophloia patches detected during the survey, both within and outside the project area, are shown in Figure 4-2.

Santos 33Ecology report – 2019 exploration program
The access track to Tanumbirini-2 passed through a patch of E. leucophloia; however, this patch will not be disturbed by the project area. Similarly, the access track to Inacumba-1 passes by a patch of E. leucophloia that will not be disturbed by the project area.
There were no E. leucophloia trees within the 500 m buffer of the Inacumba-1 well site, nor will the use of the access track to Inacumba-1 result in the removal of any E. leucophloia trees.
The few patches of E. leucophloia represented typical open-woodland to woodland vegetation communities. The characteristics of six patches and the derived habitat suitability is shown in Table 4-4 (these patches were representative of the nine crossed by the linear transects). Although unconfirmed, it is likely that the patches are within 4 km of water given the number and location of stock watering points in addition to the small residual pools, which were present within the ephemeral drainages.
E. leucophloia trees within the survey area most commonly showed a ‘mallee-like’ growth form (i.e. many thin trunks emanating from a common base). The number of hollows per tree was between zero and five across all patches. However, the number of hollows greater than 25 mm was low in all but one patch (discussed below). In all cases, the E. leucophloia patches had a tussock grass understorey with minimal signs of recent fire impact.
One patch (SG5) consisted of trees with single, larger trunks. Trees within this patch were relatively dense (40/ha) compared to other patches intersected. The number of hollows per tree were generally consistent with other patches; however, a larger percentage of hollows were greater than 25 mm wide.
No threatened species were observed during surveys. Long-tailed Finches were observed at a number of locations during the survey, and were consistently found at stock watering points. Anecdotal evidence suggests that Gouldian Finches do, or at least have occurred on Tanumbirini Station (and within EP161); however, they are more likely to occur in the northern sections – well outside the project area.
Habitat suitability assessment
The results of previous studies have shown that Gouldian Finches have strong preferences for specific hollow characteristics (Brazill-Boast 2010, Tidemann et al. 1992). Based on Brazill-Boast et al (2010), Gouldian Finches select hollows that are located in living tissue, are located in robust trees, are high off the ground, have smaller entrances, are deep into the trunk, and are close to horizontal. Studies investigating suitability of habitat for Gouldian Finch have found that density of hollows in preferred nesting habitat for the species is 4.6 hollows per hectare (Brazill-Boast et. al 2011) and 2 to 27 per hectare (Gibbons and Lindenmayer 2002).
Given these findings, although it is unknown whether these patches are used by nesting Gouldian Finches, three patches (SG8, SG9 and SG5) do present habitat that could be used by the species. Although there were hollows present, SG2 is not considered suitable habitat as only one hollow larger than 25 mm was found. Only two patches (SG5 and SG10) are intersected by the project area. SG5 is considered the best habitat for the species, as there were more hollows greater than 25 mm, tree density was high, the trees were single stemmed rather than mallee-like and the hollows were roughly horizontal. There are no hollows present within patch SG10, thus it is not considered suitable Gouldian Finch nesting habitat.

#*#*#*#*#*#*#*#*
#*
#*
#* #*
#*
#*
#*#*
#*
#*
#*
!(
!(
Carpentaria Highway
Laydownarea
SG5
SG10
Inacumba- 1
Tanumbirini- 2
460000 470000 48000081
7000
0
8170
000
8180
000
8180
000
8190
000
8190
000
0 2.5 51.25
Kilometres"
"Daly Waters
KatherineO
MAP INFORMATIONProjection: GDA 1994 MGA Zone 53Date Saved: 4/2/2019Client: SantosAuthor: F Watt (review A Campbell)DATA SOURCEProject components: ClientImagery: ESRI basemap (Digital Globe)
Path: Z:\01 EcOz_Documents\04 EcOz Vantage GIS\EZ19041 - Santos EP161 EMP aspects\01 Project Files\Figure 4-1. Location of E leucophloia patches near 2019 exploration program area.mxd
Figure 4-2. Location of E. leucophloia patches near the project area
Legend!( Proposed well
#*E. leucophloialocations
2D Seismic line
Borrow pits
Exploration permit161
Road
Access tracksexisting
proposed
Red box indicates map extent
34

Santos 35Ecology report – 2019 exploration program
Table 4-4. Habitat characteristics of E. leucophloia patches within survey area.
PatchTree
density (#/ha)
Tree heights
(m)Trunk type
Hollows per tree
Hollow heights
(m)
Number hollows > 25 mm
General hollow angle
Vegetation Fire impact Suitability
SG8 4 8 Mallee 5 2 - 5 2* 45° Open woodland of Hakea sp and Acacia sp over Tussock grassland Nil Moderate
SG9 7 8 Mixed 1 – 3 2 - 5 5* 90° Sparse Acacia spp. shrubland over Tussock grassland Nil Moderate
SG2 10 6 Mallee 3 1 – 3 1* 40° Sparse mid-story of Hakea spp. over Tussock grassland - Low
SG10 4 6 Mallee 0 N/A N/A N/A Themeda triandra and Heteropogon contortus Nil Low
SG4 8 6 -7 Mixed 0 N/A N/A N/A Themeda triandra and Heteropogon contortus Nil Low
SG5 40 6 Single 3 – 4 2.5 – 5 50% of hollows 90° Acacia sp and Grevillea sp. over Tussock
grassland, some Themeda triandra Nil High
* - total number of hollows (indicating percentage hollows > 25 mm is low)

Santos 36Ecology report – 2019 exploration program
4.4 Riparian and sensitive vegetation
4.4.1 Background
Significant or sensitive vegetation communities are described in the NT Land Clearing Guidelines (NRETAS 2010). They are vegetation communities that are distinct and limited in extent or support important ecological values, and include rainforest, vine thicket, closed forest or riparian vegetation, mangroves, monsoon vines forest, sand-sheet heath and vegetation containing large trees with hollows suitable for fauna.
Within the project area, riparian vegetation is the most likely sensitive vegetation community to occur. Where it comprises sensitive vegetation, riparian vegetation is a distinct, closed forest community that creates suitable conditions for a range of species (terrestrial and aquatic) by providing shade (DLRM 2013). It covers a relatively small land area, provides unique habitat features and dry season refuge for a range of native fauna species, and is important for maintaining bank stability and reducing erosion (DLRM 2013).
Initial site visits determined that such closed forest community riparian vegetation was present within the survey area (Figure 4-3 left). Analysis of aerial imagery indicates the project area crosses ephemeral watercourses; however, not all the vegetation along these watercourses should be considered a sensitive riparian community. The majority of vegetation along the ephemeral watercourses in the area is an extension of the surrounding vegetation communities, or consists of species not found in the surrounding vegetation (e.g. Eucalyptus camaldulensis) but is sparse and does not provide the habitat characteristics or bank stabilising properties of sensitive riparian vegetation communities (Figure 4-3 right).
In this report, two terms are used to describe vegetation along a watercourse:
Riparian vegetation – vegetation considered sensitive under the NT Land Clearing Guidelines (e.g. Figure 4-3 left).
Drainage line vegetation – vegetation along a drainage line but not considered sensitive riparian vegetation under the NT Land Clearing Guidelines (e.g. Figure 4-3 right).
Figure 4-3. Examples of sensitive riparian vegetation (left) and drainage line vegetation (right).
Field surveys were undertaken to determine where the project area intersected riparian vegetation and drainage line vegetation.

Santos 37Ecology report – 2019 exploration program
4.4.2 Methods
Surveyors recorded the location of riparian and drainage line vegetation on a handheld GPS when encountered along the survey transect, and the dominant upper strata species of the vegetation. Photographs were taken to confirm the presence of drainage channels and any vegetation present along the drainage channel.
Waypoints were loaded into an ArcGIS project to indicate the location of riparian and drainage line vegetation on aerial imagery (ESRI Base maps). Inside the 500 m well buffers, aerial imagery at a 1:10,000 scale was used to differentiate riparian and drainage line vegetation from surrounding vegetation types. Polygons were drawn to delineate patch boundaries; polygons were created for both riparian vegetation and drainage line vegetation.
4.4.3 Results
There is a patch of riparian vegetation along the edge of drainage channels within the southern sections of the Inacumba-1 survey area. Eucalyptus camaldulensis and Terminalia bursarina are the dominant species in this open woodland community. This vegetation is associated with Inacumba Creek, a minor watercourse of stream order three. There is also a patch of drainage line vegetation extending from the north of the survey to the south east. This vegetation community consists of Eucalyptus camaldulensis and Terminalia bursarina, as well as Eucalyptus pruinosa, a species that dominates the surrounding open woodland within the Inacumba-1 survey area.
The location of riparian and drainage areas has been mapped for the Inacumba-1 survey area and is shown in Figure 4-5. Photos of riparian and drainage line vegetation within Inacumba-1 are shown in Figure 4-4.
Figure 4-4. Photos of riparian (left) and drainage line (right) vegetation within Inacumba-1 survey area
The vegetation intersected by linear transects radiating out from Tanumbirini-2 at watercourse crossings comprised primarily a narrow strip of Eucalyptus camaldulensis in the upper-storey. Canopy cover along this strip is higher than the surrounding woodland and open plains; however, visual inspection did not indicate that canopy foliage cover was sufficiently dense for the vegetation to be classified as a forest community.
Height of upper-storey of riparian vegetation was between 5 and 10 metres. There was limited mid-storey vegetation at any of the watercourse crossing sites. Ground cover comprised tussock grasses consistent with the surrounding vegetation community. Vegetation at a number of drainage lines did not show any distinction between that of the surrounding landscape. Photos of vegetation at locations watercourses are shown in Figure 4-6.

!(Inacumba- 1
483000 48350081
7350
0
8173
500
8174
000
8174
000
8174
500
8174
500
0 100 20050
Metres
"
"
Daly Waters
Katherine OMAP INFORMATIONProjection: GDA 1994 MGA Zone 53Date Saved: 4/2/2019Client: SantosAuthor: F Watt (reviewed D vd Hoek)DATA SOURCEProject components: ClientWeed data: EcOzImagery: ESRI basemap (Digital Globe)
Path: Z:\01 EcOz_Documents\04 EcOz Vantage GIS\EZ19041 - Santos EP161 EMP aspects\01 Project Files\Figure 5-2. Location of riparian and drainage line vegetation within Inacumba 1_1H survey area.mxd
Figure 4-5. Map showing location of riparian and drainage line vegetation within Inacumba-1 survey area
Legend!( Proposed well
500m buffer
Vegetation typedrainage line
riparian
Red box indicates map extent
38

Santos 39Ecology report – 2019 exploration program
Figure 4-6. Photos of drainage line vegetation along transects radiating from Tanumbirini-2

#*
#*
#*
#*
#*#*#*
#*#*#*
#*#*
#*
#* #*
#*
#*
!(
Laydownarea
Tanumbirini- 2
465000 47000081
8000
0
8180
000
8185
000
8185
000
8190
000
8190
000
0 1 20.5
Kilometres
"
"
Daly Waters
Katherine OMAP INFORMATIONProjection: GDA 1994 MGA Zone 53Date Saved: 4/2/2019Client: SantosAuthor: F Watt (review A Campbell)DATA SOURCEProject components: ClientImagery: ESRI basemap (Digital Globe)
Path: Z:\01 EcOz_Documents\04 EcOz Vantage GIS\EZ19041 - Santos EP161 EMP aspects\01 Project Files\Figure 5-5. Map showing locations of drainage line vegetation along transects from Tanumbirini- 2.mxd
Figure 4-7. Map showing locations of drainage line vegetation along transects from Tanumbirini- 2
Legend!( Proposed well
#*Drainage linevegetation
5km buffer
Borrow pits
Exploration permit161
Watercourse
2D Seismic line
Road
Access tracksexisting
proposed
Red box indicates map extent
40

Santos 41Ecology report – 2019 exploration program
4.5 Discussion
Surveys within the project area were completed targeting:
Listed weed species Threatened species habitat and incidental species observations Sensitive vegetation
Weed diversity within the project area is low, with only five weed species recorded. Weeds are also at low densities except for Hyptis, which also occurs outside the project area and is common throughout the region. There is one patch of Rubber Bush beside an access track; however, this track is not part of the project area. The majority of weeds were recorded along access tracks or at stock watering points. Although it is likely that there is Hyptis seed within the station access tracks, the species is currently wide spread along the access tracks likely to be used in exploration activities.
The project area intersects two patches of E. leucophloia. The E. leucophloia patches, although relatively small should be considered as potential Gouldian Finch habitat. Although the density of trees with SG5 is relatively high, densities of E. leucophloia is such that seismic activities should be able to avoid impacting trees. In the event that a tree does need to be removed for seismic activities, it is likely that only a small number of trees will be affected. Best practice environmental management of minimising the disturbance to the smallest extent required should be employed as routine; however, it is not considered that specific management controls be undertaken.
The vegetation along the watercourses crossed by the 2D seismic line, although denser than surrounding communities, is not considered to be a riparian forest community and, as such, not sensitive vegetation. The vegetation is also sparse enough that the vehicles involved in 2D seismic exploration should be able to avoid impact to vegetation along drainage lines. Minimising the disturbance to vegetation along the drainage lines will help maintain stability of the watercourses, reduce sedimentation and retain wildlife habitat.
Patches of riparian vegetation were recorded within the southern section of Inacumba-1. Clearing within these areas should be avoid if possible to minimise the risk of erosion and sediment transfer within these areas during periods of concentrated overland flow. The appropriate buffers, as detailed in the NT Land Clearing Guidelines, should be applied.
EcOz makes the following recommendations for the 2019 exploration activities:
Weeds
All vehicles involved in exploration activities should be certified weed free prior to enteringTanumbirini Station.
Weeds should be surveyed and controlled according to the requirements outlined within theSantos – Weed Management Plan – EP 161 (EcOz, 2019)
Gouldian Finch
Avoid removal of E. leucophloia trees within the patches along the 2D seismic line. This shouldbe achievable through the design of the seismic survey (i.e. vehicles weave through trees)without specific management controls. If significant numbers of trees are to be removed,consideration should be given to having environmental staff on site to identify ways to minimiseimpact to E. leucophloia.
Although considered unlikely, if Gouldian Finches are observed incidentally during furtherenvironmental assessments (such as post Wet Season weed assessment) or project activities,Santos will engage experienced ecologists to complete further assessment. This may includepopulation characterisation or further habitat assessment.

Santos 42Ecology report – 2019 exploration program
Sensitive vegetation
Clearing within areas mapped as riparian vegetation within Inacumba-1 buffer should be avoidedwhere possible.
Borrow pits
Prior to disturbance of areas for the extraction of borrow material, environmental staff (either fromSantos or a consultant) should ensure that there are no significant environmental values in thefinal areas selected.
Although there is not expected to be any impact to Mertens’ Water Monitor, if the species are observed incidentally during further environmental assessments (such as post Wet Season weed assessment) or project activities, Santos will engage experienced ecologists to complete further assessment.

Santos 43Ecology report – 2019 exploration program
5 REFERENCES
Baker, B, Price, O, and Woinarski, J, (2005), Northern Territory Bioregions – assessment of key biodiversity values and threats, Biodiversity Group, Biodiversity Conservation, Department of Natural Resources Environment and the Arts, Darwin, Northern Territory.
Brazill-Boast J, Pryke SR and Griffith SC, 2010, ‘Nest-site utilisation and niche overlap in two sympatric, cavity-nesting finches’, Emu, 110, pp. 170-177.
Brazill-Boast J & Pryke SR, 2011, ‘Breeding habitat selection in the endangered Gouldian Finch (Erythrura gouldiae) at two spatial scales’, Emu, 111(4) 304-31.
Christian, K. (2004). Varanus mertensi. In: Pianka et al. (eds.). Varanoid lizards of the world. Indiana University Press, Bloomington, Indianapolis.
Department of Natural Resources, Environment, The Arts and Sport (NRETAS), 2010, Land clearing guidelines, Department of Natural Resources, Environment, The Arts and Sport, Darwin. Northern Territory, viewed online 01 September 2018, https://nt.gov.au/__data/assets/pdf_file/0007/236815/land-clearing-guidelines.pdf
Dostine PL and Franklin DC, 2002, A comparison of the diet of three finch species in the Yinberrie Hills area, Northern Territory. Emu, 102, 159-164.
Dostine PL, Johnson GC, Franklin DC, Zhang Y and Hempel C, 2001, Seasonal use of savanna landscapes by the Gouldian finch, Erythrura gouldiae, in the Yinberrie Hills area, Northern Territory, Wildlife Research 28, 445-458.
EcOz 2018a, Ecology report – EP161 work program 2018, prepared for Santos.
EcOz 2018b, Inacumba bore weed survey and sensitive vegetation assessment, prepared for Santos.
EcOz 2019, Weed management plan EP161, prepared for Santos
Gibbons, P & Lindenmayer, D (2002), Tree Hollows and Wildlife Conservation in Australia, CSIRO publishing, Collingwood, Victoria.
Higgins PJ, Peter JM and Cowling SJ (eds), 2006, ‘Boatbill to Starlings’, In: Handbook of Australian, New Zealand and Antarctic Birds Volume 7, Oxford University Press, Melbourne, Victoria.
O’Malley C, 2006, ‘National Recovery Plan for the Gouldian Finch (Erythrura gouldiae)’, WWF Australia, Sydney and Parks and Wildlife Northern Territory, Department of Natural Resources, Environment and the Arts, Northern Territory Government, Palmerston.
Tidemann SC, 1996, Causes of the decline of the Gouldian Finch (Erythrura gouldiae), Biological Conservation International, 6, pp. 49—61.
Tidemann SC, Lawson C, Elvish R, Boyden J & Elvish J, 1999, ‘Breeding biology of the gouldian finch Erythrura gouldiae, an endangered finch of northern Australia’, Emu, 99, pp. 191-199.
Tidemann SC, and Woinarski JCZ, 1994, ‘Moult characteristics and breeding seasons of Gouldian Erythrura gouldiae, Masked Poephila personata and Long-tailed Finches P. acuticauda in savannah woodland in the Northern Territory’, Emu, 94: pp. 46—52
Ward, S., Woinarski, J., Griffiths, T. and McKay, L. (2006). Threatened Species of the Northern Territory - Mertens Water Monitor - Varanus mertensi. Northern Territory Department of Environment and Natural Resources. [online] Available at: https://nt.gov.au/__data/assets/pdf_file/0018/206460/mertens-water-monitor.pdf [Accessed 1 May 2018].
Woinarski JCZ, and Tidemann SC, 1991, ‘The bird fauna of a deciduous woodland in the wet-dry

Santos 44Ecology report – 2019 exploration program
tropics of northern Australia’, Wildlife Research, 18: pp. 479-500.

SantosEcology report – 2019 exploration program
APPENDIX B LIKELIHOOD OF OCCURRENCE ASSESSMENT FOR THREATENED SPECIES WITHIN SURVEY AREA
StatusName
Cth NTSummary
Likelihood of occurrence
BIRDS
EN EN Habitat: NT population is restricted to dissected, topographically complex, sandstone and conglomerate hills and plateaux with infrequent fires (Lewis & Woinarski 2006). The only recent observations were recorded in a site that had been burnt only twice in the preceding 12 years. All other historic sites with no recent observations had been burnt between three and eight times.Distribution: Gulf of Carpentaria hinterland – between Limmen River in the NT and Mount Isa in Qld. No records in the Borroloola area since 1986 despite several targeted surveys in the last decade (Martin & McKean 1986; Garnett et al. 2011). Within the NT, now restricted to a tiny isolated population approximately 6 km to the west of Calvert Hills Station in the Wollogorang area (TSSC 2016).
NONE Only a small area of rocky quartz sandstone outcropping
(recently burnt) within the survey area which is unlikely to provide suitable habitat.
This species has a very restricted range that is not proximate to the survey area.
Closest known occurrence is approx. 100km ENE and pre-2000.
Carpentarian GrasswrenAmytornis dorotheae
Garnett, S.T., Szabo, J.K. and Dutson, G. (2011). The Action Plan for Australian Birds 2010. CSIRO Publishing. Collingwood, Australia. Lewis, M. & Woinarski, J. (2006). Threatened Species of the Northern Territory - Carpentarian Grass-wren - Amytornis dorotheae. Northern Territory Department of Environment and Natural Resources.
[online] Available at: https://nt.gov.au/__data/assets/pdf_file/0007/373543/carpentarian-grasswren.pdf [Accessed 18 April 2017].Martin, K.C. & McKean, J.L. (1986). A study of the distribution and status of the endangered Carpentarian grasswren Amytornis dorotheae. Report to the Conservation Commission of the Northern Territory,
Palmerston, NT.Threatened Species Scientific Committee (2016). Conservation Advice – Amytornis dorotheae – Carpentarian Grasswren. Canberra: Department of the Environment. In effect under the EPBC Act from 05-
May-2016. [online] Available at: http://www.environment.gov.au/biodiversity/threatened/species/pubs/558-conservation-advice-05052016.pdf [Accessed 18 April 2017].
VU VUHabitat: Prefers tall, open Eucalyptus forest and riparian areas. Nests in large trees, frequently the tallest and most massive in a tall stand, nest trees are invariably within 1 km of permanent water (Debus & Czechura 1988; Aumann & Baker-Gabb 1991).Distribution: Sparsely distributed across much of the northern Australia, from the Kimberley in WA to south-eastern Qld. Within this range, generally occurs in taller forests characteristic of higher rainfall areas, but there are some isolated records from central Australia (Woinarski 2006).
LOW No tall open Eucalyptus forest within 1 km of permanent
water observed within the survey area. This is the southern extent of core range. There is little riparian habitat within survey area. Closest known occurrence is approx. 150km NW in
2010.
Red GoshawkErythrotriorchis radiates
Aumann, T. & Baker-Gabb, D. (1991). A Management Plan for the Red Goshawk. RAOU Report 75, Royal Australasian Ornithologists Union, Melbourne.Debus, S. & Czechura, G. (1988). Field identification of the Red Goshawk Erythrotriorchis radiates. Australian Bird Watcher, Vol. 12, pp. 154-159.Woinarski, J. (2006). Threatened Species of the Northern Territory - Red Goshawk - Erythrotriorchis radiates. Northern Territory Department of Environment and Natural Resources. [online] Available at:
https://nt.gov.au/__data/assets/pdf_file/0018/206352/red-goshawk.pdf [Accessed 18 April 2017].
Gouldian Finch Habitat: Prefers annual and perennial grasses (especially Sorghum), a MEDIUM

SantosEcology report – 2019 exploration program
EN VU nearby source of surface water and – in the breeding season – unburnt, hollow-bearing Eucalyptus trees (especially E. tintinnans, E. brevifolia and E. leucophloia) (Tidemann 1996; O’Malley 2006).Distribution: Sparsely across northern Australia from the Kimberley to north-central Qld (Dostine 1998; Franklin et al. 1999; Barrett et al. 2003; Franklin et al. 2005). In the NT, most known breeding populations occur in the Top End. Non-breeding birds disperse widely (Garnett et al. 2011), greatly increasing the possible range of this species.
Eucalyptus leucophloia woodlands provide suitable breeding habitat within the survey area.
The survey area is towards the edge of the known range of this species.
Two closest known occurrences are within 30km of the survey area, in 2009 and 1962.
Erythrura gouldiae
Barrett, G., Silcocks, A., Barry, S., Cunningham, R. & Poulter, R. (2003). The New Atlas of Australian Birds. Royal Australian Ornithologists Union, Melbourne, Victoria.Dostine, P. (1998). Gouldian Finch Recovery Plan Erythrura gouldiae. Gouldian Finch Recovery Team and Parks & Wildlife Commission NT, Darwin.Franklin, D.C., Burbidge, A.H. & Dostine, P.L. (1999). The harvest of wild birds for aviculture: an historical perspective on finch trapping in the Kimberley with special emphasis on the Gouldian Finch.
Australian Zoologist, Vol. 31, pp. 92-109.Franklin, D.C., Whitehead, P.J., Pardon, G., Matthews, J., McMahon, P. & McIntyre, D. (2005). Geographic patterns and correlates of the decline of granivorous birds in northern Australia. Wildlife
Research, Vol. 32, pp. 399-408.Garnett, S.T., Szabo, J.K. and Dutson, G. (2011). The Action Plan for Australian Birds 2010. CSIRO Publishing. Collingwood, Australia.O'Malley, C. (2006). National Recovery Plan for the Gouldian Finch (Erythrura gouldiae). WWF-Australia, Sydney and Parks and Wildlife NT, Department of Natural Resources, Environment and the Arts,
NT Government, Palmerston.Tidemann, S.C. (1996). Causes of the decline of the Gouldian Finch Erythrura gouldiae. Biological Conservation International, Vol. 6, pp. 49-61.
- VUHabitat: Occurs in areas of lightly-timbered lowland plains, typically on inland drainage systems, where the average annual rainfall is less than 500 mm (Ward 2012).Distribution: Sparsely distributed through much of the arid and semi-arid areas of Australia but is recorded in all Australian mainland states and territories. In the NT, the majority of records are from the southern half, but there are records all the way up to Darwin (Ward 2012).
MEDIUM Region experiences higher rainfall than 500 mm
annually. Open woodland vegetation within the survey area may
provide suitable habitat. The species has a broad range but is naturally rare. Closest known occurrence was 100km NW in 2000.
Grey FalconFalco hypoleucos
Ward, S. (2012). Threatened Species of the Northern Territory - Grey Falcon - Falco hypoleucos. Northern Territory Department of Environment and Natural Resources. [online] Available at: https://nt.gov.au/__data/assets/pdf_file/0020/206354/grey-falcon.pdf [Accessed 23 March 2017].
VU -Habitat: Recorded in eight different woodland types in northern Australia, mainly those dominated by Eucalyptus miniata, E. tetrodonta or E. bleeseri (Robinson & Woinarski 1992). Distribution: North-western Australia from the Kimberley in WA, across the Top End of the NT to Borroloola (TSSC 2016). In the NT, recorded in very low densities in many isolated subpopulations (Garnett & Crowley 2000) between north-east Arnhem land and semi-arid Victoria River District. Scarcity of records suggests that populations are at very low density (Woinarski 2004). Not known to have disappeared from any area where recorded historically (TSSC 2016).
MEDIUM Woodland vegetation within the survey area is potential
habitat for the species. Known occurrences are more than 150km from the
survey area. Although suitable habitat exists within the survey area,
they are naturally rare.
Crested Shrike-tit (northern subspecies)Falcunculus frontatus whitei
Garnett, S.T. & Crowley, G.M. (2000). The Action Plan for Australian Birds 2000. Environment Australia and Birds Australia, Canberra, ACT.Robinson, D. and Woinarski, J.C.Z. (1992). ‘A review of records of the Northern Shrike-tit Falcunculus frontatus whitei in north-western Australia’. South Australian Ornithologist, Vol. 31, pp. 111-117.Threatened Species Scientific Committee (2016). Approved Conservation Advice for Falcunculus frontatus whitei - crested shrike-tit (northern). Canberra: Department of the Environment. In effect under the

SantosEcology report – 2019 exploration program
EPBC Act from 02-May-2016. Available at: http://www.environment.gov.au/biodiversity/threatened/species/pubs/26013-conservation-advice-05052016.pdf [Accessed 18 April 2017].Woinarski, J.C.Z. (2004). National multi-species Recovery Plan for the Partridge Pigeon [eastern subspecies] Geophaps smithii smithii; crested shrike-tit [northern (sub)-species] Falcunculus (frontatus)
whitei; masked owl [north Australian mainland subspecies] Tyto novaehollandiae kimberli; and masked owl [Tiwi Islands subspecies] Tyto novaehollandiae melvillensis, 2004-2008. NT Department of Infrastructure Planning and Environment, Darwin.
VU VUHabitat: Occurs in open forests and woodlands with an understorey of grasses (Woinarski 2006). Prefers woodland dominated by Eucalyptus tetrodonta and Eucalyptus miniata (Braithwaite 1985; Garnett et al. 2011; Higgins & Davies 1996).Distribution: Historically, across the Top End (from Kununurra in WA to Borroloola in the NT). Since early 20th century a severe range contraction from the western, eastern and southern parts of the former distribution (Higgins & Davies 1996; Woinarski et al. 2007). Currently, distribution is limited to sub-coastal NT from Yinberrie Hill in the south, Litchfield NP in the west and (western) Arnhem Land in the east (Garnett et al. 2011).
LOW Preferred E. tetrodonta and E. miniata dominated
woodland is not present within survey area. The survey area is at the edge of the known range. Closest known occurrences are more than 100km E. This species has likely experienced a significant range
contraction.
Partridge Pigeon (eastern subspecies)Geophaps smithii smithii
Braithwaite, R.W. (1985). The Kakadu fauna survey: an ecological survey of Kakadu National Park. Australian National Parks & Wildlife Service, Canberra. Garnett, S.T., Szabo, J.K. and Dutson, G. (2011). The Action Plan for Australian Birds 2010. Birds Australia, CSIRO Publishing, Melbourne.Higgins, P.J. and Davies S.J.J.F. (eds) (1996). Handbook of Australian, New Zealand and Antarctic Birds. Volume Three: Snipe to Pigeons. Oxford University Press. Melbourne, Victoria.Woinarski, J.C.Z. (2006). Threatened Species of the Northern Territory - Partridge Pigeon (eastern subspecies) - Geophaps smithii. Northern Territory Department of Environment and Natural Resources.
[online] Available at: https://nt.gov.au/__data/assets/pdf_file/0003/206355/partridge-pigeon.pdf [Accessed 18 April 2017].Woinarski, J., Pavey, C., Kerrigan, R., Cowie, I. and Ward, S. (Eds) (2007). Lost from Our Landscape: Threatened Species of the Northern Territory. Northern Territory Government, Darwin.
VU VUHabitat: Acacia and Eucalyptus-dominated woodlands and open forest, preferring habitats with more mature trees that host more mistletoe. Breeding times and seasonal movements (south to north) likely governed by the fruiting of mistletoe (Garnett et al. 2011).Distribution: Across eastern and northern parts of the country – but nowhere very numerous (Ward 2012). Many birds move after breeding to semi-arid regions such as north-eastern SA, central and western Qld, and central NT (TSSC 2015). Few NT records – most from the Barkly Tablelands – but no evidence of a breeding population in the NT, and the records are likely irregular visitors from south-eastern Australia (Ward 2012).
LOW Acacia and Eucalyptus woodlands within the survey
area may provide suitable habitat. While there are two more recent occurrences (2001 &
2005) located ~100km NE and SW of survey area, it is considered an irregular visitor to the NT.
Painted HoneyeaterGrantiella picta
Garnett, S.T., Szabo, J.K. and Dutson, G. (2011). The Action Plan for Australian Birds 2010. CSIRO Publishing, Collingwood, Australia. Threatened Species Scientific Committee (TSSC) (2015). Approved Conservation Advice for Grantiella picta (Painted Honeyeater). Canberra: Department of the Environment. Available
at: http://www.environment.gov.au/biodiversity/threatened/species/pubs/470-conservation-advice.pdf [Accessed 7 April 2017].Ward, S. (2012). Threatened Species of the Northern Territory – Painted Honeyeater - Grantiella picta. Northern Territory Department of Environment and Natural Resources. [online] Available at:
https://nt.gov.au/__data/assets/pdf_file/0009/373554/painted-honeyeater.pdf [Accessed 7 April 2017].
Masked Owl (northern subspecies)Tyto novaehollandiae kimberli
VU VUHabitat: Mainly in Eucalyptus tall open forests (especially those dominated by Eucalyptus miniata and E. tetrodonta), but also roosts in monsoon rainforests and forages in more open vegetation types, including grasslands (Woinarski & Ward 2012).Distribution: Poorly known, with few records from across a broad range in northern Australia. In the NT, records from the Top End, Kakadu, Coburg Peninsula (majority of records) and south-west Gulf country (Woinarski &
LOW No suitable tall open Eucalyptus forest for roosting
habitat is present in the survey area. Open woodland habitat may provide suitable foraging habitat.
Naturally rare, one known occurrence >100km E of survey area in 1977.

SantosEcology report – 2019 exploration program
Ward 2012). Survey area is located at the edge of known range.Woinarski, J.C.Z. and Ward, S. (2012). Threatened Species of the Northern Territory - Masked Owl (north Australian mainland subspecies) - Tyto novaehollandiae kimberli. Northern Territory Department of
Environment and Natural Resources. [online] Available at: https://nt.gov.au/__data/assets/word_doc/0008/373553/masked-owl-mainland-top-end.docx [Accessed 7 April 2017].
- VUHabitat: Coastal and estuarine with tidal mudflats. May roost during high tide on nearby beaches. May also be found at near-coastal swamps and lakes (apart from Red and Great Knot)Distribution: Mostly widespread around the northern Australian coast, less common in the south, with few inland records. Eastern Curlew is uncommon across Australia while Asian Dowitcher is rare. Every year these species breed in the northern hemisphere in the summer, and migrate to Australia for the southern hemisphere summer. Some birds remain in Australia during the winter.[Information above summarised from Chatto (2003), DoE (2015) and Garnett et al. (2011)].
NONE There are no tidal mudflats, preferred by these species,
within the survey area.
Eastern CurlewGreater Sand PloverCurlew Sandpiper
Chatto, R. (2003). The distribution and status of shorebirds around the coast and coastal wetlands of the Northern Territory. Technical Report 73, Parks and Wildlife Commission of the Northern Territory, Darwin. [online] Available at: https://dtc.nt.gov.au/__data/assets/pdf_file/0008/279917/2003_shorebirds_rpt76.pdf [Accessed 19 April 2017].
Department of the Environment (2015). EPBC Act Policy Statement 3.21 - Industry guidelines for avoiding, assessing and mitigating impacts on EPBC Act listed migratory shorebird species. Commonwealth of Australia, Canberra, ACT. [online] Available at: http://www.environment.gov.au/epbc/publications/shorebirds-guidelines [Accessed 19 April 2017].Garnett, S.T., Szabo, J.K. and Dutson, G. (2011). The Action Plan for Australian Birds 2010. CSIRO Publishing. Collingwood, Australia.
EN VUHabitat: Fringes of permanent and temporary wetlands, swamps and inundated grasslands (Taylor et al. 2013).Distribution: Nomadic and scattered across Australia with no predictable occurrence (Rogers 2001), but could occur at any wetland or inundated grassland across its distribution, including nearly all of the NT and Qld (Garnett et al. 2011).
LOW Closest known occurrence is approx. 50km NE (record
from 1985), others are >100km away. Nomadic species. Inundation of grassland may provide seasonally suitable
(but not core) habitat.
Australian Painted SnipeRostratula (benghalensis) australis
Garnett, S.T., Szabo, J.K. and Dutson, G. (2011). The Action Plan for Australian Birds 2010. CSIRO Publishing. Collingwood, Australia. Rogers, D. (2001). Painted Snipe. Wingspan, Vol. 11 (No. 4), pp. 6-7.Taylor, R., Chatto, R. and Woinarski, J.C.Z. (2013). Threatened Species of the Northern Territory - Australian pained snipe - Rostratula australis. Northern Territory Department of Environment and Natural
Resources. [online] Available at: https://nt.gov.au/__data/assets/pdf_file/0018/206361/australian-painted-snipe.pdf [Accessed 23 March 2017].
MAMMALS (TERRESTRIAL)Brush-tailed Rabbit-RatConilurus penicillatus
VU ENHabitat: Largely restricted to mixed Eucalyptus open forest and woodland, or on dunes with Casuarina – seeming to prefer habitats that are not burnt annually, that have an understorey of predominantly perennial grasses and a sparse-to-moderate middle storey (Firth et al. 2006; Firth 2007; Kemper & Firth 2008).Distribution: Formerly widespread across northern Australia, but has declined extensively from Qld and lower rainfall areas of the Kimberley in WA and the Top End in the NT. No recent records from much of the historically-recorded NT range between near the mouth of Victoria River (in the west) and Sir Edward Pellew island group (in east). Most recently known from
LOW There are no known occurrences nearby, with the
closest more than >150km N (2 specimens) – date not specified.
This species has likely experienced a significant range contraction and they may now be locally extinct .

SantosEcology report – 2019 exploration program
Cobourg Peninsula, Tiwi Islands, Groote Eylandt and a small area within Kakadu National Park (Woinarski & Hill 2012).
Firth, R.S.C. (2007). Ecology and conservation status of the brush-tailed rabbit-rat Conilurus penicillatus. PhD thesis, Charles Darwin University, Darwin, Northern Territory.Firth, R.S.C., Woinarski, J.C.Z. and Noske, R.A. (2006). Home range and den characteristics of the brush-tailed rabbit-rat Conilurus penicillatus in the monsoonal tropics of the Northern Territory, Australia.
Wildlife Research, Vol. 33, pp. 397-408.Kemper, C.M. and Firth, R.S.C. (2008). Brush-tailed Rabbit-rat. In: Van Dyck, S. and Strahan, R. (eds). The Mammals of Australia. Reed New Holland, Chatswood, NSW.Woinarski, J.C.Z. and Hill, B. (2012). Threatened Species of the Northern Territory - Brush-tailed rabbit-rat, Brush-tailed tree-rat - Conilurus penicillatus. Northern Territory Department of Environment and
Natural Resources. [online] Available at: https://nt.gov.au/__data/assets/pdf_file/0016/205504/brush-tailed-rabbit-rat.pdf [Accessed 20 April 2017].
VU EXHabitat: In central Australia, occurred throughout a range of habitats (Pavey 2006).Distribution: Historically occurred throughout the arid interior of the NT, now restricted to the south-west of WA (Pavey 2006). Considered extinct in the NT since the 1960’s.
NONE Locally extinct.
Western QuollDasyurus geoffroii
Pavey, C. (2006). Threatened Species of the Northern Territory - Western Quoll, Chuditch - Dasyurus geoffroii. Northern Territory Department of Environment and Natural Resources. [online] Available at: https://nt.gov.au/__data/assets/pdf_file/0018/205470/western-quoll.pdf [Accessed 23 March 2017].
EN CRHabitat: Wide range of habitats – especially coastal Eucalyptus tall open forests – but since Cane Toads the most suitable habitats are rocky areas (Van Dam et al. 2002). Prime habitat in the NT consists of rocky sandstone escarpments (Braithwaite & Griffiths 1994). Distribution: Historically occurred from Borroloola in the south-east as far west as the NT/WA border (Woinarski et al. 2007). Dramatic range contraction associated with Cane Toad invasion. Now occurs across northern Australia in five regional populations – including the Top End in the NT.
NONE No suitable rocky sandstone escarpments within the
survey area, nor preferred coastal Eucalyptus tall open forest.
Closest known occurrences are approx. 120km NE & W in 1986.
The survey area is outside the distribution of the species.
This species has experienced a significant reduction in population sizes and ranges since the invasion of Cane Toads.
Northern QuollDasyurus hallucatus
Braithwaite, R.W. and Griffiths, A.D. (1994). Demographic variation and range contraction in the Northern Quoll, Dasyurus hallucatus (Marsupialia: Dasyuridae). Wildlife Research, Vol. 21, pp. 203-218. Van Dam, R.A., Walden, D.J. and Begg, G.W. (2002). A preliminary risk assessment of cane toads in Kakadu National Park. Supervising Scientist Report 164, Darwin, Northern Territory.Woinarski, J.C.Z., Rankmore, B.R., Fisher, A. and Milne, D. (2007). The natural occurrence of northern quolls Dasyurus hallucatus on islands of the Northern Territory: assessment of refuges from the
threat posed by cane toads Bufo marinus. Report to Natural Heritage Trust.
Golden Bandicoot Isoodon auratus (auratus)
VU ENHabitat: Mainly in heathland and shrubland on sandstone sheets, avoiding vegetation with greater tree cover (Palmer et al. 2012; Southgate et al. 1996).Distribution: Formerly across most of northern, central and western Australia (across a broad range of habitats), but now only recorded population on mainland Australia is within the Kimberley. Within the NT, confined to the offshore islands of Arnhem Land. The only records from mainland NT are from the north-east corner of Arnhem Land between 1950 and 1980 (Palmer et al. 2012). Now extinct on the mainland except in a few locations in the north-west Kimberley (TSSC 2015).
NONE Extinct on the mainland NT.

SantosEcology report – 2019 exploration program
Palmer, C., Woinarski, J. and Hill, B. (2012). Threatened Species of the Northern Territory - Golden Bandicoot - Isoodon auratus. Northern Territory Department of Environment and Natural Resources. [online] Available at: https://nt.gov.au/__data/assets/pdf_file/0017/205505/golden-bandicoot.pdf [Accessed 23 March 2017].
Southgate, R., Palmer, C., Adams, C., Masters, M., Triggs, B. and Woinarski, J. (1996). Population and habitat characteristics of the Golden Bandicoot (Isoodon auratus) on Marchinbar Island, Northern Territory. Wildlife Research, Vol. 23, pp. 647-664.
Threatened Species Scientific Committee (TSSC) (2015). Approved Conservation Advice for Isoodon auratus auratus (golden bandicoot (mainland)). Canberra: Department of the Environment. [online] Available at:http://www.environment.gov.au/biodiversity/threatened/species/pubs/66665-conservation-advice-01102015.pdf [Accessed 23 March 2017].
VU -Habitat: Ranging from the arid Pilbara (WA) to tropical savannah woodlands and north Qld rainforests (TSSC 2016). Permanent roost sites are generally deep natural caves or disused mines (TSSC 2016). Distribution: Geographically-disjunct colonies occur in the Pilbara and Kimberley in WA, NT north of approximately 17⁰ latitude (including Elcho Island and Groote Eylandt), the Gulf of Carpentaria, eastern Qld from Cape York to near Rockhampton, and western Qld (including Riversleigh and Camooweal districts) (TSSC 2016). Distribution likely influenced by the availability of suitable caves and mines for roost sites (Ward & Milne 2016). Only 14 breeding sites known (Worthington Wilmer 2012). In arid Australia, including southern NT until the early 1960’s (Ward & Milne 2016).
LOW No suitable permanent roost sites within the survey
area. No occurrences close to survey area.
Ghost BatMacroderma gigas
Milne, D. and Ward, S. (2016). Threatened Species of the Northern Territory – Ghost Bat - Macroderma gigas. Northern Territory Department of Environment and Natural Resource. [online] Available at: https://nt.gov.au/__data/assets/pdf_file/0010/376138/ghost-bat.pdf [Accessed 20 April 2017].
Threatened Species Scientific Committee (2016). Approved Conservation Advice for Macroderma gigas (ghost bat). Canberra: Department of the Environment. Available at:http://www.environment.gov.au/biodiversity/threatened/species/pubs/174-conservation-advice-05052016.pdf [Accessed 20 April 2017].
Worthington Wilmer, J. (2012). Ghost Bat Macroderma gigas. In: Curtis et al. (eds.). Queensland’s Threatened Animals. CSIRO, Canberra: pp. 382-383.
VU VUHabitat: In the NT, hummock grasslands on sandy soils with a preference for palaeo-drainage lines (Southgate 1990). Has large foraging area and will move home range in search for food (Johnson 2008).Distribution: Historically widespread in arid Australia. Currently arid WA, the Tanami Desert in the NT and south-western Qld (Woinarski et al. 2014).
NONE No suitable hummock grasslands on sandy soils within
the survey area. There are no nearby records – survey area is outside of
historic extent.
Greater BilbyMacrotis lagotis
Johnson, K.A. (2008). Bilby Macrotis lagotis. In: Van Dyck, S. and Strahan, R. (eds.). Mammals of Australia. Third Edition. Reed New Holland, Queensland Government, Queensland Museum: pp. 191-193.Southgate, R. (1990). Habitat and diet of the greater bilby Macrotis lagotis Reid (Marsupalia: Peramelidae). In: Seebeck et al. (eds.). Bandicoots and Bilbies. Surrey Beatty & Sons, Sydney, NSW.Woinarski, J., Burbidge, A. & Harrison, P. (2014). The Action Plan for Australian Mammals 2012. CSIRO Publishing: pp. 203-205.
VU CRHabitat: In the NT, little known of the ecology apart that all three records were from riverine vegetation. In the Kimberley, known to occur in open Eucalyptus forests with tussock grass understorey, rainforest patches, sandstone screes, beaches, and black soil plains (Woinarski et al. 2012).Distribution: Historically, known to have occurred in three localities in the NT (Parker 1973) with no new records in the last 30 years. In 1993, reportedly spotted in Kakadu National Park; however, further surveys of suitable habitats in the NT failed to locate the species (Lee 1995). Now only known to occur in some areas of the north-western Kimberley and associated offshore islands (Palmer et al. 2003).
NONE Locally extinct.
Golden-backed Tree-ratMesembriomys macrurus
Lee, A.K. (1995). The Action Plan for Australian Rodents. Australian Nature Conservation Agency, Endangered Species Program, Canberra.

SantosEcology report – 2019 exploration program
Palmer, C., Taylor, R. & Burbidge, A. (2003). Recovery plan for the Golden Bandicoot Isoodon auratus and golden-backed tree-rat Mesembriomys macrurus 2004-2009. Northern Territory Department of Infrastructure Planning and Environment, Darwin.
Parker, S.A. (1973). An annotated checklist of the native land mammals of the Northern Territory. Records of the South Australian Museum, Vol. 16, pp. 1-57.Woinarski, J.C.Z., Palmer, C. & Hill, B. (2012). Threatened Species of the Northern Territory - Golden-backed tree-rat - Mesembriomys macrurus. Northern Territory Department of Environment and Natural
Resources. [online] Available at: https://nt.gov.au/__data/assets/pdf_file/0006/205476/golden-backed-tree-rat.pdf [Accessed 20 April 2017].
VU VUHabitat: Most often sandy substrates, seemingly favouring coastal sand dunes and sand sheets with a cover of tussock grass or heath. Also shrubland, Eucalyptus open forest, and the margins of coastal rainforest thickets (Woinarski 2004; Woinarski & Flannery 2008).Distribution: Restricted to the NT – mostly Groote Eylandt, but also central north-east Arnhem Land (Woinarski & Ward 2012). No confirmed records from the Australian mainland for at least 10 years (Woinarski et al. 2014).
NONE Species favours coastal sand dunes and sandsheets
under tussock grass/heath, of which there is none within the survey area.
Closest known occurrence is more than 150km NE.
Northern Hopping-MouseNotomys aquilo
Woinarski, J., Burbidge, A. & Harrison, P. (2014). The Action Plan for Australian Mammals 2012. CSIRO Publishing: pp. 609-611.Woinarski, J.C.Z. & Flannery, T.F. (2008). Northern Hopping-mouse. in Van Dyck, S. & Strahan, R. (eds.) The Mammals of Australia, 3rd Edition. Reed New Holland, Sydney.Woinarski, J.C.Z. (2004). National Multi-species Recovery Plan for the Carpentarian Antechinus Pseudantechinus mimulus, Butler's Dunnart Sminthopsis butleri and Northern Hopping-mouse Notomys
aquilo, 2004 - 2008. Department of the Environment and Heritage, ACT. [online] Available at: https://www.environment.gov.au/system/files/resources/dfb8a0ed-9e3e-4315-9e35-e28236ee96ba/files/p-mimulus-s-butleri-n-aquilo.pdf [Accessed 20 April 2017].
Woinarski, J. and Ward, S. (2012). Threatened Species of the Northern Territory – Northern Hopping Mouse – Notomys aquilo. Northern Territory Department of Environment and Natural Resources. [online] Available at: https://nt.gov.au/__data/assets/pdf_file/0019/205516/northern-hopping-mouse.pdf [Accessed 20 April 2017].
- VUHabitat: Sandy deserts mostly associated with dunes, sandy plains and river flats (Pavey 2015).Distribution: Central WA, northern SA and southern NT. Seems to be confined to the southern and western sections of the NT (Benshemesh & Schultz 2008) where has been found as far north as Barrow Creek (Pavey 2015).
NONE No sandy deserts utilised by this species are present
within the survey area. Closest known occurrence is more than 250km SW.
Southern Marsupial MoleNotoryctes typhlops
Pavey, C. (2015). Threatened Species of the Northern Territory - Southern Marsupial Mole - Notoryctes typhlops. Northern Territory Department of Environment and Natural Resources. [online] Available at: https://nt.gov.au/__data/assets/pdf_file/0016/205522/southern-marsupial-mole.pdf [Accessed 23 March 2017].
Benshemesh, J. & Schultz, M. (2008). Survey of the underground signs of marsupial moles in the WA Great Victoria Desert, Tropicana Joint Venture and the Department of Natural Resources, Environment and the Arts, NT Government
VU -Habitat: In the NT, sloping sandstone hills with boulders, pavement, outcrops and rocky surface, with open woodland of Eucalyptus tetrodonta and E. aspera, and a dense understorey and ground cover of Plectrachne pungens (DoE 2017).Distribution: In the NT, the Sir Edward Pellew island group and Pungalina-Seven Emu (mainland reserve south-west of Borroloola (Woinarski & Ward 2012). Also a few records around Mount Isa in Qld (DoE 2017).
LOW Only a small area of rocky outcropping which has been
recently burnt and is unlikely to provide sufficient habitat.
Survey area is towards the edge of the species’ distribution and outside areas of known populations.
Carpentarian AntechinusPseudantechinus mimulus
Department of the Environment (2017). Pseudantechinus mimulus — Carpentarian Antechinus. Species Profile and Threats Database. Department of the Environment, Canberra. [online] Available at: http://www.environment.gov.au/cgi-bin/sprat/public/publicspecies.pl?taxon_id=59283 [Accessed 21 April 2017].
Woinarski, J.C.Z. and Ward, S. (2012). Threatened Species of the Northern Territory - Carpentarian Antechinus - Pseudantechinus mimulus. Northern Territory Department of Environment and Natural Resources. [online] Available at: https://nt.gov.au/__data/assets/pdf_file/0005/376133/carpentarian-antechinus.pdf [Accessed 20 April 2017].
Pale Field-ratRattus tunneyi - VU
Habitat: Historically occurred in a wide range of habitats, but now primarily in dense vegetation along creeks (Aplin et al. 2008).
LOW Limited dense vegetation along ephemeral

SantosEcology report – 2019 exploration program
Distribution: Higher rainfall areas of northern Australia, extending from Kimberley in WA to south-eastern Qld, including the Top End of the NT (Braithwaite & Griffiths 1996).
watercourses and waterholes is unlikely to provide suitable habitat.
Survey area is located on the edge of known range. Two occurrences approx. 100km N and W (1999 and
1982), others are >150km NE.Aplin, K., Braithwaite, R. and Baverstock, P. (2008). Pale Field-rat: Rattus tunneyi. In: Van Dyck, S. and Strahan, R. (eds.). The Mammals of Australia (3rd Edition). Reed New Holland, Sydney, NSW. Braithwaite, R. and Griffiths, A. (1996). The paradox of Rattus tunneyi: endangerment of a native pest. Wildlife Research, Vol. 23, pp. 1-21.
VU -Habitat: In the NT, specimens have been collected from Pandanus woodland fringing the sedgelands of the South Alligator River and Eucalyptus tall open forests (Friend & Braithwaite 1986; Churchill 1998). Predominantly found throughout the monsoonal tropics. Most records occur within near-coastal habitats with one recent exception (Jasper Gorge) 150 km inland (Woinarski et al. 2014).Distribution: Widely distributes from India through south-eastern Asia to the Solomon Islands including north-eastern Qld and the NT. The north-eastern Australian population is described as the subspecies S. s. nudicluniatus, although it is not clear whether this should be applied to the NT (Milne & Woinarski 2006).
LOW Dry open woodlands and grasslands area unlikely to
provide suitable habitat for the species. Generally, prefers habitat closer to the coast. One occurrence in 2001 about 150km NE, no others
nearby. Survey area is on the edge of known range.
Bare-rumped Sheathtail BatSaccolaimus saccolaimus (nudicluniatus)
Churchill, S. (1998). Australian Bats. Reed New Holland, Sydney. Friend, G.R. and Braithwaite, R.W. (1986). Bat fauna of Kakadu National Park, Northern Territory. Australian Mammalogy, Vol. 9, pp. 43-52. Milne, D. and Woinarski, J. (2006). Threatened Species of the Northern Territory - Bare-rumped Sheathtail Bat - Saccolaimus saccolaimus. Northern Territory Department of Environment and Natural
Resources. [online] Available at: https://nt.gov.au/__data/assets/pdf_file/0007/376117/bare-rumped-sheathtail-bat.pdf [Accessed 21 April 2017].Woinarski, J., Burbidge, A. and Harrison, P. (2014). The Action Plan for Australian Mammals 2012. CSIRO Publishing: pp. 511-514.
EN CR
Habitat: Restricted to sandstone gorges and escarpments containing a core of dry or wet rainforest vegetation, mixed with woodland, scree slopes and permanent water, surrounded by savannah woodlands (Puckey & Woinarski 2006).Distribution: Restricted to the NT, where known only from five locations within a radius of 35 km (Puckey 2003) at Wollogorang Station in the Gulf of Carpentaria (Kitchener 1989).
NONE No suitable sandstone gorge or escarpment which would
provide suitable habitat. No proximate records.
Carpentarian Rock-ratZyzomys palatalis
Kitchener, D.J. (1989). Taxonomic appraisal of Zyzomys (Rodentia, Muridae) with descriptions of two new species from the Northern Territory, Australia. Records of the Western Australian Museum, Vol. 14, pp. 331-373.
Puckey, H. (2003). Additional records of the Carpentarian rock-rat Zyzomys palatalis at Redbank, close to the type locality. Northern Territory Naturalist, Vol. 17, pp. 43-45.Puckey, H. and Woinarski, J. (2006). Threatened Species of the Northern Territory - Carpentarian Rock-rat - Zyzomys palatalis. Northern Territory Department of Environment and Natural Resources.
[online] Available at: https://nt.gov.au/__data/assets/pdf_file/0008/205478/carpentarian-rock-rat.pdf [Accessed 21 April 2017].
REPTILES (TERRESTRIAL)Plains Death AdderAcanthophis hawkei
VU VUHabitat: Floodplains and cracking soil plains (Webb et al. 2002).Distribution: Habitat mapping suggests the potential geographic range extends from western Qld, across the north of the NT to north-eastern WA. Fragmented populations occur in the Mitchell Grass Downs of western Qld, the Barkly Tablelands on the NT/Qld border and east of Darwin in the NT
LOW No proximate records and at the edge of the species’
range. Potentially-suitable cracking clay habitat occurs in

SantosEcology report – 2019 exploration program
(TSSC 2012). alluvial plains within survey area.Webb, J.K., Christian, K.A. & Fisher, P. (2002). Fast growth and early maturation in a viviparous sit-and-wait predator, the northern death adder (Acanthophis praelongus) from tropical Australia. Journal of
Herpetology, Vol. 36, no. 3, pp. 505-509.Threatened Species Scientific Committee (2015). Approved Conservation Advice – Acanthophis hawkei – Plains Death Adder. Canberra: Department of the Environment. [online] Available at:
http://www.environment.gov.au/biodiversity/threatened/species/pubs/83821-conservation-advice.pdf [Accessed 21 April 2017].
- VU Habitat: Semi-aquatic, occupying edges of freshwater watercourses and lagoons, but seldom seen far from water (Christian 2004). Distribution: Across far northern Australia from the western Cape York Peninsula in Qld to the Kimberley in WA (Christian 2004). Widespread in the NT, occupying all of the Top End river systems (Ward et al. 2006). Susceptible to ingesting toxic Cane Toads resulting in reduced abundance (Griffiths & McKay 2007).
MEDIUM Record south of Carpentarian Highway, near to project
area. Wide distribution and potential habitat within the survey
area.
Mertens’ Water MonitorVaranus mertensi
Christian, K. (2004). Varanus mertensi. In: Pianka et al. (eds.). Varanoid lizards of the world. Indiana University Press, Bloomington, Indianapolis.Griffiths, A.D. and McKay (2007). Cane toads reduce the abundance and site occupancy of Merten’s water monitor (Varanus mertensi). Wildlife Research, Vol. 34, pp. 609-615. Ward, S., Woinarski, J., Griffiths, T. and McKay, L. (2006). Threatened Species of the Northern Territory - Mertens Water Monitor - Varanus mertensi. Northern Territory Department of Environment and Natural Resources. [online] Available at: https://nt.gov.au/__data/assets/pdf_file/0018/206460/mertens-water-monitor.pdf [Accessed 1 May 2018].
- VUHabitat: Semi-aquatic and arboreal, inhabiting margins of watercourses, swamps and lagoons (Ward 2012).Distribution: Top End of the NT and Kimberley in WA (Schultz & Doody 2004). In the NT, recorded in most catchments flowing into the Timor Sea, Arafura Sea and the Gulf of Carpentaria (Ward 2012).
LOW Ephemeral watercourses and limited pools are unlikely
to provide suitable habitat. Survey area at the edge of known range.
Mitchell's Water MonitorVaranus mitchelli
Doody, J.S., Green, B., Rhind, D., Castellano, C., Sims, R. and Robinson, T. (2009). Population-level declines in Australian predators caused by an invasive species. Animal Conservation, Vol. 12, pp. 46-53.
Schultz, T. and Doody, S. (2004). Varanus mitchelli. In: Pianka et al. (eds.). Varanoid lizards of the world. Indiana University Press, Bloomington, Indianapolis.Ward, S. (2012). Threatened Species of the Northern Territory - Mitchell’s Water Monitor - Varanus mitchelli. Northern Territory Department of Environment and Natural Resources. [online] Available at:
https://nt.gov.au/__data/assets/pdf_file/0019/206461/mitchells-water-monitor.pdf [Accessed 21 April 2017].
- VUHabitat: Broad range of habitats from coastal beaches to savannah woodlands (Christian 2004). Also common throughout floodplains grasslands and a variety of native woodlands (Ward et al. 2012).Distribution: Across northern Australia from the Kimberley in WA to Cape York Peninsula, and southwards through most of Qld. In the NT, recorded across most of the Top End and the Gulf Region (Christian 2004).
Experienced significant declines due to cane toad poisoning (Doody et al. 2009).
LOW Open woodlands within the survey area may provide
potential habitat. Survey area is at the edge of known range. Closest known occurrence is more than 100km E and
NW of survey area and prior to 1990.
Floodplain MonitorVaranus panoptes
Christian, K. (2004). Varanus panoptes. In: Pianka et al. (eds). Varanoid lizards of the world. Indiana University Press, Bloomington, Indianapolis.Doody, J.S., Green, B., Rhind, D., Castellano, C., Sims, R. and Robinson, T. (2009). Population-level declines in Australian predators caused by an invasive species. Animal Conservation, Vol. 12, pp. 46-
53. Ward, S., Woinarski, J., Griffiths, T. & McKay, L. (2012). Threatened Species of the Northern Territory - Yellow Spotted Monitor, Northern Sand Goanna, Floodplain Monitor - Varanus panoptes. Northern
Territory Department of Environment and Natural Resources. [online] Available at: https://nt.gov.au/__data/assets/pdf_file/0006/206466/floodplain-monitor.pdf [Accessed 7 April 2017].

SantosEcology report – 2019 exploration program
REPTILES (MARINE)
EN -
Habitat: Large rivers and their associated overflow lagoons and oxbow lakes (Cogger 2000; Woinarski 2006). Found in deeper permanent pools most often with muddy, sandy or rocky bottoms. Also found in the middle reaches of rivers, upstream of saline regions and downstream of escarpments, including plunge pools. Steep rocky gorges, and river reaches with intact river banks seem to be preferred habitats (Thomson et al. 1997). Distribution: Rivers in far eastern NT and far western Qld which discharge into the Gulf of Carpentaria. In the NT this includes the Roper, Limmen Bight, Robinson and Nicholson Rivers (DoE 2017).
NONE No large rivers preferred by this species are present
within the survey area. No proximate records.
Gulf Snapping TurtleElseya lavarackorum
Cogger, H.G. (2000). Reptiles and Amphibians of Australia - 6th edition. Reed New Holland, Sydney, NSW. Department of the Environment (2017). Elseya lavarackorum - Gulf Snapping Turtle. Species Profile and Threats Database, Department of the Environment, Canberra. [online] Available at:
https://www.environment.gov.au/cgi-bin/sprat/public/publicspecies.pl?taxon_id=67197 [Accessed 21 April 2017].Thomson, S., White, A. and Georges, A. (1997). Re-evaluation of Emydura lavarackorum: identification of a living fossil. Memoirs of the Queensland Museum, Vol. 42 (No. 1), pp. 327-336.Woinarski, J. (2006). Threatened Species of the Northern Territory - Gulf Snapping Turtle - Elseya lavarackorum. Northern Territory Department of Environment and Natural Resources. [online] Available
at: https://nt.gov.au/__data/assets/pdf_file/0008/376181/gulf-snapping-turtle.pdf [Accessed 21 April 2017].
FISH
VU VUHabitat: Tropical marine and estuarine habitats, entering estuarine or fresh waters to breed during the wet season and moving into marine waters following the wet season (Peverell 2005).Distribution: Circumtropical, with distinct populations in the eastern Atlantic, western Atlantic, eastern Pacific and Indo-West Pacific – including northern Australia (TSSC 2014). In the NT, reported in Adelaide, Victoria, Daly, East and South Alligator, Goomadeer, Roper, McArthur, Wearyan and Robinson Rivers (TSSC 2014).
NONE No marine / estuarine habitat used by this species is
present within the survey area. No proximate records.
Freshwater or Largetooth SawfishPristis pristis
Peverell, S.C. (2005). Distribution of sawfishes (Pristidae) in the Queensland Gulf of Carpentaria, Australia, with notes on their ecology. Environmental Biology of Fishes, Vol. 73, pp. 391‐402.Threatened Species Scientific Committee (2014). Approved Conservation Advice - Pristis pristis (largetooth sawfish). Canberra: Department of the Environment. In effect under the EPBC Act from 11-April-
2014. [online] Available at: http://www.environment.gov.au/biodiversity/threatened/species/pubs/60756-conservation-advice.pdf [Accessed 26 April 2017].
FLORA
- ENHabitat: Sheltered sandstone gorges associated with springs and groundwater seepages (Cowie & Westaway 2012).Distribution: Isolated populations in northern WA, eastern Qld, north-eastern NSW and the NT (two locations on Wollogorang Station in the Gulf region, adjacent to the Qld border) (Cowie & Westaway 2012). There are substantial areas of potentially-suitable habitat in Western Arnhem Land that are poorly surveyed at the scale and intensity necessary to exclude the possibility that more subpopulations exist; however, the chance of finding additional subpopulations in that area appears relatively low (Cowie & Westaway 2012).
NONE The survey area contains no sandstone gorges that this
species prefers. No proximate records.
SwordfernMacrothelypteris torresiana
Cowie, I. and Westaway, J. (2012). Threatened Species of the Northern Territory - Macrothelypteris torresiana. Northern Territory Department of Environment and Natural Resources. [online] Available at: https://nt.gov.au/__data/assets/pdf_file/0006/208473/macrothelypteris-torresiana.pdf [Accessed 28 April 2017].

SantosEcology report – 2019 exploration program
APPENDIX C LIKELIHOOD OF OCCURRENCE ASSESSMENT FOR MIGRATORY SPECIES WITHIN SURVEY AREA
Species Species details Likelihood of occurrence
MIGRATORY MARINE BIRDSHabitat: Almost exclusively aerial. Mostly occurs over dry or open habitats, including riparian woodland and tea-tree swamps, low scrub, heathland or saltmarsh. Catches insects on the wing (DoE 2017). Distribution: A non-breeding visitor to all states and territories of Australia. Breeds in Siberia and migrates southward during the northern winter (DoE 2017).
MEDIUM (above the project area)
Given the broad distribution and wide ranging nature of Apus pacificus it is likely to be present (at some time period) within/over the project area.
The project area is within the species’ distribution. The dry, open grasslands and riparian woodland
occurring in the project area would provide suitable habitat for this species.
Apus pacificusFork-tailed Swift
Department of Environment (DoE) 2017, Apus pacificus in Species Profile and Threats Database, Department of the Environment, Canberra, viewed September 2017, http://www.environment.gov.au/.
MIGRATORY MARINE SPECIESHabitat: Mostly occurs in tidal rivers, coastal floodplains and channels, billabongs and swamps (Webb et al. 1987) up to 150 km inland from the coast Distribution: Northern Australia coastal waters, estuaries, lakes, inland swamps and marshes.
NONE
No major river systems utilised by this species occur within the project area.
The project area is over 200km inland from the coast.
Crocodylus porosusSaltwater Crocodile
MIGRATORY TERRESTRIAL SPECIESHabitat: Predominately forages over wetlands or open areas such as golf courses. Perches on bare branches or wires (DoE 2017).Distribution: Vagrant to Australia; may be found between December and February in around the Top End including Darwin (DoE 201).
LOW
Vagrant to Australia The woodland vegetation of the project area is unlikely
to provide suitable foraging habitat for the species, which forages over wetlands.
Cecropis dauricaRed-rumped Swallow
Department of Environment (DoE) 2017, Cecropis daurica in Species Profile and Threats Database, Department of the Environment, Canberra, viewed September 2017, http://www.environment.gov.au/.

SantosEcology report – 2019 exploration program
Species Species details Likelihood of occurrence
Habitat: Uses a range of vegetated habitats such as monsoon rainforest, wet sclerophyll forest, open woodlands and appears quite often along edges of forests, or ecotones between forest types (DoE 2017).Distribution: Widespread in Top End from Darwin, north to Melville and South Goulburn Islands, east to Gove Peninsula, Groote Eylandt and Sir Edward Pellew Group and south to Roper River (DoE 2017).
LOW
The project area is within the distribution of the species
The open woodland vegetation and creek line vegetation within the project area does not provide suitable habitat for the species
Cuculus optatusOriental Cuckoo
Department of Environment (DoE) 2017, Cuculus optatus in Species Profile and Threats Database, Department of the Environment, Canberra, viewed September 2017, http://www.environment.gov.au/.
Habitat: Found above open vegetated areas including farmland, sports grounds, native grasslands and airstrips as well as over open water such as billabongs, lagoons, creeks and sewage treatment plants. Perch on bare branches or wires, and gather in flocks to during the day, and roost at night perched in vegetation, usually tall wetland grasses (DoE 2017).Distribution: Found between December and February in around the Top End including Darwin (DoE 2017).
LOW
Vagrant to the area. Nearest records > 200km to the NE
Hirundo rusticaBarn Swallow
Department of Environment (DoE) 2017, Hirundo rustica in Species Profile and Threats Database, Department of the Environment, Canberra, viewed September 2017, http://www.environment.gov.au/.
Habitat: Has a strong association with water with all confirmed Australian records being associated with water; especially creeks, rivers and waterfalls (DoE 2017).Distribution: Scarce but regular visitor to northern Australia, including the Top End of the Northern Territory around the greater Darwin region (DoE 2017).
LOW
The species is a vagrant visitor to Australia. The project area is south of the known distribution of
the species in Australia. Creek areas within the project area may provide
limited suitable habitat for the species. One record (2002) from the Roper River (>150km
north of project area)
Motacilla cinereaGrey Wagtail
Department of Environment (DoE) 2017, Motacilla cinerea in Species Profile and Threats Database, Department of the Environment, Canberra, viewed September 2017, http://www.environment.gov.au/.
Habitat: Typically inhabit open grassy flats near water, including open areas with low vegetation such as grasslands, airstrips, pastures, sports fields; damp open areas such as muddy or grassy edges of wetlands, rivers, irrigated farmland, dams, waterholes; sewage farms, sometimes utilise tidal mudflats and edges of mangroves (DEE, 2015).Distribution: Regular summer visitor to Northern Australia including the greater Darwin area (DEE, 2015).
LOW
The vegetation of the project area is unlikely to provide limited suitable open areas for foraging of the species.
The project area is south of the known distribution of the species in Australia.
Motacilla flavaYellow Wagtail
Department of Environment (DoE) 2017, Apus pacificus in Species Profile and Threats Database, Department of the Environment, Canberra, viewed September 2017, http://www.environment.gov.au/.

SantosEcology report – 2019 exploration program
Species Species details Likelihood of occurrence
MIGRATORY WETLAND SPECIESHabitat: In Australia, the species inhabits mainly coastal but some inland wetlands where the species forages in shallow water on mudflats (DoE 2017). Distribution: Widespread across coastal regions of the Top End of the Northern Territory, and widespread but scattered inland, mostly north of Tennant Creek (DoE 2017).
LOW
There is no suitable habitat within the project area for the species.Actitis hypoleucos
Common Sandpiper
Department of Environment (DoE) 2017, Actitis hypoleucos in Species Profile and Threats Database, Department of the Environment, Canberra, viewed September 2017, http://www.environment.gov.au/.
Habitat: Prefers muddy edges of shallow wetlands, with inundated low vegetation (DoE 2017). Distribution: Widespread summer migrant to coastal and inland Australia. (DoE 2017)
LOW
There is little suitable habitat within the project area for the species.
Calidris acuminataSharp-tailed Sandpiper
Department of Environment (DoE) 2017, Calidris acuminata in Species Profile and Threats Database, Department of the Environment, Canberra, viewed September 2017, http://www.environment.gov.au/.
Habitat: Shallow fresh waters, often with low grass or other herbage, flooded pastures, sewage ponds, occasionally tidal areas, saltmarshes. (Pizzey & Knight, 2012)Distribution: Widespread, common summer migrant Australia; mostly coastal. (Pizzey & Knight, 2012) In the Northern Territory (NT), the Pectoral Sandpiper is found at Darwin and Alice Springs (Higgins & Davies 1996).
LOW
Given the preference for wetland areas, there is little suitable habitat within the project area for this species.Calidris melanotos
Pectoral Sandpiper
Department of Environment (DoE) 2017, Calidris melanotos in Species Profile and Threats Database, Department of the Environment, Canberra, viewed September 2017, http://www.environment.gov.au/.
Charadrius veredusOriental Plover
Habitat: After moving from coastal environments Charadrius veredus usually inhabit flat, open, grasslands, where short grass is interspersed with hard, bare ground (Boekel 1980; Carruthers 1966; Pedler 1982) Distribution: Oriental Plover is a non-breeding visitor to Australia, where the species occurs in both coastal and inland areas, mostly in northern Australia. It is found on black soil plains in the Northern Territory and Queensland (DoE, 2016).
MEDIUM
The project area is within the species range. The grasslands (and black soil plains) within the
project area represent suitable habitat.
Department of Environment (DoE) 2017, Charadrius veredus in Species Profile and Threats Database, Department of the Environment, Canberra, viewed September 2017, http://www.environment.gov.au/.

SantosEcology report – 2019 exploration program
APPENDIX D MAP OF DESKTOP ASSESSMENT SURVEY SITES

#*#*
#*
#*
#*#*#*#* #*#*
#*#*
#*#*
#*
#*
#*
#*#*
#*
#*#*#*
#*#*
#*
#*
#*#* #*#*
#*#*#*CARPENTARIA HIGHWAY037 036 035
034032030 029
028
027
026025
024023 022
021
020019
018
017
016015
014
013 012
011010
009008 006
005
004
003 002
RH1
134°50'0"E134°40'0"E134°30'0"E
16°1
0'0"
S16
°20'
0"S
16°3
0'0"
S16
°40'
0"S
!
DALYWATERS
MAP INFORMATIONName: Field sitesProjection: GDA 1994 MGA Zone 53Date Saved: 21/09/2017Client: SantosAuthor: A. Campbell (reviewed J. Richardson)DATA SOURCEProject data: SantosLandsystems: Geoscience AustraliaSurvey Data: EcOzImagery: ESRI basemap (Digital Globe)
Path: Z:\01 EcOz_Documents\04 EcOz Vantage GIS\EZ17088 - Santos Rehab and Ecology\01 Project Files\Ecology report maps\Field sites.mxd
Map showing survey sites and land systems
LandsystemBukalara
Coolibah
Cresswell
Dalglese
Inacumba
Lancewood 2
Lancewood 3
Lansen
McArthur
Miller
Seigal
Tanumbirini
Beetaloo
O0 2.5 5
Kilometres
Survey site
#* Check site
#* Vegetation site
Survey track
Project dataSurvey area
Project area

SantosEcology report – 2019 exploration program

Santos Ltd l Environment Management Plan: McArthur Basin Civil and Seismic Program l 5 April 2019
Appendix E: Weed Management Plan

1.
Weed Management Plan2019 exploration program - EP 161
Santos
Mitch Bird Senior Environmental Adviser Environment and Access Santos Limited, 32 Turbot St, Brisbane QLD 4000t: +61 7 3838 3799
santos.com

Santos iEP161 Weed Management Plan 2019 exploration program
DOCUMENT CONTROL RECORD
Job EZ19041
Document ID 176876-11
Author(s) Felicity Watt,
DOCUMENT HISTORY
Rev Reviewed by Approved by Issued to Date
1 A. Campbell R. Hall Client 04/04/19
Recipients are responsible for eliminating all superseded documents in their possession.
EcOz Pty Ltd.ABN: 81 143 989 039Winlow House, 3rd Floor75 Woods Street DARWIN NT 0800GPO Box 381, Darwin NT 0800
Telephone: +61 8 8981 1100Facsimile: +61 8 8981 1102Email: [email protected]: www.ecoz.com.au
RELIANCE, USES and LIMITATIONSThis report is copyright and is to be used only for its intended purpose by the intended recipient, and is not to be copied or used in any other way. The report may be relied upon for its intended purpose within the limits of the following disclaimer.
This study, report and analyses have been based on the information available to EcOz Environmental Consultants at the time of preparation. EcOz Environmental Consultants accepts responsibility for the report and its conclusions to the extent that the information was sufficient and accurate at the time of preparation. EcOz Environmental Consultants does not take responsibility for errors and omissions due to incorrect information or information not available to EcOz Environmental Consultants at the time of preparation of the study, report or analyses.

Santos iiEP161 Weed Management Plan 2019 exploration program
TABLE OF CONTENTS
1 INTRODUCTION........................................................................................................................................1
1.1 Scope & objectives..............................................................................................................................1
1.2 Dedicated weed officer........................................................................................................................1
1.3 Project area .........................................................................................................................................1
2 LEGAL REQUIREMENTS .........................................................................................................................4
2.1.1 Petroleum (Environment) Regulations .........................................................................................42.1.2 Weeds Management Act..............................................................................................................42.1.3 Management plans and guidelines ..............................................................................................42.1.4 Santos environmental policy ........................................................................................................4
3 WEED RISK MITIGATION MEASURES....................................................................................................5
4 WEED SPECIES ........................................................................................................................................7
5 ANNUAL ACTION PLAN.........................................................................................................................11
6 WEED MONITORING ..............................................................................................................................14
6.1 Notification procedure .......................................................................................................................14
6.2 Recording ..........................................................................................................................................14
6.3 Reporting...........................................................................................................................................15
7 REFERENCES.........................................................................................................................................16
AppendicesAPPENDIX A SANTOS CORPORATE ENVIRONMENTAL POLICY
APPENDIX B WEED HYGIENE DECLARATION
APPENDIX C WEED CONTROL RECORDING TEMPLATE
TablesTable 3-1 Weed risk and mitigation measures .................................................................................................5Table 4-1. Declared weed species recorded within the EP ..............................................................................7Table 4-2. Potential weeds within the exploration permit .................................................................................7Table 5-1. Annual action plan .........................................................................................................................12
FiguresFigure 1-1. 2019 project area ...........................................................................................................................3Figure 4-1. Proximity of 2019 project area to baseline surveys........................................................................9Figure 4-2. Weed occurrences within, or adjacent to, the project area ..........................................................10

Santos 1EP161 Weed Management Plan 2019 exploration program
1 INTRODUCTION
Santos plan to undertake exploration works within their onshore shale gas exploration permit (EP) on Tanumbirini Station (EP 161). This work includes the installation of two exploration wells, associated civil works and infrastructure development, to be undertaken in 2019. The exploration works will be regulated through an Environmental Management Plan (EMP) approved by the Department of Environment and Natural Resources (DENR). EcOz were engaged to prepare an associated weed management plan – this document – required as a component of the EMP under the Petroleum (Environment) Regulations (the Regulations).
1.1 Scope & objectives
The scope of this weed management plan is to outline the weed management measures that will be implemented to prevent the introduction and spread of weeds during the works associated with the exploration program.
The objectives of this weed management plan are to:
Comply with all applicable legislation, regulations, conditions and regional weed management plans.
Address the specific weed management requirements of station owners. Provide controls for construction activities to avoid introducing new weed species into the 2019
exploration program project area. Avoid or control the spread of existing weed species into new areas within the exploration
program project area. Detail the monitoring, reporting and incident response procedures appropriate for the
management measures.
The weed management plan is applicable to all activities associated with the exploration program, and will be used by all personnel (including contractors) involved in program activities.
1.2 Dedicated weed officer
The Scientific Inquiry into Hydraulic Fracturing recommended a dedicated weed officer for each gas field. Contact details for Santos’ weed officer for EP 161 are:
Mitch Bird, Senior Environmental Advisor, Tel: 07 3838 3799, Email: [email protected]
1.3 Project area
EP 161 is located on Tanumbirini Station on the Carpentaria Highway south east of Katherine. Activities involved with the 2019 exploration program project area are mapped in
Figure 1-1 and include:
Drilling of two new exploration wells – Tanumbirini-2 and Inacumba-1. All disturbance for the wells (well drill pad, camps, dams etc) will be located within a 500 m buffer of the proposed well locations.
A single 2D seismic profiling line crossing the proposed Tanumbirini-2 well site Construction of two short access tracks ~900 m each, from existing station tracks to the proposed
well sites

Santos 2EP161 Weed Management Plan 2019 exploration program
Clearing for a laydown area along the access track to Tanumbirini-2, and for borrow material. Two borrow pit locations have been identified; borrow material will come from only a portion of the identified area, with pits located within one or both identified locations.

!(
!(
Carpentaria Highway
Laydownarea
Inacumba- 1
Tanumbirini- 2
460000 470000 48000081
7000
0
8170
000
8180
000
8180
000
8190
000
8190
000
Path: Z:\01 EcOz_Documents\04 EcOz Vantage GIS\EZ19041 - Santos EP161 EMP aspects\01 Project Files\WMP Figure 1-1. Map showing 2019 project area.mxd
0 2.5 51.25
Kilometres
"
"
Daly Waters
Katherine OMAP INFORMATIONProjection: GDA 1994 MGA Zone 53Date Saved: 4/2/2019Client: SantosAuthor: F Watt (review A Campbell)DATA SOURCEProject components: ClientImagery: ESRI basemap (Digital Globe)
Figure 1-1. Map showing 2019 project area
Legend!( Proposed well
500m buffer
2D Seismic line
Borrow pits
Exploration permit161
Road
Access tracksexisting
proposed
EcOz survey tracks
Red box indicates map extent

Santos 4EP161 Weed Management Plan 2019 exploration program
2 LEGAL REQUIREMENTS
This following legislation, statutory obligations and guidelines were considered during the preparation of this weed management plan.
2.1.1 Petroleum (Environment) Regulations
The Petroleum (Environment) Regulations, (the Regulations), require submission of an EMP prior to any petroleum exploration or production activity. This weed management plan represents of component of the 2019 exploration program EMP, as required under the regulations.
2.1.2 Weeds Management Act
This Act aims to:
Protect the Territory’s economy, community, industry and environment from the adverse impact of weeds
It declares undesirable species of plants as weeds, and requires these species to be controlled, eradicated or prevented from entering the Northern Territory (NT) depending on their classification. Under the Act, weeds are classified into one of three classes:
Class A declared plant – to be eradicated Class B declared plant – growth and spread to be controlled Class C declared plant – not to be introduced into the NT (all Class A and B weeds are also Class
C)
The Act specifies how weeds in each of the classes must be treated. Weed management plans for specific weeds are endorsed under this Act.
2.1.3 Management plans and guidelines
Statutory Weed Management Plans
These plans are legal documents containing specific information about management requirements for certain high priority weeds. Section 4 lists weeds that are present or have the potential for introduction onto EP 161, and notes those with an associated statutory weed management plan.
Guidelines and standards
The following guidelines associated with the management of weeds in the NT have also been considered during the preparation of this WMP:
Northern Territory Weed Management Handbook (Weed Management Branch, 2015a) Northern Territory Weed Data Collection Manual (Weed Management Branch, 2015b)
2.1.4 Santos environmental policy
Santos’ Corporate Environmental Policy is a public declaration of its understanding of the environmental impacts and risks associated with its operations, as well as a demonstration of its compliance with all relevant environmental, health and safety regulations, legislation and guidelines. A copy is provided as Appendix A.

Santos 5EP161 Weed Management Plan 2019 exploration program
3 WEED RISK MITIGATION MEASURES
The EMP risk assessment process identified a number of weed introduction and/or spread risks associated with the scope of this plan. Table 3-1 documents these risks as well as the mitigation measures that will be implemented to reduce this risk.
Table 3-1 Weed risk and mitigation measures
Weed risk Mitigation measures Measurement criteria Responsible person
All vehicles / machinery /equipment entering the EP to be cleaned and free of soil and vegetative matter, and have a valid weed hygiene declaration
A register of vehicle / equipment / machinery cleaning is kept.1 Spot checks on vehicle / equipment / machinery to ensure inspections are completed correctly
Santos Dedicated Weed OfficerIntroduction of new
weed species to EP 161 from machinery and equipment. Site environmental
inductions for all personnel and contractors to include vehicle weed hygiene requirements
All project staff undertake an environmental induction, to be recorded in the Santos Training Register
Santos Dedicated Weed Officer
All infestations of declared weeds mapped; all personnel and contractors made aware of existing infestation locations and trained in the identification of existing weeds
All project staff undertake an environmental induction, to be recorded in the Santos Training RegisterWeed maps and factsheets included as part of environmental inductionAll operational staff to attend weed identification training delivered by the NT Weed Management Branch
Santos Dedicated Weed Officer
All vehicles, machinery and equipment to stay on formed access tracks, except for those involved in clearing
All project staff undertake an environmental induction, as recorded in the Santos Training Register
Santos Dedicated Weed Officer
If infestations are identified during the 2019 program they will be demarcated and avoided, where possible, via a detour around the infestation
Maintain demarcation during operations and inspect (and rectify if needed) daily
Santos Field Representative
Weed spread resulting from vehicles/machinery traversing existing weed infestations
If infestations cannot be avoided, treat prior to traversing using methods set out in Table 5-1. Vehicles/plant to be cleaned and free of soil and vegetative matter prior to moving beyond infestation
Work plan to reflect additional tasks requiredSpot checks on vehicle / equipment / machinery to ensure inspections are completed correctly
Santos Field Representative / Santos Dedicated Weed Officer
1 Weed hygiene declaration included as Appendix B.

Santos 6EP161 Weed Management Plan 2019 exploration program
Weed risk Mitigation measures Measurement criteria Responsible personExisting weed
distribution not fully known due to survey conducted outside of prime growth period
Further monitoring to be undertaken, as set out in Section 6 of this document
Annual reporting against this WMP, as per Section 6.3
Santos Dedicated Weed Officer
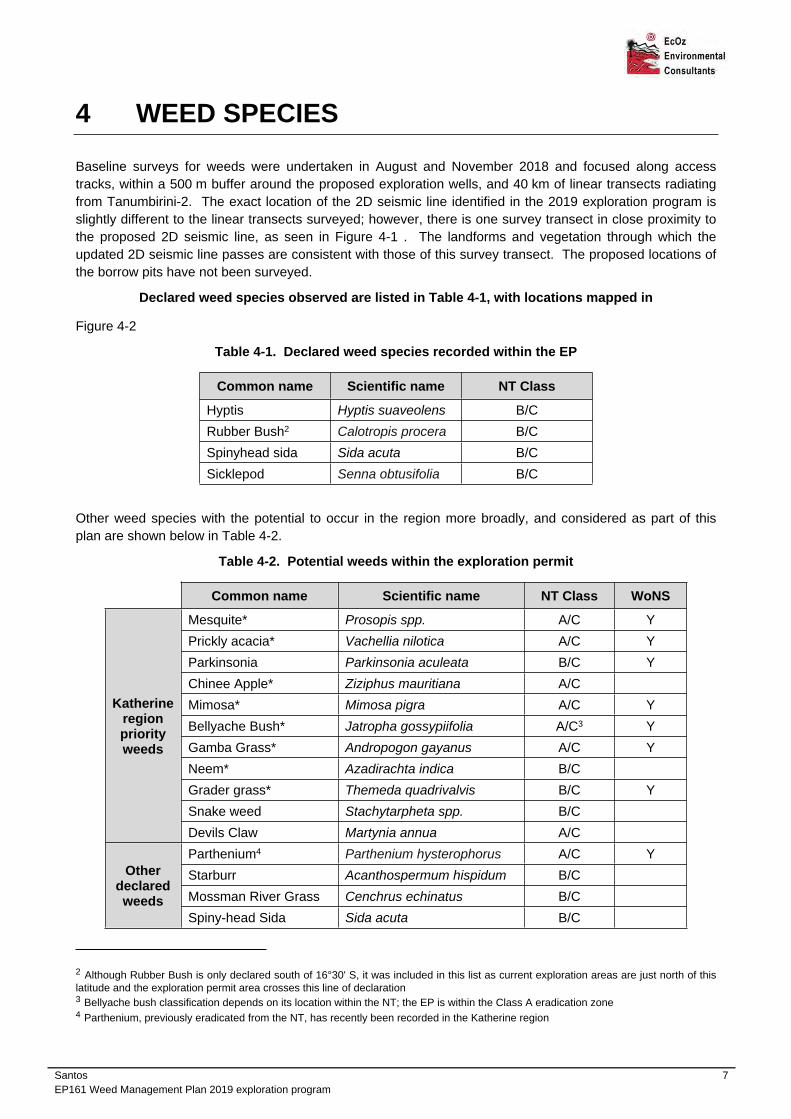
Santos 7EP161 Weed Management Plan 2019 exploration program
4 WEED SPECIES
Baseline surveys for weeds were undertaken in August and November 2018 and focused along access tracks, within a 500 m buffer around the proposed exploration wells, and 40 km of linear transects radiating from Tanumbirini-2. The exact location of the 2D seismic line identified in the 2019 exploration program is slightly different to the linear transects surveyed; however, there is one survey transect in close proximity to the proposed 2D seismic line, as seen in Figure 4-1 . The landforms and vegetation through which the updated 2D seismic line passes are consistent with those of this survey transect. The proposed locations of the borrow pits have not been surveyed.
Declared weed species observed are listed in Table 4-1, with locations mapped in
Figure 4-2
Table 4-1. Declared weed species recorded within the EP
Common name Scientific name NT Class
Hyptis Hyptis suaveolens B/CRubber Bush2 Calotropis procera B/CSpinyhead sida Sida acuta B/CSicklepod Senna obtusifolia B/C
Other weed species with the potential to occur in the region more broadly, and considered as part of this plan are shown below in Table 4-2.
Table 4-2. Potential weeds within the exploration permit
Common name Scientific name NT Class WoNS
Mesquite* Prosopis spp. A/C YPrickly acacia* Vachellia nilotica A/C YParkinsonia Parkinsonia aculeata B/C YChinee Apple* Ziziphus mauritiana A/CMimosa* Mimosa pigra A/C YBellyache Bush* Jatropha gossypiifolia A/C3 YGamba Grass* Andropogon gayanus A/C YNeem* Azadirachta indica B/CGrader grass* Themeda quadrivalvis B/C YSnake weed Stachytarpheta spp. B/C
Katherine region priority weeds
Devils Claw Martynia annua A/CParthenium4 Parthenium hysterophorus A/C YStarburr Acanthospermum hispidum B/CMossman River Grass Cenchrus echinatus B/C
Other declared weeds
Spiny-head Sida Sida acuta B/C
2 Although Rubber Bush is only declared south of 16°30' S, it was included in this list as current exploration areas are just north of this latitude and the exploration permit area crosses this line of declaration3 Bellyache bush classification depends on its location within the NT; the EP is within the Class A eradication zone4 Parthenium, previously eradicated from the NT, has recently been recorded in the Katherine region

Santos 8EP161 Weed Management Plan 2019 exploration program
Common name Scientific name NT Class WoNS
Flannel Weed Sida cordifolia B/CPaddy`s Lucerne Sida rhombifolia B/CCaltrop Tribulus terrestris B/CNoogoora Burr Xanthium strumarium B/CKhaki Weed Alternanthera pungens B/C
* indicates weeds with an associated weed management plan

!(
!(
Carpentaria Highway
Laydownarea
Inacumba- 1
Tanumbirini- 2
460000 470000 48000081
7000
0
8170
000
8180
000
8180
000
8190
000
8190
000
Path: Z:\01 EcOz_Documents\04 EcOz Vantage GIS\EZ19041 - Santos EP161 EMP aspects\01 Project Files\WMP Figure 4-1. Proximity of 2019 project area to baseline surveys.mxd
0 2.5 51.25
Kilometres
"
"
Daly Waters
Katherine OMAP INFORMATIONProjection: GDA 1994 MGA Zone 53Date Saved: 4/2/2019Client: SantosAuthor: F Watt (review A Campbell)DATA SOURCEProject components: ClientImagery: ESRI basemap (Digital Globe)
Figure 2-1. Map of 2019 exploration program project area and survey area
Legend!( Proposed well
500m buffer
2D Seismic line
Borrow pits
Exploration permit161
Road
Access tracksexisting
proposed
EcOz survey tracks
Red box indicates map extent
!(
Tanumbirini -2survey area
!(
Inacumba -1survey area
0 2.5 51.25Kilometres
0 5 102.5Kilometres

#*
#*#*#*
#*
#*#*#*#*#*#*#*
#*
#*#*#*#*
#*#*
#*
#*
#*
#*#*#*#*
#*
#*
#*#*#*
#*
#*#*#*
#*
#*
#*#*#*
#*
#*#*#*#*#*#*
#*
#*
#*
!(
!(
Carpentaria Highway
Laydownarea
Inacumba- 1
Tanumbirini- 2
460000 470000 48000081
7000
0
8170
000
8180
000
8180
000
8190
000
8190
000
Path: Z:\01 EcOz_Documents\04 EcOz Vantage GIS\EZ19041 - Santos EP161 EMP aspects\01 Project Files\WMP Figure 4-2. Location of weed occurrences within or adjacent to 2019 exploration program area.mxd
0 2.5 51.25
Kilometres"
"Daly Waters
Katherine OMAP INFORMATIONProjection: GDA 1994 MGA Zone 53Date Saved: 4/2/2019Client: SantosAuthor: F Watt (review A Campbell)DATA SOURCEProject components: ClientImagery: ESRI basemap (Digital Globe)
Figure 4-2. Weed occurrences within, or adjacent to, project area
Legend!( Proposed well
500m buffer
2D Seismic line
Borrow pits
Exploration permit161
Road
Access tracksexisting
proposed
Red box indicates map extent
Weed species densityHyptis density#* <1%
#* 1-10%
#* 11-50%
Rubber bushdensity#* <1%
#* 1-10%
Sida sp. density#* 1-10%
#* 10-50%
Senna density#* Senna <1%

Santos 11EP161 Weed Management Plan 2019 exploration program
5 ANNUAL ACTION PLAN
The annual action plan in Table 5-1 details the survey and control activities for weeds recorded within EP 161.
Table 5-1. Annual action plan
Weed Management
AreaWeed species Management
objectiveSurvey / monitoring
time/s Treatment time/s Control method/s Herbicide
Sicklepod No spreadEnd of wet season –
March depending on site access
End of wet season – March depending on
site access
Foliar spray seedlings and
adults
Dicamba 500 g/L
Rate: 500mL/100 LTanumbirini- 2
Hyptis No spreadEnd of wet season –
March depending on site access
End of wet season – March depending on
site access
Foliar spray seedlings and
adults
2, 4-D amine 625 g/L
Rate: 320 mL/100 L
Laydown area Hyptis No spreadEnd of wet season –
March depending on site access
End of wet season – March depending on
site access
Foliar spray seedlings and
adults
2, 4-D amine 625 g/L
Rate: 320 mL/100L
Tanumbirini Borrow Pit No weeds
Prevent the introduction of
weeds
End of wet season – March depending on site
access
Immediately if weeds are found
Refer to the NT Weed Management Handbook
Hyptis No spreadEnd of wet season –
March depending on site access
End of wet season – March depending on
site access
Foliar spray seedlings and
adults
2, 4-D amine 625 g/L
Rate: 320 mL/100L2D Seismic line
Sicklepod No spreadEnd of wet season –
March depending on site access
End of wet season – March depending on
site access
Foliar spray seedlings and
adults
Dicamba 500 g/L
Rate: 500mL/100 L
Tanumbirini Spinyhead sida No spread End of wet season – March depending on site
End of wet season – March depending on
Foliar spray seedlings and
2, 4-D amine 625

Santos 12EP161 Weed Management Plan 2019 exploration program
Weed Management
AreaWeed species Management
objectiveSurvey / monitoring
time/s Treatment time/s Control method/s Herbicide
access site access adults g/L
Rate: 320 mL/100 L
Hyptis No spreadEnd of wet season –
March depending on site access
End of wet season – March depending on
site access
Foliar spray seedlings and
adults
2, 4-D amine 625 g/L
Rate: 320 mL/100L
Foliar spray seedlings
Triclopyr 300 g/L
Rate: 750 mL/100 L (water)
Access tracks
Rubber Bush No spreadEnd of wet season –
March depending on site access
End of wet season – March depending on
site access
Basal Bark <5 cm stems – spray to
point of runoff
Cut stump > 5 cm stems
Triclopyr 240 g/L + Picloram 120 g/L1 L/60 L (diesel)
Inacumba-1 No weedsPrevent the
introduction of weeds
End of wet season – March depending on site
access
Immediately if weeds are found
Refer to the NT Weed Management Handbook
Inacumba Access Tracks Hyptis No spread
End of wet season – March depending on site
access
End of wet season – March depending on
site access
Foliar spray seedlings and
adults
2, 4-D amine 625 g/L
Rate: 320 mL/100L
Inacumba Borrow Pit No weeds
Prevent the introduction of
weeds
End of wet season – March depending on site
access
Immediately if weeds are found
Refer to the NT Weed Management Handbook
Treatment times, control methods and herbicide application rates have been taken from the NT Weed management handbook

Santos 13EP161 Weed Management Plan 2019 exploration program
6 WEED MONITORING
The requirements for weed monitoring within each component of the project area are outline above in Section 5. Additional to the survey / monitoring times listed in Table 5-1, monitoring for weed incursions will be ongoing during operations, as all operational staff will have a responsibility to report new weed incursions to Santos’ dedicated weed officer. Should new weed incursions be identified during the initial survey and monitoring, follow-up surveys will be within three months to ensure effective eradication of the incursions.
Upon commencement of construction, access to the proposed exploration wells will be restricted to approved access tracks. Once constructed, the potential for weed spread within the project area should be largely reduced to access tracks, the 2D seismic line and exploration well infrastructure. To target survey efforts within areas at high risk of weed establishment, weed monitoring will focus on the following areas:
Known weed locations Along access tracks 2D seismic line Borrow pits and laydown areas 50 m buffer around stock watering points traversed by access tracks 50 m buffer around exploration wells Any other areas that were disturbed during track, seismic line or well construction process
6.1 Notification procedure
All new weed incursions will be reported to the NT Weed Management Branch by Santos’ dedicated weed officer. Initial notification will be verbal, followed by written notification of preliminary species identification and location within seven working days.
6.2 Recording
All weed monitoring and survey activities will be recorded in accordance with the NT Weed Data Collection Guidelines available at: https://nt.gov.au/environment/weeds/weed-mapping-and-data-sharing.
The following attributes of any new weed infestations will be recorded into a GPS enabled device:
Site ID Weed name ID confidence Date of record Coordinate information Recorder / organisation Infestation size
o 20 m diametero 50 m diametero 100 m diameter
Infestation density
o 1 = Absent, no weeds of this species in the areao 2 = < 1%; very few, not many weedso 3 = 1 – 10%; more than one or two isolate plantso 4 = 11 – 50%; Many plants, covering up to half the areao 5 = > 50%; Weed forms the dominant cover

Santos 14EP161 Weed Management Plan 2019 exploration program
Weed data will be submitted as an excel spreadsheet to the Weeds Management Branch (refer Appendix C for an example template)
6.3 Reporting
Santos’ weed management officer will submit annual reporting against this WMP as a component of environmental reporting requirements. This will include
Details of activities implemented to address weed spread and introduction risks Submission of all weed data collected Details of survey and monitoring events, including dates, personnel, maps and track data An overview of weed control events and success rates
This annual report will be reviewed by the NT Government’s Onshore petroleum weed management officer.

Santos15EP161 Weed Management Plan 2019 exploration program
7 REFERENCES
Weed Management Branch 2015a, Northern Territory Weed Management Handbook, Department of Land Resource Management, Northern Territory Government, Darwin
Weed Management Branch 2015b, Northern Territory Weed Data Collection Manual, Department of Land Resource Management, Northern Territory Government, Darwin

SantosEP161 Weed Management Plan 2019 exploration program
APPENDIX A SANTOS CORPORATE ENVIRONMENTAL POLICY

EcOz Environmental Consultants | GPO Box 381 Level 3 Winlow House 75 Woods Street Darwin, NT 0801 | P: 08 8981 1100 www.ecoz.com.au
This declaration is valid for transport and movement of vehicles and equipment from to
(provide locations) and will stay current pursuant to the definition of clean in Definitions.
VEHICLE DESCRIPTION
Make: Registration # or engine number:
Was clean prior to entry to (destination)
Add equipment examined to the Equipment Register
Certifier name
Certifier qualification Qualification date
DECLARATION
I, (name),of (street)
town
state
telephone
declare the information I provided in this declaration is true and correct and I have read the accompanying explanatory notes before completion of this declaration.
Signature Date
EXPLANATORY NOTES
This certification process was developed to fulfill one of the stated purposes of the NT Weed Management Act and the Qld Land Protection (Pest and Stock Route Management) Act 2002.
It applies to, as a minimum, all weeds listed as weeds in the relevant jurisdiction and any plants that a stakeholder does not want transported or introduced.
DEFINITIONS
Clean:• Means that no soil or organic matter is present on vehicles or equipment
• Vehicles and equipment are considered clean if, after certified weed free, it does not touch soil or vegetative material, ie for a vehicle this means it travels on sealed or well-maintained unsealed roads.
Equipment means anything other than a vehicle.
Vehicle includes anything used for carrying a thing or person by land, water or air.
Weed reproductive material means any part of a plant that is capable of producing another plant by sexual or asexual means. This includes seeds, bulbs, rhizomes, tuber, stem, leaf cuttings or a whole plant.
Well-maintained unsealed road means roads that do not have vegetation growing on or encroaching onto the area occupied by traffic.
Weed Hygiene Declaration

Checklist-Cars, 4WD, trucks and trailer
Vehicle Rego Number Date of inspection
INTERIOR Pass Fail
• Inspect foot wells • Inspect under mats and carpet as well as the pile of carpet
BOOT OR TRAY Pass Fail
• Inspect under mats or carpet • Inspect inside spare tyre area/behind spare tyre • Inspect other recesses in the boot/rear of the vehicle • Inspect recess of boot lid
ENGINE BAY Pass Fail
Inspect all areas of the engine bay with a particular focus on areas listed below • Inspect the radiator • Inspect the grill • Inspect the top of transmission gearbox • Inspect the recess under windscreen wipers • Inspect air filter box
UNDERSIDE OF VEHICLE Pass Fail
• Inspect the wheel arches, wheel trims, flares, step treads, bumpers • Inspect the mud flaps • Inspect the tyre rims (particularly the rear side) • Inspect the top of axels and differentials • Inspect the top of muffler and surrounds • Inspect the spare tyres on 4WDs and station wagons (they are often suspended underneath). Remove to check • Inspect top side of any bash plates Note: these are potentially a high risk area as contaminants collect inside the horizontal positioned rim of the spare tyre.
CARGO Pass Fail
• Inspect all equipment, list in the equipment register below
FOR UTILITIES AND TRUCKS Pass Fail
• Inspect the floor of the tray. Inspect channels of tail gates and tray drop sides • Inspect side guards. • Inspect under chassis rails, including within steel sections • Inspect the gaps in the floor welds or boards and bolt holes on tray.
TRAILERS Pass Fail
• Inspect wheels • Inspect guards and trays • Inspect channels and draw bar • Inspect underbody

Santos
EP161 Weed Management Plan 2019 exploration program
APPENDIX C WEED CONTROL RECORDING TEMPLATE
RECORDER Fred Smith Location or Project Name:
ORGANISATION NAME Weed Terminators NT Recorder Method: E.g. High precision GPS
Your reference
eg. 2/11/2006
Set the Datum on your GPS receiver to
WGS84 or GDA94 using decimal degrees
Lat: -14.56341 Long: 132.34521
Common name
5, 20, 50, 100, 200
1,2,3,4,5 Use list Yes, No, Not recorded
use list use list
WA
YPO
INT
(SIT
E_ID
)
DA
TE_R
EC
LAT_
G94
LON
G_G
94
WEE
D_N
AM
E SIZE
_DIA
_M
DEN
S_C
AT
TREA
TMEN
T
Seed
lings
juve
nile
s
adul
ts
HER
BIC
IDE
SEED
_ PR
ES
CO
MM
ENTS
006 13/08/2015 132.31142 -14.51862 Athel Pine 5 2 Stem injection
No No Yes Triclopyr 600g/
Not recorded
Example only

Santos
EP161 Weed Management Plan

Santos Ltd l Environment Management Plan: McArthur Basin Civil and Seismic Program l 5 April 2019
Appendix F: Aboriginal and Non-indigenous Archaeological Assessment

An Aboriginal and non-Indigenous archaeological assessment of
proposed works in EP161, Northern Scope, McArthur Basin,
Northern Territory
A report to Santos Ltd
by
Johan Kamminga Allan Lance
Heritage Consulting Australia Pty LtdGPO Box 2677
Canberra ACT 2601
March 2019

Table of Contents
Executive summary .................................................................................................. ii
1. Introduction ..........................................................................................................12. The project area ..................................................................................................43. Environmental setting ..........................................................................................4
3.1 Topography .........................................................................................43.2 Land systems .....................................................................................43.3 Geology ..............................................................................................43.4 Hydrology ...........................................................................................73.5 Vegetation...........................................................................................73.6 Fauna .................................................................................................73.7 Climate ...............................................................................................83.8 Soils ....................................................................................................8
4. Aboriginal history and settlement in the region ....................................................94.1 Local Aboriginal organisation..............................................................94.2 Tribal groups in the area ...................................................................10
5. Nature of the proposed work activities ..............................................................106. Aboriginal cultural assessment methodology .................................................... 117. Results of the background research and Site Register searches .....................12
7.1 Historical places ...............................................................................178. Predictive modelling of the nature of Aboriginal sites/ relics .............................17
8.1 Degree of preservation of Aboriginal material culture.......................178.2 Incidence and size of stone artefact scatters ...................................18
9. Field survey methodology..................................................................................2010. Results of the archaeological field survey .......................................................2111. Conclusions .....................................................................................................2612. General recommendations ..............................................................................2613. References ......................................................................................................27
Appendix 1 - Glossary of technical terms ...............................................................29Appendix 2 - Aboriginal site types likely to occur in the region ...............................31
Kamminga and Lance 2019 EP161 Northern Scope, Aboriginal and non-Indigenous archaeological assessment i
Kamminga and Lance 2019 EP161 Northern Scope, Aboriginal and non-Indigenous archaeological assessment ii
Executive summaryHeritage Consulting Australia Pty Ltd (HCA) has been engaged by Santos Ltd to undertake a cul-tural heritage (archaeological) survey and assessment of Aboriginal and non-Indigenous heritage for the Tanumbirini North and Inacumba North areas in Exploration Permit 161 (EP161) in the Northern Territory’s McArthur Basin.
The area is to be subject to a further exploration program (the Northern Works Program) seeking to evaluate potential gas reserves that were identified during exploration first conducted in 2013 with subsequent seismic survey and drilling undertaken. In the earlier seismic study, 500km of 2D seismic data were acquired to map the regional sub-surface geology and an exploration well (Tanumbirini 1) was drilled in June 2014.
The area under investigation is part of the Exploration Permit Area 161, situated 350 km south-east of Katherine. The location where the next phase of exploration is to occur is near the previ-ously drilled Tanumbirini well, located 12 km north of the Carpentaria Highway (Highway 1) and approximately 135 km east of the township of Daly Waters at the junction of the Stuart Highway and Highway 1.
The further work program will entail a 2D seismic survey along a 10 km transect through the Tanumbirini North area, a drilling program (initially one horizontal well) in the same area, and a drilling program (initially one vertical and one horizontal well) in the Inacumba North area. There will be additional activities associated with this program including upgrading of access tracks to facilitate the entry and egress of vehicles during the seismic survey program. The Inacumba North area is situated ~15 km east of the Tanumbirini North location. At both locations where drilling is to occur there will be impacts within an area of approximately 200 m of the hole centre to ac-commodate drilling infrastructure, in addition to upgrades to access tracks and safe access to the Carpentaria Highway.
An archaeological field assessment was carried out by archaeologist Dr Johan Kamminga over 3 days in early March 2019, adopting a methodology consistent with the Northern Territory Cultural Heritage Act, 2011. The proposed seismic survey line route, locations of proposed upgrades to existing roads and tracks, well locations and the general project area were intensively examined for traces of prior Aboriginal habitation and resource use, and non-Indigenous settlement, to allow the development of appropriate management strategies to ensure the protection of the region’s cultural heritage values.
This archaeological study did not address places of contemporary Indigenous significance, as defined by the Northern Territory Aboriginal Sacred Sites Act, 1989. The relevant statutory body for the project area is the Northern Land Council which has previously carried out an assessment in the project area and its vicinity. Two recorded sites of special Aboriginal significance were iden-tified during this Sacred Site assessment and these sites have been protected from any potential impacts by broad exclusion zones. These Sacred Sites were not visited during the present study, nor were the exclusion zones entered.
Site register search and archaeological sensitivity modelling Prior to the field inspection of the project area, a review of previously located sites, as recorded in the Northern Territory Heritage Register, was undertaken. The mapping of these sites and the development of models of Aboriginal site distribution that this permits, revealed the most archaeo-logically sensitive zones throughout the project area. This modelling assisted with the formulation of a field survey strategy to identify locations most likely to contain evidence of prior Aboriginal activity and cover any areas that may experience ground disturbance during the planned explora-

Kamminga and Lance 2019 EP161 Northern Scope, Aboriginal and non-Indigenous archaeological assessment iii
tion and drilling program.
No Aboriginal, Macassan or non-Aboriginal archaeological places, sites or relics had previously been recorded within the project area. The closest registered Aboriginal archaeological sites or relics are at least 7 km distant from the project area. These are mostly isolated stone artefacts or stone artefact scatters. There are, however, restricted Aboriginal rock art sites 18km from the project area. These are found in rocky escarpments, a landform that does not occur in the area where construction activities are to occur.
Field investigationThe archaeological survey and assessment focused on the identification of Aboriginal, Macassan and other non-Aboriginal archaeological places, sites and relics as defined by the Northern Ter-ritory Heritage Act, 2011.
The field survey covered all environmental zones within the project area. The areas that were in-vestigated included the 10km long route of a proposed seismic line that traversed the Tanumbirini North project area; areas around the proposed Inacumba pilot well location, and around existing infrastructure including roads and well leases; and a number of other locations in and around the project area. The site inspection assisted with an understanding of the distribution of items of Aboriginal cultural heritage significance in this landscape.
ResultsThis archaeological field survey carried out as a core component of the archaeological assess-ment revealed no Aboriginal relics or sites (for example stone tools, former camp sites, or cultur-ally modified trees), nor any non-Aboriginal relics or sites. This indicates that Aboriginal sites and relics are relatively sparse to very sparse within the more general area of northern Tanumbirini Station.
There is no indication that any Aboriginal archaeological or historical sites/relics will be encoun-tered or impacted by proposed activities in this portion of EP161.
ConclusionsThe results of this archaeological study indicated that there are no identifiable archaeological heritage constraints on proposed work activities in the project area. This includes any activities in the vicinity of the existing gas and water well, the proposed seismic line, the proposed Inacumba pilot well, and the proposed widening or other modification to access tracks, or turning areas along the Carpentaria Highway.
In the unlikely event that previously undetected items of Aboriginal or non-Indigenous cultural heritage are encountered in the project area during planned exploration or construction activities, these should be noted, assessed, recorded and avoided. If avoidance is impracticable, a further assessment should be undertaken to evaluate cultural heritage significance, and in consultation with the Heritage Branch of the Northern Territory Department of Tourism, Sport and Culture, de-cide on the most appropriate remediation measures.

Kamminga and Lance 2019 EP161 Northern Scope, Aboriginal and non-Indigenous archaeological assessment 1
1. IntroductionHeritage Consulting Australia Pty Ltd (HCA) has been engaged by Santos Ltd to undertake a cultural heritage (archaeological) survey and assessment of Aboriginal and non-Indigenous heritage for the Tanumbirini North and Inacumba North areas in Exploration Permit 161 (EP161) in the Northern Territory’s McArthur Basin.
The area is to be subject to a further exploration program (the Northern Works Program) seeking to evaluate potential gas reserves that were identified during exploration first conducted in 2013 with subsequent seismic survey and drilling undertaken. In the earlier seismic study, 500 km of 2D seismic data were acquired to map the regional sub-surface geology and an exploration well (Tanumbirini 1) was drilled in June 2014.
The area under investigation is part of the Exploration Permit Area 161, situated 350 km southeast of Katherine. The location where the next phase of exploration is to occur is near the previously drilled Tanumbirini well, located 12 km north of the Carpentaria Highway (Highway 1) and approximately 135 km east of the township of Daly Waters at the junction of the Stuart Highway and Highway 1. The location of the proposed works is shown in Figure 1.
The further work program will entail a 2D seismic survey along a 10 km transect through the Tanumbirini North area, a drilling program (initially one horizontal well) in the same area, and a drilling program (initially one vertical and one horizontal well) in the Inacumba North area. There will be additional activities associated with this program including upgrading of access tracks to facilitate the entry and egress of vehicles during the seismic survey program. The Inacumba North area is situated ~15 km east of the Tanumbirini North location. At both locations where drilling is to occur there will be impacts within an area of approximately 200 m of the hole centre to accommodate drilling infrastructure, in addition to upgrades to access tracks and safe access to the Carpentaria Highway.
An archaeological field assessment was carried out by archaeologist Dr Johan Kamminga over 3 days in early March 2019, adopting a methodology consistent with the Northern Territory Cultural Heritage Act, 2011. The proposed seismic survey line route, locations of proposed upgrades to existing roads and tracks, well locations and the general project area were intensively examined for traces of prior Aboriginal habitation and resource use, and non-Indigenous settlement, to allow the development of appropriate management strategies to ensure the protection of the region’s cultural heritage values.
This archaeological study did not address places of contemporary Indigenous significance, as defined by the Northern Territory Aboriginal Sacred Sites Act, 1989. The relevant statutory body for the project area is the Northern Land Council which has previously carried out an assessment in the project area and its vicinity. Two recorded sites of special Aboriginal significance were identified during this Sacred Site assessment and these sites have been protected from any potential impacts by broad exclusion zones. These Sacred Sites were not visited during the

Kamm
inga and Lance 2019 EP161 Northern Scope, Aboriginal and non-Indigenous archaeological assessm
ent2

Kamm
inga and Lance 2019 EP161 Northern Scope, Aboriginal and non-Indigenous archaeological assessm
ent3

Kamminga and Lance 2019 EP161 Northern Scope, Aboriginal and non-Indigenous archaeological assessment 4
present study, nor were the exclusion zones entered.
2. The project areaThe project area lies within Santos exploration lease EP161, located on Tanumbirini Station, a 5,000 km2 beef cattle grazing property located 420 km southeast of Katherine in the McArthur Basin, situated in the north‐east of the Northern Territory. The project area is located within Barkly Shire and in NT Cadastral Parcel 701 of Arnold. The closest towns are Daly Waters (approximately 135 km to the west) and Borroloola (approximately 165 km to the east).
Cattle grazing is the primary activity on Tanumbirini Station, with some minor cropping around the station homestead. In the 1960s, pastoral activity was restricted to the northern, northeastern, and extreme western parts of the station, the remaining area being vegetated by scattered dense patches of lancewood (Acacia shirleyi) and “poor grass” (Paine 1963:1).
Tanumbirini Station Homestead settlement (the only permanent dwellings on the property) and the Santos project areas are accessed from the Carpentaria Highway, an all-weather public road constructed in 1959.
3. Environmental setting3.1 TopographyThe topography of the project area comprises gently undulating plain, moderately graded slopes in the order of 0-2°, and ephemeral drainage features such has creek channels and washouts (Santos 2013). The elevation of the Santos project area within the station ranges from 200 to about 260 m asl.
3.2 Land systemsThe Northern Works Program areas (Tanumbirini North and Inacumba North) are located at the boundary of the Gulf Falls and Uplands Bioregion and Sturt Bioregions (Figure 3). A detailed investigation of the regional ecosystems has been prepared for the Bullwaddy Conservation Area, situated 33 km to the west and appropriate descriptions have been derived from the Conservation Area Management Plan (NT Parks and Wildlife Commission 2005) and earlier CSIRO investigations of regional Land Systems (Christian et al. 1954 and Perry 1960; Perry 1963).
The region is characterised by flat erosional plains dominated by savannah woodlands with mixed eucalypt species, overlying an understory of mixed grasses, with open woodlands on the clay floodplains (NT Parks and Wildlife Commission 2005:5). There are pockets of acacia woodland through this region, including the lancewood (Acacia shirleyi) found in the Bullwaddy Conservation Area.
3.3 GeologyThe project area contains bedrock formations of Upper Proterozoic, Lower Cambrian, and Lower Cretaceous age, and forms a tableland, which is part of the extensive Barkly-Beetaloo Tableland (Dunn, Smith and Roberts 1962). The low-relief plain is present throughout the project area and

Kamminga and Lance 2019 EP161 Northern Scope, Aboriginal and non-Indigenous archaeological assessment 5
is bounded on the north by a well-defined scarp about 60 m high (Figure 4). The surface of the tableland, which lies between 230 and 274 m asl, is gently undulating and represents parts of an extensive laterite land surface which extends across the entirety of Tanumbirini Station (Paine 1963:3).
The project area is located within the ‘Mature Gulf Fall area’ (Paine 1963: Fig. 1), where the exposed Upper Proterozoic rocks have altered a drainage system inherited from an early Tertiary laterite surface. Relief in this area is generally 30 to 46 m and locally 76 m. Lower Cretaceous rocks abut the ranges of Upper Proterozoic rocks. Tanumbirini Creek, in the vicinity of the homestead, has been superimposed on Upper Proterozoic rocks, flowing north east across two major sandstone strike ridges of Roper Group rocks (Paine 1963:4).
The Upper Proterozoic rocks up to 5,500 m thick (Paine 1963:12), which outcrop only in the north eastern part of Tanumbirini Station, belong to a sequence laid down in the McArthur Basin, which extended from Arnhem Land to the Queensland border. The sequence is divided into Tawallah, McArthur, and Roper Groups. The Tawallah and Roper Groups are represented in the Tanumbirini Station area (Paine 1963:5).
A small outcrop of altered dolerite/basalt of the Settlement Creek Volcanics overlies glauconitic sandstone of the Rosie Creek Formation at Eight Mile Creek to the northeast of the project area (Paine 1963:5).
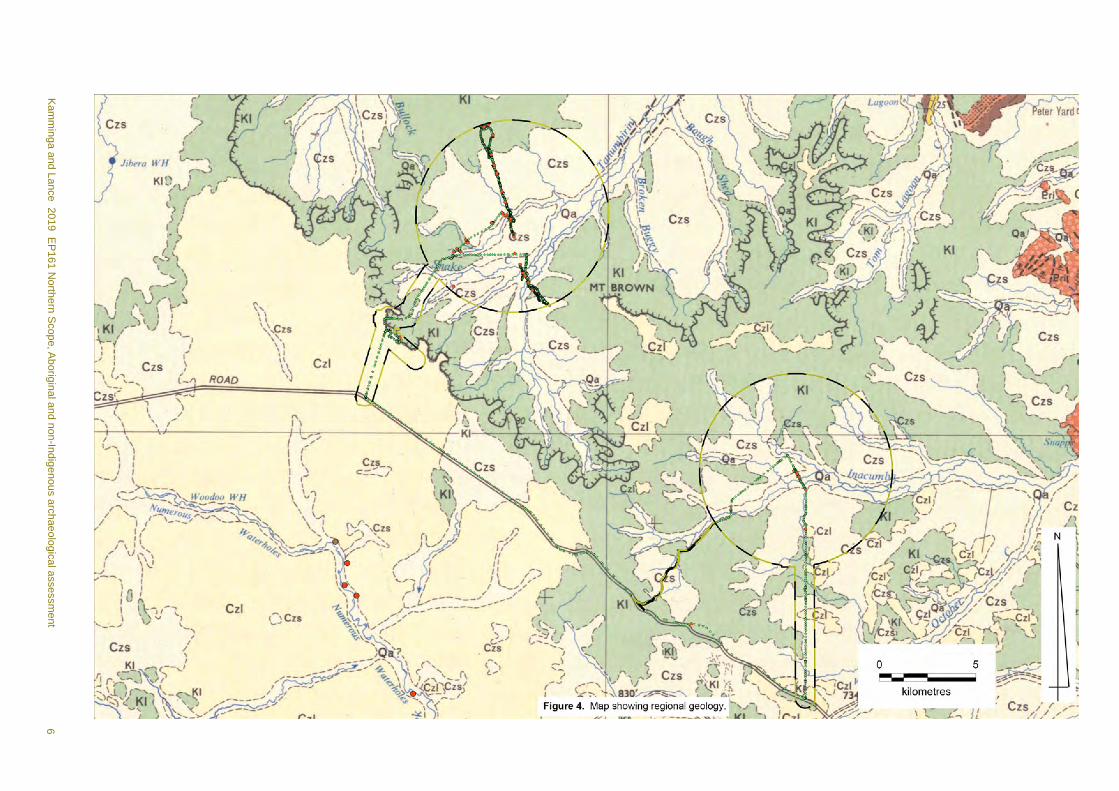
Kamm
inga and Lance 2019 EP161 Northern Scope, Aboriginal and non-Indigenous archaeological assessm
ent6

Kamminga and Lance 2019 EP161 Northern Scope, Aboriginal and non-Indigenous archaeological assessment 7
A layer of unlateritized, partly lithified white leached claystone that exhibits sub-conchoidal fracture outcrops in a road cutting of the Carpentaria Highway in the proposed road modification area at the T-intersection of the Inacumba North Area and also along the southernmost portion of the access track to the Inacumba North Area (see Paine 1963:9).
3.4 HydrologyA watershed dividing inland from seaward drainage systems extends across the property from northwest to southeast. This watershed is of very low relief and the inland drainage system is poorly developed (Paine 1963: 1). The catchment within the project area drains north-easterly towards the Gulf of Carpentaria.
Watercourses flow at intervals after rain during the wet season but are dry for the remainder of the year. Scattered waterholes may survive the dry season and, other than modern bores with reservoirs, are the only source of water for stock throughout the station during the dry season.
More specifically, water flow in Tanumbirini Creek and Inacumba Creek and in their very minor tributary and overflow drainage lines within the general project area occurs during the wet season, predominantly due to cyclones and monsoonal rainfall. The creeks and their tributary drainage lines are largely ephemeral and usually run dry during the dry season. The flow is of short duration and characterised by high turbidity causing undercutting and creation of creek channel banks especially on bends.
3.5 VegetationIn general, vegetation types include woodland, open woodland, open forest, tussock grassland and hummock grassland. The dominant species within the vegetation communities present include Darwin stringybark (Eucalyptus tetrodonta) and variable-barked bloodwood (Corymbia dichromophloia) with a spinifex understorey, and woodland dominated by Kullingal (Eucalyptus pruinose) or Melaleuca spp. with tussock grass understorey. There are also areas of Lancewood (Acacia shirleyi) thicket, Bullwaddy (Macropteranthes keckwickii) woodland and Acacia scrub (Santos 2013:5).
Within a radius of ten kilometres of the project area the vegetation types are woodland open forest and tussock grassland. The dominant vegetation type in the immediate area of the Tanumbirini North and Inacumba North project area is woodland, and along the Carpentaria Highway junction for Inacumba North it is woodland and open forest (Santos 2016). The species within the woodland vegetation communities present are dominated by Kullingal and variable barked bloodwood with Melaleuca spp. and tussock grass understorey.
3.6 FaunaFood resources available to Aboriginal people in the past would have been varied and would have included birds, marsupials, reptiles and insects, and plant parts and honey. (see Mulvaney and Kamminga 1999:79-88).

Kamminga and Lance 2019 EP161 Northern Scope, Aboriginal and non-Indigenous archaeological assessment 8
The wider McArthur Basin region supports a diverse range of fauna. Over 435 vertebrate species have been recorded from the Gulf Falls and Uplands bioregion. The sandstone ranges and stony hills of the region support a range of marsupials, reptiles, fish and birds, including a number of endemic species, including Carpentarian Rock Gecko (Gehyra Borroloola), Hosmer’s Skink (Egernia hosmeri) and the Carpentarian Grass-wren (Amytornis dorotheae). Major river systems are important environments for many species because of the much lower annual rainfall than the more northern savannas, and the very high summer temperatures.
In the project area itself, the range of plants and animals would have been more restricted, with the dominant fauna being reptiles and when local rainfall permitted, grazing macropods and birds. Spectacled hare-wallabies (Lagorchestes conspicillatus leichardtii) find refuge in vine thickets and are common (NT Parks and Wildlife Commission of the Northern Territory 2005:10).
3.7 ClimateThe region experiences a ‘grassland’ climate, based on the Köppen classification system. This classification consists of two distinct seasons: the wet season which lasts from December to March; and the generally dry conditions which last for the remainder of the year (winter drought).
Mean maximum temperature ranges from 29.7°C in June to 38.6°C in November and historically the highest temperatures recorded have been in November. The mean minimum temperature ranges from 12.2°C in July to 24.9°C in December-January. Coolest temperatures occur in June-July. At Daly Waters the average annual rainfall total is 660 mm.
The highly seasonal rainfall and absence of reliable waterholes in the minor creeks that cross the project area may have discouraged sustained occupation of the region by Aboriginal people during the dry season.
3.8 SoilsThe landscape of northern and central Australia is ancient and highly weathered. Soil types are susceptible to erosion given that the region experiences long dry periods followed by intense rainfall. In this environment, the soils become disturbed and once disturbed are highly erodible. Termite and other invertebrate bioturbation also reduce and even eliminate the original stratigraphic integrity of biomantle loose sediments.
The project area is characterised by plains and rises associated with deeply weathered soil profiles (laterite) including sand sheets, sandy and earth soils, in particular lateritic yellow earths and brown clays.
In general, the soils in the project area are mostly shallow and gravelly, often overlaying discontinuous layers of detrital ferruginous gravel (commonly termed ironstone), derived from the weathering of haematitic laterite, preserved as iron-rich rock layers in the Sturt Plateau bioregion south of the Carpentaria Highway, along with locally exposed claystone bedrock. This detrital ironstone is ubiquitous and at times extremely abundant on ground surfaces throughout the

Kamminga and Lance 2019 EP161 Northern Scope, Aboriginal and non-Indigenous archaeological assessment 9
project area (see Paine 1963:10).
The soils are Quaternary and Holocene in age and are dominated by kandosols and rudosols. Kandosols are massive and earthy soils (formerly red, yellow and brown earths) that are widespread across the Sturt plateau to the south. More specifically this soil type is a Ferric brown kandosol that has well-developed B2 horizon in which the major part is massive or has only a weak grade of structure (for descriptive classification see Isbell 1993). Rudosols are very shallow soils or those with minimal soil development and include very shallow gravely soils. In particular, this soil in the project area is a gravelly leptic rudosol originating from lateritic lithosols (Tasker 2017).
Brown demosol also occurs in the project area (Tasker 2017) and these originate from locally occurring lateritic yellow earths/brown clays. This is a clayey soil with a strong blocky structure and no clear or abrupt textural changes between horizons and tends to have a B2 horizon with structure more developed than weak.
Surficial Quaternary alluvium occurs along watercourse corridors and washouts and in other areas of watercourse catchments (Figure 4).
4. Aboriginal history and settlement in the region4.1 Local Aboriginal organisationIn his historical reconstruction of pre-contact Aboriginal Australia, Tindale (1974) identified the tribal affiliation of the area as Jingulu. Tindale defined ‘tribal’ groups on the basis of written accounts of variable quality; however, many of these records were unreliable. Tindale’s tribal boundaries were largely defined according to what he understood to be language groups and his work was conceptualised according to a model of band social organisation in which the clan or ‘horde’ was considered to be the group which possessed political power and proprietary rights to land.
The assumptions inherent in this conflation of language group with the concept of a ‘tribe’ are no longer regarded by anthropologists as appropriate. Similarly, the concept of ‘tribe’ as a territorial group is debatable. In Aboriginal society, people were invariably multilingual rather than monolingual and representing language groups as bounded social groupings is now thought to be inappropriate. In the Radcliffe-Brown model, the land/language relationship was seen as indirect: the estate of a tribe was defined as the aggregation of all the clan estates who shared a common language. This relationship is now viewed to be direct – it is recognised that the importance of land/language relations in Aboriginal society is that particular languages and particular tracts of country were directly linked according to Dreaming events and activity.
While it was previously assumed that tribes or language groups functioned as politically cohesive corporate groups, it is now recognised by anthropologists that linguistic groupings do not structure the Aboriginal social and geographical landscape. Sutton and Rigsby (1979:722) argue that Tindale’s tribal boundaries are not meaningful at either a demographic or political level. In order to overcome Tindale’s limited and flawed tribal boundary model, recourse must be made to more contemporary anthropological concepts and understanding.

Kamminga and Lance 2019 EP161 Northern Scope, Aboriginal and non-Indigenous archaeological assessment 10
Drawing on accounts of a number of early ethnographers, Wesson (2000) has defined the multi-dimensional aspect of Aboriginal social geography based on habitual place of residence, dominant mode of livelihood, and language. This approach is more meaningful that those underpinning earlier anthropological models.
4.2 Tribal groups in the areaTanumbirini Station is located within the territory of two language or tribal groups, Jingili and Alawa speakers (Tindale 1974; Sharpe 1969). The Jingili language was spoken by people who inhabited the area including Hodgson Downs, Nutwood Downs, and Tanumbirini stations, south of the Roper River and east of the Stuart Highway (Sharpe 1969).
The Jingulu language is classified as belonging to the Mirndi family of non Pama-Nyungan languages. An early word-list was compiled by F.A. Gillen (Pensalfini 2004:143). Following in the wake of pioneering work by Neil Chadwick in the 1970s, Robert Pensalfini wrote a grammar of Jingulu on the basis of fieldwork with its last known fluent speakers (Pensalfini 1997).
According to Jingulu oral tradition, the Jingili originally migrated from the Great Western Desert (Tindale 1974:236). Tindale estimated the size of Jingili territory to be approximately 15,00 km2, with the southern frontier around Renner Springs extending northwards to Newcastle Waters and also taking in the area of the Ashburton Range. To the east the territory encompassed Cattle Creek south to Wave Hill and Ucharonidge. Their western extension of their territory approached Lake Woods (Tindale 1974:236).
There has been very little academic study of the Alawa language or people (also known as Galawa or Waliburu). The most recent work was a study of the language by Sharpe nearly 50 years ago (Sharpe 1969).
In the early 1960s, Tanumbirini Station was inhabited by a single station manager and several Aboriginal people who lived and worked on the station with a number of their family members. The language or tribal affiliation of these residents was not reported.
5. Nature of the proposed work activitiesThere are a number of activities proposed as part of Santos Northern Works Program in EP161. The locations where the impacts will occur are shown in Figure 6. Proposed activities will include a 2D seismic survey along a 10 km transect through the Tanumbirini North area. There will be additional activities associated with this seismic survey program including upgrading of access tracks to facilitate the entry and egress of vehicles.
Impacts from the seismic survey will be minimal. It will be necessary for vehicle access along the 10 km line, which may require some clearing of uneven ground and to allow crossing of minor watercourses. The line will then be prepared and geophone arrays laid by hand with access provided by four wheel drive vehicles. Once the geophone lines have been laid, the seismic

Kamminga and Lance 2019 EP161 Northern Scope, Aboriginal and non-Indigenous archaeological assessment 11
survey will be conducted using vibroseis trucks shod with pneumatic tyres. The impacts from this activity will be localised and shallow and will mainly arise when access for the seismic line is prepared. Once the seismic survey program has been completed the vehicle tracks should, over time, revert to their pre-survey state.
The second area where works are planned is situated 15 km further to the east, in the Inacumba North area. Here a pilot well is to be drilled, requiring impacts within an area of approximately 200 m of the hole centre to accommodate drilling infrastructure, in addition to upgrades to access tracks and modifications of access onto the Carpentaria Highway, to permit safe entry and egress for trucks.
Construction activities for the well will require ground works that will include:
• Site preparation for a well pad,• New access roads and upgraded access roads,• Site preparation for a temporary camp including temporary sewerage treatment plant,• Site preparation of laydown areas,• Construction of borrow pits,• Construction and equipping of water bores,• Dedicated area for equipment storage,• Installation of temporary fencing, gates and motor grids.
6. Aboriginal cultural heritage assessment methodologyIdeally, there are five major steps that are required in archaeological heritage assessment.
Step 1 – Register searchA search of relevant heritage registers and databases is undertaken to:• ascertain if any known Aboriginal or non-Aboriginal heritage sites/relics occur within or in
close proximity to the project area; • provide data to assist in predicting the types and frequency of Aboriginal and non-Aboriginal
sites/relics that may occur in the development area, within the local area or region generally.
Step 2 – Assessment of landscape features and sedimentsThe second stage of the assessment process requires the examination of the landscape setting and environment of the project area. These include an understanding of the surface geology, geomorphology and sediments, which may have affected past land-use practices, survival of sites in the landscape and the detectability of sites. This assessment also includes noting of tree varieties and tree ages to assist in identifying culturally modified trees. In particular, certain landscape features have a higher potential to contain Aboriginal relics.
Step 3 – Desktop assessment and visual inspectionAn archaeologist identifies landscape features with the potential to contain sites and undisturbed relics. Relevant archaeological research reports for sites within the project area and for the

Kamminga and Lance 2019 EP161 Northern Scope, Aboriginal and non-Indigenous archaeological assessment 12
area or region generally, as appropriate, are examined to provide baseline data and a broader understanding of the cultural heritage context of the area subject to potential impact. A field assessment entails a pedestrian archaeological survey of the subject land, with particular attention to archaeologically sensitive landscape features such as watercourses, rocky escarpments, areas of exposure, and pavements with exposed gravel on which stone artefact scatters are readily detectable.
Step 4 – Reporting resultsReporting of the findings and recommendations from the assessment. A written report documenting the procedures, results and recommendations of the archaeological heritage assessment is produced to support the conclusions.
Step 5 – Further investigation and impact assessment (if required) After assessing the significance of the archaeological site/relic, recommendations are made regarding compliance with the provisions of the Northern Territory Heritage Act, 2011.
The specific aims of this archaeological assessment were to:
1. Identify known Aboriginal and non-Aboriginal archaeological heritage sites and/or relics within the subject land area and assess the area for its potential to contain unidentified sites/objects.
2. Identify any potential archaeological heritage constraints and formulate recommendations and management strategies and options with regard to the proposed activity/development.
3. Provide an assessment as to whether or not further archaeological heritage investigation or assessment is required prior to the commencement of the proposed development.
4. Determine whether further detailed investigations may be needed to be undertaken to meet statutory requirements.
7. Results of the background research and the Site Register searchesSearches of the NT Heritage Register, Aboriginal Areas Protection Authority (AAPA) database, and NT Archaeological Sites Database were undertaken on 4 March 2019. (Table 1, and Figure 5).
Other documents reviewed included the relevant work program issued to Northern Lands Council (NLC), an update to that work program, geospatial data and maps of the project area derived from the database searches, archaeological, historical and anthropological literature, and scientific literature relating to environment and geology.
Archaeological research over the past five decades has shown that Aboriginal people have occupied Australia for at least 40,000+ years (Mulvaney and Kamminga 1999:2). By 35,000 years

Kamminga and Lance 2019 EP161 Northern Scope, Aboriginal and non-Indigenous archaeological assessment 13
Site_Name Zone East GDA94 North GDA94 Site_Type ContentsBroadmere St. 1 rock art paintingsBalbirini Creek 6 53 Stone artefact scatter,
grindstone portable artefact scatter
Balbirini Creek1 53 Stone artefact scatter artefact scatterBalbirini Creek2 53 Stone artefact scatter artefact scatterBalbirini Creek3 53 Stone artefact scatter knapping flooBalbirini Creek4 53 quarry quarryBalbirini Creek5 53 Stone artefact scatter,
grindstone portable artefact scatter
Bauhinia Downs1 53 Stone artefact scatter artefact scatterBinda 53 Rock art, Restricted
anthropological site, ceremonial ground
petroglyph
Broadmere St. 10 53 Stone artefact scatter artefact scatterBroadmere St. 11 53 rock art paintingsBroadmere St. 3 53 Stone artefact scatter,
middenartefact scatter, midden
Broadmere St. 4 53 Stone artefact scatter, quarry
artefact scatter, quarry
Broadmere St. 5 53 Stone artefact scatter artefact scatterBroadmere St. 7 53 Stone artefact scatter,
middenartefact scatter, midden
Broadmere St. 8 53 rock art paintingsBroadmere St. 9 53 rock art paintingsCarpenteria Hwy 1 53 Stone artefact scatter,
grindstone portable artefact scatter
Eleanor Pool Yard1 53 stone artefact scatter, historic site, stone ar-rangement, grindstone portable
artefact scatter, stone arrangement , faunal remains
Favenc Site (Telecom) 53 Stone artefact scatter artefact scatterGoanna Site (Telecom) [Pipeline Site B - Mitchell: not located]
53 Stone artefact scatter artefact scatter
Lansen Springs (Broadmere St. 6)
53 Stone artefact scatter artefact scatter
Newcastle Creek 1 53 Isolated stone artefact stone artefactNewcastle Creek 2 53 Stone artefact scatter artefact scatterNewcastle Creek 3 53 Stone artefact scatter artefact scatterNewcastle Creek 4 53 Stone artefact scatter artefact scatterNewcastle Creek 5 53 Stone artefact scatter artefact scatterOld Tanumbirini Sta-tion
53 Skeletal remains, stone arrangement
skeletal remains, stone arrangement
OT Down2 53 Stone artefact scatter artefact scatterOT Down3 53 Stone artefact scatter,
grindstone portable artefact scatter
OT Downs1 53 quarry quarry
Table 1. List of sites recorded on the Northern Territory Heritage Register for the region around the project area. Old AGD66 coordinates have been converted into GDA94 format.

Kamminga and Lance 2019 EP161 Northern Scope, Aboriginal and non-Indigenous archaeological assessment 14
Pipeline Site A - Go-anna Creek 2
53 rockshelter deposit, rock art, stone artefact scatter, shell scatter, grindstone portable
artefact scatter, paintings, midden
Pipeline Site C - Little Creek 2
53 Stone artefact scatter artefact scatter
Urrwalala [DML - 1975, MH - 1986]
53 Stone artefact scatter, shell midden, rock art, grinding place non-portable
artefact scatter, midden, paintings, grinding hollows / grooves
Yaroo 1 53 Stone artefact scatter artefact scatterYaroo 2 53 Stone artefact scatter artefact scatterMcArthur River 2D Seismic Site 1
53 Stone artefact scatter, hearths, camp sites, knapping floor
Stone artefact scatter
ago all major environmental zones in Australia, including semi-desert and desert country and even periglacial environments of Tasmania, were occupied (Mulvaney and Kamminga 1999:114).
At the time of early Aboriginal occupation, Australia experienced moderate temperatures. At the commencement of the Last Glacial Maximum (LGM) at about 24-22,000 years ago, sea levels fell to about 130 m below present levels and accordingly, the continent was correspondingly larger. However, between 24,000 and 12,000 years ago (at the height of the Last Glacial Maximum) dry and either intensely hot or cold temperatures prevailed over the continent.
With the amelioration of glacial conditions, temperatures rose with a concomitant rise in sea levels. By ca. 6000 BP sea levels had more or less stabilised at their current position (but now again rising slowly). With the changes in climate during the Holocene, Aboriginal inhabitants had to deal not only with reduced landmass but with changing hydrological systems and vegetation; forests and woodlands again spread across the grasslands and shrublands of the Late Glacial Maximum.
Human occupation of the study area must have been very sparse throughout prehistory into modern times, especially so for earlier millennia. The area was environmentally challenging, only becoming more habitable during the later Holocene period.
Only one major archaeological consultancy report is available for the wider region generally (Guse and Collis 1998). This survey and assessment report was prepared for North Australian Basins Resource Evaluations, AGSO. The study was along a proposed 70+ km 2D seismic line in the McArthur River Region, well to the east of the project area. The topographic, geological and environmental contexts do not correspond sufficiently to those of the current archaeological survey areas to provide more than the most general information. For instance, there are rock shelters habitation sites, rock art sites and rock shelters with burials in the MacArthur River region. The land systems in which these sites occur are not present in the vicinity of the current survey
Table 1. List of sites recorded on the Northern Territory Heritage Register for the region around the project area. Old AGD66 coordinates have been converted into GDA94 format.

Kamm
inga and Lance 2019 EP161 Northern Scope, Aboriginal and non-Indigenous archaeological assessm
ent15

Kamm
inga and Lance 2019 EP161 Northern Scope, Aboriginal and non-Indigenous archaeological assessm
ent16
Kamminga and Lance 2019 EP161 Northern Scope, Aboriginal and non-Indigenous archaeological assessment 17
areas because of an absence of bedrock suitable for shelter or cave development.
Closer to the project area, small archaeological surveys have been undertaken in previous decades for various developments such as telecommunications infrastructure. Within this more proximal general area but still well beyond the current archaeological survey areas, stone artefact scatters (mostly flaking débitage) are the predominant site type, followed by a single hearth and skeletal remains, two stone arrangements, three shell middens, six rock art sites and two postulated ‘quarry’ sites.
The closest archaeological sites are approximately seven kilometres south of the Carpentaria Highway, and at least 15 km from the nearest significant construction or seismic survey impacts. This cluster of four stone artefact scatters and one isolated stone artefact are found beside waterholes in Newcastle Creek, a southward flowing stream. A rock art site is found approximately 16 km southeast of the Inacumba North Area. This site is found in a rocky escarpment near the headwaters of Parsons Creek. Further sites (quarries, stone artefact scatters and hearths) are found in the escarpments to the east of these sites and more than 30 km from the project area.
7.1 Historical places A search of the NT Heritage Register has indicated that there are no listed heritage items or places in the vicinity of the project footprint. (Santos 2018:53). Only two declared historical places have been registered in the region NRETAS (2010). Both of these places are south of the village of Elliot and more than 150 km from the project area (NRETAS 2010).
Ucharonidge Station is located 19 kilometres south of Elliott and 77 kilometres east on the Barkly Stock Route on the Barkly Tableland. Powell Creek Overland Telegraph Station, south of the village of Elliott and over 170 km distant from the proposed project area. This site was listed on the Register of the National Estate and declared a Heritage Place under provision of the Heritage Act. The station was established in 1872 and is one of 11 repeater stations built along the Overland Telegraph Line.
8. Predictive modelling of the nature of Aboriginal sites/relics 8.1 Degree of preservation Aboriginal material culture Items of organic material culture, such as wooden spears, digging sticks and small bags and nets will not have been preserved in the moderately acidic open-air sediments found in the project area.
However, various stone artefacts are likely to occur in the general region and will be preserved indefinitely:
• Macroblades (Mulvaney and Kamminga 1999:Map 12)• Hatchet heads• Unifiacial and bifacial points (Mulvaney and Kamminga 1999:Map 12c)• Unretouched and retouched flakes used for light-duty cutting

Kamminga and Lance 2019 EP161 Northern Scope, Aboriginal and non-Indigenous archaeological assessment 18
• A number of other flaked stone tool type• knapping debitage • grinding stones
Stone quarryBackground research has indicated no likelihood for the occurrence of geological sources of stone suitable for Aboriginal stone tool making, hence stone quarries are highly unlikely to occur within or in the vicinity of the project area. There are recorded quarries distant from the project area in geologically complex areas near the McArthur River.
Culturally modified tree (scarred tree)Culturally scarred old-growth trees may occur in the general area but generally will be difficult to identify with confidence (see scarred tree discussion in Appendix 2).
Aboriginal ancestral remains Generally, Aboriginal people were buried in unconsolidated sandy sediment such as sand bodies along watercourses or in sand dunes occurring in other environmental contexts. The presence of human burials of relatively recent age within or in the general vicinity of the project area cannot be completely excluded. However, there is no evidence for the occurrence of strongly alkaline sediment that would be conducive to bone preservation. The pH readings of the surficial sediment taken at different locations in the project area were consistently 6.8, indicating slightly acidic conditions. Given the prevailing climatic conditions, in particular the high wet season rainfall, and the lack of ground-surface sheltering, and the physical and chemical character of the sediments, the preservation of bone remains is unlikely.
8.2 Incidence and size of stone artefact scatters and stratified sitesAs well as the issue of stone availability, low human population density in prehistoric times equates to relatively low discard rate of stone artefacts such as flaking debris which typically marks the location of a former camping area.
A corollary of low population density in the study area is that a small number of spatially restricted base camps is the most likely prehistoric settlement pattern, along with small more transitory habitation sites. Both large and small camping areas would tend to be very close to water sources, especially during the dry season. The presence of the cluster of stone artefact scatter sites beside waterholes on the southern side of the Carpentaria Highway is evidence of such a settlement pattern.
Aboriginal hearths or remnants of hearths may be preserved in sandy sediment. Such hearths usually contain pieces of termite mound (e.g. Basedow 1907), or locally available stone.
Given the general environmental context, Aboriginal camping areas, and in particular ‘base camps’ occupied for more extended periods, would have been focussed on more permanent water sources such as watercourse channels, and waterholes during the dry season. Repeated

Kamminga and Lance 2019 EP161 Northern Scope, Aboriginal and non-Indigenous archaeological assessment 19
occupation of favoured camping areas normally resulted in repeated discard of stone artefacts in areas where stone suitable for making stone tools occurs locally. The vast majority of preserved stone artefacts at camp sites are pieces, often quite small pieces, of stone waste (‘débitage’) created during the making and resharpening of stone tools, rather than the tools themselves.
Appendix 2 provides descriptions of the types of Aboriginal sites that have previously been recorded in this region.
The review of available data, particularly the sites recorded during earlier studies throughout this region, indicated that the range of Aboriginal cultural heritage sites more likely to be preserved within the project area includes:
1. Isolated stone artefacts.2. Aboriginal hearths (earth ovens).3. Stone artefact scatters. (sometimes associated with Potential Archaeological Deposits (PADs) comprising subsurface artefacts and other objects or features).4. Scarred trees.
The background data review indicates that:
There appear to be no local sources of stone for stone tool making. All stone, other than ironstone for red and yellow pigment, would have had to be brought into the project area; possibly well beyond daily hunting and foraging distance from the encampment area. The potential distances of suitable stone sources are not known at this time, other than that sandstone possibly suitable for grinding stones and abraders; brittle siliceous stone with conchoidal fracture properties, and tough volcanic or metamorphic stone for ground stone tools, are likely to occur within the general area. The quarry sites previously recorded to the east of the project area are found in areas of siltstone and sandstone, not usually associated with quarries, except as quarries used for the projection of grinding stones.
In areas where more effort was needed to acquire stone by direct travel or through trade, it would have had increased value as a necessary material or commodity. This means that the stone tools used in the area are much more likely to have brought on site in a prepared state (rather than as unmodified or partially modified cores), hence there will be very little stone knapping débitage in campsites. Also, the stone tools were curated for longer to get the most use-life from them, making it most likely that those stone tools that are found will be small and highly reduced.
This general maxim indicates that suitable stone close at hand is more likely to have be knapped and the knapping débitage discarded in relative abundance in the areas around the sources of stone. There will be no large workshop sites in areas distant from the stone sources.
On the basis of the background environmental (particularly hydrological) and geological data it is concluded that only a small number of spatially-restricted base camps are likely to have existed

Kamminga and Lance 2019 EP161 Northern Scope, Aboriginal and non-Indigenous archaeological assessment 20
and be detectable in this region. Such sites are unlikely to occur within the project area, but rather near waterholes in more substantial creeks. Preferred camping areas would have been located very close to the more reliable water sources, especially those used during the dry season.
Within the project area in general, the human population density would have been low overall, and consequently low discard rates of stone artefacts such as flaking debris and of grinding stones will have led to small, low-density and hence low-visibility sites.
9. Field survey methodologyAn archaeological field survey was carried out within and around areas potentially subject to impact from work activities associated with the proposed exploration and drilling activities on Tanumbirini Station. This archaeological survey was undertaken by Principal Archaeologist Dr Johan Kamminga over a three-day period (6-8 March 2019). Mr. Trevor Edwards (Projects Specialist, Land Access & Management Services Pty Ltd) assisted in liaising with station staff and as guide and informant.
One main focus of the survey was the 10 km route of a proposed seismic line. This provided a transect across the Tanumbirini North Area from northwest to southeast, crossing all of the main land units present in the project area: Quaternary sediments, undifferentiated Cainozoic laterites, lateritic rubble and soil, and more resistant areas of Cretaceous lateritised claystone, soft grey claystone, sandstone and conglomerate (Figure 4).
Detailed inspection of areas along the seismic line allowed a comprehensive search for traces of prior Aboriginal visitation. These pedestrian surveys were conducted giving a coverage of approximately 5 m wide and perpendicular to the seismic survey line. Areas with relatively high ground surface visibility were selected as these offered the greatest possibility for the detection of small stone artefacts. Erosional scours were uncommon through this area. Generally, the recorded survey paths were sampled approximately between 100 and 200 m. Vehicle traverses were also carried out at a speed of approximately 5 km/hr. The vehicle traverses suited observation of the ground surface along tracks and road verges and also large expanses of flood overflow areas with exceptional ground surface visibility, generally around 100%.
Along survey routes and in other selected areas, mature trees were examined for evidence of cultural scarring. Tracks and sample locations were recorded using a hand-held GPS receiver, accurate to within 5 m. A low-magnification Wild M5 stereomicroscope was used to examine stone samples during the field survey (Plate 1).
In addition to the seismic survey line transect, areas along access tracks and a transect across the eastern portion of the Inacumba North Area were also inspected. The landscape setting of this area was similar to that found in the Tanumbirini North Area, with laterite gravel over much of the land surface. A number of sample areas were selected here and a detailed search for traces of prior Aboriginal visitation was undertaken. The environmental and landscape conditions of each

Kamminga and Lance 2019 EP161 Northern Scope, Aboriginal and non-Indigenous archaeological assessment 21
sample area were recorded.
10. Results of the archaeological field surveyThe nature and distribution of Aboriginal site types recorded on the registers and databases was reviewed during background research for this study. In reference to the environmental, geological and topographic contexts of the local and wider area, the types and distributions of sites/relics was predictable. As discussed below, the field survey has revealed no evidence for the presence of Aboriginal or non-Aboriginal archaeological sites/relics of any kind.
Ground surface visibility (GSV) within areas examined closely was generally good to very good (commonly 50-100% GSV).
The field survey corroborates the background research finding that there appear to be no local sources of stone for stone-tool making. All stone, other than ironstone for red and yellow pigment, would have had to be brought in to the area; possibly from well beyond daily hunting and foraging distances from the encampment area. The potential distances of suitable stone sources are not known at this time, other than that sandstone possibly suitable for grinding stones and abraders, and brittle siliceous stone with conchoidal fracture properties (located approximately 30 km to the east), and also volcanic or metamorphic stone for ground-stone tools, may occur within the general region.
In areas where a greater effort was needed to acquire stone by direct travel or by barter, that stone would have had increased value as a necessary material or commodity. This means that the stone tools used in the area are much more likely to have been pre-knapped, hence very little
Plate 1. Low-magnification microscopic examination of natural stone occurring in a creek bank in the Tanumbirini North Area.

Kamminga and Lance 2019 EP161 Northern Scope, Aboriginal and non-Indigenous archaeological assessment 22
Plate 2. Area of clear ground surface visibility within a washout adjacent to a small watercourse in the Tanumbirini North Area.
Plate 3. Area of exposed ground at the Tanumbirini 1 well.

Kamminga and Lance 2019 EP161 Northern Scope, Aboriginal and non-Indigenous archaeological assessment 23
Plate 4. Meandering steep outer side of bend in a creek channel where ironstone lag has been concentrated on the more gently inclined inside slope of the chan-nel. No Aboriginal stone artefacts were found in this location, despite the clear ground surface visibility on the ironstone gravel pavement.
Plate 5. Ironstone gravel lag pavement in a washout in the Ianumbirini North Area.

Kamminga and Lance 2019 EP161 Northern Scope, Aboriginal and non-Indigenous archaeological assessment 24
Plate 6. Actively migrating creek channel, exhibiting erosion causing tree fall and a steep outer channel margin exposing depth of loose clayey sand sediment. Lo-cated in the Tanumbirini North Area. Aboriginal stone artefacts are absent in the section along the channel bank or within the channel.
Plate 7. Termite mounds in the Ianumbirini North Area. Termite mounds are ubiq-uitous throughout this region.
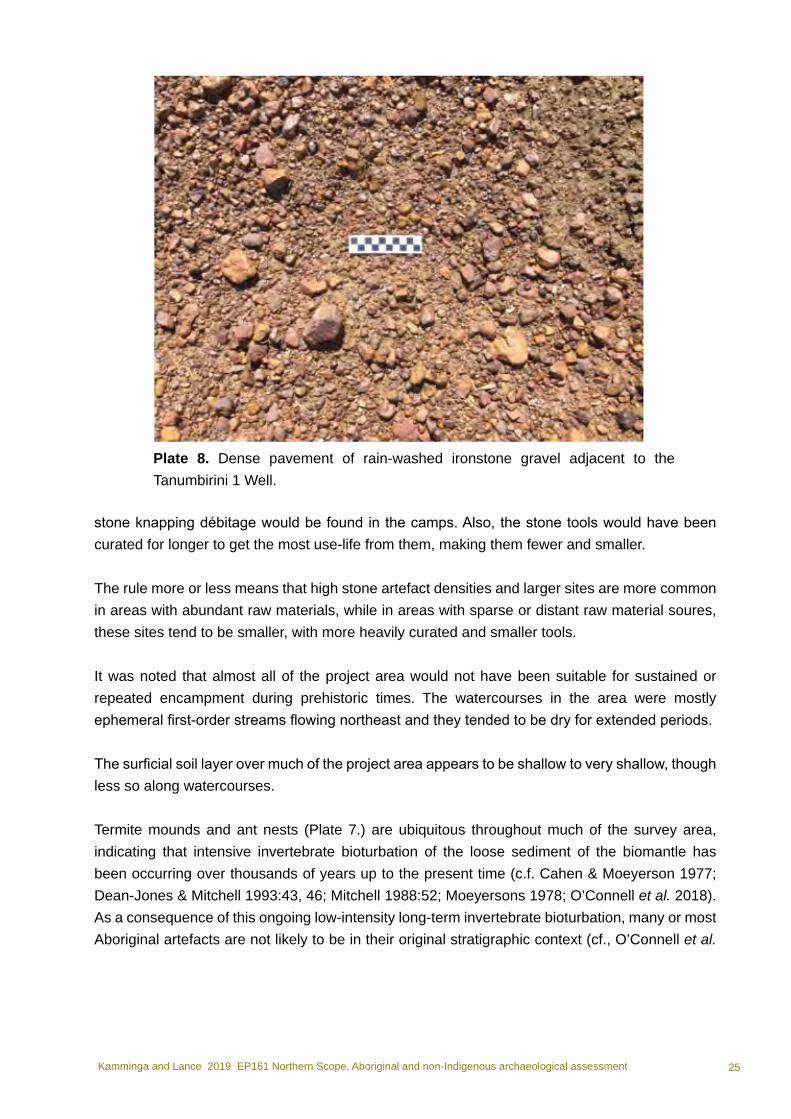
Kamminga and Lance 2019 EP161 Northern Scope, Aboriginal and non-Indigenous archaeological assessment 25
stone knapping débitage would be found in the camps. Also, the stone tools would have been curated for longer to get the most use-life from them, making them fewer and smaller.
The rule more or less means that high stone artefact densities and larger sites are more common in areas with abundant raw materials, while in areas with sparse or distant raw material soures, these sites tend to be smaller, with more heavily curated and smaller tools.
It was noted that almost all of the project area would not have been suitable for sustained or repeated encampment during prehistoric times. The watercourses in the area were mostly ephemeral first-order streams flowing northeast and they tended to be dry for extended periods.
The surficial soil layer over much of the project area appears to be shallow to very shallow, though less so along watercourses.
Termite mounds and ant nests (Plate 7.) are ubiquitous throughout much of the survey area, indicating that intensive invertebrate bioturbation of the loose sediment of the biomantle has been occurring over thousands of years up to the present time (c.f. Cahen & Moeyerson 1977; Dean-Jones & Mitchell 1993:43, 46; Mitchell 1988:52; Moeyersons 1978; O’Connell et al. 2018). As a consequence of this ongoing low-intensity long-term invertebrate bioturbation, many or most Aboriginal artefacts are not likely to be in their original stratigraphic context (cf., O’Connell et al.
Plate 8. Dense pavement of rain-washed ironstone gravel adjacent to the Tanumbirini 1 Well.

Kamminga and Lance 2019 EP161 Northern Scope, Aboriginal and non-Indigenous archaeological assessment 26
2018).
11. ConclusionsNo World Heritage Properties or National Heritage Places are registered within 10 km of the project area (see also Santos 2018:39). In addition, a search of the Northern Territory Heritage Register (DTC 2018) for NT Portion 701 (on which the Tanumbirini project area is located) was conducted and no previously recorded Aboriginal heritage items or places have been found in the project area (Santos 2018:39).
During the archaeological field survey, no Aboriginal or non-Aboriginal sites/relics were identified in the project area. It is considered that the survey coverage provides a good indication of the distribution of habitation sites through the areas likely to be affected by exploration and construction activities. The field survey has revealed that if there are traces of Aboriginal habitation in the project area, they occur at very low densities and/or are very localised. If this is the case, as we would argue, it is considered very unlikely that Aboriginal and non-Indigenous sites and relics would be disturbed or otherwise affected by the work associated with the proposed activities in the Northern Locations of the Santos McArthur Basin work program.
12. General recommendations In general, ground surface visibility was relatively high in the areas examined. It is notable that no Aboriginal or non-Aboriginal sites/relics were identified during the survey. It is recommended that no further archaeological survey is required, unless Aboriginal or non-Aboriginal sites/relics are uncovered during proposed works activities.
While there were no traces of prior Aboriginal habitation detected during the field assessment, it is necessary to proceed with due care when undertaking works in the project area. In particular, any Aboriginal site/relic identified during the activity must be reported to the Santos Cultural Heritage Team so appropriate protection measures can be implemented.
It is advisable that a cultural heritage awareness program is provided to all those involved in ground disturbance activities to ensure that should Aboriginal sites and relics be uncovered during earthworks, that workers are trained to recognise the likely cultural heritage items and be aware of their responsibilities for reporting all exposed sites and relics.
If any human skeletal remains are encountered, work must stop immediately, the area secured to prevent unauthorised access, and the Northern Territory police contacted.

Kamminga and Lance 2019 EP161 Northern Scope, Aboriginal and non-Indigenous archaeological assessment 27
13. ReferencesBasedow, Herbert 1907. Anthropological notes on the western coastal tribes of the Northern
Territory of South Australia, Transactions of the Royal Society of South Australia, 31:1-64.
Guse D. and A. Collis 1998. Archaeological survey of proposed NABRE seismic lines, McArthur River Region, NT. A report for the North Australian Basins Resource Evaluation. Australian Geological Survey Organisation. Quaternary Archaeological Surveys, Casuarina, NT.
Isbell, R.F. 1993. A Classification System for Australian Soils (Third Approximation). CSIRO Division of Soils Technical Report 2.
Kamminga, Johan 1979. The nature of polish on prehistoric stone tools; and ‘Commentary on tool design and microscopic residues’. In Lithic use-wear analysis. Brian Hayden (ed.), Academic Press, New York, pp. 143-57.
Kamminga, Johan & Allan Lance 2016. Vickery Extension Project – Scarred tree assessment. Report to Whitehaven Coal Limited. Heritage Consulting Australia Pty Ltd. May 2016.
Mulvaney, John and Johan Kamminga 1999. Prehistory of Australia. Allen & Unwin, Sydney.
NT Parks and Wildlife Commission 2005 Bullwaddy Conservation Reserve Plan of Management. Parks and Wildlife Commission of the Northern Territory, Katherine.
NRETAS (2010). Ucharonidge Station Number 1 Bore and 1949 Comet Windmill: Background Historical Information. Heritage Branch, NT Department of Natural Resources, Environment, the Arts and Sport, Darwin.
Paine, A.G.L. 1963 Tanumbirini N.T. 1:250 000 Geological Series, Explanatory Notes. Bureau of Mineral Resources, Geology and Geophysics, Canberra.
Pensalfini, Rob 2004. Eulogizing a language: the Ngarnka experience. International Journal of the Sociology of Language, 164:141–156.
Pensalfini, Robert J. 1997. Jingulu grammar, dictionary, and texts. Massachusetts Institute of Technology.
Sharpe, Margaret 1969. Alawa phonology and grammar. PhD Thesis, School of English, Media Studies and Art History, The University of Queensland.
Santos 2013. Exploration Permit 161– Tanumbirini 1 exploration well environment plan summary. ENV-EP161 TAN 0003. Report to N.T. Department of Mines and Energy, Darwin.
Santos 2016. Exploration Permit (EP)-161 2016 Stratigraphic Corehole Program. Environment Plan Summary.
Santos 2018. NT Exploration Permit 161. Tanumbirini North Water Bore Monitoring Program.

Kamminga and Lance 2019 EP161 Northern Scope, Aboriginal and non-Indigenous archaeological assessment 28
Environnent Management Plan. Document No: MAB-PLN-005.https://dpir.nt.gov.au/__data/assets/pdf_file/0005/370589/ep161-marmbulligan-environment-
plan-summary.pdf
Sutton, Peter and Bruce Rigsby 1979. Linguistic communities and social networks on Cape York Peninsula. In S. Wurm (Ed.) Australian linguistic studies. Pacific Linguistics. Canberra, pp. 713-732.
Tasker, M.C. 2017. Application to clear pastoral land (s.38(1)(h) Pastoral Land Act). Application to the Pastoral Land Board Northern Territory, Darwin, by manager of Tanumbirini Station.
Tindale, Norman B. 1974. Aboriginal Tribes of Australia: their terrain, environmental controls, distribution, limits, and proper names. University of California Press, Berkeley.
Tindale, N.B. 1974. «Kotandji (NT)». Aboriginal Tribes of Australia: Their Terrain, Environmental Controls, Distribution, Limits, and Proper Names. Australian National University, Canberra.
Wood, B., D. Siverisen and C. Olsen 1981 Land Systems of the Upper McArthur River Catchment. Conservation Commission of the Northern Territory, Darwin.

Kamminga and Lance 2019 EP161 Northern Scope, Aboriginal and non-Indigenous archaeological assessment 29
Appendix 1 - Glossary of technical termsAAPAThe Aboriginal Areas Protection Authority (AAPA) is an independent statutory authority established under the Northern Territory Aboriginal Sacred Sites Act. The Authority is responsible for overseeing the protection of Aboriginal sacred sites on land and sea across Australia’s Northern Territory.
Background scatterGenerally, a very low density, more or less continuous distribution of artefacts over the land surface. Although these artefacts do not constitute a ‘site’ they are given location details for research purposes and to fulfil legislative requirements.
Bifacial pointFlakes or blades retouched along both ventral and dorsal surfaces of a flake to enhance or give the artefact its pointed shape. They often have the flake’s initiation surface (striking platform) platform removed by retouch and this proximal end of the point rounded.
Grinding stone Top and bottom grindstones, pestles and mortars characterised by at least one use-work and abraded surface.
HammerstoneA stone that have use-wear on the surface in the form of abrasion and pitting characteristic of hammer usage.
Hatchet head (Edge ground hatchet head) have been shaped by the process of flaking, pecking and grinding (polishing). They generally have only one cutting edge that has been ground to a straight or moderately convex plan shape.
Knapping (of stone)Flaking stone to make stone implements. This is done by striking a piece of stone with a stone hammer (dynamic load in freehand percussion), or by more delicately applying pressure with a small stone or a piece of wood or bone.
Lag A lag deposit is the deposition of stones winnowed by physical action. Fluvial processes (as occurs in the Santos project area), aeolian processes, and tidal processes can remove the finer portion of a sedimentary deposit leaving the coarser stones behind.
ManuportA stone or fragment of stone that does not occur naturally in an area and must have been carried in by humans. Natural occurrences of locally-exotic stones include emu gastroliths and Permian

Kamminga and Lance 2019 EP161 Northern Scope, Aboriginal and non-Indigenous archaeological assessment 30
age ice-rafted ‘dropstones’.
NLC Northern Land Council.
Northern Territory Archaeological Site Database A database of sites recorded in the Northern Territory including location and description details. Sites are protected by Northern Territory Heritage Act, 2011.
Sacred SiteAreas of significance for sacred sites is considered through the process of securing a sacred site clearance certificate (SSCC) from the Northern Land Council (NLC) and an Authority Certificate from the Aboriginal Areas Protection Authority (AAPA). This process aims to prevent damage to, and interference with sacred sites, by identifying and setting out the conditions for entering and working on the land.
SiteAn archaeological site is defined for this survey as having more than one archaeological object within am area of two square metres, or a concentration of artefacts with an average density five times greater than the average density of the background scatter. A site will have an identifiable boundary where either artefact densities decrease to the extent as to be classified as background scatter or environmental features determine the boundary.
Siliceous stone Rock or stone that is predominantly comprised of silica, usually in the form of quartz crypto-, micro- or macro-crystals. Examples are vein and macro-crystal quartz, quartzite, sandstone, silcrete, chert and chalcedony. These are the stone types commonly used by Aborigine people for making into stone tools.
Stone artefact scatterAn area of stone artefacts scattered on the ground, usually within an area of ground surface erosion. These artefacts are very predominantly the debris from knapping stone to make stone tools. Not uncommonly the scatter is associated with stone artefacts that occur below ground surface, unless scattered across a bare rock surface.
Subject land The land area that is the subject of proposed work activities or development.
Transect (survey transect)A straight line or narrow section through an object or natural feature or across the earth’s surface, along which observations are made or measurements taken.
Unifacial point

Kamminga and Lance 2019 EP161 Northern Scope, Aboriginal and non-Indigenous archaeological assessment 31
Flakes or blades that have been retouched along the margins from one surface, either ventral or dorsal to give or enhance its pointed shape. They can be symmetrical or leaf shaped.Appendix 2 – Aboriginal site types likely to occur in this regionProbably more than 200 million people have lived on the Australian continent since it was first settled more than 40,000 years ago. The material evidence of this human presence and activity is abundant and widespread. Because stone is a highly durable material, stone artefacts are found widely distributed across the continent and sometimes are highly concentrated in certain land units, and in particular areas within these land units.
An Aboriginal archaeological site is defined as any material evidence of past Aboriginal activity in a context or place where the activity occurred (Officer and Navin 1998). Thus, significant Aboriginal sites or places such as ‘Dreaming or Story site’ do not necessarily have associated cultural remains. However, the vast majority of Aboriginal sites are open-air camps, indicated only by stone flaking debris and discarded stone implements, or sometimes an intact hearth with burnt remains.
The range of Australian Aboriginal sites likely to occur in the subject area can be categorised as:
1. Isolated artefact (usually stone).2. Isolated hearth.3. Stone artefact scatter (sometimes associated with Potential Archaeological Deposit (PAD) comprising subsurface artefacts and other objects or features).4. Aboriginal historical site (camp, residence, mission, etc). 5. Stone procurement place and stone quarry.6. Shell midden.7. Cave and rock shelter with cultural sediment8. Ceremonial ground (sometimes with earth or rock constructions).9. Scarred tree.10. Hatchet head grinding locality11. Aboriginal burial (Aboriginal Ancestral Remains).12. Rock art site.
These generally recognised site types are described below.
1. Isolated findAn isolated find, usually a single artefact or other cultural object, is defined by the absence of associated artefacts, cultural deposits or archaeological features. These finds may be indicative of random loss or deliberate discard of a single artefact, the remnant of a now dispersed artefact scatter, or a subsurface sedimentary horizon containing artefacts. They may occur anywhere within the landscape but are more frequently encountered in landscape units containing stone artefact scatters.

Kamminga and Lance 2019 EP161 Northern Scope, Aboriginal and non-Indigenous archaeological assessment 32
A conservative approach to artefact identification is required for isolated finds, especially when the find is a piece of fractured quartz. When artefact-size pieces of quartz, particularly relatively unweathered fragments of vein quartz, occur naturally in the sediment an identification of quartz items as artefactual must be based on definite evidence of knapping.
A proportion of the artefacts deemed isolated finds are part of the background scatter or count of artefacts within a land unit. Background scatter or count refers to the widespread occurrence of artefacts that cannot be related to a focus of past activity involving stone discard. The ‘background’ is an accumulation of stone artefact loss and discards events occurring since first human settlement of that region, though erosion in a local area may only reveal artefacts from any recent prehistoric activity.
The type and frequency of isolated artefacts in a landscape unit will depend on a number of factors. These include the nature of past human settlement and exploitation in the region, the proximity and nature of the stone used for toolmaking, and a range of environmental factors such as the nature of sediments, degree of erosion and degree of ground surface visibility. Generally, there are no reliable estimates of background scatter for land units within different regions of Australia.
Isolated finds may indicate:
• loss or discard of an artefact while away from a camp (while travelling); • an isolated tool-making or resharpening event away from camp, where a group of artefacts is discarded on the ground;• an encampment area, where artefacts occur within the sediment (and present-day erosion is minimal).
2. Isolated hearthAboriginal hearths (fireplaces) are an important archaeological feature of encampments and provide a range of archaeological evidence about prehistoric settlement and subsistence. These features often provide material for chronometric dating of the occupation event (Mitchell 1996) and some isolated hearths are extremely ancient.
Identifying hearths or anthropogenic hearths generally from the remains of natural occurring fire is often problematic There is a range of anthropogenic hearth types, including cooking pits, heat-treatment pits, work and sleeping fires, and ash dumps. Natural fire, such as a slowly burning tree stump, can bake clay sediment and leave a feature comprising a discrete area of burnt clay with charcoal and ash. This same polythetic set of features occurs after European forest clearance and burning of dried timber.

Kamminga and Lance 2019 EP161 Northern Scope, Aboriginal and non-Indigenous archaeological assessment 33
One way of distinguishing human-caused or archaeological fire is by its shape and size. Archaeological fires tend to be roughly circular in shape on the upper surface and basin-shaped in cross-section. Hearths diameter ranges between 20 to 30 cm and about 5 to 10 cm in depth (Mitchell 1996). Archaeological fire features may also appear as lenses of concentrated charcoal, blackened or reddened rocks and clay heat retainers (baked clay lump), and may also contain stone artefacts, cobble manuports and less commonly charred bone and shell. The shape of clay nodules in such a feature can be used to distinguish archaeological fire mounds from a burnt tree feature. Clay heat retainers are rounded nodules while natural baked clay sediment tends to be blocky or irregular in shape. Not uncommonly stone artefacts are flaked beside a fireplace and discarded flaking debris may show evidence of heating.
Mitchell (1996) has identified a number of methods by which anthropogenic can be differentiated from natural fire. However, some of these methods have failed to produce a convincing or reliable result.
Magnetic susceptibility analysis of clay nodules fired at a temperature lower than 500ºC has failed to distinguish between natural and human caused fires (Mitchell 1996). However, other analytical methods that show promise are spatial analysis, macroscopic examination, microscopic analysis, particle size analysis and chemical analysis. For instance, spatial analysis may show clustering of charcoal patches, while macroscopic analyses can help identify rounded orange-red clay nodules as well as identify charcoal size range for analysis of particle size distribution. Experimentally, fire pits produced charcoal size larger than 3 mm. Microscopic analyses allow for identification of flaking microdebitage, fragments of charred bones and identification of species of wood that was burnt. In ideal circumstances, chemical analysis of baked clays can be used to identify organic residues such as exudates from tuber roasting.
3. Stone artefact scatterWhen artefacts occur in sufficient concentration on a land surface unprotected by rock overhang the area is described as a stone artefact scatter. Other labels that have been used are: lithic scatter, artefact scatter, surface scatter, open site, open-air site, ‘open camp site, and ‘campsite’.
The stone artefact scatter is the most commonly reported Aboriginal prehistoric site type in Australia. In some regions devoid of rock shelters or caves, open sites (or stone artefact scatters) may be virtually the only type recorded in archaeological surveys. Stone artefact scatters are most likely to occur on level or low gradient land surfaces, along the crests of elevated flats on hills, ridgelines and spurs, in coastal sand dunes, and on slightly elevated flattish ground fringing watercourses and wetlands. Larger stone artefact scatters with subsurface artefact horizons tend to occur in the vicinity of major and/or reliable water sources.
Stone artefact scatters represent a range of different human activities or site uses. However, most are former open-air campsites, ranging in nature from a day camp by an individual or small group during a hunting and gathering trip, to a large, semi-sedentary base camp located at a reliable water source. Some important camping areas were reoccupied on a regular basis over hundreds
Kamminga and Lance 2019 EP161 Northern Scope, Aboriginal and non-Indigenous archaeological assessment 34
or even thousands of years.
Often, a scatter of stone artefacts and manuports (such as pebbles and burnt clays heat retainers) lying on the ground are the remains of an uppermost horizon of soil stripped of all but its heaviest items by wind and water erosion. In many instances, the artefact horizon is not removed entirely and there is still a horizon of artefacts (sometimes disturbed) and associated cultural features such as hearths in various spatial concentrations of habitation debris. Where a stone artefact scatter has an identifiable or inferred subsurface cultural horizon as well as artefacts on ground surface, the two kinds of archaeological deposit (surface and subsurface) comprise a single ‘site’.
Usually a visual inspection of the artefacts on ground surface is not sufficient to accurately determine the extent of the subsurface concentration of artefacts. Commonly, the boundary of the subsurface cultural horizon is not well defined, and the count of artefacts gradually decreases with distance from a main concentration until it merges with the average background count for a land unit.
The stone artefacts and manuports in stone artefact scatters represents stone flaking and discard activities associated with manufacture and maintenance of tools, weapons and other items of material culture, or for processing plant food. The remains of hearths, and other cultural features, also may be present within the general area of the site. Artefact density can vary considerably across a site and between different sites in the same land unit.
Stone artefact scatters normally cannot be dated with any precision (within the last few thousand years is common) and they are often difficult to interpret from the small sample of material remains. While the site’s size and its ‘density’ of artefacts are often taken as reflecting more intensive use of the site by people, a wide range of factors bears upon artefact density and site size, sufficient to limit any interpretation in the absence of professional excavation.
3.1. Bioturbation impact on site integrityDetermining the original positions and sequence in which artefacts were deposited at an open-air site often is complicated by a number of disturbance processes, such as downward soil creep on slopes, cracking of topsoil, tree growth, burrowing animals (in particular invertebrates), and human activity. Bioturbation of the soil horizon by ants, worms and termites is a significant cause of artefact sinking and mixing in soil layers (Cahen & Moeyerson 1977; Dean-Jones & Mitchell 1993:43, 46; Mitchell 1988:52; Moeyersons 1978; O’Connell et. al. 2018). Kamminga provided the first demonstration of invertebrate bioturbation of an open-air prehistoric site in southeast Australia (Kamminga et al. 1989:32-33), and there are a few other documented examples.
Tree growth and tree fall also cause bioturbation of cultural sediments (e.g. Photo 7). Gollan (1992:44) has estimated that in forested land of at least 100 trees per hectare tree growth would have would have caused extensive disturbance of sediments over a period of approximately 2,500 years. Dean-Jones and Mitchell (1993:43-44) have reported that tree fall tends to cause mixing of cultural objects (usually stone artefacts) out of stratigraphic order when sediment is washed

Kamminga and Lance 2019 EP161 Northern Scope, Aboriginal and non-Indigenous archaeological assessment 35
from the tree roots by rain. There are specific instances where this has been observed in action (Kamminga et al. 1989:27, 32-33). It should be noted however that most trees species in Australia do not significantly disturb the soil when falling, because the trunk breaks after weakened by fire, fungi and termites, and tends to remain in the ground.
In general, it is difficult to assess the effects of plant and animal bioturbation within open-air sites without first undertaking test excavations. in the first identification of invertebrate bioturbation of an open-air site in south-eastern Australia, Kamminga found by plotting artefacts weight distributions that there was a marked vertical dispersal of the lighter fraction (less than a gram) above and below a well-defined horizon of the heavier Aboriginal objects (Kamminga et al. 1989:32). This pattern could only be accounted for primarily by earthworm bioturbation. However, the effects are not always so clear. Bioturbation impacts are often relatively small-scale vertical and lateral movement of artefacts. In particular, invertebrate burrowing can result in different sizes and shapes of stone fragments sinking into the soil at different rates and eventually settling at the same level which is normally the lower limit of invertebrate activity (see review in Kuskie and Kamminga 2000).
3.2. Effects of ploughing on subsurface artefact horizonsHuman activity at a site in prehistoric times may disturb original material patterns of former occupation. Manuports and artefacts may be moved around a camp during subsequent visits, re-used or even removed. In circumstances where site integrity is high, this subsequent activity may be inferred from the character and pattern of the preserved archaeological record. However, where bioturbation or pastoral practices have diminished site integrity, practically none of this may be evident.
Ploughing occurred soon after vegetation was cleared, especially on floodplains and lower slopes. Ploughing causes both vertical and horizontal movement of artefacts and manuports and is therefore a major cause of disturbance to artefact horizons within 20-30 centimetres of the ground surface. While the stump-jump plough cut a furrow no more than about six centimetres deep, later designs of ploughs and inevitable loss of some topsoil has meant that open-air sites in cleared land tend to be seriously disturbed. Ploughing causes both vertical and horizontal movement of artefacts and manuports, resulting in disturbance to original patterns of discard, either in their original discard configuration or after already affected to some degree by natural processes. Ploughing can also cause the destruction of archaeological features such as fireplaces. After several decades of ploughing, artefacts may be displaced laterally up to several metres. For all types of ploughing equipment, larger artefacts (more than 40 mm in size) tend to be moved the greatest horizontal distance (Roper 1976, Lewarch 1979:116-122, Lewarch & O’Brien 1981a, b). Smaller cultural objects tend to displace downward (Roper 1976). Ploughing also tends to destroy hearths and other cultural features in open-air sites.
4. Aboriginal historical site (camp site, mission site, etc)Aboriginal lifestyle and settlement patterns changed significantly as British settlers colonised the continent. Surviving Aboriginal people often lost access to their traditional hunting and

Kamminga and Lance 2019 EP161 Northern Scope, Aboriginal and non-Indigenous archaeological assessment 36
foraging territories and a dependant relationship developed with the British settlers and colonial government. Aboriginal people settled in family groups on farms and camps were located at some of the British settlements.
In Australia, ‘contact-period’ base camps with intact old growth forest or woodland surrounding them tend to have a relatively large number of scarred trees in the vicinity. Artefact scatters may contain shells and the remains of hearths with burnt clay, and an assortment of items of British or colonial manufacture, such as buttons, clay pipe fragments, nails and other pieces of iron, and bottle and ceramic fragments. However, for a number of reasons, in northern interior NT scarred trees may not be that common in the vicinity of base camps.
5. Stone procurement place and stone quarryThroughout Australia various stone and mineral substances were collected and sometimes quarried to make stone implements and pigments of various kinds (Hiscock and Mitchell 1993; Mulvaney and Kamminga 1999:27-31). Sandstone also was quarried in large slabs for use as grindstones in milling seeds for flour. Gravel beds and bars in watercourses were often ideal places to collect suitable stone, because they usually provided a choice of different stone types, and size and shape of pebbles and cobbles that had been water transported and therefore naturally tested for toughness. In areas where waterworn stones were collected from stream beds and relict river gravels the rejected and discarded flaking debris is often scattered about at or near the stone source. Where particularly desirable stone occurs, the discarded flaking debris may comprise thousands of items per square metre. Some larger stone collecting localities in the arid zone were extensive rock formations, where knapping debris is scattered over the ground for many kilometres. Rarely, stone procurement sites have quarry pits and shafts following a seam of high-quality stone or ochre. Around these pits are knapping floors or ‘stone reduction sites’, where the early stages of tool manufacture occurred. However, often prehistoric stone procurement places, and at creek beds in particular, there is little or no archaeological evidence of stone procurement: there are no concentrations of preliminary knapping debris and no quarry depressions or pits.
Certain Aboriginal quarries and mines possessed significance that transcended material needs. People did not always prefer the closest source but exchanged valuable goods or travelled through arid country to a more distant source for stone they believed was imbued with spiritual power.
6. Shell middenCoastal and freshwater shell middens comprise mostly the remains of women’s shellfish collecting activities.
Many of the larger coastal middens along the seaboard of south-eastern Australia have been quarried to obtain shells for lime burning and land fill. Typically, middens are located in coastal estuaries and on headlands and sand dunes along the coast, and inland within riparian zones of watercourses and the margins of lakes with relatively permanent water. Middens and shelly lenses may occur out in the open or in rock shelters. Sometimes a midden deposit is minimal, comprising only a thin shelly layer or lens, as is common for inland lakes or riverside spreads of

Kamminga and Lance 2019 EP161 Northern Scope, Aboriginal and non-Indigenous archaeological assessment 37
mussel shells. In other instances, middens are massive in size.
6.1. Types of middensEthnoarchaeological research in Arnhem Land has identified two kinds of Aboriginal shell middens – ‘base camps’ which were occupied continuously for long periods, and ‘dinnertime camps’, representing ephemeral campsites (Meehan 1982). These ethnographic categories are often used as a rule-of-thumb guide for interpreting prehistoric middens elsewhere in Australia.
Despite the importance of middens for archaeology and the impressive size of many of them, shellfish usually provided only a small part of the Aboriginal subsistence base. While shellfish are a staple food resource, they contributed probably no more than one tenth of dietary needs in most coastal regions. Of course, they were a more significant resource during lean times. Other littoral and marine resources were important to coastal people, as were the plant foods and game obtained from wetlands and adjacent forest or woodland environments both on the coast and inland.
6.2. Antiquity of middensAccumulations of shell tend to preserve well over a long time because they generate their own alkaline sedimentary environment even in surrounding acidic sediment. Thus, middens and their carbonaceous content of shells, animal and human bones may survive for millennia. Because they fringe the present-day seashore the majority of coastal middens are less then 6,000 years old. Some inland middens are more than 20,000 years old but, like coastal middens, most of those located belong within recent millennia.
6.3. Midden identification criteriaOccasionally there is difficulty in distinguishing midden deposit from natural features such as shelly storm beach deposits and scrub fowl mounds. Sometimes a midden cannot be a natural formation because of its particular location. Commonly agreed criteria for the identification of Aboriginal midden deposits include the range of species (preference for edible, mature shellfish), usually restricted to one or two species such as oyster, Anadara, whelk and turbo shells, or freshwater mussel. This concentration of edible sized shells usually produces positively skewed size-frequency distributions. Natural shell accumulations by wave action are likely to contain random species and size samples. Other criteria for midden deposit are layers indicating cultural rather than natural deposition, the presence of stone and bone artefacts, and manuports (natural stone brought by humans, often as cooking stones), and the presence of various crustacean, fish, bird and mammal remains that are not likely to occur naturally.
7. Cave and rock shelter site with cultural sedimentTrue caves, created by water action and dissolution, are commonly found in limestone country. Large caves occur along the southern coast from Victoria to southwest Western Australia and others in Cape York Peninsula and southern Tasmania. Rock shelters are far more numerous and widespread than true caves. These shelters are formed by cavernous weathering by wind and water, usually of sedimentary rock such sandstone or quartzite, or by the inclination of large

Kamminga and Lance 2019 EP161 Northern Scope, Aboriginal and non-Indigenous archaeological assessment 38
boulders.
While caves and rock shelters are of particular interest to archaeologists they were not necessarily commonly used as campsites in prehistoric times. In general, Aborigines did not inhabit the deep and dark recesses of caves, but camped at their entrances, venturing deep into their passages only for special purposes. In some desert areas, rock shelters were normally inhabited only during heavy rain or dust storms and over a period of thousands of years may have been visited only occasionally.
The reason archaeologists concentrate on such places is that the accumulation of stratified and datable sedimentary deposits containing stone artefacts and other occupation debris are concentrated within a very limited area; in some case the cultural material in the deposit is sparse, in other cases it is abundant. The alkaline sediment in limestone caves and shelters preserves bone and shell much better than in other depositional contexts; in very dry cave deposits a wide range of organic materials may be preserved, including dried plant matter such as wood and resin. While most caves and shelters contain shallow deposits, excavations may penetrate many metres of cultural horizons containing food debris of animal bones and shells, plant materials and microscopic pollen and phytoliths (plant silica), ash and charcoal from campfires, debris from knapping stone, and discarded stone implements. These cultural materials provide the basis for reconstructing prehistory.
8. Ceremonial groundCeremonial rock arrangements and earthworks are found in many parts of Australia (Mulvaney and Kamminga 1999) and historical records and field surveys indicate that they occur commonly in parts of eastern Australia. Over a thousand are known from NSW and Queensland alone. Many former ceremonial grounds had no features or constructions, and their existence and location are evident only from historical records.
Ceremonial constructions such as rock arrangements and earthworks are always low features in the landscape and usually less than a metre high. There are however a range of different designs. Some were personifications of totemic beings who participated in creation dramas; others demarcated areas for particular ceremonial activities. The latter function possibly explains the many linear or circular arrangements of stones enclosing a clear area ranging from a few square metres to hectares in area. Many earth or piled stone features in Australia are identified as bora ring because of historical accounts of ‘bora’ ceremonies (initiation of boys) at such sites.
Construction of stone lined paths and concentric rings of earth or stones involved considerable labour to construct. Linear earthworks or pathways may link pairs of circles, one larger than the other.
There are also many examples of cairns, or large, single standing stones, some of which have religious associations.

Kamminga and Lance 2019 EP161 Northern Scope, Aboriginal and non-Indigenous archaeological assessment 39
The simpler the construction or feature the more difficulty it is to identify it as an Aboriginal relic. Some constructions have no distinctive cultural attributes and without confirmation from informants, they would be unrecognised as Aboriginal or even cultural features. The location and survey of stone arrangements, ranging from simple cairns to elaborate ground designs are a continuing challenge for archaeologists.
9. Scarred treeScarred trees are conspicuous markers of Aboriginal inhabitation of country that is now substantially different from its original state. As Long (2002:5) has noted, there are few agricultural regions in the world where the native living plants display in their fabric pre-modern human activity.
Scarred trees occur within the remnant forestlands and woodlands, and generally more frequently along the sea coast and close to reliable water sources such rivers, billabongs and swamps. However, they may occur almost anywhere. Following widespread clearance of forest and woodland, the number of mature trees suitable for bark removal would have been dramatically reduced. Culturally scarred trees are more likely to survive in state forests and reserves of various kinds (including road reserves). Thus, the few identified scarred trees have been found within remnant areas of native woodland and in narrow road reserves (c.f. Edmonds 1998:47; Kamminga and Grist 2000:78-80, 95-100; Paton 1993:17-18, 23, 25-26; Long 2002, 2005).
The wide range of uses to which bark was put is reflected in the size range of the scars, which for making canoe hulls can be up to six metres in length and two metres in width. ‘Canoe trees’ are concentrated along rivers and other suitable water bodies. Rectangular sheets also were used as roofing and walls of huts and shelters in regions in Australia with suitable tree species. Andrew Long postulates that large mature trees with straight trunks were chosen for construction sheets, and that commonly the width of the bark sheet was 50-75% of the tree’s circumference (Long 2002, 2005).
Smaller sheets cut from a curved trunk or thick limb and from burls were made into containers (carrying vessels) such as bowls and dishes. Other small sheets were used as supports for drying and scraping animal skins (mostly possum), at least in northern Victoria and the Hunter Valley in NSW where they have been documented, but probably more widely, and for bark shields in parts of south-eastern Australia. While bark artefacts of these kinds are widely documented in Australia, less conspicuous or minor uses of bark were for grave pit lining, carved bark sculpture used in corroborees, and cord and rope (the bark was stripped off the tree for making fishing lines, nets, string, climbing rope, etc). Other types of Aboriginal scarring include toeholds cut into the trunk or branches for climbing in pursuit of possums and other small arboreal animals or collecting eggs, nuts and honey, and resource extraction holes (Kamminga and Grist 2000:57; Long 2002, 2005). These features sometimes occur in association with bark procurement scars, and most often exhibit cut marks from a steel axe or hatchet.
Bark was procured from a range of tree species, some of which, such as River Red Gum, and species of box, stringybark and paperbark, were particularly useful for making constructions and

Kamminga and Lance 2019 EP161 Northern Scope, Aboriginal and non-Indigenous archaeological assessment 40
artefacts. Inevitably, due to natural death of trees, insect attack, bushfires and agricultural clearing, the number of scarred trees has diminished rapidly, and often they are now only encountered along wooded watercourses, and on the margins of lakes and swamps. Despite this dramatic reduction in numbers these relics are still being recorded in large numbers during archaeological field surveys.
Reliable identification of scars as Aboriginal is notoriously difficult Kamminga and Lance 2016), with considerable consequence for assessment of site significance and potential environmental impacts from development. It is often very difficult to distinguish Aboriginal culturally scarred trees from those made by or for settlers, who used bark most as cladding and roofing material (Kamminga and Grist 2000; Long 2002:3). Scars from the effects of fire, lightening, limb fall, faunal activity and modern human activity often have been wrongly interpreted as Aboriginal. Also, the bark around cultural scars regrow as ‘callous tissue’, especially around the sides of the scar – this regrowth often obscures the original shape of the scar and hatchet cut marks in the underlying wood. Over time the wood within Aboriginal scar degrades by weathering, bushfire or insect infestation, so that the essential for identification is lost. Finally, there are considerable difficulties in determining the age of living or dead scarred trees. Little information has been compiled on the maximum life spans of the tree species Aborigines exploited for bark, and in particular box and gum trees. Aboriginal Affairs Victoria advised in mid-2007 that only definite Aboriginal scarred trees should be registered. The manuals by Andrew Long, ‘Scarred trees: a field identification manual’, and ‘Aboriginal scarred trees in New South Wales’ are essentials guide to identifying and evaluating Aboriginal scarred trees (see also Kamminga and Grist 2000:56-65; Officer and Navin 1998:14; Officer 1992).
10. Hatchet-head grinding localityOne of the most important Aboriginal implements was the ground-stone hatchet, which is more commonly but less correctly known as the ‘edge-ground axe’ (Mulvaney and Kamminga 1999:32-34, 91-93). On current evidence, this implement first appeared in south-eastern Australia about 4500 years ago. The processes of fashioning and resharpening the hatchet head included the grinding of a cutting edge on an abrasive stone, usually found near water and close to campsites. At these places grinding grooves are worn into bedrock, which often is sandstone.
11. Aboriginal burials (Aboriginal Ancestral Remains)In general, Aboriginal people regard burials as an extremely significant and sensitive site types (Mulvaney and Kamminga 1999:35-38) and removal of Aboriginal remains for reburial are undertaken only with guidance or supervision from the relevant Aboriginal community. There are also strict legal obligations relating to the recovery of Aboriginal and non-Aboriginal human remains.
Historical evidence indicates great diversity in Aboriginal mortuary practice throughout the continent during early historical times (Hiatt 1969). Burial practices included cremation bodies wrapped in soft bark, skin or matting and buried in a shallow grave, or cached within a hollow tree trunk or ossuary in rock crevices.

Kamminga and Lance 2019 EP161 Northern Scope, Aboriginal and non-Indigenous archaeological assessment 41
Ordinarily such remains are not encountered in archaeological excavations. However, development work and erosion continue to expose prehistoric human remains. Human burials are generally only visible where sub-surface sediments have been disturbed or where an erosional process has exposed them. Most often, they are found in rock shelter deposits and in sand bodies and in sandy or silty sediments. In valleys and plains, burials may occur in locally elevated topographies rather than poorly drained sediments. Burials rarely occur on rocky hilltops.
While the majority of recorded burials date to within the last few thousand years some are much more ancient. Large cemeteries occur along the Murray River, many of which had been established for millennia. A small number of Aboriginal cemeteries have been located in other regions and it is expected that in future years more will become apparent.
Study of such remains provides information about prehistoric nutrition, diseases, injuries, and long-term biological changes. Such studies also provide information about the nature of material culture, and cultural practices and belief systems of past generations. Fibre, animal skin and wood usually disintegrate rapidly after burial, and most graves lack surviving material relics. However, stone, animal bones, bone fishhooks, shells, pellet and powdered ochre, teeth necklaces, and bone pins and points have been recovered from some burials (Mulvaney and Kamminga 1999:35-38). The kinds of information gained about prehistoric culture and society are of importance not only to Aboriginal people but the wider Australian community.
12. Rock art siteAboriginal rock art is the pictorial record of Australia’s human past, and as such is a unique component of the archaeological record (Mulvaney and Kamminga 1999:369-82). This artistic expression provides insight into aesthetics and other social practices and beliefs. Innumerable rock art motifs survive throughout Australia as paintings, drawings, and pecked and abraded ‘engravings’, on open and sheltered rock surfaces. In most areas of Australia, paintings and engravings are intimately tied to contemporary Aboriginal beliefs and rituals of group or self-identity, sometimes requiring the periodic rejuvenation of motifs. Most surviving rock art in Australia dates within the last 3,000 years. Recent dating of thin encrustations on paintings demonstrates an antiquity of at least 25,000 years for some art in Cape York.
Much of the current research on Aboriginal rock art concerns the discovery, preservation and recording of the art. While many thousands of sites are on State site registers, only a fraction is individually recorded or described, while their conservation raises great problems. More than any other site type, Aboriginal rock art is part of the tourism industry in Australia and is widely recognised for its Aboriginal, aesthetic, scientific, historical and educational values.
The preservation of rock art is dependent on a combination of environmental factors including weather, surrounding plant communities, insect and animal activity, and the geological structure and durability of rock surfaces. Some art is preserved beneath a natural hard coating of silica that has built up on the rock surface. However, rock art usually deteriorates, sometimes at an

Kamminga and Lance 2019 EP161 Northern Scope, Aboriginal and non-Indigenous archaeological assessment 42
alarming.
Images were made on rock surfaces by two basic methods – the application of substances such as pigment or beeswax, and the physical removal of the rock surface by pecking or pounding. Pigment was mixed and applied as a liquid medium to form paint, or else drawn using a dry crayon or charcoal. Paint was also blown from the mouth around an object to create a stencilled negative. Almost all the red, yellow and brown pigments are derived from iron-rich minerals, like hematite (Fe22O3), commonly known as ‘red ochre’, siderite, a yellow-coloured iron carbonate, and goethite, a yellow to brown mineral which forms naturally as a weathering product from the other iron minerals. An impure version of goethite, the mineral limonite, which has a vitreous lustre, was also used. The colour of hematite paint ranges from various shades of red to mulberry, and even to blackish when the pigment has aged on a rock surface. Hematite is chemically stable and is durable on rock surfaces because its microscopically platy structure provides strong adherence properties. Charcoal, which normally provides black colouring, was ground and mixed as paint or applied from a charred stick. White mostly comes from kaolin clay. Some carbonate minerals have been identified, such as huntite, dolomite and calcite, which were ground to powder and mixed with water. All these white paints have poor preservation and poor adhesion, so they tend to flake off surfaces. Consequently, white pigment usually indicates that motifs are relatively recent.
Rock engraving involves pounding or ‘pecking’ the rock surface to expose lighter-coloured unweathered rock. The most common engraving technique was to pound a narrow groove as an outline of the motif. Intaglio, or the pecking of an area of stone to form a negative impression of the image, was also practiced. Engravings are found commonly on stone softer than quartzite (sandstone, limestone, various indurated sediments, fine-grained granite and dolerite) and where the sub-surface is much lighter in colour than the weathered ‘skin’, so that the visual effect is dramatic. Sometimes a rock pavement that was particularly favoured or ritually significant is densely engraved for over hundreds of square metres.
Stencils are a specialised technique for creating an image of a real object, distinct from most other forms of art which rely on the free-hand interpretation of the artist. Most stencils are of hands; others are of animals, plants and artefacts. Hand stencils probably represent a pictorial signature, and ones of hematite may last for many thousands of years. The most elaborate use of stencil motifs in a narrative or artistic composition occurs in the sandstone country around the Carnarvon Range in southern Queensland.
Appendix 2 - ReferencesBell, David 1979. Aboriginal carved trees in New South Wales: a survey report. Part 1. Report to
NSW National Parks and Wildlife Service.
Berndt, Ronald and Catherine Berndt 1996. The world of the first Australians. Aboriginal traditional life past and present. Aboriginal Studies Press, Canberra.

Kamminga and Lance 2019 EP161 Northern Scope, Aboriginal and non-Indigenous archaeological assessment 43
Cahen, D. and J. Moeyersons 1977. Subsurface movements of stone artefacts and their implications for the prehistory of Central Africa. Nature, 266:812-5.
Clarke, Philip 2003. Where the ancestors walked. Allen and Unwin, Sydney.
Dean-Jones, P. and P.B. Mitchell 1993. Hunter Valley Aboriginal sites assessment project: environmental modelling for archaeological site potential in the central lowlands of the Hunter Valley. Unpublished report to NSW National Parks and Wildlife Service.
Edmonds, Vanessa 1998. The Wimmera River Cultural Heritage Study. Stage II. The Middle Wimmera Basin. Report to Goolum Goolum Aboriginal Cooperative, Horsham. Archaeological Consulting Services, Buronga, NSW. February 1997.
Frankel, David 1982. Earth rings at Sunbury, Victoria, Archaeology in Oceania, 17:89–97.
Frankel, David 1991. Remains to be seen: archaeological insights into Australian prehistory. Longman Cheshire, Melbourne.
Gollan, Klim 1992. Aboriginal cultural heritage study: northeast Forests, New South Wales. Unpublished report to NPWS.
Gorecki, Pawel and Mary Dallas 2000. Aboriginal archaeological assessment. Johns Road, Wadalba, NSW. Report to Wyong Shire Council, NSW.
Hiatt, Betty 1969. Cremation in Aboriginal Australia, Mankind, 7:104-19.
Hiscock, P. and S. Mitchell 1993. Stone artefact quarries and reduction sites in Australia: towards a type profile. Australian Government Publishing Service, Canberra.
Kamminga, Johan 2003. Aboriginal Heritage Study, Beachcomber Holiday Park, Eurobodalla National Park, NSW. Report to NSW National Parks & Wildlife Service, Far South Coast Region Office, Narooma. National Heritage Consultants, Canberra.
Kamminga, Johan & M. Grist 2000. Yarriambiack Creek Aboriginal heritage study and conservation plan. Kamminga Archaeology report to Aboriginal Affairs Victoria.
Kamminga, Johan & A. Lance 2016. Vickery Extension Project – Scarred tree assessment. Report to Whitehaven Coal Limited. Heritage Consulting Australia Pty Ltd. May 2016.
Kamminga, Johan, Robert Paton and Ingereth Macfarlane 1989. Archaeological investigations in the Thredbo Valley, Snowy Mountains. Anutech Pty Ltd report to Faraba Pty Ltd.
Kuskie, Peter and Johan Kamminga 2000. Salvage of Aboriginal archaeological sites in relation

Kamminga and Lance 2019 EP161 Northern Scope, Aboriginal and non-Indigenous archaeological assessment 44
to the F3 Freeway near Lenaghans Drive, Black Hill, New South Wales. Southeast Archaeology Report to Major Projects, Northern Region, Roads and Traffic Authority of NSW. (3 vols).
Lewarch, D.E. 1979. Effects of tillage on artifact patterning: a preliminary assessment. In Cannon Reservoir Human Ecology Project-A regional approach to cultural continuity and change. In M.J. O’Brien and R.E. Warren (Eds), Technical Report 79-14, pp. 101-149. Division of Archaeological Research, University of Nebraska, Lincoln.
Lewarch, D.E. and M.J. O’Brien 1981a. The expanding role of surface assemblages in archaeological research. In Schiffer, M.B. (Ed.), Advances in archaeological method and theory. Volume 4. Academic Press, New York.
Lewarch, D.E. and M.J. O’Brien 1981b. Effect of short term tillage on aggregate provenience surface pattern. In M.J. O’Brien, and D.E. Lewarch (Eds), Plowzone archaeology: contributions to theory and technique. Vanderbilt University, Tennessee.
Long, Andrew 2002. Scarred trees. A field identification manual. Aboriginal Affairs Victoria. Compiled by Harry Webber. Department of Natural Resources and Environment, Melbourne. (The manual is available online).
Long, Andrew 2005. Aboriginal scarred trees in New South Wales: a field manual. Department of Environment and Conservation (NSW), Hurstville. Archive version: http://nla.gov.au/nla.arc-55351.
Meehan, Betty 1982. Shell bed to shell midden. Australian Institute of Aboriginal Studies, Canberra.
Mitchell, Catherine 1996. Interpreting charcoal patches on open-site archaeology: need we be stumped for an answer? BA Honours thesis, Department of Archaeology and Paleoanthropology, University of New South England.
Mitchell, P. 1988. The influences of vegetation, animals and micro-organisms on soil processes. In H.A. Viles (Ed.), Biogeomorphology. Basil Blackwell Ltd, Oxford.
Mulvaney, John and Johan Kamminga 1999. Prehistory of Australia. Allen and Unwin, Sydney.
Moeyersons J. 1978. The behaviour of stones and stone implements buried in consolidating and creeping Kalahari sands, Earth Surface Processes, 3:115-128.
O’Connell, James F. Jim Allen, Martin A.J. Williams, Alan N. Williams, Chris S.M. Turney, Nigel A. Spooner, Johan Kamminga, Graham Brown, Alan Cooper, 2018. When did Homo sapiens first reach Southeast Asia and Sahul? Proceedings of the National

Kamminga and Lance 2019 EP161 Northern Scope, Aboriginal and non-Indigenous archaeological assessment 45
Academy of Sciences, 115(34): 8482–8490.
Officer, Kelvin 1992. An archaeological investigation and management assessment of an Aboriginal scarred tree: ‘Gunderoo Drive Four’, Gungahlin, ACT. Navin Officer Archaeological Resource Management report to R.A. Young and Associates Pty Ltd.
Officer, Kelvin and Kerry Navin 1998. Cultural heritage assessment, Proposed Visy Pulp and Paper Mill, Gadara Plains, Tumut, NSW. Report to Nolan-ITU Pty Ltd.
Roper, D.C. 1976. Lateral displacement of artefacts due to plowing, American Antiquity, 41:372-375.
Tindale, N.B. 1974. Aboriginal tribes of Australia. Their terrain, environmental controls, distribution, limits and proper names. University of California Press, Berkeley.

Santos Ltd l Environment Management Plan: McArthur Basin Civil and Seismic Program l 5 April 2019
Appendix G: Wastewater Management Plan

Wastewater Management Plan: McArthur Basin 2019 Drilling Program NT Exploration Permit (EP) 161
Date Rev Reason for Issue Author Checked Approved
08/03/2019 0 For Review DG PW DC
27/06/2019 1 Updates on waste disposal location DG PW DC
27/06/2019 2 Updates to align with final CoP DG PW DC
Santos Ltd l Wastewater Management Plan: McArthur Basin Drilling Program l 27 June 2019 Page i
Table of Contents
1.0 Introduction.................................................................................................................................. 5
1.1 Background ......................................................................................................................... 5
1.2 Scope .................................................................................................................................. 5
1.3 Wastewater management framework ................................................................................. 6
1.4 Waste management hierarchy ............................................................................................ 6
2.0 Management ................................................................................................................................ 7
2.1 Activity description .............................................................................................................. 7
2.1.1 Domestic activities .................................................................................................. 7
2.1.2 Ancillary activities to drilling ................................................................................... 8
2.1.3 Well drilling ............................................................................................................. 8
2.2 Waste characteristics .......................................................................................................... 8
2.2.1 Drill fluids ................................................................................................................ 9
2.2.2 Drill cuttings .......................................................................................................... 10
2.3 Rainfall characteristics ...................................................................................................... 10
2.4 Waste management methods and locations ..................................................................... 11
2.4.1 Proposed methods ............................................................................................... 11
2.4.2 Proposed locations ............................................................................................... 13
2.5 Waste minimisation strategies .......................................................................................... 14
2.6 Risk assessment ............................................................................................................... 15
2.7 Monitoring plan .................................................................................................................. 15
2.7.1 Baseline monitoring of soils ................................................................................. 15
2.7.2 Monitoring of stored water .................................................................................... 16
2.7.3 Monitoring of drill fluid .......................................................................................... 16
2.7.4 Monitoring of drill cuttings .................................................................................... 17
2.7.5 Quality assurance and quality control measures ................................................. 17
Appendices .......................................................................................................................................... 25

Santos Ltd l Wastewater Management Plan: McArthur Basin Drilling Program l 27 June 2019 Page ii
Tables
Table 2-1 Waste generating activities ..................................................................................................... 7
Table 2-2 Anticipated waste characteristics ............................................................................................ 9
Table 2-3 The 1 in 1000 (0.1%) year AEP for rainfall (in mm) at the location of the proposed petroleum activities ................................................................................................................................ 10
Table 2-4 Waste generating activities and management methods ....................................................... 11
Table 2-5 Waste Types and Waste Disposal Locations ........................................................................ 14
Table 2-6 Drilling waste streams – waste management hierarchy considerations ............................... 14
Table 2-7 Suite of analysis for testing of stored groundwater ............................................................... 18
Table 2-8 Suite of analyses for testing of residual drill fluid .................................................................. 19
Table 2-9 Suite of analyses for testing of drill cuttings (solid samples) ................................................. 22
Table 2-10 Suite of analyses for testing of drill cuttings (Australian Standard Leaching Procure Extract From Solid) ............................................................................................................................................ 24
Figures
No table of figures entries found.
Appendices
Appendix A: Storage tank water balance investigation Northern Territory climate analysis

Santos Ltd l Wastewater Management Plan: McArthur Basin Drilling Program l 27 June 2019 Page iii
Abbreviations and Units
Acronym / Abbreviation
Description
ALARP As low as reasonably practicable
ALRA Aboriginal Land Rights Act
AAPA Aboriginal Areas Protection Authority
APPEA Australian Petroleum Production and Exploration Association
CLA Cambrian Limestone Aquifer
Code Code of Practice
CPESC Certified Professional in Erosion and Sediment Control
DENR Department of Environment and Natural Resources
DoEE Department of Environment and Energy
DFIT Diagnostic Fracture Injection Test
DPIR Department of Primary Industry and Resources
D&C Drilling and Completions
EC Electrical Conductivity
EMP Environmental Management Plan
EP Exploration Permit
EPBC Act Environment Protection and Biodiversity Conservation Act 1999
EPS Environmental Performance Standards
ERA Environmental Risk Assessment
ESD Ecologically Sustainable Development
ha Hectares
GISERA Gas Industry Social and Environmental Research Alliance
km Kilometre
LACA Land Access Compensation Agreement
LWD Logging While Drilling
NLC Northern Land Council
m Metres
MD Measured Depth
MoC Management of Change
NRM Natural Resource Management
NT Northern Territory
NT EPA Northern Territory Environmental Protection Authority
NVIS National Vegetation Information System
Panel Independent Scientific Panel
PL Petroleum Lease
PMST Commonwealth Protected Matters Search Tool
PPL Petroleum Pipeline Licence

Santos Ltd l Wastewater Management Plan: McArthur Basin Drilling Program l 27 June 2019 Page iv
Acronym / Abbreviation
Description
SEAAOC South East Asia Australia Onshore Conference
SMS Santos Management System
SSCC Sacred Site Clearance Certificate
TOC Total Organic Content
TPWC Act Territory Parks and Wildlife Conservation Act 2014
TVD True Vertical Depth
TVDSS True Vertical Depth referenced to sea-level (Australian Height Datum)
WOMP Well Operations Management Plan
WoNS Weed of National Significance

Santos Ltd l Wastewater Management Plan: McArthur Basin Drilling Program l 27 June 2019 Page 5
1.0 Introduction
1.1 Background
Santos proposes to undertake exploration and appraisal activities in EP 161 in 2019, 2020 and beyond. The purpose of exploration and appraisal activity is to increase our understanding of the prospectivity or potential of the permit area. Our objective whenever undertaking such activity is to minimise our impact on the environment, including any activities of Traditional Owners and pastoral lessees. To meet this purpose, exploration activities in 2019 include:
Civil engineering activity – upgrading and creation of new access tracks, lease pads, water bore installation and water extraction as required
2D seismic acquisition
Exploration drilling – both vertical and horizontal drilling
Well evaluation – including mud logging, wireline logging, logging while drilling formation testing, core acquisition, fluid sampling, open-hole formation integrity testing (i.e. Diagnostic Fracture Injection Testing (DFITs)) and other standard evaluation techniques as appropriate
Cased hole DFIT
Hydraulic fracture stimulation
Flow-back and production testing
Environmental monitoring
Well suspension and/or well decommissioning
Ongoing site and well maintenance and monitoring, work-over and re-entry, and evaluation as required
Under the Petroleum (Environment) Regulations (the Regulations), interest holders in petroleum titles must prepare and submit an Environment Management Plan (EMP). Approval of an EMP is necessary for all activities that have an environmental impact or risk and is only one of several approvals required for the activity to proceed. An approved EMP is a statutory document that is enforceable. The Code of Practice for Petroleum Activities in the Northern Territory sets out the mandatory requirements for management plans for wastewater and spills. The Code states that an EMP for a petroleum activity must include a Wastewater Management Plan (WWMP).
1.2 Scope
Santos proposes to undertake a Drilling Program in 2019 at the Tanumbirini-1/2H and Inacumba-1/1H locations. This WWMP is to be included in the EMP for the Drilling Program.
This WWMP assesses all water and wastewater management activities which are proposed including:
Water that has been used in, or produced from petroleum wells, whether it be re-used,
recycled, treated or disposed of, and includes drilling fluids, completion fluids (excluding
hydraulic stimulation fluids) and well suspension fluids.
“waste material” and material containing “contaminants” as defined in s 117AAB of the
Petroleum Act 1984 (NT)
Wastewater meeting the definition of waste under the Waste Management and Pollution
Control Act 1998 (NT)

Santos Ltd l Wastewater Management Plan: McArthur Basin Drilling Program l 27 June 2019 Page 6
Water that has been acquired or used in petroleum activities that is being disposed of
Residual drilling waste, e.g. muds and cuttings (which may be more or less in a solid state) in
addition to fluids
No produced water or flow back fluid are to be produced as part of the proposed activities.
No non-aqueous drilling fluids are to be used as part of the proposed activities.
This WWMP is for the Drilling Program at the Tanumbirini-1/2H and Inacumba-1/1H locations. This program does not include hydraulic fracture stimulation activities. Santos does intend to conduct hydraulic fracture stimulation in these wells, but this will be the subject of a separate EMP.
1.3 Wastewater management framework
This WWMP comprises a component of a wastewater management framework.
1. Estimate the quantities and quality of water and wastewater from the petroleum activity
2. Define the methods and approaches that will be used to store, treat, and reuse water and
ultimately dispose of wastewater, including what activities will be undertaken at the site of the
approved petroleum activity
3. Estimate the quantities and quality of wastewater, or wastewater derived solids, that will be
removed from the petroleum site
4. Provide for the relevant activities and the environmental risks and environmental impacts they
involve in a wastewater management plan (WWMP)
1.4 Waste management hierarchy
This WWMP has been developed in consideration of the waste management hierarchy outlined in the
National Waste Policy, 2018. Where practical, waste and wastewater management activities are
designed to sequentially and preferentially avoid, reduce, reuse, recycle and treat before disposing of
waste and wastewater. This is described in Section 2.5.

Santos Ltd l Wastewater Management Plan: McArthur Basin Drilling Program l 27 June 2019 Page 7
2.0 Management
2.1 Activity description
This section contains a description of the activities that will generate waste and wastewater, including
any activities that may generate drilling materials and any other waste that is proposed to be handled,
stored or transported away from the area in which the activity is approved to be carried out
Activities that will generate waste are summarised in Table 2-1 and described in the following sections.
Table 2-1 Waste generating activities
Activity – waste source Waste Type
Domestic activity (camp and offices)
Putrescible and municipal waste
Recyclables (glass and cans)
Grey water (laundry, showers, sink wastes, etc.)
Treated sewage effluent
Toilet waste (port-a-loos)
Ancillary activities to drilling
Chemical bags and cardboard packaging materials
Scrap metals
Used chemical containers and fuel drums
Chemical wastes
Timber pallets (skids)
Vehicle tyres
Oily rags, filters
Well drilling Drilling fluids
Drilling cuttings
2.1.1 Domestic activities
Sewage management practices at all camps will consist of the use of port-a-loos and a fully self-contained sewage treatment plant (STP). Sewage from port-a-loos will be transported offsite by a waste management contractor.
The STP will be furnished with an irrigation sprinkler system to manage sewage and grey water wastes. All waste water will be disposed of in accordance with the Public and Environmental Health Regulation 2018. Discharge from the camp will be treated to achieve the specifications provided in the Northern Territory’s Code of Practice for On-site Wastewater Management. Treated effluent will be sprayed 50-100m away from the camp location to the surrounding environment, at a location will be well away from any place from which it is reasonably likely to enter any waters, and to minimise spray drift and ponding. Fencing will be installed around the irrigation area.
Wastepaper, cardboard and food scraps are disposed of into sealed bins set up adjacent to the camp area. The sealed bins will be transported for disposal of waste to a licensed landfill. Recyclable

Santos Ltd l Wastewater Management Plan: McArthur Basin Drilling Program l 27 June 2019 Page 8
materials will be managed on site and transported to an approved local waste depot facility (likely in Katherine or Darwin).
2.1.2 Ancillary activities to drilling
All waste streams from ancillary activities will be collected and stored on site. Waste will be transported for disposal or recycling as described in Section 2.4.
2.1.3 Well drilling
Drilling fluids
There are various drilling fluid systems used in the oil and gas industry. The term 'mud' is frequently used interchangeably with the term 'fluid'. The term 'mud' is used because of the thick consistency of the fluid system.
In general, drilling muds are used during the drilling of oil or gas wells to:
Carry cuttings from the hole
Cool and clean the drill bit
Reduce friction
Maintain the stability of the bore
Maintain down-hole hydrostatic pressure to prevent formation flow while drilling
Prevent damage to the formation.
The drilling fluid system will be a contained system and consist of engineered fluid storage tanks. Drilling fluids are recirculated through the mud system on the drill rig during drilling operation. Drilling muds will be formulated in-situ by mixing the different additives with water in a dedicated above-ground storage tank.
Drill cuttings
Drill cuttings are lifted out of the hole by the drilling fluid which is pumped down the inside of the drill pipe and circulated back to surface via the annulus of the drilling pipe. During an overbalanced operation, drilling fluid is utilised to mitigate subsurface drilling hazards.
Drilling fluids will be separated from drill cuttings. The returned drilling fluid flows over shale shakers to separate the drill cuttings from the drilling mud, with cuttings ejected into a skip for transferal into the cuttings pit and the drill fluid flows through the sieves and is cycled back to the mud tanks. The cuttings are sampled as they drop off the shale shakers at specified intervals for processing and analysis by the mudlogging team and wellsite geologist.
2.2 Waste characteristics
This section characterises the anticipated wastewater streams that will be generated, including
chemical characteristics and volumes of each.
Table 2-2 provides a summary of the anticipated waste characteristics. Further detail is provided for
drilling fluid and drilling cuttings.

Santos Ltd l Wastewater Management Plan: McArthur Basin Drilling Program l 27 June 2019 Page 9
Table 2-2 Anticipated waste characteristics
Waste Estimated volume
Chemical characteristic Management method
Domestic waste – putrescible, municipal and recyclable
Less than 200m3 Potentially hazardous to non-hazardous
Designated collection bins with transport off-site by licensed contractor
Domestic wastewater – grey water and treated sewage effluent
Less than 720m3 Non-hazardous Reticulated collection, on-site treatment and disposal via irrigation
Domestic wastewater – port-a-loo toilets
Less than 100m3 Potentially hazardous Collection and storage on-site, disposal off-site by licensed contractor
Ancillary activities to drilling
Less than 100m3 Hazardous to non-hazardous Collection and storage on-site, and transport off-site by licensed contractor
Drilling fluid See Section 2.2.1 Reticulated containment and storage in monitored, lined and bunded tanks and lined pits
Drilling cuttings See Section 2.2.2 Containment and storage in monitored, lined and bunded tanks, and lined pits
2.2.1 Drill fluids
Volumes
The proposed drilling mud is predominantly comprises water with the remainder made up of salts and fluid additives. It is anticipated that approximately 4-5 ML will be required.
Chemical characteristics
Drilling fluids used are a water based, homogenous blend of water, clays and other minor chemical additives. Additives used have various purposes such as:
Treating bacteria
Adjusting pH
Controlling viscosity
Reducing fluid loss to the formation
Inhibiting equipment corrosion.
It is not necessary to use all of these chemicals for every well. Specific chemicals are selected during drilling, depending upon the particular requirements or any difficulties encountered. Of the total volume used, only small volumes have the potential to move beyond the well bore to the formations due to the filter cake properties of the mud and their design.
All chemicals used in Australia must be approved for use by the Commonwealth Government, Department of Health and listed on the Australian Inventory of Chemical Substances which is maintained under the National Industrial Chemicals Notification and Assessment Scheme.

Santos Ltd l Wastewater Management Plan: McArthur Basin Drilling Program l 27 June 2019 Page 10
No drilling fluid additives that are used in the process contain benzene, toluene, ethylbenzene or xylene.
The Material Safety Data Sheets for all the chemicals will be provided as part of the Drilling Project Applications to the DENR and DPIR.
2.2.2 Drill cuttings
Volumes
The exact amount of drill cuttings produced is dependent upon a number of factors, including the depth and diameter of the hole being drilled, however, up to 500 m3 is anticipated per well.
Chemical characteristics
Drill cuttings are expected to primarily comprise siliciclastic rocks (mudstones and sandstones) containing predominantly quartz grains, feldspars, and clays that are benign in terms of environmental hazard. The drill cuttings will be inert, and appear as gravelly sandy or silty material.
It is expected that naturally occurring radiogenic materials (NORMs) will increase above background levels in the cuttings from the organic rich intervals in the Kyalla Formation and Velkerri Formation. This is because uranium has a natural affinity for concentration in similar geological settings to the preservation of organic material. The NORMs activity levels are not expected to approach reportable levels however. This assumption is based on data from other wells drilled across the Beetaloo Sub-basin.
Monitoring of drill cuttings is proposed in Section 2.7.4. The results of the sampling and analysis of the cuttings will inform disposal and rehabilitation measures.
2.3 Rainfall characteristics
This section contains estimates for the 1 in 1000 average recurrence interval (ARI) for rainfall for the
duration of activities, along with the means used for their estimation.
Appendix A provides the methodology which was used to determine the 1 in 1000 year annual
recurrence interval (ARI) for rainfall over a 3-month period in the wet and the dry season at the
location of the proposed petroleum activities. Annual recurrence interval (ARI) is assumed to be
equivalent to annual exceedance probability (AEP). Table 2-3 below summarises the findings.
Table 2-3 The 1 in 1000 (0.1%) year AEP for rainfall (in mm) at the location of the proposed petroleum
activities
0.1% AEP Rainfall Wet season (mm) Dry season (mm)
7-day 682 -
90-day 1,448 321
All drilling operations will occur outside the wet season, including the removal and transfer of all
residual drilling fluids, if required. No residual drilling fluids will be stored in open pits or tanks during
the wet season.

Santos Ltd l Wastewater Management Plan: McArthur Basin Drilling Program l 27 June 2019 Page 11
A minimum of 1m freeboard will be maintained in all pits that contain drilling fluid throughout the dry
season. This is conservative, given the 90-day AEP is 0.321 m. This adequately considers the
potential overtopping risk due to potential wind and wave action.
The available freeboard will be monitored as referenced in Section 2.7
2.4 Waste management methods and locations
This section contains a proposed method and location of water and wastewater storage,
transportation, treatment disposal and re-use as part of the proposed activity, with reference to any
requirements mandated by the COP.
2.4.1 Proposed methods
A broad overview of the waste management methods are described in Section 2.1. Disposal options
have taken into account the results of a risk assessment (see Section 2.6).
Control measures will be implemented to minimise interactions of all stored waste with wildlife, stock
and human receptors. Controls measures will comprise fencing, signage and fauna-proof containment
as necessary.
Table 2-4 Waste generating activities and management methods
Activity – waste source Waste type Management and disposal method
Domestic activity (camp and offices)
Putrescible and municipal waste
Collected at campsite for disposal to licenced landfill
Recyclables (glass and cans) Collected at campsite for deposit at licenced recycling facilities
Grey water (laundry, showers, sink wastes, etc.) and treated sewage effluent
Grey water captured and piped to a treatment system that meet the NT Code of Practice for Small On-site Sewage, then piped to an irrigation area.
Toilet waste (port-a-loos) Toilet waste will be captured and transported offsite for recycling or disposal.
Ancillary activities to drilling
Chemical bags and cardboard packaging materials
Compacted and collected at rig site for disposal to licenced landfill
Scrap metals Collected in designated skip for transport to licenced recycling facility
Used chemical and fuel drums Collected in designated skip for recycling and re-use
Chemical wastes Collected in approved containers for disposal at licenced landfill
Timber pallets (skids) Collected at site and recycled or disposed of at licenced landfill
Vehicle tyres Shredded and disposed to licenced landfill
Oily rags, filters Collected in suitable containers for disposal at licenced landfill

Santos Ltd l Wastewater Management Plan: McArthur Basin Drilling Program l 27 June 2019 Page 12
Activity – waste source Waste type Management and disposal method
Well drilling
Drilling fluids
Initially recycled. Volume reduced further via evaporation. May be transferred to the cuttings pit for temporary storage and to encourage evaporation of water. Any residual drilling fluids will be removed from the drill pit and transported for disposal off site prior to the onset of the wet season. Residual solid waste (from evaporated drill fluids) will be mixed in with drill cuttings.
Drilling cuttings
Cuttings and solid drilling residue initially stored in a lined pit. Subject to sampling and testing results drill cuttings will be buried and disposed in-situ. Certification will be sought from a suitably qualified third party that the material is of acceptable quality for disposal to land by the proposed method, and that environmental harm will not result from the proposed disposal. Approval of the certified method must be provided by DPIR/DENR. If approval cannot be granted, then waste may be disposed of to a licenced facility.
Drill cuttings storage
Design of the drill cuttings pit will comprise:
engineered pits, lined with an impermeable membrane with coefficient of permeability of less than 10-9 m/s tested in accordance with AS 1289.6.7.2 and with resistance to tearing >0.5kN (ASTM D 4073); static puncture >0.5kN (ASTM D 4833) and tensile strength >20 kN/m (ASTM D 7275); or
above ground storage tanks with secondary containment measures as detailed in section B.4.16.2 (h) of the code.
Drill fluids storage
Drill fluids will be stored in above ground engineered tanks located on the well lease pad. Multiple tanks may be used, comprising operational tanks and contingency fluid storage tanks. Additional storage may be provided by the drill cuttings storage pit.
Spill containment will be installed that comprises a secondary barrier that sits under the above ground tanks and prevents leaks and spills from contacting natural ground surface and facilitates spill collection and clean-up.
Fluid levels in the tanks will be monitored and alarmed in operational tanks to prevent overtopping. If needed, fluid will be transferred from operational tanks to contingency storage tanks and or the drill cuttings pit.

Santos Ltd l Wastewater Management Plan: McArthur Basin Drilling Program l 27 June 2019 Page 13
Disposal of residual drilling materials
Residual drill fluid will initially be stored on site and the fluid allowed to evaporate, leaving behind only solid material that can be mixed in with residual drilling cuttings. All residual drilling fluids will be removed from the pit prior to the onset of the wet season.
Results from the monitoring of drill fluid and drill cuttings (refer to Section 2.7) will be used to validate if on-site disposal of solid residual drilling material stored in the pit is feasible. Certification will be sought from a suitably qualified third party that the material is of acceptable quality for disposal to land by the proposed method, and that environmental harm will not result from the proposed disposal. The suitably qualified third party means a person who meets the criteria defined Section C.4.1.2(f) of the code. DENR/DPIR must approve of the disposal method which is certified by the suitably qualified third party.
Should the proposed and certified disposal method not be approved by DENR/DPIR, then it may be
disposed of at a licenced facility (see Table 2-5).
Fauna interaction
Control measures to prevent the interactions of wildlife, stock, and human receptors with wastewater are detailed in Table 6-1 of the EMP and include, amongst other things:
Fauna ladders will be installed at all open pits Pits and dams will be fenced Daily checks of pits and dams throughout the drilling program
2.4.2 Proposed locations
The EMP for the proposed activities provides a layout of the proposed Infrastructure for each well site
(refer to Figure 3-2 and Figure 3-3 of the EMP). These layouts show waste storage locations as
follows:
Dam – correspond to a lined earth-bund structure that will be used to store abstracted groundwater
Rig campsite – which will be the area that the grey water is reticulated and all other camp wastes are stored
Laydown area – which will be the area that waste from activities ancillary to drilling will be stored
Cuttings pit – which will be the pit used to store the residual drill cuttings, drilling fluid and solid drilling residue (from evaporated drilling fluid).
Well lease area – area in which above-ground tanks will be located and used to store drilling fluid.
Water tank pads – these are engineered pads that have been constructed to support above ground fluid storage tanks. However the construction and operation of these tanks is not included as part of the proposed petroleum activity related to this WWMP.
Proposed waste disposal locations are provided in Table 2-5.

Santos Ltd l Wastewater Management Plan: McArthur Basin Drilling Program l 27 June 2019 Page 14
Table 2-5 Waste Types and Waste Disposal Locations
Type of Waste Disposal Location
General and food Katherine or Darwin, NT
Empty IBCs Katherine or Darwin, NT
Metal and plastic drums Katherine or Darwin, NT
Waste material Katherine or Darwin, NT
Batteries and tyres Katherine or Darwin, NT
Residual drill fluids Mt Isa
Drill cuttings and solid drilling residue
In-situ disposal, if proven feasible. Otherwise Mt Isa
Listed Waste Any waste prescribed wastes under the Waste Management and Pollution Control Act as specified as a listed waste by the NT EPA as found at https://ntepa.nt.gov.au/waste-pollution/approvals-licences/listed-waste, will be disposed of in accordance with the regulations and by a company licensed to handle and dispose of this waste.
2.5 Waste minimisation strategies
This section contains strategies to minimise or reduce the volume of wastewater that will be disposed
of off-site, and the expected quality and quantity of water and wastewater that will be treated and re-
used within the petroleum activity
Table 2-6 summarises the methods that will be used to minimise waste in accordance with the waste
management hierarchy.
Table 2-6 Drilling waste streams – waste management hierarchy considerations
Waste Stream
Avoid Reduce Reuse Recycle Treat Dispose
Drilling Fluids
Only water based drilling mud planned.
Non- aqueous drilling mud will not be used.
Recycle fluids as much as possible - reduces consumption of additives and production of waste.
Transfer recycled fluids between wells where applicable. Treat fluid to avoid bacteria and prolong operational lifespan.
Recycle fluids as much as feasible with available solids control equipment.
Treat with drilling chemicals to facilitate recycling where feasible
At the end of the campaign, drilling fluids with be evaporated as much as possible, pending the weather window and freeboard requirements (minimum 1m during wet season). Remaining fluid will be transferred to a 3rd party process facility for disposal/reuse.

Santos Ltd l Wastewater Management Plan: McArthur Basin Drilling Program l 27 June 2019 Page 15
Waste Stream
Avoid Reduce Reuse Recycle Treat Dispose
Drilling Cuttings
Cannot avoid.
Mud weights designed for gauge wellbore. This will minimise excess cuttings.
Mud chemicals used for shale inhabitation to minimise wellbore instability resulting in excess cuttings.
Not proposed. Not proposed. Separate fluids from cuttings as much as possible to maximise recycling of fluid.
Cuttings burial or removal subject to sampling results. The decision on disposal of the pit contents will be made in consultation with, and on the advice of, a suitably qualified independent environmental consultant and approval by DPIR/DENR.
2.6 Risk assessment
This section contains a risk assessment in relation to the potential impact to the environment from
water and wastewater management activities proposed as part of the petroleum activity
An assessment of environmental impacts, environmental risks, performnace standards and
measurement criteria posed by the drill cuttings and residual drilling fluids, incuding the transferring of
recycled/reused fluids, has been carried out. For completeness and consistency, this is presented in
Section 6 and Section 8 of the EMP. All risks associated with wastewater have been assessed to a
level that is ALARP and acceptable.
2.7 Monitoring plan
This section contains a monitoring plan that:
- Outlines the sampling locations, frequency, proposed analytical methods and analytical
detection limits, and any quality assurance and quality control measures that will be
implemented
- Reflects all monitoring requirements mandated by the COP and the EMP, as well as any
monitoring that is determined to be necessary as part of the risk assessment
- Requires all field measurements and sampling to be undertaken by suitably qualified
personnel and to utilise equipment that is suitably maintained, laboratory checked and
calibrated
- Requires all laboratory analyses to be conducted at a National Association of Testing
Authorities (NATA) accredited lab, where possible.
2.7.1 Baseline monitoring of soils
An assessment of physical properties of representative baseline soils at each well site will be conducted.
Three samples will be taken at equidistant depth intervals in a 0.6 metre deep soil core from three locations across the well site, adjacent to:

Santos Ltd l Wastewater Management Plan: McArthur Basin Drilling Program l 27 June 2019 Page 16
- the proposed well
- the proposed location for drill fluid storage tanks (i.e. on the well pad)
- cuttings pit location.
Soil tests for each sample will include:
- A permeability test, such as falling head permeability testing on a sample or triaxial constant
head permeability testing.
- A sample tested for:
o Particle size distribution
o Total chlorides (mg/kg)
o Exchangeable sodium (%)
o Emmerson aggregate test
2.7.2 Monitoring of stored water
The quality and quantity of all water stored will be monitored as per the below.
Quantity
Volume of water that is abstracted from the water bore will be measured using flowmeter. This will by recorded weekly during bore operations.
Fluid levels in storages containing abstracted groundwater will be monitored daily during well site operations. This provides a measure of the stored quantity of water.
Quality
Water quality of abstracted groundwater stored in tanks will be sampled monthly. The suite will be tested as per Table 2-7. Testing will comprise grab samples from the tank, or a sample of water pumped from the storage tank.
2.7.3 Monitoring of drill fluid
The quality and quantity of drill fluid will be recorded while within the area of the approved petroleum
activity.
Quantity
The fluid levels in tanks containing drilling fluids will be monitored daily throughout drilling operations. Fluid level will be used to calculate the stored volume of drilling fluid in tanks.
The volume of each load of residual drill fluid that is removed for treatment and/or disposal by third-party waste management contractors will be recorded and tracked.
Quality
A representative sample of stored drill fluids will be taken each month. The sample will be tested for the suite shown in Table 2-8. Sampling and testing will occur at least once each month throughout drilling operations.

Santos Ltd l Wastewater Management Plan: McArthur Basin Drilling Program l 27 June 2019 Page 17
The composition of residual drill fluids will be analysed to determine whether it is consistent with the
assumptions used for the assessment of environmental hazards and the design of proposed disposal
methods.
2.7.4 Monitoring of drill cuttings
The quality and quantity of drill cuttings will be recorded while within the area of the approved
petroleum activity.
Quantity
The volume of drill cuttings that will be stored in the pits will be estimated based on drilling data. An estimate of the total volume of drill cuttings stored in the pit will be estimated prior to disposal.
If removed from site, the volume of each load of drill cuttings that is removed for treatment and/or disposal by third-party waste management contractors will be recorded and tracked.
Quality
Continuous X-ray fluorescence (XRF) monitoring used during drilling to characterise the composition of the cuttings will be undertaken to verify that cuttings do not pose a safety or environment hazard, including the NORM activity levels. XRF monitoring will occur continuously during drilling, at every major source rock interval (e.g. every 10m of drilling) and provide a major elemental composition. The results provide a basis for determining if the NORM activity levels are reportable. This testing satisfies the need to test for radioactivity from NORMs to determine if the waste is classified under the Radiation Protection Act 2004 (NT).
At the end of the drilling operations, representative samples will be taken of stored drill cuttings. Samples will be tested for the suite shown in Table 2-9 and Table 2-10.
Leachability testing of drill cuttings will be undertaken in accordance with the Australian Standard Leachate Procedure (Australian Standard AS4439.2 and 44396.3) by a NATA accredited laoratory.
Further samples may be taken to verify that the quality of the material has been adequately characterised for the purpose of determining that the proposed disposal option is suitable, in accordance with any requirements to classify the waste as is required under the EMPC Act 1989 (NT).
The composition of residual drill cuttings will be analysed to determine whether it is consistent with the assumptions used for the assessment of environmental hazards and the design of proposed disposal methods.
2.7.5 Quality assurance and quality control measures
All field measurements and environmental sampling will be undertaken by suitably qualified personnel.
All monitoring equipment will be suitably maintained and calibrated prior to use, as per manufacturer’s instructions.
All samples shall be collected using suitable sample containers, preservation methods and chains of custody prior to receipt by analytical laboratories. Holding times will be met, where practical.
All laboratory analyses will be conducted at a National Association of Testing Authorities (NATA) accredited lab, where possible.

Santos Ltd l Wastewater Management Plan: McArthur Basin Drilling Program l 27 June 2019 Page 18
Table 2-7 Suite of analysis for testing of stored groundwater
Analyte ALS Method
Code Limit of
reporting Units
Electrical Conductivity (EC) (measured in field) EA010-P 1 S/cm
Total Dissolved Solids (TDS) EA015H 10 mg/L
Total Suspended Solids (TSS) EA025H 5 mg/L
pH (measured in field, and in lab) EA05-P 0.01 pH Units
Sulfate (SO4-2) NT-2A 1 mg/L
Chloride (Cl-) NT-2A 1 mg/L
Carbonate (CO3-2) NT-2A 1 mg/L
Bicarbonate (HCO3-) (as CaCO3 equivalent) NT-2A 1 mg/L
Bicarbonate Alkalinity (as CaCO3 equivalent) NT-2A 1 mg/L
Hydroxide Alkalinity (as CaCO3 equivalent) NT-2A 1 mg/L
Total Alkalinity (as CaCO3 equivalent) NT-2A 1 mg/L
Nitrite (NO2-)
NT-8A 0.01 mg/L
Nitrate (NO3-) 0.01 mg/L
Fluoride (F-) NT-2A 0.1 mg/L
Sodium (Na+)
NT-1B
1 mg/L
Magnesium (Mg2+) 1 mg/L
Potassium (K+) 1 mg/L
Calcium (Ca2+) 1 mg/L
Arsenic
W-3, W-3T, EG020F, EG020T
0.001 mg/L
Barium 0.001 mg/L
Boron 0.001 mg/L
Cadmium 0.0001 mg/L
Chromium 0.001 mg/L
Lithium 0.001 mg/L
Copper 0.001 mg/L
Iron 0.05 mg/L
Lead 0.001 mg/L
Manganese 0.001 mg/L
Mercury 0.0001 mg/L
Selenium 0.001 mg/L
Silica 0.1 mg/L
Silver 0.001 mg/L
Strontium 0.001 mg/L
Zinc 0.001 mg/L

Santos Ltd l Wastewater Management Plan: McArthur Basin Drilling Program l 27 June 2019 Page 19
Table 2-8 Suite of analyses for testing of residual drill fluid
Analyte ALS Method
Code Limit of
reporting Units
Dissolved oxygen (DO) measured in situ EP025 0.1 mg/L
Electrical Conductivity (EC) measured in situ and lab EA010-P 1 S/cm
Total Dissolved Solids (TDS) EA015H 10 mg/L
Total Suspended Solids (TSS) EA025H 5 mg/L
pH measured in situ and in lab EA05-P 0.01
Temperature measured in situ - 0.1 C
Nitrate NT-6
0.01 % saturation and mg/L
Nitrite 0.01
Total Nitrogen NT-8A 0.1
Total Kjeldahl Nitrogen NT-8A 0.1
Ammonia NT-8A 0.01
Reactive Phosphorus NT-8A 0.01
Total Phosphorus NT-8A 0.01
Sulfate (SO4-2) NT-2A 1 mg/L
Chloride (Cl-) NT-2A 1 mg/L
Carbonate (CO3-2) NT-2A 1 mg/L
Bicarbonate (HCO3-) as CaCO3 equivalent NT-2A 1 mg/L
Bicarbonate Alkalinity as CaCO3 equivalent NT-2A 1 mg/L
Hydroxide Alkalinity as CaCO3 equivalent NT-2A 1 mg/L
Total Alkalinity as CaCO3 equivalent NT-2A 1 mg/L
Nitrite (NO2-)
NT-8A 0.01 mg/L
Nitrate (NO3-) 0.01 mg/L
Fluoride (F-) NT-2A 0.1 mg/L
Bromide (Br-) ED009X 0.01 mg/L
Total Cyanide EK026SF 0.004 mg/L
Sodium (Na+)
NT-1B
1 mg/L
Magnesium (Mg2+) 1 mg/L
Potassium (K+) 1 mg/L
Calcium (Ca2+) 1 mg/L
Aluminium
W-3, W-3T, EG020F, EG020T
0.01 mg/L
Antimony 0.001 mg/L
Arsenic 0.001 mg/L
Barium 0.001 mg/L
Beryllium 0.001 mg/L
Boron 0.001 mg/L
Cadmium 0.0001 mg/L
Chromium 0.001 mg/L
Cobalt 0.001 mg/L
Copper 0.001 mg/L
Iron 0.05 mg/L
Lead 0.001 mg/L

Santos Ltd l Wastewater Management Plan: McArthur Basin Drilling Program l 27 June 2019 Page 20
Analyte ALS Method
Code Limit of
reporting Units
Manganese 0.001 mg/L
Mercury 0.0001 mg/L
Molybdenum 0.001 mg/L
Nickel 0.001 mg/L
Selenium 0.001 mg/L
Silica 0.1 mg/L
Silver 0.001 mg/L
Strontium 0.001 mg/L
Thorium 0.001 mg/L
Tin 0.001 mg/L
Uranium 0.001 mg/L
Vanadium 0.05 mg/L
Zinc 0.001 mg/L
Other radionuclides and gross alpha, beta, and gamma radiation
EA250-LSC 0.05-0.1 Bq/L
Benzene
W-24
0.001 mg/L
Toluene 0.001 mg/L
Ethylbenzene 0.001 mg/L
M and p Xylene 0.001 mg/L
o Xylene 0.001 mg/L
Total Xylenes 0.002 mg/L
TRH C6 - C10
W-24
0.02 mg/L
TRH C6 - C10 less BTEX 0.02 mg/L
TRH >C10 - C16 0.02 mg/L
TRH >C10 - C16 less Naphthalene 0.02 mg/L
TRH >C16 - C34 0.01 mg/L
TRH >C34 - C40 0.01 mg/L
Total TRH C6 - C40 0.01 mg/L
3-Methylcholanthrene
W-24, EP074 A to H and EP033
0.001 mg/L
7, 12- Dimethylbenz(a)anthracene 0.001 mg/L
Acenaphthene 0.001 mg/L
Acenaphthylene 0.001 mg/L
Anthracene 0.001 mg/L
Benzo (a) pyrene 0.001 mg/L
Benzo (b) fluoranthene 0.001 mg/L
Benzo (ghi) perylene 0.001 mg/L
Benzo (k) fluoranthene 0.001 mg/L
Benzo (a) anthracene 0.001 mg/L
Chrysene 0.001 mg/L
Dibenz (ah) anthracene 0.001 mg/L
Fluoranthene 0.001 mg/L
Fluorene 0.001 mg/L
Indeno (1,2,3-cd) pyrene 0.001 mg/L
Naphthalene 0.001 mg/L

Santos Ltd l Wastewater Management Plan: McArthur Basin Drilling Program l 27 June 2019 Page 21
Analyte ALS Method
Code Limit of
reporting Units
Phenanthrene 0.001 mg/L
Pyrene 0.001 mg/L
Carcinogenic PAHs (benzo[a}pyrene equivalents
Total PAH 0.001 mg/L
2,3,4,6-Tetrachlorophenol
W-24, EP074 A to H and EP033
0.005 mg/L
2,4,5-Trichlorophenol 0.005 mg/L
2,4,6-Trichlorophenol 0.005 mg/L
2,4-Dichlorophenol 0.005 mg/L
2,4-Dimethylphenol 0.005 mg/L
2,4-Dinitrophenol 0.005 mg/L
2,6-Dichlorophenol 0.005 mg/L
2-Chlorophenol 0.005 mg/L
2-Methyl-4,6-dinitrophenol 0.005 mg/L
2-Nitrophenol 0.005 mg/L
4-Chloro-3-methylphenol 0.005 mg/L
4-Nitrophenol 0.005 mg/L
Dinoseb 0.005 mg/L
Hexachlorophene 0.005 mg/L
m- and p-Cresol 0.005 mg/L
Pentachlorophenol 0.005 mg/L
Phenol 0.005 mg/L
Dissolved Organic Carbon (DOC) EP002 1 mg/L
Total Organic Carbon (TOC) EP005 1 mg/L
Bromide ED009X 0.01 mg/L
Chlorine/Chloride NT-2A 1 mg/L
Formaldehyde EP010 mg/L

Santos Ltd l Wastewater Management Plan: McArthur Basin Drilling Program l 27 June 2019 Page 22
Table 2-9 Suite of analyses for testing of drill cuttings (solid samples)
Analyte Method Code Limit of Reporting Units
Ag iMET2SAICP 0.5 mg/kg
Al iMET2SAICP 10 mg/kg
As iMET2SAICP 1 mg/kg
B iMET2SAICP 5 mg/kg
Ba iMET2SAICP 0.1 mg/kg
Be iMET2SAICP 0.05 mg/kg
C (combs) 0.05 %
CO3 (combs) 0.25 %
Cd iMET2SAICP 0.05 mg/kg
Cl iCO1SEDA 5 mg/kg
Co iMET2SAICP 0.1 mg/kg
Cr iMET2SAICP 0.05 mg/kg
Cu iMET2SAICP 0.1 mg/kg
Electrical conductivity at 25˚C iEC1SASE 0.2 ms/m
F eF1ST 50 mg/kg
H2O_105C iMOIS1SAGR 0.1 %
Hg iMET2SAMS 0.02 mg/kg
Mn iMET2SAICP 0.2 mg/kg
Mo iMET2SAICP 0.5 mg/kg
N (total) 0.005 %
Ni iMET2SAICP 1 mg/kg
P (totals) 10 mg/kg
Pb iMET2SAICP 0.5 mg/kg
Se iMET2SAICP 2 mg/kg
Sr iMET2SAICP 0.2 mg/kg
TIC (combs) 0.05 %
TOC (combs) 0.05 %
V iMET2SAICP 0.2 mg/kg
Zn iMET2SAICP 5 mg/kg
pH iPH1SASE 0.1 -
Benzene eBTEXSoil 0.5 mg/kg
Toluene eBTEXSoil 0.5 mg/kg
Ethylbenzene eBTEXSoil 0.5 mg/kg
Xylene eBTEXSoil 1 mg/kg
Total BTEX eBTEXSoil 2.5 mg/kg
TPH C6-C9 eTPHSoils 25 mg/kg
TPH C10-C14 eTPHSoils 50 mg/kg
TPH C15-C28 eTPHSoils 100 mg/kg
TPH C29-C36 eTPHSoils 100 mg/kg
Total TPHs eTPHSoils 275 mg/kg
Acenaphthene ePAH1SOIL 1 mg/kg

Santos Ltd l Wastewater Management Plan: McArthur Basin Drilling Program l 27 June 2019 Page 23
Analyte Method Code Limit of Reporting Units
Acenaphthylene ePAH1SOIL 1 mg/kg
Anthracene ePAH1SOIL 1 mg/kg
Benz(a)anthracene ePAH1SOIL 1 mg/kg
Benzo(a)pyrene ePAH1SOIL 1 mg/kg
Benzo(b+k)fluoranthene ePAH1SOIL 1 mg/kg
Benzo(g,h,i)perylene ePAH1SOIL 1 mg/kg
Chrysene ePAH1SOIL 1 mg/kg
Dibenzo(a,h)anthracene ePAH1SOIL 1 mg/kg
Fluoranthene ePAH1SOIL 1 mg/kg
Fluorene ePAH1SOIL 1 mg/kg
Indeno(1,2,3-cd)pyrene ePAH1SOIL 1 mg/kg
Naphthalene ePAH1SOIL 1 mg/kg
Phenanthrene ePAH1SOIL 1 mg/kg
Pyrene ePAH1SOIL 1 mg/kg
Total PAHs ePAH1SOIL 16 mg/kg

Santos Ltd l Wastewater Management Plan: McArthur Basin Drilling Program l 27 June 2019 Page 24
Table 2-10 Suite of analyses for testing of drill cuttings (Australian Standard Leaching Procure Extract
From Solid)
Analyte Method Code Limit of Reporting Units
Ag iMET1WCMS 0.0001 mg/L
Al iMET1WCICP 0.005 mg/L
As iMET1WCMS 0.001 mg/L
B iMET1WCICP 0.02 mg/L
Ba iMET1WCICP 0.002 mg/L
Be iMET1WCICP 0.001 mg/L
Cd iMET1WCMS 0.0001 mg/L
Cl iCO1WCDA 1 mg/L
Co iMET1WCICP 0.005 mg/L
Cr iMET1WCICP 0.001 mg/L
Cu iMET1WCMS 0.0001 mg/L
Hg iHG1WCVG 0.0001 mg/L
Hg iMET1WCMS 0.0001 mg/L
Mn iMET1WCICP 0.001 mg/L
Mo iMET1WCMS 0.001 mg/L
Ni iMET1WCMS 0.001 mg/L
Pb iMET1WCMS 0.0001 mg/L
Se iMET1WCMS 0.001 mg/L
Sr iMET1WCICP 0.002 mg/L
V iMET1WCICP 0.005 mg/L
Zn iMET1WCICP 0.005 mg/L
pH_ASLP iASLP 0.1 -

Santos Ltd l Wastewater Management Plan: McArthur Basin Drilling Program l 27 June 2019
Appendices

Santos Ltd l Wastewater Management Plan: McArthur Basin Drilling Program l 27 June 2019
Appendix A: Storage tank water balance investigation Northern Territory climate analysis

Memorandum
Date 1 February 2019 Pages 18
Attention Philippa Kassianos
Company Santos Ltd
Job No. 1413-10-B
Subject Storage tank water balance investigation Northern Territory climate
analysis
Background and study objectives
WRM was engaged by Santos to undertake a simple water balance analysis of water
storage tanks proposed for Northern Territory petroleum operations.
The storage tanks will be used to temporarily contain wastewater (e.g. unused
hydraulic fracture fluids, drilling fluids, raw water or produced formation water)
for up to 3 months. The tanks may be open-topped and will therefore be subject to
climatic influences.
Santos requested analysis of the two areas shown in Figure 1, which experience
very different climate conditions:
• Beetaloo Basin (Dukas 1 well);
• Amadeus Basin (Inacumba North well).
Santos wish to better understand how the tanks would need to be designed and
operated to minimise the likelihood of rainfall-driven wastewater overflow. The
design standard currently under consideration is containment of rainfall inflows to
an annual exceedance probability (AEP) of 1 in 1,000 (0.1%) over the duration of
the activity.
The key objectives of this study are therefore to understand 3-month 0.1% AEP
rainfall depths, and given the temporal distribution of rainfall and evaporation
experienced in these areas, how stored water levels could be expected to respond
over periods of up to a year.

Memorandum
wrmwater.com.au 1413-10-B| 1 February 2019 | Page 2
Figure 1 – Location of the assessment locations
Climate characteristics
Rainfall and evaporation data for the Amadeus and Beetaloo Basin sites were
obtained from the Queensland Climate Change Centre of Excellence (QCCCE) SILO
Data Drill Service. The rainfall and evaporation datasets span from January 1889 to
January 2019.
As shown in Figure 2 to Figure 5, rainfall in the Amadeus Basin (average annual
rainfall 210 mm) is significantly less than in the Beetaloo Basin (average annual
rainfall 684 mm). Rainfall in the Beetaloo Basin is strongly seasonal, with most rain
falling between November and April, whereas Amadeus Basin rainfall is evenly
distributed throughout the year.
Figure 2 to Figure 5 also show evaporation is higher in the Amadeus Basin (average
annual pan evaporation 2,928 mm) than in the Beetaloo Basin (average annual pan
evaporation 2,671 mm). Evaporation in the Amadeus Basin is strongly seasonal,
with evaporation rates being significantly reduced between April and September.

Memorandum
wrmwater.com.au 1413-10-B| 1 February 2019 | Page 3
Figure 2 – Average monthly rainfall and pan evaporation - Beetaloo Basin
Figure 3 – Annual rainfall - Beetaloo Basin
-
50
100
150
200
250
300
350
400
Oct Nov Dec Jan Feb Mar Apr May Jun Jul Aug Sep
Avera
ge M
onth
ly R
ain
fall a
nd E
vapora
tion (
mm
)
Rainfall
Evaporation
0
200
400
600
800
1,000
1,200
1,400
1,600
1880
1890
1900
1910
1920
1930
1940
1950
1960
1970
1980
1990
2000
2010
Annual
Rain
fall (
mm
)

Memorandum
wrmwater.com.au 1413-10-B| 1 February 2019 | Page 4
Figure 4 – Average monthly rainfall and pan evaporation - Amadeus Basin
Figure 5 – Annual rainfall - Amadeus Basin
-
50
100
150
200
250
300
350
400
Oct Nov Dec Jan Feb Mar Apr May Jun Jul Aug Sep
Avera
ge M
onth
ly R
ain
fall a
nd E
vapora
tion (
mm
)
Rainfall
Evaporation
0
200
400
600
800
1,000
1,200
1,400
1,600
1880
1890
1900
1910
1920
1930
1940
1950
1960
1970
1980
1990
2000
2010
Annual
Rain
fall (
mm
)

Memorandum
wrmwater.com.au 1413-10-B| 1 February 2019 | Page 5
Methodology and Results
Estimation of 3-month (90 day) 0.1% AEP rainfall depth
The following methodology was used to estimate the 0.1% AEP rainfall depth.
1. For each day in the climate dataset, sum the rainfall and evaporation over
the preceding 90 day period;
2. Identify the highest 90 day rainfall total in each calendar year to create
an annual time series of 90 day maxima (130 annual maxima);
3. Identify the highest 90 day rainfall in the dry season months of each
calendar year to create an annual time series of dry season 90 day maxima
(130 annual maxima);
For the purpose of this analysis, a 90 day period is considered “dry
season” if it ends between July and November (as illustrated in the figure
below - i.e. it relates to tanks operating between May and November only)
J F M A M J J A S O N D
4. Rank the 90 day maxima and fit a Log Pearson Type III (LPIII) distribution –
repeat for the dry season time series;
5. Extrapolate the LPIII distribution to estimate the 0.1% AEP rainfall depth.
Note that the potential effects of climate change have not been incorporated into
this analysis.
The LPIII distributions to the annual series of 90 day rainfall maxima are shown in
Figure 6 to Figure 91. The 3-month, 0.1% AEP rainfall totals are estimated to be:
• Beetaloo Basin – all months: 1,448 mm;
• Beetaloo Basin – dry season: 321 mm;
• Amadeus Basin - all months 593 mm;
• Amadeus Basin - dry season: 342 mm.
For context, 0.1% AEP 7-day design rainfall depths sourced from the Bureau of
Meteorology have been listed below:
• Beetaloo Basin – 682 mm
• Amadeus Basin - 492 mm
1 Note the horizontal scale in the LPIII figures follows the terminology specified in the 2016 version of Australian Rainfall and Runoff (Book 1, Chapter 2.2.5). EY denotes events per year, and is the inverse of ‘average recurrence interval’ (ARI).

Memorandum
wrmwater.com.au 1413-10-B| 1 February 2019 | Page 6
Figure 6 – Fit of LPIII Distribution to annual series of 90 day rainfall depths - Beetaloo Basin
Figure 7 – Fit of LPIII Distribution to annual series of 90 day dry season rainfall depths - Beetaloo Basin
20111,147 mm
20011,133 mm
19401,117 mm
20091,075 mm
20171,012 mm
1974984 mm
2004973 mm
1930970 mm
1967962 mm
2003932 mm
1976899 mm
0.0
5%
0.1
%
0.2
%
0.5
%
1%
2%
5%
10%
0.2
EY
0.5
EY
1EY
2EY
3EY
4EY
100
1,000
-2.3 -1.3 -0.3 0.7 1.7 2.7
Rain
fall t
ota
l depth
(m
m)
Annual Exceedance Probability
Observed Peak Discharge
Upper 90% Confidence Limit
Expected Quantile
Lower 90% Confidence Limit
Expected Probability Quantile
Gridlines
2000284 mm
2011269 mm
2006254 mm
2017213 mm
1981192 mm
1998187 mm
1933176 mm
1950164 mm
1955161 mm
1917139 mm
1974135 mm
0.0
5%
0.1
%
0.2
%
0.5
%
1%
2%
5%
10%
0.2
EY
0.5
EY
1EY
2EY
3EY
4EY
1
10
100
1,000
-2.3 -1.3 -0.3 0.7 1.7 2.7
Rain
fall t
ota
l depth
(m
m)
Annual Exceedance Probability
Observed Peak Discharge
Upper 90% Confidence Limit
Expected Quantile
Lower 90% Confidence Limit
Expected Probability Quantile
Gridlines

Memorandum
wrmwater.com.au 1413-10-B| 1 February 2019 | Page 7
Figure 8 – Fit of LPIII Distribution to annual series of 90 day rainfall depths - Amadeus Basin
Figure 9 – Fit of LPIII Distribution to annual series of 90 day dry season rainfall depths - Amadeus Basin
1974549 mm
2000526 mm1921
406 mm
1989321 mm
1984316 mm
1920315 mm
2010310 mm
1889264 mm
1979262 mm
2002242 mm
2001242 mm
0.0
5%
0.1
%
0.2
%
0.5
%
1%
2%
5%
10%
0.2
EY
0.5
EY
1EY
2EY
3EY
4EY
10
100
1,000
-2.3 -1.3 -0.3 0.7 1.7 2.7
Rain
fall t
ota
l depth
(m
m)
Annual Exceedance Probability
Observed Peak Discharge
Upper 90% Confidence Limit
Expected Quantile
Lower 90% Confidence Limit
Expected Probability Quantile
Gridlines
2010310 mm
1974264 mm
1889236 mm
1968210 mm
1979206 mm
1921200 mm
1975188 mm
1920173 mm
2001163 mm
1978158 mm
1914150 mm
0.0
5%
0.1
%
0.2
%
0.5
%
1%
2%
5%
10%
0.2
EY
0.5
EY
1EY
2EY
3EY
4EY
1
10
100
1,000
-2.3 -1.3 -0.3 0.7 1.7 2.7
Rain
fall t
ota
l depth
(m
m)
Annual Exceedance Probability
Observed Peak Discharge
Upper 90% Confidence Limit
Expected Quantile
Lower 90% Confidence Limit
Expected Probability Quantile
Gridlines

Memorandum
wrmwater.com.au 1413-10-B| 1 February 2019 | Page 8
Estimation of total 90 day evaporation coinciding with 0.1% AEP 90 day rainfall
The Data Drill estimates of Morton’s lake evaporation were adopted for estimating
evaporative losses from the tank water surface.
As shown in Figure 10, in the Beetaloo basin, elevated 90 day rainfall totals are
associated with reduced evaporation. For the purpose of this investigation, a linear
regression line was applied to this relationship, and extrapolated to estimate the
evaporation associated with the 0.1% AEP. In the dry seasons, and the Amadeus
Basin, the correlation between rainfall and evaporation is less clear. The figures
show the evaporation rates adopted for this.
Figure 10 – Relationship between 90 day rainfall depth and evaporation - Beetaloo Basin
Figure 11 – Relationship between 90 day rainfall depth and evaporation - Amadeus Basin
435
0
100
200
300
400
500
600
700
0
100
200
300
400
500
600
700
800
900
1,0
00
1,1
00
1,2
00
1,3
00
1,4
00
1,5
00
1,6
00
evap_m
ort
on_la
ke_90day (m
m)
daily_rain_90day (mm)
300
0
100
200
300
400
500
600
700
0
100
200
300
400
500
evap_m
ort
on_la
ke_90day (m
m)
daily_rain_90day (mm)

Memorandum
wrmwater.com.au 1413-10-B| 1 February 2019 | Page 9
Figure 12 – Relationship between 90 day rainfall depth and evaporation (dry season) - Beetaloo Basin
Figure 13 – Relationship between 90 day rainfall depth and evaporation (dry season) - Amadeus Basin
Derivation of 0.1% AEP daily timestep climate datasets for water balance model
The climate dataset was sampled 20 times – each sample commencing at the start
of one of the 20 largest 90 day rainfall events.
The resultant ensemble of 20 – 366-day long rainfall and evaporation temporal
patterns was used for the analysis. The first 90 days of each cumulative rainfall
temporal pattern are shown in the figures below.
200
0
100
200
300
400
500
600
700
0
100
200
300
400
500
600
700
800
900
1,0
00
evap_m
ort
on_la
ke_90day (m
m)
daily_rain_90day (mm)200
0
100
200
300
400
500
600
0
100
200
300
400
500
evap_m
ort
on_la
ke_90day (m
m)
daily_rain_90day (mm)
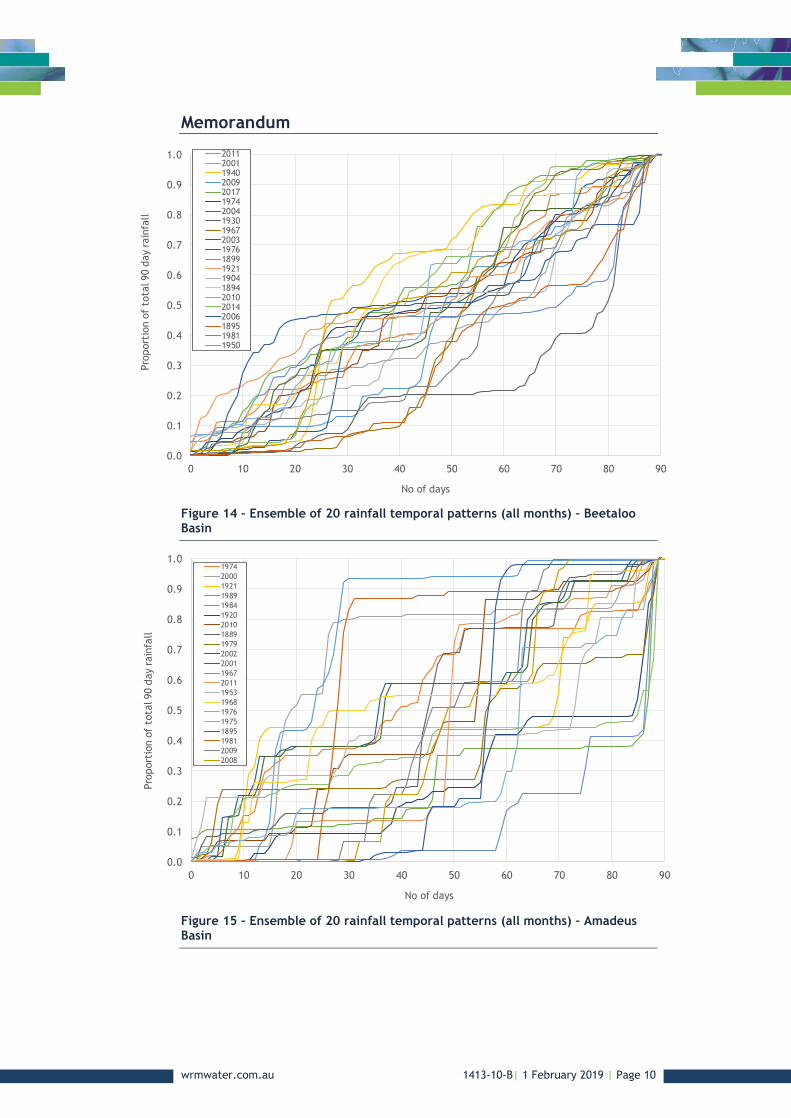
Memorandum
wrmwater.com.au 1413-10-B| 1 February 2019 | Page 10
Figure 14 – Ensemble of 20 rainfall temporal patterns (all months) – Beetaloo Basin
Figure 15 – Ensemble of 20 rainfall temporal patterns (all months) – Amadeus Basin
0.0
0.1
0.2
0.3
0.4
0.5
0.6
0.7
0.8
0.9
1.0
0 10 20 30 40 50 60 70 80 90
Pro
port
ion o
f to
tal 90 d
ay r
ain
fall
No of days
201120011940200920171974200419301967200319761899192119041894201020142006189519811950
0.0
0.1
0.2
0.3
0.4
0.5
0.6
0.7
0.8
0.9
1.0
0 10 20 30 40 50 60 70 80 90
Pro
port
ion o
f to
tal 90 d
ay r
ain
fall
No of days
1974
2000
1921
1989
1984
1920
2010
1889
1979
2002
2001
1967
2011
1953
1968
1976
1975
1895
1981
2009
2008

Memorandum
wrmwater.com.au 1413-10-B| 1 February 2019 | Page 11
Figure 16 – Ensemble of 20 rainfall temporal patterns (dry season) – Beetaloo Basin
Figure 17 – Ensemble of 20 rainfall temporal patterns (dry season) – Amadeus Basin
0.0
0.1
0.2
0.3
0.4
0.5
0.6
0.7
0.8
0.9
1.0
0 10 20 30 40 50 60 70 80 90
Pro
port
ion o
f to
tal 90 d
ay r
ain
fall
No of days
2000 2011
2006 2017
1981 1998
1933 1950
1955 1917
1974 1985
1911 2001
1920 1968
2010 1973
1986 1971
1890
0.0
0.1
0.2
0.3
0.4
0.5
0.6
0.7
0.8
0.9
1.0
0 10 20 30 40 50 60 70 80 90
Pro
port
ion o
f to
tal 90 d
ay r
ain
fall
No of days
201019741889196819791921197519202001197819141973194719521950189520042011200819081893

Memorandum
wrmwater.com.au 1413-10-B| 1 February 2019 | Page 12
The first 90 days of each rainfall temporal pattern was scaled up by the ratio of
the 0.1% AEP 90 day rainfall to the 90 day total for that event.
The first 90 days of each evaporation temporal pattern was scaled up by the ratio
of the 90 day evaporation estimate from the previous step to the 90 day total for
that event.
Model Results
The adopted climate data was input to a very simple water balance model in which
daily tank water level on each day is estimated as:
Tank WLn = Tank Wn-1 + Rainfall – (Mlake to Tank Evap Factor) *( Mlake Evap)
Where (Mlake to Tank Evap Factor) = 1.0
The results of the model are summarised in the table below and in the following
figures. When reviewing the figures, please note the following:
• The starting condition has been adjusted to ensure that no temporal patterns result in negative water levels;
• Extended outlook figures show 0.1% AEP rainfall conditions for the first 90 days of the simulation, and historical climate for the remainder of the simulation period. The intent of these figures is to give an indication as to how the water levels in the tank may recover (or otherwise) after a 0.1% AEP rainfall sequence, if the tank were left in place for longer than three months.
Table 1 – Summary of tank water balance model results (all units: mm)
Item Beetaloo Basin Amadeus Basin
Wet SeasonA Dry Season Wet SeasonA Dry Season
0.1% 90-day AEP rainfall 1,448C 321C 593D 342D
Co-incident evaporation -435 -300 -200 -200
Net 90-day water level increase 1,013 21 393 142
Max water level increase during the 90-day periodB
1,168 278 522 328
A Based on all months (not wet season only) B The largest difference between minimum and maximum water level occurring during the 90d simulation period, out of the 20 temporal patterns. C Note that BOM IFD 0.1% AEP 7d design rainfall is 682 mm for Beetaloo Basin location. This rainfall can
notionally occur at any time throughout the year. D Note that BOM IFD 0.1% AEP 7d design rainfall is 492 mm for Amadeus Basin location. This rainfall can notionally occur at any time throughout the year.

Memorandum
wrmwater.com.au 1413-10-B| 1 February 2019 | Page 13
Figure 18 – Water balance model results – all months – 90 days – Beetaloo Basin
Figure 19 – Water balance model results – all months – 366 days – Beetaloo Basin
0
200
400
600
800
1,000
1,200
1,400
0 10 20 30 40 50 60 70 80 90
Modelled w
ate
r depth
(m
m)
Number of days
2011 2001
1940 2009
2017 2004
1930 2003
1976 1899
1921 1904
1894 2010
2014 2006
1895 1981
1950 1967[C]
Critical sequence maximum
Critical sequence minimum
Max. increase inwater level during
three month period: 1,168 mm
0
200
400
600
800
1,000
1,200
1,400
0 50 100 150 200 250 300 350
Modelled w
ate
r depth
(m
m)
Number of days
2011 2001
1940 2009
2017 2004
1930 2003
1976 1899
1921 1904
1894 2010
2014 2006
1895 1981
1950 1967[C]
Critical sequence maximum
Critical sequence minimum
Max. increase inwater level during three month period: 1,168 mm
Simulated draw-down after 90 day 0.1% AEP rainfall sequence

Memorandum
wrmwater.com.au 1413-10-B| 1 February 2019 | Page 14
Figure 20 – Water balance model results – all months – 90 days – Amadeus Basin
Figure 21 – Water balance model results – all months – 366 days – Amadeus Basin
0
100
200
300
400
500
600
700
0 10 20 30 40 50 60 70 80 90
Modelled w
ate
r depth
(m
m)
Number of days
1974 2000
1921 1989
1984 1920
2010 1889
1979 2002
2001 1967
2011 1953
1968 1976
1975 1981
2009 2008
1895[C]
Critical sequence maximum
Critical sequence minimum
Max. increase inwater level during three month period: 522 mm
0
100
200
300
400
500
600
700
0 50 100 150 200 250 300 350
Modelled w
ate
r depth
(m
m)
Number of days
1974 2000
1921 1989
1984 1920
2010 1889
1979 2002
2001 1967
2011 1953
1968 1976
1975 1981
2009 2008
1895[C]
Critical sequence maximum
Critical sequence minimum
Max. increase inwater level during three month period: 522 mm
Simulated climate response after 90 day 0.1% AEP rainfall sequence

Memorandum
wrmwater.com.au 1413-10-B| 1 February 2019 | Page 15
Figure 22 – Water balance model results – dry season – 90 days – Beetaloo Basin
Figure 23 – Water balance model results – dry season – 366 days – Beetaloo Basin
0
100
200
300
400
500
600
700
0 10 20 30 40 50 60 70 80 90
Modelled w
ate
r depth
(m
m)
Number of days
2000 2011
2006 2017
1981 1933
1950 1955
1917 1974
1985 2001
1920 1968
2010 1973
1986 1971
1890 1911[C]
Critical sequence maximum
Critical sequence minimum
Max. increase inwater level during three month period: 278 mm
0
200
400
600
800
1,000
1,200
0 50 100 150 200 250 300 350
Modelled w
ate
r depth
(m
m)
Number of days
2000 2011
2006 2017
1981 1933
1950 1955
1917 1974
1985 2001
1920 1968
2010 1973
1986 1971
1890 1911[C]
Critical sequence maximum
Critical sequence minimum
Max. increase inwater level during three month period: 278 mm
Simulated climate response after 90 day 0.1% AEP rainfall sequence

Memorandum
wrmwater.com.au 1413-10-B| 1 February 2019 | Page 16
Figure 24 – Water balance model results – dry season – 90 days – Amadeus Basin
Figure 25 – Water balance model results – dry season – 366 days – Amadeus Basin
0
50
100
150
200
250
300
350
400
450
500
0 10 20 30 40 50 60 70 80 90
Modelled w
ate
r depth
(m
m)
Number of days
2010 1974
1889 1968
1979 1975
1920 2001
1978 1914
1973 1947
1952 1950
1895 2004
2011 2008
1893 1908[C]
Critical sequence minimum
Critical sequence maximum
Max. increase inwater level during three month period: 328 mm
0
50
100
150
200
250
300
350
400
450
500
0 50 100 150 200 250 300 350
Modelled w
ate
r depth
(m
m)
Number of days
2010 1974
1889 1968
1979 1975
1920 2001
1978 1914
1973 1947
1952 1950
1895 2004
2011 2008
1893 1908[C]
Critical sequence minimum
Critical sequence maximum
Max. increase inwater level during three month period: 328 mm
Simulated climate response after 90 day 0.1% AEP rainfall sequence

Memorandum
wrmwater.com.au 1413-10-B| 1 February 2019 | Page 17
Maximum operating level considerations
The values in the bottom row of Table 1 may be used by Santos when selecting
where to set the maximum operating levels in the proposed ponds. The maximum
operating level (MOL) should be set some distance below the overflow level of the
tank. The distance between the MOL and overflow level is defined as the
freeboard. The freeboard depth will correspond to either the design 0.1% AEP
rainfall inflow (i.e. Table 1 values), or a 0.1% AEP wave allowance estimated using
a recognised engineering method, whichever of the two is greater. Figure 26 shows
an example tank control level configuration.
Figure 26 – Conceptual tank configuration – maximum operating level setting
As an example, for a tank located in the Betaloo Basin that will be in service for
three months during the wet-season, the design rainfall inflow is 1,168 mm from
Table 1. Assuming this will dominate over any wave action, the MOL would be set
at 1.2m (rounded to 1 decimal place) below the overflow level of the tank. For a
hypothetical total tank depth of 3m, the MOL would be set at a depth of 1.8m.
Figure 19 gives an indication as to how such a tank would perform if it were left in
place beyond its design life of three months.
The last sentence in the paragraph above ties into an important factor that should
be considered when setting an MOL, particularly for the Betaloo Basin site. Review
of Figure 23 shows that setting MOLs based on the assumption that a tank will only
be in place during the dry season (i.e. using Beetaloo 0.1% AEP rainfall of 278mm),
could lead to an increased containment risk in the following wet-season, if for
some reason the tank were to be left in place longer than originally anticipated.
More intense storm events within the dry-season could also produce greater tank
water level increases than those shown in Table 1 (i.e. Beetaloo 0.1% AEP design 7-
day rainfall from BOM IFD is 682 mm vs 278 mm critical dry-season rainfall in table
1).
Estimation of inflow volumes
The outcomes of the water balance analysis (Table 1) have been equated to
volumes in Table 2, for a range of tank sizes. Tank specifications have been
calculated based on information (diameter versus tank capacity) available on the
CONCEPT tank vendor website2.
2 https://www.conceptservices.com.au/concept-tanks/

Memorandum
wrmwater.com.au 1413-10-B| 1 February 2019 | Page 18
Table 2 – Design wet-season depths and volumes for a range of tank sizes
Item Units
Tank Size
12ML 15.5ML 25ML 40ML
Tank specifications
Diameter m 70 80 110 130
Area m2 3,850 5,025 9,505 13,275
Depth m 3.1 3.1 2.6 3.0
Capacity ML 12.0 15.5 25.0 40.0
Betaloo Basin (wet-season)
Depths
0.1% AEP 90d rainfall mm 1,448 1,448 1,448 1,448
Co-incident evaporation mm 435 435 435 435
Net increase over 90d mm 1,013 1,013 1,013 1,013
Max incr. within 90d mm 1,168 1,168 1,168 1,168
Volumes
0.1% AEP 90d rainfall ML 5.6 7.3 13.8 19.2
Co-incident evaporation ML -1.7 -2.2 -4.1 -5.8
Net increase over 90d ML 3.9 5.1 9.6 13.4
Max incr. within 90d ML 4.5 5.9 11.1 15.5
Amadeus Basin (wet-season)
Depths
0.1% AEP 90d rainfall mm 593 593 593 593
Co-incident evaporation mm 200 200 200 200
Net increase over 90d mm 393 393 393 393
Max incr. within 90d mm 522 522 522 522
Volumes
0.1% AEP 90d rainfall ML 2.3 3.0 5.6 7.9
Co-incident evaporation ML -0.8 -1.0 -1.9 -2.7
Net increase over 90d ML 1.5 2.0 3.7 5.2
Max incr. within 90d ML 2.0 2.6 5.0 6.9
Closing
We trust this information satisfies your immediate requirements. If you have any
queries or require any additional information in relation to the contents of this
document, please do not hesitate to contact our offices.
For and on behalf of
WRM Water & Environment Pty Ltd
Gavin Rootsey
Principal Engineer

Santos Ltd l Environment Management Plan: McArthur Basin Civil and Seismic Program l 5 April 2019
Appendix H: Spill Management Plan

Spill Management Plan: MacArthur Basin 2019 Drilling Program NT Exploration Permit (EP) 161
Date Rev Reason for Issue Author Checked Approved
05/04/2019 0 For Review MB PW DC
23/05/2019 1 For Review MB PW DC
24/06/2019 3 Reviewed to fix typographical error MB PW DC

Santos Ltd l Spill Management Plan: MacArthur Basin 2019 Drilling Program l 27 June 2019 Page i
Table of Contents
1.0 Introduction.................................................................................................................................. 5
1.1 Background ......................................................................................................................... 5
1.2 Scope .................................................................................................................................. 5
2.0 Potential Spill Materials .............................................................................................................. 6
2.1 Chemicals used in the Activity ............................................................................................ 6
2.1.1 Gray water and Sewage ......................................................................................... 6
2.1.2 Hydraulic fluids and Fuel ........................................................................................ 6
2.1.3 Drilling Fluid ............................................................................................................ 6
3.0 Spill Risk Assessment .............................................................................................................. 10
3.1 Potential Spill Scenarios ................................................................................................... 10
3.2 Potential Impact to the Environment ................................................................................. 10
3.3 Risk Assessment Table..................................................................................................... 11
4.0 Proceedures and Process ........................................................................................................ 12
4.1 Minimising the Risk of a Spill ............................................................................................ 12
4.1.1 Santos SMS ......................................................................................................... 12
4.1.2 Emergency Response Plan .................................................................................. 12
4.1.3 Well Operations Management Plan ..................................................................... 13
4.2 Spill Detection ................................................................................................................... 13
5.0 Spill Response Strategy ........................................................................................................... 14
5.1 Response .......................................................................................................................... 14
5.2 Communication Plan ......................................................................................................... 16
5.2.1 Communication to Personelle .............................................................................. 16
5.2.2 Incident Reporting and Recording ........................................................................ 16
Appendices .......................................................................................................................................... 19
Tables
Table 2-1: Estimated Volumes and Storage of Fuels and Oils ............................................................... 6
Table 2-2: Proposed Drilling Chemicals .................................................................................................. 7
Table 3-1 Quality and quantity of spill scenarios ................................................................................... 10

Santos Ltd l Spill Management Plan: MacArthur Basin 2019 Drilling Program l 27 June 2019 Page ii
Figures
Figure 1: Detailed Emergency Response Arrangements ...................................................................... 15
Appendices
Appendix A: Technical Memorandum for Three Spill Scenarios

Santos Ltd l Spill Management Plan: MacArthur Basin 2019 Drilling Program l 27 June 2019 Page iii
Abbreviations and Units
Acronym / Abbreviation
Description
ALARP As low as reasonably practicable
ALRA Aboriginal Land Rights Act
AAPA Aboriginal Areas Protection Authority
APPEA Australian Petroleum Production and Exploration Association
CLA Cambrian Limestone Aquifer
Code Code of Practice
CPESC Certified Professional in Erosion and Sediment Control
DENR Department of Environment and Natural Resources
DoEE Department of Environment and Energy
DFIT Diagnostic Fracture Injection Test
DPIR Department of Primary Industry and Resources
D&C Drilling and Completions
EC Electrical Conductivity
EMP Environmental Management Plan
EP Exploration Permit
EPBC Act Environment Protection and Biodiversity Conservation Act 1999
EPS Environmental Performance Standards
ERA Environmental Risk Assessment
ESD Ecologically Sustainable Development
ha Hectares
GISERA Gas Industry Social and Environmental Research Alliance
km Kilometre
LACA Land Access Compensation Agreement
LWD Logging While Drilling
NLC Northern Land Council
m Metres
MD Measured Depth
MoC Management of Change
NRM Natural Resource Management
NT Northern Territory
NT EPA Northern Territory Environmental Protection Authority
NVIS National Vegetation Information System
Panel Independent Scientific Panel
PL Petroleum Lease
PMST Commonwealth Protected Matters Search Tool
PPL Petroleum Pipeline Licence

Santos Ltd l Spill Management Plan: MacArthur Basin 2019 Drilling Program l 27 June 2019 Page iv
Acronym / Abbreviation
Description
SEAAOC South East Asia Australia Onshore Conference
SMS Santos Management System
SSCC Sacred Site Clearance Certificate
TOC Total Organic Content
TPWC Act Territory Parks and Wildlife Conservation Act 2014
TVD True Vertical Depth
TVDSS True Vertical Depth referenced to sea-level (Australian Height Datum)
WOMP Well Operations Management Plan
WoNS Weed of National Significance

Santos Ltd l Spill Management Plan: MacArthur Basin 2019 Drilling Program l 27 June 2019 Page 5
1.0 Introduction
1.1 Background
Santos proposes to undertake exploration activities in 2019, this Spill Management Plan is in support of the Drilling Program Environmental Management Plan. The primary activities considered in the Drilling EMP include:
Exploration drilling – both vertical and horizontal drilling
Well evaluation – including wireline logging, logging while drilling formation testing, core acquisition, fluid sampling, open-hole formation integrity testing (i.e. Diagnostic Fracture Injection Testing (DFITs)) and other standard evaluation techniques as appropriate
Cased hole DFIT
Well suspension and/or well decommissioning
Ongoing site and well maintenance and monitoring, work-over and re-entry, and evaluation as required
Under the Petroleum (Environment) Regulations (the Regulations), interest holders in petroleum titles must prepare and submit an Environment Management Plan (EMP). Approval of an EMP is necessary for all activities that have an environmental impact or risk and is only one of several approvals required for the activity to proceed. An approved EMP is a statutory document that is enforceable. The Code of Practice for Petroleum Activities in the Northern Territory sets out the mandatory requirements for management plans for wastewater and spills. The Code states that an EMP for a petroleum activity must include a Spill Management Plan (SMP).
1.2 Scope
Santos proposes to undertake a Drilling Program in 2019 at the Tanumbirini-1/2H and Inacumba-1/1H locations. This Spill Management Plan (SMP) is to be included in the EMP for the Drilling Program.
This spill management plan assesses and manages the risks posed by potential spills of waste, wastewater, fluids and any chemicals used or stored as part of the Drilling Program at the Tanumbirini-1/2H and Inacumba-1/1H locations. The Drilling Program EMP at the Tanumbirini-1/2H and Inacumba-1/1H locations does not cover any hydraulic fracture stimulation scope of work, accordingly this SMP is specific to the Drilling Program scope of work and a further SMP will be developed to support an EMP for any proposed hydraulic fracture stimulation activity.

Santos Ltd l Spill Management Plan: MacArthur Basin 2019 Drilling Program l 27 June 2019 Page 6
2.0 Potential Spill Materials A list of chemicals, water and wastewater and the way that they will be stored, transported and transferred as part of activity is provided below
2.1 Chemicals used in the Activity
2.1.1 Grey water and Sewage
Camp wastewater from laundry, showers and kitchen is proposed to be piped to an irrigation area. For treated sewage is sewage that has passed through a sewage treatment system, the liquid component of the sewage treatment is either disposed of using an irrigation system or transported with the solid waste to an approved disposal facility. Macerated sewage is not treated sewage.
2.1.2 Hydraulic fluids and Fuel
Hydraulic fluid and fuel drums are stored within portable bunding and bulk fuel is stored within tankers equipped with safety features such as double-skins (or temporary bunding), safety cut-off valves, top accessing etc. Spill leak and drip trays will be used to address the risk of minor drips and spills associated with re-fuelling operations. The estimated volumes and storage of fuels and oils used in the Drilling Program is provided in Table 2-1 below.
Table 2-1: Estimated Volumes and Storage of Fuels and Oils
Description Stored on Site
(m3) Storage Location Containment
Diesel Fuel 100 Rig Fuel Storage Tanks (Double Skinned)
Secondary Containment
Hydraulic Oil 3.8 Storage Tanks and Drums Secondary Containment (Double Skinned Tank or
Bunded Containment Area or Bunded Pallet Storage)
Other Chemicals (excluding drilling
additives)
10 Oil Storage Skids or Mechanics Shack
Secondary Containment (Double Skinned Tank or
Bunded Containment Area or Bunded Pallet Storage)
2.1.3 Drilling Fluid
All chemicals used in Australia must be approved for use by the Commonwealth Government, Department of Health and listed on the Australian Inventory of Chemical Substances which is maintained under the National Industrial Chemicals Notification and Assessment Scheme. No drilling muds or additives that are used in the process contain benzene, toluene, ethylbenzene and xylene.
The proposed drilling fluid is comprised of predominantly water with the remaining made up of salts and fluid additives. The anticipated that approximately 4-5 ML will be required. A list of fluid additives potentially used in the activity are provided in Table 2-2.
Testing of the residual drilling fluid will be undertaken in accordance with an approved Wastewater Management Plan (submitted in support of the Drilling Program EMP).

Santos Ltd l Spill Management Plan: MacArthur Basin 2019 Drilling Program l 27 June 2019 Page 7
Table 2-2: Proposed Drilling Chemicals
Trade name Supplier name Purpose of use Component
name
Maximum ingredient
concentration
Maximum ingredient
concentration in total fluid
used
Potassium Chloride
Potassium Chloride Inhibitor / Weighting
Agent Potassium Chloride
22 lb/bbl 17.4 lb/bbl
Soda Ash Soda Ash pH Controller Soda Ash 0.3 lb/bbl 0.2 lb/bbl
Bentonite Bentonite Viscosifier Sodium
montmorillonite clay
15 lb/bbl 10 lb/bbl
Biocide ALDACIDE G Biocide Biocide 0.3 lb/bbl 0.2 lb/bbl
Xantham Gum BARAZAN D PLUS Rheology Modifier BARAZAN D
PLUS 2 lb/bbl 1.6 lb/bbl
Polyanionic cellulose, low
viscosity PAC-L Fluid Loss Additive PAC-L 5 lb.bbl 3 lb/bbl
Cross-linked Starch
N-DRILL HT PLUS HTHP Filtration Control Additive
N-DRILL HT PLUS
8 lb/bbl 5 lb/bbl
Sodium Bicarbonate
Sodium Bicarbonate pH Controller Sodium
Bicarbonate
N/A – contingent
only
N/A – contingent
only
Citric Acid Citric Acid pH Controller Citric Acid N/A –
contingent only
N/A – contingent
only
Barite Barite Weighting Agent Barium
sulphate 500 lb/bbl 120 lb/bbl
Sodium Chloride
Sodium Chloride Inhibitor / Weighting
Agent Sodium Chloride
50 lb/bbl N/A
LCM KWIKSEAL
BAROFIBRE STOPPIT
Lost Circulation Material
LCM N/A –
contingent only
N/A – contingent
only
Lubricant DRIL-N-SLIDE Lubricant Lubricant N/A –
contingent only
N/A – contingent
only
Oxygen Scavenger
OXYGON Oxygen Scavenger Oxygen
Scavenger
N/A – contingent
only
N/A – contingent
only
Caustic Soda Caustic Soda pH Control Caustic Soda (
Sodium Hydroxide)
0.6 lb/bbl 0.2 lb/bbl

Santos Ltd l Spill Management Plan: MacArthur Basin 2019 Drilling Program l 27 June 2019 Page 8
Trade name Supplier name Purpose of use Component
name
Maximum ingredient
concentration
Maximum ingredient
concentration in total fluid
used
BARABUF BARABUF pH Stabilizer pH Buffer N/A –
contingent only
N/A – contingent
only
Foaming Agent
ULTRAFOAM Foaming Agent Foaming Agent N/A –
contingent only
N/A – contingent
only
Defoamer BARA-DEFOAM HP Defoamer Defoamer N/A –
contingent only
N/A – contingent
only
Corrosion Inhibitor
BARACOR 100 Corrosion Inhibitor Filming Amine N/A –
contingent only
N/A – contingent
only
Calcium Carbonate
BARACARB Weighting/Bridging
Agent Calcium
Carbonate
N/A – contingent
only
N/A – contingent
only
Anti-Balling surfactant
CON-DET Anti-Balling surfactant
CON-DET N/A –
contingent only
N/A – contingent
only
SAPP SAPP Thinner/Dispersant SAPP N/A –
contingent only
N/A – contingent
only
Modified Starch
DEXTRID LTE Filtration Control
Agent Modified Starch
8 lb/bbl 6 lb/bbl
H2S Scavenger
SOURSCAV H2S Scavenger H2S
Scavenger
N/A – contingent
only
N/A – contingent
only
Polyglycol GEM CP/GP Shale Stabilizer glycol N/A –
contingent only
N/A – contingent
only
Non-amine inhibitor
BORE-HIB Shale Stabilizer Non-amine
inhibitor
N/A – contingent
only
N/A – contingent
only
Non-amine inhibitor
PERFORMATROL Shale Stabilizer Non-amine
inhibitor
N/A – contingent
only
N/A – contingent
only
Low toxicity spotting
fluid/lubricant QUIK-FREE
Stuck Pipe Spotting Fluid
Low toxicity spotting
fluid/lubricant
N/A – contingent
only
N/A – contingent
only
PHPA EZ-MUD DP
EZ MUD Shale Stabilizer PHPA
N/A – contingent
only
N/A – contingent
only

Santos Ltd l Spill Management Plan: MacArthur Basin 2019 Drilling Program l 27 June 2019 Page 9
Trade name Supplier name Purpose of use Component
name
Maximum ingredient
concentration
Maximum ingredient
concentration in total fluid
used
PHPA EZ-MUD
DP EZ MUD Shale Stabilizer PHPA
N/A – contingent
only
N/A – contingent
only
PHPA EZ-MUD DP EZ
MUD Shale Stabilizer PHPA
N/A – contingent
only
N/A – contingent
only
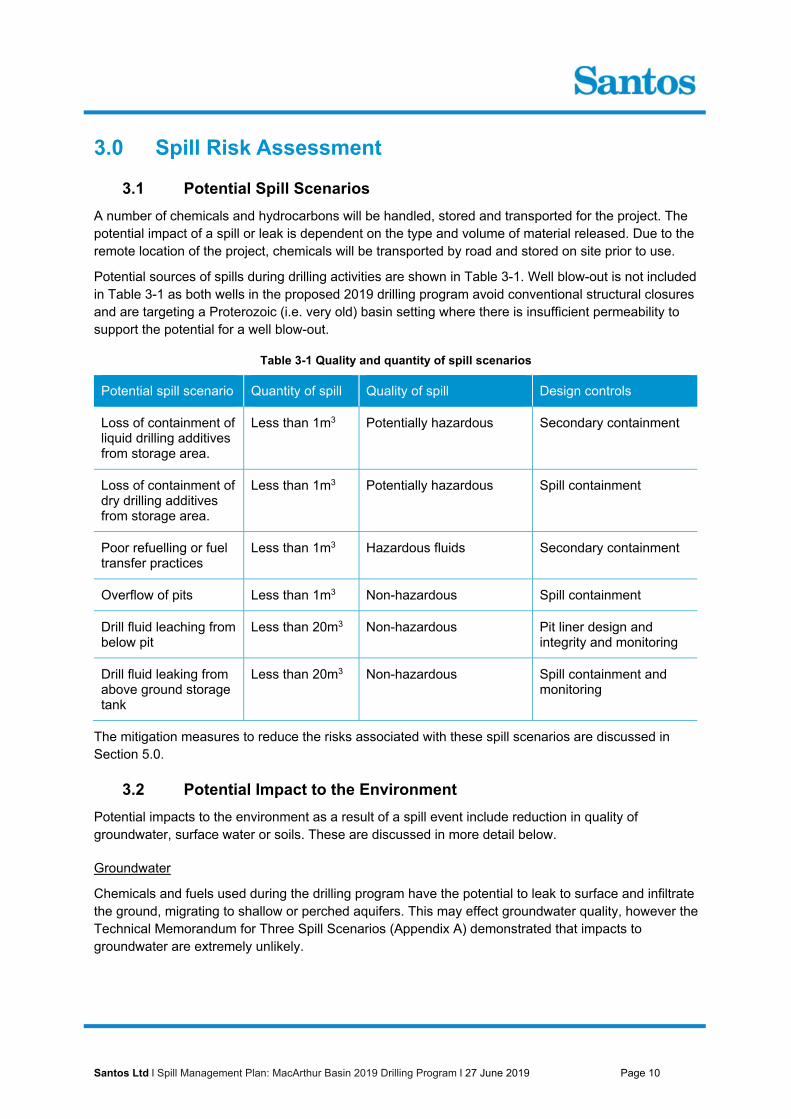
Santos Ltd l Spill Management Plan: MacArthur Basin 2019 Drilling Program l 27 June 2019 Page 10
3.0 Spill Risk Assessment
3.1 Potential Spill Scenarios
A number of chemicals and hydrocarbons will be handled, stored and transported for the project. The potential impact of a spill or leak is dependent on the type and volume of material released. Due to the remote location of the project, chemicals will be transported by road and stored on site prior to use.
Potential sources of spills during drilling activities are shown in Table 3-1. Well blow-out is not included in Table 3-1 as both wells in the proposed 2019 drilling program avoid conventional structural closures and are targeting a Proterozoic (i.e. very old) basin setting where there is insufficient permeability to support the potential for a well blow-out.
Table 3-1 Quality and quantity of spill scenarios
Potential spill scenario Quantity of spill Quality of spill Design controls
Loss of containment of liquid drilling additives from storage area.
Less than 1m3 Potentially hazardous Secondary containment
Loss of containment of dry drilling additives from storage area.
Less than 1m3 Potentially hazardous Spill containment
Poor refuelling or fuel transfer practices
Less than 1m3 Hazardous fluids Secondary containment
Overflow of pits Less than 1m3 Non-hazardous Spill containment
Drill fluid leaching from below pit
Less than 20m3 Non-hazardous Pit liner design and integrity and monitoring
Drill fluid leaking from above ground storage tank
Less than 20m3 Non-hazardous Spill containment and monitoring
The mitigation measures to reduce the risks associated with these spill scenarios are discussed in Section 5.0.
3.2 Potential Impact to the Environment
Potential impacts to the environment as a result of a spill event include reduction in quality of groundwater, surface water or soils. These are discussed in more detail below.
Groundwater
Chemicals and fuels used during the drilling program have the potential to leak to surface and infiltrate the ground, migrating to shallow or perched aquifers. This may effect groundwater quality, however the Technical Memorandum for Three Spill Scenarios (Appendix A) demonstrated that impacts to groundwater are extremely unlikely.

Santos Ltd l Spill Management Plan: MacArthur Basin 2019 Drilling Program l 27 June 2019 Page 11
Surface Water
Spills to surface have the potential to migrate to surface waters such as ephemeral watercourses. This has the potential to effect surface water quality and ecological values of that habitat.
Soil
For smaller spills and leaks (<1m3), migration is likely to be contained within the surface soils and would be readily removed or remediated. If a larger spill were to occur, such as that from a bulk tanker, there is the potential that product could infiltrate.
Shallow lithology obtained from exploration well Tanumbirini-1 (See Appendix 1) reveals two main hydrogeological units; a relatively impermeable siltstone/claystone followed by limestone which has highly variable hydrogeological properties, but the potential for high permeability.
3.3 Risk Assessment Table
An assessment of environmental impacts and environmental risks posed by a spill event has been carried out. For completeness and consistency with the EMP, the environmental risk assessment of all activities is presented in Section 6 of the EMP.

Santos Ltd l Spill Management Plan: MacArthur Basin 2019 Drilling Program l 27 June 2019 Page 12
4.0 Procedures and Process
4.1 Site material and fluids management
The well site layout and design has been approved in the Civils and Seismic EMP and has been designed to minimise the potential for harm to others and the environment with considerations of the Land Clearing Guidelines and Part A of the Code.
Through the implementation of the mitigations measures provided in the Table 6-1 of the EMP, the relevant mandatory site material and fluids management requirements will be met. In particular the well will be:
designed and operated to minimise the risk of causing a fire on the well site or in the surrounding environment
adequately secured to prevent access by wildlife. designed and operated to minimise the potential for releases of contaminants to the
environment and the impacts of such a release. designed to ensure the use, storage and handling of materials is adequate comply with the
code.
4.2 Minimising the Risk of a Spill
4.2.1 Santos SMS
Santos manages the environmental impacts and risks of its activities through the implementation of the Santos Management System (SMS). The SMS provides a formal and consistent framework for all activities of Santos employees and contractors. This SMP and the Project EMPO have been developed in consideration of the Santos SMS, including:
SMS-MS1 Risk – ST13 Environmental Hazard Controls Procedure SMS-MS11 Incident and Crisis Management Standard SMS-MS1 Incident and Crisis – ST1 – Emergency and Crisis Management Procedure.
In addition to this the Santos Emergency Response Plan (ERP) and the Contractors ERP provide additional processes and procedures to minimise the risks of a spill.
4.2.2 Emergency Response Plan
The Emergency Response Plan for the activity will be prepared by the drilling contractors and will be provided to DENR and DPIR and made available upon request. If the Emergency Response Plan is updated, a revised version will be provided to DENR and DPIR.
The emergency response arrangements within the Emergency Response Plan will be exercised early in the campaign to ensure that personnel are familiar with the plan and the type of emergencies to which it applies and that there will be a rapid and effective response in the event of a real emergency occurring. Following the exercise, lessons will be captured and the plan updated if required.
Other triggers for revising or updating the Emergency Response Plan may include:
New information becomes available following an incident, near miss or hazard Learnings from an exercise or drill Change in contractor undertaking the work Organisational changes

Santos Ltd l Spill Management Plan: MacArthur Basin 2019 Drilling Program l 27 June 2019 Page 13
Changes to government agency contact details or portfolios
4.2.3 Well Operations Management Plan
Well Operations Management Plan (WOMP) will be submitted to the regulator for approval prior to spud of the first well activity to which the plan would apply. The WOMP will provide details on:
Description of the well and well activities Well integrity risk management process Design, construction, operations and management of wells Performance outcomes Well lifecycle control measures Performance standards for control measures Performance objectives measurement criteria Monitoring, audit and well integrity assurance Well Abandonment and suspension considerations Responsibilities and competencies of contractors service providers Source control and blowout contingency measures
Fundamentally the risks of spills associated with the activity are managed effectively through the implementation of the mitigation measures described in the EMP. With the application of mitigation and management measures described in this plan and the EMP, the potential for chemical spills and leaks is reduced to an acceptable level. The impacts and risks associated with chemical spills and leaks are well-understood and that are established practices in place to manage these risks. With implementation of the control measures, it is considered that the risks and impacts of physical disturbance have been reduced to ALARP.
4.3 Spill Detection
Spills monitoring measures used to detect spills throughout the Drilling Program include:
Drill fluids that are contained in engineered fluid storage tanks. These tanks and system as a whole will be monitored throughout the Drilling Program.
Cuttings and fluid storages will be inspected daily to check integrity throughout drilling operations.
Daily monitoring of weather and for predicted significant rainfall events will be undertaken Completion of the daily monitoring checklist

Santos Ltd l Spill Management Plan: MacArthur Basin 2019 Drilling Program l 27 June 2019 Page 14
5.0 Spill Response Strategy
5.1 Response
Small spills will be managed locally at the site using dedicated spill kits; which are readily available and appropriately stocked. For spills that are large and cannot be managed locally, the Operating Company Representative is to notify the Santos D&C Superintendent as shown in the Detailed Emergency Response flowchart to provide incident details and initiate an appropriately response supported (See Figure 1).
All spills will be managed in accordance with:
Santos Emergency Response Plan Contractors ERP SMS-MS1 Risk – ST13 Environmental Hazard Controls Procedure Incident & Crisis ST2 - Incident Reporting, Investigation and Learning Procedure The EMP

Santos Ltd l Spill Management Plan: MacArthur Basin 2019 Drilling Program l 27 June 2019 Page 15
Figure 1: Detailed Emergency Response Arrangements

Santos Ltd l Spill Management Plan: MacArthur Basin 2019 Drilling Program l 27 June 2019 Page 16
5.2 Communication Plan
5.2.1 Communication to Personnel
Spill prevention and monitoring strategies will be communicated to personnel working on the 2019 Drilling Program via:
This Plan The EMP Site Inductions Safety Meetings Tool Box Talks Daily Meetings
Communications about a spill will be undertaken in accordance with the Emergency Communications section of the Emergency Response Plan. This includes the following steps:
Incident Management Team Leader (IMTL) informed of incident and establishes contact with affected site to be provided with details of the incident, understanding of severity and response resource requirements
Assessment of the emergency and severity is made (based on information from the affected site) and an emergency/incident response level determined
IMT activated to provide support to the affected site or facilities D&C Superintendent attends the Incident Management Team (IMT) (where practicable) and
liaises with IMTL to provide technical input and guidance IMTL maintains open communications with the affected site - On-Scene Commander (OSC) Affected site OSC supervises the Field Response Team (FRT) Other D&C personnel (roles) may be conscripted into the IMT as required
5.2.1.1 Wellsite Emergency Response Numbers (ERN)
The well site will be clearly identified in a permanent manner with the well name, well number, major hazards and details of the interest holder. The name of the person-in-charge of any active well operations will be displayed in writing where the lease pad meets the well site.
Maintaining key well information and contact details is critical to ensure a timely response to an emergency. The aid in this Wellsite ERNs are provided for and available at each wellsite location include the following details:
Name of the well Wellsite and camp site location coordinates and driving route Estimated travel distance to the nearest medical support Contact details for contractor personnel (mobile phone and satellite phone) Contact details of local Santos base (if relevant) and nearest emergency response support
facilities
5.2.2 Incident Reporting and Recording
In the case of any inconsistencies the reporting requirement of the Petroleum (Environment) Regulations and the Waste Management and Pollution Control Act (WMPC Act) trump any requirements listed in this plan.
Spills located entirely within EP 161 will be reported to the minister in accordance with Part 3 of the Petroleum (Environment) Regulations. Spills that are located entirely outside of the EP 161 permit

Santos Ltd l Spill Management Plan: MacArthur Basin 2019 Drilling Program l 27 June 2019 Page 17
area will be reported to the NT Pollution Hotline (1800 064 567) in accordance with Section 14 of the WMPC Act. Where a spill occurs initially within the EP 161 permit area, but discharges out of the permit area, it will be reported to the minister in accordance with Part of the Petroleum (Environment) Regulations and to the NT Pollution Hotline (1800 064 567) in accordance with Section 14 of the WMPC Act.
5.2.2.1 Notice of a reportable incident under the Petroleum (Environment) Regulations
Santos must give the Minister notice of a reportable incident in accordance with this regulation for reportable incidents within the EP 161 area. A reportable incident means an incident, arising from a regulated activity that has caused or has the potential to cause material environmental harm or serious environmental harm. A notice of the reportable incident must be given to the Minister as soon as practicable but not later than 2 hours after the incident first occurred or if the incident was not detected at the time it first occurred – the time the interest holder became aware of the reportable incident.
Report about reportable incident
An initial report about a reportable incident will be given to the Minister as soon as practicable but not later than 3 days after the reportable incident first occurs; and must include comprehensive details about the following:
the results of any assessment or investigation of the conditions or circumstances that caused or contributed to the occurrence of the reportable incident, including an assessment of the effectiveness of the designs, equipment, procedures and management systems that were in place to prevent the occurrence of an incident of that nature.
the nature and extent of the material environmental harm or serious environmental harm that the incident caused or had the potential to cause
any actions taken, or proposed to be taken, to clean up or rehabilitate an area affected by the incident
any actions taken, or proposed to be taken, to prevent a recurrence of an incident of a similar nature
A report about recordable incidents:
must relate to each reporting period for the regulated activity and must be given as soon as practicable but not later than 15 days after the end of the reporting period. The report must contain:
a record of all recordable incidents that occurred during the reporting period all material facts and circumstances concerning the recordable incidents that the interest
holder knows or is able, by reasonable search or enquiry, to find out any action taken to avoid or mitigate any environmental impacts and environmental risks of the
recordable incidents the corrective action that has been taken, or is proposed to be taken, to prevent similar
recordable incidents.
Reporting will occur at a period agreed in writing between the interest holder and the Minister or each 90 day period after the day on which the environment management plan is approved.
Recordable incident means an incident arising from a regulated activity that has resulted in an environmental impact or environmental risk not specified in the current plan for the activity; or has resulted in a contravention of an environmental performance standard specified in the current plan for the activity; or is inconsistent with an environmental outcome specified in the current plan for the activity. A recordable incident is not a reportable incident.

Santos Ltd l Spill Management Plan: MacArthur Basin 2019 Drilling Program l 27 June 2019 Page 18
5.2.2.2 Duty to notify of incidents causing or threatening to cause pollution under the WMPC Act
Santos must notify the NT EPA on their Pollution Hotline (1800 064 567) as soon as practicable after (and in any case within 24 hours) first becoming aware of a reportable incident or the time they ought reasonable be expected to become aware of a reportable incident. A reportable incident under the WMPC Act includes an incident that causes, or is threatening or may threaten to cause, pollution resulting in material environmental harm or serious environmental harm.
The notification must include the following details:
a) the incident causing or threatening to cause pollution;
b) the place where the incident occurred;
c) the date and time of the incident;
d) how the pollution has occurred, is occurring or may occur;
e) the attempts made to prevent, reduce, control, rectify or clean up the pollution or resultant environmental harm caused or threatening to be caused by the incident; and
f) the identity of the person notifying.

Santos Ltd l Spill Management Plan: McArthur Basin Drilling Program l 27 June 2019
Appendices

Santos Ltd l Spill Management Plan: McArthur Basin Drilling Program l 27 June 2019
Appendix A: Technical Memorandum for Three Spill Scenarios

www.ehs-support.com
09 April, 2019 Santos Ltd 32 Turbot Street, Brisbane QLD 4000
EHS Support Pty Ltd PO Box 297
Port Melbourne, Victoria, 3207
Please find attached, EHS Support Pty Ltd technical memorandum for the assessment of potential risk to groundwater associated with hypothetical shale gas activities in the Northern Territory.
Should you have any questions or require additional information, please feel free to contact me at (+61) 400 470 070 or [email protected].
Sincerely, EHS Support Pty Ltd
Chris Smitt Nigel Goulding Principal Hydrogeologist Chief Technical Officer

www.ehs-support.com
1. INTRODUCTION
The following memorandum provides an assessment of the potential for impacts on groundwater associated with hypothetical shale gas activities in the Northern Territory. For the purpose of this assessment two primary modes of potential impact were identified (releases to the land surface and the strategic burial of drilling mud) and technical assessment and modelling is provided in the sections below.
1.1. OBJECTIVE
The objective of this assessment is to define the potential extent of the area impacted by a release or “spill” of fluids. Specifically, the following questions were addressed:
1. Using three spill scenarios (1,000L; 100,000L and 1ML), determine the maximum pooled area in which a spill would inundate;
2. Over the size of the pooled area, determine infiltration rates to gain an understanding of vertical groundwater movement and associated travel times;
3. Evaluate the potential impacts on groundwater from burial/management of drilling muds at the well sites (where muds are blended and buried with soils); and.
4. Provide a description of what remedial actions could be implemented if impacts to groundwater were observed.
1.2. SCOPE OF WORK
To meet the objectives described above, the following work tasks were undertaken: 1. Establishment of applicable soil/aquifer characteristics within the area of interest based on a
literature review and geological log from Santos exploration bore Tanumbirini-1; 2. Assessment of the water pooling area on a flat surface using the formulae proposed by Grimaz et
al. (2007); 3. Assessment of the infiltration capacity of surface soils and ponding time using the analytical Green
and Ampt infiltration equation; 4. Evaluation of potential migration and attenuation of common drilling fluid constituents if materials
were buried below surface as part of the management of drilling muds; and 5. Discuss the remedial technologies that would be employed if impacts to groundwater occurred due
to surficial releases and associated infiltration.
2. OVERVIEW OF HYDROGEOLOGY/GEOLOGY
The area of interest where this assessment will occur is within Santos exploration areas of the Beetaloo Sub-Basin (refer Figure 1).
The hydrogeological unit of interest is the Cambrian Limestone Aquifer (CLA) defined as the Top Springs Limestone (also commonly referred to as the Tindal Limestone or Gum Ridge Formation) depending on which part of the basin you are in. The unit comprises massive and commonly dolomitised (and often fractured and karstic) limestone beds with minor siliclastic mudstone. Results from Santos exploration bore Tanumbirini-1 (refer Figure 1 for location and Figure 2 for stratigraphy), reveal that the Top Springs Limestone can be found at a depth of 52mbgl with a thickness of 150m. For detailed broad scale geological interpretation of the regions geology refer to Fulton, 2009; Kruse et al, 2013.
In the vicinity of exploration bore, Tanumbirini-1, the CLA is confined by Cretaceous siltstones mudstones. The permeability of the CLA is highly dependent on the development of dissolution and fracture features

- 3 -
(Fulton and Knapton, 2015). A review of water bores that intersect cavities or record circulation loss during drilling suggests that the karst development is widespread across the Beetaloo Sub-Basin and that aquifer permeability is generally not spatially correlated. Within the broader basin over 415 operational and abandoned water bores screen the CLA, with bore depths ranging from 34 – 221 m (average 105 m) (ibid).
Fulton and Knapton, (2015), reported airlift yields range from 0.3 – 20 l/s (average 3.5 l/s), with the standing water level (SWL) in the Gum Ridge Formation ranging from 23 to 155 metres below ground level (mBGL). Water levels along the Carpentaria Highway on Amungee Mungee and Tanumbirini stations are reported to be (125 mBGL) (ibid). Results from 21 pumping tests undertaken by WRD report a Transmissivity (T) range of 3 – 3377 m2/d. The lowest T values (<50 m2/d) occur in the northwest of the basin where the CLA has limited saturated thickness and aquifer development is restricted to the unconformity with the underlying Antrim Plateau Volcanics (Yin Foo, 2002).
Figure 1. Location of the Beetaloo Basin along with Santos assets, stratigraphy and a north-south section. Reference used to create Figure 1: Silverman et al. (2008) [geological cross-section], and
Close et al: 2016 [SEEBASETM depth-to-basin image & stratigraphic column]

- 4 -
Figure 2 Shallow Lithology from Santos well “Tanumbirini-1
3. ANALYTICAL ASSESSMENT (METHODOLOGY)
3.1. WATER POOLING ON FLAT SURFACES
For instantaneous releases on flat surfaces, the formulae (Equation 1) proposed by Grimaz et al. (2007) was used to estimate the area of the pool of liquid on flat ground. This method is used for oil spills but can allow for water by varying the liquid properties (primarily viscosity and permeability).
𝐴 ≅ 2.3782⁄
⁄ (1)
Where: 𝐴 is the area of the pool of liquid on the surface [m2]; 𝑞 is the flow rate of release [m3 s-1]; Q is the total amount of liquid released [m3]; 𝜗 is the kinematic viscosity of the liquid [m2 s -1]; g is the gravitational acceleration [ms-2]; ki is the intrinsic permeability of soil [m2]; kr, is the relative permeability of the liquid [-]

- 5 -
3.2. TIME FOR WATER TO REMAIN ON SURFACE
Equation (2) taken from Grimaz et al. (2007), can be used to estimate the duration of the pool on the surface 𝑡 . and can be considered equal to the time of complete infiltration of the fluid into the porous medium. The method (Equation 2) is based on Darcy’s Law and considers a theoretical depth of water pool and the seepage velocity at complete saturation:
𝑡,
∅
∅ (2)
where; 𝑡 is the estimated duration of the liquid pool on the surface [s]; ℎ is the depth of the liquid pool [m]; 𝑣 , is the velocity of penetration of the liquid into soil in saturated conditions [ms-1]; 𝑉 is the volume of the liquid spilt [m3 ]; K is the soil hydraulic conductivity [ms-1]; 𝜃 is the porosity of soil [-], ∅ the kinematic viscosity [m2 s -1]; and 𝐾 is the is the relative permeability of the liquid [-].
Then, in order to estimate the percentage of fluid evaporated from the pool in 𝑡 the daily pan evaporation rate can be applied. (Fulton and Knapton, 2015) report pan evaporation ranges between 5 and 11 mm/d (average about 7-8 mm/d) in the region.
3.3. INFILTRATION INTO UNSATURATED ZONE
The spilt fluid will not only tend to spread out over the surface of the soil and evaporate, but will also penetrate into the ground (unless it is impermeable). Infiltration to the unsaturated zone, and in particular infiltration capacity and time for ponding to occur can determined using the infiltration equation of Green and Ampt (1911).
The infiltration rate actually experienced in a given soil depends on the amount and distribution of soil moisture and on the availability of water at the surface with a maximum rate at which the soil in a given condition can absorb water. This upper limit is called the infiltration capacity, fc and is a limitation on the rate at which water can move into the ground. If surface water input is less than infiltration capacity, the infiltration rate will be equal to the surface water input rate (w). If irrigation (analogous to a release) intensity exceeds the ability of the soil to absorb moisture, infiltration occurs at the infiltration capacity rate until the soil is saturated and ponding and associated runoff occurs. Infiltration capacity declines over time until a steady state is reached.
Several processes combine to reduce the infiltration capacity. The filling of fine pores with water reduces capillary forces drawing water into pores reducing the storage potential of the soil. Clay swells as it becomes wetter and the size of pores is reduced. Coarse-textured soils such as sands have large pores down which water can easily drain, while the fine pores in clays retard drainage. If the soil particles are held together in aggregates by organic matter or a small amount of clay, the soil will have a loose, friable structure that will allow rapid infiltration and drainage.
The calculation of infiltration at a point combines the physical conservation of mass (water) principle expressed through the continuity equation with quantification of unsaturated flow through soils, expressed by Darcy's equation. The downward hydraulic gradient inducing infiltration is from a combination of the effect of gravity, quantified by the elevation head, and capillary surface tension forces, quantified by the pressure head (negative due to suction) being lower at depth due to lower moisture content. If the water input rate is greater than the saturated hydraulic conductivity (i.e. w > Ksat), at some point in time the water content at the surface will reach saturation. At this time, the infiltration capacity drops below the surface

- 6 -
water input rate and runoff is generated. This time is referred to as the ponding time. After ponding occurs, water continues to infiltrate and a zone of saturation begins to propagate downward into the soil as the wetting front. After ponding, the infiltration rate is less than the water input rate and the excess water accumulates at the surface and becomes infiltration excess runoff. As time progresses and the depth of the zone of saturation increases, the contribution of the suction head to the gradient inducing infiltration is reduced, so infiltration capacity is reduced. Once the soil profile is completely saturated no further water can infiltrate.
3.3.1. GREEN AND AMPT INFILTRATION MODEL
The Green – Ampt (1911) model (Equation 3) is an approximation of the infiltration process described above and was utilised to assess infiltration capacity and time for ponding for various soils.
f
ffs
f
ffsss z
HzK
z
HzK
zz
hhK
dz
dhKq
0
0
12
12 (3)
Where: H = the depth of ponding, cm, Ks = saturated hydraulic conductivity (cm/s), q = flux at the surface (cm/h) and is negative, f = suction at wetting front (negative pressure head), i = initial moisture content
(dimensionless) and s = saturated moisture content (dimensionless).
The following assumptions are implicit in the Green and Ampt equation:
1. As water infiltrates, the wetting front advances at the same rate with depth, which produces a well-defined wetting front;
2. The volumetric water content remains constant above and below the wetting front as it advances; and
3. The soil-water suction immediately below the wetting front remains constant with both time and location as the wetting front advances.
As described in the results discussion (Section 4), the travel times for surface releases to reach groundwater are very long and therefore the potential for impacts to groundwater are low
soil
water
z (negative direction)
s i
wetting front f
H 01 Hh
ff zh 2 fzz
0z

- 7 -
3.4. ASSESSMENT OF LEACHING TO GROUNDWATER
The potential risk associated with the leaching of constituents from drilling muds over time was evaluated using the VLEACH model. This model determines vertical contaminant transport from materials placed in the unsaturated zone and its response to recharge over time. VLEACH was developed by the United States Geological Service for the United States Environmental Protection Agency (USEPA) and is an industry recognised model. This model allows for very conservative modelling of organic constituents moving through the unsaturated zone towards groundwater systems.
4. ANALYTICAL ASSESSMENT (RESULTS)
4.1. WATER POOLING ON FLAT SURFACES
The “pooled area” for the instantaneous releases of fluid was determined for the following release volumes:
1000L (1m3); 100,000 L (100m3); and 1,000,000 L (1000m3).
Shallow lithology obtained from exploration well Tanumbirini-1 (Figure 2), summarized in Table 1: reveals two main hydrogeological units; a relatively impermeable siltstone/claystone followed by limestone which has been reported to have highly variable hydrogeological properties (see Section 2).
As a result, and for the purposes of assessing surface water pooling, soil properties reflective of a clay have been applied to Equation 1. These are presented in Table 2. Therefore using, Equation 1, and the information presented in Table 2, the theoretical area of pooled water over Clay is presented in Table 3. For the purpose of providing comparison, a more permeable sandier soils is also presented.
Table 1 Shallow lithology at Tanumbirini-1
Depth From (mbgl)
Depth to (mbgl)
Lithology (Figure 2)
Hydrogeological Unit
0 20 Silty Claystone Anthony Lagoon Beds?
20 52 Siltstone
52 Limestone Tops Springs Formation / Tindal ‐ Gum Ridge Limestone
Table 2 Modelling Input Parameters
Parameter Clay /
Claystone / Siltstone
Permeable Sandstone / Limestone
Literature Source
Porosity 0.482* 0.4** * Dingman, 1994
**Knapton 2009
Saturated Hydraulic Conductivity (Ksat) (cm/s)
0.0007 0.038** **Knapton 2006 (based on relevant aquifer transmissivity and thickness)
Air-Entry Tension (cm) 40.5 12.1 Dingman, 1994
Saturated Tension (cm) 30.78 9.2 Dingman, 1994
Intrinsic permeability (m2) 1x10-13 1x10⁻⁸ Dingman, 1994

- 8 -
Table 3 Model Results - Pooled Water Area
Volume Released (L)
Volume Released (m3) Area (m2) Radius (m)
Clay / Claystone / Siltstone 1,000 1 947 17 100,000 100 37691 110 1,000,000 1000 237820 275
Permeable Sandstone / Limestone
1 1 95 6 100,000 100 3770 35 1,000,000 1000 23782 87
4.2. TIME FOR WATER TO REMAIN ON SURFACE
Using Equation 2, the results presented in Table 3 and assuming the kinematic viscosity of the fluid is 1x10⁻⁶ m2/s and a Kh:Kv of 1:100, the time it will take for a 5cm deep pool over the 1ML spill area is ~6 days. For a smaller spill of 1,000L, infiltration time is less than 1 day (~2 hours).
4.2.1. GREEN AND AMPT INFILTRATION MODEL
The results of the Green and Ampt Infiltration equation are present in Table 4.
As there are two distinct hydrogeological units (siltstone to a depth of ~50m followed by karstic limestone). The time it takes for water to infiltrate 50m through the siltstone (to the top of the limestone) and the time to migrate through an additional 50 m (to a depth of 100 m) and 150 m of limestone (to a depth of 200m) has been calculated to enable evaluation of travel times based on the potential variable depth to groundwater within the limestone across the field.
Previous studies have indicated the CLA (limestone) can be highly fractured and karstic (refer Section 2), a sensitivity analysis assuming k is 100 times greater in this limestone has been undertaken. This has also been applied to the overlying siltstone.
The results indicate that any spill will take ~690 years to move through the initial 50m before rapidly moving though the more permeable limestone. To provide a comparative / conservative case where permeability of the sub surface is increased by 2 orders of magnitude, travel times to the top of the CLA reduce to ~7 years. Furthermore, under each spill scenario, the release rate exceeds the infiltration capacity of the subsurface, therefore as the area increases with each spill (refer Table 3), the driving force on the wetting front remains the same and is constrained by the permeability.
It should be noted that the assessment is highly conservative. Due to CLA aquifer anisotropy, bulk basin scale hydraulic conductivities are likely to be lower than those modelled. Further the higher hydraulic conductivities used in the sensitivity analysis for the siltstone are considered improbable based on literature information for this unit.

- 9 -
Table 4 Green and Ampt Modelling Results
Time for wetting front to reach 50 mbgs (days)
Time for wetting front to reach 100 mbgs (days)
Time for wetting front to reach 200 mbgs (days)
Siltstone (K = 0.000007 cm/s; 0.01 m/d)
Run 1 252267 (690 yrs)
Run 2 252267 (690 yrs) - -
Run 3 252267 (690 yrs)
Karstic Limestone (K = 0.005 cm/s; 4.3 m/d)
Run 1 - 252271 (~690 yrs) 252275 (~690 yrs)
Run 2 252271 (~690 yrs) 252275 (~690 yrs)
Run 3 252271 (~690 yrs) 252275 (~690 yrs) Run 1 = 1,000L spill; Run 2 = 100,000L spill Run 3 = 1,000,000 L spill
Table 5 Green and Ampt Modelling Results (Sensitivity Analysis K = 100x Increase)
Time for wetting front to reach 50 mbgs (days)
Time for wetting front to reach 100 mbgs (days)
Time for wetting front to reach 200 mbgs (days)
Clay (K = 0.0007 cm/s; 0.6 m/d)
Run 1 2522 (~7 yrs) - -
Run 2 2522 (~7 yrs) - -
Run 3 2522 (~7 yrs) - -
Karstic Limestone (K = 0.5 cm/s; 432 m/d)
Run 1 - 2523 (~7 yrs) 2523 (~ 7yrs)
Run 2 - 2523 (~7 yrs) 2523 (~7 yrs)
Run 3 - 2523 (~7 yrs) 2523 (~7 yrs) Run 1 = 1,000L spill; Run 2 = 100,000L spill Run 3 = 1,000,000 L spill

10
4.3. ASSESSMENT OF BURIAL/MANAGEMENT OF DRILLING MUDS
Based on the chemistry for example drilling muds (refer Table 6), leaching assessments were conducted on a scenario where drilling muds were stabilized (by blending with native soils to manage residual moisture) and compacted and placed below ground surface. The blend of drilling muds and cuttings produces a low permeability material with a high cation exchange capacity (CEC). This typically results in metals and metalloids being strongly bound within the muds and the mud and cuttings exhibiting very low permeabilities. Drilling muds by design typically exhibit permeabilities between 1x10⁻⁸ m/s and 1x10⁻¹⁰ m/s.
For the purposes of this assessment it has been assumed that the hydraulic conductivity of the blended materials it is assumed that the combined material will have a hydraulic conductivity no lower than 1x10⁻⁶ m/s. Typically the drilling muds are buried 1-2 m below ground surface to ensure the materials are below the rooting depth of crops and plants and the area graded to prevent ponding and preferential infiltration of water.
For the purposes of the modelling, only water soluble organic compounds were assessed (insoluble organic compounds like starch and polymers would have no mobility in the formation) and Sodium from Sodium Chloride was evaluated conservatively by assuming no attenuation (although cation exchange with the dominant calcium ions would impede vertical migration of sodium and potassium). Furthermore, as the lithology is likely to be rich in clay, a sensitivity analysis was undertaken on Sodium to increase its “retardation factor” or Distribution Coefficient by 2 orders of magnitude.
The VLEACH model results for each chemical constituent (BOLDED, in Table 6) are presented in Figure 3.
The results indicate that the modelled constituents take a very long time to move through the subsurface and contain immeasurable concentrations once below several meters depth even before dilution and without taking into account biodegradation.
Table 6 Drilling Mud Chemistry (BOLD values indicate those subject to VLEACH Modelling)
Chemical Name Concentration in Drilling Mud Solids (mg/kg)
Ethylene oxide/propylene oxide copolymer 24
Polyalkylene 22260
Polypropylene glycol 48
Silicic acid, potassium salt 22200
Sodium Chloride 45600
Sodium polyacrylate 1092
Copolymer of acrylamide and sodium acrylate 702
Glutaraldehyde 300
Glyoxal 31

11
Chemical Name Concentration in Drilling Mud Solids (mg/kg)
Methanol 3
Potassium Chloride 41520
Sodium Carbonate 78
Sodium carboxymethyl cellulose 3117
Sodium Hydroxide 300
Starch 3058
Xanthan Gum 3060
Methylisothiocyanate (MITC) 30

12
Table 7 Constituent Properties
Concentration in drilling (mg/L)
Organic Distribution Coefficient (ml/g)
Henry's Law Constant (atm-m3/mol)
Water Solubility (mg/L)
Free Air Diffusion Coefficient (m2/day)
Source
Methanol 3000 0.014 0.0001937 1000000 1.296
GSI Chemical Properties Database (http://www.gsi-net.com/en/publications/gsi-chemical-database.html)
Glutaraldehyde 300,000 0.07 0.0000108 85500000 0.096
GSI Chemical Properties Database (http://www.gsi-net.com/en/publications/gsi-chemical-database.html)
Sodium Chloride 29,900,000**
(converted from Table 6) 1930* / 19.3 1E-20 360000** 0
*Bencala (1985)
**http://srdata.nist.gov/solubility/index.aspx

13
Figure 3 VLEACH Results. [Note: Bottom left Na assumes a Distribution Coefficient 2 orders of magnitude higher then bottom right results].
‐60
‐50
‐40
‐30
‐20
‐10
0
0.00E+00 5.00E‐10 1.00E‐09 1.50E‐09 2.00E‐09 2.50E‐09 3.00E‐09
Dep
th (m
bgl)
Concentration in soil (g/g)
Methanol
1 yr10 yrs50 yrs20 yrs100 yrs690 yrs
‐60
‐50
‐40
‐30
‐20
‐10
0
0.00E+00 2.00E‐07 4.00E‐07 6.00E‐07 8.00E‐07 1.00E‐06 1.20E‐06 1.40E‐06 1.60E‐06
Dep
th (m
bgl)
Concentration in soil (g/g)
Glutaraldehyde
1 yr10 yrs50 yrs20 yrs100 yrs690 yrs
Dep
th (m
bgl)
Concentration in soil (g/g)
Na from Sodium Chloride
1 yr10 yrs50 yrs20 yrs100 yrs1 yr
‐60
‐50
‐40
‐30
‐20
‐10
0
0.00E+00 5.00E‐03 1.00E‐02 1.50E‐02 2.00E‐02 2.50E‐02
Dep
th (m
bgl)
Concentration in soil (g/g)
Na from Sodium Chloride
1 yr10 yrs50 yrs20 yrs100 yrs690 yrs

- 14 -
5. REMEDIAL OPTIONS OF GROUNDWATER
Based on the modelling provided above and considering the retardation processes in the formation, only water soluble constituents have the potential to migrate to and impact on groundwater. As demonstrated in the assessment above, the potential for impact on groundwater is considered limited and travel times are sufficient slow (>500 yrs to travel 50m) that management/monitoring and remediation (if required) could be implemented.
In the context of this hydrogeologic system, which has deep and prolific aquifer systems and considering the constituents of potential concern are soluble compounds, groundwater extraction and water treatment provides the best remedial option (if needed).
Based on the drilling fluid constituents that may impact on groundwater a range of treatment options are available including open air storage to facilitate natural dissociation, photodegradation, etc, biological treatment for alcohols, glycols, glutaraldehyde (they biodegrade rapidly in the presence of oxygen), activated carbon absorption (non-polar organics) and ion exchange. All of these technologies are readily available and could be quickly implemented.
6. REFERENCES
Bencala, (1985). Performance of Sodium as a Transport Tracer Experimental and Simulation Analysis. In May (1985) pg 83-89. Selected Papers in the Hydrologic Sciences 1985. United States Geological Survey Water-Supply Paper 2270.
Bergman, (2009). Exploration Licence Numbers 25956, 25957 and 25958. BEETALOO PROJECT. Combined Final Report for the Period Ending 4 November 2009. Report for Beetaloo Uranium.
Close DI, Baruch ET, Altmann CM, Cote AJ, Mohinudeen FM, Richards B and Stonier S, (2016). Unconventional gas potential in Proterozoic source rocks: Exploring the Beetaloo Sub-basin: in Annual Geoscience Exploration Seminar (AGES) Proceedings, Alice Springs, Northern Territory 15–16 March. Northern Territory Geological Survey, Darwin, 91–94.
Dingman, S. L., (2002). “Physical Hydrology. Volume 1”. Prentice Hall Publishing.
Fulton S, and Knapton A., (2015). Beetaloo Basin Hydrogeological Assessment
Grimaz, S., S. Allen, J. Steward, and G. Dolcetti. (2007). “Predictive evaluation of the extent of the surface spreading for the case of accidental spillage of oil on ground”. Selected Paper IcheaP8, AIDIC Conference series, Vol. 8, pp. 151-160.
Kruse P. D, Dunster J. N and Munson T. J, (2013). Chapter 28: Georgina Basin: in Ahmad M and Munson TJ (compilers). ‘Geology and mineral resources of the Northern Territory’. Northern Territory Geological Survey, Special Publication 5.
Knapton, (2006). Regional Groundwater Modelling of the Cambrian Limestone Aquifer System of the Wiso Basin, Georgina Basin and Daly Basin. Technical Report No. 29/2006A Department of Natural Resources, Environment & The Arts, Alice Springs

- 15 -
Silverman M., Landon S., Leaver J., Mather T. and Berg E., (2008), No fuel like an old fuel: Proterozoic oil and gas potential in the Beetaloo Basin, Northern Territory, Australia: Proterozoic oil and gas potential in the Beetaloo Basin, Northern Territory.
Silverman MR, Landon SM, Leaver JS, Mather TJ and Berg E,. (2007). No fuel like an old fuel: Proterozoic oil and gas potential in the Beetaloo Basin, Northern Territory, Australia: in Munson TJ and Ambrose GJ (editors) 'Proceedings of the Central Australian Basins Symposium (CABS), Alice Springs, Northern Territory, 16–18 August, 2005'. Northern Territory Geological Survey, Special Publication 2, 205–215. Munson (2014).
Yin Foo D. and Matthews, I., (2000). Hydrogeology of the Sturt Plateau. Department of Infrastructure and Planning and Environment. Northern Territory Government. Report 17/2000D.

Santos Ltd l Environment Management Plan: MacArthur Basin Civil and Seismic Program 17 June 2019
Appendix I: Stakeholder Engagement Records

Santos Ltd l Environment Management Plan: MacArthur Basin Civil and Seismic Program 17 June 2019
Table I-1: List of Relevant Stakeholders
Stakeholder Role/Position Phone number Email or other contact
Aboriginal Affairs Protection Authority
Chief Executive Officer (CEO) AAPA
Landholders/Managers
Tanumbirini Station Manager
Beetaloo / O.T Downs Station Manager
Broadmere Station Manager
Northern Land Council
Manager Minerals and Energy
Northern Territory Government
Executive Director – Onshore Gas Reform (DENR)
Executive Director (DPIR)
DENR
Senior Onshore Petroleum Advisor
Senior Assessment Officer - Petroleum
Regional Weed Officer (Onshore Shale Gas Development) – DENR

Santos Ltd l Environment Management Plan: MacArthur Basin Civil and Seismic Program 17 June 2019
Table I-2: Stakeholder Engagement Records
Stakeholder Role /
Position Date
Type of Contact
Method of Contact
Matters Raised Written
Responses Received
Santos Response (If required)
Tanumbirini Station
Managers
1-2 Feb 2019
Face to face
Consultation Accompanying CSIRO crew conducting methane survey
No None Required
Thames Pastoral
25 Jan 2019
Email Consultation Completed Santos 2018 activities and initiate engagement for Santos plans for 2019 and requirement for LACA
No None Required
Tanumbirini Station
Managers
24 Jan 2019
Email Notice of entry EP 161 CSIRO Methane Survey Activity No None Required
Tanumbirini Station
Managers
18-20 Dec 2018
Face to face
Consultation Close out 2018 Santos activities and face to face conversation about Santos plans for 2019
No None Required
Tanumbirini Station
Managers
19 Oct 2018
Email Notice of Entry 2019 Beetaloo Drilling Program Scout EP161
No None Required
Tanumbirini Station
Managers
18 Oct 2018
Email Consultation Ongoing communication regarding accommodation requirements at Tanumbirini Station
No None Required
Tanumbirini Station
Managers
15 Oct 2018 /16 Oct 2018
Email Consultation Accommodation requirements/availability at Tanumbirini Station
No None Required
Tanumbirini Station
Managers
15 Oct 2018
Email Notice of Entry EP 161 Water Bore Baseline Monitoring No None Required

Santos Ltd l Environment Management Plan: MacArthur Basin Civil and Seismic Program 17 June 2019
Stakeholder Role /
Position Date
Type of Contact
Method of Contact
Matters Raised Written
Responses Received
Santos Response (If required)
Tanumbirini Station
Managers
Oct 2018-Jan 2019
Phone calls
and text messag
es
Consultation
Numerous phone calls and text messages regarding Santos activities – survey, accommodation, contractor camp, civil activities for bore drills
No None Required
Tanumbirini Station
Managers
24/10/2018 /
23/10/2018 /
22/10/2018
Face to face/
Email / Email
Consultation Daily contact onsite on Tanumbirini Station regarding requirements to access bores, fuel equipment etc.
No None Required
Beetaloo Station
Managers
25/10/2018 /
24/10/2018
Face to face/ Email
Consultation Met onsite on Beetaloo Station regarding requirements to access bores and planned activity.
No None Required
Tanumbirini Station
Managers
16/10/2018 /
15/10/2018 Email Communication
Correspondence regarding CSIRO and Santos representatives conducting bore monitoring and accommodation requirements
No None Required
Broadmere Station
Managers
17/10/2018/ 15/10/2018
Email Communication Update on Beetaloo groundwatermonitoring program
No None Required
Tanumbirini Station
Managers 19/10/2018 Email Notice of Entry
Survey and Scout for 2019 BeetalooDrilling Program
No None Required
Beetaloo / O.T Downs Managers
15/10/2018 Email Notice of Entry Beetaloo - Groundwater monitoring EP161
No None Required

Santos Ltd l Environment Management Plan: MacArthur Basin Civil and Seismic Program 17 June 2019
Stakeholder Role /
Position Date
Type of Contact
Method of Contact
Matters Raised Written
Responses Received
Santos Response (If required)
Tanumbirini Station
Managers 15/10/2018 Email Notice of Entry
Tanumbirini - Groundwater monitoring EP161
No None Required
Tanumbirini Station
Managers 6/10/2018 Email Notice of Entry
2018 Work Program Tanumbirini –Survey
No None Required
Broadmere Station
Managers 29/08/2018 Email Notice of Entry
Beetaloo groundwater monitoringprogram
No None Required
Tanumbirini Station
Managers
12/08/201811/08/2018 10/08/2018 09/08/201808/08/2018 07/08/2018
Face to face
Consultation
Daily contact onsite on Tanumbirini Station regarding requirements to access bores, fuel, equipment and updates on progress etc.
No None Required
Beetaloo / O.T Downs Managers
24/04/2018 Email Notice of Entry Beetaloo groundwater monitoringprogram
No None Required
Tanumbirini Station
Managers 24/04/2018 Email Notice of Entry
Beetaloo Groundwater MonitoringProgram
No None Required
NLC Manager Minerals
and Energy 16/01/2019 Email Work Program
In accordance with clause 5.1(c) of the EP 161 Co-operation and Exploration Agreement Santos provided a Work Program (Northern Scope) and supporting spatial files with respect to areas within EP 161 where it proposes to undertake activities. (Full Program provided Below)
No None Required
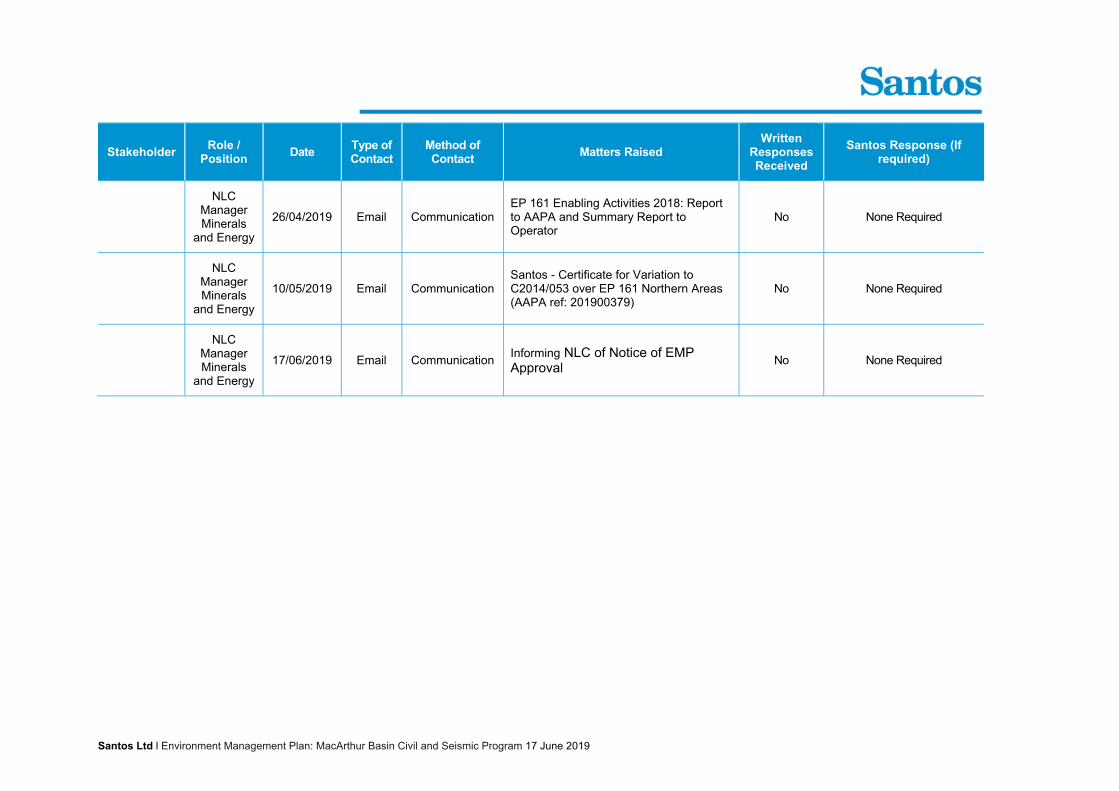
Santos Ltd l Environment Management Plan: MacArthur Basin Civil and Seismic Program 17 June 2019
Stakeholder Role /
Position Date
Type of Contact
Method of Contact
Matters Raised Written
Responses Received
Santos Response (If required)
NLC Manager Minerals
and Energy
26/04/2019 Email Communication EP 161 Enabling Activities 2018: Report to AAPA and Summary Report to Operator
No None Required
NLC Manager Minerals
and Energy
10/05/2019 Email Communication Santos - Certificate for Variation to C2014/053 over EP 161 Northern Areas (AAPA ref: 201900379)
No None Required
NLC Manager Minerals
and Energy
17/06/2019 Email Communication Informing NLC of Notice of EMPApproval
No None Required

Santos Ltd l Environment Management Plan: MacArthur Basin Civil and Seismic Program 17 June 2019
McArthur 2019 Work Program – Northern Scope NLC Submission

Santos Ltd
ABN 80 007 550 923
Ground Floor Santos Centre
60 Flinders Street
Adelaide SA 5000
GPO Box 2455 Adelaide SA 5001
Telephone: 08 8116 5111
WP-19-0002
15 January 2019
CONFIDENTIAL – Commercial in Confidence
Attention: Native Title Parties Representative C/o Northern Land Council 45 Mitchell Street Darwin NT 0800
Mr. Malcolm Hauser Senior Project Officer Borroloola - Barkly Region Minerals and Energy Northern Land Council 45 Mitchell Street, Darwin NT 0801
Dear Malcolm,
WP-19-0002_EP 161_McArthur_2019_Work Program – Northern Scope
Santos (QNT) Pty Ltd (Santos), in accordance with clause 5.1(c) of the Co-operation and Exploration Agreement, EP 161, provides this Work Program with respect to areas within EP 161 where it proposes to undertake activities. The areas identified in this submission (Tanumbirini North and Inacumba North; or collectively the Northern Locations) are identical to those submitted, and subsequently surveyed by the NLC and Traditional Owners, in 2013/14 and resulted in an Anthropological Report being provided to AAPA and the attached AAPA Authority Certificate C2014/053 being issued. These locations were also surveyed more recently in late 2018, although for the purpose of drilling water bores rather than exploration wells; these activities are covered by AAPA Authority Certificate C2018/105.
Many of the activities included in this submission, such as exploration drilling, have therefore, been the subject of previous sacred site surveys. These areas have also been the subject of previous surveying associated with seismic activity undertaken in 2013 (Authority Certificate C2013/142).
This submission includes further activity at the previously surveyed Northern Locations, as outlined in summary below and in detail in the attached tables and annexures. We request the opportunity to inform the host Traditional Owners via a community consultation and for the host Traditional Owners to review the Northern Locations (and their access routes) via a remote mapping exercise given the extensive and recent sacred site surveys. Noting the timeframes to undertake work in 2019 any assistance in expediting the process for the Northern locations would greatly assist the planned 2019 exploration program.
In parallel to this submission, Santos will also submit a work program for identical activity clearances at two locations (Tanumbirini South and Inacumba South; collectively the Southern Locations) where water bore installation has recently been approved but approval for exploration drilling has not previously been sought via the work program process. We understand that approvals for the Southern Locations are unlikely to be able to be expedited given that they will likely require sacred site surveys following the 2018-19 wet season along with community consultation.

Scope (Northern Locations) Approved by and entirely within the areas included in Authority Certificate C2014/053 and Authority Certificate C2018/105:
• Civil engineering activity – upgrading and creation of new access tracks, lease pads, water boreinstallation and water extraction as required (note that water extraction will require a WaterExtraction License)
• 2D seismic acquisition
New activities for approval in the areas included in Authority Certificate C2014/053 and Authority Certificate C2018/105:
• Civil engineering activity – upgrading and creation of new access tracks, lease pads, water boreinstallation and water extraction as required (note that water extraction will require a WaterExtraction License)
• 2D seismic acquisition• Exploration drilling – both vertical and horizontal drilling (where horizontal wells will be contained
entirely within the 5km radius subject area)• Well evaluation – including wireline logging, formation testing, core acquisition, fluid sampling,
open-hole formation integrity testing (i.e. DFITs) and other standard oilfield evaluation techniquesas deemed appropriate
• Hydraulic fracture stimulation• Flow-back and production testing• Well suspension and/or well decommissioning• Ongoing site and well maintenance and monitoring, work-over and re-entry, and evaluation as required
Details of the proposed project work activities are included in the attached tables and annexures, and have been identified by undertaking a combination of desktop assessment and information from locations previously scouted.
Purpose The purpose of exploration and appraisal activity undertaken at the Northern Locations in 2019, 2020 and beyond is to increase our understanding of the prospectivity or potential of the EP161 permit area. Our objective whenever undertaking such activity is to minimise our impact on the environment, including any activities of Traditional Owners and pastoral lessees.
AAPA Authority Certificate Santos will seek an Authority Certificate from Aboriginal Areas Protection Authority (AAPA). As previously agreed and discussed, the NLC will undertake the on ground assessment remote assessment and provide the report findings to AAPA in the AAPA template which has been previously provided.
Work Program Meeting Santos is available to attend work program meetings on country or, in the absence of a work program meeting, resource the NLC accordingly to meet any community requirements. Santos is willing to fund and resource interpreters or any other specific requirements to meet community requirements.
Well Locations and Coordinates Refer to the attached maps, spatial data and the table below for the coordinates of the proposed project works, including access.

Attachments Please refer to the attachments which contain maps, spatial data, tables and descriptions of the proposed activities proposed at each location with approximate coordinates of the proposed well locations under application:
1. Attachment 1: Summary table, maps, tables of proposed work activities and locations.2. Attachment 2: Annexures describing industry work activities3. Attachment 3: GIS data and supporting imagery
Santos is seeking your approval to proceed on this basis and look forward to meeting at an agreed date to discuss in detail and progress this work program.
Santos also notes the importance of the community consultation requirements to ensure the host traditional owners are adequately consulted and informed of project activities. We look forward to working with the NLC to ensure the community consultations fully inform the host traditional owners.
Please contact Che Cockatoo Collins on the details below if you require any further information or clarification of the proposed works.
Kind regards,
** Names Redacted **

Attachment 1 – EP 161
1. Summary of proposed activities
All of the activities included in Table 1 and annexures are subject to extensive regulatory approvals or review by the Department of Primary Infrastructure and Resources, the Department of Environment and Natural Resources, the Environmental Protection Authority, and other regulatory agencies. Moreover, substantial baseline data acquisition (including water monitoring bores installed at least six months prior to drilling hydraulic fracture stimulation activity) is required under the Petroleum Act and associated Petroleum Environment Regulations. Further details regarding these approvals and or approval submissions can be provided on request.
Table 1. Summary of the Proposed Work Program
(A) The nature, scope and objectives of proposed activities;
Please refer to Annexures for detailed descriptions of the exploration activities summarised in this table, which include 2D seismic, exploration drilling, hydraulic fracture stimulation, flow-back and production testing, well monitoring and site maintenance, and associated civils works. The annexures detail the following activities that could potentially be proposed at both the Tanumbirini North and Inacumba North locations: • 2D seismic acquisition (Annexure 1) • Wellsite civils works, access and camps (Annexure 2) • Diagnostic Fracture Injectivity Testing (DFIT)
(Annexure 3) • Exploration drilling and evaluation (Annexure 3) • Microseismic and tiltmeter monitoring (Annexure 3) • Fracture stimulation (Annexure 3) • Flow or production testing (Annexure 3) • Completion including suspension and/or well
decommissioning (Annexure 3) • Ongoing well and site monitoring, maintenance,
work-over and evaluation Refer to the provided maps and spatial data for proposed locations, access, and approximate areas of disturbance. All proposed work activities will be located within the boundaries of the AAPA Authority Certificates C2014/053 and C2018/105.
(B) The estimated time and period for the performance of such activities;
It is proposed that seismic and civils activity could commence as early as Q2 2019 and that drilling activities could commence in late Q2 2019. However, activity commencement will require substantial approvals and it is possible some or all activity will be deferred until 2020. Activity could be repeated in future years at these locations pending appropriate notification and discussion by Traditional Owners through On Country Work Program meetings. The following summarises typical time-frames for discrete work packages or activities and reflects the planned 2019 or 2020 (pending approvals) work program plan. In future years, timings could vary and activity

could reduce. It is unlikely that 2D seismic acquisition will be repeated and, once access and a well lease is constructed, these activities will not be repeated (although maintenance will be required). 4-12 weeks – Lease and Access Track Preparations: Access track preparation, well pad construction and associated works will be undertaken in preparation for drilling operations. Where possible existing access tracks will be upgraded; however, new access tracks will be created (within the surveyed areas only) if it achieves the objective to minimise the overall impact of the operations. Temporary camps will be used to support these activities. 2-8 weeks – Seismic Acquisition (well focused not regional surveying): Line preparation and surveying typically takes 1-2 weeks depending on the extent of the survey. The seismic recording crew then typically commence 1-2 weeks after line preparation and surveying crews and will typically take a further 1-2 weeks to complete the seismic survey. The extent of any surveying that could be considered under this clearance request is relatively limited as it will be contained within the 5km radius buffer around the well lease. 60-90 days (per well) – Drilling Phase: Following completion of lease and access track preparations, the drilling phase is anticipated to take approximately 60-90 days per well. 15-40 days (per well) – Fracture Stimulation Phase: Following completion of drilling and well completion, the fracture stimulation phase is anticipated to take approximately 15-25 days per well. 3-5 days (per well) – Completion Phase: Pending the initial gas flow rates, wells may be completed with a tubing string that is run in the well to improve productivity. The tubing will be installed with a workover rig and is anticipated to take approximately 3-5 days per well. Flow Testing Phase and Well Suspension: Subject to a successful reservoir outcome, the well will be put on extended flow test for an initial period of approximately 90 days. We will seek approvals to extend the flow testing period for one or more years from the Northern Territory regulator for early exploration wells to allow key data to be gathered. Flaring will be used to ensure hydrocarbon gases are safely and efficiently handled. Such approvals will be subject to rigorous environmental management plan approvals. Subsequent to any flow testing the well will be suspended. A build-up test may be incorporated into the well suspension to aid in the evaluation of the well results. Following the build-up test a successful test well will likely be suspended until a development project is sanctioned or a well is decommissioned at the end of the project life.

Further on-going well integrity monitoring, well-head maintenance, site maintenance, in-hole evaluation and work-over will be performed as required. If required, Santos will provide further details prior to the field work and as planning progresses
(C) The techniques, infrastructure and major items of equipment to be used;
Civils Surveying: Surveying of proposed access tracks, leases, gravel/borrow pits, camp sites and associated facilities will be carried out using 4WD vehicles and GPS units utilising existing roads and station tracks where possible. Road Construction: Existing access roads and tracks will be upgraded and widened (within approved subject land area only) to accommodate larger vehicles and the drilling rig mobilisation to well site. New access roads or tracks will be created where necessary to access the lease pad or minimise our overall environmental impact or impact on pastoral lessee infrastructure or activities. The attached maps (Attachment 1) and spatial data show the locations of the proposed access tracks based on previous scouting and authority certificate subject lands. All proposed access tracks are within the clearance area of the C2014/053 Authority Certificate and/or the C2018/105 Authority Certificate. Changes to these proposed routes may occur to minimise overall impact; however, at no times will the surveyed area previously approved by Traditional Owners (via the NLC) and AAPA (under C2015/053 and C2018/105) be exceeded. 2D Seismic Acquisition: Refer to Annexure 1 for details of the 2D seismic survey process Well Pad / Lease Construction: Well lease construction will include clearing and stockpiling, grading and capping with clay/suitable material if deemed required based on ground condition. Construction of turkey’s nests and above ground storage tanks will occur if required. Stockpiled vegetation and top soil will be respread as part of the rehabilitation process, following well decommissioning (which may be some or many years in the future depending on exploration and appraisal activities and project success). Drilling Activities: The wells will be drilled using either drilling mud or air hammer as required to suit formation properties. Wells will be either vertical only (i.e. a vertical well), or initially vertical with a subsequent inclined section leading to a lateral or horizontal section (i.e. a deviated or horizontal well). Vertical well sections could vary between approximately 1000m and 4500m and horizontal sections could vary from less than approximately 250m to in excess of 3000m (where the absolute limit of any horizontal well

would be the area surveyed and cleared for sacred sites (i.e. the clearance area). Where possible, drill core and/or cutting samples and/or fluid samples will be obtained for geological assessment and analyses as per Santos and regulatory requirements. Evaluation Activities: Open-hole wireline logs will be acquired over the open-hole sections as per Santos and Northern Territory Government requirements. In addition to wireline logging Santos may undertake formation testing, open-hole formation integrity testing (i.e. DFITs) and other standard oilfield evaluation techniques as deemed appropriate. Vertical seismic profiling may also be completed, this activity combines surface seismic activities (Annexure 1) with down-hole wireline evaluation tools (geophones). Diagnostic Fracture Injection Test (DFIT): A DFIT refers to the act of injecting small volumes of a clear fluid, typically water (usually with a small percentage of Potassium Chloride e.g. 2 to 3% KCl) at low pumping rates to create a fracture before the wellhead is shut-in and the pressure allowed to fall-off naturally. The fluid contains no proppant so that the fracture can relax and close naturally when pressure is released. The pressure changes are measured with high-accuracy gauges that are either placed deep in the wellbore or at surface on the wellhead. The analyses of fracturing pressure, during injection and after shut-in, provide information data for understanding and improving the fracturing process. The DFIT process differs from fracture stimulation in a number of key ways, primarily it is of a much smaller scale, does not involve pumping proppant, and is not intended to induce hydrocarbon production. Well Completion Activities: The wells will have casing set in the well to meet the design objectives of the well and the meet the standards from the NT Well Operations Code of Practice and the Santos Drilling and Completions Management Process (DCMP). Casing will be set in order to isolate shallow aquifers present, isolate any geohazards that may present like significant formation losses or tight hole, as well as being designed to withstand the expected forces during hydraulic fracturing. Each casing string will be cemented in place to ensure aquifer isolation and overall wellbore integrity is maintained. Once each casing is cemented in place, it is pressure tested to ensure the cement and casing meet and/or exceed their design specifications. The final casing string, the production string, is tested to above the maximum anticipated pressure to stimulate and confirm the integrity of the designed well envelope. Hydraulic Fracture Stimulation Activities: Prior to the hydraulic fracture stimulation (or frac) “spread” (the term used to describe the various trucks and equipment needed to frac) arriving on location, the well will be logged to confirm the cement bond and ensure isolation between the fracture stimulation target intervals and shallow aquifers. A number of valves are

installed on the wellhead known as the “Christmas Tree” which are rated to above the maximum designed surface pressure, and allow for the transfer of fluid and proppant/sand into the wellbore. The complete system is then pressure tested again to simulate hydraulic fracturing conditions. Intervals to be fracture stimulated will be perforated using a shaped charge which creates small holes in the casing providing a conduit between the wellbore and the formation. The combination of water, proppant and chemicals (generally <2% of total mix) known as the slurry are mixed together at surface using a “blender” – see Annexure 4 for summaries of the chemical composition of potential frac fluids and solids that could be included, and note that they are typically used at low concentrations (the final fluid composition must be provided to the NT Government as part of the environmental approval process). The slurry is transferred to pumps that convert it from low pressure to high pressure, and allow it to be injected through the wellhead into the well, and ultimately into the formation that is being hydraulically fracture stimulated. After each frac stage, a plug is pumped down on wireline and the next frac stage is perforated, and the process starts again. At the completion of hydraulic fracturing, Coiled Tubing is used, which is run in hole with a motor and mill on the end to remove the isolation plugs in place. After reaching the bottom of the well with the coiled tubing and establishing a flow path to the surface for all frac stages, the well flowback commences in order to recover the frac fluids pumped into the well. Fracture Diagnostics are often used to determine the fracture effectiveness and allow for future optimisation. Chemicals Tracers may be pumped with the slurry at a known concentration. Their concentration during flowback can be measured to determine the relative contribution from each stage. Microseismic geophones may be used either at surface or in a neighbouring well, to listen for the very small seismic events that are created during fracture stimulation. Triangulation is used from the geophone array to determine the location of the event and hence gain a picture for fracture dimension (height and length) and direction. Tiltmeters may be used to gain an understanding of the micro deformation that takes place during a frac. These small changes can be used to determine the verticality of the frac and also indicate the direction in which the fracture has propagated. The installation of either surface geophones or tiltmeters is low-impact, and down-hole geophones have no impact on the environment. Flow-back and Well Testing Activities: Some flow testing may be conducted with the drilling rig on location prior or post open hole logging activities. Subject to a successful reservoir outcome, wells will be flow tested for an initial period of approximately 90 days.

We will seek approvals to extend the flow testing period for one or more years from the Northern Territory regulator for early exploration wells to allow key data to be gathered. Flaring will be used to ensure hydrocarbon gases are safely and efficiently handled. Such approvals will be subject to rigorous environmental management plan approvals. Well Status: Exploration wells in the McArthur/Beetaloo area are exploration wells with relatively high uncertainty on reservoir outcome. The following activities may occur post logging evaluation:
1. The well will be suspended with steel casing cemented in place for future re-entry; or
2. The well will be decommissioned. As part of the well suspension process, wellbore barriers will be put in place as per Santos and Northern Territory regulatory requirements. A well integrity monitoring plan will be put in place for any suspended well for monitoring of wellbore barriers. As part of well decommissioning process, cement plugs will be permanently placed in the well as per Northern Territory regulatory requirements. The wellhead will be removed; leases and roads rehabilitated and signed properly as per Northern Territory regulatory requirements. Site Rehabilitation Activities: For any decommissioned well, the well pad and associated camp sites, etc. will be rehabilitated to ensure minimal disturbance. For any suspended well, the wellhead area will be fenced off and the well pad site rehabilitated as much as practical to ensure re-entry for well integrity monitoring and intervention activities can be maintained. Further technical details can be provided on request. Camps Camps may be constructed within the approved subject lands to support the above activities. These camps may be capped with suitable clay material if required based on ground conditions. Preference will be given to utilising previously disturbed areas. All camps will be covered by a valid Environmental Management Plan and comply with all conditions of that plan to minimise environmental impacts.
(D) The likely Environmental Impact of such activities and proposals to minimise the Environmental Impact, in particular, the disturbance to Native Title Parties;
Where possible, access roads, borrow/gravel pits, leases, camp sites and associated works will be planned so as to use existing station roads and/or access roads or resources to minimise any new disturbance. Access tracks planned to be utilised have been identified from initial scouting activities. Where it is not possible to use existing

tracks and access roads, due to the requirements of heavy vehicle access (where upgrading of the existing track is not feasible), some new access tracks will need to be constructed. New access tracks will not exceed the approved subject lands in the authority certificates referenced above. Roads/access tracks could extend up to 10m either side of centre line (i.e. up to 20m in width). Where possible and practical new access tracks will be oriented to minimise or avoid disturbance to land systems and native flora. Santos will construct stock proof fencing around specific work areas such as drilling sumps and pits, to minimise potential impacts on native fauna and livestock. Where possible, consideration of the use of above ground tanks/water storage facilities will be included in the project scope of works to reduce the disturbance footprint and minimise environmental impact. Following completion of drilling activities, remnant fluids will be left in-situ (lined sumps or lined ponds) to evaporate with the ability to transfer to covered above-ground pond as per the NT Well Operations Code of Practice. Where the volume of remnant fluid poses a risk of overflow during the wetter part of the year, fluids may be removed from site or stored (on-site) temporarily in purpose built containers. Chemicals will be stored in appropriately bunded and designated areas for the duration of the drilling operations. No surplus chemicals will be left on site after the well is decommissioned or suspended. In shale hydraulic stimulation treatments, water accounts for more than 90% of the mixture and sand accounts for about 5-9%. Chemicals generally account for less than 1% of the mixture and assist in carrying and dispersing the sand in the low permeability rock. In accordance with regulatory requirements, the chemicals additives are subject to full disclosure. The chemical additives are not specific to the hydraulic fracture stimulation process, having many common household uses such as in swimming pools, toothpaste, baked goods, ice cream, food additives, detergents, cosmetics and soap. An above ground water storage tank provides temporary water storage for use in the hydraulic stimulation process. Source water can either be trucked from a nearby water source or piped along a temporary network. Small dosages of biocide are added to control algal growth particularly under warm and stagnant conditions. Following completion of works, temporary water storage infrastructure is removed from site. The equipment and machinery required to carry out a hydraulic stimulation operation is highly mobile and able to be installed and removed relatively quickly (generally within a couple days). They are designed to comply with state and federal regulations for road transport, and are fitted with safeguards such as an in-vehicle monitoring

system (IVMS) to ensure compliance of the individual contractors. For any decommissioned well, the well pad and associated camp sites, etc. will be rehabilitated to ensure minimal disturbance. For any suspended well, the wellhead area will be fenced off and well pad site rehabilitated as much as practical to ensure that re-entry for well integrity monitoring and intervention activities can be maintained. Further technical details can be provided on request.
(E) The proposed means of access and access routes for personnel and equipment, both into and within the Permit Area, including particulars of the amount of vehicular and airborne access and any proposals to construct or upgrade roads, landing strips, or other access facilities;
Please refer to Attachment 1 for details of the proposed access routes for personnel and equipment and proposals to construct or upgrade roads. Please note that multiple access options have been included; however, these will not all be required for the final scope. The amount of vehicular access will be variable during the scope of proposed activities, but Santos will aim to design proposed infrastructure that does not adversely impact Traditional Owners, pastoral lessees, nearby industry or the general public. Initial Access Roads Planned earthworks are required to provide a safe and practical work area and access to drill exploration wells, water wells, campsites, airstrips and for other operational needs. The access roads for the Northern Locations already exist, but may need upgrading in some sections to meet Santos standards, which are designed to accommodate heavy vehicle usage. Regular watering may occur to reduce dust and additional capping may be added to the surface to reduce maintenance or closure following periods of rain. Landing Strip Airstrips and Helipads are commonly used to bring the workforce from a main centre closer to worksites with the aim of reducing fatigue and exposure to land transportation risks. Existing landowner airstrips will be utilised and upgraded under agreement to a condition where charter operator (for crew change), or RFDS or Careflight Air Ambulance (emergency evacuation) aircraft can be accommodated. Helipads may be constructed at each wellsite to provide additional direct access to remote wellsites. Initial Mobilisation and Final Demobilisation: Initial mobilisation of drilling rig requires approximately 80-120 loads/trailers mobilised to the nominated Wellsite. A combination of standard trailer loads and oversize loads (for which the required permits for transport will be in place with the NT government) will be used. Demobilisation will involve moving all equipment out from location via the proposed access routes. During drilling activities:

A small number of trailer loads to the wellsite will be required, with some mobilisation of equipment to lay down areas via a combination of trailerised loads (singles, doubles, road trains). A daily commute will occur by 4WD vehicle for crew changes between campsite and rig site. Road maintenance will include the application of imported capping to repair creeks or holes, the addition of water to the road surface to restore compaction or reduce dust generation, and grading to restore drainage by reshaping the road profile or removing rutting. Rollers will be used where necessary to aid compaction. Fracture stimulation Initial mobilisation of the frac spread and associated services like coiled tubing and wireline will require approximately 40-60 loads/trailers mobilised to the nominated wellsite. There will also be 50-100 loads to the wellsite required to transport frac materials like proppant to the location. Demobilisation will involve moving all equipment out from location via the proposed access routes. There will be a daily commute by 4WD to mobilise and demobilise crews from the camp to the frac spread and vice versa. Flow testing: Minimal personnel, some trailerised equipment haulage to site for initial set up of equipment and then 4WD transport as required for monitoring during flow testing activities. Well Integrity Monitoring Scheduled visits for well integrity monitoring one or two personnel as required.
(F) Any fly-camps or other camp sites of less than five days duration proposed to be used;
When and where feasible, temporary local accommodation (i.e. Tanumbirini Station) will be considered to minimise environmental impact. Camps may be constructed within the subject areas. These camps may be capped with suitable clay material if required based on ground conditions. Preference will be given to utilising previously disturbed areas.
(G) Any water, timber or other resources proposed to be obtained from within the Permit Area and surrounding areas;
Water bores: Drilling of new water bores and use of existing water monitoring bores are the preferred water supply sources; followed by use of existing station water bores. Water bores have been previously constructed by Santos proximal to the Tanumbirini North and Inacumba North locations, so it may not be necessary to install more. However, further water bores may be installed if needed and will always be located within the subject land. The water taken from water bores is limited by the conditions of the NT Government Water Act provisions and/or appropriate water extraction licence(s) In addition, earthen water holding pond(s) and loadout facilities may be constructed and fenced as required.

Water will be used for drilling and fracture stimulation purposes and for road maintenance as required. Construction materials (soils and gravels): Where in-situ materials are unsuitable, additional fill/clay/rubble for capping of roads, flood-ways, landowner pipeline crossings and leases will be sourced from approved areas; wherever possible this will be done by extending existing quarries or borrow pits. Borrow/gravel pits: Borrow pits may be required as a source for extraction of construction materials. The presence of suitable borrow/gravel pits within the subject land approved areas has been confirmed through initial scouting. Management practices include stockpiling cleared vegetation and topsoil in separate piles for respreading over progressively reclaimed areas, and areas to be restored will have battered edges. Maximum excavation depth will be based on the available soil types and volume; however, excavations will not typically extend beyond 3m depth. Where possible, materials stockpiled for construction will be stored within the cleared area and transferred to site as required. Mixing of water with materials to create a cohesive mix may be undertaken at the pit or at the construction site – e.g. lease pad or roadway.
(H) The estimated costs of implementing such activities;
$80m to $100m 2019 budget estimate only. Future activities beyond 2019 will be budgeted separately.
(I) Any proposals concerning employment, training and business opportunities;
To be determined. Santos will provide further details as logistical and program requirements are finalised. Refer to section J below.
(J) If known, the identity of any proposed contractors and sub-contractors engaged or likely to be engaged and the minimum and maximum number of personnel likely to be on the Permit Area from time to time and their roles in undertaking such activities;
2D seismic acquisition The contractor is unknown at this point in time as the procurement process is ongoing. At any one time, the seismic crew may consist of approximately 15 personnel, including:
Line preparation (4 personnel); Surveying (2 personnel); and Seismic recording (15 personnel).
The crew will consist of plant operators, surveyors, line labourers, truck drivers, technical personnel, camp support personnel, paramedics and field management personnel. Civil Works Wellsite & Access Road Construction (Includes Water Bore Construction) At this point in time the procurement process is ongoing. Santos has been in discussion with several contractors who have good indigenous engagement and local

experience. It is expected that the following companies will be invited to tender for the 2019/20 scopes of work.
• Cairns Industries • Crowhurst / Goodline • Intract • MS Contracting • Rusca Bros • Yindwati
At any one time, the civil works crew may consist of approximately 20 personnel, including:
Site management (3 personnel); Water Bore Drillers (4) Earthmoving Construction Crew (9) and Support Crew (4)
The crew will consist of plant operators, water bore specialists, truck drivers, camp support, and field management personnel. Drilling Primary drilling contractor is proposed to be Ensign Australia Pty Limited for the 2019 program. Future programs could use other, equally qualified, drilling services providers. For other services, Santos will initiate preliminary discussions with contractors to ascertain availability and operational capacity. Further information can be provided once these arrangements are finalised. Fracture stimulation The most common contractors for hydraulic fracture stimulation scopes of work are Halliburton, Schlumberger and Condor. We anticipate that one, or a combination, of these companies will undertake the frac works. Each company is highly experienced and qualified for the activities in scope. The workforce associated with this phase of activity will vary from approximately 10 to 40 depending on the specific daily activities undertaken.
(K) The chemical composition of any fluids and solids proposed for use in Hydraulic Fracturing of potential Hydrocarbon producing formations;
Refer to Annexure 4 for a list of chemicals used by Halliburton, Schlumberger and Condor in Fracture Stimulation operations. If chemicals other than those listed are proposed for use, these will be provided to the NLC and disclosed to Traditional Owners at On Country Work Program meetings.
(L) The area, or where appropriate, line distance the subject of such activities (in square or, where appropriate (for example, seismic lines and roads), line kilometres); and
The proposed 2019 work program includes an approximately 10km 2D seismic line around the Tanumbirini North location (see maps below), which is entirely within the previously surveyed area of Authority Certificate C2014/053. The line will not interact with any sacred sites or ‘cleared with constraints’ areas and will be planned to minimise environmental impact. Any future seismic survey is likely to be of a similar scope, or would require separate cultural heritage and sacred site clearances. Please refer to the below maps and the spatial data provided.

(M) Any other aspect of such activities that is likely to have any Environmental Impact, or in particular, any impact upon Native Title Parties.
Santos has procedures and extensive experience in operating in arid environments. Santos will ensure that any risk of long term impact is minimised and that there is no risk or impact to sacred sites and cultural heritage as a result of the work. To ensure there is no risk or impact to sacred sites and cultural heritage as a result of the proposed work, it is suggested that representative/s of the Traditional Owner group/s accompany the team where possible for any sampling, survey, or construction activities. Santos also welcomes the involvement of local Traditional Owner groups to provide cultural awareness training, welcome to country, and to visit the operations during our activities.

2. Areas of proposed work activities
The proposed work activity falls within previously approved NLC reviewed & AAPA authorised areas approved under AAPA Authority Certificates C2014/053 and C2018/105 that were granted in April 2014 and December 2018 respectively (Figure 2.1.1). This application provides a refreshed work program detailing proposed activities within the approved areas and ensuring that no activity will occur within the identified restricted work areas (RWAs). Pending authority, council and state approvals Santos would propose to commence seismic & civil activities as early as Q2 2019. Access track preparation, well pad construction and associated works will be undertaken in preparation for seismic and drilling operations. Where possible existing access tracks will be upgraded; however, new access tracks will be created (within the surveyed areas only) if it achieves the objective to minimise the overall impact of the operations. Temporary camps will be used to support these activities and will remain with the current cultural heritage authorised areas.
2.1 Inacumba North Lease Pad and Access
Civils work at Inacumba North is proposed to facilitate access and prepare the area for the exploration of the Inacumba well. The approximate coordinates of the proposed location are presented in Table 2.1.1. GIS files are attached to this application that complement the scope of work described Table 1. Figure 2.1.1 is a location map showing the Inacumba North Area.
Projection GDA94 Zone 53, CM 135°
Latitude 16° 30’ 58.92” S
Longitude 134° 50’ 33.11” E
Easting 483196 Northing 8173939
Table 2.1.1: Approximate wellhead coordinates of proposed 2019 Inacumba North well.
2.2 Tanumbirini North Wellsite Infrastructure & Access
Civils work at Tanumbirini North is proposed to access and prepare the area for the exploration and appraisal of the Tanumbirini wells. Tanumbirini-1 well coordinates and the approximate coordinates of the proposed Tanumbirini-2H location are presented in Table 2.2.1. GIS files are attached to this application that complement the work-scope briefly described in Table 2.2.2. Images have been provided in figures 2.2.1 to 2.2.4 as a guide of the approximate location of each zone proposed in the lease pad area and access to the lease.
Location Projection GDA94 Zone 53, CM 135° Tanumbirini-1 (drilled in 2014)
Latitude 16° 23' 56.59" S
Longitude 134° 42’ 13.76” E
Easting 468375 Northing 8186900
Proposed Tanumbirini-2H well (2019 program)
Latitude 16° 23’ 58.01”S Longitude 134° 42’ 12.71”E Easting 468344 Northing 8186856
Table 2.2.1: Approximate wellhead coordinates of proposed 2019 Tanumbirini North well

Figure 2.1.1: Overview of the Northern Area showing the Inacumba North Area and Tanumbirini North Area.

Figure 2.1.2: Map showing the Inacumba North Area

Figure 2.2.1: Tanumbirini North Area

Attachment 2 – ANNEXURES
Annexure 1 – Description of 2D Seismic Operations
The seismic method Seismic acquisition allows the explorer to ‘image’ below the surface and identifies areas where oil and gas may have accumulated. The seismic method uses energy sources such as vibrator trucks (or equivalent) to generate sound waves that travel into the earth and are then reflected from subsurface geological structures. The returning reflections are recorded in a digital format and sent to a seismic data processing centre to produce a ‘cross-section’ of the layers of the earth’s crust. The following sections explain the field procedures for recording seismic data. Figure: Schematic of typical seismic acquisition operation Planning Once the exploration team have proposed a seismic program, the line layout is plotted onto detailed topographic maps and aerial images to begin planning the survey. Seismic surveys can be of a regional nature covering a very large area including the first look at an area or an infill type survey that is infilling other seismic surveys. Typically infill surveys are a tighter density of lines covering a smaller area than a regional survey. Regardless of their regional or infill nature, a seismic survey can be as small as a single line or up to dozens of lines totalling hundreds of linear kilometres. In the case of an infill type survey, the lines will usually be set out in a rough grid with line spacing ranging between 0.5 – 5km. 2D Seismic lines are used to layout the seismic detectors that pick up the reflected sound waves and are also travelled by the vibrator trucks that provide the sound waves recorded on the seismic detectors. Seismic lines are usually prepared tracks that are 4-5 m wide. The energy source for conventional 2D seismic lines typically moves along the line as recording progresses. The seismic lines are carefully laid out to avoid sensitive environmental sites as well as cultural features such as buildings, dams, water wells and known cultural heritage sites. The key aspect of field acquisition is to get equipment (usually vehicular based) and personnel along the planned seismic lines and acquire sufficient data to adequately ‘image’ the subsurface.

The safety of field personnel is a key aspect of any seismic operation. This involves compromise between what is logistically, environmentally and economically possible. Cultural heritage clearance A cultural heritage clearance is usually the first field activity to occur on a 2D seismic survey. Clearance logistics vary from project to project. The appropriate method for the project is decided during early discussions between representatives of the explorer and the Native Title Claimants/Traditional Owners. Depending on the method used, Santos may employ a field liaison officer who will be the link between the field clearance operation and Santos. He/she will work closely with Traditional Owners and will provide survey support to the group if required. In the case of the McArthur, all requests for Cultural Heritage Clearance are directed to the Northern Land Council who will then in turn consult with Traditional Owners and their own technical specialists to facilitate approval to proceed with the survey. Typically this approval will come with a number of conditions that must be abided by for the survey to proceed. No work will commence on the ground by Santos or any of its contractors until this approval (whatever its form) is obtained. Seismic Line and Access track preparation Once the line positions for a project have been cleared by the cultural heritage group(s), the line preparation crew can commence work. The line preparation crew usually operates simultaneously on different lines using D6 bulldozers (or equivalent) for the initial pass and then a grader may be utilised for tidy up work if required. Daily production of prepared line varies greatly and is primarily dependent on the terrain. It may vary from 5-20km per day per machine. In areas of low or sparse vegetation, the bulldozer will be utilised to simply walk with the blade up in easily traversable terrain, with the marks of the tracks being sufficient for the grader (if required) and the surveyors to follow. Where required for safety reasons, the blade may be used for minor clearing of topsoil or sand dune access. Blade work is kept to a minimum and generally restricted to skimming the top off rough ground to provide safe access for subsequent operations. The grader that follows the dozer simply tidies up the resultant line. If any windrows are left behind the grader will knock them down to prevent any channelling of rain water and thereby prevent future erosion. In many areas, the dozer will simply walk and there will be no work required by the grader. All machine operators are given detailed project inductions at the start of each survey with project specific issues discussed in great detail such as Cultural Heritage, Environmental, Safety and infrastructure requirements. The line positions are pre-programmed into GPS units mounted in the dozers. These GPS units allow the dozer operators to get real time position updates. These are plotted on a display that also indicates the Cultural Heritage cleared corridor for the dozer operators. The dozers weave around vegetation stands and on open ground the machines weave every 75-100m to reduce the visual impact. Other items such as roads, infrastructure, detours plus any exclusion zones or restricted work areas are also displayed on the dozer GPS units so the operator has a d e t a i l e d project map shown in relation to their position at all times.

Figure: Example seismic line (Mereenie) after line Preparation
The line preparation personnel typically operate out of a small mobile self-contained camp that moves with operations regularly. The project surveyors are also normally accommodated in the same camp along with a paramedic and Santos supervisor. The line preparation phase may last anywhere from a couple of days to a couple of months dependent on the size of the survey. Seismic Line Surveying Surveying commences within a day or two of the commencement of line preparation. A survey team is typically made up of a Senior Surveyor and a number of GPS operators. The senior surveyor is typically responsible for all office work plus doubles as the dozer pointer to assist the dozer operators if they are working in a highly constrained area. The GPS operators are responsible for surveying each seismic line and placing the required survey markers. The GPS operators use real time kinematic GPS receivers to position receiver/source points. Surveyors general ly insert numbered wooden pegs and p las t ic t ipped “pin flags” to indicate the points; however, a seismic line can be “stakeless” in special circumstances such as when working on properties with a certified organic status. Markers protrude about 30cm above ground level and may be placed as deep as 100mm in soft sandy terrain. All of these markers are removed on completion of the recording phase. Line detours are often marked with biodegradable flagging, which is also removed. Each survey team (one surveyor in a light 4WD vehicle) generally makes only one pass over any given section of line.
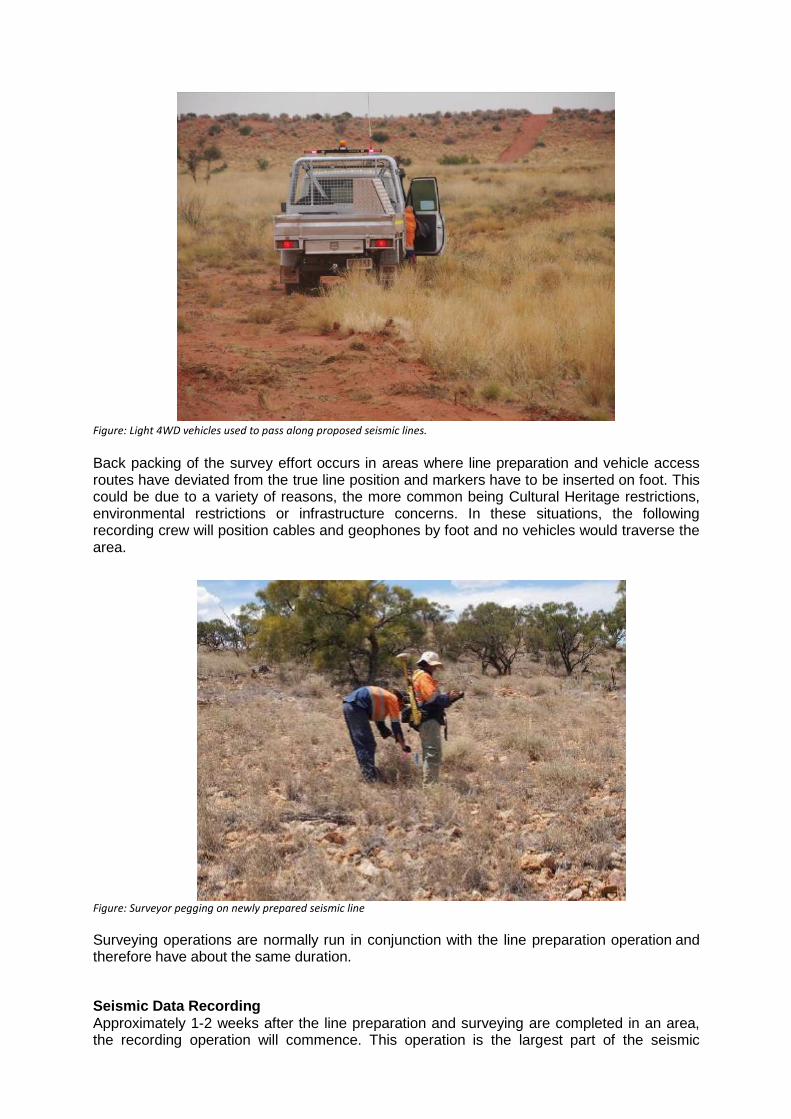
Figure: Light 4WD vehicles used to pass along proposed seismic lines.
Back packing of the survey effort occurs in areas where line preparation and vehicle access routes have deviated from the true line position and markers have to be inserted on foot. This could be due to a variety of reasons, the more common being Cultural Heritage restrictions, environmental restrictions or infrastructure concerns. In these situations, the following recording crew will position cables and geophones by foot and no vehicles would traverse the area.
Figure: Surveyor pegging on newly prepared seismic line Surveying operations are normally run in conjunction with the line preparation operation and therefore have about the same duration.
Seismic Data Recording Approximately 1-2 weeks after the line preparation and surveying are completed in an area, the recording operation will commence. This operation is the largest part of the seismic

operation in terms of personnel and vehicles. D e p e n d i n g o n t h e s i z e o f t h e p r o g r a m , a 2 D recording crew would normally number up to 35 personnel and up to 15 light vehicles. It should be noted that the bulk of the on ground equipment is transported to site in heavy vehicles. These heavy vehicles will only be used on existing tracks/roads and will not travel along the seismic lines. Work commences with the deployment of small seismic detectors (geophones) that contain the geophone element, a GPS receiver, hard disk storage and a battery. These are deployed along the line at a pre-determined interval, dependent on geophysical target, which can be between 2.5m and 25m increments.
Figure: Seismic line crew deploying geophones
Recording would normally commence when a sufficient number of geophones have been deployed. This layout is termed “the spread” and it picks up the acoustic energy transmitted from subsurface layers during the seismic surveying process, converts it to electrical energy and stores that information on a hard drive within the unit. Surveys may have up to 12km or more of spread live at any one time. Recording consists of the vibrator trucks travelling along the line and stopping at regular increments, generally between every 10m and 20m, to “shake” the ground. After shaking in one spot for around 12-15 seconds, the trucks will move onto the next point along the line and shake again. During this, the trucks are centrally located in the line spread, resulting in around 6km of spread behind the trucks and 6km in front of the trucks. The seismic labourers (or “juggies”) rotate the redundant spread from behind the vibrator trucks to in front of the vibrator trucks continuously throughout the day to ensure the vibrators can continue without delay.

Figure: Seismic line crew planting geophones
Figure: Geophone planted in the ground Once the vibrators are finished on a line, the final spread behind the vibrators is picked up and the line is complete.

Figure: Seismic Recording Truck All operational vehicles stay on the prepared line with the exception of parked vehicles that have to park off line to avoid causing noise on the spread and interference with line traffic. While parked off the prepared line, vehicles remain within the corridor cleared by the cultural heritage teams. Along any single line the following vehicle passes can be expected to occur during normal operations. Bulldozer: 1 pass Grader: 1 o r 2 passes Light vehicles: Multiple passes during surveying and recording operations.
Seismic Line/Access Track and Campsite Restoration Once a seismic line is completed, restoration work may commence if required. The majority of seismic lines and access tracks do not require restoration work, as one of the main objectives is to prepare and utilise them in a way that will facilitate rapid natural recovery. However, instances that can give rise to restoration are:
• It is a requirement of the project Environment Plan for all lines to be restored • Wheel ruts have been created after wet periods or bulldust • Windrows have not been fully removed by the grader • Windrows need to be removed at intersection of lines and public tracks • Public access tracks need to be reshouldered where necessary • Access tracks have sustained damage due to extensive seismic traffic.
Normally a single grader i s all that is required to carry out the restoration work. Methods used for rehabilitation include;
• Ripping of compacted areas with rear tynes • Windrow material and vegetation pushed onto the line • Public road windrows reinstated. • Wheel rut material used to infill affected areas. • Affected water course channels and creek banks reinstated to pre-survey profile.

Environmental Monitoring During the above activities the maintenance of environmental standards are monitored closely by the Santos field representatives and Contractor section heads. All crew personnel are environmentally inducted prior to start up. Environmental monitoring points (EMP’s) are set up close to easy vehicle access and the natural rehabilitation is monitored photographically over a period of years until rehabilitation is complete.

Annexure 2 – Description of wellsite civils works and access
Various earthworks are required to provide a safe and practical work area and access to drill gas wells, water wells, campsites, airstrips and other operational needs. The construction designs will be determined by a framework that supports users, landowner and regulatory needs. All civil work activities will be fit for purpose and will be undertaken to minimise impacts on Traditional Owners, pastoral lessees, nearby industry or the general public. Design and construction will be appropriate for:
a. The types of vehicles that need to use the road. b. The type of road planned and the surface material – e.g. high clay (Black Soil), dunefields or fine
bulldust soils require differing construction and maintenance requirements. c. Expected weather conditions – i.e. all weather access and mobility can be improved by formation
design, adequate drainage, plus capping with rock, rubble, or “Durabase Matting”. d. The conditions of the approved Environmental management plan, which requires a civil solution to
manage erosion, wildlife impact, bushfire, and flood risks. Optimally designed, planning and execution of civil works are critical to ensure that:
1. Wellsites are constructed to create safe, fit for purpose work areas that include several distinct zones: i. Drill hardstand is level and compacted using selected fill that supports the loads and pressures
of drilling rig equipment operations. ii. Drill pad work area is level and surrounds the drill hardstand – this area needs to be compacted
and support ancillary equipment like generators, fluid treatment systems, piperacks and forklifts. iii. Wellsite work areas that surround the drill hardstand and cuttings pits have a level tolerance of
<2% and must be compacted to support the movement of trucks and forklifts and bunded areas created for the storage of chemicals, racks and shelving supporting casings and other consumables.
iv. Cuttings pits should be located in an area accessible directly from the fluid treatment systems (Mud Tanks) or loaders (in the case of “sumpless drilling”), usually on multi well pad sites. Pits can be unlined, lined with a bentonite and clay mix to create an impermeable layer, or lined with a synthetic membrane to retain drilling fluids during drilling and subsequent dehydration process prior to backfill.
v. Flarepits should be located in a position down-wind from the prevailing wind direction and ideally >35m from hole centre or any other sensitive zones.
vi. Mini camps, crib/first aid rooms and site management offices, are located outside the wellsite work/hardstand areas; offices will have a clear view of the rig floor. This area will be level, compacted and accessible to supplies and emergency vehicles, and usually include emergency muster points and vehicle parking.
2. Access Roads are designed and constructed so that road trains can deliver equipment and supplies
to the sites, and personnel can be safely moved around or delivered to site. Roads may be watered to reduce dust, and/or capped to reduce maintenance and/or closed following rain.
3. Laydown yards are constructed so that materials can be offloaded and stored for use as and when required. Materials include, casings, tools and mud chemicals. Laydown yards must provide enough room for the safe movement of trucks and forklifts.
4. Campsites for workers’ accommodation, and refuge during severe weather, illness or injury, are located in positions that provide isolation from fire and flood dangers. Campsites must be reliably resupplied and provide workers with good comfort and recreation facilities. The location of campsites should reduce travel and fatigue exposure to acceptable levels.
5. Water Bores for the supply of water to aid compaction and reduce dust; support drilling, completion and hydraulic fracture stimulation operations; and supply water to the campsite for amenity needs. It is preferable to have a low salinity water supply close to site. However, saline aquifers are suitable for some operations, reducing road maintenance costs and the quantity of imported potable water.
6. Water Storage Pads, are required so that water tanks can be erected, providing sufficient volume and delivery of water at a rate required to support the works. Typically larger storage is required where water bore flow to surface is low.
7. Airstrips and Helipads are used to transport the workforce from a main centre to the worksite. Air transport reduces fatigue and exposure to land transportation risks. Existing landowner airstrips will be utilised and upgraded under agreement to a condition where charter operators (for crew change),

or RFDS or Careflight Air Ambulance (emergency evacuation) aircraft can be used. Helipads may be constructed at each wellsite to provide additional direct access to remote wellsites.
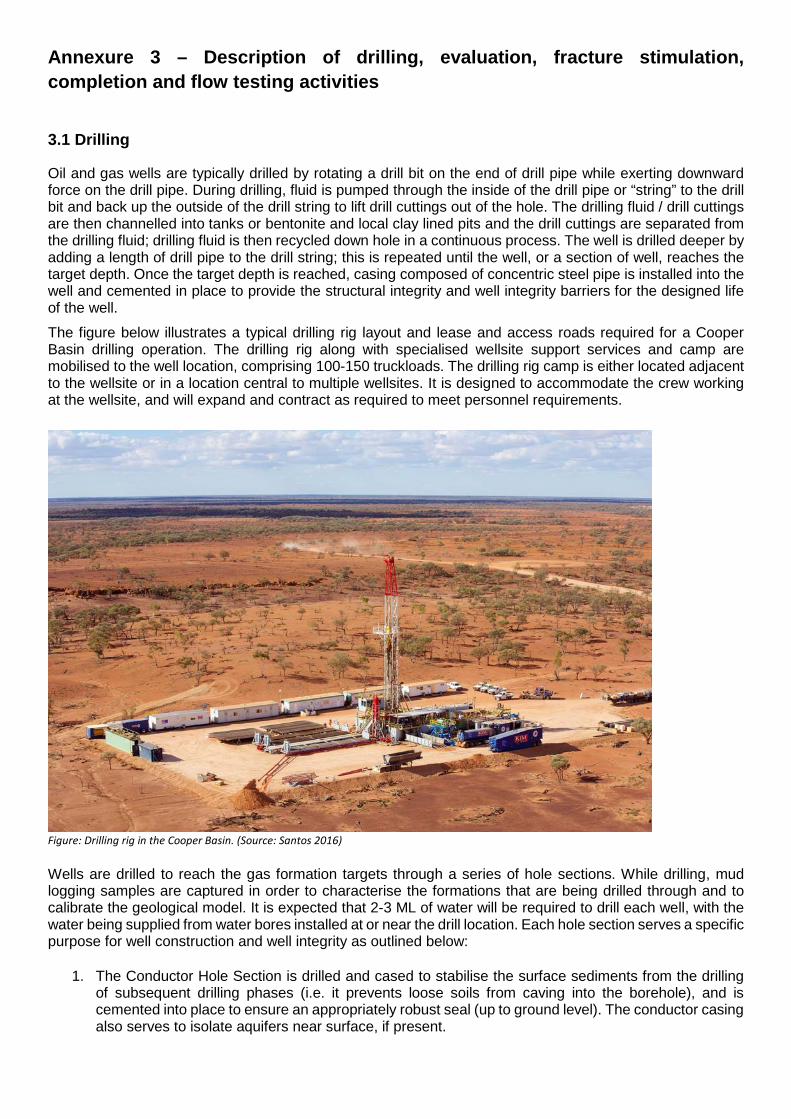
Annexure 3 – Description of drilling, evaluation, fracture stimulation, completion and flow testing activities
3.1 Drilling
Oil and gas wells are typically drilled by rotating a drill bit on the end of drill pipe while exerting downward force on the drill pipe. During drilling, fluid is pumped through the inside of the drill pipe or “string” to the drill bit and back up the outside of the drill string to lift drill cuttings out of the hole. The drilling fluid / drill cuttings are then channelled into tanks or bentonite and local clay lined pits and the drill cuttings are separated from the drilling fluid; drilling fluid is then recycled down hole in a continuous process. The well is drilled deeper by adding a length of drill pipe to the drill string; this is repeated until the well, or a section of well, reaches the target depth. Once the target depth is reached, casing composed of concentric steel pipe is installed into the well and cemented in place to provide the structural integrity and well integrity barriers for the designed life of the well. The figure below illustrates a typical drilling rig layout and lease and access roads required for a Cooper Basin drilling operation. The drilling rig along with specialised wellsite support services and camp are mobilised to the well location, comprising 100-150 truckloads. The drilling rig camp is either located adjacent to the wellsite or in a location central to multiple wellsites. It is designed to accommodate the crew working at the wellsite, and will expand and contract as required to meet personnel requirements.
Figure: Drilling rig in the Cooper Basin. (Source: Santos 2016) Wells are drilled to reach the gas formation targets through a series of hole sections. While drilling, mud logging samples are captured in order to characterise the formations that are being drilled through and to calibrate the geological model. It is expected that 2-3 ML of water will be required to drill each well, with the water being supplied from water bores installed at or near the drill location. Each hole section serves a specific purpose for well construction and well integrity as outlined below:
1. The Conductor Hole Section is drilled and cased to stabilise the surface sediments from the drilling of subsequent drilling phases (i.e. it prevents loose soils from caving into the borehole), and is cemented into place to ensure an appropriately robust seal (up to ground level). The conductor casing also serves to isolate aquifers near surface, if present.

2. The Surface Hole Section is drilled and cased to isolate shallow aquifer systems and to stabilise the
well for subsequent hole sections. The hole section will be drilled with drilling fluid that exerts a higher hydrostatic pressure on the rock face than is present naturally in the rock pore space, ensuring formation fluids do not enter the wellbore. Other techniques such as underbalanced or managed pressure drilling may be applied dependant on the downhole environment. The surface casing is cemented in place from bottom to top to ensure effective pressure isolation of shallow aquifers from deeper hydrocarbon bearing zones encountered in subsequent hole sections. Finally, the casing is pressure tested to simulate well life design specifications.
3. After the surface casing is installed, a Blowout Preventer (BOP) is installed onto the well at surface to provide a second barrier along with the drilling fluid. At the commencement of drilling the next hole section (i.e. only 2-3m of new hole drilled), a Leak Off Test (LOT) or Formation Integrity Test (FIT) is conducted to determine the rock strength. This will ensure the well is drilled without risk of the rock failing due to exerted pressure and will ensure the fluid used for drilling the well has the appropriate kick tolerance.
4. The Intermediate Hole Section(s) may be drilled and cased to isolate deeper aquifer systems (if present), to contain pressure that may occur during the subsequent hole section, or to isolate a geohazard, like a salt formation prior to drilling deeper. The hole section is drilled with drilling fluid that exerts a higher hydrostatic pressure on the rock face than is present naturally in the rock pore space, ensuring formation fluids do not enter the wellbore. Other techniques such as underbalanced or managed pressure drilling may be applied dependant on the downhole environment. As with the surface casing, the intermediate casing is cemented in place to ensure appropriate well integrity. Finally, it is pressure tested to simulate well life design specifications.
5. The Production Hole Section is drilled to intersect formation targets containing oil and/or gas and is
drilled to a depth below the lowest hydrocarbon bearing target. The hole section is typically drilled with drilling fluid that exerts a higher hydrostatic pressure on the rock face than is present naturally in the rock pore space, ensuring formation fluids do not enter the wellbore. Other techniques such as underbalanced or managed pressure drilling may be applied dependant on the downhole environment. Logging while Drilling (LWD) can be used to gather data in real time to gain an understanding of the petrophysical environment.
6. If well trajectory allows, openhole wireline logging is generally performed after the production hole section has been drilled and prior to the production casing being run. Wireline operations for Santos are undertaken by a number of different industry recognised specialist service companies. Different energy sources are lowered into the well via wireline including density, neutron, acoustic and electrical logging tools. Calculations based on the received signals are undertaken to evaluate the different parameters of the formation such as porosity, permeability, rock type and hydrocarbon saturation. This information is used to ascertain whether the well is economical to run production casing for future production. If the well is not currently economic, a decision not to run production casing may be made requiring the well to be plugged and decommissioned or plugged and suspend for future operation.
7. The wireline logging evaluation program may include a vertical seismic profile (VSP) or checkshot survey, or a ‘walk-away’ VSP. These geophysical techniques are similar to surface seismic exploration, except the detectors (geophones) are located in the well bore, rather than at the surface, and the surface source is stationed at specific locations around the well. The geophone array comprises one to several geophones on wireline. The surface seismic energy source is either an airgun (in a water filled drum and pit) or a small vibrator truck located as close as is safe and practical to the well bore. The geophone array is run to the bottom of the hole on the wireline, and is then moved up the hole at regular intervals (e.g. 15m) and the stationary surface source is triggered. The geophones record the time it takes for the seismic energy from the surface source to arrive downhole at the geophone. The data recorded provides accurate velocity information and is processed to produce a seismic wavelet well-tie, such that the well can be “tied” to the 2D seismic line on which it is located.

8. After the production hole is drilled and logged, production casing is installed to the total depth of the wellbore and cemented in place. It is pressure tested to simulate well life design specifications. The purpose of the production casing is to provide isolation between the hydrocarbon reservoirs and all other overlying formations, to contain the pressurised fluid used to hydraulically stimulate the target zones, and to provide effective wellbore integrity for well production. High quality steel casing is designed specifically for each well. If the well does not require hydraulic stimulation, a lower grade of steel casing may be used that meets the design requirements for the life of the well.
Casing design scenarios are modelled using well-established and reviewed techniques to simulate the design loads for collapse, burst and tensile failures that could conceivably be observed during the operational and production phases. The results of these analyses direct the selection of casing grade and weight. All casing is tested by Santos and the contractor using specific Quality Assessment and Quality Control (QA / QC) procedures prior to installation to ensure compliance with the Santos engineering and regulatory specifications. After each hole section is drilled, the steel casing is cemented in place. The correct composition, volume and placement of cement is critical for well integrity. The cement serves two purposes – it provides protection and structural support to the casing while also providing zonal isolation between different formations, including groundwater and aquifers. The cement and required additives are high quality materials produced specifically for oil and gas operations with the materials selected designed to address the specific conditions of a particular well.
Santos and the cementing contractor ensure the cementing material and equipment is adequate to achieve the well design objectives and ensure effective isolation. Prior to pumping the cement, it will be laboratory tested against the engineering design and actual downhole conditions such as temperature. The cement is tested using specific QA / QC procedures and includes the following:
1. slurry density 2. thickening time 3. fluid loss control 4. free fluid 5. compressive strength development 6. fluid compatibility (cement, mix fluid, mud) 7. sedimentation control 8. expansion or shrinkage characteristics of the set cement 9. static gel strength development 10. mechanical properties (e.g. Young’s Modulus, Poisson’s Ratio, elastic / compressibility
characteristics) Cased hole logs can be run inside the cemented casing to validate the quality and integrity of the cement sheath bond to the casing and to the formation. Typically, these logs include:
1. gamma ray - measures naturally occurring gamma radiation to characterise the rock or sediment in a borehole
2. casing collar locator - a magnetic device that detects the casing collars 3. cement bond log - an acoustic device used to measure the properties of the cement sheath and the
quality of the cement bond between the casing and the formation The cement bond log is an acoustic device that can detect cemented or non-cemented casing. It works by transmitting a sound or vibration signal into the casing, and then recording the amplitude of the arrival signal. Casing that has no or poor quality cement surrounding it (i.e. free pipe) will have large amplitude acoustic signal because the energy remains in the pipe and isn’t transmitted to the formation. Casing that has a good cement sheath (fills the annular space between the casing and the formation and effectively couples the two) will have a much smaller acoustic amplitude signal as the energy is absorbed by the formation due to effective acoustic coupling. Santos uses experienced contractors to identify the key features of the cement quality to ensure the integrity of the cement seal for each casing pipe sheath.
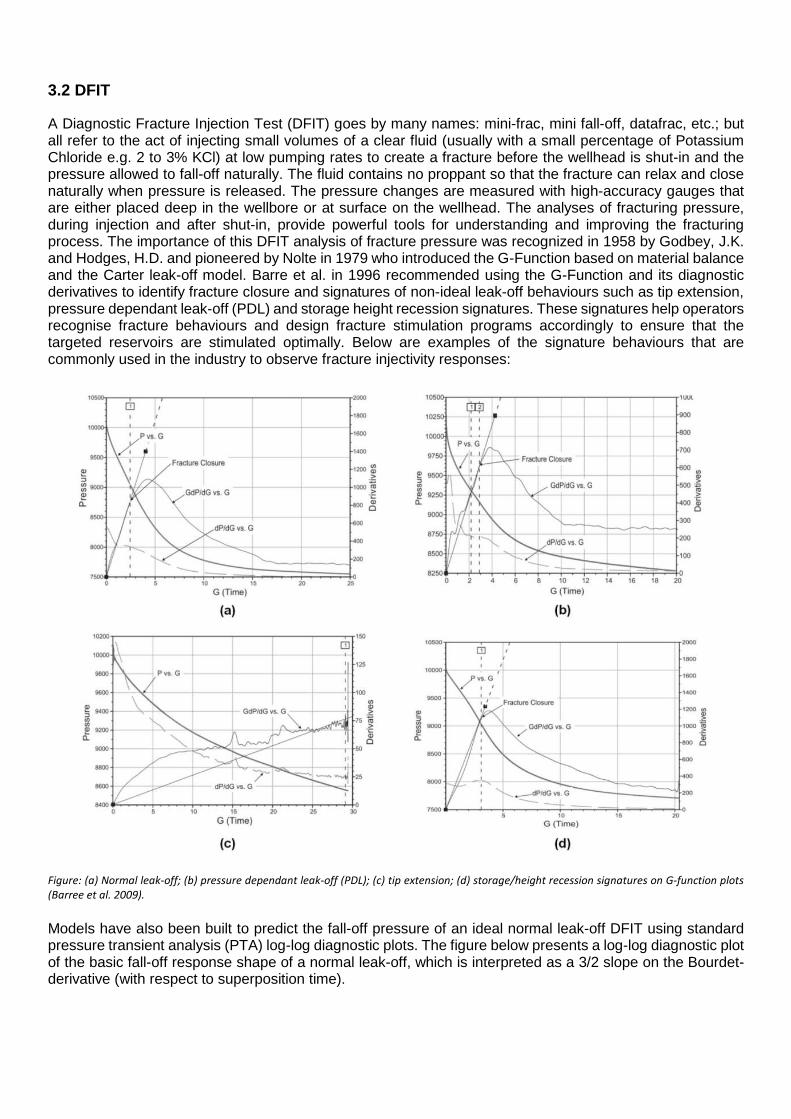
3.2 DFIT
A Diagnostic Fracture Injection Test (DFIT) goes by many names: mini-frac, mini fall-off, datafrac, etc.; but all refer to the act of injecting small volumes of a clear fluid (usually with a small percentage of Potassium Chloride e.g. 2 to 3% KCl) at low pumping rates to create a fracture before the wellhead is shut-in and the pressure allowed to fall-off naturally. The fluid contains no proppant so that the fracture can relax and close naturally when pressure is released. The pressure changes are measured with high-accuracy gauges that are either placed deep in the wellbore or at surface on the wellhead. The analyses of fracturing pressure, during injection and after shut-in, provide powerful tools for understanding and improving the fracturing process. The importance of this DFIT analysis of fracture pressure was recognized in 1958 by Godbey, J.K. and Hodges, H.D. and pioneered by Nolte in 1979 who introduced the G-Function based on material balance and the Carter leak-off model. Barre et al. in 1996 recommended using the G-Function and its diagnostic derivatives to identify fracture closure and signatures of non-ideal leak-off behaviours such as tip extension, pressure dependant leak-off (PDL) and storage height recession signatures. These signatures help operators recognise fracture behaviours and design fracture stimulation programs accordingly to ensure that the targeted reservoirs are stimulated optimally. Below are examples of the signature behaviours that are commonly used in the industry to observe fracture injectivity responses:
Figure: (a) Normal leak-off; (b) pressure dependant leak-off (PDL); (c) tip extension; (d) storage/height recession signatures on G-function plots (Barree et al. 2009). Models have also been built to predict the fall-off pressure of an ideal normal leak-off DFIT using standard pressure transient analysis (PTA) log-log diagnostic plots. The figure below presents a log-log diagnostic plot of the basic fall-off response shape of a normal leak-off, which is interpreted as a 3/2 slope on the Bourdet-derivative (with respect to superposition time).

Figure: Log-log diagnostic plot of an idealised fracture-injection/fall-off test (Marongiu-Porcu et al. 2011). 3.3 Fracture Stimulation Evaluation
Pressure Monitoring During a fracture stimulation treatment, computer assisted live monitoring allows for potential problems (surface or down-hole) to be identified and corrected quickly. An example of live monitoring applied to downhole conditions is if pressure communication between the annulus of the well and inside of the well is identified. Where communication is identified, it may be an indication that the first barrier control (as part of the well’s integrity management) has been compromised and the treatment will be stopped immediately. The figure below depicts information presented during real time stimulation operation monitoring. Key parameters such as surface, bottom-hole and annular treatment pressures, proppant concentrations, volume of injected fluid and fluid additives are monitored. The modelled pressures are compared with the actual pressures and can provide useful information in evaluating the overall fracture growth and fracture geometry achieved. This calibration process is used to refine and improve subsequent designs as part of the design optimisation process.
Figure: Real time monitoring of hydraulic fracture parameters (pressure, rate etc.) on a shale gas frac in the Cooper Basin (Santos 2014)

Tracers Chemical tracers are used to determine the relative contribution from each fracture stimulation stage. The low dosage chemical are designed to be unique in composition and able to be absorbed into the water or gas phase. This enables the operator to determine the performance of each frac stage and incorporate optimisation learnings into future campaigns. Microseismic Advanced stimulation monitoring techniques such as microseismic monitoring, may be used to evaluate fracture azimuth, fracture height and fracture half length. This information can be further used to calibrate the hydraulic stimulation model predictions. Microseismic monitoring involves the use of sensitive receivers (“geophones”) at the surface or within one or more nearby wells to detect and locate in 3D space the releases of energy associated with the propagation of the stimulated fractures. The figure below shows an example of a side-view of the locatable microseismic events that were detected during the multi-stage hydraulic stimulation of a Cooper Basin horizontal shale well, with the positions of the events colour-coded by stimulation stage. The modelling and field results show good agreement.
Figure: Microseismic events mapped during the 10 stage shale hydraulic fracture treatments pumped in the Cooper Basin. The different colours represent the different frac stages (Santos 2014). The microseismic results are supported by detailed studies such as by Fisher and Warpinski (2012) which have reviewed height growth data from unconventional (shale) plays in the US including the Barnett, Marcellus and Woodford shales. These studies have indicated that maximum height growth is typically far less than 300m when contained within a relatively homogeneous layer. Tiltmeter installation Tiltmeters are very sensitive surface tools for measuring very minor displacement or movement in the subsurface. They are used in hydraulic fracture stimulation operations to provide insight into the spatial extent and orientation of induced fractures. Tiltmeters are typically installed into pre-drilled and cased holes drilled with an 8” or 10” diameter bit to a depth of around 12 metres. Once the drilling is completed a 4” PVC pipe is then cemented in place within the hole. The cement secures the 4” PVC pipe to the ground around it to ensure good coupling for the tiltmeter. The cement ends around

1.2m below ground. To further minimize unwanted noise a larger 8 – 10” pipe around 1.8m in length is then placed around the smaller pipe to a depth of about 1.2m below the surface. The tiltmeter tools are then lowered into the inner 4” string of PVC. A small amount of sand is poured around the tools to give positive coupling to the surrounding ground. An end cap is then placed over the 8” PVC pipe to make the entire setup weatherproof. Drilling of the tiltmeter holes will be performed by a small truck mounted rig as pictured below. There will also be an additional vehicle and trailer for transporting extra equipment and consumables such as concrete and sand. As the vehicles are light vehicles only minimal (if any) line preparation will be needed for access. It is expected that most hole / tiltmeter sites will be accessible with no access track preparation at all. Drill cuttings will be stacked adjacent the hole to be re-used to backfill the holes upon completion of the project. Installation would typically be completed in a 2 week period.
Figure: Schematic of typical tiltmeter installation

Figure: Truck mounted rig preparing shallow hole to install tiltmeter.
Access track preparation
The proposed locations have not yet been finalised but, wherever possible, they will be located close to existing roads or tracks for ease of access. These should all be accessible with no access track preparation. A small number of holes may be required that are remote to existing roads and will need longer cross country travel to reach. Each hole is likely to only have 2 or 3 light vehicles access it during the installation process. Should access line preparation be required, the lines will be prepared to the standard of seismic lines and access line preparation will be a conventional approach using a dozer and possibly a grader. Tiltmeter recording Once the tiltmeter installation is complete, the meters themselves are basically maintenance free and do not require any revisits until the project is complete and the meters are removed. The tiltmeters are expected to remain in-situ for 2 – 3 months. Tiltmeter recovery and restoration Once the tiltmeter survey is complete, the tiltmeters are removed and the location restored. To do this, each site is once again visited by a couple of light vehicles and the meter is manually removed. The outer 8” PVC casing is also removed. The remaining 4” PVC casing is then broken off around 1.2m below ground and the resultant hole is backfilled to ground level using the drill cuttings form the initial drilling if possible. If any access tracks were prepared, they will be inspected at the time of tiltmeter removal and if required a grader will be brought in to restore the access tracks.

3.4 Fracture Stimulation
Objective After determining that a well has the required design and well integrity to undergo stimulation and completions, the well is handed over to ‘complete’ the well and set it up for production. Hydraulic fracture stimulation is not part of the drilling process but is a completion technique applied after the well is drilled. The intent of hydraulic stimulation is to place a highly conductive channel into the reservoir to increase the flow capacity of the well. Typically used in low permeability reservoirs that cannot sustain economic production such as shale. It is a process that has been used in the oil and gas industry since 1947. The Society of Petroleum Engineers (SPE) estimates that over 2.5 million hydraulic stimulation treatments have been undertaken in oil and gas wells worldwide. It has been successfully used on wells in the Cooper Basin for nearly 50 years without a primary barrier breach and is currently performed in many basins around Australia, including the Amadeus Basin in the Northern Territory.
Figure: Fracture Stimulation spread rigged up on a 3-well pad in the Cooper Basin. (Source: Santos 2016)
Figure: Multi stage fracture stimulation operations in a horizontal well.
Vertical depth to proppant placement in hydraulically opened fractures will likely range between 1500m and 4000m below surface.

The stimulation process involves pumping water, a specific blend of chemical additives and a propping agent such as sand or ceramic beads down the well at sufficient pressure to create a fracture in the target formation. Proppant keeps the fractures open once the pump pressure is released which thereby improves the productive potential of the well. A fracture created in deep shale reservoirs, will propagate laterally from the well in a vertical plane. Common dimensional terminology for the created fracture includes fracture half length (xf), fracture height (hf) and propped width (wf), as depicted in the figure below. An unconventional shale gas well typically takes 10 to 15 days to complete hydraulic stimulation operations, with a hydraulic stimulation fluid flowback period of 3 to 90 days, depending on the reservoir and clean up profile, which is typically followed by ongoing flaring and production testing. Production tests may be short if it is possible to put hydrocarbons into existing infrastructure (e.g. Cooper Basin, Surat Basin); however, for exploration wells in frontier basins extended periods (>1 year) of flaring and production testing will be required to establish whether a well or field has the potential to be developed economically
Figure: Conceptualised Shape of Hydraulic Stimulation Zone of Influence. (Source: Economides and Martin, 2007)
Santos has a long history of demonstrated well integrity during hydraulic fracturing operations. In nearly 50 years of hydraulic fracturing operations on over 1,150 wells, there has never been a loss of the primary barrier during the fracture treatment. The primary barrier during the stimulation phase is generally the production casing, with the secondary barrier being the surface well pressure control. Should the primary barrier fail, a pressure relief valve (PRV) installed to monitor pressure between the primary barrier and surface casing, is triggered to open at a pressure well below the failure point of the surface casing. This ensures that the surface casing is not exposed to pressure above its design specification, and as a result prevents the risk of failure. Also, programmable pressure triggers (kickouts) on each of the high pressure pumps will physically shutdown each pump (and associated pressure) if a certain trigger pressure is reached. This trigger is below the design of the well. If the primary barrier did fail during hydraulic fracturing operations, operations would cease and it would be repaired to meet the design requirements before going forward with completing the well again.
Engineering Design Open hole and cased hole logging provides information required for the hydraulic stimulation design process, including rock stress and lithological parameters. This data is processed using industry-accredited stimulation software to develop an optimal design. The basis of well specific hydraulic fracture design is to create a fracture within the target formation that will produce hydrocarbon through the number of required fractures. This is achieved by modelling fracture length, fracture conductivity, and fracture height for each created fracture as depicted in the figure below. A number of considerations influence the final design for each treatment, including:

• depth and thickness of the formation target • lithology of formation target and bounding layers • minimum and maximum horizontal stress across all layers (target and bounding) • thickness of the seals above and below the target reservoir formation • porosity and permeability of the formation • pore fluid saturations (percentage of formation pore volume occupied by oil, gas or water) • pore fluid properties (e.g. density, water salinity) • well performance data, including flow rates, formation pressure and produced fluid properties • formation boundaries (as identified from offset wells, log data, cuttings data, and/or seismic data) • bulk rock density, elastic properties and compressibility • natural fracture networks • stress field analysis to determine the maximum principle stress direction and the minimum principle
stress direction
Figure: Modelled side view output from industry accredited stimulation software for a Cooper Basin horizontal well shale hydraulic fracture (Source: Santos 2014)
Proppant and Chemicals In shale hydraulic stimulation treatments, water accounts for more than 90% of the mixture and sand accounts for about 5-9%. Chemicals generally account for less than 1% of the mixture and assist in carrying and dispersing the sand in the low permeability rock, and ensuring the fluids and formation are compatible and will have the desired physical properties. In accordance with regulatory requirements, chemical additives are subject to full disclosure. The chemical additives are not specific to the hydraulic fracture stimulation process, having many common household uses such as in swimming pools, toothpaste, baked goods, ice cream, food additives, detergents, cosmetics and soap. The chemicals used provide the following functions:
• Viscosity – gelling agents (natural plant based) are added to the water to provide viscosity to enable the proppant material to be transported down the well and into the created fractures.
• Friction reduction – to reduce the force required to pump the fluid, making the fluid more slippery and easier to pump at high pressures and high rates required to create the fracture network.
• Biocide – added to ensure that there are no microbes or organisms present in the water that will affect the gelling agents and to ensure they will not enter and affect the reservoir.
• Scale and corrosion – scale and corrosion inhibitors are added to prevent deposition of mineral scales and to prevent corrosion of the primary wellbore barrier (i.e. the steel casing).

• Surface tension – surfactants or surface tension modifiers are added to assist the flowback of fluids from the formation.
The process is initiated by pumping a pre-designed volume of the stimulation fluid without proppant, referred to as the “pad volume”. The purpose of the pad volume is to create the fracture geometry required to receive the designed proppant volume. Prior to and during pumping the pad into the well, the base gel is prepared and tested using specific QA/QC procedures. Programmed and automated control systems are used to maintain the fluid properties during the pumping of the treatment process. The viscosity of the fluid is typically in the region of 10 to 40 centipoise (cp), depending on the specific fluid design. This may require the use of a base gel or cross-linked gel, both made from guar. In shale fracture stimulation, it is generally possible to use only Friction Reduced (FR) water (instead of a base or cross linked gel), by the addition of a friction reducing agent. This fluid system has the effect of making the fluid slippery to minimise friction pressure lost to the casing.
Figure: Example of a typical slurry gum constituent, guar gum – illustrating its native form, seed form, splits and powder. ** Note: Guar gum is a vegetable product which is ground into a powder and used to create a viscous liquid for hydraulic fracturing. (Source: Economides and Martin, 2007)
Once the pad volume has been pumped, the injection of the “slurry stages” begins. Proppant is added to the blender and proportioned into the stimulation fluid. The concentration of proppant generally increases through the slurry stages as designed within the fracture treatment simulator. Previously mentioned chemical additives are incorporated to provide a suitable fluid for transporting proppant into the already created fracture. In a cross-linked gel fluid system, breaker compounds are added at progressively increasing concentrations throughout the pad and slurry stages. The breaker comprises an oxidizing compound or enzyme that breaks the crosslink sites, as well as the long chain polymers. The end result is a fluid with significantly lower viscosity that can be easily flowed back from the formation to assist with fracture clean-up. The “break time” is designed to coincide with the known pump time at reservoir conditions plus some additional time to ensure the treatment is pumped to completion. This enables the fluid to be more easily recovered from the formation. Proppant addition begins at low concentrations and is staged up to the final designed concentration which is specific to the formation being hydraulically stimulated. Typical proppant concentrations will range from 0.5 lb/gal (60 kg/m3) to 8 lb/gal (1000 kg/m3) for conventional reservoir stimulation, and typically range from 0.5 lb/gal (60 kg/m3) to 2.0 lb/gal (240 kg/m3) for shale reservoir stimulation. Proppant used in hydraulic stimulation range from graded quartz sand to higher strength ceramic proppants. The strength of this inert material varies, with ceramic proppant being much stronger than quartz sand. Ceramic proppant is used in formations with higher effective stresses, to prevent it from crushing and losing the created fractures conductive properties.
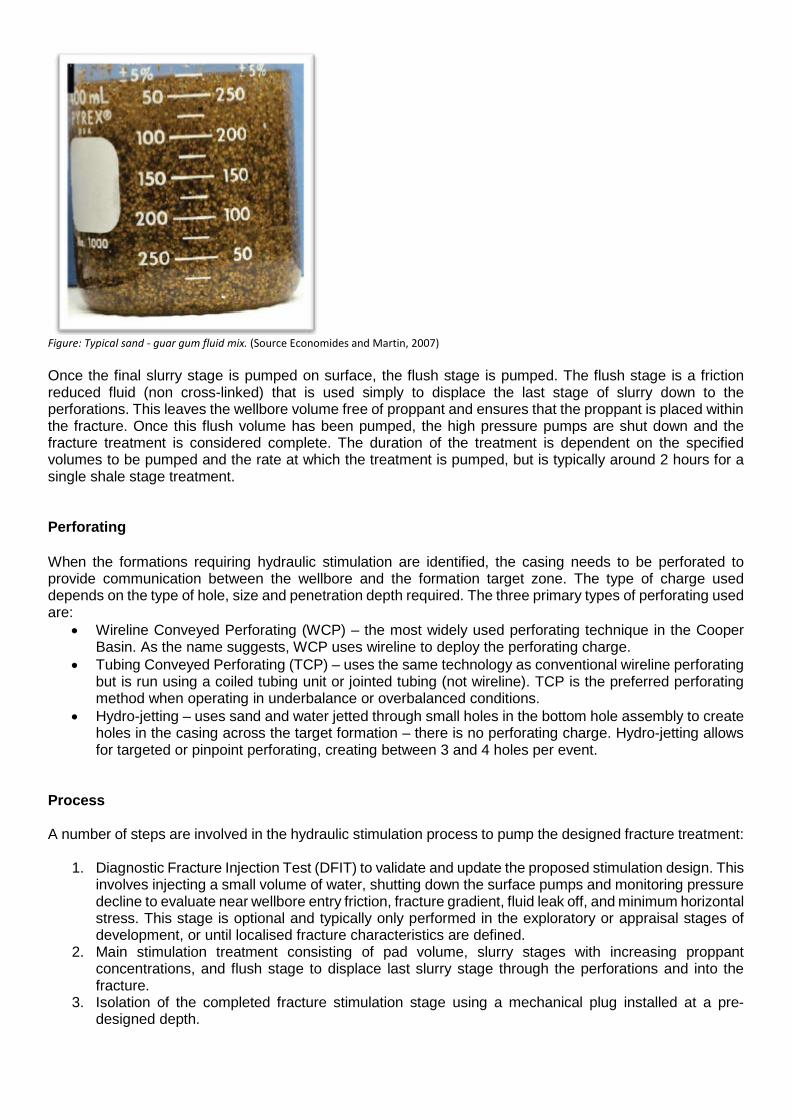
Figure: Typical sand - guar gum fluid mix. (Source Economides and Martin, 2007) Once the final slurry stage is pumped on surface, the flush stage is pumped. The flush stage is a friction reduced fluid (non cross-linked) that is used simply to displace the last stage of slurry down to the perforations. This leaves the wellbore volume free of proppant and ensures that the proppant is placed within the fracture. Once this flush volume has been pumped, the high pressure pumps are shut down and the fracture treatment is considered complete. The duration of the treatment is dependent on the specified volumes to be pumped and the rate at which the treatment is pumped, but is typically around 2 hours for a single shale stage treatment.
Perforating When the formations requiring hydraulic stimulation are identified, the casing needs to be perforated to provide communication between the wellbore and the formation target zone. The type of charge used depends on the type of hole, size and penetration depth required. The three primary types of perforating used are:
• Wireline Conveyed Perforating (WCP) – the most widely used perforating technique in the Cooper Basin. As the name suggests, WCP uses wireline to deploy the perforating charge.
• Tubing Conveyed Perforating (TCP) – uses the same technology as conventional wireline perforating but is run using a coiled tubing unit or jointed tubing (not wireline). TCP is the preferred perforating method when operating in underbalance or overbalanced conditions.
• Hydro-jetting – uses sand and water jetted through small holes in the bottom hole assembly to create holes in the casing across the target formation – there is no perforating charge. Hydro-jetting allows for targeted or pinpoint perforating, creating between 3 and 4 holes per event.
Process A number of steps are involved in the hydraulic stimulation process to pump the designed fracture treatment:
1. Diagnostic Fracture Injection Test (DFIT) to validate and update the proposed stimulation design. This involves injecting a small volume of water, shutting down the surface pumps and monitoring pressure decline to evaluate near wellbore entry friction, fracture gradient, fluid leak off, and minimum horizontal stress. This stage is optional and typically only performed in the exploratory or appraisal stages of development, or until localised fracture characteristics are defined.
2. Main stimulation treatment consisting of pad volume, slurry stages with increasing proppant concentrations, and flush stage to displace last slurry stage through the perforations and into the fracture.
3. Isolation of the completed fracture stimulation stage using a mechanical plug installed at a pre-designed depth.

4. Perforation of the next stage to be hydraulically stimulated and repetition of the process in steps 2 to 4 above until the final fracture stimulation stage is completed.
5. Removal of all mechanical isolation devices by milling out the mechanical isolations. 6. Flowback well to clean up fracture stimulation fluids and monitor hydrocarbon production. This step
may also be combined with an Extended Production Test (EPT) to help define the field reserves and expected production life. The flowback of stimulation fluid is conducted through a separator, which separates and captures liquids, and flares produced gas through a vertical ‘flare stack’.
The above method describes the “plug and perf” technique for fracture stimulation. Another technique is to use coiled tubing assisted annular stimulation which is used to provide a conduit for “pin-point fracturing”. Coiled tubing is run into the well to the deepest target. The bottom-hole assembly run on the end of the coiled tubing incorporates a jetting assembly that allows low concentration sand slurry to cut holes or slots into the casing and cement. The hydraulic stimulation treatment is then pumped into the coiled tubing / casing annulus to initiate and propagate the fracture. Equipment The equipment and machinery required to carry out a hydraulic stimulation operation is highly mobile and able to be installed and removed relatively quickly (generally within a couple days). The equipment is designed to comply with state and federal regulations for road transport, and are fitted with safeguards such as an in-vehicle monitoring system (IVMS) to ensure compliance of the individual contractors. The Wellhead – is used to inject into and control the well, during hydraulic stimulation operations. The stimulation fluids, which are injected from the surface via the wellhead, are injected through the perforations in the well casing under high pressures in order to physically fracture the reservoir rock. The wellhead provides the primary surface barriers for well control.
Figure: Typical hydraulic stimulation wellhead used for shale stimulation operations Above ground storage tanks – on site, above ground water storage tanks provide temporary water storage for use in the hydraulic stimulation process. Source water can either be trucked from a nearby water source or piped along a temporary network. Small dosages of biocide are added to control algal growth particularly under warm and stagnant conditions. Following completion of works, temporary water storage infrastructure is removed from site.

Figure: Above ground storage ponds used for frac make up water storage and frac flowback water storage in the Cooper Basin, (Santos 2013) Sand Trailer Unit – a large, multi-compartment trailer that holds proppant (sand or ceramic material) required for the treatment. When proppant is required, a conveyor system distributes proppant from the compartments to the blender unit.
Figure: Sand trailer unit. (Halliburton 2012) Blender Units – In general, two different blending units are used: A pre-gel blender; and a down-hole blender. The pre-gel blender combines the source water with additives required for the base stimulation fluid and proportions of required additives to provide the final hydraulic stimulation fluid. The down-hole blender unit then proportions proppant to the stimulation fluid to provide the proppant concentrations specified in the treatment design. The final hydraulic stimulation fluid, without proppant, is referred to as the “clean fluid”. The final hydraulic stimulation fluid, with proppant added, is referred to as “slurry”. Chemical additives are precisely measured, controlled and recorded by the blender throughout the stimulation treatment process.
Figure: Blender unit. (Halliburton 2012)

High Pressure Pumps – Reciprocating triplex or quintaplex pumps that receive low pressure hydraulic stimulation fluid from the down-hole blender and inject these fluids at the required higher pressure into the well during the hydraulic stimulation process. 6-20 units are typically used on shale hydraulic fracture stimulation treatments. The pumps contain programmable pressure triggers (kick outs) to prevent pressure from exceeding the wellbore design limits. High pressure treating iron (pipes, manifolds, connectors, etc.) connecting the stimulation pumps and the wellhead also contain pressure safety valves (PSVs) that are set to open at a pre-set pressure to ensure the well components are protected.
Figure: High pressure pump. (Halliburton 2012)
Control or Data Acquisition Unit – telemetry from all units connects to a central control room during hydraulic stimulation treatments. Treatment parameter data, including surface and bottom-hole pressure, pumping rate, chemical rate and fluid density, are monitored, recorded and plotted. Treatment supervisors monitor and control the treatment to ensure that the treatment is pumped according to design. Satellite communication facilities allow further ‘remote’ oversight by technical experts.
Figure: Control unit. (Halliburton 2012) Coiled Tubing Unit – a Coiled Tubing Unit (CTU) has many uses within oil and gas operations but is not always required as part of hydraulic stimulation operations. On some occasions the stimulation treatments are placed using coiled tubing assisted annular fracturing, as opposed to “perf and plug” completions (as described above). Coiled tubing can be used in place of wireline jet perforating by jetting holes through the casing and cement using abrasive jetting. Once perforations are jetted, the coiled tubing is left inside the well and the hydraulic stimulation treatment is pumped down the coiled tubing / casing annulus.

In Plug and Perf operations, the Coiled Tubing Unit is generally used at the completion of hydraulic fracturing operations and prior to flowing back into the well, in order to remove or “mill out” the bridge plugs set in the well to hydraulically isolate each stage.
Figure 3.19: Coiled tubing unit. (Halliburton 2012)
Flowback Ponds and/or Tanks – are used to receive fluids produced during stimulation operations and during the initial clean-up phase (following stimulation activities), and potentially during the early weeks and/or months (or possibly longer) of production testing operations. Typically the returning fluid decreases over time until it ceases and a hydrocarbon stream is solely produced. Ponds are typically double lined with UV stabilised synthetic liners to prevent leaks. Typically, after the initial clean-up phase, the produced fluids are allowed to evaporate or treated for disposal or re-use.
3.5 Completion
At the end of the clean-up phase, a workover rig may be used to install production tubing and associated completion equipment such as packers, nipple profiles, tubing hanger, and the production tree. Production tubing which has a smaller internal diameter than casing, is generally required to ensure the well can continue to ‘clean up’ and there is sufficient vertical lift performance to enable fluid to be removed from the well under natural lift from the well. After the well has been “completed” it is ready for longer term production via an inline production network.
3.6 Flow Testing
Once the injection process is complete, the internal pressure of the rock formation causes fluid to return or “flowback” to the surface through the shale gas well. This fluid, often referred to as flowback, contains the dissociation or breakdown products of the injected fluids plus naturally occurring geogenic compounds (i.e. material or substances that are mobilised through the process that must also be considered for any potential health or environmental impact). A considerable volume of the injected fluids are recovered as flowback. Studies performed by the US EPA (US Environment Protection Agency (EPA), 2004) indicated that approximately 60% of the fluids are recovered in the first three weeks, and total recovery back to surface was estimated to be from 68–82%; however, this is variable across different fields and can be less than 20% in some instances. The flowback water is typically temporarily stored tanks or lined pits before treatment for reuse or disposal. Initial flowback is typically performed with a mobile separator on location during exploration and appraisal when there are no or limited surface processing facilities. The separator is normally located on the well-pad and connected via relatively short flowlines that include debris catchers and choke manifolds to the wellhead

in order to optimise the flowing conditions and frac clean-up. Separators are generally 3-phase which have the ability to effectively segregate gas, oil and water. The gas is sent through to a flare stack where it is flared on location (unless a gas network is already in place), while the liquid hydrocarbon (oil/condensate) is stored in onsite storage tanks, and the water or flowback is stored as described above
Figure 3.20: Flow testing separator rig up on a pad location. (Farley Riggs 2014) The recovered fluids produced during the initial clean-up phase (following stimulation activities), are stored in Flowback Ponds or Tanks, which are double lined with UV stabilised synthetic liners to prevent leaks. The fluid is allowed to evaporate or it is treated for disposal or reuse in the next hydraulic fracturing event. Waste treatment and management facilities are modular, factory fabricated and transported to site for assembly and connected to piping, electrical controls and instrumentation. By-products from wastewater treatment are contained in fully engineered, purpose built structures for further treatment and disposal. Strategic opportunities for further treatment and beneficial use will be reassessed once composition and technology is assessed. The NT Government will mandate a number of conditions through a Code of Practice that Santos will be required to comply with as a condition of its authorisation to undertake exploration activity. Fluid samples are taken during the flowback period. The analysed samples are used to determine flow contribution from each of the fracture stimulation stages. Gas sampling is also performed in order to determine the composition of the gas (methane, ethane, butane, carbon dioxide, hydrogen sulphide [not expected], etc.). This will define the value of the product as well as optimising the casing and wellhead material specifications for future campaigns.

Annexure 4 – List of Chemicals Proposed for use in Hydraulic Fracturing of Potential Hydrocarbon Producing Formations
Below is a list of chemicals used by Halliburton, Schlumberger and Condor in Fracture Stimulation operations. If chemicals other than those listed are proposed for use, these will be provided to the NLC and disclosed to Traditional Owners at On Country Work Program meetings.
Chemical Name 1,6-Hexanediol 2-Ethoxy-naphthalene 2-hydroxy-N,N,N-trimethylethanaminium chloride 2-Mercaptoethyl Alcohol 2-methyl-2h-isothiazol-3-one 2-Propenamid (impurity) 2-Propenoic acid, homopolymer, ammonium salt 5-chloro-2-methyl-2h-isothiazolol-3-one Acetic acid Acrylamide acrylate copolymer "Acrylamide, 2-acrylamido-2-methylpropanesulfonic acid, sodium salt polymer" Acrylamide, sodium acrylate polymer Acrylonitrile Alcohols, C10-16, ethoxylated propoxylated Alcohols, C11-14-iso-, C13-rich, ethoxylated Alcohols, C12-15, ethoxylated Alcohols, C12-16, ethoxylated Alcohols, C6-12, ethoxylated propoxylated Alcohols, C9-11, ethoxylated Alkyl Alcohol Amides, tall-oil fatty, N,N-bis(hydroxyethyl) Amine oxides, cocoalkyldimethyl Ammonium Chloride Ammonium Persulphate Ammonium Sulphate Amylase, Alpha Benzaldehyde but-2-enedioic acid Butyl alcohol Calcium magnesium sodium phosphate frit Carbolite (proppant) Castor Oil Ceramic (proppant) Chlorous acid, sodium salt Choline Chloride Cinnamaldehyde Citric acid Copper(II) sulfate Cristobalite Crystalline silica, quartz Decamethyl cyclopentasiloxane D-Gluconic acid, monosodium salt Diammonium peroxodisulphate Diatomaceous earth, calcined Dicoco dimethyl quaternary ammonium chloride Diethanolamine Diethylene glycol

Diethylene Glycol Dimethyl siloxanes and silicones Disodium octaborate tetrahydrate Distillates, Hydrotreated Light Diutan Diutan gum Dodecamethylcyclohexasiloxane EGMBE Ethanol Ethoxylated branched C13 alcohol Ethoxylated C11 Alcohol Ethylene Glycol Fatty acids, tall-oil, ethoxylated Formic Acid Glutaraldehyde Guar Gum Hemicellulase Hydrochloric acid Hydrotreated light petroleum distillate Inorganic Salt Isopropanol ISP (proppant) Magnesium chloride Magnesium nitrate Magnesium silicate hydrate (talc) Methanol N-Benzyl-Alkylpyridinium Chloride Non-crystalline silica (impurity) Octamethylcyclotetrasiloxane Partially neutralized polycarboxylic acid polymer Pine Oil Poly(oxy-1,2-ethanediyl), alphahexyl-omega-hydroxy- poly(tetrafluoroethylene) Polyacrylamide Polyethylene glycol "Polymer of 2-acrylamido-2-methylpropanesulfonic acid sodium salt and methyl acrylate" Polyoxyethylene nonylphenol ether Polyoxyethylene-polyoxypropylene Block Copolymer Potassium Chloride Potassium Hydroxide Potassium persulfate Pottasium Sorbate Propan-2-ol Quartz, Crystalline silica Quaternary ammonium compounds, bis(hydrogenated tallow alkyl) dimethyl, salts with bentonite Sand (proppant) Siloxanes and silicones, dimethyl, reaction products with silica Sobitan, mono-9-octadecenoate, (Z) Sodium acrylate, polymer with acrylamide and sodium AMPS Sodium Benzoate Sodium bisulfite Sodium Bromate Sodium calcium pentaborate octahydrate Sodium Chloride Sodium diacetate Sodium erythorbate

Sodium hydroxide Sodium iodide Sodium perborate tetrahydrate Sodium persulfate Sodium polyacrylate Sodium Sulfate sodium sulphite Sodium Tetraborate Decahydrate sodium thiosulphate Sorbitan monooleate polyoxyethylene derivative Sorbitan, mono-(9Z)-9-octadecenoate Sorbitan, monooleate, polyoxyethylene derivs. Tar Bases, Quinoline Derivatives, Benzyl Chloride-Quat Tetrasodium ethylenediaminetetraacetate Tributyl tetradecyl phosphonium chloride Triethanol amine Ulexite Urea

Santos Ltd l Environment Management Plan: MacArthur Basin Civil and Seismic Program 17 June 2019
Pastoral Land Access and Compensation Agreement – Annexure D Plans
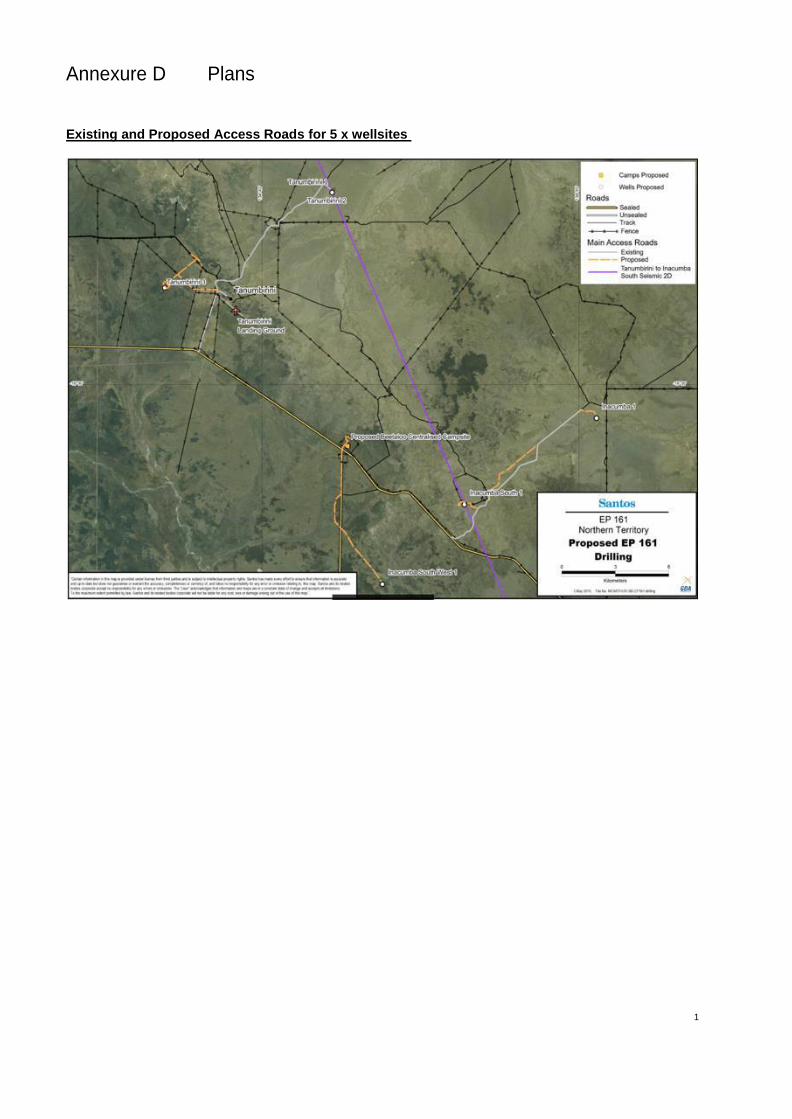
1
Annexure D Plans
Existing and Proposed Access Roads for 5 x wellsites

2
Tanumbirini #2 access road and wellsite maps

3
Inacumba #1 access road and wellsite maps

4
Inacumba South #1 access road and wellsite maps

5
Inacumba South West #1 access road and wellsite maps

6
Tanumbirini #3 access road and wellsite maps

7
2D seismic line between Tanumbirini #2 and Inacumba South #1